Intel NUC 12 Dragon Canyon review with Intel Core i9-12900
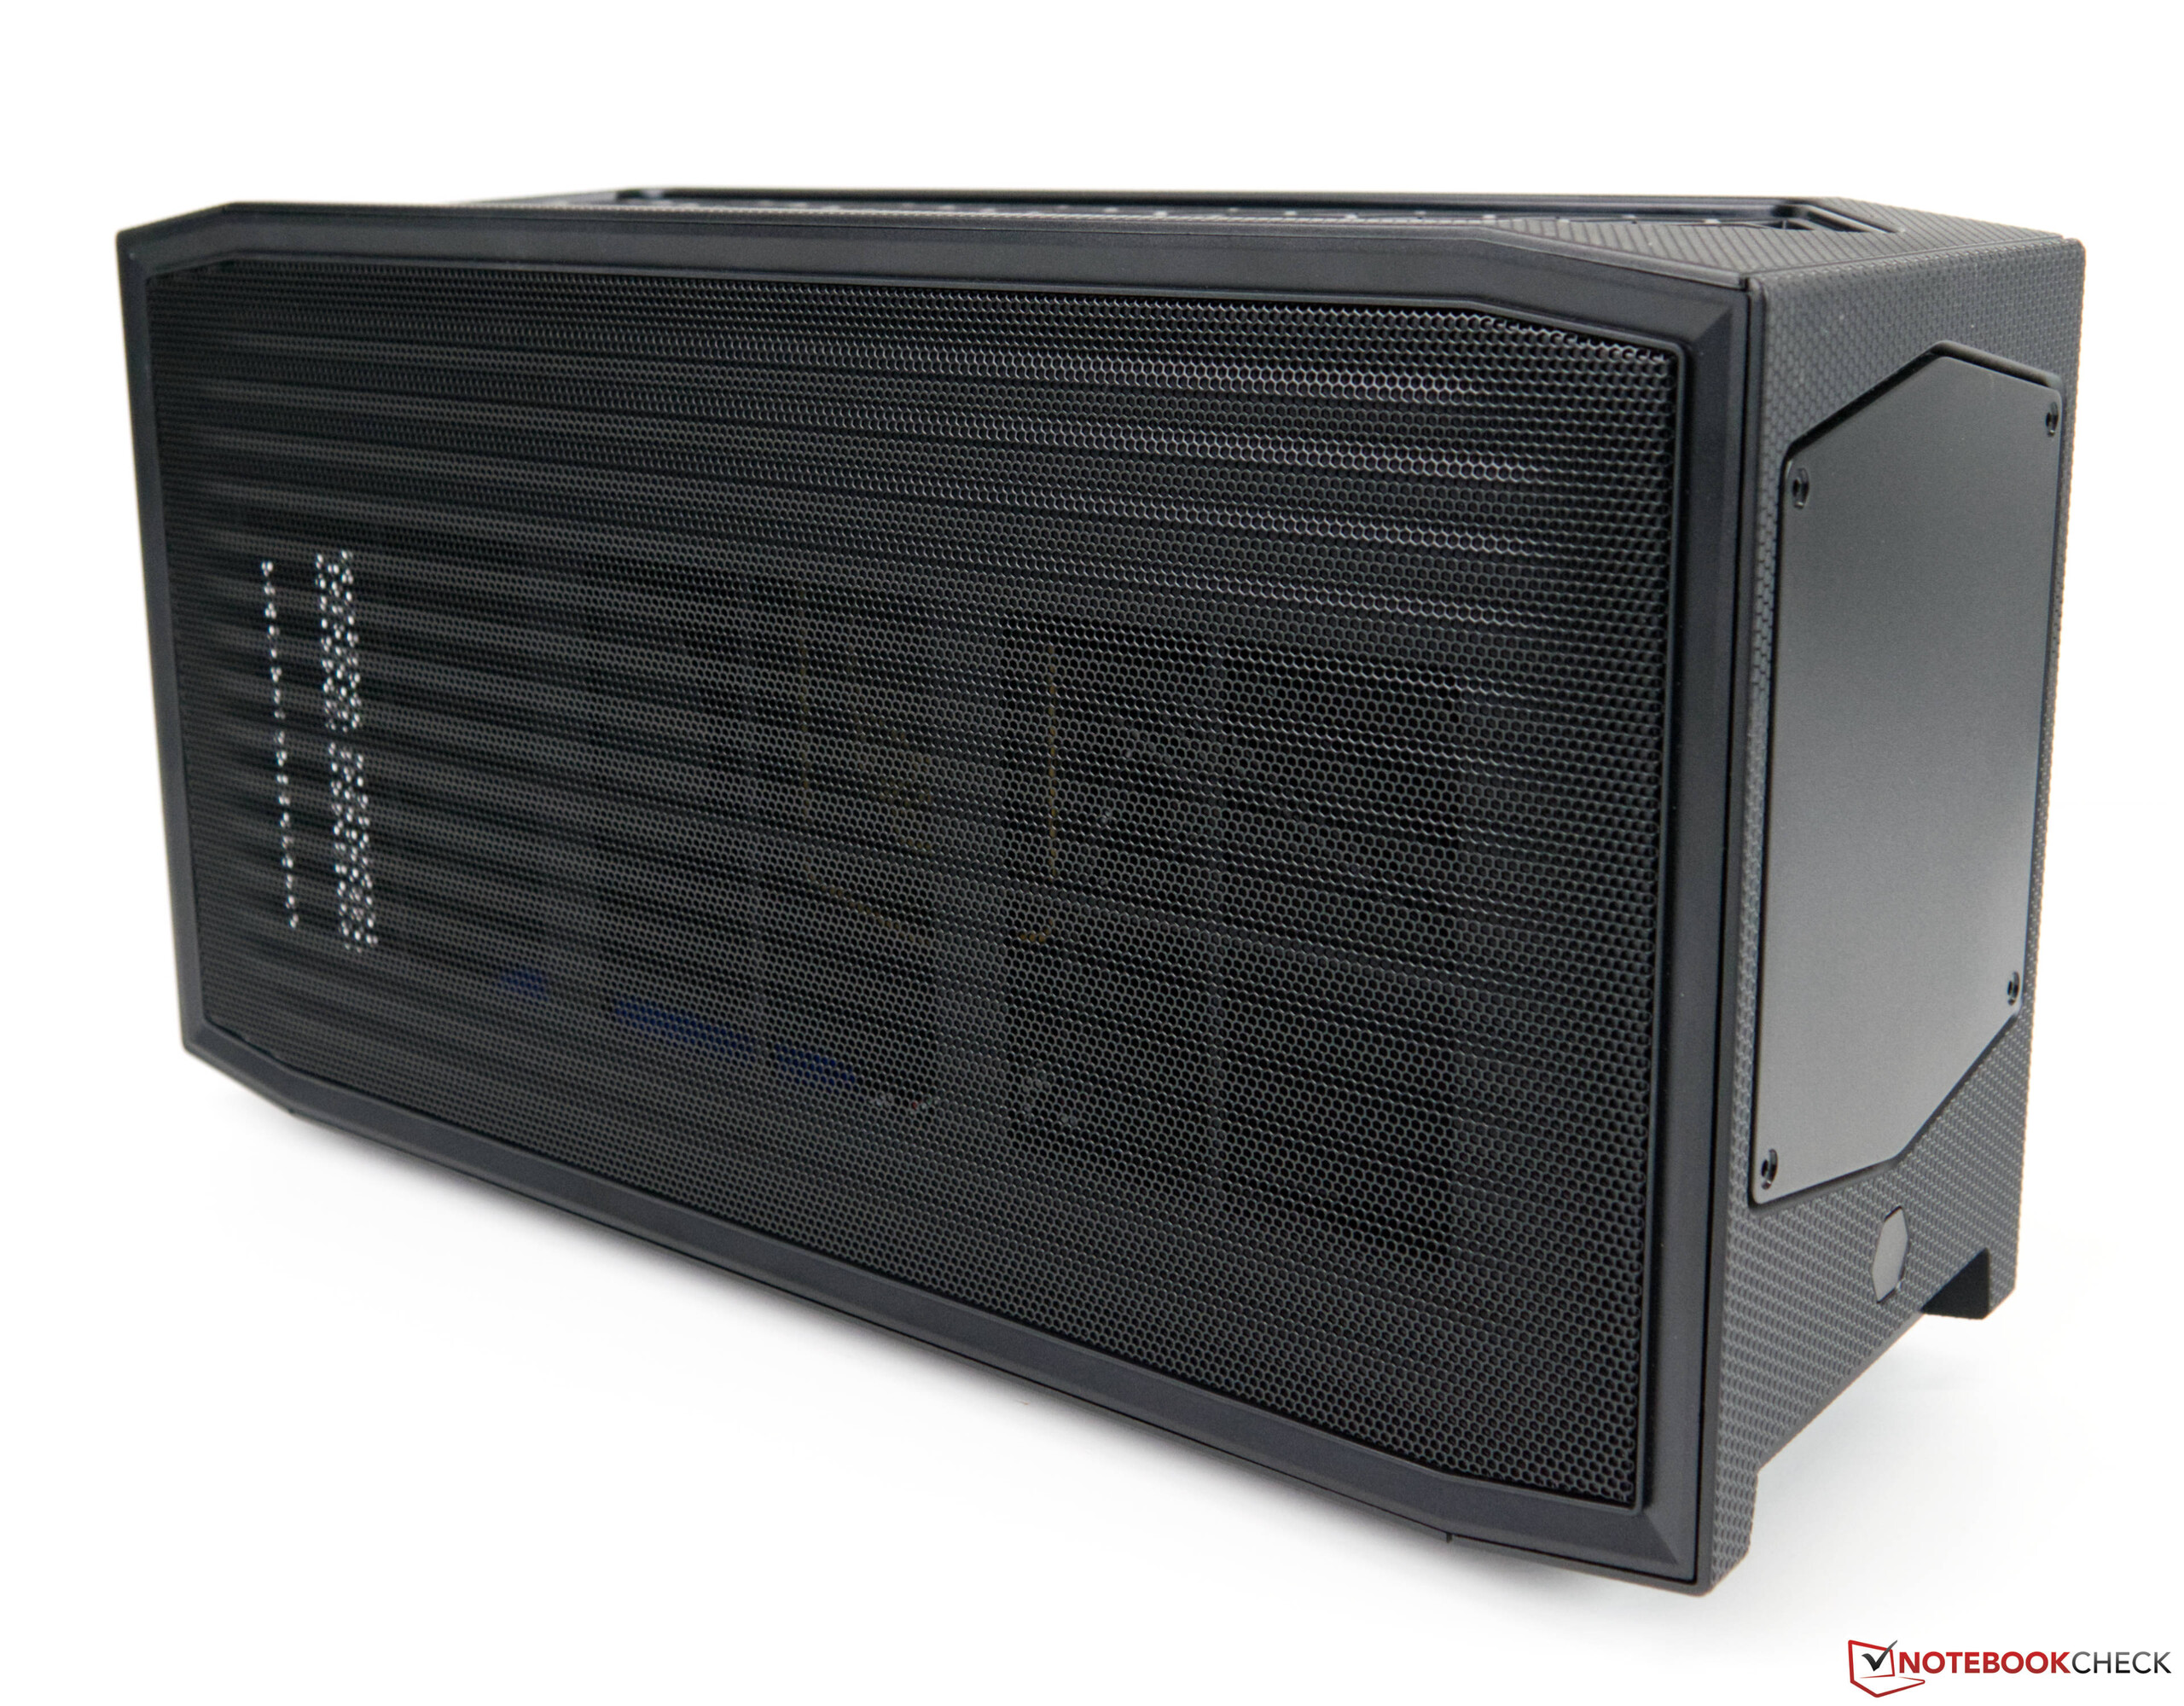
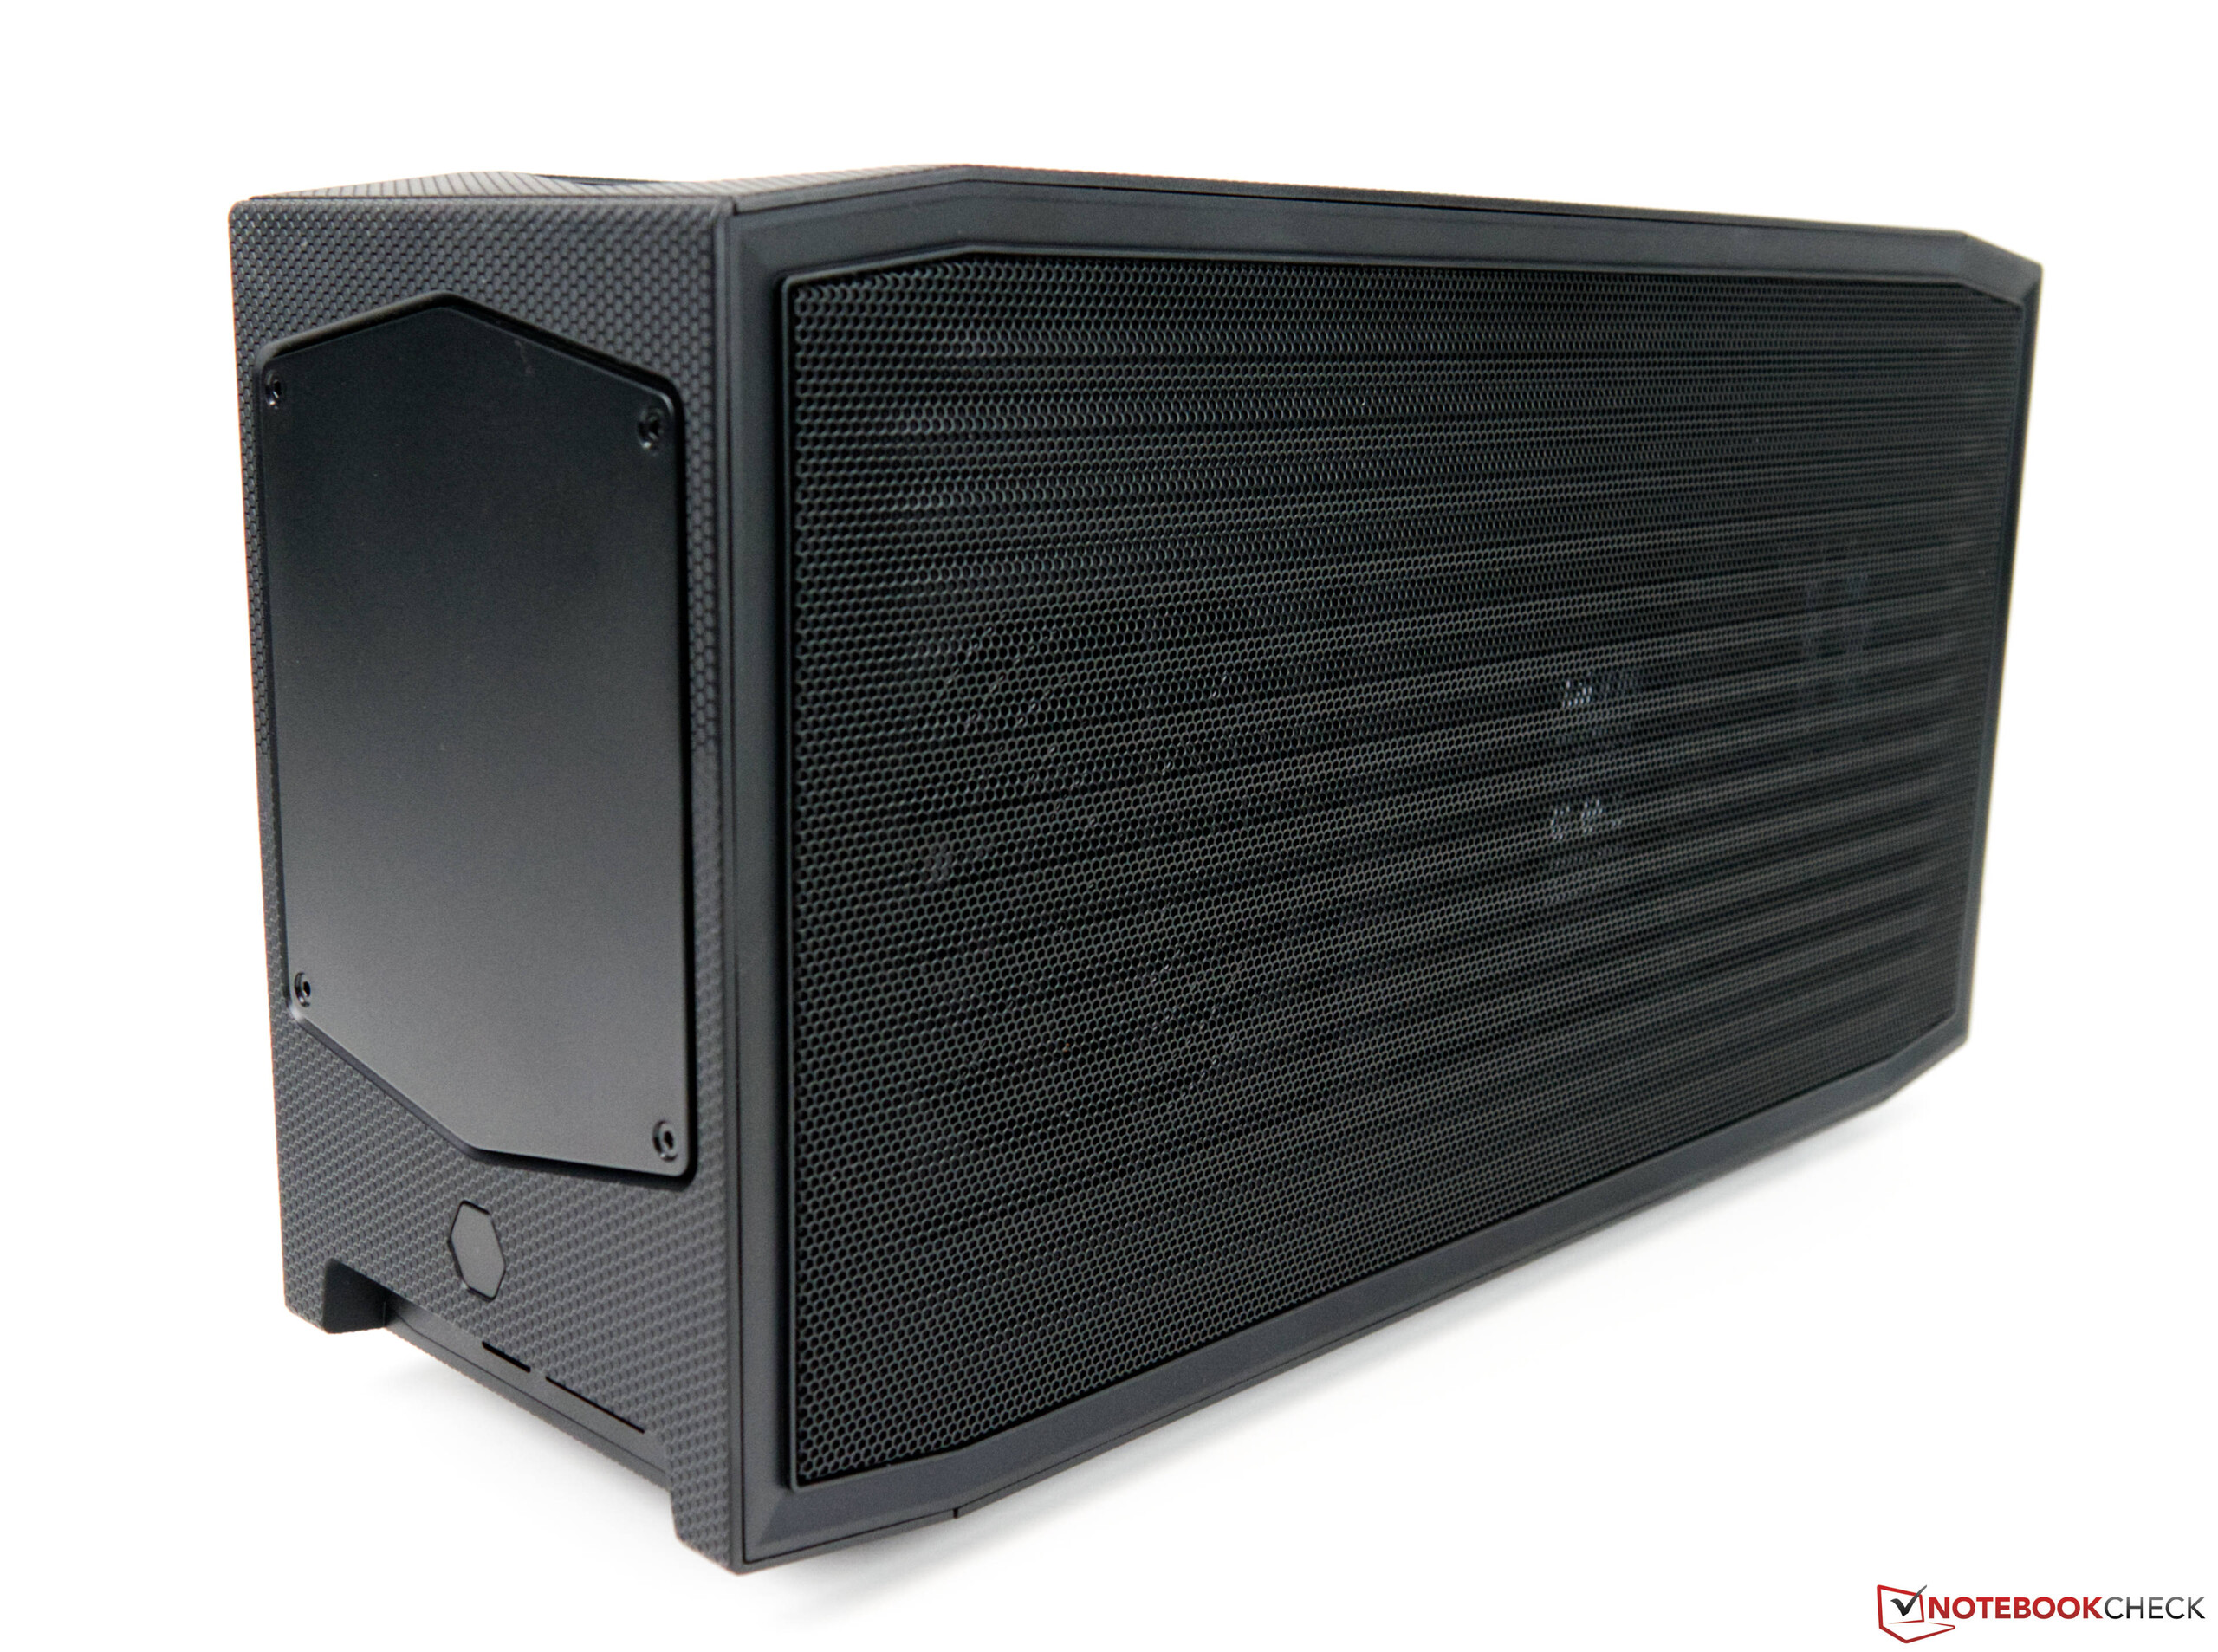
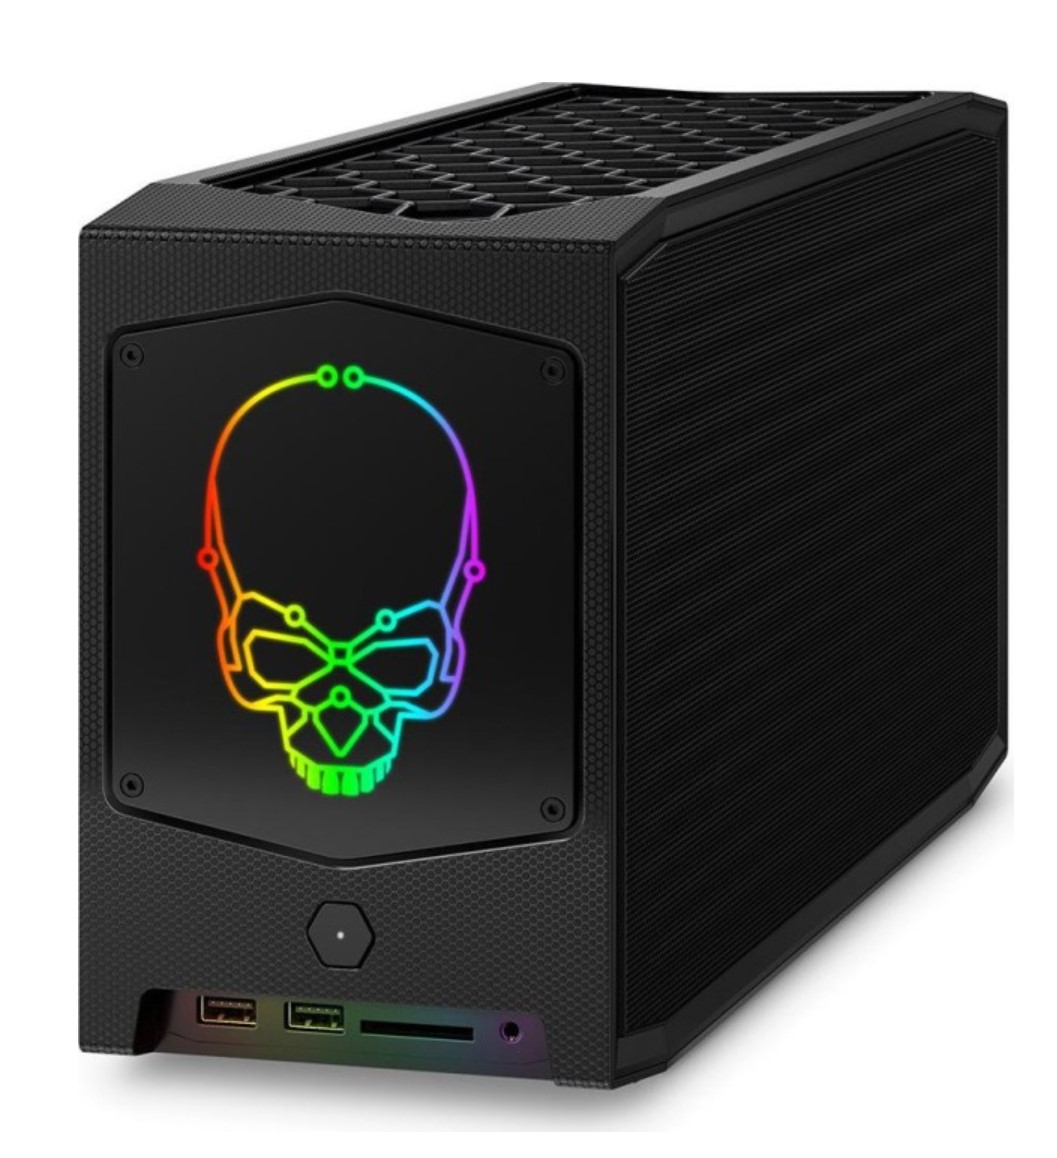
The Intel NUC Extreme Kit has already been known for some time. With its compact build and good equipment, it stands out from the masses, and the design of the compact desktop computer can be easily recognized, without a doubt.
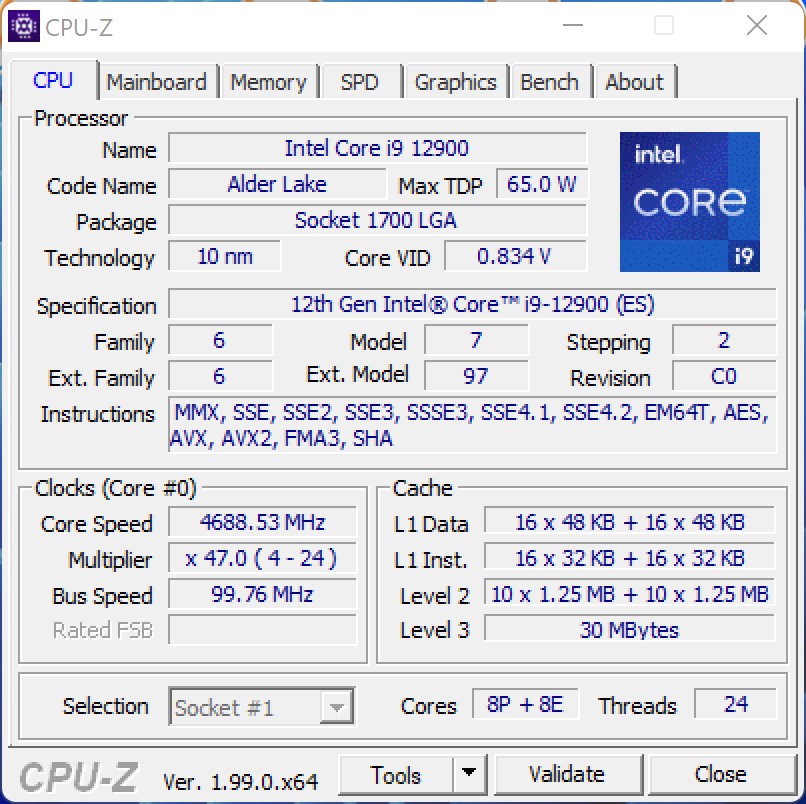
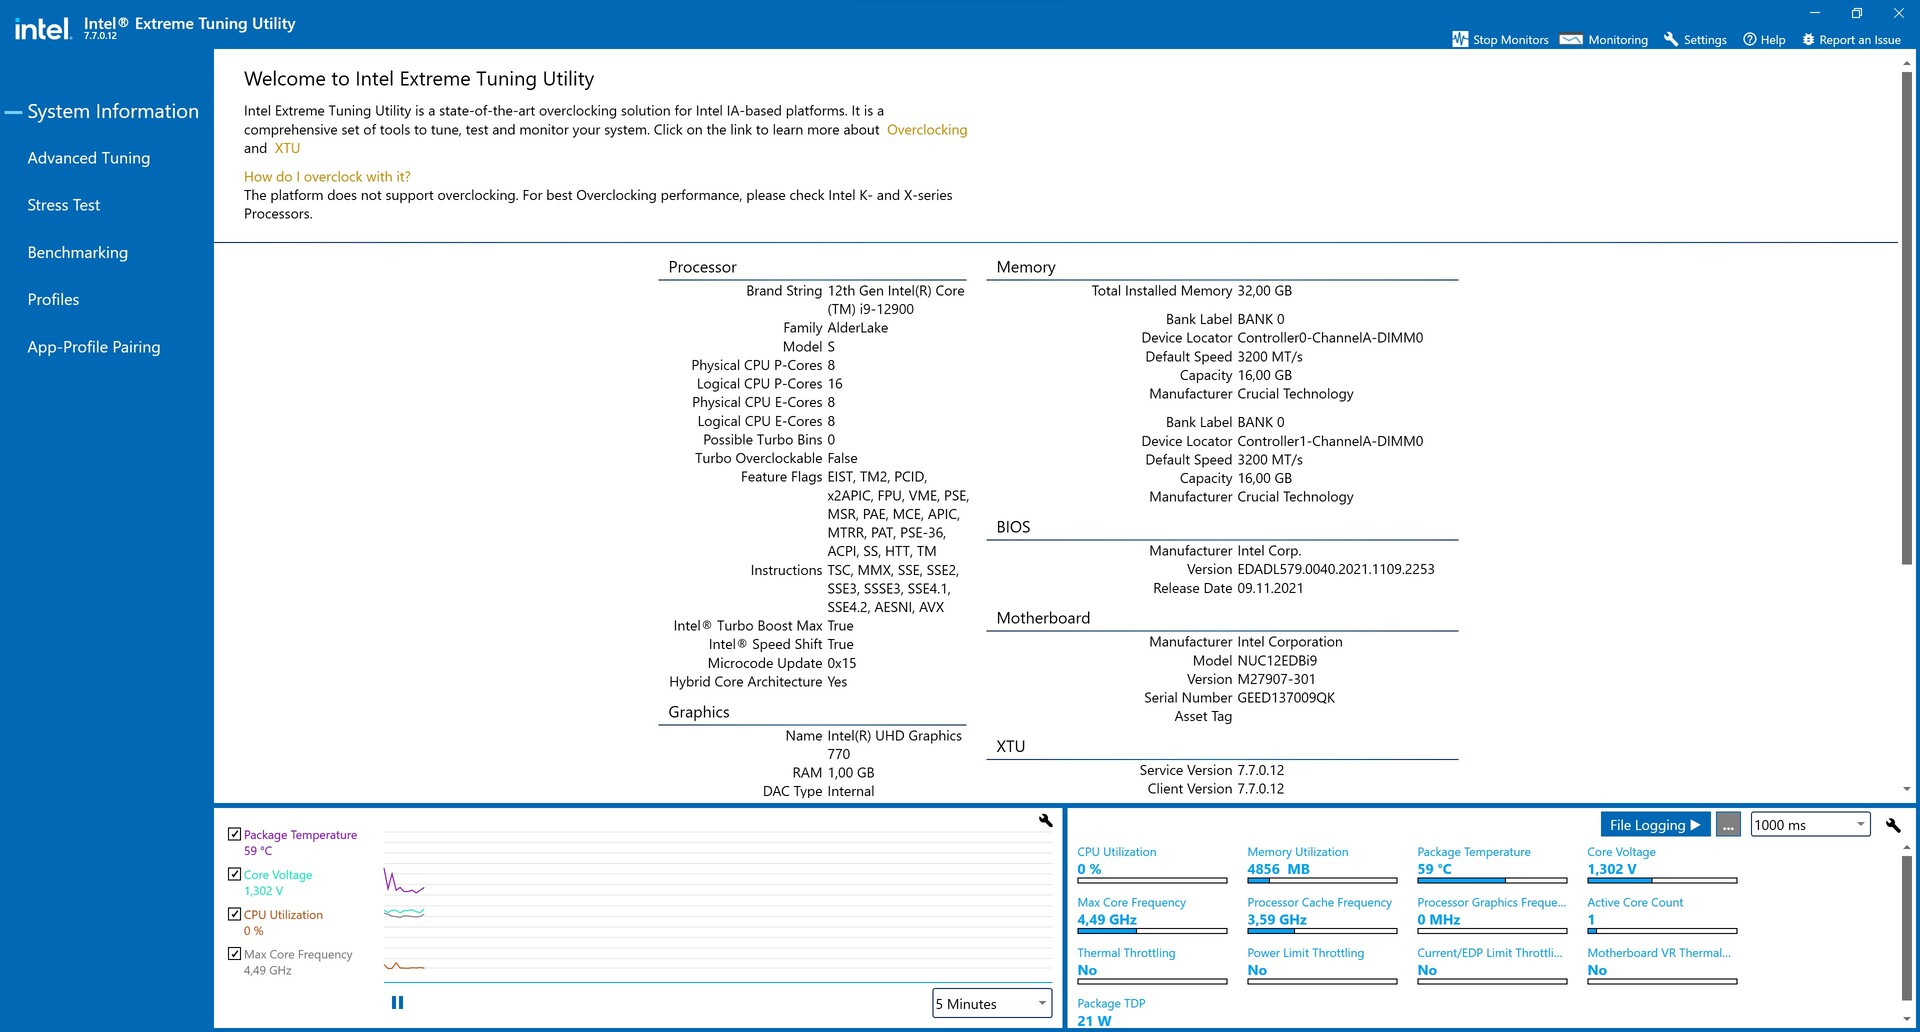
We recently took a detailed look at the Intel NUC 11 Extreme Kit alias Beast Canyon and were already surprised by its powerful capabilities at that time. With the Intel NUC 12 Extreme Kit alias Dragon Canyon, Intel now introduces the successor, showing that there is even more power now with the new CPU. But this could also be expected due to the progress in the chip development, since Alder Lake has a significant advantage to the older Tiger Lake platform. It still uses the Compute Element we already know, which combines all the important components of a PC. For the first time, Intel takes the direction of using a socketed CPU as we know it from the standard desktop segment. Here, the Intel Core i9-12900 from the current Alder Lake S series is used. Just like the Intel Core i9-12900K, the processor offers the P and E cores we already know, which are able to operate on up to 24 threads simultaneously. However, with a slightly lower TDP, we also expect a slightly lower performance. Find out more details on this in the performance segment further below.
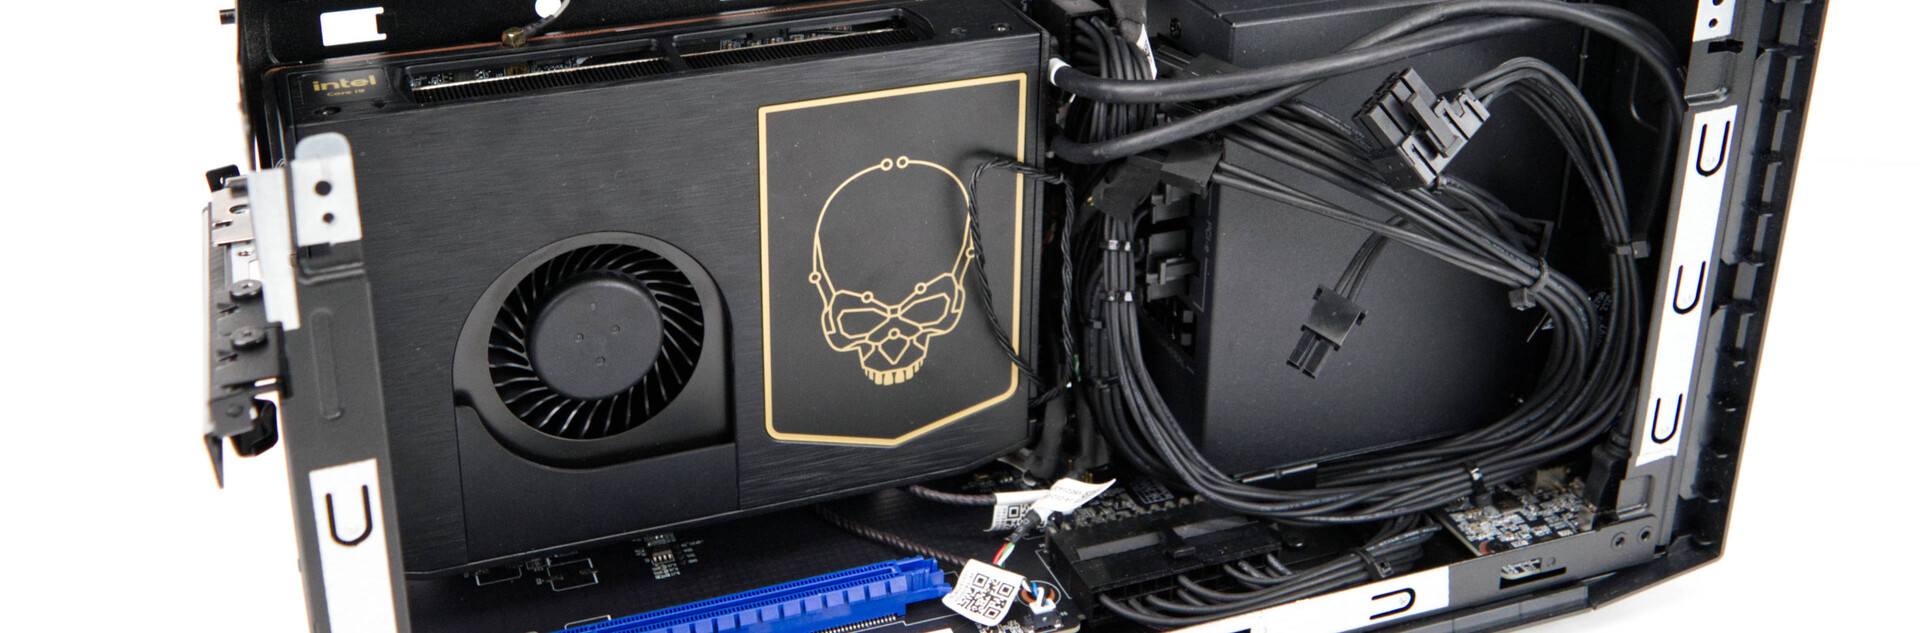
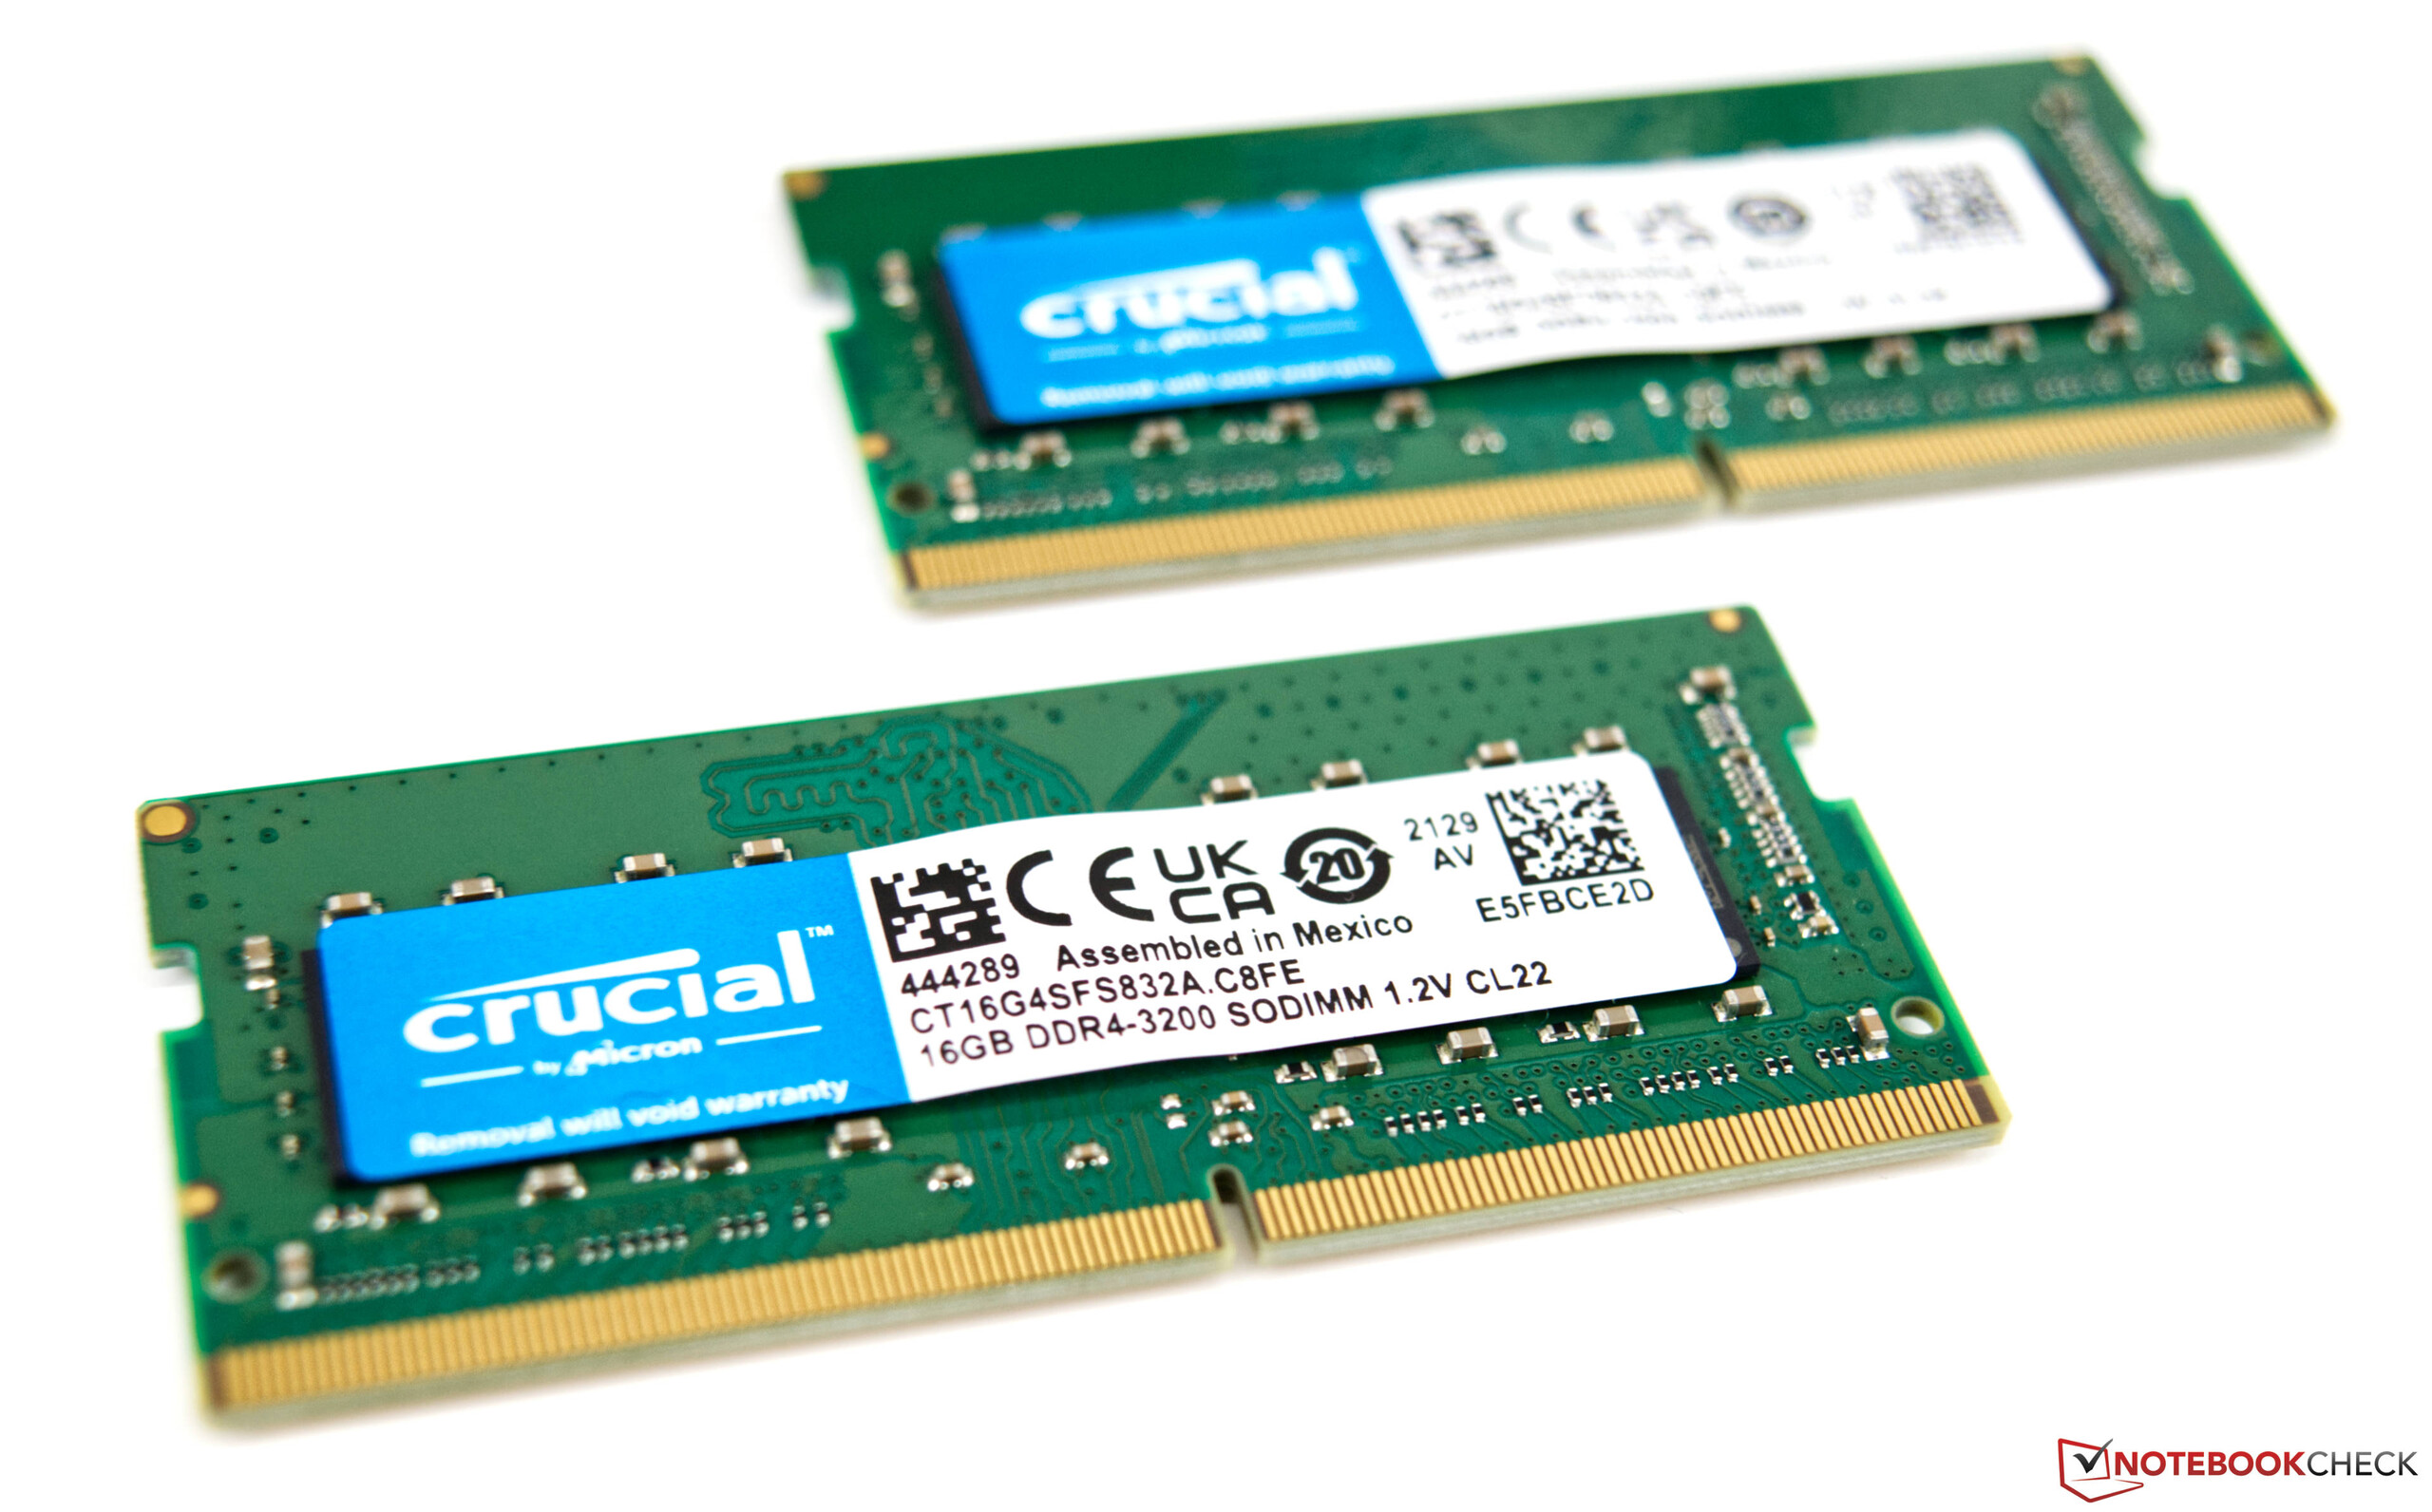
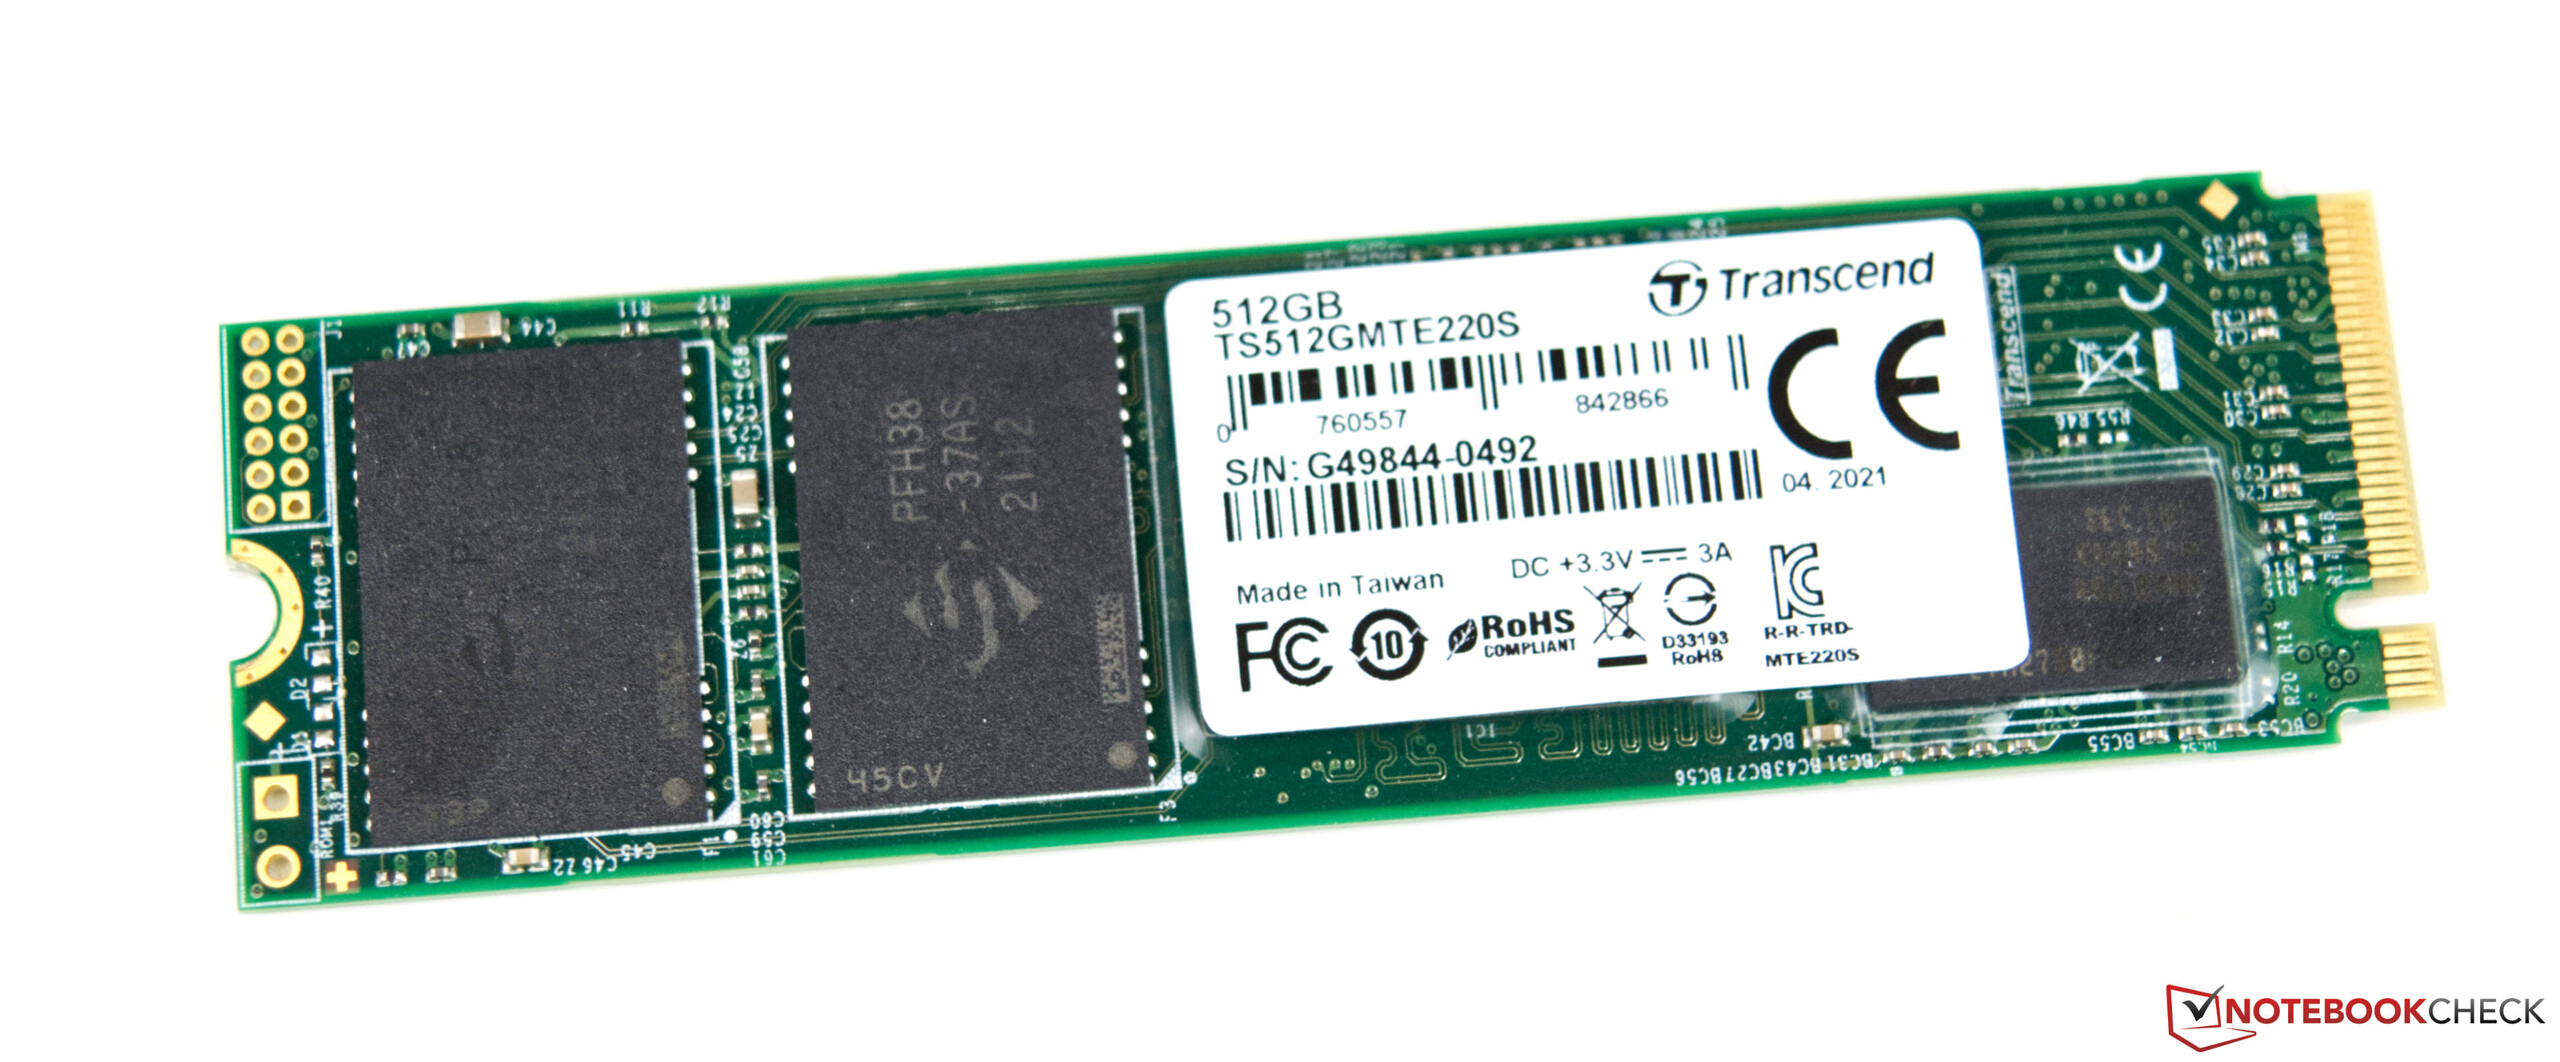
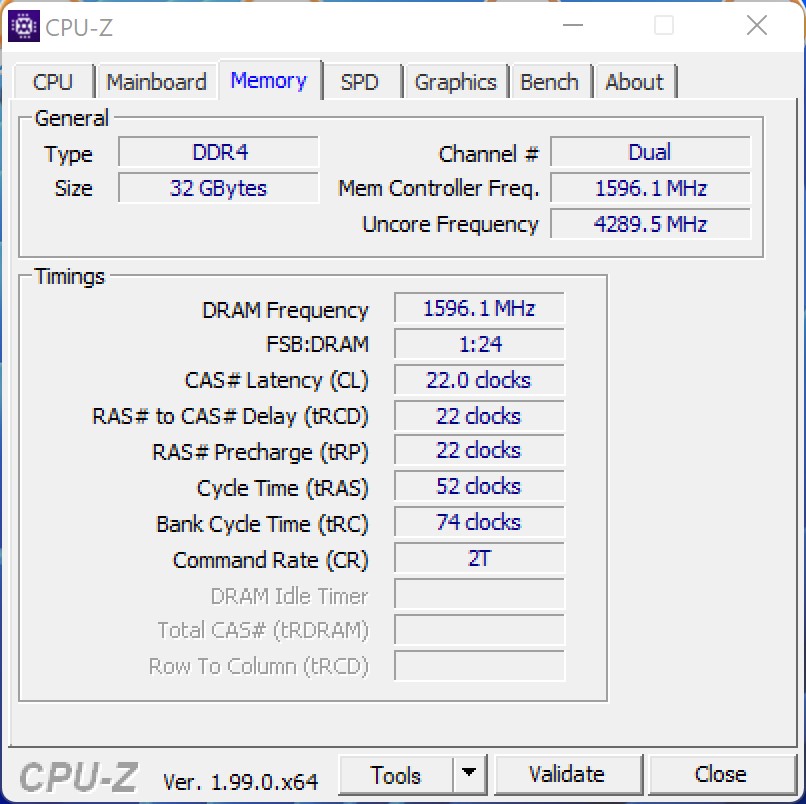
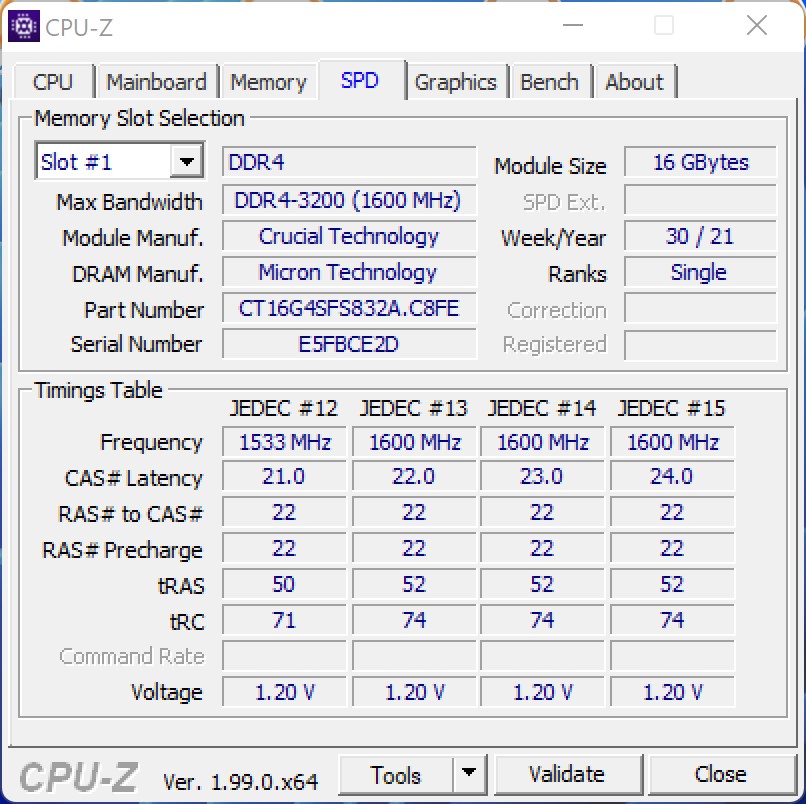
When purchasing the Intel NUC 12 Extreme Kit, you have to consider that this is a barebone system. The SSD, RAM, and a dedicated graphics card are not included. For those, we looked at our own supplies and equipped the system with a 512 GB NVME SSD and 32 GB of DDR4 RAM. In terms of the dedicated graphics card, we purposefully decided for the Nvidia GeForce RTX 3060, in order to allow for a fair comparison with the Intel NUC 11 Extreme Kit.
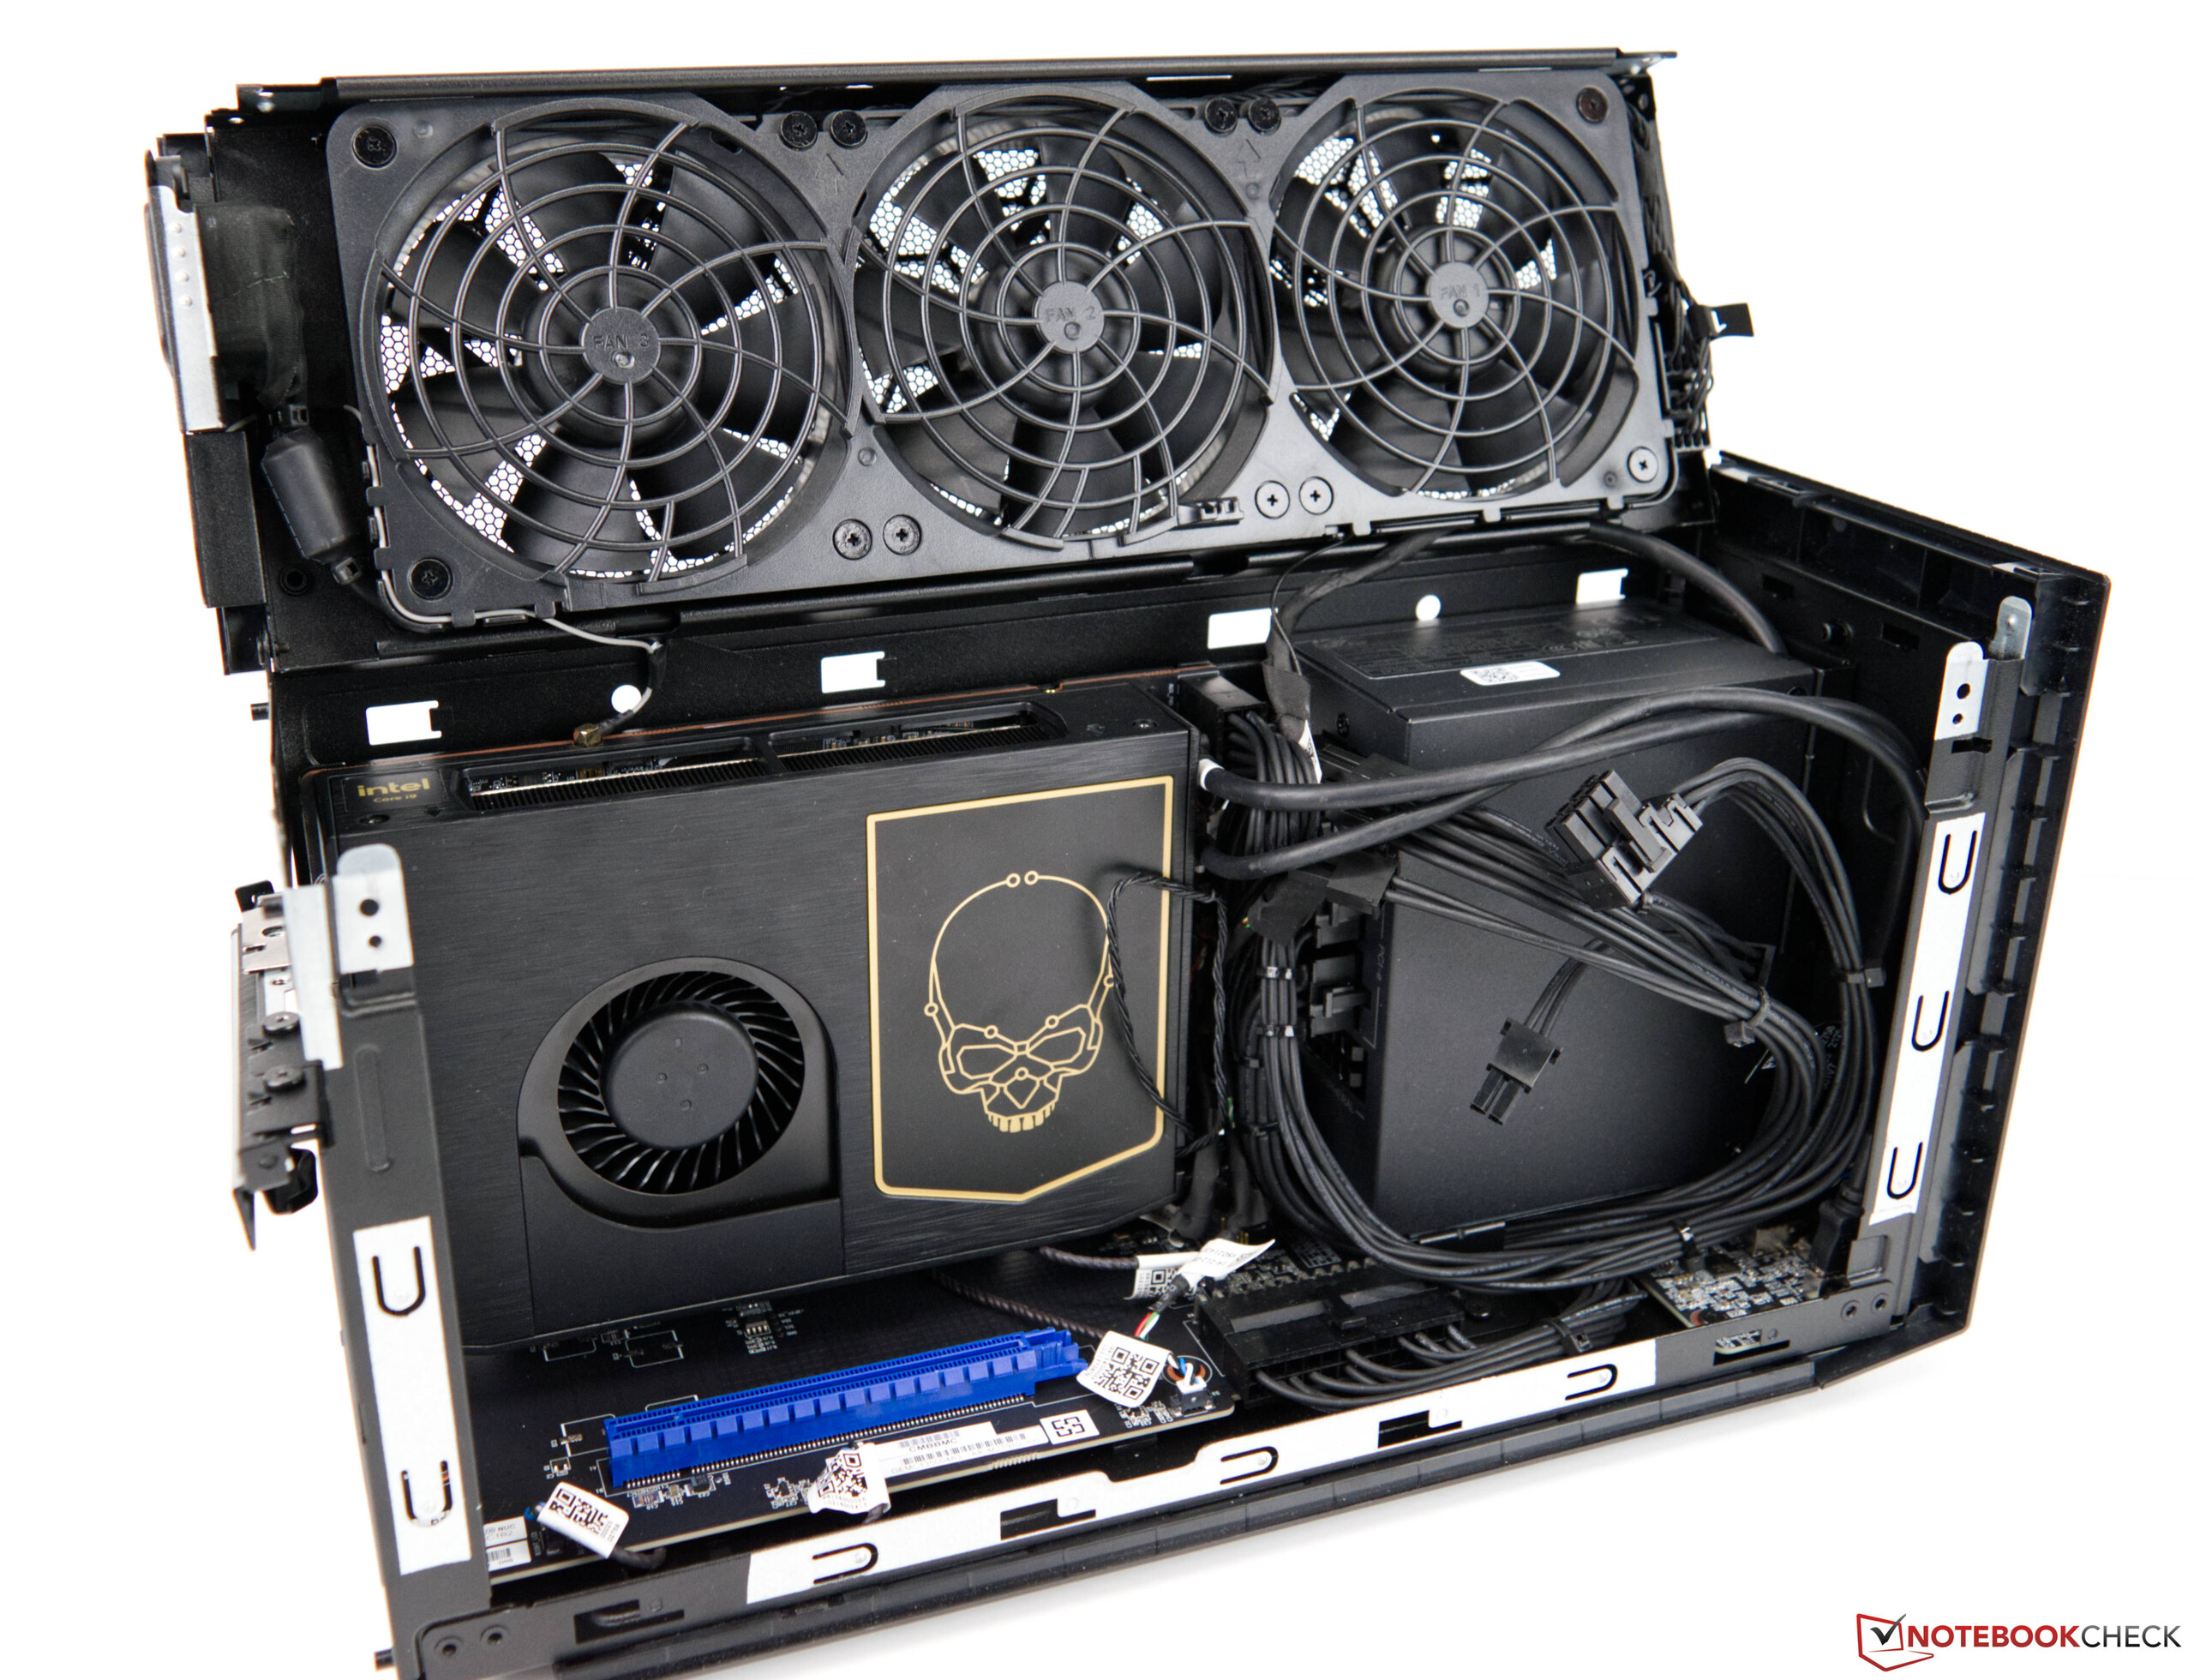
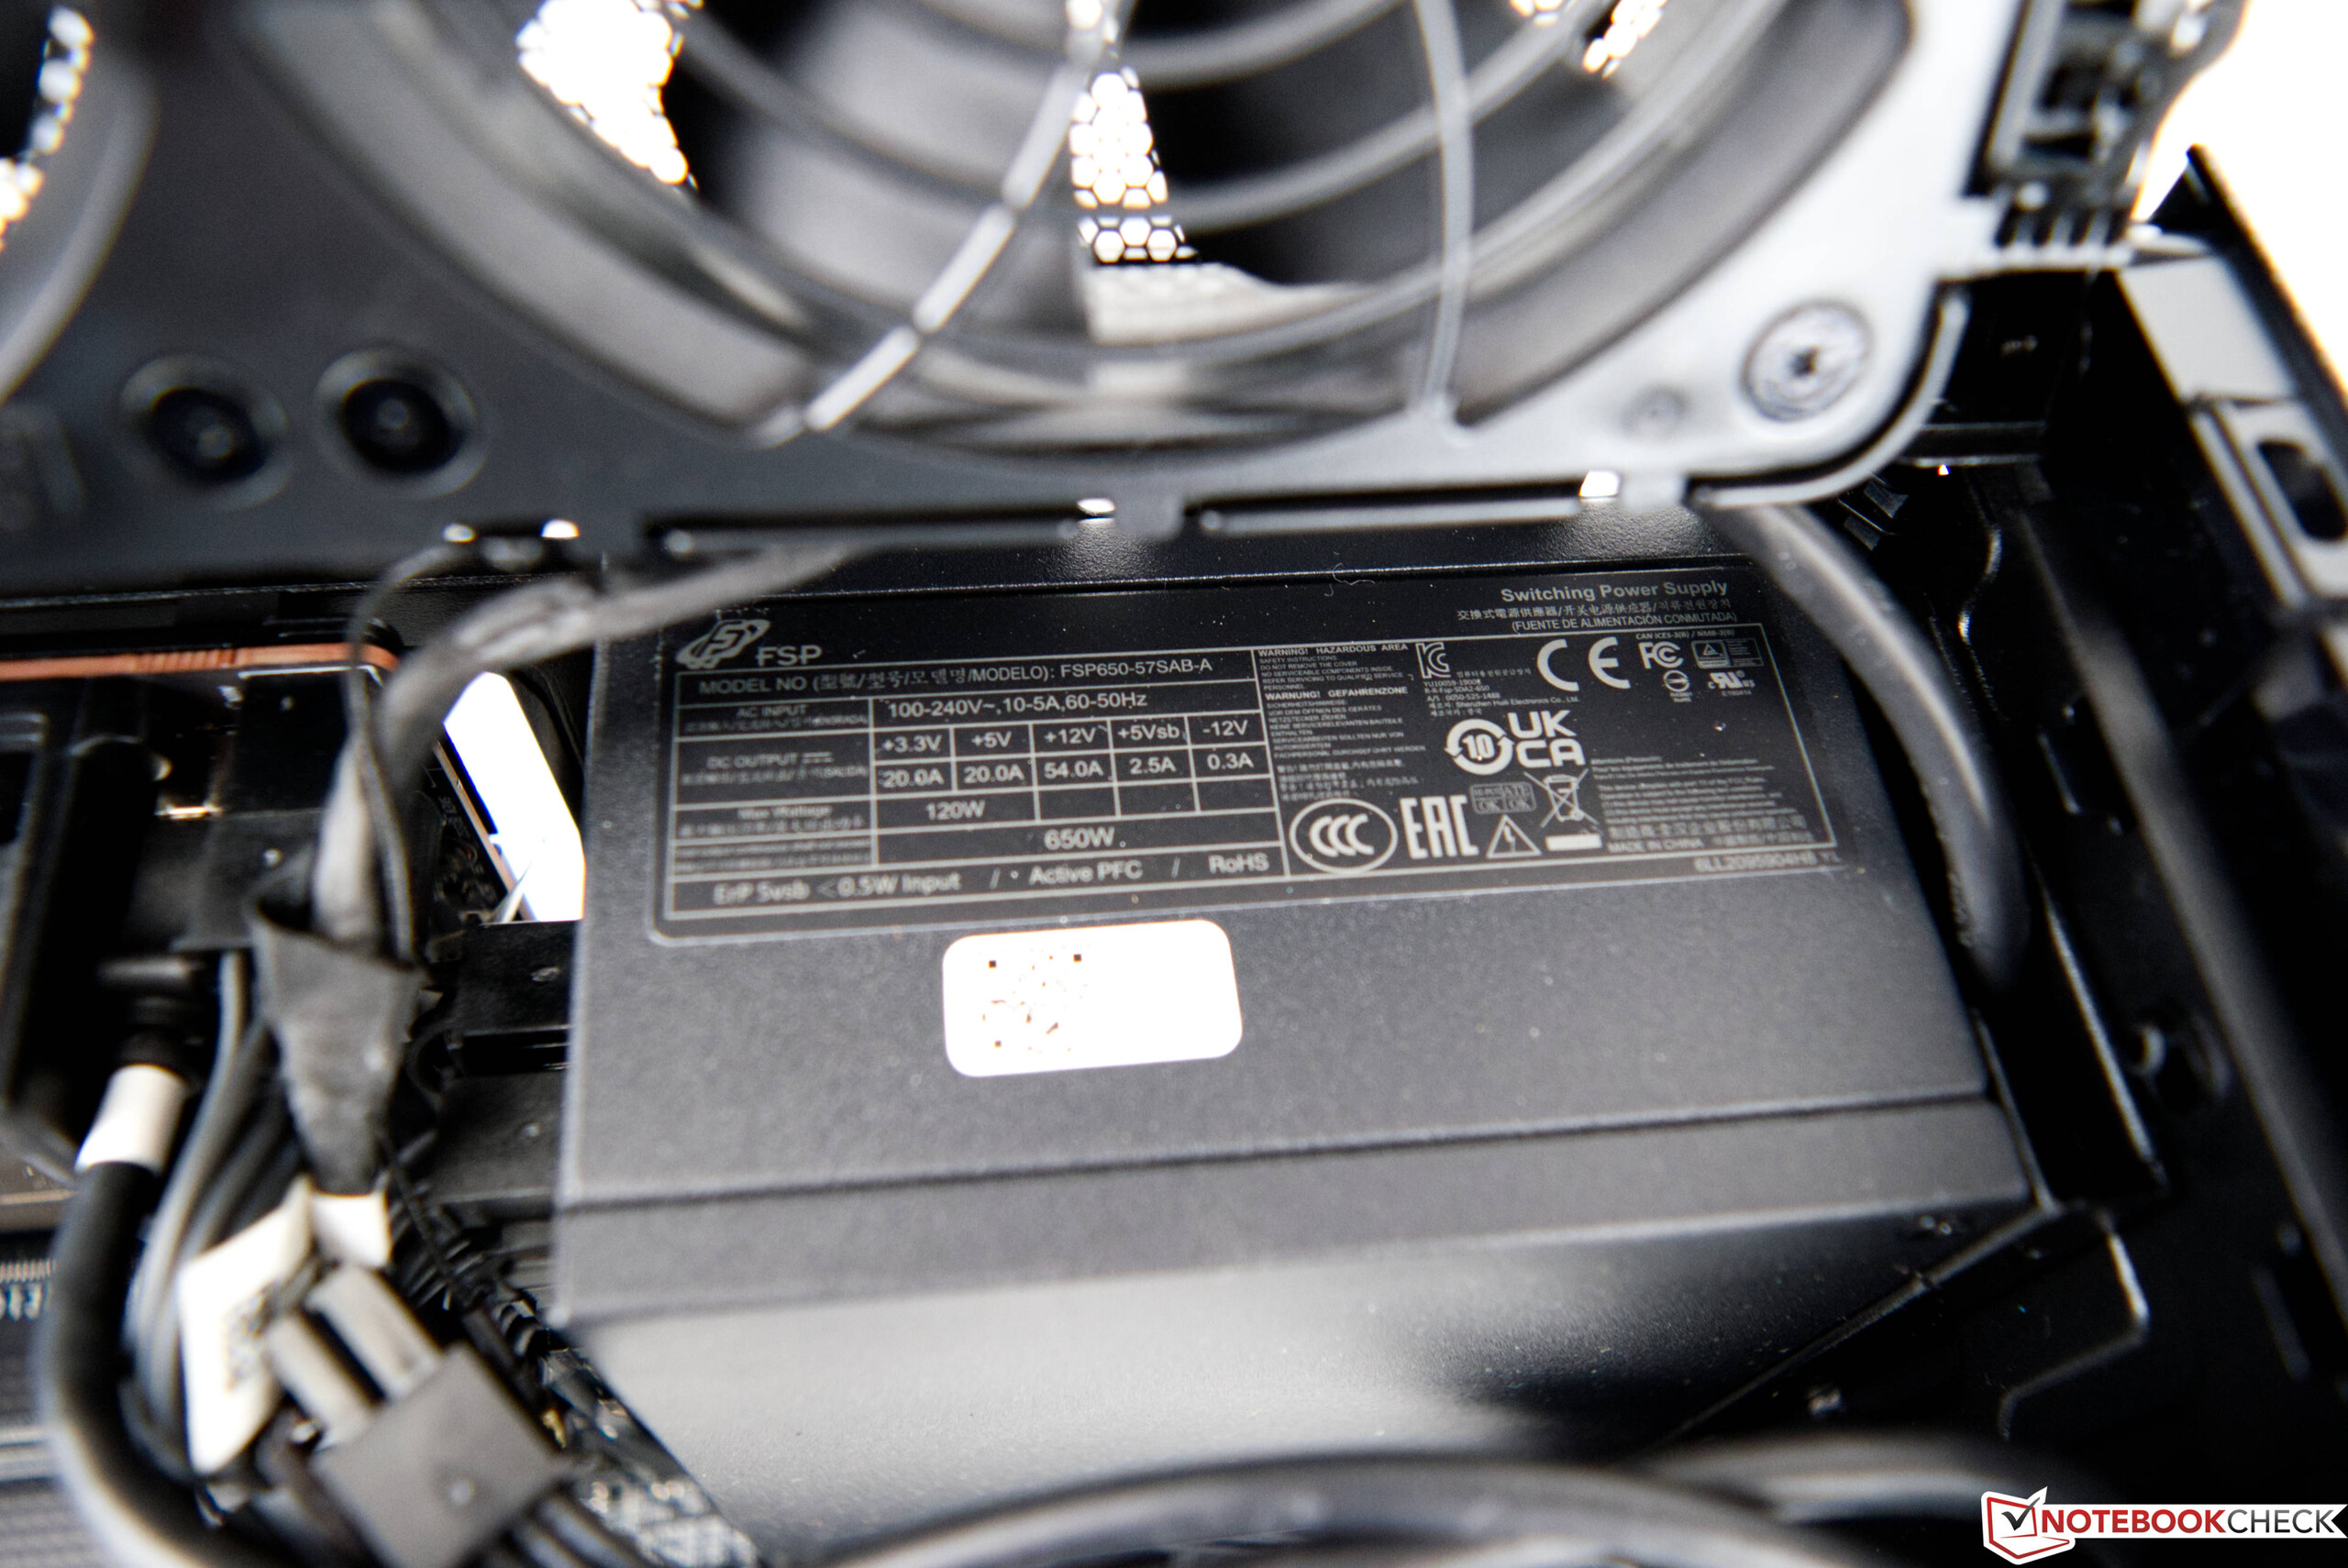
For a dedicated graphics card, you can use models with a maximum length of 30.5 cm (~12 in). The 650-Watt SFX power supply offers sufficient power to also run the current high-end models. However, the cooling of these pixel accelerators should not take up more than two slots. You can currently get the Intel NUC 12 Extreme Kit for 1450 Euros (~$1589).
Intel NUC 12 Extreme Compute Element in detail
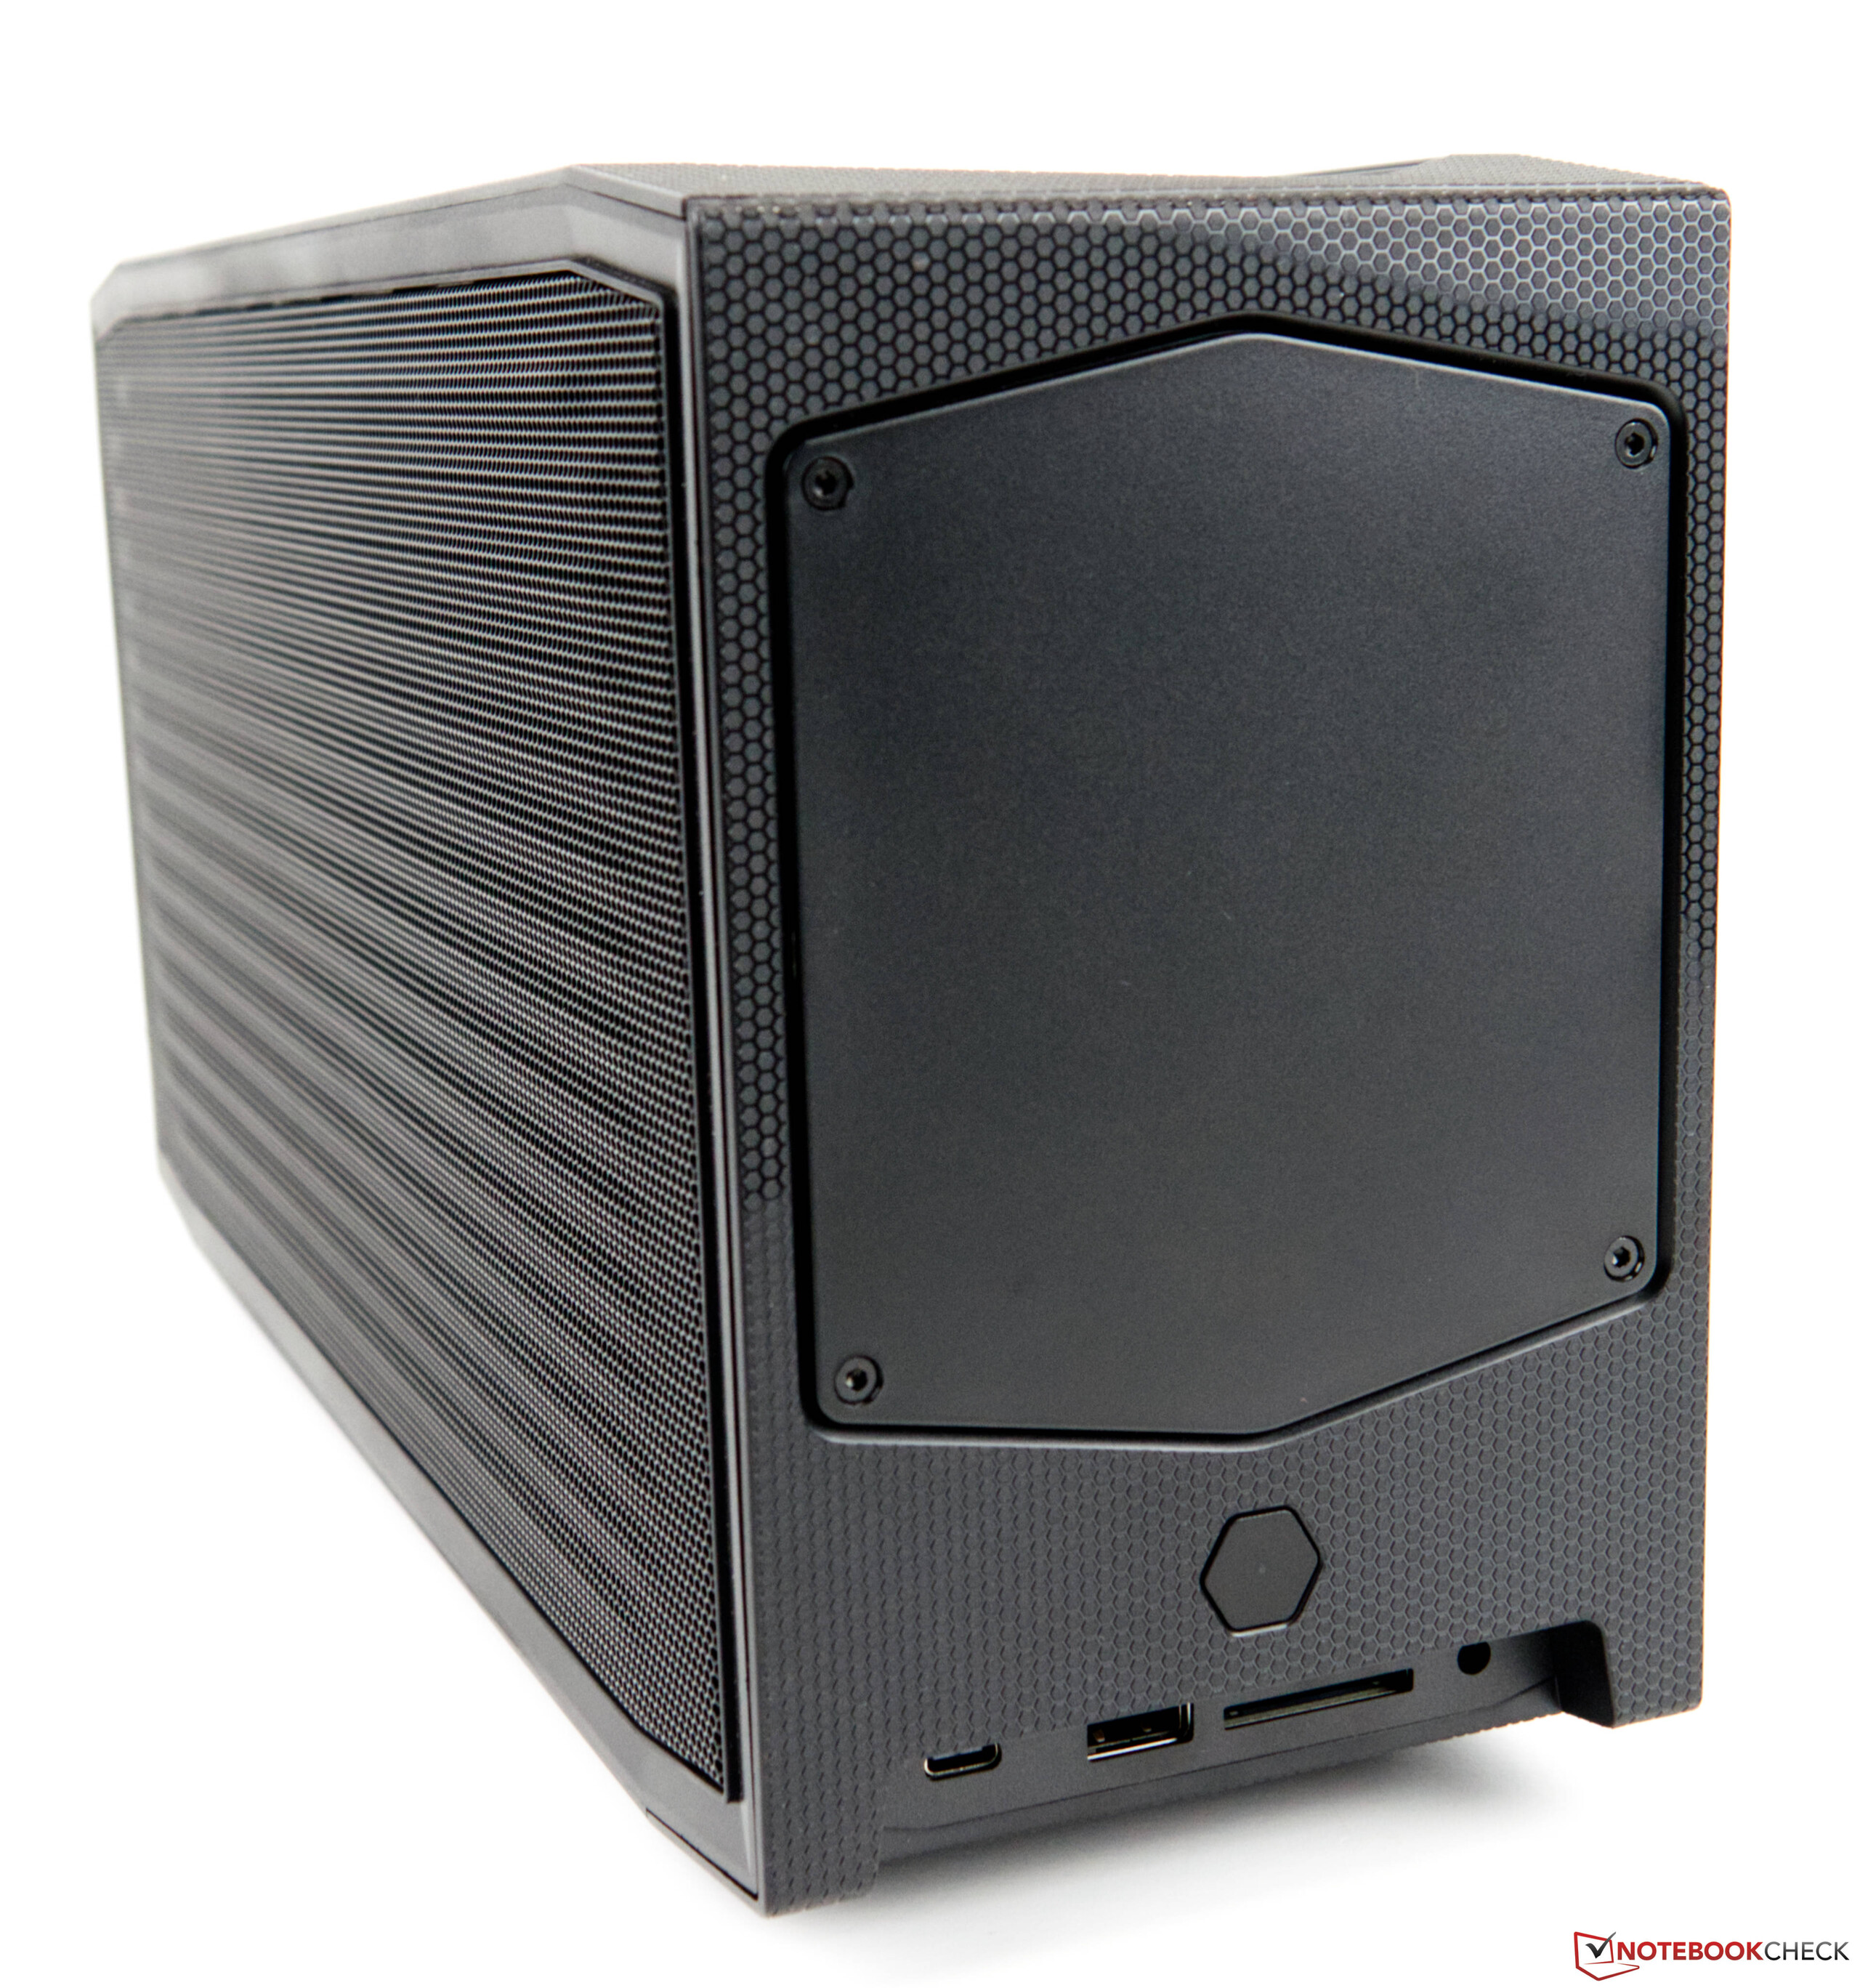
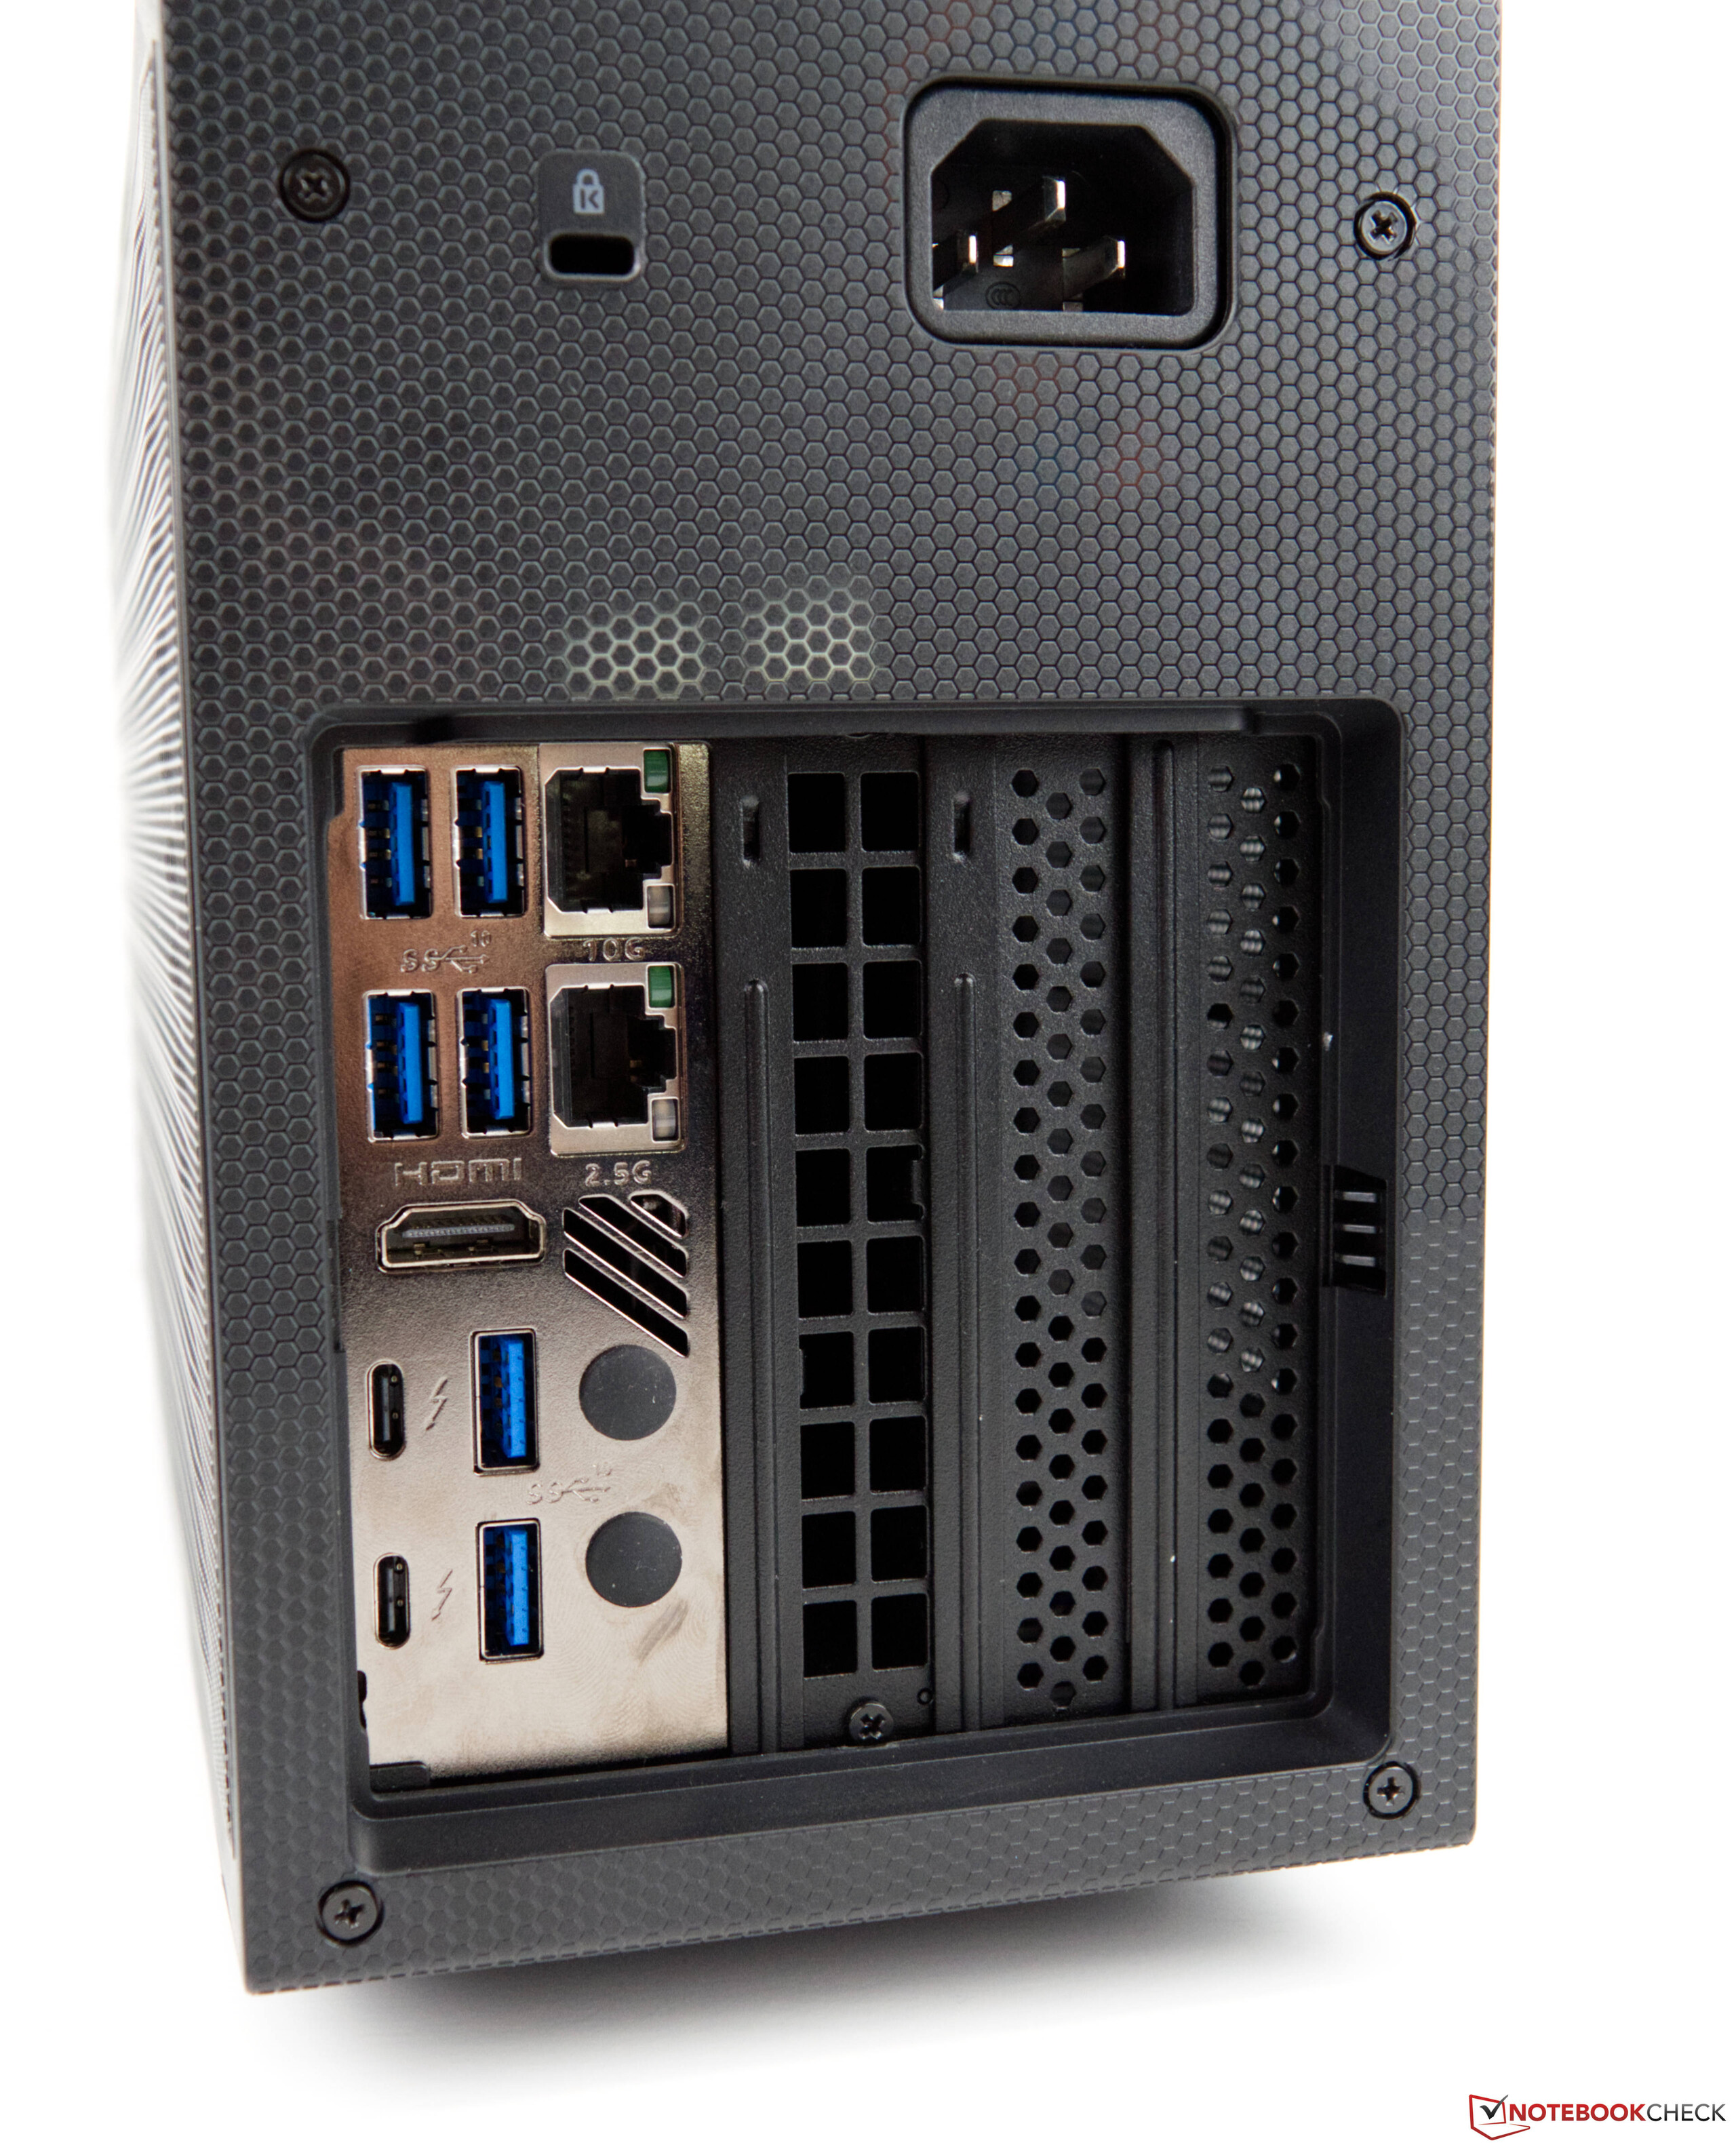
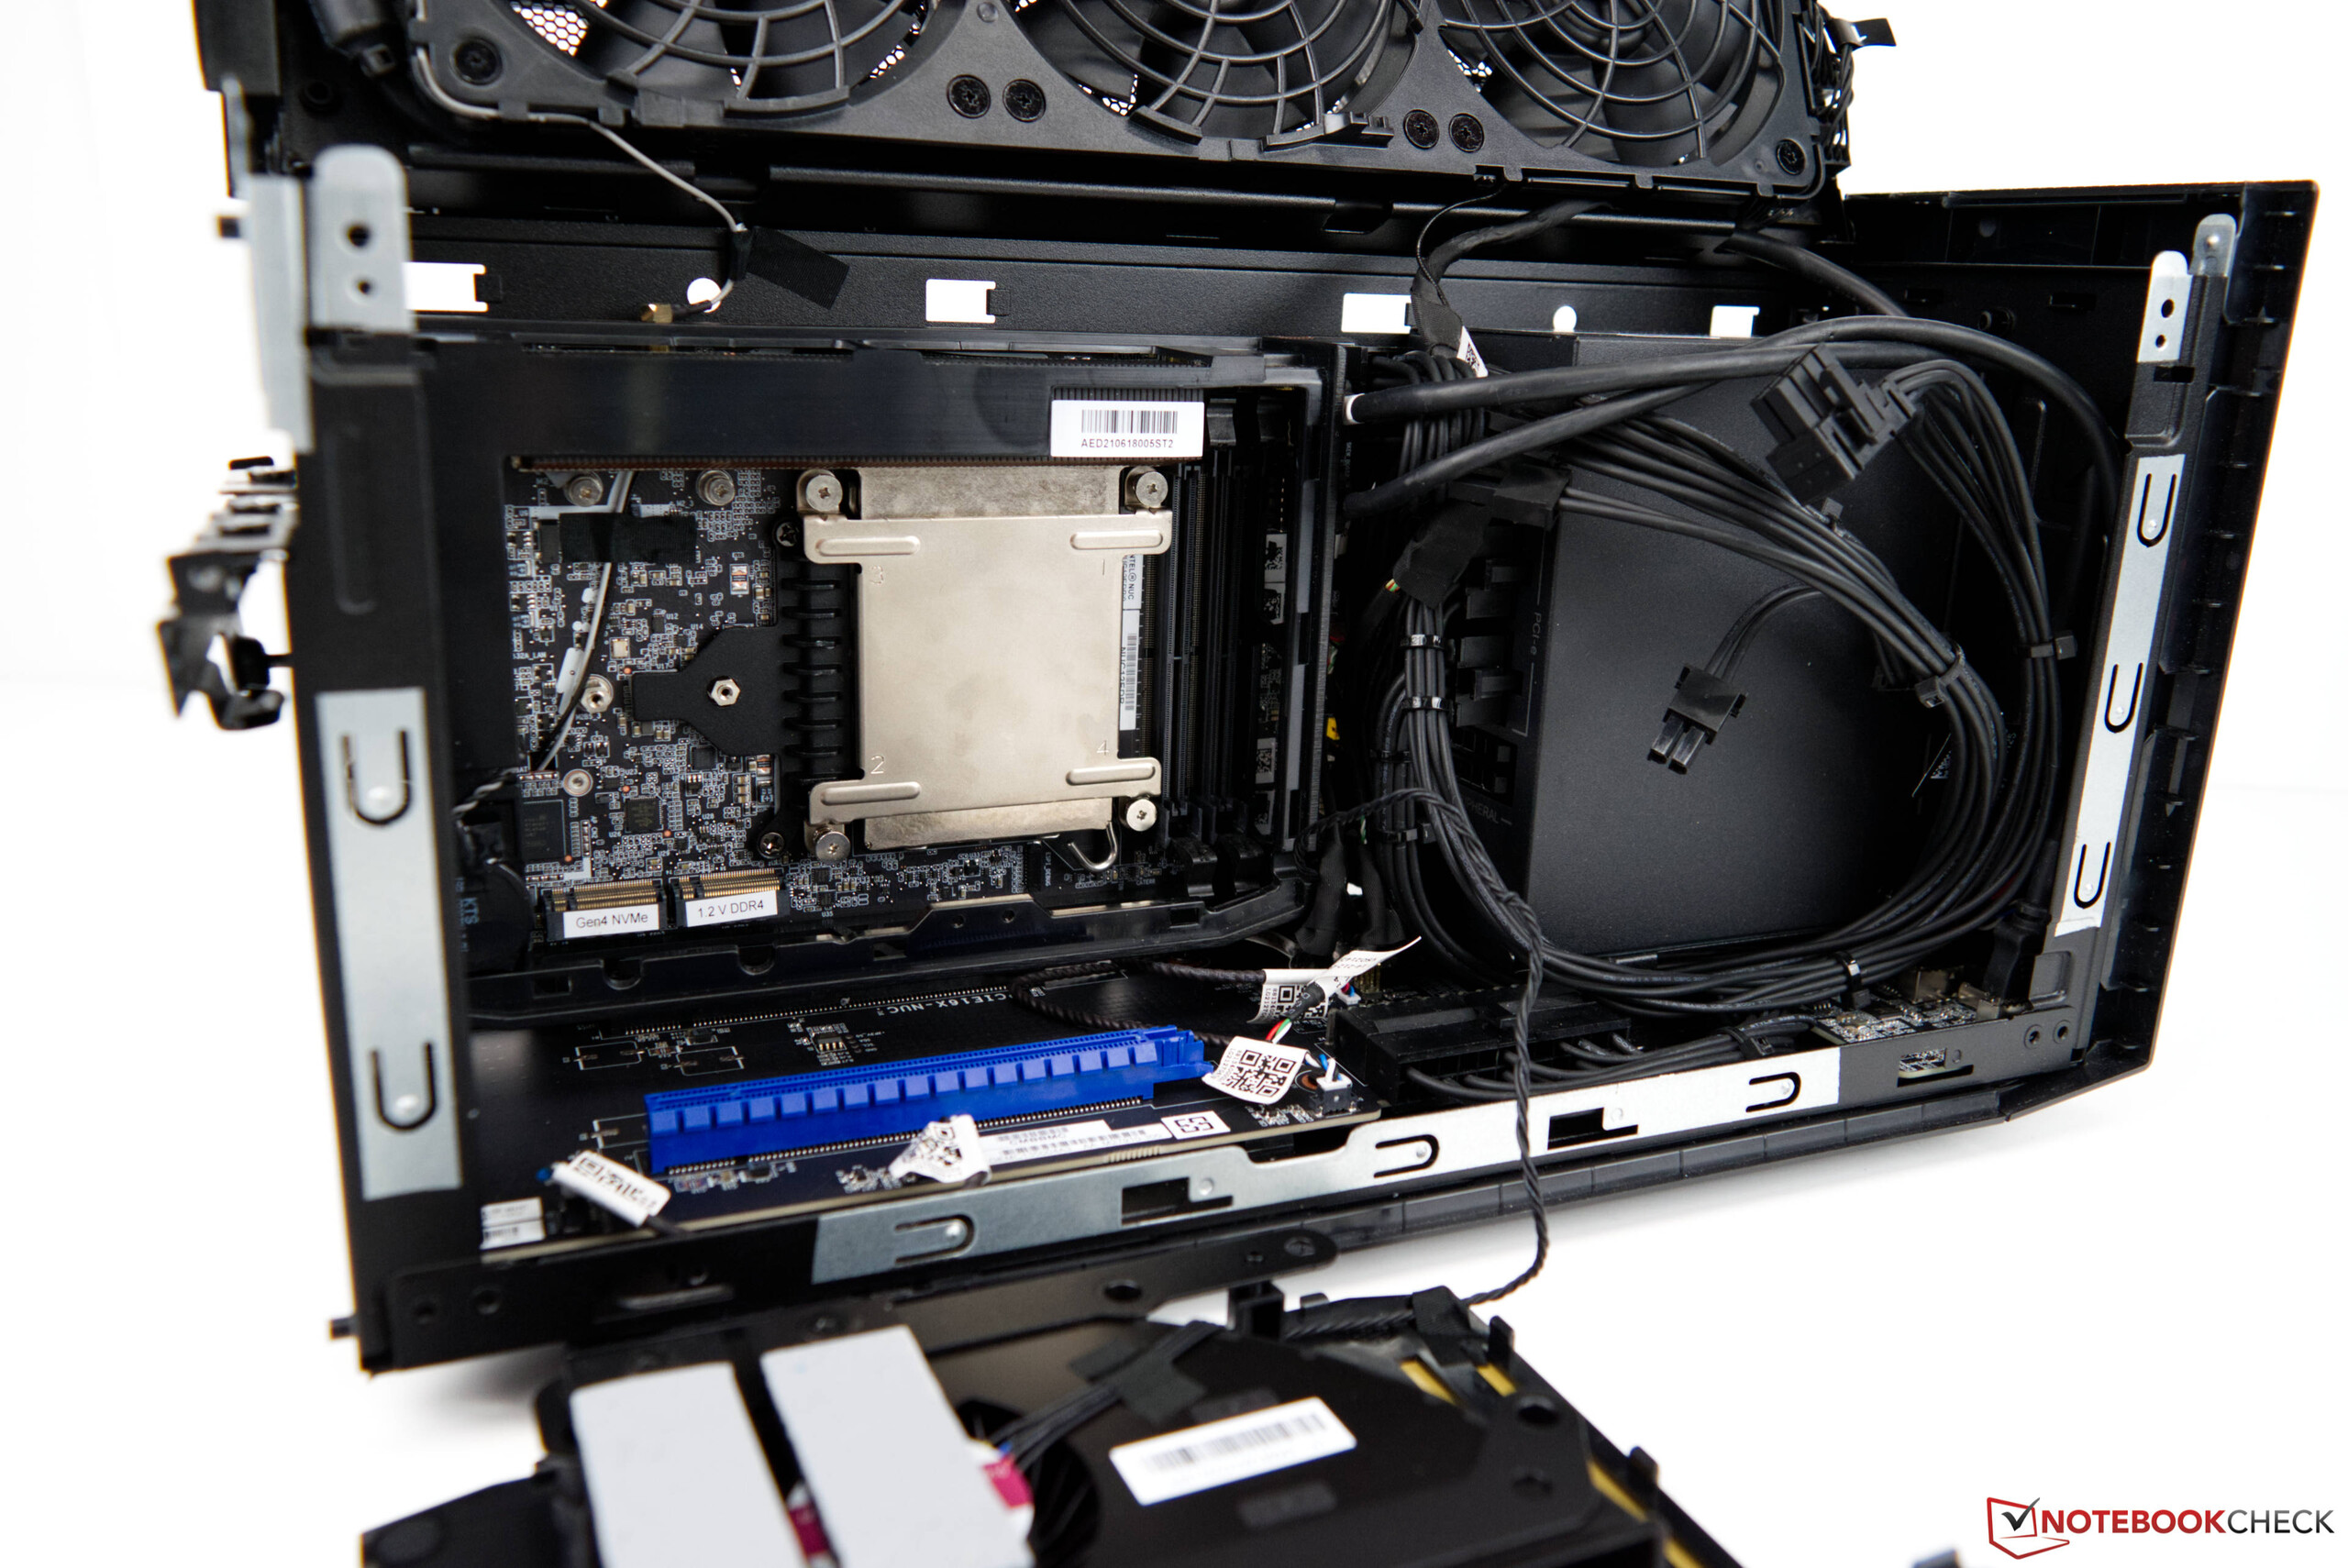
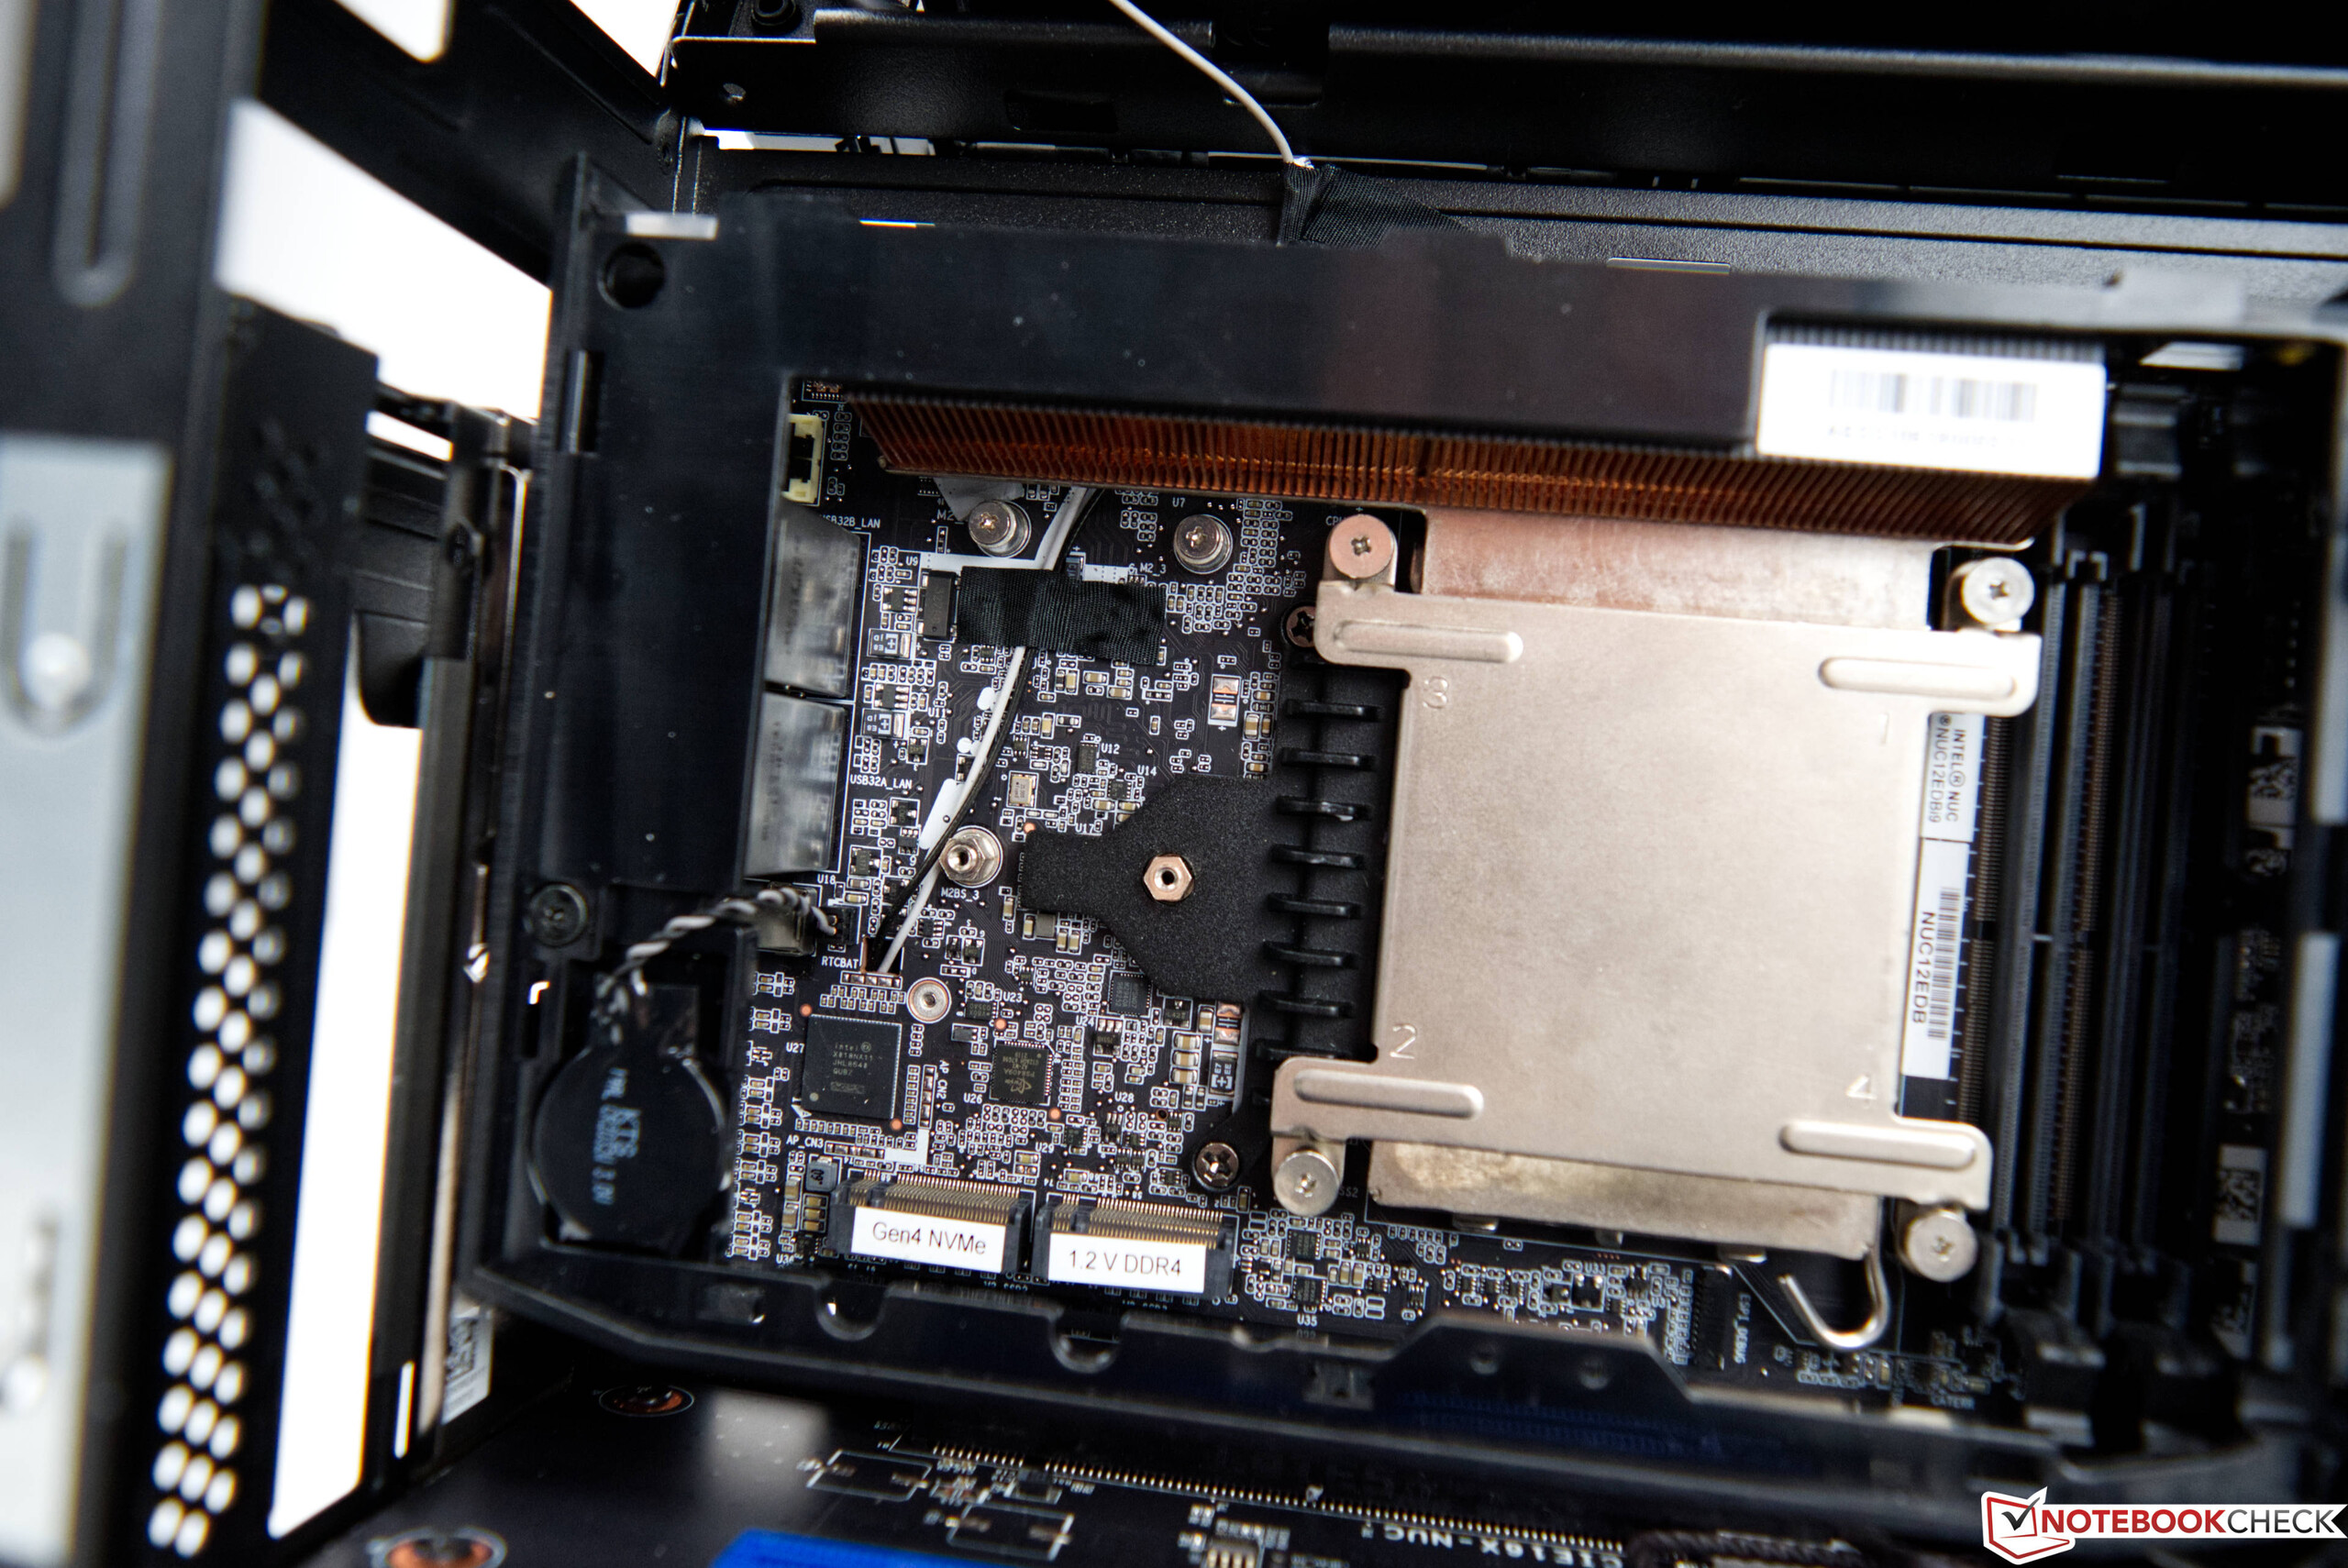
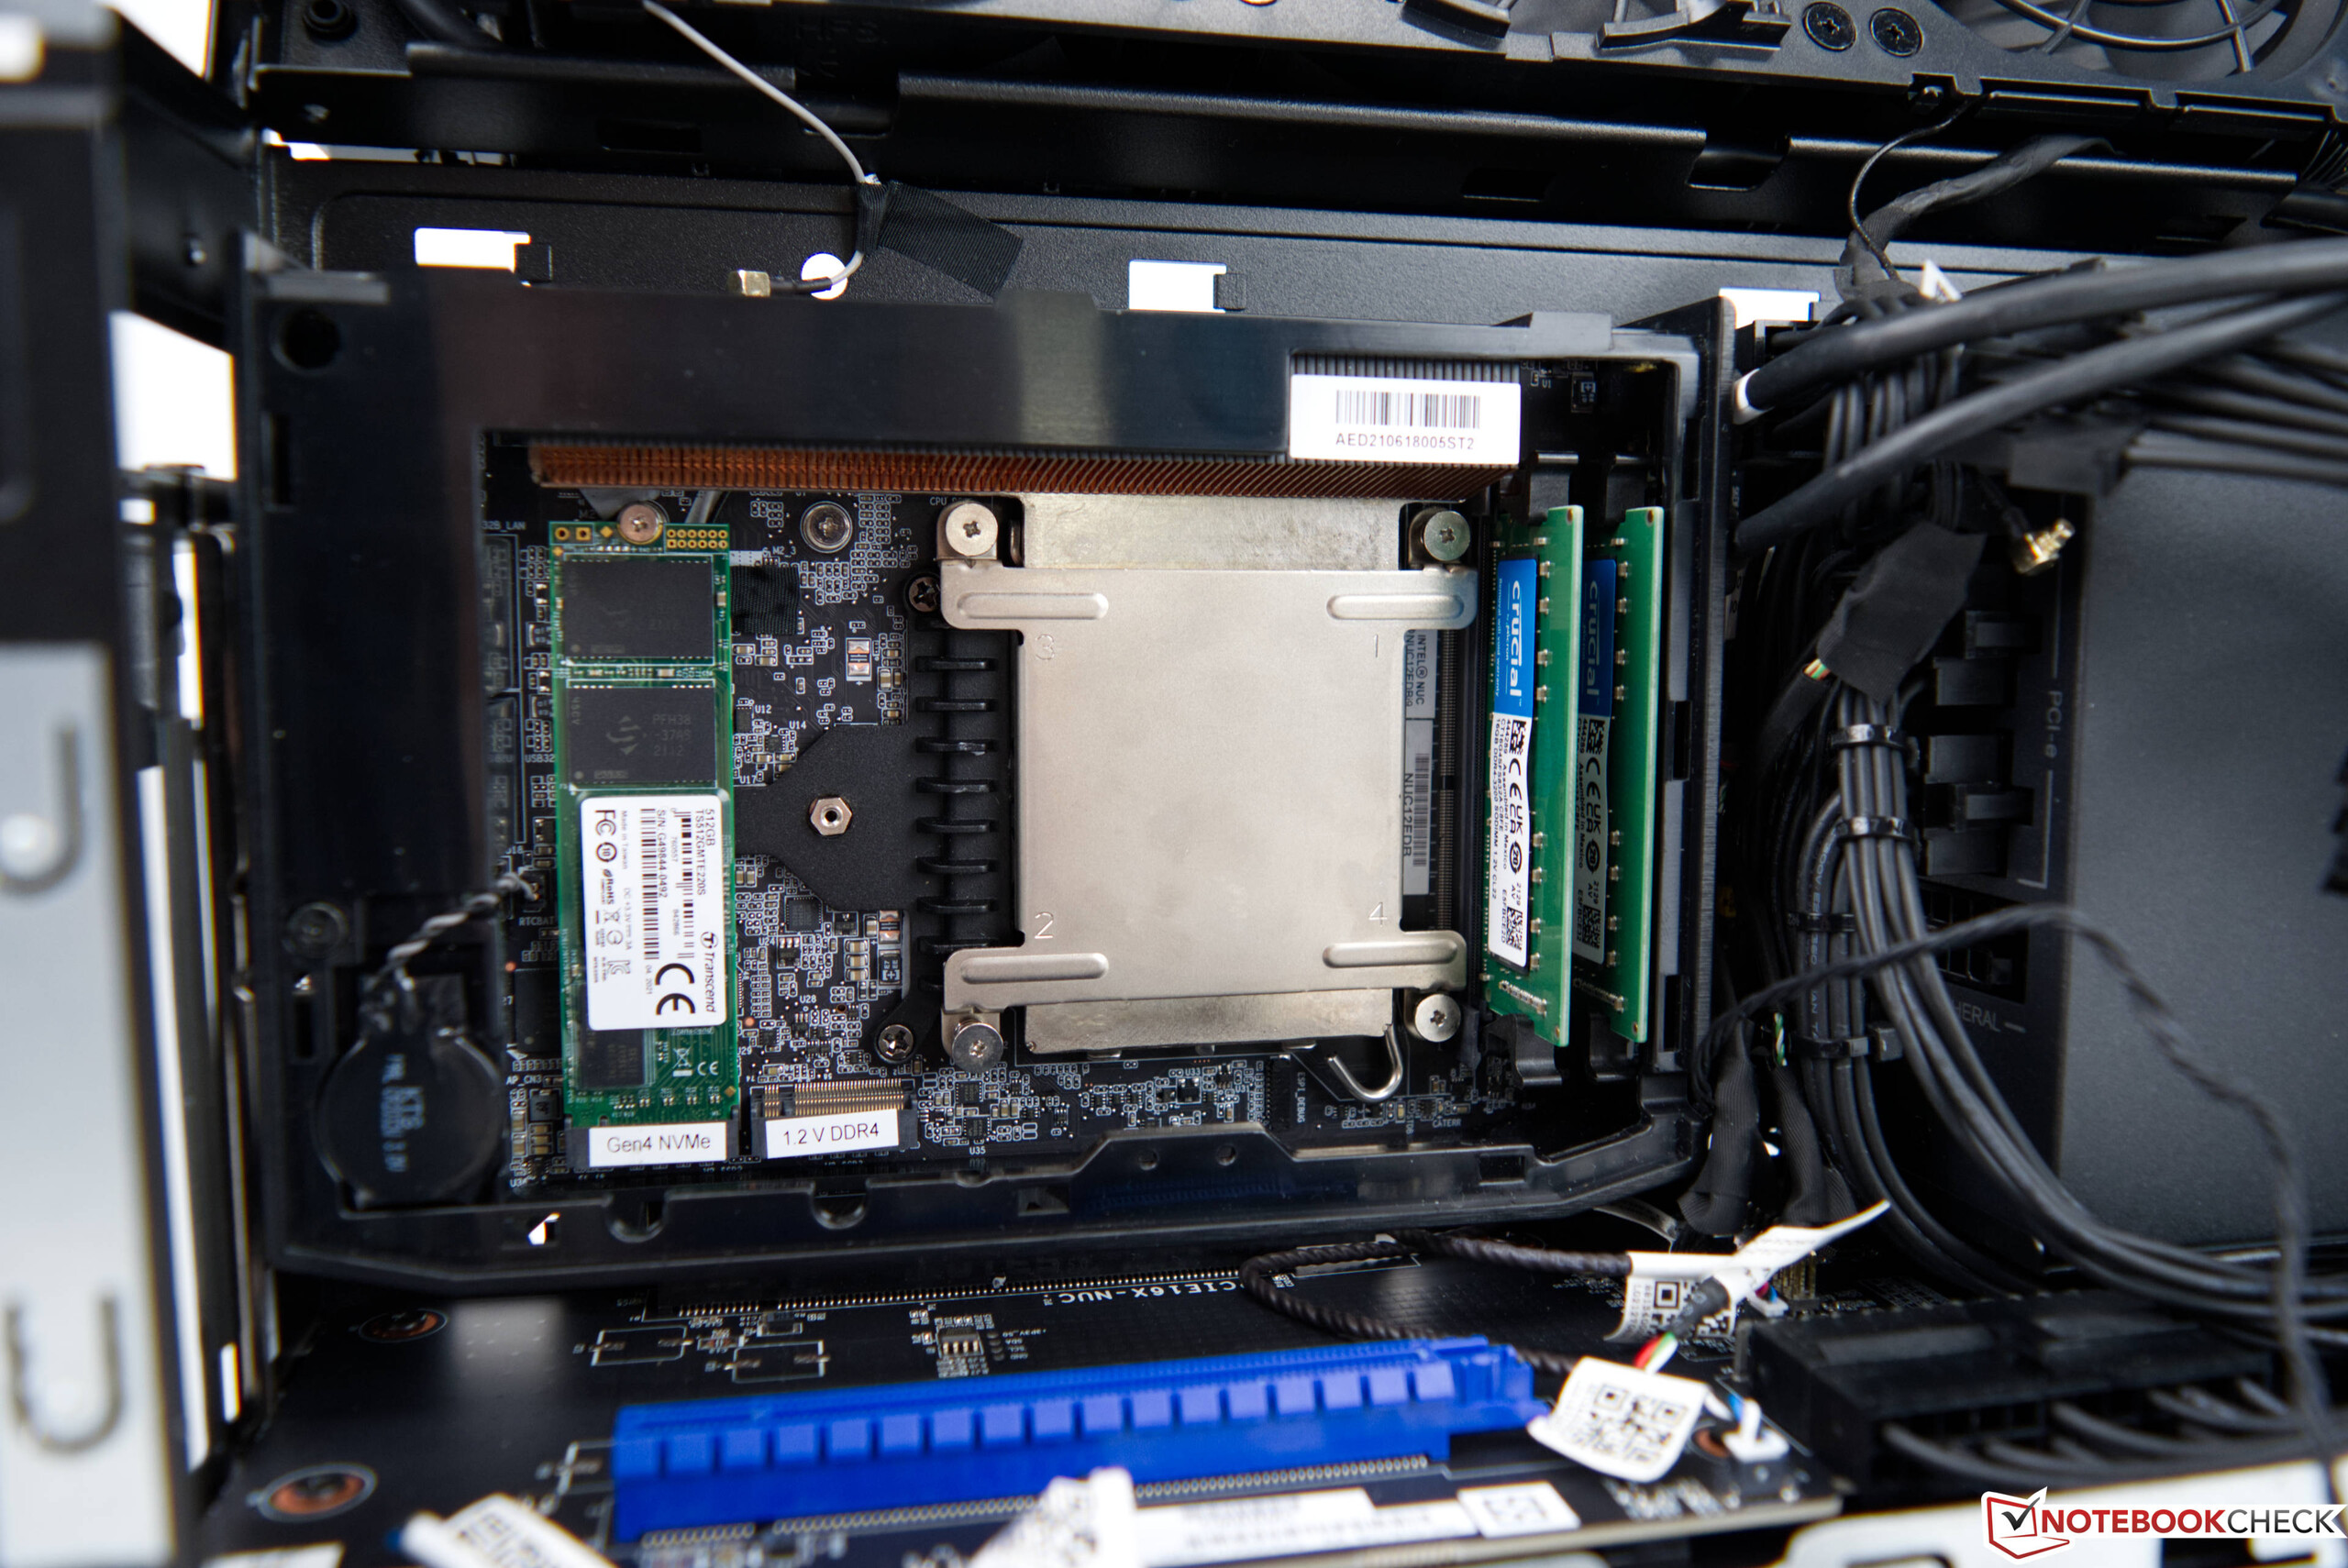
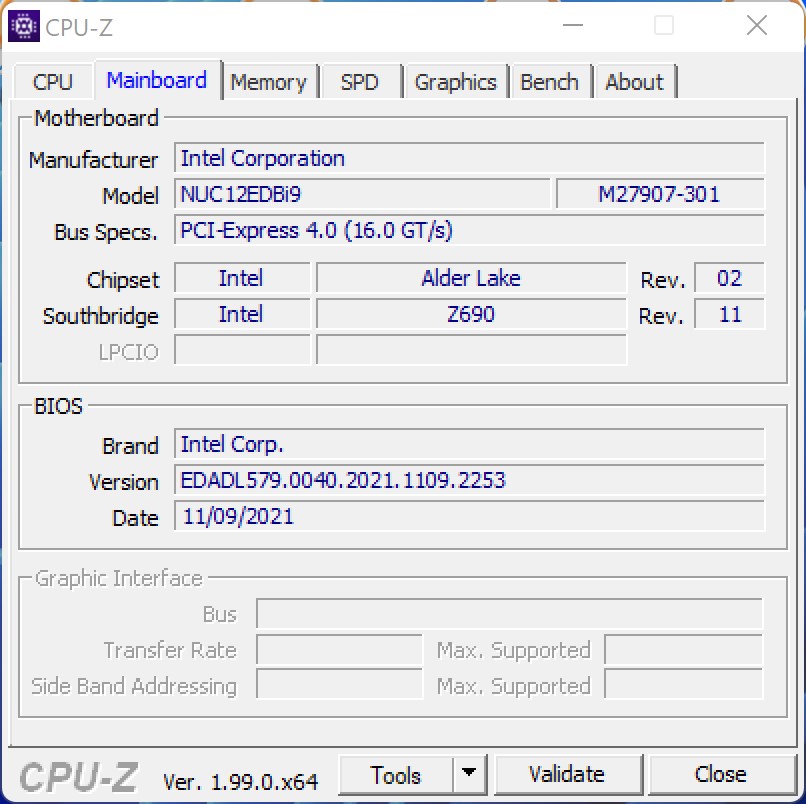
With the Intel Core i9-12900, the Intel NUC 12 Extreme offers a 16-core SoC with 24 threads based on the Alder Lake S series. As we already mentioned, the Core i9-12900 uses a mix of P and E cores. In contrast to the Intel NUC 11 Extreme Kit before, now a full-size desktop processor is used. All the external connections continue to be placed on the Compute Element, which is housed in the system in the known form of a PCI Express card. In the back are six USB 3.1 Gen2 Type-A and two USB-C connections that support Thunderbolt 4. With HDMI or Thunderbolt, you can run up to three displays at the same time. There are 10G and 2.5G connections for wired networking. In addition, the Intel WiFi 6E AX211 communicates using the newest standard. The Compute Element itself offers space for two SO-DIMM RAM modules of up to 64 GB each, and there is also space for two M.2 SSDs.
WLAN performance
In the WLAN test, the Intel WiFi 6E AX211 is able to achieve very good transfer rates in the 6 GHz range in combination with our ASUS GT-AXE11000 test router. In our test, we measure a good 1850 Mbit/s on average when sending or receiving data.
| Networking | |
| iperf3 transmit AXE11000 6GHz | |
| Intel Dragon Canyon NUC - RTX 3060 | |
| Average of class (229 - 2373, n=822) | |
| Average Intel Wi-Fi 6E AX211 (385 - 1851, n=226) | |
| Minisforum EliteMini TH50 | |
| iperf3 receive AXE11000 6GHz | |
| Intel Dragon Canyon NUC - RTX 3060 | |
| Average Intel Wi-Fi 6E AX211 (700 - 1857, n=226) | |
| Average of class (291 - 2361, n=826) | |
| Minisforum EliteMini TH50 | |
| iperf3 receive AX12 | |
| MSI Vector GP66 12UGS | |
| Average Intel Wi-Fi 6E AX211 (1178 - 1623, n=4) | |
| Alienware x14 i7 RTX 3060 | |
| Average of class (5 - 2374, n=2624) | |
| iperf3 transmit AX12 | |
| MSI Vector GP66 12UGS | |
| Alienware x14 i7 RTX 3060 | |
| Average Intel Wi-Fi 6E AX211 (1003 - 1501, n=4) | |
| Average of class (5.59 - 2371, n=2621) | |
Processor benchmarks
The Intel Core i9-12900 is a desktop model from the current Alder Lake S series. The PL1 power consumption is 65 watts, which can be increased up to the PL2 value of 202 watts.
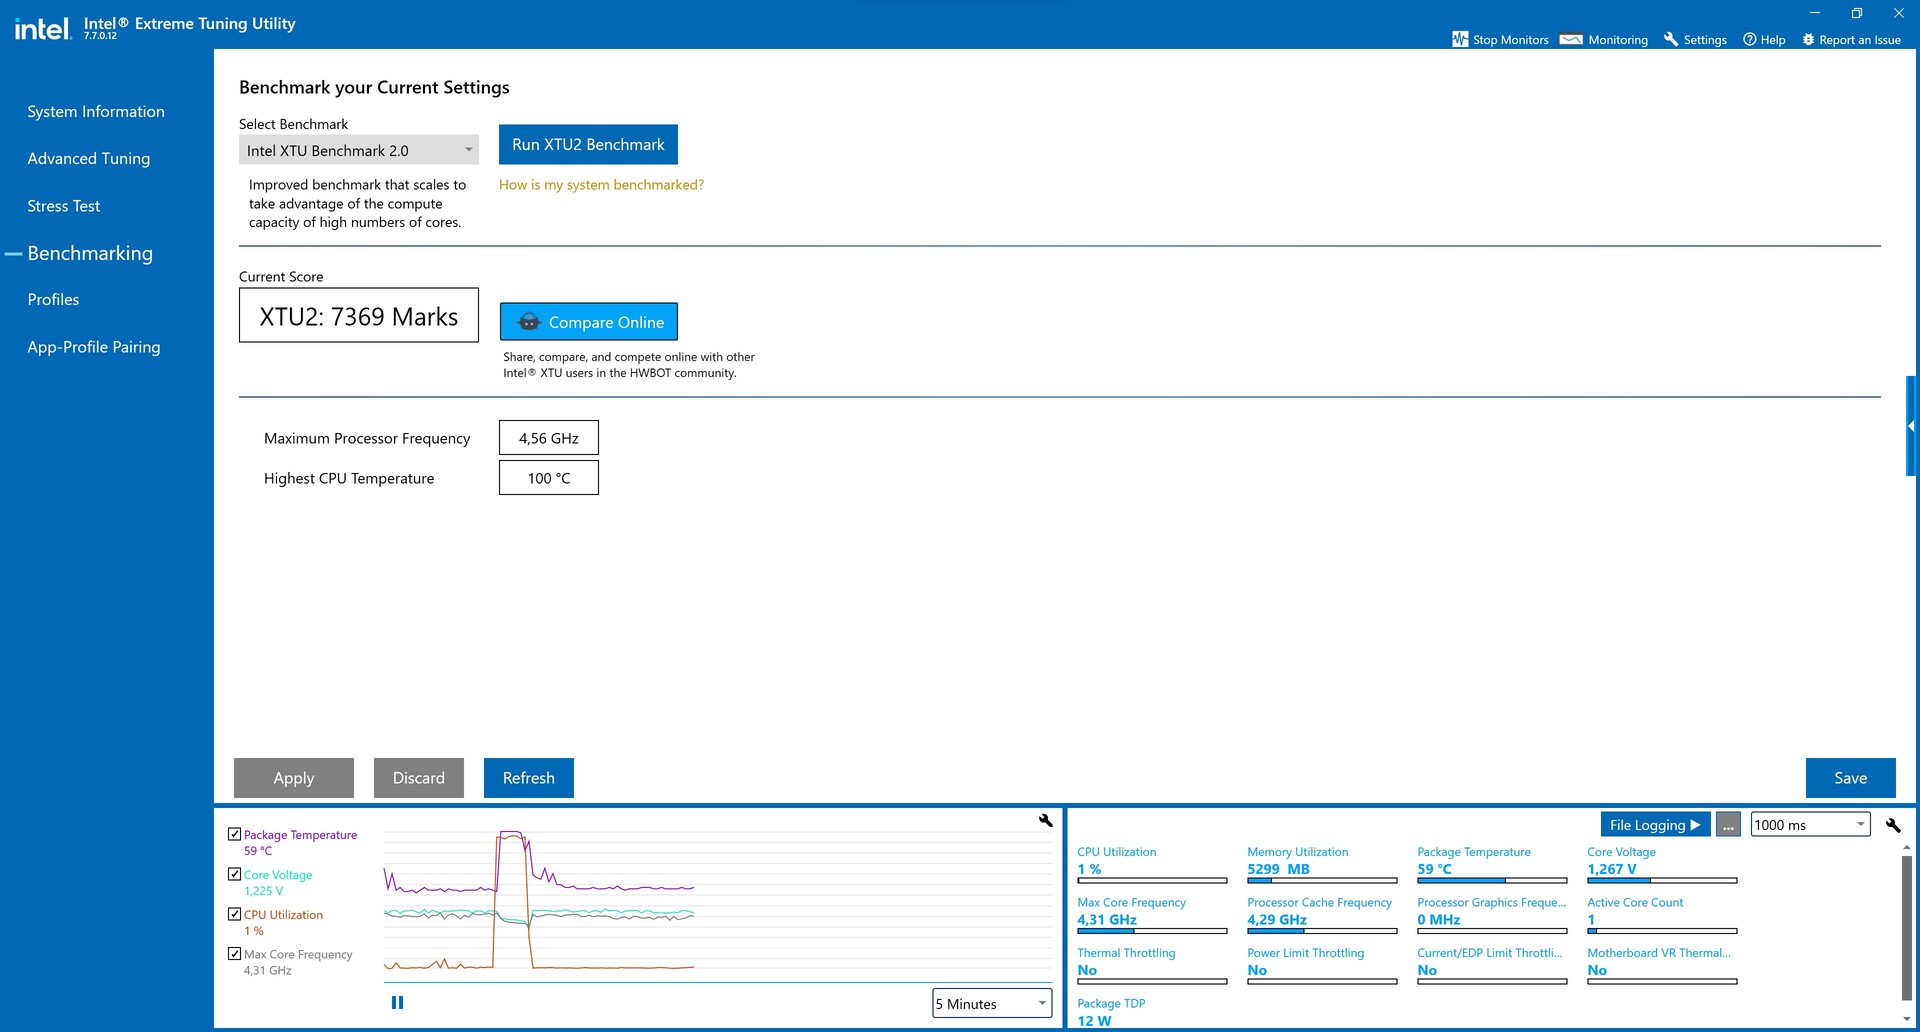
The Intel Core i9-12900 does justice to its class in the test, surpassing the performance of the Intel Core i9-11900KB by 15%, if we look at the results across all the benchmarks (performance rating). When being compared to standard desktop systems, the Intel Core i9-12900 in the Intel NUC 12 Extreme Kit is also able to keep up with an AMD Ryzen 7 5800X or Intel Core i9-11900K. On the other hand, the Intel Core i7-12700K is able to beat our Dragon Canyon NUC, and we see a first sign of a slightly throttled performance due to the very small cooling system. However, the disadvantage remains within limits, and the Intel Core i7-12700K was barely 10% faster in the test.
You can find additional comparisons and benchmarks in our CPU comparison chart.

* ... smaller is better
Intel NUC 12 Extreme Kit in the Cinebench R15 Multi loop
In the load test with the Cinebench R15 Mult loop, we see a significant performance drop after the initial run, before it continues to level out at 2,592 points. However, compared to the two predecessors there is still a clear performance advantage even under full load.
Application performance
In the application benchmarks, the pure performance advantage compared to the predecessor model turns out significantly lower than expected. However, looking at this subjectively, both the Beast Canyon NUC at that time and also the Dragon Canyon NUC now have a very high operational speed and leave a very good impression in everyday operation. If you install a fast SSD, the system is ready for use already after a few seconds. We did not encounter any long wait times in our test configuration. But when comparing it to current high-end systems, they will still surpass the Intel NUC 12 Extreme Kit. The GPU that is used has a large impact here. At the same time, our test unit is still 14% faster than a system based on an AMD Ryzen 9 5900X with the identical GPU.
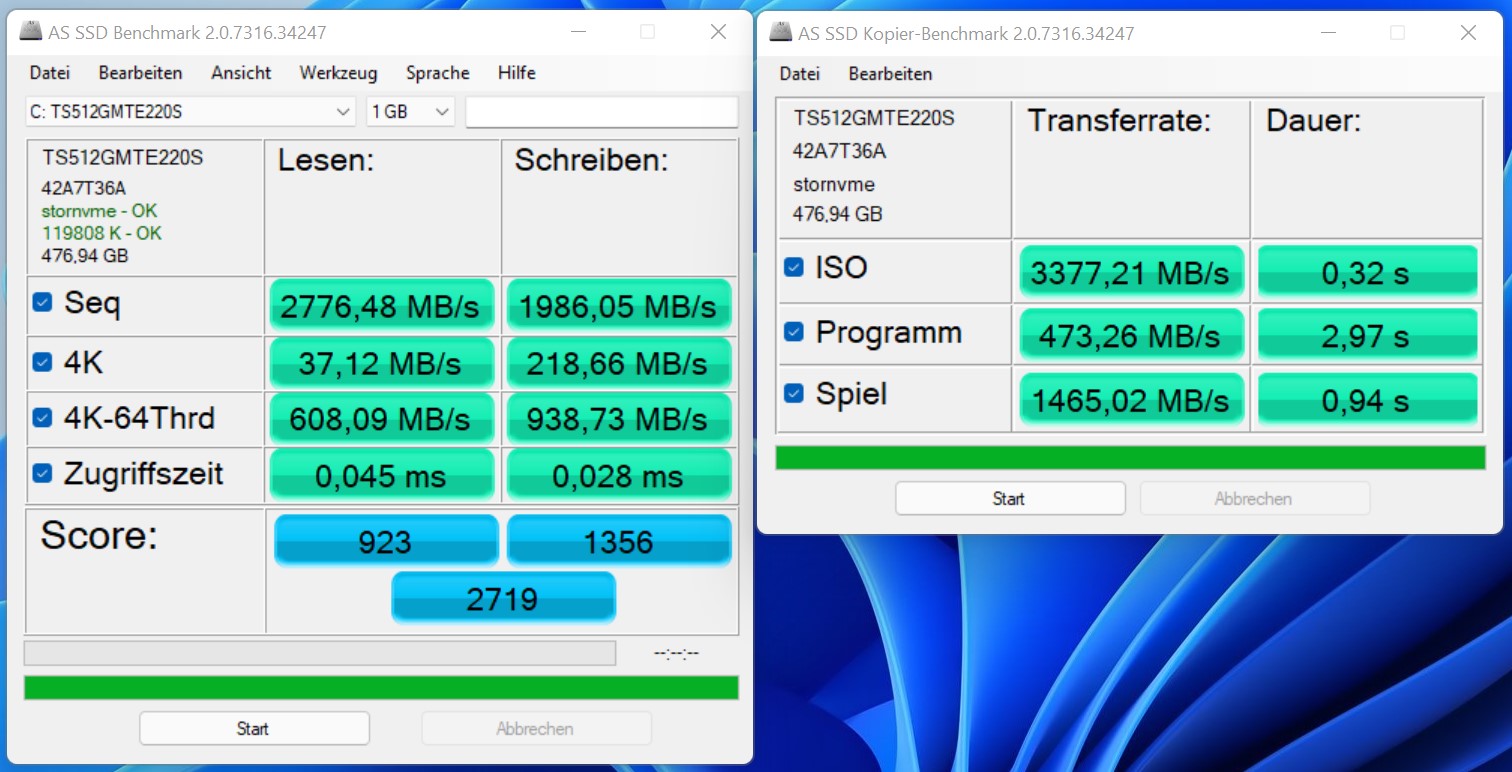
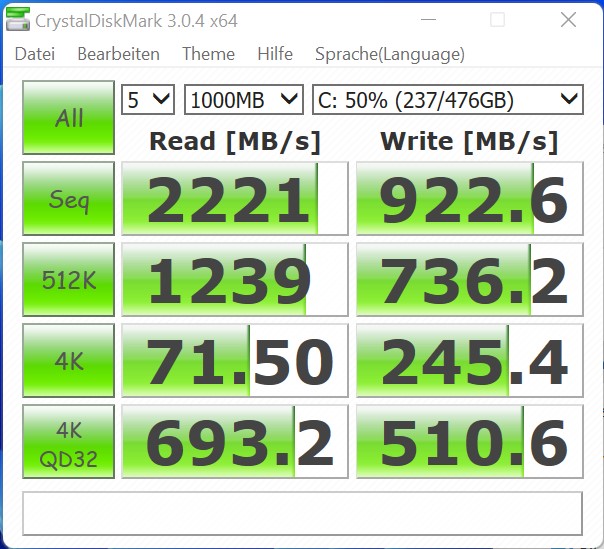
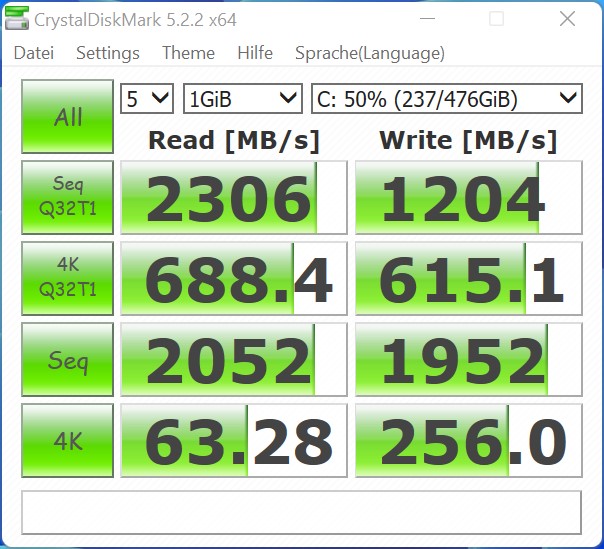
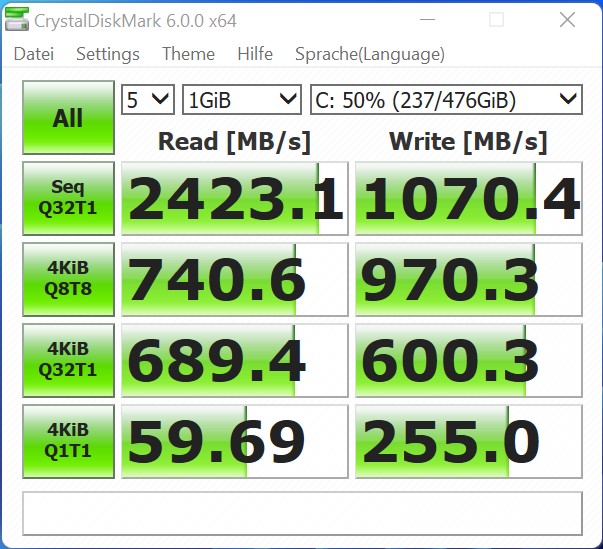
We equipped the barebone system with a 512-GB NVMe SSD. In our test, the model from Transcend delivered a solid performance. You can insert a total of two M.2-2280 SSDs in the Compute Element.
3D and gaming performance
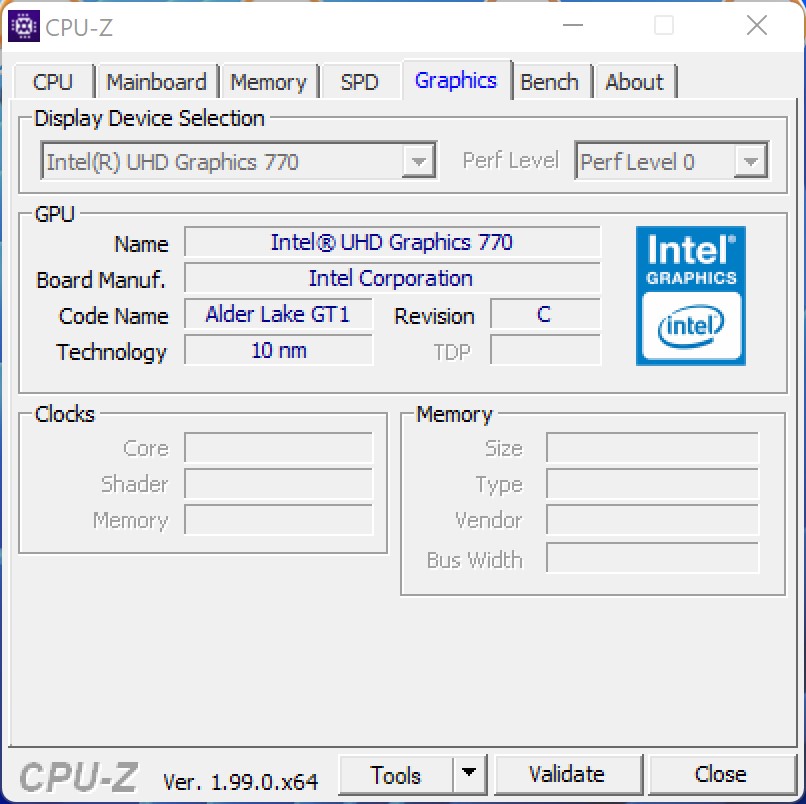
Since the Intel Core i9-12900 only offers a simple iGPU with the Intel UHD Graphics 770, the 3D performance for demanding video games is simply not there. However, you can install a dedicated graphics card in the case, which will turn the NUC into a very compact gaming PC. Because we already tested the Beast Canyon NUC with an Nvidia GeForce RTX 3060 at that time, we decided to also use a model of the RTX 3060 for the Dragon Canyon NUC. In combination with the Alder Lake processor, the performance increases by about 4% in gaming operation. This result doesn't justify an upgrade, so it should only be relevant for a new purchase.
The cooperation with the Nvidia GeForce RTX 3060 from INNO 3D works very well. All the current games can be enjoyed at sufficient frame rates in 1440 resolution without any problems. At times, you can even play many games in 2160p. However, since increasing resolution and higher detail levels concern more the GPU limits, the performance of the CPU is only secondary, which explains the low performance increase compared to the Beast Canyon NUC.
You can find additional comparisons and benchmarks in our GPU comparison chart.
Those who want to equip their Dragon Canyon NUC with a dedicated graphics card should find out beforehand about the exact dimensions of the GPU. The graphics card cannot have a cooling design that takes up more than two slots, and you should also note the maximum length of 30.5 cm (12 in).
| Performance rating - Percent | |
| Zotac Magnus One (ECM73070C) | |
| Inno3D GeForce RTX 3060 Twin X2 | |
| Intel Dragon Canyon NUC - RTX 3060 | |
| Intel Beast Canyon NUC | |
| Intel Ghost Canyon NUC (RTX 2070) | |
| Borderlands 3 | |
| 1280x720 Very Low Overall Quality (DX11) | |
| Intel Dragon Canyon NUC - RTX 3060 | |
| Inno3D GeForce RTX 3060 Twin X2 | |
| Intel Beast Canyon NUC | |
| Intel Ghost Canyon NUC (RTX 2070) | |
| Zotac Magnus One (ECM73070C) | |
| 1920x1080 Badass Overall Quality (DX11) | |
| Intel Beast Canyon NUC | |
| Zotac Magnus One (ECM73070C) | |
| Intel Dragon Canyon NUC - RTX 3060 | |
| Inno3D GeForce RTX 3060 Twin X2 | |
| Intel Ghost Canyon NUC (RTX 2070) | |
| Dota 2 Reborn | |
| 1280x720 min (0/3) fastest | |
| Inno3D GeForce RTX 3060 Twin X2 | |
| Intel Beast Canyon NUC | |
| Intel Dragon Canyon NUC - RTX 3060 | |
| Zotac Magnus One (ECM73070C) | |
| Intel Ghost Canyon NUC (RTX 2070) | |
| 1920x1080 ultra (3/3) best looking | |
| Inno3D GeForce RTX 3060 Twin X2 | |
| Intel Beast Canyon NUC | |
| Intel Dragon Canyon NUC - RTX 3060 | |
| Intel Ghost Canyon NUC (RTX 2070) | |
| Zotac Magnus One (ECM73070C) | |
Intel NUC 12 Dragon Canyon + Nvidia GeForce RTX 3060
| low | med. | high | ultra | QHD | 4K | |
|---|---|---|---|---|---|---|
| GTA V (2015) | 186 | 181 | 177 | 104 | 81.4 | 82.3 |
| The Witcher 3 (2015) | 462 | 305 | 178 | 91.3 | 62.5 | |
| Dota 2 Reborn (2015) | 178.3 | 161.7 | 155.6 | 147.1 | 116.1 | |
| Final Fantasy XV Benchmark (2018) | 196 | 123 | 88.6 | 64.8 | 38 | |
| X-Plane 11.11 (2018) | 151 | 133 | 105 | 88.5 | ||
| Far Cry 5 (2018) | 193 | 153 | 139 | 132 | 94 | 48 |
| Strange Brigade (2018) | 491 | 230 | 180 | 154 | 116 | 66.8 |
| Far Cry New Dawn (2019) | 161 | 132 | 126 | 113 | 92 | 51 |
| Metro Exodus (2019) | 207 | 113 | 83.7 | 65.3 | 51.7 | 32.2 |
| Borderlands 3 (2019) | 185 | 148 | 104 | 84.7 | 60.3 | 33.3 |
| F1 2020 (2020) | 355 | 259 | 208 | 142 | 106 | 60.2 |
| F1 2021 (2021) | 419 | 261 | 206 | 96.9 | 72 | 40.9 |
| Far Cry 6 (2021) | 167 | 129 | 110 | 96 | 70.5 | 39.3 |
Power consumption, heat development, and noise of the Intel NUC 12 Dragon Canyon
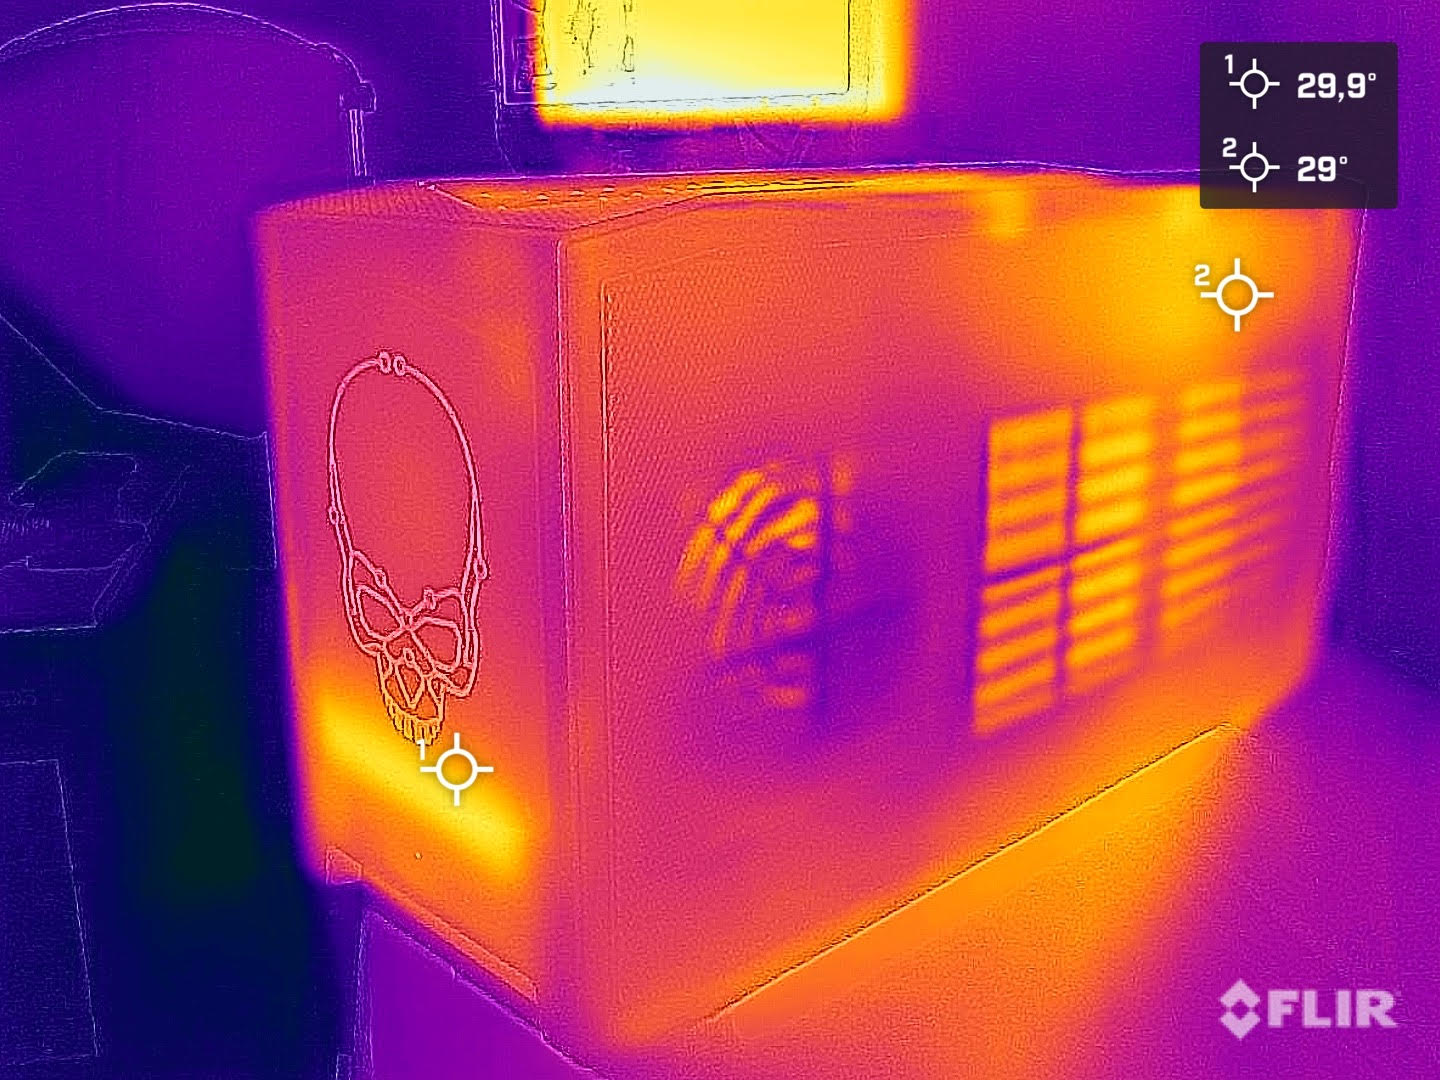
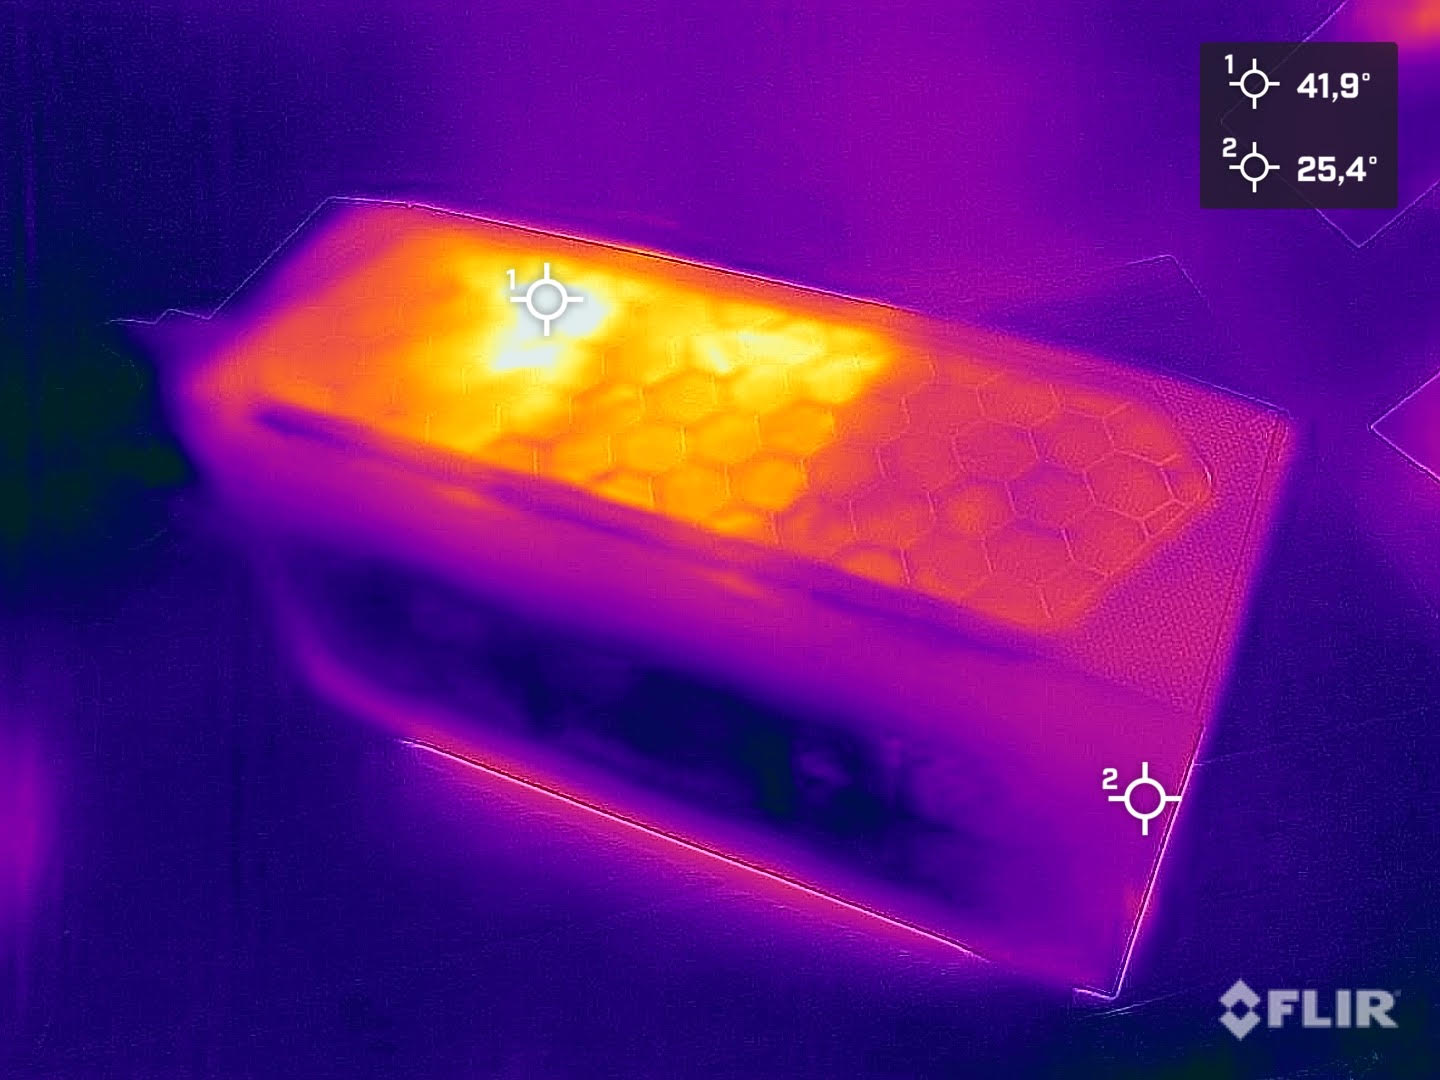
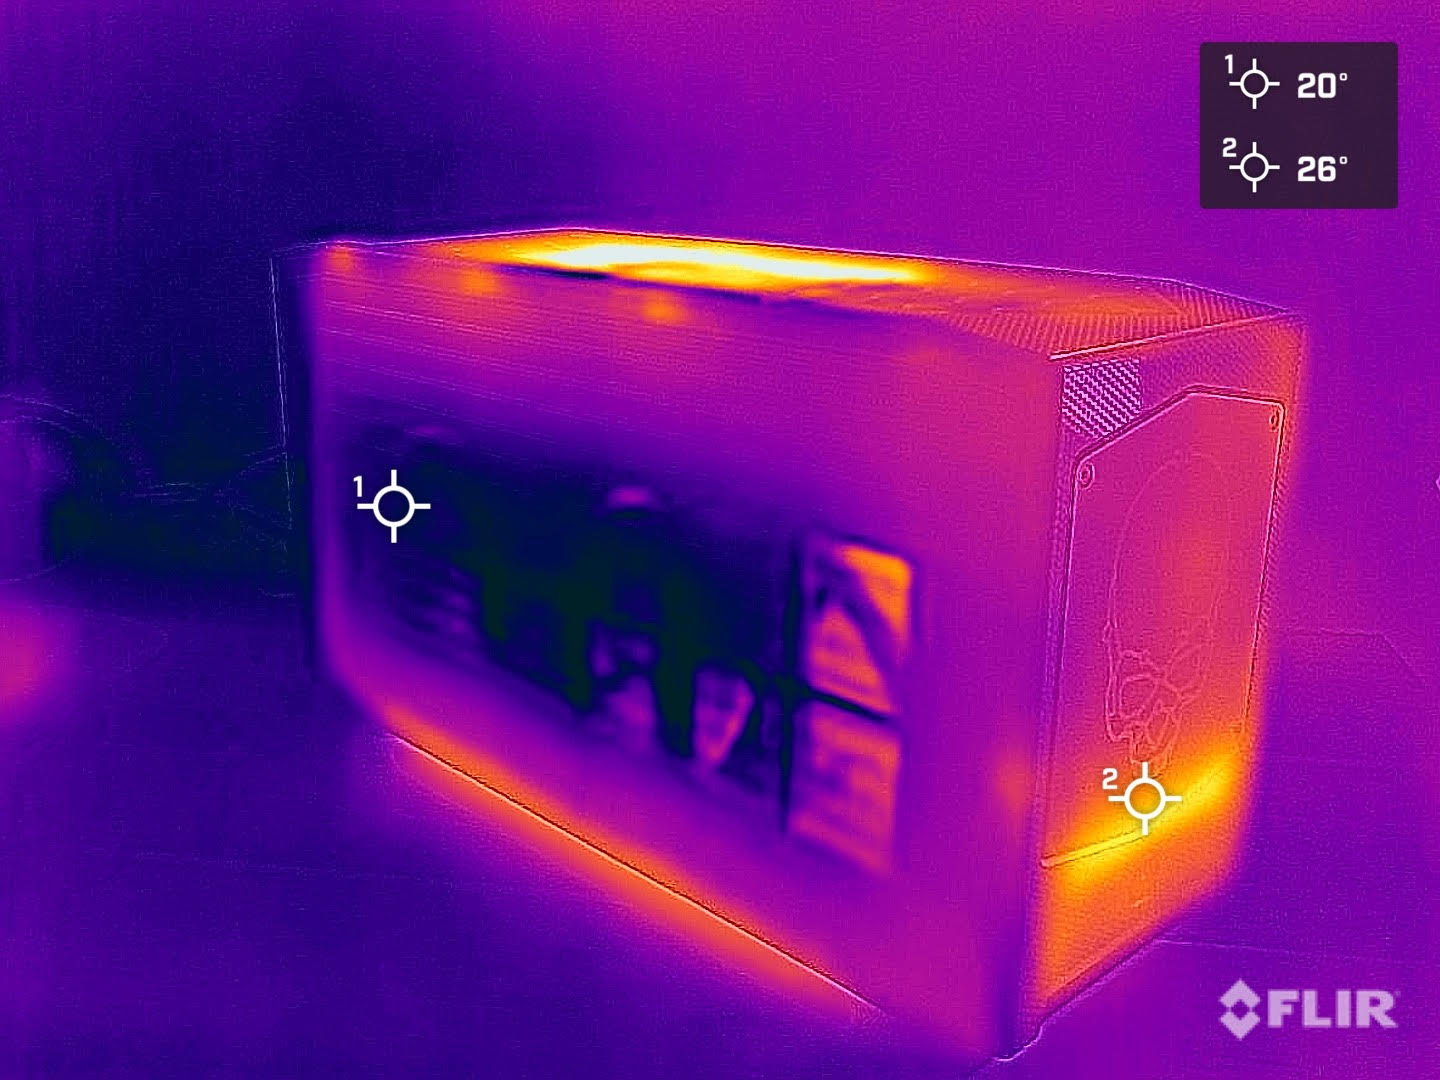
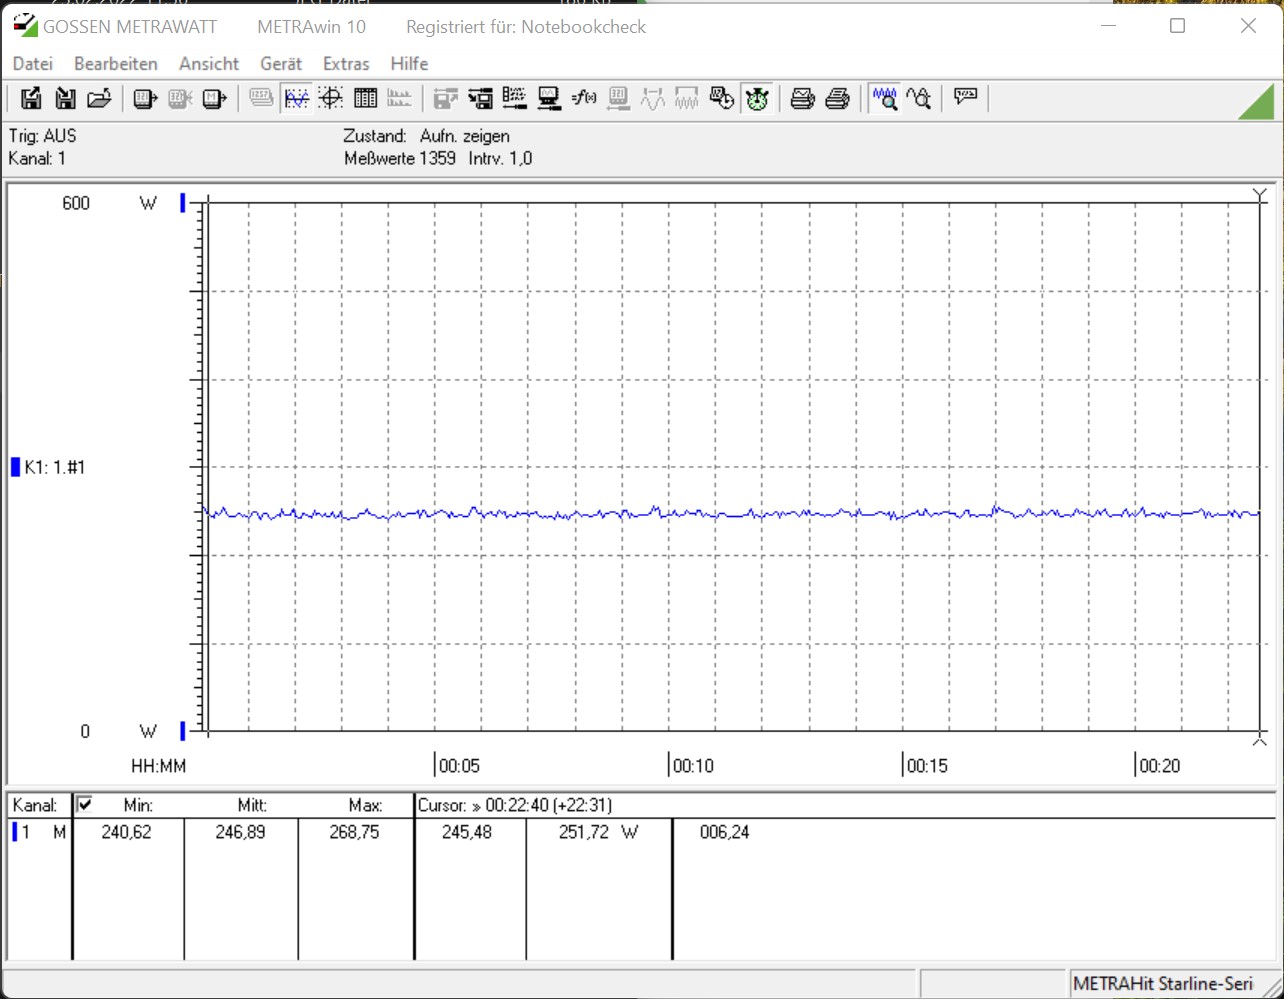
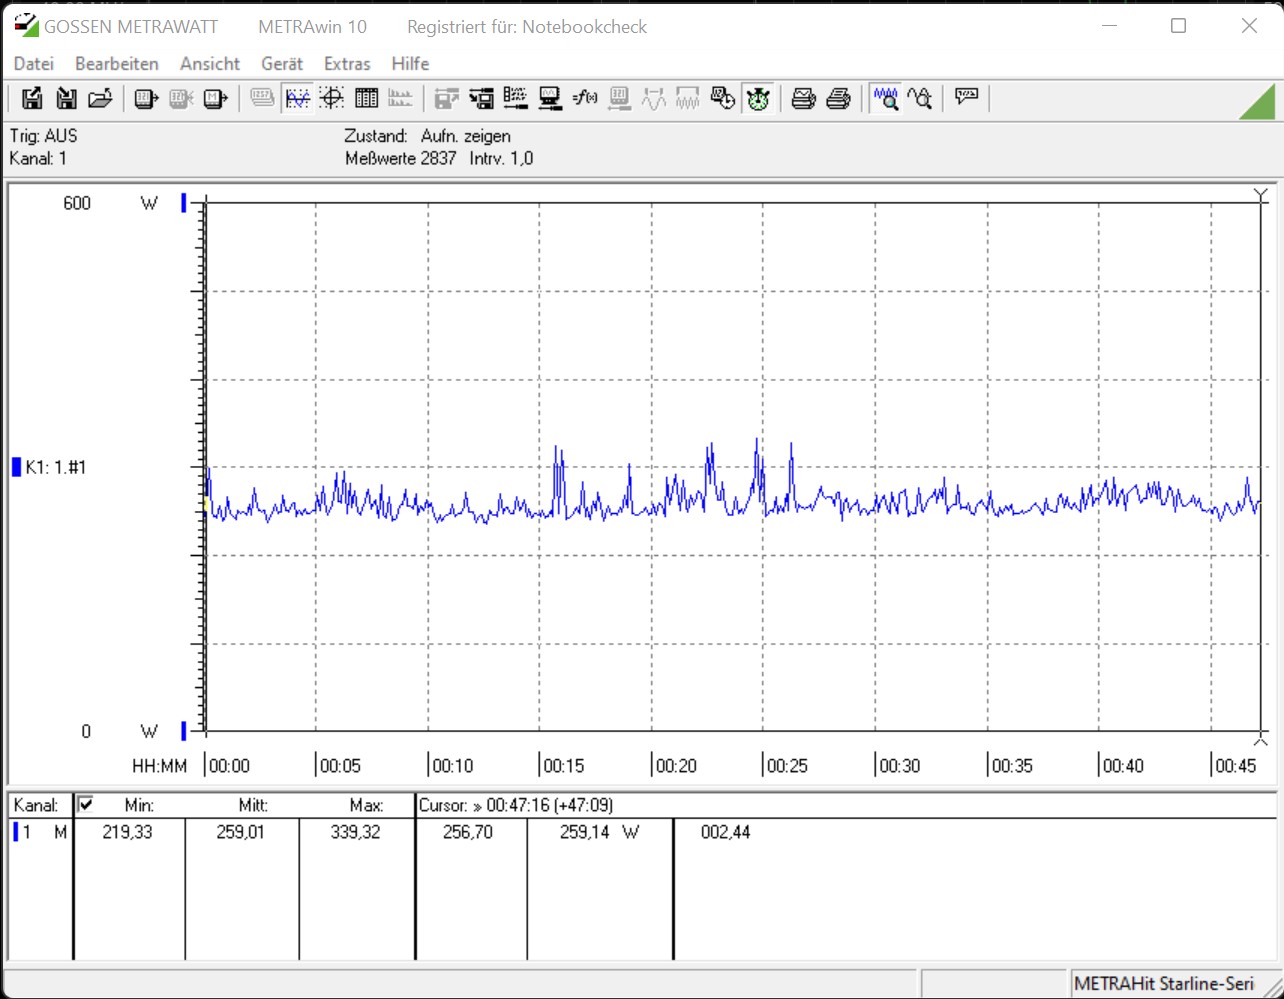
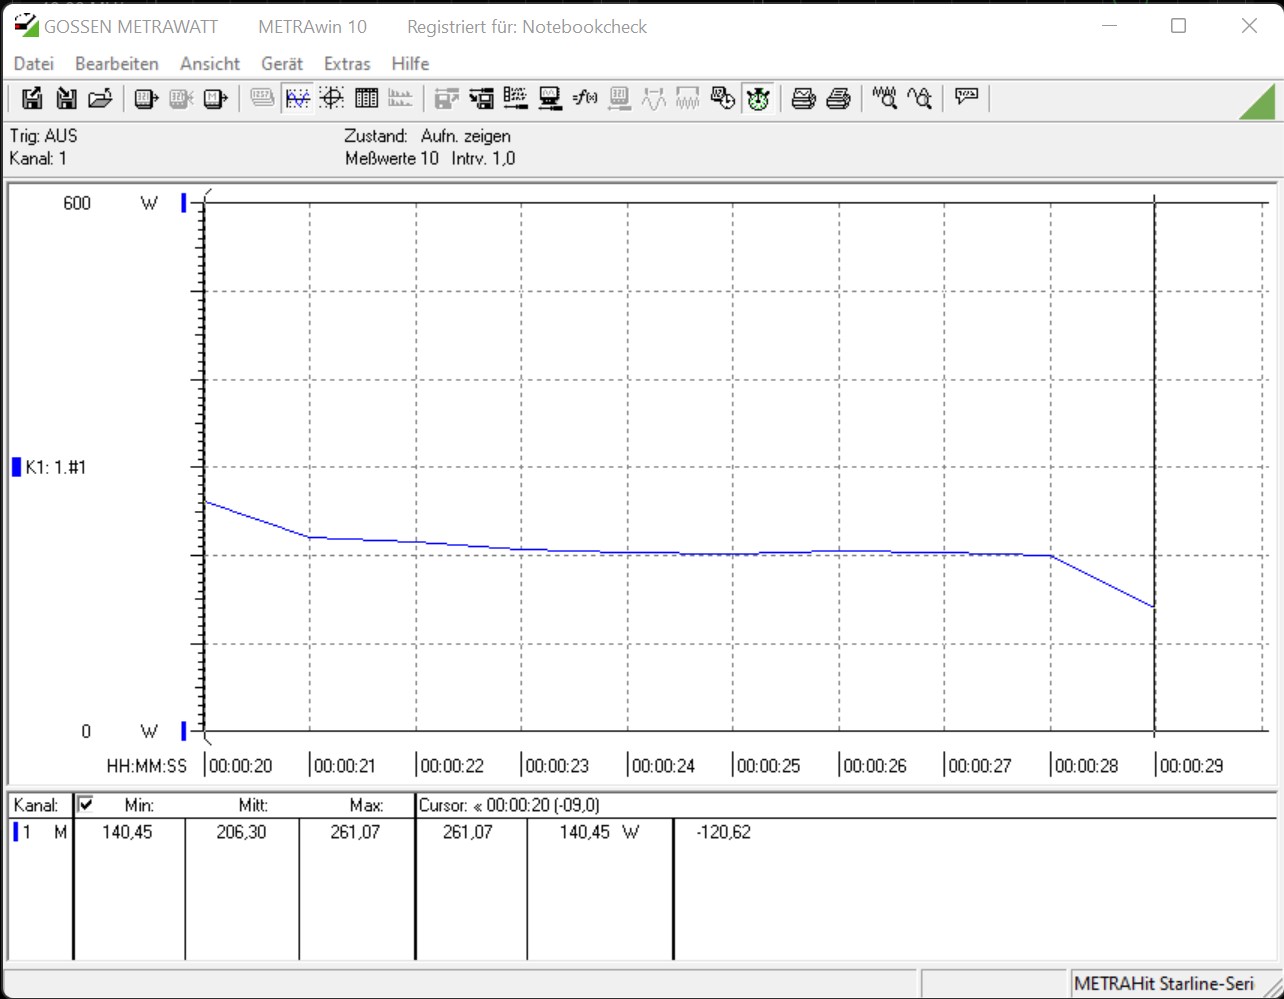
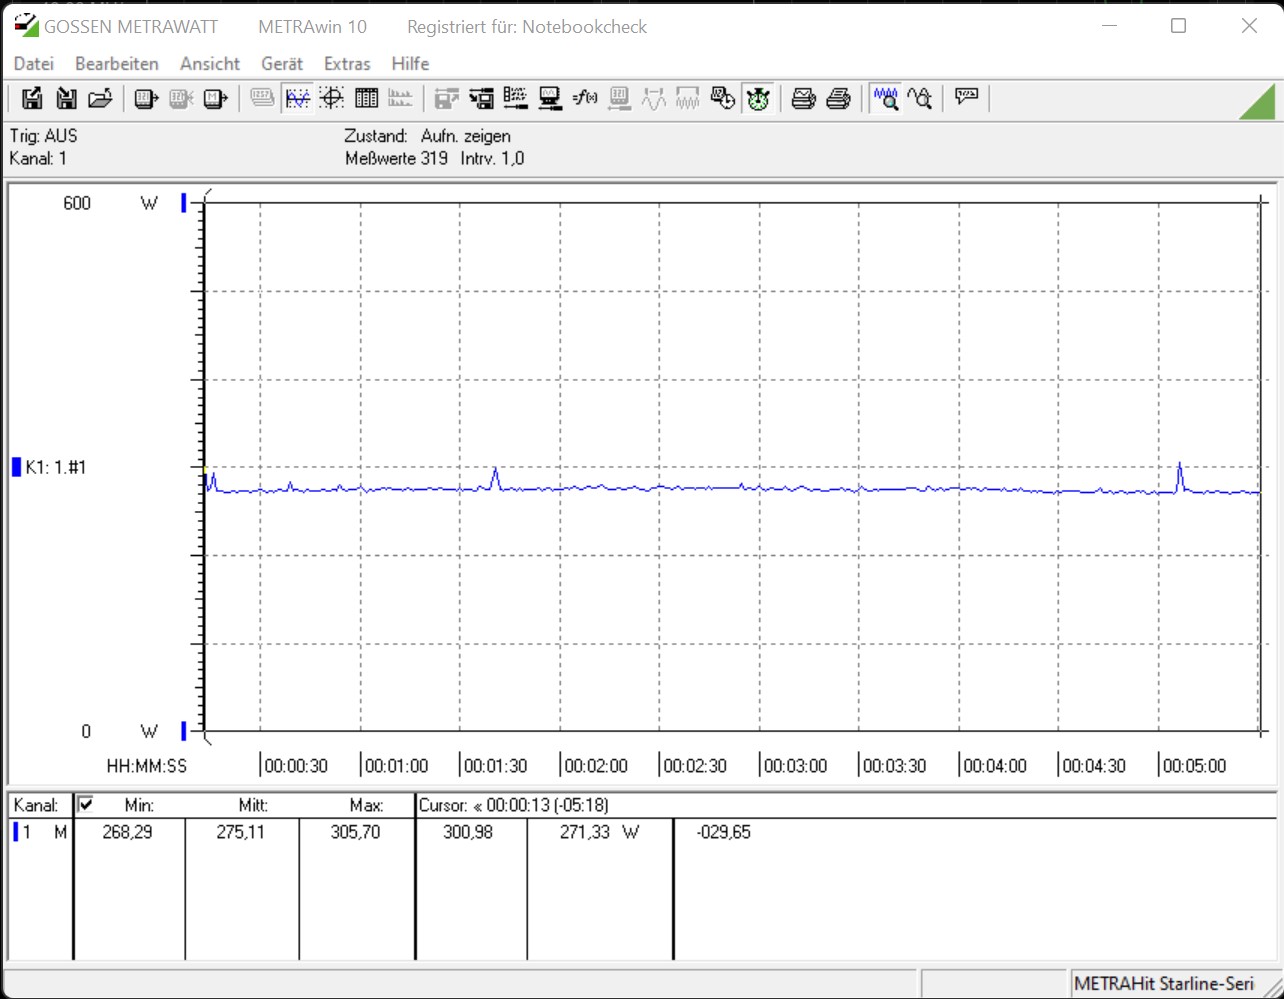
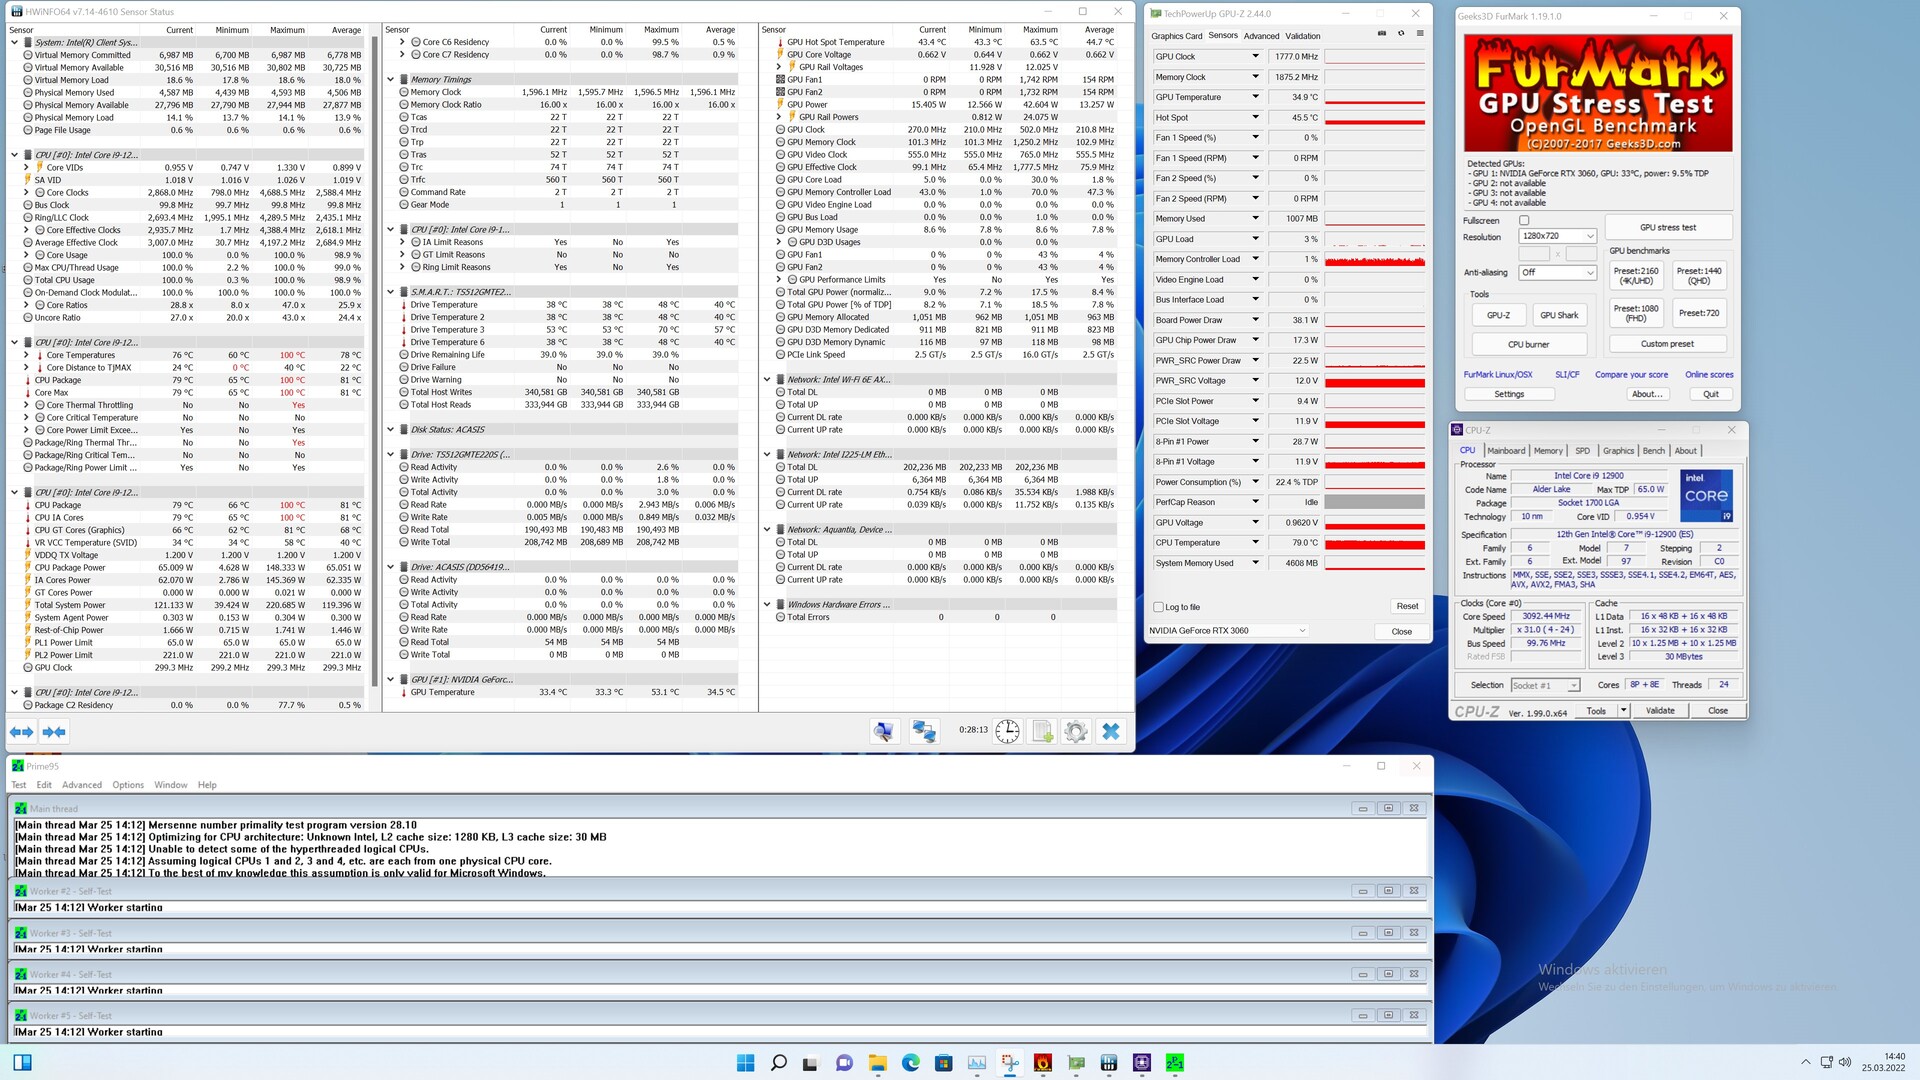
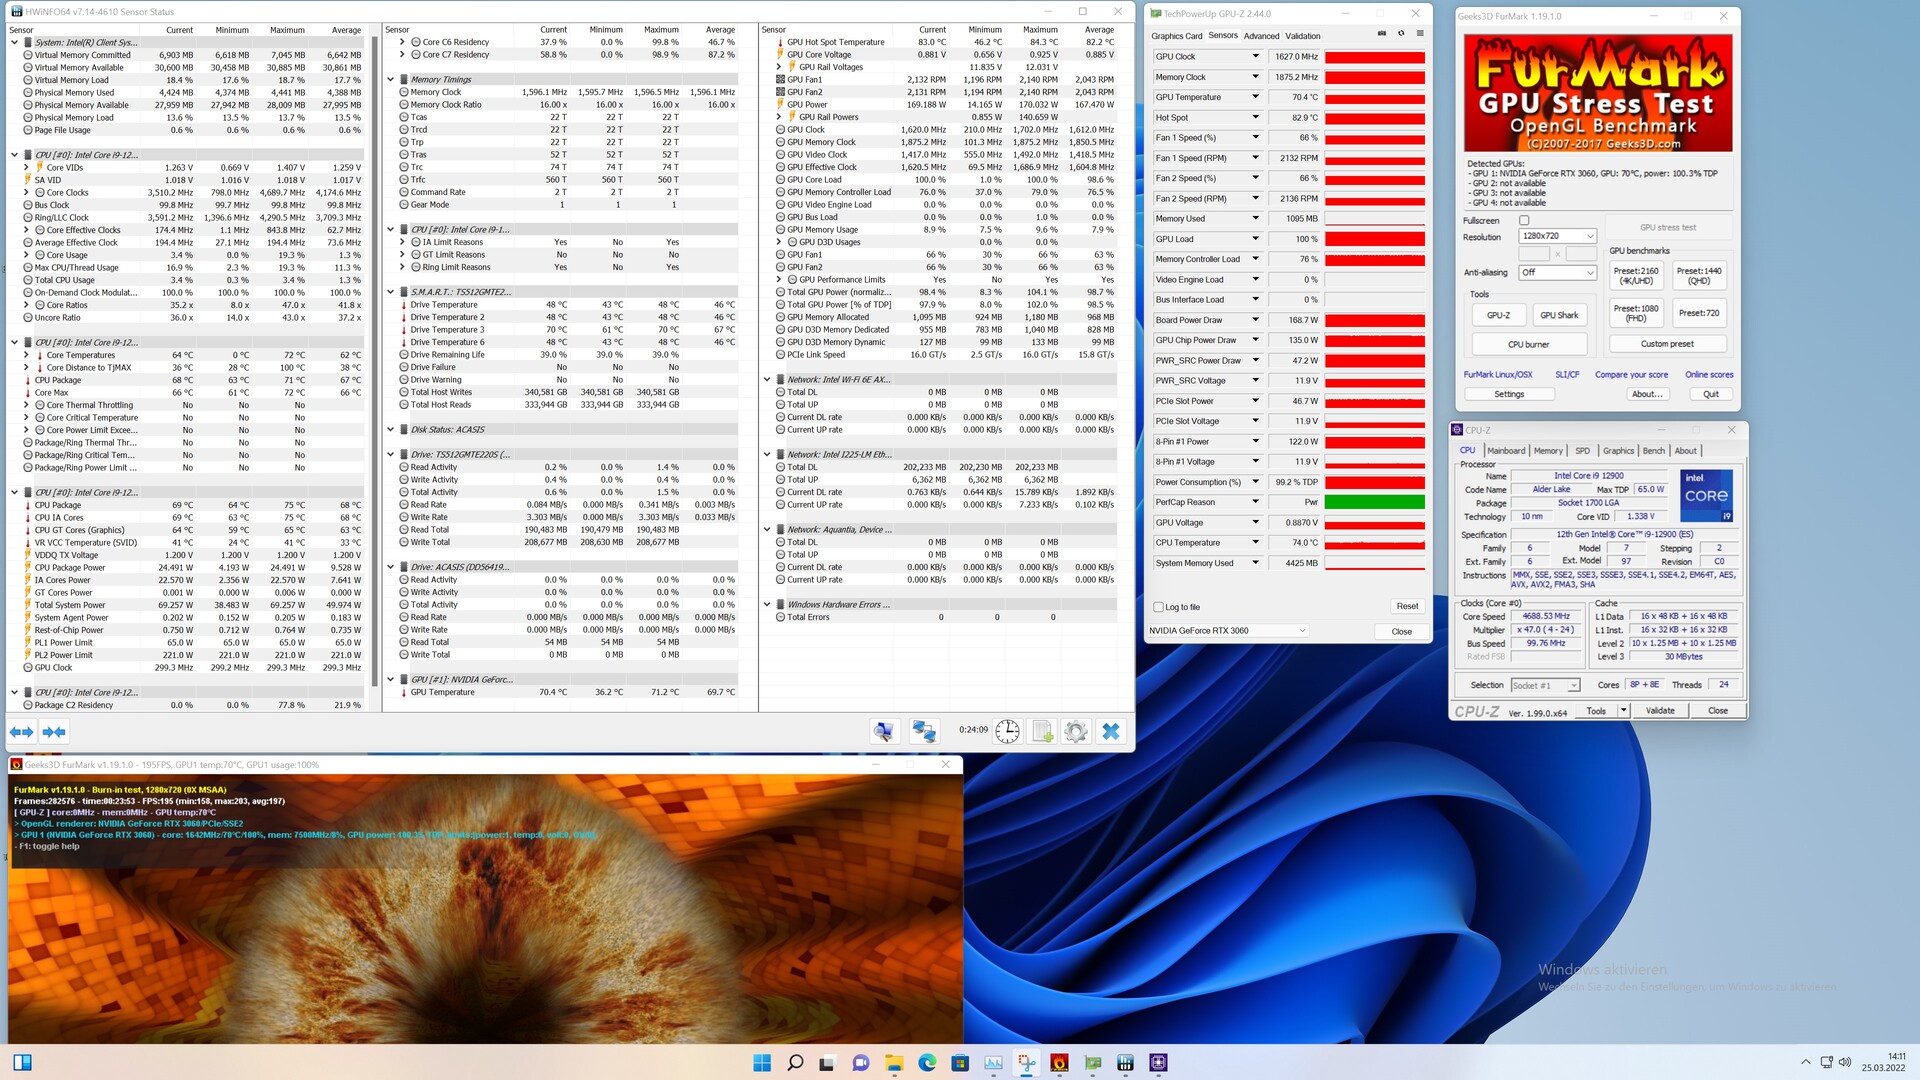
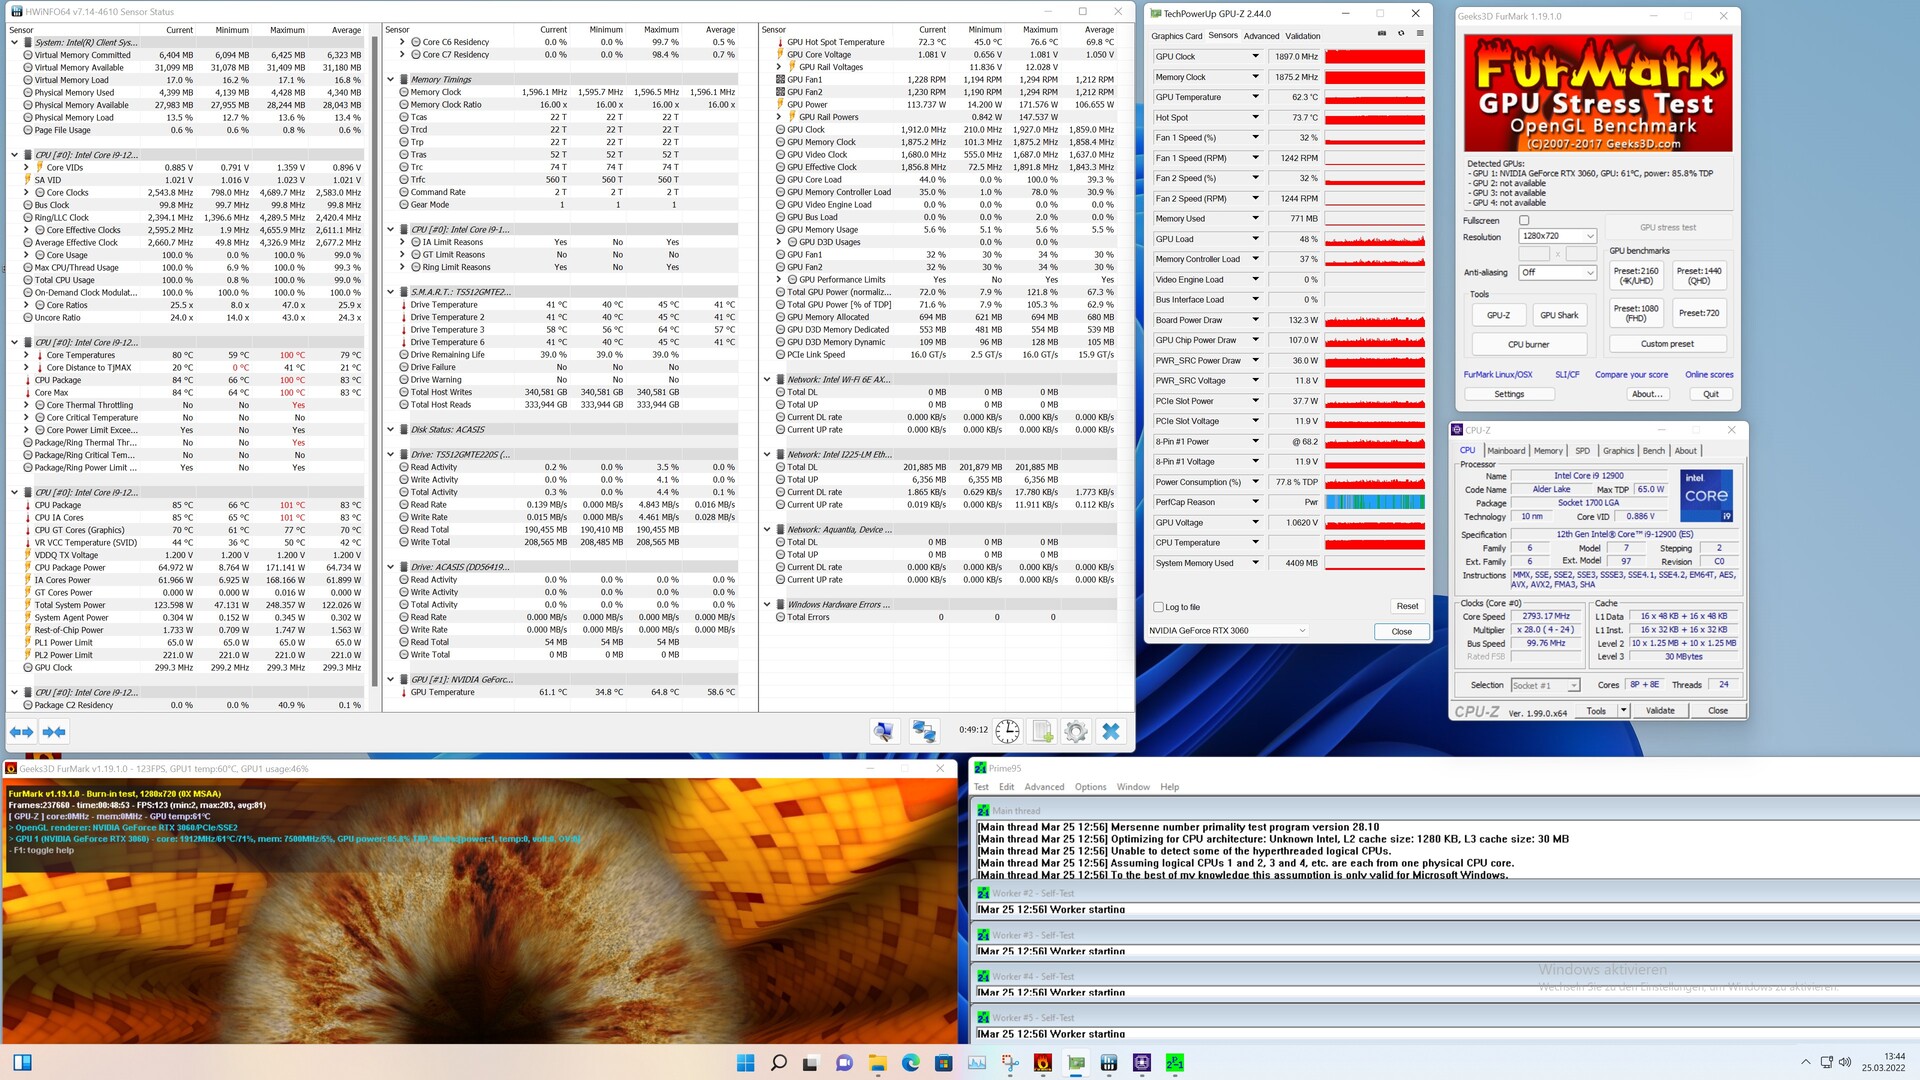
In the Intel NUC 12 Extreme Kit, the Intel Core i9-12900 brings a significantly higher power consumption compared to the Intel NUC 11 Extreme Kit. Due to the higher TDP of the Intel Core i9-12900 compared to the Intel Core i9-11900KB, this was already expected. In comparison with the two other Alder Lake systems that we also listed here, the power consumption of the Intel Dragon Canyon NUC turns out significantly lower, though. The reason for this can be found easily, since the relatively small cooling unit quickly reaches its limits with the Intel Core i9-12900 under load, so that the processor performance has to be throttled. Under load, the temperature limit of 100 °C (212 °F) is almost always reached quickly. In the stress test with Prime95, the temperature limit is already reached after a few seconds. However, the Intel Core i9-12900 still runs at almost 2.6 GHz on average, which is still slightly more than the basic clock speed (2.4 GHz). We should also mention that the temperature limit is only reached very briefly. Across the whole test, the average temperature lies at 78 °C (172 °F), which is a reasonable value overall. We also see a similar picture during simultaneous load of the CPU and GPU.
The compact build brings one large disadvantage. The Intel Beast Canyon NUC could already be heard clearly under load. Intel does a slightly better job with the Dragon Canyon NUC, although that is also still clearly audible at 45.1 dB(A) under full load. But during idle operation or under low load, the system remains silent for the most part. We only hear the revving of the fans from time to time, but due to its low frequency the fan noise is relatively comfortable.
Noise level
| Idle |
| 30.2 / 30.4 / 30.8 dB(A) |
| Load |
| / 45.1 dB(A) |
 | ||
30 dB silent 40 dB(A) audible 50 dB(A) loud |
||
min: | ||
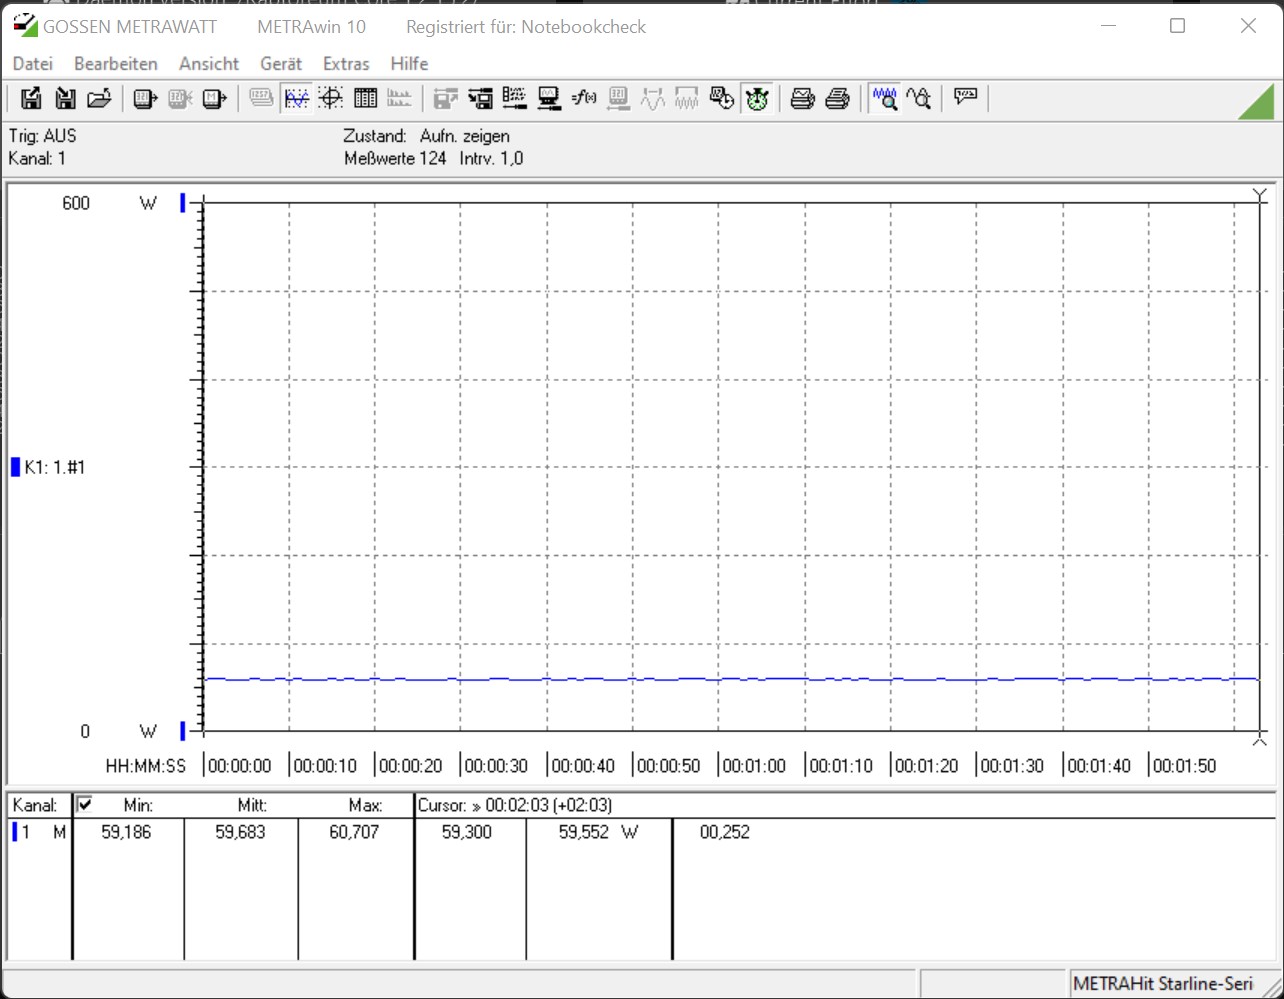
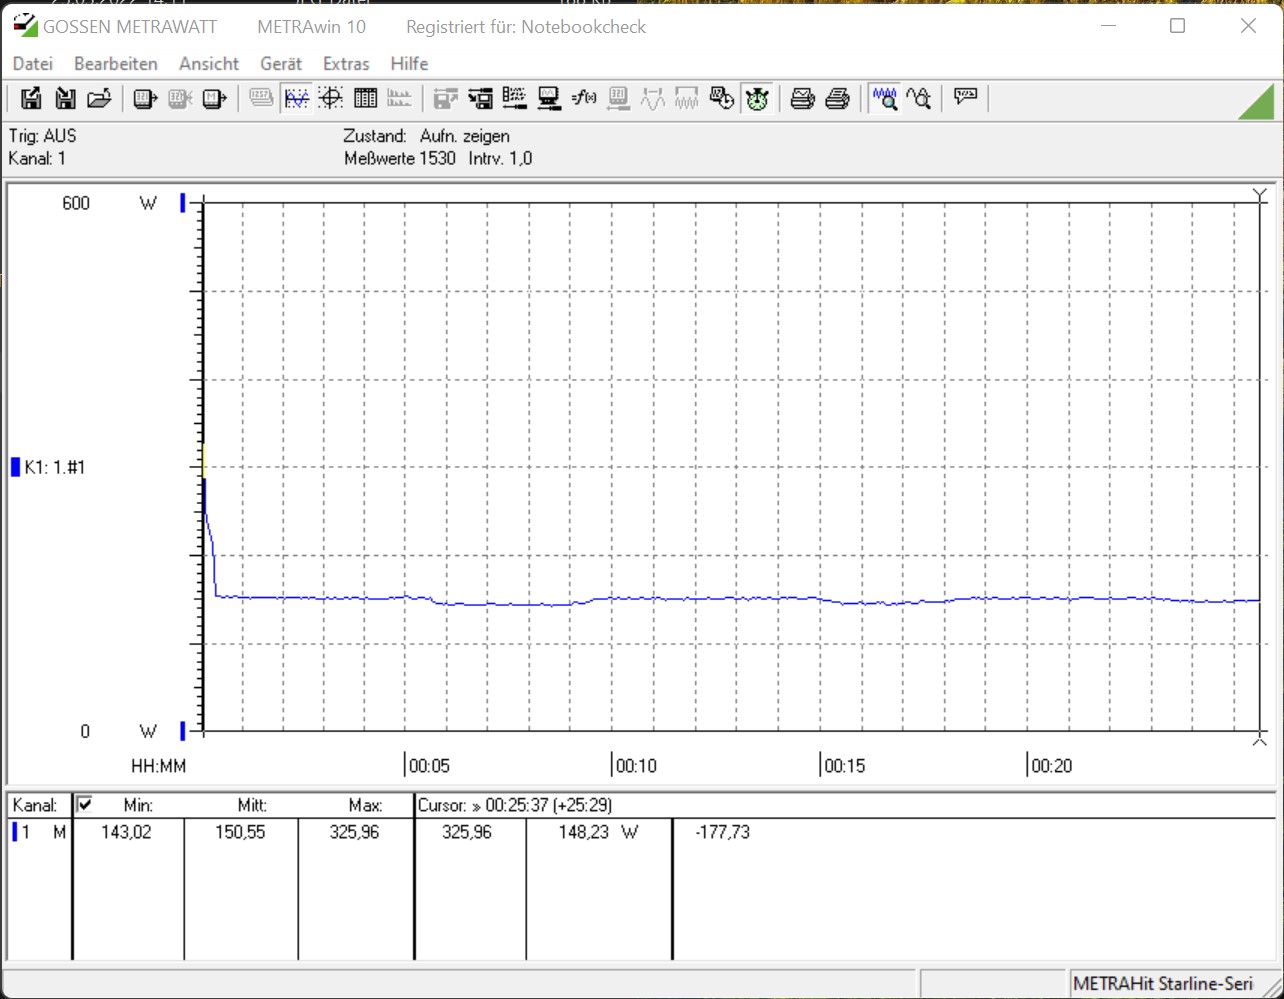
| Power Consumption | |
| 1920x1080 The Witcher 3 ultra (external Monitor) | |
| Intel Core i9-12900K (Idle: 70.5 W) | |
| AMD Ryzen 9 3950X (Idle: 95 W) | |
| Intel Core i7-12700K (Idle: 81 W) | |
| Intel Core i9-10900K (Idle: 52.3 W) | |
| Intel Core i5-10600K (Idle: 52.2 W) | |
| Corsair One i160 (Idle: 51.5 W) | |
| Intel Dragon Canyon NUC - RTX 3060 | |
| Intel Ghost Canyon NUC (RTX 2070) (Idle: 33.1 W) | |
| Intel Beast Canyon NUC (Idle: 32 W) | |
| Prime95 V2810 Stress (external Monitor) | |
| Intel Core i7-12700K (Idle: 81 W) | |
| Intel Core i9-12900K (Idle: 70.5 W) | |
| Intel Core i9-10900K (Idle: 52.3 W) | |
| Intel Core i5-10600K (Idle: 52.2 W) | |
| AMD Ryzen 9 3950X (Idle: 95 W) | |
| Intel Dragon Canyon NUC - RTX 3060 | |
| Intel Beast Canyon NUC (Idle: 34 W) | |
| Intel Ghost Canyon NUC (RTX 2070) (Idle: 33.1 W) | |
| Cinebench R15 Multi (external Monitor) | |
| Intel Core i9-12900K (Idle: 70.5 W) | |
| Intel Core i7-12700K (Idle: 81 W) | |
| Intel Core i9-10900K (Idle: 52.3 W) | |
| AMD Ryzen 9 3950X (Idle: 95 W) | |
| Intel Dragon Canyon NUC - RTX 3060 | |
| Intel Core i5-10600K (Idle: 52.2 W) | |
| Intel Beast Canyon NUC (Idle: 32 W) | |
| Temperatures - CPU Temperature Prime95 | |
| Intel Dragon Canyon NUC - RTX 3060 | |
| Intel Core i9-10900K | |
| AMD Ryzen 9 3950X | |
| Intel Core i5-10600K | |
* ... smaller is better
Pros
Cons
Verdict - A compact workhorse
The Intel NUC 12 Dragon Canyon is a small upgrade of the Intel NUC 11 Extreme Kit alias Beast Canyon. With the new Alder Lake CPU, Intel performs some product maintenance, retiring the older Tiger Lake processor. In addition, there is a socketed CPU in the Compute Element for the first time, allowing usage of different processors. In terms of pure performance, what the Intel Core i9-12900 is able to deliver is slightly better than the Intel Core i9-11900KB. At the same time, the compact build only offers limited space for suitable cooling. Under load, that hits its limits very quickly with an unthrottled Intel Core i9-12900, repeatedly causing it to reach the temperature limit.
At this point, the purchase price for the barebone system is 1450 Euros (~$1585). If you include the rest of the components such as RAM, SSD, and GPU, the Intel NUC 12 Dragon Canyon is not much more expensive than other complete systems. This puts the onus of the choice to the customer. If you like the design of the Intel NUC 12 Dragon Canyon, you can pick it without any caveats. The variety of connections make it future proof and their number is also sufficient. There even is a fast SD card reader that supports the UHS-II standard.
With the Intel NUC 12 Extreme Kit alias Dragon Canyon, Intel again raises the bar for its compact devices in terms of performance.
Finally, we still need to answer the question we posed at the beginning. Judging purely from its looks, we would rather consider the Intel NUC 12 Dragon Canyon to be in the gaming segment. Due to the performance of the Alder Lake processor and iGPU, the system is also suitable as a high-end office PC. At the same time, you also have the option to insert a professional graphics card, which turns the system into a full workstation. You can then also easily use the small Intel NUC Dragon Canyon for some image and video processing.
The alternative to the Intel NUC 12 Extreme Kit Dragon Canyon would be building a system yourself, which would probably cost about the same. With the Zotac Magnus One, there is also a good alternative if you want a very compact gaming PC.

