Thread Director (in hardware) can support the operating system to decide which thread to use on the performance or efficiency cores for the best performance.
The integrated graphics adapter is based on the Xe-architecture and called Intel UHD Graphics 770. It clocks between 300 and 1.5 GHz.
For AI tasks, the CPU also integrates GNA 3.0 and DL Boost. Quick Sync in version 8 is the same as in the Rocket Lake CPUs and supports MPEG-2, AVC, VC-1 decode, JPEG, VP8 decode, VP9, HEVC and AV1 decode in hardware.
This Core i7 series chip has a Base power consumption of 125 W, with its highest Intel-recommended Turbo power consumption sitting at 190 W. It might be a good idea to get an AIO cooling solution for a chip this power hungry.
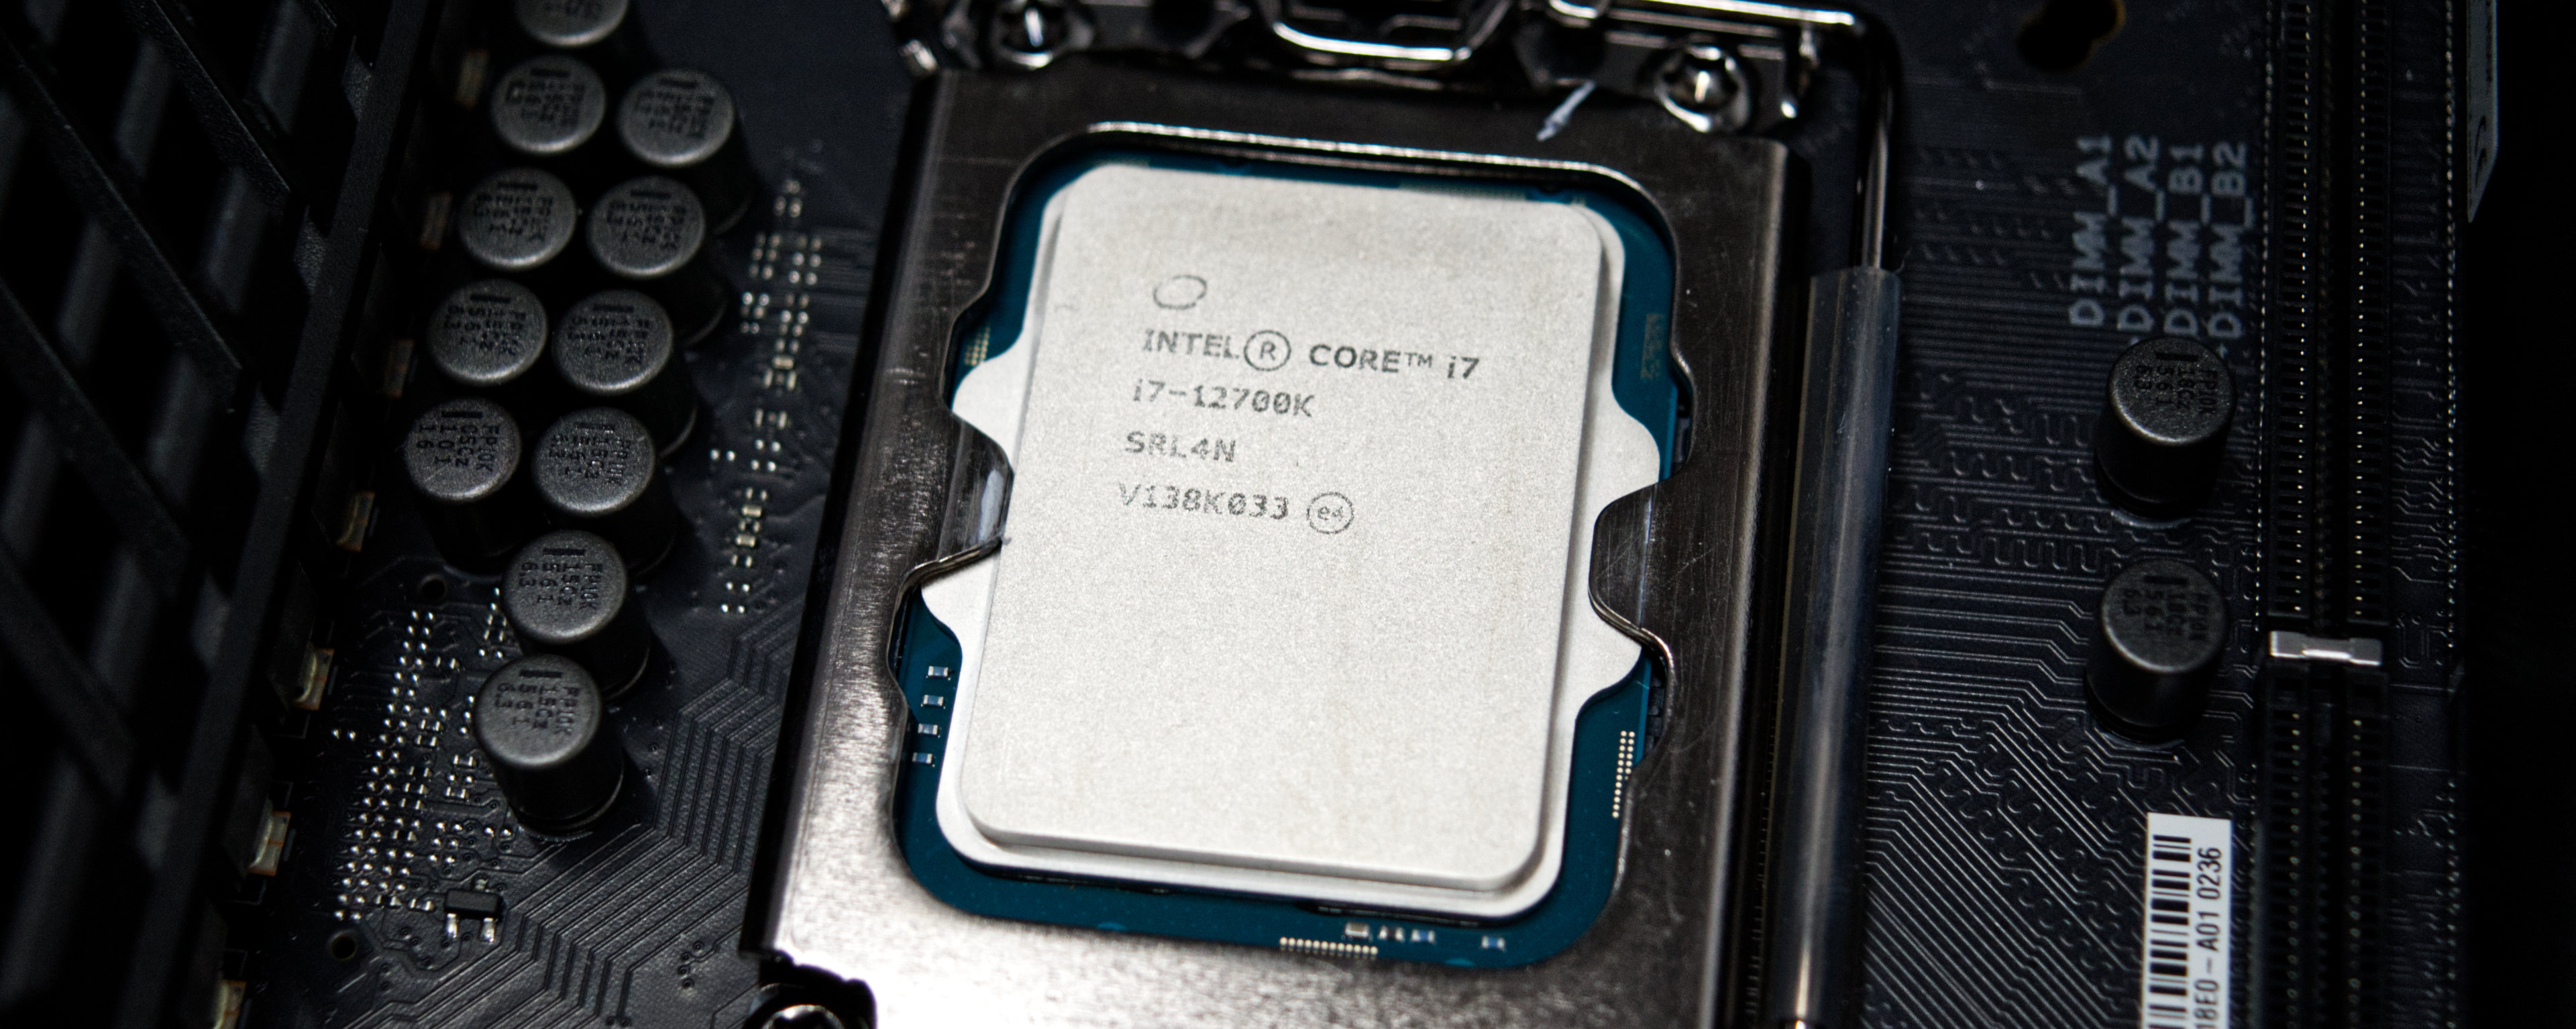
The i7-12700K is manufactured on Intel's fourth-generation 10 nm process marketed as Intel 7 for lower-than-average, as of early 2023, energy efficiency.
Codename Alder Lake Series Intel Alder Lake-S Series: Alder Lake-S Alder Lake Clock Rate 2700 - 5000 MHz Level 2 Cache 12 MB Level 3 Cache 25 MB Number of Cores / Threads 12 / 20 Power Consumption (TDP = Thermal Design Power) 125 Watt Manufacturing Technology 10 nm Max. Temperature 100 °C Socket LGA1700 Features DDR4-3200/DDR5-4800 RAM, PCIe 5, Thr. Dir., DL Boost, GNA, vPro Enterp., MMX, SSE, SSE2, SSE3, SSSE3, SSE4.1, SSE4.2, AVX, AVX2, BMI2, ABM, FMA, ADX, SMEP, SMAP, EIST, TM1, TM2, HT, Turbo, SST, AES-NI, RDRAND, RDSEED, SHA GPU Intel UHD Graphics 770 (300 - 1500 MHz)64 Bit 64 Bit support Architecture x86 Starting Price $409 U.S. Announcement Date 11/05/2021 Product Link (external) ark.intel.com
Performance Rating - CB R15 + R20 + 7-Zip + X265 + Blender + 3DM11 CPU
Cinebench R23 - Cinebench R23 Multi Core
min: 17003 avg: 19784 median: 19784 (18%) max: 22565 Points
Cinebench R23 - Cinebench R23 Single Core
min: 1806 avg: 1851 median: 1850.5 (75%) max: 1895 Points
Cinebench R20 - Cinebench R20 CPU (Single Core)
min: 731 avg: 736 median: 735.5 (79%) max: 740 Points
Cinebench R20 - Cinebench R20 CPU (Multi Core)
min: 6953 avg: 7801 median: 7800.5 (19%) max: 8648 Points
Cinebench R15 - Cinebench R15 CPU Multi 64 Bit
Model CPU GPU RAM Value Intel Core i7-12700K i7-12700K 125 W / 190 W Titan RTX 280 W 1350 / 7000 MHz 24 GB 32 GB 3325
...
AMD Ryzen 7 9850X3D
...
0 70 140 210 280 350 420 490 560 630 700 770 840 910 980 1050 1120 1190 1260 1330 1400 1470 1540 1610 1680 1750 1820 1890 1960 2030 2100 2170 2240 2310 2380 2450 2520 2590 2660 2730 2800 2870 2940 3010 3080 3150 3220 3290 Tooltip Intel Core i7-12700K: Ø3121 (3053.2-3310.16)
Cinebench R15 - Cinebench R15 CPU Single 64 Bit
Model CPU GPU RAM Value Intel Core i7-12700K i7-12700K 125 W / 190 W Titan RTX 280 W 1350 / 7000 MHz 24 GB 32 GB 272
Cinebench R11.5 - Cinebench R11.5 CPU Multi 64 Bit
Model CPU GPU RAM Value Intel Core i7-12700K i7-12700K 125 W / 190 W Titan RTX 280 W 1350 / 7000 MHz 24 GB 32 GB 38.38
...
AMD Ryzen 7 9850X3D
...
Cinebench R11.5 - Cinebench R11.5 CPU Single 64 Bit
Model CPU GPU RAM Value Intel Core i7-12700K i7-12700K 125 W / 190 W Titan RTX 280 W 1350 / 7000 MHz 24 GB 32 GB 3.29
Cinebench R10 - Cinebench R10 Rend. Single (32bit)
Model CPU GPU RAM Value Intel Core i7-12700K i7-12700K 125 W / 190 W Titan RTX 280 W 1350 / 7000 MHz 24 GB 32 GB 9305
AMD Geode LX 800
...
AMD Ryzen 7 9850X3D
...
Cinebench R10 - Cinebench R10 Rend. Multi (32bit)
Model CPU GPU RAM Value Intel Core i7-12700K i7-12700K 125 W / 190 W Titan RTX 280 W 1350 / 7000 MHz 24 GB 32 GB 63484
...
AMD Ryzen 7 9850X3D
...
Cinebench R10 - Cinebench R10 Rend. Multi (64bit)
Model CPU GPU RAM Value Intel Core i7-12700K i7-12700K 125 W / 190 W Titan RTX 280 W 1350 / 7000 MHz 24 GB 32 GB 102539
Cinebench R10 - Cinebench R10 Rend. Single (64bit)
Model CPU GPU RAM Value Intel Core i7-12700K i7-12700K 125 W / 190 W Titan RTX 280 W 1350 / 7000 MHz 24 GB 32 GB 15179
wPrime 2.10 - wPrime 2.0 1024m *
Model CPU GPU RAM Value Intel Core i7-12700K i7-12700K 125 W / 190 W Titan RTX 280 W 1350 / 7000 MHz 24 GB 32 GB 171.2
wPrime 2.10 - wPrime 2.0 32m *
Model CPU GPU RAM Value Intel Core i7-12700K i7-12700K 125 W / 190 W Titan RTX 280 W 1350 / 7000 MHz 24 GB 32 GB 2.659
WinRAR - WinRAR 4.0
Model CPU GPU RAM Value Intel Core i7-12700K i7-12700K 125 W / 190 W Titan RTX 280 W 1350 / 7000 MHz 24 GB 32 GB 10389
7-Zip 18.03 - 7-Zip 18.03 Multi Thread 4 runs
min: 65508 avg: 73439 median: 73438.5 (42%) max: 81369 MIPS
7-Zip 18.03 - 7-Zip 18.03 Single Thread 4 runs
min: 6117 avg: 6270 median: 6269.5 (71%) max: 6422 MIPS
...
...
AMD Ryzen 7 9850X3D
X264 HD Benchmark 4.0 - x264 Pass 2
Model CPU GPU RAM Value Intel Core i7-12700K i7-12700K 125 W / 190 W Titan RTX 280 W 1350 / 7000 MHz 24 GB 32 GB 179
Intel Pentium 4 2.4 GHz
...
AMD Ryzen 7 9850X3D
...
X264 HD Benchmark 4.0 - x264 Pass 1
Model CPU GPU RAM Value Intel Core i7-12700K i7-12700K 125 W / 190 W Titan RTX 280 W 1350 / 7000 MHz 24 GB 32 GB 349.5
HWBOT x265 Benchmark v2.2 - HWBOT x265 4k Preset
min: 14.9 avg: 20.5 median: 20.5 (36%) max: 26.1 fps
0 5 10 15 20 25 30 35 40 Tooltip Eurocom Raptor X15: Ø16.3 (1.45-30.9)
Intel Core i7-12700K: Ø26.7 (1.82-40.4)
TrueCrypt - TrueCrypt Serpent
Model CPU GPU RAM Value Intel Core i7-12700K i7-12700K 125 W / 190 W Titan RTX 280 W 1350 / 7000 MHz 24 GB 32 GB 1.6
TrueCrypt - TrueCrypt Twofish
Model CPU GPU RAM Value Intel Core i7-12700K i7-12700K 125 W / 190 W Titan RTX 280 W 1350 / 7000 MHz 24 GB 32 GB 2.8
...
AMD Ryzen 7 9850X3D
...
TrueCrypt - TrueCrypt AES
Model CPU GPU RAM Value Intel Core i7-12700K i7-12700K 125 W / 190 W Titan RTX 280 W 1350 / 7000 MHz 24 GB 32 GB 15.7
Blender - Blender 2.79 BMW27 CPU *
min: 152.3 avg: 173.1 median: 173.1 (1%) max: 193.9 Seconds
R Benchmark 2.5 - R Benchmark 2.5 *
min: 0.412 avg: 0.4 median: 0.4 (9%) max: 0.423 sec
AMD Ryzen 7 9850X3D
...
...
3DMark 06 - CPU - 3DMark 06 - CPU
Model CPU GPU RAM Value Intel Core i7-12700K i7-12700K 125 W / 190 W Titan RTX 280 W 1350 / 7000 MHz 24 GB 32 GB 16827
Super Pi mod 1.5 XS 1M - Super Pi mod 1.5 XS 1M *
Model CPU GPU RAM Value Intel Core i7-12700K i7-12700K 125 W / 190 W Titan RTX 280 W 1350 / 7000 MHz 24 GB 32 GB 7.346
Super Pi mod 1.5 XS 2M - Super Pi mod 1.5 XS 2M *
Model CPU GPU RAM Value Intel Core i7-12700K i7-12700K 125 W / 190 W Titan RTX 280 W 1350 / 7000 MHz 24 GB 32 GB 16.55
Super Pi Mod 1.5 XS 32M - Super Pi mod 1.5 XS 32M *
Model CPU GPU RAM Value Intel Core i7-12700K i7-12700K 125 W / 190 W Titan RTX 280 W 1350 / 7000 MHz 24 GB 32 GB 387
3DMark Vantage - 3DM Vant. Perf. CPU no Physx
Model CPU GPU RAM Value Intel Core i7-12700K i7-12700K 125 W / 190 W Titan RTX 280 W 1350 / 7000 MHz 24 GB 32 GB 93250
3DMark 11 - 3DM11 Performance Physics
min: 23129 avg: 24947 median: 24947 (61%) max: 26765 Points
3DMark - 3DMark Ice Storm Physics
Model CPU GPU RAM Value Intel Core i7-12700K i7-12700K 125 W / 190 W Titan RTX 280 W 1350 / 7000 MHz 24 GB 32 GB 109742
...
Intel Core Ultra 5 250K Plus
...
3DMark - 3DMark Ice Storm Extreme Physics
Model CPU GPU RAM Value Intel Core i7-12700K i7-12700K 125 W / 190 W Titan RTX 280 W 1350 / 7000 MHz 24 GB 32 GB 112268
...
Intel Core Ultra 5 250K Plus
3DMark - 3DMark Ice Storm Unlimited Physics
Model CPU GPU RAM Value Intel Core i7-12700K i7-12700K 125 W / 190 W Titan RTX 280 W 1350 / 7000 MHz 24 GB 32 GB 109389
...
...
Intel Core Ultra 5 250K Plus
3DMark - 3DMark Cloud Gate Physics
min: 21804 avg: 23017 median: 23017 (58%) max: 24230 Points
3DMark - 3DMark Fire Strike Standard Physics
min: 31240 avg: 34160 median: 34159.5 (61%) max: 37079 Points
3DMark - 3DMark Time Spy CPU
min: 13915 avg: 15550 median: 15550 (66%) max: 17185 Points
...
AMD Ryzen 7 9850X3D
...
Geekbench 6.7 - Geekbench 6.7.1 Single-Core
Model CPU GPU RAM Value Intel Core i7-12700K i7-12700K 125 W / 190 W Titan RTX 280 W 1350 / 7000 MHz 24 GB 32 GB 2580
Geekbench 6.7 - Geekbench 6.7.1 Multi-Core
Model CPU GPU RAM Value Intel Core i7-12700K i7-12700K 125 W / 190 W Titan RTX 280 W 1350 / 7000 MHz 24 GB 32 GB 16200
Geekbench 5.5 - Geekbench 5.1 - 5.5 64 Bit Single-Core
min: 1890 avg: 1912 median: 1911.5 (64%) max: 1933 points
Geekbench 5.5 - Geekbench 5.1 - 5.5 64 Bit Multi-Core
min: 12475 avg: 14016 median: 14016 (25%) max: 15557 points
Geekbench 5.0 - Geekbench 5.0 64 Bit Single-Core
min: 1835 avg: 1841 median: 1840.5 (8%) max: 1846 points
...
...
AMD Ryzen 7 9850X3D
Geekbench 5.0 - Geekbench 5.0 64 Bit Multi-Core
min: 12318 avg: 13879 median: 13879 (44%) max: 15440 points
Geekbench 4.4 - Geekbench 4.1 - 4.4 64 Bit Single-Core
Model CPU GPU RAM Value Intel Core i7-12700K i7-12700K 125 W / 190 W Titan RTX 280 W 1350 / 7000 MHz 24 GB 32 GB 8133
Geekbench 4.4 - Geekbench 4.1 - 4.4 64 Bit Multi-Core
Model CPU GPU RAM Value Intel Core i7-12700K i7-12700K 125 W / 190 W Titan RTX 280 W 1350 / 7000 MHz 24 GB 32 GB 55786
Mozilla Kraken 1.1 - Kraken 1.1 Total Score *
min: 496 avg: 498 median: 498 (1%) max: 500 ms
WebXPRT 3 - WebXPRT 3 Score
min: 301 avg: 303.5 median: 303.5 (51%) max: 306 Points
CrossMark - CrossMark Overall
Power Consumption - Prime95 Power Consumption - external Monitor *
min: 132.1 avg: 206.6 median: 206.6 (36%) max: 281 Watt
0 5 10 15 20 25 30 35 40 45 50 55 60 65 70 75 80 85 90 95 100 105 110 115 120 125 130 135 140 145 150 155 160 165 170 175 180 Tooltip Eurocom Raptor X15: Ø132.1 (121.5-182.5)
Power Consumption - Cinebench R15 Multi Power Consumption - external Monitor *
Model CPU GPU RAM Value Intel Core i7-12700K i7-12700K 125 W / 190 W Titan RTX 280 W 1350 / 7000 MHz 24 GB 32 GB 278.2
Power Consumption - Power Efficiency - Cinebench R15 Multi external Monitor
Model CPU GPU RAM Value Intel Core i7-12700K i7-12700K 125 W / 190 W Titan RTX 280 W 1350 / 7000 MHz 24 GB 32 GB 12
- Range of benchmark values
- Average benchmark values
* Smaller numbers mean a higher performance
log 30. 08:38:41
#0 ran 0s before starting gpusingle class +0s ... 0s
#1 no ids found in url (should be separated by "_") +0s ... 0s
#2 not redirecting to Ajax server +0s ... 0s
#3 did not recreate cache, as it is less than 5 days old! Created at Tue, 28 Jul 2026 05:30:19 +0200 +0.003s ... 0.003s
#4 composed specs +0.013s ... 0.016s
#5 did output specs +0s ... 0.016s
#6 getting avg benchmarks for device 14033 +0.028s ... 0.044s
#7 got single benchmarks 14033 +0.009s ... 0.054s
#8 got avg benchmarks for devices +0s ... 0.054s
#9 min, max, avg, median took s +2.971s ... 3.025s
#10 return log +0.664s ... 3.689s