Reviews for the AMD Ryzen AI 9 365 processor
Slimmer and with OLED, but only the RTX 5070 Laptop - Razer Blade 14 2025 Review
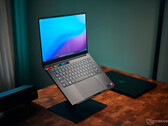
Razer's new Blade 14 is a high-quality and fast 14-inch all-rounder, which is now more compact and equipped with a 120 Hz OLED screen. The price is lower than before, but the limitation to the GeForce RTX 5070 Laptop GPU with 8 GB VRAM is a drawback.
AMD Ryzen AI 9 365, NVIDIA GeForce RTX 5070 Laptop, 14", 1.6 kgRazer Blade 16 RTX 5080 laptop review: Almost as fast but so much cheaper
We all prefer to have the GeForce RTX 5090 configuration, of course, but when the RTX 5080 option is $1000 less expensive, the slower SKU suddenly becomes so much more attractive. The performance deficit between the RTX 5080 and RTX 5090 can be narrower than one might expect.
AMD Ryzen AI 9 365, NVIDIA GeForce RTX 5080 Laptop, 16", 2.1 kgMSI Prestige A16 AI+ review: Multimedia laptop with powerful Ryzen 9 365
Last year, MSI introduced the Prestige 16 laptop featuring the Core Ultra 155H processor. Now, an AMD-powered A16 variant has arrived, equipped with a Ryzen 9 processor and an NPU (Copilot+), priced at €1,599. This new model makes a significant leap forward in performance. However, the AMD version isn't without its trade-offs compared to its Intel counterpart. Here's a closer look!
AMD Ryzen AI 9 365, Radeon 880M, 16", 2 kgLenovo ThinkBook 16 G7+ review - A 16-inch multimedia laptop with AMD Zen 5 and a 3.2K display upgrade
With the ThinkBook 16 G7+, Lenovo is offering an upgraded version of the normal ThinkBook 16 with an AMD Zen 5 processor, significantly improved cooling, a larger battery, and a better 3.2K display with P3 coverage and 165 Hz.
AMD Ryzen AI 9 365, Radeon 880M, 16", 1.9 kgMSI Summit A16 AI Plus review: Powerful AMD Ryzen 9 convertible
The MSI model is now one of the fastest 16-inch convertibles in the market when it comes to processor performance. However, its lack of discrete graphics options holds it back against other major competitors like the HP Spectre x360 16.
AMD Ryzen AI 9 365, Radeon 880M, 16", 2.1 kgLenovo Yoga Pro 7 14ASP G9: AMD Radeon 880M, 14.50", 1.5 kg
Review » Lenovo Yoga Pro 7 14 G9 review - The powerful multimedia laptop with AMD Zen 5 and 120-Hz OLED
Asus Zenbook S 16 UM5606WA-RK052W: AMD Radeon 880M, 16.00", 1.5 kg
Review » Asus ZenBook S 16 OLED laptop review: Premiere for Ryzen AI 9 365 and Radeon 880M
Lenovo ThinkBook 16 G7+ AMD: AMD Radeon 880M, 16.00", 1.9 kg
External Review » Lenovo ThinkBook 16 G7+ AMD
Acer Nitro 18 AI AN18-61: NVIDIA GeForce RTX 5070 Laptop, 18.00", 3 kg
External Review » Acer Nitro 18 AI AN18-61
Razer Blade 16 2025, RTX 5070 Ti: NVIDIA GeForce RTX 5070 Ti Laptop, 16.00", 2.1 kg
External Review » Razer Blade 16 2025, RTX 5070 Ti
HP Omen 16-ap0000: NVIDIA GeForce RTX 5070 Laptop, 16.00", 2.4 kg
External Review » HP Omen 16-ap0000
Acer Swift X 14 AI SFX14-61G: AMD Radeon 880M, 14.50", 1.6 kg
External Review » Acer Swift X 14 AI SFX14-61G
MSI Creator A16 AI+ A3XVFG: NVIDIA GeForce RTX 4070 Laptop GPU, 16.00", 2.1 kg
External Review » MSI Creator A16 AI+ A3XVFG
Razer Blade 14 2025: NVIDIA GeForce RTX 5070 Laptop, 14.00", 1.6 kg
External Review » Razer Blade 14 2025
Razer Blade 16 RTX 5080: NVIDIA GeForce RTX 5080 Laptop, 16.00", 2.1 kg
External Review » Razer Blade 16 RTX 5080
Asus VivoBook S 14 OLED M5406WA, Ryzen AI 9 365: AMD Radeon 880M, 14.00", 1.3 kg
External Review » Asus VivoBook S 14 OLED M5406WA, Ryzen AI 9 365
MSI Creator A16 AI+ A3HVGG: NVIDIA GeForce RTX 4070 Laptop GPU, 16.00", 2.1 kg
External Review » MSI Creator A16 AI+ A3HVGG
MSI Summit A16 AI Plus A3HMTG: AMD Radeon 880M, 16.00", 2.1 kg
External Review » MSI Summit A16 AI Plus A3HMTG
Acer Swift 14 AI SF14-61T: AMD Radeon 880M, 14.00", 1.3 kg
External Review » Acer Swift 14 AI SF14-61T
MSI Stealth A16 AI+ A3XVFG: NVIDIA GeForce RTX 4060 Laptop GPU, 16.00", 2.1 kg
External Review » MSI Stealth A16 AI+ A3XVFG
MSI Prestige A16 AI+ A3HMG-036: AMD Radeon 880M, 16.00", 2 kg
External Review » MSI Prestige A16 AI+ A3HMG-036
MSI Stealth A16 AI+ A3XVGG: NVIDIA GeForce RTX 4070 Laptop GPU, 16.00", 2.1 kg
External Review » MSI Stealth A16 AI+ A3XVGG
Asus ProArt PX13 HN7306WU: NVIDIA GeForce RTX 4050 Laptop GPU, 13.30", 1.4 kg
External Review » Asus ProArt PX13 HN7306WU
Lenovo Yoga Pro 7 14ASP G9: AMD Radeon 880M, 14.50", 1.5 kg
External Review » Lenovo Yoga Pro 7 14ASP G9
Asus Zenbook S 16 UM5606WA-RK052W: AMD Radeon 880M, 16.00", 1.5 kg
External Review » Asus Zenbook S 16 UM5606WA-RK052W
» This OLED laptop with 24 GB RAM might be best sub-$1000 Windows laptop currently on market
Razer Blade 14 2025: NVIDIA GeForce RTX 5070 Laptop, 14.00", 1.6 kg
» Is 8 GB VRAM enough for the Blade 14? For 1080p gaming, yes
» Razer's Blade 14 does not rival the Asus ROG Zephyrus G14 for the performance crown, but is also much more affordable
MSI Prestige A16 AI+ A3HMG-036: AMD Radeon 880M, 16.00", 2 kg
» MSI Prestige A16 AI+ with 4K OLED and 32 GB RAM discounted by $400
Asus Zenbook S 16 UM5606WA-RK052W: AMD Radeon 880M, 16.00", 1.5 kg
» Slim Asus Zenbook S 16 laptop with 120 Hz OLED panel enjoys $300 discount vs list price
» "Open-Box Excellent" Asus Zenbook S 16 with Ryzen AI 9 365 APU and 120 Hz OLED panel is now enjoying 41% price cut
Lenovo Yoga Pro 7 14ASP G9: AMD Radeon 880M, 14.50", 1.5 kg
» Lenovo Yoga Pro 9i Gen 9 price drops by $300 for RTX 4060 SKU with 16-inch Mini-LED display