Notebookcheck Logo
The Prestige 16 AI+

MSI Prestige A16 AI+ review: Multimedia laptop with powerful Ryzen 9 365

It's creaky.

Last year, MSI introduced the Prestige 16 laptop featuring the Core Ultra 155H processor. Now, an AMD-powered A16 variant has arrived, equipped with a Ryzen 9 processor and an NPU (Copilot+), priced at €1,599. This new model makes a significant leap forward in performance. However, the AMD version isn't without its trade-offs compared to its Intel counterpart. Here's a closer look!
Christian Hintze, 👁 Christian Hintze, Sebastian Jankowski (translated by DeepL / Ninh Duy) Published 🇩🇪 🇫🇷 ...
Arc Convertible / 2-in-1 Intel Laptop Meteor Lake Thunderbolt Touchscreen Ultrabook Wi-Fi 7

Verdict - Prestige A16 AI+ with great performance, but also problems

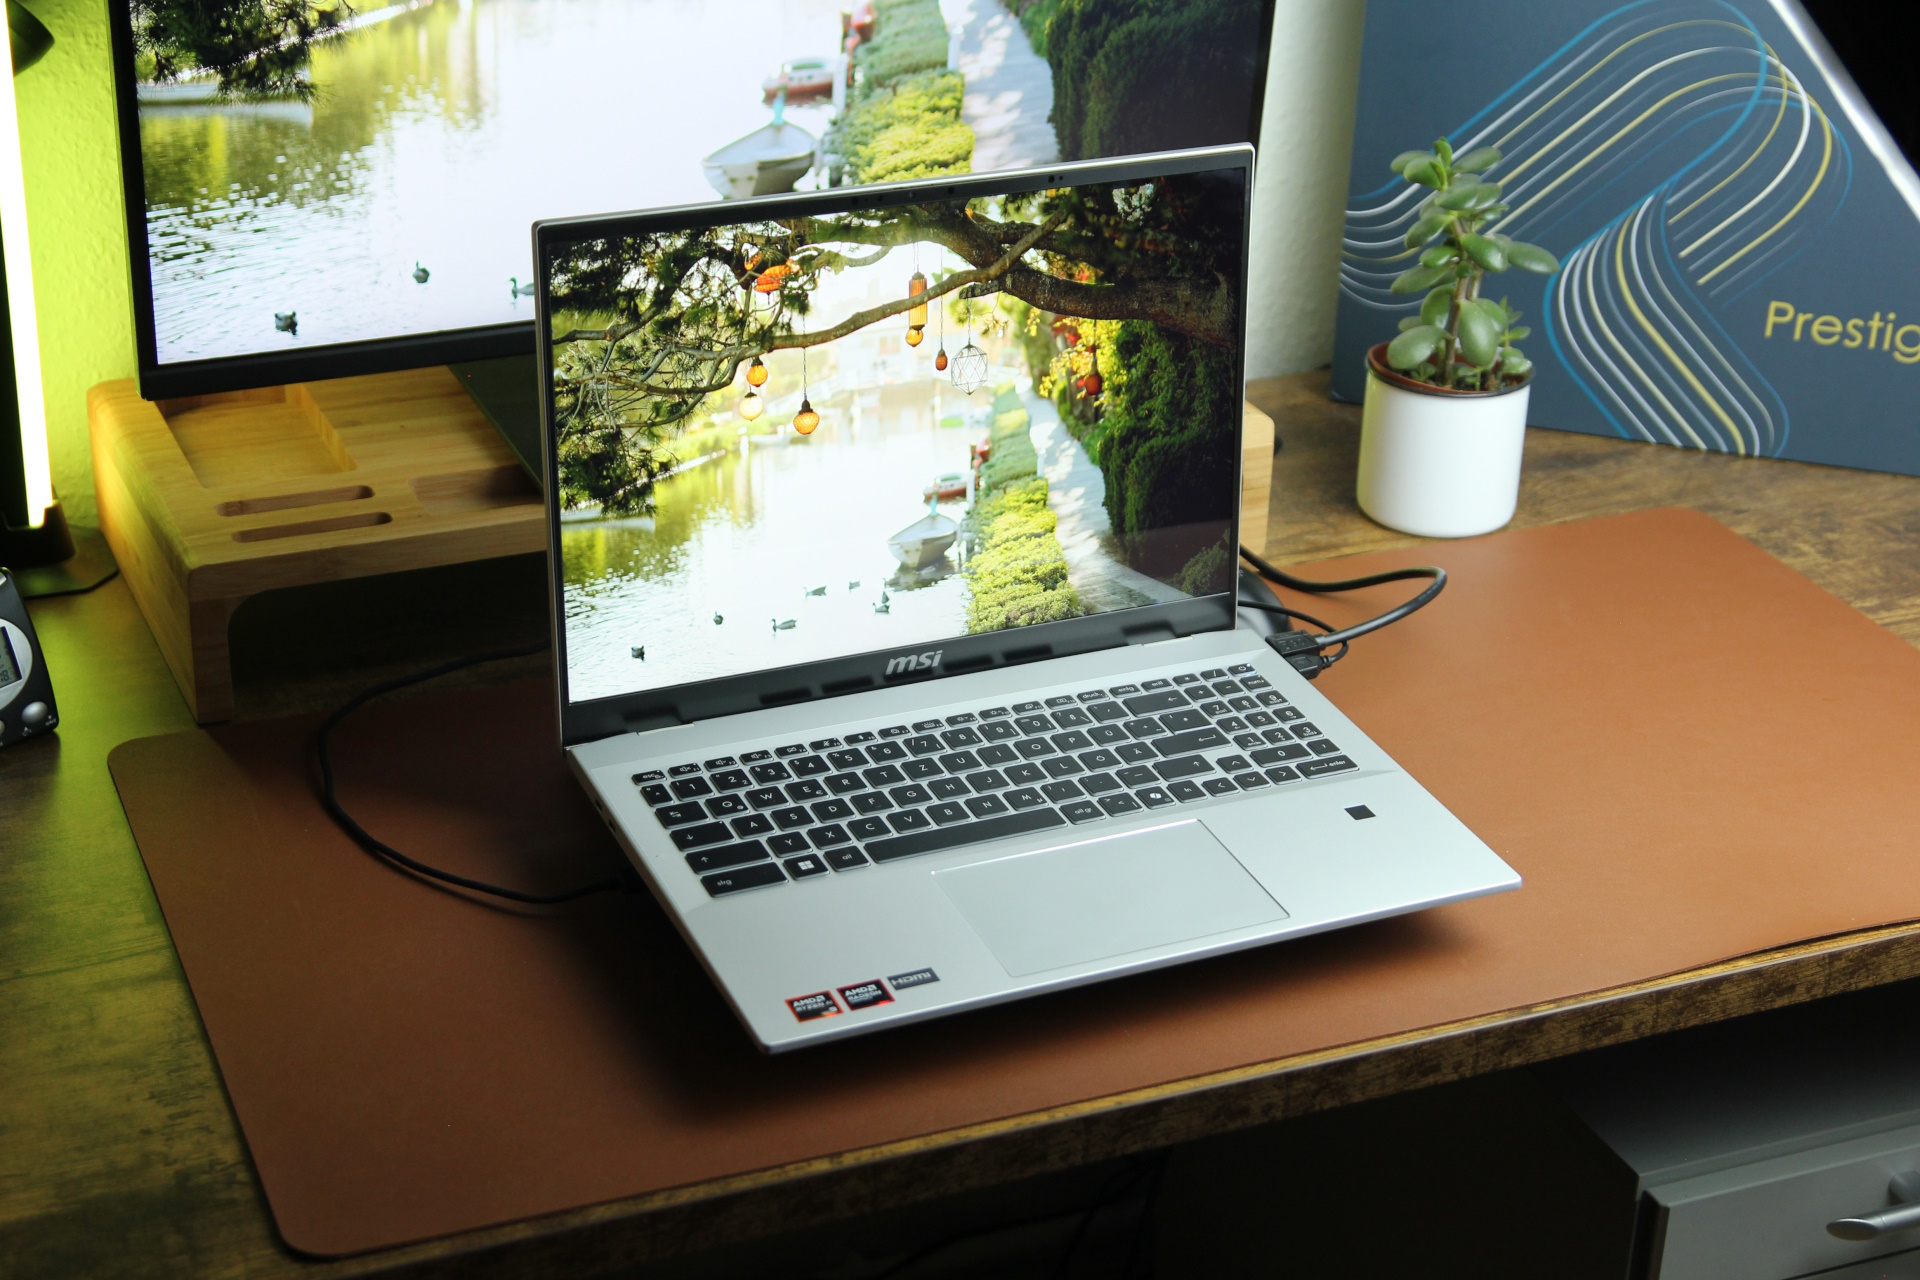
At first glance, the 1,600p IPS display on the MSI Prestige A16 AI+ stands out as a key feature. Its high resolution, paired with a reflective surface, provides a clear and vibrant viewing experience. The Ryzen 9 365 processor also impresses, delivering approximately 10% better performance compared to the Prestige A16's Intel counterpart. Its gaming capabilities are equally noteworthy, with the added advantage of maintaining consistent performance even in battery mode. Overall, it comfortably outperforms rivals like the ZenBook S 16 and the Intel-based Prestige 16.

However, technical issues during testing prevented the system from getting a higher 3D performance score. The system occasionally struggled with certain programs and games, though future driver updates may resolve these issues. Additionally, the build quality leaves room for improvement. While the metal case is sturdy, it can makes unpleasant creaking sounds when under moderate pressure or twisting force, and the touchpad buttons occasionally get "stuck".

While the AMD Prestige A16 outperforms the Intel Prestige 16 in terms of raw performance, the one-year-older Intel system shows no signs of technical issues, offers longer battery life, and appears to have better build quality. At this stage, we cannot yet recommend upgrading to the AMD variant.

Pros

+ metal case
+ fast Wi-Fi 7
+ good, clear, bright 1,600p display
+ above-average CPU/GPU performance

Cons

- case crackles strongly when twisted slightly
- only just Full HD webcam
- touchpad buttons can get "stuck"
- technical issues with some apps and games

Price and availability

Our test model can be purchased from Amazon Germany for 1,599 euros.

Possible competitors in comparison

Image
Model / Review
Price
Weight
Height
Display
1.
81.9%
MSI Prestige A16 AI+ A3HMG-036
AMD Ryzen AI 9 365 ⎘
AMD Radeon 880M ⎘
32 GB Memory, 1024 GB SSD
List Price: 1599 Euro2 kg17.35 mm16.00"
2560x1600
189 PPI
IPS
2.
84.1%
Asus Zenbook S 16 UM5606WA-RK052W
AMD Ryzen AI 9 365 ⎘
AMD Radeon 880M ⎘
24 GB Memory, 1024 GB SSD
Amazon:
1. $1,859.00
HIDevolution [2024] ASUS Zen...
2. $1,479.99
ASUS Zenbook S 16 Laptop, AM...
3. $11.99
KEANBOLL (3 Pack) Designed f...
List Price: 1700 EUR
1.5 kg12.9 mm16.00"
2880x1800
212 PPI
OLED
3.
85.6%
Lenovo ThinkPad T16 Gen 3 21MN005XGE
Intel Core Ultra 5 125U ⎘
Intel Graphics 4-Core iGPU (Arc) ⎘
32 GB Memory, 1000 GB SSD
Amazon: $999.00
List Price: 1800 Euro
2 kg23.7 mm16.00"
1920x1200
142 PPI
IPS LED
4.
74.7%
Lenovo IdeaPad Slim 5 16IRU9
Intel Core 7 150U ⎘
Intel Iris Xe Graphics G7 96EUs ⎘
16 GB Memory
Amazon:
1. $679.99
Lenovo IdeaPad Slim 5 16IRU9...
2. $799.99
Lenovo IdeaPad Slim 5 16IRU9...
3. $899.99
Lenovo IdeaPad Slim 5 16IRU9...
List Price: 800 USD
1.8 kg16.9 mm16.00"
1920x1200
142 PPI
IPS
5.
80%
Ninkear A16 Pro
Ninkear A16 Pro
AMD Ryzen 7 8845HS ⎘
AMD Radeon 780M ⎘
32 GB Memory, 1000 GB SSD
Amazon:
1. $12.99
Vaxson 2-Pack Protector Film...
2. $18.99
Vaxson 2-Pack Protector Film...
3. $18.99
Vaxson 2-Pack Protector Film...
List Price: 799 Euro
1.8 kg24 mm16.00"
2560x1600
189 PPI
IPS
6.
79.1%
Acer Aspire 16 A16-51GM-77G2
Intel Core 7 150U ⎘
NVIDIA GeForce RTX 2050 Mobile ⎘
16 GB Memory, 1024 GB SSD
List Price: 929 Euro1.9 kg21 mm16.00"
1920x1200
142 PPI
IPS

Last year, MSI introduced the MSI Prestige 16 sans the "A" (A meaning AMD in this case), powered by the Intel Core Ultra 7 155H which scored 88 percentage points in our review. This year, the MSI Prestige A16 AI+ ups the ante with features like WiFi 7, the MSI AI Engine, and a stunning OLED display, making it the perfect companion for doing work on the go. In this review, let's see exactly how portable and powerful the laptop is plus how it contrasts with its predecessor, Intel-based; and, most importantly, what has been upgraded.

Unlike the just-launched MSI Summit A16 AI+ , the Prestige A16 AI+ is a traditional clamshell laptop, not a convertible. But the two laptops do share the same AMD Zen 5 processor, so performance comparisons between them are apples-to-apples. Another perfect point of comparison is the Asus ZenBook S 16 OLED, which also uses the same CPU.

Specifications - Powerful processor

Prestige A16 AI+
Processor
AMD Ryzen AI 9 365 10 x 2 - 5 GHz, Strix Point (Zen 5)
Graphics adapter
AMD Radeon 880M, 32.0.11038.4002
Memory
32 GB 
, 32 GB LPDDR5X-7500 RAM (dual-channel)
Display
16.00 inch 16:10, 2560 x 1600 pixel 189 PPI, AUO28B2 (B160QAN02.N), IPS, glossy: yes, HDR, 165 Hz
Mainboard
AMD Promontory/Bixby FCH
Storage
Samsung PM9C1 MZVL81T0HELB-00BTW, 1024 GB 
, 960 GB free
Soundcard
AMD Zen - Audio Processor - HD Audio Controller
Connections
1 USB 3.1 Gen2, 2 USB 4.0 40 Gbps, 2 Thunderbolt, USB-C Power Delivery (PD), 1 HDMI, 2 DisplayPort, Audio Connections: 3.5 mm, Card Reader: microSD, 1 Fingerprint Reader, Brightness Sensor, Sensors: User proximity sensor
Networking
Qualcomm FastConnect 7800 (b/g/n = Wi-Fi 4/ac = Wi-Fi 5/ax = Wi-Fi 6/ Wi-Fi 6E 6 GHz be = Wi-Fi 7), Bluetooth Bluetooth 5.4
Size
height x width x depth (in mm): 17.35 x 358 x 259 ( = 0.68 x 14.09 x 10.2 in)
Battery
82 Wh Lithium-Polymer
Charging
fast charging / Quickcharge
Operating System
Microsoft Windows 11 Home
Camera
Webcam: Full HD (1080p 30 fps) with IR-sensor, Privacy Cover, 3D Noise Reduction+, Spatial-Array mic, AI Noise Cancellation Pro
Primary Camera: 0.9 MPix
Additional features
Speakers: stereo speakers, Keyboard: Chiclet, Keyboard Light: yes, 24 Months Warranty, 2 years with pick-up & return service
Weight
2.02 kg ( = 71.25 oz / 4.45 pounds), Power Supply: 383 g ( = 13.51 oz / 0.84 pounds)
Price
1599 Euro
Note: The manufacturer may use components from different suppliers including display panels, drives or memory sticks with similar specifications.


Case and Features

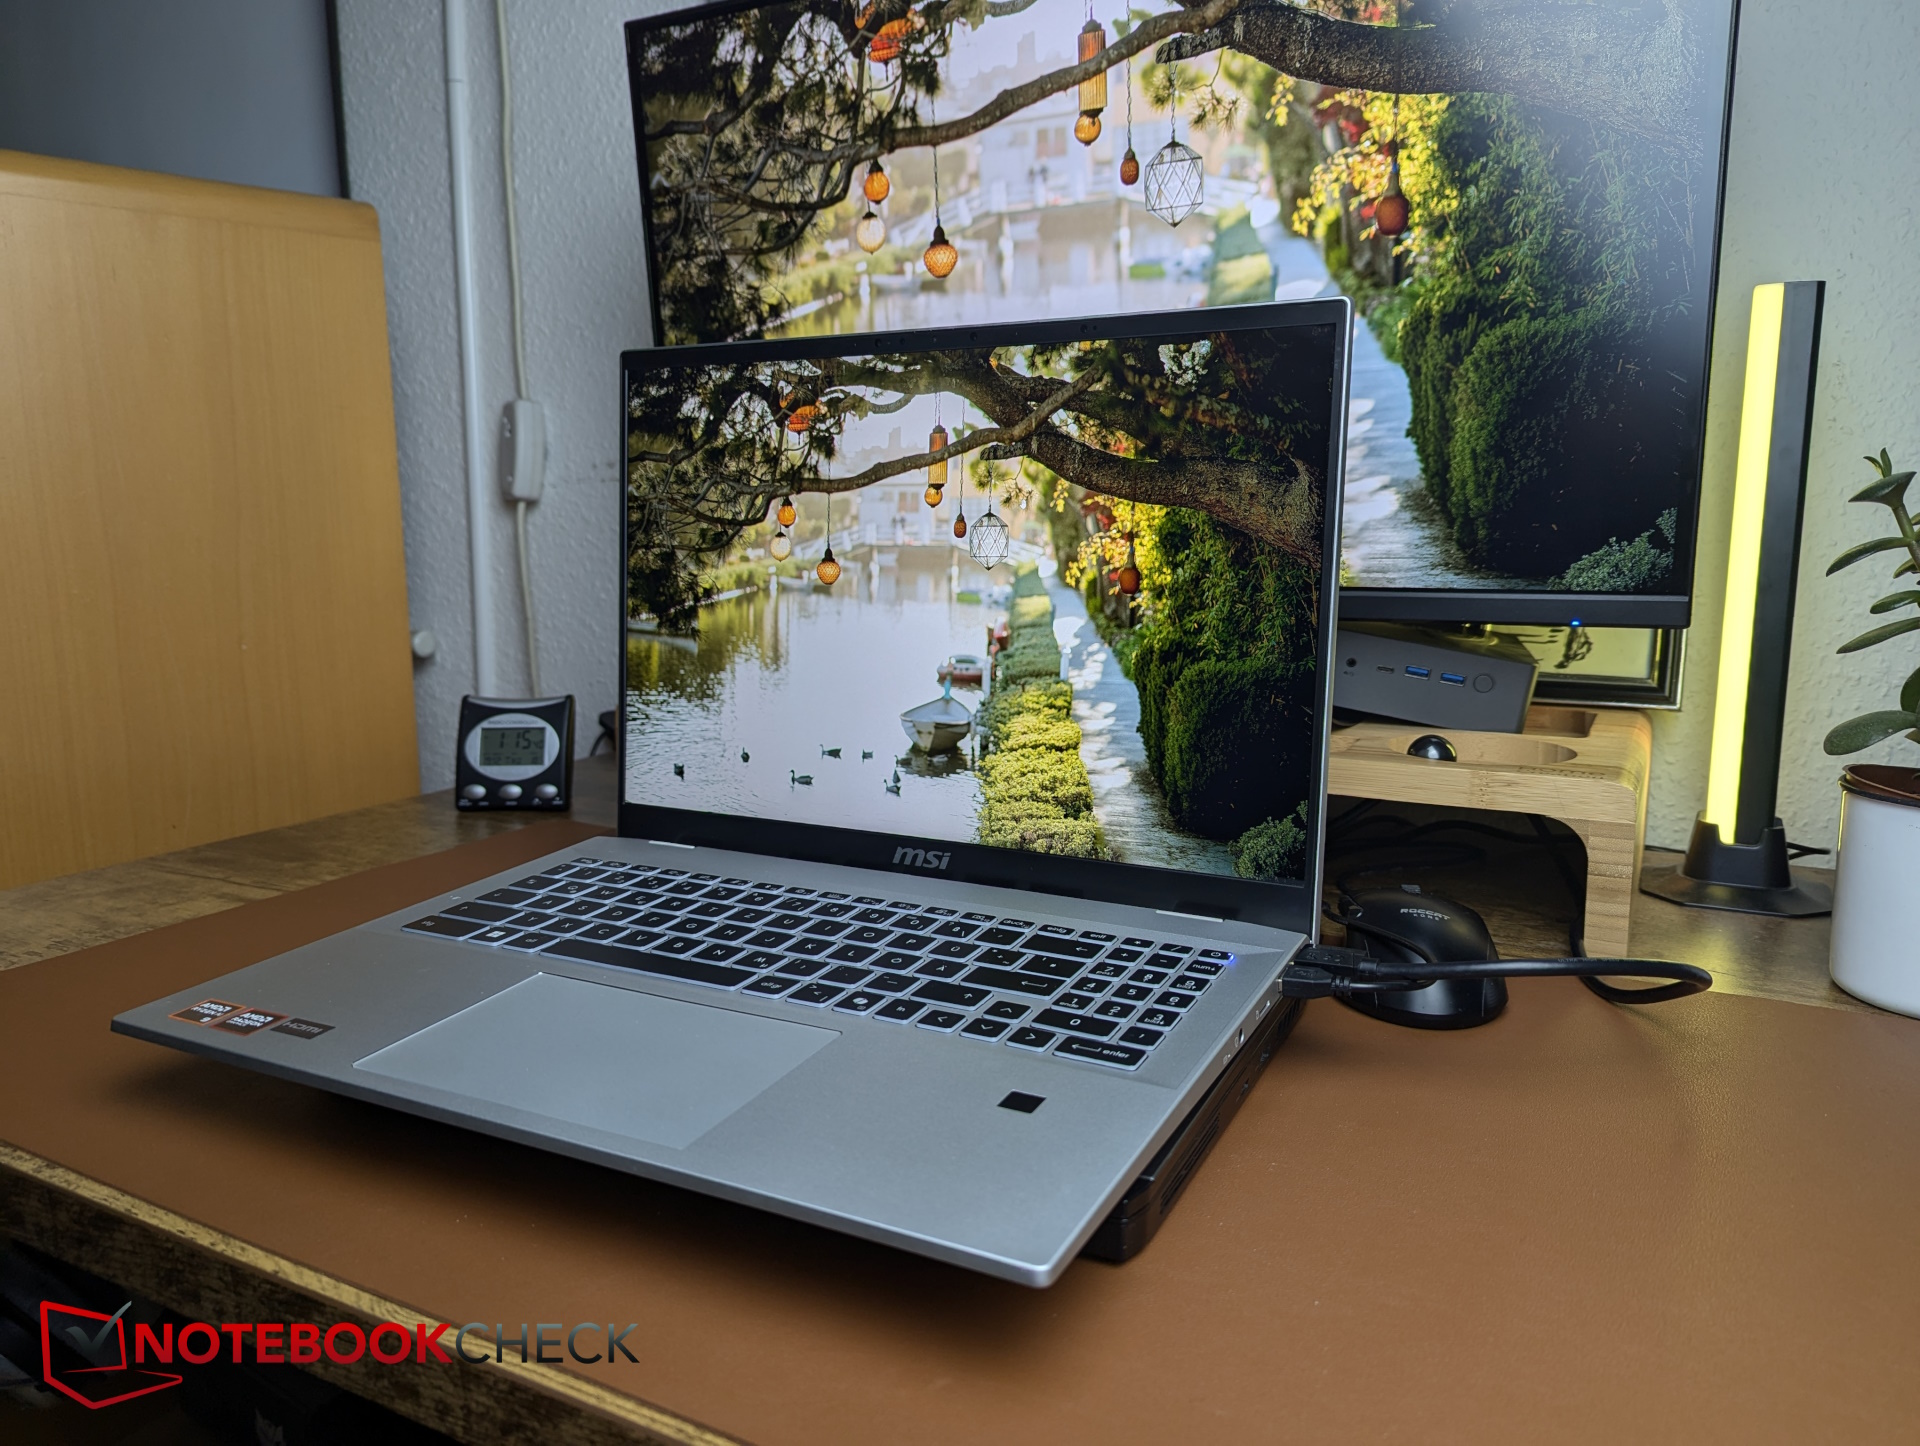
The case has been completely redesigned and is now crafted from aluminum with a silver finish. However, it is significantly heavier than its predecessor (1.9 kg vs. 1.6 kg), which means it no longer competes with the more lightweight options like the LG Gram 16. This added weight has slightly impacted portability, an area where the predecessor model holds an advantage. On the positive side, the display lid is notably sturdier, showing minimal flex, and the hinges feel robust. Things aren't quite as good with the base. Generally stable, it does make some noise when twisted, like someone left a plastic bag inside.

To access the internals for maintenance, you’ll need to remove seven Phillips screws of varying lengths (notably, the two screws at the front are shorter), with one screw concealed centrally beneath a misleading warranty sticker. The internals have been rearranged, the WiFi module and the SSD can be replaced, there is no second M.2 slot. The fans and battery are easily accessible, but RAM is soldered and thus not user-upgradeable.

A look at the innards of the Prestige 16 AI+
The WiFi module and SSD are both socketed

The infrared webcam with its Full HD resolution falls short compared to many competitors' models, which now offer resolutions of 3.7MP or even 5MP—as highlighted in our review of the Acer Swift Go 14 AI. Alongside the webcam and microphones, the system also includes ambient light sensors and a user proximity sensor.

There's no LAN (RJ45) port on the Prestige A16 AI+, but there is WiFi 7 courtesy of a Qualcomm chip, and this performs very well indeed on both 5GHz and 6GHz networks.

The A16 AI+ is not particularly well-appointed in terms of ports, but it does have a MicroSD slot, a total of three USB ports—only one of which is a Type A port—feels like a scant few for a laptop, especially since one of the two USB-C ports is usually occupied by the power supply. Additional ports include an HDMI output and a headset jack. In terms of design, the HDMI and USB-A ports are positioned quite close together on the right side, which could cause some inconvenience.

Size comparison

359.7 mm / 14.2 in 250.8 mm / 9.87 in 23.7 mm / 0.933 in 2 kg4.34 lbs361 mm / 14.2 in 249 mm / 9.8 in 21 mm / 0.827 in 1.9 kg4.11 lbs355 mm / 14 in 248 mm / 9.76 in 24 mm / 0.945 in 1.8 kg3.99 lbs358 mm / 14.1 in 258 mm / 10.2 in 19.1 mm / 0.752 in 1.6 kg3.43 lbs358 mm / 14.1 in 259 mm / 10.2 in 17.35 mm / 0.683 in 2 kg4.45 lbs356 mm / 14 in 251 mm / 9.88 in 16.9 mm / 0.665 in 1.8 kg3.99 lbs353 mm / 13.9 in 243 mm / 9.57 in 12.9 mm / 0.508 in 1.5 kg3.31 lbs297 mm / 11.7 in 210 mm / 8.27 in 1 mm / 0.03937 in 5.7 g0.01257 lbs
Left: 2x USB-C / Thunderbolt 4 (40 Gbit/s)
Right: Headset jack, MicroSD card reader, USB-A (10 Gbit/s), HDMI 2.1
Rear: No ports
Rear: No ports
Front: No ports
Front: No ports
SD Card Reader
average JPG Copy Test (av. of 3 runs)
Asus Zenbook S 16 UM5606WA-RK052W
AMD Ryzen AI 9 365 (AV PRO microSD 128 GB V60)
198 MB/s +63%
MSI Prestige A16 AI+ A3HMG-036
AMD Ryzen AI 9 365
121.6 (100.3min - 135.39max) MB/s
Average of class Multimedia
  (19.3 - 198, n=43, last 2 years)
102.3 MB/s -16%
Lenovo IdeaPad Slim 5 16IRU9
Intel Core 7 150U (Angelbird AV Pro V60)
44.8 MB/s -63%
maximum AS SSD Seq Read Test (1GB)
Asus Zenbook S 16 UM5606WA-RK052W
AMD Ryzen AI 9 365 (AV PRO microSD 128 GB V60)
260 MB/s +32%
MSI Prestige A16 AI+ A3HMG-036
AMD Ryzen AI 9 365
197.44 MB/s
Average of class Multimedia
  (27.4 - 262, n=43, last 2 years)
144.8 MB/s -27%
Lenovo IdeaPad Slim 5 16IRU9
Intel Core 7 150U (Angelbird AV Pro V60)
90.3 MB/s -54%
Networking
iperf3 transmit AXE11000
MSI Prestige A16 AI+ A3HMG-036
Qualcomm FastConnect 7800
1613 (800min - 1663max) MBit/s
Lenovo ThinkPad T16 Gen 3 21MN005XGE
Intel Wi-Fi 6E AX211
1453 (1153min - 1649max) MBit/s -10%
Average of class Multimedia
  (668 - 1978, n=62, last 2 years)
1384 MBit/s -14%
Average Qualcomm FastConnect 7800
  (470 - 1613, n=20)
1274 MBit/s -21%
Asus Zenbook S 16 UM5606WA-RK052W
Mediatek Wi-Fi 7 MT7925 Wireless LAN Card
983 (529min - 1209max) MBit/s -39%
Acer Aspire 16 A16-51GM-77G2
Intel Wi-Fi 6E AX211
893 (806min - 969max) MBit/s -45%
Lenovo IdeaPad Slim 5 16IRU9
Intel Wi-Fi 6 AX203
831 (765min - 872max) MBit/s -48%
Ninkear A16 Pro
Realtek RTL8852BE
803 (755min - 846max) MBit/s -50%
iperf3 receive AXE11000
MSI Prestige A16 AI+ A3HMG-036
Qualcomm FastConnect 7800
1753 (1729min - 1767max) MBit/s
Asus Zenbook S 16 UM5606WA-RK052W
Mediatek Wi-Fi 7 MT7925 Wireless LAN Card
1689 (1670min - 1706max) MBit/s -4%
Lenovo ThinkPad T16 Gen 3 21MN005XGE
Intel Wi-Fi 6E AX211
1679 (1608min - 1701max) MBit/s -4%
Average of class Multimedia
  (689 - 1789, n=62, last 2 years)
1452 MBit/s -17%
Average Qualcomm FastConnect 7800
  (492 - 1753, n=20)
1393 MBit/s -21%
Ninkear A16 Pro
Realtek RTL8852BE
898 (855min - 915max) MBit/s -49%
Acer Aspire 16 A16-51GM-77G2
Intel Wi-Fi 6E AX211
875 (860min - 885max) MBit/s -50%
Lenovo IdeaPad Slim 5 16IRU9
Intel Wi-Fi 6 AX203
819 (751min - 846max) MBit/s -53%
iperf3 transmit AXE11000 6GHz
MSI Prestige A16 AI+ A3HMG-036
Qualcomm FastConnect 7800
1559 (1508min - 1585max) MBit/s
Acer Aspire 16 A16-51GM-77G2
Intel Wi-Fi 6E AX211
1522 (1417min - 1577max) MBit/s -2%
Average of class Multimedia
  (705 - 2340, n=23, last 2 years)
1431 MBit/s -8%
Average Qualcomm FastConnect 7800
  (848 - 1852, n=14)
1427 MBit/s -8%
Lenovo ThinkPad T16 Gen 3 21MN005XGE
Intel Wi-Fi 6E AX211
1397 (557min - 1592max) MBit/s -10%
iperf3 receive AXE11000 6GHz
MSI Prestige A16 AI+ A3HMG-036
Qualcomm FastConnect 7800
1725 (1696min - 1746max) MBit/s
Lenovo ThinkPad T16 Gen 3 21MN005XGE
Intel Wi-Fi 6E AX211
1677 (1552min - 1720max) MBit/s -3%
Average Qualcomm FastConnect 7800
  (928 - 1775, n=14)
1545 MBit/s -10%
Average of class Multimedia
  (700 - 2087, n=23, last 2 years)
1504 MBit/s -13%
Acer Aspire 16 A16-51GM-77G2
Intel Wi-Fi 6E AX211
1356 (1218min - 1385max) MBit/s -21%
0501001502002503003504004505005506006507007508008509009501000105011001150120012501300135014001450150015501600165017001750Tooltip
MSI Prestige A16 AI+ A3HMG-036 Qualcomm FastConnect 7800; iperf3 transmit AXE11000 6GHz; iperf 3.1.3: Ø1559 (1508-1585)
Lenovo ThinkPad T16 Gen 3 21MN005XGE Intel Wi-Fi 6E AX211; iperf3 transmit AXE11000 6GHz; iperf 3.1.3: Ø1397 (557-1592)
MSI Prestige A16 AI+ A3HMG-036 Qualcomm FastConnect 7800; iperf3 receive AXE11000 6GHz; iperf 3.1.3: Ø1724 (1696-1746)
Lenovo ThinkPad T16 Gen 3 21MN005XGE Intel Wi-Fi 6E AX211; iperf3 receive AXE11000 6GHz; iperf 3.1.3: Ø1677 (1552-1720)
MSI Prestige A16 AI+ A3HMG-036 Qualcomm FastConnect 7800; iperf3 transmit AXE11000; iperf 3.1.3: Ø1587 (800-1663)
Asus Zenbook S 16 UM5606WA-RK052W Mediatek Wi-Fi 7 MT7925 Wireless LAN Card; iperf3 transmit AXE11000; iperf 3.1.3: Ø983 (695-1209)
Lenovo ThinkPad T16 Gen 3 21MN005XGE Intel Wi-Fi 6E AX211; iperf3 transmit AXE11000; iperf 3.1.3: Ø1454 (1153-1649)
MSI Prestige A16 AI+ A3HMG-036 Qualcomm FastConnect 7800; iperf3 receive AXE11000; iperf 3.1.3: Ø1752 (1729-1767)
Asus Zenbook S 16 UM5606WA-RK052W Mediatek Wi-Fi 7 MT7925 Wireless LAN Card; iperf3 receive AXE11000; iperf 3.1.3: Ø1689 (1670-1706)
Lenovo ThinkPad T16 Gen 3 21MN005XGE Intel Wi-Fi 6E AX211; iperf3 receive AXE11000; iperf 3.1.3: Ø1679 (1608-1701)
ColorChecker
9.3 ∆E
11.3 ∆E
7 ∆E
8.4 ∆E
7.9 ∆E
8 ∆E
8.1 ∆E
8.9 ∆E
7.8 ∆E
6.1 ∆E
5.7 ∆E
6 ∆E
7.8 ∆E
6.7 ∆E
7.1 ∆E
6 ∆E
6 ∆E
12.7 ∆E
5.7 ∆E
6.9 ∆E
10.2 ∆E
10.4 ∆E
10.4 ∆E
9.3 ∆E
ColorChecker MSI Prestige A16 AI+ A3HMG-036: 8.07 ∆E min: 5.7 - max: 12.72 ∆E

Sustainability

Unlike Lenovo, which provides CO₂ footprint data for models like the ThinkPad X13 2-in-1 or the X12 Detachable G2, MSI offers no information regarding production impact or the use of recycled materials. While the packaging is primarily cardboard, MSI still uses plastic to wrap the laptop and power supply unit.

Input devices - Good keyboard, with sticky pad buttons

The layout is neat, with a (narrow) numpad found on the right-hand side. However, MSI being MSI, the Fn key is position to the right of Space by default, so the user may find themselves hitting the Windows key by mistake because it's large and placed exactly where Fn normally is. The new Copilot key is positioned on the right, too, right next to Fn. Most keys measure 1.5 x 1.5cm and are evenly spaced, while the smaller function keys range from 0.5–0.8cm x 1cm but remain aligned. The compact arrow keys, reduced to 1.3cm in width, are neatly positioned in their designated area.

A white, three-stage backlight highlights the clear lettering, making it possible to work in the dark. The keys have medium travel and provide crisp feedback, allowing for fast typing with moderate noise.

The touchpad measures about 13.1 x 8.2 cm and possesses great gliding properties. Left clicks feel good to the finger, whereas right clicks feel a bit shallow and lacking in travel distance. After some time, the left click stopped working as expected. It would sometimes jam, failing to release properly.

The keyboard, touchpad and fingerprint sensor
3-stage, white backlighting

Display - Prestige A16 AI+ comes with reflective IPS and OLED options

Subpixel structure
Subpixel structure
Minimal backlight bleeding

The Prestige A16 AI+ makes use of a reflective IPS display featuring a 1,600p resolution in a 16:10 aspect ratio. The screen is specified to cover the P3 color space and have a 165Hz refresh rate. A 2,400p OLED screen is available on other SKUs, which do not appear to be currently available or even listed on MSI's website. Be that as it may, the manufacturer still advertises the OLED option.

Subjectively, the IPS panel on the SKU tested is excellent, offering a clear and vibrant image thanks to its reflective surface. In terms of measurements, the similar panel in the predecessor was slightly better, boasting a lower black level and thus a higher contrast ratio among other differences. Otherwise, both screens do not substantially differ from each other. Both offer impressive visuals.

The average brightness is just under 450 nits. While MSI claims 100% DCI-P3 coverage, our measurements indicate around 95%, with full sRGB coverage confirmed as expected.

458
cd/m²
438
cd/m²
446
cd/m²
438
cd/m²
488
cd/m²
432
cd/m²
432
cd/m²
443
cd/m²
421
cd/m²
Distribution of brightness
AUO28B2 (B160QAN02.N) tested with X-Rite i1Pro 3
Maximum: 488 cd/m² (Nits) Average: 444 cd/m² Minimum: 23 cd/m²
Brightness Distribution: 86 %
Center on Battery: 488 cd/m²
Contrast: 1356:1 (Black: 0.36 cd/m²)
ΔE ColorChecker Calman: 3.45 | ∀{0.5-29.43 Ø4.83}
calibrated: 1.35
ΔE Greyscale Calman: 4.16 | ∀{0.09-98 Ø5.1}
83.4% AdobeRGB 1998 (Argyll 3D)
99.7% sRGB (Argyll 3D)
94.6% Display P3 (Argyll 3D)
Gamma: 2.52
CCT: 6832 K
MSI Prestige A16 AI+ A3HMG-036
AUO28B2 (B160QAN02.N), IPS, 2560x1600, 16", 165 Hz
MSI Prestige 16 B1MG-001US
AU Optronics B160QAN03.R, IPS, 2560x1600, 16", 60 Hz
Asus Zenbook S 16 UM5606WA-RK052W
ATNA60CL10-0, OLED, 2880x1800, 16", 120 Hz
Lenovo ThinkPad T16 Gen 3 21MN005XGE
B160UAN01.K, IPS LED, 1920x1200, 16", 60 Hz
Lenovo IdeaPad Slim 5 16IRU9
LEN160WUXGA, IPS, 1920x1200, 16", 60 Hz
Ninkear A16 Pro
cso1623, IPS, 2560x1600, 16", 120 Hz
Acer Aspire 16 A16-51GM-77G2
N160JCA-EEK (Chi Mei CMN163D), IPS, 1920x1200, 16", 60 Hz
Display
1%
6%
-7%
-48%
-15%
-46%
Display P3 Coverage
94.6
96.7
2%
99.8
5%
79
-16%
41.5
-56%
68.7
-27%
42.3
-55%
sRGB Coverage
99.7
99.8
0%
100
0%
99.9
0%
61.2
-39%
97.6
-2%
63.6
-36%
AdobeRGB 1998 Coverage
83.4
84.6
1%
94.6
13%
79.8
-4%
42.9
-49%
71.1
-15%
43.7
-48%
Response Times
-493%
94%
-304%
-153%
-97%
-279%
Response Time Grey 50% / Grey 80% *
5.6 ?(1.8, 3.8)
49.4 ?(22.6, 26.8)
-782%
0.4 ?(0.3, 0.1)
93%
33.6 ?(14.9, 18.7)
-500%
20.7 ?(11, 9.7)
-270%
16.4 ?(8.2, 8.2)
-193%
31.4 ?(15.2, 16.2)
-461%
Response Time Black / White *
11.2 ?(5.8, 5.4)
33.9 ?(15.6, 18.3)
-203%
0.6 ?(0.3, 0.3)
95%
23.3 ?(13, 10.3)
-108%
15.1 ?(7.7, 7.4)
-35%
11.2 ?(6.2, 5)
-0%
22 ?(12.6, 9.4)
-96%
PWM Frequency
480
PWM Amplitude *
30
Screen
-2%
174%
4%
-65%
6%
-36%
Brightness middle
488
473.6
-3%
391
-20%
468
-4%
313.3
-36%
393.6
-19%
352
-28%
Brightness
444
456
3%
391
-12%
434
-2%
308
-31%
398
-10%
324
-27%
Brightness Distribution
86
87
1%
98
14%
90
5%
91
6%
91
6%
86
0%
Black Level *
0.36
0.19
47%
0.02
94%
0.23
36%
0.37
-3%
0.44
-22%
0.27
25%
Contrast
1356
2493
84%
19550
1342%
2035
50%
847
-38%
895
-34%
1304
-4%
Colorchecker dE 2000 *
3.45
5.9
-71%
1.42
59%
3.4
1%
8.42
-144%
2.32
33%
4.41
-28%
Colorchecker dE 2000 max. *
6.77
9.37
-38%
4.69
31%
7.2
-6%
19.09
-182%
3.72
45%
15.04
-122%
Colorchecker dE 2000 calibrated *
1.35
0.89
34%
1.49
-10%
1.8
-33%
2.16
-60%
1.05
22%
3.52
-161%
Greyscale dE 2000 *
4.16
7.3
-75%
1.5
64%
4.5
-8%
8.3
-100%
2.69
35%
3.32
20%
Gamma
2.52 87%
1.9 116%
2.199 100%
2.1 105%
2.83 78%
2.38 92%
2.44 90%
CCT
6832 95%
7260 90%
6684 97%
6373 102%
6296 103%
6086 107%
7122 91%
Total Average (Program / Settings)
-165% / -71%
91% / 126%
-102% / -42%
-89% / -74%
-35% / -13%
-120% / -73%

* ... smaller is better

Color deviations against the DCI-P3 color space are too high out of the box, but performing a calibration using CalMAN software and an X-Rite i1Pro 3 drops Delta-E values significantly. At just 0.21, the grayscale accuracy is very good; ColorChecker still shows a noticeable outlier in the blue range.

Grayscale
Grayscale
Saturation Sweeps
Saturation Sweeps
ColorChecker
ColorChecker
Grayscale calibrated
Saturation Sweeps calibrated
ColorChecker calibrated

Display Response Times

Display response times show how fast the screen is able to change from one color to the next. Slow response times can lead to afterimages and can cause moving objects to appear blurry (ghosting). Gamers of fast-paced 3D titles should pay special attention to fast response times.
       Response Time Black to White
11.2 ms ... rise ↗ and fall ↘ combined↗ 5.8 ms rise
↘ 5.4 ms fall
The screen shows good response rates in our tests, but may be too slow for competitive gamers.
In comparison, all tested devices range from 0.1 (minimum) to 240 (maximum) ms. » 28 % of all devices are better.
This means that the measured response time is better than the average of all tested devices (20.5 ms).
       Response Time 50% Grey to 80% Grey
5.6 ms ... rise ↗ and fall ↘ combined↗ 1.8 ms rise
↘ 3.8 ms fall
The screen shows very fast response rates in our tests and should be very well suited for fast-paced gaming.
In comparison, all tested devices range from 0.165 (minimum) to 636 (maximum) ms. » 16 % of all devices are better.
This means that the measured response time is better than the average of all tested devices (32 ms).

Screen Flickering / PWM (Pulse-Width Modulation)

To dim the screen, some notebooks will simply cycle the backlight on and off in rapid succession - a method called Pulse Width Modulation (PWM) . This cycling frequency should ideally be undetectable to the human eye. If said frequency is too low, users with sensitive eyes may experience strain or headaches or even notice the flickering altogether.
Screen flickering / PWM not detected

In comparison: 53 % of all tested devices do not use PWM to dim the display. If PWM was detected, an average of 8320 (minimum: 5 - maximum: 343500) Hz was measured.

Working outdoors is feasible thanks to this display's good brightness. It's best, though, to look for shaded areas and position yourself right in front of the screen since the reflective surface may hinder visibility otherwise.

Good IPS viewing angles

Performance - Powerful MSI Prestige A16 AI+

An AMD Ryzen AI 9 365 combined with an AMD Radeon 880M, 32GB of soldered RAM, and a 1TB Samsung SSD make for an enticing offering, making the device perfect for business and productivity tasks.


Testing conditions

The MSI Center is the software hub and also provides the AI-powered webcam and display features, in addition to the three performance modes: Eco-Silent, Balanced, and Extreme Performance. We stuck to the default Balanced mode for testing, with the AI engine turned off.

Out of the box, Windows Defender flagged a "potentially unwanted app" in the form of a pre-installed AskToolbar, which we promptly removed.

We encountered unexpected issues during some of our tests. WEBXPRT 4 initially failed to generate results, and DOTA 2 Reborn exhibited several graphical glitches along with a partially minimized application window. Cyberpunk 2077 suffered issues when gaming using an external monitor—issues that weren't replicated in any other application—as the screen went black from time to time, seemingly as if the signal was lost. Additionally, BatteryEater, our standard tool for battery testing, occasionally crashed, though a restart resolved the issue. These things do indeed attest to the fact that this system isn't running exactly as smoothly as one might expect.

Home screen with performance modes and some settings
Hardware information
AI features and settings
The support page only offers web links
Windows Defender detects pre-installed unwanted software out of the box

Processor

Balanced
Balanced
AI Engine
AI Engine
Extreme performance
Extreme performance
Eco-Silent
Eco-Silent
On battery
On battery

The AMD Ryzen AI 9 365 is a fast mobile CPU from the Zen 5 Strix Point series, featuring 10 cores, a powerful integrated GPU (iGPU), and an AI accelerator capable of 50 TOPS—combined with the iGPU, it reaches 73 TOPS.

The Cinebench R15 loop shows a fairly consistent performance graph, with only a slight drop after half an hour. CPU performance is much better than the Asus ZenBook S 16, which uses the same processor. In fact, the Prestige A16 tops the charts in all of our CPU tests, besting the Intel-based Prestige by about 12%.

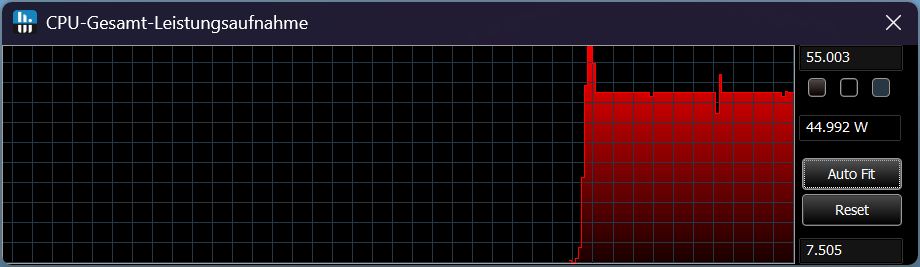
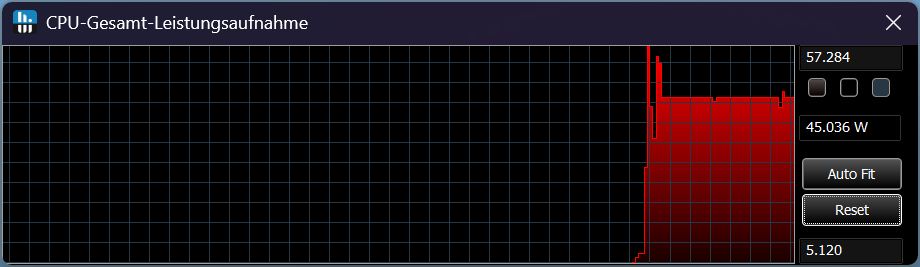
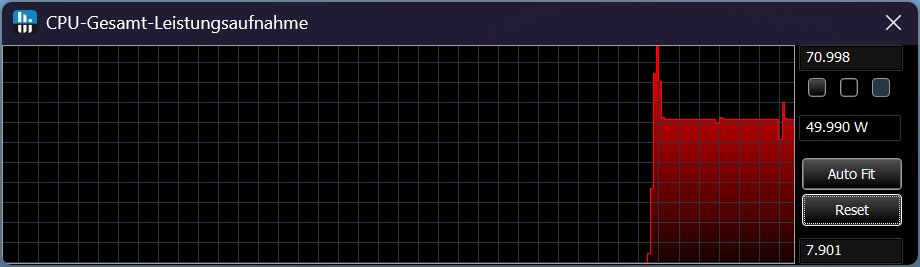
The TDP values observed during Cinebench R23 run in some interesting patterns. In Balanced mode, the system briefly starts at 55W before quickly stabilizing at a constant 45W. The AI engine follows the same pattern. In Extreme Performance mode, the TDP peaks at 70W briefly before settling at 50W instead of 45W, while Eco-Silent starts with a brief spike at 27W before immediately falling down to a steady 20W.

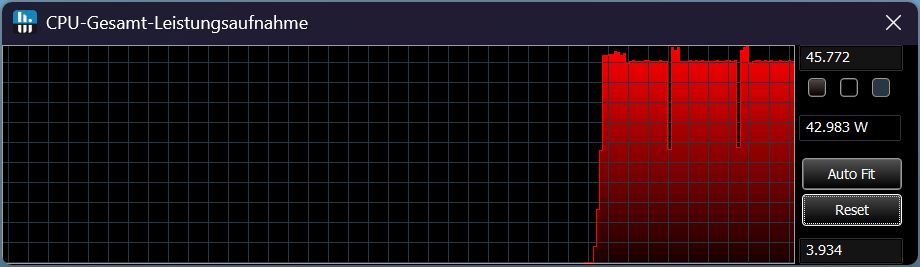
In battery mode, the performance in Cinebench R15 drops by a moderate 12%. The TDP is fairly constant at 43W in Cinebench R23, which is quite impressive, as one might expect the performance to be about as low as in Eco-Silent mode.

Cinebench R15 Multi sustained load test

0140280420560700840980112012601400154016801820196021002240238025202660Tooltip
MSI Prestige A16 AI+ A3HMG-036 AMD Ryzen AI 9 365: Ø2688 (2563.28-2772.58)
MSI Prestige 16 B1MG-001US Intel Core Ultra 7 155H: Ø2289 (2208.24-2361.97)
Asus Zenbook S 16 UM5606WA-RK052W AMD Ryzen AI 9 365: Ø1724 (1686.84-1949.7)
Lenovo ThinkPad T16 Gen 3 21MN005XGE Intel Core Ultra 5 125U: Ø1358 (1249.84-1661.41)
Lenovo IdeaPad Slim 5 16IRU9 Intel Core 7 150U: Ø1256 (1223.84-1461.77)
Ninkear A16 Pro AMD Ryzen 7 8845HS: Ø2337 (2329.51-2341.78)
Acer Aspire 16 A16-51GM-77G2 Intel Core 7 150U: Ø1353 (1306.93-1549.25)
CPU Performance Rating: Percent
Cinebench R23: Multi Core | Single Core
Cinebench R20: CPU (Multi Core) | CPU (Single Core)
Cinebench R15: CPU Multi 64Bit | CPU Single 64Bit
Blender: v2.79 BMW27 CPU
7-Zip 18.03: 7z b 4 | 7z b 4 -mmt1
Geekbench 6.4: Multi-Core | Single-Core
Geekbench 5.5: Multi-Core | Single-Core
HWBOT x265 Benchmark v2.2: 4k Preset
LibreOffice : 20 Documents To PDF
R Benchmark 2.5: Overall mean
CPU Performance Rating
Average AMD Ryzen AI 9 365
 
85.1 pt
MSI Prestige A16 AI+ A3HMG-036
AMD Ryzen AI 9 365
83.8 pt
Ninkear A16 Pro
AMD Ryzen 7 8845HS
75.7 pt
Average of class Multimedia
 
75.2 pt
MSI Prestige 16 B1MG-001US
Intel Core Ultra 7 155H
74.8 pt
Asus Zenbook S 16 UM5606WA-RK052W
AMD Ryzen AI 9 365
72.9 pt
Acer Aspire 16 A16-51GM-77G2
Intel Core 7 150U
65.5 pt
Lenovo IdeaPad Slim 5 16IRU9
Intel Core 7 150U
62.3 pt
Lenovo ThinkPad T16 Gen 3 21MN005XGE
Intel Core Ultra 5 125U
56 pt
Cinebench R23 / Multi Core
MSI Prestige A16 AI+ A3HMG-036
AMD Ryzen AI 9 365
18069 Points
Average AMD Ryzen AI 9 365
  (11462 - 20649, n=7)
17784 Points -2%
Average of class Multimedia
  (4861 - 30783, n=80, last 2 years)
15531 Points -14%
Ninkear A16 Pro
AMD Ryzen 7 8845HS
15026 Points -17%
MSI Prestige 16 B1MG-001US
Intel Core Ultra 7 155H
15013 (14365.6min - 15012.9max) Points -17%
Asus Zenbook S 16 UM5606WA-RK052W
AMD Ryzen AI 9 365
11462 Points -37%
Lenovo ThinkPad T16 Gen 3 21MN005XGE
Intel Core Ultra 5 125U
10483 Points -42%
Lenovo IdeaPad Slim 5 16IRU9
Intel Core 7 150U
9895 (8061.94min - 9895.33max) Points -45%
Acer Aspire 16 A16-51GM-77G2
Intel Core 7 150U
8692 Points -52%
Cinebench R23 / Single Core
Acer Aspire 16 A16-51GM-77G2
Intel Core 7 150U
2032 Points +2%
MSI Prestige A16 AI+ A3HMG-036
AMD Ryzen AI 9 365
1992 Points
Average AMD Ryzen AI 9 365
  (1942 - 2001, n=7)
1985 Points 0%
Asus Zenbook S 16 UM5606WA-RK052W
AMD Ryzen AI 9 365
1942 Points -3%
Lenovo IdeaPad Slim 5 16IRU9
Intel Core 7 150U
1873 Points -6%
Average of class Multimedia
  (1128 - 2290, n=72, last 2 years)
1821 Points -9%
MSI Prestige 16 B1MG-001US
Intel Core Ultra 7 155H
1749 Points -12%
Ninkear A16 Pro
AMD Ryzen 7 8845HS
1737 Points -13%
Lenovo ThinkPad T16 Gen 3 21MN005XGE
Intel Core Ultra 5 125U
1534 Points -23%
Cinebench R20 / CPU (Multi Core)
Average AMD Ryzen AI 9 365
  (5247 - 8070, n=7)
7126 Points +1%
MSI Prestige A16 AI+ A3HMG-036
AMD Ryzen AI 9 365
7057 Points
Ninkear A16 Pro
AMD Ryzen 7 8845HS
5883 Points -17%
Average of class Multimedia
  (1887 - 11924, n=64, last 2 years)
5742 Points -19%
MSI Prestige 16 B1MG-001US
Intel Core Ultra 7 155H
5741 Points -19%
Asus Zenbook S 16 UM5606WA-RK052W
AMD Ryzen AI 9 365
5247 Points -26%
Lenovo ThinkPad T16 Gen 3 21MN005XGE
Intel Core Ultra 5 125U
4033 Points -43%
Lenovo IdeaPad Slim 5 16IRU9
Intel Core 7 150U
3790 Points -46%
Acer Aspire 16 A16-51GM-77G2
Intel Core 7 150U
3370 Points -52%
Cinebench R20 / CPU (Single Core)
MSI Prestige A16 AI+ A3HMG-036
AMD Ryzen AI 9 365
785 Points
Acer Aspire 16 A16-51GM-77G2
Intel Core 7 150U
782 Points 0%
Average AMD Ryzen AI 9 365
  (758 - 787, n=7)
780 Points -1%
Asus Zenbook S 16 UM5606WA-RK052W
AMD Ryzen AI 9 365
758 Points -3%
Lenovo IdeaPad Slim 5 16IRU9
Intel Core 7 150U
699 Points -11%
Ninkear A16 Pro
AMD Ryzen 7 8845HS
673 Points -14%
Average of class Multimedia
  (420 - 853, n=64, last 2 years)
670 Points -15%
MSI Prestige 16 B1MG-001US
Intel Core Ultra 7 155H
669 Points -15%
Lenovo ThinkPad T16 Gen 3 21MN005XGE
Intel Core Ultra 5 125U
604 Points -23%
Cinebench R15 / CPU Multi 64Bit
MSI Prestige A16 AI+ A3HMG-036
AMD Ryzen AI 9 365
2773 (2563.28min - 2772.58max) Points
Average AMD Ryzen AI 9 365
  (1950 - 3075, n=7)
2759 Points -1%
Average of class Multimedia
  (856 - 5224, n=71, last 2 years)
2449 Points -12%
MSI Prestige 16 B1MG-001US
Intel Core Ultra 7 155H
2362 (2208.24min - 2361.97max) Points -15%
Ninkear A16 Pro
AMD Ryzen 7 8845HS
2342 (2329.51min - 2341.78max) Points -16%
Asus Zenbook S 16 UM5606WA-RK052W
AMD Ryzen AI 9 365
1950 (1686.84min - 1949.7max) Points -30%
Lenovo ThinkPad T16 Gen 3 21MN005XGE
Intel Core Ultra 5 125U
1661 (1249.84min - 1661.41max) Points -40%
Acer Aspire 16 A16-51GM-77G2
Intel Core 7 150U
1549 (1306.93min - 1549.25max) Points -44%
Lenovo IdeaPad Slim 5 16IRU9
Intel Core 7 150U
1462 (1223.84min - 1461.77max) Points -47%
Cinebench R15 / CPU Single 64Bit
MSI Prestige A16 AI+ A3HMG-036
AMD Ryzen AI 9 365
305 Points
Asus Zenbook S 16 UM5606WA-RK052W
AMD Ryzen AI 9 365
293 Points -4%
Acer Aspire 16 A16-51GM-77G2
Intel Core 7 150U
290 Points -5%
Average AMD Ryzen AI 9 365
  (195.7 - 306, n=7)
287 Points -6%
Ninkear A16 Pro
AMD Ryzen 7 8845HS
272 Points -11%
Average of class Multimedia
  (99.6 - 323, n=66, last 2 years)
263 Points -14%
MSI Prestige 16 B1MG-001US
Intel Core Ultra 7 155H
257 Points -16%
Lenovo IdeaPad Slim 5 16IRU9
Intel Core 7 150U
250 Points -18%
Lenovo ThinkPad T16 Gen 3 21MN005XGE
Intel Core Ultra 5 125U
229 Points -25%
Blender / v2.79 BMW27 CPU
Lenovo IdeaPad Slim 5 16IRU9
Intel Core 7 150U
360 Seconds * -77%
Acer Aspire 16 A16-51GM-77G2
Intel Core 7 150U
356 Seconds * -75%
Lenovo ThinkPad T16 Gen 3 21MN005XGE
Intel Core Ultra 5 125U
352 Seconds * -73%
Asus Zenbook S 16 UM5606WA-RK052W
AMD Ryzen AI 9 365
270 Seconds * -33%
Average of class Multimedia
  (100 - 557, n=65, last 2 years)
262 Seconds * -29%
Ninkear A16 Pro
AMD Ryzen 7 8845HS
216 Seconds * -6%
MSI Prestige 16 B1MG-001US
Intel Core Ultra 7 155H
214 Seconds * -5%
MSI Prestige A16 AI+ A3HMG-036
AMD Ryzen AI 9 365
203 Seconds *
Average AMD Ryzen AI 9 365
  (160 - 270, n=7)
192.3 Seconds * +5%
7-Zip 18.03 / 7z b 4
Ninkear A16 Pro
AMD Ryzen 7 8845HS
65460 MIPS +9%
Average AMD Ryzen AI 9 365
  (47754 - 71722, n=7)
65201 MIPS +8%
MSI Prestige 16 B1MG-001US
Intel Core Ultra 7 155H
64527 MIPS +7%
MSI Prestige A16 AI+ A3HMG-036
AMD Ryzen AI 9 365
60226 MIPS
Average of class Multimedia
  (29095 - 130368, n=59, last 2 years)
58499 MIPS -3%
Asus Zenbook S 16 UM5606WA-RK052W
AMD Ryzen AI 9 365
47754 MIPS -21%
Lenovo ThinkPad T16 Gen 3 21MN005XGE
Intel Core Ultra 5 125U
41152 MIPS -32%
Lenovo IdeaPad Slim 5 16IRU9
Intel Core 7 150U
39286 MIPS -35%
Acer Aspire 16 A16-51GM-77G2
Intel Core 7 150U
37914 MIPS -37%
7-Zip 18.03 / 7z b 4 -mmt1
Acer Aspire 16 A16-51GM-77G2
Intel Core 7 150U
6261 MIPS +3%
MSI Prestige A16 AI+ A3HMG-036
AMD Ryzen AI 9 365
6062 MIPS
Asus Zenbook S 16 UM5606WA-RK052W
AMD Ryzen AI 9 365
6012 MIPS -1%
Average AMD Ryzen AI 9 365
  (5790 - 6062, n=7)
5984 MIPS -1%
Lenovo IdeaPad Slim 5 16IRU9
Intel Core 7 150U
5745 MIPS -5%
Average of class Multimedia
  (3666 - 7545, n=59, last 2 years)
5718 MIPS -6%
Ninkear A16 Pro
AMD Ryzen 7 8845HS
5662 MIPS -7%
MSI Prestige 16 B1MG-001US
Intel Core Ultra 7 155H
5291 MIPS -13%
Lenovo ThinkPad T16 Gen 3 21MN005XGE
Intel Core Ultra 5 125U
4652 MIPS -23%
Geekbench 6.4 / Multi-Core
Average AMD Ryzen AI 9 365
  (12627 - 15137, n=7)
14265 Points +1%
MSI Prestige A16 AI+ A3HMG-036
AMD Ryzen AI 9 365
14189 Points
Average of class Multimedia
  (4983 - 25760, n=77, last 2 years)
13511 Points -5%
Ninkear A16 Pro
AMD Ryzen 7 8845HS
13056 Points -8%
MSI Prestige 16 B1MG-001US
Intel Core Ultra 7 155H
12727 Points -10%
Asus Zenbook S 16 UM5606WA-RK052W
AMD Ryzen AI 9 365
12627 Points -11%
Acer Aspire 16 A16-51GM-77G2
Intel Core 7 150U
10160 Points -28%
Lenovo ThinkPad T16 Gen 3 21MN005XGE
Intel Core Ultra 5 125U
9490 Points -33%
Lenovo IdeaPad Slim 5 16IRU9
Intel Core 7 150U
9319 Points -34%
Geekbench 6.4 / Single-Core
Average AMD Ryzen AI 9 365
  (2778 - 2920, n=7)
2832 Points 0%
MSI Prestige A16 AI+ A3HMG-036
AMD Ryzen AI 9 365
2830 Points
Acer Aspire 16 A16-51GM-77G2
Intel Core 7 150U
2781 Points -2%
Asus Zenbook S 16 UM5606WA-RK052W
AMD Ryzen AI 9 365
2778 Points -2%
Average of class Multimedia
  (1534 - 3927, n=73, last 2 years)
2702 Points -5%
Lenovo IdeaPad Slim 5 16IRU9
Intel Core 7 150U
2665 Points -6%
Ninkear A16 Pro
AMD Ryzen 7 8845HS
2618 Points -7%
MSI Prestige 16 B1MG-001US
Intel Core Ultra 7 155H
2418 Points -15%
Lenovo ThinkPad T16 Gen 3 21MN005XGE
Intel Core Ultra 5 125U
2177 Points -23%
Geekbench 5.5 / Multi-Core
Average AMD Ryzen AI 9 365
  (9599 - 14182, n=7)
12817 Points +1%
MSI Prestige A16 AI+ A3HMG-036
AMD Ryzen AI 9 365
12660 Points
MSI Prestige 16 B1MG-001US
Intel Core Ultra 7 155H
12499 Points -1%
Average of class Multimedia
  (4652 - 23059, n=63, last 2 years)
12189 Points -4%
Ninkear A16 Pro
AMD Ryzen 7 8845HS
11516 Points -9%
Asus Zenbook S 16 UM5606WA-RK052W
AMD Ryzen AI 9 365
9599 Points -24%
Acer Aspire 16 A16-51GM-77G2
Intel Core 7 150U
8354 Points -34%
Lenovo ThinkPad T16 Gen 3 21MN005XGE
Intel Core Ultra 5 125U
8267 Points -35%
Lenovo IdeaPad Slim 5 16IRU9
Intel Core 7 150U
8186 Points -35%
Geekbench 5.5 / Single-Core
Average AMD Ryzen AI 9 365
  (2062 - 2104, n=7)
2080 Points +1%
MSI Prestige A16 AI+ A3HMG-036
AMD Ryzen AI 9 365
2066 Points
Asus Zenbook S 16 UM5606WA-RK052W
AMD Ryzen AI 9 365
2065 Points 0%
Acer Aspire 16 A16-51GM-77G2
Intel Core 7 150U
1969 Points -5%
Lenovo IdeaPad Slim 5 16IRU9
Intel Core 7 150U
1909 Points -8%
Average of class Multimedia
  (891 - 2555, n=63, last 2 years)
1882 Points -9%
Ninkear A16 Pro
AMD Ryzen 7 8845HS
1816 Points -12%
MSI Prestige 16 B1MG-001US
Intel Core Ultra 7 155H
1749 Points -15%
Lenovo ThinkPad T16 Gen 3 21MN005XGE
Intel Core Ultra 5 125U
1549 Points -25%
HWBOT x265 Benchmark v2.2 / 4k Preset
Average AMD Ryzen AI 9 365
  (18.6 - 24.5, n=7)
21.8 fps +12%
MSI Prestige A16 AI+ A3HMG-036
AMD Ryzen AI 9 365
19.5 fps
Ninkear A16 Pro
AMD Ryzen 7 8845HS
18.7 fps -4%
Asus Zenbook S 16 UM5606WA-RK052W
AMD Ryzen AI 9 365
18.6 fps -5%
MSI Prestige 16 B1MG-001US
Intel Core Ultra 7 155H
16.9 fps -13%
Average of class Multimedia
  (5.26 - 34.3, n=59, last 2 years)
16.6 fps -15%
Lenovo ThinkPad T16 Gen 3 21MN005XGE
Intel Core Ultra 5 125U
12 fps -38%
Lenovo IdeaPad Slim 5 16IRU9
Intel Core 7 150U
11.1 fps -43%
Acer Aspire 16 A16-51GM-77G2
Intel Core 7 150U
9.17 fps -53%
LibreOffice / 20 Documents To PDF
MSI Prestige A16 AI+ A3HMG-036
AMD Ryzen AI 9 365
59.5 s *
Average AMD Ryzen AI 9 365
  (50.8 - 60, n=7)
55.3 s * +7%
Asus Zenbook S 16 UM5606WA-RK052W
AMD Ryzen AI 9 365
54.9 s * +8%
Ninkear A16 Pro
AMD Ryzen 7 8845HS
51.7 s * +13%
Average of class Multimedia
  (23.9 - 146.7, n=60, last 2 years)
50.3 s * +15%
Lenovo ThinkPad T16 Gen 3 21MN005XGE
Intel Core Ultra 5 125U
49.4 s * +17%
MSI Prestige 16 B1MG-001US
Intel Core Ultra 7 155H
46.9 s * +21%
Lenovo IdeaPad Slim 5 16IRU9
Intel Core 7 150U
38.2 s * +36%
Acer Aspire 16 A16-51GM-77G2
Intel Core 7 150U
29 s * +51%
R Benchmark 2.5 / Overall mean
Lenovo ThinkPad T16 Gen 3 21MN005XGE
Intel Core Ultra 5 125U
0.55 sec * -33%
Ninkear A16 Pro
AMD Ryzen 7 8845HS
0.4908 sec * -18%
Average of class Multimedia
  (0.3604 - 0.947, n=59, last 2 years)
0.4825 sec * -16%
MSI Prestige 16 B1MG-001US
Intel Core Ultra 7 155H
0.4723 sec * -14%
Lenovo IdeaPad Slim 5 16IRU9
Intel Core 7 150U
0.443 sec * -7%
Acer Aspire 16 A16-51GM-77G2
Intel Core 7 150U
0.4386 sec * -6%
Asus Zenbook S 16 UM5606WA-RK052W
AMD Ryzen AI 9 365
0.4272 sec * -3%
Average AMD Ryzen AI 9 365
  (0.4091 - 0.4272, n=7)
0.4174 sec * -1%
MSI Prestige A16 AI+ A3HMG-036
AMD Ryzen AI 9 365
0.4142 sec *

* ... smaller is better

Cinebench R15 CPU Multi 64Bit
2773 Points
Cinebench R15 OpenGL 64Bit
229 fps
Cinebench R15 Ref. Match 64Bit
97.9 %
Cinebench R15 CPU Single 64Bit
305 Points
Cinebench R20 CPU (Multi Core)
7057 Points
Cinebench R20 CPU (Single Core)
785 Points
Cinebench R23 Single Core
1992 Points
Cinebench R23 Multi Core
18069 Points
Help
Performance Rating
MSI Prestige A16 AI+ A3HMG-036
AMD Ryzen AI 9 365, Radeon 880M
91.7 pt
Average AMD Ryzen AI 9 365
 
91.6 pt
Ninkear A16 Pro
AMD Ryzen 7 8845HS, Radeon 780M
89.2 pt
MSI Prestige 16 B1MG-001US
Intel Core Ultra 7 155H, Arc 8-Core
69.7 pt
Average of class Multimedia
 
66.6 pt
Asus Zenbook S 16 UM5606WA-RK052W
AMD Ryzen AI 9 365, Radeon 880M
62.8 pt
Lenovo ThinkPad T16 Gen 3 21MN005XGE
Intel Core Ultra 5 125U, Graphics 4-Core
46.7 pt
Lenovo IdeaPad Slim 5 16IRU9
Intel Core 7 150U, Iris Xe G7 96EUs
42.4 pt
Acer Aspire 16 A16-51GM-77G2
Intel Core 7 150U, GeForce RTX 2050 Mobile
41.8 pt
AIDA64 / FP32 Ray-Trace
MSI Prestige A16 AI+ A3HMG-036
AMD Ryzen AI 9 365, Radeon 880M
28614 KRay/s
Average AMD Ryzen AI 9 365
  (17096 - 32742, n=7)
28330 KRay/s -1%
Ninkear A16 Pro
AMD Ryzen 7 8845HS, Radeon 780M
23708 KRay/s -17%
Asus Zenbook S 16 UM5606WA-RK052W
AMD Ryzen AI 9 365, Radeon 880M
17096 KRay/s -40%
Average of class Multimedia
  (5121 - 50388, n=58, last 2 years)
15771 KRay/s -45%
MSI Prestige 16 B1MG-001US
Intel Core Ultra 7 155H, Arc 8-Core
15218 KRay/s -47%
Lenovo ThinkPad T16 Gen 3 21MN005XGE
Intel Core Ultra 5 125U, Graphics 4-Core
9282 KRay/s -68%
Lenovo IdeaPad Slim 5 16IRU9
Intel Core 7 150U, Iris Xe G7 96EUs
7909 KRay/s -72%
Acer Aspire 16 A16-51GM-77G2
Intel Core 7 150U, GeForce RTX 2050 Mobile
7856 KRay/s -73%
AIDA64 / FPU Julia
MSI Prestige A16 AI+ A3HMG-036
AMD Ryzen AI 9 365, Radeon 880M
108501 Points
Average AMD Ryzen AI 9 365
  (61976 - 126955, n=7)
108009 Points 0%
Ninkear A16 Pro
AMD Ryzen 7 8845HS, Radeon 780M
99659 Points -8%
MSI Prestige 16 B1MG-001US
Intel Core Ultra 7 155H, Arc 8-Core
78381 Points -28%
Average of class Multimedia
  (14528 - 201874, n=59, last 2 years)
75254 Points -31%
Asus Zenbook S 16 UM5606WA-RK052W
AMD Ryzen AI 9 365, Radeon 880M
61976 Points -43%
Lenovo ThinkPad T16 Gen 3 21MN005XGE
Intel Core Ultra 5 125U, Graphics 4-Core
47366 Points -56%
Lenovo IdeaPad Slim 5 16IRU9
Intel Core 7 150U, Iris Xe G7 96EUs
41382 Points -62%
Acer Aspire 16 A16-51GM-77G2
Intel Core 7 150U, GeForce RTX 2050 Mobile
40050 Points -63%
AIDA64 / CPU SHA3
MSI Prestige A16 AI+ A3HMG-036
AMD Ryzen AI 9 365, Radeon 880M
4676 MB/s
Average AMD Ryzen AI 9 365
  (2951 - 5178, n=7)
4601 MB/s -2%
Ninkear A16 Pro
AMD Ryzen 7 8845HS, Radeon 780M
4551 MB/s -3%
MSI Prestige 16 B1MG-001US
Intel Core Ultra 7 155H, Arc 8-Core
3616 MB/s -23%
Average of class Multimedia
  (1188 - 8623, n=59, last 2 years)
3524 MB/s -25%
Asus Zenbook S 16 UM5606WA-RK052W
AMD Ryzen AI 9 365, Radeon 880M
2951 MB/s -37%
Lenovo ThinkPad T16 Gen 3 21MN005XGE
Intel Core Ultra 5 125U, Graphics 4-Core
2669 MB/s -43%
Lenovo IdeaPad Slim 5 16IRU9
Intel Core 7 150U, Iris Xe G7 96EUs
2165 MB/s -54%
Acer Aspire 16 A16-51GM-77G2
Intel Core 7 150U, GeForce RTX 2050 Mobile
2108 MB/s -55%
AIDA64 / CPU Queen
Ninkear A16 Pro
AMD Ryzen 7 8845HS, Radeon 780M
115197 Points +32%
MSI Prestige 16 B1MG-001US
Intel Core Ultra 7 155H, Arc 8-Core
93266 Points +7%
Average AMD Ryzen AI 9 365
  (85333 - 93045, n=7)
90014 Points +3%
MSI Prestige A16 AI+ A3HMG-036
AMD Ryzen AI 9 365, Radeon 880M
87502 Points
Asus Zenbook S 16 UM5606WA-RK052W
AMD Ryzen AI 9 365, Radeon 880M
85333 Points -2%
Average of class Multimedia
  (21547 - 181505, n=59, last 2 years)
84041 Points -4%
Acer Aspire 16 A16-51GM-77G2
Intel Core 7 150U, GeForce RTX 2050 Mobile
70820 Points -19%
Lenovo IdeaPad Slim 5 16IRU9
Intel Core 7 150U, Iris Xe G7 96EUs
67123 Points -23%
Lenovo ThinkPad T16 Gen 3 21MN005XGE
Intel Core Ultra 5 125U, Graphics 4-Core
47868 Points -45%
AIDA64 / FPU SinJulia
MSI Prestige A16 AI+ A3HMG-036
AMD Ryzen AI 9 365, Radeon 880M
15987 Points
Average AMD Ryzen AI 9 365
  (11586 - 16342, n=7)
15516 Points -3%
Ninkear A16 Pro
AMD Ryzen 7 8845HS, Radeon 780M
14062 Points -12%
Asus Zenbook S 16 UM5606WA-RK052W
AMD Ryzen AI 9 365, Radeon 880M
11586 Points -28%
MSI Prestige 16 B1MG-001US
Intel Core Ultra 7 155H, Arc 8-Core
10170 Points -36%
Average of class Multimedia
  (1240 - 28794, n=59, last 2 years)
9592 Points -40%
Lenovo ThinkPad T16 Gen 3 21MN005XGE
Intel Core Ultra 5 125U, Graphics 4-Core
5481 Points -66%
Acer Aspire 16 A16-51GM-77G2
Intel Core 7 150U, GeForce RTX 2050 Mobile
5293 Points -67%
Lenovo IdeaPad Slim 5 16IRU9
Intel Core 7 150U, Iris Xe G7 96EUs
5192 Points -68%
AIDA64 / FPU Mandel
MSI Prestige A16 AI+ A3HMG-036
AMD Ryzen AI 9 365, Radeon 880M
57916 Points
Average AMD Ryzen AI 9 365
  (33409 - 67374, n=7)
57638 Points 0%
Ninkear A16 Pro
AMD Ryzen 7 8845HS, Radeon 780M
53705 Points -7%
MSI Prestige 16 B1MG-001US
Intel Core Ultra 7 155H, Arc 8-Core
38412 Points -34%
Average of class Multimedia
  (9903 - 105740, n=58, last 2 years)
37480 Points -35%
Asus Zenbook S 16 UM5606WA-RK052W
AMD Ryzen AI 9 365, Radeon 880M
33409 Points -42%
Lenovo ThinkPad T16 Gen 3 21MN005XGE
Intel Core Ultra 5 125U, Graphics 4-Core
23052 Points -60%
Lenovo IdeaPad Slim 5 16IRU9
Intel Core 7 150U, Iris Xe G7 96EUs
20259 Points -65%
Acer Aspire 16 A16-51GM-77G2
Intel Core 7 150U, GeForce RTX 2050 Mobile
19915 Points -66%
AIDA64 / CPU AES
Ninkear A16 Pro
AMD Ryzen 7 8845HS, Radeon 780M
155900 MB/s +130%
MSI Prestige 16 B1MG-001US
Intel Core Ultra 7 155H, Arc 8-Core
76481 MB/s +13%
Average of class Multimedia
  (26066 - 169946, n=59, last 2 years)
72098 MB/s +6%
Average AMD Ryzen AI 9 365
  (47468 - 99502, n=7)
69342 MB/s +2%
MSI Prestige A16 AI+ A3HMG-036
AMD Ryzen AI 9 365, Radeon 880M
67856 MB/s
Lenovo ThinkPad T16 Gen 3 21MN005XGE
Intel Core Ultra 5 125U, Graphics 4-Core
47808 MB/s -30%
Asus Zenbook S 16 UM5606WA-RK052W
AMD Ryzen AI 9 365, Radeon 880M
47468 MB/s -30%
Lenovo IdeaPad Slim 5 16IRU9
Intel Core 7 150U, Iris Xe G7 96EUs
41731 MB/s -39%
Acer Aspire 16 A16-51GM-77G2
Intel Core 7 150U, GeForce RTX 2050 Mobile
41601 MB/s -39%
AIDA64 / CPU ZLib
Average AMD Ryzen AI 9 365
  (706 - 1343, n=7)
1169 MB/s +1%
MSI Prestige A16 AI+ A3HMG-036
AMD Ryzen AI 9 365, Radeon 880M
1159 MB/s
MSI Prestige 16 B1MG-001US
Intel Core Ultra 7 155H, Arc 8-Core
1058 MB/s -9%
Ninkear A16 Pro
AMD Ryzen 7 8845HS, Radeon 780M
964 MB/s -17%
Average of class Multimedia
  (440 - 2022, n=59, last 2 years)
946 MB/s -18%
Lenovo ThinkPad T16 Gen 3 21MN005XGE
Intel Core Ultra 5 125U, Graphics 4-Core
766 MB/s -34%
Asus Zenbook S 16 UM5606WA-RK052W
AMD Ryzen AI 9 365, Radeon 880M
706 MB/s -39%
Lenovo IdeaPad Slim 5 16IRU9
Intel Core 7 150U, Iris Xe G7 96EUs
650 MB/s -44%
Acer Aspire 16 A16-51GM-77G2
Intel Core 7 150U, GeForce RTX 2050 Mobile
627 MB/s -46%
AIDA64 / FP64 Ray-Trace
MSI Prestige A16 AI+ A3HMG-036
AMD Ryzen AI 9 365, Radeon 880M
15341 KRay/s
Average AMD Ryzen AI 9 365
  (9061 - 17848, n=7)
15301 KRay/s 0%
Ninkear A16 Pro
AMD Ryzen 7 8845HS, Radeon 780M
12361 KRay/s -19%
Asus Zenbook S 16 UM5606WA-RK052W
AMD Ryzen AI 9 365, Radeon 880M
9061 KRay/s -41%
Average of class Multimedia
  (2759 - 26875, n=59, last 2 years)
8619 KRay/s -44%
MSI Prestige 16 B1MG-001US
Intel Core Ultra 7 155H, Arc 8-Core
8102 KRay/s -47%
Lenovo ThinkPad T16 Gen 3 21MN005XGE
Intel Core Ultra 5 125U, Graphics 4-Core
4846 KRay/s -68%
Acer Aspire 16 A16-51GM-77G2
Intel Core 7 150U, GeForce RTX 2050 Mobile
4243 KRay/s -72%
Lenovo IdeaPad Slim 5 16IRU9
Intel Core 7 150U, Iris Xe G7 96EUs
4213 KRay/s -73%
AIDA64 / CPU PhotoWorxx
Average AMD Ryzen AI 9 365
  (47654 - 53550, n=7)
50655 MPixel/s +2%
MSI Prestige A16 AI+ A3HMG-036
AMD Ryzen AI 9 365, Radeon 880M
49843 MPixel/s
Asus Zenbook S 16 UM5606WA-RK052W
AMD Ryzen AI 9 365, Radeon 880M
47654 MPixel/s -4%
MSI Prestige 16 B1MG-001US
Intel Core Ultra 7 155H, Arc 8-Core
46208 MPixel/s -7%
Lenovo ThinkPad T16 Gen 3 21MN005XGE
Intel Core Ultra 5 125U, Graphics 4-Core
45688 MPixel/s -8%
Average of class Multimedia
  (12860 - 65787, n=59, last 2 years)
43274 MPixel/s -13%
Lenovo IdeaPad Slim 5 16IRU9
Intel Core 7 150U, Iris Xe G7 96EUs
38866 MPixel/s -22%
Ninkear A16 Pro
AMD Ryzen 7 8845HS, Radeon 780M
38801 MPixel/s -22%
Acer Aspire 16 A16-51GM-77G2
Intel Core 7 150U, GeForce RTX 2050 Mobile
36447 MPixel/s -27%

System performance

This is where another interesting contrast reveals itself. While the Prestige A16 AI+ came in 8 percentage points ahead of the Intel-based Prestige 16 in the PCMark 10 test, they switch places in the CrossMark test.

Overall, the system is responsive, with no noticeable dropouts or stutters. However, there are the aforementioned technical issues with certain applications.

PCMark 10
PCMark 10
PCMark 10 / Score
MSI Prestige A16 AI+ A3HMG-036
Radeon 880M, Ryzen AI 9 365, Samsung PM9C1 MZVL81T0HELB-00BTW
7596 Points
Average AMD Ryzen AI 9 365, AMD Radeon 880M
  (7045 - 7641, n=5)
7481 Points -2%
Ninkear A16 Pro
Radeon 780M, R7 8845HS, Authorain NV900-1T
7344 Points -3%
Asus Zenbook S 16 UM5606WA-RK052W
Radeon 880M, Ryzen AI 9 365, Micron 2400 MTFDKBA1T0QFM
7045 Points -7%
MSI Prestige 16 B1MG-001US
Arc 8-Core, Ultra 7 155H, Samsung PM9A1 MZVL22T0HBLB
7033 Points -7%
Average of class Multimedia
  (4325 - 8670, n=55, last 2 years)
6831 Points -10%
Acer Aspire 16 A16-51GM-77G2
GeForce RTX 2050 Mobile, Core 7 150U, WD PC SN740 SDDQNQD-1T00-1014
6704 Points -12%
Lenovo IdeaPad Slim 5 16IRU9
Iris Xe G7 96EUs, Core 7 150U
6173 Points -19%
Lenovo ThinkPad T16 Gen 3 21MN005XGE
Graphics 4-Core, Ultra 5 125U, Lenovo UMIS RPETJ1T24MHP2QDQ
5845 Points -23%
PCMark 10 / Essentials
Lenovo IdeaPad Slim 5 16IRU9
Iris Xe G7 96EUs, Core 7 150U
11219 Points +2%
MSI Prestige 16 B1MG-001US
Arc 8-Core, Ultra 7 155H, Samsung PM9A1 MZVL22T0HBLB
11156 Points +1%
Acer Aspire 16 A16-51GM-77G2
GeForce RTX 2050 Mobile, Core 7 150U, WD PC SN740 SDDQNQD-1T00-1014
11094 Points +1%
Ninkear A16 Pro
Radeon 780M, R7 8845HS, Authorain NV900-1T
11043 Points 0%
MSI Prestige A16 AI+ A3HMG-036
Radeon 880M, Ryzen AI 9 365, Samsung PM9C1 MZVL81T0HELB-00BTW
11027 Points
Average AMD Ryzen AI 9 365, AMD Radeon 880M
  (10421 - 11140, n=5)
10852 Points -2%
Average of class Multimedia
  (8025 - 12420, n=55, last 2 years)
10462 Points -5%
Asus Zenbook S 16 UM5606WA-RK052W
Radeon 880M, Ryzen AI 9 365, Micron 2400 MTFDKBA1T0QFM
10421 Points -5%
Lenovo ThinkPad T16 Gen 3 21MN005XGE
Graphics 4-Core, Ultra 5 125U, Lenovo UMIS RPETJ1T24MHP2QDQ
10130 Points -8%
PCMark 10 / Productivity
Ninkear A16 Pro
Radeon 780M, R7 8845HS, Authorain NV900-1T
10415 Points +2%
MSI Prestige A16 AI+ A3HMG-036
Radeon 880M, Ryzen AI 9 365, Samsung PM9C1 MZVL81T0HELB-00BTW
10186 Points
Asus Zenbook S 16 UM5606WA-RK052W
Radeon 880M, Ryzen AI 9 365, Micron 2400 MTFDKBA1T0QFM
10150 Points 0%
Average AMD Ryzen AI 9 365, AMD Radeon 880M
  (9841 - 10293, n=5)
10107 Points -1%
Acer Aspire 16 A16-51GM-77G2
GeForce RTX 2050 Mobile, Core 7 150U, WD PC SN740 SDDQNQD-1T00-1014
9407 Points -8%
Average of class Multimedia
  (6763 - 10615, n=55, last 2 years)
8902 Points -13%
MSI Prestige 16 B1MG-001US
Arc 8-Core, Ultra 7 155H, Samsung PM9A1 MZVL22T0HBLB
8705 Points -15%
Lenovo IdeaPad Slim 5 16IRU9
Iris Xe G7 96EUs, Core 7 150U
8399 Points -18%
Lenovo ThinkPad T16 Gen 3 21MN005XGE
Graphics 4-Core, Ultra 5 125U, Lenovo UMIS RPETJ1T24MHP2QDQ
8025 Points -21%
PCMark 10 / Digital Content Creation
MSI Prestige A16 AI+ A3HMG-036
Radeon 880M, Ryzen AI 9 365, Samsung PM9C1 MZVL81T0HELB-00BTW
10589 Points
Average AMD Ryzen AI 9 365, AMD Radeon 880M
  (8973 - 10976, n=5)
10377 Points -2%
MSI Prestige 16 B1MG-001US
Arc 8-Core, Ultra 7 155H, Samsung PM9A1 MZVL22T0HBLB
9720 Points -8%
Average of class Multimedia
  (3651 - 15187, n=55, last 2 years)
9470 Points -11%
Ninkear A16 Pro
Radeon 780M, R7 8845HS, Authorain NV900-1T
9346 Points -12%
Asus Zenbook S 16 UM5606WA-RK052W
Radeon 880M, Ryzen AI 9 365, Micron 2400 MTFDKBA1T0QFM
8973 Points -15%
Acer Aspire 16 A16-51GM-77G2
GeForce RTX 2050 Mobile, Core 7 150U, WD PC SN740 SDDQNQD-1T00-1014
7837 Points -26%
Lenovo IdeaPad Slim 5 16IRU9
Iris Xe G7 96EUs, Core 7 150U
6775 Points -36%
Lenovo ThinkPad T16 Gen 3 21MN005XGE
Graphics 4-Core, Ultra 5 125U, Lenovo UMIS RPETJ1T24MHP2QDQ
6667 Points -37%
CrossMark / Overall
Acer Aspire 16 A16-51GM-77G2
GeForce RTX 2050 Mobile, Core 7 150U, WD PC SN740 SDDQNQD-1T00-1014
1874 Points +8%
MSI Prestige 16 B1MG-001US
Arc 8-Core, Ultra 7 155H, Samsung PM9A1 MZVL22T0HBLB
1769 Points +2%
Average of class Multimedia
  (866 - 2255, n=65, last 2 years)
1746 Points 0%
MSI Prestige A16 AI+ A3HMG-036
Radeon 880M, Ryzen AI 9 365, Samsung PM9C1 MZVL81T0HELB-00BTW
1742 Points
Average AMD Ryzen AI 9 365, AMD Radeon 880M
  (1658 - 1743, n=4)
1719 Points -1%
Lenovo IdeaPad Slim 5 16IRU9
Iris Xe G7 96EUs, Core 7 150U
1660 Points -5%
Ninkear A16 Pro
Radeon 780M, R7 8845HS, Authorain NV900-1T
1652 Points -5%
Lenovo ThinkPad T16 Gen 3 21MN005XGE
Graphics 4-Core, Ultra 5 125U, Lenovo UMIS RPETJ1T24MHP2QDQ
1425 Points -18%
CrossMark / Productivity
Acer Aspire 16 A16-51GM-77G2
GeForce RTX 2050 Mobile, Core 7 150U, WD PC SN740 SDDQNQD-1T00-1014
1901 Points +19%
MSI Prestige 16 B1MG-001US
Arc 8-Core, Ultra 7 155H, Samsung PM9A1 MZVL22T0HBLB
1693 Points +6%
Average of class Multimedia
  (913 - 2050, n=65, last 2 years)
1651 Points +3%
Lenovo IdeaPad Slim 5 16IRU9
Iris Xe G7 96EUs, Core 7 150U
1649 Points +3%
MSI Prestige A16 AI+ A3HMG-036
Radeon 880M, Ryzen AI 9 365, Samsung PM9C1 MZVL81T0HELB-00BTW
1596 Points
Average AMD Ryzen AI 9 365, AMD Radeon 880M
  (1508 - 1599, n=4)
1574 Points -1%
Ninkear A16 Pro
Radeon 780M, R7 8845HS, Authorain NV900-1T
1562 Points -2%
Lenovo ThinkPad T16 Gen 3 21MN005XGE
Graphics 4-Core, Ultra 5 125U, Lenovo UMIS RPETJ1T24MHP2QDQ
1382 Points -13%
CrossMark / Creativity
MSI Prestige A16 AI+ A3HMG-036
Radeon 880M, Ryzen AI 9 365, Samsung PM9C1 MZVL81T0HELB-00BTW
2073 Points
Average AMD Ryzen AI 9 365, AMD Radeon 880M
  (2044 - 2074, n=4)
2065 Points 0%
Average of class Multimedia
  (907 - 2795, n=65, last 2 years)
1975 Points -5%
MSI Prestige 16 B1MG-001US
Arc 8-Core, Ultra 7 155H, Samsung PM9A1 MZVL22T0HBLB
1928 Points -7%
Ninkear A16 Pro
Radeon 780M, R7 8845HS, Authorain NV900-1T
1822 Points -12%
Acer Aspire 16 A16-51GM-77G2
GeForce RTX 2050 Mobile, Core 7 150U, WD PC SN740 SDDQNQD-1T00-1014
1821 Points -12%
Lenovo IdeaPad Slim 5 16IRU9
Iris Xe G7 96EUs, Core 7 150U
1730 Points -17%
Lenovo ThinkPad T16 Gen 3 21MN005XGE
Graphics 4-Core, Ultra 5 125U, Lenovo UMIS RPETJ1T24MHP2QDQ
1536 Points -26%
CrossMark / Responsiveness
Acer Aspire 16 A16-51GM-77G2
GeForce RTX 2050 Mobile, Core 7 150U, WD PC SN740 SDDQNQD-1T00-1014
1956 Points +45%
MSI Prestige 16 B1MG-001US
Arc 8-Core, Ultra 7 155H, Samsung PM9A1 MZVL22T0HBLB
1556 Points +16%
Lenovo IdeaPad Slim 5 16IRU9
Iris Xe G7 96EUs, Core 7 150U
1493 Points +11%
Ninkear A16 Pro
Radeon 780M, R7 8845HS, Authorain NV900-1T
1456 Points +8%
Average of class Multimedia
  (605 - 2094, n=65, last 2 years)
1439 Points +7%
MSI Prestige A16 AI+ A3HMG-036
Radeon 880M, Ryzen AI 9 365, Samsung PM9C1 MZVL81T0HELB-00BTW
1345 Points
Average AMD Ryzen AI 9 365, AMD Radeon 880M
  (1124 - 1360, n=4)
1294 Points -4%
Lenovo ThinkPad T16 Gen 3 21MN005XGE
Graphics 4-Core, Ultra 5 125U, Lenovo UMIS RPETJ1T24MHP2QDQ
1244 Points -8%
WebXPRT 3 / Overall
Average of class Multimedia
  (136.4 - 545, n=67, last 2 years)
326 Points +6%
Average AMD Ryzen AI 9 365, AMD Radeon 880M
  (309 - 336, n=4)
321 Points +4%
MSI Prestige A16 AI+ A3HMG-036
Radeon 880M, Ryzen AI 9 365, Samsung PM9C1 MZVL81T0HELB-00BTW
309 Points
Lenovo IdeaPad Slim 5 16IRU9
Iris Xe G7 96EUs, Core 7 150U
307 Points -1%
Acer Aspire 16 A16-51GM-77G2
GeForce RTX 2050 Mobile, Core 7 150U, WD PC SN740 SDDQNQD-1T00-1014
305 Points -1%
MSI Prestige 16 B1MG-001US
Arc 8-Core, Ultra 7 155H, Samsung PM9A1 MZVL22T0HBLB
299 Points -3%
Ninkear A16 Pro
Radeon 780M, R7 8845HS, Authorain NV900-1T
299 Points -3%
Lenovo ThinkPad T16 Gen 3 21MN005XGE
Graphics 4-Core, Ultra 5 125U, Lenovo UMIS RPETJ1T24MHP2QDQ
253 Points -18%
WebXPRT 4 / Overall
MSI Prestige A16 AI+ A3HMG-036
Radeon 880M, Ryzen AI 9 365, Samsung PM9C1 MZVL81T0HELB-00BTW
330 Points
Acer Aspire 16 A16-51GM-77G2
GeForce RTX 2050 Mobile, Core 7 150U, WD PC SN740 SDDQNQD-1T00-1014
281 Points -15%
Lenovo IdeaPad Slim 5 16IRU9
Iris Xe G7 96EUs, Core 7 150U
276 Points -16%
Average of class Multimedia
  (167.3 - 353, n=60, last 2 years)
274 Points -17%
Average AMD Ryzen AI 9 365, AMD Radeon 880M
  (255 - 330, n=6)
271 Points -18%
MSI Prestige 16 B1MG-001US
Arc 8-Core, Ultra 7 155H, Samsung PM9A1 MZVL22T0HBLB
263 Points -20%
Ninkear A16 Pro
Radeon 780M, R7 8845HS, Authorain NV900-1T
257 Points -22%
Asus Zenbook S 16 UM5606WA-RK052W
Radeon 880M, Ryzen AI 9 365, Micron 2400 MTFDKBA1T0QFM
255 Points -23%
Asus Zenbook S 16 UM5606WA-RK052W
Radeon 880M, Ryzen AI 9 365, Micron 2400 MTFDKBA1T0QFM
255 Points -23%
Lenovo ThinkPad T16 Gen 3 21MN005XGE
Graphics 4-Core, Ultra 5 125U, Lenovo UMIS RPETJ1T24MHP2QDQ
228 Points -31%
Mozilla Kraken 1.1 / Total
Lenovo ThinkPad T16 Gen 3 21MN005XGE
Graphics 4-Core, Ultra 5 125U, Lenovo UMIS RPETJ1T24MHP2QDQ
579 ms * -34%
Ninkear A16 Pro
Radeon 780M, R7 8845HS, Authorain NV900-1T
530 ms * -22%
MSI Prestige 16 B1MG-001US
Arc 8-Core, Ultra 7 155H, Samsung PM9A1 MZVL22T0HBLB
525 ms * -21%
Lenovo IdeaPad Slim 5 16IRU9
Iris Xe G7 96EUs, Core 7 150U
502 ms * -16%
Average of class Multimedia
  (254 - 835, n=72, last 2 years)
482 ms * -11%
Acer Aspire 16 A16-51GM-77G2
GeForce RTX 2050 Mobile, Core 7 150U, WD PC SN740 SDDQNQD-1T00-1014
463 ms * -7%
Asus Zenbook S 16 UM5606WA-RK052W
Radeon 880M, Ryzen AI 9 365, Micron 2400 MTFDKBA1T0QFM
456 ms * -5%
Asus Zenbook S 16 UM5606WA-RK052W
Radeon 880M, Ryzen AI 9 365, Micron 2400 MTFDKBA1T0QFM
456 ms * -5%
Average AMD Ryzen AI 9 365, AMD Radeon 880M
  (430 - 456, n=6)
443 ms * -2%
MSI Prestige A16 AI+ A3HMG-036
Radeon 880M, Ryzen AI 9 365, Samsung PM9C1 MZVL81T0HELB-00BTW
433 ms *

* ... smaller is better

PCMark 10 Score
7596 points
Help
AIDA64 / Memory Copy
Average AMD Ryzen AI 9 365
  (87648 - 94710, n=7)
90480 MB/s +2%
Asus Zenbook S 16 UM5606WA-RK052W
AMD Ryzen AI 9 365, Radeon 880M
90113 MB/s +2%
MSI Prestige A16 AI+ A3HMG-036
AMD Ryzen AI 9 365, Radeon 880M
88745 MB/s
MSI Prestige 16 B1MG-001US
Intel Core Ultra 7 155H, Arc 8-Core
80951 MB/s -9%
Average of class Multimedia
  (21158 - 108302, n=59, last 2 years)
75322 MB/s -15%
Lenovo ThinkPad T16 Gen 3 21MN005XGE
Intel Core Ultra 5 125U, Graphics 4-Core
69839 MB/s -21%
Ninkear A16 Pro
AMD Ryzen 7 8845HS, Radeon 780M
63614 MB/s -28%
Lenovo IdeaPad Slim 5 16IRU9
Intel Core 7 150U, Iris Xe G7 96EUs
61190 MB/s -31%
Acer Aspire 16 A16-51GM-77G2
Intel Core 7 150U, GeForce RTX 2050 Mobile
55527 MB/s -37%
AIDA64 / Memory Read
Average AMD Ryzen AI 9 365
  (89012 - 104349, n=7)
98565 MB/s +1%
MSI Prestige A16 AI+ A3HMG-036
AMD Ryzen AI 9 365, Radeon 880M
97219 MB/s
Asus Zenbook S 16 UM5606WA-RK052W
AMD Ryzen AI 9 365, Radeon 880M
89012 MB/s -8%
Average of class Multimedia
  (24312 - 125604, n=59, last 2 years)
76695 MB/s -21%
MSI Prestige 16 B1MG-001US
Intel Core Ultra 7 155H, Arc 8-Core
75886 MB/s -22%
Lenovo ThinkPad T16 Gen 3 21MN005XGE
Intel Core Ultra 5 125U, Graphics 4-Core
62640 MB/s -36%
Ninkear A16 Pro
AMD Ryzen 7 8845HS, Radeon 780M
61558 MB/s -37%
Acer Aspire 16 A16-51GM-77G2
Intel Core 7 150U, GeForce RTX 2050 Mobile
60894 MB/s -37%
Lenovo IdeaPad Slim 5 16IRU9
Intel Core 7 150U, Iris Xe G7 96EUs
51757 MB/s -47%
AIDA64 / Memory Write
Asus Zenbook S 16 UM5606WA-RK052W
AMD Ryzen AI 9 365, Radeon 880M
100507 MB/s +5%
Average AMD Ryzen AI 9 365
  (93627 - 106646, n=7)
99489 MB/s +4%
MSI Prestige A16 AI+ A3HMG-036
AMD Ryzen AI 9 365, Radeon 880M
95663 MB/s
Lenovo IdeaPad Slim 5 16IRU9
Intel Core 7 150U, Iris Xe G7 96EUs
78327 MB/s -18%
MSI Prestige 16 B1MG-001US
Intel Core Ultra 7 155H, Arc 8-Core
75909 MB/s -21%
Average of class Multimedia
  (24382 - 117933, n=59, last 2 years)
74141 MB/s -22%
Ninkear A16 Pro
AMD Ryzen 7 8845HS, Radeon 780M
68425 MB/s -28%
Lenovo ThinkPad T16 Gen 3 21MN005XGE
Intel Core Ultra 5 125U, Graphics 4-Core
62624 MB/s -35%
Acer Aspire 16 A16-51GM-77G2
Intel Core 7 150U, GeForce RTX 2050 Mobile
59016 MB/s -38%
AIDA64 / Memory Latency
MSI Prestige 16 B1MG-001US
Intel Core Ultra 7 155H, Arc 8-Core
135.9 ns * -5%
MSI Prestige A16 AI+ A3HMG-036
AMD Ryzen AI 9 365, Radeon 880M
129.8 ns *
Lenovo ThinkPad T16 Gen 3 21MN005XGE
Intel Core Ultra 5 125U, Graphics 4-Core
125.9 ns * +3%
Ninkear A16 Pro
AMD Ryzen 7 8845HS, Radeon 780M
117 ns * +10%
Asus Zenbook S 16 UM5606WA-RK052W
AMD Ryzen AI 9 365, Radeon 880M
116.3 ns * +10%
Average AMD Ryzen AI 9 365
  (103.6 - 129.8, n=7)
115.7 ns * +11%
Average of class Multimedia
  (7 - 346, n=59, last 2 years)
113.7 ns * +12%
Lenovo IdeaPad Slim 5 16IRU9
Intel Core 7 150U, Iris Xe G7 96EUs
100 ns * +23%
Acer Aspire 16 A16-51GM-77G2
Intel Core 7 150U, GeForce RTX 2050 Mobile
89.7 ns * +31%

* ... smaller is better

DPC latencies

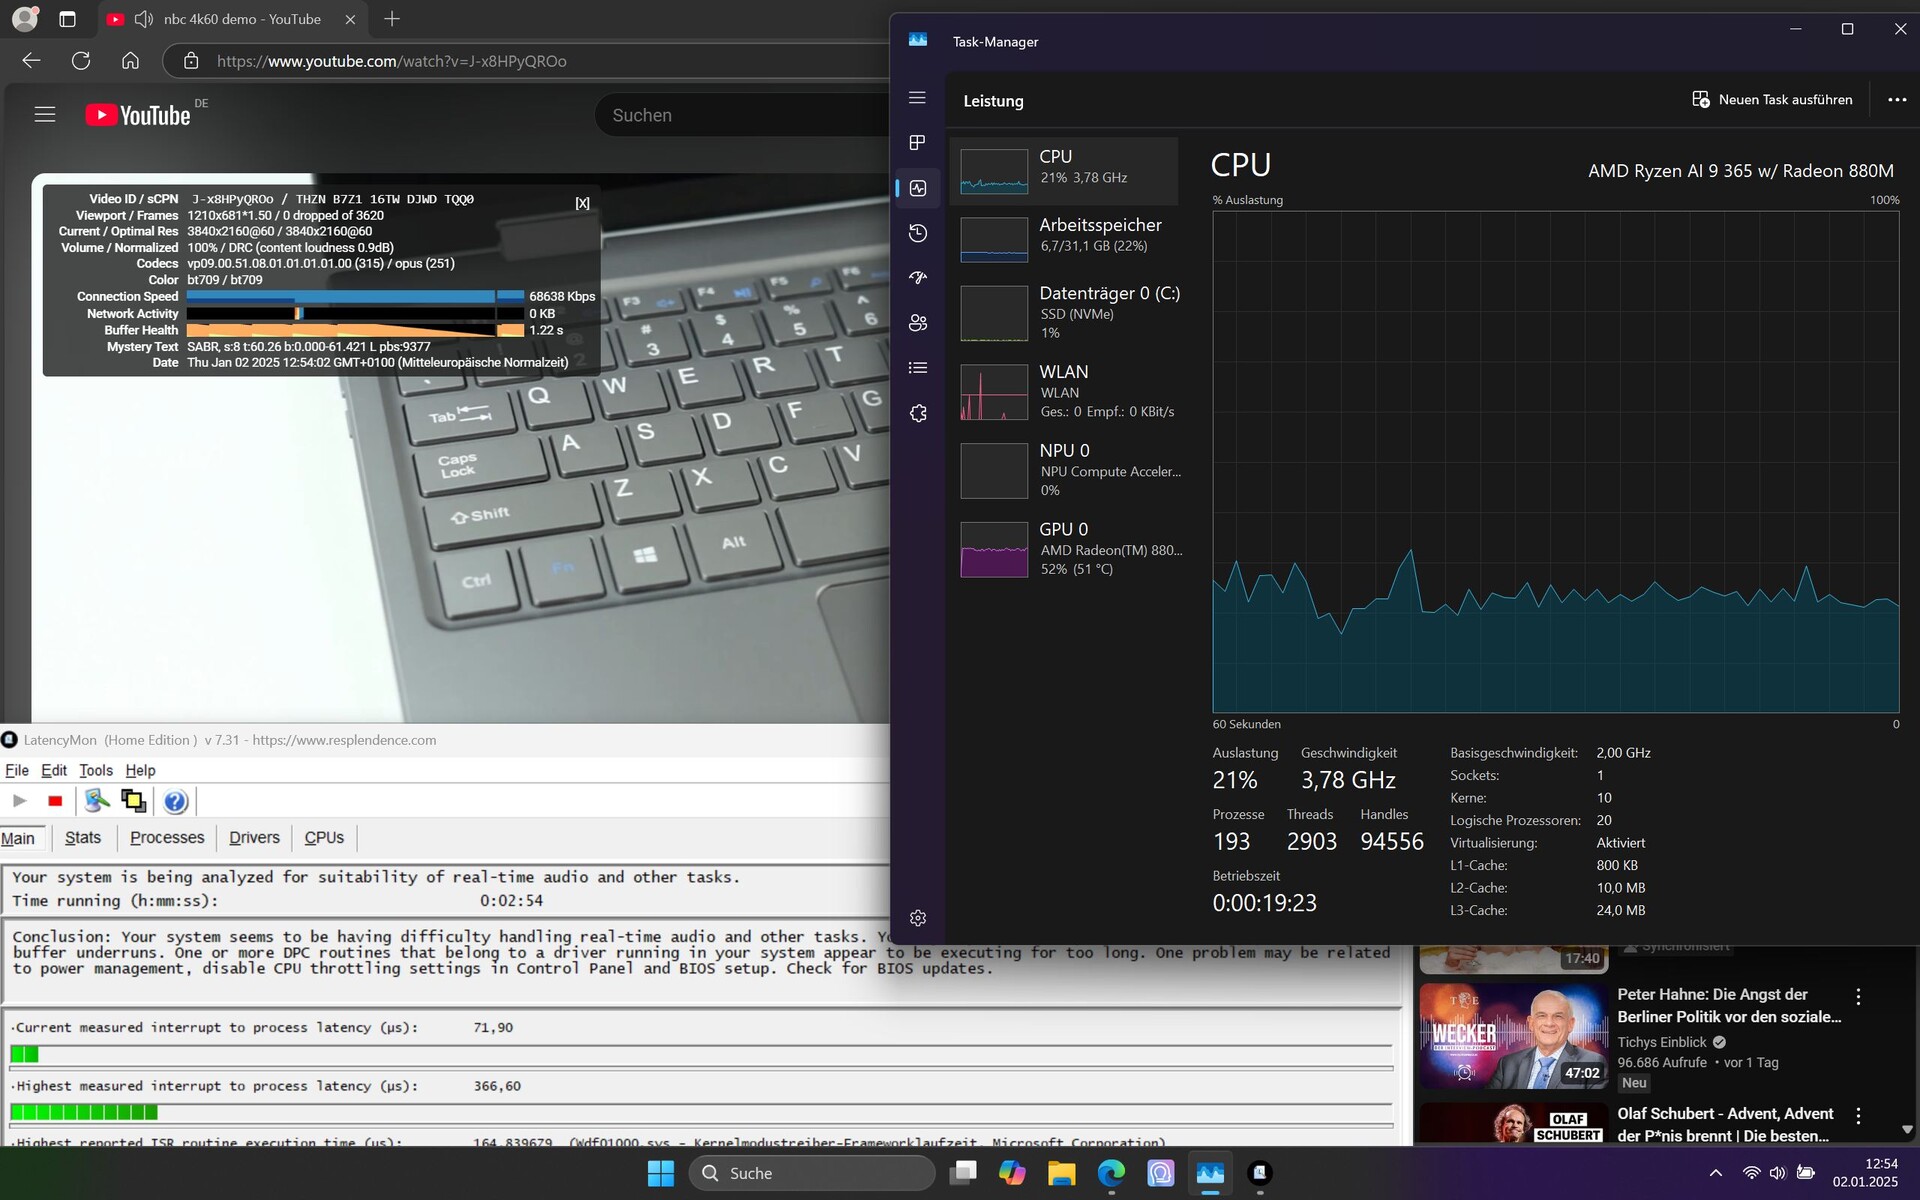
With the LatencyMon tool active, our test laptop shows minor latency issues when opening multiple browser tabs. However, 4K/60 fps YouTube playback runs smoothly without dropped frames, and its latency value is among the lowest when compared to the competition.

YouTube playback test
LatencyMon
LatencyMon
LatencyMon Drivers
LatencyMon Drivers
DPC Latencies / LatencyMon - interrupt to process latency (max), Web, Youtube, Prime95
Asus Zenbook S 16 UM5606WA-RK052W
Radeon 880M, Ryzen AI 9 365, Micron 2400 MTFDKBA1T0QFM
3298 μs * -800%
Acer Aspire 16 A16-51GM-77G2
GeForce RTX 2050 Mobile, Core 7 150U, WD PC SN740 SDDQNQD-1T00-1014
2733.7 μs * -646%
Lenovo IdeaPad Slim 5 16IRU9
Iris Xe G7 96EUs, Core 7 150U
2145.8 μs * -485%
Ninkear A16 Pro
Radeon 780M, R7 8845HS, Authorain NV900-1T
1352.1 μs * -269%
MSI Prestige 16 B1MG-001US
Arc 8-Core, Ultra 7 155H, Samsung PM9A1 MZVL22T0HBLB
527.2 μs * -44%
Lenovo ThinkPad T16 Gen 3 21MN005XGE
Graphics 4-Core, Ultra 5 125U, Lenovo UMIS RPETJ1T24MHP2QDQ
450.3 μs * -23%
MSI Prestige A16 AI+ A3HMG-036
Radeon 880M, Ryzen AI 9 365, Samsung PM9C1 MZVL81T0HELB-00BTW
366.6 μs *

* ... smaller is better

Storage devices

Just like the Intel model, the A16 AI+ features a Samsung NVMe SSD. While MSI laptops tend to ship with higher-end SSDs, the SKU tested gets a mid-range drive for storing user data. As a result, its transfer rates are noticeably slower compared to the Intel Prestige. On the positive side, performance remains stable during extended use, unlike competitors such as the Lenovo ThinkPad T16 and Acer Aspire 16 A16, which both suffer from thermal throttling. In our best SSD list the under-the-radar drive is ranked 182nd. Despite the SSD model being around since mid 2020, the Prestige A16 AI+ is the first laptop we've tested with this particular drive.

Samsung PM9C1 MZVL81T0HELB-00BTW
CDM 5/6 Read Seq Q32T1: 5057 MB/s
CDM 5/6 Write Seq Q32T1: 3457 MB/s
CDM 5/6 Read 4K Q32T1: 456 MB/s
CDM 5/6 Write 4K Q32T1: 428 MB/s
CDM 5/6 Read 4K: 58.2 MB/s
CDM 5/6 Write 4K: 150.7 MB/s
CDM 6 Write 4K Q8T8: 389 MB/s
CDM 6 Read 4K Q8T8: 613 MB/s
Drive Performance Rating - Percent
MSI Prestige 16 B1MG-001US
Samsung PM9A1 MZVL22T0HBLB
92.3 pt
Acer Aspire 16 A16-51GM-77G2
WD PC SN740 SDDQNQD-1T00-1014
83.2 pt
Average of class Multimedia
 
63.1 pt
Lenovo ThinkPad T16 Gen 3 21MN005XGE
Lenovo UMIS RPETJ1T24MHP2QDQ
60.8 pt
Average Samsung PM9C1 MZVL81T0HELB-00BTW
 
57.6 pt
Lenovo IdeaPad Slim 5 16IRU9
 
53.2 pt
MSI Prestige A16 AI+ A3HMG-036
Samsung PM9C1 MZVL81T0HELB-00BTW
52.9 pt
Asus Zenbook S 16 UM5606WA-RK052W
Micron 2400 MTFDKBA1T0QFM
48.1 pt
Ninkear A16 Pro
Authorain NV900-1T
39.6 pt
DiskSpd
seq read
MSI Prestige 16 B1MG-001US
Samsung PM9A1 MZVL22T0HBLB
4432 (4393.32min - 4432.27max) MB/s +39%
Lenovo ThinkPad T16 Gen 3 21MN005XGE
Lenovo UMIS RPETJ1T24MHP2QDQ
3903 (3817.36min - 3903.01max) MB/s +22%
Acer Aspire 16 A16-51GM-77G2
WD PC SN740 SDDQNQD-1T00-1014
3273 (3194.7min - 3273.03max) MB/s +3%
MSI Prestige A16 AI+ A3HMG-036
Samsung PM9C1 MZVL81T0HELB-00BTW
3191 (3164.39min - 3191.45max) MB/s
Lenovo IdeaPad Slim 5 16IRU9
 
3065 (3026.4min - 3064.99max) MB/s -4%
Average of class Multimedia
  (453 - 4432, n=59, last 2 years)
2907 MB/s -9%
Average Samsung PM9C1 MZVL81T0HELB-00BTW
  (2400 - 3248, n=5)
2844 MB/s -11%
Asus Zenbook S 16 UM5606WA-RK052W
Micron 2400 MTFDKBA1T0QFM
2421 (2387.4min - 2420.55max) MB/s -24%
Ninkear A16 Pro
Authorain NV900-1T
2073 (2068.27min - 2072.87max) MB/s -35%
seq write
MSI Prestige 16 B1MG-001US
Samsung PM9A1 MZVL22T0HBLB
4432 (4395.44min - 4431.7max) MB/s +36%
Acer Aspire 16 A16-51GM-77G2
WD PC SN740 SDDQNQD-1T00-1014
4317 (4246.1min - 4316.53max) MB/s +32%
Lenovo ThinkPad T16 Gen 3 21MN005XGE
Lenovo UMIS RPETJ1T24MHP2QDQ
3296 (3157.26min - 3296.21max) MB/s +1%
MSI Prestige A16 AI+ A3HMG-036
Samsung PM9C1 MZVL81T0HELB-00BTW
3259 (2970.55min - 3258.99max) MB/s
Average of class Multimedia
  (384 - 5711, n=59, last 2 years)
3123 MB/s -4%
Lenovo IdeaPad Slim 5 16IRU9
 
3064 (2803.89min - 3063.78max) MB/s -6%
Average Samsung PM9C1 MZVL81T0HELB-00BTW
  (2368 - 3474, n=5)
2990 MB/s -8%
Asus Zenbook S 16 UM5606WA-RK052W
Micron 2400 MTFDKBA1T0QFM
2729 (2601.73min - 2729.02max) MB/s -16%
Ninkear A16 Pro
Authorain NV900-1T
1752 (1704.98min - 1752.17max) MB/s -46%
seq q8 t1 read
MSI Prestige 16 B1MG-001US
Samsung PM9A1 MZVL22T0HBLB
7107 (6650.61min - 7107.46max) MB/s +41%
Lenovo ThinkPad T16 Gen 3 21MN005XGE
Lenovo UMIS RPETJ1T24MHP2QDQ
7033 (6064.54min - 7033.22max) MB/s +40%
Average of class Multimedia
  (467 - 7126, n=59, last 2 years)
5282 MB/s +5%
Acer Aspire 16 A16-51GM-77G2
WD PC SN740 SDDQNQD-1T00-1014
5245 (4687.55min - 5244.97max) MB/s +4%
Asus Zenbook S 16 UM5606WA-RK052W
Micron 2400 MTFDKBA1T0QFM
5093 (4325.8min - 5093.35max) MB/s +1%
MSI Prestige A16 AI+ A3HMG-036
Samsung PM9C1 MZVL81T0HELB-00BTW
5035 (4487.49min - 5035.47max) MB/s
Lenovo IdeaPad Slim 5 16IRU9
 
4978 (4332.09min - 4978.22max) MB/s -1%
Average Samsung PM9C1 MZVL81T0HELB-00BTW
  (4468 - 5044, n=5)
4920 MB/s -2%
Ninkear A16 Pro
Authorain NV900-1T
2107 (1922.53min - 2107.2max) MB/s -58%
seq q8 t1 write
MSI Prestige 16 B1MG-001US
Samsung PM9A1 MZVL22T0HBLB
5249 (5168.16min - 5248.53max) MB/s +49%
Lenovo ThinkPad T16 Gen 3 21MN005XGE
Lenovo UMIS RPETJ1T24MHP2QDQ
5189 (4837.53min - 5188.88max) MB/s +48%
Lenovo IdeaPad Slim 5 16IRU9
 
4561 (4547.04min - 4560.99max) MB/s +30%
Acer Aspire 16 A16-51GM-77G2
WD PC SN740 SDDQNQD-1T00-1014
4403 (4374.24min - 4402.55max) MB/s +25%
Average of class Multimedia
  (247 - 6898, n=59, last 2 years)
4099 MB/s +17%
Asus Zenbook S 16 UM5606WA-RK052W
Micron 2400 MTFDKBA1T0QFM
3626 (3509.49min - 3625.77max) MB/s +3%
MSI Prestige A16 AI+ A3HMG-036
Samsung PM9C1 MZVL81T0HELB-00BTW
3513 (3437.28min - 3513.15max) MB/s
Average Samsung PM9C1 MZVL81T0HELB-00BTW
  (3358 - 3621, n=5)
3481 MB/s -1%
Ninkear A16 Pro
Authorain NV900-1T
1694 (1658.88min - 1693.63max) MB/s -52%
4k q1 t1 read
Acer Aspire 16 A16-51GM-77G2
WD PC SN740 SDDQNQD-1T00-1014
83.3 (81.53min - 83.32max) MB/s +49%
MSI Prestige 16 B1MG-001US
Samsung PM9A1 MZVL22T0HBLB
81.5 (81.19min - 81.46max) MB/s +46%
Lenovo IdeaPad Slim 5 16IRU9
 
63.8 (62.67min - 63.75max) MB/s +14%
Average of class Multimedia
  (14.6 - 97.7, n=59, last 2 years)
61.4 MB/s +10%
Average Samsung PM9C1 MZVL81T0HELB-00BTW
  (52.7 - 75.1, n=5)
59.7 MB/s +7%
MSI Prestige A16 AI+ A3HMG-036
Samsung PM9C1 MZVL81T0HELB-00BTW
55.9 (55.19min - 55.86max) MB/s
Lenovo ThinkPad T16 Gen 3 21MN005XGE
Lenovo UMIS RPETJ1T24MHP2QDQ
54.6 (53.78min - 54.61max) MB/s -2%
Ninkear A16 Pro
Authorain NV900-1T
47.2 (46.94min - 47.15max) MB/s -16%
Asus Zenbook S 16 UM5606WA-RK052W
Micron 2400 MTFDKBA1T0QFM
32.8 (32.29min - 32.8max) MB/s -41%
4k q1 t1 write
Acer Aspire 16 A16-51GM-77G2
WD PC SN740 SDDQNQD-1T00-1014
311 (306.79min - 311.34max) MB/s +116%
Ninkear A16 Pro
Authorain NV900-1T
215 (210.88min - 215.42max) MB/s +49%
MSI Prestige 16 B1MG-001US
Samsung PM9A1 MZVL22T0HBLB
202 (200.14min - 201.86max) MB/s +40%
Lenovo IdeaPad Slim 5 16IRU9
 
178 (170.53min - 178.04max) MB/s +23%
Average of class Multimedia
  (44.4 - 378, n=59, last 2 years)
164.6 MB/s +14%
Average Samsung PM9C1 MZVL81T0HELB-00BTW
  (131 - 253, n=5)
161.3 MB/s +12%
MSI Prestige A16 AI+ A3HMG-036
Samsung PM9C1 MZVL81T0HELB-00BTW
144.3 (128.92min - 144.27max) MB/s
Asus Zenbook S 16 UM5606WA-RK052W
Micron 2400 MTFDKBA1T0QFM
139.3 (133.75min - 139.27max) MB/s -3%
Lenovo ThinkPad T16 Gen 3 21MN005XGE
Lenovo UMIS RPETJ1T24MHP2QDQ
125.2 (121.39min - 125.16max) MB/s -13%
4k q32 t16 read
MSI Prestige 16 B1MG-001US
Samsung PM9A1 MZVL22T0HBLB
3839 (3251.93min - 3838.52max) MB/s +626%
Acer Aspire 16 A16-51GM-77G2
WD PC SN740 SDDQNQD-1T00-1014
2796 (2683.72min - 2796.09max) MB/s +429%
Average of class Multimedia
  (190.3 - 4881, n=59, last 2 years)
1334 MB/s +152%
Average Samsung PM9C1 MZVL81T0HELB-00BTW
  (529 - 2834, n=5)
1012 MB/s +91%
Ninkear A16 Pro
Authorain NV900-1T
905 (898.75min - 904.6max) MB/s +71%
Lenovo IdeaPad Slim 5 16IRU9
 
715 (699.07min - 715.11max) MB/s +35%
Lenovo ThinkPad T16 Gen 3 21MN005XGE
Lenovo UMIS RPETJ1T24MHP2QDQ
606 (601.3min - 606.15max) MB/s +15%
MSI Prestige A16 AI+ A3HMG-036
Samsung PM9C1 MZVL81T0HELB-00BTW
529 (509.41min - 528.85max) MB/s
Asus Zenbook S 16 UM5606WA-RK052W
Micron 2400 MTFDKBA1T0QFM
470 (452.58min - 469.76max) MB/s -11%
4k q32 t16 write
MSI Prestige 16 B1MG-001US
Samsung PM9A1 MZVL22T0HBLB
3063 (2744.16min - 3062.6max) MB/s +834%
Acer Aspire 16 A16-51GM-77G2
WD PC SN740 SDDQNQD-1T00-1014
2410 (2182.33min - 2409.85max) MB/s +635%
Ninkear A16 Pro
Authorain NV900-1T
1020 (998.49min - 1019.8max) MB/s +211%
Average of class Multimedia
  (164.6 - 4074, n=59, last 2 years)
996 MB/s +204%
Average Samsung PM9C1 MZVL81T0HELB-00BTW
  (309 - 2693, n=5)
812 MB/s +148%
Lenovo IdeaPad Slim 5 16IRU9
 
444 (433.94min - 444.21max) MB/s +35%
MSI Prestige A16 AI+ A3HMG-036
Samsung PM9C1 MZVL81T0HELB-00BTW
328 (306.9min - 328.4max) MB/s
Lenovo ThinkPad T16 Gen 3 21MN005XGE
Lenovo UMIS RPETJ1T24MHP2QDQ
301 (288.11min - 301.27max) MB/s -8%
Asus Zenbook S 16 UM5606WA-RK052W
Micron 2400 MTFDKBA1T0QFM
271 (259.81min - 271.42max) MB/s -17%
AS SSD
Score Total
MSI Prestige 16 B1MG-001US
Samsung PM9A1 MZVL22T0HBLB
7524 Points +140%
Acer Aspire 16 A16-51GM-77G2
WD PC SN740 SDDQNQD-1T00-1014
6536 Points +108%
Average of class Multimedia
  (482 - 9972, n=56, last 2 years)
4778 Points +52%
Average Samsung PM9C1 MZVL81T0HELB-00BTW
  (3137 - 6913, n=4)
4304 Points +37%
Lenovo ThinkPad T16 Gen 3 21MN005XGE
Lenovo UMIS RPETJ1T24MHP2QDQ
4211 Points +34%
Lenovo IdeaPad Slim 5 16IRU9
 
3740 Points +19%
Asus Zenbook S 16 UM5606WA-RK052W
Micron 2400 MTFDKBA1T0QFM
3398 Points +8%
MSI Prestige A16 AI+ A3HMG-036
Samsung PM9C1 MZVL81T0HELB-00BTW
3137 Points
Ninkear A16 Pro
Authorain NV900-1T
2665 Points -15%
Score Read
MSI Prestige 16 B1MG-001US
Samsung PM9A1 MZVL22T0HBLB
2677 Points +181%
Acer Aspire 16 A16-51GM-77G2
WD PC SN740 SDDQNQD-1T00-1014
2609 Points +174%
Average of class Multimedia
  (192 - 3501, n=56, last 2 years)
1535 Points +61%
Average Samsung PM9C1 MZVL81T0HELB-00BTW
  (951 - 2692, n=4)
1419 Points +49%
Lenovo IdeaPad Slim 5 16IRU9
 
1182 Points +24%
Lenovo ThinkPad T16 Gen 3 21MN005XGE
Lenovo UMIS RPETJ1T24MHP2QDQ
1182 Points +24%
Ninkear A16 Pro
Authorain NV900-1T
1115 Points +17%
MSI Prestige A16 AI+ A3HMG-036
Samsung PM9C1 MZVL81T0HELB-00BTW
951 Points
Asus Zenbook S 16 UM5606WA-RK052W
Micron 2400 MTFDKBA1T0QFM
936 Points -2%
Score Write
MSI Prestige 16 B1MG-001US
Samsung PM9A1 MZVL22T0HBLB
3528 Points +99%
Acer Aspire 16 A16-51GM-77G2
WD PC SN740 SDDQNQD-1T00-1014
2694 Points +52%
Lenovo ThinkPad T16 Gen 3 21MN005XGE
Lenovo UMIS RPETJ1T24MHP2QDQ
2542 Points +43%
Average of class Multimedia
  (191 - 4684, n=56, last 2 years)
2514 Points +42%
Average Samsung PM9C1 MZVL81T0HELB-00BTW
  (1772 - 2880, n=4)
2219 Points +25%
Asus Zenbook S 16 UM5606WA-RK052W
Micron 2400 MTFDKBA1T0QFM
2047 Points +16%
Lenovo IdeaPad Slim 5 16IRU9
 
2038 Points +15%
MSI Prestige A16 AI+ A3HMG-036
Samsung PM9C1 MZVL81T0HELB-00BTW
1772 Points
Ninkear A16 Pro
Authorain NV900-1T
988 Points -44%
Seq Read
MSI Prestige 16 B1MG-001US
Samsung PM9A1 MZVL22T0HBLB
5528.24 MB/s +39%
Lenovo ThinkPad T16 Gen 3 21MN005XGE
Lenovo UMIS RPETJ1T24MHP2QDQ
4963 MB/s +25%
Acer Aspire 16 A16-51GM-77G2
WD PC SN740 SDDQNQD-1T00-1014
4471 MB/s +12%
Average of class Multimedia
  (484 - 5730, n=56, last 2 years)
4212 MB/s +6%
Lenovo IdeaPad Slim 5 16IRU9
 
4057.88 MB/s +2%
MSI Prestige A16 AI+ A3HMG-036
Samsung PM9C1 MZVL81T0HELB-00BTW
3976 MB/s
Average Samsung PM9C1 MZVL81T0HELB-00BTW
  (3470 - 4167, n=4)
3901 MB/s -2%
Asus Zenbook S 16 UM5606WA-RK052W
Micron 2400 MTFDKBA1T0QFM
3873.54 MB/s -3%
Ninkear A16 Pro
Authorain NV900-1T
1905 MB/s -52%
Seq Write
MSI Prestige 16 B1MG-001US
Samsung PM9A1 MZVL22T0HBLB
4449.45 MB/s +106%
Average of class Multimedia
  (344 - 5651, n=56, last 2 years)
2830 MB/s +31%
Average Samsung PM9C1 MZVL81T0HELB-00BTW
  (1844 - 3388, n=4)
2429 MB/s +13%
Lenovo ThinkPad T16 Gen 3 21MN005XGE
Lenovo UMIS RPETJ1T24MHP2QDQ
2350 MB/s +9%
Asus Zenbook S 16 UM5606WA-RK052W
Micron 2400 MTFDKBA1T0QFM
2324.19 MB/s +8%
Acer Aspire 16 A16-51GM-77G2
WD PC SN740 SDDQNQD-1T00-1014
2257 MB/s +5%
MSI Prestige A16 AI+ A3HMG-036
Samsung PM9C1 MZVL81T0HELB-00BTW
2159 MB/s
Lenovo IdeaPad Slim 5 16IRU9
 
2060.59 MB/s -5%
Ninkear A16 Pro
Authorain NV900-1T
1575 MB/s -27%
4K Read
Acer Aspire 16 A16-51GM-77G2
WD PC SN740 SDDQNQD-1T00-1014
76.1 MB/s +36%
MSI Prestige 16 B1MG-001US
Samsung PM9A1 MZVL22T0HBLB
69.33 MB/s +24%
Average Samsung PM9C1 MZVL81T0HELB-00BTW
  (55.8 - 69.7, n=4)
60.9 MB/s +9%
Average of class Multimedia
  (17.5 - 97.4, n=56, last 2 years)
59.7 MB/s +7%
Lenovo IdeaPad Slim 5 16IRU9
 
59.03 MB/s +6%
MSI Prestige A16 AI+ A3HMG-036
Samsung PM9C1 MZVL81T0HELB-00BTW
55.8 MB/s
Lenovo ThinkPad T16 Gen 3 21MN005XGE
Lenovo UMIS RPETJ1T24MHP2QDQ
54.2 MB/s -3%
Asus Zenbook S 16 UM5606WA-RK052W
Micron 2400 MTFDKBA1T0QFM
48.19 MB/s -14%
Ninkear A16 Pro
Authorain NV900-1T
42.9 MB/s -23%
4K Write
Acer Aspire 16 A16-51GM-77G2
WD PC SN740 SDDQNQD-1T00-1014
268 MB/s +46%
Lenovo IdeaPad Slim 5 16IRU9
 
228.11 MB/s +24%
Average Samsung PM9C1 MZVL81T0HELB-00BTW
  (184.1 - 215, n=4)
195.3 MB/s +6%
Average of class Multimedia
  (43.1 - 328, n=56, last 2 years)
188.9 MB/s +3%
Asus Zenbook S 16 UM5606WA-RK052W
Micron 2400 MTFDKBA1T0QFM
186.11 MB/s +1%
MSI Prestige A16 AI+ A3HMG-036
Samsung PM9C1 MZVL81T0HELB-00BTW
184.1 MB/s
MSI Prestige 16 B1MG-001US
Samsung PM9A1 MZVL22T0HBLB
178.71 MB/s -3%
Ninkear A16 Pro
Authorain NV900-1T
178.5 MB/s -3%
Lenovo ThinkPad T16 Gen 3 21MN005XGE
Lenovo UMIS RPETJ1T24MHP2QDQ
162.9 MB/s -12%
4K-64 Read
Acer Aspire 16 A16-51GM-77G2
WD PC SN740 SDDQNQD-1T00-1014
2086 MB/s +319%
MSI Prestige 16 B1MG-001US
Samsung PM9A1 MZVL22T0HBLB
2054.46 MB/s +313%
Average of class Multimedia
  (125.7 - 2989, n=56, last 2 years)
1054 MB/s +112%
Average Samsung PM9C1 MZVL81T0HELB-00BTW
  (498 - 2205, n=4)
968 MB/s +94%
Ninkear A16 Pro
Authorain NV900-1T
881 MB/s +77%
Lenovo IdeaPad Slim 5 16IRU9
 
717.05 MB/s +44%
Lenovo ThinkPad T16 Gen 3 21MN005XGE
Lenovo UMIS RPETJ1T24MHP2QDQ
632 MB/s +27%
Asus Zenbook S 16 UM5606WA-RK052W
Micron 2400 MTFDKBA1T0QFM
500.47 MB/s 0%
MSI Prestige A16 AI+ A3HMG-036
Samsung PM9C1 MZVL81T0HELB-00BTW
498 MB/s
4K-64 Write
MSI Prestige 16 B1MG-001US
Samsung PM9A1 MZVL22T0HBLB
2904.81 MB/s +112%
Acer Aspire 16 A16-51GM-77G2
WD PC SN740 SDDQNQD-1T00-1014
2201 MB/s +60%
Lenovo ThinkPad T16 Gen 3 21MN005XGE
Lenovo UMIS RPETJ1T24MHP2QDQ
2144 MB/s +56%
Average of class Multimedia
  (75.2 - 3975, n=56, last 2 years)
2042 MB/s +49%
Average Samsung PM9C1 MZVL81T0HELB-00BTW
  (1372 - 2326, n=4)
1781 MB/s +30%
Asus Zenbook S 16 UM5606WA-RK052W
Micron 2400 MTFDKBA1T0QFM
1628.92 MB/s +19%
Lenovo IdeaPad Slim 5 16IRU9
 
1603.4 MB/s +17%
MSI Prestige A16 AI+ A3HMG-036
Samsung PM9C1 MZVL81T0HELB-00BTW
1372 MB/s
Ninkear A16 Pro
Authorain NV900-1T
652 MB/s -52%
Access Time Read
Ninkear A16 Pro
Authorain NV900-1T
0.088 ms * -44%
Average Samsung PM9C1 MZVL81T0HELB-00BTW
  (0.061 - 0.095, n=4)
0.07975 ms * -31%
Asus Zenbook S 16 UM5606WA-RK052W
Micron 2400 MTFDKBA1T0QFM
0.076 ms * -25%
Lenovo ThinkPad T16 Gen 3 21MN005XGE
Lenovo UMIS RPETJ1T24MHP2QDQ
0.069 ms * -13%
Lenovo IdeaPad Slim 5 16IRU9
 
0.066 ms * -8%
MSI Prestige A16 AI+ A3HMG-036
Samsung PM9C1 MZVL81T0HELB-00BTW
0.061 ms *
Acer Aspire 16 A16-51GM-77G2
WD PC SN740 SDDQNQD-1T00-1014
0.056 ms * +8%
Average of class Multimedia
  (0.019 - 0.168, n=56, last 2 years)
0.05391 ms * +12%
MSI Prestige 16 B1MG-001US
Samsung PM9A1 MZVL22T0HBLB
0.037 ms * +39%
Access Time Write
Lenovo IdeaPad Slim 5 16IRU9
 
0.289 ms * -1214%
Ninkear A16 Pro
Authorain NV900-1T
0.12 ms * -445%
Asus Zenbook S 16 UM5606WA-RK052W
Micron 2400 MTFDKBA1T0QFM
0.102 ms * -364%
Average of class Multimedia
  (0.014 - 0.754, n=56, last 2 years)
0.06859 ms * -212%
MSI Prestige 16 B1MG-001US
Samsung PM9A1 MZVL22T0HBLB
0.068 ms * -209%
Average Samsung PM9C1 MZVL81T0HELB-00BTW
  (0.022 - 0.059, n=4)
0.04775 ms * -117%
Lenovo ThinkPad T16 Gen 3 21MN005XGE
Lenovo UMIS RPETJ1T24MHP2QDQ
0.024 ms * -9%
MSI Prestige A16 AI+ A3HMG-036
Samsung PM9C1 MZVL81T0HELB-00BTW
0.022 ms *
Acer Aspire 16 A16-51GM-77G2
WD PC SN740 SDDQNQD-1T00-1014
0.014 ms * +36%

* ... smaller is better

Sustained Read: DiskSpd Read Loop, Queue Depth 8

036072010801440180021602520288032403600396043204680504054005760612064806840Tooltip
MSI Prestige A16 AI+ A3HMG-036 Samsung PM9C1 MZVL81T0HELB-00BTW; diskspd 2.0.17 f: Ø5045 (4214.02-5067.07)
MSI Prestige 16 B1MG-001US Samsung PM9A1 MZVL22T0HBLB; diskspd 2.0.17 f: Ø7096 (6683.26-7117.73)
Asus Zenbook S 16 UM5606WA-RK052W Micron 2400 MTFDKBA1T0QFM; diskspd 2.0.17 f: Ø5057 (4144.49-5095.03)
Lenovo ThinkPad T16 Gen 3 21MN005XGE Lenovo UMIS RPETJ1T24MHP2QDQ; diskspd 2.0.17 f: Ø6010 (4618.97-7045.38)
Acer Aspire 16 A16-51GM-77G2 WD PC SN740 SDDQNQD-1T00-1014; diskspd 2.0.17 f: Ø3805 (2866.6-5145.14)

GPU performance

For 3D applications, the processor's integrated AMD Radeon 880M, one of the more powerful iGPUs available as of testing, performs exceptionally well in synthetic 3DMark tests. 

It's 10% faster than the average laptop with the same iGPU in our database, nearly matching the performance of the dedicated RTX 2050 Mobile in the Acer Aspire 16. The Asus Zenbook S 16, with the same CPU and GPU, lags around 20% behind, while the Intel Arc 8-Core in its sister model is outperformed by approximately 15%.

The A16 AI+ secured second place in gaming, trailing only the Aspire 16 with a dGPU, but outperforming other competitors with no dGPU and the Intel Prestige. The Aspire takes the lead with its RTX 2050, while occasional graphics glitches in DOTA 2 Reborn prevent a higher performance score for the AMD model. Still, the Prestige A16 AI+ can handle modern games like Cyberpunk 2077 and Baldur's Gate 3 in Full HD, albeit at low to medium settings. Switching to Extreme Performance mode provides a slight boost, with Baldur’s Gate 3 Ultra seeing a 7% performance increase, from 27 to 28.9 fps.

When unplugged, 3D performance drops by only around 4 to 5% in a Fire Strike run.

3DMark 11
3DMark 11
Fire Strike
Fire Strike
Time Spy
Time Spy
Cloud Gate
Cloud Gate
3DMark Performance Rating - Percent
Average of class Multimedia
 
94.5 pt
Acer Aspire 16 A16-51GM-77G2
NVIDIA GeForce RTX 2050 Mobile, Intel Core 7 150U
78.4 pt
MSI Prestige A16 AI+ A3HMG-036
AMD Radeon 880M, AMD Ryzen AI 9 365
76.3 pt
Average AMD Radeon 880M
 
70.4 pt
MSI Prestige 16 B1MG-001US
Intel Arc 8-Core iGPU, Intel Core Ultra 7 155H
66.4 pt
Ninkear A16 Pro
AMD Radeon 780M, AMD Ryzen 7 8845HS
63.2 pt
Asus Zenbook S 16 UM5606WA-RK052W
AMD Radeon 880M, AMD Ryzen AI 9 365
62.2 pt
Lenovo IdeaPad Slim 5 16IRU9
Intel Iris Xe Graphics G7 96EUs, Intel Core 7 150U
38.2 pt
Lenovo ThinkPad T16 Gen 3 21MN005XGE -1!
Intel Graphics 4-Core iGPU (Arc), Intel Core Ultra 5 125U
37.6 pt
3DMark 11 - 1280x720 Performance GPU
Average of class Multimedia
  (3765 - 45564, n=58, last 2 years)
18949 Points +23%
MSI Prestige A16 AI+ A3HMG-036
AMD Radeon 880M, AMD Ryzen AI 9 365
15428 Points
Average AMD Radeon 880M
  (12321 - 15744, n=6)
14478 Points -6%
Acer Aspire 16 A16-51GM-77G2
NVIDIA GeForce RTX 2050 Mobile, Intel Core 7 150U
13694 Points -11%
Ninkear A16 Pro
AMD Radeon 780M, AMD Ryzen 7 8845HS
12550 Points -19%
MSI Prestige 16 B1MG-001US
Intel Arc 8-Core iGPU, Intel Core Ultra 7 155H
12520 Points -19%
Asus Zenbook S 16 UM5606WA-RK052W
AMD Radeon 880M, AMD Ryzen AI 9 365
12439 Points -19%
Lenovo ThinkPad T16 Gen 3 21MN005XGE
Intel Graphics 4-Core iGPU (Arc), Intel Core Ultra 5 125U
6811 Points -56%
Lenovo IdeaPad Slim 5 16IRU9
Intel Iris Xe Graphics G7 96EUs, Intel Core 7 150U
6438 Points -58%
3DMark
1280x720 Cloud Gate Standard Graphics
Acer Aspire 16 A16-51GM-77G2
NVIDIA GeForce RTX 2050 Mobile, Intel Core 7 150U
65047 Points +13%
MSI Prestige A16 AI+ A3HMG-036
AMD Radeon 880M, AMD Ryzen AI 9 365
57533 Points
Average AMD Radeon 880M
  (46354 - 57533, n=4)
53127 Points -8%
Average of class Multimedia
  (16765 - 130614, n=26, last 2 years)
50702 Points -12%
Ninkear A16 Pro
AMD Radeon 780M, AMD Ryzen 7 8845HS
49373 Points -14%
Asus Zenbook S 16 UM5606WA-RK052W
AMD Radeon 880M, AMD Ryzen AI 9 365
46354 Points -19%
MSI Prestige 16 B1MG-001US
Intel Arc 8-Core iGPU, Intel Core Ultra 7 155H
44351 Points -23%
Lenovo IdeaPad Slim 5 16IRU9
Intel Iris Xe Graphics G7 96EUs, Intel Core 7 150U
33070 Points -43%
1920x1080 Fire Strike Graphics
Average of class Multimedia
  (2328 - 34440, n=61, last 2 years)
13673 Points +45%
Acer Aspire 16 A16-51GM-77G2
NVIDIA GeForce RTX 2050 Mobile, Intel Core 7 150U
9886 Points +4%
MSI Prestige A16 AI+ A3HMG-036
AMD Radeon 880M, AMD Ryzen AI 9 365
9462 Points
MSI Prestige 16 B1MG-001US
Intel Arc 8-Core iGPU, Intel Core Ultra 7 155H
8796 Points -7%
Average AMD Radeon 880M
  (7404 - 9651, n=6)
8774 Points -7%
Ninkear A16 Pro
AMD Radeon 780M, AMD Ryzen 7 8845HS
7993 Points -16%
Asus Zenbook S 16 UM5606WA-RK052W
AMD Radeon 880M, AMD Ryzen AI 9 365
7538 Points -20%
Lenovo ThinkPad T16 Gen 3 21MN005XGE
Intel Graphics 4-Core iGPU (Arc), Intel Core Ultra 5 125U
5296 Points -44%
Lenovo IdeaPad Slim 5 16IRU9
Intel Iris Xe Graphics G7 96EUs, Intel Core 7 150U
5237 Points -45%
2560x1440 Time Spy Graphics
Average of class Multimedia
  (696 - 13010, n=62, last 2 years)
5245 Points +51%
Acer Aspire 16 A16-51GM-77G2
NVIDIA GeForce RTX 2050 Mobile, Intel Core 7 150U
3626 Points +5%
MSI Prestige 16 B1MG-001US
Intel Arc 8-Core iGPU, Intel Core Ultra 7 155H
3511 Points +1%
MSI Prestige A16 AI+ A3HMG-036
AMD Radeon 880M, AMD Ryzen AI 9 365
3464 Points
Average AMD Radeon 880M
  (2300 - 3464, n=6)
3110 Points -10%
Asus Zenbook S 16 UM5606WA-RK052W
AMD Radeon 880M, AMD Ryzen AI 9 365
2970 Points -14%
Ninkear A16 Pro
AMD Radeon 780M, AMD Ryzen 7 8845HS
2732 Points -21%
Lenovo ThinkPad T16 Gen 3 21MN005XGE
Intel Graphics 4-Core iGPU (Arc), Intel Core Ultra 5 125U
1992 Points -42%
Lenovo IdeaPad Slim 5 16IRU9
Intel Iris Xe Graphics G7 96EUs, Intel Core 7 150U
1567 Points -55%
3DMark 11 Performance
14703 points
3DMark Cloud Gate Standard Score
39393 points
3DMark Fire Strike Score
8786 points
3DMark Time Spy Score
3856 points
Help
Blender - v3.3 Classroom CPU
Lenovo IdeaPad Slim 5 16IRU9
Intel Iris Xe Graphics G7 96EUs, Intel Core 7 150U
689 Seconds * -106%
Lenovo ThinkPad T16 Gen 3 21MN005XGE
Intel Graphics 4-Core iGPU (Arc), Intel Core Ultra 5 125U
661 Seconds * -98%
Average of class Multimedia
  (160 - 1042, n=65, last 2 years)
435 Seconds * -30%
Asus Zenbook S 16 UM5606WA-RK052W
AMD Radeon 880M, AMD Ryzen AI 9 365
429 Seconds * -28%
MSI Prestige 16 B1MG-001US
Intel Arc 8-Core iGPU, Intel Core Ultra 7 155H
374 Seconds * -12%
Ninkear A16 Pro
AMD Radeon 780M, AMD Ryzen 7 8845HS
352 Seconds * -5%
MSI Prestige A16 AI+ A3HMG-036
AMD Radeon 880M, AMD Ryzen AI 9 365
334 Seconds *
Average AMD Radeon 880M
  (269 - 429, n=6)
332 Seconds * +1%

* ... smaller is better

Performance Rating - Percent
Average of class Multimedia
 
93.8 pt
Acer Aspire 16 A16-51GM-77G2
Intel Core 7 150U, NVIDIA GeForce RTX 2050 Mobile
86.4 pt
MSI Prestige A16 AI+ A3HMG-036
AMD Ryzen AI 9 365, AMD Radeon 880M
58.8 pt
Ninkear A16 Pro
AMD Ryzen 7 8845HS, AMD Radeon 780M
56.6 pt
MSI Prestige 16 B1MG-001US -1!
Intel Core Ultra 7 155H, Intel Arc 8-Core iGPU
56.1 pt
Asus Zenbook S 16 UM5606WA-RK052W
AMD Ryzen AI 9 365, AMD Radeon 880M
47.4 pt
Lenovo IdeaPad Slim 5 16IRU9
Intel Core 7 150U, Intel Iris Xe Graphics G7 96EUs
33.7 pt
Lenovo ThinkPad T16 Gen 3 21MN005XGE -1!
Intel Core Ultra 5 125U, Intel Graphics 4-Core iGPU (Arc)
33.5 pt
Cyberpunk 2077 2.2 Phantom Liberty - 1920x1080 Ultra Preset (FSR off)
Average of class Multimedia
  (6.41 - 97.8, n=65, last 2 years)
35.8 fps +39%
MSI Prestige A16 AI+ A3HMG-036
AMD Ryzen AI 9 365, AMD Radeon 880M
25.8 (21.5min) fps
Acer Aspire 16 A16-51GM-77G2
Intel Core 7 150U, NVIDIA GeForce RTX 2050 Mobile
24.7 (13.5min, 18.1P0.1, 18.9P1) fps -4%
MSI Prestige 16 B1MG-001US
Intel Core Ultra 7 155H, Intel Arc 8-Core iGPU
22.1 (7.2min) fps -14%
Ninkear A16 Pro
AMD Ryzen 7 8845HS, AMD Radeon 780M
21.8 (18.3min) fps -16%
Asus Zenbook S 16 UM5606WA-RK052W
AMD Ryzen AI 9 365, AMD Radeon 880M
20 (16min) fps -22%
Lenovo ThinkPad T16 Gen 3 21MN005XGE
Intel Core Ultra 5 125U, Intel Graphics 4-Core iGPU (Arc)
12.2 (10.4min) fps -53%
Lenovo IdeaPad Slim 5 16IRU9
Intel Core 7 150U, Intel Iris Xe Graphics G7 96EUs
10.9 (9.32min) fps -58%
Baldur's Gate 3 - 1920x1080 Ultra Preset AA:T
Average of class Multimedia
  (7.8 - 127.3, n=54, last 2 years)
46 fps +70%
Acer Aspire 16 A16-51GM-77G2
Intel Core 7 150U, NVIDIA GeForce RTX 2050 Mobile
37 fps +37%
Ninkear A16 Pro
AMD Ryzen 7 8845HS, AMD Radeon 780M
27 fps 0%
MSI Prestige A16 AI+ A3HMG-036
AMD Ryzen AI 9 365, AMD Radeon 880M
27 fps
MSI Prestige 16 B1MG-001US
Intel Core Ultra 7 155H, Intel Arc 8-Core iGPU
23.4 fps -13%
Asus Zenbook S 16 UM5606WA-RK052W
AMD Ryzen AI 9 365, AMD Radeon 880M
17.6 (7.48min, 8.78P0.1, 12.3P1) fps -35%
Lenovo ThinkPad T16 Gen 3 21MN005XGE
Intel Core Ultra 5 125U, Intel Graphics 4-Core iGPU (Arc)
14.2 (10.1min, 10.2P0.1, 11.7P1) fps -47%
Lenovo IdeaPad Slim 5 16IRU9
Intel Core 7 150U, Intel Iris Xe Graphics G7 96EUs
9.3 fps -66%
GTA V - 1920x1080 Highest Settings possible AA:4xMSAA + FX AF:16x
Acer Aspire 16 A16-51GM-77G2
Intel Core 7 150U, NVIDIA GeForce RTX 2050 Mobile
50.3 (12.4min, 32.3P1) fps +61%
Average of class Multimedia
  (9.38 - 141.6, n=59, last 2 years)
50 fps +60%
MSI Prestige A16 AI+ A3HMG-036
AMD Ryzen AI 9 365, AMD Radeon 880M
31.2 (2.11min, 21.7P1) fps
Asus Zenbook S 16 UM5606WA-RK052W
AMD Ryzen AI 9 365, AMD Radeon 880M
27.5 (1.477min, 18.2P1) fps -12%
Ninkear A16 Pro
AMD Ryzen 7 8845HS, AMD Radeon 780M
25.1 (3.5min, 16.4P1) fps -20%
Lenovo IdeaPad Slim 5 16IRU9
Intel Core 7 150U, Intel Iris Xe Graphics G7 96EUs
10.5 (4.93min, 6.67P1) fps -66%
Lenovo ThinkPad T16 Gen 3 21MN005XGE
Intel Core Ultra 5 125U, Intel Graphics 4-Core iGPU (Arc)
8.82 (2.6min, 6.29P1) fps -72%
Final Fantasy XV Benchmark - 1920x1080 High Quality
Average of class Multimedia
  (7.61 - 132, n=62, last 2 years)
48.3 fps +68%
Acer Aspire 16 A16-51GM-77G2
Intel Core 7 150U, NVIDIA GeForce RTX 2050 Mobile
39.3 fps +37%
MSI Prestige A16 AI+ A3HMG-036
AMD Ryzen AI 9 365, AMD Radeon 880M
28.7 fps
Ninkear A16 Pro
AMD Ryzen 7 8845HS, AMD Radeon 780M
27 fps -6%
Asus Zenbook S 16 UM5606WA-RK052W
AMD Ryzen AI 9 365, AMD Radeon 880M
25.1 fps -13%
MSI Prestige 16 B1MG-001US
Intel Core Ultra 7 155H, Intel Arc 8-Core iGPU
24.6 fps -14%
Lenovo IdeaPad Slim 5 16IRU9
Intel Core 7 150U, Intel Iris Xe Graphics G7 96EUs
17.6 fps -39%
Lenovo ThinkPad T16 Gen 3 21MN005XGE
Intel Core Ultra 5 125U, Intel Graphics 4-Core iGPU (Arc)
17.4 fps -39%
Strange Brigade - 1920x1080 ultra AA:ultra AF:16
Average of class Multimedia
  (13.3 - 247, n=63, last 2 years)
84.5 fps +69%
Acer Aspire 16 A16-51GM-77G2
Intel Core 7 150U, NVIDIA GeForce RTX 2050 Mobile
62.8 (46.5min, 48.8P1) fps +26%
MSI Prestige A16 AI+ A3HMG-036
AMD Ryzen AI 9 365, AMD Radeon 880M
49.9 (15.3min, 20.3P1) fps
MSI Prestige 16 B1MG-001US
Intel Core Ultra 7 155H, Intel Arc 8-Core iGPU
46.1 (5min, 20.8P1) fps -8%
Ninkear A16 Pro
AMD Ryzen 7 8845HS, AMD Radeon 780M
45.6 (11.1min, 17.7P1) fps -9%
Asus Zenbook S 16 UM5606WA-RK052W
AMD Ryzen AI 9 365, AMD Radeon 880M
44.2 (7.8min, 23P1) fps -11%
Lenovo IdeaPad Slim 5 16IRU9
Intel Core 7 150U, Intel Iris Xe Graphics G7 96EUs
25.3 (5.1min, 6.9P1) fps -49%
Dota 2 Reborn - 1920x1080 ultra (3/3) best looking
Acer Aspire 16 A16-51GM-77G2
Intel Core 7 150U, NVIDIA GeForce RTX 2050 Mobile
110.6 (92.5min) fps +141%
Average of class Multimedia
  (29 - 179.9, n=63, last 2 years)
88.4 fps +93%
MSI Prestige 16 B1MG-001US
Intel Core Ultra 7 155H, Intel Arc 8-Core iGPU
75.6 (49.1min) fps +65%
Ninkear A16 Pro
AMD Ryzen 7 8845HS, AMD Radeon 780M
70.6 (54.4min) fps +54%
Lenovo IdeaPad Slim 5 16IRU9
Intel Core 7 150U, Intel Iris Xe Graphics G7 96EUs
60.1 (51min) fps +31%
Lenovo ThinkPad T16 Gen 3 21MN005XGE
Intel Core Ultra 5 125U, Intel Graphics 4-Core iGPU (Arc)
56 (33.1min) fps +22%
MSI Prestige A16 AI+ A3HMG-036
AMD Ryzen AI 9 365, AMD Radeon 880M
45.9 (33.4min) fps
Asus Zenbook S 16 UM5606WA-RK052W
AMD Ryzen AI 9 365, AMD Radeon 880M
29 (15.8min) fps -37%
X-Plane 11.11 - 1920x1080 high (fps_test=3)
Acer Aspire 16 A16-51GM-77G2
Intel Core 7 150U, NVIDIA GeForce RTX 2050 Mobile
75.5 fps +71%
Average of class Multimedia
  (16.9 - 141.1, n=58, last 2 years)
58.3 fps +32%
MSI Prestige A16 AI+ A3HMG-036
AMD Ryzen AI 9 365, AMD Radeon 880M
44.2 fps
Ninkear A16 Pro
AMD Ryzen 7 8845HS, AMD Radeon 780M
40.1 fps -9%
Asus Zenbook S 16 UM5606WA-RK052W
AMD Ryzen AI 9 365, AMD Radeon 880M
39.8 fps -10%
MSI Prestige 16 B1MG-001US
Intel Core Ultra 7 155H, Intel Arc 8-Core iGPU
37.8 fps -14%
Lenovo IdeaPad Slim 5 16IRU9
Intel Core 7 150U, Intel Iris Xe Graphics G7 96EUs
33 fps -25%
Lenovo ThinkPad T16 Gen 3 21MN005XGE
Intel Core Ultra 5 125U, Intel Graphics 4-Core iGPU (Arc)
24.1 fps -45%

Cyberpunk 2077 Ultra settings FPS chart

05101520Tooltip
MSI Prestige A16 AI+ A3HMG-036 Ryzen AI 9 365, Radeon 880M: Ø22.4 (21.4-24.5)
Asus Zenbook S 16 UM5606WA-RK052W Ryzen AI 9 365, Radeon 880M: Ø22.7 (21.1-23.3)
lowmed.highultra
GTA V (2015) 166.1 76.9 31.2
Dota 2 Reborn (2015) 160.8 132.6 47.7 45.9
Final Fantasy XV Benchmark (2018) 78.1 39.8 28.7
X-Plane 11.11 (2018) 75.7 56.4 44.2
Strange Brigade (2018) 175.5 72.8 60.6 49.9
Baldur's Gate 3 (2023) 45.9 34.2 27.9 27
Cyberpunk 2077 2.2 Phantom Liberty (2023) 48 38.1 30.1 25.8

Emissions and Power - Less prestige for battery life

Noise emissions

The two fans usually remain off in idle mode, but after a heavier load, they quickly quiet down without turning off entirely, even in Eco-Silent mode. At around 25dB, the fan noise is almost imperceptible, though in extremely quiet surroundings, a slight pulsing can be detected 

In the 3DMark06 test, the fans gradually ramp up to around 35dB for most of the run, reaching a peak of about 41dB towards the end. 

This peak volume is reached very seldom, though. While performing the stress test, the noise varied between 35 and 39dB, and a similar pattern occurred in Cyberpunk 2077.

Noise Level

Idle
23 / 23 / 25.02 dB(A)
Load
41.88 / 41.88 dB(A)
  red to green bar
 
 
30 dB
silent
40 dB(A)
audible
50 dB(A)
loud
 
min: dark, med: mid, max: light   Earthworks M23R, Arta (15 cm distance)   environment noise: 23 dB(A)
dB(A) 0102030405060708090Deep BassMiddle BassHigh BassLower RangeMidsHigher MidsLower HighsMid HighsUpper HighsSuper Highs2031.928.931.92539.829.739.83136.334.836.34024.727.824.75022.722.322.76322.320.822.38017.615.117.610018.617.118.612514.910.814.916013.410.113.420016.516.416.525020.61520.631517.99.517.940015.27.215.250018.28.818.263021.37.721.3800258.325100027.58.227.5125030.28.730.2160031.810.231.8200032.19.832.1250033.610.733.6315035.210.935.240002711.227500025.811.425.8630024.111.424.1800017.711.817.71000013.611.713.61250012.711.612.71600011.810.911.8SPL41.922.641.9N3.20.43.2median 20.6median 10.8median 20.6Delta6.81.36.8hearing rangehide median Fan NoiseMSI Prestige A16 AI+ A3HMG-036
MSI Prestige A16 AI+ A3HMG-036
Radeon 880M, Ryzen AI 9 365, Samsung PM9C1 MZVL81T0HELB-00BTW
MSI Prestige 16 B1MG-001US
Arc 8-Core, Ultra 7 155H, Samsung PM9A1 MZVL22T0HBLB
Asus Zenbook S 16 UM5606WA-RK052W
Radeon 880M, Ryzen AI 9 365, Micron 2400 MTFDKBA1T0QFM
Lenovo ThinkPad T16 Gen 3 21MN005XGE
Graphics 4-Core, Ultra 5 125U, Lenovo UMIS RPETJ1T24MHP2QDQ
Lenovo IdeaPad Slim 5 16IRU9
Iris Xe G7 96EUs, Core 7 150U
Ninkear A16 Pro
Radeon 780M, R7 8845HS, Authorain NV900-1T
Acer Aspire 16 A16-51GM-77G2
GeForce RTX 2050 Mobile, Core 7 150U, WD PC SN740 SDDQNQD-1T00-1014
Noise
-8%
3%
-4%
1%
5%
-11%
off / environment *
23
24.5
-7%
24
-4%
24.7
-7%
23
-0%
23
-0%
23
-0%
Idle Minimum *
23
24.5
-7%
24
-4%
24.7
-7%
23
-0%
23
-0%
23
-0%
Idle Average *
23
26.3
-14%
25
-9%
24.7
-7%
23
-0%
23
-0%
23
-0%
Idle Maximum *
25.02
26.3
-5%
26
-4%
24.7
1%
23
8%
23
8%
31
-24%
Load Average *
41.88
36.5
13%
35
16%
34
19%
43.3
-3%
37.68
10%
46.57
-11%
Cyberpunk 2077 ultra *
39.79
36
10%
45.9
-15%
40.8
-3%
37.68
5%
50
-26%
Load Maximum *
41.88
52.9
-26%
36
14%
46.2
-10%
40.9
2%
37.41
11%
50
-19%
Witcher 3 ultra *
46.3

* ... smaller is better

Temperature

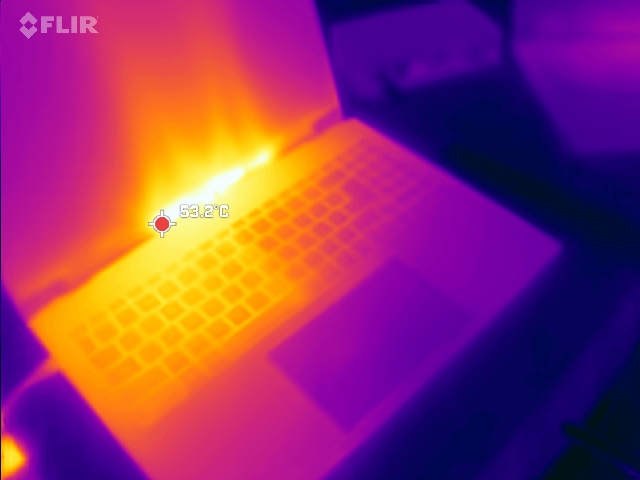
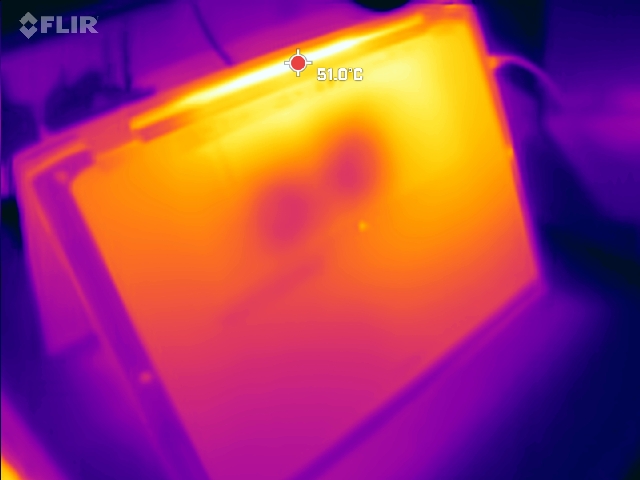
Although the fans are located centrally, close to the display, the left-hand side of the top case gets warmer because that's where the SoC is placed. Under maximum load, the keyboard is noticeably warmer on the left side compared to the right. We measured the hot spot near the top-center which reached 52°C, while the underside remained relatively cooler with a maximum of 44°C.

Max. Load
 48 °C
118 F
52 °C
126 F
44 °C
111 F
 
 44 °C
111 F
44 °C
111 F
34 °C
93 F
 
 30 °C
86 F
26 °C
79 F
25 °C
77 F
 
Maximum: 52 °C = 126 F
Average: 38.6 °C = 101 F
36 °C
97 F
42 °C
108 F
44 °C
111 F
29 °C
84 F
35 °C
95 F
40 °C
104 F
27 °C
81 F
30 °C
86 F
32 °C
90 F
Maximum: 44 °C = 111 F
Average: 35 °C = 95 F
Power Supply (max.)  45 °C = 113 F | Room Temperature 18.5 °C = 65 F | Fluke t3000FC (calibrated), Fluke 62 Mini
(-) The average temperature for the upper side under maximal load is 38.6 °C / 101 F, compared to the average of 31.3 °C / 88 F for the devices in the class Multimedia.
(-) The maximum temperature on the upper side is 52 °C / 126 F, compared to the average of 36.9 °C / 98 F, ranging from 21.1 to 71 °C for the class Multimedia.
(±) The bottom heats up to a maximum of 44 °C / 111 F, compared to the average of 39.2 °C / 103 F
(+) In idle usage, the average temperature for the upper side is 26.4 °C / 80 F, compared to the device average of 31.3 °C / 88 F.
(±) 3: The average temperature for the upper side is 37.4 °C / 99 F, compared to the average of 31.3 °C / 88 F for the class Multimedia.
(+) The palmrests and touchpad are cooler than skin temperature with a maximum of 30 °C / 86 F and are therefore cool to the touch.
(±) The average temperature of the palmrest area of similar devices was 28.7 °C / 83.7 F (-1.3 °C / -2.3 F).
Stress test - top
Stress test - top
Stress test - bottom
Stress test - charger
MSI Prestige A16 AI+ A3HMG-036
AMD Ryzen AI 9 365, AMD Radeon 880M
MSI Prestige 16 B1MG-001US
Intel Core Ultra 7 155H, Intel Arc 8-Core iGPU
Asus Zenbook S 16 UM5606WA-RK052W
AMD Ryzen AI 9 365, AMD Radeon 880M
Lenovo ThinkPad T16 Gen 3 21MN005XGE
Intel Core Ultra 5 125U, Intel Graphics 4-Core iGPU (Arc)
Lenovo IdeaPad Slim 5 16IRU9
Intel Core 7 150U, Intel Iris Xe Graphics G7 96EUs
Ninkear A16 Pro
AMD Ryzen 7 8845HS, AMD Radeon 780M
Acer Aspire 16 A16-51GM-77G2
Intel Core 7 150U, NVIDIA GeForce RTX 2050 Mobile
Heat
7%
-9%
12%
10%
2%
-7%
Maximum Upper Side *
52
48.8
6%
48
8%
37.1
29%
35.4
32%
43
17%
47
10%
Maximum Bottom *
44
47.6
-8%
53
-20%
43.7
1%
33
25%
50
-14%
50
-14%
Idle Upper Side *
28
24.2
14%
31
-11%
24.9
11%
30.2
-8%
31
-11%
Idle Bottom *
28
23.6
16%
32
-14%
26
7%
30.2
-8%
32
-14%

* ... smaller is better

Speakers

These speakers get loud, but the bass is weak, and overall, the sound is not well-balanced. Included is a combined 3.5mm headset port, which enables the user to connect analog audio devices such as headphones or external amplifiers.

dB(A) 0102030405060708090Deep BassMiddle BassHigh BassLower RangeMidsHigher MidsLower HighsMid HighsUpper HighsSuper Highs2029.928.929.92529.729.729.73135.634.835.64026.227.826.25024.922.324.96326.420.826.48018.515.118.510017.917.117.912522.310.822.316038.210.138.220049.216.449.225054.71554.731556.19.556.140055.17.255.150060.98.860.963063.57.763.580068.78.368.71000728.272125074.18.774.1160067.810.267.8200072.99.872.9250073.410.773.4315071.310.971.3400068.811.268.8500068.511.468.5630064.911.464.9800064.311.864.3100005511.755125005211.6521600052.110.952.1SPL82.122.682.1N49.90.449.9median 63.5median 10.8median 63.5Delta9.51.39.53647.732.139.440.143.230.328.131.335.723.72917.342.714.750.716.457.917.560.121.262.316.965.513.866.912.969.112.868.511.768.111.566.611.364.211.565.311.767.81271.312.370.312.665.11371.313.271.113.468.113.670.213.465.312.862.112.263.624.980.80.653.2median 12.9median 66.61.83.1hearing rangehide median Pink NoiseMSI Prestige A16 AI+ A3HMG-036Asus Zenbook S 16 UM5606WA-RK052W
Frequency diagram (checkboxes can be checked and unchecked to compare devices)
MSI Prestige A16 AI+ A3HMG-036 audio analysis

(+) | speakers can play relatively loud (82.02 dB)
Bass 100 - 315 Hz
(-) | nearly no bass - on average 23.7% lower than median
(±) | linearity of bass is average (12.3% delta to prev. frequency)
Mids 400 - 2000 Hz
(±) | higher mids - on average 6.2% higher than median
(±) | linearity of mids is average (7.5% delta to prev. frequency)
Highs 2 - 16 kHz
(±) | higher highs - on average 5.6% higher than median
(+) | highs are linear (5.1% delta to prev. frequency)
Overall 100 - 16.000 Hz
(±) | linearity of overall sound is average (21.7% difference to median)
Compared to same class
» 75% of all tested devices in this class were better, 4% similar, 20% worse
» The best had a delta of 5%, average was 18%, worst was 45%
Compared to all devices tested
» 60% of all tested devices were better, 7% similar, 33% worse
» The best had a delta of 4%, average was 24%, worst was 134%

Asus Zenbook S 16 UM5606WA-RK052W audio analysis

(±) | speaker loudness is average but good (81 dB)
Bass 100 - 315 Hz
(±) | reduced bass - on average 6.1% lower than median
(±) | linearity of bass is average (7.5% delta to prev. frequency)
Mids 400 - 2000 Hz
(+) | balanced mids - only 1.9% away from median
(+) | mids are linear (3.3% delta to prev. frequency)
Highs 2 - 16 kHz
(+) | balanced highs - only 3% away from median
(+) | highs are linear (6.1% delta to prev. frequency)
Overall 100 - 16.000 Hz
(+) | overall sound is linear (8.1% difference to median)
Compared to same class
» 6% of all tested devices in this class were better, 1% similar, 93% worse
» The best had a delta of 5%, average was 18%, worst was 45%
Compared to all devices tested
» 1% of all tested devices were better, 1% similar, 98% worse
» The best had a delta of 4%, average was 24%, worst was 134%

Power consumption

With this system, screen brightness has the most significant impact on energy consumption when idling. When set to 150 nits, the laptop draws around 8 to 8.5W, and at full brightness, it consumes over 12W, which is comparable to the Intel-based model. The ZenBook S 16, which features the same CPU, exhibits similar power usage. However, on average, rivals with Ryzen CPUs tend to consume slightly less power while idle.

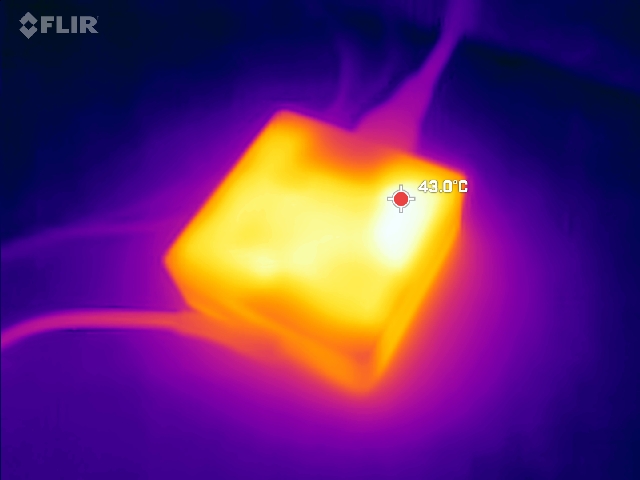
The maximum power draw of around 96W is short-lived and slightly lower than that of the Intel-based A16. The compact 100W USB-C power supply from MSI efficiently handles these peak loads. The AMD Prestige only goes over the limit during short, intense loads due to its higher Turbo Boost clock speeds.

The Intel competition may have a slight edge in terms of gaming power consumption, but this difference is relatively insignificant when you consider the higher performance offered by the Ryzen AI 9 365.

Power Consumption
Off / Standbydarklight 0.6 / 0.5 Watt
Idledarkmidlight 6.9 / 12 / 12.5 Watt
Load midlight 79.8 / 96 Watt
 color bar
Key: min: dark, med: mid, max: light        Metrahit Energy
MSI Prestige A16 AI+ A3HMG-036
Ryzen AI 9 365, Radeon 880M, Samsung PM9C1 MZVL81T0HELB-00BTW, IPS, 2560x1600, 16"
MSI Prestige 16 B1MG-001US
Ultra 7 155H, Arc 8-Core, Samsung PM9A1 MZVL22T0HBLB, IPS, 2560x1600, 16"
Asus Zenbook S 16 UM5606WA-RK052W
Ryzen AI 9 365, Radeon 880M, Micron 2400 MTFDKBA1T0QFM, OLED, 2880x1800, 16"
Lenovo ThinkPad T16 Gen 3 21MN005XGE
Ultra 5 125U, Graphics 4-Core, Lenovo UMIS RPETJ1T24MHP2QDQ, IPS LED, 1920x1200, 16"
Lenovo IdeaPad Slim 5 16IRU9
Core 7 150U, Iris Xe G7 96EUs, , IPS, 1920x1200, 16"
Ninkear A16 Pro
R7 8845HS, Radeon 780M, Authorain NV900-1T, IPS, 2560x1600, 16"
Acer Aspire 16 A16-51GM-77G2
Core 7 150U, GeForce RTX 2050 Mobile, WD PC SN740 SDDQNQD-1T00-1014, IPS, 1920x1200, 16"
Average AMD Radeon 880M
 
Average of class Multimedia
 
Power Consumption
17%
28%
40%
37%
-4%
-8%
17%
4%
Idle Minimum *
6.9
3
57%
6
13%
3.1
55%
3.3
52%
6.5
6%
8.8
-28%
5.5 ?(2.8 - 6.9, n=6)
20%
Idle Average *
12
9.5
21%
7
42%
6.4
47%
7.5
37%
10.7
11%
12.8
-7%
9.47 ?(5.1 - 14.1, n=6)
21%
Idle Maximum *
12.5
12
4%
13
-4%
7.9
37%
7.8
38%
11.1
11%
14.1
-13%
10.8 ?(5.8 - 14.3, n=6)
14%
Load Average *
79.8
68.3
14%
44
45%
44
45%
56.9
29%
68.5
14%
80
-0%
Cyberpunk 2077 ultra *
62.5
44.6
29%
40.6
35%
48.7
22%
72.8
-16%
73.5
-18%
Cyberpunk 2077 ultra external monitor *
74.5
36.7
51%
41.2
45%
104.4
-40%
72
3%
Load Maximum *
96
104.8
-9%
58
40%
86.5
10%
62.4
35%
107
-11%
90.53
6%
Witcher 3 ultra *
59.8

* ... smaller is better

Power consumption - Cyberpunk 2077 (gaming stress test)

05101520253035404550556065707580859095Tooltip
MSI Prestige A16 AI+ A3HMG-036; 1280x720 Prime95 28.10 and Furmark 1.25: Ø64.5 (59.729-95.95)
MSI Prestige A16 AI+ A3HMG-036; Idle 150cd/m2: Ø8.49 (4.1304-23.143)
MSI Prestige A16 AI+ A3HMG-036; Cyberpunk 2077 FHD ultra no FSR 150cd: Ø62.5 (57.017-84.46)

Power consumption - external monitor

0510152025303540455055606570758085Tooltip
MSI Prestige A16 AI+ A3HMG-036; Prime95 V2810 Stress (external Monitor): Ø75.8 (73.63-87.43)
MSI Prestige A16 AI+ A3HMG-036; Cinebench R15 Multi (external Monitor): Ø75.1 (64.65-82.54)
MSI Prestige A16 AI+ A3HMG-036; Cinebench R23 Multi (external Monitor): Ø70.5 (44.302-82.76)
MSI Prestige A16 AI+ A3HMG-036; 1280x720 FurMark 1.19 GPU Stress Test (external Monitor): Ø67.4 (63.32-77.3)
MSI Prestige A16 AI+ A3HMG-036; Idle 1min (external Monitor): Ø8.19 (5.3847-26.165)
MSI Prestige A16 AI+ A3HMG-036; Cyberpunk 2077 FHD ultra no FSR (external Monitor): Ø74.5 (73.25-75.73)

Battery life

The MSI tested here comes with an 82Wh battery, while the Intel-powered version has a 99.99Wh battery. As a result, runtimes are slightly shorter here compared to the sister model. We measured around 11.5 hours of WiFi Web browsing and 10 hours of video playback runtime with the display brightness lowered to 150 cd/m2. The Intel Prestige lasts almost 50% longer with its 18% larger battery. However, other competitors aren't noticeably ahead. 

Battery Runtime
WiFi Websurfing
11h 23min
Big Buck Bunny H.264 1080p
10h 9min
Load (maximum brightness)
2h 07min
MSI Prestige A16 AI+ A3HMG-036
Ryzen AI 9 365, Radeon 880M, 82 Wh
MSI Prestige 16 B1MG-001US
Ultra 7 155H, Arc 8-Core, 99.9 Wh
Asus Zenbook S 16 UM5606WA-RK052W
Ryzen AI 9 365, Radeon 880M, 78 Wh
Lenovo ThinkPad T16 Gen 3 21MN005XGE
Ultra 5 125U, Graphics 4-Core, 86 Wh
Lenovo IdeaPad Slim 5 16IRU9
Core 7 150U, Iris Xe G7 96EUs, 57 Wh
Ninkear A16 Pro
R7 8845HS, Radeon 780M, 80 Wh
Acer Aspire 16 A16-51GM-77G2
Core 7 150U, GeForce RTX 2050 Mobile, 48.5 Wh
Average of class Multimedia
 
Battery Runtime
46%
6%
8%
-8%
-32%
-9%
13%
H.264
609
498
-18%
WiFi v1.3
683
1100
61%
722
6%
820
20%
761
11%
450
-34%
607
-11%
Load
127
166
31%
122
-4%
94
-26%
89
-30%
130
2%
Reader / Idle
1506
1568

Notebookcheck rating - Not as good as other options

The MSI Prestige A16 AI+ stands out with its impressive performance, powered by the above-average Ryzen 9 365. However, it doesn't fully reach its potential due to technical issues, meaning its competitors are noticeably ahead overall. The build quality could also benefit from some refinement.

MSI Prestige A16 AI+ A3HMG-036 - 01/08/2025 v8
Christian Hintze

Chassis
79 / 98 → 80%
Keyboard
87%
Pointing Device
88%
Connectivity
73 / 80 → 91%
Weight
63 / 20-74 → 79%
Battery
88 / 95 → 93%
Display
80%
Games Performance
53 / 88 → 60%
Application Performance
86 / 92 → 94%
AI Performance
88%
Temperature
85%
Noise
87 / 95 → 92%
Audio
68%
Camera
38 / 75 → 50%
Average
61%
82%
Multimedia - Weighted Average
CO2 Emissions
No Data
Materials
0%
Packaging
40%
Power Use
80.1%
Repairability
46%
Software Updates
22.3%
Recycle Logo Total Sustainability Score: 31.4%

Transparency

The selection of devices to be reviewed is made by our editorial team. The test sample was provided to the author as a loan by the manufacturer or retailer for the purpose of this review. The lender had no influence on this review, nor did the manufacturer receive a copy of this review before publication. There was no obligation to publish this review. We never accept compensation or payment in return for our reviews. As an independent media company, Notebookcheck is not subjected to the authority of manufacturers, retailers or publishers.

This is how Notebookcheck is testing

Every year, Notebookcheck independently reviews hundreds of laptops and smartphones using standardized procedures to ensure that all results are comparable. We have continuously developed our test methods for around 20 years and set industry standards in the process. In our test labs, high-quality measuring equipment is utilized by experienced technicians and editors. These tests involve a multi-stage validation process. Our complex rating system is based on hundreds of well-founded measurements and benchmarks, which maintains objectivity. Further information on our test methods can be found here.

Read all 2 comments / answer
static version load dynamic
Loading Comments
Comment on this article
Please share our article, every link counts!
Mail Logo
> Expert Reviews and News on Laptops, Smartphones and Tech Innovations > Reviews > MSI Prestige A16 AI+ review: Multimedia laptop with powerful Ryzen 9 365
Christian Hintze, 2025-01-26 (Update: 2025-01-26)