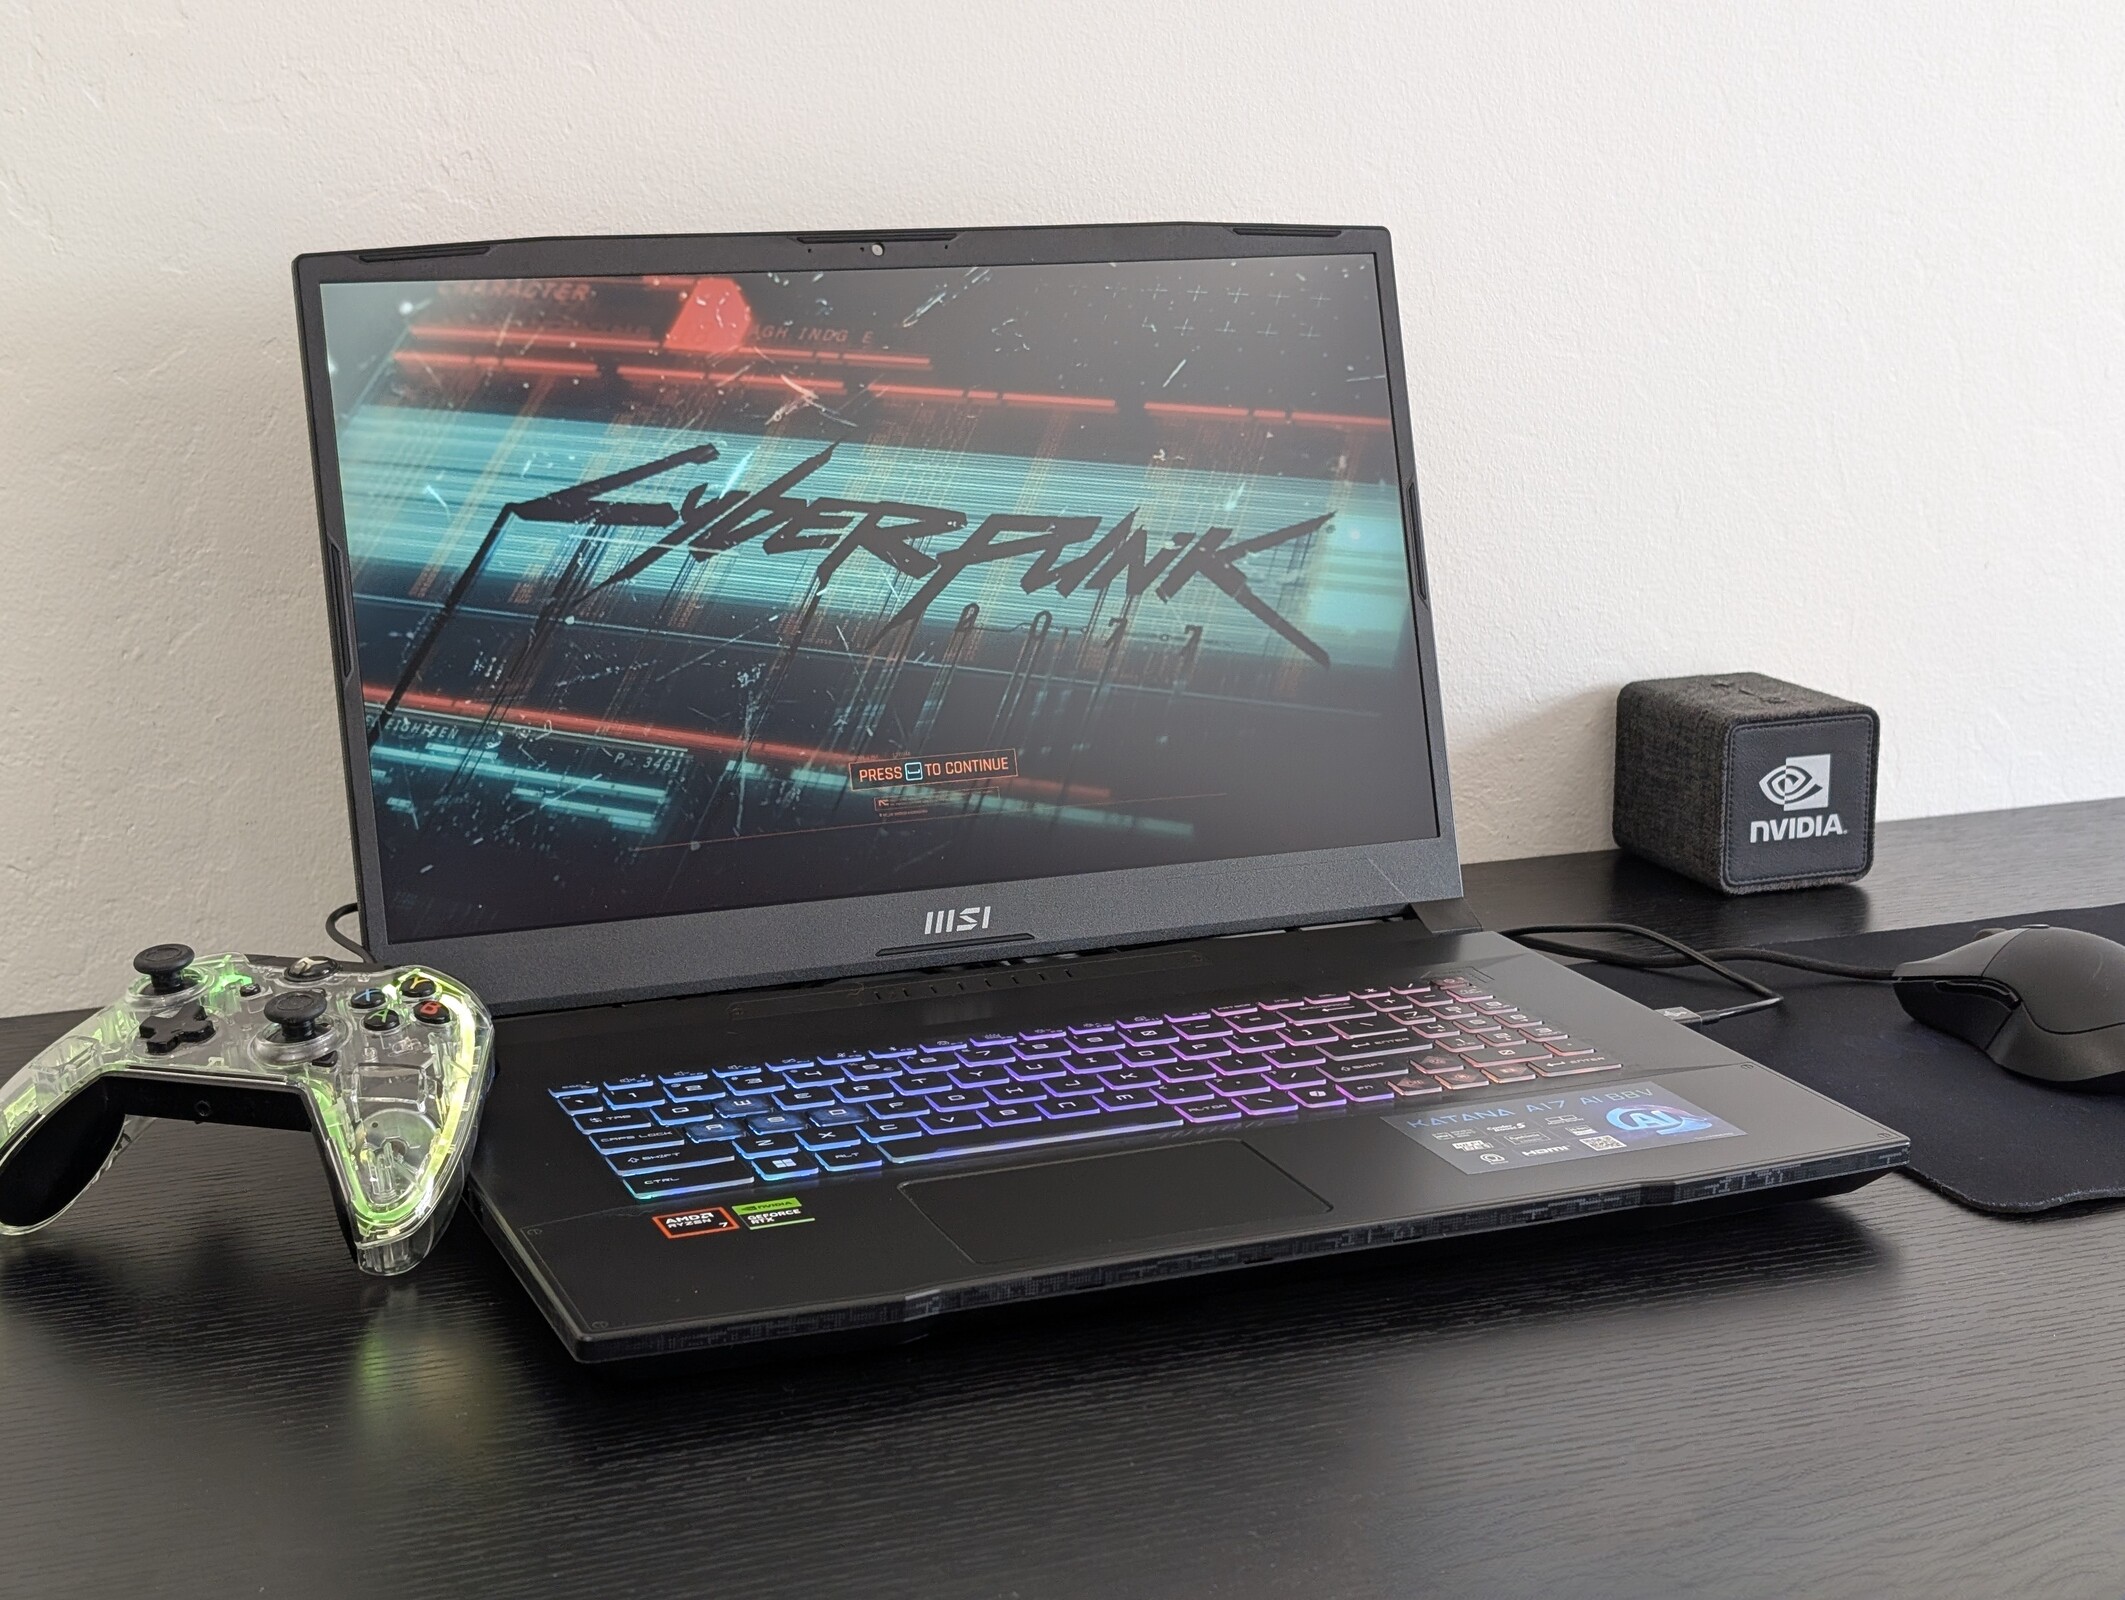
MSI Katana A17 AI laptop review: Strong graphics let down by a weak display
Base 1080p display leaves a lot to be desired.
The Katana A17 is a cheaper alternative to the GE, GS, or GT series while still offering excellent graphics performance with its 105 W GeForce RTX 4070 GPU. Unfortunately, its 1080p panel lacks full sRGB colors, fast response times, and G-Sync support.Allen Ngo 👁 Published 🇫🇷 🇪🇸 ...
Verdict — Great For Gaming If You Can Avoid The Cheaper Display Option
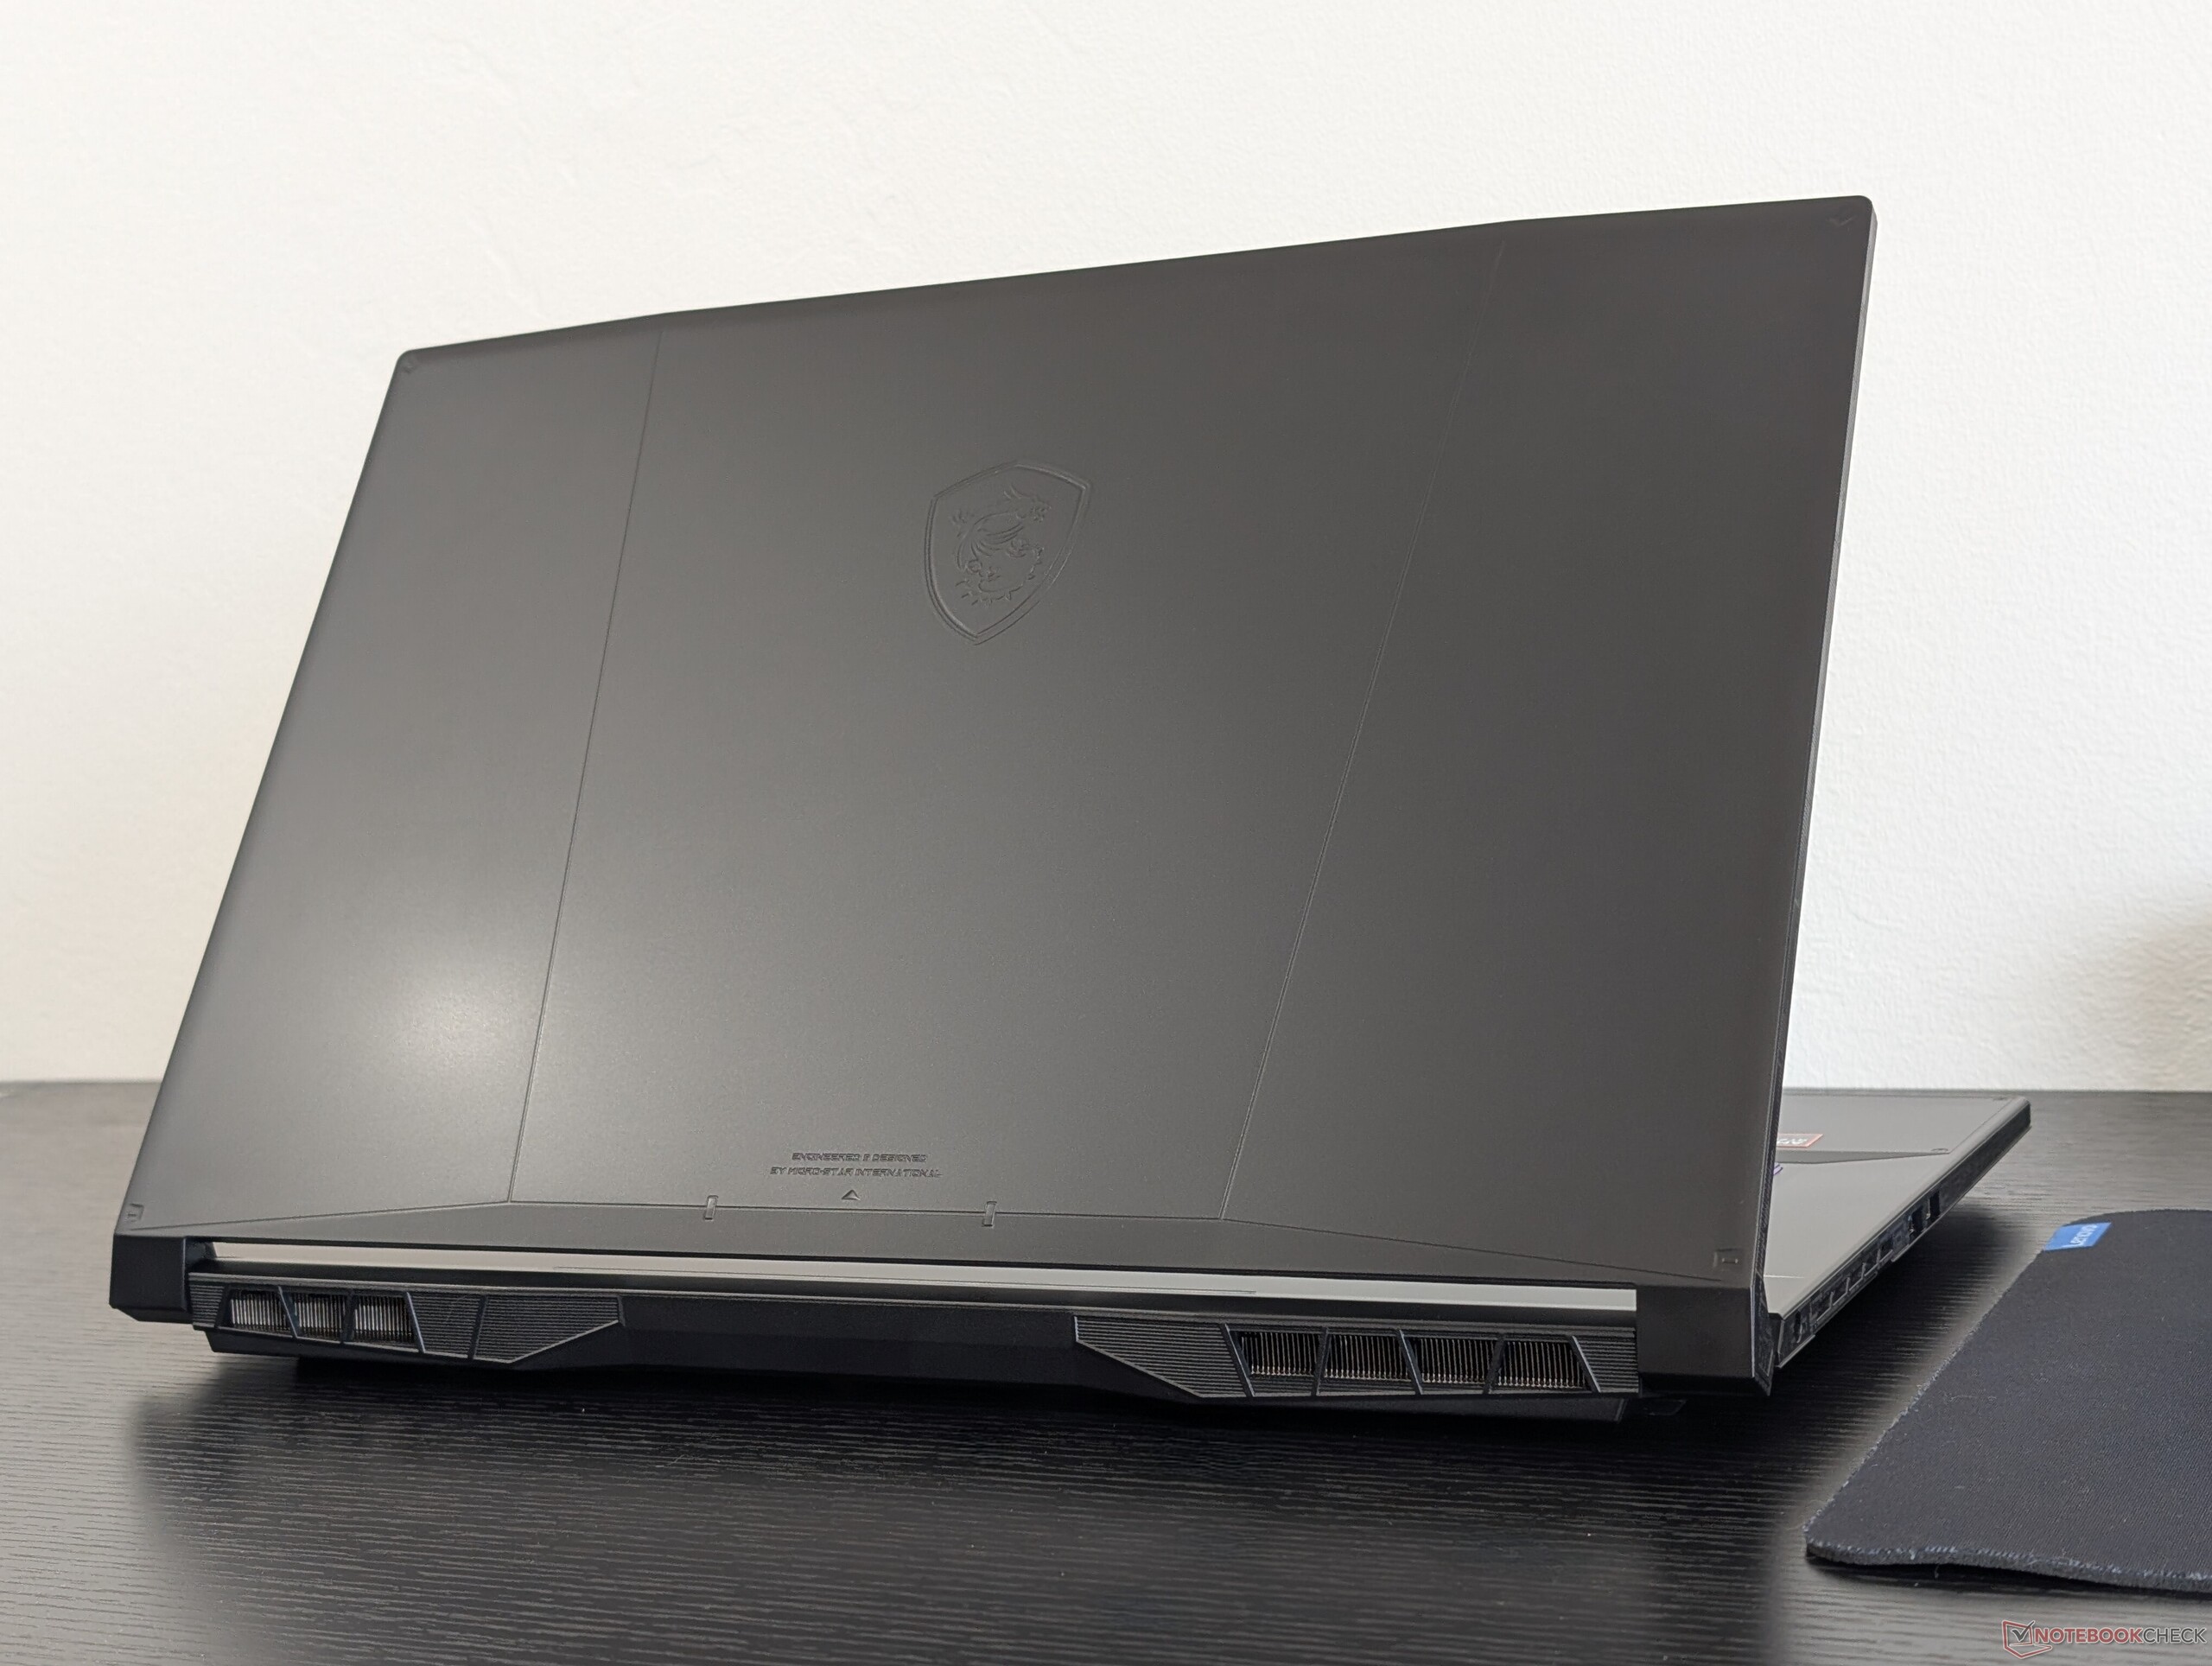
As one of MSI's more affordable gaming laptops, the Katana A17 cuts back on fancy LEDs and metal materials for a more basic plastic design while preserving high native refresh rates and GPU options like the GeForce RTX 4070. To core gamers on tighter budgets, the GPU likely takes priority over other aspects and the Katana A17 delivers on that front while also providing decent fan noise levels and a comfortable keyboard for non-gaming tasks.
The cut corners, however, can run a bit deep. Most notably, battery life is short and the 1080p144 display offers poor colors and brightness for a less-than-stellar viewing experience. The 1440p240 option addresses this issue directly, but it is unavailable with the Ryzen 7 configuration as it is instead tied to the Ryzen 9 CPU meaning that users will have to pay an extra $400 just for the better screen. When you take into account that the Ryzen 9 8945HS offers almost no benefits over the Ryzen 7 8845HS, the QHD configuration will look overpriced especially when the higher-end MSI GS series can be found for around the same price.
Pros
Cons
Price and Availability
Amazon is not offering our Ryzen 7 FHD review configuration at the moment. Instead, the Ryzen 9 QHD configuration is available for $1800 USD.
Potential Competitors in Comparison
Image | Model / Review | Price | Weight | Height | Display |
|---|---|---|---|---|---|
1. 78.6%  | MSI Katana A17 AI B8VG AMD Ryzen 7 8845HS ⎘ NVIDIA GeForce RTX 4070 Laptop GPU ⎘ 32 GB Memory, 1024 GB SSD | Amazon: List Price: 1400 USD | 2.7 kg | 25.2 mm | 17.30" 1920x1080 127 PPI IPS |
2. 80.4%  | HP Omen 17-db0079ng AMD Ryzen 7 8845HS ⎘ NVIDIA GeForce RTX 4070 Laptop GPU ⎘ 32 GB Memory, 1024 GB SSD | Amazon: 1. $2,329.00 HP OMEN 17 Gaming Laptop, AM... 2. $185.83 GENTERUN 17.3 Inch Matrix LC... 3. $115.99 Docking Station for HP Omen ... List Price: 1900€ | 2.8 kg | 30.1 mm | 17.30" 2560x1440 170 PPI IPS |
3. 85.6% v7 (old)  | Asus TUF Gaming A17 FA707XI-NS94 AMD Ryzen 9 7940HS ⎘ NVIDIA GeForce RTX 4070 Laptop GPU ⎘ 16 GB Memory, 1024 GB SSD | Amazon: List Price: 1400 USD | 2.5 kg | 25.4 mm | 17.30" 1920x1080 127 PPI IPS |
4. 87.2% v7 (old)  | Acer Nitro 17 AN17-51-71ER Intel Core i7-13700H ⎘ NVIDIA GeForce RTX 4060 Laptop GPU ⎘ 16 GB Memory, 1024 GB SSD | Amazon: 1. $96.99 LCDOLED Compatible with Acer... 2. $128.88 POBRIDA Replacement for Acer... 3. $25.99 Deal4GO CPU GPU Graphics Coo... List Price: 1900€ | 3 kg | 30.3 mm | 17.30" 2560x1440 170 PPI |
5. 86.3% v7 (old)  | MSI Pulse 17 B13VGK Intel Core i7-13700H ⎘ NVIDIA GeForce RTX 4070 Laptop GPU ⎘ 16 GB Memory, 1024 GB SSD | Amazon: 1. $49.99 HSXIRQA 230W 240W AC Charger... 2. $47.99 20V 12A 240W Laptop Charger ... 3. $59.99 240W 200W AC Charger for MSI... List Price: 2500€ | 2.7 kg | 27.2 mm | 17.30" 1920x1080 127 PPI IPS |
6. 85.2% v7 (old)  | Lenovo Legion 5 17ACH6H-82JY0003GE AMD Ryzen 5 5600H ⎘ NVIDIA GeForce RTX 3060 Laptop GPU ⎘ 16 GB Memory, 512 GB SSD | Amazon: 1. $101.50 FIXARAMA Screen Replacement ... 2. $1,368.99 Lenovo Legion 5 Gen 10 Gamin... 3. $1,809.99 Lenovo Legion Pro 5 AI Gamin... List Price: 1810 EUR | 3.1 kg | 24.3 mm | 17.30" 1920x1080 127 PPI IPS |
Table of Contents
- Verdict — Great For Gaming If You Can Avoid The Cheaper Display Option
- Specifications
- Case — Plastic All-Around
- Connectivity
- Display — Decent Refresh Rate But With Poor Colors
- Performance — Greater Performance-Per-Watt With AMD Zen 4
- Emissions
- Energy Management — Great Performance-Per-Watt But With Poor Battery Life
- Notebookcheck Rating
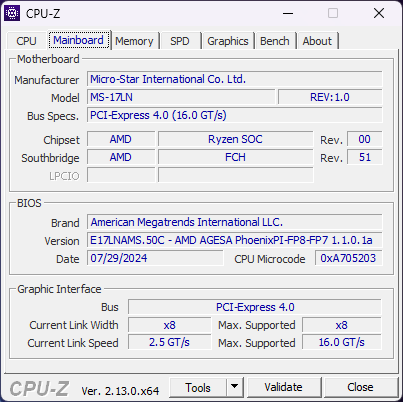
The budget-oriented Katana A17 is the newer AMD version of last year's Intel-powered Katana 17. To keep prices in check, it uses CPUs from the Zen 4 series instead of the latest Zen 5.
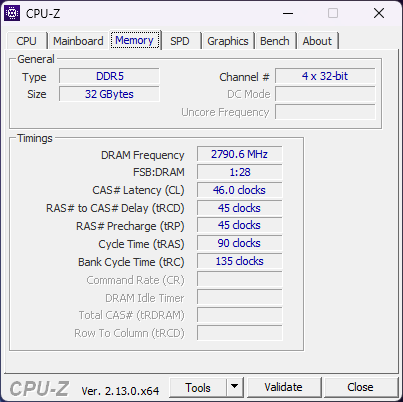
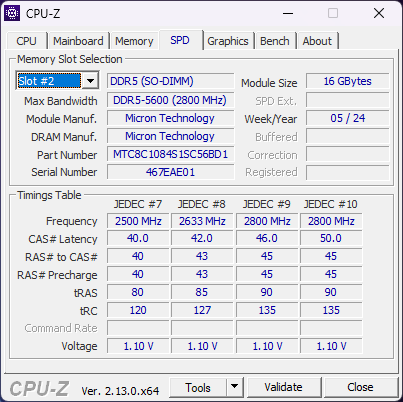
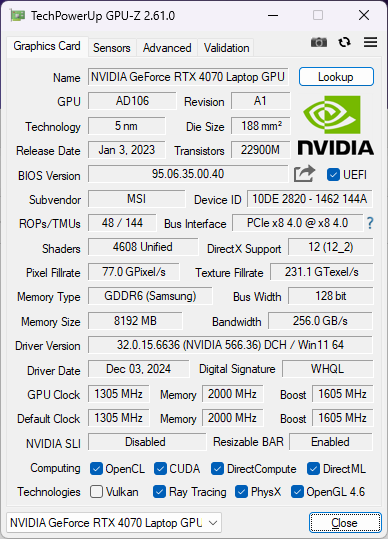
Our test unit is a midrange configuration with the Ryzen 7 8845HS CPU, GeForce RTX 4070 GPU, and 17.3-inch 1080p144 display for approximately $1400. Lesser SKUs may come with the RTX 4060 or 4050 instead while higher-end SKUs come with the Ryzen 9 8945HS and 1440p240 Hz display. A 15-inch version of this model is available called the Katana A15.
Alternatives to the Katana A17 include other budget-oriented gaming laptops like the Asus TUF Gaming A17, Acer Nitro 17, or Lenovo Legion 5.
More MSI reviews:
Specifications
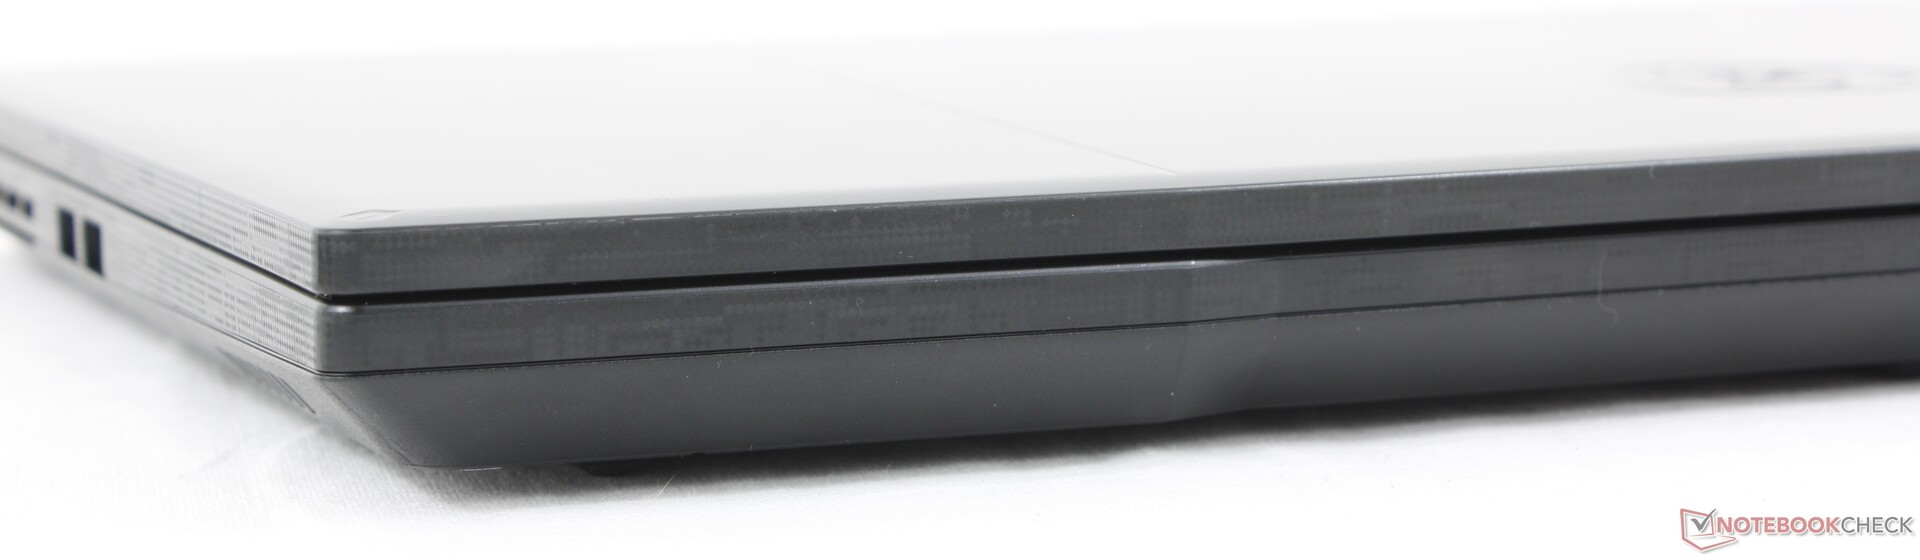
Case — Plastic All-Around
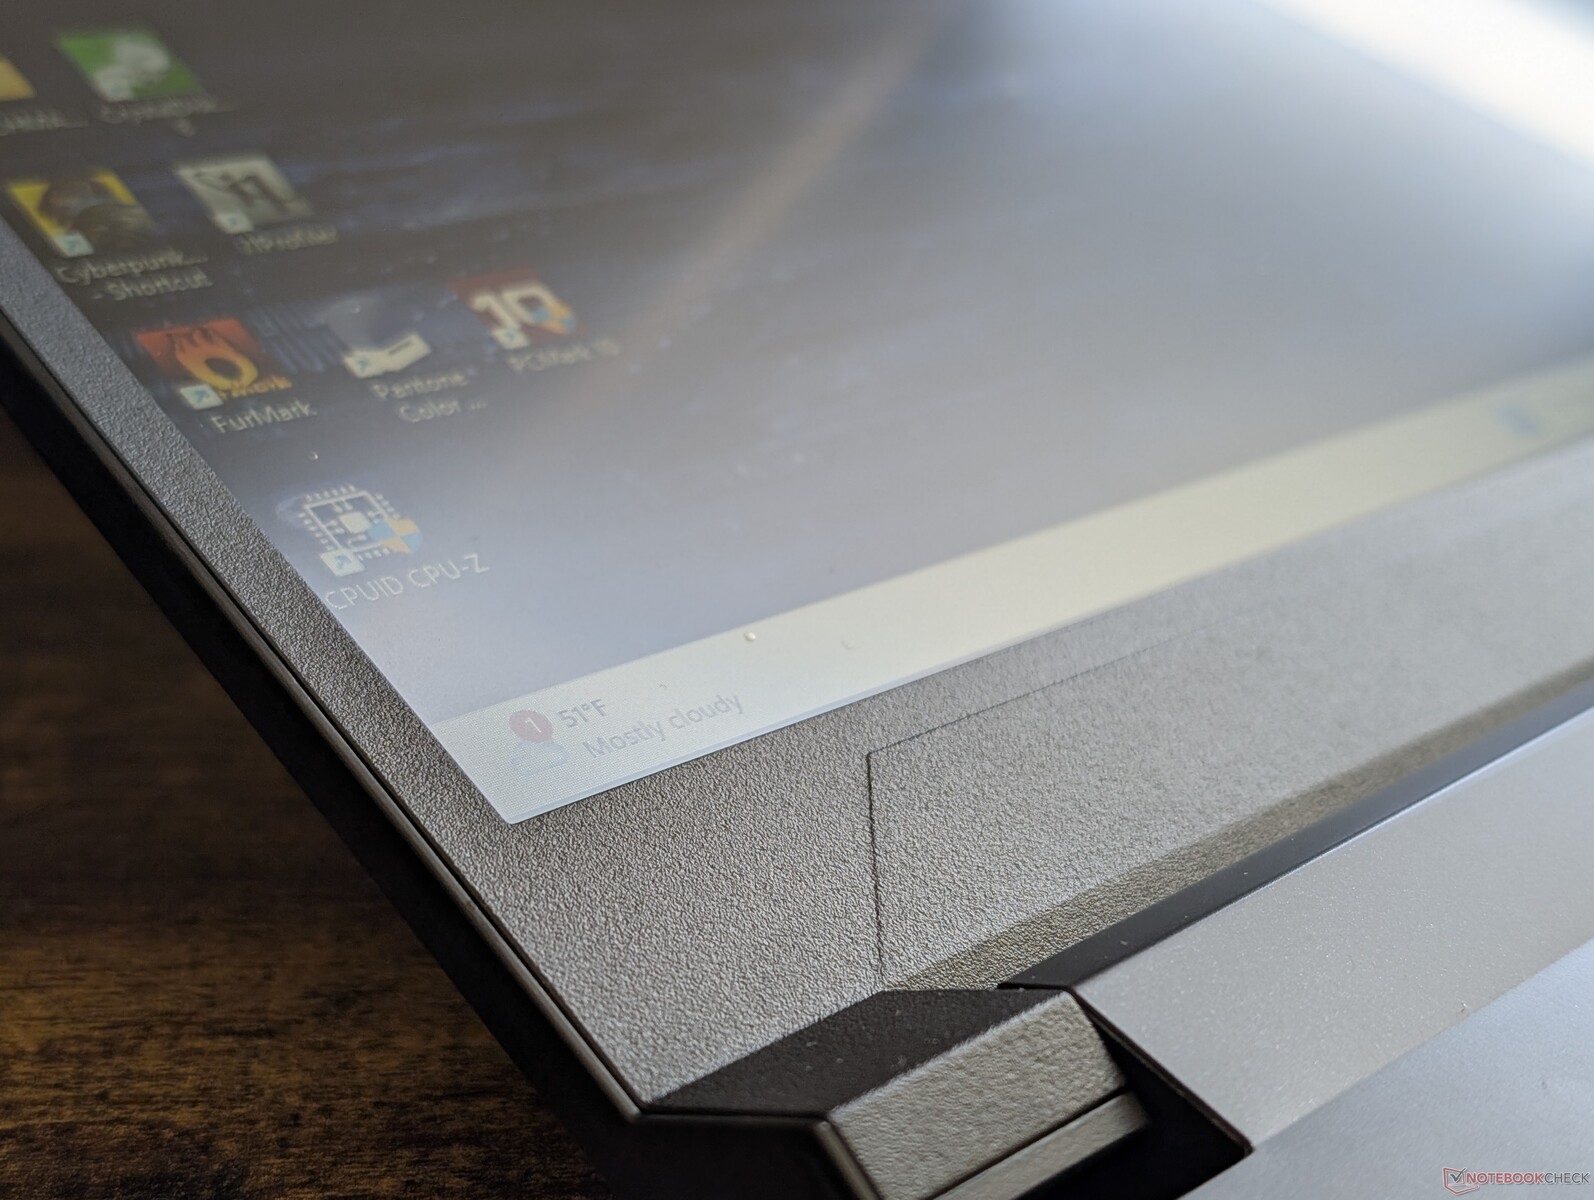
The chassis has not changed from the 2023 Katana 17 model and so it carries the same ABS plastic skeleton, keyboard, and connectivity options as before. In comparison, higher-end models from the GT or GS series utilize more metal alloys for a more luxurious look. The hinges could certainly be more rigid for future iterations of the Katana A17.
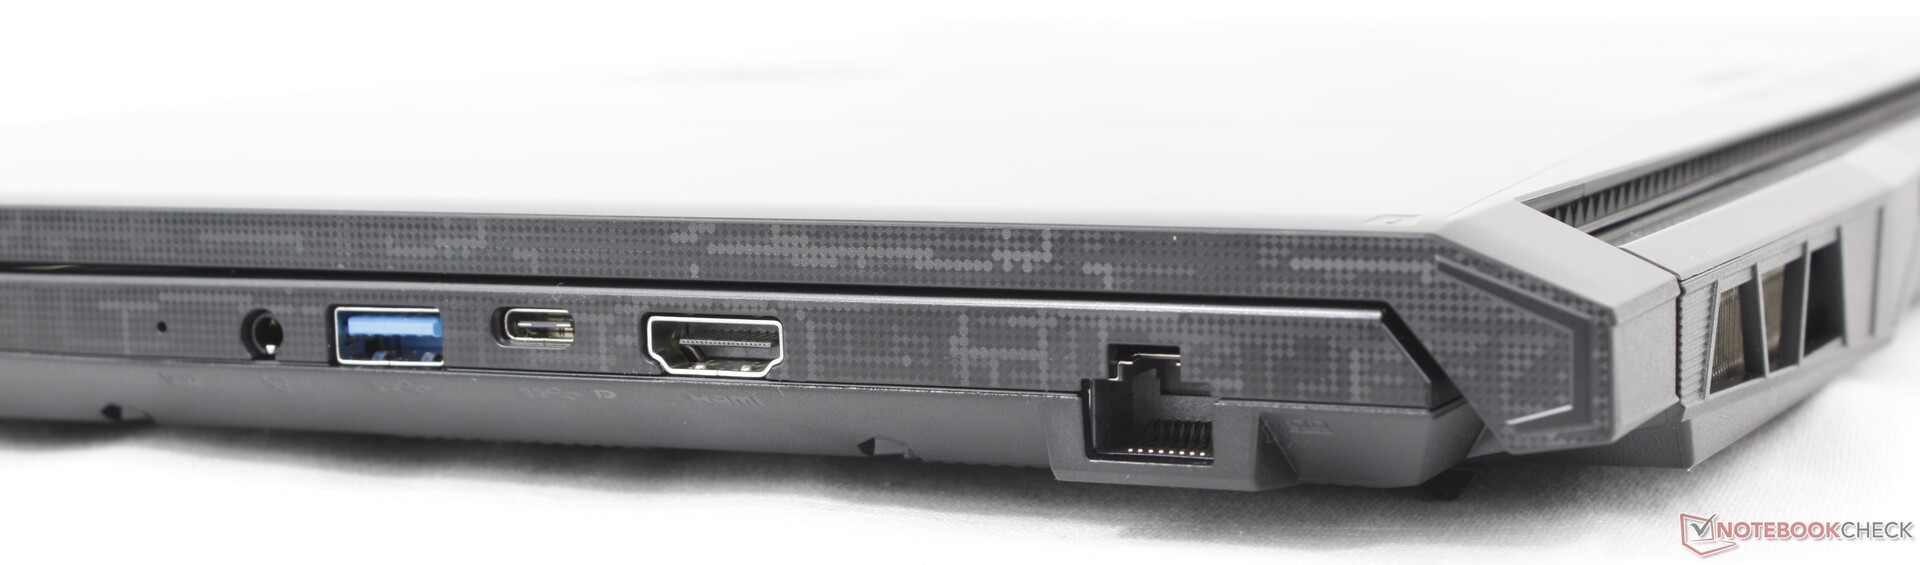
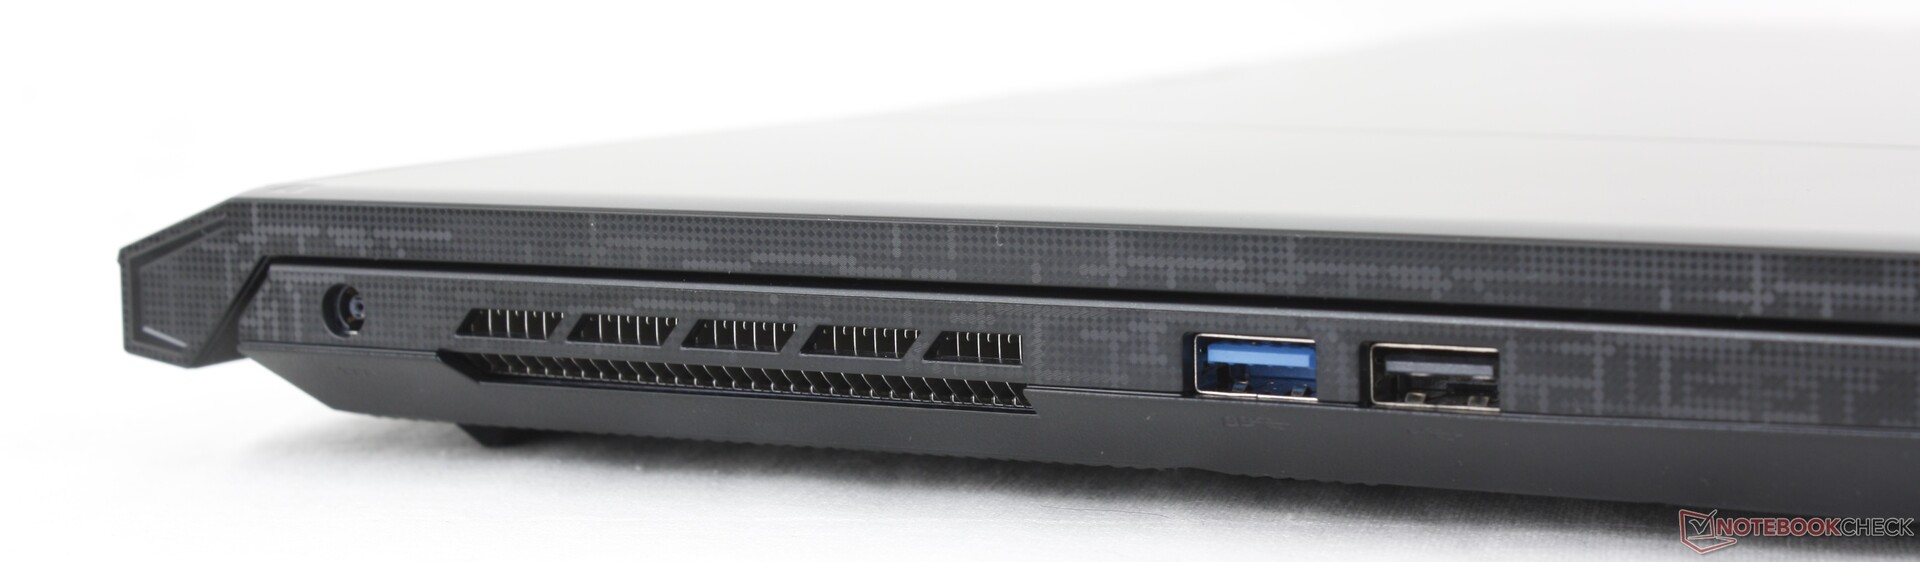
Connectivity
Communication
| Networking | |
| iperf3 transmit AX12 | |
| Lenovo Legion 5 17ACH6H-82JY0003GE | |
| iperf3 receive AX12 | |
| Lenovo Legion 5 17ACH6H-82JY0003GE | |
| iperf3 transmit AXE11000 | |
| Acer Nitro 17 AN17-51-71ER | |
| MSI Pulse 17 B13VGK | |
| MSI Katana A17 AI B8VG | |
| Asus TUF Gaming A17 FA707XI-NS94 | |
| HP Omen 17-db0079ng | |
| iperf3 receive AXE11000 | |
| MSI Pulse 17 B13VGK | |
| Acer Nitro 17 AN17-51-71ER | |
| MSI Katana A17 AI B8VG | |
| HP Omen 17-db0079ng | |
| Asus TUF Gaming A17 FA707XI-NS94 | |
| iperf3 transmit AXE11000 6GHz | |
| MSI Katana A17 AI B8VG | |
| iperf3 receive AXE11000 6GHz | |
| MSI Katana A17 AI B8VG | |
Webcam
The model integrates a low quality 720p or 1 MP webcam with no privacy shutter or IR. The camera can instead be disabled electronically with a hotkey.


Maintenance
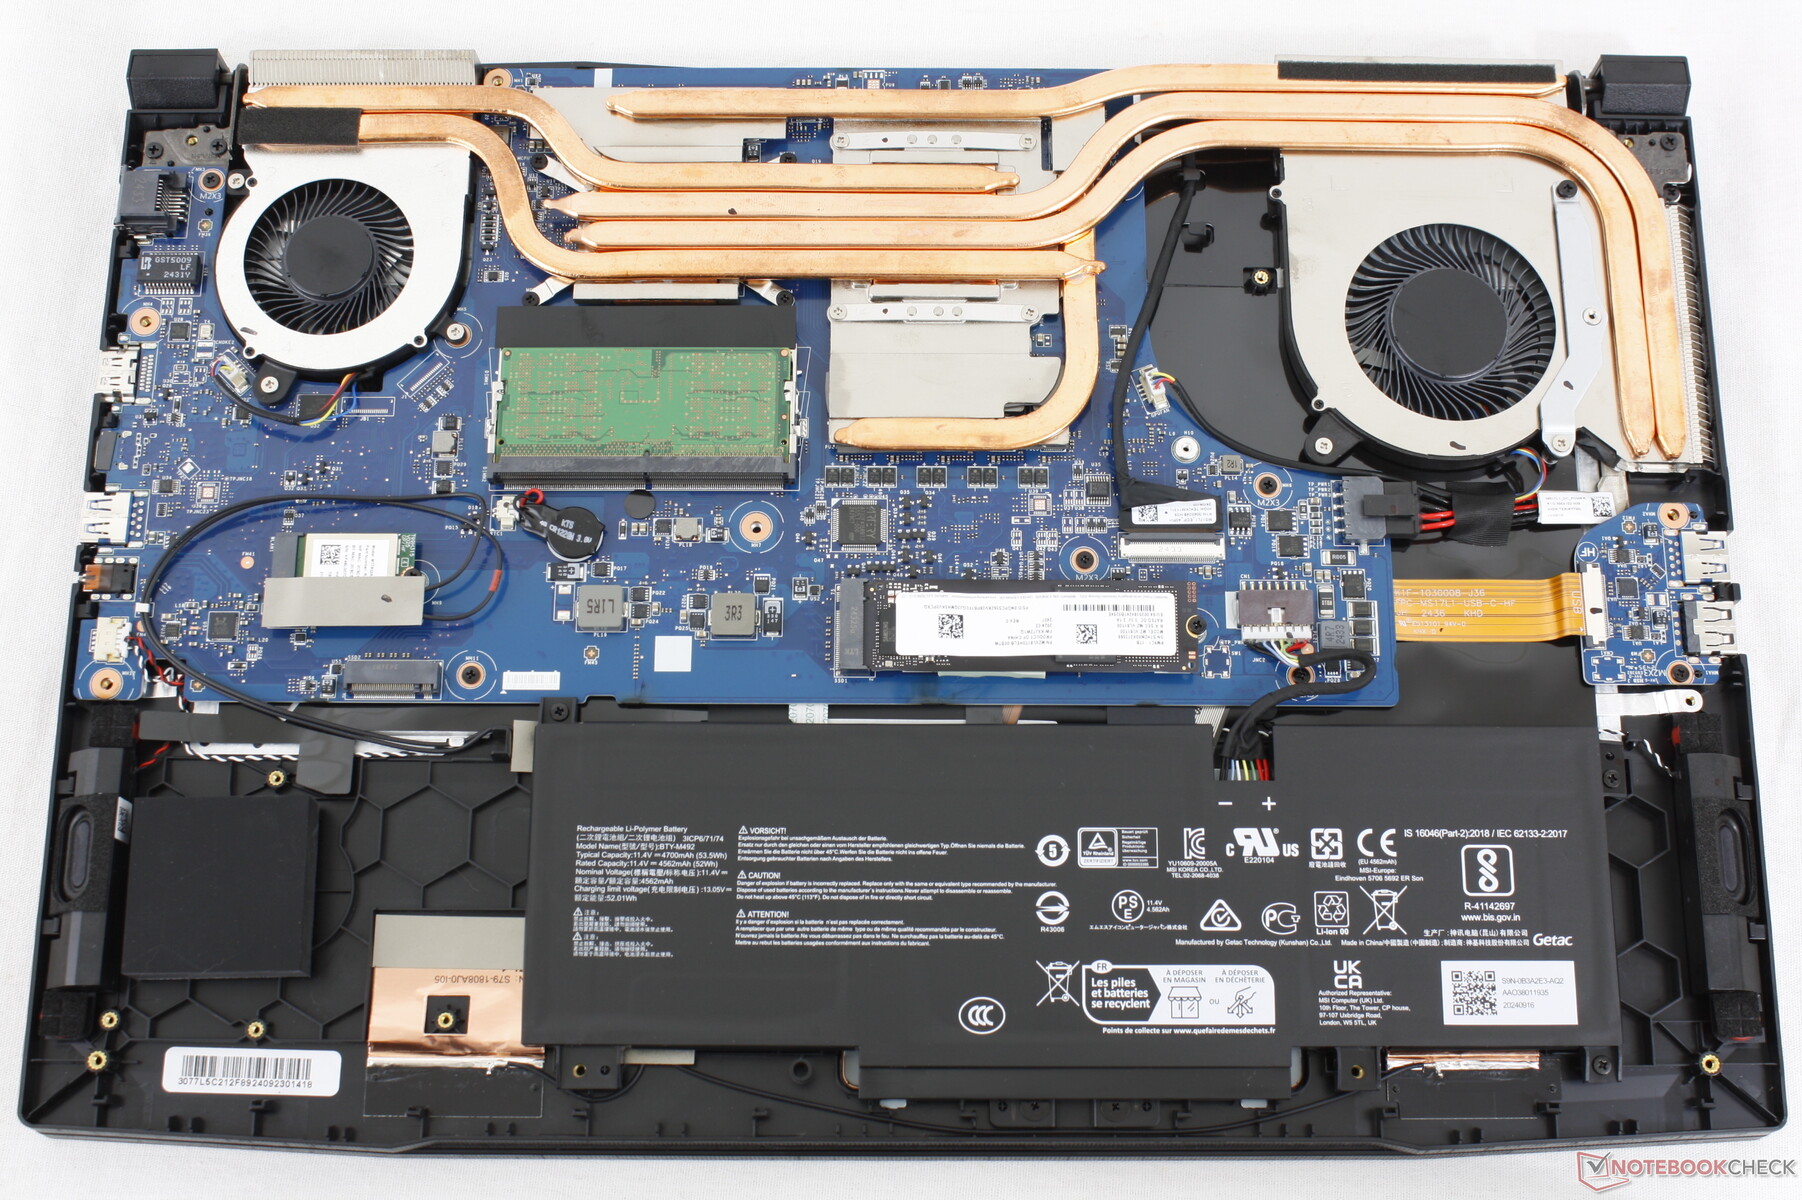
The bottom panel is secured by 13 Phillips screws for relatively easy servicing. Note that an anti-tamper sticker must be broken in order to access the motherboard. Once inside, users will have 2x M.2 2280 slots, 2x SODIMM slots, and the removable WLAN module.
Sustainability
MSI advertises no sustainability claims for the Katana A17 series. The packaging is otherwise mostly cardboard with some protective plastic wrapping.
Accessories And Warranty
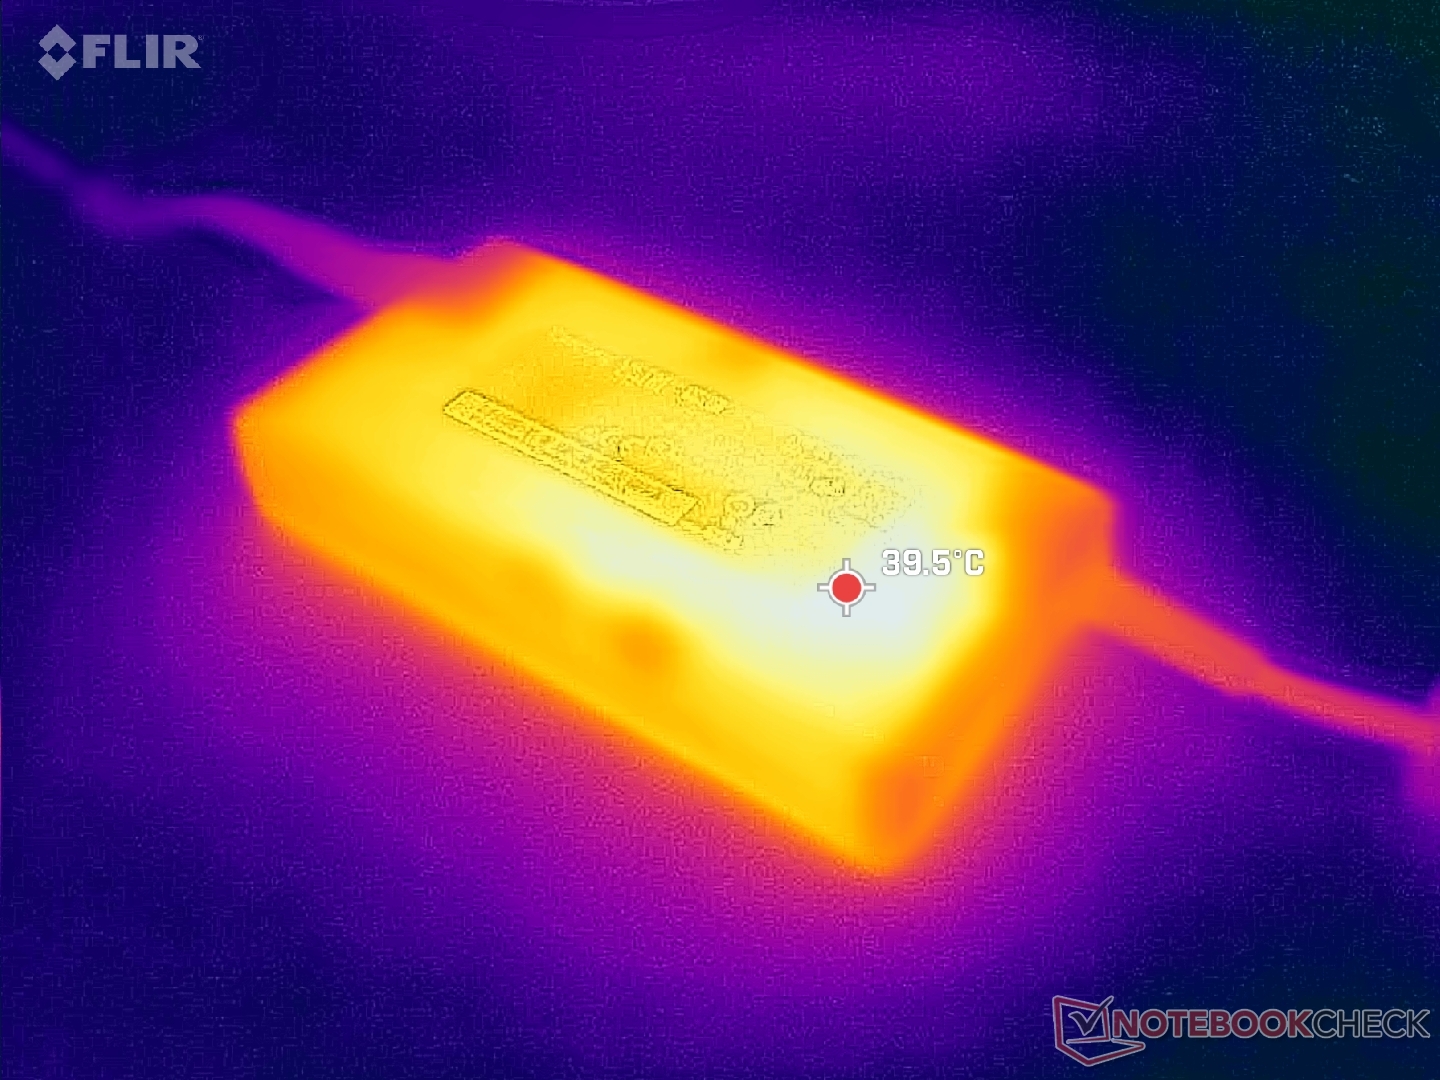
There are no extras in the box other than the 200 W AC adapter and paperwork. The usual one-year limited manufacturer warranty applies.
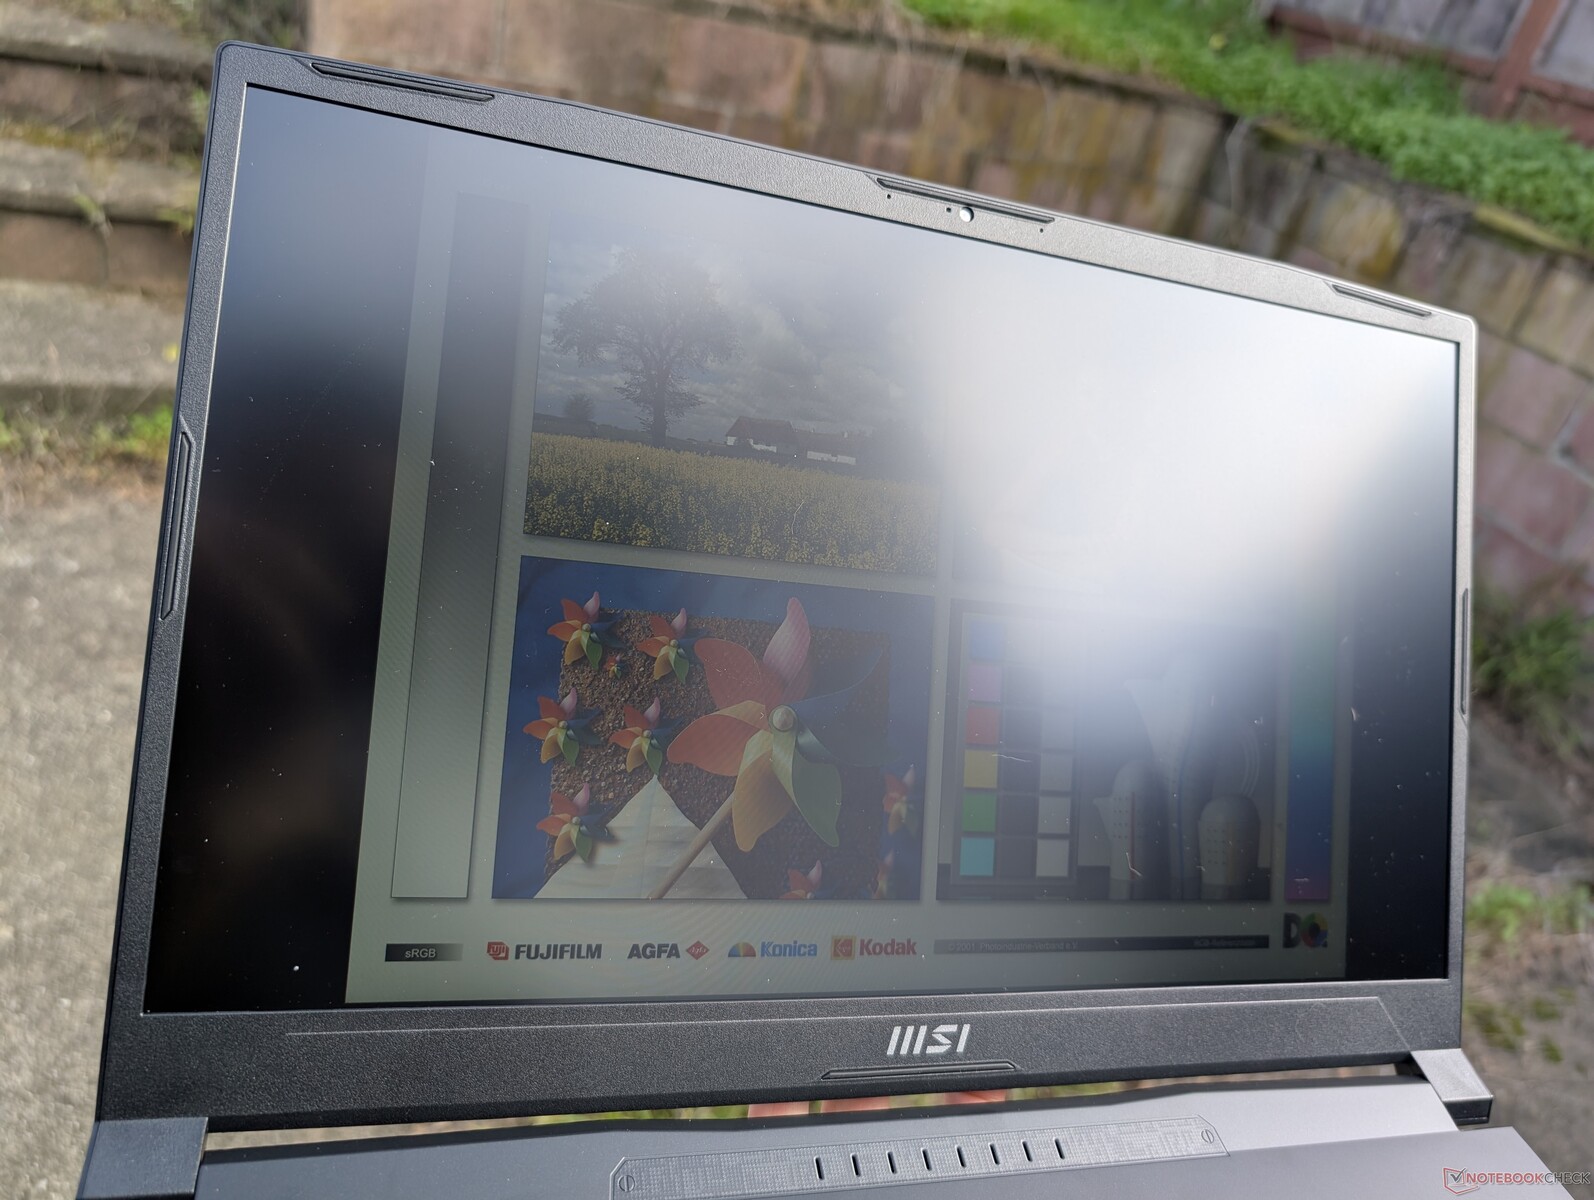
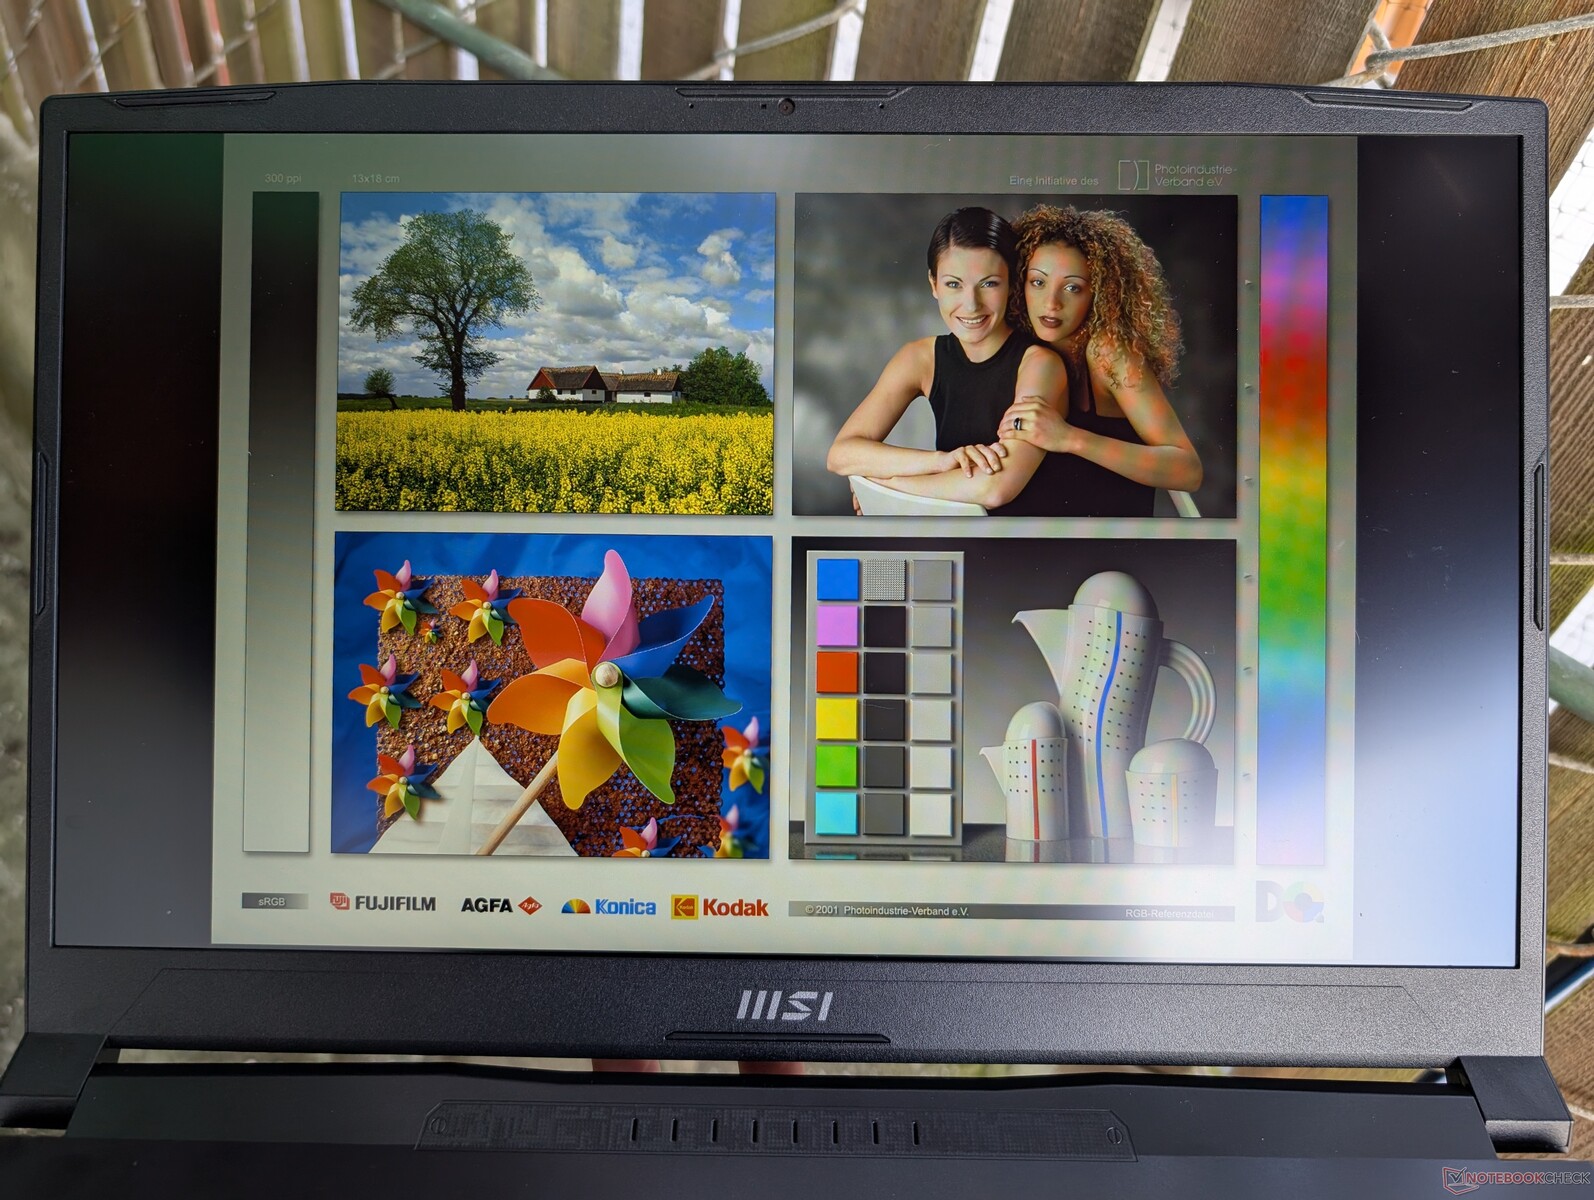
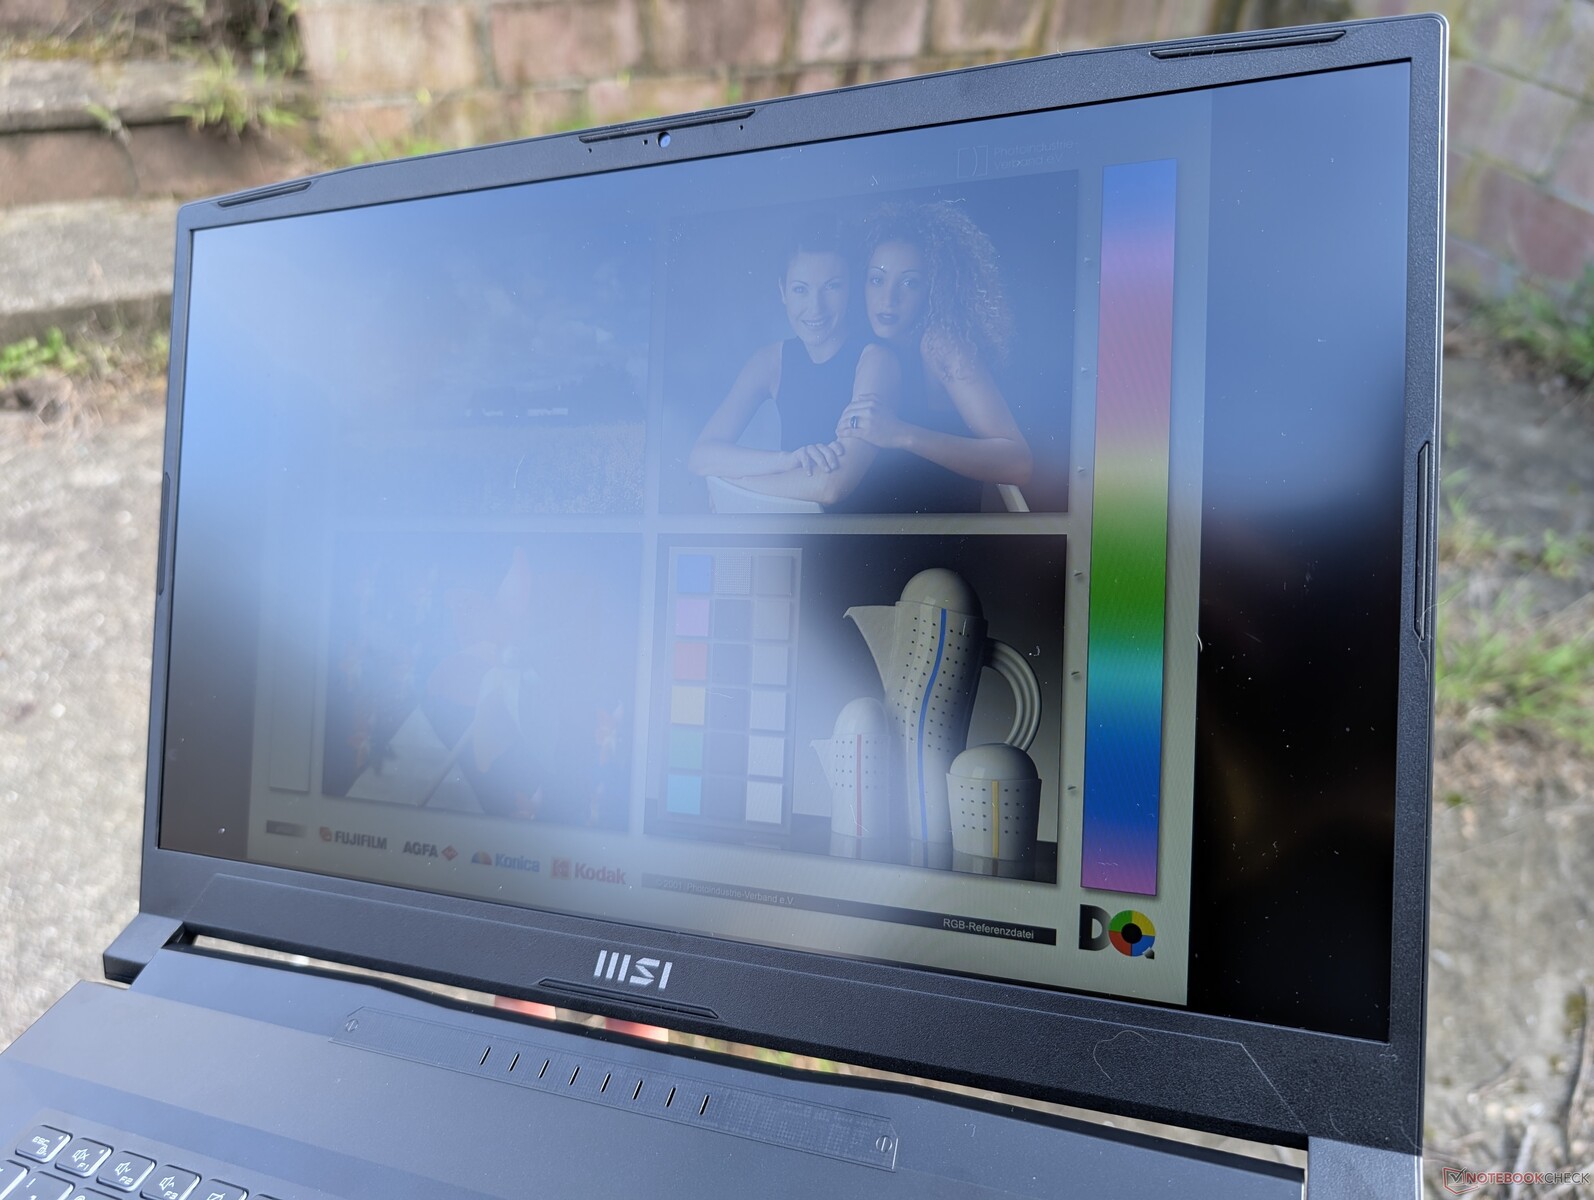
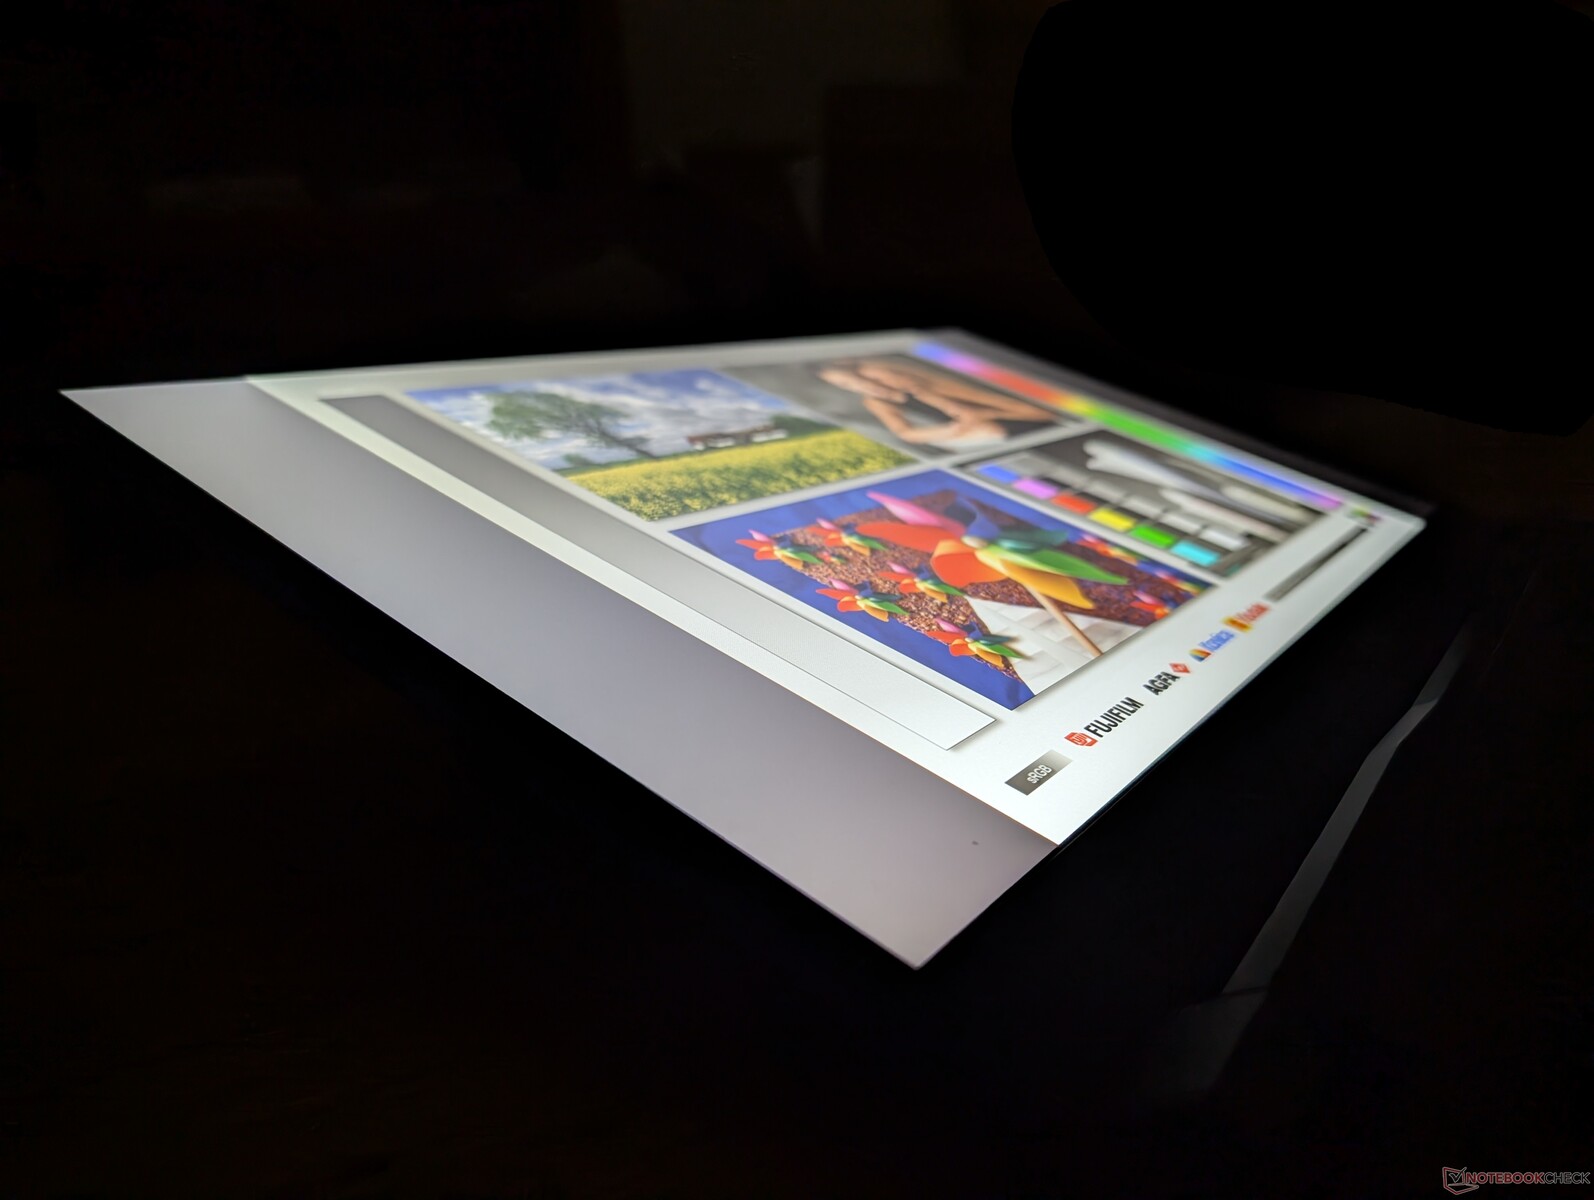
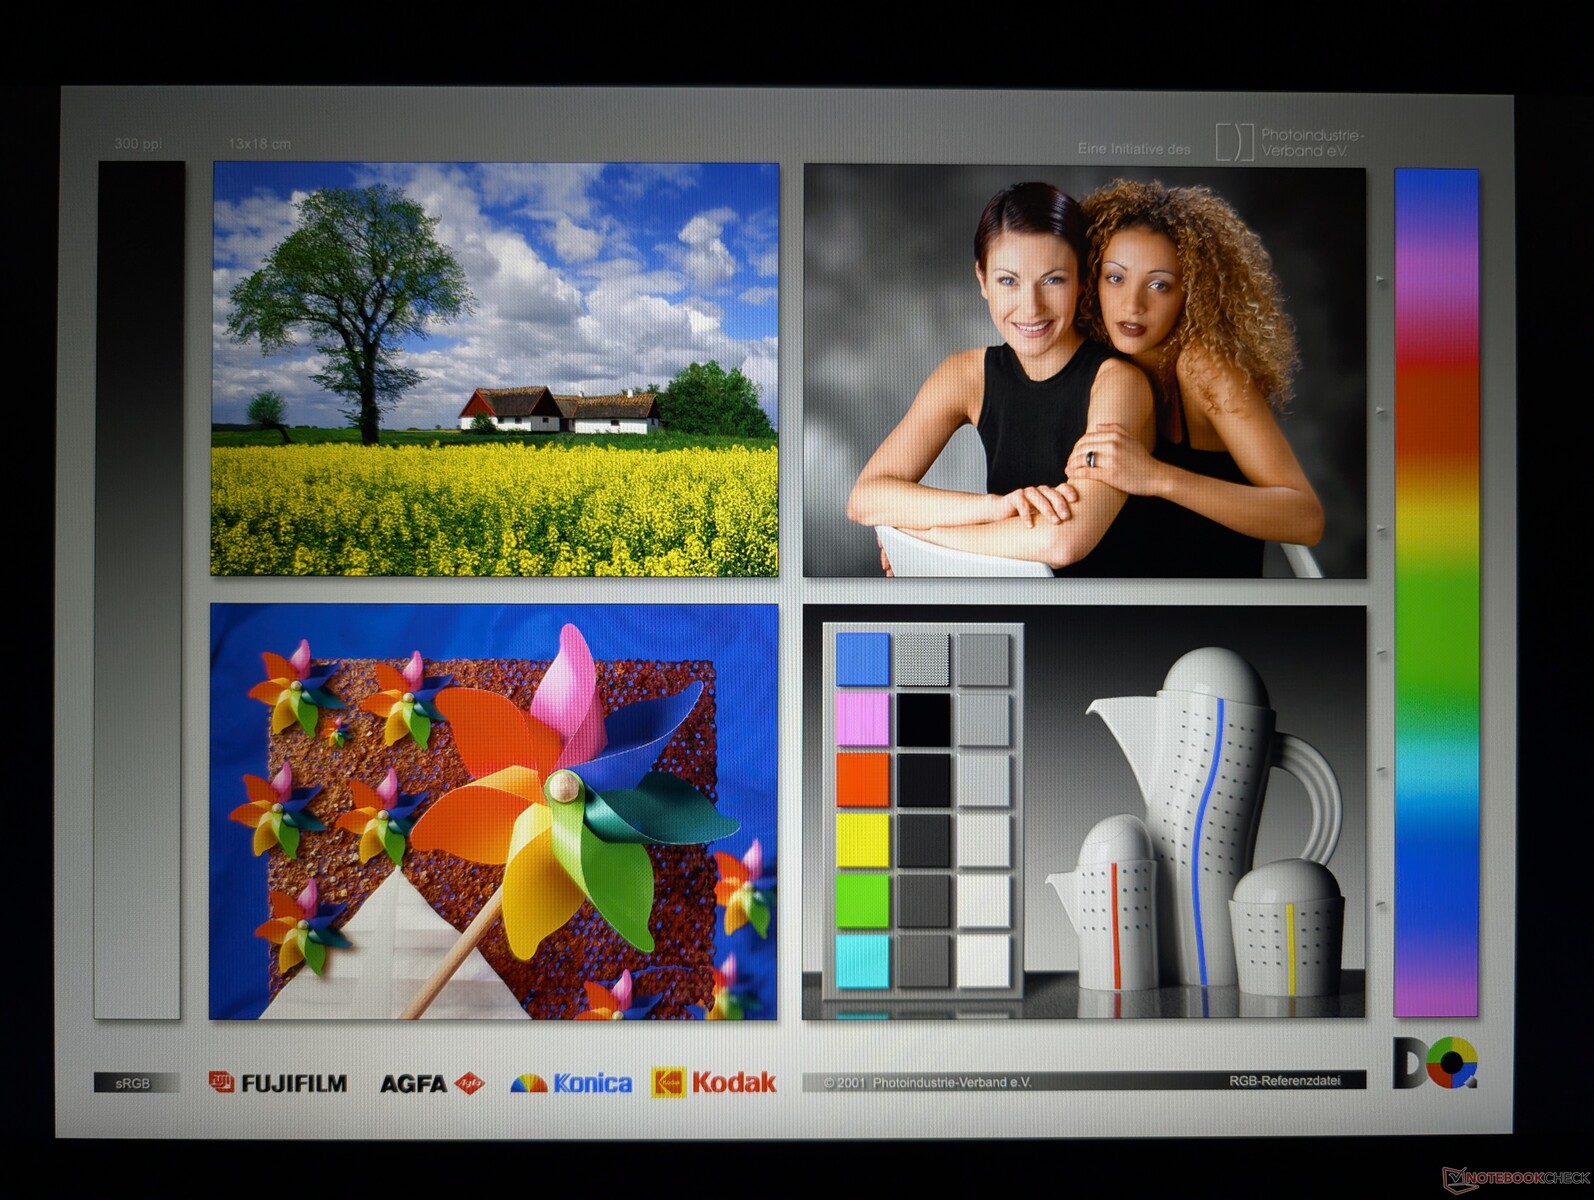
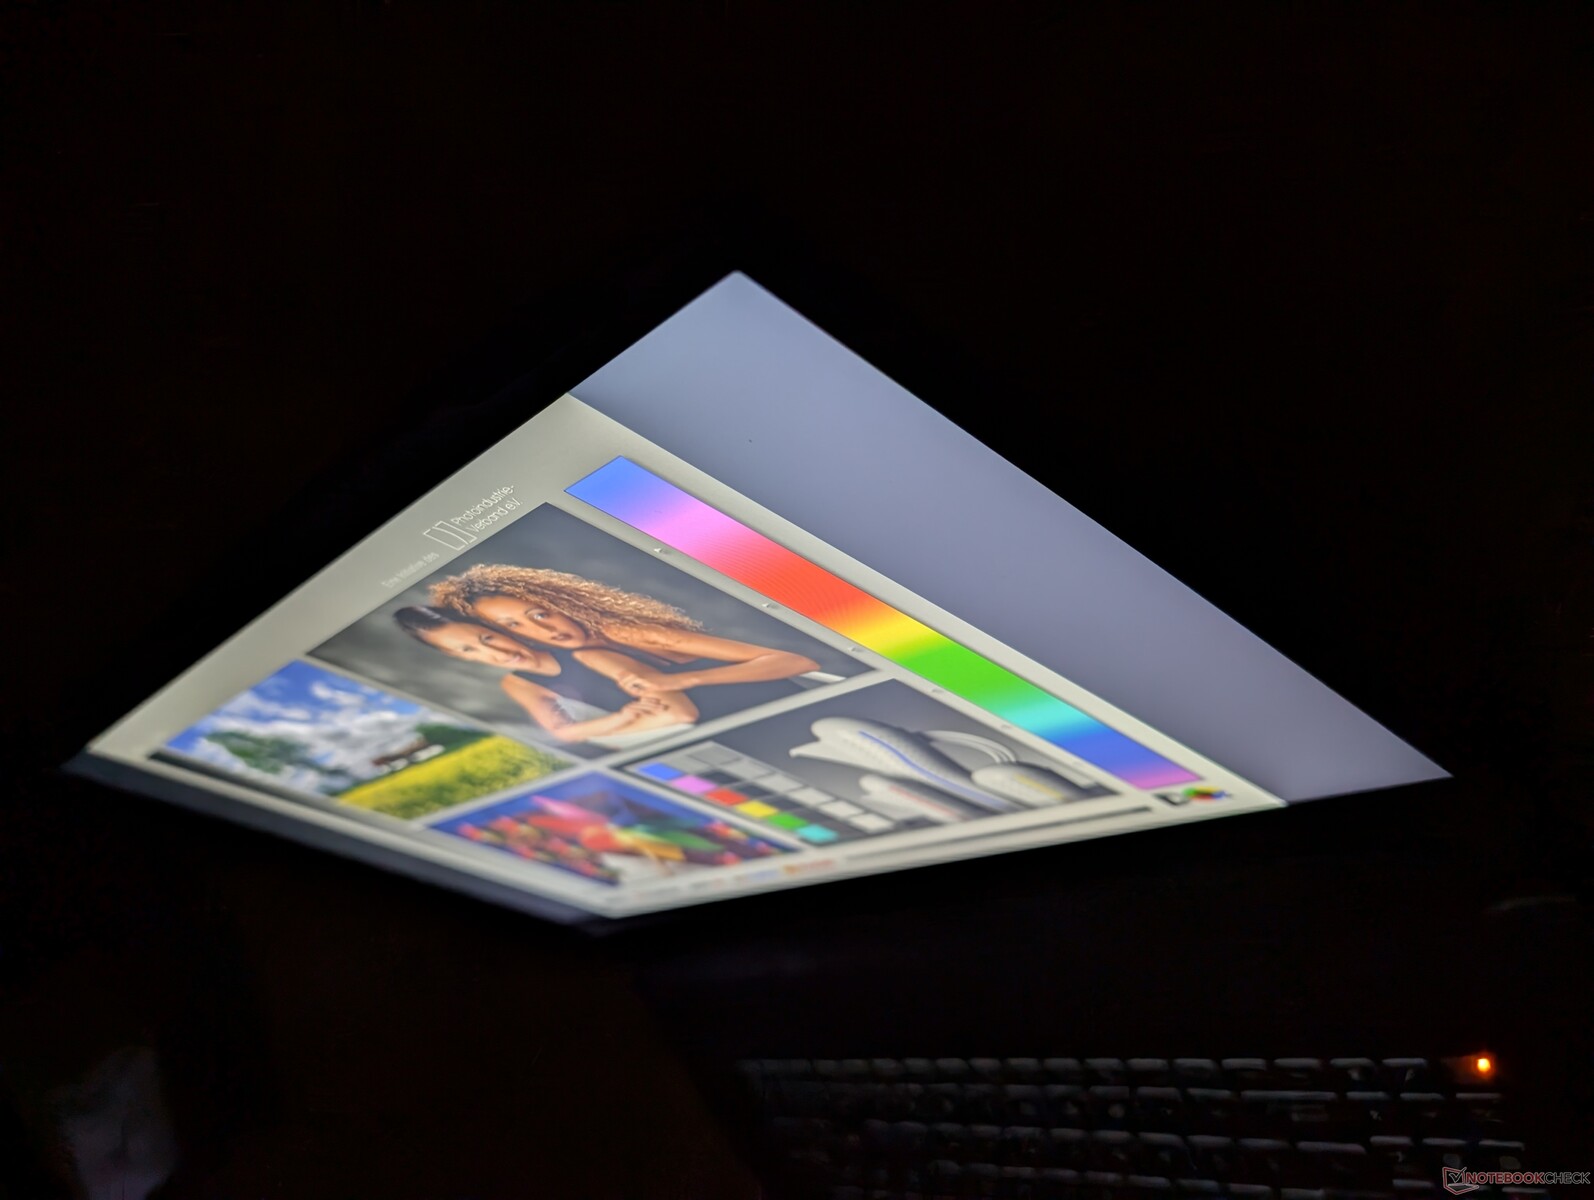
Display — Decent Refresh Rate But With Poor Colors
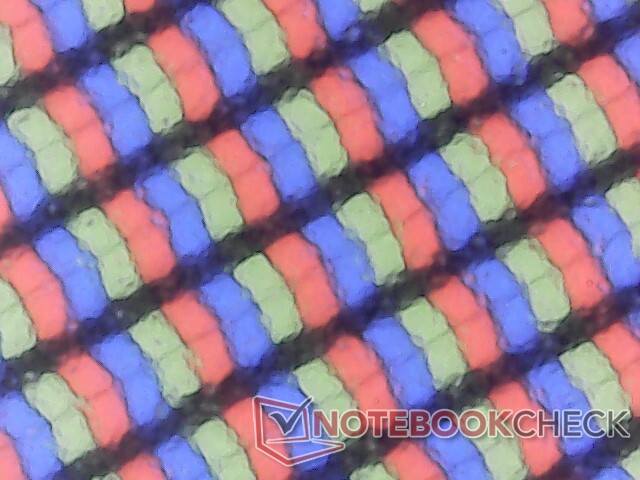
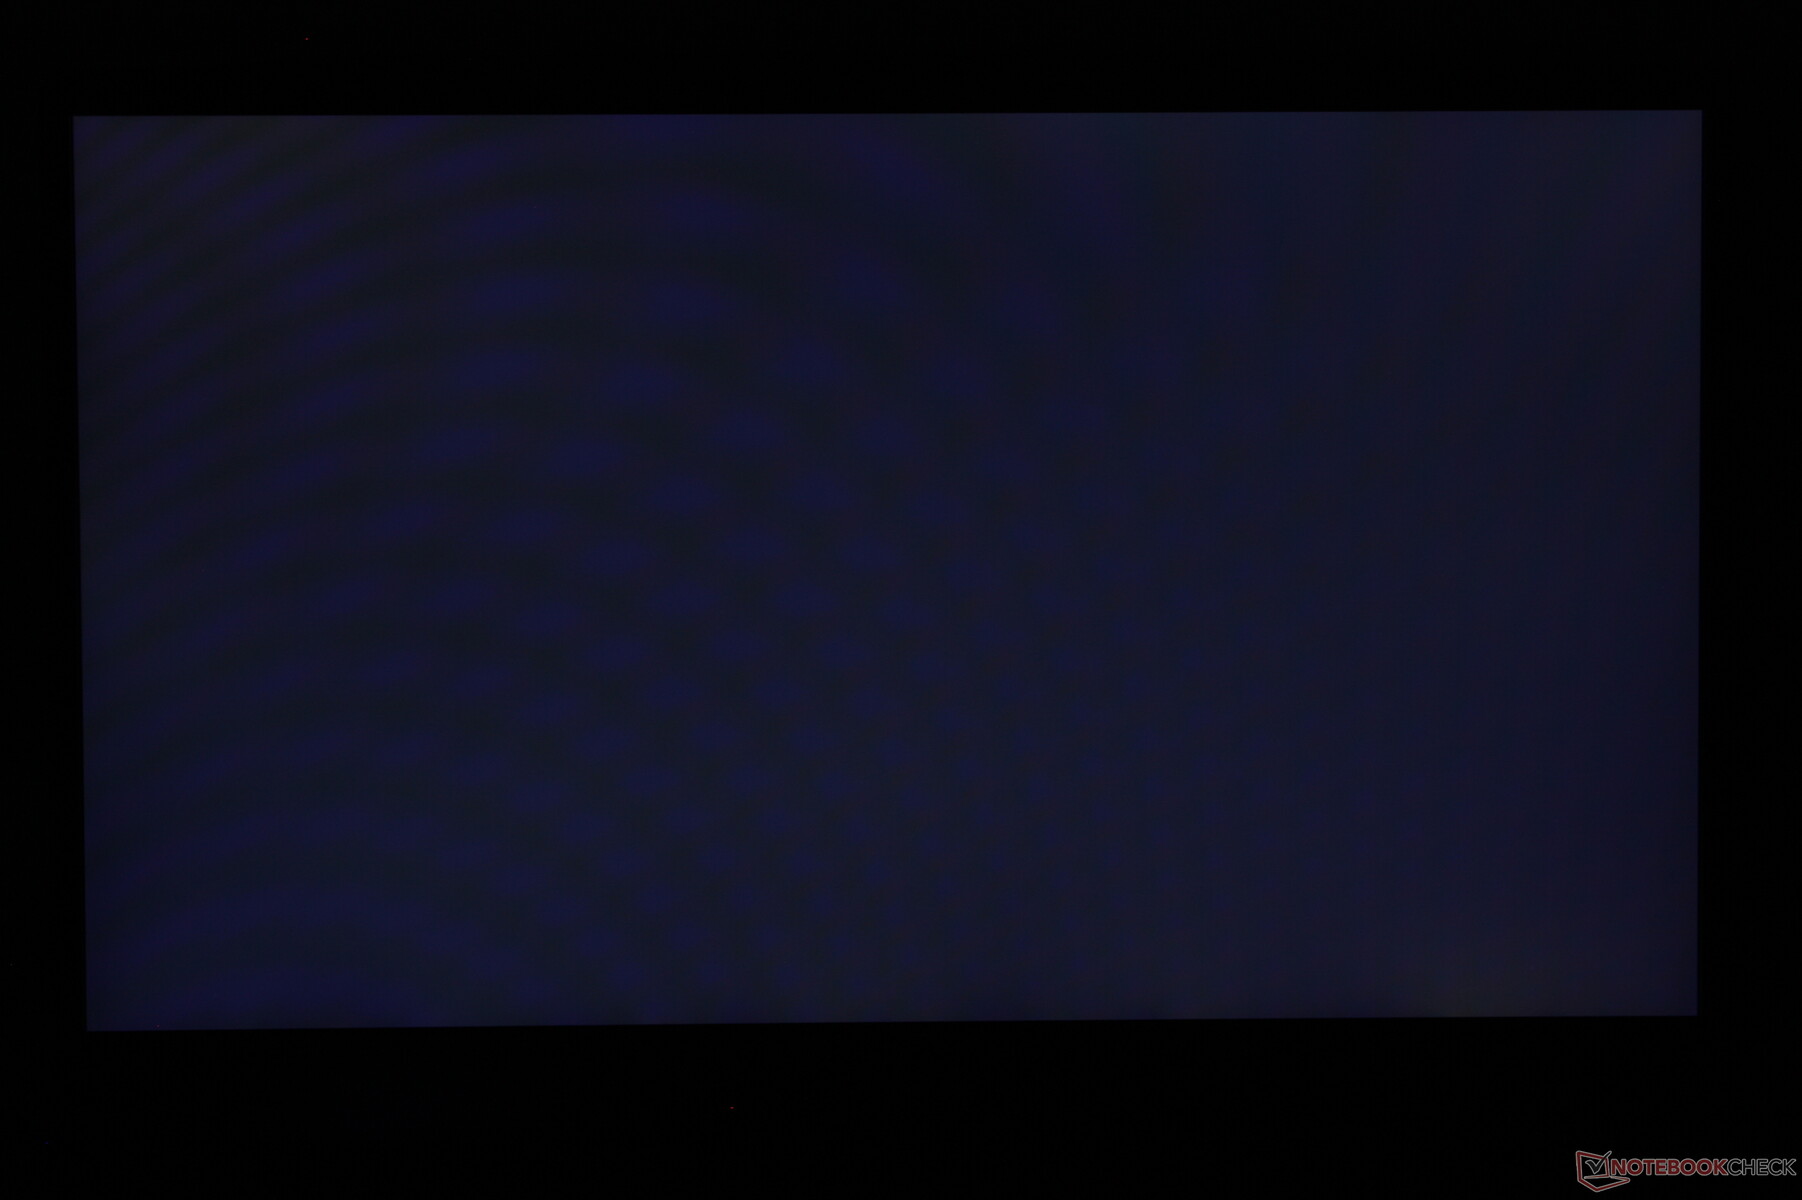
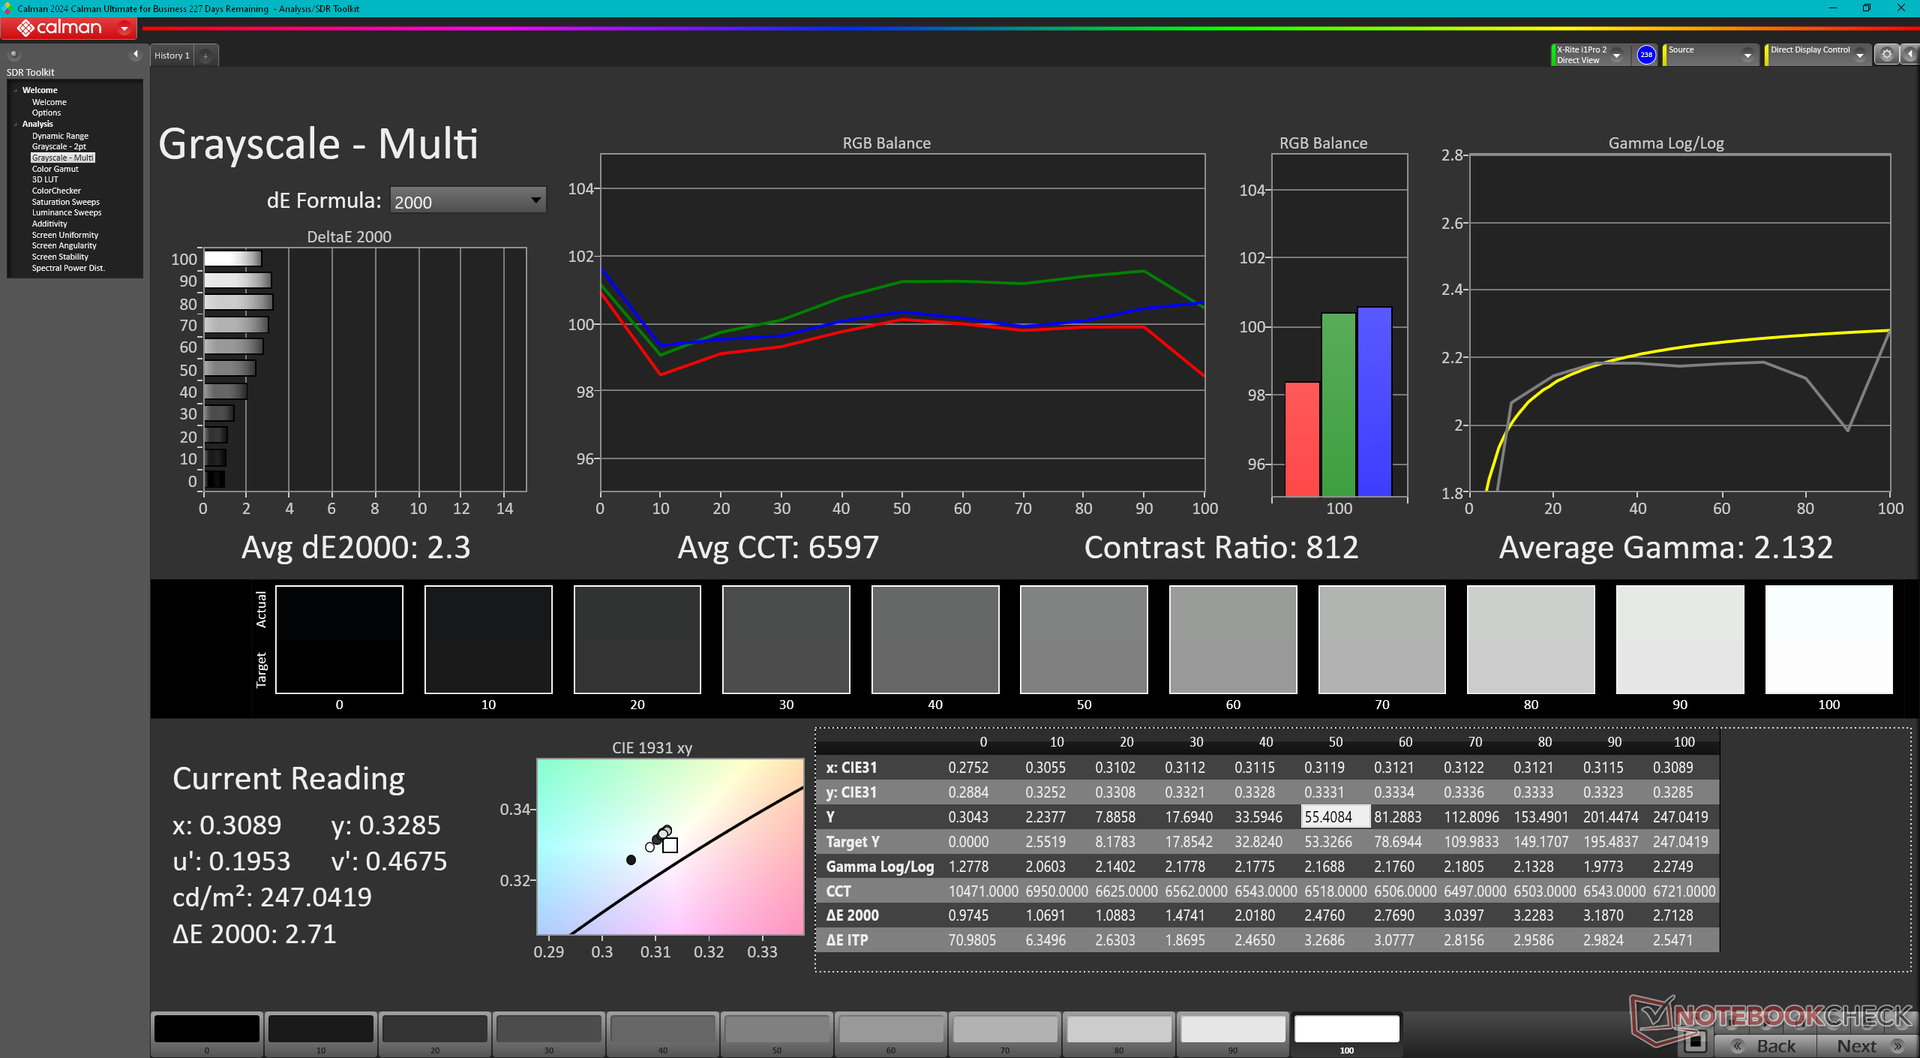
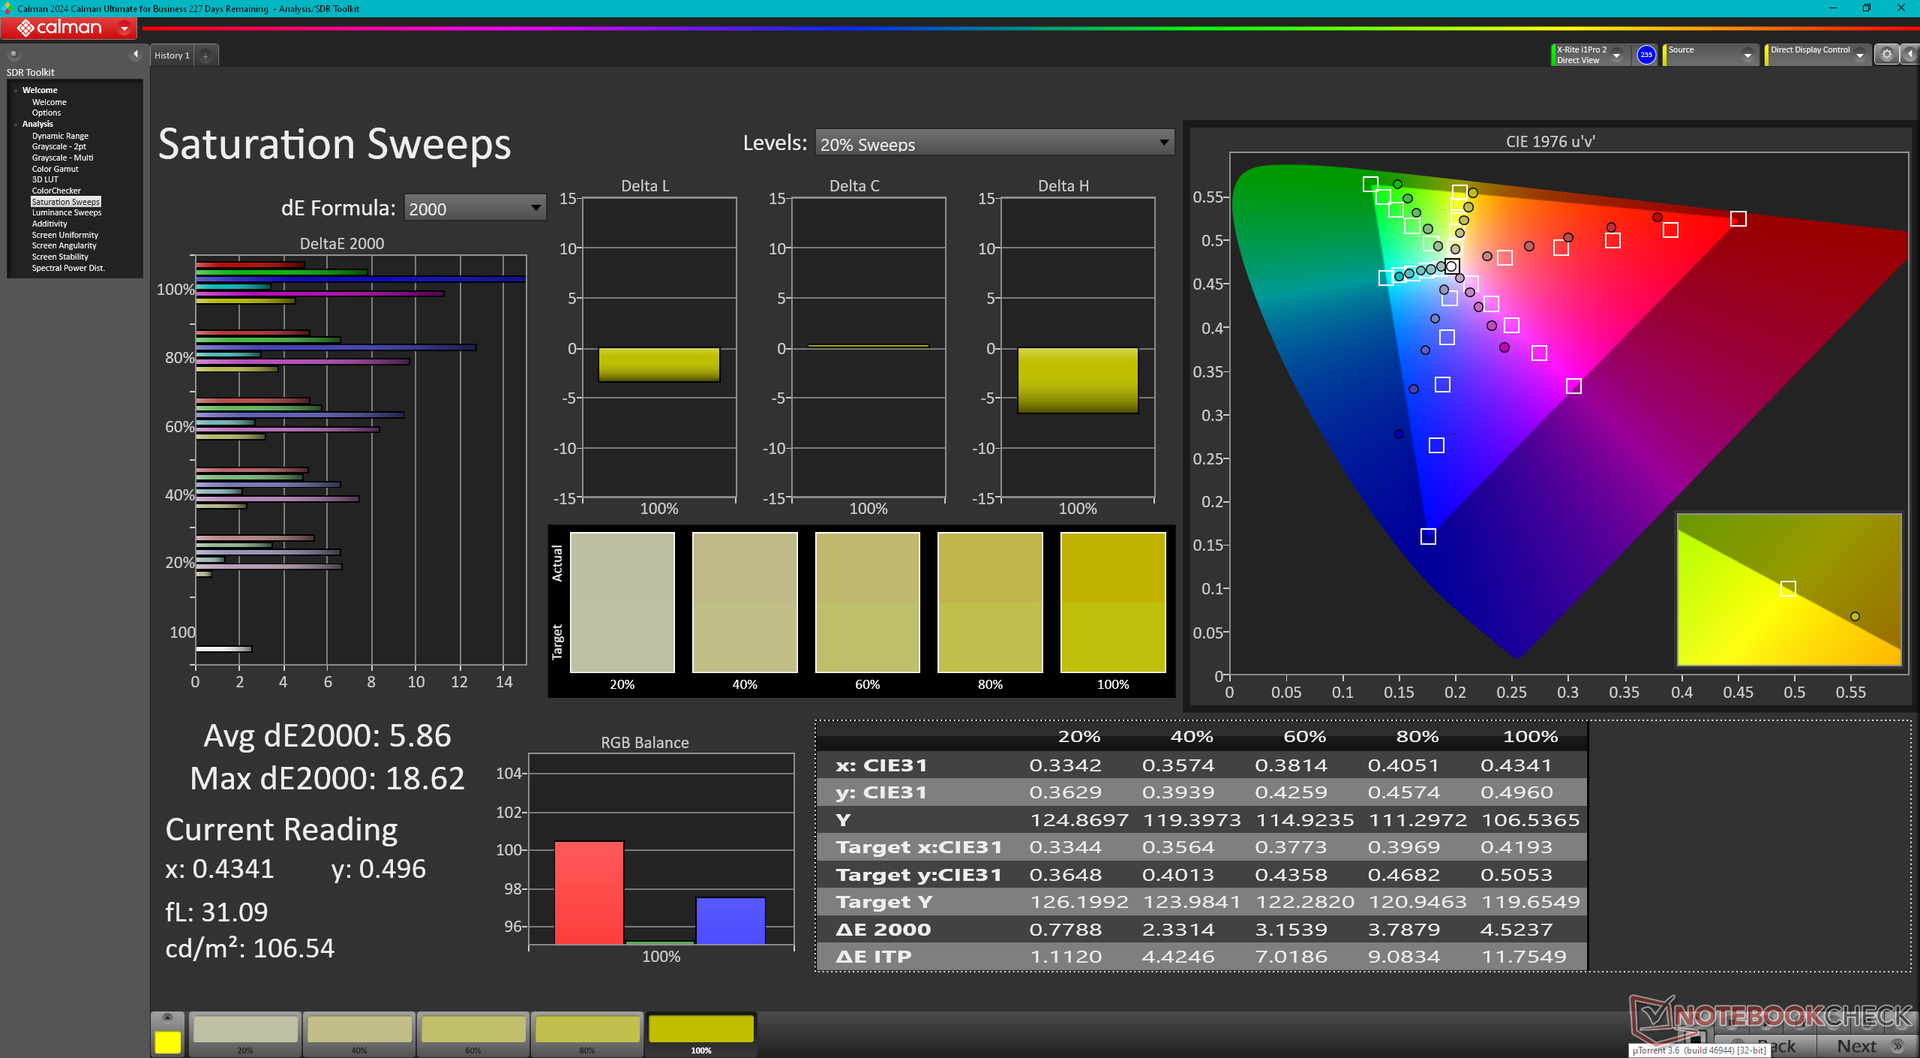
Don't let the fast 144 Hz refresh rate fool you as the display is otherwise unimpressive. Brightness, response times, and color coverage are dim, average, and narrow, respectively, to represent a a budget panel. Even subjectively the colors and ghosting are noticeably inferior to the smoother displays on more expensive models like the Lenovo Legion 5 17 or the MSI GT series. At least image quality is clean and with no major backlight bleeding or graininess problems.
Note that this exact same AU Optronics B173HAN04.9 panel also appears on the competing Asus TUF Gaming A17. The pricier 1440p240Hz configuration is expected to offer much better colors and features.
| |||||||||||||||||||||||||
Brightness Distribution: 83 %
Center on Battery: 244.5 cd/m²
Contrast: 1111:1 (Black: 0.22 cd/m²)
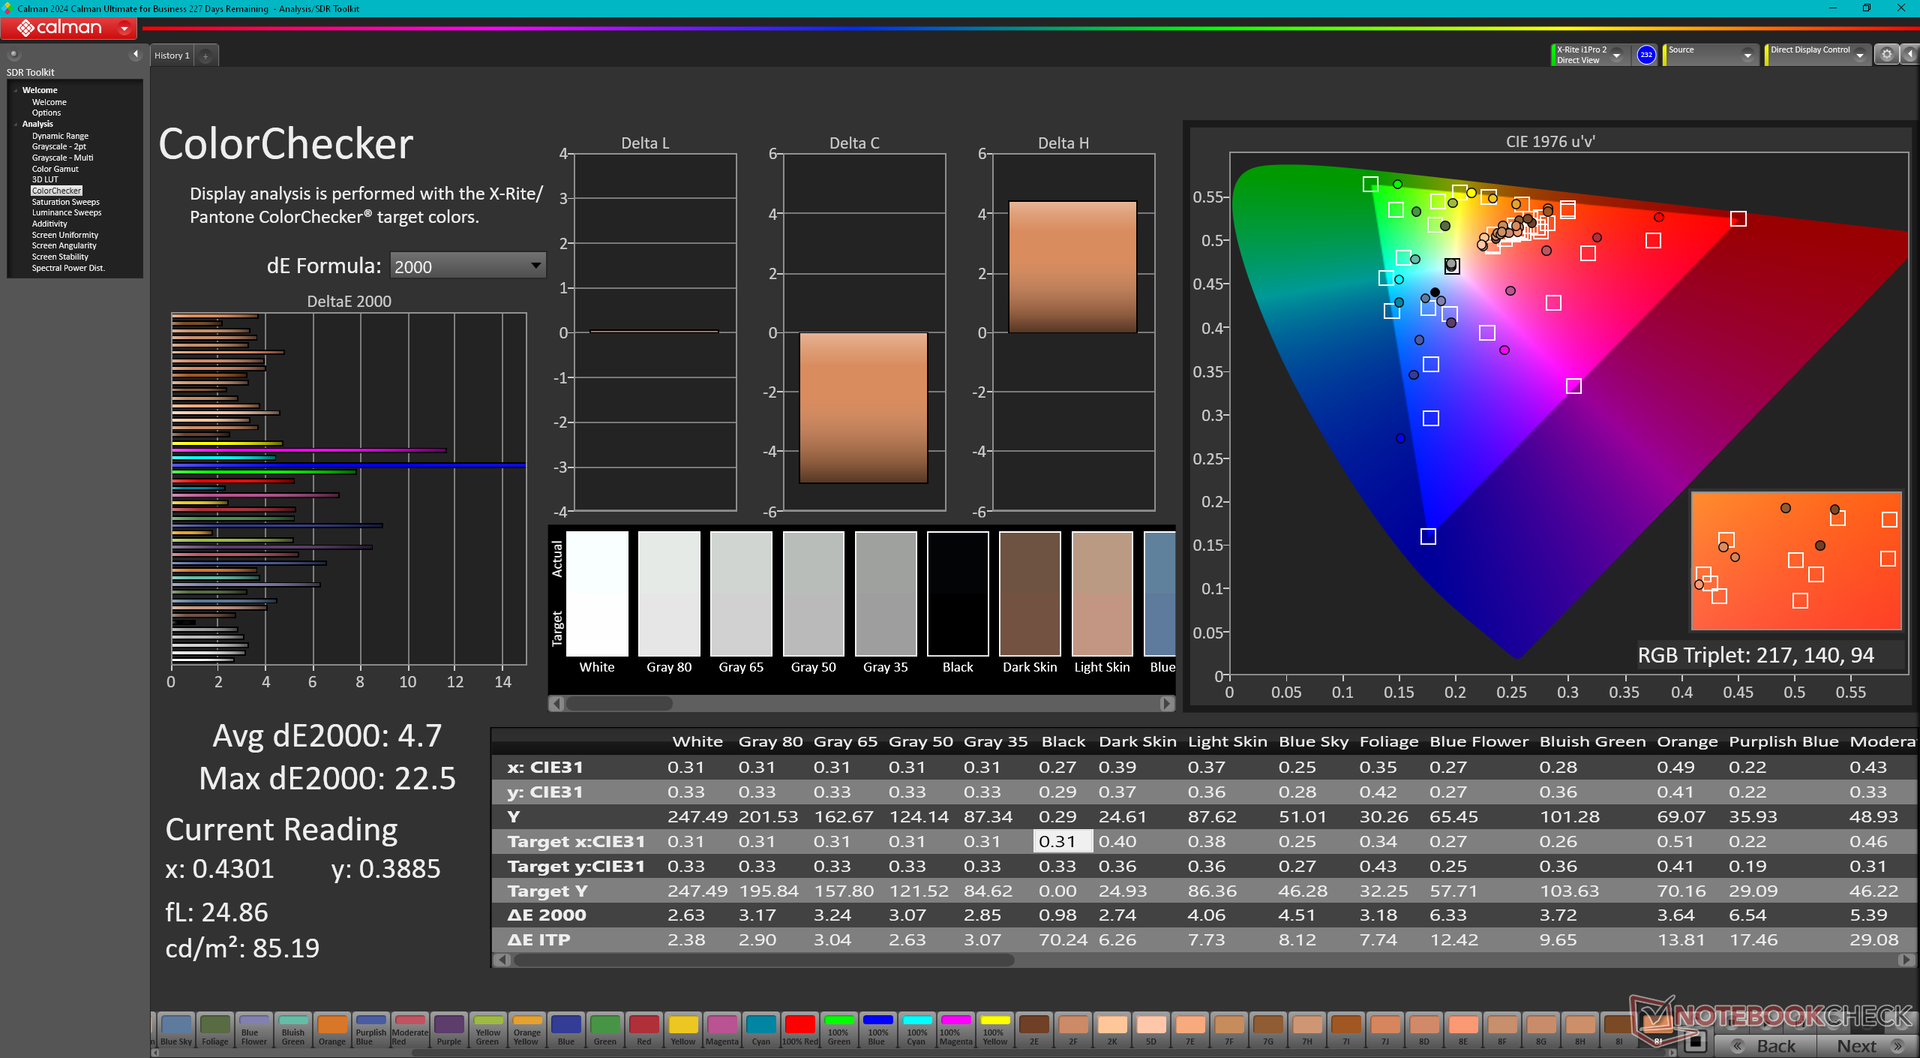
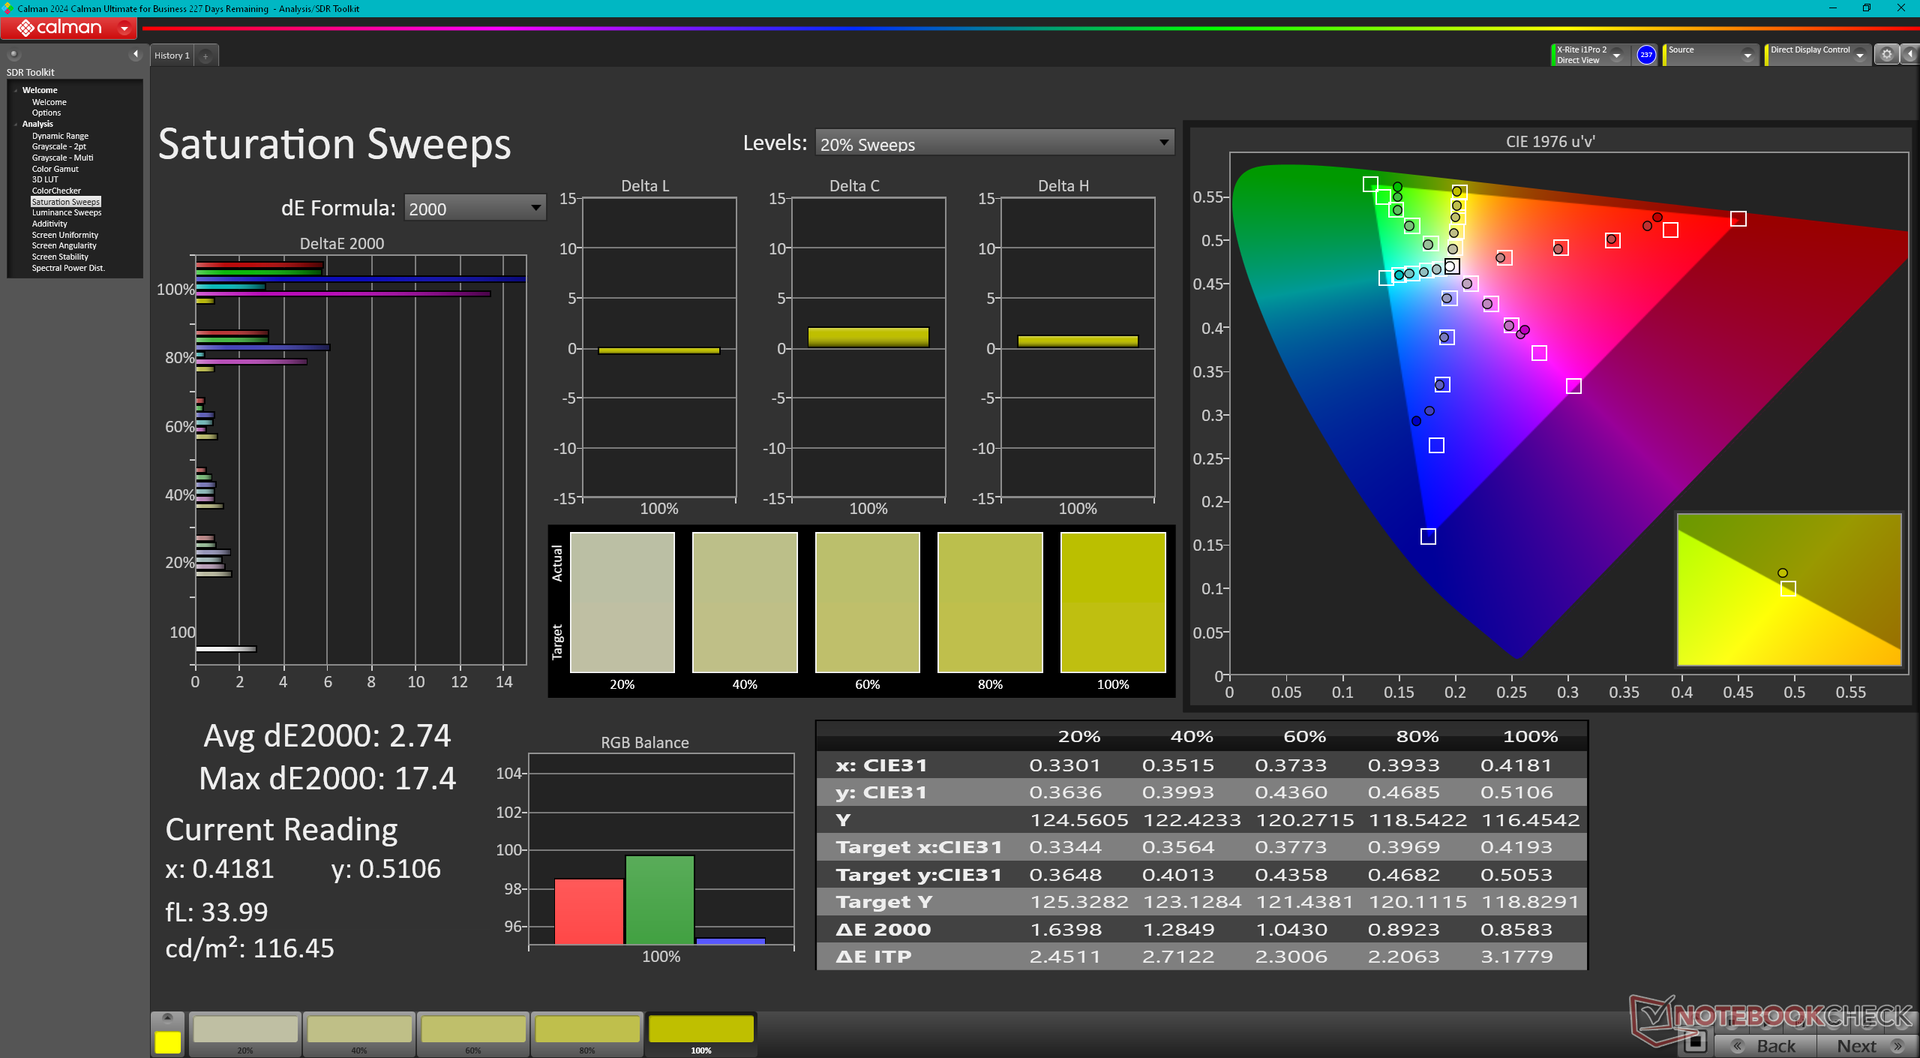
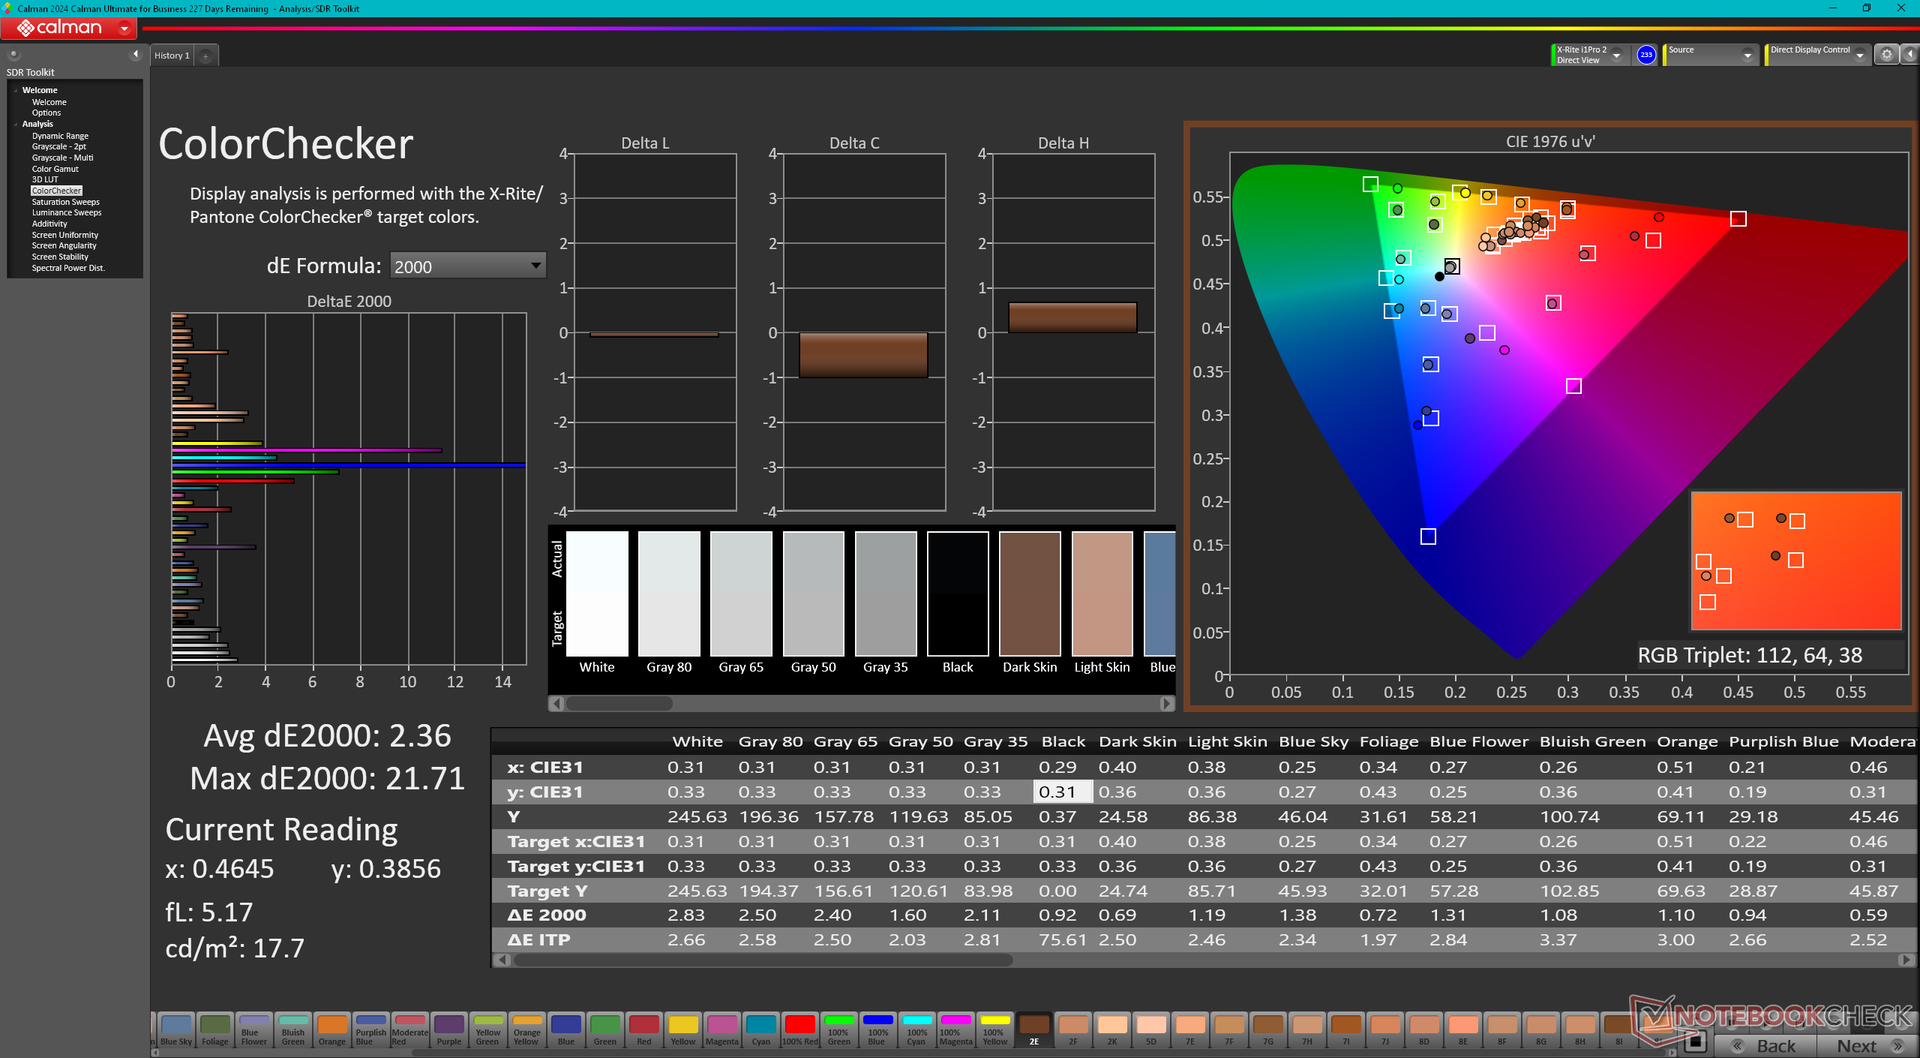
ΔE ColorChecker Calman: 4.7 | ∀{0.5-29.43 Ø4.72}
calibrated: 2.36
ΔE Greyscale Calman: 2.3 | ∀{0.09-98 Ø4.97}
41.1% AdobeRGB 1998 (Argyll 3D)
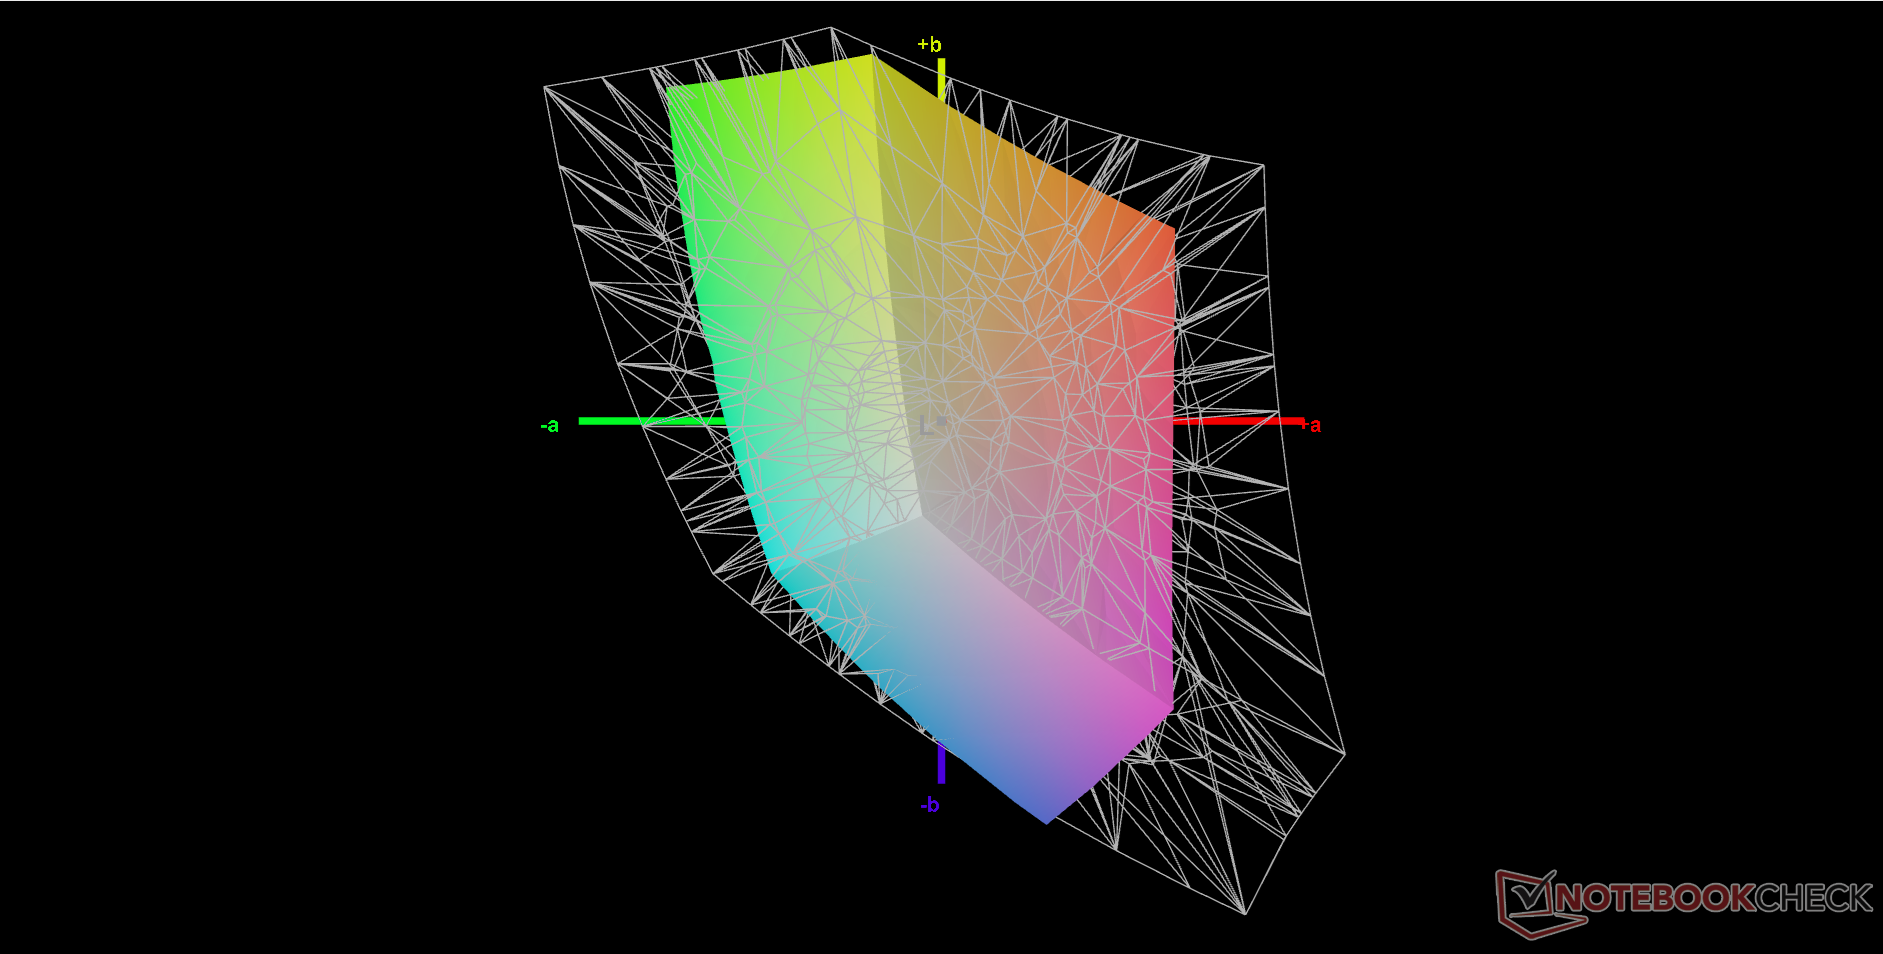
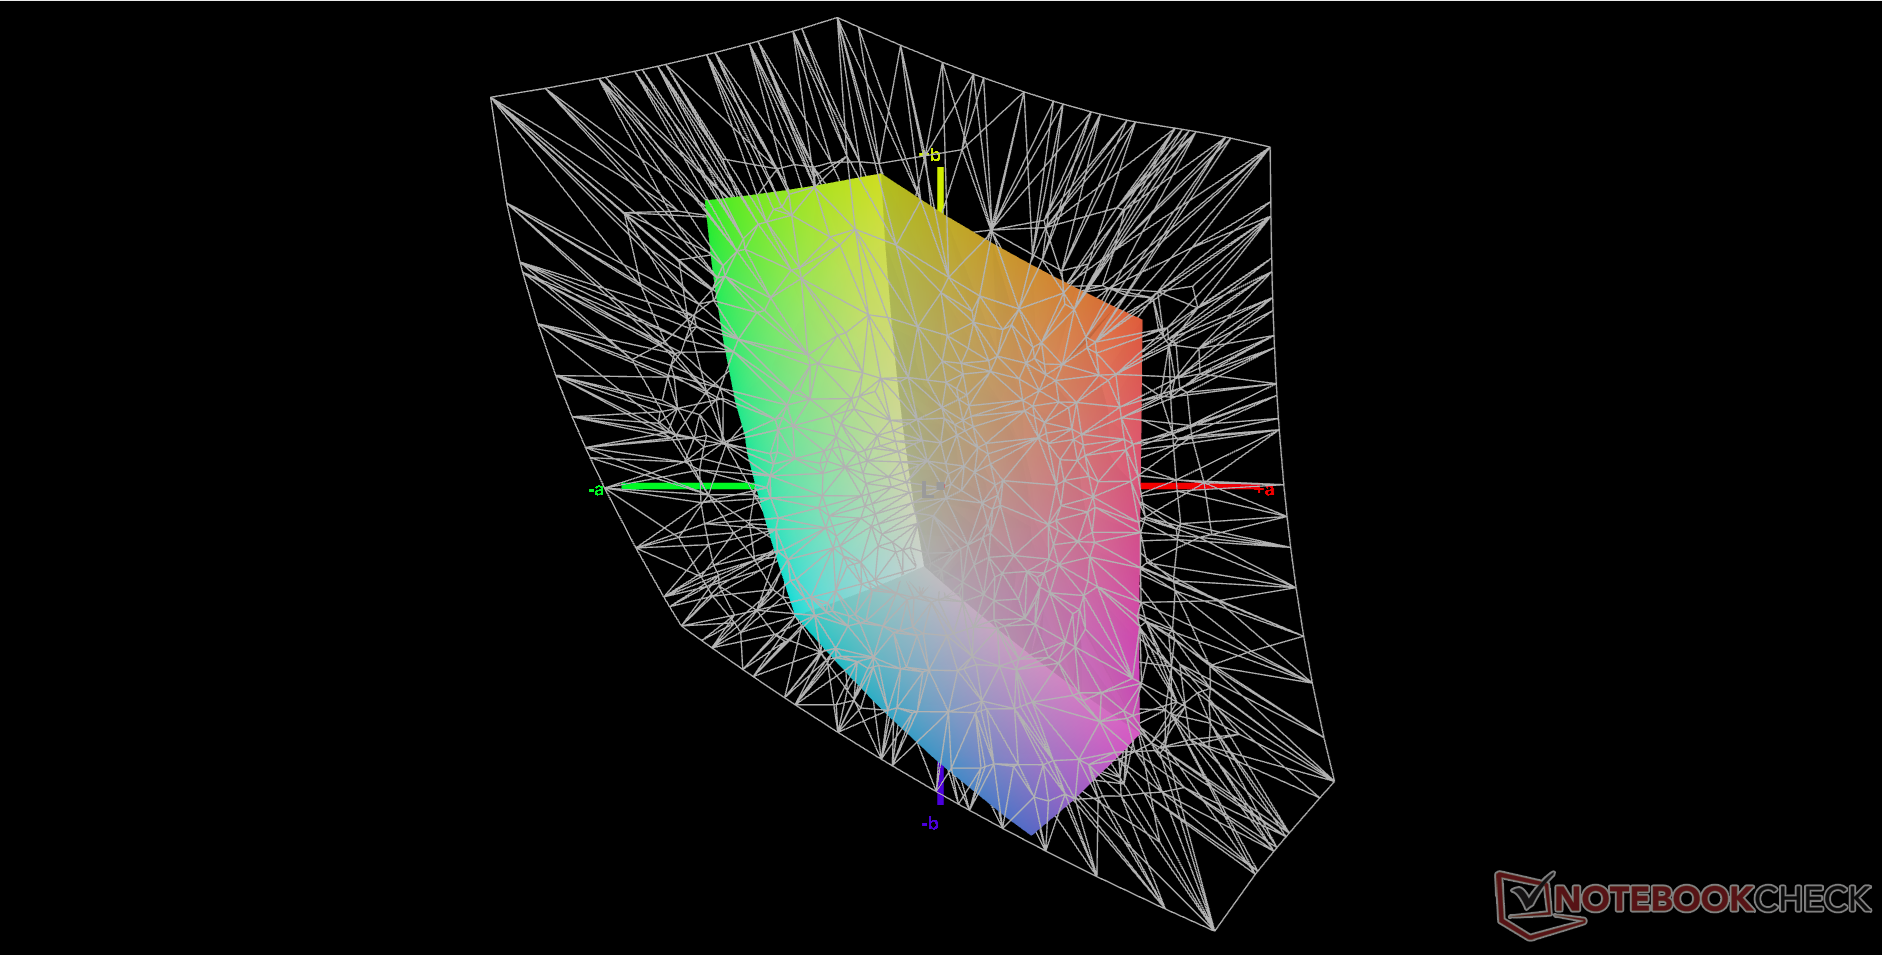
59.3% sRGB (Argyll 3D)
39.8% Display P3 (Argyll 3D)
Gamma: 2.13
CCT: 6597 K
| MSI Katana A17 AI B8VG AU Optronics B173HAN04.9, IPS, 1920x1080, 17.3", 144 Hz | HP Omen 17-db0079ng BOE0B67, IPS, 2560x1440, 17.3", 240 Hz | Asus TUF Gaming A17 FA707XI-NS94 AU Optronics B173HAN04.9, IPS, 1920x1080, 17.3", 144 Hz | Acer Nitro 17 AN17-51-71ER BOE0B7C NE173QHM-NY6, , 2560x1440, 17.3", 165 Hz | MSI Pulse 17 B13VGK AU Optronics B173HAN04.9, IPS, 1920x1080, 17.3", 144 Hz | Lenovo Legion 5 17ACH6H-82JY0003GE LEN173FHD, IPS, 1920x1080, 17.3", 144 Hz | |
|---|---|---|---|---|---|---|
| Display | 64% | 0% | 108% | -3% | 63% | |
| Display P3 Coverage (%) | 39.8 | 66.2 66% | 39.7 0% | 98.3 147% | 38.4 -4% | 64.8 63% |
| sRGB Coverage (%) | 59.3 | 95.5 61% | 59.1 0% | 100 69% | 57.5 -3% | 97.2 64% |
| AdobeRGB 1998 Coverage (%) | 41.1 | 68.1 66% | 41 0% | 85.7 109% | 39.7 -3% | 66.7 62% |
| Response Times | 60% | -18% | 60% | 2% | 57% | |
| Response Time Grey 50% / Grey 80% * (ms) | 30.8 ? | 14.4 ? 53% | 39 ? -27% | 14.8 ? 52% | 31.2 ? -1% | 15 ? 51% |
| Response Time Black / White * (ms) | 24.6 ? | 8.3 ? 66% | 26.9 ? -9% | 8 ? 67% | 23.6 ? 4% | 9 ? 63% |
| PWM Frequency (Hz) | ||||||
| Screen | 25% | 4% | -14% | 11% | 29% | |
| Brightness middle (cd/m²) | 244.5 | 363 48% | 255.9 5% | 361 48% | 254 4% | 323 32% |
| Brightness (cd/m²) | 234 | 341 46% | 248 6% | 326 39% | 250 7% | 305 30% |
| Brightness Distribution (%) | 83 | 84 1% | 91 10% | 87 5% | 91 10% | 89 7% |
| Black Level * (cd/m²) | 0.22 | 0.38 -73% | 0.21 5% | 0.6 -173% | 0.14 36% | 0.25 -14% |
| Contrast (:1) | 1111 | 955 -14% | 1219 10% | 602 -46% | 1814 63% | 1292 16% |
| Colorchecker dE 2000 * | 4.7 | 1.74 63% | 4.51 4% | 3.83 19% | 4.52 4% | 1.87 60% |
| Colorchecker dE 2000 max. * | 22.5 | 5.39 76% | 20.77 8% | 5.71 75% | 21.22 6% | 4.84 78% |
| Colorchecker dE 2000 calibrated * | 2.36 | 1.43 39% | 1.82 23% | 3.48 -47% | 4.52 -92% | 0.92 61% |
| Greyscale dE 2000 * | 2.3 | 1.3 43% | 3.2 -39% | 3.29 -43% | 1 57% | 2.57 -12% |
| Gamma | 2.13 103% | 2.235 98% | 2.08 106% | 2.29 96% | 2.44 90% | 2.42 91% |
| CCT | 6597 99% | 6346 102% | 6054 107% | 6679 97% | 6502 100% | 7012 93% |
| Total Average (Program / Settings) | 50% /
39% | -5% /
-0% | 51% /
23% | 3% /
6% | 50% /
40% |
* ... smaller is better
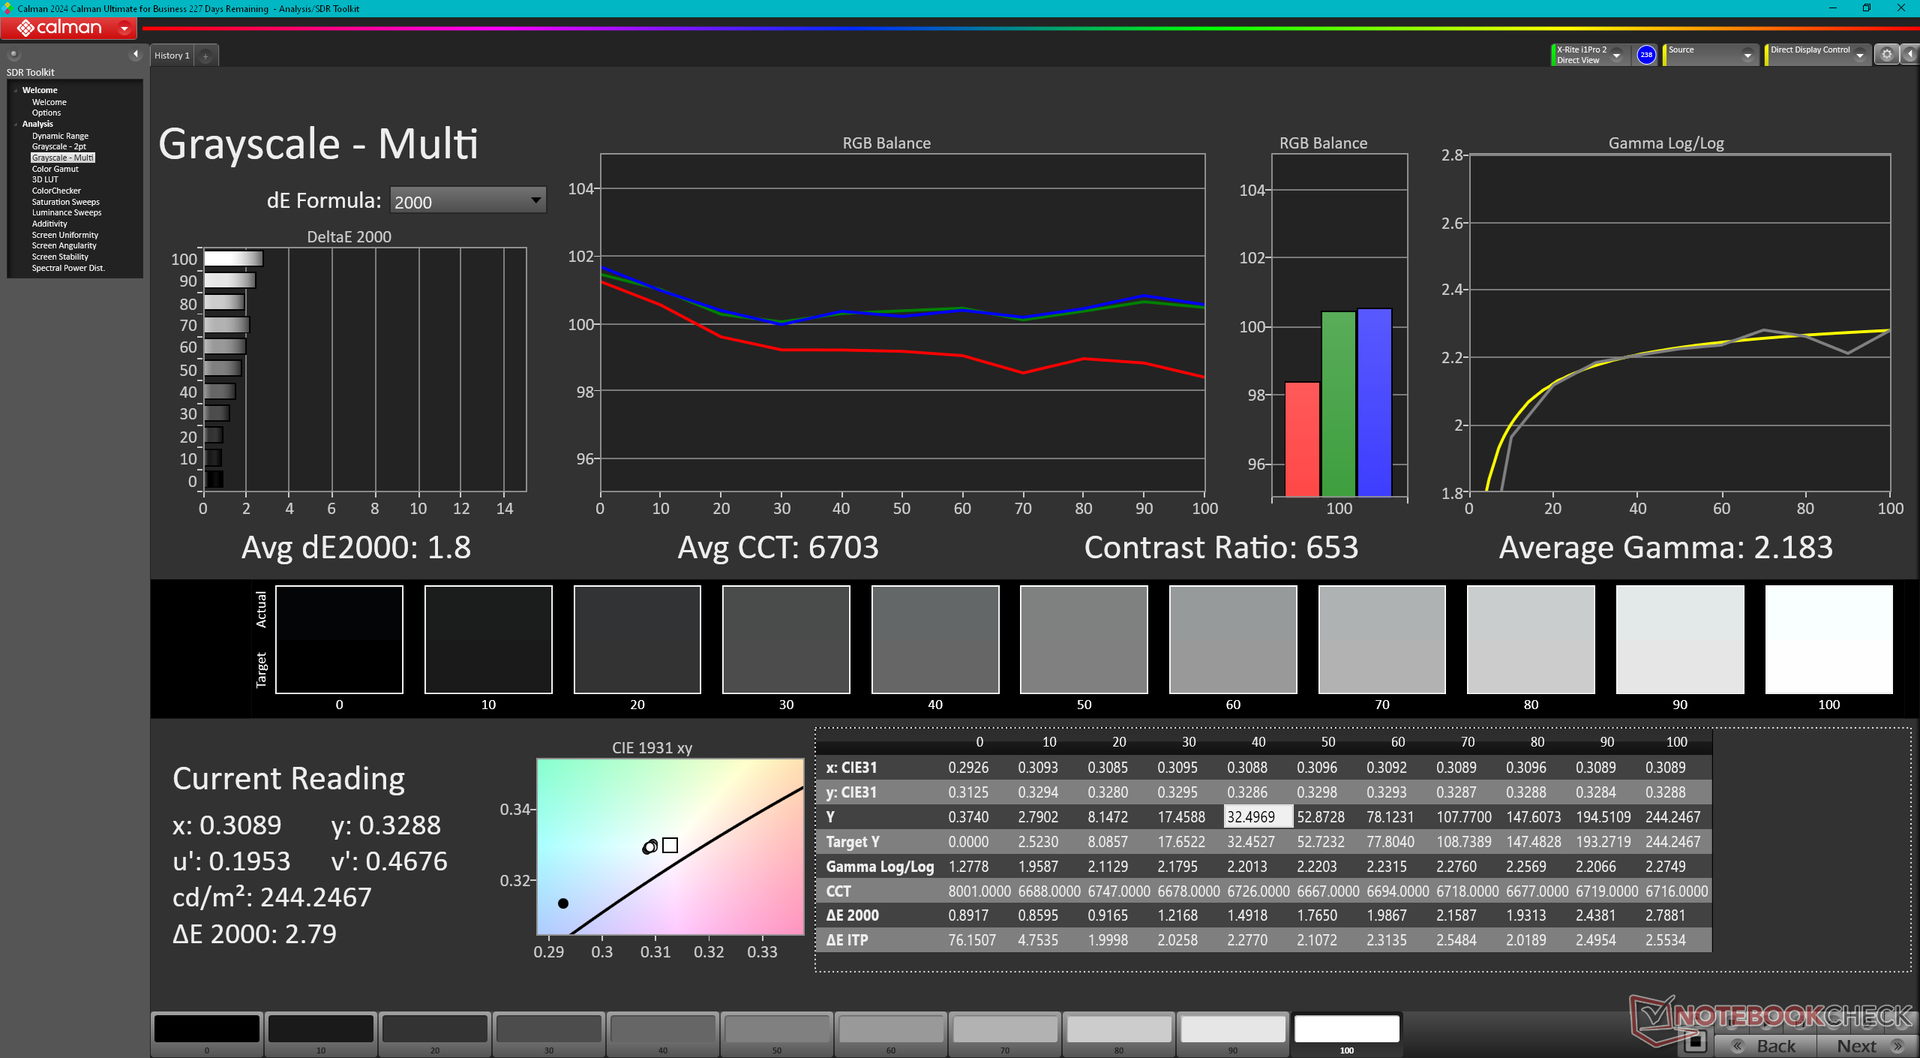
Grayscale is decent out of the box while color accuracy could be improved. Calibrating the panel ourselves would improve average grayscale and color deltaE values from 2.3 to 1.8 and 4.7 to 2.36, respectively. Our calibrated ICM profile is available to download above for free.
Display Response Times
| ↔ Response Time Black to White | ||
|---|---|---|
| 24.6 ms ... rise ↗ and fall ↘ combined | ↗ 12.7 ms rise | 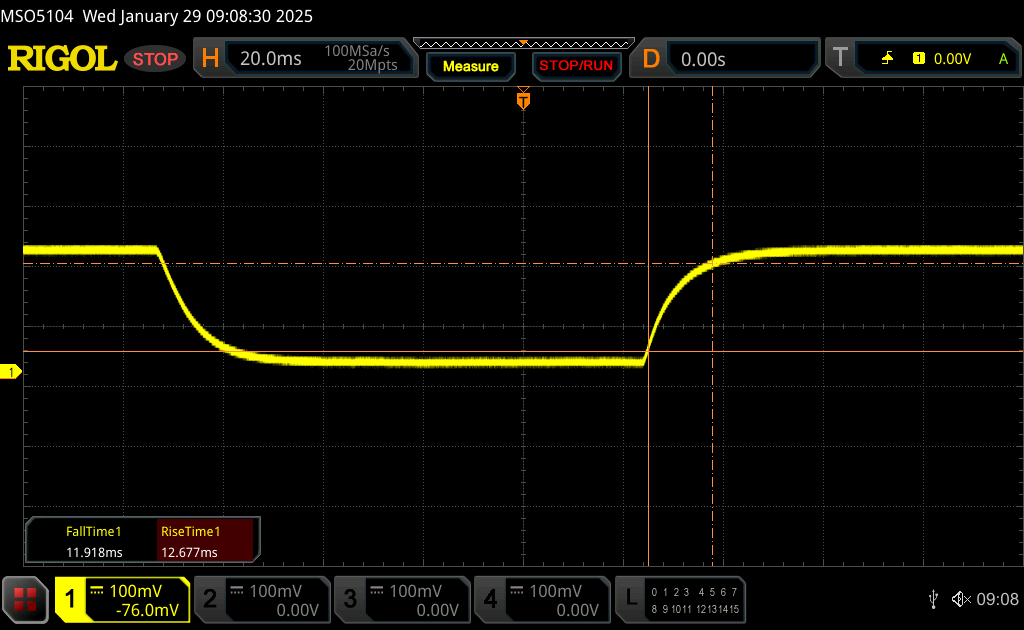 |
| ↘ 11.9 ms fall | ||
| The screen shows good response rates in our tests, but may be too slow for competitive gamers. In comparison, all tested devices range from 0.1 (minimum) to 240 (maximum) ms. » 58 % of all devices are better. This means that the measured response time is worse than the average of all tested devices (19.8 ms). | ||
| ↔ Response Time 50% Grey to 80% Grey | ||
| 30.8 ms ... rise ↗ and fall ↘ combined | ↗ 14.4 ms rise | 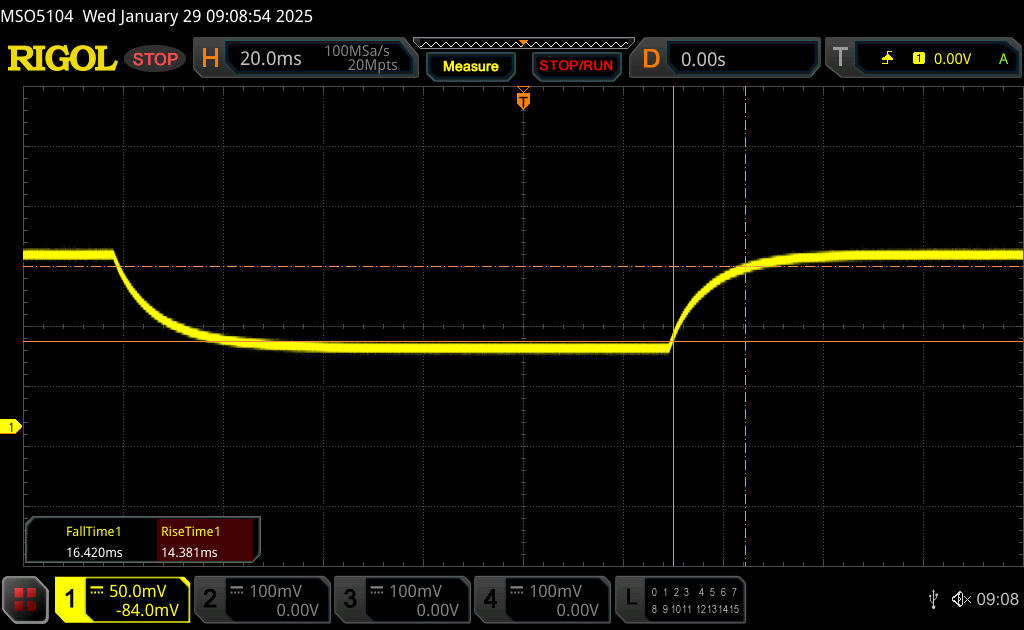 |
| ↘ 16.4 ms fall | ||
| The screen shows slow response rates in our tests and will be unsatisfactory for gamers. In comparison, all tested devices range from 0.165 (minimum) to 636 (maximum) ms. » 41 % of all devices are better. This means that the measured response time is similar to the average of all tested devices (31 ms). | ||
Screen Flickering / PWM (Pulse-Width Modulation)
| Screen flickering / PWM not detected |  | ||
In comparison: 52 % of all tested devices do not use PWM to dim the display. If PWM was detected, an average of 7763 (minimum: 5 - maximum: 343500) Hz was measured. | |||
Performance — Greater Performance-Per-Watt With AMD Zen 4
Testing Conditions
We set Windows and MSI Center to Performance mode prior to running the benchmarks below. We also set the system to discrete GPU mode instead of MSHybrid. Owners should become familiar with MSI Center as many key settings are toggled here.
Processor
The Ryzen 7 8845HS is most comparable to the Core i7-12700H both of which pair very well with the mobile RTX 4070. Upgrading to the Ryzen 9 8945HS configuration is only expected to provide very marginal gains of up to 5 percent based on our time with the Katana A15.
Cinebench R15 Multi Loop
Cinebench R23: Multi Core | Single Core
Cinebench R20: CPU (Multi Core) | CPU (Single Core)
Cinebench R15: CPU Multi 64Bit | CPU Single 64Bit
Blender: v2.79 BMW27 CPU
7-Zip 18.03: 7z b 4 | 7z b 4 -mmt1
Geekbench 6.7: Multi-Core | Single-Core
Geekbench 5.5: Multi-Core | Single-Core
HWBOT x265 Benchmark v2.2: 4k Preset
LibreOffice : 20 Documents To PDF
R Benchmark 2.5: Overall mean
| Geekbench 6.7 / Multi-Core | |
| Eurocom Raptor X17 Core i9-14900HX | |
| MSI Katana A17 AI B8VG | |
| Average AMD Ryzen 7 8845HS (11073 - 14014, n=18) | |
| HP Omen 17-db0079ng | |
| Asus TUF Gaming A17 FA707XI-NS94 | |
| Acer Nitro 17 AN17-41-R9LN | |
| Geekbench 6.7 / Single-Core | |
| Eurocom Raptor X17 Core i9-14900HX | |
| Asus TUF Gaming A17 FA707XI-NS94 | |
| MSI Katana A17 AI B8VG | |
| Average AMD Ryzen 7 8845HS (2510 - 2698, n=16) | |
| HP Omen 17-db0079ng | |
| Acer Nitro 17 AN17-41-R9LN | |
Cinebench R23: Multi Core | Single Core
Cinebench R20: CPU (Multi Core) | CPU (Single Core)
Cinebench R15: CPU Multi 64Bit | CPU Single 64Bit
Blender: v2.79 BMW27 CPU
7-Zip 18.03: 7z b 4 | 7z b 4 -mmt1
Geekbench 6.7: Multi-Core | Single-Core
Geekbench 5.5: Multi-Core | Single-Core
HWBOT x265 Benchmark v2.2: 4k Preset
LibreOffice : 20 Documents To PDF
R Benchmark 2.5: Overall mean
* ... smaller is better
AIDA64: FP32 Ray-Trace | FPU Julia | CPU SHA3 | CPU Queen | FPU SinJulia | FPU Mandel | CPU AES | CPU ZLib | FP64 Ray-Trace | CPU PhotoWorxx
| Performance rating | |
| Asus TUF Gaming A17 FA707XI-NS94 | |
| HP Omen 17-db0079ng | |
| MSI Katana A17 AI B8VG | |
| Average AMD Ryzen 7 8845HS | |
| Acer Nitro 17 AN17-51-71ER | |
| MSI Pulse 17 B13VGK | |
| Lenovo Legion 5 17ACH6H-82JY0003GE | |
| AIDA64 / FP32 Ray-Trace | |
| Asus TUF Gaming A17 FA707XI-NS94 | |
| HP Omen 17-db0079ng | |
| MSI Katana A17 AI B8VG | |
| Average AMD Ryzen 7 8845HS (23708 - 29544, n=13) | |
| MSI Pulse 17 B13VGK | |
| Acer Nitro 17 AN17-51-71ER | |
| Lenovo Legion 5 17ACH6H-82JY0003GE | |
| AIDA64 / FPU Julia | |
| Asus TUF Gaming A17 FA707XI-NS94 | |
| HP Omen 17-db0079ng | |
| MSI Katana A17 AI B8VG | |
| Average AMD Ryzen 7 8845HS (99659 - 125873, n=13) | |
| MSI Pulse 17 B13VGK | |
| Acer Nitro 17 AN17-51-71ER | |
| Lenovo Legion 5 17ACH6H-82JY0003GE | |
| AIDA64 / CPU SHA3 | |
| Asus TUF Gaming A17 FA707XI-NS94 | |
| HP Omen 17-db0079ng | |
| MSI Katana A17 AI B8VG | |
| Average AMD Ryzen 7 8845HS (4332 - 5180, n=13) | |
| Acer Nitro 17 AN17-51-71ER | |
| MSI Pulse 17 B13VGK | |
| Lenovo Legion 5 17ACH6H-82JY0003GE | |
| AIDA64 / CPU Queen | |
| Asus TUF Gaming A17 FA707XI-NS94 | |
| MSI Katana A17 AI B8VG | |
| Average AMD Ryzen 7 8845HS (109458 - 124695, n=13) | |
| HP Omen 17-db0079ng | |
| Acer Nitro 17 AN17-51-71ER | |
| MSI Pulse 17 B13VGK | |
| Lenovo Legion 5 17ACH6H-82JY0003GE | |
| AIDA64 / FPU SinJulia | |
| Asus TUF Gaming A17 FA707XI-NS94 | |
| MSI Katana A17 AI B8VG | |
| HP Omen 17-db0079ng | |
| Average AMD Ryzen 7 8845HS (14062 - 15519, n=13) | |
| MSI Pulse 17 B13VGK | |
| Acer Nitro 17 AN17-51-71ER | |
| Lenovo Legion 5 17ACH6H-82JY0003GE | |
| AIDA64 / FPU Mandel | |
| Asus TUF Gaming A17 FA707XI-NS94 | |
| HP Omen 17-db0079ng | |
| MSI Katana A17 AI B8VG | |
| Average AMD Ryzen 7 8845HS (53436 - 67367, n=13) | |
| MSI Pulse 17 B13VGK | |
| Acer Nitro 17 AN17-51-71ER | |
| Lenovo Legion 5 17ACH6H-82JY0003GE | |
| AIDA64 / CPU AES | |
| Acer Nitro 17 AN17-51-71ER | |
| Lenovo Legion 5 17ACH6H-82JY0003GE | |
| Average AMD Ryzen 7 8845HS (64515 - 172642, n=13) | |
| Asus TUF Gaming A17 FA707XI-NS94 | |
| HP Omen 17-db0079ng | |
| MSI Katana A17 AI B8VG | |
| MSI Pulse 17 B13VGK | |
| AIDA64 / CPU ZLib | |
| Acer Nitro 17 AN17-51-71ER | |
| MSI Pulse 17 B13VGK | |
| Asus TUF Gaming A17 FA707XI-NS94 | |
| HP Omen 17-db0079ng | |
| MSI Katana A17 AI B8VG | |
| Average AMD Ryzen 7 8845HS (627 - 1080, n=13) | |
| Lenovo Legion 5 17ACH6H-82JY0003GE | |
| AIDA64 / FP64 Ray-Trace | |
| Asus TUF Gaming A17 FA707XI-NS94 | |
| HP Omen 17-db0079ng | |
| MSI Katana A17 AI B8VG | |
| Average AMD Ryzen 7 8845HS (12361 - 15911, n=13) | |
| MSI Pulse 17 B13VGK | |
| Acer Nitro 17 AN17-51-71ER | |
| Lenovo Legion 5 17ACH6H-82JY0003GE | |
| AIDA64 / CPU PhotoWorxx | |
| HP Omen 17-db0079ng | |
| MSI Katana A17 AI B8VG | |
| Average AMD Ryzen 7 8845HS (33192 - 41668, n=13) | |
| MSI Pulse 17 B13VGK | |
| Acer Nitro 17 AN17-51-71ER | |
| Asus TUF Gaming A17 FA707XI-NS94 | |
| Lenovo Legion 5 17ACH6H-82JY0003GE | |
Stress Test
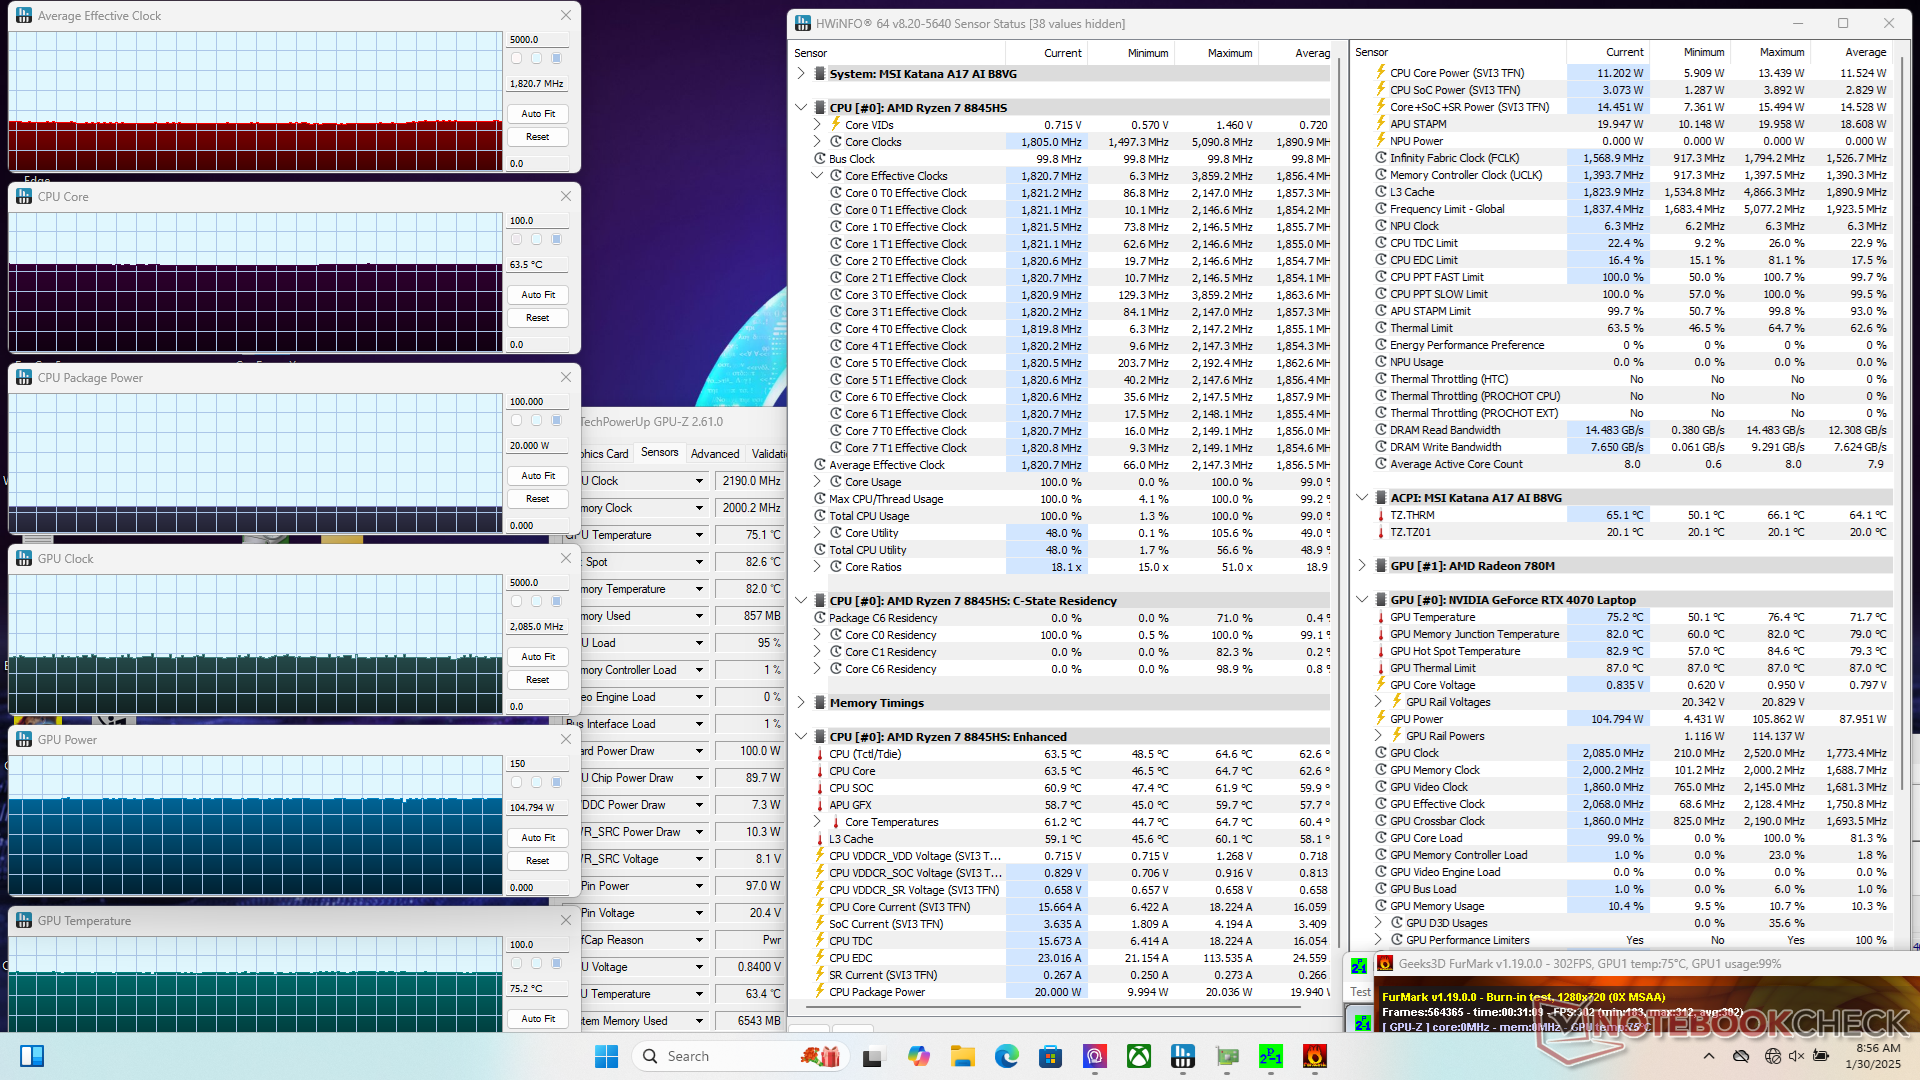
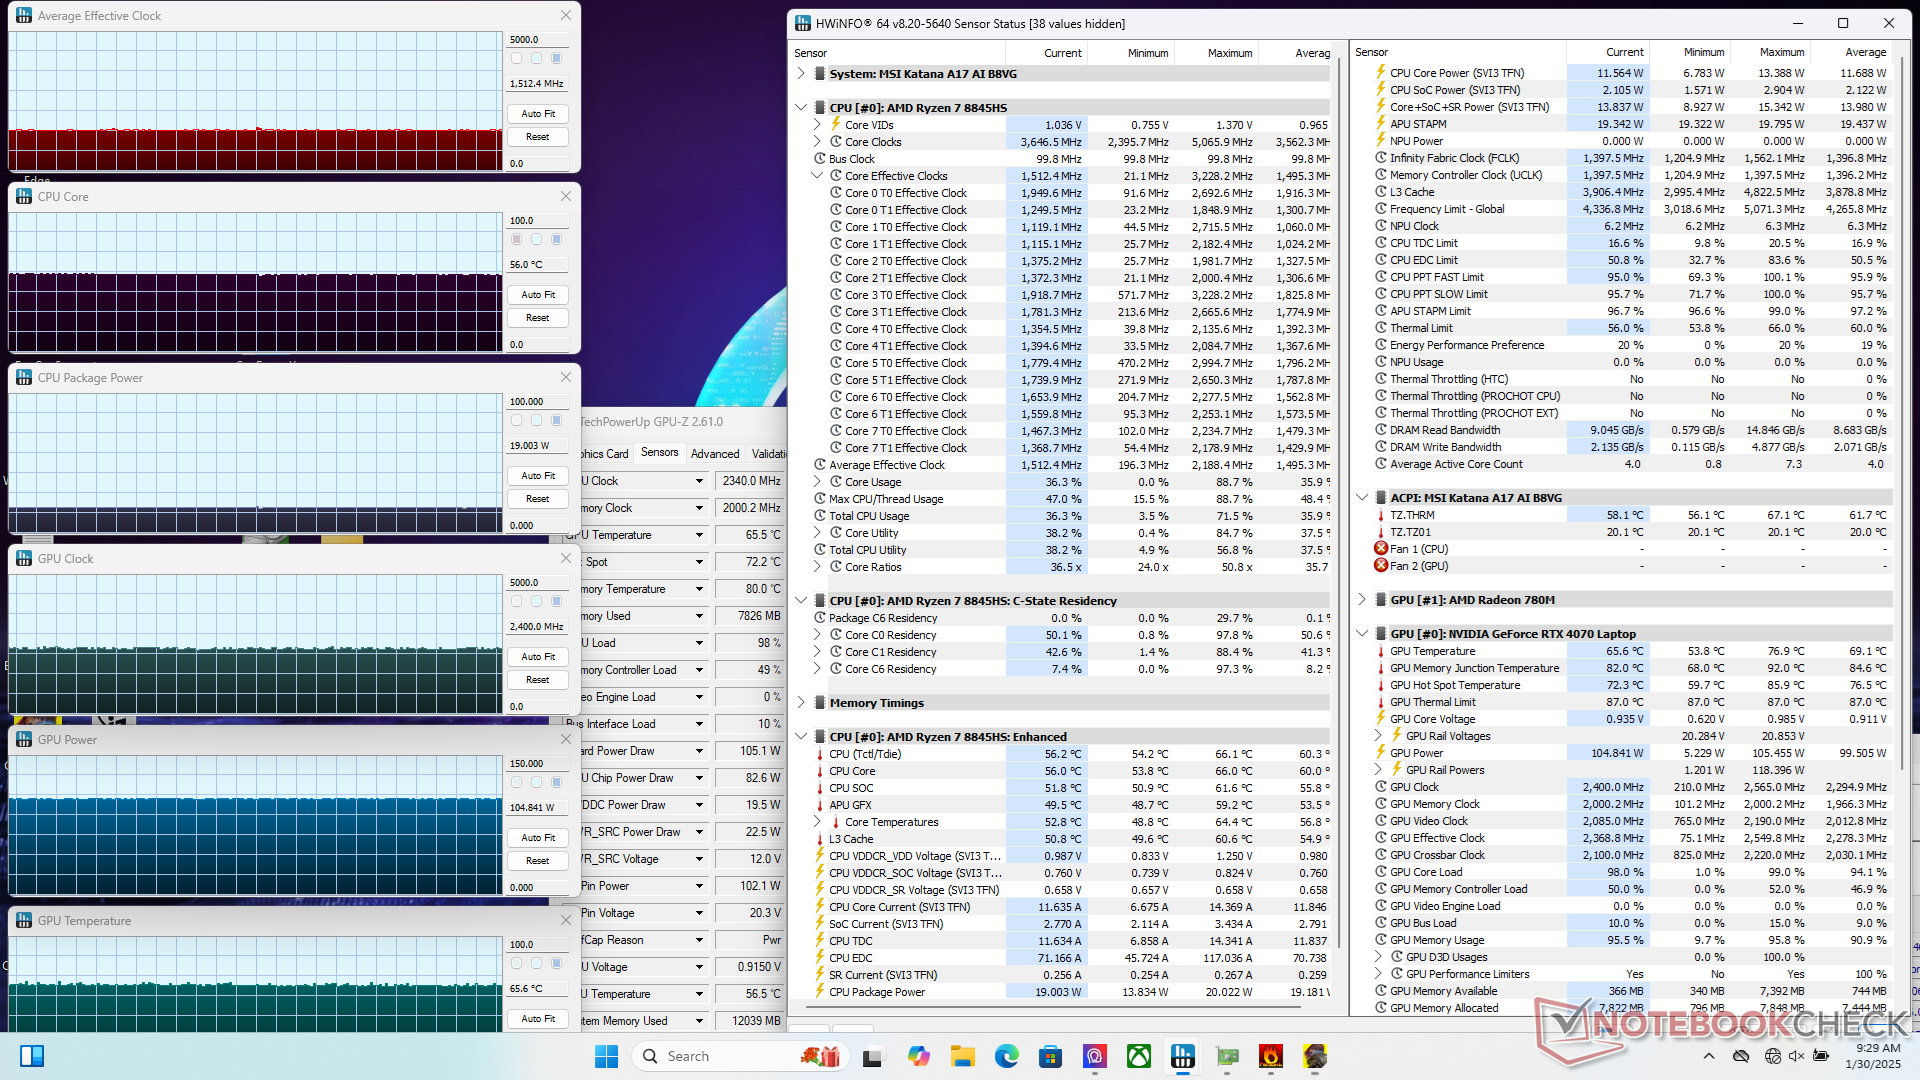
The CPU would maintain a clock rate and package power draw of 2.0 GHz and 20 W, respectively, when initiating Prime95 stress. CPU and GPU temperatures would also remain relatively cool for a gaming laptop at just ~65 C each when running demanding loads like games. In comparison, the CPU and GPU in the Maingear ML-16 would stabilize at much warmer temperatures of ~100 C and 85 C, respectively, when under similar conditions.
Note that Cooler Boost mode (i.e., maximum fan mode) has no major impact on gaming performance as shown by our screenshots below. However, dropping to Balanced mode puts a lower cap on GPU clock rate. These results align with what we've observed on other MSI gaming laptops as well.
GPU power draw would drop from 100 W to just 65 W if switching from Performance mode to Balanced mode.
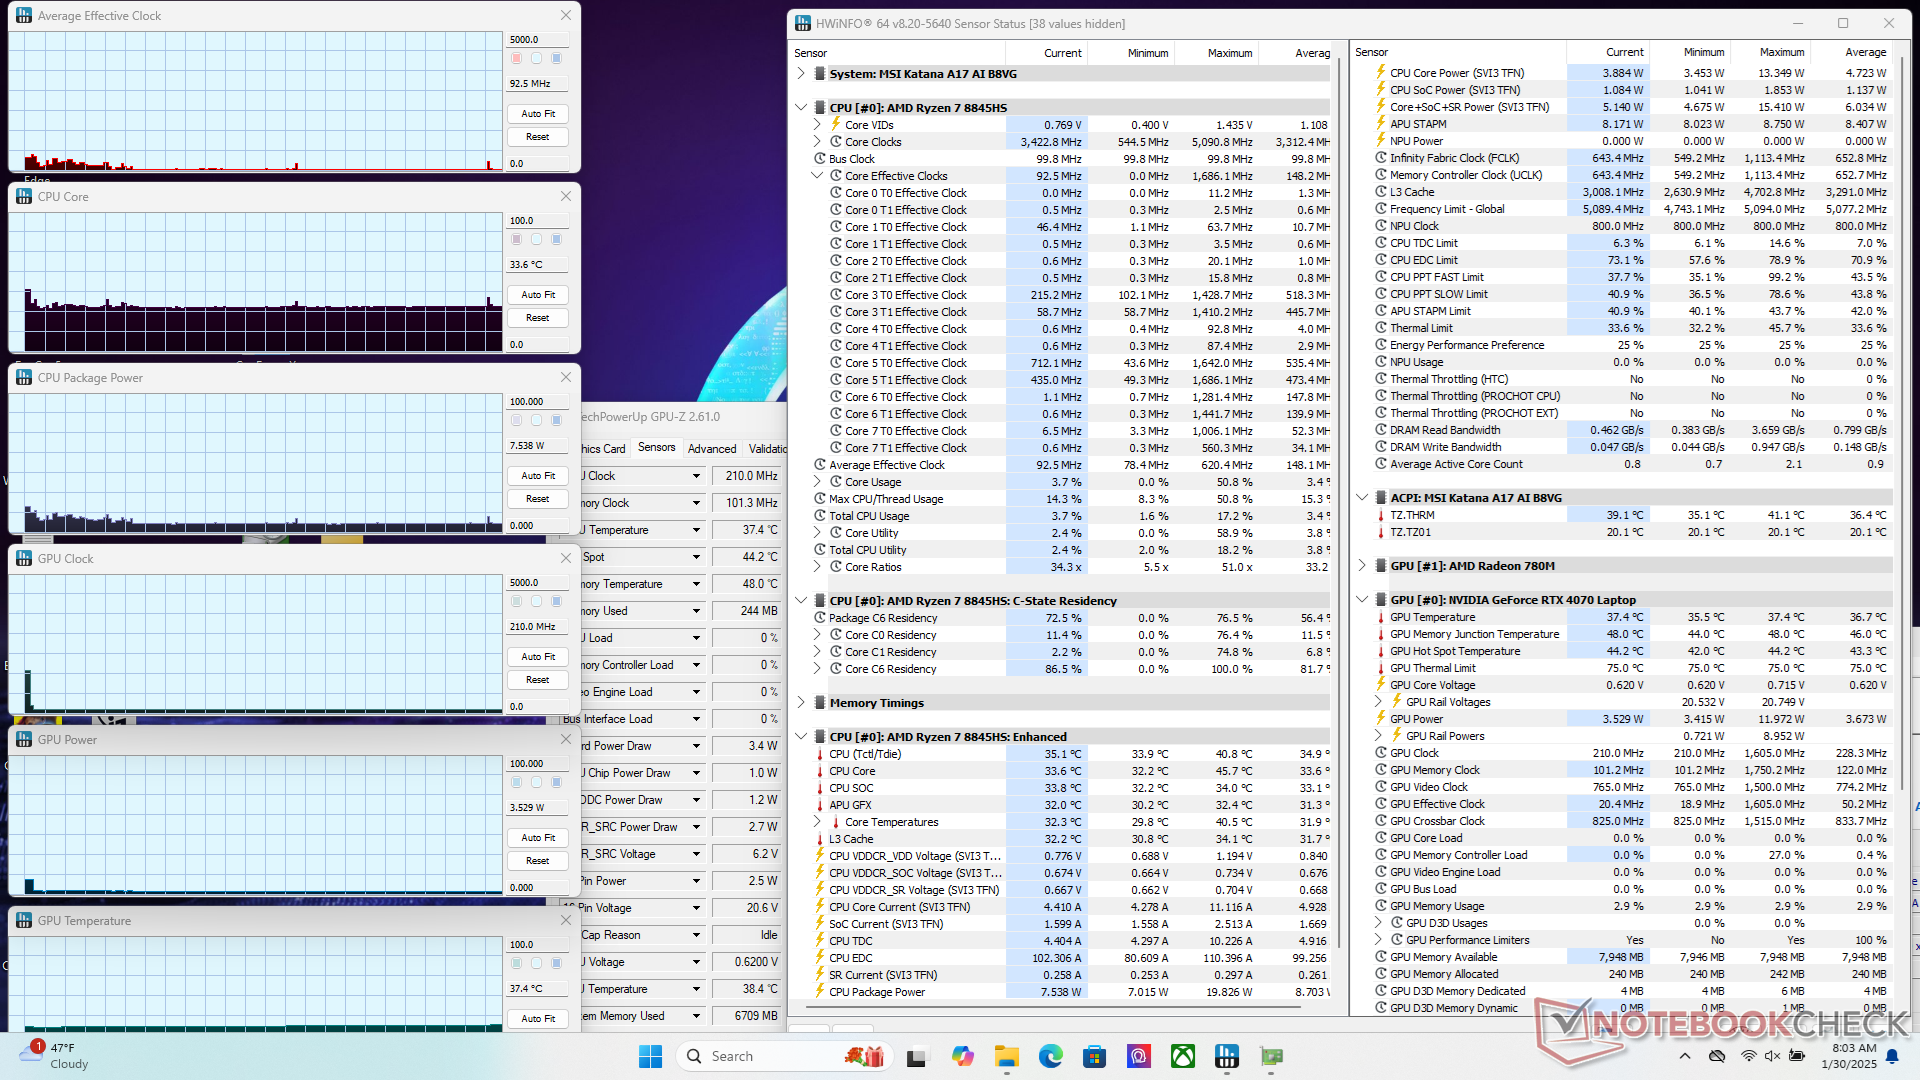
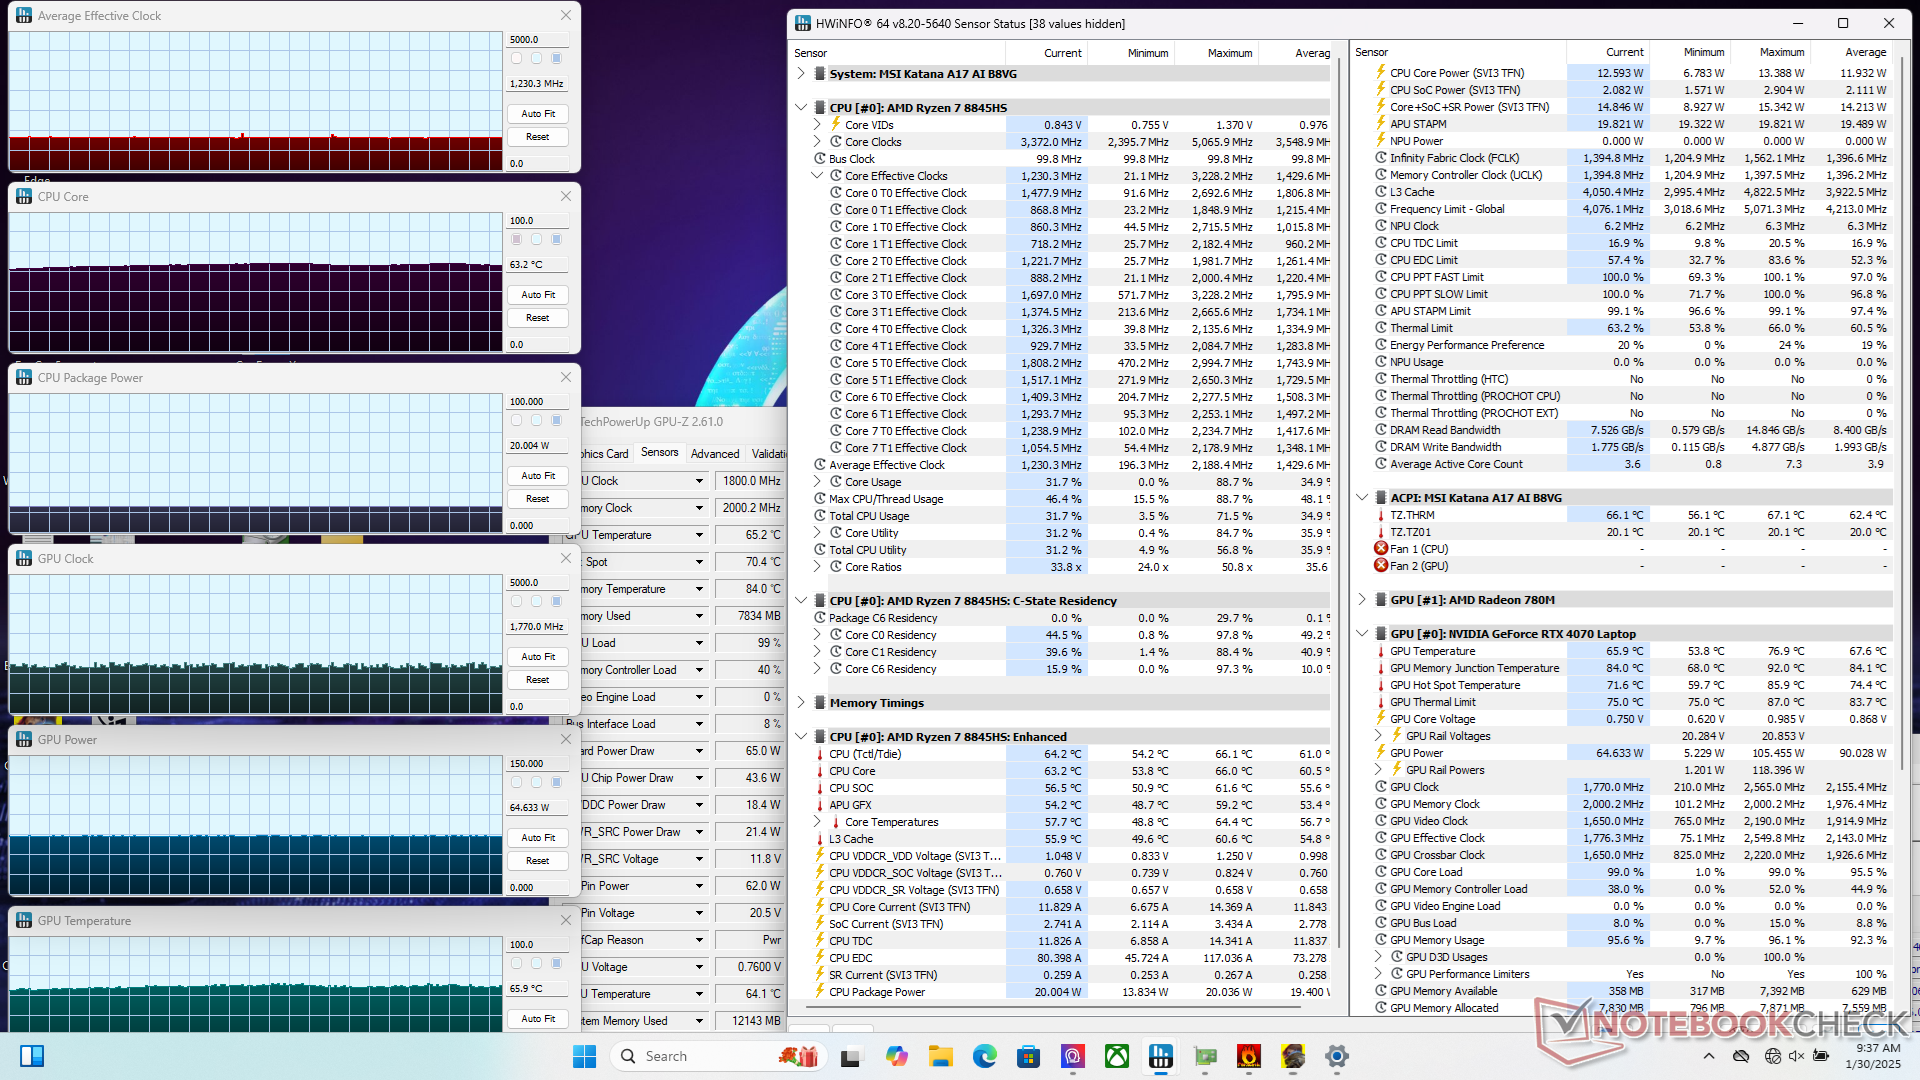
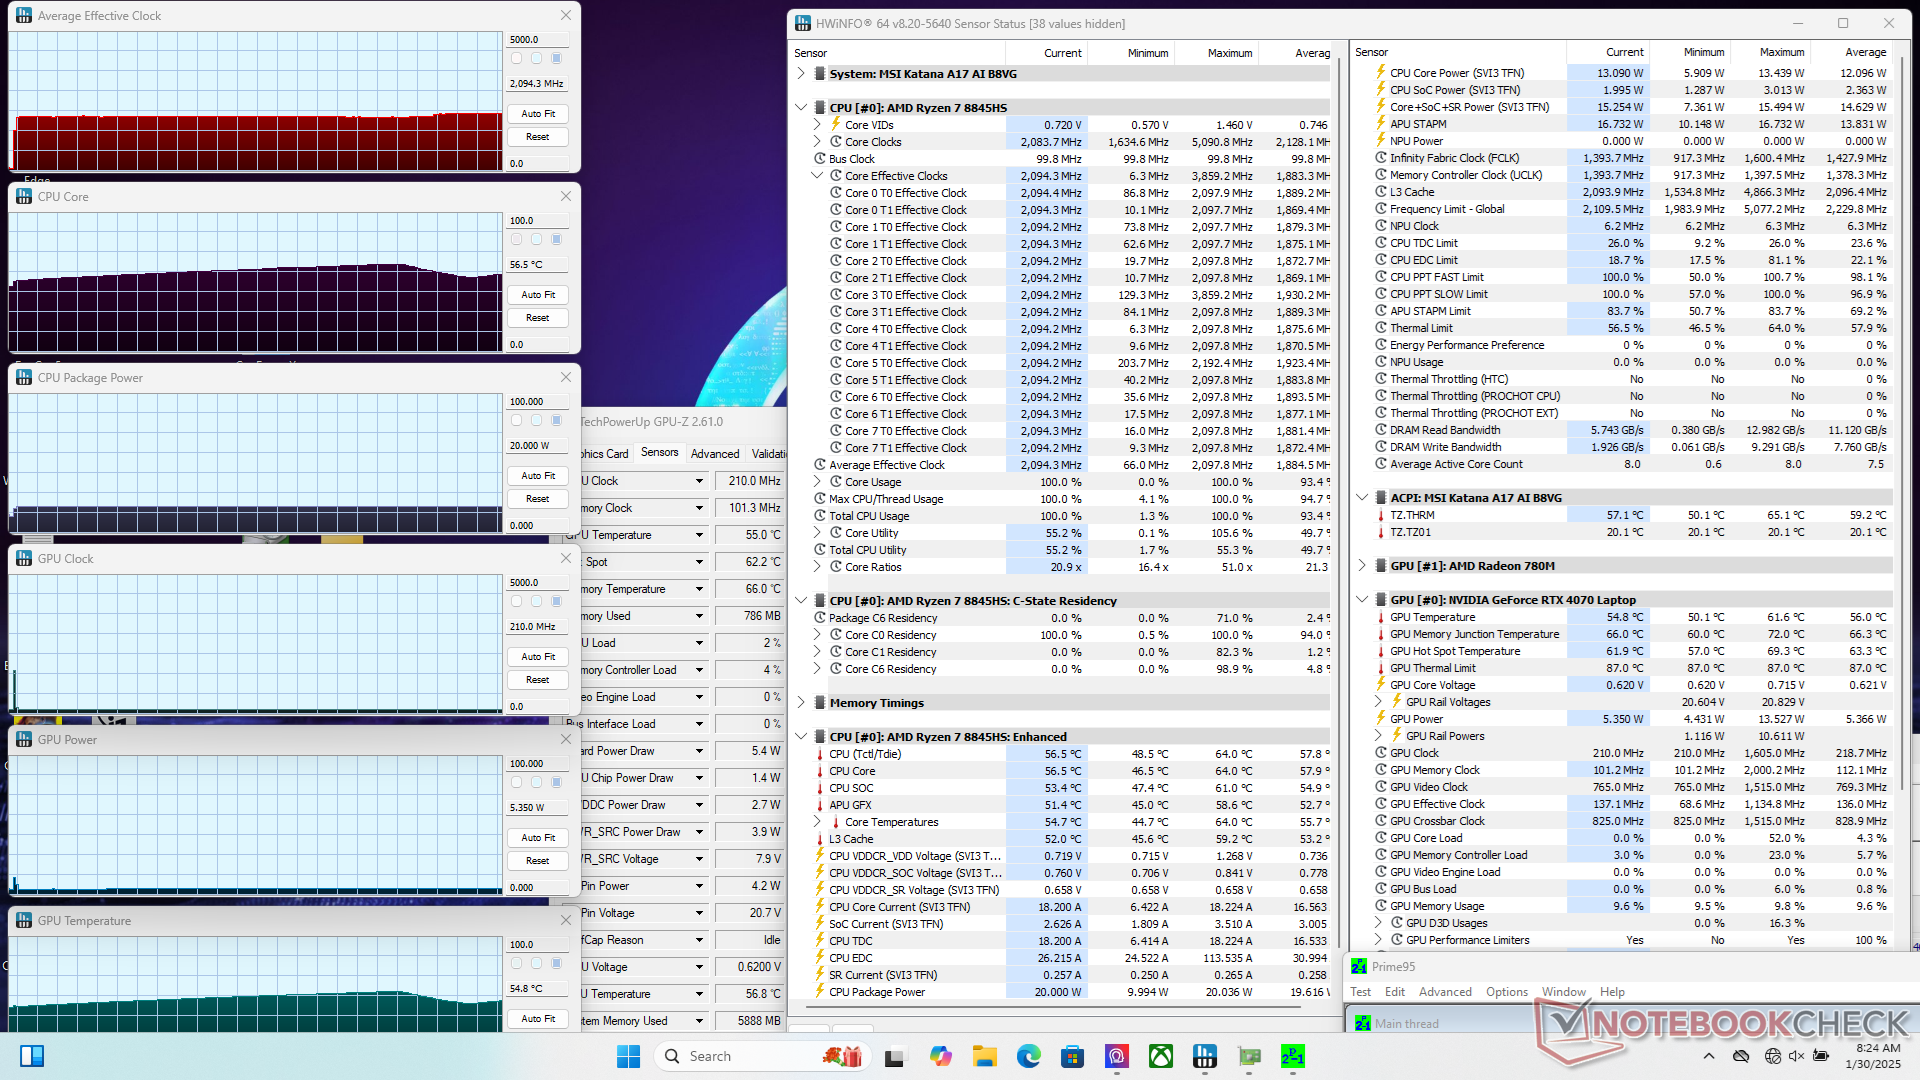
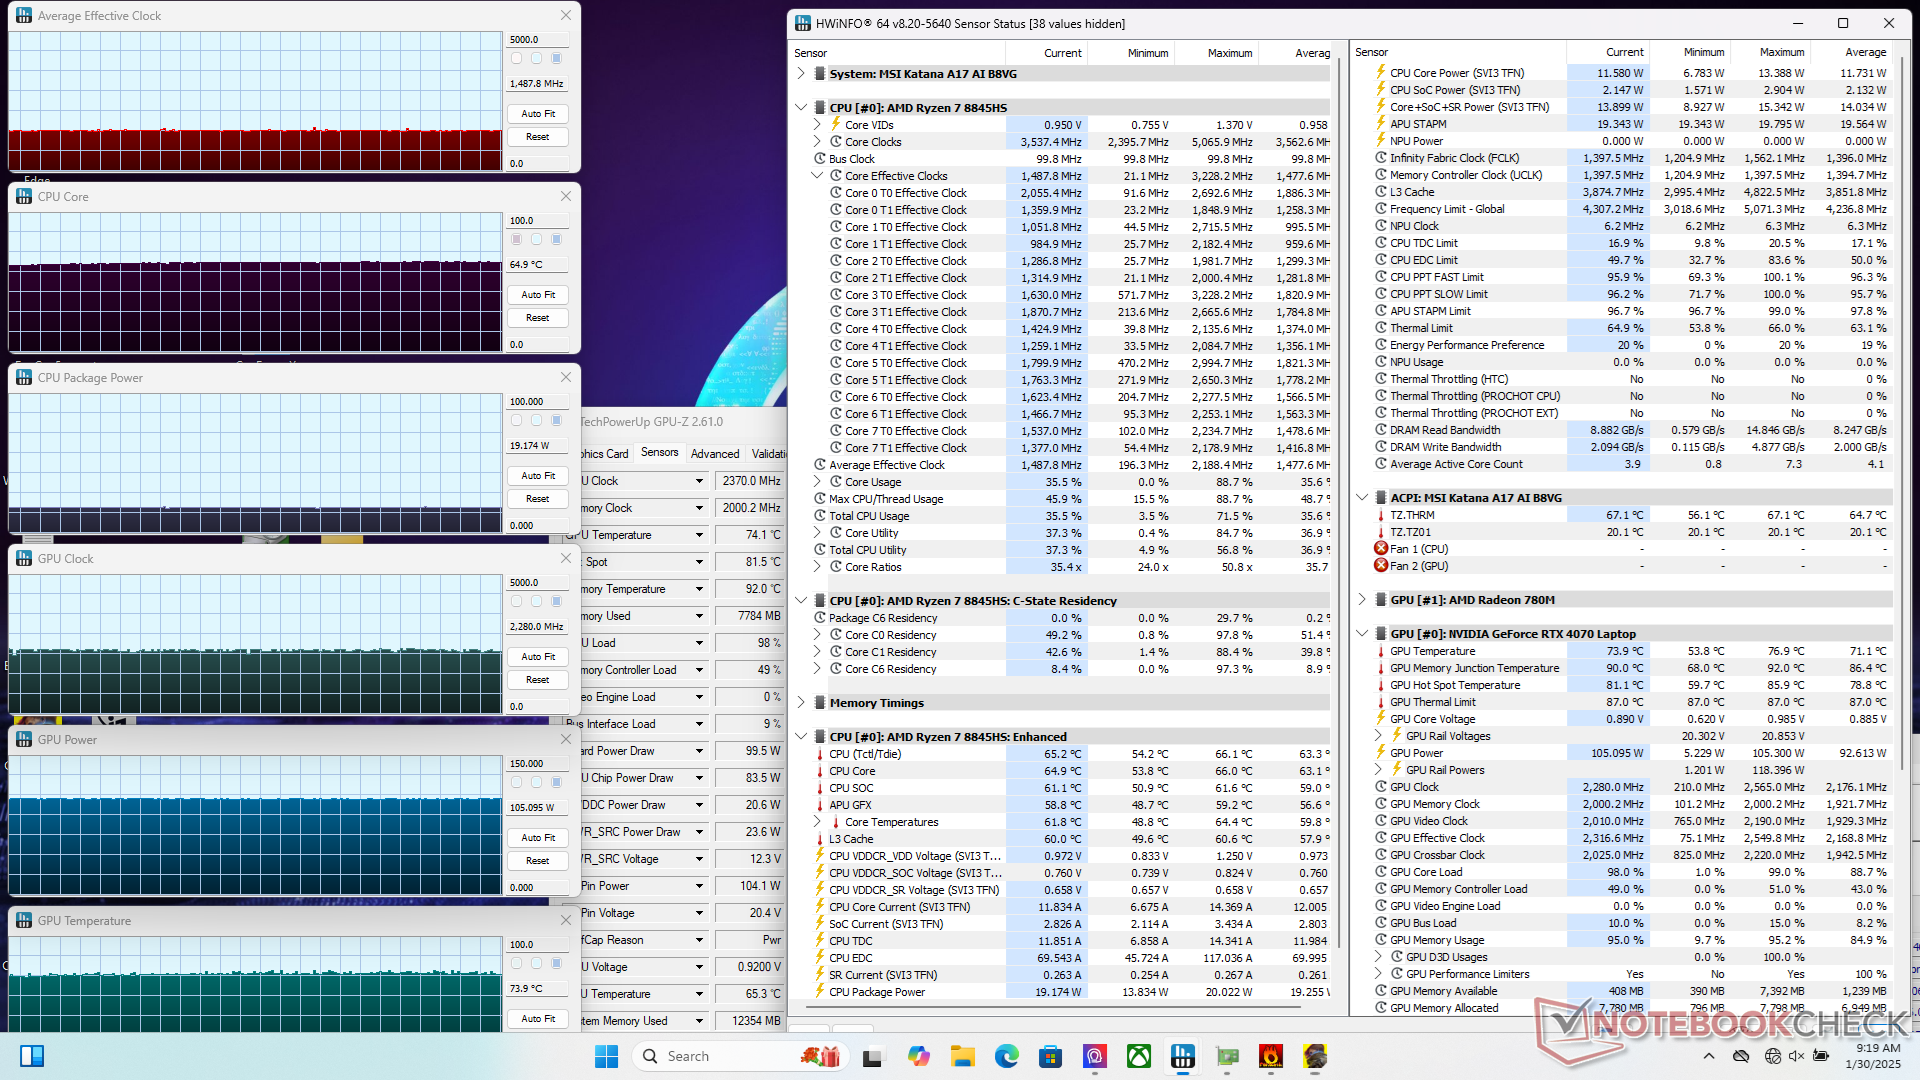
| Average CPU Clock (GHz) | GPU Clock (MHz) | Average CPU Temperature (°C) | Average GPU Temperature (°C) | |
| System Idle | -- | -- | 34 | 37 |
| Prime95 Stress | 2.0 | -- | 57 | 55 |
| Prime95 + FurMark Stress | 1.8 | 2190 | 64 | 75 |
| Cyberpunk 2077 Stress (Balanced profile) | 1.2 | 1800 | 63 | 66 |
| Cyberpunk 2077 Stress (Cooler Boost off) | 1.5 | 2370 | 65 | 74 |
| Cyberpunk 2077 Stress (Cooler Boost on) | 1.5 | 2340 | 56 | 66 |
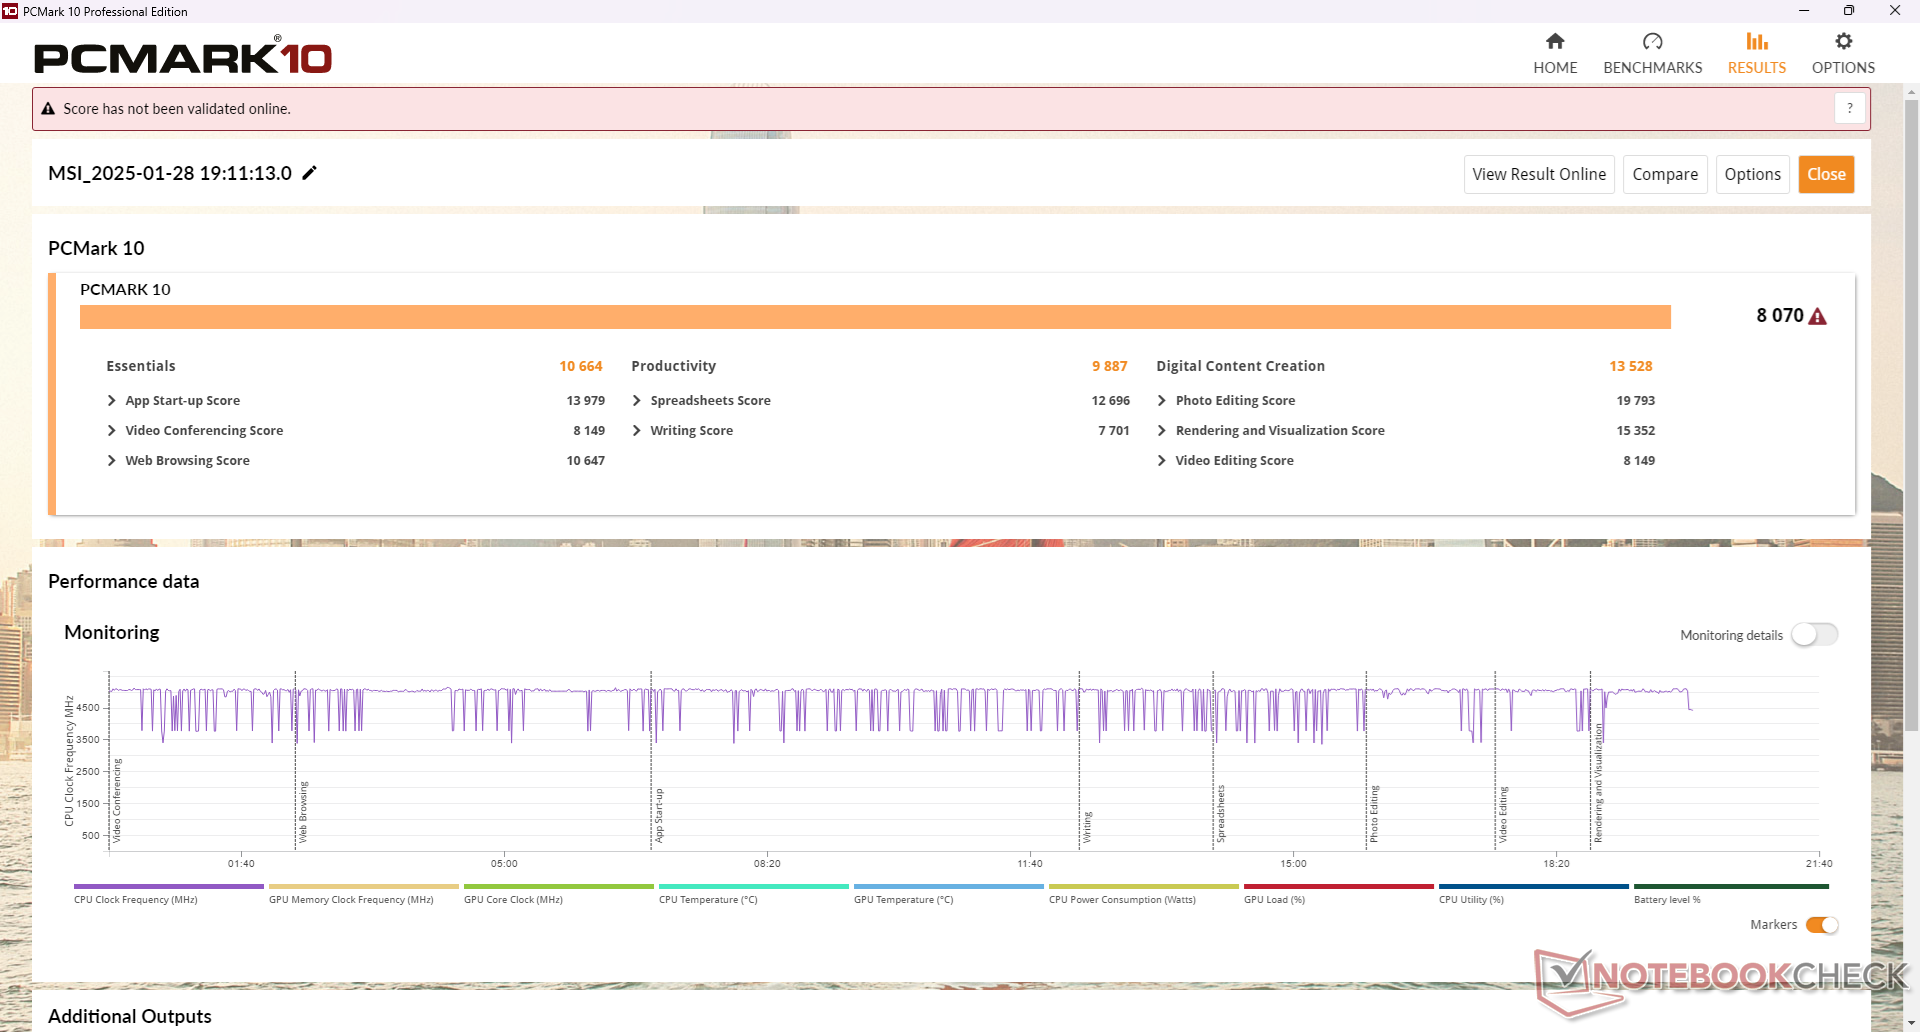
System Performance
PCMark scores are higher than the older Katana 17 especially in the Digital Content Creation subtest due to our much faster GPU. On the other hand, our processor-heavy Productivity subtest score is only slightly higher. The results align with what we've observed on our CPU and GPU benchmarks. RAM performance is also much greater this time around.
CrossMark: Overall | Productivity | Creativity | Responsiveness
WebXPRT 3: Overall
WebXPRT 4: Overall
Mozilla Kraken 1.1: Total
| PCMark 10 / Score | |
| Asus TUF Gaming A17 FA707XI-NS94 | |
| MSI Katana A17 AI B8VG | |
| Average AMD Ryzen 7 8845HS, NVIDIA GeForce RTX 4070 Laptop GPU (7800 - 8070, n=2) | |
| HP Omen 17-db0079ng | |
| MSI Pulse 17 B13VGK | |
| Acer Nitro 17 AN17-51-71ER | |
| Lenovo Legion 5 17ACH6H-82JY0003GE | |
| PCMark 10 / Essentials | |
| Asus TUF Gaming A17 FA707XI-NS94 | |
| MSI Katana A17 AI B8VG | |
| Average AMD Ryzen 7 8845HS, NVIDIA GeForce RTX 4070 Laptop GPU (10499 - 10664, n=2) | |
| HP Omen 17-db0079ng | |
| MSI Pulse 17 B13VGK | |
| Acer Nitro 17 AN17-51-71ER | |
| Lenovo Legion 5 17ACH6H-82JY0003GE | |
| PCMark 10 / Productivity | |
| MSI Pulse 17 B13VGK | |
| HP Omen 17-db0079ng | |
| Average AMD Ryzen 7 8845HS, NVIDIA GeForce RTX 4070 Laptop GPU (9887 - 10202, n=2) | |
| MSI Katana A17 AI B8VG | |
| Asus TUF Gaming A17 FA707XI-NS94 | |
| Lenovo Legion 5 17ACH6H-82JY0003GE | |
| Acer Nitro 17 AN17-51-71ER | |
| PCMark 10 / Digital Content Creation | |
| Asus TUF Gaming A17 FA707XI-NS94 | |
| MSI Katana A17 AI B8VG | |
| Average AMD Ryzen 7 8845HS, NVIDIA GeForce RTX 4070 Laptop GPU (12023 - 13528, n=2) | |
| HP Omen 17-db0079ng | |
| Acer Nitro 17 AN17-51-71ER | |
| MSI Pulse 17 B13VGK | |
| Lenovo Legion 5 17ACH6H-82JY0003GE | |
| CrossMark / Overall | |
| MSI Pulse 17 B13VGK | |
| Asus TUF Gaming A17 FA707XI-NS94 | |
| MSI Katana A17 AI B8VG | |
| Average AMD Ryzen 7 8845HS, NVIDIA GeForce RTX 4070 Laptop GPU (1531 - 1790, n=2) | |
| Acer Nitro 17 AN17-51-71ER | |
| HP Omen 17-db0079ng | |
| Lenovo Legion 5 17ACH6H-82JY0003GE | |
| CrossMark / Productivity | |
| MSI Pulse 17 B13VGK | |
| Asus TUF Gaming A17 FA707XI-NS94 | |
| MSI Katana A17 AI B8VG | |
| Average AMD Ryzen 7 8845HS, NVIDIA GeForce RTX 4070 Laptop GPU (1488 - 1720, n=2) | |
| Acer Nitro 17 AN17-51-71ER | |
| HP Omen 17-db0079ng | |
| Lenovo Legion 5 17ACH6H-82JY0003GE | |
| CrossMark / Creativity | |
| MSI Pulse 17 B13VGK | |
| Asus TUF Gaming A17 FA707XI-NS94 | |
| MSI Katana A17 AI B8VG | |
| Average AMD Ryzen 7 8845HS, NVIDIA GeForce RTX 4070 Laptop GPU (1683 - 1932, n=2) | |
| Acer Nitro 17 AN17-51-71ER | |
| HP Omen 17-db0079ng | |
| Lenovo Legion 5 17ACH6H-82JY0003GE | |
| CrossMark / Responsiveness | |
| MSI Pulse 17 B13VGK | |
| Acer Nitro 17 AN17-51-71ER | |
| MSI Katana A17 AI B8VG | |
| Asus TUF Gaming A17 FA707XI-NS94 | |
| Average AMD Ryzen 7 8845HS, NVIDIA GeForce RTX 4070 Laptop GPU (1255 - 1603, n=2) | |
| HP Omen 17-db0079ng | |
| Lenovo Legion 5 17ACH6H-82JY0003GE | |
| WebXPRT 3 / Overall | |
| Asus TUF Gaming A17 FA707XI-NS94 | |
| MSI Katana A17 AI B8VG | |
| Average AMD Ryzen 7 8845HS, NVIDIA GeForce RTX 4070 Laptop GPU (275 - 312, n=2) | |
| HP Omen 17-db0079ng | |
| MSI Pulse 17 B13VGK | |
| Lenovo Legion 5 17ACH6H-82JY0003GE | |
| Acer Nitro 17 AN17-51-71ER | |
| WebXPRT 4 / Overall | |
| Asus TUF Gaming A17 FA707XI-NS94 | |
| MSI Katana A17 AI B8VG | |
| Average AMD Ryzen 7 8845HS, NVIDIA GeForce RTX 4070 Laptop GPU (n=1) | |
| MSI Pulse 17 B13VGK | |
| Acer Nitro 17 AN17-51-71ER | |
| Mozilla Kraken 1.1 / Total | |
| Lenovo Legion 5 17ACH6H-82JY0003GE | |
| Acer Nitro 17 AN17-51-71ER | |
| HP Omen 17-db0079ng | |
| MSI Pulse 17 B13VGK | |
| Average AMD Ryzen 7 8845HS, NVIDIA GeForce RTX 4070 Laptop GPU (500 - 564, n=2) | |
| MSI Katana A17 AI B8VG | |
| Asus TUF Gaming A17 FA707XI-NS94 | |
* ... smaller is better
| PCMark 10 Score | 8070 points | |
Help | ||
| AIDA64 / Memory Copy | |
| MSI Katana A17 AI B8VG | |
| HP Omen 17-db0079ng | |
| Average AMD Ryzen 7 8845HS (61459 - 71873, n=13) | |
| MSI Pulse 17 B13VGK | |
| Asus TUF Gaming A17 FA707XI-NS94 | |
| Acer Nitro 17 AN17-51-71ER | |
| Lenovo Legion 5 17ACH6H-82JY0003GE | |
| AIDA64 / Memory Read | |
| MSI Pulse 17 B13VGK | |
| Acer Nitro 17 AN17-51-71ER | |
| Asus TUF Gaming A17 FA707XI-NS94 | |
| MSI Katana A17 AI B8VG | |
| HP Omen 17-db0079ng | |
| Average AMD Ryzen 7 8845HS (49866 - 61976, n=13) | |
| Lenovo Legion 5 17ACH6H-82JY0003GE | |
| AIDA64 / Memory Write | |
| MSI Katana A17 AI B8VG | |
| HP Omen 17-db0079ng | |
| Average AMD Ryzen 7 8845HS (68425 - 93239, n=13) | |
| Asus TUF Gaming A17 FA707XI-NS94 | |
| Acer Nitro 17 AN17-51-71ER | |
| MSI Pulse 17 B13VGK | |
| Lenovo Legion 5 17ACH6H-82JY0003GE | |
| AIDA64 / Memory Latency | |
| Acer Nitro 17 AN17-51-71ER | |
| HP Omen 17-db0079ng | |
| MSI Katana A17 AI B8VG | |
| Average AMD Ryzen 7 8845HS (82.5 - 117, n=13) | |
| MSI Pulse 17 B13VGK | |
| Asus TUF Gaming A17 FA707XI-NS94 | |
| Lenovo Legion 5 17ACH6H-82JY0003GE | |
* ... smaller is better
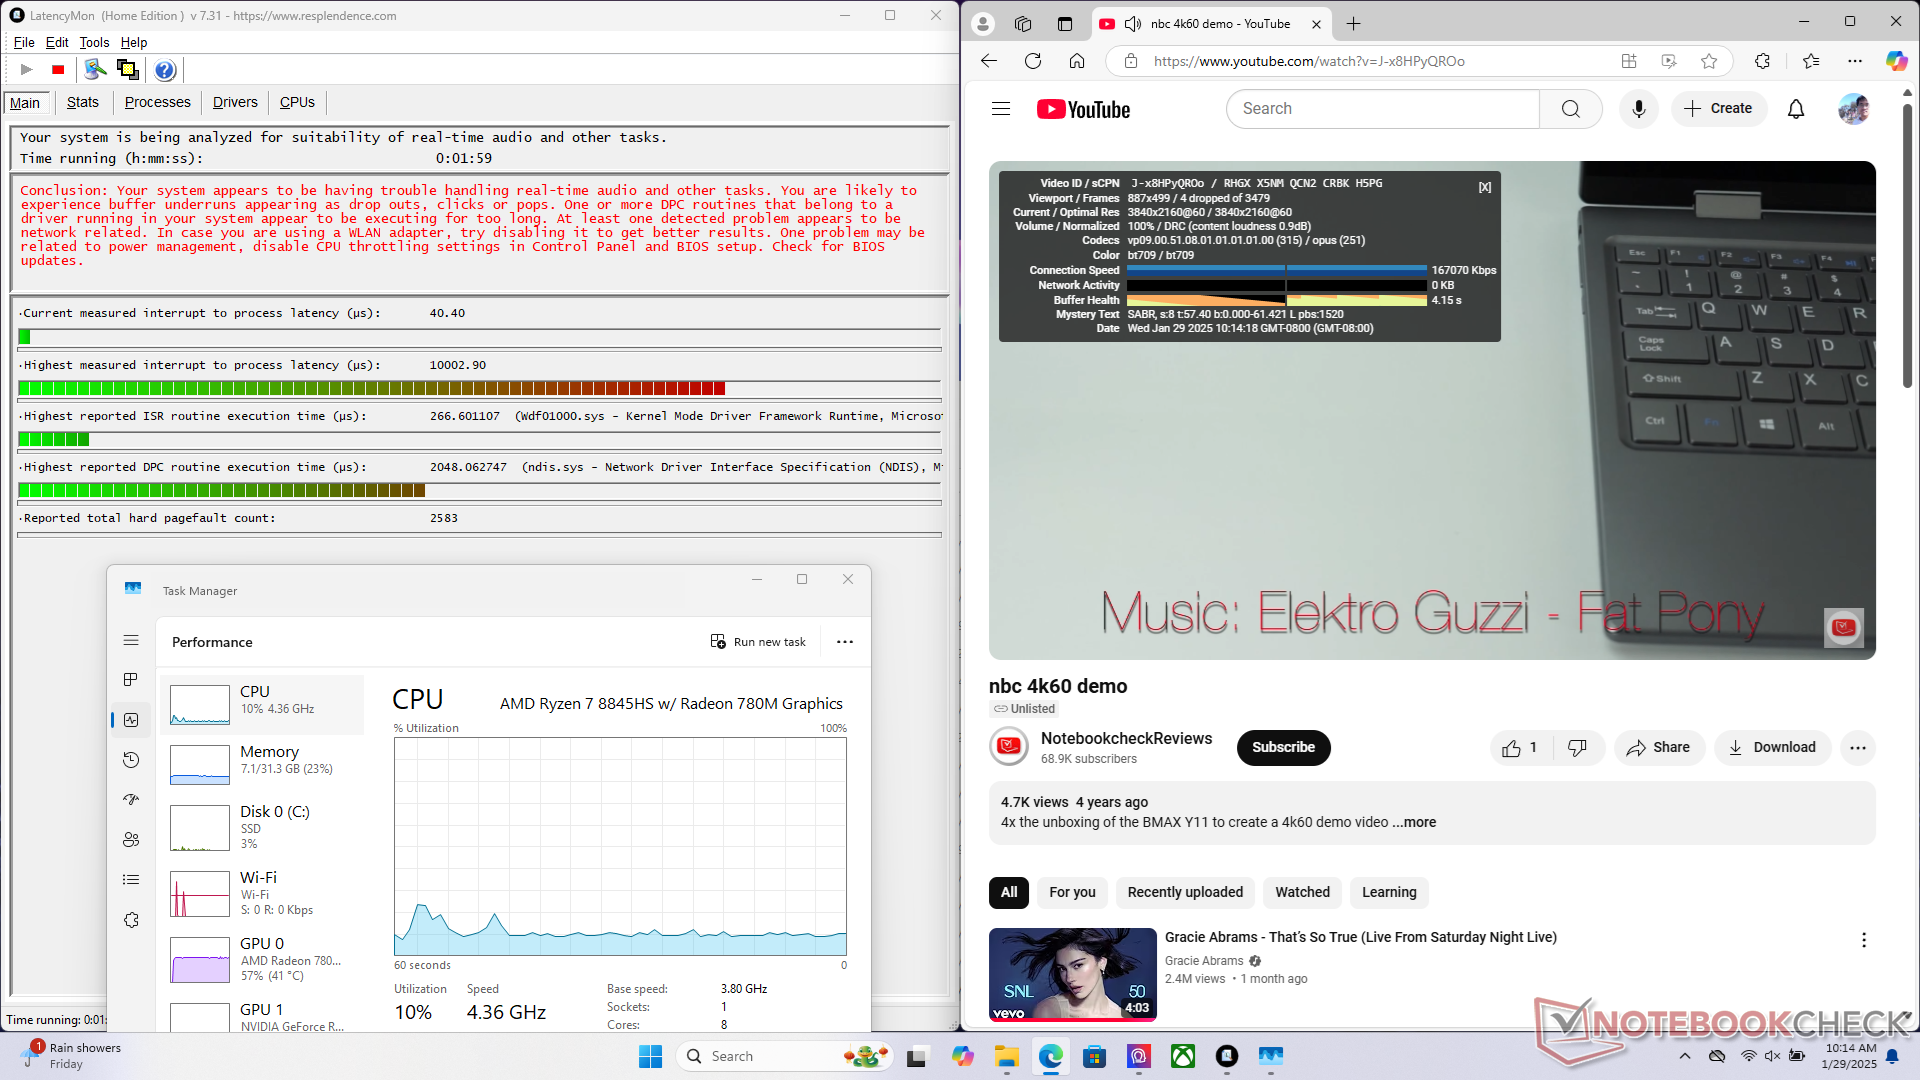
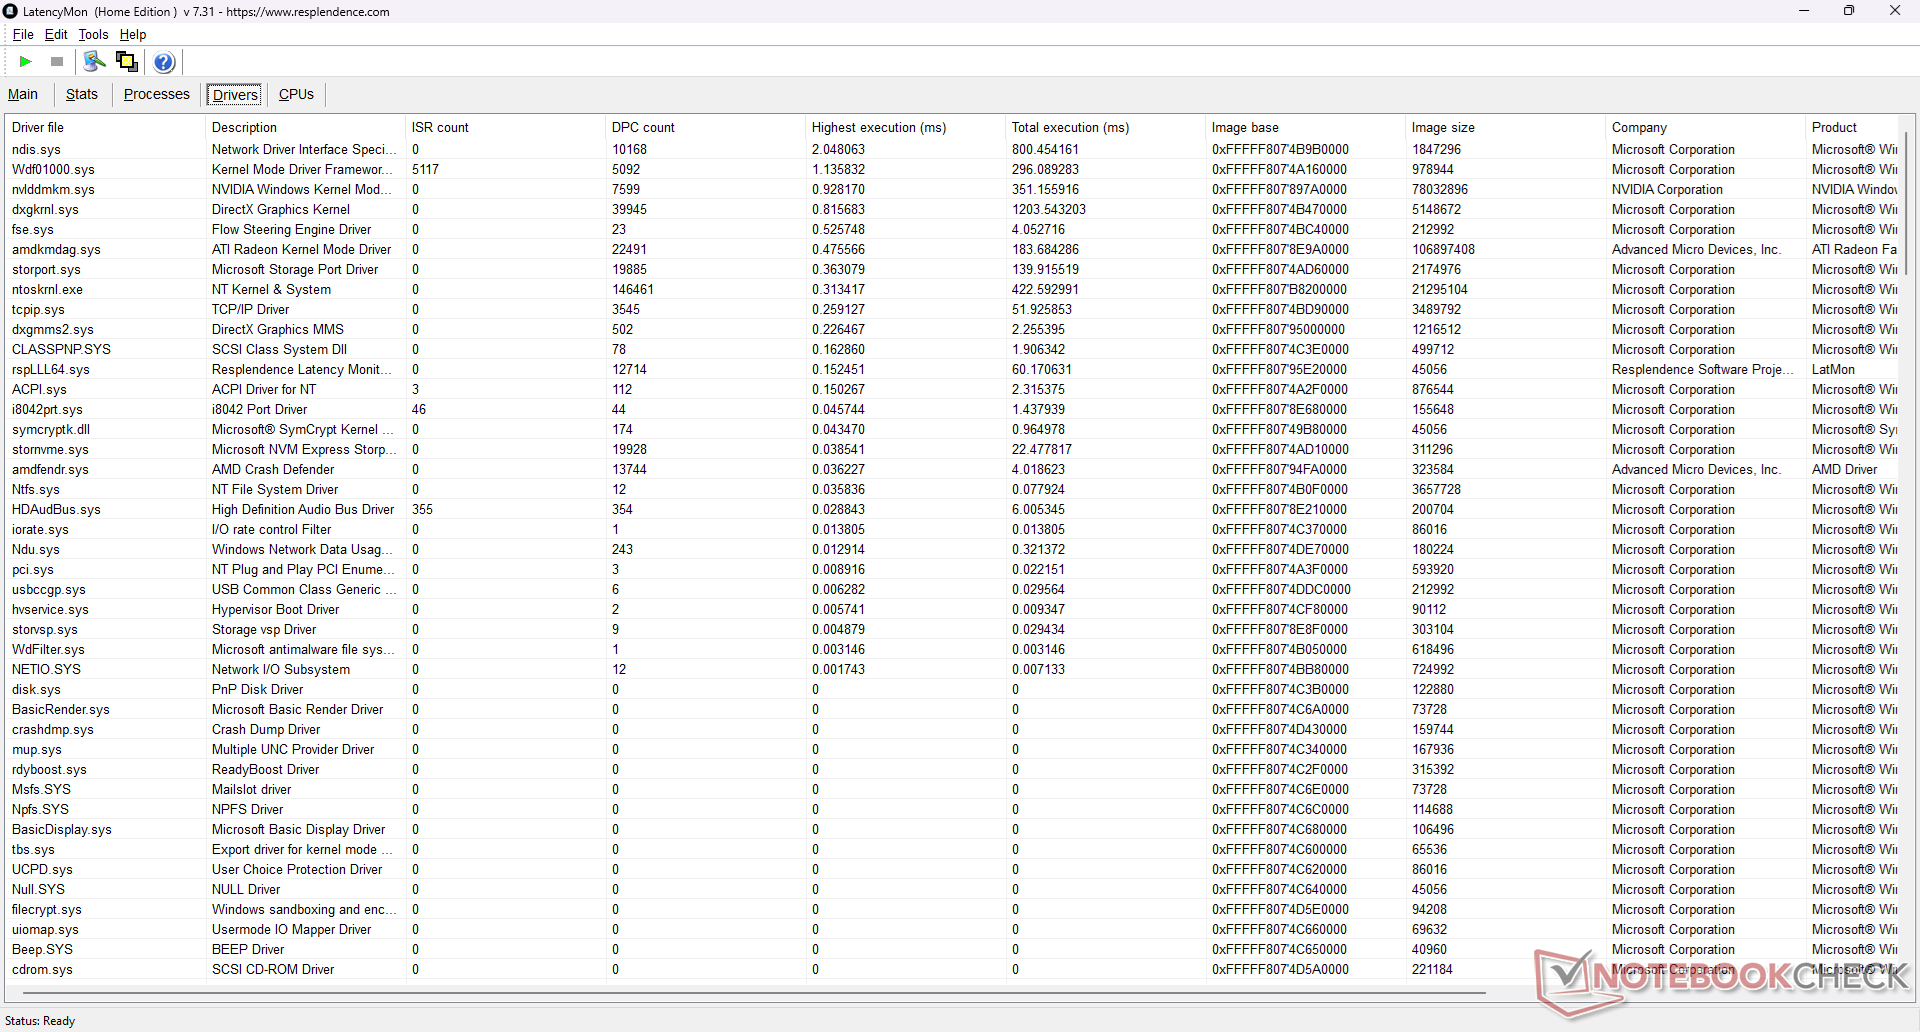
DPC Latency
LatencyMon reveals DPC latency issues when opening multiple browser tabs of our homepage. Additionally, 4K60 video playback is imperfect with 4 dropped frames recorded during a 60-second time span even when set to iGPU mode.
| DPC Latencies / LatencyMon - interrupt to process latency (max), Web, Youtube, Prime95 | |
| MSI Katana A17 AI B8VG | |
| HP Omen 17-db0079ng | |
| Asus TUF Gaming A17 FA707XI-NS94 | |
| Lenovo Legion 5 17ACH6H-82JY0003GE | |
| Acer Nitro 17 AN17-51-71ER | |
| MSI Pulse 17 B13VGK | |
* ... smaller is better
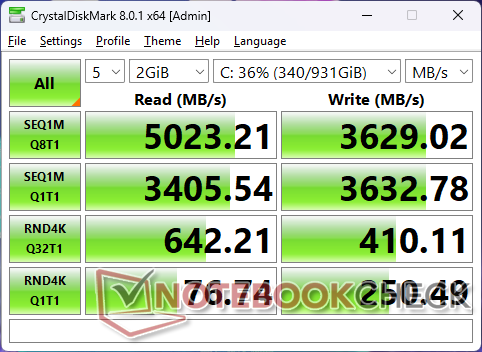
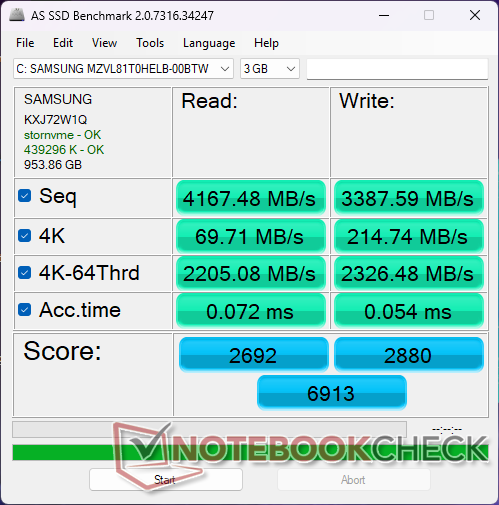
Storage Devices
The Samsung PM9C1 is a midrange PCIe4 x4 NVMe SSD offering transfer rates of up to 5000 MB/s. Unfortunately, this maximum rate is only sustainable for a minute or so before steadily falling to the low 3000 MB/s range.

| Drive Performance rating - Percent | |
| Acer Nitro 17 AN17-51-71ER -1! | |
| MSI Katana A17 AI B8VG | |
| MSI Pulse 17 B13VGK | |
| HP Omen 17-db0079ng | |
| Asus TUF Gaming A17 FA707XI-NS94 | |
| Lenovo Legion 5 17ACH6H-82JY0003GE | |
* ... smaller is better
Disk Throttling: DiskSpd Read Loop, Queue Depth 8
GPU Performance — 105 W GeForce RTX 4070
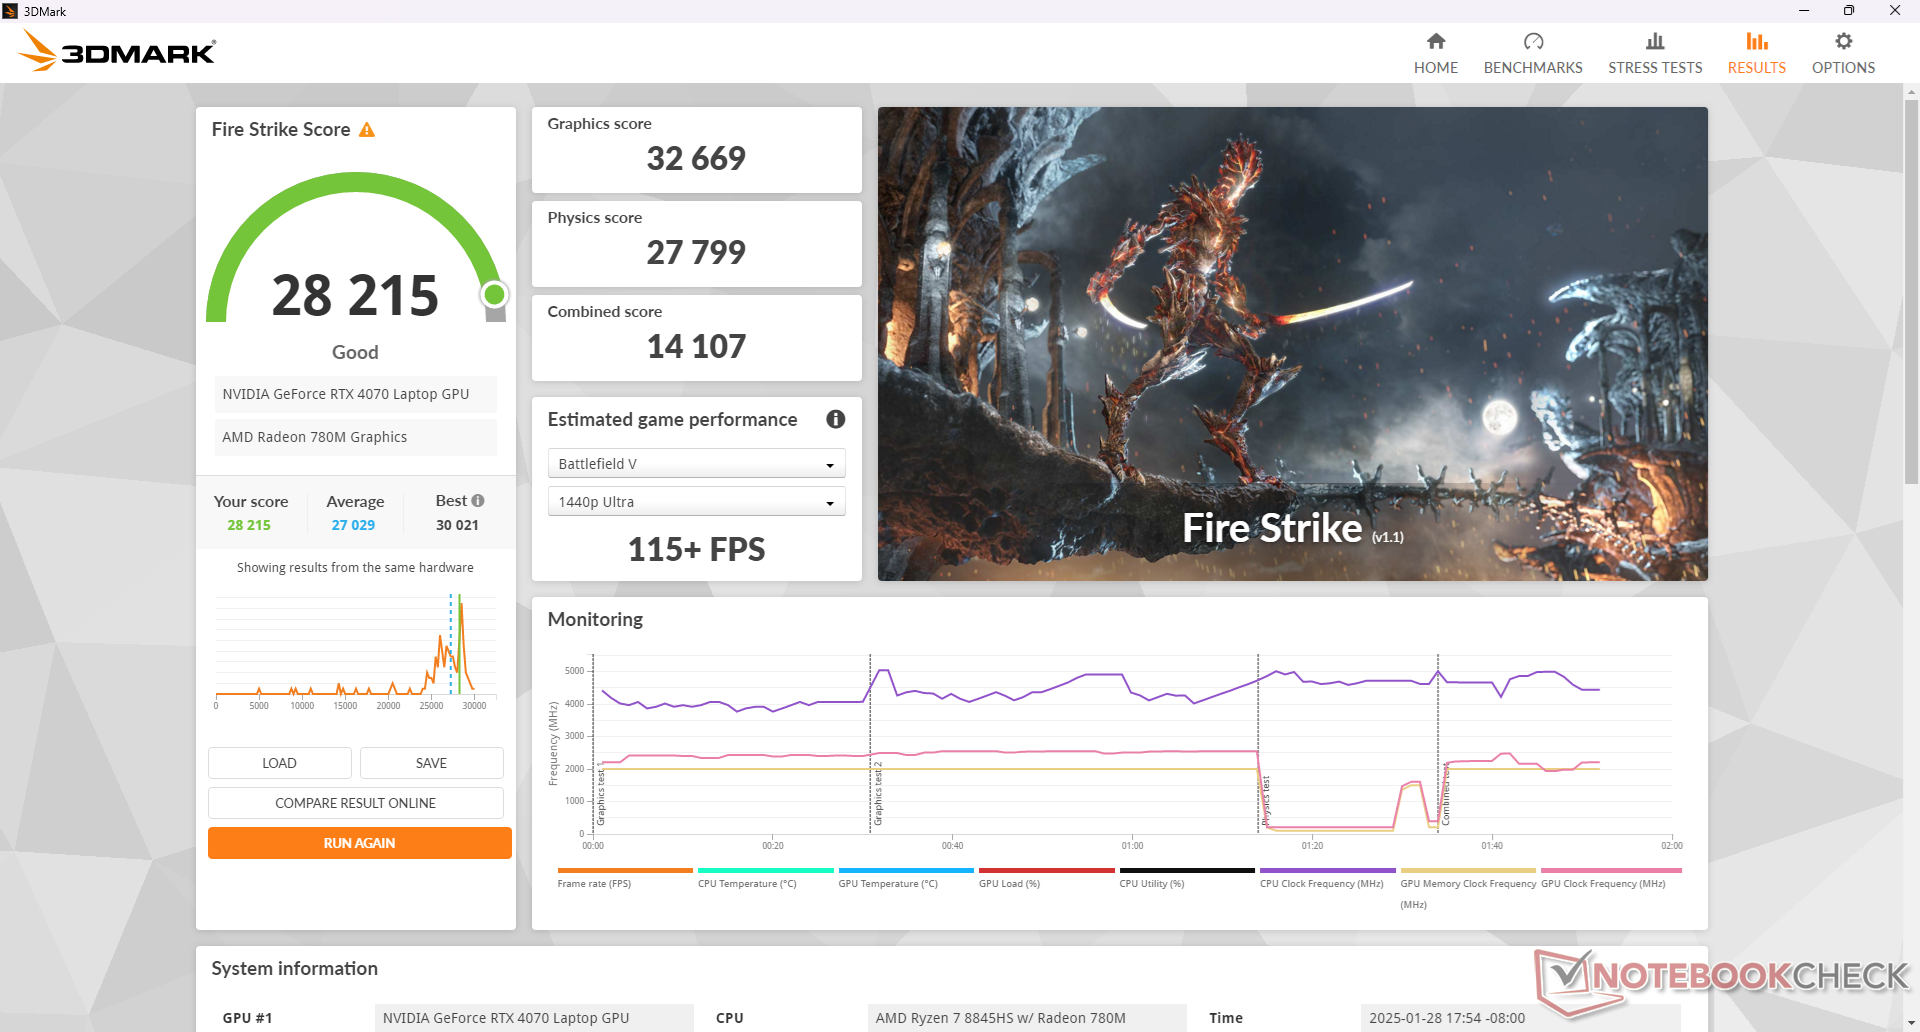
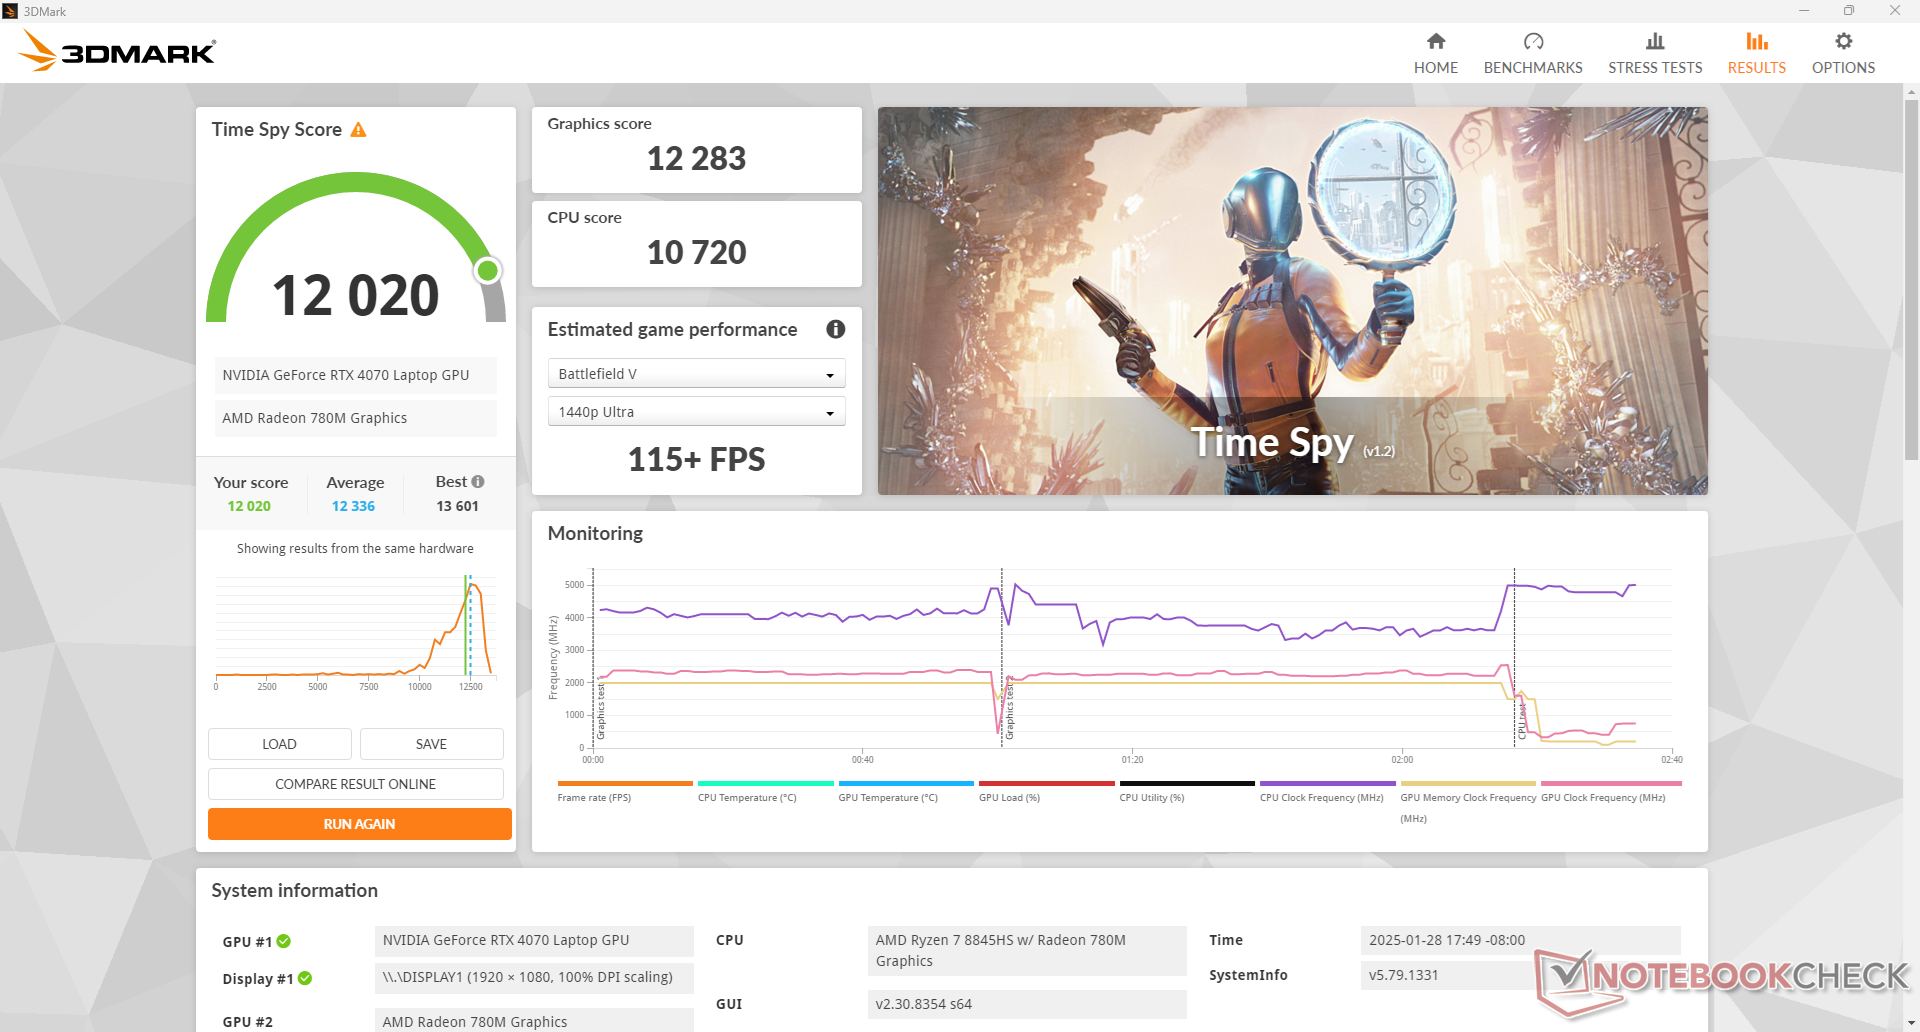
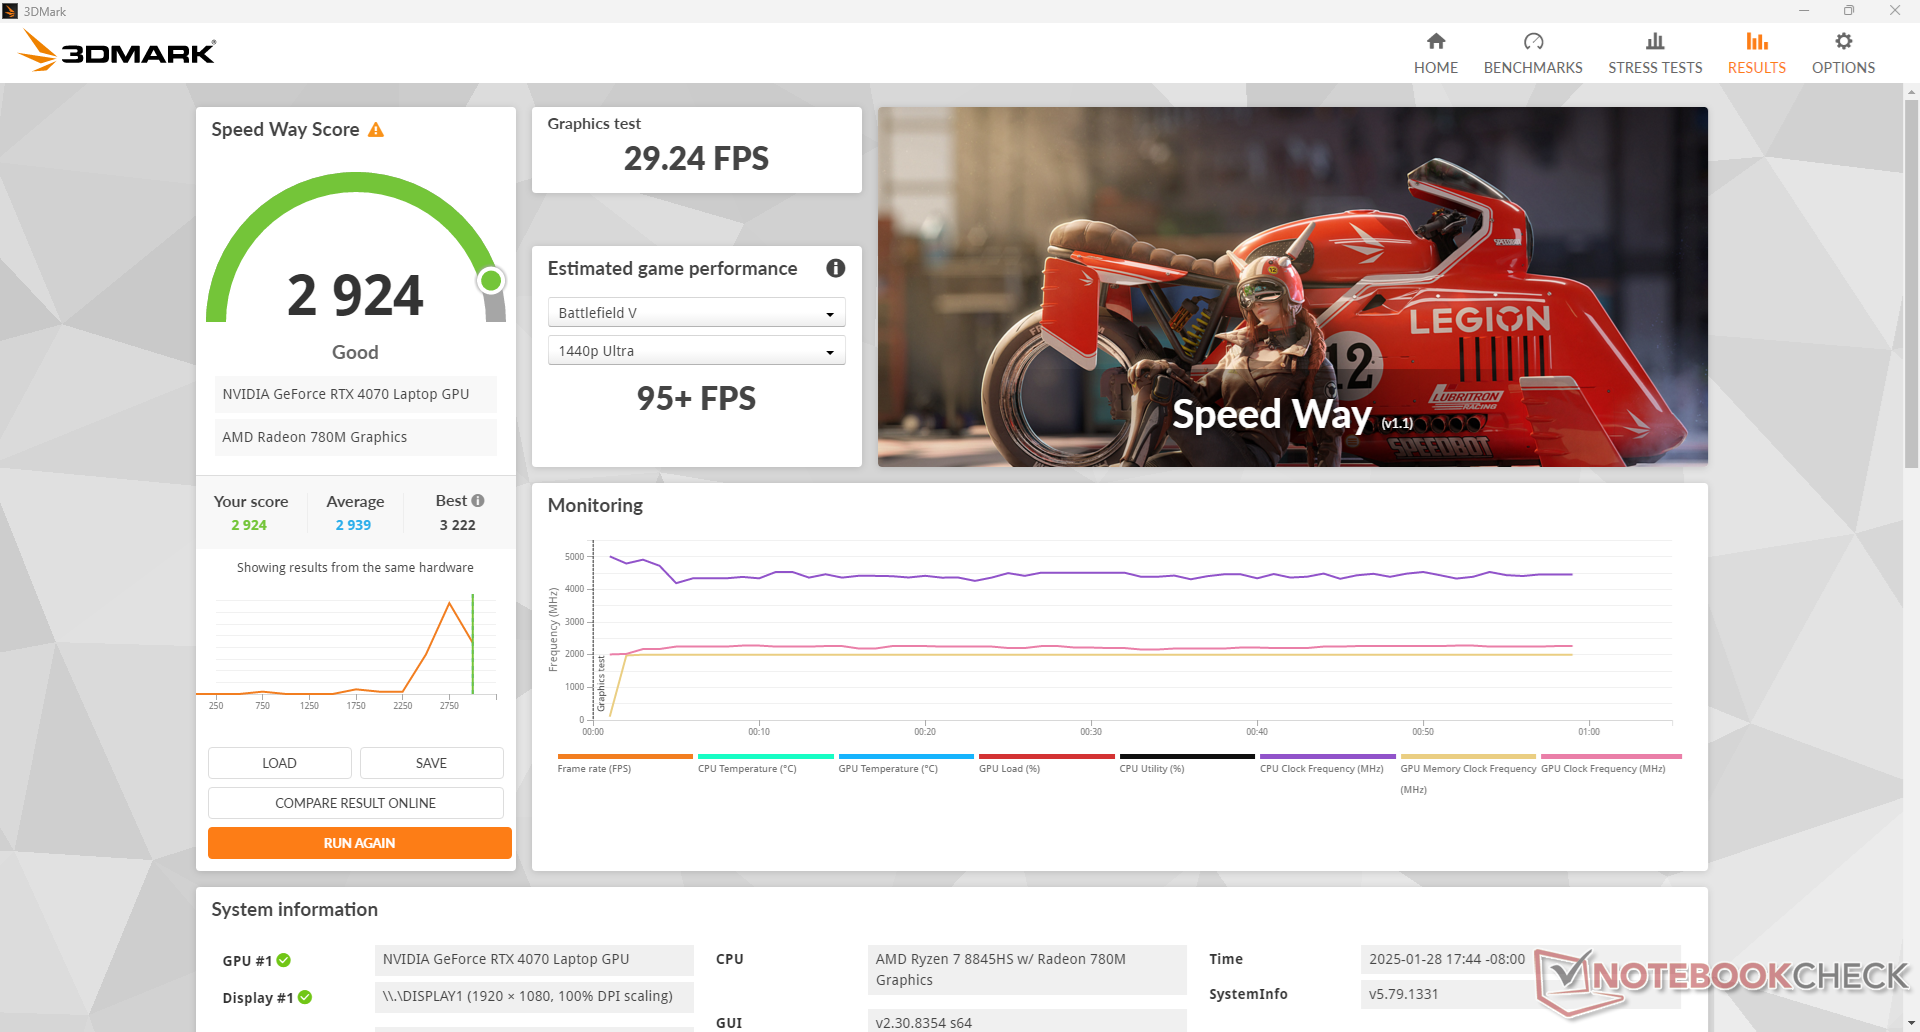
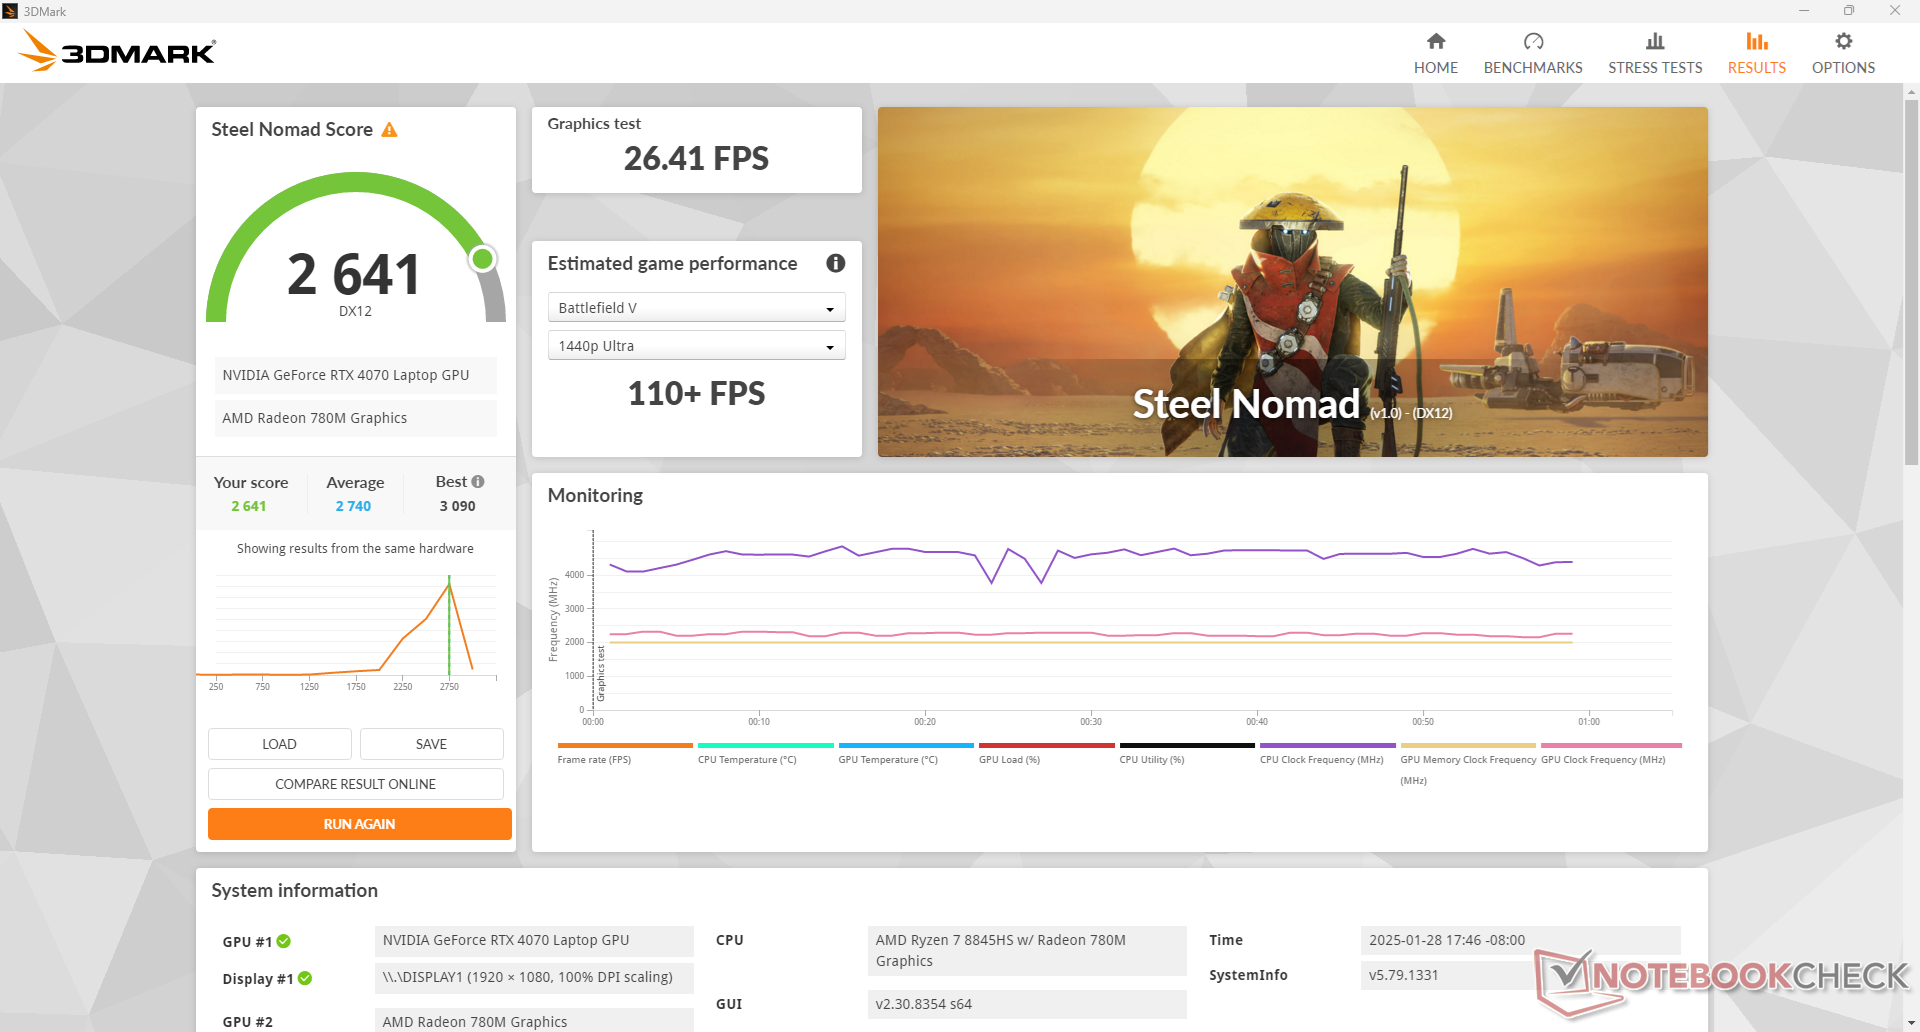
Graphics performance is between 5 and 15 percent faster than the average laptop in our database equipped with the same GeForce RTX 4070 GPU which is great to see on a budget-oriented model like the Katana A17. However, keep in mind that the mobile RTX 4070 carries much less VRAM than the desktop RTX 4070 which can impact performance on higher texture settings or resolutions.
| Power Profile | Graphics Score | Physics Score | Combined Score |
| Performance Mode | 32669 | 27799 | 14107 |
| Balanced Mode | 27310 (-16%) | 28029 (-1%) | 11927 (-15%) |
| Battery Power | 16481 (-50%) | 20600 (-26%) | 4877 (-65%) |
Running on Balanced mode impacts graphics performance by just over 15 percent and the deficit becomes even larger if running on battery power as shown by our Fire Strike results table above.
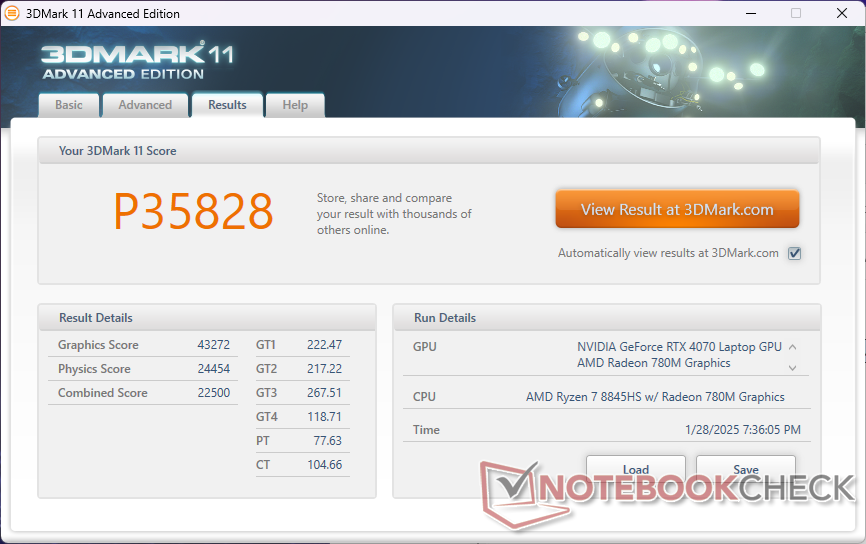
| 3DMark 11 Performance | 35828 points | |
| 3DMark Cloud Gate Standard Score | 63840 points | |
| 3DMark Fire Strike Score | 28215 points | |
| 3DMark Time Spy Score | 12020 points | |
| 3DMark Steel Nomad Score | 2641 points | |
Help | ||
* ... smaller is better
Gaming Performance
The mobile RTX 4070 is sufficient for gaming on High to Maximum settings with the internal 1080p or 1440p display. Enabling DLSS is recommended if trying to reach a stable 144 FPS to fully exploit the 144 Hz refresh rate of the 1080p panel. Oddly, Strange Brigade would fail to launch even after re-installation and multiple tries.
| Baldur's Gate 3 | |
| 1920x1080 Low Preset AA:SM | |
| Eurocom Raptor X17 Core i9-14900HX | |
| MSI Katana A17 AI B8VG | |
| Average NVIDIA GeForce RTX 4070 Laptop GPU (127.4 - 176, n=23) | |
| 1920x1080 Medium Preset AA:T | |
| Eurocom Raptor X17 Core i9-14900HX | |
| MSI Katana A17 AI B8VG | |
| Average NVIDIA GeForce RTX 4070 Laptop GPU (107.1 - 150.8, n=28) | |
| 1920x1080 High Preset AA:T | |
| Eurocom Raptor X17 Core i9-14900HX | |
| MSI Katana A17 AI B8VG | |
| Average NVIDIA GeForce RTX 4070 Laptop GPU (72.7 - 129.3, n=28) | |
| 1920x1080 Ultra Preset AA:T | |
| Eurocom Raptor X17 Core i9-14900HX | |
| MSI Katana A17 AI B8VG | |
| Asus TUF Gaming A17 FA707XI-NS94 | |
| Average NVIDIA GeForce RTX 4070 Laptop GPU (66.7 - 128.5, n=30) | |
| Cyberpunk 2077 | |
| 1280x720 Low Preset (FSR off) | |
| Eurocom Raptor X17 Core i9-14900HX | |
| Asus TUF Gaming A17 FA707XI-NS94 | |
| MSI Katana A17 AI B8VG | |
| Average NVIDIA GeForce RTX 4070 Laptop GPU (110.2 - 175.5, n=18) | |
| 1920x1080 Low Preset (FSR off) | |
| Eurocom Raptor X17 Core i9-14900HX | |
| Asus TUF Gaming A17 FA707XI-NS94 | |
| MSI Katana A17 AI B8VG | |
| Average NVIDIA GeForce RTX 4070 Laptop GPU (43.1 - 156.6, n=29) | |
| 1920x1080 Medium Preset (FSR off) | |
| Eurocom Raptor X17 Core i9-14900HX | |
| MSI Katana A17 AI B8VG | |
| Asus TUF Gaming A17 FA707XI-NS94 | |
| Average NVIDIA GeForce RTX 4070 Laptop GPU (81.6 - 124.5, n=31) | |
| 1920x1080 High Preset (FSR off) | |
| Eurocom Raptor X17 Core i9-14900HX | |
| MSI Katana A17 AI B8VG | |
| Asus TUF Gaming A17 FA707XI-NS94 | |
| Average NVIDIA GeForce RTX 4070 Laptop GPU (74.7 - 103.6, n=32) | |
| 1920x1080 Ultra Preset (FSR off) | |
| Eurocom Raptor X17 Core i9-14900HX | |
| Asus TUF Gaming A17 FA707XI-NS94 | |
| MSI Katana A17 AI B8VG | |
| Average NVIDIA GeForce RTX 4070 Laptop GPU (30.7 - 90.7, n=40) | |
| Tiny Tina's Wonderlands | |
| 1280x720 Lowest Preset (DX12) | |
| KFA2 GeForce RTX 4070 EX Gamer | |
| Average NVIDIA GeForce RTX 4070 Laptop GPU (231 - 345, n=5) | |
| MSI Katana A17 AI B8VG | |
| 1920x1080 Low Preset (DX12) | |
| KFA2 GeForce RTX 4070 EX Gamer | |
| MSI Katana A17 AI B8VG | |
| Average NVIDIA GeForce RTX 4070 Laptop GPU (98.1 - 283, n=15) | |
| MSI Katana 17 B13VFK | |
| 1920x1080 Medium Preset (DX12) | |
| KFA2 GeForce RTX 4070 EX Gamer | |
| MSI Katana A17 AI B8VG | |
| Average NVIDIA GeForce RTX 4070 Laptop GPU (92.5 - 231, n=15) | |
| MSI Katana 17 B13VFK | |
| 1920x1080 High Preset (DX12) | |
| KFA2 GeForce RTX 4070 EX Gamer | |
| MSI Katana A17 AI B8VG | |
| Average NVIDIA GeForce RTX 4070 Laptop GPU (74.3 - 151.4, n=15) | |
| MSI Katana 17 B13VFK | |
| 1920x1080 Badass Preset (DX12) | |
| KFA2 GeForce RTX 4070 EX Gamer | |
| Asus TUF Gaming A17 FA707XI-NS94 | |
| MSI Katana A17 AI B8VG | |
| Average NVIDIA GeForce RTX 4070 Laptop GPU (58.6 - 115.9, n=18) | |
| MSI Katana 17 B13VFK | |
Cyberpunk 2077 ultra FPS Chart
| low | med. | high | ultra | |
|---|---|---|---|---|
| GTA V (2015) | 184 | 179.8 | 171.1 | 120 |
| Dota 2 Reborn (2015) | 168.4 | 154 | 149.1 | 143.1 |
| Final Fantasy XV Benchmark (2018) | 218 | 162.2 | 120.1 | |
| X-Plane 11.11 (2018) | 88.9 | 82 | 66.2 | |
| Far Cry 5 (2018) | 158 | 139 | 133 | 124 |
| Tiny Tina's Wonderlands (2022) | 245.9 | 199.6 | 138.7 | 107.7 |
| F1 22 (2022) | 256 | 252 | 216 | 81.9 |
| Baldur's Gate 3 (2023) | 162.6 | 139.3 | 122.4 | 121.4 |
| Cyberpunk 2077 (2023) | 135.1 | 119.1 | 101 | 85.5 |
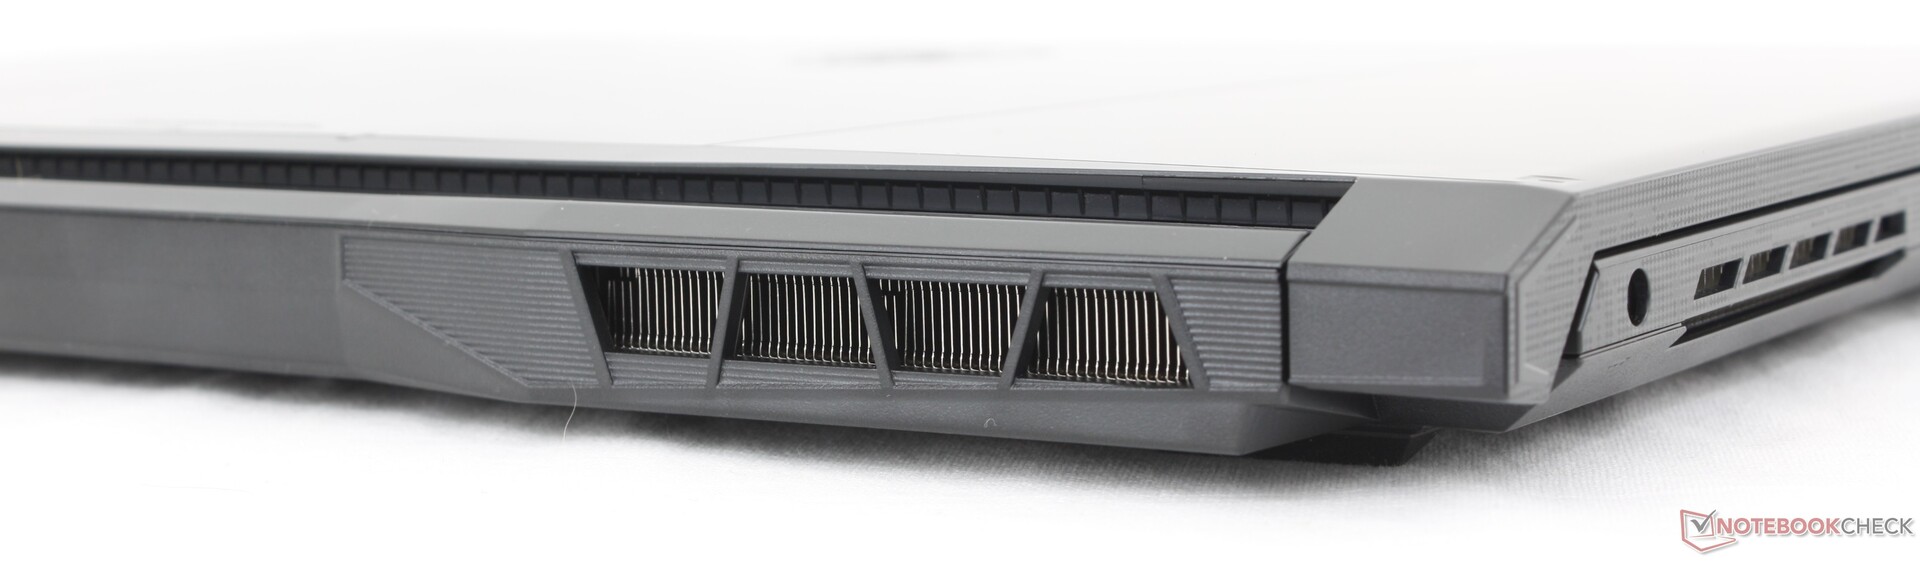
Emissions
System Noise
Fan noise is generally quieter than what we recorded on the older Katana 17. More specfiically, our Katana A17 is able to remain quieter for longer before plateauing at similar noise levels as before.
Note that there is a significant noise level difference when gaming with Cooler Boost off instead of on (51 dB(A) vs. 60 dB(A)) even though their performance differences are extremely minor. It's therefore recommended to game with Cooler Boost off for most scenarios.
Noise level
| Idle |
| 23.9 / 24.1 / 24.2 dB(A) |
| Load |
| 24 / 59.8 dB(A) |
 | ||
30 dB silent 40 dB(A) audible 50 dB(A) loud |
||
min: | ||
| MSI Katana A17 AI B8VG GeForce RTX 4070 Laptop GPU, R7 8845HS, Samsung PM9C1 MZVL81T0HELB-00BTW | HP Omen 17-db0079ng GeForce RTX 4070 Laptop GPU, R7 8845HS, WD PC SN560 SDDPNQE-1T00 | Asus TUF Gaming A17 FA707XI-NS94 GeForce RTX 4070 Laptop GPU, R9 7940HS, WD PC SN560 SDDPNQE-1T00 | Acer Nitro 17 AN17-51-71ER GeForce RTX 4060 Laptop GPU, i7-13700H, Samsung PM9A1 MZVL21T0HCLR | MSI Pulse 17 B13VGK GeForce RTX 4070 Laptop GPU, i7-13700H, Micron 2400 MTFDKBA1T0QFM | Lenovo Legion 5 17ACH6H-82JY0003GE GeForce RTX 3060 Laptop GPU, R5 5600H, Samsung PM991a MZALQ512HBLU | |
|---|---|---|---|---|---|---|
| Noise | -19% | -21% | -13% | -2% | -14% | |
| off / environment * (dB) | 23.5 | 25 -6% | 27.9 -19% | 24 -2% | 24 -2% | 25 -6% |
| Idle Minimum * (dB) | 23.9 | 25 -5% | 28.5 -19% | 24 -0% | 24 -0% | 25 -5% |
| Idle Average * (dB) | 24.1 | 29 -20% | 29.8 -24% | 24 -0% | 24 -0% | 25 -4% |
| Idle Maximum * (dB) | 24.2 | 33 -36% | 29.8 -23% | 32.32 -34% | 24 1% | 30.5 -26% |
| Load Average * (dB) | 24 | 45 -88% | 34.8 -45% | 35.18 -47% | 32.49 -35% | 37.5 -56% |
| Cyberpunk 2077 ultra * (dB) | 51.2 | 48 6% | ||||
| Load Maximum * (dB) | 59.8 | 52 13% | 57.3 4% | 54.78 8% | 46.51 22% | 51 15% |
| Witcher 3 ultra * (dB) | 57.1 | 54.78 | 46.51 |
* ... smaller is better
Temperature
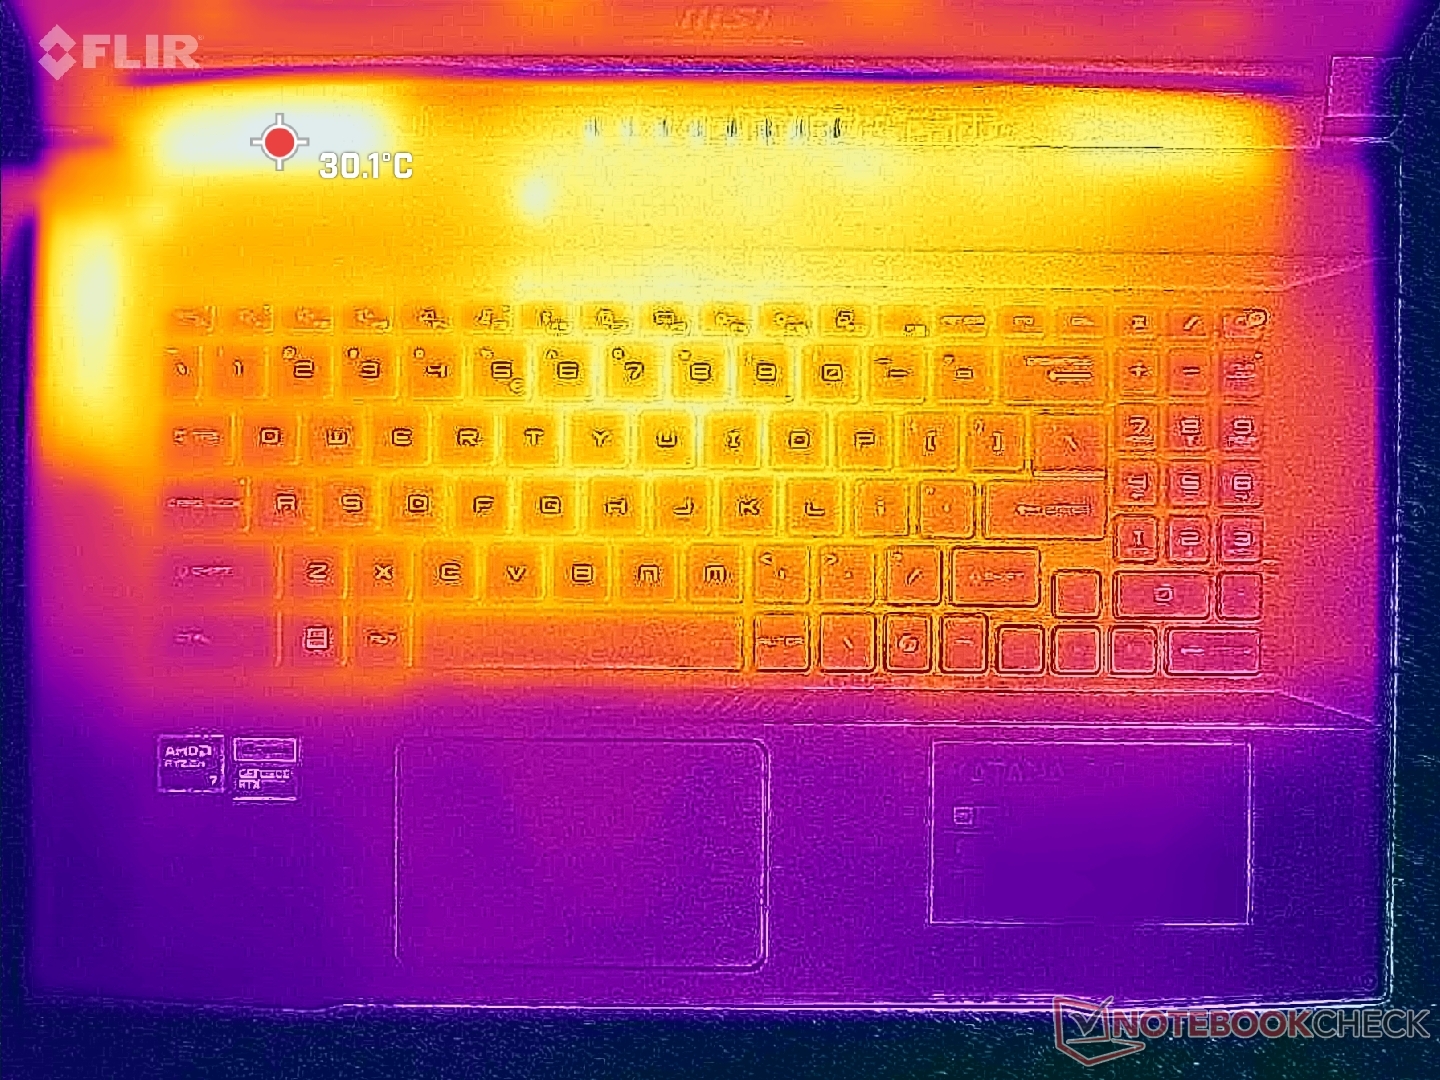
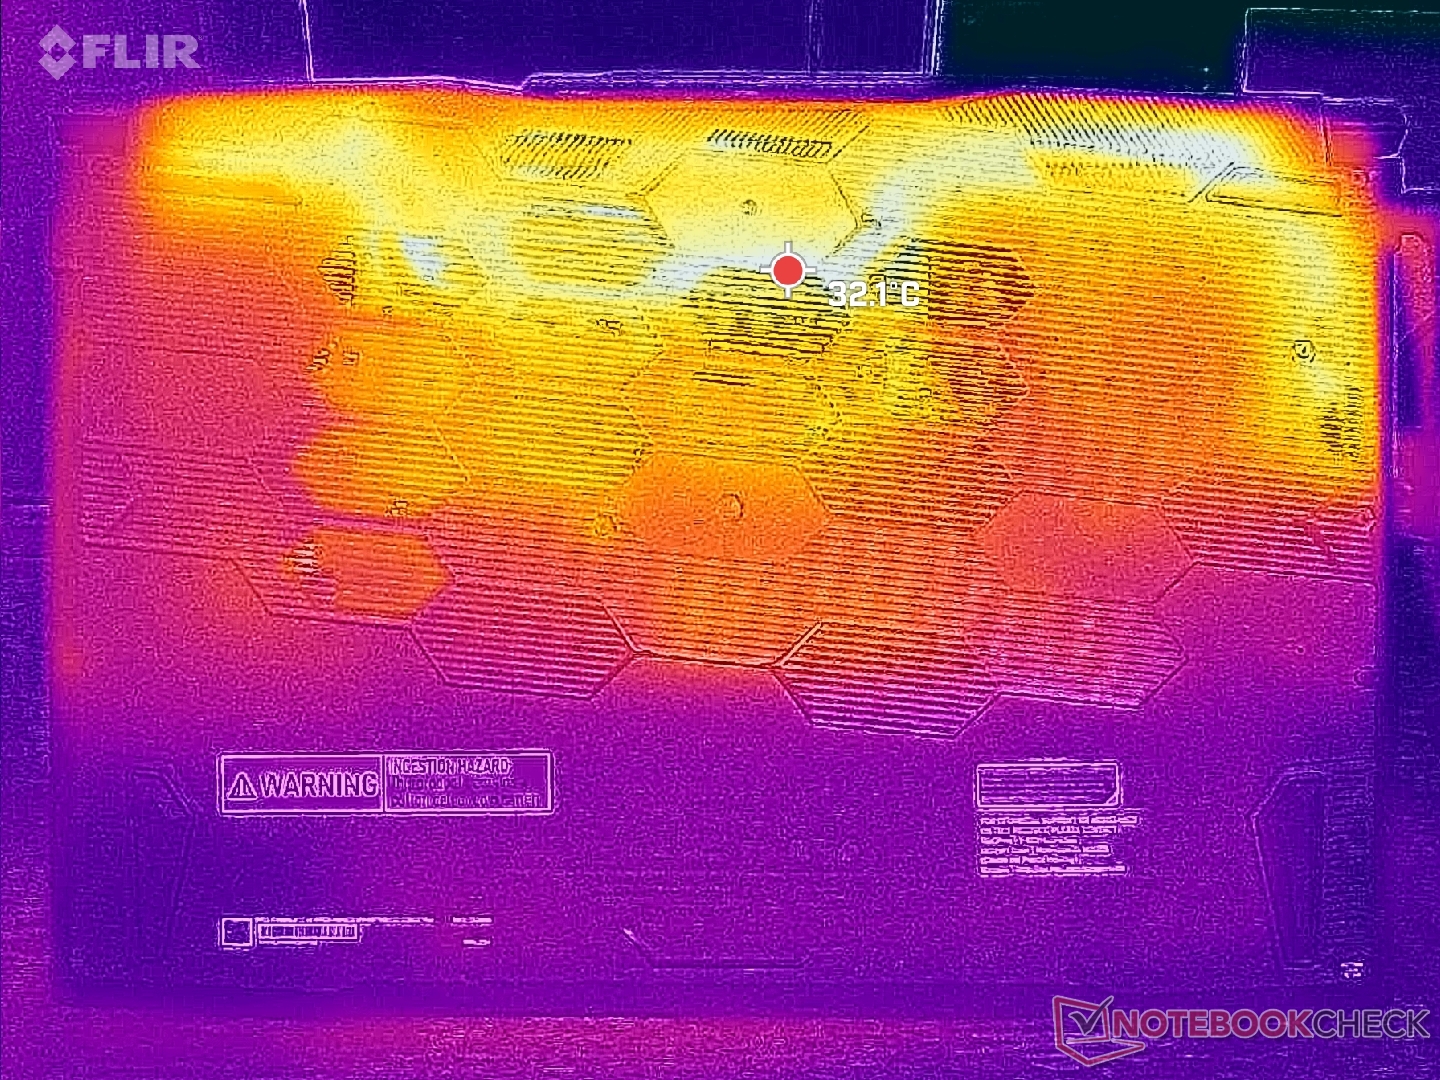
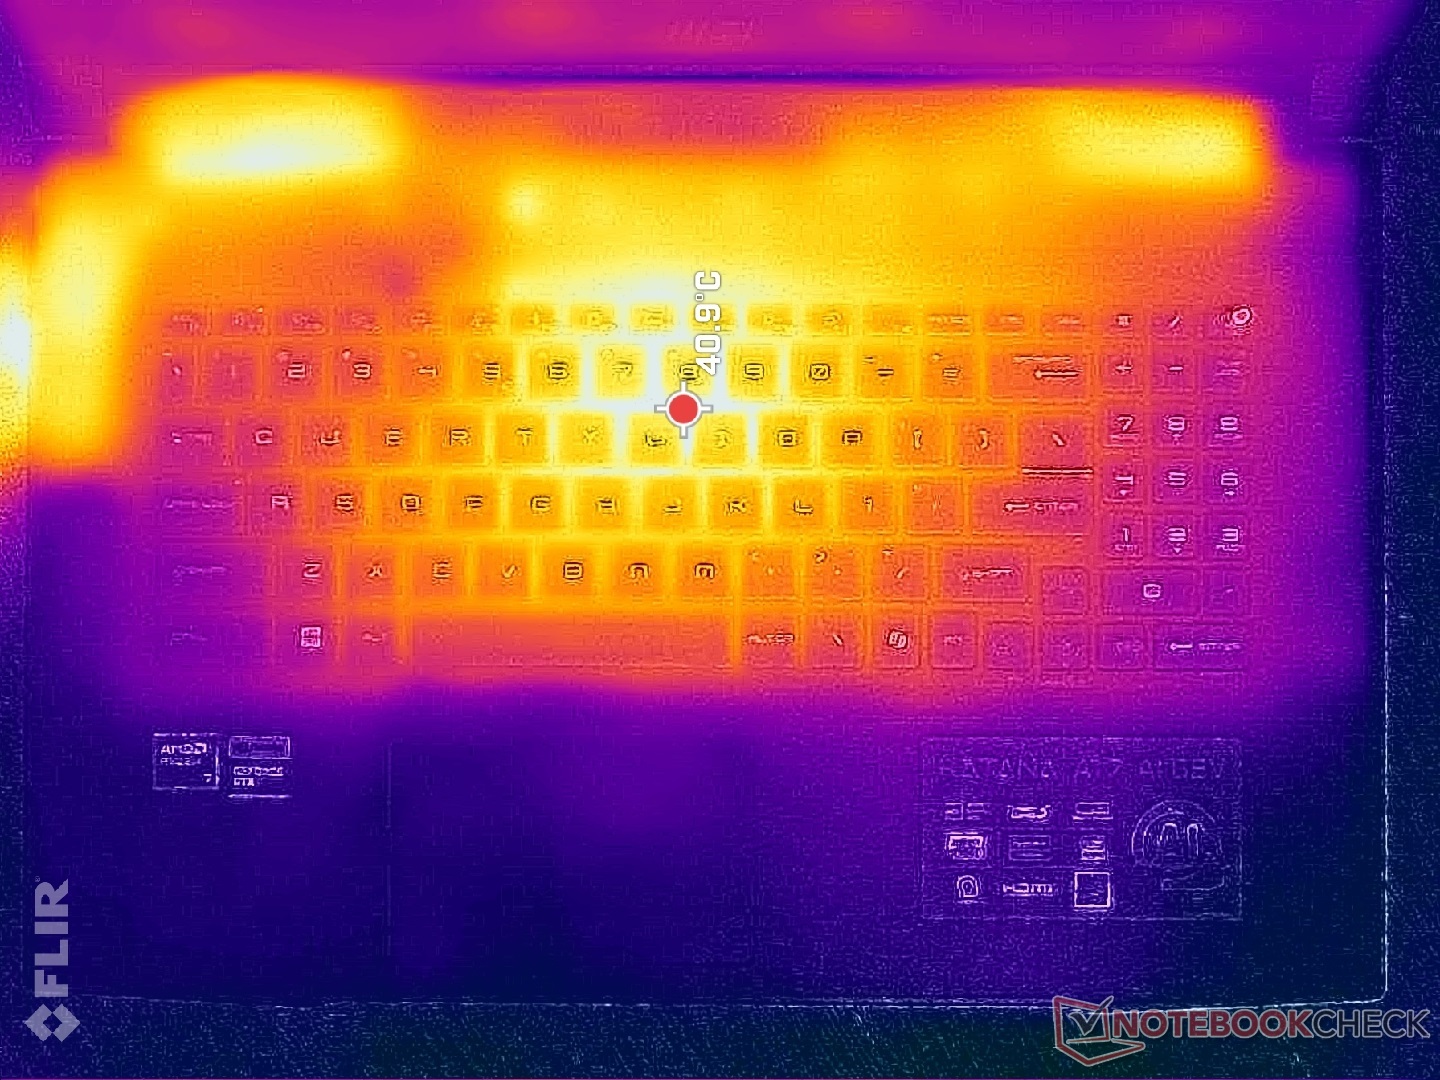
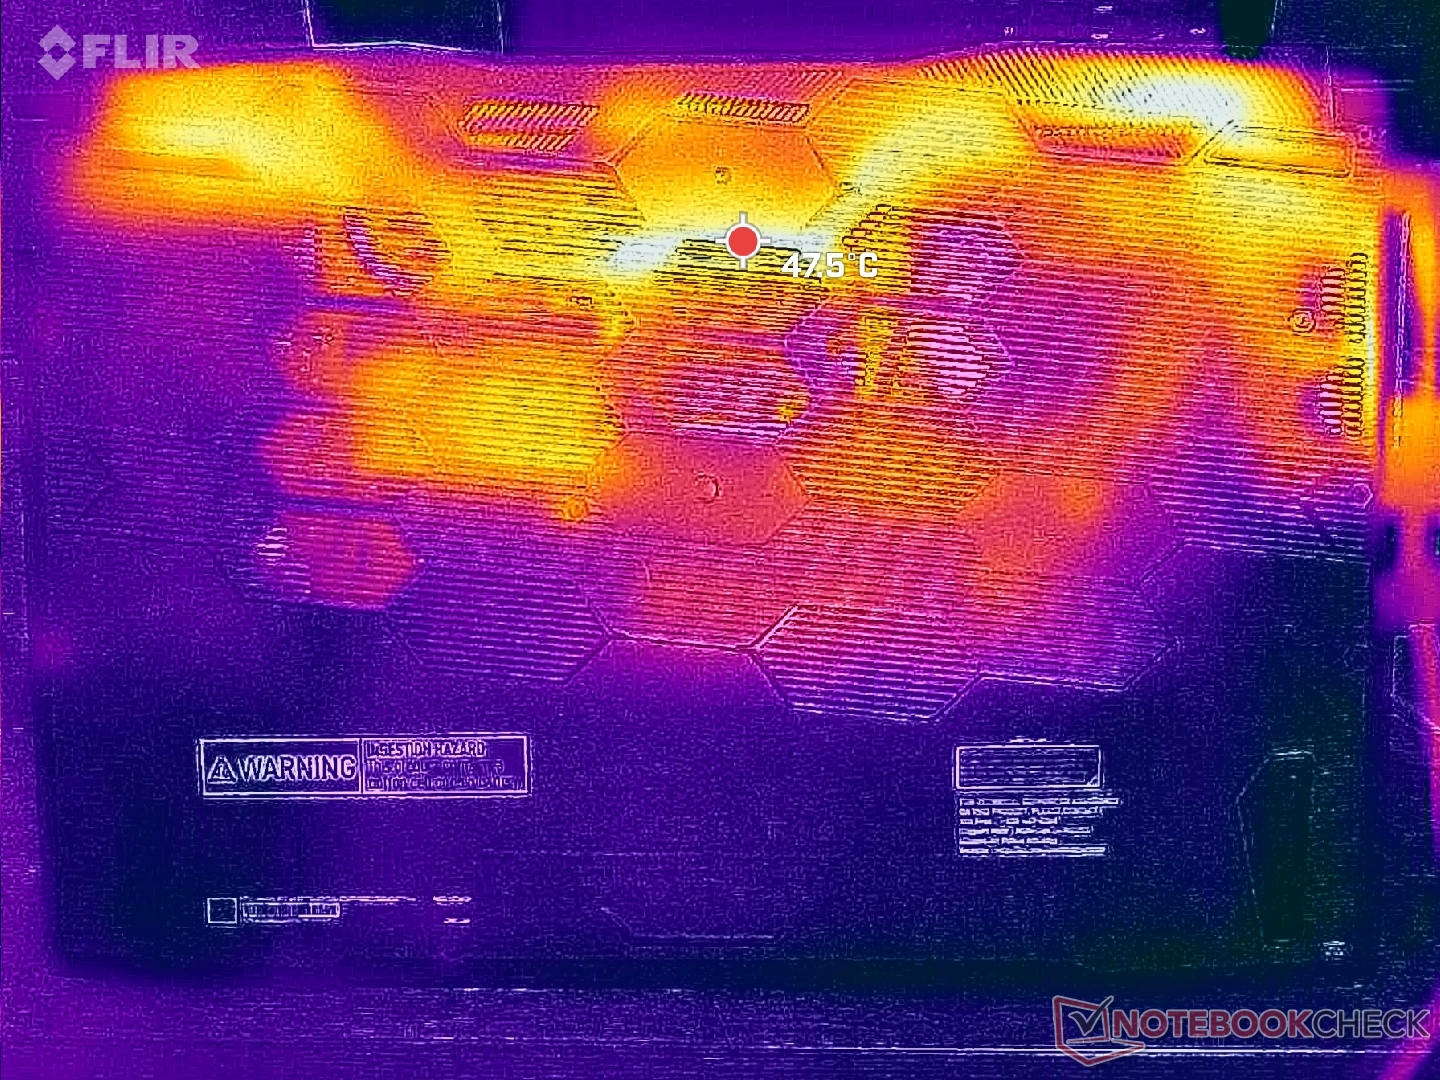
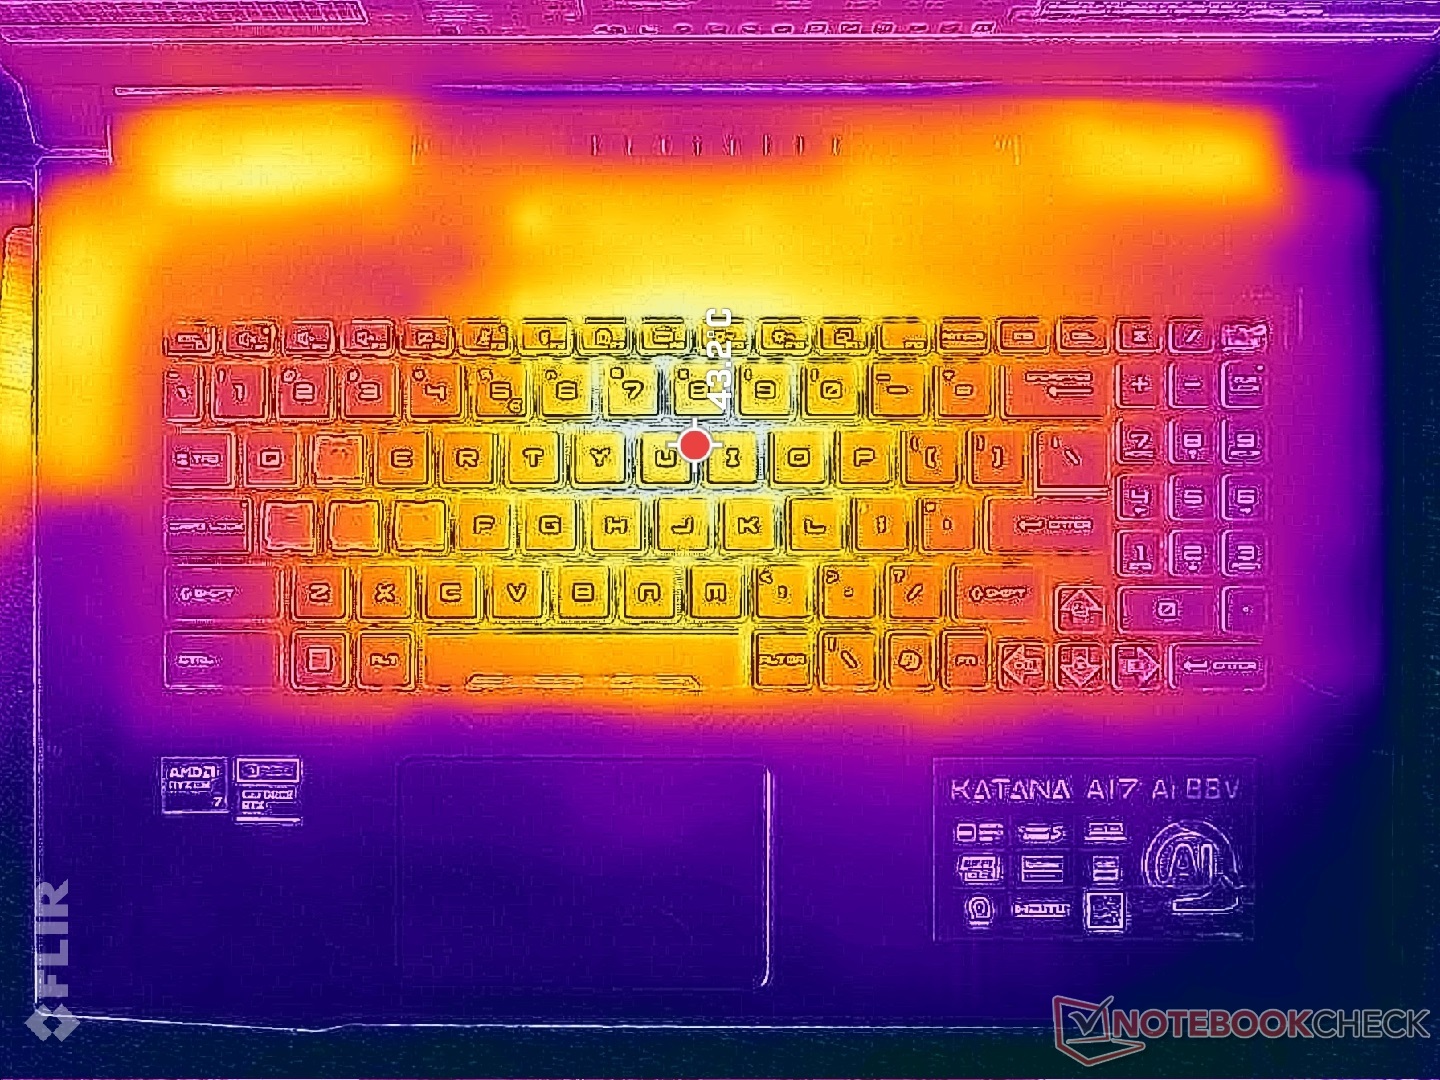
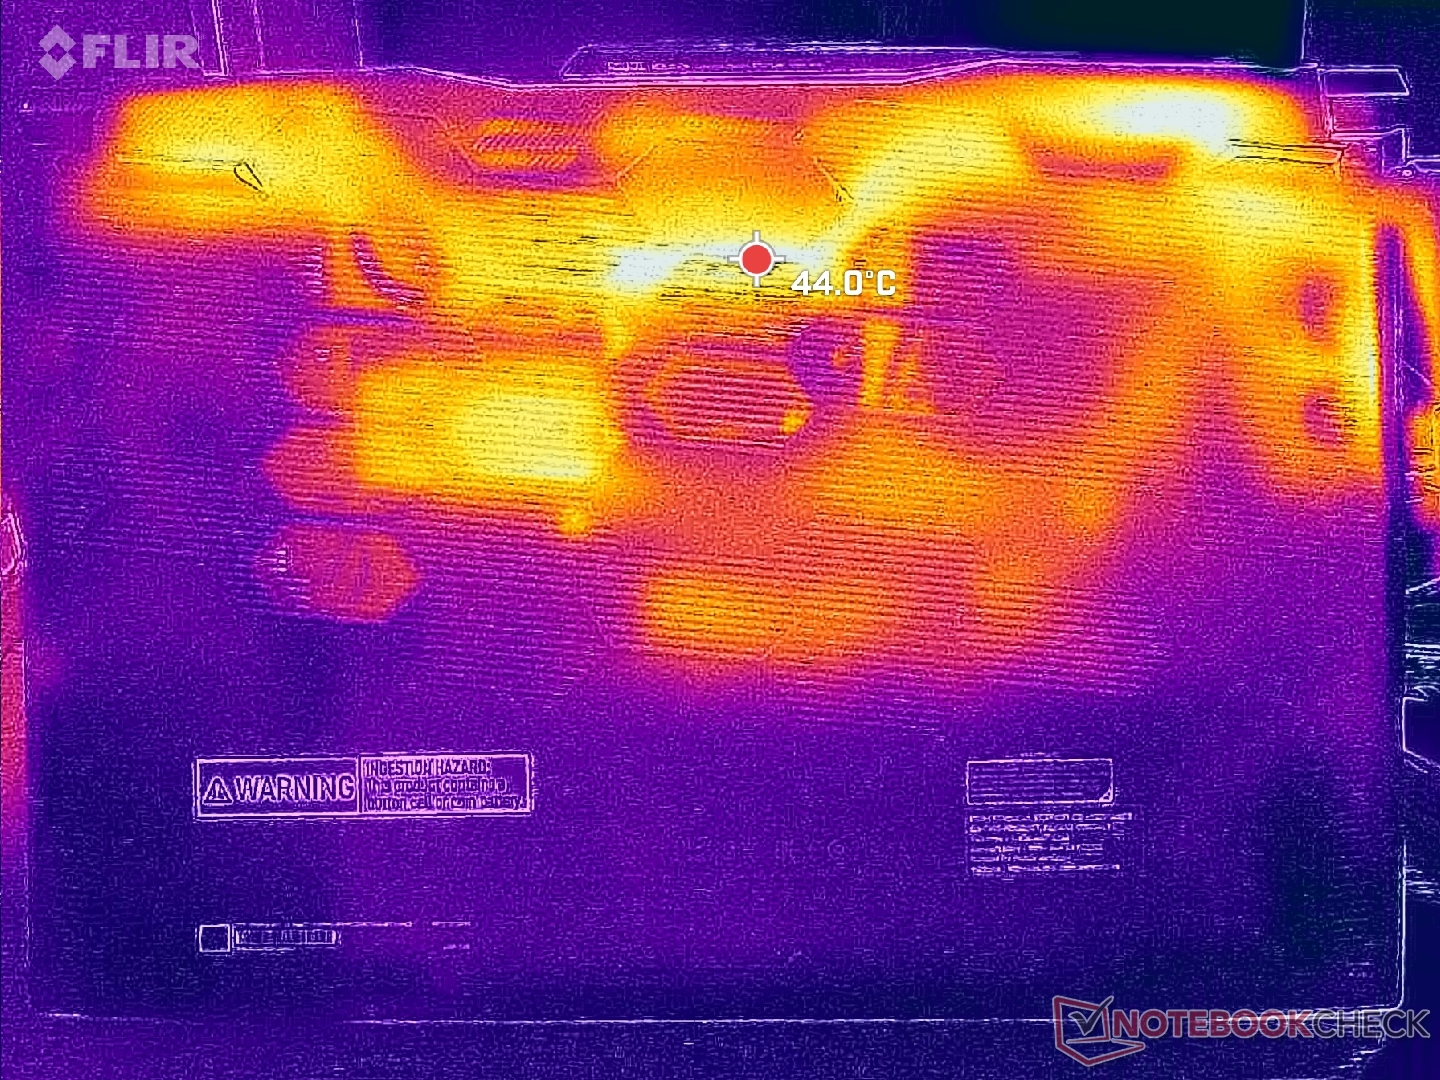
Surface temperatures are warmest at the keyboard center where contact with palms and fingers is minimized when gaming. Results are comparable to the Asus TUF Gaming A17 which ships with similar CPU and GPU options.
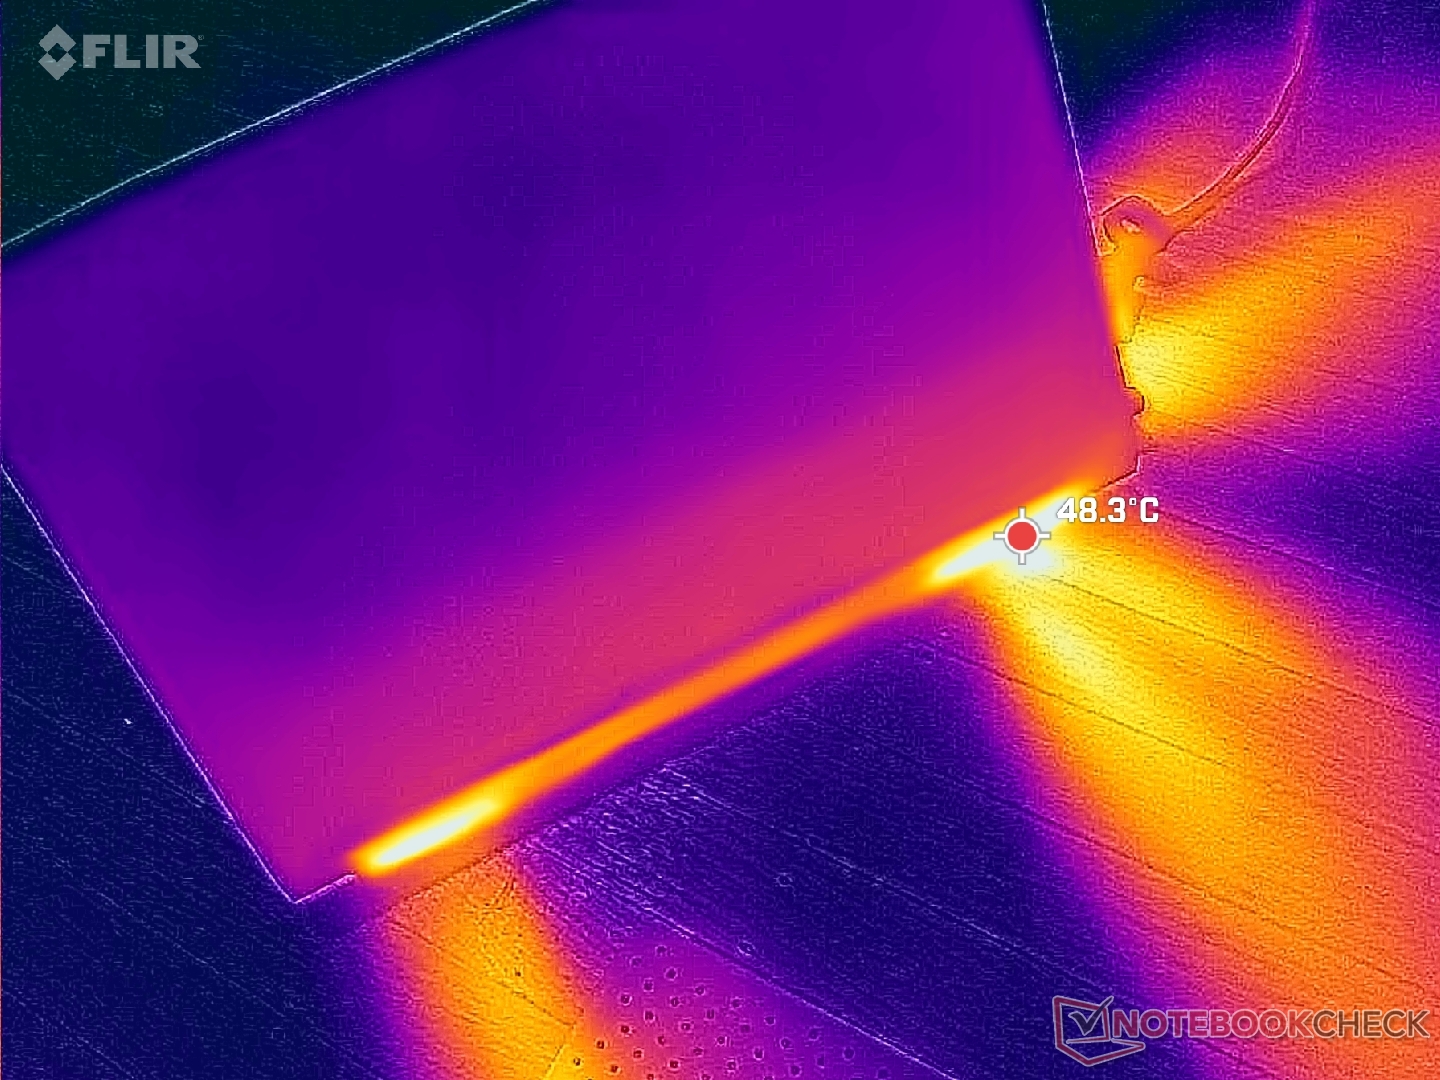
(±) The maximum temperature on the upper side is 42 °C / 108 F, compared to the average of 40.4 °C / 105 F, ranging from 21.2 to 68.8 °C for the class Gaming.
(±) The bottom heats up to a maximum of 41.4 °C / 107 F, compared to the average of 43.2 °C / 110 F
(+) In idle usage, the average temperature for the upper side is 26.5 °C / 80 F, compared to the device average of 33.9 °C / 93 F.
(+) 3: The average temperature for the upper side is 30.3 °C / 87 F, compared to the average of 33.9 °C / 93 F for the class Gaming.
(+) The palmrests and touchpad are cooler than skin temperature with a maximum of 22.4 °C / 72.3 F and are therefore cool to the touch.
(+) The average temperature of the palmrest area of similar devices was 28.8 °C / 83.8 F (+6.4 °C / 11.5 F).
| MSI Katana A17 AI B8VG AMD Ryzen 7 8845HS, NVIDIA GeForce RTX 4070 Laptop GPU | HP Omen 17-db0079ng AMD Ryzen 7 8845HS, NVIDIA GeForce RTX 4070 Laptop GPU | Asus TUF Gaming A17 FA707XI-NS94 AMD Ryzen 9 7940HS, NVIDIA GeForce RTX 4070 Laptop GPU | Acer Nitro 17 AN17-51-71ER Intel Core i7-13700H, NVIDIA GeForce RTX 4060 Laptop GPU | MSI Pulse 17 B13VGK Intel Core i7-13700H, NVIDIA GeForce RTX 4070 Laptop GPU | Lenovo Legion 5 17ACH6H-82JY0003GE AMD Ryzen 5 5600H, NVIDIA GeForce RTX 3060 Laptop GPU | |
|---|---|---|---|---|---|---|
| Heat | 9% | 20% | -6% | -3% | -3% | |
| Maximum Upper Side * (°C) | 42 | 44 -5% | 40 5% | 46 -10% | 48 -14% | 42.2 -0% |
| Maximum Bottom * (°C) | 41.4 | 45 -9% | 33.6 19% | 51 -23% | 50 -21% | 50.9 -23% |
| Idle Upper Side * (°C) | 32.6 | 26 20% | 26.6 18% | 34 -4% | 30 8% | 34.3 -5% |
| Idle Bottom * (°C) | 38.2 | 27 29% | 24.4 36% | 33 14% | 33 14% | 32 16% |
* ... smaller is better
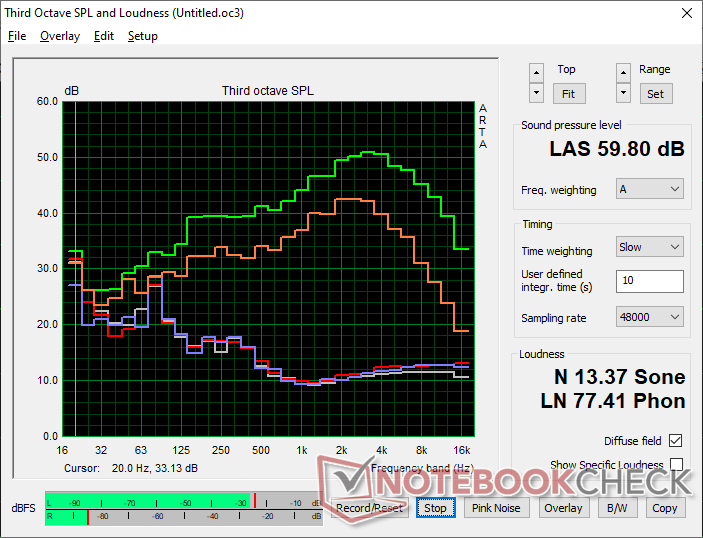
Speakers
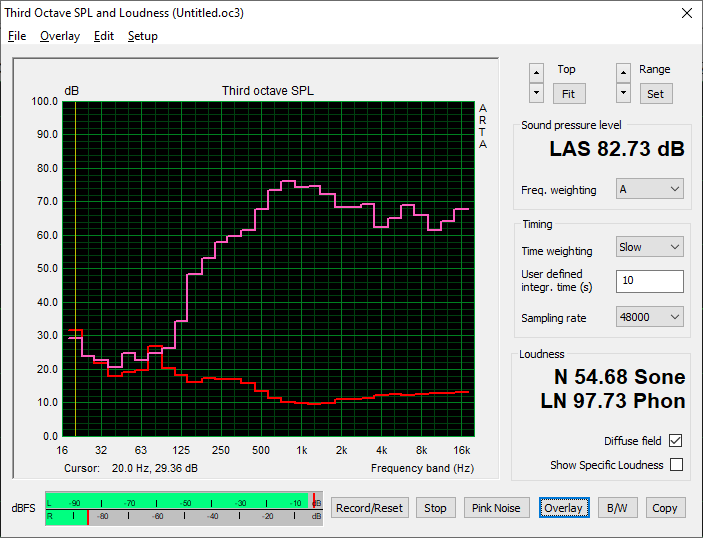
MSI Katana A17 AI B8VG audio analysis
(+) | speakers can play relatively loud (82.7 dB)
Bass 100 - 315 Hz
(-) | nearly no bass - on average 19.3% lower than median
(±) | linearity of bass is average (10.9% delta to prev. frequency)
Mids 400 - 2000 Hz
(±) | higher mids - on average 6.3% higher than median
(+) | mids are linear (5.8% delta to prev. frequency)
Highs 2 - 16 kHz
(+) | balanced highs - only 2.5% away from median
(+) | highs are linear (5.9% delta to prev. frequency)
Overall 100 - 16.000 Hz
(±) | linearity of overall sound is average (16.2% difference to median)
Compared to same class
» 40% of all tested devices in this class were better, 7% similar, 54% worse
» The best had a delta of 6%, average was 18%, worst was 132%
Compared to all devices tested
» 26% of all tested devices were better, 6% similar, 68% worse
» The best had a delta of 4%, average was 24%, worst was 134%
Apple MacBook Pro 16 2021 M1 Pro audio analysis
(+) | speakers can play relatively loud (84.7 dB)
Bass 100 - 315 Hz
(+) | good bass - only 3.8% away from median
(+) | bass is linear (5.2% delta to prev. frequency)
Mids 400 - 2000 Hz
(+) | balanced mids - only 1.3% away from median
(+) | mids are linear (2.1% delta to prev. frequency)
Highs 2 - 16 kHz
(+) | balanced highs - only 1.9% away from median
(+) | highs are linear (2.7% delta to prev. frequency)
Overall 100 - 16.000 Hz
(+) | overall sound is linear (4.6% difference to median)
Compared to same class
» 0% of all tested devices in this class were better, 0% similar, 100% worse
» The best had a delta of 5%, average was 17%, worst was 45%
Compared to all devices tested
» 0% of all tested devices were better, 0% similar, 100% worse
» The best had a delta of 4%, average was 24%, worst was 134%
Energy Management — Great Performance-Per-Watt But With Poor Battery Life
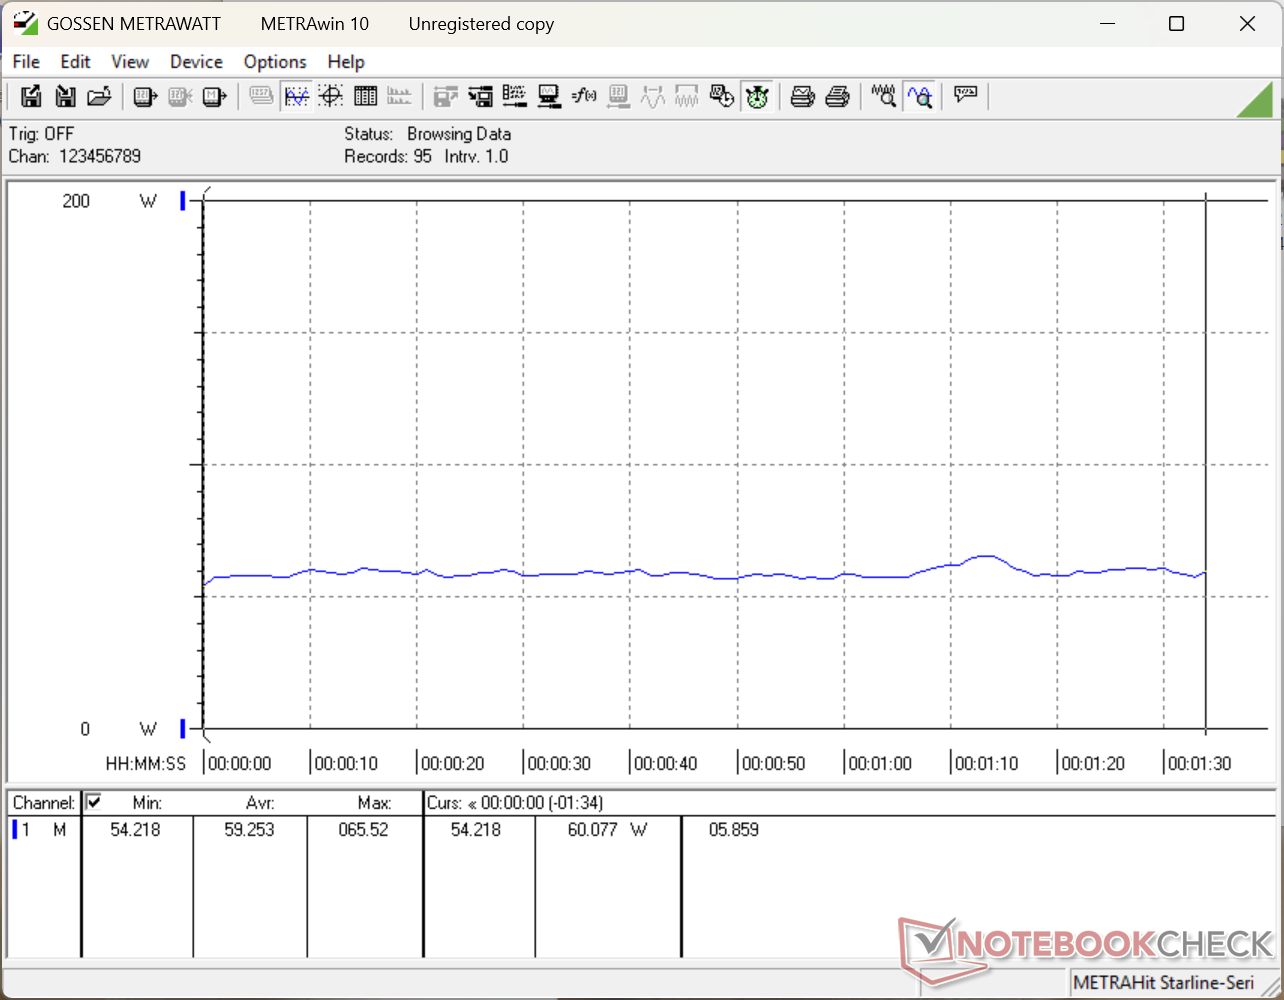
Power Consumption
Overall consumption is very close to what we recorded on the two-year-old Katana 17 despite the fact that our Katana A17 provides roughly the same CPU performance but with up to 20 percent faster graphics performance. Performance-per-watt is therefore greater especially when it comes to the Ryzen 7 7 8845HS vs. the Core i7-13620H.

| Off / Standby | |
| Idle | |
| Load |
|
Key:
min: | |
| MSI Katana A17 AI B8VG R7 8845HS, GeForce RTX 4070 Laptop GPU, Samsung PM9C1 MZVL81T0HELB-00BTW, IPS, 1920x1080, 17.3" | HP Omen 17-db0079ng R7 8845HS, GeForce RTX 4070 Laptop GPU, WD PC SN560 SDDPNQE-1T00, IPS, 2560x1440, 17.3" | Asus TUF Gaming A17 FA707XI-NS94 R9 7940HS, GeForce RTX 4070 Laptop GPU, WD PC SN560 SDDPNQE-1T00, IPS, 1920x1080, 17.3" | Acer Nitro 17 AN17-51-71ER i7-13700H, GeForce RTX 4060 Laptop GPU, Samsung PM9A1 MZVL21T0HCLR, , 2560x1440, 17.3" | MSI Pulse 17 B13VGK i7-13700H, GeForce RTX 4070 Laptop GPU, Micron 2400 MTFDKBA1T0QFM, IPS, 1920x1080, 17.3" | Lenovo Legion 5 17ACH6H-82JY0003GE R5 5600H, GeForce RTX 3060 Laptop GPU, Samsung PM991a MZALQ512HBLU, IPS, 1920x1080, 17.3" | |
|---|---|---|---|---|---|---|
| Power Consumption | -6% | -11% | -3% | 12% | -38% | |
| Idle Minimum * (Watt) | 15.4 | 6 61% | 6.2 60% | 8.3 46% | 9 42% | 15.6 -1% |
| Idle Average * (Watt) | 16.8 | 12 29% | 21.8 -30% | 13.5 20% | 10.2 39% | 20.7 -23% |
| Idle Maximum * (Watt) | 17.1 | 18 -5% | 22 -29% | 14.8 13% | 10.8 37% | 22.9 -34% |
| Load Average * (Watt) | 59.3 | 71 -20% | 59.2 -0% | 77 -30% | 72 -21% | 134 -126% |
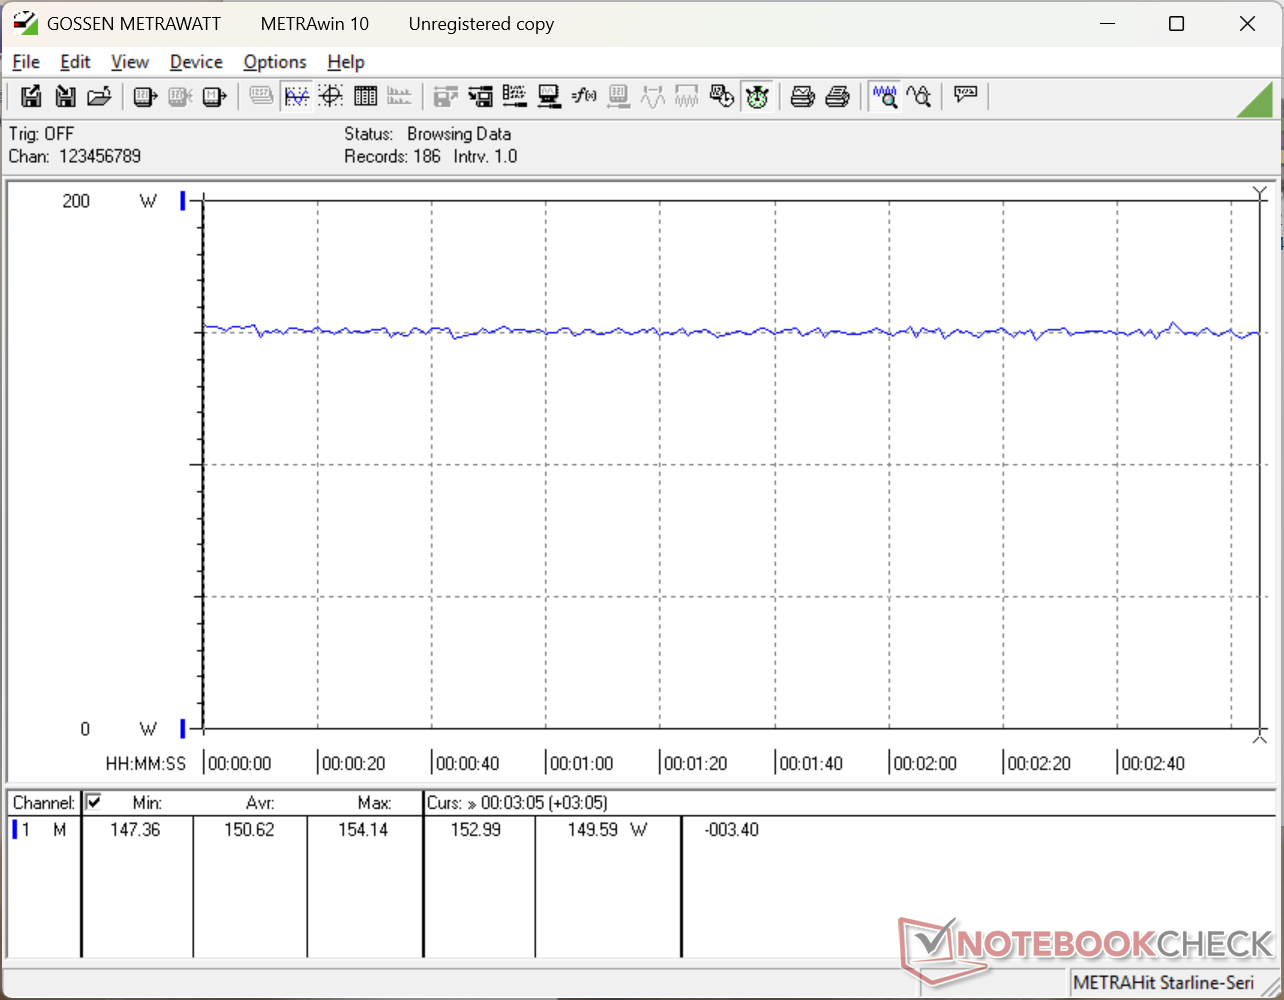
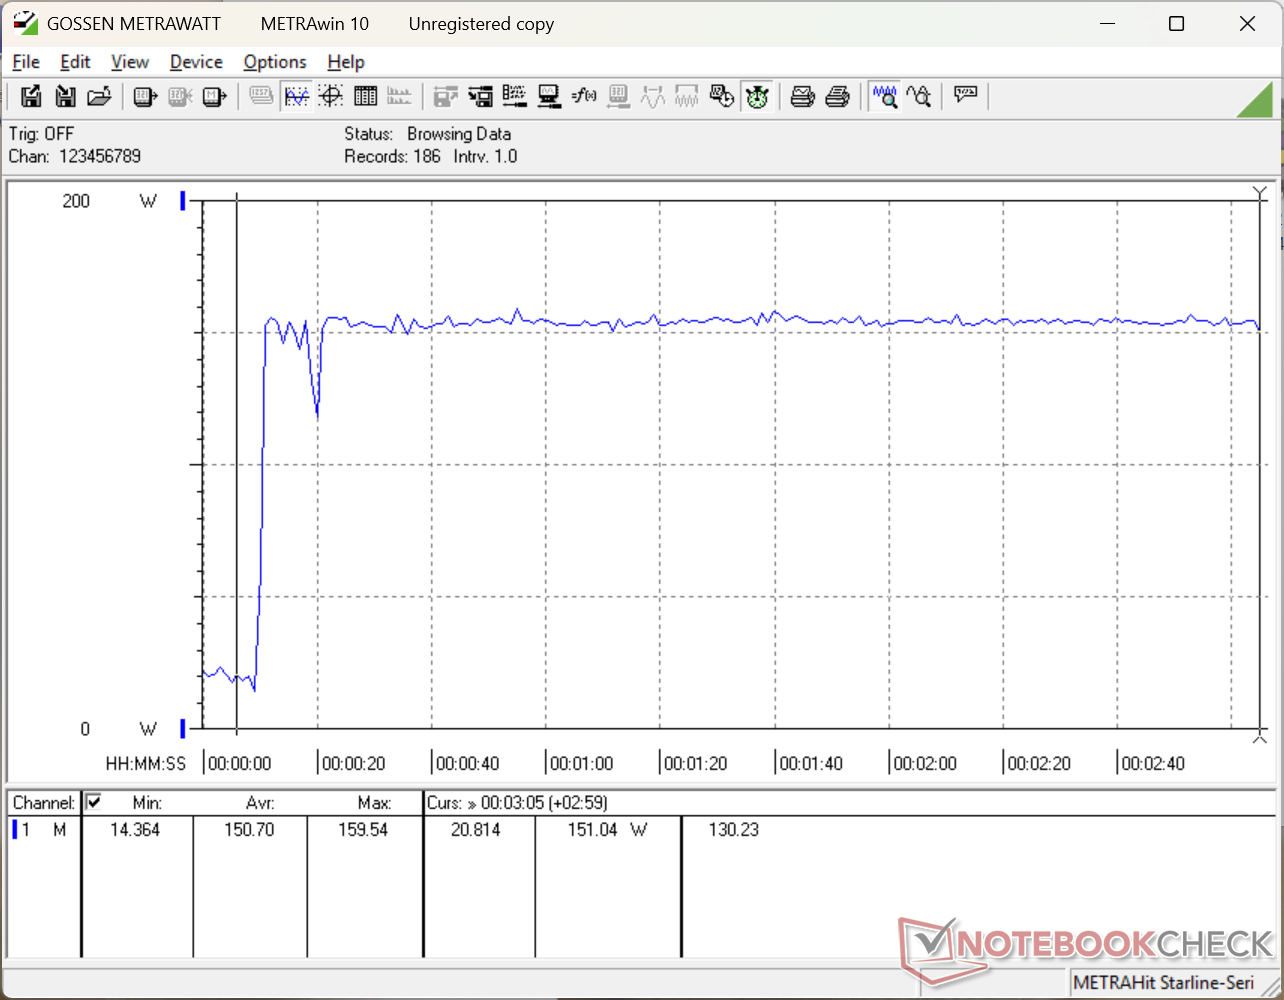
| Cyberpunk 2077 ultra external monitor * (Watt) | 147.4 | 191.8 -30% | ||||
| Cyberpunk 2077 ultra * (Watt) | 150.6 | 197 -31% | ||||
| Load Maximum * (Watt) | 160 | 228 -43% | 247.8 -55% | 263 -64% | 221 -38% | 170 -6% |
| Witcher 3 ultra * (Watt) | 189.7 | 154 | 130 | 135 |
* ... smaller is better
Power Consumption Cyberpunk / Stress Test
Power Consumption external Monitor
Battery Life
Battery capacity is small at just 53 Wh for generally shorter runtimes than most other gaming laptops even when set to iGPU mode.
| MSI Katana A17 AI B8VG R7 8845HS, GeForce RTX 4070 Laptop GPU, 53.5 Wh | HP Omen 17-db0079ng R7 8845HS, GeForce RTX 4070 Laptop GPU, 83 Wh | Asus TUF Gaming A17 FA707XI-NS94 R9 7940HS, GeForce RTX 4070 Laptop GPU, 90 Wh | Acer Nitro 17 AN17-51-71ER i7-13700H, GeForce RTX 4060 Laptop GPU, 90 Wh | MSI Pulse 17 B13VGK i7-13700H, GeForce RTX 4070 Laptop GPU, 90 Wh | Lenovo Legion 5 17ACH6H-82JY0003GE R5 5600H, GeForce RTX 3060 Laptop GPU, 80 Wh | |
|---|---|---|---|---|---|---|
| Battery runtime | 133% | 133% | 110% | 131% | 13% | |
| WiFi v1.3 (h) | 3.9 | 9.1 133% | 9.1 133% | 8.2 110% | 9 131% | 4.4 13% |
| H.264 (h) | 7.7 | 6.9 | 3.5 | |||
| Cyberpunk 2077 ultra 150cd (h) | 1 | |||||
| Reader / Idle (h) | 19.7 | 5.5 | ||||
| Load (h) | 1.7 | 2.2 | 1.9 | |||
| Witcher 3 ultra (h) | 2.5 |
Notebookcheck Rating
MSI Katana A17 AI B8VG
- 02/03/2025 v8
Allen Ngo
 Total Sustainability Score:
 Transparency
The selection of devices to be reviewed is made by our editorial team. The test sample was provided to the author as a loan by the manufacturer or retailer for the purpose of this review. The lender had no influence on this review, nor did the manufacturer receive a copy of this review before publication. There was no obligation to publish this review. As an independent media company, Notebookcheck is not subjected to the authority of manufacturers, retailers or publishers.
This is how Notebookcheck is testing
Every year, Notebookcheck independently reviews hundreds of laptops and smartphones using standardized procedures to ensure that all results are comparable. We have continuously developed our test methods for around 20 years and set industry standards in the process. In our test labs, high-quality measuring equipment is utilized by experienced technicians and editors. These tests involve a multi-stage validation process. Our complex rating system is based on hundreds of well-founded measurements and benchmarks, which maintains objectivity. Further information on our test methods can be found here.
