MSI Katana A15 AI laptop review: RTX 4070 gamer hurt by cost-saving measures
Close but no cigar.
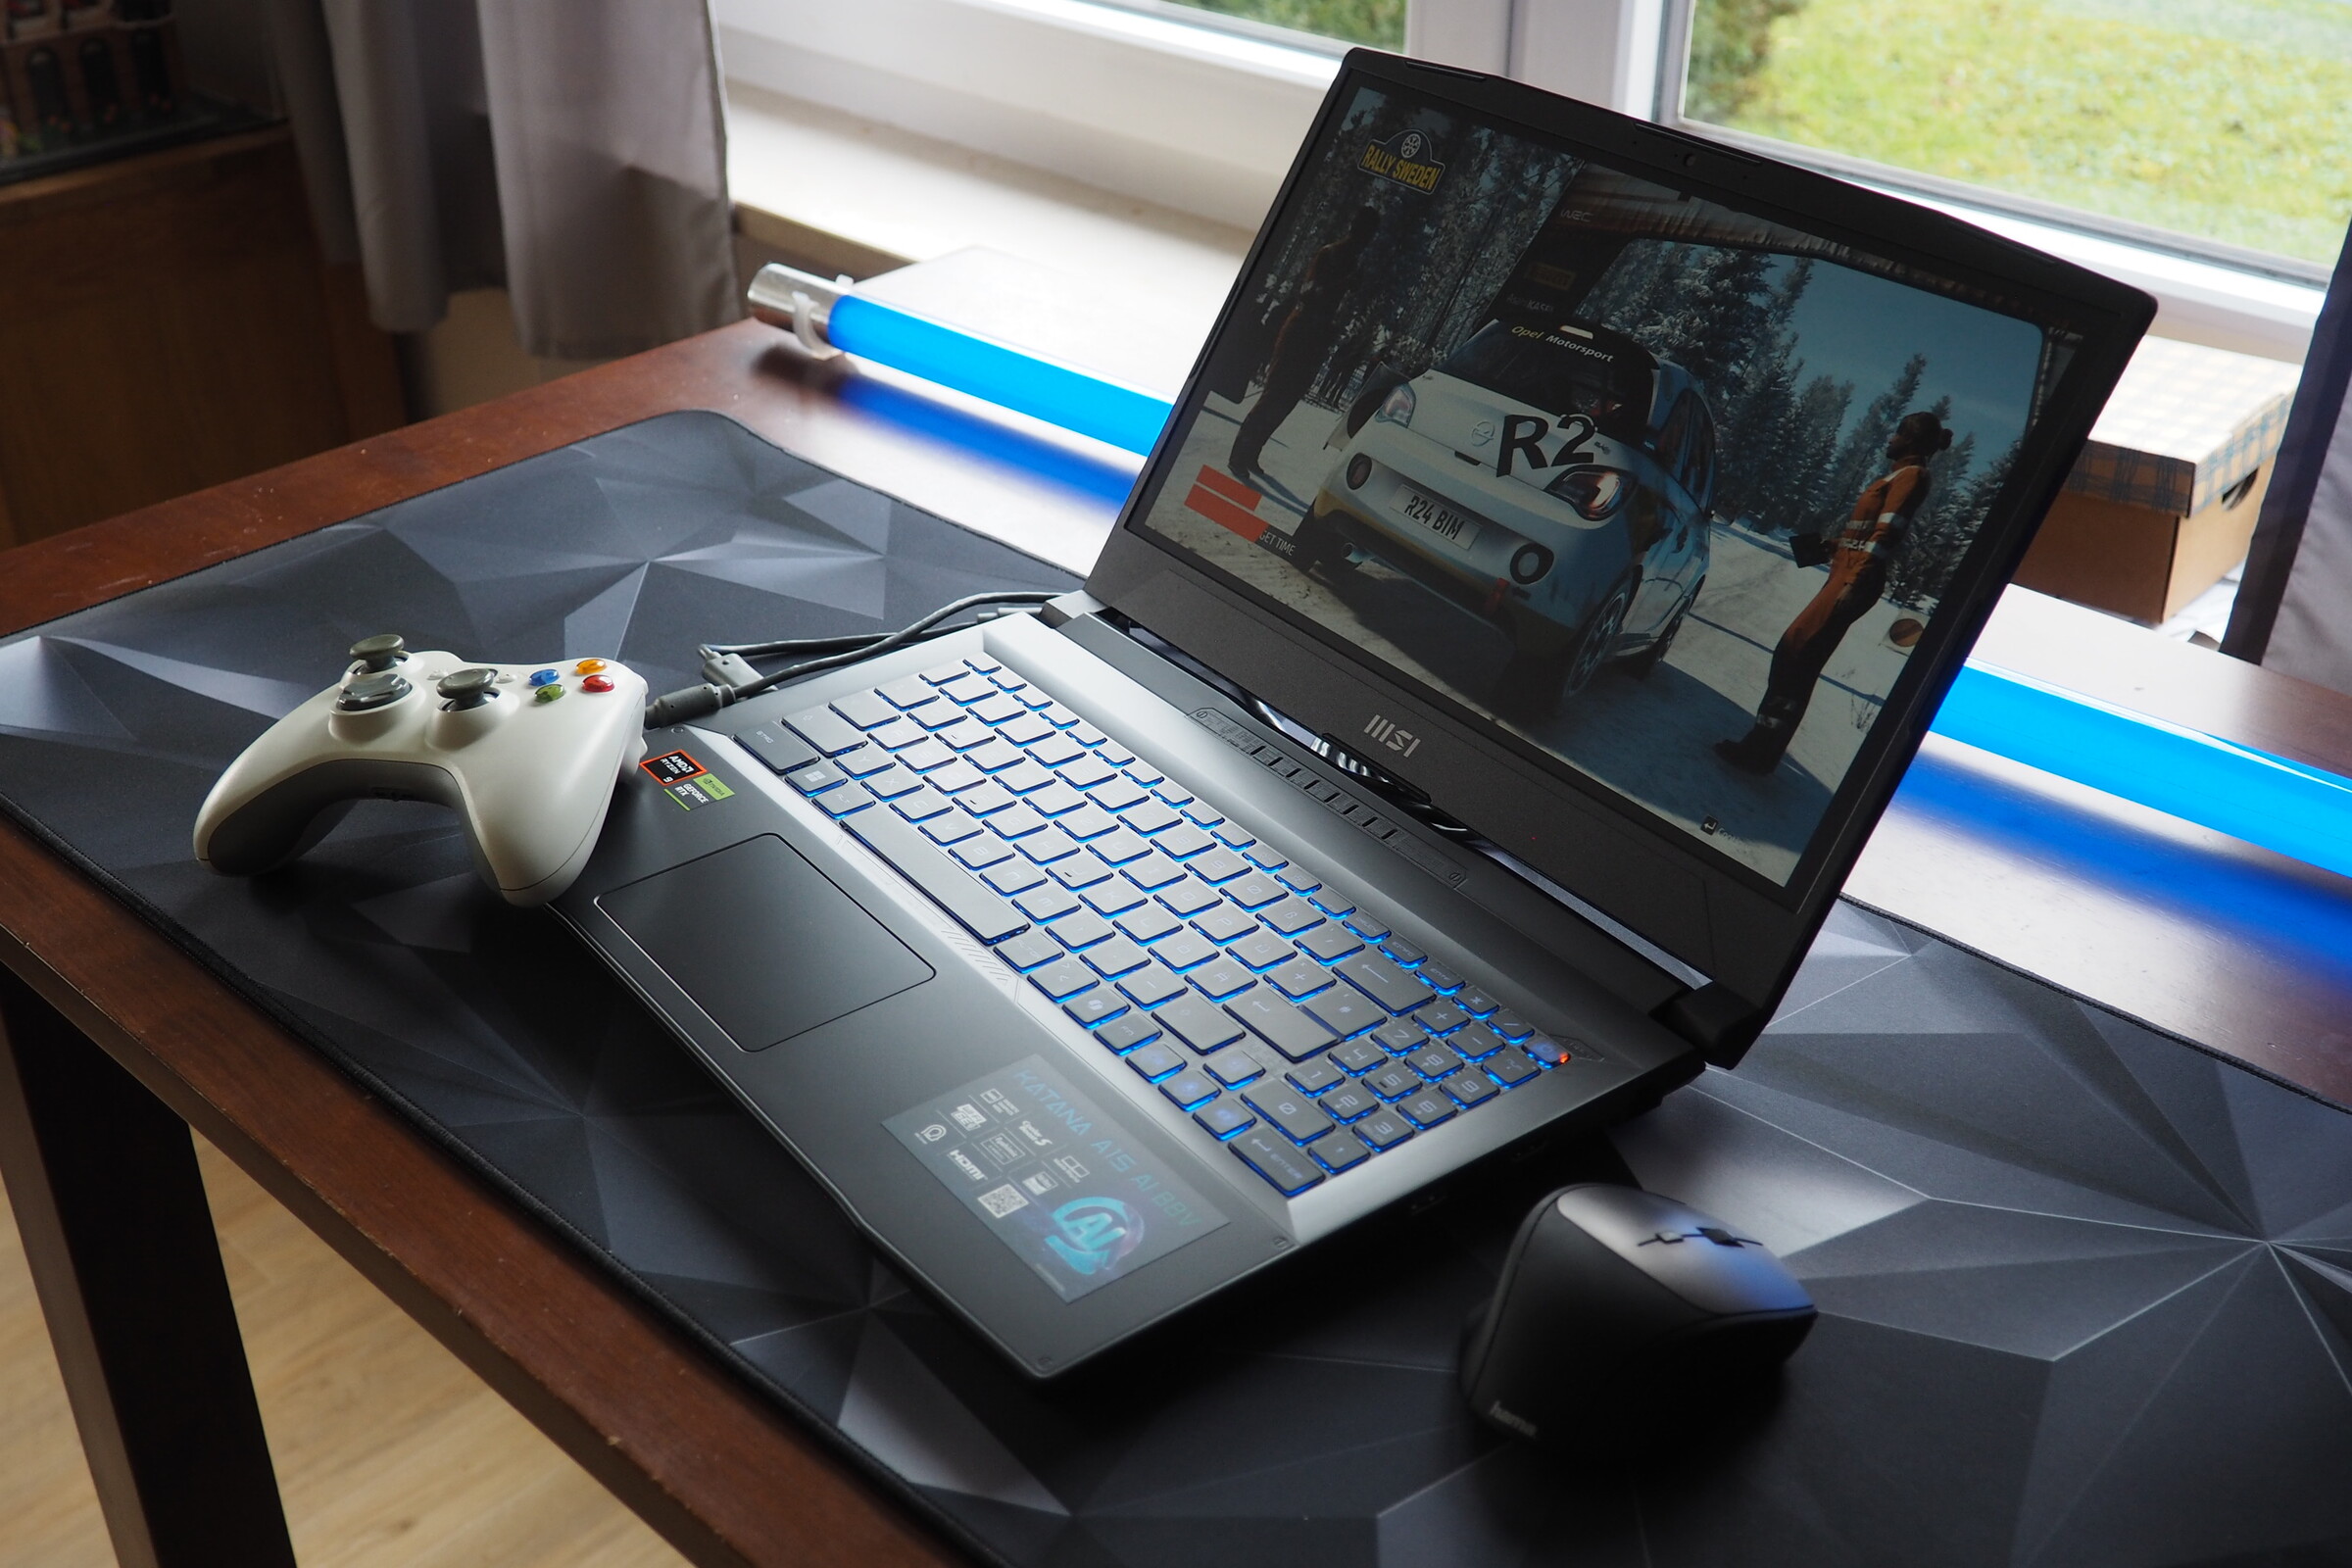
MSI ventures into the competitive mid-range gaming laptop sector with the Katana A15 AI. This 15-inch laptop features a powerful Ryzen processor along with a GeForce RTX 4060 or RTX 4070 - and is massively disappointing in one crucial area.Florian Glaser, 👁 Florian Glaser, ✓ Hariharan Gunasekaran (translated by DeepL / Ninh Duy) Published 🇩🇪 🇫🇷 ...
Verdict - MSI cuts too many corners
The Katana A15 AI has the same set of shortcomings as the recently reviewed Acer Nitro V 16 ANV16. Its display just doesn't cut it considering the price, which is quite substantial. While a few more affordable RTX 4070 laptops like the Lenovo LOQ 15ARP9, Asus TUF Gaming F15 FX507ZI4-LP031 and the HP Victus 16-s0177ng offer 100% sRGB coverage (according to the respective spec sheets at least), the MSI laptop falls short at under 70%, making the image displayed rather pale and lackluster.
MSI should have put more effort into other areas as well, such as the cheap-looking, rickety case, the meager battery capacity and runtimes, small touchpad, and mediocre speakers. There is no USB 4 here and the unconventional keyboard layout may take some getting used to.
The Katana A15 stands out from the crowd in only a few positive ways, with its two RAM and two M.2 slots being particularly commendable. Overall, it's hard to recommend this laptop for purchase due to the numerous issues we uncovered, especially considering the price (the test SKU starts at 1,500 euros). Several rival systems are noticeably faster. Some of them are cheaper, too.
Pros
Cons
Price and availability
In the US, the MSI Katana A15 AI is available from Amazon among other options.
Possible alternatives compared
Image | Model / Review | Price | Weight | Height | Display |
|---|---|---|---|---|---|
1. 76.4%  | MSI Katana A15 AI B8VG AMD Ryzen 9 8945HS ⎘ NVIDIA GeForce RTX 4070 Laptop GPU ⎘ 16 GB Memory, 1024 GB SSD | Amazon: List Price: 1500 EUR | 2.3 kg | 24.9 mm | 15.60" 1920x1080 141 PPI IPS |
2. 86.6% v7 (old)  | HP Omen 16-xf0376ng AMD Ryzen 7 7840HS ⎘ NVIDIA GeForce RTX 4070 Laptop GPU ⎘ 16 GB Memory, 512 GB SSD | Amazon: List Price: 1900 EUR | 2.4 kg | 23.5 mm | 16.10" 1920x1080 137 PPI IPS |
3. 85.1% v7 (old)  | HP Victus 16-r0077ng Intel Core i7-13700H ⎘ NVIDIA GeForce RTX 4070 Laptop GPU ⎘ 16 GB Memory, 1024 GB SSD | Amazon: List Price: 1630 EUR | 2.4 kg | 24 mm | 16.10" 1920x1080 137 PPI IPS |
4. 85.7% v7 (old)  | Aorus 15 BSF Intel Core i7-13700H ⎘ NVIDIA GeForce RTX 4070 Laptop GPU ⎘ 16 GB Memory, 1024 GB SSD | Amazon: List Price: 1749 Euro | 2.4 kg | 20.9 mm | 15.60" 2560x1440 188 PPI IPS |
5. 88.4% v7 (old)  | Lenovo Legion Pro 5 16ARX8 AMD Ryzen 7 7745HX ⎘ NVIDIA GeForce RTX 4070 Laptop GPU ⎘ 16 GB Memory, 1024 GB SSD | Amazon: List Price: 1600 USD | 2.5 kg | 26.8 mm | 16.00" 2560x1600 189 PPI IPS |
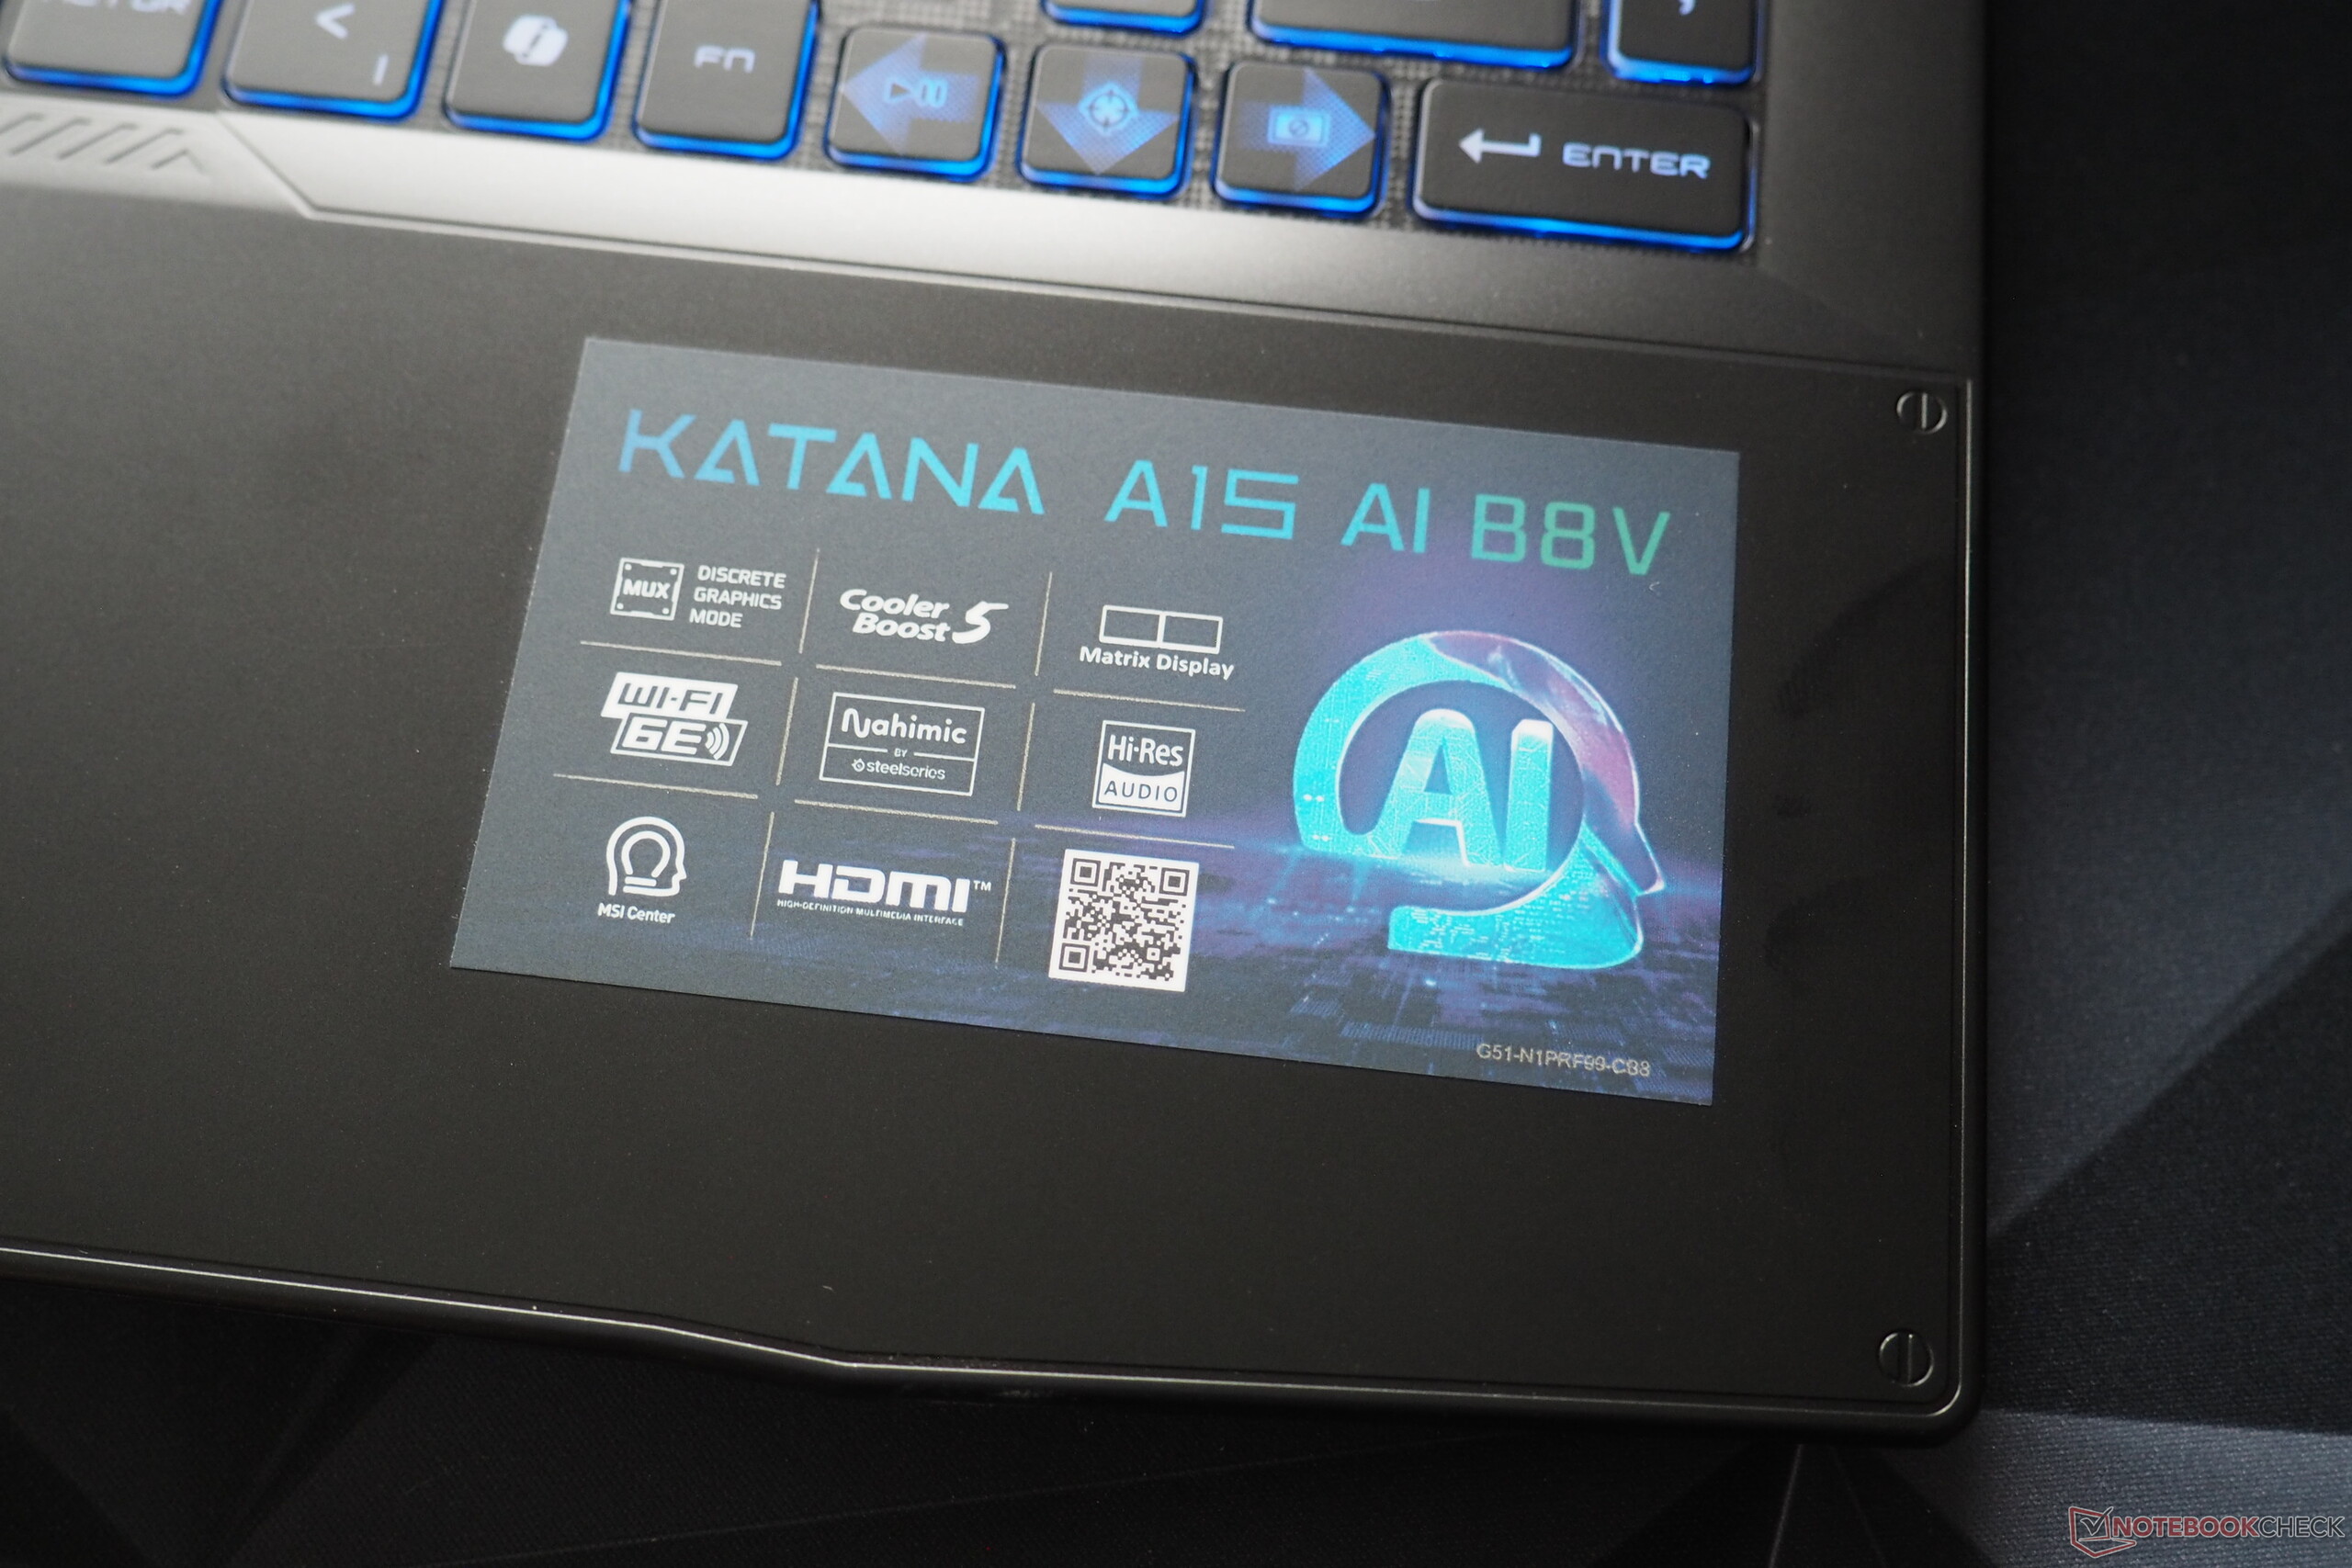
In Germany where the testing took place, the Katana A15 AI is currently offered in two configurations. The B8VG-451 model that costs upwards of 1,100 euros comes with the Ryzen 7 8845HS, GeForce RTX 4060 Laptop and a 512 GB SSD while our test model, the B8VG-459, is priced at 1,500 euros and features the Ryzen 9 8945HS, GeForce RTX 4070 Laptop and a 1 TB SSD. Both SKUs are equipped with a matte 144 Hz Full-HD IPS display and 16 GB of DDR5-5600 RAM.
Specifications
Case
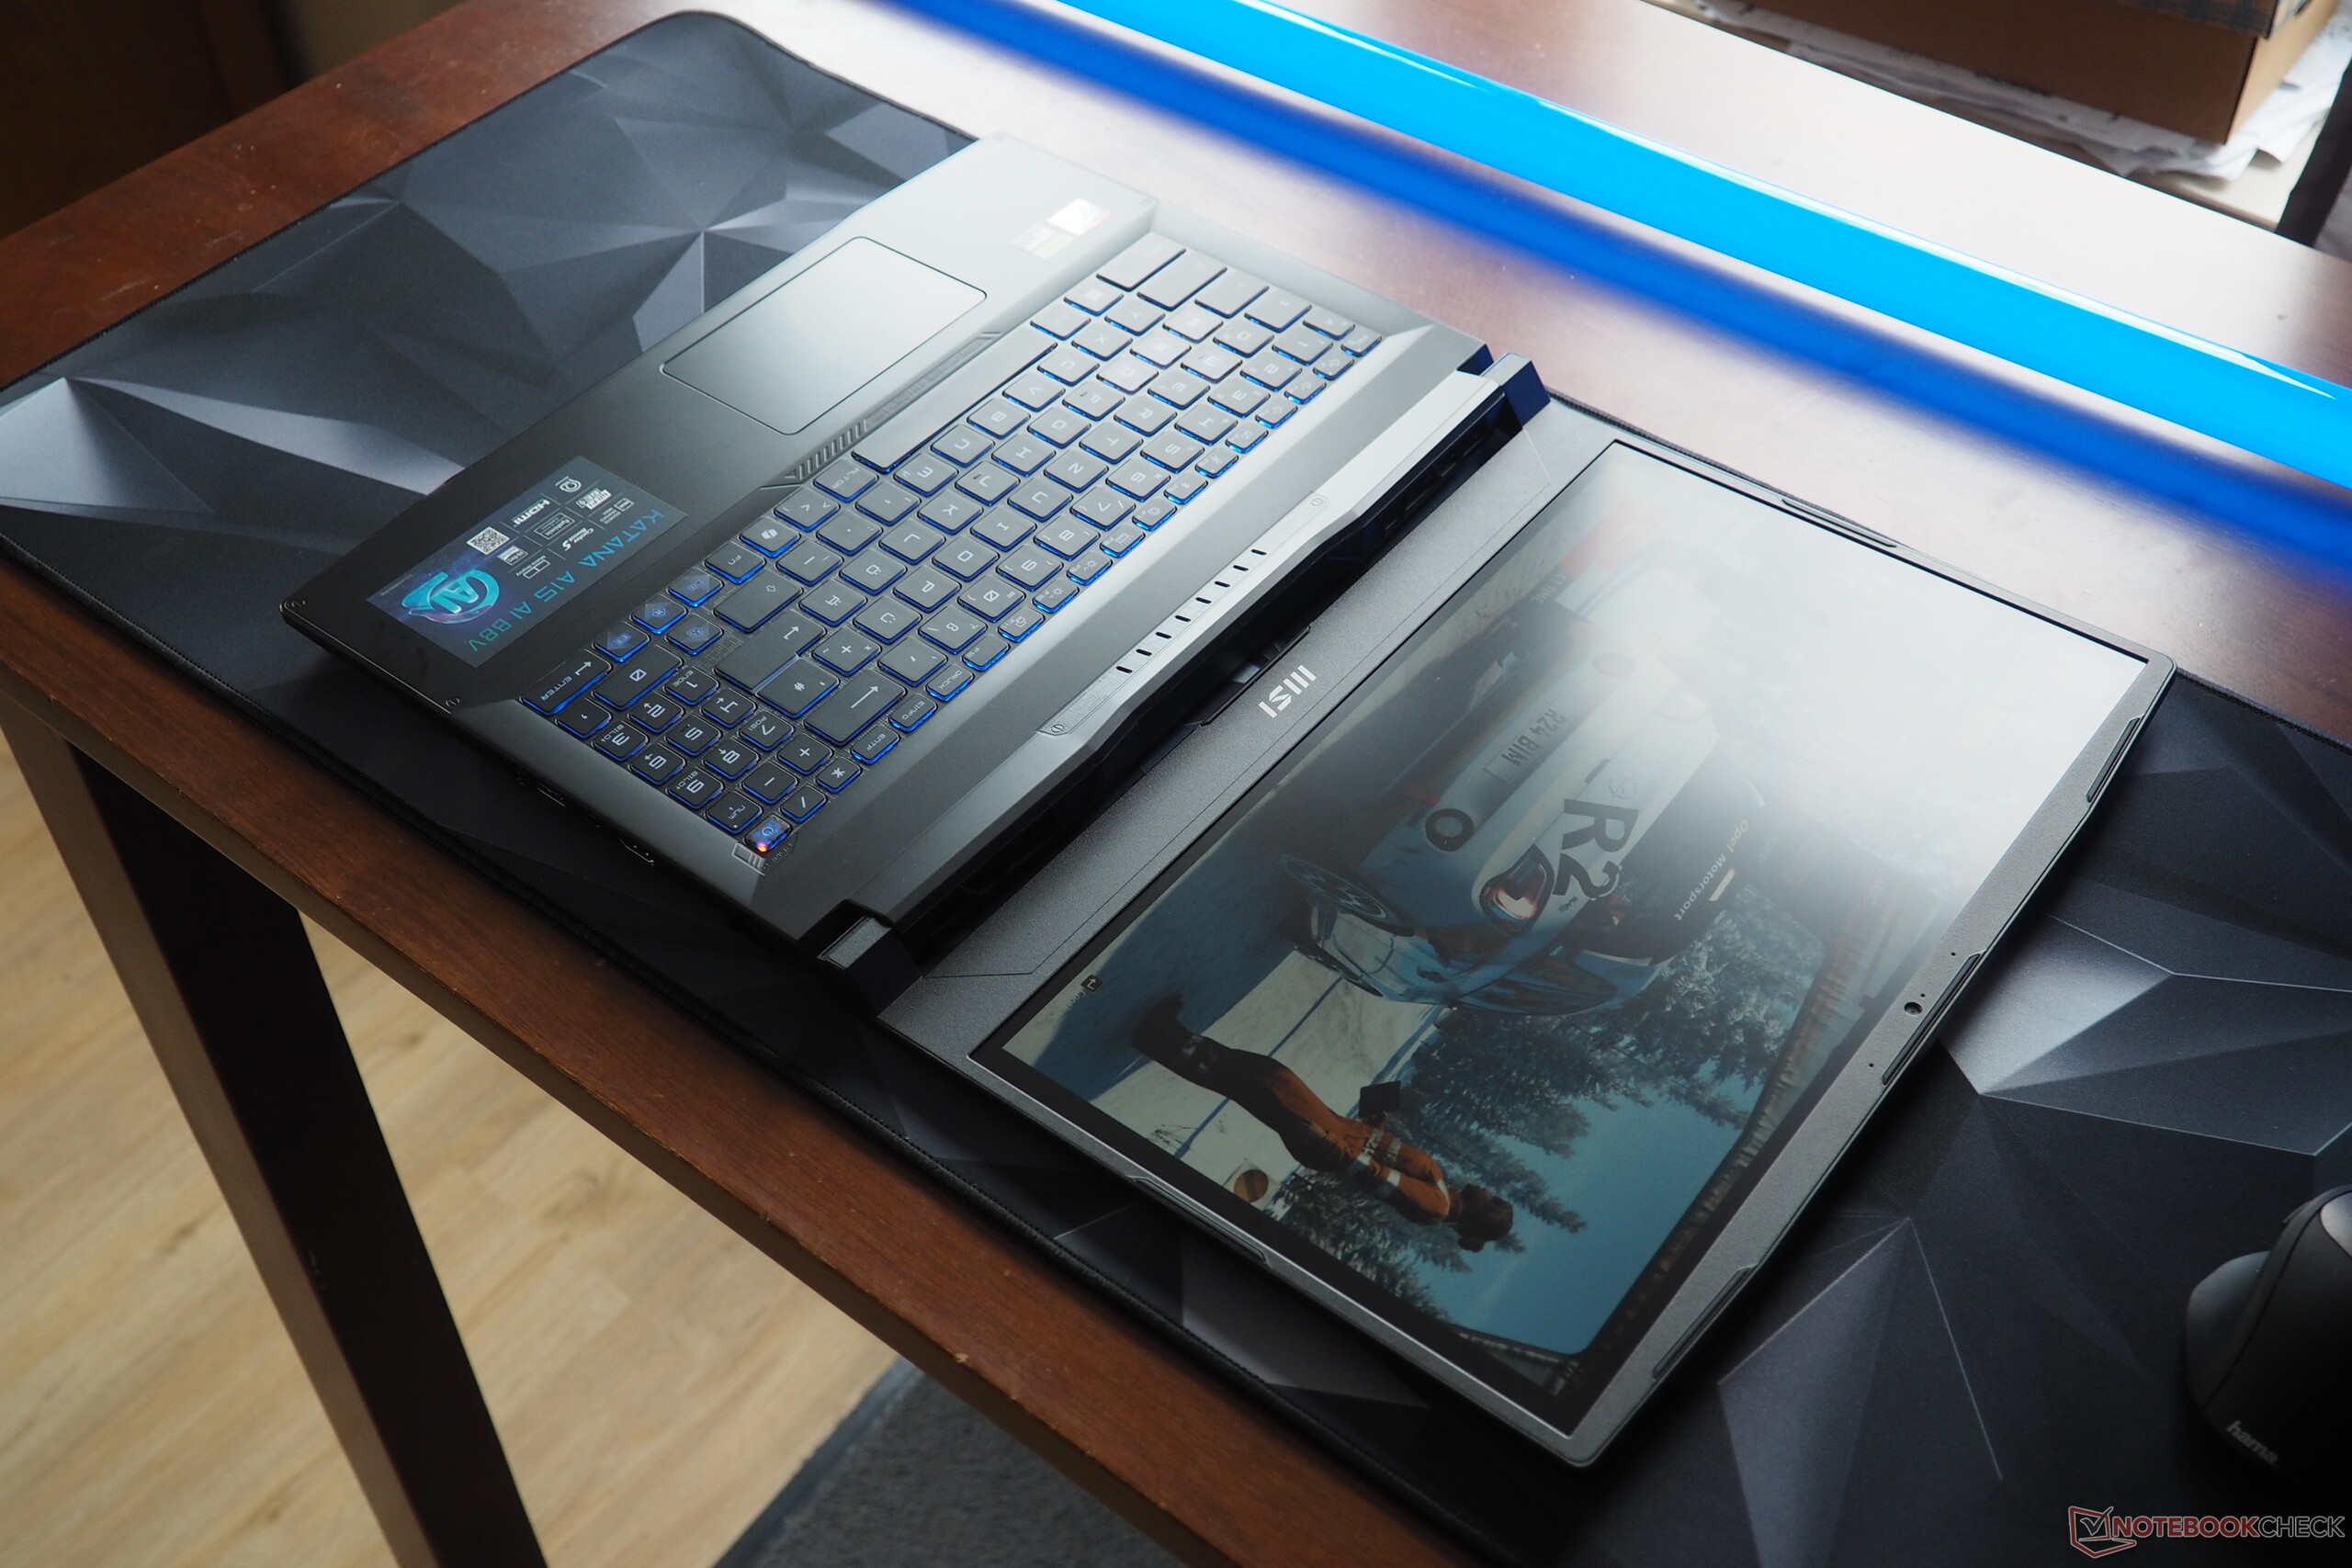
Buyers of budget gaming laptops often have to be content with poor quality cases. It's the same story with the Katana. The case doesn’t feel particularly high-quality, largely due to the extensive use of plastics. Its dark color also makes it highly prone to fingerprints, and its stability is mediocre. On the plus side, the laptop is relatively well-made and has a generous 180° max opening angle, which is always a welcome touch.
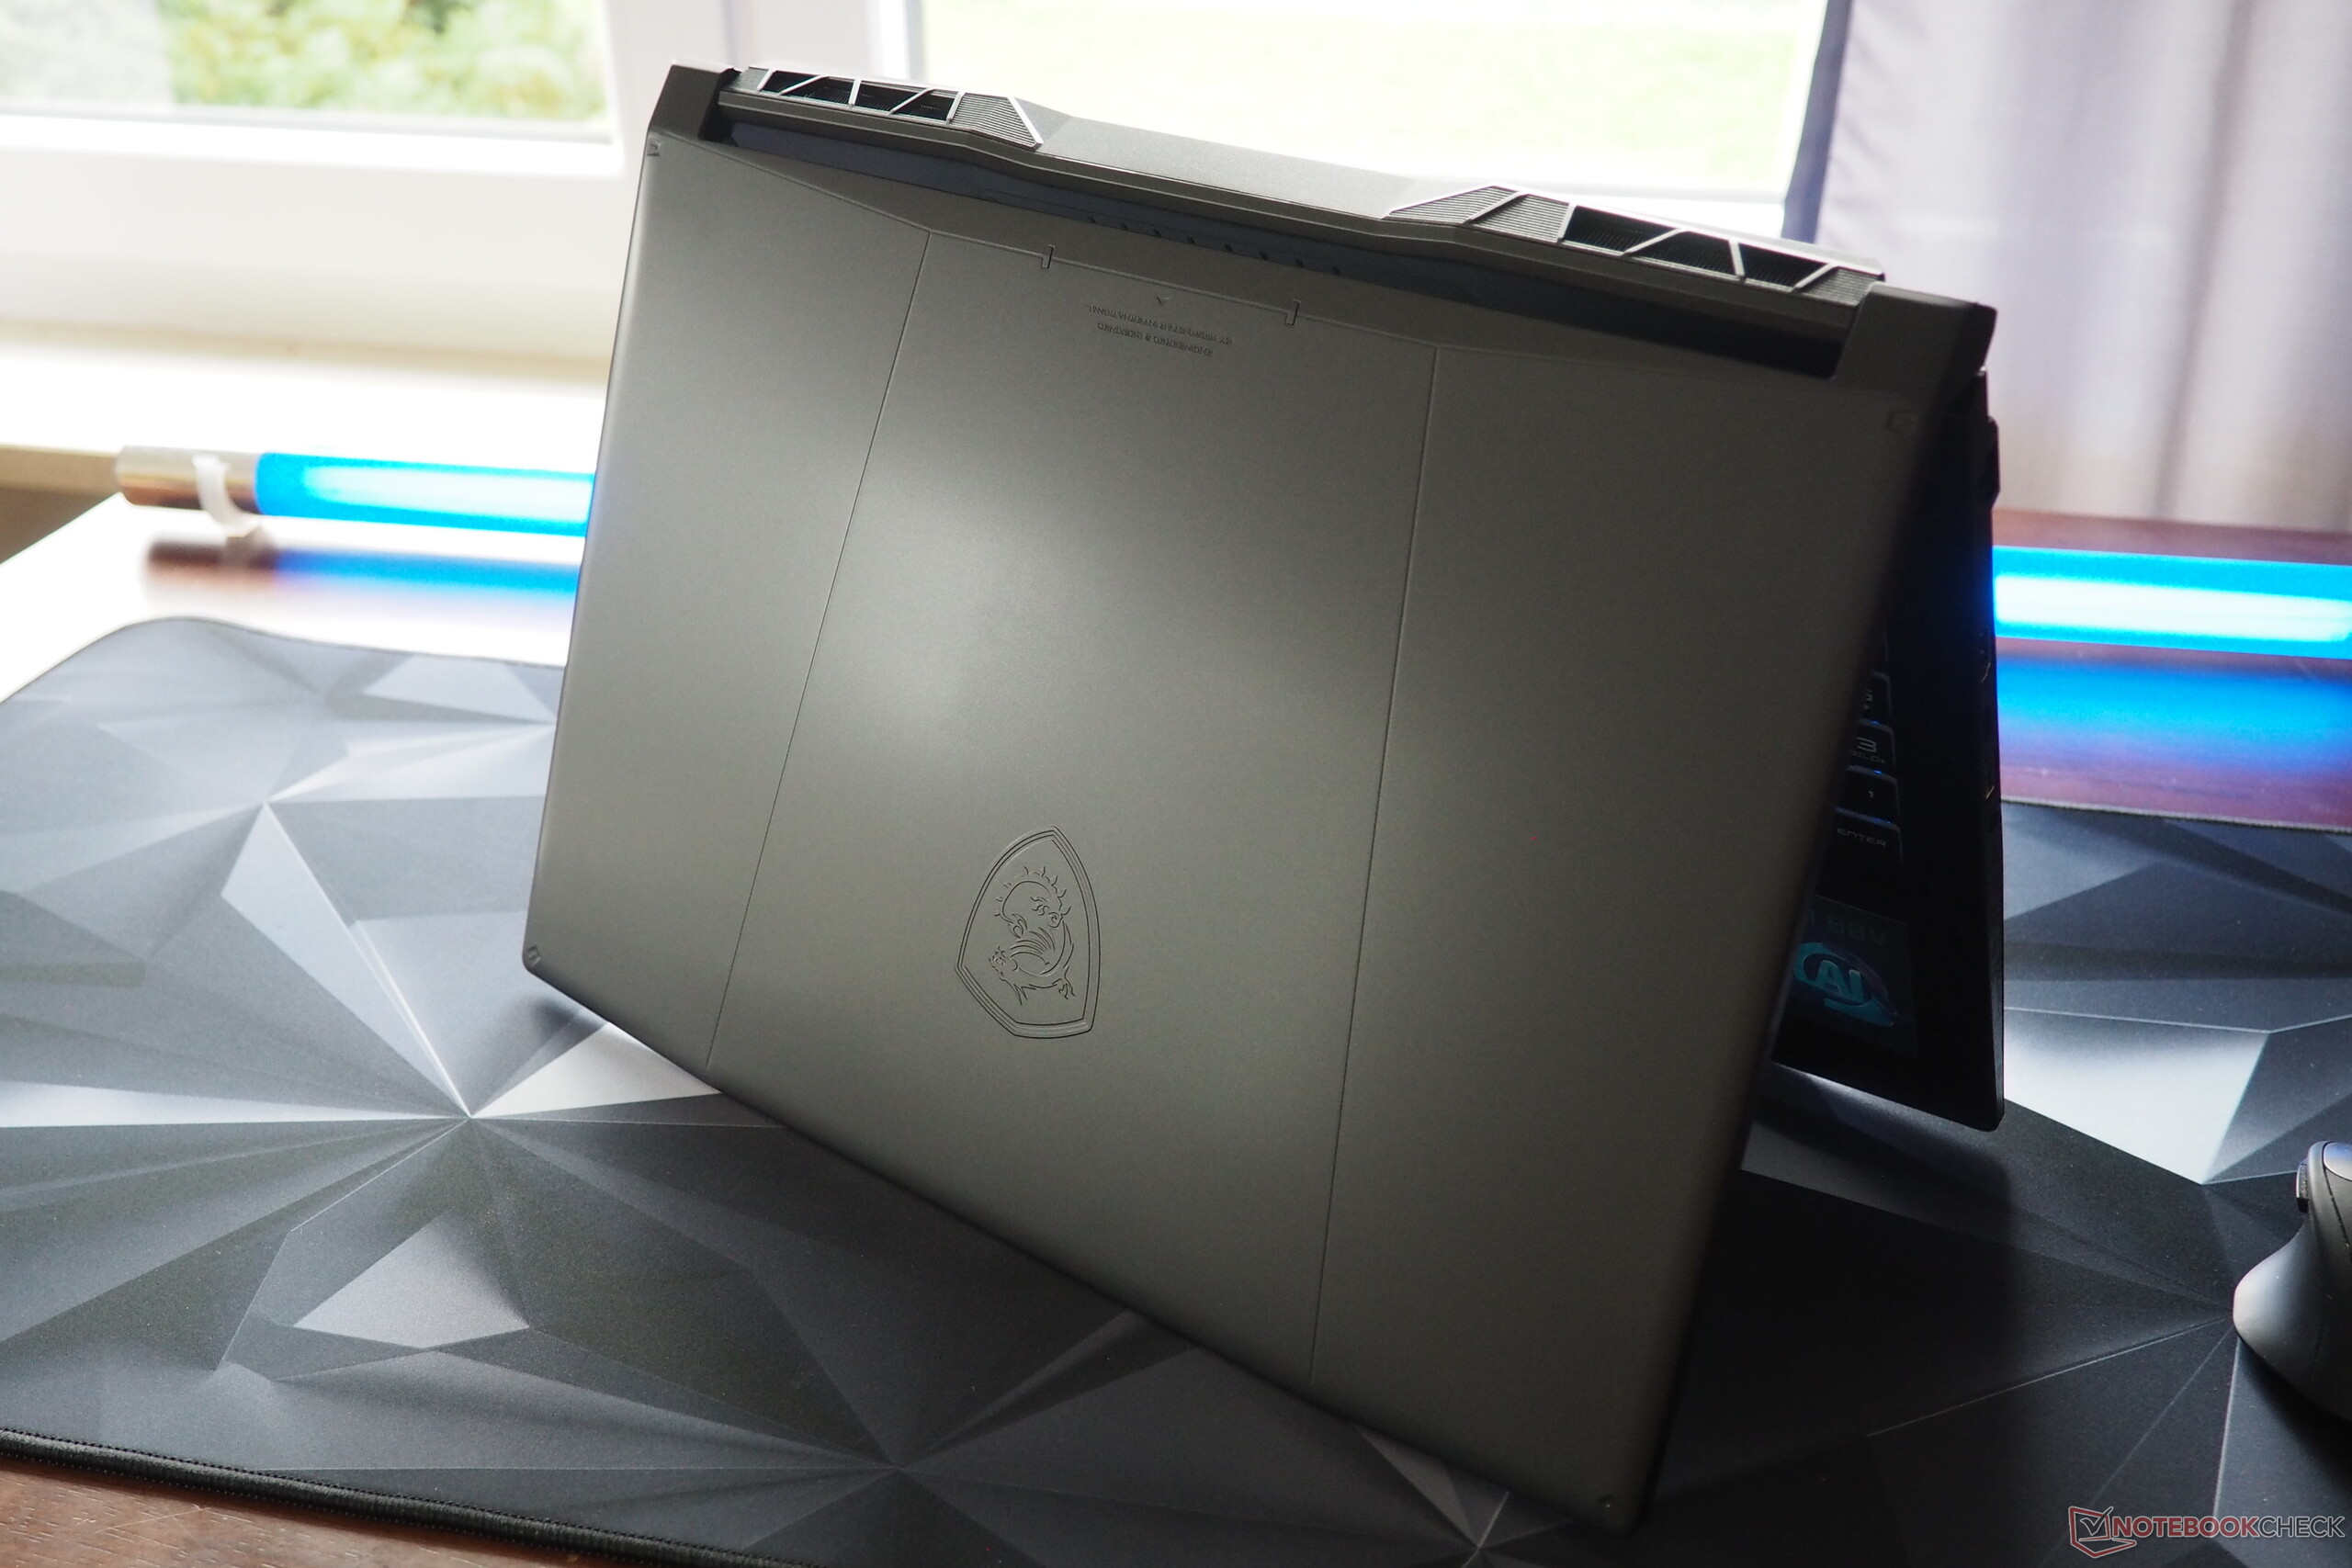

The MSI laptop's size and weight are on par with the competition. Tipping the scales at 2.3 kg, the system is ever-so-slightly lighter than its 2.4 to 2.5 kg rivals.
Connectivity
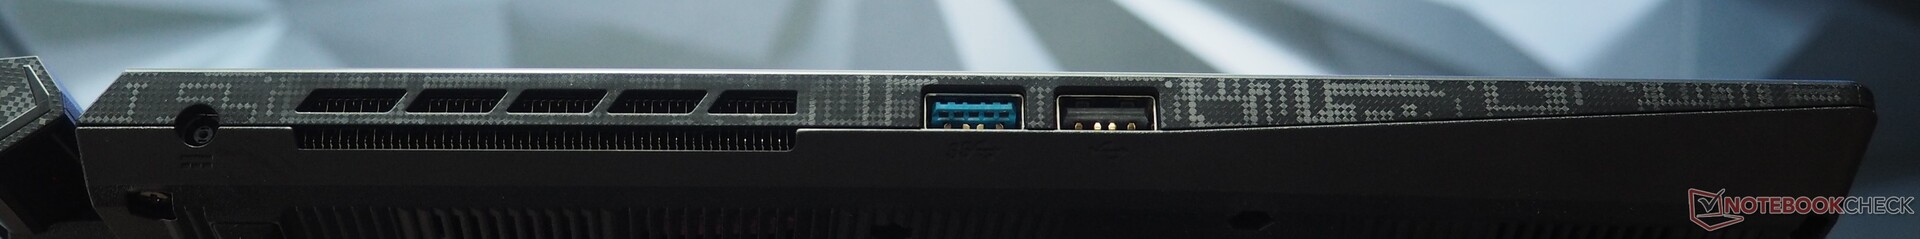
For those who can live without a card reader and last-gen USB ports, the Katana A15 AI offers a solid port selection. Its left-hand edge features a power-in port and two USB ports (one 3.0, the other one 2.0), while the right side is home to an audio jack, USB-A 3.0, USB-C 3.0 (with DisplayPort), HDMI 2.1, and an RJ45 Gigabit LAN port. Since some ports are positioned in the middle of the case's edge, cables may get in the way of the user's mouse-holding hand.

Communication
The built-in RZ616 Wi-Fi 6E module comes from MediaTek and delivers slightly below-average upload speeds combined with download speeds that are slightly above average.
Webcam
As expected, the 720p webcam produces images that aren't very sharp, with color accuracy falling in the mid range. There is no privacy cover.


Accessories
The notebook comes with several information booklets and a 200-watt charger (including the cable) weighing around 0.7 kg.
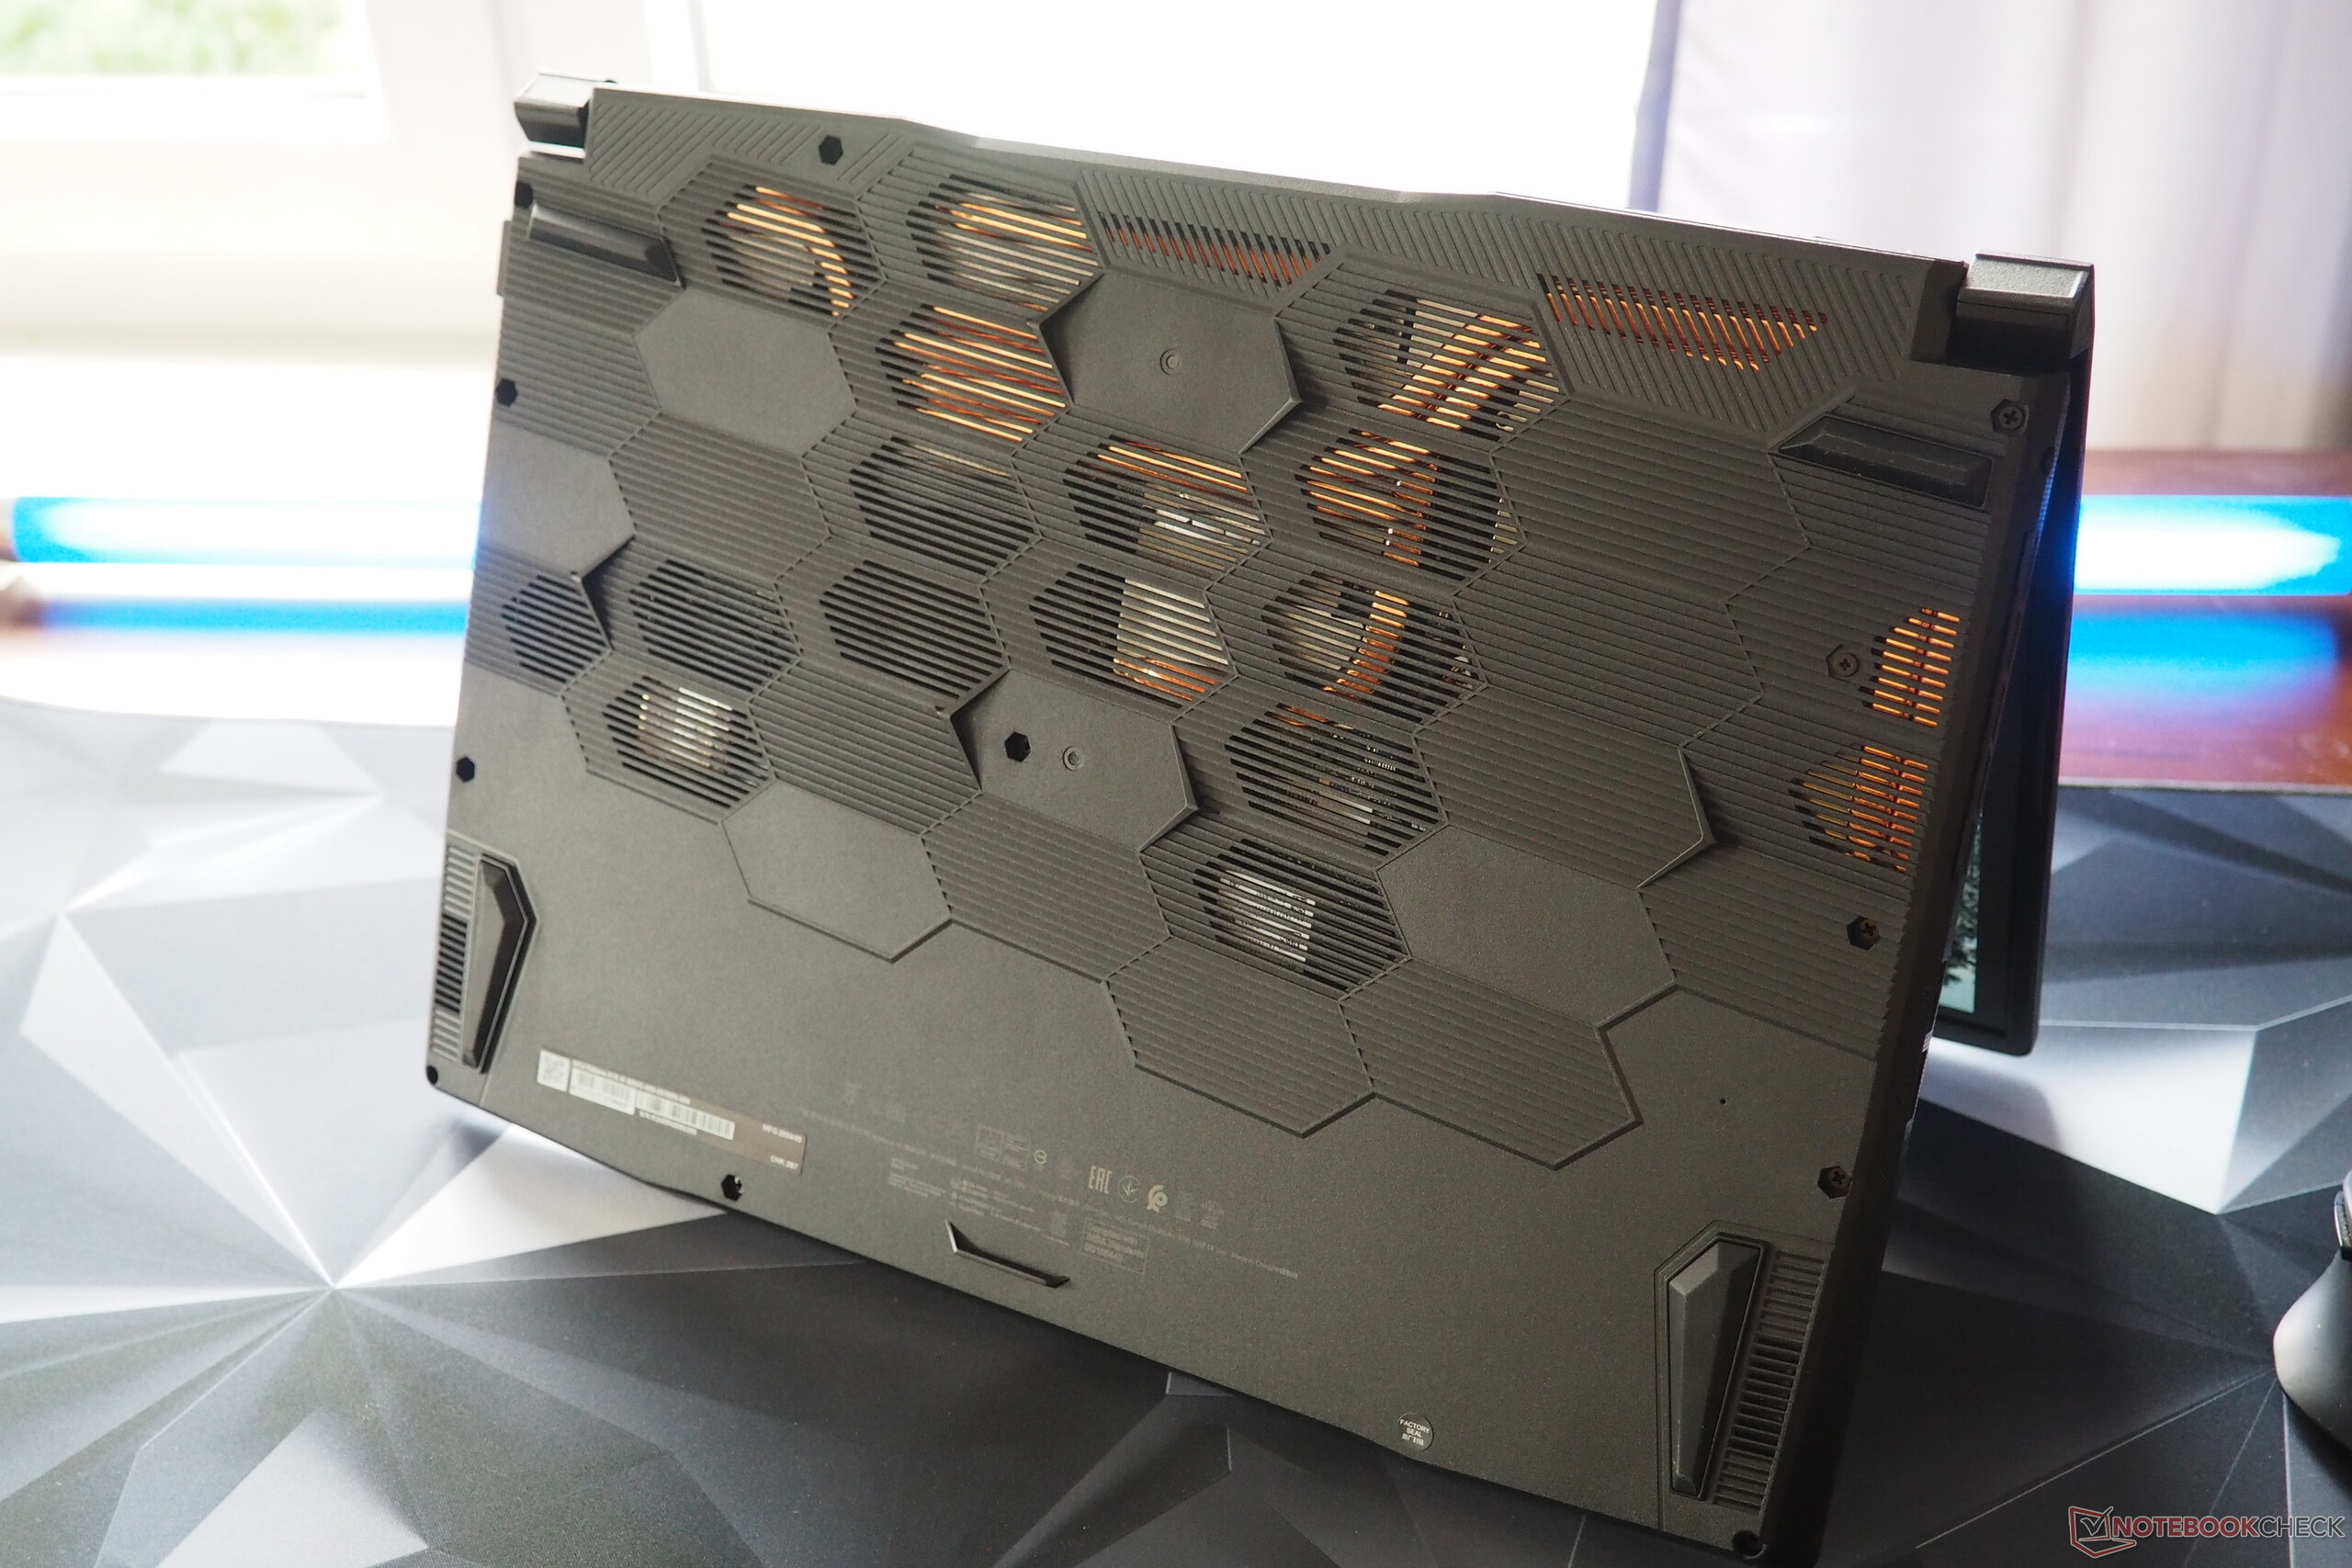
Maintenance
As one of the screws is covered by a 'factory seal' sticker and the device was a store unit, we refrained from opening the chassis. However, as long as maintenance and upgrades are performed professionally, the sticker should be OK to remove (at least in Germany).
Sustainability
Cardboard is the primary packaging material used, though MSI also employs plastic film for some components, such as the laptop, the charger (including its cable), and information booklets.
Warranty
In Germany, the usual 2-year warranty applies.
Input devices
Keyboard
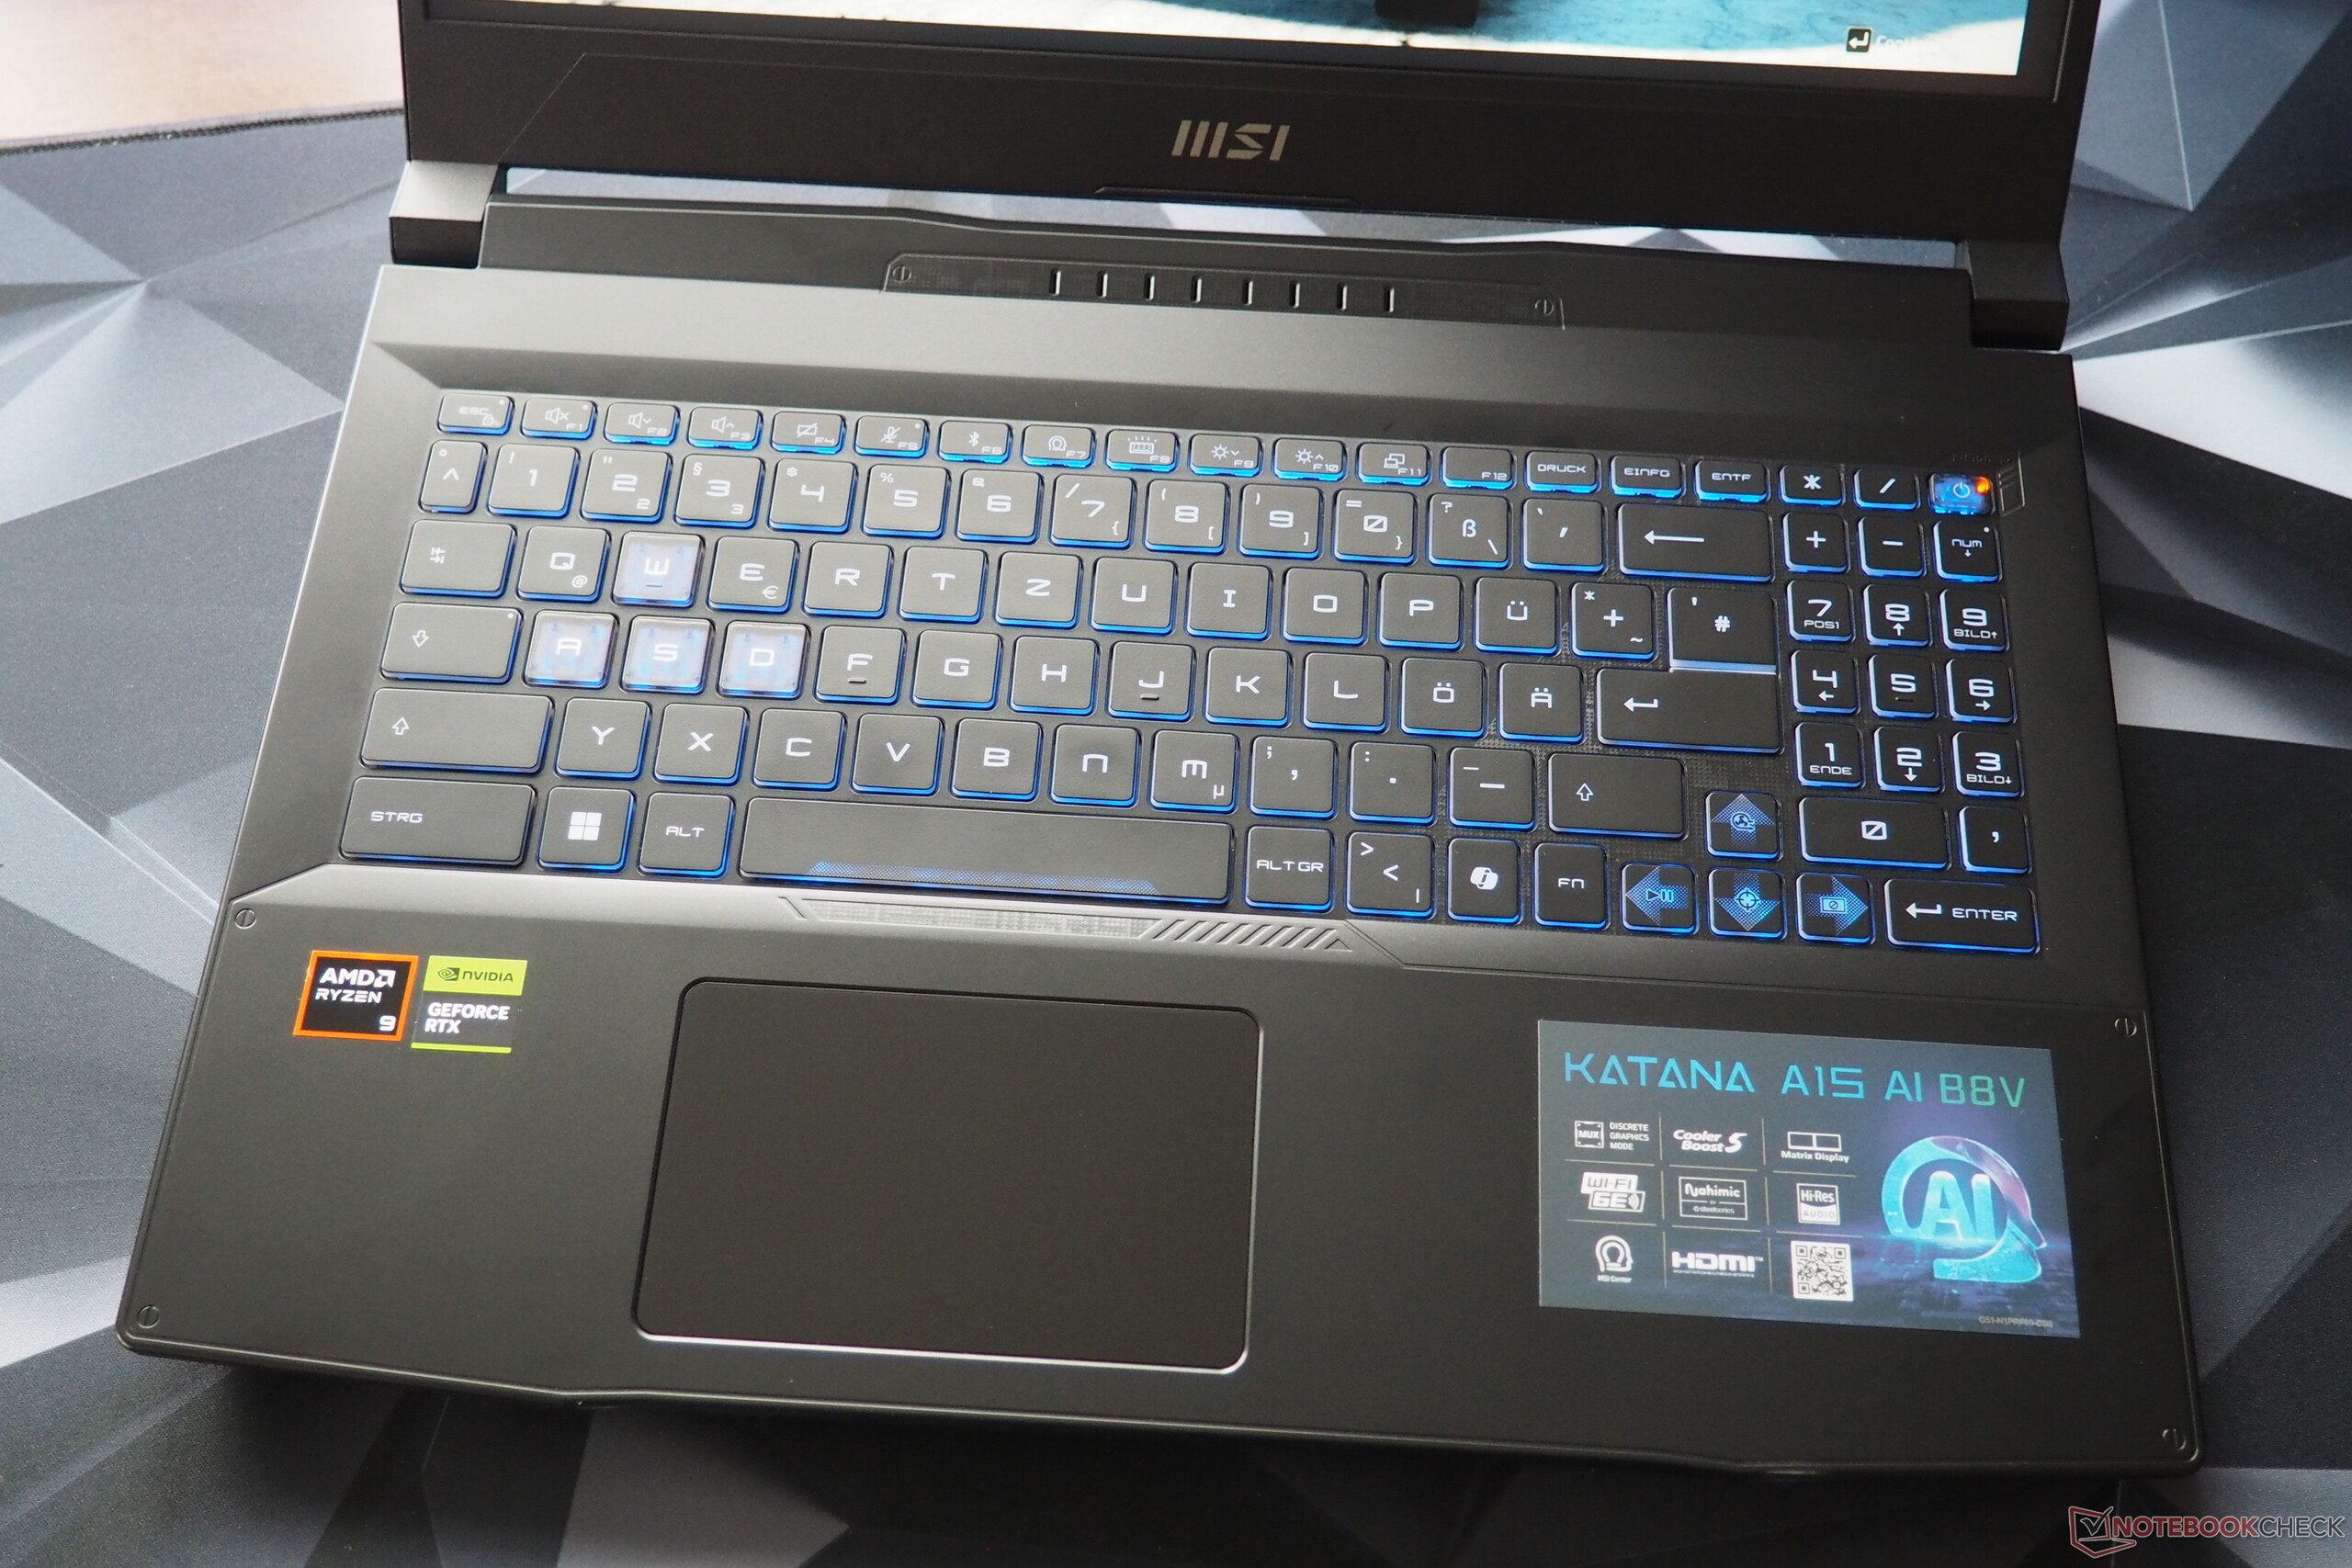
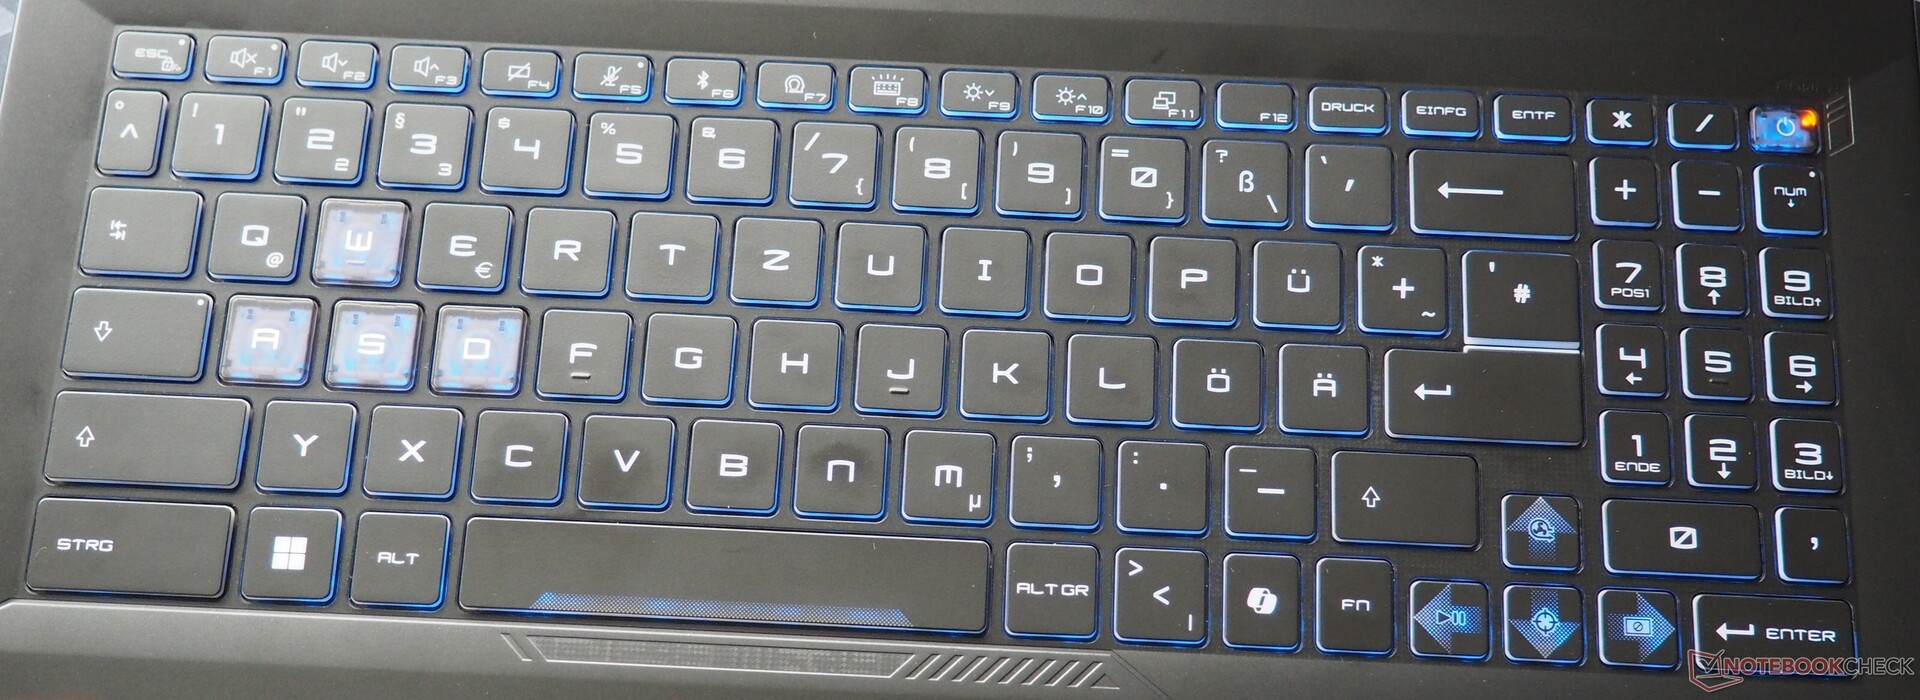
The input devices are solid overall, though there is still room for improvement. The keyboard's layout may not sit well with some users, for starters. MSI continues to use its unconventional layout, which deviates from the German standard in several ways. The three-column numeric keypad instead of the usual four-column layout takes some getting used to. While the typing experience is decent for a gaming laptop, typing doesn't feel as good as it would be with a mechanical keyboard and feedback isn't as refined here. On the plus side, those who like colorful setups will appreciate the RGB lighting effects.
Touchpad
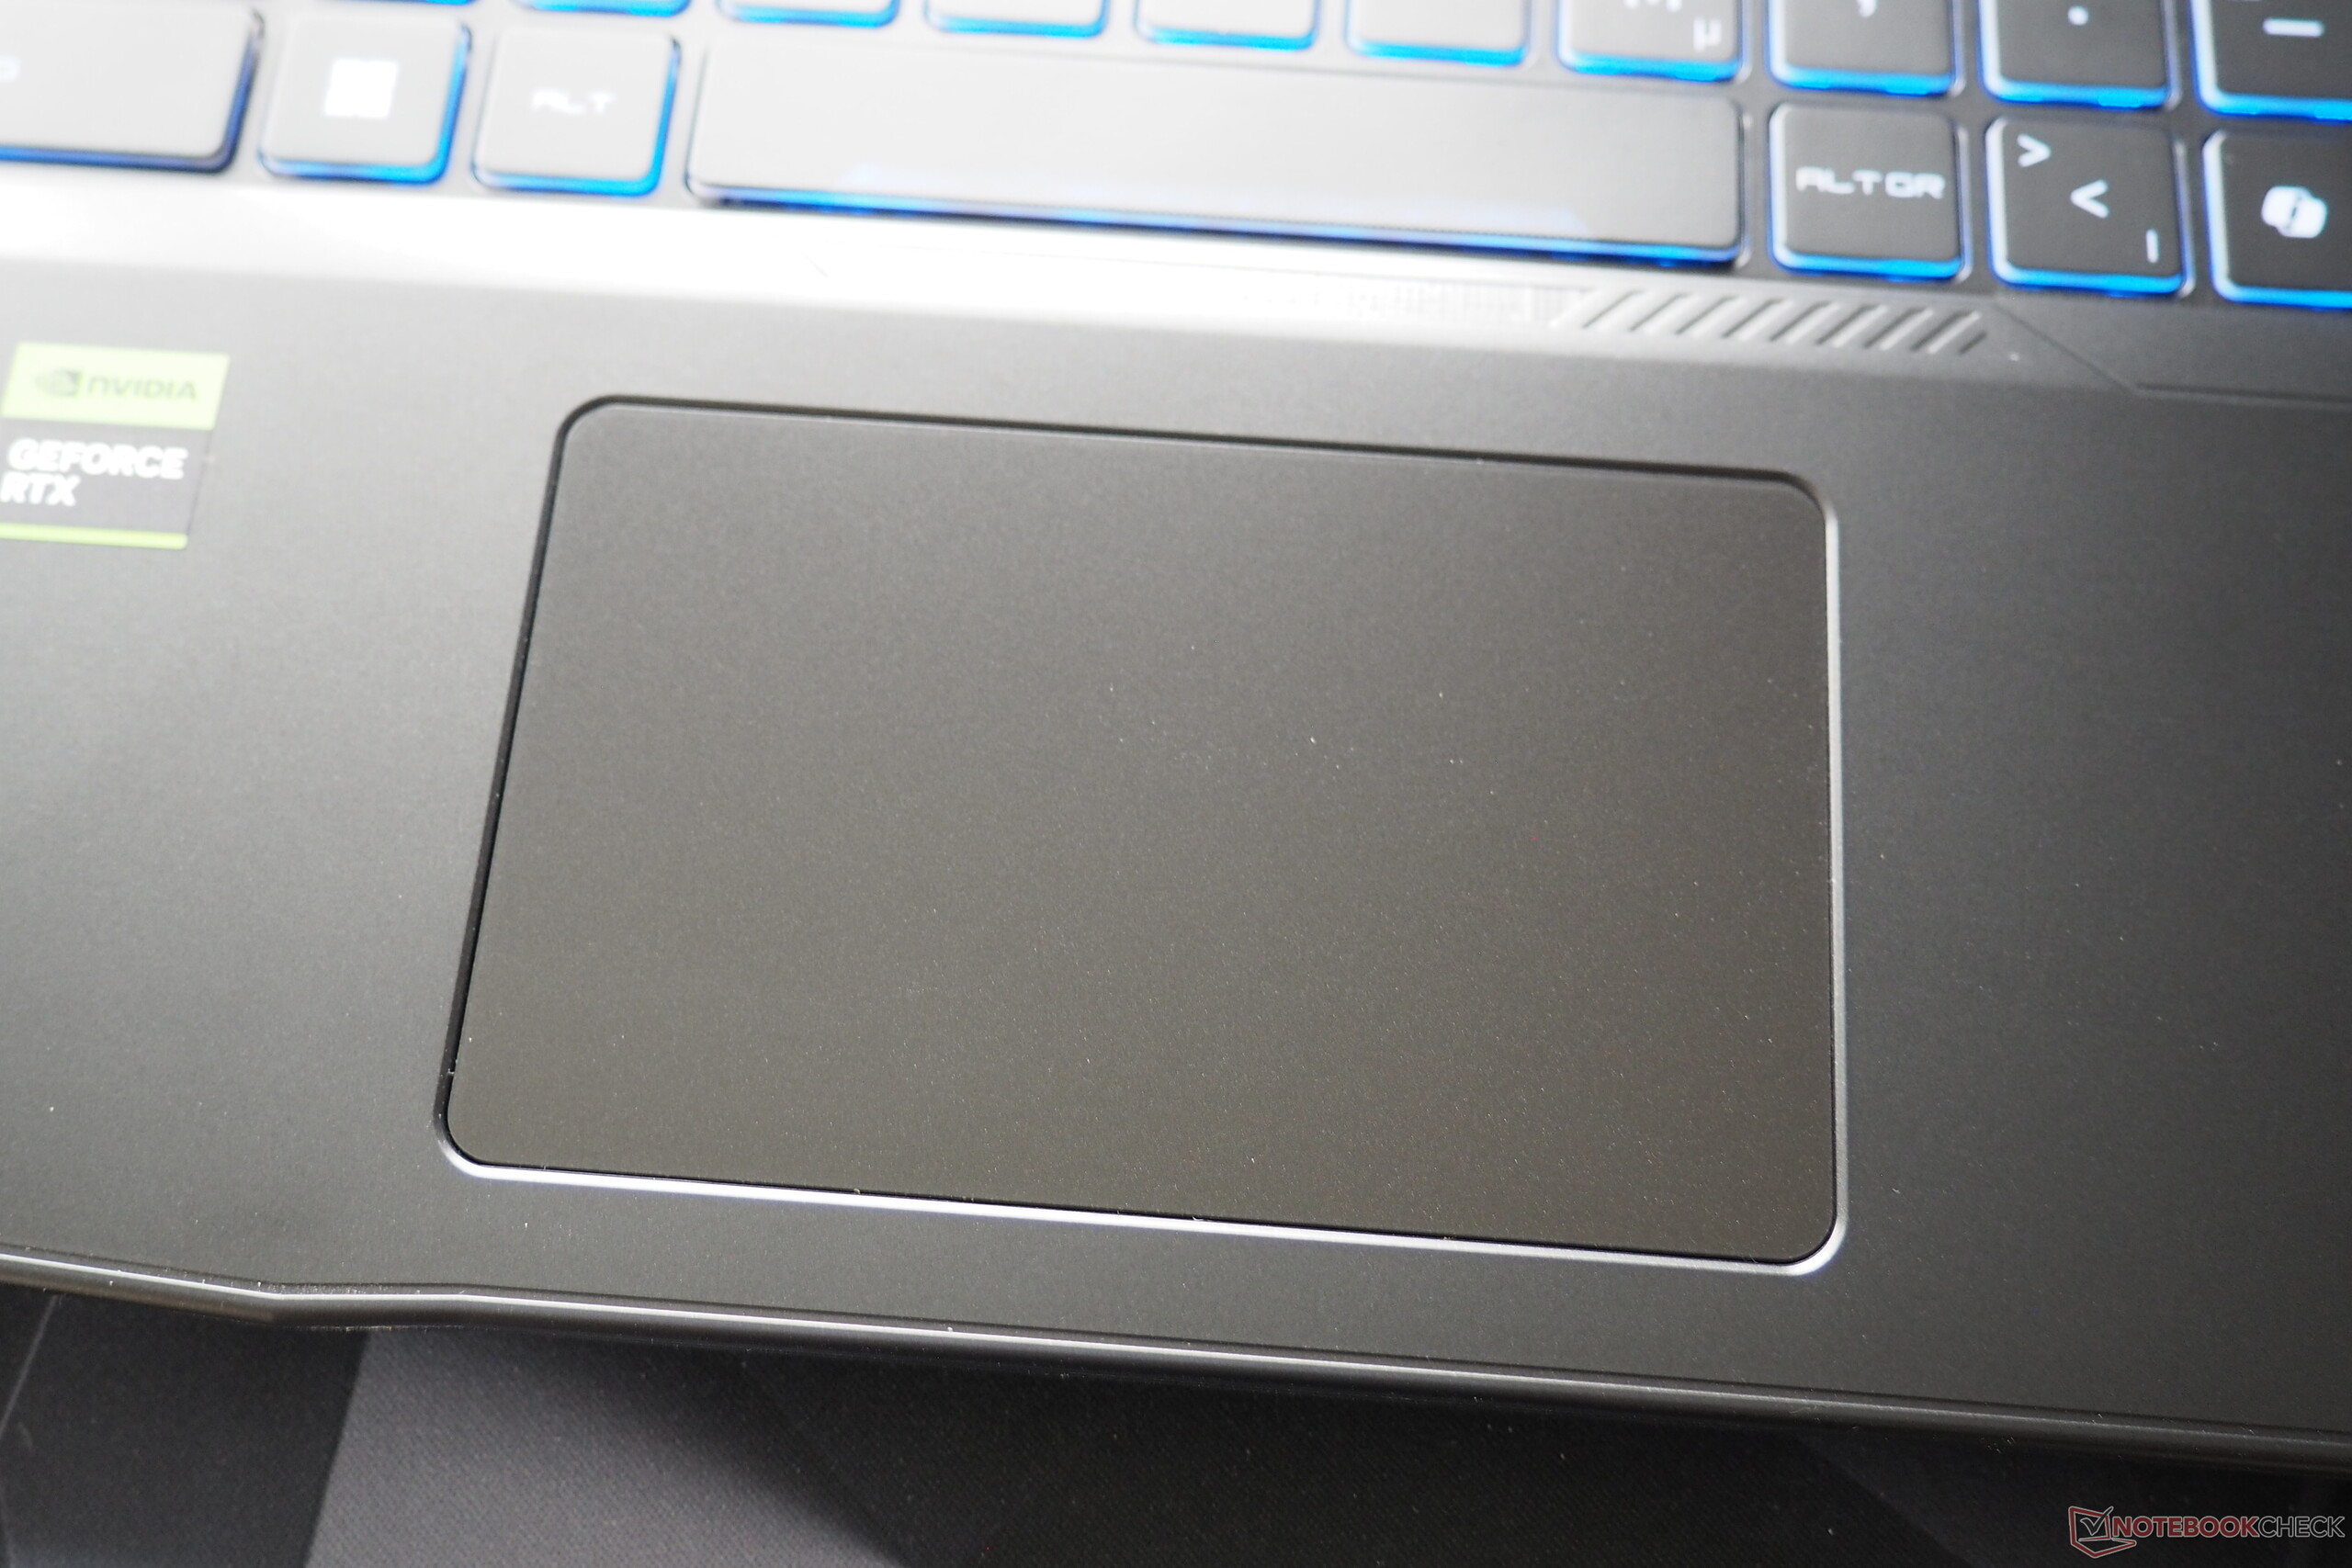
The touchpad is relatively small for a 15-inch notebook, measuring 10.5 x 6.5 cm. While its surface appears smooth enough, its gliding properties leave room for improvement. The same goes for its precision, which is not exactly ideal. Additionally, the touchpad tends to rattle during use which doesn't really make for a high-quality impression. This is a reminder of the case's subpar build quality.
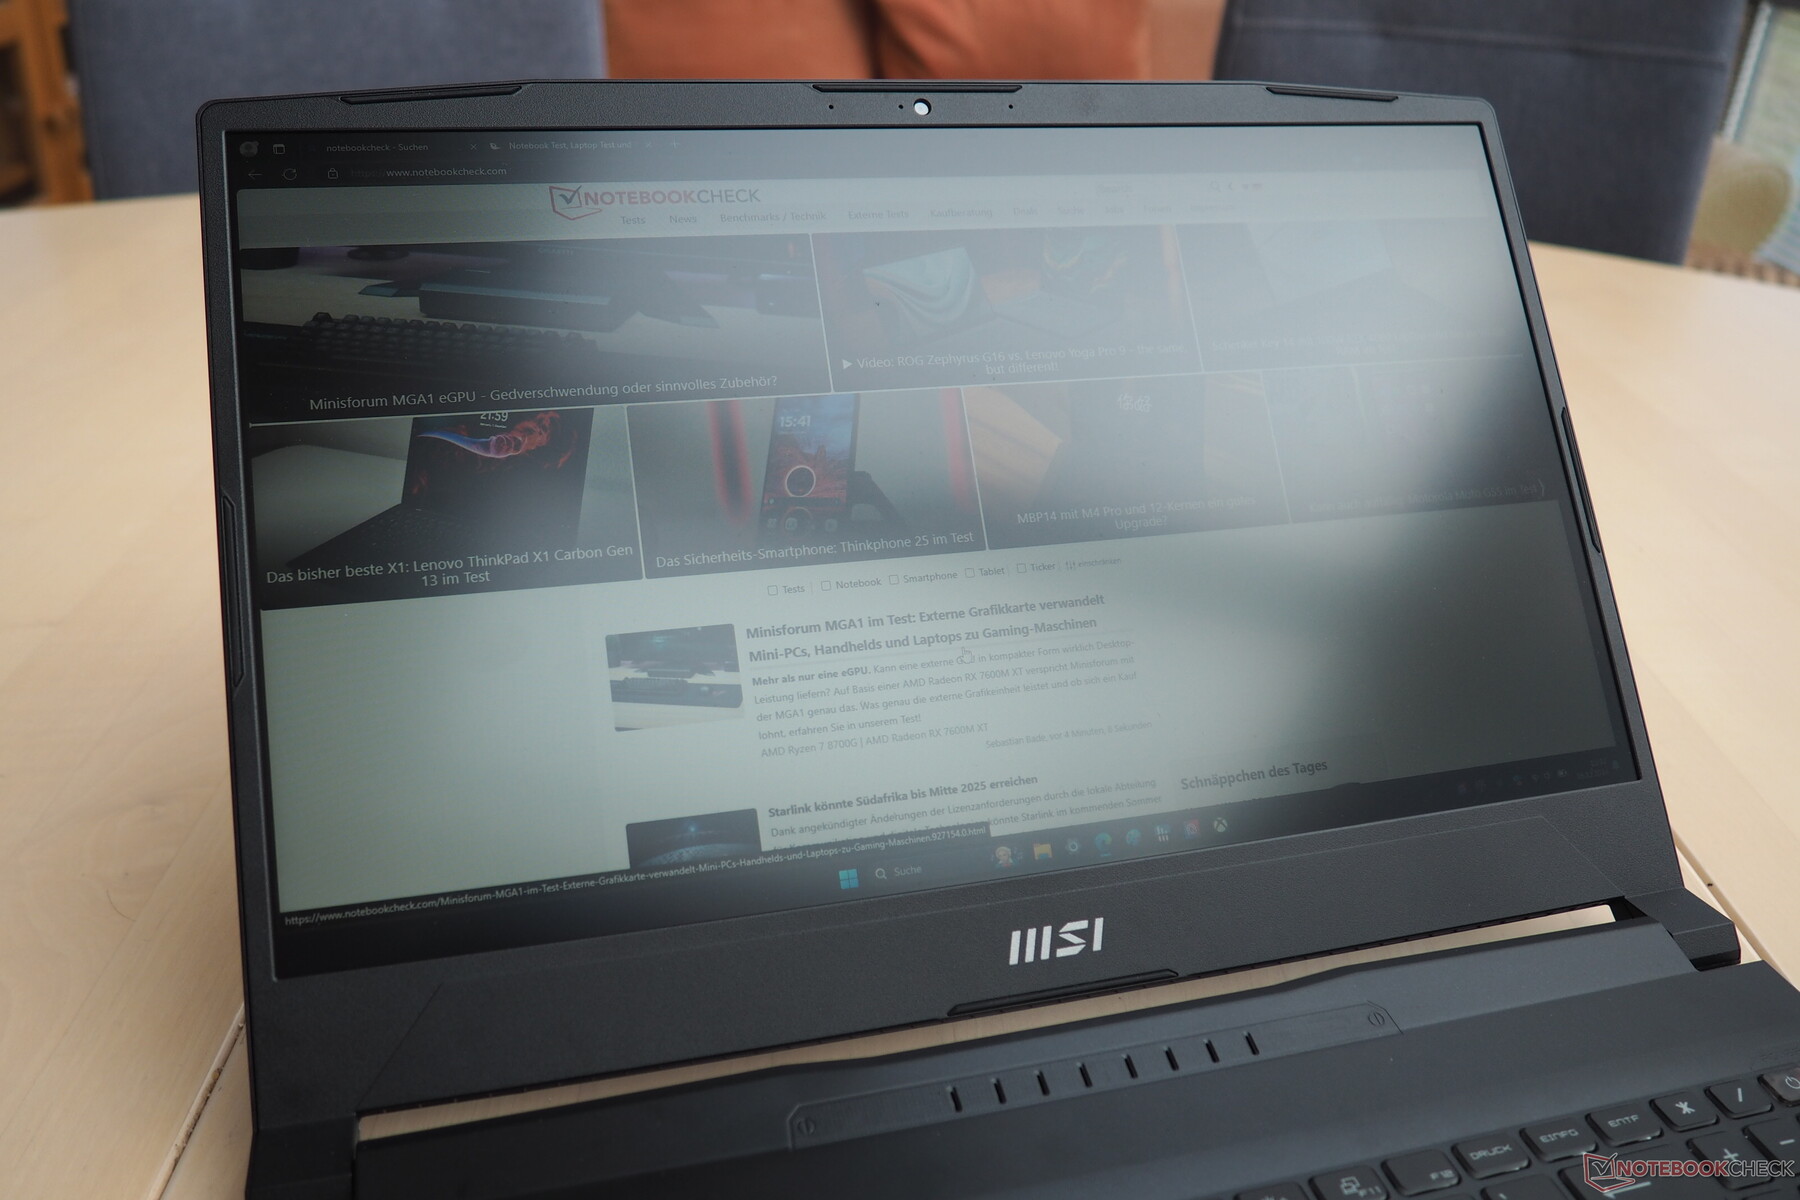
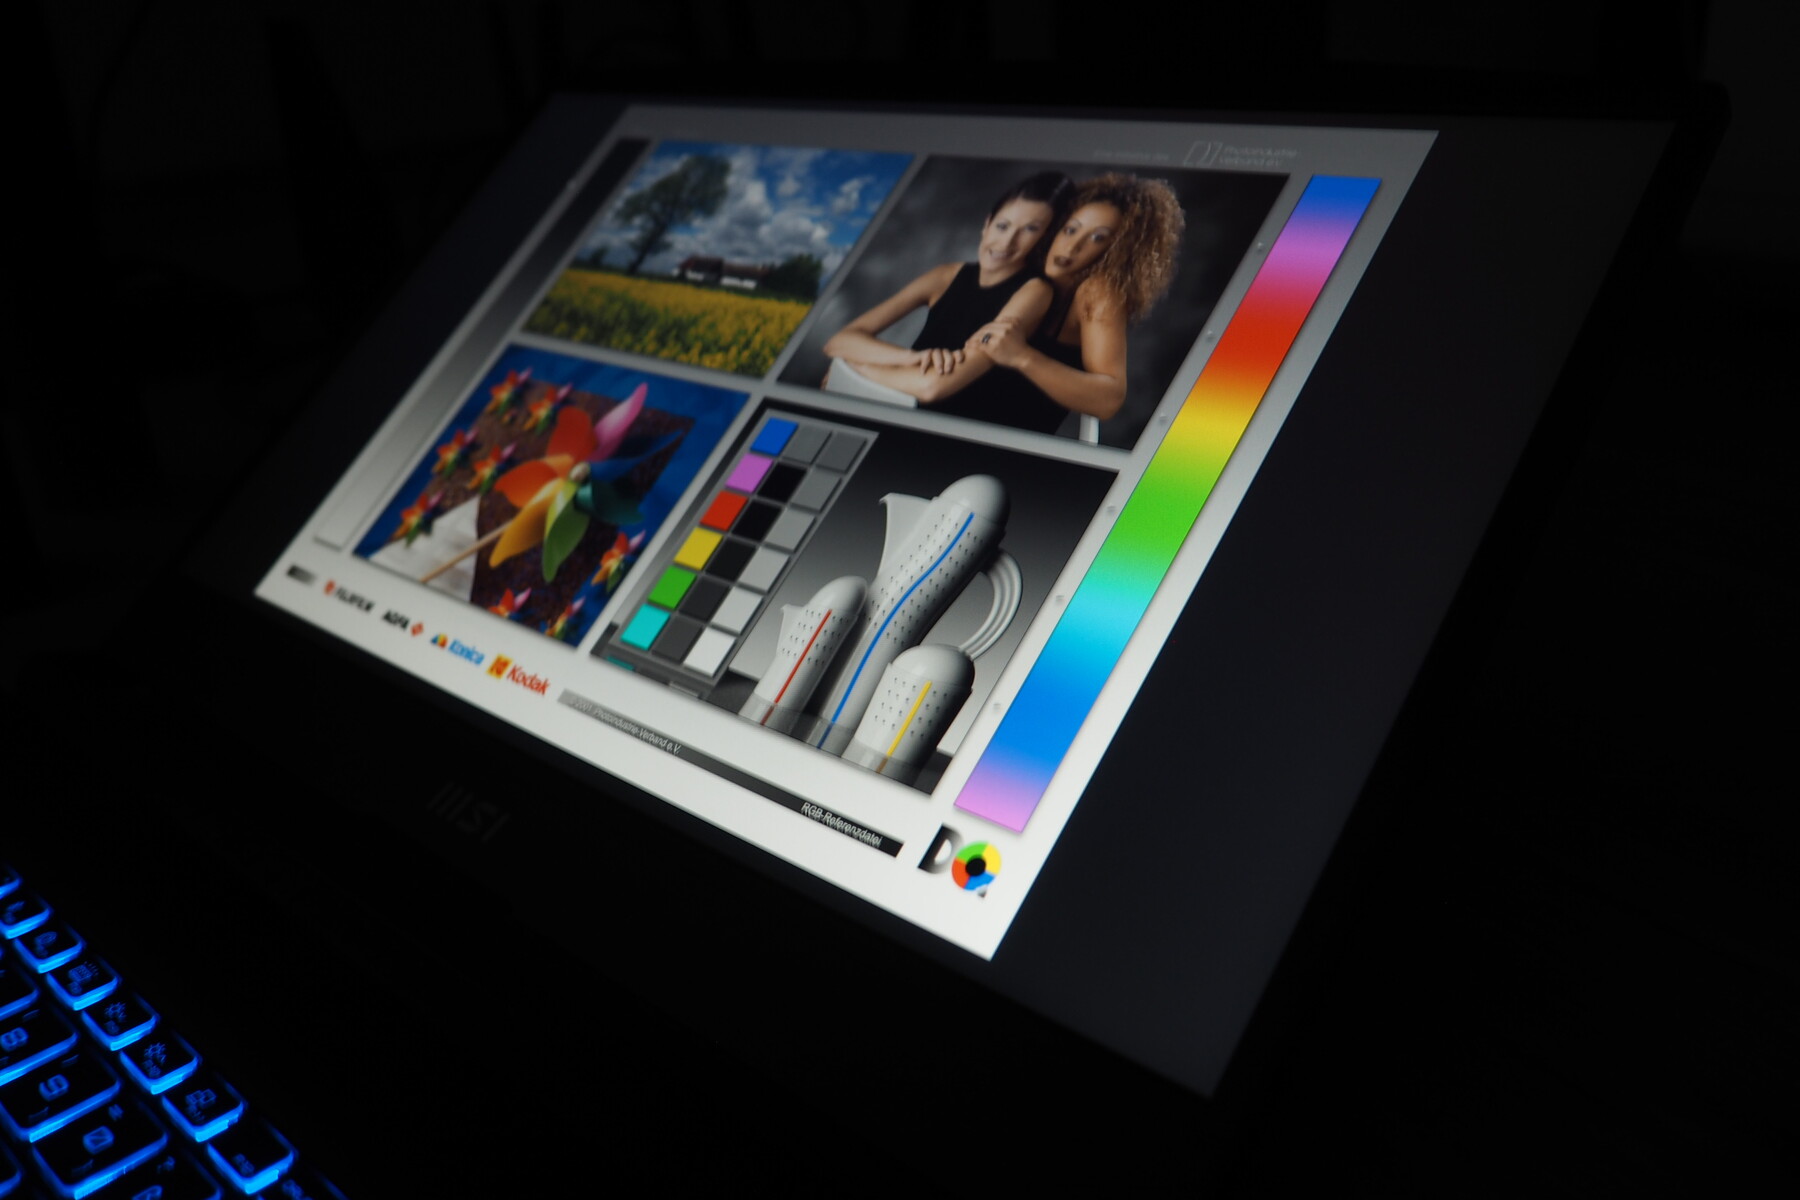
Display
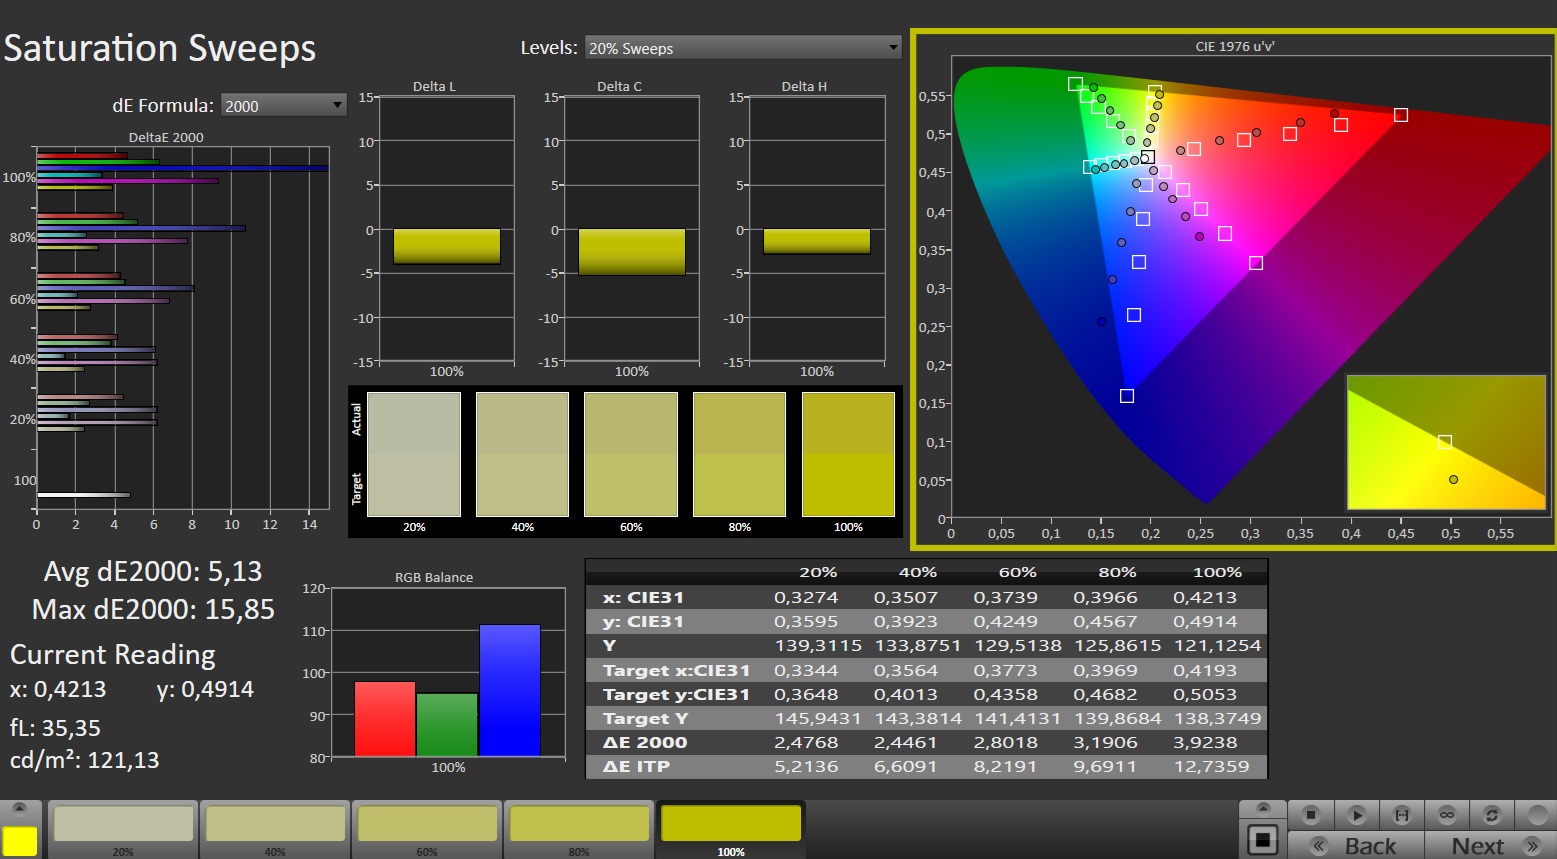
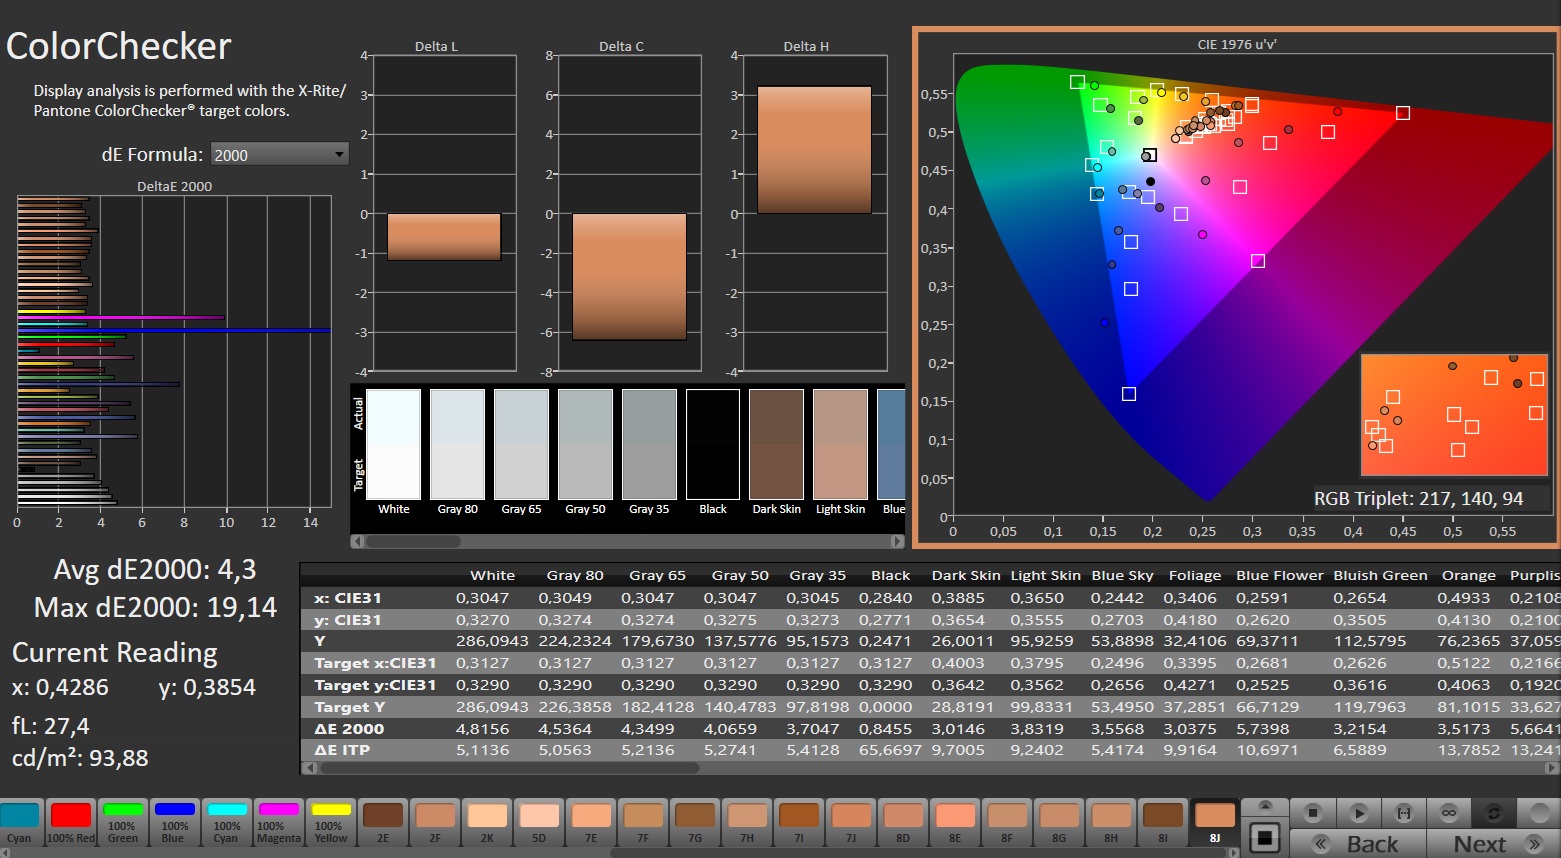
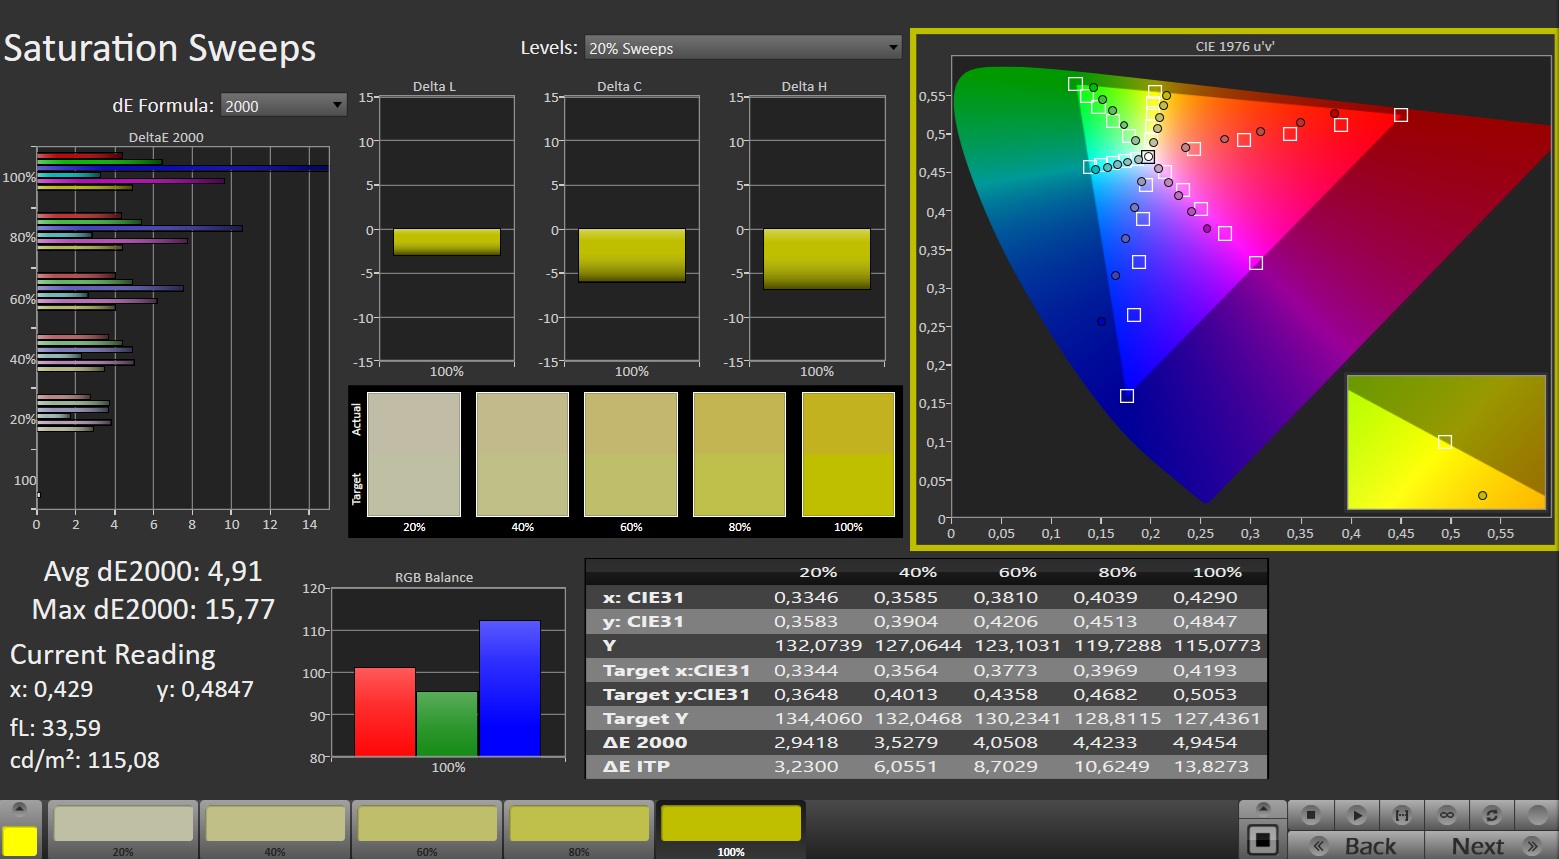
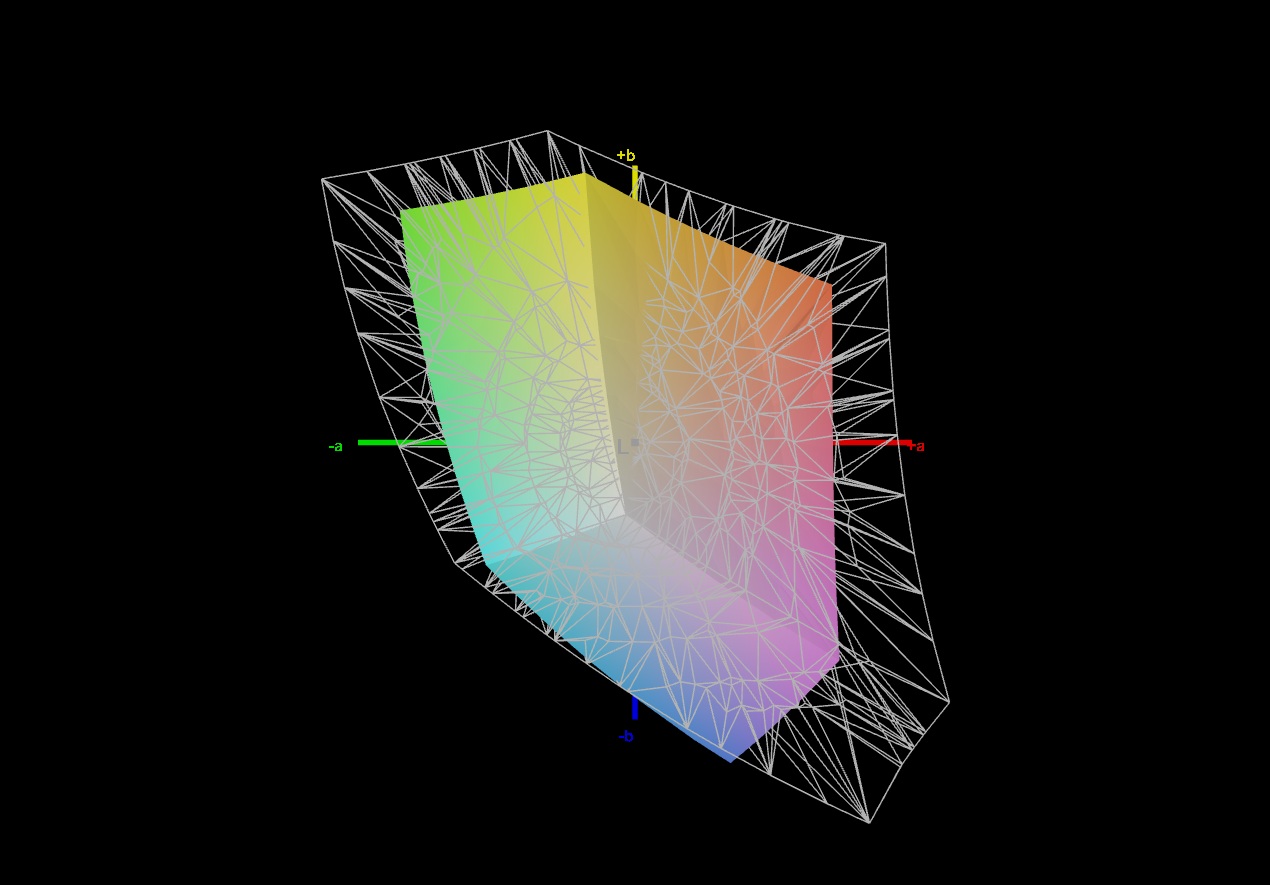
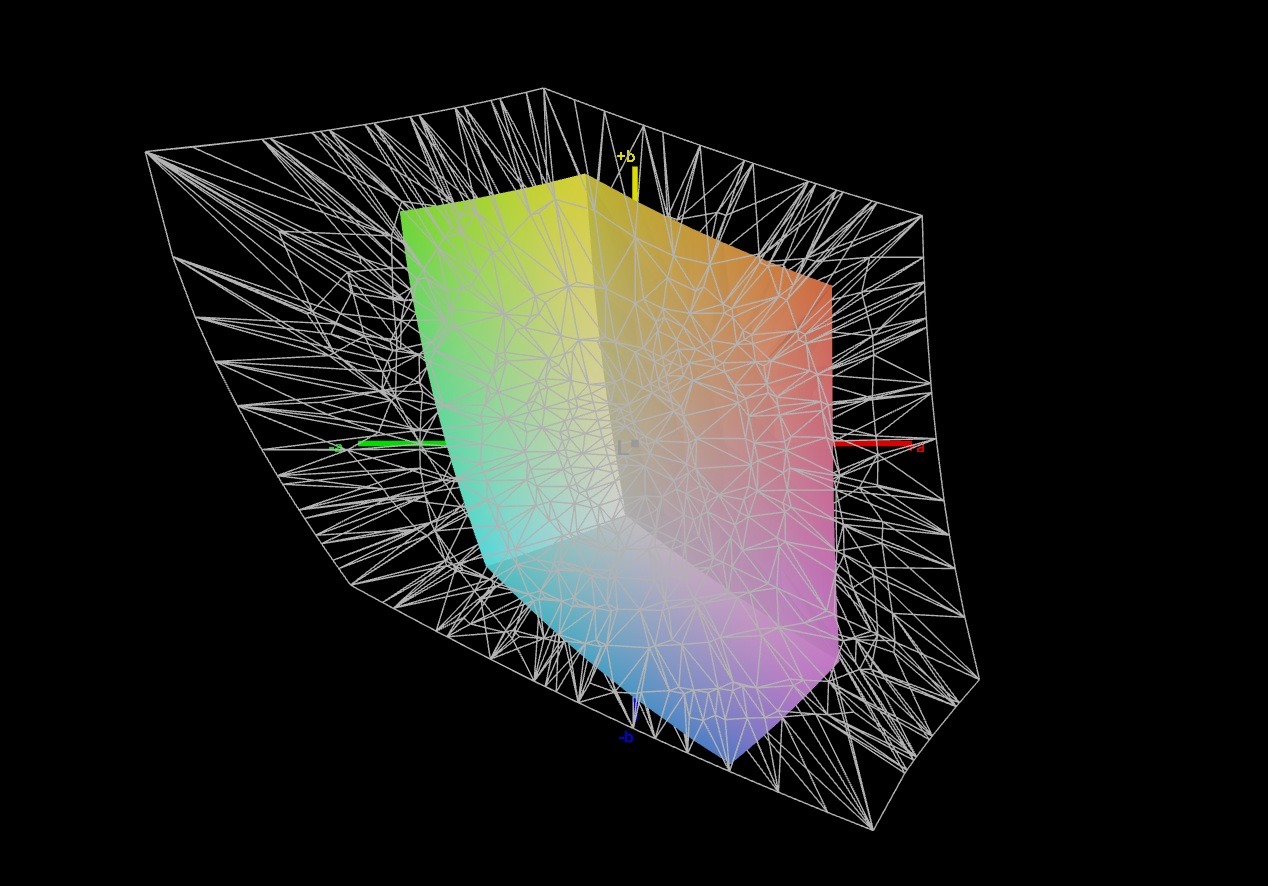
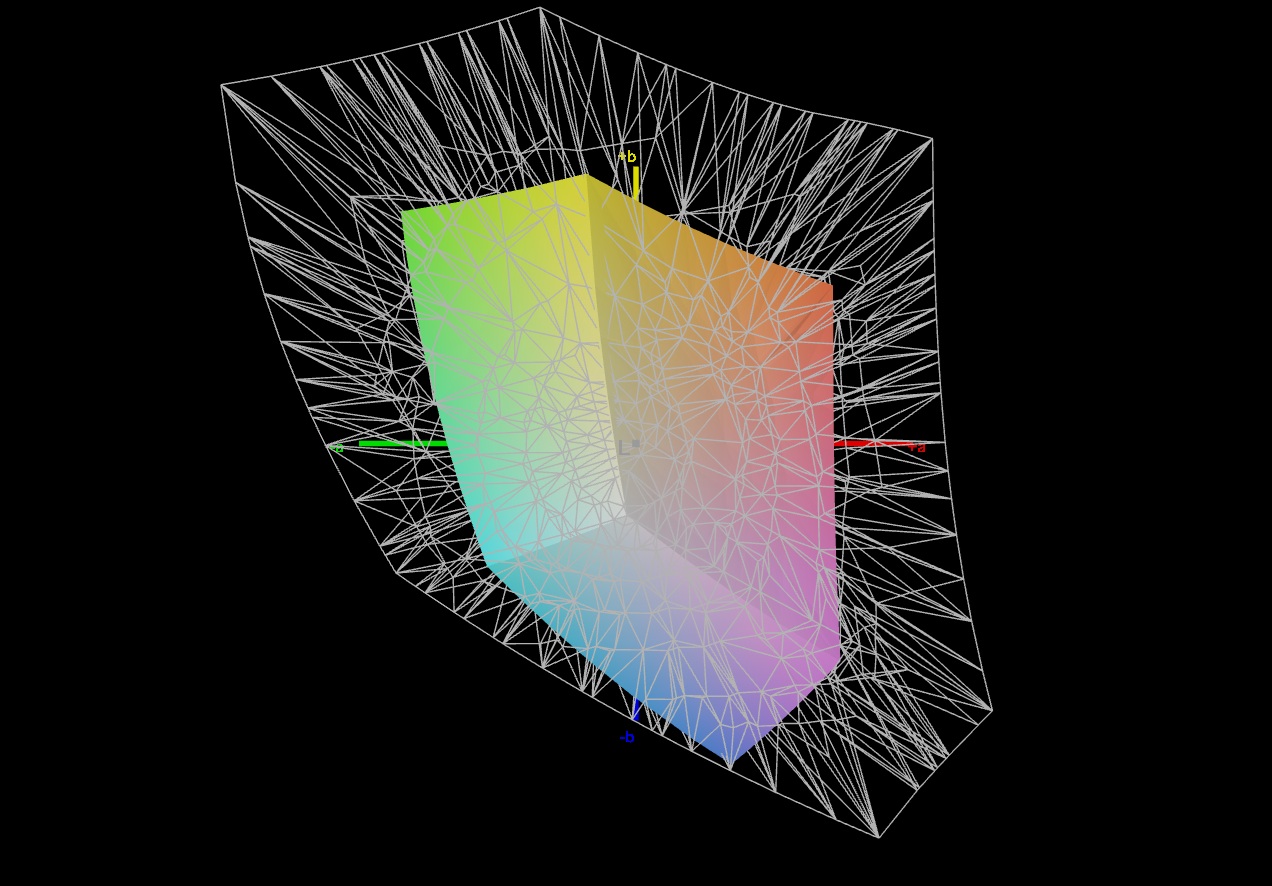
While the touchpad isn't great, the Katana A15's greatest weakness is its display, which, as noted earlier, has a very poor color space coverage of just 65% sRGB.
| |||||||||||||||||||||||||
Brightness Distribution: 77 %
Center on Battery: 277 cd/m²
Contrast: 1458:1 (Black: 0.19 cd/m²)
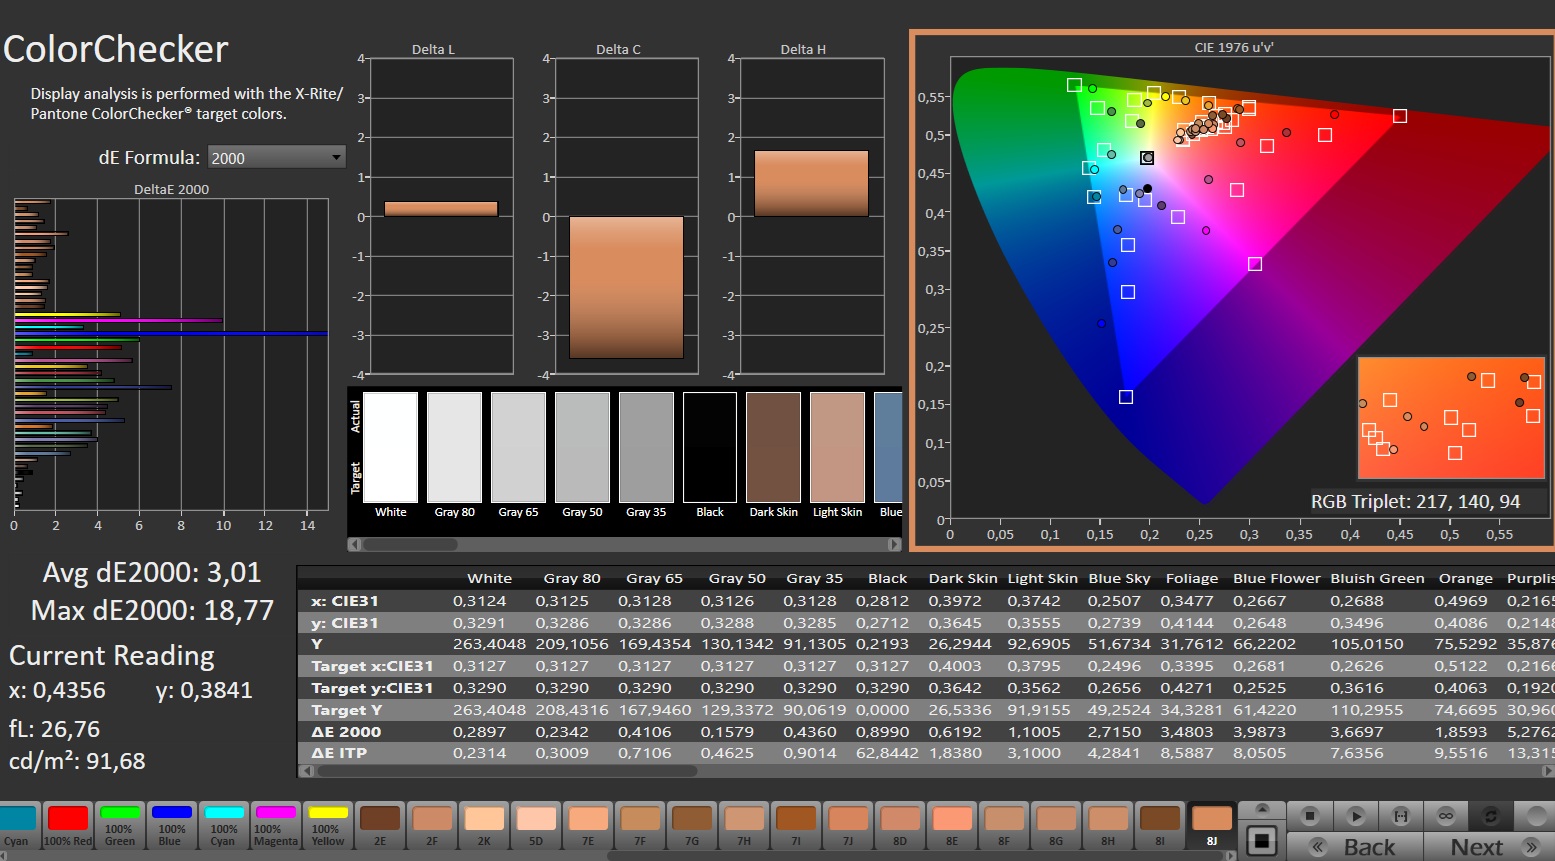
ΔE ColorChecker Calman: 4.3 | ∀{0.5-29.43 Ø4.72}
calibrated: 3.01
ΔE Greyscale Calman: 3.6 | ∀{0.09-98 Ø4.97}
45.1% AdobeRGB 1998 (Argyll 3D)
65.1% sRGB (Argyll 3D)
43.6% Display P3 (Argyll 3D)
Gamma: 2.322
CCT: 7182 K
| MSI Katana A15 AI B8VG CMN N156HRA-EA1, IPS, 1920x1080, 15.6", 144 Hz | HP Omen 16-xf0376ng BOE0B81, IPS, 1920x1080, 16.1", 165 Hz | HP Victus 16-r0077ng CMN162D, IPS, 1920x1080, 16.1", 144 Hz | Aorus 15 BSF Sharp LQ156T1JW05, IPS, 2560x1440, 15.6", 165 Hz | Lenovo Legion Pro 5 16ARX8 CSOT T3 MNG007DA1-Q, IPS, 2560x1600, 16", 165 Hz | |
|---|---|---|---|---|---|
| Display | 59% | 52% | 89% | 58% | |
| Display P3 Coverage (%) | 43.6 | 72.1 65% | 66.7 53% | 98.2 125% | 70.4 61% |
| sRGB Coverage (%) | 65.1 | 99.6 53% | 98 51% | 99.9 53% | 99.6 53% |
| AdobeRGB 1998 Coverage (%) | 45.1 | 72.3 60% | 69 53% | 85.7 90% | 72.6 61% |
| Response Times | 59% | 54% | 61% | 63% | |
| Response Time Grey 50% / Grey 80% * (ms) | 28.5 ? | 12.3 ? 57% | 13.3 ? 53% | 11.3 ? 60% | 7 ? 75% |
| Response Time Black / White * (ms) | 18.3 ? | 7.2 ? 61% | 8.2 ? 55% | 7 ? 62% | 9.1 ? 50% |
| PWM Frequency (Hz) | |||||
| Screen | 8% | 29% | 9% | 33% | |
| Brightness middle (cd/m²) | 277 | 350 26% | 308 11% | 299 8% | 355.3 28% |
| Brightness (cd/m²) | 259 | 338 31% | 285 10% | 282 9% | 340 31% |
| Brightness Distribution (%) | 77 | 91 18% | 85 10% | 82 6% | 91 18% |
| Black Level * (cd/m²) | 0.19 | 0.35 -84% | 0.25 -32% | 0.31 -63% | 0.32 -68% |
| Contrast (:1) | 1458 | 1000 -31% | 1232 -16% | 965 -34% | 1110 -24% |
| Colorchecker dE 2000 * | 4.3 | 3.29 23% | 1.3 70% | 2.24 48% | 1.13 74% |
| Colorchecker dE 2000 max. * | 19.14 | 8.47 56% | 2.76 86% | 4.29 78% | 2.78 85% |
| Colorchecker dE 2000 calibrated * | 3.01 | 2.23 26% | 0.92 69% | 2.62 13% | 0.32 89% |
| Greyscale dE 2000 * | 3.6 | 3.2 11% | 1.7 53% | 3 17% | 1.4 61% |
| Gamma | 2.322 95% | 2.131 103% | 2.167 102% | 2.086 105% | 2.24 98% |
| CCT | 7182 91% | 6317 103% | 6767 96% | 6289 103% | 6372 102% |
| Total Average (Program / Settings) | 42% /
27% | 45% /
38% | 53% /
34% | 51% /
42% |
* ... smaller is better
The above, combined with a very moderate backlight brightness (~259 cd/m²), means the display's contents can often be hard to make out. Simply put, such display panels are entirely inappropriate for any product in this price range.
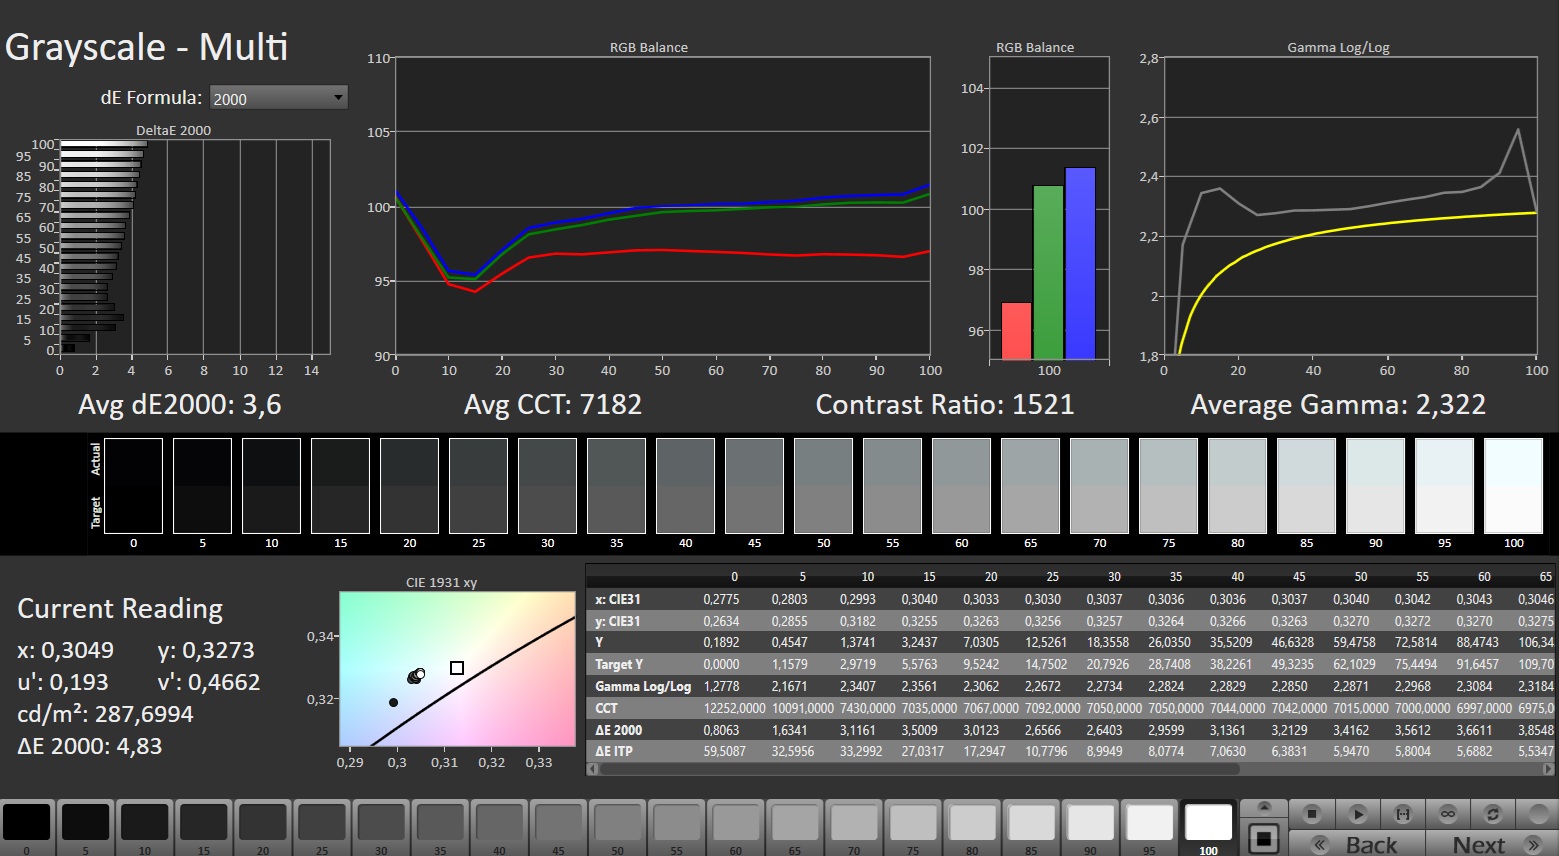
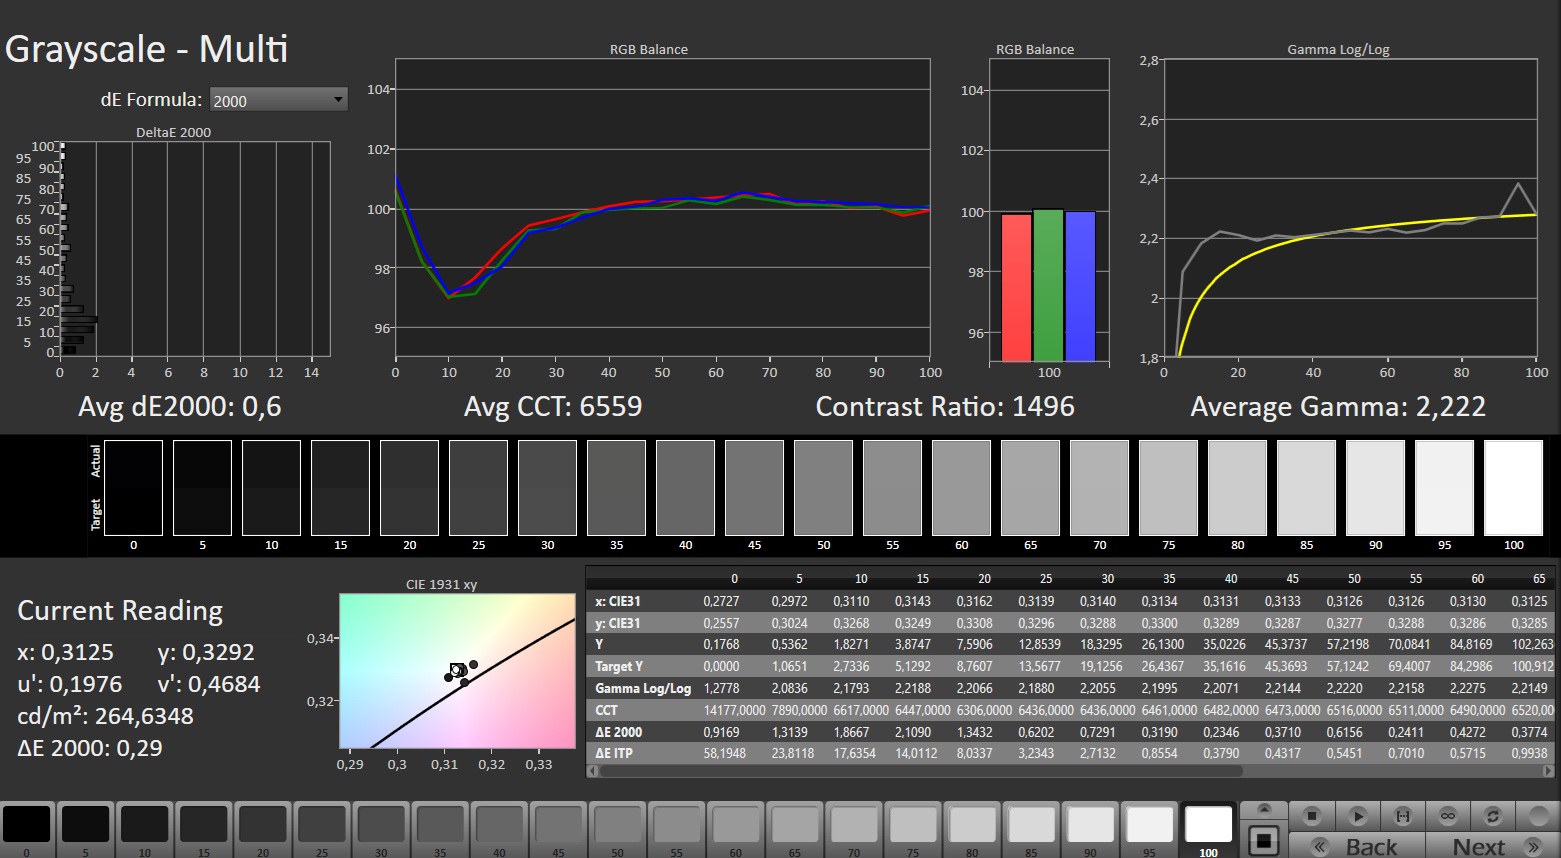
The 144 Hz screen actually is good in some respects—by IPS standards, at least. Not that it makes a lot of difference. Its contrast ratio is quite decent at 1458:1, and the black value of 0.19 cd/m² is nothing to sneeze at, either.
On the other hand, its response times are behind the competition. Good thing there is no PWM flickering common for OLED panels here.
Viewing angles are decent, though not particularly impressive.
Display Response Times
| ↔ Response Time Black to White | ||
|---|---|---|
| 18.3 ms ... rise ↗ and fall ↘ combined | ↗ 9.9 ms rise | 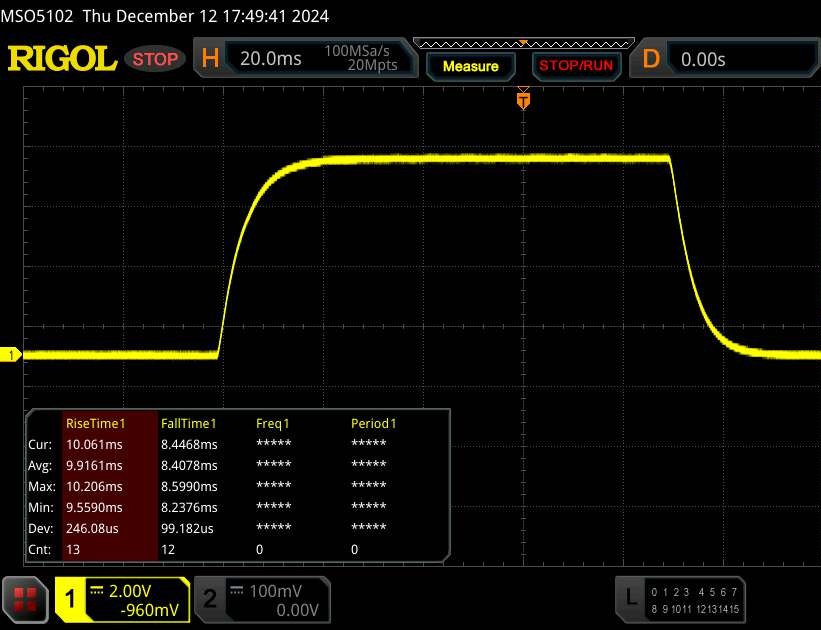 |
| ↘ 8.4 ms fall | ||
| The screen shows good response rates in our tests, but may be too slow for competitive gamers. In comparison, all tested devices range from 0.1 (minimum) to 240 (maximum) ms. » 41 % of all devices are better. This means that the measured response time is similar to the average of all tested devices (19.8 ms). | ||
| ↔ Response Time 50% Grey to 80% Grey | ||
| 28.5 ms ... rise ↗ and fall ↘ combined | ↗ 13.6 ms rise | 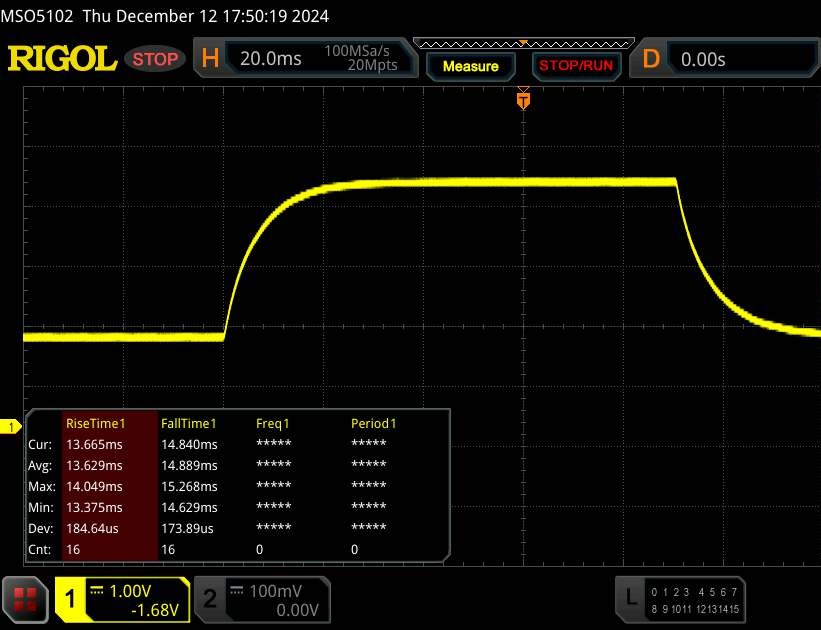 |
| ↘ 14.9 ms fall | ||
| The screen shows relatively slow response rates in our tests and may be too slow for gamers. In comparison, all tested devices range from 0.165 (minimum) to 636 (maximum) ms. » 38 % of all devices are better. This means that the measured response time is similar to the average of all tested devices (31 ms). | ||
Screen Flickering / PWM (Pulse-Width Modulation)
| Screen flickering / PWM not detected | 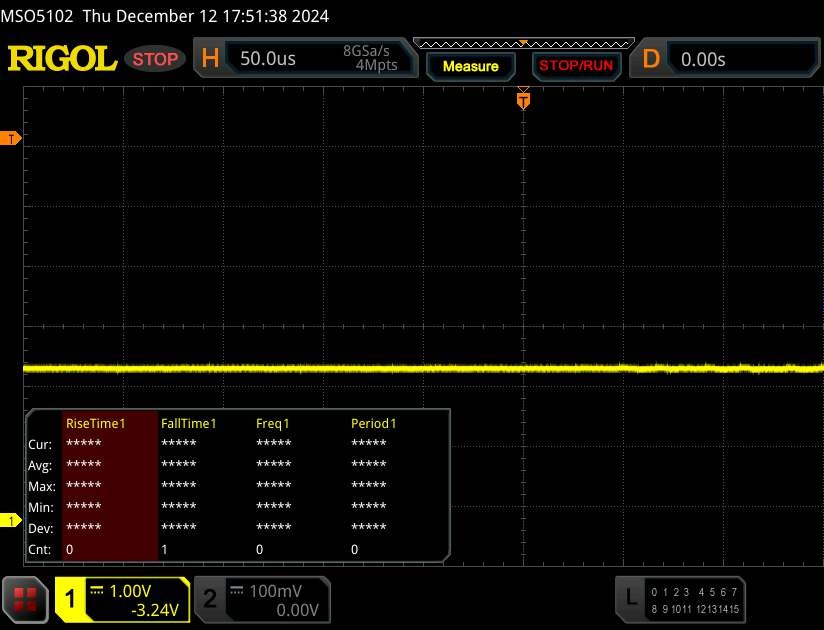 | ||
In comparison: 52 % of all tested devices do not use PWM to dim the display. If PWM was detected, an average of 7763 (minimum: 5 - maximum: 343500) Hz was measured. | |||
Performance
Both the RTX 4060 and the RTX 4070 come with 8 GB of VRAM which isn't a lot. This essentially makes the Katana A15 AI a mid-range gaming laptop. However, the Ryzen chips used should have enough power for demanding applications for years to come. Additionally, RAM and storage can be upgraded or replaced if needed.
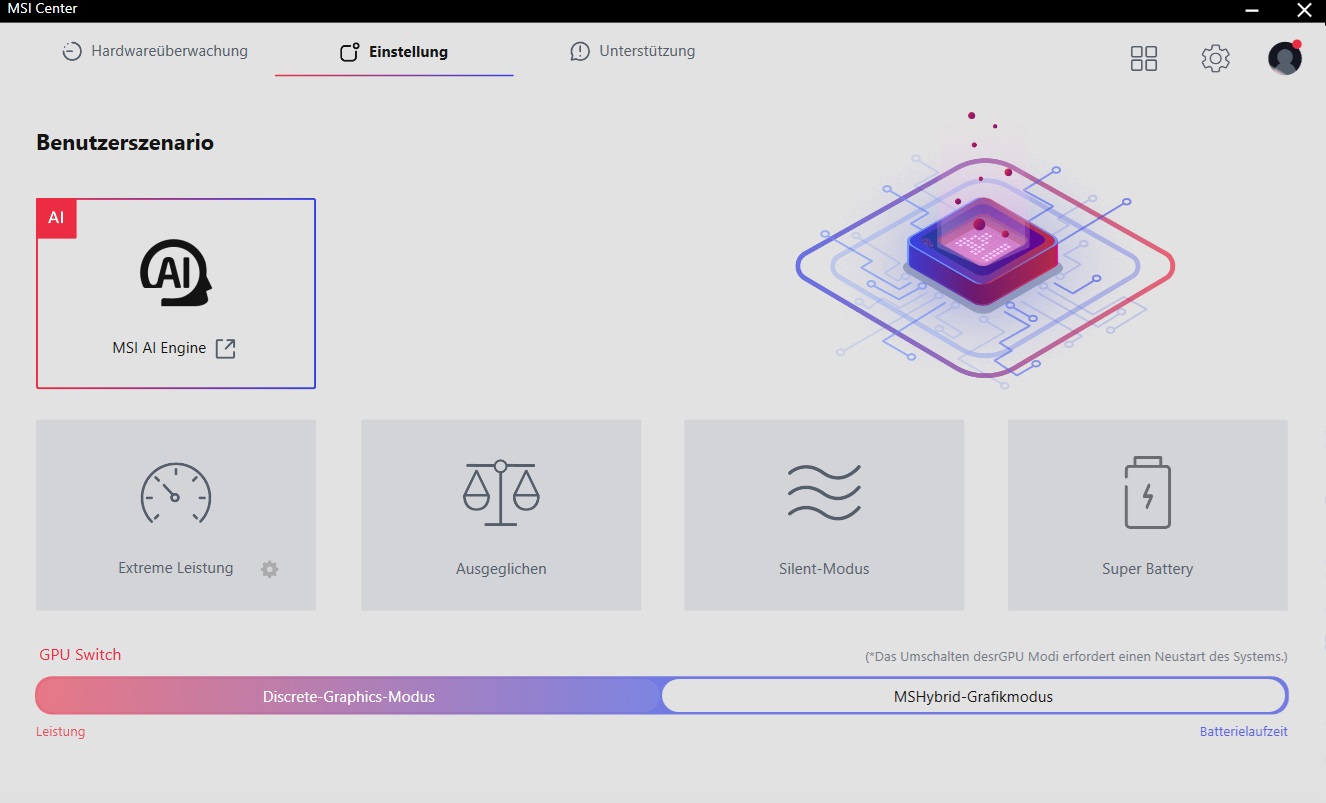
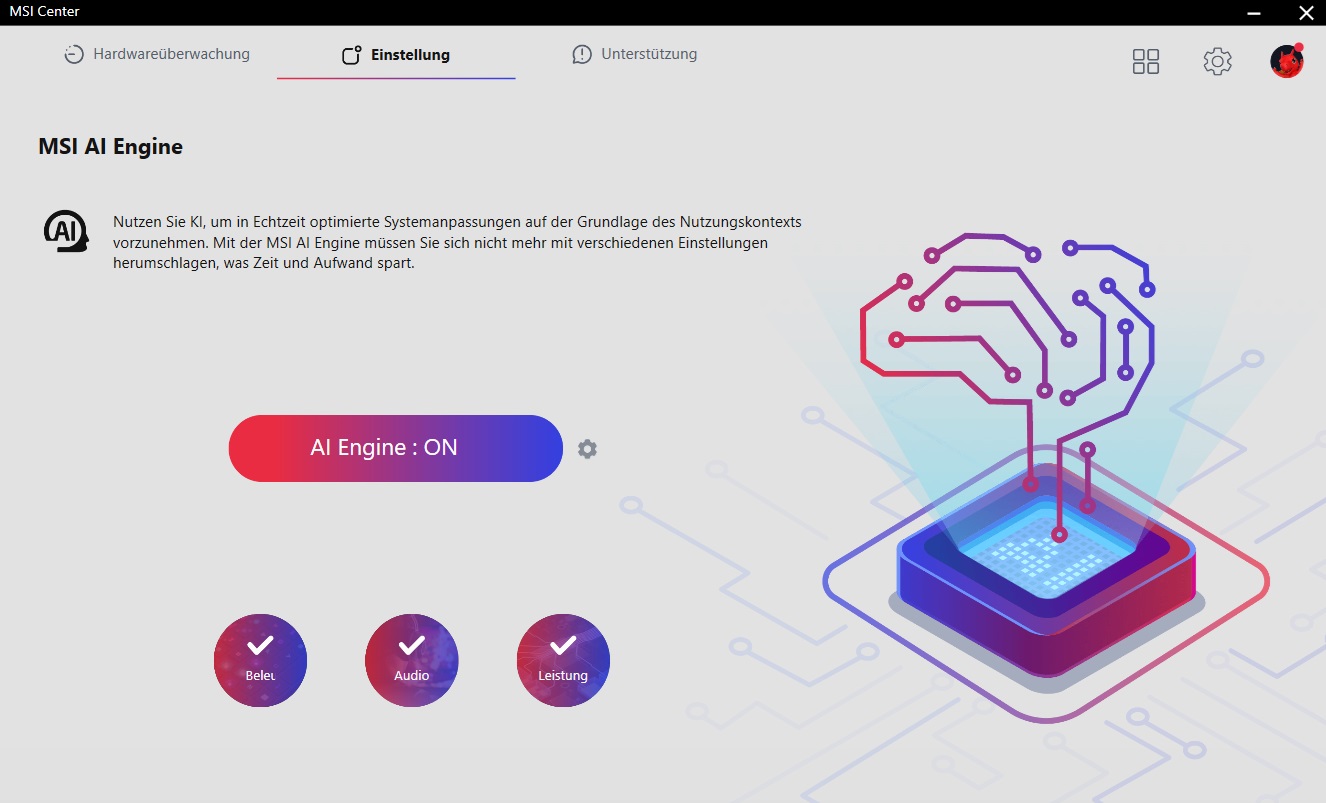
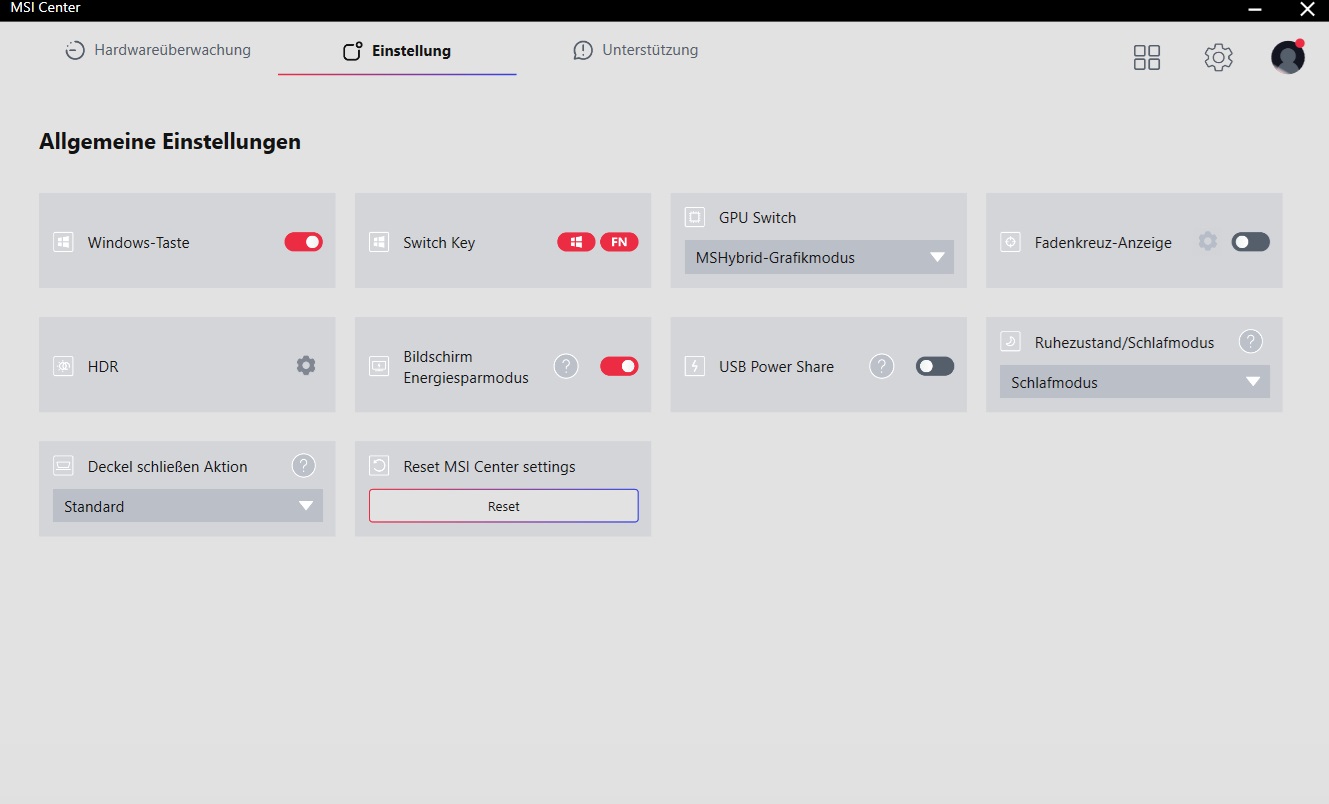
Test conditions
The somewhat sluggish MSI Center offers various modes under 'User Scenario,' ranging from 'Super Battery' to 'Extreme Performance,' with some modes causing fan behavior to change dramatically. All our measurements and tests were conducted with the 'MSI AI Engine' mode active, which maximizes graphics performance while keeping the CPU's TDP at the 'Balanced' mode level.
| Cyberpunk 2077 Loop (FHD/Ultra) | MSI AI Engine | Extreme performance | Balanced | Silent mode |
| Noise | 52 dB(A) | 52 dB(A) | 48 dB(A) | 39 dB(A) |
| Performance | 74 fps | 74 fps | 64 fps | 62 fps |
| CPU PL1 (HWiNFO) | 50 W | 54 W | 50 W | 35 W |
| CPU PL2 (HWiNFO) | 54 W | 65 W | 54 W | 40 W |
Processor
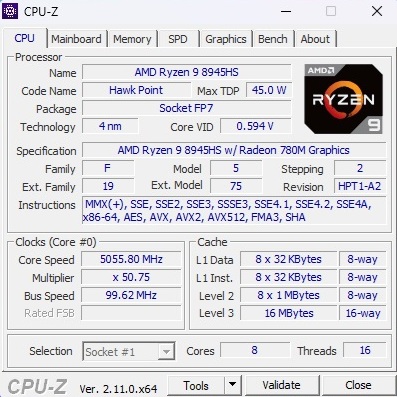
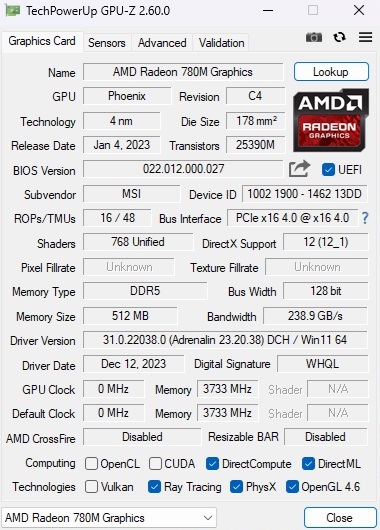
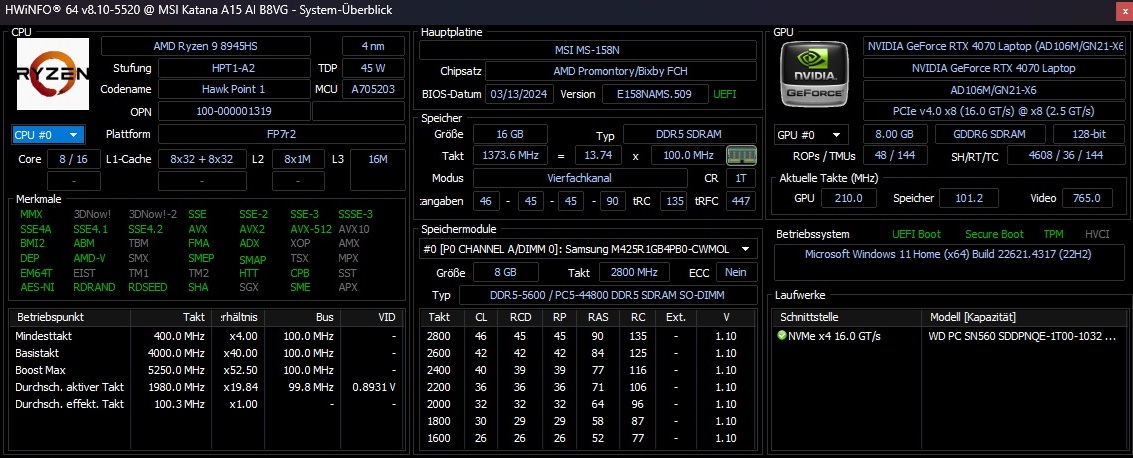
The Ryzen 9 8945HS in the Katana A15 AI delivers performance that is neither particularly impressive nor disappointing. Its results are comparable to the Ryzen 7 7840HS in the HP Omen 16, while the Ryzen 7 7745HX in the Lenovo Legion Pro 5 16 is approximately 10% faster across all tests. The 8945HS features eight CPU cores capable of processing up to 16 threads simultaneously via SMT. With integrated graphics switching, simple tasks such as office work, video playback, and Web browsing are handled by the processor's integrated Radeon 780M, conserving energy. The MUX switch allows one to deactivate the integrated GPU and rely solely on the Nvidia graphics card.
Cinebench R15 Multi loop
| CPU Performance rating - Percent | |
| Average of class Gaming | |
| Lenovo Legion Pro 5 16ARX8 -2! | |
| Average AMD Ryzen 9 8945HS | |
| Aorus 15 BSF | |
| HP Omen 16-xf0376ng | |
| MSI Katana A15 AI B8VG | |
| HP Victus 16-r0077ng | |
* ... smaller is better
AIDA64: FP32 Ray-Trace | FPU Julia | CPU SHA3 | CPU Queen | FPU SinJulia | FPU Mandel | CPU AES | CPU ZLib | FP64 Ray-Trace | CPU PhotoWorxx
| Performance rating | |
| Average of class Gaming | |
| Average AMD Ryzen 9 8945HS | |
| Lenovo Legion Pro 5 16ARX8 | |
| MSI Katana A15 AI B8VG | |
| HP Omen 16-xf0376ng | |
| Aorus 15 BSF | |
| HP Victus 16-r0077ng | |
| AIDA64 / FP32 Ray-Trace | |
| Average of class Gaming (10227 - 85542, n=107, last 2 years) | |
| Lenovo Legion Pro 5 16ARX8 | |
| MSI Katana A15 AI B8VG | |
| Average AMD Ryzen 9 8945HS (23462 - 28836, n=8) | |
| HP Omen 16-xf0376ng | |
| HP Victus 16-r0077ng | |
| Aorus 15 BSF | |
| AIDA64 / FPU Julia | |
| Average of class Gaming (51376 - 238426, n=107, last 2 years) | |
| Lenovo Legion Pro 5 16ARX8 | |
| MSI Katana A15 AI B8VG | |
| Average AMD Ryzen 9 8945HS (95557 - 122633, n=8) | |
| HP Omen 16-xf0376ng | |
| HP Victus 16-r0077ng | |
| Aorus 15 BSF | |
| AIDA64 / CPU SHA3 | |
| Average of class Gaming (2180 - 9817, n=107, last 2 years) | |
| Lenovo Legion Pro 5 16ARX8 | |
| Average AMD Ryzen 9 8945HS (4338 - 5077, n=8) | |
| MSI Katana A15 AI B8VG | |
| HP Omen 16-xf0376ng | |
| HP Victus 16-r0077ng | |
| Aorus 15 BSF | |
| AIDA64 / CPU Queen | |
| Lenovo Legion Pro 5 16ARX8 | |
| MSI Katana A15 AI B8VG | |
| HP Omen 16-xf0376ng | |
| Average AMD Ryzen 9 8945HS (101809 - 125044, n=8) | |
| Average of class Gaming (49785 - 173351, n=94, last 2 years) | |
| Aorus 15 BSF | |
| HP Victus 16-r0077ng | |
| AIDA64 / FPU SinJulia | |
| Lenovo Legion Pro 5 16ARX8 | |
| MSI Katana A15 AI B8VG | |
| Average AMD Ryzen 9 8945HS (13669 - 15661, n=8) | |
| HP Omen 16-xf0376ng | |
| Average of class Gaming (4424 - 33636, n=107, last 2 years) | |
| Aorus 15 BSF | |
| HP Victus 16-r0077ng | |
| AIDA64 / FPU Mandel | |
| Average of class Gaming (25115 - 128721, n=107, last 2 years) | |
| Lenovo Legion Pro 5 16ARX8 | |
| MSI Katana A15 AI B8VG | |
| Average AMD Ryzen 9 8945HS (50872 - 65746, n=8) | |
| HP Omen 16-xf0376ng | |
| HP Victus 16-r0077ng | |
| Aorus 15 BSF | |
| AIDA64 / CPU AES | |
| Aorus 15 BSF | |
| Average AMD Ryzen 9 8945HS (77854 - 169431, n=8) | |
| Average of class Gaming (39258 - 247074, n=107, last 2 years) | |
| MSI Katana A15 AI B8VG | |
| Lenovo Legion Pro 5 16ARX8 | |
| HP Omen 16-xf0376ng | |
| HP Victus 16-r0077ng | |
| AIDA64 / CPU ZLib | |
| Average of class Gaming (574 - 2531, n=107, last 2 years) | |
| Lenovo Legion Pro 5 16ARX8 | |
| MSI Katana A15 AI B8VG | |
| HP Omen 16-xf0376ng | |
| Average AMD Ryzen 9 8945HS (935 - 1135, n=8) | |
| HP Victus 16-r0077ng | |
| Aorus 15 BSF | |
| AIDA64 / FP64 Ray-Trace | |
| Average of class Gaming (5509 - 45446, n=107, last 2 years) | |
| Lenovo Legion Pro 5 16ARX8 | |
| Average AMD Ryzen 9 8945HS (12443 - 15588, n=8) | |
| MSI Katana A15 AI B8VG | |
| HP Omen 16-xf0376ng | |
| HP Victus 16-r0077ng | |
| Aorus 15 BSF | |
| AIDA64 / CPU PhotoWorxx | |
| Average of class Gaming (12271 - 89891, n=107, last 2 years) | |
| Average AMD Ryzen 9 8945HS (33371 - 40815, n=8) | |
| HP Victus 16-r0077ng | |
| Aorus 15 BSF | |
| HP Omen 16-xf0376ng | |
| MSI Katana A15 AI B8VG | |
| Lenovo Legion Pro 5 16ARX8 | |
System performance
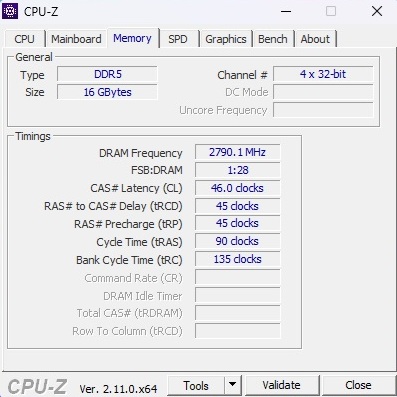
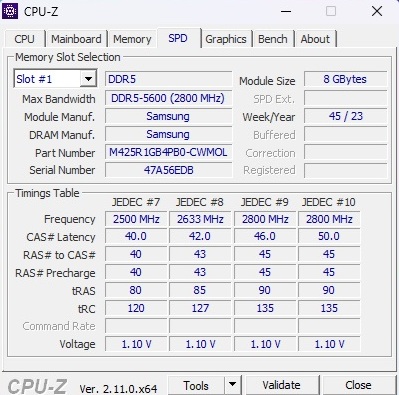
System performance is consistently good, with the Katana performing similarly to its competitors in PCMark 10. RAM data transfer speeds are impressive for 5,600 MT/s modules.
CrossMark: Overall | Productivity | Creativity | Responsiveness
WebXPRT 3: Overall
WebXPRT 4: Overall
Mozilla Kraken 1.1: Total
| PCMark 10 / Score | |
| Average of class Gaming (5828 - 11574, n=95, last 2 years) | |
| Lenovo Legion Pro 5 16ARX8 | |
| HP Omen 16-xf0376ng | |
| Average AMD Ryzen 9 8945HS, NVIDIA GeForce RTX 4070 Laptop GPU (7436 - 8312, n=3) | |
| MSI Katana A15 AI B8VG | |
| Aorus 15 BSF | |
| HP Victus 16-r0077ng | |
| PCMark 10 / Essentials | |
| HP Omen 16-xf0376ng | |
| Lenovo Legion Pro 5 16ARX8 | |
| Aorus 15 BSF | |
| HP Victus 16-r0077ng | |
| Average of class Gaming (8810 - 12600, n=99, last 2 years) | |
| Average AMD Ryzen 9 8945HS, NVIDIA GeForce RTX 4070 Laptop GPU (9672 - 11290, n=3) | |
| MSI Katana A15 AI B8VG | |
| PCMark 10 / Productivity | |
| Average of class Gaming (6845 - 21327, n=97, last 2 years) | |
| Lenovo Legion Pro 5 16ARX8 | |
| HP Omen 16-xf0376ng | |
| Average AMD Ryzen 9 8945HS, NVIDIA GeForce RTX 4070 Laptop GPU (9502 - 10332, n=3) | |
| MSI Katana A15 AI B8VG | |
| Aorus 15 BSF | |
| HP Victus 16-r0077ng | |
| PCMark 10 / Digital Content Creation | |
| Average of class Gaming (7602 - 19657, n=97, last 2 years) | |
| Lenovo Legion Pro 5 16ARX8 | |
| HP Omen 16-xf0376ng | |
| Average AMD Ryzen 9 8945HS, NVIDIA GeForce RTX 4070 Laptop GPU (11907 - 13363, n=3) | |
| MSI Katana A15 AI B8VG | |
| Aorus 15 BSF | |
| HP Victus 16-r0077ng | |
| CrossMark / Overall | |
| Aorus 15 BSF | |
| Lenovo Legion Pro 5 16ARX8 | |
| Average of class Gaming (1366 - 2409, n=96, last 2 years) | |
| Average AMD Ryzen 9 8945HS, NVIDIA GeForce RTX 4070 Laptop GPU (1767 - 1830, n=2) | |
| CrossMark / Productivity | |
| Aorus 15 BSF | |
| Lenovo Legion Pro 5 16ARX8 | |
| Average of class Gaming (1386 - 2254, n=96, last 2 years) | |
| Average AMD Ryzen 9 8945HS, NVIDIA GeForce RTX 4070 Laptop GPU (1686 - 1783, n=2) | |
| CrossMark / Creativity | |
| Average of class Gaming (1343 - 2729, n=96, last 2 years) | |
| Lenovo Legion Pro 5 16ARX8 | |
| Aorus 15 BSF | |
| Average AMD Ryzen 9 8945HS, NVIDIA GeForce RTX 4070 Laptop GPU (1935 - 1960, n=2) | |
| CrossMark / Responsiveness | |
| Aorus 15 BSF | |
| Lenovo Legion Pro 5 16ARX8 | |
| Average of class Gaming (1226 - 2334, n=96, last 2 years) | |
| Average AMD Ryzen 9 8945HS, NVIDIA GeForce RTX 4070 Laptop GPU (1489 - 1672, n=2) | |
| WebXPRT 3 / Overall | |
| Lenovo Legion Pro 5 16ARX8 | |
| HP Omen 16-xf0376ng | |
| HP Omen 16-xf0376ng | |
| Average of class Gaming (220 - 532, n=100, last 2 years) | |
| Aorus 15 BSF | |
| Average AMD Ryzen 9 8945HS, NVIDIA GeForce RTX 4070 Laptop GPU (268 - 324, n=3) | |
| HP Victus 16-r0077ng | |
| HP Victus 16-r0077ng | |
| MSI Katana A15 AI B8VG | |
| WebXPRT 4 / Overall | |
| Lenovo Legion Pro 5 16ARX8 | |
| Average of class Gaming (165 - 354, n=101, last 2 years) | |
| Aorus 15 BSF | |
| HP Omen 16-xf0376ng | |
| HP Omen 16-xf0376ng | |
| Average AMD Ryzen 9 8945HS, NVIDIA GeForce RTX 4070 Laptop GPU (226 - 269, n=3) | |
| HP Victus 16-r0077ng | |
| HP Victus 16-r0077ng | |
| MSI Katana A15 AI B8VG | |
| Mozilla Kraken 1.1 / Total | |
| MSI Katana A15 AI B8VG | |
| MSI Katana A15 AI B8VG | |
| HP Victus 16-r0077ng | |
| HP Victus 16-r0077ng | |
| Average AMD Ryzen 9 8945HS, NVIDIA GeForce RTX 4070 Laptop GPU (488 - 586, n=4) | |
| HP Omen 16-xf0376ng | |
| HP Omen 16-xf0376ng | |
| Aorus 15 BSF | |
| Lenovo Legion Pro 5 16ARX8 | |
| Average of class Gaming (391 - 590, n=104, last 2 years) | |
* ... smaller is better
| PCMark 10 Score | 7473 points | |
Help | ||
| AIDA64 / Memory Copy | |
| Average of class Gaming (21750 - 129946, n=107, last 2 years) | |
| Average AMD Ryzen 9 8945HS (62371 - 69218, n=8) | |
| MSI Katana A15 AI B8VG | |
| HP Omen 16-xf0376ng | |
| HP Victus 16-r0077ng | |
| Aorus 15 BSF | |
| Lenovo Legion Pro 5 16ARX8 | |
| AIDA64 / Memory Read | |
| Average of class Gaming (22956 - 118858, n=107, last 2 years) | |
| HP Victus 16-r0077ng | |
| Aorus 15 BSF | |
| MSI Katana A15 AI B8VG | |
| HP Omen 16-xf0376ng | |
| Average AMD Ryzen 9 8945HS (49966 - 61710, n=8) | |
| Lenovo Legion Pro 5 16ARX8 | |
| AIDA64 / Memory Write | |
| Aorus 15 BSF | |
| Average AMD Ryzen 9 8945HS (78351 - 93153, n=8) | |
| HP Omen 16-xf0376ng | |
| MSI Katana A15 AI B8VG | |
| Average of class Gaming (22297 - 135096, n=107, last 2 years) | |
| HP Victus 16-r0077ng | |
| Lenovo Legion Pro 5 16ARX8 | |
| AIDA64 / Memory Latency | |
| Average of class Gaming (75.3 - 259, n=107, last 2 years) | |
| HP Victus 16-r0077ng | |
| Average AMD Ryzen 9 8945HS (87.8 - 110.4, n=8) | |
| Aorus 15 BSF | |
| MSI Katana A15 AI B8VG | |
| HP Omen 16-xf0376ng | |
| Lenovo Legion Pro 5 16ARX8 | |
* ... smaller is better
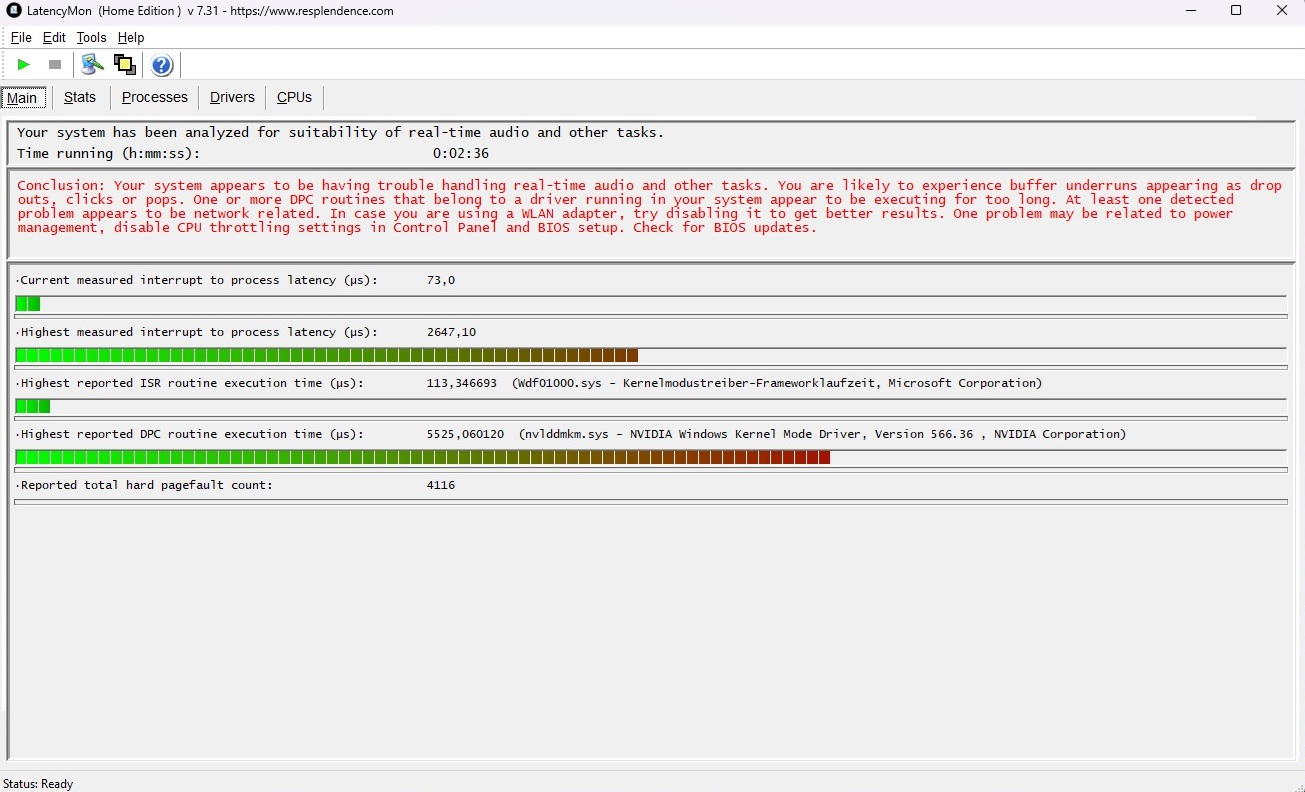
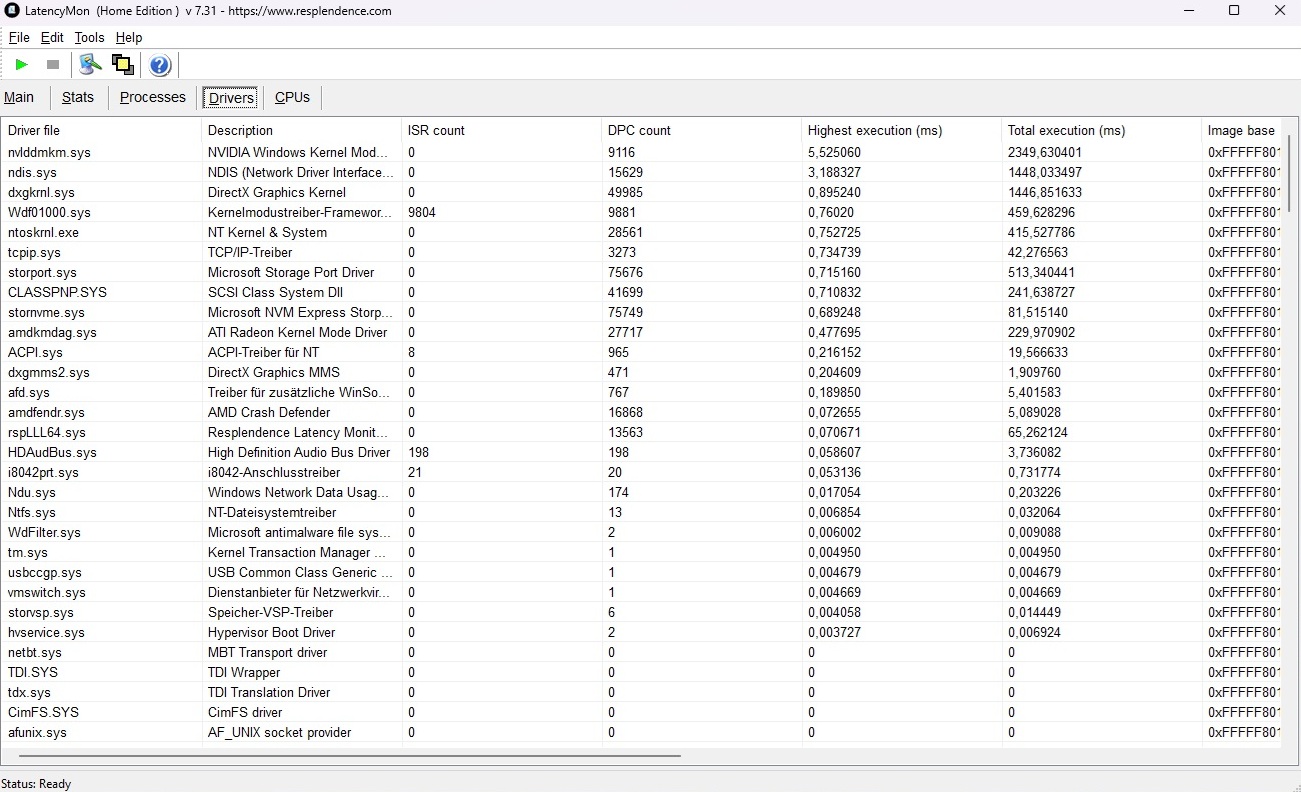
DPC latencies
Things are far less impressive in this department. According to the LatencyMon tool, latencies may spike during certain tasks. That being said, of the rival systems, only the Legion Pro 5 manages to stay below 1000 µs.
| DPC Latencies / LatencyMon - interrupt to process latency (max), Web, Youtube, Prime95 | |
| MSI Katana A15 AI B8VG | |
| HP Omen 16-xf0376ng | |
| HP Victus 16-r0077ng | |
| Aorus 15 BSF | |
| Lenovo Legion Pro 5 16ARX8 | |
* ... smaller is better
Storage devices
The 1 TB SSD from WDC (model PC SN560) may not be among the fastest in its class, but its performance is far from disappointing. While our loop test revealed some performance fluctuations over time, these remained within acceptable limits which is something we can't say for the Legion Pro 5.

| Drive Performance rating - Percent | |
| Aorus 15 BSF | |
| Lenovo Legion Pro 5 16ARX8 | |
| Average of class Gaming | |
| HP Omen 16-xf0376ng | |
| MSI Katana A15 AI B8VG | |
| HP Victus 16-r0077ng | |
| Average WD PC SN560 SDDPNQE-1T00 | |
* ... smaller is better
Reading continuous performance: DiskSpd Read Loop, Queue Depth 8
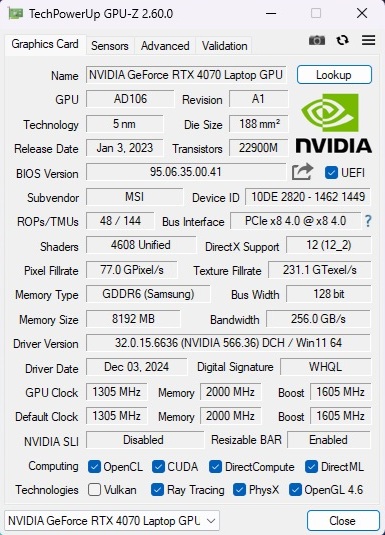
GPU performance
The GeForce RTX 4070 is expected to be succeeded by a new model in the coming weeks or months. While it remains a very fast gaming GPU in the notebook sector as of 2024, its limited 8 GB of VRAM are increasingly often proving to be a bottleneck, sometimes even in Full HD. Recently released titles, such as Indiana Jones, highlight that those serious about gaming would be better served by a graphics card featuring at least 12 GB of VRAM. In other words, the RTX 4070 might not be a good long-term investment.
The other thing to consider is that MSI has opted for a relatively low TGP of 105 watts for the RTX 4070, even though the GPU supports up to 140 watts. This decision is reflected in the benchmark results that see the Katana lag behind the competition. On average, its RTX 4070-powered rivals outperform it by 9 to 16% in synthetic graphics tests.
| 3DMark Performance rating - Percent | |
| Average of class Gaming | |
| HP Omen 16-xf0376ng | |
| Lenovo Legion Pro 5 16ARX8 -1! | |
| Aorus 15 BSF | |
| HP Victus 16-r0077ng | |
| Average NVIDIA GeForce RTX 4070 Laptop GPU | |
| MSI Katana A15 AI B8VG | |
| 3DMark 11 Performance | 28162 points | |
| 3DMark Ice Storm Standard Score | 147014 points | |
| 3DMark Cloud Gate Standard Score | 61833 points | |
| 3DMark Fire Strike Score | 23834 points | |
| 3DMark Time Spy Score | 9759 points | |
Help | ||
* ... smaller is better
Gaming performance
Thankfully, the 15-incher fares slightly better in games than it does in benchmarks, with results that put it on an equal footing with the average RTX 4070-toting laptop in our database. In general, the graphics card can handle nearly all modern titles smoothly at maximum settings in the native resolution of 1,920 x 1,080. However, in extremely CPU-intensive or poorly optimized games, such as Star Wars Outlaws, it may struggle to deliver high enough fps rate. In these cases, the DLSS upscaling tech comes in handy.
| Performance rating - Percent | |
| Average of class Gaming | |
| Lenovo Legion Pro 5 16ARX8 -2! | |
| Average NVIDIA GeForce RTX 4070 Laptop GPU | |
| MSI Katana A15 AI B8VG -1! | |
| HP Omen 16-xf0376ng -2! | |
| Aorus 15 BSF -2! | |
| HP Victus 16-r0077ng -1! | |
| Cyberpunk 2077 - 1920x1080 Ultra Preset (FSR off) | |
| Average of class Gaming (17.7 - 169.9, n=118, last 2 years) | |
| MSI Katana A15 AI B8VG | |
| Average NVIDIA GeForce RTX 4070 Laptop GPU (30.7 - 90.7, n=40) | |
| Baldur's Gate 3 - 1920x1080 Ultra Preset AA:T | |
| Average of class Gaming (59.4 - 246, n=105, last 2 years) | |
| MSI Katana A15 AI B8VG | |
| Average NVIDIA GeForce RTX 4070 Laptop GPU (66.7 - 128.5, n=30) | |
| HP Victus 16-r0077ng | |
| Aorus 15 BSF | |
| GTA V - 1920x1080 Highest AA:4xMSAA + FX AF:16x | |
| Average of class Gaming (48.3 - 186.9, n=97, last 2 years) | |
| Lenovo Legion Pro 5 16ARX8 | |
| HP Victus 16-r0077ng | |
| Average NVIDIA GeForce RTX 4070 Laptop GPU (48.3 - 141.6, n=63) | |
| MSI Katana A15 AI B8VG | |
| HP Omen 16-xf0376ng | |
| Final Fantasy XV Benchmark - 1920x1080 High Quality | |
| Average of class Gaming (41 - 215, n=98, last 2 years) | |
| Lenovo Legion Pro 5 16ARX8 | |
| Aorus 15 BSF | |
| Average NVIDIA GeForce RTX 4070 Laptop GPU (41 - 131.9, n=65) | |
| HP Victus 16-r0077ng | |
| HP Omen 16-xf0376ng | |
| MSI Katana A15 AI B8VG | |
| Strange Brigade - 1920x1080 ultra AA:ultra AF:16 | |
| Average of class Gaming (76.3 - 456, n=88, last 2 years) | |
| Lenovo Legion Pro 5 16ARX8 | |
| Aorus 15 BSF | |
| Average NVIDIA GeForce RTX 4070 Laptop GPU (76.3 - 234, n=63) | |
| HP Victus 16-r0077ng | |
| HP Omen 16-xf0376ng | |
| Dota 2 Reborn - 1920x1080 ultra (3/3) best looking | |
| Lenovo Legion Pro 5 16ARX8 | |
| Average of class Gaming (84.8 - 248, n=110, last 2 years) | |
| Aorus 15 BSF | |
| Average NVIDIA GeForce RTX 4070 Laptop GPU (89.7 - 191.2, n=67) | |
| HP Omen 16-xf0376ng | |
| HP Victus 16-r0077ng | |
| MSI Katana A15 AI B8VG | |
| low | med. | high | ultra | |
|---|---|---|---|---|
| GTA V (2015) | 174.9 | 164.8 | 108.7 | |
| Dota 2 Reborn (2015) | 158.8 | 136.1 | 138.6 | 129.9 |
| Final Fantasy XV Benchmark (2018) | 135.6 | 101.1 | ||
| X-Plane 11.11 (2018) | 80.6 | 74.7 | 52.1 | |
| Baldur's Gate 3 (2023) | 130.5 | 108.2 | 104.9 | |
| Cyberpunk 2077 (2023) | 113.8 | 96.2 | 84 | |
| Prince of Persia The Lost Crown (2024) | 323 | 322 | 321 | |
| Star Wars Outlaws (2024) | 45.9 | 39.6 | 31.9 | |
| Space Marine 2 (2024) | 75.2 | 74.2 | 73.1 | |
| Final Fantasy XVI (2024) | 68.1 | 59 | 50.6 | |
| God of War Ragnarök (2024) | 111.7 | 97.9 | 90.5 | |
| Until Dawn (2024) | 88.2 | 62.7 | 46.9 | |
| Call of Duty Black Ops 6 (2024) | 121 | 87 | 81 | |
| Stalker 2 (2024) | 54.5 | 49.9 | 43.5 |
| Cyberpunk 2077 | |
| 1920x1080 High Preset (FSR off) | |
| Average of class Gaming (17.8 - 185, n=102, last 2 years) | |
| MSI Katana A15 AI B8VG | |
| Average NVIDIA GeForce RTX 4070 Laptop GPU (74.7 - 103.6, n=32) | |
| 1920x1080 Ultra Preset (FSR off) | |
| Average of class Gaming (17.7 - 169.9, n=118, last 2 years) | |
| MSI Katana A15 AI B8VG | |
| Average NVIDIA GeForce RTX 4070 Laptop GPU (30.7 - 90.7, n=40) | |
We checked the system's sustained 3D performance by running Cyberpunk 2077 for approximately 30 minutes. The result: The Katana A15 delivered stable frame rates with no unexpected fps drops.
Cyberpunk 2077 Ultra fps chart
Emissions
Noise emissions
The AI mode keeps noise levels moderate when idling, aside from occasional bursts of fan activity, but generates a lot of noise when the system is stressed. When running Cyberpunk 2077, the system was as loud as 52 dB(A), which many users are likely to find unpleasant—especially when not using headphones.
Noise level
| Idle |
| 25 / 26 / 27 dB(A) |
| Load |
| 40 / 50 dB(A) |
 | ||
30 dB silent 40 dB(A) audible 50 dB(A) loud |
||
min: | ||
| MSI Katana A15 AI B8VG R9 8945HS, GeForce RTX 4070 Laptop GPU | HP Omen 16-xf0376ng R7 7840HS, GeForce RTX 4070 Laptop GPU | HP Victus 16-r0077ng i7-13700H, GeForce RTX 4070 Laptop GPU | Aorus 15 BSF i7-13700H, GeForce RTX 4070 Laptop GPU | Lenovo Legion Pro 5 16ARX8 R7 7745HX, GeForce RTX 4070 Laptop GPU | |
|---|---|---|---|---|---|
| Noise | -5% | -7% | -16% | 7% | |
| off / environment * (dB) | 25 | 24 4% | 25 -0% | 24 4% | 23.2 7% |
| Idle Minimum * (dB) | 25 | 25 -0% | 28 -12% | 25 -0% | 23.2 7% |
| Idle Average * (dB) | 26 | 29 -12% | 29 -12% | 31 -19% | 23.2 11% |
| Idle Maximum * (dB) | 27 | 32 -19% | 30 -11% | 37 -37% | 26.2 3% |
| Load Average * (dB) | 40 | 44 -10% | 43 -8% | 51 -27% | 31.4 22% |
| Cyberpunk 2077 ultra * (dB) | 52 | ||||
| Load Maximum * (dB) | 50 | 46 8% | 48 4% | 57 -14% | 53.8 -8% |
| Witcher 3 ultra * (dB) | 44 | 46 | 48.4 |
* ... smaller is better
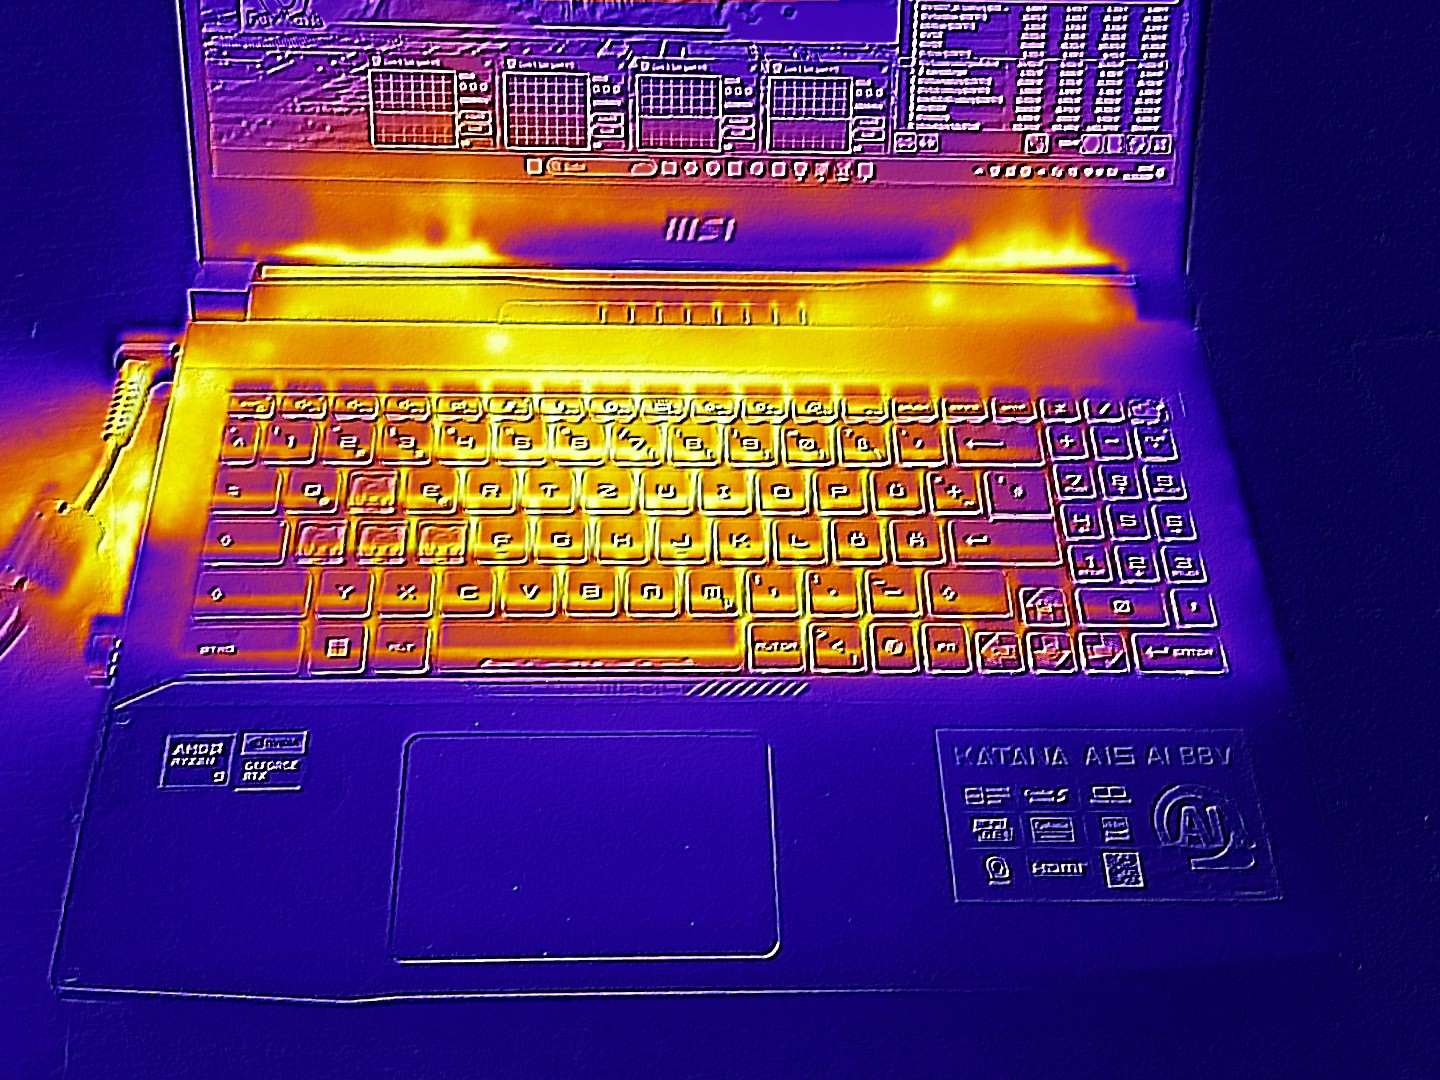
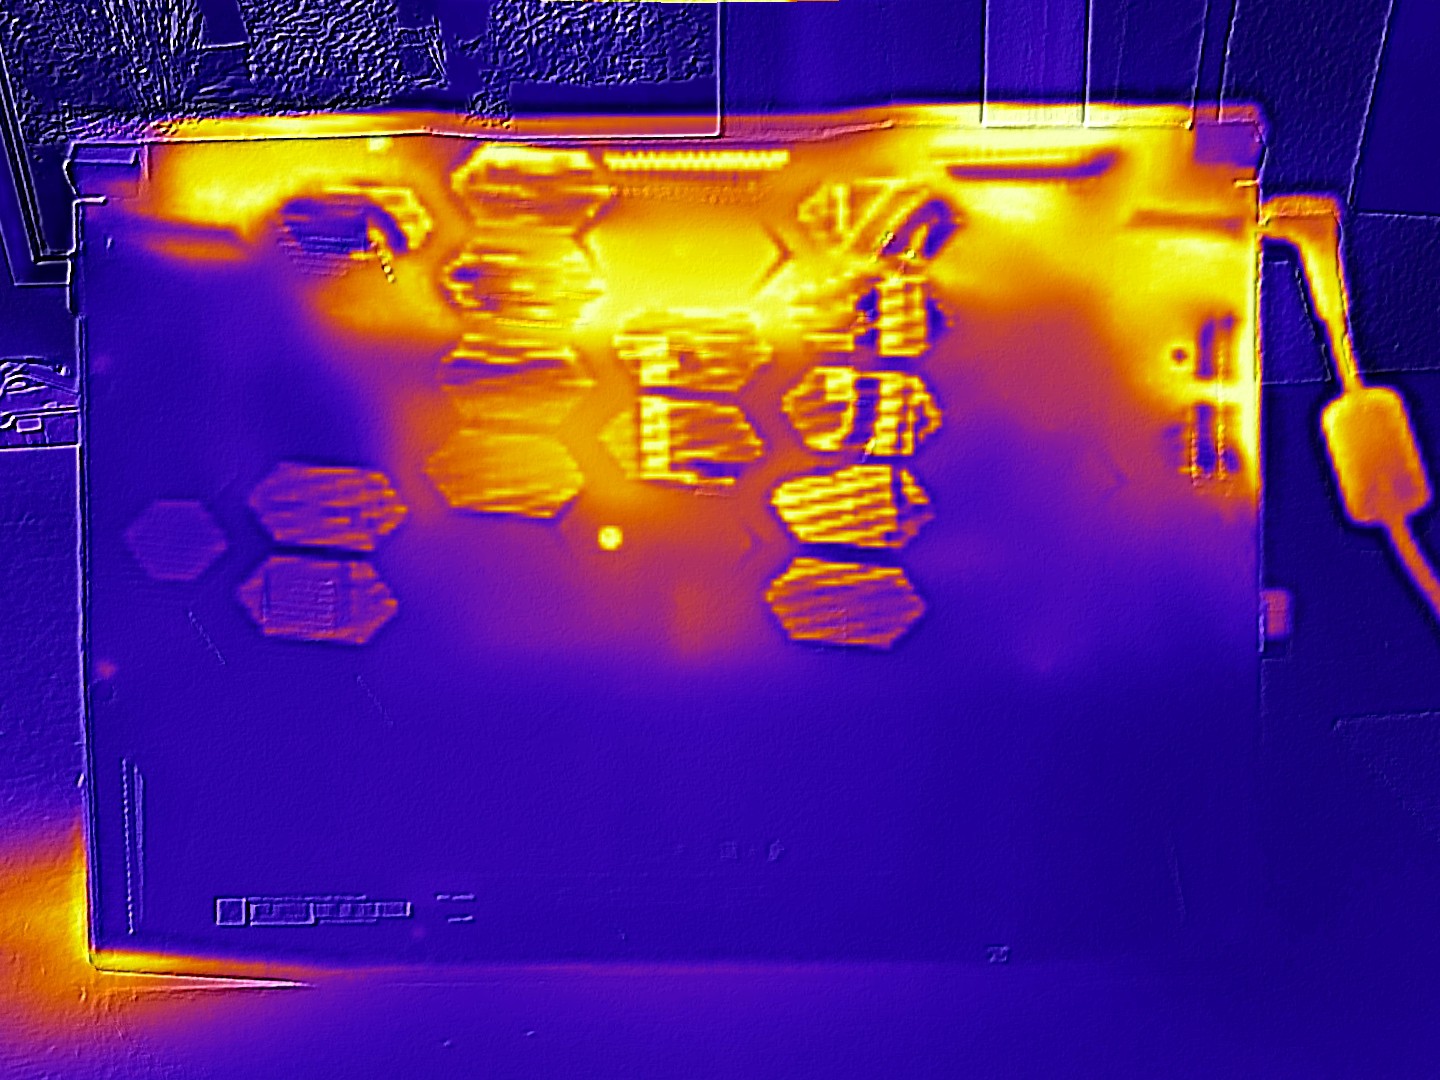
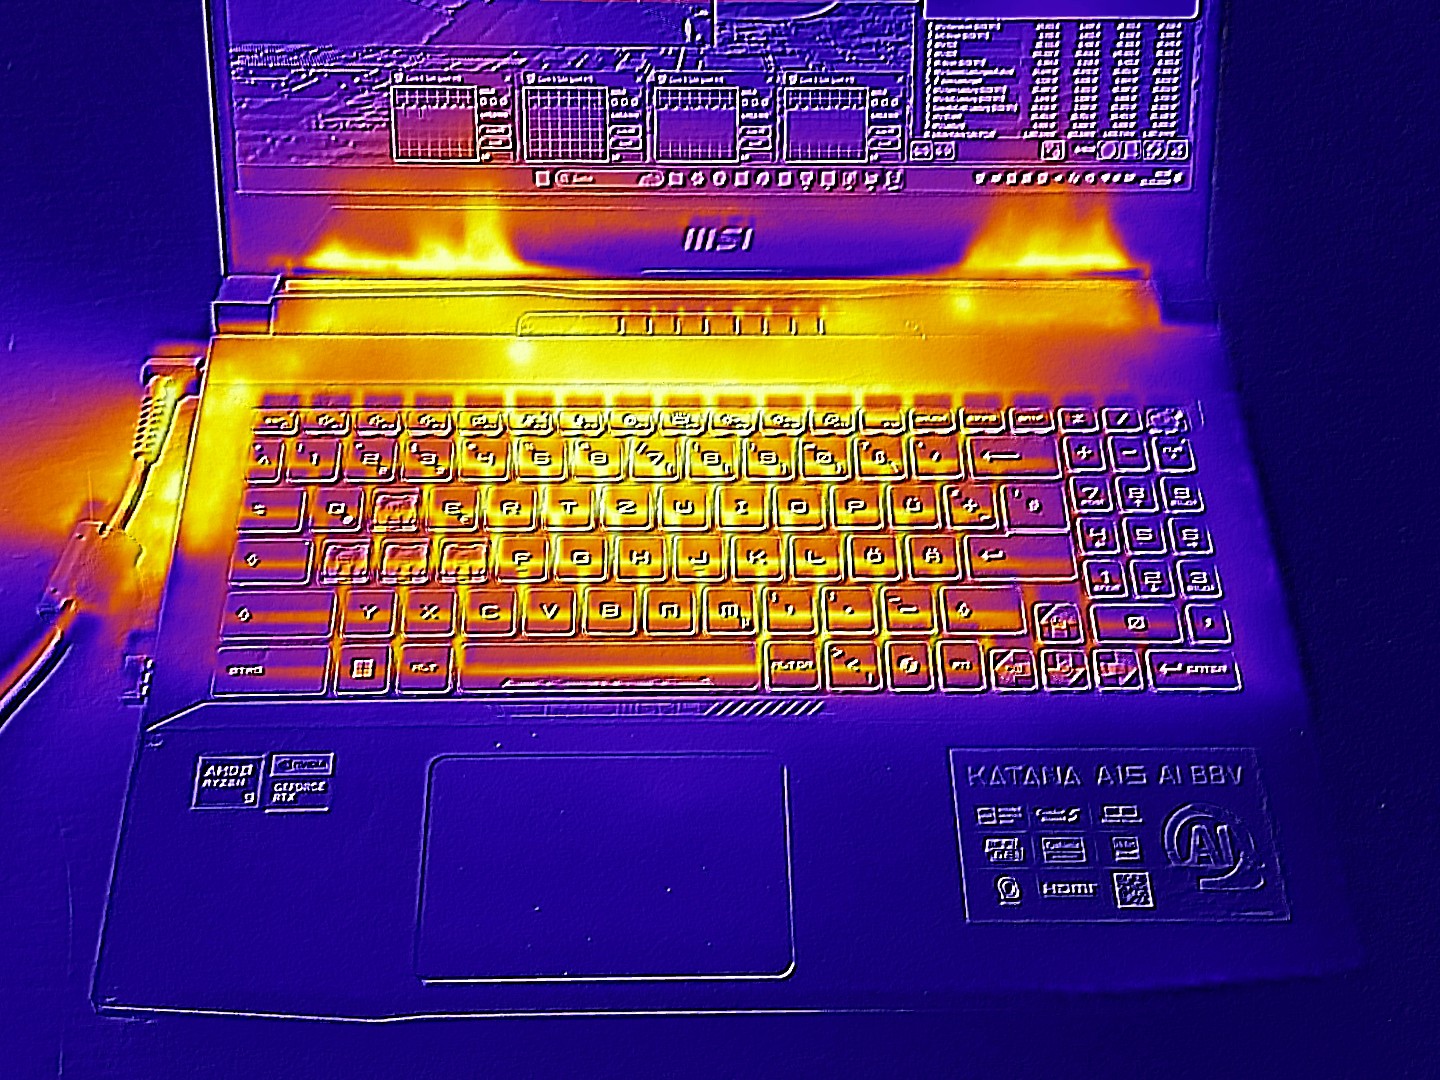
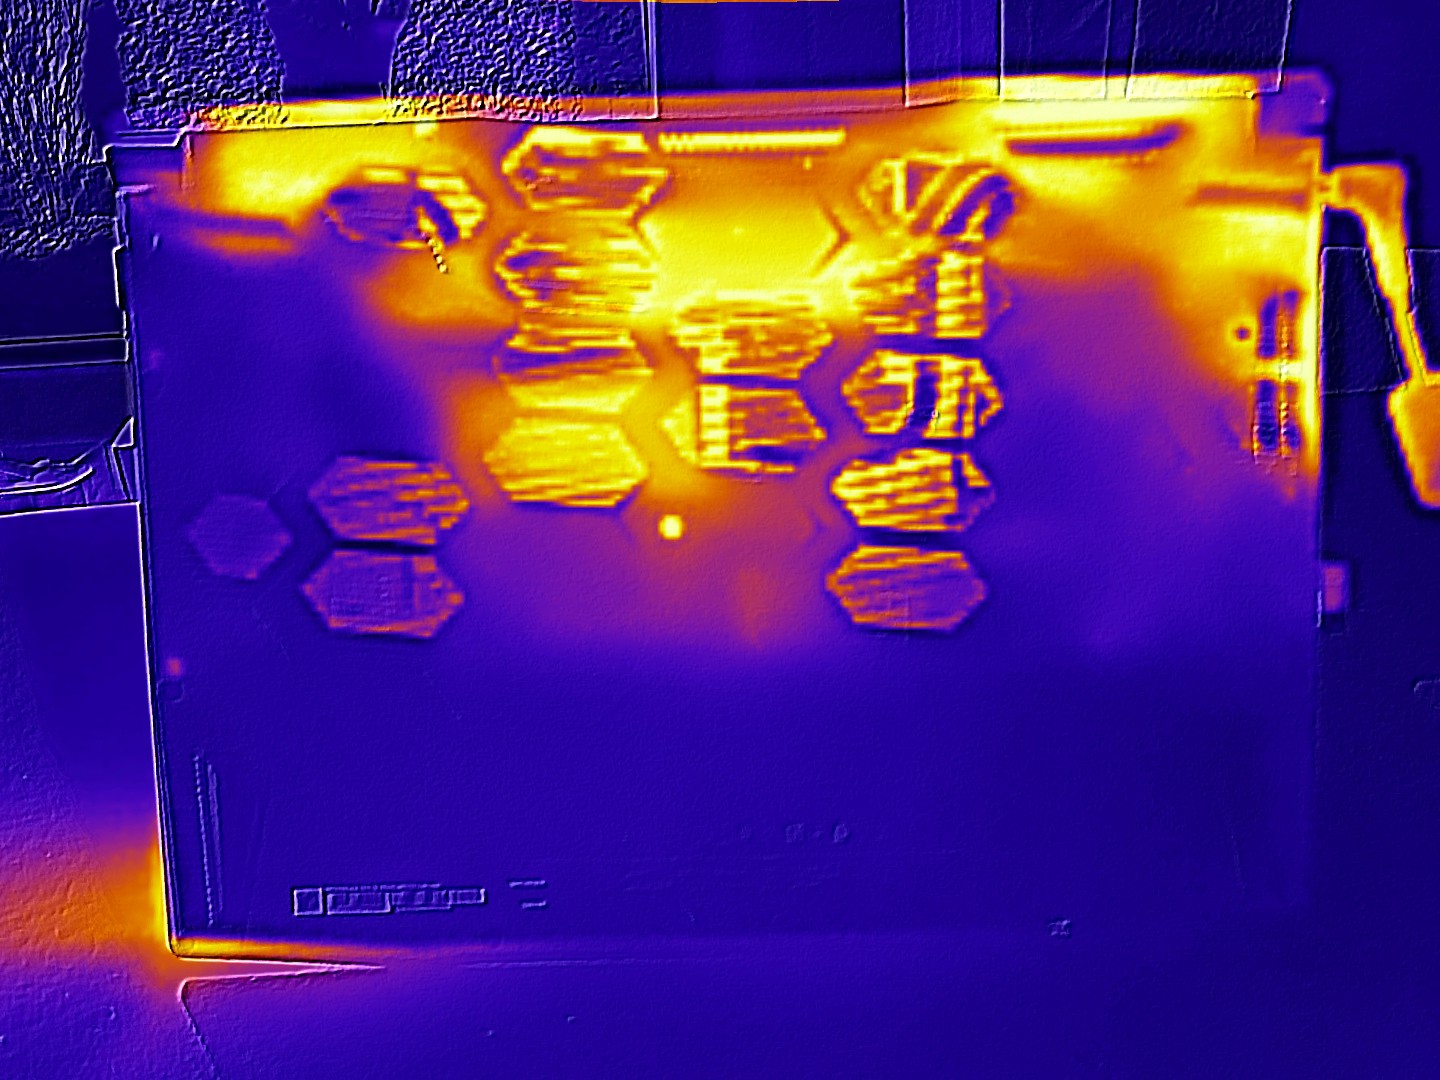
Temperature
Gaming notebooks tend to heat up significantly when running graphics-intensive applications. This is unlikely to come as a surprise to anyone. The Katana A15 reaches a maximum of 47 °C on the top and 46 °C on the bottom, making it somewhat uncomfortable to interact with but still cooler than some of its competitors (please have a look at the table).
On the bright side, the palm rest stays relatively cool under all conditions, ensuring some comfort during use.
(-) The maximum temperature on the upper side is 48 °C / 118 F, compared to the average of 40.4 °C / 105 F, ranging from 21.2 to 68.8 °C for the class Gaming.
(-) The bottom heats up to a maximum of 46 °C / 115 F, compared to the average of 43.2 °C / 110 F
(+) In idle usage, the average temperature for the upper side is 31.1 °C / 88 F, compared to the device average of 33.9 °C / 93 F.
(-) 3: The average temperature for the upper side is 41.6 °C / 107 F, compared to the average of 33.9 °C / 93 F for the class Gaming.
(+) The palmrests and touchpad are reaching skin temperature as a maximum (34 °C / 93.2 F) and are therefore not hot.
(-) The average temperature of the palmrest area of similar devices was 28.8 °C / 83.8 F (-5.2 °C / -9.4 F).
| MSI Katana A15 AI B8VG R9 8945HS, GeForce RTX 4070 Laptop GPU | HP Omen 16-xf0376ng R7 7840HS, GeForce RTX 4070 Laptop GPU | HP Victus 16-r0077ng i7-13700H, GeForce RTX 4070 Laptop GPU | Aorus 15 BSF i7-13700H, GeForce RTX 4070 Laptop GPU | Lenovo Legion Pro 5 16ARX8 R7 7745HX, GeForce RTX 4070 Laptop GPU | |
|---|---|---|---|---|---|
| Heat | -2% | -4% | -5% | 12% | |
| Maximum Upper Side * (°C) | 48 | 49 -2% | 51 -6% | 48 -0% | 41.8 13% |
| Maximum Bottom * (°C) | 46 | 57 -24% | 54 -17% | 47 -2% | 41.4 10% |
| Idle Upper Side * (°C) | 34 | 31 9% | 37 -9% | 39 -15% | 29 15% |
| Idle Bottom * (°C) | 34 | 31 9% | 29 15% | 35 -3% | 30.4 11% |
* ... smaller is better
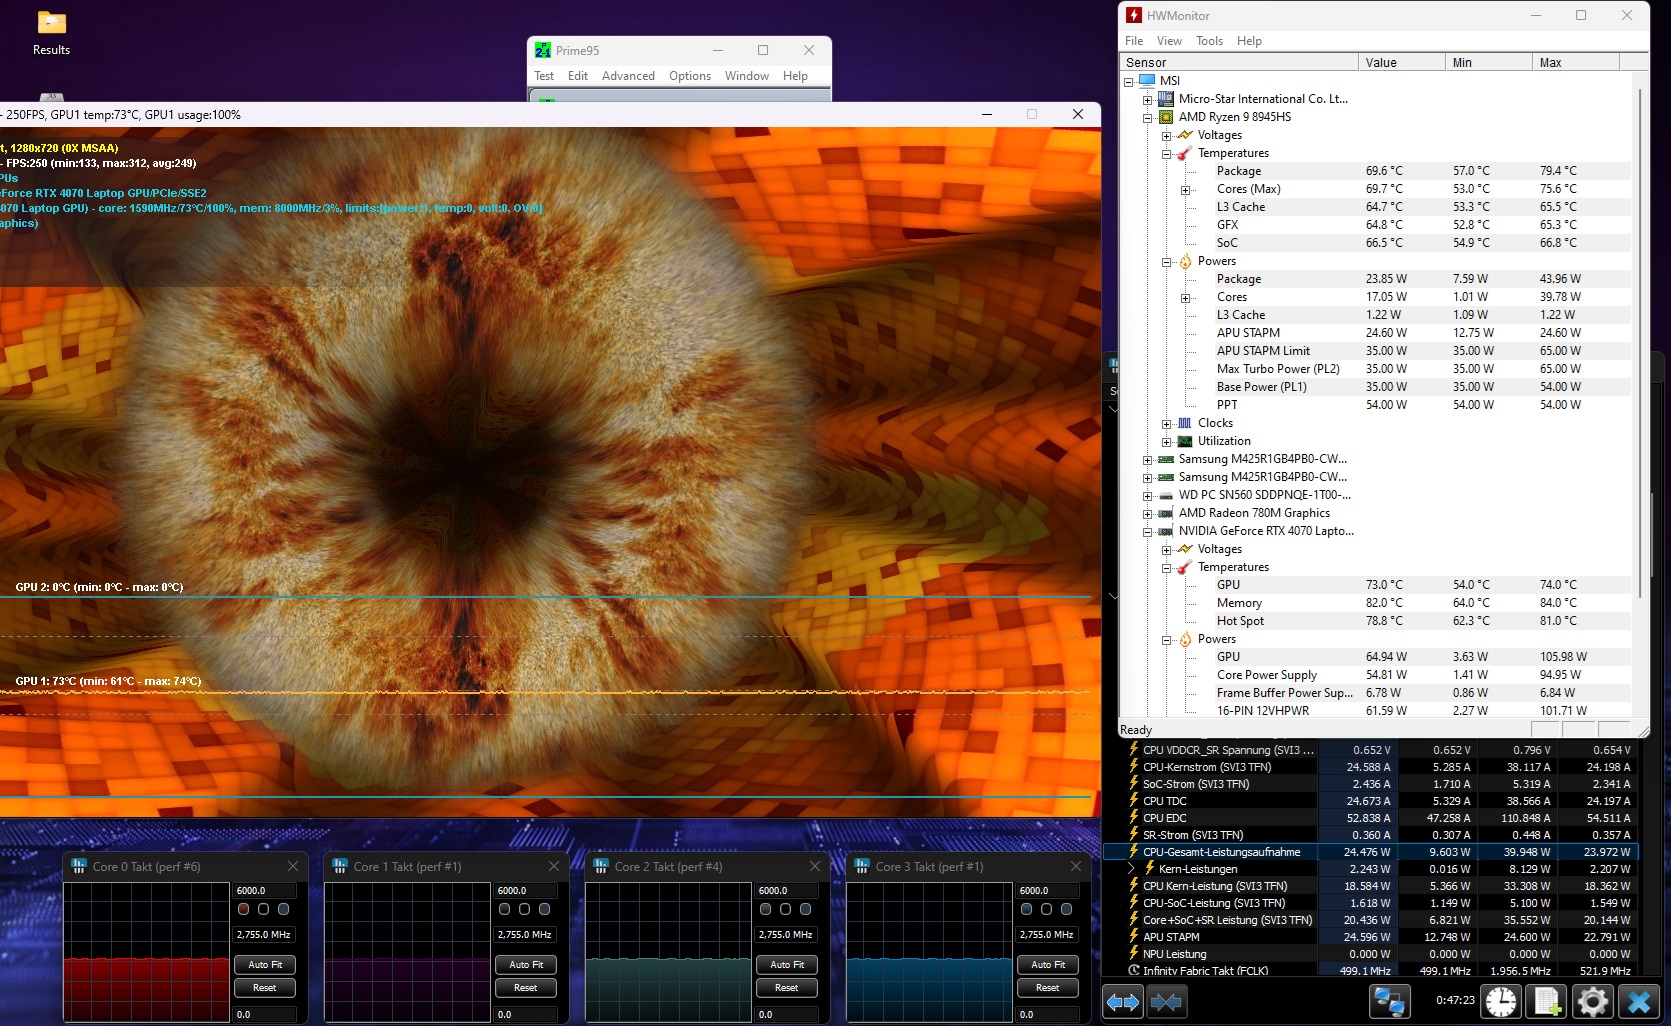
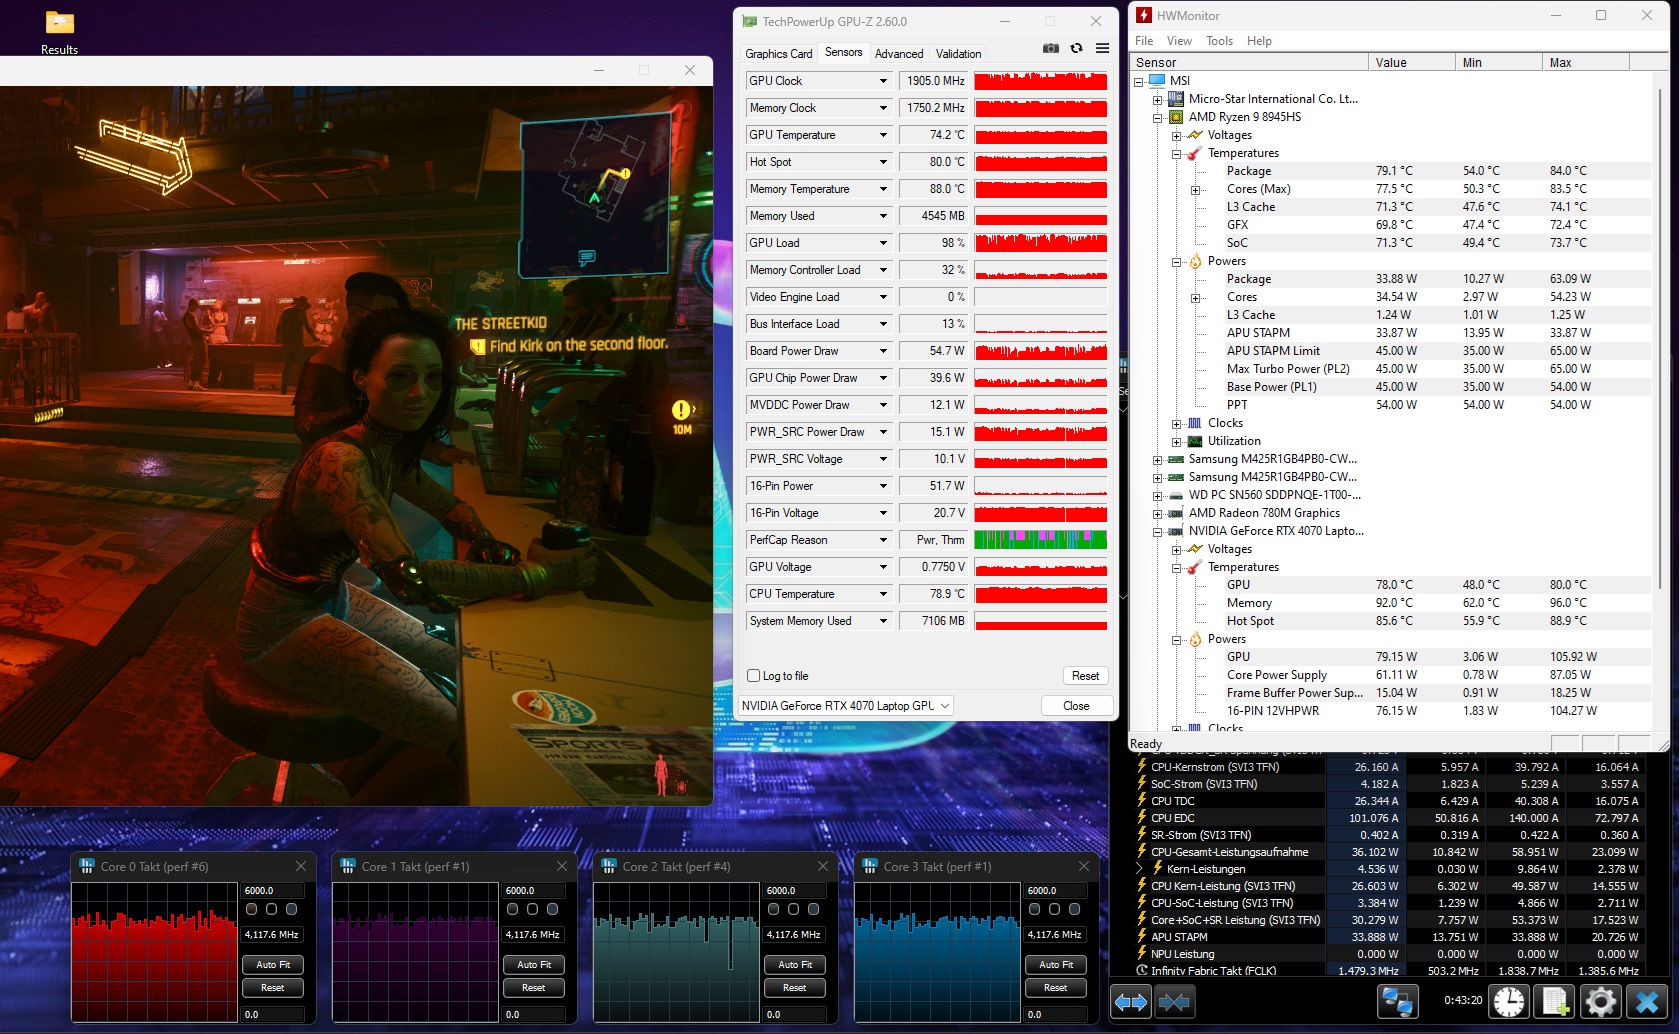
Stress test
Due to higher clock rates, the components reach higher temperatures when under Cyberpunk 2077 gaming load compared to our stress testing with Furmark and Prime95. The role-playing game causes both the CPU and GPU to heat up to nearly 80 °C.
Speakers
The 2.0 speakers deliver a rather unimpressive performance. They only do well when it comes to treble. Our audio analysis reveals that bass and mid-range tones are equally underwhelming. Competing manufacturers, such as HP (see the Omen 16 for comparison), tend to put more effort into their audio systems. The maximum volume of 81 dB leaves room for improvement, too.
MSI Katana A15 AI B8VG audio analysis
(±) | speaker loudness is average but good (81 dB)
Bass 100 - 315 Hz
(-) | nearly no bass - on average 21.6% lower than median
(±) | linearity of bass is average (10% delta to prev. frequency)
Mids 400 - 2000 Hz
(±) | higher mids - on average 6.2% higher than median
(±) | linearity of mids is average (8.6% delta to prev. frequency)
Highs 2 - 16 kHz
(+) | balanced highs - only 2.8% away from median
(+) | highs are linear (6% delta to prev. frequency)
Overall 100 - 16.000 Hz
(±) | linearity of overall sound is average (19.2% difference to median)
Compared to same class
» 65% of all tested devices in this class were better, 7% similar, 28% worse
» The best had a delta of 6%, average was 18%, worst was 132%
Compared to all devices tested
» 46% of all tested devices were better, 7% similar, 47% worse
» The best had a delta of 4%, average was 24%, worst was 134%
HP Omen 16-xf0376ng audio analysis
(±) | speaker loudness is average but good (81 dB)
Bass 100 - 315 Hz
(±) | reduced bass - on average 14.9% lower than median
(±) | linearity of bass is average (13.6% delta to prev. frequency)
Mids 400 - 2000 Hz
(±) | higher mids - on average 5.2% higher than median
(+) | mids are linear (4.7% delta to prev. frequency)
Highs 2 - 16 kHz
(+) | balanced highs - only 3.7% away from median
(+) | highs are linear (6.6% delta to prev. frequency)
Overall 100 - 16.000 Hz
(+) | overall sound is linear (14.6% difference to median)
Compared to same class
» 28% of all tested devices in this class were better, 7% similar, 65% worse
» The best had a delta of 6%, average was 18%, worst was 132%
Compared to all devices tested
» 19% of all tested devices were better, 4% similar, 77% worse
» The best had a delta of 4%, average was 24%, worst was 134%
Energy management
Power consumption
AMD Ryzen chips get a lot of praise for their moderate energy consumption. While this holds true under load here, the system's consumption when idling is suspiciously high. Even with graphics switching activated, the Katana A15 consumes 13 to 23 watts in the AI mode, exceeding the values we got when testing rival systems.
| Off / Standby | |
| Idle | |
| Load |
|
Key:
min: | |
| MSI Katana A15 AI B8VG R9 8945HS, GeForce RTX 4070 Laptop GPU | HP Omen 16-xf0376ng R7 7840HS, GeForce RTX 4070 Laptop GPU | HP Victus 16-r0077ng i7-13700H, GeForce RTX 4070 Laptop GPU | Aorus 15 BSF i7-13700H, GeForce RTX 4070 Laptop GPU | Lenovo Legion Pro 5 16ARX8 R7 7745HX, GeForce RTX 4070 Laptop GPU | Average of class Gaming | |
|---|---|---|---|---|---|---|
| Power Consumption | 4% | -3% | -2% | -24% | -28% | |
| Idle Minimum * (Watt) | 13 | 9 31% | 8 38% | 7 46% | 8.1 38% | 13 ? -0% |
| Idle Average * (Watt) | 18 | 14 22% | 13 28% | 12 33% | 15.9 12% | 18.7 ? -4% |
| Idle Maximum * (Watt) | 23 | 20 13% | 22 4% | 20 13% | 37.2 -62% | 24.3 ? -6% |
| Load Average * (Watt) | 63 | 84 -33% | 86 -37% | 94 -49% | 90.9 -44% | 108.2 ? -72% |
| Cyberpunk 2077 ultra external monitor * (Watt) | 156 | |||||
| Cyberpunk 2077 ultra * (Watt) | 156.8 | |||||
| Load Maximum * (Watt) | 159 | 176 -11% | 233 -47% | 247 -55% | 263.5 -66% | 254 ? -60% |
| Witcher 3 ultra * (Watt) | 140.9 | 141.8 | 175.8 | 189.6 |
* ... smaller is better
Power consumption - Cyberpunk 2077
Power consumption - external monitor
Battery life
Its power consumption when idling is pretty high and its battery capacity of just 53.5 Wh is rather modest. The combination of the two factors results is an unimpressive battery life. In our Wi-Fi Web browsing test with display brightness set to 150 cd/m², the Katana A15 barely lasts 4 hours which is quite an underwhelming result. Most competitors perform noticeably better, often aided by larger battery capacities.
| MSI Katana A15 AI B8VG R9 8945HS, GeForce RTX 4070 Laptop GPU, 53.5 Wh | HP Omen 16-xf0376ng R7 7840HS, GeForce RTX 4070 Laptop GPU, 83 Wh | HP Victus 16-r0077ng i7-13700H, GeForce RTX 4070 Laptop GPU, 83 Wh | Aorus 15 BSF i7-13700H, GeForce RTX 4070 Laptop GPU, 99 Wh | Lenovo Legion Pro 5 16ARX8 R7 7745HX, GeForce RTX 4070 Laptop GPU, 80 Wh | Average of class Gaming | |
|---|---|---|---|---|---|---|
| Battery runtime | 43% | 78% | 158% | 0% | 75% | |
| WiFi v1.3 (h) | 4 | 5.7 43% | 7.1 78% | 10.3 158% | 4 0% | 7 ? 75% |
| Reader / Idle (h) | 10.9 | 6.5 | 8.71 ? | |||
| H.264 (h) | 9 | 8.9 ? | ||||
| Load (h) | 2.2 | 1 | 1.51 ? |
Notebookcheck Rating
If the Katana A15 AI had a higher-quality case, a better display and a larger battery, its price would be much easier to swallow. The way things stand now, however, the system is barely competitive and feels overpriced compared to some of the rivals.
MSI Katana A15 AI B8VG
- 12/20/2024 v8
Florian Glaser
 Total Sustainability Score:
 Transparency
The selection of devices to be reviewed is made by our editorial team. The test sample was provided to the author as a loan by the manufacturer or retailer for the purpose of this review. The lender had no influence on this review, nor did the manufacturer receive a copy of this review before publication. There was no obligation to publish this review. As an independent media company, Notebookcheck is not subjected to the authority of manufacturers, retailers or publishers.
This is how Notebookcheck is testing
Every year, Notebookcheck independently reviews hundreds of laptops and smartphones using standardized procedures to ensure that all results are comparable. We have continuously developed our test methods for around 20 years and set industry standards in the process. In our test labs, high-quality measuring equipment is utilized by experienced technicians and editors. These tests involve a multi-stage validation process. Our complex rating system is based on hundreds of well-founded measurements and benchmarks, which maintains objectivity. Further information on our test methods can be found here.

