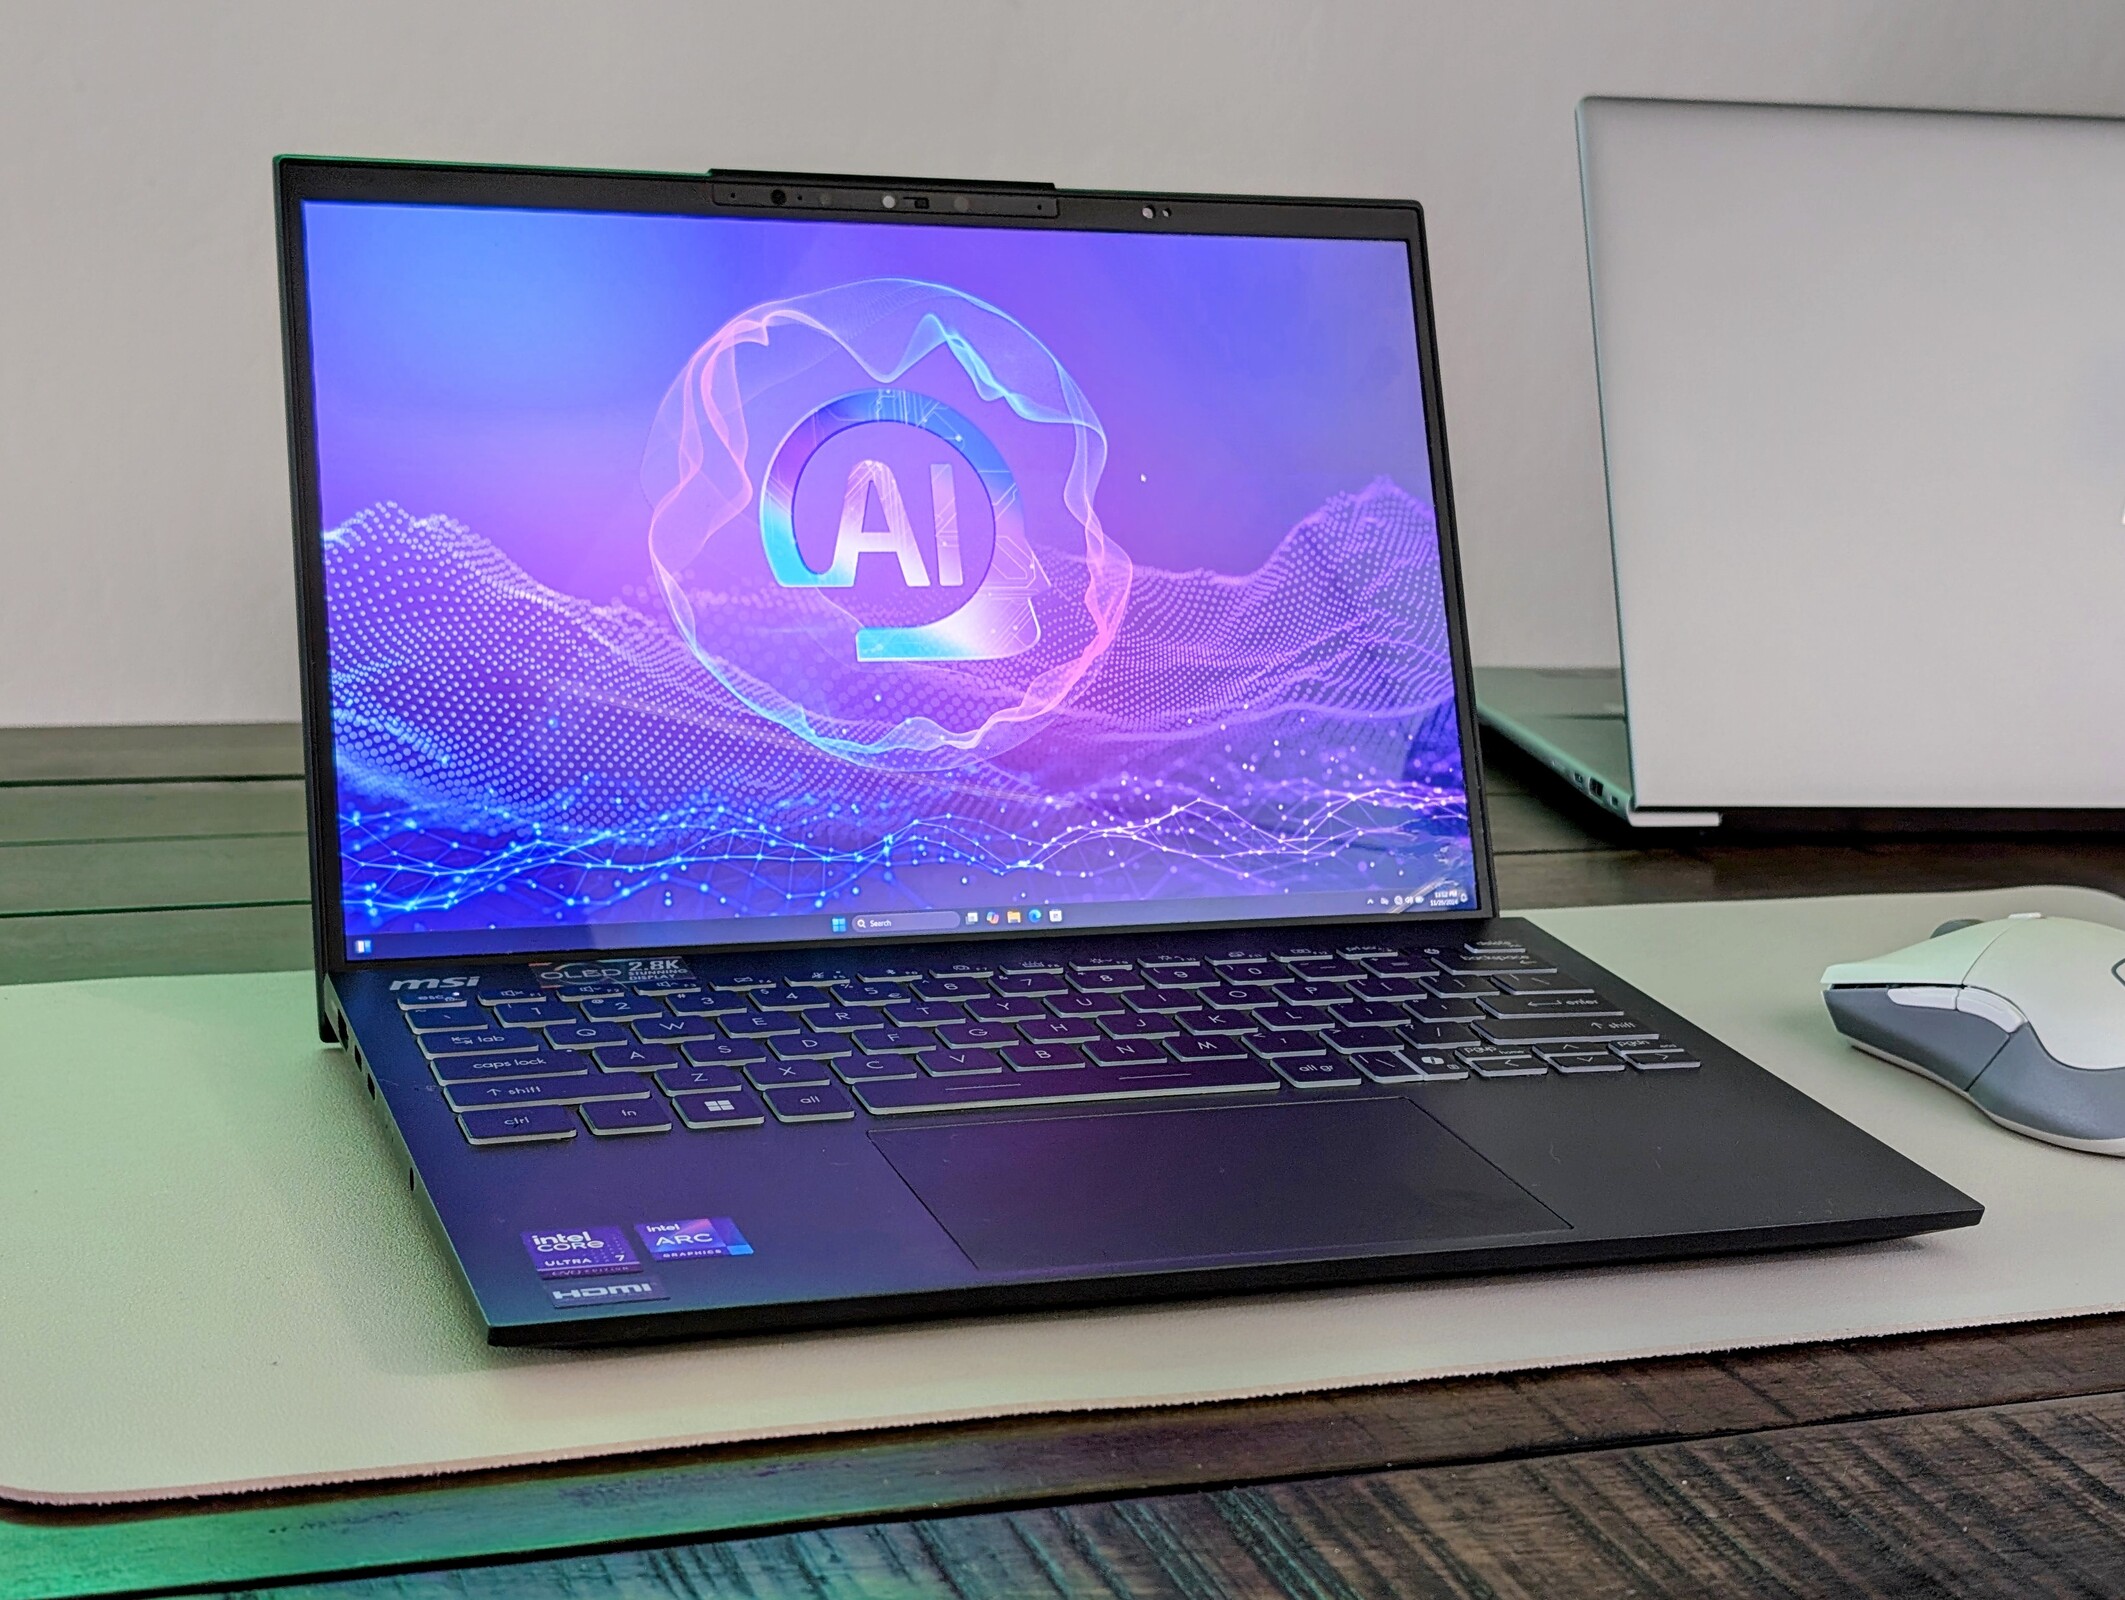
MSI Prestige 13 AI Plus Evo laptop review: Great graphics performance for under 1 kg
Verdict — Impressive Performance and Ports For The Weight
One of our main complaints about the original Prestige 13 AI Evo was its steeper-than-expected processor throttling when running CPU-intensive loads. The new Lunar Lake CPU addresses this issue by lowering the maximum Turbo Boost potential while raising the minimum performance level when running such loads. This has allowed for steadier and faster performance over time which should appeal to content creators or editors who have to process or encode larger files or videos. Additionally, these benefits don't appear to impact battery life, temperature, or fan noise by any noticeable degree between the Prestige 13 AI Evo and newer Prestige 13 AI Plus Evo.
Graphics performance has increased significantly.by as much as 1.5x to 2x depending on the application. Though far from being a gaming machine, the Arc 140V is impressive nonetheless given how light the MSI laptop is.
While performance has seen an almost universal uptick, all other disadvantages we mentioned on our Prestige 13 AI Evo review remain unchanged. The 1800p OLED display, while sharp and vivid, is limited to only 60 Hz with no VRR or touchscreen options. Webcam quality and chassis rigidity are also a few steps down when compared to heavier alternatives from Dell or HP. Even so, the MSI offers a lot of performance and ports given how lightweight it is.
Pros
Cons
Price and Availability
Amazon is now shipping the MSI Prestige 13 AI Plus Evo as reviewed for $1400 USD.
Potential Competitors in Comparison
Image | Model / Review | Price | Weight | Height | Display |
|---|---|---|---|---|---|
1. 85%  | MSI Prestige 13 AI Plus Evo A2VMG Intel Core Ultra 7 258V ⎘ Intel Arc Graphics 140V ⎘ 32 GB Memory | Amazon: 1. $31.99 CPU Cooling Fan Replacement ... 2. $1,479.00 MSI Prestige 16 AI+ Evo 16" ... 3. $1,349.00 HIDevolution [2024] MSI Pres... List Price: 1400 USD | 970 g | 16.9 mm | 13.30" 2880x1800 255 PPI OLED |
2. 86.6% v7 (old)  | MSI Prestige 13 AI Evo Intel Core Ultra 7 155H ⎘ Intel Arc 8-Core iGPU ⎘ 32 GB Memory, 1024 GB SSD | Amazon: List Price: 1599€ | 967 g | 16.9 mm | 13.30" 2880x1800 OLED |
3. 85.3%  | Dell XPS 13 9350 Intel Core Ultra 7 256V ⎘ Intel Arc Graphics 140V ⎘ 16 GB Memory, 512 GB SSD | Amazon: List Price: 1400 USD | 1.2 kg | 15.3 mm | 13.40" 1920x1200 169 PPI IPS |
4. 84%  | Framework Laptop 13.5 Core Ultra 7 155H Intel Core Ultra 7 155H ⎘ Intel Arc 8-Core iGPU ⎘ 32 GB Memory | Amazon: 1. $795.00 MSI Modern 13 inch Ultrabook... List Price: 1500 USD | 1.4 kg | 15.85 mm | 13.50" 2880x1920 256 PPI IPS |
5. 87% v7 (old)  | Lenovo Yoga Book 9 13IMU9 Intel Core Ultra 7 155U ⎘ Intel Graphics 4-Core iGPU (Meteor / Arrow Lake) ⎘ 16 GB Memory | Amazon: List Price: 2000 USD | 1.4 kg | 15.95 mm | 13.30" 2880x1800 255 PPI OLED |
6. 91.9% v7 (old)  | HP Dragonfly G4 Intel Core i7-1365U ⎘ Intel Iris Xe Graphics G7 96EUs ⎘ 16 GB Memory, 512 GB SSD | Amazon: List Price: 1700 USD | 1.1 kg | 16.3 mm | 13.50" 1920x1280 171 PPI IPS |
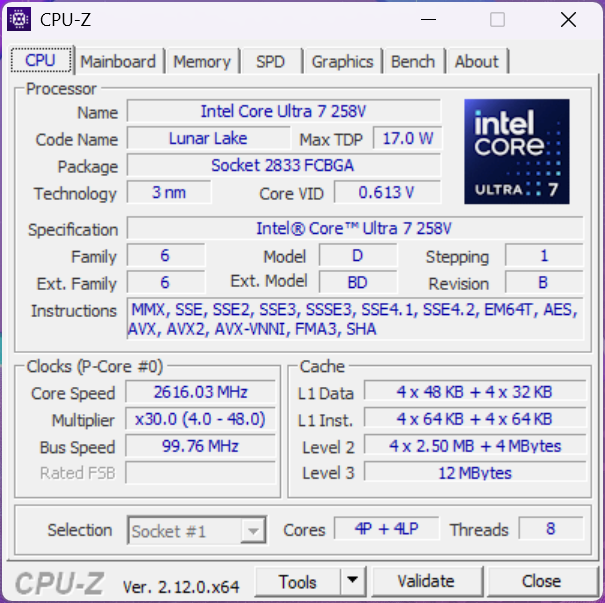
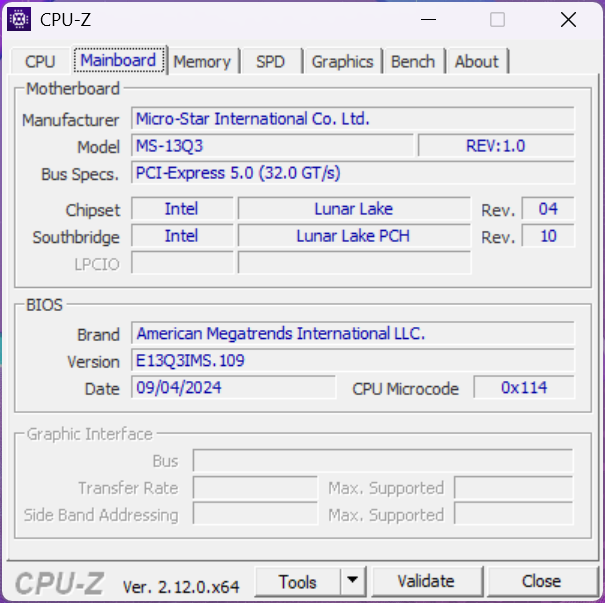
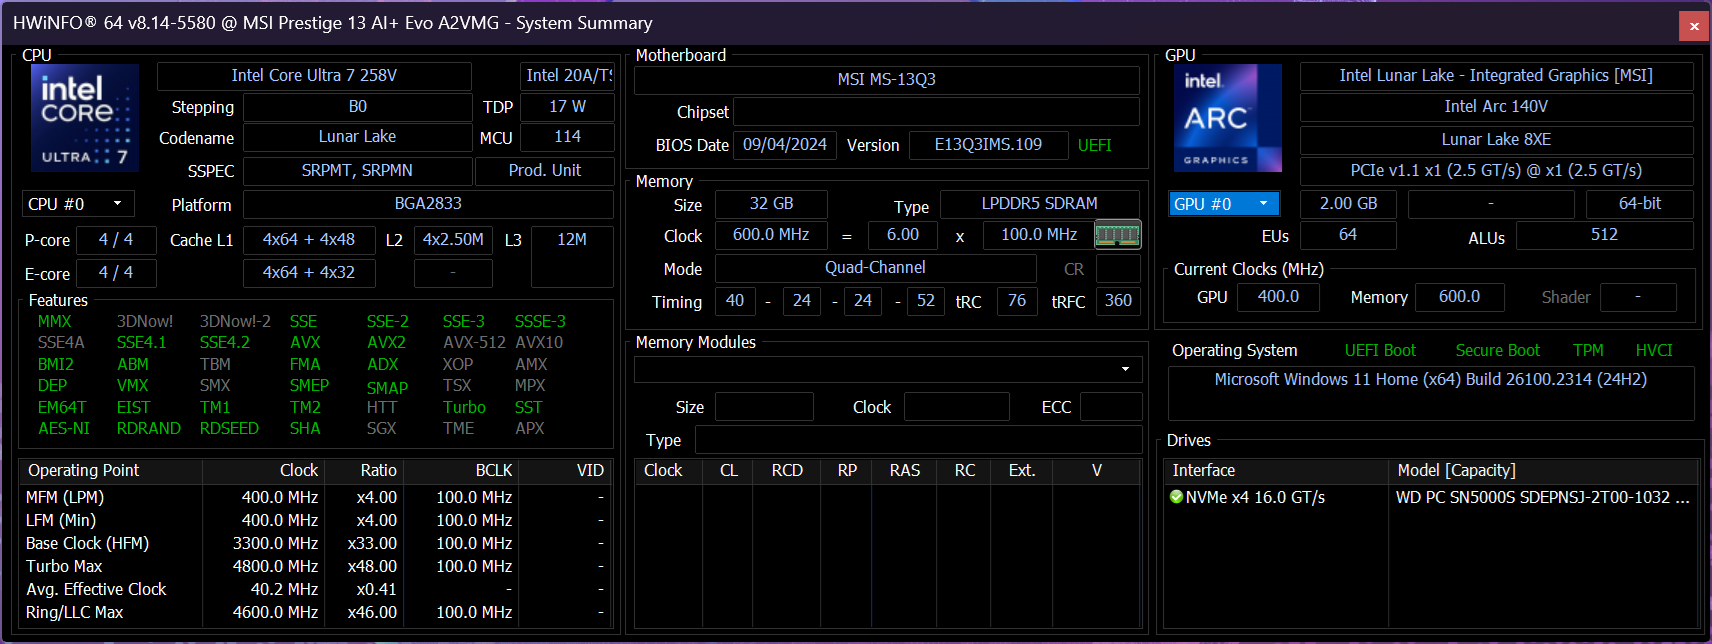
It's been only six months the launch of the original Prestige 13 AI Evo and MSI has already refreshed the model with newer Intel processors. Called the Prestige 13 AI Plus Evo, the latest iteration ships with Lunar Lake CPUs instead of Meteor Lake.
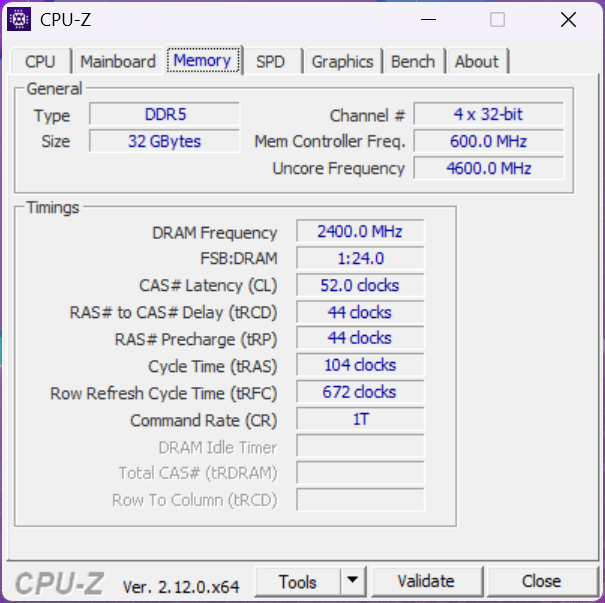
Our test unit is a middle configuration with the Core Ultra 7 258V, 32 GB LPDDR5x-8533 RAM, and 1800p OLED display for approximately $1400. Other SKUs may ship with a Core Ultra 9 288V or Core Ultra 7 256V instead with half the RAM.
Competitors include other high-end subnotebooks like the Dell XPS 13 9350, Framework Laptop 13.5, or the HP Dragonfly 14.
More MSI reviews:
Specifications
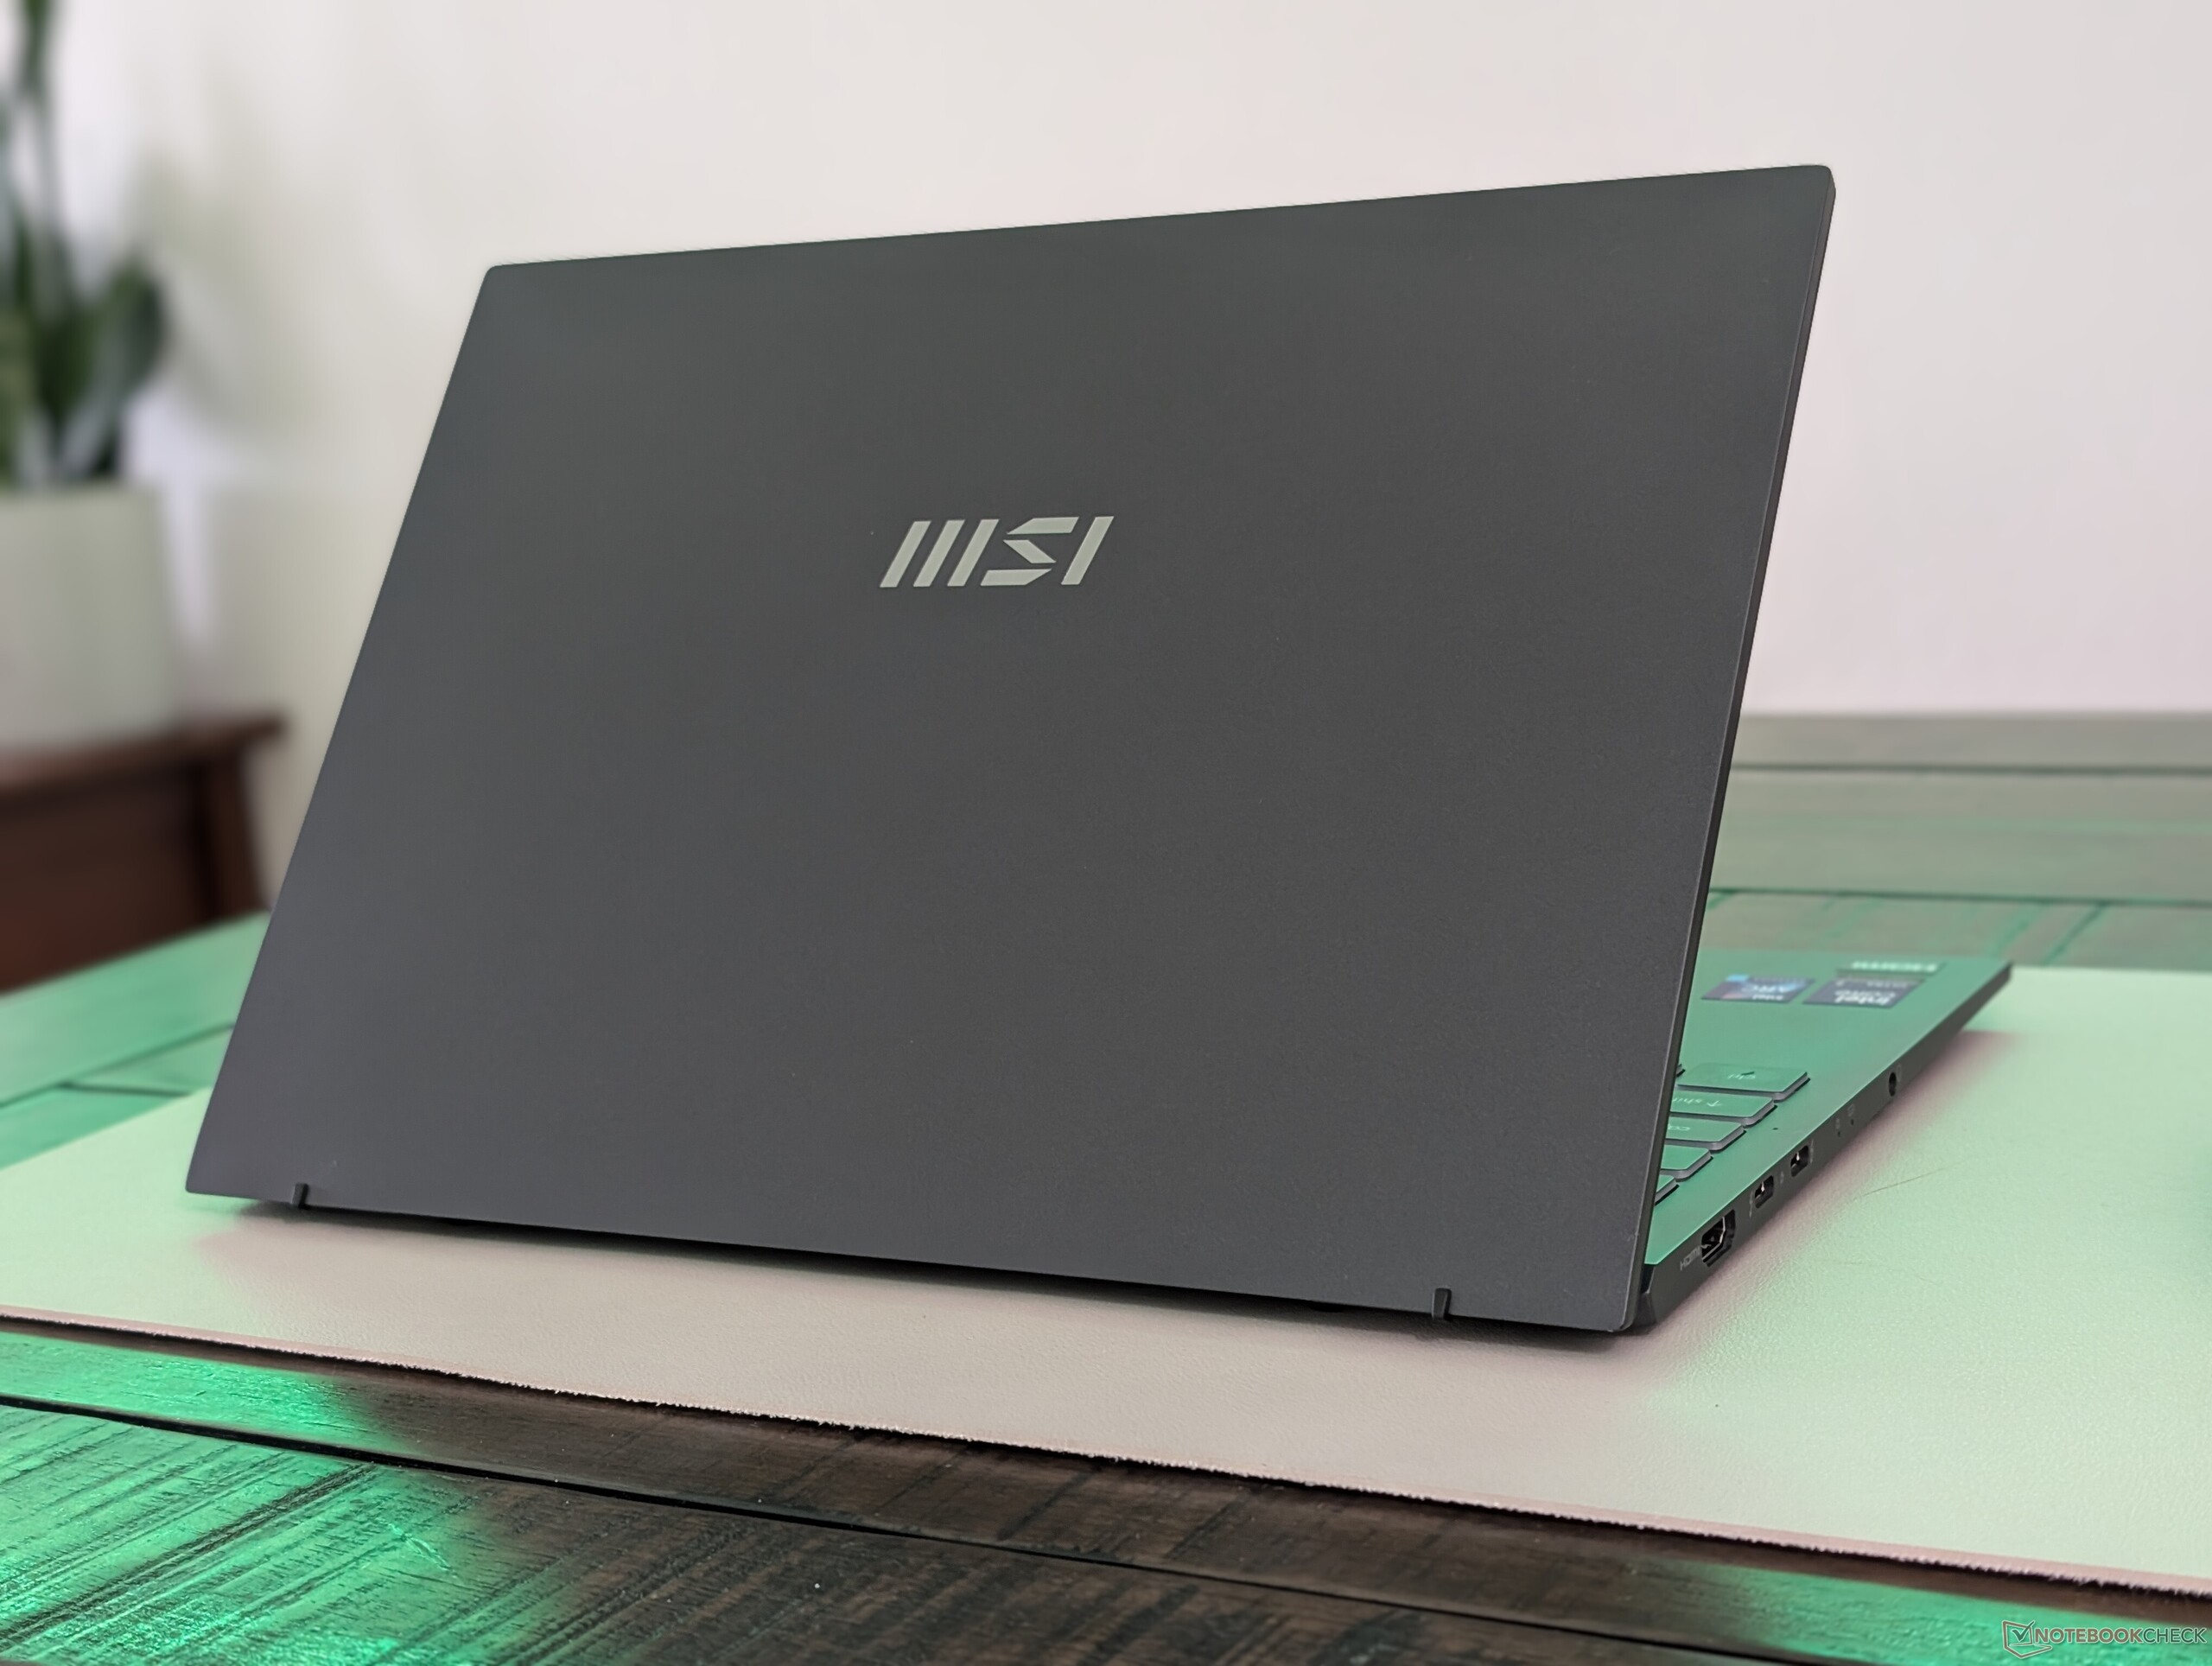
Case
We recommend checking out our review on the Prestige 13 AI Evo as there are no external differences between it and our Prestige 13 AI Plus Evo. The system is one of the lightest 13-inch subnotebooks in the market at under 1 kg, but the chassis tends to flex and creak more readily when compared to heavier models like the XPS 13.
Connectivity
The Prestige 13 AI is one of the few remaining subnotebooks with both integrated HDMI and USB-A ports. We appreciate that the system doesn't rely fully on USB-C ports only.
SD Card Reader
| SD Card Reader | |
| average JPG Copy Test (av. of 3 runs) | |
| Framework Laptop 13.5 Core Ultra 7 155H (Toshiba Exceria Pro SDXC 64 GB UHS-II) | |
| MSI Prestige 13 AI Evo (Angelbird AV Pro V60) | |
| MSI Prestige 13 AI Plus Evo A2VMG (Angelbird AV Pro V60) | |
| maximum AS SSD Seq Read Test (1GB) | |
| Framework Laptop 13.5 Core Ultra 7 155H (Toshiba Exceria Pro SDXC 64 GB UHS-II) | |
| MSI Prestige 13 AI Evo (Angelbird AV Pro V60) | |
| MSI Prestige 13 AI Plus Evo A2VMG (Angelbird AV Pro V60) | |
Communication
Interestingly, our unit ships with the Intel Killer AX1775s instead of the BE1750W as found on the Core Ultra 7 155H configuration. The AX1775s does not support Wi-Fi 7 unlike on the BE1750W.
Webcam
Webcam quality has improved from 2 MP on the original model to 5 MP for sharper images.


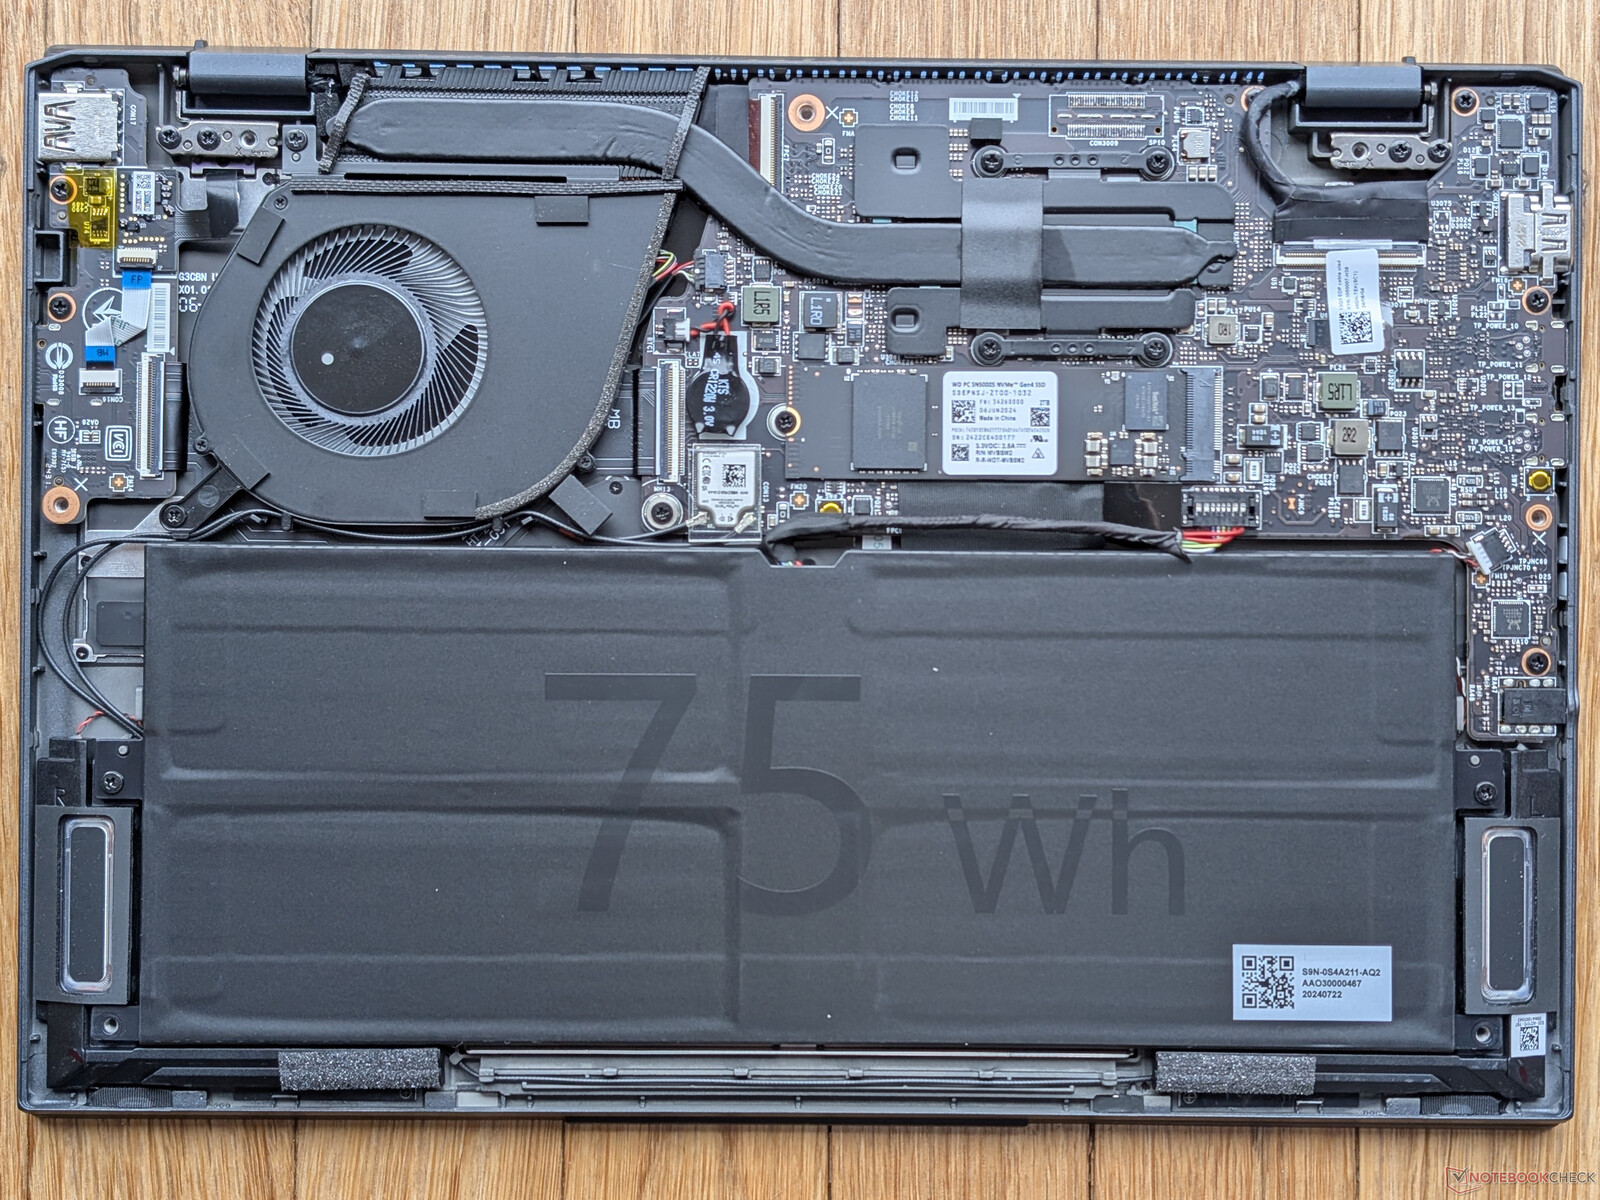
Maintenance
Sustainability
The model follows EPEAT Silver guidelines for sustainability while the packaging is mostly cardboard and paper with some plastic wrapping around the laptop and AC adapter.
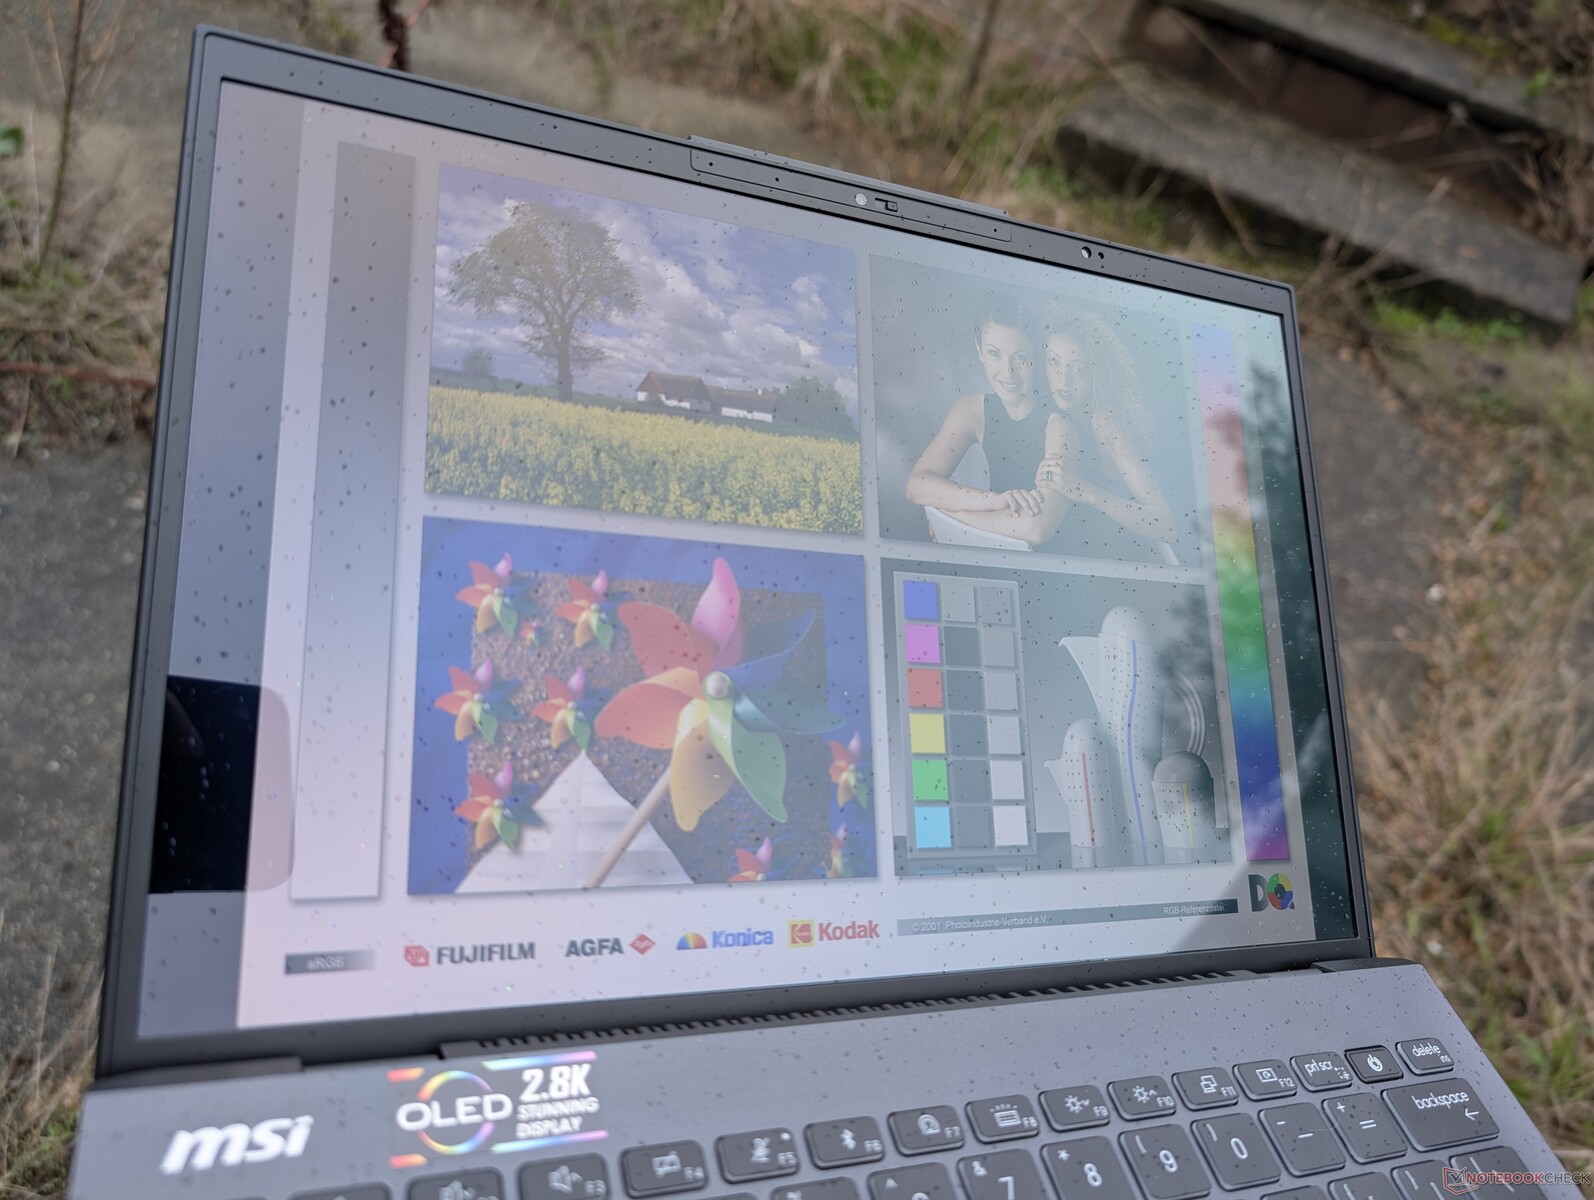
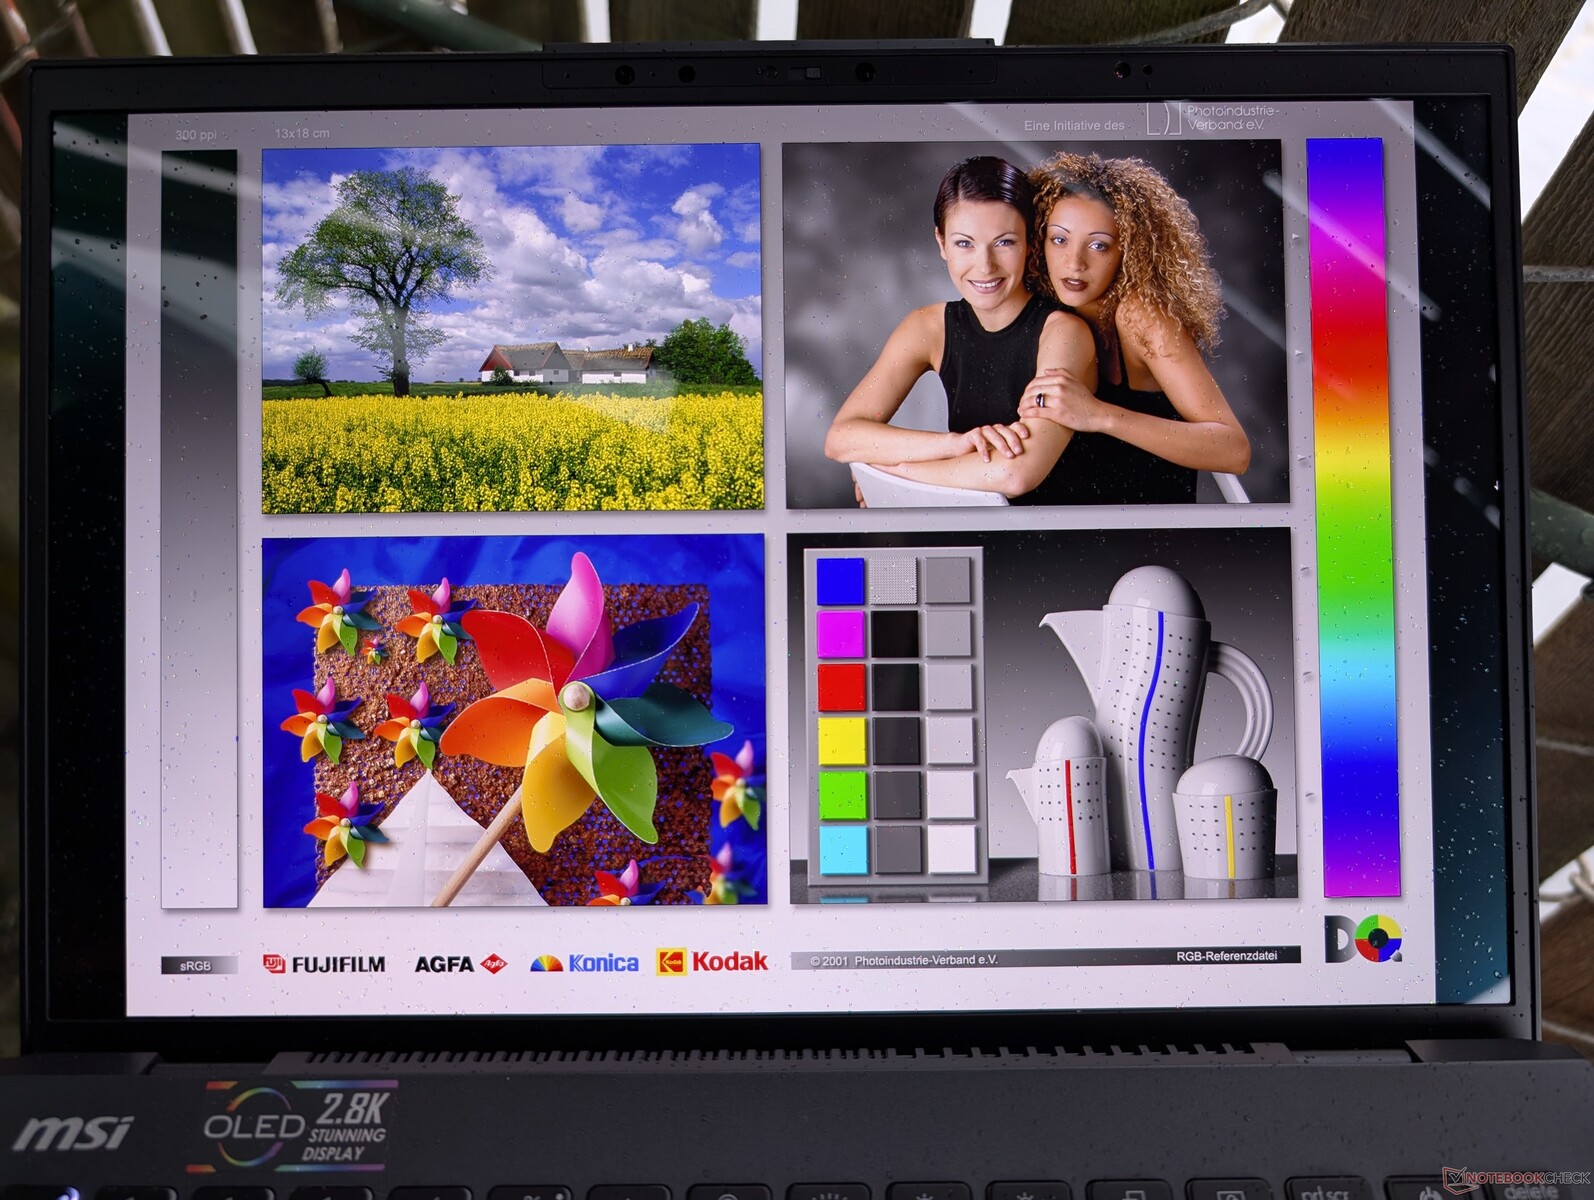
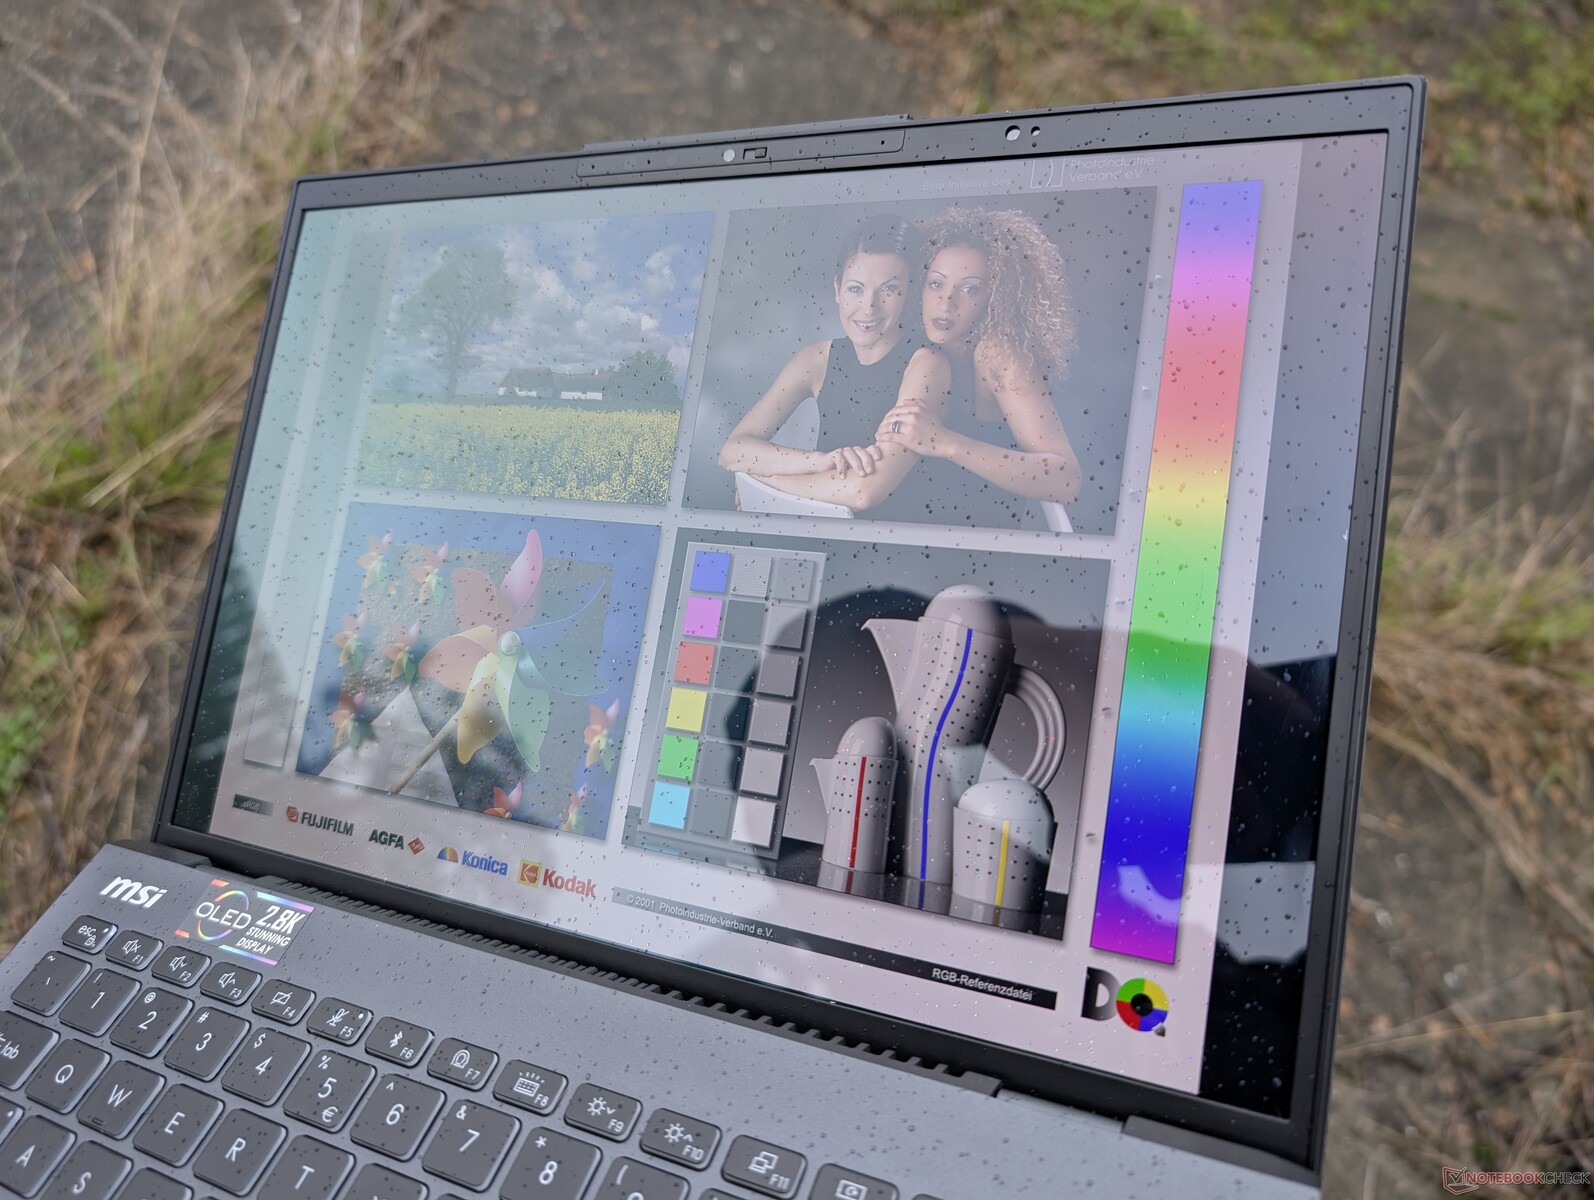
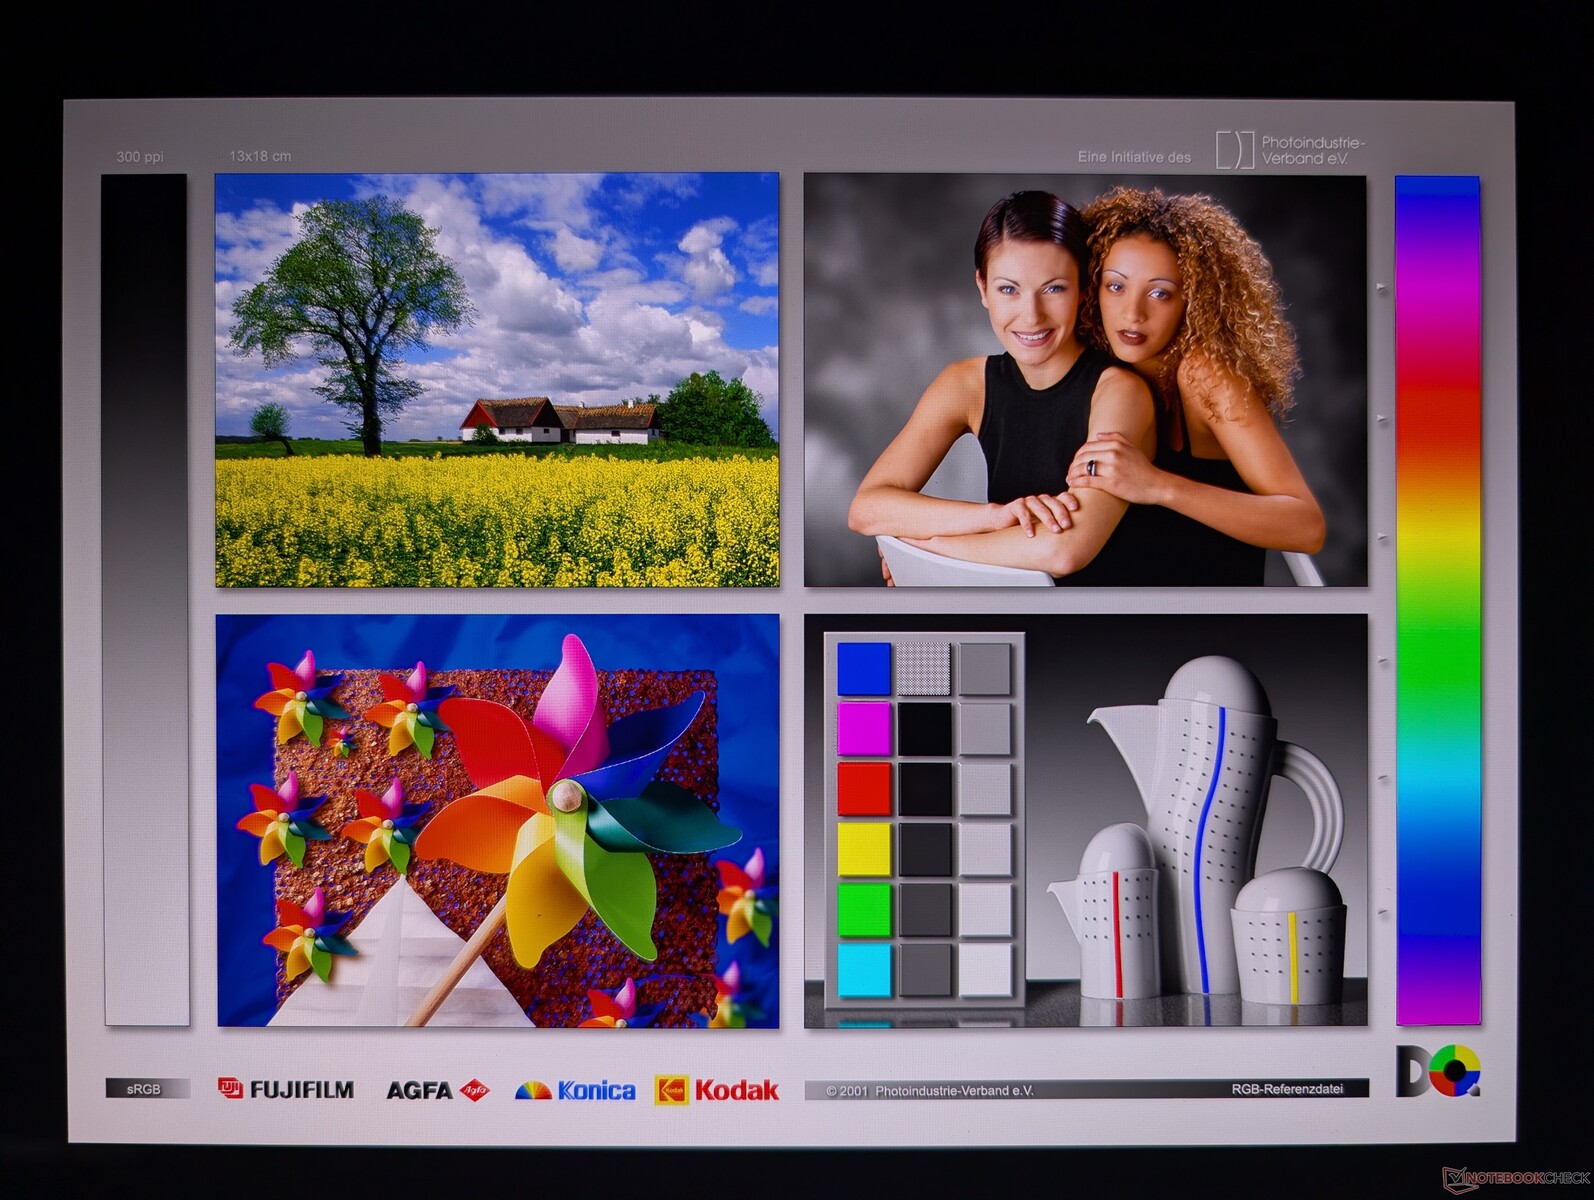
Display

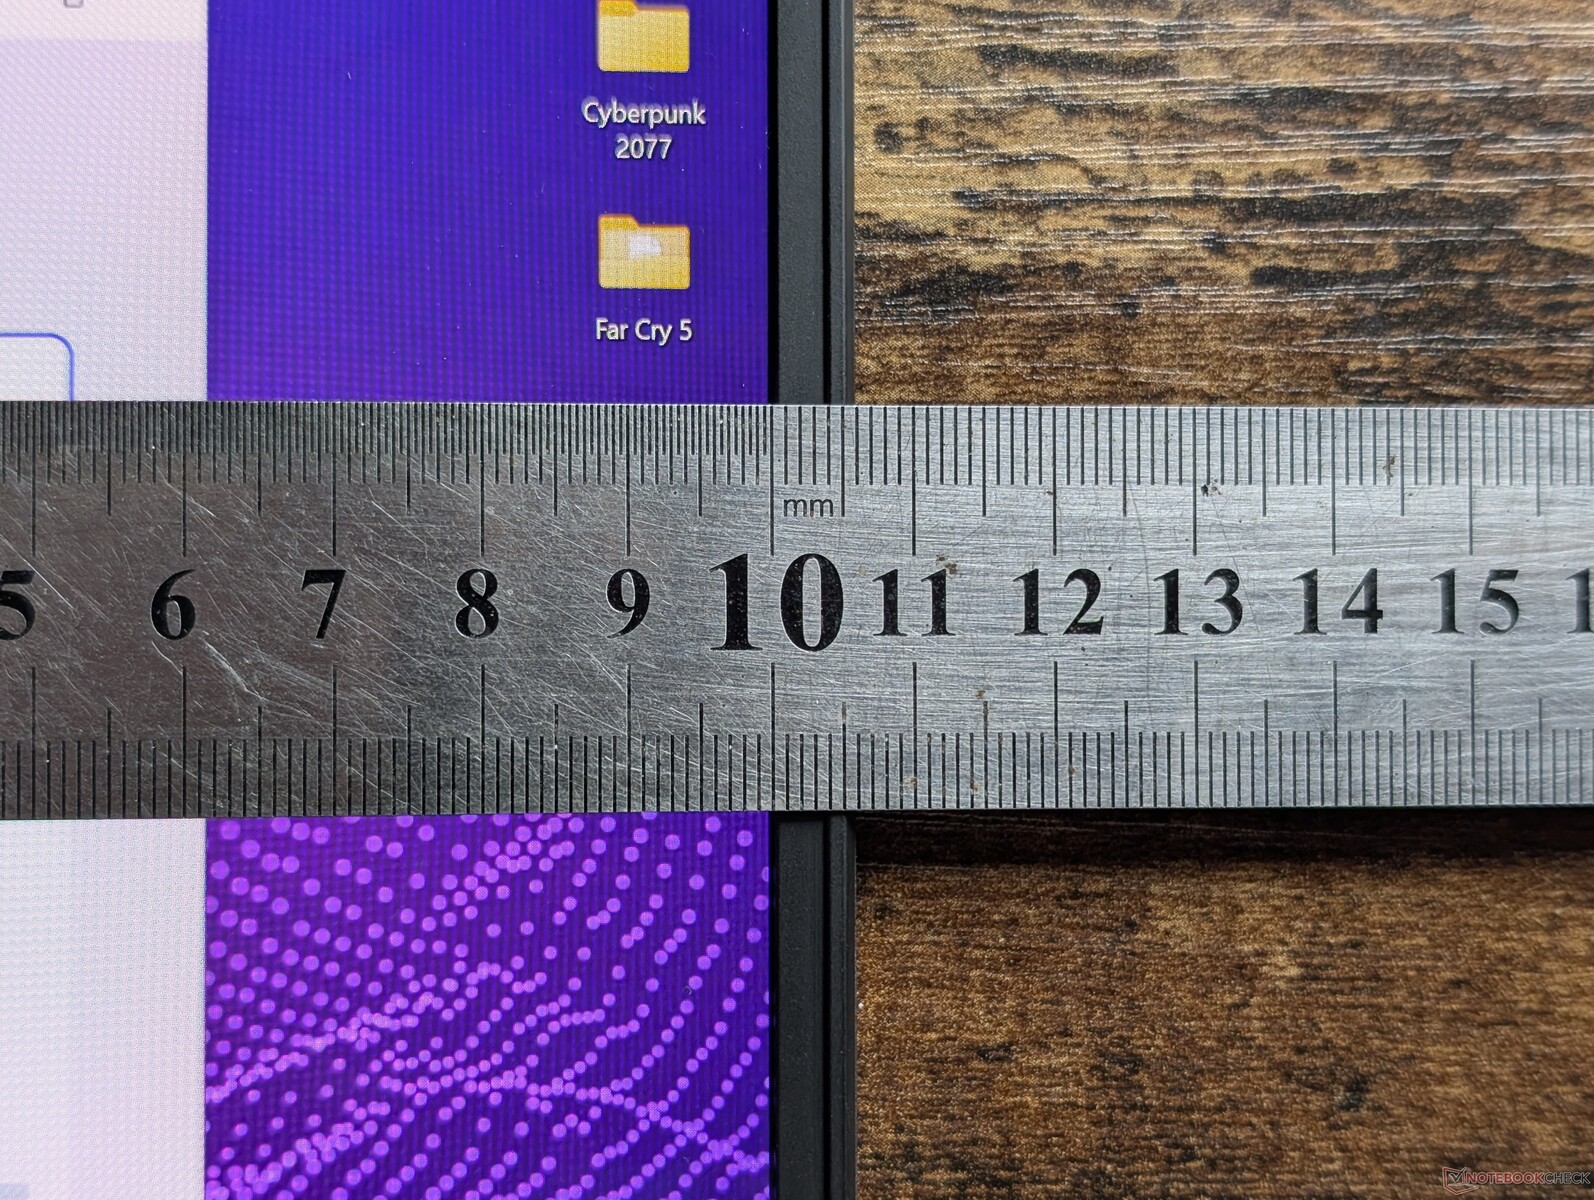
The 1800p Samsung OLED display remains the same as before. While image quality is excellent and with no graininess issues, we would have preferred a refresh rate upgrade to 90 Hz or 120 Hz as 60 Hz is beginning to look outdated for a high-end subnotebook.
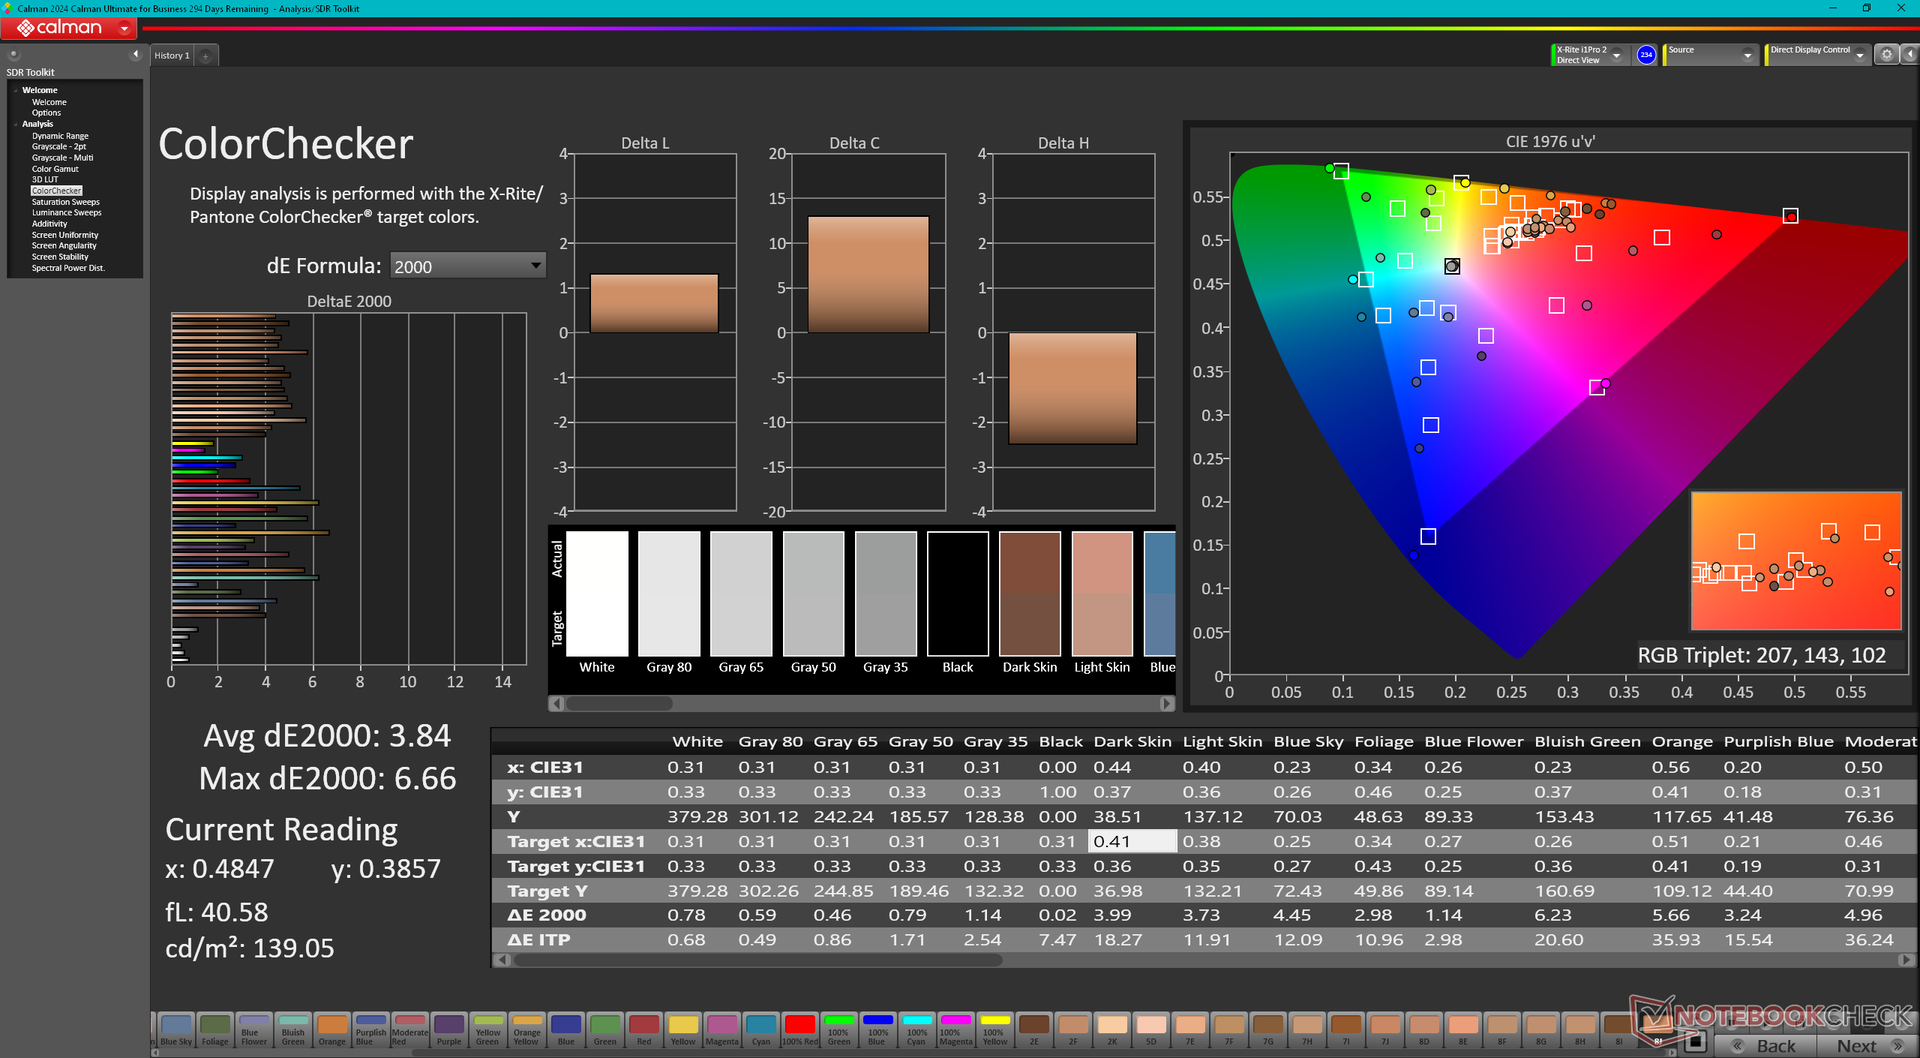
Maximum brightness can reach up to 598 nits if on HDR mode. Otherwise, it peaks at 382 nits if on SDR mode.
| |||||||||||||||||||||||||
Brightness Distribution: 99 %
Center on Battery: 382.4 cd/m²
Contrast: ∞:1 (Black: 0 cd/m²)
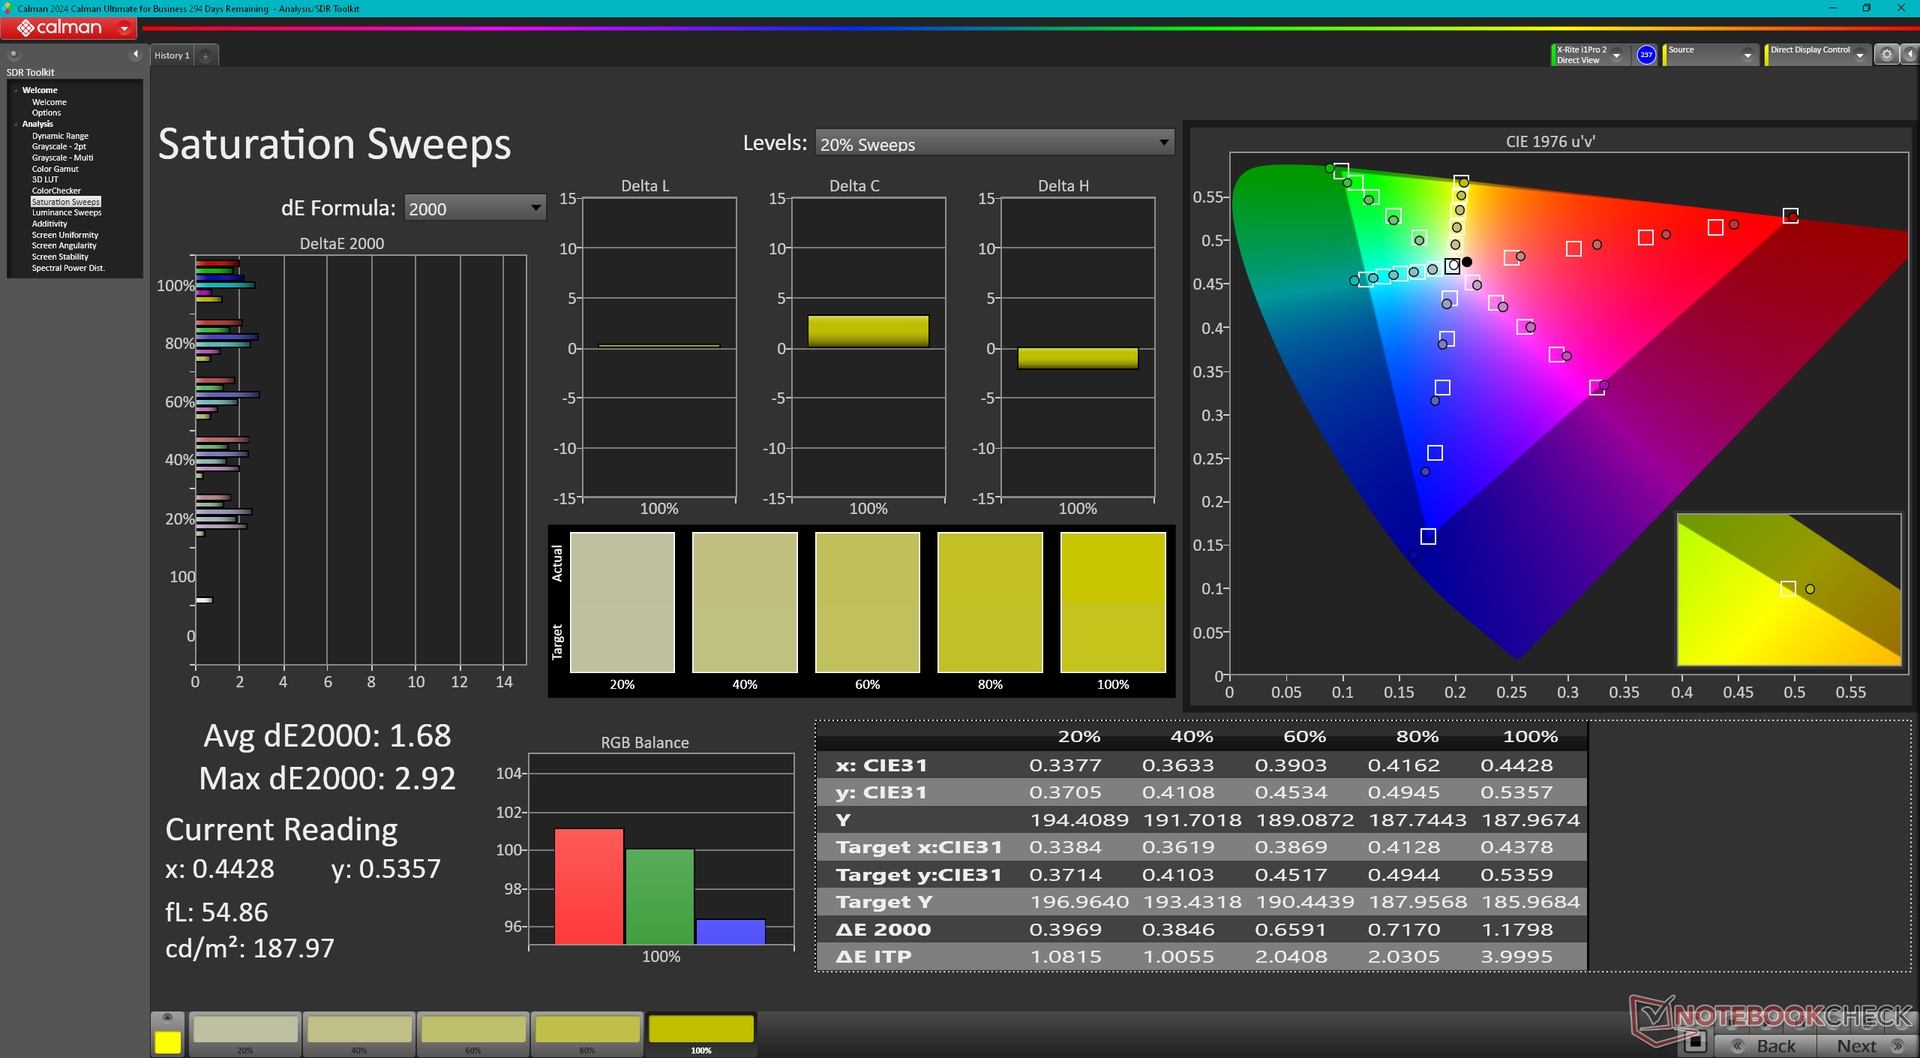
ΔE ColorChecker Calman: 3.84 | ∀{0.5-29.43 Ø4.73}
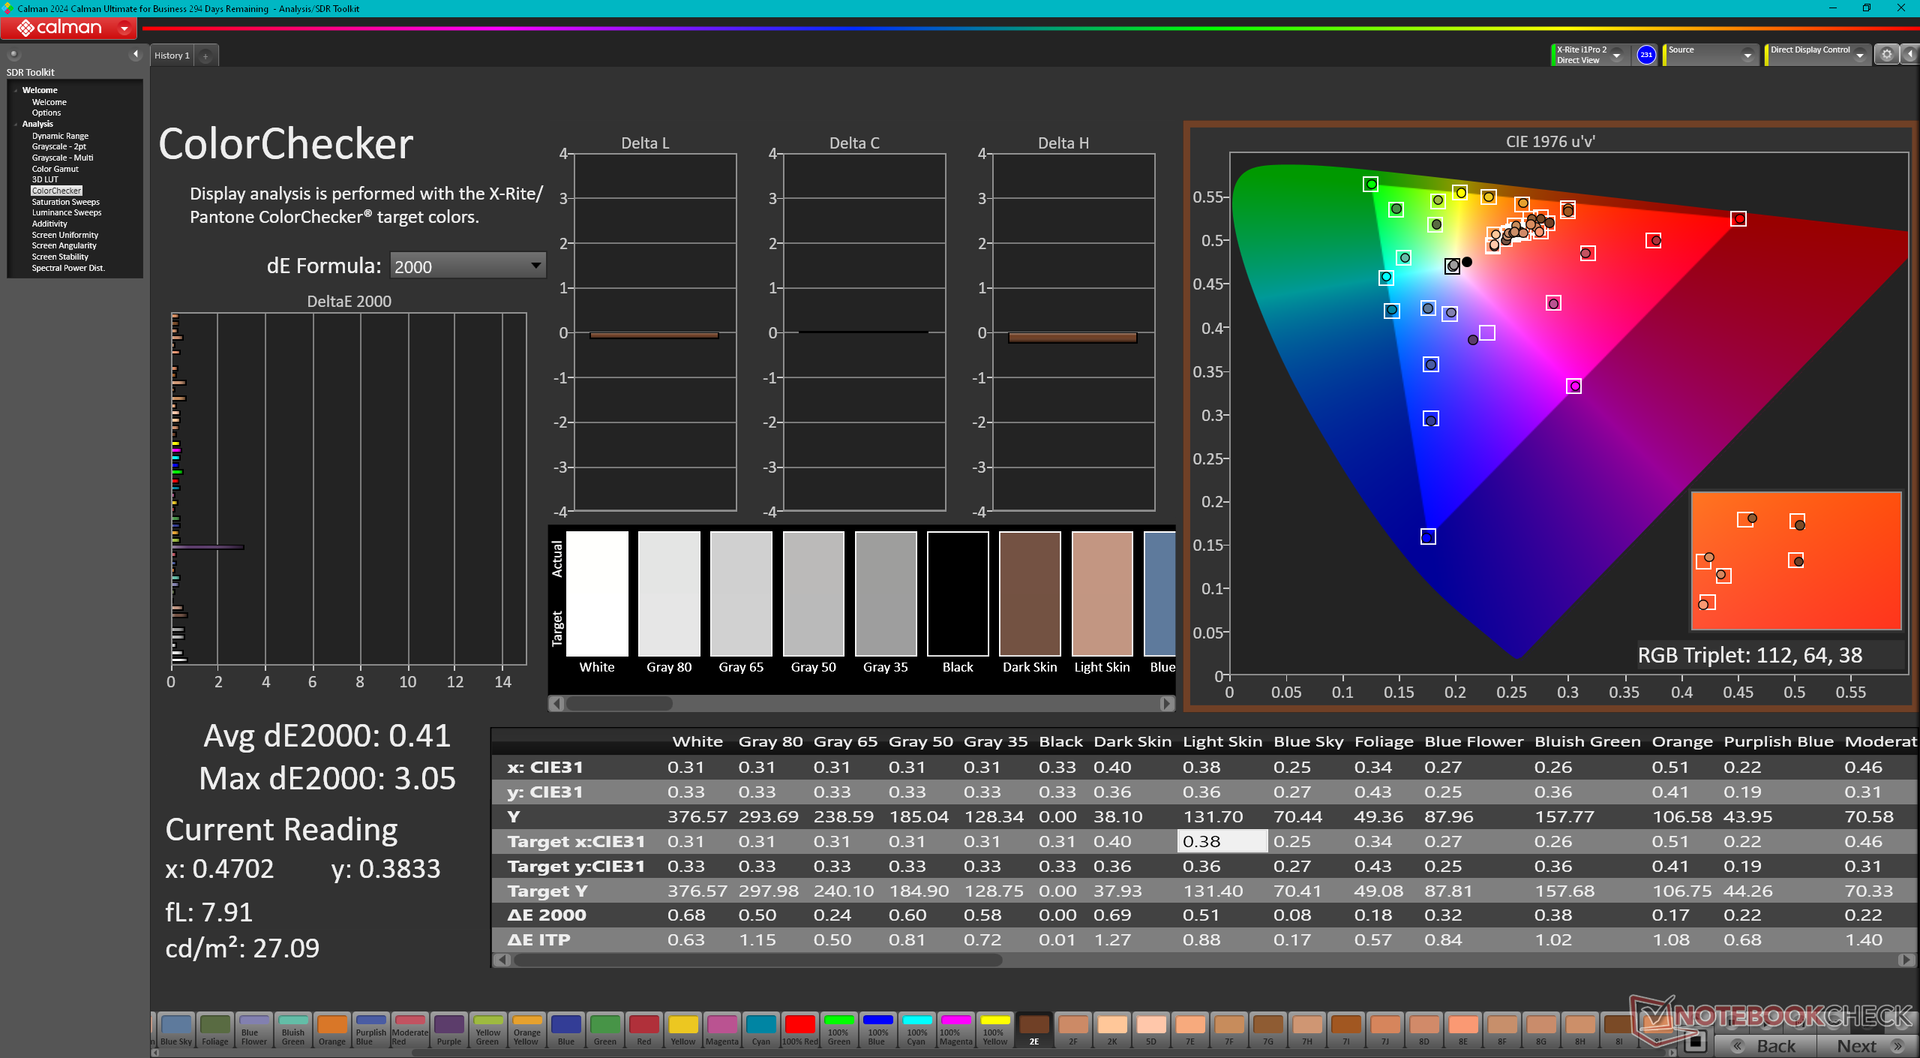
calibrated: 0.41
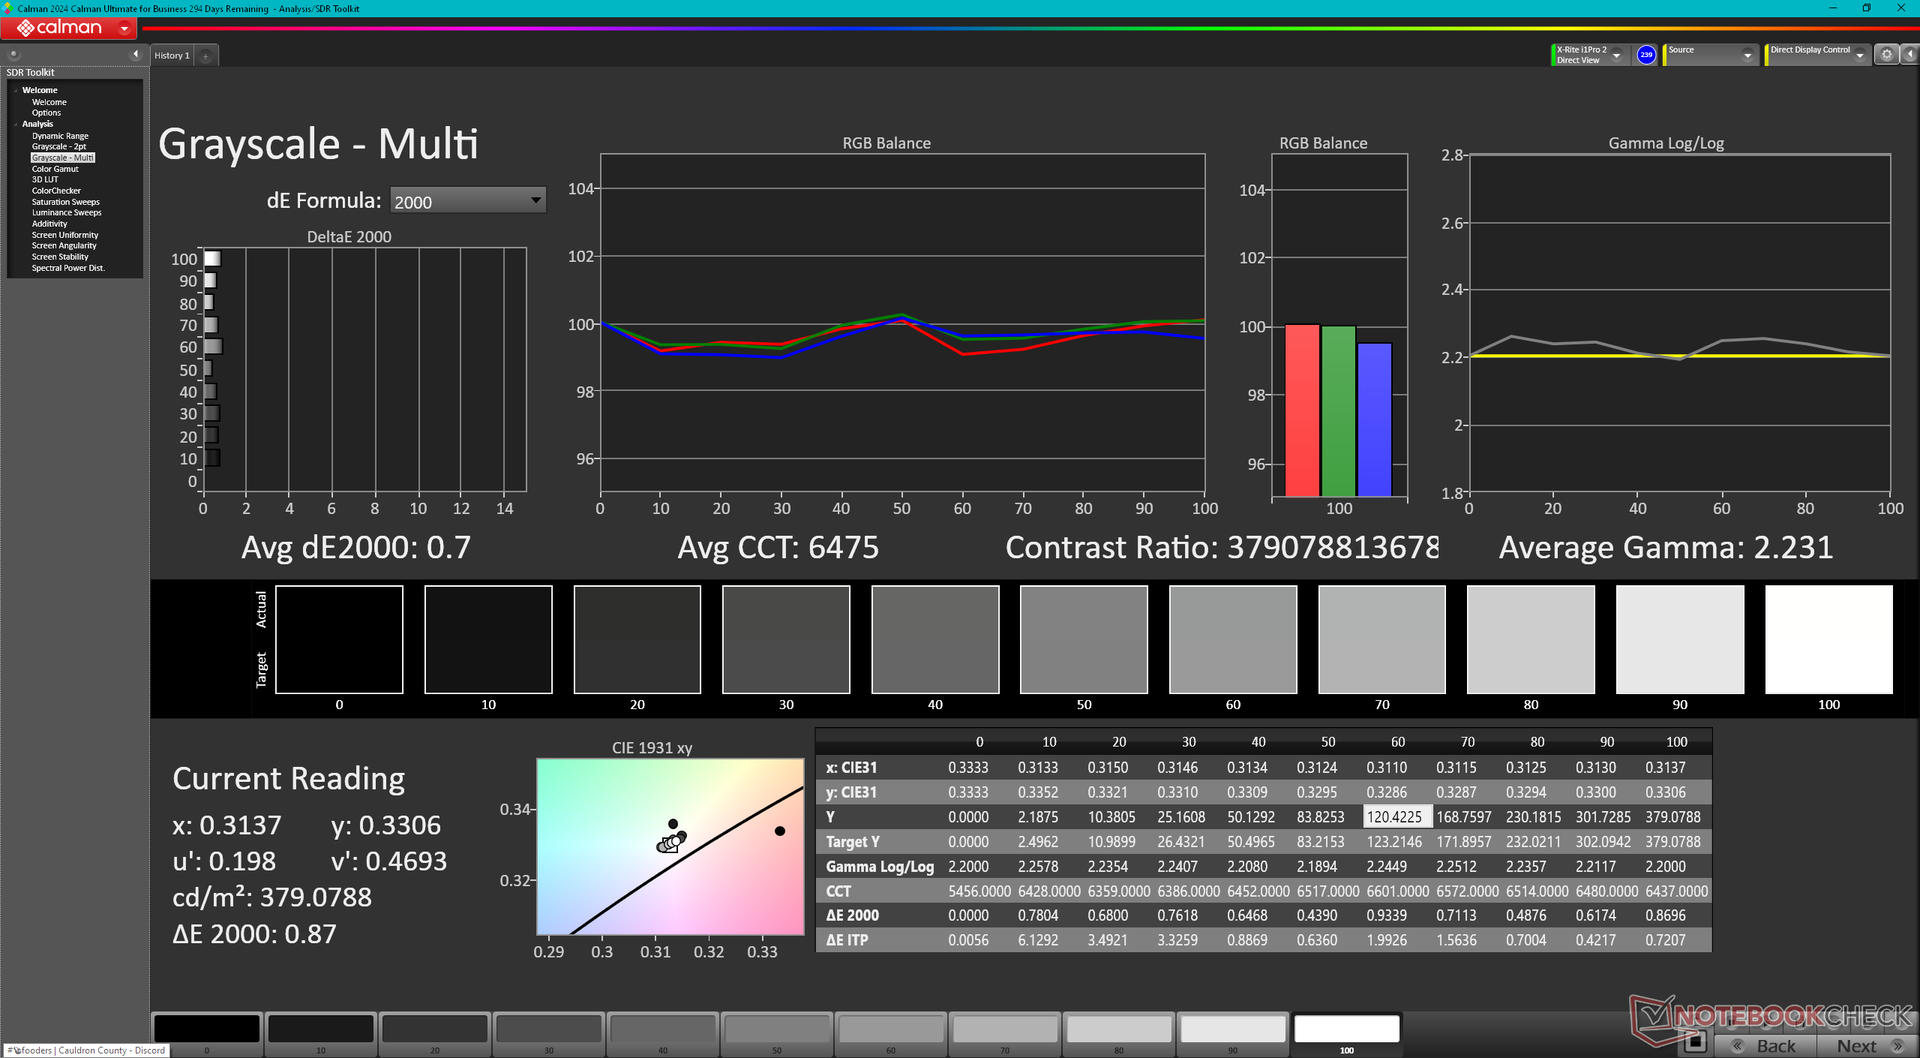
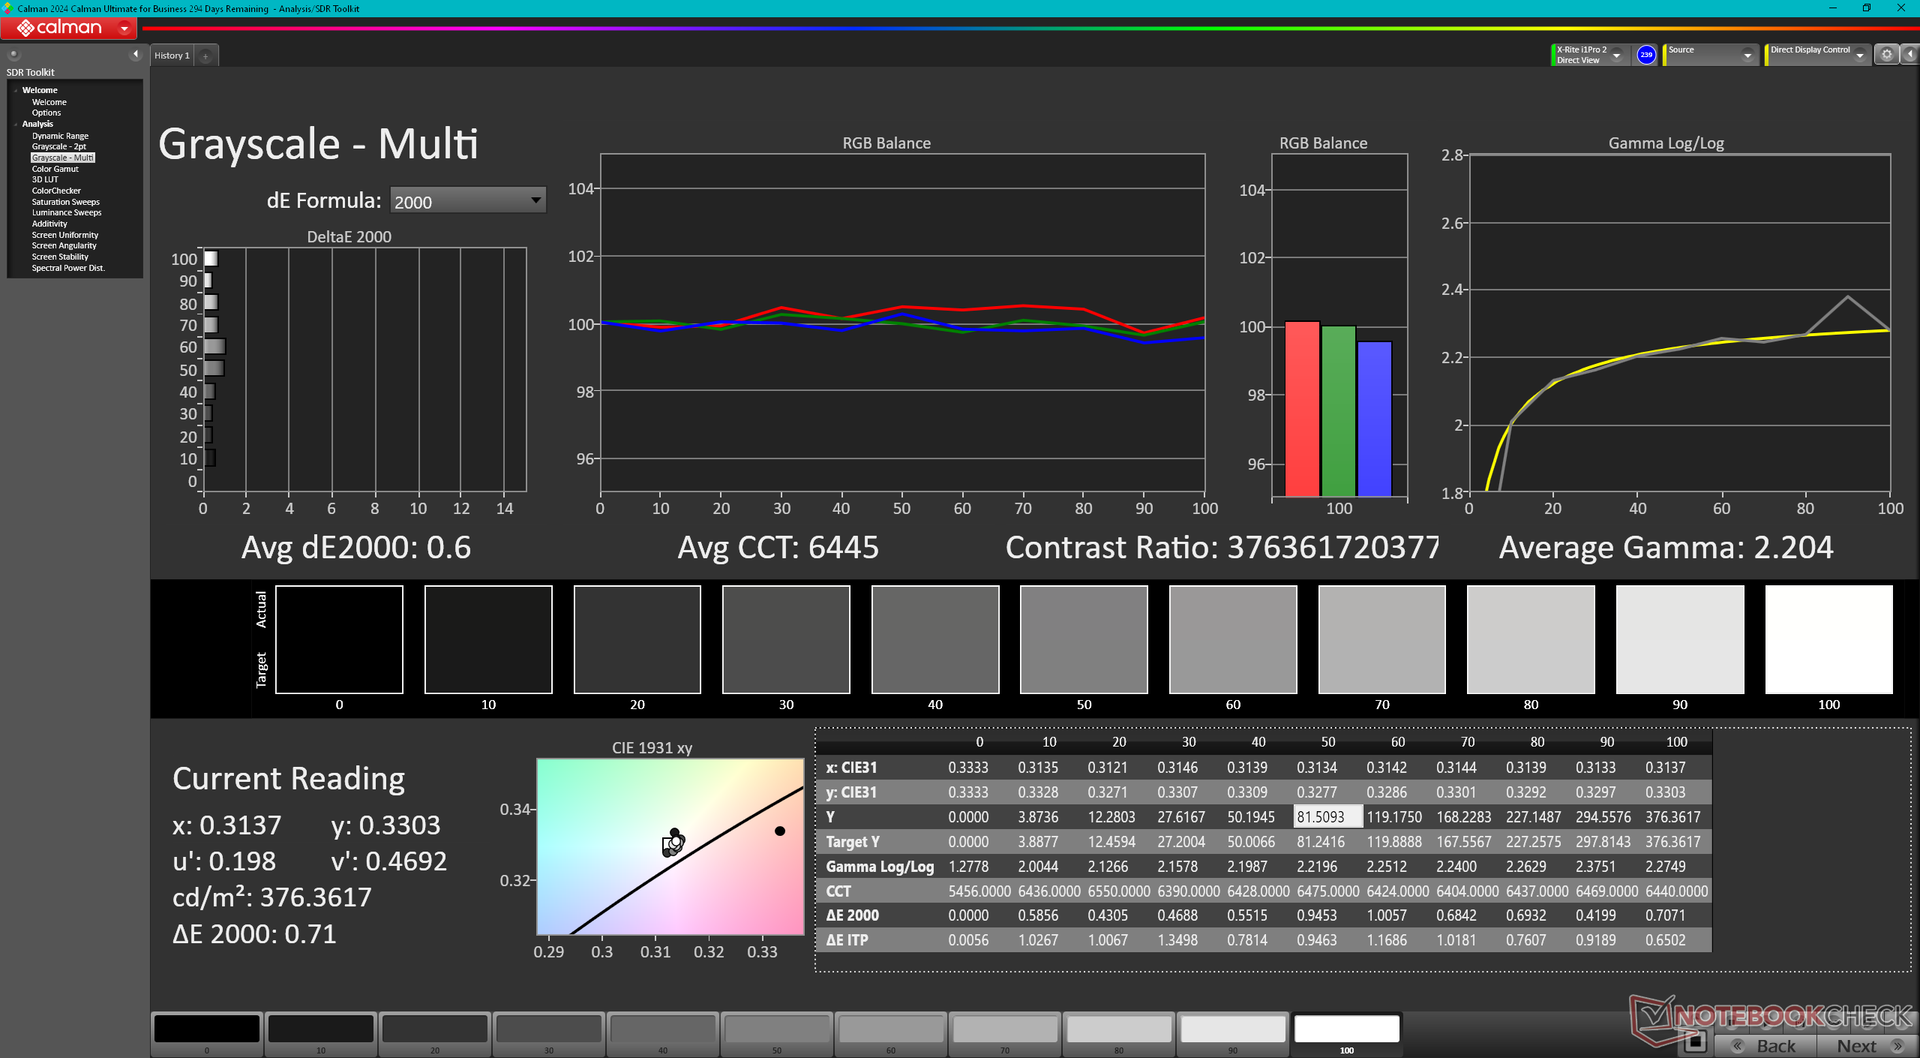
ΔE Greyscale Calman: 0.7 | ∀{0.09-98 Ø4.97}
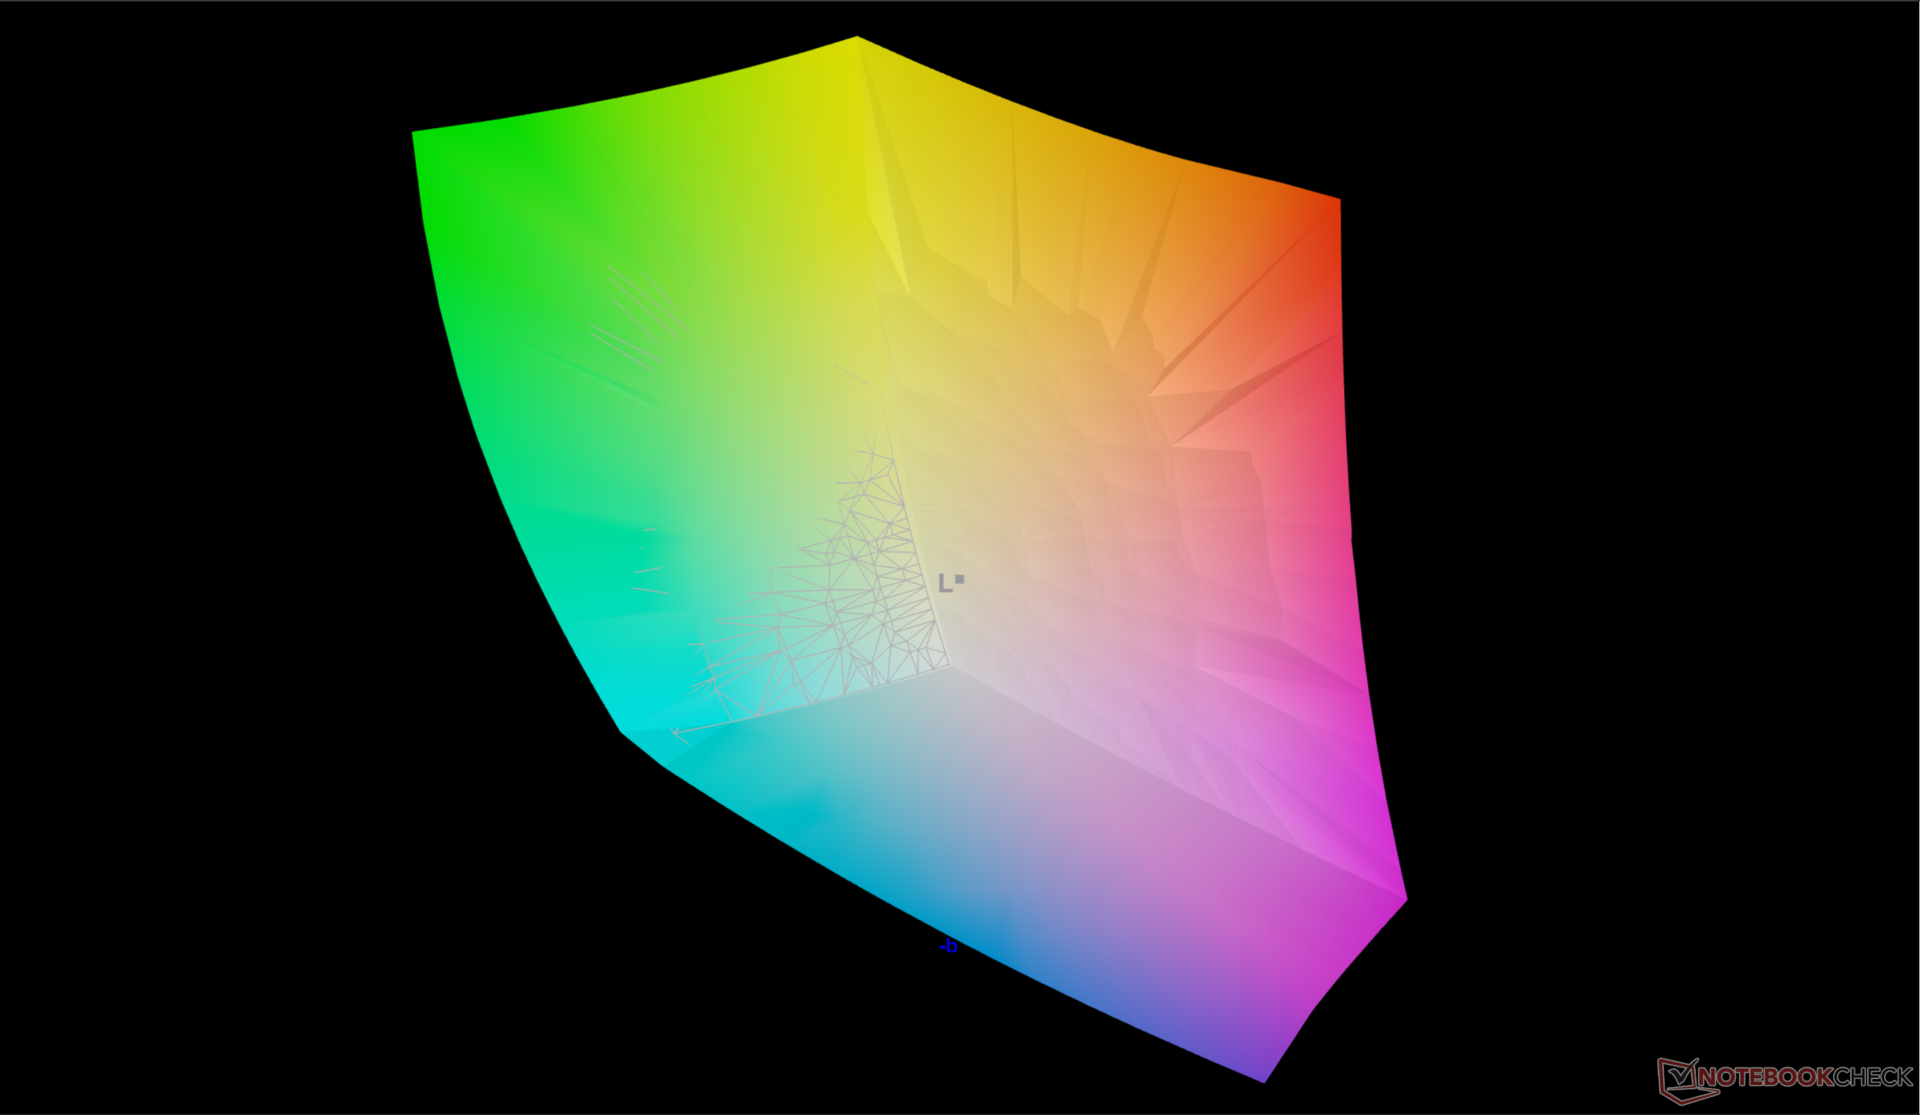
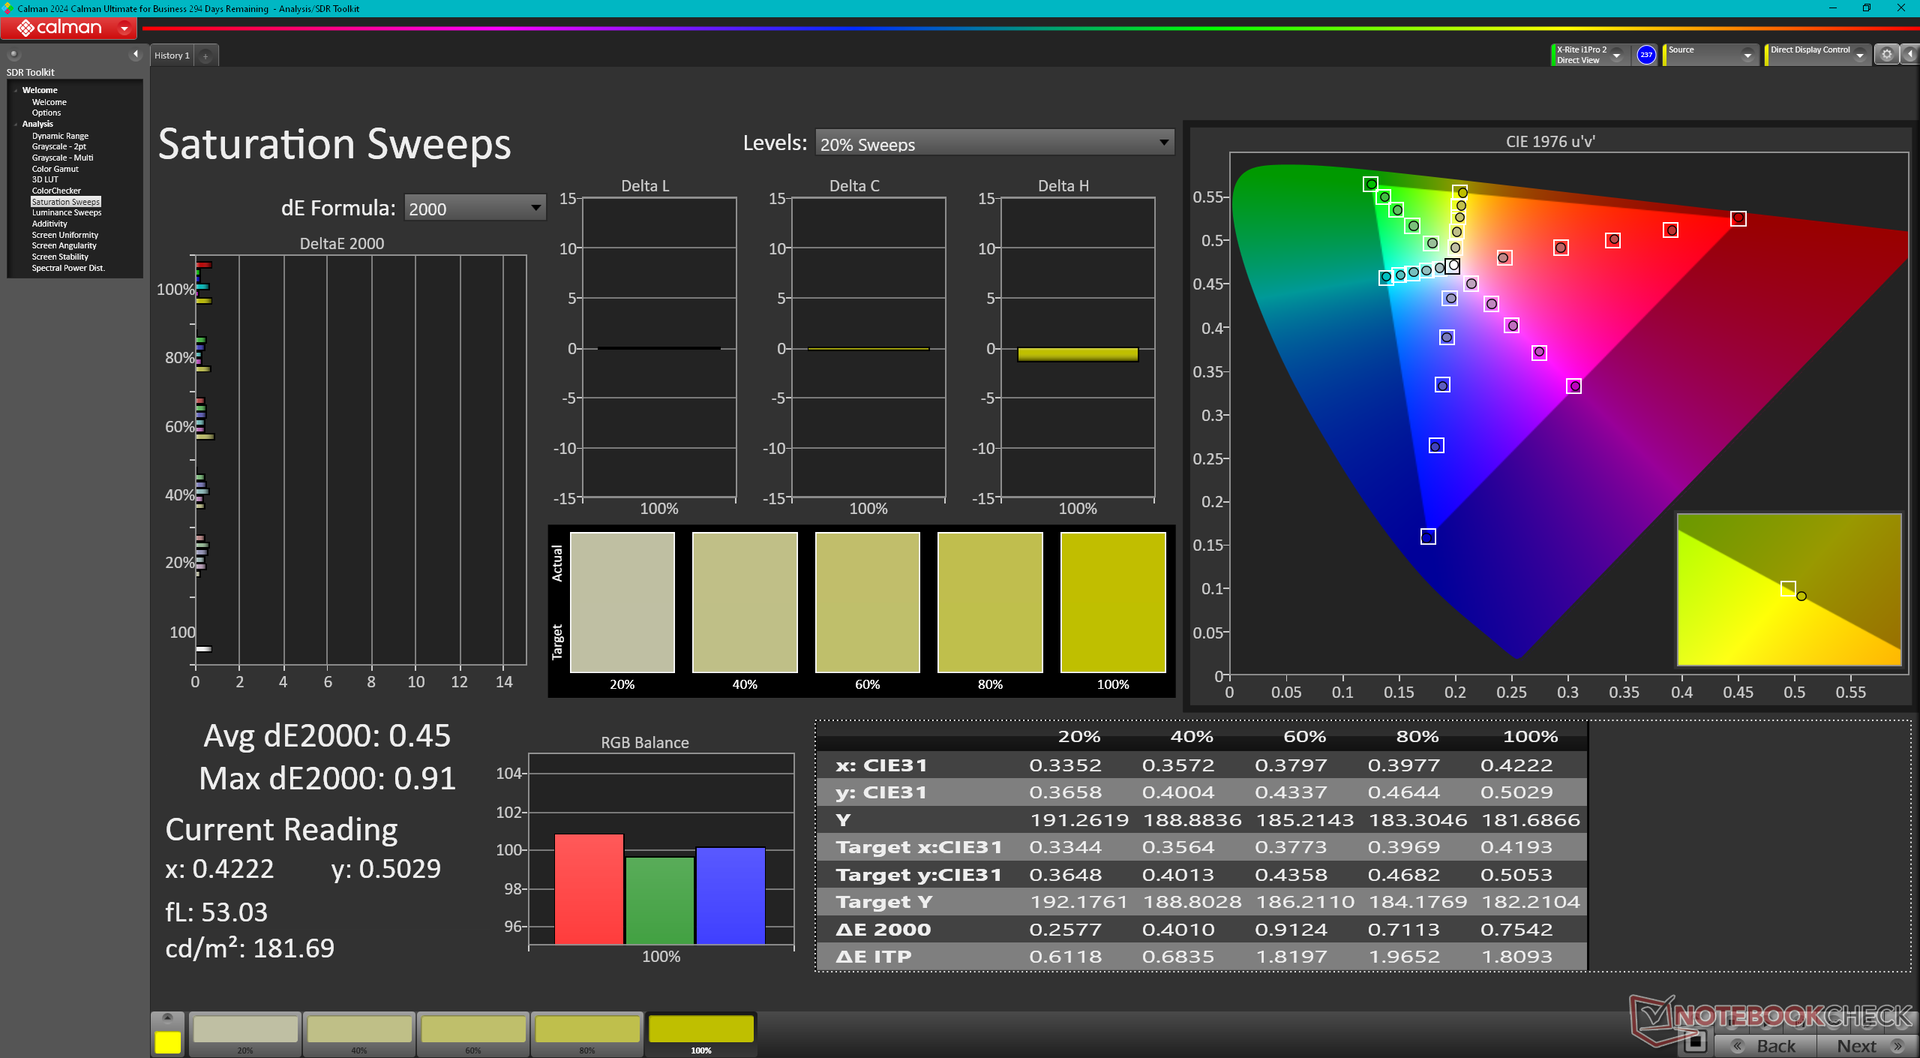
95.8% AdobeRGB 1998 (Argyll 3D)
100% sRGB (Argyll 3D)
99.9% Display P3 (Argyll 3D)
Gamma: 2.23
CCT: 6475 K
| MSI Prestige 13 AI Plus Evo A2VMG ATNA33AA07-0, OLED, 2880x1800, 13.3", 60 Hz | MSI Prestige 13 AI Evo ATNA33AA07-0, OLED, 2880x1800, 13.3", 60 Hz | Dell XPS 13 9350 LG Philips 134WU2, IPS, 1920x1200, 13.4", 120 Hz | Framework Laptop 13.5 Core Ultra 7 155H BOE NE135A1M-NY1, IPS, 2880x1920, 13.5", 120 Hz | Lenovo Yoga Book 9 13IMU9 SDC ATNA33AA02-0, OLED, 2880x1800, 13.3", 60 Hz | HP Dragonfly G4 Chi Mei CMN13C0, IPS, 1920x1280, 13.5", 60 Hz | |
|---|---|---|---|---|---|---|
| Display | 1% | -21% | -17% | 0% | -20% | |
| Display P3 Coverage (%) | 99.9 | 99.9 0% | 67.3 -33% | 72.8 -27% | 99.7 0% | 68.4 -32% |
| sRGB Coverage (%) | 100 | 100 0% | 99 -1% | 98.6 -1% | 100 0% | 98.3 -2% |
| AdobeRGB 1998 Coverage (%) | 95.8 | 97.8 2% | 68.6 -28% | 72.9 -24% | 97 1% | 70.4 -27% |
| Response Times | 25% | -1503% | -1567% | -1% | -1933% | |
| Response Time Grey 50% / Grey 80% * (ms) | 1.94 ? | 1.54 ? 21% | 37.3 ? -1823% | 41.9 ? -2060% | 1.88 ? 3% | 48.8 ? -2415% |
| Response Time Black / White * (ms) | 2.02 ? | 1.44 ? 29% | 25.9 ? -1182% | 23.7 ? -1073% | 2.1 ? -4% | 31.3 ? -1450% |
| PWM Frequency (Hz) | 60 ? | 240 ? | 60 ? | |||
| PWM Amplitude * (%) | 21.9 | |||||
| Screen | 3% | 17% | -108% | -50% | -27% | |
| Brightness middle (cd/m²) | 382.4 | 404 6% | 462.8 21% | 498.5 30% | 362.6 -5% | 408.8 7% |
| Brightness (cd/m²) | 383 | 407 6% | 435 14% | 464 21% | 368 -4% | 399 4% |
| Brightness Distribution (%) | 99 | 98 -1% | 87 -12% | 86 -13% | 97 -2% | 90 -9% |
| Black Level * (cd/m²) | 0.19 | 0.36 | 0.32 | |||
| Colorchecker dE 2000 * | 3.84 | 2.1 45% | 1.92 50% | 4.27 -11% | 4.66 -21% | 2.02 47% |
| Colorchecker dE 2000 max. * | 6.66 | 4.3 35% | 3.45 48% | 7.08 -6% | 7.25 -9% | 3.84 42% |
| Colorchecker dE 2000 calibrated * | 0.41 | 0.48 -17% | 1.26 -207% | 0.56 -37% | 0.61 -49% | |
| Greyscale dE 2000 * | 0.7 | 1.2 -71% | 0.6 14% | 4.7 -571% | 2.6 -271% | 2.3 -229% |
| Gamma | 2.23 99% | 2.16 102% | 2.19 100% | 2.09 105% | 2.2 100% | 2.2 100% |
| CCT | 6475 100% | 6465 101% | 6539 99% | 7417 88% | 6055 107% | 6203 105% |
| Contrast (:1) | 2436 | 1385 | 1278 | |||
| Total Average (Program / Settings) | 10% /
7% | -502% /
-246% | -564% /
-329% | -17% /
-29% | -660% /
-343% |
* ... smaller is better

The display comes well-calibrated out of the box against the P3 standard with average grayscale and ColorChecker deltaE values of just 0.7 and 3.84, respectively.
Display Response Times
| ↔ Response Time Black to White | ||
|---|---|---|
| 2.02 ms ... rise ↗ and fall ↘ combined | ↗ 0.92 ms rise |  |
| ↘ 1.1 ms fall | ||
| The screen shows very fast response rates in our tests and should be very well suited for fast-paced gaming. In comparison, all tested devices range from 0.1 (minimum) to 240 (maximum) ms. » 12 % of all devices are better. This means that the measured response time is better than the average of all tested devices (19.9 ms). | ||
| ↔ Response Time 50% Grey to 80% Grey | ||
| 1.94 ms ... rise ↗ and fall ↘ combined | ↗ 1 ms rise |  |
| ↘ 0.94 ms fall | ||
| The screen shows very fast response rates in our tests and should be very well suited for fast-paced gaming. In comparison, all tested devices range from 0.165 (minimum) to 636 (maximum) ms. » 9 % of all devices are better. This means that the measured response time is better than the average of all tested devices (31.1 ms). | ||
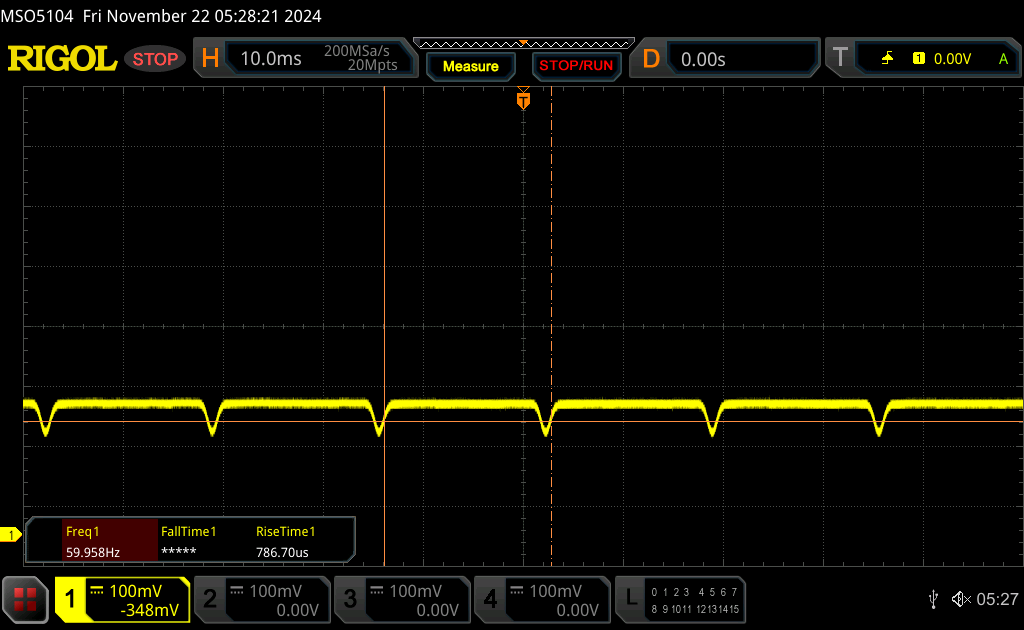
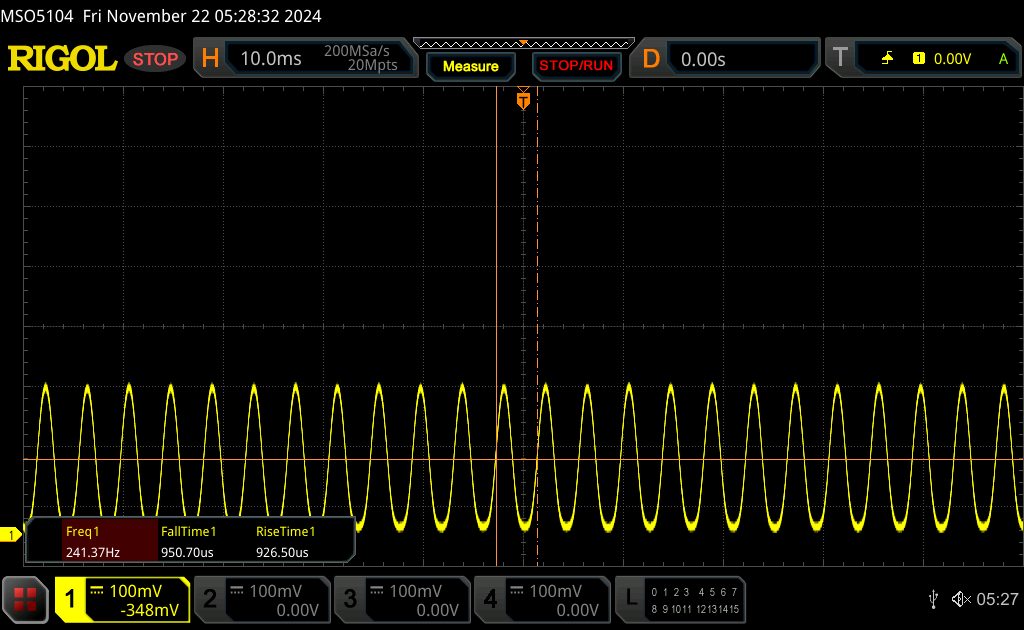
Screen Flickering / PWM (Pulse-Width Modulation)
| Screen flickering / PWM detected | 60 Hz Amplitude: 21.9 % | ≤ 100 % brightness setting |  |
The display backlight flickers at 60 Hz (worst case, e.g., utilizing PWM) Flickering detected at a brightness setting of 100 % and below. There should be no flickering or PWM above this brightness setting. The frequency of 60 Hz is very low, so the flickering may cause eyestrain and headaches after extended use. In comparison: 52 % of all tested devices do not use PWM to dim the display. If PWM was detected, an average of 7798 (minimum: 5 - maximum: 343500) Hz was measured. | |||


Performance
Testing Conditions
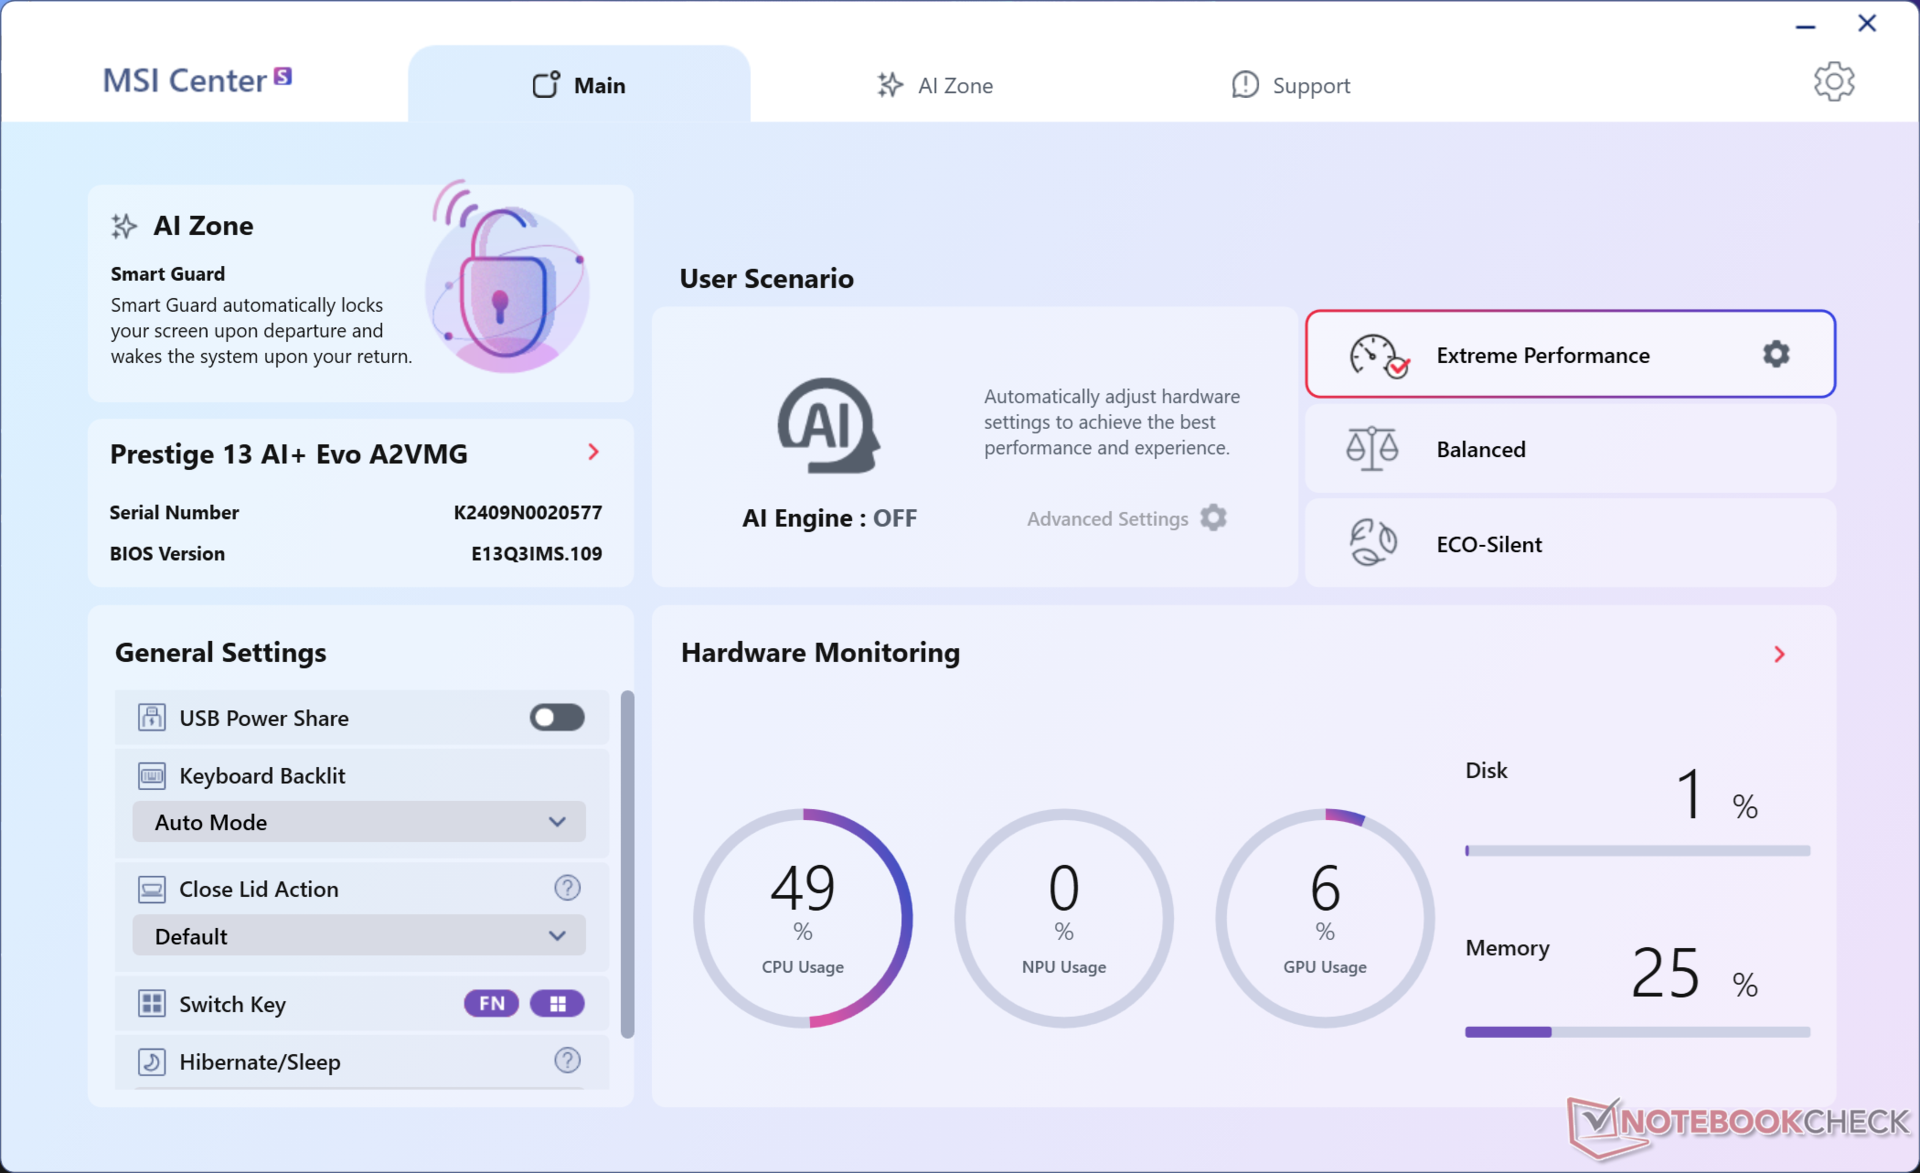
We set both Windows and MSI Center to Performance mode prior to running the benchmarks below. Cooler Boost mode (aka maximum fan mode) is also available, but it does not significantly impact performance as our benchmarks below will show.


Processor
When compared to the Core Ultra 7 155H, our Core Ultra 7 258V has slower Turbo Boost potential but steadier and faster performance over longer periods. This is evident when running CineBench R15 xT in a loop as shown by the graph below where the Core Ultra 7 155H configuration would only outperform our Core Ultra 7 258V configuration during the start of the test before eventually throttling more heavily after just the first loop.
Cinebench R15 Multi Loop
Cinebench R23: Multi Core | Single Core
Cinebench R20: CPU (Multi Core) | CPU (Single Core)
Cinebench R15: CPU Multi 64Bit | CPU Single 64Bit
Blender: v2.79 BMW27 CPU
7-Zip 18.03: 7z b 4 | 7z b 4 -mmt1
Geekbench 6.7: Multi-Core | Single-Core
Geekbench 5.5: Multi-Core | Single-Core
HWBOT x265 Benchmark v2.2: 4k Preset
LibreOffice : 20 Documents To PDF
R Benchmark 2.5: Overall mean
* ... smaller is better
AIDA64: FP32 Ray-Trace | FPU Julia | CPU SHA3 | CPU Queen | FPU SinJulia | FPU Mandel | CPU AES | CPU ZLib | FP64 Ray-Trace | CPU PhotoWorxx
| Performance rating | |
| Framework Laptop 13.5 Core Ultra 7 155H | |
| MSI Prestige 13 AI Plus Evo A2VMG | |
| Dell XPS 13 9350 | |
| Average Intel Core Ultra 7 258V | |
| Lenovo Yoga Book 9 13IMU9 | |
| MSI Prestige 13 AI Evo | |
| HP Dragonfly G4 | |
| AIDA64 / FP32 Ray-Trace | |
| MSI Prestige 13 AI Plus Evo A2VMG | |
| Dell XPS 13 9350 | |
| Framework Laptop 13.5 Core Ultra 7 155H | |
| Average Intel Core Ultra 7 258V (8454 - 12781, n=26) | |
| Lenovo Yoga Book 9 13IMU9 | |
| HP Dragonfly G4 | |
| MSI Prestige 13 AI Evo | |
| AIDA64 / FPU Julia | |
| MSI Prestige 13 AI Plus Evo A2VMG | |
| Dell XPS 13 9350 | |
| Framework Laptop 13.5 Core Ultra 7 155H | |
| Average Intel Core Ultra 7 258V (40875 - 63401, n=26) | |
| MSI Prestige 13 AI Evo | |
| Lenovo Yoga Book 9 13IMU9 | |
| HP Dragonfly G4 | |
| AIDA64 / CPU SHA3 | |
| MSI Prestige 13 AI Plus Evo A2VMG | |
| Framework Laptop 13.5 Core Ultra 7 155H | |
| Dell XPS 13 9350 | |
| Average Intel Core Ultra 7 258V (1930 - 2817, n=26) | |
| Lenovo Yoga Book 9 13IMU9 | |
| MSI Prestige 13 AI Evo | |
| HP Dragonfly G4 | |
| AIDA64 / CPU Queen | |
| Framework Laptop 13.5 Core Ultra 7 155H | |
| HP Dragonfly G4 | |
| MSI Prestige 13 AI Evo | |
| MSI Prestige 13 AI Plus Evo A2VMG | |
| Average Intel Core Ultra 7 258V (48816 - 49818, n=24) | |
| Dell XPS 13 9350 | |
| Lenovo Yoga Book 9 13IMU9 | |
| AIDA64 / FPU SinJulia | |
| Framework Laptop 13.5 Core Ultra 7 155H | |
| MSI Prestige 13 AI Evo | |
| Lenovo Yoga Book 9 13IMU9 | |
| HP Dragonfly G4 | |
| Dell XPS 13 9350 | |
| MSI Prestige 13 AI Plus Evo A2VMG | |
| Average Intel Core Ultra 7 258V (3817 - 4440, n=26) | |
| AIDA64 / FPU Mandel | |
| MSI Prestige 13 AI Plus Evo A2VMG | |
| Dell XPS 13 9350 | |
| Average Intel Core Ultra 7 258V (21670 - 33565, n=26) | |
| Framework Laptop 13.5 Core Ultra 7 155H | |
| MSI Prestige 13 AI Evo | |
| Lenovo Yoga Book 9 13IMU9 | |
| HP Dragonfly G4 | |
| AIDA64 / CPU AES | |
| Framework Laptop 13.5 Core Ultra 7 155H | |
| MSI Prestige 13 AI Evo | |
| Lenovo Yoga Book 9 13IMU9 | |
| Dell XPS 13 9350 | |
| MSI Prestige 13 AI Plus Evo A2VMG | |
| Average Intel Core Ultra 7 258V (30957 - 40753, n=26) | |
| HP Dragonfly G4 | |
| AIDA64 / CPU ZLib | |
| Framework Laptop 13.5 Core Ultra 7 155H | |
| Lenovo Yoga Book 9 13IMU9 | |
| MSI Prestige 13 AI Plus Evo A2VMG | |
| MSI Prestige 13 AI Evo | |
| Average Intel Core Ultra 7 258V (422 - 632, n=26) | |
| Dell XPS 13 9350 | |
| HP Dragonfly G4 | |
| AIDA64 / FP64 Ray-Trace | |
| MSI Prestige 13 AI Plus Evo A2VMG | |
| Dell XPS 13 9350 | |
| Average Intel Core Ultra 7 258V (4258 - 6930, n=26) | |
| Framework Laptop 13.5 Core Ultra 7 155H | |
| Lenovo Yoga Book 9 13IMU9 | |
| MSI Prestige 13 AI Evo | |
| HP Dragonfly G4 | |
| AIDA64 / CPU PhotoWorxx | |
| MSI Prestige 13 AI Plus Evo A2VMG | |
| Average Intel Core Ultra 7 258V (44223 - 59245, n=26) | |
| Dell XPS 13 9350 | |
| Framework Laptop 13.5 Core Ultra 7 155H | |
| Lenovo Yoga Book 9 13IMU9 | |
| MSI Prestige 13 AI Evo | |
| HP Dragonfly G4 | |
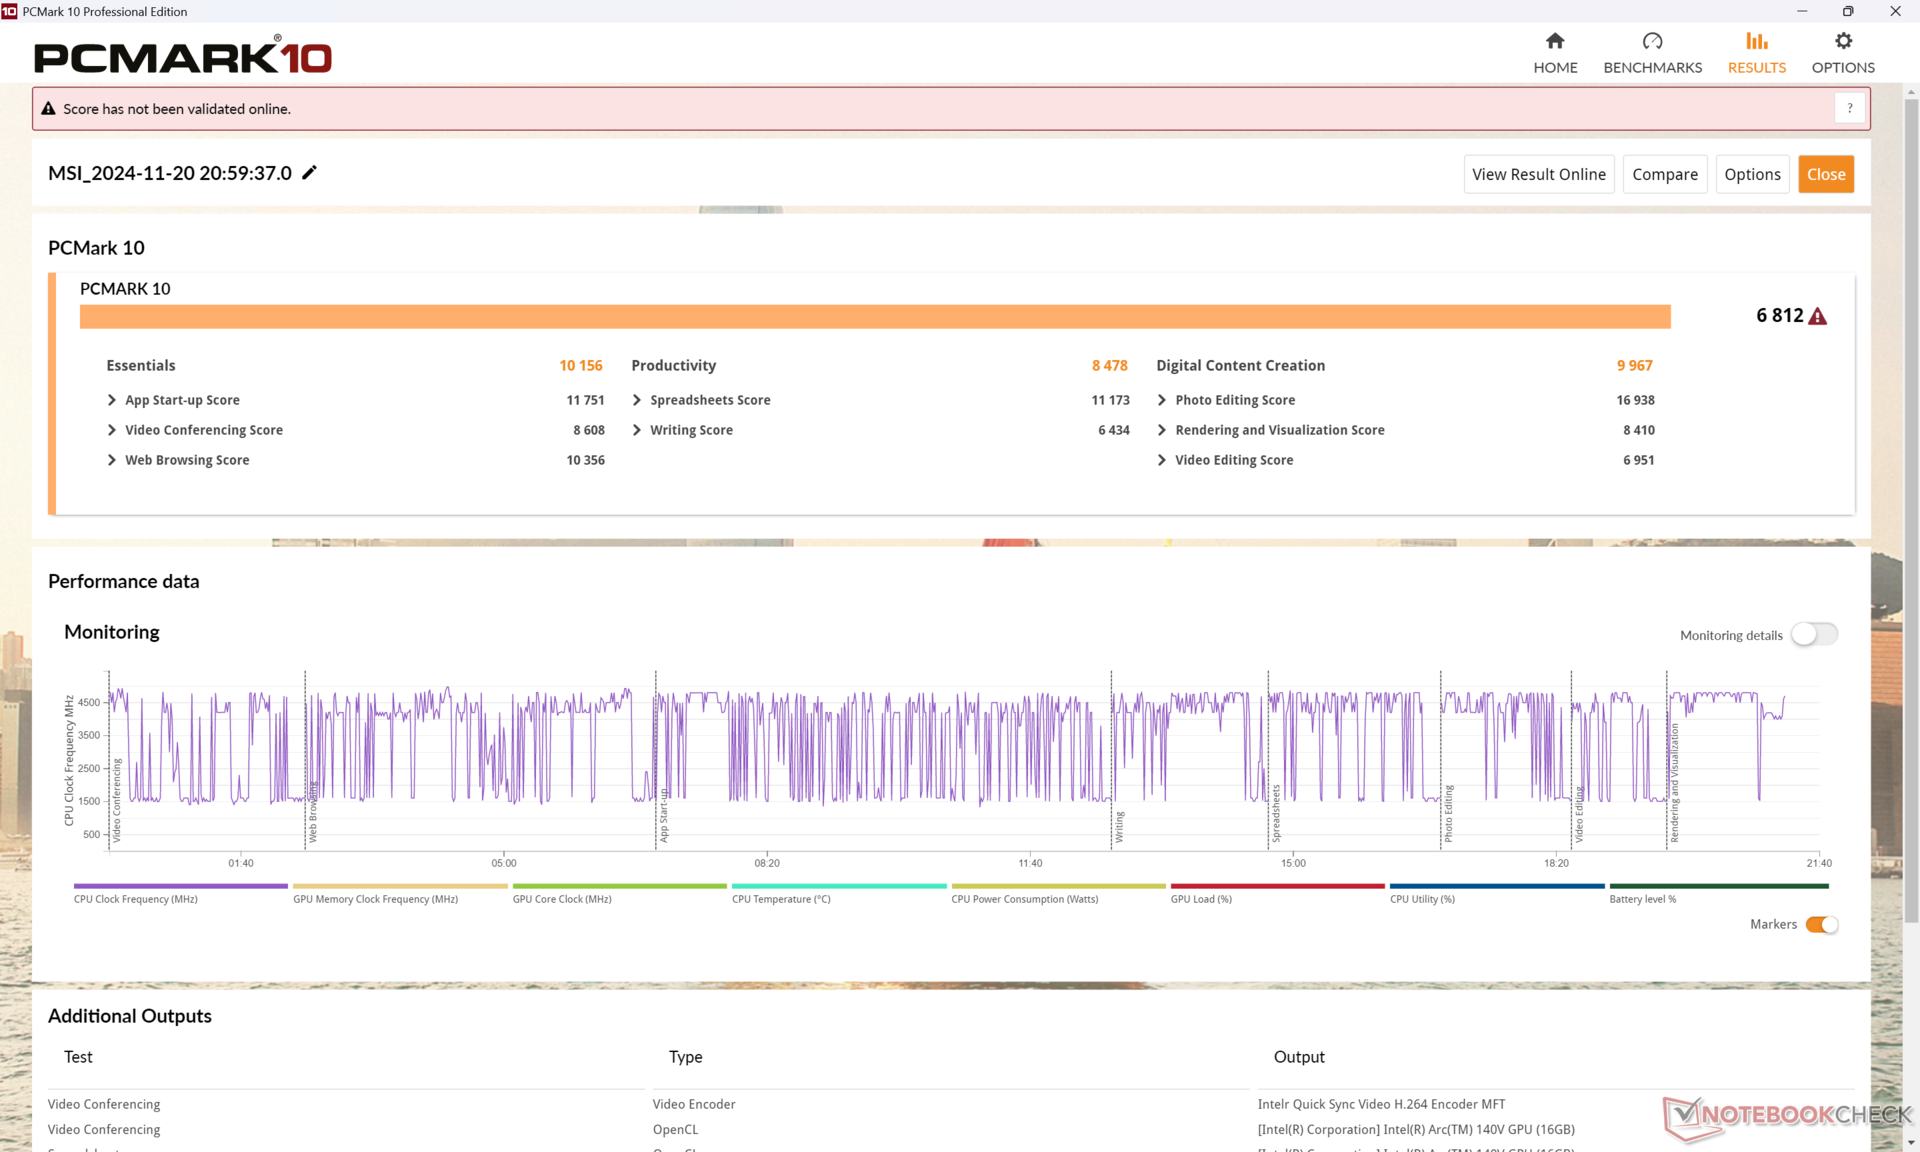
System Performance
Both PCMark 10 and AIDA64 Memory results are notably higher than on the Core Ultra 7 155H configuration due to the faster integrated GPU and RAM in our newer unit, respectively.
CrossMark: Overall | Productivity | Creativity | Responsiveness
WebXPRT 3: Overall
WebXPRT 4: Overall
Mozilla Kraken 1.1: Total
| PCMark 10 / Score | |
| Dell XPS 13 9350 | |
| Average Intel Core Ultra 7 258V, Intel Arc Graphics 140V (6265 - 7420, n=23) | |
| Framework Laptop 13.5 Core Ultra 7 155H | |
| MSI Prestige 13 AI Plus Evo A2VMG | |
| Lenovo Yoga Book 9 13IMU9 | |
| MSI Prestige 13 AI Evo | |
| HP Dragonfly G4 | |
| PCMark 10 / Essentials | |
| Lenovo Yoga Book 9 13IMU9 | |
| HP Dragonfly G4 | |
| Framework Laptop 13.5 Core Ultra 7 155H | |
| Average Intel Core Ultra 7 258V, Intel Arc Graphics 140V (9295 - 11467, n=23) | |
| MSI Prestige 13 AI Plus Evo A2VMG | |
| Dell XPS 13 9350 | |
| MSI Prestige 13 AI Evo | |
| PCMark 10 / Productivity | |
| Dell XPS 13 9350 | |
| Average Intel Core Ultra 7 258V, Intel Arc Graphics 140V (7357 - 13600, n=23) | |
| MSI Prestige 13 AI Evo | |
| Framework Laptop 13.5 Core Ultra 7 155H | |
| MSI Prestige 13 AI Plus Evo A2VMG | |
| Lenovo Yoga Book 9 13IMU9 | |
| HP Dragonfly G4 | |
| PCMark 10 / Digital Content Creation | |
| MSI Prestige 13 AI Plus Evo A2VMG | |
| Dell XPS 13 9350 | |
| Average Intel Core Ultra 7 258V, Intel Arc Graphics 140V (8160 - 10308, n=23) | |
| Framework Laptop 13.5 Core Ultra 7 155H | |
| Lenovo Yoga Book 9 13IMU9 | |
| MSI Prestige 13 AI Evo | |
| HP Dragonfly G4 | |
| CrossMark / Overall | |
| Dell XPS 13 9350 | |
| MSI Prestige 13 AI Plus Evo A2VMG | |
| Framework Laptop 13.5 Core Ultra 7 155H | |
| Average Intel Core Ultra 7 258V, Intel Arc Graphics 140V (1275 - 1742, n=22) | |
| HP Dragonfly G4 | |
| Lenovo Yoga Book 9 13IMU9 | |
| MSI Prestige 13 AI Evo | |
| CrossMark / Productivity | |
| Dell XPS 13 9350 | |
| MSI Prestige 13 AI Plus Evo A2VMG | |
| HP Dragonfly G4 | |
| Framework Laptop 13.5 Core Ultra 7 155H | |
| Average Intel Core Ultra 7 258V, Intel Arc Graphics 140V (1267 - 1684, n=22) | |
| MSI Prestige 13 AI Evo | |
| Lenovo Yoga Book 9 13IMU9 | |
| CrossMark / Creativity | |
| MSI Prestige 13 AI Plus Evo A2VMG | |
| Dell XPS 13 9350 | |
| Framework Laptop 13.5 Core Ultra 7 155H | |
| Average Intel Core Ultra 7 258V, Intel Arc Graphics 140V (1393 - 1977, n=22) | |
| HP Dragonfly G4 | |
| Lenovo Yoga Book 9 13IMU9 | |
| MSI Prestige 13 AI Evo | |
| CrossMark / Responsiveness | |
| HP Dragonfly G4 | |
| Framework Laptop 13.5 Core Ultra 7 155H | |
| Dell XPS 13 9350 | |
| MSI Prestige 13 AI Plus Evo A2VMG | |
| Average Intel Core Ultra 7 258V, Intel Arc Graphics 140V (999 - 1411, n=22) | |
| MSI Prestige 13 AI Evo | |
| Lenovo Yoga Book 9 13IMU9 | |
| WebXPRT 3 / Overall | |
| Dell XPS 13 9350 | |
| HP Dragonfly G4 | |
| MSI Prestige 13 AI Plus Evo A2VMG | |
| Framework Laptop 13.5 Core Ultra 7 155H | |
| Average Intel Core Ultra 7 258V, Intel Arc Graphics 140V (219 - 317, n=22) | |
| Lenovo Yoga Book 9 13IMU9 | |
| MSI Prestige 13 AI Evo | |
| WebXPRT 4 / Overall | |
| MSI Prestige 13 AI Plus Evo A2VMG | |
| Dell XPS 13 9350 | |
| Average Intel Core Ultra 7 258V, Intel Arc Graphics 140V (199.5 - 291, n=22) | |
| HP Dragonfly G4 | |
| Framework Laptop 13.5 Core Ultra 7 155H | |
| Lenovo Yoga Book 9 13IMU9 | |
| MSI Prestige 13 AI Evo | |
| Mozilla Kraken 1.1 / Total | |
| Lenovo Yoga Book 9 13IMU9 | |
| MSI Prestige 13 AI Evo | |
| Framework Laptop 13.5 Core Ultra 7 155H | |
| HP Dragonfly G4 | |
| Average Intel Core Ultra 7 258V, Intel Arc Graphics 140V (468 - 559, n=24) | |
| MSI Prestige 13 AI Plus Evo A2VMG | |
| Dell XPS 13 9350 | |
* ... smaller is better
| PCMark 10 Score | 6812 points | |
Help | ||
| AIDA64 / Memory Copy | |
| MSI Prestige 13 AI Plus Evo A2VMG | |
| Average Intel Core Ultra 7 258V (104408 - 114336, n=24) | |
| Dell XPS 13 9350 | |
| MSI Prestige 13 AI Evo | |
| Lenovo Yoga Book 9 13IMU9 | |
| Framework Laptop 13.5 Core Ultra 7 155H | |
| HP Dragonfly G4 | |
| AIDA64 / Memory Read | |
| Dell XPS 13 9350 | |
| Average Intel Core Ultra 7 258V (82846 - 89417, n=24) | |
| MSI Prestige 13 AI Plus Evo A2VMG | |
| Framework Laptop 13.5 Core Ultra 7 155H | |
| MSI Prestige 13 AI Evo | |
| Lenovo Yoga Book 9 13IMU9 | |
| HP Dragonfly G4 | |
| AIDA64 / Memory Write | |
| MSI Prestige 13 AI Plus Evo A2VMG | |
| Average Intel Core Ultra 7 258V (108824 - 117989, n=24) | |
| Dell XPS 13 9350 | |
| MSI Prestige 13 AI Evo | |
| Framework Laptop 13.5 Core Ultra 7 155H | |
| HP Dragonfly G4 | |
| Lenovo Yoga Book 9 13IMU9 | |
| AIDA64 / Memory Latency | |
| MSI Prestige 13 AI Evo | |
| Lenovo Yoga Book 9 13IMU9 | |
| Framework Laptop 13.5 Core Ultra 7 155H | |
| MSI Prestige 13 AI Plus Evo A2VMG | |
| Dell XPS 13 9350 | |
| Average Intel Core Ultra 7 258V (95 - 101.7, n=24) | |
| HP Dragonfly G4 | |
* ... smaller is better
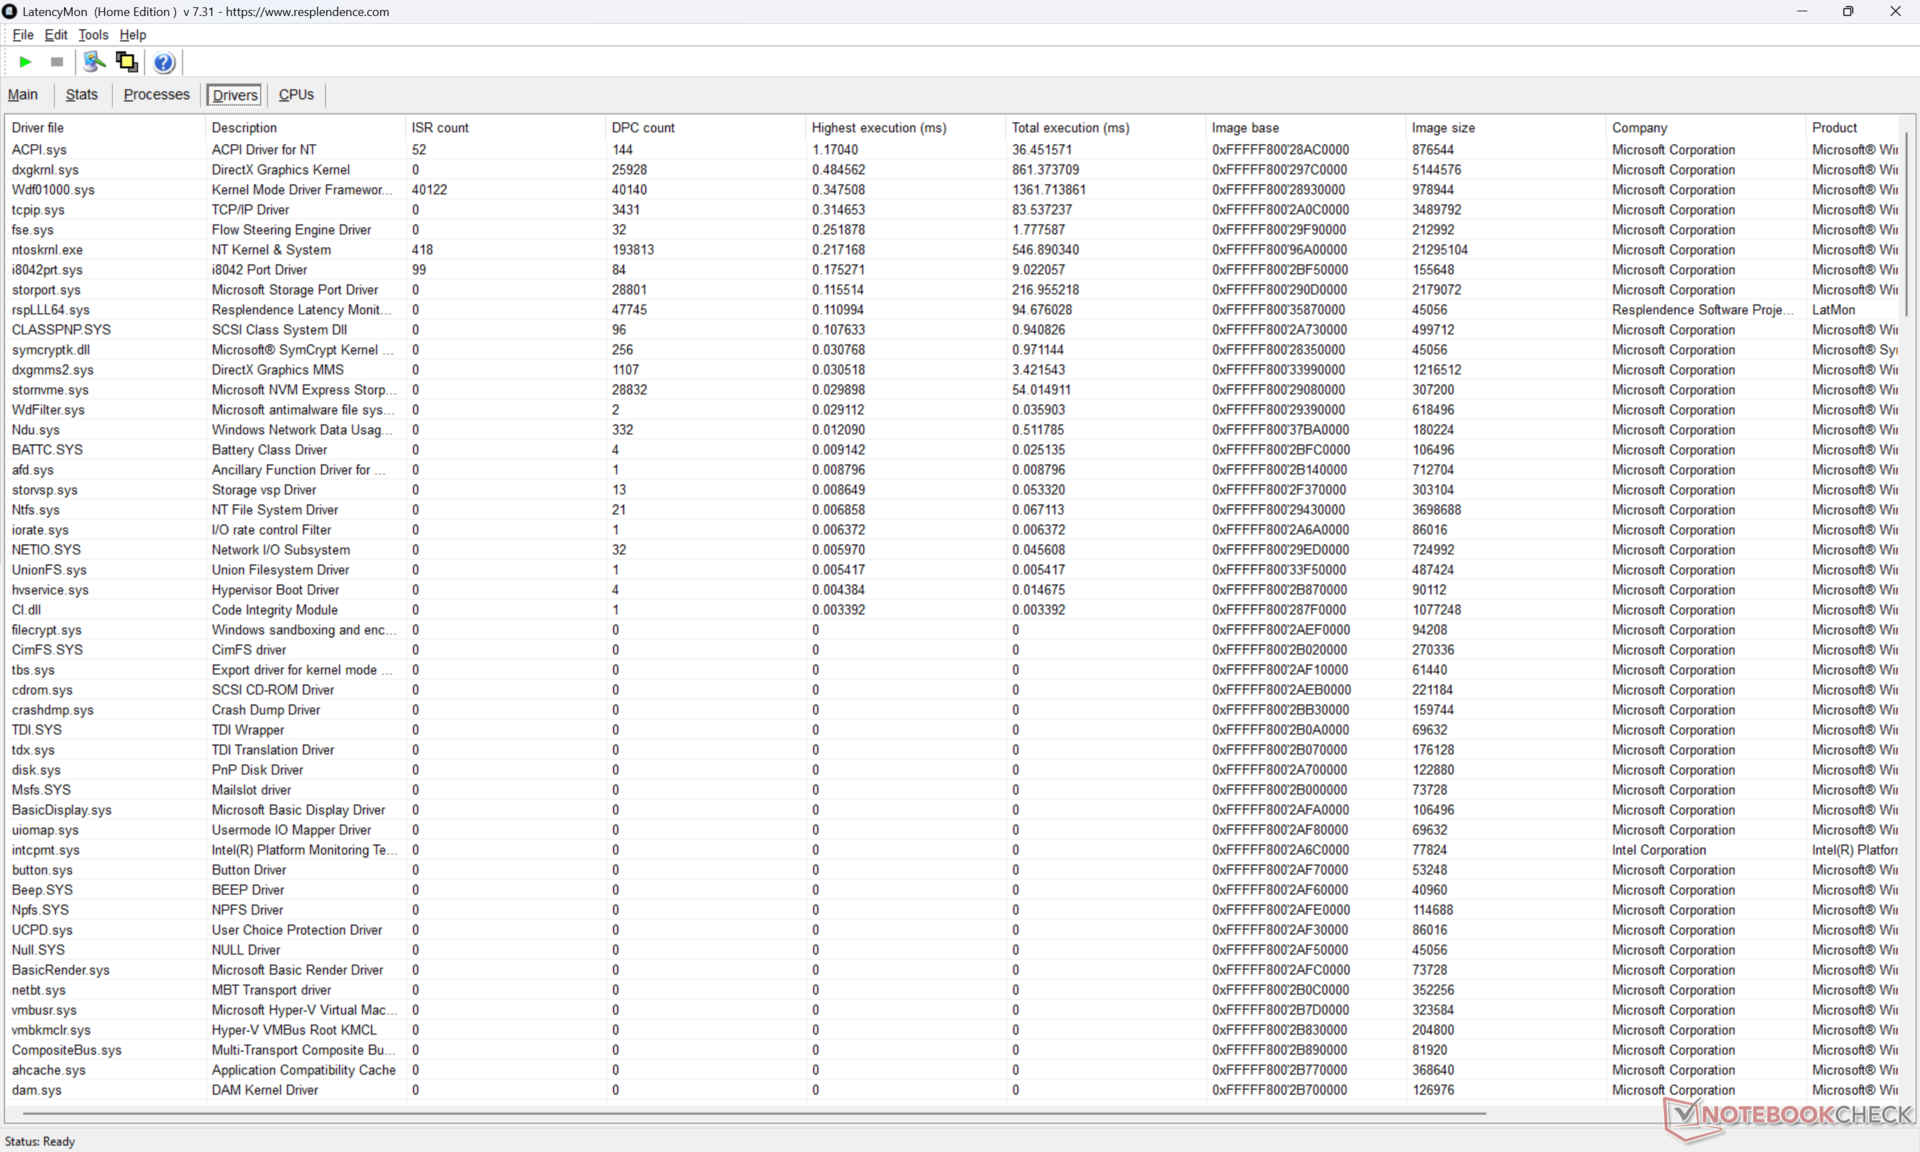
DPC Latency
LatencyMon shows only minor DPC issues and no dropped frames when playing back 4K 60 FPS video.

| DPC Latencies / LatencyMon - interrupt to process latency (max), Web, Youtube, Prime95 | |
| MSI Prestige 13 AI Evo | |
| Lenovo Yoga Book 9 13IMU9 | |
| HP Dragonfly G4 | |
| MSI Prestige 13 AI Plus Evo A2VMG | |
| Framework Laptop 13.5 Core Ultra 7 155H | |
* ... smaller is better
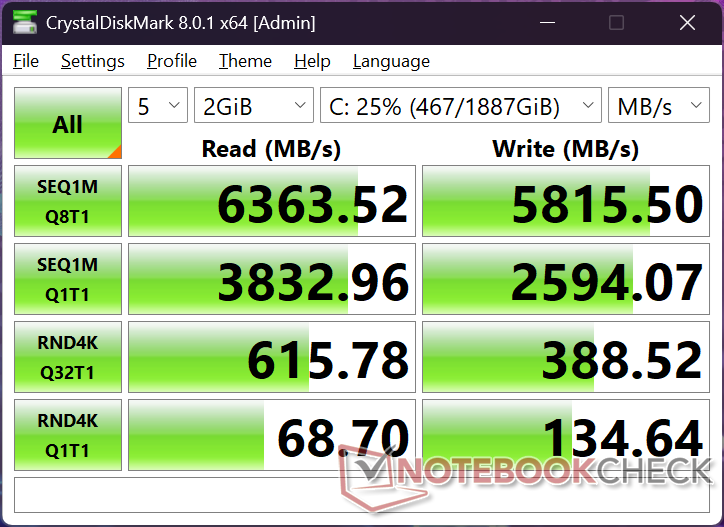
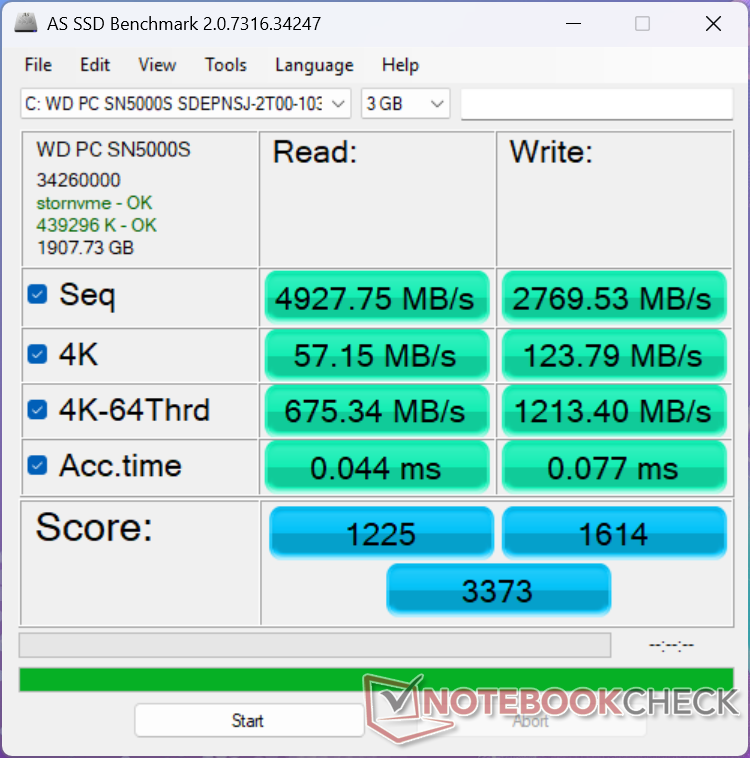
Storage Devices
Our unit ships with the WD SN5000S instead of the Samsung PM9A1 as found on our Core Ultra 7 155H configuration. The drive does not exhibit any of the throttling issues that we experienced on the original Prestige 13 AI.

| Drive Performance rating - Percent | |
| MSI Prestige 13 AI Evo | |
| Framework Laptop 13.5 Core Ultra 7 155H | |
| HP Dragonfly G4 | |
| MSI Prestige 13 AI Plus Evo A2VMG | |
| Lenovo Yoga Book 9 13IMU9 | |
| Dell XPS 13 9350 | |
* ... smaller is better
Disk Throttling: DiskSpd Read Loop, Queue Depth 8
GPU Performance
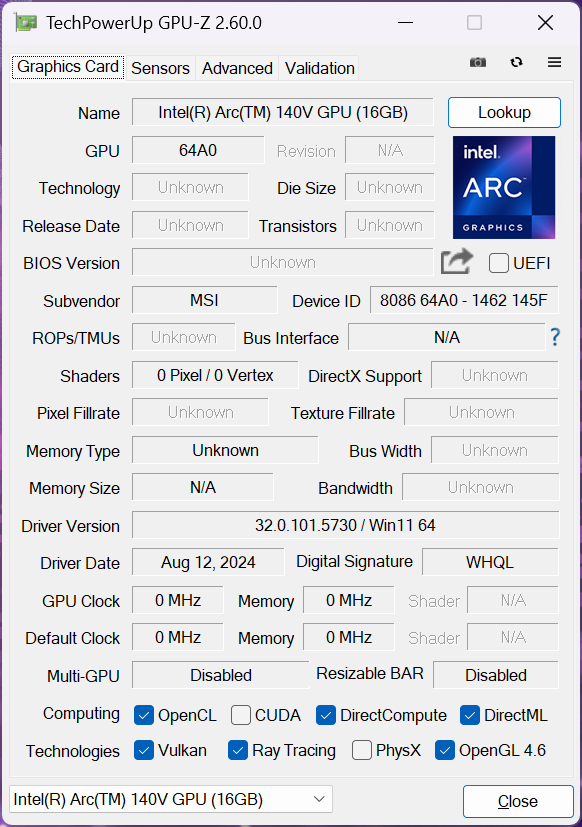
The new integrated Arc 140V GPU is arguably one of the biggest upgrades over the Arc 8 in the Core Ultra 7 155H configuration. 3DMark results are 1.5x to 2x faster and this translates quite well to gaming scenarios such as GTA V or even Cyberpunk 2077 where the Core Ultra 7 155H configuration tends to underperform.
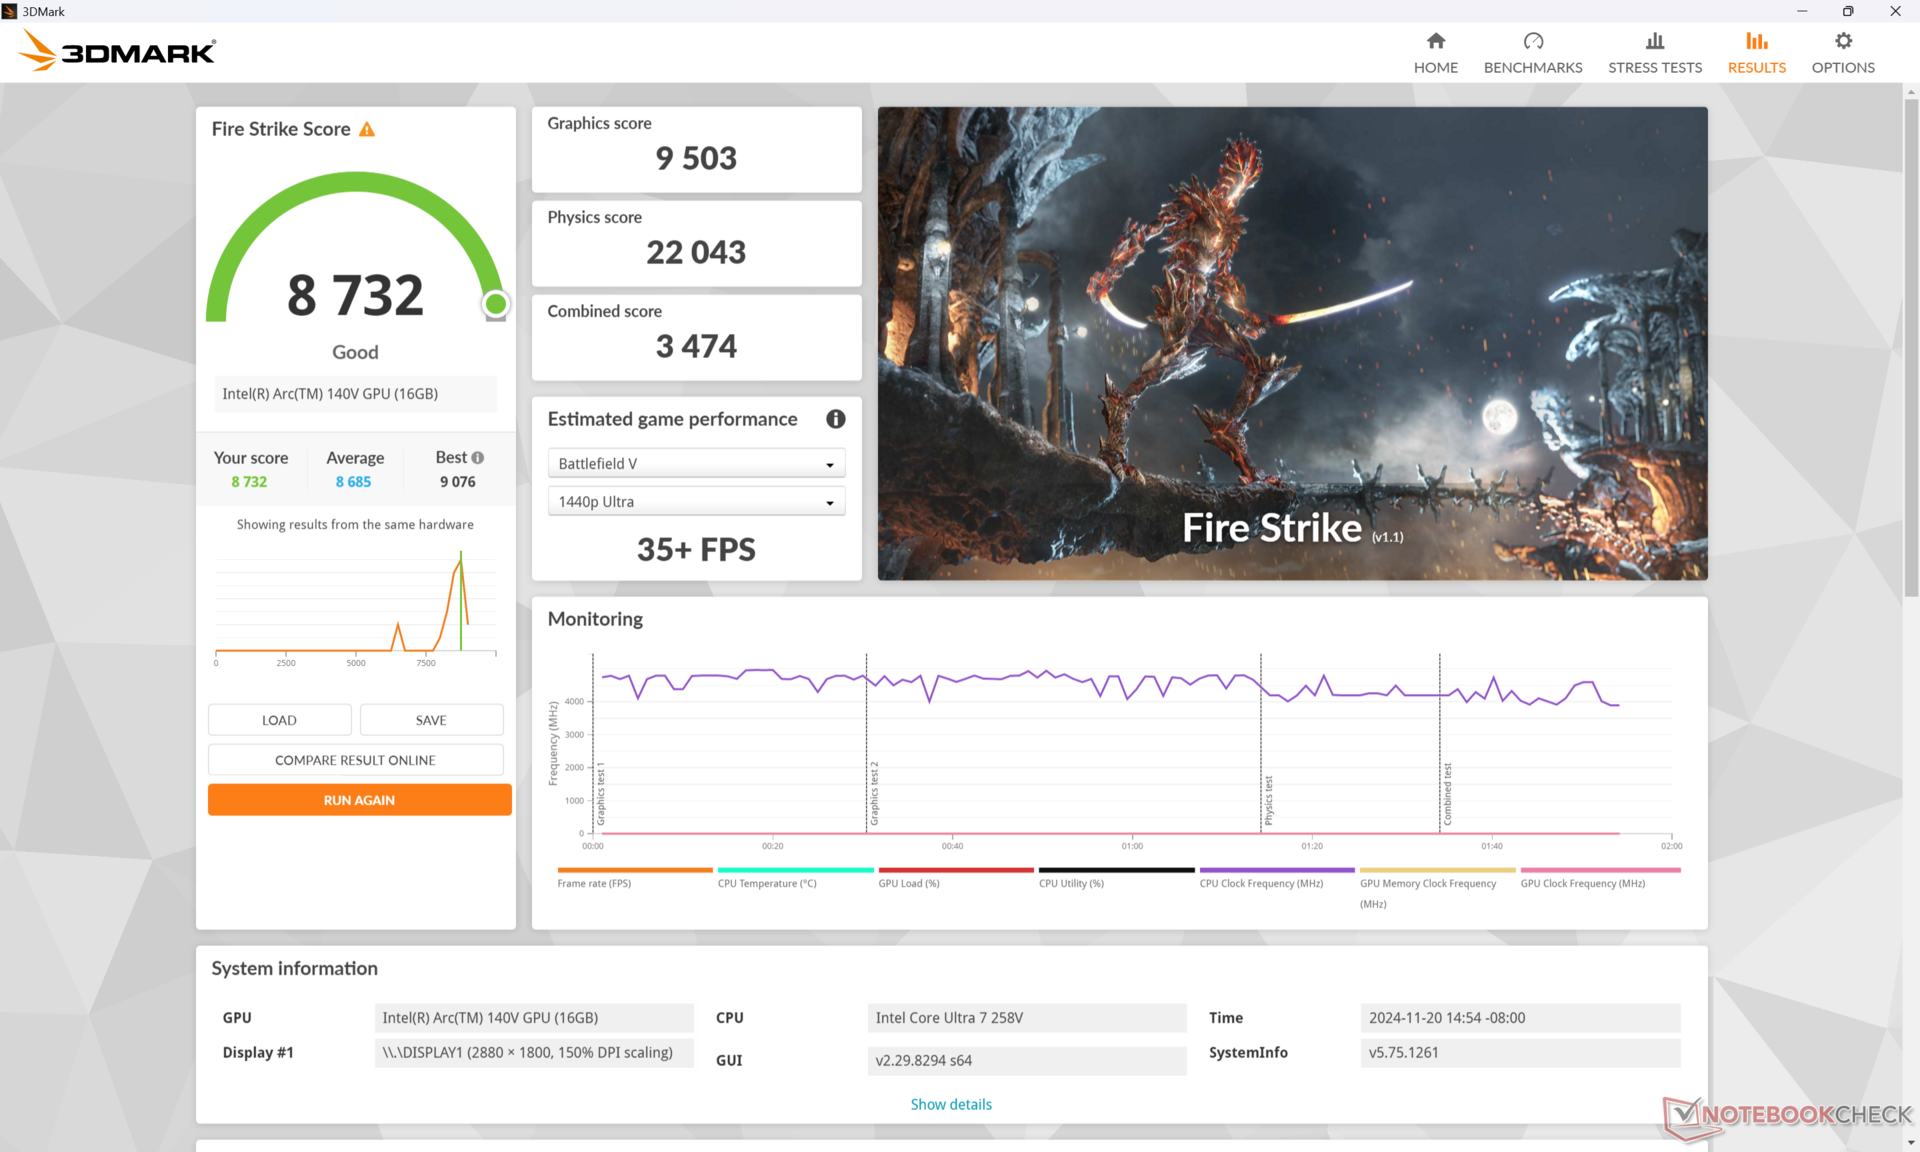
| Power Profile | Graphics Score | Physics Score | Combined Score |
| Performance Mode (Cooler Boost on) | 9513 | 21842 | 3426 |
| Performance Mode (Cooler Boost off) | 9503 | 22043 | 3474 |
| Balanced Mode | 9376 | 21037 | 3019 |
| Battery Power | 9471 | 21837 | 3440 |
Running the system with Cooler Boost enabled or on Balanced mode or even just battery power will not significantly impact performance as shown by our Fire Strike results table above.
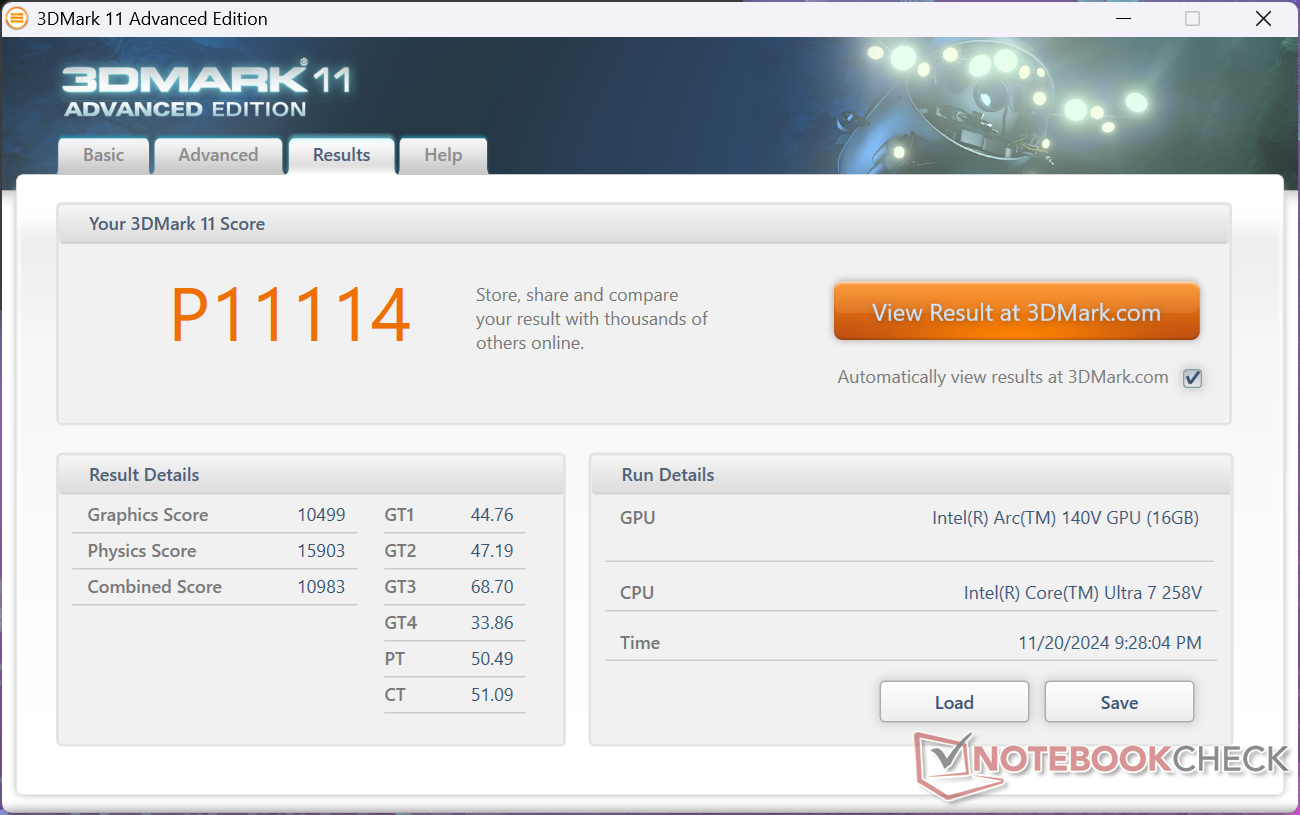

| 3DMark 11 Performance | 11114 points | |
| 3DMark Cloud Gate Standard Score | 33012 points | |
| 3DMark Fire Strike Score | 8732 points | |
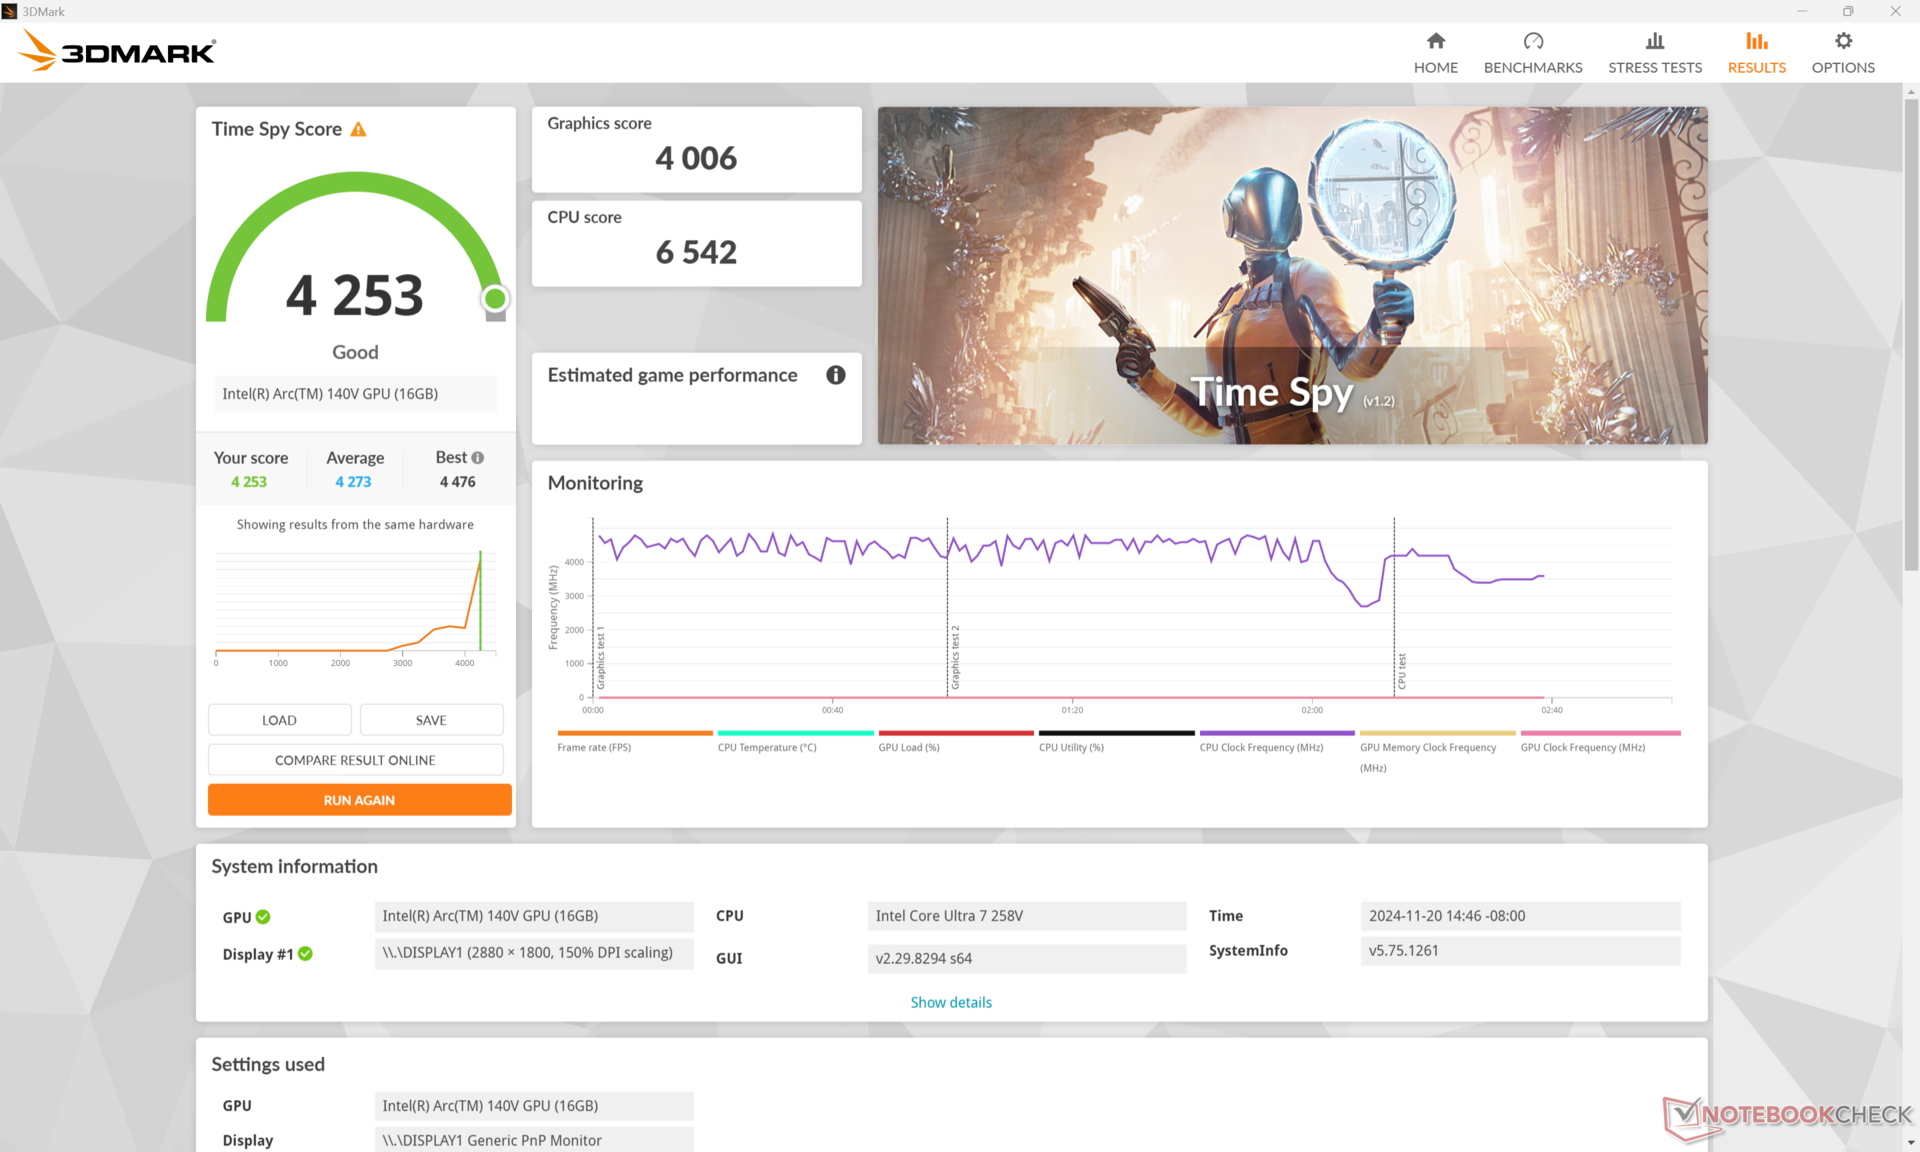
| 3DMark Time Spy Score | 4253 points | |
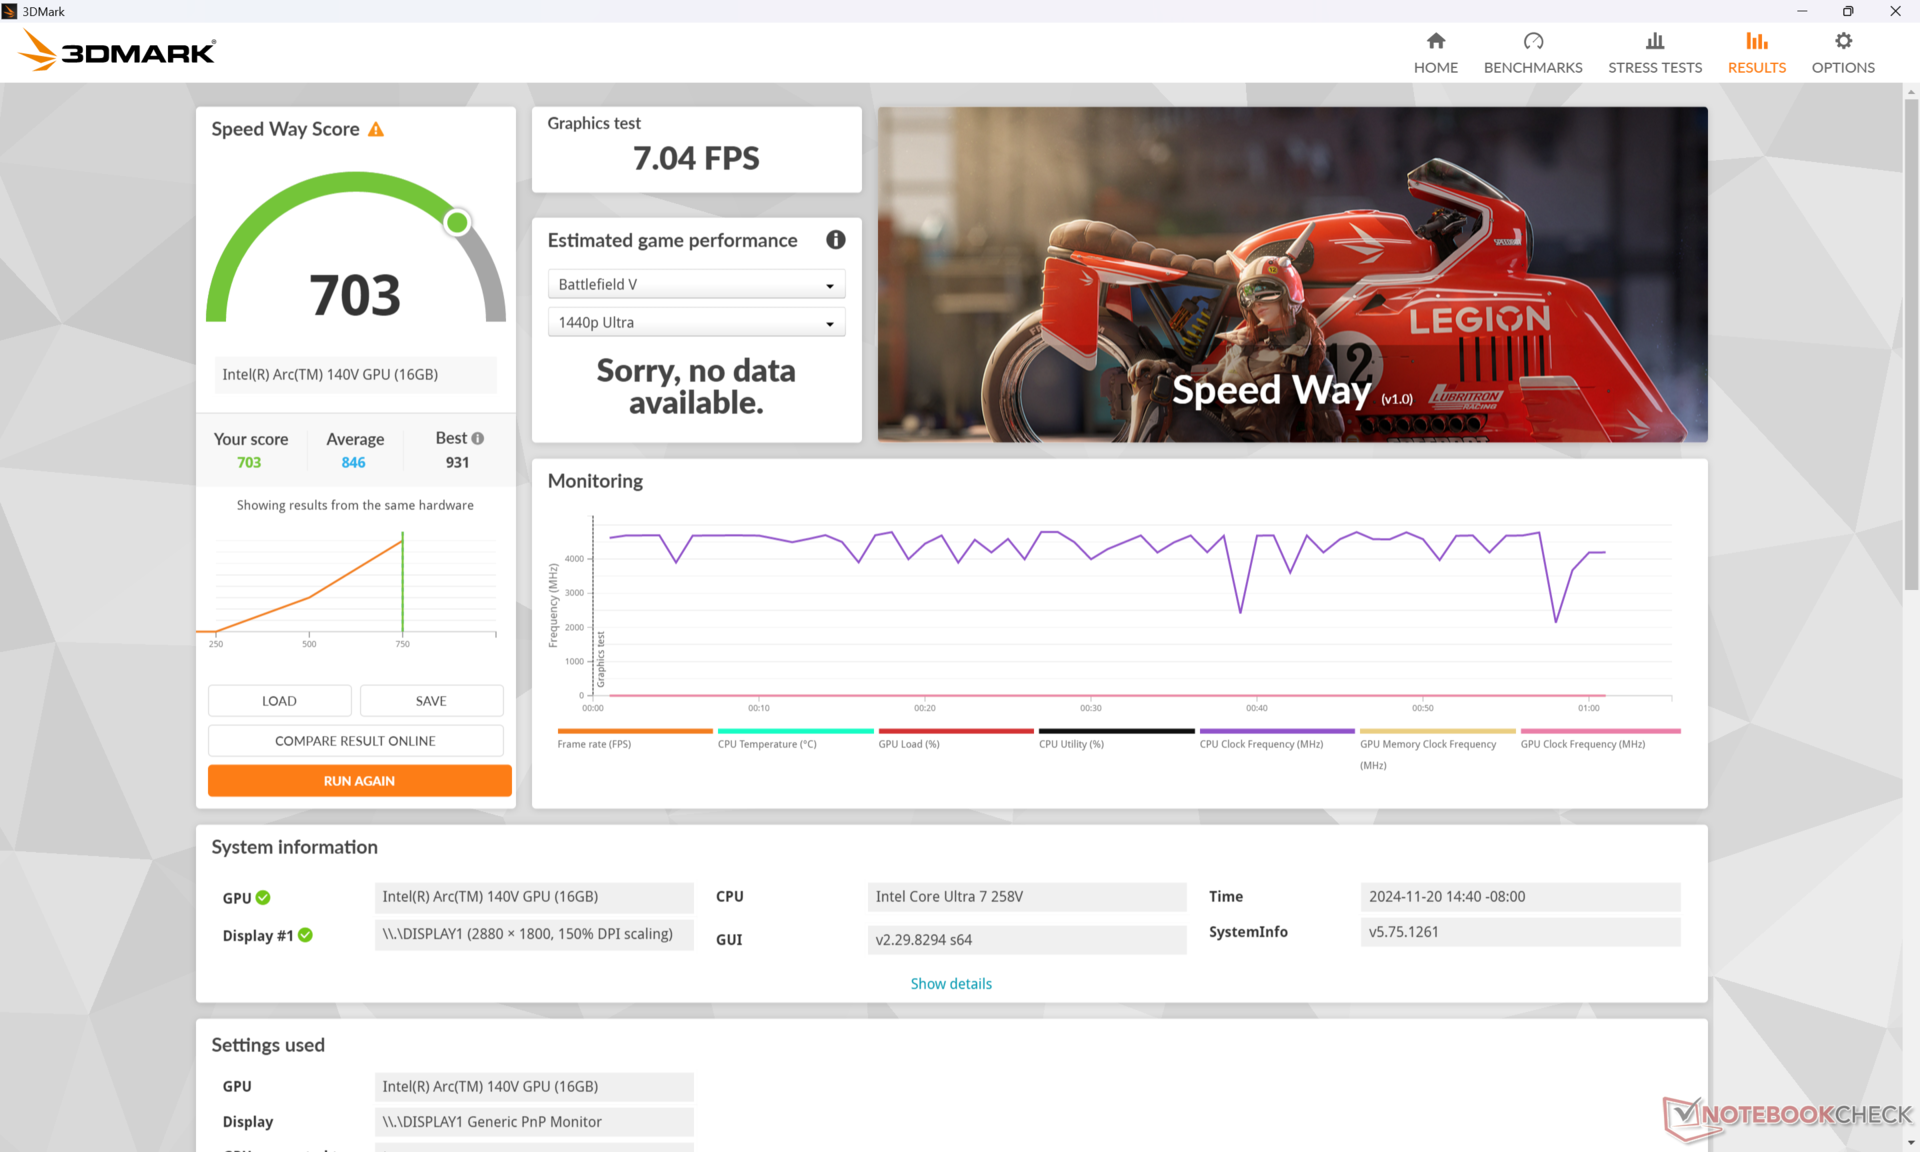
| 3DMark Steel Nomad Score | 681 points | |
Help | ||
* ... smaller is better
| Performance rating - Percent | |
| MSI Prestige 13 AI Plus Evo A2VMG | |
| Dell XPS 13 9350 | |
| Framework Laptop 13.5 Core Ultra 7 155H | |
| MSI Prestige 13 AI Evo -2! | |
| Lenovo Yoga Book 9 13IMU9 -2! | |
| HP Dragonfly G4 -2! | |
| Cyberpunk 2077 - 1920x1080 Ultra Preset (FSR off) | |
| MSI Prestige 13 AI Plus Evo A2VMG | |
| Framework Laptop 13.5 Core Ultra 7 155H | |
| Dell XPS 13 9350 | |
| Lenovo Yoga Book 9 13IMU9 | |
| Baldur's Gate 3 - 1920x1080 Ultra Preset AA:T | |
| MSI Prestige 13 AI Plus Evo A2VMG | |
| Framework Laptop 13.5 Core Ultra 7 155H | |
| Dell XPS 13 9350 | |
| GTA V - 1920x1080 Highest AA:4xMSAA + FX AF:16x | |
| MSI Prestige 13 AI Plus Evo A2VMG | |
| Dell XPS 13 9350 | |
| Framework Laptop 13.5 Core Ultra 7 155H | |
| HP Dragonfly G4 | |
| MSI Prestige 13 AI Evo | |
| Final Fantasy XV Benchmark - 1920x1080 High Quality | |
| MSI Prestige 13 AI Plus Evo A2VMG | |
| Dell XPS 13 9350 | |
| Framework Laptop 13.5 Core Ultra 7 155H | |
| MSI Prestige 13 AI Evo | |
| HP Dragonfly G4 | |
| Lenovo Yoga Book 9 13IMU9 | |
| Strange Brigade - 1920x1080 ultra AA:ultra AF:16 | |
| Dell XPS 13 9350 | |
| MSI Prestige 13 AI Plus Evo A2VMG | |
| Framework Laptop 13.5 Core Ultra 7 155H | |
| MSI Prestige 13 AI Evo | |
| Lenovo Yoga Book 9 13IMU9 | |
| HP Dragonfly G4 | |
| Dota 2 Reborn - 1920x1080 ultra (3/3) best looking | |
| MSI Prestige 13 AI Plus Evo A2VMG | |
| Dell XPS 13 9350 | |
| Framework Laptop 13.5 Core Ultra 7 155H | |
| Lenovo Yoga Book 9 13IMU9 | |
| HP Dragonfly G4 | |
| MSI Prestige 13 AI Evo | |
| X-Plane 11.11 - 1920x1080 high (fps_test=3) | |
| MSI Prestige 13 AI Plus Evo A2VMG | |
| Framework Laptop 13.5 Core Ultra 7 155H | |
| MSI Prestige 13 AI Evo | |
| Dell XPS 13 9350 | |
| HP Dragonfly G4 | |
| Lenovo Yoga Book 9 13IMU9 | |
Cyberpunk 2077 ultra FPS Chart
| low | med. | high | ultra | |
|---|---|---|---|---|
| GTA V (2015) | 161.6 | 155.6 | 67.4 | 26.7 |
| Dota 2 Reborn (2015) | 97.2 | 87.8 | 72.1 | 83 |
| Final Fantasy XV Benchmark (2018) | 84 | 46.2 | 31.7 | |
| X-Plane 11.11 (2018) | 56.6 | 42.6 | 36.9 | |
| Far Cry 5 (2018) | 92 | 57 | 49 | 45 |
| Strange Brigade (2018) | 216 | 74.6 | 63 | 55.4 |
| Tiny Tina's Wonderlands (2022) | 72.1 | 53.3 | 36 | 28 |
| F1 22 (2022) | 96.2 | 88.5 | 63.9 | 19.9 |
| Baldur's Gate 3 (2023) | 39.6 | 33.5 | 29.8 | 29.1 |
| Cyberpunk 2077 (2023) | 46.6 | 37.4 | 32.5 | 28.5 |
Emissions
System Noise
Fan noise is generally louder than before when running more demanding loads like games. Running Cyberpunk 2077 on Performance mode would induce a fan noise level of 45 dB(A) compared to almost 51 dB(A) if on Cooler Boost mode.
Noise level
| Idle |
| 24.8 / 24.8 / 26.7 dB(A) |
| Load |
| 36.8 / 50.8 dB(A) |
 | ||
30 dB silent 40 dB(A) audible 50 dB(A) loud |
||
min: | ||
| MSI Prestige 13 AI Plus Evo A2VMG Arc 140V, Core Ultra 7 258V | MSI Prestige 13 AI Evo Arc 8-Core, Ultra 7 155H, Samsung PM9A1 MZVL21T0HCLR | Dell XPS 13 9350 Arc 140V, Core Ultra 7 256V, Micron 2550 512GB | Framework Laptop 13.5 Core Ultra 7 155H Arc 8-Core, Ultra 7 155H | Lenovo Yoga Book 9 13IMU9 Graphics 4-Core iGPU (Arrow Lake), Ultra 7 155U | HP Dragonfly G4 Iris Xe G7 96EUs, i7-1365U, Micron 3400 MTFDKBA512TFH 512GB | |
|---|---|---|---|---|---|---|
| Noise | 6% | 11% | 1% | 16% | 12% | |
| off / environment * (dB) | 24.1 | 23.4 3% | 24.1 -0% | 24 -0% | 23.3 3% | 23.3 3% |
| Idle Minimum * (dB) | 24.8 | 23.4 6% | 24.4 2% | 24.1 3% | 23.3 6% | 23.5 5% |
| Idle Average * (dB) | 24.8 | 26.9 -8% | 24.4 2% | 25.1 -1% | 23.3 6% | 23.5 5% |
| Idle Maximum * (dB) | 26.7 | 26.9 -1% | 24.4 9% | 27 -1% | 24.6 8% | 26.8 -0% |
| Load Average * (dB) | 36.8 | 32 13% | 26.2 29% | 38.4 -4% | 26.2 29% | 27.2 26% |
| Cyberpunk 2077 ultra * (dB) | 44.5 | 34.2 23% | 43.7 2% | |||
| Load Maximum * (dB) | 50.8 | 40.3 21% | 45.2 11% | 45.8 10% | 27.3 46% | 35 31% |
| Witcher 3 ultra * (dB) | 32 | 27.3 | 32.7 |
* ... smaller is better
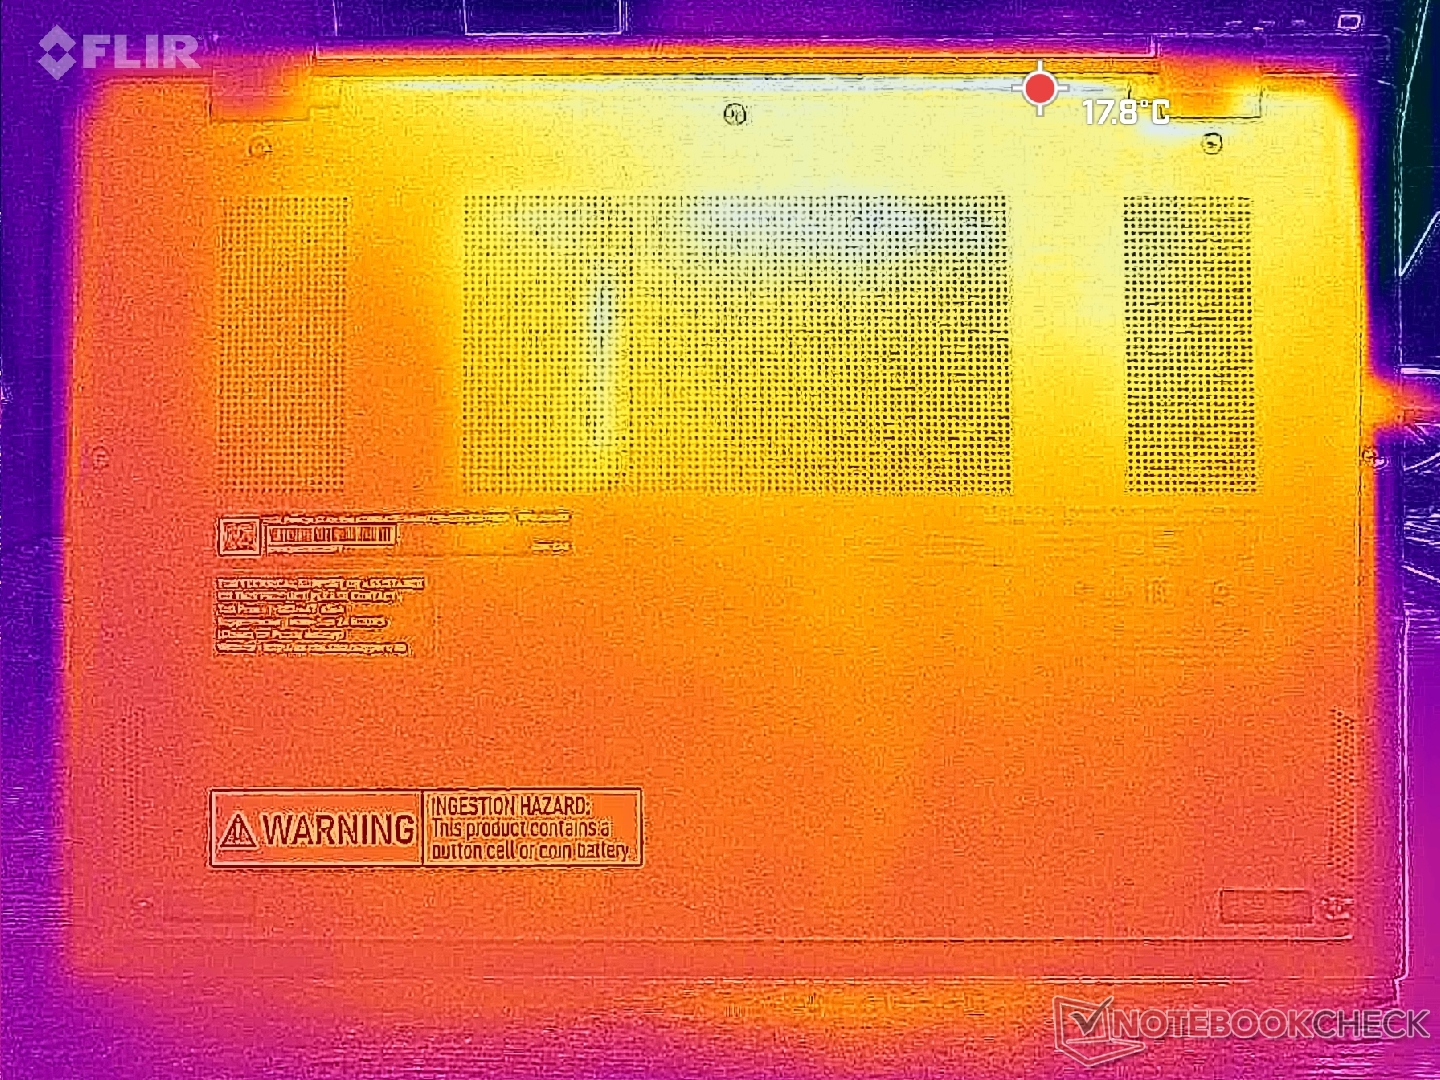
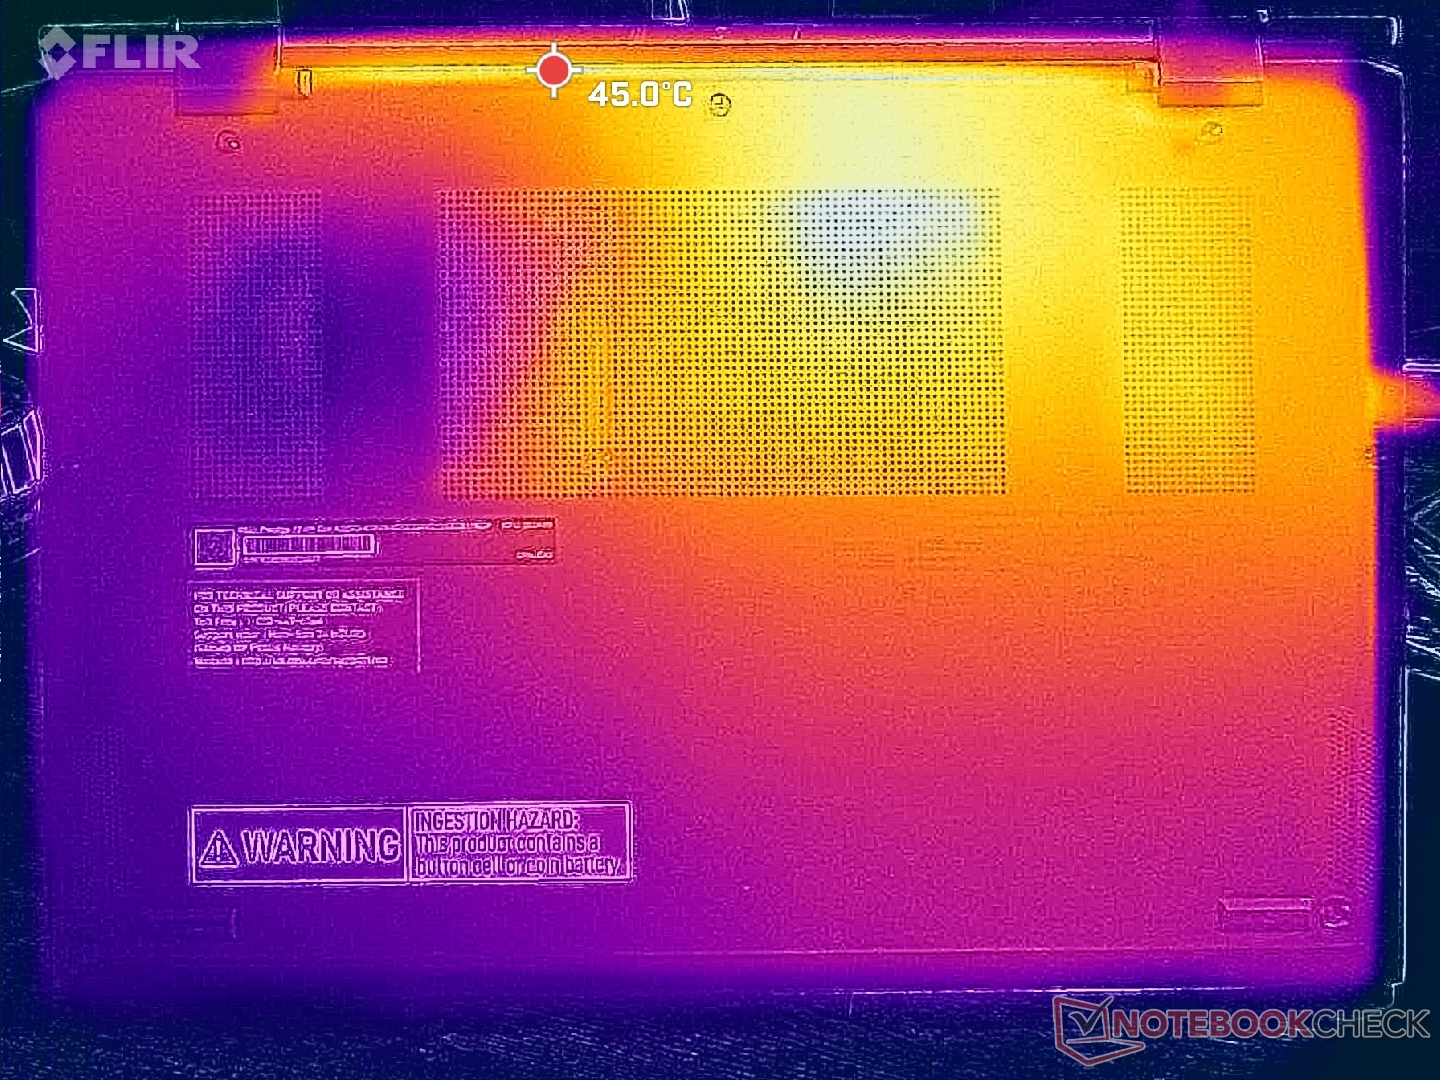
Temperature
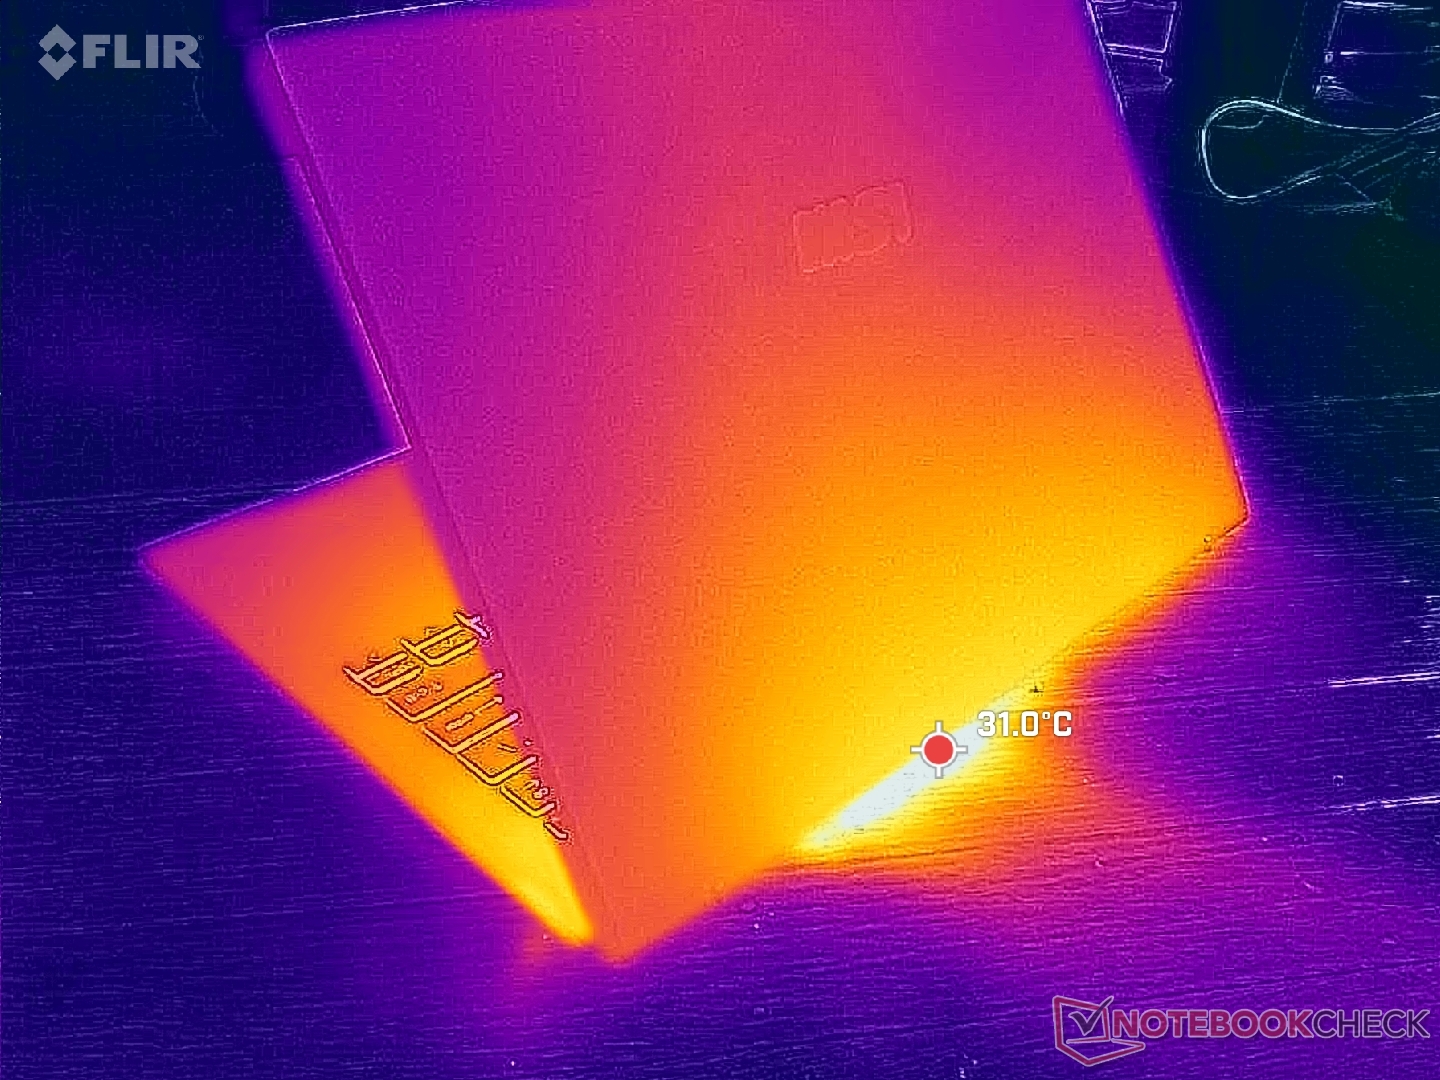
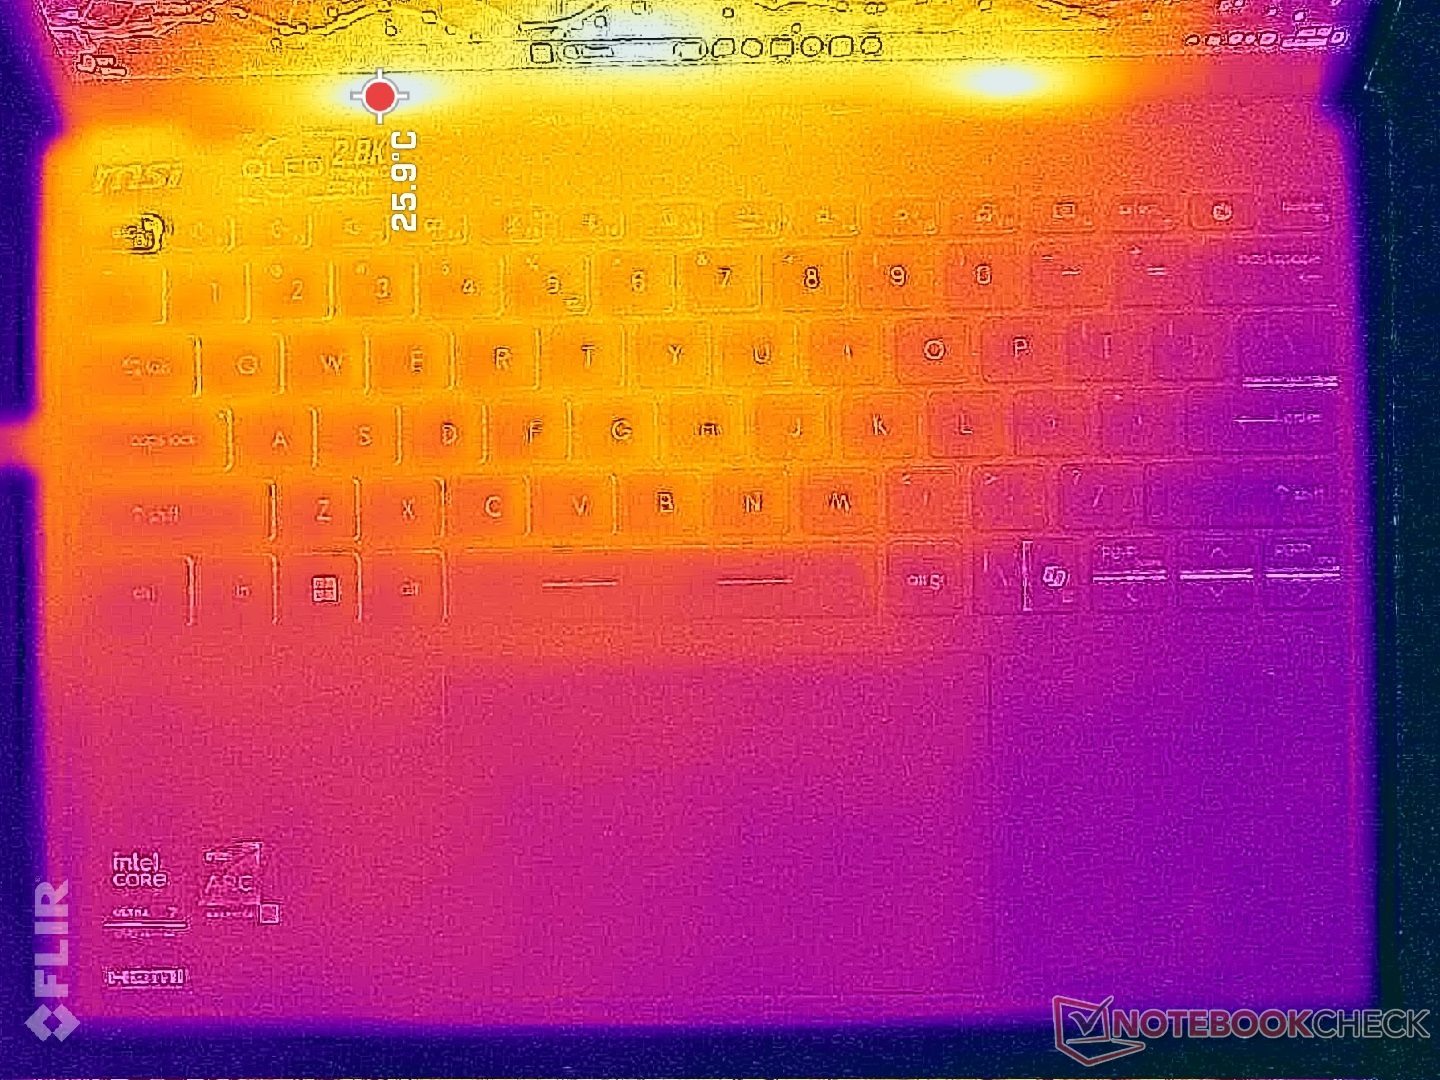
Surface temperatures are warmer on the left half of the chassis than the right. Hot spots are about as warm as on the original Prestige 13 AI despite the processor upgrade.
(±) The maximum temperature on the upper side is 43.4 °C / 110 F, compared to the average of 35.9 °C / 97 F, ranging from 21.4 to 59 °C for the class Subnotebook.
(±) The bottom heats up to a maximum of 42.4 °C / 108 F, compared to the average of 39.2 °C / 103 F
(+) In idle usage, the average temperature for the upper side is 23.4 °C / 74 F, compared to the device average of 30.8 °C / 87 F.
(+) The palmrests and touchpad are cooler than skin temperature with a maximum of 29.8 °C / 85.6 F and are therefore cool to the touch.
(±) The average temperature of the palmrest area of similar devices was 28.2 °C / 82.8 F (-1.6 °C / -2.8 F).

| MSI Prestige 13 AI Plus Evo A2VMG Intel Core Ultra 7 258V, Intel Arc Graphics 140V | MSI Prestige 13 AI Evo Intel Core Ultra 7 155H, Intel Arc 8-Core iGPU | Dell XPS 13 9350 Intel Core Ultra 7 256V, Intel Arc Graphics 140V | Framework Laptop 13.5 Core Ultra 7 155H Intel Core Ultra 7 155H, Intel Arc 8-Core iGPU | Lenovo Yoga Book 9 13IMU9 Intel Core Ultra 7 155U, Intel Graphics 4-Core iGPU (Meteor / Arrow Lake) | HP Dragonfly G4 Intel Core i7-1365U, Intel Iris Xe Graphics G7 96EUs | |
|---|---|---|---|---|---|---|
| Heat | 3% | 8% | -6% | -9% | -2% | |
| Maximum Upper Side * (°C) | 43.4 | 40.9 6% | 34.8 20% | 42.8 1% | 39.2 10% | 38.6 11% |
| Maximum Bottom * (°C) | 42.4 | 40.4 5% | 37.4 12% | 45.2 -7% | 41 3% | 40.4 5% |
| Idle Upper Side * (°C) | 25.4 | 25 2% | 25.4 -0% | 27.2 -7% | 32.2 -27% | 28.2 -11% |
| Idle Bottom * (°C) | 25.6 | 25.5 -0% | 26.2 -2% | 28.6 -12% | 31.6 -23% | 29 -13% |
* ... smaller is better
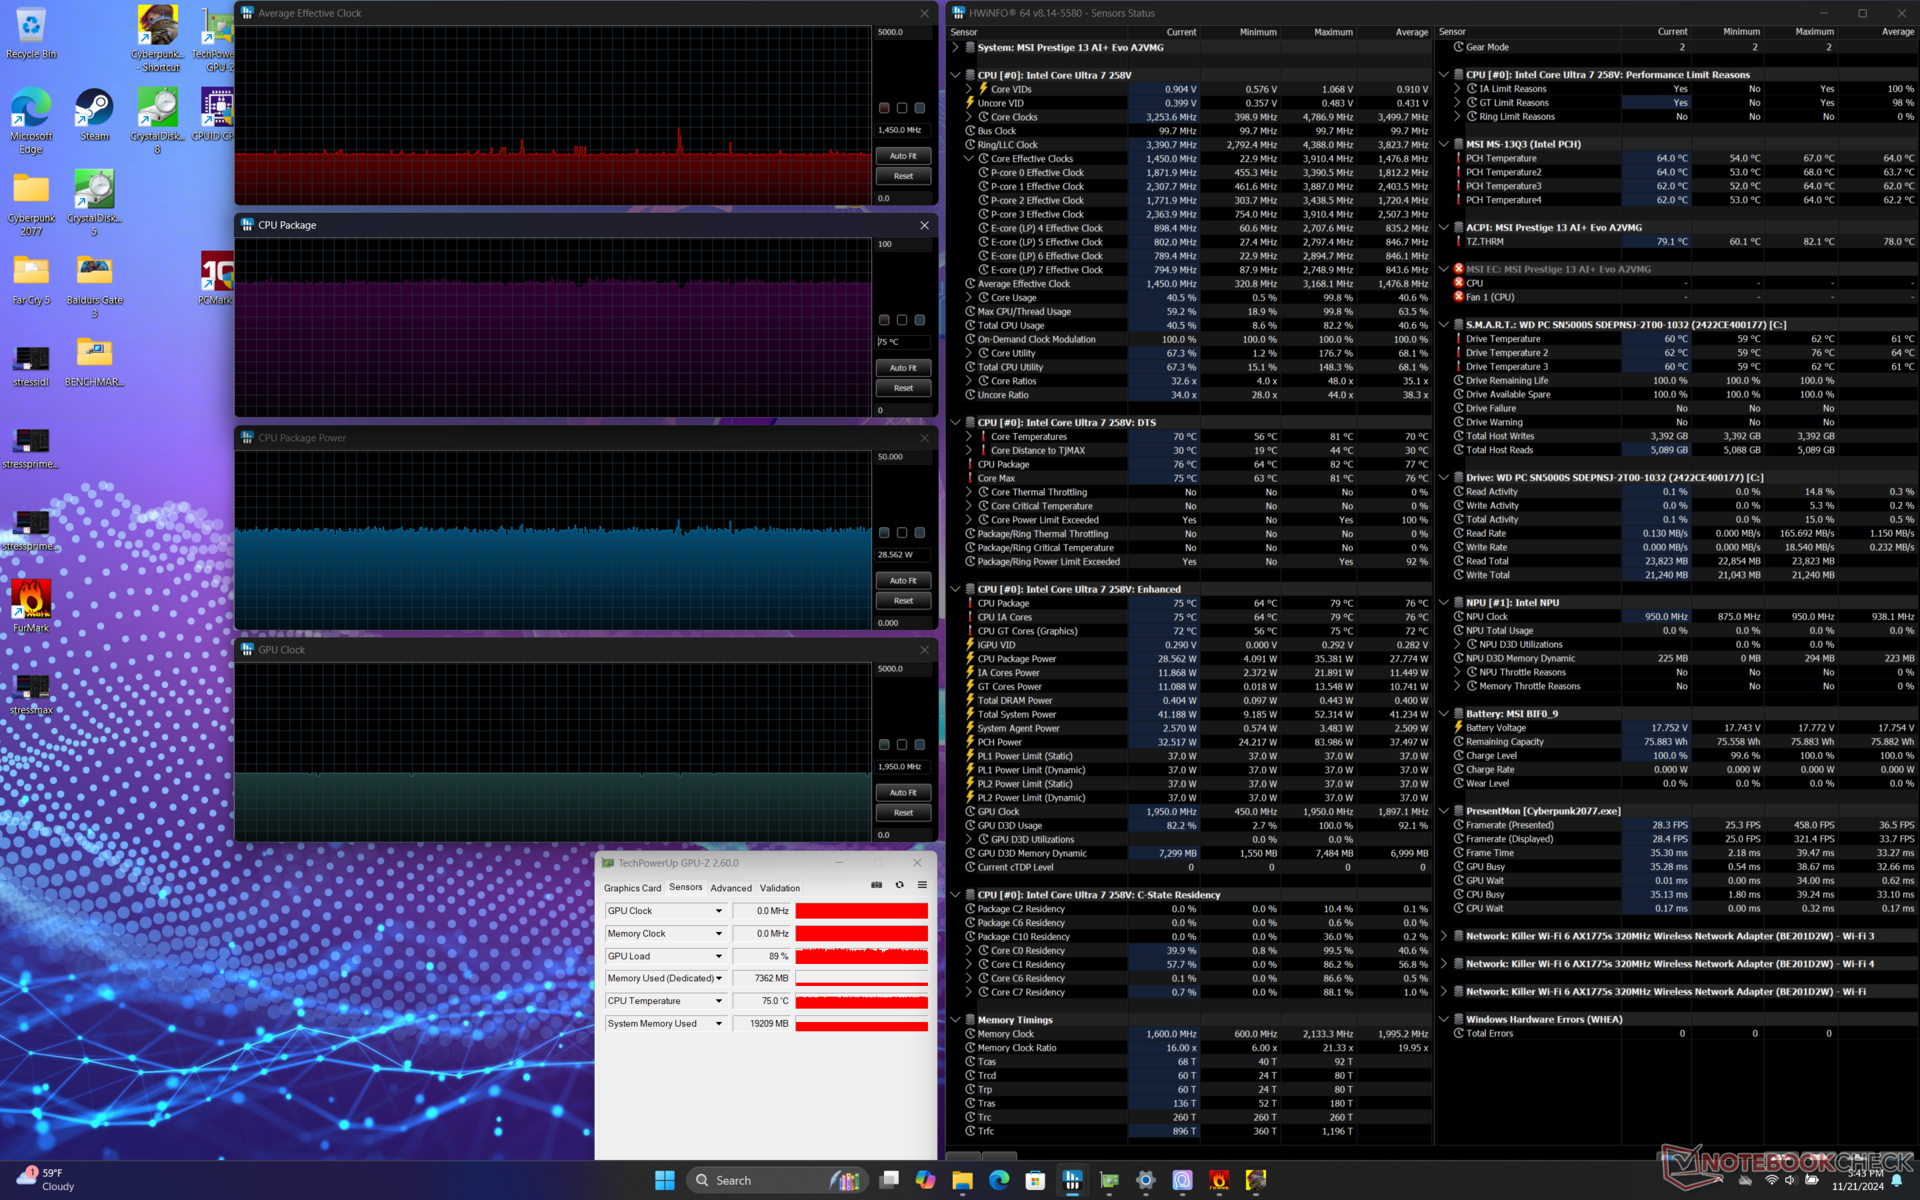
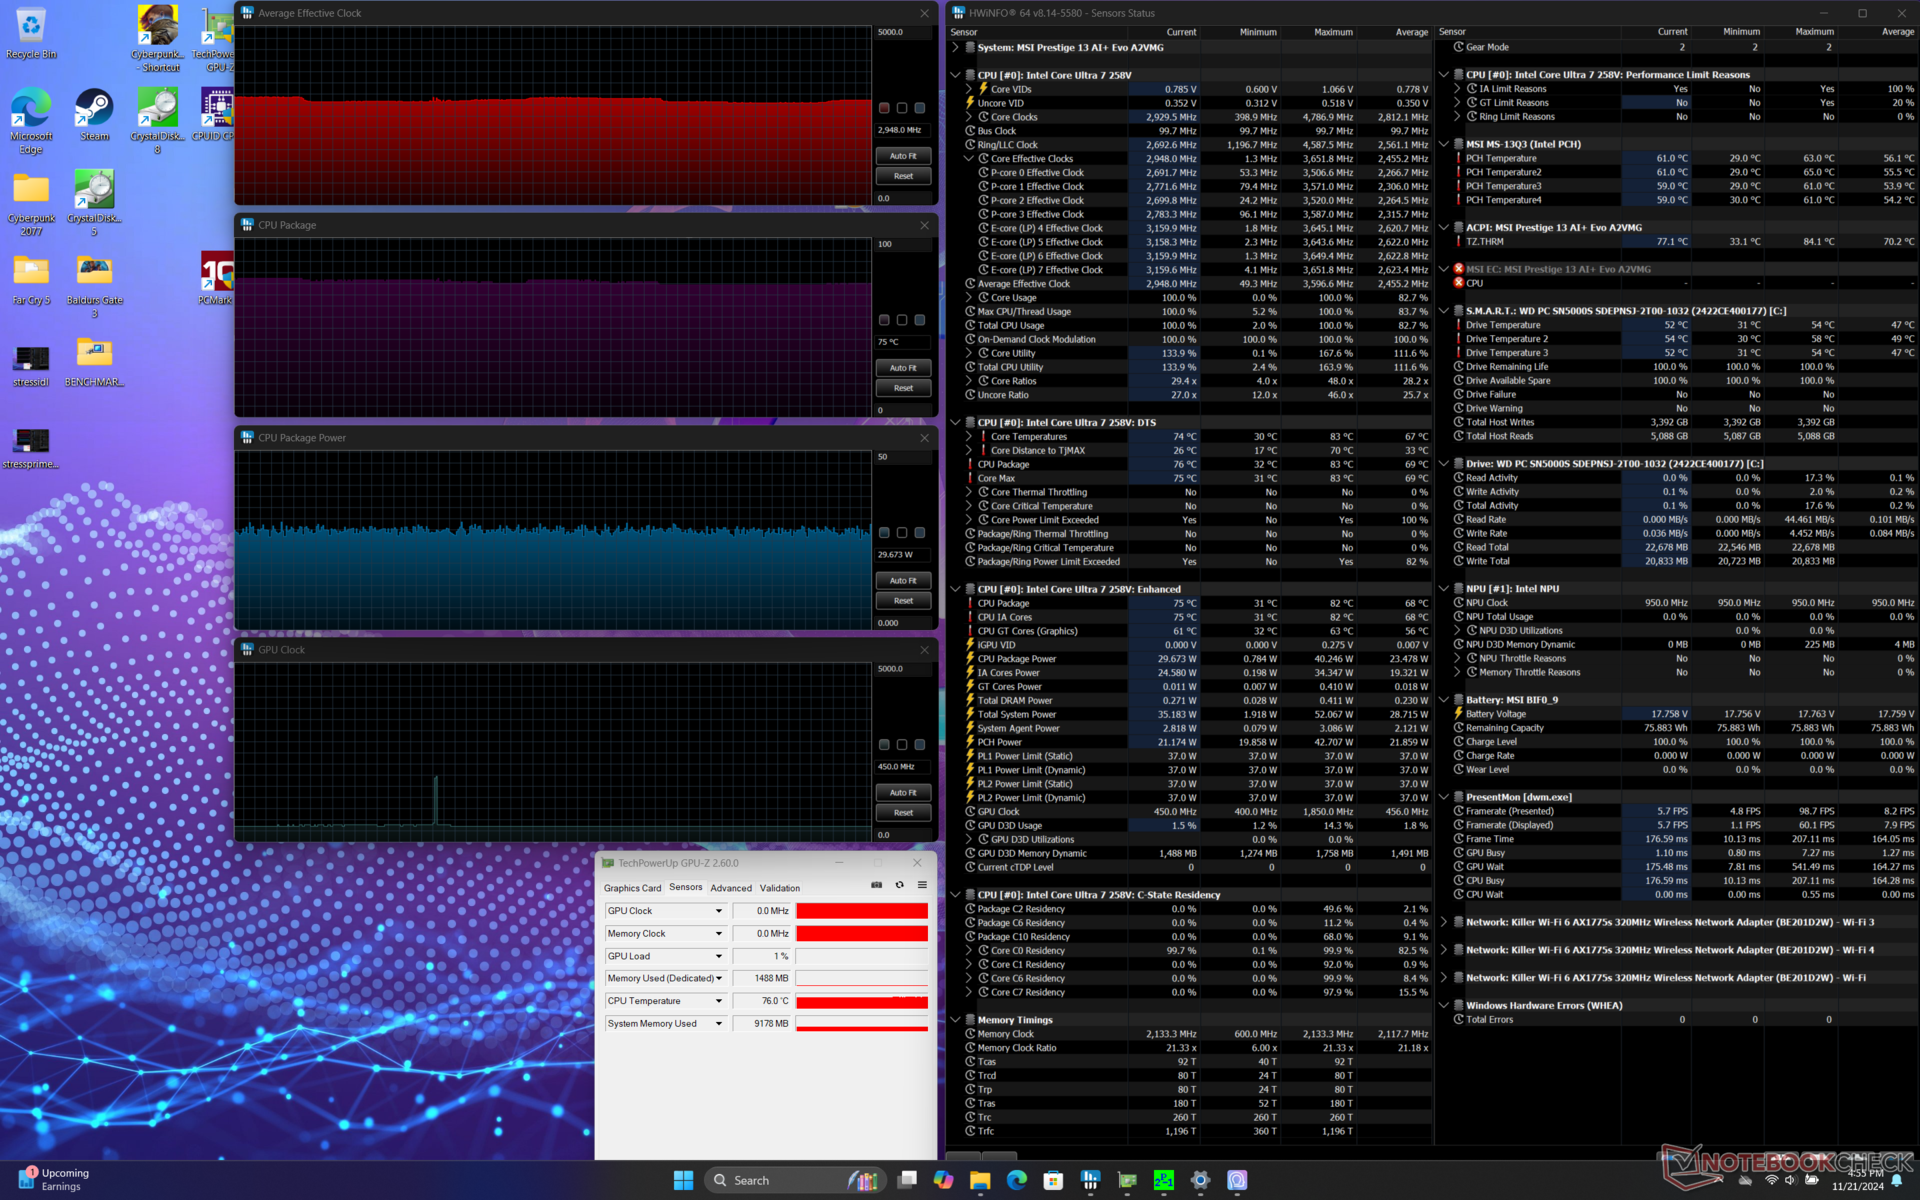
Stress Test

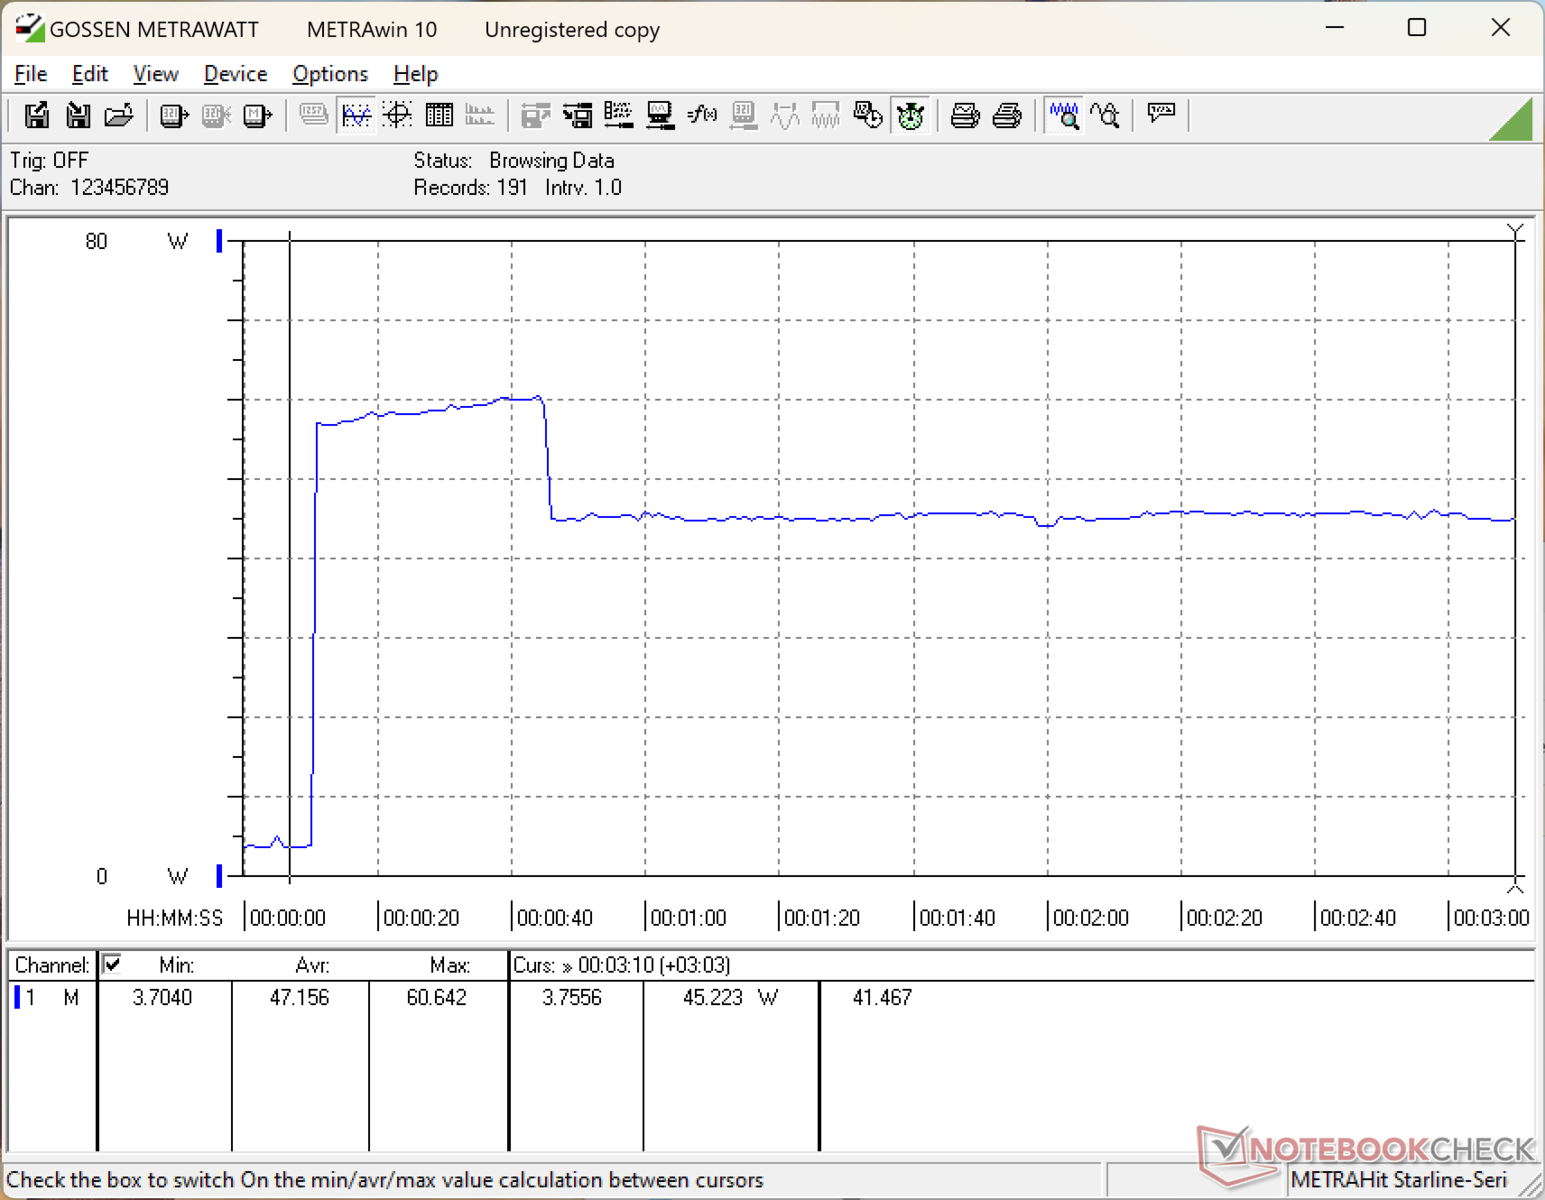
When running Prime95 stress, the CPU would boost to 3.6 GHz, 40 W, and 82 C lasting for about 30 seconds. Afterwards, it would swiftly drop and stabilize at 2.9 GHz and 27 W in order to maintain a cooler core temperature of 77 C. If Cooler Boost is enabled, core temperature would drop slightly while clock rates would remain almost the same.
If gaming, core temperature would stabilize at 75 C compared to 71 C on the Dell XPS 13 with a similar Lunar Lake CPU.


| Average CPU Clock (GHz) | GPU Clock (MHz) | Average CPU Temperature (°C) | |
| System Idle | -- | 400 | 32 |
| Prime95 Stress (Cooler Boost off) | 2.9 | -- | 77 |
| Prime95 Stress (Cooler Boost on) | 3.0 | -- | 75 |
| Prime95 + FurMark Stress | 1.6 | 1800 | 76 |
| Cyberpunk 2077 Stress | 1.5 | 1950 | 75 |
Speakers
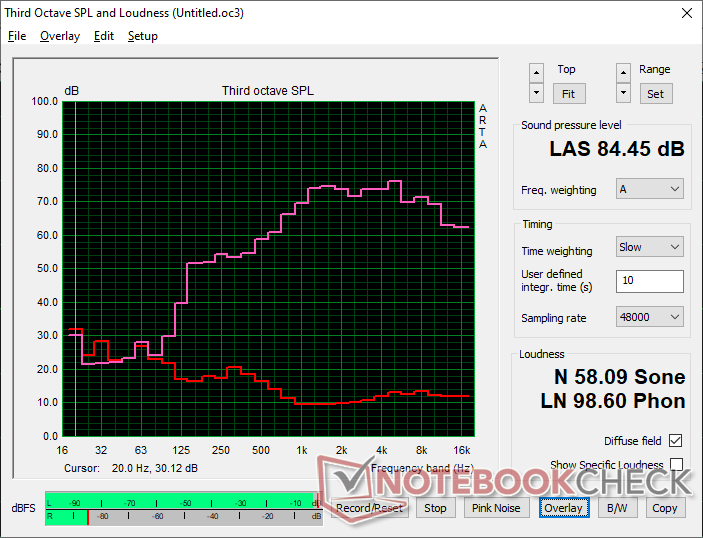
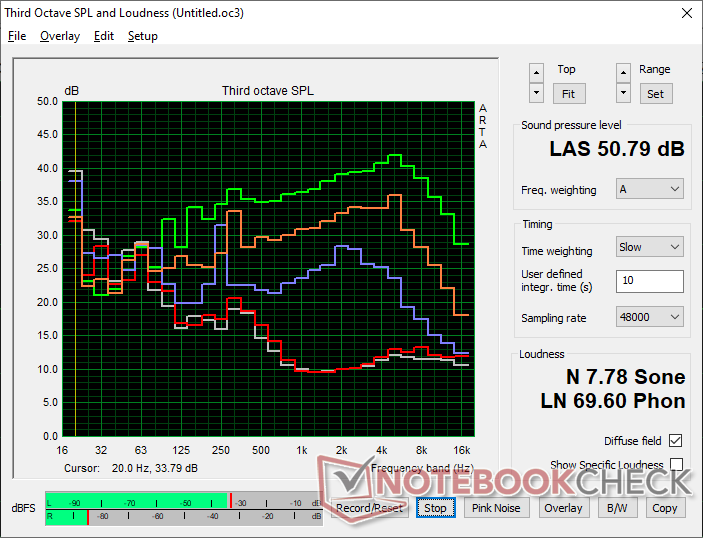
MSI Prestige 13 AI Plus Evo A2VMG audio analysis
(+) | speakers can play relatively loud (84.5 dB)
Bass 100 - 315 Hz
(-) | nearly no bass - on average 19.4% lower than median
(±) | linearity of bass is average (9.6% delta to prev. frequency)
Mids 400 - 2000 Hz
(±) | higher mids - on average 6.4% higher than median
(+) | mids are linear (5.1% delta to prev. frequency)
Highs 2 - 16 kHz
(±) | higher highs - on average 6.1% higher than median
(+) | highs are linear (4.6% delta to prev. frequency)
Overall 100 - 16.000 Hz
(±) | linearity of overall sound is average (18.2% difference to median)
Compared to same class
» 52% of all tested devices in this class were better, 7% similar, 41% worse
» The best had a delta of 5%, average was 18%, worst was 53%
Compared to all devices tested
» 39% of all tested devices were better, 8% similar, 53% worse
» The best had a delta of 4%, average was 24%, worst was 134%
Apple MacBook Pro 16 2021 M1 Pro audio analysis
(+) | speakers can play relatively loud (84.7 dB)
Bass 100 - 315 Hz
(+) | good bass - only 3.8% away from median
(+) | bass is linear (5.2% delta to prev. frequency)
Mids 400 - 2000 Hz
(+) | balanced mids - only 1.3% away from median
(+) | mids are linear (2.1% delta to prev. frequency)
Highs 2 - 16 kHz
(+) | balanced highs - only 1.9% away from median
(+) | highs are linear (2.7% delta to prev. frequency)
Overall 100 - 16.000 Hz
(+) | overall sound is linear (4.6% difference to median)
Compared to same class
» 0% of all tested devices in this class were better, 0% similar, 100% worse
» The best had a delta of 5%, average was 17%, worst was 45%
Compared to all devices tested
» 0% of all tested devices were better, 0% similar, 100% worse
» The best had a delta of 4%, average was 24%, worst was 134%
Energy Management
Power Consumption
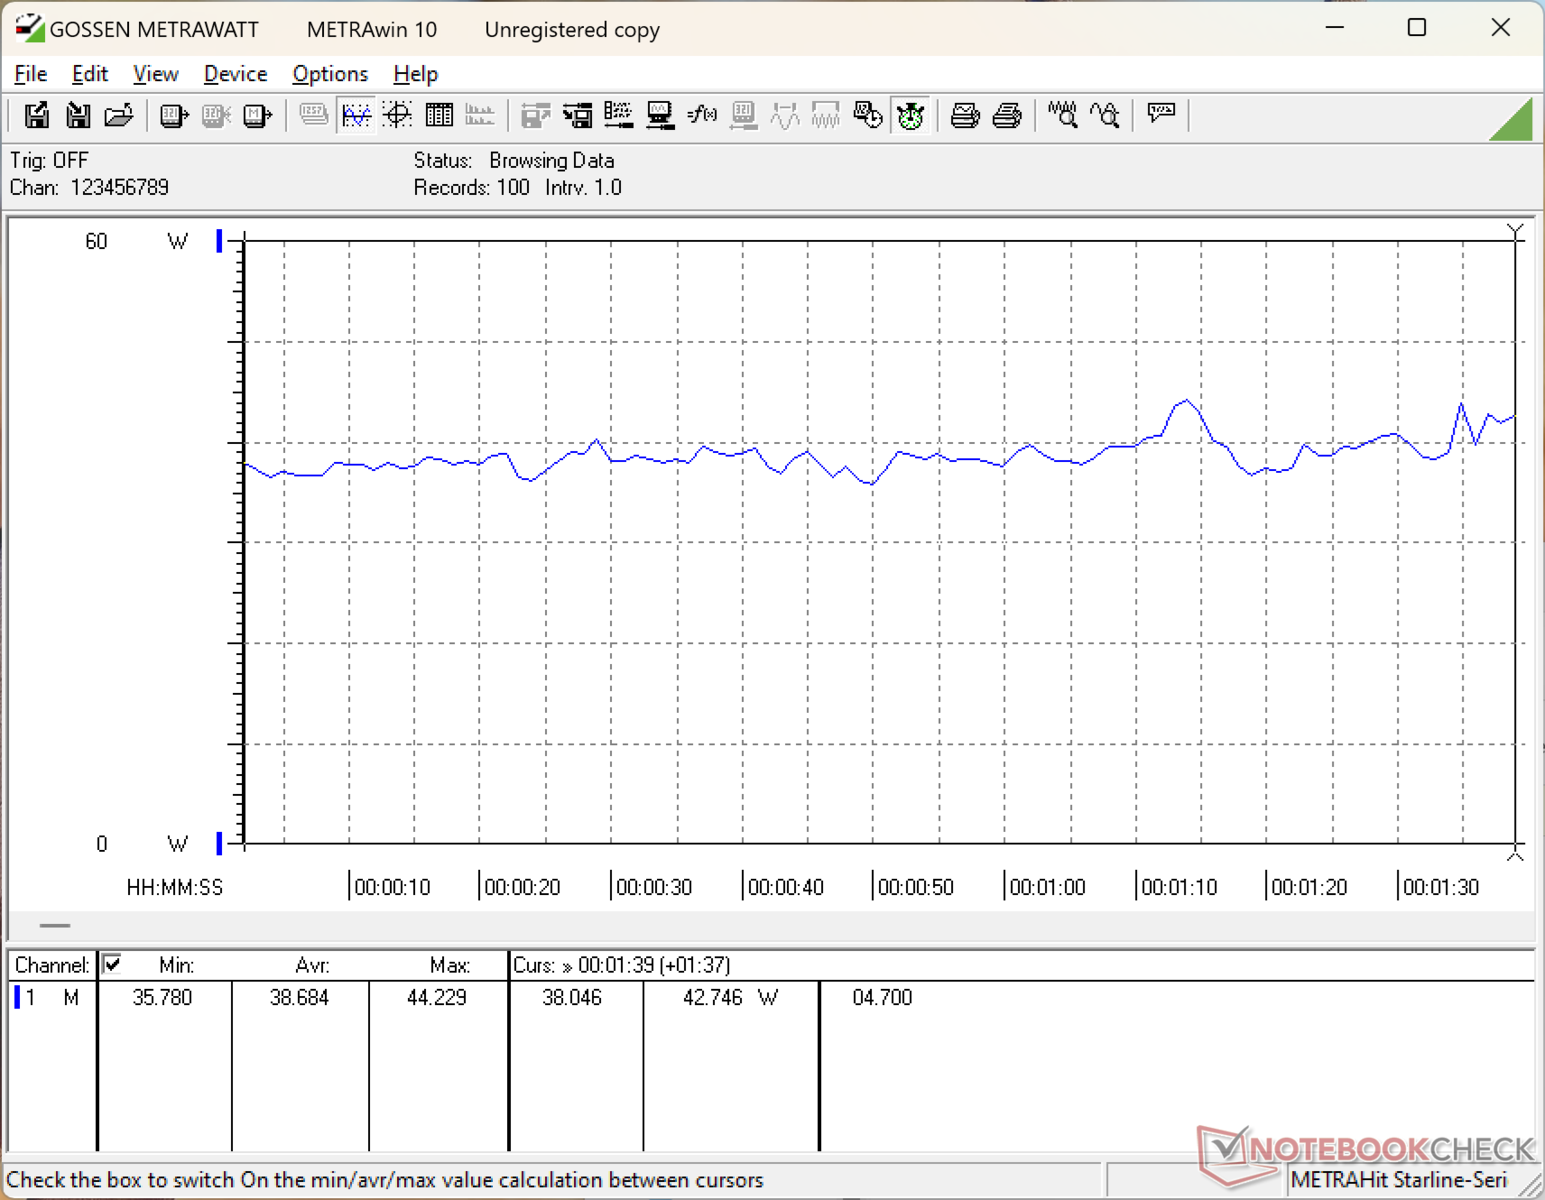
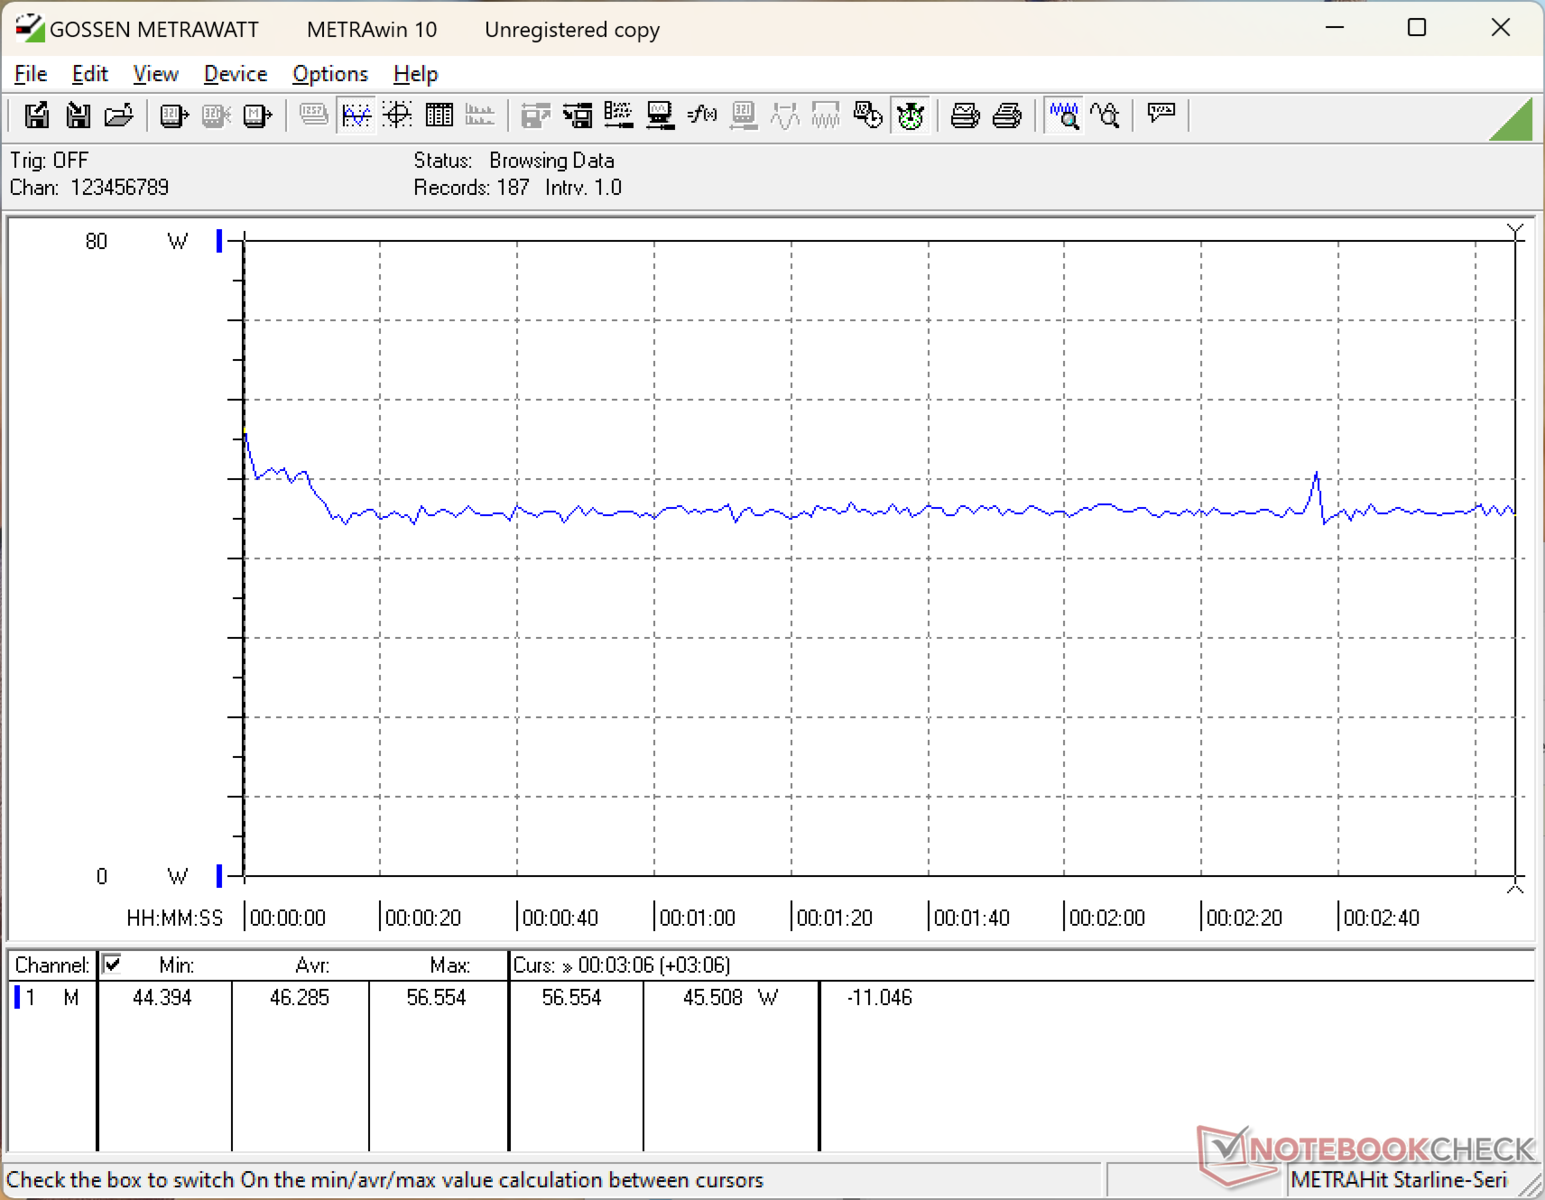
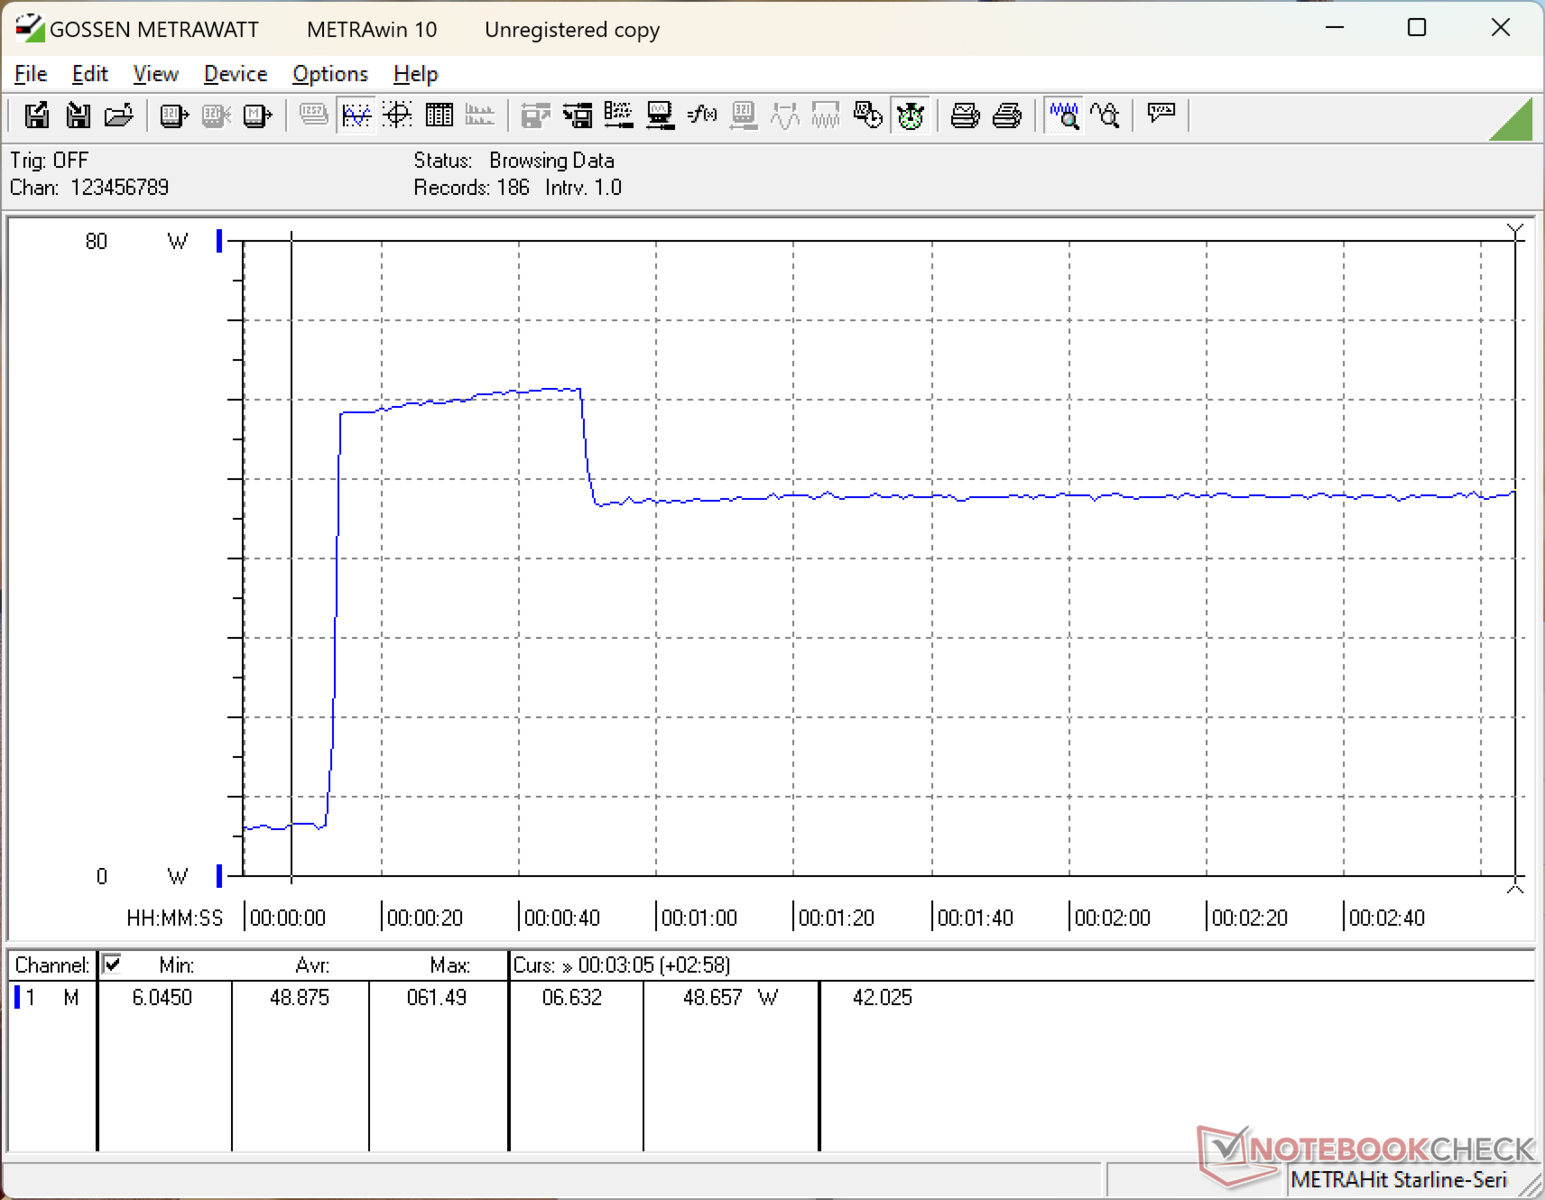
The system becomes more demanding than the Core Ultra 7 155H configuration when running CPU-heavy tasks over longer periods since it doesn't throttle as heavily. Consumption is also higher by about 50 percent when gaming which aligns with the much faster graphics performance.
| Off / Standby | |
| Idle | |
| Load |
|
Key:
min: | |
| MSI Prestige 13 AI Plus Evo A2VMG Core Ultra 7 258V, Arc 140V, , OLED, 2880x1800, 13.3" | MSI Prestige 13 AI Evo Ultra 7 155H, Arc 8-Core, Samsung PM9A1 MZVL21T0HCLR, OLED, 2880x1800, 13.3" | Dell XPS 13 9350 Core Ultra 7 256V, Arc 140V, Micron 2550 512GB, IPS, 1920x1200, 13.4" | Framework Laptop 13.5 Core Ultra 7 155H Ultra 7 155H, Arc 8-Core, , IPS, 2880x1920, 13.5" | Lenovo Yoga Book 9 13IMU9 Ultra 7 155U, Graphics 4-Core iGPU (Arrow Lake), , OLED, 2880x1800, 13.3" | HP Dragonfly G4 i7-1365U, Iris Xe G7 96EUs, Micron 3400 MTFDKBA512TFH 512GB, IPS, 1920x1280, 13.5" | |
|---|---|---|---|---|---|---|
| Power Consumption | -10% | 27% | 4% | -56% | -5% | |
| Idle Minimum * (Watt) | 3.5 | 4.5 -29% | 1.3 63% | 2.5 29% | 7.1 -103% | 4.1 -17% |
| Idle Average * (Watt) | 5.9 | 8 -36% | 2.5 58% | 5.2 12% | 9.1 -54% | 7.5 -27% |
| Idle Maximum * (Watt) | 10 | 8.7 13% | 4.1 59% | 5.8 42% | 18.4 -84% | 8.2 18% |
| Load Average * (Watt) | 38.7 | 36.1 7% | 40.1 -4% | 47.5 -23% | 51.3 -33% | 35.5 8% |
| Cyberpunk 2077 ultra external monitor * (Watt) | 45.6 | 43.1 5% | 52.4 -15% | |||
| Cyberpunk 2077 ultra * (Watt) | 46.3 | 46.1 -0% | 54.5 -18% | |||
| Load Maximum * (Watt) | 61.5 | 65 -6% | 57.3 7% | 61.5 -0% | 65.5 -7% | 66.5 -8% |
| Witcher 3 ultra * (Watt) | 29.7 | 41.5 | 37.5 |
* ... smaller is better
Power Consumption Cyberpunk / Stress Test
Power Consumption external Monitor
Battery Life
Runtimes are almost two hours longer than the Core Ultra 7 155H configuration owing to the more efficient Lunar Lake processor.
| MSI Prestige 13 AI Plus Evo A2VMG Core Ultra 7 258V, Arc 140V, 75 Wh | MSI Prestige 13 AI Evo Ultra 7 155H, Arc 8-Core, 75 Wh | Dell XPS 13 9350 Core Ultra 7 256V, Arc 140V, 55 Wh | Framework Laptop 13.5 Core Ultra 7 155H Ultra 7 155H, Arc 8-Core, 61 Wh | Lenovo Yoga Book 9 13IMU9 Ultra 7 155U, Graphics 4-Core iGPU (Arrow Lake), 80 Wh | HP Dragonfly G4 i7-1365U, Iris Xe G7 96EUs, 68 Wh | |
|---|---|---|---|---|---|---|
| Battery runtime | -13% | 54% | -22% | -25% | 19% | |
| WiFi v1.3 (h) | 13.4 | 11.6 -13% | 20.6 54% | 10.5 -22% | 10.1 -25% | 15.9 19% |
| H.264 (h) | 16.7 | |||||
| Load (h) | 2.8 | 2.4 | 1.5 | 3.2 | ||
| Reader / Idle (h) | 56.8 | 38.3 | 42.5 |
Notebookcheck Rating
MSI Prestige 13 AI Plus Evo A2VMG
- 11/26/2024 v8
Allen Ngo
 Total Sustainability Score:
 Transparency
The selection of devices to be reviewed is made by our editorial team. The test sample was provided to the author as a loan by the manufacturer or retailer for the purpose of this review. The lender had no influence on this review, nor did the manufacturer receive a copy of this review before publication. There was no obligation to publish this review. As an independent media company, Notebookcheck is not subjected to the authority of manufacturers, retailers or publishers.
This is how Notebookcheck is testing
Every year, Notebookcheck independently reviews hundreds of laptops and smartphones using standardized procedures to ensure that all results are comparable. We have continuously developed our test methods for around 20 years and set industry standards in the process. In our test labs, high-quality measuring equipment is utilized by experienced technicians and editors. These tests involve a multi-stage validation process. Our complex rating system is based on hundreds of well-founded measurements and benchmarks, which maintains objectivity. Further information on our test methods can be found here.
