Verdict
As mentioned at the beginning, the MSI Prestige 13 AI+ impresses above all with its slim design combined with its very low weight. At just under 900 g, it is significantly lighter than many competitors, which usually weigh more than 1 kg and often approach 1.5 kg. As a result, the 13-inch model is very easy to carry around.
Thanks to the efficient Panther Lake CPU, which does lose some performance under prolonged load, emissions remain reasonably well controlled despite the compact dimensions. Battery life proves to be another strength, although almost all rivals also perform well in this area. The Prestige 13 AI+ once again sets itself apart from the crowd with its fast card reader, strong Wi-Fi 7 module, and two Thunderbolt 4 ports. MSI should improve the sound, as the speakers are rather mediocre, as well as the keyboard layout and the size of some keys.
The Prestige 13 AI+ competes with other subnotebooks featuring current Panther Lake chips, such as the Lenovo Yoga Slim 7 14 (Core Ultra 7 355), the Lenovo IdeaPad 5i 2-in-1 14 (Core Ultra 5 322) or the Honor MagicBook Pro 14 (Core Ultra 5 338H). On the AMD side, devices with the Ryzen AI 7 350 are suitable comparisons, such as the Asus ZenBook 14 OLED. On the Snapdragon side, the ZenBook A14 is a relevant alternative.
Pros
Cons
Price and availability
The tested Prestige 13 AI+ A3MG is available from various online retailers starting at around 1,600 euros (approx. $1,847).
Specifications
Case, connectivity, maintenance, and input devices
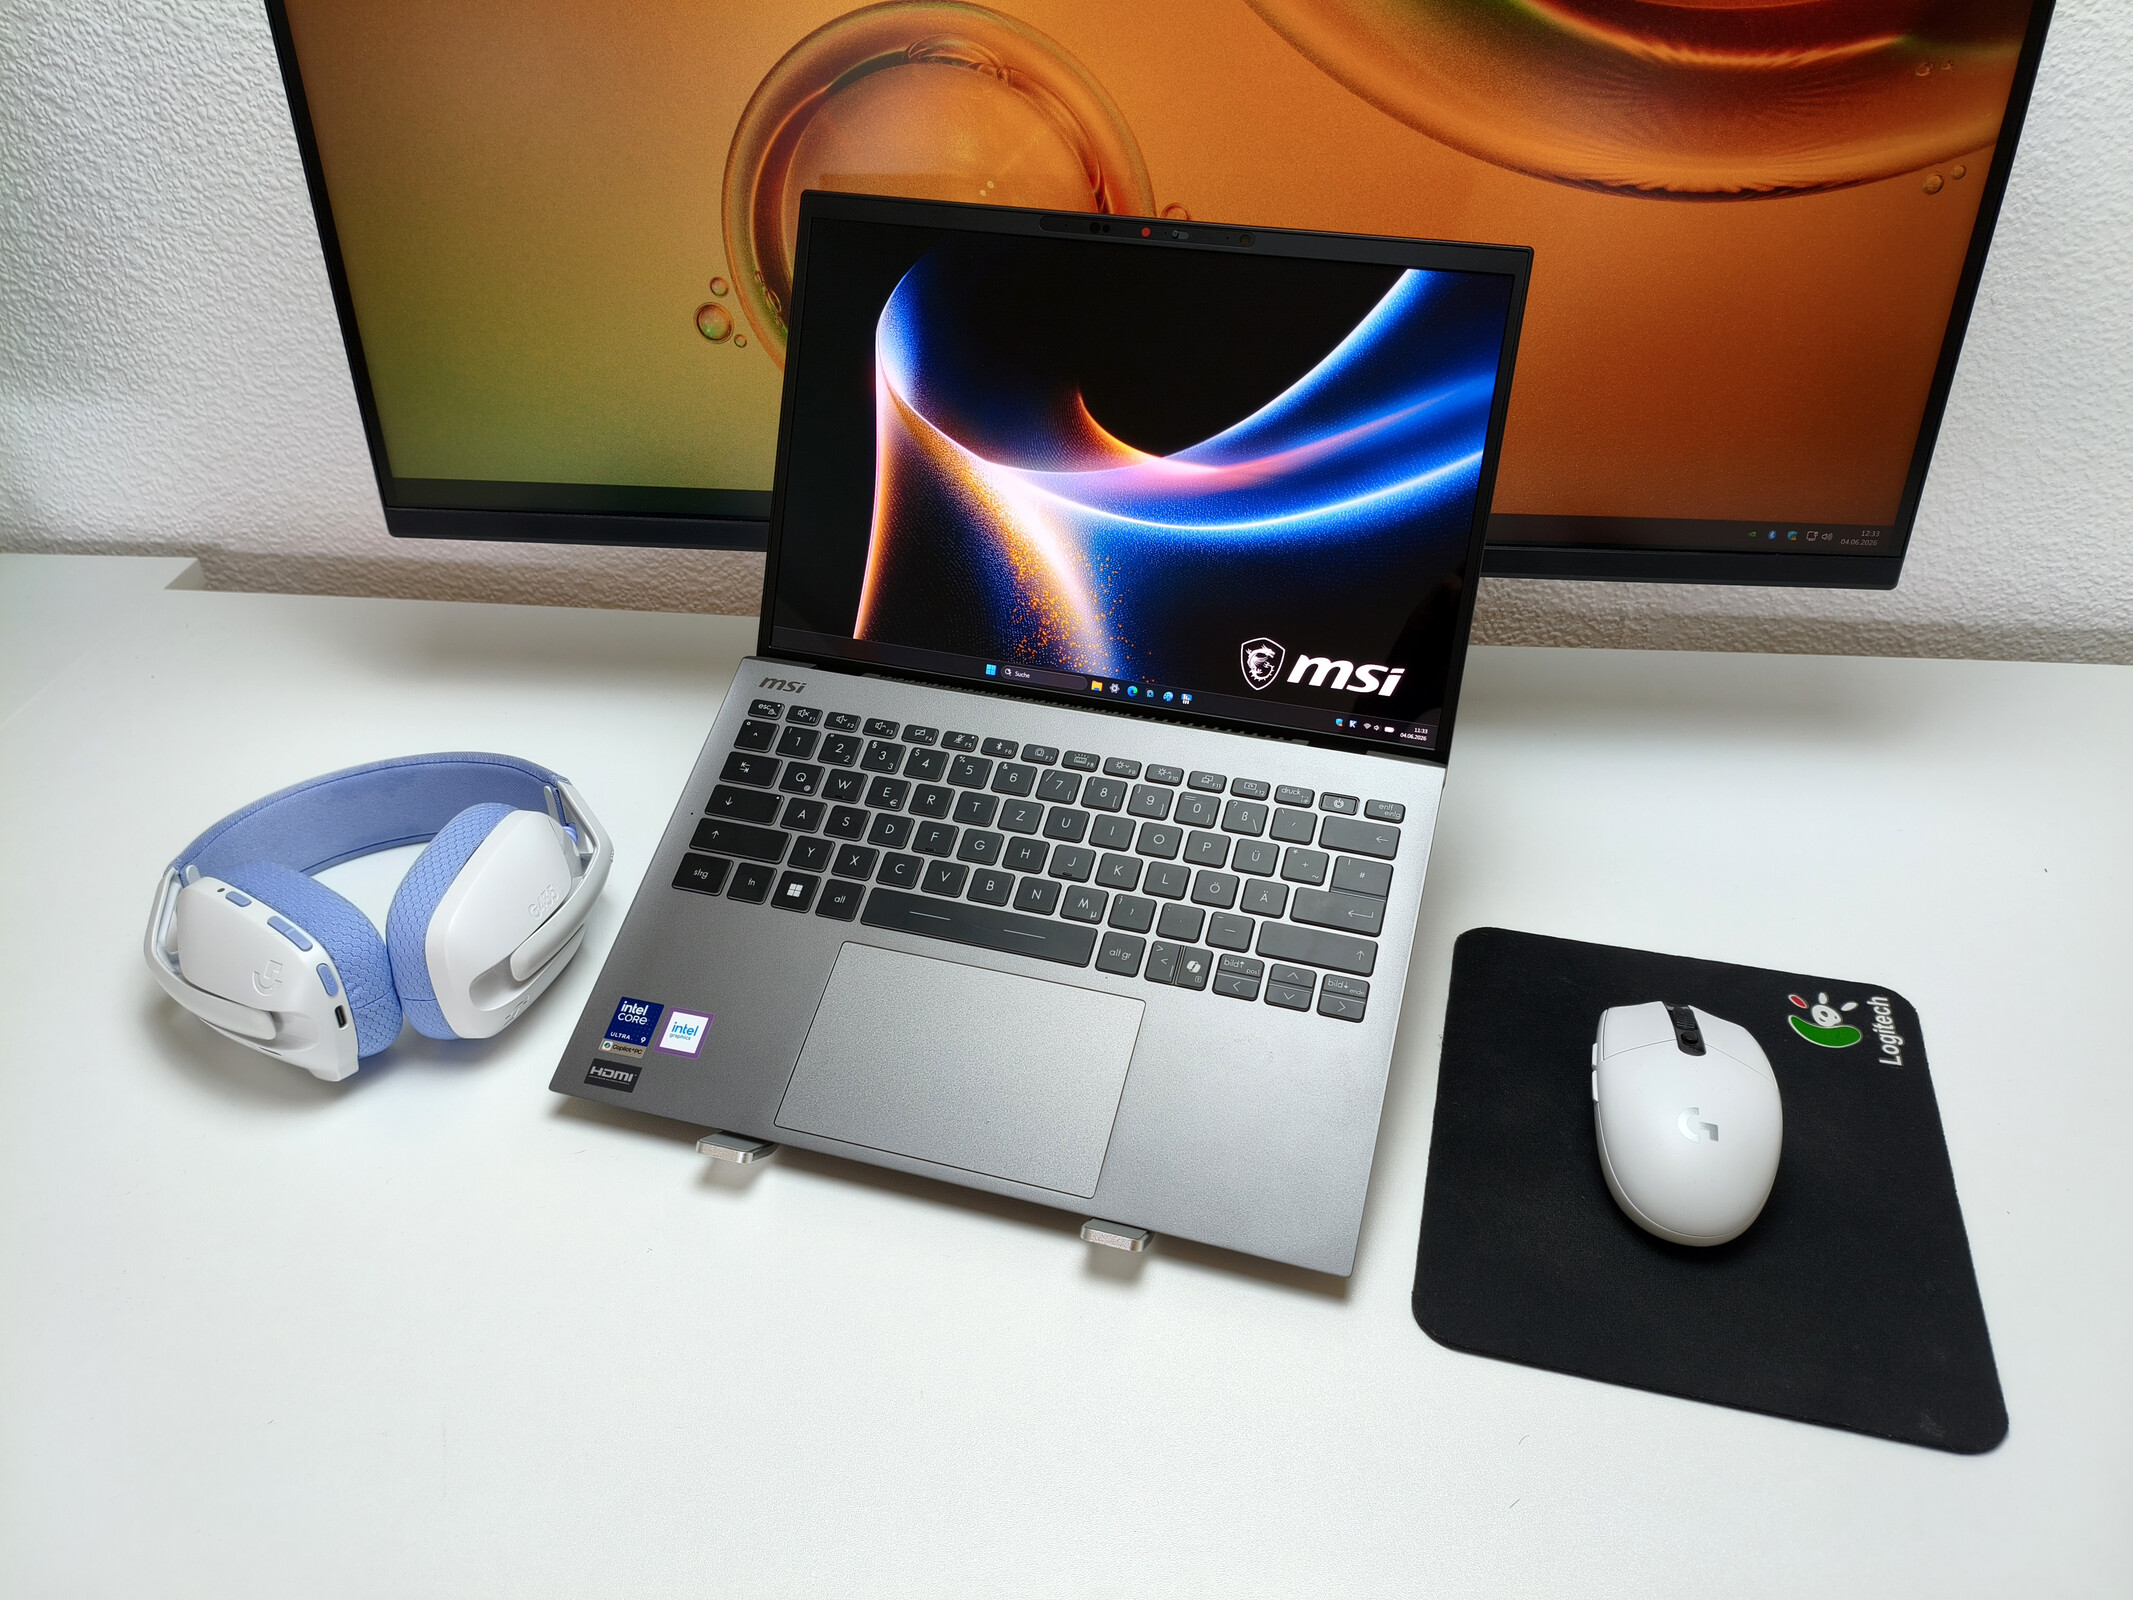
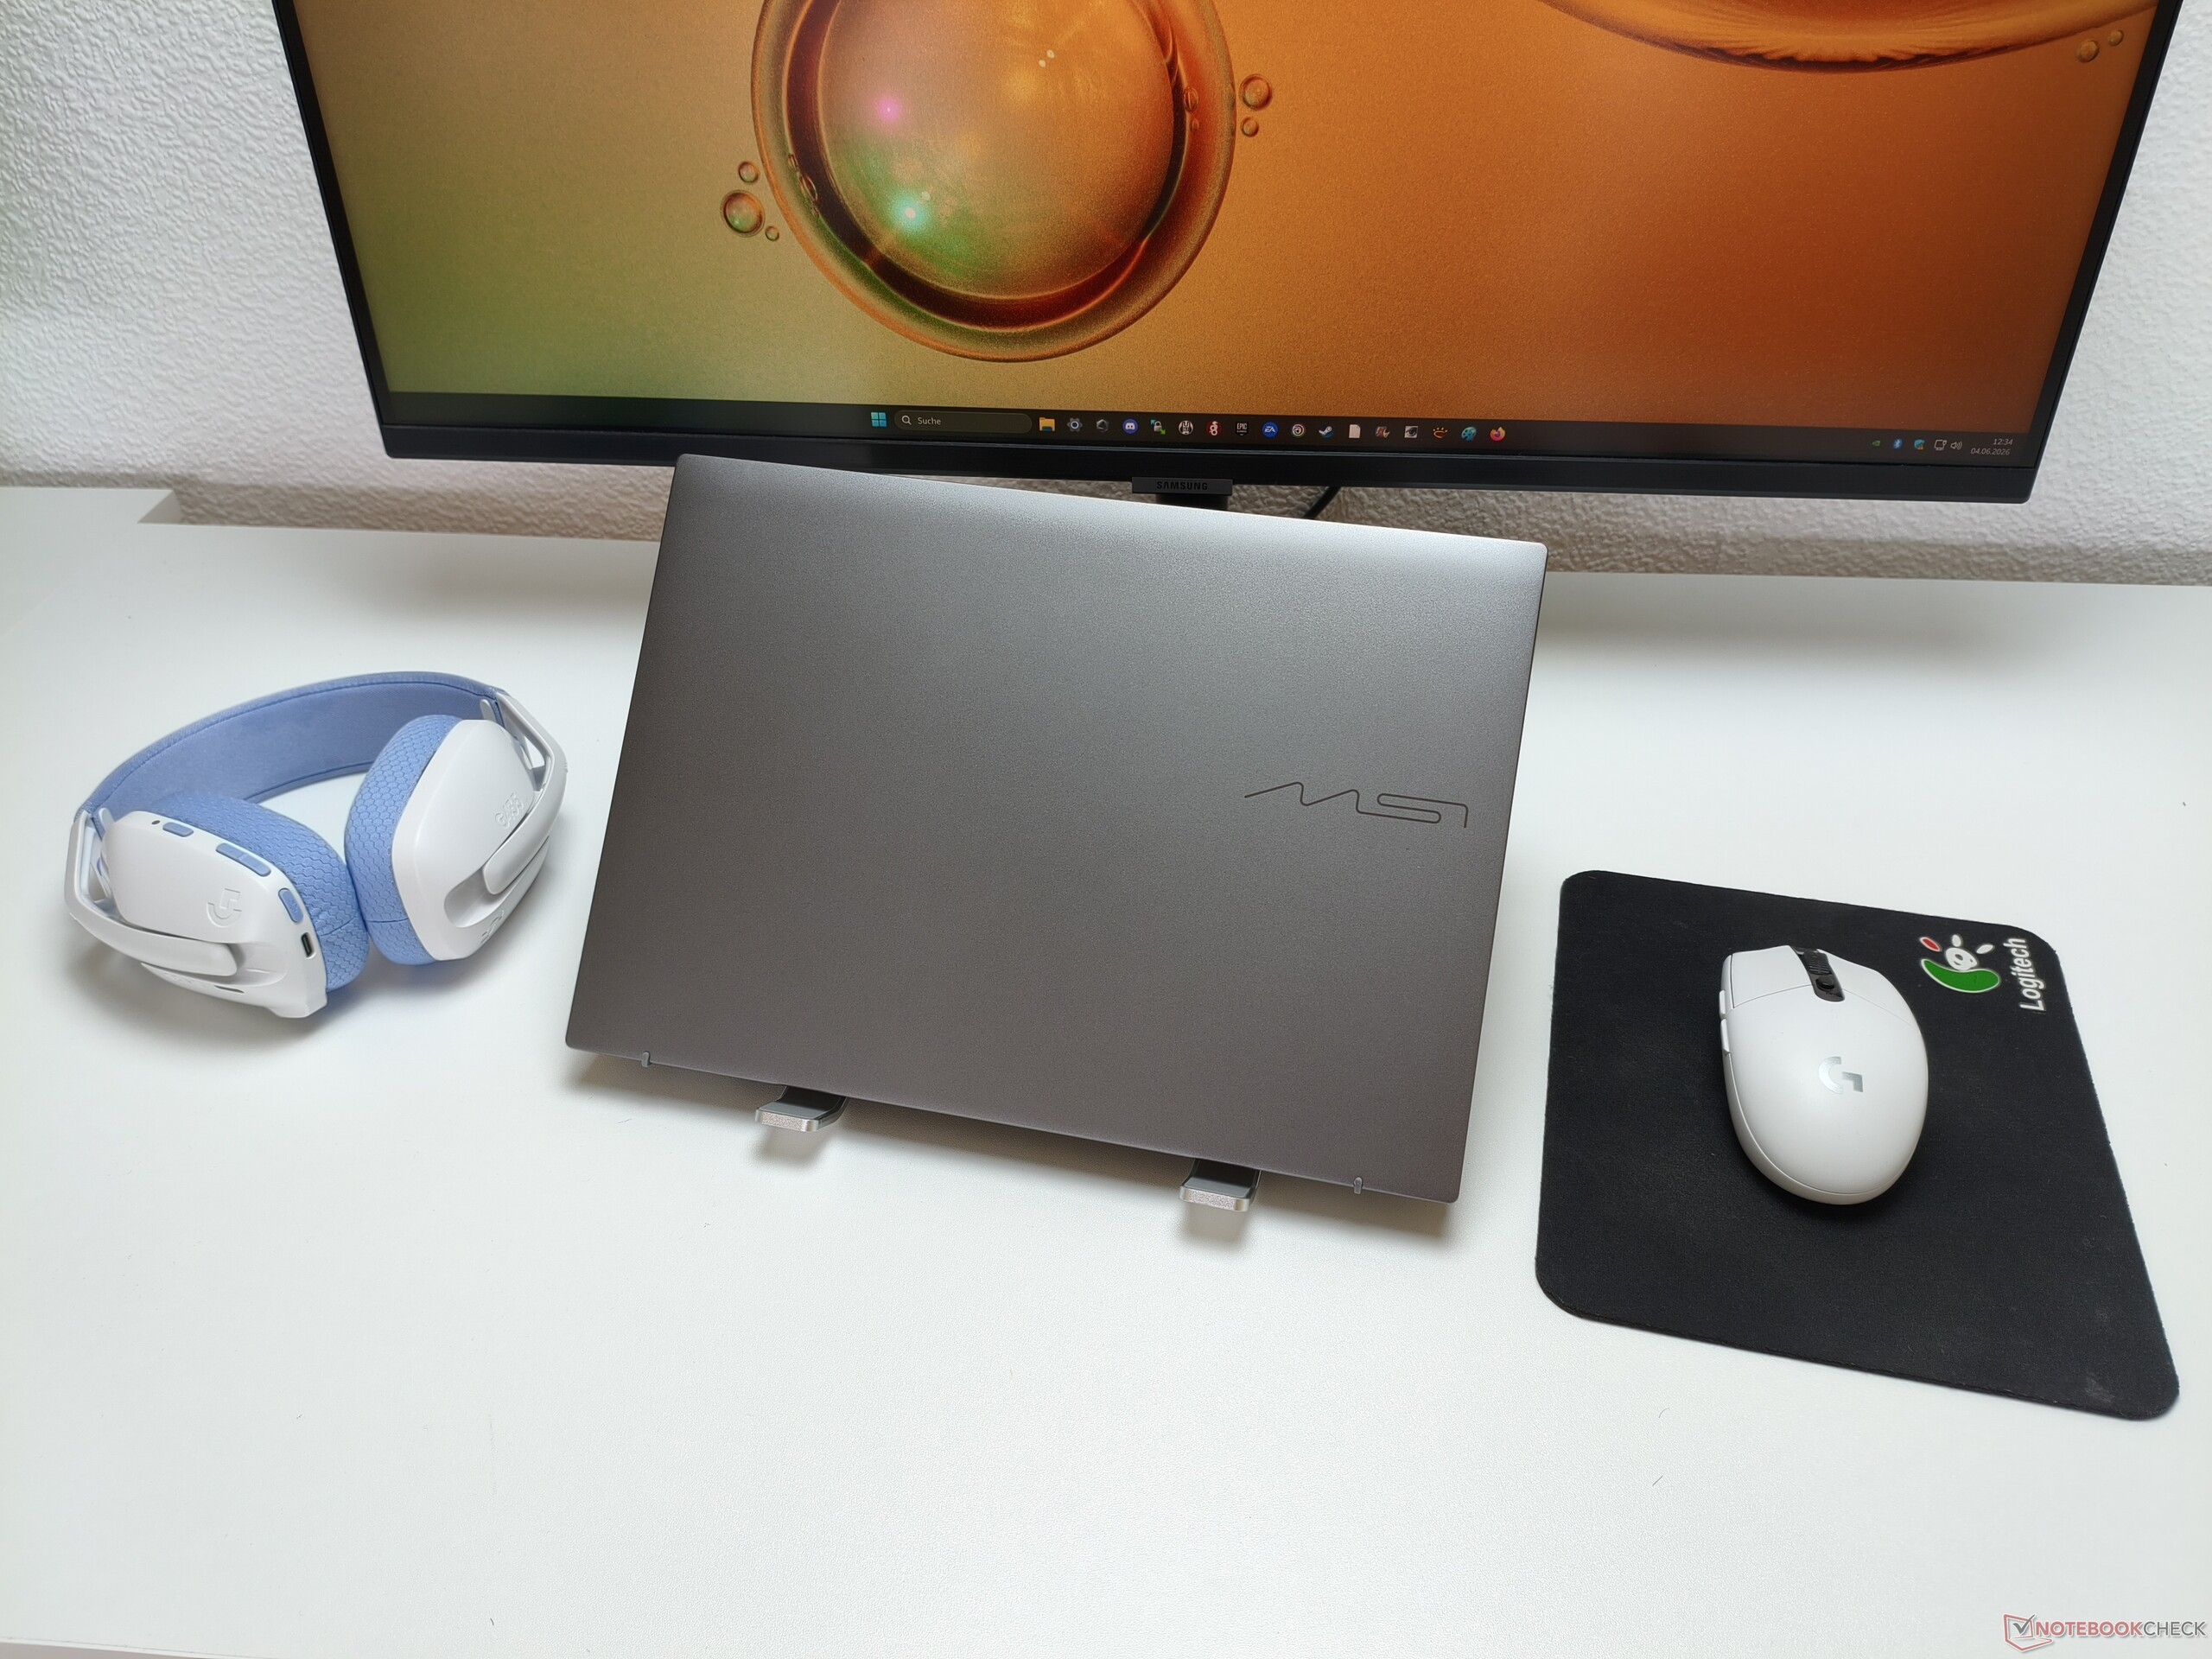
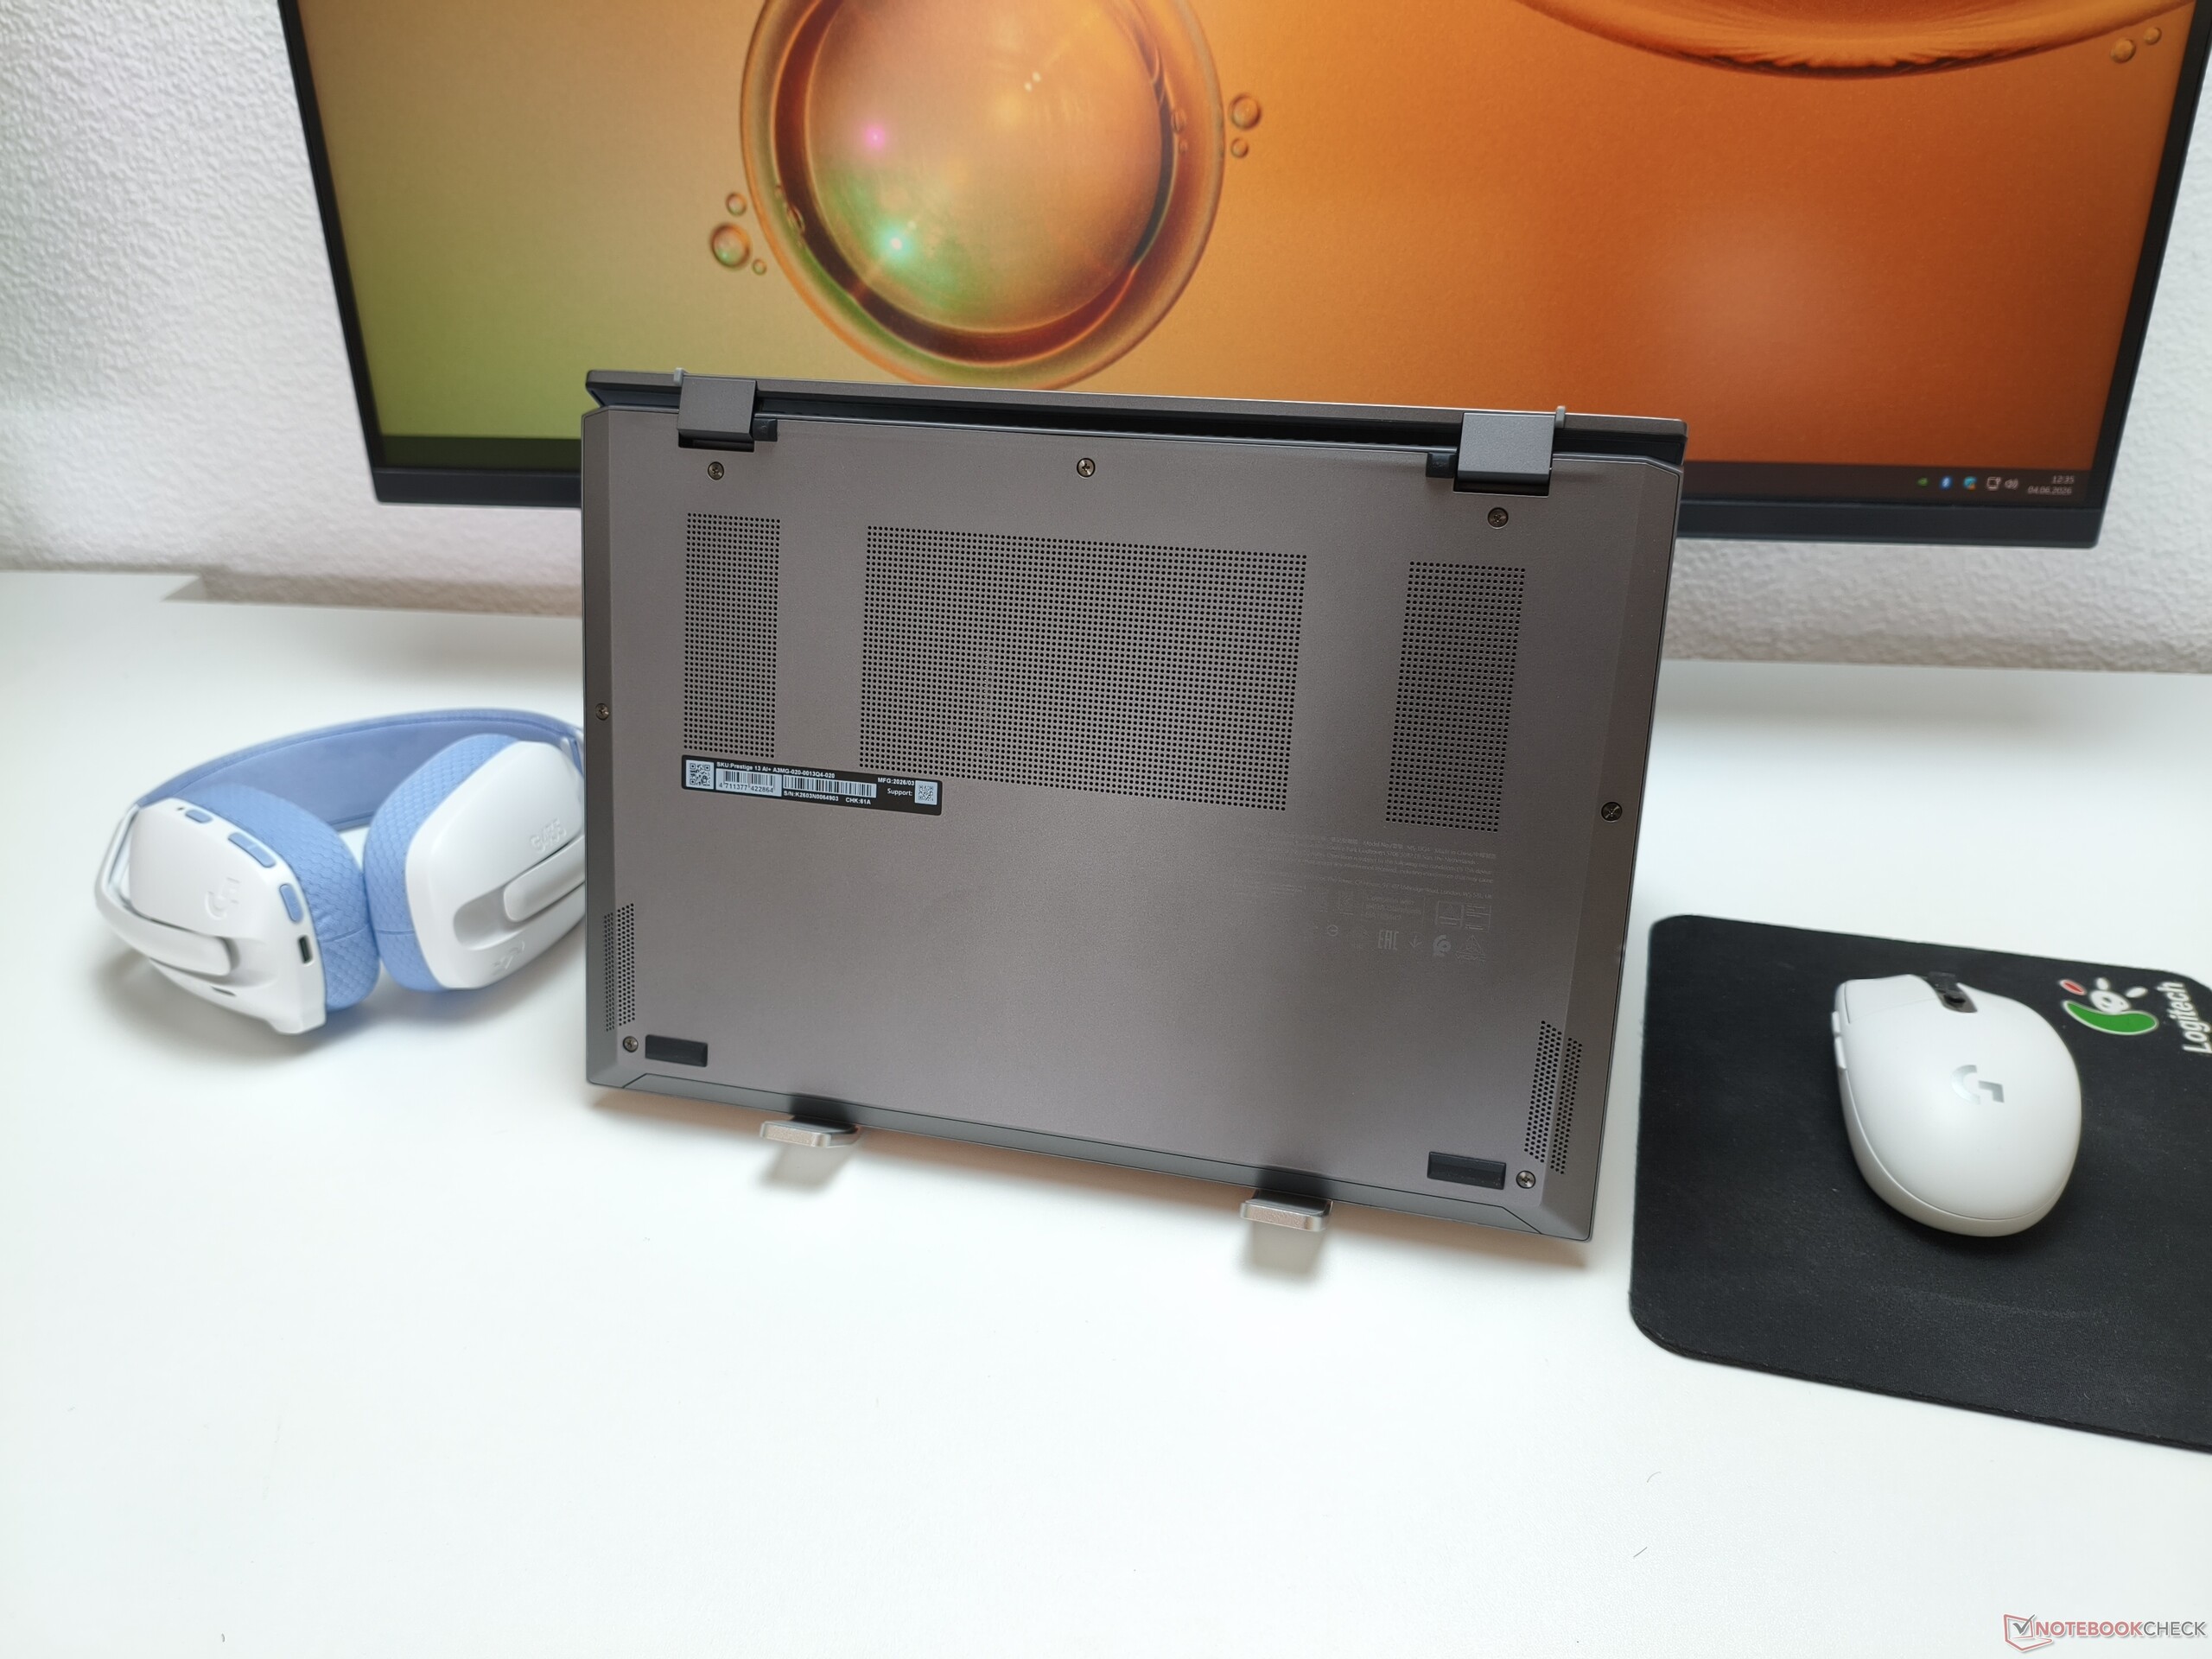
The stylishly designed silver-gray case is made of magnesium-aluminum, which is one reason the 13-inch device is so light. While the materials do not feel quite as premium as pure aluminum, they seem similarly stable and are higher-quality than inexpensive plastic chassis. With a height of around 1.6 cm, the 13-inch model is in line with its rivals, which range from 1.4 to 1.7 cm. There is nothing to criticize in terms of workmanship, provided you ignore the two side-mounted case screws, which protrude slightly due to the design. A nice touch: the lid can be opened a full 180 degrees.
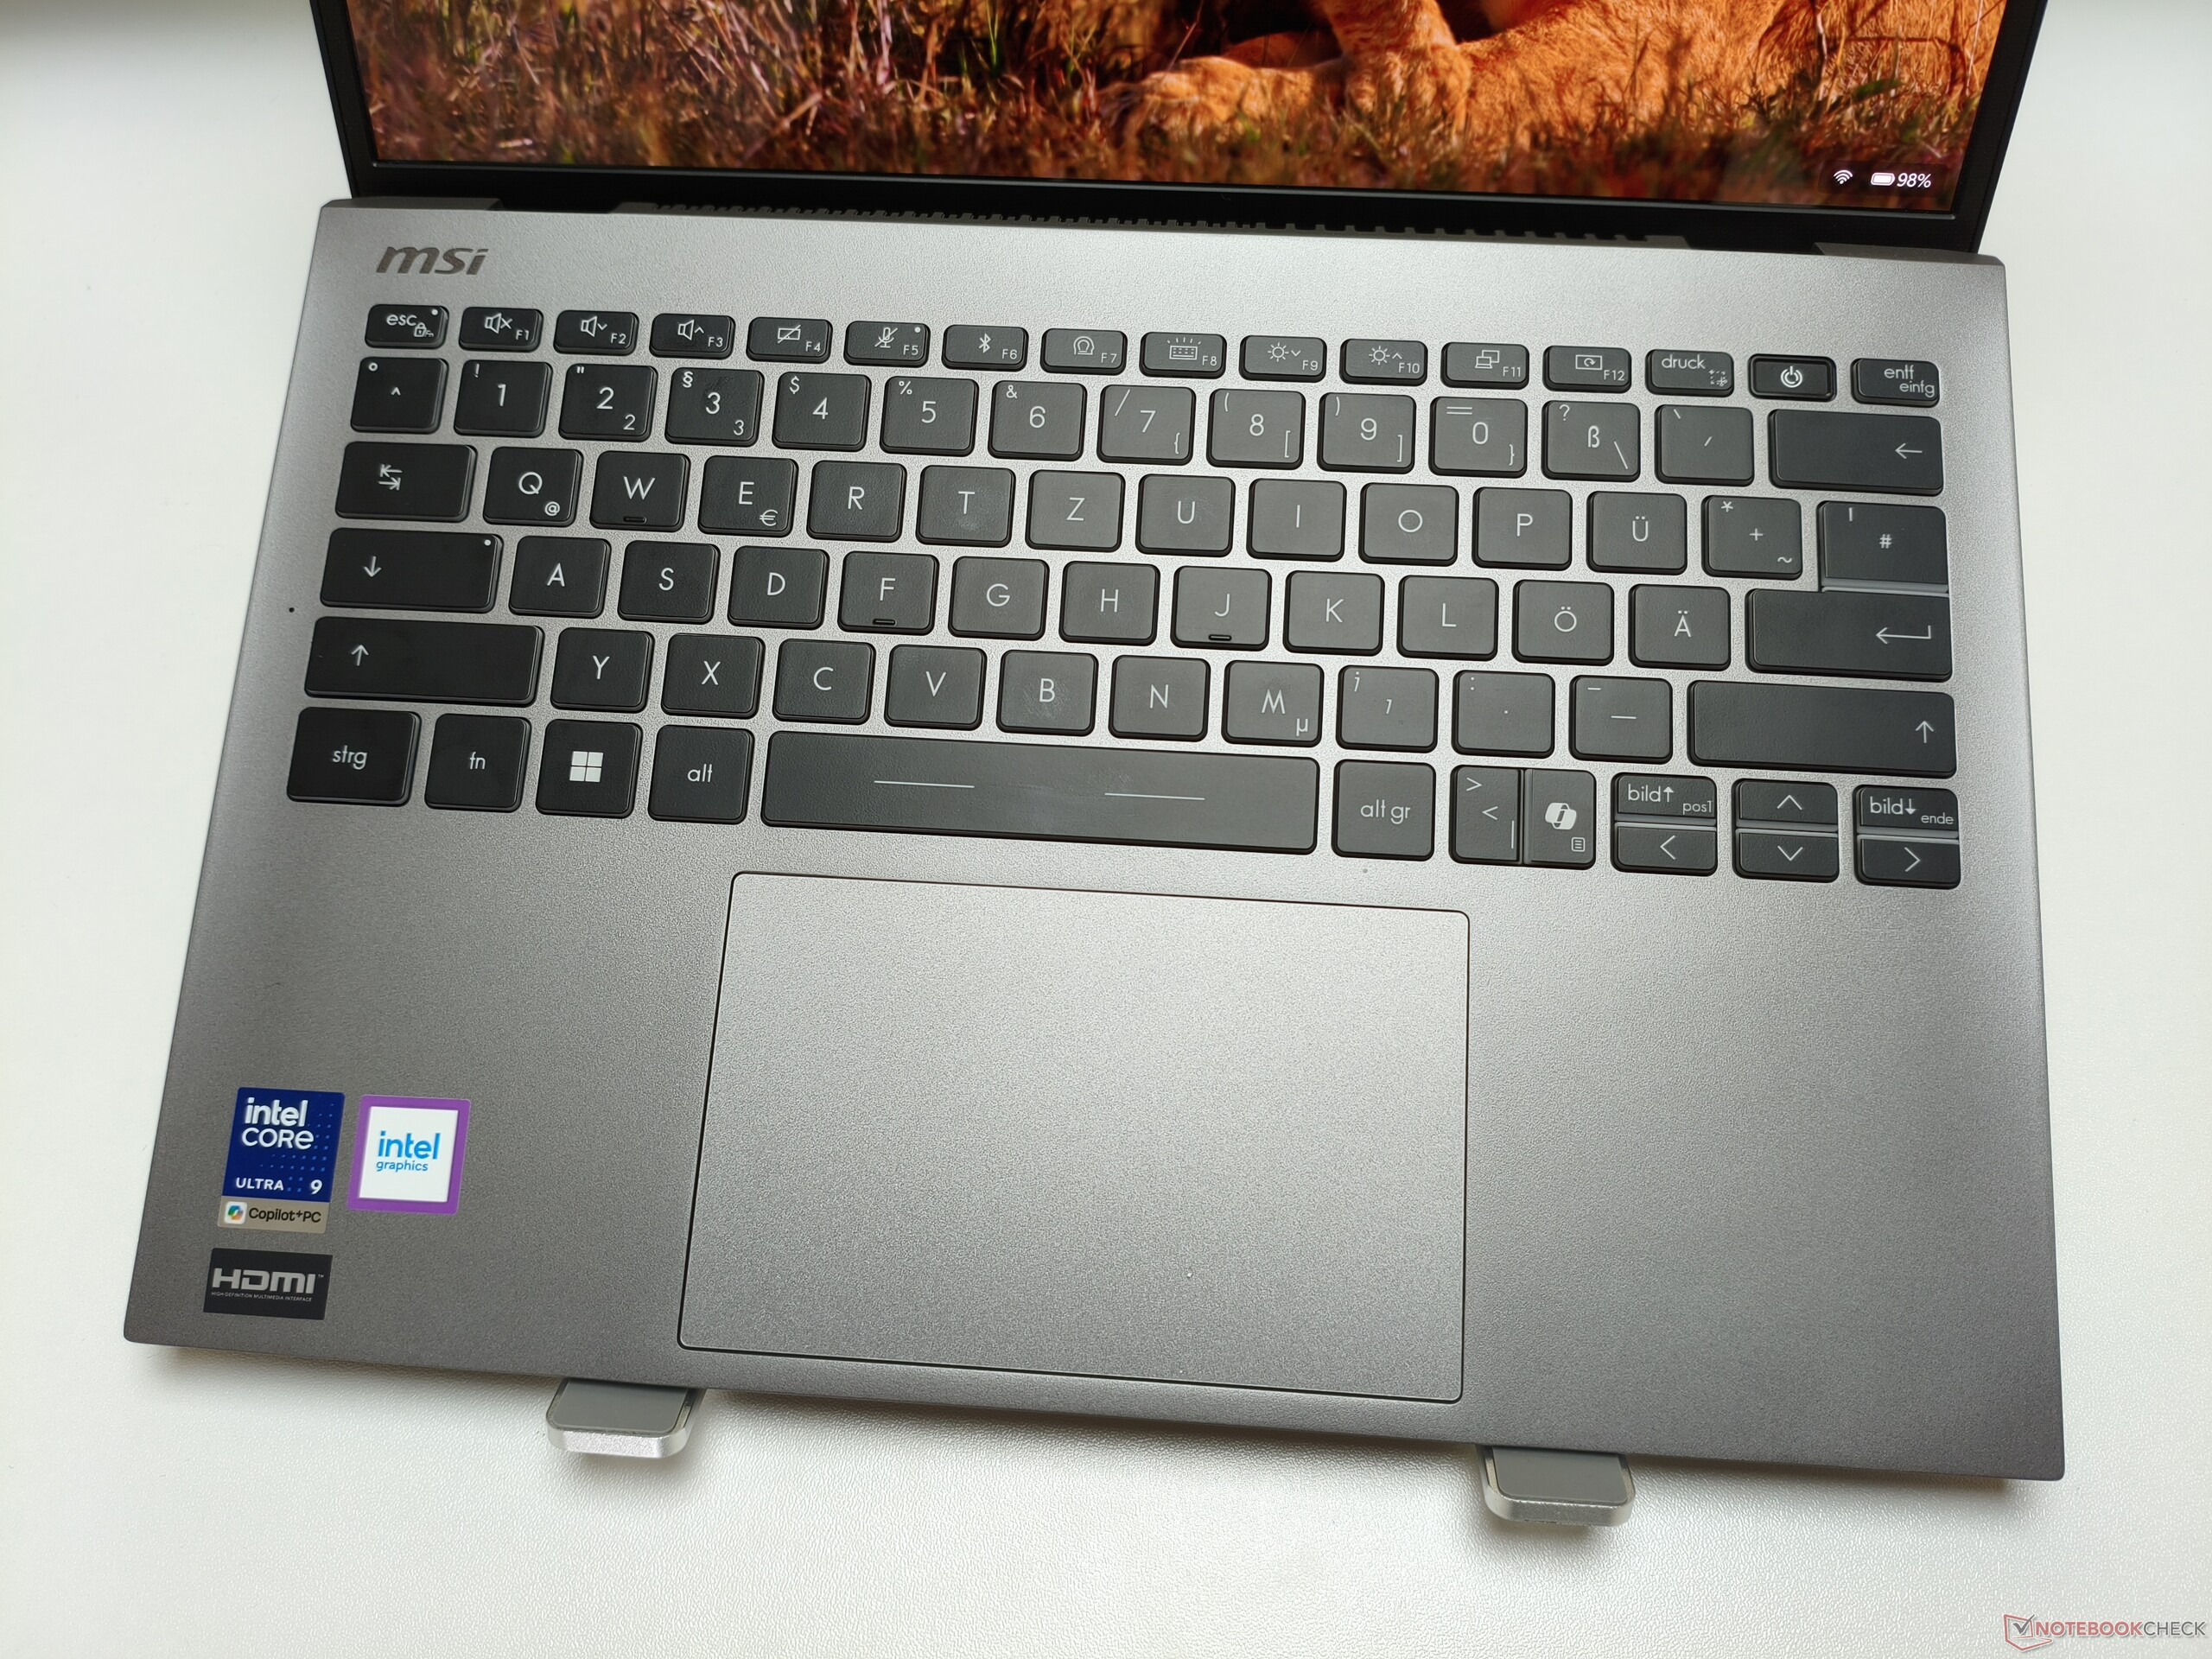
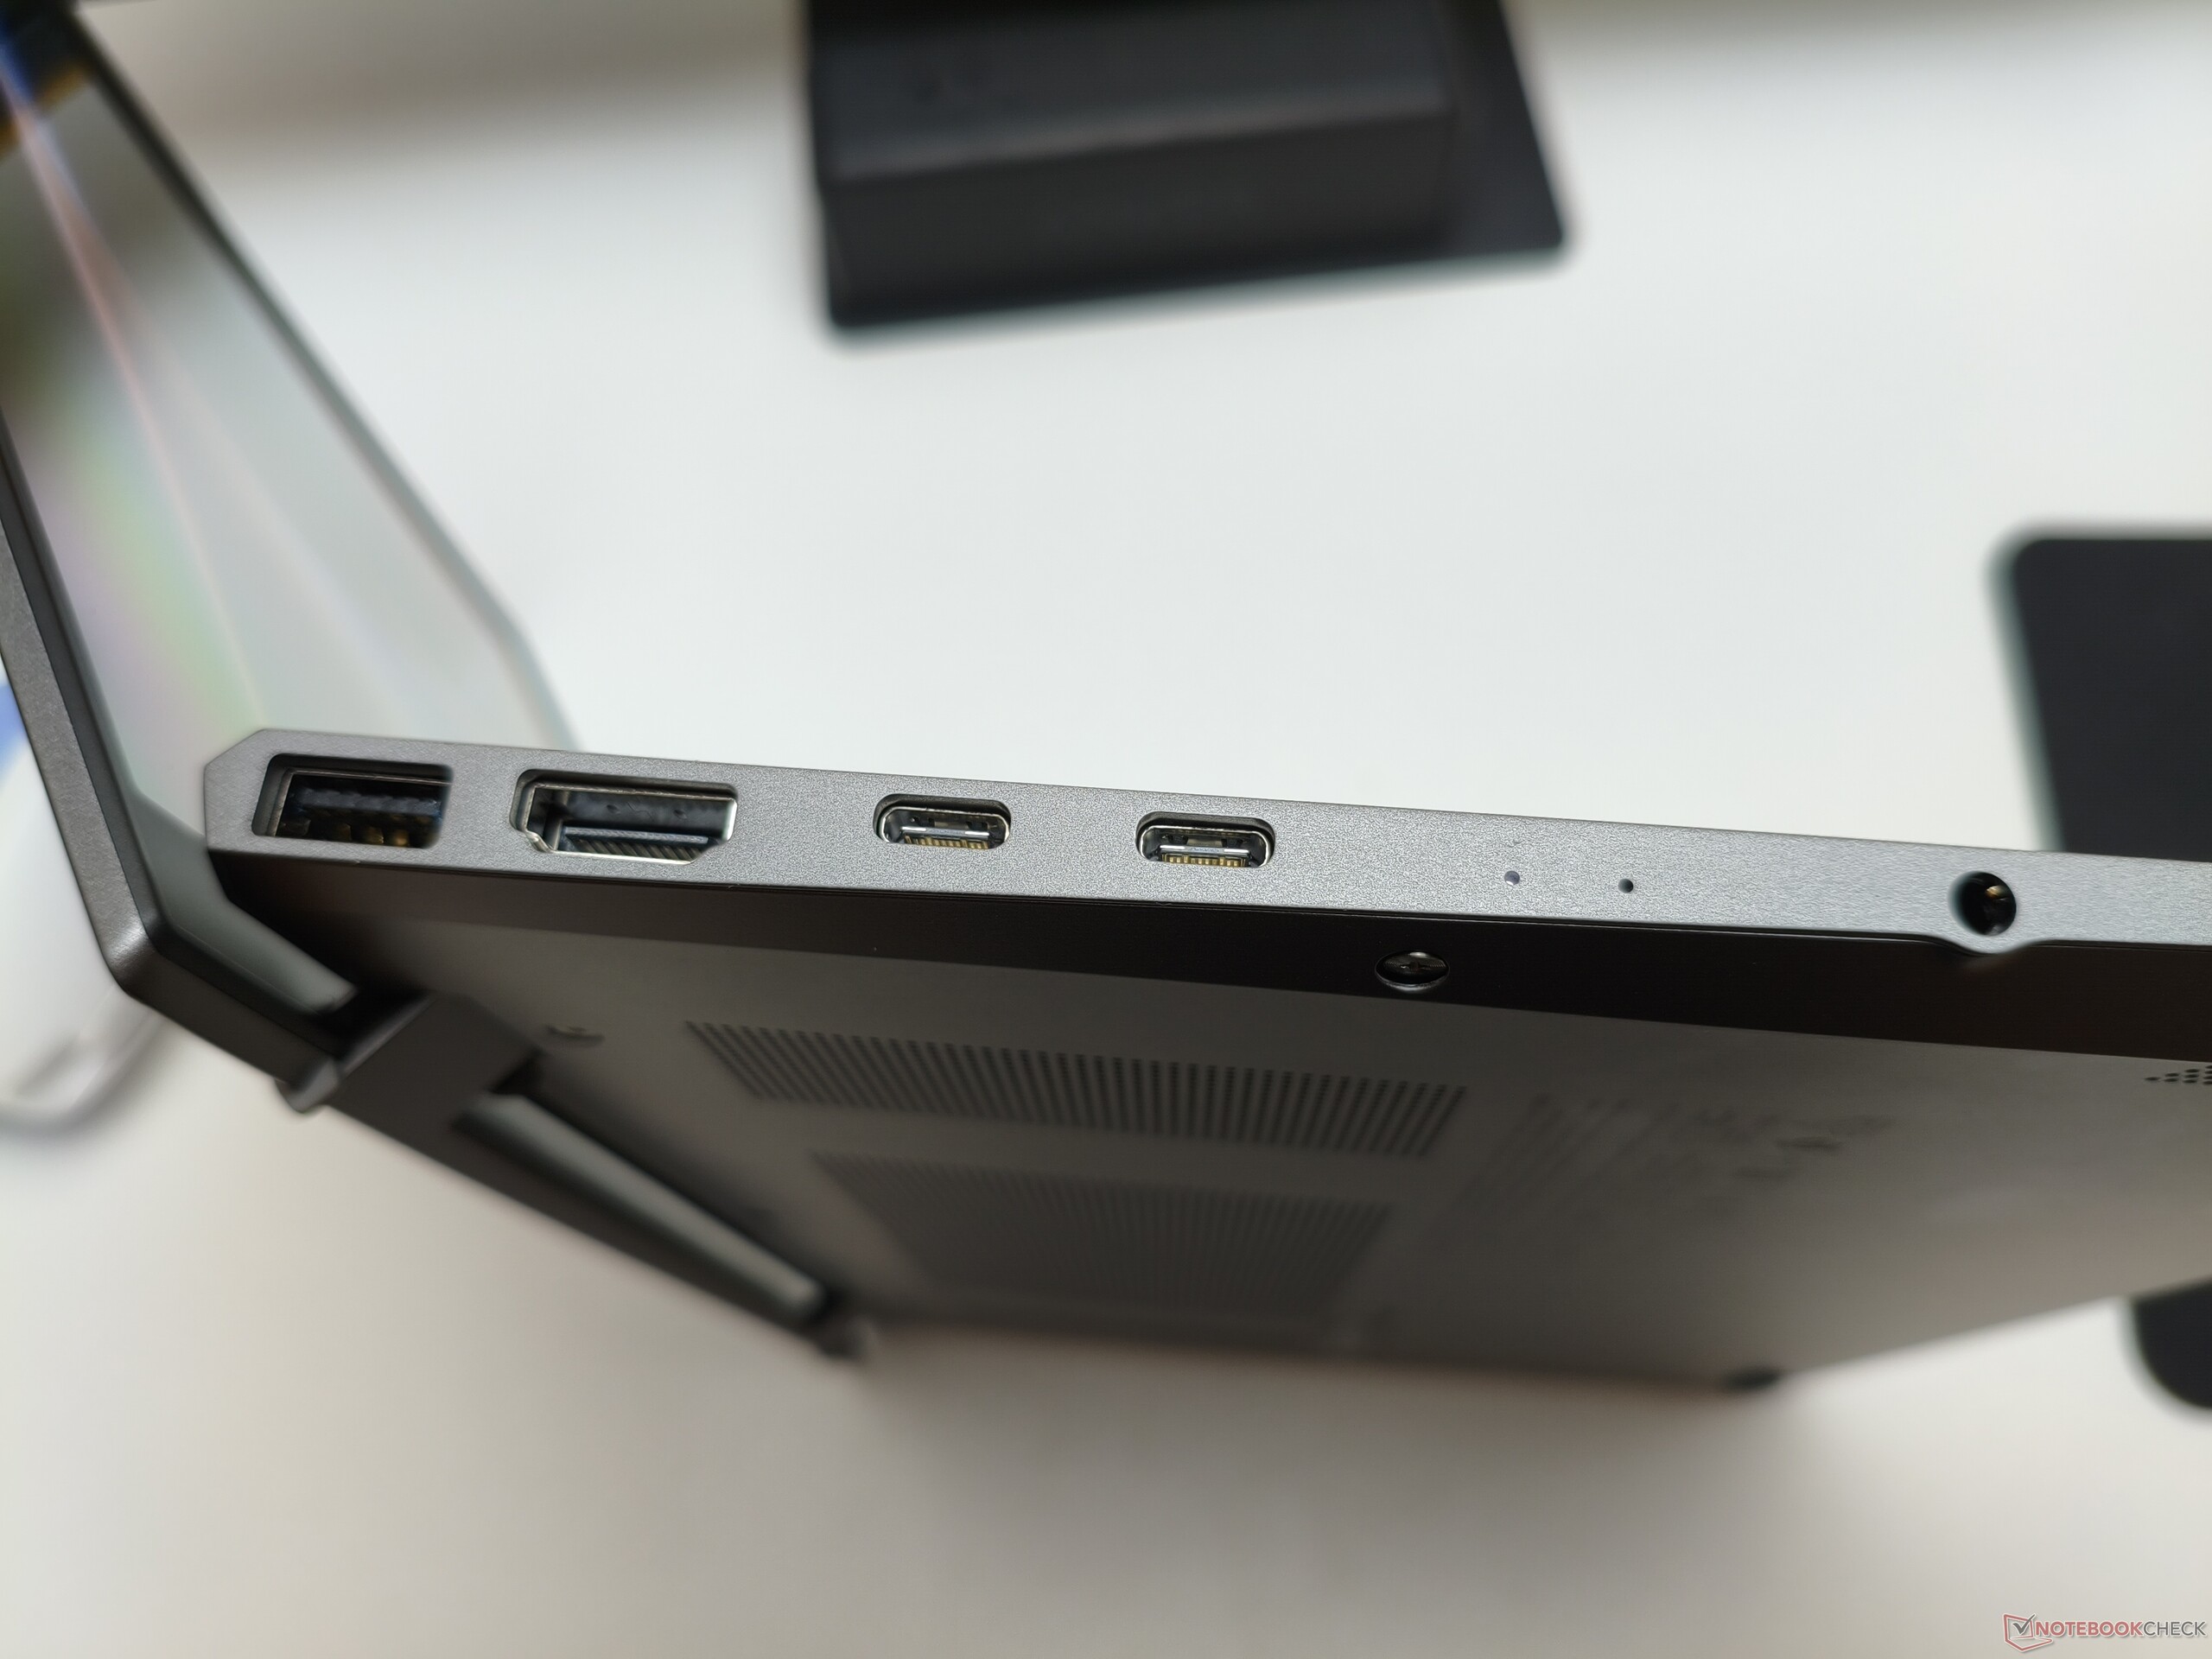
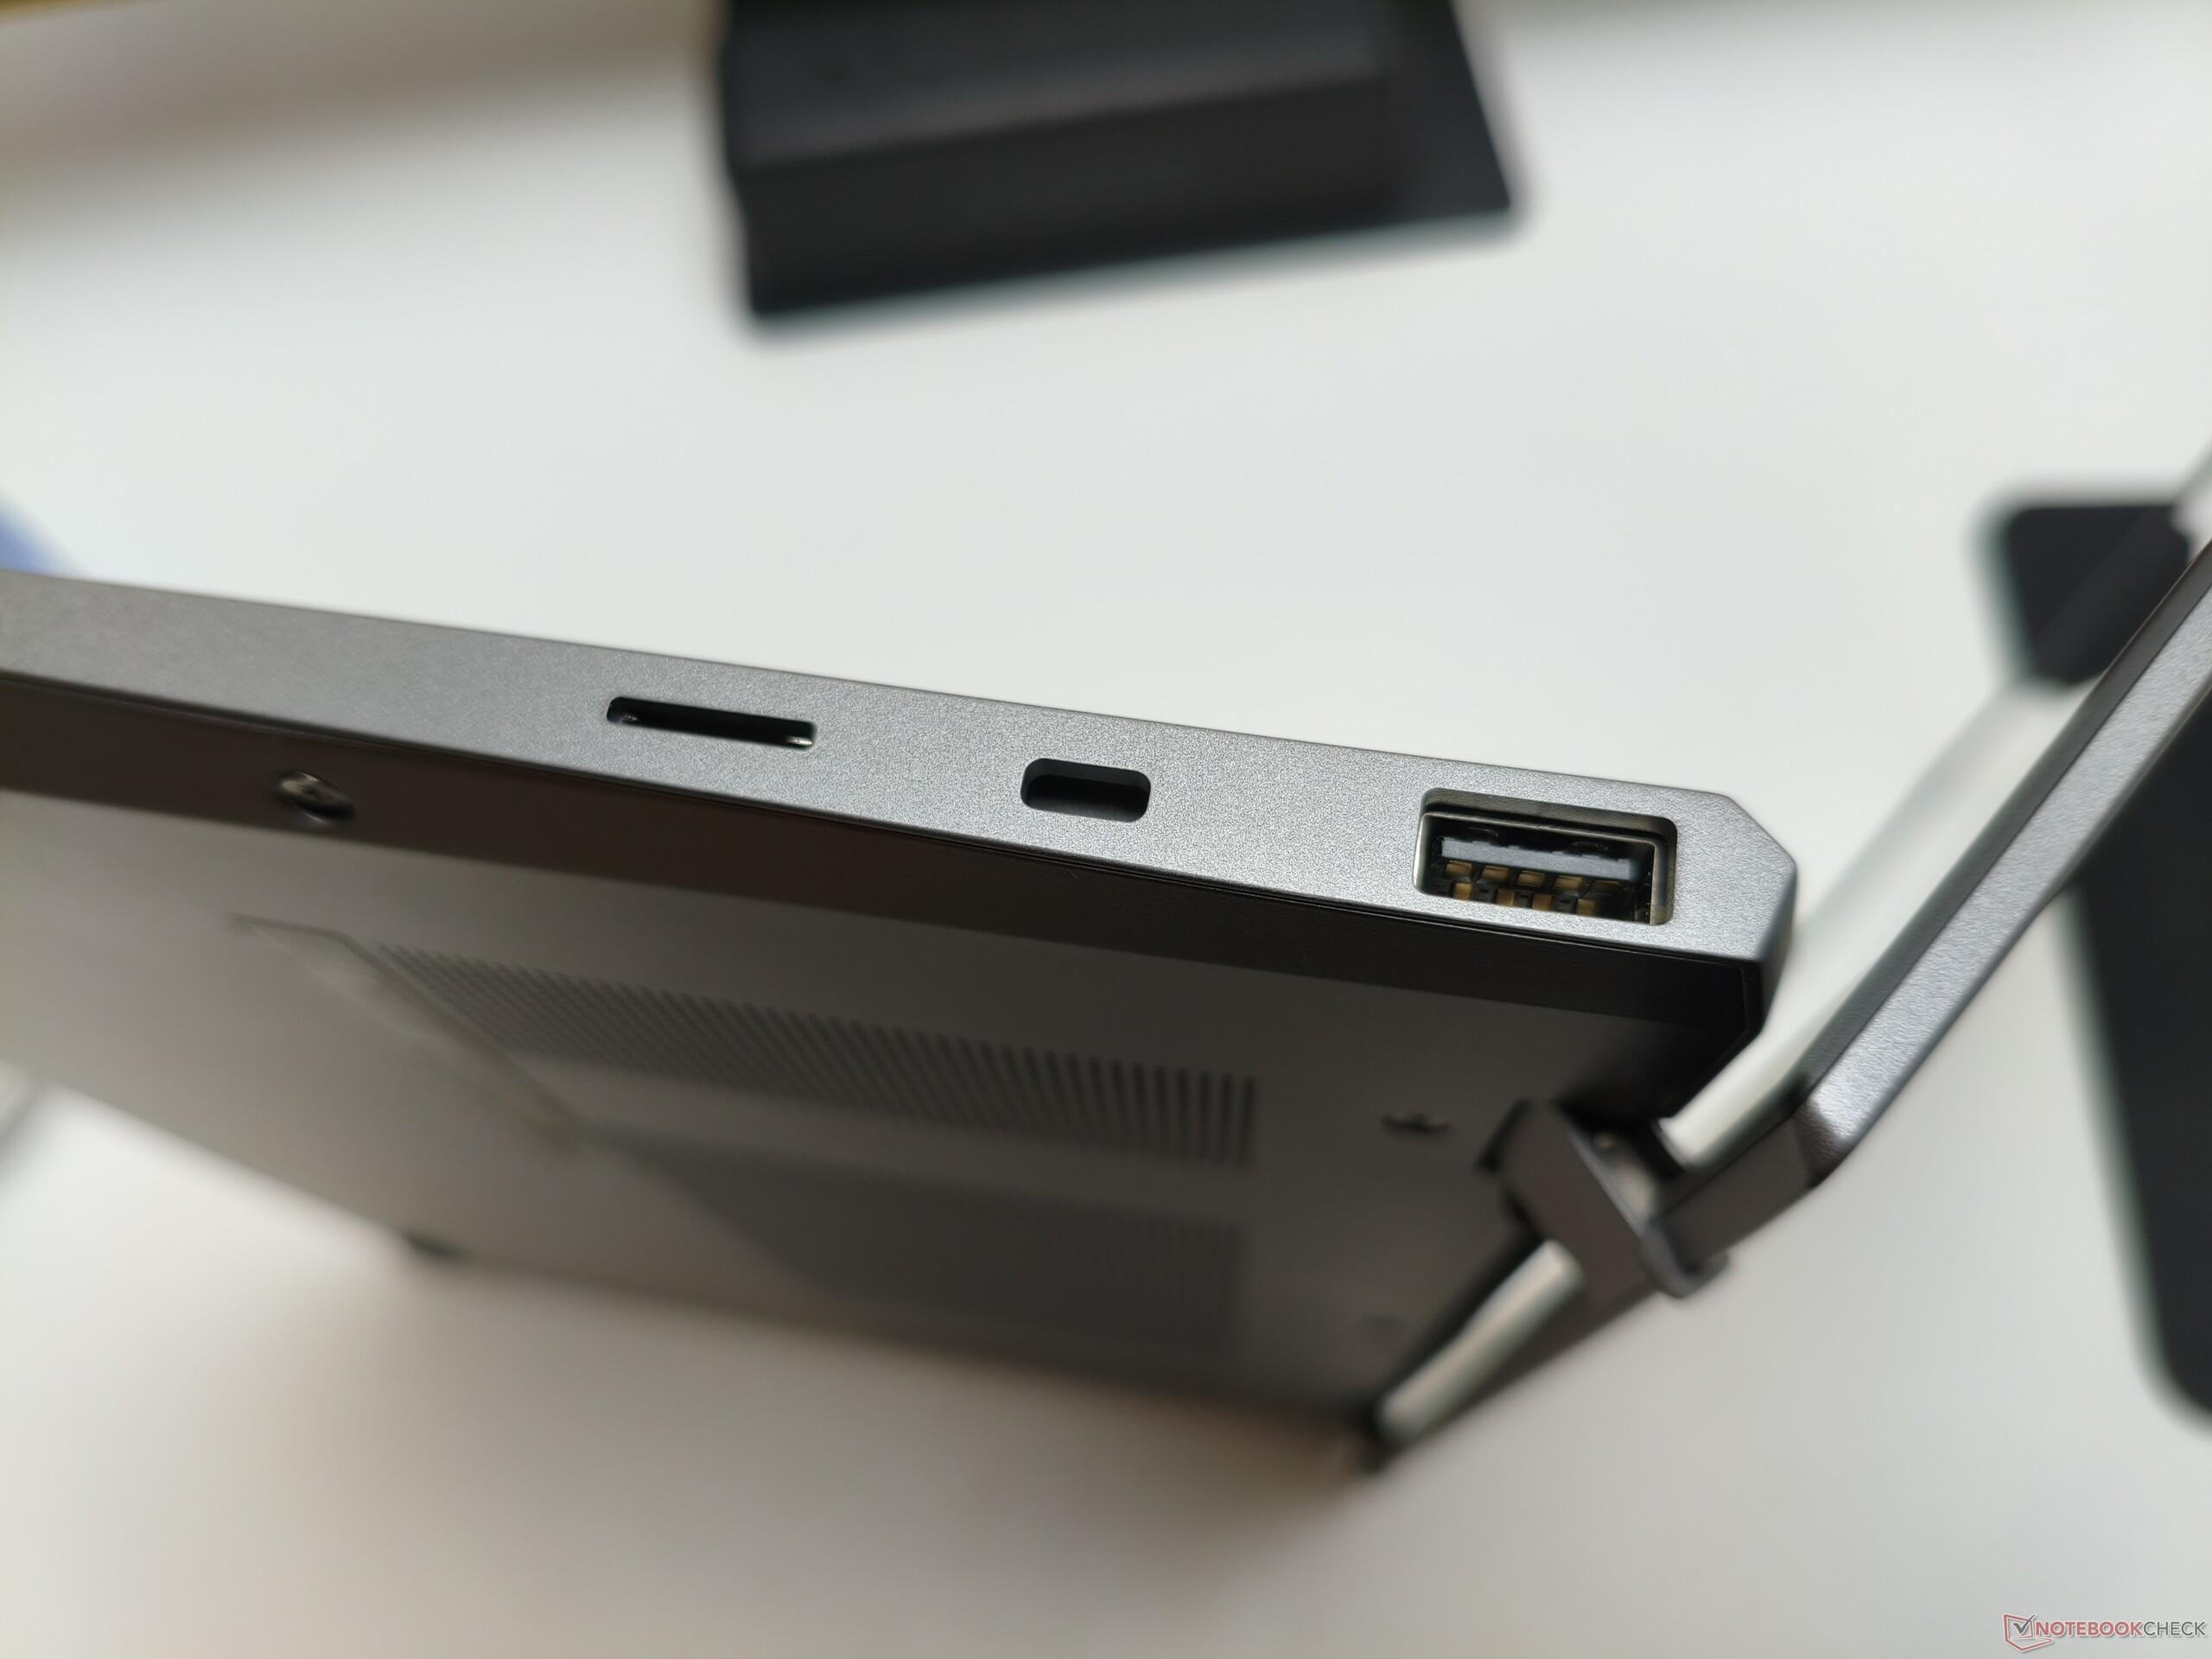
For ports, MSI includes an audio jack, an HDMI 2.1 output, a pleasingly fast microSD card reader, a slot for Kensington locks, and four USB ports. The two Type-C ports support Thunderbolt 4, including DisplayPort and Power Delivery. The webcam delivers fairly typical, mediocre laptop fare.
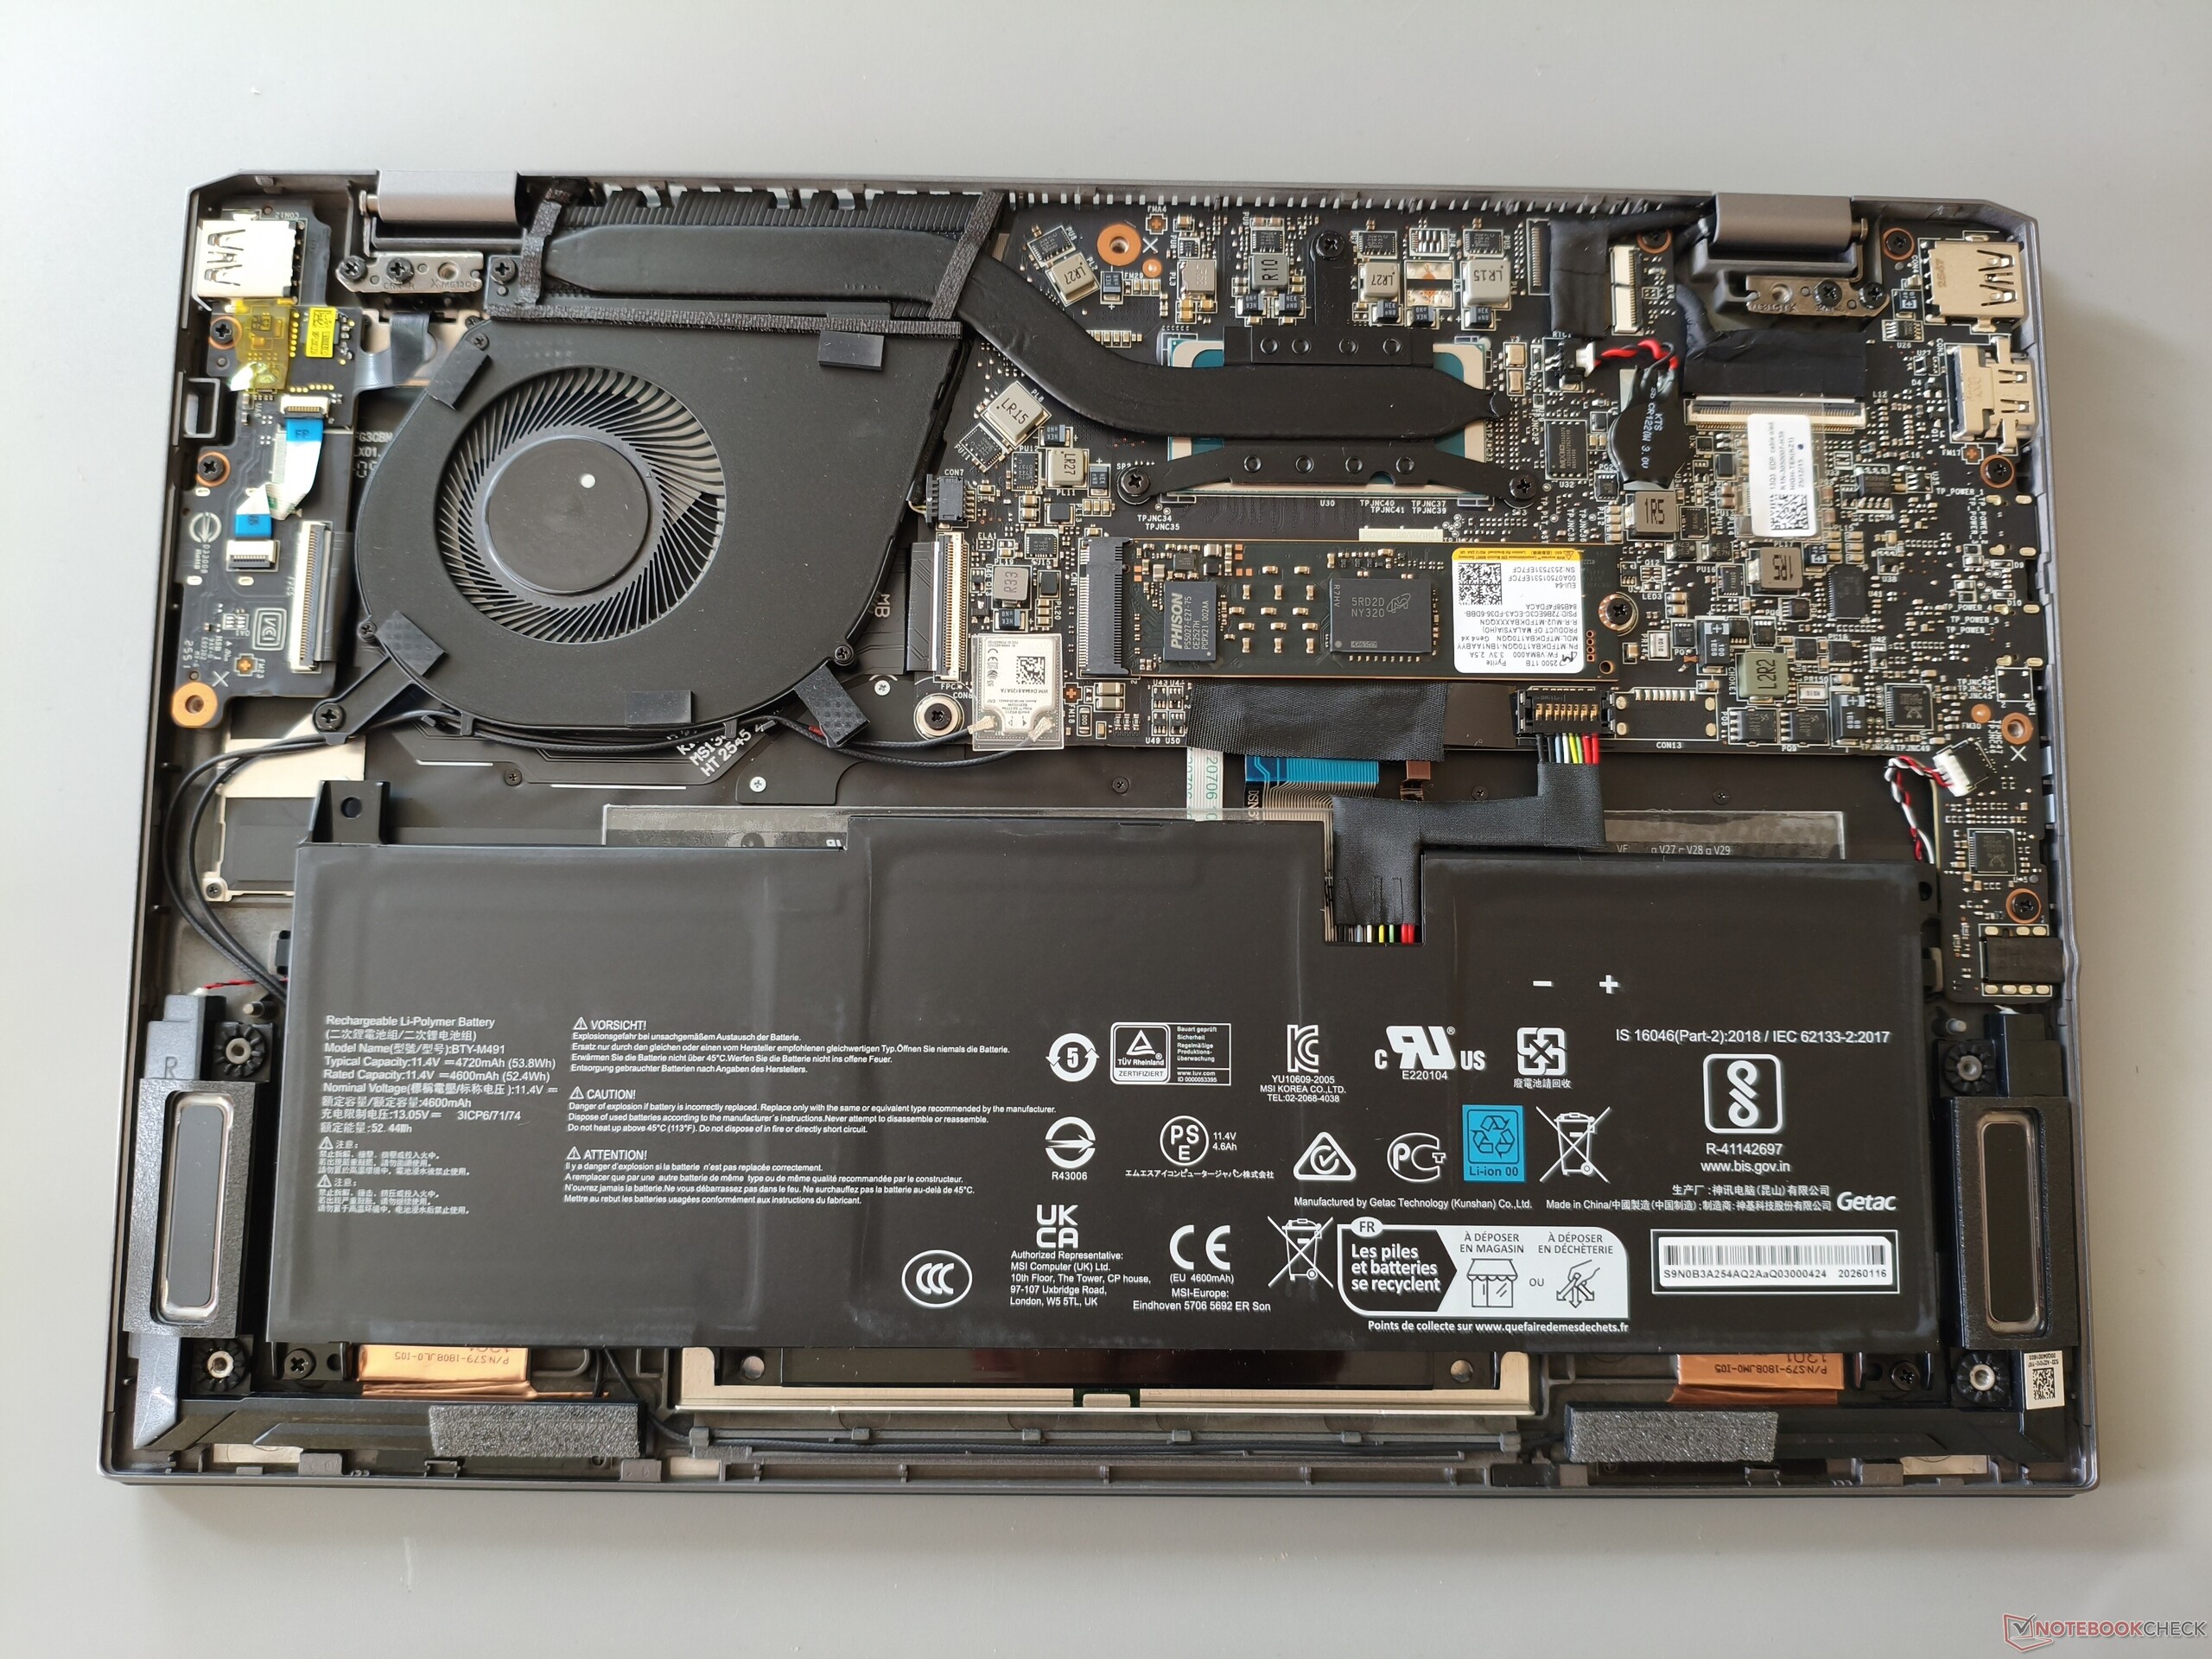
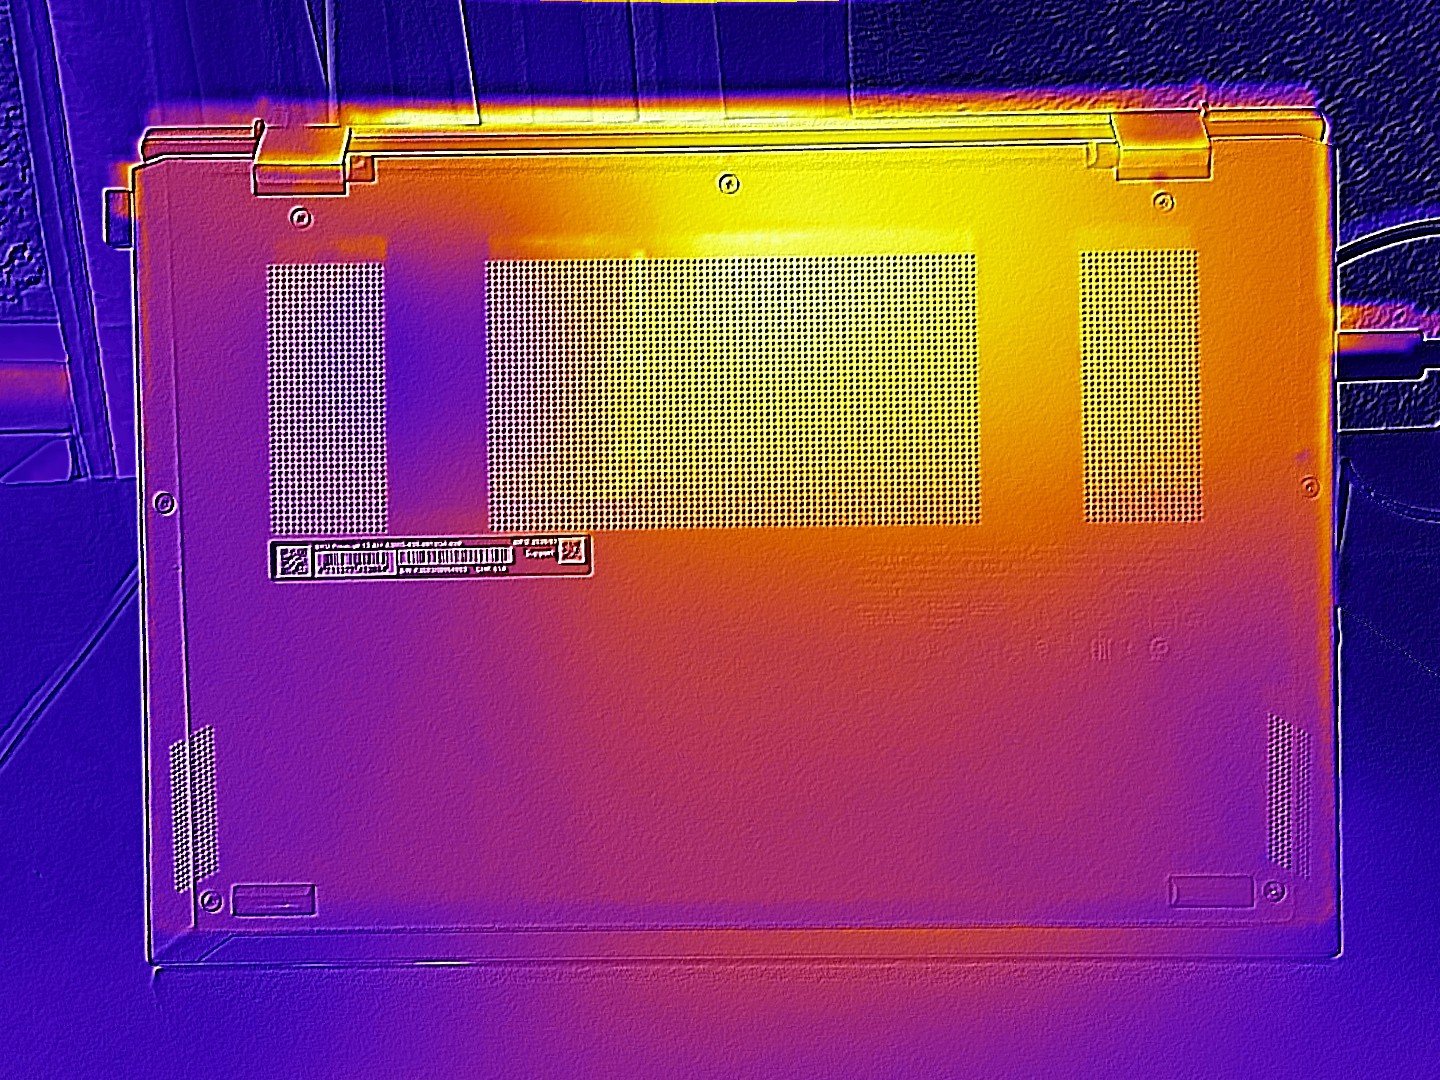
The bottom cover can be removed after loosening seven Phillips screws. Under the hood is a cooling system with one fan and one heat pipe. There is also an occupied M.2 slot for SSDs, while the battery and the fast wireless module are accessible as well. The RAM, however, cannot be replaced because it is soldered.
The white-backlit keyboard offers a decent typing experience but, as we have come to expect from MSI laptops, suffers from a layout that takes considerable getting used to and is suboptimal in our view. Points are also deducted for some very small keys, including the arrow keys, the ><| key, and the Windows Copilot key. The approximately 12 x 7.5 cm touchpad is pleasantly smooth and usually works reliably, making it better overall than the keyboard. However, the clicks, as on many laptops, could sound a little less rattly.
| SD Card Reader | |
| average JPG Copy Test (av. of 3 runs) | |
| MSI Prestige 13 AI+ A3MG (AV PRO microSD 128 GB V60) | |
| Lenovo IdeaPad 5i 2-in-1 14IPH11 (AV PRO microSD 128 GB V60) | |
| Average of class Subnotebook (23.7 - 188, n=9, last 2 years) | |
| maximum AS SSD Seq Read Test (1GB) | |
| MSI Prestige 13 AI+ A3MG (AV PRO microSD 128 GB V60) | |
| Average of class Subnotebook (24.9 - 195, n=8, last 2 years) | |
| Lenovo IdeaPad 5i 2-in-1 14IPH11 (AV PRO microSD 128 GB V60) | |
| Networking | |
| iperf3 receive Wi-Fi6/7 RT-BE96U | |
| Average of class Subnotebook (2236 - 3088, n=3, last 2 years) | |
| MSI Prestige 13 AI+ A3MG | |
| Average Intel® Killer™ Wi-Fi 7 BE1775s (n=1) | |
| Lenovo IdeaPad 5i 2-in-1 14IPH11 | |
| iperf3 transmit Wi-Fi6/7 RT-BE96U | |
| Average of class Subnotebook (2156 - 4549, n=3, last 2 years) | |
| MSI Prestige 13 AI+ A3MG | |
| Average Intel® Killer™ Wi-Fi 7 BE1775s (n=1) | |
| Lenovo IdeaPad 5i 2-in-1 14IPH11 | |
Webcam


Display
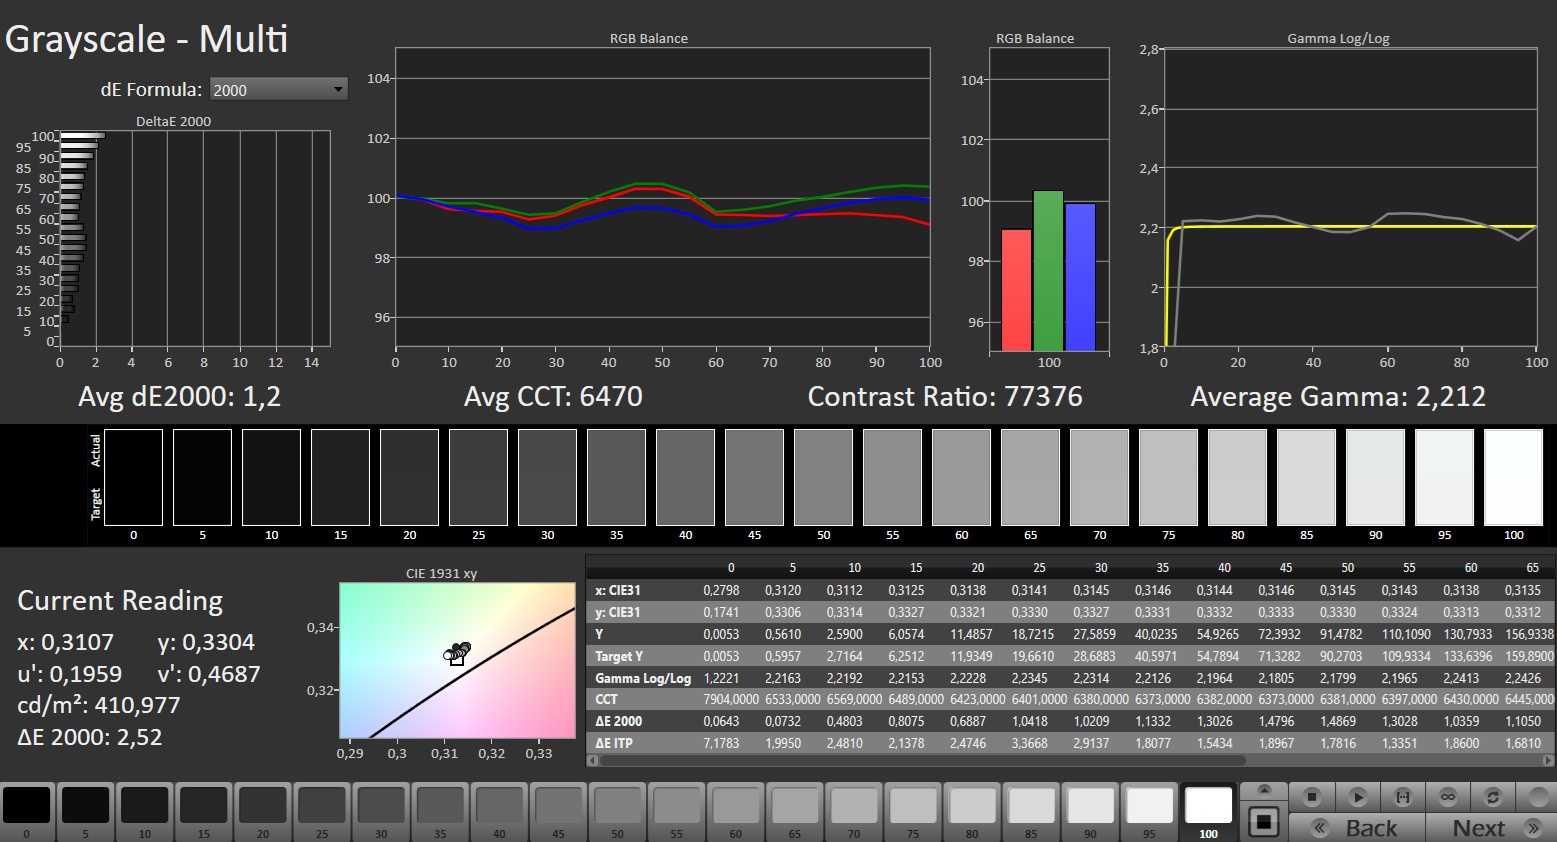
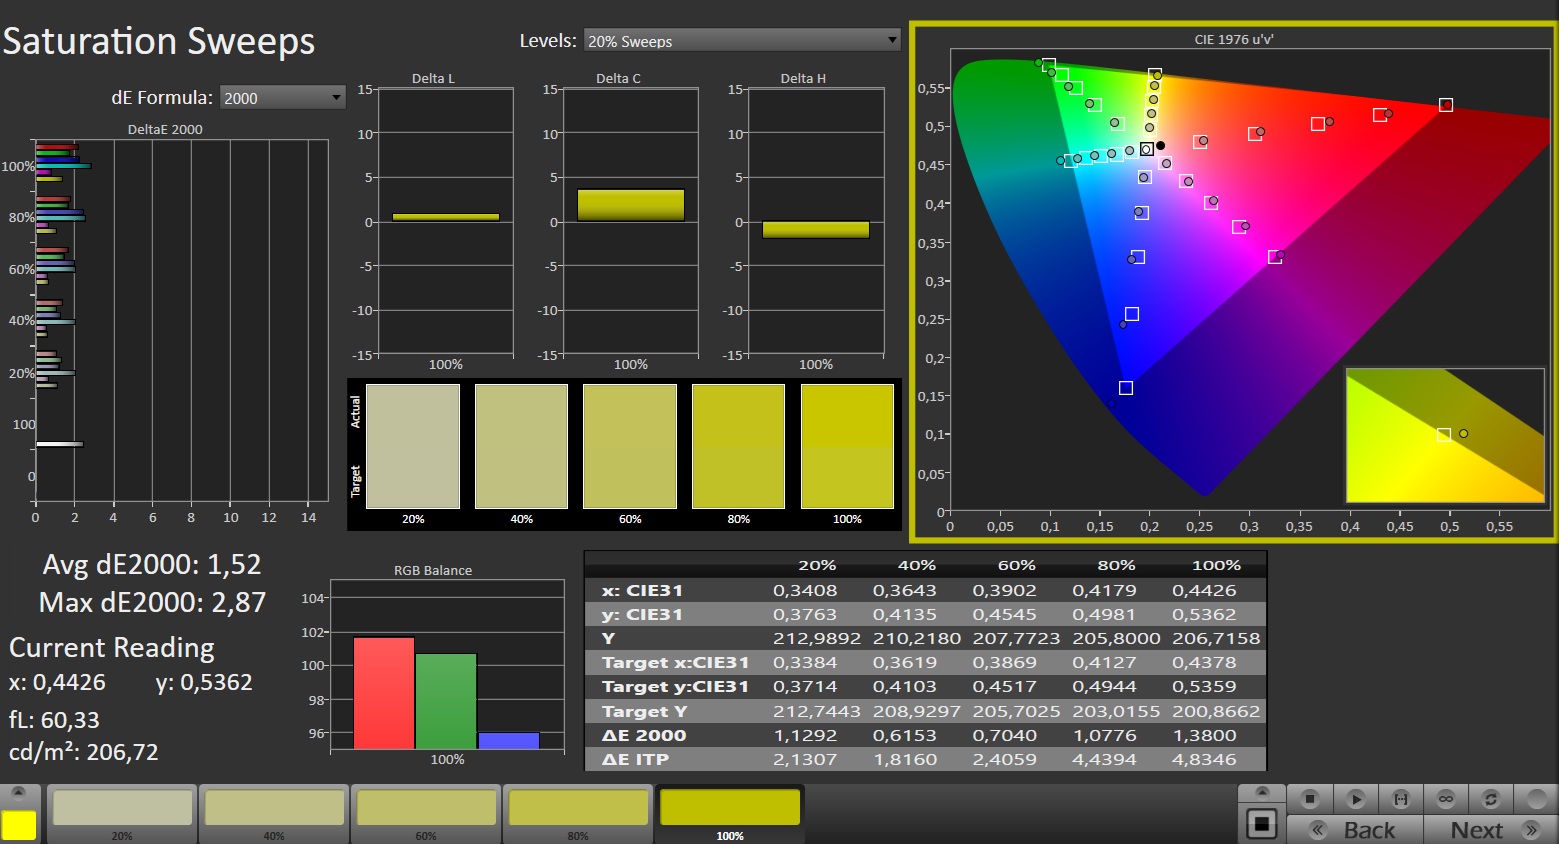
MSI has opted for an OLED panel with a very sharp 2880 x 1800 resolution, though its reflective surface makes it rather weak for outdoor use. We measured an average brightness of just under 400 cd/m², which is solid. The remaining values also meet the expectations for an OLED display. Thanks to the excellent black level, contrast is extremely high and easily outclasses classic IPS panels.
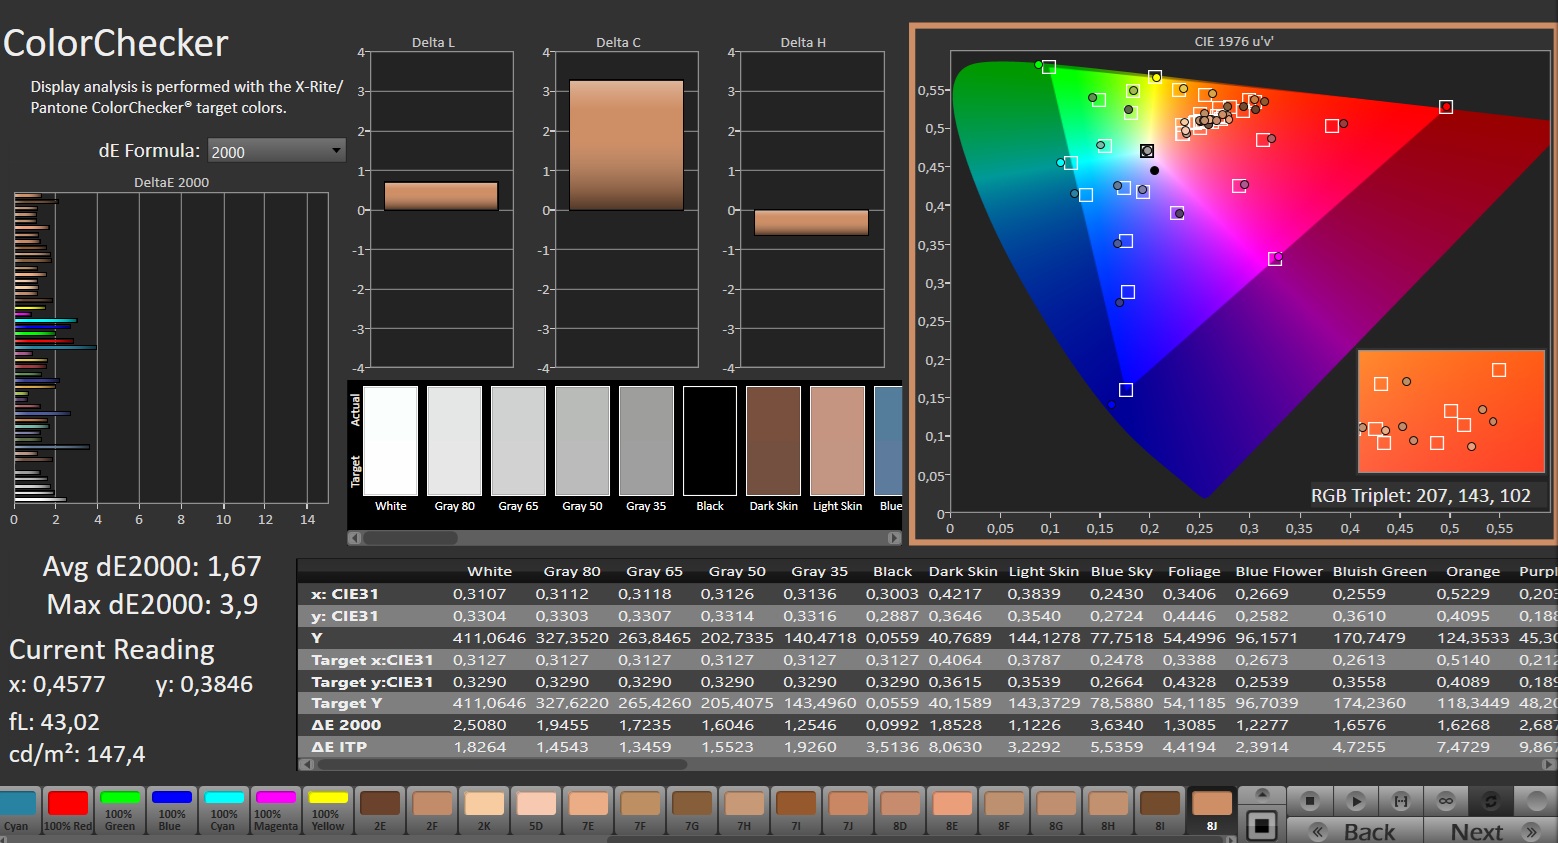
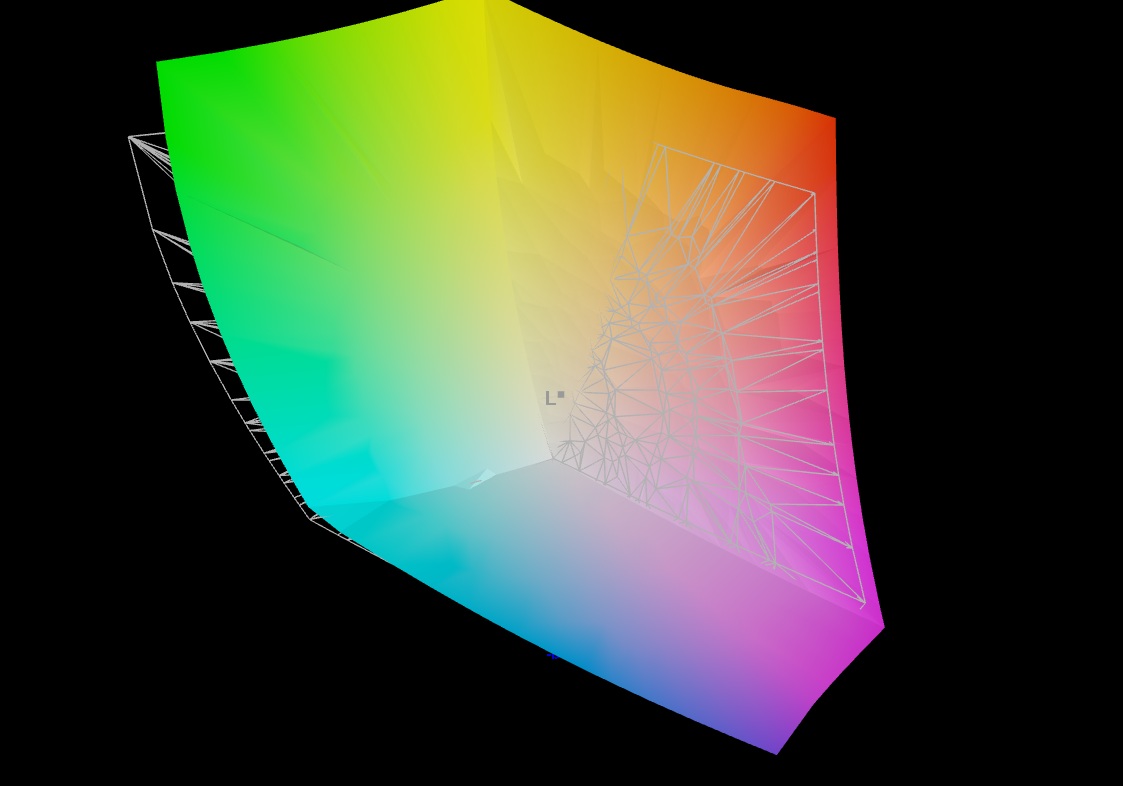
There is also nothing to criticize when it comes to response times, color accuracy, and color-space coverage: 100% sRGB and DCI-P3, plus 96% AdobeRGB. However, sensitive users may run into problems due to the detected screen flickering. A frequency of 60 Hz in the worst case is quite low.
| |||||||||||||||||||||||||
Brightness Distribution: 98 %
Center on Battery: 394 cd/m²
Contrast: 78800:1 (Black: 0.005 cd/m²)
ΔE ColorChecker Calman: 1.67 | ∀{0.5-29.43 Ø4.71}
ΔE Greyscale Calman: 1.2 | ∀{0.09-98 Ø4.96}
95.7% AdobeRGB 1998 (Argyll 3D)
100% sRGB (Argyll 3D)
99.9% Display P3 (Argyll 3D)
Gamma: 2.212
CCT: 6470 K
| MSI Prestige 13 AI+ A3MG ATNA33AA07-0, OLED, 2880x1800, 13.3", 60 Hz | Lenovo Yoga Slim 7 Ultra 14IPH11 LEN140WQ+, OLED, 2880x1800, 14", 120 Hz | Lenovo IdeaPad 5i 2-in-1 14IPH11 LEN140WUXGA, IPS, 1920x1200, 14", 60 Hz | Honor MagicBook Pro 14 2026 EDO14.55, OLED, 3120x2080, 14.6", 120 Hz | Asus ZenBook 14 OLED UM3406K, Ryzen AI 7 350 ATNA40CT02-0, OLED, 1920x1200, 14", 60 Hz | Asus Zenbook A14 UX3704NA ATNA40CT06-0, OLED, 1920x1200, 14", 60 Hz | |
|---|---|---|---|---|---|---|
| Display | -3% | -51% | -5% | 0% | -3% | |
| Display P3 Coverage (%) | 99.9 | 99.3 -1% | 42 -58% | 96.3 -4% | 99.9 0% | 99.5 0% |
| sRGB Coverage (%) | 100 | 100 0% | 60.9 -39% | 99.9 0% | 100 0% | 98.8 -1% |
| AdobeRGB 1998 Coverage (%) | 95.7 | 87.7 -8% | 43.4 -55% | 85 -11% | 96.4 1% | 88.9 -7% |
| Response Times | 16% | -1228% | 67% | -2% | 34% | |
| Response Time Grey 50% / Grey 80% * (ms) | 1.8 ? | 0.64 ? 64% | 26.8 ? -1389% | 0.55 ? 69% | 1.6 ? 11% | 1.22 ? 32% |
| Response Time Black / White * (ms) | 1.5 ? | 0.94 ? 37% | 17.5 ? -1067% | 0.51 ? 66% | 2 ? -33% | 1.26 ? 16% |
| PWM Frequency (Hz) | 60 ? | 479.46 ? | 120 ? | 480 | 480 ? | |
| PWM Amplitude * (%) | 33 | 50 -52% | 11 67% | 28 15% | 15 55% | |
| Screen | 5% | -938% | -6% | -66% | -1% | |
| Brightness middle (cd/m²) | 394 | 470.7 19% | 411 4% | 519 32% | 386 -2% | 404 3% |
| Brightness (cd/m²) | 395 | 488 24% | 397 1% | 526 33% | 387 -2% | 408 3% |
| Brightness Distribution (%) | 98 | 94 -4% | 91 -7% | 89 -9% | 97 -1% | 98 0% |
| Black Level * (cd/m²) | 0.005 | 0.32 -6300% | 0.01 -100% | 0.03 -500% | ||
| Contrast (:1) | 78800 | 1284 -98% | 51900 -34% | 12867 -84% | ||
| Colorchecker dE 2000 * | 1.67 | 2.21 -32% | 6.88 -312% | 1.1 34% | 1.55 7% | 1.1 34% |
| Colorchecker dE 2000 max. * | 3.9 | 5.02 -29% | 19.85 -409% | 2.2 44% | 3.39 13% | 3.3 15% |
| Greyscale dE 2000 * | 1.2 | 0.6 50% | 5.8 -383% | 1.8 -50% | 0.67 44% | 1.9 -58% |
| Gamma | 2.212 99% | 2.2 100% | 2.202 100% | 2.23 99% | 2.42 91% | 2.17 101% |
| CCT | 6470 100% | 6472 100% | 6359 102% | 6496 100% | 6505 100% | 6547 99% |
| Colorchecker dE 2000 calibrated * | 0.82 | 0.7 | 1.55 | |||
| Total Average (Program / Settings) | 6% /
6% | -739% /
-778% | 19% /
10% | -23% /
-38% | 10% /
8% |
* ... smaller is better


Display Response Times
| ↔ Response Time Black to White | ||
|---|---|---|
| 1.5 ms ... rise ↗ and fall ↘ combined | ↗ 0.8 ms rise | 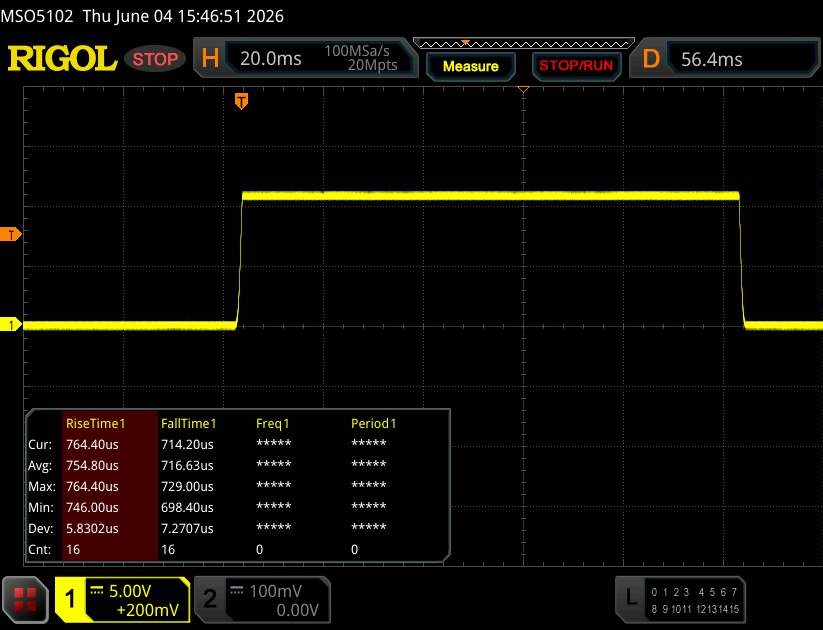 |
| ↘ 0.7 ms fall | ||
| The screen shows very fast response rates in our tests and should be very well suited for fast-paced gaming. In comparison, all tested devices range from 0.1 (minimum) to 240 (maximum) ms. » 9 % of all devices are better. This means that the measured response time is better than the average of all tested devices (19.8 ms). | ||
| ↔ Response Time 50% Grey to 80% Grey | ||
| 1.8 ms ... rise ↗ and fall ↘ combined | ↗ 0.9 ms rise | 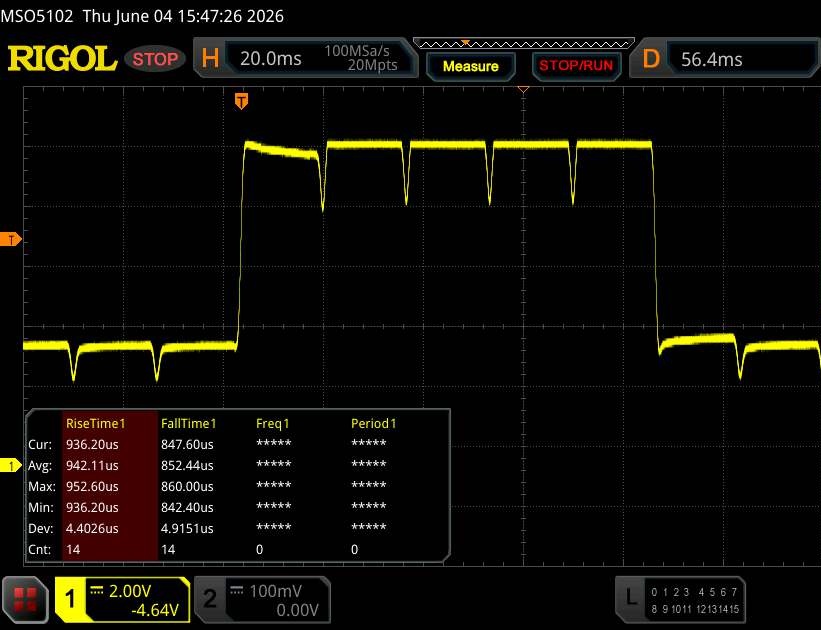 |
| ↘ 0.9 ms fall | ||
| The screen shows very fast response rates in our tests and should be very well suited for fast-paced gaming. In comparison, all tested devices range from 0.165 (minimum) to 636 (maximum) ms. » 9 % of all devices are better. This means that the measured response time is better than the average of all tested devices (31 ms). | ||
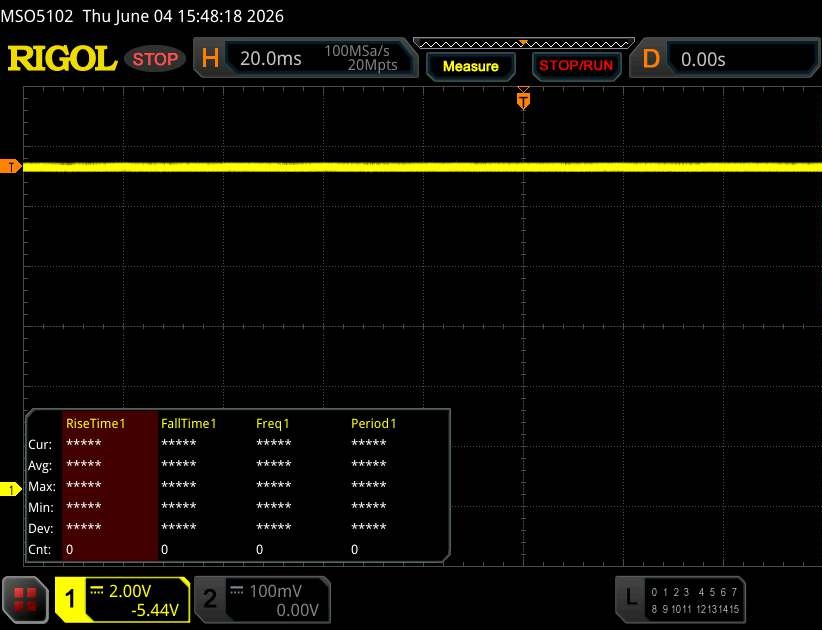
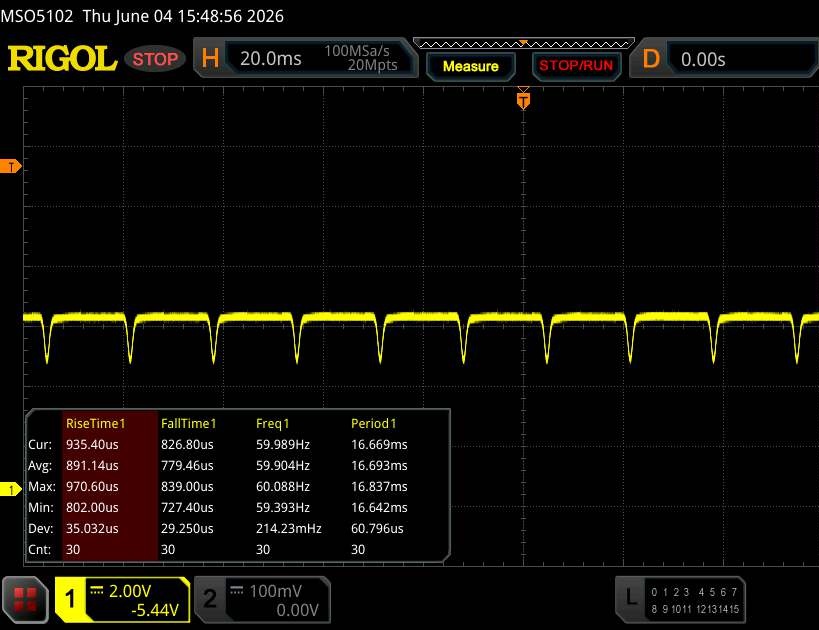
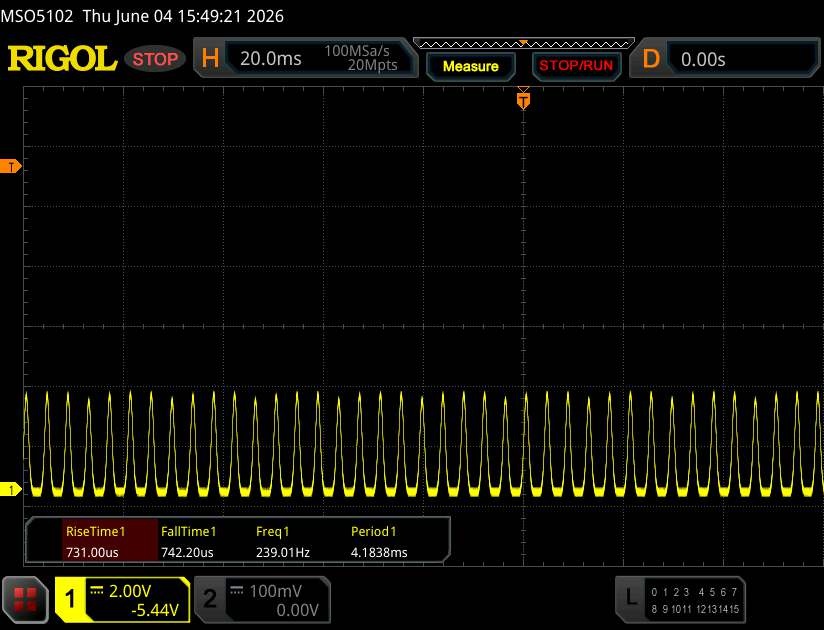
Screen Flickering / PWM (Pulse-Width Modulation)
| Screen flickering / PWM detected | 60 Hz Amplitude: 33 % | ≤ 90 % brightness setting | |
The display backlight flickers at 60 Hz (worst case, e.g., utilizing PWM) Flickering detected at a brightness setting of 90 % and below. There should be no flickering or PWM above this brightness setting. The frequency of 60 Hz is very low, so the flickering may cause eyestrain and headaches after extended use. In comparison: 52 % of all tested devices do not use PWM to dim the display. If PWM was detected, an average of 7757 (minimum: 5 - maximum: 343500) Hz was measured. | |||
Performance
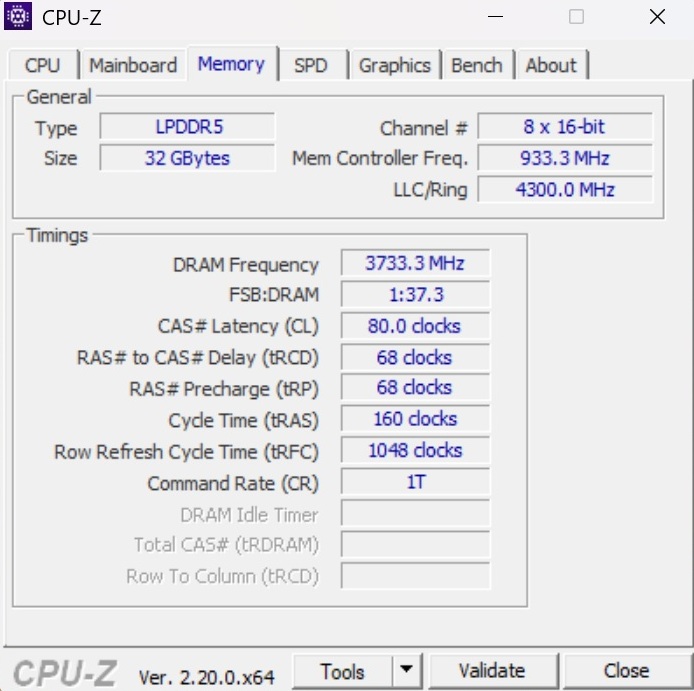
The Core Ultra 9 386H delivers mid-range performance. For the purchase price of around 1,600 euros, buyers also get a 1 TB SSD and 32 GB of LPDDR5X RAM, which remains reasonable given the current memory crisis.
Test conditions
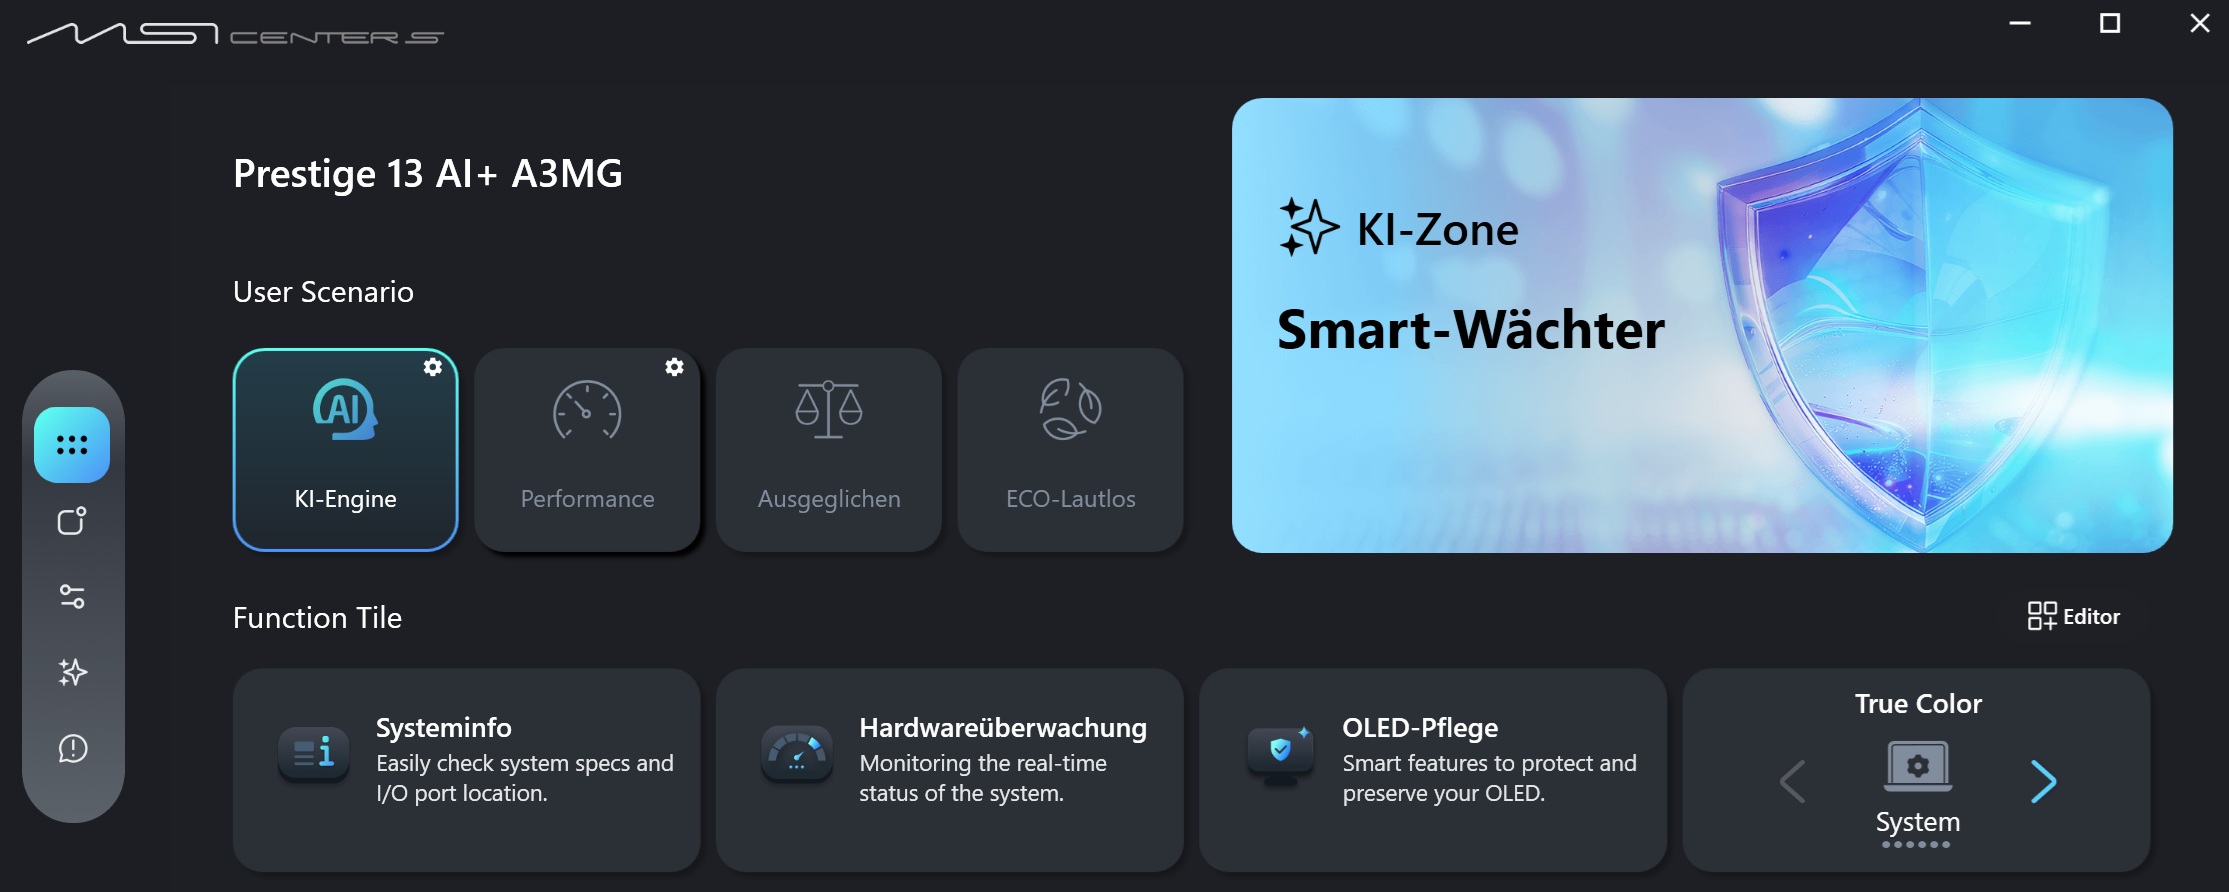
As is typical for the manufacturer, several profiles are available through MSI Center. Since the laptop carries the AI branding, all measurements were performed using the AI Engine. The behavior of the other modes can be found in the table.
| Mode | AI Engine | Performance | Balanced | ECO Silent |
| Cyberpunk 2077 Noise | 41 dB(A) | 40 dB(A) | 32 dB(A) | 31 dB(A) |
| Cyberpunk 2077 frame rate (FHD/Ultra) | 19.1 fps | 19.3 fps | 16.2 fps | 10.1 fps |
| CPU PL1 | variable | 24 W | 15 W | 10 W |
| CPU PL2 | variable | 34 W | 25 W | 10 W |
| Cinebench R15 Multi Score | 2513 Points | 2490 Points | 1963 Points | 1224 Points |
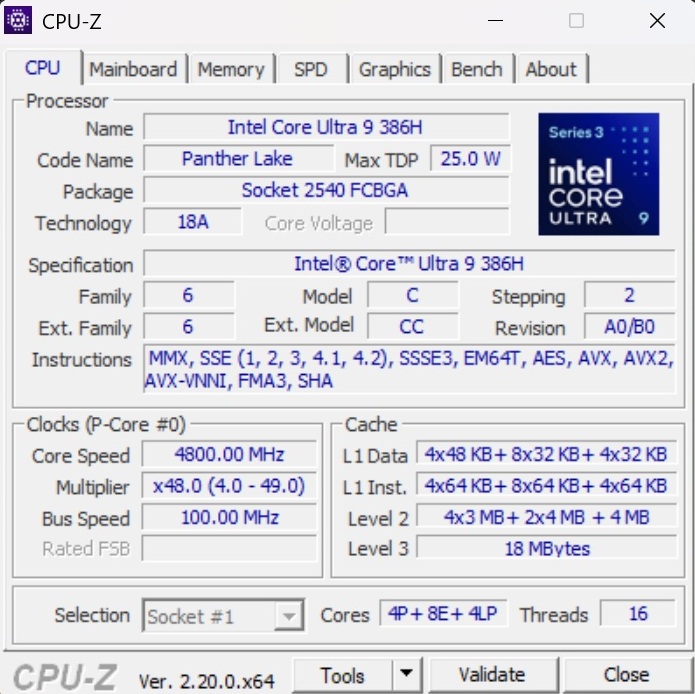
Processor
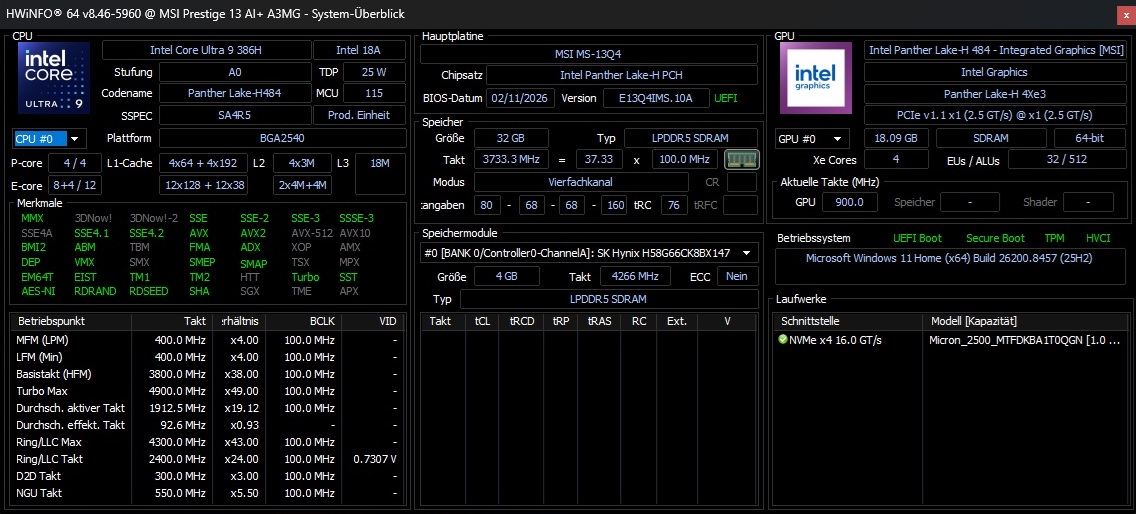
The Core Ultra 9 386H is a modern Panther Lake processor with 16 cores and no Hyper-Threading, and we have already tested it several times. In our benchmark suite, the Prestige 13 AI+ places only slightly ahead of devices with the Ryzen AI 7 350 and Core Ultra 7 355 despite its higher core count. As our Cinebench loop shows, the laptop unfortunately cannot maintain its CPU performance after even a short period of load, and performance drops slightly. Most rivals handle this better.
Cinebench R15 Multi endurance test
* ... smaller is better
AIDA64: FP32 Ray-Trace | FPU Julia | CPU SHA3 | CPU Queen | FPU SinJulia | FPU Mandel | CPU AES | CPU ZLib | FP64 Ray-Trace | CPU PhotoWorxx
| Performance rating | |
| Average Intel Core Ultra 9 386H -1! | |
| Asus ZenBook 14 OLED UM3406K, Ryzen AI 7 350 | |
| Honor MagicBook Pro 14 2026 -1! | |
| Average of class Subnotebook | |
| Asus Zenbook A14 UX3704NA -1! | |
| Lenovo Yoga Slim 7 Ultra 14IPH11 -1! | |
| MSI Prestige 13 AI+ A3MG -1! | |
| Lenovo IdeaPad 5i 2-in-1 14IPH11 -1! | |
| AIDA64 / FP32 Ray-Trace | |
| Asus ZenBook 14 OLED UM3406K, Ryzen AI 7 350 (v6.92.6600) | |
| Average Intel Core Ultra 9 386H (10001 - 21727, n=8) | |
| Honor MagicBook Pro 14 2026 (v8.20.8100) | |
| Average of class Subnotebook (1135 - 32888, n=57, last 2 years) | |
| Lenovo Yoga Slim 7 Ultra 14IPH11 (v8.20.8100) | |
| MSI Prestige 13 AI+ A3MG (v8.20.8100) | |
| Asus Zenbook A14 UX3704NA (v8.20.8100) | |
| Lenovo IdeaPad 5i 2-in-1 14IPH11 (v8.20.8100) | |
| AIDA64 / FPU Julia | |
| Average Intel Core Ultra 9 386H (53370 - 113595, n=8) | |
| Honor MagicBook Pro 14 2026 (v8.20.8100) | |
| Asus ZenBook 14 OLED UM3406K, Ryzen AI 7 350 (v6.92.6600) | |
| Average of class Subnotebook (5218 - 123315, n=57, last 2 years) | |
| Lenovo Yoga Slim 7 Ultra 14IPH11 (v8.20.8100) | |
| MSI Prestige 13 AI+ A3MG (v8.20.8100) | |
| Lenovo IdeaPad 5i 2-in-1 14IPH11 (v8.20.8100) | |
| Asus Zenbook A14 UX3704NA (v8.20.8100) | |
| AIDA64 / CPU SHA3 | |
| Average Intel Core Ultra 9 386H (2776 - 5604, n=8) | |
| Asus Zenbook A14 UX3704NA (v8.20.8100) | |
| Honor MagicBook Pro 14 2026 (v8.20.8100) | |
| Asus ZenBook 14 OLED UM3406K, Ryzen AI 7 350 (v6.92.6600) | |
| Average of class Subnotebook (444 - 5287, n=57, last 2 years) | |
| Lenovo Yoga Slim 7 Ultra 14IPH11 (v8.20.8100) | |
| MSI Prestige 13 AI+ A3MG (v8.20.8100) | |
| Lenovo IdeaPad 5i 2-in-1 14IPH11 (v8.20.8100) | |
| AIDA64 / CPU Queen | |
| Asus ZenBook 14 OLED UM3406K, Ryzen AI 7 350 (v6.92.6600) | |
| Average of class Subnotebook (10579 - 95002, n=48, last 2 years) | |
| AIDA64 / FPU SinJulia | |
| Asus ZenBook 14 OLED UM3406K, Ryzen AI 7 350 (v6.92.6600) | |
| Average Intel Core Ultra 9 386H (5314 - 7332, n=8) | |
| Average of class Subnotebook (744 - 18418, n=57, last 2 years) | |
| Honor MagicBook Pro 14 2026 (v8.20.8100) | |
| MSI Prestige 13 AI+ A3MG (v8.20.8100) | |
| Lenovo Yoga Slim 7 Ultra 14IPH11 (v8.20.8100) | |
| Asus Zenbook A14 UX3704NA (v8.20.8100) | |
| Lenovo IdeaPad 5i 2-in-1 14IPH11 (v8.20.8100) | |
| AIDA64 / FPU Mandel | |
| Average Intel Core Ultra 9 386H (28414 - 61578, n=8) | |
| Honor MagicBook Pro 14 2026 (v8.20.8100) | |
| Asus ZenBook 14 OLED UM3406K, Ryzen AI 7 350 (v6.92.6600) | |
| Average of class Subnotebook (3341 - 65433, n=57, last 2 years) | |
| Lenovo Yoga Slim 7 Ultra 14IPH11 (v8.20.8100) | |
| MSI Prestige 13 AI+ A3MG (v8.20.8100) | |
| Lenovo IdeaPad 5i 2-in-1 14IPH11 (v8.20.8100) | |
| Asus Zenbook A14 UX3704NA (v8.20.8100) | |
| AIDA64 / CPU AES | |
| Asus Zenbook A14 UX3704NA (v8.20.8100) | |
| Asus ZenBook 14 OLED UM3406K, Ryzen AI 7 350 (v6.92.6600) | |
| Average Intel Core Ultra 9 386H (46362 - 72112, n=8) | |
| Average of class Subnotebook (638 - 96917, n=57, last 2 years) | |
| Honor MagicBook Pro 14 2026 (v8.20.8100) | |
| MSI Prestige 13 AI+ A3MG (v8.20.8100) | |
| Lenovo Yoga Slim 7 Ultra 14IPH11 (v8.20.8100) | |
| Lenovo IdeaPad 5i 2-in-1 14IPH11 (v8.20.8100) | |
| AIDA64 / CPU ZLib | |
| Asus Zenbook A14 UX3704NA (v8.20.8100) | |
| Average Intel Core Ultra 9 386H (669 - 1271, n=8) | |
| Honor MagicBook Pro 14 2026 (v8.20.8100) | |
| Asus ZenBook 14 OLED UM3406K, Ryzen AI 7 350 (v6.92.6600) | |
| Average of class Subnotebook (164.9 - 1379, n=57, last 2 years) | |
| MSI Prestige 13 AI+ A3MG (v8.20.8100) | |
| Lenovo Yoga Slim 7 Ultra 14IPH11 (v8.20.8100) | |
| Lenovo IdeaPad 5i 2-in-1 14IPH11 (v8.20.8100) | |
| AIDA64 / FP64 Ray-Trace | |
| Asus ZenBook 14 OLED UM3406K, Ryzen AI 7 350 (v6.92.6600) | |
| Average Intel Core Ultra 9 386H (5138 - 11627, n=8) | |
| Honor MagicBook Pro 14 2026 (v8.20.8100) | |
| Average of class Subnotebook (610 - 17495, n=57, last 2 years) | |
| Lenovo Yoga Slim 7 Ultra 14IPH11 (v8.20.8100) | |
| Asus Zenbook A14 UX3704NA (v8.20.8100) | |
| MSI Prestige 13 AI+ A3MG (v8.20.8100) | |
| Lenovo IdeaPad 5i 2-in-1 14IPH11 (v8.20.8100) | |
| AIDA64 / CPU PhotoWorxx | |
| Average Intel Core Ultra 9 386H (54042 - 89891, n=8) | |
| Honor MagicBook Pro 14 2026 (v8.20.8100) | |
| MSI Prestige 13 AI+ A3MG (v8.20.8100) | |
| Lenovo Yoga Slim 7 Ultra 14IPH11 (v8.20.8100) | |
| Asus Zenbook A14 UX3704NA (v8.20.8100) | |
| Average of class Subnotebook (6569 - 85600, n=57, last 2 years) | |
| Asus ZenBook 14 OLED UM3406K, Ryzen AI 7 350 (v6.92.6600) | |
| Lenovo IdeaPad 5i 2-in-1 14IPH11 (v8.20.8100) | |
System performance
Nevertheless, the system benchmarks place the 13-inch model third in the comparison field, just behind the Honor MagicBook Pro 14. In everyday use, the laptop responds pleasantly quickly.
PCMark 10: Score | Essentials | Productivity | Digital Content Creation
CrossMark: Overall | Productivity | Creativity | Responsiveness
WebXPRT 3: Overall
WebXPRT 4: Overall
Mozilla Kraken 1.1: Total
| Performance rating | |
| Asus Zenbook A14 UX3704NA -4! | |
| Honor MagicBook Pro 14 2026 | |
| Average Intel Core Ultra 9 386H, Intel Graphics 4 Xe3 Panther Lake iGPU | |
| MSI Prestige 13 AI+ A3MG | |
| Lenovo Yoga Slim 7 Ultra 14IPH11 | |
| Average of class Subnotebook | |
| Asus ZenBook 14 OLED UM3406K, Ryzen AI 7 350 | |
| Lenovo IdeaPad 5i 2-in-1 14IPH11 | |
| PCMark 10 / Score | |
| Honor MagicBook Pro 14 2026 | |
| Average Intel Core Ultra 9 386H, Intel Graphics 4 Xe3 Panther Lake iGPU (7679 - 8639, n=3) | |
| Lenovo Yoga Slim 7 Ultra 14IPH11 | |
| MSI Prestige 13 AI+ A3MG | |
| Average of class Subnotebook (4920 - 9939, n=45, last 2 years) | |
| Asus ZenBook 14 OLED UM3406K, Ryzen AI 7 350 | |
| Lenovo IdeaPad 5i 2-in-1 14IPH11 | |
| PCMark 10 / Essentials | |
| MSI Prestige 13 AI+ A3MG | |
| Asus ZenBook 14 OLED UM3406K, Ryzen AI 7 350 | |
| Average Intel Core Ultra 9 386H, Intel Graphics 4 Xe3 Panther Lake iGPU (10375 - 10934, n=3) | |
| Honor MagicBook Pro 14 2026 | |
| Lenovo Yoga Slim 7 Ultra 14IPH11 | |
| Average of class Subnotebook (8552 - 11646, n=45, last 2 years) | |
| Lenovo IdeaPad 5i 2-in-1 14IPH11 | |
| PCMark 10 / Productivity | |
| Honor MagicBook Pro 14 2026 | |
| Lenovo Yoga Slim 7 Ultra 14IPH11 | |
| Average Intel Core Ultra 9 386H, Intel Graphics 4 Xe3 Panther Lake iGPU (12295 - 15282, n=3) | |
| MSI Prestige 13 AI+ A3MG | |
| Lenovo IdeaPad 5i 2-in-1 14IPH11 | |
| Asus ZenBook 14 OLED UM3406K, Ryzen AI 7 350 | |
| Average of class Subnotebook (5435 - 16606, n=45, last 2 years) | |
| PCMark 10 / Digital Content Creation | |
| Honor MagicBook Pro 14 2026 | |
| Average Intel Core Ultra 9 386H, Intel Graphics 4 Xe3 Panther Lake iGPU (9175 - 10562, n=3) | |
| Average of class Subnotebook (5722 - 13779, n=45, last 2 years) | |
| Lenovo Yoga Slim 7 Ultra 14IPH11 | |
| MSI Prestige 13 AI+ A3MG | |
| Asus ZenBook 14 OLED UM3406K, Ryzen AI 7 350 | |
| Lenovo IdeaPad 5i 2-in-1 14IPH11 | |
| CrossMark / Overall | |
| Average Intel Core Ultra 9 386H, Intel Graphics 4 Xe3 Panther Lake iGPU (1975 - 2143, n=3) | |
| MSI Prestige 13 AI+ A3MG | |
| Asus Zenbook A14 UX3704NA | |
| Honor MagicBook Pro 14 2026 | |
| Lenovo Yoga Slim 7 Ultra 14IPH11 | |
| Asus ZenBook 14 OLED UM3406K, Ryzen AI 7 350 | |
| Average of class Subnotebook (365 - 2356, n=59, last 2 years) | |
| Lenovo IdeaPad 5i 2-in-1 14IPH11 | |
| CrossMark / Productivity | |
| Average Intel Core Ultra 9 386H, Intel Graphics 4 Xe3 Panther Lake iGPU (1842 - 1955, n=3) | |
| MSI Prestige 13 AI+ A3MG | |
| Asus Zenbook A14 UX3704NA | |
| Honor MagicBook Pro 14 2026 | |
| Lenovo Yoga Slim 7 Ultra 14IPH11 | |
| Asus ZenBook 14 OLED UM3406K, Ryzen AI 7 350 | |
| Average of class Subnotebook (364 - 2277, n=59, last 2 years) | |
| Lenovo IdeaPad 5i 2-in-1 14IPH11 | |
| CrossMark / Creativity | |
| Average Intel Core Ultra 9 386H, Intel Graphics 4 Xe3 Panther Lake iGPU (2169 - 2477, n=3) | |
| MSI Prestige 13 AI+ A3MG | |
| Asus Zenbook A14 UX3704NA | |
| Honor MagicBook Pro 14 2026 | |
| Asus ZenBook 14 OLED UM3406K, Ryzen AI 7 350 | |
| Lenovo Yoga Slim 7 Ultra 14IPH11 | |
| Average of class Subnotebook (372 - 2743, n=59, last 2 years) | |
| Lenovo IdeaPad 5i 2-in-1 14IPH11 | |
| CrossMark / Responsiveness | |
| Asus Zenbook A14 UX3704NA | |
| Average Intel Core Ultra 9 386H, Intel Graphics 4 Xe3 Panther Lake iGPU (1667 - 1831, n=3) | |
| Honor MagicBook Pro 14 2026 | |
| MSI Prestige 13 AI+ A3MG | |
| Lenovo Yoga Slim 7 Ultra 14IPH11 | |
| Asus ZenBook 14 OLED UM3406K, Ryzen AI 7 350 | |
| Average of class Subnotebook (312 - 1854, n=59, last 2 years) | |
| Lenovo IdeaPad 5i 2-in-1 14IPH11 | |
| WebXPRT 3 / Overall | |
| Asus Zenbook A14 UX3704NA | |
| Average of class Subnotebook (156 - 530, n=55, last 2 years) | |
| MSI Prestige 13 AI+ A3MG | |
| Average Intel Core Ultra 9 386H, Intel Graphics 4 Xe3 Panther Lake iGPU (302 - 323, n=3) | |
| Lenovo Yoga Slim 7 Ultra 14IPH11 | |
| Honor MagicBook Pro 14 2026 | |
| Lenovo IdeaPad 5i 2-in-1 14IPH11 | |
| Asus ZenBook 14 OLED UM3406K, Ryzen AI 7 350 | |
| WebXPRT 4 / Overall | |
| Asus Zenbook A14 UX3704NA | |
| MSI Prestige 13 AI+ A3MG | |
| Average Intel Core Ultra 9 386H, Intel Graphics 4 Xe3 Panther Lake iGPU (282 - 309, n=3) | |
| Honor MagicBook Pro 14 2026 | |
| Lenovo Yoga Slim 7 Ultra 14IPH11 | |
| Average of class Subnotebook (132 - 378, n=60, last 2 years) | |
| Lenovo IdeaPad 5i 2-in-1 14IPH11 | |
| Asus ZenBook 14 OLED UM3406K, Ryzen AI 7 350 | |
| Mozilla Kraken 1.1 / Total | |
| Asus ZenBook 14 OLED UM3406K, Ryzen AI 7 350 | |
| Lenovo IdeaPad 5i 2-in-1 14IPH11 | |
| Average of class Subnotebook (234 - 1104, n=60, last 2 years) | |
| Lenovo Yoga Slim 7 Ultra 14IPH11 | |
| Honor MagicBook Pro 14 2026 | |
| Average Intel Core Ultra 9 386H, Intel Graphics 4 Xe3 Panther Lake iGPU (447 - 456, n=3) | |
| MSI Prestige 13 AI+ A3MG | |
| Asus Zenbook A14 UX3704NA | |
* ... smaller is better
| PCMark 10 Score | 7679 points | |
Help | ||
| AIDA64 / Memory Copy | |
| Honor MagicBook Pro 14 2026 | |
| Average Intel Core Ultra 9 386H (75437 - 129946, n=8) | |
| Lenovo Yoga Slim 7 Ultra 14IPH11 | |
| MSI Prestige 13 AI+ A3MG | |
| Average of class Subnotebook (14554 - 131023, n=57, last 2 years) | |
| Asus ZenBook 14 OLED UM3406K, Ryzen AI 7 350 | |
| Asus Zenbook A14 UX3704NA | |
| Lenovo IdeaPad 5i 2-in-1 14IPH11 | |
| AIDA64 / Memory Read | |
| Asus Zenbook A14 UX3704NA | |
| Average Intel Core Ultra 9 386H (81021 - 118858, n=8) | |
| Honor MagicBook Pro 14 2026 | |
| MSI Prestige 13 AI+ A3MG | |
| Lenovo Yoga Slim 7 Ultra 14IPH11 | |
| Average of class Subnotebook (15948 - 127174, n=57, last 2 years) | |
| Asus ZenBook 14 OLED UM3406K, Ryzen AI 7 350 | |
| Lenovo IdeaPad 5i 2-in-1 14IPH11 | |
| AIDA64 / Memory Write | |
| Honor MagicBook Pro 14 2026 | |
| Average Intel Core Ultra 9 386H (75959 - 135096, n=8) | |
| Lenovo Yoga Slim 7 Ultra 14IPH11 | |
| MSI Prestige 13 AI+ A3MG | |
| Asus ZenBook 14 OLED UM3406K, Ryzen AI 7 350 | |
| Average of class Subnotebook (15709 - 135141, n=57, last 2 years) | |
| Lenovo IdeaPad 5i 2-in-1 14IPH11 | |
| Asus Zenbook A14 UX3704NA | |
| AIDA64 / Memory Latency | |
| Lenovo IdeaPad 5i 2-in-1 14IPH11 | |
| MSI Prestige 13 AI+ A3MG | |
| Asus ZenBook 14 OLED UM3406K, Ryzen AI 7 350 | |
| Lenovo Yoga Slim 7 Ultra 14IPH11 | |
| Average of class Subnotebook (6.1 - 159.9, n=55, last 2 years) | |
| Average Intel Core Ultra 9 386H (87.2 - 116.9, n=8) | |
| Honor MagicBook Pro 14 2026 | |
* ... smaller is better
Storage
Similar to the CPU, the SSD also suffers from speed drops under heavier load. The latter also affects the Lenovo IdeaPad 5i 2-in-1 14. Otherwise, the built-in NVMe drive from Micron delivers good performance, especially in sequential reads.

* ... smaller is better
Read continuous performance: DiskSpd Read Loop, Queue Depth 8
GPU performance
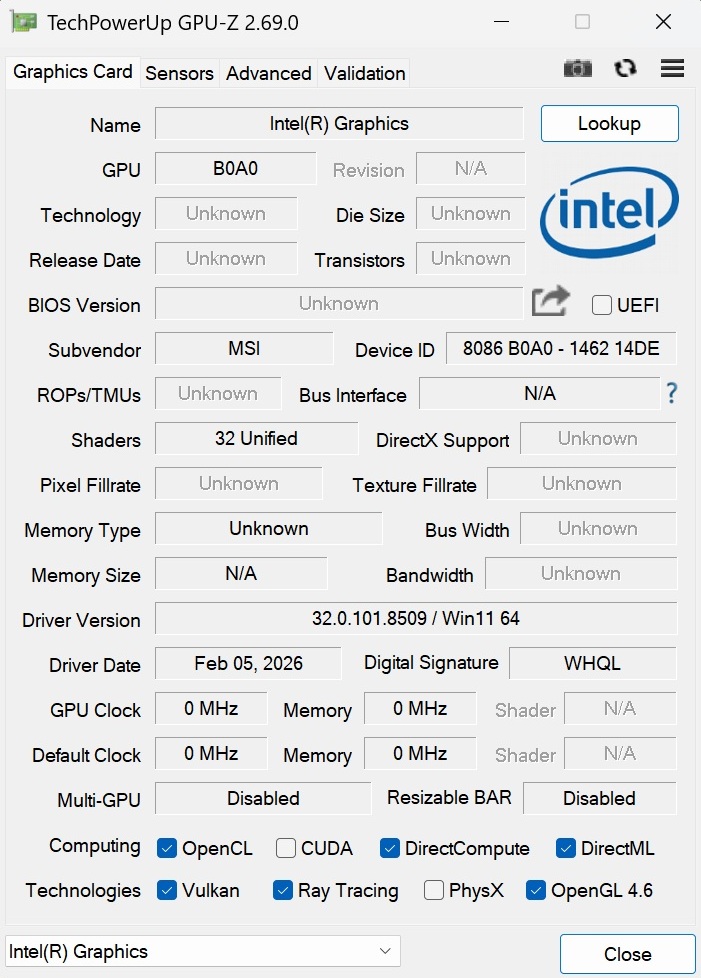
While the Graphics 2 Xe3 in the previously mentioned Lenovo laptop was recently very disappointing, the Graphics 4 Xe3 integrated into the Core Ultra 9 386H, with 32 shader units, at least makes a decent impression by iGPU standards. However, the Prestige 13 AI+ falls somewhat short of its potential here when comparing its 3DMark results with laptops based on the Core Ultra 7 355, which also features a Graphics 4 Xe3.
| 3DMark 11 Performance | 7026 points | |
| 3DMark Ice Storm Standard Score | 143052 points | |
| 3DMark Cloud Gate Standard Score | 23108 points | |
| 3DMark Fire Strike Score | 5086 points | |
| 3DMark Time Spy Score | 2672 points | |
Help | ||
Gaming performance
Our gaming test suite shows that games can roughly be divided into three categories. Undemanding or older titles such as F1 25 run smoothly, at least in the Full HD range, meaning 1920 x 1080 pixels, and in some cases even at high settings. Particularly CPU-intensive titles such as Crimson Desert and 007 First Light, on the other hand, stutter heavily even at minimum settings. The rest fall somewhere in between and can at least be pushed to usable frame rates with XeSS upscaling. Overall, gaming performance is in line with the Radeon 860M.
| Kingdom Come Deliverance 2 | |
| 1920x1080 Low Preset | |
| Average of class Subnotebook (32.7 - 43.4, n=2, last 2 years) | |
| MSI Prestige 13 AI+ A3MG | |
| Average Intel Graphics 4 Xe3 Panther Lake iGPU (n=1) | |
| Lenovo IdeaPad 5i 2-in-1 14IPH11 | |
| 1920x1080 Medium Preset | |
| Average of class Subnotebook (23.7 - 31.3, n=2, last 2 years) | |
| MSI Prestige 13 AI+ A3MG | |
| Average Intel Graphics 4 Xe3 Panther Lake iGPU (n=1) | |
| Lenovo IdeaPad 5i 2-in-1 14IPH11 | |
| 007 First Light | |
| 1920x1080 Low Settings AF:16x | |
| Average of class Subnotebook (17 - 21, n=2, last 2 years) | |
| MSI Prestige 13 AI+ A3MG | |
| Average Intel Graphics 4 Xe3 Panther Lake iGPU (n=1) | |
| Lenovo IdeaPad 5i 2-in-1 14IPH11 | |
| 1920x1080 Medium Settings AF:16x | |
| Average of class Subnotebook (14.8 - 20.1, n=2, last 2 years) | |
| MSI Prestige 13 AI+ A3MG | |
| Average Intel Graphics 4 Xe3 Panther Lake iGPU (n=1) | |
| Lenovo IdeaPad 5i 2-in-1 14IPH11 | |
Cyberpunk 2077 ultra FPS chart
| low | med. | high | ultra | |
|---|---|---|---|---|
| Dota 2 Reborn (2015) | 139.2 | 67.5 | 77.7 | 73 |
| X-Plane 11.11 (2018) | 44.6 | 33.5 | 30.1 | |
| Cyberpunk 2077 (2023) | 37.3 | 28.8 | 24.4 | 19.1 |
| Counter-Strike 2 (2023) | 78.8 | 59.1 | 33.4 | 20.9 |
| Kingdom Come Deliverance 2 (2025) | 32.7 | 23.7 | 18.8 | 12.6 |
| F1 25 (2025) | 62 | 53 | 39 | 10 |
| Call of Duty Black Ops 7 (2025) | 52 | 47 | 33 | 9 |
| Resident Evil Requiem (2026) | 25.3 | 18.8 | 16.2 | 8.21 |
| Crimson Desert (2026) | 16.5 | 13.9 | 13 | 12.4 |
| Pragmata (2026) | 27.7 | 20.8 | 16.6 | |
| 007 First Light (2026) | 17 | 14.8 | 13.6 | 12.8 |
Emissions & Energy
Noise emissions
While the Prestige 13 AI+ is often slightly more noticeable than its rivals when idling, its 31 to 42 dB(A) under load is roughly on par with the competition.
Noise level
| Idle |
| 26 / 27 / 28 dB(A) |
| Load |
| 31 / 42 dB(A) |
 | ||
30 dB silent 40 dB(A) audible 50 dB(A) loud |
||
min: | ||
| MSI Prestige 13 AI+ A3MG Ultra 9 386H, Intel Graphics 4 Xe3 PTL | Lenovo Yoga Slim 7 Ultra 14IPH11 Ultra 7 355, Intel Graphics 4 Xe3 PTL | Lenovo IdeaPad 5i 2-in-1 14IPH11 Ultra 5 322, Intel Graphics 2 Xe3 PTL | Honor MagicBook Pro 14 2026 Ultra 5 338H, Arc B370 Panther Lake iGPU | Asus ZenBook 14 OLED UM3406K, Ryzen AI 7 350 Ryzen AI 7 350, Radeon 860M | Asus Zenbook A14 UX3704NA X2E-88-100, X2-90 | |
|---|---|---|---|---|---|---|
| Noise | -5% | -3% | 2% | 6% | -3% | |
| off / environment * (dB) | 25 | 23.1 8% | 24 4% | 25.7 -3% | 24 4% | 24.2 3% |
| Idle Minimum * (dB) | 26 | 25.4 2% | 24 8% | 25.7 1% | 24 8% | 24.2 7% |
| Idle Average * (dB) | 27 | 25.5 6% | 25 7% | 25.7 5% | 24 11% | 24.2 10% |
| Idle Maximum * (dB) | 28 | 25.5 9% | 26 7% | 25.7 8% | 24 14% | 24.2 14% |
| Load Average * (dB) | 31 | 44.4 -43% | 43 -39% | 30.2 3% | 31.75 -2% | 41.3 -33% |
| Cyberpunk 2077 ultra * (dB) | 41 | 43.4 -6% | 42 -2% | 39.4 4% | 39.25 4% | 41.3 -1% |
| Load Maximum * (dB) | 42 | 45.5 -8% | 44 -5% | 42.9 -2% | 42.16 -0% | 51.7 -23% |
* ... smaller is better
Temperature
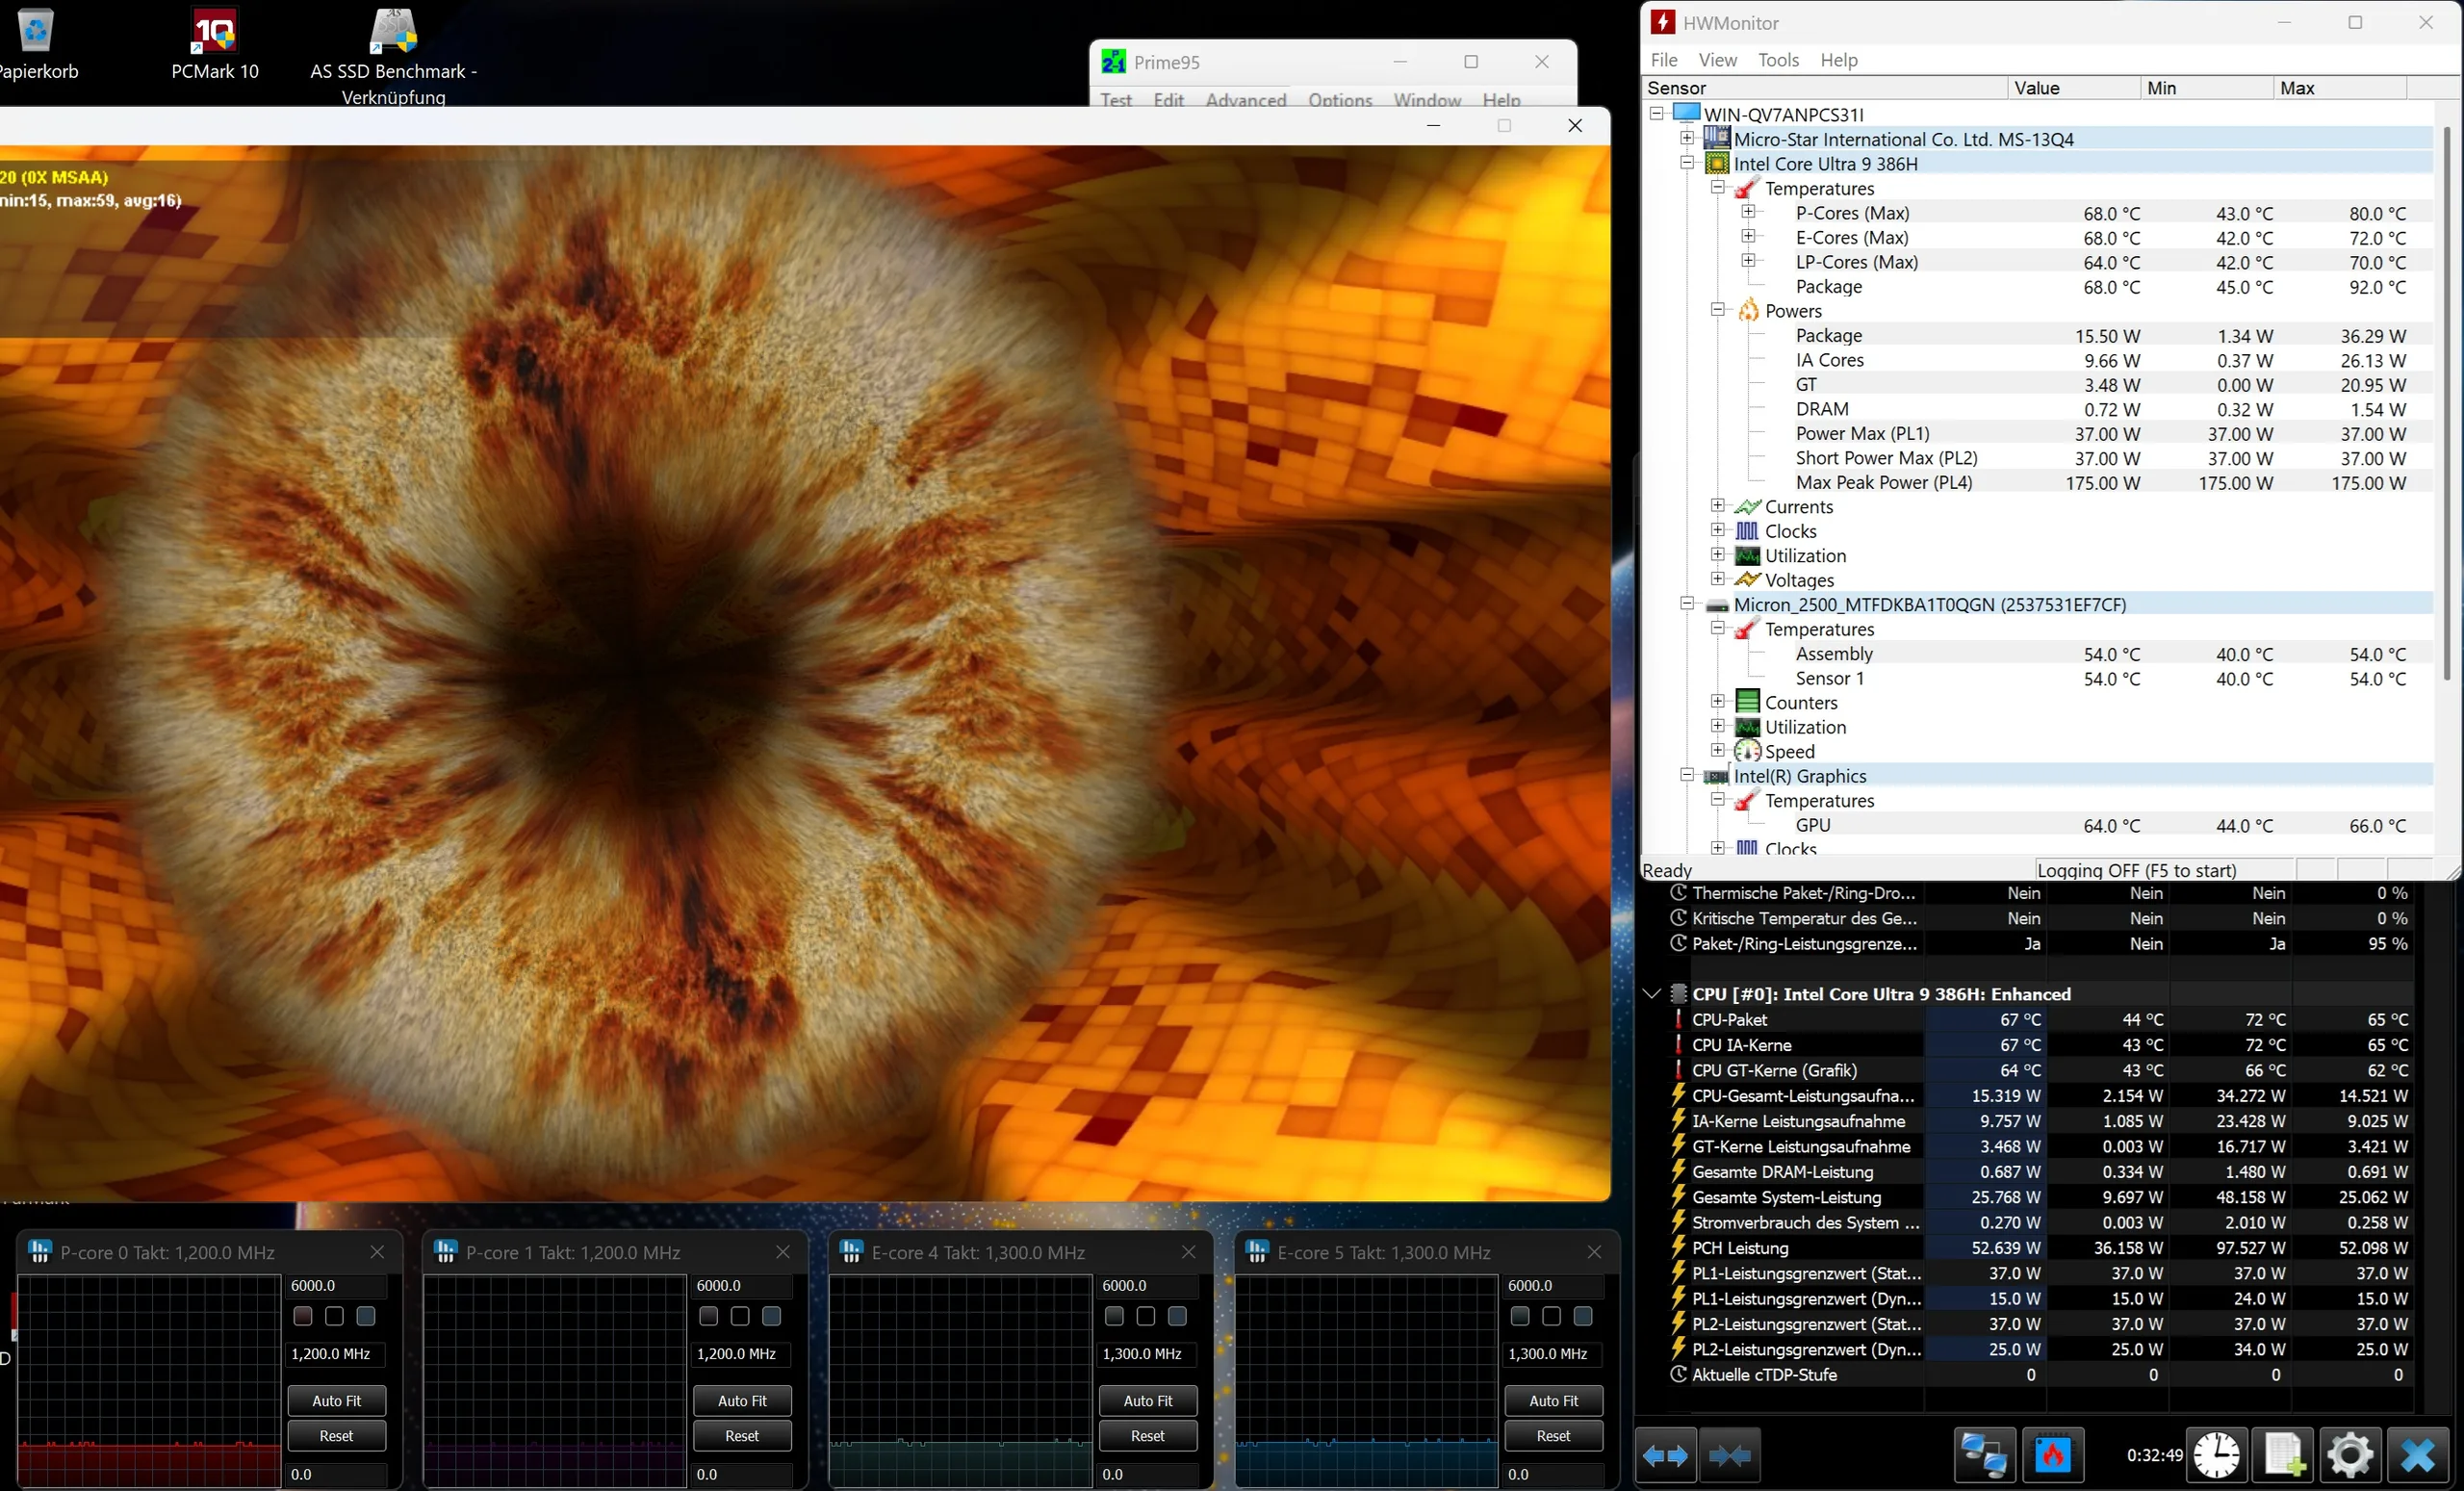
The case does not heat up excessively in 3D mode, reaching a maximum of 42 °C on the top and up to 41 °C on the bottom. In the stress test with FurMark and Prime95, the processor stabilized at just under 70 °C, which is a moderate value.
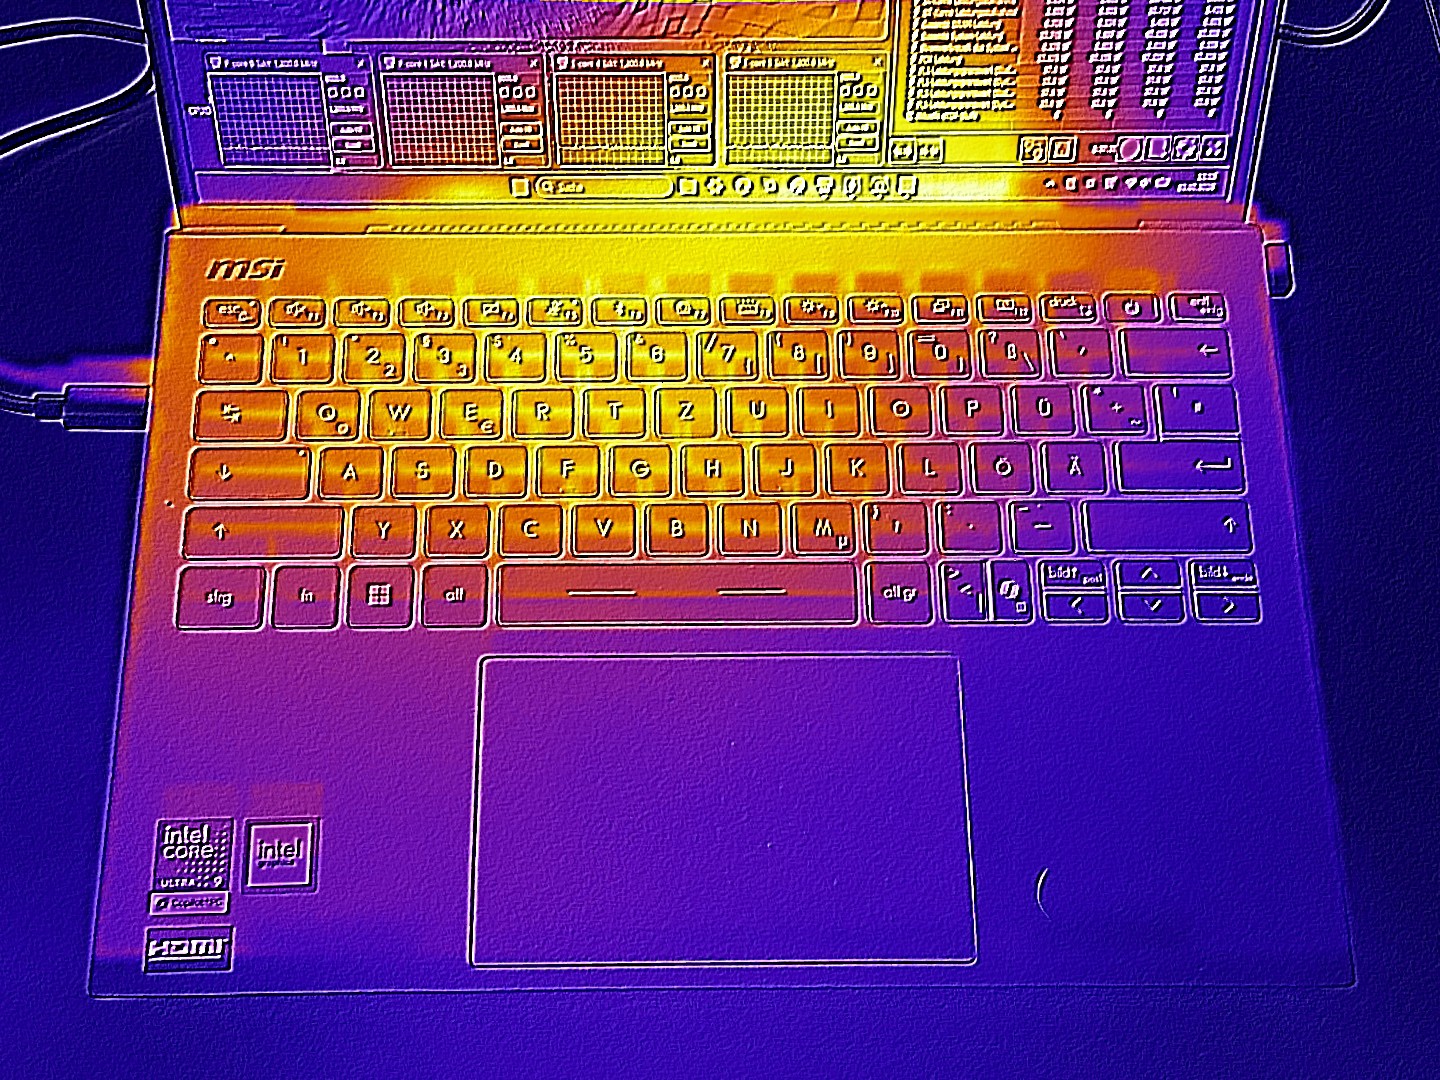
(±) The maximum temperature on the upper side is 42 °C / 108 F, compared to the average of 35.9 °C / 97 F, ranging from 21.4 to 59 °C for the class Subnotebook.
(±) The bottom heats up to a maximum of 41 °C / 106 F, compared to the average of 39.2 °C / 103 F
(+) The palmrests and touchpad are cooler than skin temperature with a maximum of 29 °C / 84.2 F and are therefore cool to the touch.
(±) The average temperature of the palmrest area of similar devices was 28.2 °C / 82.8 F (-0.8 °C / -1.4 F).
| MSI Prestige 13 AI+ A3MG Ultra 9 386H, Intel Graphics 4 Xe3 PTL | Lenovo Yoga Slim 7 Ultra 14IPH11 Ultra 7 355, Intel Graphics 4 Xe3 PTL | Lenovo IdeaPad 5i 2-in-1 14IPH11 Ultra 5 322, Intel Graphics 2 Xe3 PTL | Honor MagicBook Pro 14 2026 Ultra 5 338H, Arc B370 Panther Lake iGPU | Asus ZenBook 14 OLED UM3406K, Ryzen AI 7 350 Ryzen AI 7 350, Radeon 860M | Asus Zenbook A14 UX3704NA X2E-88-100, X2-90 | |
|---|---|---|---|---|---|---|
| Heat | 25% | -22% | 10% | -7% | -6% | |
| Maximum Upper Side * (°C) | 42 | 33.6 20% | 47 -12% | 39.1 7% | 41 2% | 40.9 3% |
| Maximum Bottom * (°C) | 41 | 28.8 30% | 54 -32% | 35.7 13% | 47 -15% | 47.2 -15% |
| Idle Upper Side * (°C) | 25.2 | 25.2 | 29 | 24.5 | ||
| Idle Bottom * (°C) | 24.6 | 24.9 | 30 | 24 |
* ... smaller is better
Speakers
The sound quality of the 2.0 system is below average. In addition to the maximum volume, the bass in particular could be better. Most competitors have the edge here.
MSI Prestige 13 AI+ A3MG audio analysis
(±) | speaker loudness is average but good (79 dB)
Bass 100 - 315 Hz
(±) | reduced bass - on average 14.9% lower than median
(±) | linearity of bass is average (13.9% delta to prev. frequency)
Mids 400 - 2000 Hz
(±) | higher mids - on average 7.1% higher than median
(+) | mids are linear (6% delta to prev. frequency)
Highs 2 - 16 kHz
(±) | higher highs - on average 5.1% higher than median
(+) | highs are linear (6.2% delta to prev. frequency)
Overall 100 - 16.000 Hz
(±) | linearity of overall sound is average (19.8% difference to median)
Compared to same class
» 63% of all tested devices in this class were better, 7% similar, 31% worse
» The best had a delta of 5%, average was 18%, worst was 53%
Compared to all devices tested
» 51% of all tested devices were better, 7% similar, 42% worse
» The best had a delta of 4%, average was 23%, worst was 134%
Lenovo Yoga Slim 7 Ultra 14IPH11 audio analysis
(+) | speakers can play relatively loud (82.3 dB)
Bass 100 - 315 Hz
(±) | reduced bass - on average 6.7% lower than median
(±) | linearity of bass is average (9% delta to prev. frequency)
Mids 400 - 2000 Hz
(+) | balanced mids - only 3.7% away from median
(+) | mids are linear (5.8% delta to prev. frequency)
Highs 2 - 16 kHz
(+) | balanced highs - only 2.4% away from median
(+) | highs are linear (2.4% delta to prev. frequency)
Overall 100 - 16.000 Hz
(+) | overall sound is linear (8.4% difference to median)
Compared to same class
» 9% of all tested devices in this class were better, 2% similar, 89% worse
» The best had a delta of 5%, average was 17%, worst was 45%
Compared to all devices tested
» 2% of all tested devices were better, 1% similar, 97% worse
» The best had a delta of 4%, average was 23%, worst was 134%
Lenovo IdeaPad 5i 2-in-1 14IPH11 audio analysis
(±) | speaker loudness is average but good (81 dB)
Bass 100 - 315 Hz
(±) | reduced bass - on average 14.1% lower than median
(±) | linearity of bass is average (10.8% delta to prev. frequency)
Mids 400 - 2000 Hz
(+) | balanced mids - only 4.6% away from median
(+) | mids are linear (3.6% delta to prev. frequency)
Highs 2 - 16 kHz
(+) | balanced highs - only 4.2% away from median
(+) | highs are linear (6.1% delta to prev. frequency)
Overall 100 - 16.000 Hz
(±) | linearity of overall sound is average (15.2% difference to median)
Compared to same class
» 24% of all tested devices in this class were better, 5% similar, 71% worse
» The best had a delta of 6%, average was 20%, worst was 57%
Compared to all devices tested
» 22% of all tested devices were better, 4% similar, 74% worse
» The best had a delta of 4%, average was 23%, worst was 134%
Honor MagicBook Pro 14 2026 audio analysis
(±) | speaker loudness is average but good (81.2 dB)
Bass 100 - 315 Hz
(±) | reduced bass - on average 12.8% lower than median
(±) | linearity of bass is average (8.9% delta to prev. frequency)
Mids 400 - 2000 Hz
(+) | balanced mids - only 4.5% away from median
(+) | mids are linear (5.2% delta to prev. frequency)
Highs 2 - 16 kHz
(+) | balanced highs - only 1.1% away from median
(+) | highs are linear (3.9% delta to prev. frequency)
Overall 100 - 16.000 Hz
(+) | overall sound is linear (12.1% difference to median)
Compared to same class
» 22% of all tested devices in this class were better, 3% similar, 76% worse
» The best had a delta of 5%, average was 17%, worst was 45%
Compared to all devices tested
» 10% of all tested devices were better, 2% similar, 88% worse
» The best had a delta of 4%, average was 23%, worst was 134%
Asus ZenBook 14 OLED UM3406K, Ryzen AI 7 350 audio analysis
(±) | speaker loudness is average but good (75 dB)
Bass 100 - 315 Hz
(-) | nearly no bass - on average 20.2% lower than median
(±) | linearity of bass is average (10.9% delta to prev. frequency)
Mids 400 - 2000 Hz
(+) | balanced mids - only 4.4% away from median
(+) | mids are linear (5.3% delta to prev. frequency)
Highs 2 - 16 kHz
(+) | balanced highs - only 2% away from median
(+) | highs are linear (6% delta to prev. frequency)
Overall 100 - 16.000 Hz
(±) | linearity of overall sound is average (20.2% difference to median)
Compared to same class
» 64% of all tested devices in this class were better, 9% similar, 27% worse
» The best had a delta of 5%, average was 18%, worst was 53%
Compared to all devices tested
» 53% of all tested devices were better, 8% similar, 39% worse
» The best had a delta of 4%, average was 23%, worst was 134%
Asus Zenbook A14 UX3704NA audio analysis
(+) | speakers can play relatively loud (84.5 dB)
Bass 100 - 315 Hz
(±) | reduced bass - on average 14.8% lower than median
(±) | linearity of bass is average (9.1% delta to prev. frequency)
Mids 400 - 2000 Hz
(+) | balanced mids - only 2.9% away from median
(+) | mids are linear (4.7% delta to prev. frequency)
Highs 2 - 16 kHz
(+) | balanced highs - only 3.2% away from median
(+) | highs are linear (3.9% delta to prev. frequency)
Overall 100 - 16.000 Hz
(+) | overall sound is linear (12.2% difference to median)
Compared to same class
» 15% of all tested devices in this class were better, 5% similar, 80% worse
» The best had a delta of 5%, average was 18%, worst was 53%
Compared to all devices tested
» 10% of all tested devices were better, 2% similar, 88% worse
» The best had a delta of 4%, average was 23%, worst was 134%
Power consumption
Taken together, all values show that the Prestige 13 AI+ is one of the most efficient laptops in the test field, which points to good battery runtimes.
| Off / Standby | |
| Idle | |
| Load |
|
Key:
min: | |
| MSI Prestige 13 AI+ A3MG Ultra 9 386H, Intel Graphics 4 Xe3 PTL | Lenovo Yoga Slim 7 Ultra 14IPH11 Ultra 7 355, Intel Graphics 4 Xe3 PTL | Lenovo IdeaPad 5i 2-in-1 14IPH11 Ultra 5 322, Intel Graphics 2 Xe3 PTL | Honor MagicBook Pro 14 2026 Ultra 5 338H, Arc B370 Panther Lake iGPU | Asus ZenBook 14 OLED UM3406K, Ryzen AI 7 350 Ryzen AI 7 350, Radeon 860M | Asus Zenbook A14 UX3704NA X2E-88-100, X2-90 | Average of class Subnotebook | |
|---|---|---|---|---|---|---|---|
| Power Consumption | -20% | -8% | -63% | -19% | -44% | -22% | |
| Idle Minimum * (Watt) | 3.5 | 3.2 9% | 4 -14% | 6.8 -94% | 3.8 -9% | 4.7 -34% | 3.73 ? -7% |
| Idle Average * (Watt) | 4 | 3.9 2% | 4.8 -20% | 8.2 -105% | 6.7 -68% | 7.1 -78% | 6.51 ? -63% |
| Idle Maximum * (Watt) | 6.4 | 12.3 -92% | 7.4 -16% | 9.1 -42% | 6.9 -8% | 7.4 -16% | 7.88 ? -23% |
| Load Average * (Watt) | 44 | 36.5 17% | 36 18% | 40.4 8% | 51.6 -17% | 39.6 10% | 42.3 ? 4% |
| Cyberpunk 2077 ultra * (Watt) | 41 | 51.1 -25% | 34 17% | 66.1 -61% | 35.7 13% | 65.3 -59% | |
| Load Maximum * (Watt) | 54 | 69 -28% | 71 -31% | 100.2 -86% | 66 -22% | 101.8 -89% | 64.8 ? -20% |
| Cyberpunk 2077 ultra external monitor * (Watt) | 50.6 | 66 | 45 | 31.4 |
* ... smaller is better
Battery life
MSI equips the 13-inch device with a battery of just under 54 Wh, which is somewhat small compared with the competition’s 60 to 92 Wh. However, around 12 hours in our Wi-Fi test with the brightness reduced to 150 cd/m² is still impressive.
| MSI Prestige 13 AI+ A3MG Ultra 9 386H, Intel Graphics 4 Xe3 PTL, 53.8 Wh | Lenovo Yoga Slim 7 Ultra 14IPH11 Ultra 7 355, Intel Graphics 4 Xe3 PTL, 75 Wh | Lenovo IdeaPad 5i 2-in-1 14IPH11 Ultra 5 322, Intel Graphics 2 Xe3 PTL, 60 Wh | Honor MagicBook Pro 14 2026 Ultra 5 338H, Arc B370 Panther Lake iGPU, 92 Wh | Asus ZenBook 14 OLED UM3406K, Ryzen AI 7 350 Ryzen AI 7 350, Radeon 860M, 75 Wh | Asus Zenbook A14 UX3704NA X2E-88-100, X2-90, 70 Wh | Average of class Subnotebook | |
|---|---|---|---|---|---|---|---|
| Battery runtime | -12% | 28% | 24% | 8% | 34% | 17% | |
| WiFi v1.3 (h) | 12 | 10.6 -12% | 15.3 28% | 14.9 24% | 13 8% | 16.1 34% | 14 ? 17% |
| H.264 (h) | 15.7 | 15.3 ? | |||||
| Load (h) | 2.3 | 1.998 ? |
Notebookcheck overall rating
The Prestige 13 AI+ A3MG presents itself as an extremely portable all-around laptop that impresses above all with its low weight. However, a Core Ultra 7 355 would also have been sufficient at a lower price, since the Core Ultra 9 386H cannot fully realize its potential.
MSI Prestige 13 AI+ A3MG
- 06/08/2026 v8
Florian Glaser
 Total Sustainability Score:
 Possible alternatives in comparison
Image | Model / Review | Price | Weight | Height | Display |
|---|---|---|---|---|---|
1. 84% 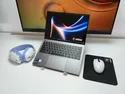 | MSI Prestige 13 AI+ A3MG Intel Core Ultra 9 386H ⎘ Intel Graphics 4 Xe3 Panther Lake iGPU ⎘ 32 GB Memory, 1024 GB SSD | Amazon: List Price: 1600 EUR | 888 g | 15.9 mm | 13.30" 2880x1800 255 PPI OLED |
2. 84.9%  | Lenovo Yoga Slim 7 Ultra 14IPH11 Intel Core Ultra 7 355 ⎘ Intel Graphics 4 Xe3 Panther Lake iGPU ⎘ 32 GB Memory, 1024 GB SSD | Amazon: List Price: 1700 USD | 978 g | 13.9 mm | 14.00" 2880x1800 243 PPI OLED |
3. 81.1%  | Lenovo IdeaPad 5i 2-in-1 14IPH11 Intel Core Ultra 5 322 ⎘ Intel Graphics 2 Xe3 Panther Lake iGPU ⎘ 16 GB Memory | Amazon: 1. $899.00 Lenovo IdeaPad 5i 2-in-1 16"... 2. $739.99 Lenovo IdeaPad 5i 2-in-1 16"... 3. $440.99 Lenovo IdeaPad 5i 2-in-1 14"... List Price: 800 EUR | 1.6 kg | 17.4 mm | 14.00" 1920x1200 162 PPI IPS |
4. 88.9%  | Honor MagicBook Pro 14 2026 Intel Core Ultra 5 338H ⎘ Intel Arc B370 10 Xe3 Panther Lake iGPU ⎘ 32 GB Memory, 1024 GB SSD | Amazon: | 1.4 kg | 15.9 mm | 14.60" 3120x2080 257 PPI OLED |
5. 86%  | Asus ZenBook 14 OLED UM3406K, Ryzen AI 7 350 AMD Ryzen AI 7 350 ⎘ AMD Radeon 860M ⎘ 32 GB Memory, 1024 GB SSD | Amazon: List Price: 1399 Euro | 1.2 kg | 14.9 mm | 14.00" 1920x1200 162 PPI OLED |
6. 87.5%  | Asus Zenbook A14 UX3704NA Qualcomm Snapdragon X2 Elite X2E-88-100 ⎘ Qualcomm Adreno X2-90 ⎘ 32 GB Memory, 1024 GB SSD | Amazon: 1. $1,049.00 ASUS Zenbook A14 14" FHD+ OL... 2. $1,519.99 ASUS Zenbook A14 Iceland Gra... 3. $799.99 ASUS Zenbook A14 Laptop 14" ... | 992 g | 15.9 mm | 14.00" 1920x1200 162 PPI OLED |
Transparency
The selection of devices to be reviewed is made by our editorial team. The test sample was provided to the author as a loan by the manufacturer or retailer for the purpose of this review. The lender had no influence on this review, nor did the manufacturer receive a copy of this review before publication. There was no obligation to publish this review. As an independent media company, Notebookcheck is not subjected to the authority of manufacturers, retailers or publishers.
This is how Notebookcheck is testing
Every year, Notebookcheck independently reviews hundreds of laptops and smartphones using standardized procedures to ensure that all results are comparable. We have continuously developed our test methods for around 20 years and set industry standards in the process. In our test labs, high-quality measuring equipment is utilized by experienced technicians and editors. These tests involve a multi-stage validation process. Our complex rating system is based on hundreds of well-founded measurements and benchmarks, which maintains objectivity. Further information on our test methods can be found here.

