Verdict
The Acer Swift Go 16 AI offers an impressive combination of performance and portability. It not only impresses with its outstanding OLED display, long battery life, and powerful AMD Ryzen AI processor, but also with its design. Weighing in at 1.5 kg, the laptop is perfectly suited for on-the-go use. The aluminum casing gives it a modern, sleek appearance and adds to its toughness.
Potential problems could arise over time with the warm airflow onto the OLED panel. Also, the fan noise under full load and the relatively moderate speaker quality might be a thorn in the side of demanding users. The 16 GB of built-in RAM could also prove insufficient for extensive AI applications.
Despite these points, the Acer Swift Go AI remains an impressive laptop within its class, especially considering its price point below 1000 Euros.
Pros
Cons
Specifications
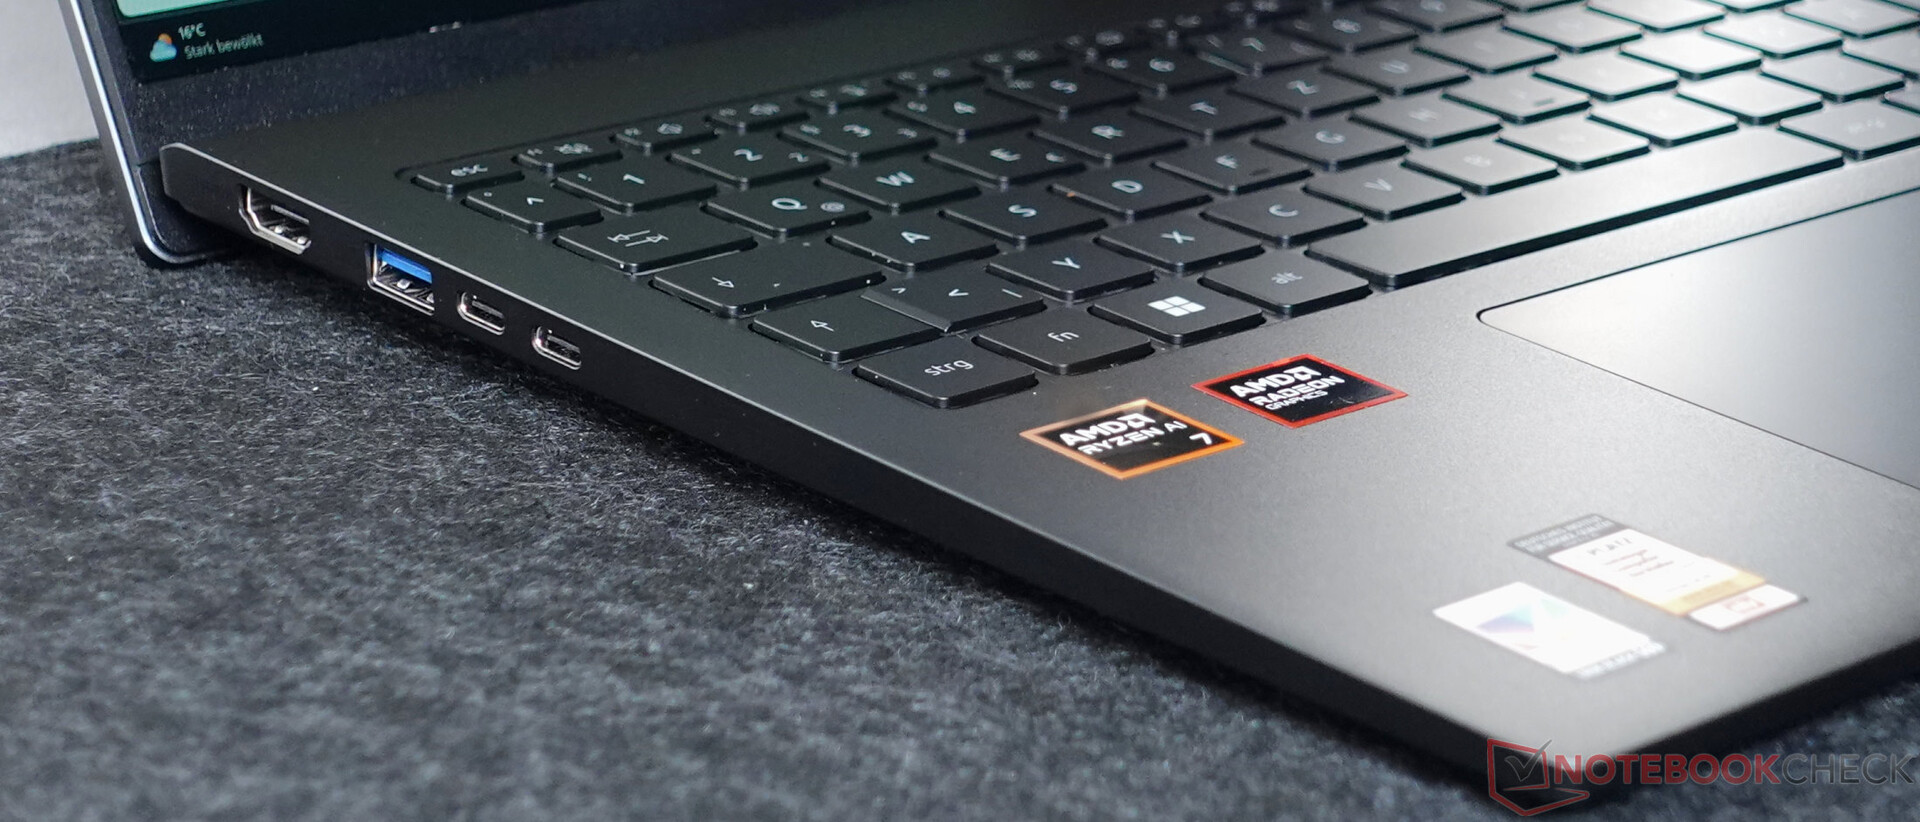
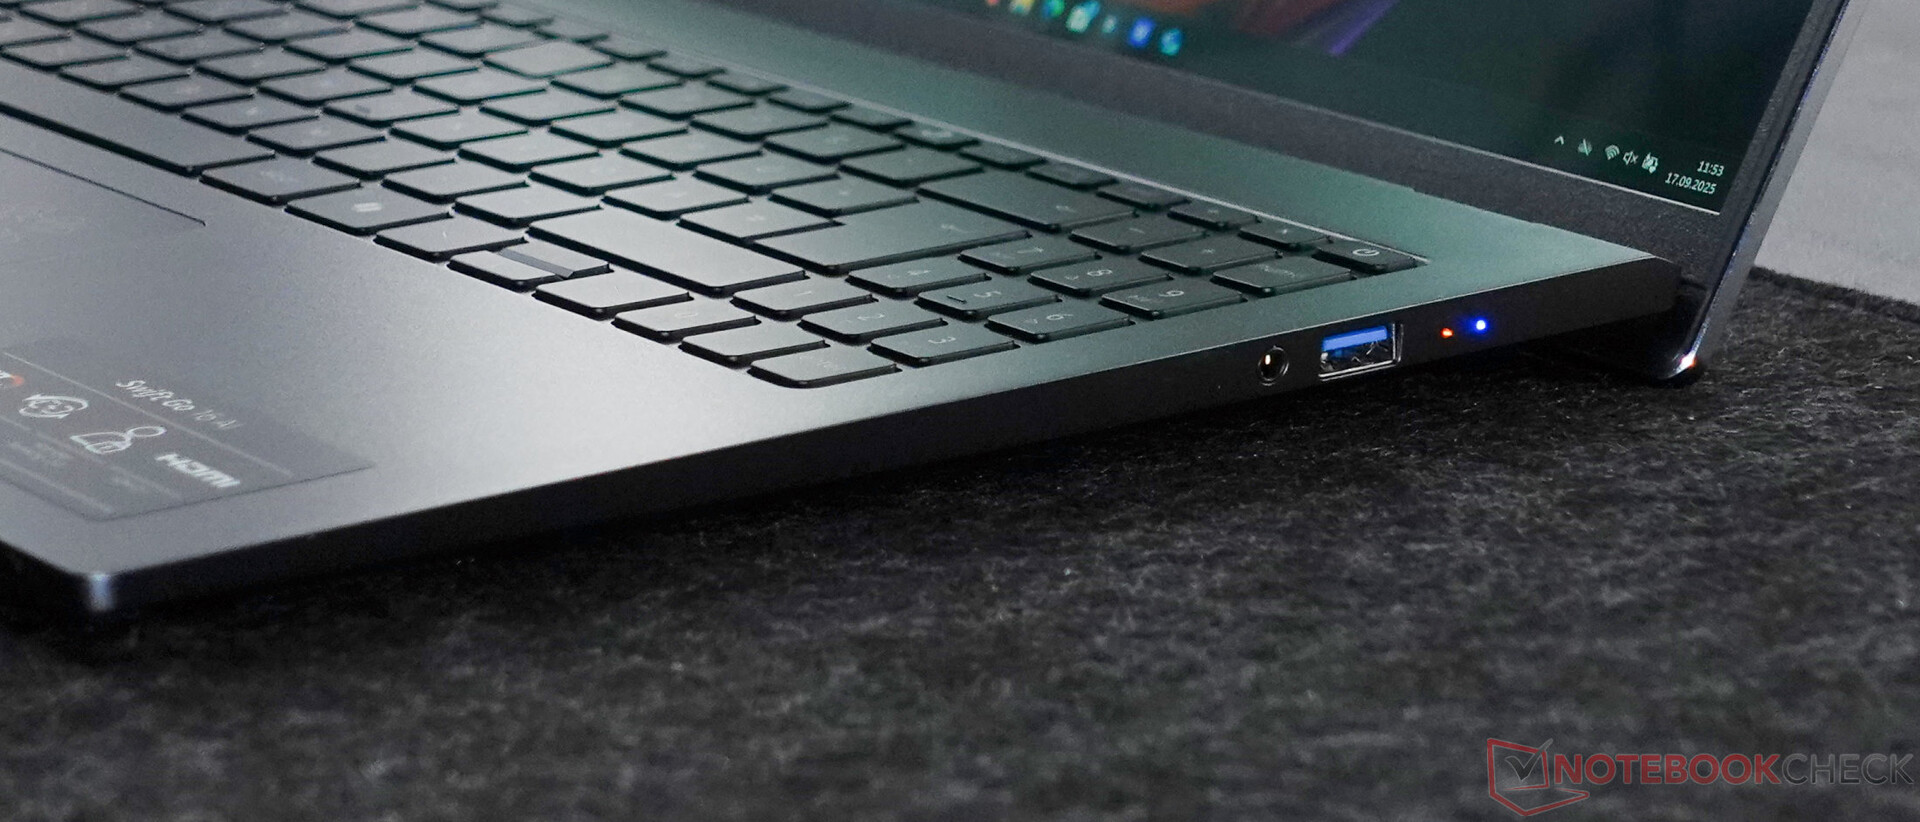
Case and connectivity
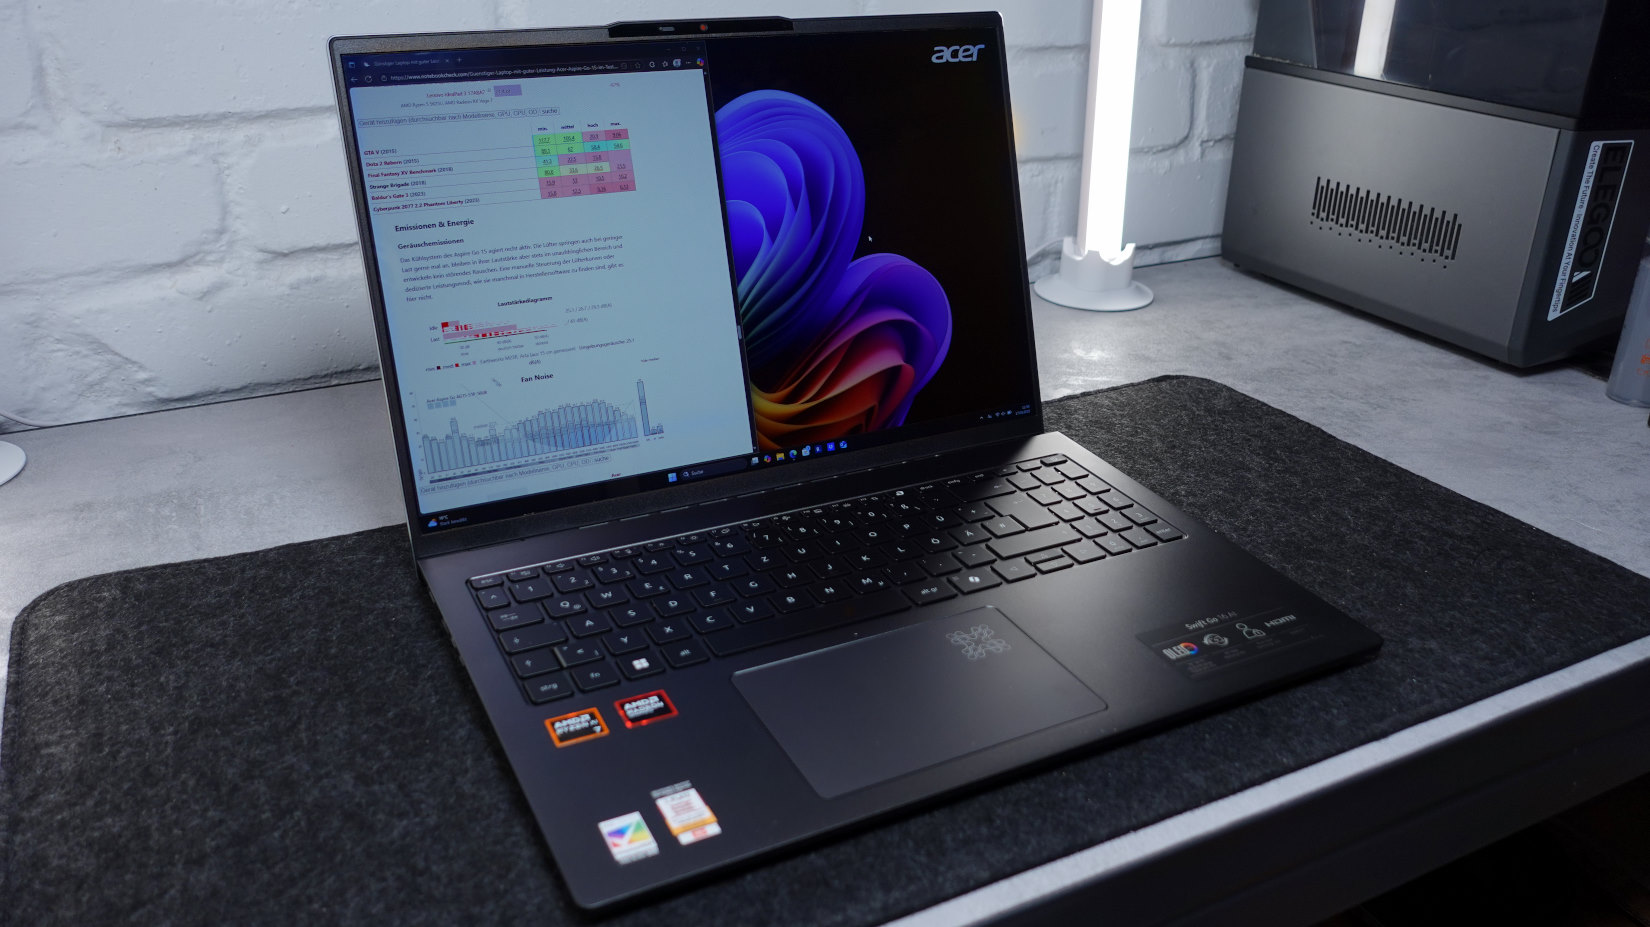
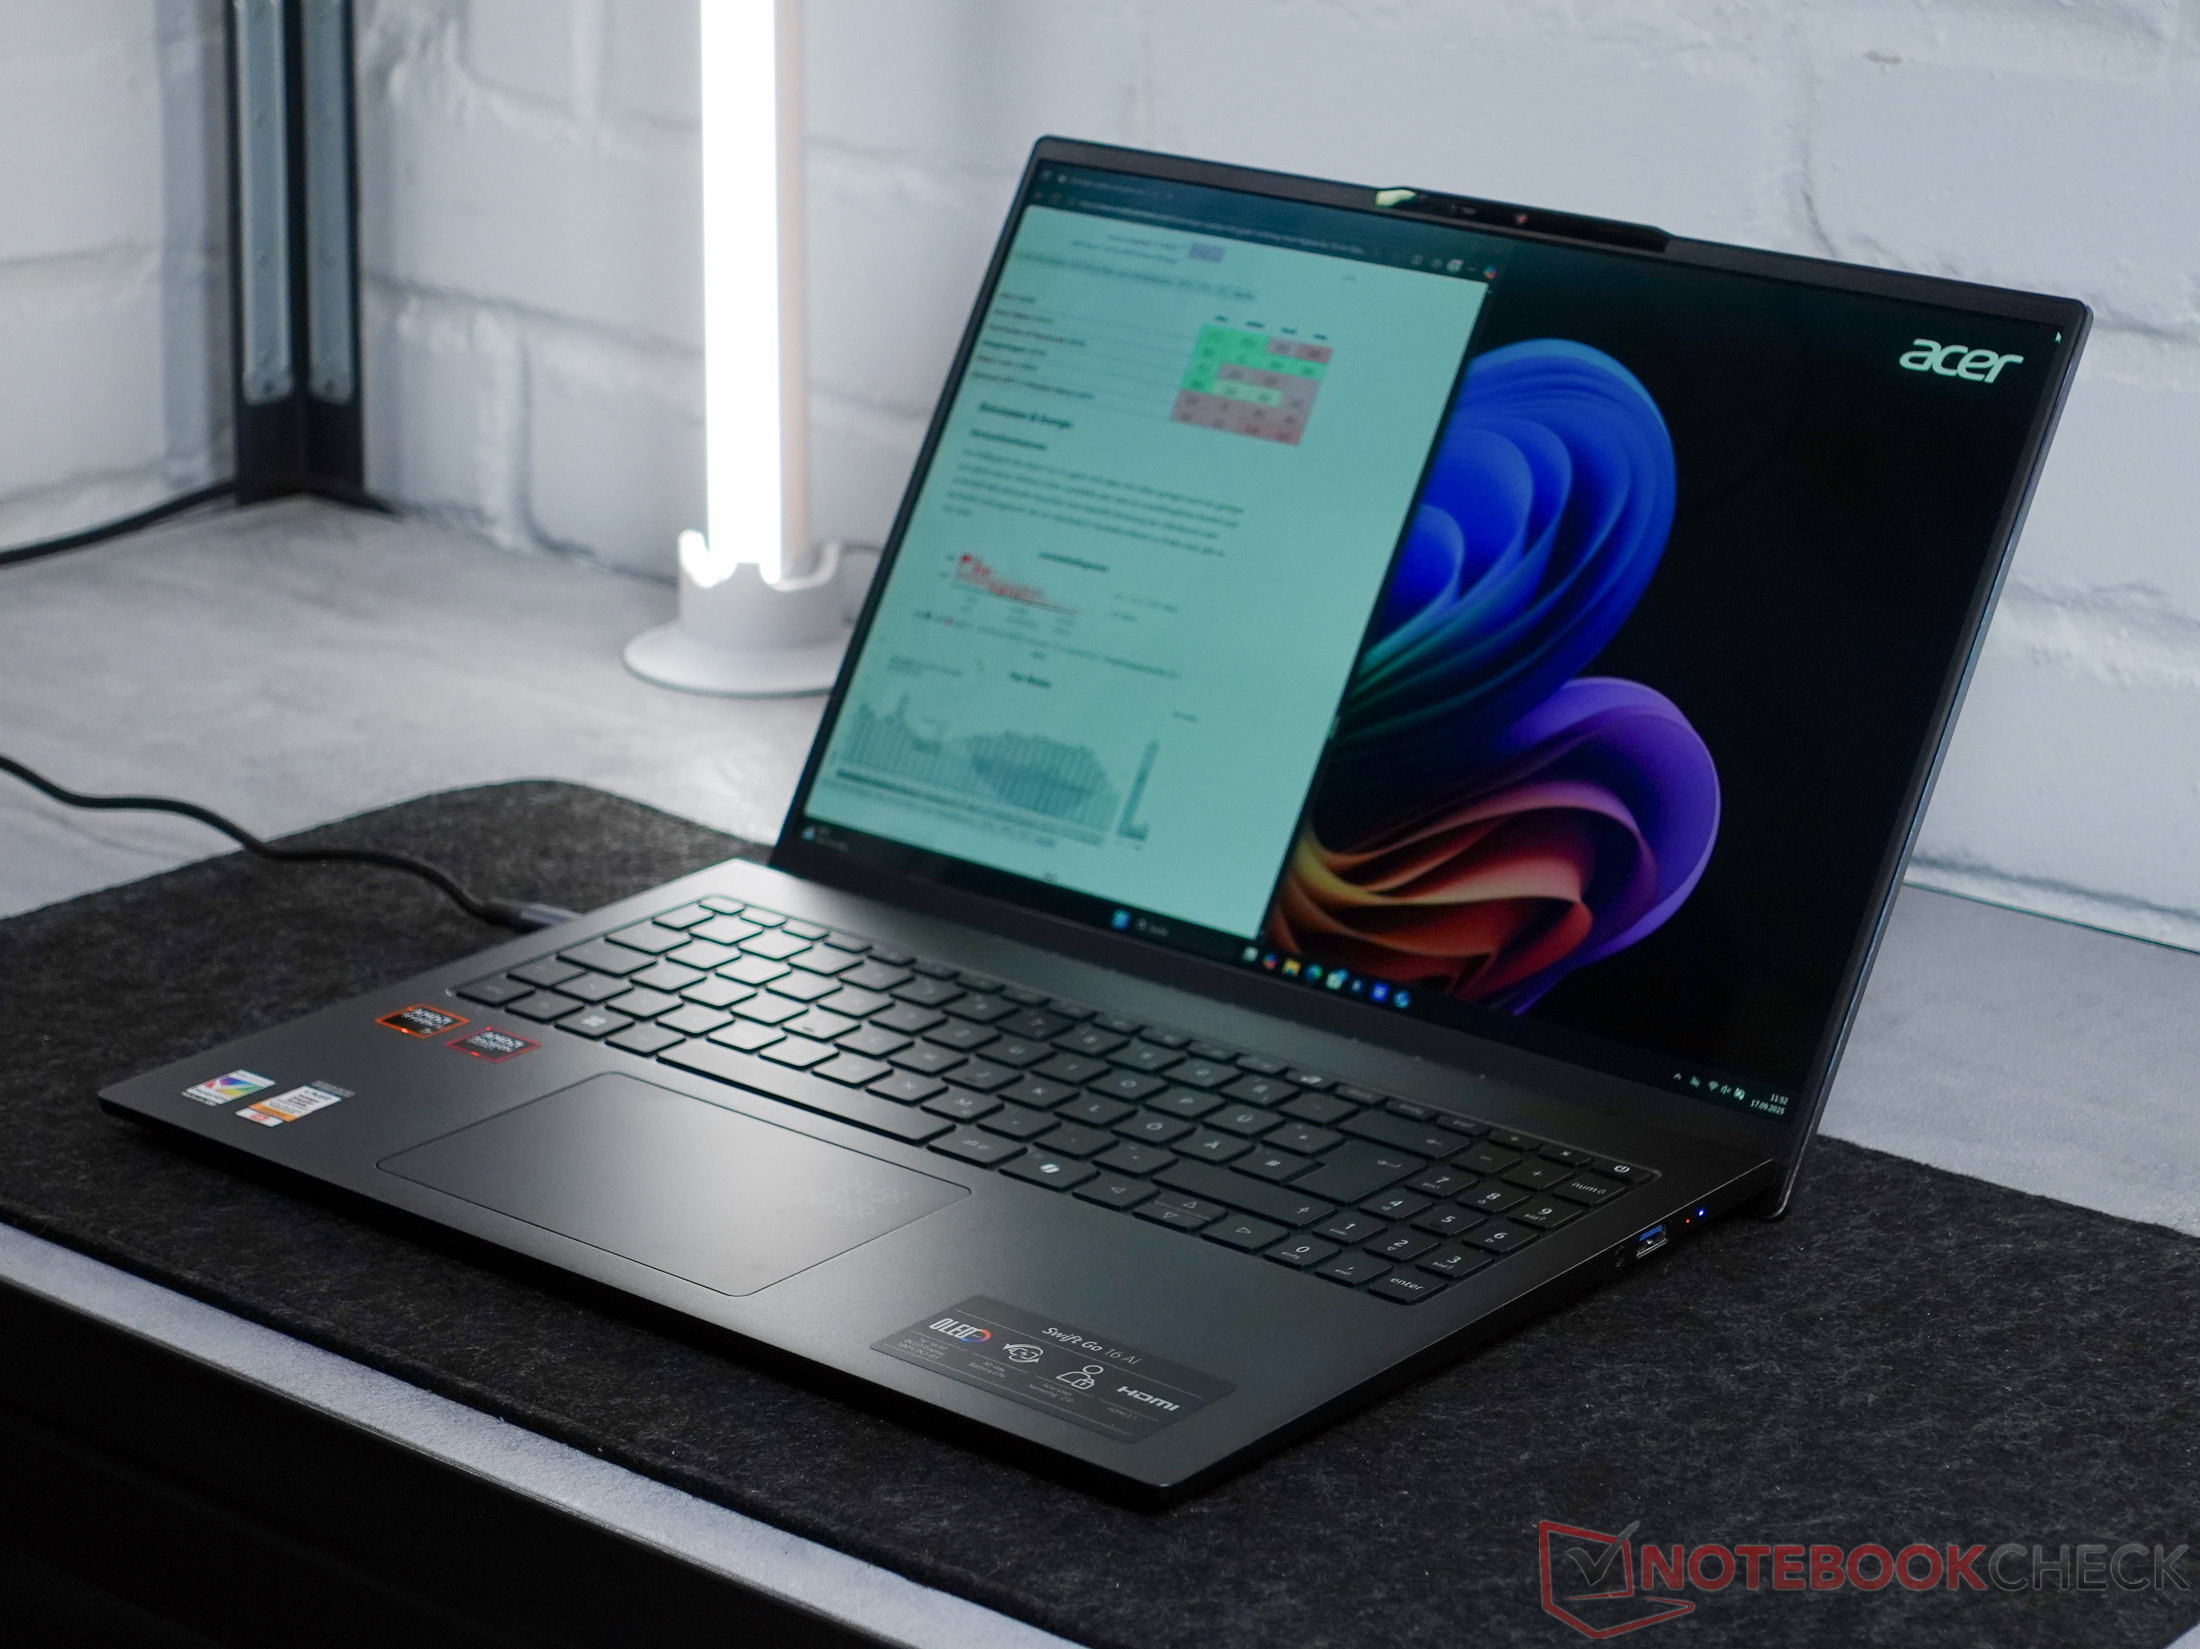
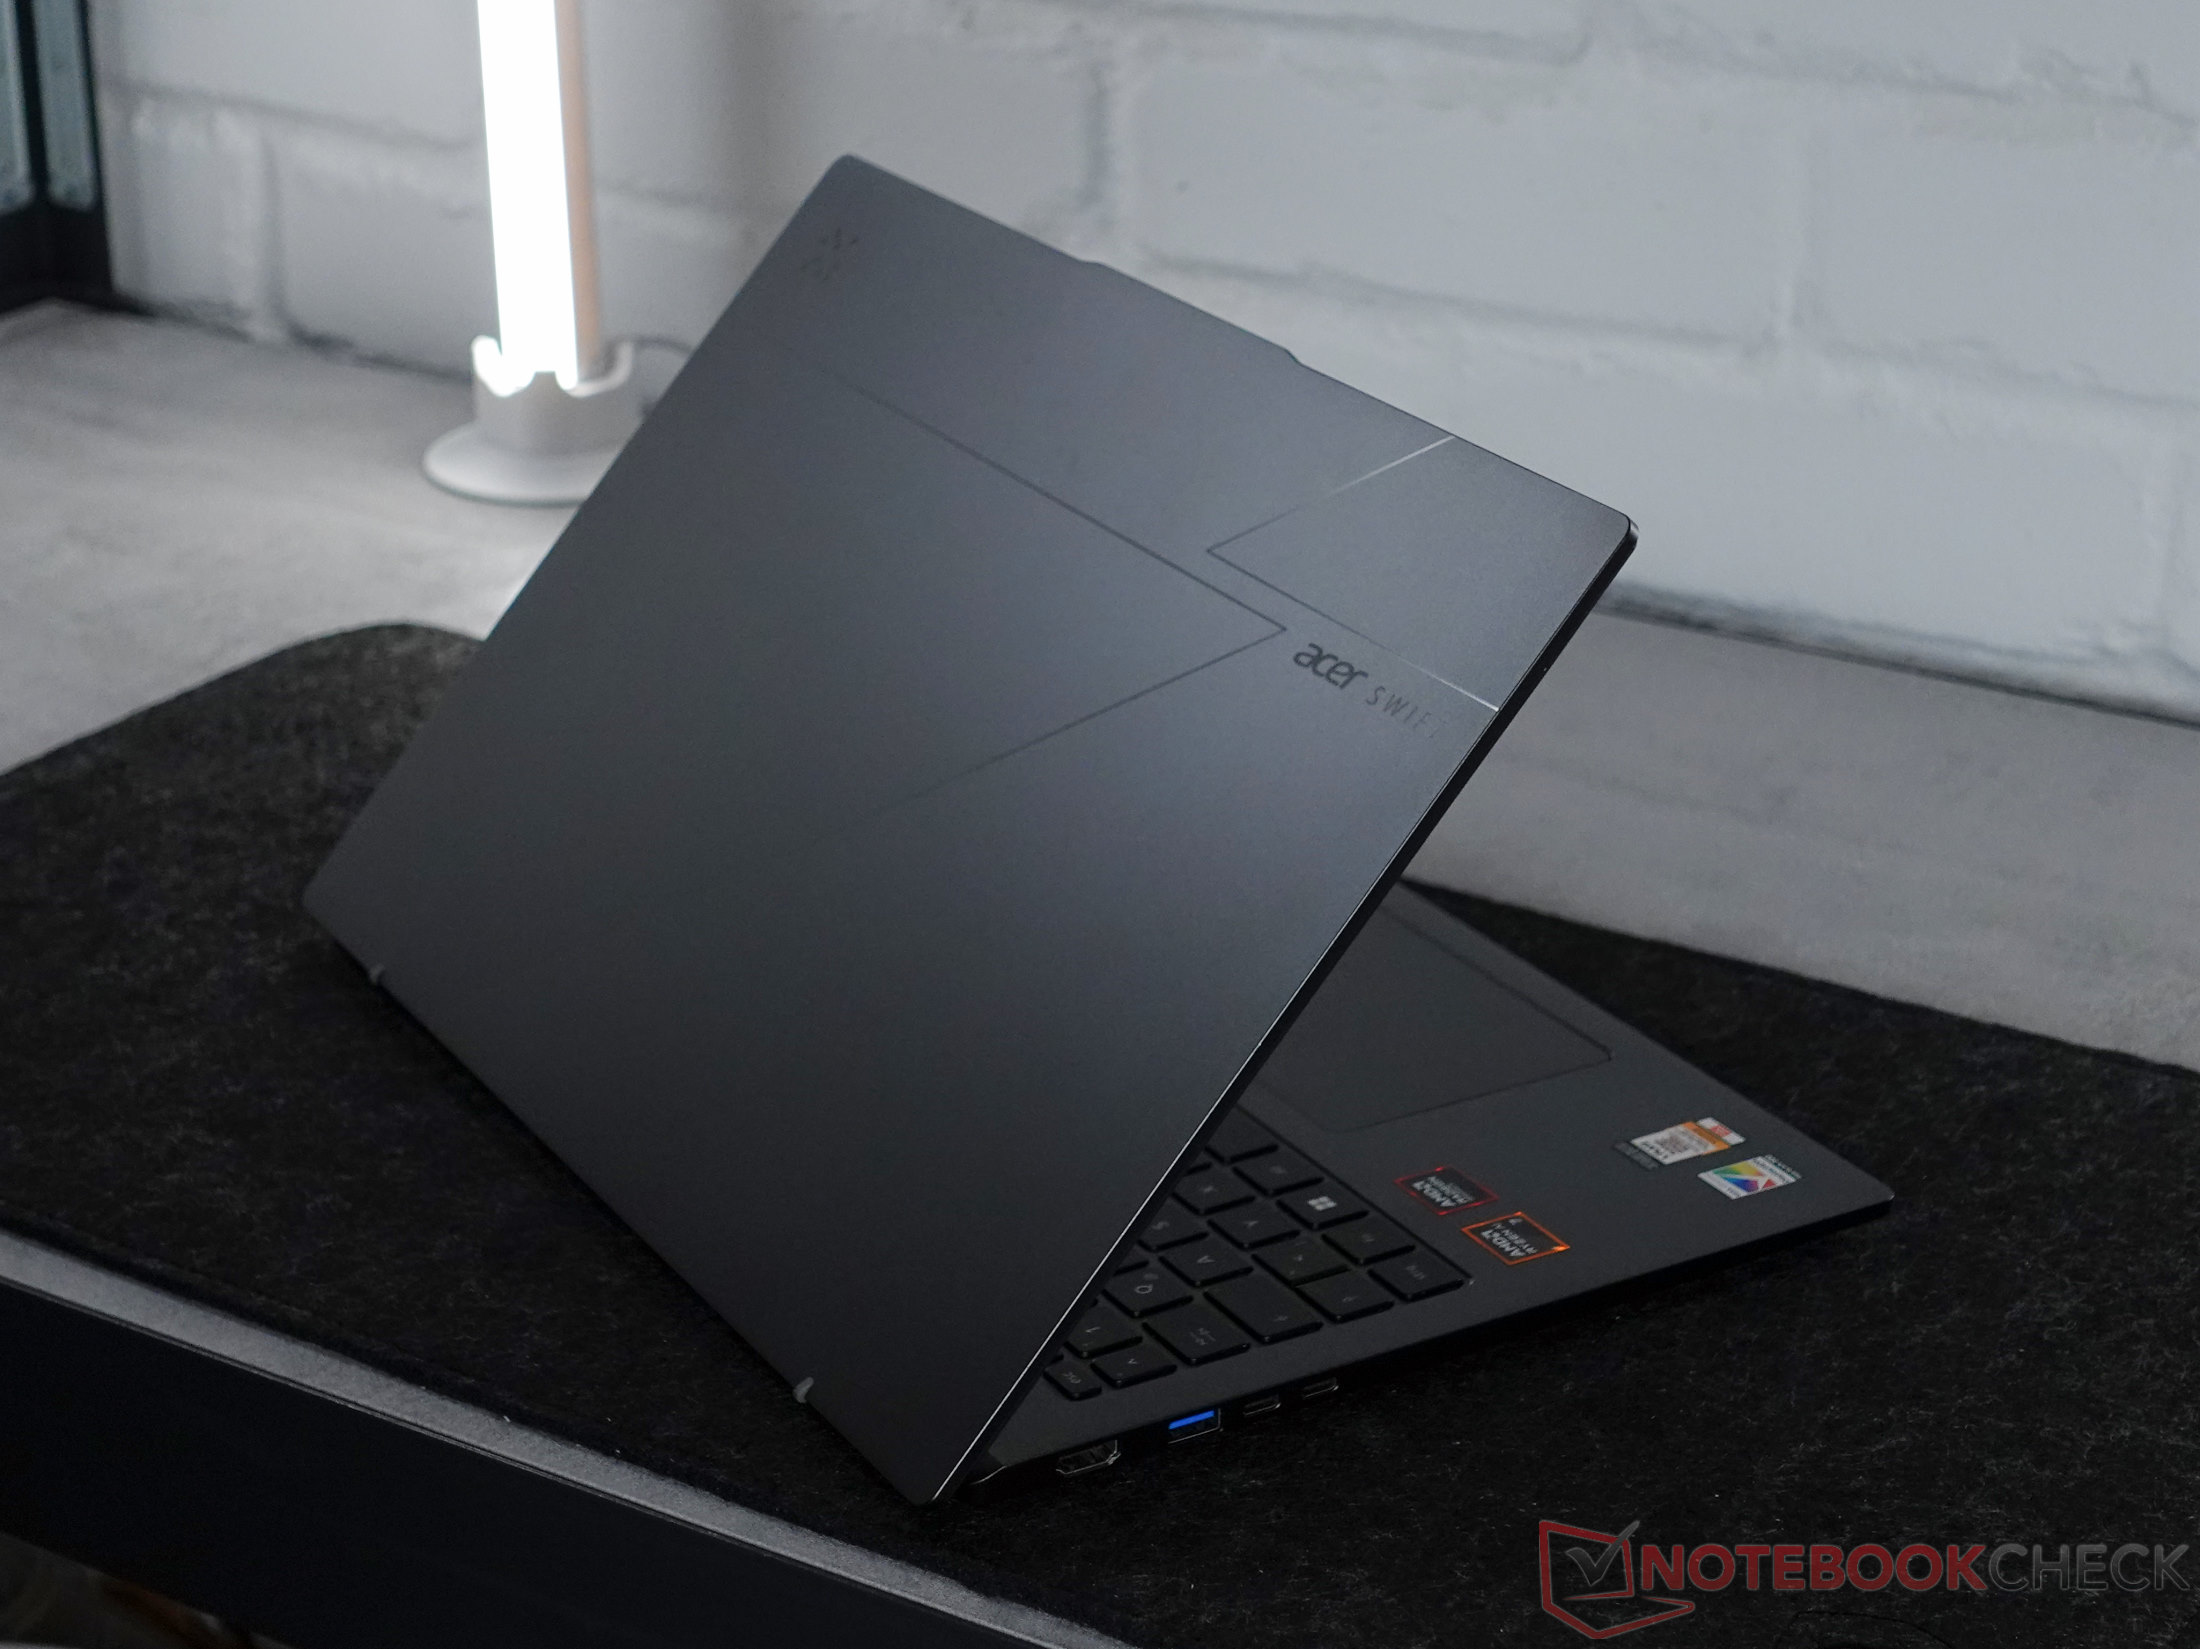
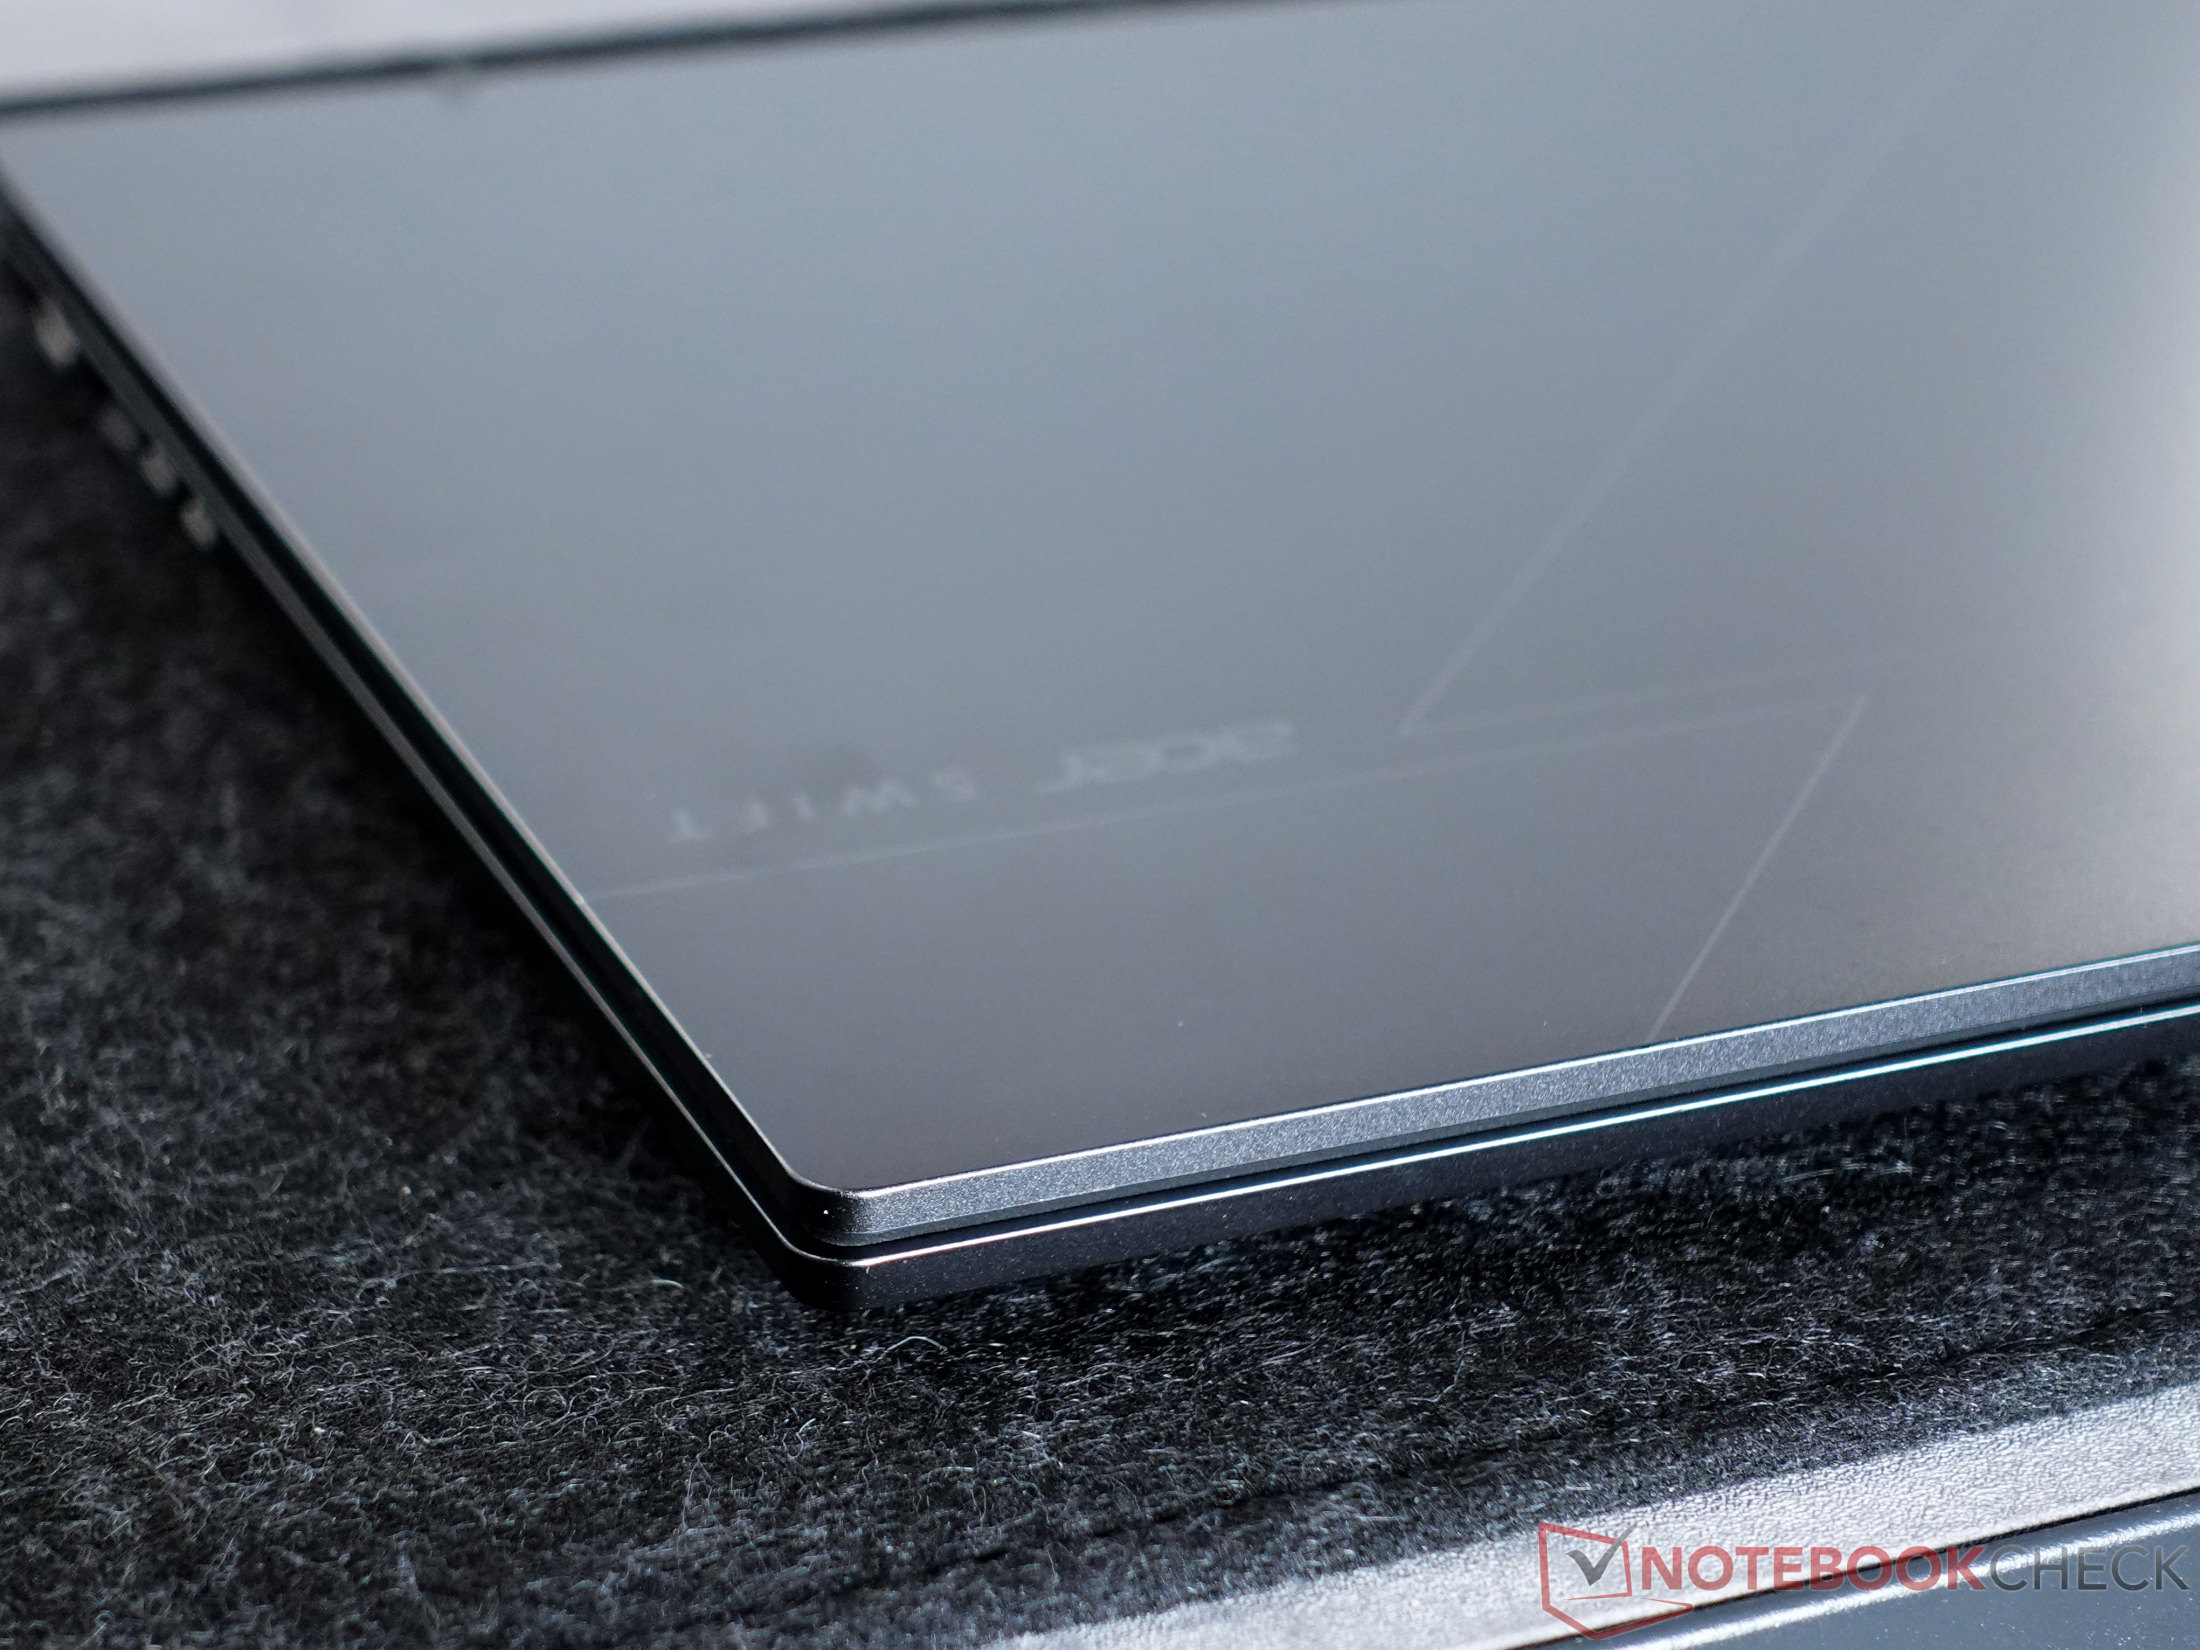
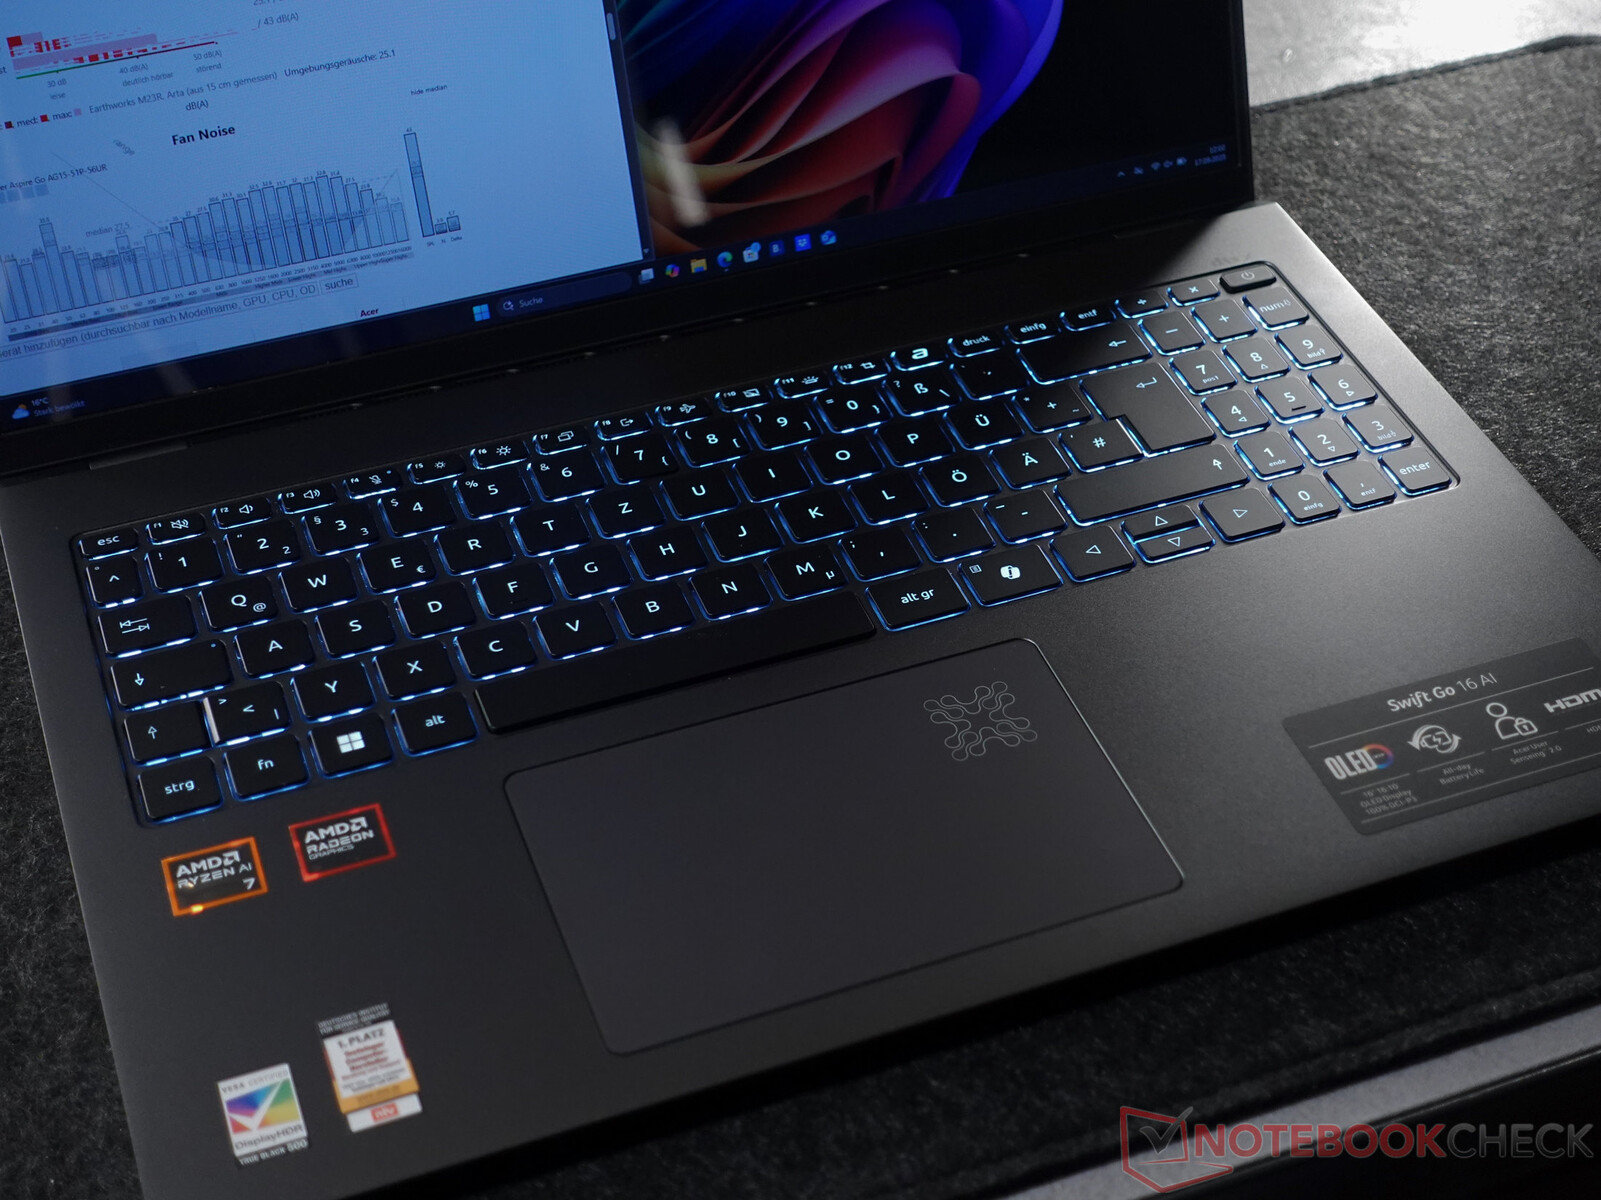
The Acer Swift Go presents itself as sleek, slightly angular, and made of aluminum. The screen lid is adorned with fine lines and subtle branding. When opened with one hand, the laptop lifts slightly at the back, which improves ergonomics and cooling. This gives the laptop a high-end appearance.
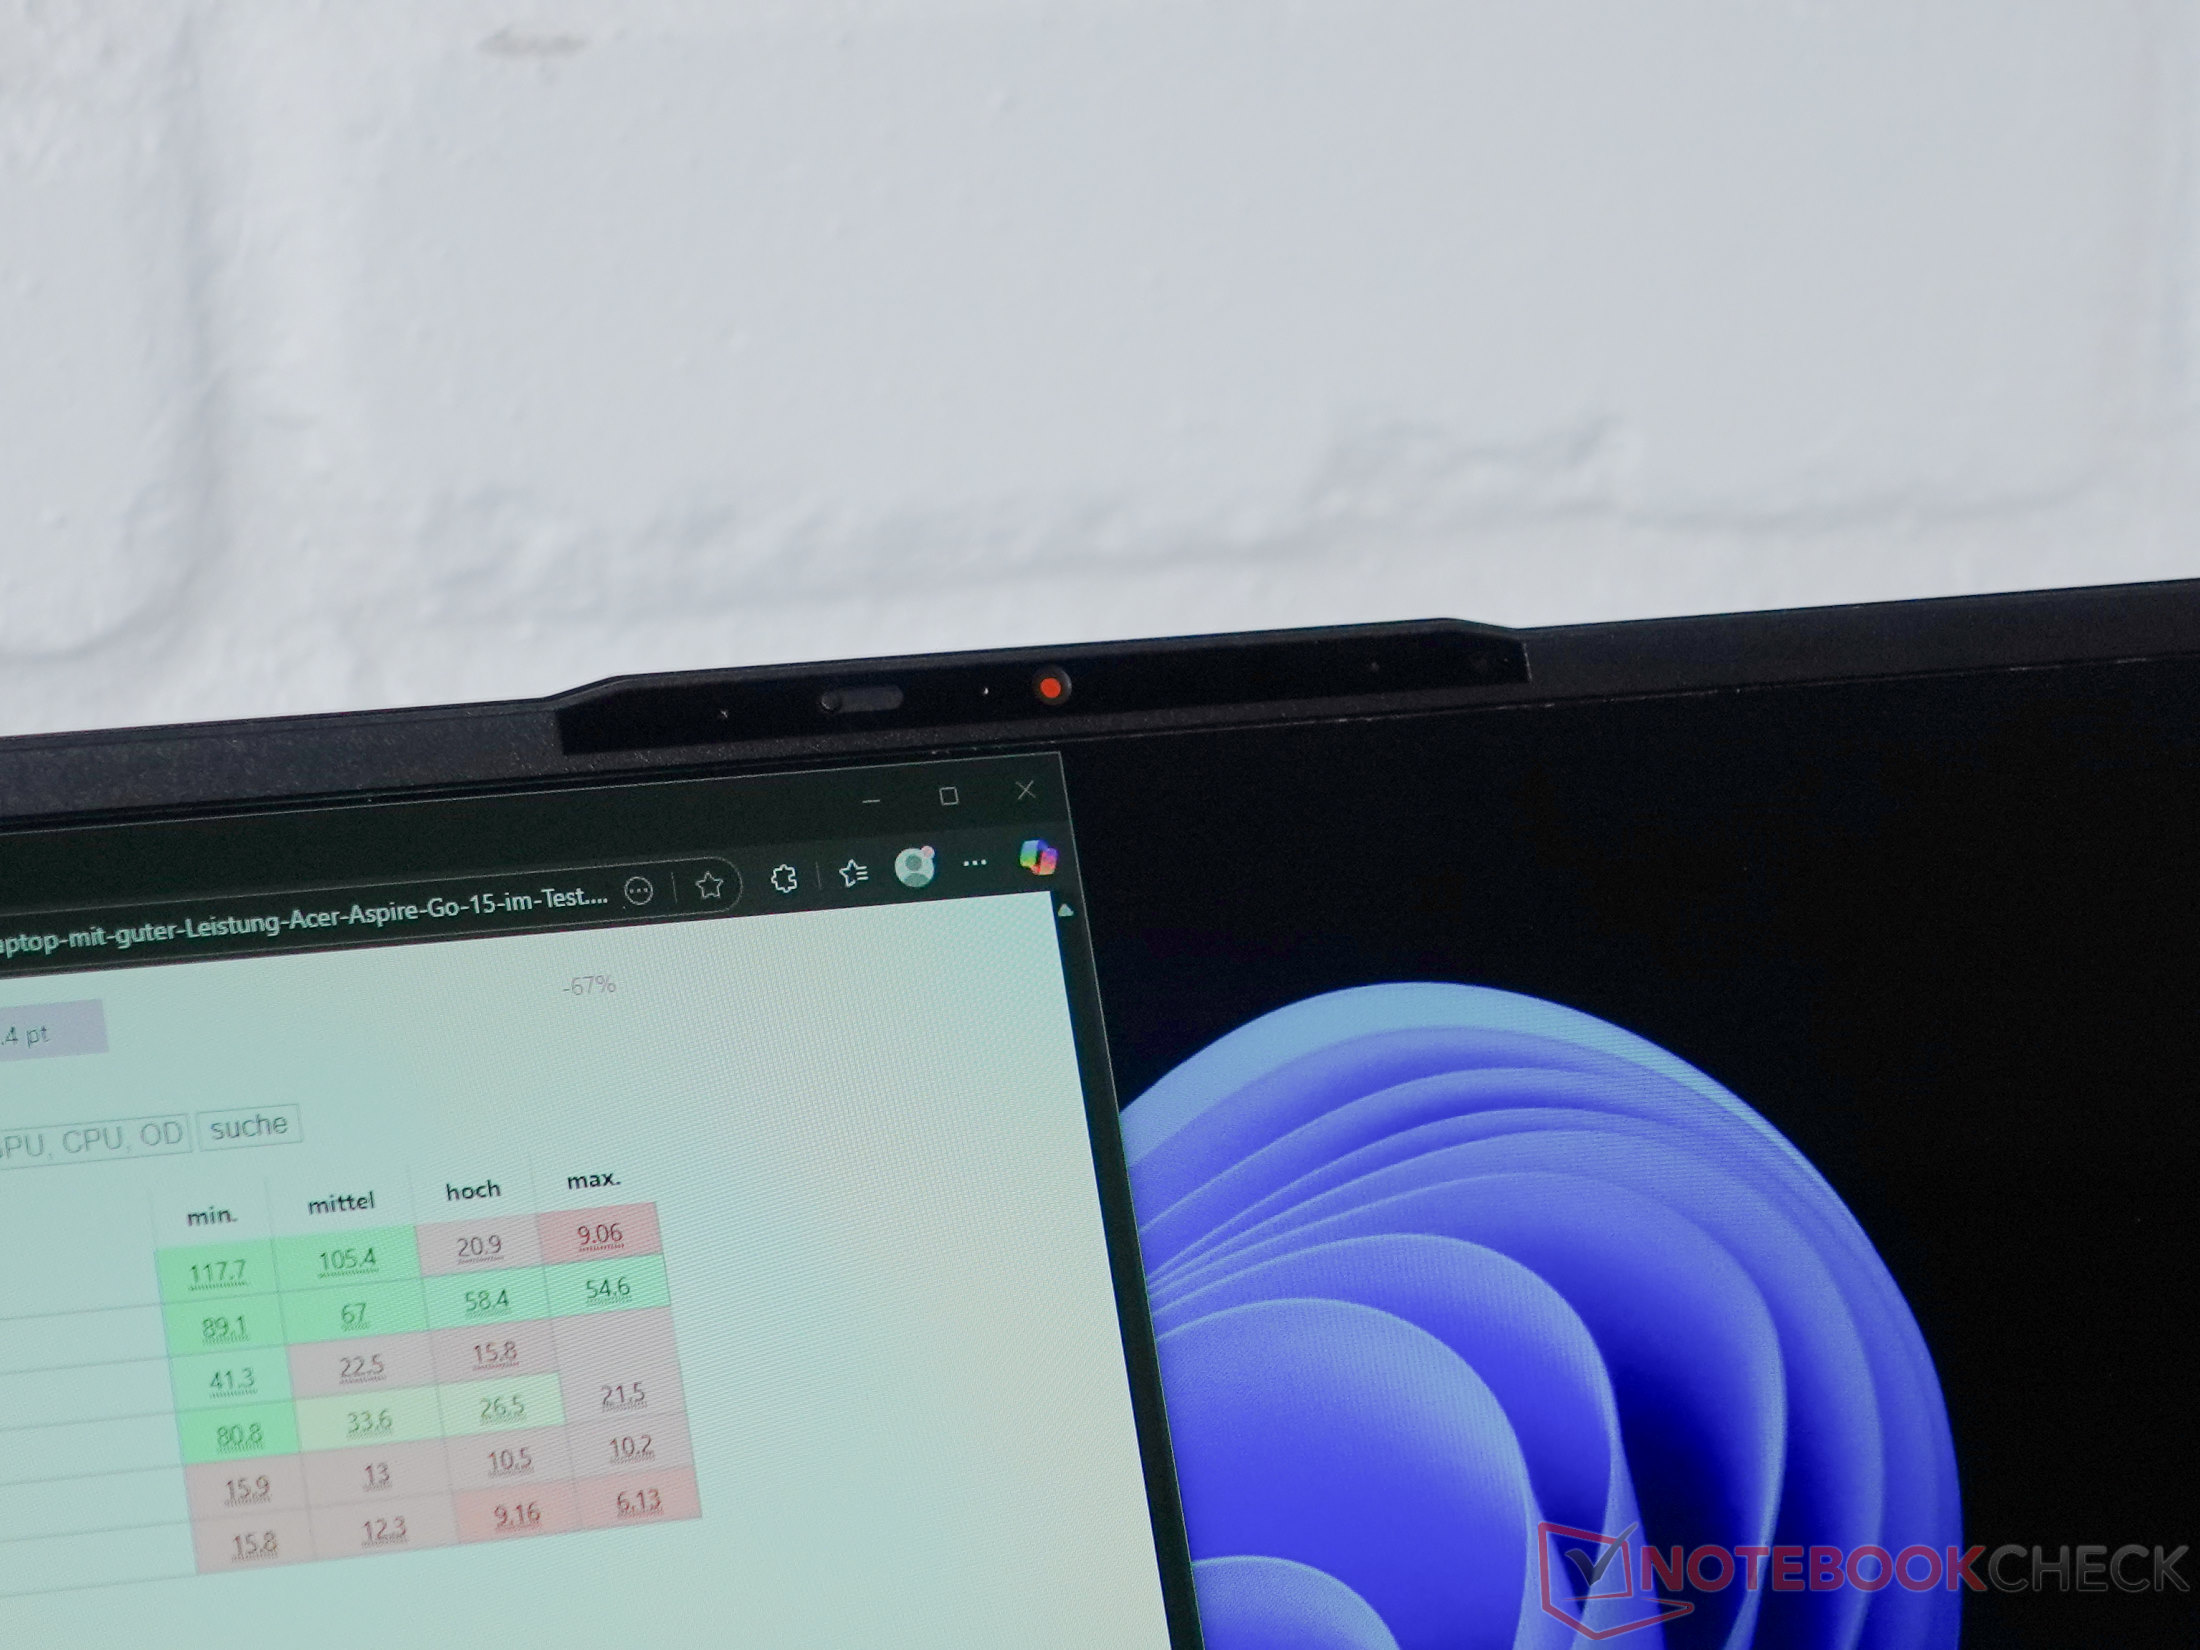
The 2.5K webcam in its small protrusion on the display produces good images. Stable Wi-Fi connectivity is ensured by a MediaTek module with Wi-Fi 7. On the left side of the laptop, most connections are concentrated. Two USB-4 ports are also available here.


Sustainability
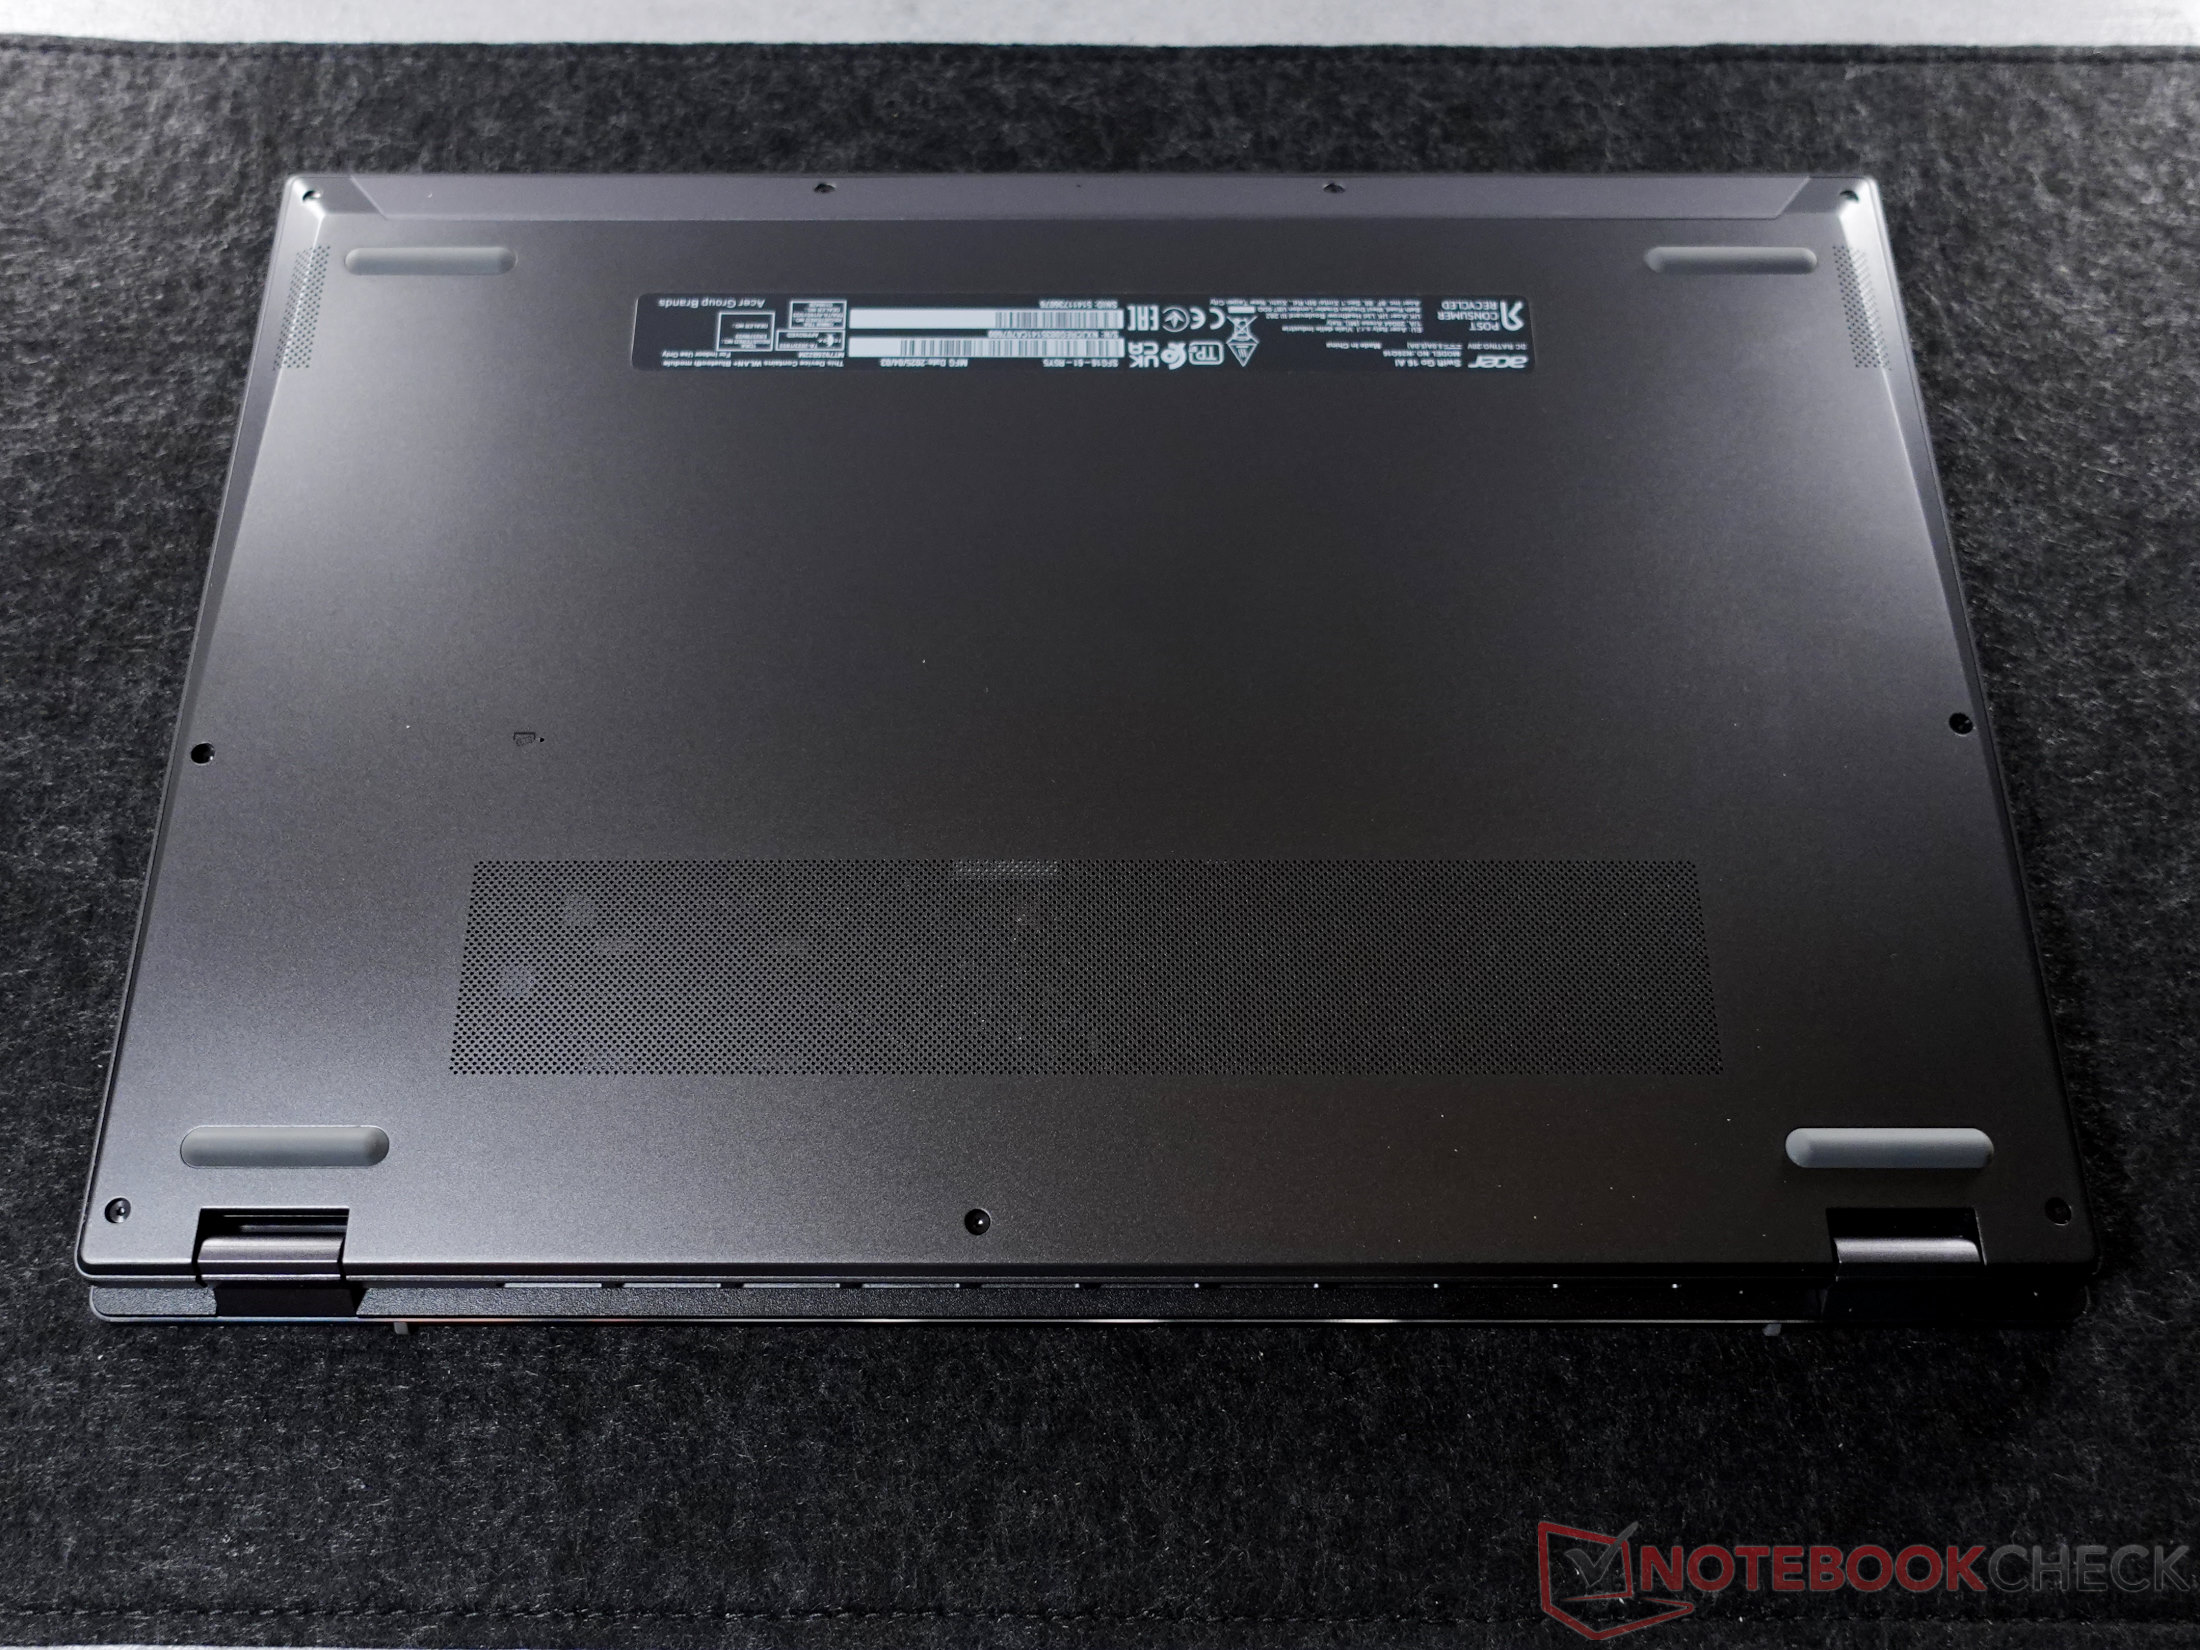
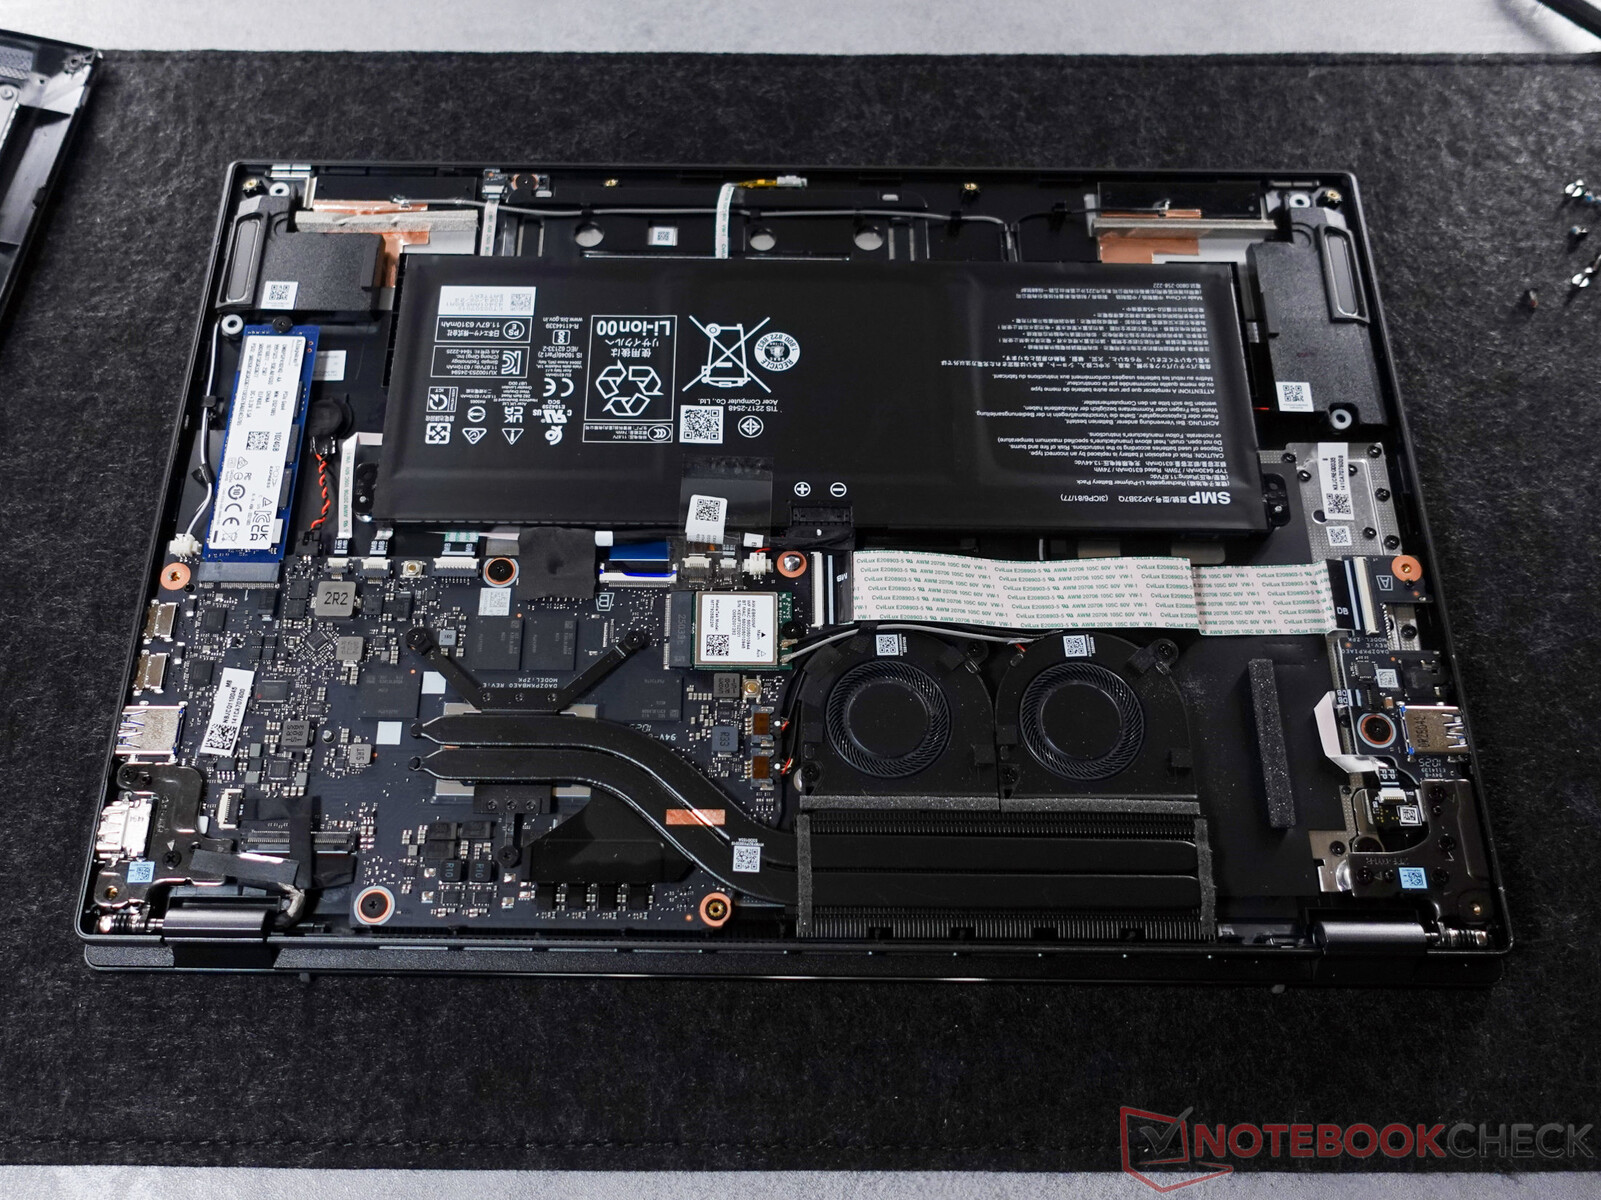
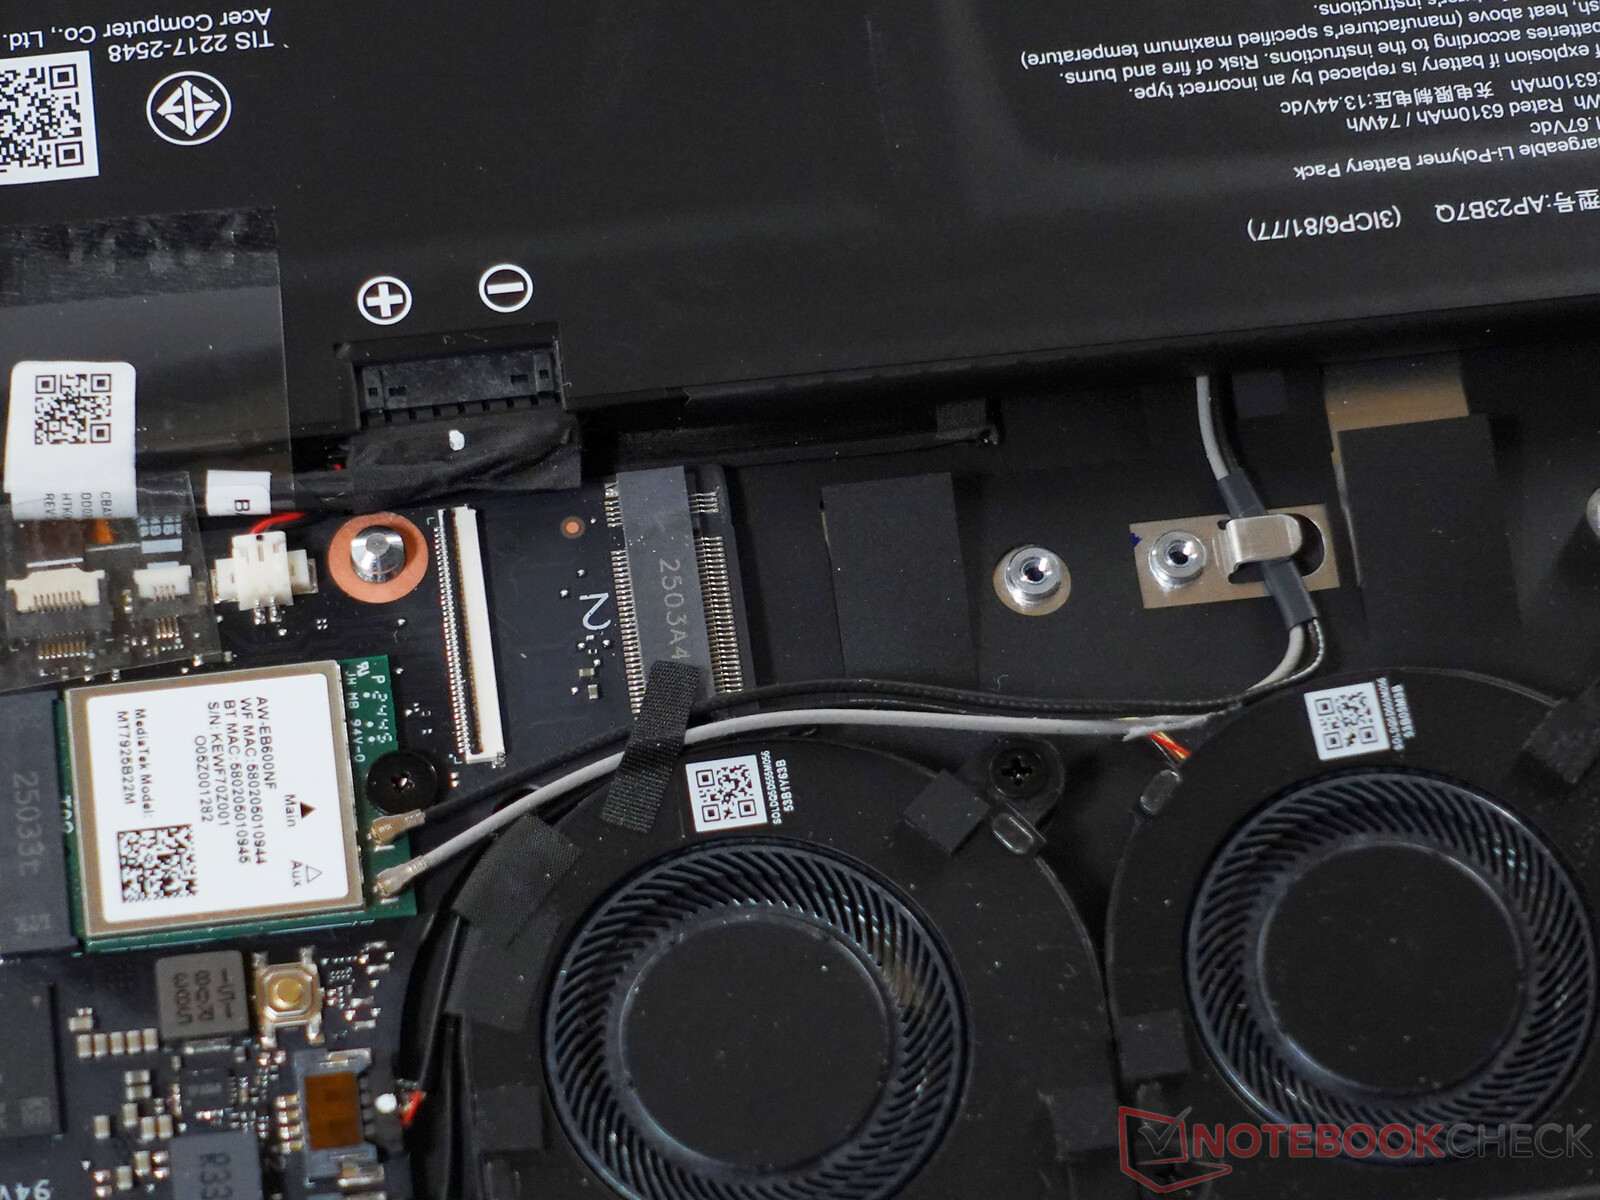
The device is EPEAT registered and provides solid transparency regarding its environmental impact through the provision of a PCF document (Product Carbon Footprint). The fact that it is easy to access and clean is a plus. The case is removable, the SSDs and WLAN modules are swappable, and there's a second M.2 SSD slot hidden under the flat cable that connects to the sub-board.
Input devices
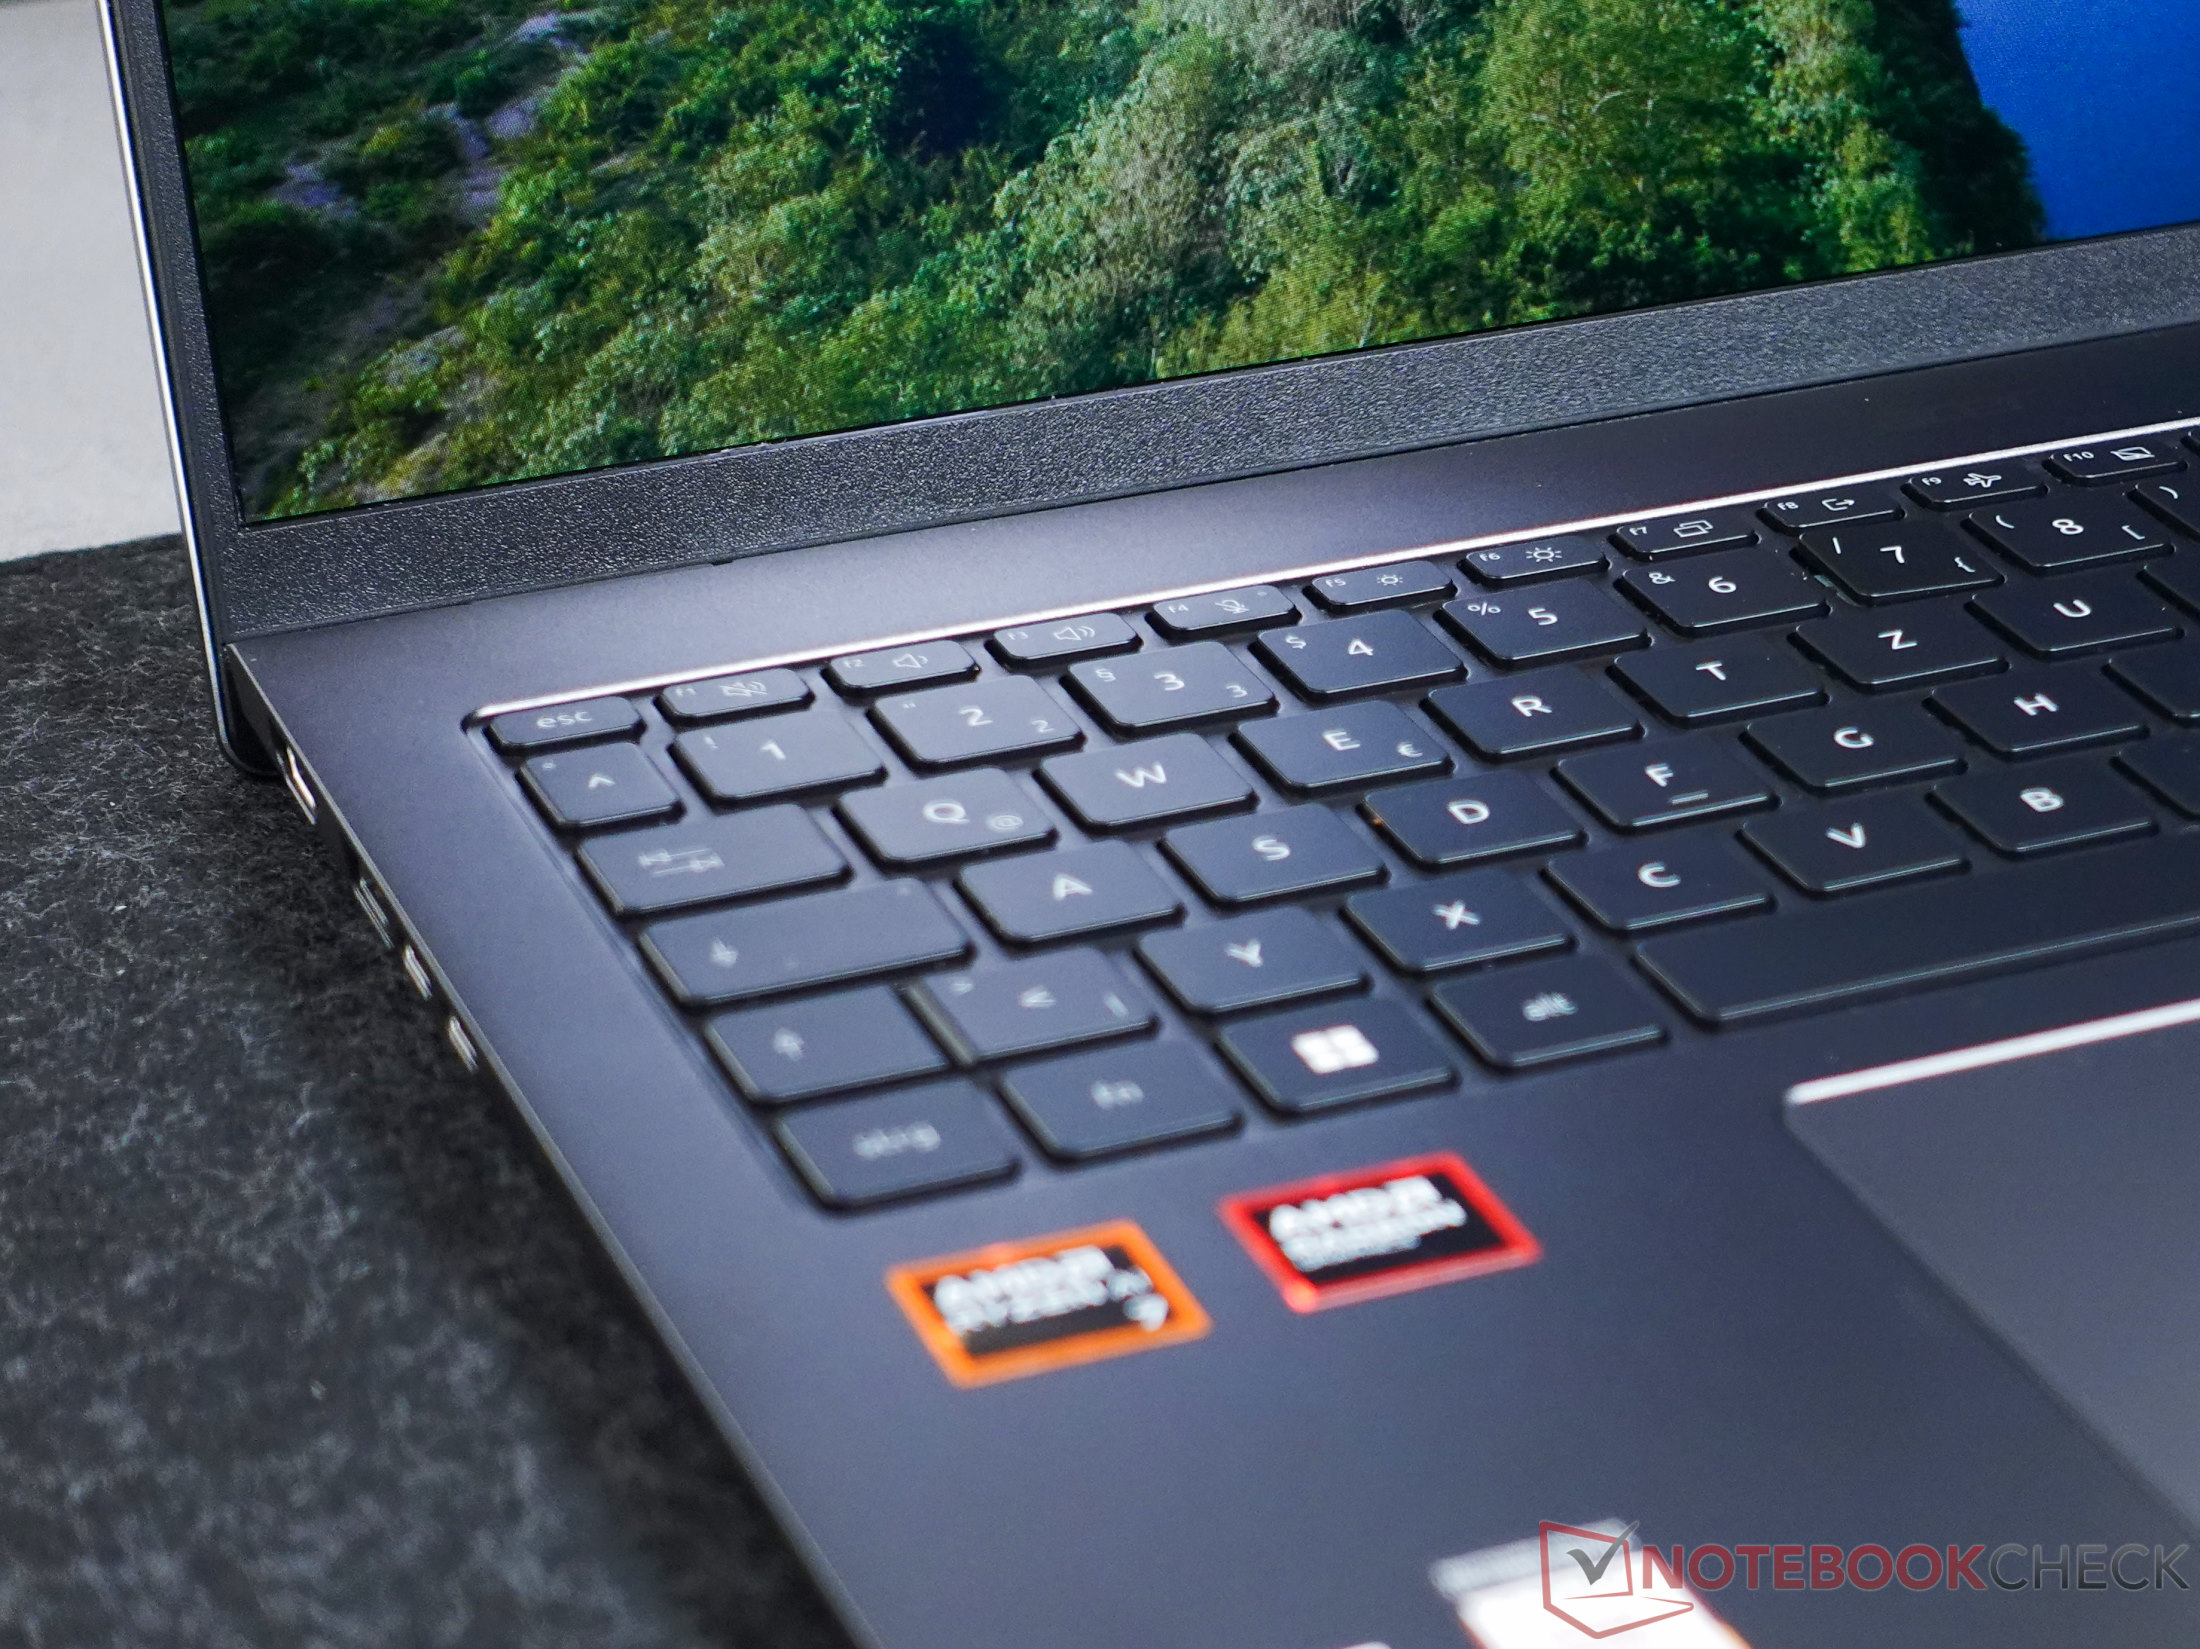
The keyboard of the Swift Go 16 AI offers a complete layout, including a dedicated number block. Backlighting and nice, well-defined pressure points are hallmarks of these keys. The generously sized touchpad operates precisely. As a special feature, it signals via subtle lighting effects when the NPU (Neural Processing Unit) of the processor or other AI functions are actively used.
Display
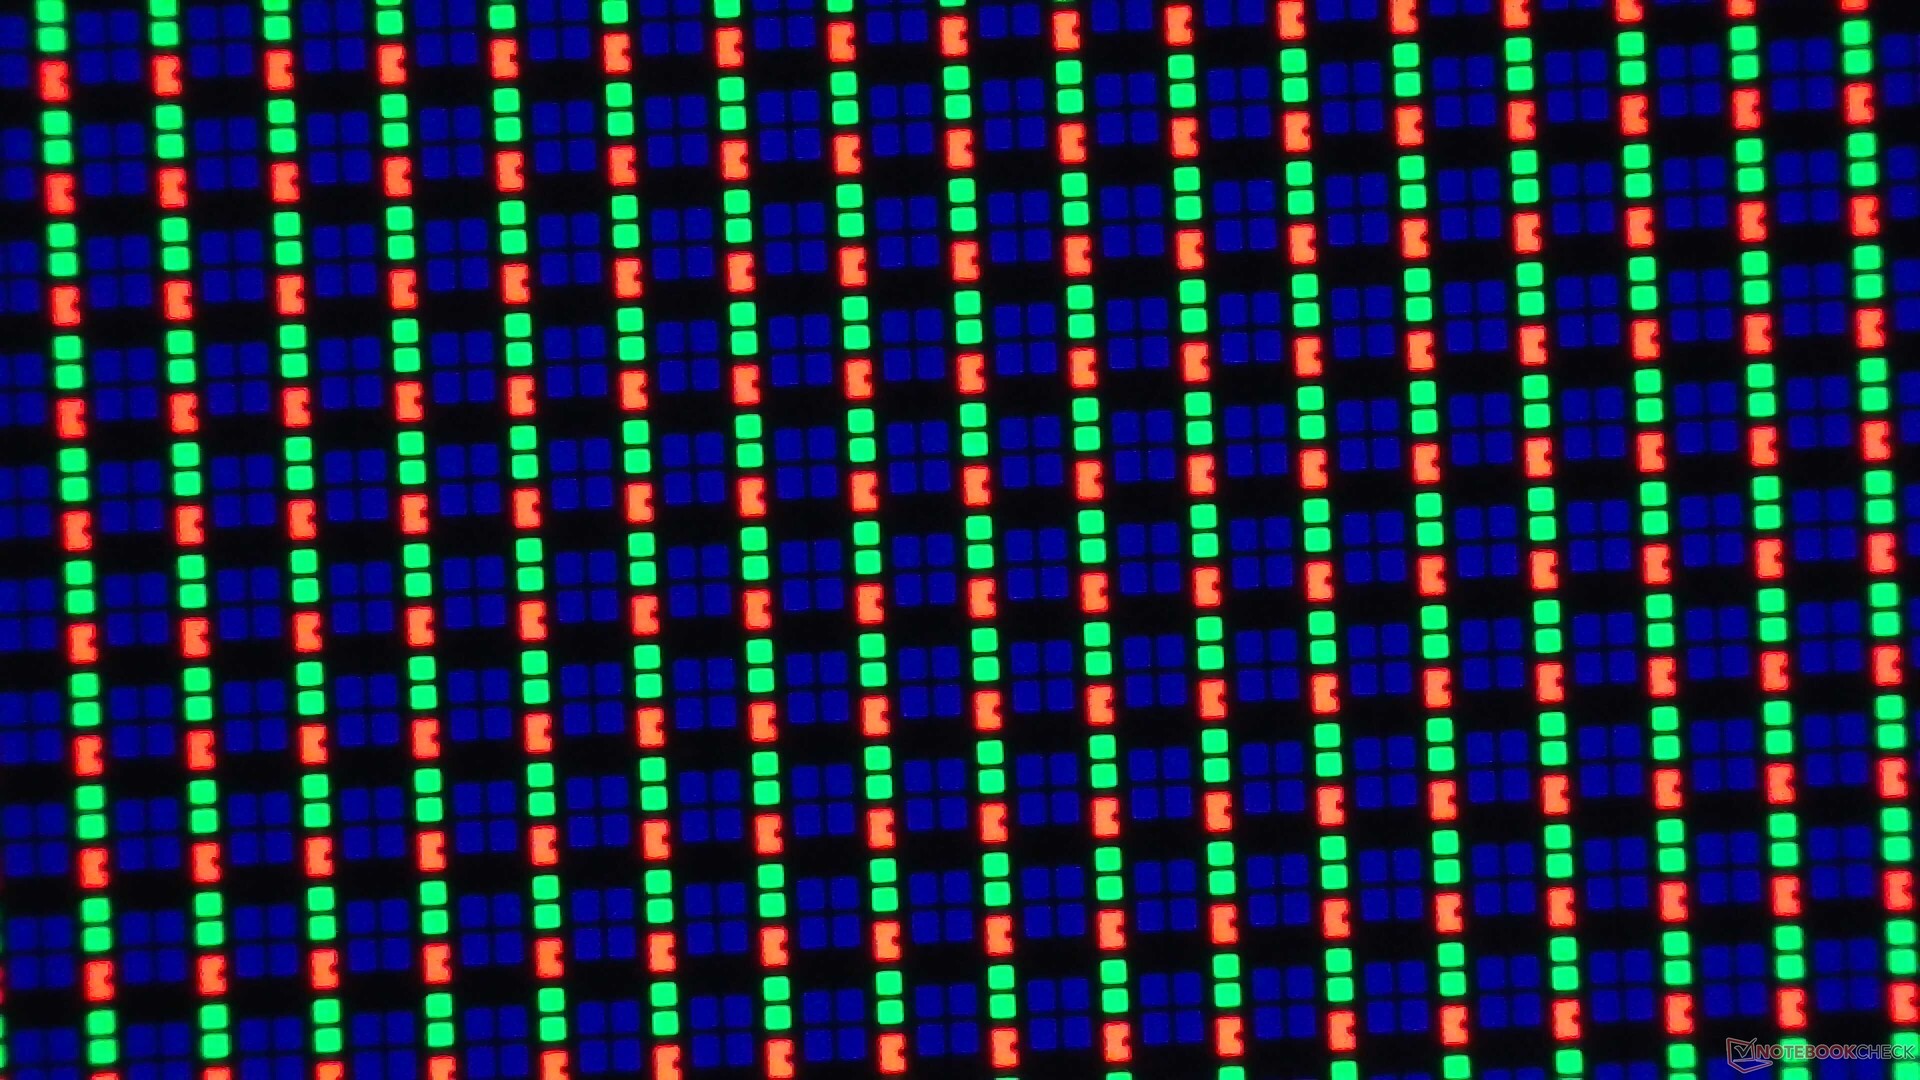
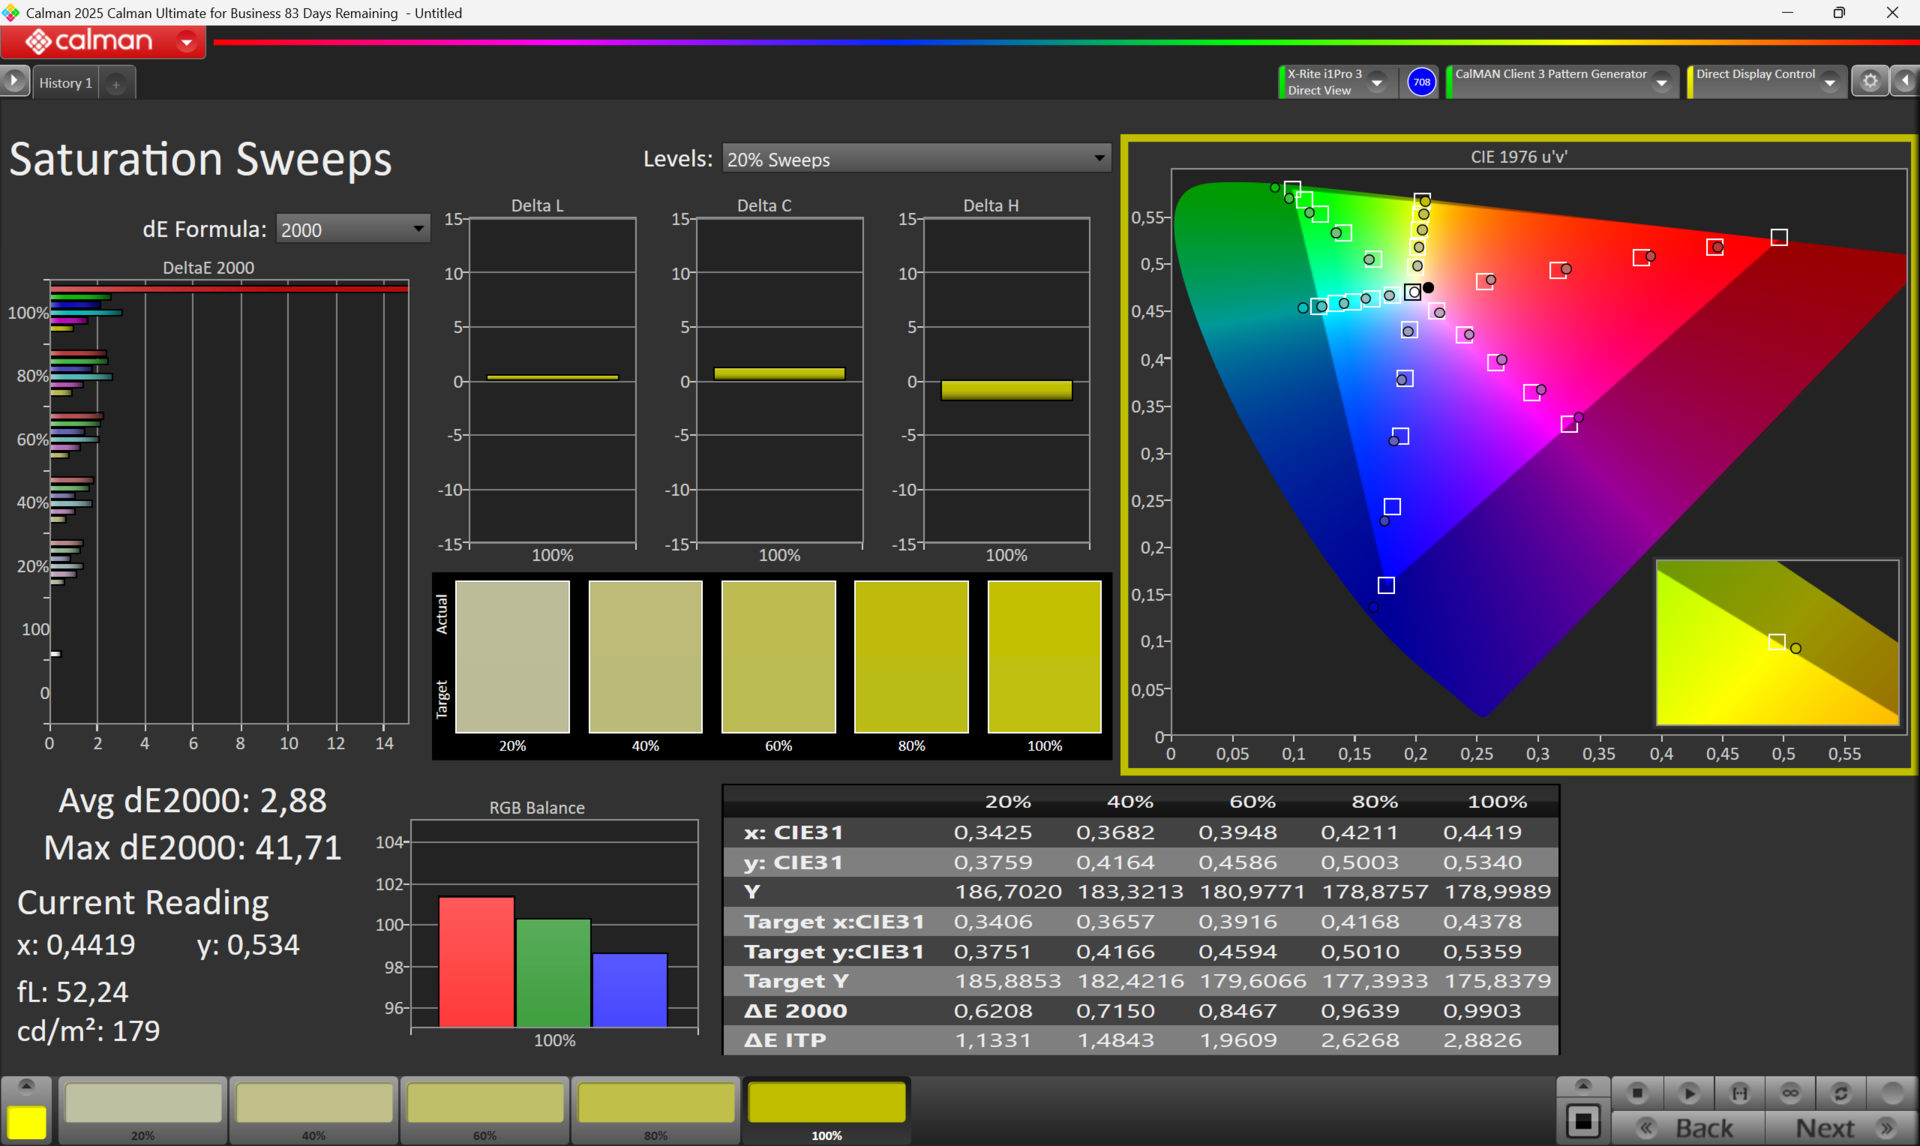
The Acer Swift Go 16 AI is equipped with an outstanding OLED display that immediately catches the eye. Expectations for this panel technology's signature vivid presentation with flawless blacks and extraordinarily high contrasts are satisfied. The 2,880 x 1,800 pixel resolution (16:10 format) is somewhat unusual, but it provides an outstanding pixel density. To ensure particularly smooth display performance, it features a refresh rate of 120 Hz.
| |||||||||||||||||||||||||
Brightness Distribution: 98 %
Center on Battery: 391 cd/m²
Contrast: ∞:1 (Black: 0 cd/m²)
ΔE ColorChecker Calman: 2.62 | ∀{0.5-29.43 Ø4.73}
calibrated: 1.54
ΔE Greyscale Calman: 3.3 | ∀{0.09-98 Ø4.98}
96.87% AdobeRGB 1998 (Argyll 3D)
100% sRGB (Argyll 3D)
99.66% Display P3 (Argyll 3D)
Gamma: 2.205
CCT: 6437 K
| Acer Swift Go 16 AI SFG16-61-R5Y5 ATNA60FV03-0, OLED, 2880x1800, 16", 120 Hz | Lenovo Yoga Pro 9 16IAH G10 RTX 5060 ATNA60HR04-0, OLED, 2880x1800, 16", 120 Hz | Dell 16 Plus AU Optronics B160QAN, IPS, 2560x1600, 16", 120 Hz | LG Gram Pro 16Z90TS-G.AU89G LG DISPLAY LP160WQ2-SPF1, IPS, 2560x1600, 16", 144 Hz | MSI Prestige 16 AI Evo B2HMG B160QAN03_R, IPS, 2560x1600, 16", 60 Hz | Acer Aspire 16 A16-51GM-77G2 N160JCA-EEK (Chi Mei CMN163D), IPS, 1920x1200, 16", 60 Hz | |
|---|---|---|---|---|---|---|
| Display | -3% | -14% | -4% | -5% | -50% | |
| Display P3 Coverage (%) | 99.66 | 99 -1% | 76.6 -23% | 97.96 -2% | 96.4 -3% | 42.3 -58% |
| sRGB Coverage (%) | 100 | 100 0% | 99.8 0% | 100 0% | 99.7 0% | 63.6 -36% |
| AdobeRGB 1998 Coverage (%) | 96.87 | 89.6 -8% | 78.4 -19% | 86.65 -11% | 84.3 -13% | 43.7 -55% |
| Response Times | 54% | -991% | -1454% | -1578% | -943% | |
| Response Time Grey 50% / Grey 80% * (ms) | 1.6 ? | 1.47 ? 8% | 32.8 ? -1950% | 47 ? -2838% | 51.5 ? -3119% | 31.4 ? -1862% |
| Response Time Black / White * (ms) | 17.8 ? | 0.42 ? 98% | 23.4 ? -31% | 30 ? -69% | 24.3 ? -37% | 22 ? -24% |
| PWM Frequency (Hz) | 220 | 1200 ? | ||||
| PWM Amplitude * (%) | 82 | 37 55% | ||||
| Screen | 38% | -33% | 34% | -52% | -62% | |
| Brightness middle (cd/m²) | 393 | 475 21% | 335.6 -15% | 442 12% | 471 20% | 352 -10% |
| Brightness (cd/m²) | 393 | 474 21% | 308 -22% | 406 3% | 455 16% | 324 -18% |
| Brightness Distribution (%) | 98 | 97 -1% | 88 -10% | 86 -12% | 92 -6% | 86 -12% |
| Black Level * (cd/m²) | 0.22 | 0.17 | 0.2 | 0.27 | ||
| Colorchecker dE 2000 * | 2.62 | 1 62% | 4.15 -58% | 0.84 68% | 5.8 -121% | 4.41 -68% |
| Colorchecker dE 2000 max. * | 5.11 | 2 61% | 9.8 -92% | 1.62 68% | 10.8 -111% | 15.04 -194% |
| Colorchecker dE 2000 calibrated * | 1.54 | 0.44 71% | 0.88 43% | 1.9 -23% | 3.52 -129% | |
| Greyscale dE 2000 * | 3.3 | 1.3 61% | 6.7 -103% | 1.53 54% | 7.8 -136% | 3.32 -1% |
| Gamma | 2.205 100% | 2.24 98% | 2.25 98% | 2.173 101% | 2.07 106% | 2.44 90% |
| CCT | 6437 101% | 6672 97% | 6260 104% | 6496 100% | 7262 90% | 7122 91% |
| Contrast (:1) | 1525 | 2600 | 2355 | 1304 | ||
| Total Average (Program / Settings) | 30% /
31% | -346% /
-188% | -475% /
-224% | -545% /
-294% | -352% /
-206% |
* ... smaller is better
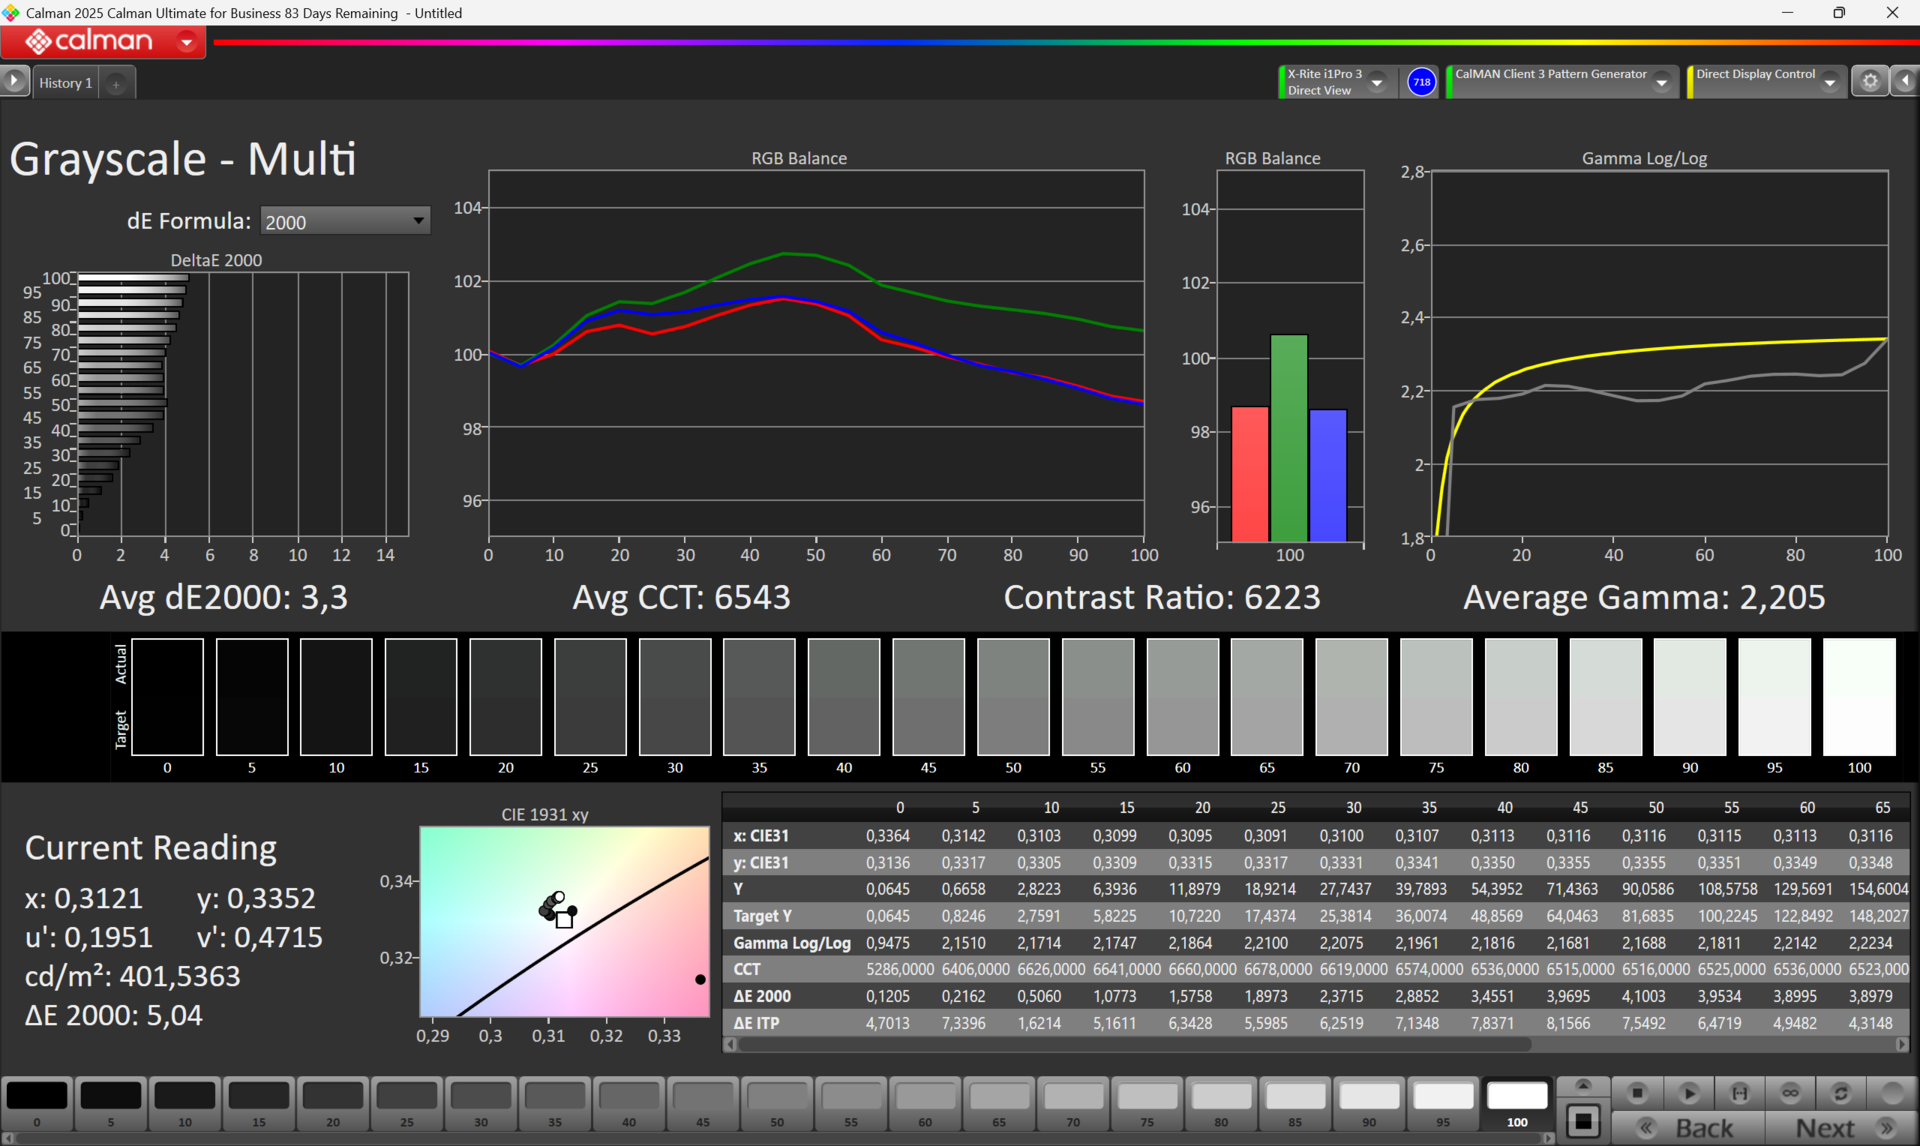
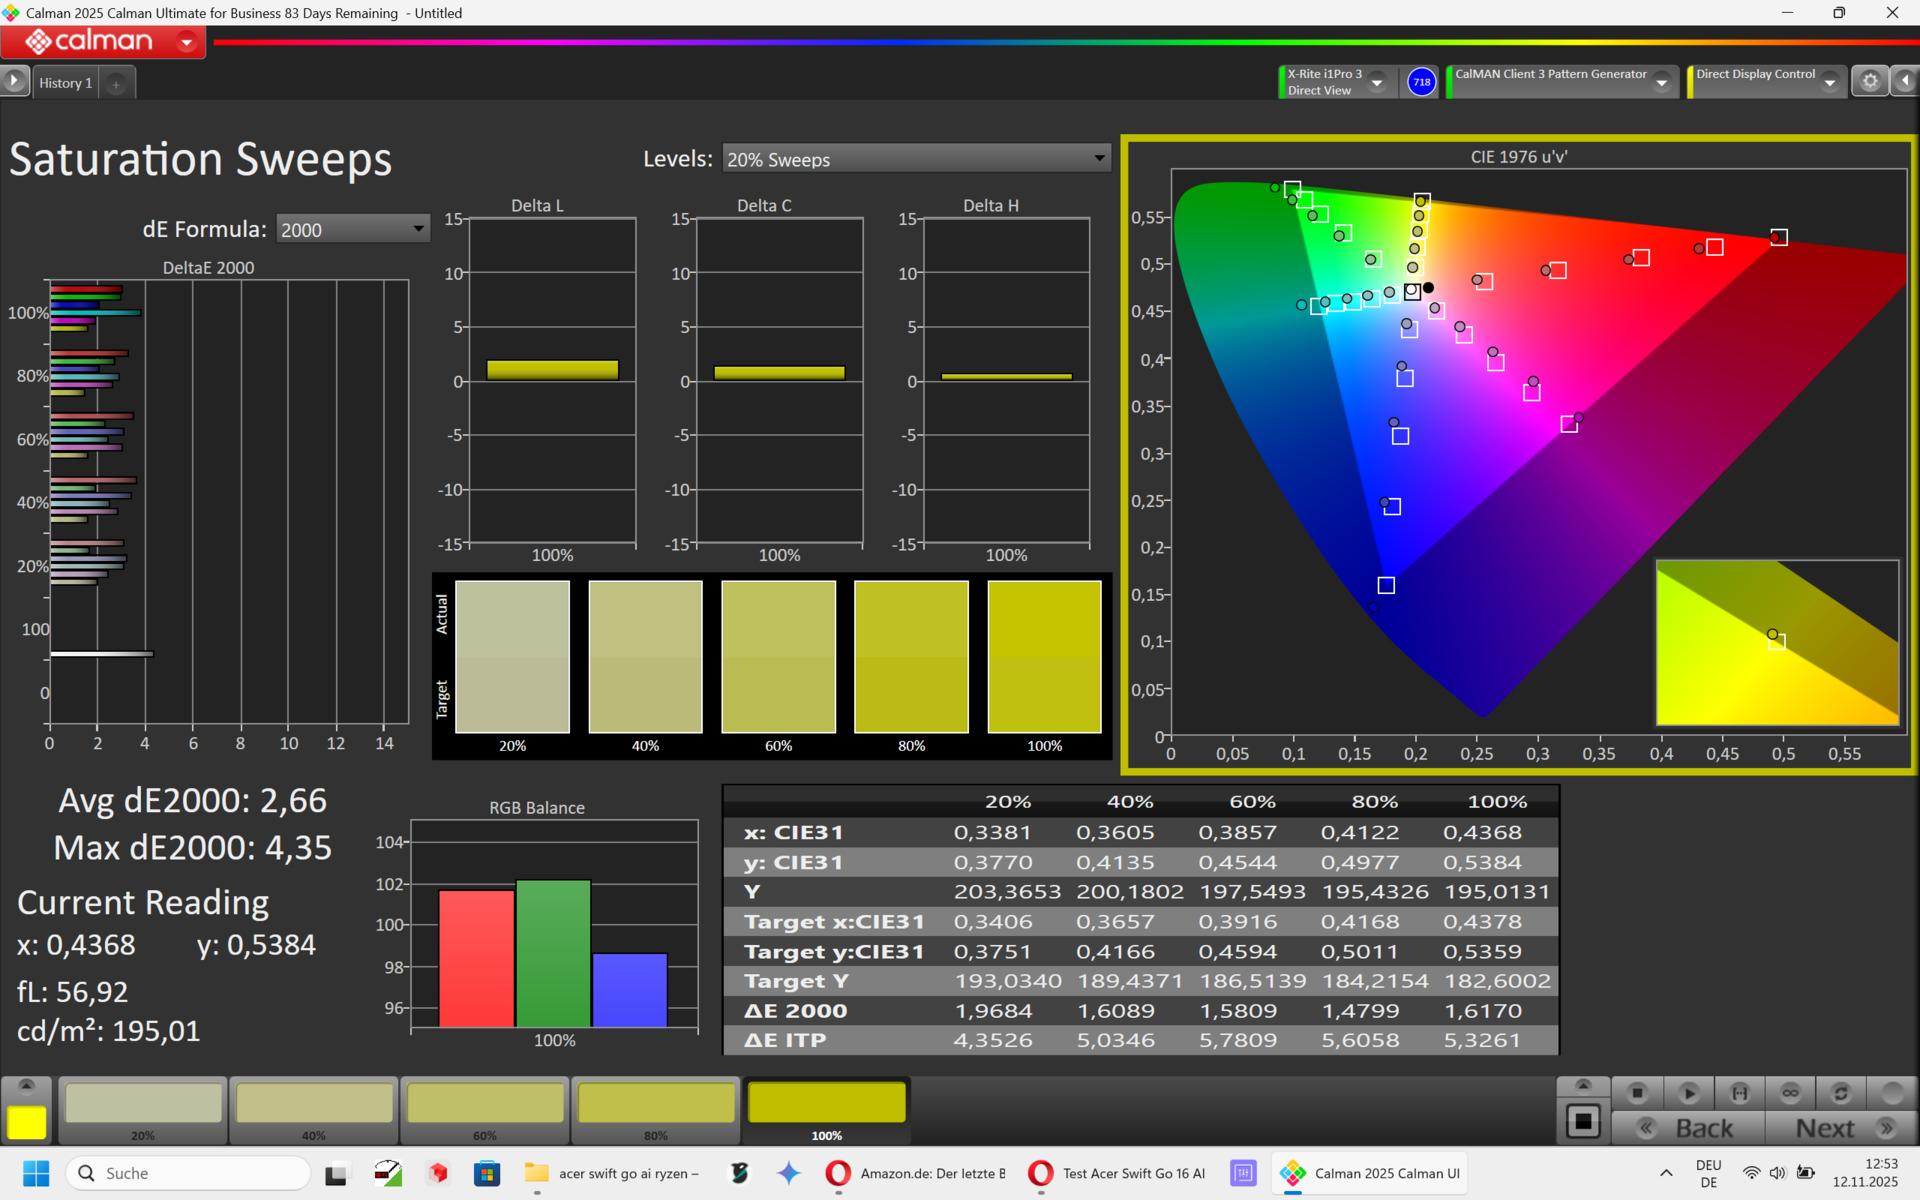
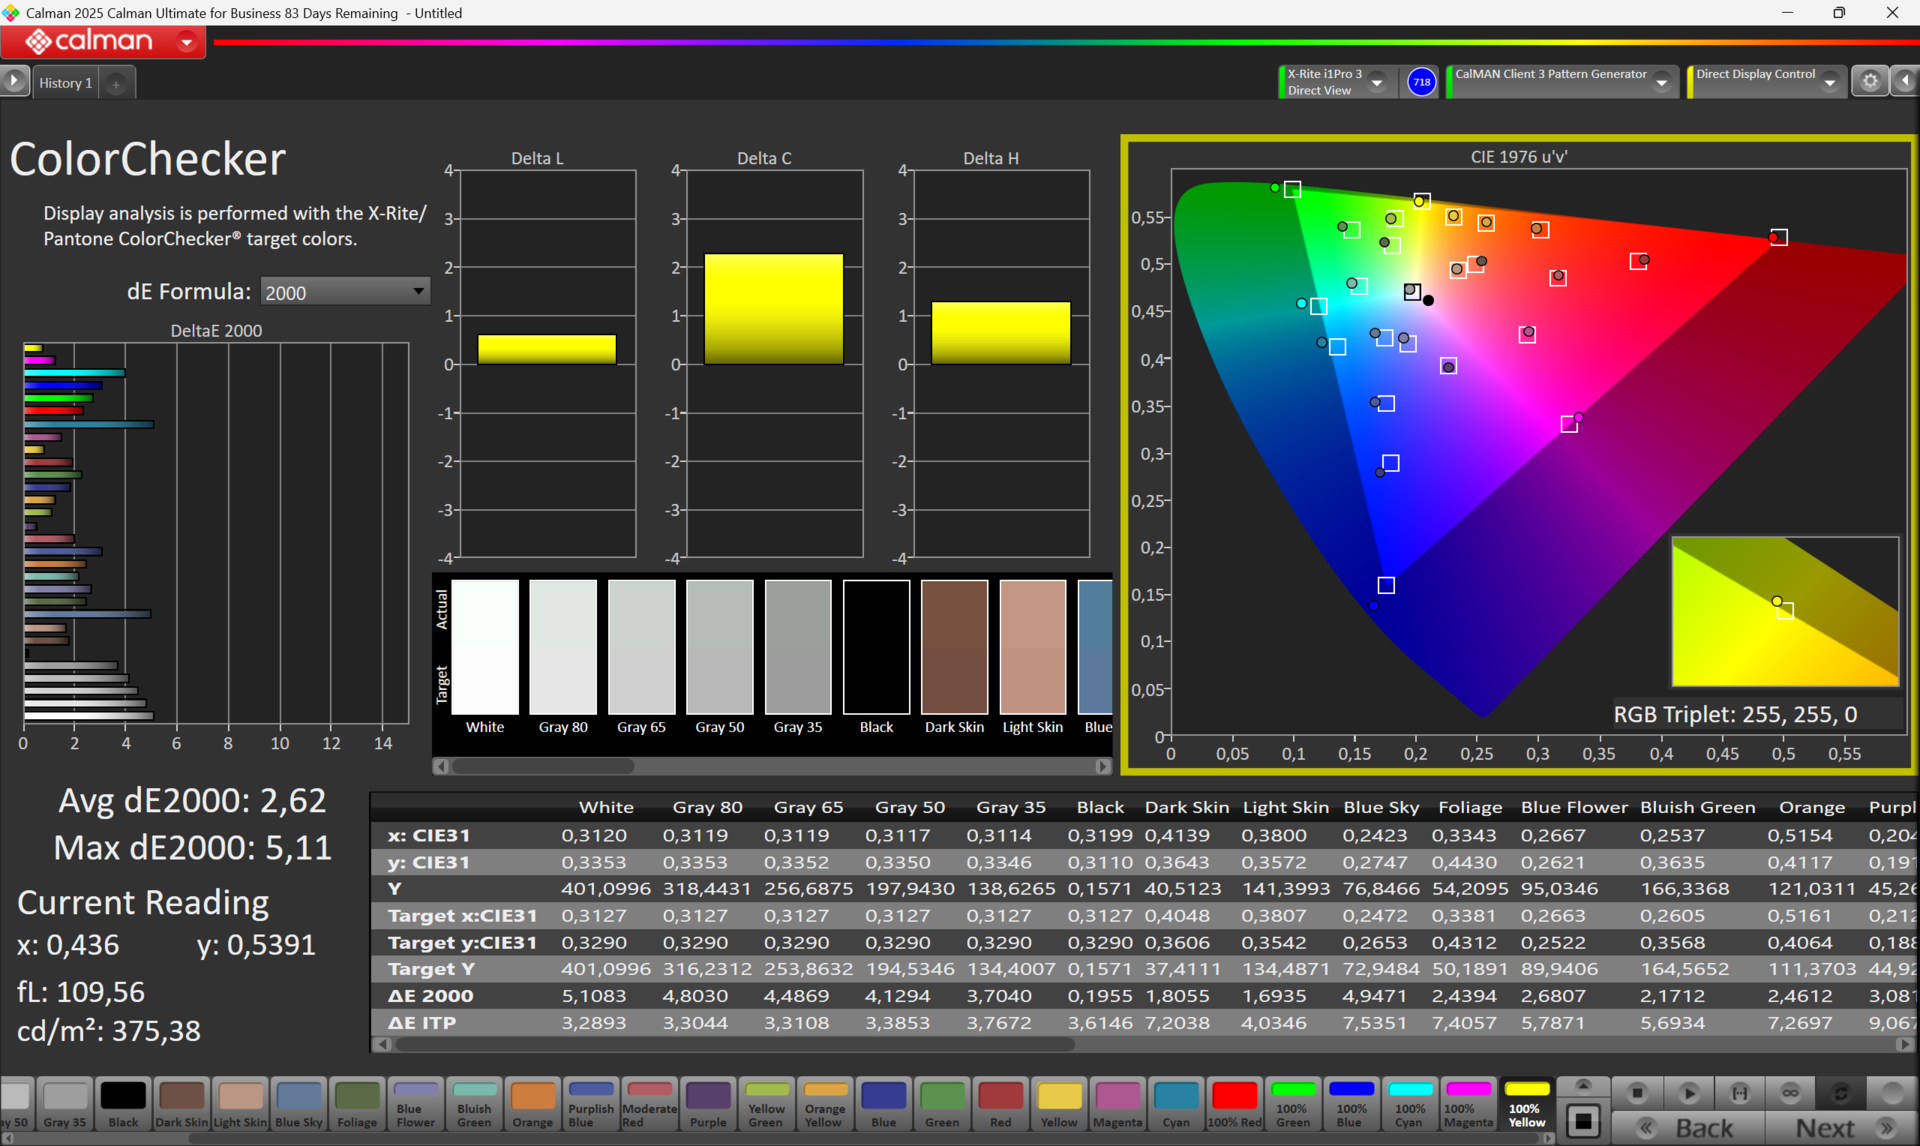
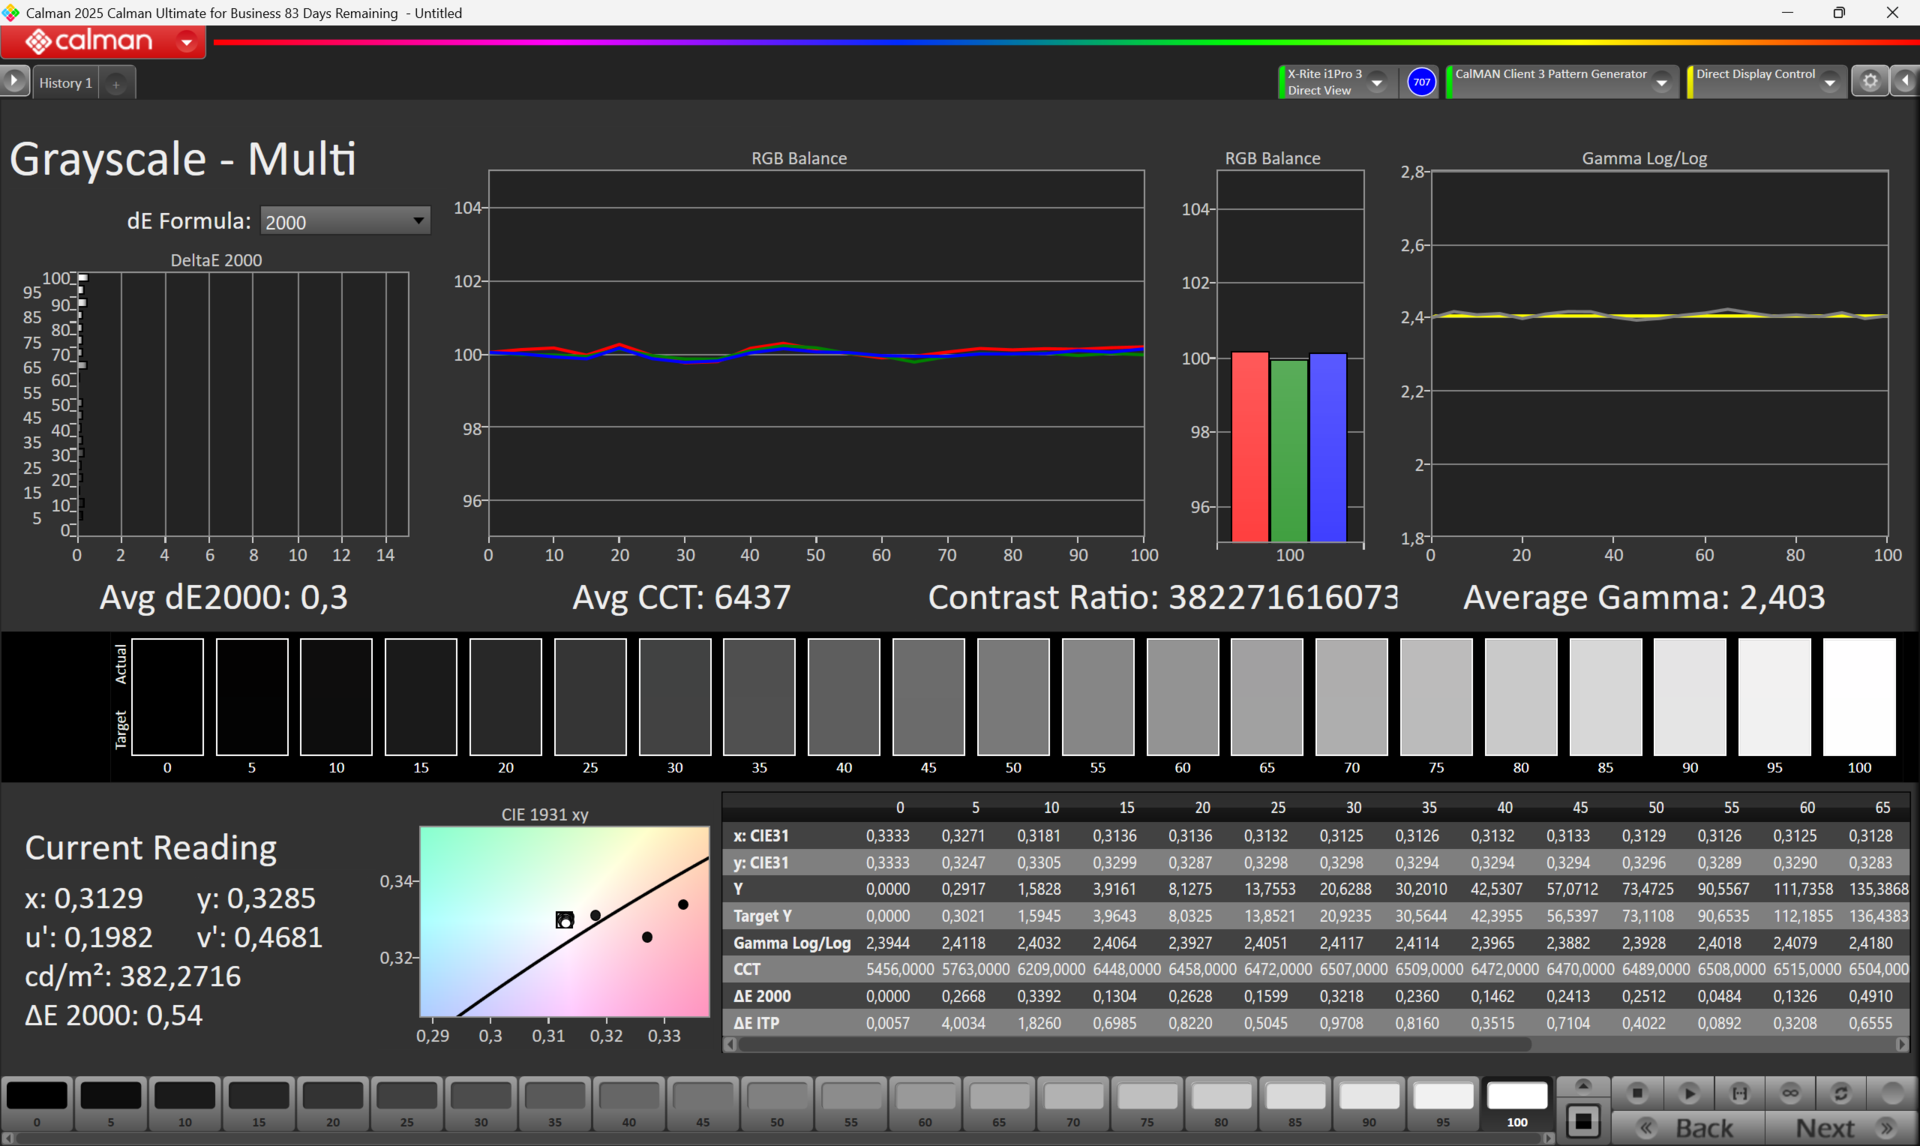
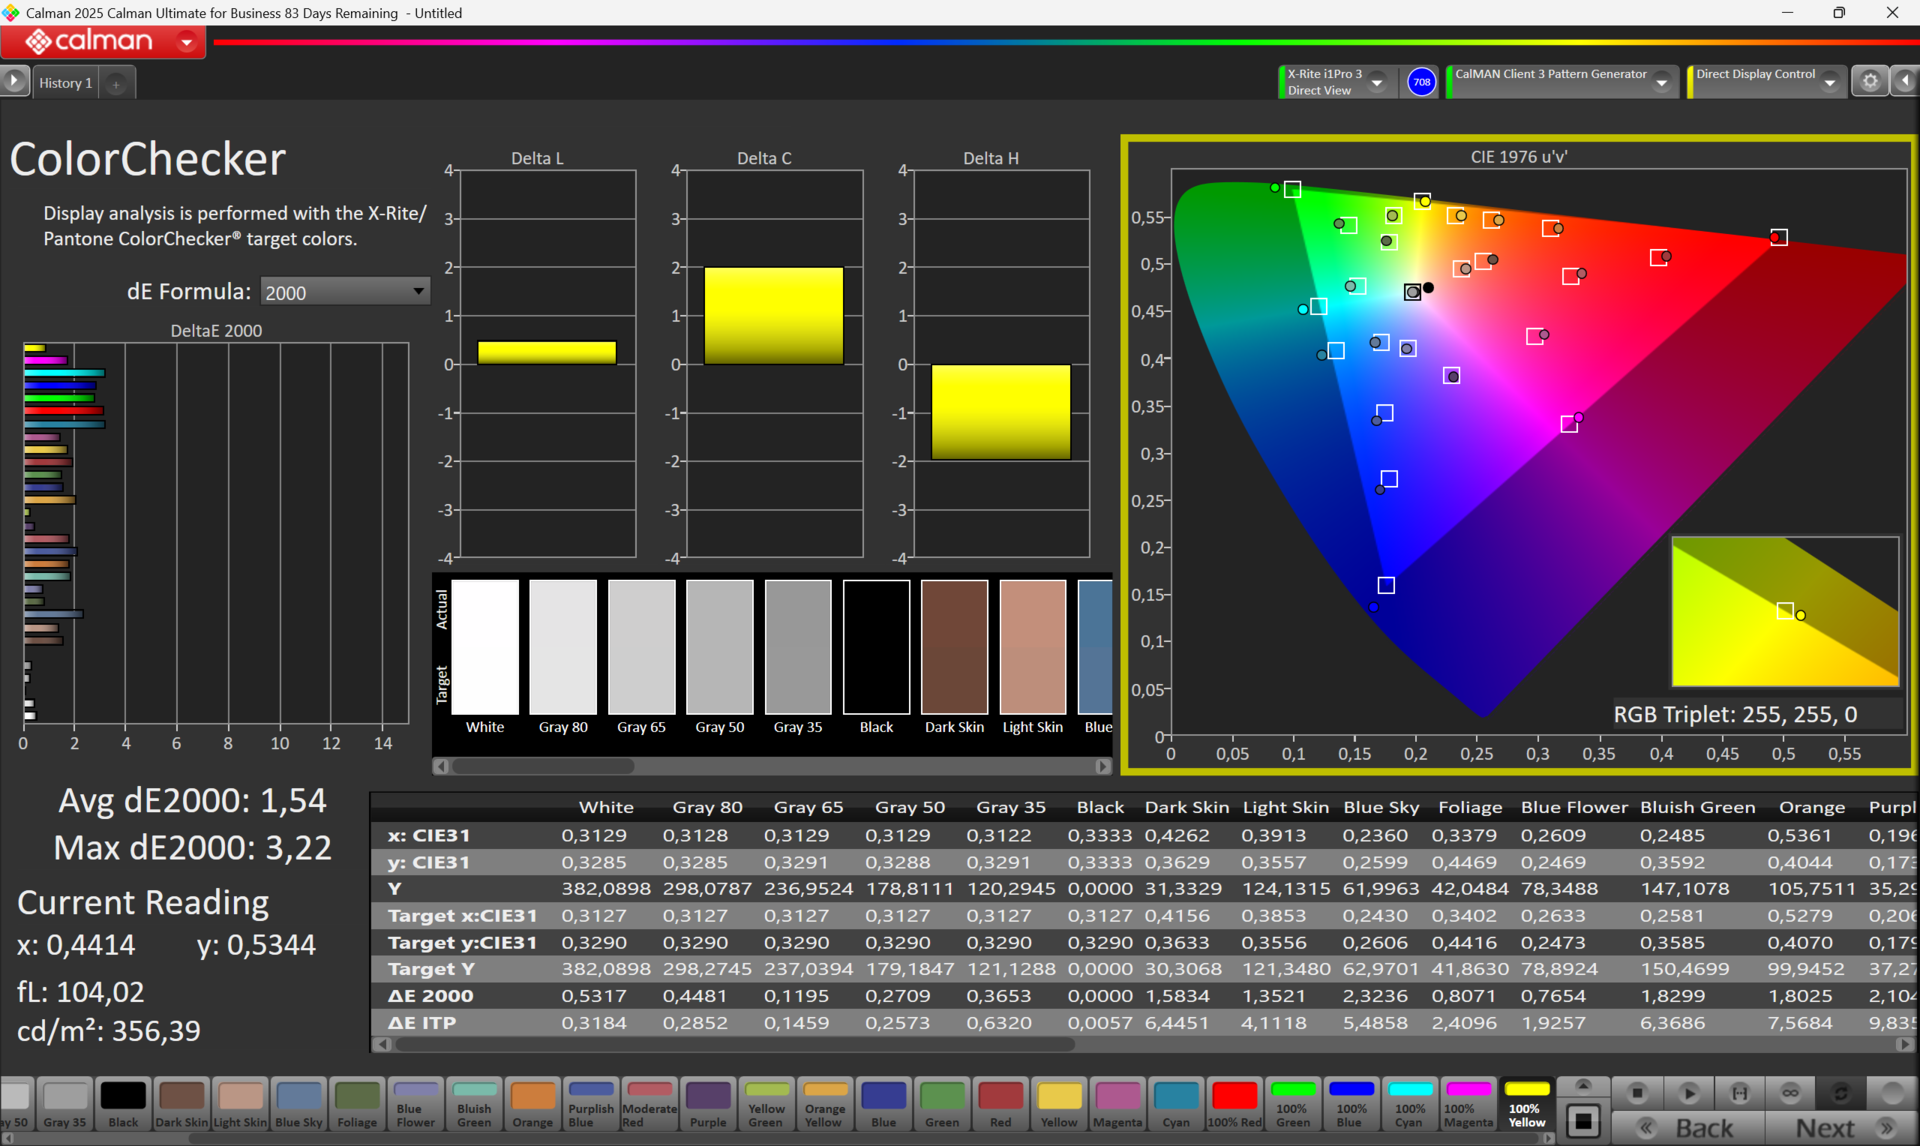
For creatives, color gamut coverage is crucial: The display covers nearly the entire Display P3 color space. The color accuracy out of the box is already remarkably good, requiring little calibration. Flickering during image refreshment is a characteristic of OLED panels. This happens here at a frequency of 220 to 250 Hz.
Display Response Times
| ↔ Response Time Black to White | ||
|---|---|---|
| 17.8 ms ... rise ↗ and fall ↘ combined | ↗ 17 ms rise |  |
| ↘ 0.8 ms fall | ||
| The screen shows good response rates in our tests, but may be too slow for competitive gamers. In comparison, all tested devices range from 0.1 (minimum) to 240 (maximum) ms. » 40 % of all devices are better. This means that the measured response time is better than the average of all tested devices (19.9 ms). | ||
| ↔ Response Time 50% Grey to 80% Grey | ||
| 1.6 ms ... rise ↗ and fall ↘ combined | ↗ 0.8 ms rise |  |
| ↘ 0.8 ms fall | ||
| The screen shows very fast response rates in our tests and should be very well suited for fast-paced gaming. In comparison, all tested devices range from 0.165 (minimum) to 636 (maximum) ms. » 8 % of all devices are better. This means that the measured response time is better than the average of all tested devices (31.1 ms). | ||
Screen Flickering / PWM (Pulse-Width Modulation)
| Screen flickering / PWM detected | 220 Hz Amplitude: 82 % |  | |
The display backlight flickers at 220 Hz (worst case, e.g., utilizing PWM) . The frequency of 220 Hz is relatively low, so sensitive users will likely notice flickering and experience eyestrain at the stated brightness setting and below. In comparison: 52 % of all tested devices do not use PWM to dim the display. If PWM was detected, an average of 7832 (minimum: 5 - maximum: 343500) Hz was measured. | |||


Performance
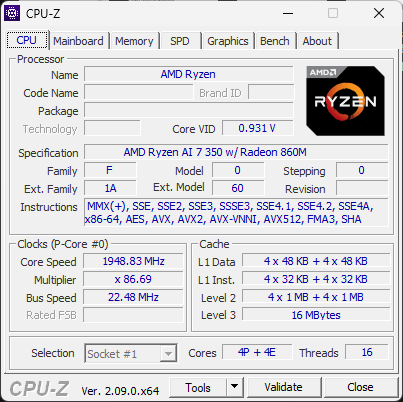
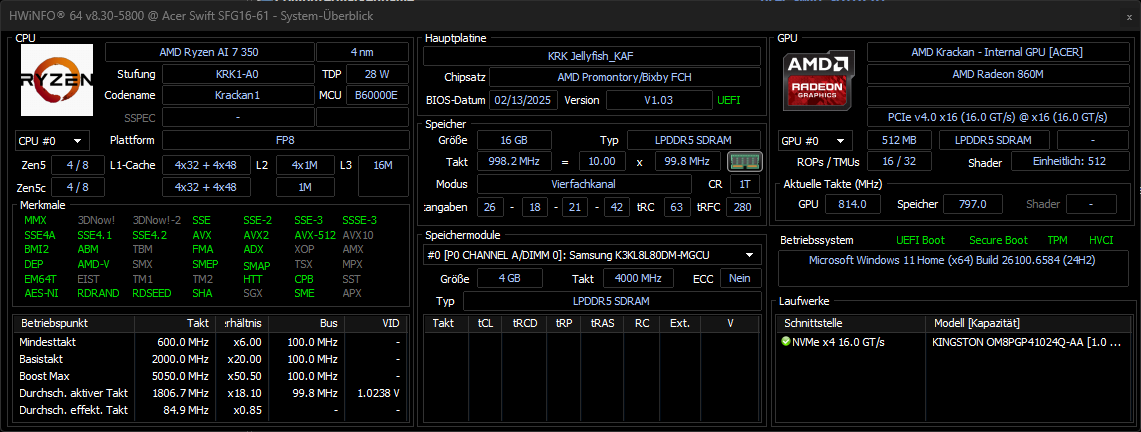
Acer provides a variety of hardware configurations for the Swift Go AI. Our test device is equipped with the AMD Ryzen AI 7 350 processor, accompanied by 16 GB of RAM, which seems somewhat limited considering the powerful processor.
Testing conditions
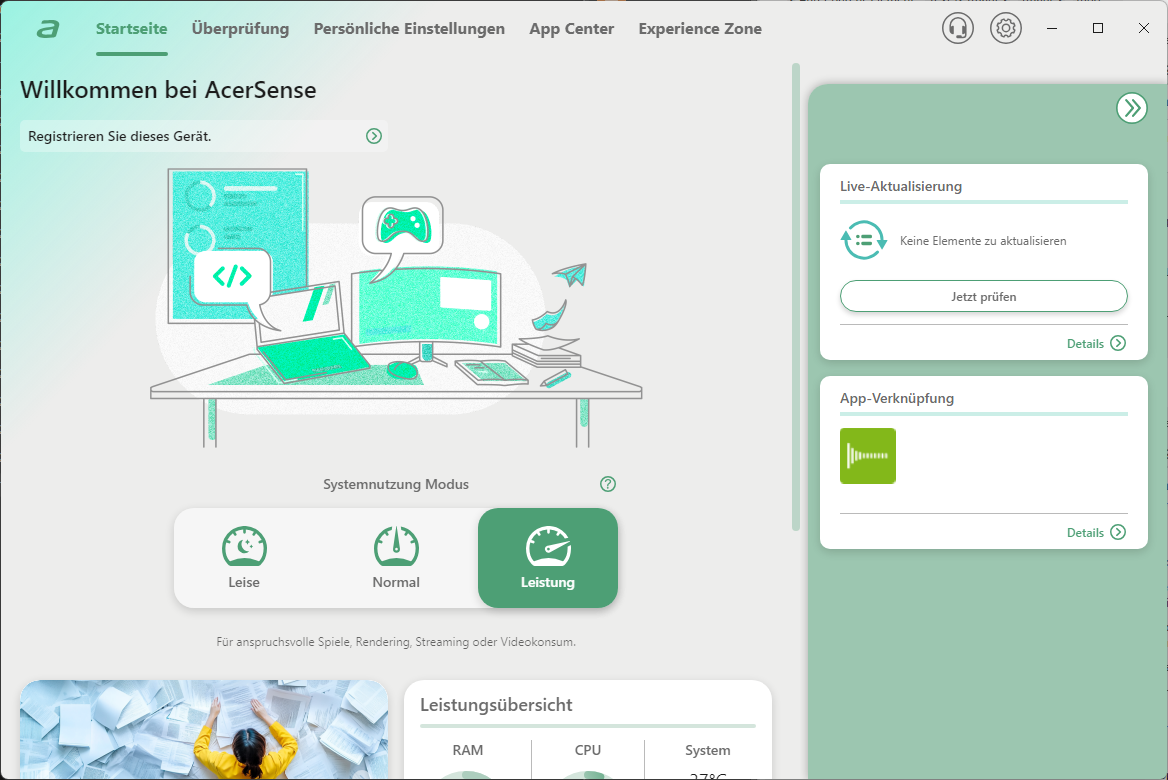
With the used "Performance" profile in the Acer Sense program, the CPU is briefly fired up with around 65 Watts (boost power), before settling down to a sustained performance of arround 45 Watts.
Processor
The Ryzen AI 7 delivers a comparatively high CPU performance that suffices for all tasks on a day-to-day basis. However, when directly compared to the Lenovo Yoga Pro 9 and MSI Prestige AI in pure computational benchmarks, it must concede to more powerful competitors such as the Intel Core Ultra 9 285H or the Intel Core Ultra 7 255H. These Intel chips offer higher clock speeds and sometimes superior single-core performance.
Cinebench R15 multi loop
Cinebench R23: Multi Core | Single Core
Cinebench R20: CPU (Multi Core) | CPU (Single Core)
Cinebench R15: CPU Multi 64Bit | CPU Single 64Bit
Blender: v2.79 BMW27 CPU
7-Zip 18.03: 7z b 4 | 7z b 4 -mmt1
Geekbench 6.6: Multi-Core | Single-Core
Geekbench 5.5: Multi-Core | Single-Core
HWBOT x265 Benchmark v2.2: 4k Preset
LibreOffice : 20 Documents To PDF
R Benchmark 2.5: Overall mean
| CPU Performance rating | |
| Lenovo Yoga Pro 9 16IAH G10 RTX 5060 | |
| MSI Prestige 16 AI Evo B2HMG | |
| Average of class Multimedia | |
| Average AMD Ryzen AI 7 350 | |
| Acer Swift Go 16 AI SFG16-61-R5Y5 | |
| Acer Aspire 16 A16-51GM-77G2 | |
| LG Gram Pro 16Z90TS-G.AU89G | |
| Dell 16 Plus | |
| Cinebench R23 / Multi Core | |
| Lenovo Yoga Pro 9 16IAH G10 RTX 5060 | |
| MSI Prestige 16 AI Evo B2HMG | |
| Average of class Multimedia (4861 - 33362, n=82, last 2 years) | |
| Acer Swift Go 16 AI SFG16-61-R5Y5 | |
| Acer Swift Go 16 AI SFG16-61-R5Y5 | |
| Average AMD Ryzen AI 7 350 (12647 - 18243, n=18) | |
| LG Gram Pro 16Z90TS-G.AU89G | |
| LG Gram Pro 16Z90TS-G.AU89G | |
| Dell 16 Plus | |
| Acer Aspire 16 A16-51GM-77G2 | |
| Cinebench R23 / Single Core | |
| MSI Prestige 16 AI Evo B2HMG | |
| Lenovo Yoga Pro 9 16IAH G10 RTX 5060 | |
| Acer Aspire 16 A16-51GM-77G2 | |
| Average AMD Ryzen AI 7 350 (1916 - 2006, n=18) | |
| Acer Swift Go 16 AI SFG16-61-R5Y5 | |
| Acer Swift Go 16 AI SFG16-61-R5Y5 | |
| Average of class Multimedia (1128 - 2459, n=74, last 2 years) | |
| LG Gram Pro 16Z90TS-G.AU89G | |
| LG Gram Pro 16Z90TS-G.AU89G | |
| Dell 16 Plus | |
| Cinebench R20 / CPU (Multi Core) | |
| Lenovo Yoga Pro 9 16IAH G10 RTX 5060 | |
| MSI Prestige 16 AI Evo B2HMG | |
| Average of class Multimedia (1887 - 12912, n=65, last 2 years) | |
| Average AMD Ryzen AI 7 350 (4897 - 7067, n=16) | |
| Acer Swift Go 16 AI SFG16-61-R5Y5 | |
| LG Gram Pro 16Z90TS-G.AU89G | |
| Dell 16 Plus | |
| Acer Aspire 16 A16-51GM-77G2 | |
| Cinebench R20 / CPU (Single Core) | |
| MSI Prestige 16 AI Evo B2HMG | |
| Lenovo Yoga Pro 9 16IAH G10 RTX 5060 | |
| Acer Aspire 16 A16-51GM-77G2 | |
| Average AMD Ryzen AI 7 350 (751 - 784, n=16) | |
| Acer Swift Go 16 AI SFG16-61-R5Y5 | |
| LG Gram Pro 16Z90TS-G.AU89G | |
| Average of class Multimedia (420 - 853, n=65, last 2 years) | |
| Dell 16 Plus | |
| Cinebench R15 / CPU Multi 64Bit | |
| Lenovo Yoga Pro 9 16IAH G10 RTX 5060 | |
| MSI Prestige 16 AI Evo B2HMG | |
| Average of class Multimedia (856 - 5224, n=69, last 2 years) | |
| Acer Swift Go 16 AI SFG16-61-R5Y5 | |
| Acer Swift Go 16 AI SFG16-61-R5Y5 | |
| Average AMD Ryzen AI 7 350 (1932 - 2734, n=17) | |
| LG Gram Pro 16Z90TS-G.AU89G | |
| Acer Aspire 16 A16-51GM-77G2 | |
| Dell 16 Plus | |
| Cinebench R15 / CPU Single 64Bit | |
| MSI Prestige 16 AI Evo B2HMG | |
| Lenovo Yoga Pro 9 16IAH G10 RTX 5060 | |
| Acer Aspire 16 A16-51GM-77G2 | |
| Acer Swift Go 16 AI SFG16-61-R5Y5 | |
| Acer Swift Go 16 AI SFG16-61-R5Y5 | |
| LG Gram Pro 16Z90TS-G.AU89G | |
| Average of class Multimedia (184.8 - 326, n=67, last 2 years) | |
| Dell 16 Plus | |
| Average AMD Ryzen AI 7 350 (203 - 305, n=17) | |
| Blender / v2.79 BMW27 CPU | |
| Acer Swift Go 16 AI SFG16-61-R5Y5 | |
| Acer Swift Go 16 AI SFG16-61-R5Y5 | |
| Dell 16 Plus | |
| Acer Aspire 16 A16-51GM-77G2 | |
| LG Gram Pro 16Z90TS-G.AU89G | |
| Average of class Multimedia (100 - 557, n=66, last 2 years) | |
| Average AMD Ryzen AI 7 350 (181 - 386, n=17) | |
| MSI Prestige 16 AI Evo B2HMG | |
| Lenovo Yoga Pro 9 16IAH G10 RTX 5060 | |
| 7-Zip 18.03 / 7z b 4 | |
| Lenovo Yoga Pro 9 16IAH G10 RTX 5060 | |
| MSI Prestige 16 AI Evo B2HMG | |
| Average of class Multimedia (29095 - 130368, n=63, last 2 years) | |
| Acer Swift Go 16 AI SFG16-61-R5Y5 | |
| Average AMD Ryzen AI 7 350 (48124 - 64653, n=16) | |
| Acer Aspire 16 A16-51GM-77G2 | |
| LG Gram Pro 16Z90TS-G.AU89G | |
| Dell 16 Plus | |
| 7-Zip 18.03 / 7z b 4 -mmt1 | |
| Acer Aspire 16 A16-51GM-77G2 | |
| MSI Prestige 16 AI Evo B2HMG | |
| Average AMD Ryzen AI 7 350 (4609 - 6371, n=16) | |
| Acer Swift Go 16 AI SFG16-61-R5Y5 | |
| Lenovo Yoga Pro 9 16IAH G10 RTX 5060 | |
| Average of class Multimedia (3666 - 7545, n=64, last 2 years) | |
| LG Gram Pro 16Z90TS-G.AU89G | |
| Dell 16 Plus | |
| Geekbench 6.6 / Multi-Core | |
| MSI Prestige 16 AI Evo B2HMG | |
| Lenovo Yoga Pro 9 16IAH G10 RTX 5060 | |
| Average of class Multimedia (4983 - 29415, n=80, last 2 years) | |
| Average AMD Ryzen AI 7 350 (10774 - 14194, n=17) | |
| Acer Swift Go 16 AI SFG16-61-R5Y5 | |
| LG Gram Pro 16Z90TS-G.AU89G | |
| Dell 16 Plus | |
| Acer Aspire 16 A16-51GM-77G2 | |
| Geekbench 6.6 / Single-Core | |
| MSI Prestige 16 AI Evo B2HMG | |
| Average of class Multimedia (1534 - 4335, n=76, last 2 years) | |
| Lenovo Yoga Pro 9 16IAH G10 RTX 5060 | |
| Acer Swift Go 16 AI SFG16-61-R5Y5 | |
| Acer Aspire 16 A16-51GM-77G2 | |
| Dell 16 Plus | |
| LG Gram Pro 16Z90TS-G.AU89G | |
| Average AMD Ryzen AI 7 350 (1874 - 2942, n=17) | |
| Geekbench 5.5 / Multi-Core | |
| Lenovo Yoga Pro 9 16IAH G10 RTX 5060 | |
| MSI Prestige 16 AI Evo B2HMG | |
| Average of class Multimedia (4652 - 20422, n=63, last 2 years) | |
| Acer Swift Go 16 AI SFG16-61-R5Y5 | |
| Acer Swift Go 16 AI SFG16-61-R5Y5 | |
| Average AMD Ryzen AI 7 350 (6705 - 12968, n=18) | |
| Dell 16 Plus | |
| LG Gram Pro 16Z90TS-G.AU89G | |
| Acer Aspire 16 A16-51GM-77G2 | |
| Geekbench 5.5 / Single-Core | |
| MSI Prestige 16 AI Evo B2HMG | |
| Acer Swift Go 16 AI SFG16-61-R5Y5 | |
| Acer Swift Go 16 AI SFG16-61-R5Y5 | |
| LG Gram Pro 16Z90TS-G.AU89G | |
| Dell 16 Plus | |
| Lenovo Yoga Pro 9 16IAH G10 RTX 5060 | |
| Acer Aspire 16 A16-51GM-77G2 | |
| Average of class Multimedia (805 - 2974, n=63, last 2 years) | |
| Average AMD Ryzen AI 7 350 (805 - 2155, n=18) | |
| HWBOT x265 Benchmark v2.2 / 4k Preset | |
| Lenovo Yoga Pro 9 16IAH G10 RTX 5060 | |
| MSI Prestige 16 AI Evo B2HMG | |
| Acer Swift Go 16 AI SFG16-61-R5Y5 | |
| Average AMD Ryzen AI 7 350 (14 - 22.9, n=16) | |
| Average of class Multimedia (5.26 - 36.1, n=64, last 2 years) | |
| LG Gram Pro 16Z90TS-G.AU89G | |
| Dell 16 Plus | |
| Acer Aspire 16 A16-51GM-77G2 | |
| LibreOffice / 20 Documents To PDF | |
| Average AMD Ryzen AI 7 350 (43.3 - 88.8, n=16) | |
| Average of class Multimedia (23.9 - 146.7, n=65, last 2 years) | |
| LG Gram Pro 16Z90TS-G.AU89G | |
| Dell 16 Plus | |
| MSI Prestige 16 AI Evo B2HMG | |
| Acer Swift Go 16 AI SFG16-61-R5Y5 | |
| Lenovo Yoga Pro 9 16IAH G10 RTX 5060 | |
| Acer Aspire 16 A16-51GM-77G2 | |
| R Benchmark 2.5 / Overall mean | |
| Average of class Multimedia (0.3604 - 0.947, n=64, last 2 years) | |
| LG Gram Pro 16Z90TS-G.AU89G | |
| Dell 16 Plus | |
| Acer Aspire 16 A16-51GM-77G2 | |
| Lenovo Yoga Pro 9 16IAH G10 RTX 5060 | |
| MSI Prestige 16 AI Evo B2HMG | |
| Average AMD Ryzen AI 7 350 (0.403 - 0.565, n=16) | |
| Acer Swift Go 16 AI SFG16-61-R5Y5 | |
* ... smaller is better
AIDA64: FP32 Ray-Trace | FPU Julia | CPU SHA3 | CPU Queen | FPU SinJulia | FPU Mandel | CPU AES | CPU ZLib | FP64 Ray-Trace | CPU PhotoWorxx
| Performance rating | |
| Lenovo Yoga Pro 9 16IAH G10 RTX 5060 | |
| Acer Swift Go 16 AI SFG16-61-R5Y5 | |
| Average AMD Ryzen AI 7 350 | |
| MSI Prestige 16 AI Evo B2HMG | |
| Average of class Multimedia | |
| LG Gram Pro 16Z90TS-G.AU89G | |
| Dell 16 Plus | |
| Acer Aspire 16 A16-51GM-77G2 | |
| AIDA64 / FP32 Ray-Trace | |
| Average AMD Ryzen AI 7 350 (20203 - 28112, n=16) | |
| Acer Swift Go 16 AI SFG16-61-R5Y5 | |
| Lenovo Yoga Pro 9 16IAH G10 RTX 5060 | |
| MSI Prestige 16 AI Evo B2HMG | |
| Average of class Multimedia (2214 - 50388, n=61, last 2 years) | |
| LG Gram Pro 16Z90TS-G.AU89G | |
| Dell 16 Plus | |
| Acer Aspire 16 A16-51GM-77G2 | |
| AIDA64 / FPU Julia | |
| Lenovo Yoga Pro 9 16IAH G10 RTX 5060 | |
| Average AMD Ryzen AI 7 350 (75098 - 110301, n=16) | |
| Acer Swift Go 16 AI SFG16-61-R5Y5 | |
| MSI Prestige 16 AI Evo B2HMG | |
| Average of class Multimedia (12867 - 201874, n=62, last 2 years) | |
| LG Gram Pro 16Z90TS-G.AU89G | |
| Dell 16 Plus | |
| Acer Aspire 16 A16-51GM-77G2 | |
| AIDA64 / CPU SHA3 | |
| Lenovo Yoga Pro 9 16IAH G10 RTX 5060 | |
| MSI Prestige 16 AI Evo B2HMG | |
| Acer Swift Go 16 AI SFG16-61-R5Y5 | |
| Average AMD Ryzen AI 7 350 (3395 - 4399, n=16) | |
| Average of class Multimedia (653 - 8623, n=62, last 2 years) | |
| LG Gram Pro 16Z90TS-G.AU89G | |
| Dell 16 Plus | |
| Acer Aspire 16 A16-51GM-77G2 | |
| AIDA64 / CPU Queen | |
| Average of class Multimedia (13483 - 181505, n=51, last 2 years) | |
| Average AMD Ryzen AI 7 350 (67317 - 77400, n=16) | |
| Acer Swift Go 16 AI SFG16-61-R5Y5 | |
| Acer Aspire 16 A16-51GM-77G2 | |
| MSI Prestige 16 AI Evo B2HMG | |
| Lenovo Yoga Pro 9 16IAH G10 RTX 5060 | |
| LG Gram Pro 16Z90TS-G.AU89G | |
| Dell 16 Plus | |
| AIDA64 / FPU SinJulia | |
| Acer Swift Go 16 AI SFG16-61-R5Y5 | |
| Average AMD Ryzen AI 7 350 (11916 - 13856, n=16) | |
| Average of class Multimedia (1240 - 28794, n=62, last 2 years) | |
| Lenovo Yoga Pro 9 16IAH G10 RTX 5060 | |
| MSI Prestige 16 AI Evo B2HMG | |
| Acer Aspire 16 A16-51GM-77G2 | |
| LG Gram Pro 16Z90TS-G.AU89G | |
| Dell 16 Plus | |
| AIDA64 / FPU Mandel | |
| Lenovo Yoga Pro 9 16IAH G10 RTX 5060 | |
| Average AMD Ryzen AI 7 350 (39456 - 59540, n=15) | |
| Acer Swift Go 16 AI SFG16-61-R5Y5 | |
| MSI Prestige 16 AI Evo B2HMG | |
| Average of class Multimedia (6395 - 105740, n=61, last 2 years) | |
| LG Gram Pro 16Z90TS-G.AU89G | |
| Dell 16 Plus | |
| Acer Aspire 16 A16-51GM-77G2 | |
| AIDA64 / CPU AES | |
| Lenovo Yoga Pro 9 16IAH G10 RTX 5060 | |
| Acer Swift Go 16 AI SFG16-61-R5Y5 | |
| Average AMD Ryzen AI 7 350 (56915 - 87670, n=16) | |
| MSI Prestige 16 AI Evo B2HMG | |
| Average of class Multimedia (13243 - 126790, n=62, last 2 years) | |
| Acer Aspire 16 A16-51GM-77G2 | |
| Dell 16 Plus | |
| LG Gram Pro 16Z90TS-G.AU89G | |
| AIDA64 / CPU ZLib | |
| Lenovo Yoga Pro 9 16IAH G10 RTX 5060 | |
| Acer Swift Go 16 AI SFG16-61-R5Y5 | |
| Average AMD Ryzen AI 7 350 (663 - 1140, n=16) | |
| MSI Prestige 16 AI Evo B2HMG | |
| Average of class Multimedia (167.2 - 2022, n=62, last 2 years) | |
| Acer Aspire 16 A16-51GM-77G2 | |
| LG Gram Pro 16Z90TS-G.AU89G | |
| Dell 16 Plus | |
| AIDA64 / FP64 Ray-Trace | |
| Average AMD Ryzen AI 7 350 (10707 - 15222, n=15) | |
| Acer Swift Go 16 AI SFG16-61-R5Y5 | |
| Lenovo Yoga Pro 9 16IAH G10 RTX 5060 | |
| MSI Prestige 16 AI Evo B2HMG | |
| Average of class Multimedia (1014 - 26875, n=62, last 2 years) | |
| LG Gram Pro 16Z90TS-G.AU89G | |
| Dell 16 Plus | |
| Acer Aspire 16 A16-51GM-77G2 | |
| AIDA64 / CPU PhotoWorxx | |
| Lenovo Yoga Pro 9 16IAH G10 RTX 5060 | |
| MSI Prestige 16 AI Evo B2HMG | |
| LG Gram Pro 16Z90TS-G.AU89G | |
| Dell 16 Plus | |
| Average of class Multimedia (12860 - 88154, n=62, last 2 years) | |
| Average AMD Ryzen AI 7 350 (25170 - 47405, n=16) | |
| Acer Swift Go 16 AI SFG16-61-R5Y5 | |
| Acer Aspire 16 A16-51GM-77G2 | |
System performance
In the overall picture of system performance, this difference is rather negligible. This can be attributed to the excellent tuning of the components. The fast LPDDR5X memory and the powerful integrated graphics unit (iGPU) significantly contribute to ensuring that the entire system operates smoothly and responsively at all times.
PCMark 10: Score | Essentials | Productivity | Digital Content Creation
CrossMark: Overall | Productivity | Creativity | Responsiveness
WebXPRT 3: Overall
WebXPRT 4: Overall
Mozilla Kraken 1.1: Total
| Performance rating | |
| MSI Prestige 16 AI Evo B2HMG | |
| Lenovo Yoga Pro 9 16IAH G10 RTX 5060 | |
| Average of class Multimedia | |
| Acer Aspire 16 A16-51GM-77G2 | |
| Acer Swift Go 16 AI SFG16-61-R5Y5 | |
| Average AMD Ryzen AI 7 350, AMD Radeon 860M | |
| Dell 16 Plus | |
| LG Gram Pro 16Z90TS-G.AU89G | |
| PCMark 10 / Score | |
| MSI Prestige 16 AI Evo B2HMG | |
| Lenovo Yoga Pro 9 16IAH G10 RTX 5060 | |
| Average of class Multimedia (4325 - 10386, n=58, last 2 years) | |
| Average AMD Ryzen AI 7 350, AMD Radeon 860M (6982 - 8588, n=12) | |
| Acer Swift Go 16 AI SFG16-61-R5Y5 | |
| Dell 16 Plus | |
| LG Gram Pro 16Z90TS-G.AU89G | |
| Acer Aspire 16 A16-51GM-77G2 | |
| PCMark 10 / Essentials | |
| Average AMD Ryzen AI 7 350, AMD Radeon 860M (10801 - 12383, n=12) | |
| MSI Prestige 16 AI Evo B2HMG | |
| Acer Aspire 16 A16-51GM-77G2 | |
| Acer Swift Go 16 AI SFG16-61-R5Y5 | |
| Lenovo Yoga Pro 9 16IAH G10 RTX 5060 | |
| Average of class Multimedia (8025 - 11664, n=57, last 2 years) | |
| Dell 16 Plus | |
| LG Gram Pro 16Z90TS-G.AU89G | |
| PCMark 10 / Productivity | |
| Average of class Multimedia (7323 - 18233, n=57, last 2 years) | |
| Average AMD Ryzen AI 7 350, AMD Radeon 860M (9674 - 17243, n=12) | |
| Acer Swift Go 16 AI SFG16-61-R5Y5 | |
| MSI Prestige 16 AI Evo B2HMG | |
| Dell 16 Plus | |
| Acer Aspire 16 A16-51GM-77G2 | |
| Lenovo Yoga Pro 9 16IAH G10 RTX 5060 | |
| LG Gram Pro 16Z90TS-G.AU89G | |
| PCMark 10 / Digital Content Creation | |
| Lenovo Yoga Pro 9 16IAH G10 RTX 5060 | |
| MSI Prestige 16 AI Evo B2HMG | |
| Average of class Multimedia (3651 - 16240, n=57, last 2 years) | |
| Dell 16 Plus | |
| Acer Swift Go 16 AI SFG16-61-R5Y5 | |
| LG Gram Pro 16Z90TS-G.AU89G | |
| Average AMD Ryzen AI 7 350, AMD Radeon 860M (8746 - 10028, n=12) | |
| Acer Aspire 16 A16-51GM-77G2 | |
| CrossMark / Overall | |
| MSI Prestige 16 AI Evo B2HMG | |
| Lenovo Yoga Pro 9 16IAH G10 RTX 5060 | |
| Acer Aspire 16 A16-51GM-77G2 | |
| Average of class Multimedia (866 - 2728, n=68, last 2 years) | |
| Average AMD Ryzen AI 7 350, AMD Radeon 860M (1301 - 2005, n=12) | |
| Acer Swift Go 16 AI SFG16-61-R5Y5 | |
| Dell 16 Plus | |
| LG Gram Pro 16Z90TS-G.AU89G | |
| CrossMark / Productivity | |
| MSI Prestige 16 AI Evo B2HMG | |
| Acer Aspire 16 A16-51GM-77G2 | |
| Lenovo Yoga Pro 9 16IAH G10 RTX 5060 | |
| Average of class Multimedia (913 - 2489, n=68, last 2 years) | |
| Dell 16 Plus | |
| Acer Swift Go 16 AI SFG16-61-R5Y5 | |
| Average AMD Ryzen AI 7 350, AMD Radeon 860M (1199 - 1869, n=12) | |
| LG Gram Pro 16Z90TS-G.AU89G | |
| CrossMark / Creativity | |
| Lenovo Yoga Pro 9 16IAH G10 RTX 5060 | |
| MSI Prestige 16 AI Evo B2HMG | |
| Average of class Multimedia (907 - 3465, n=68, last 2 years) | |
| Average AMD Ryzen AI 7 350, AMD Radeon 860M (1514 - 2236, n=12) | |
| Dell 16 Plus | |
| LG Gram Pro 16Z90TS-G.AU89G | |
| Acer Swift Go 16 AI SFG16-61-R5Y5 | |
| Acer Aspire 16 A16-51GM-77G2 | |
| CrossMark / Responsiveness | |
| MSI Prestige 16 AI Evo B2HMG | |
| Acer Aspire 16 A16-51GM-77G2 | |
| Lenovo Yoga Pro 9 16IAH G10 RTX 5060 | |
| Average of class Multimedia (605 - 2024, n=68, last 2 years) | |
| Acer Swift Go 16 AI SFG16-61-R5Y5 | |
| Average AMD Ryzen AI 7 350, AMD Radeon 860M (1052 - 1784, n=12) | |
| Dell 16 Plus | |
| LG Gram Pro 16Z90TS-G.AU89G | |
| WebXPRT 3 / Overall | |
| MSI Prestige 16 AI Evo B2HMG | |
| Average of class Multimedia (136.4 - 596, n=71, last 2 years) | |
| Acer Swift Go 16 AI SFG16-61-R5Y5 | |
| Lenovo Yoga Pro 9 16IAH G10 RTX 5060 | |
| Acer Aspire 16 A16-51GM-77G2 | |
| Dell 16 Plus | |
| Average AMD Ryzen AI 7 350, AMD Radeon 860M (255 - 328, n=12) | |
| LG Gram Pro 16Z90TS-G.AU89G | |
| WebXPRT 4 / Overall | |
| MSI Prestige 16 AI Evo B2HMG | |
| Lenovo Yoga Pro 9 16IAH G10 RTX 5060 | |
| Average of class Multimedia (167.3 - 402, n=72, last 2 years) | |
| Dell 16 Plus | |
| LG Gram Pro 16Z90TS-G.AU89G | |
| Acer Aspire 16 A16-51GM-77G2 | |
| Acer Swift Go 16 AI SFG16-61-R5Y5 | |
| Average AMD Ryzen AI 7 350, AMD Radeon 860M (199.1 - 275, n=12) | |
| Mozilla Kraken 1.1 / Total | |
| Average AMD Ryzen AI 7 350, AMD Radeon 860M (434 - 702, n=12) | |
| LG Gram Pro 16Z90TS-G.AU89G | |
| Dell 16 Plus | |
| Acer Aspire 16 A16-51GM-77G2 | |
| Average of class Multimedia (228 - 835, n=75, last 2 years) | |
| Lenovo Yoga Pro 9 16IAH G10 RTX 5060 | |
| Acer Swift Go 16 AI SFG16-61-R5Y5 | |
| MSI Prestige 16 AI Evo B2HMG | |
* ... smaller is better
| PCMark 10 Score | 7494 points | |
Help | ||
| AIDA64 / Memory Copy | |
| Lenovo Yoga Pro 9 16IAH G10 RTX 5060 | |
| LG Gram Pro 16Z90TS-G.AU89G | |
| Dell 16 Plus | |
| MSI Prestige 16 AI Evo B2HMG | |
| Acer Swift Go 16 AI SFG16-61-R5Y5 | |
| Average of class Multimedia (21158 - 132135, n=62, last 2 years) | |
| Average AMD Ryzen AI 7 350 (37823 - 106997, n=16) | |
| Acer Aspire 16 A16-51GM-77G2 | |
| AIDA64 / Memory Read | |
| Dell 16 Plus | |
| LG Gram Pro 16Z90TS-G.AU89G | |
| Lenovo Yoga Pro 9 16IAH G10 RTX 5060 | |
| Average of class Multimedia (19699 - 174586, n=62, last 2 years) | |
| MSI Prestige 16 AI Evo B2HMG | |
| Acer Swift Go 16 AI SFG16-61-R5Y5 | |
| Acer Aspire 16 A16-51GM-77G2 | |
| Average AMD Ryzen AI 7 350 (43921 - 63650, n=16) | |
| AIDA64 / Memory Write | |
| Dell 16 Plus | |
| Acer Swift Go 16 AI SFG16-61-R5Y5 | |
| LG Gram Pro 16Z90TS-G.AU89G | |
| Average AMD Ryzen AI 7 350 (42576 - 110817, n=16) | |
| Lenovo Yoga Pro 9 16IAH G10 RTX 5060 | |
| Average of class Multimedia (17733 - 134998, n=62, last 2 years) | |
| MSI Prestige 16 AI Evo B2HMG | |
| Acer Aspire 16 A16-51GM-77G2 | |
| AIDA64 / Memory Latency | |
| MSI Prestige 16 AI Evo B2HMG | |
| Lenovo Yoga Pro 9 16IAH G10 RTX 5060 | |
| Average of class Multimedia (7 - 535, n=61, last 2 years) | |
| Acer Swift Go 16 AI SFG16-61-R5Y5 | |
| Dell 16 Plus | |
| Average AMD Ryzen AI 7 350 (87.7 - 109.8, n=16) | |
| LG Gram Pro 16Z90TS-G.AU89G | |
| Acer Aspire 16 A16-51GM-77G2 | |
* ... smaller is better
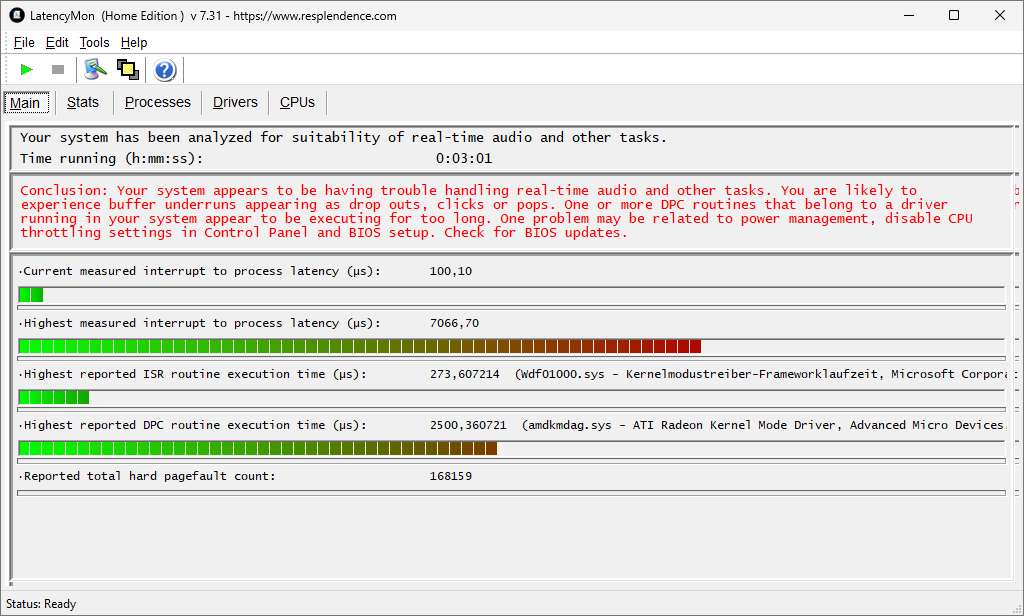
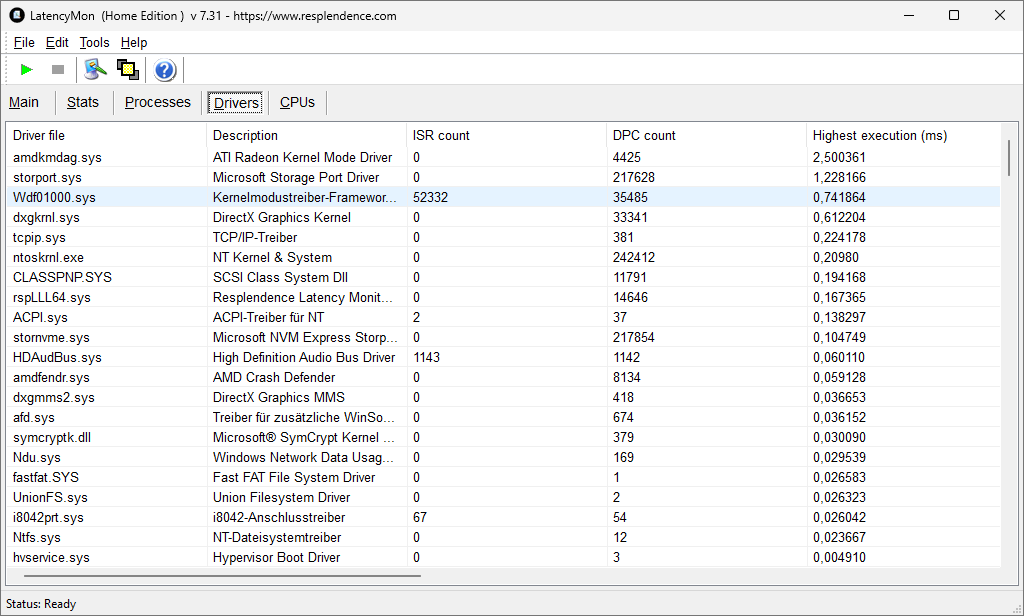
DPC latency
Although the tool LatencyMon indicates potential issues, no significant impairments were observed in practice. Neither during playback of 4K/60Hz content on YouTube nor when operating with demanding audio programs did any interruptions or disturbances occur.
| DPC Latencies / LatencyMon - interrupt to process latency (max), Web, Youtube, Prime95 | |
| Acer Swift Go 16 AI SFG16-61-R5Y5 | |
* ... smaller is better
Storage devices
The mass storage consists of a 1 TB NVMe SSD from Kingston. The transfer rates are decent and in everyday use ensure fast boot times and quick loading processes. However, a weakness is the temperature-dependent performance throttling during prolonged sustained read or write operations. The SSD cannot maintain its high performance under continuous load.

* ... smaller is better
Disk Throttling: DiskSpd Read Loop, Queue Depth 8
GPU performance
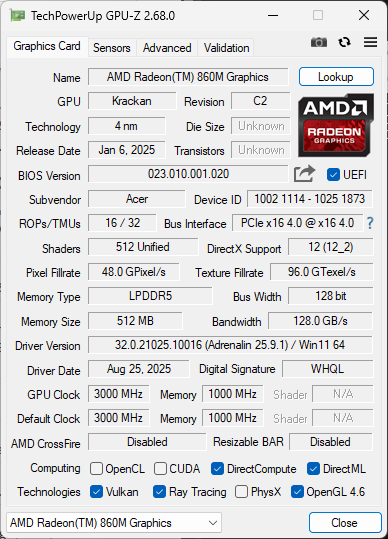
The integrated AMD Radeon 860M (iGPU) is powerful for a mobile solution. To achieve playable frame rates (FPS) in modern games, it's advisable to limit the resolution to Full HD and choose medium quality settings. Higher settings can quickly lead to a significant drop in FPS in current AAA titles, severely affecting game smoothness. For casual gaming and older games, however, the 860M offers solid performance.
| 3DMark Performance rating - Percent | |
| Average of class Multimedia | |
| Acer Swift Go 16 AI SFG16-61-R5Y5 | |
| Average AMD Radeon 860M | |
| 3DMark 11 - 1280x720 Performance GPU | |
| Average of class Multimedia (3765 - 60002, n=63, last 2 years) | |
| Acer Swift Go 16 AI SFG16-61-R5Y5 | |
| Average AMD Radeon 860M (6901 - 12149, n=18) | |
| 3DMark | |
| 1280x720 Cloud Gate Standard Graphics | |
| Average of class Multimedia (16765 - 143501, n=34, last 2 years) | |
| Acer Swift Go 16 AI SFG16-61-R5Y5 | |
| Average AMD Radeon 860M (24614 - 46356, n=9) | |
| 1920x1080 Fire Strike Graphics | |
| Average of class Multimedia (2328 - 48907, n=67, last 2 years) | |
| Acer Swift Go 16 AI SFG16-61-R5Y5 | |
| Average AMD Radeon 860M (4376 - 7935, n=19) | |
| 2560x1440 Time Spy Graphics | |
| Average of class Multimedia (696 - 19403, n=68, last 2 years) | |
| Average AMD Radeon 860M (1656 - 2987, n=19) | |
| Acer Swift Go 16 AI SFG16-61-R5Y5 | |
| 3DMark 11 Performance | 11710 points | |
| 3DMark Ice Storm Standard Score | 199679 points | |
| 3DMark Cloud Gate Standard Score | 33922 points | |
| 3DMark Fire Strike Score | 6796 points | |
| 3DMark Time Spy Score | 2109 points | |
| 3DMark Steel Nomad Score | 492 points | |
| 3DMark Steel Nomad Light Score | 2001 points | |
Help | ||
| Blender - v3.3 Classroom CPU | |
| Average of class Multimedia (134.5 - 1042, n=69, last 2 years) | |
| Average AMD Radeon 860M (280 - 427, n=20) | |
| Acer Swift Go 16 AI SFG16-61-R5Y5 | |
| Acer Swift Go 16 AI SFG16-61-R5Y5 | |
* ... smaller is better
Cyberpunk 2077 ultra FPS Chart
| low | med. | high | ultra | QHD | |
|---|---|---|---|---|---|
| GTA V (2015) | 171.8 | 58.1 | 22 | ||
| Dota 2 Reborn (2015) | 153.3 | 130.1 | 87.4 | 77.1 | |
| Final Fantasy XV Benchmark (2018) | 76.7 | 37.1 | 26.3 | 18.4 | |
| X-Plane 11.11 (2018) | 69.5 | 55.6 | 44.5 | ||
| Strange Brigade (2018) | 150.1 | 56.5 | 47.8 | 41.4 | |
| Baldur's Gate 3 (2023) | 18 | ||||
| Cyberpunk 2077 (2023) | 36.1 | 18 | 16.7 | ||
| F1 25 (2025) | 65.4 | 54.2 | 38 | 30.7 |
Emissions & Energy
System noise
A robust set of eardrums is necessary for those who want to get the most out of this device. While the Acer Swift Go remains almost inaudible during normal operation, it becomes quite loud in our stress test with maximal cooling. We measured up to 53 dB(A) at a distance of 15 cm.
Noise level
| Idle |
| 25.1 / 25.1 / 25.1 dB(A) |
| Load |
| / 52.3 dB(A) |
 | ||
30 dB silent 40 dB(A) audible 50 dB(A) loud |
||
min: | ||
| Acer Swift Go 16 AI SFG16-61-R5Y5 Radeon 860M, Ryzen AI 7 350, Kingston OM8PGP41024Q-A0 | Lenovo Yoga Pro 9 16IAH G10 RTX 5060 GeForce RTX 5060 Laptop, Ultra 7 255H, WD PC SN7100S SDFPMSL-1T00-1101 | Dell 16 Plus Arc 140V, Core Ultra 7 256V, Samsung BM9C1 1024GB | LG Gram Pro 16Z90TS-G.AU89G Arc 140V, Core Ultra 7 256V, Samsung PM9A1a MZVL21T0HDLU | MSI Prestige 16 AI Evo B2HMG Arc 140T, Ultra 9 285H, Micron 2500 1TB MTFDKBA1T0QGN | Acer Aspire 16 A16-51GM-77G2 GeForce RTX 2050 Mobile, Core 7 150U, WD PC SN740 SDDQNQD-1T00-1014 | |
|---|---|---|---|---|---|---|
| Noise | -1% | 9% | 4% | 9% | 2% | |
| off / environment * (dB) | 25 | 25.2 -1% | 23.4 6% | 25.2 -1% | 23.6 6% | 23 8% |
| Idle Minimum * (dB) | 25.1 | 25.2 -0% | 23.5 6% | 25.2 -0% | 23.6 6% | 23 8% |
| Idle Average * (dB) | 25.1 | 25.2 -0% | 23.5 6% | 25.2 -0% | 23.6 6% | 23 8% |
| Idle Maximum * (dB) | 25.1 | 26.9 -7% | 23.5 6% | 27.7 -10% | 26.2 -4% | 31 -24% |
| Cyberpunk 2077 ultra * (dB) | 52.4 | 50.2 4% | 42.6 19% | 42.6 19% | 42.1 20% | 50 5% |
| Load Maximum * (dB) | 52.3 | 52.7 -1% | 46.9 10% | 42.7 18% | 42.1 20% | 50 4% |
| Load Average * (dB) | 44.5 | 31.9 | 37.1 | 46.57 |
* ... smaller is better
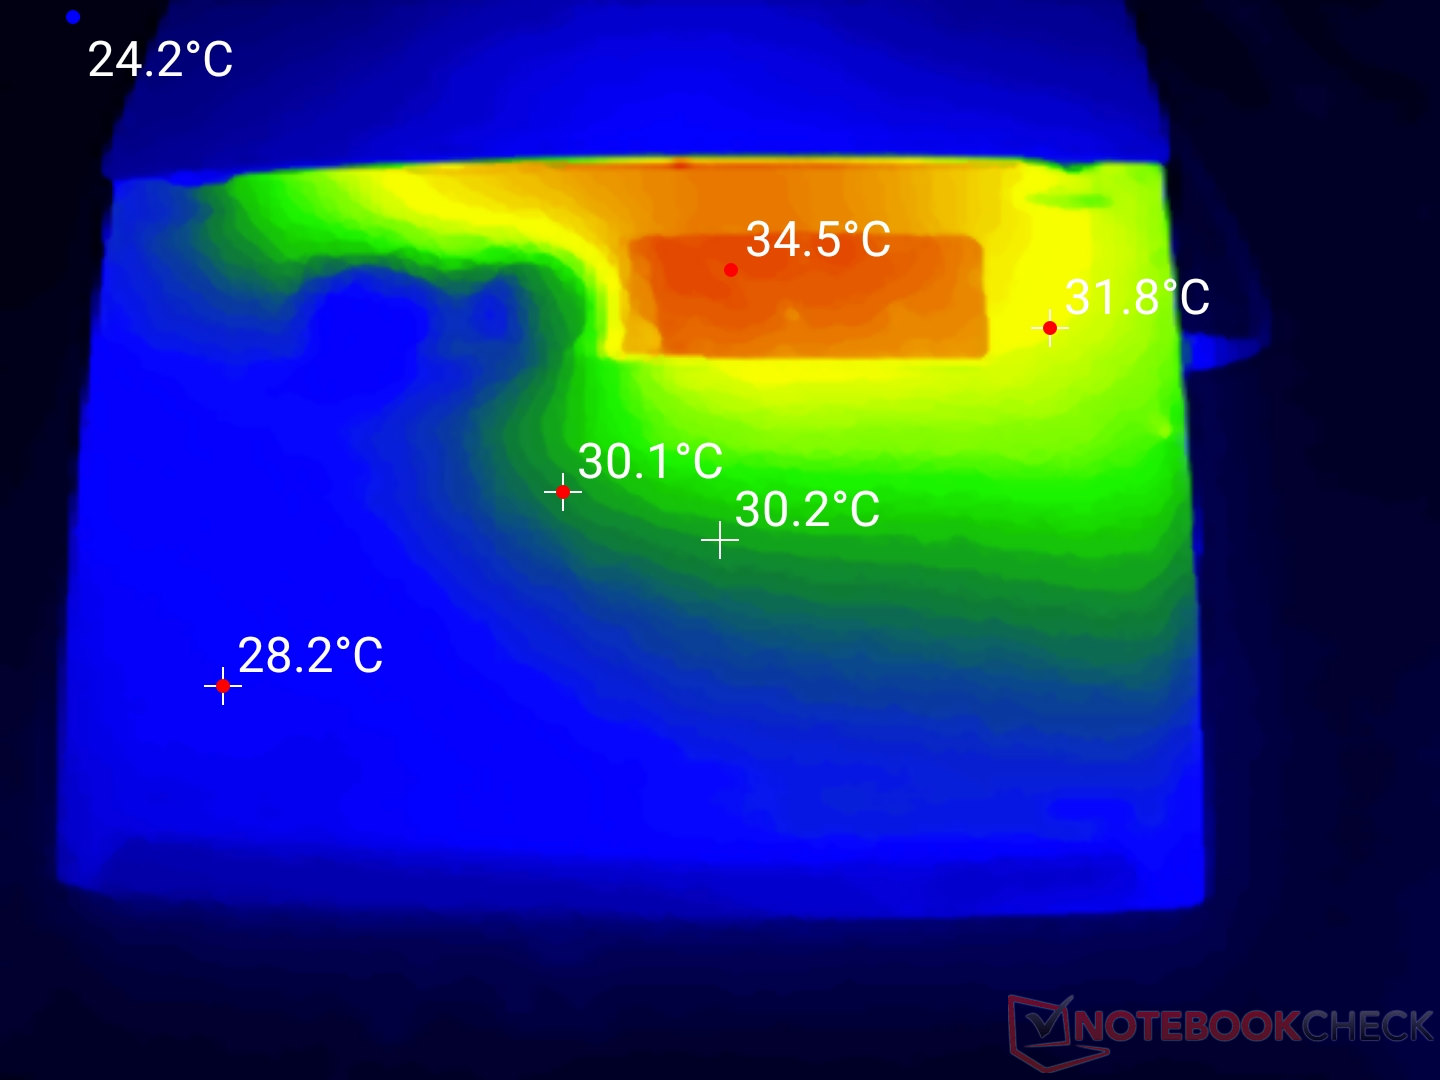
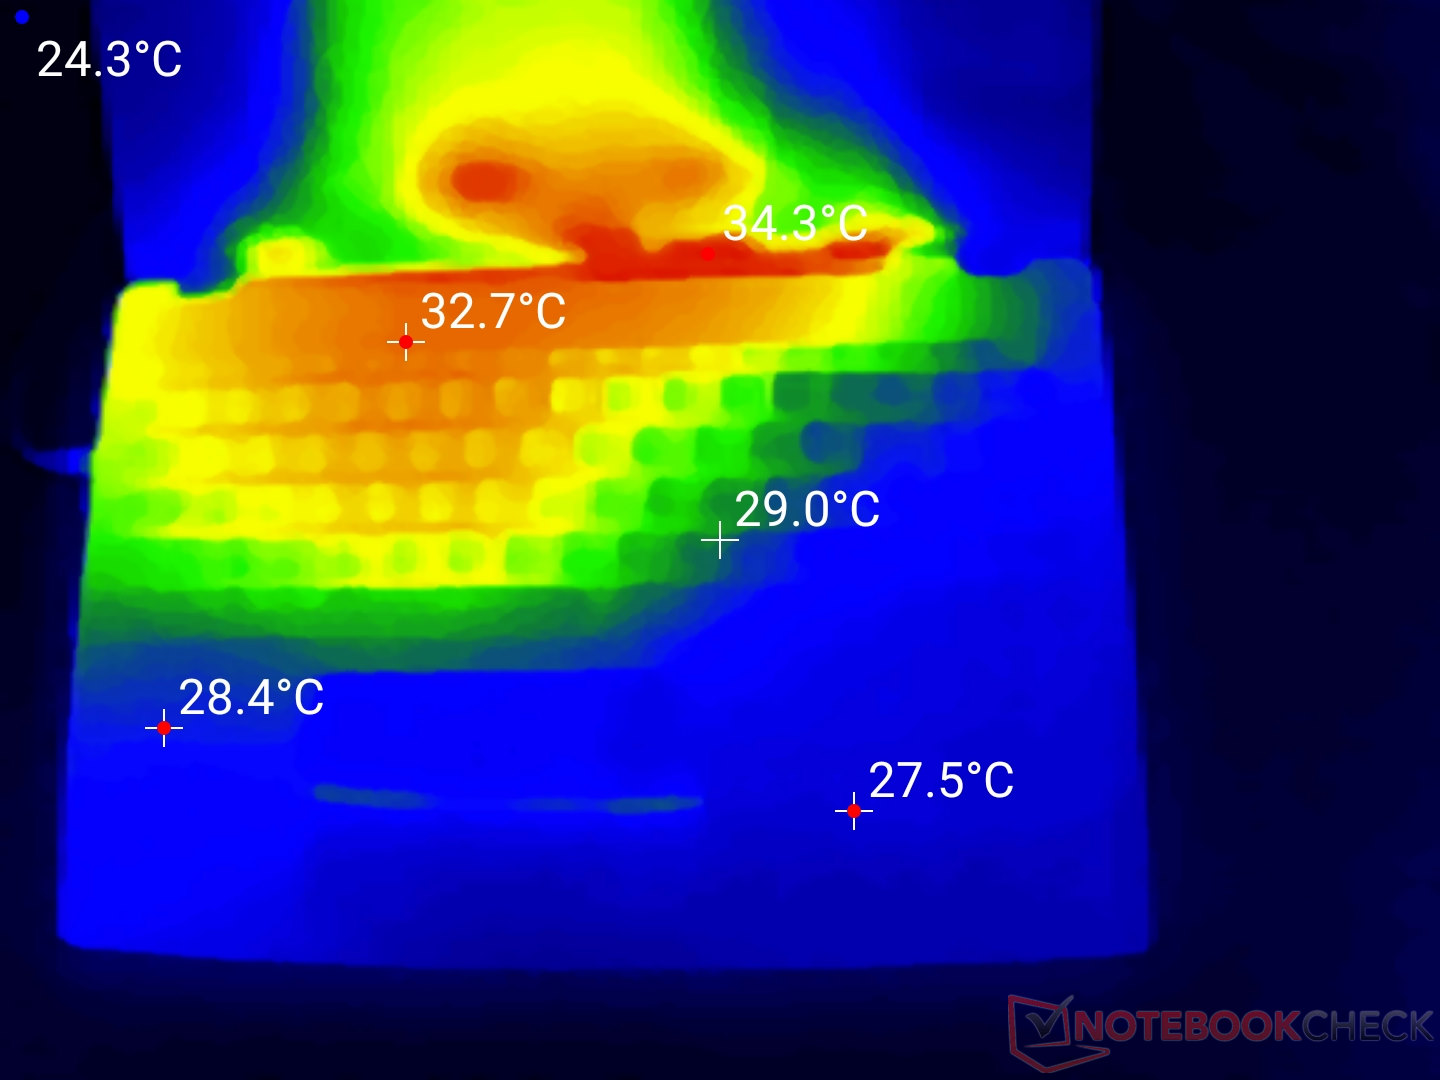
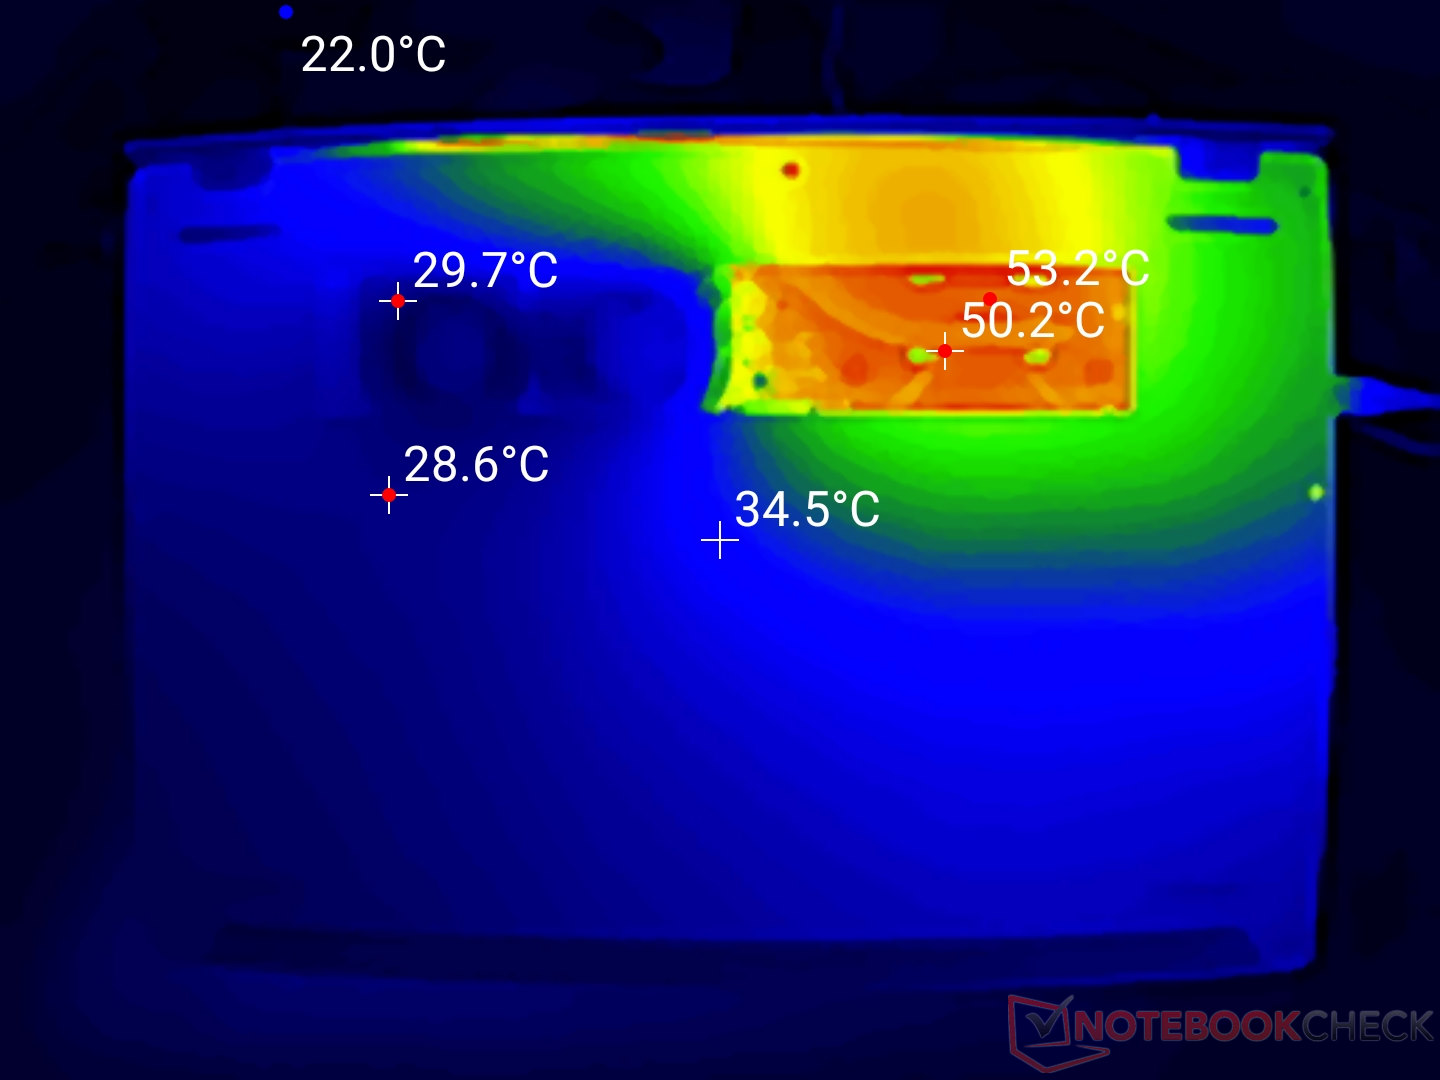
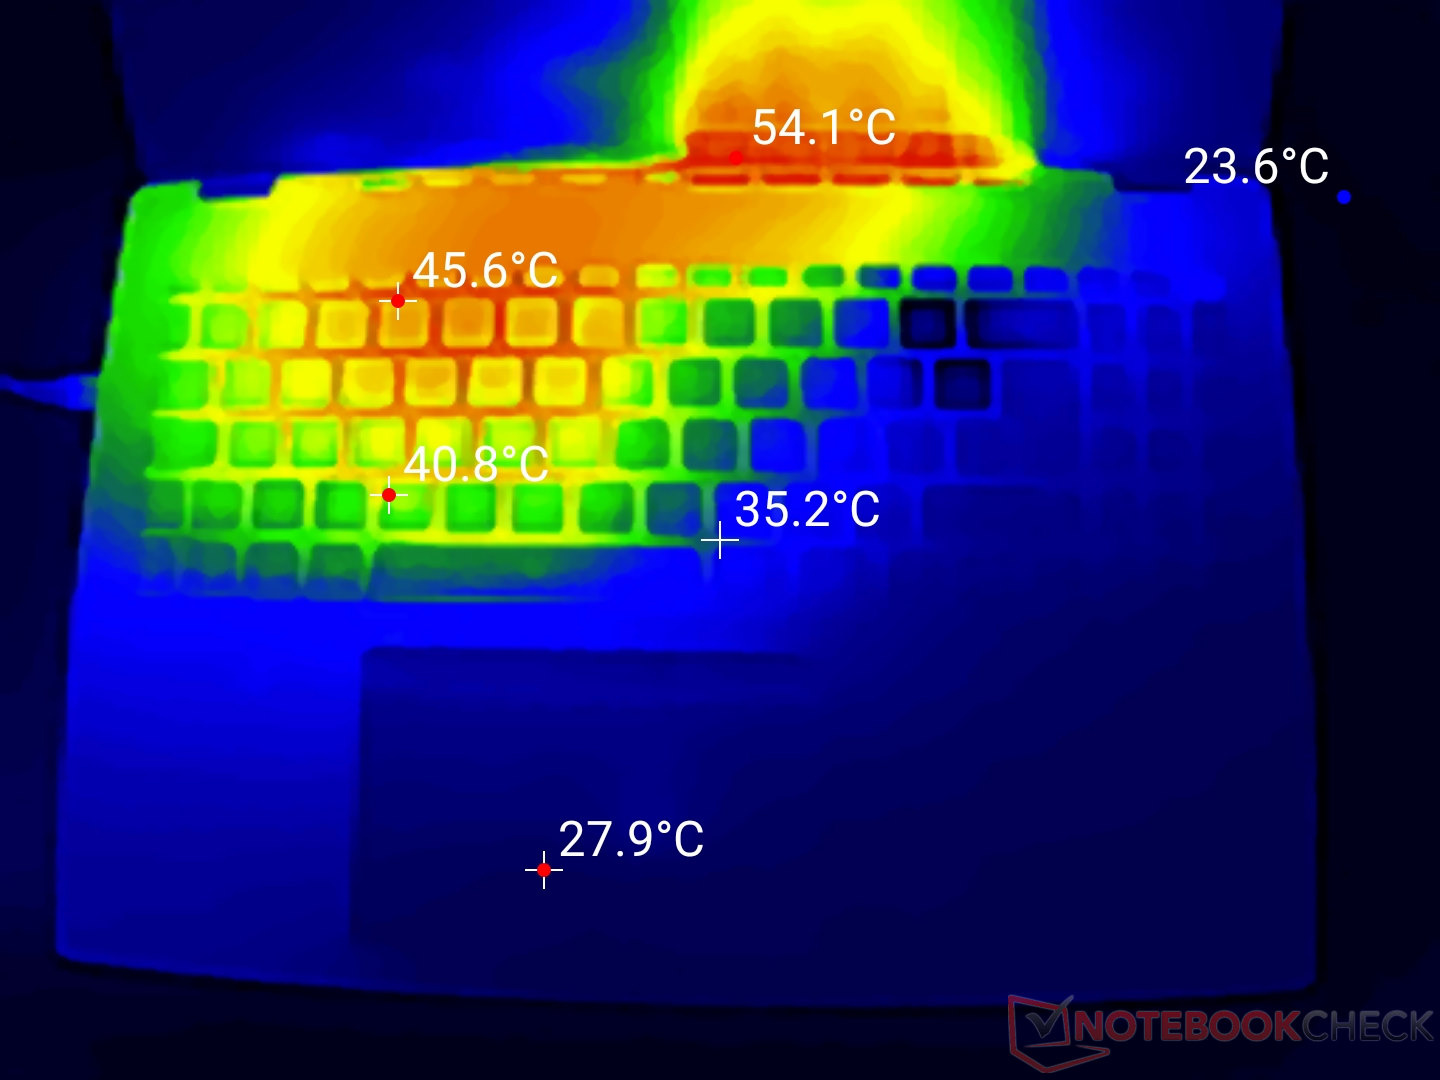
Temperatures
The surface temperatures of the Swift Go are mostly manageable for users. Keys, hand rest areas, and touchpad remain at comfortable temperatures even during stress tests. We're more concerned about the hot air blowing onto the OLED panel, which measures over 50 °C on the lower edge of the display. At such high temperatures, OLED panels could lose a part of their lifespan.
(±) The maximum temperature on the upper side is 45 °C / 113 F, compared to the average of 36.8 °C / 98 F, ranging from 21 to 71 °C for the class Multimedia.
(+) The bottom heats up to a maximum of 38 °C / 100 F, compared to the average of 39.1 °C / 102 F
(+) In idle usage, the average temperature for the upper side is 28.9 °C / 84 F, compared to the device average of 31.3 °C / 88 F.
(+) The palmrests and touchpad are cooler than skin temperature with a maximum of 27 °C / 80.6 F and are therefore cool to the touch.
(±) The average temperature of the palmrest area of similar devices was 28.7 °C / 83.7 F (+1.7 °C / 3.1 F).
| Acer Swift Go 16 AI SFG16-61-R5Y5 AMD Ryzen AI 7 350, AMD Radeon 860M | Lenovo Yoga Pro 9 16IAH G10 RTX 5060 Intel Core Ultra 7 255H, NVIDIA GeForce RTX 5060 Laptop | Dell 16 Plus Intel Core Ultra 7 256V, Intel Arc Graphics 140V | LG Gram Pro 16Z90TS-G.AU89G Intel Core Ultra 7 256V, Intel Arc Graphics 140V | MSI Prestige 16 AI Evo B2HMG Intel Core Ultra 9 285H, Intel Arc Graphics 140T | Acer Aspire 16 A16-51GM-77G2 Intel Core 7 150U, NVIDIA GeForce RTX 2050 Mobile | |
|---|---|---|---|---|---|---|
| Heat | 2% | 8% | 6% | 1% | -7% | |
| Maximum Upper Side * (°C) | 45 | 42.9 5% | 40.6 10% | 40.5 10% | 48.1 -7% | 47 -4% |
| Maximum Bottom * (°C) | 38 | 47.4 -25% | 40 -5% | 45 -18% | 51.6 -36% | 50 -32% |
| Idle Upper Side * (°C) | 32 | 27.6 14% | 29.2 9% | 27.1 15% | 25.9 19% | 31 3% |
| Idle Bottom * (°C) | 34 | 29 15% | 28.6 16% | 28.8 15% | 25.2 26% | 32 6% |
* ... smaller is better
Speakers
The speakers of the Swift Go AI reach approximately 83 dB(A) and provide a clear sound for speech and podcasts. Their bass response is rather weak, and their treble response is slightly overdone. Therefore, their sound dynamics are not ideal for movies or music.
Acer Swift Go 16 AI SFG16-61-R5Y5 audio analysis
(+) | speakers can play relatively loud (83.7 dB)
Bass 100 - 315 Hz
(-) | nearly no bass - on average 28% lower than median
(±) | linearity of bass is average (7.9% delta to prev. frequency)
Mids 400 - 2000 Hz
(±) | higher mids - on average 5.1% higher than median
(±) | linearity of mids is average (7% delta to prev. frequency)
Highs 2 - 16 kHz
(+) | balanced highs - only 3.2% away from median
(+) | highs are linear (6.2% delta to prev. frequency)
Overall 100 - 16.000 Hz
(±) | linearity of overall sound is average (19.8% difference to median)
Compared to same class
» 65% of all tested devices in this class were better, 7% similar, 28% worse
» The best had a delta of 5%, average was 17%, worst was 45%
Compared to all devices tested
» 50% of all tested devices were better, 7% similar, 43% worse
» The best had a delta of 4%, average was 24%, worst was 134%
Apple MacBook Pro 16 2021 M1 Pro audio analysis
(+) | speakers can play relatively loud (84.7 dB)
Bass 100 - 315 Hz
(+) | good bass - only 3.8% away from median
(+) | bass is linear (5.2% delta to prev. frequency)
Mids 400 - 2000 Hz
(+) | balanced mids - only 1.3% away from median
(+) | mids are linear (2.1% delta to prev. frequency)
Highs 2 - 16 kHz
(+) | balanced highs - only 1.9% away from median
(+) | highs are linear (2.7% delta to prev. frequency)
Overall 100 - 16.000 Hz
(+) | overall sound is linear (4.6% difference to median)
Compared to same class
» 0% of all tested devices in this class were better, 0% similar, 100% worse
» The best had a delta of 5%, average was 17%, worst was 45%
Compared to all devices tested
» 0% of all tested devices were better, 0% similar, 100% worse
» The best had a delta of 4%, average was 24%, worst was 134%
Power consumption
The included 100-watt power supply is more than sufficient here – the measured maximum consumption reaches briefly up to 98 watts. After the short boost phase, there's enough power available for the laptop even during stress tests to charge its battery.
In standby mode, the system consumes 6-9 watts, which is typical for many IPS panel laptops. Thus, considering an OLED display, the Swift Go AI can boast a comparatively low power consumption.
| Off / Standby | |
| Idle | |
Key:
min: | |
Power consumption Cyberpunk / stress test
Power consumption external Monitor
Battery life
The battery has a capacity of 75 Wh and is average for a laptop of this size. With practical web surfing on WiFi, it lasts around 16 hours. This should be more than enough for a workday without worrying about carrying a power supply.
| Acer Swift Go 16 AI SFG16-61-R5Y5 Ryzen AI 7 350, Radeon 860M, 75 Wh | Lenovo Yoga Pro 9 16IAH G10 RTX 5060 Ultra 7 255H, GeForce RTX 5060 Laptop, 84 Wh | Dell 16 Plus Core Ultra 7 256V, Arc 140V, 64 Wh | LG Gram Pro 16Z90TS-G.AU89G Core Ultra 7 256V, Arc 140V, 77 Wh | MSI Prestige 16 AI Evo B2HMG Ultra 9 285H, Arc 140T, 99.9 Wh | Acer Aspire 16 A16-51GM-77G2 Core 7 150U, GeForce RTX 2050 Mobile, 48.5 Wh | Average of class Multimedia | |
|---|---|---|---|---|---|---|---|
| Battery runtime | -41% | -16% | 17% | -2% | -40% | -29% | |
| WiFi v1.3 (h) | 16.8 | 9.9 -41% | 14.1 -16% | 19.6 17% | 16.5 -2% | 10.1 -40% | 12 ? -29% |
| H.264 (h) | 20.8 | 8.3 | 16.3 ? | ||||
| Load (h) | 2.4 | 2.2 | 1.672 ? |
Notebookcheck rating
Acer Swift Go 16 AI SFG16-61-R5Y5
- 11/25/2025 v8
Marc Herter
 Total Sustainability Score:
 Mögliche Alternativen im Vergleich
Image | Model / Review | Price | Weight | Height | Display |
|---|---|---|---|---|---|
1. 81.1%  | Acer Swift Go 16 AI SFG16-61-R5Y5 AMD Ryzen AI 7 350 ⎘ AMD Radeon 860M ⎘ 16 GB Memory, 1024 GB SSD | Amazon: List Price: 1299€ | 1.5 kg | 17 mm | 16.00" 2880x1800 151 PPI OLED |
2. 89.1%  | Lenovo Yoga Pro 9 16IAH G10 RTX 5060 Intel Core Ultra 7 255H ⎘ NVIDIA GeForce RTX 5060 Laptop ⎘ 32 GB Memory, 1024 GB SSD | Amazon: List Price: 2199€ | 1.9 kg | 17.9 mm | 16.00" 2880x1800 212 PPI OLED |
3. 81.8%  | Dell 16 Plus Intel Core Ultra 7 256V ⎘ Intel Arc Graphics 140V ⎘ 16 GB Memory, 1024 GB SSD | Amazon: List Price: 1150 USD | 1.8 kg | 16.99 mm | 16.00" 2560x1600 189 PPI IPS |
4. 83.9%  | LG Gram Pro 16Z90TS-G.AU89G Intel Core Ultra 7 256V ⎘ Intel Arc Graphics 140V ⎘ 16 GB Memory, 1024 GB SSD | Amazon: List Price: 2050€ | 1.2 kg | 13 mm | 16.00" 2560x1600 189 PPI IPS |
5. 82.8%  | MSI Prestige 16 AI Evo B2HMG Intel Core Ultra 9 285H ⎘ Intel Arc Graphics 140T ⎘ 32 GB Memory, 1024 GB SSD | Amazon: 1. $1,479.00 MSI Prestige 16 AI+ Evo 16" ... 2. $961.85 msi Prestige 16 EVO 16" QHD+... 3. $1,399.51 MSI Prestige 14 AI+ EVO PRE1... | 1.6 kg | 18.95 mm | 16.00" 2560x1600 189 PPI IPS |
6. 79.1%  | Acer Aspire 16 A16-51GM-77G2 Intel Core 7 150U ⎘ NVIDIA GeForce RTX 2050 Mobile ⎘ 16 GB Memory, 1024 GB SSD | Amazon: List Price: 929 Euro | 1.9 kg | 21 mm | 16.00" 1920x1200 142 PPI IPS |
7. 87.9%  | Dell 16 Premium DA16250 Intel Core Ultra 7 255H ⎘ NVIDIA GeForce RTX 5070 Laptop ⎘ 32 GB Memory, 1024 GB SSD | Amazon: List Price: 3300 USD | 2.3 kg | 18.7 mm | 16.30" 3840x2400 278 PPI OLED |
8. 80.8%  | Lenovo IdeaPad Slim 5 16AKP10 AMD Ryzen AI 5 330 ⎘ AMD Radeon 820M ⎘ 16 GB Memory, 512 GB SSD | Amazon: List Price: 700 EUR | 1.9 kg | 18.4 mm | 16.00" 1920x1200 142 PPI IPS |
Transparency
The selection of devices to be reviewed is made by our editorial team. The test sample was provided to the author as a loan by the manufacturer or retailer for the purpose of this review. The lender had no influence on this review, nor did the manufacturer receive a copy of this review before publication. There was no obligation to publish this review. As an independent media company, Notebookcheck is not subjected to the authority of manufacturers, retailers or publishers.
This is how Notebookcheck is testing
Every year, Notebookcheck independently reviews hundreds of laptops and smartphones using standardized procedures to ensure that all results are comparable. We have continuously developed our test methods for around 20 years and set industry standards in the process. In our test labs, high-quality measuring equipment is utilized by experienced technicians and editors. These tests involve a multi-stage validation process. Our complex rating system is based on hundreds of well-founded measurements and benchmarks, which maintains objectivity. Further information on our test methods can be found here.
