MSI Prestige 16 AI Evo review - The multimedia laptop with a speedy Arrow Lake CPU and impressive runtimes
Debut for the Core Ultra 9 285H.
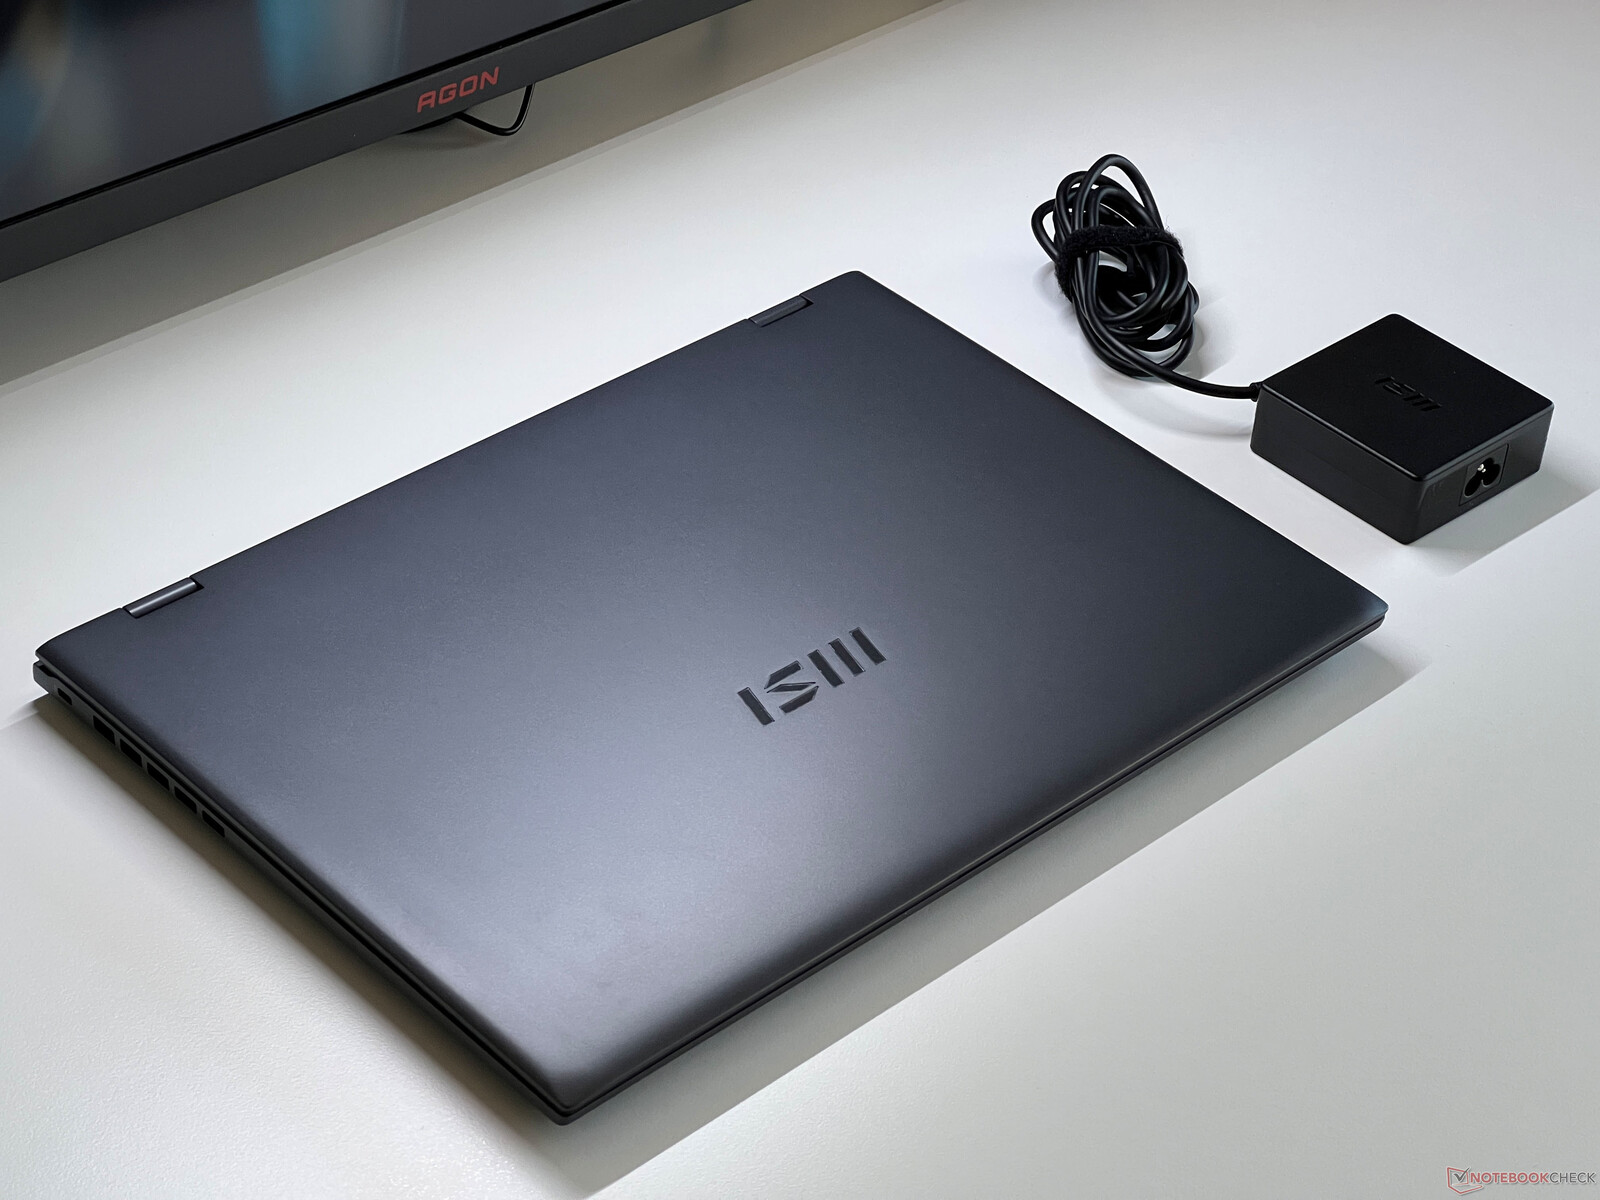
MSI's Prestige 16 AI Evo is a slim and lightweight 16-inch laptop powered by Intel's brand-new Arrow Lake processor, the Core Ultra 9 285H. In addition, its 99-Wh battery ensures extremely good runtimes.Andreas Osthoff, 👁 Andreas Osthoff (translated by Daisy Dickson) Published 🇩🇪 🇫🇷 ...
Verdict - The MSI Prestige 16 Evo has a lot of potential, but weaknesses in its implementation
The MSI Prestige 16 AI Evo is a 16-inch multimedia laptop with a high-quality yet lightweight metal case, comfortable input devices and very long battery life. The new Arrow-Lake-generation Intel Core Ultra 9 285H delivers around 20% more performance than the old Meteor Lake chips, but its problems with high power limits remain. This is also noticeable in its cooling, as MSI has only decided to install a single fan. This is enough for the more frugal Lunar Lake configurations, but the Arrow Lake model would benefit massively from more powerful cooling. MSI has missed a very good opportunity to create a quiet multimedia laptop.
Its display offers decent quality, but its low frequency of 60 Hz, highly reflective surface and slow response times are all disadvantages. We don't yet know exactly which panel the Prestige will be launched with here in Germany, where this test was carried out; the Lunar Lake version, for example, is sold with a 4K IPS panel and there is also a 4K OLED version—but the frequency is always 60 Hz.
In addition, the distribution of its ports proved to be less than ideal during our test, as all USB ports are located on the back of the device, which is simply impractical. Further disadvantages include its soldered-on RAM, 1080p webcam (the identical Lunar Lake model already comes with a 5 MP sensor) and its 100-watt power supply unit, which isn't sufficient to cover the processor's power requirements during peak loads. All-in-all, the Prestige 16 AI Evo has the potential to be an amazing multimedia laptop, but some unnecessary design decisions prevent this from being the case.
Pros
Cons
Price and availability
The MSI Prestige 16 AI with the new Arrow Lake processor is not yet available in stores.
Possible alternatives compared
Image | Model / Review | Price | Weight | Height | Display |
|---|---|---|---|---|---|
1. 82.8%  | MSI Prestige 16 AI Evo B2HMG Intel Core Ultra 9 285H ⎘ Intel Arc Graphics 140T ⎘ 32 GB Memory, 1024 GB SSD | Amazon: 1. $1,479.00 MSI Prestige 16 AI+ Evo 16" ... 2. $1,495.36 msi Prestige 16 AI Evo Lapto... 3. $1,149.49 msi Prestige 13 AI Evo Lapto... | 1.6 kg | 18.95 mm | 16.00" 2560x1600 189 PPI IPS |
2. 86.6%  | Lenovo ThinkBook 16 G7+ AMD AMD Ryzen AI 9 365 ⎘ AMD Radeon 880M ⎘ 32 GB Memory, 1024 GB SSD | Amazon: 1. $1,199.99 Lenovo ThinkBook 16 G7 Busin... 2. $999.95 Lenovo ThinkBook 16 G7 Busin... 3. $1,199.95 Lenovo ThinkBook 16 G7 Busin... List Price: 1399€ | 1.9 kg | 16.9 mm | 16.00" 3200x2000 236 PPI IPS |
3. 81.9%  | MSI Prestige A16 AI+ A3HMG-036 AMD Ryzen AI 9 365 ⎘ AMD Radeon 880M ⎘ 32 GB Memory, 1024 GB SSD | Amazon: List Price: 1599 Euro | 2 kg | 17.35 mm | 16.00" 2560x1600 189 PPI IPS |
4. 93%  | Apple MacBook Pro 16 2024 M4 Pro Apple M4 Pro 14-Core ⎘ Apple M4 Pro 20-Core GPU ⎘ 48 GB Memory, 2048 GB SSD | Amazon: List Price: 4219€ | 2.1 kg | 16.8 mm | 16.20" 3456x2234 254 PPI Mini-LED |
5. 84.7%  | Asus Zenbook S 16 UM5606-RK333W AMD Ryzen AI 9 HX 370 ⎘ AMD Radeon 890M ⎘ 32 GB Memory, 1024 GB SSD | Amazon: List Price: 2100€ | 1.5 kg | 12.9 mm | 16.00" 2880x1800 212 PPI OLED |
6. 88.9% v7 (old)  | Samsung Galaxy Book4 Pro 16 Intel Core Ultra 7 155H ⎘ Intel Arc 8-Core iGPU ⎘ 16 GB Memory, 512 GB SSD | Amazon: List Price: 1999€ | 1.5 kg | 12.5 mm | 16.00" 2880x1800 212 PPI OLED |
Table of Contents
- Verdict - The MSI Prestige 16 Evo has a lot of potential, but weaknesses in its implementation
- Specifications
- Case - Magnesium-aluminum alloy
- Connectivity - Thunderbolt & Wi-Fi 7
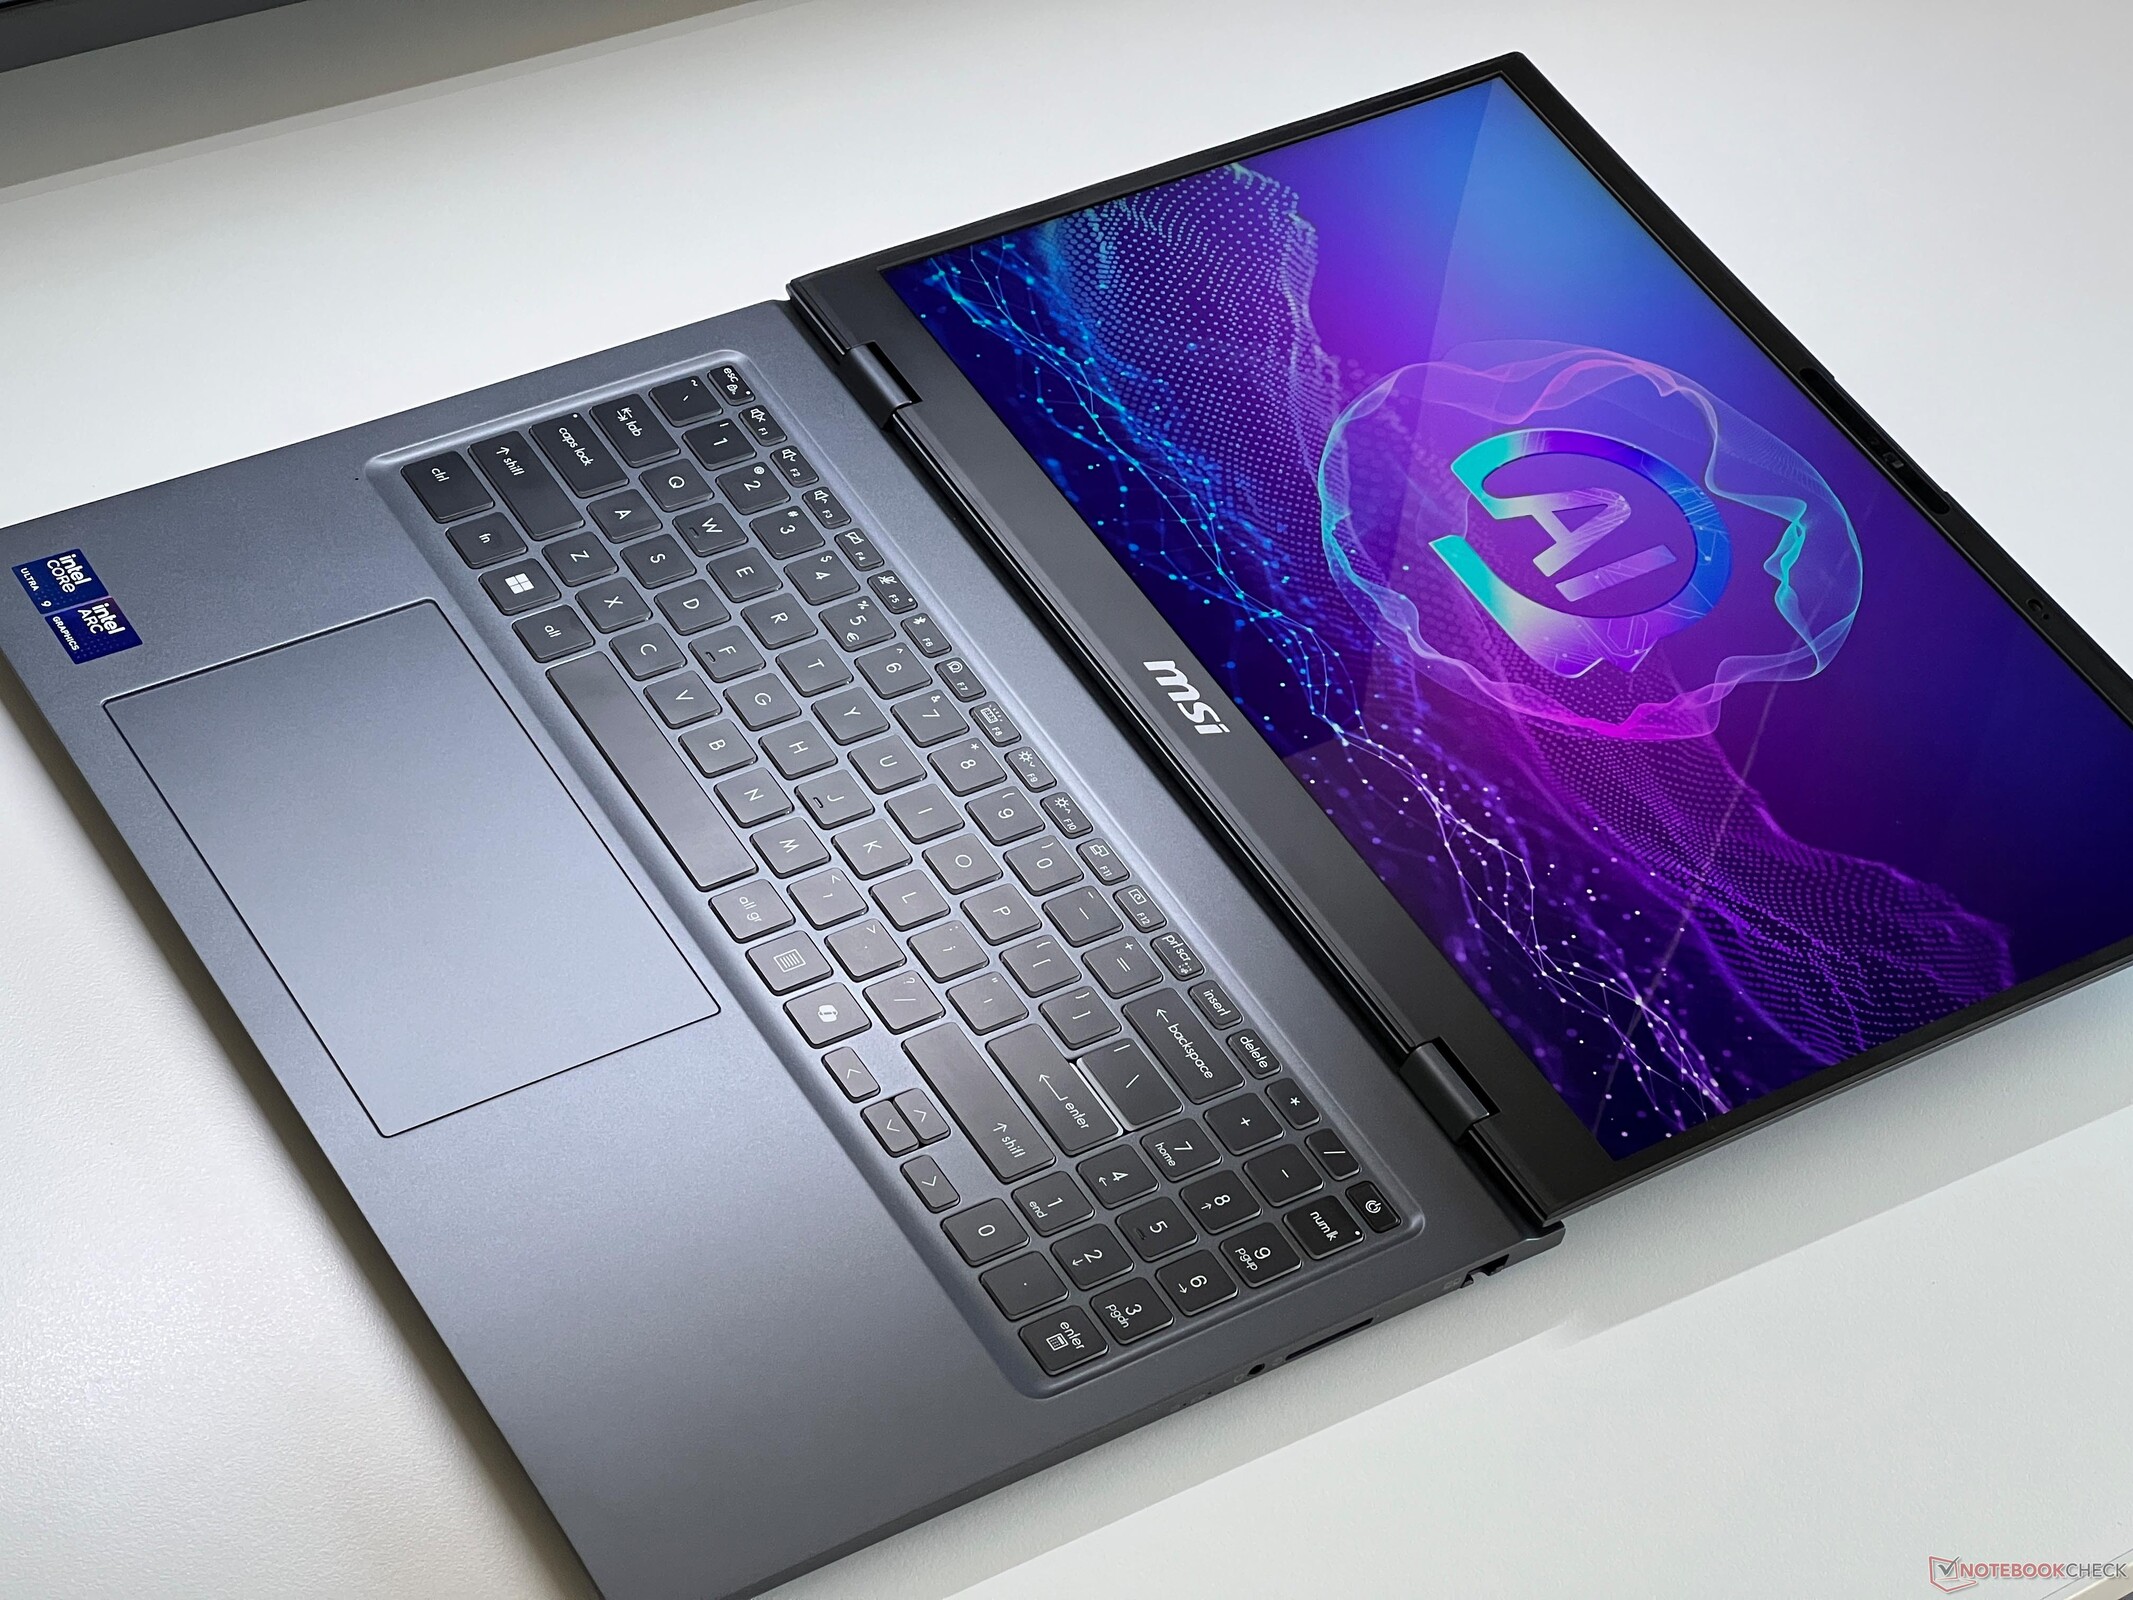
- Input devices - Comfortable keyboard
- Display - WQHD IPS at 60 Hz
- Performance - Arrow Lake-H at 115 watts
- Emissions - The MSI Prestige with only one fan
- Power management - Impressive battery life
- Notebookcheck total rating
The MSI Prestige 16 AI Evo is a slim and lightweight 16-inch multimedia laptop with a magnesium case and the brand new Arrow Lake mobile processor, the Intel Core Ultra 9 285H. Our test device has an IPS display with a resolution of 2,560 x 1,600 pixels. The Arrow Lake model is not yet available in stores; only the identical Lunar Lake model with a 4K IPS display is available for the time being. We are currently assuming a price of just over $2,000.
Specifications
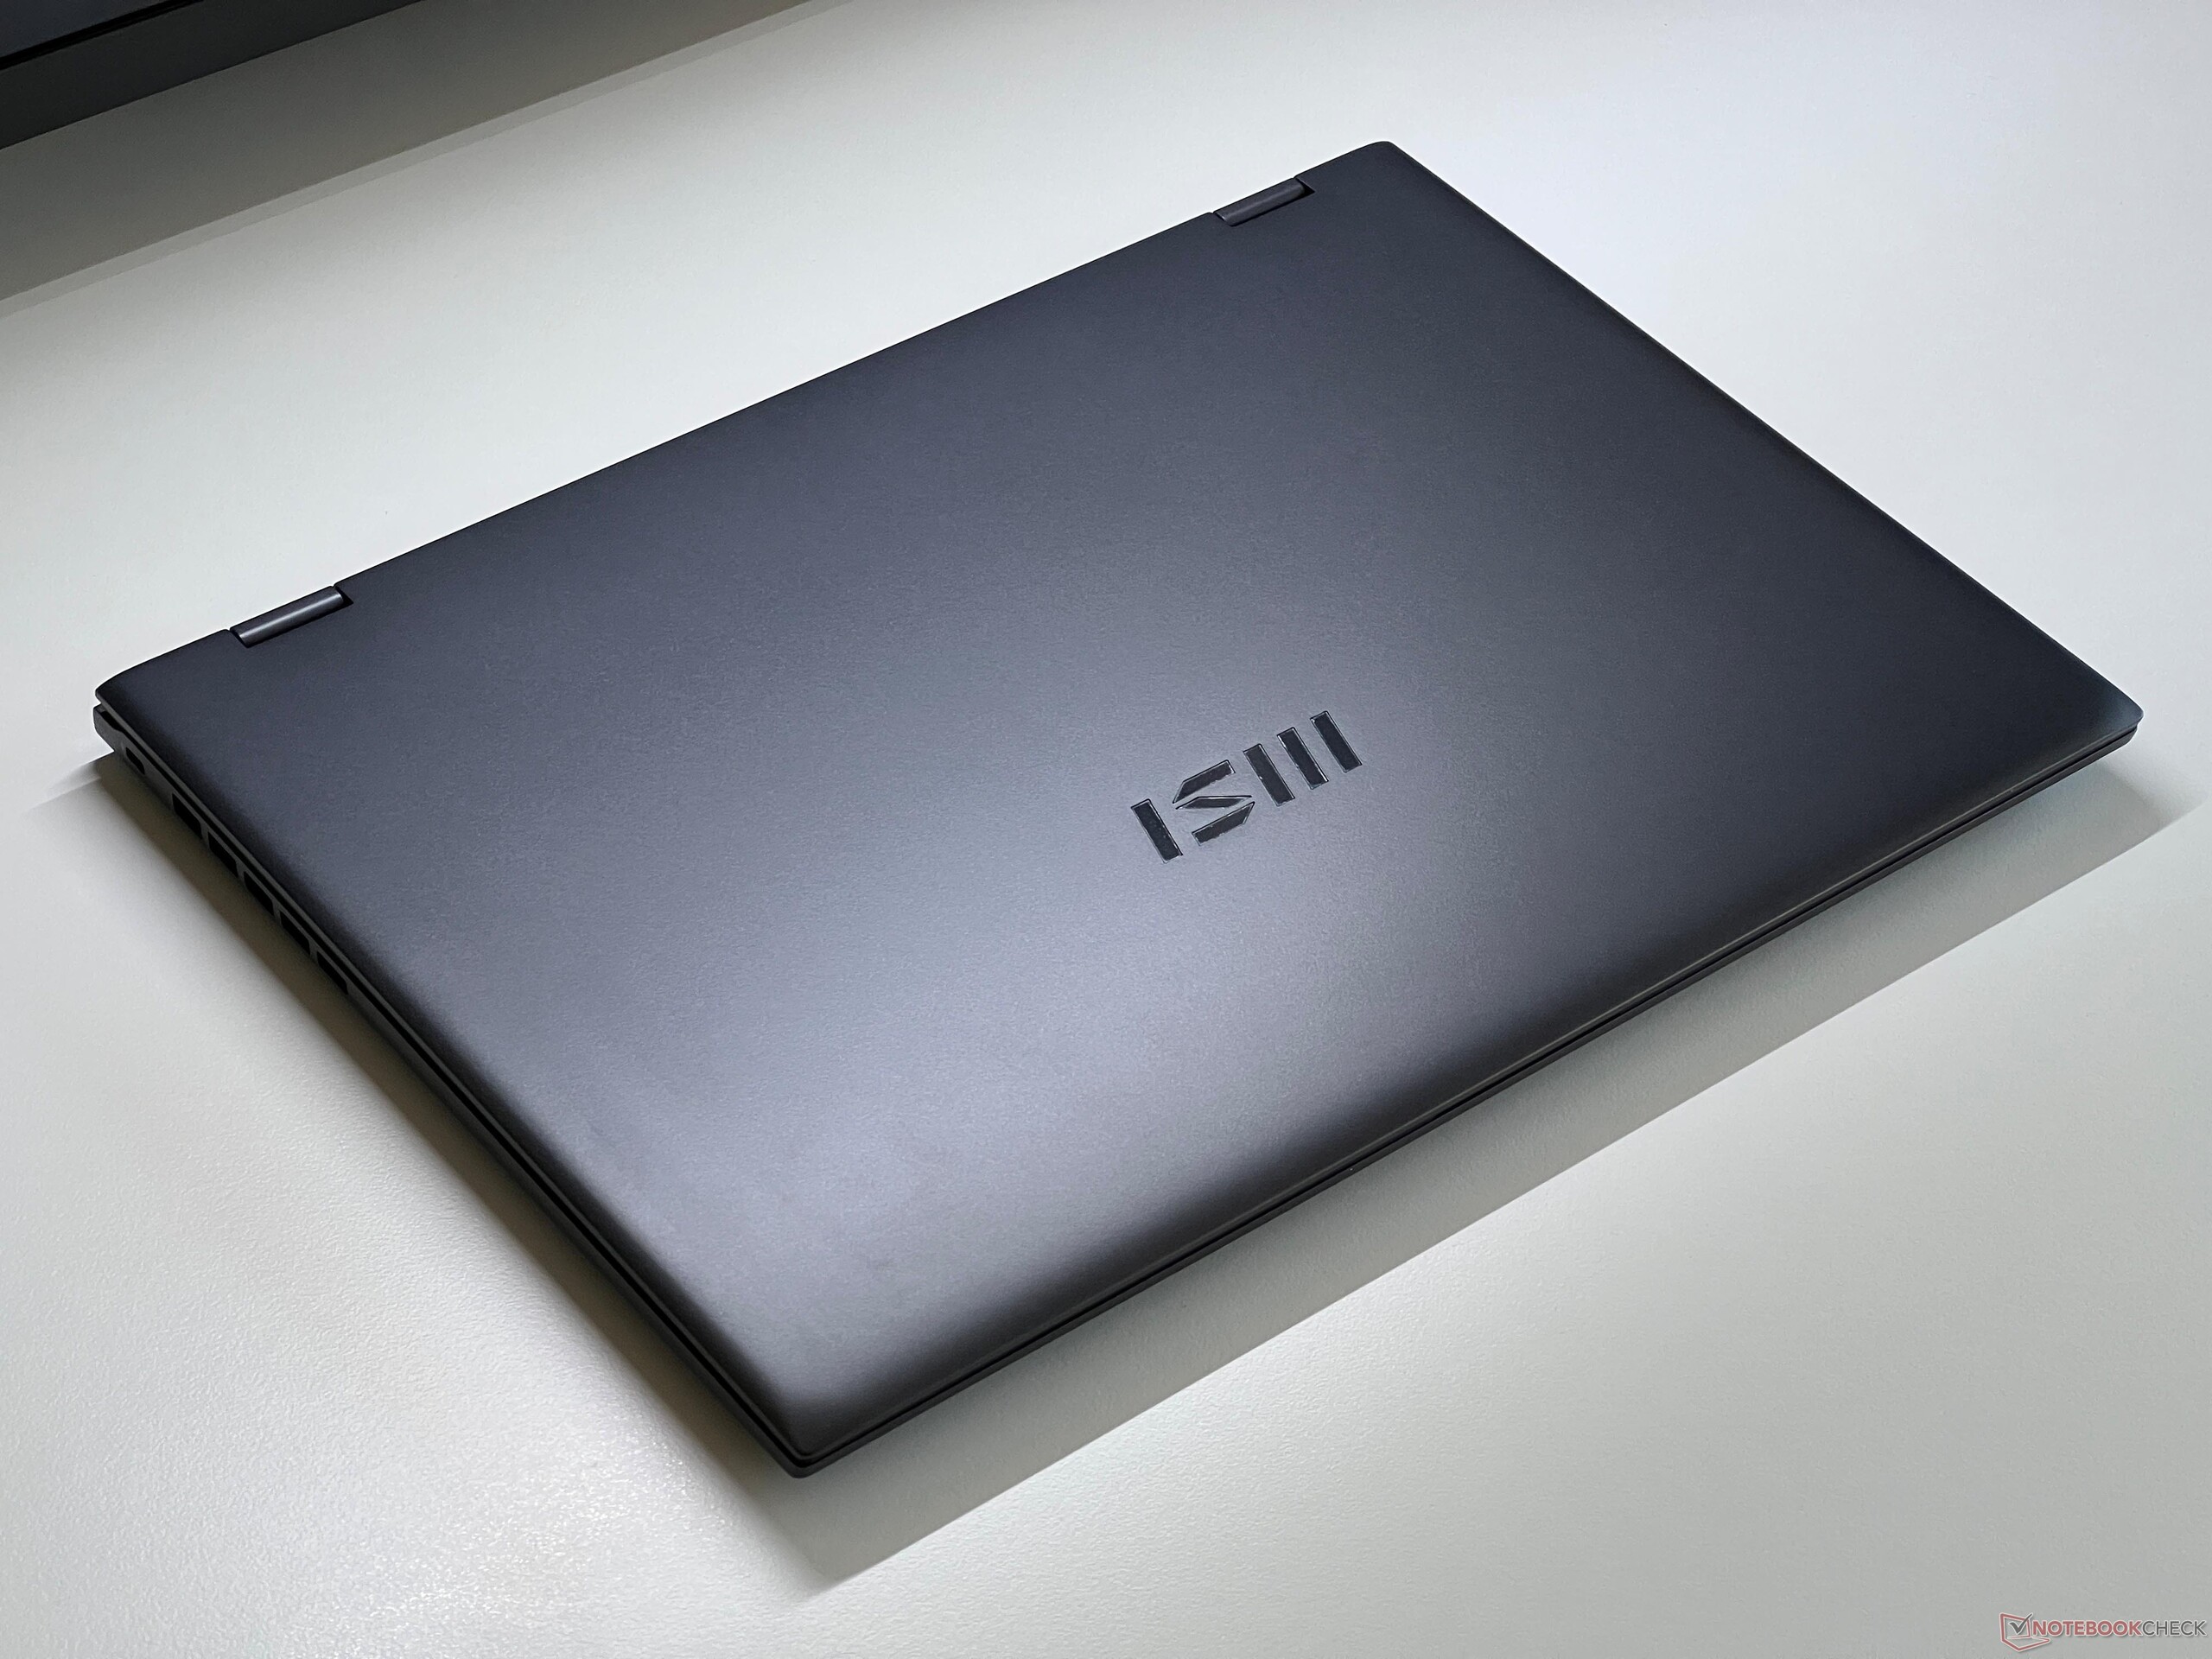
Case - Magnesium-aluminum alloy
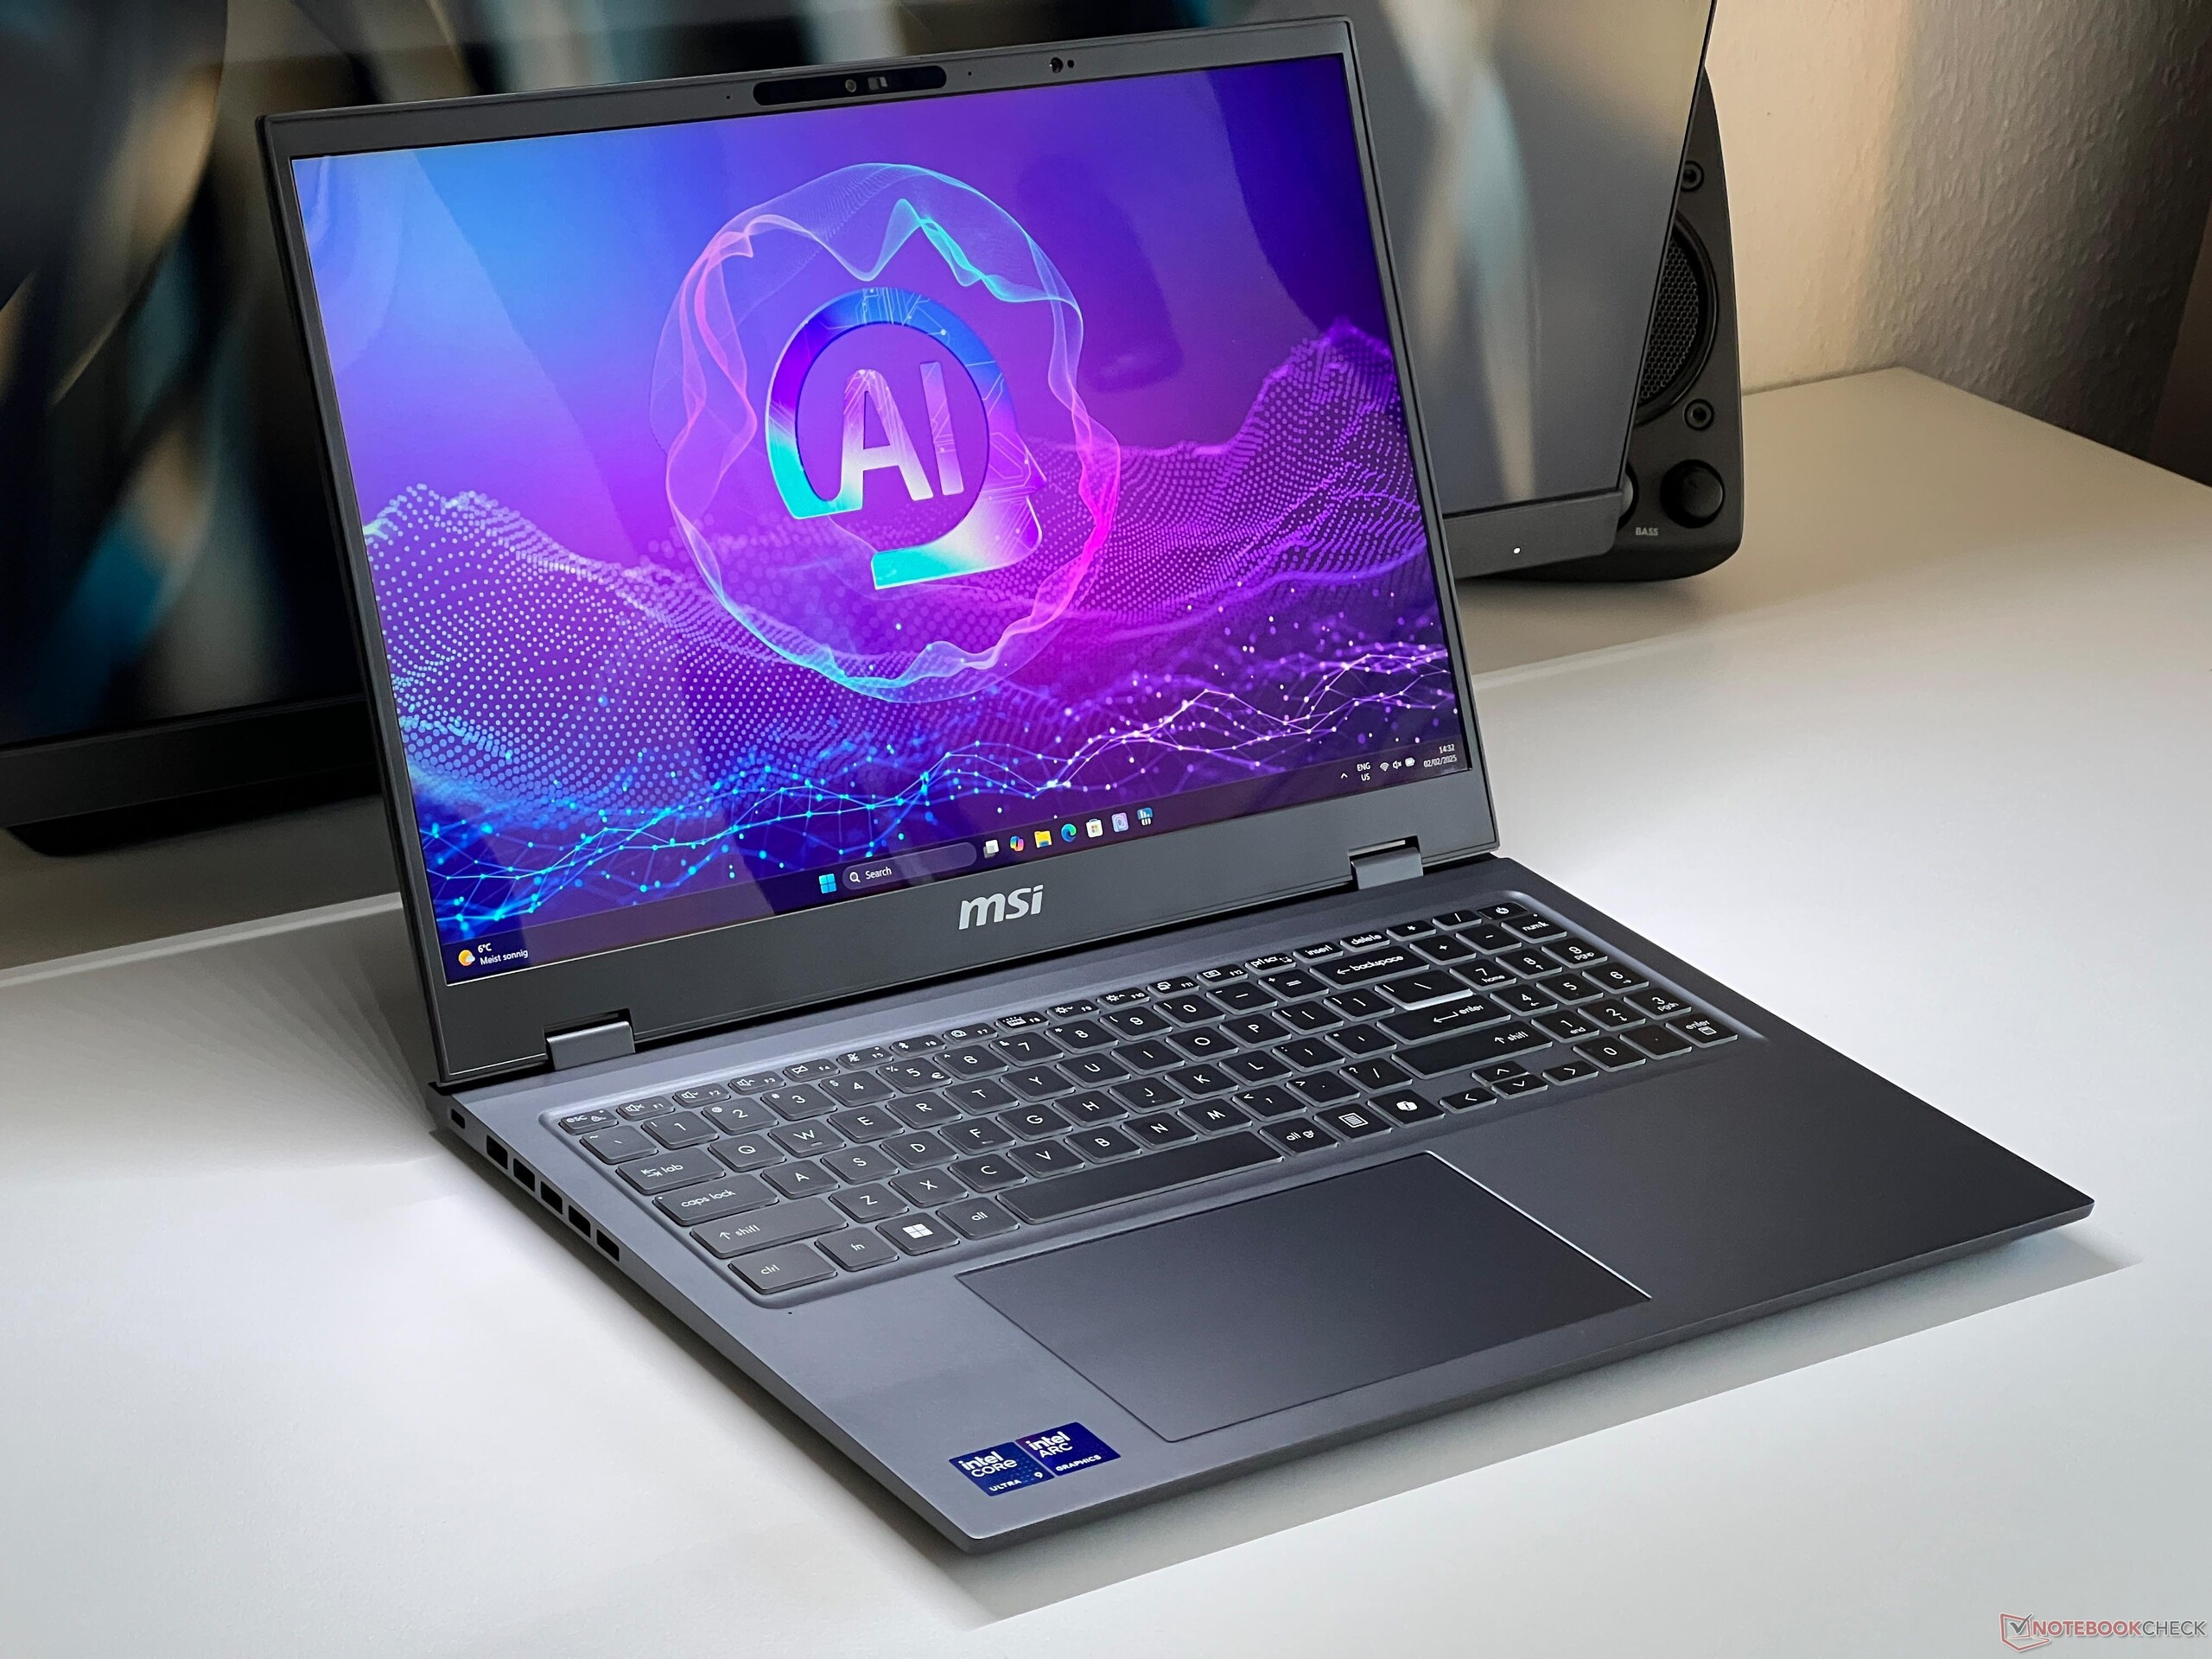
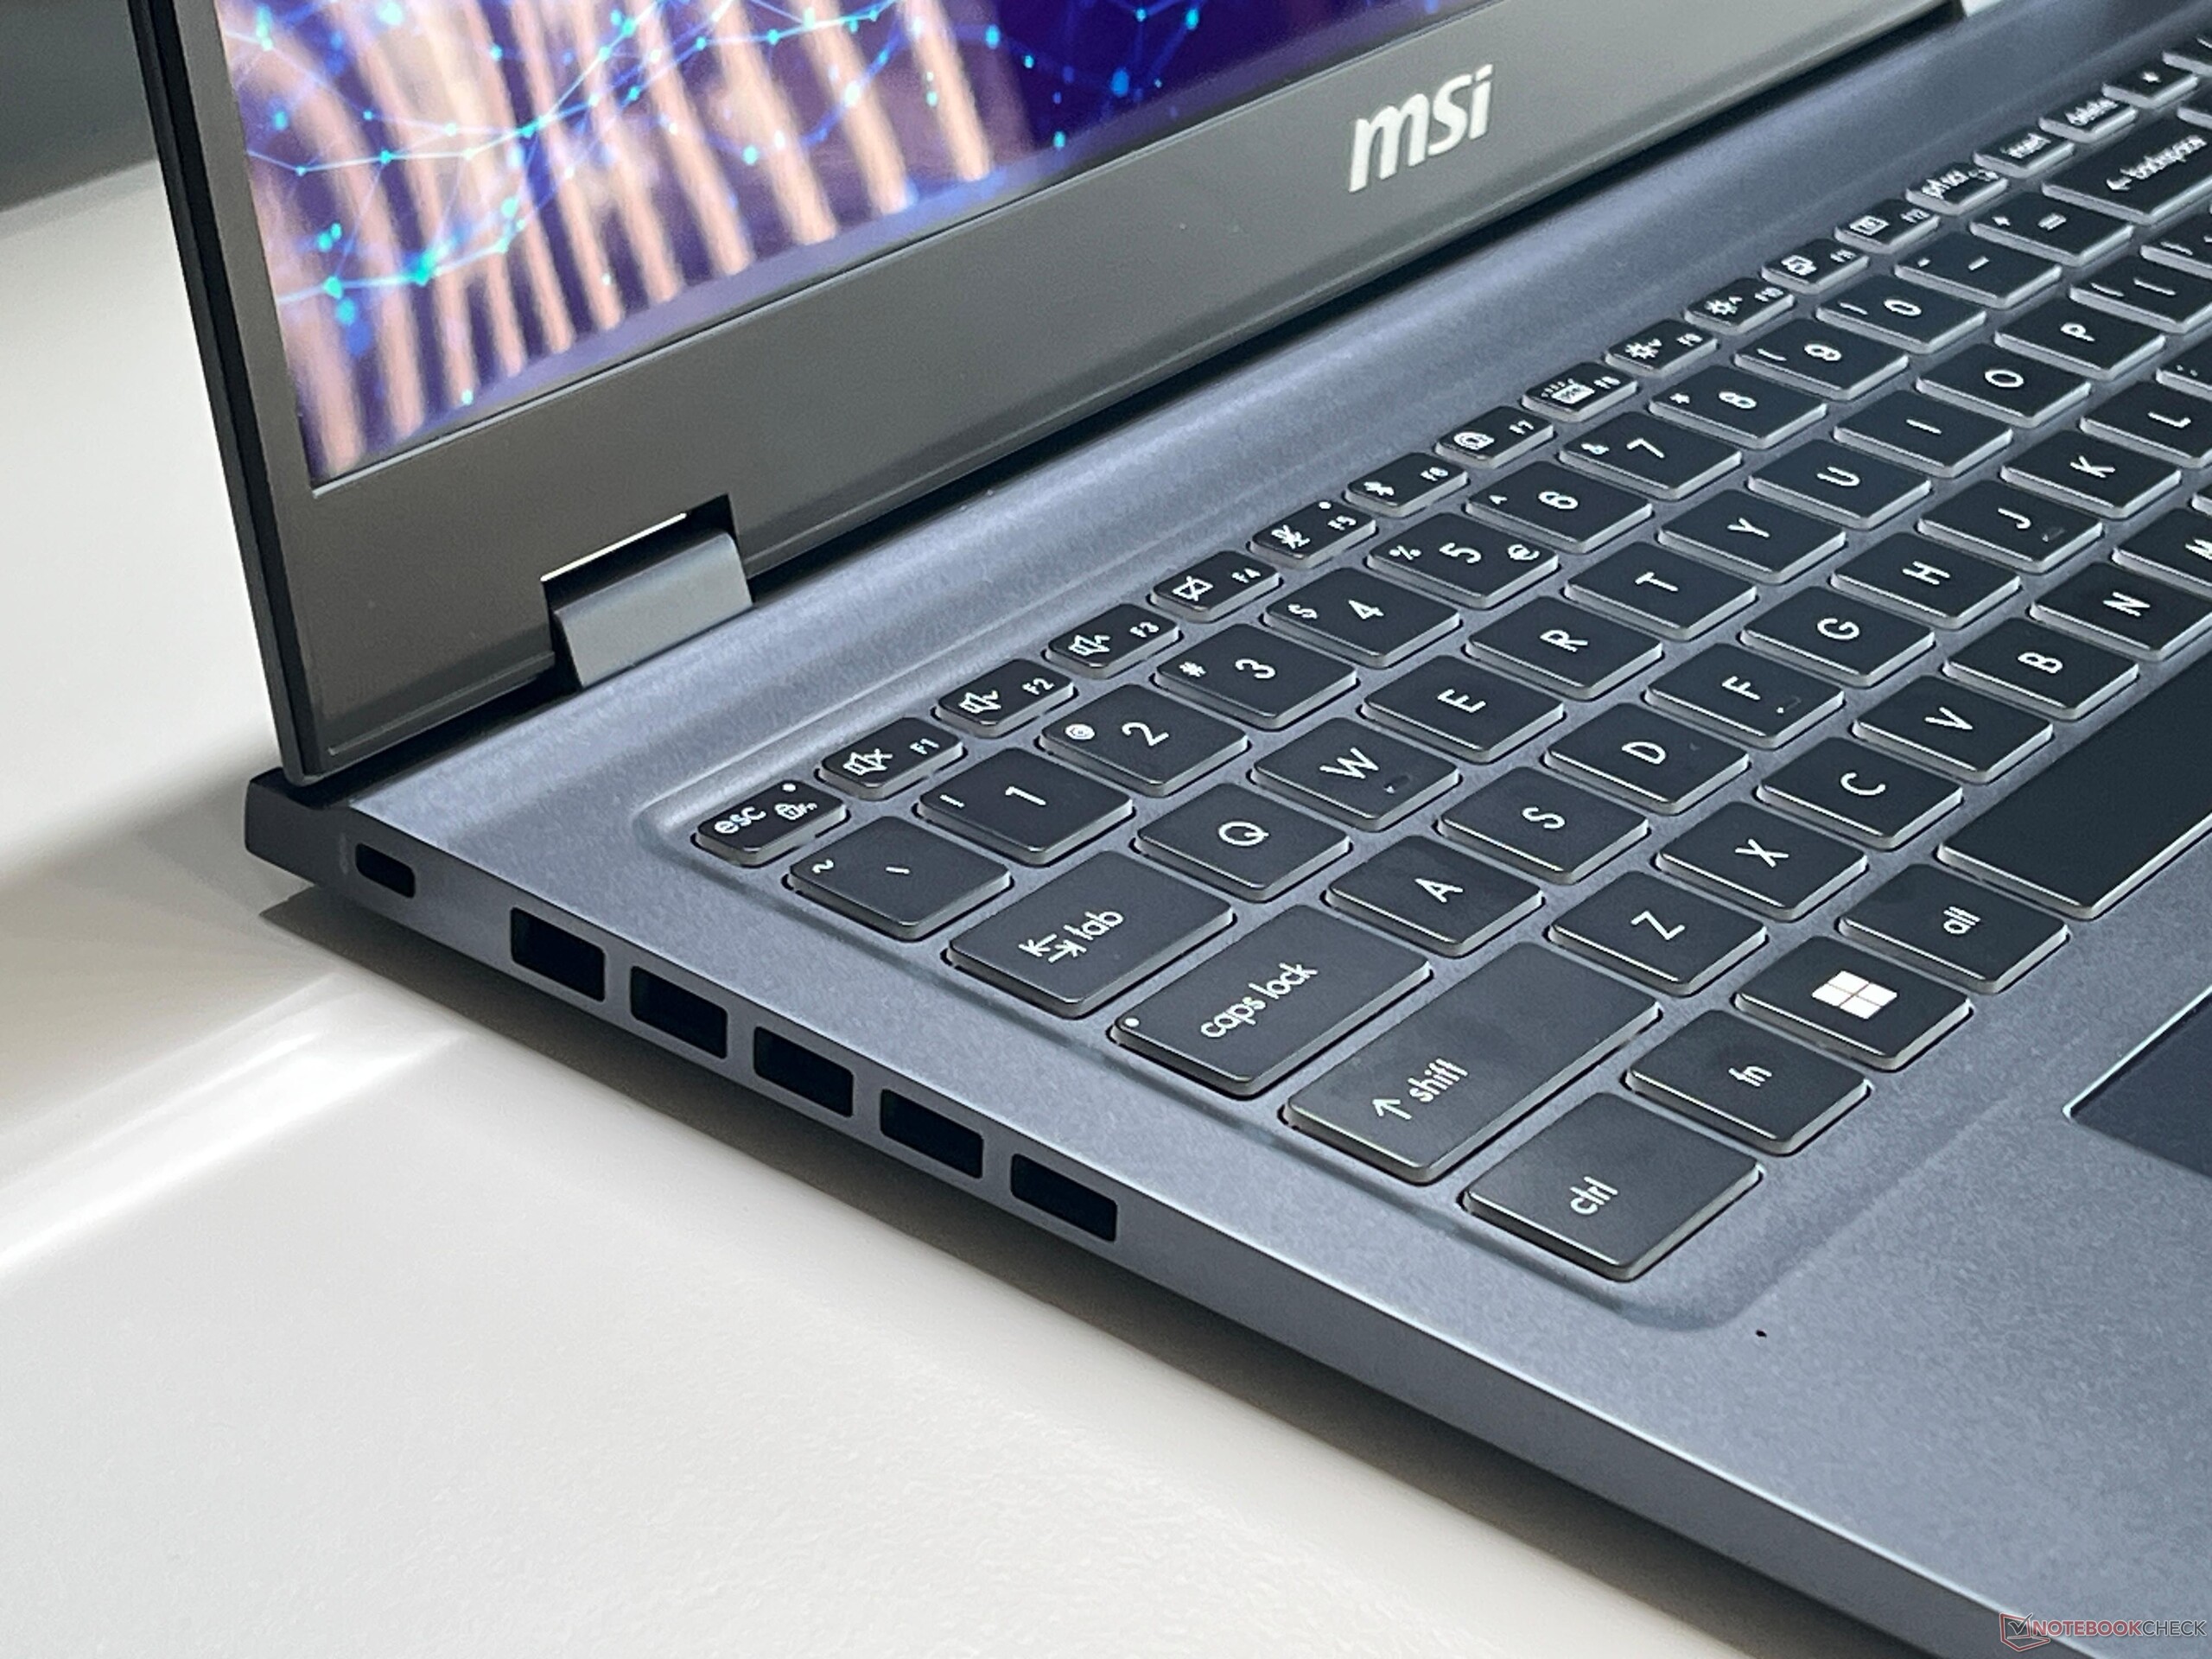
For the Prestige 16 AI Evo's case, MSI has gone for a unibody design consisting of a magnesium-aluminum alloy in a dark grey color (Stellar Gray). Its finish and build quality seem to be very good, and the case's stability is also impressive. The base unit can hardly be pressed in or twisted, and we couldn't elicit any creaking noises from it during our test. Its surfaces also aren't overly susceptible to collecting fingerprint marks.
Furthermore, the screen lid is similarly stable and we couldn't provoke any image errors when applying selective pressure. The hinges are very tight, but the lid still wobbles slightly when you adjust its angle.You can just about open it with one hand and its maximum opening angle is 180 degrees.

Our test device weighs 1.561 kg and, as a result, is one of the lighter models in our comparison group (comparable to the Zenbook S 16 & Galaxy Book4 Pro 16), while the other models are significantly heavier at around 2 kg. At just under 17-19 mm, the MSI is actually the thickest device and when it comes to their footprint, the competitors are all pretty similar. The 100-watt power supply weighs 365 grams with the power cable included.
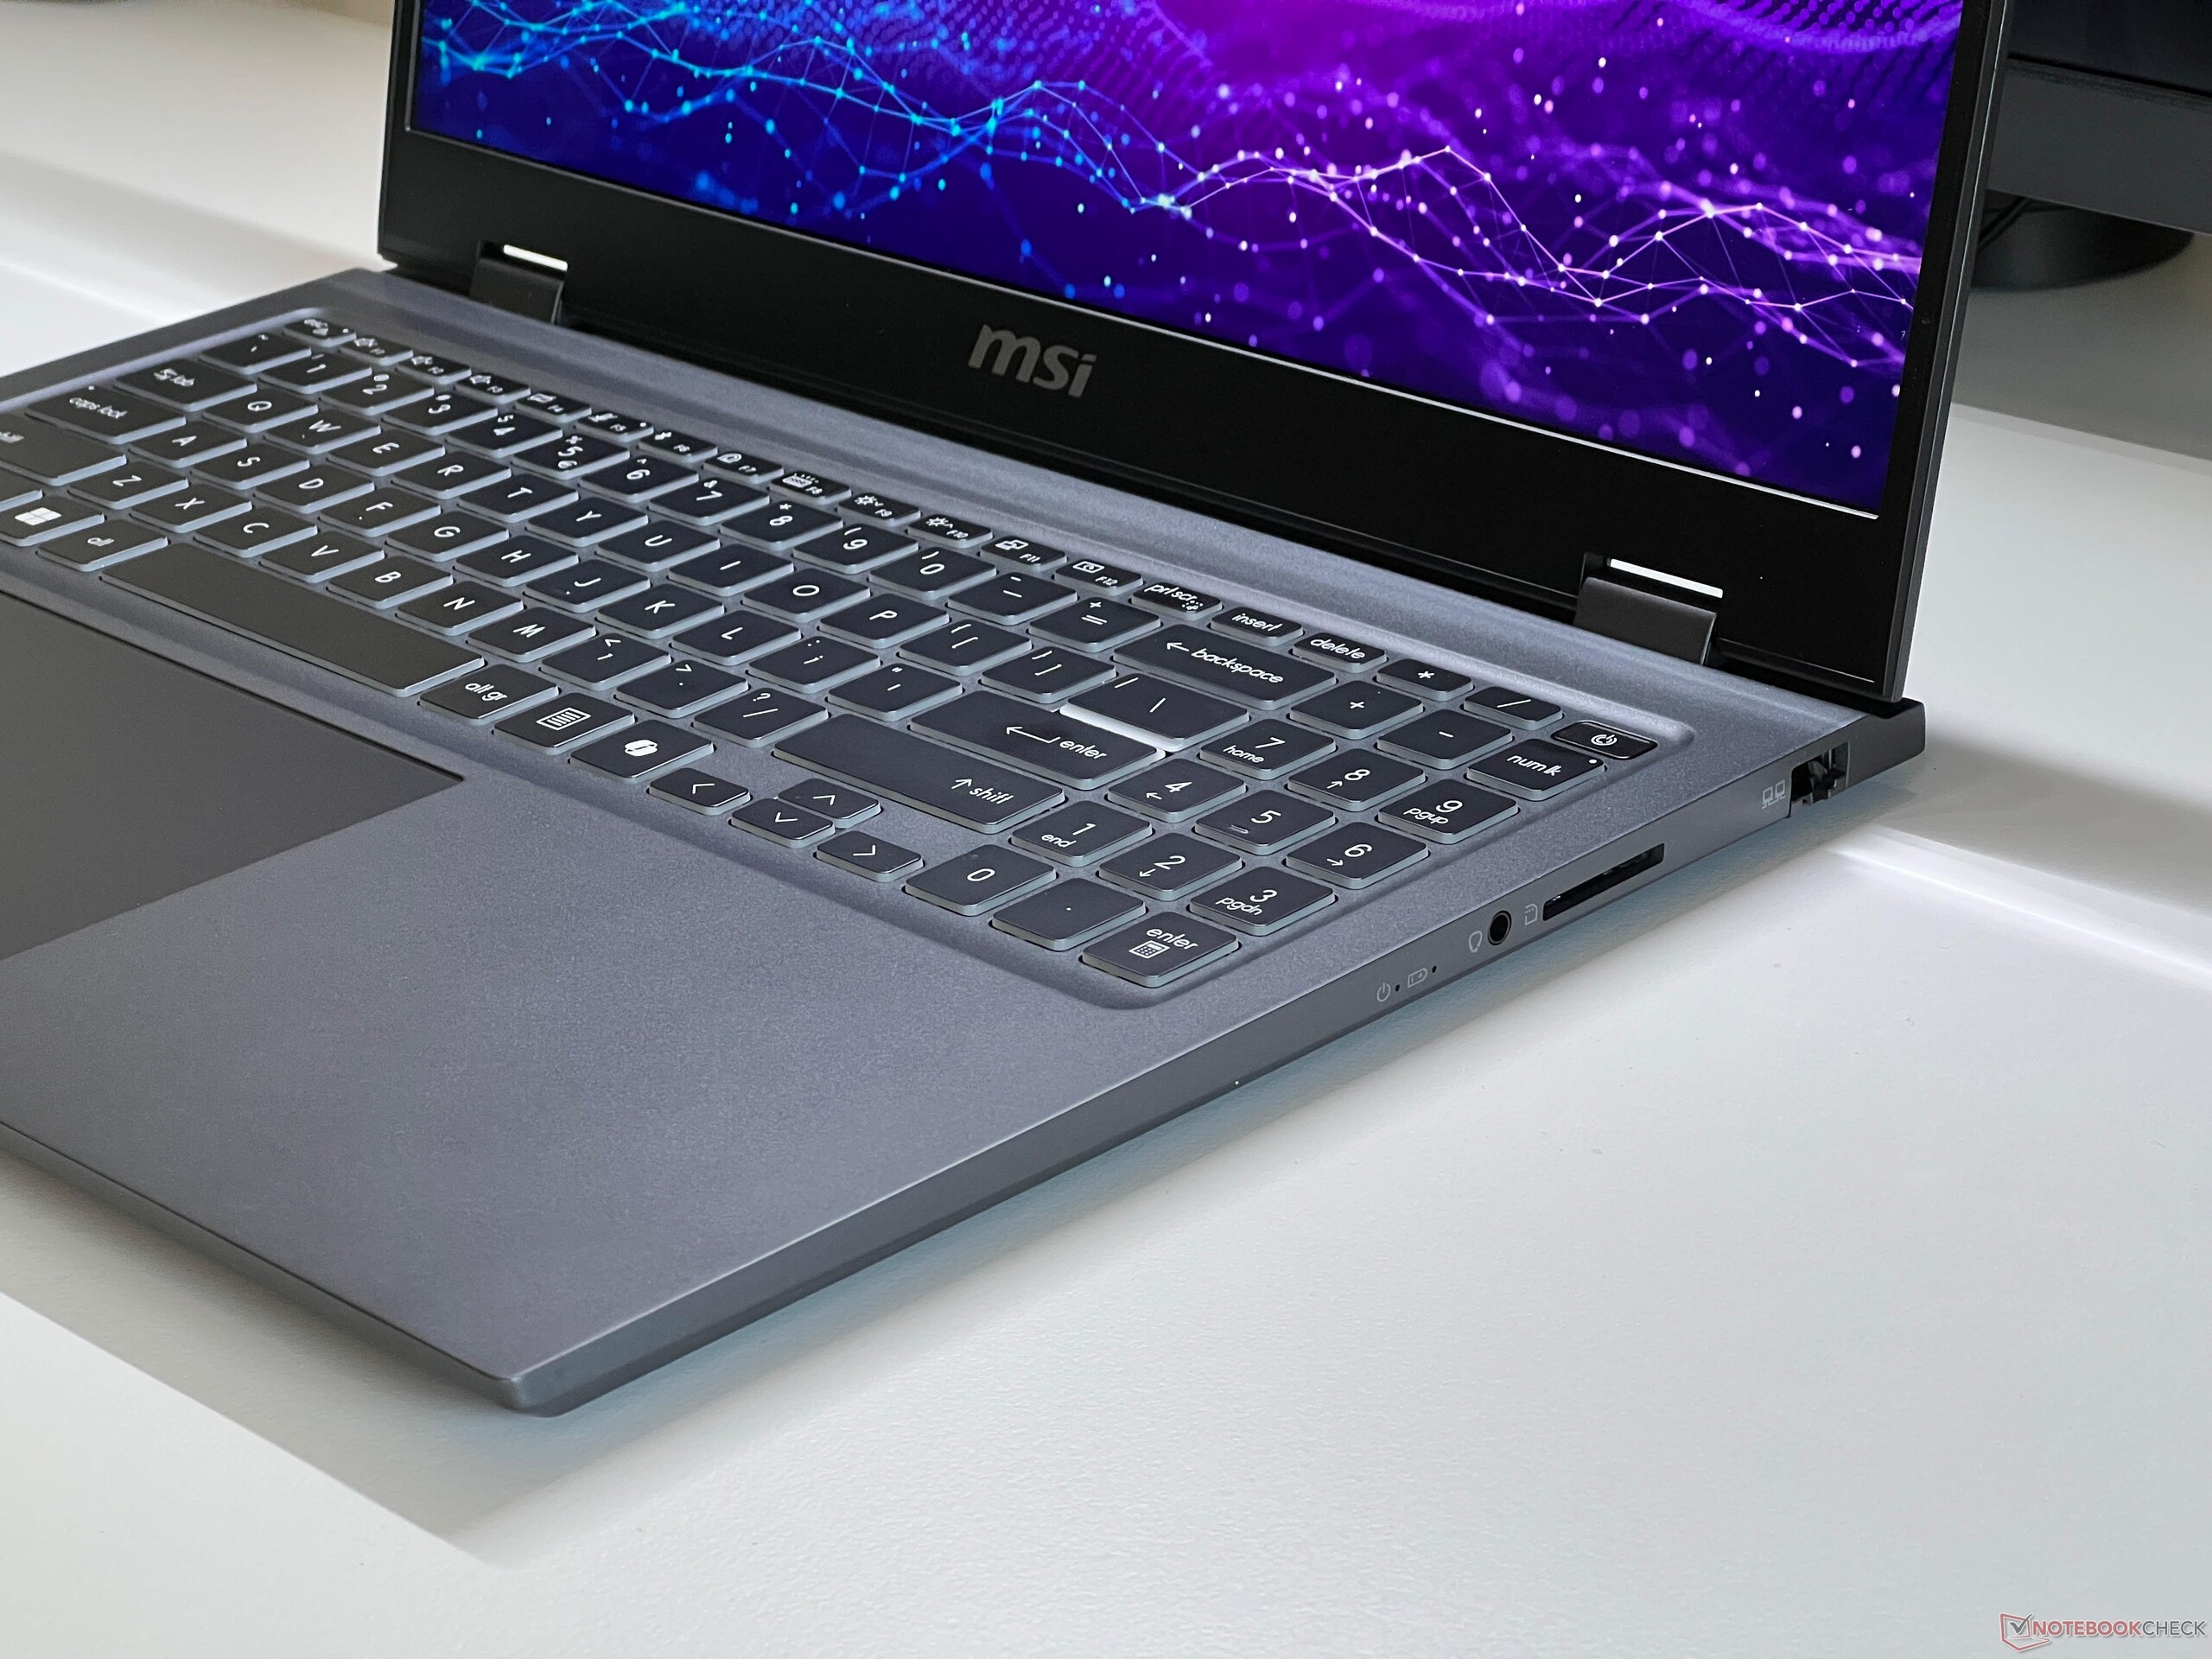
Connectivity - Thunderbolt & Wi-Fi 7
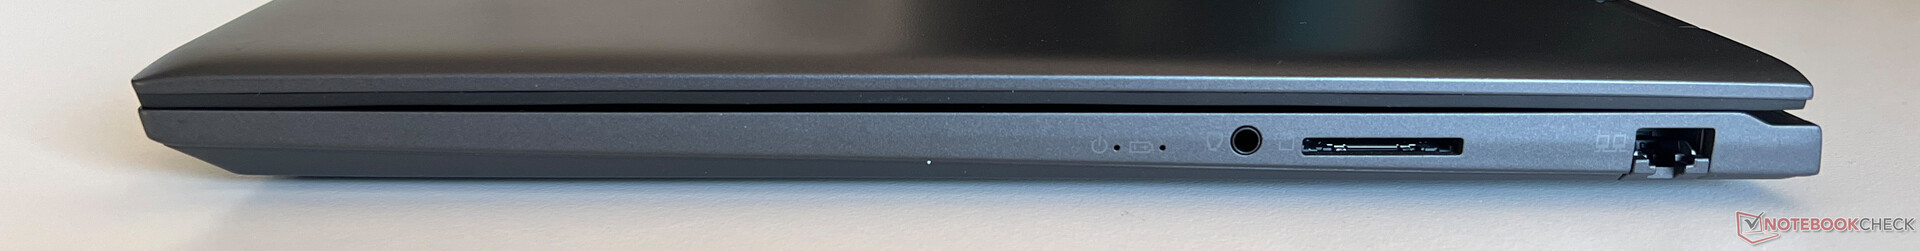
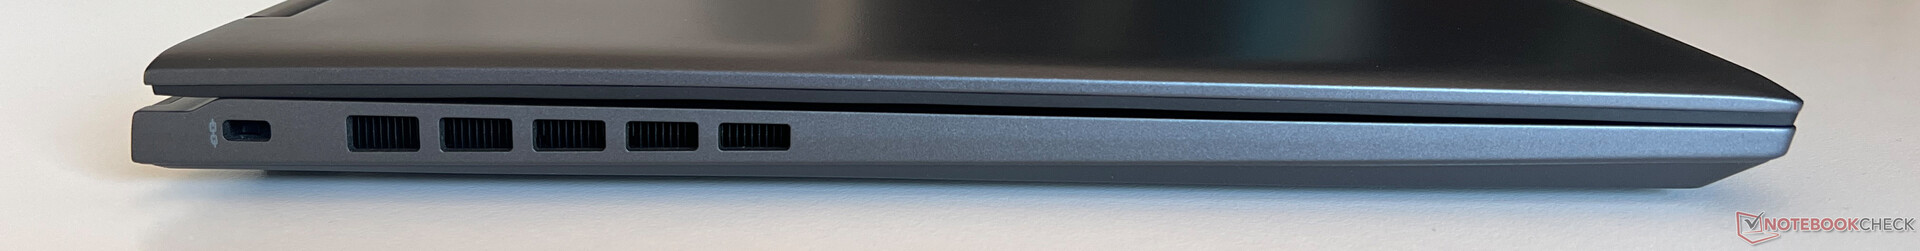
In general, the Prestige features all the most important ports, including USB-C, USB-A, Gigabit Ethernet and an SD card reader. However, we are not at all satisfied with the distribution of them, as all USB ports are located at the back of the device. There's not a single port on the left-hand side, which is due to the laptop's internal arrangement. This is simply incredibly impractical during everyday use and we don't understand this decision whatsoever. The NPU of the new Arrow Lake processors doesn't meet the minimum requirements for a Copilot+ PC, but functions such as Studio Effects or live subtitling are still supported.

SD card reader
There is a fully-fledged card reader with a spring mechanism on the right-hand side of the laptop. Inserted cards protrude only minimally from its case. In conjunction with our reference card (Angelbird AV Pro V60), we measured transfer rates in the 80-90 MB/s range. These results are okay, but many of the comparison devices performed better.
| SD Card Reader | |
| average JPG Copy Test (av. of 3 runs) | |
| Apple MacBook Pro 16 2024 M4 Pro (Angelbird AV Pro V60) | |
| Asus Zenbook S 16 UM5606-RK333W (Angelbird AV Pro V60) | |
| Average of class Multimedia (23 - 531, n=41, last 2 years) | |
| MSI Prestige A16 AI+ A3HMG-036 | |
| Lenovo ThinkBook 16 G7+ AMD (Angelbird AV Pro V60) | |
| MSI Prestige 16 AI Evo B2HMG (Angelbird AV Pro V60) | |
| Samsung Galaxy Book4 Pro 16 (Angelbird AV Pro V60) | |
| maximum AS SSD Seq Read Test (1GB) | |
| Asus Zenbook S 16 UM5606-RK333W (Angelbird AV Pro V60) | |
| Apple MacBook Pro 16 2024 M4 Pro (Angelbird AV Pro V60) | |
| MSI Prestige A16 AI+ A3HMG-036 | |
| Average of class Multimedia (37.3 - 1455, n=40, last 2 years) | |
| Samsung Galaxy Book4 Pro 16 (Angelbird AV Pro V60) | |
| Lenovo ThinkBook 16 G7+ AMD (Angelbird AV Pro V60) | |
| MSI Prestige 16 AI Evo B2HMG (Angelbird AV Pro V60) | |
Communication

The Prestige has a Gigabit Ethernet port on the right-hand side. Of course, a WLAN module is also installed, namely the modern Intel Killer BE1750 Wi-Fi 7 module. In conjunction with our reference router from Asus, we recorded very good and stable transfer rates. The module also supports Bluetooth 5.4.
| Networking | |
| MSI Prestige 16 AI Evo B2HMG | |
| iperf3 transmit AXE11000 | |
| iperf3 receive AXE11000 | |
| Lenovo ThinkBook 16 G7+ AMD | |
| iperf3 transmit AXE11000 | |
| iperf3 receive AXE11000 | |
| MSI Prestige A16 AI+ A3HMG-036 | |
| iperf3 transmit AXE11000 | |
| iperf3 receive AXE11000 | |
| iperf3 transmit AXE11000 6GHz | |
| iperf3 receive AXE11000 6GHz | |
| Apple MacBook Pro 16 2024 M4 Pro | |
| iperf3 transmit AXE11000 | |
| iperf3 receive AXE11000 | |
| Asus Zenbook S 16 UM5606-RK333W | |
| iperf3 transmit AXE11000 | |
| iperf3 receive AXE11000 | |
| Samsung Galaxy Book4 Pro 16 | |
| iperf3 transmit AXE11000 | |
| iperf3 receive AXE11000 | |
Webcam
An FHD webcam with a mechanical aperture is built into the device's upper display frame. It supports Windows' advanced Studio Effects and its overall image quality is okay, but the Lunar Lake model is equipped with a better 5 MP camera. It also has an IR camera for facial recognition via Windows Hello.


Maintenance
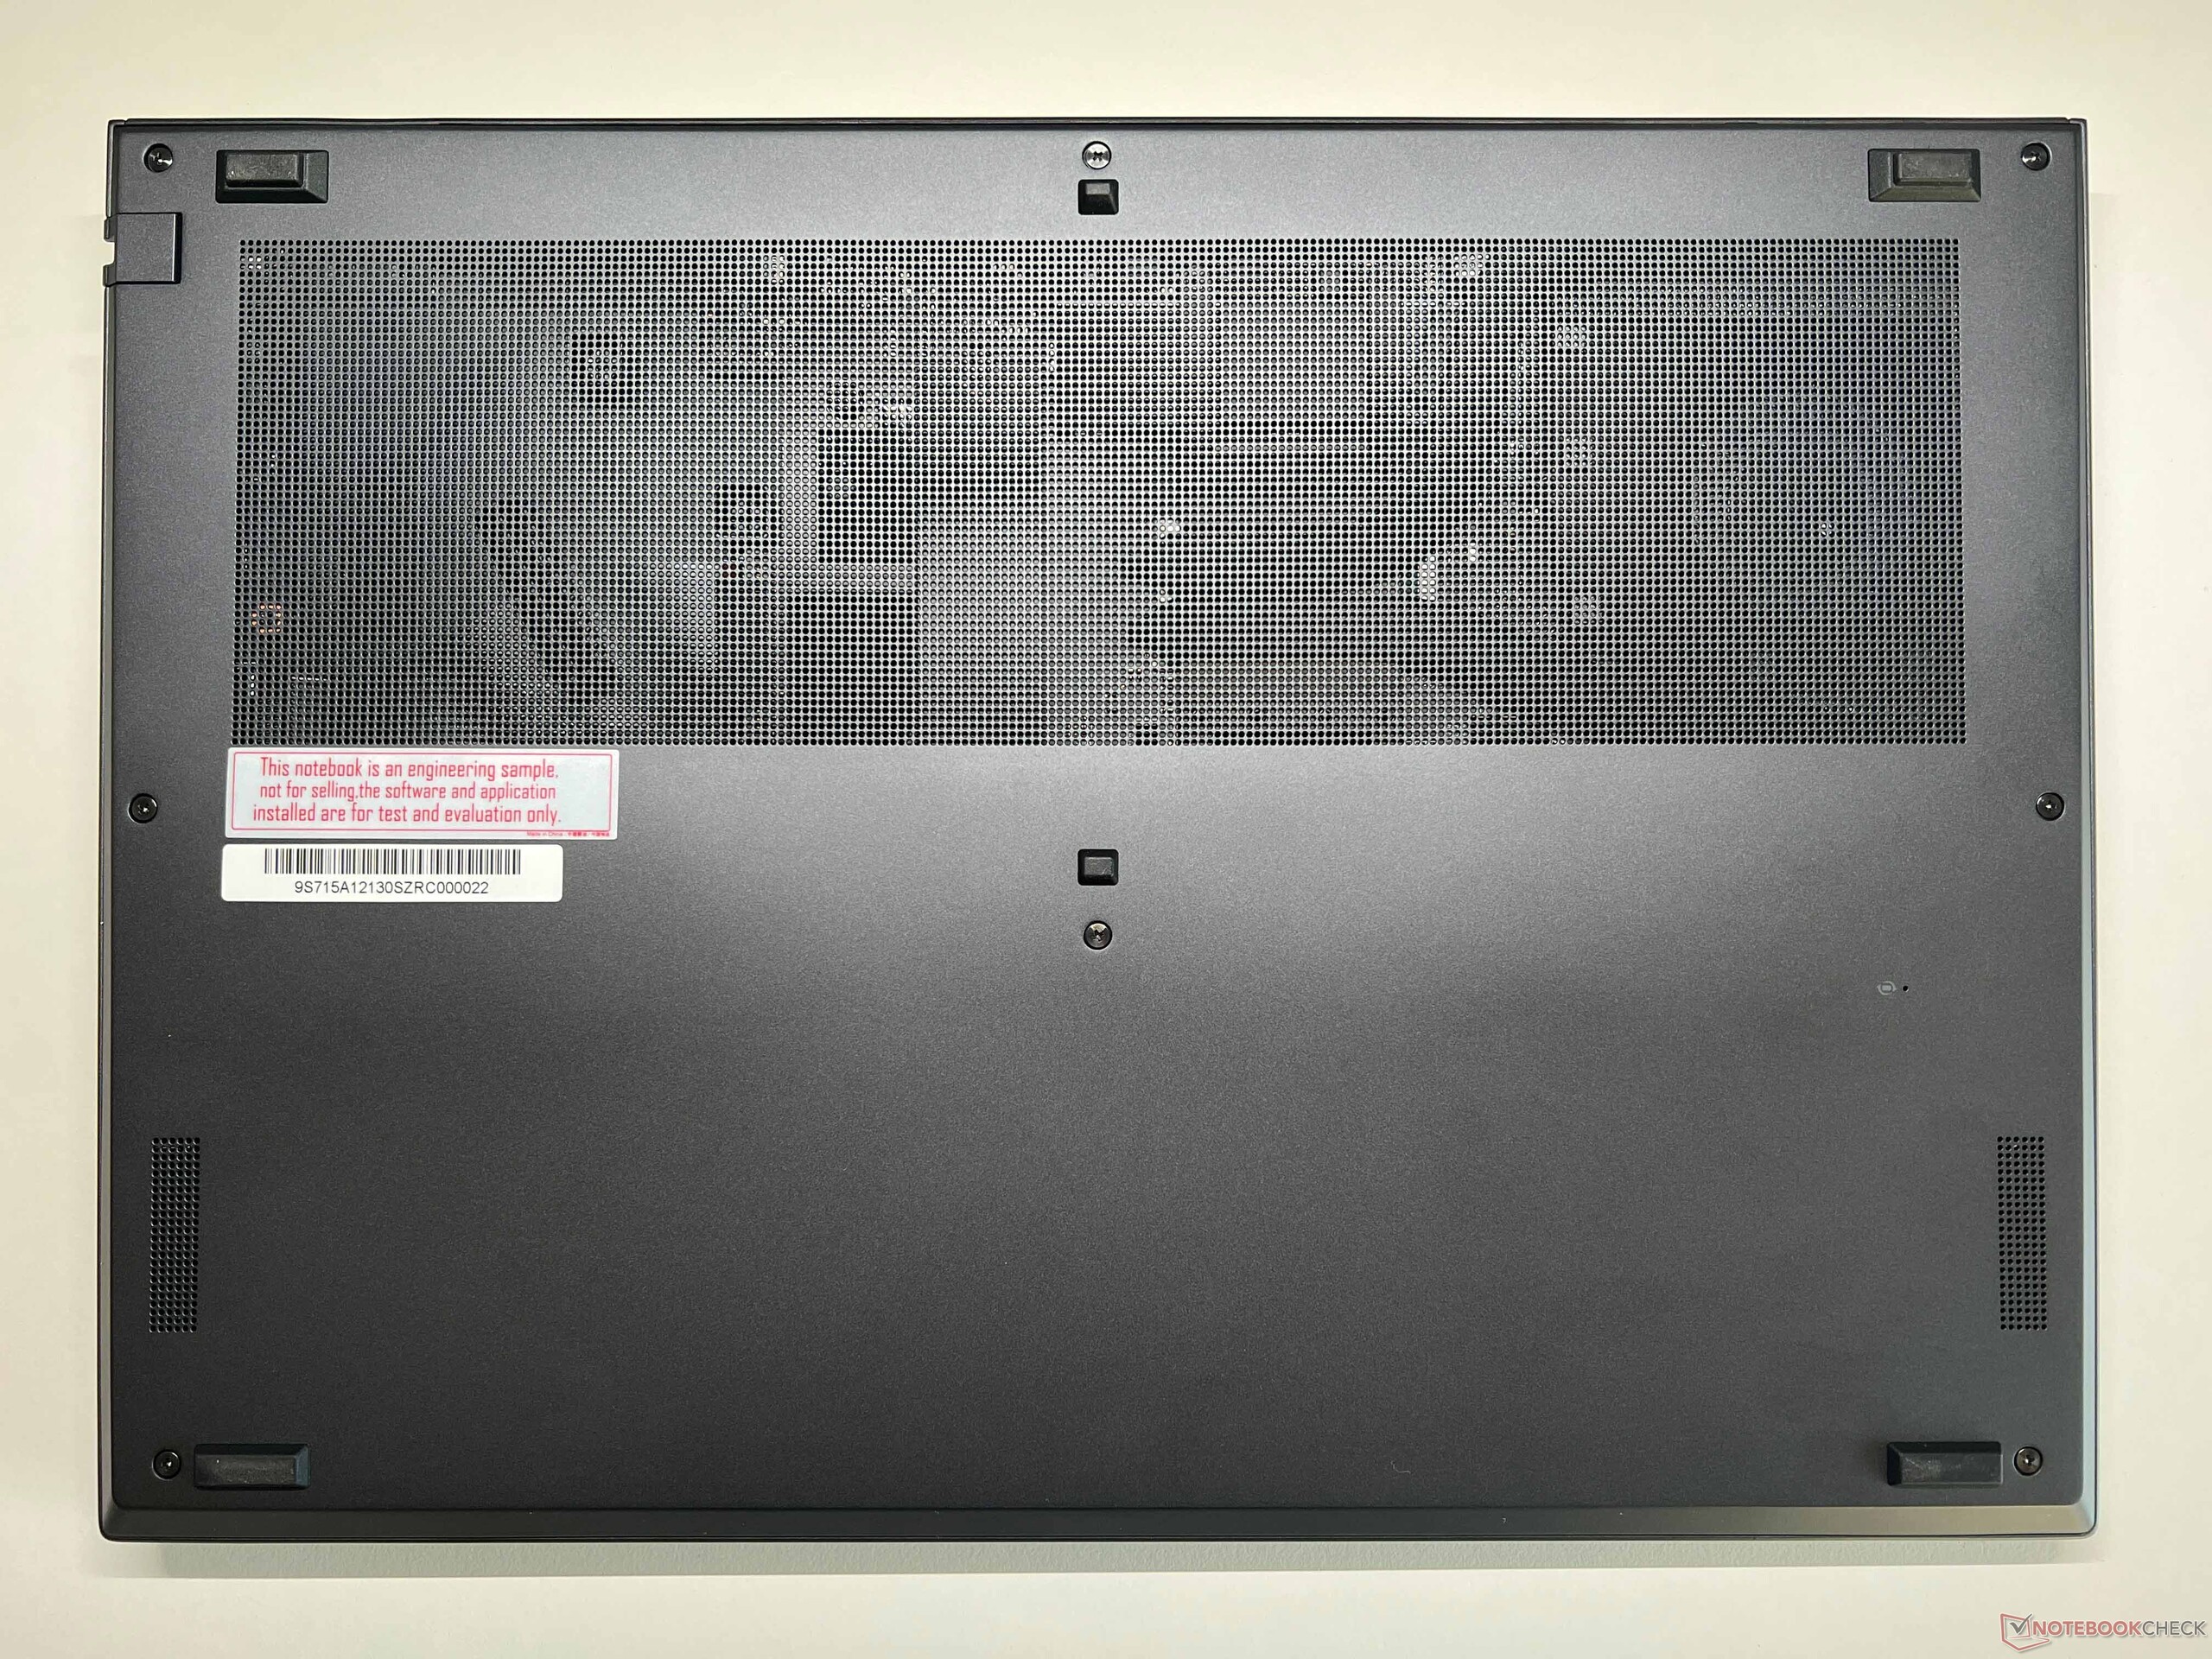
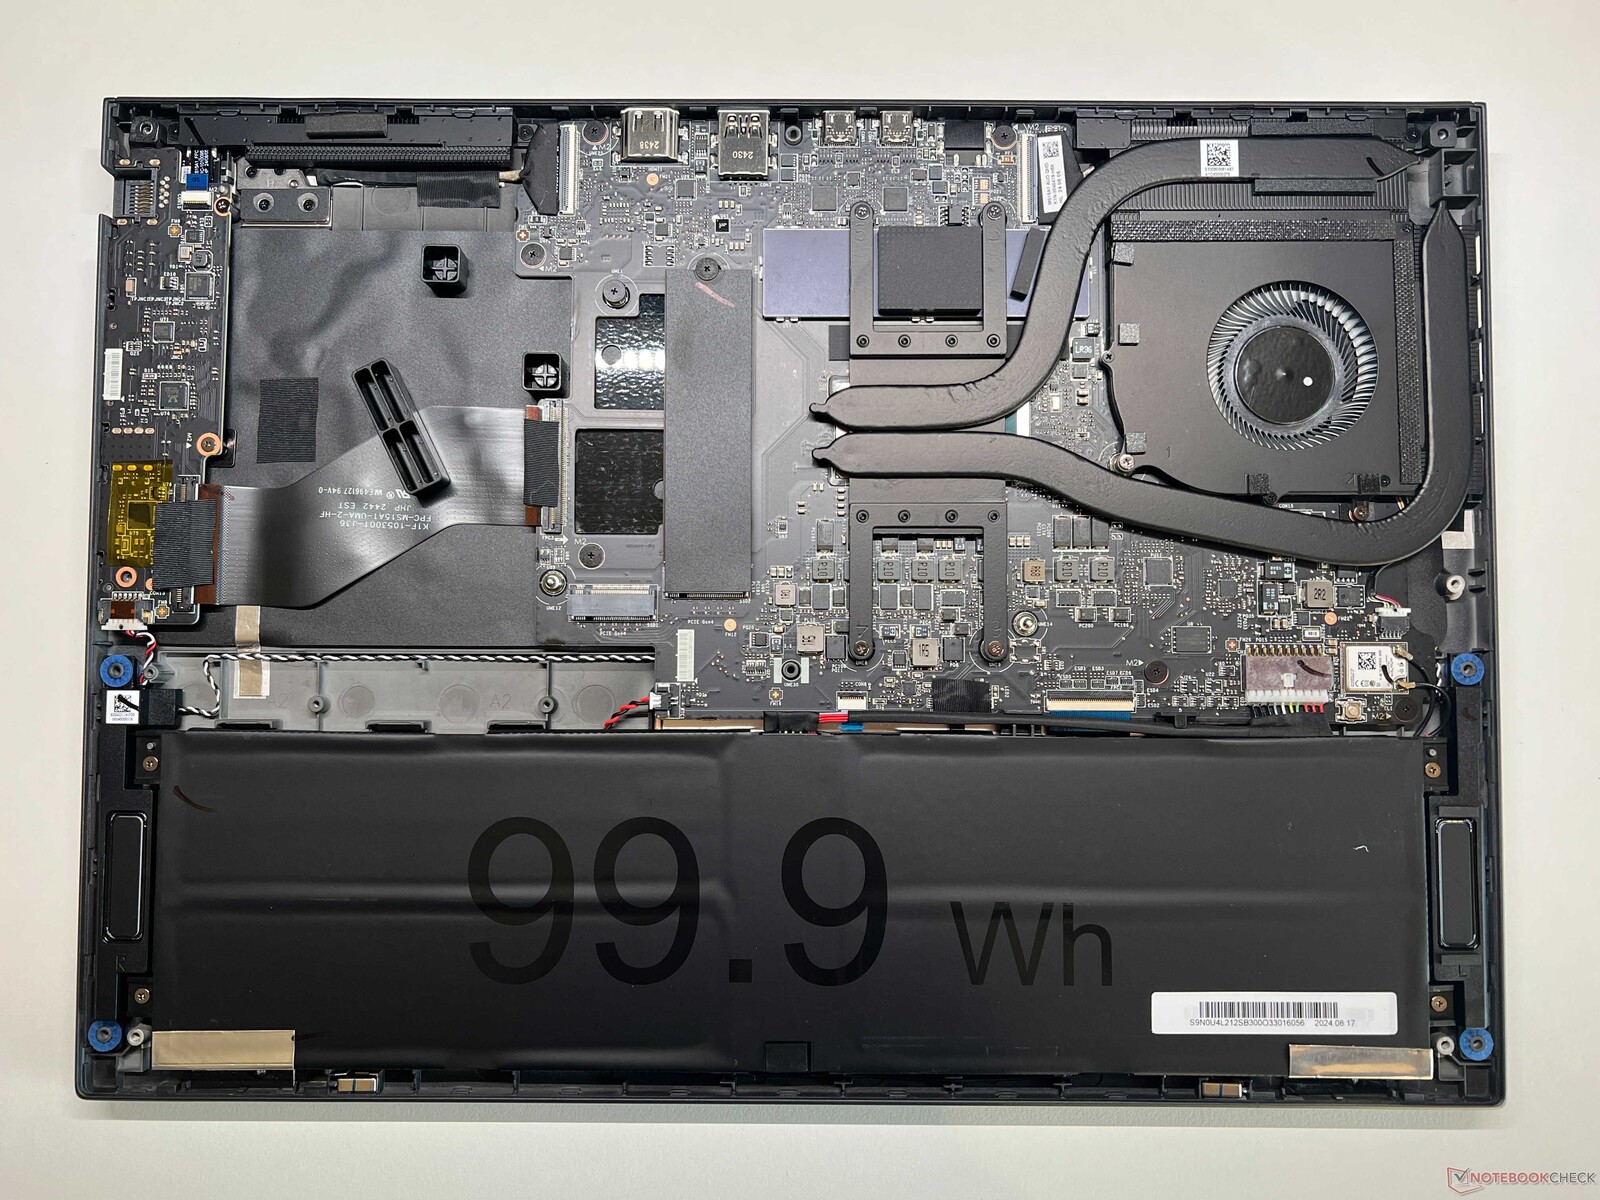
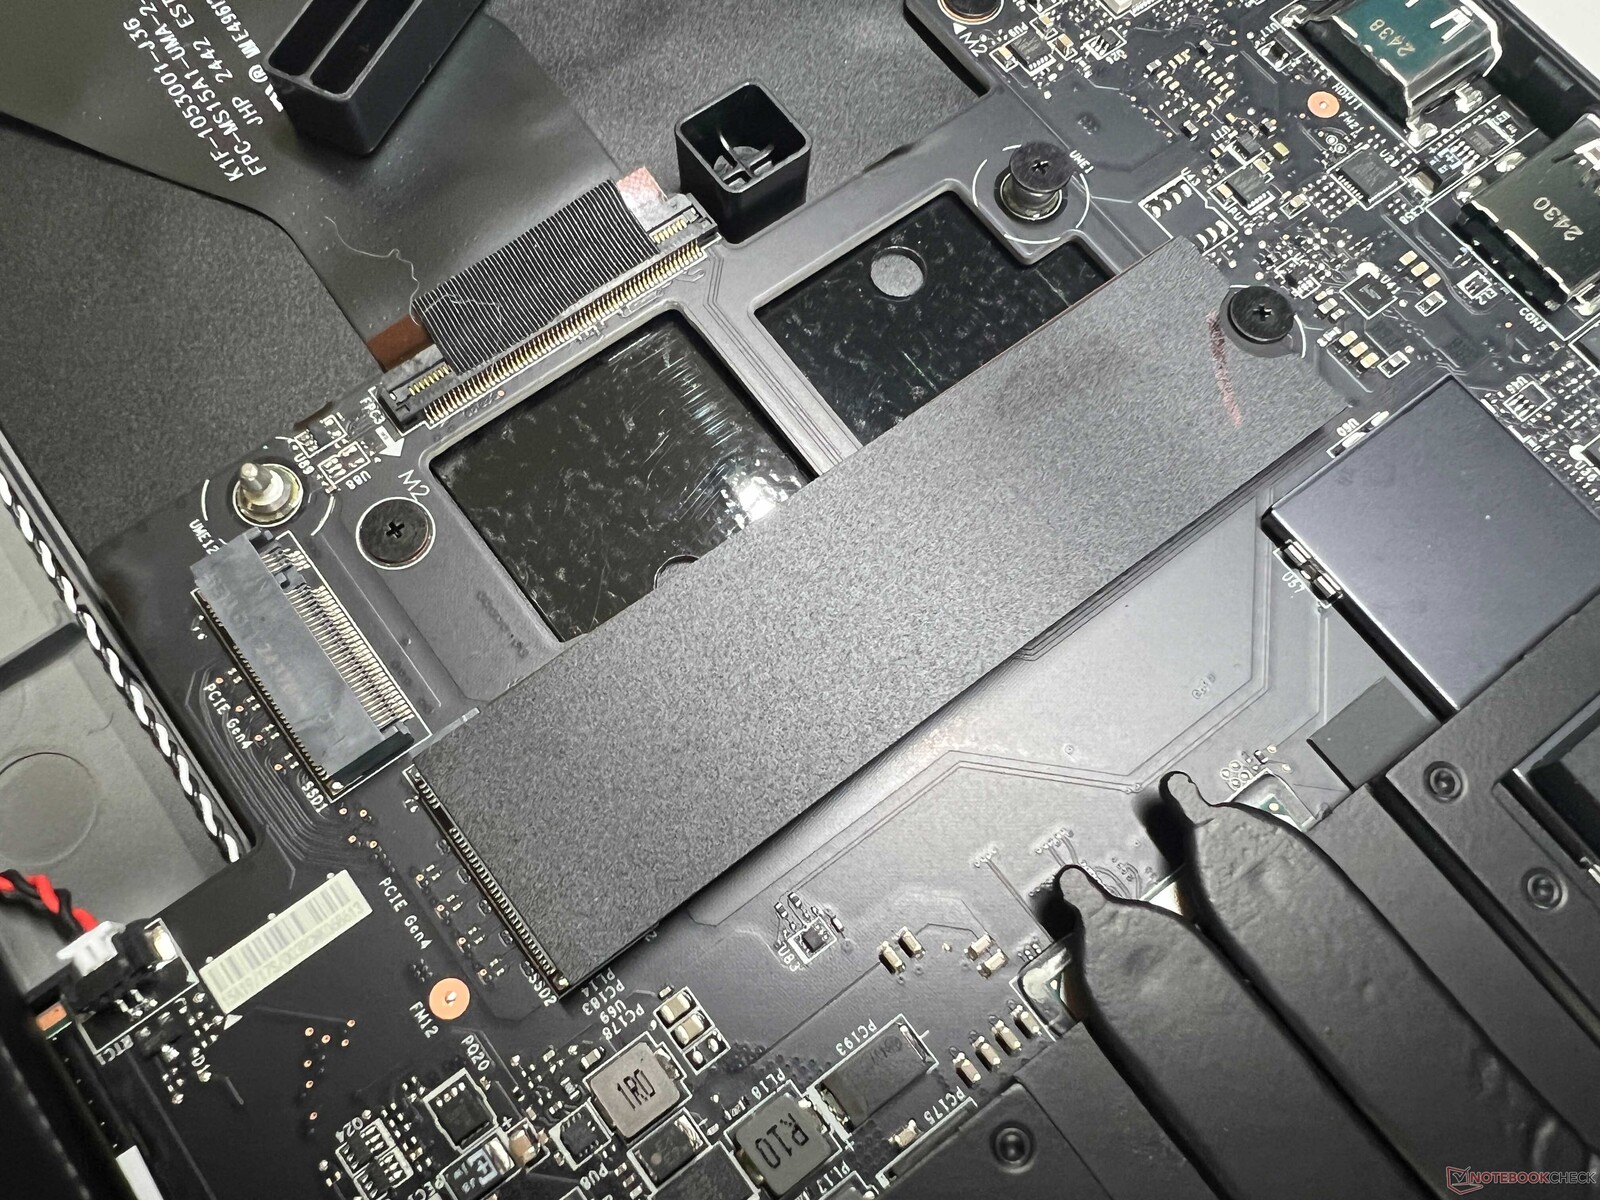
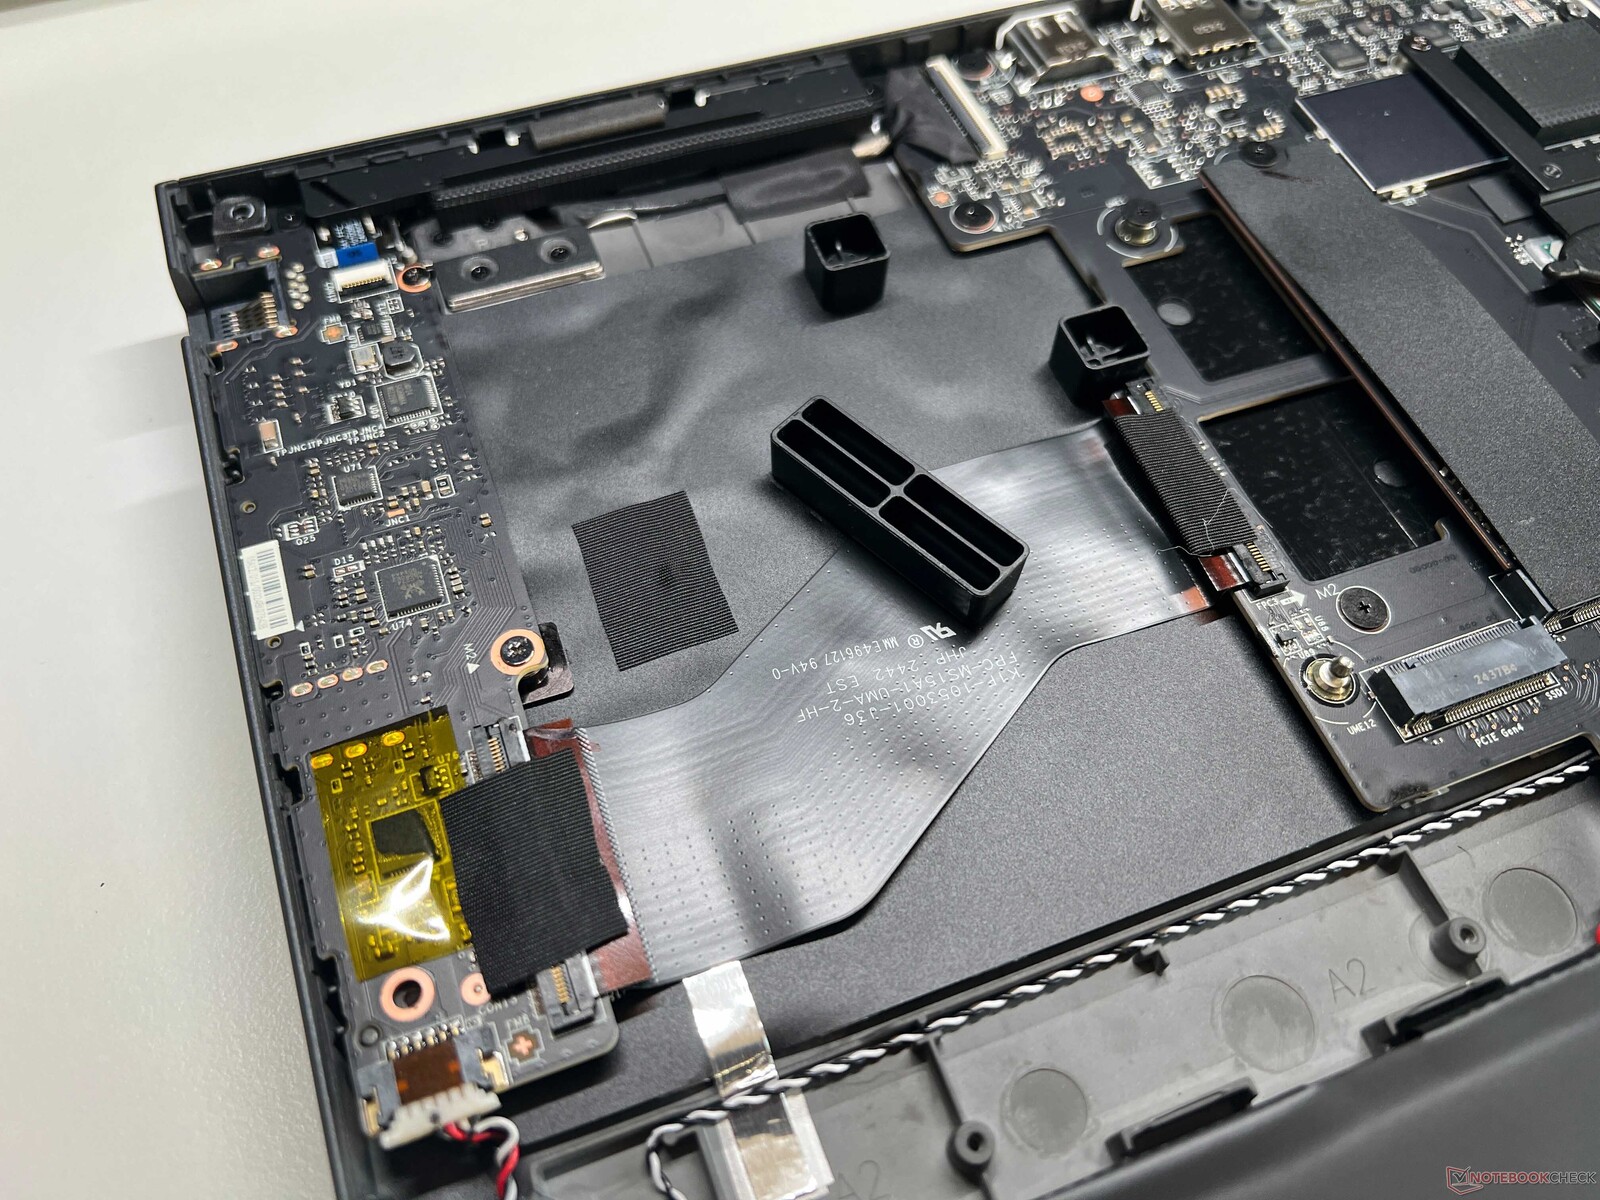
The bottom case cover is screwed on and can be easily removed. Inside, you have access to the fan, the battery and the two M.2 2280 SSDs, but the remaining components are all soldered on. In addition to the large battery (99.9 Wh), the unused area on the right-hand side of the case stands out.
Sustainability
The manufacturer hasn't provided any information on the CO2 footprint created during the laptop's production or the proportion of recycled materials that are used. Still, its packaging is mainly made of paper. Repair guides are not available.
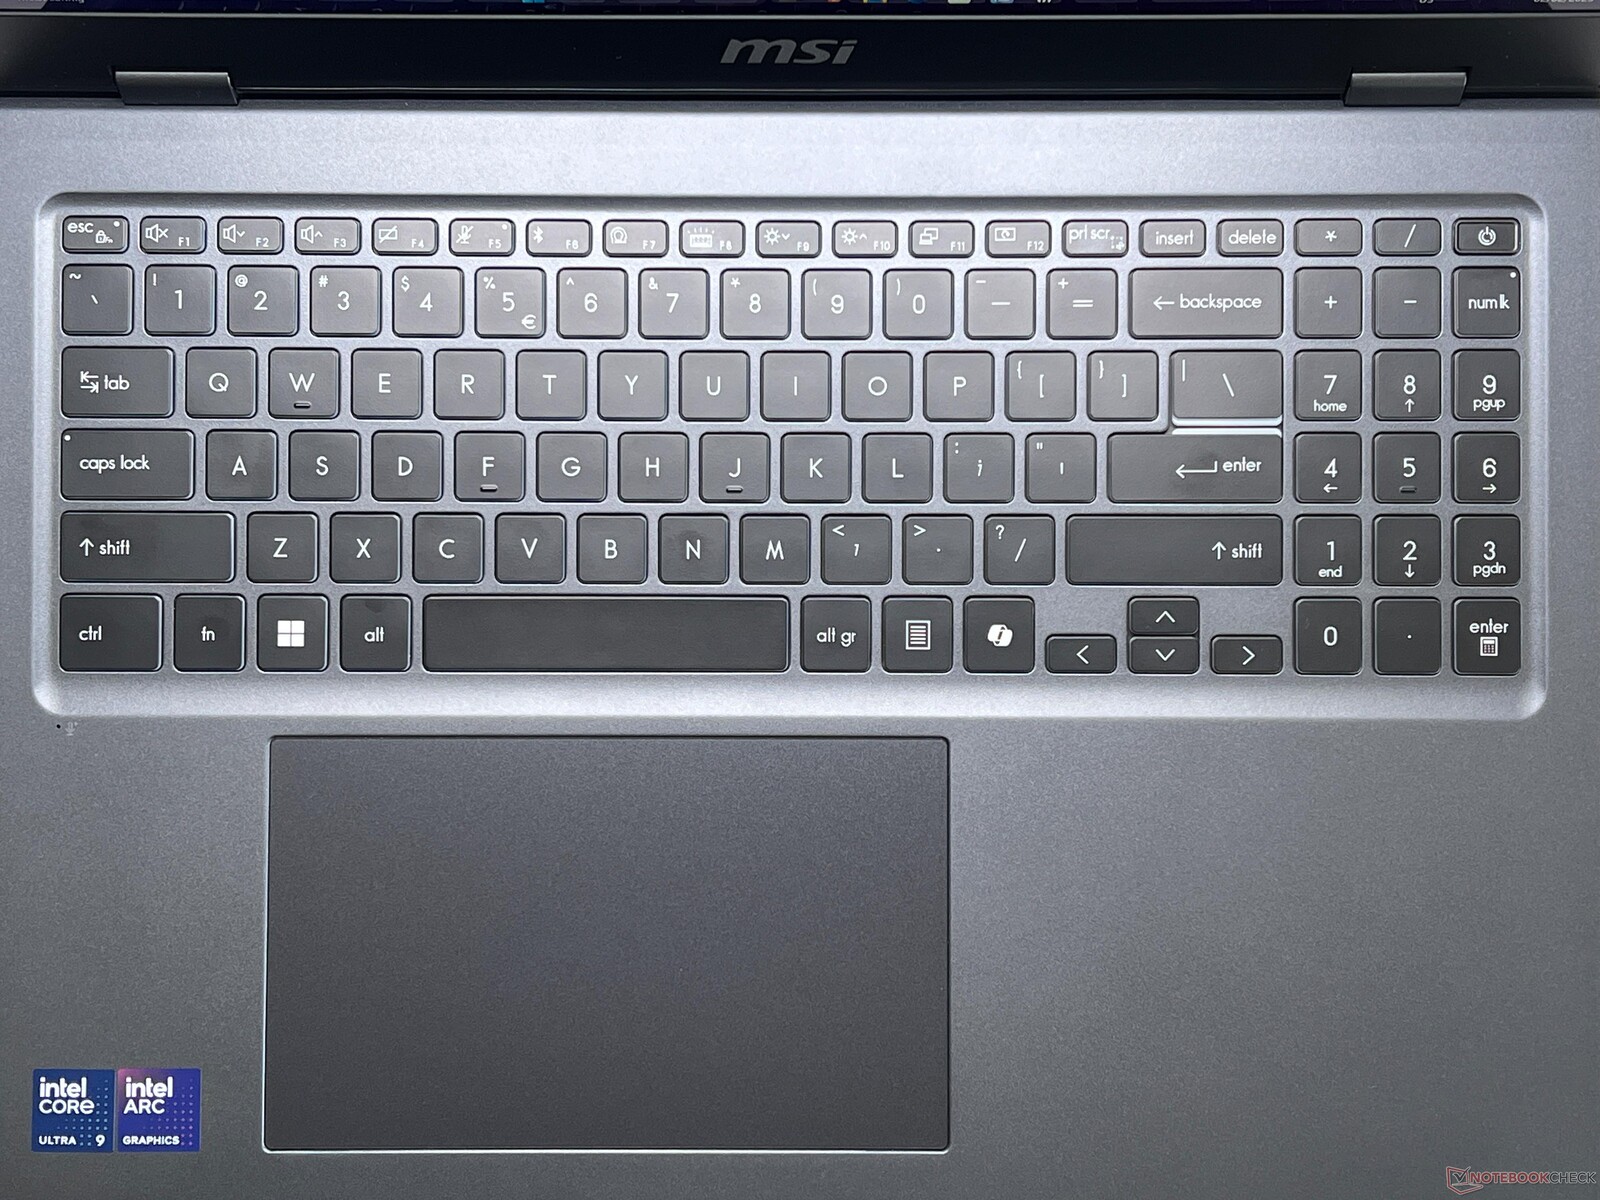
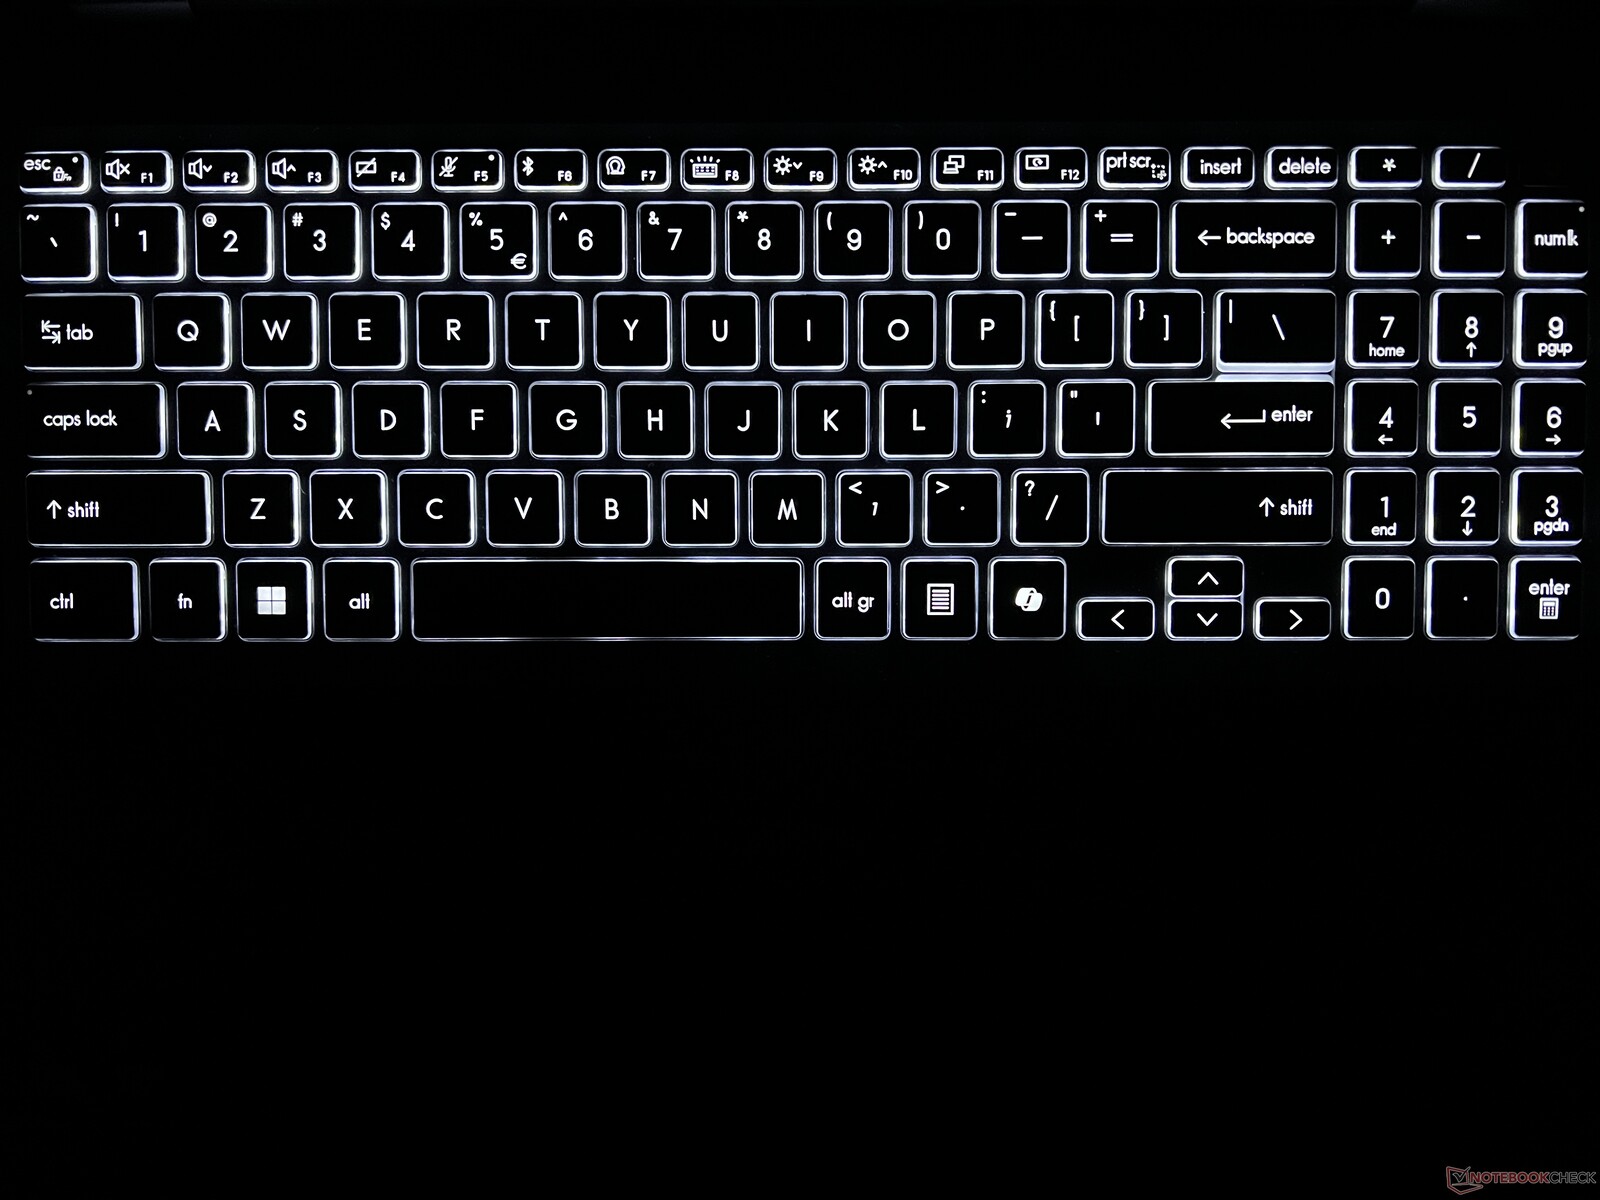
Input devices - Comfortable keyboard
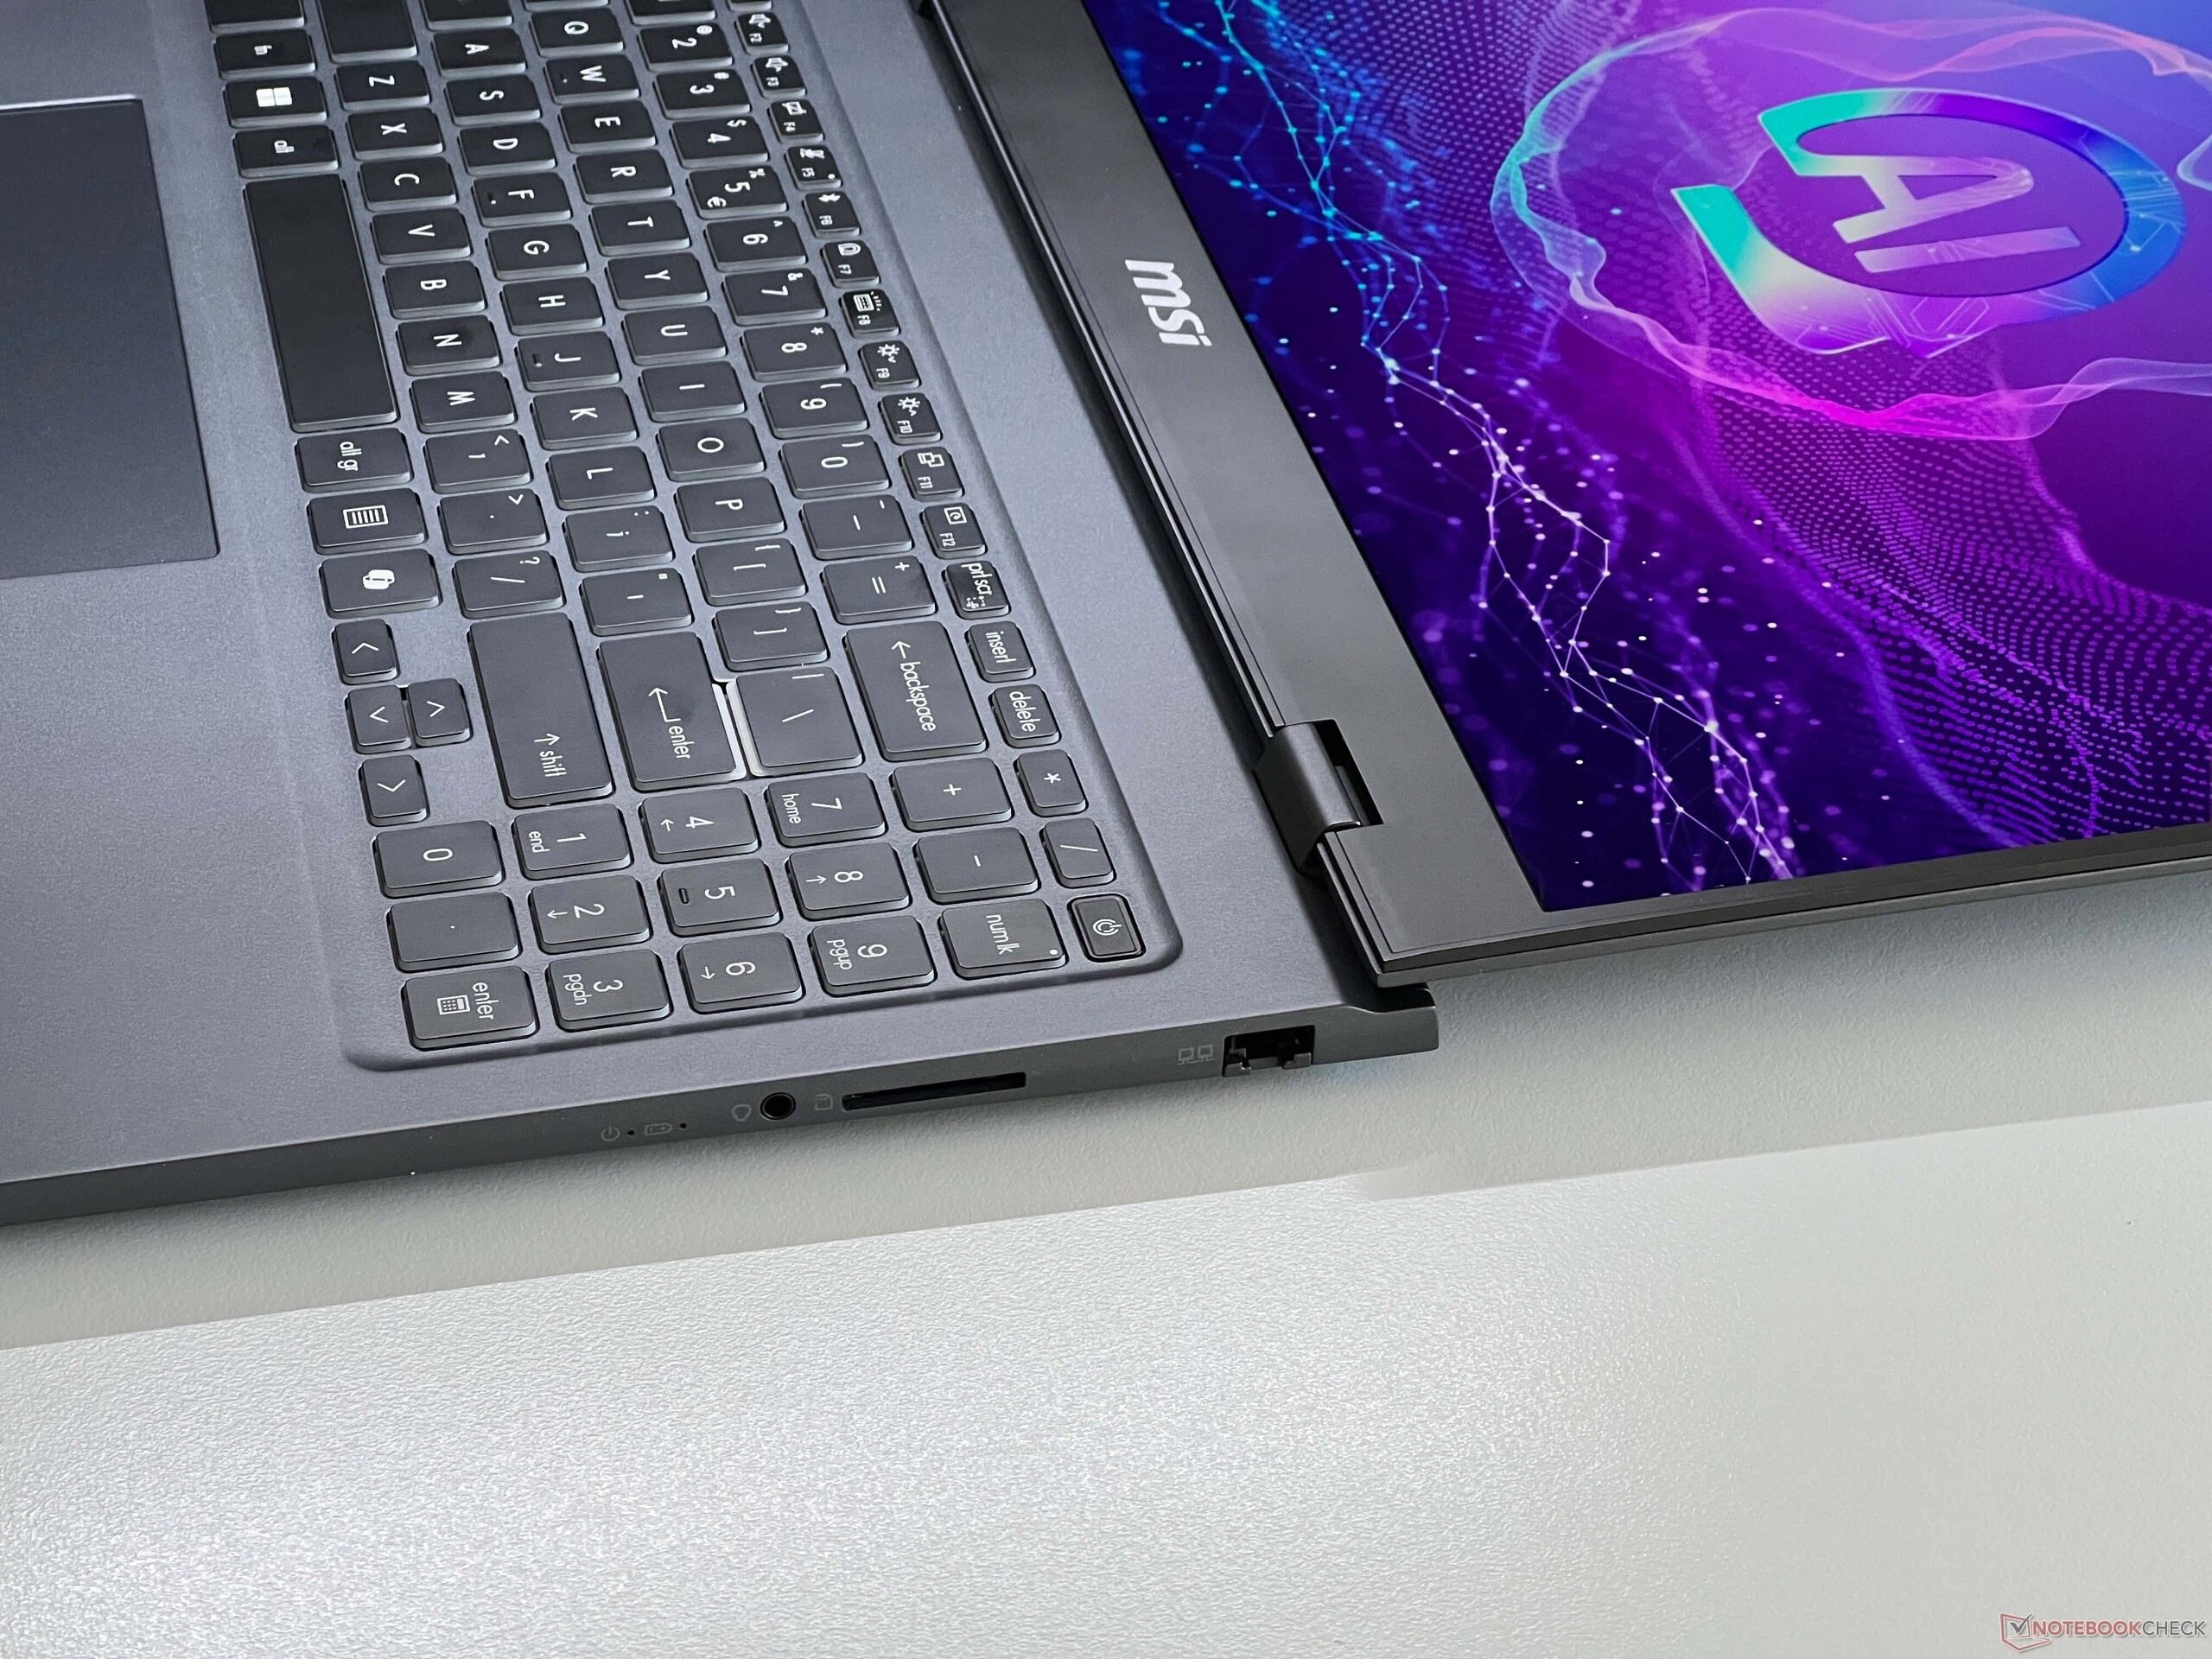
The Prestige is equipped with a comfortable keyboard with white backlighting that can be activated automatically via a sensor. Its key travel is sufficient and the keystrokes aren't too loud. You can write longer texts without any problems, and the keyboard even features a dedicated numeric keypad. The power button at the top right also acts as a fingerprint scanner.
The ClickPad works smoothly and fingers glide over its surface nicely. At 15 x 9 cm, it is very large and has enough space for gestures. The lower area of the pad can be pressed down, but this is met with loud clicking noises. The entire ClickPad isn't centered in the base unit, but is rather shifted to the left.
Display - WQHD IPS at 60 Hz
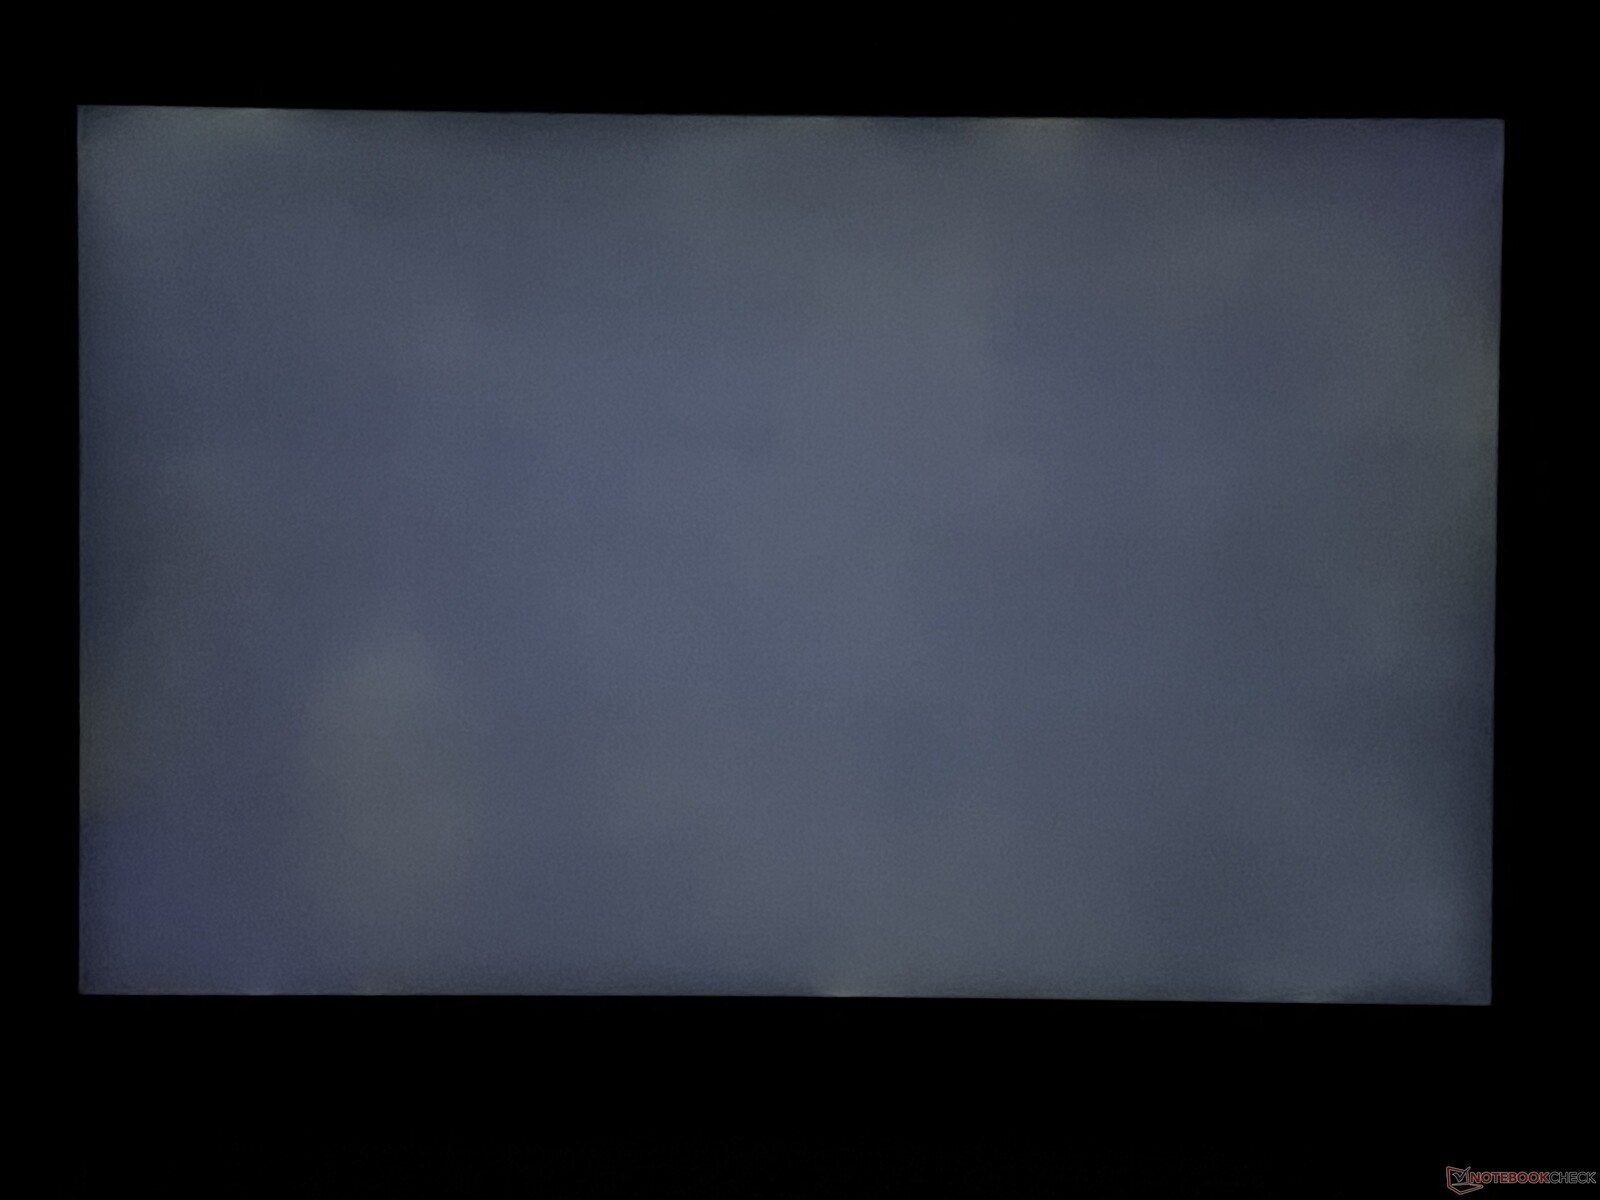
Our test device is kitted out with a 16-inch IPS display with a resolution of 2,560 x 1,600 pixels, a 16:10 aspect ratio and a frequency of 60 Hz. Subjectively, the reflective panel's picture quality is good, as all content looks sharp and colors appear vivid. It doesn't use PWM flickering, but its response times are quite slow and there are visible ghosting effects. However, backlight bleeding doesn't seem to be a major issue on this device and is only visible at high brightness levels on a dark background. The brightness can be adjusted automatically, but the color temperature can't.
Its maximum brightness is ~450 cd/m² on average and together with its low black level of 0.2 cd/m², this results in a very high maximum contrast ratio of more than 2,000:1.
| |||||||||||||||||||||||||
Brightness Distribution: 92 %
Center on Battery: 471 cd/m²
Contrast: 2355:1 (Black: 0.2 cd/m²)
ΔE ColorChecker Calman: 5.8 | ∀{0.5-29.43 Ø4.72}
calibrated: 1.9
ΔE Greyscale Calman: 7.8 | ∀{0.09-98 Ø4.97}
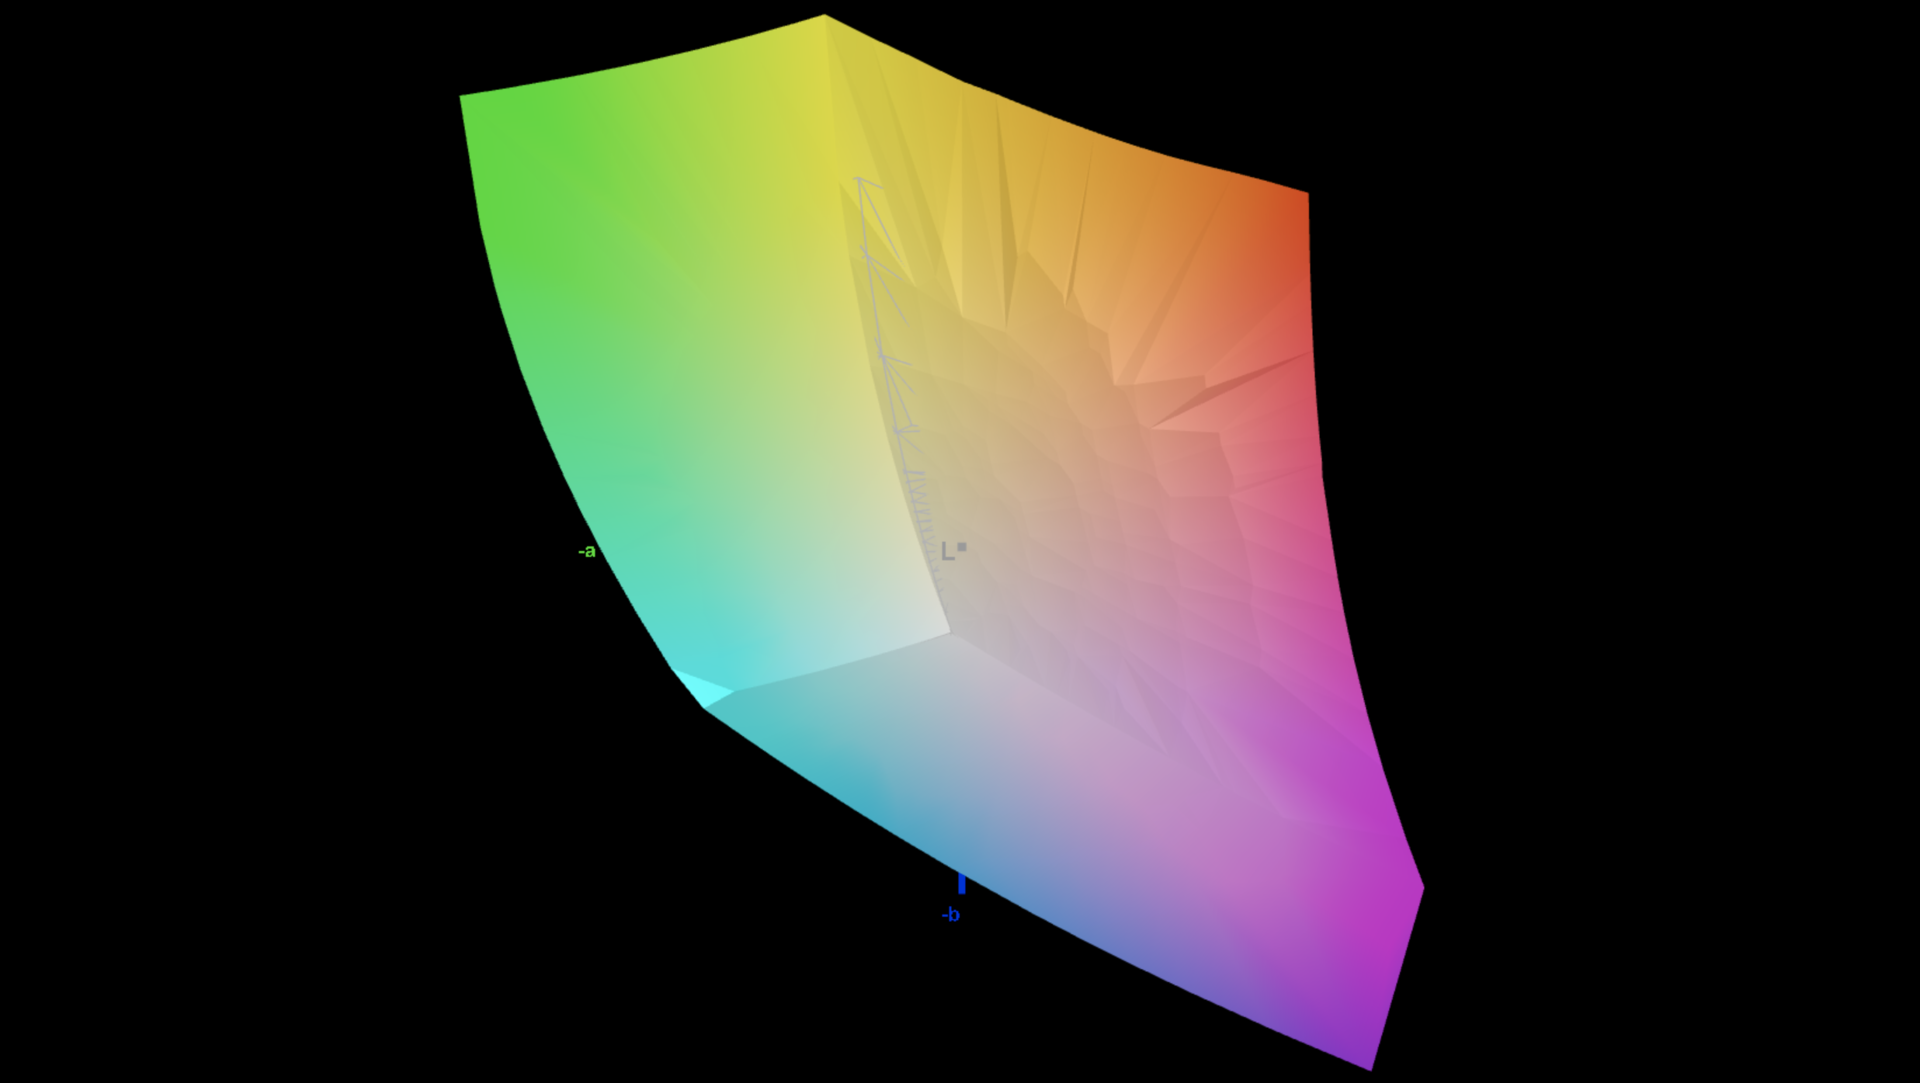
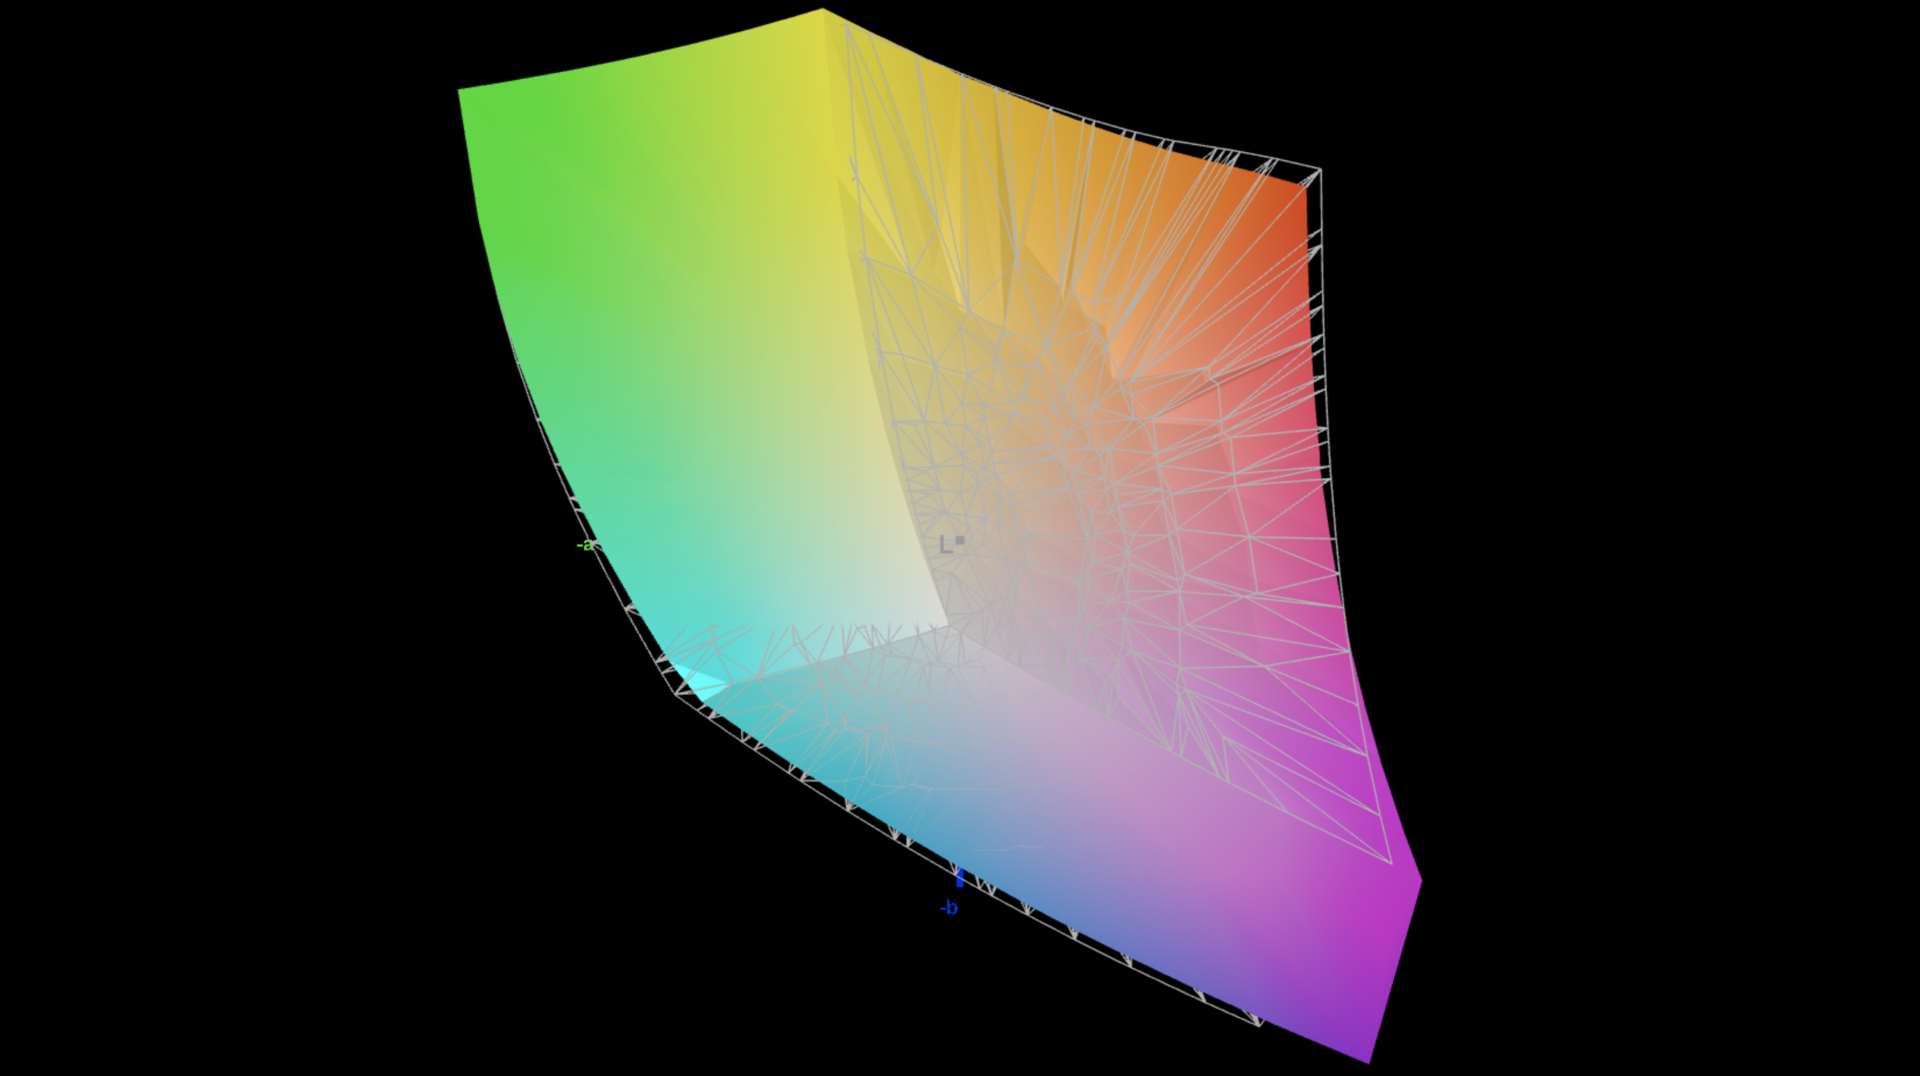
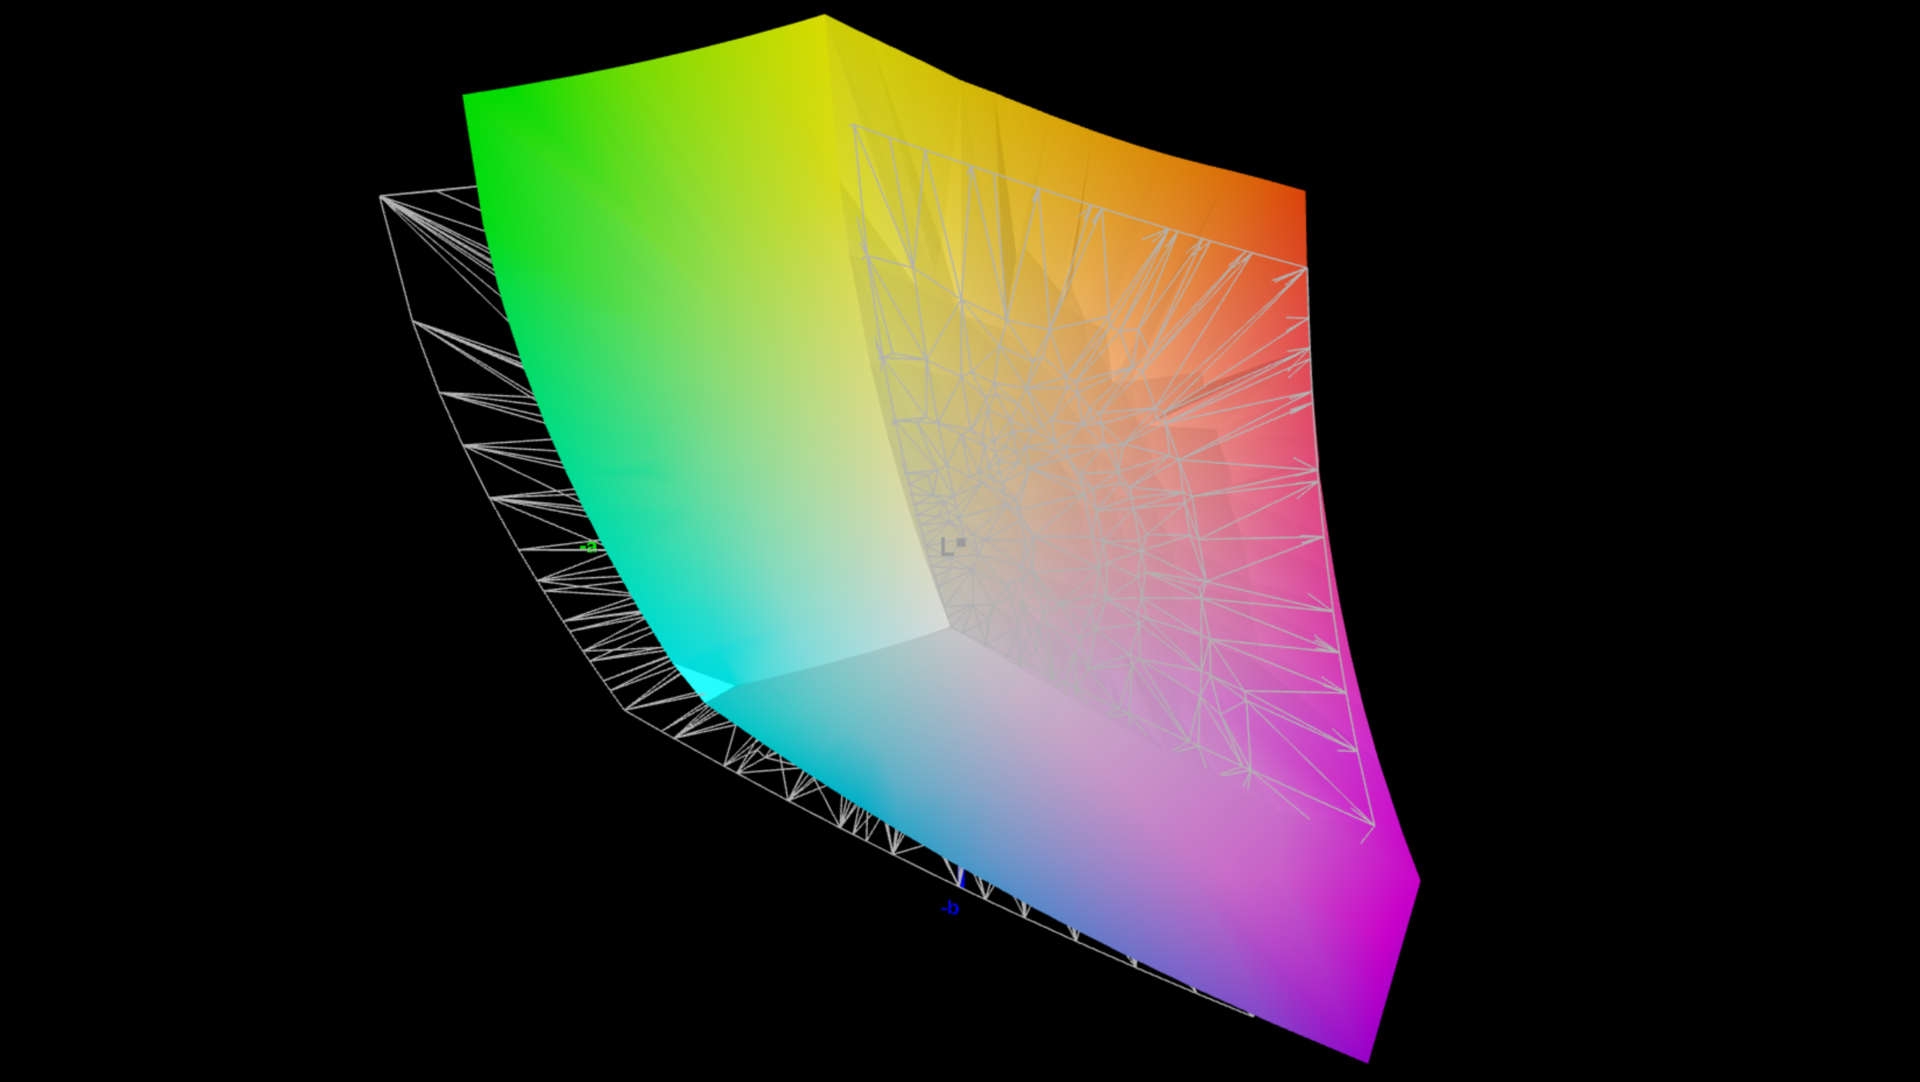
84.3% AdobeRGB 1998 (Argyll 3D)
99.7% sRGB (Argyll 3D)
96.4% Display P3 (Argyll 3D)
Gamma: 2.07
CCT: 7262 K
| MSI Prestige 16 AI Evo B2HMG B160QAN03_R, IPS, 2560x1600, 16", 60 Hz | Lenovo ThinkBook 16 G7+ AMD LEN160-3.2K, IPS, 3200x2000, 16", 165 Hz | MSI Prestige A16 AI+ A3HMG-036 AUO28B2 (B160QAN02.N), IPS, 2560x1600, 16", 165 Hz | Apple MacBook Pro 16 2024 M4 Pro Mini-LED, 3456x2234, 16.2", 120 Hz | Asus Zenbook S 16 UM5606-RK333W ATNA60CL10-0, OLED, 2880x1800, 16", 120 Hz | Samsung Galaxy Book4 Pro 16 ATNA60CL07-0, OLED, 2880x1800, 16", 120 Hz | |
|---|---|---|---|---|---|---|
| Display | 1% | -1% | 3% | 6% | 6% | |
| Display P3 Coverage (%) | 96.4 | 96.3 0% | 94.6 -2% | 99.7 3% | 99.9 4% | 99.5 3% |
| sRGB Coverage (%) | 99.7 | 100 0% | 99.7 0% | 100 0% | 100 0% | 100 0% |
| AdobeRGB 1998 Coverage (%) | 84.3 | 86.9 3% | 83.4 -1% | 88.8 5% | 95.6 13% | 97.5 16% |
| Response Times | 74% | 72% | -27% | 98% | 98% | |
| Response Time Grey 50% / Grey 80% * (ms) | 51.5 ? | 13.9 ? 73% | 5.6 ? 89% | 43 ? 17% | 0.56 ? 99% | 0.64 ? 99% |
| Response Time Black / White * (ms) | 24.3 ? | 6.3 ? 74% | 11.2 ? 54% | 41.2 ? -70% | 0.65 ? 97% | 0.68 ? 97% |
| PWM Frequency (Hz) | 14880 | 480 | 240 ? | |||
| PWM Amplitude * (%) | 90 | 30 | ||||
| Screen | 18% | 3% | 57% | 138% | 37% | |
| Brightness middle (cd/m²) | 471 | 422 -10% | 488 4% | 632 34% | 407 -14% | 385 -18% |
| Brightness (cd/m²) | 455 | 403 -11% | 444 -2% | 616 35% | 405 -11% | 391 -14% |
| Brightness Distribution (%) | 92 | 93 1% | 86 -7% | 95 3% | 97 5% | 97 5% |
| Black Level * (cd/m²) | 0.2 | 0.3 -50% | 0.36 -80% | 0.02 90% | ||
| Contrast (:1) | 2355 | 1407 -40% | 1356 -42% | 20350 764% | ||
| Colorchecker dE 2000 * | 5.8 | 1.7 71% | 3.45 41% | 0.6 90% | 0.6 90% | 1.1 81% |
| Colorchecker dE 2000 max. * | 10.8 | 3.4 69% | 6.77 37% | 1.2 89% | 1.2 89% | 1.8 83% |
| Colorchecker dE 2000 calibrated * | 1.9 | 0.7 63% | 1.35 29% | |||
| Greyscale dE 2000 * | 7.8 | 2.4 69% | 4.16 47% | 0.8 90% | 0.5 94% | 1.4 82% |
| Gamma | 2.07 106% | 2.19 100% | 2.52 87% | 2.21 100% | 2.2 100% | 2.24 98% |
| CCT | 7262 90% | 6989 93% | 6832 95% | 6450 101% | 6453 101% | 6444 101% |
| Total Average (Program / Settings) | 31% /
22% | 25% /
12% | 11% /
27% | 81% /
102% | 47% /
39% |
* ... smaller is better

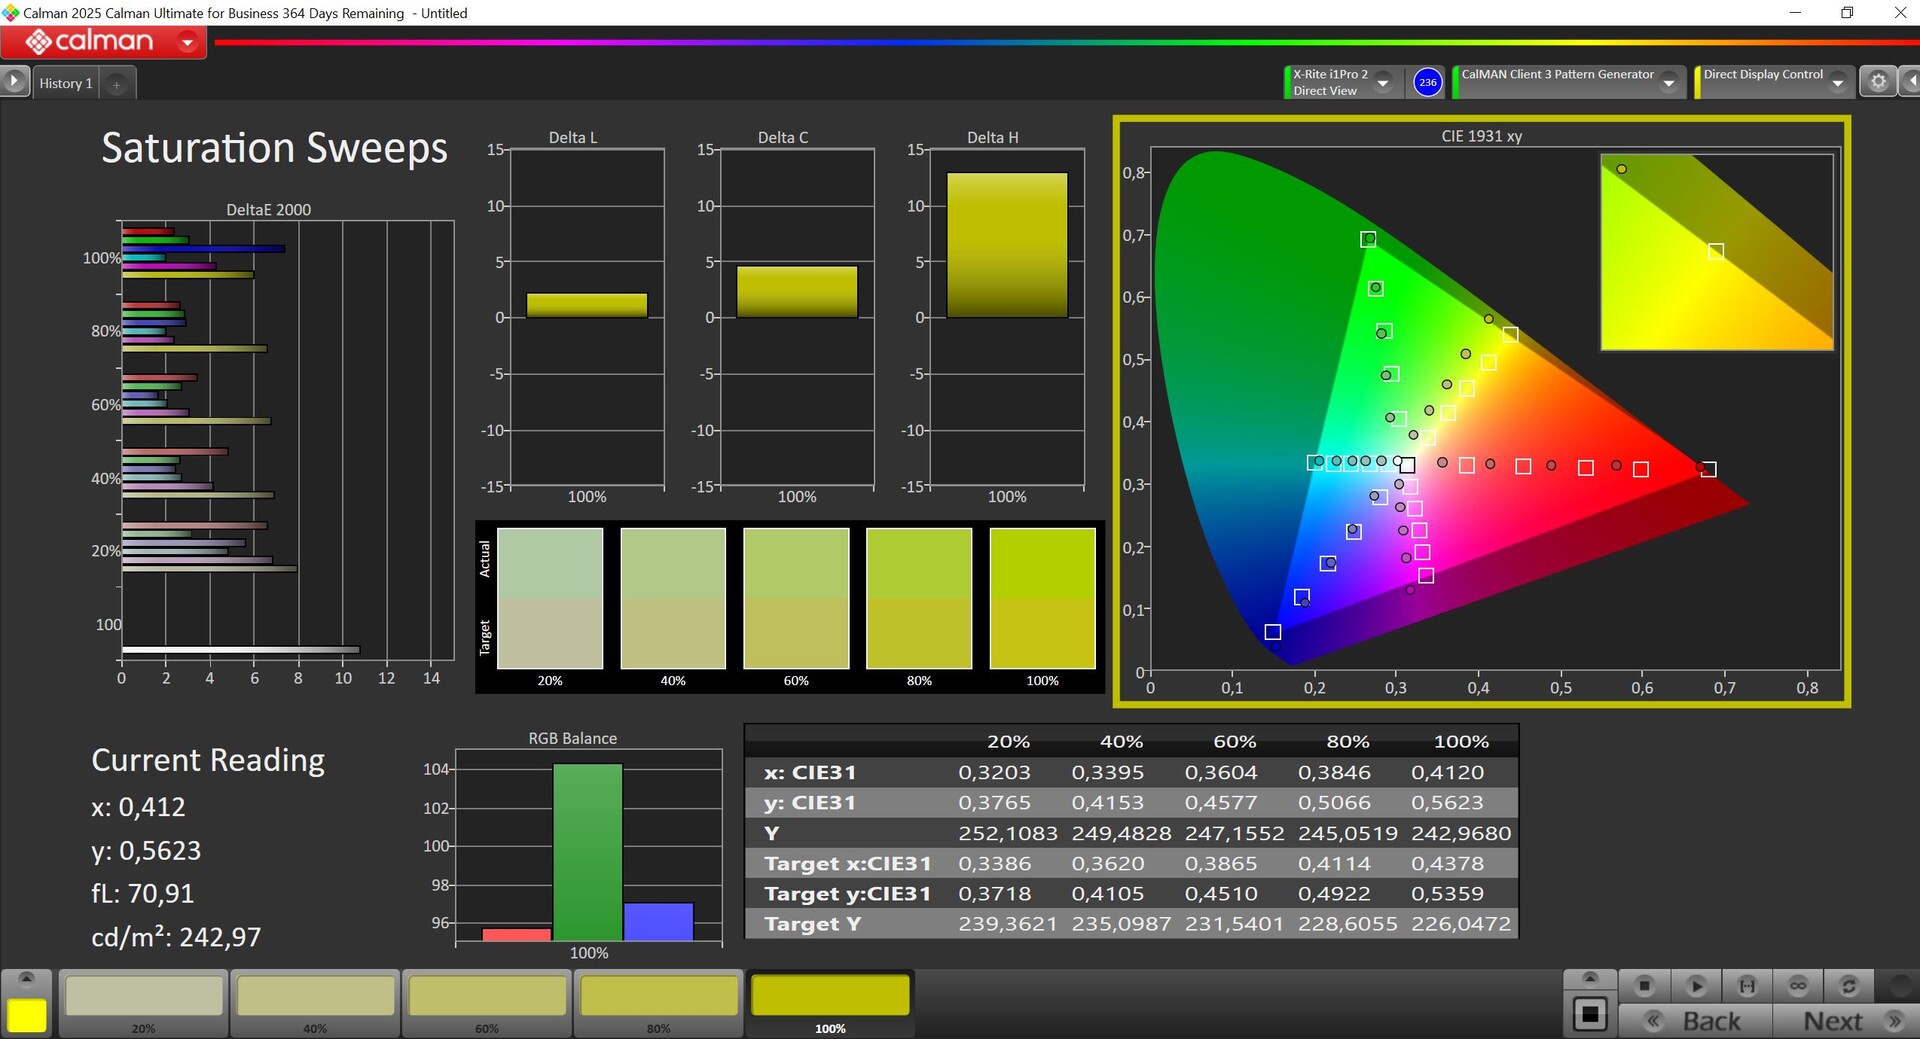


We tested the display using the professional CalMAN software, and its factory profile isn't particularly accurate; we noted a clear blue cast combined with a color temperature that was too cool. However, there is a possibility that the devices will be delivered with an optimized profile, as we were able to significantly improve the display with our own calibration. Even so, there were still some color outliers. The P3 color space is almost completely covered.
Display Response Times
| ↔ Response Time Black to White | ||
|---|---|---|
| 24.3 ms ... rise ↗ and fall ↘ combined | ↗ 8.7 ms rise | 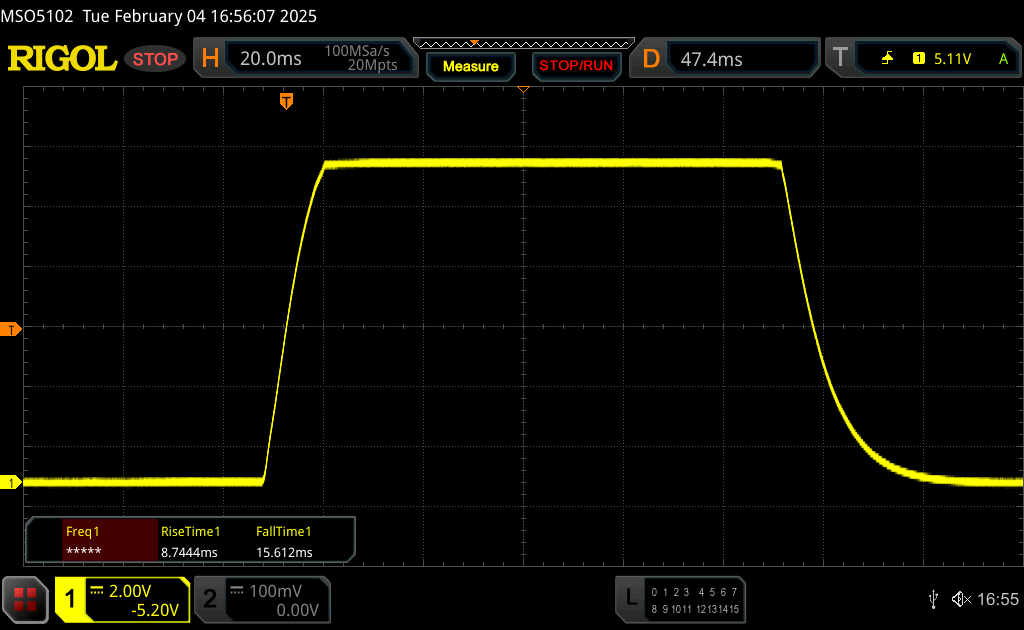 |
| ↘ 15.6 ms fall | ||
| The screen shows good response rates in our tests, but may be too slow for competitive gamers. In comparison, all tested devices range from 0.1 (minimum) to 240 (maximum) ms. » 58 % of all devices are better. This means that the measured response time is worse than the average of all tested devices (19.8 ms). | ||
| ↔ Response Time 50% Grey to 80% Grey | ||
| 51.5 ms ... rise ↗ and fall ↘ combined | ↗ 23.1 ms rise | 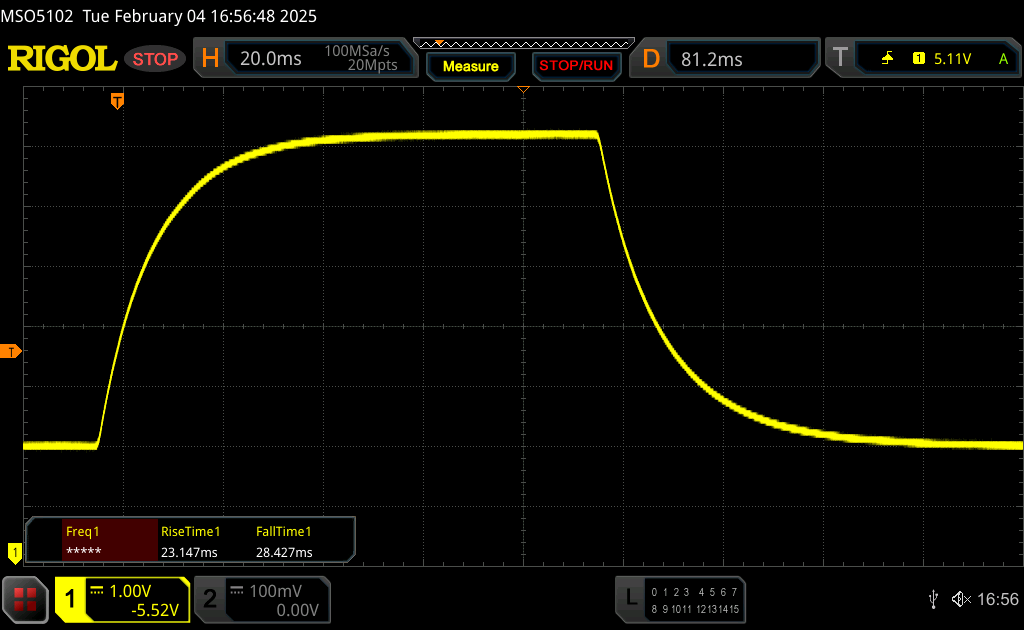 |
| ↘ 28.4 ms fall | ||
| The screen shows slow response rates in our tests and will be unsatisfactory for gamers. In comparison, all tested devices range from 0.165 (minimum) to 636 (maximum) ms. » 88 % of all devices are better. This means that the measured response time is worse than the average of all tested devices (31 ms). | ||
Screen Flickering / PWM (Pulse-Width Modulation)
| Screen flickering / PWM not detected |  | ||
In comparison: 52 % of all tested devices do not use PWM to dim the display. If PWM was detected, an average of 7747 (minimum: 5 - maximum: 343500) Hz was measured. | |||


The highly reflective display becomes an issue outdoors; you can only work reasonably if you're seated in the shade. In bright surroundings, on the other hand, reflections are simply too strong. The IPS panel's viewing-angle stability is good.

Performance - Arrow Lake-H at 115 watts
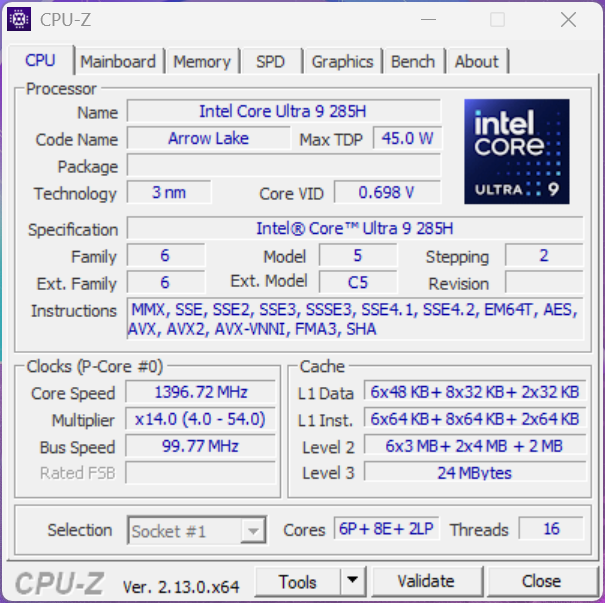
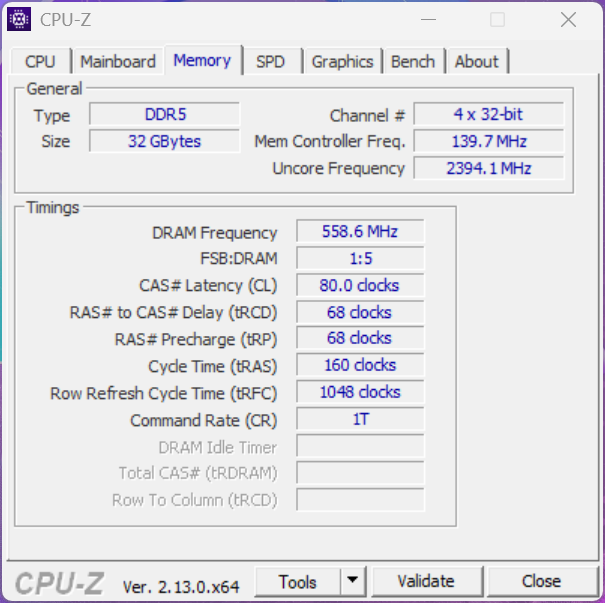
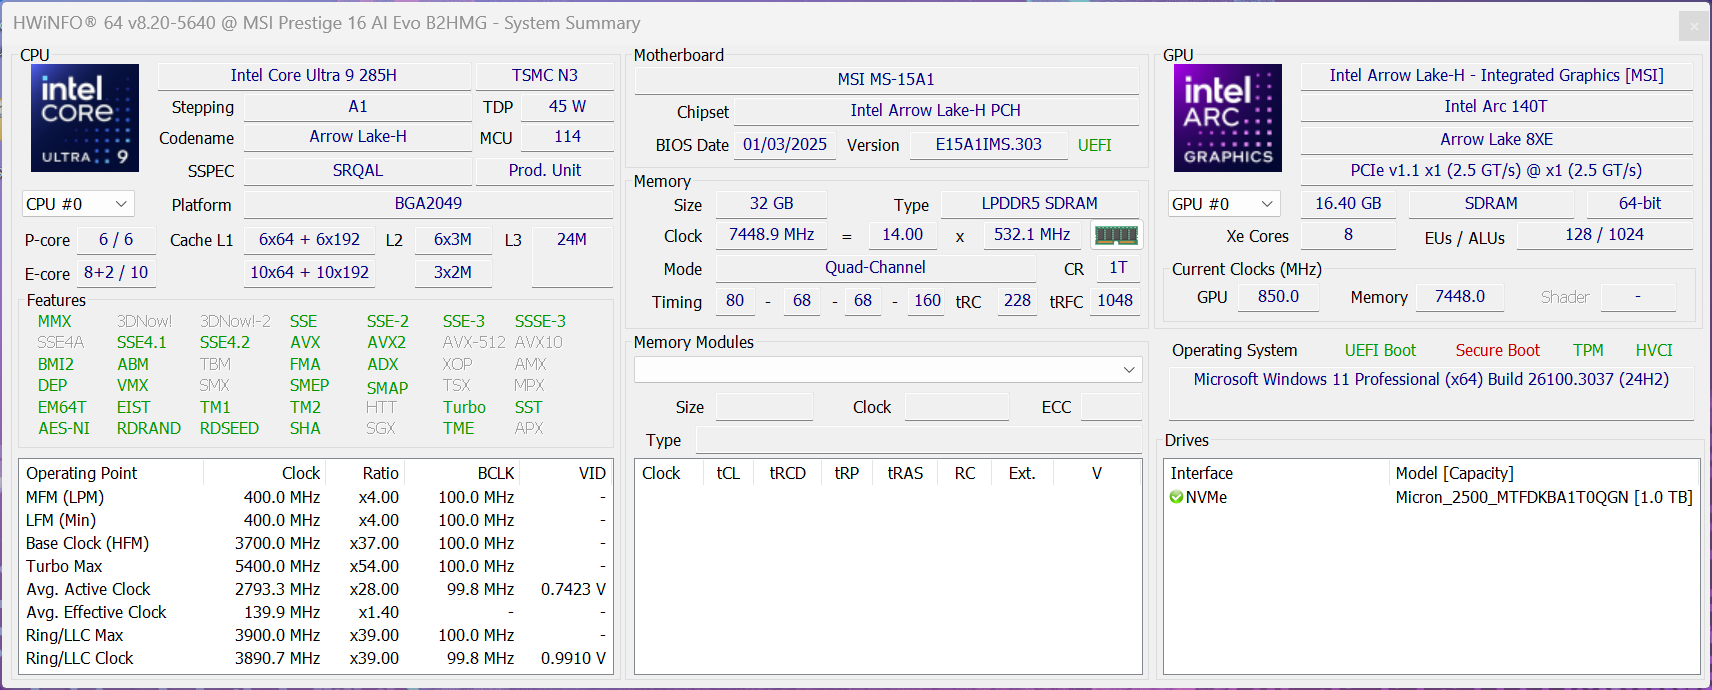
The MSI Prestige 16 AI Evo is equipped with the new Arrow Lake H mobile processors (Core Ultra 200). Our test device comes with 32 GB RAM (LPDDR5x-7500), which can't be upgraded. Dedicated graphics cards are not offered by MSI.
Testing conditions
Multiple energy profiles are available to choose from in the pre-installed MSI Center (Eco Silent, Balanced & Extreme Performance). There is also an AI mode, but this produces fluctuating results. We deactivated the AI engine and carried out the following benchmarks and measurements using Balanced mode, which is activated by default.
| Energy profile | CPU TDP | Cinebench 2024 Multi | Time Spy Graphics | max. fan noise emissions |
|---|---|---|---|---|
| Eco Silent | 20/15 watts | 449 points | 2,595 points | 31 dB(A) |
| Balanced | 115/45 watts | 991 points | 4,194 points | 42.1 dB(A) |
| Extreme Performance | 115/55 watts | 1,075 points | 4,094 points | 46.4 dB(A) |
Processor - Core Ultra 9 285H
The Core Ultra 9 285H is the new top-of-the-range model from Intel's Arrow Lake H series (Core Ultra 200) and the direct successor to the Meteor Lake generation. It has a total of 16 CPU cores (22 threads), with the six fast performance cores (including hyper-threading) reaching a clock speed of up to 5.4 GHz. Further technical details and efficiency comparisons are available in our analysis article.
Inside the Prestige 16, the processor consumed a maximum of 115 watts for a short time, but its power consumption dropped slowly under continuous load and then stabilized at 45 watts during our test. Its multi-core performance naturally benefitted from this, especially during short load phases, but its performance dropped by 30% under continuous load. Overall, however, the test device was still able to place itself ahead of competitors with the Core Ultra 9 185H in our multi-core tests, although the power limits were higher there. In the single-core tests, its performance was 12-14% higher, but the Core Ultra 9 285H couldn't come close to the current M4 chips from Apple. The processor consumes a maximum of 42 watts in battery mode. Further benchmarks are available in our tech section.
Cinebench R15 Multi continuous test
Cinebench R23: Multi Core | Single Core
Cinebench R20: CPU (Multi Core) | CPU (Single Core)
Cinebench R15: CPU Multi 64Bit | CPU Single 64Bit
Blender: v2.79 BMW27 CPU
7-Zip 18.03: 7z b 4 | 7z b 4 -mmt1
Geekbench 6.7: Multi-Core | Single-Core
Geekbench 5.5: Multi-Core | Single-Core
HWBOT x265 Benchmark v2.2: 4k Preset
LibreOffice : 20 Documents To PDF
R Benchmark 2.5: Overall mean
| CPU Performance rating | |
| Apple MacBook Pro 16 2024 M4 Pro -12! | |
| MSI Prestige 16 AI Evo B2HMG | |
| Average Intel Core Ultra 9 285H | |
| Lenovo Yoga Pro 9 16IMH9 | |
| Lenovo ThinkBook 16 G7+ AMD | |
| Dell Precision 5690 | |
| MSI Prestige A16 AI+ A3HMG-036 | |
| Asus Zenbook S 16 UM5606-RK333W | |
| Average of class Multimedia | |
| Samsung Galaxy Book4 Pro 16 | |
| Cinebench R23 / Multi Core | |
| Apple MacBook Pro 16 2024 M4 Pro | |
| MSI Prestige 16 AI Evo B2HMG | |
| Average Intel Core Ultra 9 285H (15070 - 23576, n=12) | |
| Lenovo Yoga Pro 9 16IMH9 | |
| Dell Precision 5690 | |
| MSI Prestige A16 AI+ A3HMG-036 | |
| Lenovo ThinkBook 16 G7+ AMD | |
| Average of class Multimedia (4861 - 33362, n=77, last 2 years) | |
| Asus Zenbook S 16 UM5606-RK333W | |
| Samsung Galaxy Book4 Pro 16 | |
| Cinebench R23 / Single Core | |
| Apple MacBook Pro 16 2024 M4 Pro | |
| MSI Prestige 16 AI Evo B2HMG | |
| Average Intel Core Ultra 9 285H (1979 - 2166, n=12) | |
| Lenovo ThinkBook 16 G7+ AMD | |
| MSI Prestige A16 AI+ A3HMG-036 | |
| Asus Zenbook S 16 UM5606-RK333W | |
| Average of class Multimedia (1128 - 2459, n=69, last 2 years) | |
| Lenovo Yoga Pro 9 16IMH9 | |
| Dell Precision 5690 | |
| Samsung Galaxy Book4 Pro 16 | |
| Cinebench R20 / CPU (Multi Core) | |
| MSI Prestige 16 AI Evo B2HMG | |
| Average Intel Core Ultra 9 285H (5861 - 9208, n=12) | |
| Lenovo Yoga Pro 9 16IMH9 | |
| Dell Precision 5690 | |
| Lenovo ThinkBook 16 G7+ AMD | |
| MSI Prestige A16 AI+ A3HMG-036 | |
| Asus Zenbook S 16 UM5606-RK333W | |
| Average of class Multimedia (1887 - 12912, n=60, last 2 years) | |
| Samsung Galaxy Book4 Pro 16 | |
| Cinebench R20 / CPU (Single Core) | |
| Average Intel Core Ultra 9 285H (761 - 837, n=12) | |
| MSI Prestige 16 AI Evo B2HMG | |
| Lenovo ThinkBook 16 G7+ AMD | |
| MSI Prestige A16 AI+ A3HMG-036 | |
| Asus Zenbook S 16 UM5606-RK333W | |
| Lenovo Yoga Pro 9 16IMH9 | |
| Average of class Multimedia (425 - 853, n=60, last 2 years) | |
| Dell Precision 5690 | |
| Samsung Galaxy Book4 Pro 16 | |
| Cinebench R15 / CPU Multi 64Bit | |
| MSI Prestige 16 AI Evo B2HMG | |
| Dell Precision 5690 | |
| Average Intel Core Ultra 9 285H (2280 - 3496, n=12) | |
| Lenovo Yoga Pro 9 16IMH9 | |
| Lenovo ThinkBook 16 G7+ AMD | |
| MSI Prestige A16 AI+ A3HMG-036 | |
| Average of class Multimedia (856 - 5224, n=64, last 2 years) | |
| Samsung Galaxy Book4 Pro 16 | |
| Asus Zenbook S 16 UM5606-RK333W | |
| Cinebench R15 / CPU Single 64Bit | |
| MSI Prestige 16 AI Evo B2HMG | |
| Average Intel Core Ultra 9 285H (288 - 322, n=12) | |
| Lenovo ThinkBook 16 G7+ AMD | |
| MSI Prestige A16 AI+ A3HMG-036 | |
| Asus Zenbook S 16 UM5606-RK333W | |
| Average of class Multimedia (184.8 - 326, n=62, last 2 years) | |
| Lenovo Yoga Pro 9 16IMH9 | |
| Dell Precision 5690 | |
| Samsung Galaxy Book4 Pro 16 | |
| Blender / v2.79 BMW27 CPU | |
| Average of class Multimedia (100 - 557, n=61, last 2 years) | |
| Samsung Galaxy Book4 Pro 16 | |
| Dell Precision 5690 | |
| MSI Prestige A16 AI+ A3HMG-036 | |
| MSI Prestige 16 AI Evo B2HMG | |
| Asus Zenbook S 16 UM5606-RK333W | |
| Average Intel Core Ultra 9 285H (151 - 235, n=12) | |
| Lenovo ThinkBook 16 G7+ AMD | |
| Lenovo Yoga Pro 9 16IMH9 | |
| 7-Zip 18.03 / 7z b 4 | |
| Lenovo Yoga Pro 9 16IMH9 | |
| Dell Precision 5690 | |
| Lenovo ThinkBook 16 G7+ AMD | |
| Asus Zenbook S 16 UM5606-RK333W | |
| Average Intel Core Ultra 9 285H (50116 - 71959, n=12) | |
| Samsung Galaxy Book4 Pro 16 | |
| MSI Prestige 16 AI Evo B2HMG | |
| MSI Prestige A16 AI+ A3HMG-036 | |
| Average of class Multimedia (26062 - 130368, n=58, last 2 years) | |
| 7-Zip 18.03 / 7z b 4 -mmt1 | |
| Average Intel Core Ultra 9 285H (5403 - 6419, n=12) | |
| Asus Zenbook S 16 UM5606-RK333W | |
| MSI Prestige A16 AI+ A3HMG-036 | |
| Lenovo ThinkBook 16 G7+ AMD | |
| MSI Prestige 16 AI Evo B2HMG | |
| Average of class Multimedia (3666 - 7545, n=59, last 2 years) | |
| Lenovo Yoga Pro 9 16IMH9 | |
| Samsung Galaxy Book4 Pro 16 | |
| Dell Precision 5690 | |
| Geekbench 6.7 / Multi-Core | |
| Apple MacBook Pro 16 2024 M4 Pro | |
| MSI Prestige 16 AI Evo B2HMG | |
| Average Intel Core Ultra 9 285H (15284 - 17992, n=15) | |
| Average of class Multimedia (4983 - 29415, n=72, last 2 years) | |
| Lenovo ThinkBook 16 G7+ AMD | |
| MSI Prestige A16 AI+ A3HMG-036 | |
| Dell Precision 5690 | |
| Lenovo Yoga Pro 9 16IMH9 | |
| Asus Zenbook S 16 UM5606-RK333W | |
| Samsung Galaxy Book4 Pro 16 | |
| Geekbench 6.7 / Single-Core | |
| Apple MacBook Pro 16 2024 M4 Pro | |
| MSI Prestige 16 AI Evo B2HMG | |
| Average of class Multimedia (1534 - 4335, n=71, last 2 years) | |
| Average Intel Core Ultra 9 285H (2665 - 3110, n=15) | |
| MSI Prestige A16 AI+ A3HMG-036 | |
| Asus Zenbook S 16 UM5606-RK333W | |
| Lenovo ThinkBook 16 G7+ AMD | |
| Lenovo Yoga Pro 9 16IMH9 | |
| Dell Precision 5690 | |
| Samsung Galaxy Book4 Pro 16 | |
| Geekbench 5.5 / Multi-Core | |
| MSI Prestige 16 AI Evo B2HMG | |
| Average Intel Core Ultra 9 285H (13140 - 17487, n=13) | |
| Dell Precision 5690 | |
| Lenovo Yoga Pro 9 16IMH9 | |
| Lenovo ThinkBook 16 G7+ AMD | |
| Average of class Multimedia (4652 - 20422, n=59, last 2 years) | |
| MSI Prestige A16 AI+ A3HMG-036 | |
| Asus Zenbook S 16 UM5606-RK333W | |
| Samsung Galaxy Book4 Pro 16 | |
| Geekbench 5.5 / Single-Core | |
| MSI Prestige 16 AI Evo B2HMG | |
| Asus Zenbook S 16 UM5606-RK333W | |
| Lenovo ThinkBook 16 G7+ AMD | |
| MSI Prestige A16 AI+ A3HMG-036 | |
| Average Intel Core Ultra 9 285H (1689 - 2256, n=13) | |
| Average of class Multimedia (805 - 2974, n=59, last 2 years) | |
| Lenovo Yoga Pro 9 16IMH9 | |
| Dell Precision 5690 | |
| Samsung Galaxy Book4 Pro 16 | |
| HWBOT x265 Benchmark v2.2 / 4k Preset | |
| MSI Prestige 16 AI Evo B2HMG | |
| Average Intel Core Ultra 9 285H (17.9 - 27.2, n=12) | |
| Lenovo Yoga Pro 9 16IMH9 | |
| Lenovo ThinkBook 16 G7+ AMD | |
| Dell Precision 5690 | |
| Asus Zenbook S 16 UM5606-RK333W | |
| MSI Prestige A16 AI+ A3HMG-036 | |
| Average of class Multimedia (5.26 - 36.1, n=59, last 2 years) | |
| Samsung Galaxy Book4 Pro 16 | |
| LibreOffice / 20 Documents To PDF | |
| MSI Prestige A16 AI+ A3HMG-036 | |
| Lenovo ThinkBook 16 G7+ AMD | |
| Asus Zenbook S 16 UM5606-RK333W | |
| Average of class Multimedia (23.9 - 146.7, n=60, last 2 years) | |
| Average Intel Core Ultra 9 285H (39.4 - 56.1, n=12) | |
| MSI Prestige 16 AI Evo B2HMG | |
| Dell Precision 5690 | |
| Samsung Galaxy Book4 Pro 16 | |
| Lenovo Yoga Pro 9 16IMH9 | |
| R Benchmark 2.5 / Overall mean | |
| Samsung Galaxy Book4 Pro 16 | |
| Average of class Multimedia (0.3604 - 0.947, n=59, last 2 years) | |
| Dell Precision 5690 | |
| Lenovo Yoga Pro 9 16IMH9 | |
| MSI Prestige 16 AI Evo B2HMG | |
| Average Intel Core Ultra 9 285H (0.4079 - 0.4794, n=12) | |
| Asus Zenbook S 16 UM5606-RK333W | |
| Lenovo ThinkBook 16 G7+ AMD | |
| MSI Prestige A16 AI+ A3HMG-036 | |
* ... smaller is better
AIDA64: FP32 Ray-Trace | FPU Julia | CPU SHA3 | CPU Queen | FPU SinJulia | FPU Mandel | CPU AES | CPU ZLib | FP64 Ray-Trace | CPU PhotoWorxx
| Performance rating | |
| Lenovo ThinkBook 16 G7+ AMD | |
| MSI Prestige A16 AI+ A3HMG-036 | |
| Asus Zenbook S 16 UM5606-RK333W | |
| Average Intel Core Ultra 9 285H | |
| MSI Prestige 16 AI Evo B2HMG | |
| Average of class Multimedia | |
| Samsung Galaxy Book4 Pro 16 | |
| AIDA64 / FP32 Ray-Trace | |
| Lenovo ThinkBook 16 G7+ AMD | |
| MSI Prestige A16 AI+ A3HMG-036 | |
| Asus Zenbook S 16 UM5606-RK333W | |
| Average Intel Core Ultra 9 285H (13687 - 24612, n=14) | |
| MSI Prestige 16 AI Evo B2HMG | |
| Average of class Multimedia (2214 - 50388, n=56, last 2 years) | |
| Samsung Galaxy Book4 Pro 16 | |
| AIDA64 / FPU Julia | |
| Lenovo ThinkBook 16 G7+ AMD | |
| MSI Prestige A16 AI+ A3HMG-036 | |
| Average Intel Core Ultra 9 285H (54365 - 129641, n=14) | |
| Asus Zenbook S 16 UM5606-RK333W | |
| MSI Prestige 16 AI Evo B2HMG | |
| Average of class Multimedia (12867 - 201874, n=57, last 2 years) | |
| Samsung Galaxy Book4 Pro 16 | |
| AIDA64 / CPU SHA3 | |
| Lenovo ThinkBook 16 G7+ AMD | |
| Average Intel Core Ultra 9 285H (3473 - 5879, n=14) | |
| MSI Prestige A16 AI+ A3HMG-036 | |
| Asus Zenbook S 16 UM5606-RK333W | |
| MSI Prestige 16 AI Evo B2HMG | |
| Average of class Multimedia (626 - 8623, n=57, last 2 years) | |
| Samsung Galaxy Book4 Pro 16 | |
| AIDA64 / CPU Queen | |
| MSI Prestige A16 AI+ A3HMG-036 | |
| Lenovo ThinkBook 16 G7+ AMD | |
| Asus Zenbook S 16 UM5606-RK333W | |
| Samsung Galaxy Book4 Pro 16 | |
| Average of class Multimedia (13483 - 181505, n=44, last 2 years) | |
| MSI Prestige 16 AI Evo B2HMG | |
| Average Intel Core Ultra 9 285H (53557 - 67363, n=12) | |
| AIDA64 / FPU SinJulia | |
| Asus Zenbook S 16 UM5606-RK333W | |
| Lenovo ThinkBook 16 G7+ AMD | |
| MSI Prestige A16 AI+ A3HMG-036 | |
| Samsung Galaxy Book4 Pro 16 | |
| Average of class Multimedia (886 - 28794, n=57, last 2 years) | |
| Average Intel Core Ultra 9 285H (6921 - 9378, n=14) | |
| MSI Prestige 16 AI Evo B2HMG | |
| AIDA64 / FPU Mandel | |
| Lenovo ThinkBook 16 G7+ AMD | |
| MSI Prestige A16 AI+ A3HMG-036 | |
| Average Intel Core Ultra 9 285H (38174 - 64632, n=14) | |
| Asus Zenbook S 16 UM5606-RK333W | |
| MSI Prestige 16 AI Evo B2HMG | |
| Average of class Multimedia (6395 - 105740, n=56, last 2 years) | |
| Samsung Galaxy Book4 Pro 16 | |
| AIDA64 / CPU AES | |
| Average Intel Core Ultra 9 285H (58110 - 117613, n=14) | |
| Samsung Galaxy Book4 Pro 16 | |
| Lenovo ThinkBook 16 G7+ AMD | |
| Asus Zenbook S 16 UM5606-RK333W | |
| MSI Prestige 16 AI Evo B2HMG | |
| MSI Prestige A16 AI+ A3HMG-036 | |
| Average of class Multimedia (8171 - 126790, n=57, last 2 years) | |
| AIDA64 / CPU ZLib | |
| Lenovo ThinkBook 16 G7+ AMD | |
| MSI Prestige A16 AI+ A3HMG-036 | |
| Average Intel Core Ultra 9 285H (574 - 1366, n=14) | |
| Asus Zenbook S 16 UM5606-RK333W | |
| MSI Prestige 16 AI Evo B2HMG | |
| Average of class Multimedia (143.8 - 2022, n=57, last 2 years) | |
| Samsung Galaxy Book4 Pro 16 | |
| AIDA64 / FP64 Ray-Trace | |
| Lenovo ThinkBook 16 G7+ AMD | |
| MSI Prestige A16 AI+ A3HMG-036 | |
| Asus Zenbook S 16 UM5606-RK333W | |
| Average Intel Core Ultra 9 285H (5509 - 13527, n=14) | |
| MSI Prestige 16 AI Evo B2HMG | |
| Average of class Multimedia (1014 - 26875, n=57, last 2 years) | |
| Samsung Galaxy Book4 Pro 16 | |
| AIDA64 / CPU PhotoWorxx | |
| MSI Prestige 16 AI Evo B2HMG | |
| Average Intel Core Ultra 9 285H (49874 - 65392, n=14) | |
| Samsung Galaxy Book4 Pro 16 | |
| Average of class Multimedia (8187 - 88154, n=57, last 2 years) | |
| MSI Prestige A16 AI+ A3HMG-036 | |
| Lenovo ThinkBook 16 G7+ AMD | |
| Asus Zenbook S 16 UM5606-RK333W | |
System performance
Our test device performed very well in the system benchmarks and proved to be a very responsive laptop, but this also applied to the other comparison devices.
CrossMark: Overall | Productivity | Creativity | Responsiveness
WebXPRT 3: Overall
WebXPRT 4: Overall
Mozilla Kraken 1.1: Total
| PCMark 10 / Score | |
| MSI Prestige 16 AI Evo B2HMG | |
| Average of class Multimedia (4325 - 10386, n=55, last 2 years) | |
| Average Intel Core Ultra 9 285H, Intel Arc Graphics 140T (7196 - 7873, n=7) | |
| MSI Prestige A16 AI+ A3HMG-036 | |
| Lenovo ThinkBook 16 G7+ AMD | |
| Asus Zenbook S 16 UM5606-RK333W | |
| Samsung Galaxy Book4 Pro 16 | |
| PCMark 10 / Essentials | |
| MSI Prestige 16 AI Evo B2HMG | |
| Samsung Galaxy Book4 Pro 16 | |
| MSI Prestige A16 AI+ A3HMG-036 | |
| Asus Zenbook S 16 UM5606-RK333W | |
| Average Intel Core Ultra 9 285H, Intel Arc Graphics 140T (10028 - 11218, n=7) | |
| Lenovo ThinkBook 16 G7+ AMD | |
| Average of class Multimedia (8025 - 11664, n=54, last 2 years) | |
| PCMark 10 / Productivity | |
| Average of class Multimedia (7323 - 18233, n=54, last 2 years) | |
| Asus Zenbook S 16 UM5606-RK333W | |
| MSI Prestige A16 AI+ A3HMG-036 | |
| Lenovo ThinkBook 16 G7+ AMD | |
| MSI Prestige 16 AI Evo B2HMG | |
| Average Intel Core Ultra 9 285H, Intel Arc Graphics 140T (8635 - 10667, n=7) | |
| Samsung Galaxy Book4 Pro 16 | |
| PCMark 10 / Digital Content Creation | |
| MSI Prestige 16 AI Evo B2HMG | |
| Average Intel Core Ultra 9 285H, Intel Arc Graphics 140T (10773 - 12660, n=7) | |
| Lenovo ThinkBook 16 G7+ AMD | |
| MSI Prestige A16 AI+ A3HMG-036 | |
| Average of class Multimedia (3651 - 16240, n=54, last 2 years) | |
| Asus Zenbook S 16 UM5606-RK333W | |
| Samsung Galaxy Book4 Pro 16 | |
| CrossMark / Overall | |
| MSI Prestige 16 AI Evo B2HMG | |
| Apple MacBook Pro 16 2024 M4 Pro | |
| Average Intel Core Ultra 9 285H, Intel Arc Graphics 140T (1771 - 2227, n=7) | |
| Average of class Multimedia (866 - 2728, n=63, last 2 years) | |
| Samsung Galaxy Book4 Pro 16 | |
| Asus Zenbook S 16 UM5606-RK333W | |
| Lenovo ThinkBook 16 G7+ AMD | |
| MSI Prestige A16 AI+ A3HMG-036 | |
| CrossMark / Productivity | |
| MSI Prestige 16 AI Evo B2HMG | |
| Apple MacBook Pro 16 2024 M4 Pro | |
| Average Intel Core Ultra 9 285H, Intel Arc Graphics 140T (1637 - 2170, n=7) | |
| Average of class Multimedia (931 - 2489, n=63, last 2 years) | |
| Samsung Galaxy Book4 Pro 16 | |
| Asus Zenbook S 16 UM5606-RK333W | |
| Lenovo ThinkBook 16 G7+ AMD | |
| MSI Prestige A16 AI+ A3HMG-036 | |
| CrossMark / Creativity | |
| Apple MacBook Pro 16 2024 M4 Pro | |
| MSI Prestige 16 AI Evo B2HMG | |
| Average Intel Core Ultra 9 285H, Intel Arc Graphics 140T (2115 - 2377, n=7) | |
| Average of class Multimedia (907 - 3465, n=63, last 2 years) | |
| MSI Prestige A16 AI+ A3HMG-036 | |
| Lenovo ThinkBook 16 G7+ AMD | |
| Asus Zenbook S 16 UM5606-RK333W | |
| Samsung Galaxy Book4 Pro 16 | |
| CrossMark / Responsiveness | |
| MSI Prestige 16 AI Evo B2HMG | |
| Average Intel Core Ultra 9 285H, Intel Arc Graphics 140T (1314 - 2191, n=7) | |
| Apple MacBook Pro 16 2024 M4 Pro | |
| Average of class Multimedia (605 - 2024, n=63, last 2 years) | |
| Samsung Galaxy Book4 Pro 16 | |
| Asus Zenbook S 16 UM5606-RK333W | |
| Lenovo ThinkBook 16 G7+ AMD | |
| MSI Prestige A16 AI+ A3HMG-036 | |
| WebXPRT 3 / Overall | |
| Apple MacBook Pro 16 2024 M4 Pro | |
| MSI Prestige 16 AI Evo B2HMG | |
| Average of class Multimedia (136.4 - 596, n=66, last 2 years) | |
| Asus Zenbook S 16 UM5606-RK333W | |
| Lenovo ThinkBook 16 G7+ AMD | |
| Average Intel Core Ultra 9 285H, Intel Arc Graphics 140T (230 - 358, n=7) | |
| MSI Prestige A16 AI+ A3HMG-036 | |
| Samsung Galaxy Book4 Pro 16 | |
| WebXPRT 4 / Overall | |
| Apple MacBook Pro 16 2024 M4 Pro | |
| MSI Prestige A16 AI+ A3HMG-036 | |
| MSI Prestige 16 AI Evo B2HMG | |
| Average Intel Core Ultra 9 285H, Intel Arc Graphics 140T (236 - 324, n=7) | |
| Average of class Multimedia (167.3 - 402, n=68, last 2 years) | |
| Asus Zenbook S 16 UM5606-RK333W | |
| Samsung Galaxy Book4 Pro 16 | |
| Lenovo ThinkBook 16 G7+ AMD | |
| Mozilla Kraken 1.1 / Total | |
| Samsung Galaxy Book4 Pro 16 | |
| Average of class Multimedia (228 - 835, n=69, last 2 years) | |
| Average Intel Core Ultra 9 285H, Intel Arc Graphics 140T (418 - 473, n=7) | |
| Asus Zenbook S 16 UM5606-RK333W | |
| MSI Prestige A16 AI+ A3HMG-036 | |
| Lenovo ThinkBook 16 G7+ AMD | |
| MSI Prestige 16 AI Evo B2HMG | |
| Apple MacBook Pro 16 2024 M4 Pro | |
* ... smaller is better
| PCMark 10 Score | 7838 points | |
Help | ||
| AIDA64 / Memory Copy | |
| MSI Prestige 16 AI Evo B2HMG | |
| Samsung Galaxy Book4 Pro 16 | |
| Average Intel Core Ultra 9 285H (76179 - 109252, n=14) | |
| Asus Zenbook S 16 UM5606-RK333W | |
| MSI Prestige A16 AI+ A3HMG-036 | |
| Lenovo ThinkBook 16 G7+ AMD | |
| Average of class Multimedia (11299 - 132135, n=57, last 2 years) | |
| AIDA64 / Memory Read | |
| Asus Zenbook S 16 UM5606-RK333W | |
| Lenovo ThinkBook 16 G7+ AMD | |
| MSI Prestige A16 AI+ A3HMG-036 | |
| Samsung Galaxy Book4 Pro 16 | |
| Average Intel Core Ultra 9 285H (74572 - 89837, n=14) | |
| Average of class Multimedia (11624 - 174586, n=57, last 2 years) | |
| MSI Prestige 16 AI Evo B2HMG | |
| AIDA64 / Memory Write | |
| Asus Zenbook S 16 UM5606-RK333W | |
| Lenovo ThinkBook 16 G7+ AMD | |
| MSI Prestige A16 AI+ A3HMG-036 | |
| Average of class Multimedia (11755 - 134998, n=57, last 2 years) | |
| Average Intel Core Ultra 9 285H (62446 - 107584, n=14) | |
| Samsung Galaxy Book4 Pro 16 | |
| MSI Prestige 16 AI Evo B2HMG | |
| AIDA64 / Memory Latency | |
| MSI Prestige 16 AI Evo B2HMG | |
| MSI Prestige A16 AI+ A3HMG-036 | |
| Samsung Galaxy Book4 Pro 16 | |
| Average Intel Core Ultra 9 285H (106.2 - 136.7, n=14) | |
| Average of class Multimedia (7 - 535, n=56, last 2 years) | |
| Lenovo ThinkBook 16 G7+ AMD | |
| Asus Zenbook S 16 UM5606-RK333W | |
* ... smaller is better
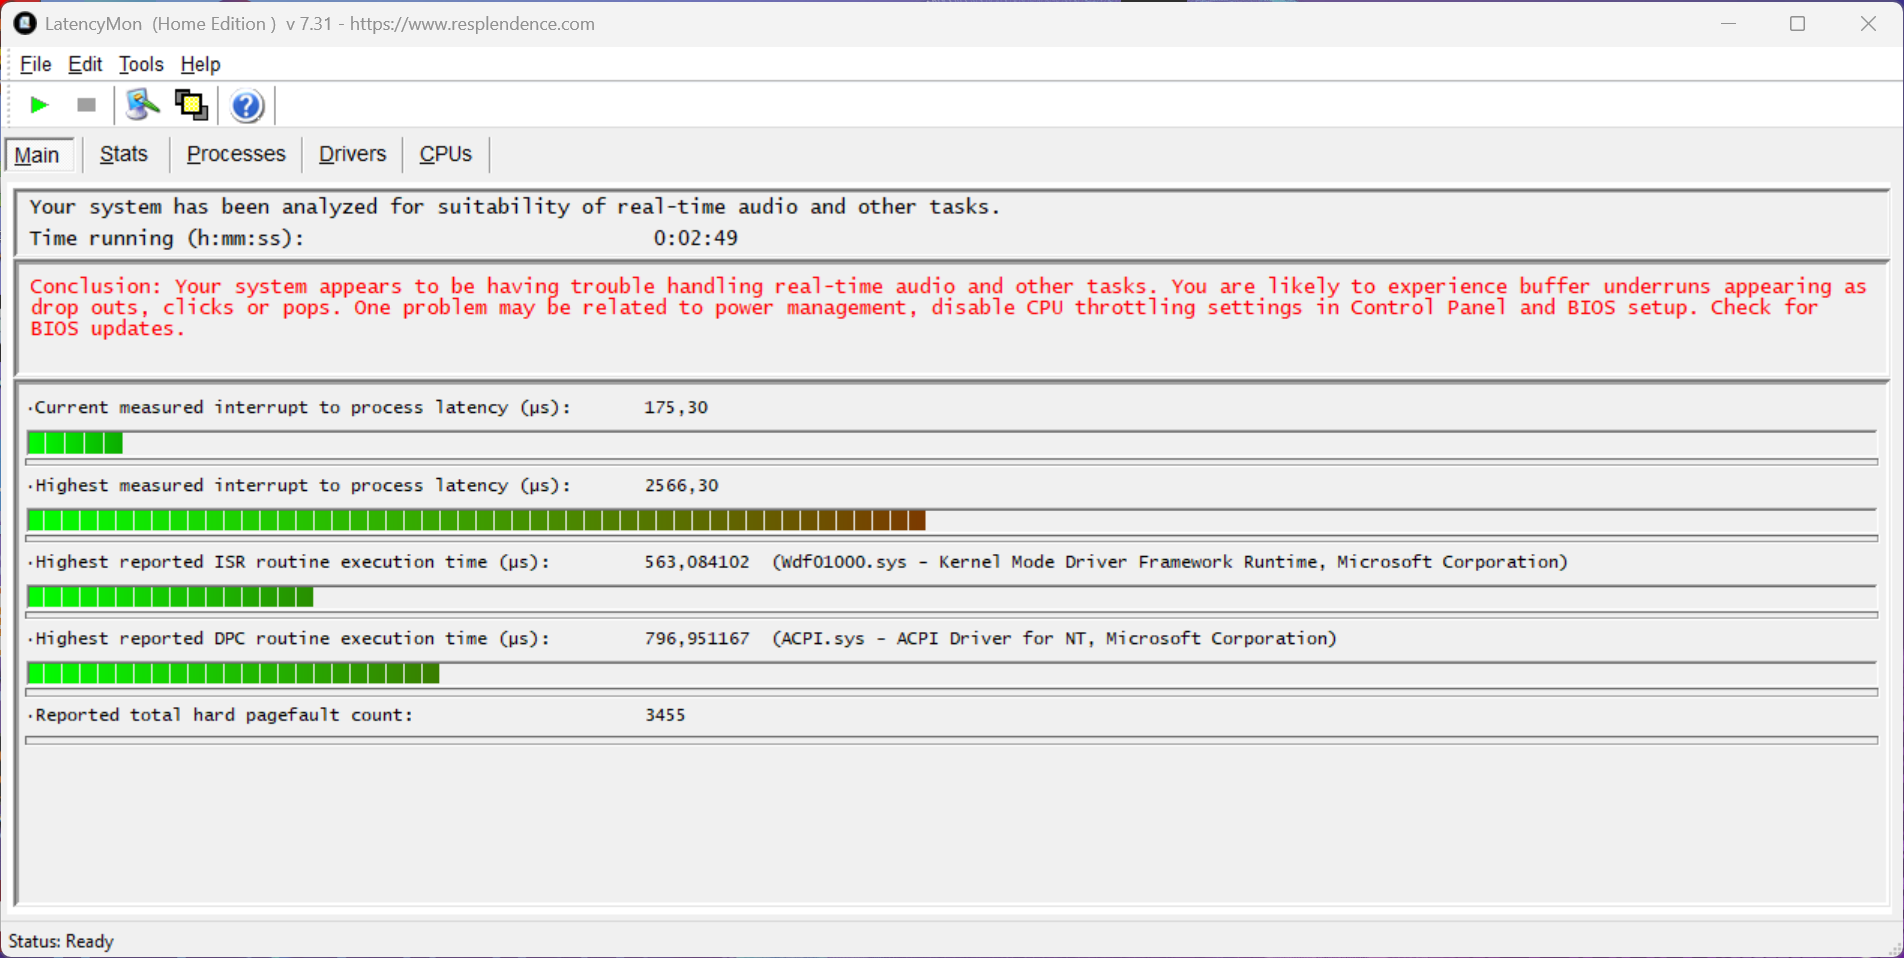
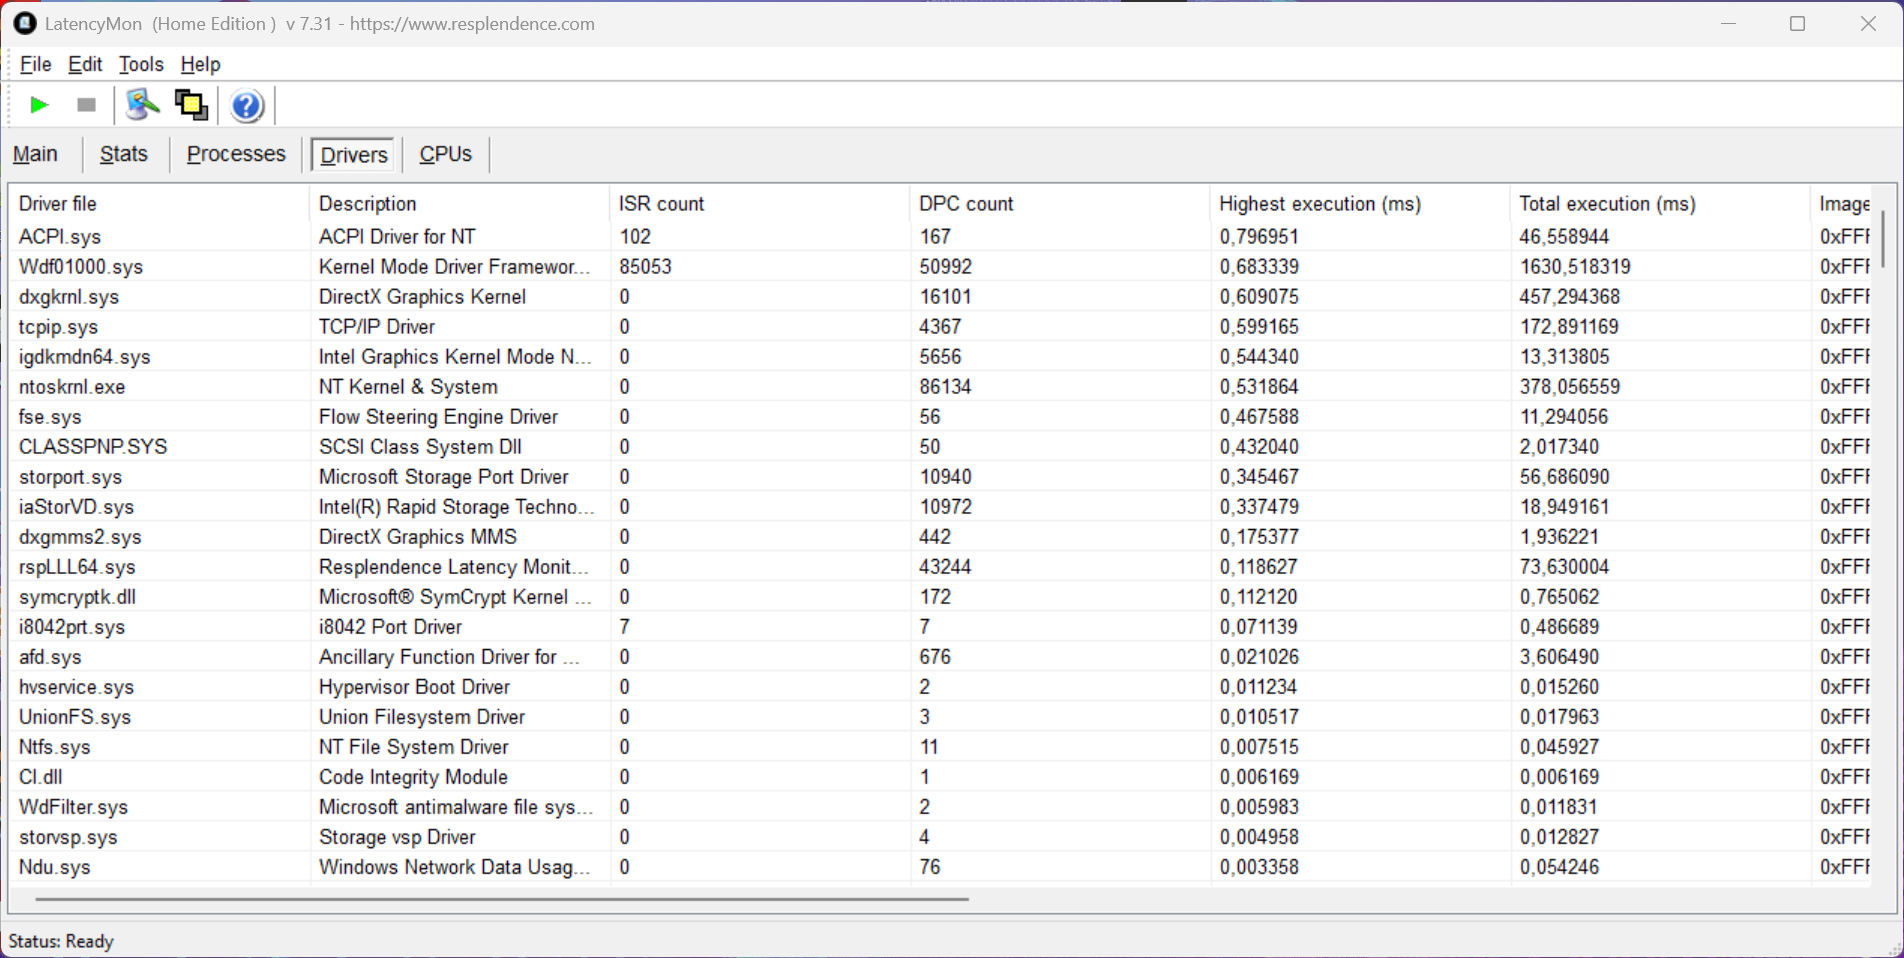
DPC latencies
In our standardized latency test (surfing the web, 4K YouTube playback, CPU load), our test device with the current BIOS version showed limitations when using real-time audio applications.
| DPC Latencies / LatencyMon - interrupt to process latency (max), Web, Youtube, Prime95 | |
| MSI Prestige 16 AI Evo B2HMG | |
| Samsung Galaxy Book4 Pro 16 | |
| Lenovo ThinkBook 16 G7+ AMD | |
| MSI Prestige A16 AI+ A3HMG-036 | |
* ... smaller is better
Storage device
The MSI laptop is equipped with two full-fledged M.2 2280 SSD slots, and a 1-TB version of the Micron 2500 is installed in our test device. After first starting up the device, users have 884 GB at their disposal. The PCIe 4.0 SSD's performance was very good during our test, remaining completely stable even under constant load. Further SSD benchmarks can be found here.

* ... smaller is better
Reading continuous performance: DiskSpd Read Loop, Queue Depth 8
Graphics card
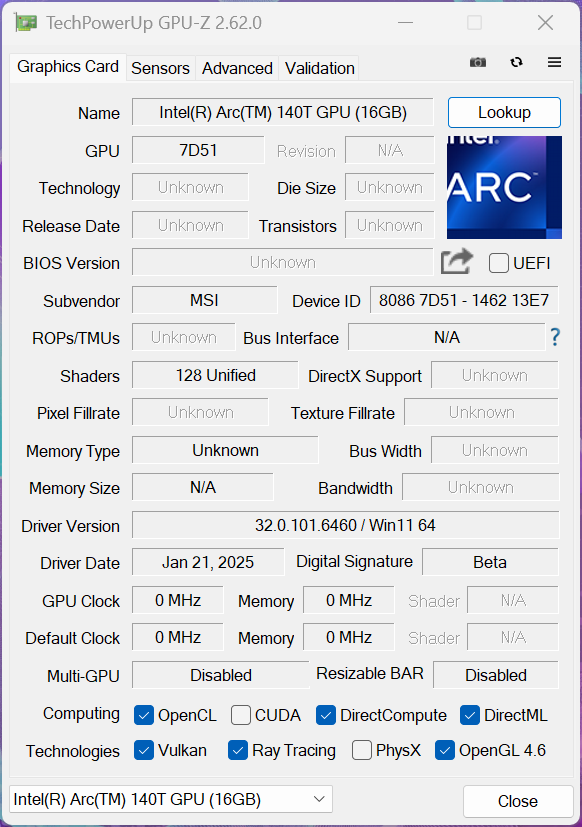
The new Core Ultra 9 285H is equipped with the Arc Graphics 140T, which is fundamentally different from the Arc Graphics 140V of the Lunar Lake processors. While the 140V uses second-generation Xe cores, the 140T is an improved version of the Arc Graphics with 8 Xe cores of the first generation, which was used in the Meteor Lake chips. The Lunar Lake chips work with significantly lower power limits, but if you look at the fastest variants, there are no major differences in performance between the 140T/140V. Its GPU performance remains stable under continuous load and its performance only drops minimally (around 5%) in battery mode.
The drivers don't seem to be fully developed yet either, as we noted significant differences depending on the benchmark. In some cases, the new 140T was barely faster than the old Arc Graphics, but in some tests, it was up to more than 20% faster. This also applied to comparisons with the current AMD Radeon 880M/890M iGPUs. This picture was repeated in our standard gaming tests, with an average performance increase of around 20%. In addition to the familiar XeSS upscaling, the new GPUs now also support Frame Generation in selected games. We tried this out when running F1 2024 and were able to record a massive increase in performance, which we have documented in the table below. It is interesting to note that Frame Generation can also be used without XeSS upscaling. Further details on its technology and efficiency are available in our analysis article.
| Native | Frame Generation | XeSS Quality | XeSS Quality + Frame Generation | |
|---|---|---|---|---|
| F1 24 1080p High | 59 FPS | 87 FPS | 73 FPS | 105 FPS |
| F1 24 1080p Ultra | 20 FPS | 36 FPS | 32 FPS | 56 FPS |
| 3DMark 06 Standard Score | 48766 points | |
| 3DMark Vantage P Result | 58039 points | |
| 3DMark 11 Performance | 13286 points | |
| 3DMark Ice Storm Standard Score | 227616 points | |
| 3DMark Cloud Gate Standard Score | 40950 points | |
| 3DMark Fire Strike Score | 8721 points | |
| 3DMark Time Spy Score | 4639 points | |
| 3DMark Steel Nomad Score | 919 points | |
| 3DMark Steel Nomad Light Score | 3692 points | |
Help | ||
| Blender / v3.3 Classroom CPU | |
| Samsung Galaxy Book4 Pro 16 | |
| Average of class Multimedia (134.5 - 1042, n=64, last 2 years) | |
| MSI Prestige 16 AI Evo B2HMG | |
| Average Intel Arc Graphics 140T (254 - 492, n=20) | |
| MSI Prestige A16 AI+ A3HMG-036 | |
| Asus Zenbook S 16 UM5606-RK333W | |
| Lenovo ThinkBook 16 G7+ AMD | |
* ... smaller is better
Cyberpunk 2077 ultra FPS diagram
| low | med. | high | ultra | |
|---|---|---|---|---|
| GTA V (2015) | 156.4 | 152.3 | 43.2 | 17 |
| Dota 2 Reborn (2015) | 107.7 | 84.7 | 76.8 | 83.8 |
| Final Fantasy XV Benchmark (2018) | 90.1 | 47.9 | 30.6 | |
| X-Plane 11.11 (2018) | 55.7 | 45.1 | 38.4 | |
| Far Cry 5 (2018) | 87 | 48 | 44 | 42 |
| Strange Brigade (2018) | 216 | 90.9 | 75.1 | 61.6 |
| Baldur's Gate 3 (2023) | 40.9 | 31.4 | 26.9 | 26.4 |
| Cyberpunk 2077 (2023) | 41.7 | 34.7 | 29.7 | 27.3 |
| F1 24 (2024) | 82.3 | 74.1 | 58.9 | 19.9 |
Emissions - The MSI Prestige with only one fan
Noise emissions
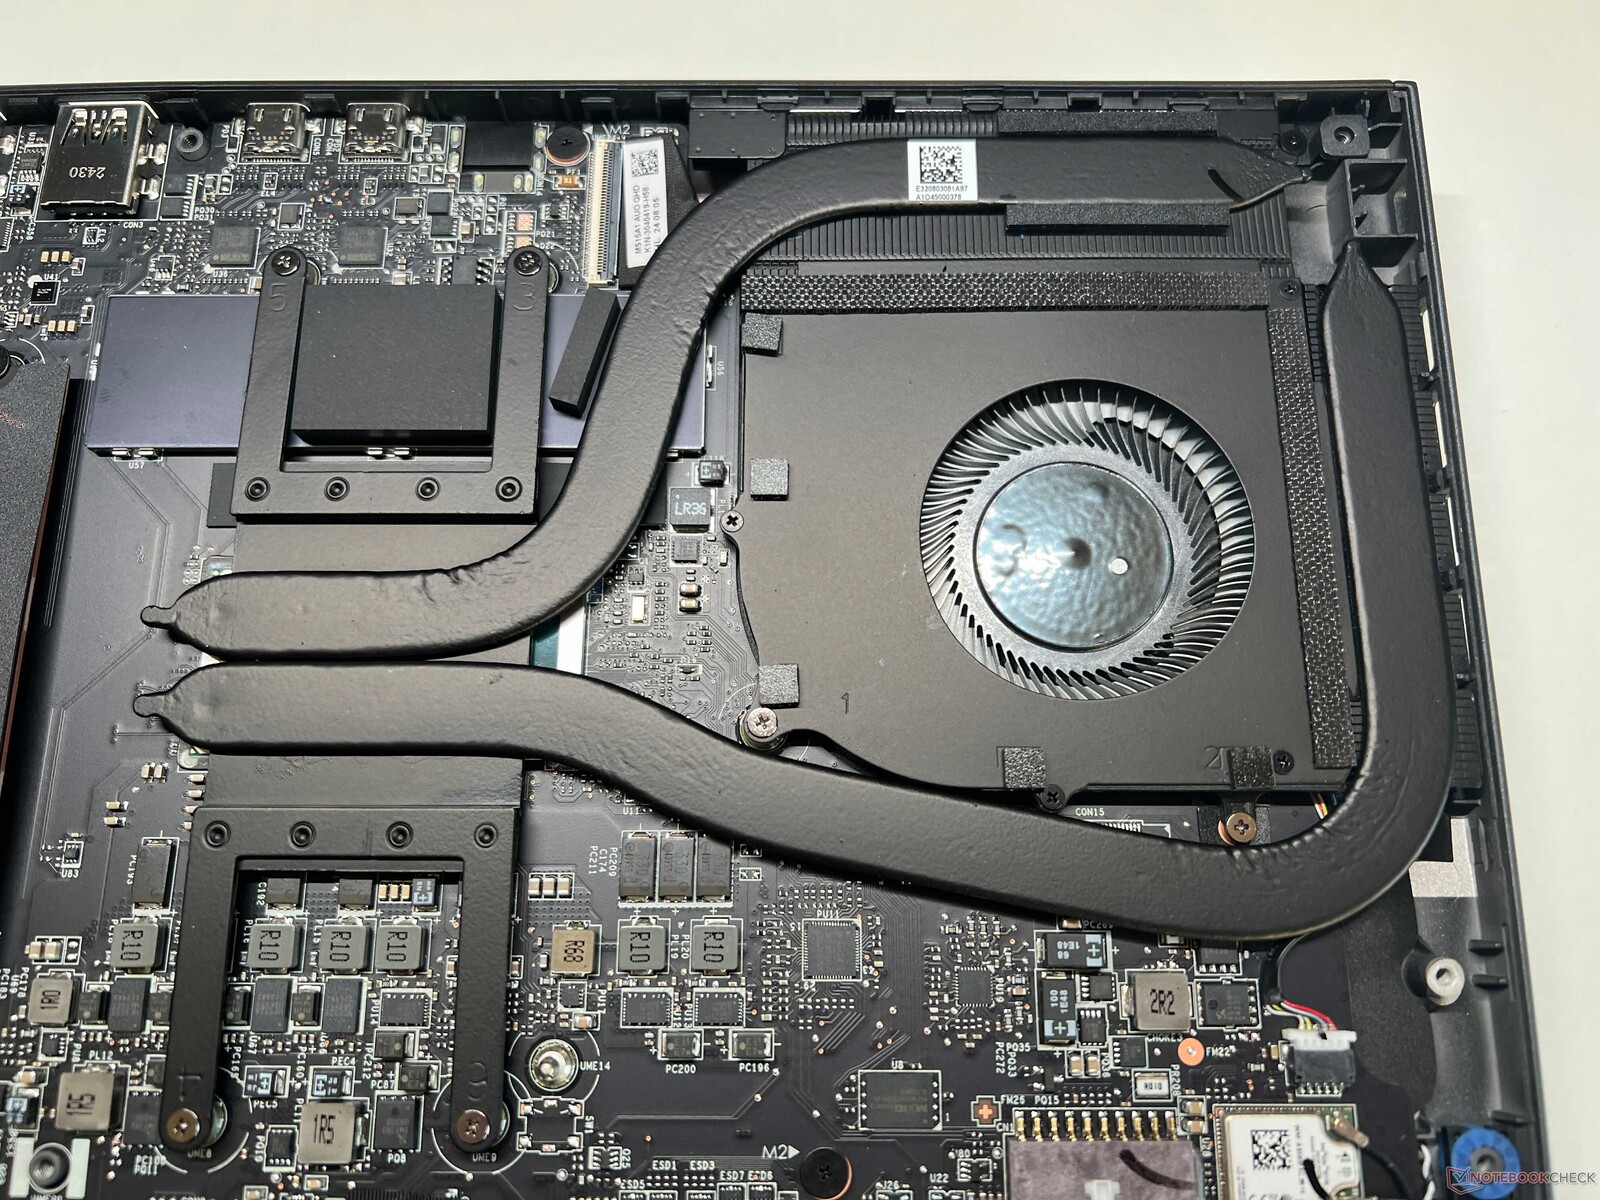
The Prestige is only equipped with one single fan, which is of course not ideal given its high power limits. During everyday use, the fan starts up relatively quickly, but stays quite quiet in Balanced mode during simple tasks. We only measured 42 dB(A) under higher loads. In Extreme Performance mode, we noted up to 46 dB(A) and due to its high speed, it gets significantly more annoying than in Balanced mode. In Eco-Silent mode, the maximum we measured was 31 dB(A), but its performance was also significantly lower. There were no other electronic noises on our test device.
The fan in the Lunar Lake model should perform significantly better due to its lower power limits, but in our opinion, MSI has missed the opportunity to offer a significantly quieter device by installing a second fan into the Arrow Lake models.
Noise level
| Idle |
| 23.6 / 23.6 / 26.2 dB(A) |
| Load |
| 37.1 / 42.1 dB(A) |
 | ||
30 dB silent 40 dB(A) audible 50 dB(A) loud |
||
min: | ||
| MSI Prestige 16 AI Evo B2HMG Arc 140T, Ultra 9 285H, Micron 2500 1TB MTFDKBA1T0QGN | Lenovo ThinkBook 16 G7+ AMD Radeon 880M, Ryzen AI 9 365, Samsung PM9C1a MZAL81T0HDLB | MSI Prestige A16 AI+ A3HMG-036 Radeon 880M, Ryzen AI 9 365, Samsung PM9C1 MZVL81T0HELB-00BTW | Apple MacBook Pro 16 2024 M4 Pro M4 Pro 20-Core GPU, M4 Pro 14-Core, Apple SSD AP2048Z | Asus Zenbook S 16 UM5606-RK333W Radeon 890M, Ryzen AI 9 HX 370, Micron 2400 MTFDKBA1T0QFM | Samsung Galaxy Book4 Pro 16 Arc 8-Core, Ultra 7 155H, Samsung PM9B1 512GB MZVL4512HBLU | |
|---|---|---|---|---|---|---|
| Noise | 0% | 1% | 8% | 2% | -3% | |
| off / environment * (dB) | 23.6 | 24.5 -4% | 23 3% | 24 -2% | 24.7 -5% | 24.6 -4% |
| Idle Minimum * (dB) | 23.6 | 24.5 -4% | 23 3% | 24 -2% | 24.7 -5% | 24.6 -4% |
| Idle Average * (dB) | 23.6 | 24.5 -4% | 23 3% | 24 -2% | 24.7 -5% | 24.6 -4% |
| Idle Maximum * (dB) | 26.2 | 25.9 1% | 25.02 5% | 24 8% | 26.4 -1% | 26.4 -1% |
| Load Average * (dB) | 37.1 | 36.2 2% | 41.88 -13% | 25.3 32% | 35.7 4% | 40 -8% |
| Cyberpunk 2077 ultra * (dB) | 42.1 | 40.1 5% | 39.79 5% | 33.9 19% | 36.8 13% | |
| Load Maximum * (dB) | 42.1 | 40.1 5% | 41.88 1% | 42.3 -0% | 36.8 13% | 40 5% |
| Witcher 3 ultra * (dB) | 40 |
* ... smaller is better
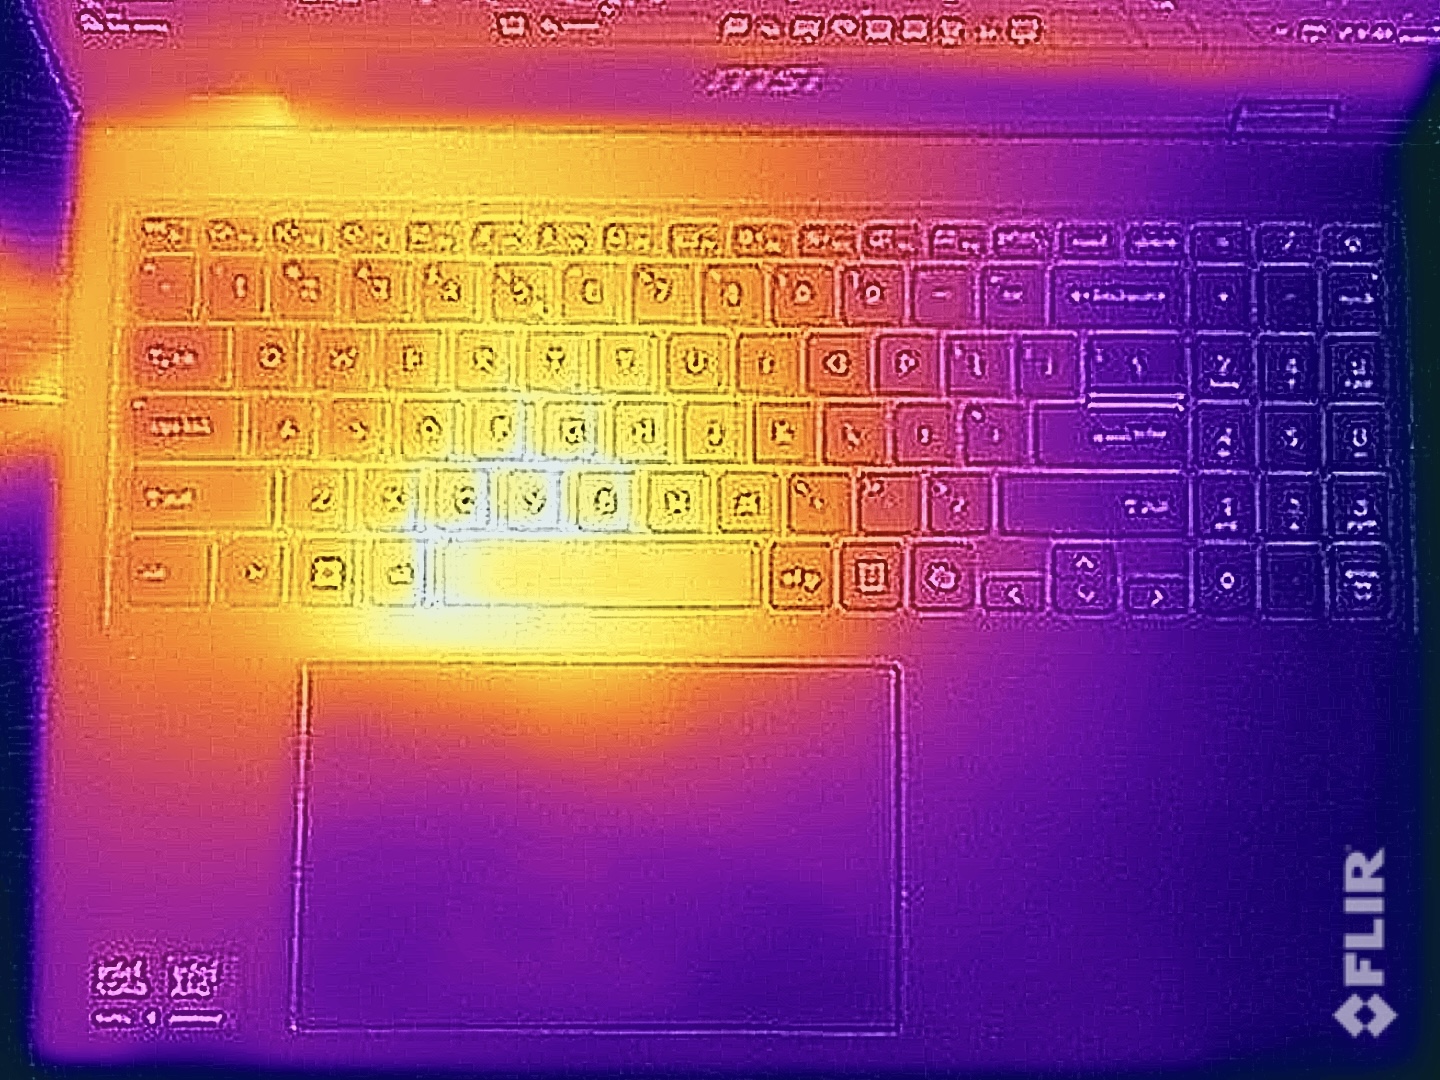
Temperature
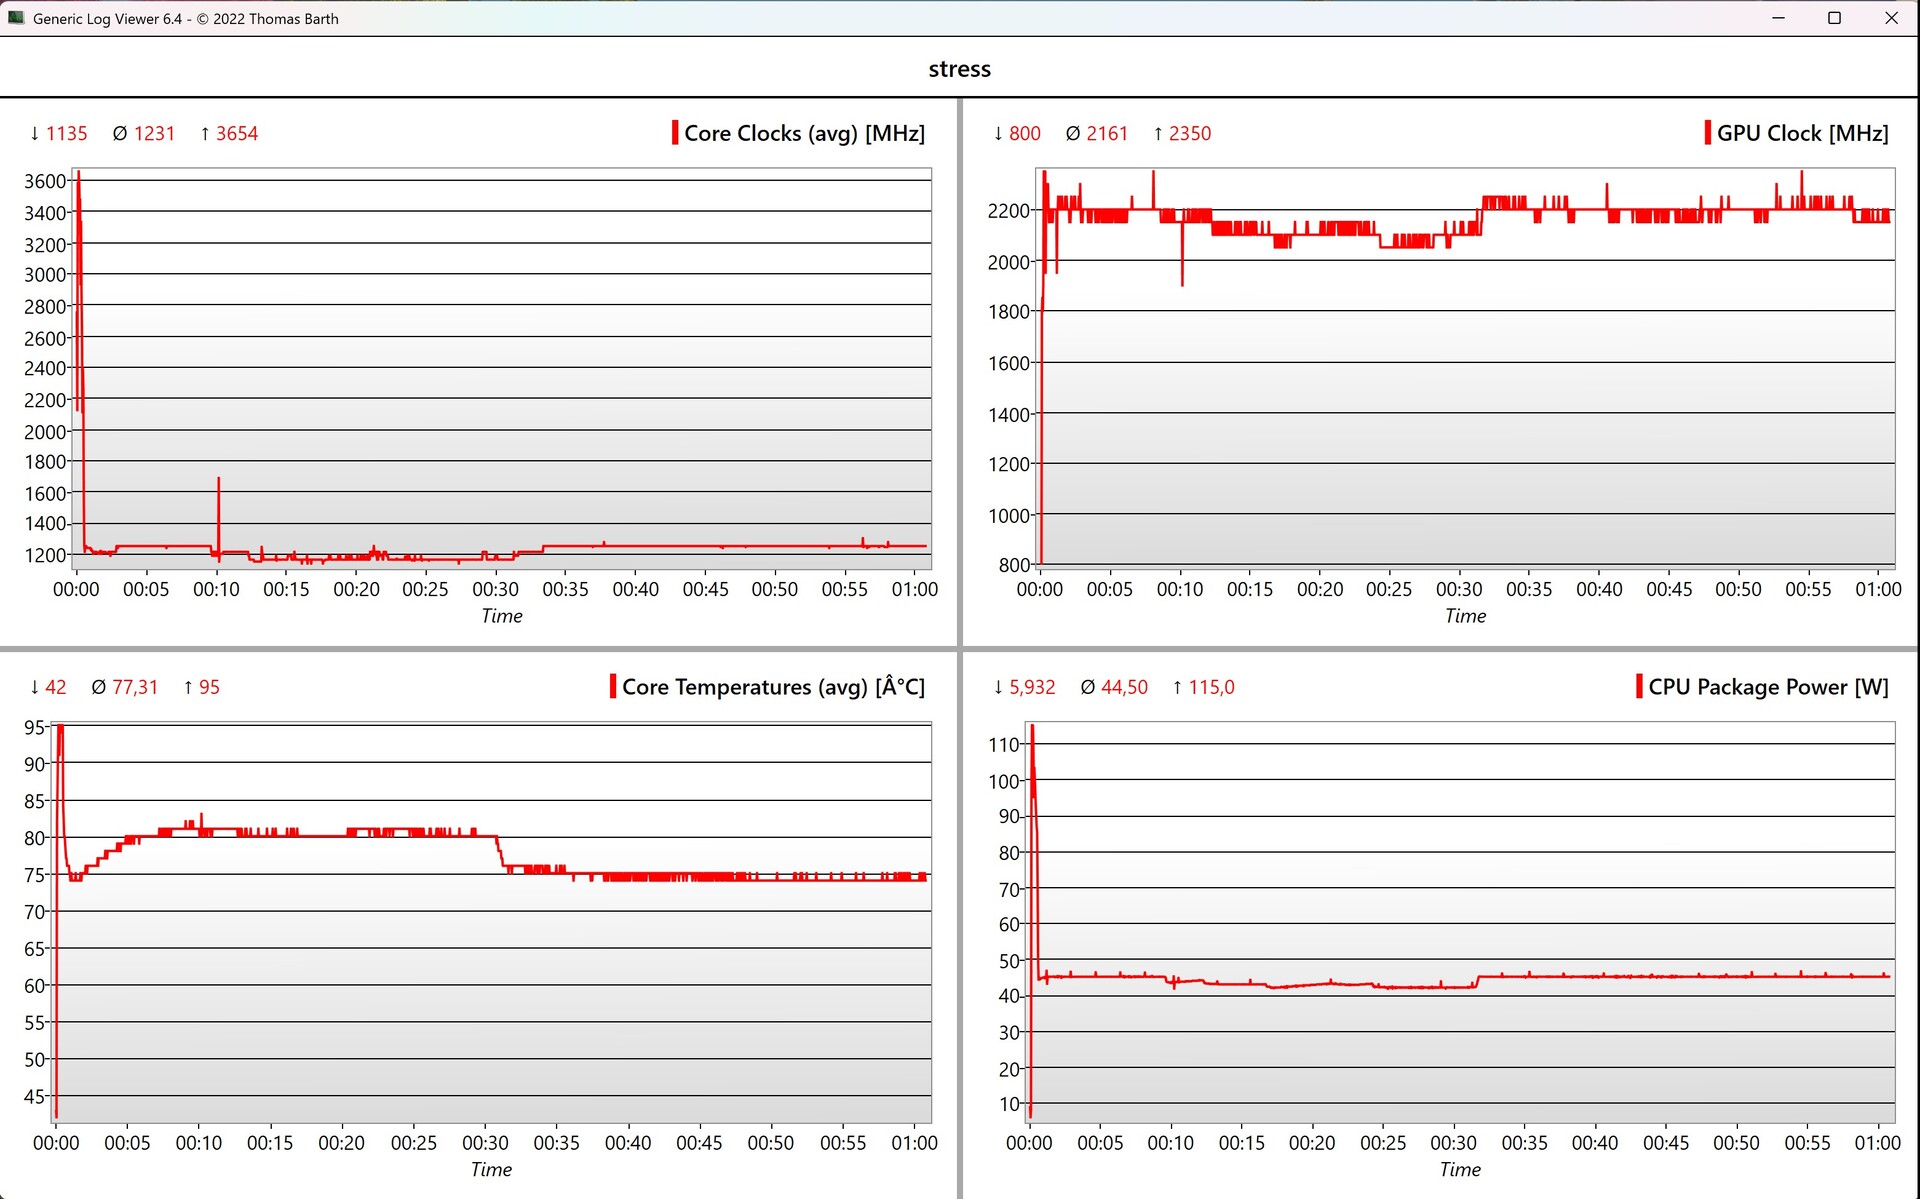
The laptop's case stays very cool in idle mode and during simple tasks, but the one-sided cooling becomes noticeable under load. Only the left half gets warm, with up to 48 °C on the top and even up to 51 °C on the bottom. This leads to very warm fingers when typing and you shouldn't place the computer on your thigh in this scenario. This also shows that the single fan has some difficulties with the Arrow Lake chip. During the stress test, the 115 watts were only present for a short time, but in contrast to pure CPU load, this value then dropped very quickly to 45 watts and remained at this level.
(-) The maximum temperature on the upper side is 48.1 °C / 119 F, compared to the average of 36.8 °C / 98 F, ranging from 21 to 71 °C for the class Multimedia.
(-) The bottom heats up to a maximum of 51.6 °C / 125 F, compared to the average of 39.1 °C / 102 F
(+) In idle usage, the average temperature for the upper side is 24.3 °C / 76 F, compared to the device average of 31.3 °C / 88 F.
(±) 3: The average temperature for the upper side is 37.1 °C / 99 F, compared to the average of 31.3 °C / 88 F for the class Multimedia.
(+) The palmrests and touchpad are reaching skin temperature as a maximum (33.1 °C / 91.6 F) and are therefore not hot.
(-) The average temperature of the palmrest area of similar devices was 28.7 °C / 83.7 F (-4.4 °C / -7.9 F).

| MSI Prestige 16 AI Evo B2HMG Intel Core Ultra 9 285H, Intel Arc Graphics 140T | Lenovo ThinkBook 16 G7+ AMD AMD Ryzen AI 9 365, AMD Radeon 880M | MSI Prestige A16 AI+ A3HMG-036 AMD Ryzen AI 9 365, AMD Radeon 880M | Apple MacBook Pro 16 2024 M4 Pro Apple M4 Pro 14-Core, Apple M4 Pro 20-Core GPU | Asus Zenbook S 16 UM5606-RK333W AMD Ryzen AI 9 HX 370, AMD Radeon 890M | Samsung Galaxy Book4 Pro 16 Intel Core Ultra 7 155H, Intel Arc 8-Core iGPU | |
|---|---|---|---|---|---|---|
| Heat | 12% | -3% | 15% | -9% | 10% | |
| Maximum Upper Side * (°C) | 48.1 | 38.2 21% | 52 -8% | 42.7 11% | 46.9 2% | 40.9 15% |
| Maximum Bottom * (°C) | 51.6 | 37.9 27% | 44 15% | 43.1 16% | 53.5 -4% | 42.6 17% |
| Idle Upper Side * (°C) | 25.9 | 25.4 2% | 28 -8% | 21.5 17% | 29.5 -14% | 24.5 5% |
| Idle Bottom * (°C) | 25.2 | 25.7 -2% | 28 -11% | 21.5 15% | 30.2 -20% | 24.8 2% |
* ... smaller is better
Speakers
The Prestige 16's two stereo speakers can get very loud, but their overall sound is a little lacking. Playing back voices benefits from the clear highs, but music or movies in particular simply lack a little power.
MSI Prestige 16 AI Evo B2HMG audio analysis
(+) | speakers can play relatively loud (86.6 dB)
Bass 100 - 315 Hz
(-) | nearly no bass - on average 18.4% lower than median
(±) | linearity of bass is average (7.9% delta to prev. frequency)
Mids 400 - 2000 Hz
(+) | balanced mids - only 4.3% away from median
(+) | mids are linear (4.6% delta to prev. frequency)
Highs 2 - 16 kHz
(+) | balanced highs - only 3.8% away from median
(+) | highs are linear (3% delta to prev. frequency)
Overall 100 - 16.000 Hz
(+) | overall sound is linear (13% difference to median)
Compared to same class
» 26% of all tested devices in this class were better, 5% similar, 70% worse
» The best had a delta of 5%, average was 17%, worst was 45%
Compared to all devices tested
» 13% of all tested devices were better, 2% similar, 85% worse
» The best had a delta of 4%, average was 23%, worst was 134%
Lenovo ThinkBook 16 G7+ AMD audio analysis
(±) | speaker loudness is average but good (74.8 dB)
Bass 100 - 315 Hz
(-) | nearly no bass - on average 16.5% lower than median
(±) | linearity of bass is average (13.1% delta to prev. frequency)
Mids 400 - 2000 Hz
(+) | balanced mids - only 3.5% away from median
(+) | mids are linear (5.9% delta to prev. frequency)
Highs 2 - 16 kHz
(+) | balanced highs - only 1.6% away from median
(+) | highs are linear (5% delta to prev. frequency)
Overall 100 - 16.000 Hz
(±) | linearity of overall sound is average (16% difference to median)
Compared to same class
» 40% of all tested devices in this class were better, 6% similar, 54% worse
» The best had a delta of 5%, average was 17%, worst was 45%
Compared to all devices tested
» 25% of all tested devices were better, 5% similar, 70% worse
» The best had a delta of 4%, average was 23%, worst was 134%
MSI Prestige A16 AI+ A3HMG-036 audio analysis
(+) | speakers can play relatively loud (82.02 dB)
Bass 100 - 315 Hz
(-) | nearly no bass - on average 23.7% lower than median
(±) | linearity of bass is average (12.3% delta to prev. frequency)
Mids 400 - 2000 Hz
(±) | higher mids - on average 6.2% higher than median
(±) | linearity of mids is average (7.5% delta to prev. frequency)
Highs 2 - 16 kHz
(±) | higher highs - on average 5.6% higher than median
(+) | highs are linear (5.1% delta to prev. frequency)
Overall 100 - 16.000 Hz
(±) | linearity of overall sound is average (21.7% difference to median)
Compared to same class
» 77% of all tested devices in this class were better, 4% similar, 19% worse
» The best had a delta of 5%, average was 17%, worst was 45%
Compared to all devices tested
» 62% of all tested devices were better, 7% similar, 31% worse
» The best had a delta of 4%, average was 23%, worst was 134%
Apple MacBook Pro 16 2024 M4 Pro audio analysis
(+) | speakers can play relatively loud (84.6 dB)
Bass 100 - 315 Hz
(±) | reduced bass - on average 5.1% lower than median
(+) | bass is linear (5.6% delta to prev. frequency)
Mids 400 - 2000 Hz
(+) | balanced mids - only 1.4% away from median
(+) | mids are linear (2.4% delta to prev. frequency)
Highs 2 - 16 kHz
(+) | balanced highs - only 1.6% away from median
(+) | highs are linear (3% delta to prev. frequency)
Overall 100 - 16.000 Hz
(+) | overall sound is linear (4.8% difference to median)
Compared to same class
» 0% of all tested devices in this class were better, 0% similar, 99% worse
» The best had a delta of 5%, average was 17%, worst was 45%
Compared to all devices tested
» 0% of all tested devices were better, 0% similar, 100% worse
» The best had a delta of 4%, average was 23%, worst was 134%
Asus Zenbook S 16 UM5606-RK333W audio analysis
(±) | speaker loudness is average but good (79.7 dB)
Bass 100 - 315 Hz
(±) | reduced bass - on average 9.7% lower than median
(±) | linearity of bass is average (8.3% delta to prev. frequency)
Mids 400 - 2000 Hz
(+) | balanced mids - only 2.7% away from median
(+) | mids are linear (4.8% delta to prev. frequency)
Highs 2 - 16 kHz
(+) | balanced highs - only 3.7% away from median
(+) | highs are linear (4.6% delta to prev. frequency)
Overall 100 - 16.000 Hz
(+) | overall sound is linear (12.2% difference to median)
Compared to same class
» 22% of all tested devices in this class were better, 4% similar, 74% worse
» The best had a delta of 5%, average was 17%, worst was 45%
Compared to all devices tested
» 10% of all tested devices were better, 2% similar, 88% worse
» The best had a delta of 4%, average was 23%, worst was 134%
Samsung Galaxy Book4 Pro 16 audio analysis
(+) | speakers can play relatively loud (83.4 dB)
Bass 100 - 315 Hz
(±) | reduced bass - on average 12.4% lower than median
(±) | linearity of bass is average (11.4% delta to prev. frequency)
Mids 400 - 2000 Hz
(+) | balanced mids - only 4.7% away from median
(+) | mids are linear (4.7% delta to prev. frequency)
Highs 2 - 16 kHz
(+) | balanced highs - only 3.1% away from median
(+) | highs are linear (5.4% delta to prev. frequency)
Overall 100 - 16.000 Hz
(+) | overall sound is linear (12.5% difference to median)
Compared to same class
» 24% of all tested devices in this class were better, 3% similar, 73% worse
» The best had a delta of 5%, average was 17%, worst was 45%
Compared to all devices tested
» 11% of all tested devices were better, 2% similar, 87% worse
» The best had a delta of 4%, average was 23%, worst was 134%
Power management - Impressive battery life
Power consumption
Its idle measurements are very low for a 16-inch laptop, which is of course in part due to its 60 Hz display. Under load, however, there seems to be a problem concerning its high power limits because, unsurprisingly, the 100-watt power supply isn't enough when the processor alone consumes 115 watts under multi-core load. This means that the battery always has to be tapped for a short time to cover the power consumption, which is surely ideal for the battery. After about 20 seconds, its consumption drops to 88 watts and then to around 70 watts.
| Off / Standby | |
| Idle | |
| Load |
|
Key:
min: | |
| MSI Prestige 16 AI Evo B2HMG Ultra 9 285H, Arc 140T, Micron 2500 1TB MTFDKBA1T0QGN, IPS, 2560x1600, 16" | Lenovo ThinkBook 16 G7+ AMD Ryzen AI 9 365, Radeon 880M, Samsung PM9C1a MZAL81T0HDLB, IPS, 3200x2000, 16" | MSI Prestige A16 AI+ A3HMG-036 Ryzen AI 9 365, Radeon 880M, Samsung PM9C1 MZVL81T0HELB-00BTW, IPS, 2560x1600, 16" | Apple MacBook Pro 16 2024 M4 Pro M4 Pro 14-Core, M4 Pro 20-Core GPU, Apple SSD AP2048Z, Mini-LED, 3456x2234, 16.2" | Asus Zenbook S 16 UM5606-RK333W Ryzen AI 9 HX 370, Radeon 890M, Micron 2400 MTFDKBA1T0QFM, OLED, 2880x1800, 16" | Samsung Galaxy Book4 Pro 16 Ultra 7 155H, Arc 8-Core, Samsung PM9B1 512GB MZVL4512HBLU, OLED, 2880x1800, 16" | Average Intel Arc Graphics 140T | Average of class Multimedia | |
|---|---|---|---|---|---|---|---|---|
| Power Consumption | -29% | -19% | -36% | 11% | 30% | -12% | -16% | |
| Idle Minimum * (Watt) | 4.4 | 6.4 -45% | 6.9 -57% | 4.6 -5% | 5.4 -23% | 3.6 18% | 6.59 ? -50% | 5.68 ? -29% |
| Idle Average * (Watt) | 9.2 | 14.1 -53% | 12 -30% | 16.8 -83% | 10.5 -14% | 5.7 38% | 9.52 ? -3% | 10.2 ? -11% |
| Idle Maximum * (Watt) | 9.5 | 14.3 -51% | 12.5 -32% | 17.1 -80% | 10.9 -15% | 6.1 36% | 12.9 ? -36% | 12.4 ? -31% |
| Load Average * (Watt) | 66.9 | 83.4 -25% | 79.8 -19% | 76.4 -14% | 47.8 29% | 52.5 22% | 57.7 ? 14% | 65.4 ? 2% |
| Cyberpunk 2077 ultra * (Watt) | 68.8 | 79.8 -16% | 62.5 9% | 83.4 -21% | 49.2 28% | |||
| Cyberpunk 2077 ultra external monitor * (Watt) | 67.4 | 77.5 -15% | 74.5 -11% | 79.3 -18% | 46.7 31% | |||
| Load Maximum * (Watt) | 102.9 | 102.9 -0% | 96 7% | 138.1 -34% | 58.6 43% | 64.7 37% | 87.9 ? 15% | 113.3 ? -10% |
| Witcher 3 ultra * (Watt) | 46.6 |
* ... smaller is better
Power consumption Cyberpunk / stress test
Power consumption with external monitor
Runtimes
At 99.9 Wh, MSI has installed the largest possible battery in its Prestige 16. Together with its fairly low consumption rates, we measured very good battery runtimes. In the WLAN test at a brightness of 150 cd/m² (corresponds to 32% of our test device's maximum brightness), we noted an impressive 16.5 hours and more than 11.5 hours at full brightness. The video test even lasted for almost 21 hours. This beat the Windows comparison devices; only the MacBook Pro 16 delivered even longer battery runtimes. A full charge with the device switched on takes around two hours, with 80% of its capacity being available again after around one hour.
| MSI Prestige 16 AI Evo B2HMG Ultra 9 285H, Arc 140T, 99.9 Wh | Lenovo ThinkBook 16 G7+ AMD Ryzen AI 9 365, Radeon 880M, 85 Wh | MSI Prestige A16 AI+ A3HMG-036 Ryzen AI 9 365, Radeon 880M, 82 Wh | Apple MacBook Pro 16 2024 M4 Pro M4 Pro 14-Core, M4 Pro 20-Core GPU, 99.6 Wh | Asus Zenbook S 16 UM5606-RK333W Ryzen AI 9 HX 370, Radeon 890M, 78 Wh | Samsung Galaxy Book4 Pro 16 Ultra 7 155H, Arc 8-Core, 76 Wh | Average of class Multimedia | |
|---|---|---|---|---|---|---|---|
| Battery runtime | -34% | -31% | 19% | -21% | -24% | -26% | |
| H.264 (h) | 20.8 | 13.9 -33% | 10.2 -51% | 24.6 18% | 20.1 -3% | 19.1 -8% | 16.4 ? -21% |
| WiFi v1.3 (h) | 16.5 | 10.8 -35% | 11.4 -31% | 19.6 19% | 10.7 -35% | 10.7 -35% | 12.2 ? -26% |
| Load (h) | 2.4 | 2.1 -12% | 1.8 -25% | 1.7 -29% | 1.662 ? -31% |
Notebookcheck total rating
The MSI Prestige 16 AI Evo is a lightweight and high-quality 16-inch laptop with a fast Arrow Lake processor, comfortable keyboard and long battery life. However, the device suffers some weaknesses in certain areas, such as cooling (a second fan would help), and the distribution of its ports is additionally impractical during everyday use. Its display could also be better (only 60 Hz & slow response times), and it is very reflective.
MSI Prestige 16 AI Evo B2HMG
- 02/09/2025 v8
Andreas Osthoff
 Total Sustainability Score:
 Transparency
The selection of devices to be reviewed is made by our editorial team. The test sample was provided to the author as a loan by the manufacturer or retailer for the purpose of this review. The lender had no influence on this review, nor did the manufacturer receive a copy of this review before publication. There was no obligation to publish this review. As an independent media company, Notebookcheck is not subjected to the authority of manufacturers, retailers or publishers.
This is how Notebookcheck is testing
Every year, Notebookcheck independently reviews hundreds of laptops and smartphones using standardized procedures to ensure that all results are comparable. We have continuously developed our test methods for around 20 years and set industry standards in the process. In our test labs, high-quality measuring equipment is utilized by experienced technicians and editors. These tests involve a multi-stage validation process. Our complex rating system is based on hundreds of well-founded measurements and benchmarks, which maintains objectivity. Further information on our test methods can be found here.

