
Apple MacBook Pro 16 2024 review - Enormous battery life and better performance of the M4 Pro
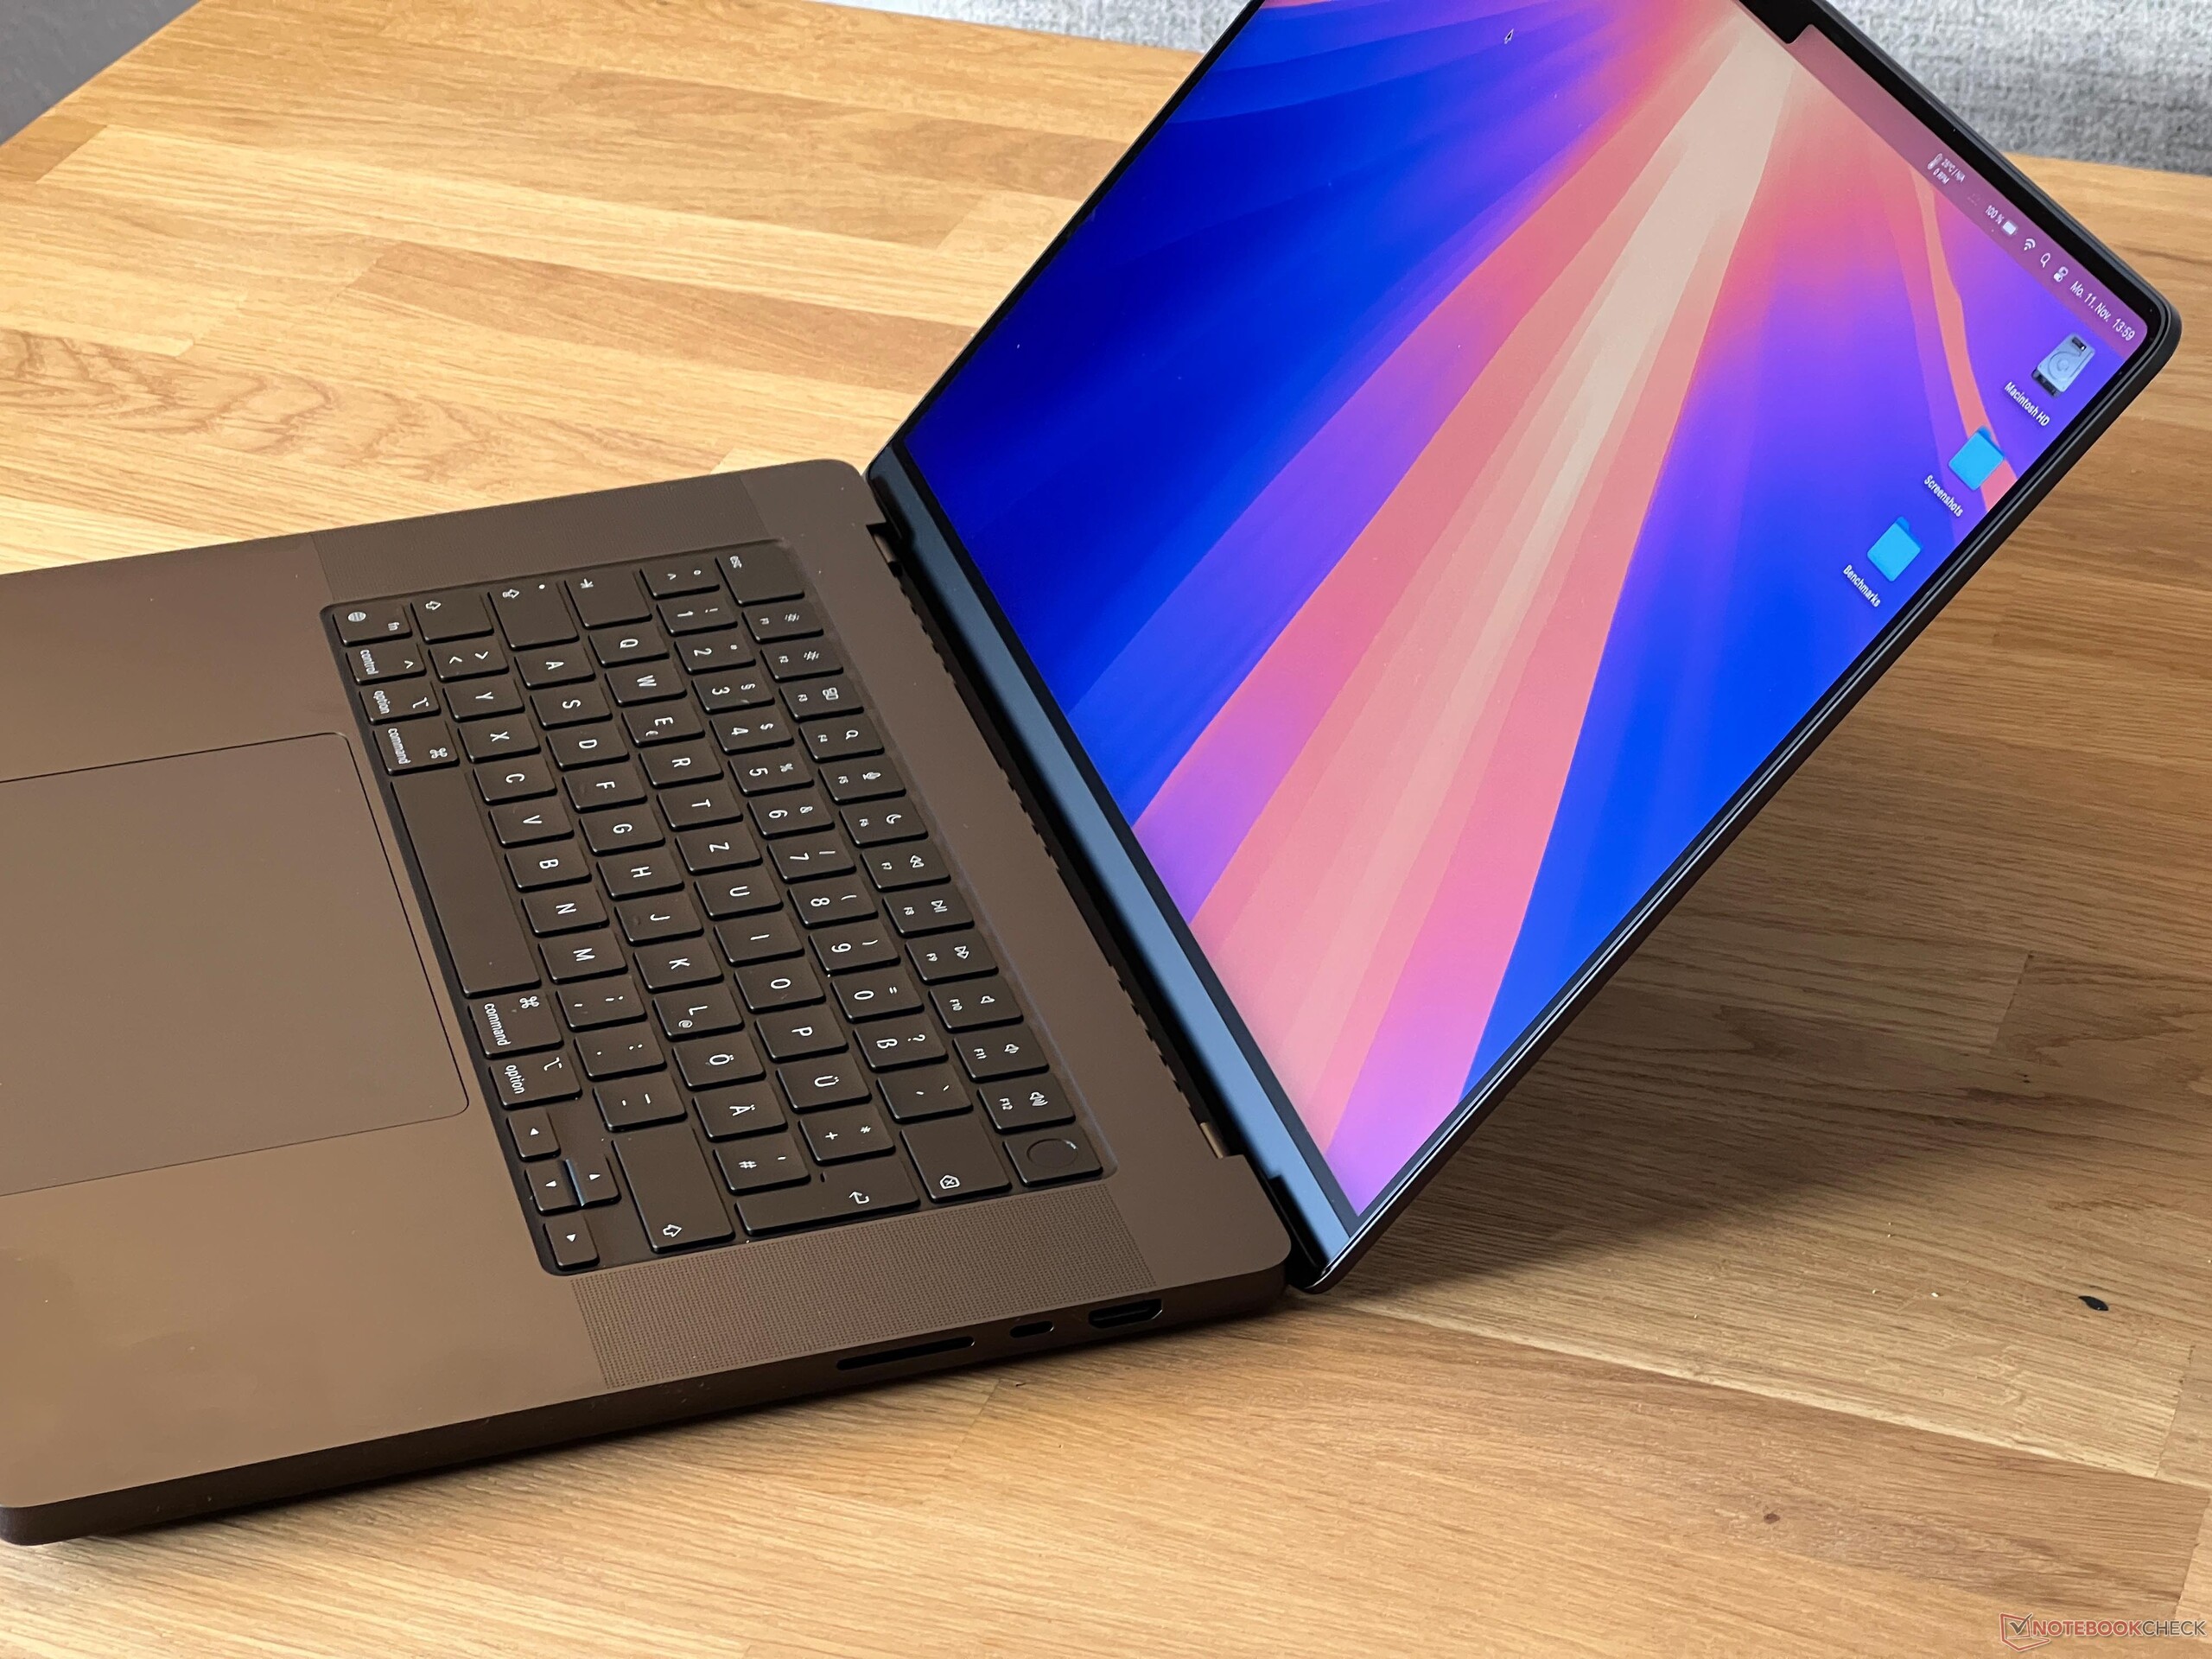
Even more versatile thanks to a matte display.
The large MacBook Pro 16 can better make use of the new Apple M4 Pro SoC's performance potential compared to the smaller MacBook Pro 14—plus, its battery life is even better. Again, its optional matte panel proves to be a real advantage if you often find yourself working in bright environments.Andreas Osthoff, 👁 Andreas Osthoff (translated by Daisy Dickson) Published 🇩🇪 🇫🇷 ...
Verdict - The MacBook Pro 16 is transformed into an even better multimedia laptop with the M4 Pro and a matte display
The 2024 model of the Apple MacBook Pro 16 is once again an impressive multimedia laptop. Its larger 16-inch case can better take advantage of the new M4 Pro SoC compared to the smaller MacBook Pro 14 and at the same time, its emissions remain lower. Apple has been able to raise its CPU and GPU performance considerably and especially in the single-core area, Apple's M4 generation currently faces no competition.
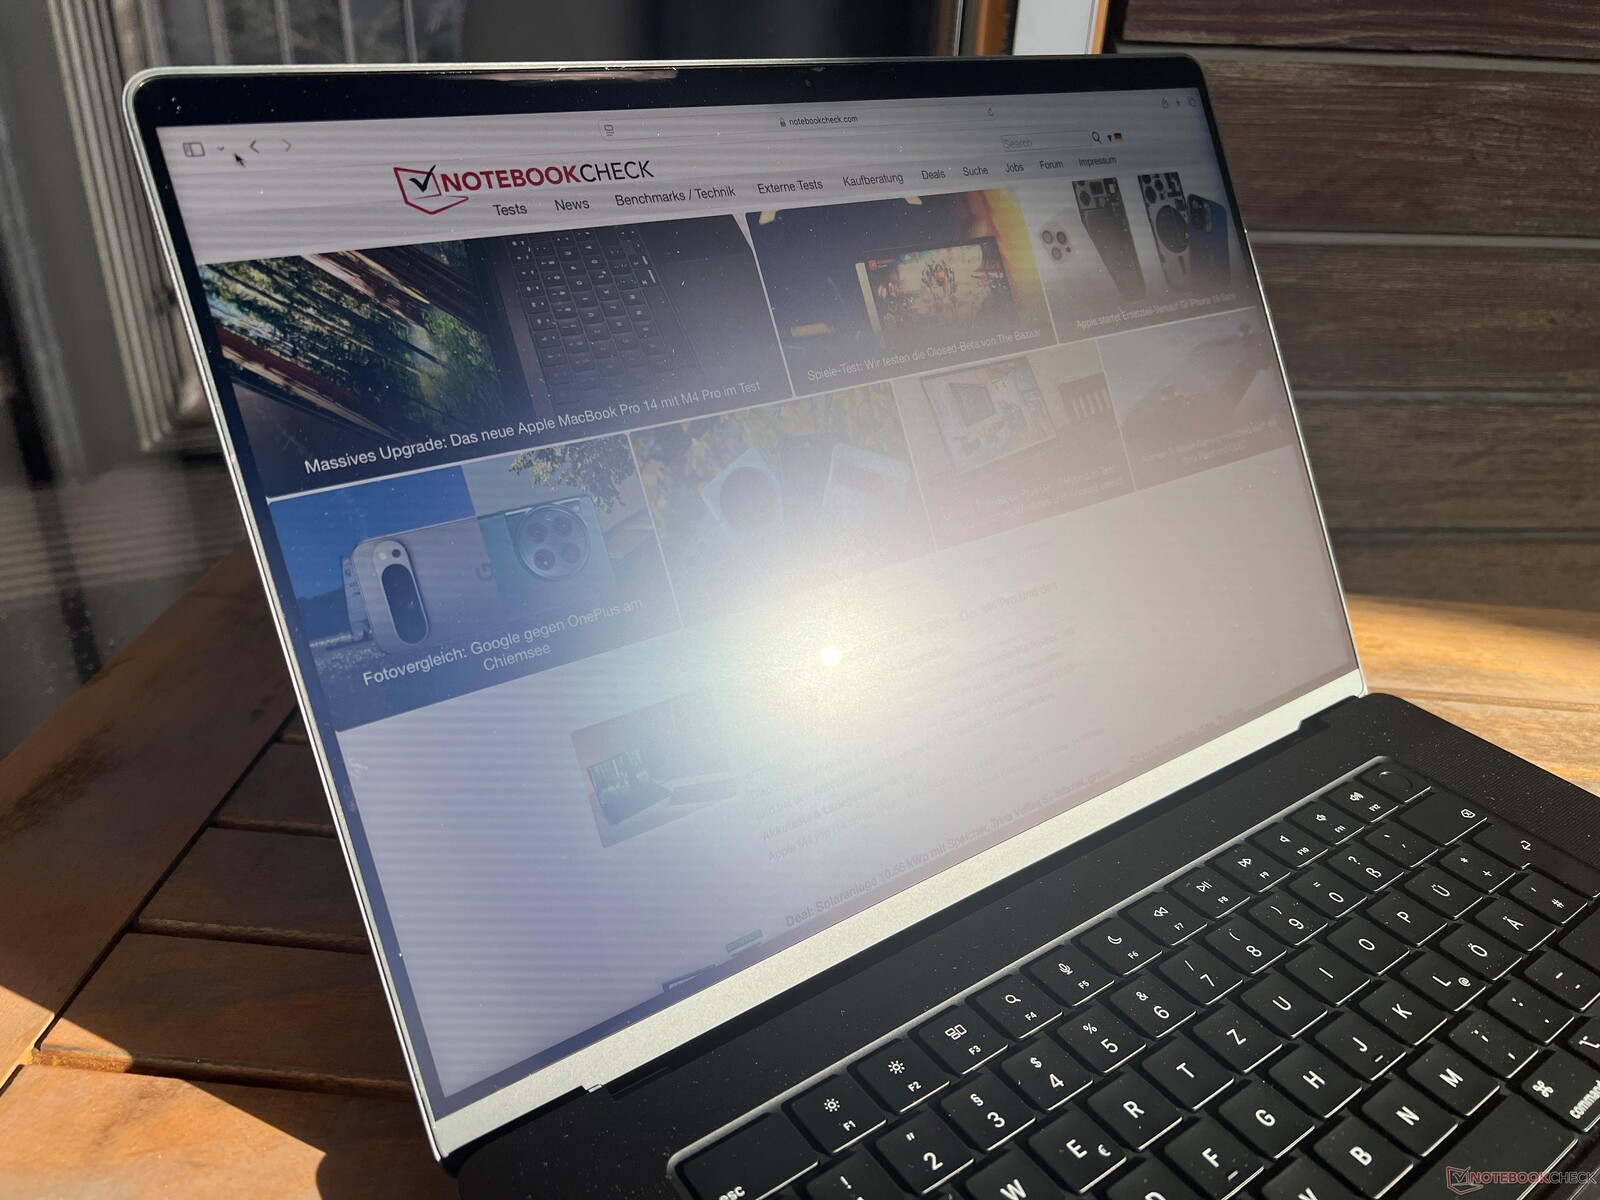
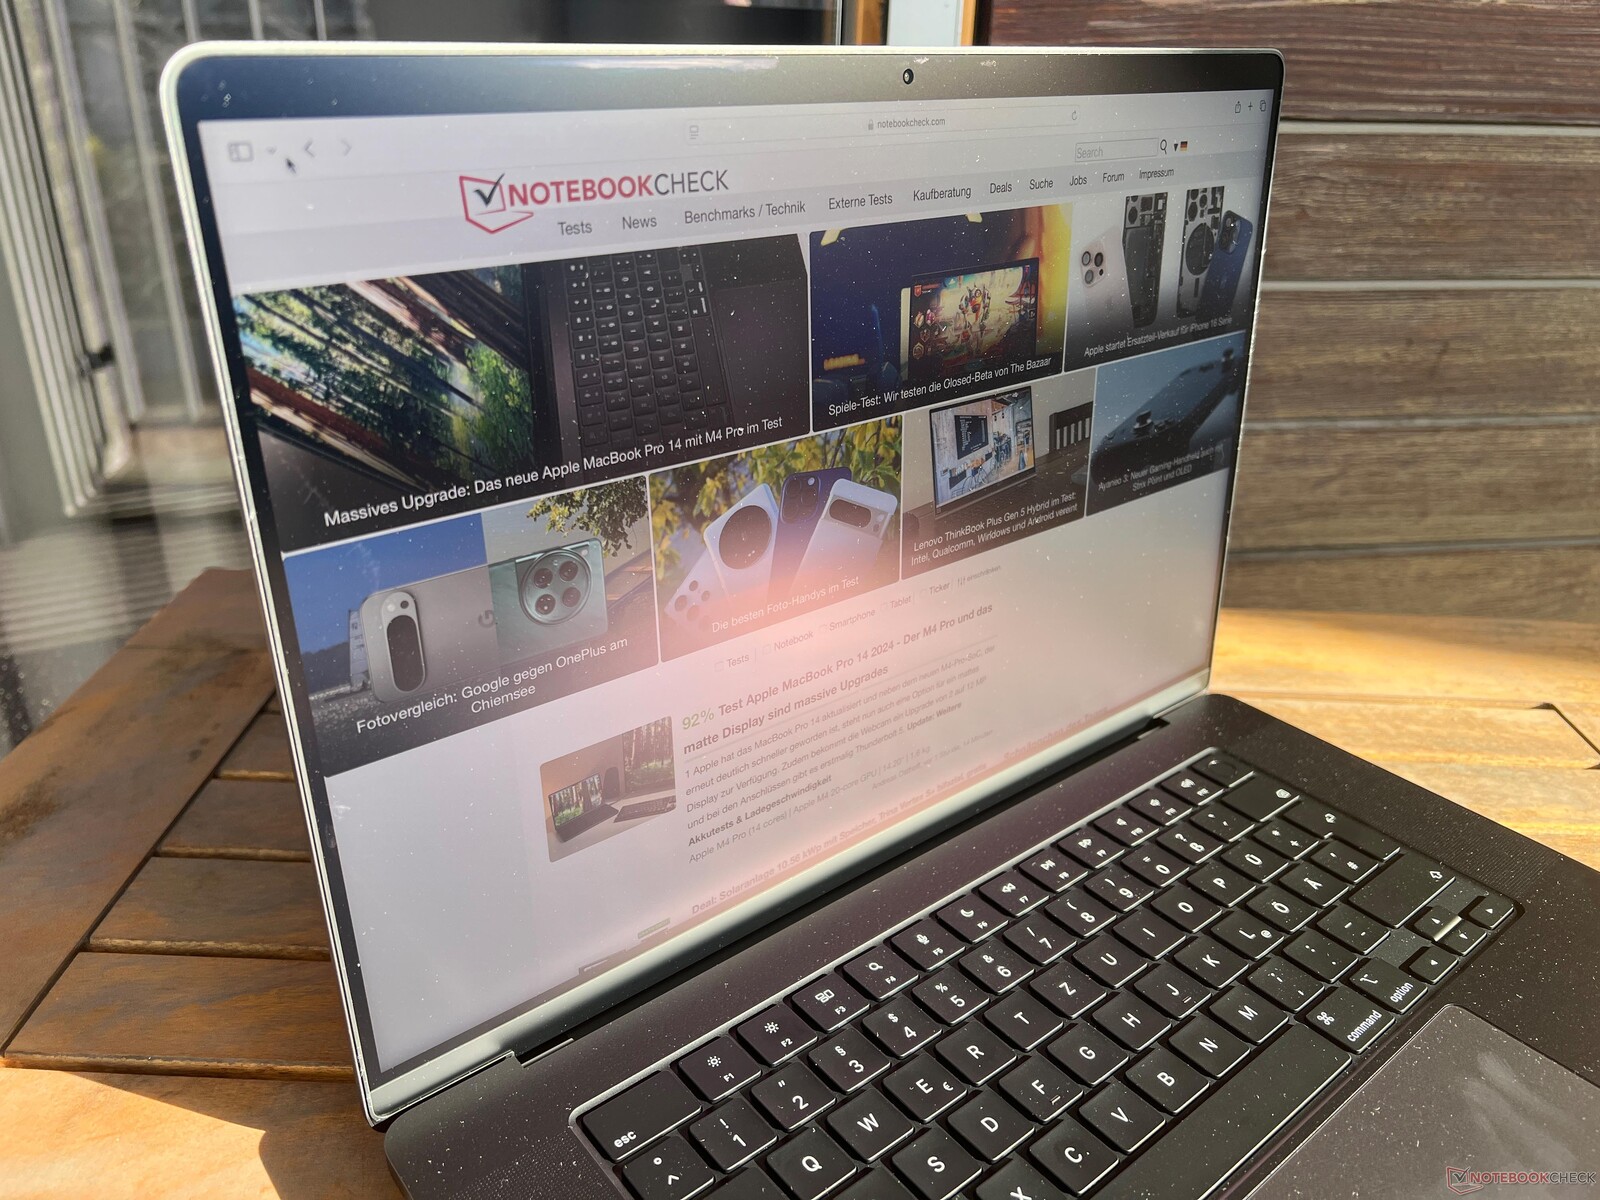
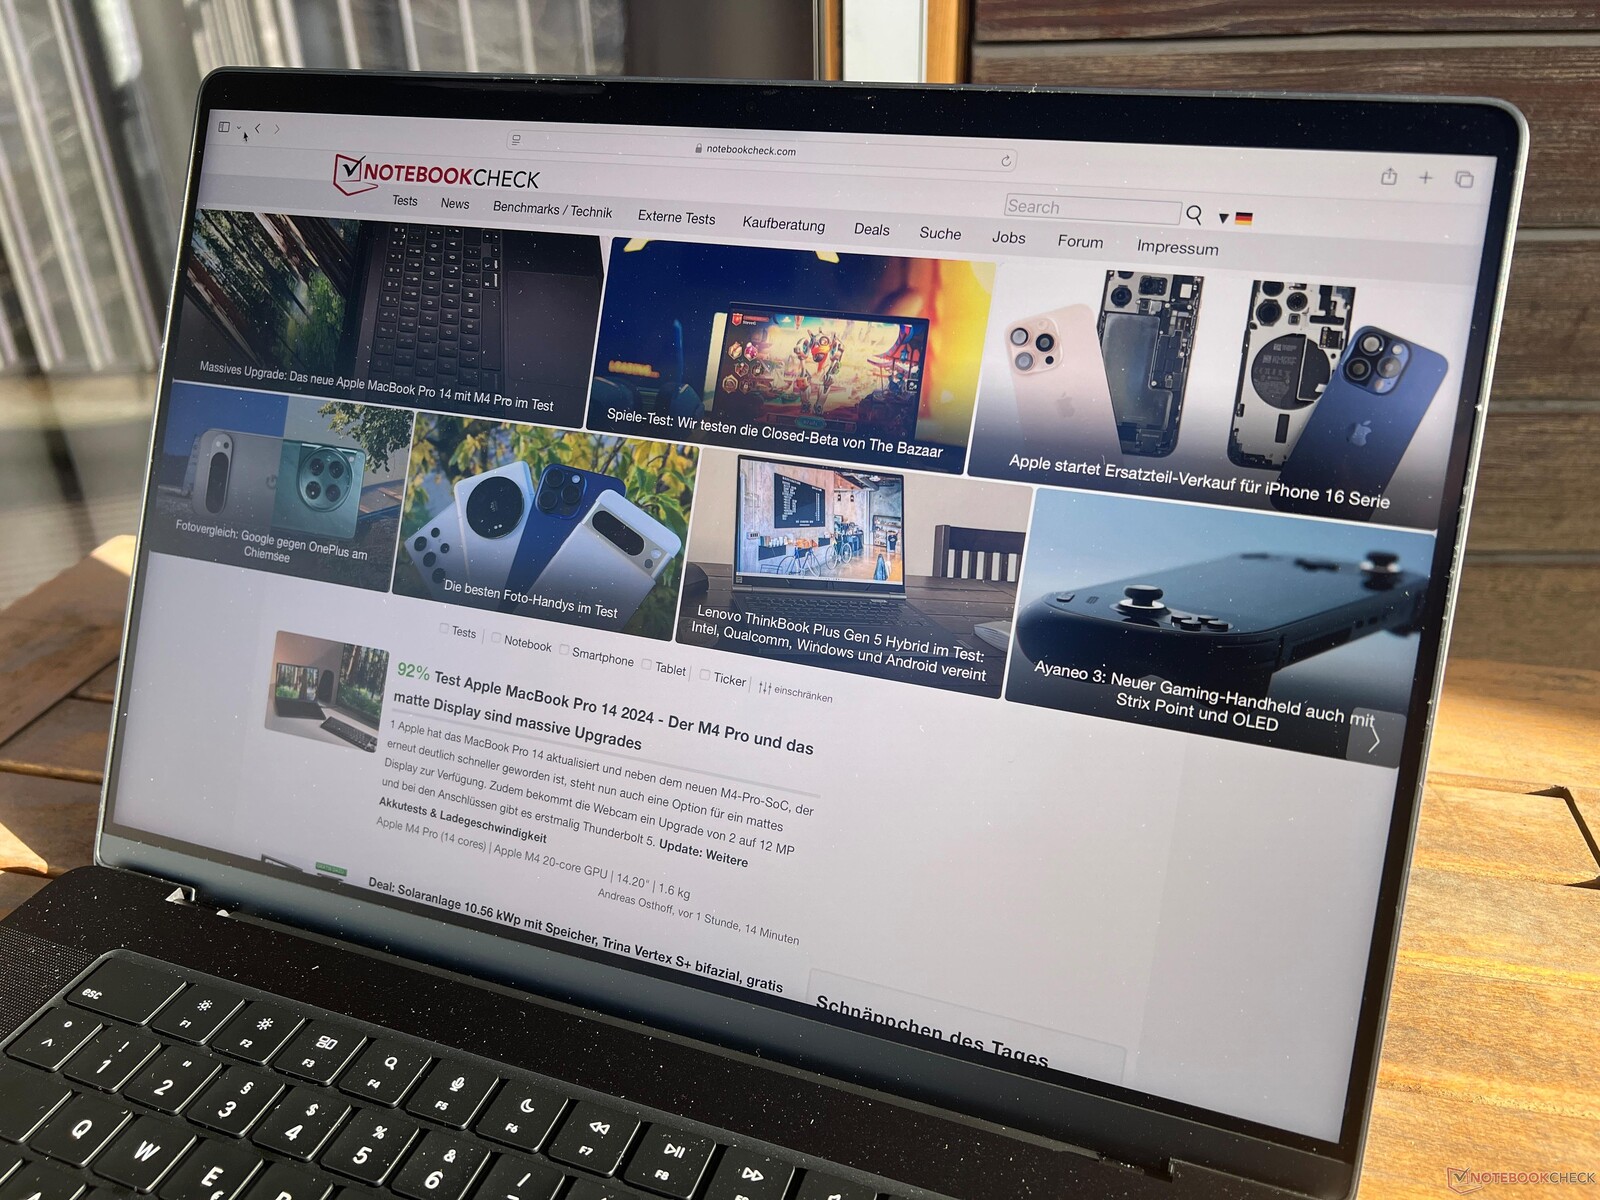
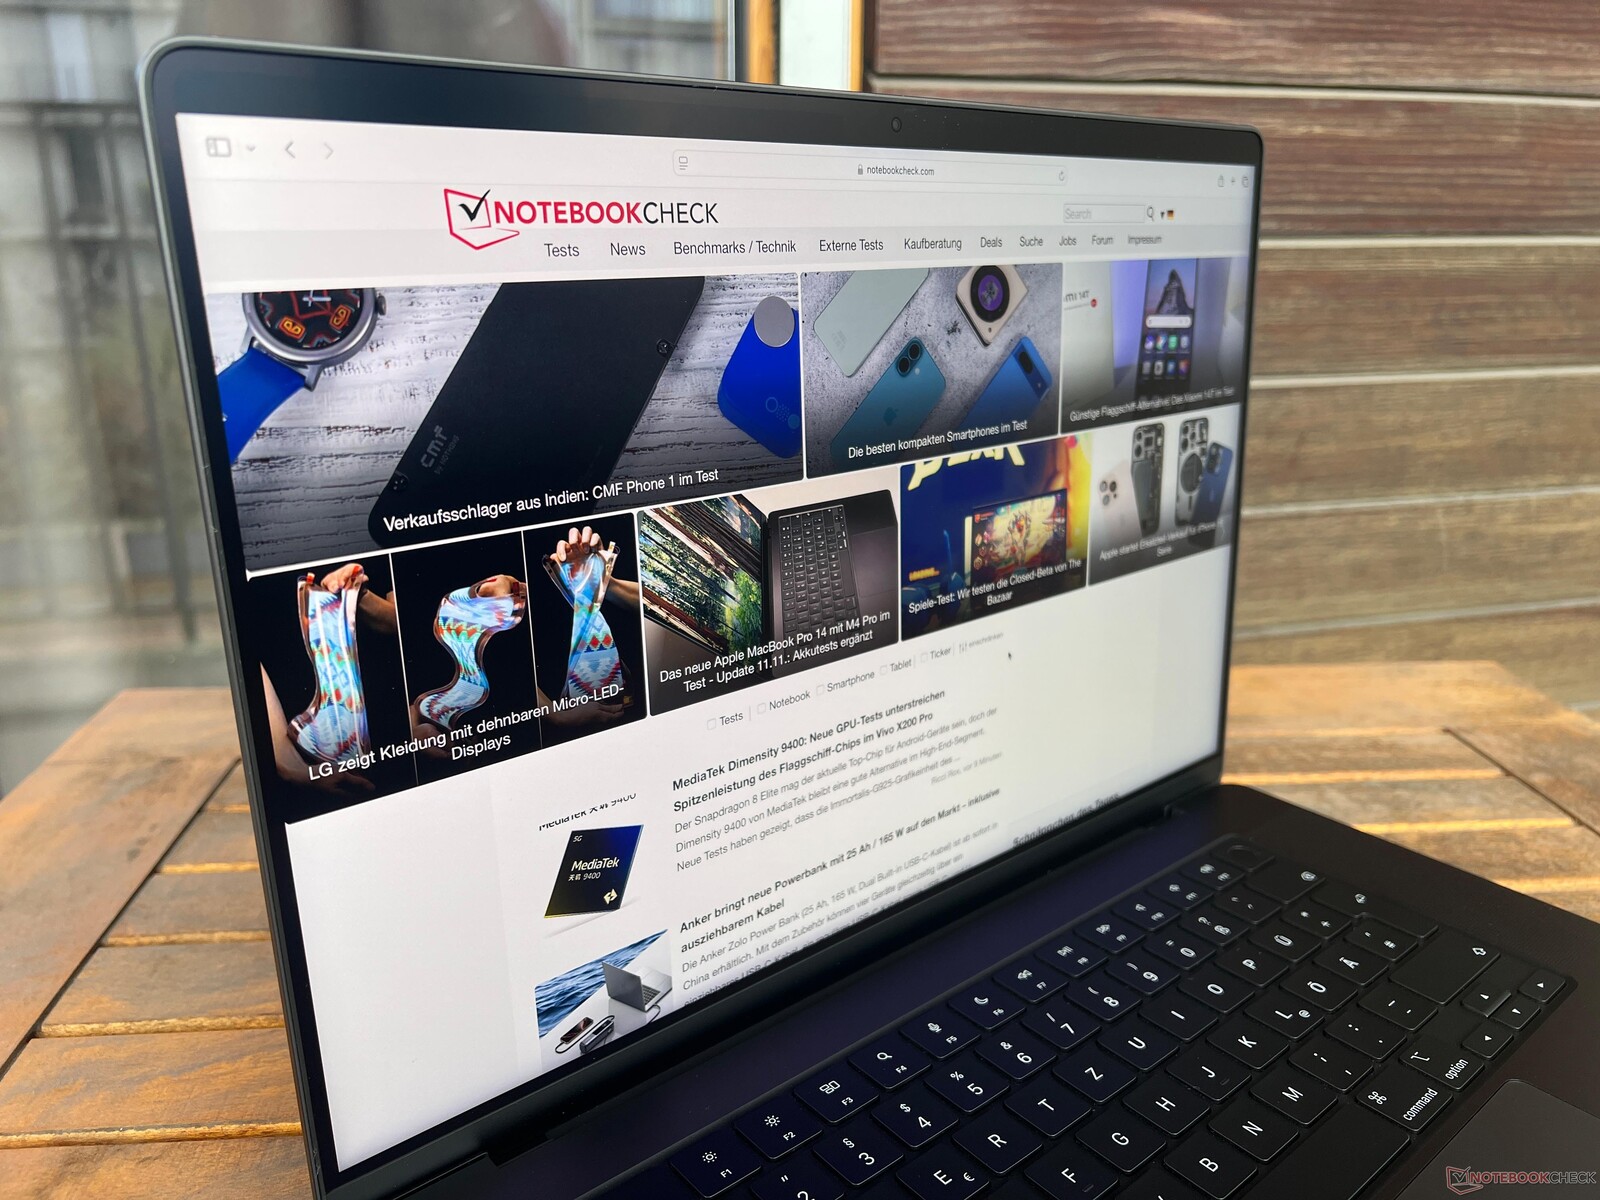
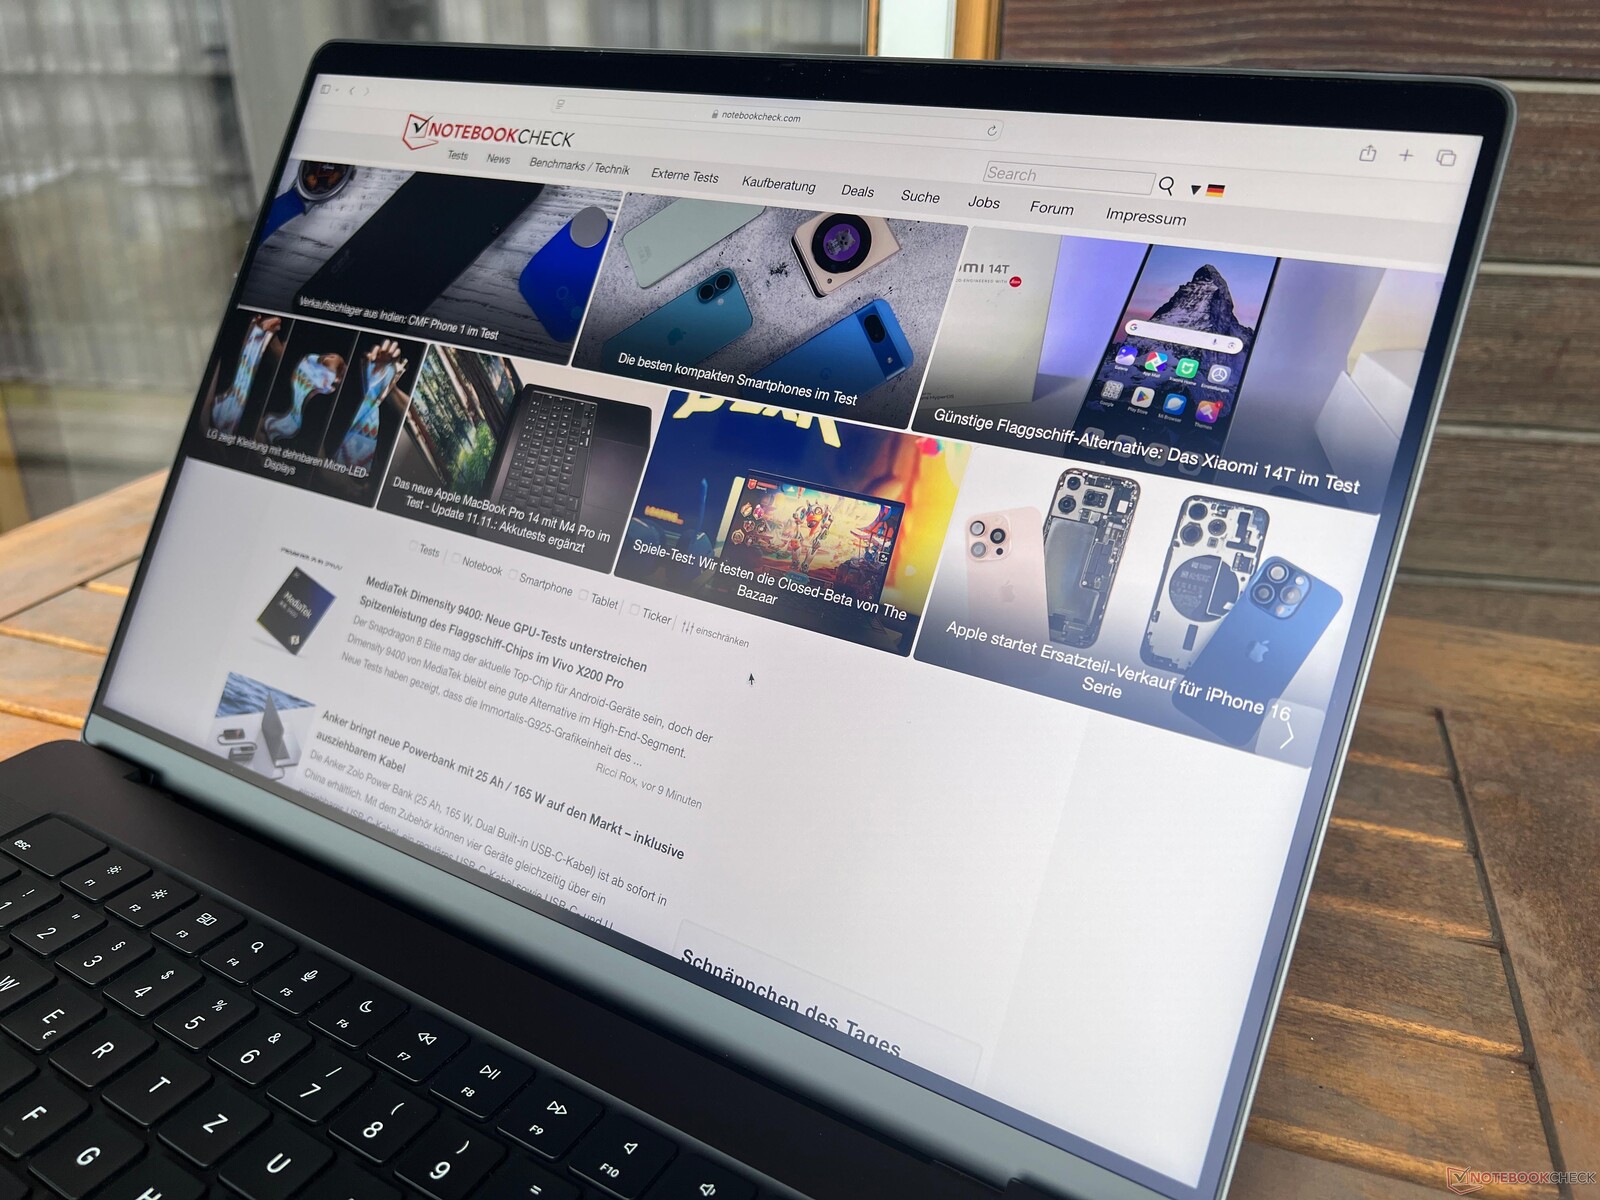
Although nothing has changed about the case itself, there has been a whole range of improvements introduced overall. Included in this is the mini-LED panel's improved SDR brightness alongside its new nano-texture coating—i.e. a matte display option. This means you can use the MacBook in super bright environments without any annoying reflections getting in your way. Its USB-C ports now support Thunderbolt 5 and its new 12-MP camera delivers a better picture during video calls as well as advanced features such as a desktop view. However, you'll have to make do without Wi-Fi 7. As always, its battery life is great, leaving the direct Windows competition in the dust.
Disadvantages include its lack of maintenance options and enormous surcharges for more RAM/SSD storage. Compared to Windows laptops, its choice of games is still limited, although the M4 Pro's gaming performance is generally very good and all native macOS titles run smoothly.
Pros
Cons
Price and availability
You can configure the new MacBook Pro 16 with the M4 Pro directly on Apple's website. The configuration with the M4 Pro, 48 GB RAM and a 512-GB SSD can be purchased from Amazon, where it currently costs $2,664.
Possible alternatives compared
Image | Model / Review | Price | Weight | Height | Display |
|---|---|---|---|---|---|
1. 93%  | Apple MacBook Pro 16 2024 M4 Pro Apple M4 Pro 14-Core ⎘ Apple M4 Pro 20-Core GPU ⎘ 48 GB Memory, 2048 GB SSD | Amazon: List Price: 4219€ | 2.1 kg | 16.8 mm | 16.20" 3456x2234 254 PPI Mini-LED |
2. 93.7% v7 (old) 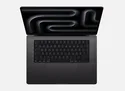 | Apple MacBook Pro 16 2023 M3 Pro Apple M3 Pro 12-Core ⎘ Apple M3 Pro 18-Core GPU ⎘ 18 GB Memory, 512 GB SSD | Amazon: 1. $2,480.00 Apple 2023 MacBook Pro with ... 2. $1,846.90 Apple 2023 MacBook Pro with ... 3. $1,390.00 2023 Apple MacBook Pro with ... List Price: 2999€ | 2.1 kg | 16.9 mm | 16.20" 3456x2234 254 PPI Mini-LED |
3. 83.5% 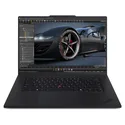 | Lenovo ThinkPad P1 Gen 7 21KV001SGE Intel Core Ultra 7 155H ⎘ NVIDIA GeForce RTX 4060 Laptop GPU ⎘ 32 GB Memory, 1024 GB SSD | Amazon: List Price: 3239 Euro | 2 kg | 20.5 mm | 16.00" 2560x1600 189 PPI IPS LED |
4. 87.8% 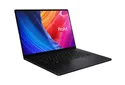 | Asus ProArt P16 H7606WI AMD Ryzen AI 9 HX 370 ⎘ NVIDIA GeForce RTX 4070 Laptop GPU ⎘ 64 GB Memory, 1024 GB SSD | Amazon: List Price: 4000€ | 1.8 kg | 17.3 mm | 16.00" 3840x2400 283 PPI OLED |
5. 91.7% v7 (old) 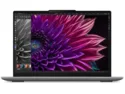 | Lenovo Yoga Pro 9 16IMH9 RTX 4050 Intel Core Ultra 9 185H ⎘ NVIDIA GeForce RTX 4050 Laptop GPU ⎘ 32 GB Memory, 1024 GB SSD | Amazon: List Price: 1900 USD | 2.1 kg | 18.3 mm | 16.00" 3200x2000 236 PPI IPS |
6. 88.6% v7 (old)  | Dell XPS 16 9640 Intel Core Ultra 7 155H ⎘ NVIDIA GeForce RTX 4070 Laptop GPU ⎘ 32 GB Memory, 1024 GB SSD | Amazon: 1. $2,199.00 New XPS 16 9640 Business Lap... 2. $2,499.00 Dell XPS 16 9640 16.3" Touch... 3. $2,199.00 New XPS 16 9640 Powerful AI ... | 2.3 kg | 18.7 mm | 16.30" 3840x2400 139 PPI OLED |
7. 90.4% v7 (old)  | Samsung Galaxy Book4 Ultra Intel Core Ultra 7 155H ⎘ NVIDIA GeForce RTX 4050 Laptop GPU ⎘ 16 GB Memory, 512 GB SSD | Amazon: List Price: 2799€ | 1.8 kg | 17 mm | 16.00" 2880x1800 212 PPI OLED |
Table of Contents
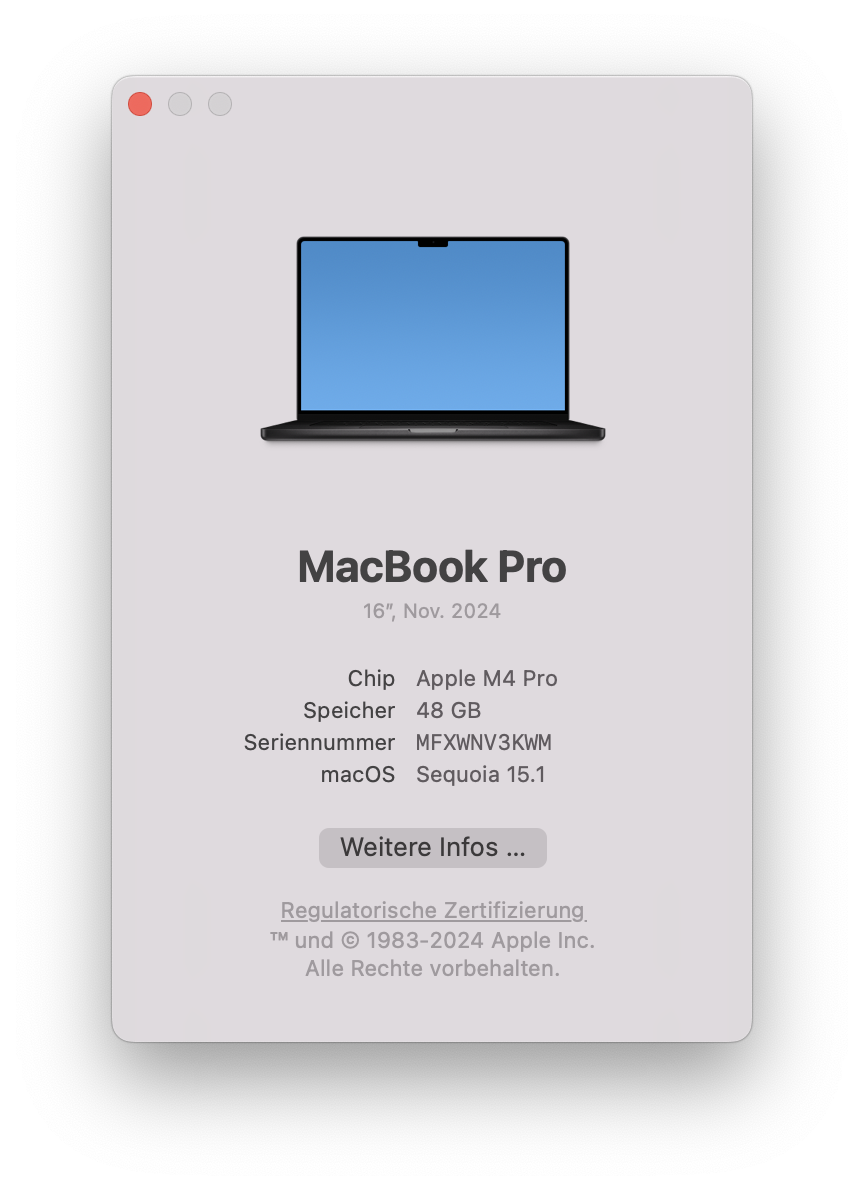
Apple has presented its new MacBook Pro 16 and the base variant is already equipped with the full configuration of the M4 Pro SoC. In combination with 24 GB RAM and a 512-GB SSD, the new MBP 16 costs $2,499. Our test configuration comes with the new optional matte nano-texture panel ($150 surcharge) as well as 48 GB RAM and a 2-TB SSD. Due to Apple's enormous surcharges for RAM/SSD, its price rises to $3,649.
Specifications
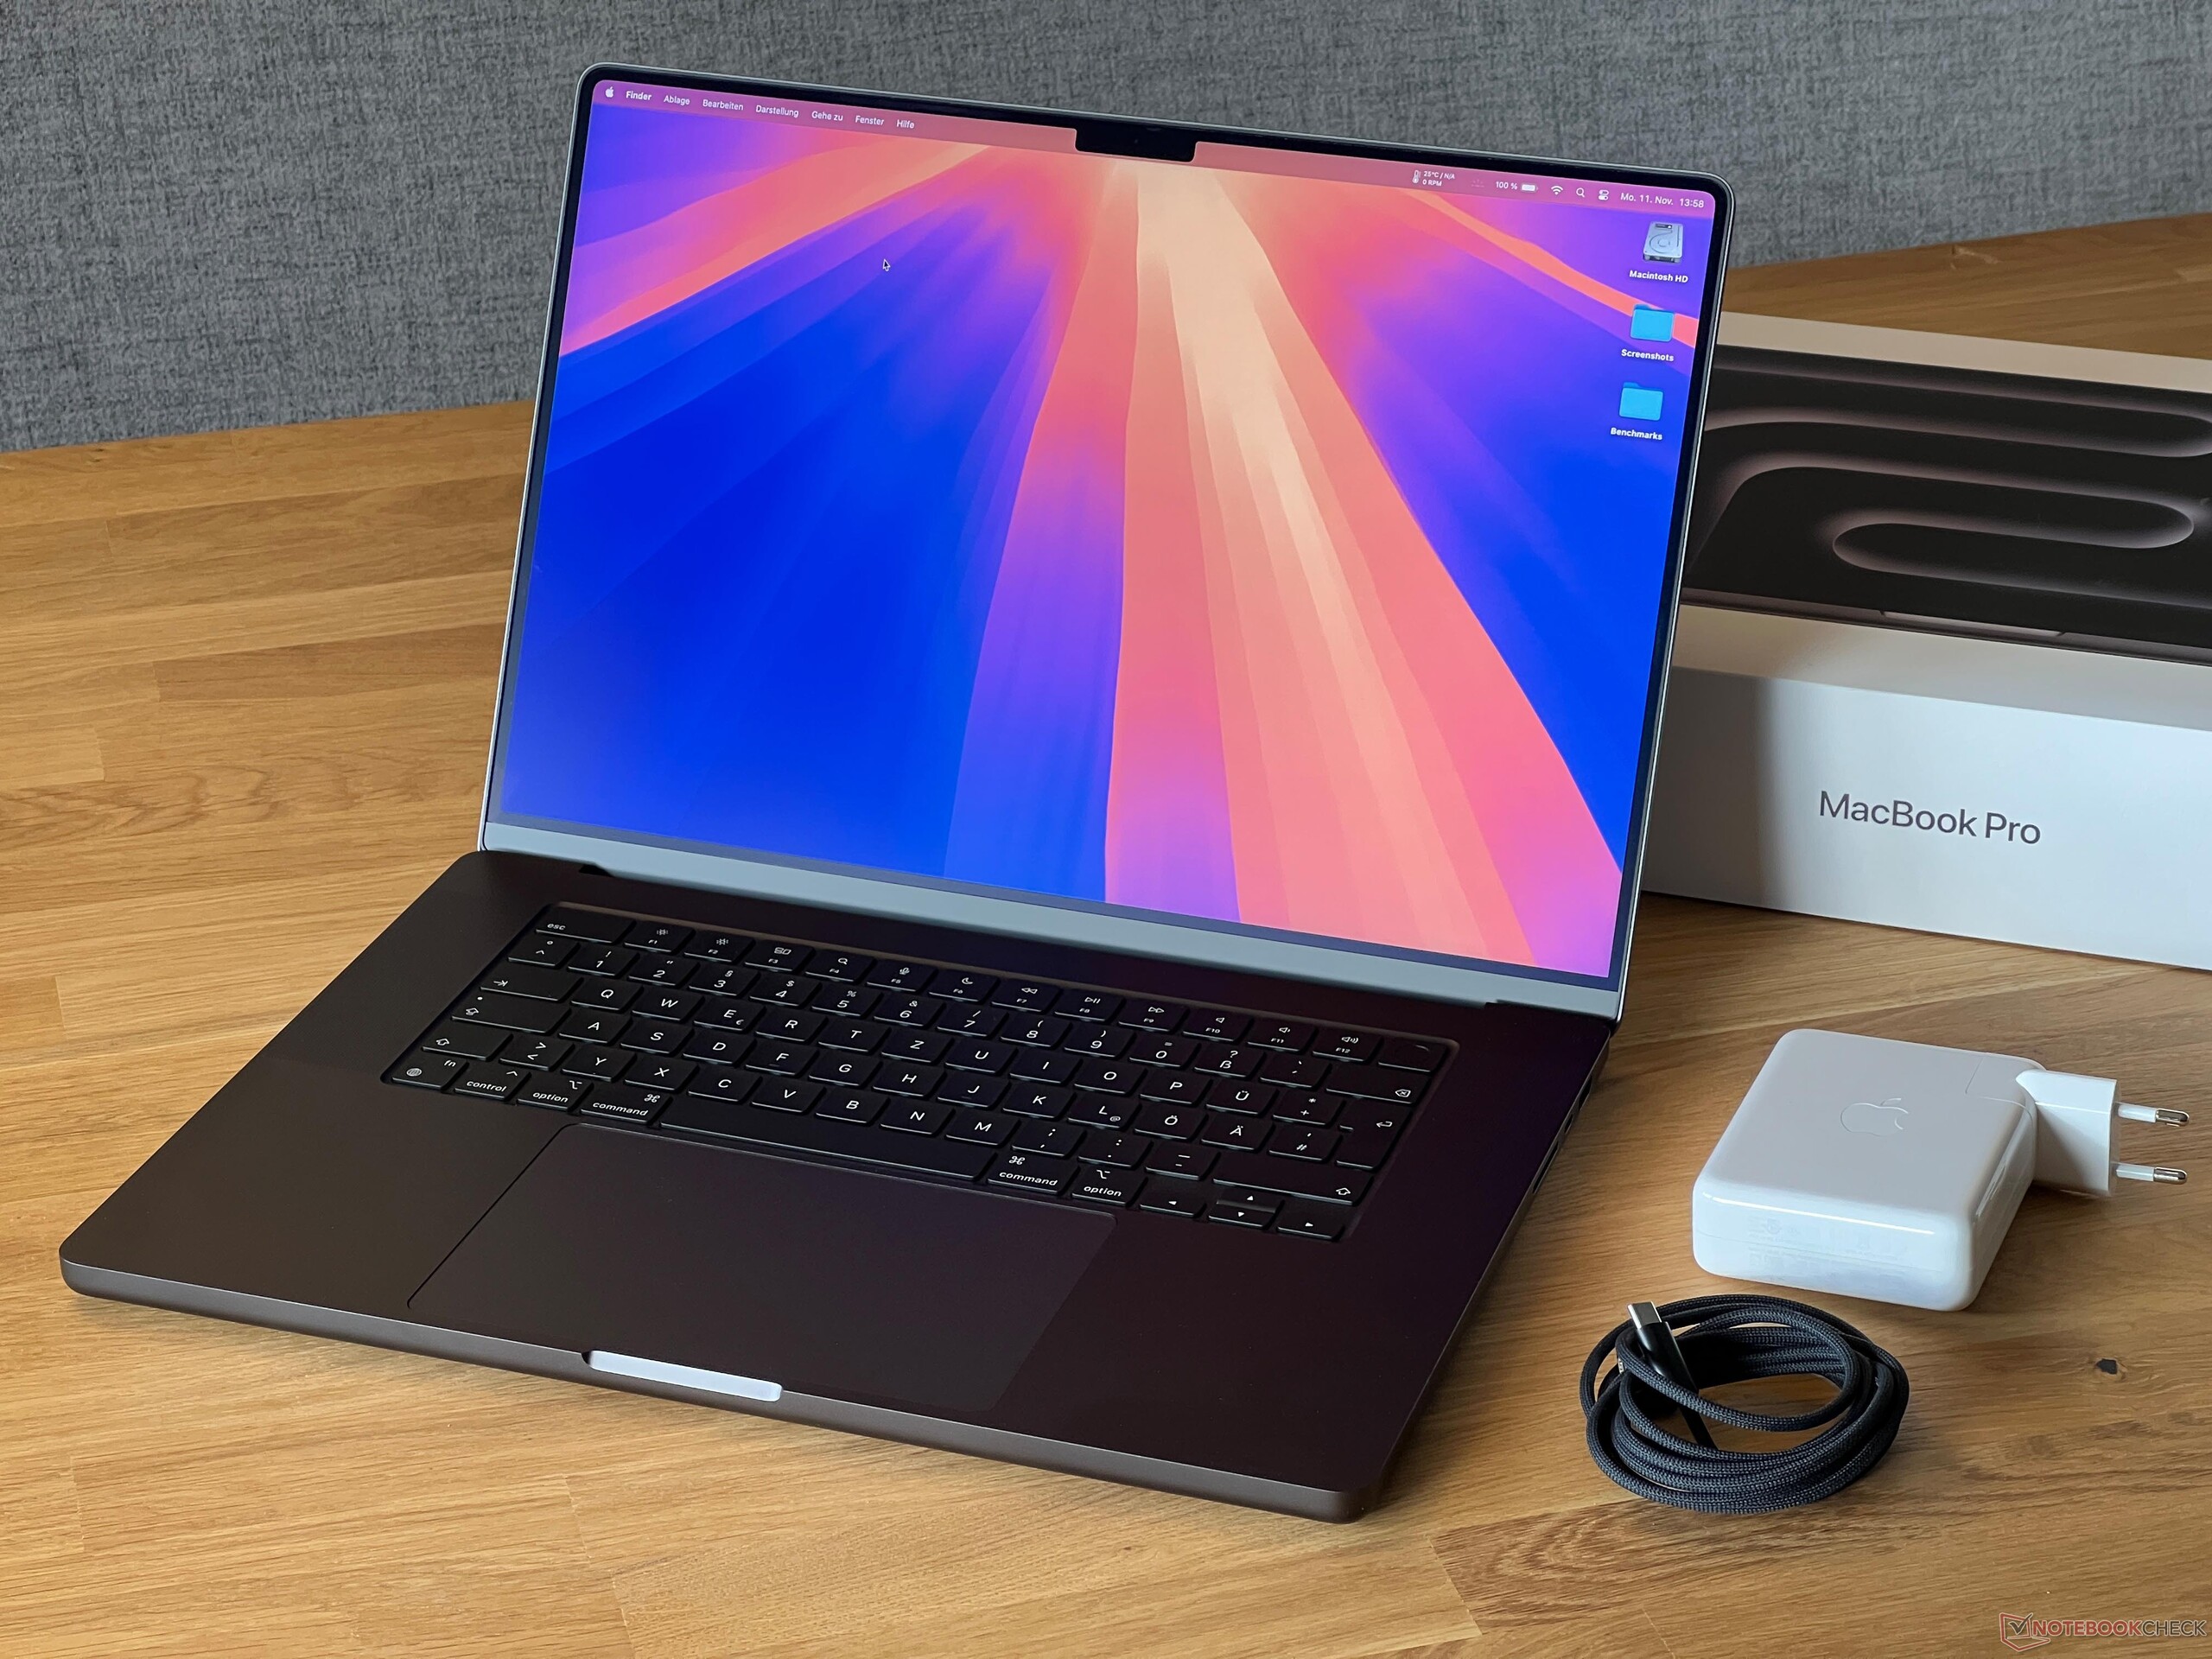
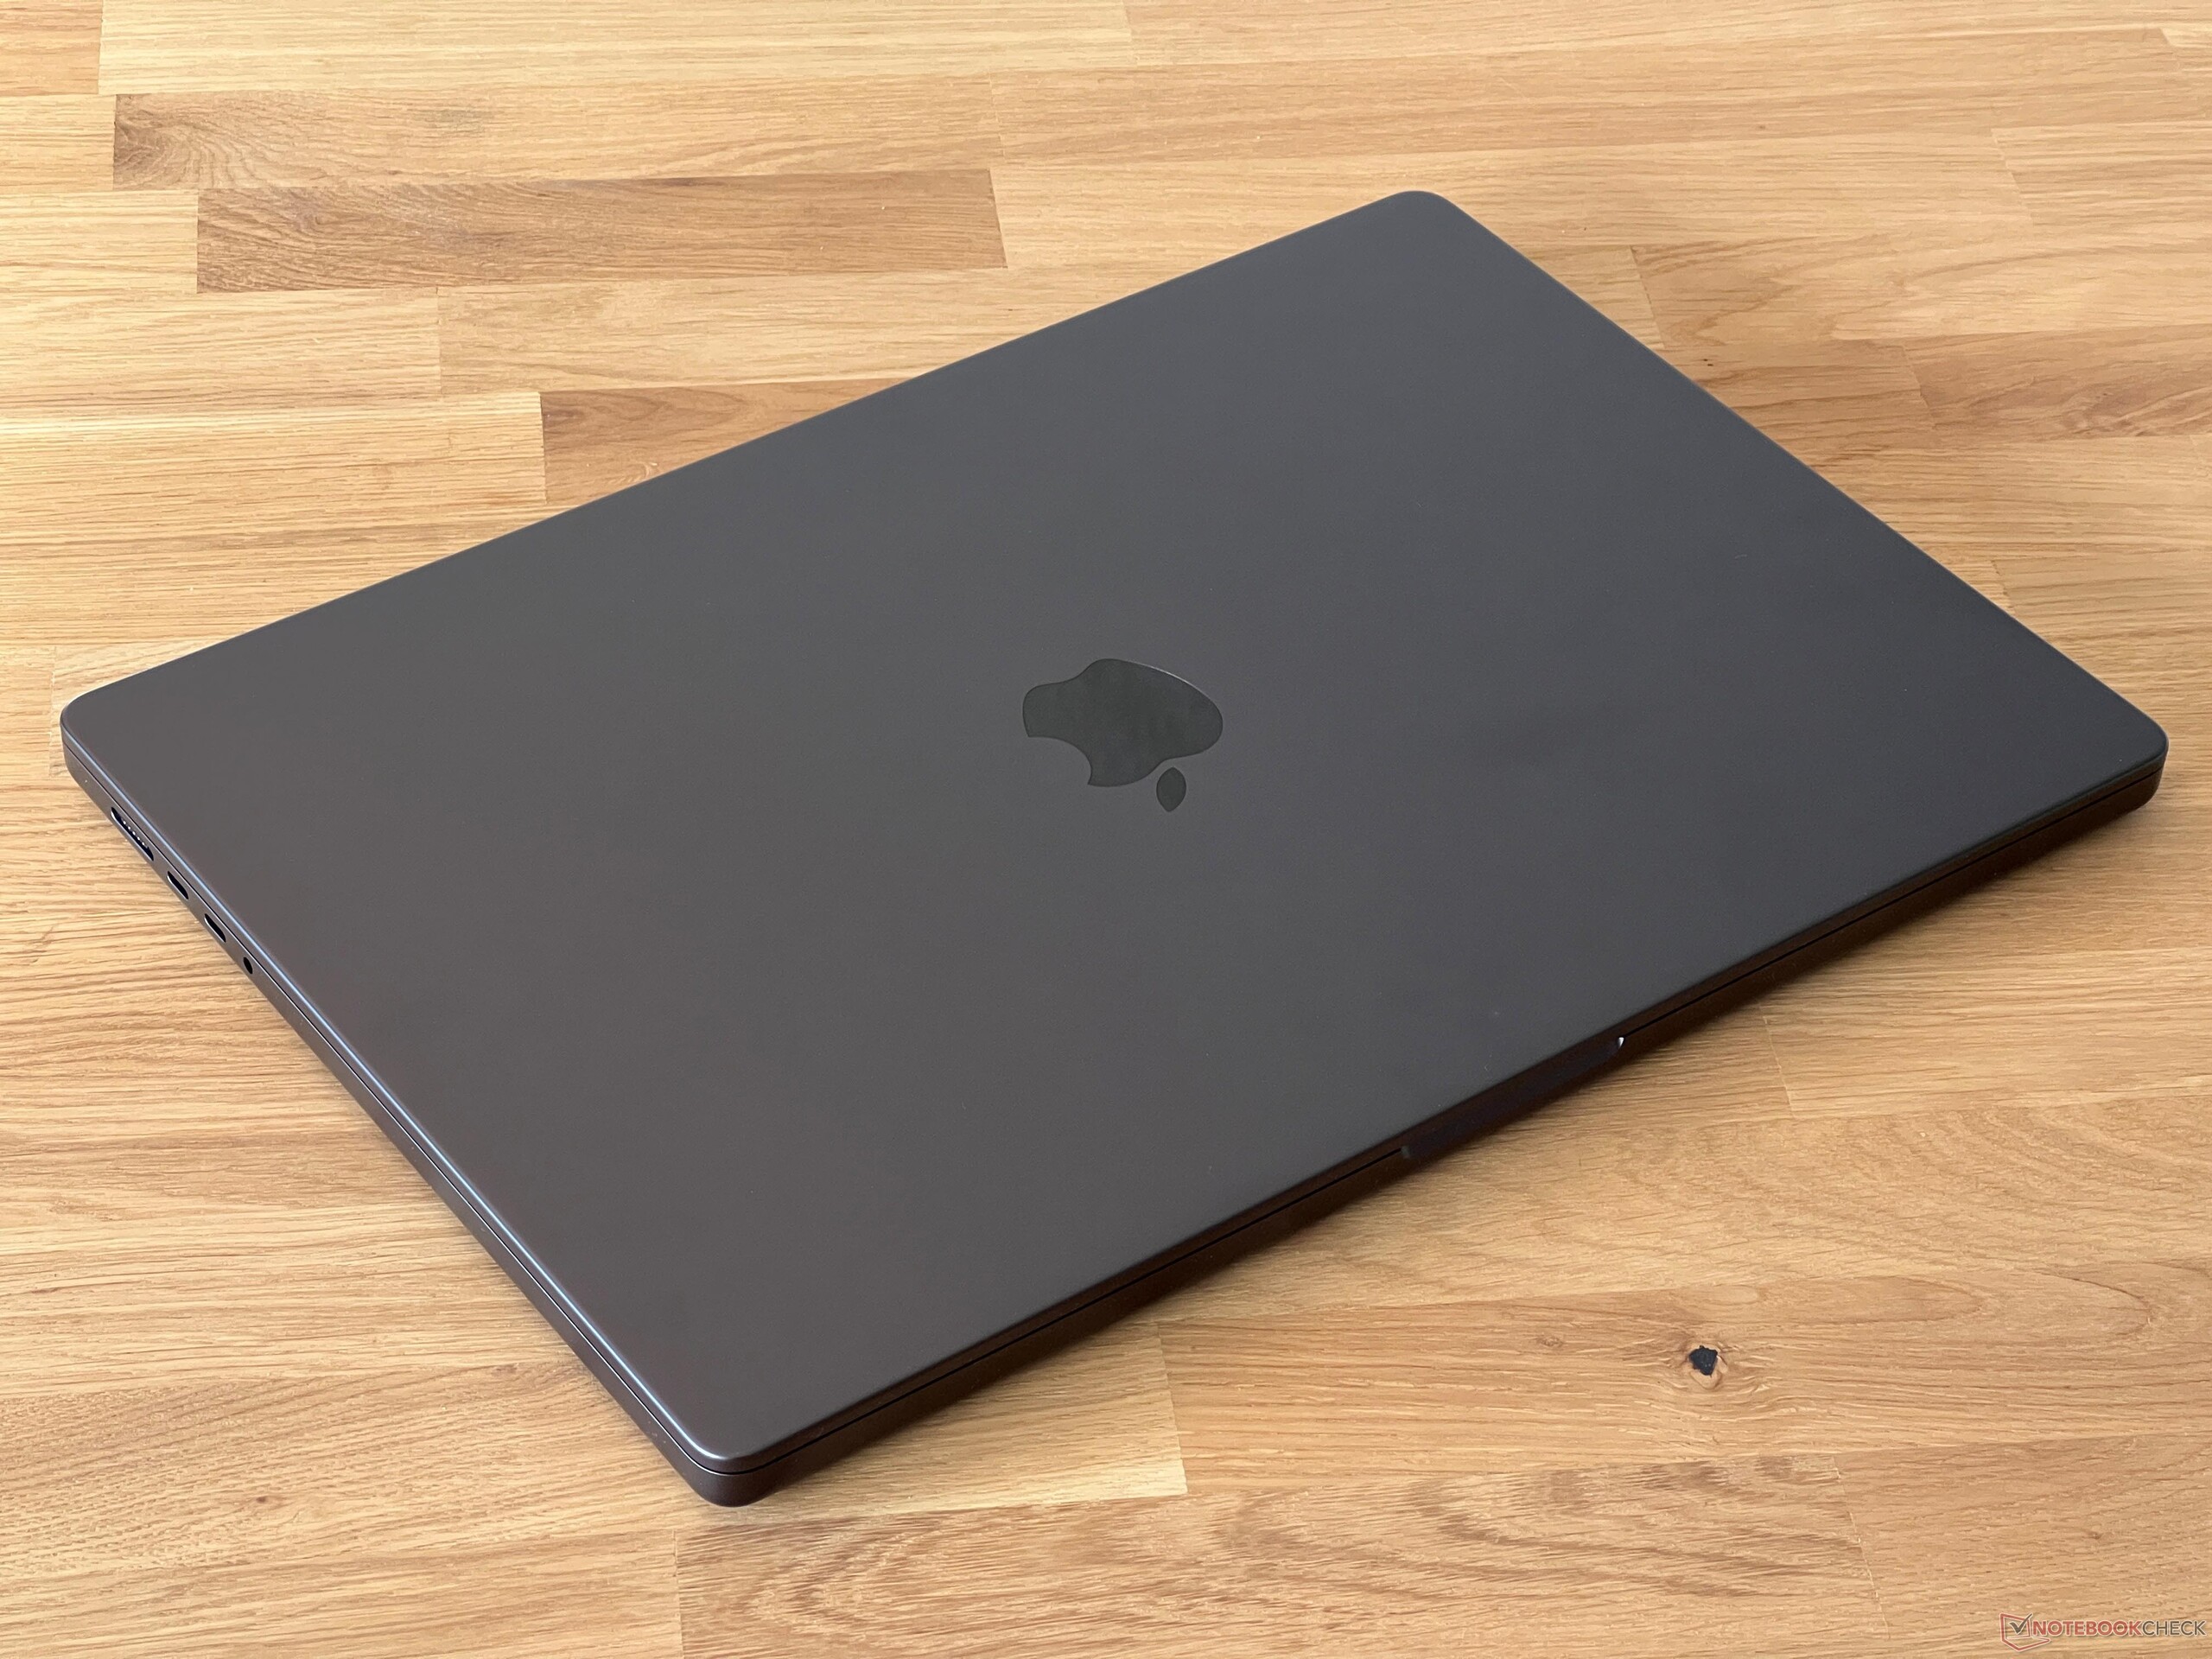
Case & connectivity
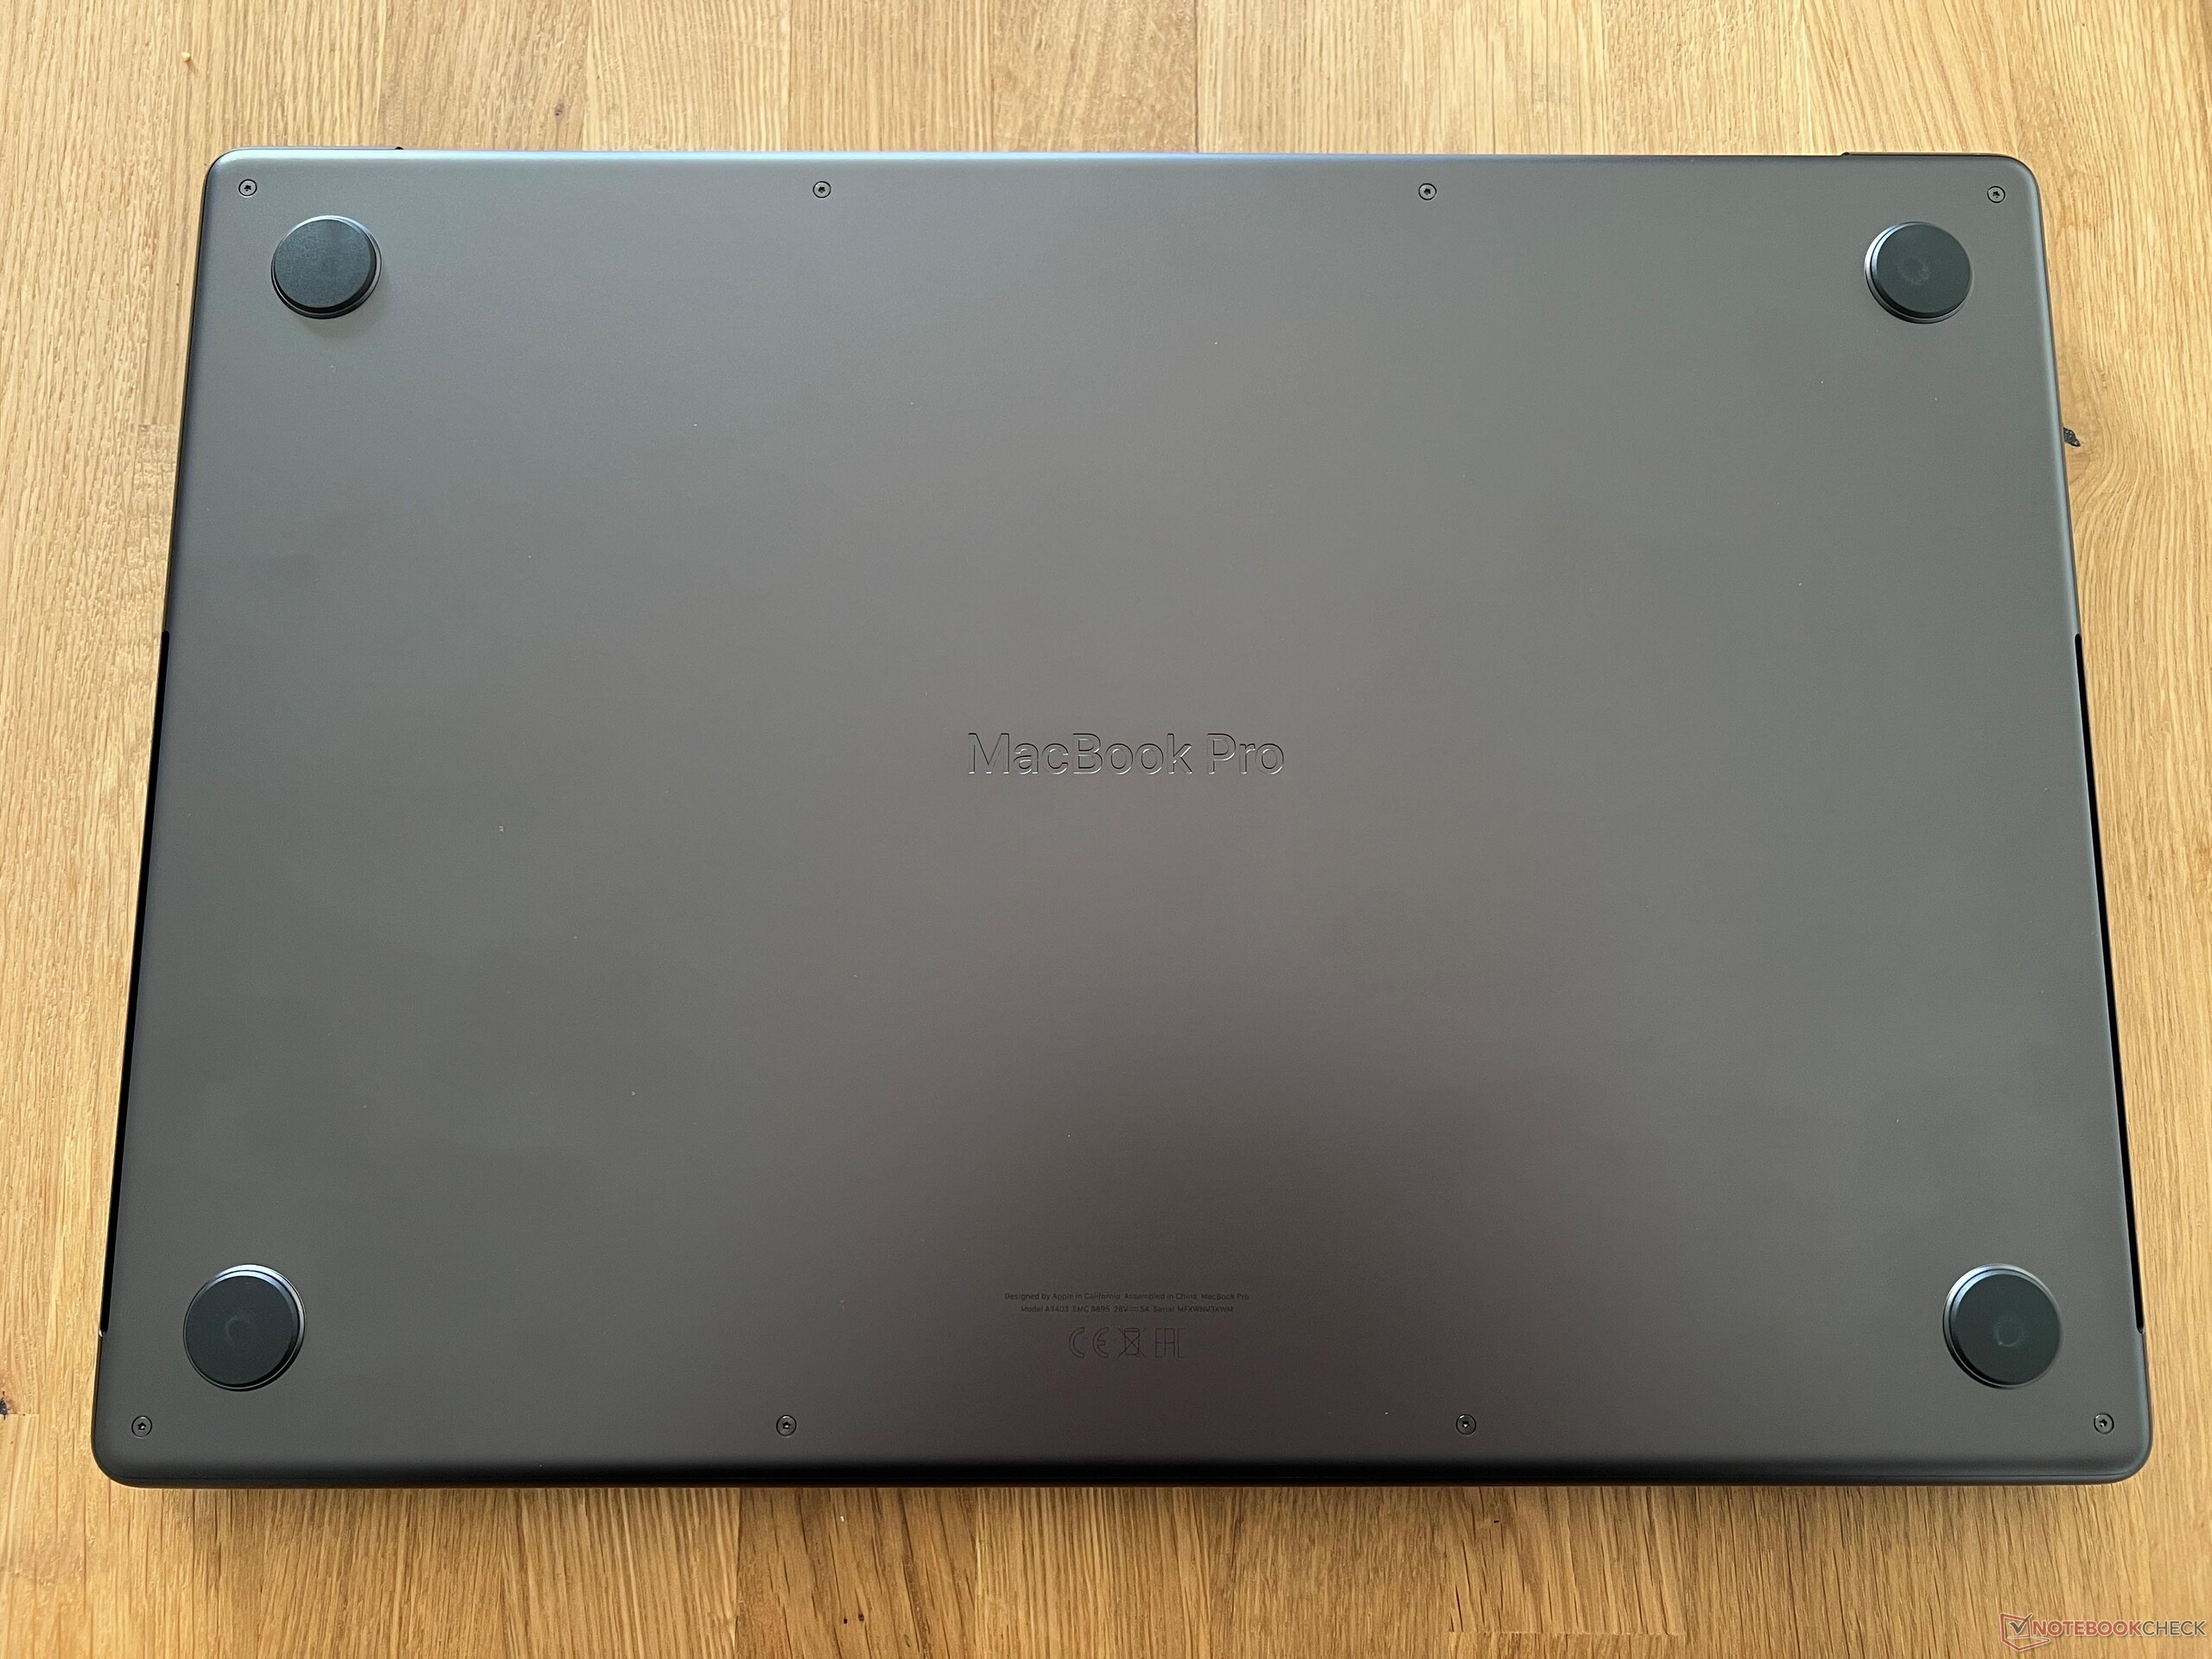
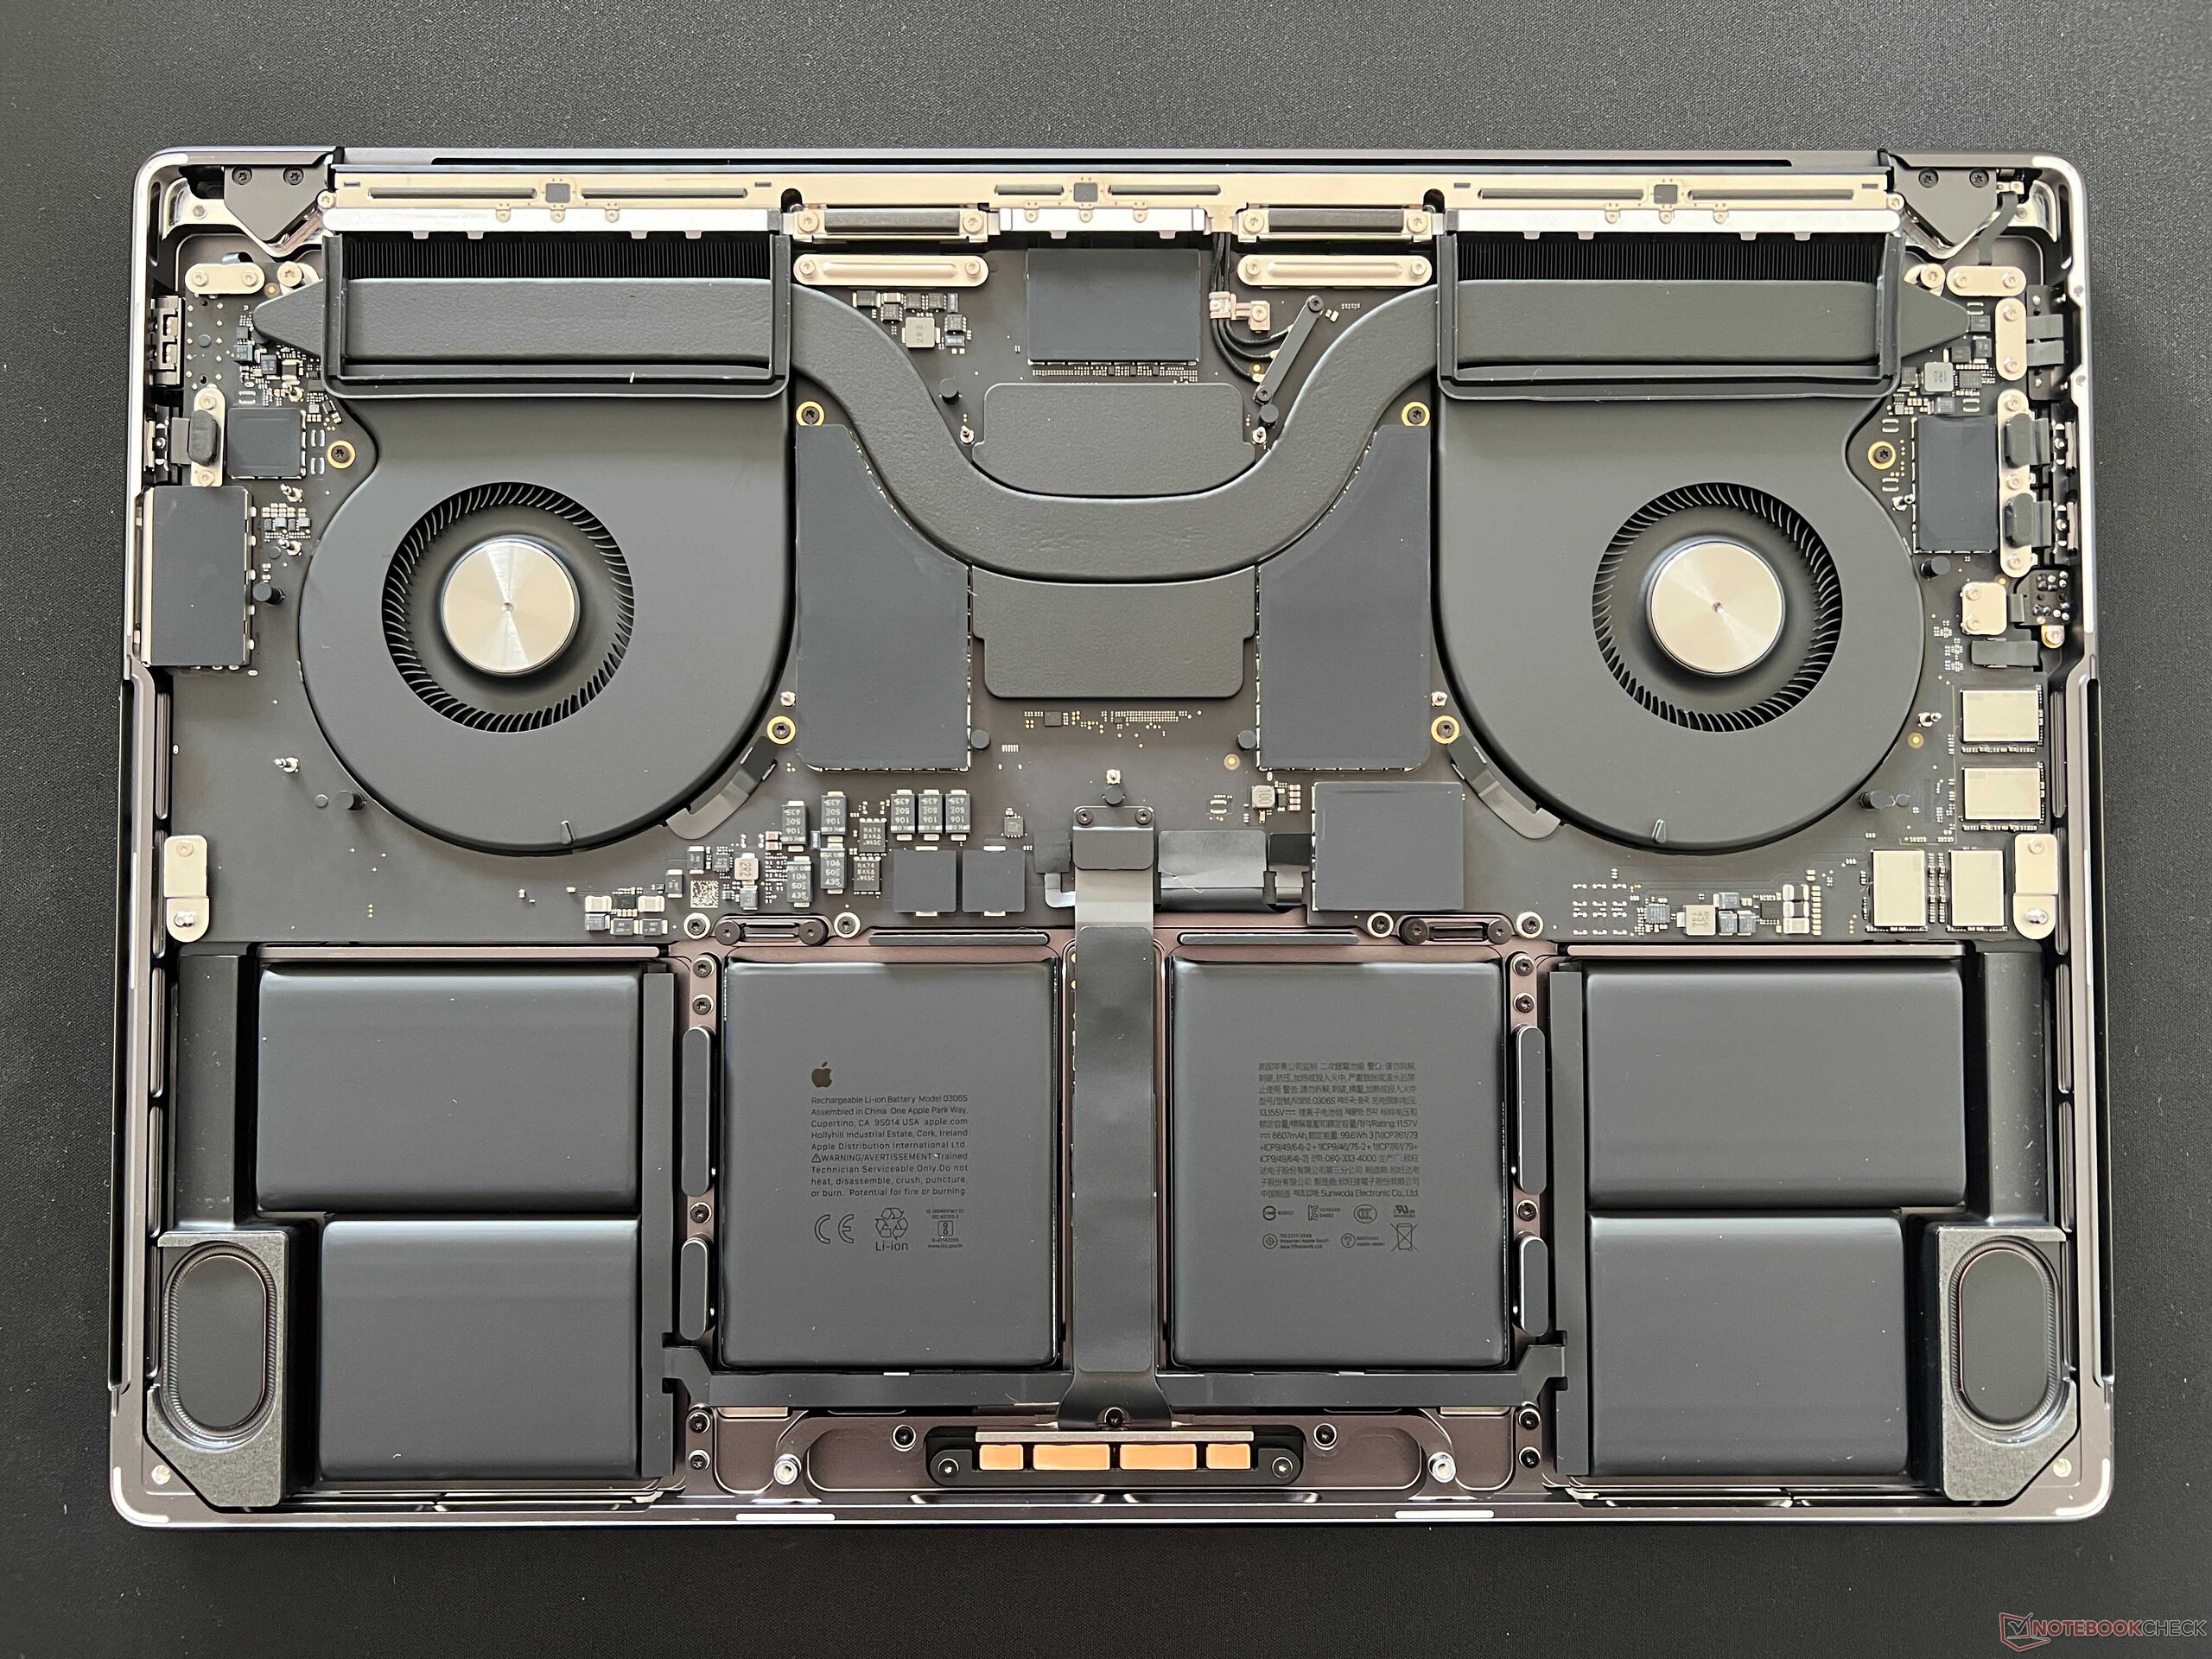
Compared to its predecessor, the new MacBook Pro's case is the exact same. It faces no quality issues and is an amazing laptop when it comes to stability and build. However, apart from being able to clean the fans, it again doesn't provide any maintenance options. The black color variant is once again slightly more sensitive to collecting fingerprint marks than the silver model.
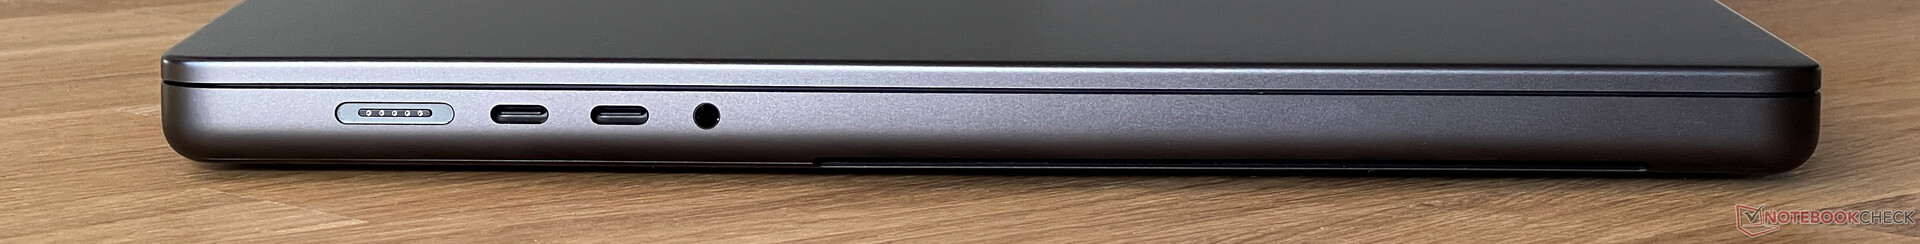
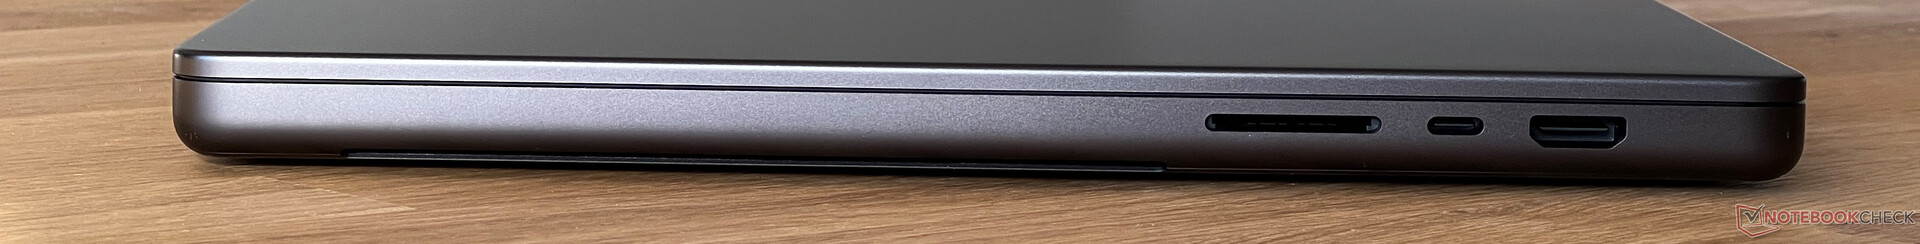
All three of its USB-C ports now support Thunderbolt 5 and its webcam now uses a 12-MP sensor. Its quality during video calls is good and the webcam now supports a desktop view—however, photos taken using the webcam continue to have a low resolution (photos 1,440 x 900, videos max. 1080p) and FaceID isn't supported. Its WLAN module supports Wi-Fi 6E as well as Bluetooth 5.3, but not Wi-Fi 7. We noted no transfer rate issues. The installed SD card reader is fast, but inserted cards stick out of the case by 1.6 cm.
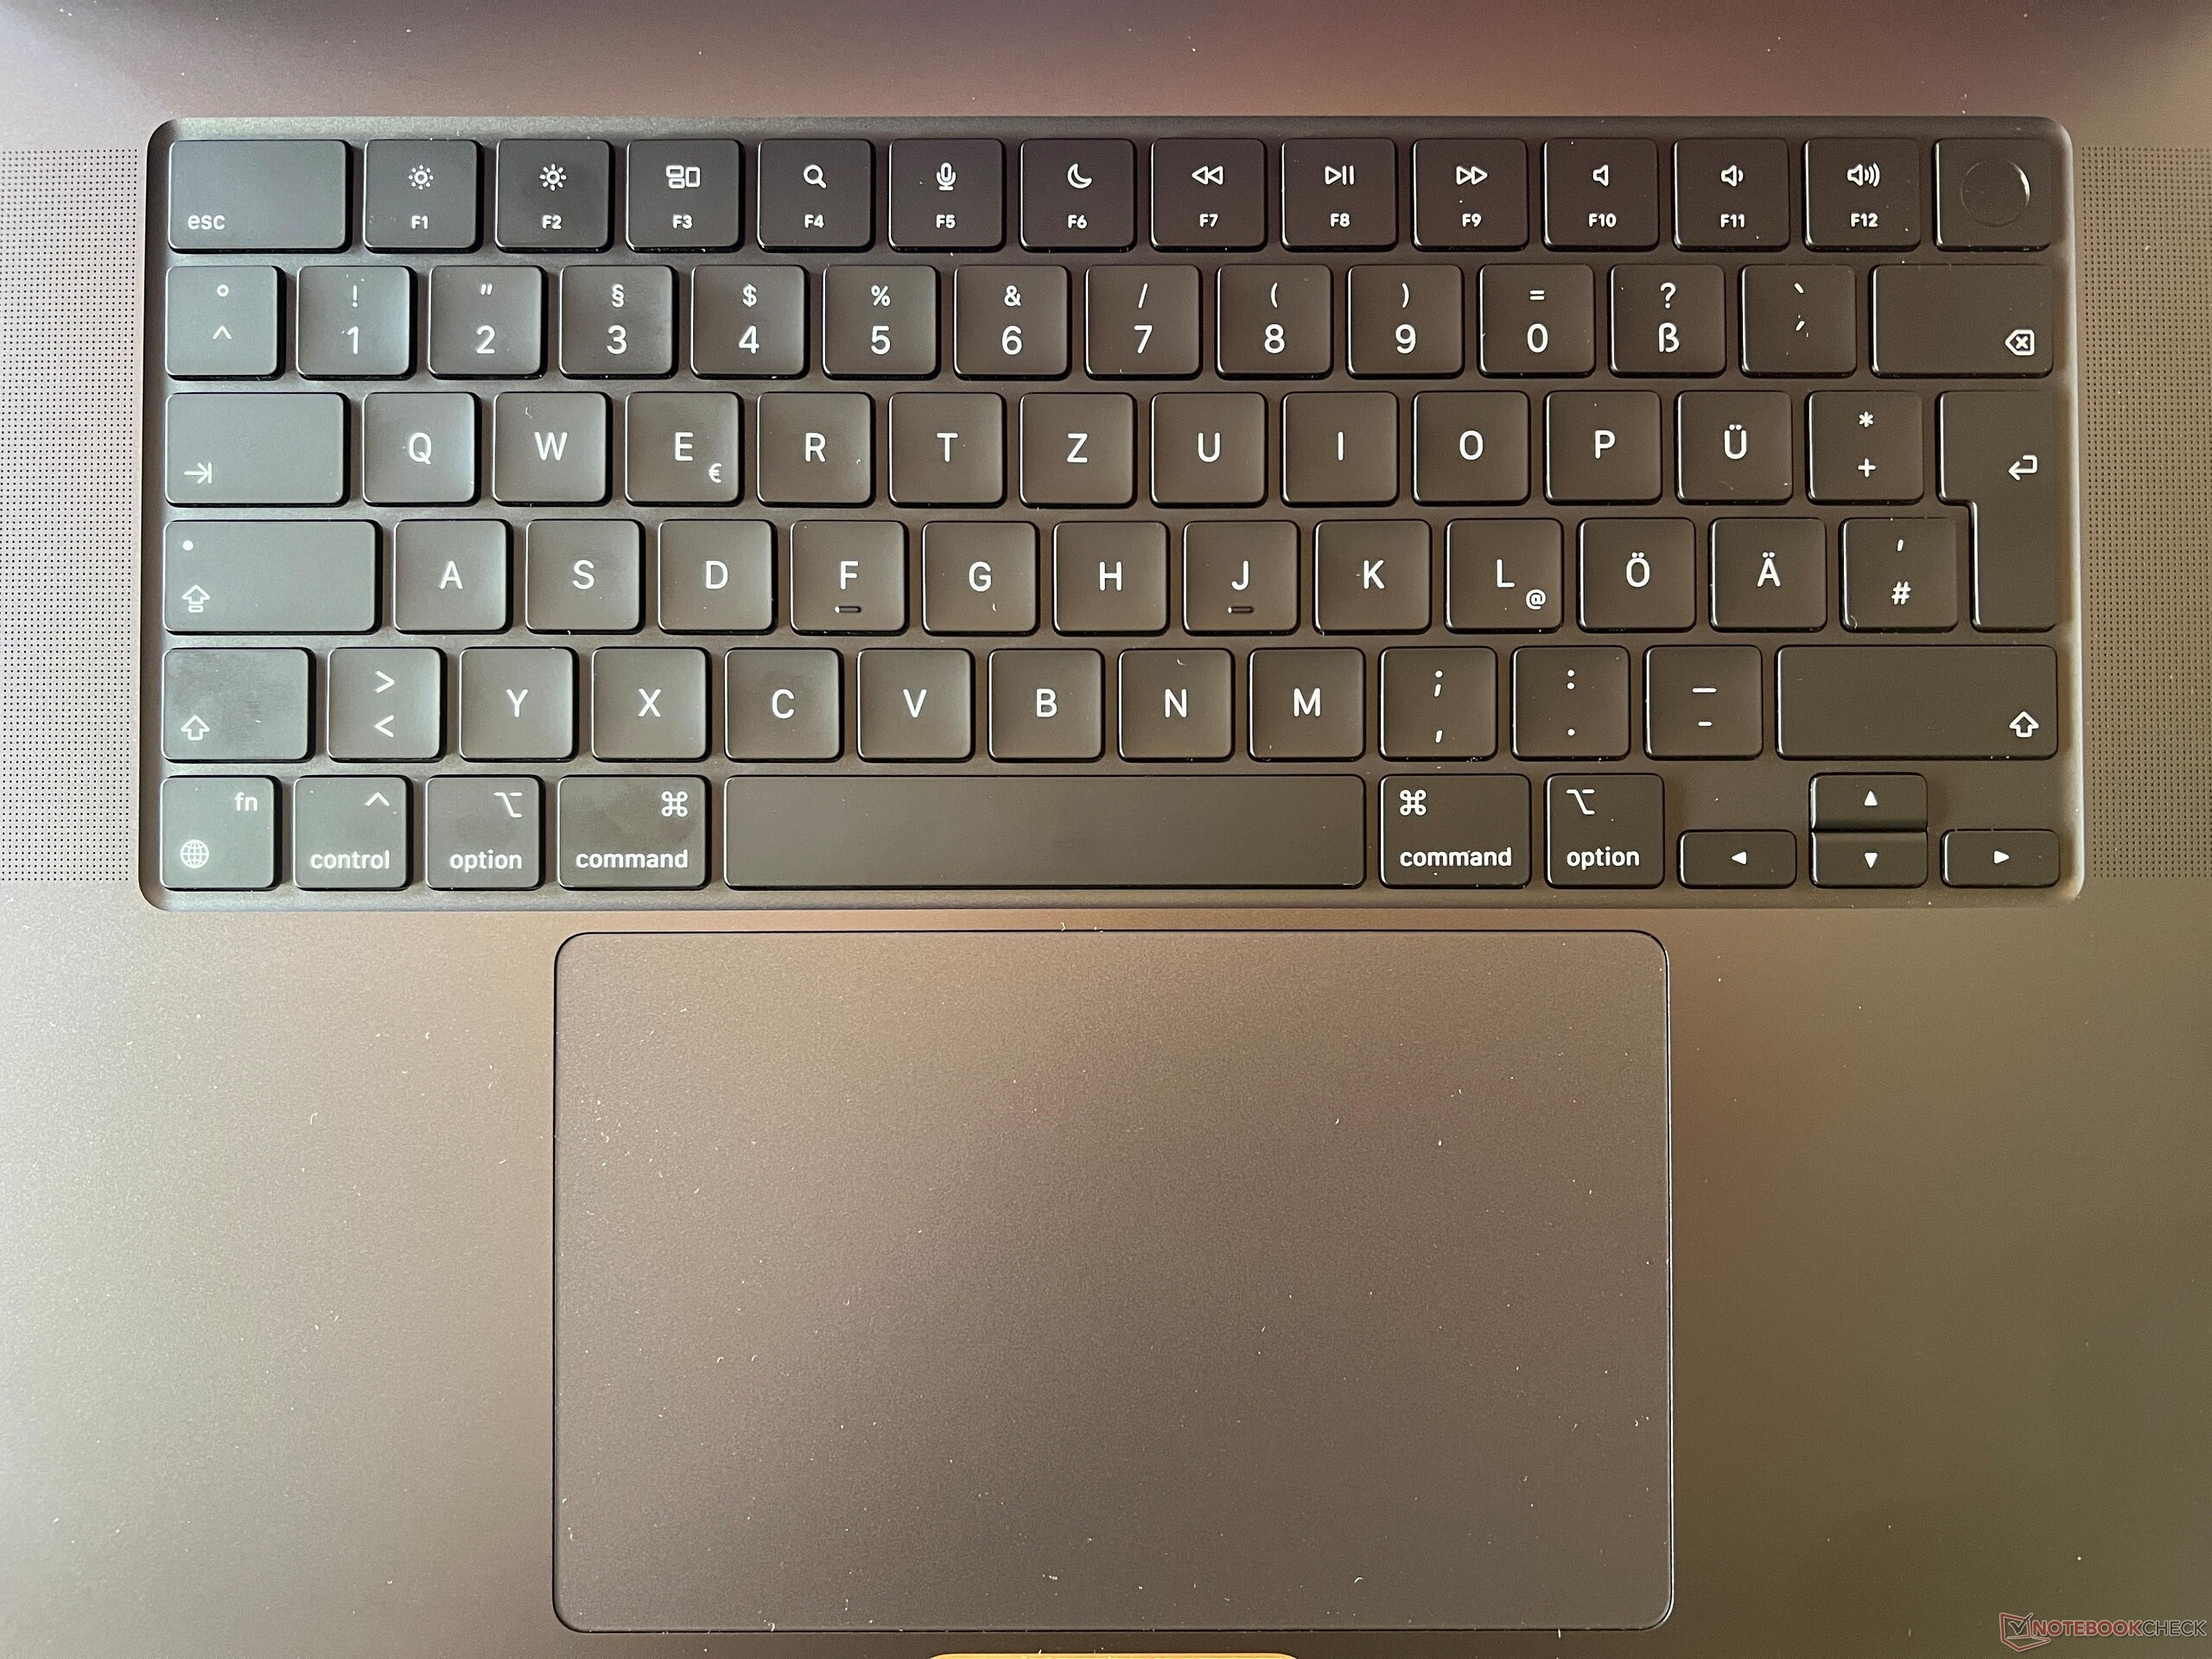
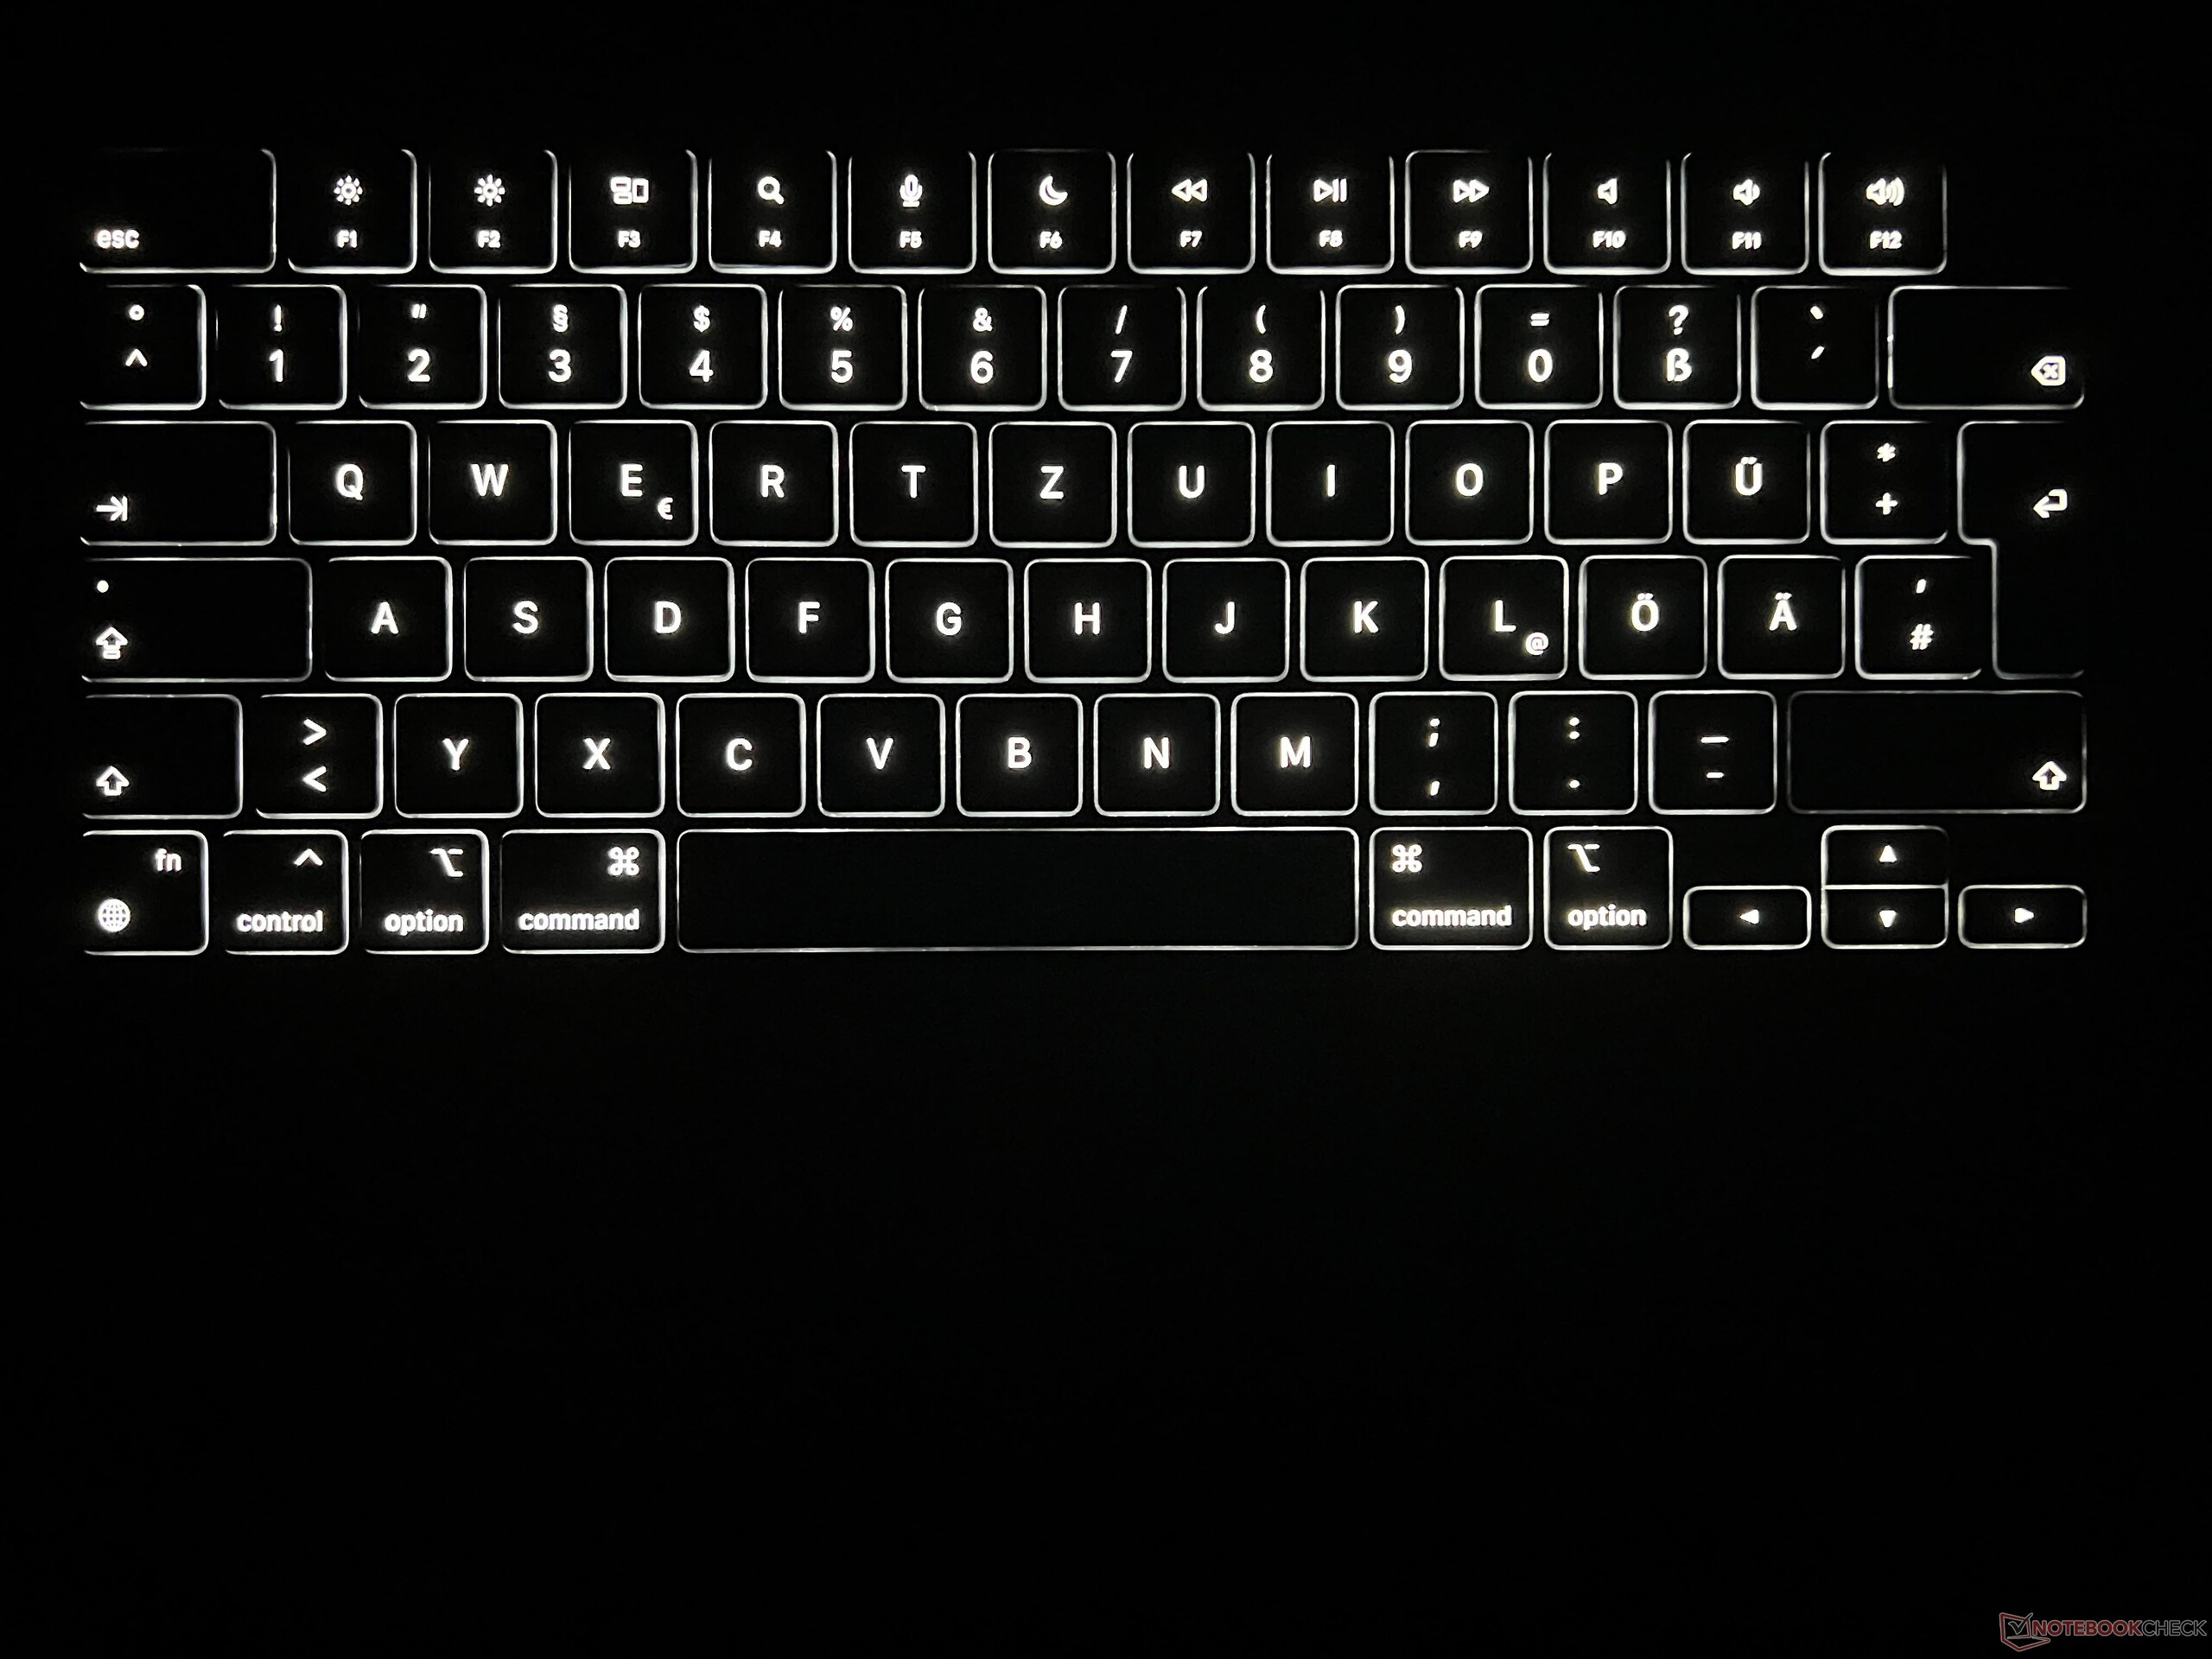
Its input devices are the same as on the old model. Its keyboard is generally comfortable to type on, but it could benefit from a higher key travel. The haptic trackpad, as always, works great.

| SD Card Reader | |
| average JPG Copy Test (av. of 3 runs) | |
| Apple MacBook Pro 16 2024 M4 Pro (Angelbird AV Pro V60) | |
| Dell XPS 16 9640 (Angelbird AV Pro V60) | |
| Average of class Multimedia (23 - 531, n=37, last 2 years) | |
| Asus ProArt P16 H7606WI (Angelbird AV Pro V60) | |
| Lenovo Yoga Pro 9 16IMH9 RTX 4050 (Angelbird AV Pro V60) | |
| Samsung Galaxy Book4 Ultra (Angelbird AV Pro V60) | |
| Lenovo ThinkPad P1 Gen 7 21KV001SGE (AV Pro V60) | |
| maximum AS SSD Seq Read Test (1GB) | |
| Asus ProArt P16 H7606WI (Angelbird AV Pro V60) | |
| Apple MacBook Pro 16 2024 M4 Pro (Angelbird AV Pro V60) | |
| Dell XPS 16 9640 (Angelbird AV Pro V60) | |
| Average of class Multimedia (37.3 - 1455, n=36, last 2 years) | |
| Lenovo Yoga Pro 9 16IMH9 RTX 4050 (Angelbird AV Pro V60) | |
| Lenovo ThinkPad P1 Gen 7 21KV001SGE (AV Pro V60) | |
| Samsung Galaxy Book4 Ultra (Angelbird AV Pro V60) | |
| Networking | |
| Apple MacBook Pro 16 2024 M4 Pro | |
| iperf3 transmit AXE11000 | |
| iperf3 receive AXE11000 | |
| Lenovo ThinkPad P1 Gen 7 21KV001SGE | |
| iperf3 transmit AXE11000 | |
| iperf3 receive AXE11000 | |
| iperf3 transmit AXE11000 6GHz | |
| iperf3 receive AXE11000 6GHz | |
| Asus ProArt P16 H7606WI | |
| iperf3 transmit AXE11000 | |
| iperf3 receive AXE11000 | |
| Lenovo Yoga Pro 9 16IMH9 RTX 4050 | |
| iperf3 transmit AXE11000 | |
| iperf3 receive AXE11000 | |
| iperf3 transmit AXE11000 6GHz | |
| iperf3 receive AXE11000 6GHz | |
| Dell XPS 16 9640 | |
| iperf3 transmit AXE11000 | |
| iperf3 receive AXE11000 | |
| Samsung Galaxy Book4 Ultra | |
| iperf3 transmit AXE11000 | |
| iperf3 receive AXE11000 | |


Display - Mini-LED now with a matte surface
Apple continues to rely on the familiar mini-LED panel with a diagonal of 16.2 inches and a resolution of 3,456 x 2,234 pixels. New, on the other hand, is its nano-texture option, which our test device is equipped with. Subjectively, its picture is only slightly negatively impacted by this, as light areas look a little grainy upon closer inspection—but from a normal distance, we noted no problems and would definitely prefer to go for the matte option. Its second improvement is its increased SDR brightness with the ambient light sensor activated, which can now reach over 1,000 cd/m² (1,063 cd/m²).
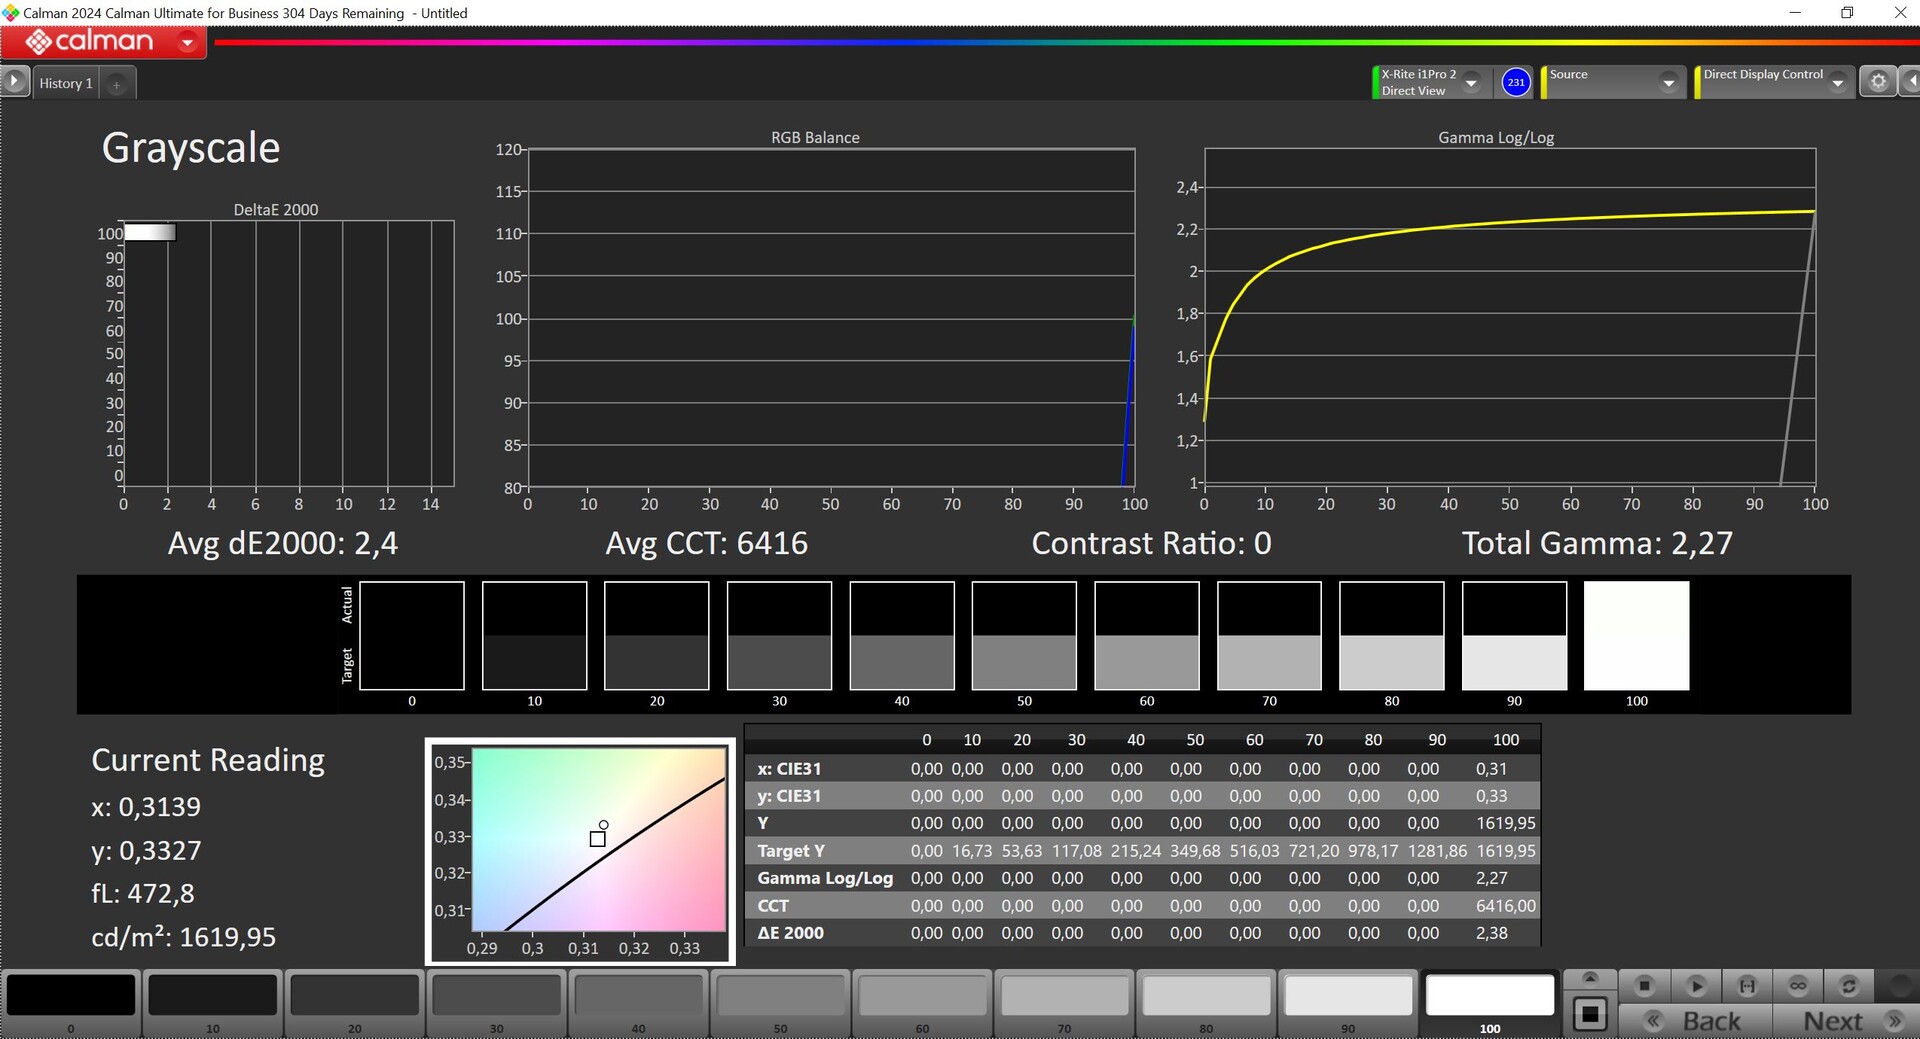
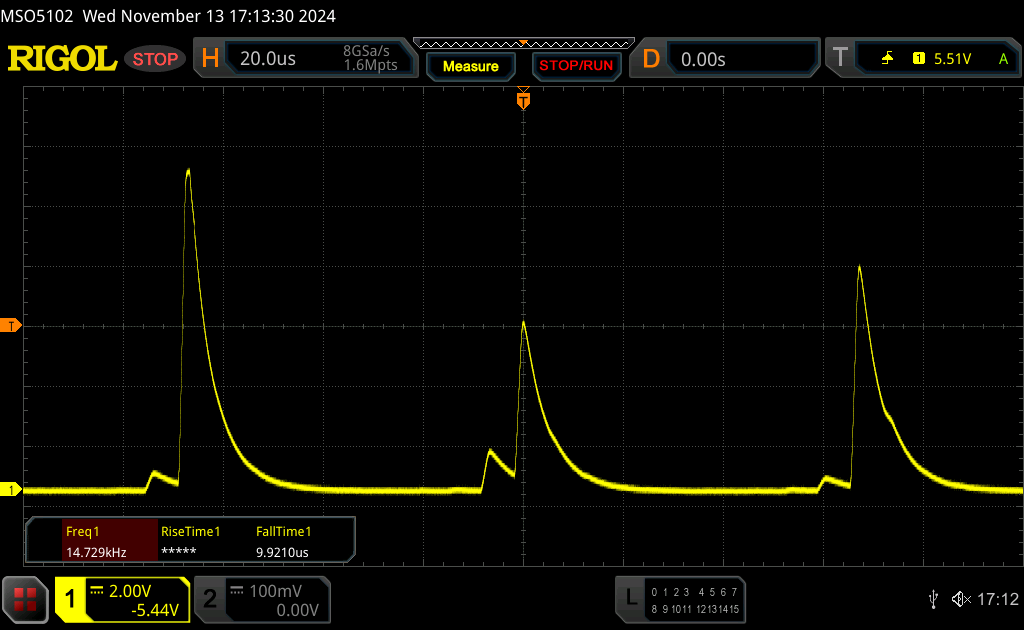
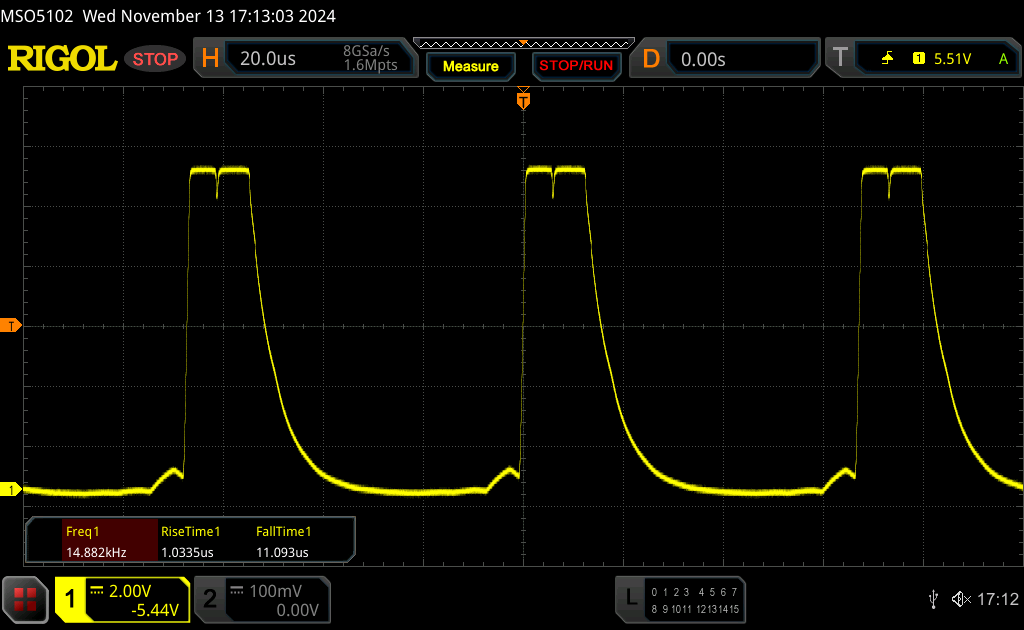
Apart from this, the MacBook's display remains the market reference in many areas (black value, HDR brightness of up to 1,620 cd/m² & 1,214 cd/m² when depicting an almost fully white screen, HDR capabilities) and at this stage, we would recommend taking a look at our review of the MacBook Pro 14 M4 Pro, where we spoke about these aspects in greater detail. The MBP 16 also uses constant PWM flickering at 14.8 kHz, which shouldn't be a problem for most users. The constant PWM flickering makes it extremely difficult to determine the screen's response times, but this applies to all mini LED panels (not just Apple). Even if our values seem very high (especially compared to OLED screens), they shouldn't be overestimated. In everyday use, you won't notice any lagging effects (also thanks to the ProMotion technology at 120 Hz) and there are no problems with lots of games (e.g. Baldur's Gate 3 or Resident Evil Village), but OLED panels are nevertheless the better choice for extremely fast shooters.
| |||||||||||||||||||||||||
Brightness Distribution: 95 %
Center on Battery: 632 cd/m²
Contrast: ∞:1 (Black: 0 cd/m²)
ΔE ColorChecker Calman: 0.6 | ∀{0.5-29.43 Ø4.71}
ΔE Greyscale Calman: 0.8 | ∀{0.09-98 Ø4.96}
88.8% AdobeRGB 1998 (Argyll 3D)
100% sRGB (Argyll 3D)
99.7% Display P3 (Argyll 3D)
Gamma: 2.21
CCT: 6450 K
| Apple MacBook Pro 16 2024 M4 Pro Mini-LED, 3456x2234, 16.2", 120 Hz | Lenovo ThinkPad P1 Gen 7 21KV001SGE MNG007DA1-9 , IPS LED, 2560x1600, 16", 165 Hz | Asus ProArt P16 H7606WI ATNA60YV02-0, OLED, 3840x2400, 16", 60 Hz | Lenovo Yoga Pro 9 16IMH9 RTX 4050 LEN160-3.2K, IPS, 3200x2000, 16", 165 Hz | Dell XPS 16 9640 SDC4196, OLED, 3840x2400, 16.3", 90 Hz | Samsung Galaxy Book4 Ultra ATNA60CL07-0, OLED, 2880x1800, 16", 120 Hz | Apple MacBook Pro 16 2023 M3 Max Mini-LED, 3456x2234, 16", 120 Hz | |
|---|---|---|---|---|---|---|---|
| Display | -17% | 4% | -2% | -1% | -0% | -1% | |
| Display P3 Coverage (%) | 99.7 | 69.4 -30% | 99.9 0% | 95.6 -4% | 98.3 -1% | 98.6 -1% | 99.2 -1% |
| sRGB Coverage (%) | 100 | 97.6 -2% | 100 0% | 99.9 0% | 100 0% | 99.9 0% | |
| AdobeRGB 1998 Coverage (%) | 88.8 | 71.8 -19% | 99.1 12% | 86.5 -3% | 87.8 -1% | 88.5 0% | |
| Response Times | 74% | 84% | 75% | 98% | 99% | -31% | |
| Response Time Grey 50% / Grey 80% * (ms) | 43 ? | 11.2 ? 74% | 1.58 ? 96% | 12.4 ? 71% | 0.82 ? 98% | 0.54 ? 99% | 66.9 ? -56% |
| Response Time Black / White * (ms) | 41.2 ? | 10.6 ? 74% | 1.25 ? 97% | 8.9 ? 78% | 0.85 ? 98% | 0.69 ? 98% | 43.6 ? -6% |
| PWM Frequency (Hz) | 14880 | 240 ? | 360 ? | 240 ? | 14877 | ||
| PWM Amplitude * (%) | 90 | 36 60% | |||||
| Screen | -293% | -58% | -118% | -96% | -82% | -62% | |
| Brightness middle (cd/m²) | 632 | 516 -18% | 355 -44% | 404.9 -36% | 366 -42% | 390 -38% | 630 0% |
| Brightness (cd/m²) | 616 | 505 -18% | 360 -42% | 390 -37% | 367 -40% | 393 -36% | 604 -2% |
| Brightness Distribution (%) | 95 | 89 -6% | 98 3% | 91 -4% | 96 1% | 98 3% | 94 -1% |
| Black Level * (cd/m²) | 0.41 | 0.4 | |||||
| Colorchecker dE 2000 * | 0.6 | 3.5 -483% | 1.2 -100% | 2.42 -303% | 1.3 -117% | 1.4 -133% | 1.2 -100% |
| Colorchecker dE 2000 max. * | 1.2 | 8.8 -633% | 2.6 -117% | 4.65 -288% | 3.6 -200% | 2.7 -125% | 2.8 -133% |
| Greyscale dE 2000 * | 0.8 | 5.6 -600% | 1.2 -50% | 1.1 -38% | 2.2 -175% | 2.1 -163% | 1.9 -137% |
| Gamma | 2.21 100% | 2.27 97% | 2.14 103% | 2.22 99% | 2.14 103% | 2.27 97% | 2.29 96% |
| CCT | 6450 101% | 6071 107% | 6526 100% | 6468 100% | 6680 97% | 6431 101% | 6812 95% |
| Contrast (:1) | 1259 | 1012 | |||||
| Colorchecker dE 2000 calibrated * | 1.2 | 0.93 | 1 | ||||
| Total Average (Program / Settings) | -79% /
-151% | 10% /
-7% | -15% /
-51% | 0% /
-34% | 6% /
-27% | -31% /
-48% |
* ... smaller is better

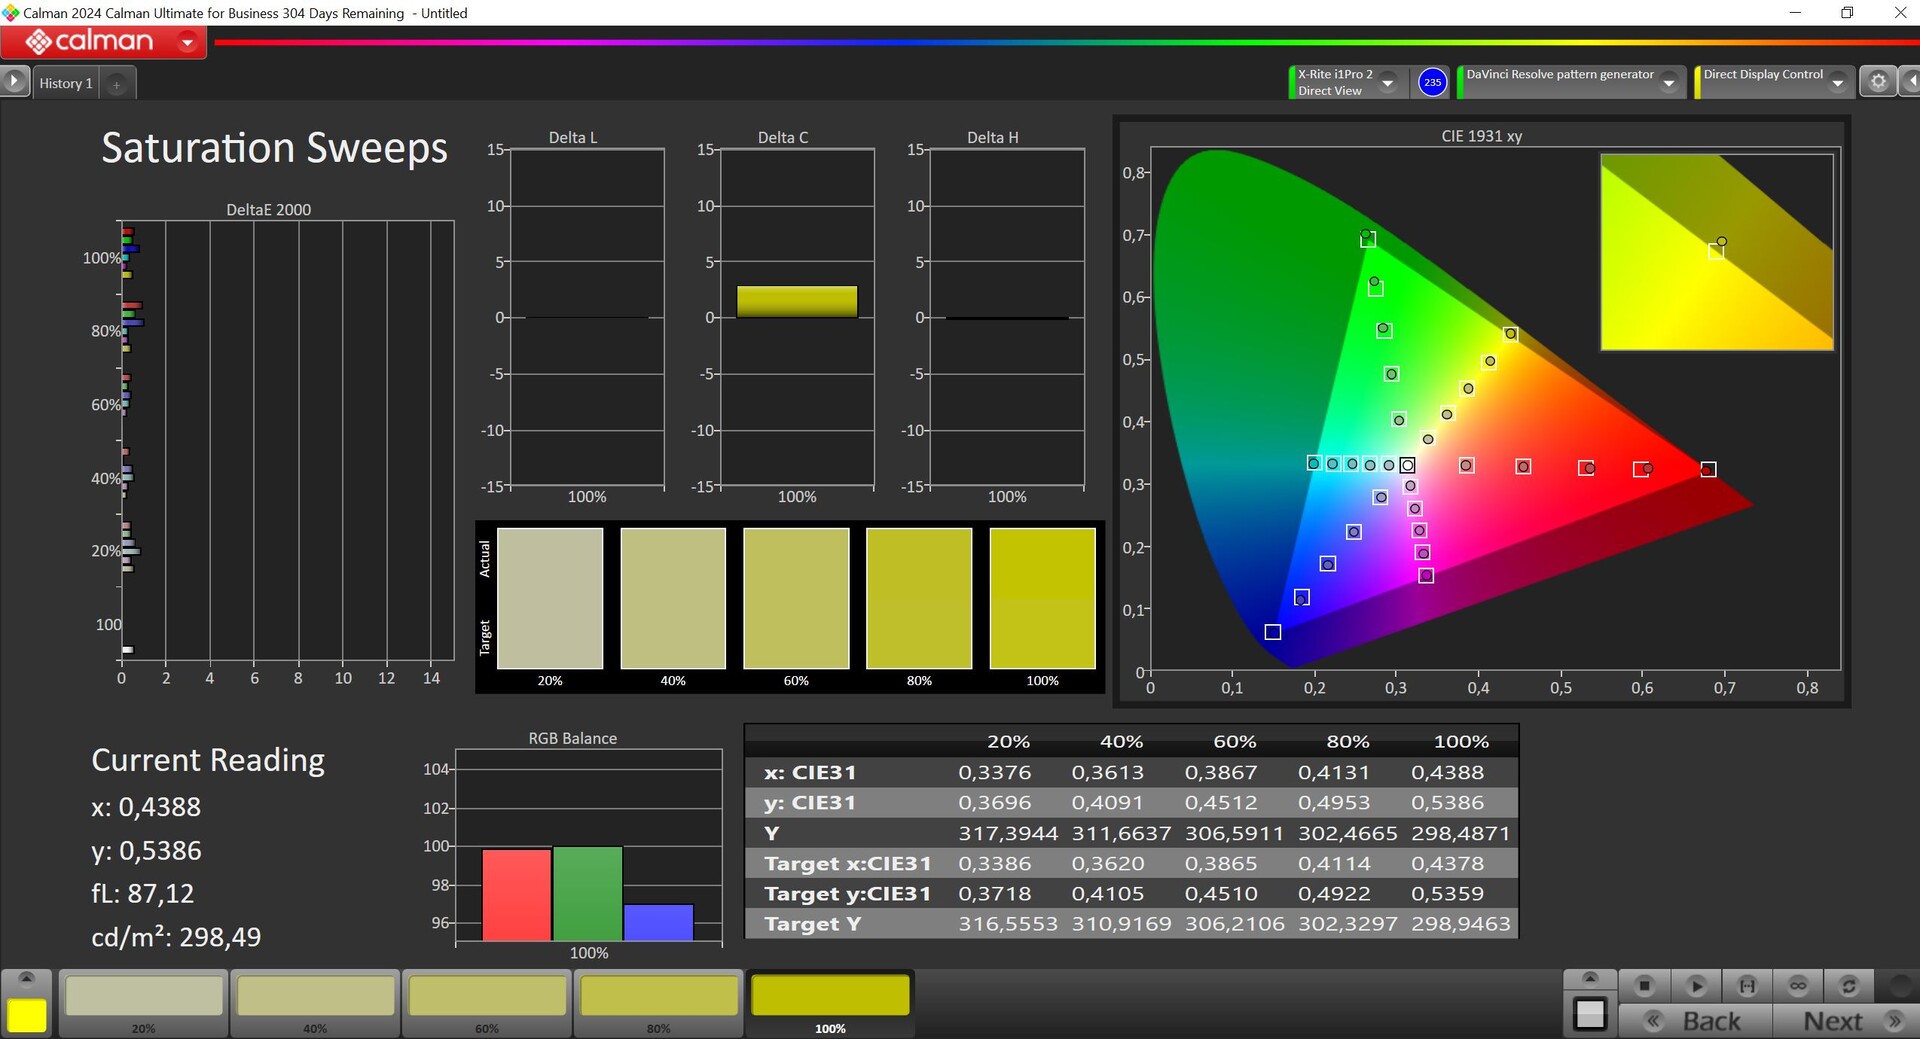
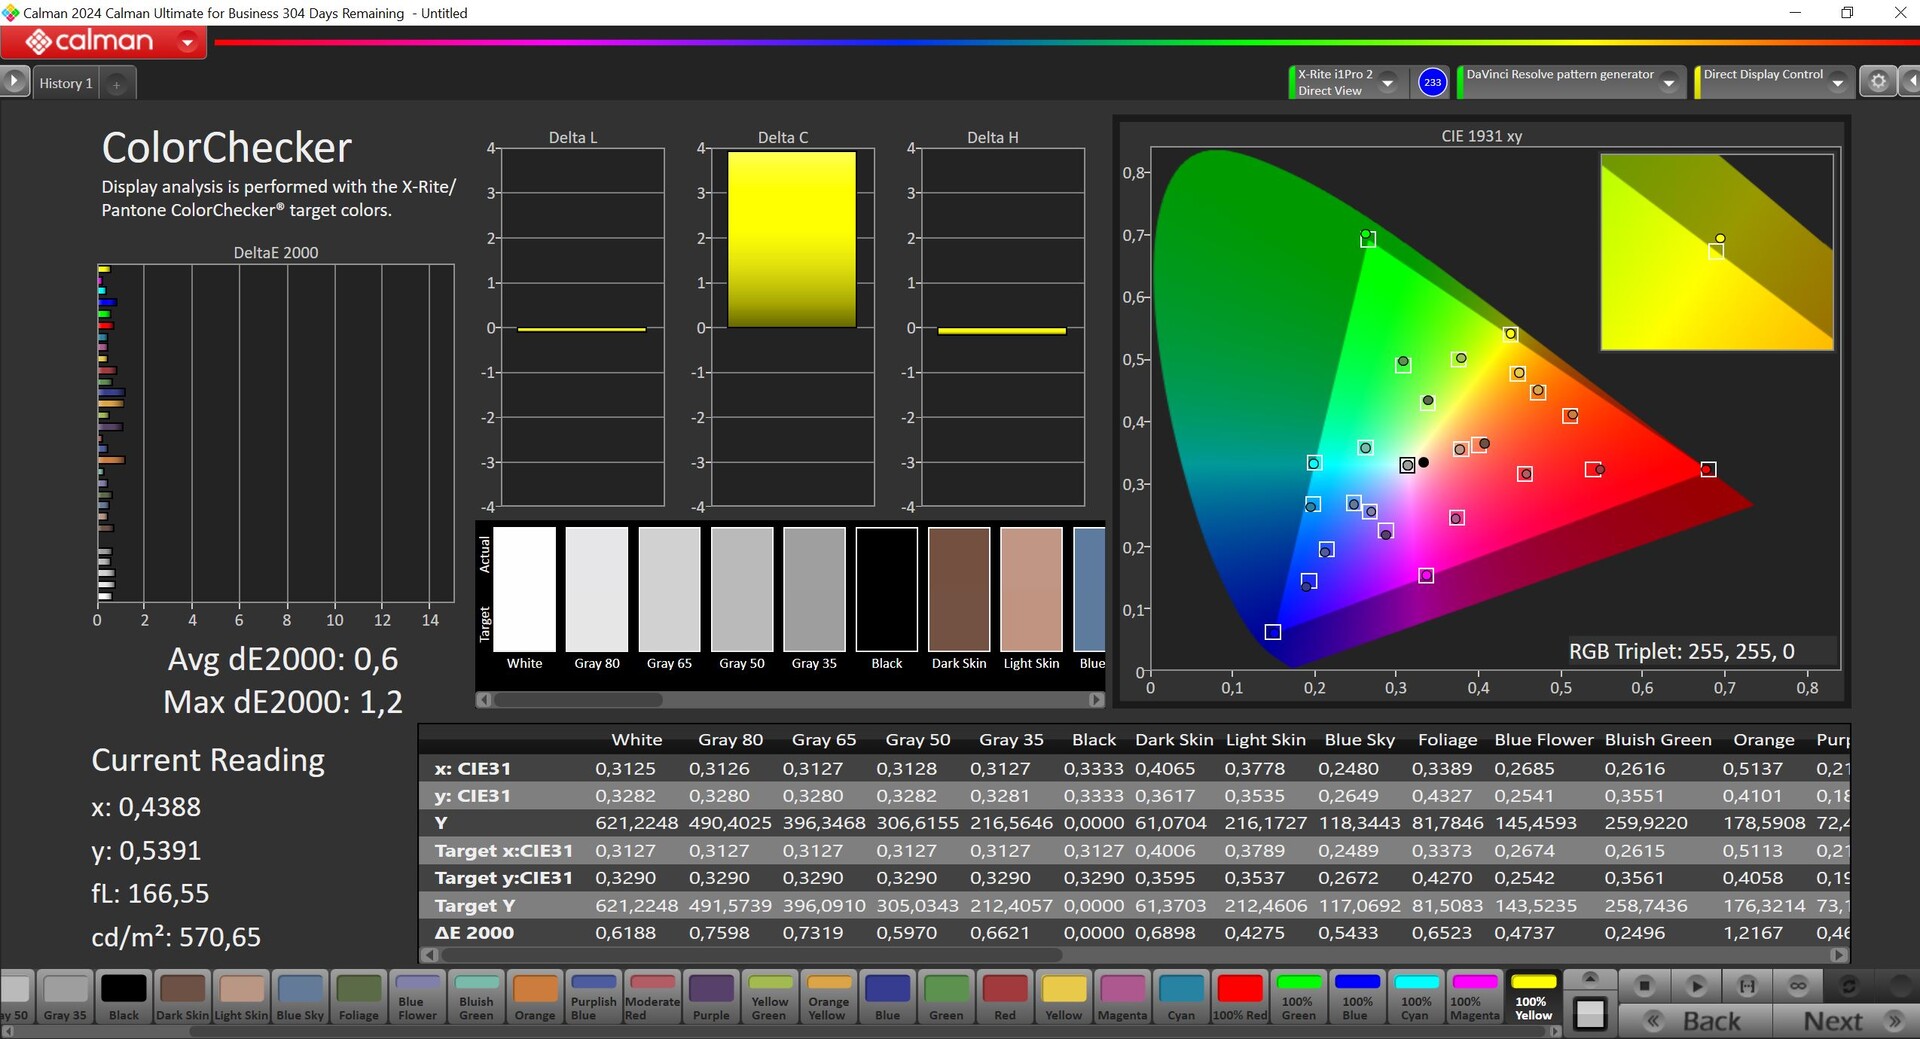
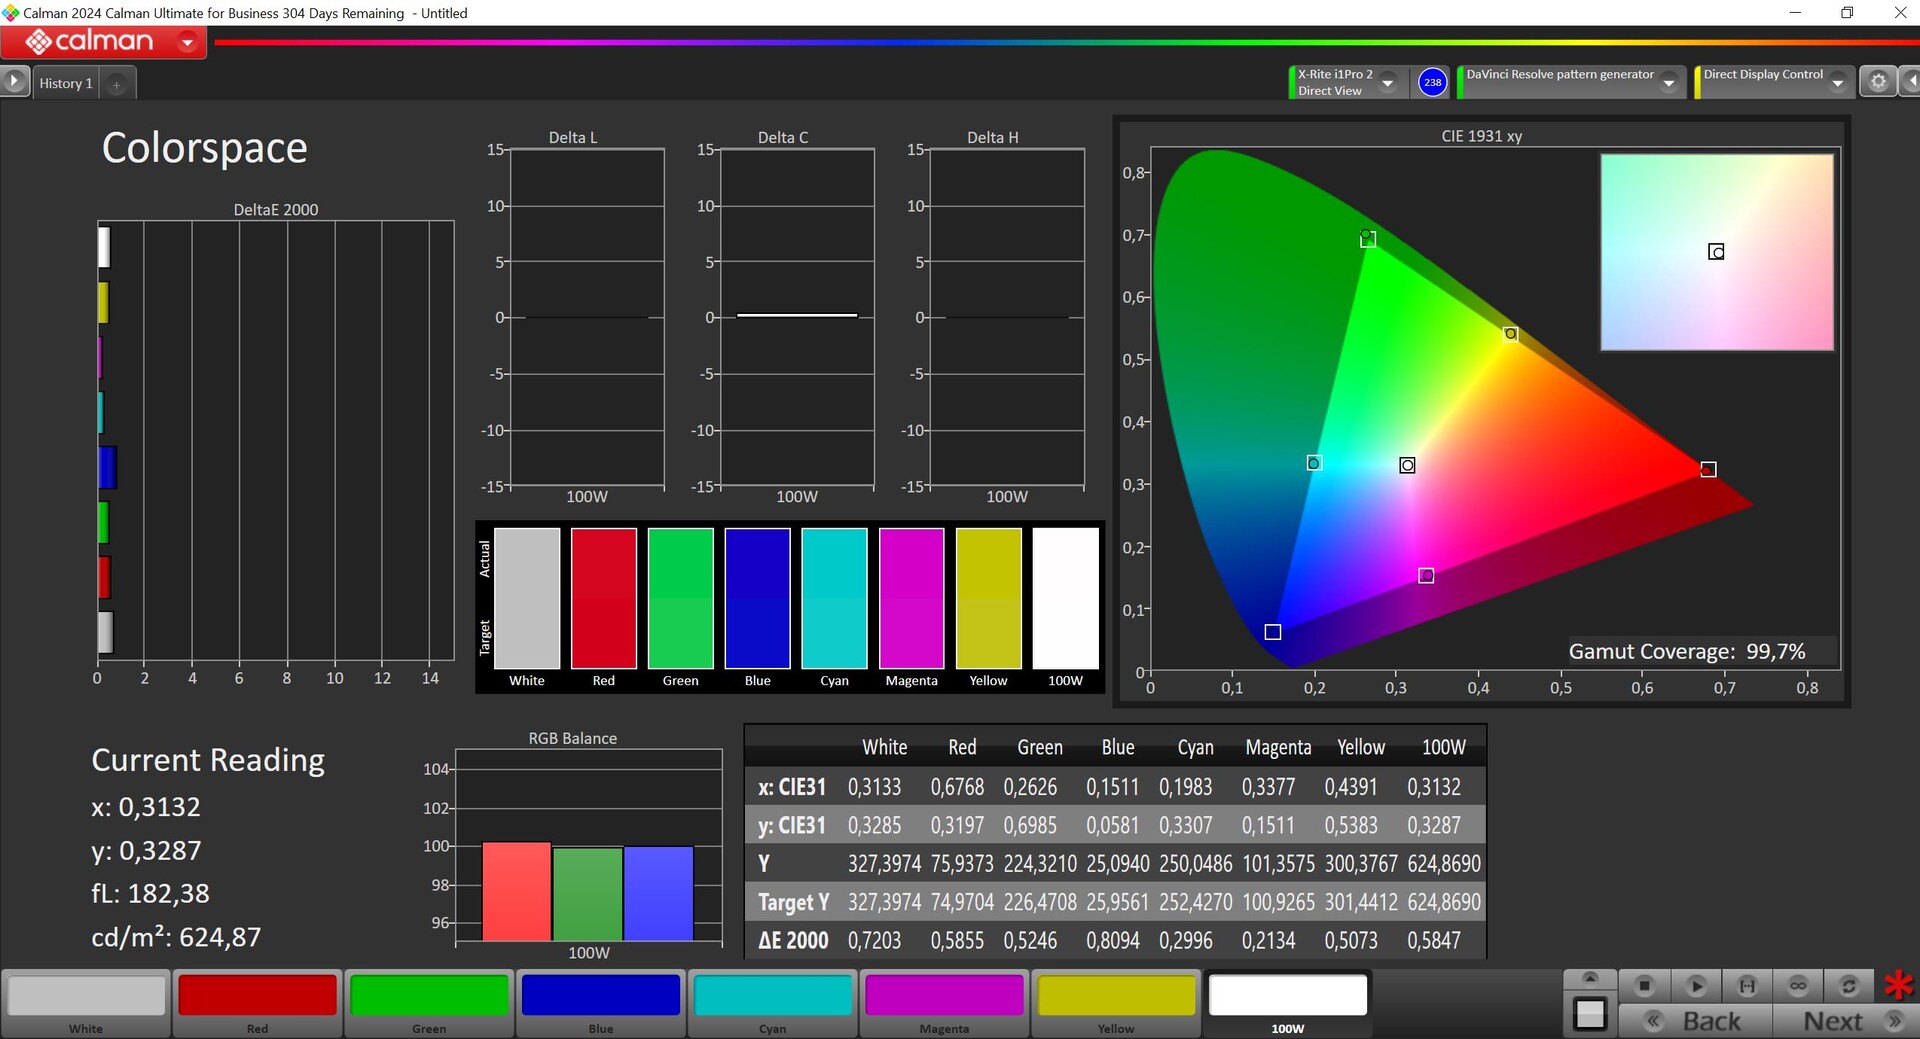
The panel's calibration straight out of the box is excellent. We analyzed it using the professional CalMAN software and its deviations compared to the P3 reference color space were minimal for both grayscale and colors. The P3 and sRGB color spaces are covered completely, and AdobeRGB is covered by 88.8%.
Display Response Times
| ↔ Response Time Black to White | ||
|---|---|---|
| 41.2 ms ... rise ↗ and fall ↘ combined | ↗ 24.5 ms rise |  |
| ↘ 16.7 ms fall | ||
| The screen shows slow response rates in our tests and will be unsatisfactory for gamers. In comparison, all tested devices range from 0.1 (minimum) to 240 (maximum) ms. » 98 % of all devices are better. This means that the measured response time is worse than the average of all tested devices (19.8 ms). | ||
| ↔ Response Time 50% Grey to 80% Grey | ||
| 43 ms ... rise ↗ and fall ↘ combined | ↗ 9.6 ms rise | 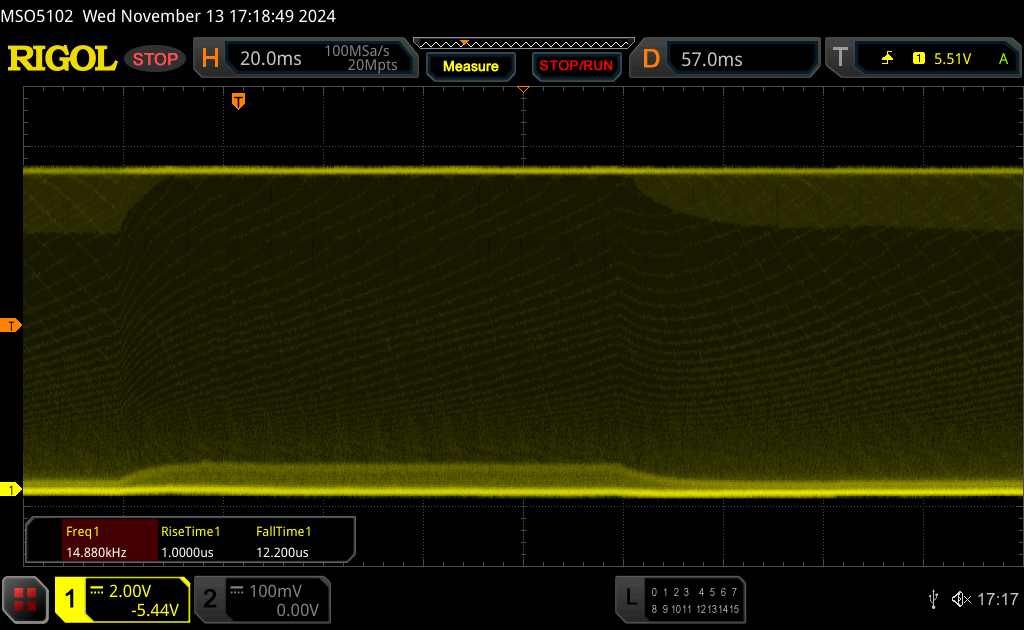 |
| ↘ 33.4 ms fall | ||
| The screen shows slow response rates in our tests and will be unsatisfactory for gamers. In comparison, all tested devices range from 0.165 (minimum) to 636 (maximum) ms. » 71 % of all devices are better. This means that the measured response time is worse than the average of all tested devices (31 ms). | ||
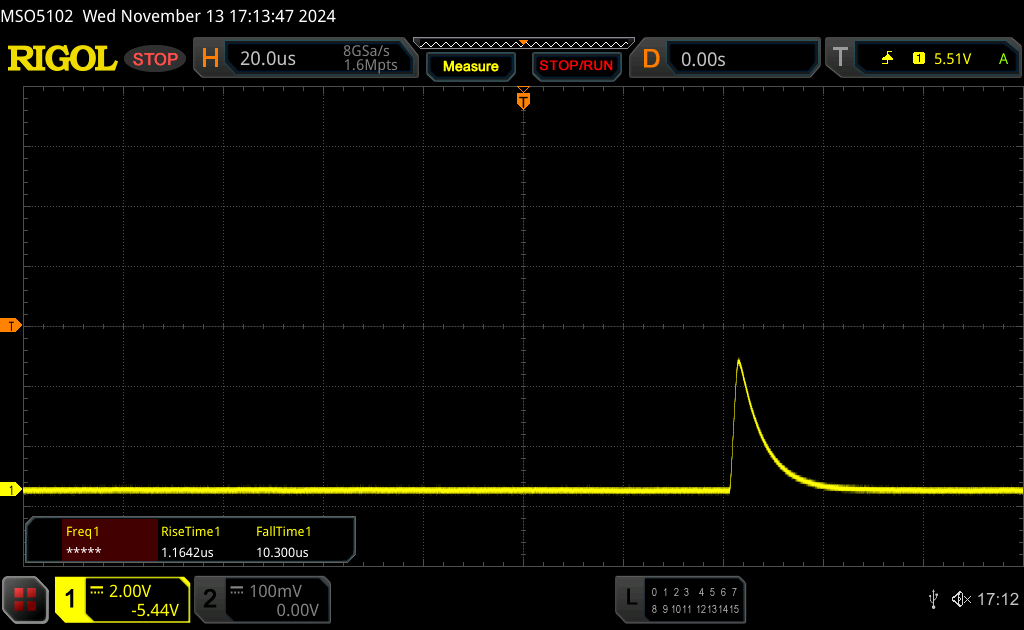
Screen Flickering / PWM (Pulse-Width Modulation)
| Screen flickering / PWM detected | 14880 Hz Amplitude: 90 % | 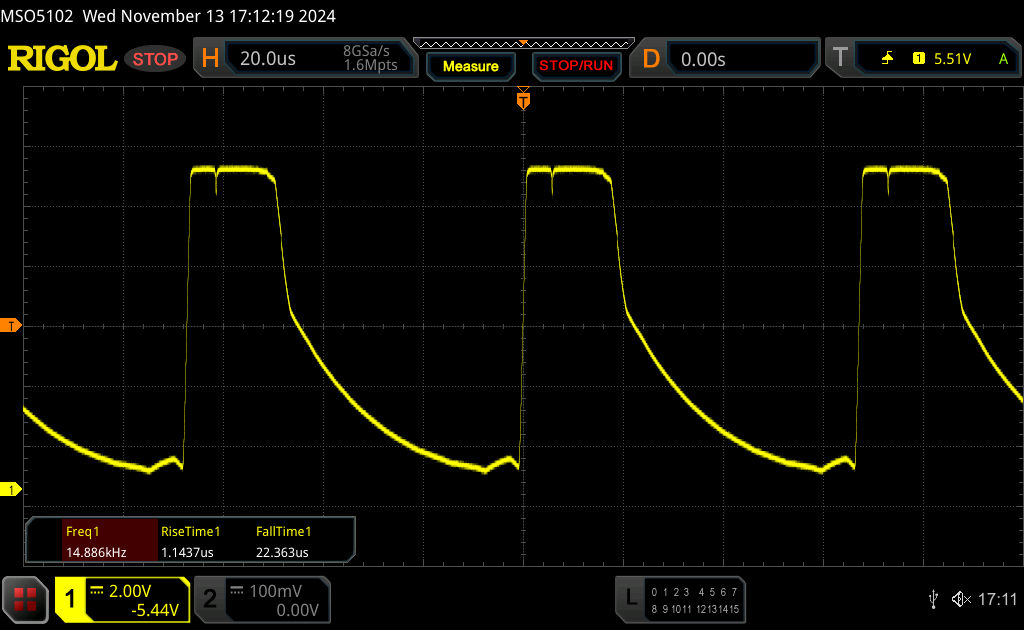 | |
The display backlight flickers at 14880 Hz (worst case, e.g., utilizing PWM) . The frequency of 14880 Hz is quite high, so most users sensitive to PWM should not notice any flickering. In comparison: 52 % of all tested devices do not use PWM to dim the display. If PWM was detected, an average of 7754 (minimum: 5 - maximum: 343500) Hz was measured. | |||


Performance - The MBP 16 with the more powerful M4 Pro
Apple equips its MacBook Pro 16 with the full configuration of the M4 Pro (14 CPU cores, 20 GPU cores) as standard, as well as with 24/48 GB RAM. You can optionally go for the two M4 Max SoCs with 36, 64 or 128 GB RAM.

Testing conditions
The MBP 16 offers three energy profiles: Low Charge, Automatic & High Performance. The latter brings only a slight advantage in its combined CPU/GPU utilization, but the fans are also significantly louder (42.3 vs. 55.6 dB(A)). We performed our benchmarks and measurements using Automatic mode.
Processor - M4 Pro with 14 CPU cores
We already took a detailed look at the new M4 Pro SoC in our analysis article. In its full configuration, it features 10 performance and 4 efficiency cores. The same as in the smaller MacBook Pro, the M4 Pro can consume up to 46 watts, whereas the larger MBP 16 can keep this value constant under continuous load. Its benchmark results were impressive and in the multi-core tests, it performed a little better than inside the smaller MBP 14. Furthermore, its results were even a bit better than those of the old M3 Max, and the multimedia competition from AMD/Intel also couldn't keep up. Although the respective HX chips from AMD or Intel offer even more multi-core performance, they are usually only installed in gaming laptops and also require significantly more power. AMD's Ryzen 9 7945HX is faster at 55 watts and should offer comparable performance at 45 watts, but is not operated at these power limits inside any laptop. The current Ryzen AI 9 HX 370 in the ProArt P16 (80 watts), on the other hand, is slower.
In contrast, the M4 generation's single-core performance faces no competition whatsoever and there are currently no faster competing products on the market (by a long shot). In battery mode, its performance remains completely stable.
| Cinebench 2024 / CPU Multi Core | |
| Apple MacBook Pro 16 2024 M4 Pro | |
| Average Apple M4 Pro 14-Core (1662 - 1729, n=2) | |
| Apple MacBook Pro 14 2024 M4 Pro | |
| Apple MacBook Pro 16 2023 M3 Max | |
| Asus ProArt P16 H7606WI | |
| Average of class Multimedia (327 - 2437, n=73, last 2 years) | |
| Apple MacBook Pro 16 2023 M3 Pro | |
| Dell XPS 16 9640 | |
| Lenovo ThinkPad P1 Gen 7 21KV001SGE | |
| Cinebench 2024 / CPU Single Core | |
| Apple MacBook Pro 16 2024 M4 Pro | |
| Average Apple M4 Pro 14-Core (177 - 178, n=2) | |
| Apple MacBook Pro 14 2024 M4 Pro | |
| Apple MacBook Pro 16 2023 M3 Pro | |
| Apple MacBook Pro 16 2023 M3 Max | |
| Average of class Multimedia (72.5 - 201, n=58, last 2 years) | |
| Asus ProArt P16 H7606WI | |
| Dell XPS 16 9640 | |
| Lenovo ThinkPad P1 Gen 7 21KV001SGE | |
| Geekbench 6.7 / Multi-Core | |
| Apple MacBook Pro 14 2024 M4 Pro | |
| Average Apple M4 Pro 14-Core (22509 - 22544, n=2) | |
| Apple MacBook Pro 16 2024 M4 Pro | |
| Apple MacBook Pro 16 2023 M3 Max | |
| Apple MacBook Pro 16 2023 M3 Pro | |
| Asus ProArt P16 H7606WI | |
| Average of class Multimedia (4983 - 29415, n=69, last 2 years) | |
| Lenovo Yoga Pro 9 16IMH9 RTX 4050 | |
| Dell XPS 16 9640 | |
| Lenovo ThinkPad P1 Gen 7 21KV001SGE | |
| Samsung Galaxy Book4 Ultra | |
| Geekbench 6.7 / Single-Core | |
| Apple MacBook Pro 14 2024 M4 Pro | |
| Average Apple M4 Pro 14-Core (3836 - 3927, n=2) | |
| Apple MacBook Pro 16 2024 M4 Pro | |
| Apple MacBook Pro 16 2023 M3 Pro | |
| Apple MacBook Pro 16 2023 M3 Max | |
| Average of class Multimedia (1534 - 4335, n=68, last 2 years) | |
| Asus ProArt P16 H7606WI | |
| Lenovo Yoga Pro 9 16IMH9 RTX 4050 | |
| Samsung Galaxy Book4 Ultra | |
| Dell XPS 16 9640 | |
| Lenovo ThinkPad P1 Gen 7 21KV001SGE | |
System performance
The new MacBook Pro 16 is an extremely fast device for everyday use as well as in the synthetic benchmarks and during our test, we noted no stability issues at all. The new M4 Pro did particularly well in the browser tests.
WebXPRT 3: Overall
WebXPRT 4: Overall
Mozilla Kraken 1.1: Total
| CrossMark / Overall | |
| Average Apple M4 Pro 14-Core, Apple M4 Pro 20-Core GPU (2148 - 2162, n=2) | |
| Apple MacBook Pro 16 2024 M4 Pro | |
| Apple MacBook Pro 16 2023 M3 Pro | |
| Average of class Multimedia (866 - 2728, n=60, last 2 years) | |
| Dell XPS 16 9640 | |
| Lenovo Yoga Pro 9 16IMH9 RTX 4050 | |
| Asus ProArt P16 H7606WI | |
| Samsung Galaxy Book4 Ultra | |
| Lenovo ThinkPad P1 Gen 7 21KV001SGE | |
| CrossMark / Productivity | |
| Average Apple M4 Pro 14-Core, Apple M4 Pro 20-Core GPU (1980 - 2010, n=2) | |
| Apple MacBook Pro 16 2024 M4 Pro | |
| Apple MacBook Pro 16 2023 M3 Pro | |
| Average of class Multimedia (931 - 2489, n=60, last 2 years) | |
| Dell XPS 16 9640 | |
| Lenovo Yoga Pro 9 16IMH9 RTX 4050 | |
| Samsung Galaxy Book4 Ultra | |
| Lenovo ThinkPad P1 Gen 7 21KV001SGE | |
| Asus ProArt P16 H7606WI | |
| CrossMark / Creativity | |
| Average Apple M4 Pro 14-Core, Apple M4 Pro 20-Core GPU (2590 - 2594, n=2) | |
| Apple MacBook Pro 16 2024 M4 Pro | |
| Apple MacBook Pro 16 2023 M3 Pro | |
| Asus ProArt P16 H7606WI | |
| Average of class Multimedia (907 - 3465, n=60, last 2 years) | |
| Lenovo Yoga Pro 9 16IMH9 RTX 4050 | |
| Dell XPS 16 9640 | |
| Samsung Galaxy Book4 Ultra | |
| Lenovo ThinkPad P1 Gen 7 21KV001SGE | |
| CrossMark / Responsiveness | |
| Dell XPS 16 9640 | |
| Apple MacBook Pro 16 2024 M4 Pro | |
| Average Apple M4 Pro 14-Core, Apple M4 Pro 20-Core GPU (1556 - 1566, n=2) | |
| Average of class Multimedia (605 - 2024, n=60, last 2 years) | |
| Lenovo Yoga Pro 9 16IMH9 RTX 4050 | |
| Samsung Galaxy Book4 Ultra | |
| Apple MacBook Pro 16 2023 M3 Pro | |
| Lenovo ThinkPad P1 Gen 7 21KV001SGE | |
| Asus ProArt P16 H7606WI | |
| WebXPRT 3 / Overall | |
| Average Apple M4 Pro 14-Core, Apple M4 Pro 20-Core GPU (525 - 545, n=2) | |
| Apple MacBook Pro 16 2024 M4 Pro | |
| Apple MacBook Pro 16 2023 M3 Pro | |
| Average of class Multimedia (136.4 - 596, n=63, last 2 years) | |
| Asus ProArt P16 H7606WI | |
| Lenovo Yoga Pro 9 16IMH9 RTX 4050 | |
| Lenovo ThinkPad P1 Gen 7 21KV001SGE | |
| Dell XPS 16 9640 | |
| Samsung Galaxy Book4 Ultra | |
| WebXPRT 4 / Overall | |
| Average Apple M4 Pro 14-Core, Apple M4 Pro 20-Core GPU (337 - 353, n=2) | |
| Apple MacBook Pro 16 2024 M4 Pro | |
| Average of class Multimedia (167.3 - 402, n=65, last 2 years) | |
| Lenovo Yoga Pro 9 16IMH9 RTX 4050 | |
| Samsung Galaxy Book4 Ultra | |
| Lenovo ThinkPad P1 Gen 7 21KV001SGE | |
| Dell XPS 16 9640 | |
| Asus ProArt P16 H7606WI | |
| Mozilla Kraken 1.1 / Total | |
| Lenovo ThinkPad P1 Gen 7 21KV001SGE | |
| Lenovo Yoga Pro 9 16IMH9 RTX 4050 | |
| Average of class Multimedia (228 - 835, n=66, last 2 years) | |
| Asus ProArt P16 H7606WI | |
| Samsung Galaxy Book4 Ultra | |
| Apple MacBook Pro 16 2023 M3 Pro | |
| Apple MacBook Pro 16 2024 M4 Pro | |
| Average Apple M4 Pro 14-Core, Apple M4 Pro 20-Core GPU (254 - 255, n=2) | |
* ... smaller is better
Storage device
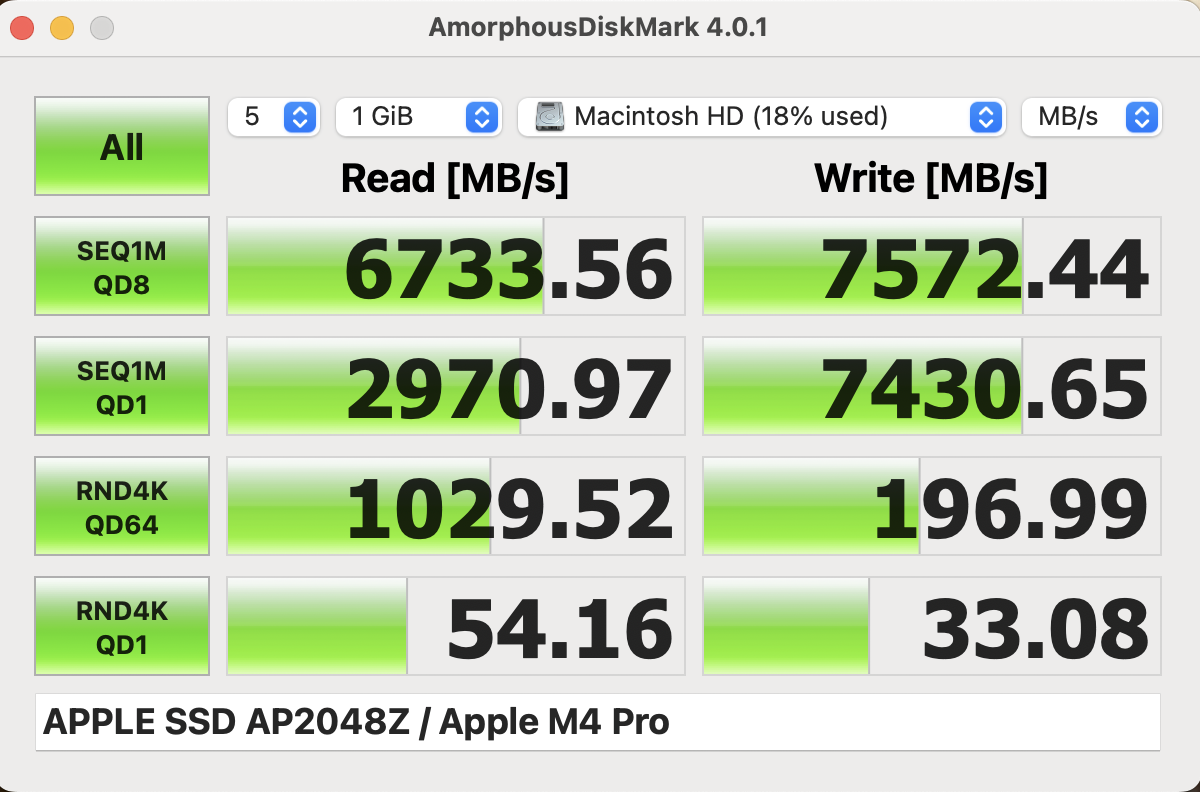
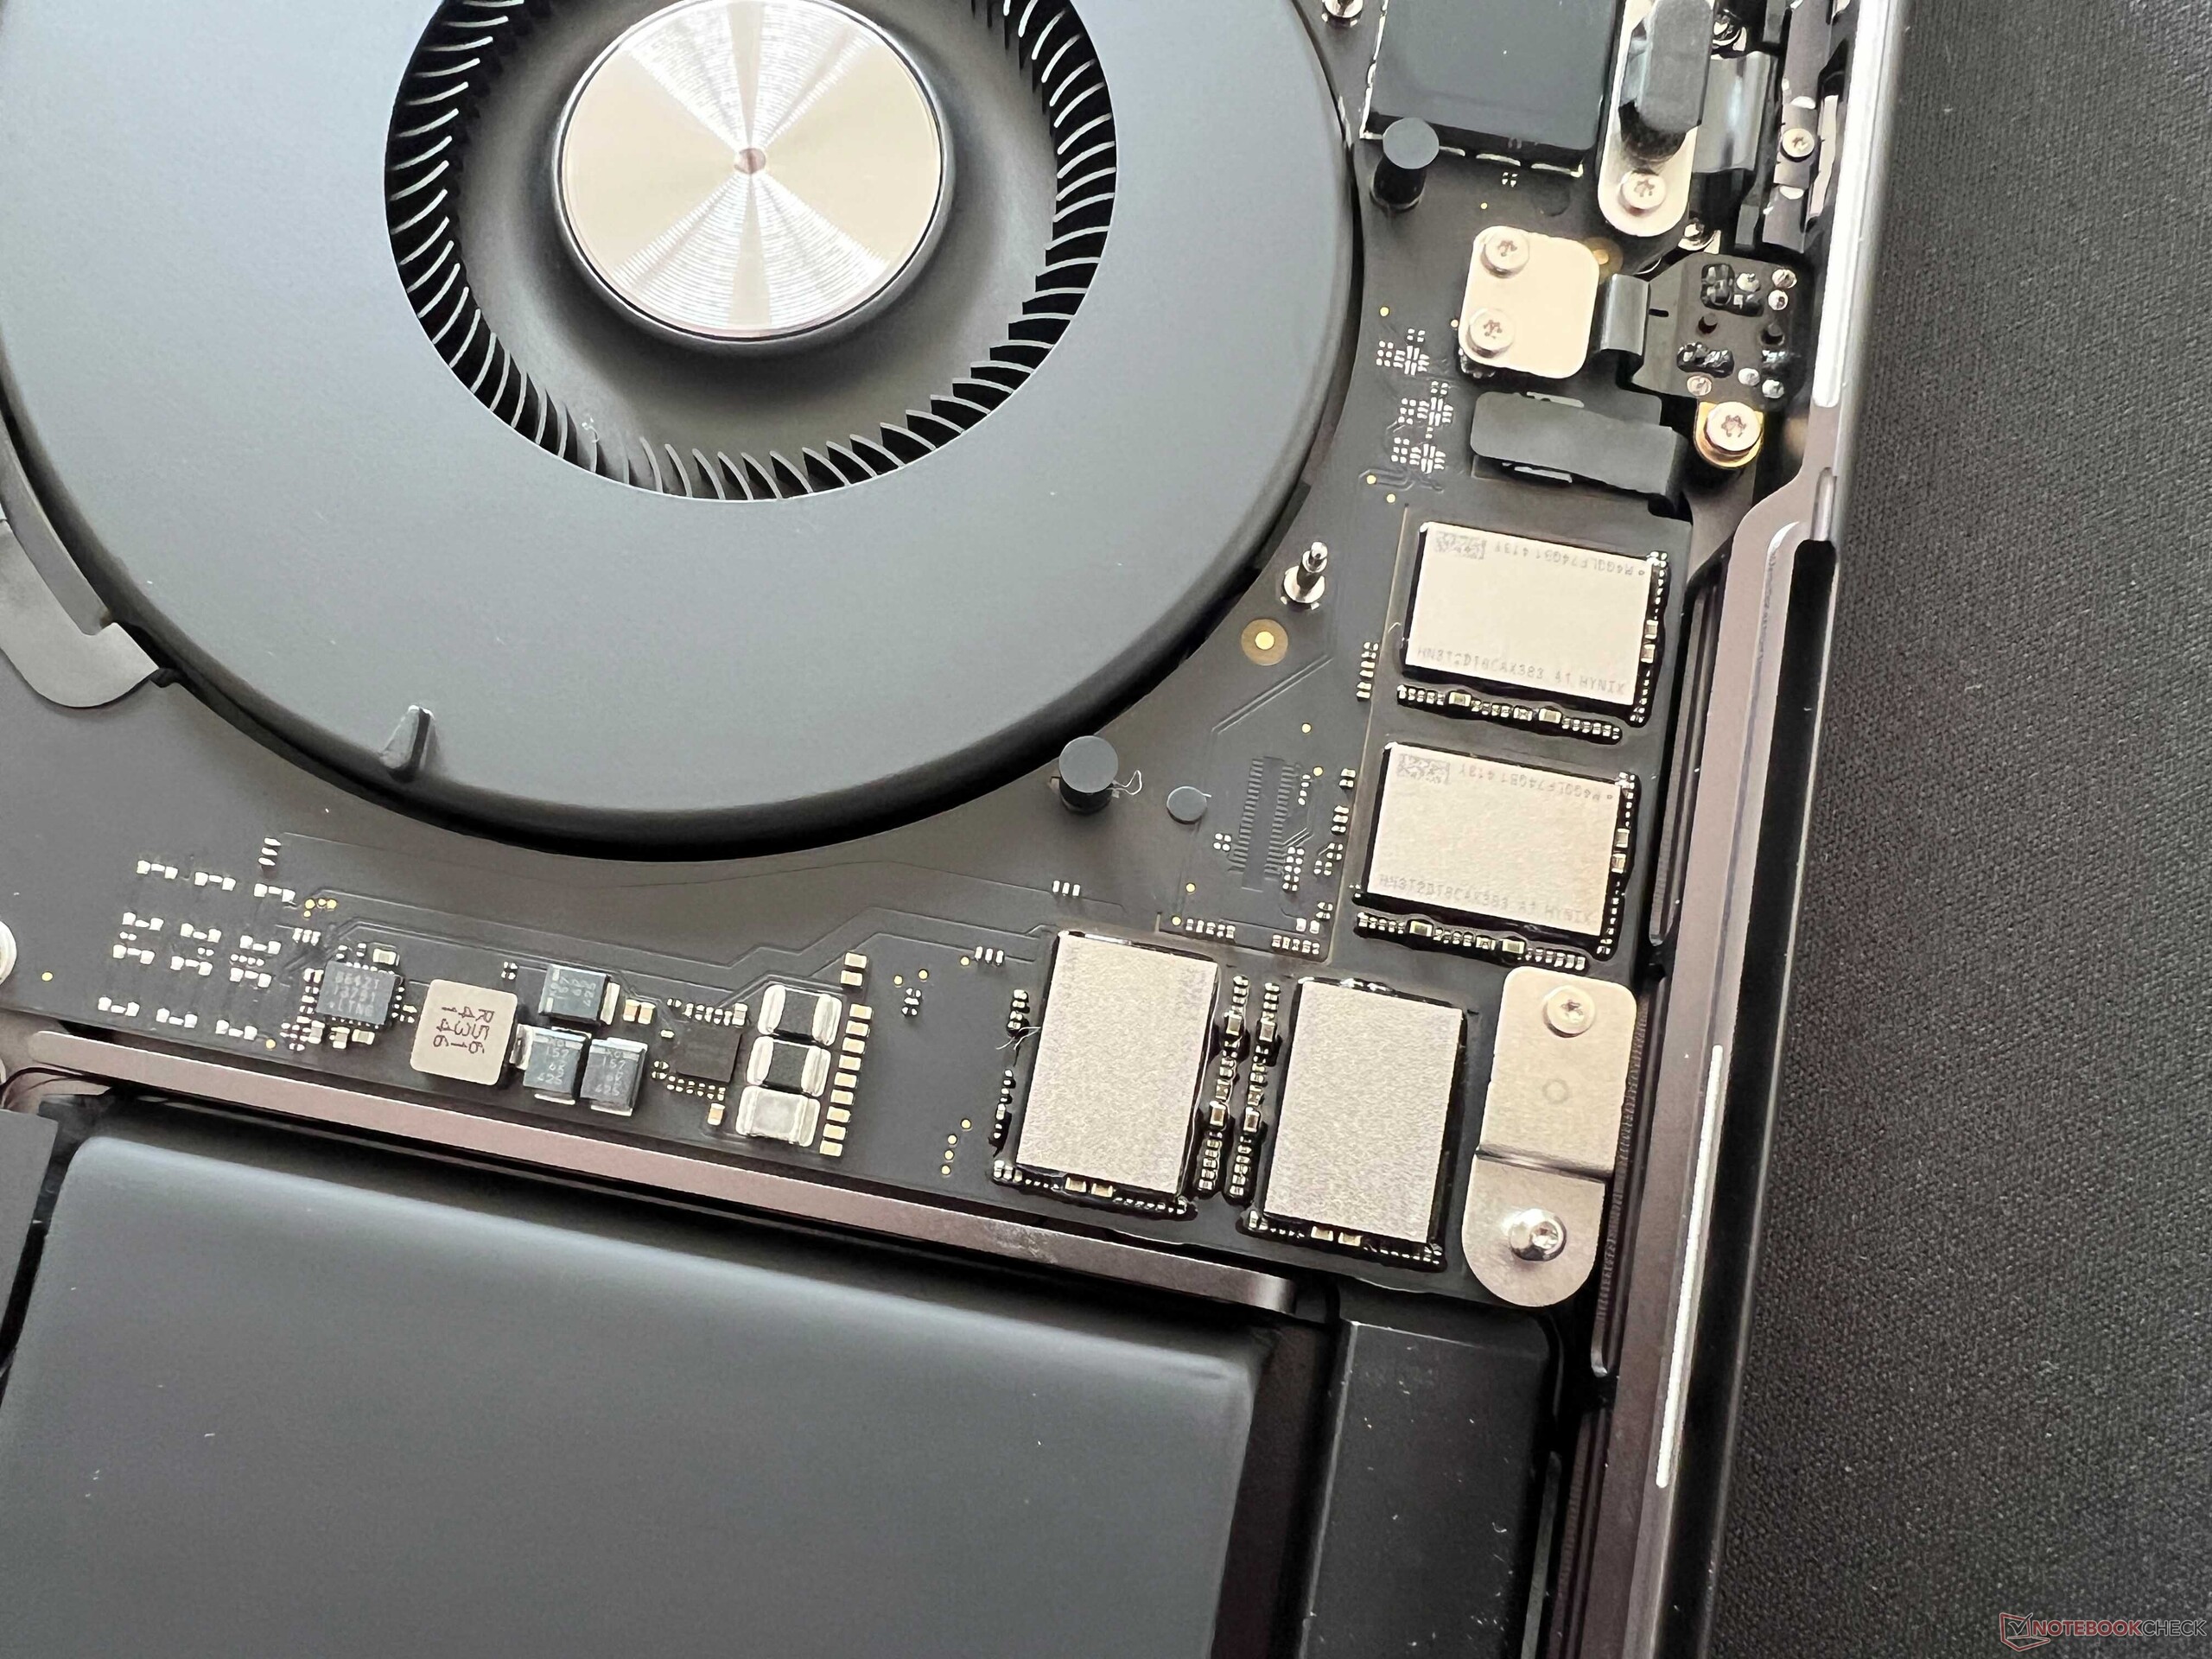
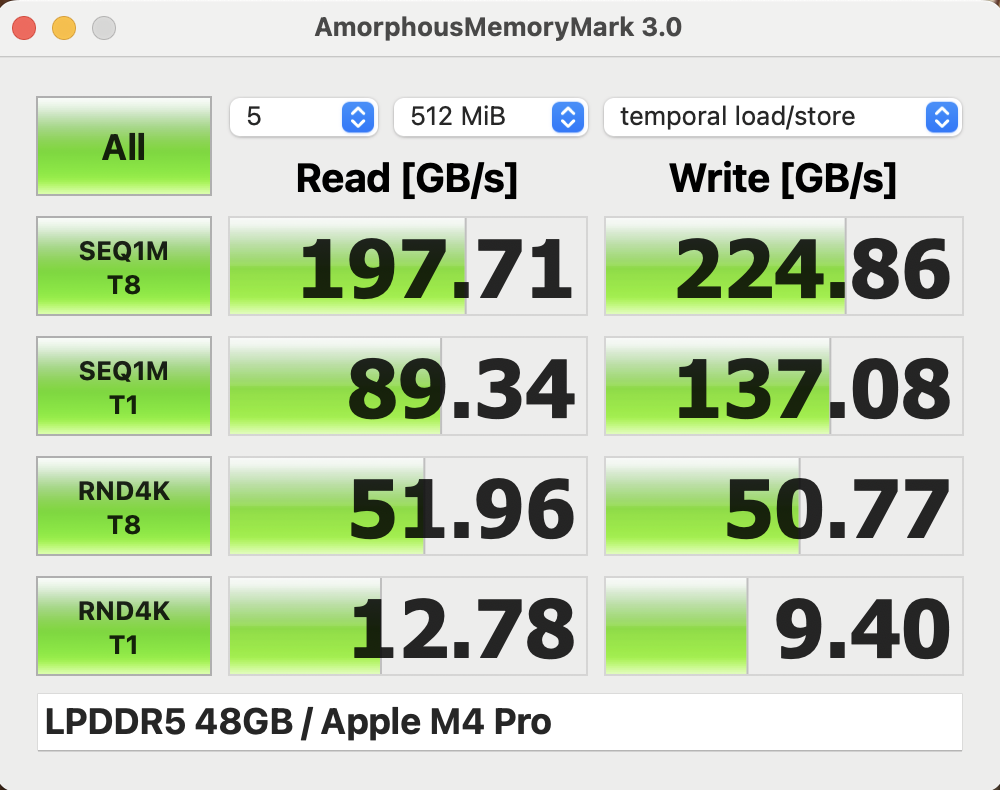
The base model of the MacBook Pro 16 is equipped with 512 GB of SSD storage; our test device has the 2 TB AP2048Z variant installed (+$600), of which 1.96 TB is available after first starting up the laptop. Four NAND modules with 512 GB capacity each are installed, and the SSD's performance is very good. Further SSD benchmarks are listed here. The M4 Pro can be combined with a 4-TB SSD at best; 8 TB is only available in combination with the fast M4 Max.
Graphics card
The new M4 Pro GPU features 20 cores and can consume a maximum of 32 watts—but it can keep this value stable. Apple has been able to increase its performance by over 30% compared to the fast M3 Pro GPU. However, in contrast to the CPU, the M4 Pro's GPU keeps a respectable distance from the old M3 Max GPU. In the benchmarks, the M4 Pro GPU was even able to outperform the GeForce RTX 4070 Laptop inside the Dell XPS 16 (60-watt TGP) at times, but it lagged behind the ProArt P16's 4070 Laptop (105-watt TGP). Its biggest advantage (especially when editing video or coding) is its unified memory. However, AMD's Strix Halo GPU is likely to become a strong competitor in the future.
When it comes to gaming, on the other hand, the tables are turned, with the dedicated GeForce GPUs showing an advantage—even with native macOS games such as Baldur's Gate 3. Nevertheless, the M4 Pro GPU still performed well and could, for example, easily display 1080p with maximum details. All other games we tested were emulated on the MacBook Pro, which of course comes at the cost of some performance. Nevertheless, its performance remained completely stable and even Cyberpunk 2077 ran smoothly. We can't wait to see how the native version of Cyberpunk will perform next year. We haven't yet been able to test GTA V on the new MacBooks, as the new BattleEye anti-cheat software is causing us some problems.
| 3DMark Steel Nomad Light Score | 7781 points | |
Help | ||
| Shadow of the Tomb Raider - 1920x1080 Highest Preset AA:T | |
| Apple MacBook Pro 16 2024 M4 Pro | |
| Average of class Multimedia (23 - 129, n=8, last 2 years) | |
| Apple MacBook Pro 16 2023 M3 Pro | |
| Total War Pharaoh - 1920x1080 Ultra Preset | |
| Apple MacBook Pro 16 2023 M3 Pro | |
| Average of class Multimedia (23.4 - 84.1, n=12, last 2 years) | |
| Apple MacBook Pro 16 2024 M4 Pro | |
| low | med. | high | ultra | QHD | |
|---|---|---|---|---|---|
| Shadow of the Tomb Raider (2018) | 204 | 111 | 100 | 87 | 57 |
| Baldur's Gate 3 (2023) | 92 | 78 | 64 | 62 | 43 |
| Cyberpunk 2077 (2023) | 50.5 | 48.7 | 44.5 | 39.6 | 24.8 |
| Total War Pharaoh (2023) | 65.8 | 55.4 | 51.7 | 51.2 | 49.3 |
Emissions & power
Noise emissions
The larger MacBook Pro 16 with the M4 Pro is generally quieter than the smaller MacBook Pro 14, as its fans operate at a lower speed. During our test, the MBP 16 generally remained silent for a very long time and the first fan speed of ~1,400 rpm which we measured was practically inaudible at ~25 dB(A). When gaming, it reached a maximum of 33.9 dB(A) (~2,700 rpm), and a maximum of 42.3 dB(A) (~3,600 rpm) during the stress test. In High Performance mode, it got significantly louder, reaching 55.6 dB(A) at ~5,560 rpm; in Low Charge mode, the MacBook remained extremely quiet at all times (25.3 dB(A) at ~1,400 rpm). There were no other electronic noises coming from our test device.
Noise level
| Idle |
| 24 / 24 / 24 dB(A) |
| Load |
| 25.3 / 42.3 dB(A) |
 | ||
30 dB silent 40 dB(A) audible 50 dB(A) loud |
||
min: | ||
| Apple MacBook Pro 16 2024 M4 Pro M4 Pro 20-Core GPU, M4 Pro 14-Core, Apple SSD AP2048Z | Apple MacBook Pro 16 2023 M3 Pro M3 Pro 18-Core GPU, Apple M3 Pro 12-Core, Apple SSD AP0512Z | Lenovo ThinkPad P1 Gen 7 21KV001SGE GeForce RTX 4060 Laptop GPU, Ultra 7 155H, Kioxia XG8 KXG8AZNV1T02 | Asus ProArt P16 H7606WI GeForce RTX 4070 Laptop GPU, Ryzen AI 9 HX 370, Micron 2400 MTFDKBA1T0QFM | Lenovo Yoga Pro 9 16IMH9 RTX 4050 GeForce RTX 4050 Laptop GPU, Ultra 9 185H, SK Hynix HFS001TEJ9X115N | Dell XPS 16 9640 GeForce RTX 4070 Laptop GPU, Ultra 7 155H, Kioxia XG8 KXG80ZNV1T02 | Samsung Galaxy Book4 Ultra GeForce RTX 4050 Laptop GPU, Ultra 7 155H, Samsung PM9A1 MZVL2512HCJQ | |
|---|---|---|---|---|---|---|---|
| Noise | -6% | -24% | -29% | -18% | -16% | -9% | |
| off / environment * (dB) | 24 | 24.4 -2% | 24.7 -3% | 24.4 -2% | 23.6 2% | 24.5 -2% | 24.2 -1% |
| Idle Minimum * (dB) | 24 | 24.4 -2% | 24.7 -3% | 24.4 -2% | 23.6 2% | 24.5 -2% | 24.2 -1% |
| Idle Average * (dB) | 24 | 24.4 -2% | 24.7 -3% | 27.7 -15% | 25.4 -6% | 24.5 -2% | 24.2 -1% |
| Idle Maximum * (dB) | 24 | 24.4 -2% | 24.7 -3% | 32.3 -35% | 25.4 -6% | 27.5 -15% | 24.2 -1% |
| Load Average * (dB) | 25.3 | 26.9 -6% | 43.7 -73% | 42.2 -67% | 44.2 -75% | 39.6 -57% | 37.9 -50% |
| Cyberpunk 2077 ultra * (dB) | 33.9 | 53.2 -57% | 53.2 -57% | ||||
| Load Maximum * (dB) | 42.3 | 50.4 -19% | 53.3 -26% | 53.2 -26% | 52.6 -24% | 49.7 -17% | 41.7 1% |
| Witcher 3 ultra * (dB) | 25.1 | 48.9 | 49.7 | 41.7 |
* ... smaller is better
Temperature
In addition to its low fan noise, the surface temperatures also remain lower on the larger MBP 16. Its metal case stays super cool during less demanding tasks and even during the stress test, we only measured a maximum of 43 °C in some places.
In the stress test with combined CPU/GPU load, the M4 Pro inside the large MBP 16 again performed better than in the smaller 14-inch model. The M4 Pro SoC consumed a maximum of 74 watts and then stabilized at around 60 watts. The High Performance mode provided an advantage in this case, as the SoC's consumption then stayed at around 66 watts under continuous load.
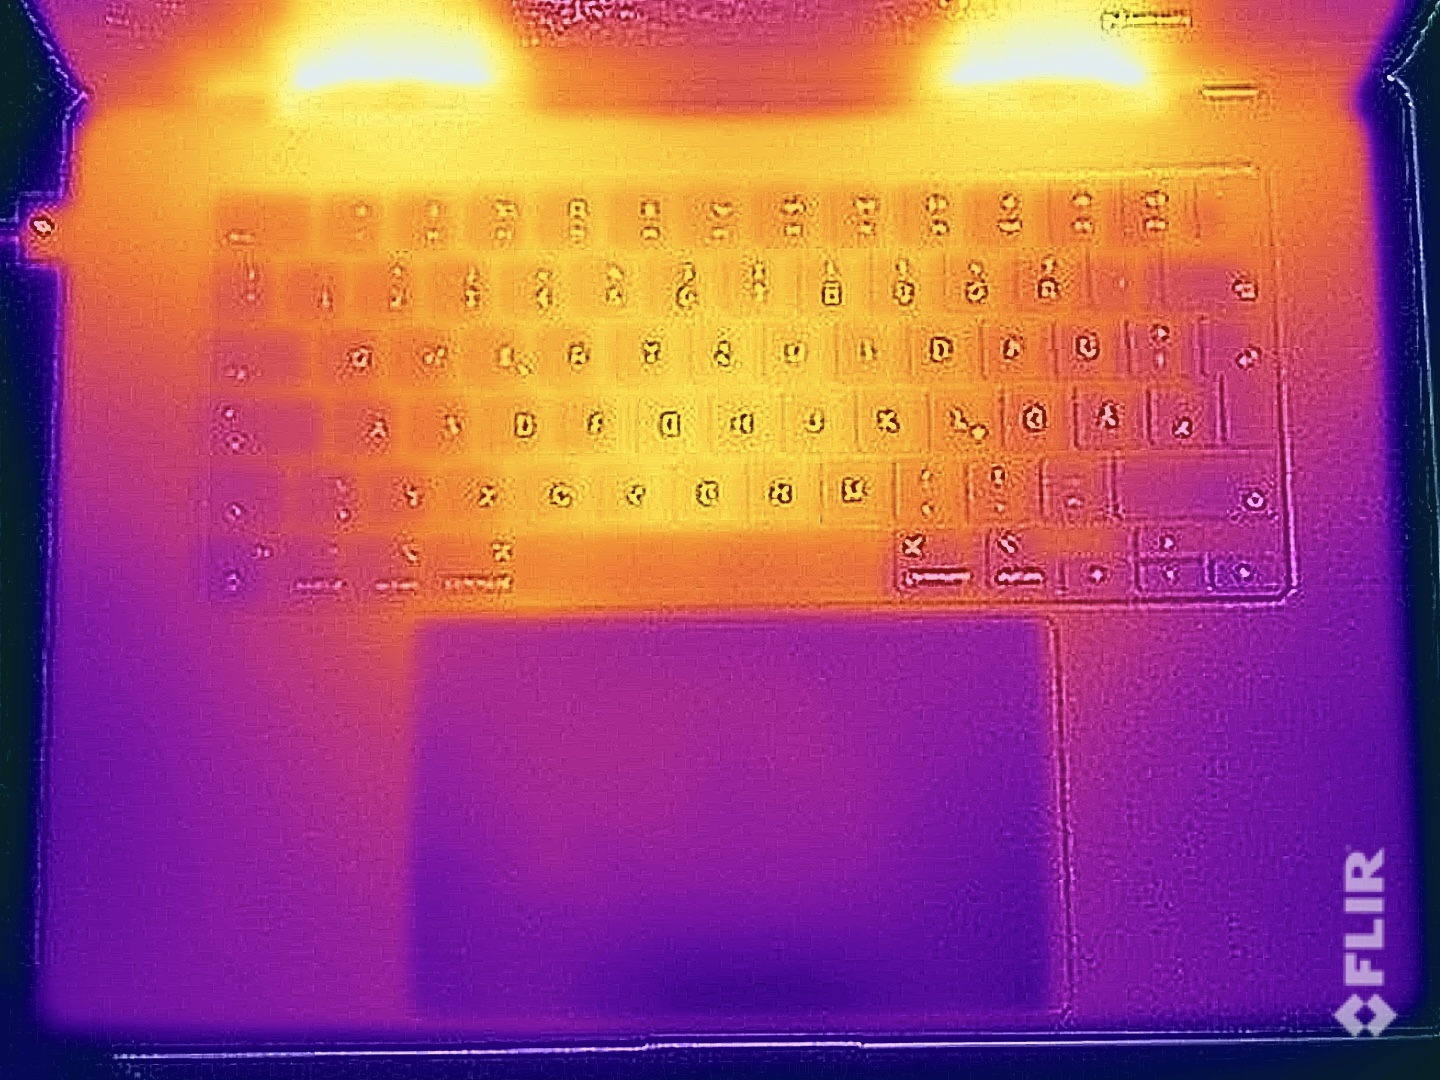
(±) The maximum temperature on the upper side is 42.7 °C / 109 F, compared to the average of 36.8 °C / 98 F, ranging from 21 to 71 °C for the class Multimedia.
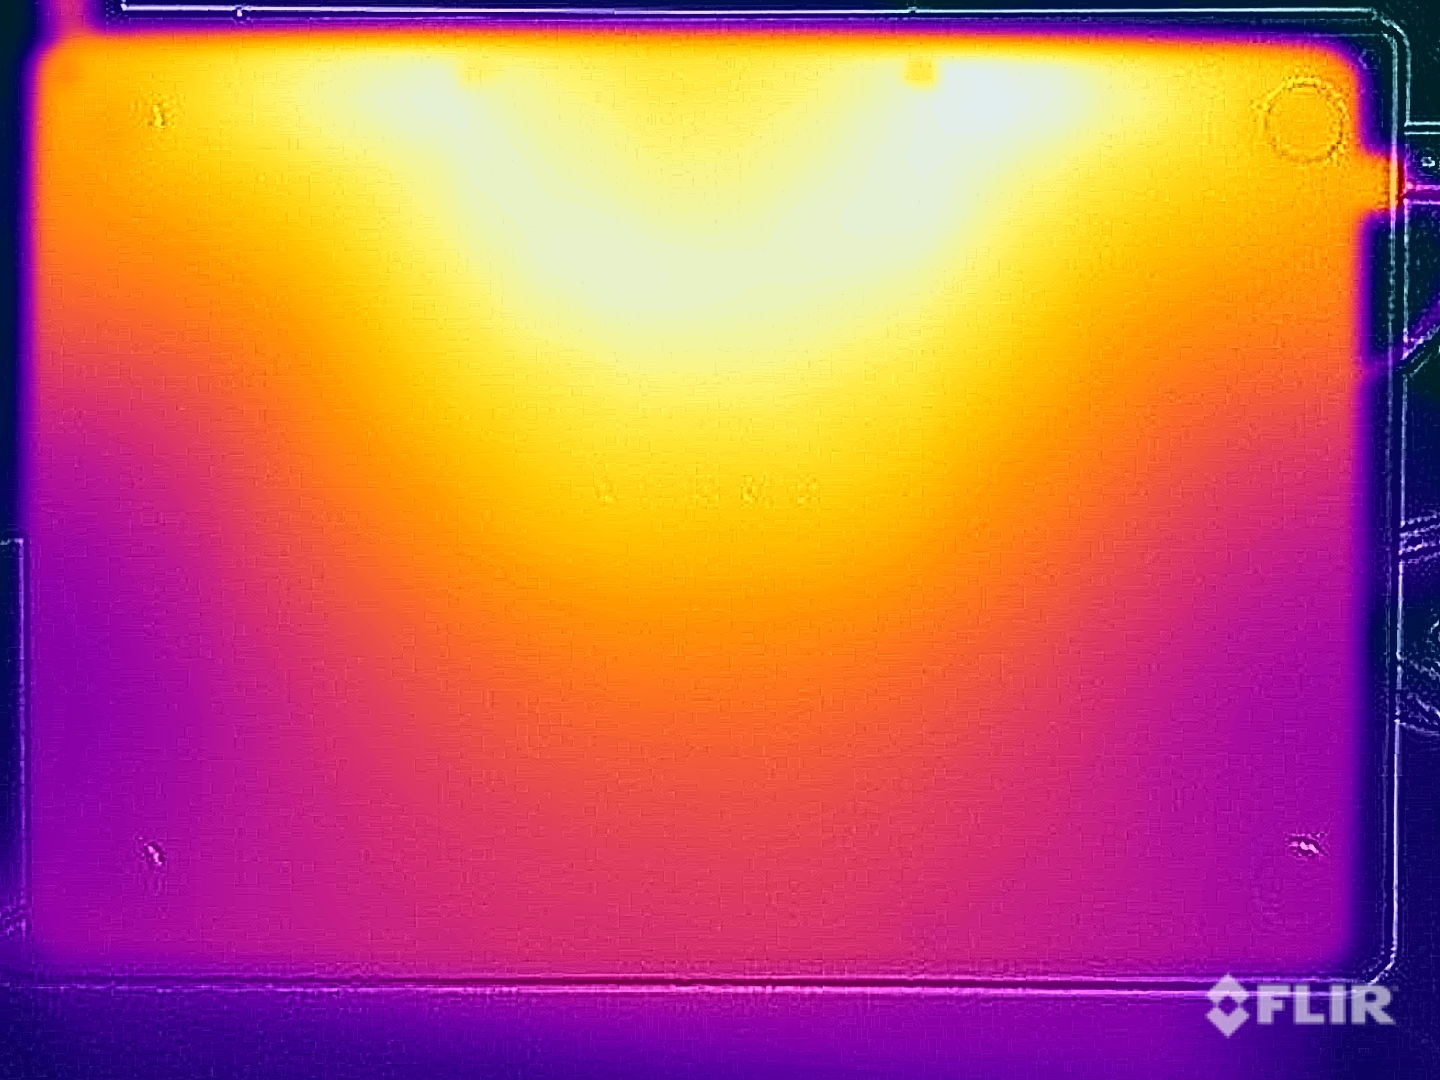
(±) The bottom heats up to a maximum of 43.1 °C / 110 F, compared to the average of 39.1 °C / 102 F
(+) In idle usage, the average temperature for the upper side is 21.3 °C / 70 F, compared to the device average of 31.3 °C / 88 F.
(±) 3: The average temperature for the upper side is 37.4 °C / 99 F, compared to the average of 31.3 °C / 88 F for the class Multimedia.
(+) The palmrests and touchpad are reaching skin temperature as a maximum (32.7 °C / 90.9 F) and are therefore not hot.
(-) The average temperature of the palmrest area of similar devices was 28.7 °C / 83.7 F (-4 °C / -7.2 F).
| Apple MacBook Pro 16 2024 M4 Pro Apple M4 Pro 14-Core, Apple M4 Pro 20-Core GPU | Apple MacBook Pro 16 2023 M3 Pro Apple M3 Pro 12-Core, Apple M3 Pro 18-Core GPU | Lenovo ThinkPad P1 Gen 7 21KV001SGE Intel Core Ultra 7 155H, NVIDIA GeForce RTX 4060 Laptop GPU | Asus ProArt P16 H7606WI AMD Ryzen AI 9 HX 370, NVIDIA GeForce RTX 4070 Laptop GPU | Lenovo Yoga Pro 9 16IMH9 RTX 4050 Intel Core Ultra 9 185H, NVIDIA GeForce RTX 4050 Laptop GPU | Dell XPS 16 9640 Intel Core Ultra 7 155H, NVIDIA GeForce RTX 4070 Laptop GPU | Samsung Galaxy Book4 Ultra Intel Core Ultra 7 155H, NVIDIA GeForce RTX 4050 Laptop GPU | |
|---|---|---|---|---|---|---|---|
| Heat | -1% | -16% | -26% | -19% | -9% | -2% | |
| Maximum Upper Side * (°C) | 42.7 | 38.1 11% | 50.3 -18% | 46.9 -10% | 41 4% | 39.4 8% | 38.5 10% |
| Maximum Bottom * (°C) | 43.1 | 37 14% | 38 12% | 50.9 -18% | 40.6 6% | 36.9 14% | 41.2 4% |
| Idle Upper Side * (°C) | 21.5 | 24.2 -13% | 28.3 -32% | 28.9 -34% | 30.2 -40% | 28.2 -31% | 23.5 -9% |
| Idle Bottom * (°C) | 21.5 | 24.6 -14% | 27.3 -27% | 30 -40% | 31.4 -46% | 27.4 -27% | 24.1 -12% |
* ... smaller is better
Speakers
The MacBook Pro 16's sound system is once again excellent and is one of the best on the market—but the competition doesn't have to hide in this respect, delivering similar results at times.
Apple MacBook Pro 16 2024 M4 Pro audio analysis
(+) | speakers can play relatively loud (84.6 dB)
Bass 100 - 315 Hz
(±) | reduced bass - on average 5.1% lower than median
(+) | bass is linear (5.6% delta to prev. frequency)
Mids 400 - 2000 Hz
(+) | balanced mids - only 1.4% away from median
(+) | mids are linear (2.4% delta to prev. frequency)
Highs 2 - 16 kHz
(+) | balanced highs - only 1.6% away from median
(+) | highs are linear (3% delta to prev. frequency)
Overall 100 - 16.000 Hz
(+) | overall sound is linear (4.8% difference to median)
Compared to same class
» 0% of all tested devices in this class were better, 0% similar, 99% worse
» The best had a delta of 5%, average was 17%, worst was 45%
Compared to all devices tested
» 0% of all tested devices were better, 0% similar, 100% worse
» The best had a delta of 4%, average was 23%, worst was 134%
Lenovo ThinkPad P1 Gen 7 21KV001SGE audio analysis
(±) | speaker loudness is average but good (81.4 dB)
Bass 100 - 315 Hz
(±) | reduced bass - on average 6.8% lower than median
(±) | linearity of bass is average (10.3% delta to prev. frequency)
Mids 400 - 2000 Hz
(+) | balanced mids - only 3.4% away from median
(+) | mids are linear (4.7% delta to prev. frequency)
Highs 2 - 16 kHz
(+) | balanced highs - only 3.1% away from median
(+) | highs are linear (6% delta to prev. frequency)
Overall 100 - 16.000 Hz
(+) | overall sound is linear (9.2% difference to median)
Compared to same class
» 4% of all tested devices in this class were better, 2% similar, 94% worse
» The best had a delta of 7%, average was 17%, worst was 35%
Compared to all devices tested
» 3% of all tested devices were better, 1% similar, 96% worse
» The best had a delta of 4%, average was 23%, worst was 134%
Asus ProArt P16 H7606WI audio analysis
(±) | speaker loudness is average but good (81.4 dB)
Bass 100 - 315 Hz
(+) | good bass - only 3% away from median
(±) | linearity of bass is average (8.3% delta to prev. frequency)
Mids 400 - 2000 Hz
(+) | balanced mids - only 3.5% away from median
(+) | mids are linear (2.5% delta to prev. frequency)
Highs 2 - 16 kHz
(+) | balanced highs - only 3% away from median
(+) | highs are linear (3.6% delta to prev. frequency)
Overall 100 - 16.000 Hz
(+) | overall sound is linear (8.5% difference to median)
Compared to same class
» 9% of all tested devices in this class were better, 3% similar, 88% worse
» The best had a delta of 5%, average was 17%, worst was 45%
Compared to all devices tested
» 2% of all tested devices were better, 1% similar, 97% worse
» The best had a delta of 4%, average was 23%, worst was 134%
Lenovo Yoga Pro 9 16IMH9 RTX 4050 audio analysis
(+) | speakers can play relatively loud (85.5 dB)
Bass 100 - 315 Hz
(+) | good bass - only 2.1% away from median
(+) | bass is linear (3.8% delta to prev. frequency)
Mids 400 - 2000 Hz
(+) | balanced mids - only 2.6% away from median
(+) | mids are linear (3.1% delta to prev. frequency)
Highs 2 - 16 kHz
(+) | balanced highs - only 3.1% away from median
(+) | highs are linear (3% delta to prev. frequency)
Overall 100 - 16.000 Hz
(+) | overall sound is linear (5.8% difference to median)
Compared to same class
» 0% of all tested devices in this class were better, 0% similar, 100% worse
» The best had a delta of 6%, average was 18%, worst was 132%
Compared to all devices tested
» 0% of all tested devices were better, 0% similar, 100% worse
» The best had a delta of 4%, average was 23%, worst was 134%
Dell XPS 16 9640 audio analysis
(+) | speakers can play relatively loud (83.4 dB)
Bass 100 - 315 Hz
(±) | reduced bass - on average 11.2% lower than median
(±) | linearity of bass is average (8.9% delta to prev. frequency)
Mids 400 - 2000 Hz
(+) | balanced mids - only 4.5% away from median
(+) | mids are linear (3% delta to prev. frequency)
Highs 2 - 16 kHz
(+) | balanced highs - only 1.4% away from median
(+) | highs are linear (2% delta to prev. frequency)
Overall 100 - 16.000 Hz
(+) | overall sound is linear (10% difference to median)
Compared to same class
» 13% of all tested devices in this class were better, 2% similar, 84% worse
» The best had a delta of 5%, average was 17%, worst was 45%
Compared to all devices tested
» 4% of all tested devices were better, 1% similar, 94% worse
» The best had a delta of 4%, average was 23%, worst was 134%
Samsung Galaxy Book4 Ultra audio analysis
(+) | speakers can play relatively loud (85 dB)
Bass 100 - 315 Hz
(±) | reduced bass - on average 14.4% lower than median
(±) | linearity of bass is average (11.3% delta to prev. frequency)
Mids 400 - 2000 Hz
(+) | balanced mids - only 3.4% away from median
(+) | mids are linear (3.4% delta to prev. frequency)
Highs 2 - 16 kHz
(+) | balanced highs - only 3% away from median
(+) | highs are linear (5.6% delta to prev. frequency)
Overall 100 - 16.000 Hz
(+) | overall sound is linear (11.5% difference to median)
Compared to same class
» 18% of all tested devices in this class were better, 4% similar, 78% worse
» The best had a delta of 5%, average was 17%, worst was 45%
Compared to all devices tested
» 8% of all tested devices were better, 2% similar, 90% worse
» The best had a delta of 4%, average was 23%, worst was 134%
Power consumption
We noted no major differences between the new MacBook Pro 16 and its predecessor in idle mode, but the new M4 Pro's increased power consumption becomes clearly evident under load. We measured around 75-85 watts when gaming, and a maximum of up to 138 watts in the stress test. This value then stabilized at 124 watts during the test, so the 140-watt power supply unit supplied is sufficient in size. However, things might get problematic with the M4 Max, but we will test this soon.
| Apple MacBook Pro 16 2024 M4 Pro M4 Pro 20-Core GPU, M4 Pro 14-Core, Apple SSD AP2048Z | Apple MacBook Pro 16 2023 M3 Pro M3 Pro 18-Core GPU, Apple M3 Pro 12-Core, Apple SSD AP0512Z | Lenovo ThinkPad P1 Gen 7 21KV001SGE GeForce RTX 4060 Laptop GPU, Ultra 7 155H, Kioxia XG8 KXG8AZNV1T02 | Asus ProArt P16 H7606WI GeForce RTX 4070 Laptop GPU, Ryzen AI 9 HX 370, Micron 2400 MTFDKBA1T0QFM | Lenovo Yoga Pro 9 16IMH9 RTX 4050 GeForce RTX 4050 Laptop GPU, Ultra 9 185H, SK Hynix HFS001TEJ9X115N | Dell XPS 16 9640 GeForce RTX 4070 Laptop GPU, Ultra 7 155H, Kioxia XG8 KXG80ZNV1T02 | Samsung Galaxy Book4 Ultra GeForce RTX 4050 Laptop GPU, Ultra 7 155H, Samsung PM9A1 MZVL2512HCJQ | |
|---|---|---|---|---|---|---|---|
| Power Consumption | 10% | -22% | -35% | -50% | 2% | 22% | |
| Idle Minimum * (Watt) | 4.6 | 4.5 2% | 7.3 -59% | 8 -74% | 9.9 -115% | 7.7 -67% | 4.8 -4% |
| Idle Average * (Watt) | 16.8 | 16.5 2% | 12.3 27% | 9.9 41% | 16.6 1% | 10.3 39% | 7.5 55% |
| Idle Maximum * (Watt) | 17.1 | 16.7 2% | 17.9 -5% | 11.6 32% | 29.2 -71% | 10.6 38% | 7.9 54% |
| Load Average * (Watt) | 76.4 | 60.4 21% | 78.2 -2% | 76.9 -1% | 100.9 -32% | 76.5 -0% | 79.3 -4% |
| Cyberpunk 2077 ultra * (Watt) | 83.4 | 123.5 -48% | 157.7 -89% | ||||
| Cyberpunk 2077 ultra external monitor * (Watt) | 79.3 | 117.7 -48% | 156.6 -97% | ||||
| Load Maximum * (Watt) | 138.1 | 102.9 25% | 167.5 -21% | 212.6 -54% | 182.2 -32% | 138.5 -0% | 125 9% |
| Witcher 3 ultra * (Watt) | 52.1 | 151.8 | 126.4 | 79.2 |
* ... smaller is better
| Off / Standby | |
| Idle | |
| Load |
|
Key:
min: | |
Power consumption Cyberpunk / stress test
Power consumption with external monitor
Runtimes
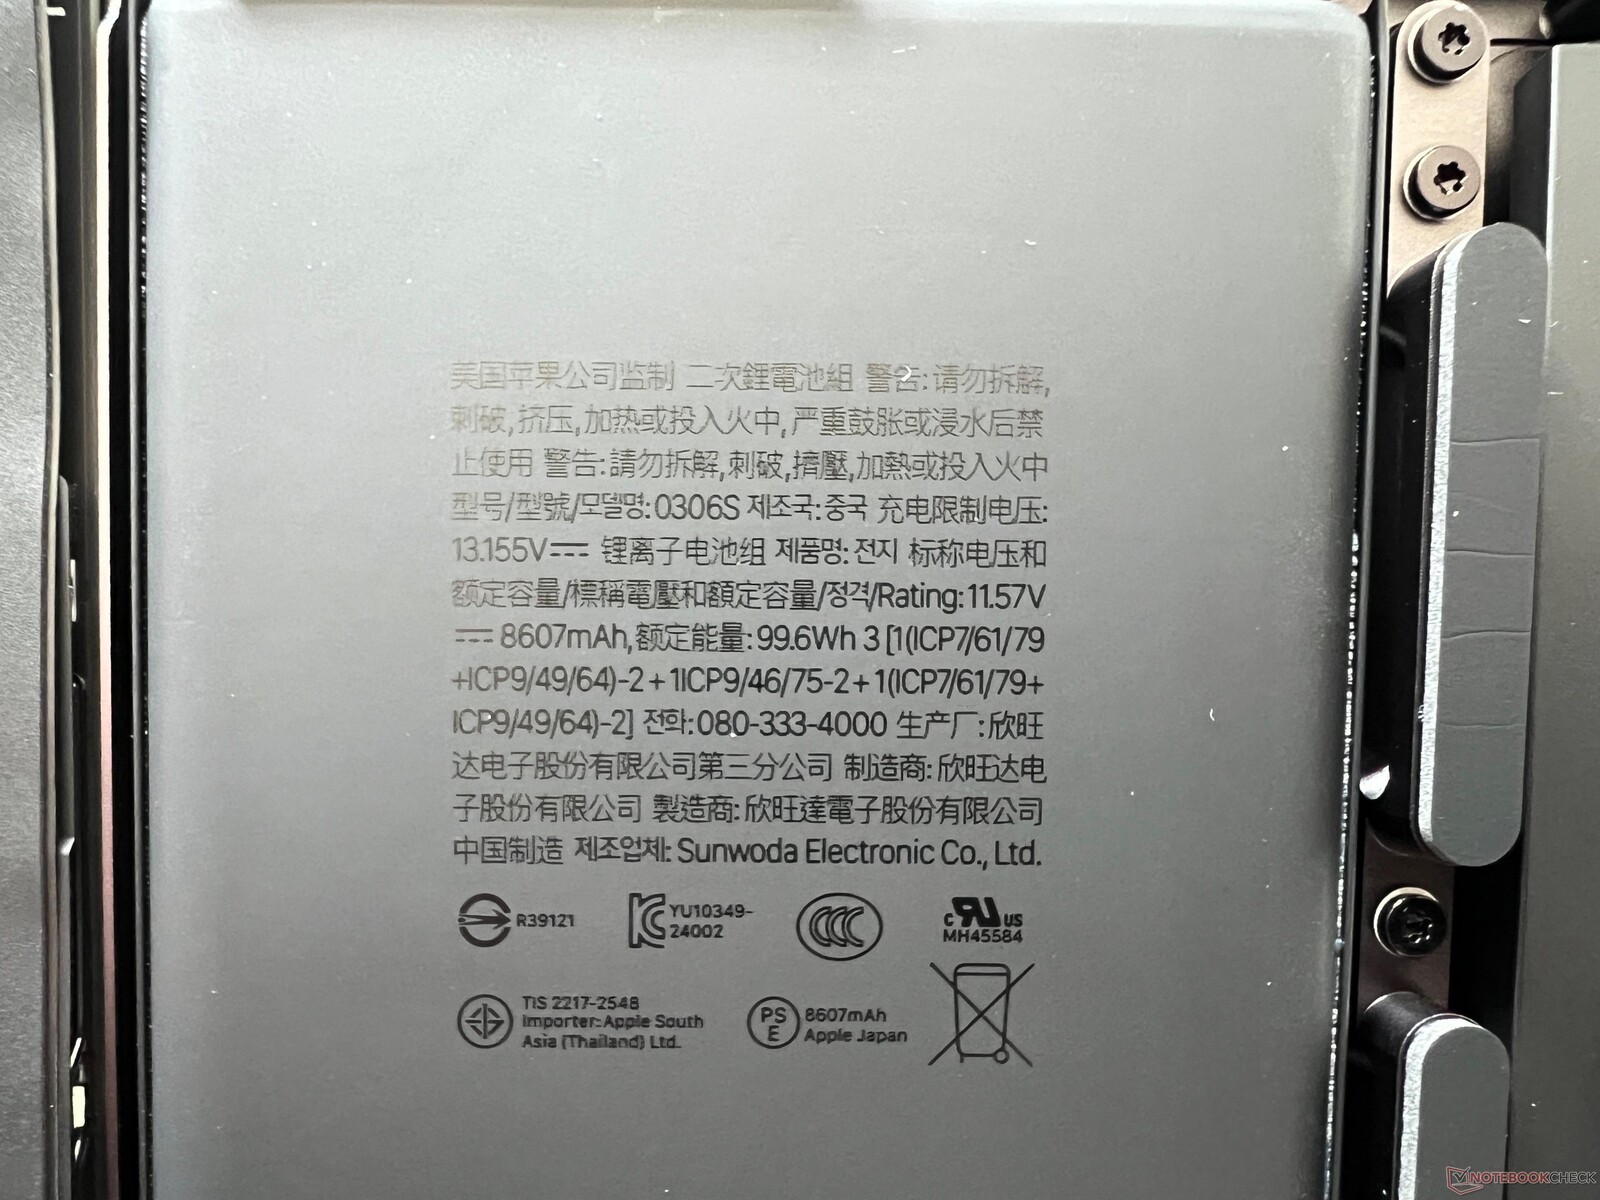
Nothing has changed about its battery capacity of 99.6 Wh, and the same can be said for its runtimes. The MBP's results were impressive as during the WLAN test at 150 cd/m², we noted almost 20 hours and at full SDR brightness, it still held on for almost 7.5 hours. During the video test at 150 cd/m², the MacBook even ran for over 24 hours before its battery was empty. When playing an HDR video at full brightness, we measured 6.5 hours. The direct Windows competition doesn't stand a chance against these runtimes.
A full charge with the device switched on takes 88 minutes using the 140-watt power supply unit. 50% of its capacity is available again after 26 minutes, 80% after 49 minutes and 90% after 63 minutes.
| Apple MacBook Pro 16 2024 M4 Pro M4 Pro 14-Core, M4 Pro 20-Core GPU, 99.6 Wh | Apple MacBook Pro 16 2023 M3 Pro Apple M3 Pro 12-Core, M3 Pro 18-Core GPU, 99.6 Wh | Lenovo ThinkPad P1 Gen 7 21KV001SGE Ultra 7 155H, GeForce RTX 4060 Laptop GPU, 90 Wh | Asus ProArt P16 H7606WI Ryzen AI 9 HX 370, GeForce RTX 4070 Laptop GPU, 90 Wh | Lenovo Yoga Pro 9 16IMH9 RTX 4050 Ultra 9 185H, GeForce RTX 4050 Laptop GPU, 84 Wh | Dell XPS 16 9640 Ultra 7 155H, GeForce RTX 4070 Laptop GPU, 99.5 Wh | Samsung Galaxy Book4 Ultra Ultra 7 155H, GeForce RTX 4050 Laptop GPU, 76 Wh | Average of class Multimedia | |
|---|---|---|---|---|---|---|---|---|
| Battery runtime | 2% | -49% | -37% | -54% | -40% | -36% | -34% | |
| H.264 (h) | 24.6 | 24.7 0% | 21 -15% | 16.5 -33% | 17.9 -27% | 17.1 ? -30% | ||
| WiFi v1.3 (h) | 19.6 | 20.1 3% | 9.9 -49% | 8.3 -58% | 9 -54% | 10.5 -46% | 10.9 -44% | 12.2 ? -38% |
Notebookcheck total rating
The MacBook Pro 16 2024 has gotten a significant performance boost thanks to the M4 Pro and in addition, the large 16-inch laptop can make better use of the new M4 Pro than the smaller MacBook Pro 14. Its mini-LED screen remains the reference in the mobile sector and benefits from the additional SDR brightness and optional matte nano-texture surface. Combined with low emissions and long runtimes, the MacBook Pro 16 M4 Pro is one of the best multimedia laptops on the market.
Apple MacBook Pro 16 2024 M4 Pro
- 11/14/2024 v8
Andreas Osthoff
 Total Sustainability Score:
 Transparency
The selection of devices to be reviewed is made by our editorial team. The test sample was provided to the author as a loan by the manufacturer or retailer for the purpose of this review. The lender had no influence on this review, nor did the manufacturer receive a copy of this review before publication. There was no obligation to publish this review. As an independent media company, Notebookcheck is not subjected to the authority of manufacturers, retailers or publishers.
This is how Notebookcheck is testing
Every year, Notebookcheck independently reviews hundreds of laptops and smartphones using standardized procedures to ensure that all results are comparable. We have continuously developed our test methods for around 20 years and set industry standards in the process. In our test labs, high-quality measuring equipment is utilized by experienced technicians and editors. These tests involve a multi-stage validation process. Our complex rating system is based on hundreds of well-founded measurements and benchmarks, which maintains objectivity. Further information on our test methods can be found here.

