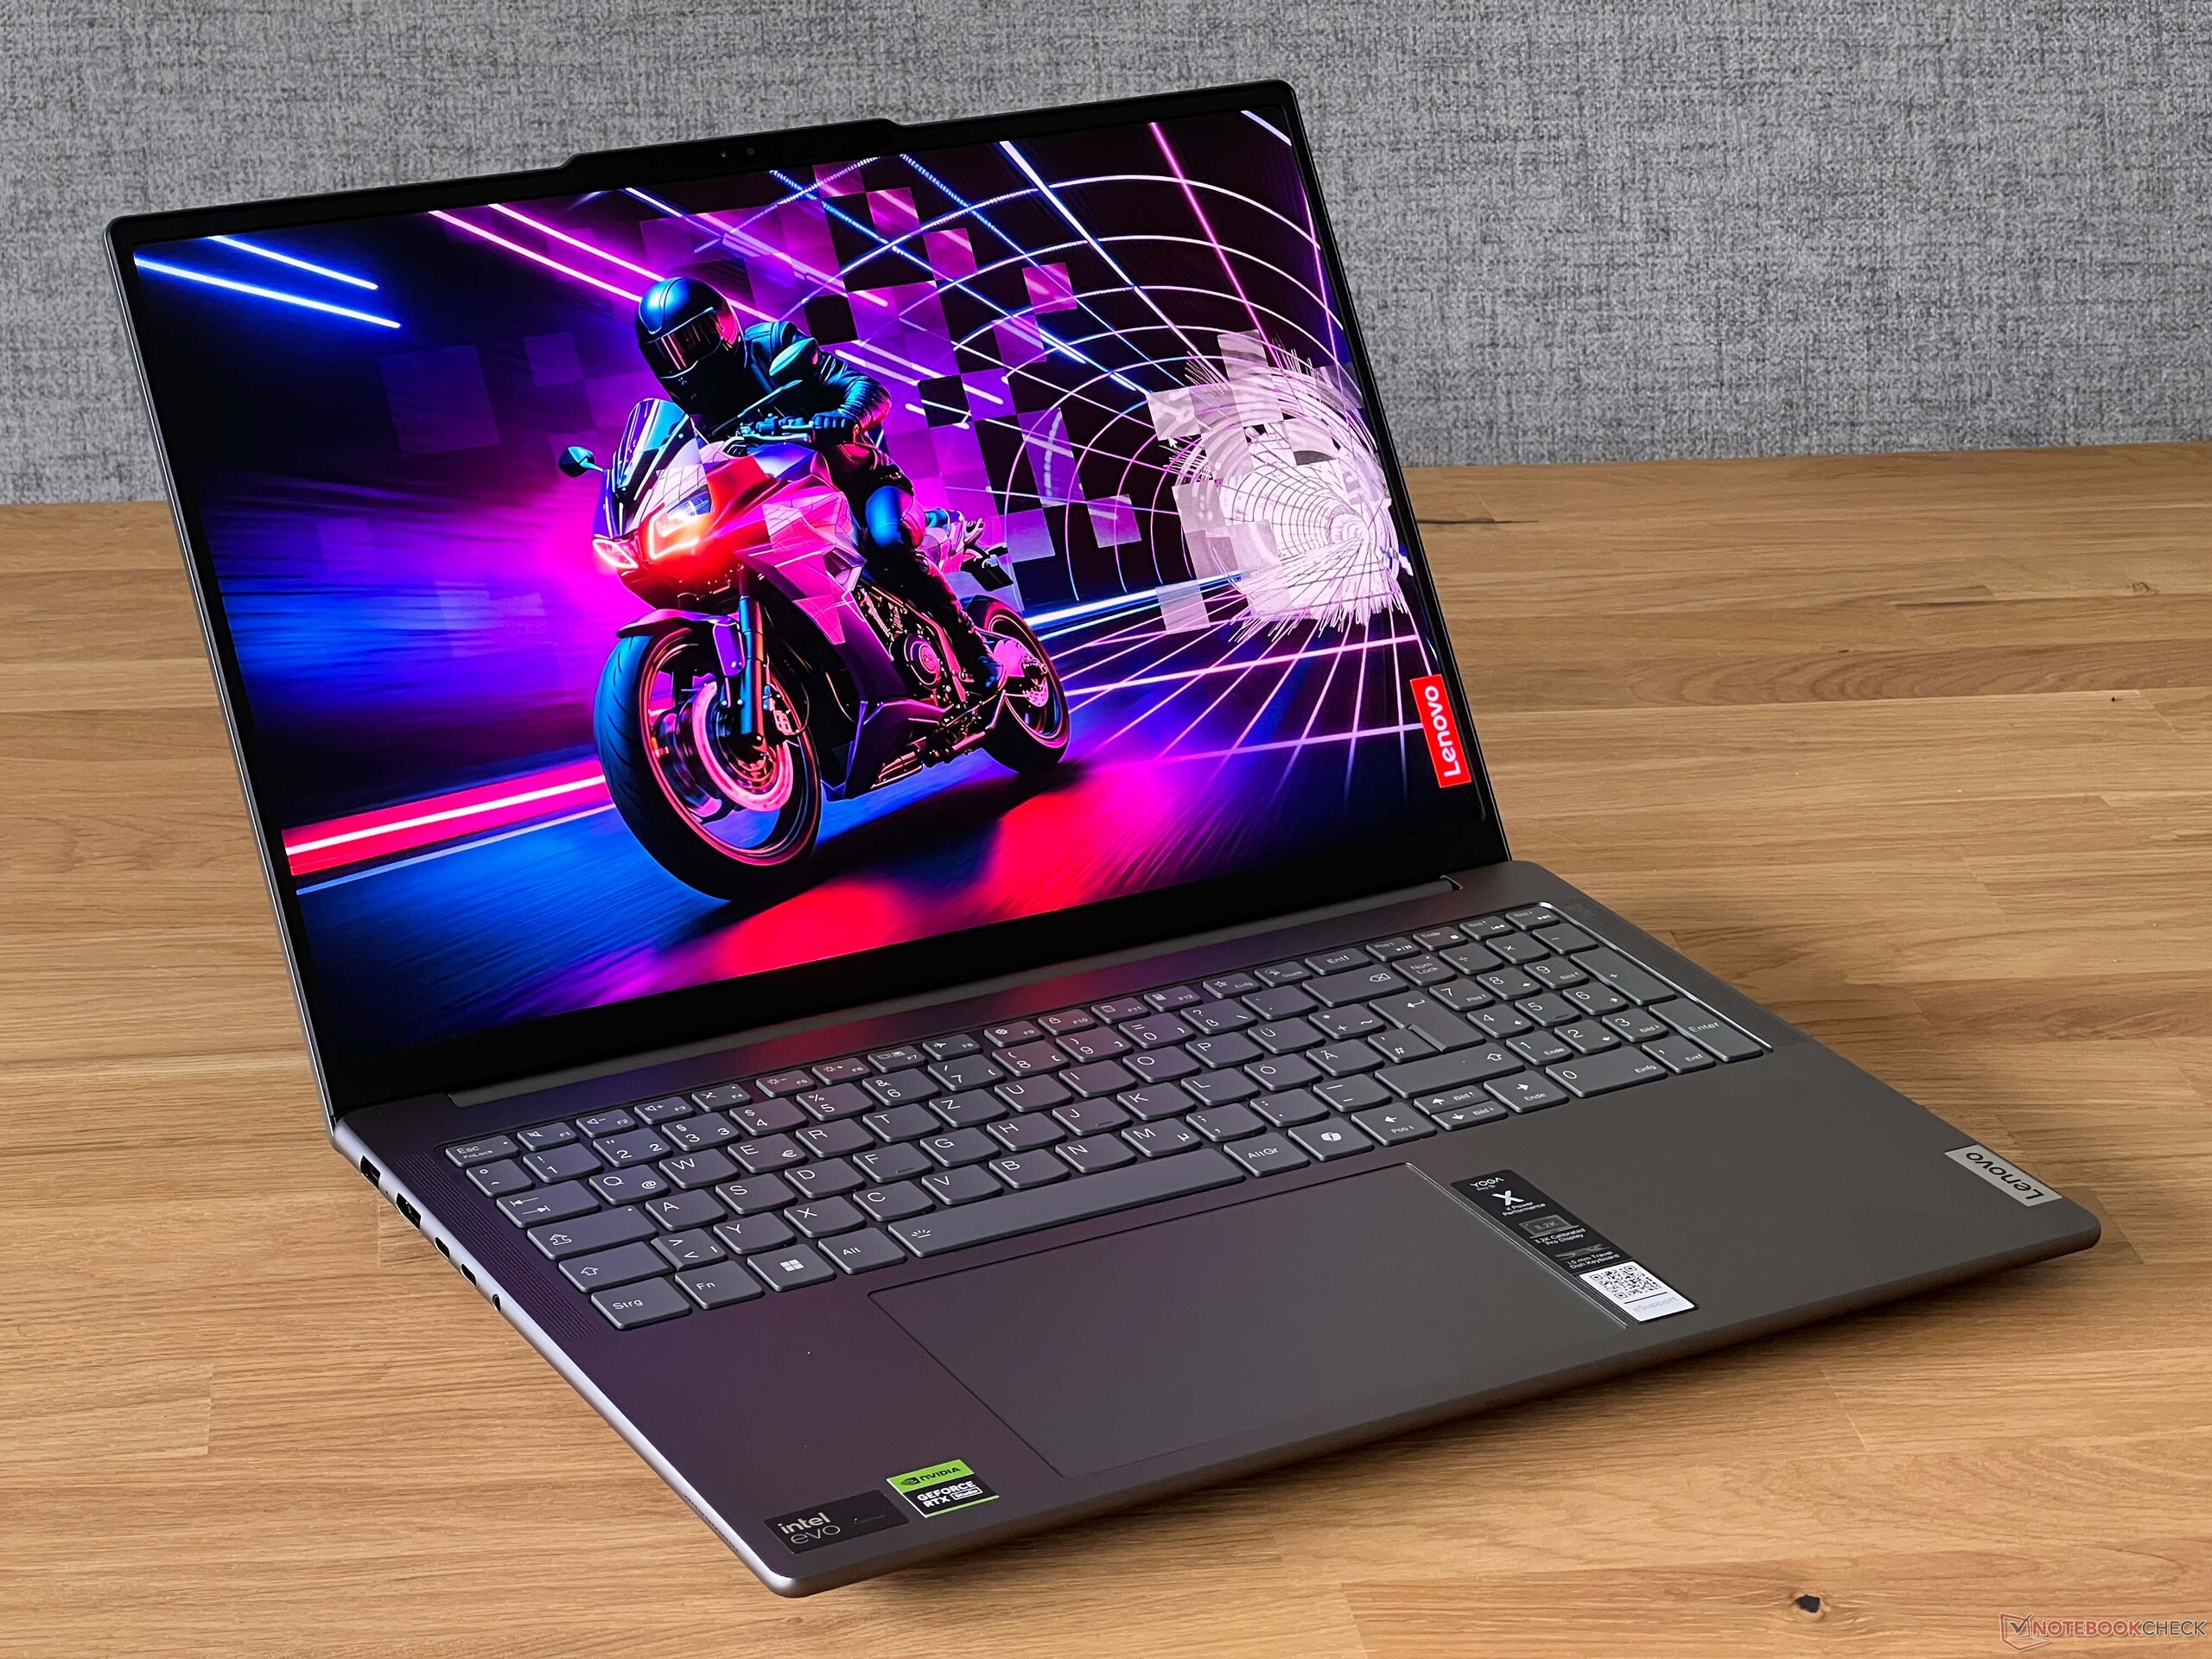
Lenovo Yoga Pro 9 16IMH9 laptop review: 75 W GeForce RTX 4050 overperforms

The Yoga Pro 9 series is home to Lenovo's flagship lineup of multimedia laptops above the upper mid-range Yoga 7 16 series and lower-end IdeaPad Pro 5 16 series. We recently walked away impressed by the highest-end Yoga Pro 9 configuration equipped with mini-LED and GeForce RTX 4070 graphics. This time, we're checking out a less expensive SKU with standard IPS and GeForce RTX 4050 graphics instead.
Our configuration in review can be found online for approximately $1700. Alternatives include other 16-inch multimedia or studio-centric laptops like the MSI Stealth 16, HP Envy x360 2-in-1 16, Dell XPS 16 9640, or Samsung Galaxy Book4 Ultra.
More Lenovo reviews:
Potential Competitors in Comparison
Rating | Date | Model | Weight | Height | Size | Resolution | Price |
|---|---|---|---|---|---|---|---|
| 91.7 % v7 (old) | 06 / 2024 | Lenovo Yoga Pro 9 16IMH9 RTX 4050 Ultra 9 185H, GeForce RTX 4050 Laptop GPU | 2.1 kg | 18.3 mm | 16.00" | 3200x2000 | |
| 88.7 % v7 (old) | 04 / 2024 | Lenovo Yoga Pro 9 16IMH9 Ultra 9 185H, GeForce RTX 4070 Laptop GPU | 2.1 kg | 18.3 mm | 16.00" | 3200x2000 | |
| 87.2 % v7 (old) | 05 / 2024 | HP Envy x360 2-in-1 16-ad0097nr R7 8840HS, Radeon 780M | 1.8 kg | 18.3 mm | 16.00" | 2880x1800 | |
| 88.6 % v7 (old) | 04 / 2024 | Dell XPS 16 9640 Ultra 7 155H, GeForce RTX 4070 Laptop GPU | 2.3 kg | 18.7 mm | 16.30" | 3840x2400 | |
| 90.4 % v7 (old) | 03 / 2024 | Samsung Galaxy Book4 Ultra Ultra 7 155H, GeForce RTX 4050 Laptop GPU | 1.8 kg | 17 mm | 16.00" | 2880x1800 | |
| 87.6 % v7 (old) | 11 / 2023 | Asus VivoBook Pro 16 K6602VU i9-13900H, GeForce RTX 4050 Laptop GPU | 1.9 kg | 19 mm | 16.00" | 3200x2000 |
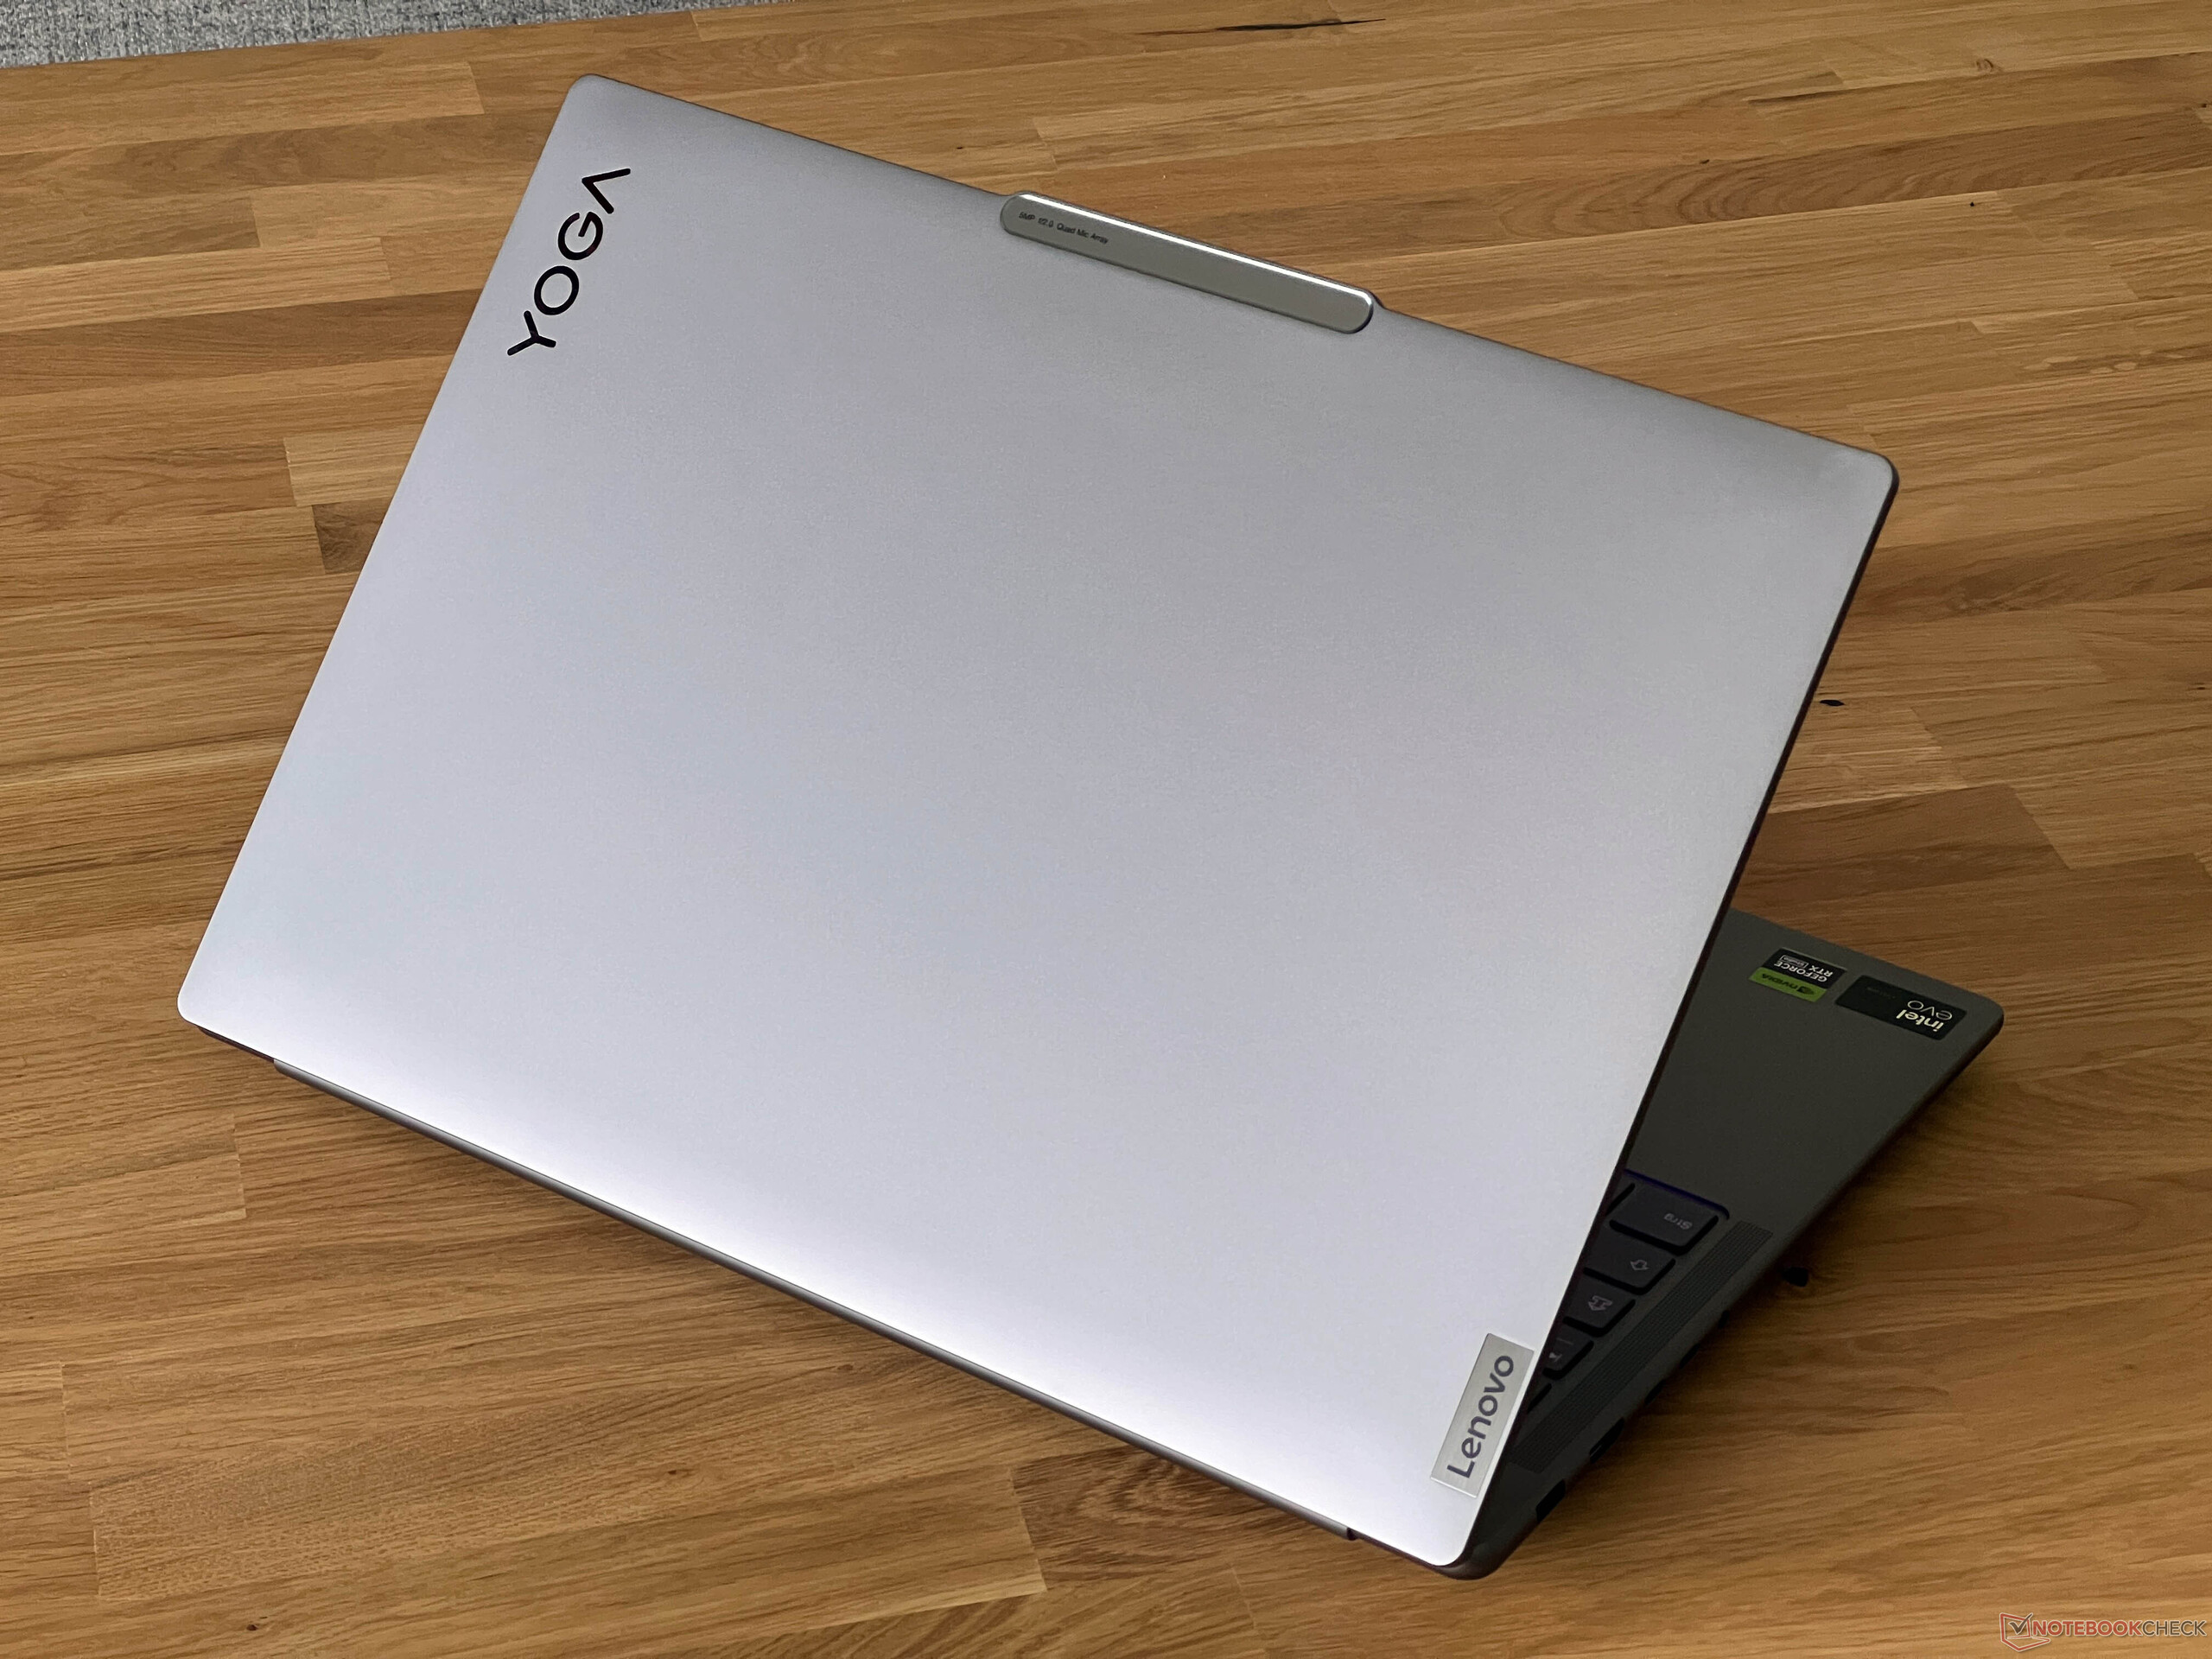
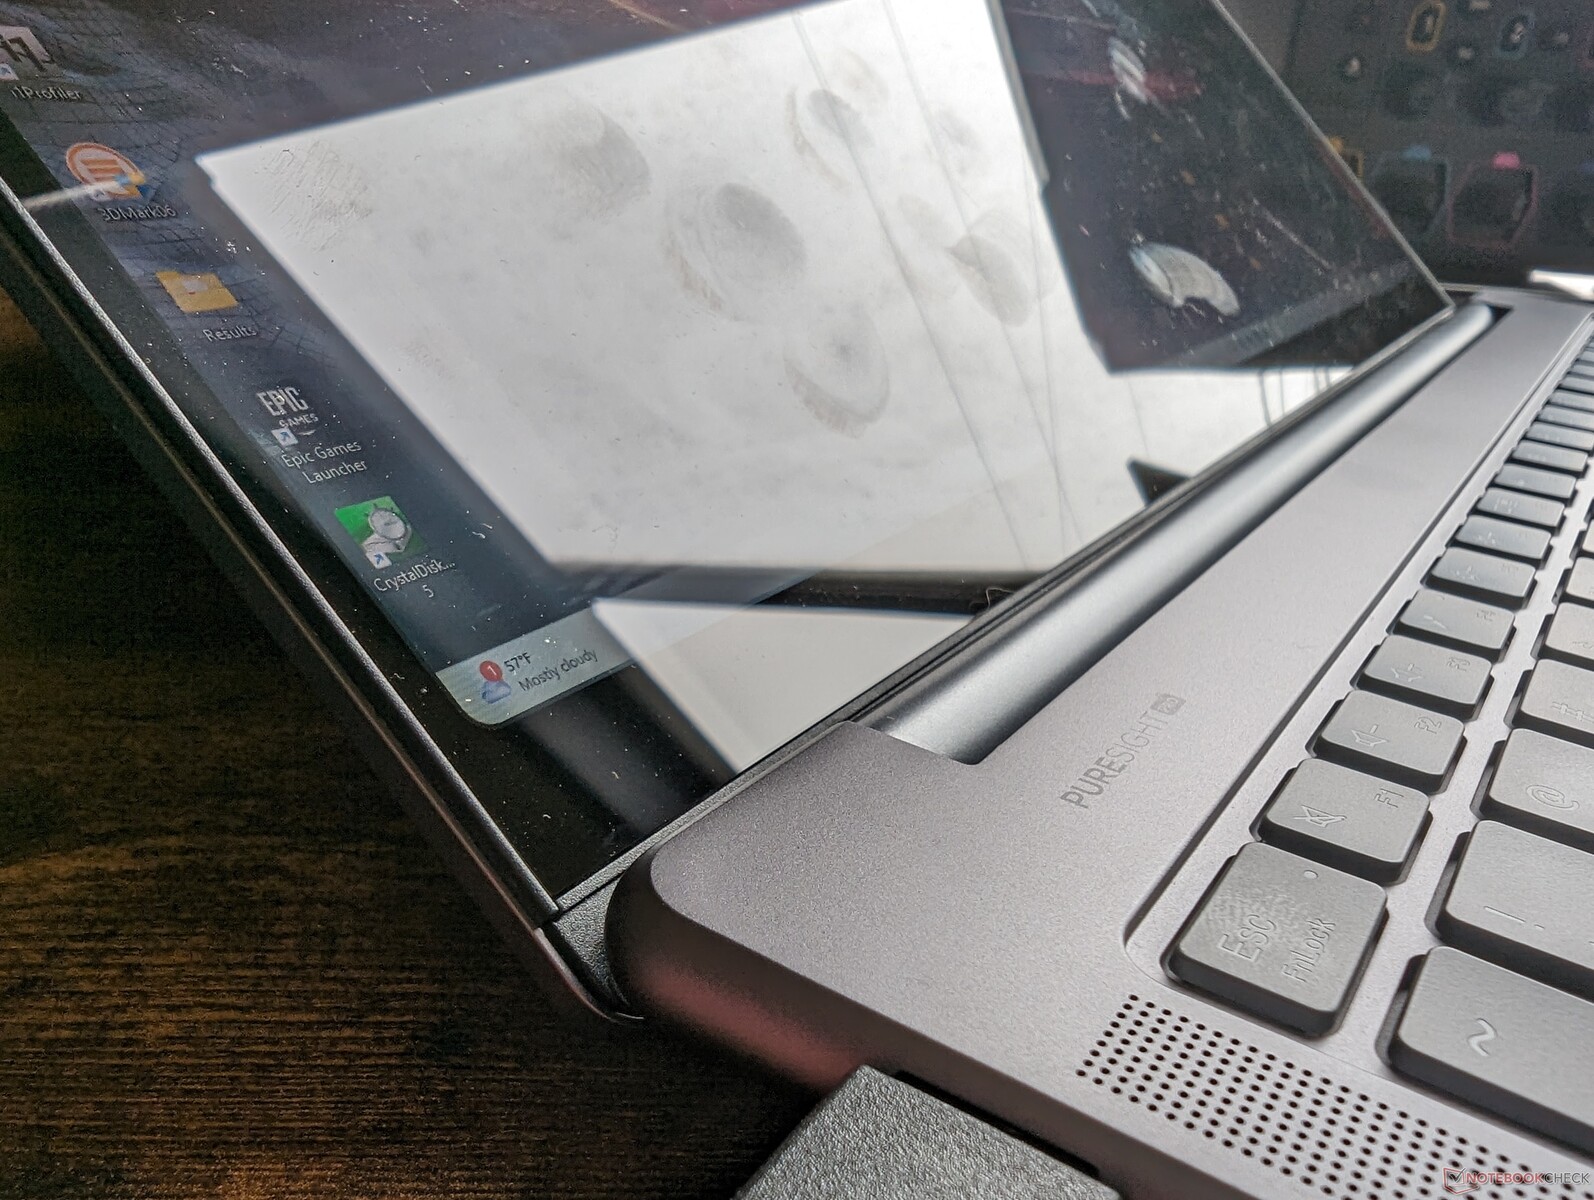
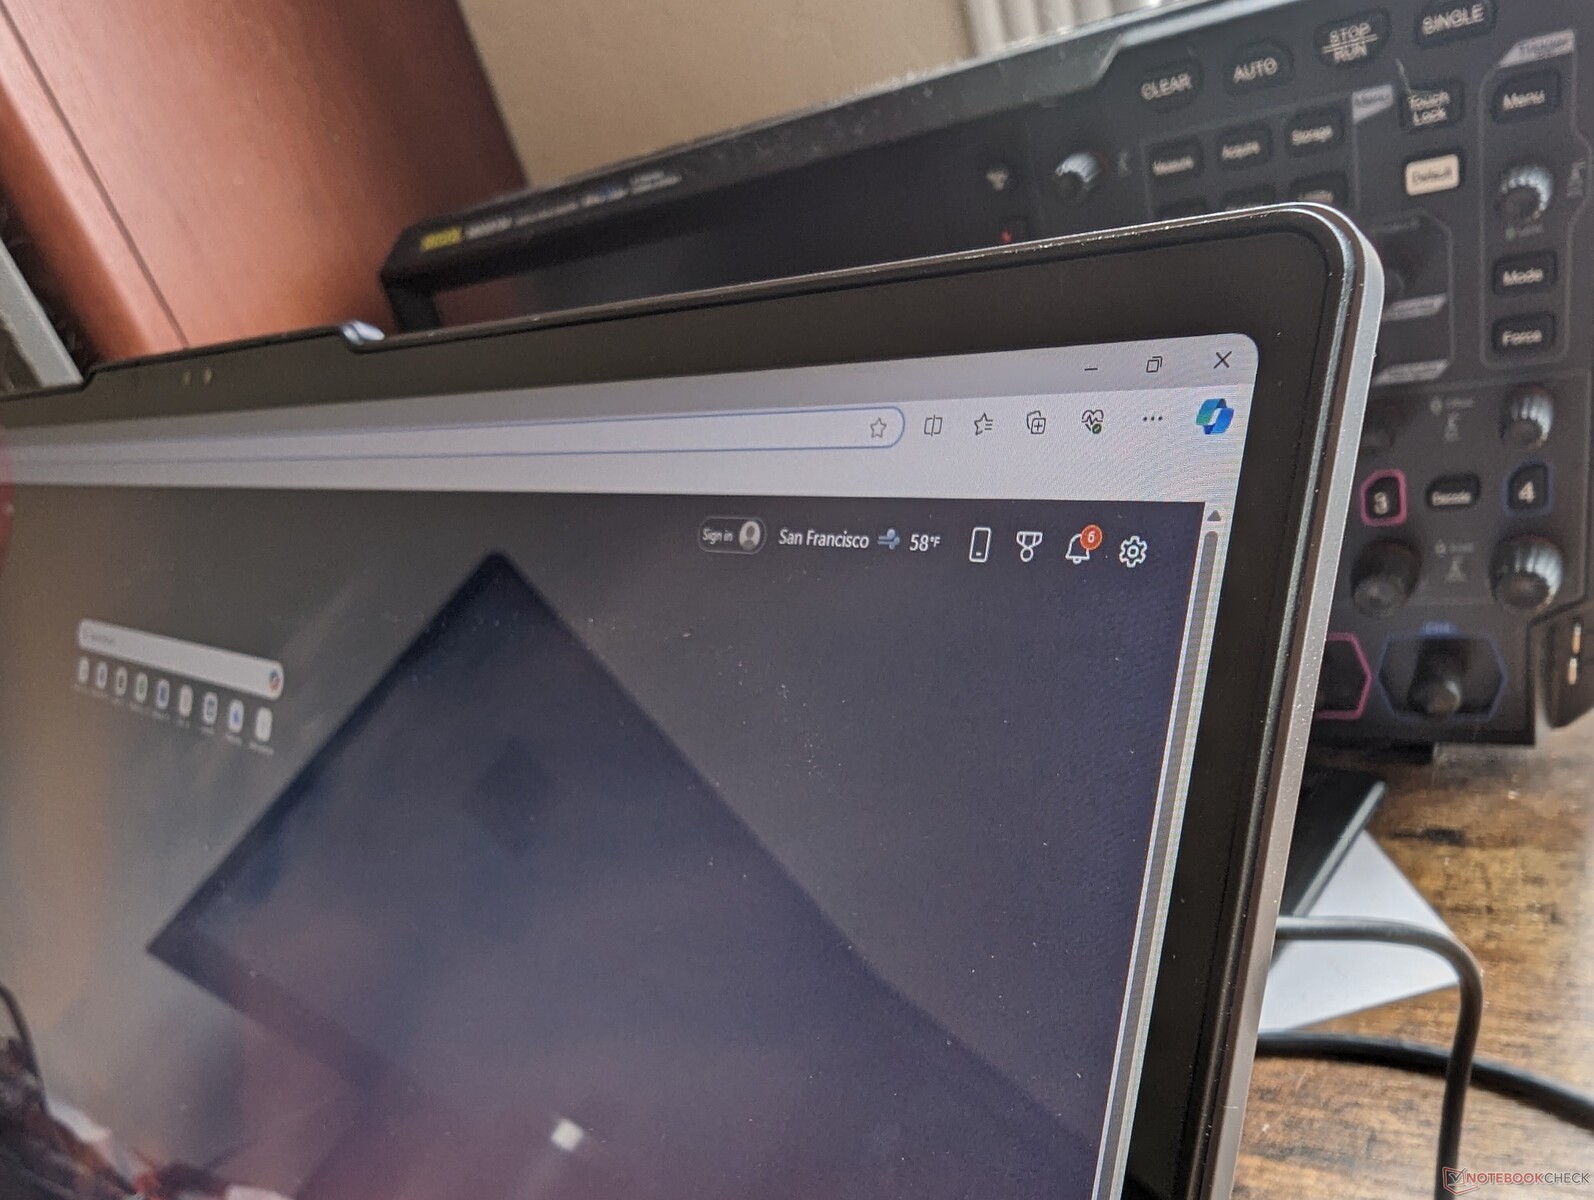
Case


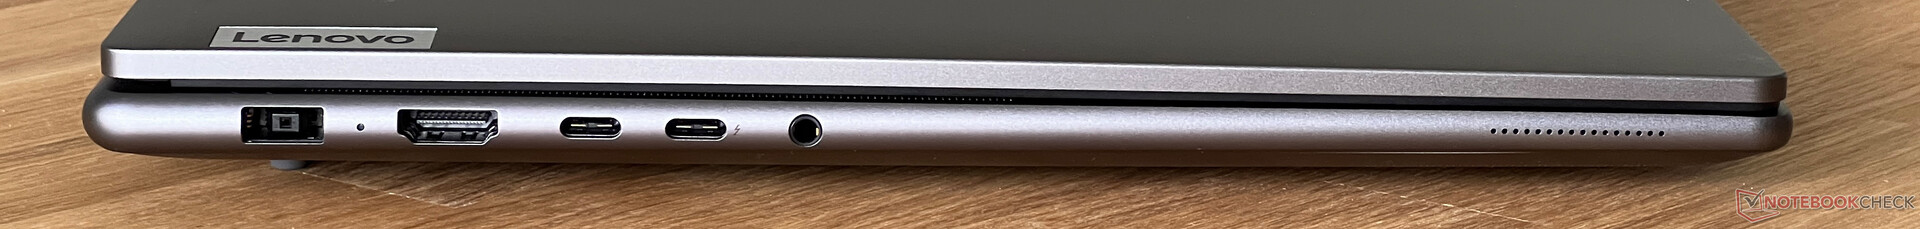
Connectivity

SD Card Reader
| SD Card Reader | |
| average JPG Copy Test (av. of 3 runs) | |
| Asus VivoBook Pro 16 K6602VU (Angelbird AV Pro V60) | |
| Dell XPS 16 9640 (Angelbird AV Pro V60) | |
| Lenovo Yoga Pro 9 16IMH9 RTX 4050 (Angelbird AV Pro V60) | |
| Samsung Galaxy Book4 Ultra (Angelbird AV Pro V60) | |
| Lenovo Yoga Pro 9 16IMH9 (Angelbird AV Pro V60) | |
| maximum AS SSD Seq Read Test (1GB) | |
| Asus VivoBook Pro 16 K6602VU (Angelbird AV Pro V60) | |
| Dell XPS 16 9640 (Angelbird AV Pro V60) | |
| Lenovo Yoga Pro 9 16IMH9 RTX 4050 (Angelbird AV Pro V60) | |
| Lenovo Yoga Pro 9 16IMH9 (Angelbird AV Pro V60) | |
| Samsung Galaxy Book4 Ultra (Angelbird AV Pro V60) | |
Communication
Webcam


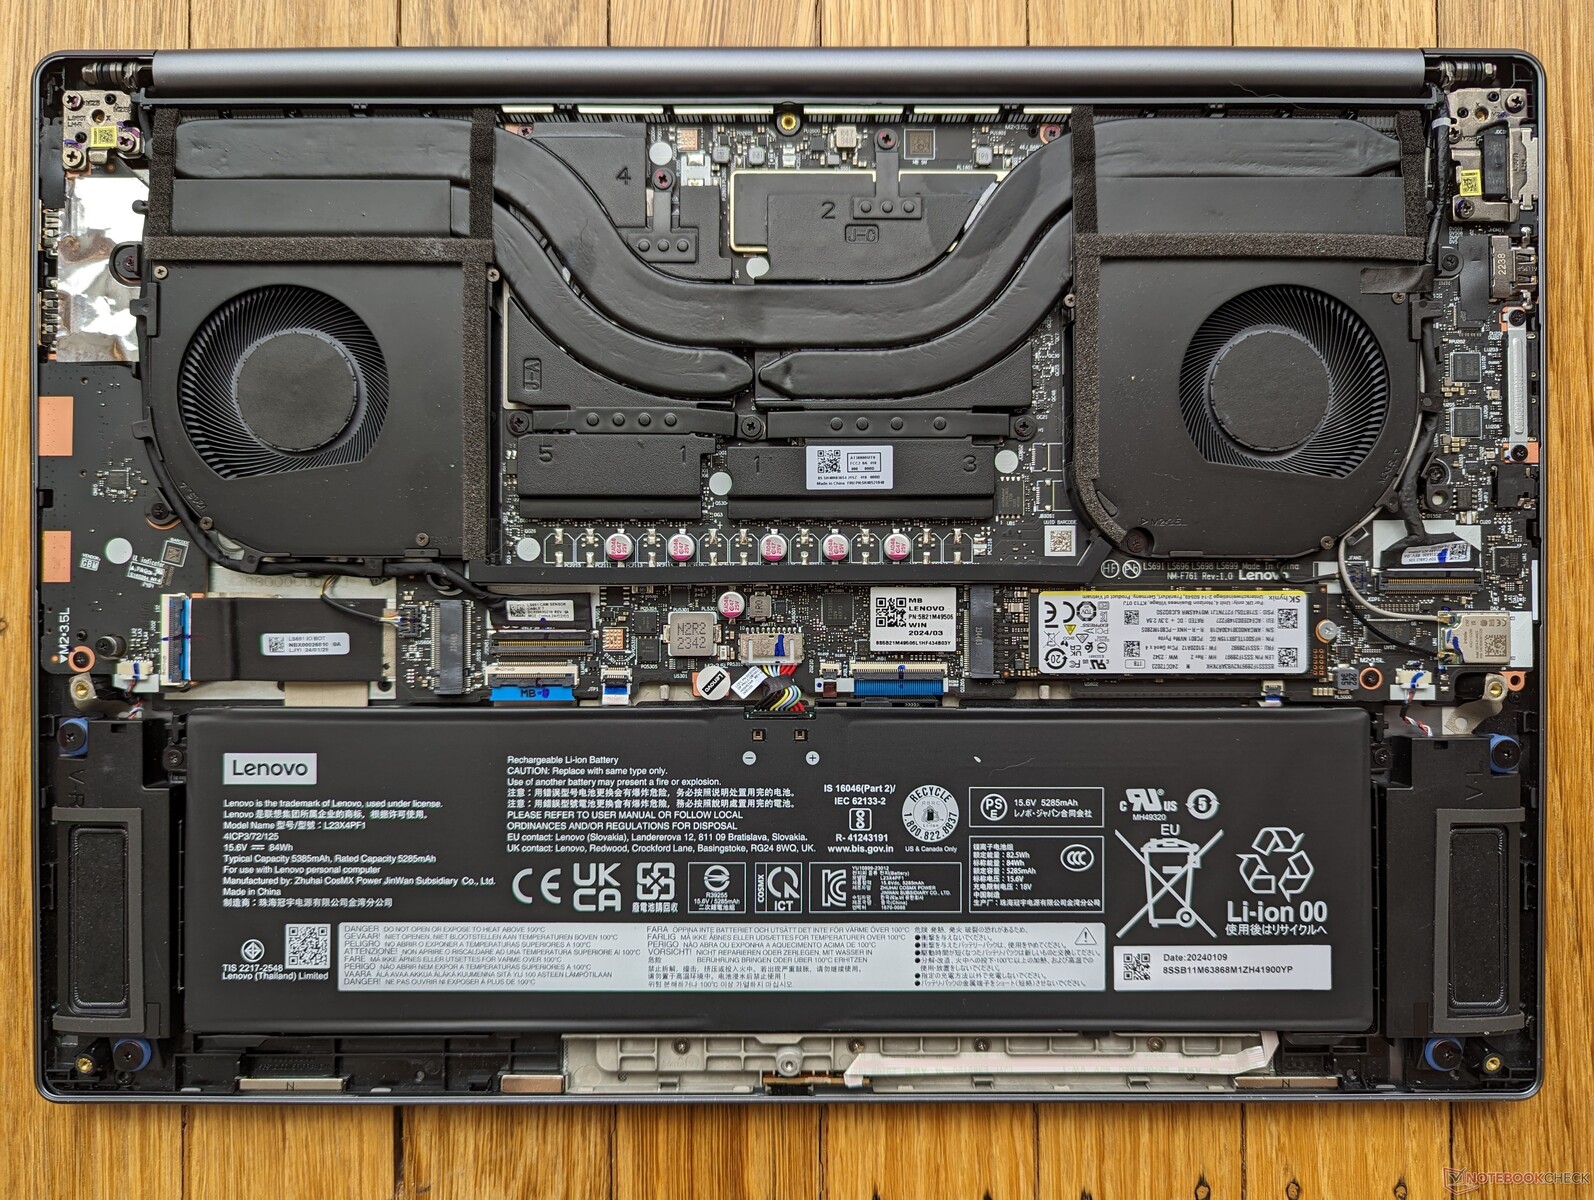
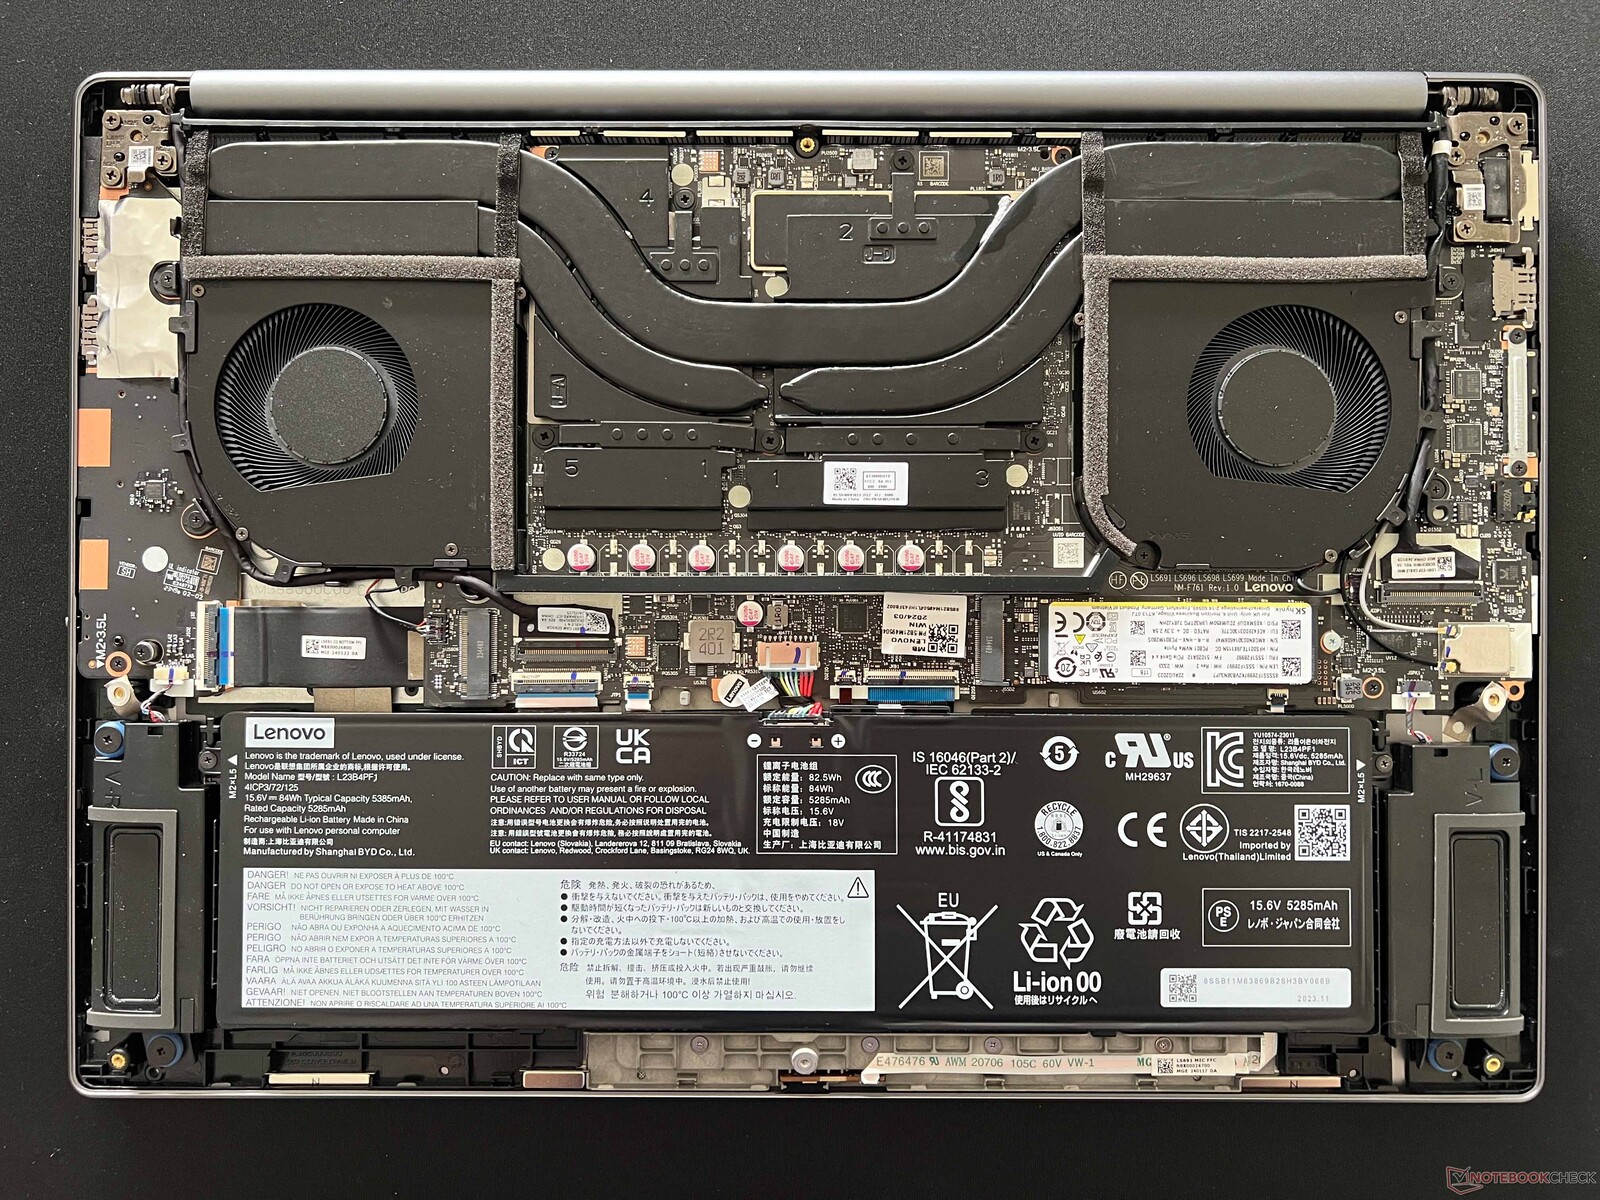
Maintenance
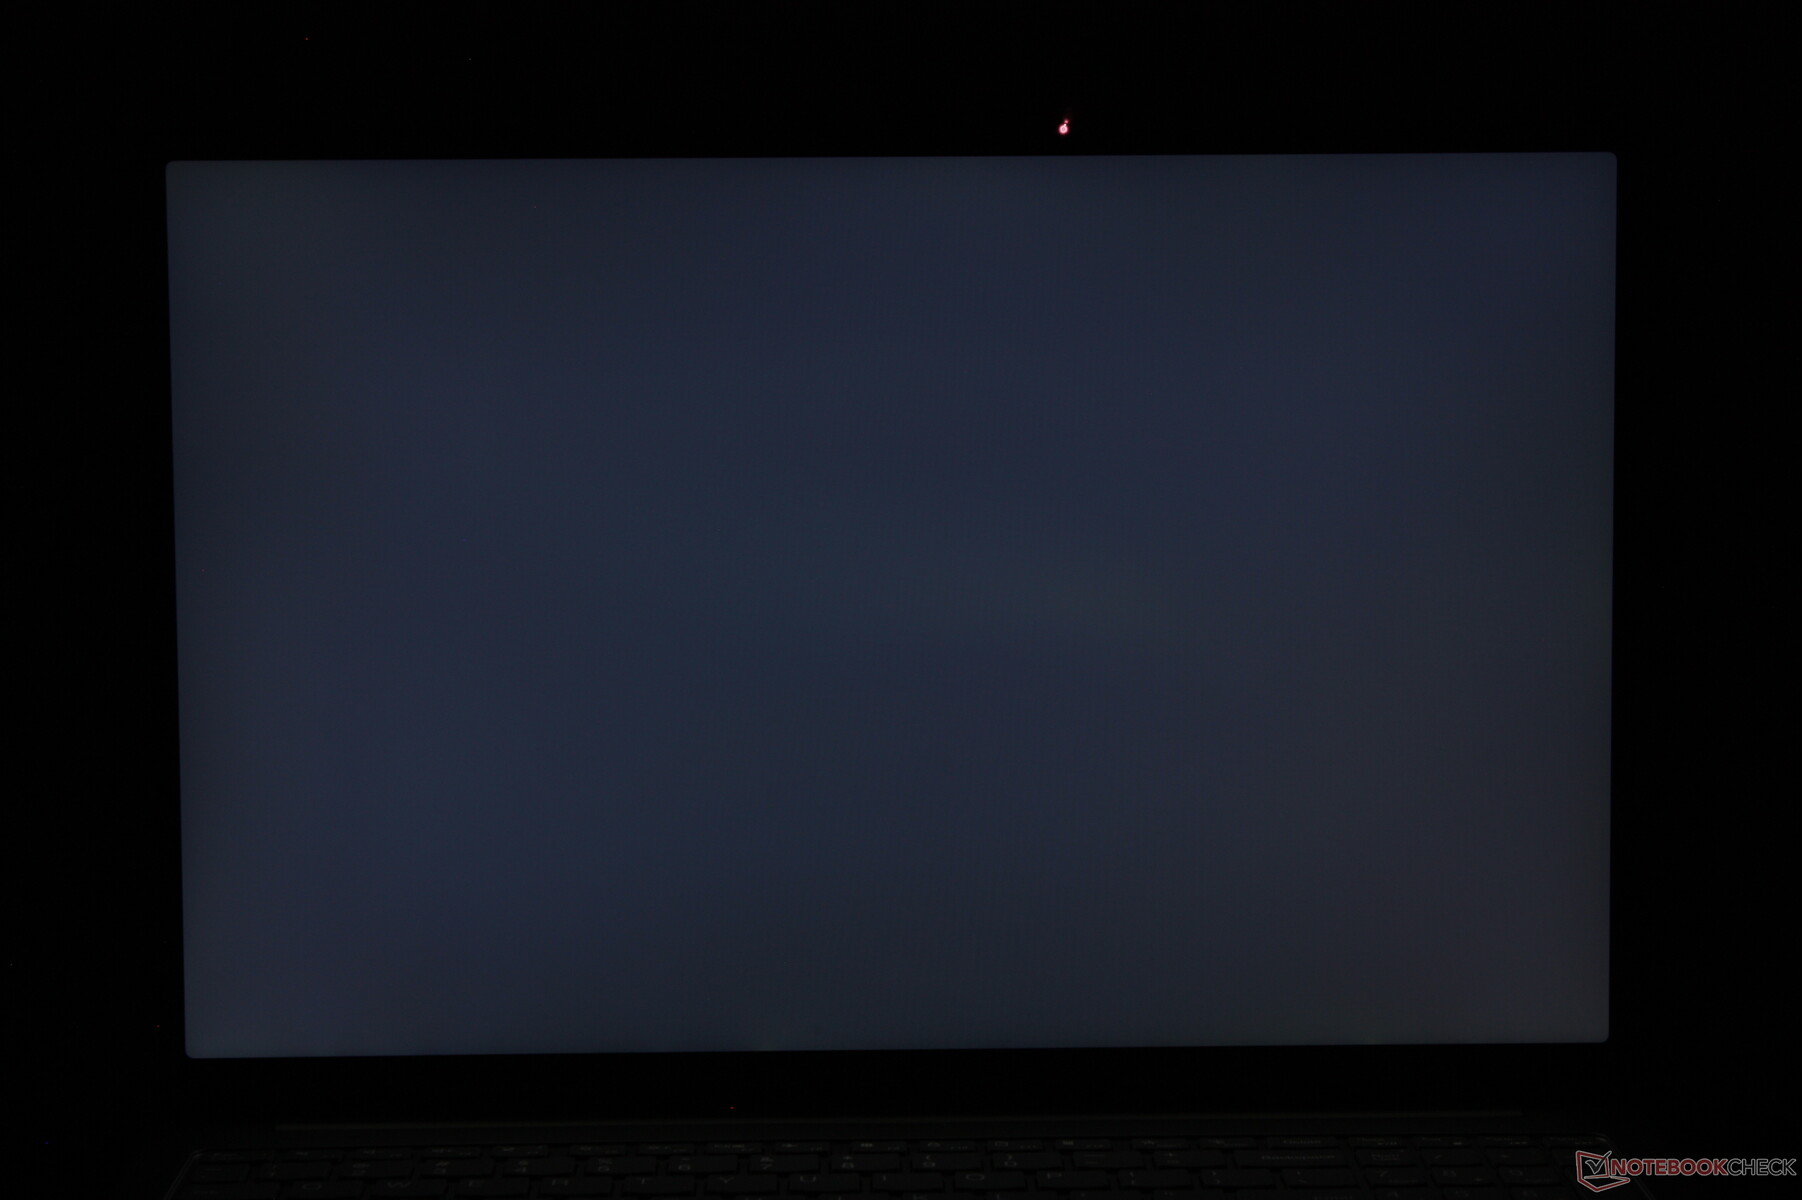
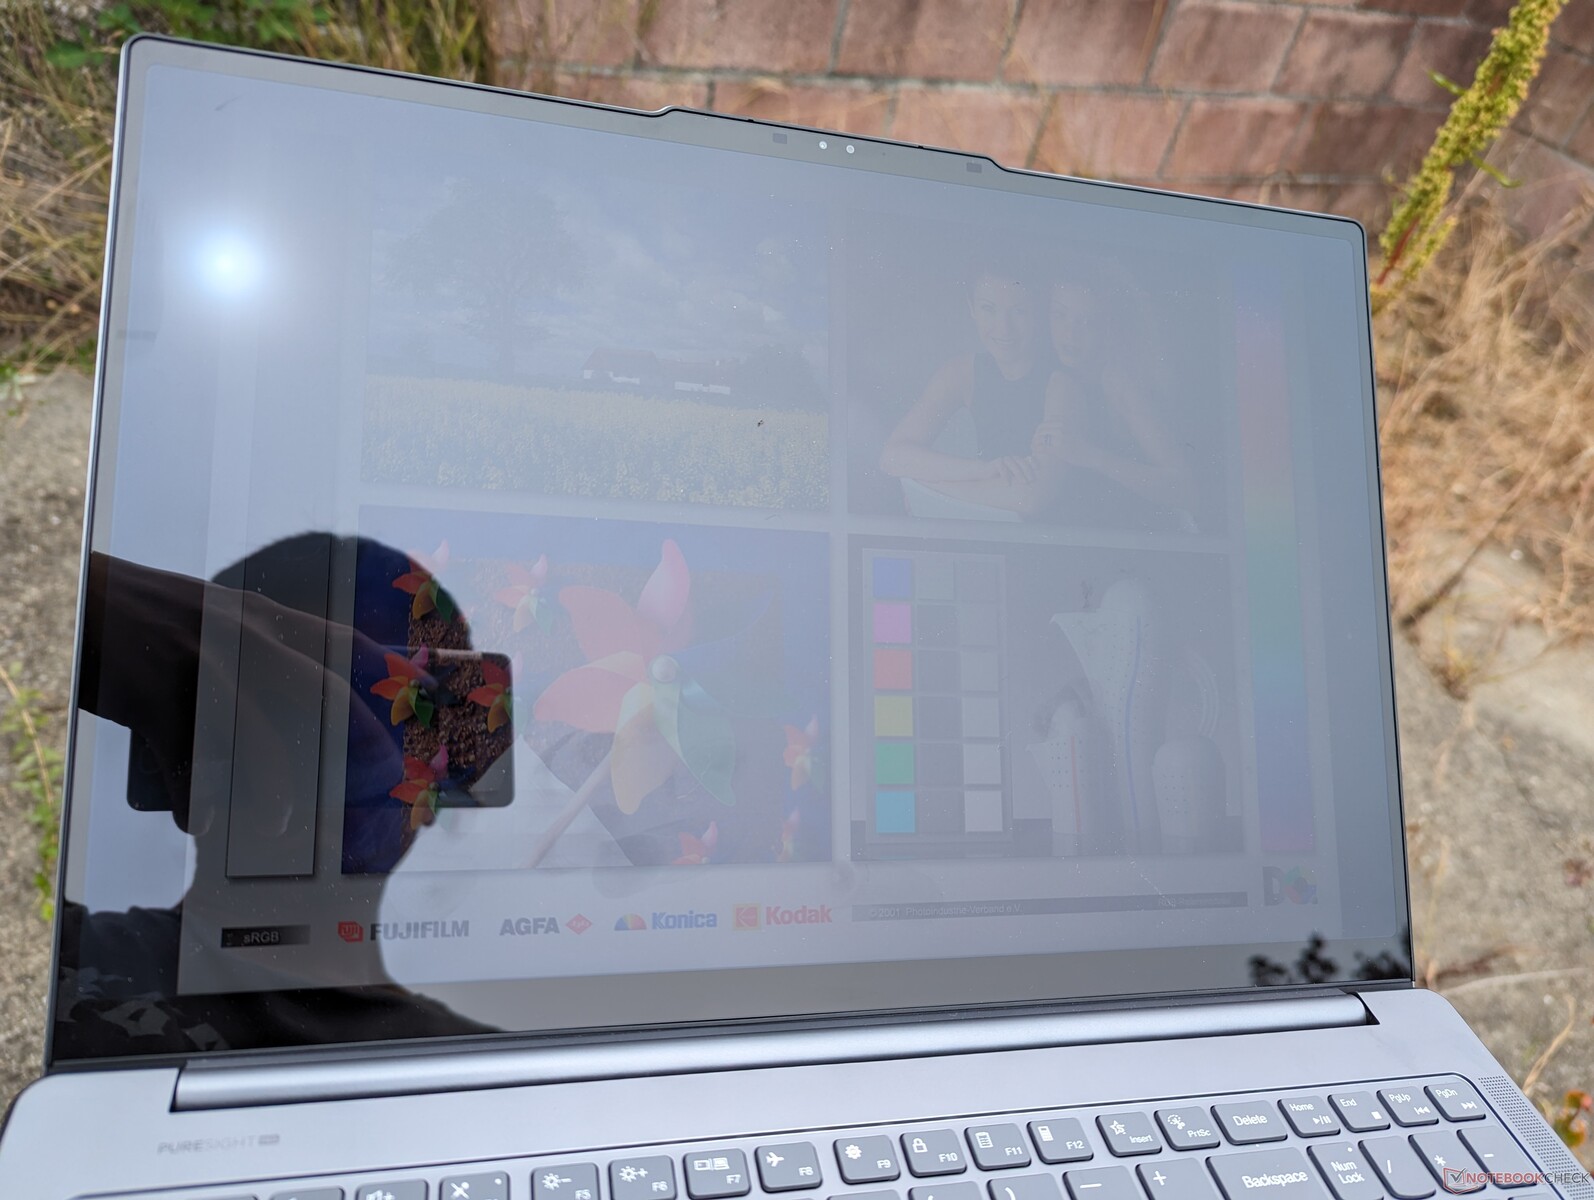
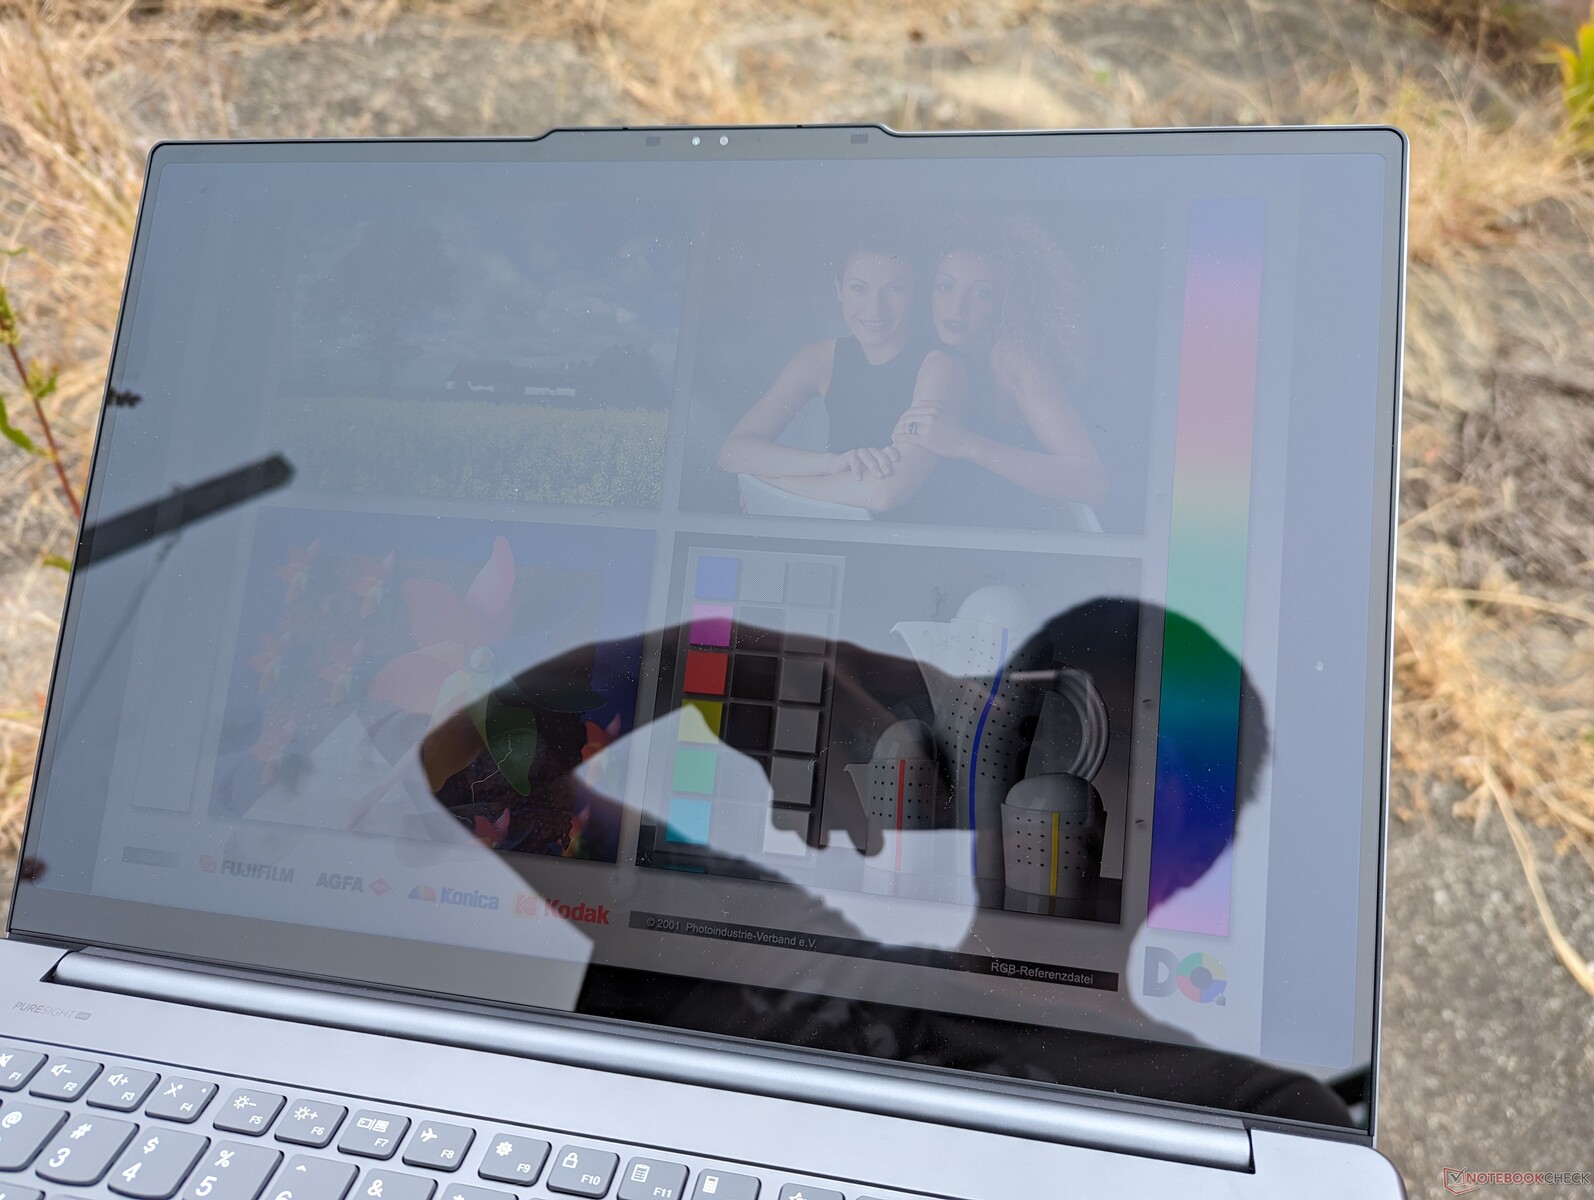
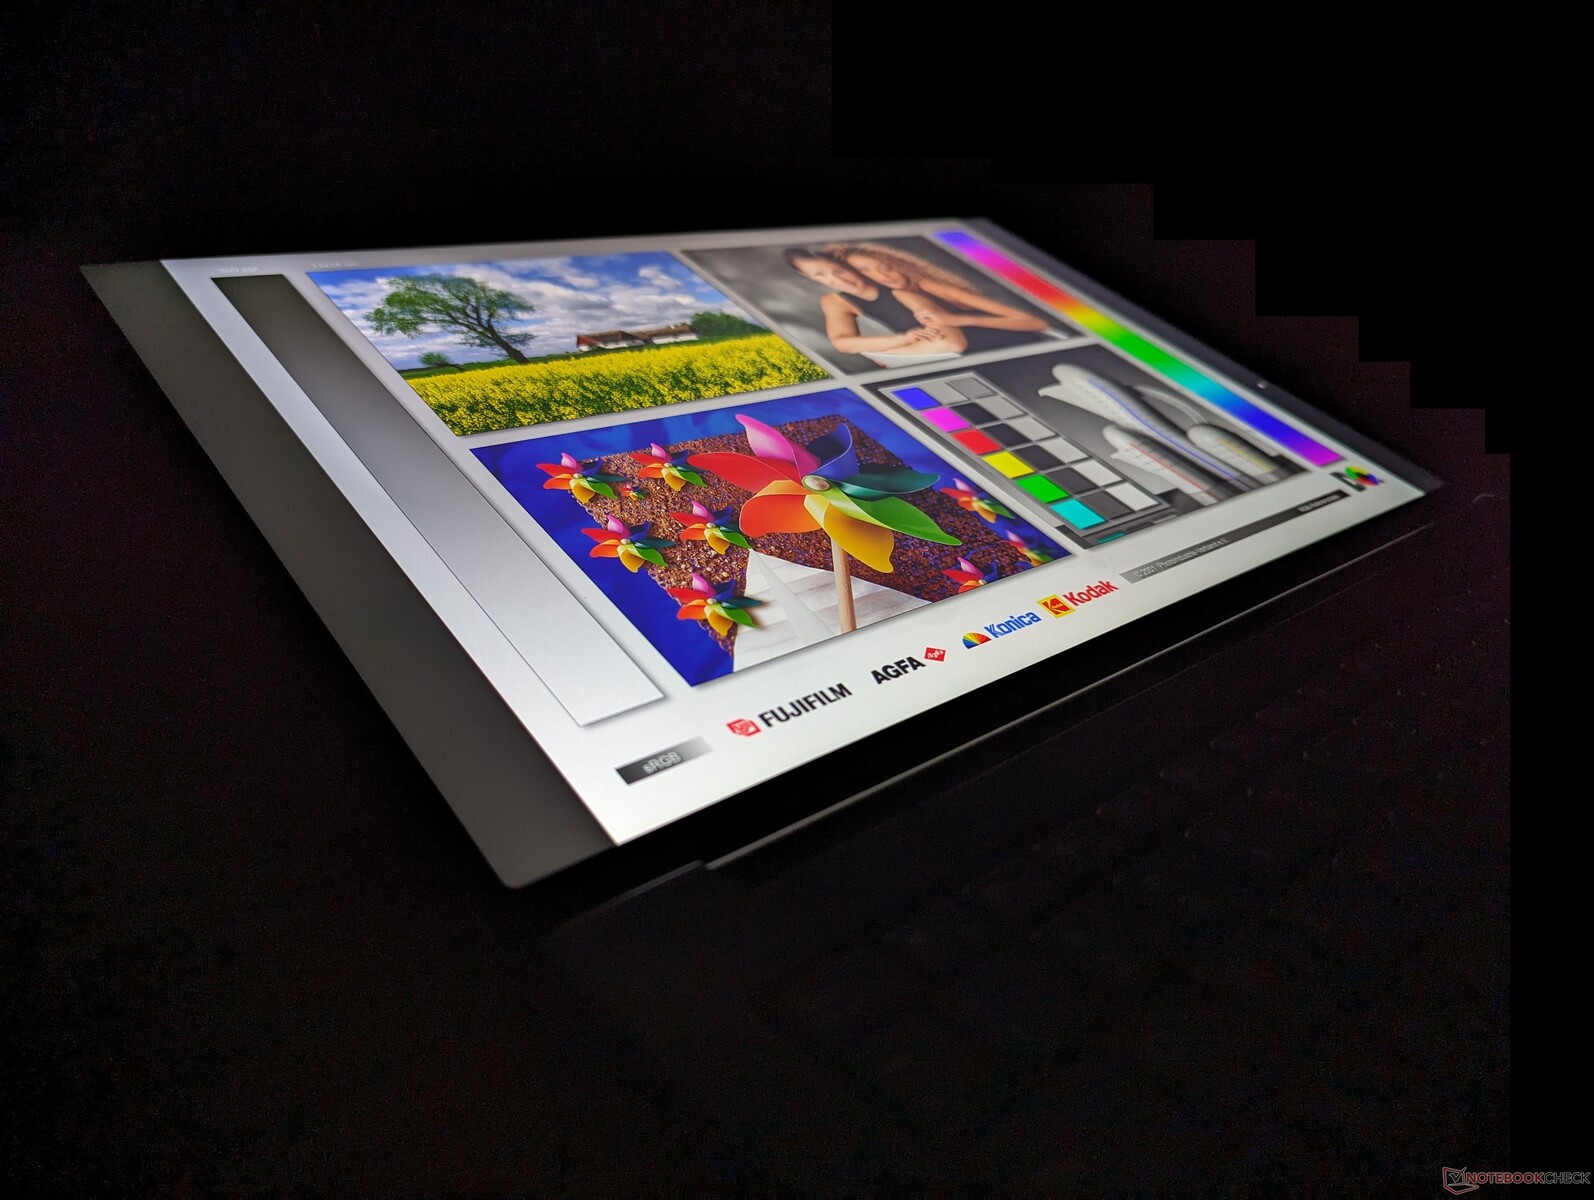
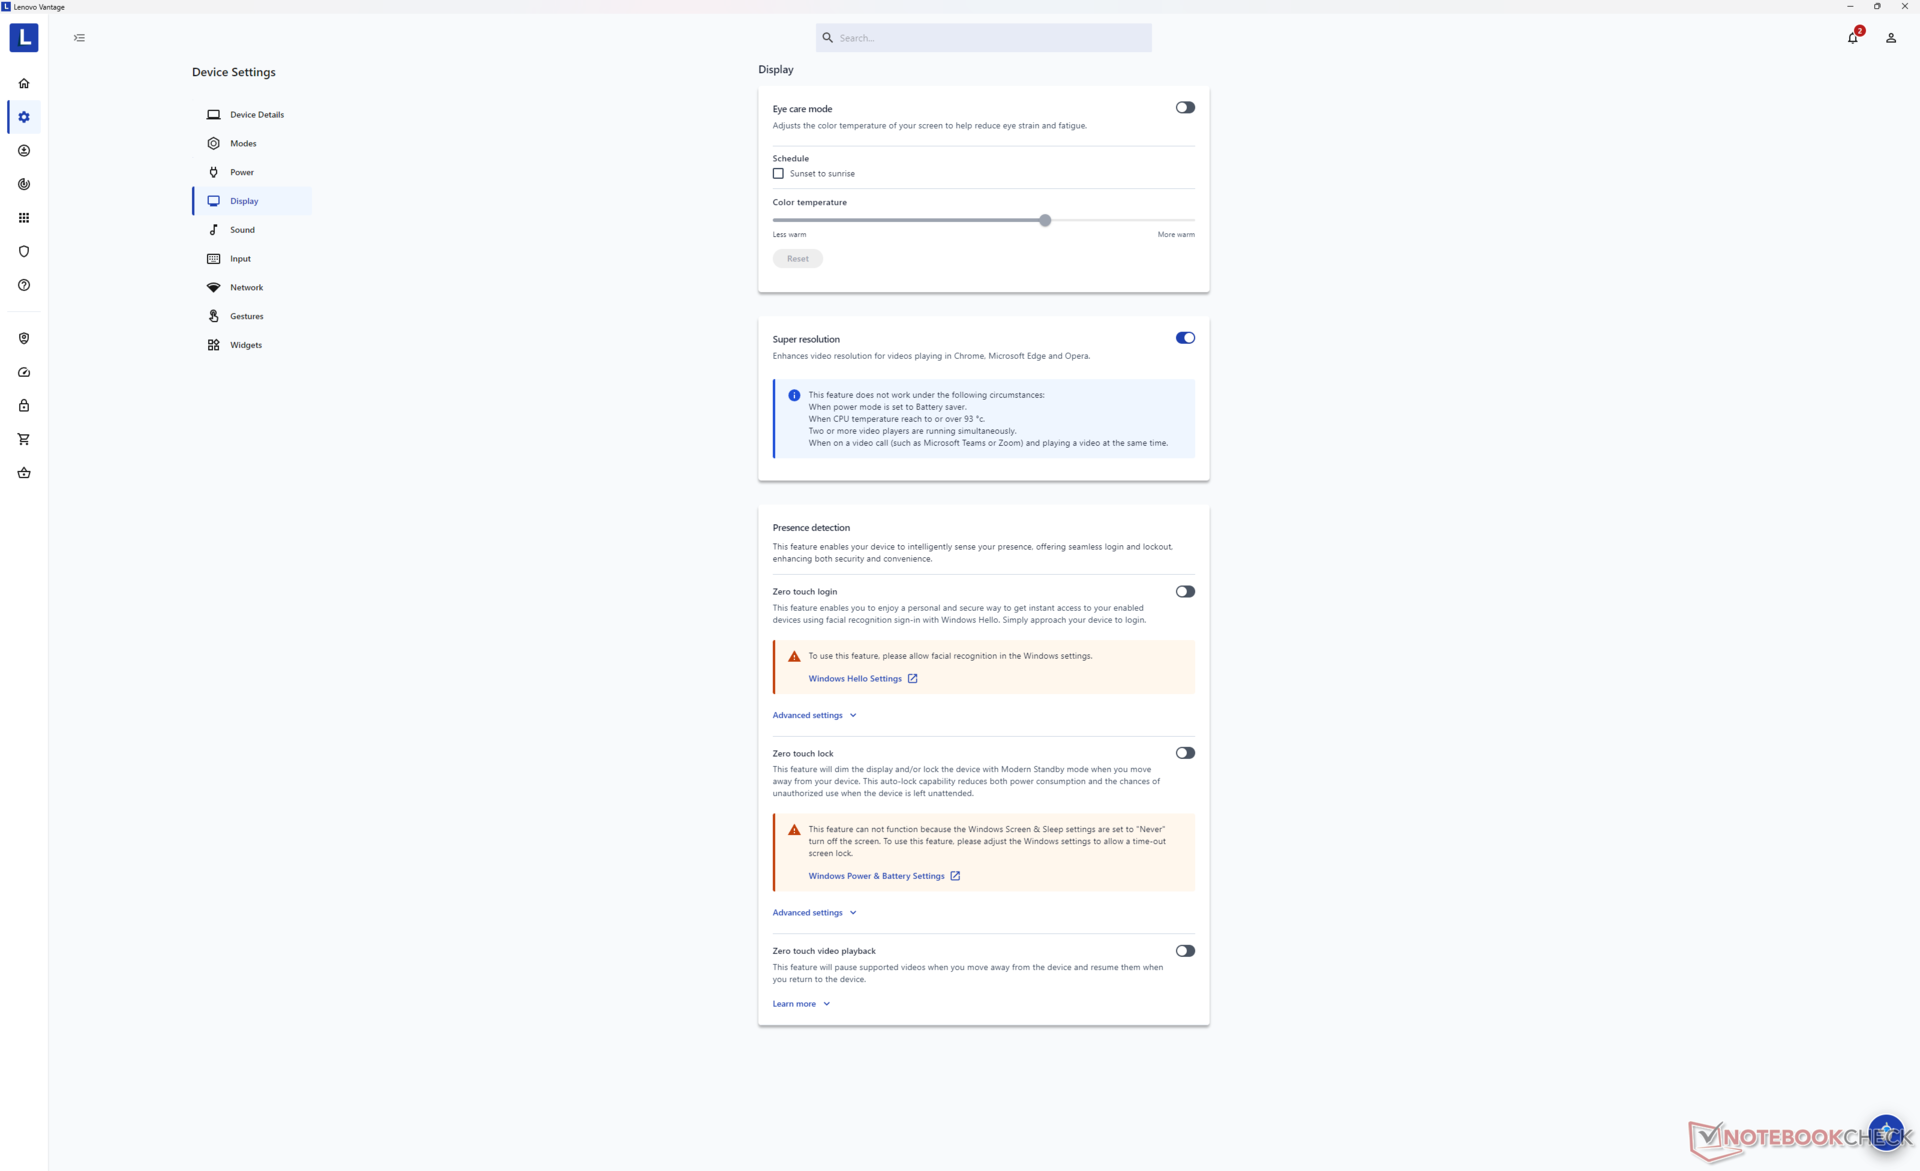
Display — 3.2K IPS And Mini-LED Options
Lenovo offers three display options as follows. All panels have the same 3200 x 2000 native resolution and refresh rate with Advanced Optimus support but no G-Sync. Our test unit carries the bolded option below whereas the higher-end RTX 4070 configuration carries the mini-LED option.
- 3.2K, 165 Hz, IPS, 400 nits, 100% P3, matte, non-touch
- 3.2K, 165 Hz, IPS, 400 nits, 100% P3, glossy, touch
- 3.2K, 165 Hz, Mini-LED, 1200 nits, 100% P3, glossy, touch
The visual experience between the IPS and mini-LED options is surprisingly quite similar since their color ranges and refresh rates are essentially the same. IPS, however, benefits from both faster black-white response times and no major halo effect issues when compared to mini-LED. Their differences are instead amplified when running HDR-enabled content which is where mini-LED truly shines with its superior contrast and brightness levels. Users who watch or play a lot of HDR media may therefore prefer mini-LED while those who want to save money or don't mind foregoing HDR can get a more traditional experience with IPS.

| |||||||||||||||||||||||||
Brightness Distribution: 91 %
Center on Battery: 404.9 cd/m²
Contrast: 1012:1 (Black: 0.4 cd/m²)
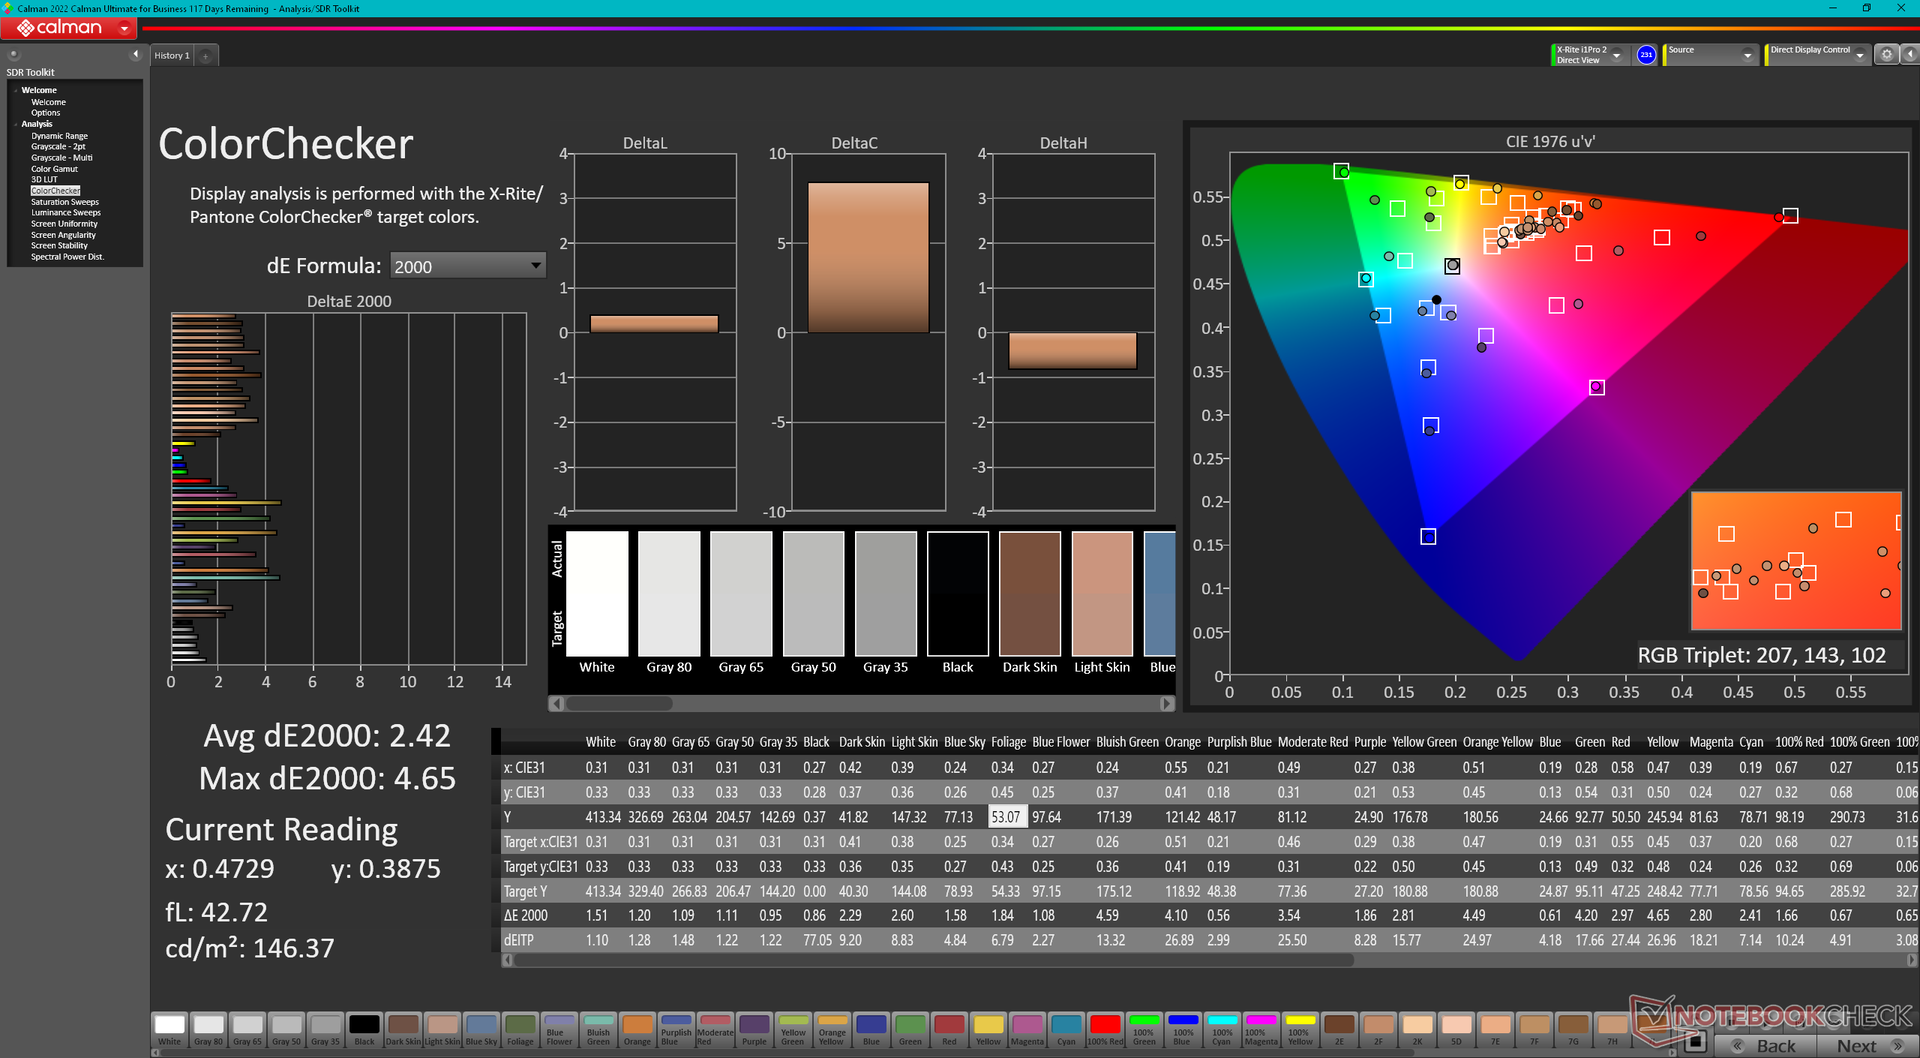
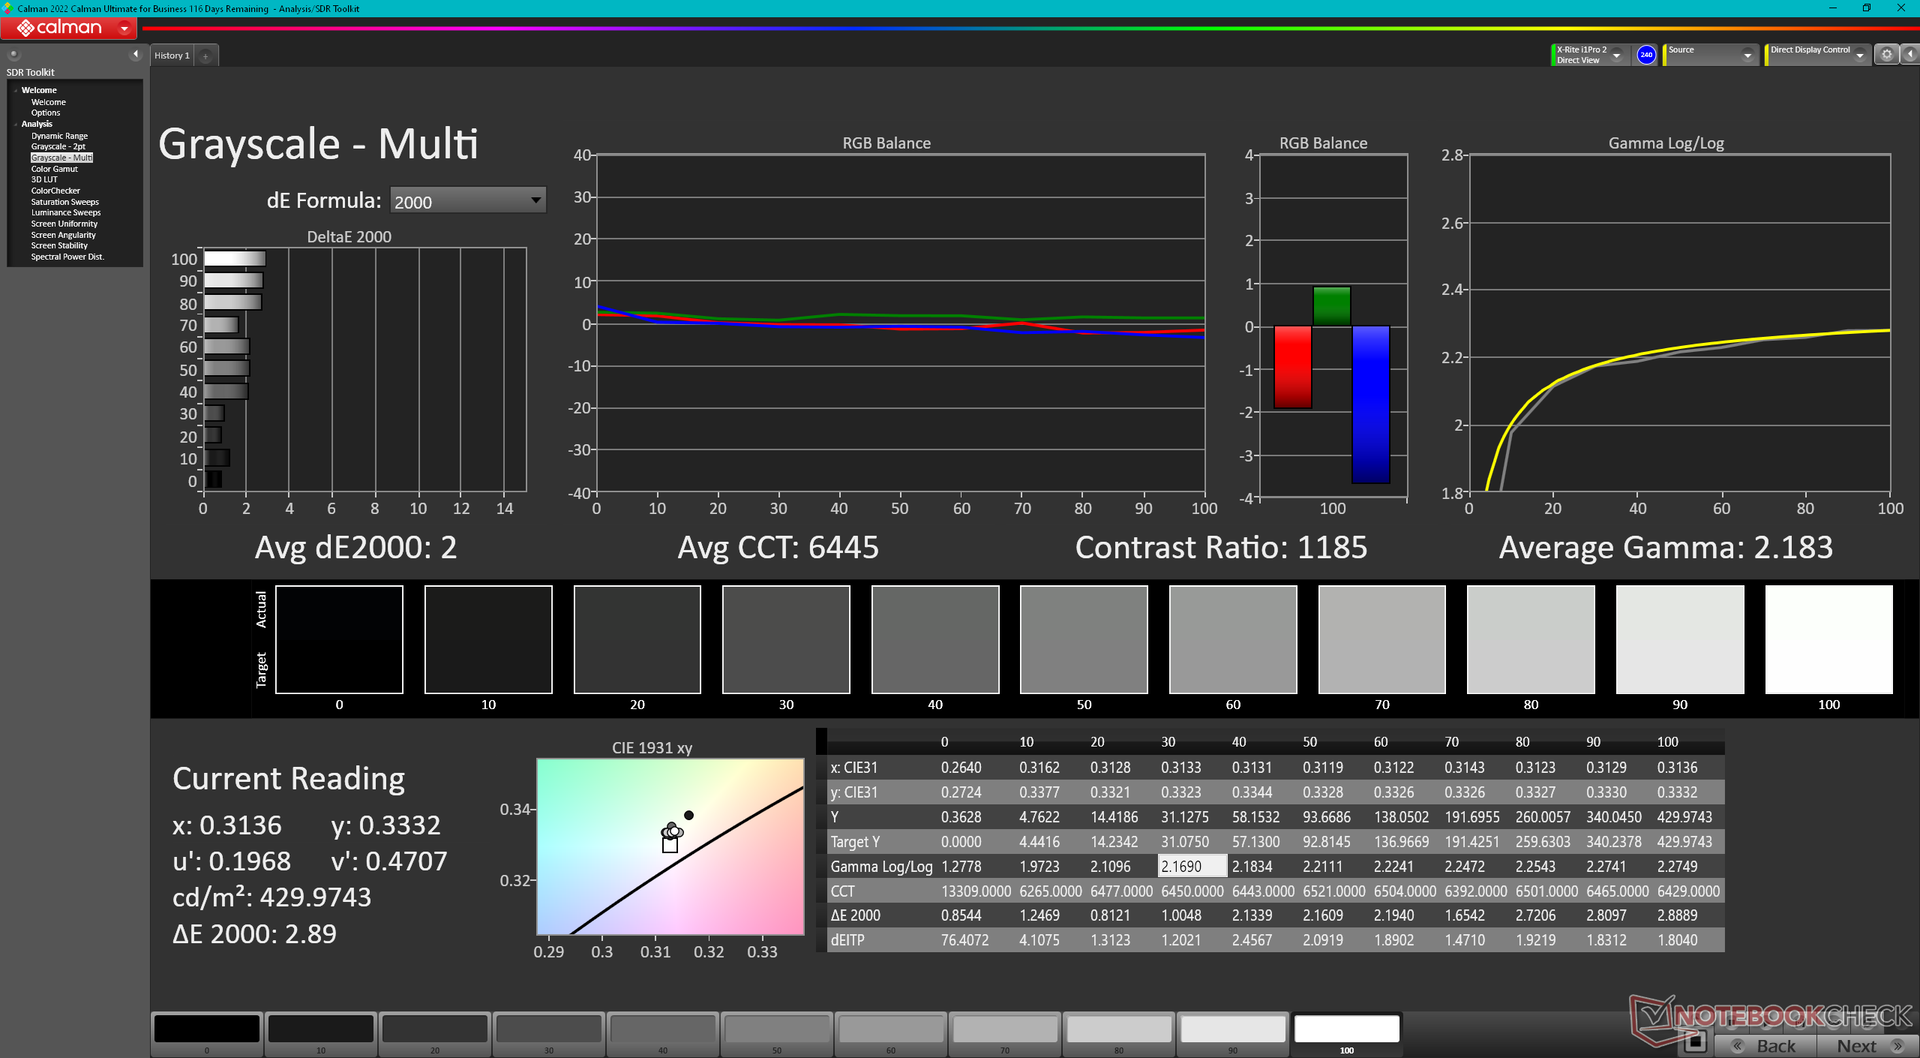
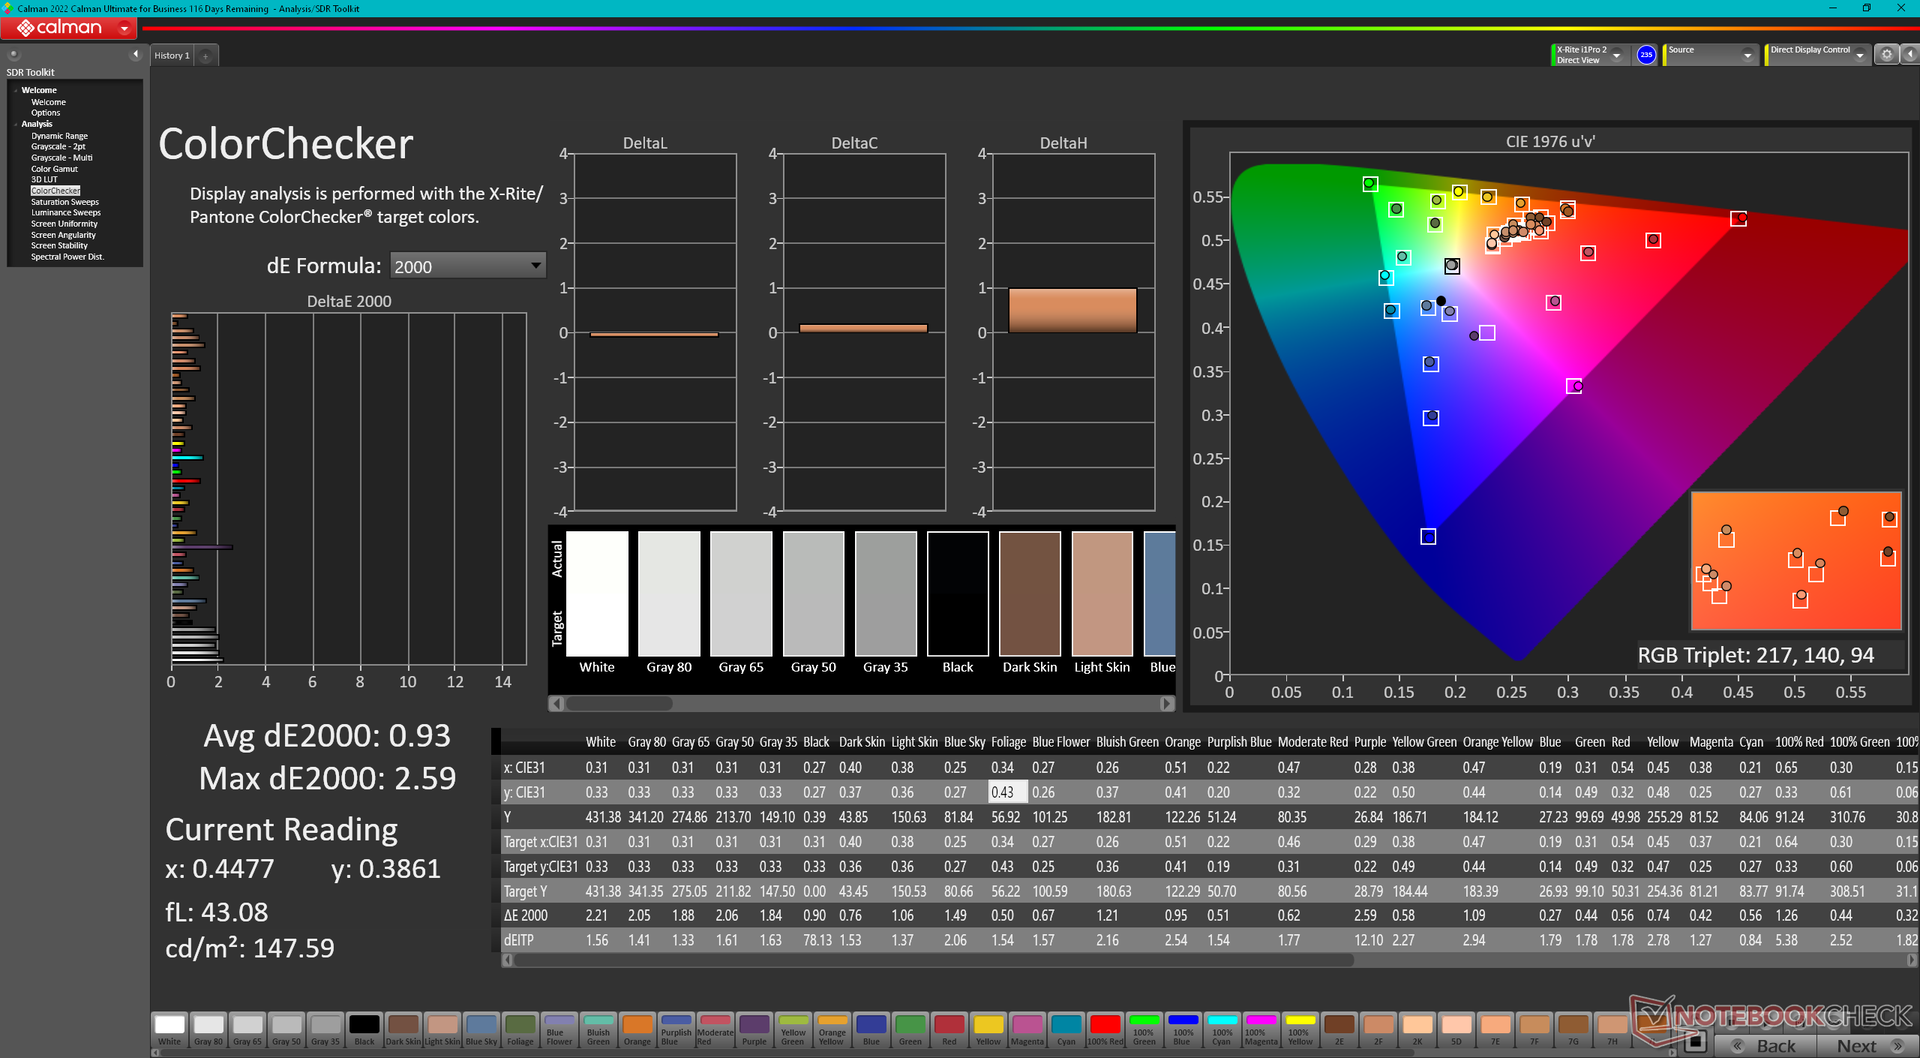
ΔE ColorChecker Calman: 2.42 | ∀{0.5-29.43 Ø4.73}
calibrated: 0.93
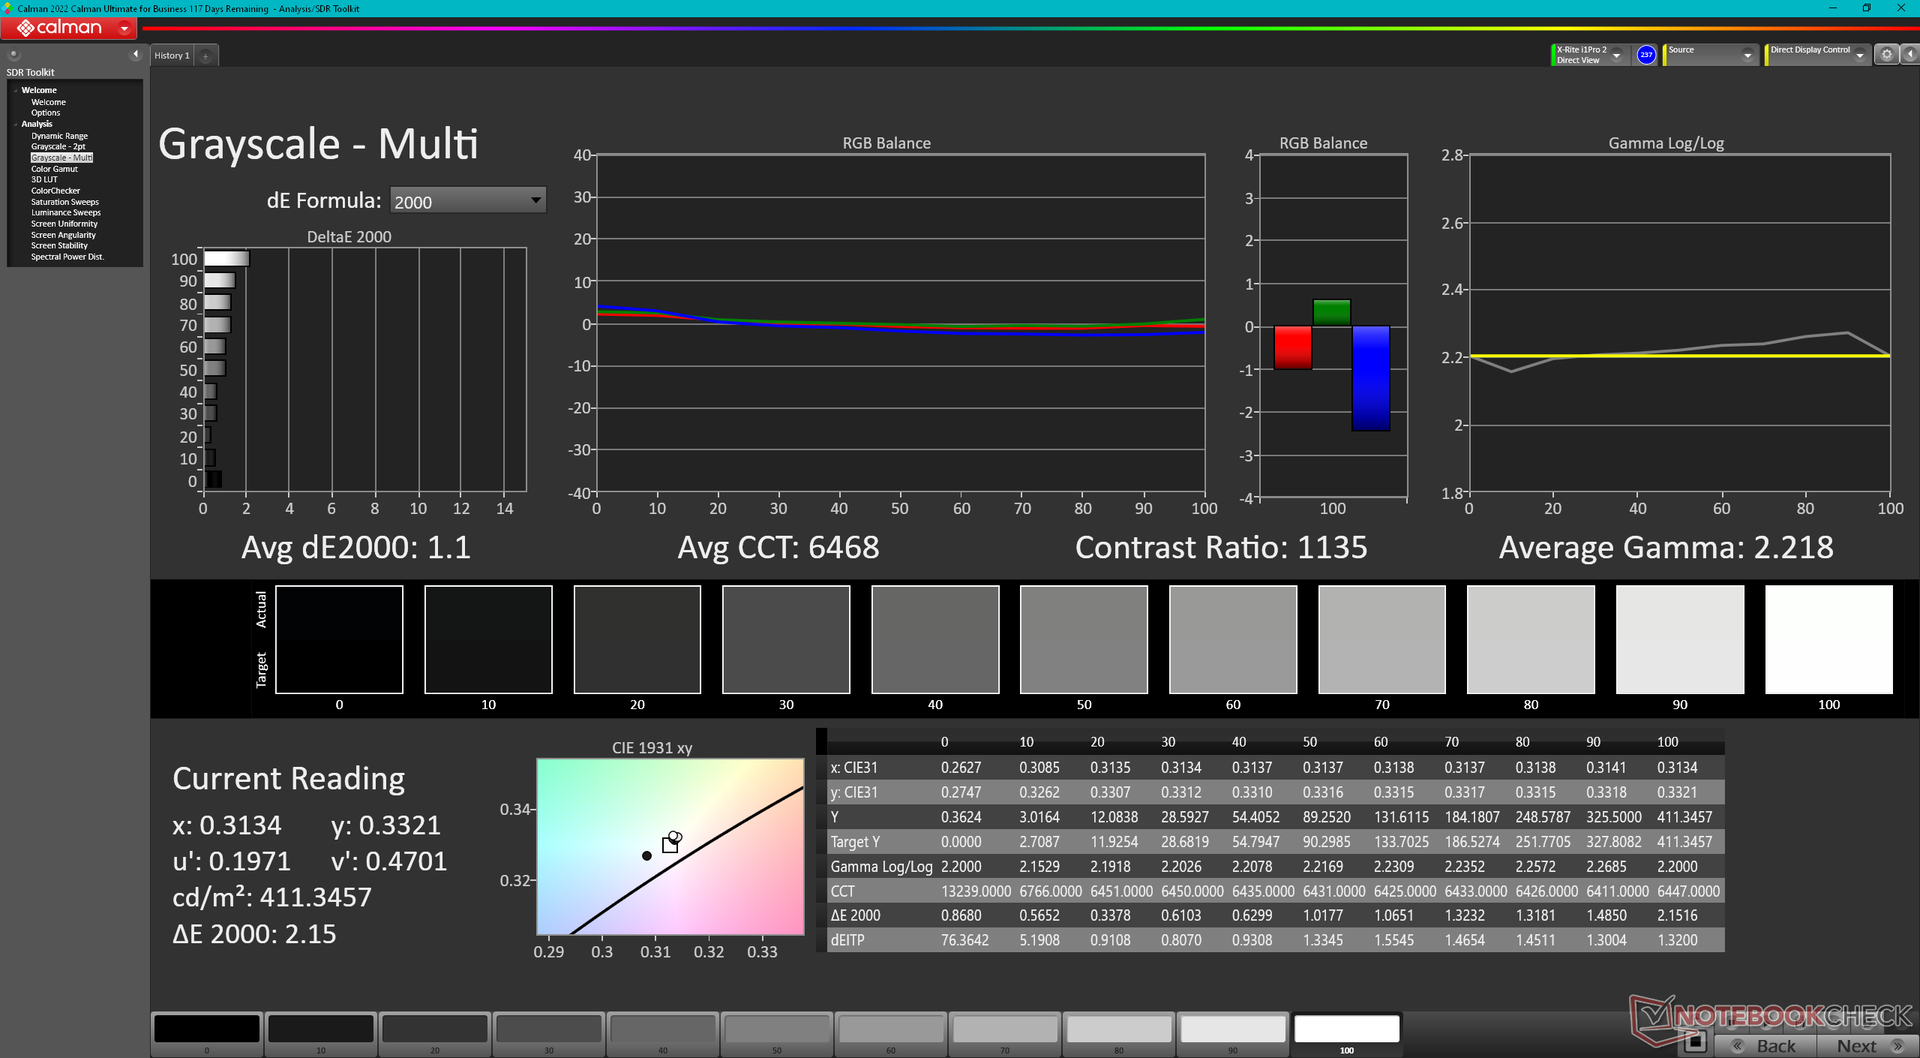
ΔE Greyscale Calman: 1.1 | ∀{0.09-98 Ø4.97}
86.5% AdobeRGB 1998 (Argyll 3D)
99.9% sRGB (Argyll 3D)
95.6% Display P3 (Argyll 3D)
Gamma: 2.22
CCT: 6468 K
| Lenovo Yoga Pro 9 16IMH9 RTX 4050 LEN160-3.2K, IPS, 3200x2000, 16" | Lenovo Yoga Pro 9 16IMH9 LEN160-3.2K, Mini-LED, 3200x2000, 16" | HP Envy x360 2-in-1 16-ad0097nr Samsung SDC41A6, OLED, 2880x1800, 16" | Dell XPS 16 9640 SDC4196, OLED, 3840x2400, 16.3" | Samsung Galaxy Book4 Ultra ATNA60CL07-0, OLED, 2880x1800, 16" | Asus VivoBook Pro 16 K6602VU Samsung ATNA60BX01-1, OLED, 3200x2000, 16" | |
|---|---|---|---|---|---|---|
| Display | 0% | 5% | 2% | 2% | 5% | |
| Display P3 Coverage (%) | 95.6 | 97 1% | 99.6 4% | 98.3 3% | 98.6 3% | 98.7 3% |
| sRGB Coverage (%) | 99.9 | 99.9 0% | 100 0% | 100 0% | 99.9 0% | 99.7 0% |
| AdobeRGB 1998 Coverage (%) | 86.5 | 86.6 0% | 96.5 12% | 87.8 2% | 88.5 2% | 96.5 12% |
| Response Times | -85% | 92% | 92% | 94% | 24% | |
| Response Time Grey 50% / Grey 80% * (ms) | 12.4 ? | 22.2 ? -79% | 0.8 ? 94% | 0.82 ? 93% | 0.54 ? 96% | 0.68 ? 95% |
| Response Time Black / White * (ms) | 8.9 ? | 17 ? -91% | 0.89 ? 90% | 0.85 ? 90% | 0.69 ? 92% | 13.2 ? -48% |
| PWM Frequency (Hz) | 4840 ? | 491.8 ? | 360 ? | 240 ? | 240 ? | |
| Screen | 30% | -16% | -7% | -0% | -61% | |
| Brightness middle (cd/m²) | 404.9 | 651 61% | 399.4 -1% | 366 -10% | 390 -4% | 353 -13% |
| Brightness (cd/m²) | 390 | 673 73% | 405 4% | 367 -6% | 393 1% | 354 -9% |
| Brightness Distribution (%) | 91 | 93 2% | 98 8% | 96 5% | 98 8% | 98 8% |
| Black Level * (cd/m²) | 0.4 | 0.22 45% | ||||
| Contrast (:1) | 1012 | 2959 192% | ||||
| Colorchecker dE 2000 * | 2.42 | 1.9 21% | 4.05 -67% | 1.3 46% | 1.4 42% | 4.23 -75% |
| Colorchecker dE 2000 max. * | 4.65 | 4.2 10% | 6.69 -44% | 3.6 23% | 2.7 42% | 7.13 -53% |
| Colorchecker dE 2000 calibrated * | 0.93 | 0.6 35% | 1.02 -10% | 1 -8% | 2.42 -160% | |
| Greyscale dE 2000 * | 1.1 | 3 -173% | 1.1 -0% | 2.2 -100% | 2.1 -91% | 2.5 -127% |
| Gamma | 2.22 99% | 2.18 101% | 2.27 97% | 2.14 103% | 2.27 97% | 2.4 92% |
| CCT | 6468 100% | 6738 96% | 6419 101% | 6680 97% | 6431 101% | 6642 98% |
| Total Average (Program / Settings) | -18% /
7% | 27% /
8% | 29% /
12% | 32% /
17% | -11% /
-31% |
* ... smaller is better

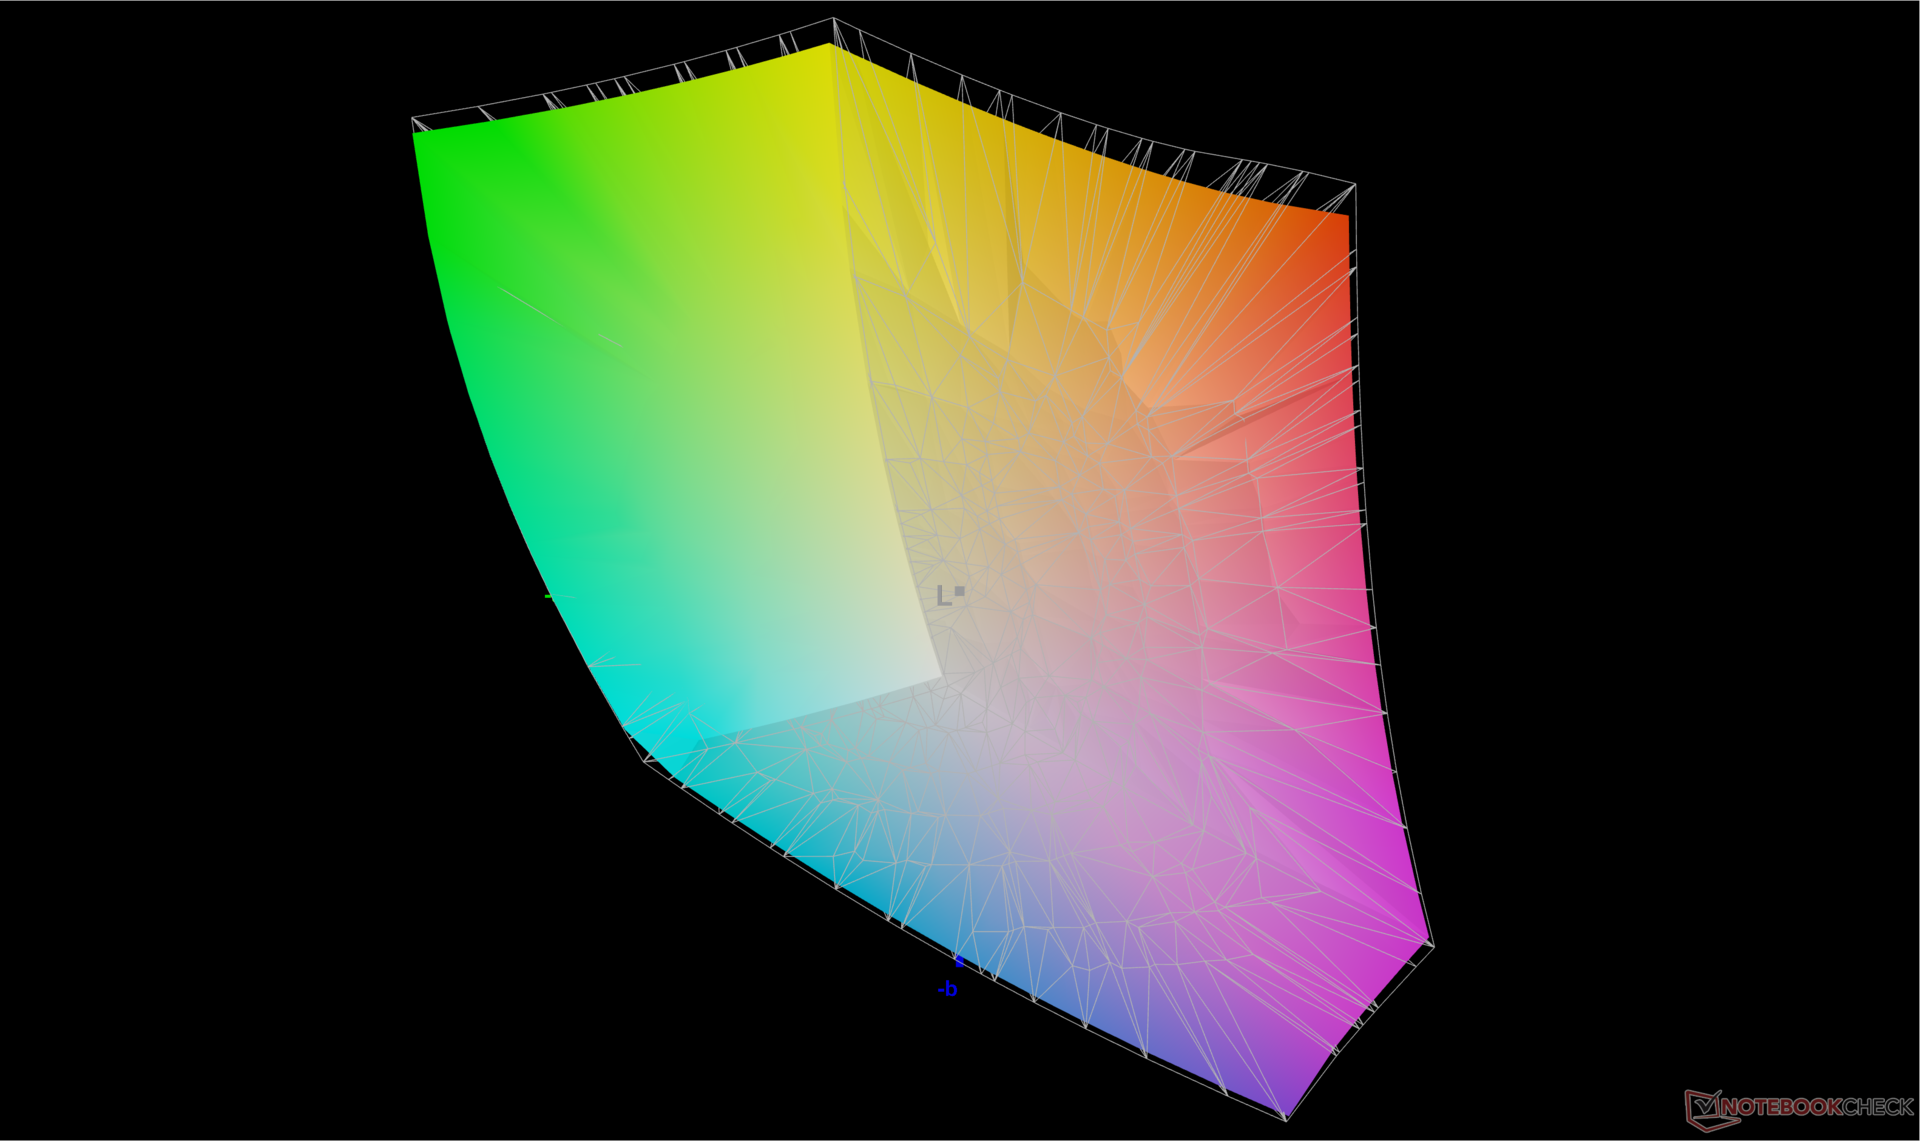
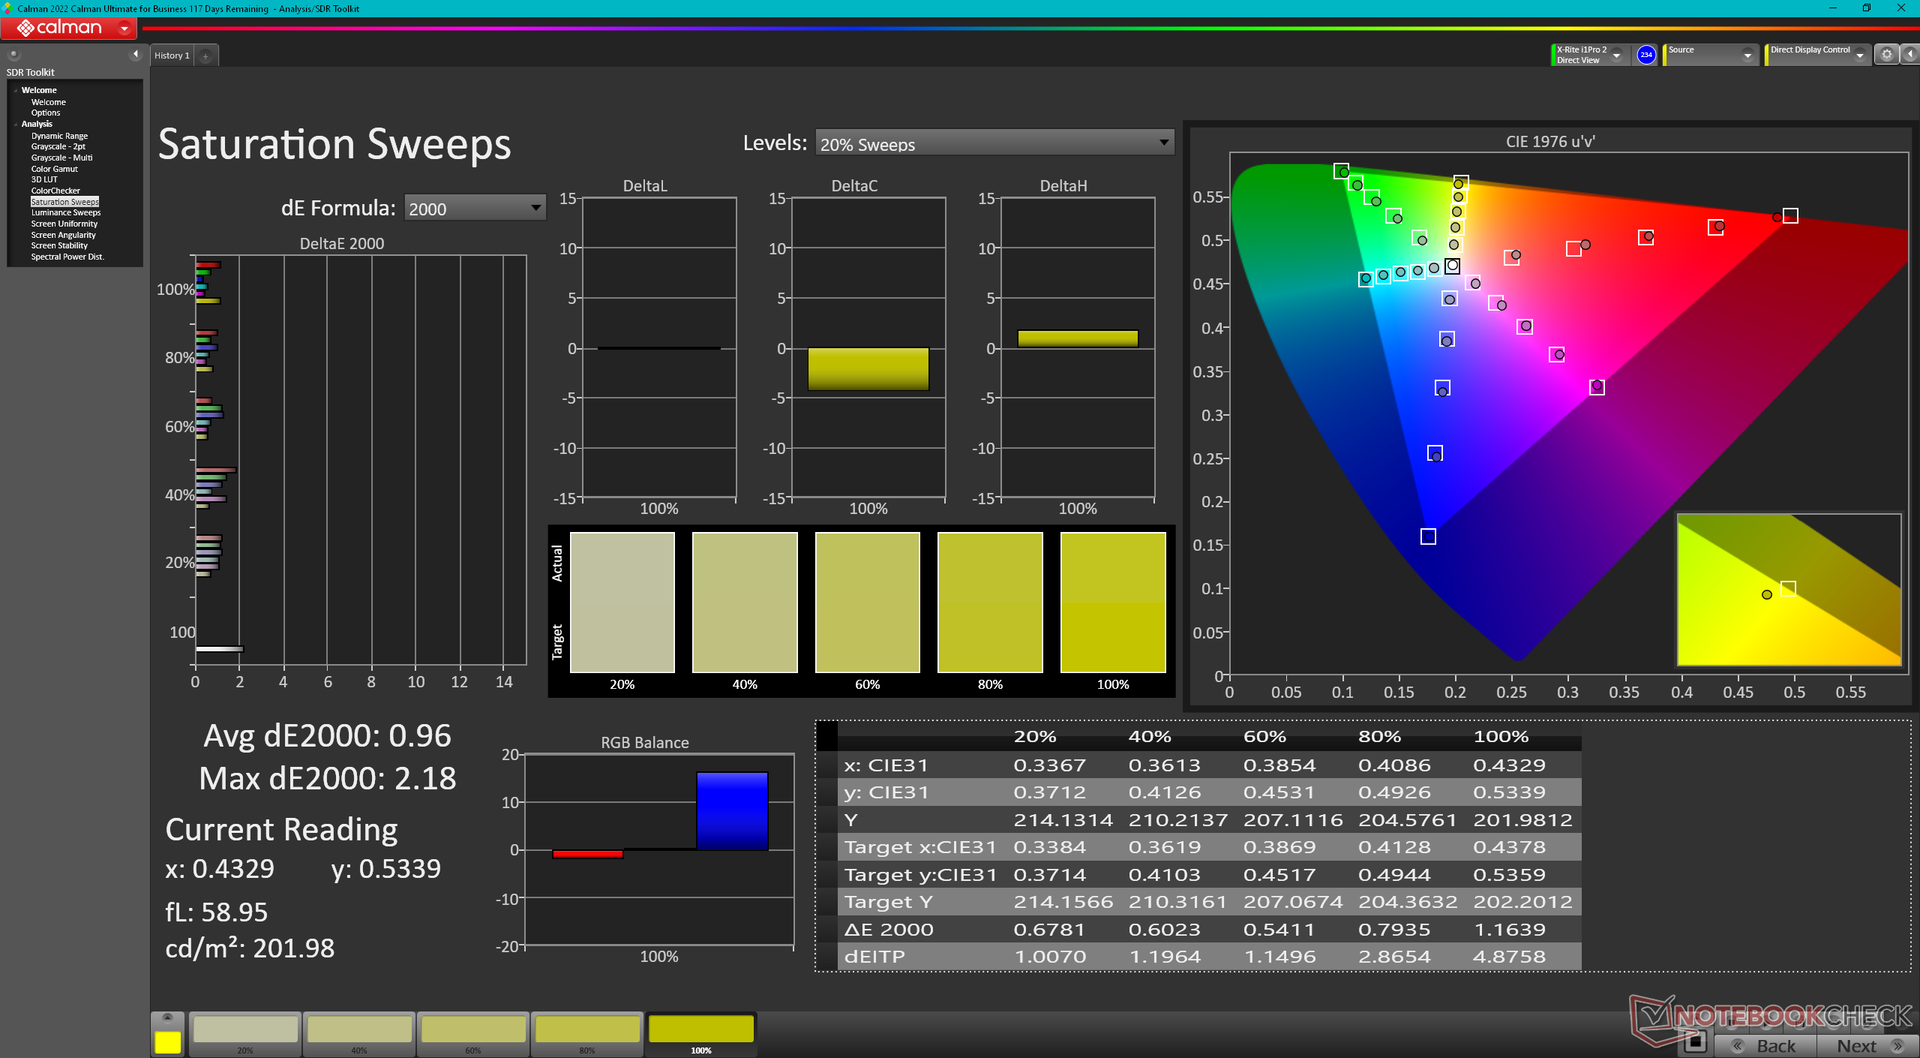
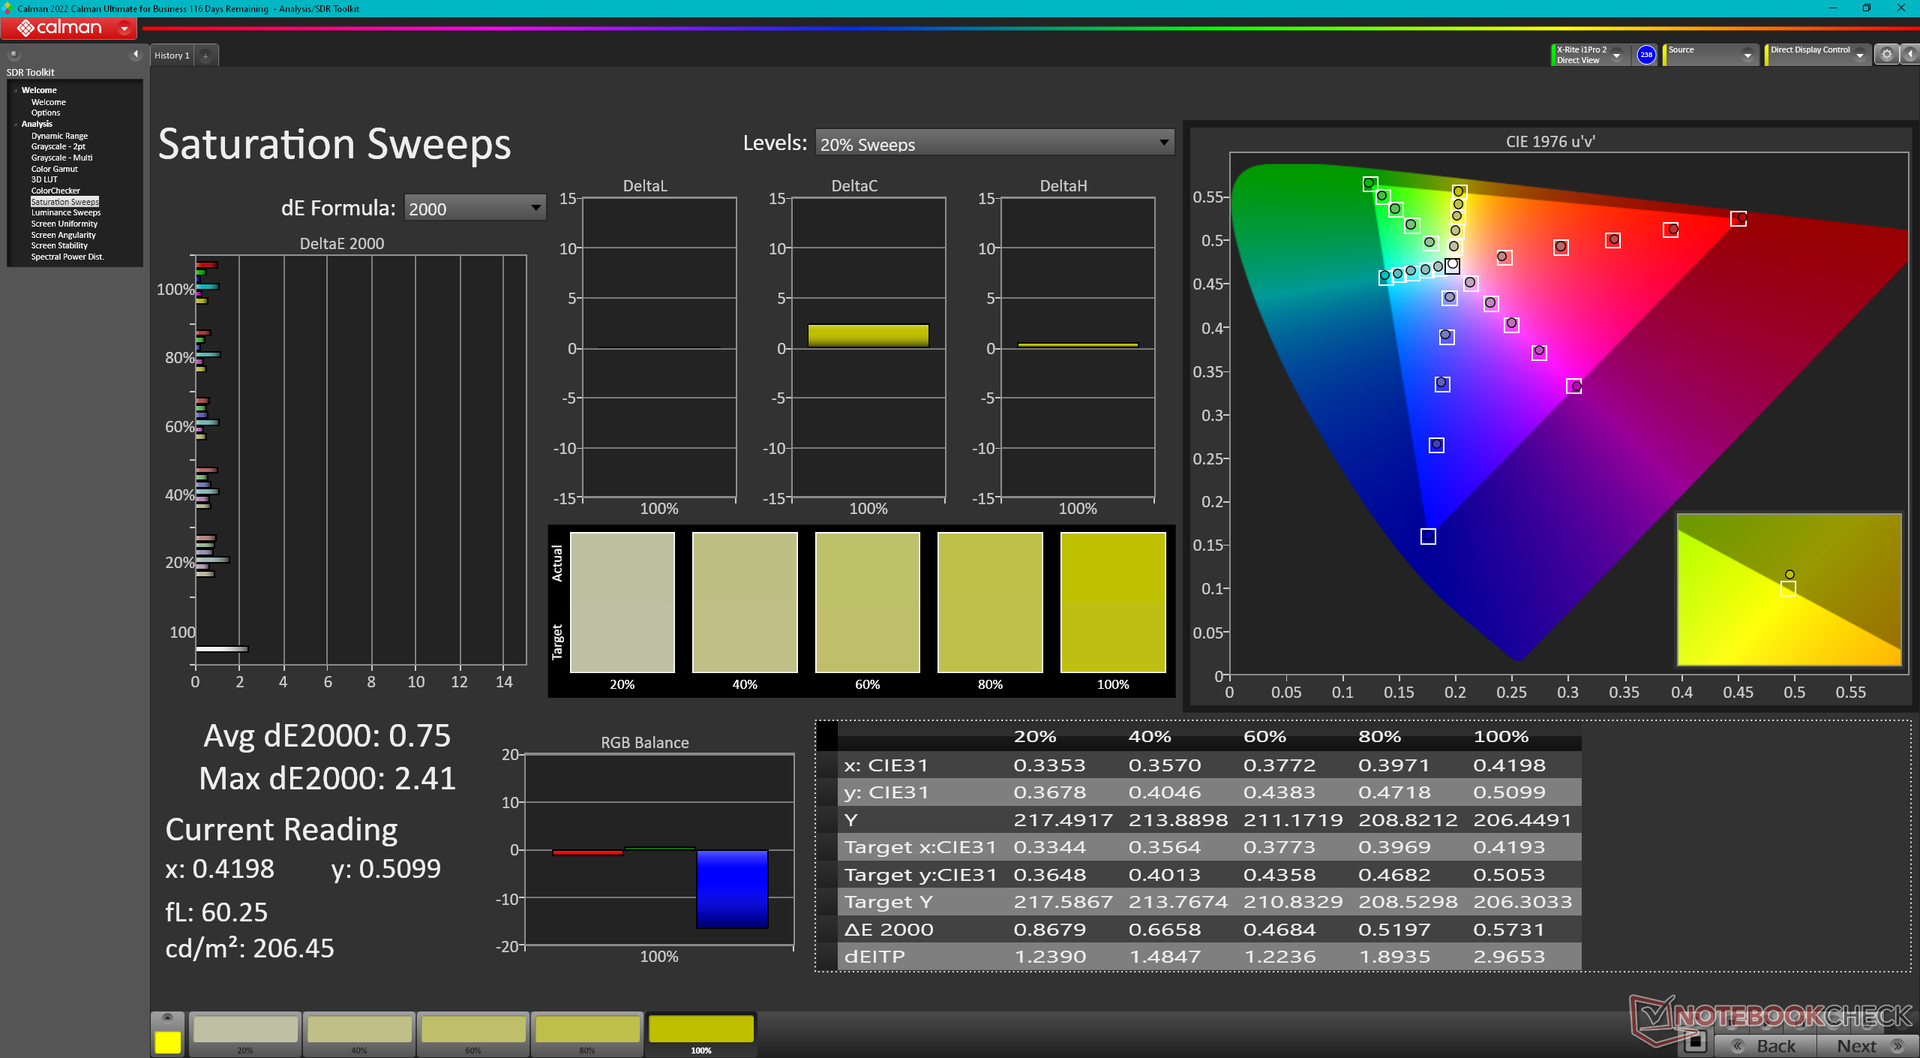
The display comes calibrated out of the box against the P3 standard with average grayscale and color deltaE values of just 1.1 and 2.42, respectively. An end-user calibration is therefore not necessary for the majority of users.
Display Response Times
| ↔ Response Time Black to White | ||
|---|---|---|
| 8.9 ms ... rise ↗ and fall ↘ combined | ↗ 4.8 ms rise | 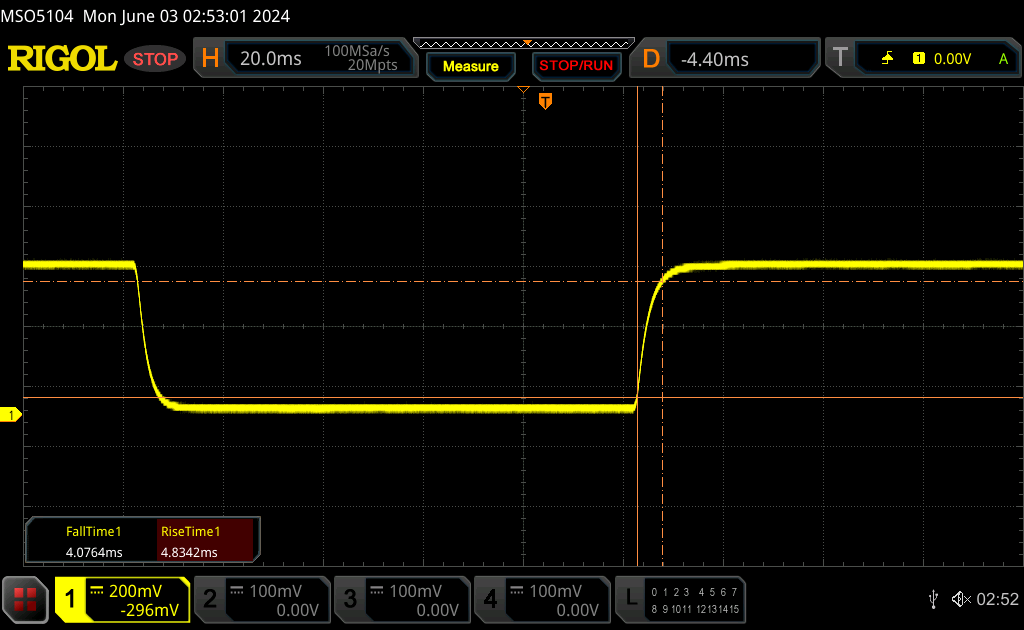 |
| ↘ 4.1 ms fall | ||
| The screen shows fast response rates in our tests and should be suited for gaming. In comparison, all tested devices range from 0.1 (minimum) to 240 (maximum) ms. » 25 % of all devices are better. This means that the measured response time is better than the average of all tested devices (19.9 ms). | ||
| ↔ Response Time 50% Grey to 80% Grey | ||
| 12.4 ms ... rise ↗ and fall ↘ combined | ↗ 6.3 ms rise | 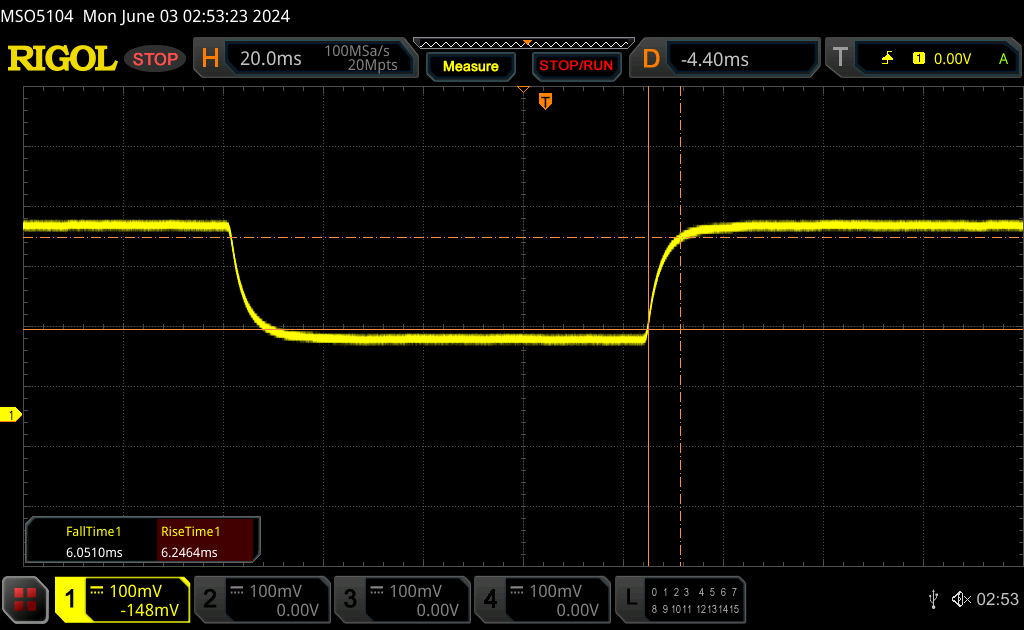 |
| ↘ 6.1 ms fall | ||
| The screen shows good response rates in our tests, but may be too slow for competitive gamers. In comparison, all tested devices range from 0.165 (minimum) to 636 (maximum) ms. » 26 % of all devices are better. This means that the measured response time is better than the average of all tested devices (31.1 ms). | ||
Screen Flickering / PWM (Pulse-Width Modulation)
| Screen flickering / PWM not detected | 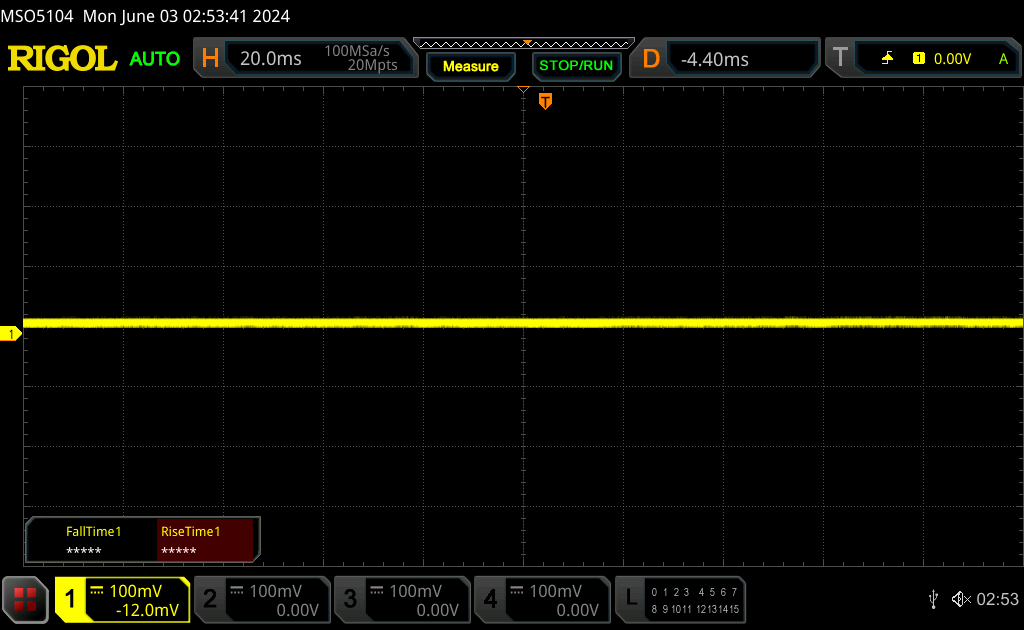 | ||
In comparison: 52 % of all tested devices do not use PWM to dim the display. If PWM was detected, an average of 7798 (minimum: 5 - maximum: 343500) Hz was measured. | |||


Performance — All-Rounder Multimedia-Gaming Machine
Testing Conditions
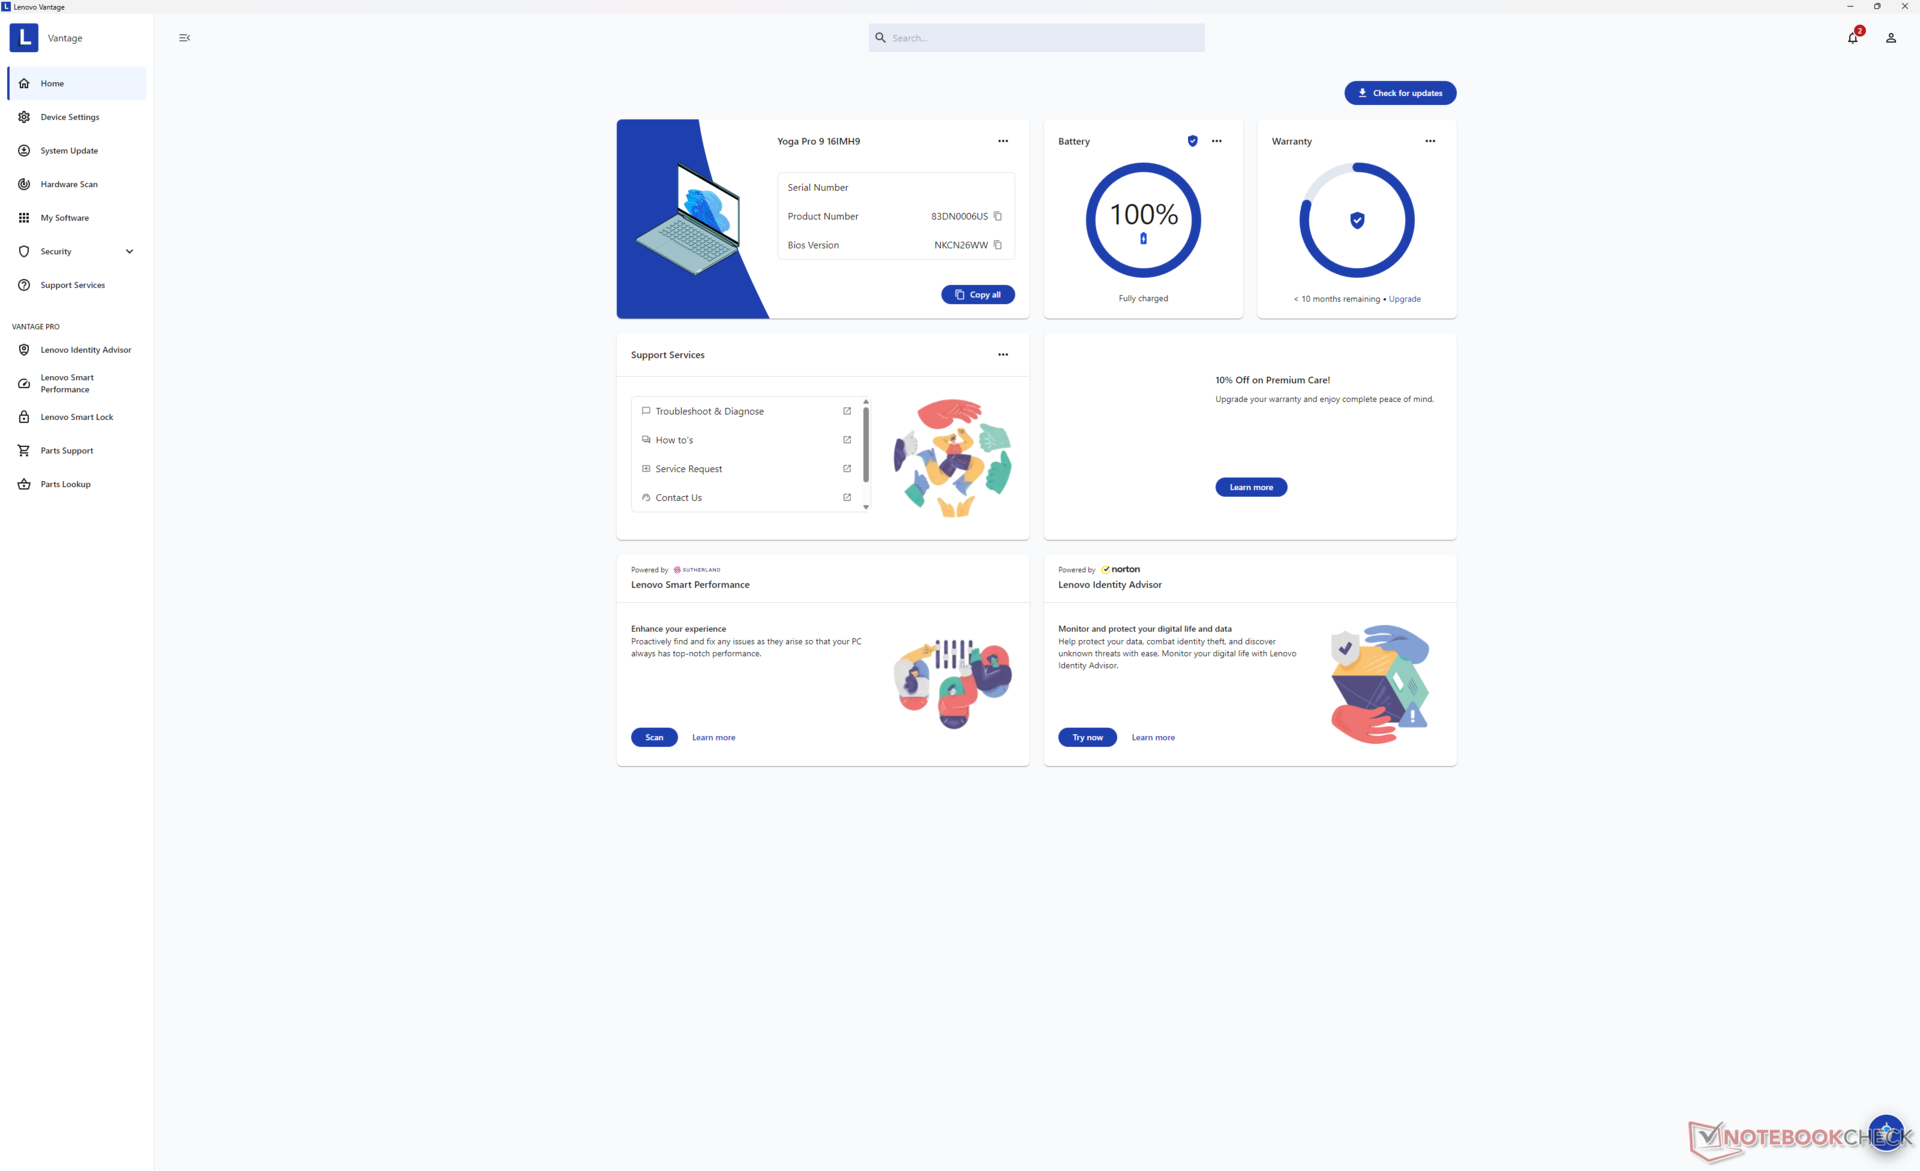
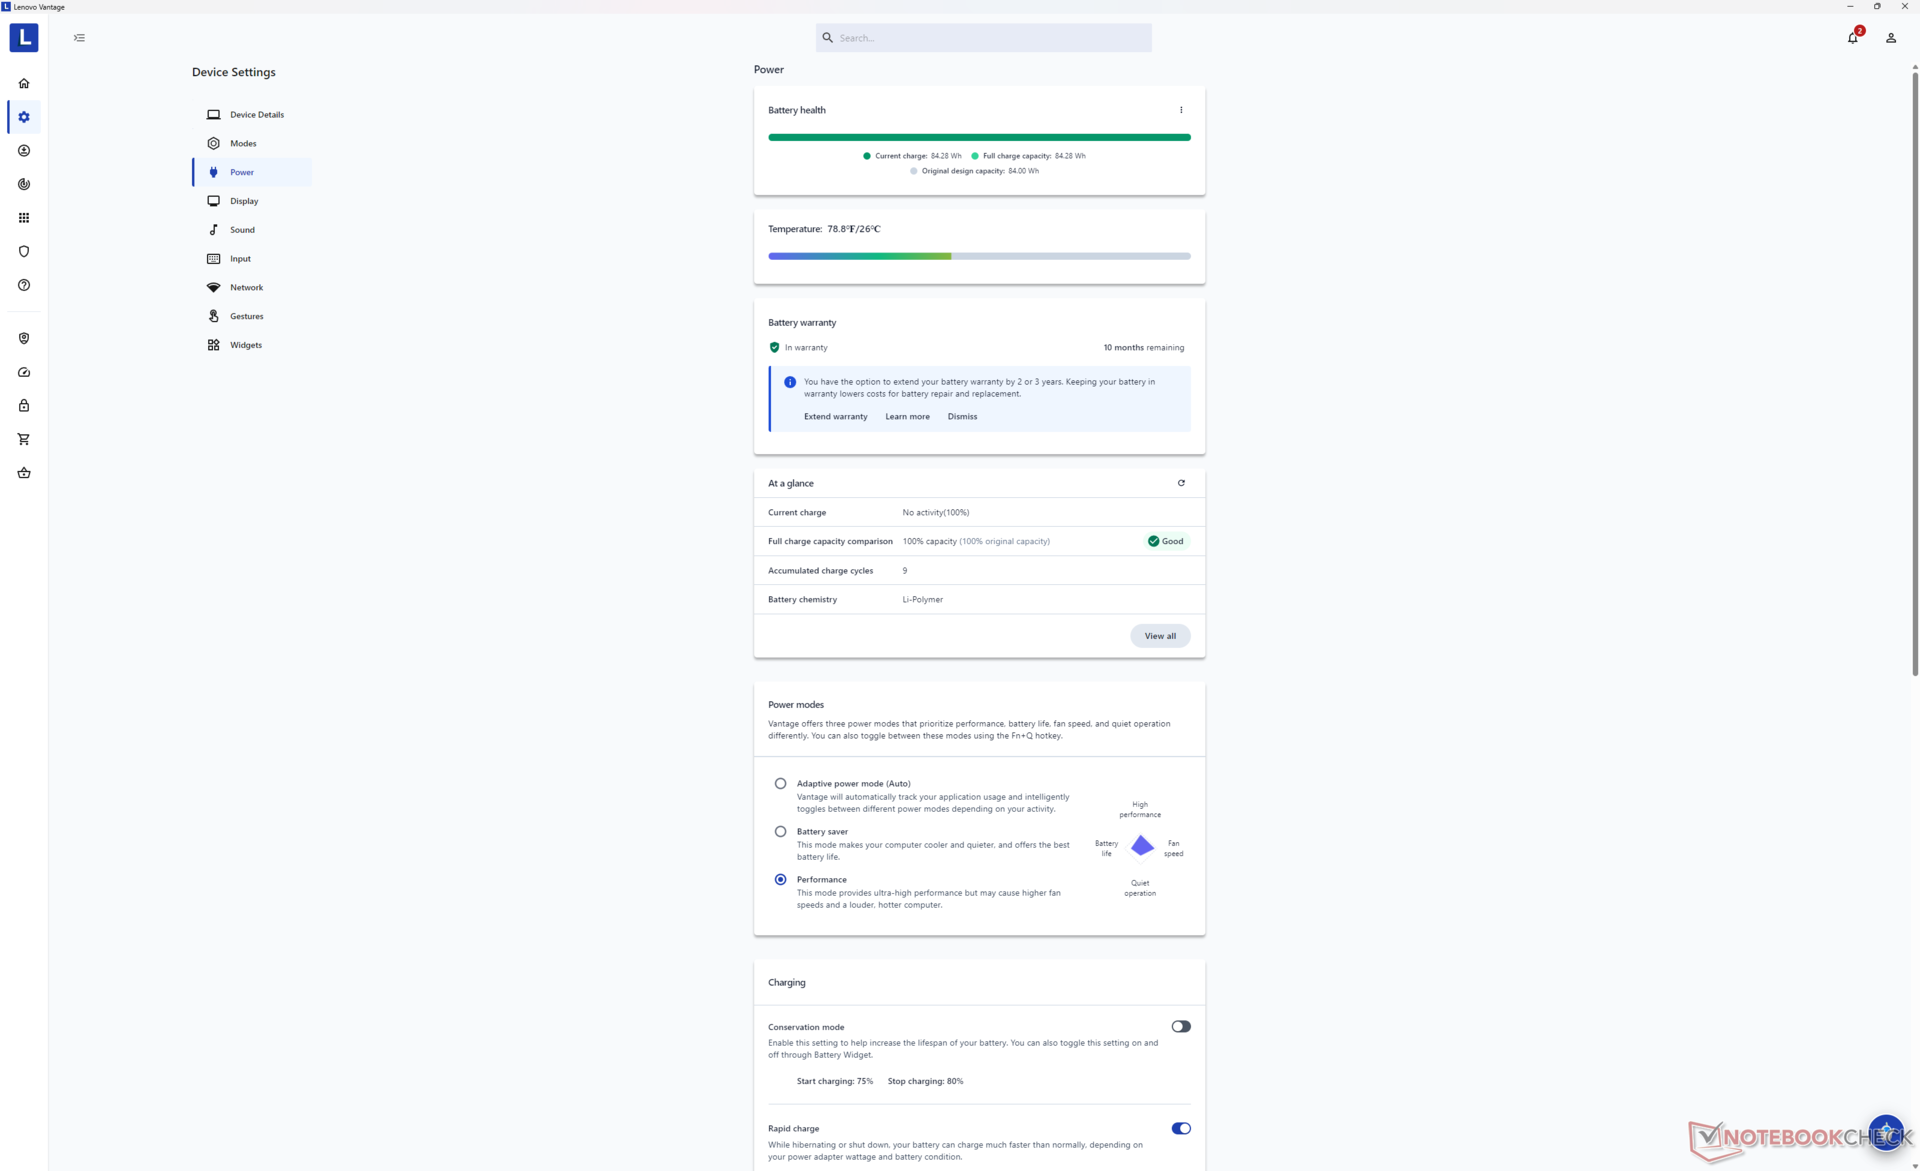
We set Lenovo Vantage to Performance mode and Nvidia to dGPU mode prior to running the benchmarks below.
Note that while the GPU can be set to discrete mode only, there is no "iGPU only" mode on Nvidia Control Panel.
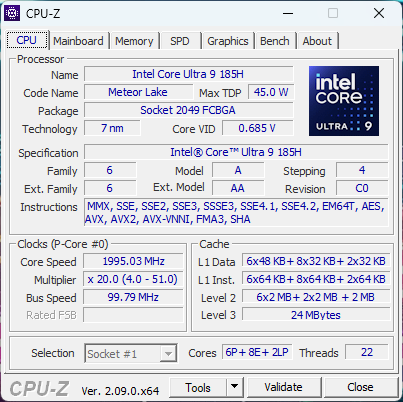
Processor
The Core Ultra 9 185H in our RTX 4050 configuration performs within 3 percentage points of the same CPU in the higher-end RTX 4070 configuration. It offers faster performance than the outgoing Core i7-13900H while also integrating an NPU for AI-accelerated tasks. Downgrading to the Core Ultra 7 155H configuration is only expected to impact performance by just 5 to 10 percent based on our time with the Dell XPS 16 9640.
Cinebench R15 Multi Loop
Cinebench R23: Multi Core | Single Core
Cinebench R20: CPU (Multi Core) | CPU (Single Core)
Cinebench R15: CPU Multi 64Bit | CPU Single 64Bit
Blender: v2.79 BMW27 CPU
7-Zip 18.03: 7z b 4 | 7z b 4 -mmt1
Geekbench 6.7: Multi-Core | Single-Core
Geekbench 5.5: Multi-Core | Single-Core
HWBOT x265 Benchmark v2.2: 4k Preset
LibreOffice : 20 Documents To PDF
R Benchmark 2.5: Overall mean
* ... smaller is better
AIDA64: FP32 Ray-Trace | FPU Julia | CPU SHA3 | CPU Queen | FPU SinJulia | FPU Mandel | CPU AES | CPU ZLib | FP64 Ray-Trace | CPU PhotoWorxx
| Performance rating | |
| Lenovo Yoga Pro 9 16IMH9 | |
| Lenovo Yoga Pro 9 16IMH9 RTX 4050 | |
| Dell XPS 16 9640 | |
| HP Envy x360 2-in-1 16-ad0097nr | |
| Average Intel Core Ultra 9 185H | |
| Asus VivoBook Pro 16 K6602VU | |
| Samsung Galaxy Book4 Ultra | |
| AIDA64 / FP32 Ray-Trace | |
| HP Envy x360 2-in-1 16-ad0097nr | |
| Lenovo Yoga Pro 9 16IMH9 RTX 4050 | |
| Lenovo Yoga Pro 9 16IMH9 | |
| Dell XPS 16 9640 | |
| Average Intel Core Ultra 9 185H (9220 - 18676, n=20) | |
| Asus VivoBook Pro 16 K6602VU | |
| Samsung Galaxy Book4 Ultra | |
| AIDA64 / FPU Julia | |
| Lenovo Yoga Pro 9 16IMH9 | |
| Lenovo Yoga Pro 9 16IMH9 RTX 4050 | |
| Dell XPS 16 9640 | |
| HP Envy x360 2-in-1 16-ad0097nr | |
| Average Intel Core Ultra 9 185H (48865 - 96463, n=20) | |
| Asus VivoBook Pro 16 K6602VU | |
| Samsung Galaxy Book4 Ultra | |
| AIDA64 / CPU SHA3 | |
| Lenovo Yoga Pro 9 16IMH9 RTX 4050 | |
| Lenovo Yoga Pro 9 16IMH9 | |
| Dell XPS 16 9640 | |
| Average Intel Core Ultra 9 185H (2394 - 4534, n=20) | |
| HP Envy x360 2-in-1 16-ad0097nr | |
| Asus VivoBook Pro 16 K6602VU | |
| Samsung Galaxy Book4 Ultra | |
| AIDA64 / CPU Queen | |
| HP Envy x360 2-in-1 16-ad0097nr | |
| Lenovo Yoga Pro 9 16IMH9 RTX 4050 | |
| Asus VivoBook Pro 16 K6602VU | |
| Lenovo Yoga Pro 9 16IMH9 | |
| Dell XPS 16 9640 | |
| Average Intel Core Ultra 9 185H (66785 - 95241, n=20) | |
| Samsung Galaxy Book4 Ultra | |
| AIDA64 / FPU SinJulia | |
| HP Envy x360 2-in-1 16-ad0097nr | |
| Lenovo Yoga Pro 9 16IMH9 | |
| Lenovo Yoga Pro 9 16IMH9 RTX 4050 | |
| Dell XPS 16 9640 | |
| Average Intel Core Ultra 9 185H (7255 - 11392, n=20) | |
| Samsung Galaxy Book4 Ultra | |
| Asus VivoBook Pro 16 K6602VU | |
| AIDA64 / FPU Mandel | |
| Lenovo Yoga Pro 9 16IMH9 | |
| Lenovo Yoga Pro 9 16IMH9 RTX 4050 | |
| HP Envy x360 2-in-1 16-ad0097nr | |
| Dell XPS 16 9640 | |
| Average Intel Core Ultra 9 185H (24004 - 48020, n=20) | |
| Samsung Galaxy Book4 Ultra | |
| Asus VivoBook Pro 16 K6602VU | |
| AIDA64 / CPU AES | |
| Asus VivoBook Pro 16 K6602VU | |
| Lenovo Yoga Pro 9 16IMH9 | |
| Lenovo Yoga Pro 9 16IMH9 RTX 4050 | |
| Average Intel Core Ultra 9 185H (53116 - 154066, n=20) | |
| Dell XPS 16 9640 | |
| HP Envy x360 2-in-1 16-ad0097nr | |
| Samsung Galaxy Book4 Ultra | |
| AIDA64 / CPU ZLib | |
| Lenovo Yoga Pro 9 16IMH9 | |
| Lenovo Yoga Pro 9 16IMH9 RTX 4050 | |
| Dell XPS 16 9640 | |
| Average Intel Core Ultra 9 185H (678 - 1341, n=20) | |
| Samsung Galaxy Book4 Ultra | |
| Asus VivoBook Pro 16 K6602VU | |
| HP Envy x360 2-in-1 16-ad0097nr | |
| AIDA64 / FP64 Ray-Trace | |
| HP Envy x360 2-in-1 16-ad0097nr | |
| Lenovo Yoga Pro 9 16IMH9 | |
| Lenovo Yoga Pro 9 16IMH9 RTX 4050 | |
| Dell XPS 16 9640 | |
| Average Intel Core Ultra 9 185H (4428 - 10078, n=20) | |
| Asus VivoBook Pro 16 K6602VU | |
| Samsung Galaxy Book4 Ultra | |
| AIDA64 / CPU PhotoWorxx | |
| Lenovo Yoga Pro 9 16IMH9 | |
| Lenovo Yoga Pro 9 16IMH9 RTX 4050 | |
| Dell XPS 16 9640 | |
| Samsung Galaxy Book4 Ultra | |
| Average Intel Core Ultra 9 185H (44547 - 53918, n=20) | |
| Asus VivoBook Pro 16 K6602VU | |
| HP Envy x360 2-in-1 16-ad0097nr | |
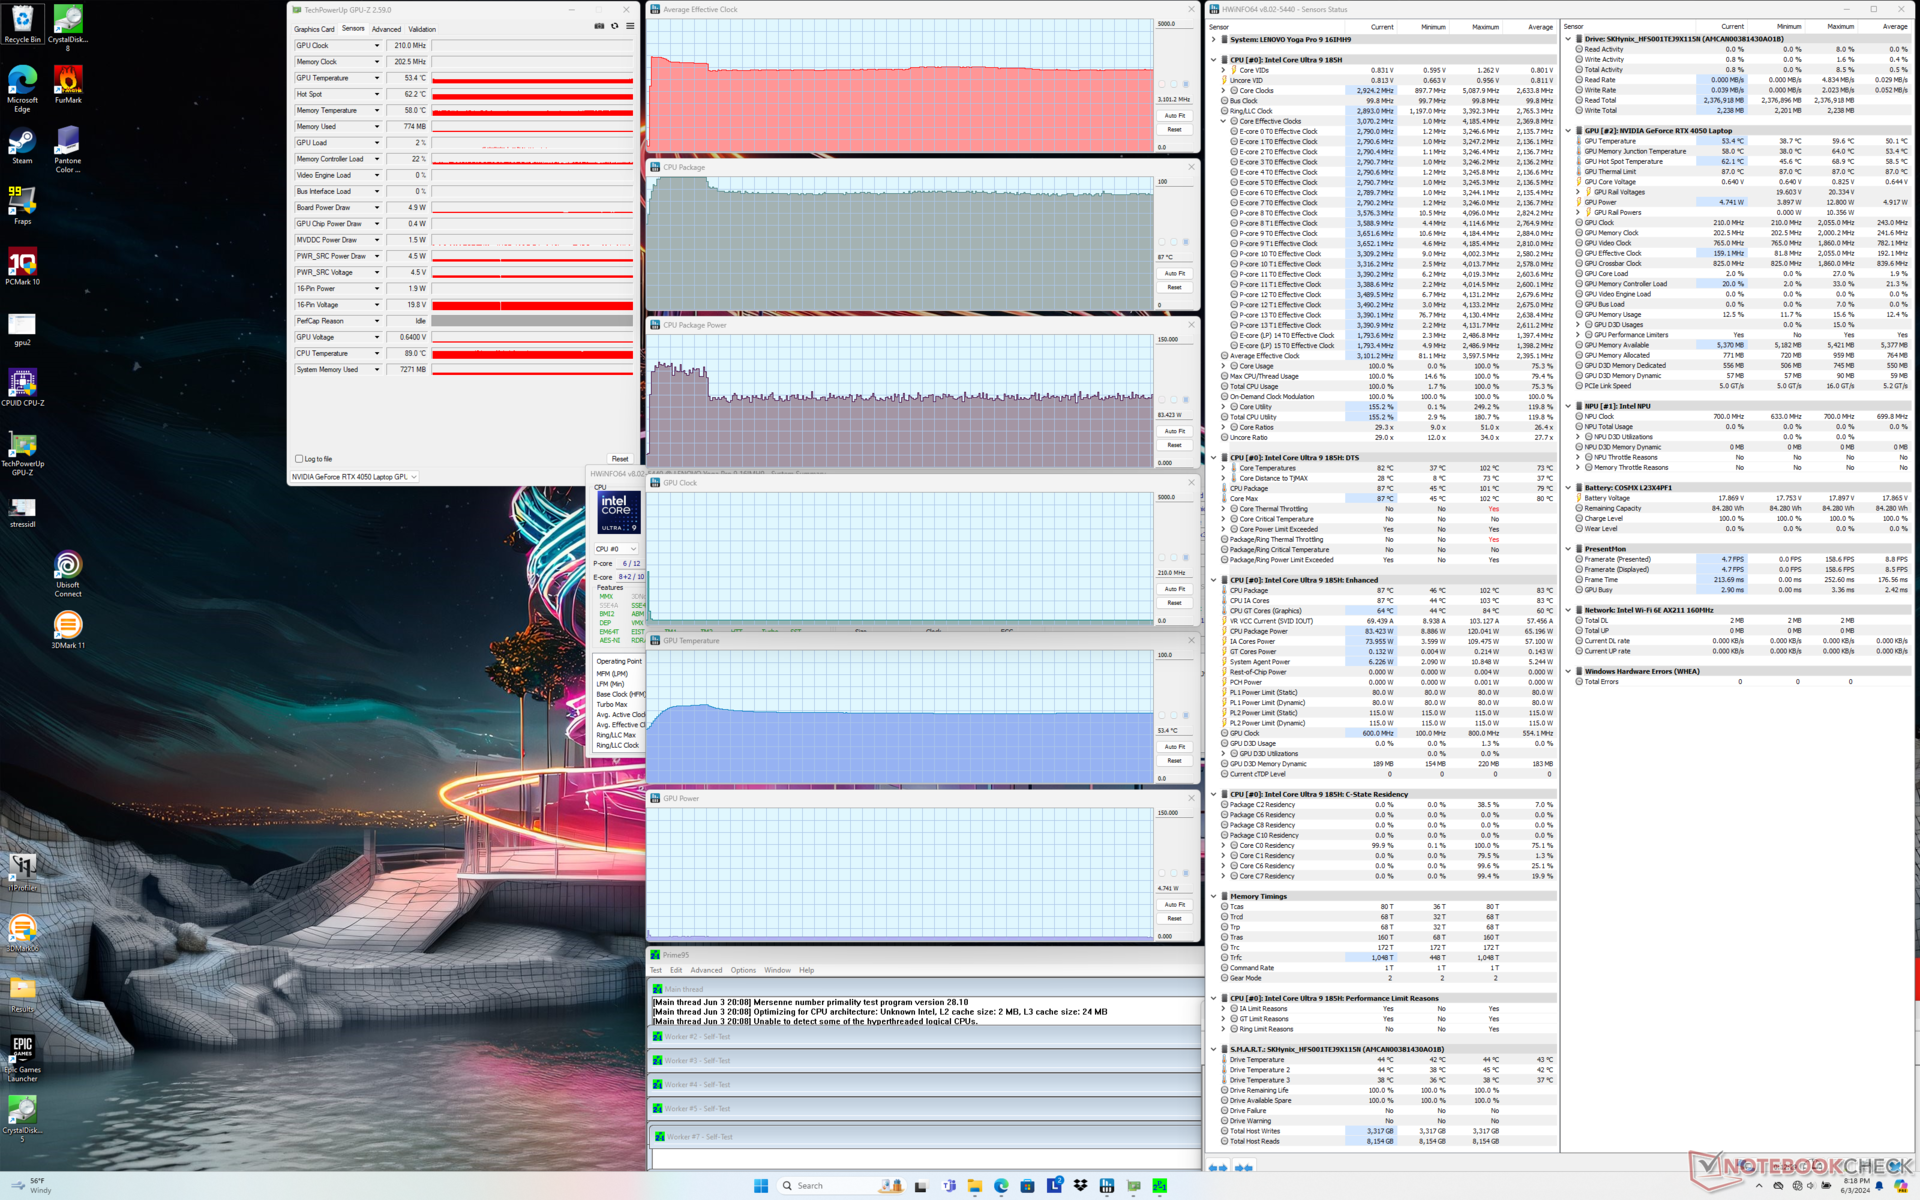
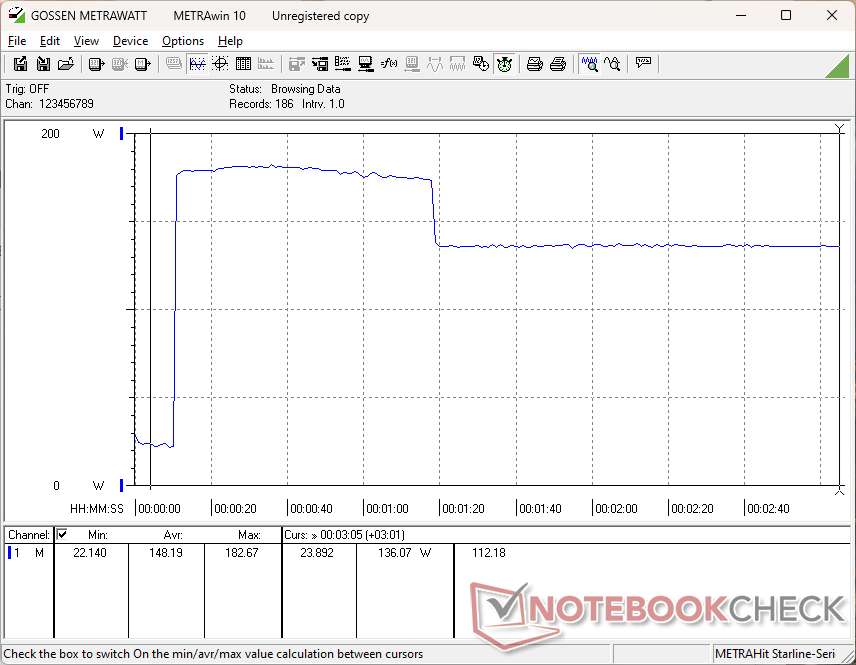
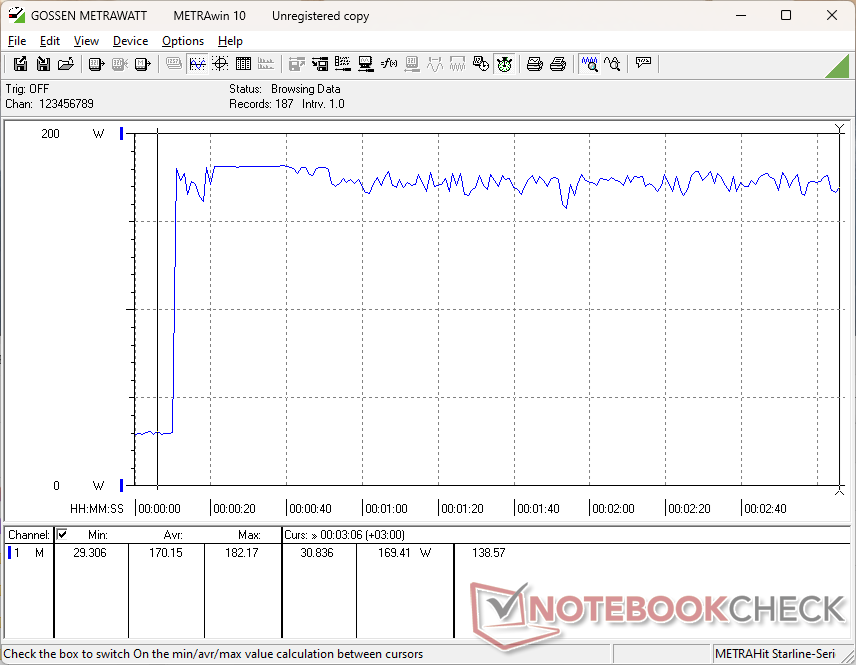
Stress Test
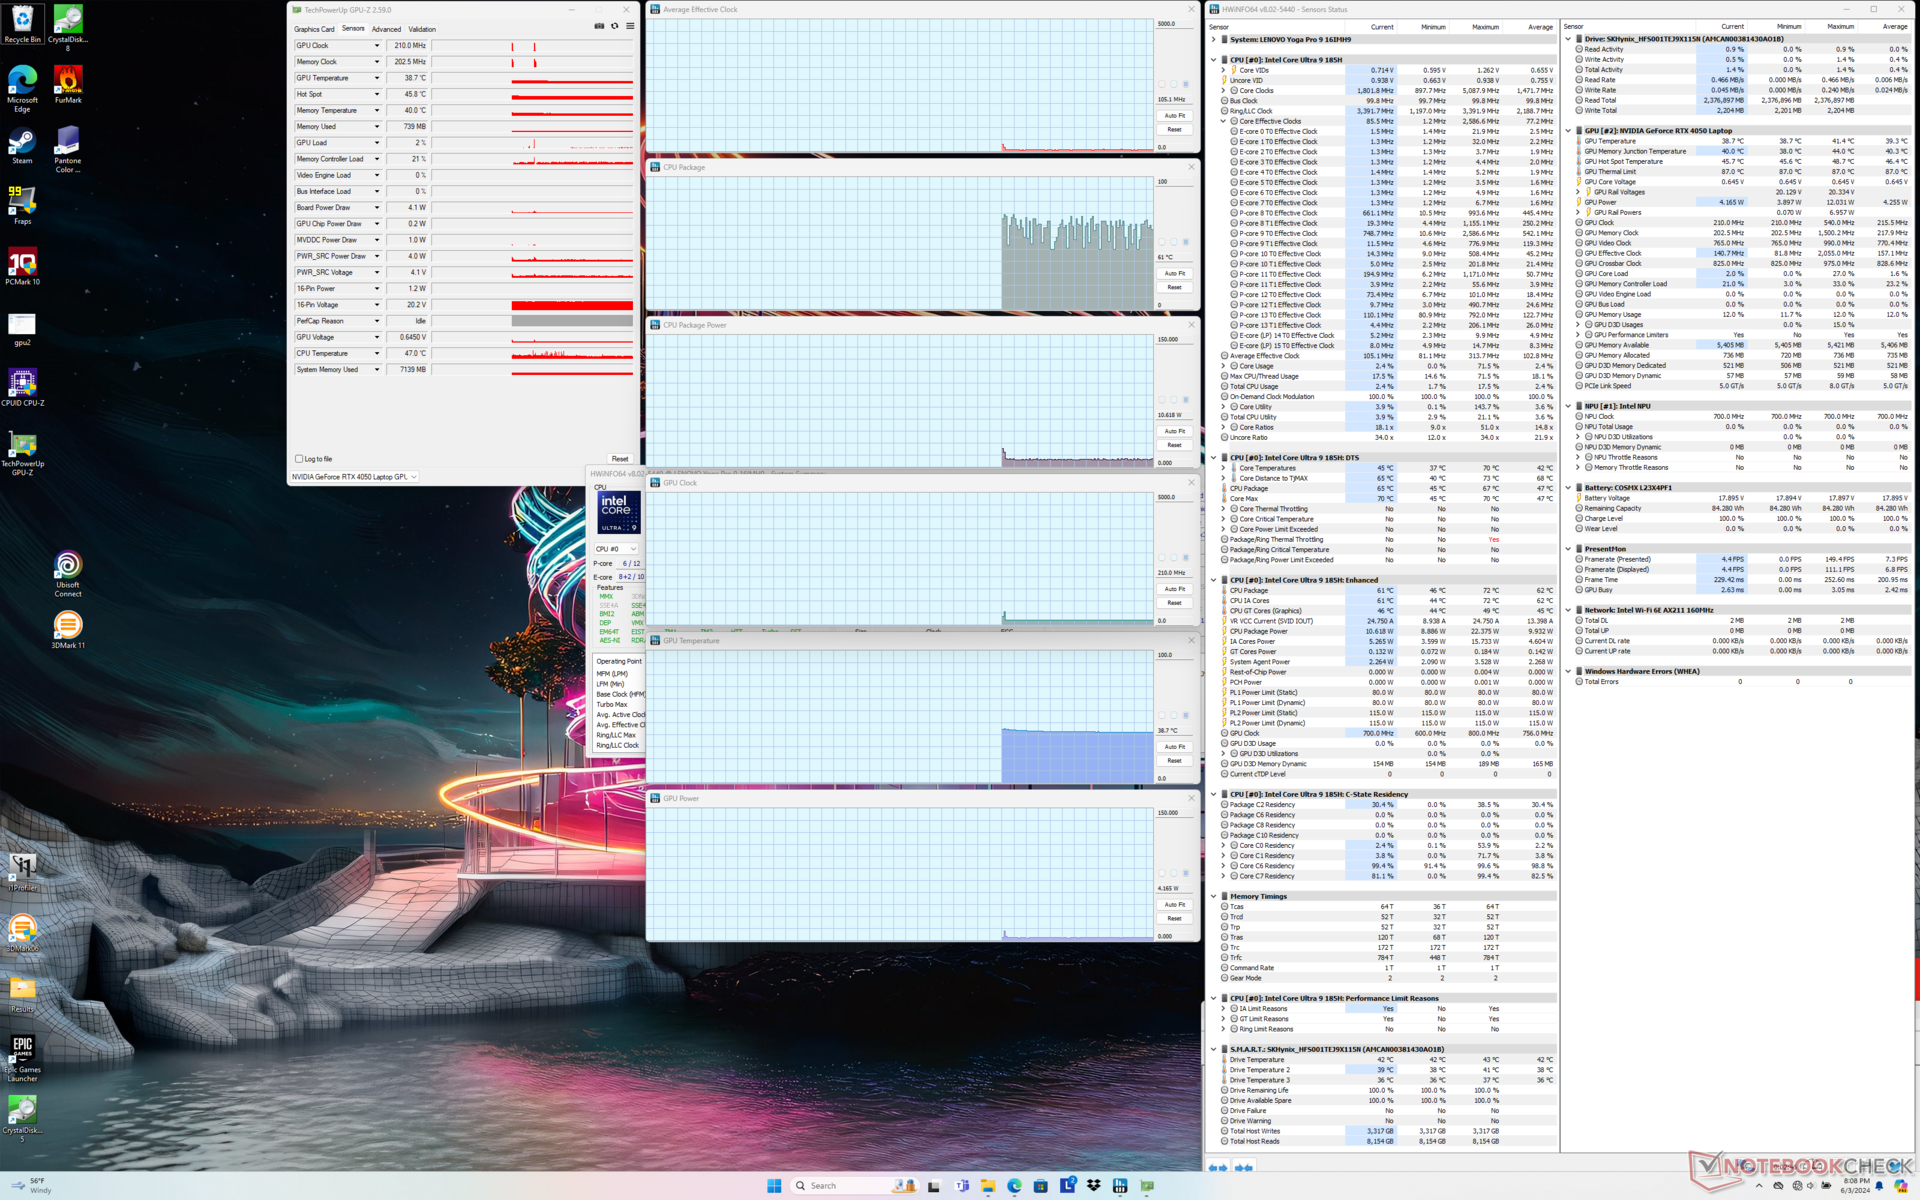
The CPU would boost to 3.6 GHz, 100 C, and 120 W after initiating Prime95 stress before falling and stabilizing at 3.1 GHz, 90 C, and 83 W about 70 seconds later.
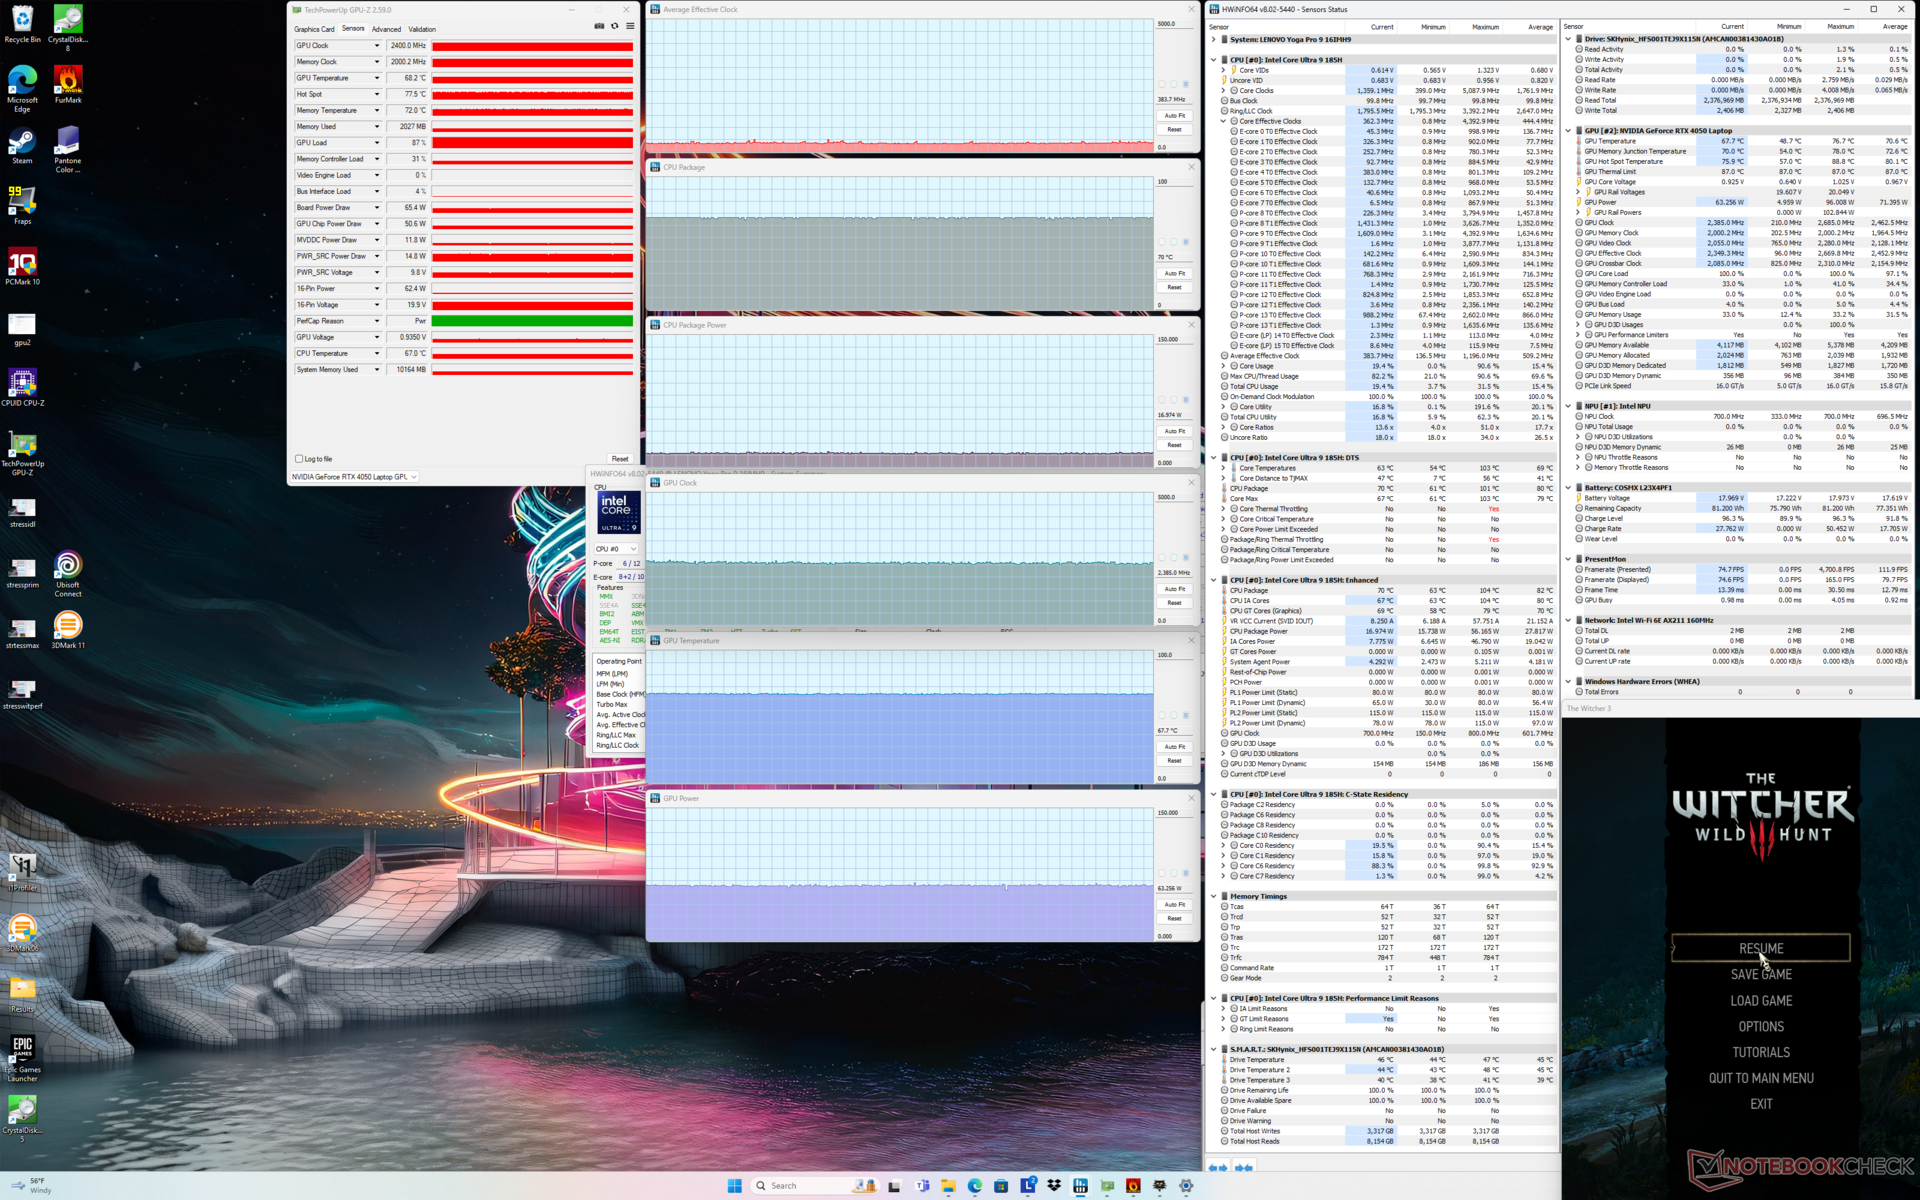
Graphics performance is impacted if running on Balanced mode instead of Performance mode which complements our GPU Performance results below. The Nvidia GPU would maintain 2855 MHz and 78 W when running Witcher 3 on Performance mode compared to 2385 MHz and 63 W if on Balanced mode. GPU temperature would also be warmer on Performance mode.
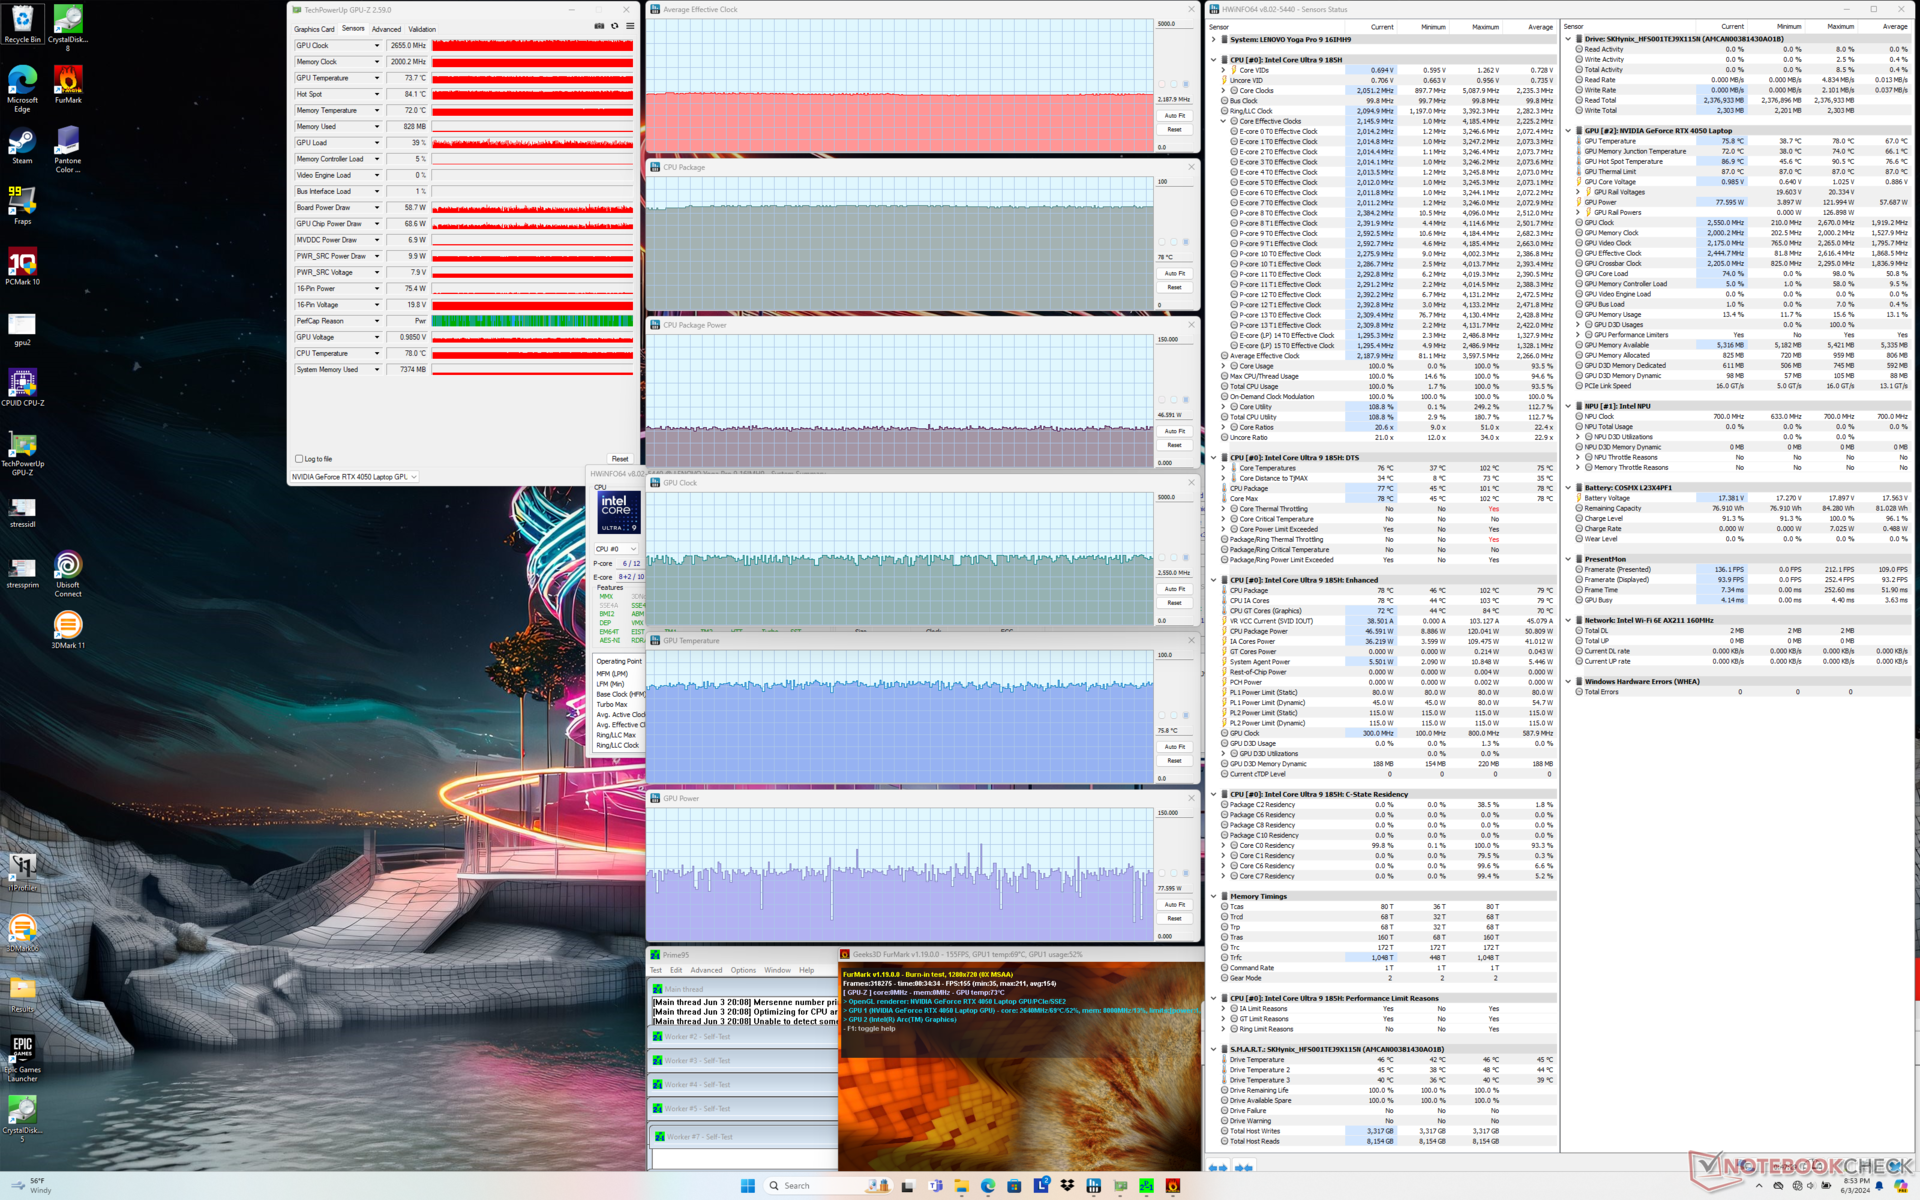

| Average CPU Clock (GHz) | GPU Clock (MHz) | Average CPU Temperature (°C) | Average GPU Temperature (°C) | |
| System Idle | -- | -- | 61 | 39 |
| Prime95 Stress | 3.1 | -- | 87 | 53 |
| Prime95 + FurMark Stress | 2.2 | 2550 | 78 | 76 |
| Witcher 3 Stress (Balanced mode) | 0.4 | 2385 | 70 | 68 |
| Witcher 3 Stress (Performance mode) | 0.7 | 2655 | 99 | 76 |
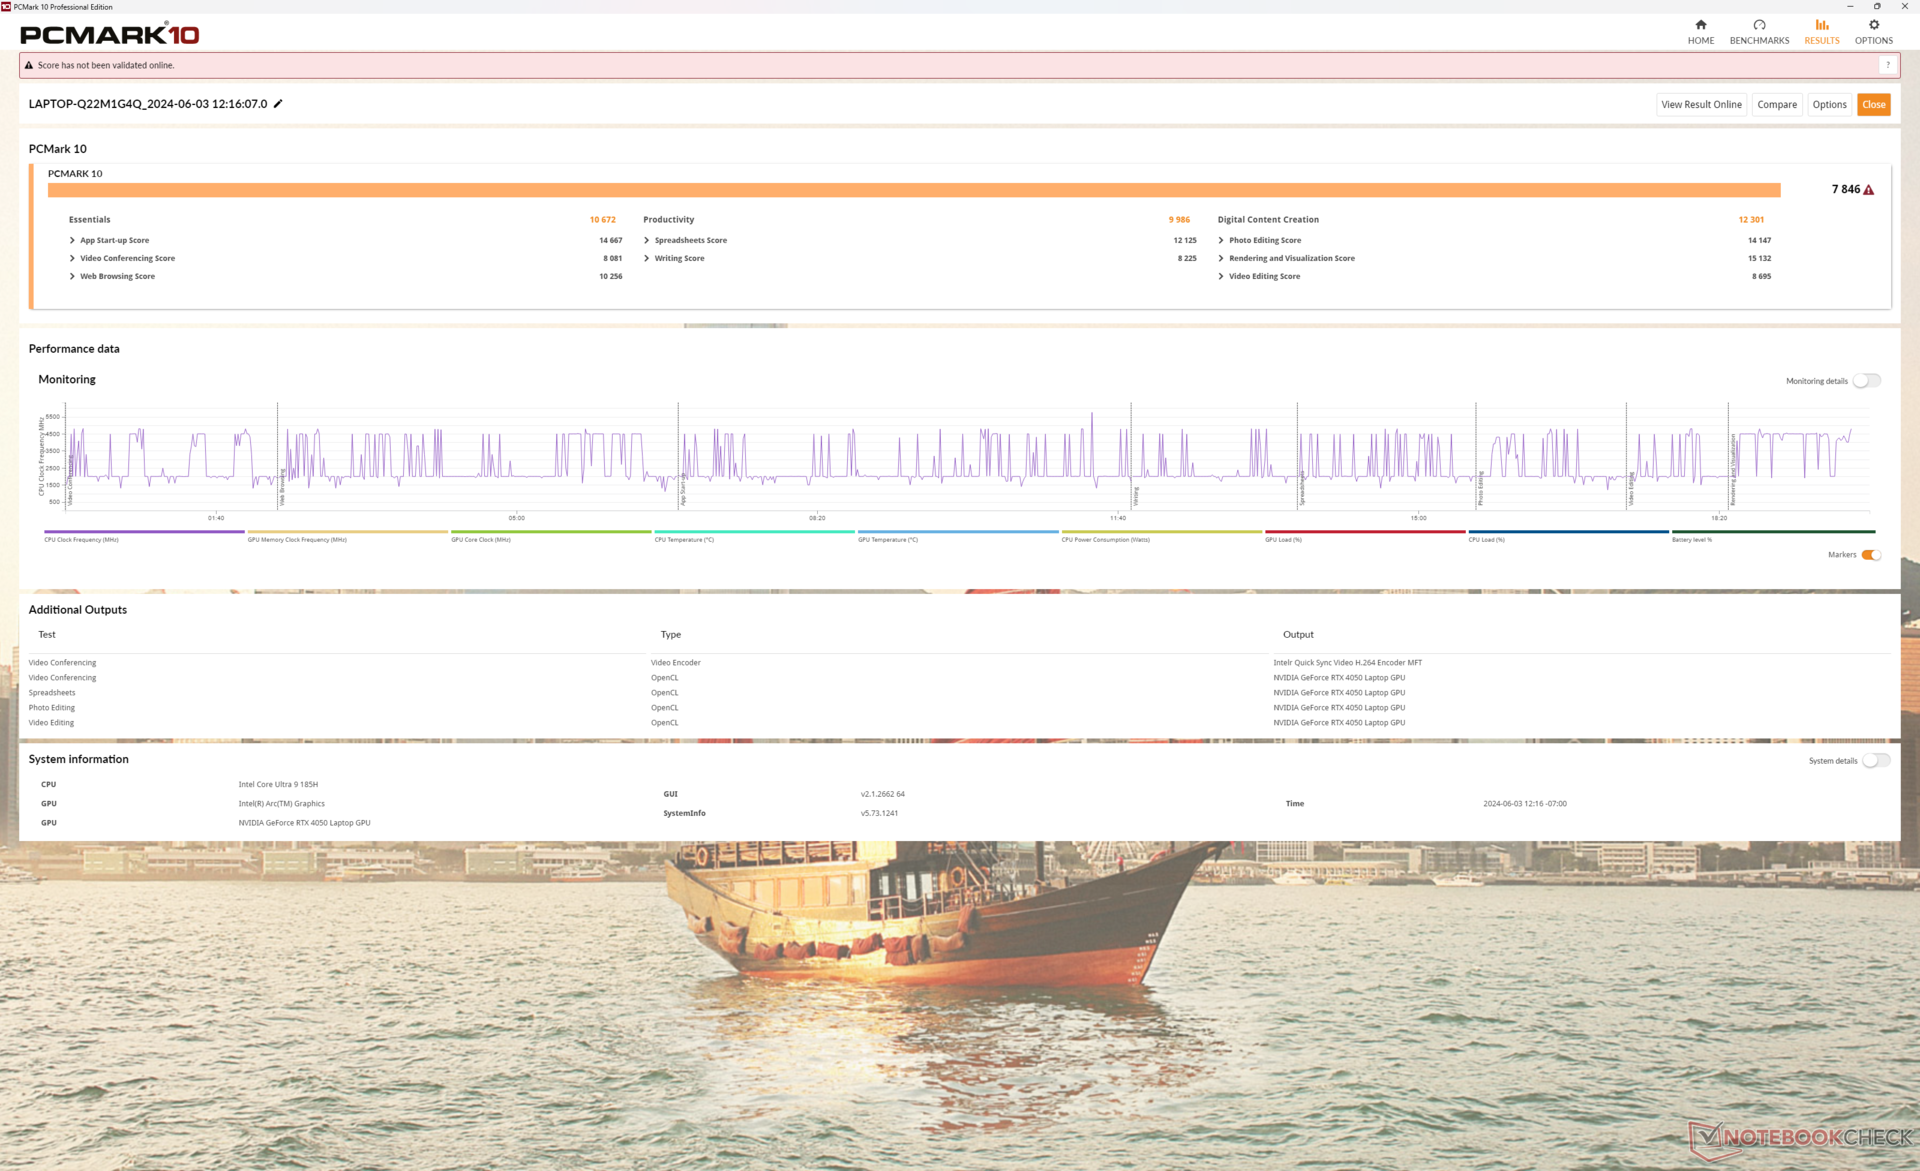
System Performance
PCMark scores are comparable to most other multimedia laptops to suggest that the Lenovo isn't significantly slower in most day-to-day workloads or editing tasks in spite of our lower-end RTX 4050 configuration.
CrossMark: Overall | Productivity | Creativity | Responsiveness
WebXPRT 3: Overall
WebXPRT 4: Overall
Mozilla Kraken 1.1: Total
| PCMark 10 / Score | |
| Lenovo Yoga Pro 9 16IMH9 RTX 4050 | |
| Average Intel Core Ultra 9 185H, NVIDIA GeForce RTX 4050 Laptop GPU (7431 - 7846, n=2) | |
| Lenovo Yoga Pro 9 16IMH9 | |
| Dell XPS 16 9640 | |
| Asus VivoBook Pro 16 K6602VU | |
| Samsung Galaxy Book4 Ultra | |
| HP Envy x360 2-in-1 16-ad0097nr | |
| PCMark 10 / Essentials | |
| Lenovo Yoga Pro 9 16IMH9 | |
| Average Intel Core Ultra 9 185H, NVIDIA GeForce RTX 4050 Laptop GPU (10672 - 10807, n=2) | |
| Lenovo Yoga Pro 9 16IMH9 RTX 4050 | |
| HP Envy x360 2-in-1 16-ad0097nr | |
| Samsung Galaxy Book4 Ultra | |
| Dell XPS 16 9640 | |
| Asus VivoBook Pro 16 K6602VU | |
| PCMark 10 / Productivity | |
| Lenovo Yoga Pro 9 16IMH9 RTX 4050 | |
| HP Envy x360 2-in-1 16-ad0097nr | |
| Average Intel Core Ultra 9 185H, NVIDIA GeForce RTX 4050 Laptop GPU (9717 - 9986, n=2) | |
| Dell XPS 16 9640 | |
| Samsung Galaxy Book4 Ultra | |
| Lenovo Yoga Pro 9 16IMH9 | |
| Asus VivoBook Pro 16 K6602VU | |
| PCMark 10 / Digital Content Creation | |
| Lenovo Yoga Pro 9 16IMH9 RTX 4050 | |
| Lenovo Yoga Pro 9 16IMH9 | |
| Average Intel Core Ultra 9 185H, NVIDIA GeForce RTX 4050 Laptop GPU (10607 - 12301, n=2) | |
| Asus VivoBook Pro 16 K6602VU | |
| Dell XPS 16 9640 | |
| Samsung Galaxy Book4 Ultra | |
| HP Envy x360 2-in-1 16-ad0097nr | |
| CrossMark / Overall | |
| Dell XPS 16 9640 | |
| Lenovo Yoga Pro 9 16IMH9 RTX 4050 | |
| Average Intel Core Ultra 9 185H, NVIDIA GeForce RTX 4050 Laptop GPU (1790 - 1811, n=2) | |
| Samsung Galaxy Book4 Ultra | |
| Asus VivoBook Pro 16 K6602VU | |
| Lenovo Yoga Pro 9 16IMH9 | |
| HP Envy x360 2-in-1 16-ad0097nr | |
| CrossMark / Productivity | |
| Dell XPS 16 9640 | |
| Lenovo Yoga Pro 9 16IMH9 RTX 4050 | |
| Average Intel Core Ultra 9 185H, NVIDIA GeForce RTX 4050 Laptop GPU (1700 - 1717, n=2) | |
| Asus VivoBook Pro 16 K6602VU | |
| Samsung Galaxy Book4 Ultra | |
| Lenovo Yoga Pro 9 16IMH9 | |
| HP Envy x360 2-in-1 16-ad0097nr | |
| CrossMark / Creativity | |
| Average Intel Core Ultra 9 185H, NVIDIA GeForce RTX 4050 Laptop GPU (2037 - 2038, n=2) | |
| Lenovo Yoga Pro 9 16IMH9 RTX 4050 | |
| Dell XPS 16 9640 | |
| Lenovo Yoga Pro 9 16IMH9 | |
| Samsung Galaxy Book4 Ultra | |
| Asus VivoBook Pro 16 K6602VU | |
| HP Envy x360 2-in-1 16-ad0097nr | |
| CrossMark / Responsiveness | |
| Dell XPS 16 9640 | |
| Asus VivoBook Pro 16 K6602VU | |
| Lenovo Yoga Pro 9 16IMH9 RTX 4050 | |
| Samsung Galaxy Book4 Ultra | |
| Average Intel Core Ultra 9 185H, NVIDIA GeForce RTX 4050 Laptop GPU (1419 - 1493, n=2) | |
| HP Envy x360 2-in-1 16-ad0097nr | |
| Lenovo Yoga Pro 9 16IMH9 | |
| WebXPRT 3 / Overall | |
| HP Envy x360 2-in-1 16-ad0097nr | |
| Average Intel Core Ultra 9 185H, NVIDIA GeForce RTX 4050 Laptop GPU (293 - 301, n=2) | |
| Lenovo Yoga Pro 9 16IMH9 | |
| Lenovo Yoga Pro 9 16IMH9 RTX 4050 | |
| Dell XPS 16 9640 | |
| Samsung Galaxy Book4 Ultra | |
| WebXPRT 4 / Overall | |
| Average Intel Core Ultra 9 185H, NVIDIA GeForce RTX 4050 Laptop GPU (268 - 271, n=2) | |
| Lenovo Yoga Pro 9 16IMH9 | |
| Lenovo Yoga Pro 9 16IMH9 RTX 4050 | |
| Samsung Galaxy Book4 Ultra | |
| Dell XPS 16 9640 | |
| HP Envy x360 2-in-1 16-ad0097nr | |
| Asus VivoBook Pro 16 K6602VU | |
| Mozilla Kraken 1.1 / Total | |
| Asus VivoBook Pro 16 K6602VU | |
| HP Envy x360 2-in-1 16-ad0097nr | |
| Lenovo Yoga Pro 9 16IMH9 RTX 4050 | |
| Average Intel Core Ultra 9 185H, NVIDIA GeForce RTX 4050 Laptop GPU (498 - 512, n=2) | |
| Lenovo Yoga Pro 9 16IMH9 | |
| Samsung Galaxy Book4 Ultra | |
* ... smaller is better
| PCMark 10 Score | 7846 points | |
Help | ||
| AIDA64 / Memory Copy | |
| Lenovo Yoga Pro 9 16IMH9 | |
| Lenovo Yoga Pro 9 16IMH9 RTX 4050 | |
| Dell XPS 16 9640 | |
| Samsung Galaxy Book4 Ultra | |
| Average Intel Core Ultra 9 185H (69929 - 95718, n=20) | |
| HP Envy x360 2-in-1 16-ad0097nr | |
| Asus VivoBook Pro 16 K6602VU | |
| AIDA64 / Memory Read | |
| Samsung Galaxy Book4 Ultra | |
| Lenovo Yoga Pro 9 16IMH9 | |
| Lenovo Yoga Pro 9 16IMH9 RTX 4050 | |
| Dell XPS 16 9640 | |
| Average Intel Core Ultra 9 185H (64619 - 87768, n=20) | |
| Asus VivoBook Pro 16 K6602VU | |
| HP Envy x360 2-in-1 16-ad0097nr | |
| AIDA64 / Memory Write | |
| HP Envy x360 2-in-1 16-ad0097nr | |
| Samsung Galaxy Book4 Ultra | |
| Lenovo Yoga Pro 9 16IMH9 | |
| Lenovo Yoga Pro 9 16IMH9 RTX 4050 | |
| Dell XPS 16 9640 | |
| Average Intel Core Ultra 9 185H (51114 - 93871, n=20) | |
| Asus VivoBook Pro 16 K6602VU | |
| AIDA64 / Memory Latency | |
| Average Intel Core Ultra 9 185H (121.4 - 259, n=20) | |
| Samsung Galaxy Book4 Ultra | |
| Dell XPS 16 9640 | |
| Lenovo Yoga Pro 9 16IMH9 RTX 4050 | |
| Lenovo Yoga Pro 9 16IMH9 | |
| HP Envy x360 2-in-1 16-ad0097nr | |
| Asus VivoBook Pro 16 K6602VU | |
* ... smaller is better
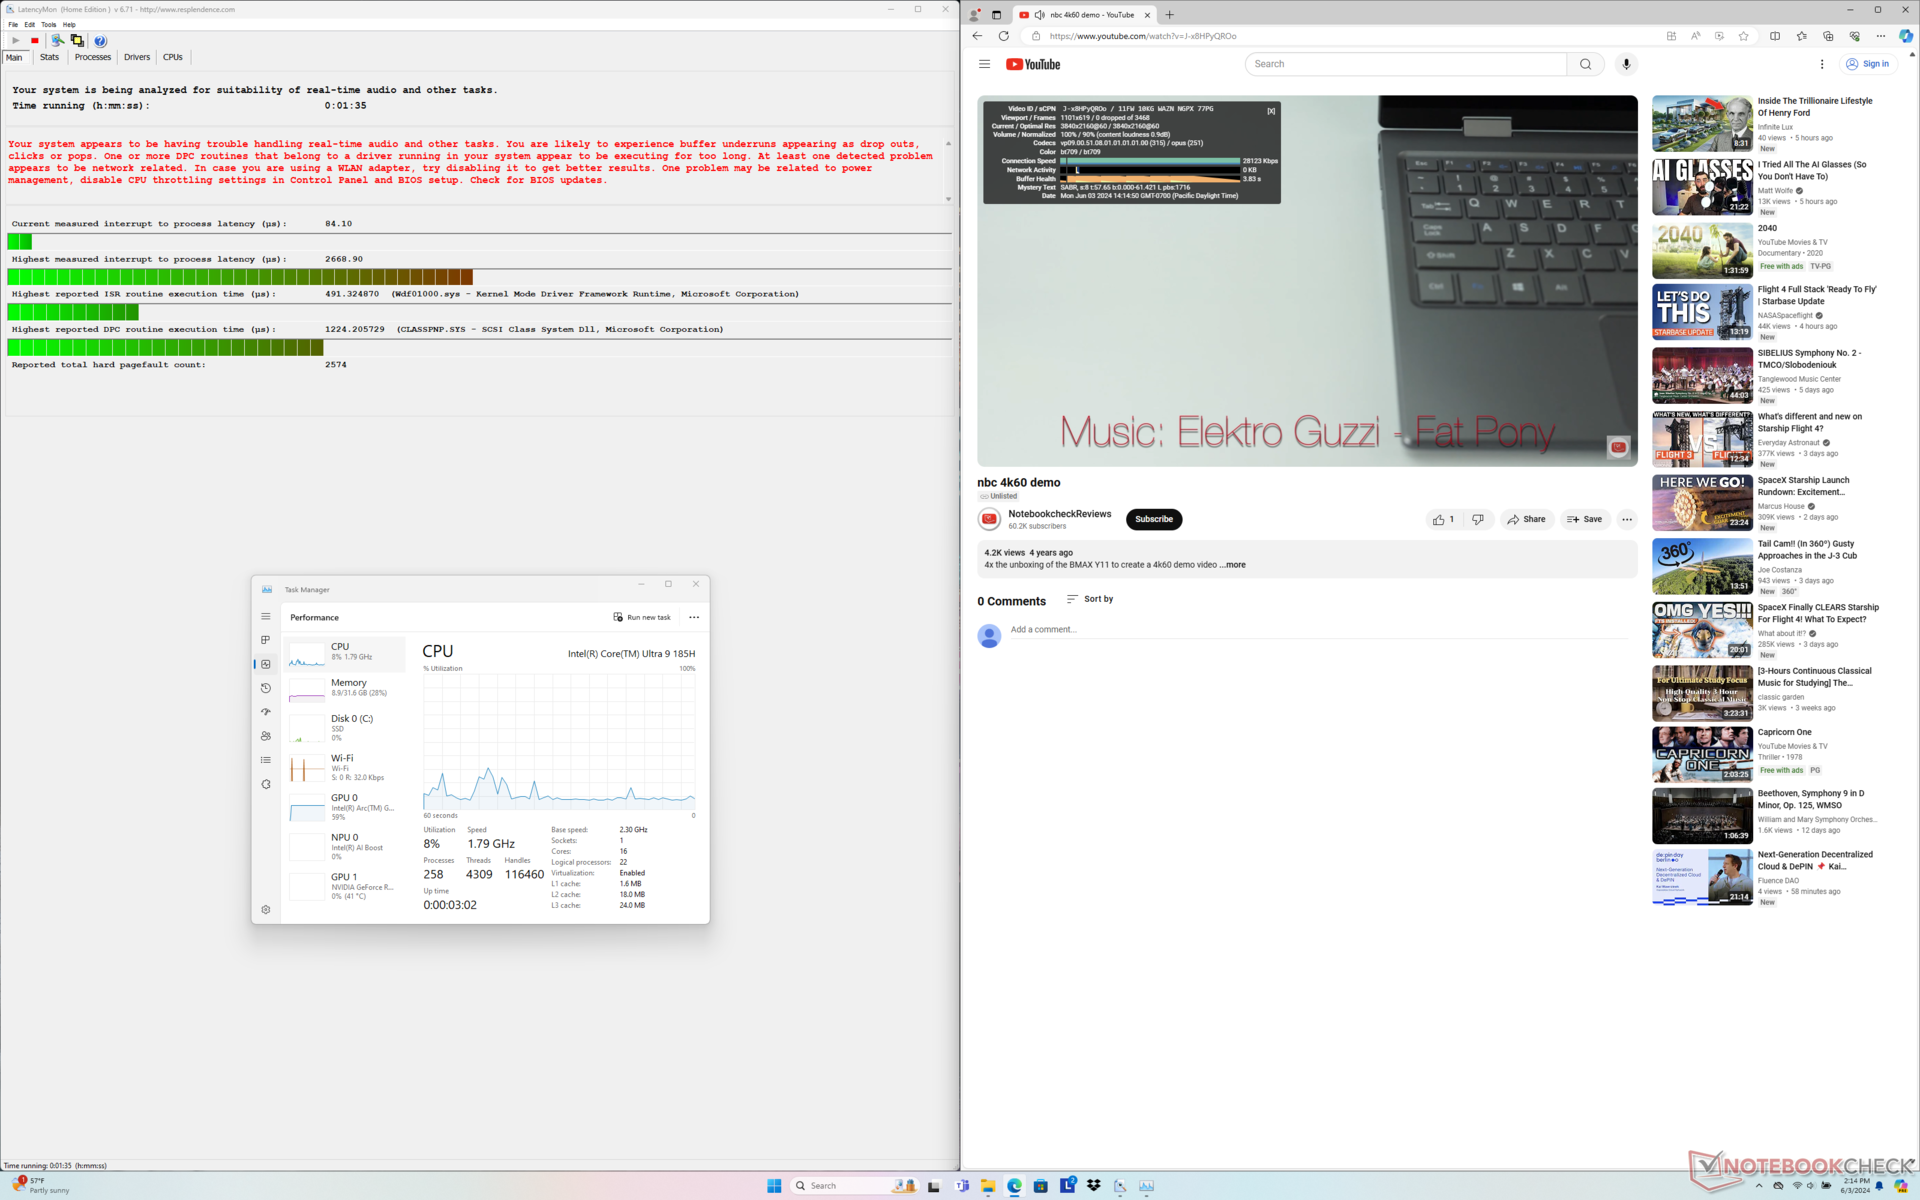
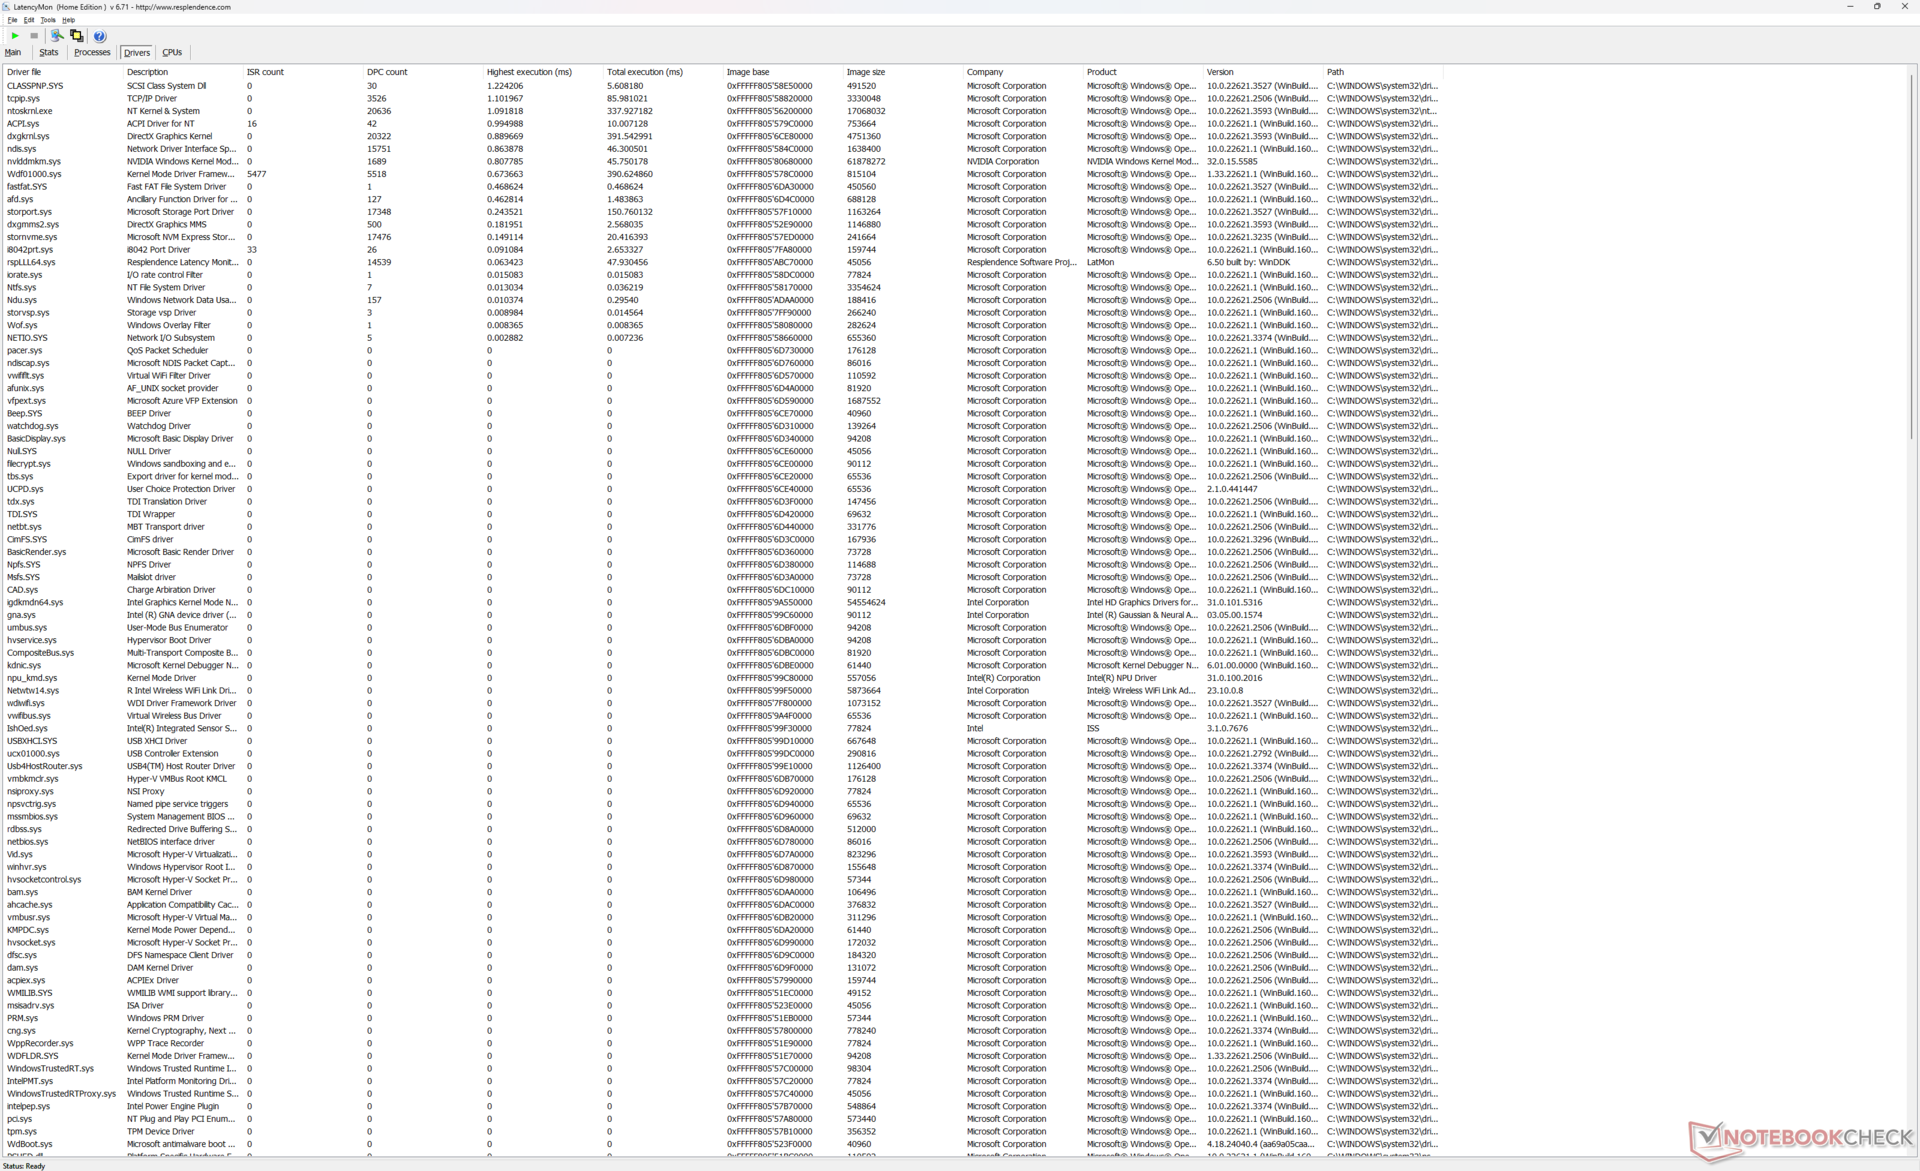
DPC Latency
LatencyMon reveals more DPC issues than the RTX 4070 configuration when opening multiple browser tabs of our homepage. 4K video playback at 60 FPS is otherwise perfect with no dropped frames recorded.
| DPC Latencies / LatencyMon - interrupt to process latency (max), Web, Youtube, Prime95 | |
| Lenovo Yoga Pro 9 16IMH9 RTX 4050 | |
| Asus VivoBook Pro 16 K6602VU | |
| HP Envy x360 2-in-1 16-ad0097nr | |
| Dell XPS 16 9640 | |
| Samsung Galaxy Book4 Ultra | |
| Lenovo Yoga Pro 9 16IMH9 | |
* ... smaller is better
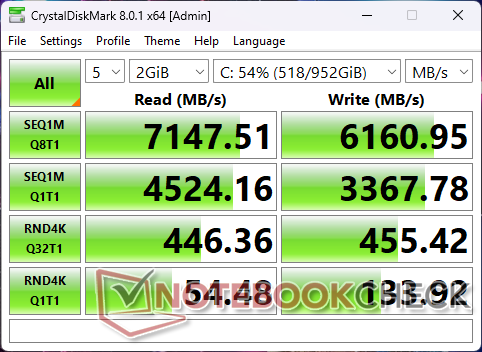
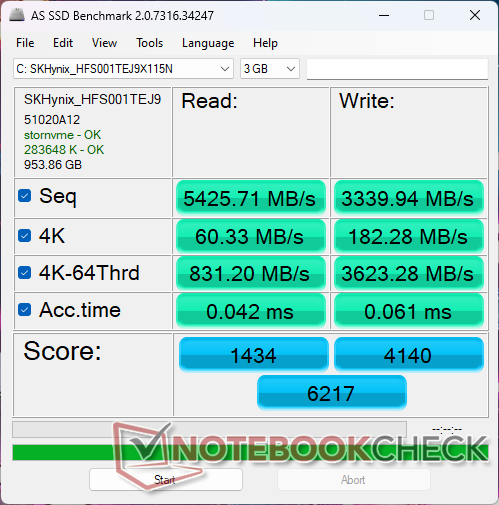
Storage Devices
Lenovo ships the same SK Hynix HFS001TEJ9X115N PCIe4 NVMe SSD between its lowest-end RTX 4050 and highest-end RTX 4070 configurations.

| Drive Performance rating - Percent | |
| Dell XPS 16 9640 | |
| Samsung Galaxy Book4 Ultra | |
| Lenovo Yoga Pro 9 16IMH9 RTX 4050 | |
| Lenovo Yoga Pro 9 16IMH9 | |
| Asus VivoBook Pro 16 K6602VU | |
| HP Envy x360 2-in-1 16-ad0097nr | |
* ... smaller is better
Disk Throttling: DiskSpd Read Loop, Queue Depth 8
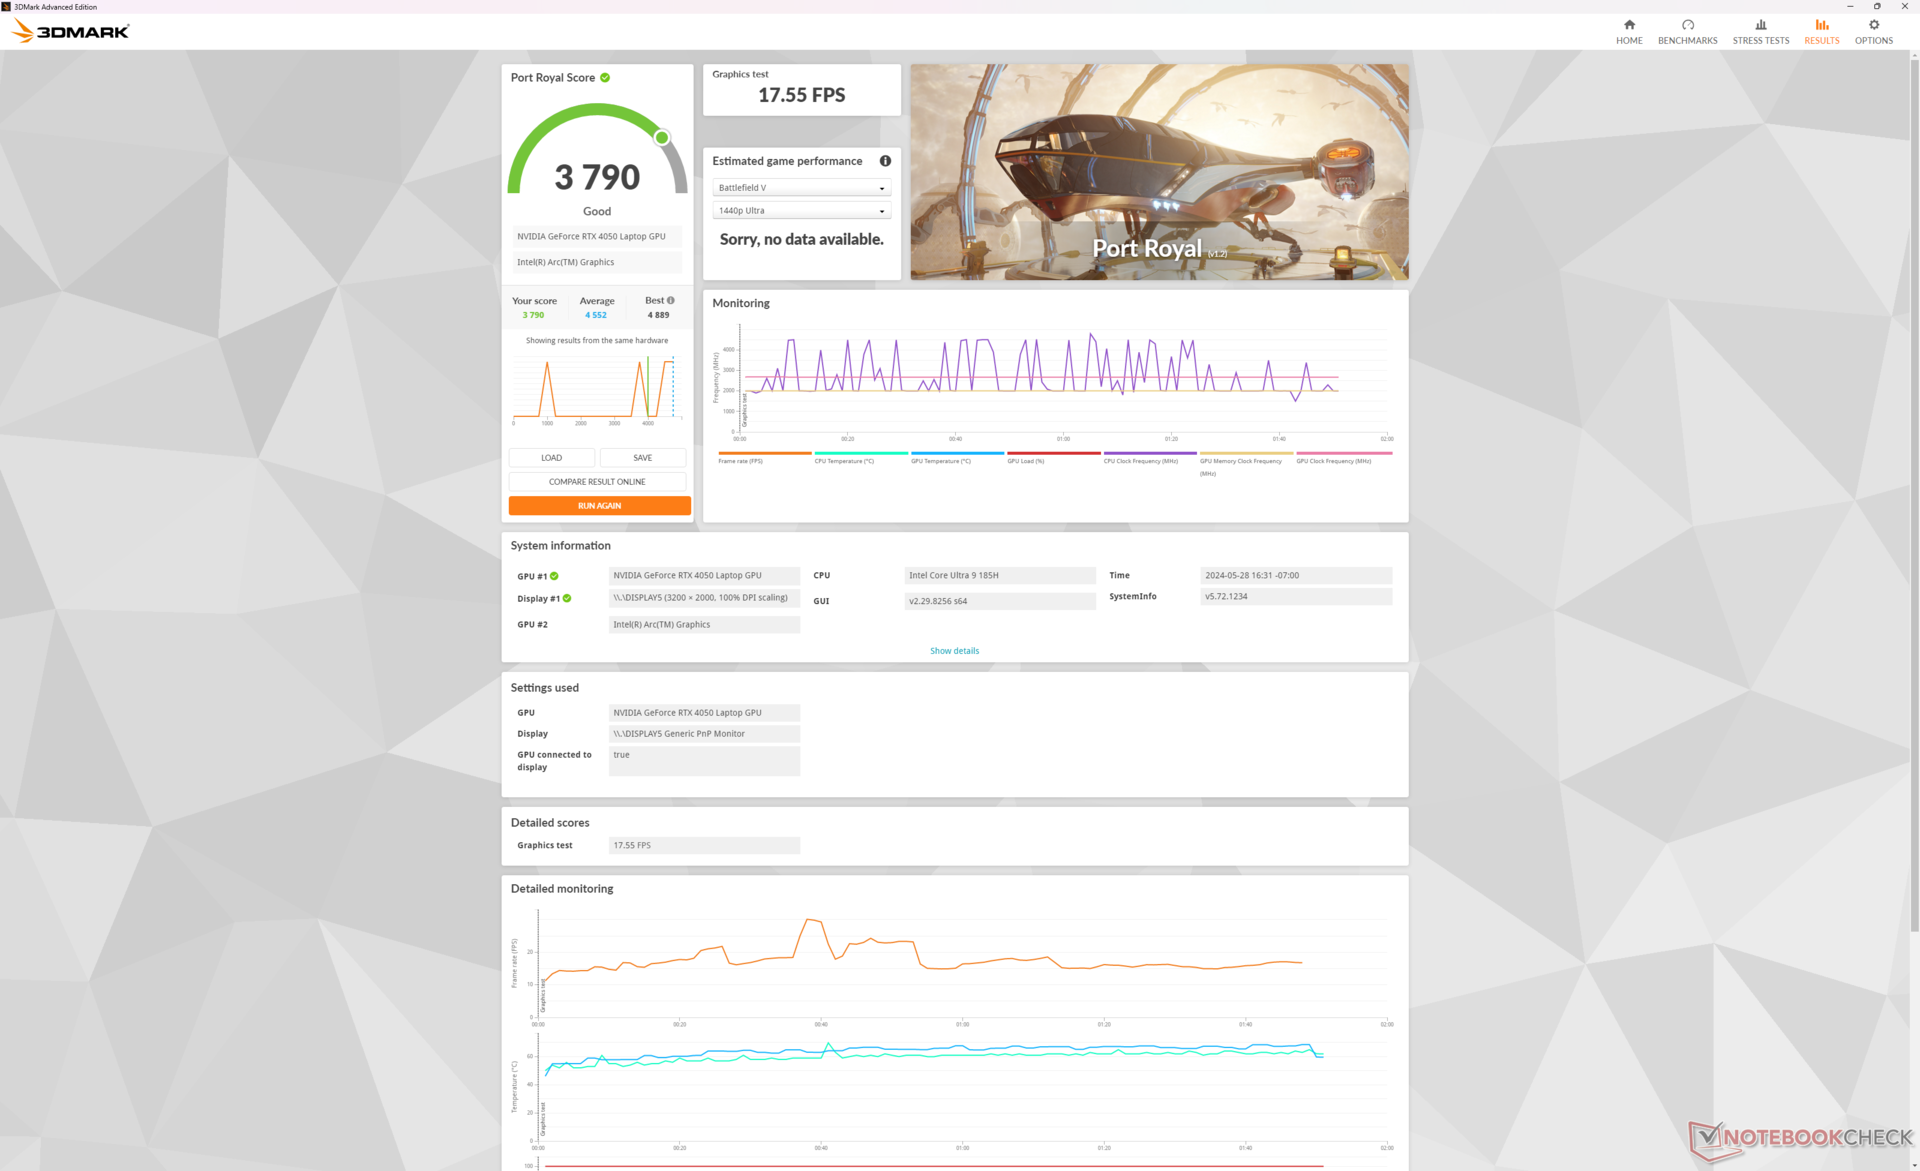
GPU Performance
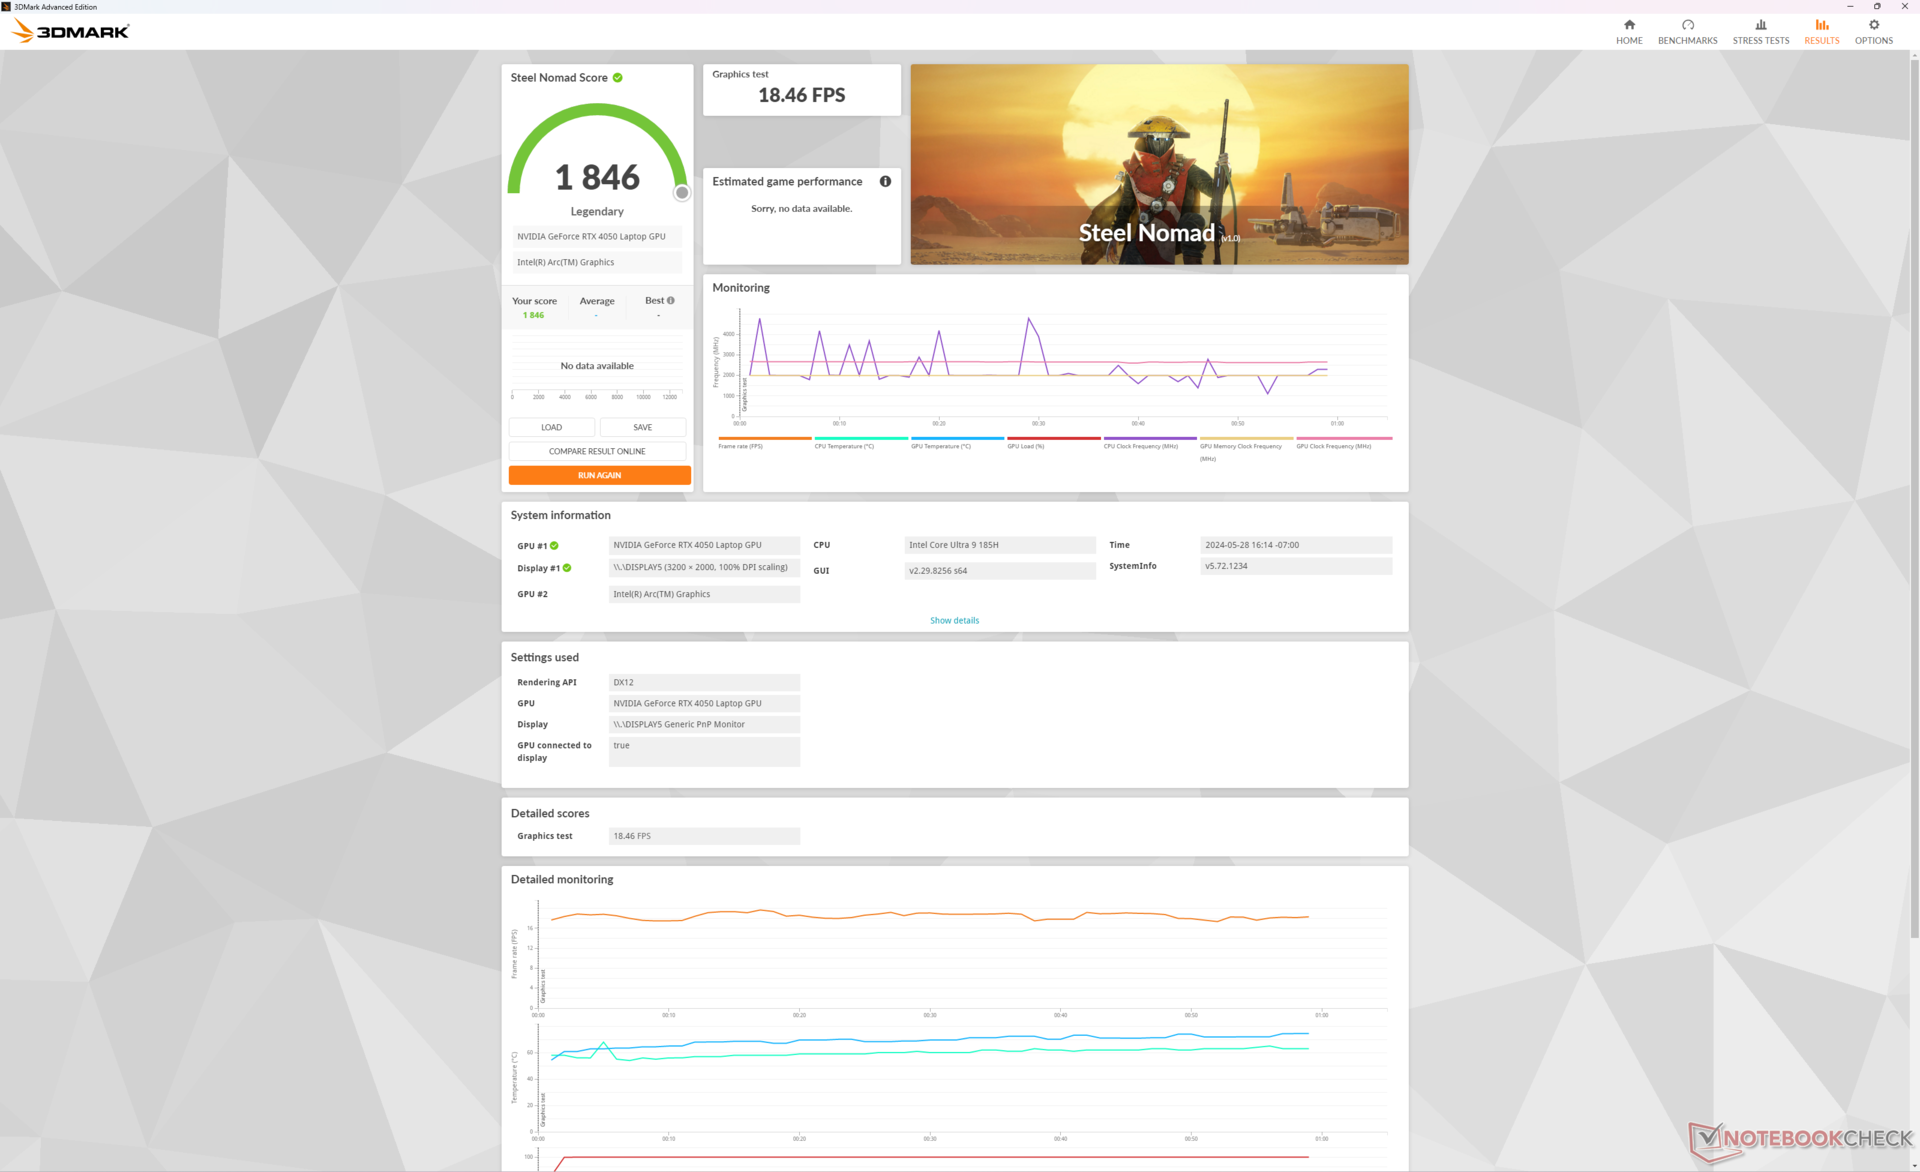
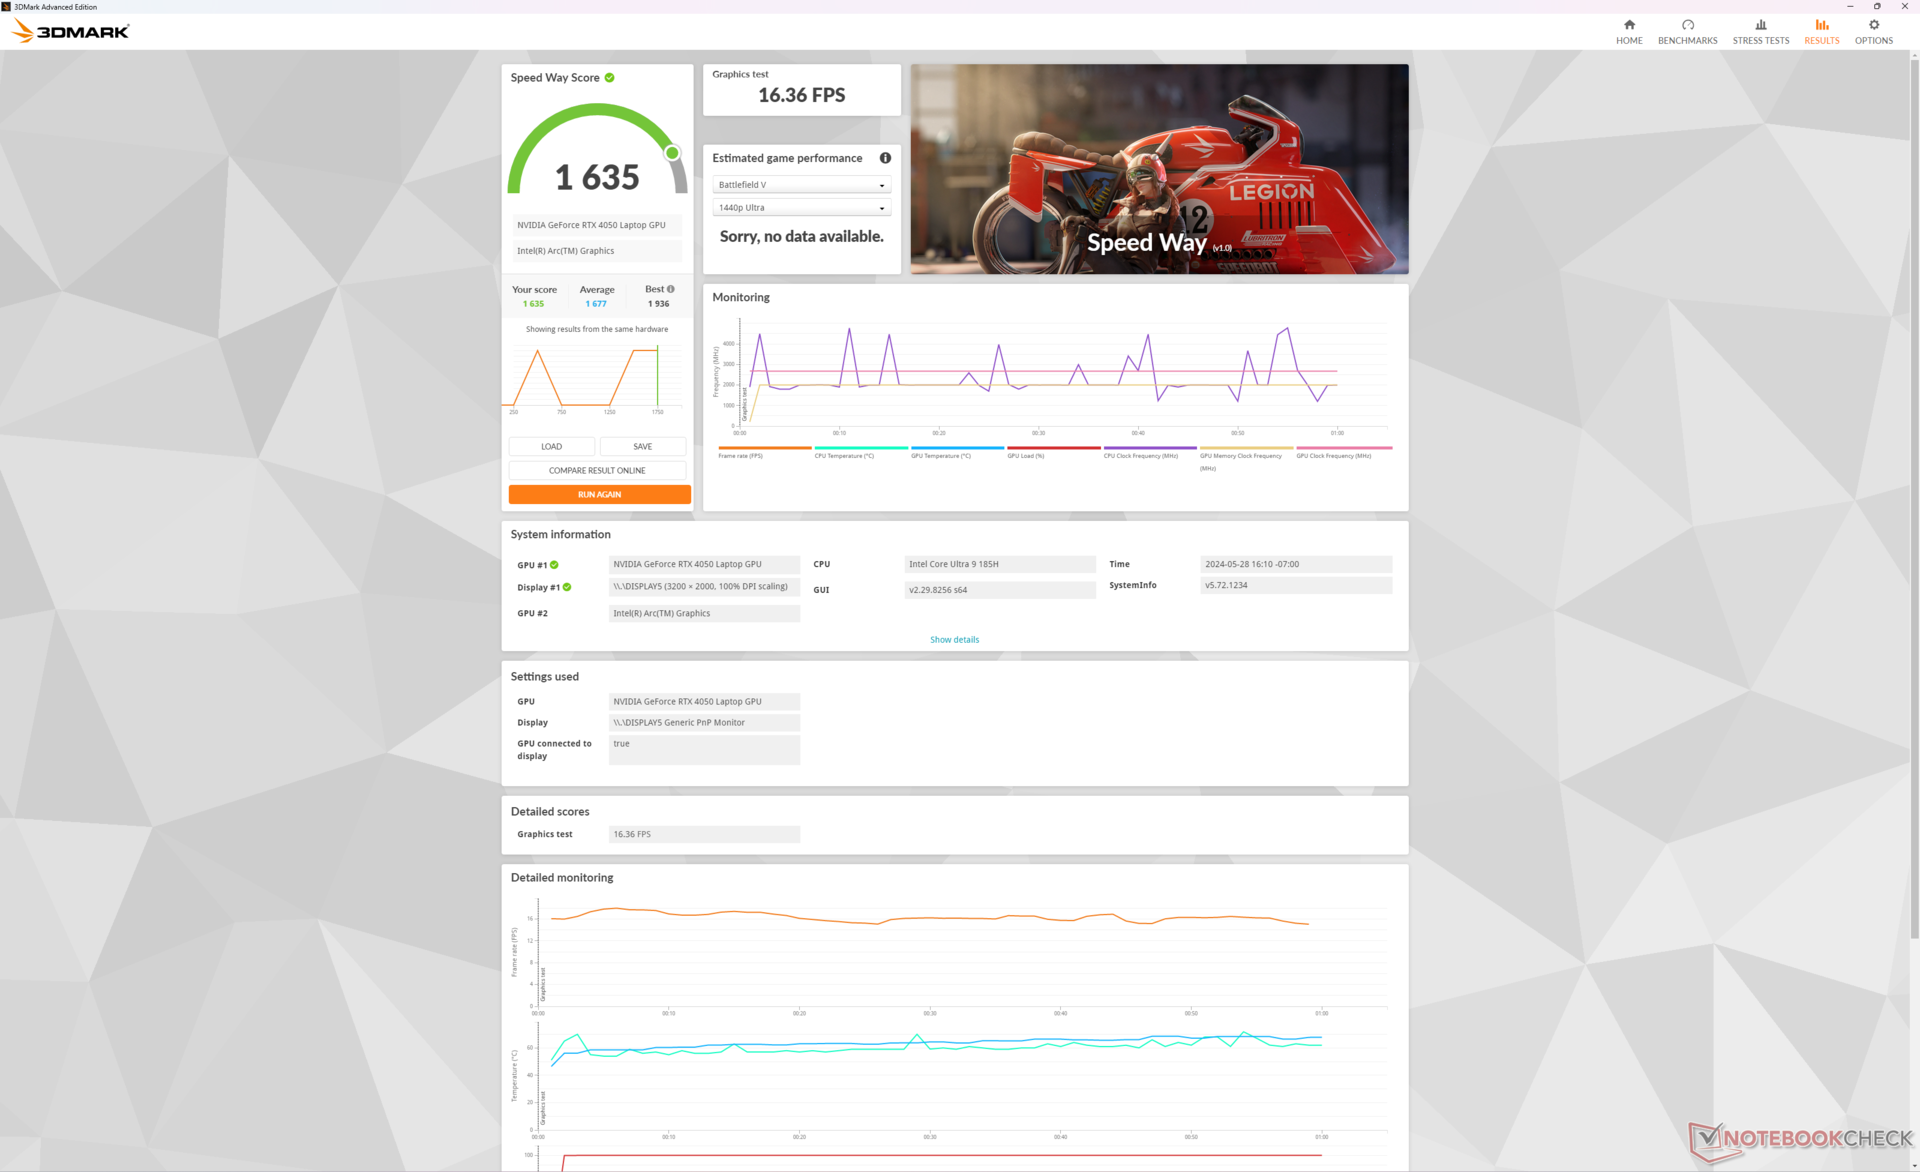
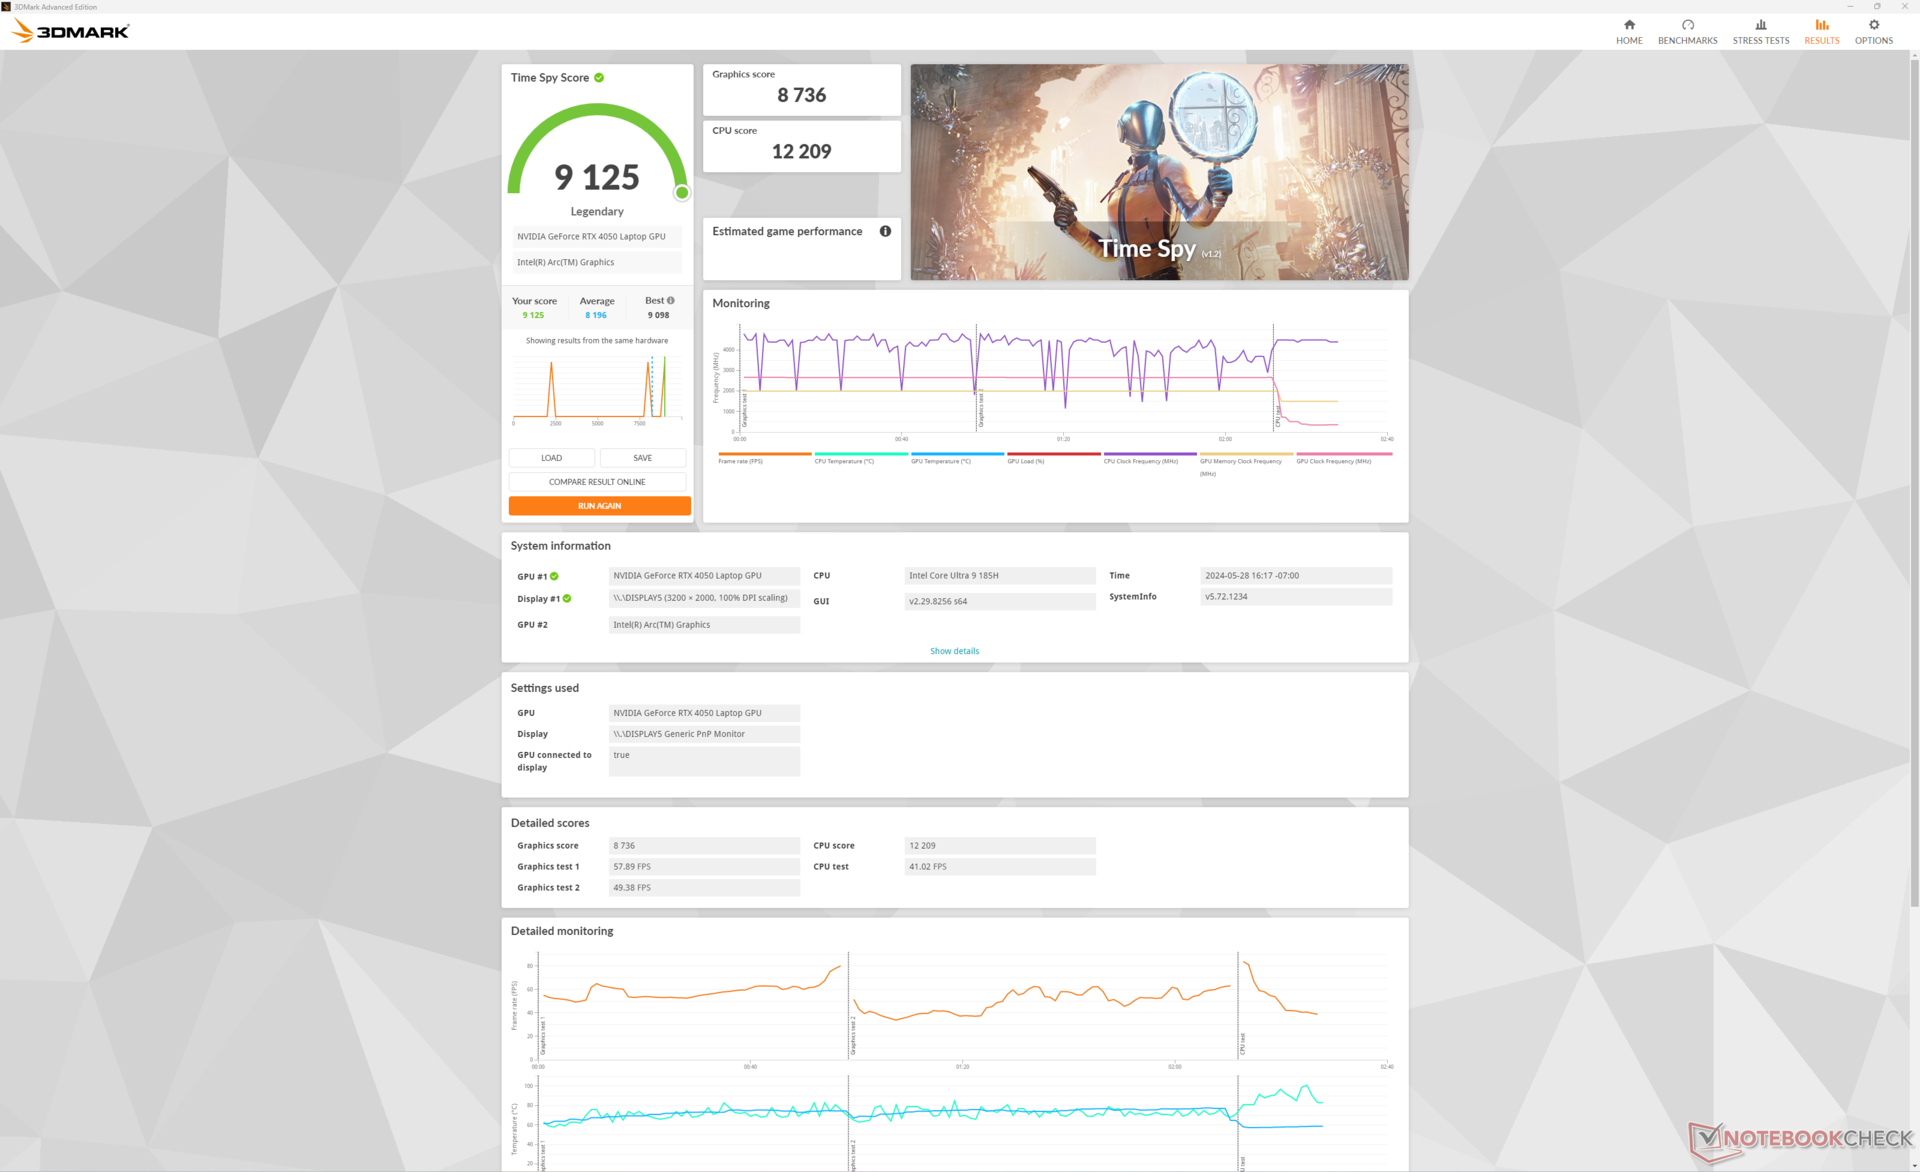
Graphics performance is better than expected with 3DMark scores that are about 10 percent faster than the average laptop in our database with the same GeForce RTX 4050 GPU. This advantage can be largely attributed to the high 75 W to 100 W TGP target in the Lenovo as most other laptops with the same GPU have lower TGP ceilings. While Nvidia control panel claims a total graphics power of 100 W for the RTX 4050, it would typically stabilize at around 75 W to 85 W instead when running games as exemplified in our Stress Test section above.
Overall performance is around 25 to 30 percent slower than the RTX 4070 configuration which can reach higher power ranges between 90 W and 100 W. This is important to note for the Power Consumption section below for performance-per-watt analyses.
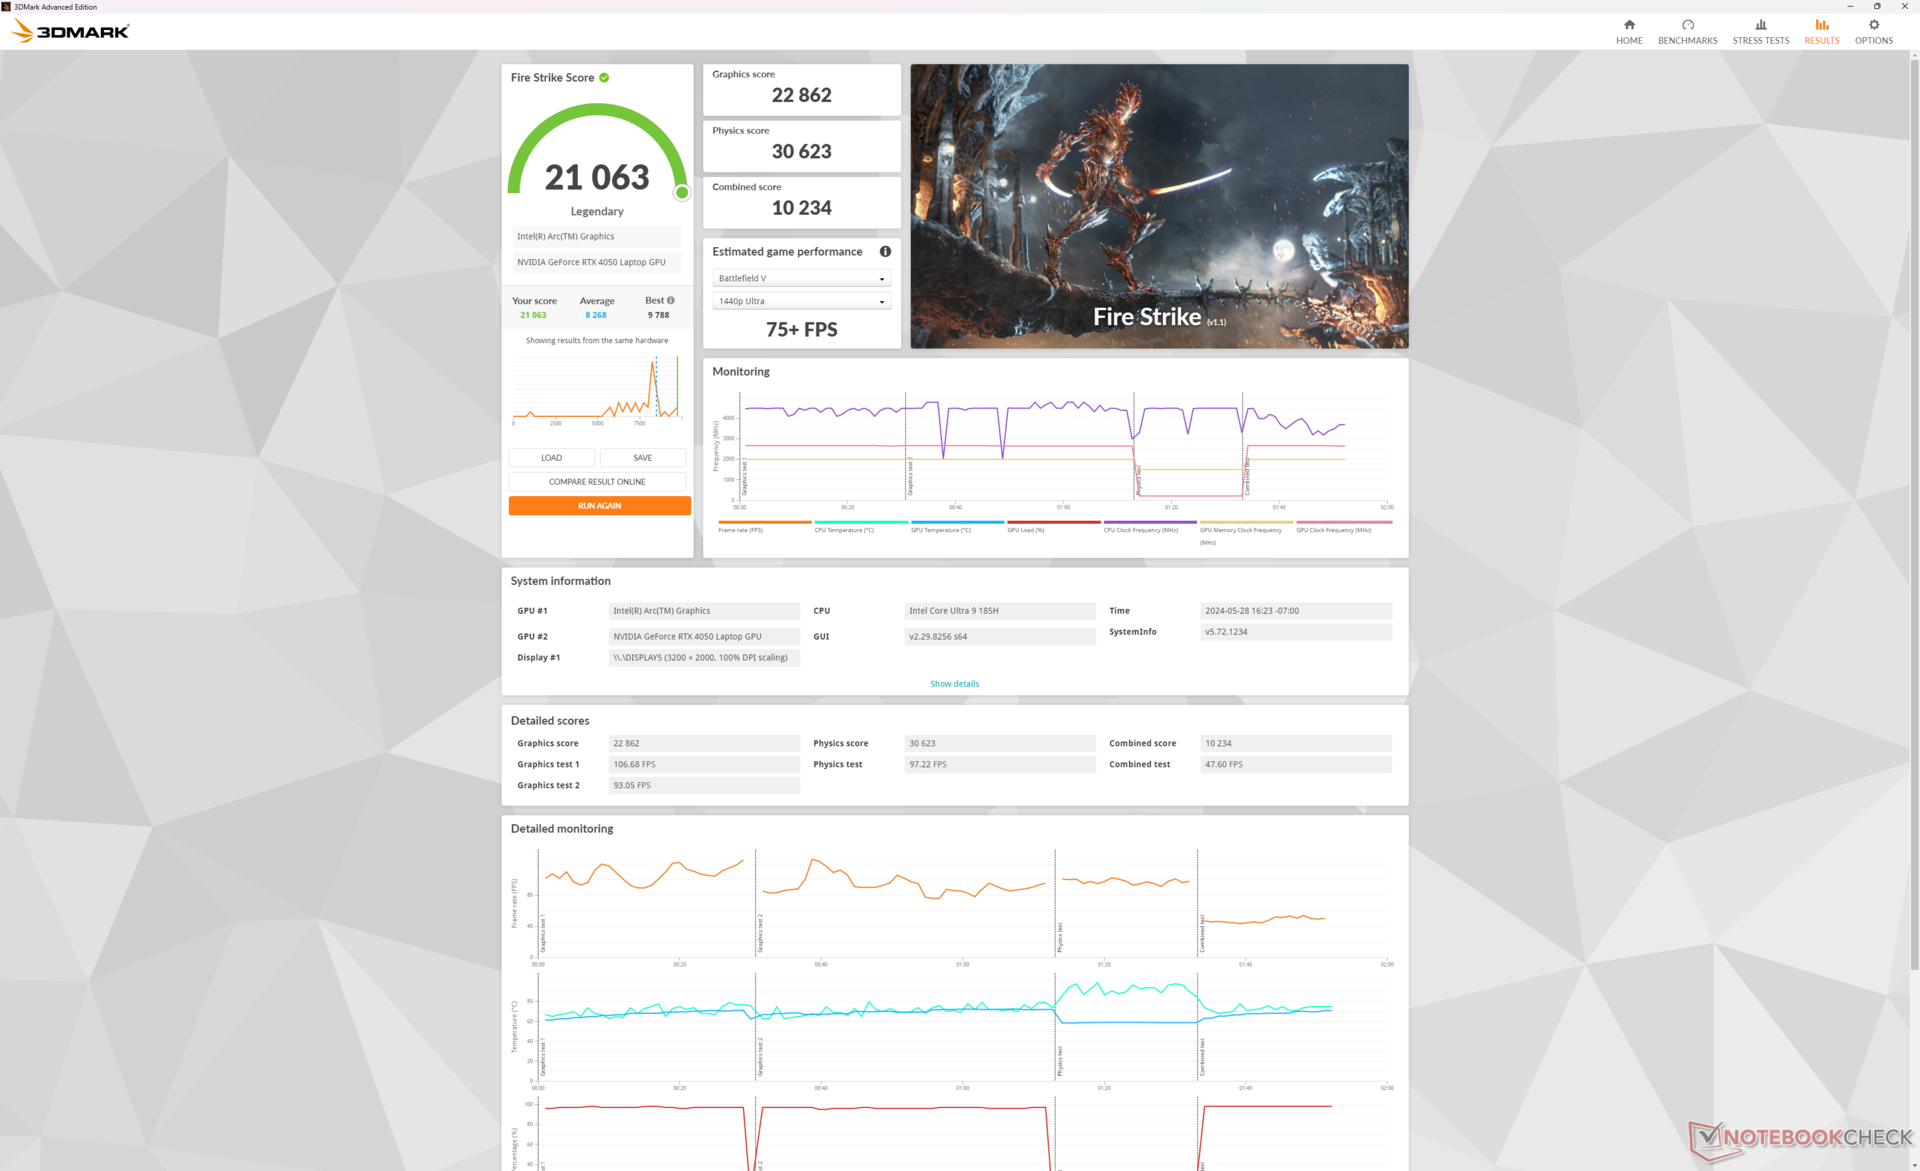
| Power Profile | Graphics Score | Physics Score | Combined Score |
| Performance Mode | 22862 | 30623 | 10234 |
| Balanced Mode | 21008 (-8%) | 29772 (-3%) | 8401 (-18%) |
| Battery Power | 20095 (-12%) | 30278 (-1%) | 7999 (-22%) |
Running on Balanced mode impacts GPU performance more than CPU performance as shown by our Fire Strike results table.
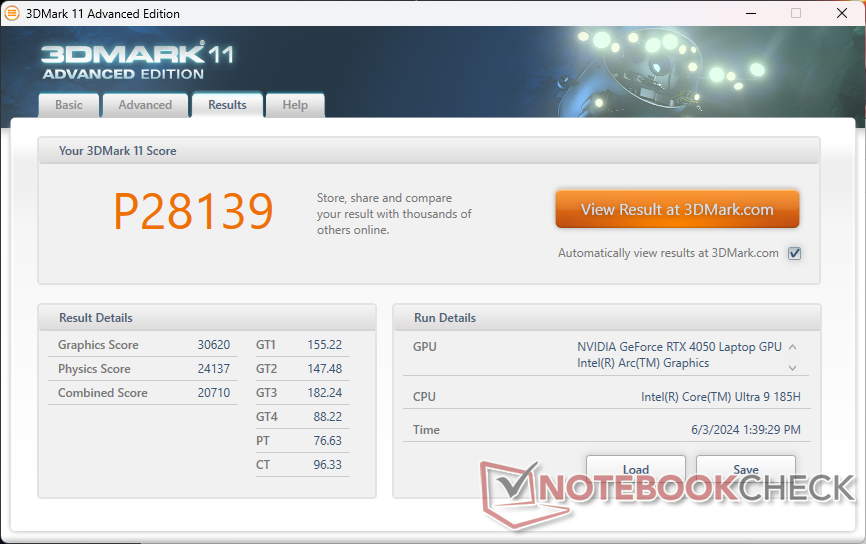
| 3DMark 11 Performance | 28139 points | |
| 3DMark Fire Strike Score | 21063 points | |
| 3DMark Time Spy Score | 9125 points | |
| 3DMark Steel Nomad Score | 1846 points | |
Help | ||
* ... smaller is better
Gaming Performance
The system is powerful enough to run demanding games like Cyberpunk 2077 at the native 3200 x 2000 resolution with medium or lower settings. For the best results, however, it's recommended to enable DLSS whenever possible to boost frame rates closer to 60+ FPS.
| Performance rating - Percent | |
| Lenovo Yoga Pro 9 16IMH9 | |
| Lenovo Yoga Pro 9 16IMH9 RTX 4050 | |
| Asus VivoBook Pro 16 K6602VU | |
| Dell XPS 16 9640 | |
| Samsung Galaxy Book4 Ultra | |
| HP Envy x360 2-in-1 16-ad0097nr | |
| The Witcher 3 - 1920x1080 Ultra Graphics & Postprocessing (HBAO+) | |
| Lenovo Yoga Pro 9 16IMH9 | |
| Dell XPS 16 9640 | |
| Lenovo Yoga Pro 9 16IMH9 RTX 4050 | |
| Asus VivoBook Pro 16 K6602VU | |
| Samsung Galaxy Book4 Ultra | |
| HP Envy x360 2-in-1 16-ad0097nr | |
| Final Fantasy XV Benchmark - 1920x1080 High Quality | |
| Lenovo Yoga Pro 9 16IMH9 | |
| Dell XPS 16 9640 | |
| Lenovo Yoga Pro 9 16IMH9 RTX 4050 | |
| Asus VivoBook Pro 16 K6602VU | |
| Samsung Galaxy Book4 Ultra | |
| HP Envy x360 2-in-1 16-ad0097nr | |
| Strange Brigade - 1920x1080 ultra AA:ultra AF:16 | |
| Lenovo Yoga Pro 9 16IMH9 | |
| Dell XPS 16 9640 | |
| Lenovo Yoga Pro 9 16IMH9 RTX 4050 | |
| Asus VivoBook Pro 16 K6602VU | |
| Samsung Galaxy Book4 Ultra | |
| HP Envy x360 2-in-1 16-ad0097nr | |
| Dota 2 Reborn - 1920x1080 ultra (3/3) best looking | |
| Lenovo Yoga Pro 9 16IMH9 | |
| Lenovo Yoga Pro 9 16IMH9 RTX 4050 | |
| Samsung Galaxy Book4 Ultra | |
| Asus VivoBook Pro 16 K6602VU | |
| Dell XPS 16 9640 | |
| HP Envy x360 2-in-1 16-ad0097nr | |
| X-Plane 11.11 - 1920x1080 high (fps_test=3) | |
| Asus VivoBook Pro 16 K6602VU | |
| Lenovo Yoga Pro 9 16IMH9 | |
| Lenovo Yoga Pro 9 16IMH9 RTX 4050 | |
| Dell XPS 16 9640 | |
| Dell XPS 16 9640 | |
| Samsung Galaxy Book4 Ultra | |
| HP Envy x360 2-in-1 16-ad0097nr | |
Witcher 3 FPS Chart
| low | med. | high | ultra | QHD | |
|---|---|---|---|---|---|
| The Witcher 3 (2015) | 395.6 | 290.5 | 164 | 83.7 | 61 |
| Dota 2 Reborn (2015) | 174.6 | 148.7 | 145.1 | 138.5 | |
| Final Fantasy XV Benchmark (2018) | 182.4 | 121.5 | 84.2 | 61.6 | |
| X-Plane 11.11 (2018) | 134.8 | 117.7 | 89.4 | ||
| Far Cry 5 (2018) | 151 | 129 | 121 | 113 | 86 |
| Strange Brigade (2018) | 432 | 213 | 170.9 | 150 | 99.7 |
| Tiny Tina's Wonderlands (2022) | 181.1 | 141.8 | 93.3 | 72.3 | 49.5 |
| F1 22 (2022) | 221 | 219 | 171.5 | 53.4 | 34 |
| Baldur's Gate 3 (2023) | 112.3 | 91.9 | 83.5 | 81.3 | 55 |
| Cyberpunk 2077 (2023) | 101.9 | 79.6 | 67.8 | 58.3 | 36.4 |
Emissions
System Noise
Fan noise behavior is almost identical to what we recorded on the higher RTX 4070 configuration to suggest that the weaker RTX 4050 configuration is not any quieter despite its slower GPU.
Noise level
| Idle |
| 23.6 / 25.4 / 25.4 dB(A) |
| Load |
| 44.2 / 52.6 dB(A) |
 | ||
30 dB silent 40 dB(A) audible 50 dB(A) loud |
||
min: | ||
| Lenovo Yoga Pro 9 16IMH9 RTX 4050 GeForce RTX 4050 Laptop GPU, Ultra 9 185H, SK Hynix HFS001TEJ9X115N | Lenovo Yoga Pro 9 16IMH9 GeForce RTX 4070 Laptop GPU, Ultra 9 185H, SK Hynix HFS001TEJ9X115N | HP Envy x360 2-in-1 16-ad0097nr Radeon 780M, R7 8840HS, KIOXIA BG5 KBG50ZNV1T02 | Dell XPS 16 9640 GeForce RTX 4070 Laptop GPU, Ultra 7 155H, Kioxia XG8 KXG80ZNV1T02 | Samsung Galaxy Book4 Ultra GeForce RTX 4050 Laptop GPU, Ultra 7 155H, Samsung PM9A1 MZVL2512HCJQ | Asus VivoBook Pro 16 K6602VU GeForce RTX 4050 Laptop GPU, i9-13900H, Micron 2400 MTFDKBA1T0QFM | |
|---|---|---|---|---|---|---|
| Noise | -2% | 14% | 0% | 8% | -2% | |
| off / environment * (dB) | 23.6 | 24.3 -3% | 22.9 3% | 24.5 -4% | 24.2 -3% | 20.96 11% |
| Idle Minimum * (dB) | 23.6 | 24.3 -3% | 23 3% | 24.5 -4% | 24.2 -3% | 25.28 -7% |
| Idle Average * (dB) | 25.4 | 24.3 4% | 23 9% | 24.5 4% | 24.2 5% | 25.28 -0% |
| Idle Maximum * (dB) | 25.4 | 25.8 -2% | 23 9% | 27.5 -8% | 24.2 5% | 25.28 -0% |
| Load Average * (dB) | 44.2 | 48.1 -9% | 23.8 46% | 39.6 10% | 37.9 14% | 51.88 -17% |
| Witcher 3 ultra * (dB) | 48.9 | 49.7 -2% | 43.8 10% | 49.7 -2% | 41.7 15% | 49 -0% |
| Load Maximum * (dB) | 52.6 | 53.9 -2% | 43.8 17% | 49.7 6% | 41.7 21% | 51.8 2% |
* ... smaller is better
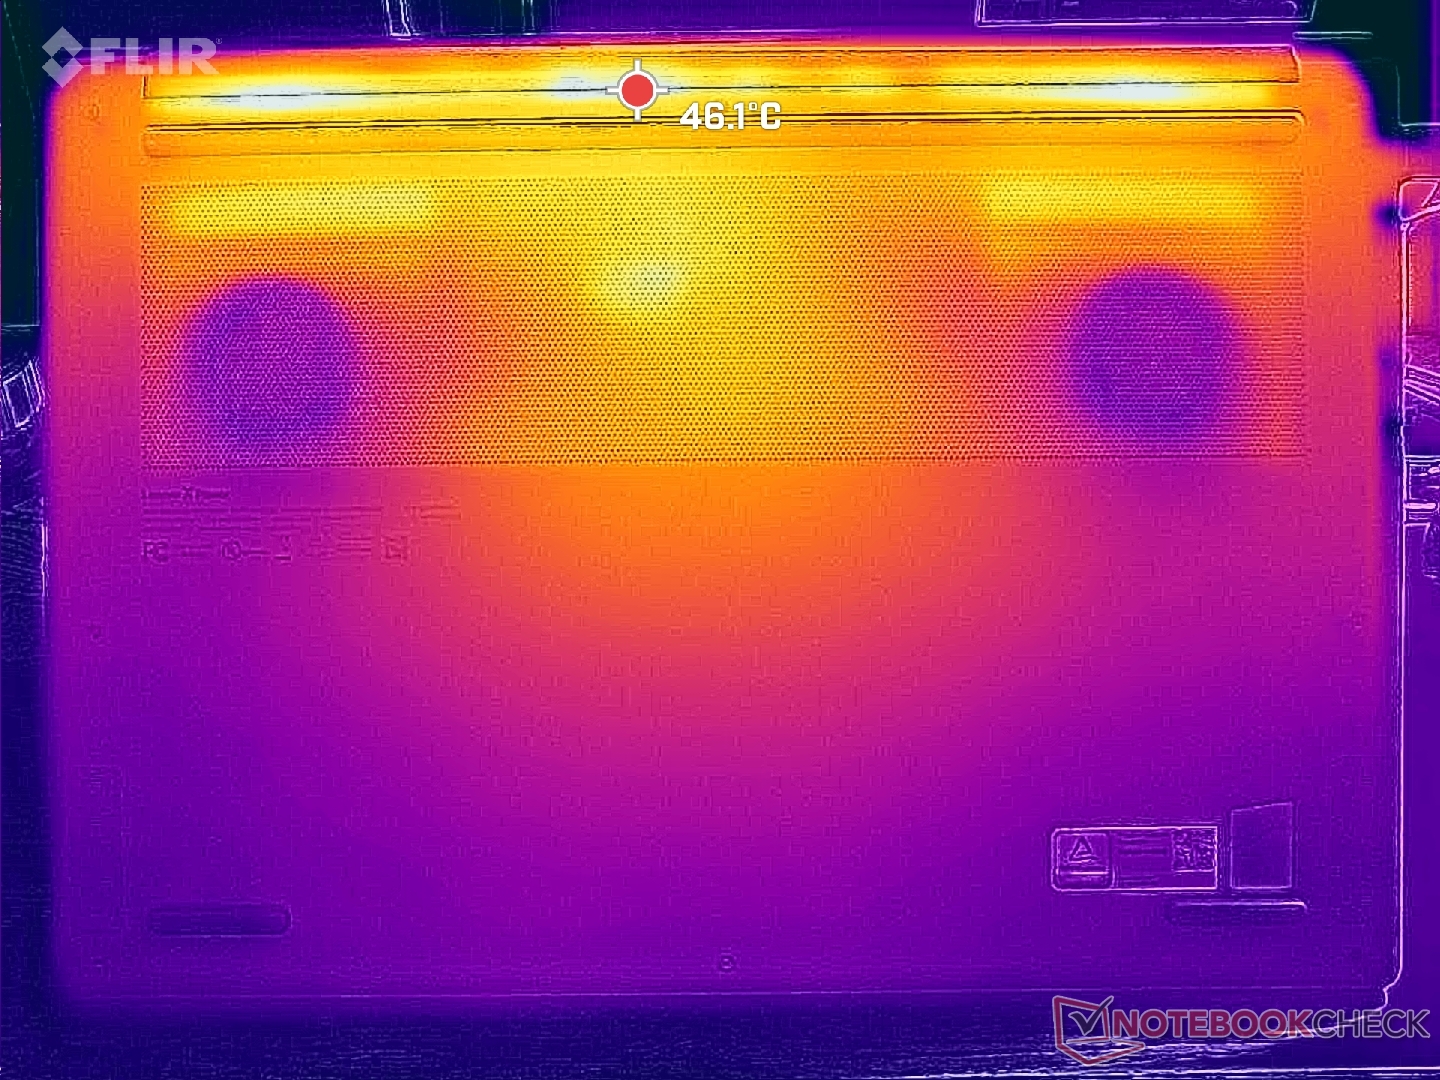
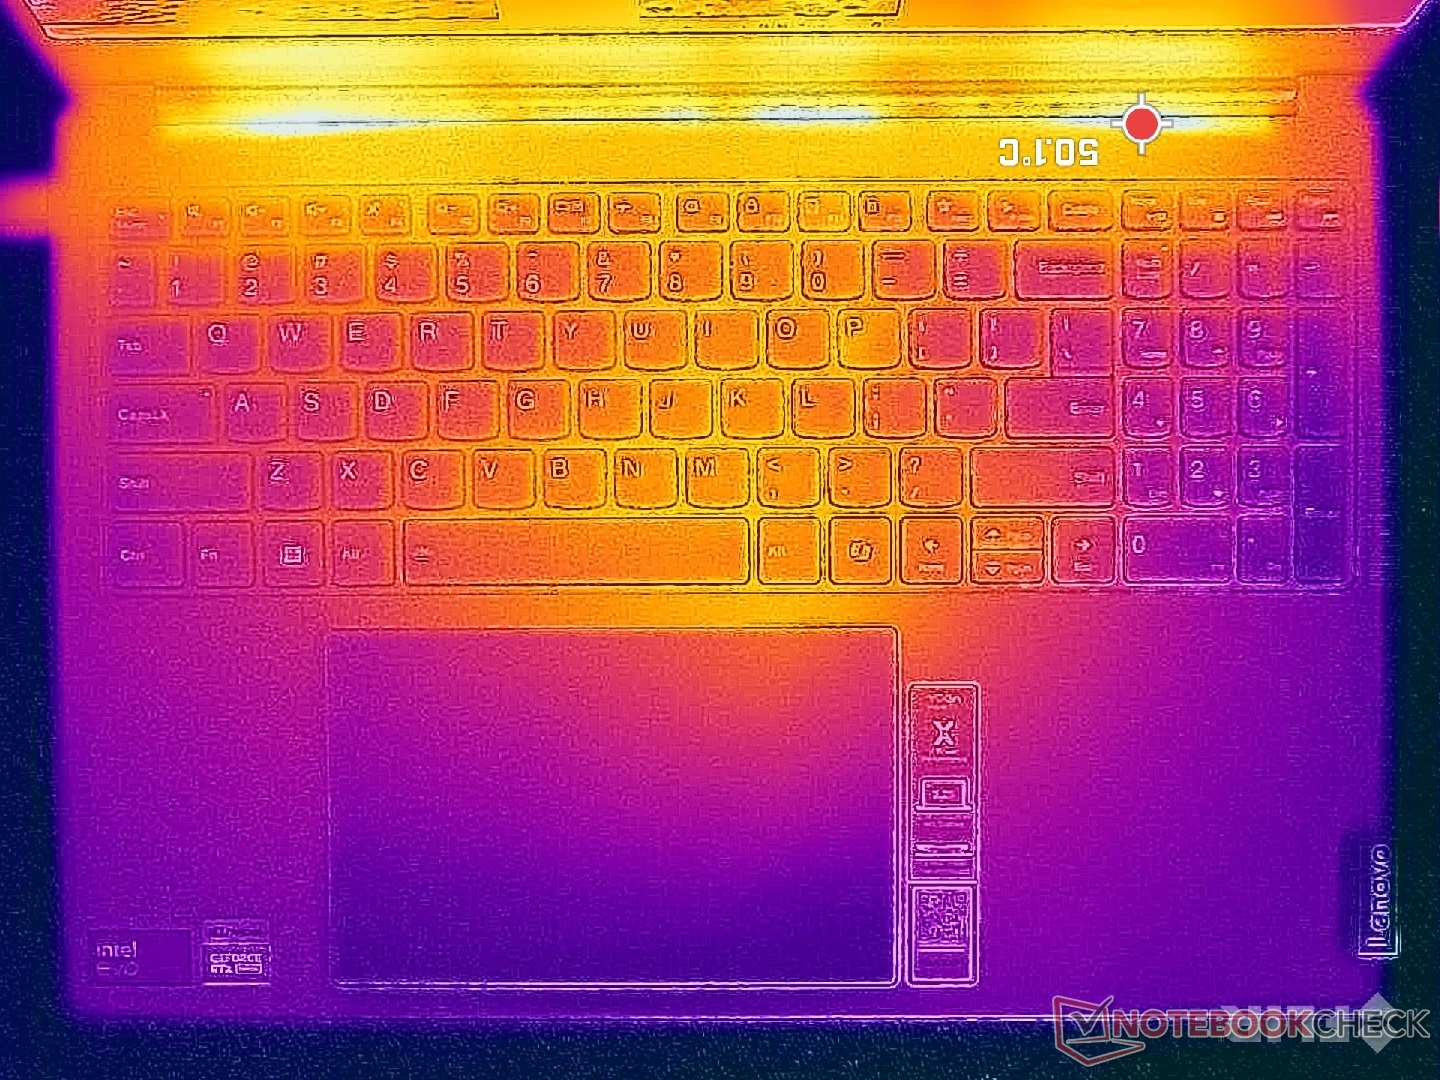
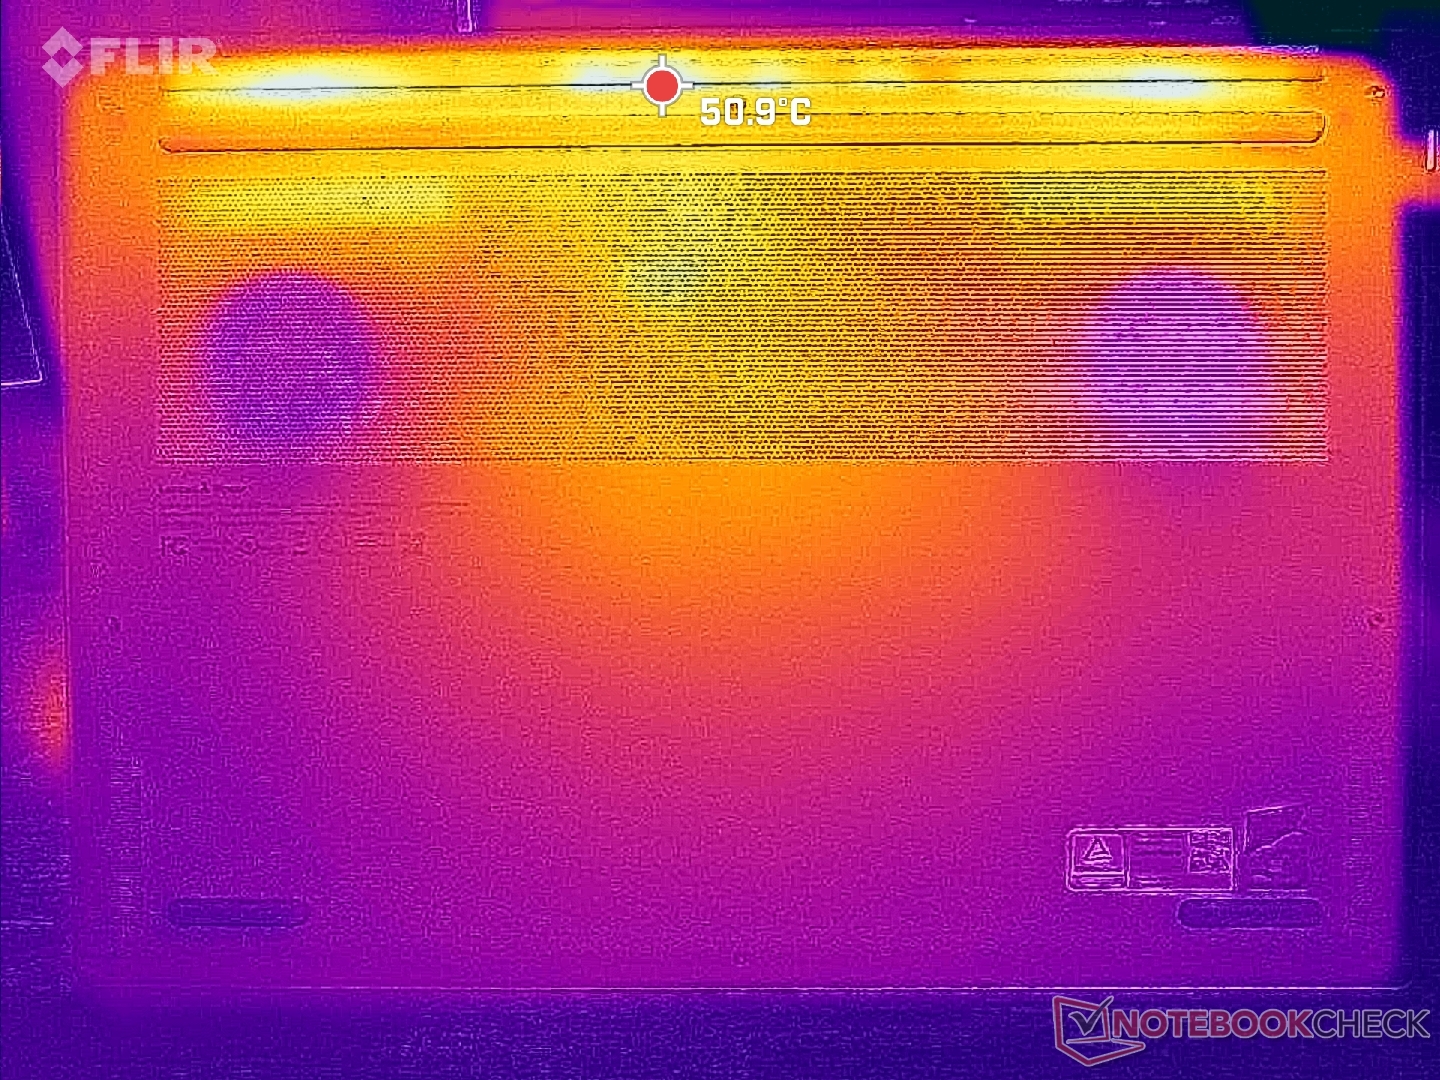
Temperature
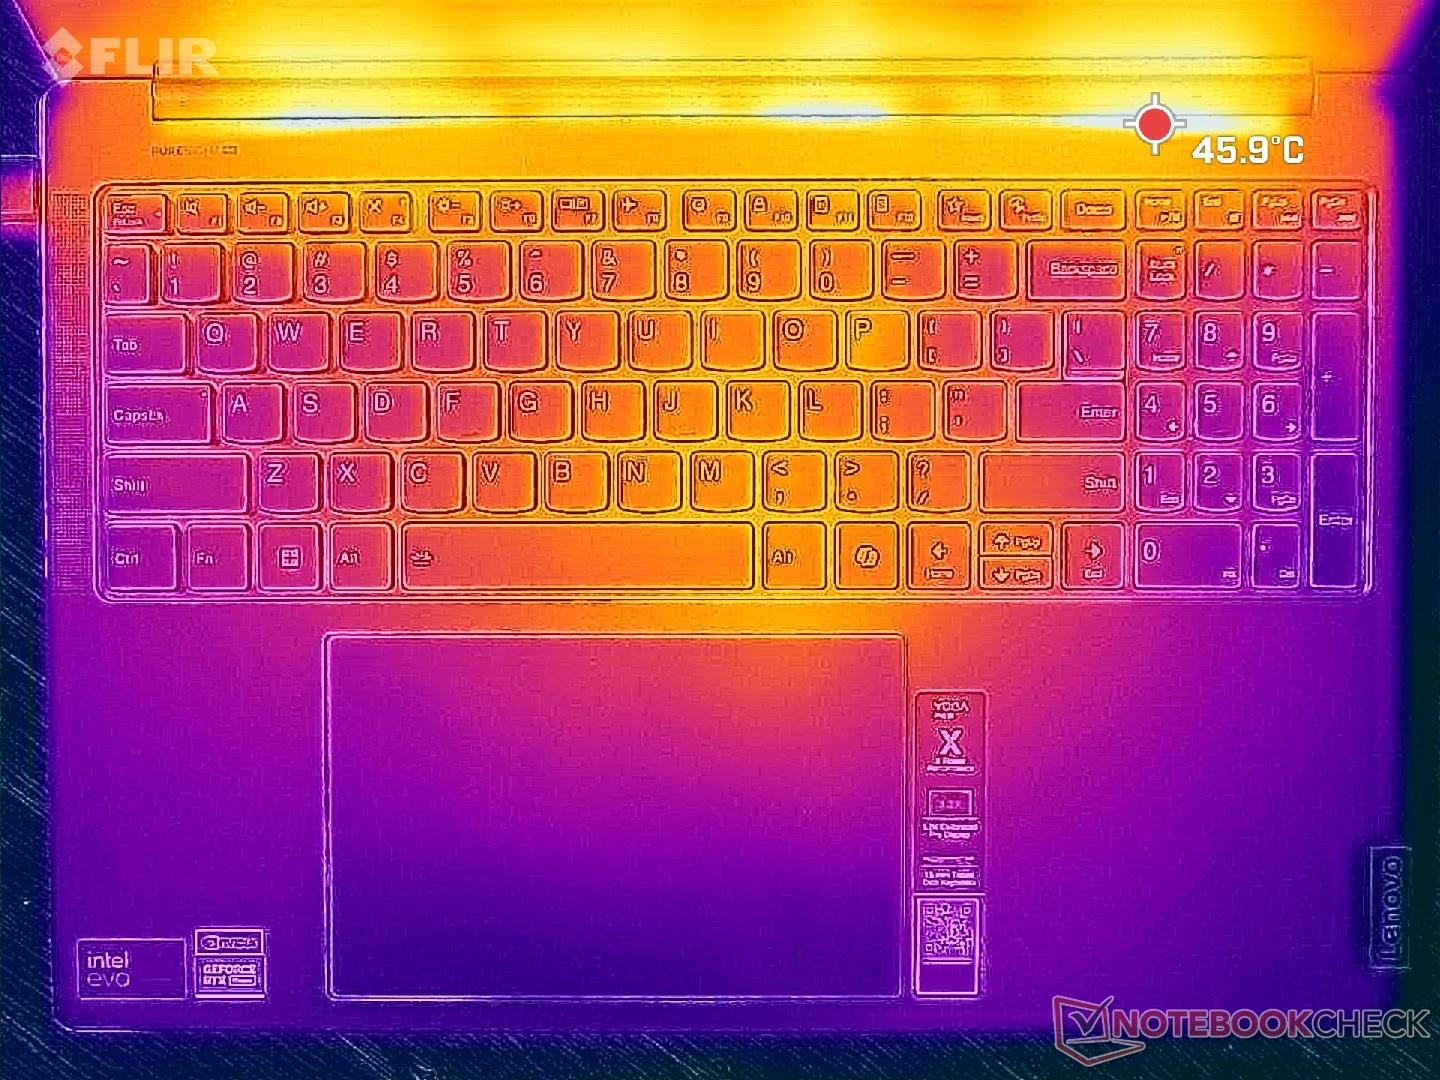
Hot spots can reach over 41 C when running demanding loads which is several degrees cooler than what we recorded on the Asus VivoBook Pro 16 with the same RTX 4050 GPU.
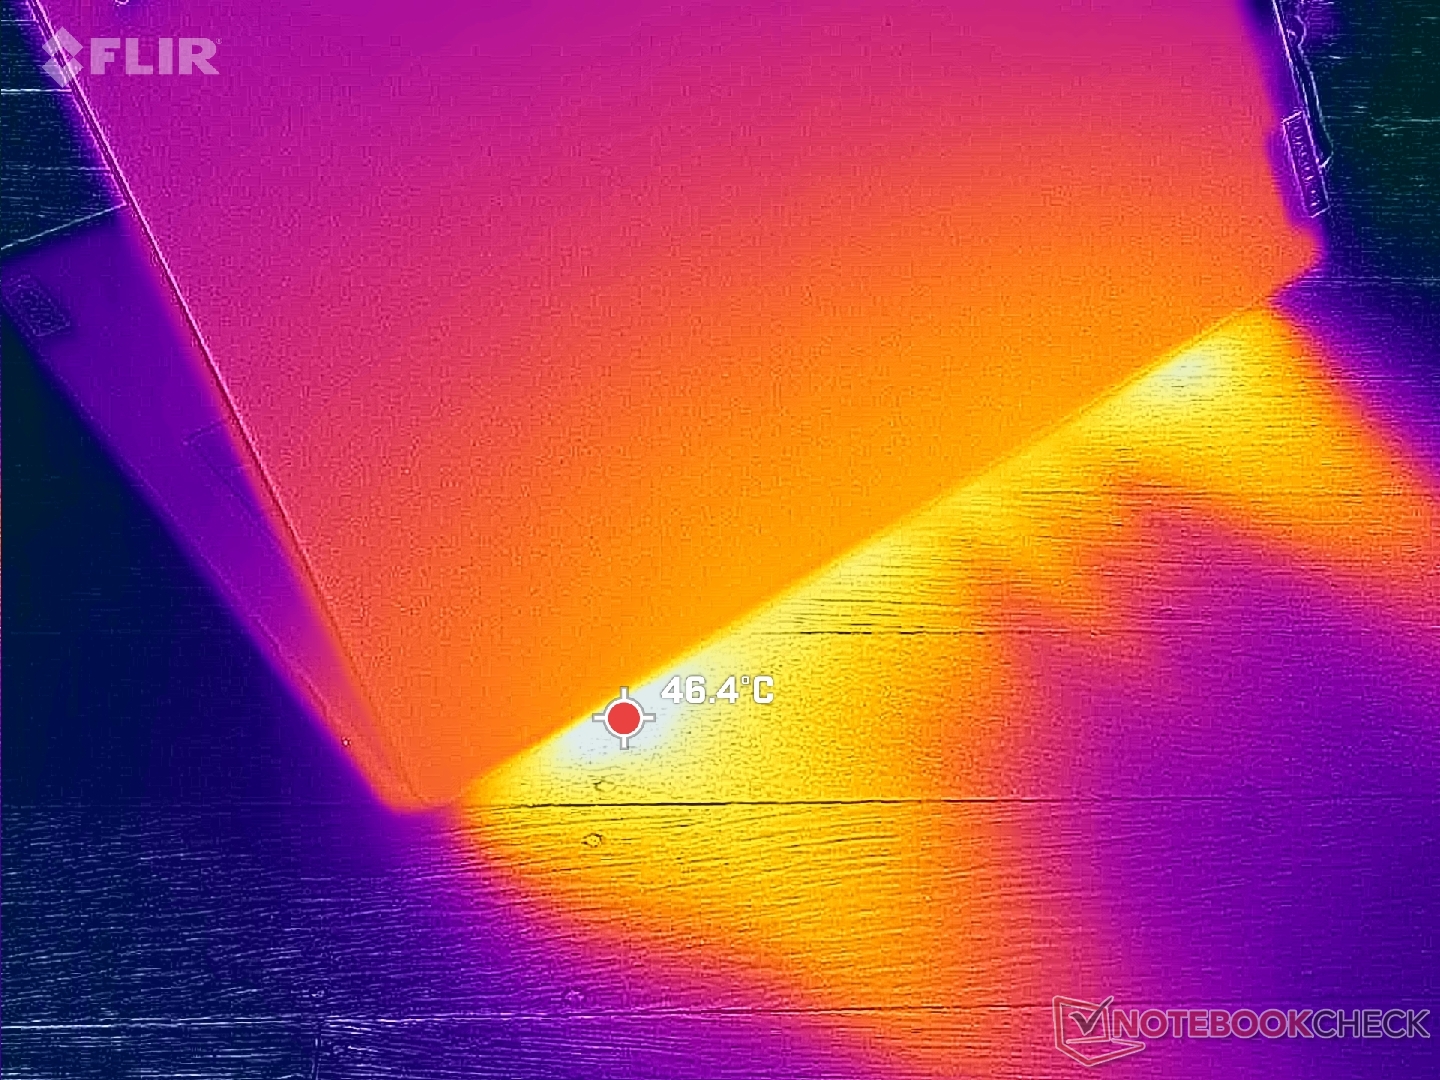
(±) The maximum temperature on the upper side is 41 °C / 106 F, compared to the average of 40.4 °C / 105 F, ranging from 21.2 to 68.8 °C for the class Gaming.
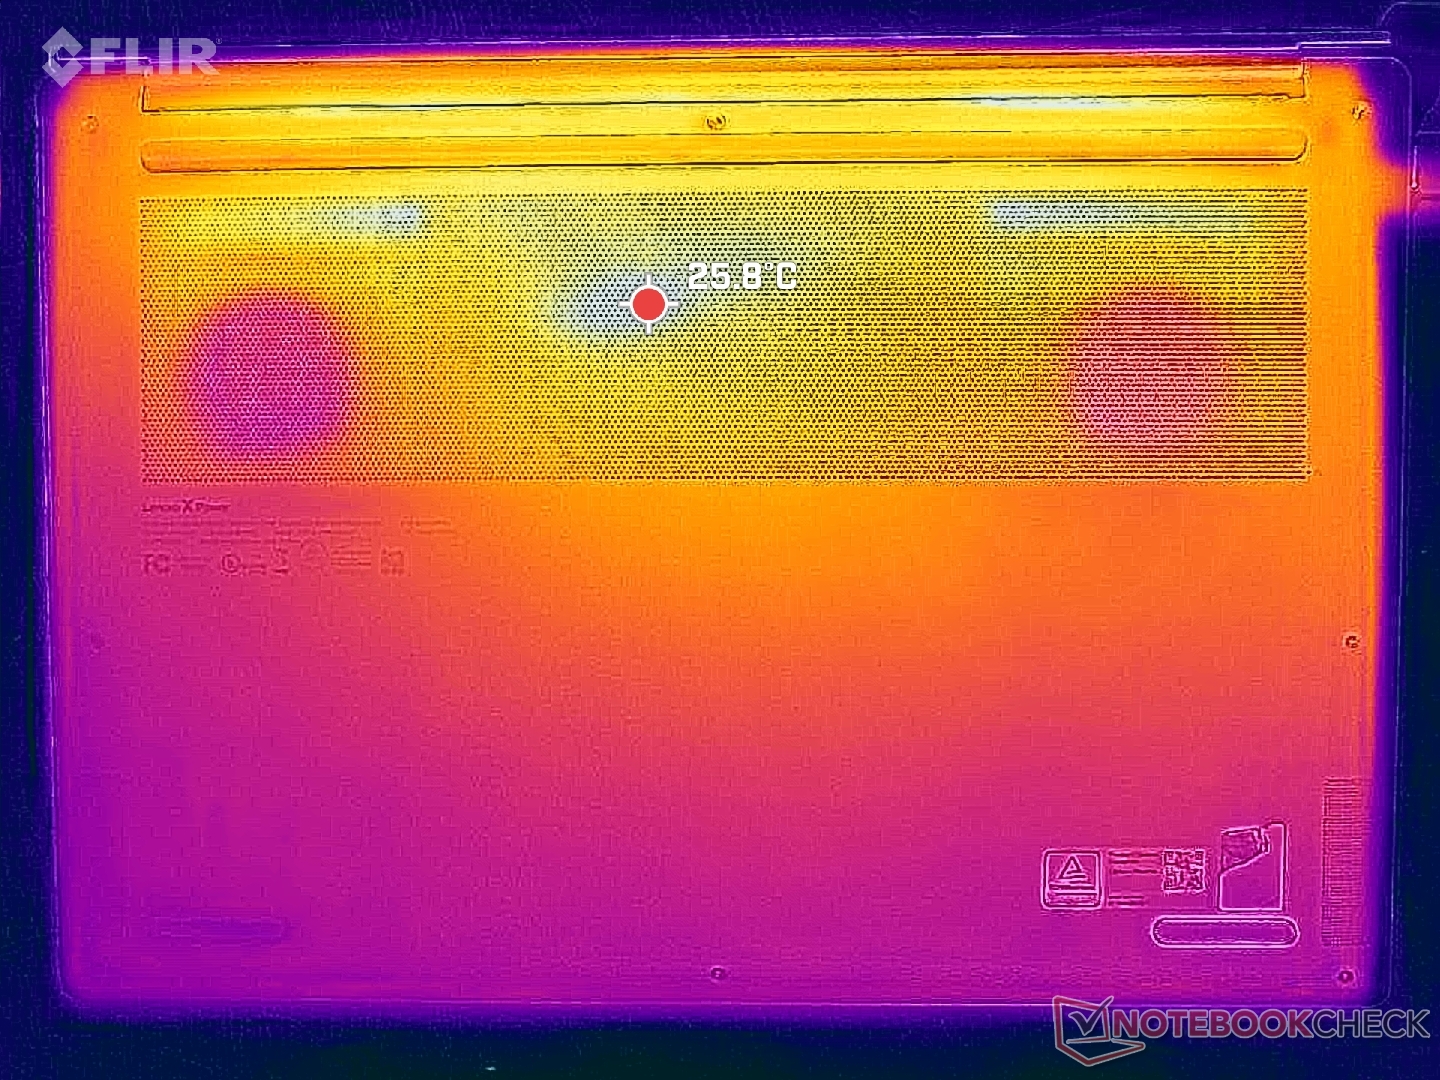
(±) The bottom heats up to a maximum of 40.6 °C / 105 F, compared to the average of 43.2 °C / 110 F
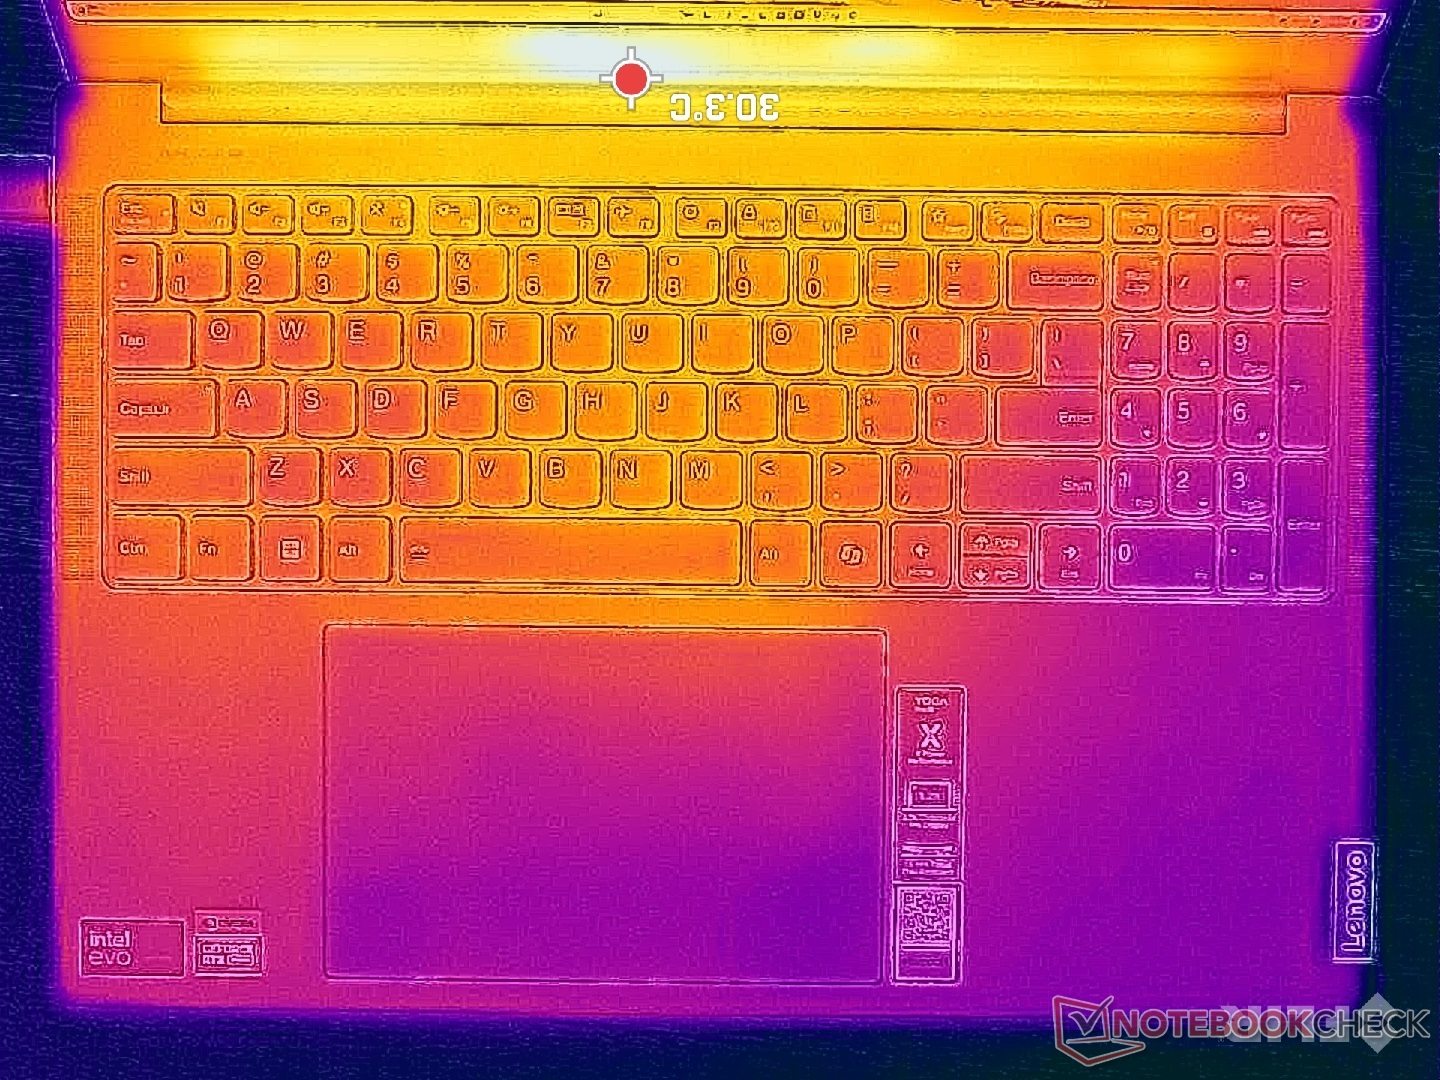
(+) In idle usage, the average temperature for the upper side is 27.8 °C / 82 F, compared to the device average of 33.9 °C / 93 F.
(±) Playing The Witcher 3, the average temperature for the upper side is 33 °C / 91 F, compared to the device average of 33.9 °C / 93 F.
(+) The palmrests and touchpad are cooler than skin temperature with a maximum of 29.6 °C / 85.3 F and are therefore cool to the touch.
(±) The average temperature of the palmrest area of similar devices was 28.8 °C / 83.8 F (-0.8 °C / -1.5 F).
| Lenovo Yoga Pro 9 16IMH9 RTX 4050 Intel Core Ultra 9 185H, NVIDIA GeForce RTX 4050 Laptop GPU | Lenovo Yoga Pro 9 16IMH9 Intel Core Ultra 9 185H, NVIDIA GeForce RTX 4070 Laptop GPU | HP Envy x360 2-in-1 16-ad0097nr AMD Ryzen 7 8840HS, AMD Radeon 780M | Dell XPS 16 9640 Intel Core Ultra 7 155H, NVIDIA GeForce RTX 4070 Laptop GPU | Samsung Galaxy Book4 Ultra Intel Core Ultra 7 155H, NVIDIA GeForce RTX 4050 Laptop GPU | Asus VivoBook Pro 16 K6602VU Intel Core i9-13900H, NVIDIA GeForce RTX 4050 Laptop GPU | |
|---|---|---|---|---|---|---|
| Heat | 3% | -1% | 8% | 13% | -20% | |
| Maximum Upper Side * (°C) | 41 | 41.7 -2% | 42.6 -4% | 39.4 4% | 38.5 6% | 42.6 -4% |
| Maximum Bottom * (°C) | 40.6 | 46.3 -14% | 47.8 -18% | 36.9 9% | 41.2 -1% | 48.4 -19% |
| Idle Upper Side * (°C) | 30.2 | 26.2 13% | 27.4 9% | 28.2 7% | 23.5 22% | 39.4 -30% |
| Idle Bottom * (°C) | 31.4 | 27.2 13% | 27.8 11% | 27.4 13% | 24.1 23% | 39.8 -27% |
* ... smaller is better
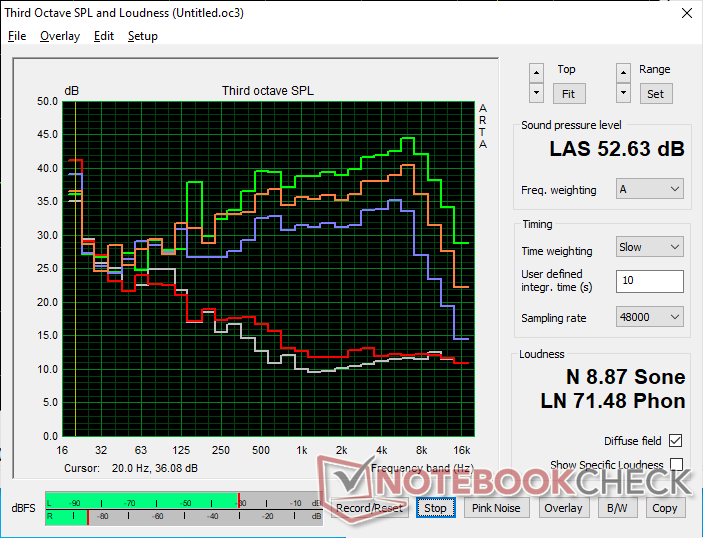
Speakers
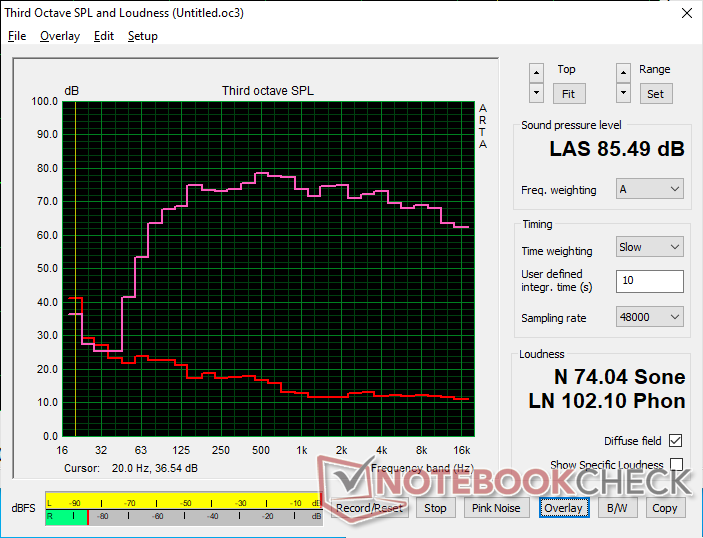
Lenovo Yoga Pro 9 16IMH9 RTX 4050 audio analysis
(+) | speakers can play relatively loud (85.5 dB)
Bass 100 - 315 Hz
(+) | good bass - only 2.1% away from median
(+) | bass is linear (3.8% delta to prev. frequency)
Mids 400 - 2000 Hz
(+) | balanced mids - only 2.6% away from median
(+) | mids are linear (3.1% delta to prev. frequency)
Highs 2 - 16 kHz
(+) | balanced highs - only 3.1% away from median
(+) | highs are linear (3% delta to prev. frequency)
Overall 100 - 16.000 Hz
(+) | overall sound is linear (5.8% difference to median)
Compared to same class
» 0% of all tested devices in this class were better, 0% similar, 100% worse
» The best had a delta of 6%, average was 18%, worst was 132%
Compared to all devices tested
» 0% of all tested devices were better, 0% similar, 100% worse
» The best had a delta of 4%, average was 24%, worst was 134%
Apple MacBook Pro 16 2021 M1 Pro audio analysis
(+) | speakers can play relatively loud (84.7 dB)
Bass 100 - 315 Hz
(+) | good bass - only 3.8% away from median
(+) | bass is linear (5.2% delta to prev. frequency)
Mids 400 - 2000 Hz
(+) | balanced mids - only 1.3% away from median
(+) | mids are linear (2.1% delta to prev. frequency)
Highs 2 - 16 kHz
(+) | balanced highs - only 1.9% away from median
(+) | highs are linear (2.7% delta to prev. frequency)
Overall 100 - 16.000 Hz
(+) | overall sound is linear (4.6% difference to median)
Compared to same class
» 0% of all tested devices in this class were better, 0% similar, 100% worse
» The best had a delta of 5%, average was 17%, worst was 45%
Compared to all devices tested
» 0% of all tested devices were better, 0% similar, 100% worse
» The best had a delta of 4%, average was 24%, worst was 134%
Energy Management
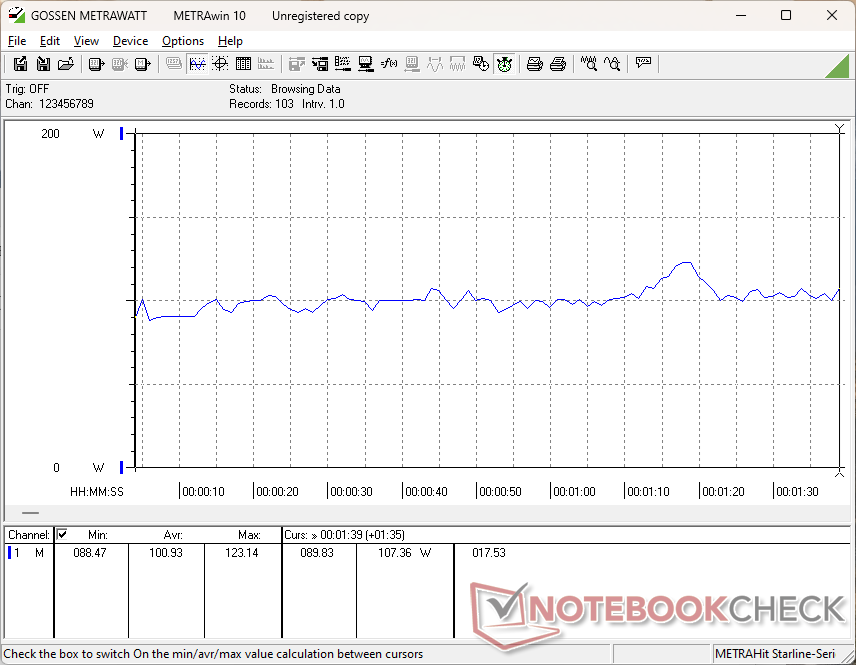
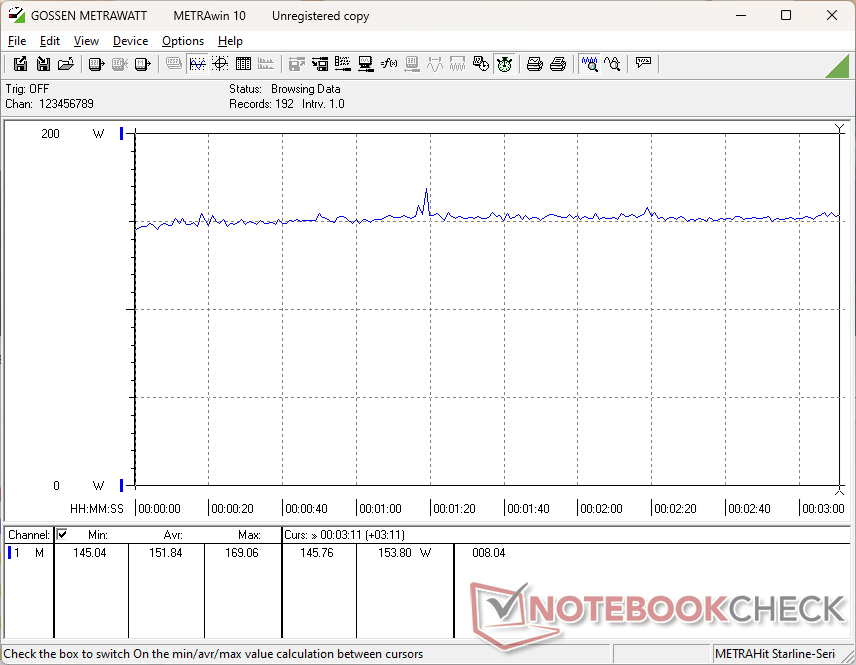
Power Consumption
Overall consumption levels are very close to what we recorded on the higher-end Mini-LED RTX 4070 configuration. When running Witcher 3, for example, our lower-end configuration would consume just 5 percent less on average even though it entails a 25 to 30 percent graphics performance deficit against the RTX 4070. Performance-per-watt therefore favors the RTX 4070 quite heavily.
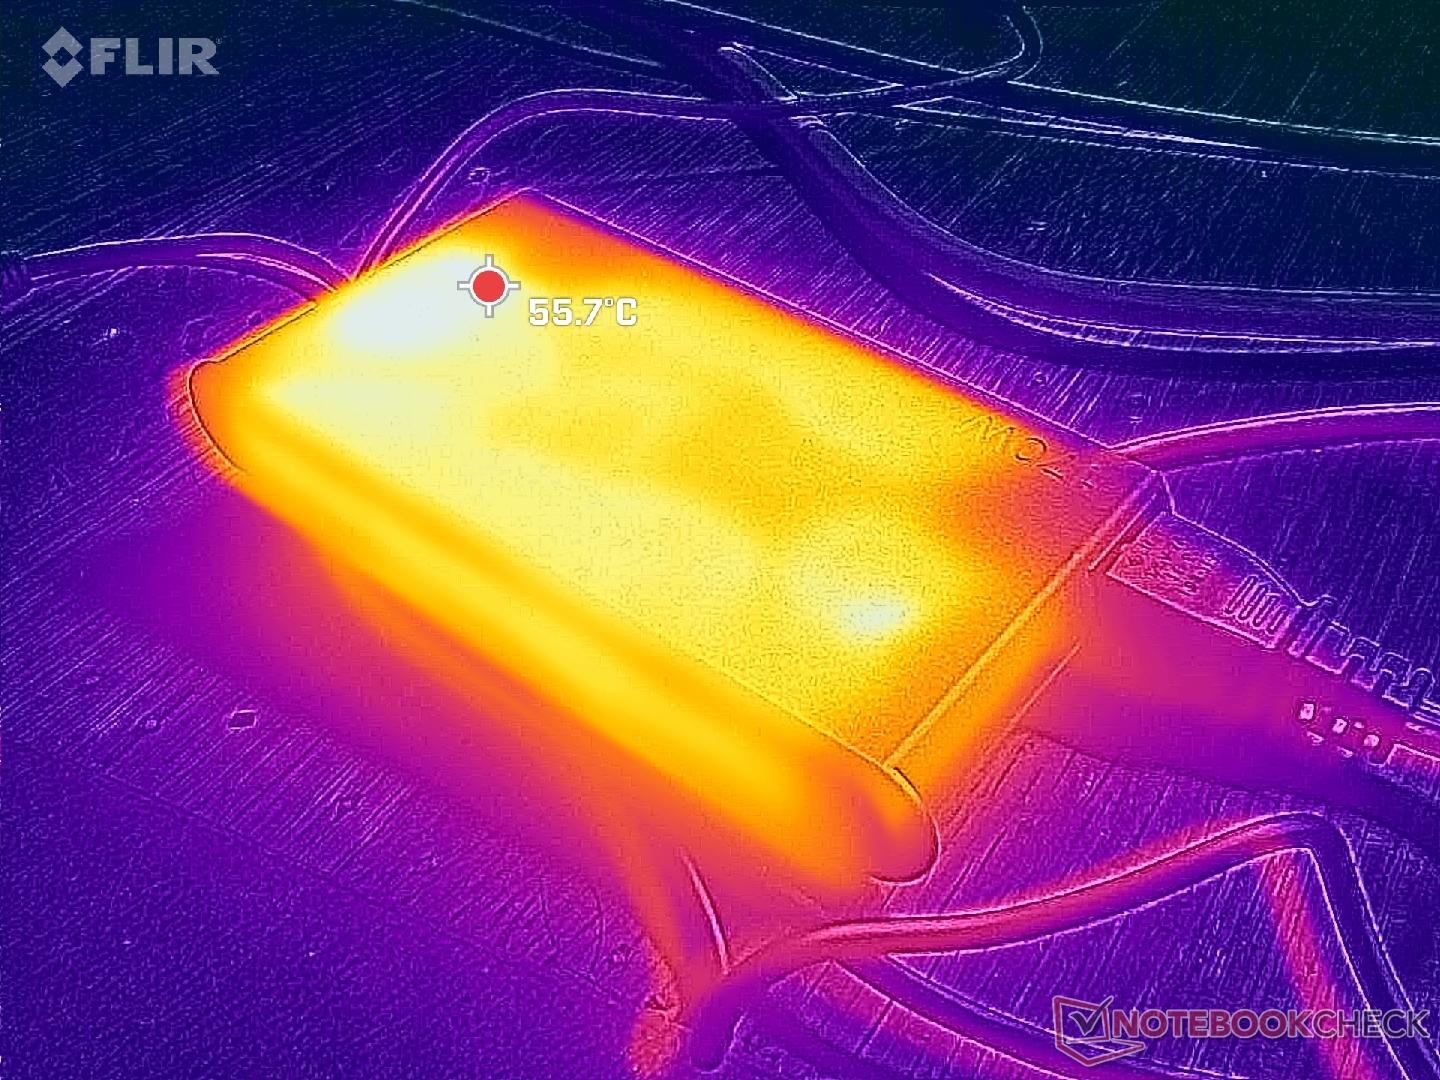
Users should keep in mind that the AC adapter is rated for only 170 W. Since gaming already demands between 150 W to 160 W, attempting to charge the laptop while gaming will result in a very slow charging rate.
| Off / Standby | |
| Idle | |
| Load |
|
Key:
min: | |
| Lenovo Yoga Pro 9 16IMH9 RTX 4050 Ultra 9 185H, GeForce RTX 4050 Laptop GPU, SK Hynix HFS001TEJ9X115N, IPS, 3200x2000, 16" | Lenovo Yoga Pro 9 16IMH9 Ultra 9 185H, GeForce RTX 4070 Laptop GPU, SK Hynix HFS001TEJ9X115N, Mini-LED, 3200x2000, 16" | HP Envy x360 2-in-1 16-ad0097nr R7 8840HS, Radeon 780M, KIOXIA BG5 KBG50ZNV1T02, OLED, 2880x1800, 16" | Dell XPS 16 9640 Ultra 7 155H, GeForce RTX 4070 Laptop GPU, Kioxia XG8 KXG80ZNV1T02, OLED, 3840x2400, 16.3" | Samsung Galaxy Book4 Ultra Ultra 7 155H, GeForce RTX 4050 Laptop GPU, Samsung PM9A1 MZVL2512HCJQ, OLED, 2880x1800, 16" | Asus VivoBook Pro 16 K6602VU i9-13900H, GeForce RTX 4050 Laptop GPU, Micron 2400 MTFDKBA1T0QFM, OLED, 3200x2000, 16" | |
|---|---|---|---|---|---|---|
| Power Consumption | -2% | 57% | 32% | 47% | -8% | |
| Idle Minimum * (Watt) | 9.9 | 10.3 -4% | 5 49% | 7.7 22% | 4.8 52% | 21.06 -113% |
| Idle Average * (Watt) | 16.6 | 21.9 -32% | 6.2 63% | 10.3 38% | 7.5 55% | 24.27 -46% |
| Idle Maximum * (Watt) | 29.2 | 22.4 23% | 14.7 50% | 10.6 64% | 7.9 73% | 25.12 14% |
| Load Average * (Watt) | 100.9 | 96.9 4% | 49.9 51% | 76.5 24% | 79.3 21% | 52.4 48% |
| Witcher 3 ultra * (Watt) | 151.8 | 159.6 -5% | 54.5 64% | 126.4 17% | 79.2 48% | 110.2 27% |
| Load Maximum * (Watt) | 182.2 | 173.8 5% | 65 64% | 138.5 24% | 125 31% | 146 20% |
* ... smaller is better
Power Consumption Witcher 3 / Stresstest
Power Consumption external Monitor
Battery Life
WLAN runtime on Balanced and Optimus modes with the display set to 150 nits would last for about the same time as the pricier RTX 4070 Mini-LED configuration. Results are a bit surprising on the surface since mini-LED and RTX 4070 GPU can be more power demanding than IPS and the RTX 4050, but the data makes sense once you factor in Optimus mode and the similar brightness settings during testing. The 9-hour browsing time is still very good for a 16-inch multimedia laptop with discrete graphics even if it's a bit shorter than competitors like the Dell XPS 16 or Samsung Galaxy Book4 Ultra.
| Lenovo Yoga Pro 9 16IMH9 RTX 4050 Ultra 9 185H, GeForce RTX 4050 Laptop GPU, 84 Wh | Lenovo Yoga Pro 9 16IMH9 Ultra 9 185H, GeForce RTX 4070 Laptop GPU, 84 Wh | HP Envy x360 2-in-1 16-ad0097nr R7 8840HS, Radeon 780M, 68 Wh | Dell XPS 16 9640 Ultra 7 155H, GeForce RTX 4070 Laptop GPU, 99.5 Wh | Samsung Galaxy Book4 Ultra Ultra 7 155H, GeForce RTX 4050 Laptop GPU, 76 Wh | Asus VivoBook Pro 16 K6602VU i9-13900H, GeForce RTX 4050 Laptop GPU, 96 Wh | |
|---|---|---|---|---|---|---|
| Battery runtime | -2% | -14% | 17% | 21% | 12% | |
| WiFi v1.3 (h) | 9 | 8.8 -2% | 7.7 -14% | 10.5 17% | 10.9 21% | 10.1 12% |
| H.264 (h) | 11.5 | 16.5 | 17.9 | 9.8 | ||
| Load (h) | 1.2 | 1.9 | 1.5 | 1.3 | ||
| Reader / Idle (h) | 15.6 |
Pros
Cons
Verdict — One Of Lenovo's Best If You're Willing To Pay
The Yoga Pro 9 16IMH9 is the most impressive model in the series thus far even at the lower-end configuration without RTX 4070 graphics or the fancy mini-LED screen to be a real alternative to the XPS 16 or MacBook Pro 16. Its IPS display, performance, and size are competitive to the Dell or Apple equivalents while being easier to service and with an arguably better keyboard than the XPS. We can certainly appreciate its wider variety of ports as well whereas the two competing models have only USB-C.
Other factors like battery life and fan noise aren't noticeably longer or quieter, respectively, than the higher-end RTX 4070 configuration.
The AI-ready Lenovo Yoga Pro 9 16IMH9 isn't just a great alternative to the Dell XPS 16 or MacBook Pro 16, but it also does a few things better than both.
The retail price of $1700 for the RTX 4050 configuration is a bit high since gaming laptops with the same GPU like the MSI Thin GF63 or Acer Nitro V can be found for under $1000 each. When compared to the competing XPS 16 or MacBook Pro 15, however, the Lenovo is several hundred dollars cheaper to be an attractive solution for those looking to save some cash while retaining the premium user experience.
Price and Availability
Best Buy is currently shipping the Lenovo Yoga Pro 9 16 configuration as reviewed for $1700.
Lenovo Yoga Pro 9 16IMH9 RTX 4050
- 06/06/2024 v7 (old)
Allen Ngo
Transparency
The selection of devices to be reviewed is made by our editorial team. The test sample was provided to the author as a loan by the manufacturer or retailer for the purpose of this review. The lender had no influence on this review, nor did the manufacturer receive a copy of this review before publication. There was no obligation to publish this review. As an independent media company, Notebookcheck is not subjected to the authority of manufacturers, retailers or publishers.
This is how Notebookcheck is testing
Every year, Notebookcheck independently reviews hundreds of laptops and smartphones using standardized procedures to ensure that all results are comparable. We have continuously developed our test methods for around 20 years and set industry standards in the process. In our test labs, high-quality measuring equipment is utilized by experienced technicians and editors. These tests involve a multi-stage validation process. Our complex rating system is based on hundreds of well-founded measurements and benchmarks, which maintains objectivity. Further information on our test methods can be found here.
Price comparison
