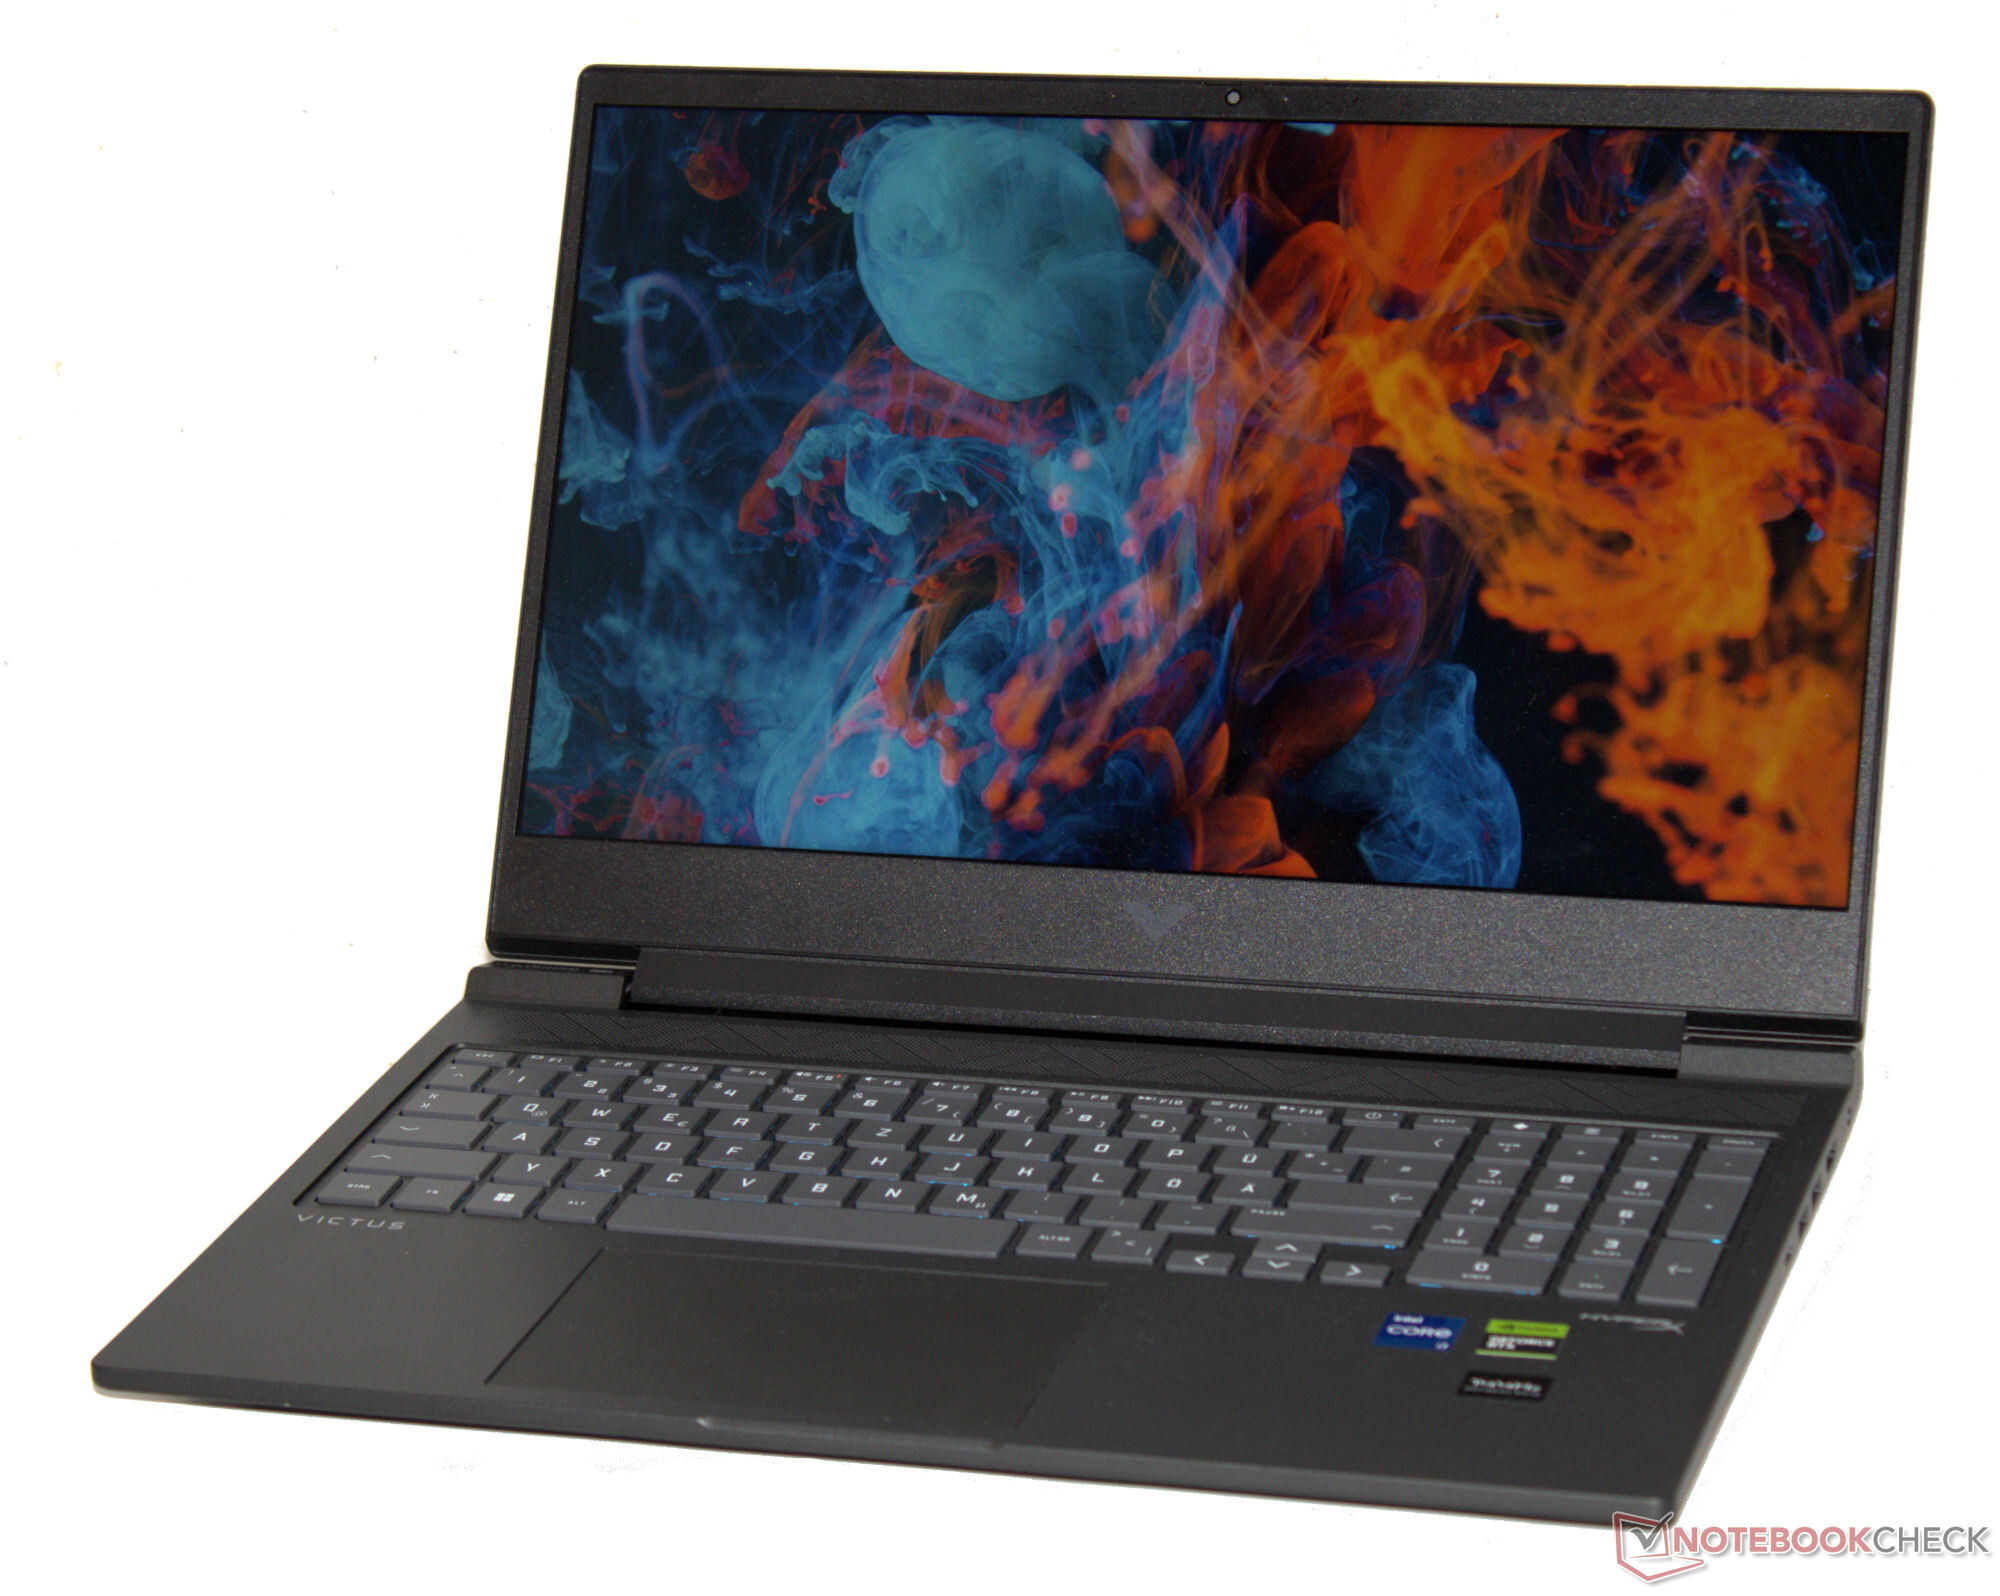
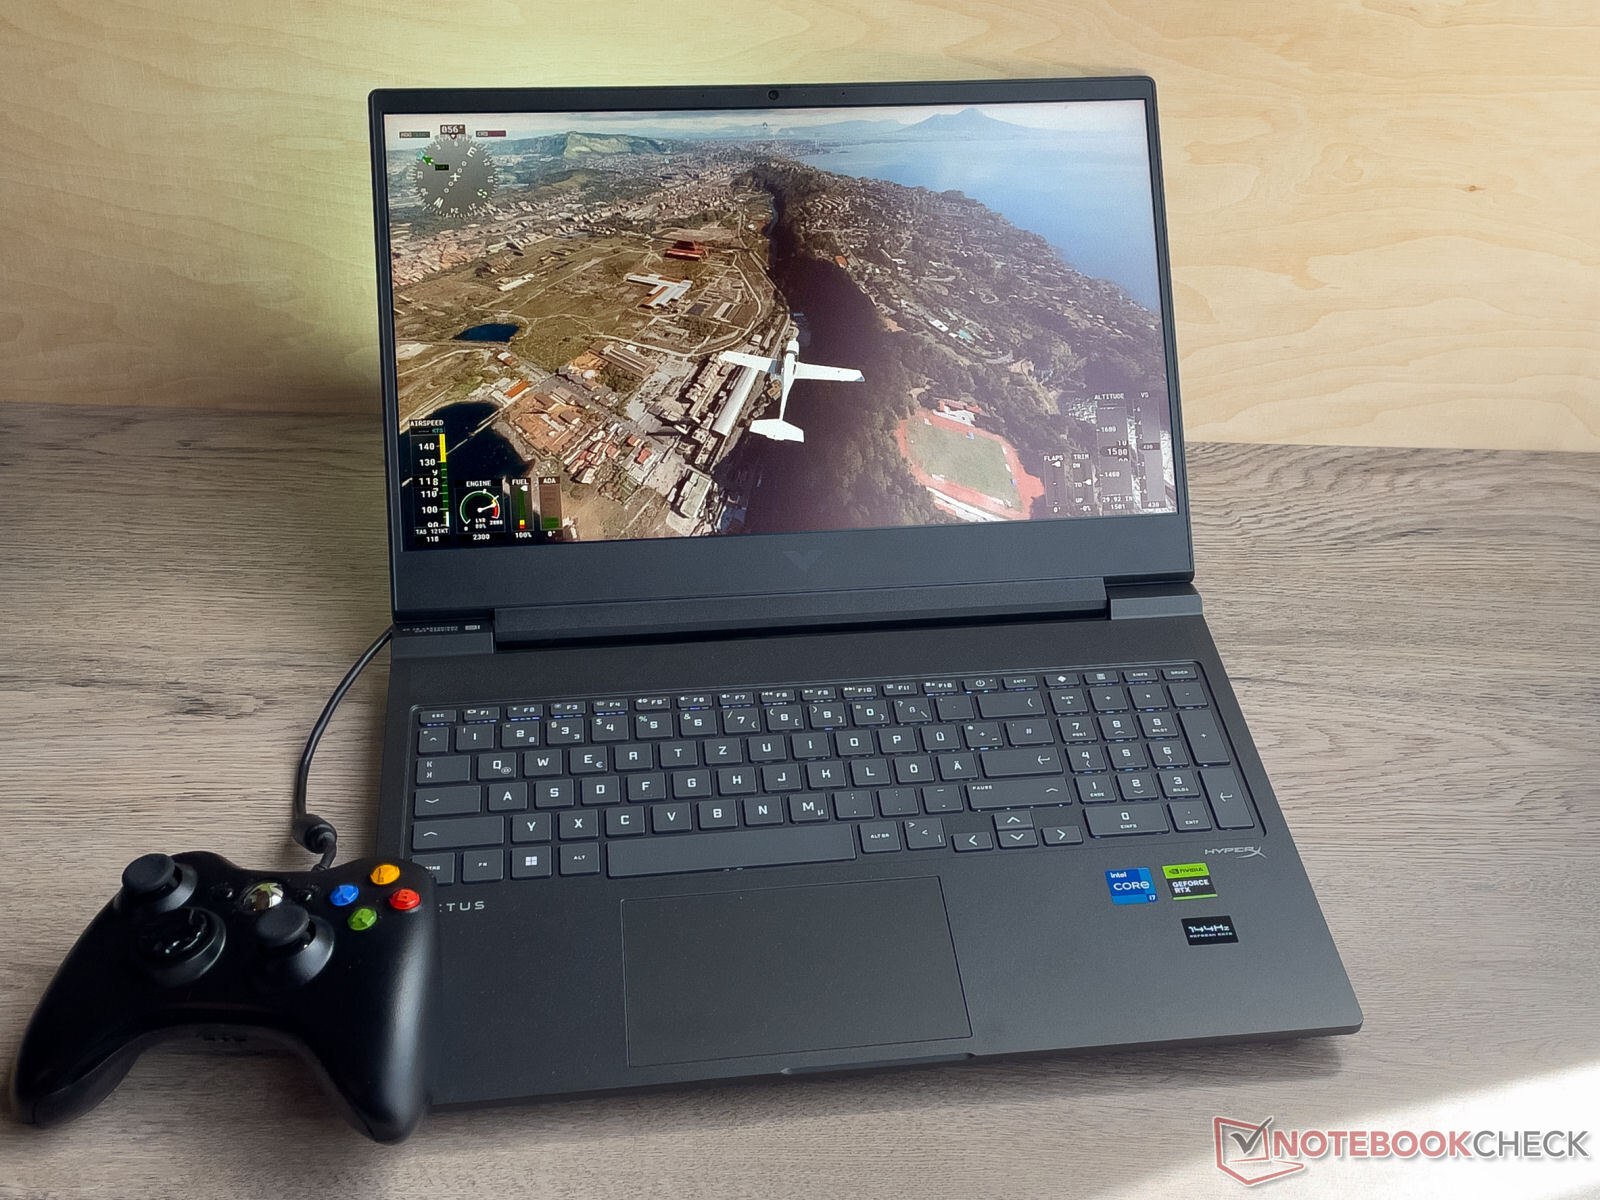
HP Victus 16 (2024) laptop review: RTX 4060 power paired with long runtimes

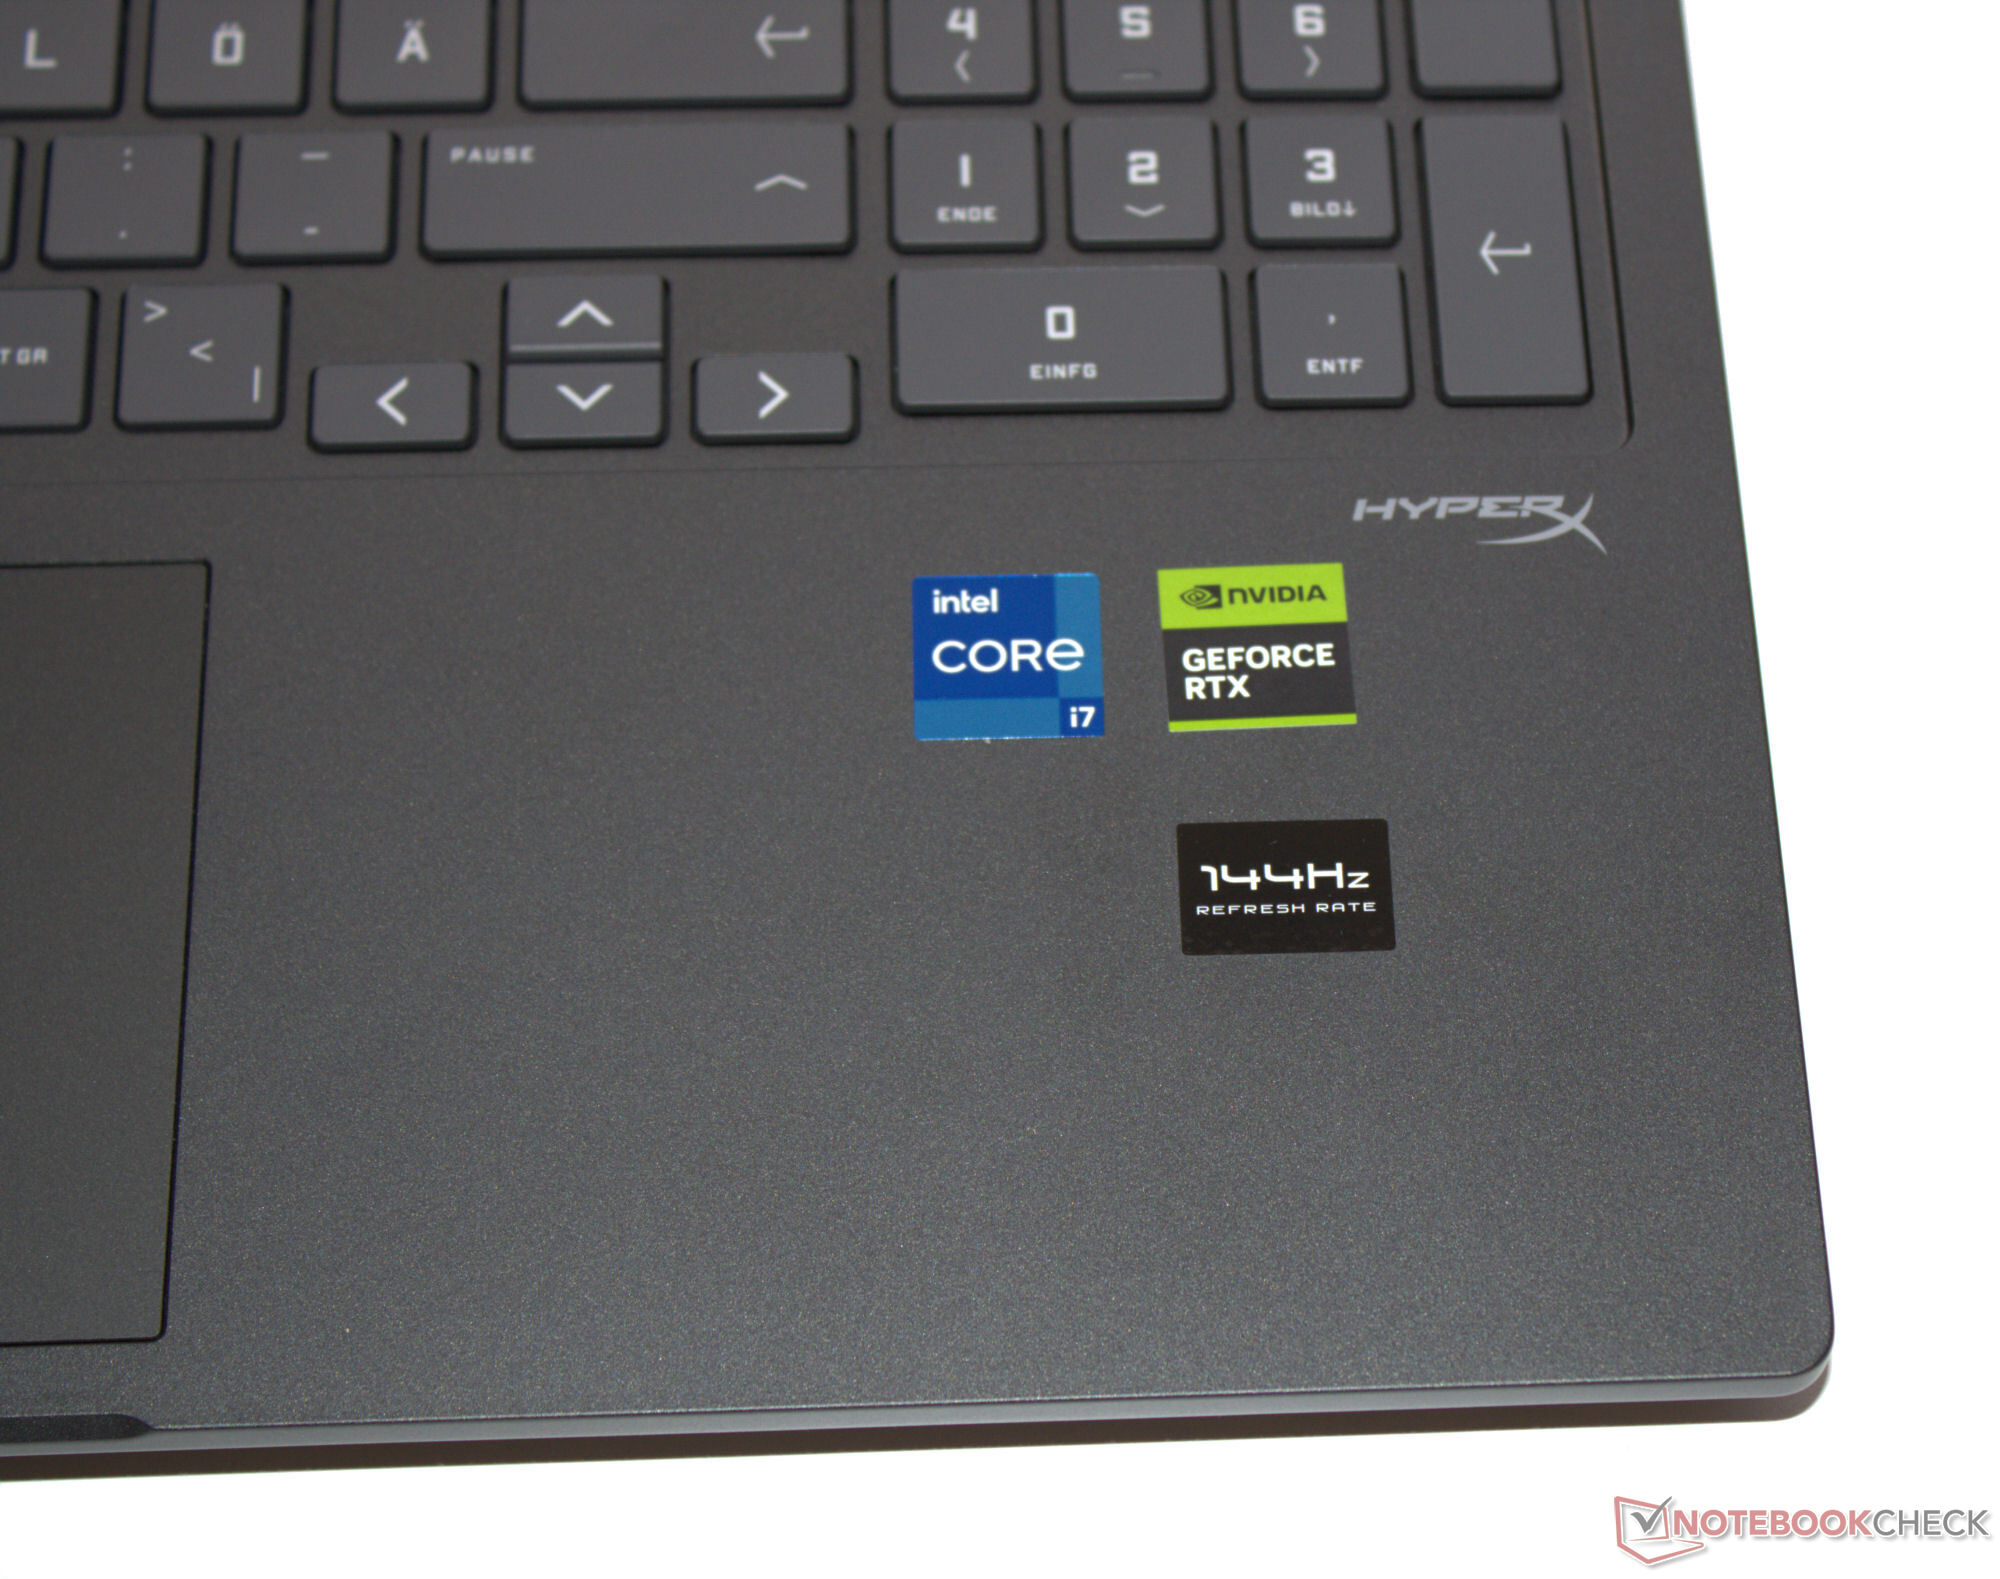
HP's Victus series consists of entry-level to mid-range gaming laptops—the present test device can be classed as the latter: A Raptor Lake processor, GeForce RTX 4060, 16 GB RAM and a 512-GB SSD all contribute to a total package costing around US$1,600. Competitors include devices such as the Gigabyte G6X 9KG (2024), Dell G16, Asus TUF Gaming A16 FA617XS and the Lenovo Legion 5 16IRX G9.
The 2024 version of the Victus 16 is built identically to the 2023 model. We already tested two incarnations of the latter (RTX 4050 and RTX 4070).
Possible competitors compared
Rating | Date | Model | Weight | Height | Size | Resolution | Price |
|---|---|---|---|---|---|---|---|
| 84.3 % v7 (old) | 05 / 2024 | HP Victus 16 (2024) i7-14700HX, GeForce RTX 4060 Laptop GPU | 2.4 kg | 23.9 mm | 16.10" | 1920x1080 | |
| 83.2 % v7 (old) | 03 / 2024 | Gigabyte G6X 9KG (2024) i7-13650HX, GeForce RTX 4060 Laptop GPU | 2.6 kg | 25.1 mm | 16.00" | 1920x1200 | |
| 85.5 % v7 (old) | 02 / 2024 | Dell G16, i7-13650HX, RTX 4060 i7-13650HX, GeForce RTX 4060 Laptop GPU | 2.8 kg | 25.65 mm | 16.00" | 2560x1600 | |
| 89.1 % v7 (old) | 01 / 2024 | Lenovo Legion 5 16IRX G9 i7-14650HX, GeForce RTX 4060 Laptop GPU | 2.4 kg | 25.2 mm | 16.00" | 2560x1600 | |
| 86.9 % v7 (old) | 06 / 2023 | Asus TUF Gaming A16 FA617XS R9 7940HS, Radeon RX 7600S | 2.2 kg | 22.1 mm | 16.00" | 1920x1200 |
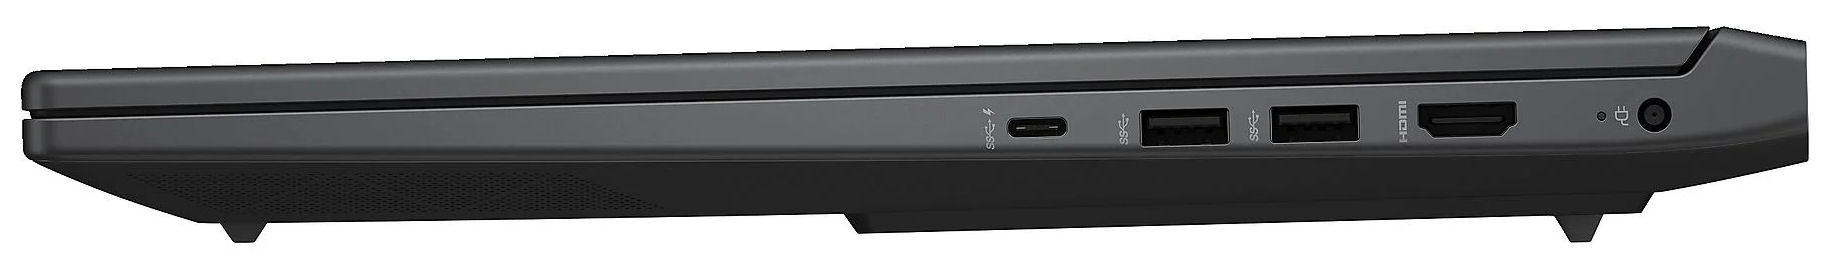
Case & connectivity - The HP Victus features Power Delivery
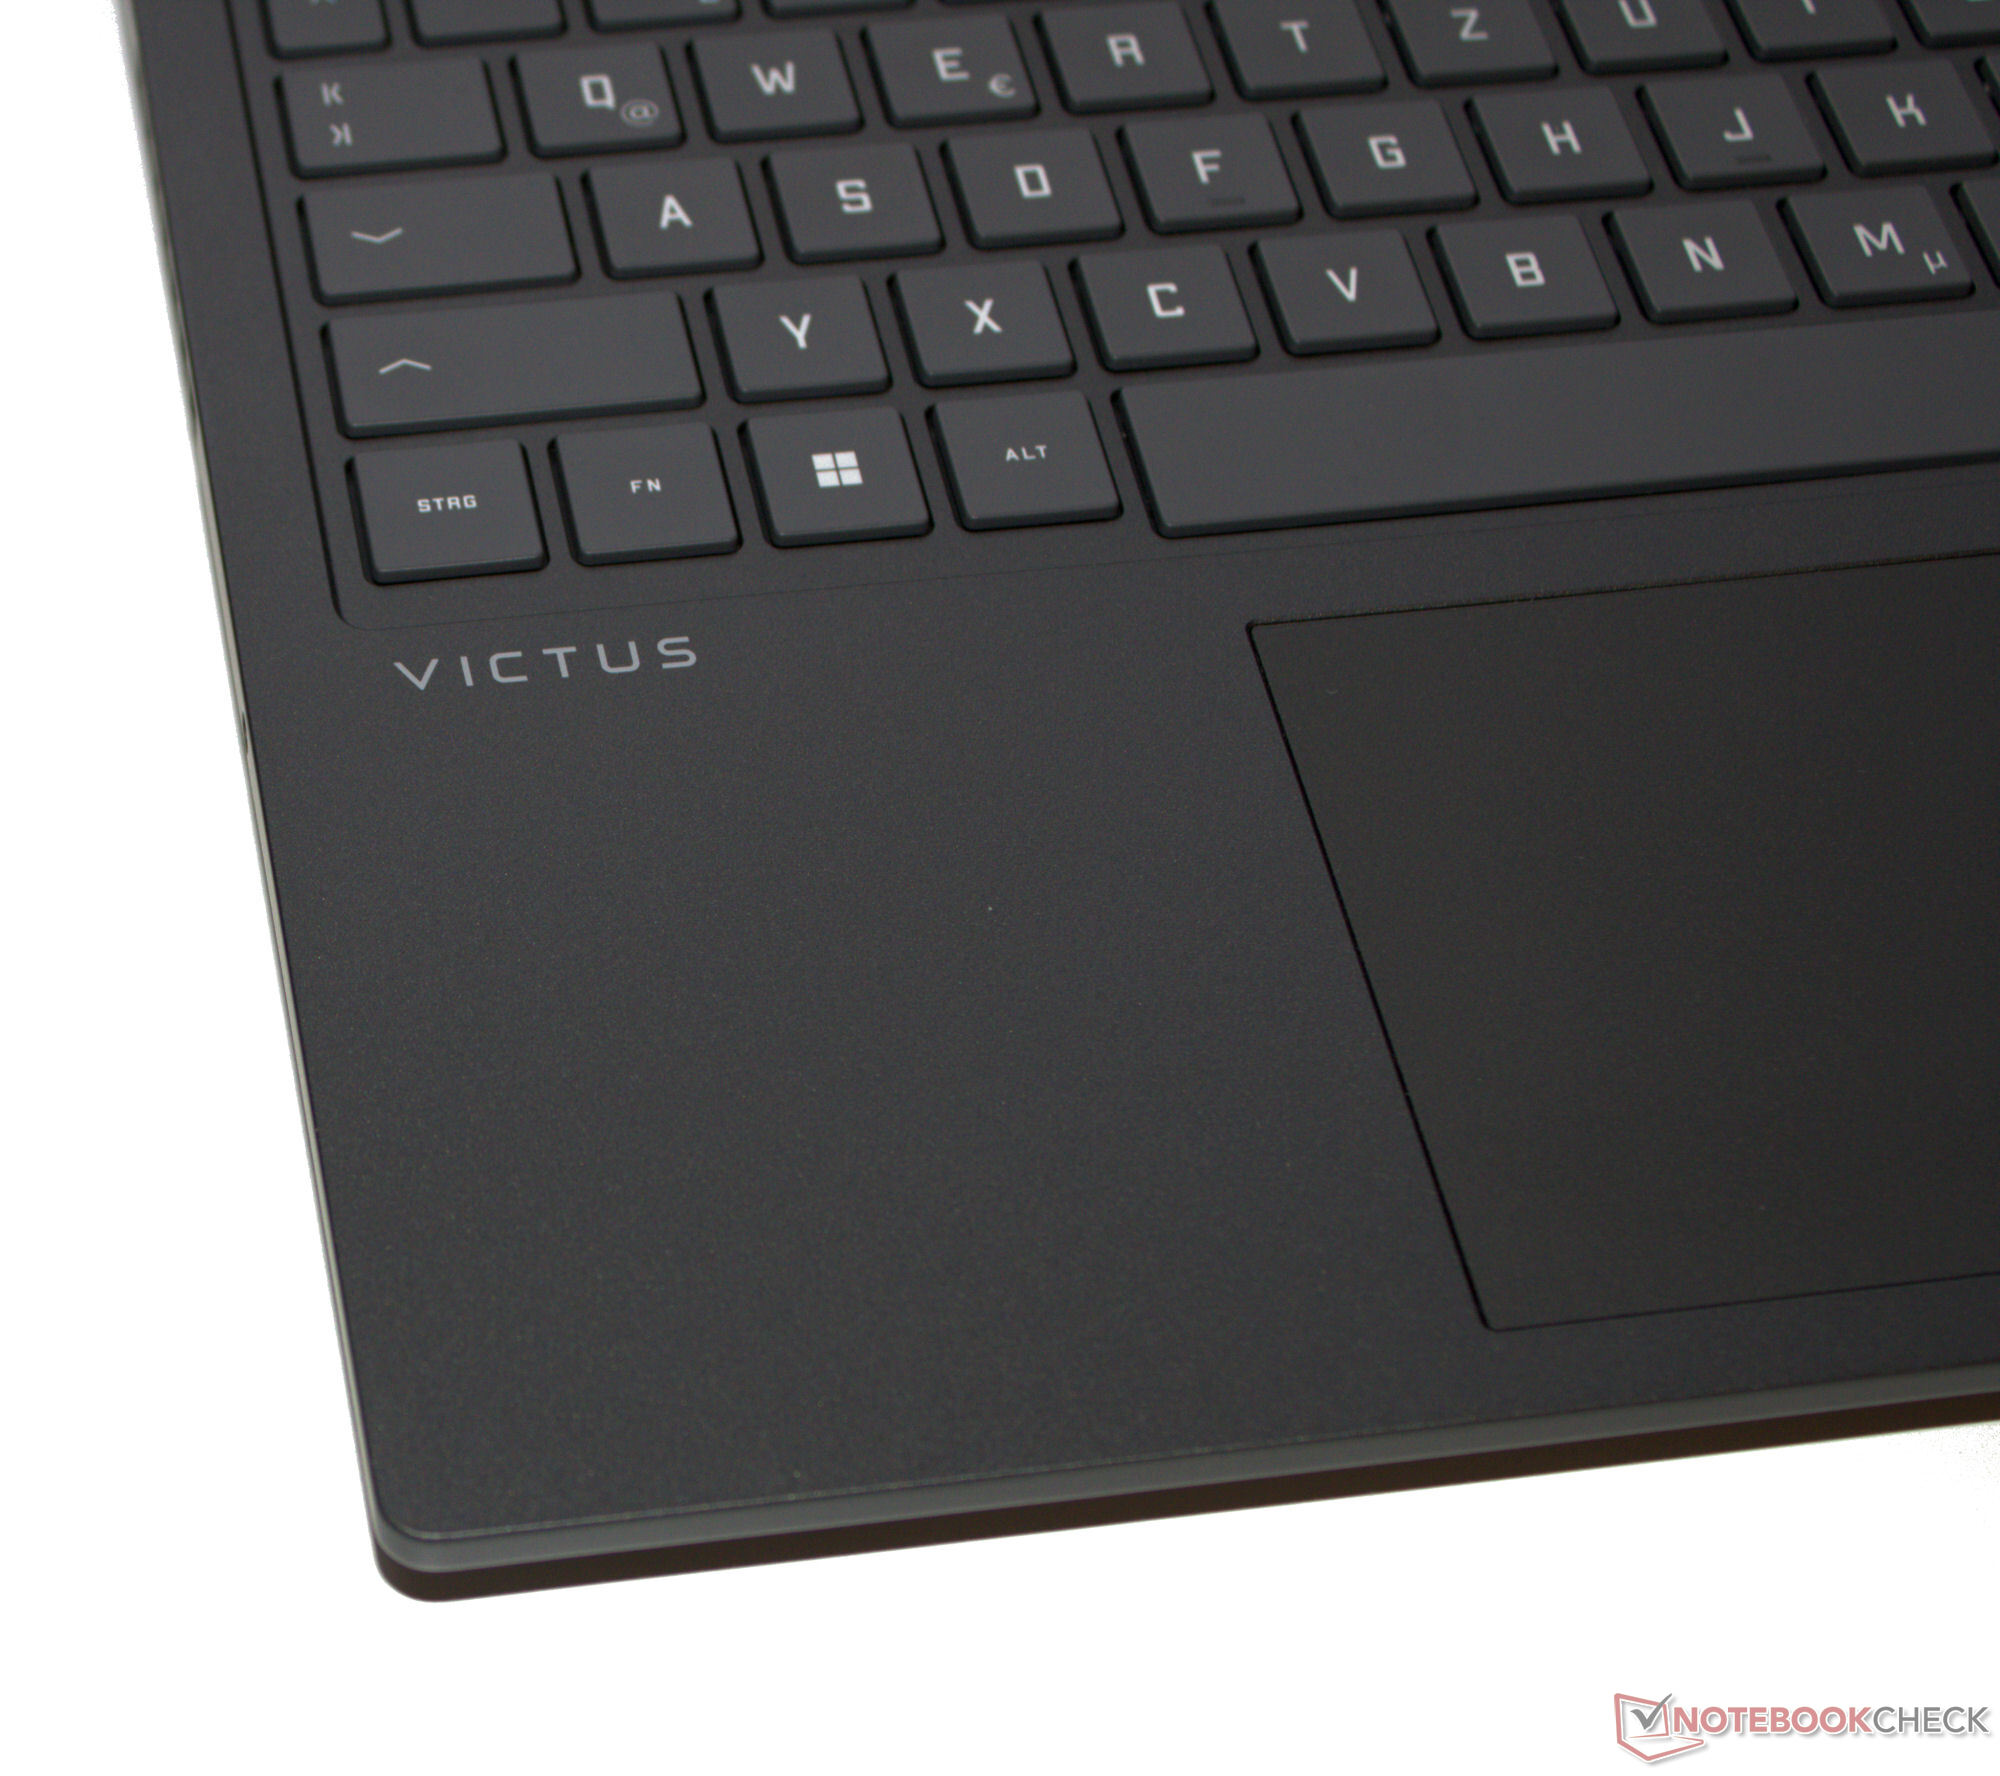
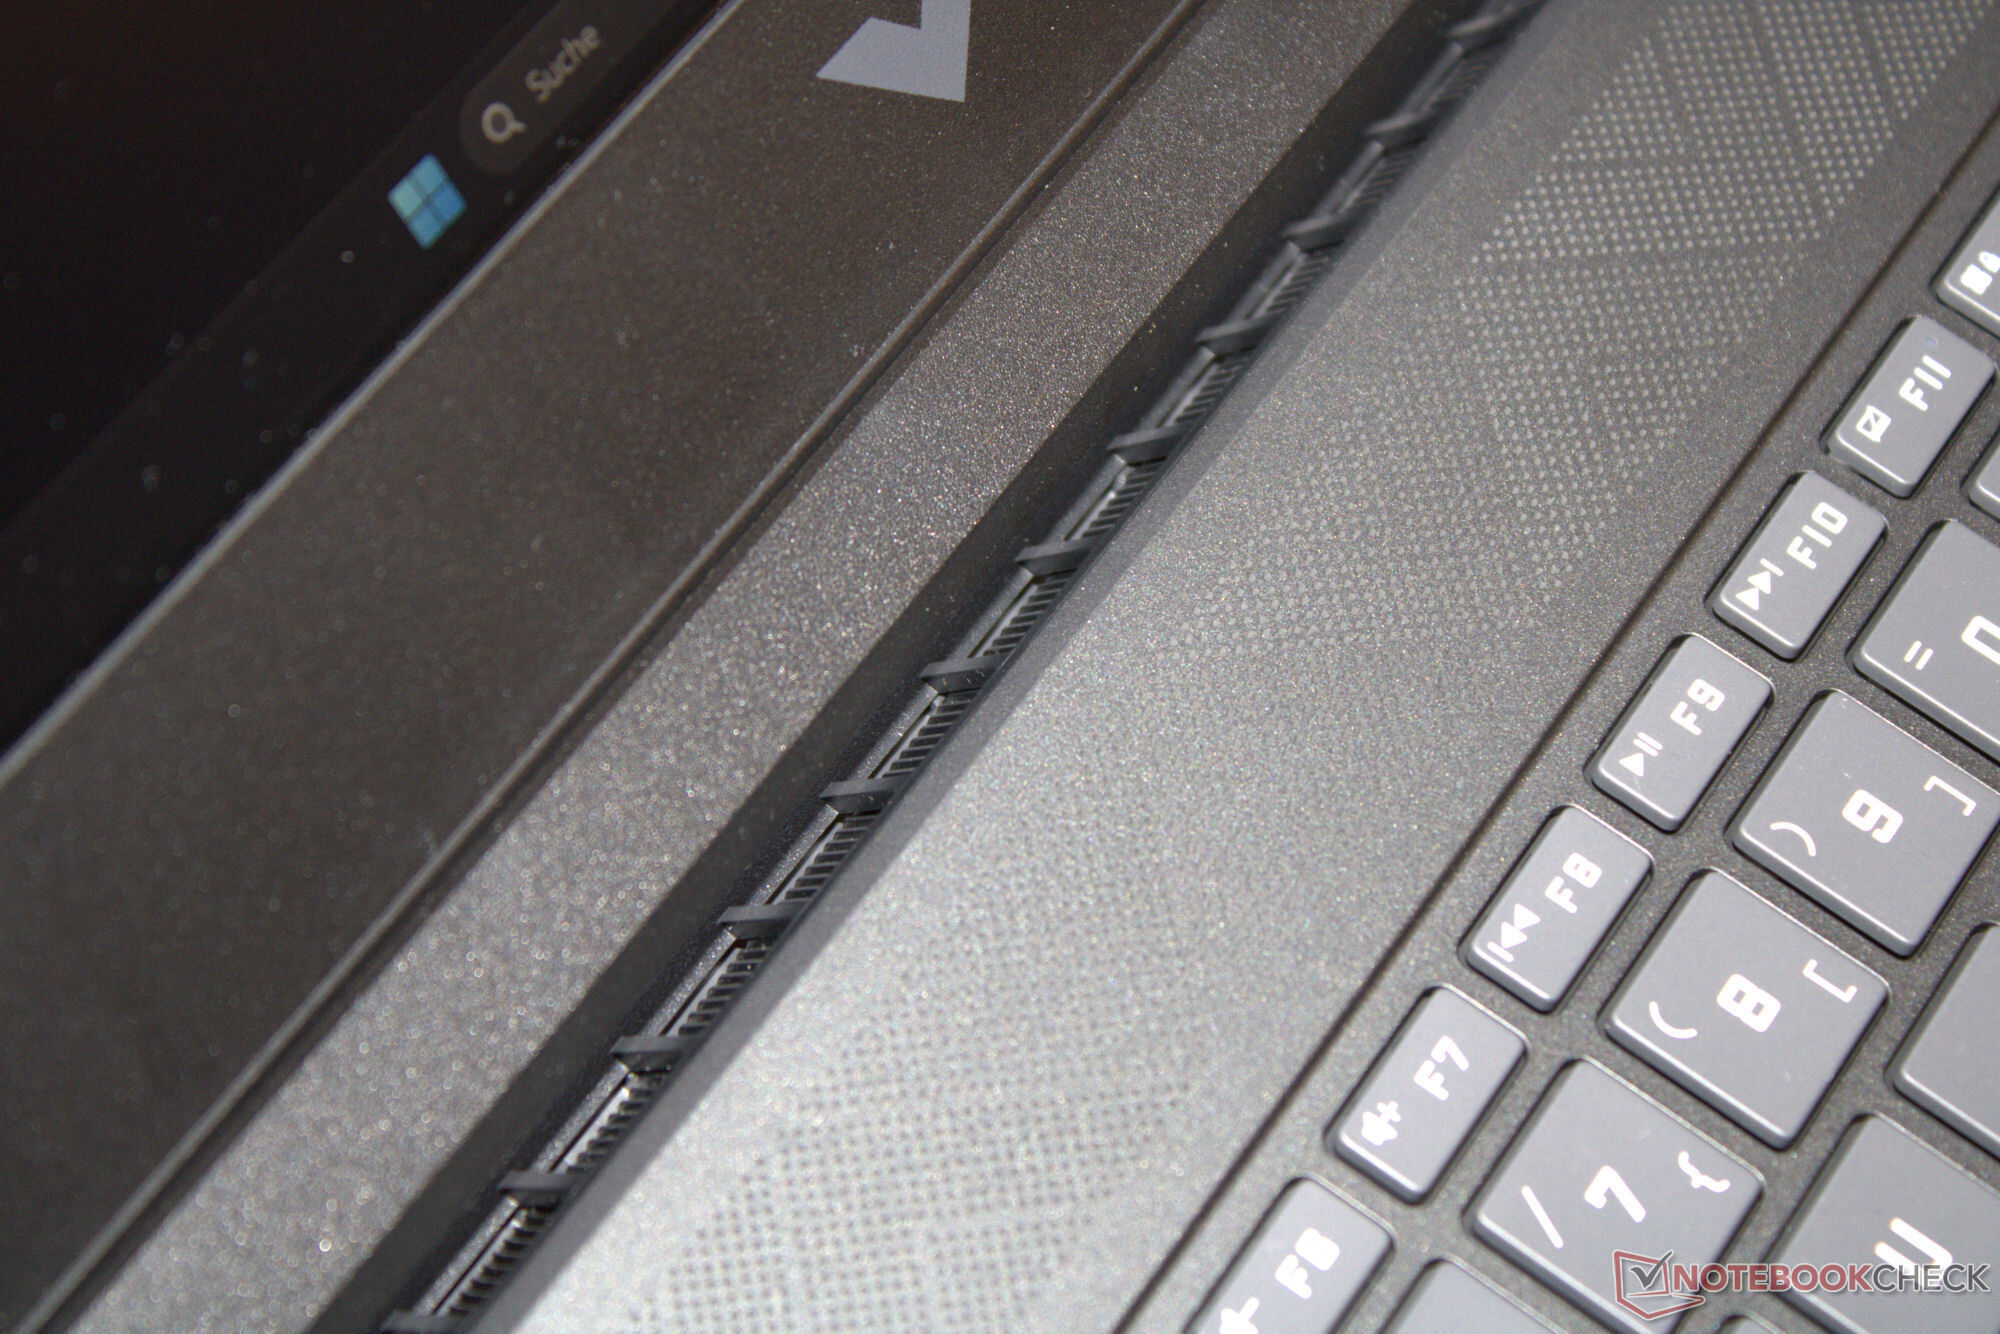
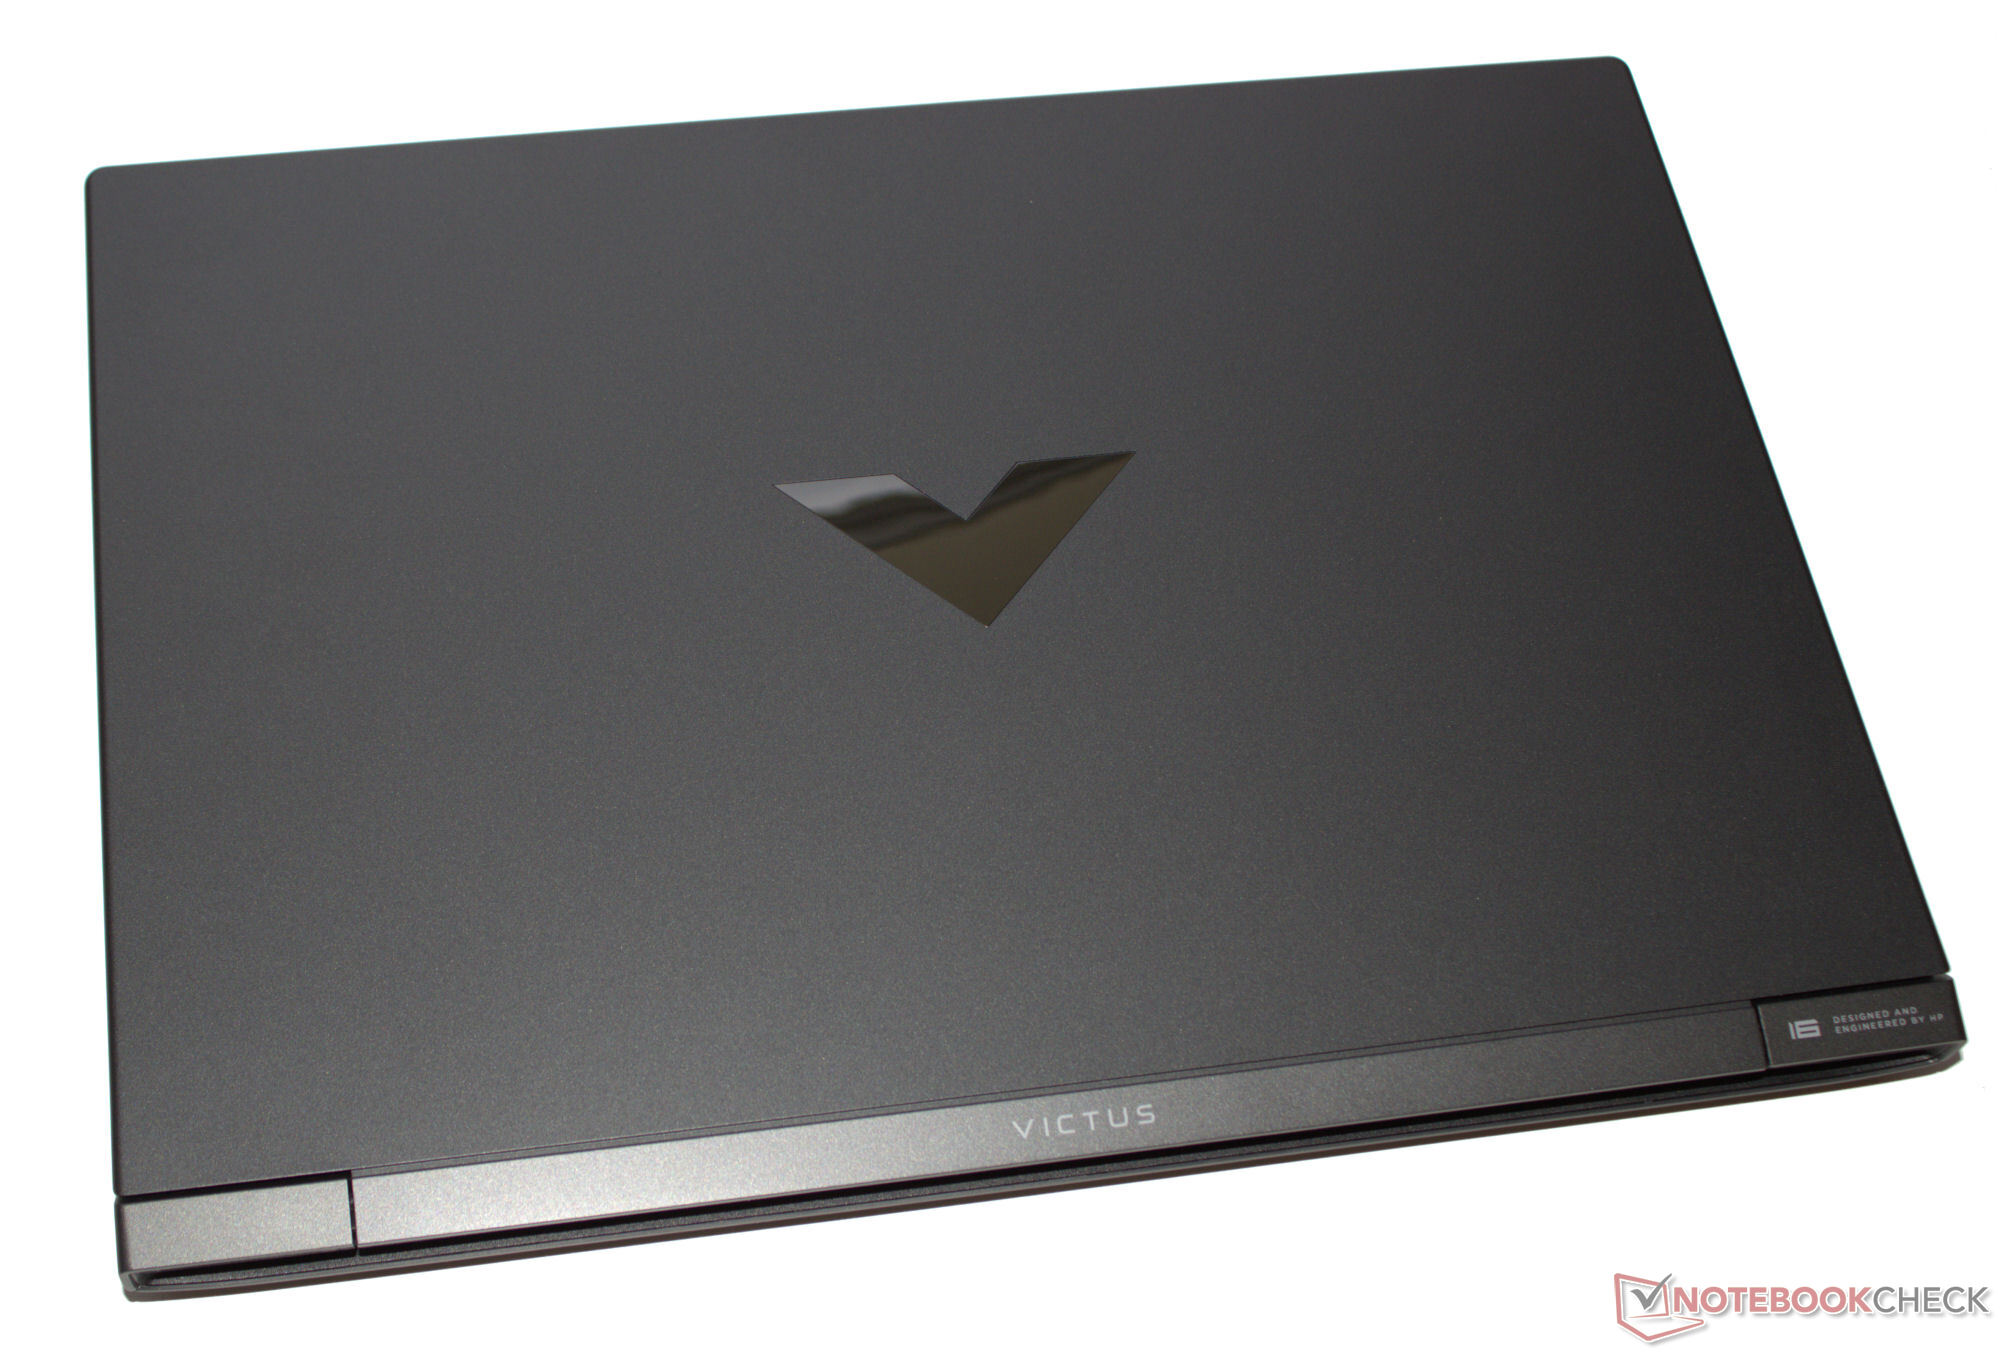
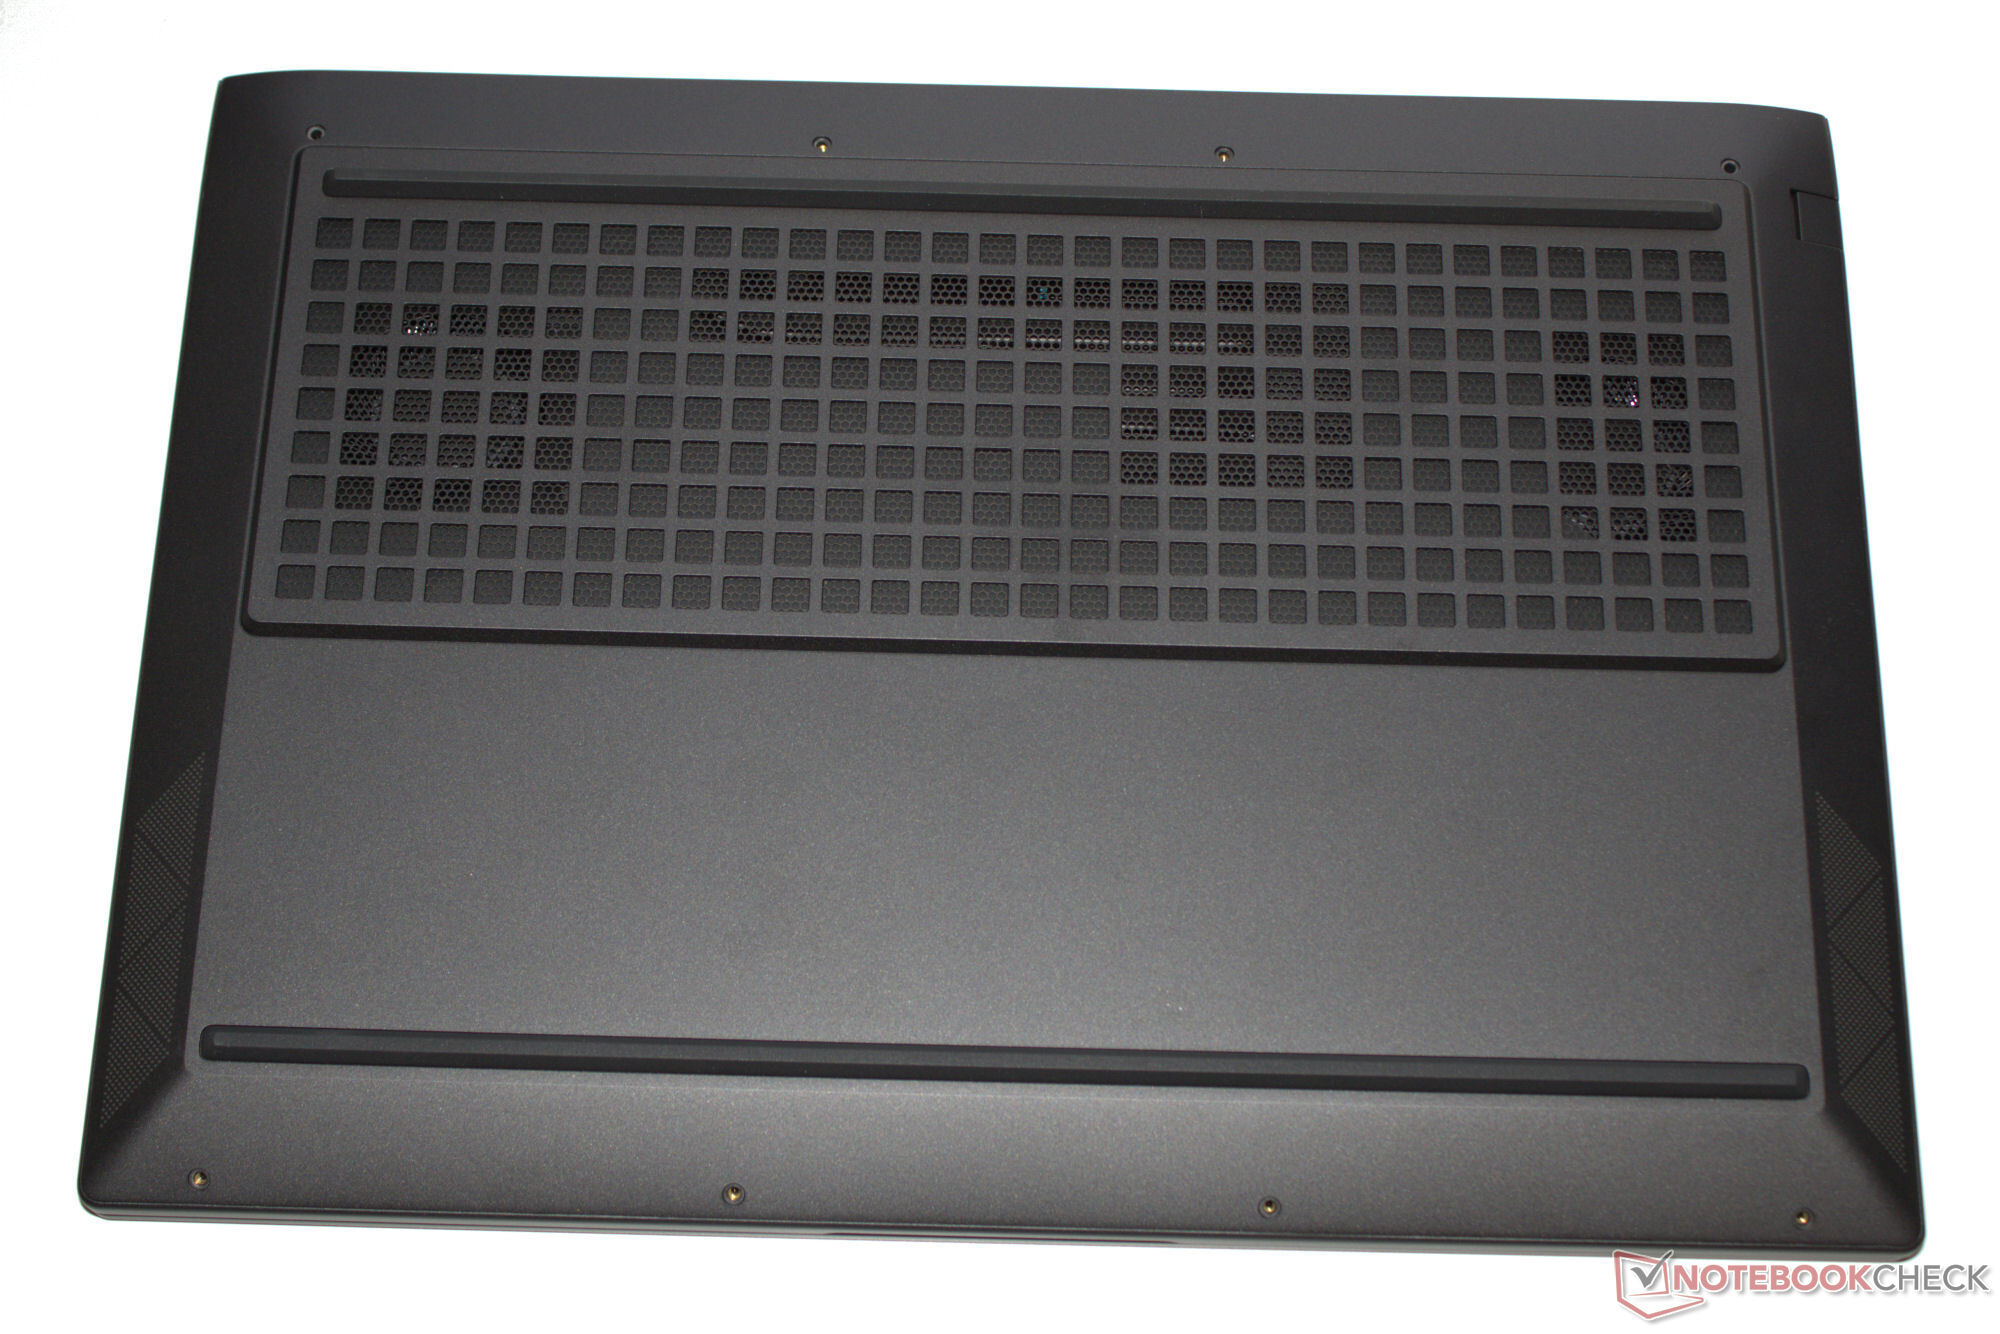
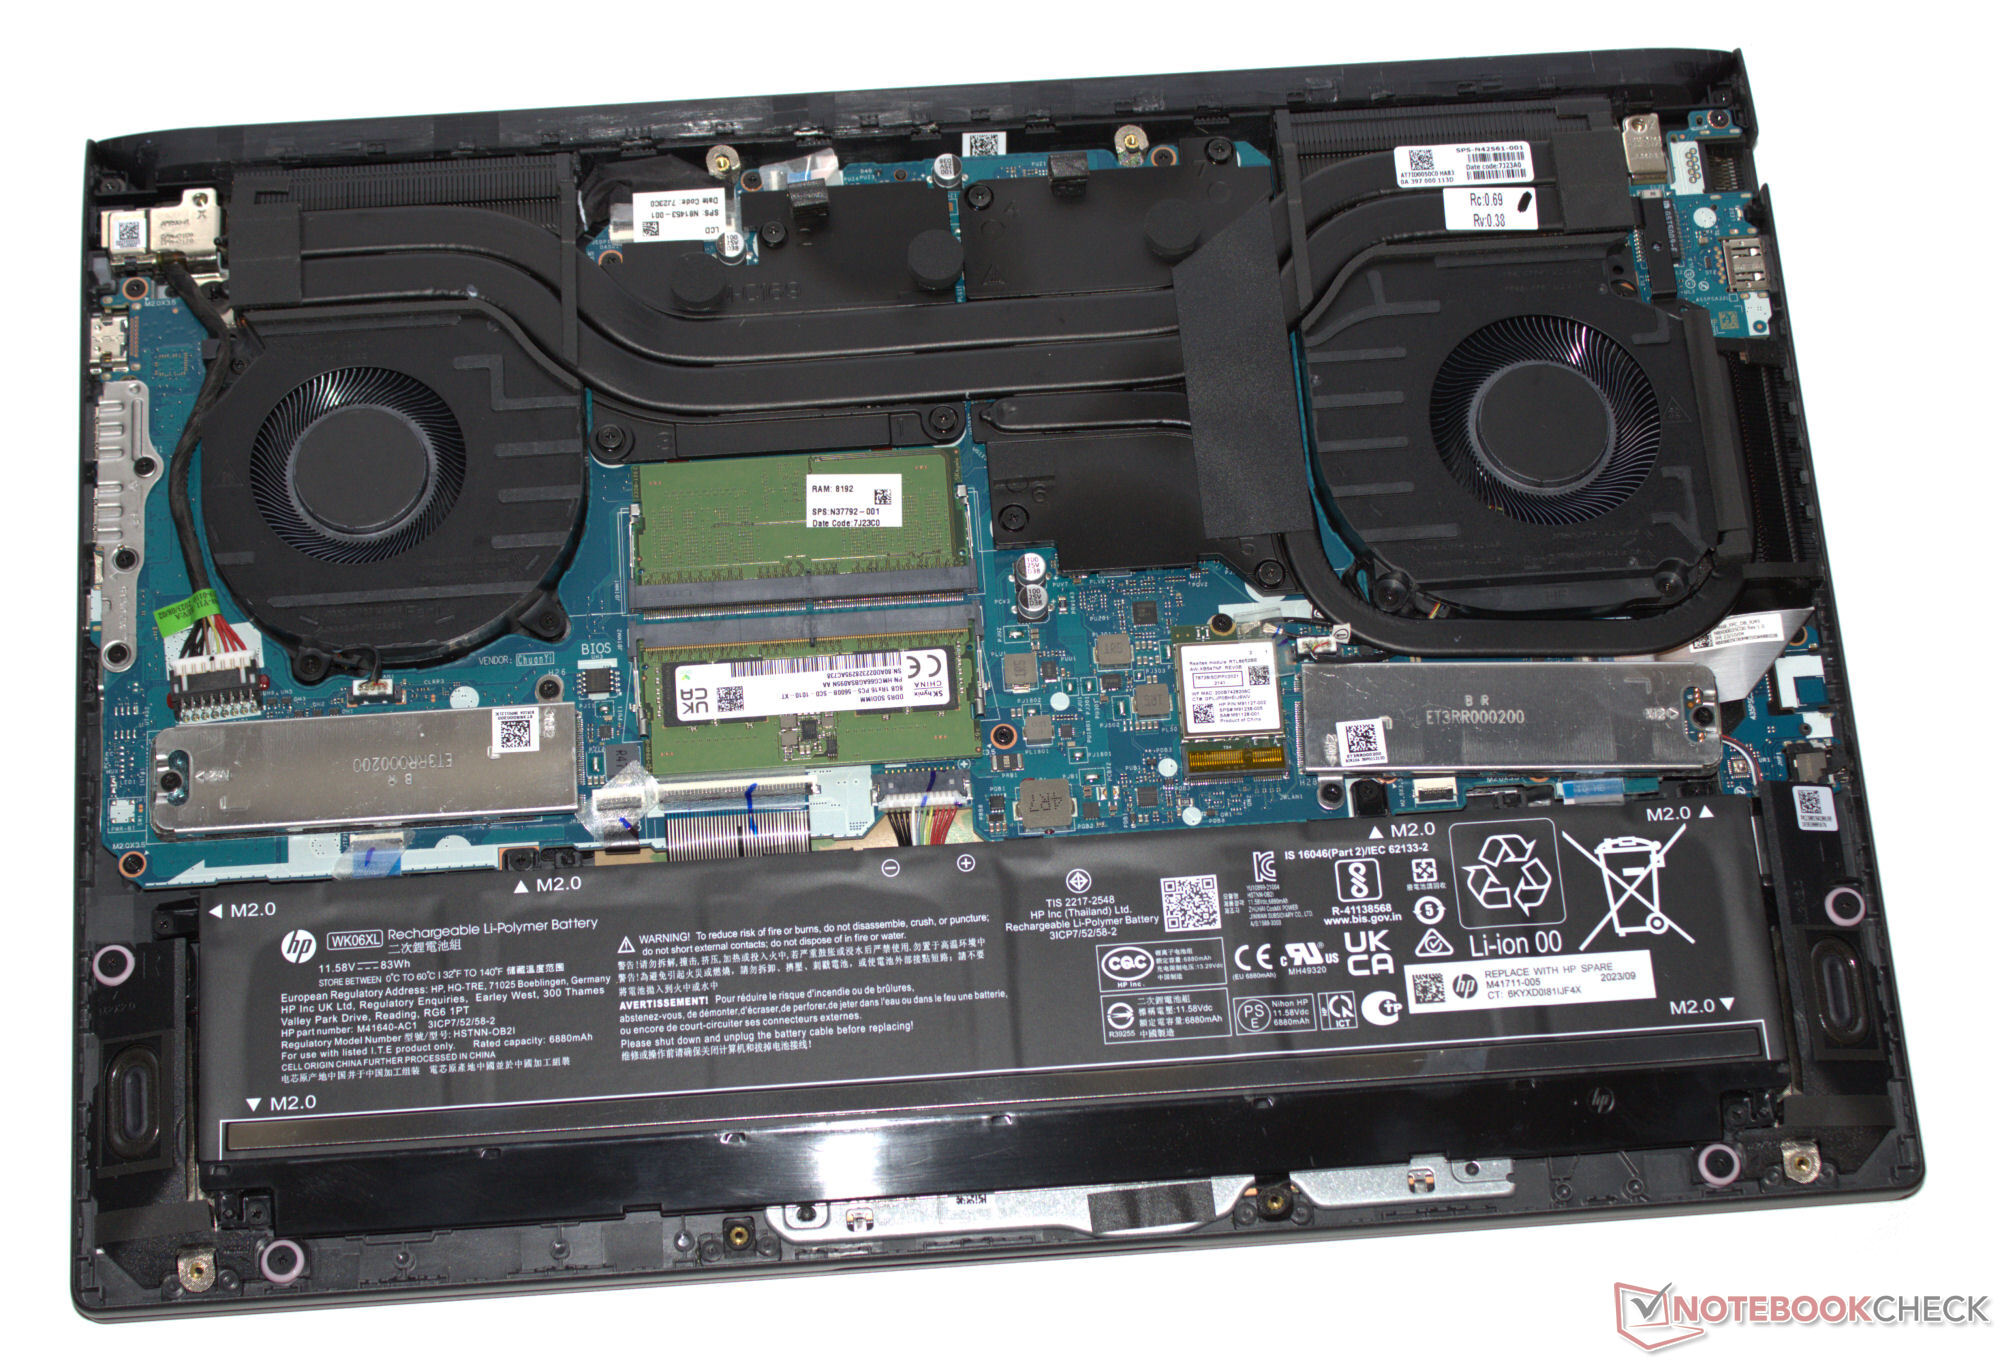
You can't expect high-quality materials: The laptop's entire case is made from matte plastic in the colorway "Mica Silver"—a dark-gray anthracite black. The lid and base unit can be twisted. No LED elements are used on its stripped-back case and the most eye-catching accessory is the Victus logo on the back of the device's lid. The battery (screwed in, not glued on) as well as the rest of its hardware can be accessed after removing the bottom case part.
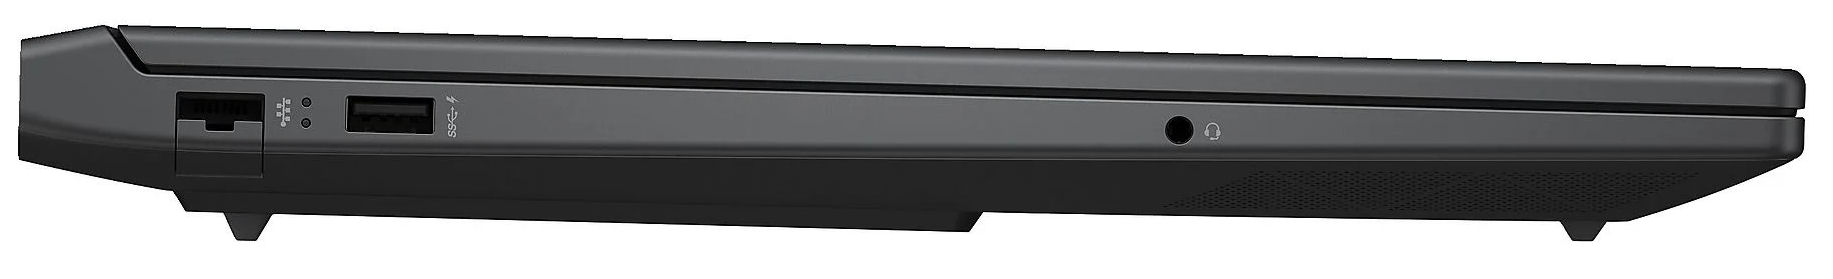
You will search for Thunderbolt and USB 4 in vain: All four USB ports (3x USB-A, 1x USB-C) follow the USB 3.2 Gen 1 standard. The USB-C port supports Power Delivery and can output a DisplayPort signal. In total, the laptop features two video outputs (1x HDMI, 1x DP). Its webcam (2.1 MP, with cover) delivers average results. It isn't equipped with an SD card reader.
The Victus is fitted with a Realtek WiFi 6 chip (RTL8852BE) which cannot compete with its competitors' Intel chips: The WiFi data rates we measured were decent, but they fall short of today's possibilities.

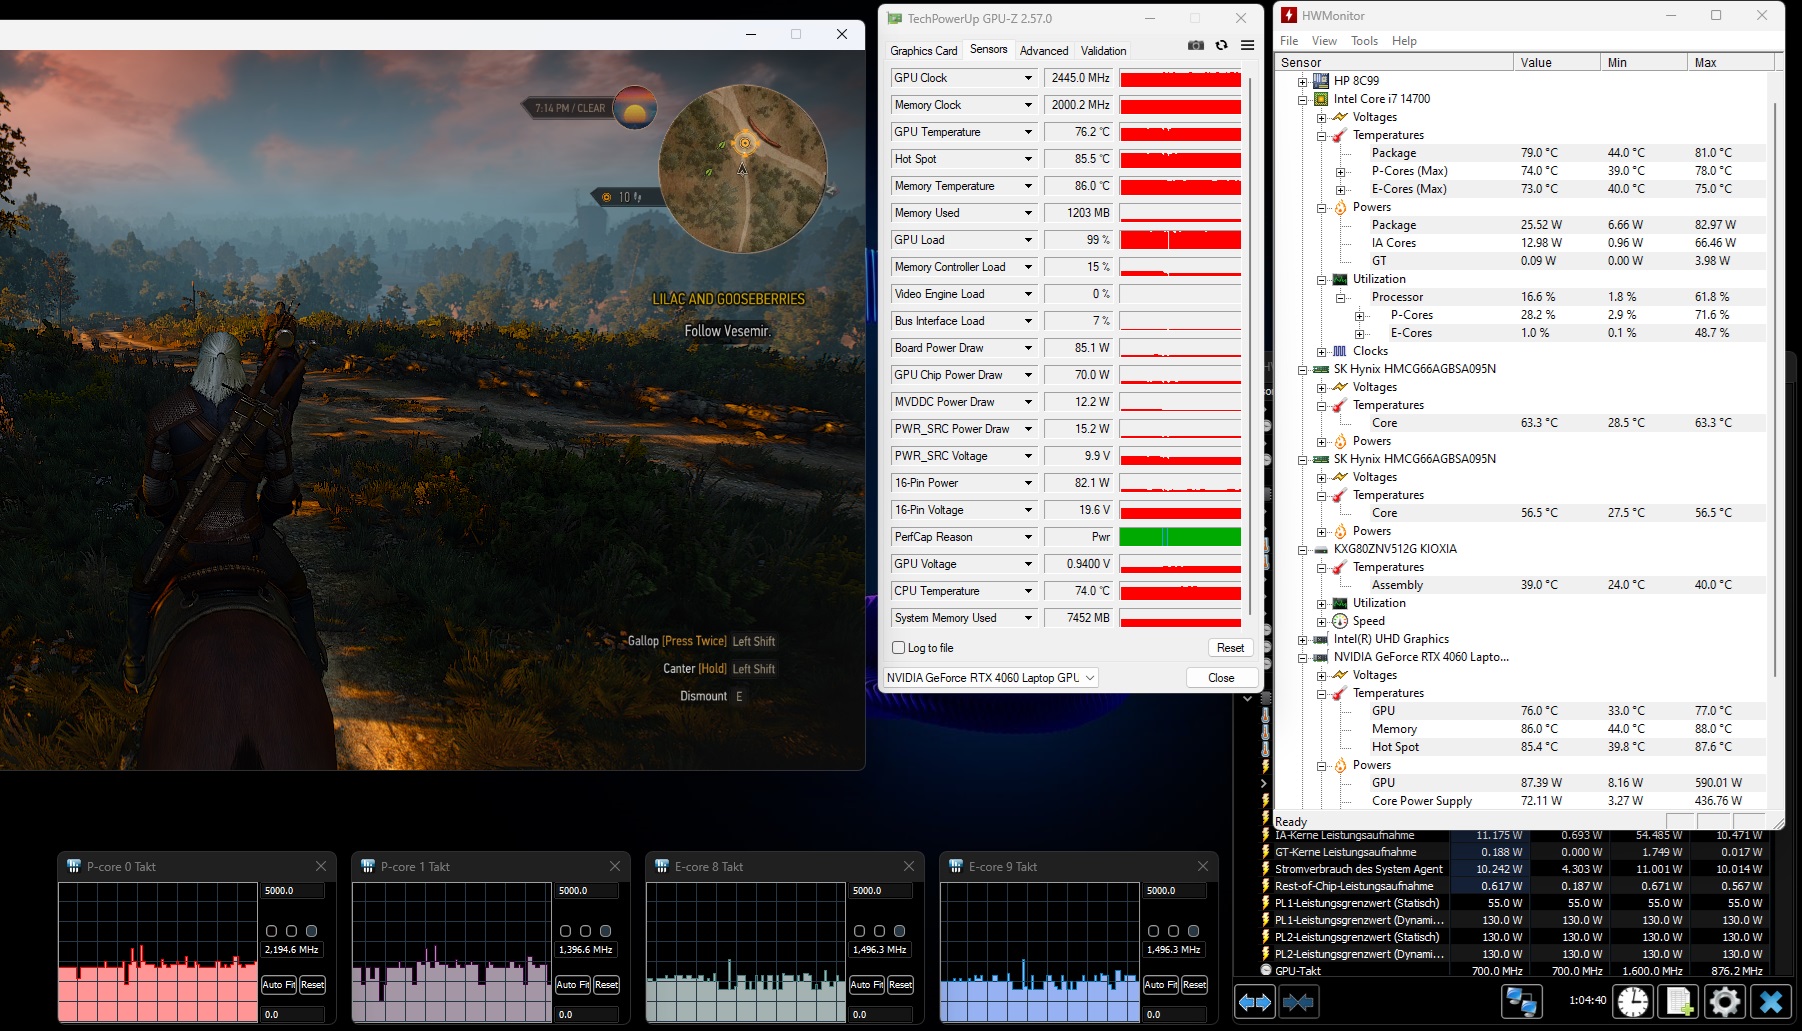
 GeForce RTX 4060 Laptop GPU, i7-14700HX, Kioxia XG8 KXG80ZNV512G")
 GeForce RTX 4060 Laptop GPU, i7-14700HX, Kioxia XG8 KXG80ZNV512G")
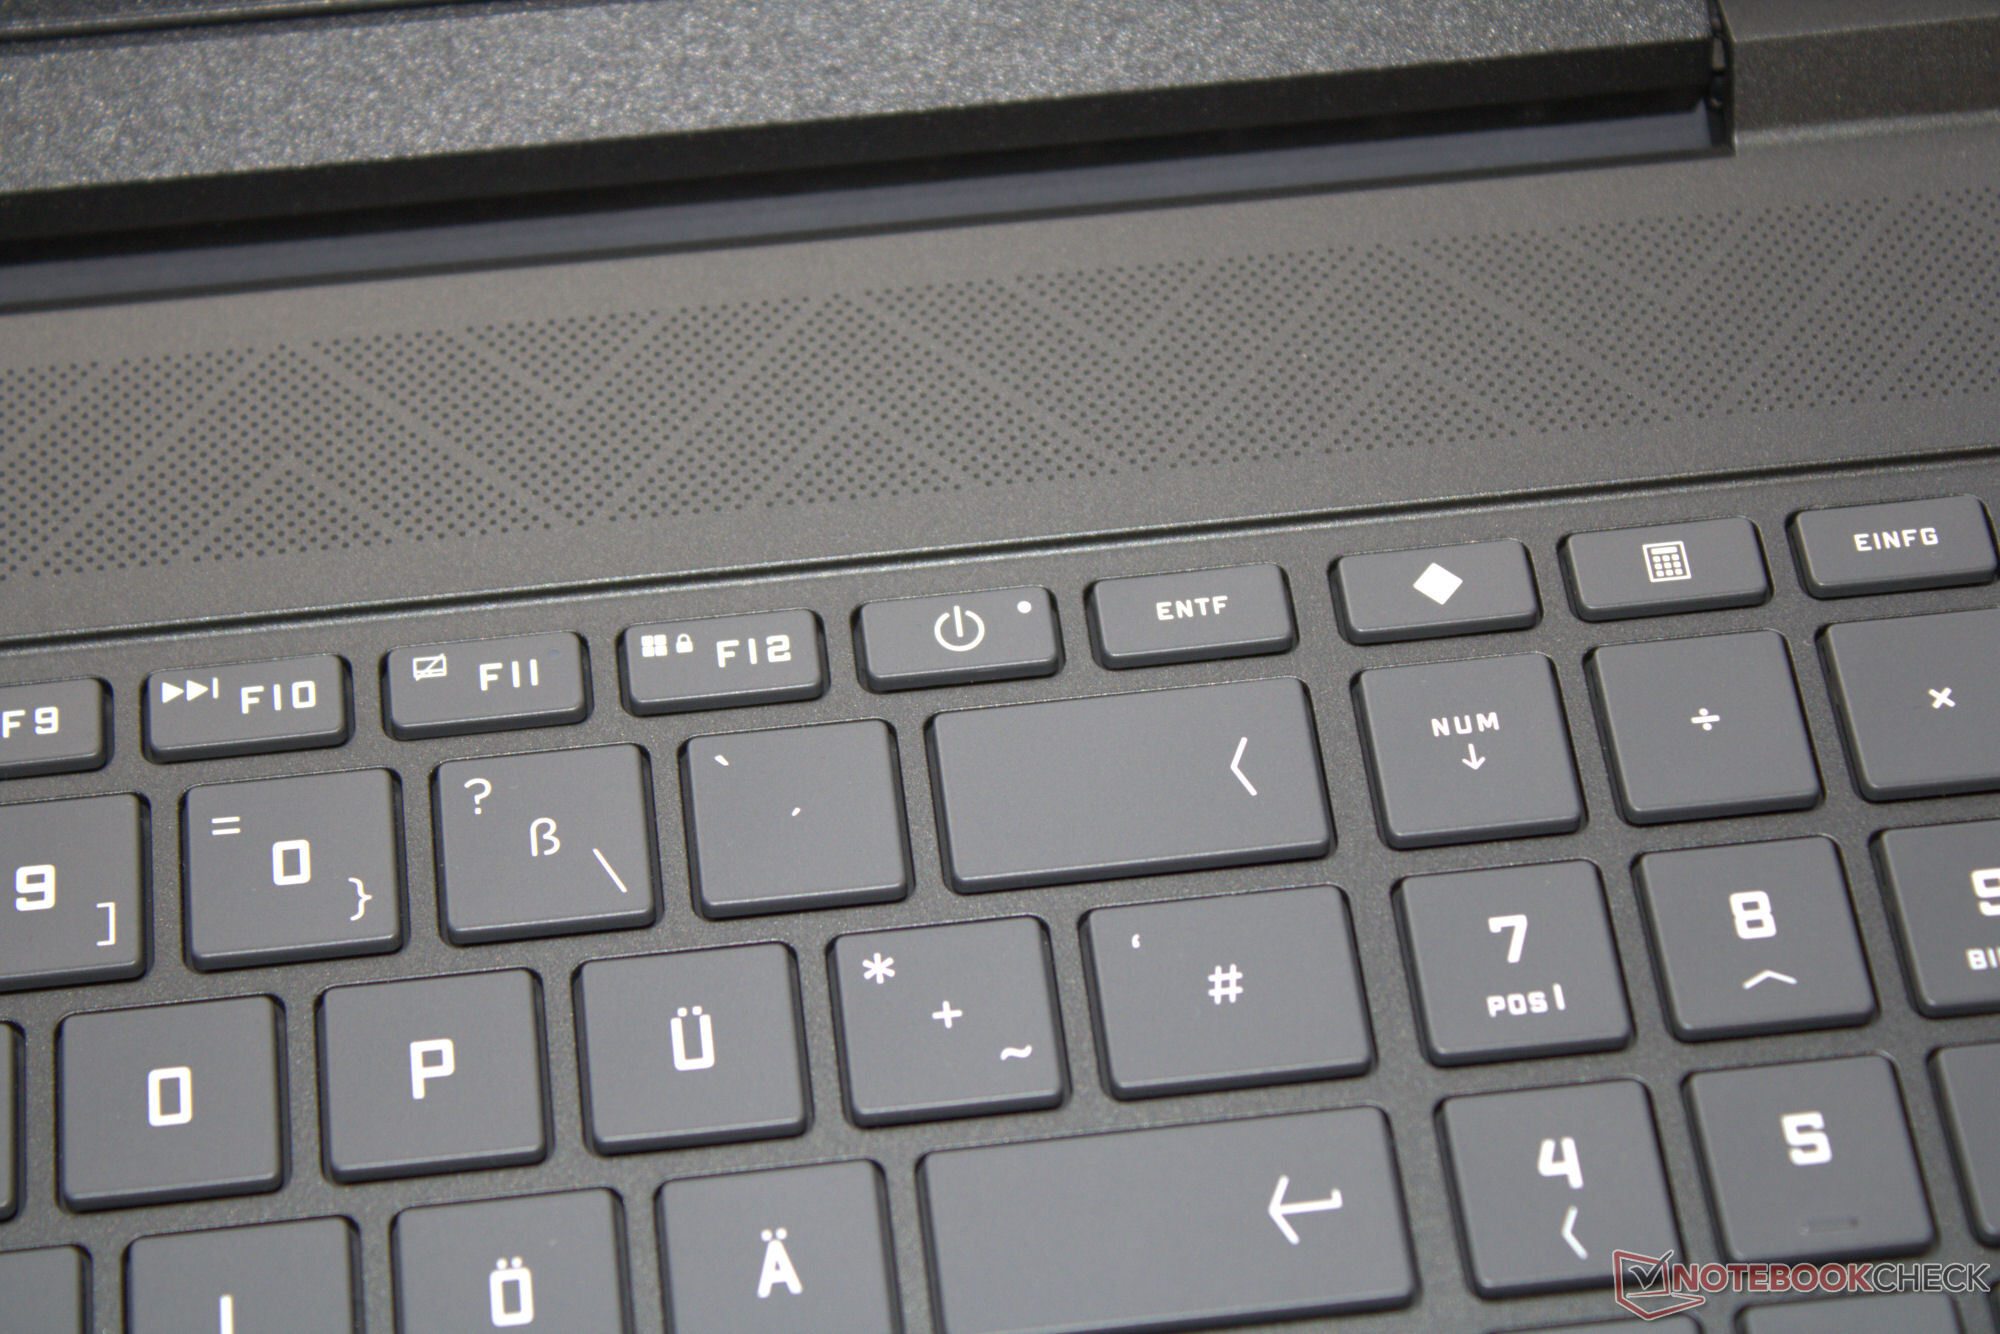
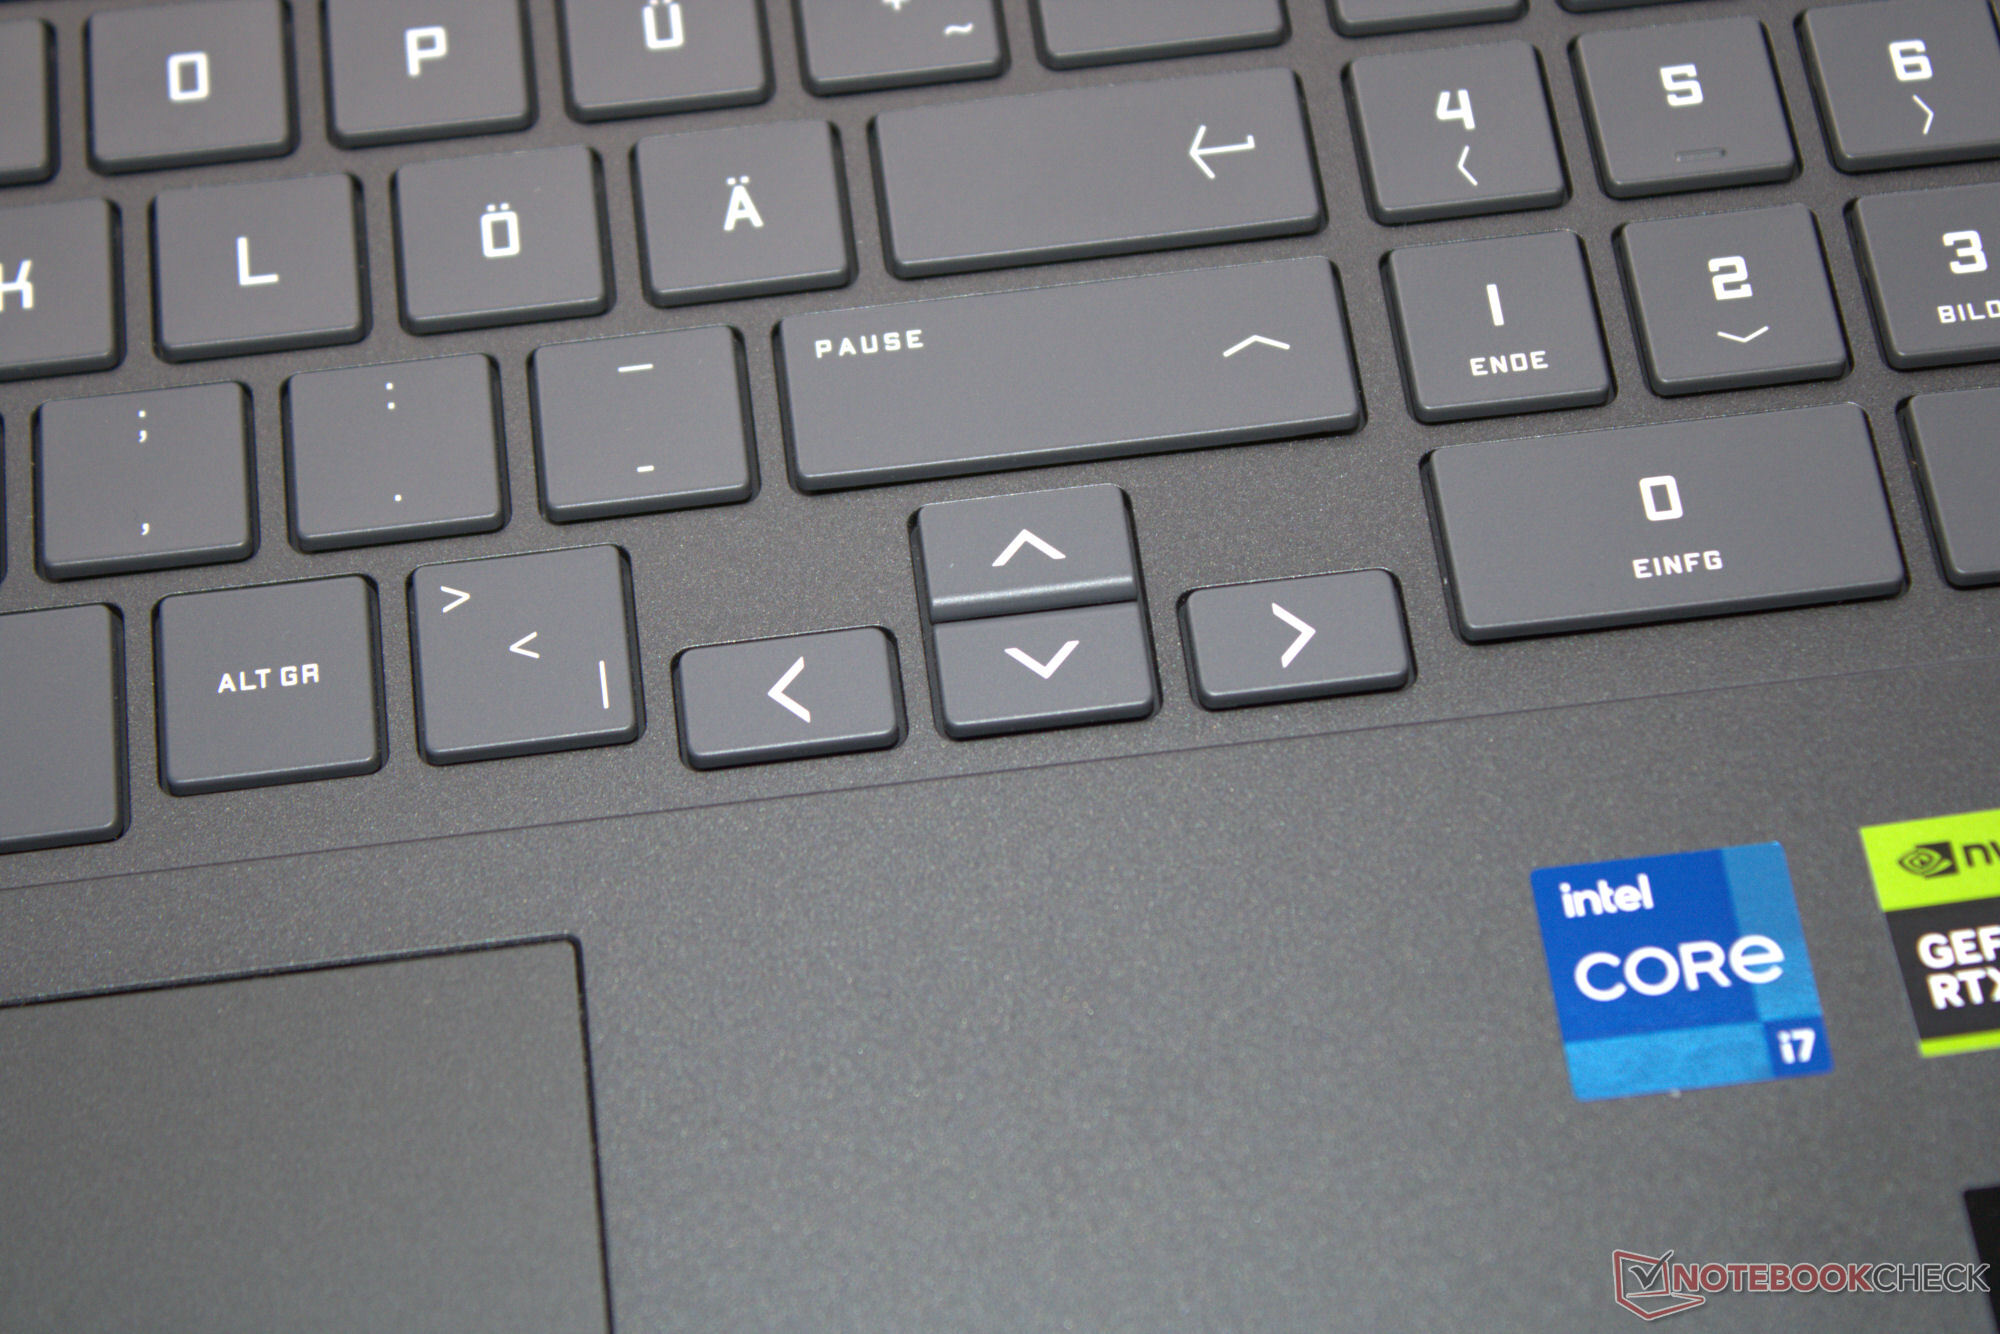
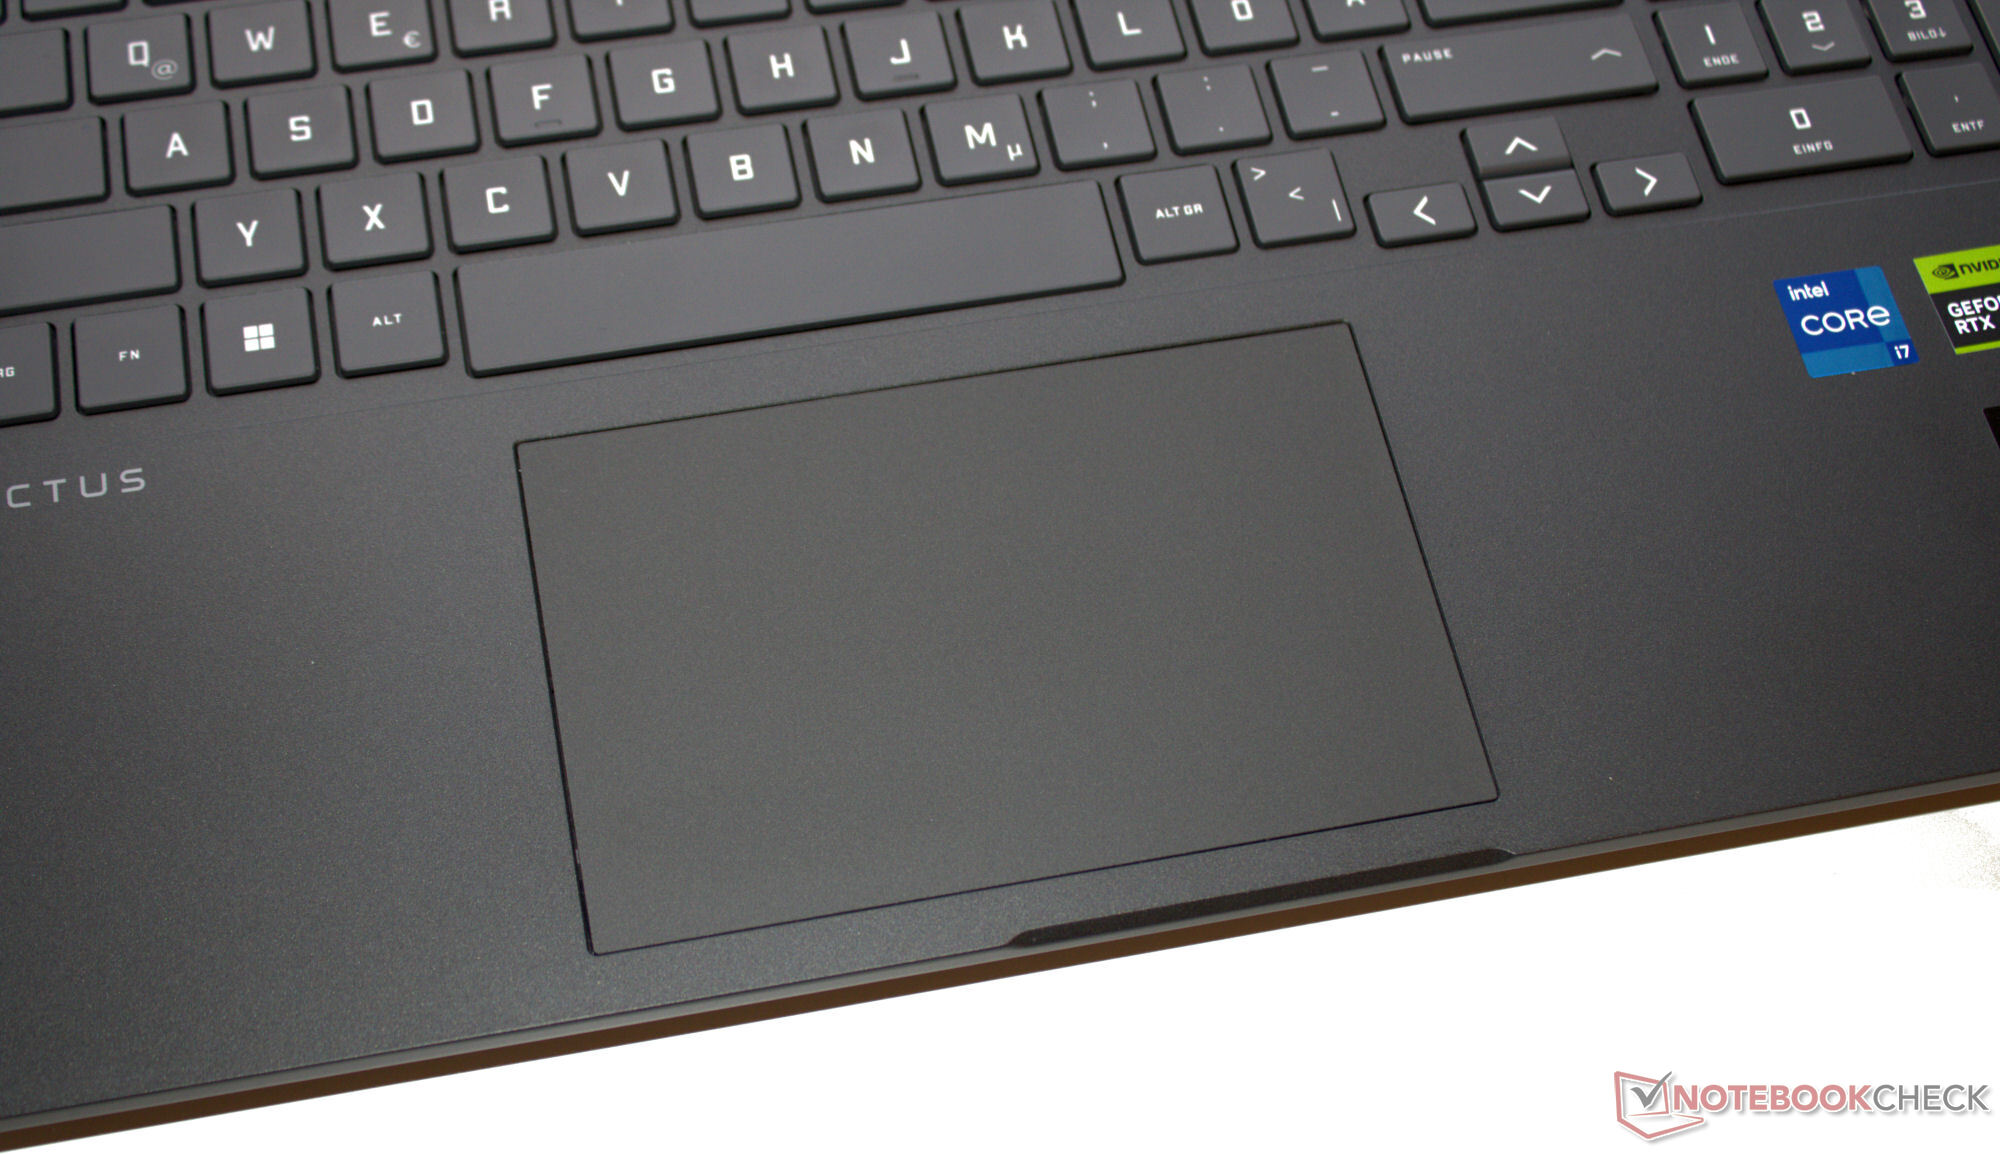
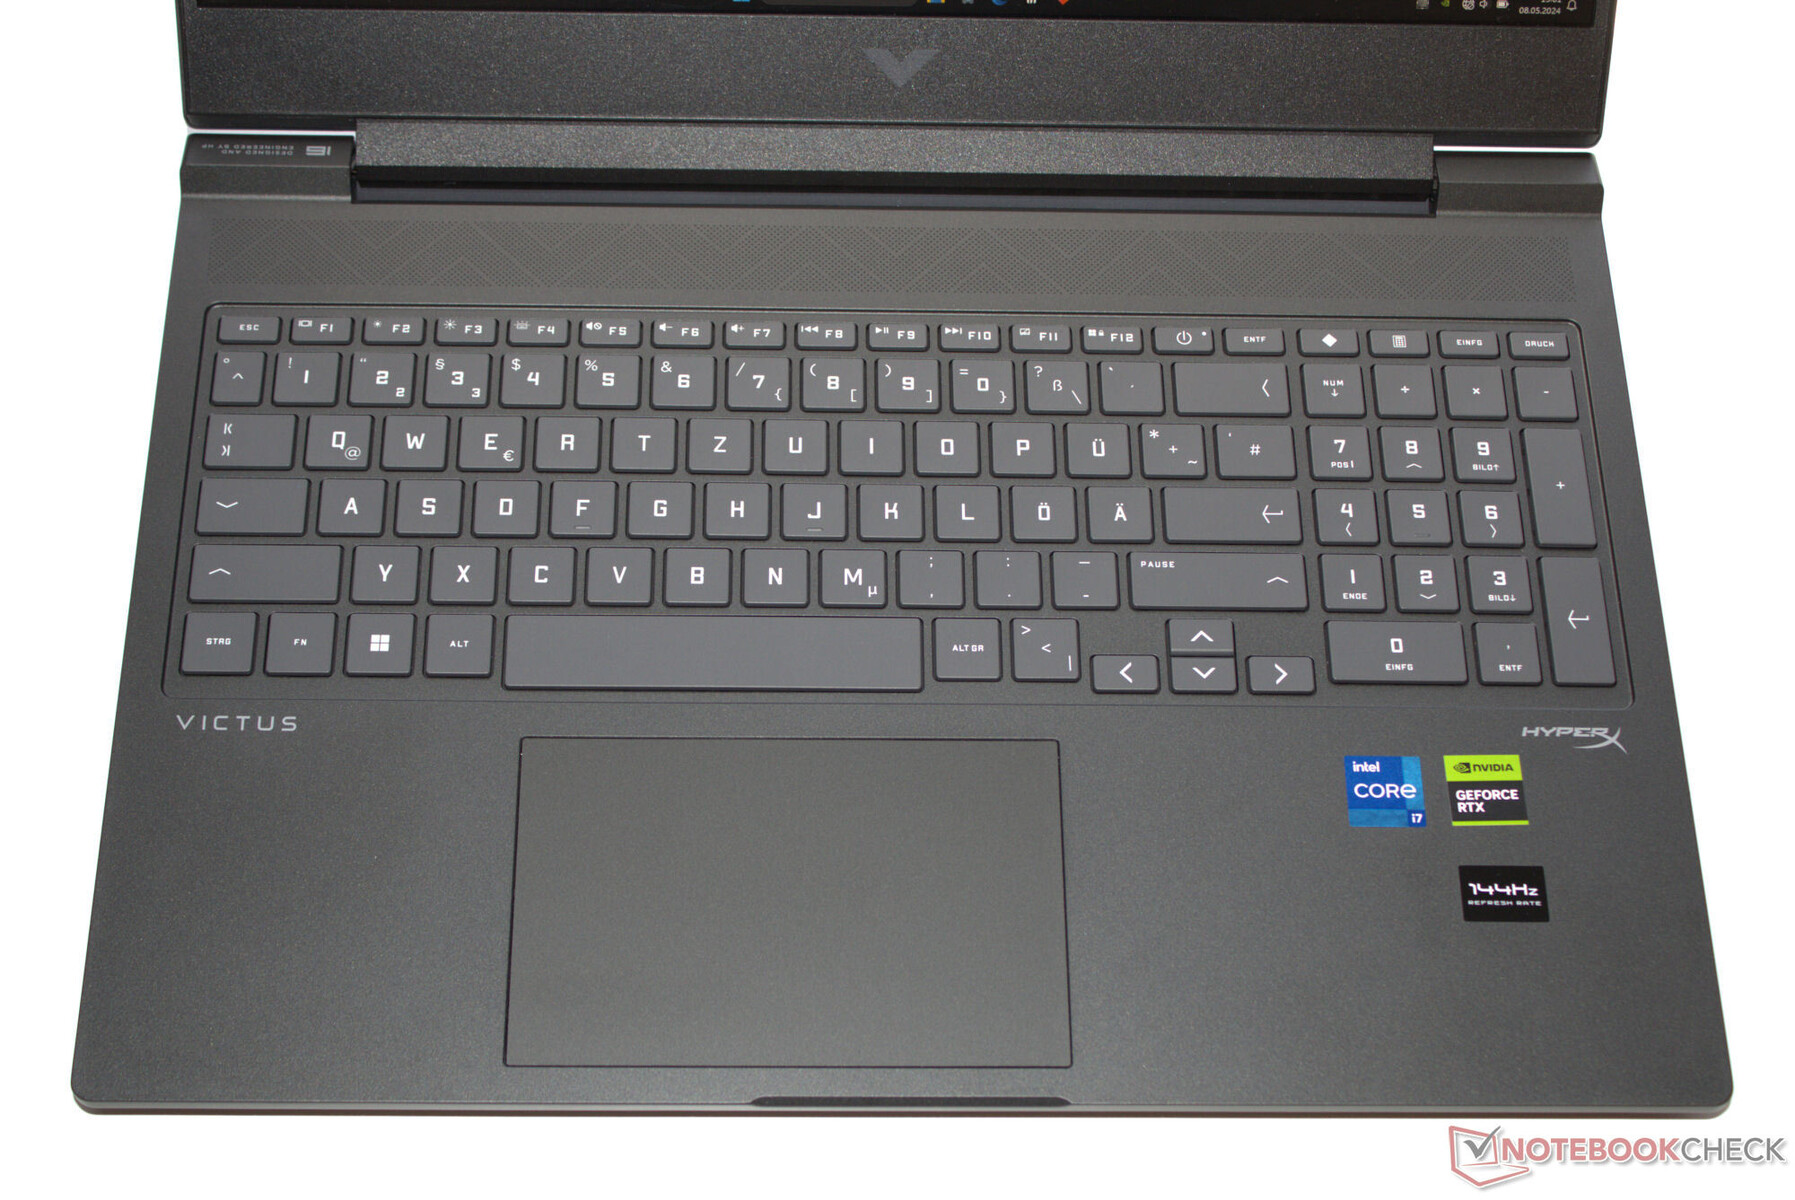
Input devices - The HP laptop with small arrow keys
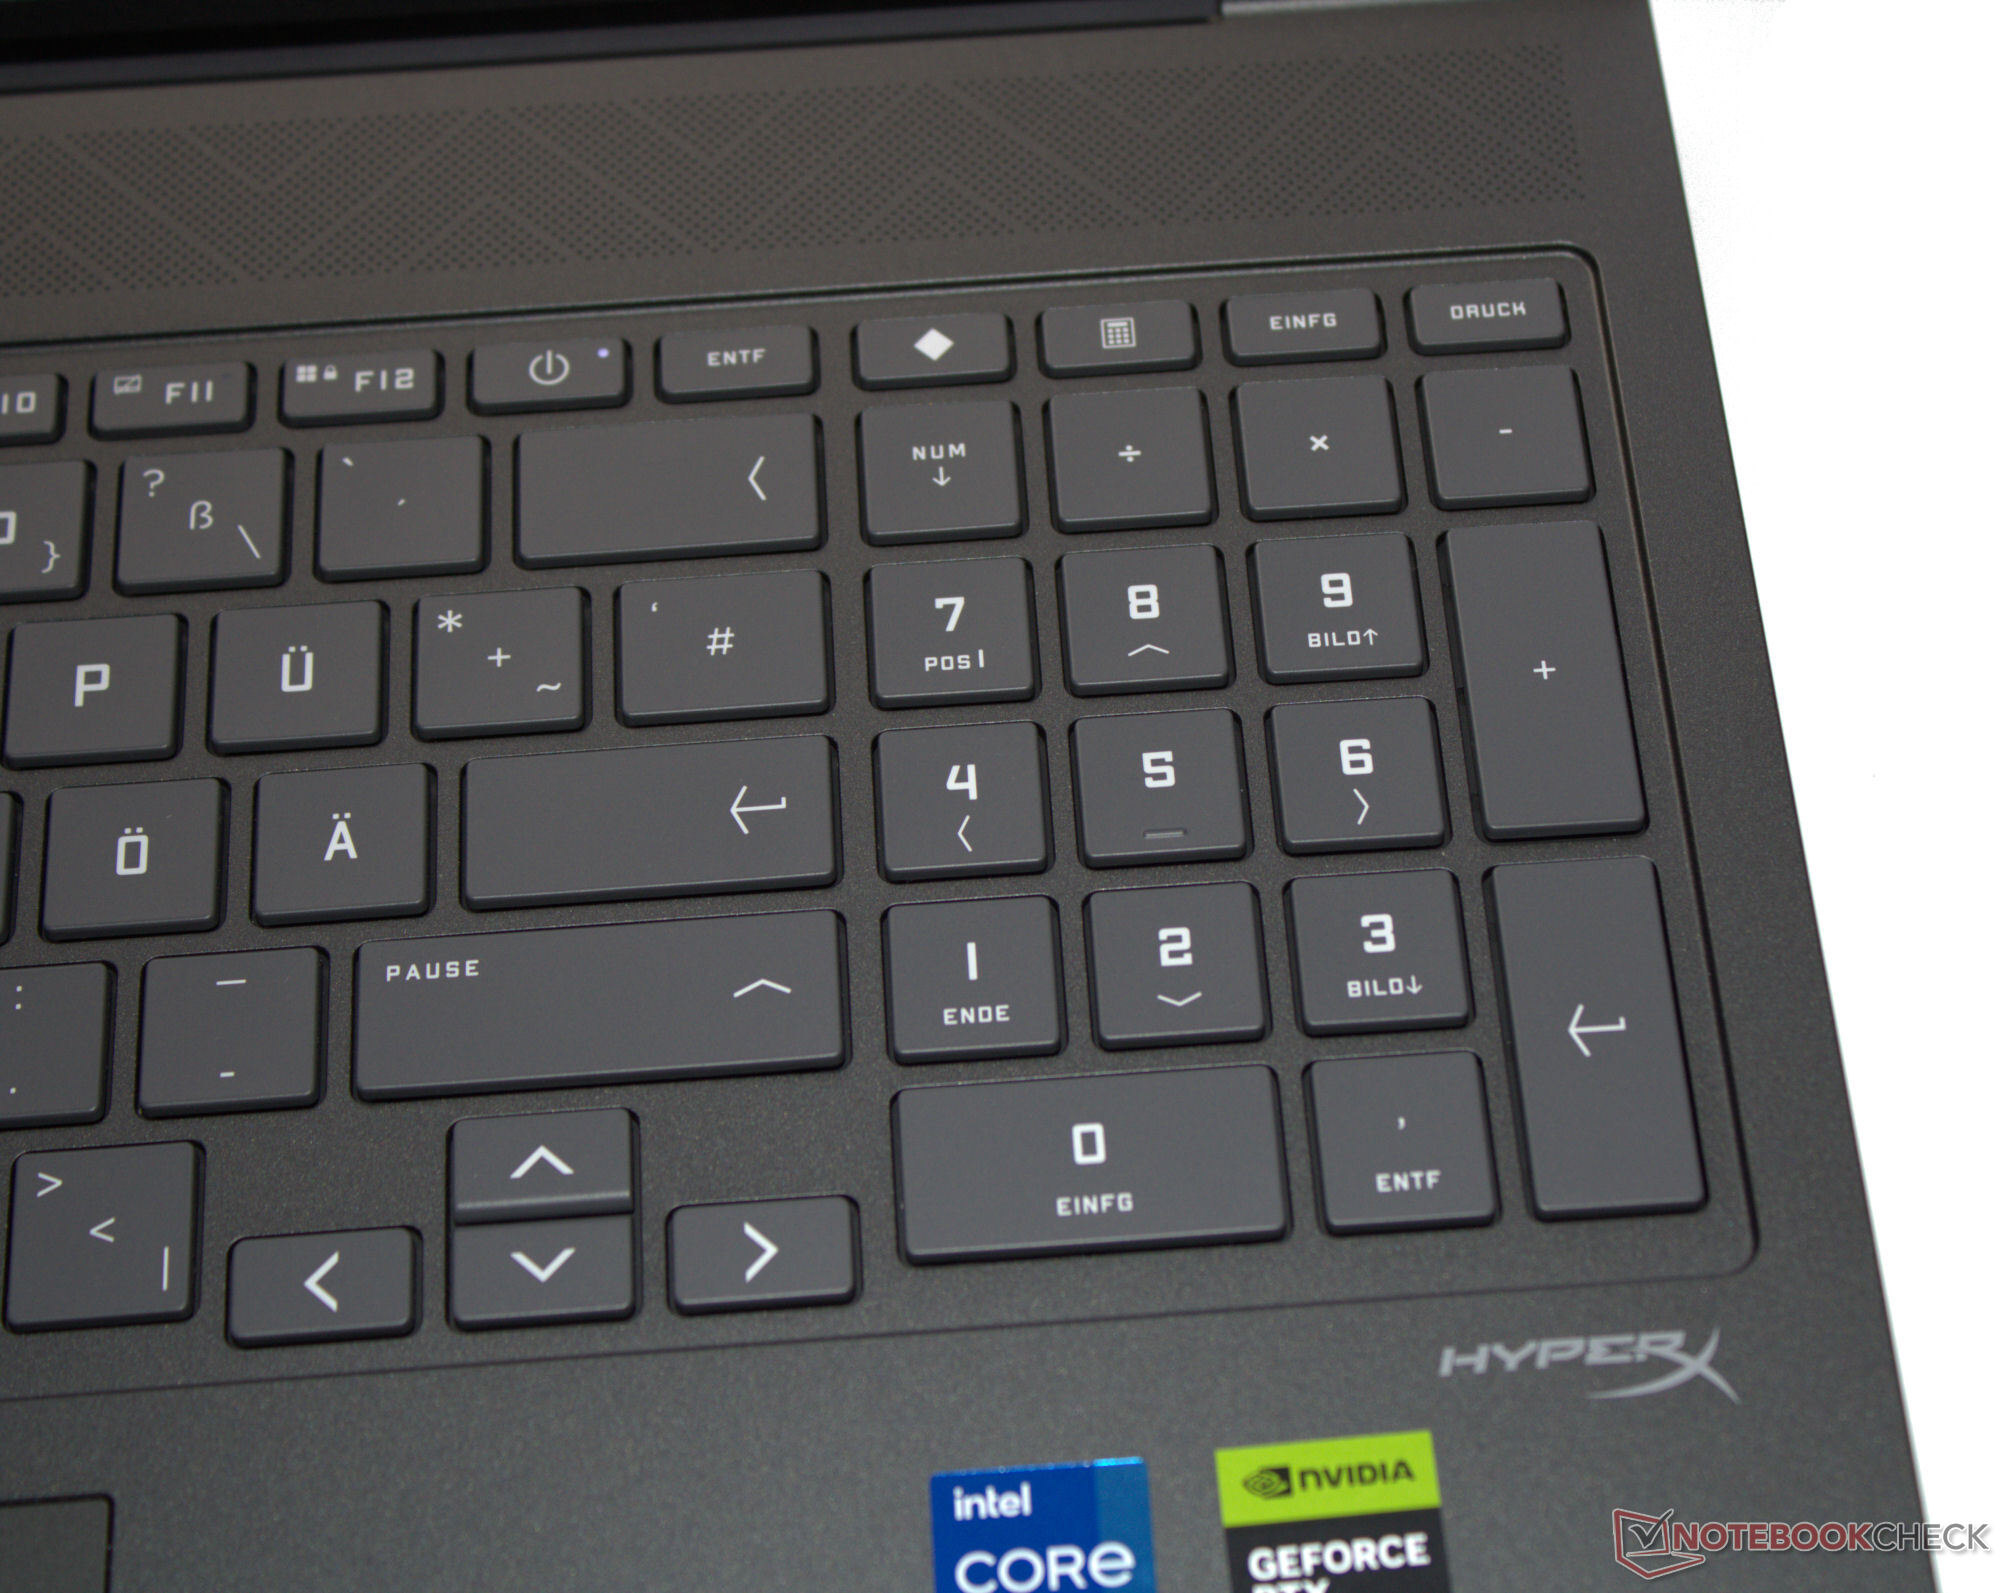
The chiclet keyboard's smooth keys (RGB lighting, number pad) feature a short lift and a clear pressure point. Their resistance could do with being a little more crisp. The keyboard bounces slightly when typing. Negative: Both the arrow keys and the Enter key are comparatively small. A clickpad (12.5 x 7.5 cm) with a short lift and a clear pressure point acts as a mouse replacement.
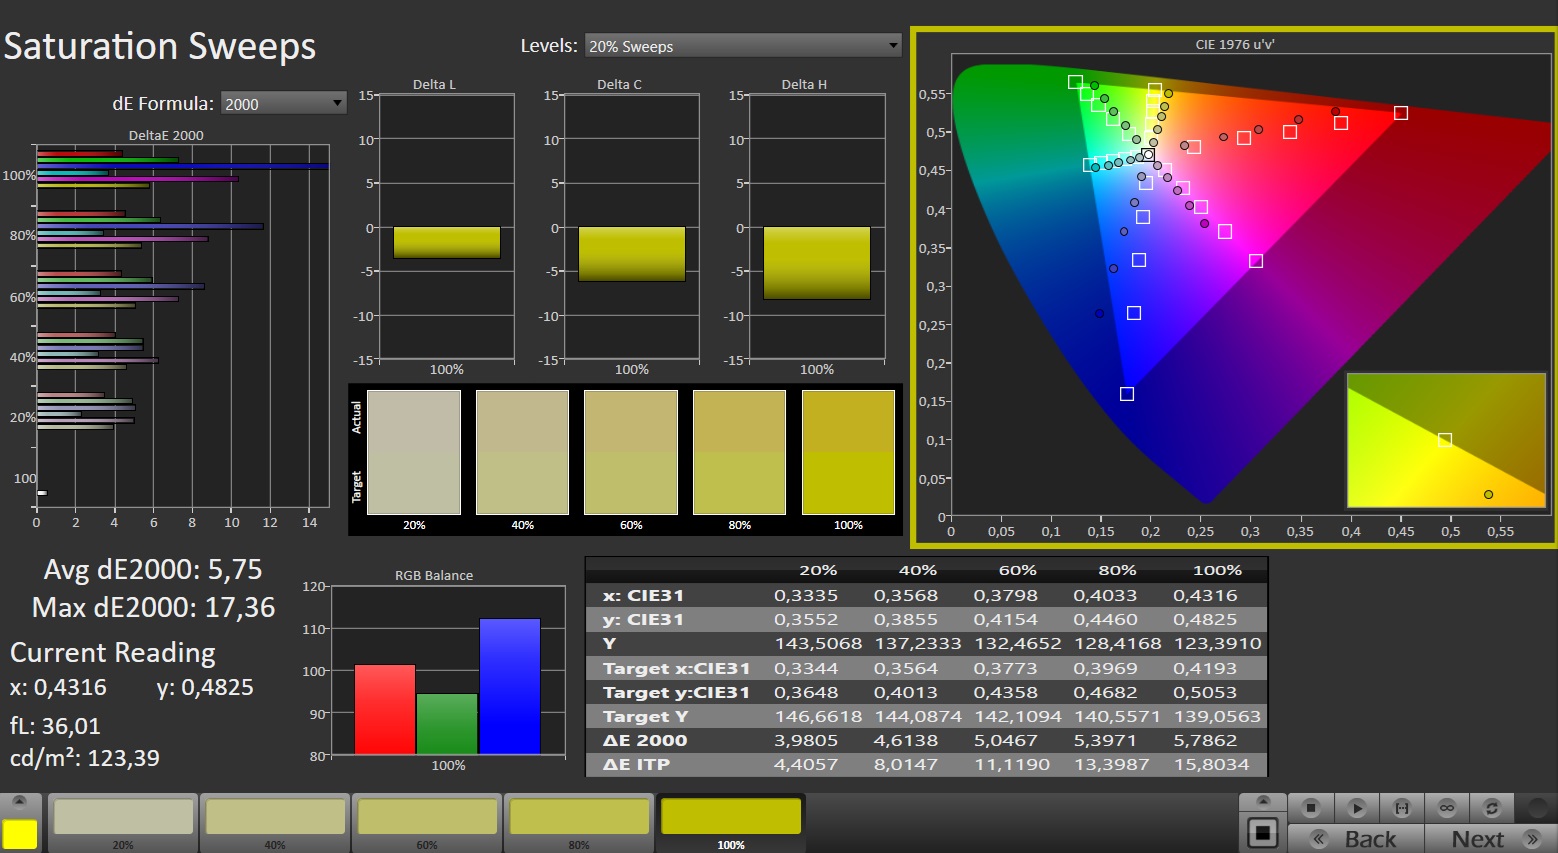
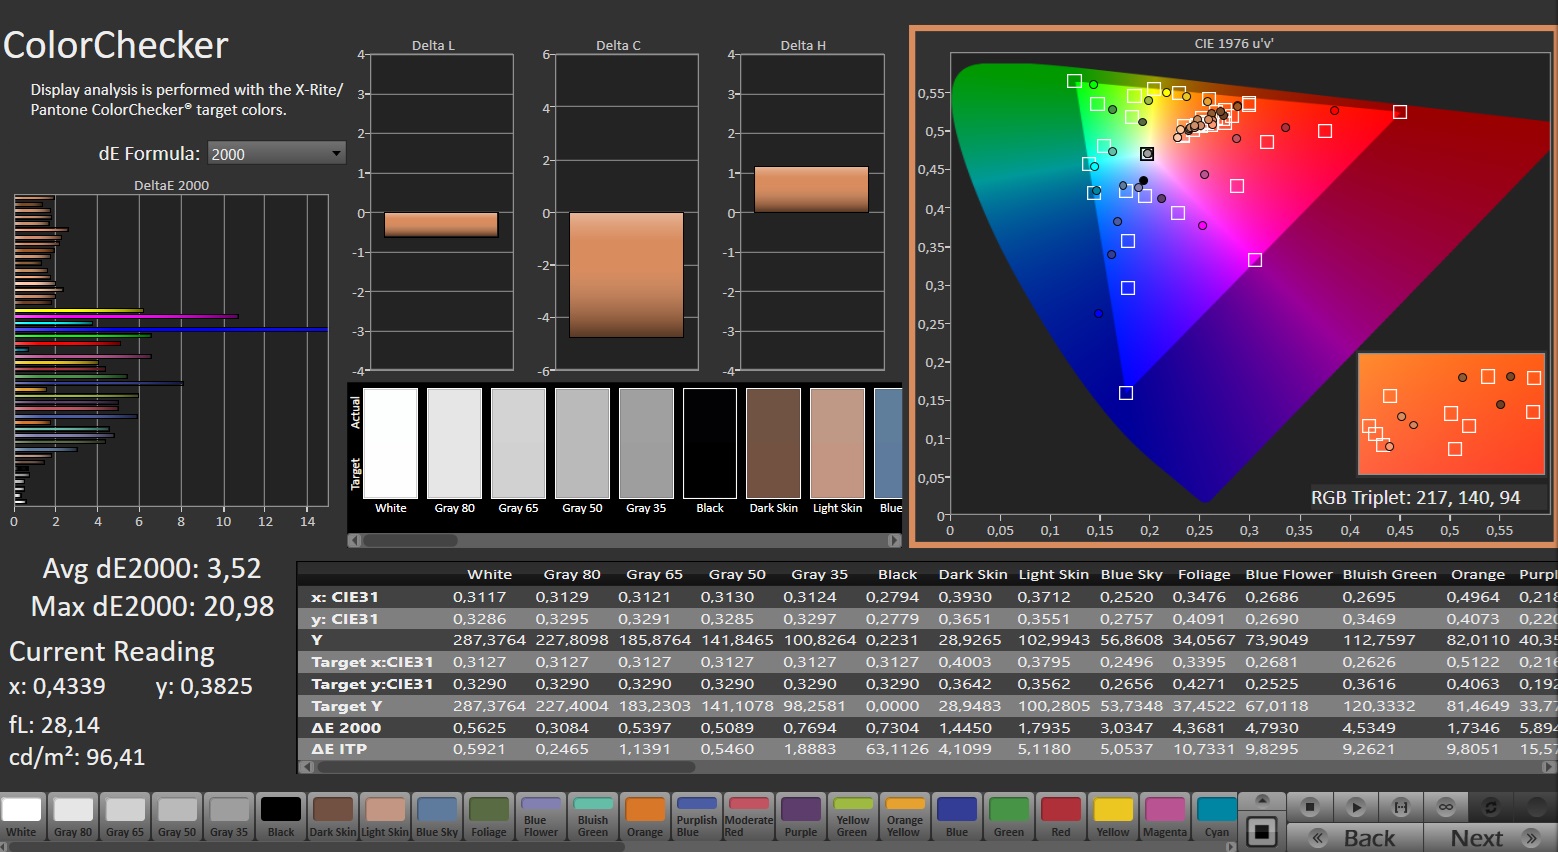
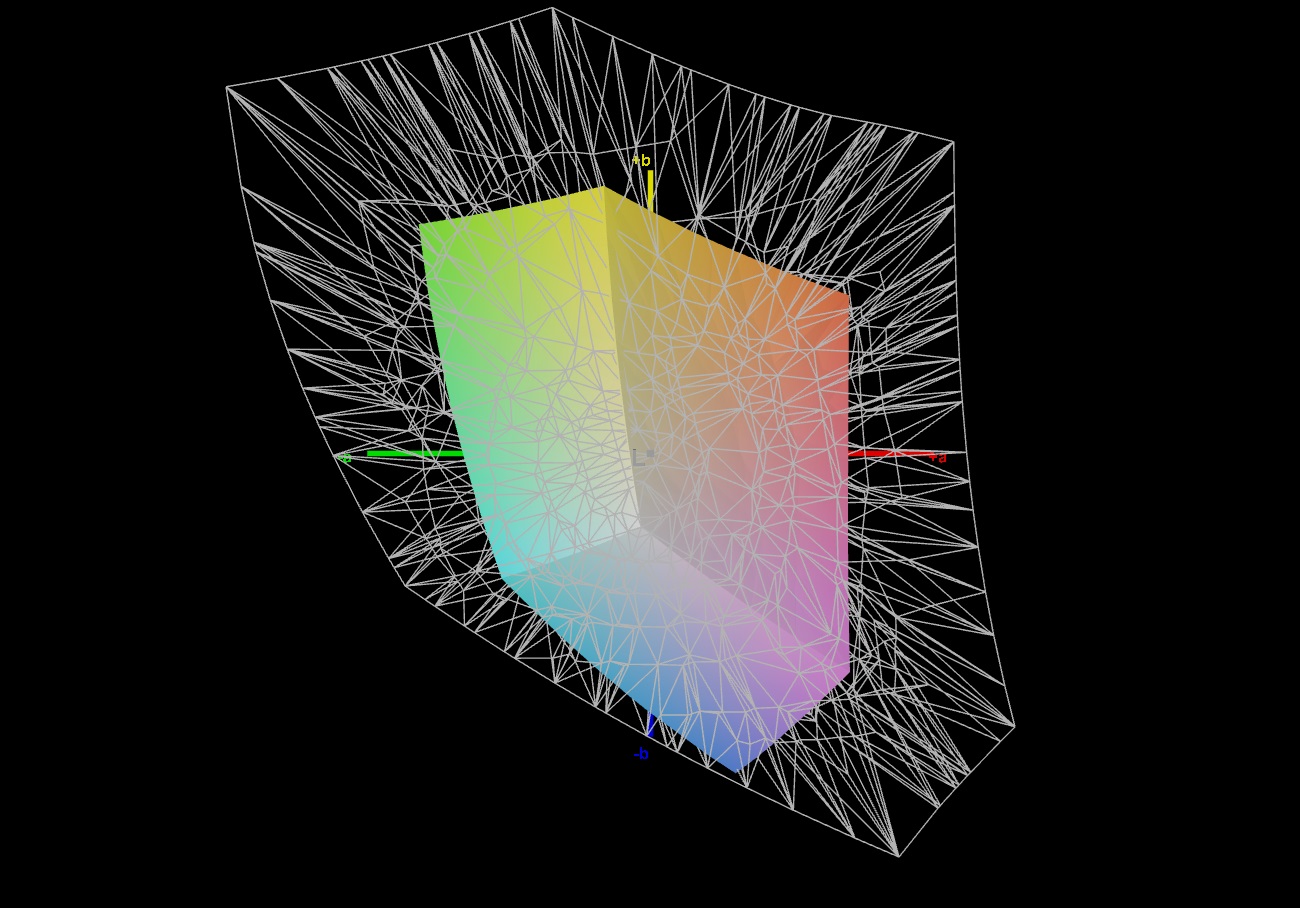
Display - IPS panel with low color accuracy
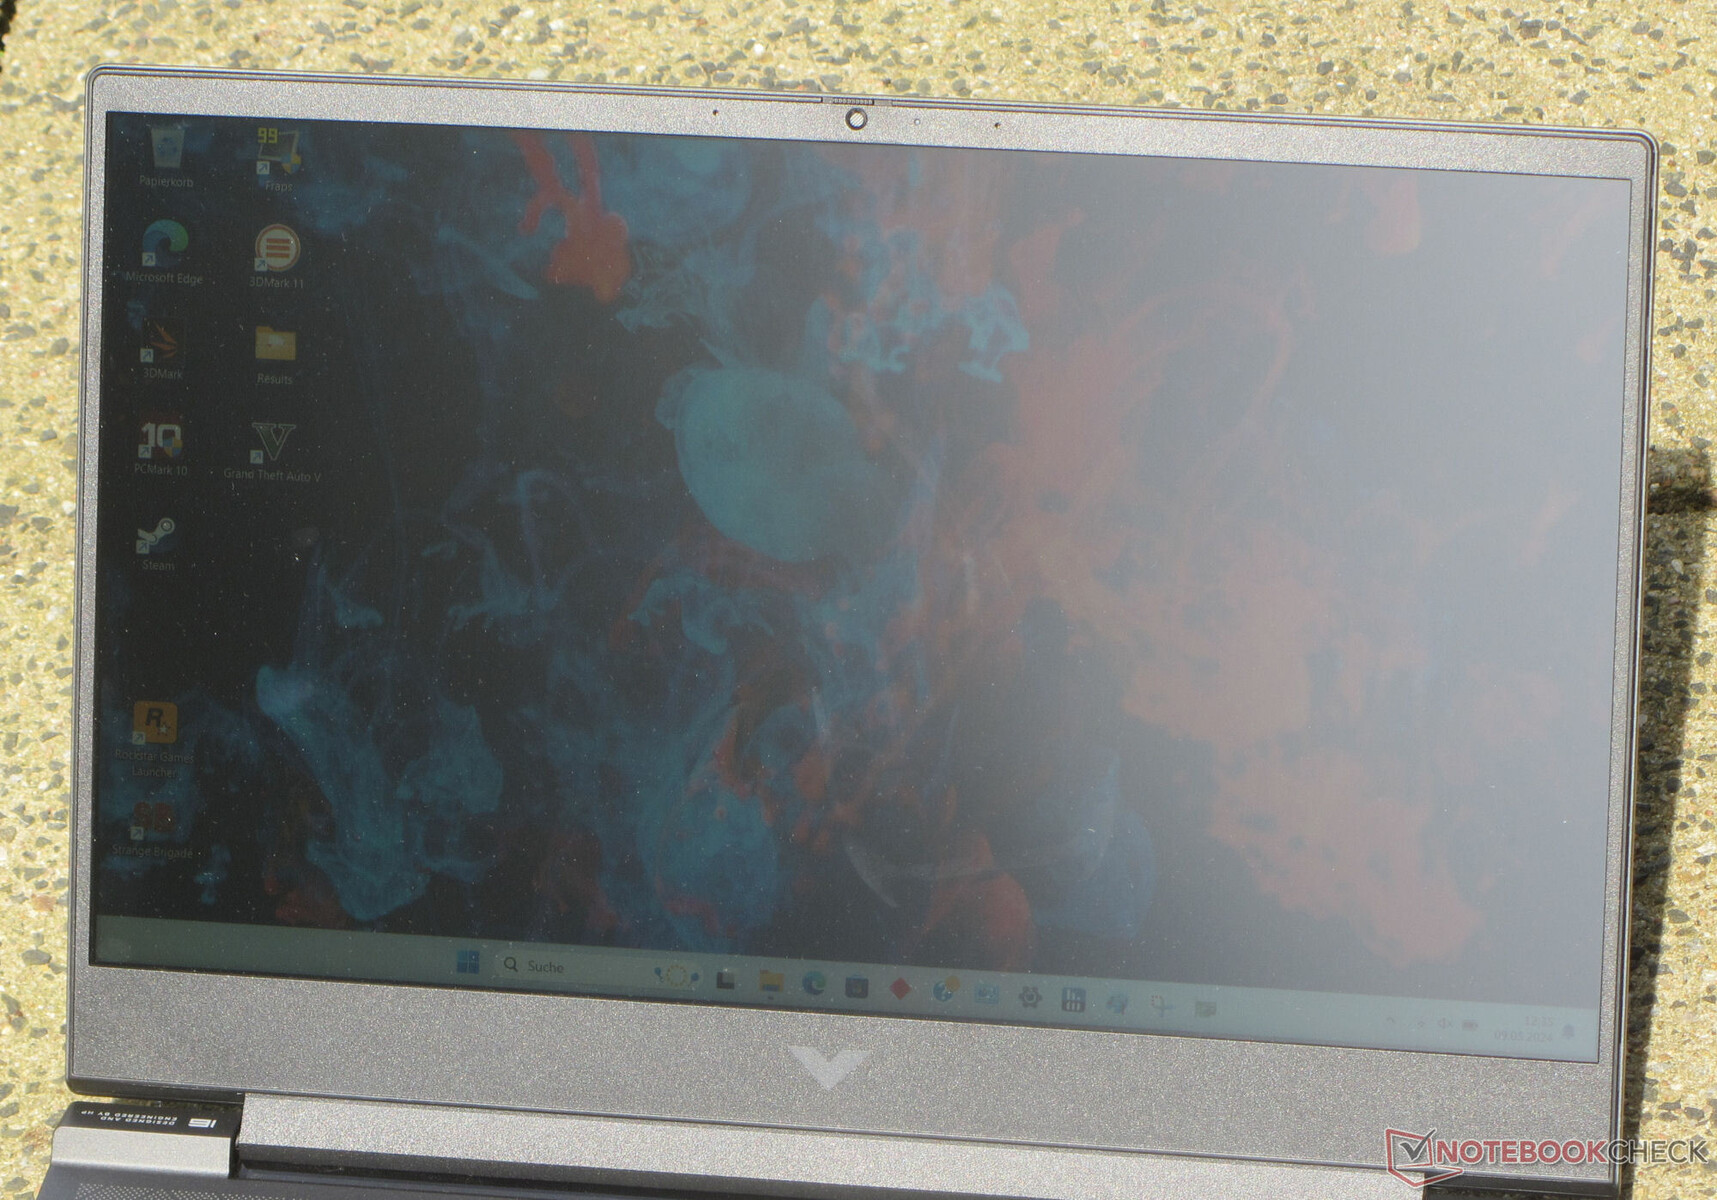
HP has equipped the Victus with a viewing-angle-stable 144 Hz panel (FHD, IPS) which has an aspect ratio of 16:9. It doesn't show any PWM flickering across all brightness levels. The 16.1-inch display's brightness and contrast are designed for indoor use—the target value (> 300 cd/m²) hasn't quite been met. You can read from the display outside as long as the sun isn't shining all too brightly.
| |||||||||||||||||||||||||
Brightness Distribution: 86 %
Center on Battery: 287 cd/m²
Contrast: 1511:1 (Black: 0.19 cd/m²)
ΔE ColorChecker Calman: 5.46 | ∀{0.5-29.43 Ø4.72}
calibrated: 3.52
ΔE Greyscale Calman: 4.8 | ∀{0.09-98 Ø4.97}
42.7% AdobeRGB 1998 (Argyll 3D)
61.7% sRGB (Argyll 3D)
41.3% Display P3 (Argyll 3D)
Gamma: 2.108
CCT: 6442 K
| HP Victus 16 (2024) Chi Mei CMN163E, IPS, 1920x1080, 16.1" | Gigabyte G6X 9KG (2024) BOE NE160WUM-NX6, IPS, 1920x1200, 16" | Dell G16, i7-13650HX, RTX 4060 Chi Mei CMN161D (160GME), IPS, 2560x1600, 16" | Lenovo Legion 5 16IRX G9 NE160QDM-NZ3, IPS, 2560x1600, 16" | Asus TUF Gaming A16 FA617XS BOE NE160WUM-NX2, IPS, 1920x1200, 16" | |
|---|---|---|---|---|---|
| Display | 1% | 62% | 70% | 64% | |
| Display P3 Coverage (%) | 41.3 | 41.8 1% | 67.5 63% | 72.4 75% | 69.3 68% |
| sRGB Coverage (%) | 61.7 | 62.4 1% | 98.5 60% | 100 62% | 97.3 58% |
| AdobeRGB 1998 Coverage (%) | 42.7 | 43.3 1% | 69.3 62% | 74.1 74% | 70.7 66% |
| Response Times | -29% | 59% | 55% | 46% | |
| Response Time Grey 50% / Grey 80% * (ms) | 28.6 ? | 40.5 ? -42% | 7.6 ? 73% | 12.5 ? 56% | 15.6 ? 45% |
| Response Time Black / White * (ms) | 18.7 ? | 21.6 ? -16% | 10.4 ? 44% | 8.7 ? 53% | 10 ? 47% |
| PWM Frequency (Hz) | |||||
| Screen | 6% | 21% | 45% | 29% | |
| Brightness middle (cd/m²) | 287 | 353 23% | 369 29% | 526 83% | 301 5% |
| Brightness (cd/m²) | 288 | 318 10% | 344 19% | 500 74% | 294 2% |
| Brightness Distribution (%) | 86 | 81 -6% | 89 3% | 87 1% | 94 9% |
| Black Level * (cd/m²) | 0.19 | 0.21 -11% | 0.26 -37% | 0.33 -74% | 0.21 -11% |
| Contrast (:1) | 1511 | 1681 11% | 1419 -6% | 1594 5% | 1433 -5% |
| Colorchecker dE 2000 * | 5.46 | 5.21 5% | 3.04 44% | 1.2 78% | 1.79 67% |
| Colorchecker dE 2000 max. * | 20.36 | 19.95 2% | 5.56 73% | 2.1 90% | 3.48 83% |
| Colorchecker dE 2000 calibrated * | 3.52 | 3.61 -3% | 2.35 33% | 1 72% | 1.2 66% |
| Greyscale dE 2000 * | 4.8 | 3.6 25% | 3.38 30% | 1.3 73% | 2.5 48% |
| Gamma | 2.108 104% | 2.367 93% | 2.47 89% | 2.23 99% | 2.265 97% |
| CCT | 6442 101% | 7138 91% | 6040 108% | 6391 102% | 6157 106% |
| Total Average (Program / Settings) | -7% /
0% | 47% /
35% | 57% /
52% | 46% /
39% |
* ... smaller is better
The panel cannot reproduce the common color spaces (AdobeRGB, sRGB, DCI-P3). In this respect, the screens of some competitors offer more. Its color reproduction is also not the best: Its factory deviation is 5.5 and a calibration reduces the value to around 3.5—in any case, its target (DeltaE < 3) has been missed.
Display Response Times
| ↔ Response Time Black to White | ||
|---|---|---|
| 18.7 ms ... rise ↗ and fall ↘ combined | ↗ 9.6 ms rise | 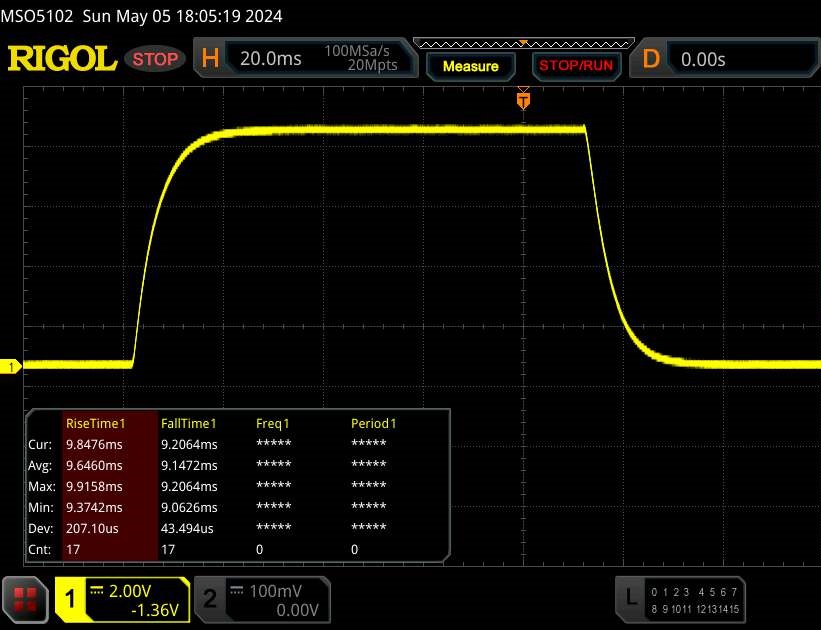 |
| ↘ 9.1 ms fall | ||
| The screen shows good response rates in our tests, but may be too slow for competitive gamers. In comparison, all tested devices range from 0.1 (minimum) to 240 (maximum) ms. » 42 % of all devices are better. This means that the measured response time is similar to the average of all tested devices (19.8 ms). | ||
| ↔ Response Time 50% Grey to 80% Grey | ||
| 28.6 ms ... rise ↗ and fall ↘ combined | ↗ 13.3 ms rise | 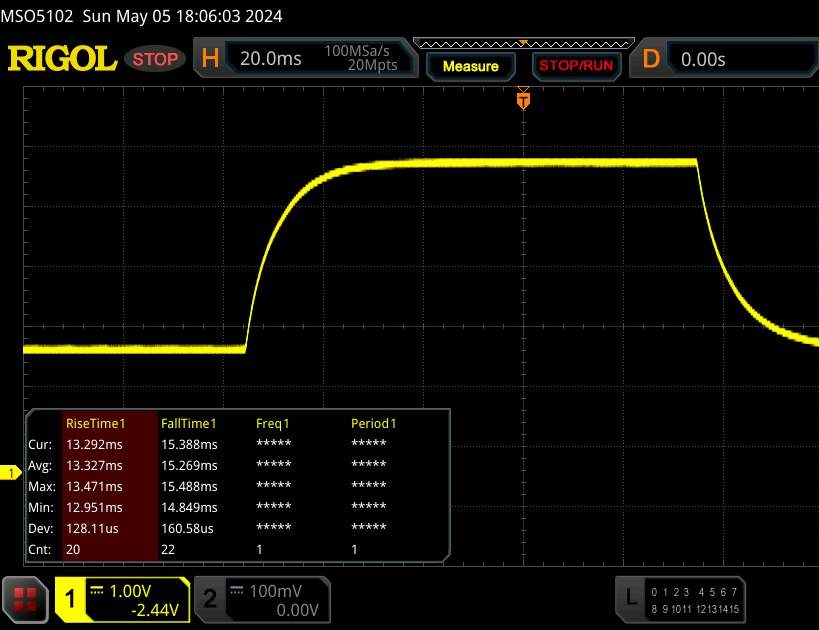 |
| ↘ 15.3 ms fall | ||
| The screen shows relatively slow response rates in our tests and may be too slow for gamers. In comparison, all tested devices range from 0.165 (minimum) to 636 (maximum) ms. » 38 % of all devices are better. This means that the measured response time is similar to the average of all tested devices (31 ms). | ||
Screen Flickering / PWM (Pulse-Width Modulation)
| Screen flickering / PWM not detected |  | ||
In comparison: 52 % of all tested devices do not use PWM to dim the display. If PWM was detected, an average of 7778 (minimum: 5 - maximum: 343500) Hz was measured. | |||
Performance - Raptor Lake and Ada Lovelace provide steam
HP has various configuration variants of the Victus 16 on offer. The currently cheapest version of the Victus 16 r1000 series can be found for around US$1,300 (Core i5-14500HX, GeForce RTX 4050, 16 GB RAM, 512 GB SSD, no Windows). For the present test device, you would have to spend around US$1,600.
Testing conditions
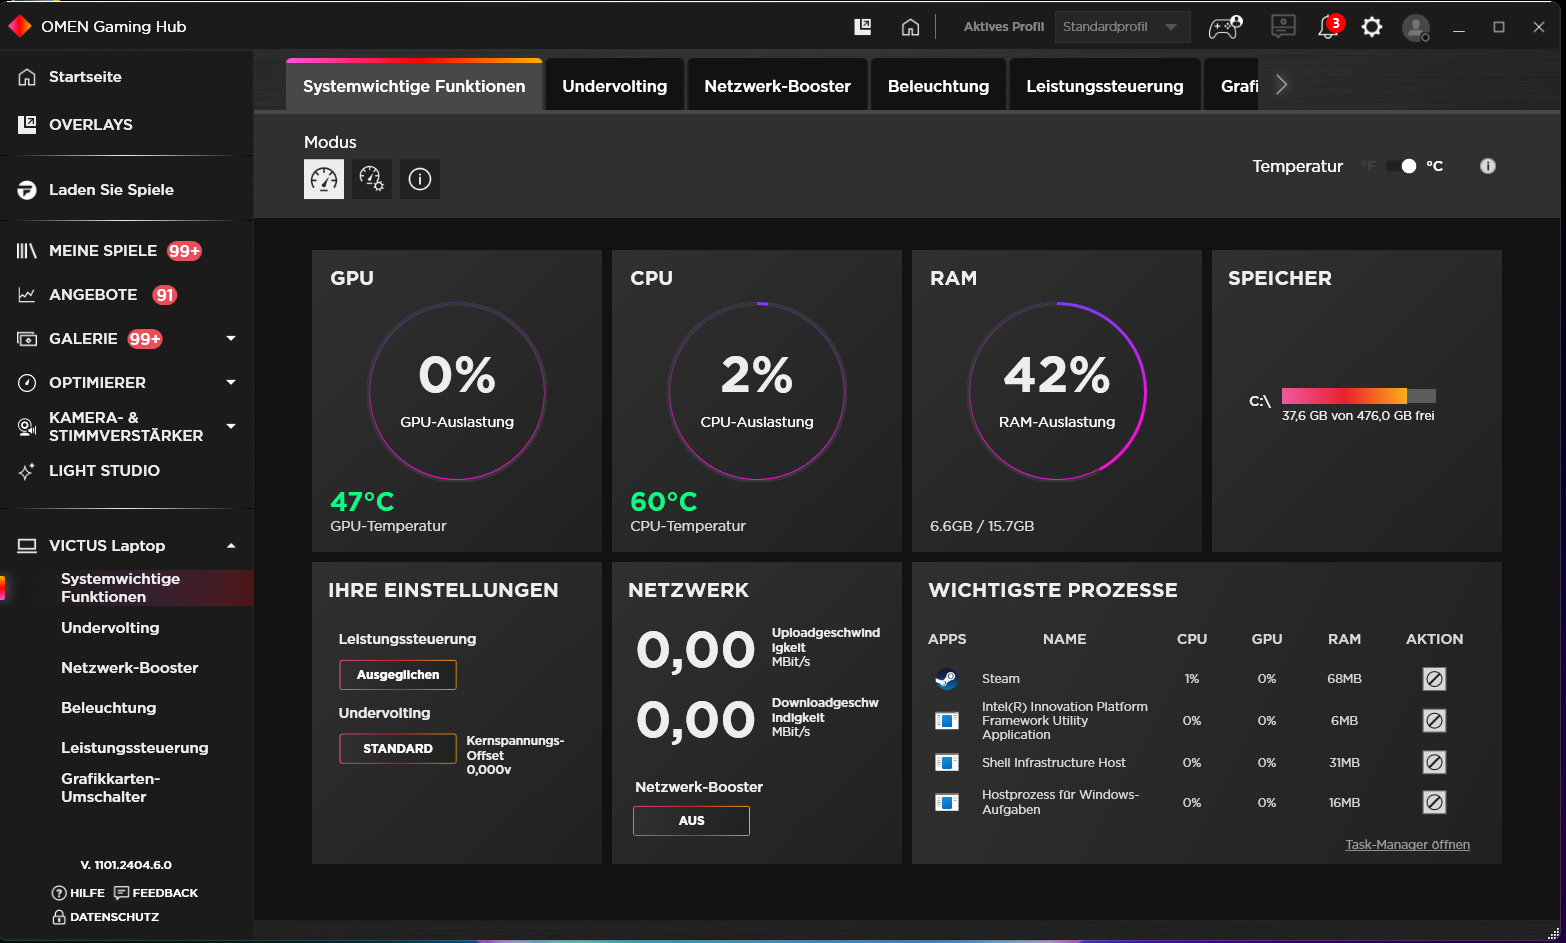
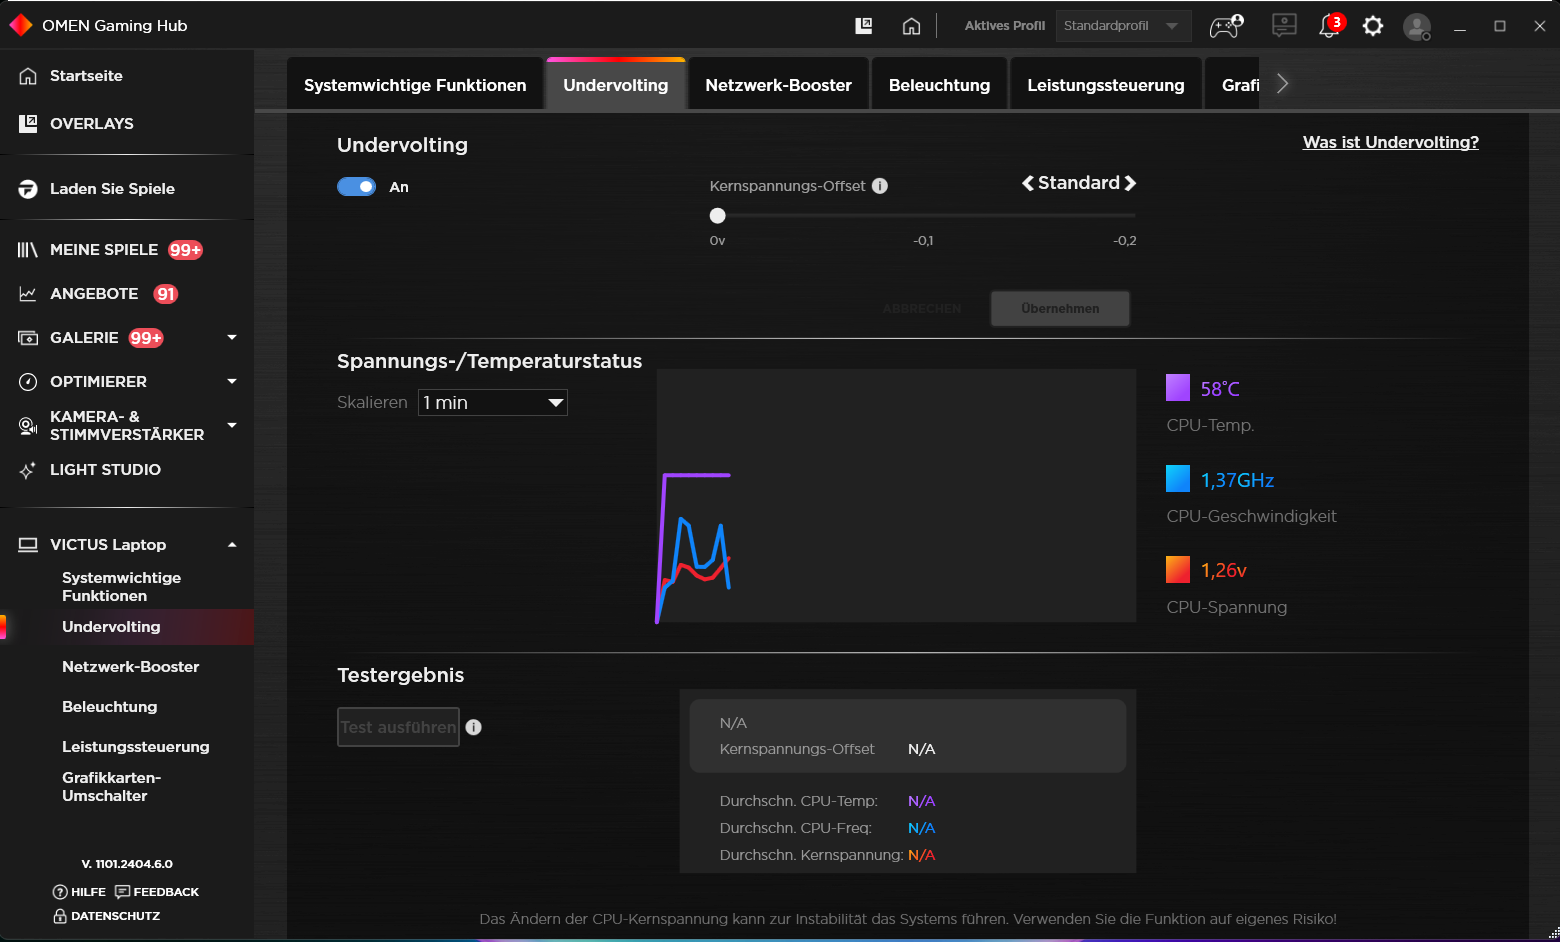
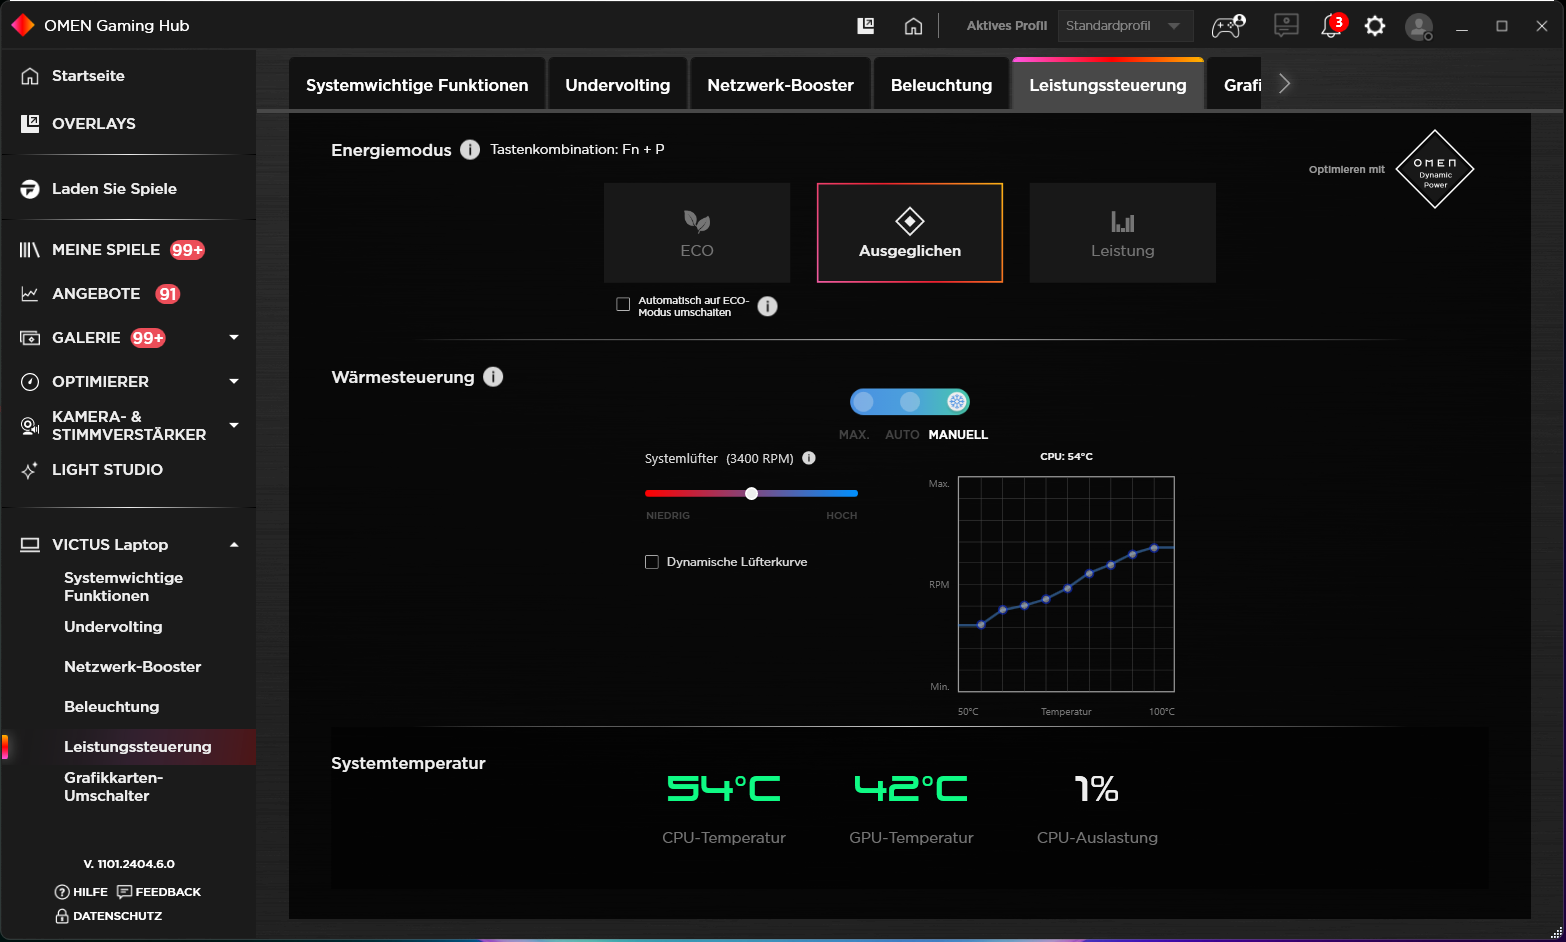
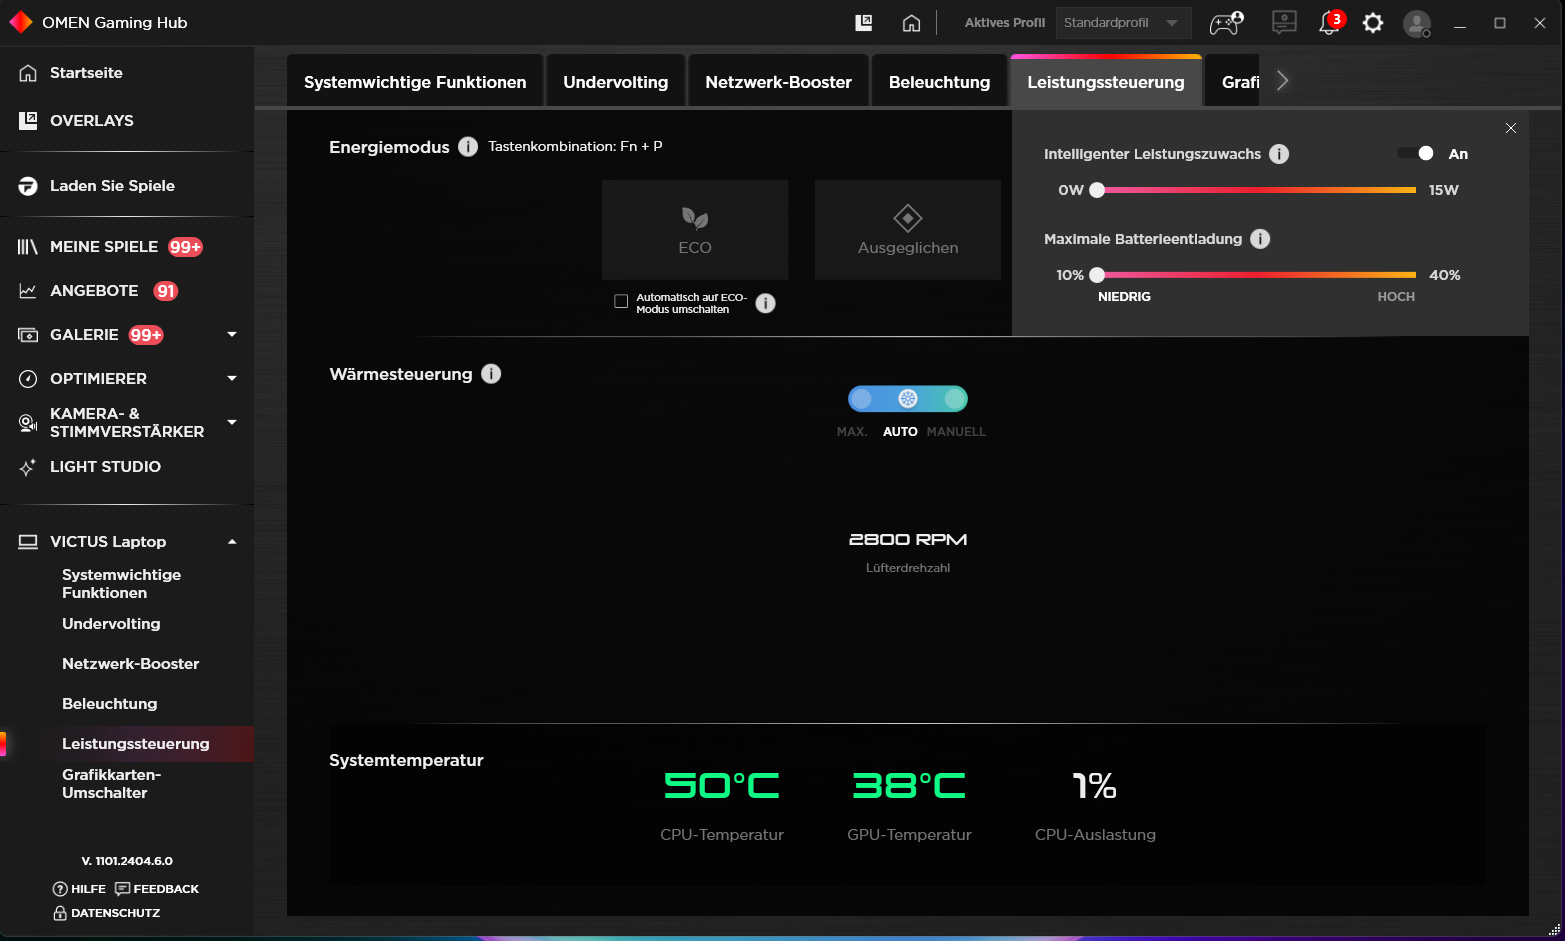
Three HP-specific system modes (see table) are available for users to choose from. The “Balanced” (benchmarks) and “ECO” (battery tests) modes were used during our test. Changing modes quickly can be done via a key combination (Fn + P). The “Omen Gaming Hub” (control center of the laptop) also lets you to select the mode. It also allows the CPU to be undervolted and an individual fan curve to be set, among other things.
| Balanced | Performance | Eco | |
|---|---|---|---|
| Power Limit 1 (HWInfo) | 130 watts | 130 watts | 130 watts |
| Power Limit 2 (HWInfo) | 130 watts | 130 watts | 130 watts |
| Performance (Witcher 3) | 98 fps | 100 fps | 60 fps (locked) |
| Noise (Witcher 3) | 43 dB(A) | 52 dB(A) | 38 dB(A) |
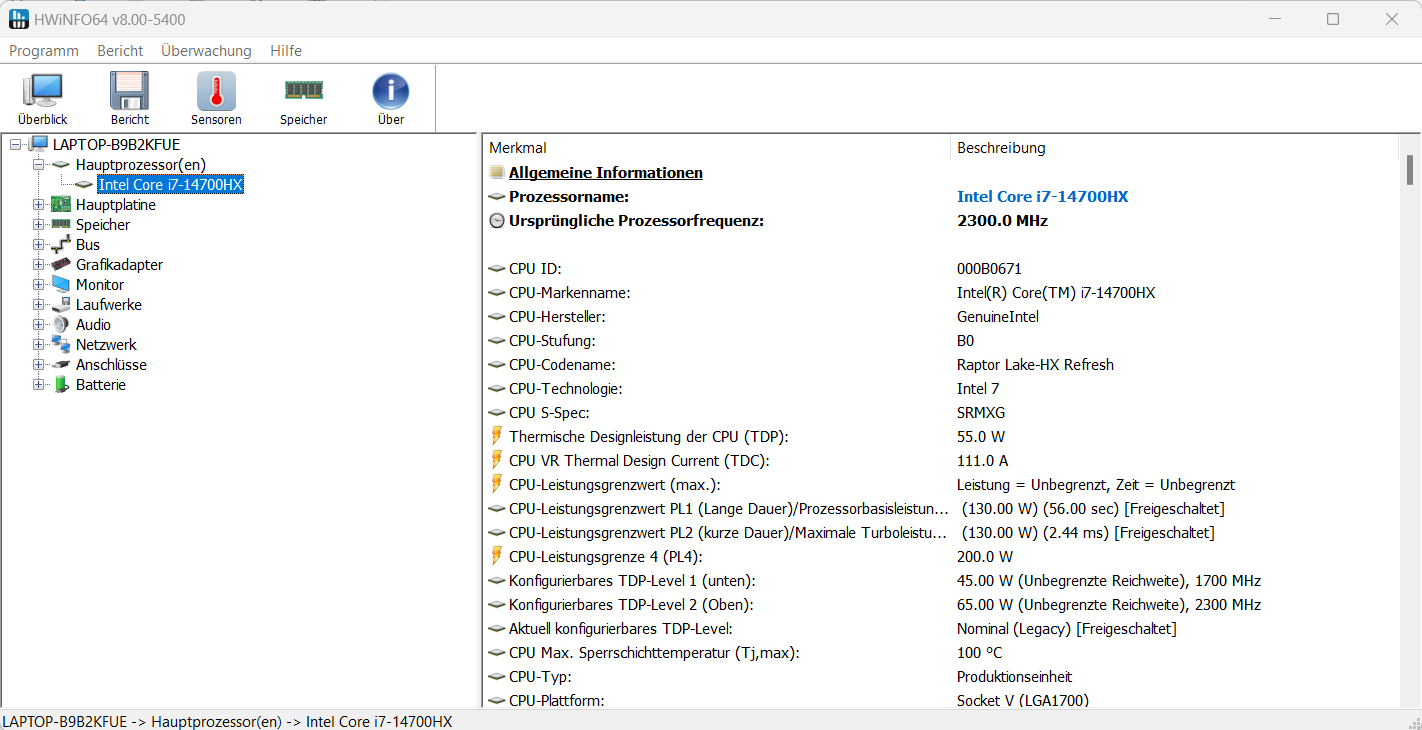
Processor
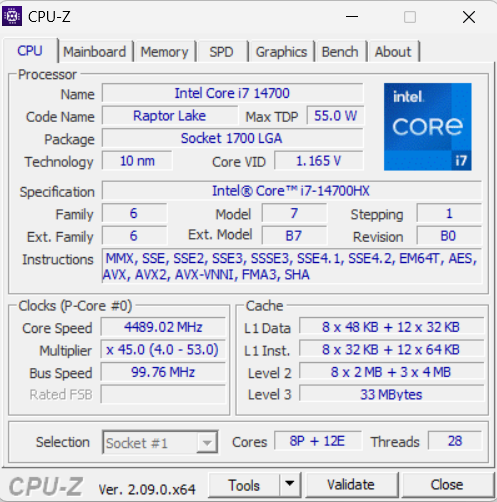
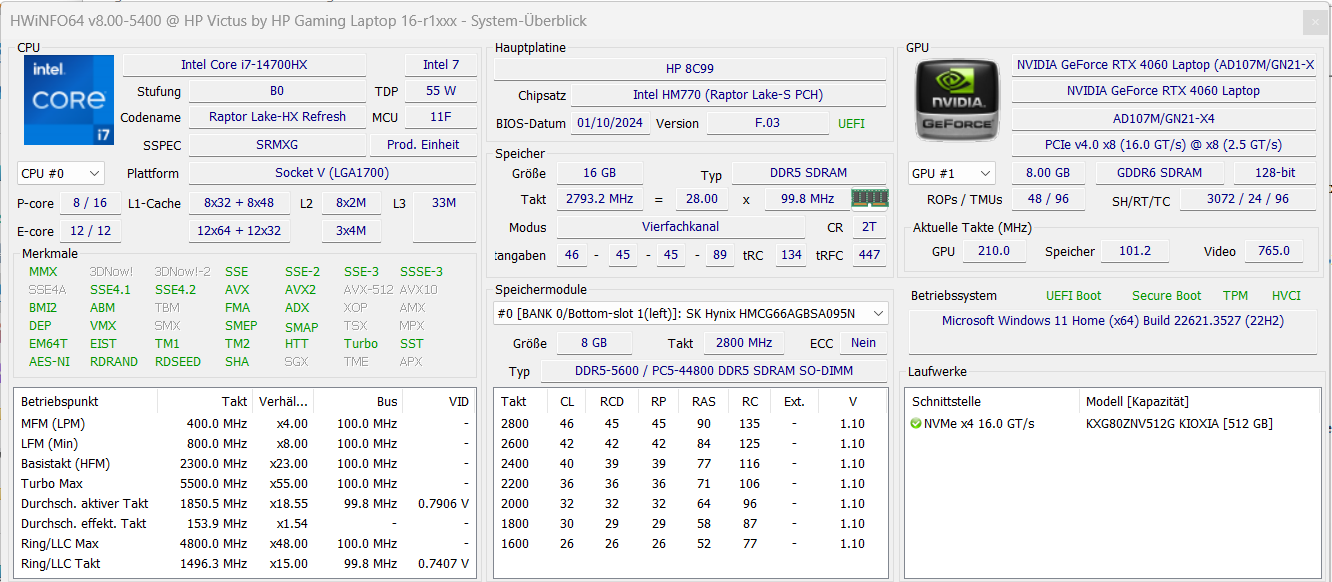
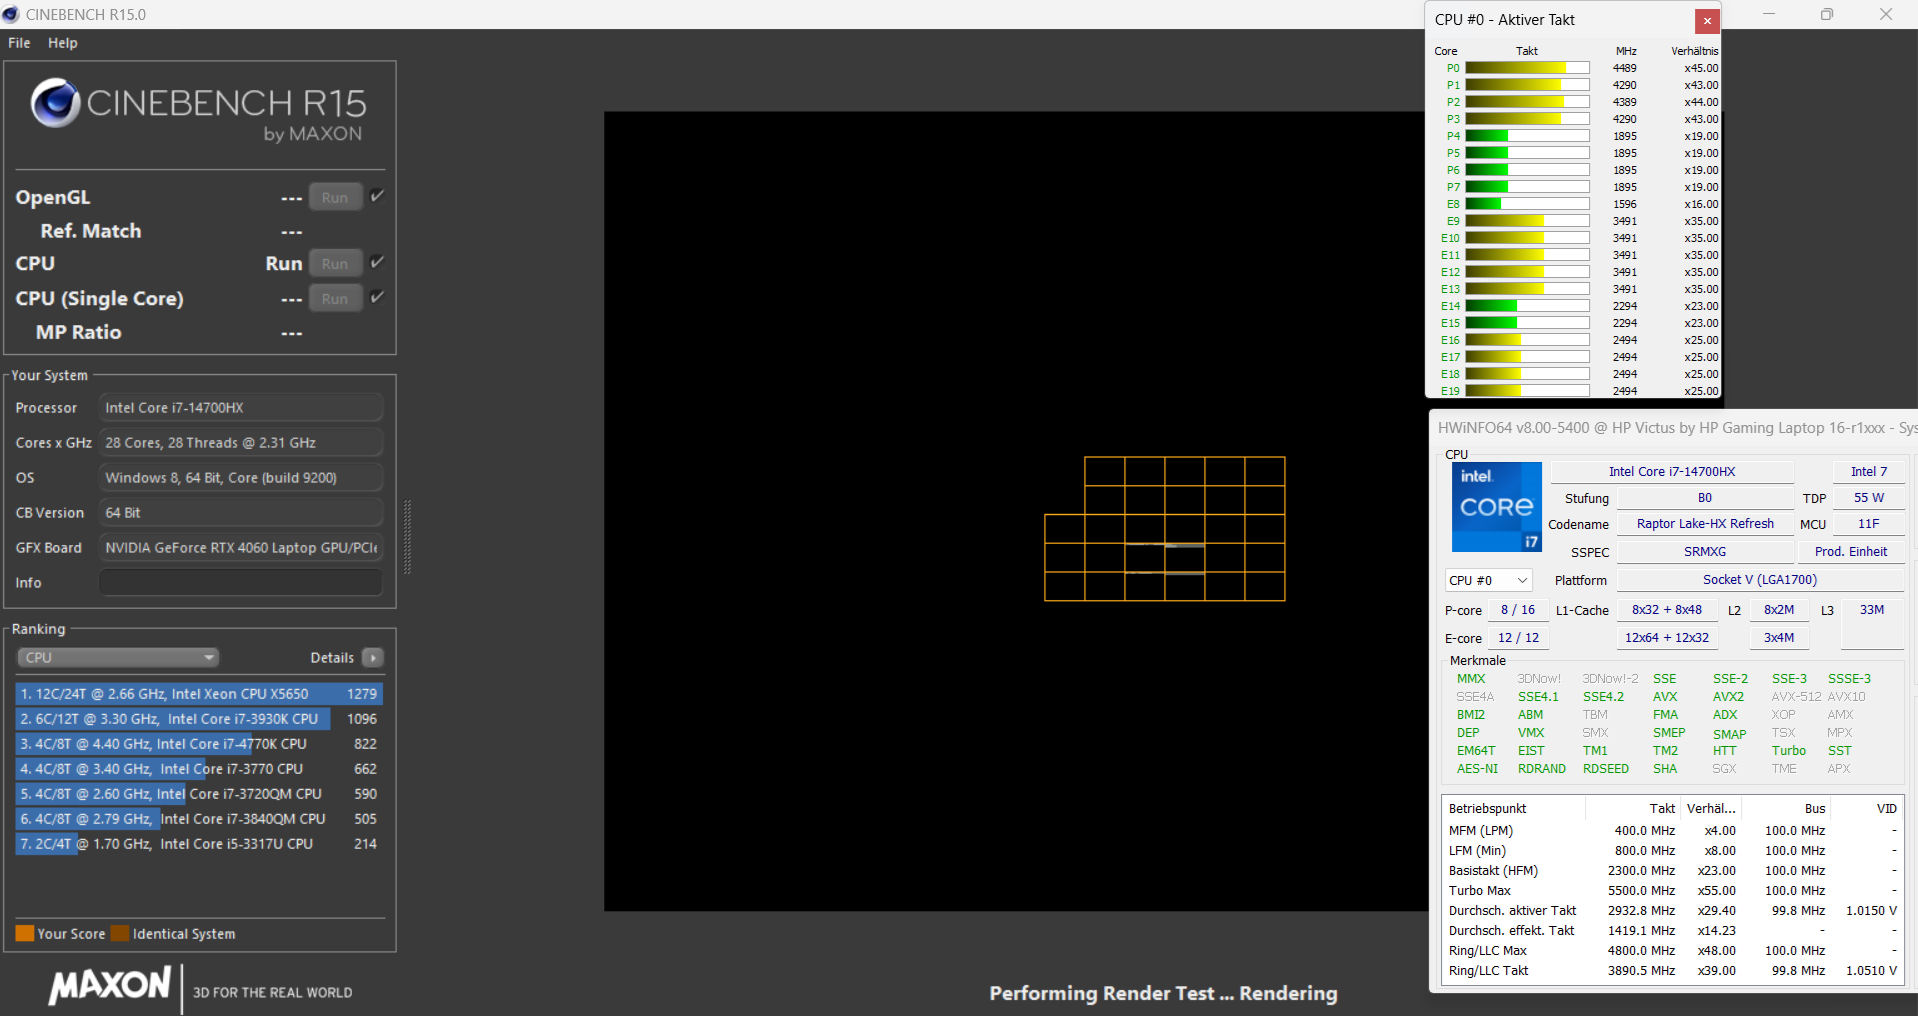
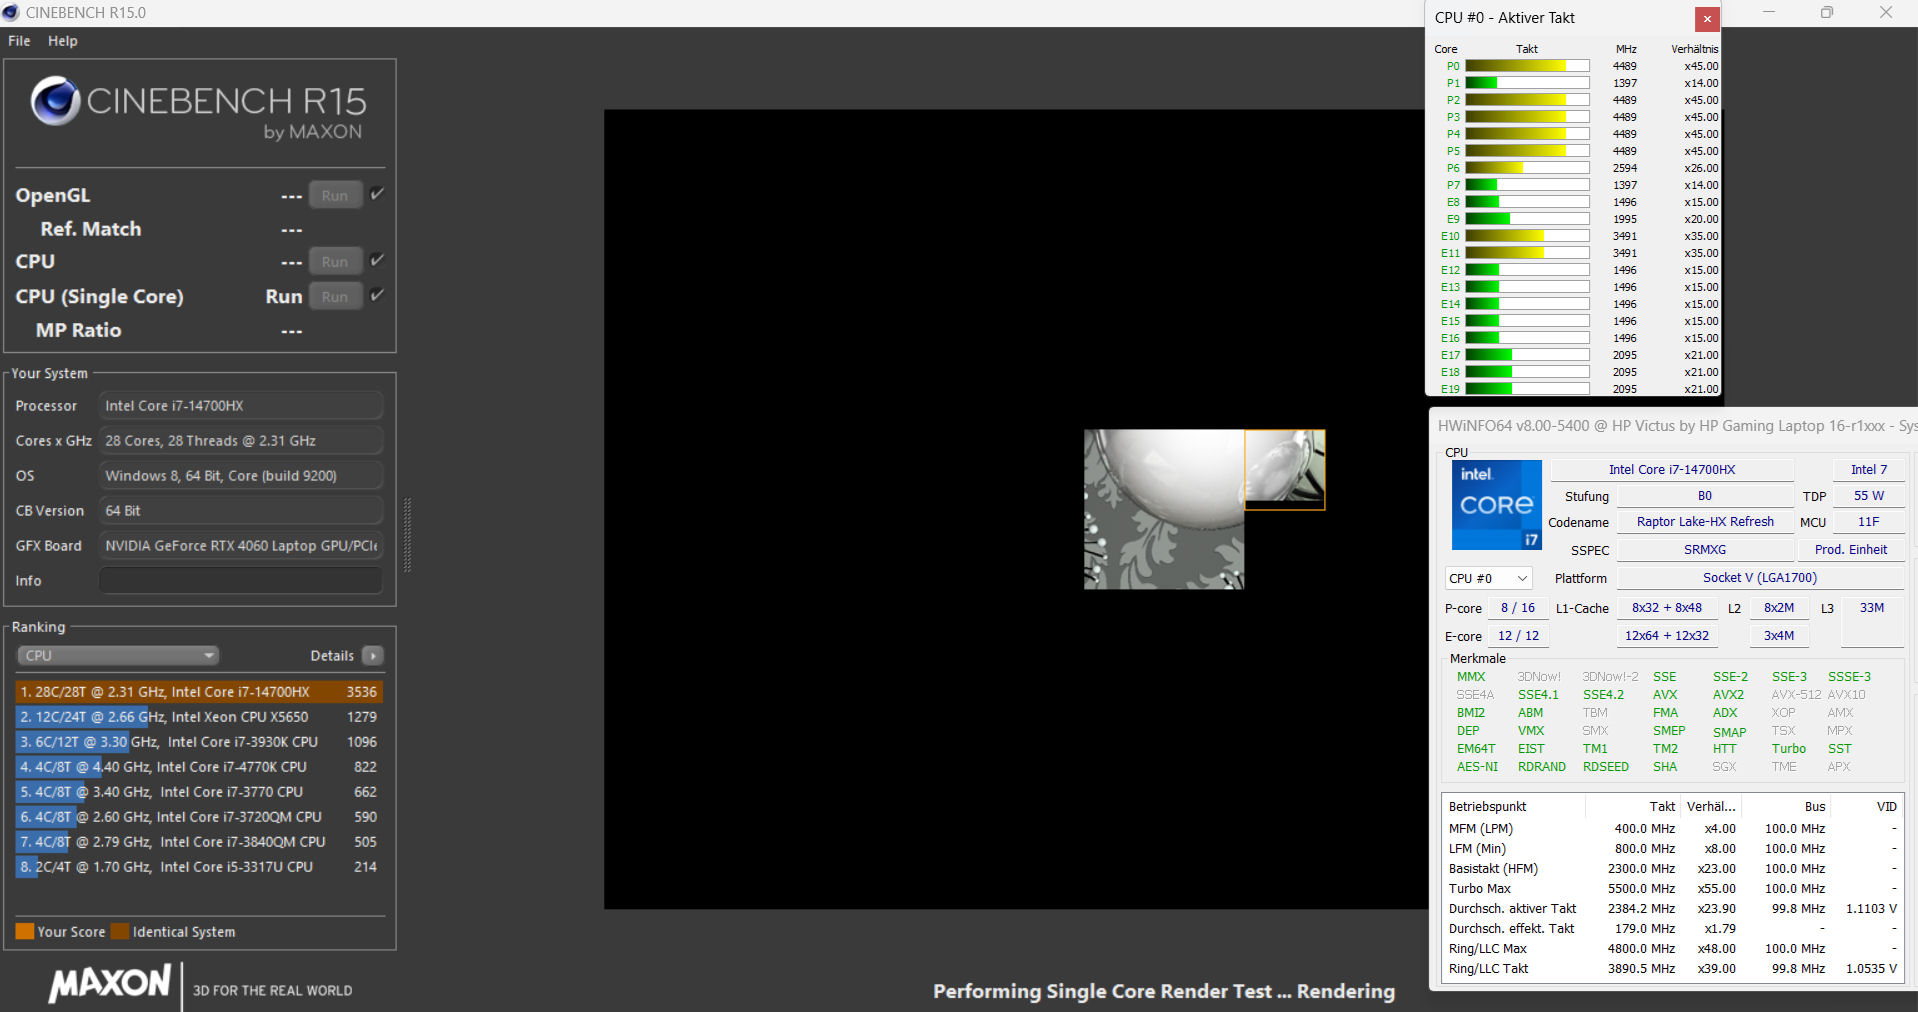
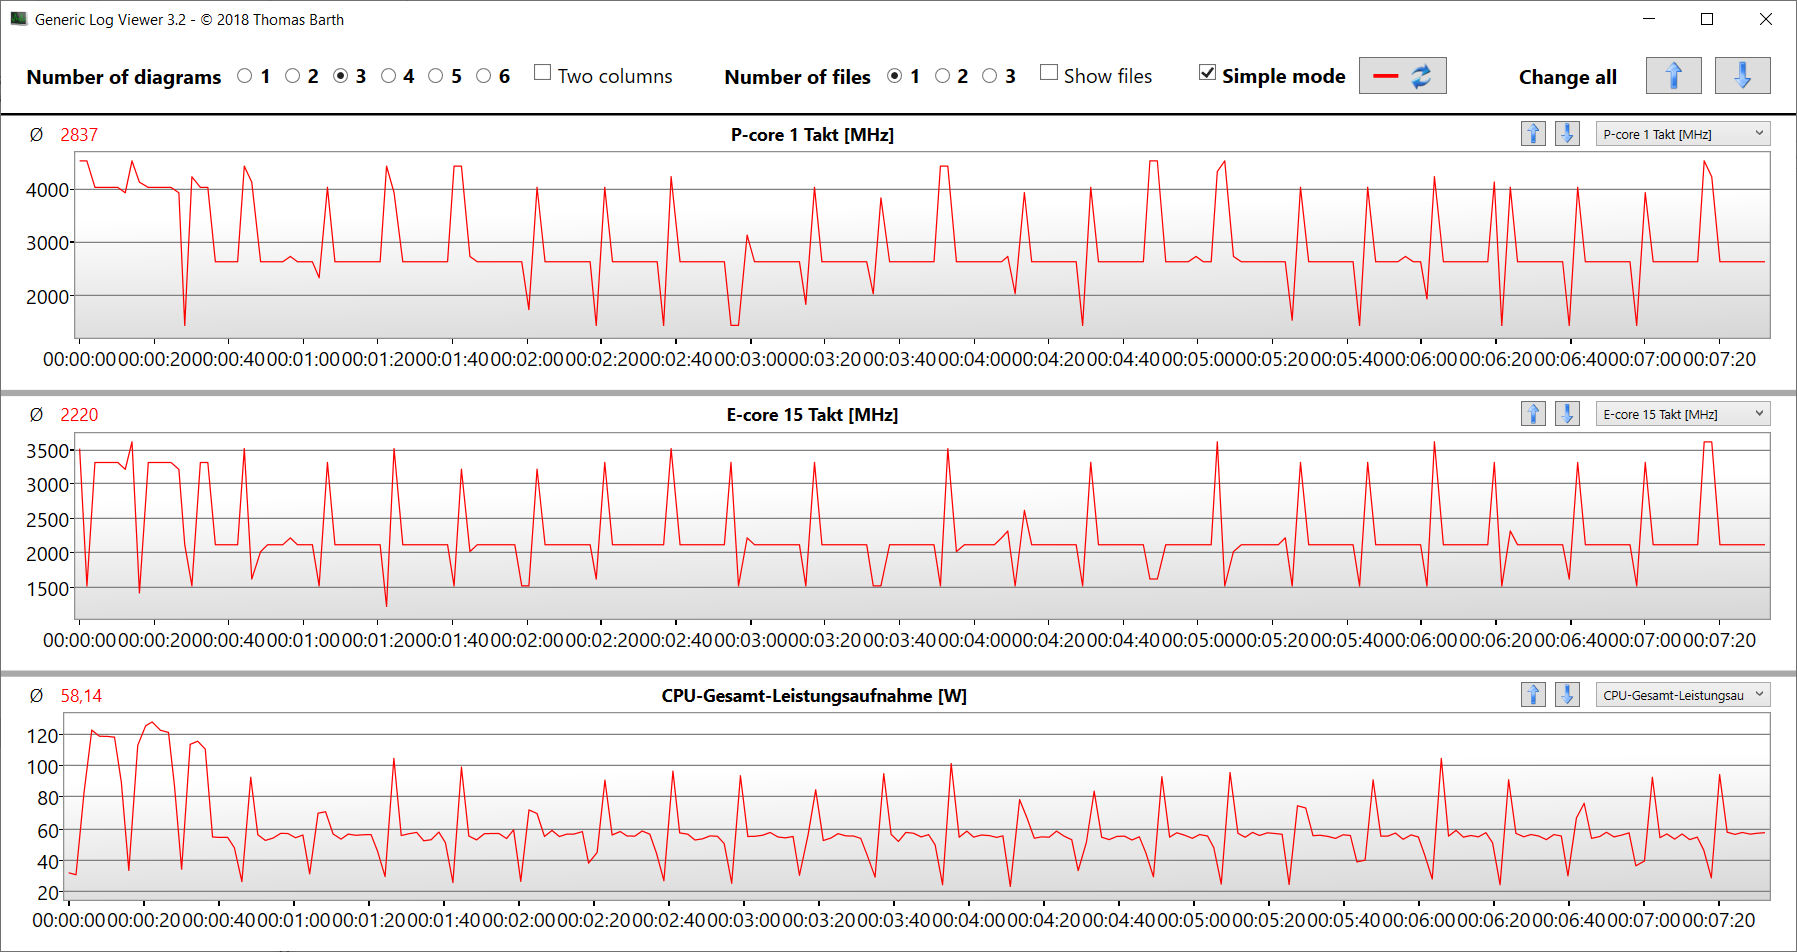
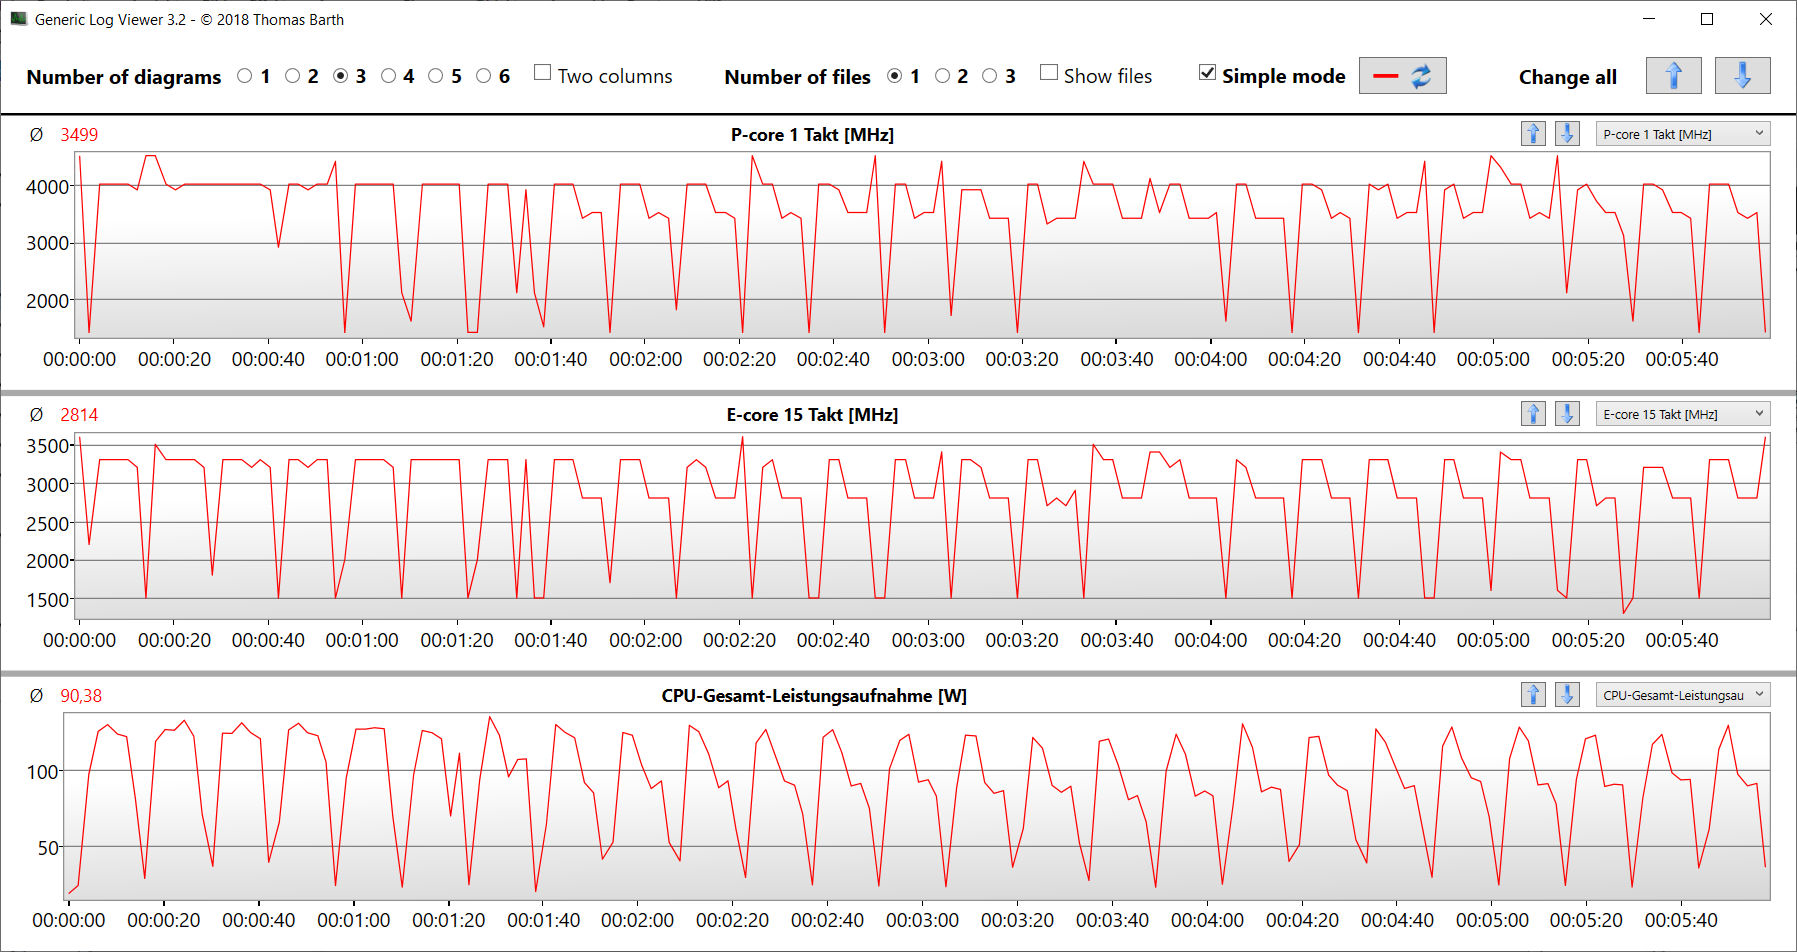
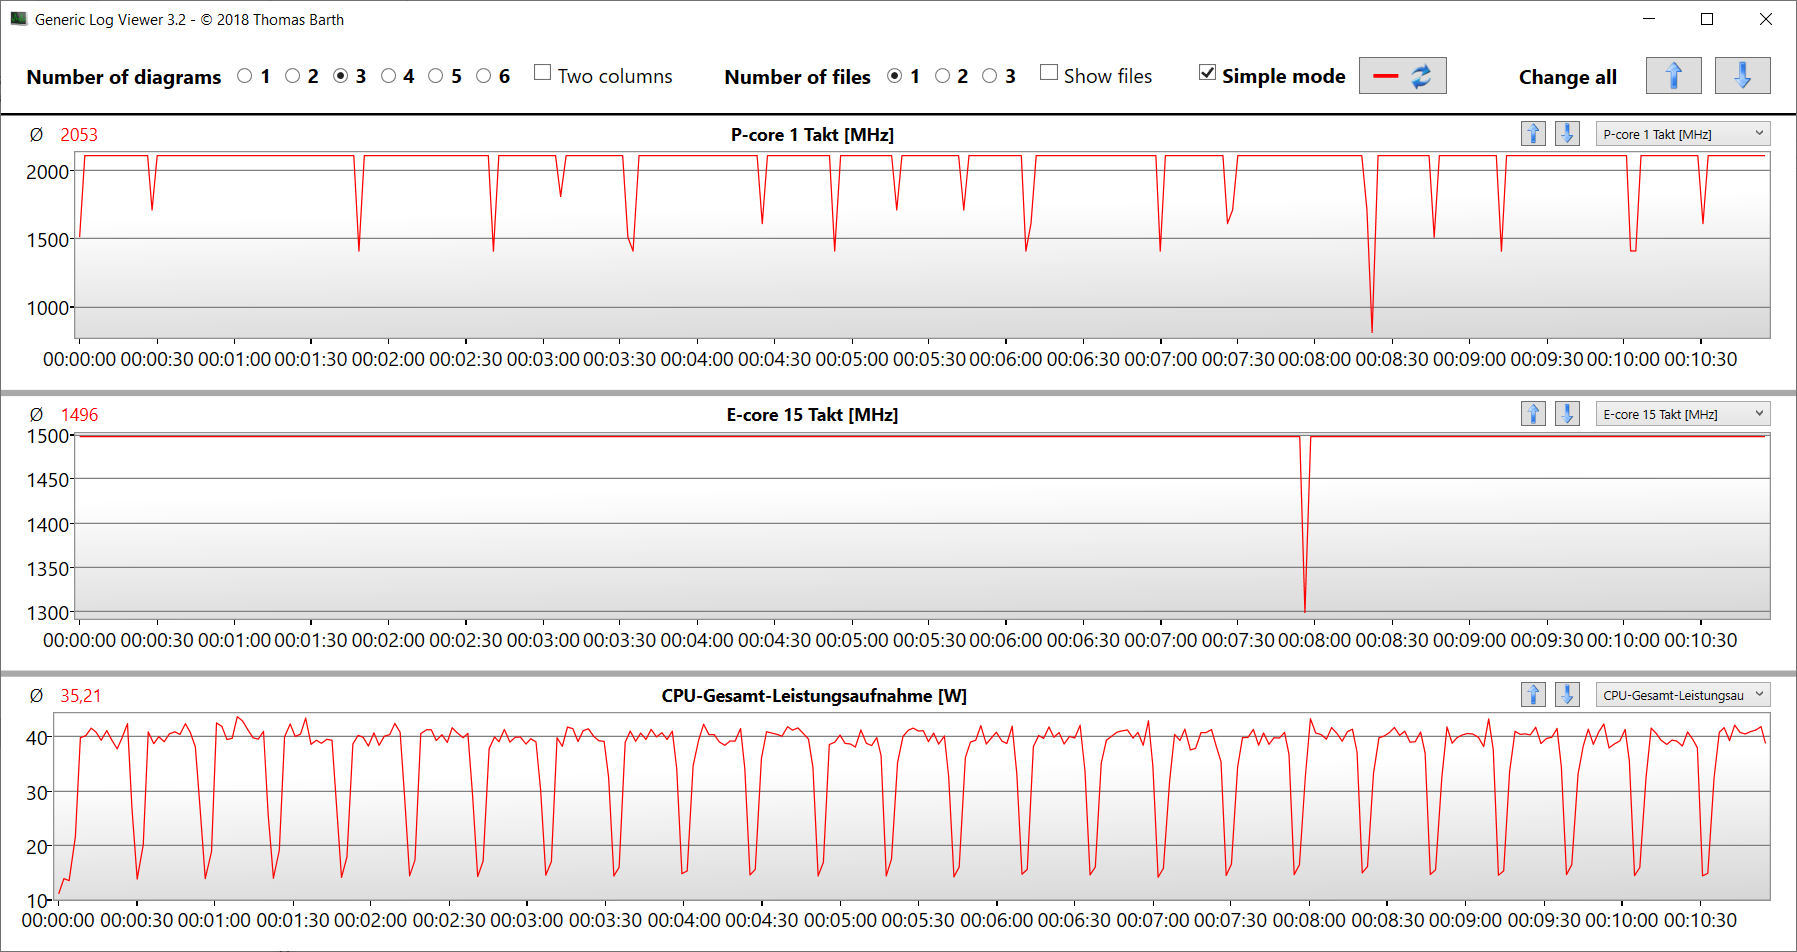
The Core i7-14700HX's (Raptor Lake) 20 CPU cores (8P + 12E = 28 threads) achieve maximum clock rates of 5.5 GHz (P) and 3.9 GHz (E). Permanent multi-thread load (CB15 Loop) leads the clock rate to sink from the first to the fourth run ("Balanced"). After this, it keeps a constant level. "Performance" results in a permanently higher clock rate.
The benchmark results were a little disappointing: Despite four additional CPU cores and higher clock rates, the CPU couldn't distance itself from the Legion 5 16IRX G9's Core i7-14650HX. Its multi-thread performance is practically the same, whereas the 14650HX is the clear winner when it comes to single-thread performance.
Cinebench R15 Multi continuous test
| CPU Performance rating - Percent | |
| Average of class Gaming | |
| Lenovo Legion 5 16IRX G9 | |
| Average Intel Core i7-14700HX | |
| HP Victus 16 (2024) | |
| HP Victus 16 (2024) | |
| Dell G16, i7-13650HX, RTX 4060 | |
| Gigabyte G6X 9KG (2024) | |
| Asus TUF Gaming A16 FA617XS -2! | |
| Cinebench R20 | |
| CPU (Multi Core) | |
| Average of class Gaming (4029 - 16108, n=111, last 2 years) | |
| Lenovo Legion 5 16IRX G9 | |
| HP Victus 16 (2024) | |
| Average Intel Core i7-14700HX (7988 - 10540, n=9) | |
| HP Victus 16 (2024) (Leistung) | |
| Dell G16, i7-13650HX, RTX 4060 | |
| Gigabyte G6X 9KG (2024) | |
| Asus TUF Gaming A16 FA617XS | |
| CPU (Single Core) | |
| Average of class Gaming (442 - 895, n=111, last 2 years) | |
| Average Intel Core i7-14700HX (651 - 821, n=9) | |
| Lenovo Legion 5 16IRX G9 | |
| Dell G16, i7-13650HX, RTX 4060 | |
| Asus TUF Gaming A16 FA617XS | |
| Gigabyte G6X 9KG (2024) | |
| HP Victus 16 (2024) (Leistung) | |
| HP Victus 16 (2024) | |
| Cinebench R15 | |
| CPU Multi 64Bit | |
| Average of class Gaming (1578 - 6271, n=111, last 2 years) | |
| HP Victus 16 (2024) | |
| Average Intel Core i7-14700HX (3328 - 4248, n=9) | |
| Lenovo Legion 5 16IRX G9 | |
| HP Victus 16 (2024) (Leistung) | |
| Dell G16, i7-13650HX, RTX 4060 | |
| Gigabyte G6X 9KG (2024) | |
| Asus TUF Gaming A16 FA617XS | |
| CPU Single 64Bit | |
| Average of class Gaming (188.8 - 343, n=111, last 2 years) | |
| Lenovo Legion 5 16IRX G9 | |
| Average Intel Core i7-14700HX (238 - 304, n=9) | |
| Asus TUF Gaming A16 FA617XS | |
| Dell G16, i7-13650HX, RTX 4060 | |
| Gigabyte G6X 9KG (2024) | |
| HP Victus 16 (2024) (Leistung) | |
| HP Victus 16 (2024) | |
| Blender - v2.79 BMW27 CPU | |
| Gigabyte G6X 9KG (2024) | |
| Asus TUF Gaming A16 FA617XS | |
| HP Victus 16 (2024) | |
| Dell G16, i7-13650HX, RTX 4060 | |
| Average Intel Core i7-14700HX (126 - 212, n=9) | |
| Average of class Gaming (80 - 330, n=109, last 2 years) | |
| Lenovo Legion 5 16IRX G9 | |
| HP Victus 16 (2024) (Leistung) | |
| Geekbench 6.7 | |
| Multi-Core | |
| Lenovo Legion 5 16IRX G9 (6.2.1) | |
| Average Intel Core i7-14700HX (14163 - 17562, n=9) | |
| Average of class Gaming (6625 - 22104, n=111, last 2 years) | |
| HP Victus 16 (2024) (6.2.1, Leistung) | |
| HP Victus 16 (2024) (6.2.1) | |
| Dell G16, i7-13650HX, RTX 4060 (6.2.1) | |
| Gigabyte G6X 9KG (2024) (6.2.1) | |
| Single-Core | |
| Average of class Gaming (1490 - 3259, n=111, last 2 years) | |
| Average Intel Core i7-14700HX (2378 - 2975, n=9) | |
| Lenovo Legion 5 16IRX G9 (6.2.1) | |
| Dell G16, i7-13650HX, RTX 4060 (6.2.1) | |
| Gigabyte G6X 9KG (2024) (6.2.1) | |
| HP Victus 16 (2024) (6.2.1, Leistung) | |
| HP Victus 16 (2024) (6.2.1) | |
| HWBOT x265 Benchmark v2.2 - 4k Preset | |
| Average of class Gaming (11.5 - 44.3, n=110, last 2 years) | |
| HP Victus 16 (2024) (Leistung) | |
| Lenovo Legion 5 16IRX G9 | |
| Average Intel Core i7-14700HX (19.5 - 27.4, n=9) | |
| HP Victus 16 (2024) | |
| Asus TUF Gaming A16 FA617XS | |
| Dell G16, i7-13650HX, RTX 4060 | |
| Gigabyte G6X 9KG (2024) | |
| LibreOffice - 20 Documents To PDF | |
| HP Victus 16 (2024) (6.3.4.2) | |
| Dell G16, i7-13650HX, RTX 4060 (6.3.4.2) | |
| Average of class Gaming (19 - 88.8, n=110, last 2 years) | |
| Average Intel Core i7-14700HX (41.9 - 55.3, n=9) | |
| Lenovo Legion 5 16IRX G9 (6.3.4.2) | |
| HP Victus 16 (2024) (6.3.4.2. Leistung) | |
| Asus TUF Gaming A16 FA617XS | |
| Gigabyte G6X 9KG (2024) (6.3.4.2) | |
| R Benchmark 2.5 - Overall mean | |
| HP Victus 16 (2024) | |
| HP Victus 16 (2024) (Leistung) | |
| Gigabyte G6X 9KG (2024) | |
| Average of class Gaming (0.3439 - 0.759, n=111, last 2 years) | |
| Asus TUF Gaming A16 FA617XS | |
| Dell G16, i7-13650HX, RTX 4060 | |
| Dell G16, i7-13650HX, RTX 4060 | |
| Lenovo Legion 5 16IRX G9 | |
| Average Intel Core i7-14700HX (0.3821 - 0.4896, n=9) | |
* ... smaller is better
AIDA64: FP32 Ray-Trace | FPU Julia | CPU SHA3 | CPU Queen | FPU SinJulia | FPU Mandel | CPU AES | CPU ZLib | FP64 Ray-Trace | CPU PhotoWorxx
| Performance rating | |
| Average of class Gaming | |
| HP Victus 16 (2024) | |
| Asus TUF Gaming A16 FA617XS | |
| Average Intel Core i7-14700HX | |
| Lenovo Legion 5 16IRX G9 | |
| Dell G16, i7-13650HX, RTX 4060 | |
| HP Victus 16 (2024) | |
| Gigabyte G6X 9KG (2024) | |
| AIDA64 / FP32 Ray-Trace | |
| Average of class Gaming (10227 - 85542, n=109, last 2 years) | |
| Asus TUF Gaming A16 FA617XS (v6.75.6100) | |
| HP Victus 16 (2024) (v6.92.6600, Leistung) | |
| Average Intel Core i7-14700HX (14147 - 23676, n=9) | |
| Lenovo Legion 5 16IRX G9 (v6.92.6600) | |
| Dell G16, i7-13650HX, RTX 4060 (v6.92.6600) | |
| HP Victus 16 (2024) (v6.92.6600) | |
| Gigabyte G6X 9KG (2024) (v6.92.6600) | |
| AIDA64 / FPU Julia | |
| Average of class Gaming (51376 - 238426, n=109, last 2 years) | |
| Asus TUF Gaming A16 FA617XS (v6.75.6100) | |
| HP Victus 16 (2024) (v6.92.6600, Leistung) | |
| Average Intel Core i7-14700HX (71875 - 116556, n=9) | |
| Lenovo Legion 5 16IRX G9 (v6.92.6600) | |
| Dell G16, i7-13650HX, RTX 4060 (v6.92.6600) | |
| HP Victus 16 (2024) (v6.92.6600) | |
| Gigabyte G6X 9KG (2024) (v6.92.6600) | |
| AIDA64 / CPU SHA3 | |
| Average of class Gaming (2180 - 9817, n=109, last 2 years) | |
| HP Victus 16 (2024) (v6.92.6600, Leistung) | |
| Average Intel Core i7-14700HX (3388 - 5567, n=9) | |
| Asus TUF Gaming A16 FA617XS (v6.75.6100) | |
| Dell G16, i7-13650HX, RTX 4060 (v6.92.6600) | |
| Lenovo Legion 5 16IRX G9 (v6.92.6600) | |
| HP Victus 16 (2024) (v6.92.6600) | |
| Gigabyte G6X 9KG (2024) (v6.92.6600) | |
| AIDA64 / CPU Queen | |
| Average Intel Core i7-14700HX (129134 - 152200, n=9) | |
| HP Victus 16 (2024) (v6.92.6600, Leistung) | |
| HP Victus 16 (2024) (v6.92.6600) | |
| Asus TUF Gaming A16 FA617XS (v6.75.6100) | |
| Average of class Gaming (49785 - 173351, n=98, last 2 years) | |
| Gigabyte G6X 9KG (2024) (v6.92.6600) | |
| Dell G16, i7-13650HX, RTX 4060 (v6.92.6600) | |
| Lenovo Legion 5 16IRX G9 (v6.92.6600) | |
| AIDA64 / FPU SinJulia | |
| Asus TUF Gaming A16 FA617XS (v6.75.6100) | |
| Average of class Gaming (4424 - 33636, n=109, last 2 years) | |
| HP Victus 16 (2024) (v6.92.6600, Leistung) | |
| Average Intel Core i7-14700HX (10266 - 14434, n=9) | |
| Lenovo Legion 5 16IRX G9 (v6.92.6600) | |
| HP Victus 16 (2024) (v6.92.6600) | |
| Dell G16, i7-13650HX, RTX 4060 (v6.92.6600) | |
| Gigabyte G6X 9KG (2024) (v6.92.6600) | |
| AIDA64 / FPU Mandel | |
| Average of class Gaming (25115 - 128721, n=109, last 2 years) | |
| Asus TUF Gaming A16 FA617XS (v6.75.6100) | |
| HP Victus 16 (2024) (v6.92.6600, Leistung) | |
| Average Intel Core i7-14700HX (35155 - 58380, n=9) | |
| Lenovo Legion 5 16IRX G9 (v6.92.6600) | |
| Dell G16, i7-13650HX, RTX 4060 (v6.92.6600) | |
| HP Victus 16 (2024) (v6.92.6600) | |
| Gigabyte G6X 9KG (2024) (v6.92.6600) | |
| AIDA64 / CPU AES | |
| HP Victus 16 (2024) (v6.92.6600, Leistung) | |
| Average of class Gaming (39258 - 247074, n=109, last 2 years) | |
| Average Intel Core i7-14700HX (68616 - 113157, n=9) | |
| Lenovo Legion 5 16IRX G9 (v6.92.6600) | |
| Asus TUF Gaming A16 FA617XS (v6.75.6100) | |
| Dell G16, i7-13650HX, RTX 4060 (v6.92.6600) | |
| HP Victus 16 (2024) (v6.92.6600) | |
| Gigabyte G6X 9KG (2024) (v6.92.6600) | |
| AIDA64 / CPU ZLib | |
| HP Victus 16 (2024) (v6.92.6600, Leistung) | |
| Average of class Gaming (574 - 2531, n=109, last 2 years) | |
| Average Intel Core i7-14700HX (1003 - 1682, n=9) | |
| Lenovo Legion 5 16IRX G9 (v6.92.6600) | |
| Dell G16, i7-13650HX, RTX 4060 (v6.92.6600) | |
| HP Victus 16 (2024) (v6.92.6600) | |
| Gigabyte G6X 9KG (2024) (v6.92.6600) | |
| Asus TUF Gaming A16 FA617XS (v6.75.6100) | |
| AIDA64 / FP64 Ray-Trace | |
| Average of class Gaming (5509 - 45446, n=109, last 2 years) | |
| Asus TUF Gaming A16 FA617XS (v6.75.6100) | |
| HP Victus 16 (2024) (v6.92.6600, Leistung) | |
| Average Intel Core i7-14700HX (7585 - 12928, n=9) | |
| Dell G16, i7-13650HX, RTX 4060 (v6.92.6600) | |
| Lenovo Legion 5 16IRX G9 (v6.92.6600) | |
| HP Victus 16 (2024) (v6.92.6600) | |
| Gigabyte G6X 9KG (2024) (v6.92.6600) | |
| AIDA64 / CPU PhotoWorxx | |
| Average of class Gaming (12271 - 89891, n=109, last 2 years) | |
| Average Intel Core i7-14700HX (24276 - 49671, n=9) | |
| HP Victus 16 (2024) (v6.92.6600) | |
| HP Victus 16 (2024) (v6.92.6600, Leistung) | |
| Gigabyte G6X 9KG (2024) (v6.92.6600) | |
| Dell G16, i7-13650HX, RTX 4060 (v6.92.6600) | |
| Lenovo Legion 5 16IRX G9 (v6.92.6600) | |
| Asus TUF Gaming A16 FA617XS (v6.75.6100) | |
System performance
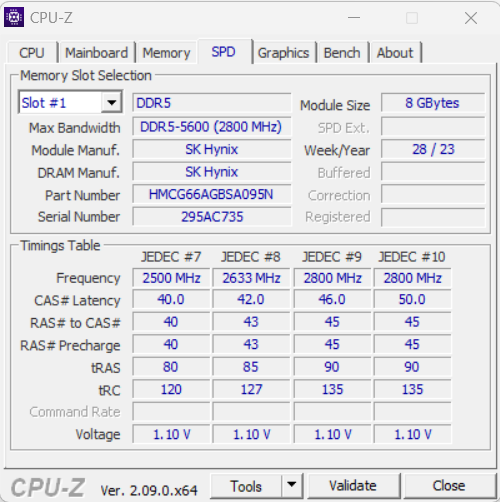
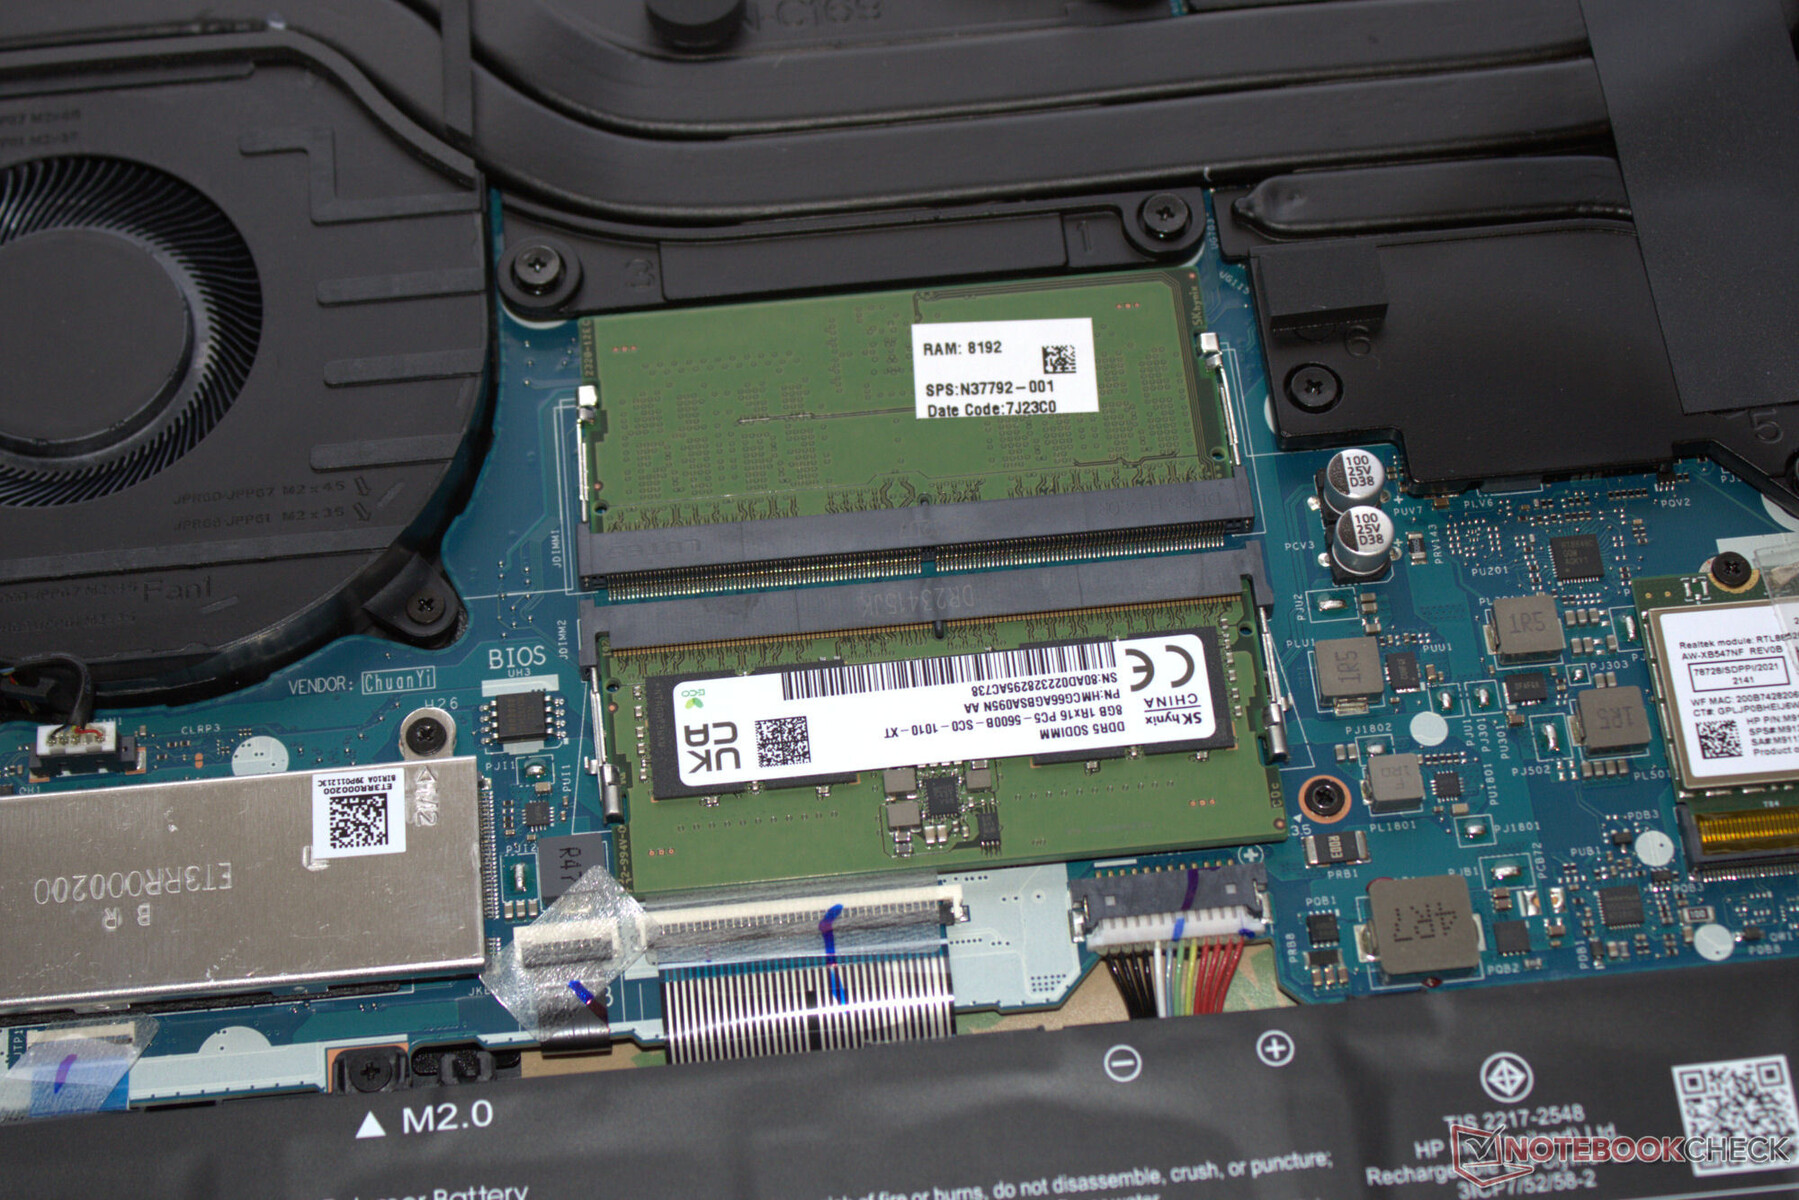
The smooth-running system provides enough performance for demanding applications such as gaming, rendering and streaming. The RAM's transfer rates are at a normal level for DDR5-5600 RAM.
CrossMark: Overall | Productivity | Creativity | Responsiveness
WebXPRT 3: Overall
WebXPRT 4: Overall
Mozilla Kraken 1.1: Total
| PCMark 10 / Score | |
| Average of class Gaming (5828 - 11574, n=96, last 2 years) | |
| Asus TUF Gaming A16 FA617XS | |
| Average Intel Core i7-14700HX, NVIDIA GeForce RTX 4060 Laptop GPU (7528 - 8278, n=2) | |
| Lenovo Legion 5 16IRX G9 | |
| Gigabyte G6X 9KG (2024) | |
| HP Victus 16 (2024) | |
| Dell G16, i7-13650HX, RTX 4060 | |
| PCMark 10 / Essentials | |
| Average Intel Core i7-14700HX, NVIDIA GeForce RTX 4060 Laptop GPU (10778 - 11087, n=2) | |
| Asus TUF Gaming A16 FA617XS | |
| Lenovo Legion 5 16IRX G9 | |
| HP Victus 16 (2024) | |
| Average of class Gaming (8810 - 12600, n=100, last 2 years) | |
| Gigabyte G6X 9KG (2024) | |
| Dell G16, i7-13650HX, RTX 4060 | |
| PCMark 10 / Productivity | |
| Average of class Gaming (6845 - 21327, n=98, last 2 years) | |
| Asus TUF Gaming A16 FA617XS | |
| Gigabyte G6X 9KG (2024) | |
| Dell G16, i7-13650HX, RTX 4060 | |
| HP Victus 16 (2024) | |
| Average Intel Core i7-14700HX, NVIDIA GeForce RTX 4060 Laptop GPU (9823 - 9910, n=2) | |
| Lenovo Legion 5 16IRX G9 | |
| PCMark 10 / Digital Content Creation | |
| Average of class Gaming (7602 - 19657, n=98, last 2 years) | |
| Average Intel Core i7-14700HX, NVIDIA GeForce RTX 4060 Laptop GPU (10841 - 14135, n=2) | |
| Lenovo Legion 5 16IRX G9 | |
| Asus TUF Gaming A16 FA617XS | |
| Dell G16, i7-13650HX, RTX 4060 | |
| Gigabyte G6X 9KG (2024) | |
| HP Victus 16 (2024) | |
| CrossMark / Overall | |
| Lenovo Legion 5 16IRX G9 | |
| Average Intel Core i7-14700HX, NVIDIA GeForce RTX 4060 Laptop GPU (1923 - 2132, n=2) | |
| Average of class Gaming (1366 - 2409, n=97, last 2 years) | |
| Gigabyte G6X 9KG (2024) | |
| HP Victus 16 (2024) | |
| Dell G16, i7-13650HX, RTX 4060 | |
| Asus TUF Gaming A16 FA617XS | |
| CrossMark / Productivity | |
| Lenovo Legion 5 16IRX G9 | |
| Average Intel Core i7-14700HX, NVIDIA GeForce RTX 4060 Laptop GPU (1782 - 1973, n=2) | |
| Gigabyte G6X 9KG (2024) | |
| Average of class Gaming (1386 - 2254, n=97, last 2 years) | |
| HP Victus 16 (2024) | |
| Dell G16, i7-13650HX, RTX 4060 | |
| Asus TUF Gaming A16 FA617XS | |
| CrossMark / Creativity | |
| Lenovo Legion 5 16IRX G9 | |
| Average Intel Core i7-14700HX, NVIDIA GeForce RTX 4060 Laptop GPU (2107 - 2399, n=2) | |
| Average of class Gaming (1343 - 2729, n=97, last 2 years) | |
| HP Victus 16 (2024) | |
| Gigabyte G6X 9KG (2024) | |
| Dell G16, i7-13650HX, RTX 4060 | |
| Asus TUF Gaming A16 FA617XS | |
| CrossMark / Responsiveness | |
| Gigabyte G6X 9KG (2024) | |
| Lenovo Legion 5 16IRX G9 | |
| Average Intel Core i7-14700HX, NVIDIA GeForce RTX 4060 Laptop GPU (1835 - 1885, n=2) | |
| HP Victus 16 (2024) | |
| Average of class Gaming (1226 - 2334, n=97, last 2 years) | |
| Dell G16, i7-13650HX, RTX 4060 | |
| Asus TUF Gaming A16 FA617XS | |
| WebXPRT 3 / Overall | |
| Average of class Gaming (242 - 532, n=101, last 2 years) | |
| Lenovo Legion 5 16IRX G9 | |
| Gigabyte G6X 9KG (2024) | |
| Average Intel Core i7-14700HX, NVIDIA GeForce RTX 4060 Laptop GPU (276 - 301, n=2) | |
| HP Victus 16 (2024) | |
| Dell G16, i7-13650HX, RTX 4060 | |
| WebXPRT 4 / Overall | |
| Average of class Gaming (176.4 - 354, n=101, last 2 years) | |
| Lenovo Legion 5 16IRX G9 | |
| Asus TUF Gaming A16 FA617XS | |
| Average Intel Core i7-14700HX, NVIDIA GeForce RTX 4060 Laptop GPU (251 - 273, n=2) | |
| Gigabyte G6X 9KG (2024) | |
| HP Victus 16 (2024) | |
| Mozilla Kraken 1.1 / Total | |
| HP Victus 16 (2024) | |
| Gigabyte G6X 9KG (2024) | |
| Dell G16, i7-13650HX, RTX 4060 | |
| Average Intel Core i7-14700HX, NVIDIA GeForce RTX 4060 Laptop GPU (467 - 542, n=2) | |
| Asus TUF Gaming A16 FA617XS | |
| Lenovo Legion 5 16IRX G9 | |
| Average of class Gaming (391 - 590, n=106, last 2 years) | |
* ... smaller is better
| PCMark 10 Score | 7528 points | |
Help | ||
| AIDA64 / Memory Copy | |
| Average of class Gaming (21750 - 129946, n=109, last 2 years) | |
| Average Intel Core i7-14700HX (41617 - 78742, n=9) | |
| HP Victus 16 (2024) | |
| Gigabyte G6X 9KG (2024) | |
| Lenovo Legion 5 16IRX G9 | |
| Asus TUF Gaming A16 FA617XS | |
| Dell G16, i7-13650HX, RTX 4060 | |
| AIDA64 / Memory Read | |
| HP Victus 16 (2024) | |
| Average Intel Core i7-14700HX (46627 - 86175, n=9) | |
| Average of class Gaming (22956 - 118858, n=109, last 2 years) | |
| Lenovo Legion 5 16IRX G9 | |
| Gigabyte G6X 9KG (2024) | |
| Dell G16, i7-13650HX, RTX 4060 | |
| Asus TUF Gaming A16 FA617XS | |
| AIDA64 / Memory Write | |
| Average of class Gaming (22297 - 135096, n=109, last 2 years) | |
| Asus TUF Gaming A16 FA617XS | |
| Average Intel Core i7-14700HX (39155 - 76976, n=9) | |
| HP Victus 16 (2024) | |
| Gigabyte G6X 9KG (2024) | |
| Dell G16, i7-13650HX, RTX 4060 | |
| Lenovo Legion 5 16IRX G9 | |
| AIDA64 / Memory Latency | |
| Average of class Gaming (75.3 - 259, n=109, last 2 years) | |
| HP Victus 16 (2024) | |
| Dell G16, i7-13650HX, RTX 4060 | |
| Asus TUF Gaming A16 FA617XS | |
| Gigabyte G6X 9KG (2024) | |
| Lenovo Legion 5 16IRX G9 | |
| Average Intel Core i7-14700HX (82.7 - 96.4, n=9) | |
* ... smaller is better
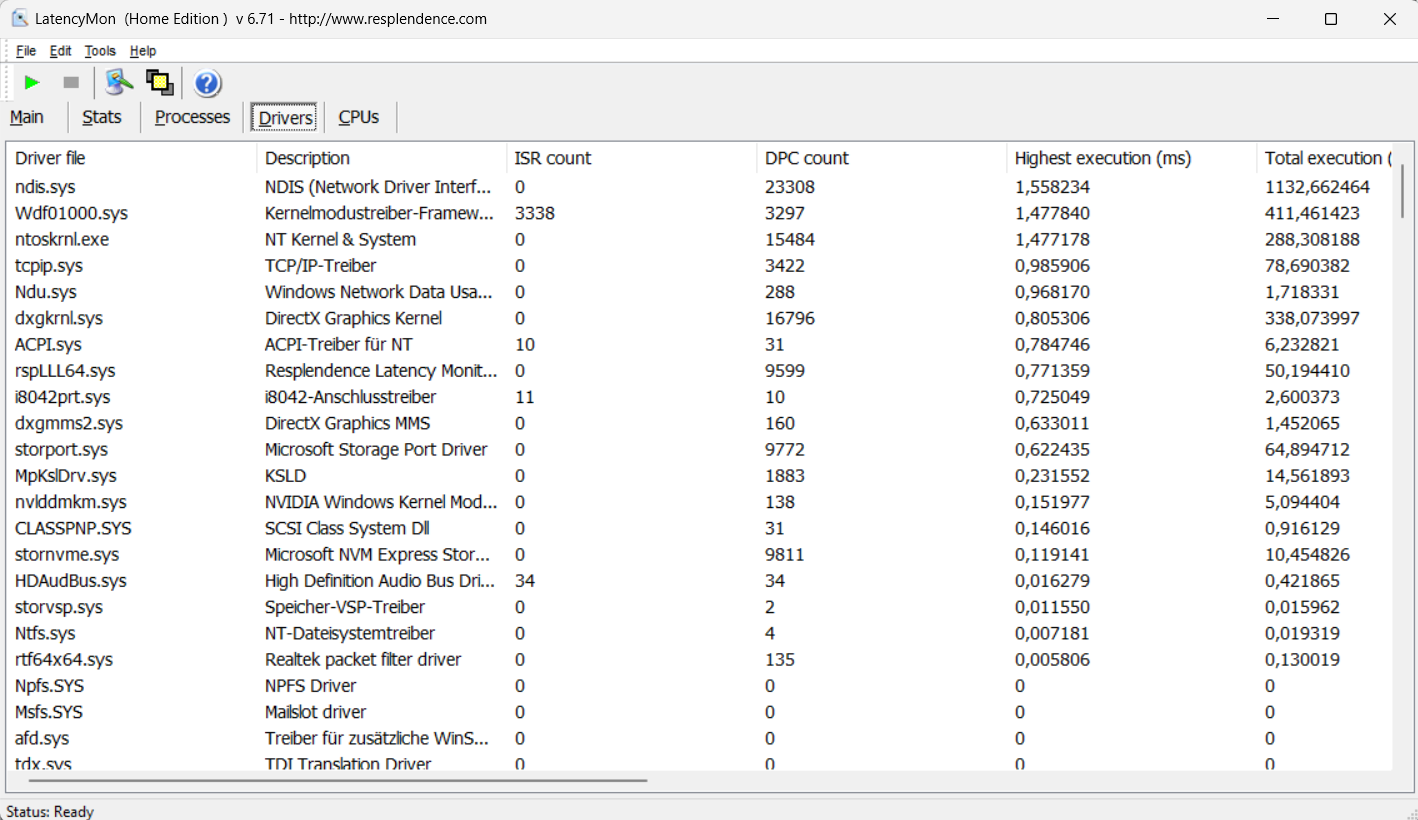
DPC latencies
Checking the laptop's latencies (web surfing, 4k video playback, Prime95 high load) revealed some anomalies. The present hardware-software combination does not appear to be suitable for video and audio editing in real-time. Future software updates could lead to changes.
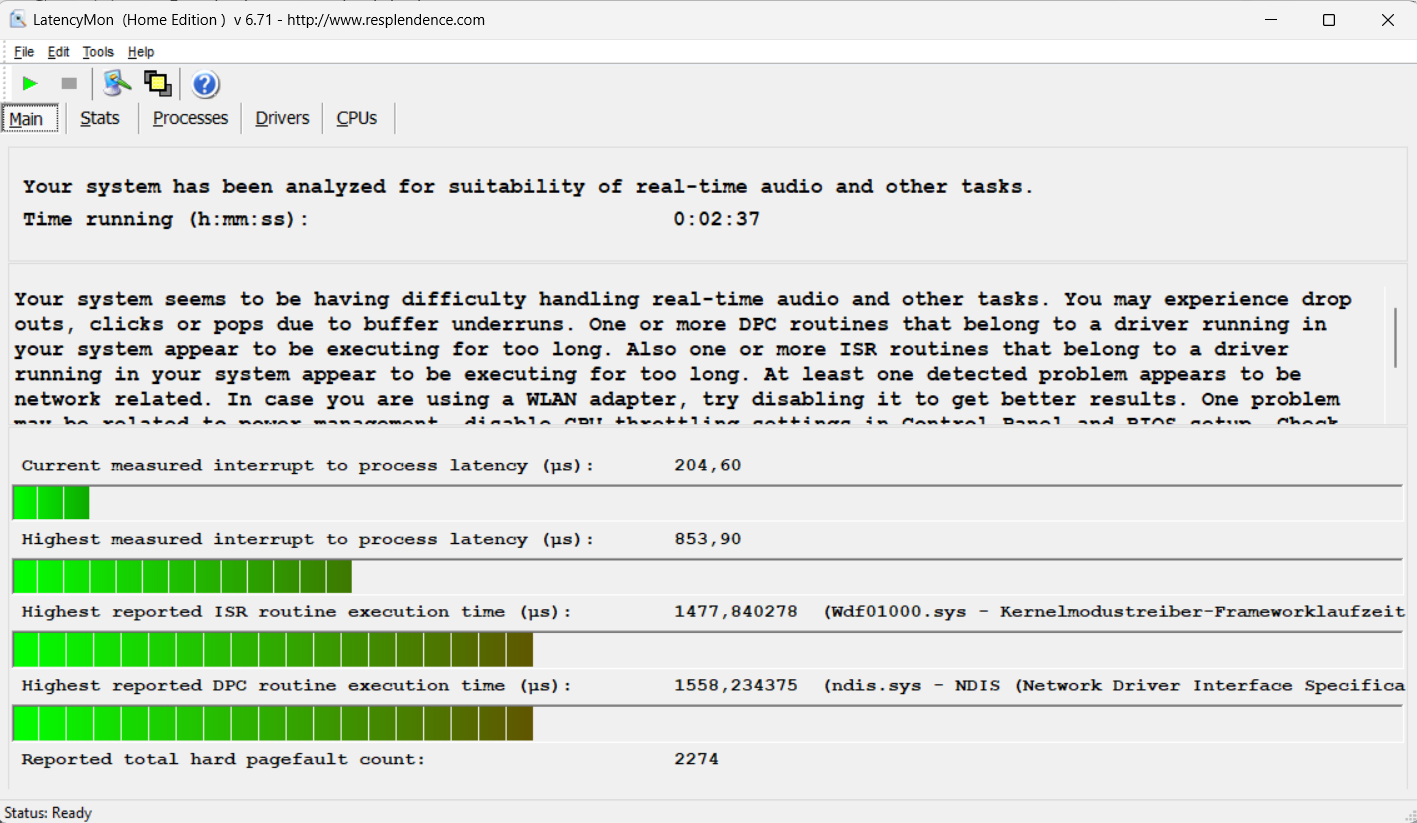
| DPC Latencies / LatencyMon - interrupt to process latency (max), Web, Youtube, Prime95 | |
| Gigabyte G6X 9KG (2024) | |
| Lenovo Legion 5 16IRX G9 | |
| Asus TUF Gaming A16 FA617XS | |
| Dell G16, i7-13650HX, RTX 4060 | |
| HP Victus 16 (2024) | |
* ... smaller is better
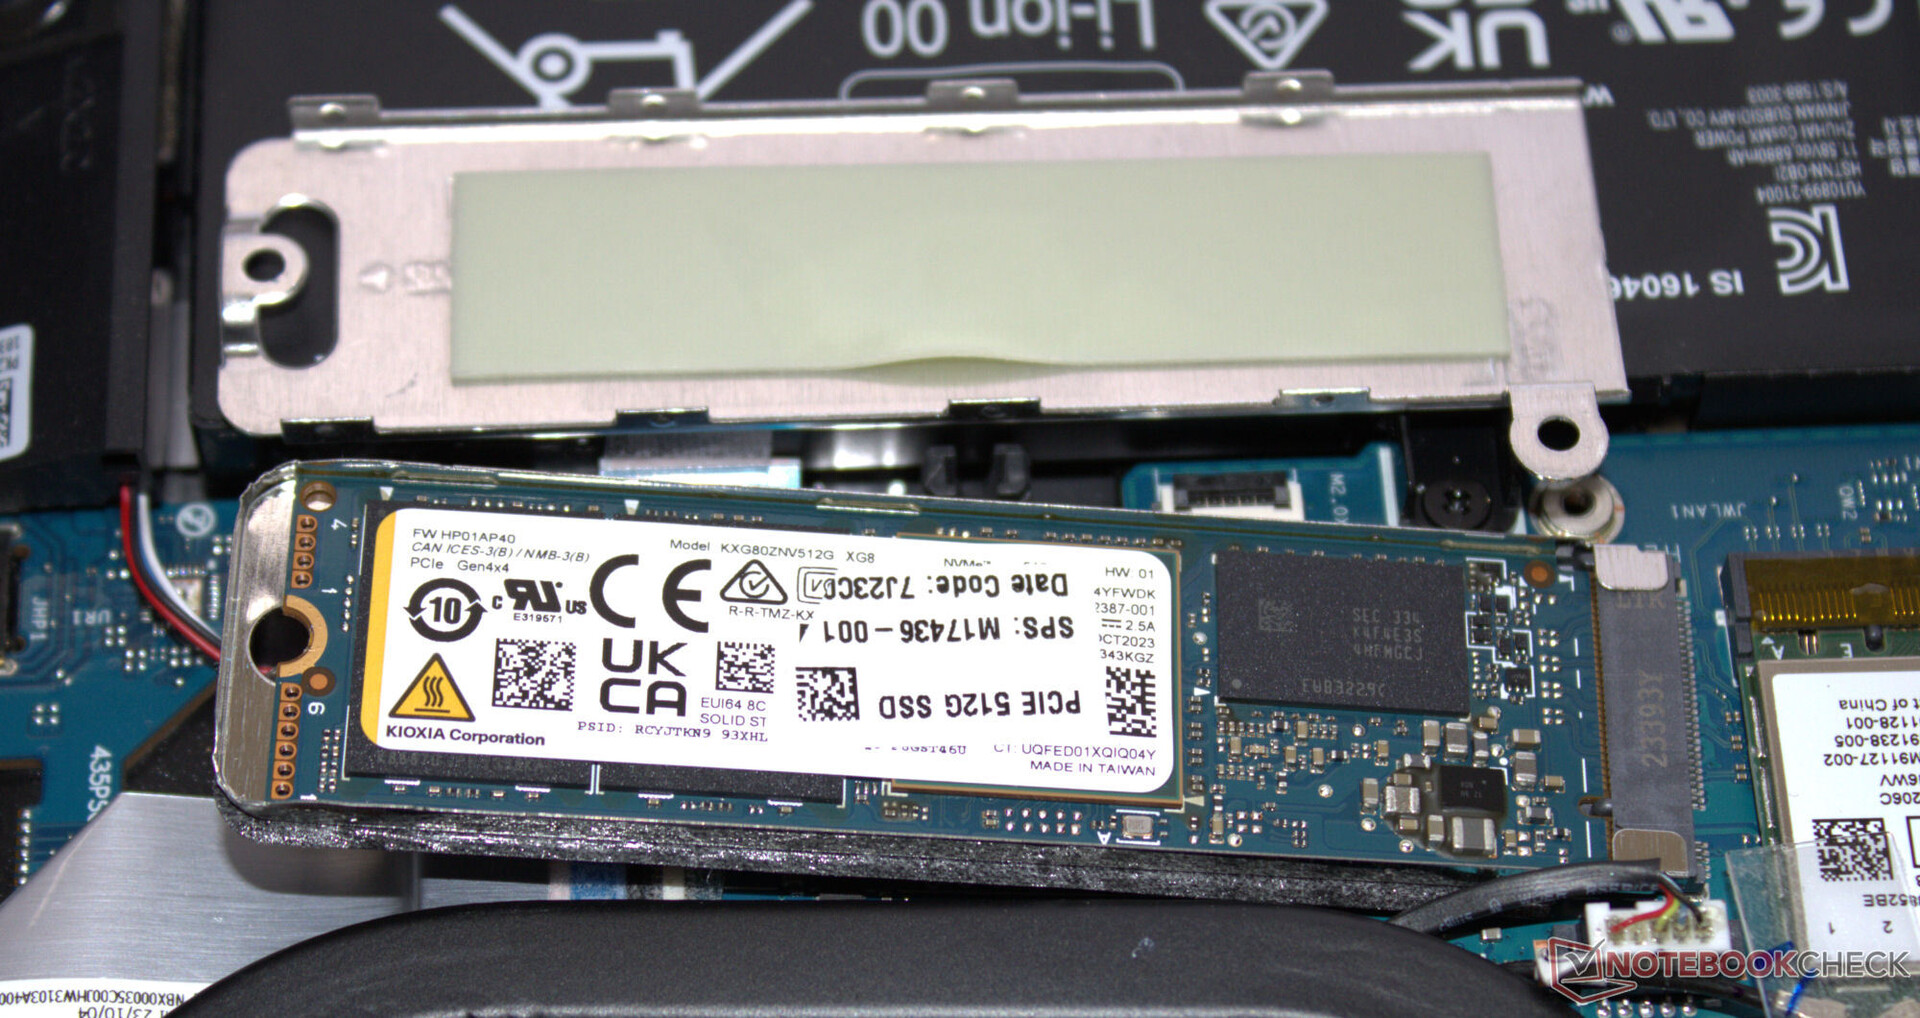
Storage devices
The PCIe 4 SSD (M.2-2280) from Kioxia features a capacity of 512 GB and delivers good transfer rates. During the course of the DiskSpd loop, its data rates sank step by step to a lower level as a result of thermal throttling. The laptop has space for a second SSD.

* ... smaller is better
Reading continuous performance: DiskSpd Read Loop, Queue Depth 8
Graphics card
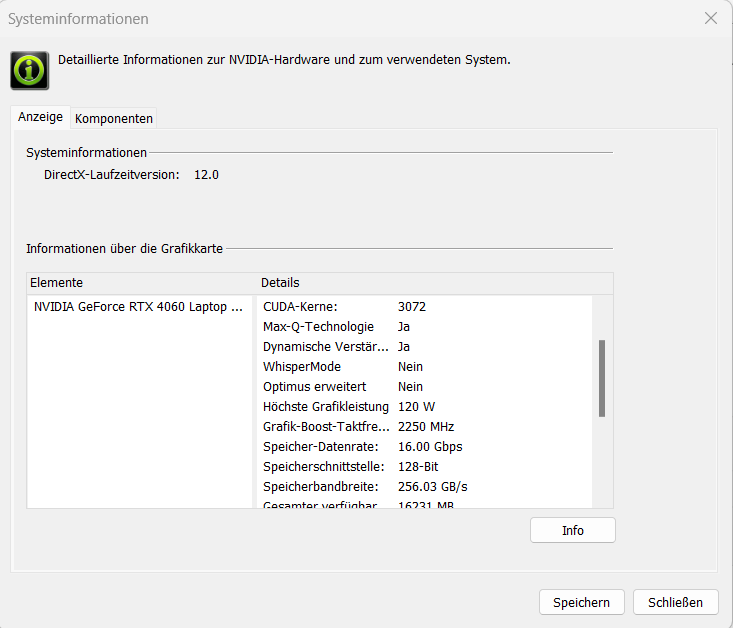
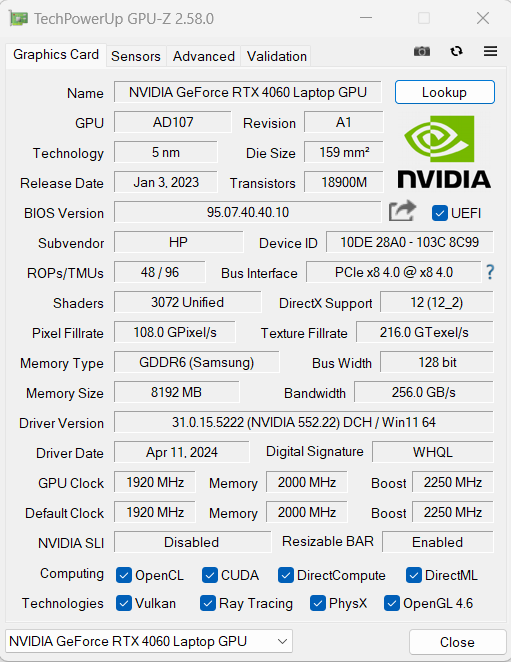
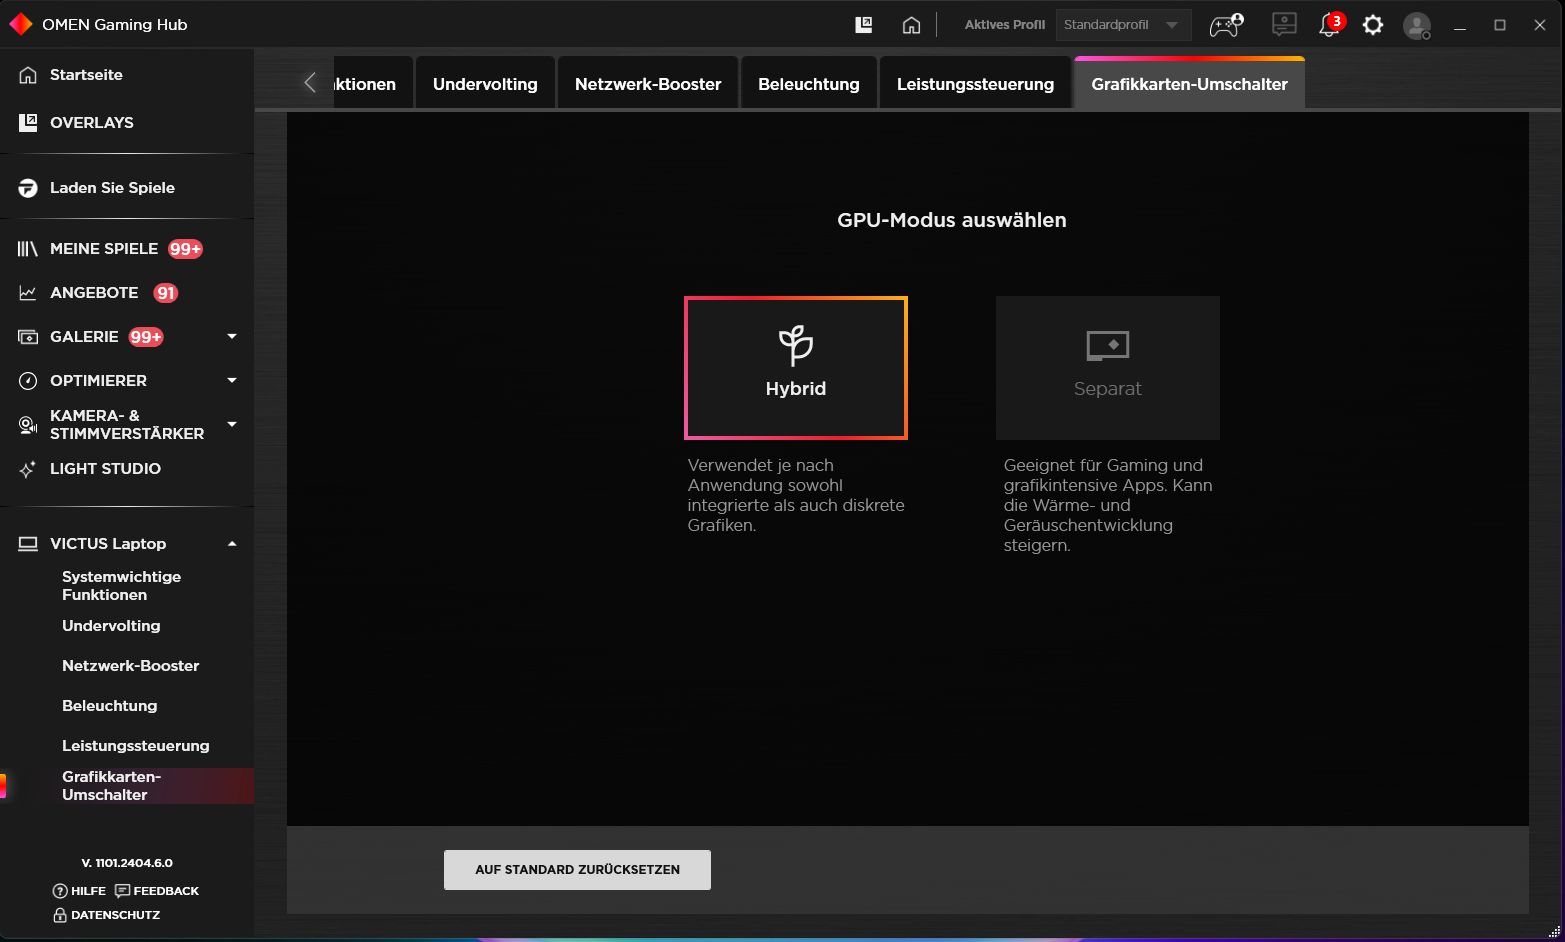
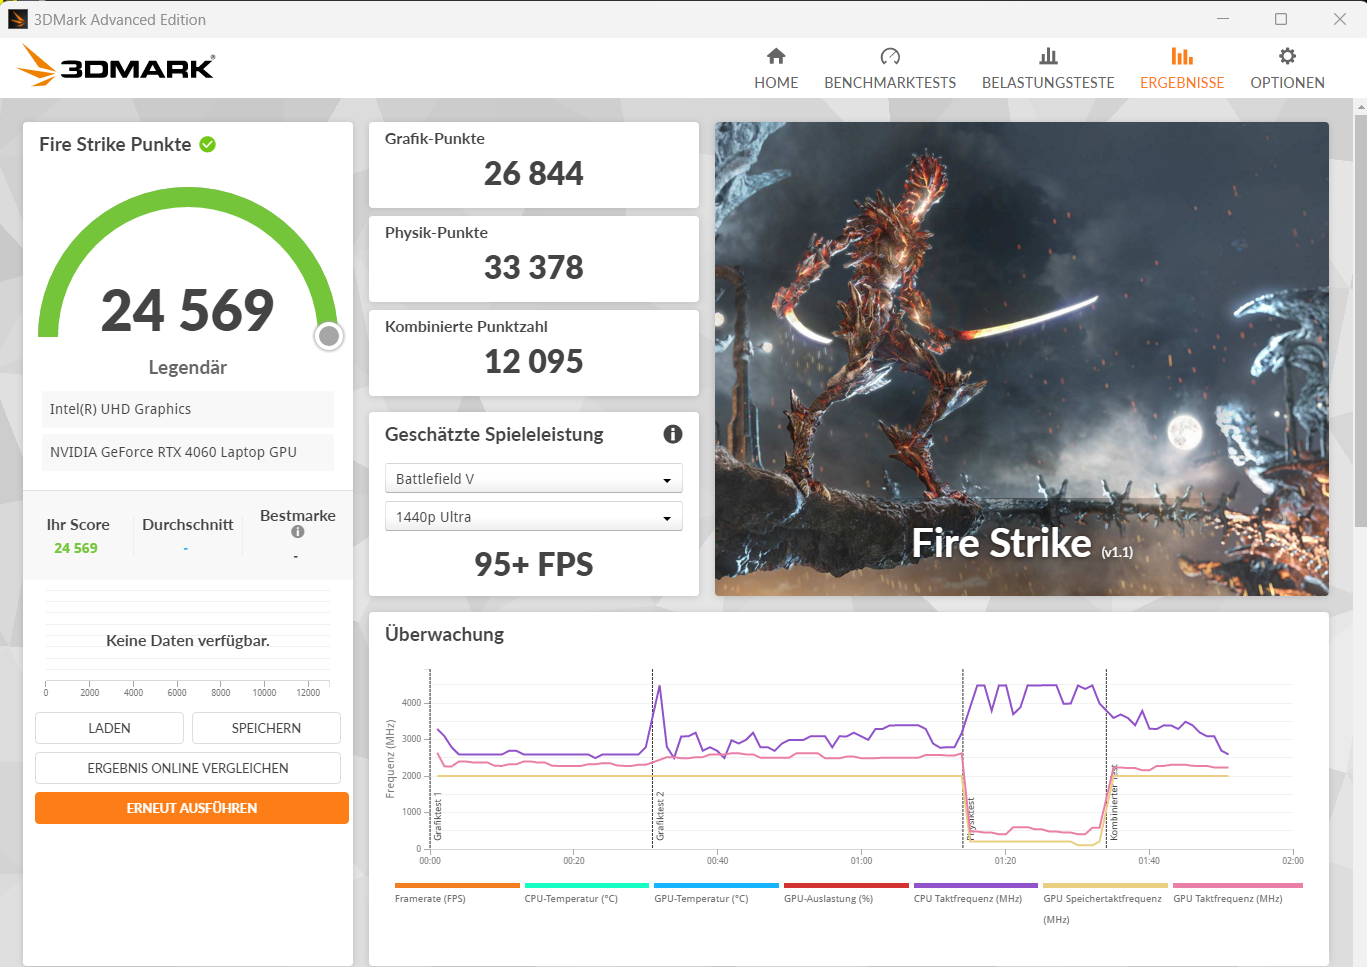
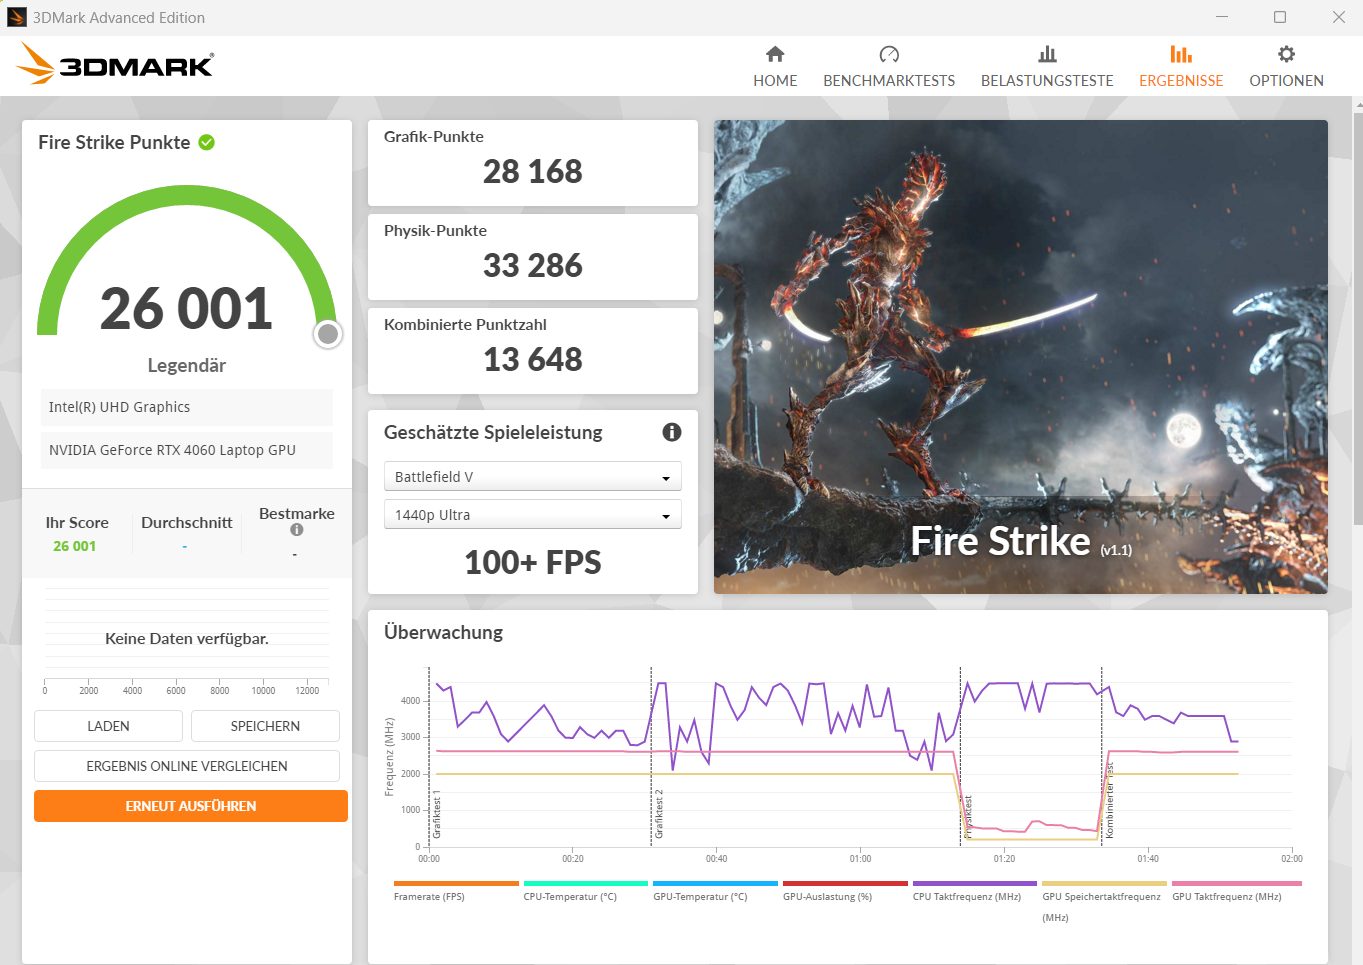
The mid-range GeForce RTX 4060 GPU (3,072 shaders, 128 bit bus, 8 GB GDDR6, 120 watts) allows FHD gaming using high to maximum settings. Its benchmark values and frame rates came slightly above the RTX 4060's average ("Balanced"). The profile "Performance" resulted in a minor advantage. Advanced Optimus isn't supported. This means that changing between the dGPU and Optimus requires a restart.


| 3DMark Performance rating - Percent | |
| Average of class Gaming | |
| Lenovo Legion 5 16IRX G9 | |
| HP Victus 16 (2024) | |
| Dell G16, i7-13650HX, RTX 4060 | |
| Gigabyte G6X 9KG (2024) | |
| HP Victus 16 (2024) | |
| Average NVIDIA GeForce RTX 4060 Laptop GPU | |
| Asus TUF Gaming A16 FA617XS | |
| 3DMark 11 - 1280x720 Performance GPU | |
| Average of class Gaming (21841 - 80022, n=108, last 2 years) | |
| Lenovo Legion 5 16IRX G9 | |
| HP Victus 16 (2024) (Leistung) | |
| Dell G16, i7-13650HX, RTX 4060 | |
| Gigabyte G6X 9KG (2024) | |
| HP Victus 16 (2024) | |
| Average NVIDIA GeForce RTX 4060 Laptop GPU (28136 - 38912, n=57) | |
| Asus TUF Gaming A16 FA617XS | |
| 3DMark | |
| 1920x1080 Fire Strike Graphics | |
| Average of class Gaming (12242 - 62849, n=120, last 2 years) | |
| HP Victus 16 (2024) (Leistung) | |
| Lenovo Legion 5 16IRX G9 | |
| Gigabyte G6X 9KG (2024) | |
| Dell G16, i7-13650HX, RTX 4060 | |
| HP Victus 16 (2024) | |
| Asus TUF Gaming A16 FA617XS | |
| Average NVIDIA GeForce RTX 4060 Laptop GPU (20533 - 29656, n=54) | |
| 2560x1440 Time Spy Graphics | |
| Average of class Gaming (5012 - 26212, n=119, last 2 years) | |
| Lenovo Legion 5 16IRX G9 | |
| HP Victus 16 (2024) (Leistung) | |
| Dell G16, i7-13650HX, RTX 4060 | |
| Average NVIDIA GeForce RTX 4060 Laptop GPU (7484 - 11451, n=56) | |
| HP Victus 16 (2024) | |
| Gigabyte G6X 9KG (2024) | |
| Asus TUF Gaming A16 FA617XS | |
| 3DMark 11 Performance | 30439 points | |
| 3DMark Fire Strike Score | 24569 points | |
| 3DMark Time Spy Score | 10542 points | |
Help | ||
| Blender | |
| v3.3 Classroom OPTIX/RTX | |
| Dell G16, i7-13650HX, RTX 4060 (3.3.3) | |
| Lenovo Legion 5 16IRX G9 (3.3.3) | |
| Average NVIDIA GeForce RTX 4060 Laptop GPU (19 - 28, n=53) | |
| HP Victus 16 (2024) (3.3.3) | |
| HP Victus 16 (2024) (3.3.3, Leistung) | |
| Gigabyte G6X 9KG (2024) (3.3.3) | |
| Average of class Gaming (9 - 32, n=111, last 2 years) | |
| v3.3 Classroom CUDA | |
| Dell G16, i7-13650HX, RTX 4060 (3.3.3) | |
| Average NVIDIA GeForce RTX 4060 Laptop GPU (39 - 53, n=53) | |
| Lenovo Legion 5 16IRX G9 (3.3.3) | |
| HP Victus 16 (2024) (3.3.3) | |
| HP Victus 16 (2024) (3.3.3, Leistung) | |
| Gigabyte G6X 9KG (2024) (3.3.3) | |
| Average of class Gaming (15 - 228, n=111, last 2 years) | |
| v3.3 Classroom CPU | |
| Gigabyte G6X 9KG (2024) (3.3.3) | |
| HP Victus 16 (2024) (3.3.3) | |
| Average NVIDIA GeForce RTX 4060 Laptop GPU (189 - 452, n=53) | |
| Asus TUF Gaming A16 FA617XS (3.3.3) | |
| Dell G16, i7-13650HX, RTX 4060 (3.3.3) | |
| Average of class Gaming (122 - 565, n=107, last 2 years) | |
| Lenovo Legion 5 16IRX G9 (3.3.3) | |
| HP Victus 16 (2024) (3.3.3, Leistung) | |
| Geekbench 5.5 | |
| OpenCL Score | |
| Average of class Gaming (80702 - 277970, n=107, last 2 years) | |
| HP Victus 16 (2024) (Leistung) | |
| Gigabyte G6X 9KG (2024) | |
| Dell G16, i7-13650HX, RTX 4060 | |
| HP Victus 16 (2024) | |
| Average NVIDIA GeForce RTX 4060 Laptop GPU (5039 - 112238, n=53) | |
| Asus TUF Gaming A16 FA617XS | |
| Lenovo Legion 5 16IRX G9 | |
| Vulkan Score 5.5 | |
| Average of class Gaming (9296 - 246759, n=82, last 2 years) | |
| HP Victus 16 (2024) (Leistung) | |
| Average NVIDIA GeForce RTX 4060 Laptop GPU (46347 - 87612, n=30) | |
| HP Victus 16 (2024) | |
| Gigabyte G6X 9KG (2024) | |
| Asus TUF Gaming A16 FA617XS | |
| Geekbench 6.7 | |
| GPU OpenCL | |
| Average of class Gaming (67235 - 253130, n=108, last 2 years) | |
| Gigabyte G6X 9KG (2024) (6.2.1) | |
| HP Victus 16 (2024) (6.2.1) | |
| Dell G16, i7-13650HX, RTX 4060 (6.2.1) | |
| Average NVIDIA GeForce RTX 4060 Laptop GPU (76525 - 100831, n=39) | |
| HP Victus 16 (2024) (6.2.1, Leistung) | |
| GPU Vulkan | |
| Average of class Gaming (7562 - 231659, n=60, last 2 years) | |
| Gigabyte G6X 9KG (2024) (6.2.1) | |
| HP Victus 16 (2024) (6.2.1, Leistung) | |
| Average NVIDIA GeForce RTX 4060 Laptop GPU (75631 - 101001, n=24) | |
| HP Victus 16 (2024) (6.2.1) | |
| V-Ray 5 Benchmark | |
| GPU RTX | |
| Average of class Gaming (1146 - 4363, n=36, last 2 years) | |
| Gigabyte G6X 9KG (2024) (5.0.1) | |
| HP Victus 16 (2024) (5.0.1) | |
| HP Victus 16 (2024) (5.0.1, Leistung) | |
| Dell G16, i7-13650HX, RTX 4060 (5.0.1) | |
| Average NVIDIA GeForce RTX 4060 Laptop GPU (1387 - 1817, n=28) | |
| GPU CUDA | |
| Average of class Gaming (887 - 3288, n=36, last 2 years) | |
| Gigabyte G6X 9KG (2024) (5.0.1) | |
| HP Victus 16 (2024) (5.0.1) | |
| HP Victus 16 (2024) (5.0.1, Leistung) | |
| Average NVIDIA GeForce RTX 4060 Laptop GPU (957 - 1294, n=29) | |
| Dell G16, i7-13650HX, RTX 4060 (5.0.1) | |
| Asus TUF Gaming A16 FA617XS (5.0.1) | |
| CPU | |
| Average of class Gaming (5864 - 30302, n=35, last 2 years) | |
| HP Victus 16 (2024) (5.0.1) | |
| HP Victus 16 (2024) (5.0.1) | |
| Average NVIDIA GeForce RTX 4060 Laptop GPU (8364 - 21065, n=28) | |
| Asus TUF Gaming A16 FA617XS (5.0.1) | |
| Gigabyte G6X 9KG (2024) (5.0.1) | |
| Dell G16, i7-13650HX, RTX 4060 (5.0.1) | |
| V-Ray Benchmark Next 4.10 | |
| GPU | |
| Average of class Gaming (427 - 1627, n=105, last 2 years) | |
| Lenovo Legion 5 16IRX G9 (v4.10.07 ) | |
| Gigabyte G6X 9KG (2024) (v4.10.07 ) | |
| HP Victus 16 (2024) (v4.10.07, Leistung) | |
| Average NVIDIA GeForce RTX 4060 Laptop GPU (483 - 715, n=46) | |
| HP Victus 16 (2024) (v4.10.07 ) | |
| Asus TUF Gaming A16 FA617XS (v4.10.07 ) | |
| CPU | |
| HP Victus 16 (2024) (v4.10.07, Leistung) | |
| Average of class Gaming (10048 - 45327, n=103, last 2 years) | |
| Lenovo Legion 5 16IRX G9 (v4.10.07 ) | |
| HP Victus 16 (2024) (v4.10.07 ) | |
| Average NVIDIA GeForce RTX 4060 Laptop GPU (12680 - 32360, n=46) | |
| Gigabyte G6X 9KG (2024) (v4.10.07 ) | |
| Asus TUF Gaming A16 FA617XS (v4.10.07 ) | |
* ... smaller is better
| Performance rating - Percent | |
| Average of class Gaming | |
| Lenovo Legion 5 16IRX G9 | |
| HP Victus 16 (2024) | |
| Dell G16, i7-13650HX, RTX 4060 | |
| Gigabyte G6X 9KG (2024) | |
| HP Victus 16 (2024) | |
| Average NVIDIA GeForce RTX 4060 Laptop GPU | |
| Asus TUF Gaming A16 FA617XS | |
| The Witcher 3 - 1920x1080 Ultra Graphics & Postprocessing (HBAO+) | |
| Average of class Gaming (95 - 240, n=8, last 2 years) | |
| Dell G16, i7-13650HX, RTX 4060 | |
| HP Victus 16 (2024) | |
| Average NVIDIA GeForce RTX 4060 Laptop GPU (77 - 159.7, n=42) | |
| Gigabyte G6X 9KG (2024) | |
| HP Victus 16 (2024) | |
| Asus TUF Gaming A16 FA617XS | |
| Lenovo Legion 5 16IRX G9 | |
| GTA V - 1920x1080 Highest AA:4xMSAA + FX AF:16x | |
| Average of class Gaming (48.3 - 186.9, n=101, last 2 years) | |
| Lenovo Legion 5 16IRX G9 | |
| Dell G16, i7-13650HX, RTX 4060 | |
| HP Victus 16 (2024) | |
| Gigabyte G6X 9KG (2024) | |
| HP Victus 16 (2024) | |
| Average NVIDIA GeForce RTX 4060 Laptop GPU (76.9 - 126.3, n=48) | |
| Asus TUF Gaming A16 FA617XS | |
| Final Fantasy XV Benchmark - 1920x1080 High Quality | |
| Average of class Gaming (41 - 215, n=102, last 2 years) | |
| Lenovo Legion 5 16IRX G9 | |
| HP Victus 16 (2024) | |
| Dell G16, i7-13650HX, RTX 4060 | |
| Gigabyte G6X 9KG (2024) | |
| HP Victus 16 (2024) | |
| Average NVIDIA GeForce RTX 4060 Laptop GPU (75.1 - 109.8, n=51) | |
| Asus TUF Gaming A16 FA617XS | |
| Strange Brigade - 1920x1080 ultra AA:ultra AF:16 | |
| Average of class Gaming (76.3 - 456, n=92, last 2 years) | |
| Lenovo Legion 5 16IRX G9 | |
| Dell G16, i7-13650HX, RTX 4060 | |
| HP Victus 16 (2024) | |
| Gigabyte G6X 9KG (2024) | |
| Average NVIDIA GeForce RTX 4060 Laptop GPU (135.3 - 210, n=50) | |
| HP Victus 16 (2024) | |
| Asus TUF Gaming A16 FA617XS | |
| Dota 2 Reborn - 1920x1080 ultra (3/3) best looking | |
| Lenovo Legion 5 16IRX G9 | |
| HP Victus 16 (2024) | |
| Average of class Gaming (84.8 - 248, n=112, last 2 years) | |
| HP Victus 16 (2024) | |
| Dell G16, i7-13650HX, RTX 4060 | |
| Average NVIDIA GeForce RTX 4060 Laptop GPU (115 - 183.8, n=53) | |
| Gigabyte G6X 9KG (2024) | |
| Asus TUF Gaming A16 FA617XS | |
| X-Plane 11.11 - 1920x1080 high (fps_test=3) | |
| Lenovo Legion 5 16IRX G9 | |
| HP Victus 16 (2024) | |
| Dell G16, i7-13650HX, RTX 4060 | |
| Gigabyte G6X 9KG (2024) | |
| Average NVIDIA GeForce RTX 4060 Laptop GPU (60.7 - 141.1, n=54) | |
| HP Victus 16 (2024) | |
| Average of class Gaming (52.1 - 143.5, n=115, last 2 years) | |
| Asus TUF Gaming A16 FA617XS | |
| Cyberpunk 2077 | |
| 1920x1080 Ultra Preset (FSR off) | |
| Average of class Gaming (17.7 - 169.9, n=120, last 2 years) | |
| Lenovo Legion 5 16IRX G9 (2.02) | |
| HP Victus 16 (2024) (2.02, Leistung) | |
| Average NVIDIA GeForce RTX 4060 Laptop GPU (56.4 - 93.1, n=31) | |
| Dell G16, i7-13650HX, RTX 4060 (2.11) | |
| Gigabyte G6X 9KG (2024) (2.02) | |
| HP Victus 16 (2024) (2.02) | |
| 2560x1440 Ultra Preset (FSR off) | |
| Average of class Gaming (24.8 - 122.8, n=94, last 2 years) | |
| Lenovo Legion 5 16IRX G9 (2.02) | |
| Dell G16, i7-13650HX, RTX 4060 (2.11) | |
| Average NVIDIA GeForce RTX 4060 Laptop GPU (32.9 - 51.8, n=19) | |
| 1920x1080 Ray Tracing Ultra Preset (DLSS off) | |
| Average of class Gaming (19.1 - 84.9, n=42, last 2 years) | |
| HP Victus 16 (2024) (2.02, Leistung) | |
| Average NVIDIA GeForce RTX 4060 Laptop GPU (23.6 - 37.4, n=21) | |
| Gigabyte G6X 9KG (2024) (2.02) | |
| HP Victus 16 (2024) (2.02) | |
| Dragon's Dogma 2 - 1920x1080 High Preset | |
| Average of class Gaming (59.9 - 99.3, n=7, last 2 years) | |
| HP Victus 16 (2024) | |
| Average NVIDIA GeForce RTX 4060 Laptop GPU (57.2 - 67.7, n=5) | |
| Razer Blade 14 Mid 23 | |
| Palworld - 1920x1080 Epic Preset AA:TSR | |
| Razer Blade 14 Mid 23 | |
| Average NVIDIA GeForce RTX 4060 Laptop GPU (83.9 - 87.8, n=2) | |
| HP Victus 16 (2024) | |
| Average of class Gaming (n=1last 2 years) | |
| The Finals | |
| 1920x1080 Epic Preset | |
| Razer Blade 14 Mid 23 | |
| Average NVIDIA GeForce RTX 4060 Laptop GPU (122.3 - 126, n=2) | |
| HP Victus 16 (2024) | |
| Average of class Gaming (n=1last 2 years) | |
| 1920x1080 Epic Preset + Epic RTX Global Illumination | |
| Razer Blade 14 Mid 23 | |
| Average NVIDIA GeForce RTX 4060 Laptop GPU (116.8 - 121.1, n=2) | |
| HP Victus 16 (2024) | |
| EA Sports WRC - 1920x1080 Ultra Preset AA:Epic AF:16x | |
| HP Victus 16 (2024) | |
| Average NVIDIA GeForce RTX 4060 Laptop GPU (78.4 - 79.6, n=2) | |
| Razer Blade 14 Mid 23 | |
| Average of class Gaming (n=1last 2 years) | |
| Enshrouded - 1920x1080 Max. Quality AA:FX | |
| HP Victus 16 (2024) | |
| Average NVIDIA GeForce RTX 4060 Laptop GPU (43 - 51.1, n=2) | |
| Razer Blade 14 Mid 23 | |
| Average of class Gaming (n=1last 2 years) | |
Witcher 3 FPS diagram
| low | med. | high | ultra | |
|---|---|---|---|---|
| GTA V (2015) | 185.8 | 181.2 | 176.1 | 110.2 |
| The Witcher 3 (2015) | 448.6 | 297.7 | 181.9 | 99.9 |
| Dota 2 Reborn (2015) | 198.1 | 177.8 | 168.4 | 149.7 |
| Final Fantasy XV Benchmark (2018) | 208 | 135.3 | 98.1 | |
| X-Plane 11.11 (2018) | 154.4 | 129.2 | 100.3 | |
| Strange Brigade (2018) | 406 | 253 | 205 | 179 |
| Cyberpunk 2077 (2023) | 113.6 | 90 | 76.9 | 67.1 |
| EA Sports WRC (2023) | 129.3 | 93.7 | 85.2 | 79.6 |
| The Finals (2023) | 196.7 | 161.7 | 155.9 | 122.3 |
| Palworld (2024) | 139.2 | 116.3 | 91.8 | 83.9 |
| Enshrouded (2024) | 85.5 | 71.2 | 59.7 | 51.1 |
| Dragon's Dogma 2 (2024) | 67.1 | 63.3 |
Emissions & power - The gaming laptop with impressive runtimes
Noise emissions
The fans are usually kept as low as possible and only spin faster when there is no other option. Nevertheless, the device's noise emissions rise to up to 48 dB(A) under full load ("Balanced"). "Performance" results in even higher values. Significantly quieter use can be achieved using the "Eco" mode.
In idle mode or under low load, it is possible that the fans remain completely still. However, the HP bios option "fan always on" (which is active by default) would have to be deactivated for this. Otherwise, it ensures that the fans are always running.
Noise level
| Idle |
| 28 / 29 / 33 dB(A) |
| Load |
| 45 / 48 dB(A) |
 | ||
30 dB silent 40 dB(A) audible 50 dB(A) loud |
||
min: | ||
| HP Victus 16 (2024) GeForce RTX 4060 Laptop GPU, i7-14700HX, Kioxia XG8 KXG80ZNV512G | Gigabyte G6X 9KG (2024) GeForce RTX 4060 Laptop GPU, i7-13650HX, Gigabyte AG450E1024-SI | Dell G16, i7-13650HX, RTX 4060 GeForce RTX 4060 Laptop GPU, i7-13650HX, WD PC SN740 SDDPNQD-1T00 | Lenovo Legion 5 16IRX G9 GeForce RTX 4060 Laptop GPU, i7-14650HX, Samsung PM9A1 MZVL21T0HCLR | Asus TUF Gaming A16 FA617XS Radeon RX 7600S, R9 7940HS, Micron 2400 MTFDKBA512QFM | |
|---|---|---|---|---|---|
| Noise | -10% | 13% | -3% | 2% | |
| off / environment * (dB) | 25 | 26 -4% | 23 8% | 24 4% | 25 -0% |
| Idle Minimum * (dB) | 28 | 30 -7% | 23 18% | 24 14% | 25 11% |
| Idle Average * (dB) | 29 | 32 -10% | 23 21% | 28.8 1% | 26 10% |
| Idle Maximum * (dB) | 33 | 35 -6% | 27.96 15% | 32 3% | 28 15% |
| Load Average * (dB) | 45 | 51 -13% | 27.96 38% | 45.5 -1% | 43 4% |
| Witcher 3 ultra * (dB) | 43 | 51 -19% | 47.89 -11% | 53.1 -23% | 51 -19% |
| Load Maximum * (dB) | 48 | 54 -13% | 47.89 -0% | 55.7 -16% | 53 -10% |
* ... smaller is better
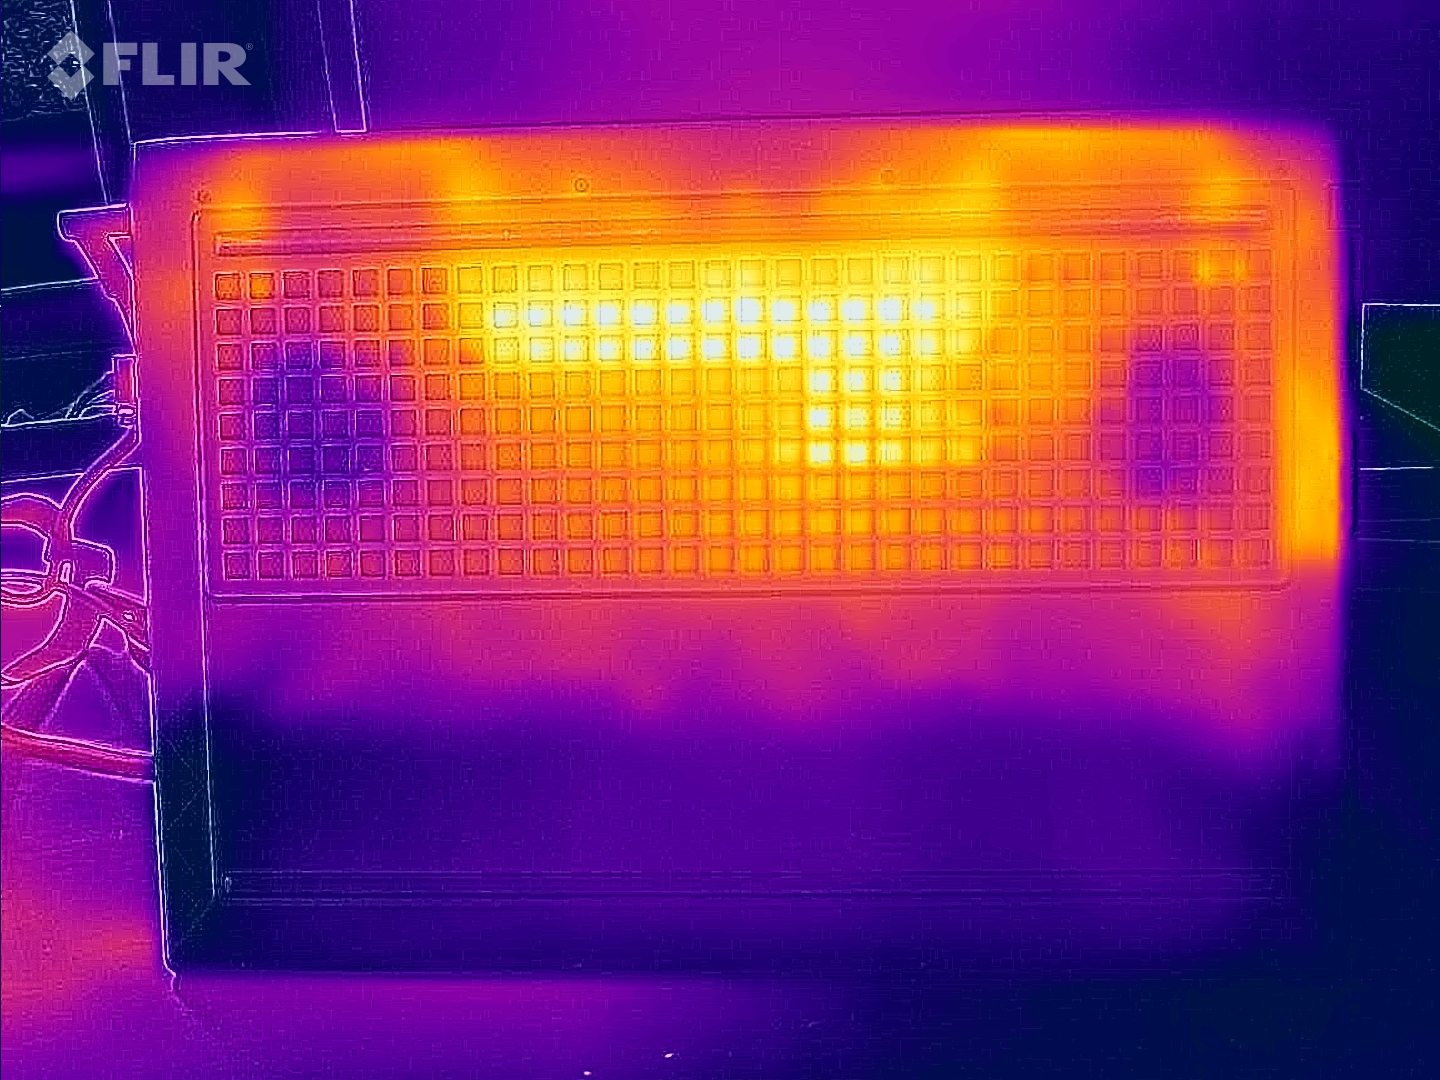
Temperature
The stress test and Witcher 3 test cause the laptop to heat up noticeably. Temperatures of 50 °C were reached at certain points during the tests. In everyday use (office, internet), the values generally remain in the green range.
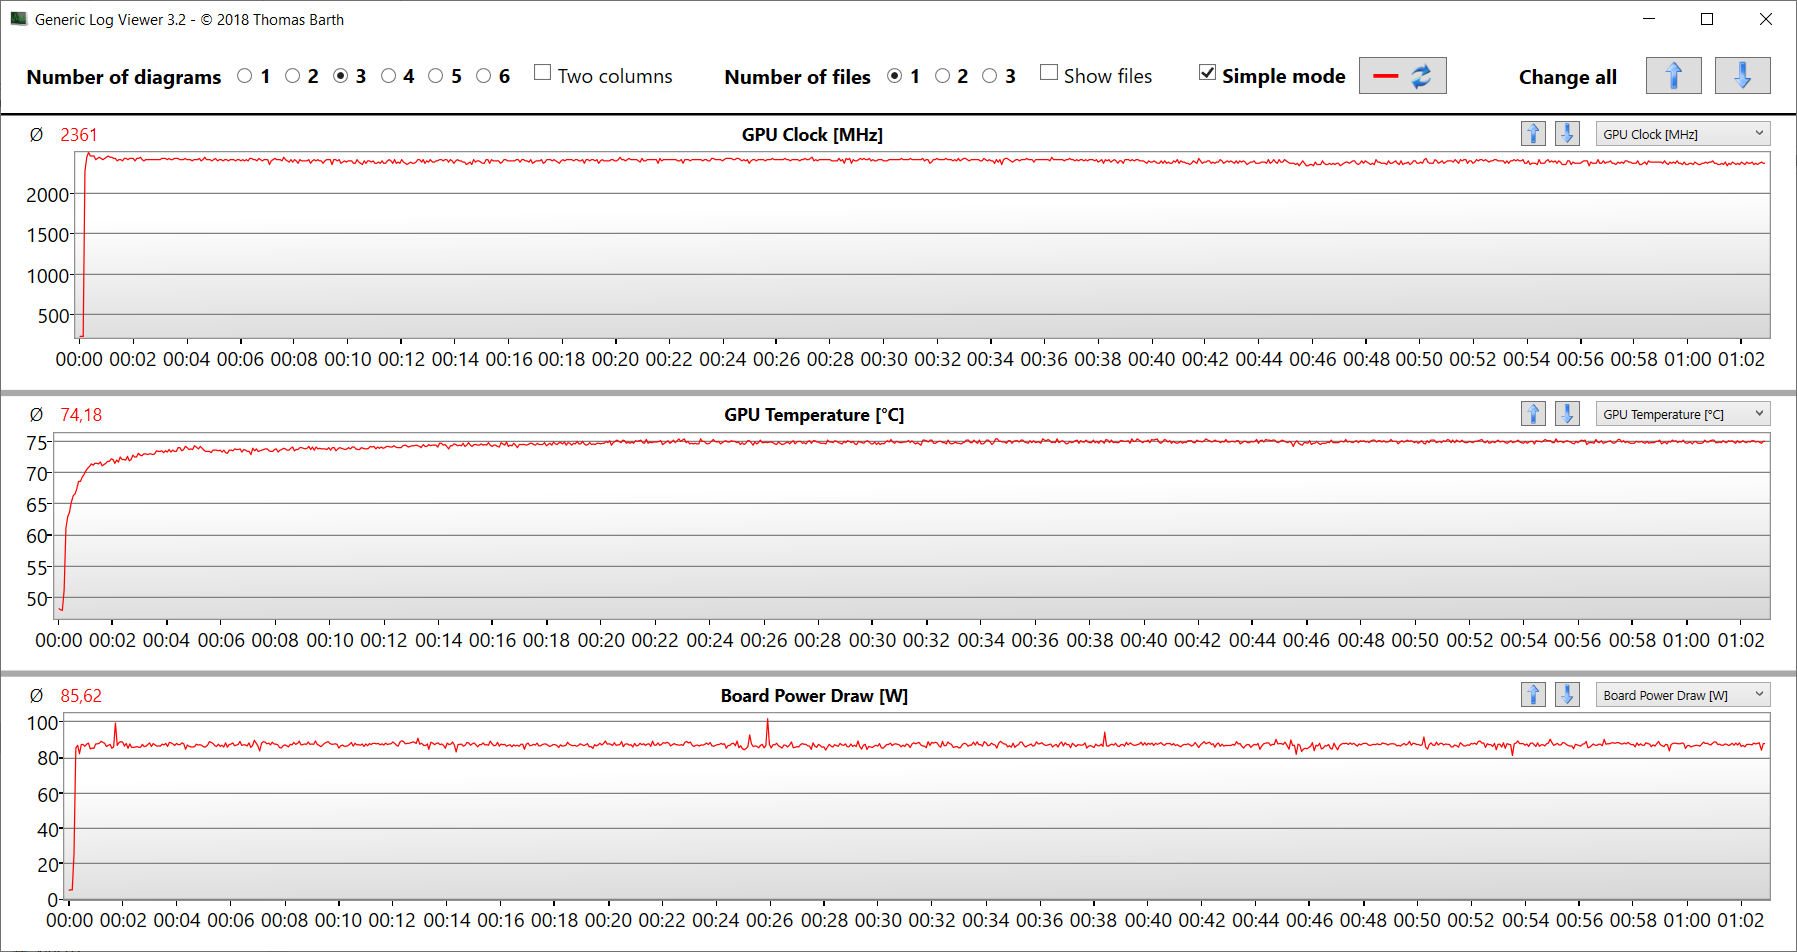
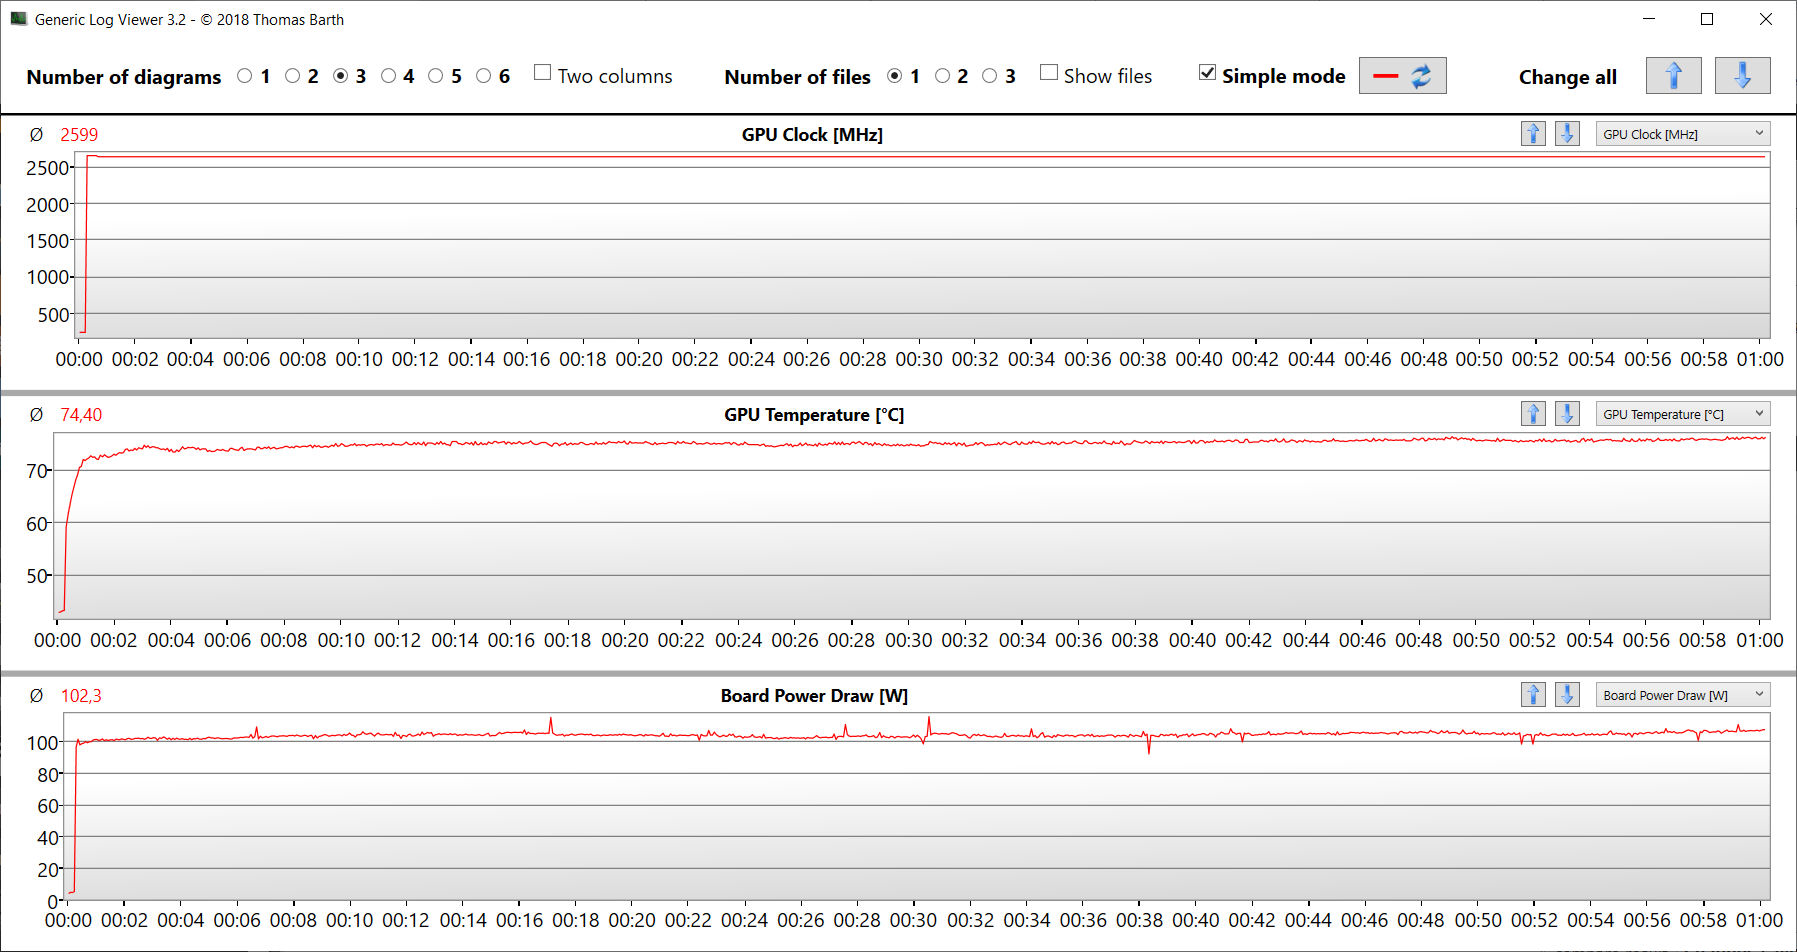
The extreme stress test scenario (Prime95 and Furmark in continuous operation) checks the system's stability under full load. The CPU clock fluctuated at the beginning, but then it stabilized at a low level later on. The GPU worked at almost full power.
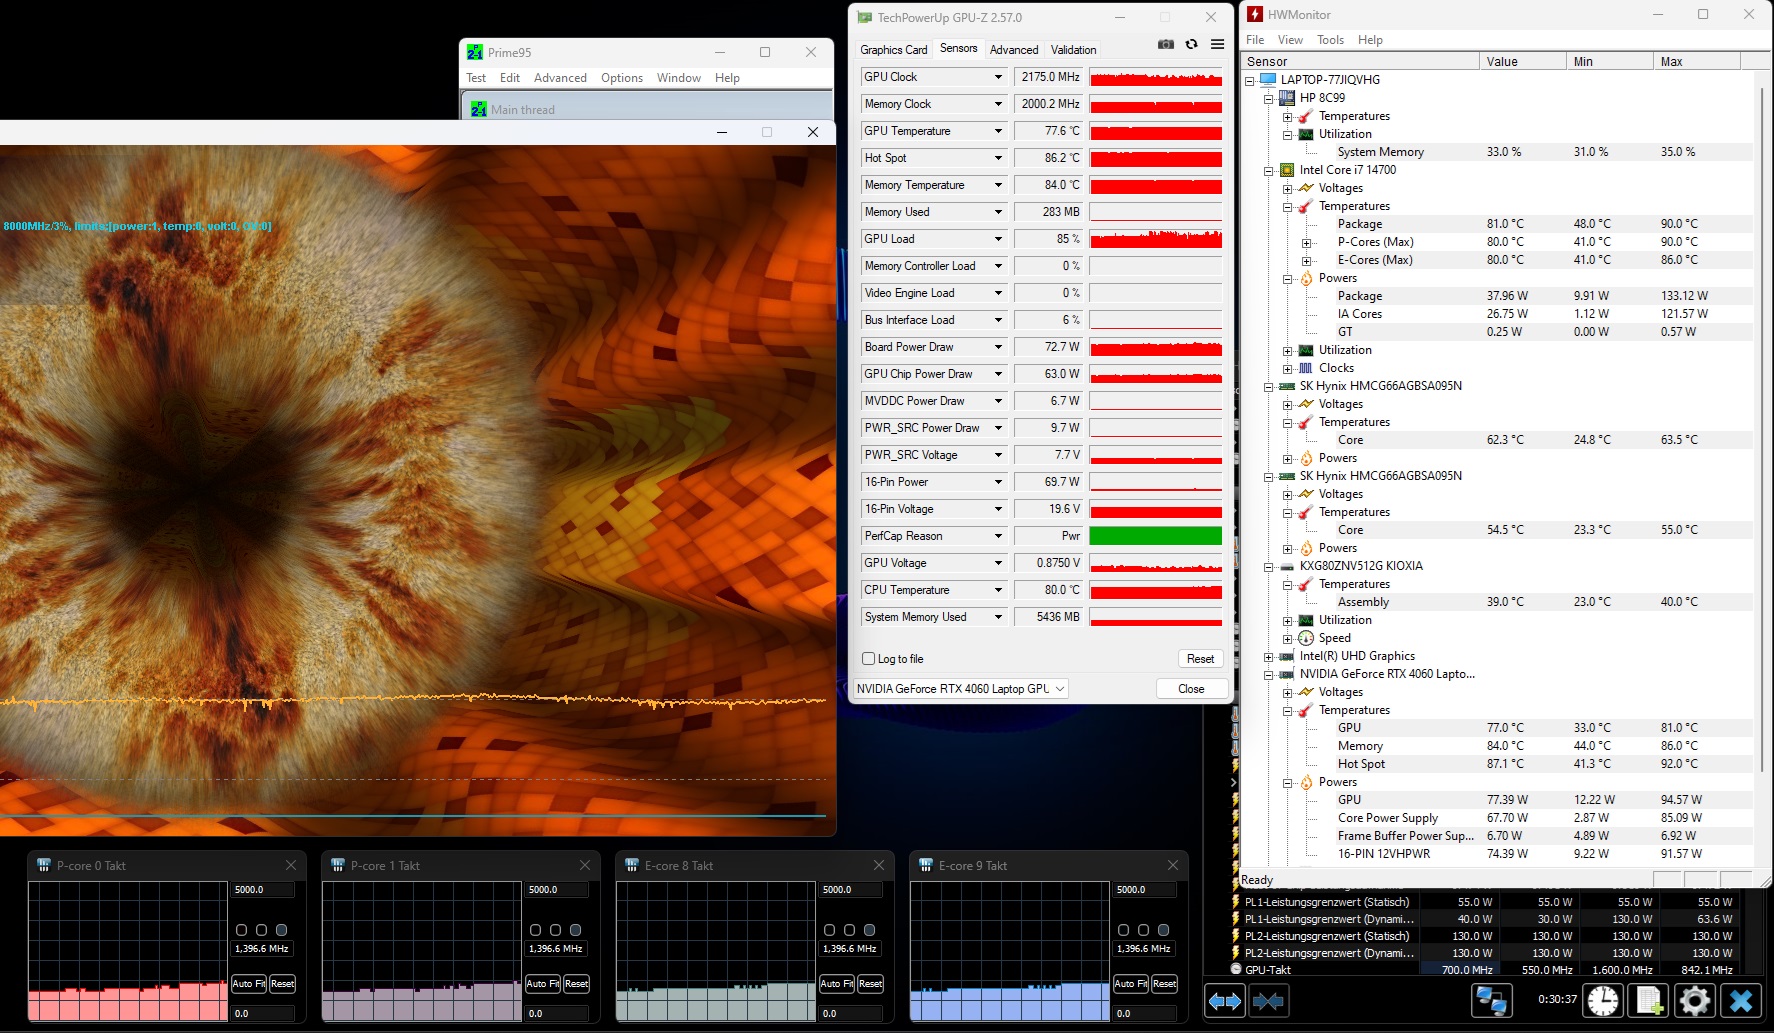
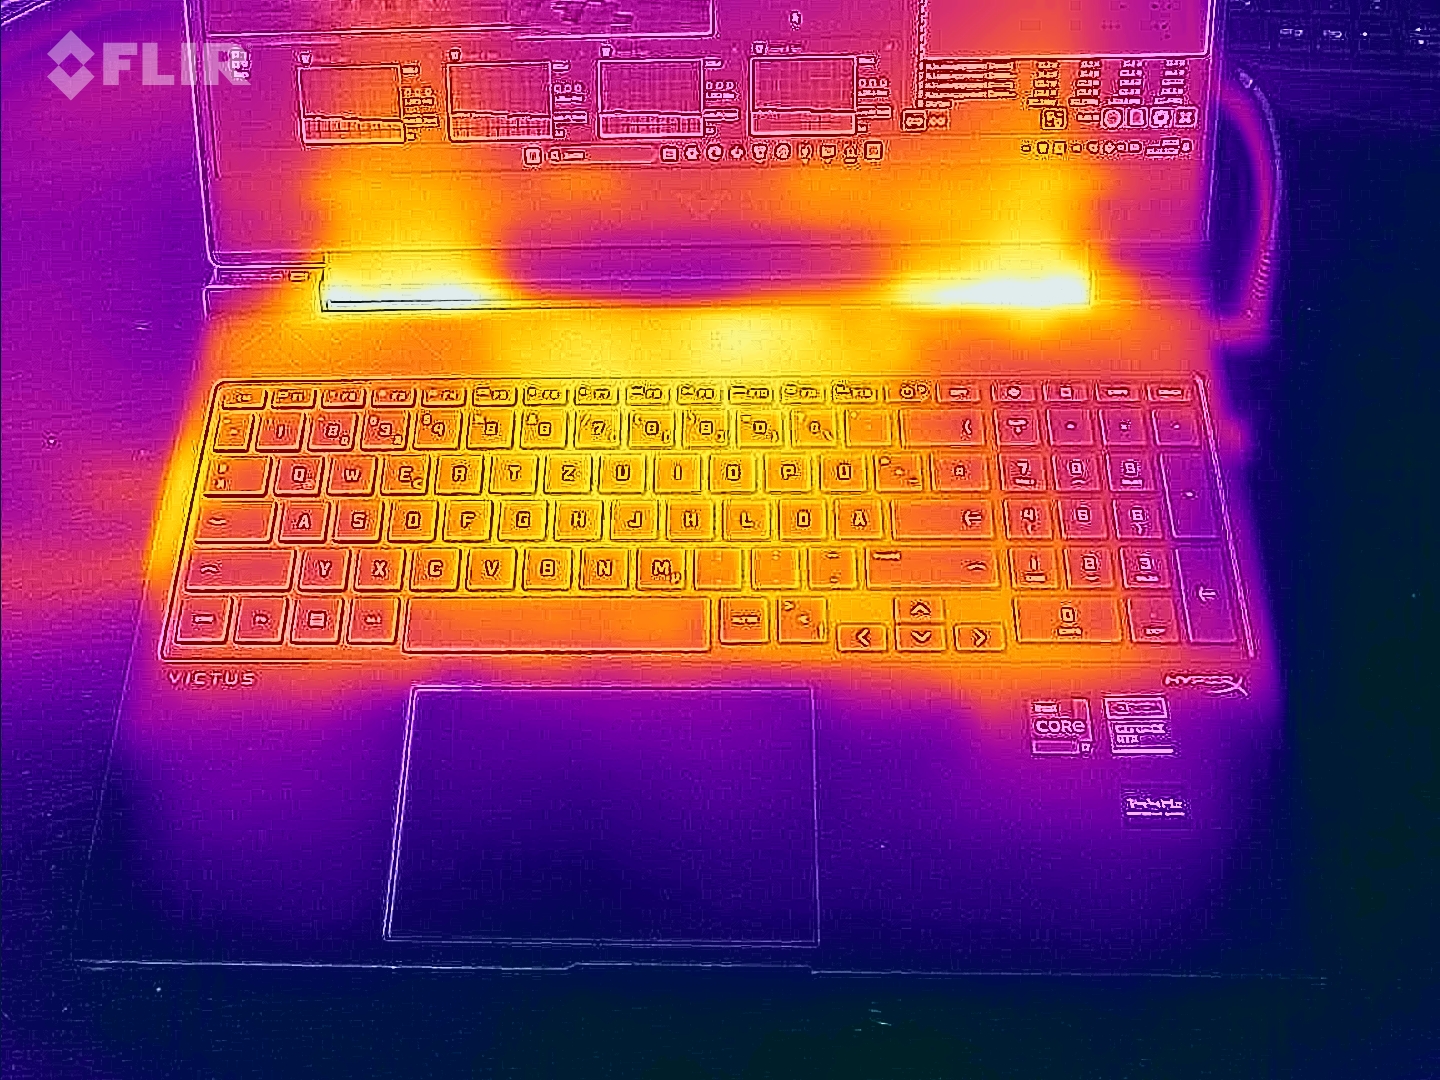
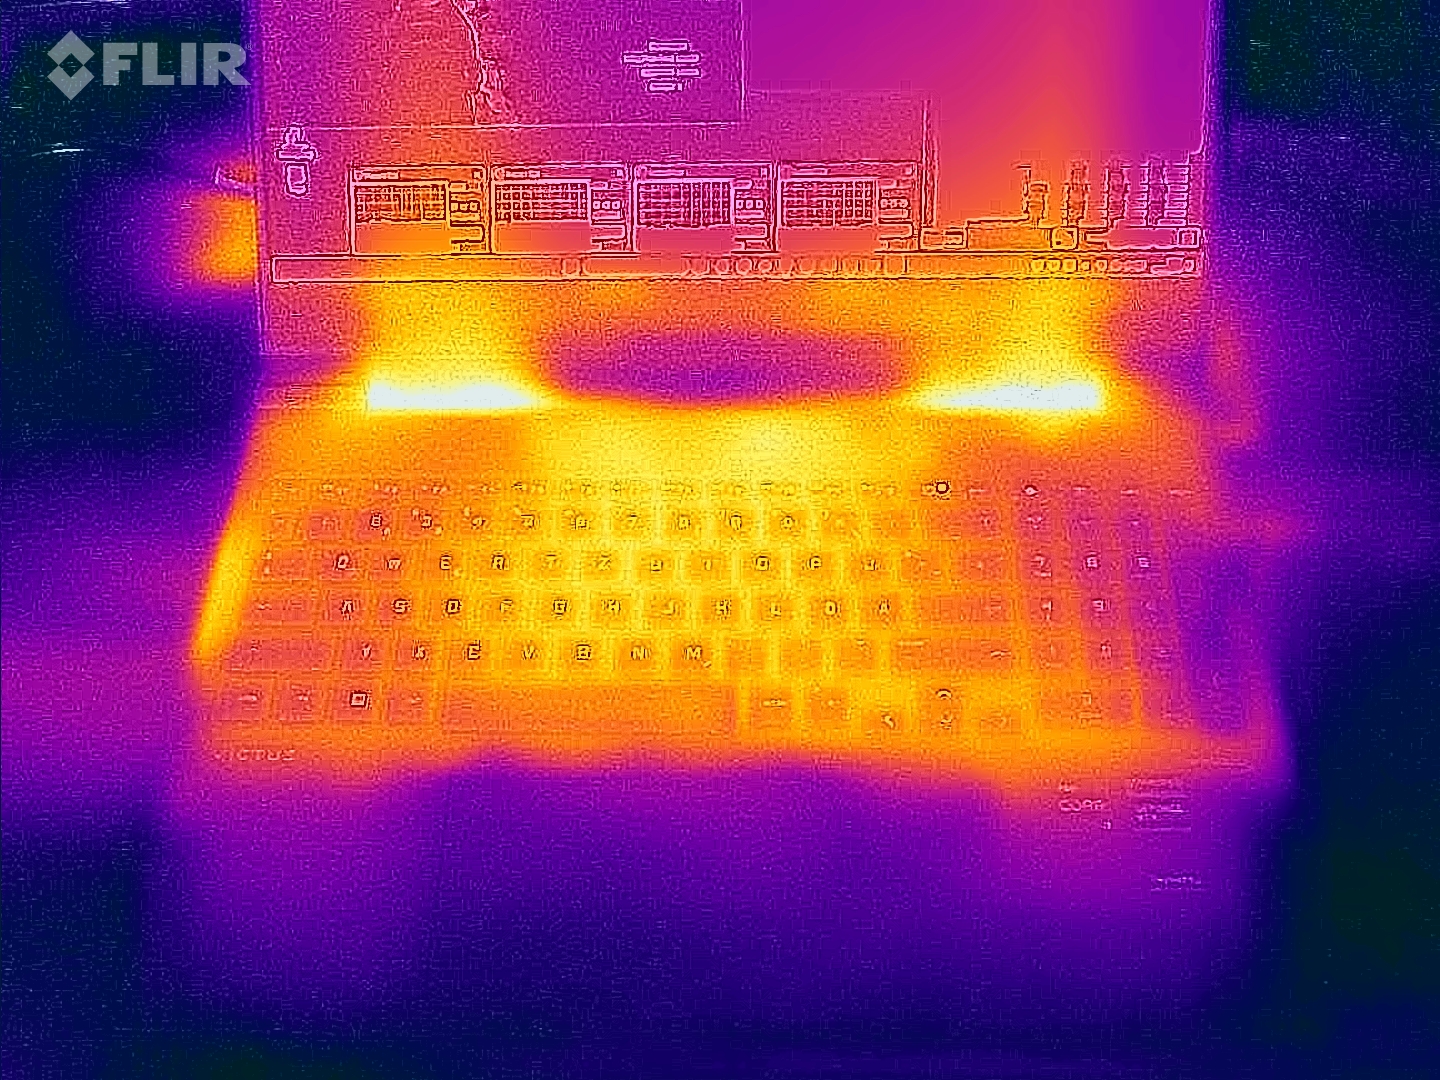
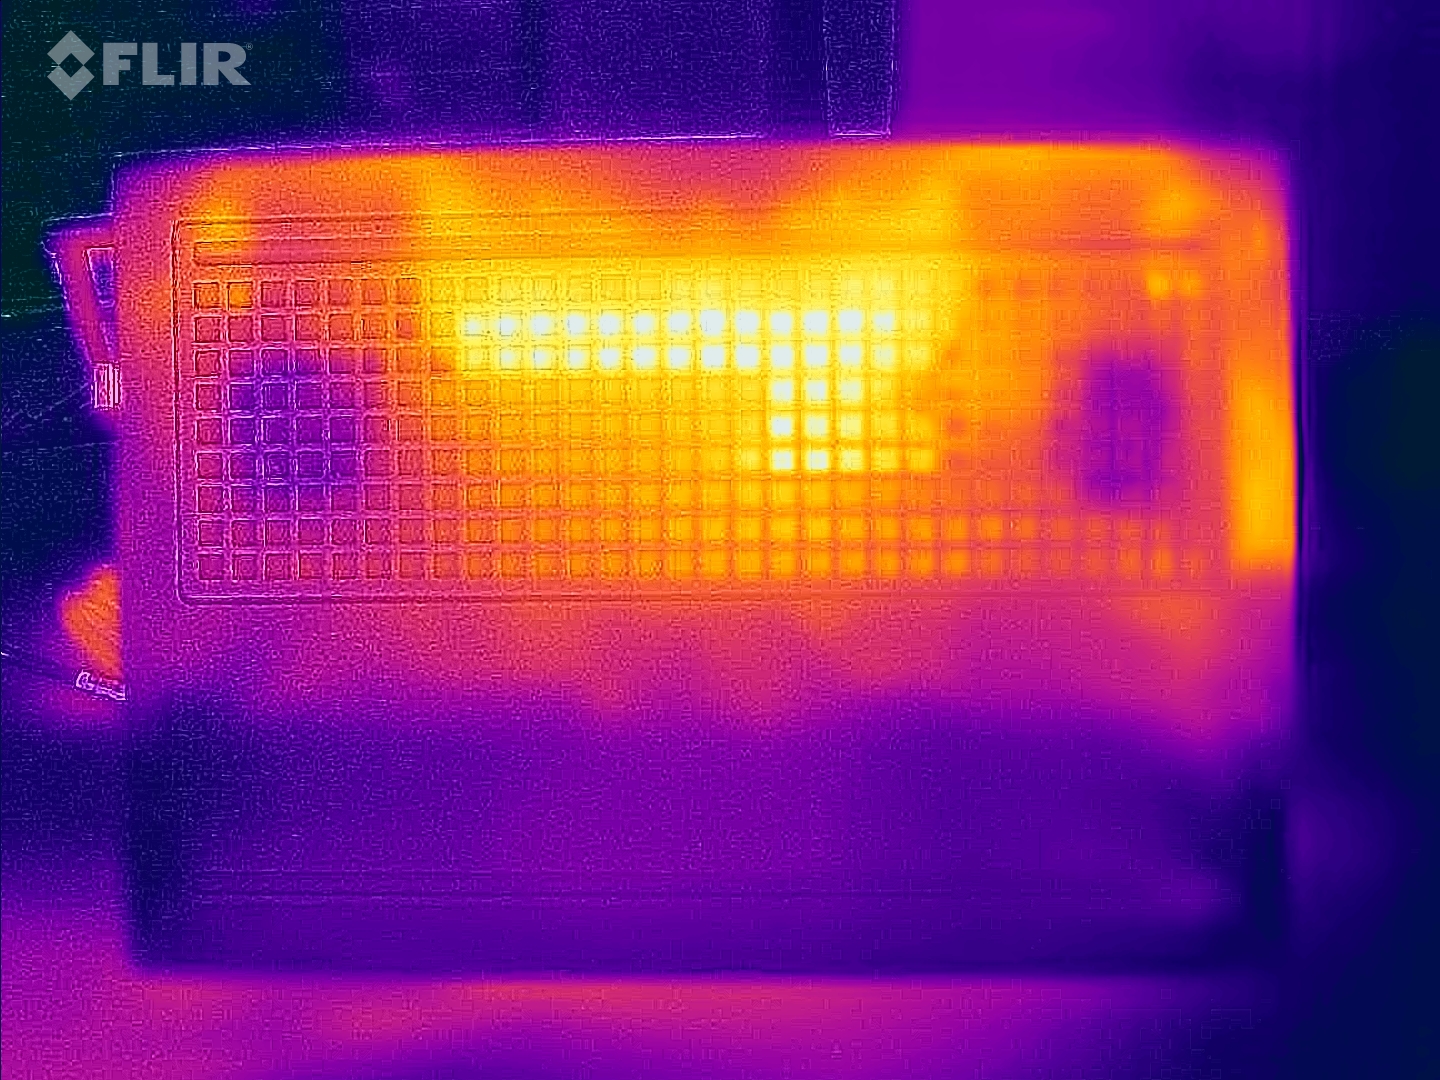
(-) The maximum temperature on the upper side is 50 °C / 122 F, compared to the average of 40.4 °C / 105 F, ranging from 21.2 to 68.8 °C for the class Gaming.
(-) The bottom heats up to a maximum of 50 °C / 122 F, compared to the average of 43.2 °C / 110 F
(+) In idle usage, the average temperature for the upper side is 24.7 °C / 76 F, compared to the device average of 33.9 °C / 93 F.
(-) Playing The Witcher 3, the average temperature for the upper side is 38.3 °C / 101 F, compared to the device average of 33.9 °C / 93 F.
(+) The palmrests and touchpad are cooler than skin temperature with a maximum of 31 °C / 87.8 F and are therefore cool to the touch.
(-) The average temperature of the palmrest area of similar devices was 28.8 °C / 83.8 F (-2.2 °C / -4 F).
| HP Victus 16 (2024) Intel Core i7-14700HX, NVIDIA GeForce RTX 4060 Laptop GPU | Gigabyte G6X 9KG (2024) Intel Core i7-13650HX, NVIDIA GeForce RTX 4060 Laptop GPU | Dell G16, i7-13650HX, RTX 4060 Intel Core i7-13650HX, NVIDIA GeForce RTX 4060 Laptop GPU | Lenovo Legion 5 16IRX G9 Intel Core i7-14650HX, NVIDIA GeForce RTX 4060 Laptop GPU | Asus TUF Gaming A16 FA617XS AMD Ryzen 9 7940HS, AMD Radeon RX 7600S | |
|---|---|---|---|---|---|
| Heat | -10% | -22% | -7% | -9% | |
| Maximum Upper Side * (°C) | 50 | 41 18% | 49 2% | 40.4 19% | 53 -6% |
| Maximum Bottom * (°C) | 50 | 43 14% | 58 -16% | 43.8 12% | 48 4% |
| Idle Upper Side * (°C) | 25 | 32 -28% | 35 -40% | 30.3 -21% | 30 -20% |
| Idle Bottom * (°C) | 26 | 37 -42% | 35 -35% | 35.3 -36% | 30 -15% |
* ... smaller is better
Speakers
The laptop's stereo speakers produce a decent sound overall, although it could do with having more bass.
HP Victus 16 (2024) audio analysis
(+) | speakers can play relatively loud (82 dB)
Bass 100 - 315 Hz
(-) | nearly no bass - on average 20.3% lower than median
(±) | linearity of bass is average (13.3% delta to prev. frequency)
Mids 400 - 2000 Hz
(+) | balanced mids - only 1.6% away from median
(+) | mids are linear (3.3% delta to prev. frequency)
Highs 2 - 16 kHz
(+) | balanced highs - only 3.1% away from median
(+) | highs are linear (4.7% delta to prev. frequency)
Overall 100 - 16.000 Hz
(+) | overall sound is linear (14% difference to median)
Compared to same class
» 23% of all tested devices in this class were better, 7% similar, 70% worse
» The best had a delta of 6%, average was 18%, worst was 132%
Compared to all devices tested
» 16% of all tested devices were better, 4% similar, 80% worse
» The best had a delta of 4%, average was 24%, worst was 134%
Gigabyte G6X 9KG (2024) audio analysis
(+) | speakers can play relatively loud (82 dB)
Bass 100 - 315 Hz
(-) | nearly no bass - on average 24.9% lower than median
(±) | linearity of bass is average (13.7% delta to prev. frequency)
Mids 400 - 2000 Hz
(+) | balanced mids - only 4.1% away from median
(+) | mids are linear (5.4% delta to prev. frequency)
Highs 2 - 16 kHz
(+) | balanced highs - only 2.2% away from median
(±) | linearity of highs is average (7.4% delta to prev. frequency)
Overall 100 - 16.000 Hz
(±) | linearity of overall sound is average (17.2% difference to median)
Compared to same class
» 46% of all tested devices in this class were better, 11% similar, 42% worse
» The best had a delta of 6%, average was 18%, worst was 132%
Compared to all devices tested
» 32% of all tested devices were better, 8% similar, 60% worse
» The best had a delta of 4%, average was 24%, worst was 134%
Power consumption
Its power consumption is pretty normal for the installed hardware. While the Witcher 3 test was run with constant power consumption, the laptop's demand fluctuated at the start of the stress test. The power supply unit (230 watts) is sufficiently sized.
| Off / Standby | |
| Idle | |
| Load |
|
Key:
min: | |
Power consumption Witcher 3 / stress test
Power consumption with external monitor
Runtimes
The 16.1-inch device achieved a runtime of 8:31 hours during our practical WLAN test (illustrating the load when accessing websites using a script)—a very good value. Within the comparison field, only the Asus TUF Gaming A16 did better.
Pros
Cons
Verdict - A solid mid-range gaming laptop
The Victus allows FHD gaming with high to maximum settings. The required power is delivered by the Core i7-14700HX and the GeForce RTX 4060. A shame: The CPU's single-core performance is slightly below what could be possible. As is standard for the class, its emissions can be sunk down to moderate values by forgoing some performance. Positive: Below full load, the laptop's noise emissions are acceptable.
Storage greed at HP: A US$1,600 gaming laptop needs to offer more storage.
HP hasn't hopped on the 16:10 bandwagon—instead, it has stayed true to the 16:9 aspect ratio: The installed 16.1-inch panel (FHD, 144 Hz) is fine—however, when taken into account the device's price of about US$1,600, it should really offer better color space coverage. Its 512 GB storage is not a lot for a gaming laptop. You would expect more for the price in this aspect, too.
HP hasn't given this laptop modern connections such as Thunderbolt 4/USB 4 but even so, it hasn't forgotten useful functions such as Power Delivery—the battery can be charged via a USB-C power supply (100 watts). Positive: The fully charged battery is enough for WiFi runtimes of around 8.5 hours—a value which a lot of other gaming laptops can only dream of achieving.
A viable alternative could be the Gigabyte G6X 9KG (2024). This laptop offers comparable computing power and similarly good runtimes but instead of a 16:9 panel, it features a 16:10 one.
Price and availability
The HP Victus 16 (2024) can currently be purchased on Amazon for about US$1,333. This is the variant with the Core i7-13700HX, NVIDIA GeForce RTX 4060, 64GB DDR5 RAM and a 2TB SSD.
You can also configure a custom variant via HP's website.
HP Victus 16 (2024)
- 05/14/2024 v7 (old)
Sascha Mölck
Transparency
The selection of devices to be reviewed is made by our editorial team. The test sample was provided to the author as a loan by the manufacturer or retailer for the purpose of this review. The lender had no influence on this review, nor did the manufacturer receive a copy of this review before publication. There was no obligation to publish this review. As an independent media company, Notebookcheck is not subjected to the authority of manufacturers, retailers or publishers.
This is how Notebookcheck is testing
Every year, Notebookcheck independently reviews hundreds of laptops and smartphones using standardized procedures to ensure that all results are comparable. We have continuously developed our test methods for around 20 years and set industry standards in the process. In our test labs, high-quality measuring equipment is utilized by experienced technicians and editors. These tests involve a multi-stage validation process. Our complex rating system is based on hundreds of well-founded measurements and benchmarks, which maintains objectivity. Further information on our test methods can be found here.
Price comparison

