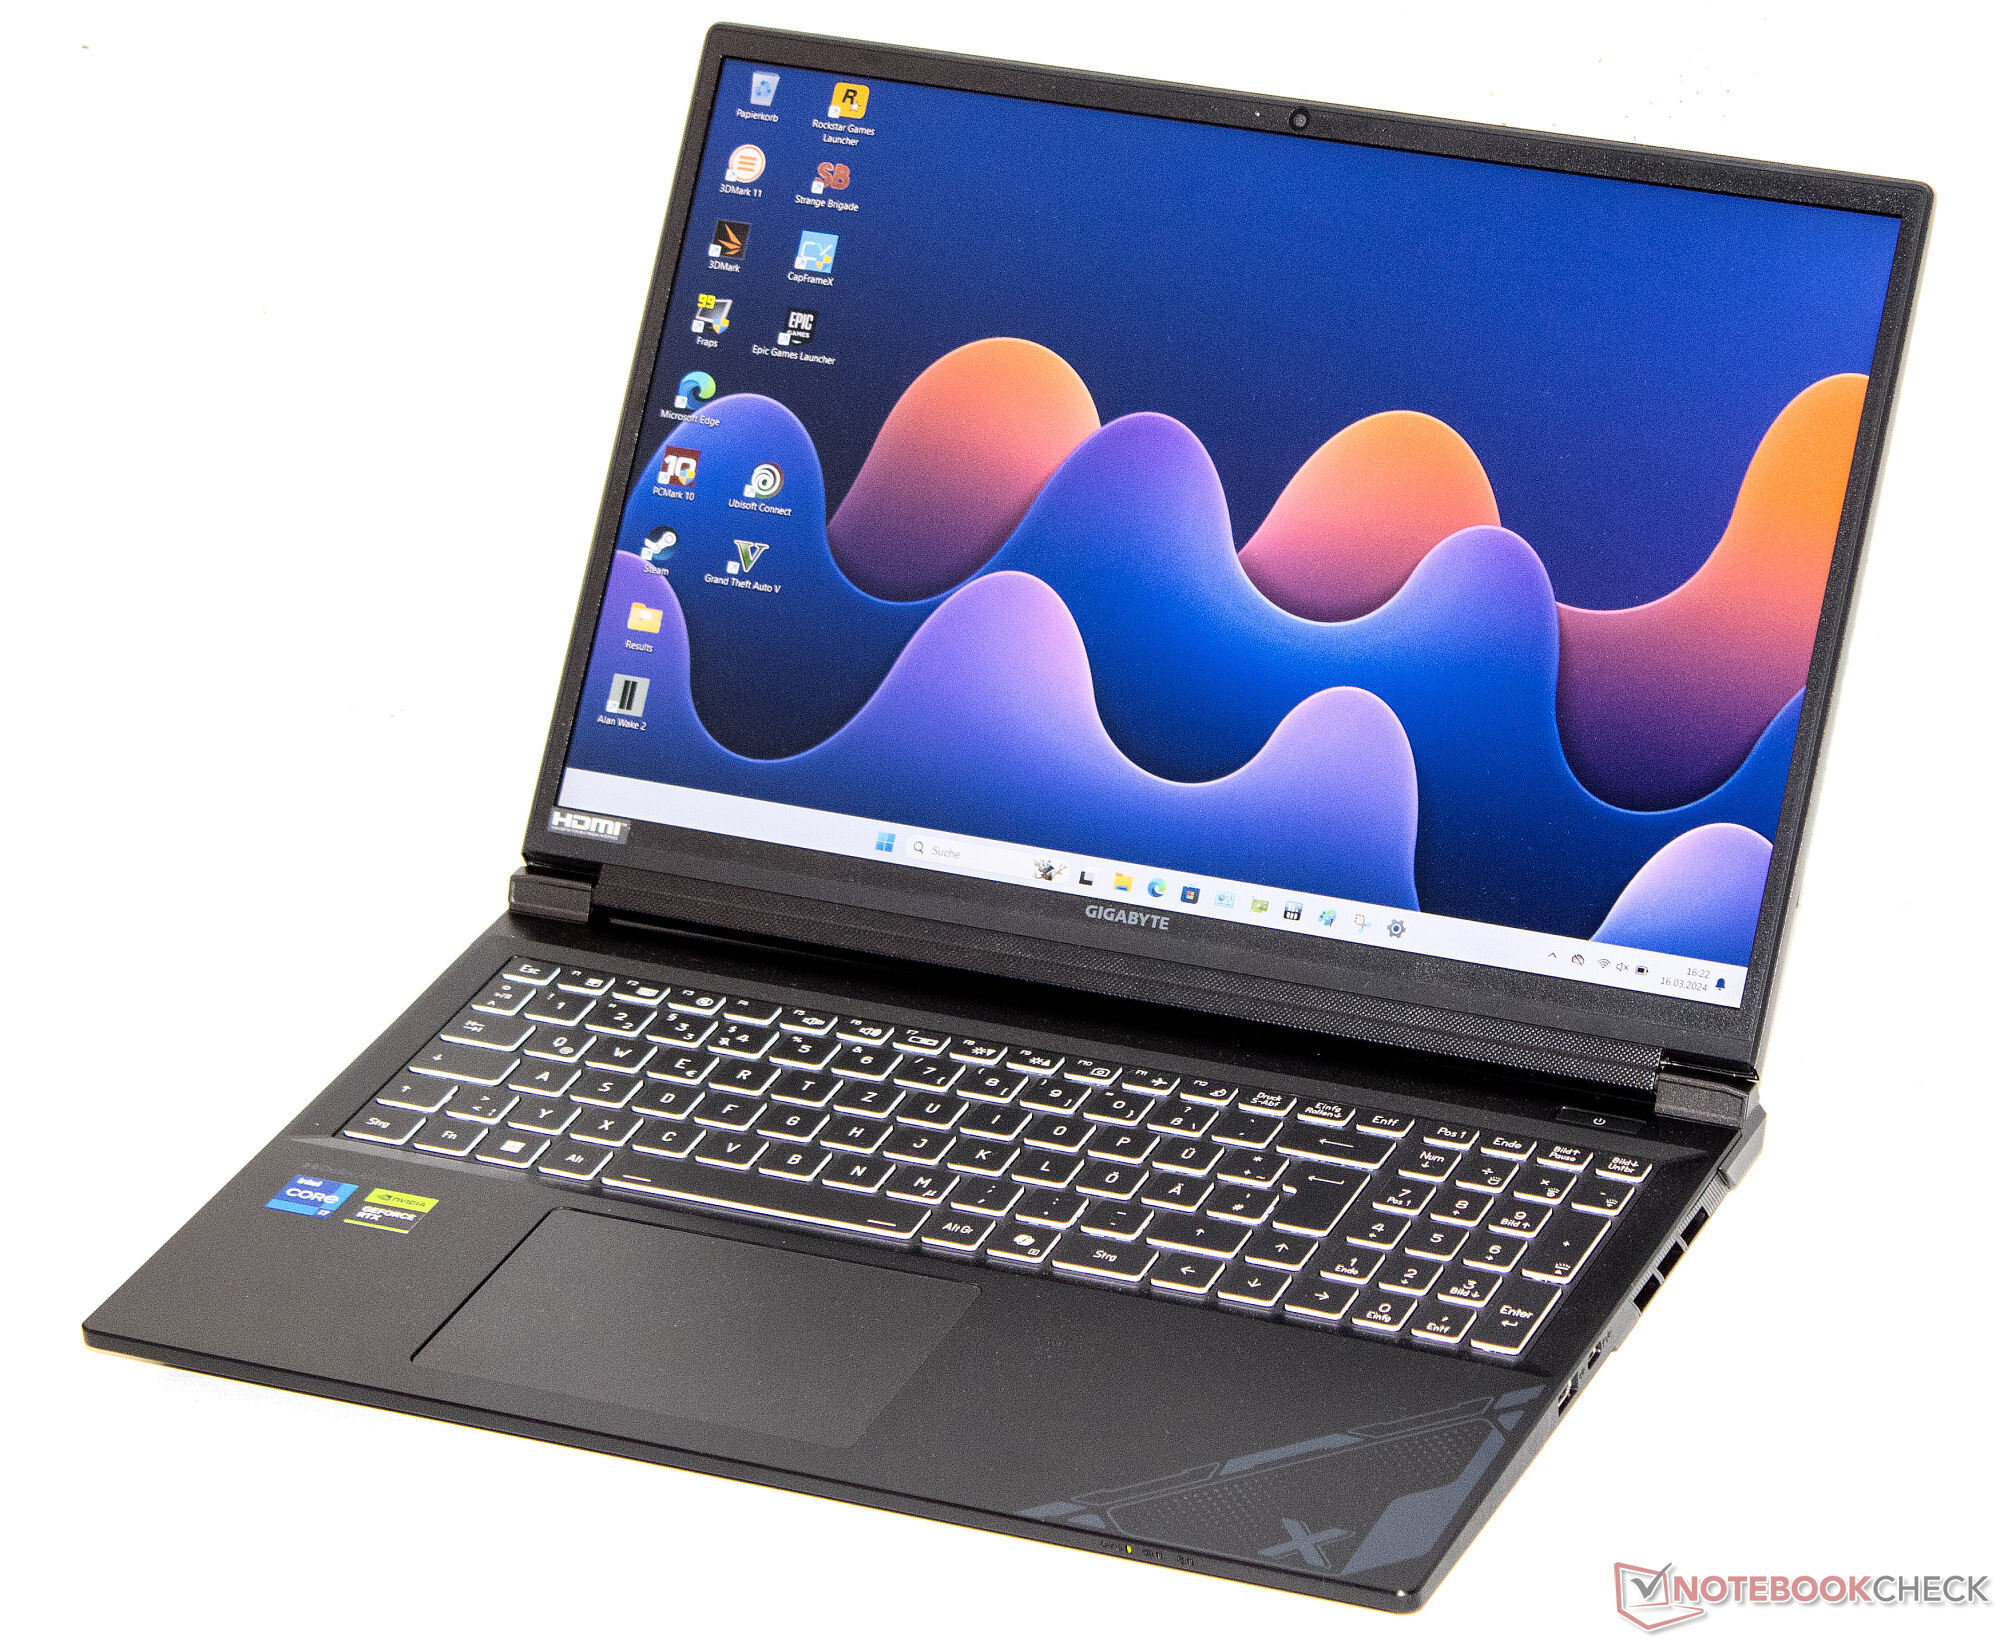
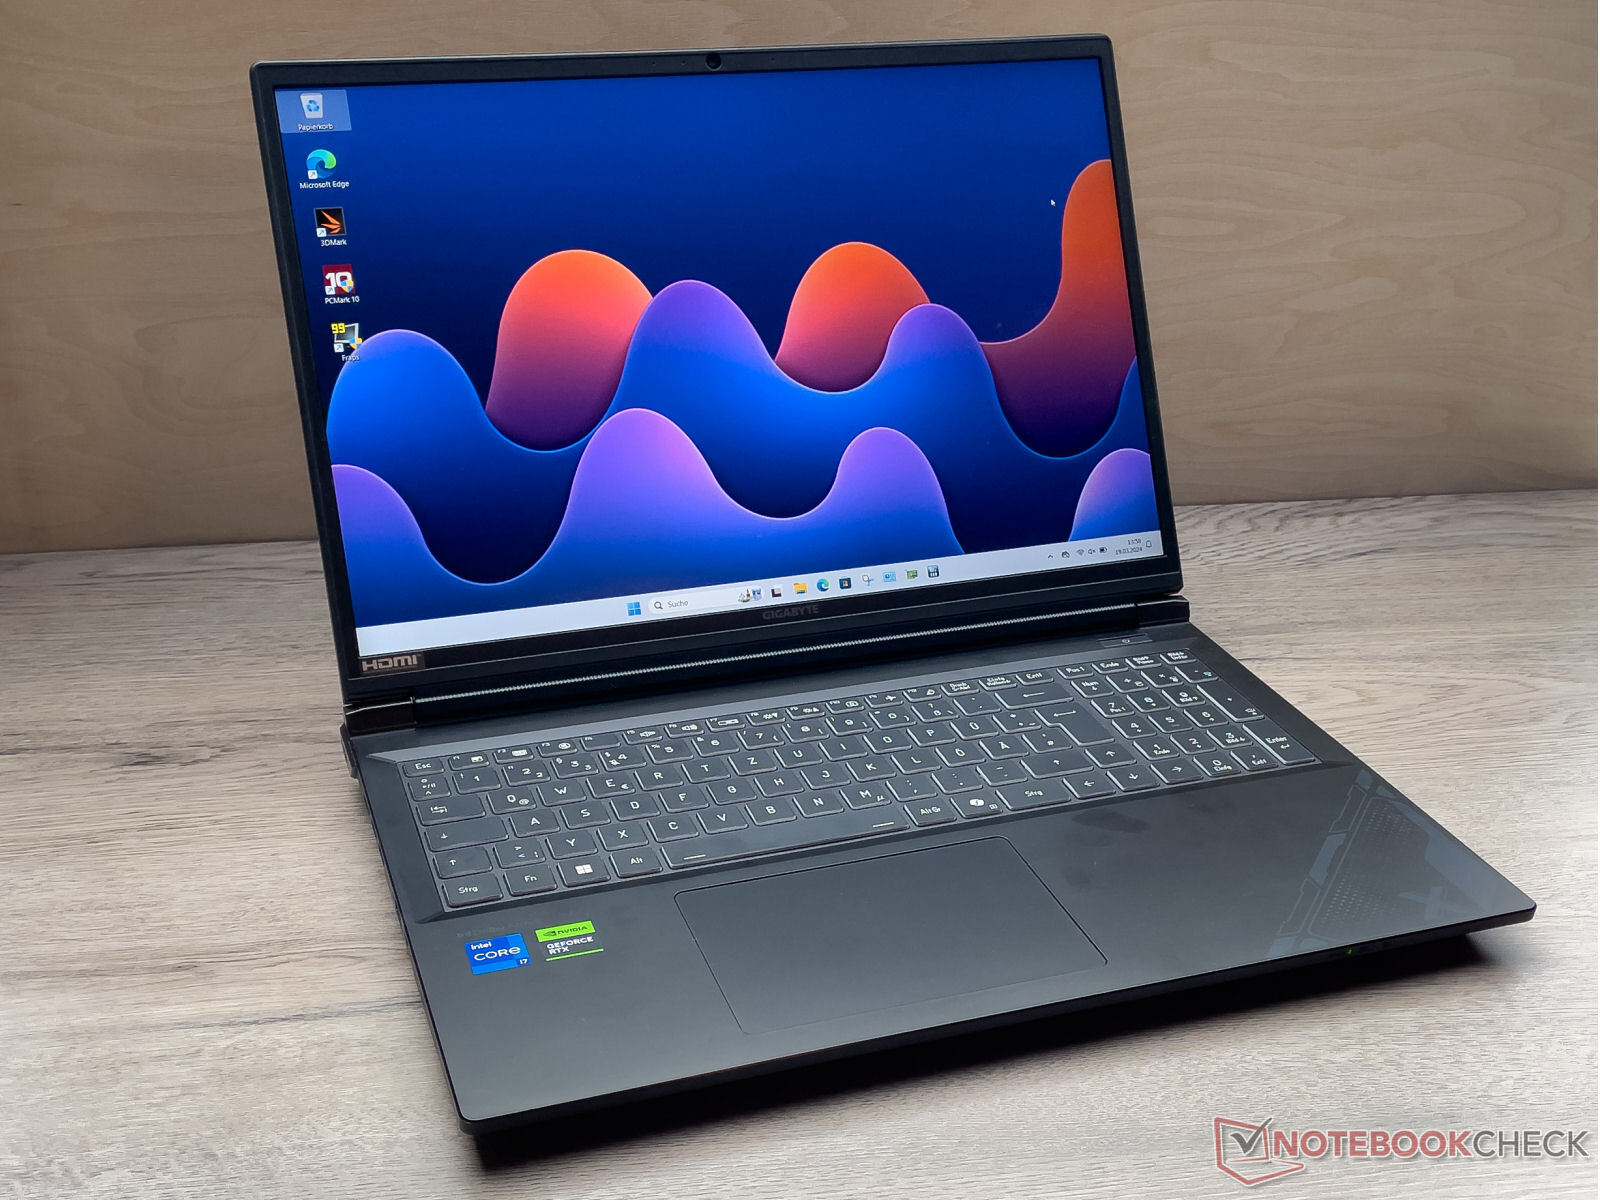
Gigabyte G6X 9KG (2024) review: Affordable gaming notebook with RTX 4060

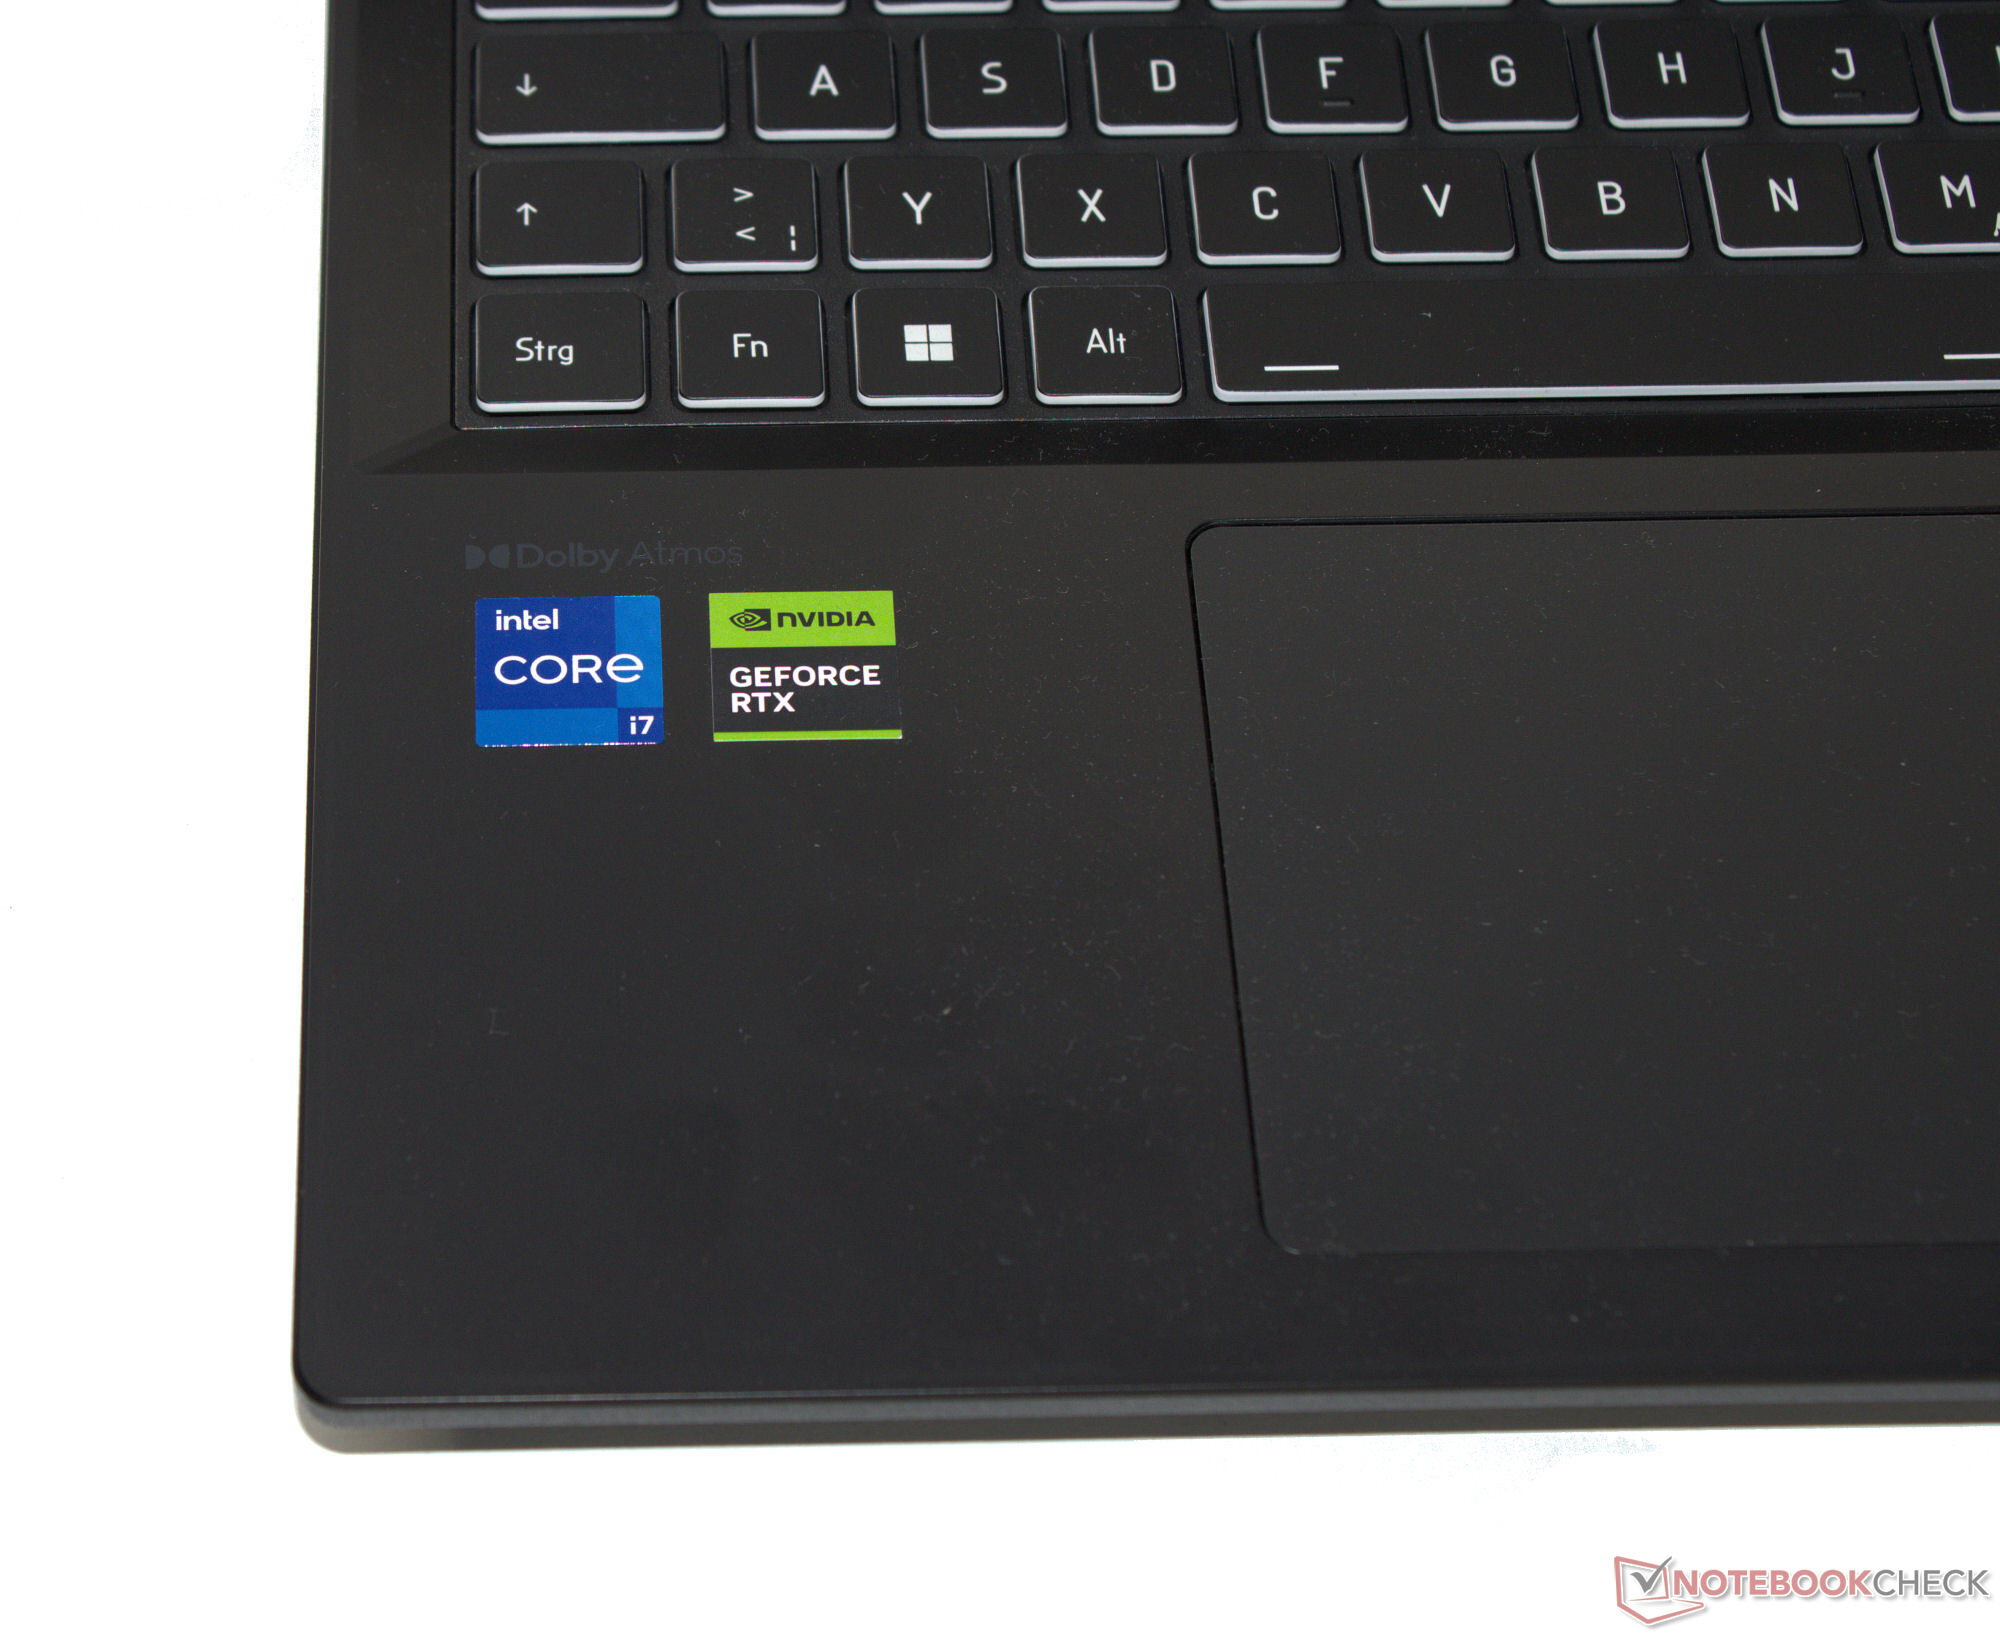
The Gigabyte G6X 9KG is among the affordable gaming notebooks with a price of just under €1,350. The laptop is powered by the Intel Core i7-13650HX Raptor Lake-HX CPU and an Nvidia GeForce RTX 4060 Ada Lovelace Laptop GPU.
The competition includes laptops such as the Dell G16, Lenovo Legion 5 16IRX G9, MSI Raider GE68HX 13VF, and Asus TUF Gaming A16 FA617XS.
Possible competitors in comparison
Rating | Date | Model | Weight | Height | Size | Resolution | Price |
|---|---|---|---|---|---|---|---|
| 83.2 % v7 (old) | 03 / 2024 | Gigabyte G6X 9KG (2024) i7-13650HX, GeForce RTX 4060 Laptop GPU | 2.6 kg | 25.1 mm | 16.00" | 1920x1200 | |
| 85.5 % v7 (old) | 02 / 2024 | Dell G16, i7-13650HX, RTX 4060 i7-13650HX, GeForce RTX 4060 Laptop GPU | 2.8 kg | 25.65 mm | 16.00" | 2560x1600 | |
| 89.1 % v7 (old) | 01 / 2024 | Lenovo Legion 5 16IRX G9 i7-14650HX, GeForce RTX 4060 Laptop GPU | 2.4 kg | 25.2 mm | 16.00" | 2560x1600 | |
| 86.9 % v7 (old) | 09 / 2023 | MSI Raider GE68HX 13VF i9-13950HX, GeForce RTX 4060 Laptop GPU | 2.7 kg | 27.9 mm | 16.00" | 1900x1200 | |
| 86.9 % v7 (old) | 06 / 2023 | Asus TUF Gaming A16 FA617XS R9 7940HS, Radeon RX 7600S | 2.2 kg | 22.1 mm | 16.00" | 1920x1200 |
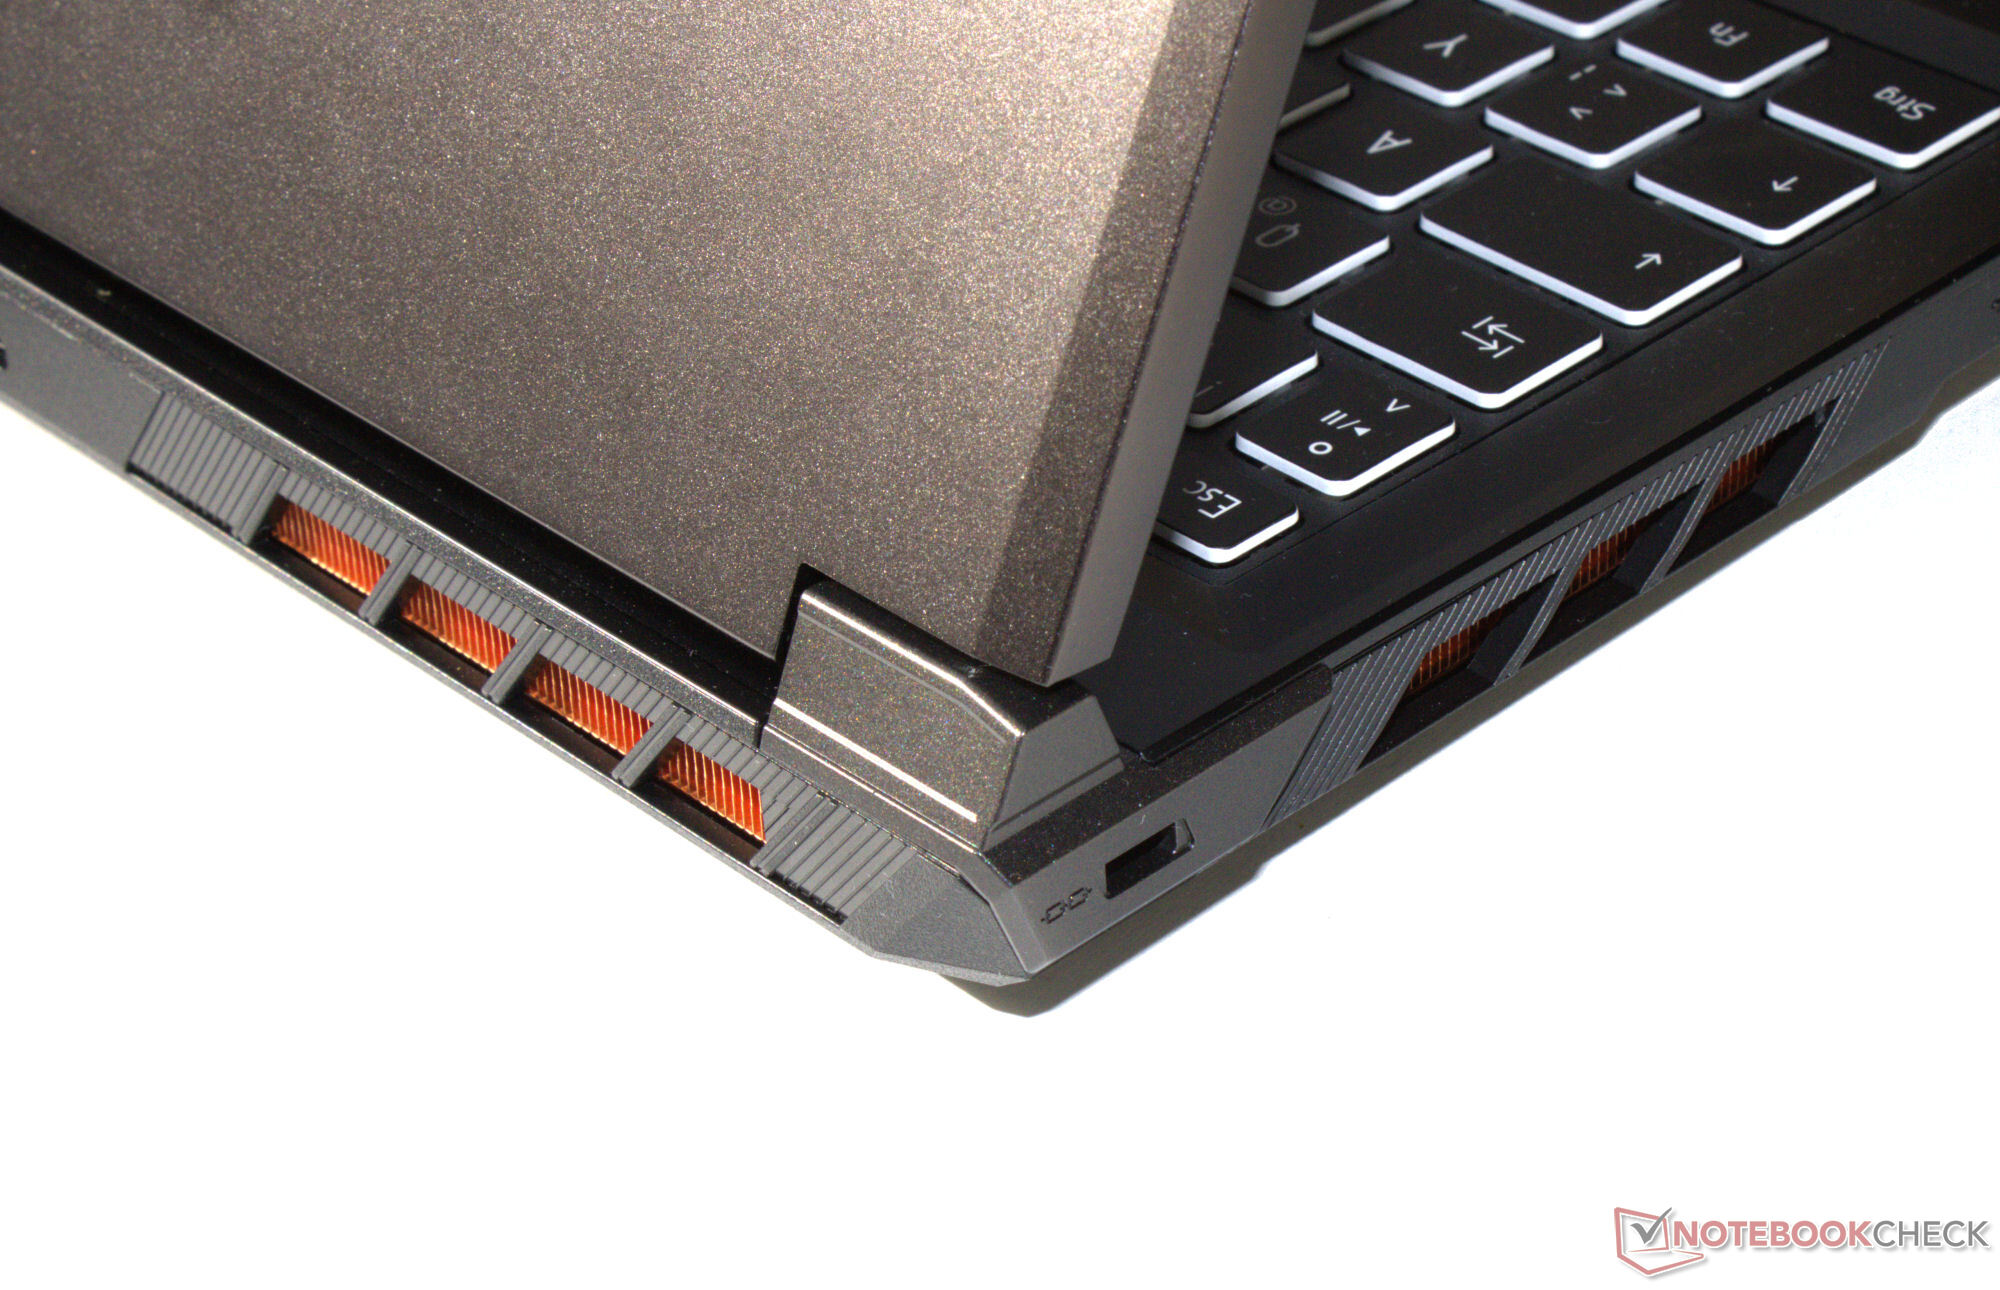
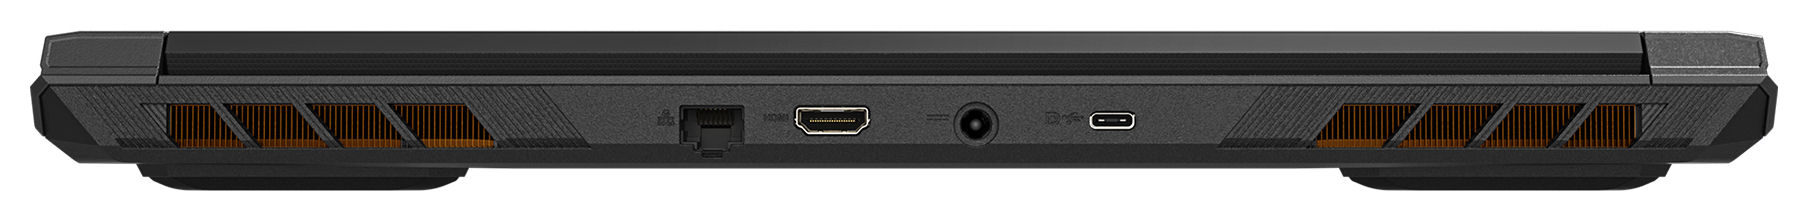
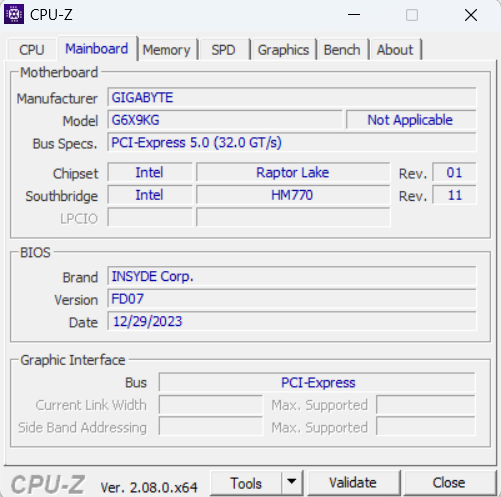
Case and features: The G6X lacks Thunderbolt 4
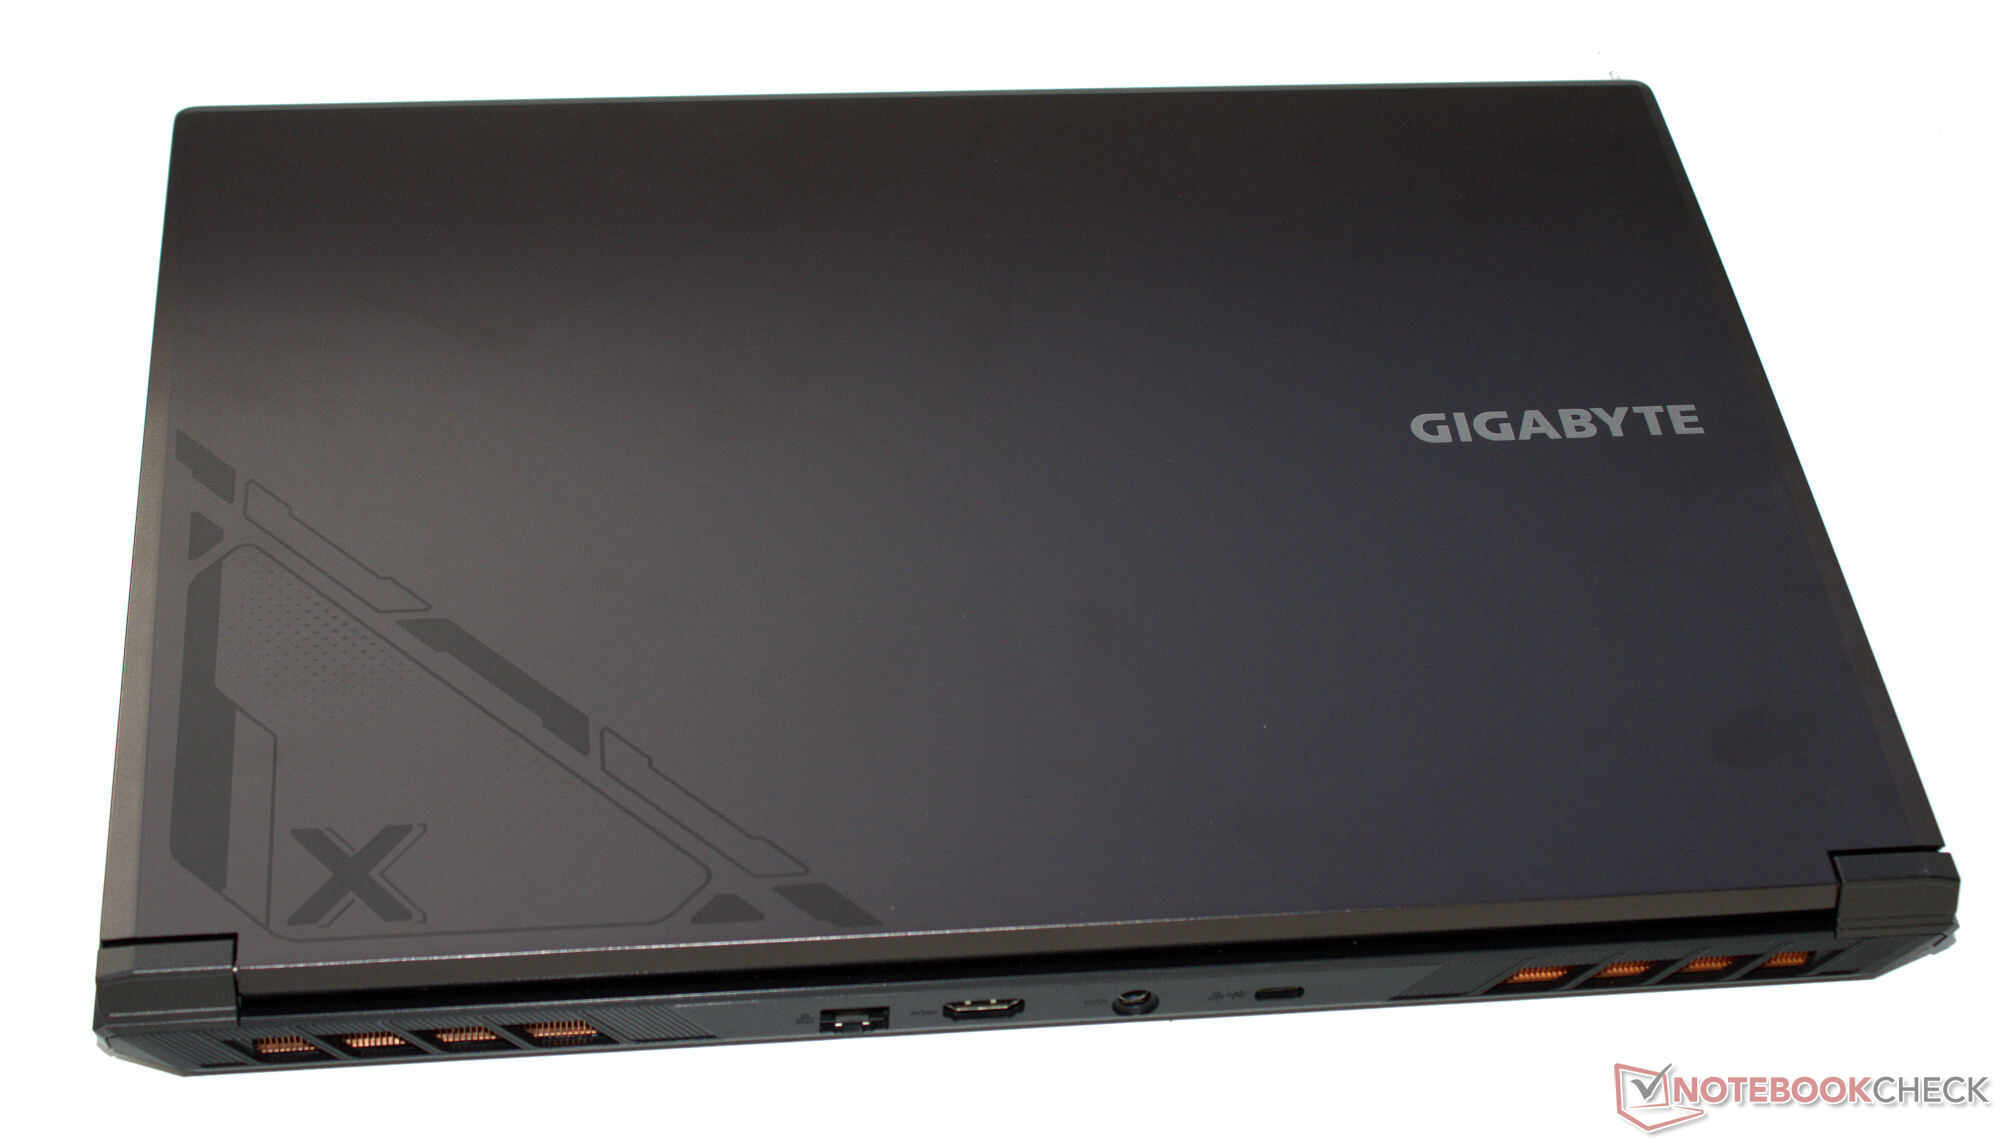
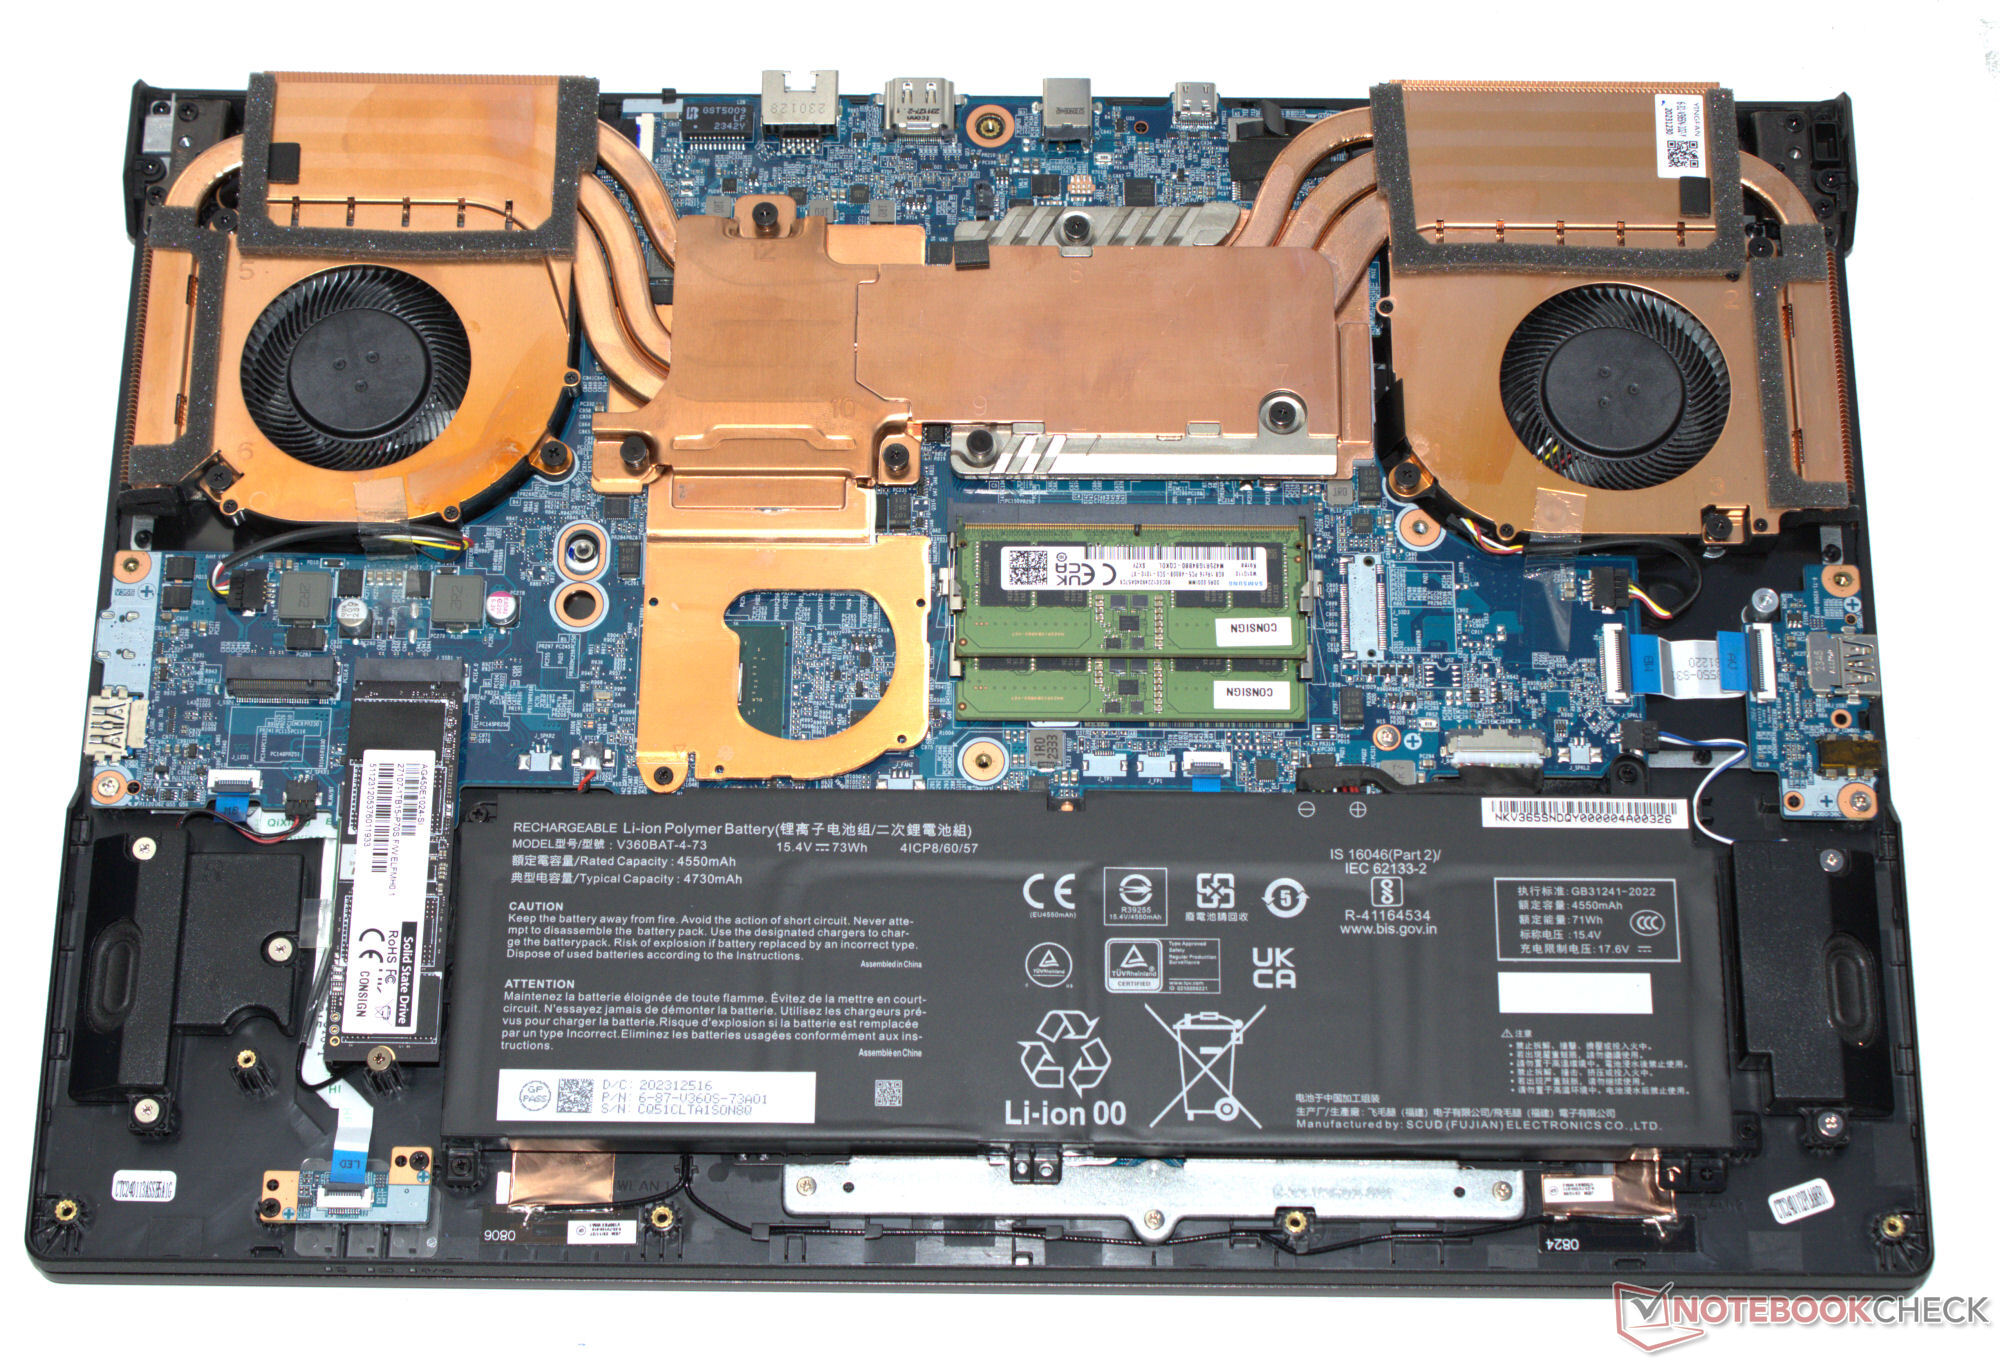
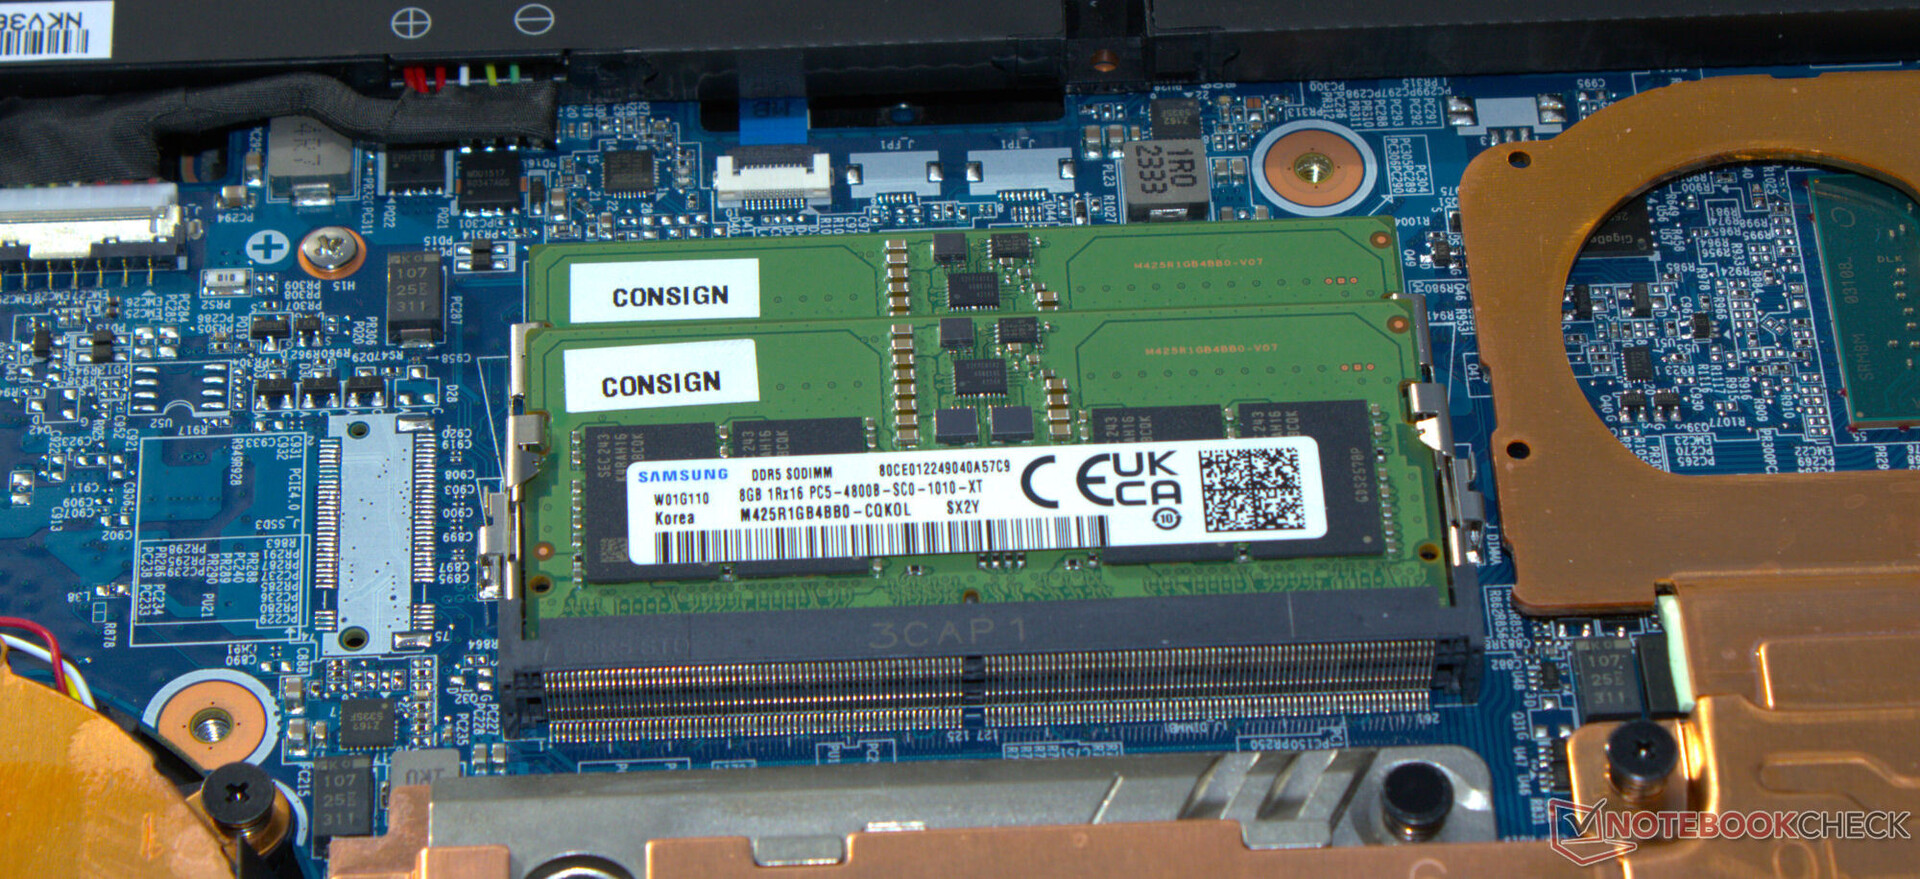
The base unit of the G6X's matt-grey ("Gunmetal Grey") chassis is made of plastic while aluminum is used for the back of the lid. There are no noticeable workmanship defects; the stability and rigidity seem fine. The battery and the other internal components are accessible after removing the base shell.
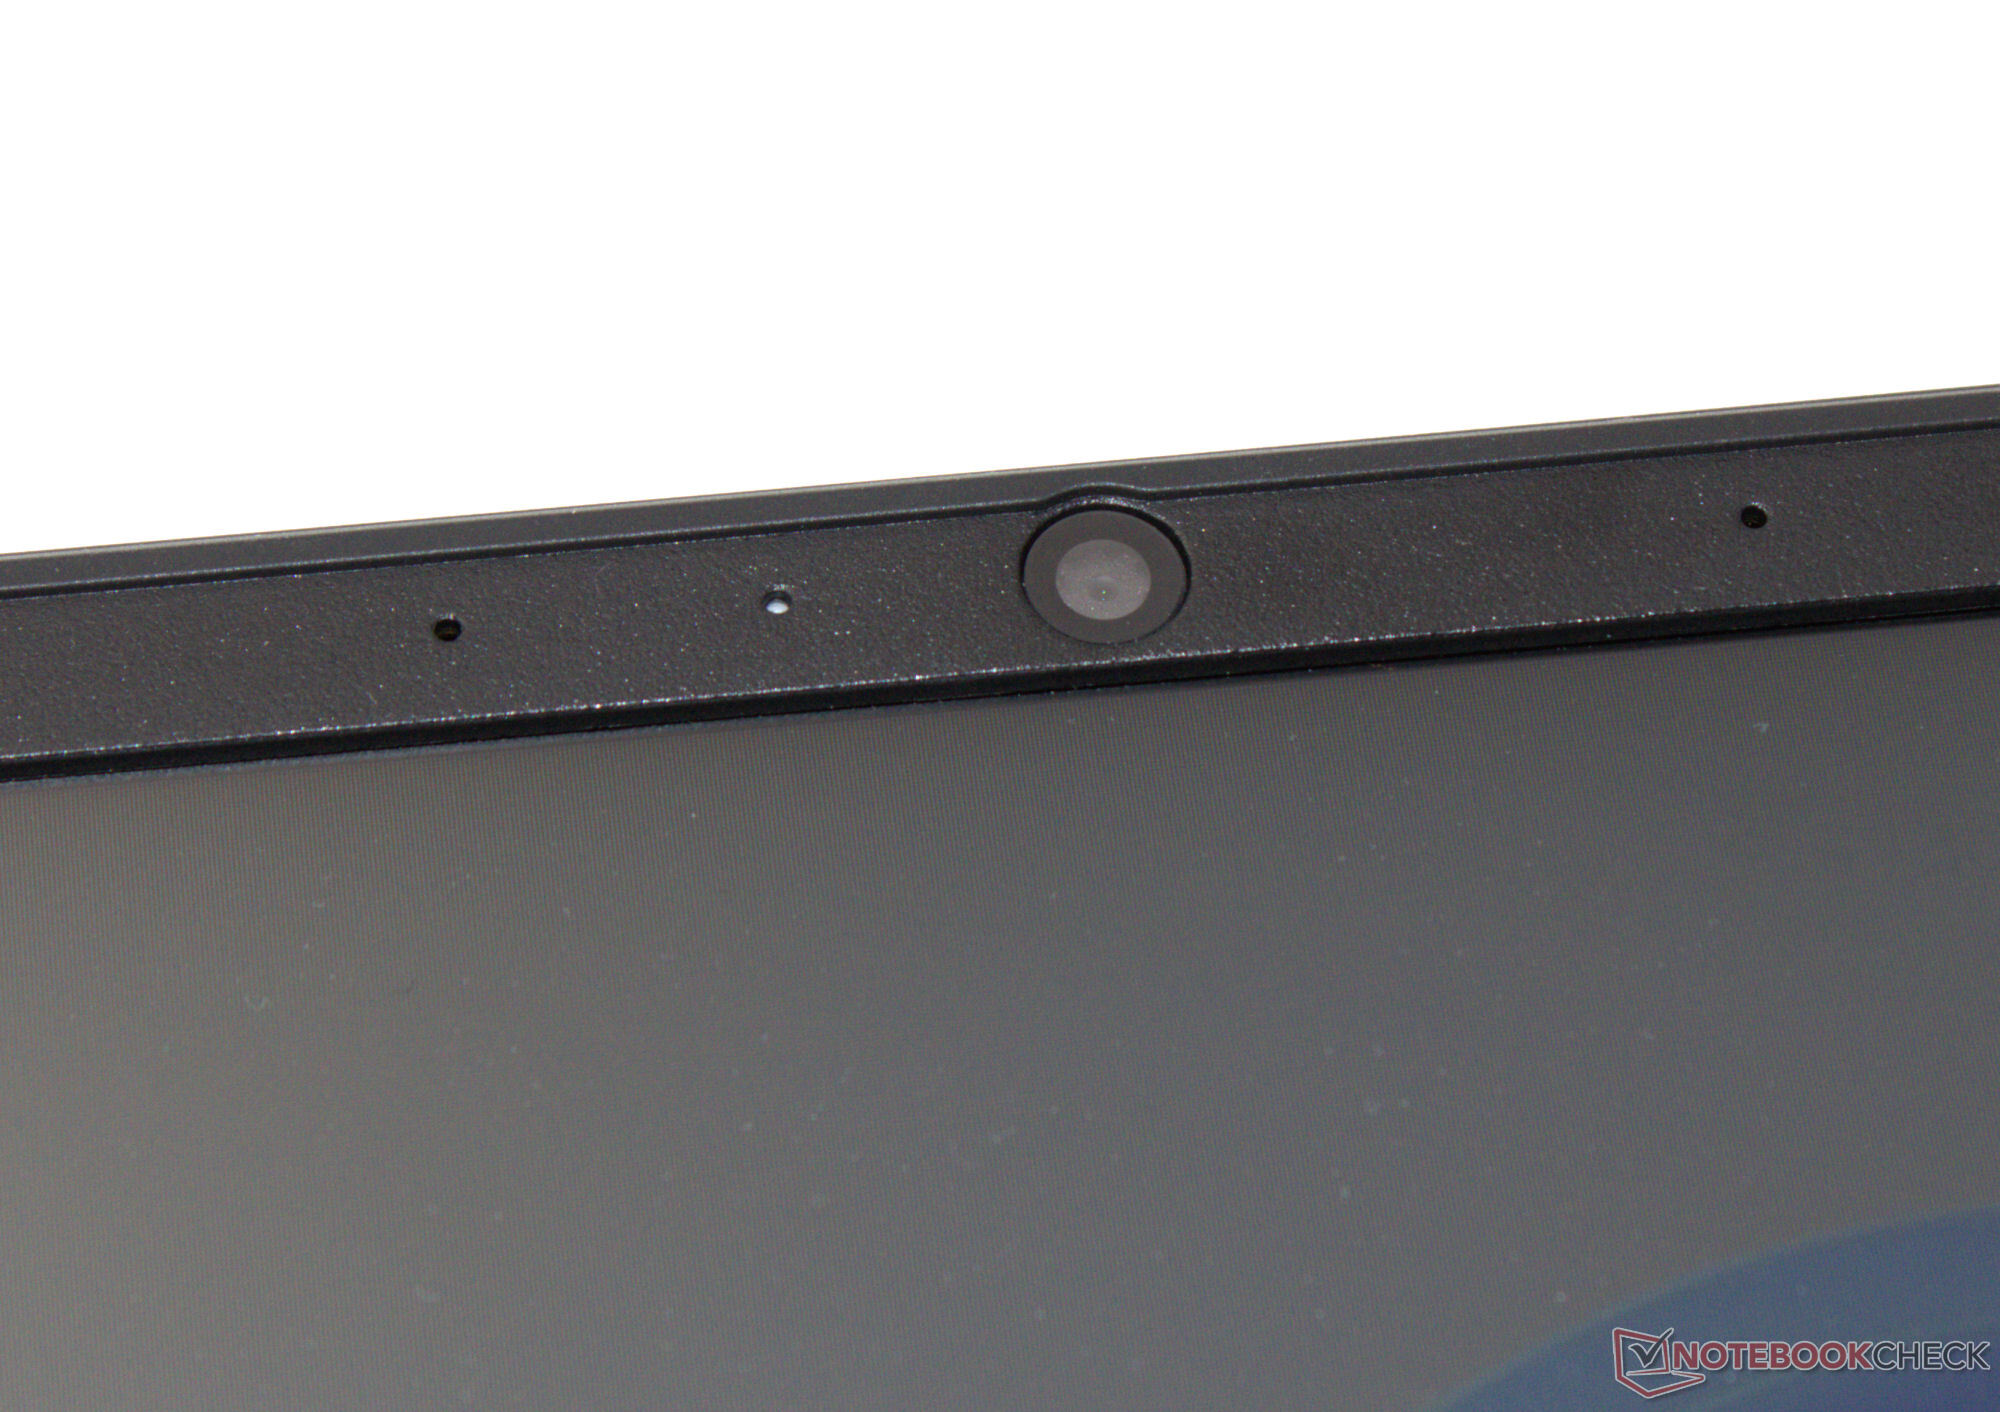
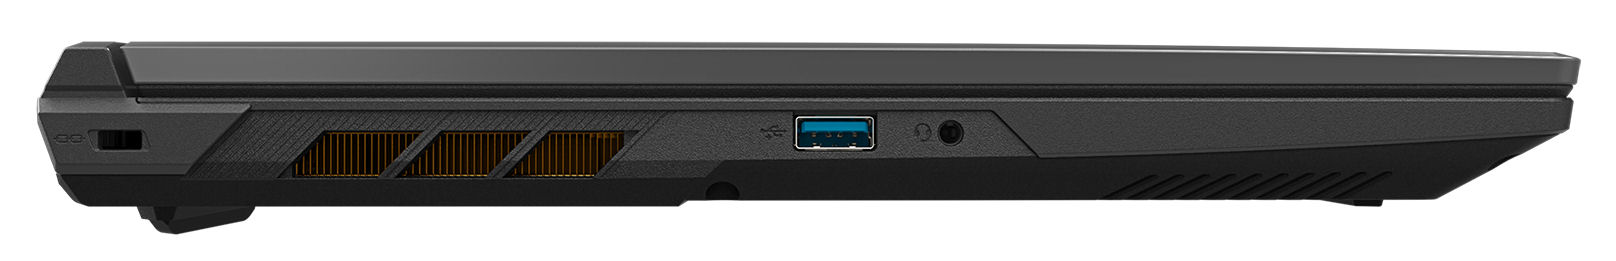
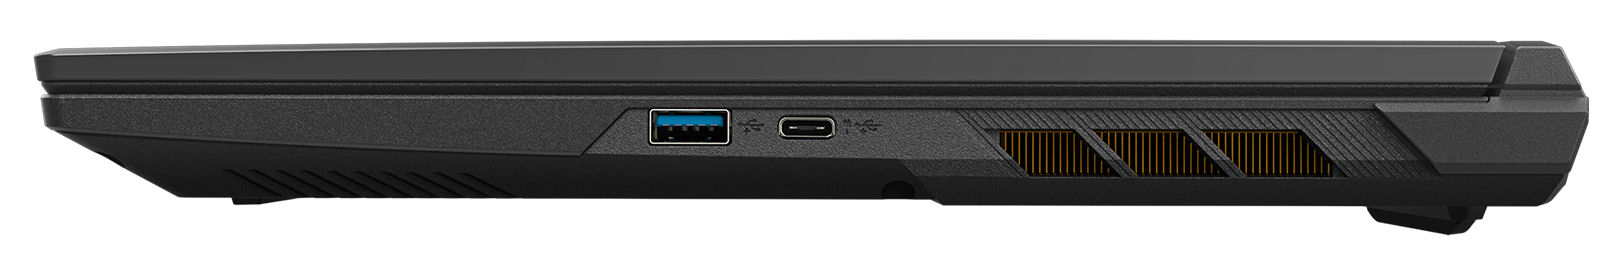
The Gigabyte G6X 9KG has one each of USB 3.2 Gen 1 and 1x USB 3.2 Gen 2 Type-A ports and two USB 3.2 Gen 2 Type-C ports that individually offer Power Delivery and DisplayPort-out. All in all, the G6X has two video outputs (1x HDMI, 1x DP). There is no memory card reader. The 1280 x 720 0.9 MP webcam delivers standard fare.
We achieved excellent Wi-Fi data throughput under optimal test conditions wherein there are no Wi-Fi devices in the immediate vicinity and at a short 1 m distance between the laptop and the server PC. The notebook uses an Intel AX211 Wi-Fi 6E chip. Wired connections are handled by a Realtek RTL8168/8111 controller.

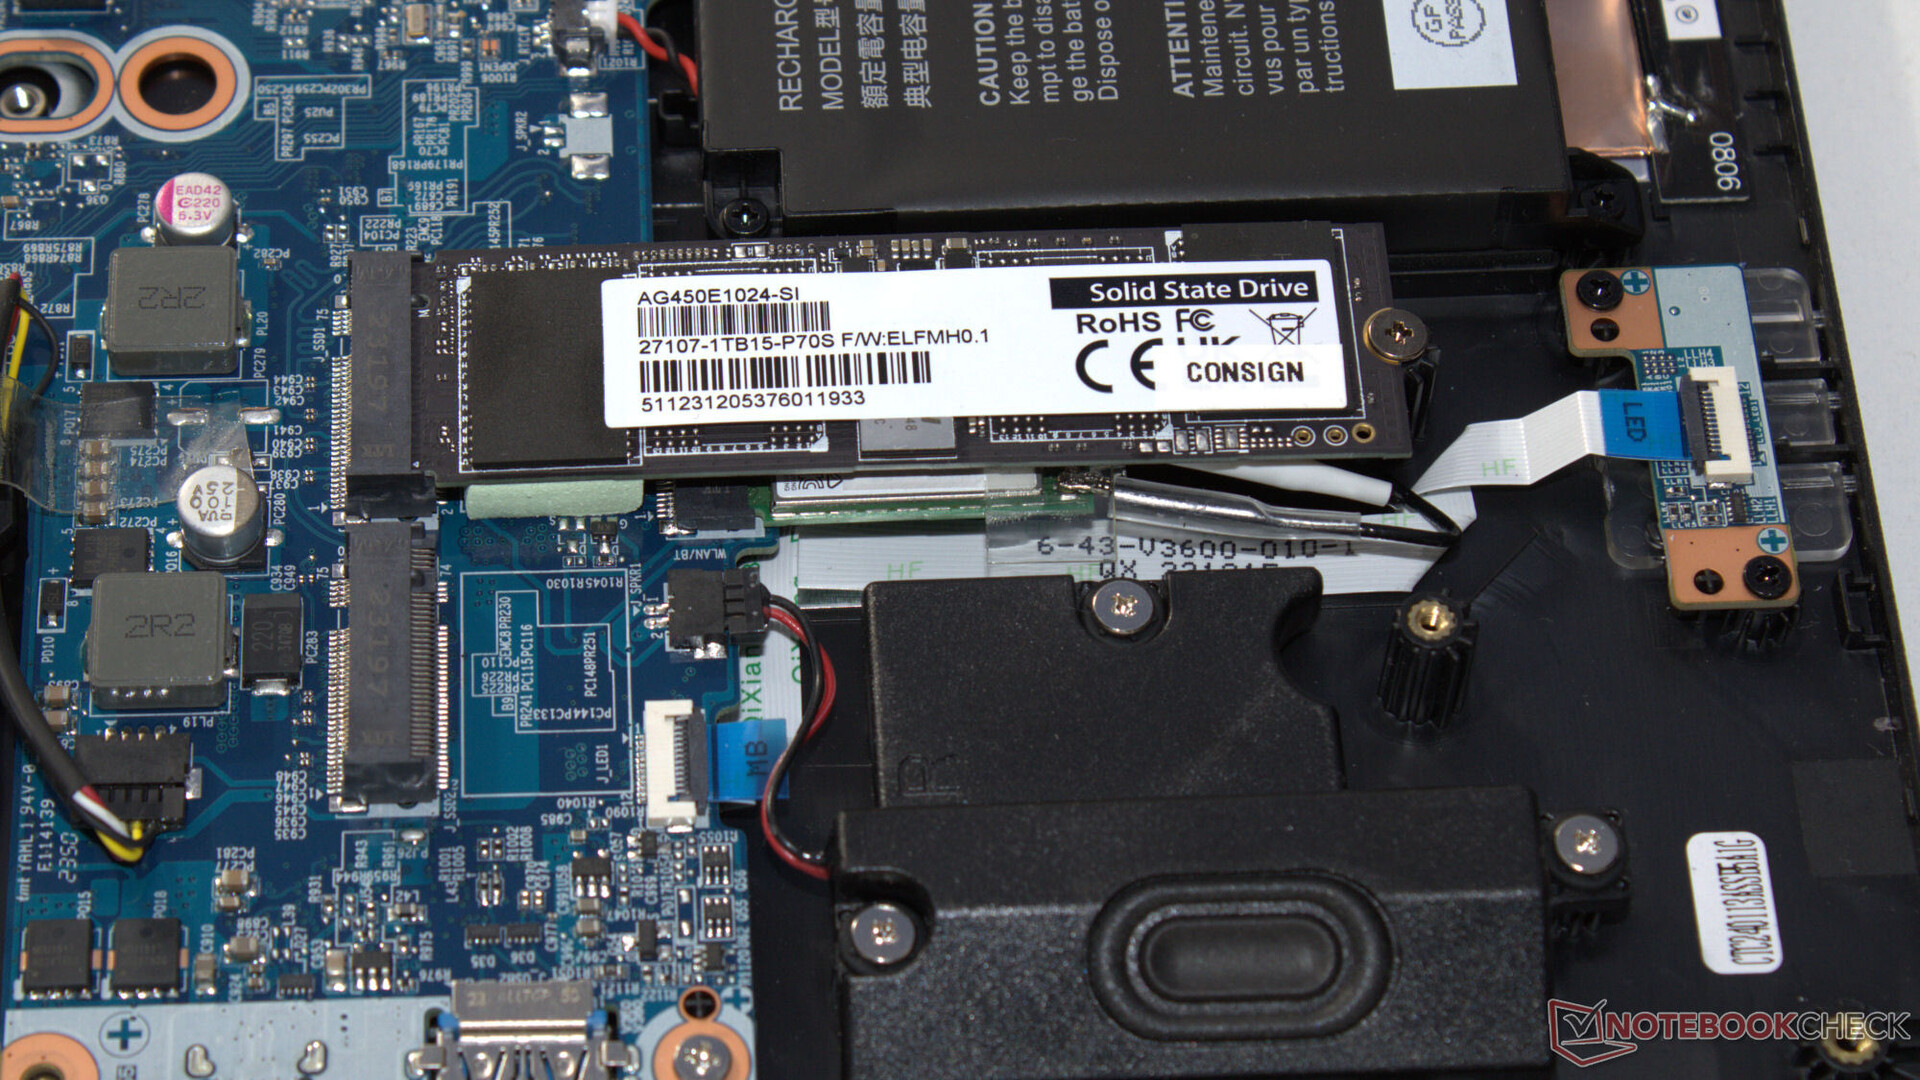
 GeForce RTX 4060 Laptop GPU, i7-13650HX, Gigabyte AG450E1024-SI")
 GeForce RTX 4060 Laptop GPU, i7-13650HX, Gigabyte AG450E1024-SI")
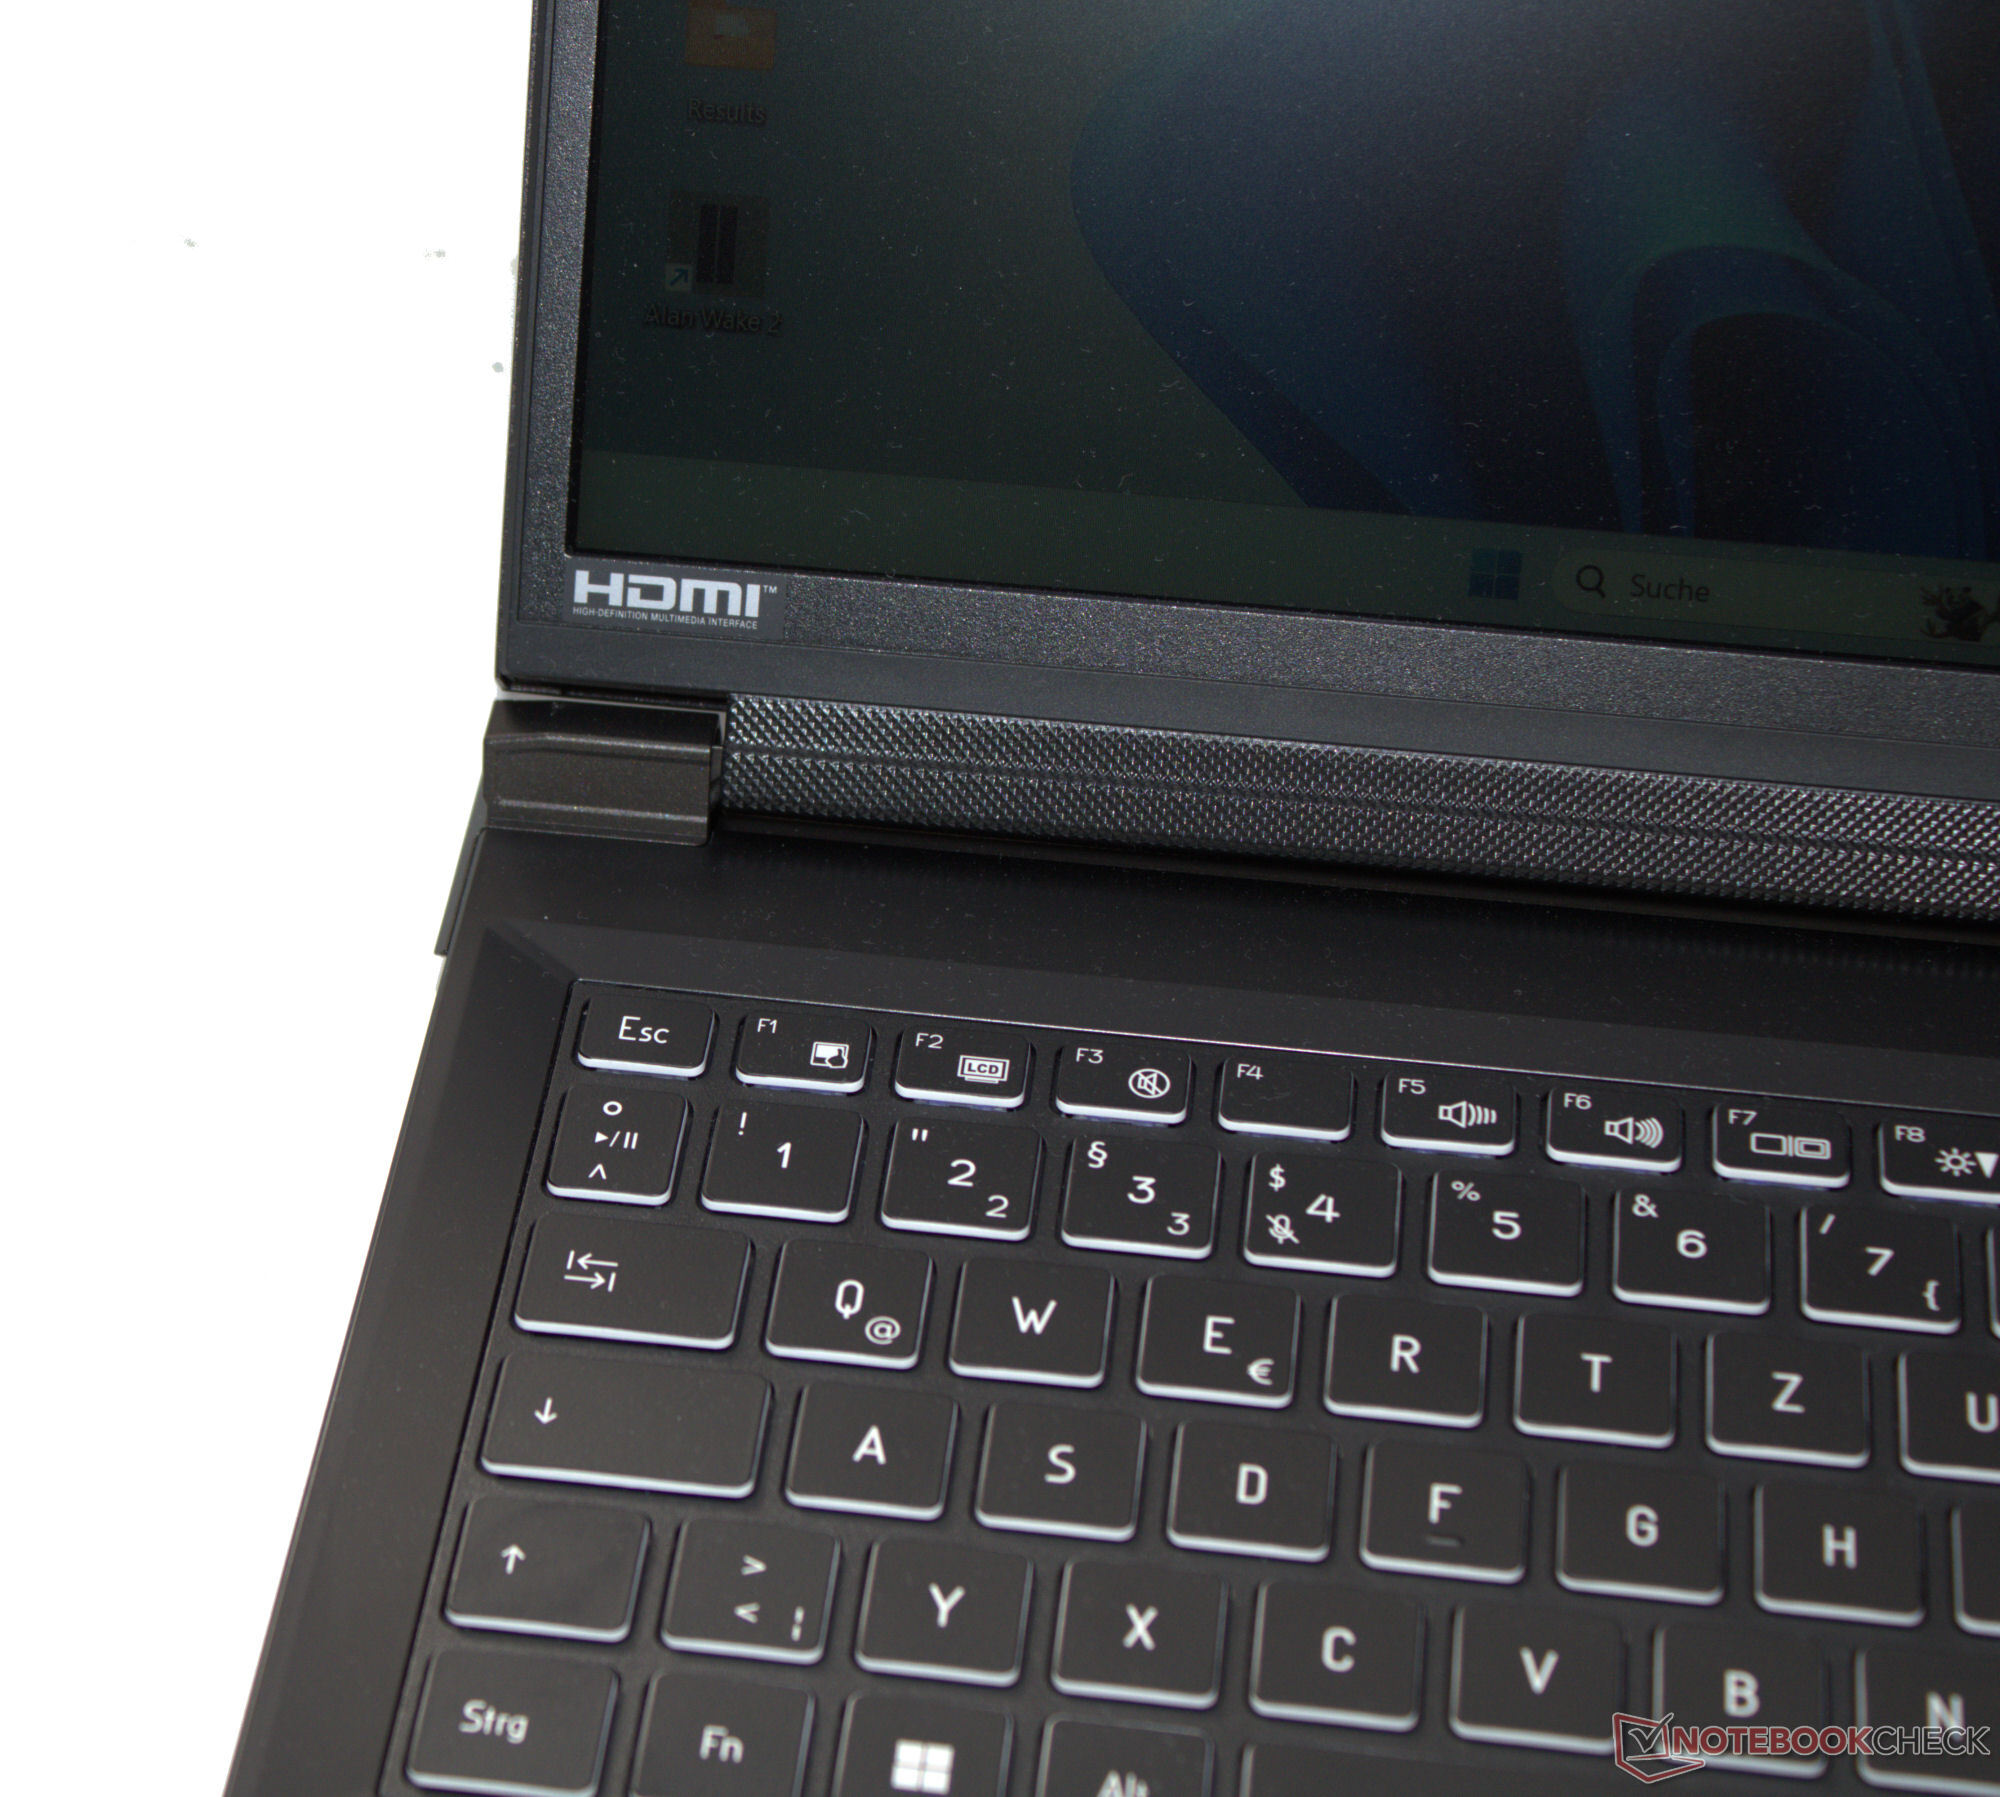
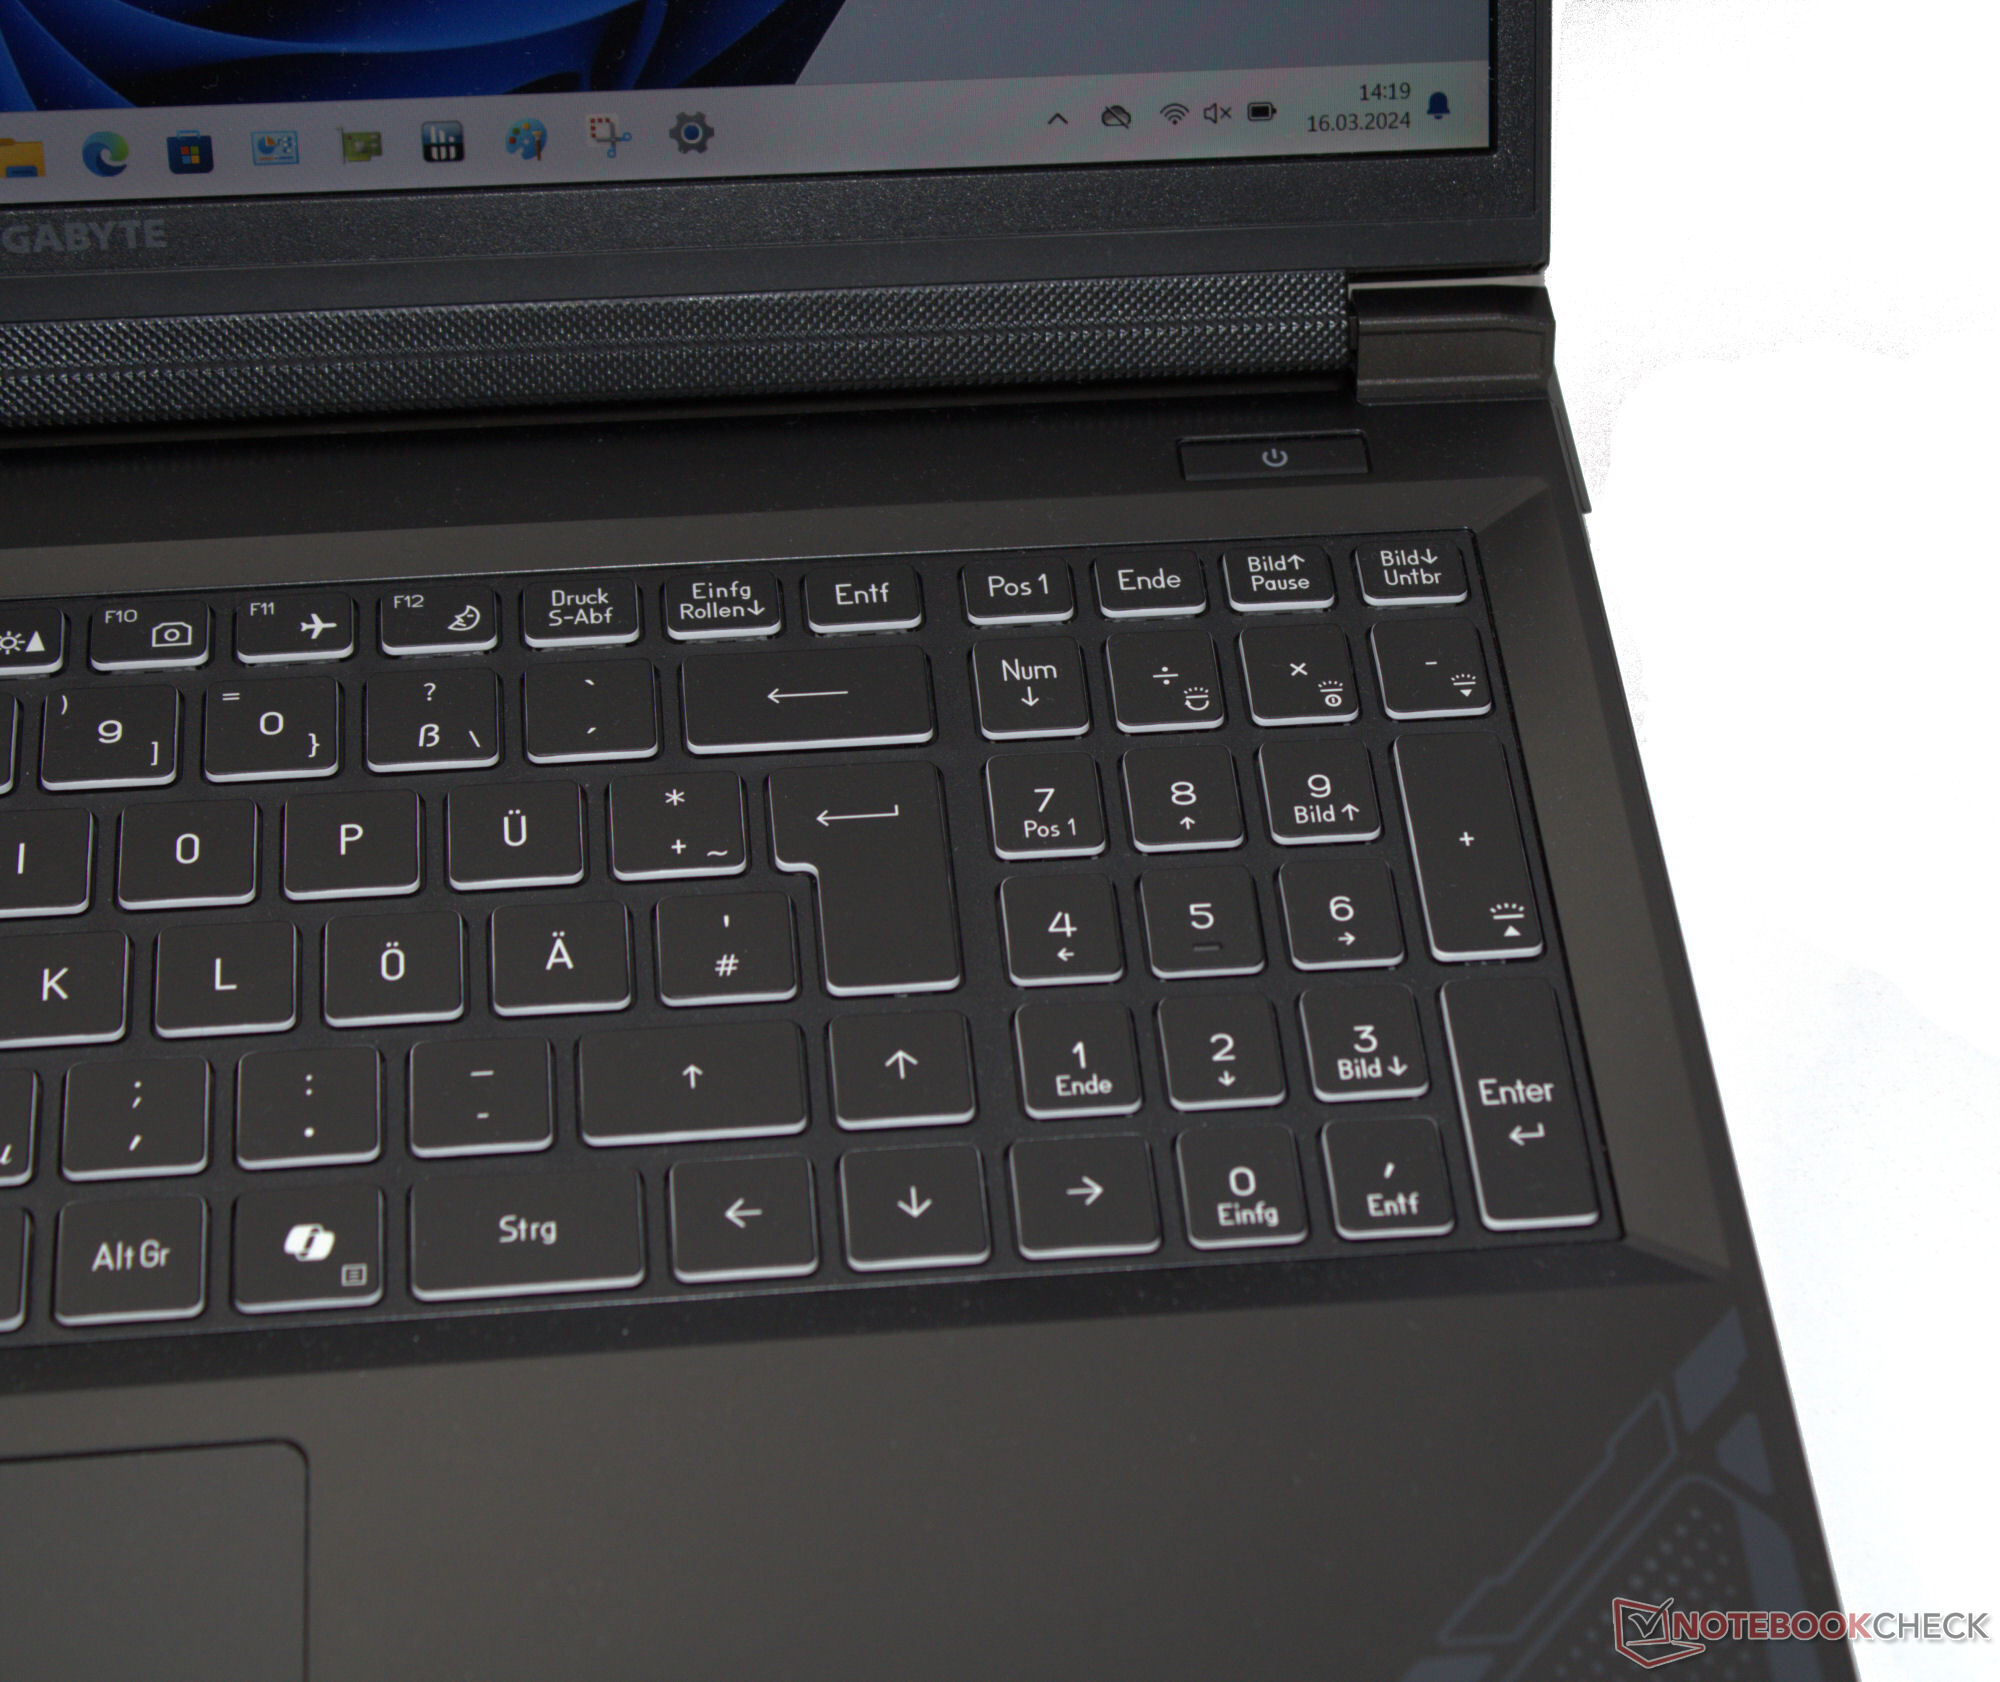
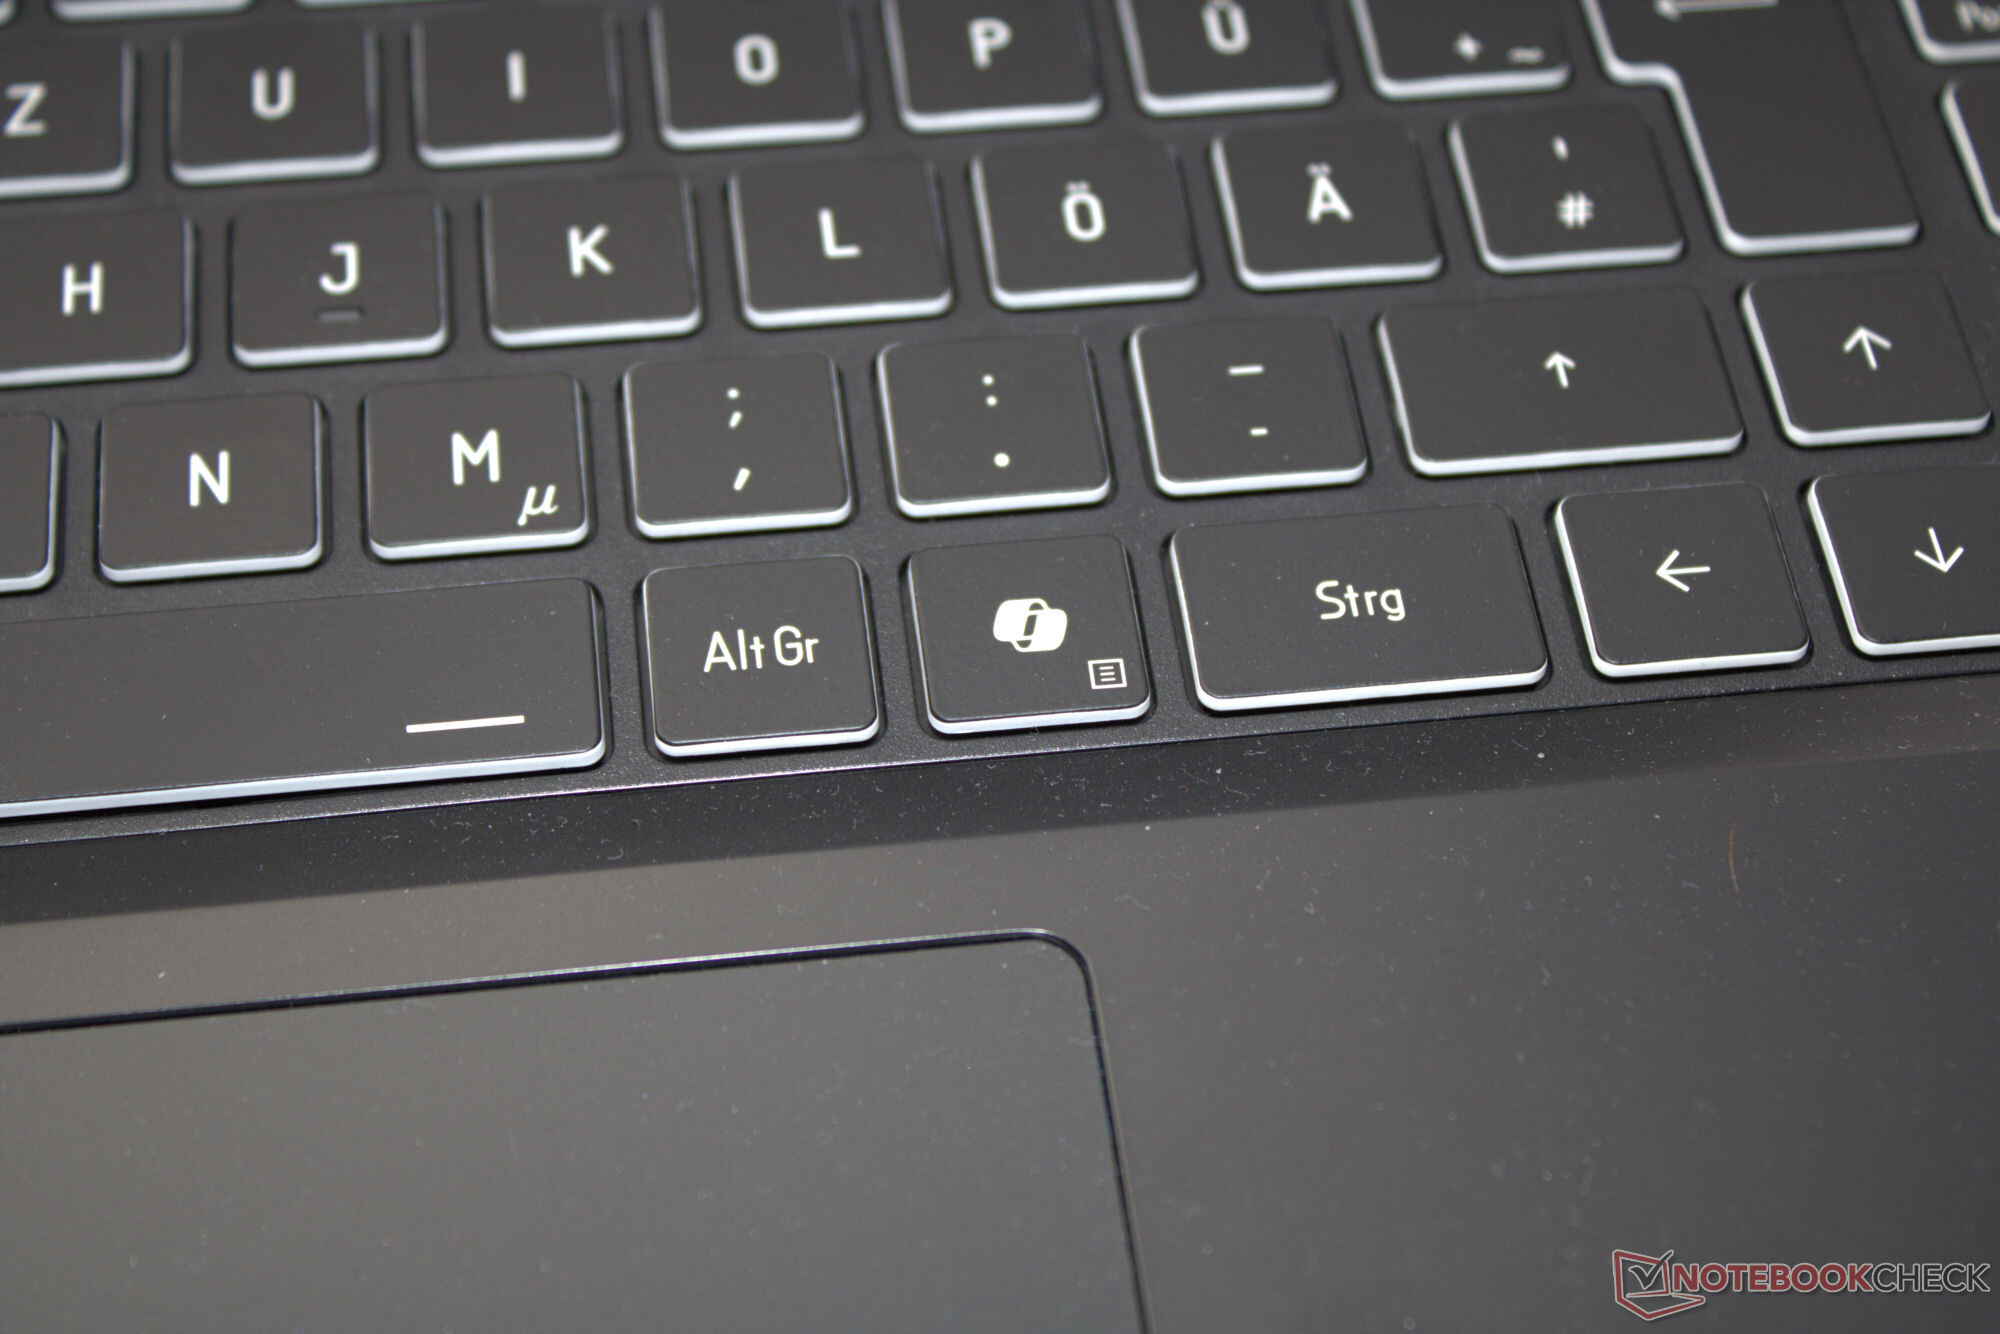
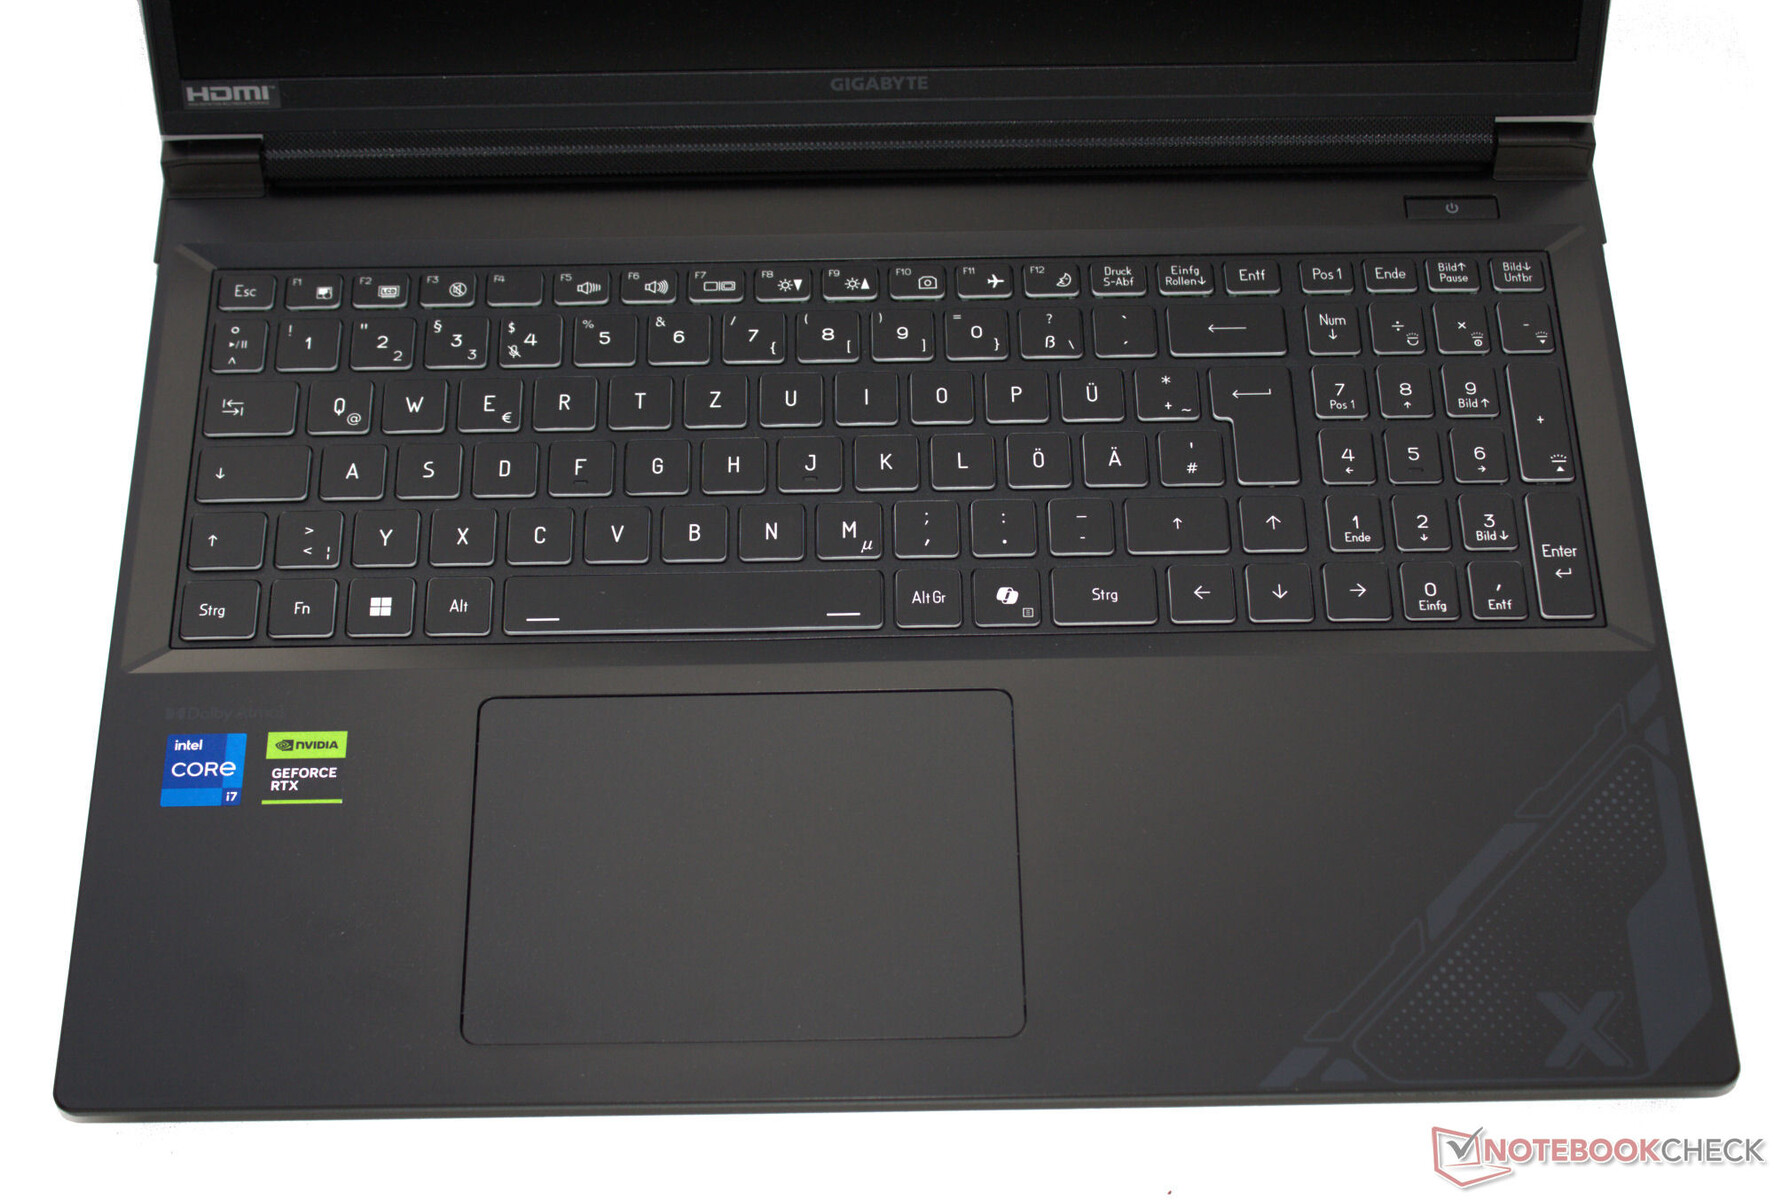
Input devices: Backlit keyboard suitable for everyday use
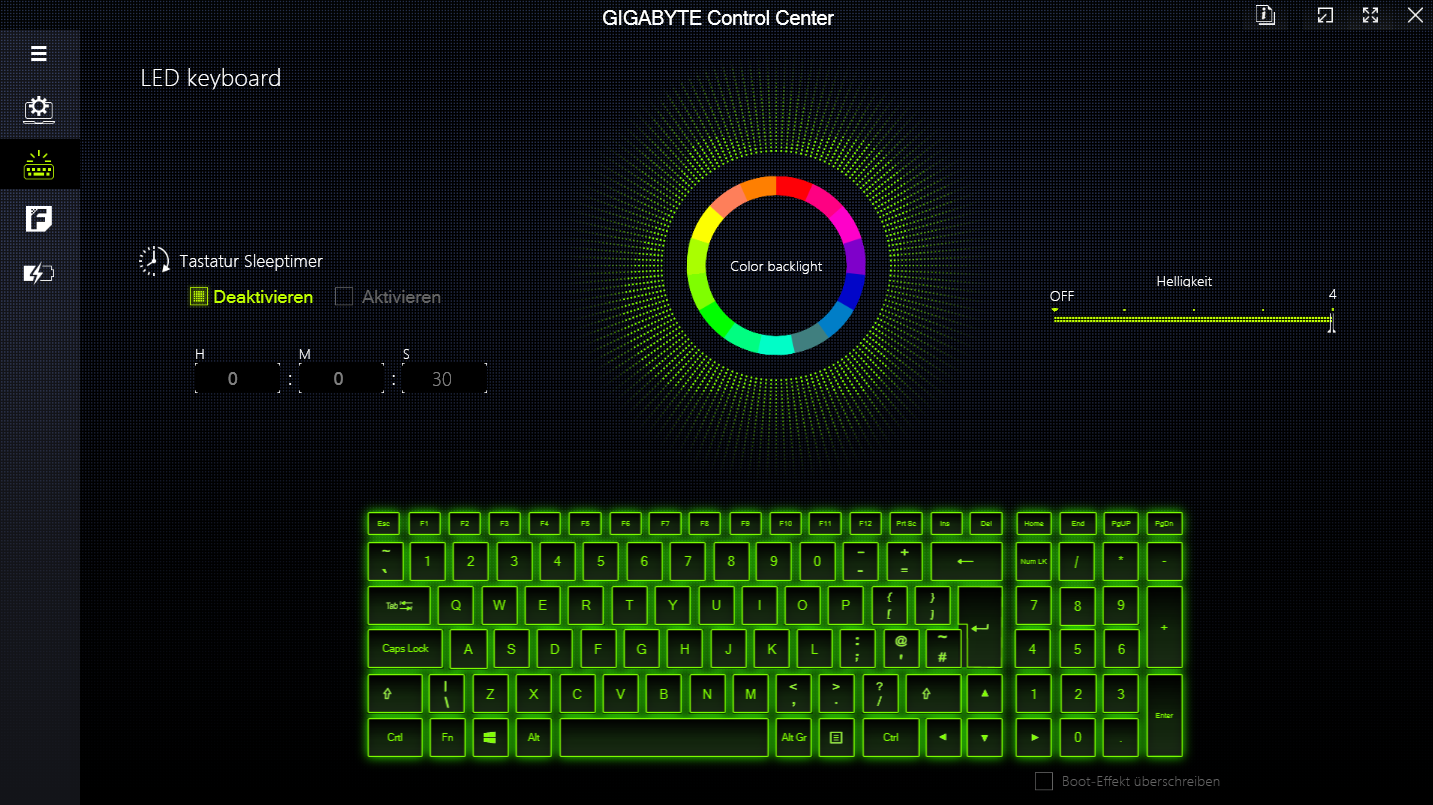
The G6X's sports a chiclet keyboard with a numpad, RGB lighting, and flat, smooth keys that are amenable for daily typing needs. The keyboard yields slightly when typing, but this is not a dealbreaker.
The key resistance feels crisp. A good aspect is that the arrow keys are full-sized.
A multi-touch touchpad (12.1 cm x 8.5 cm) with a short stroke and clear pressure point serves as a mouse replacement.
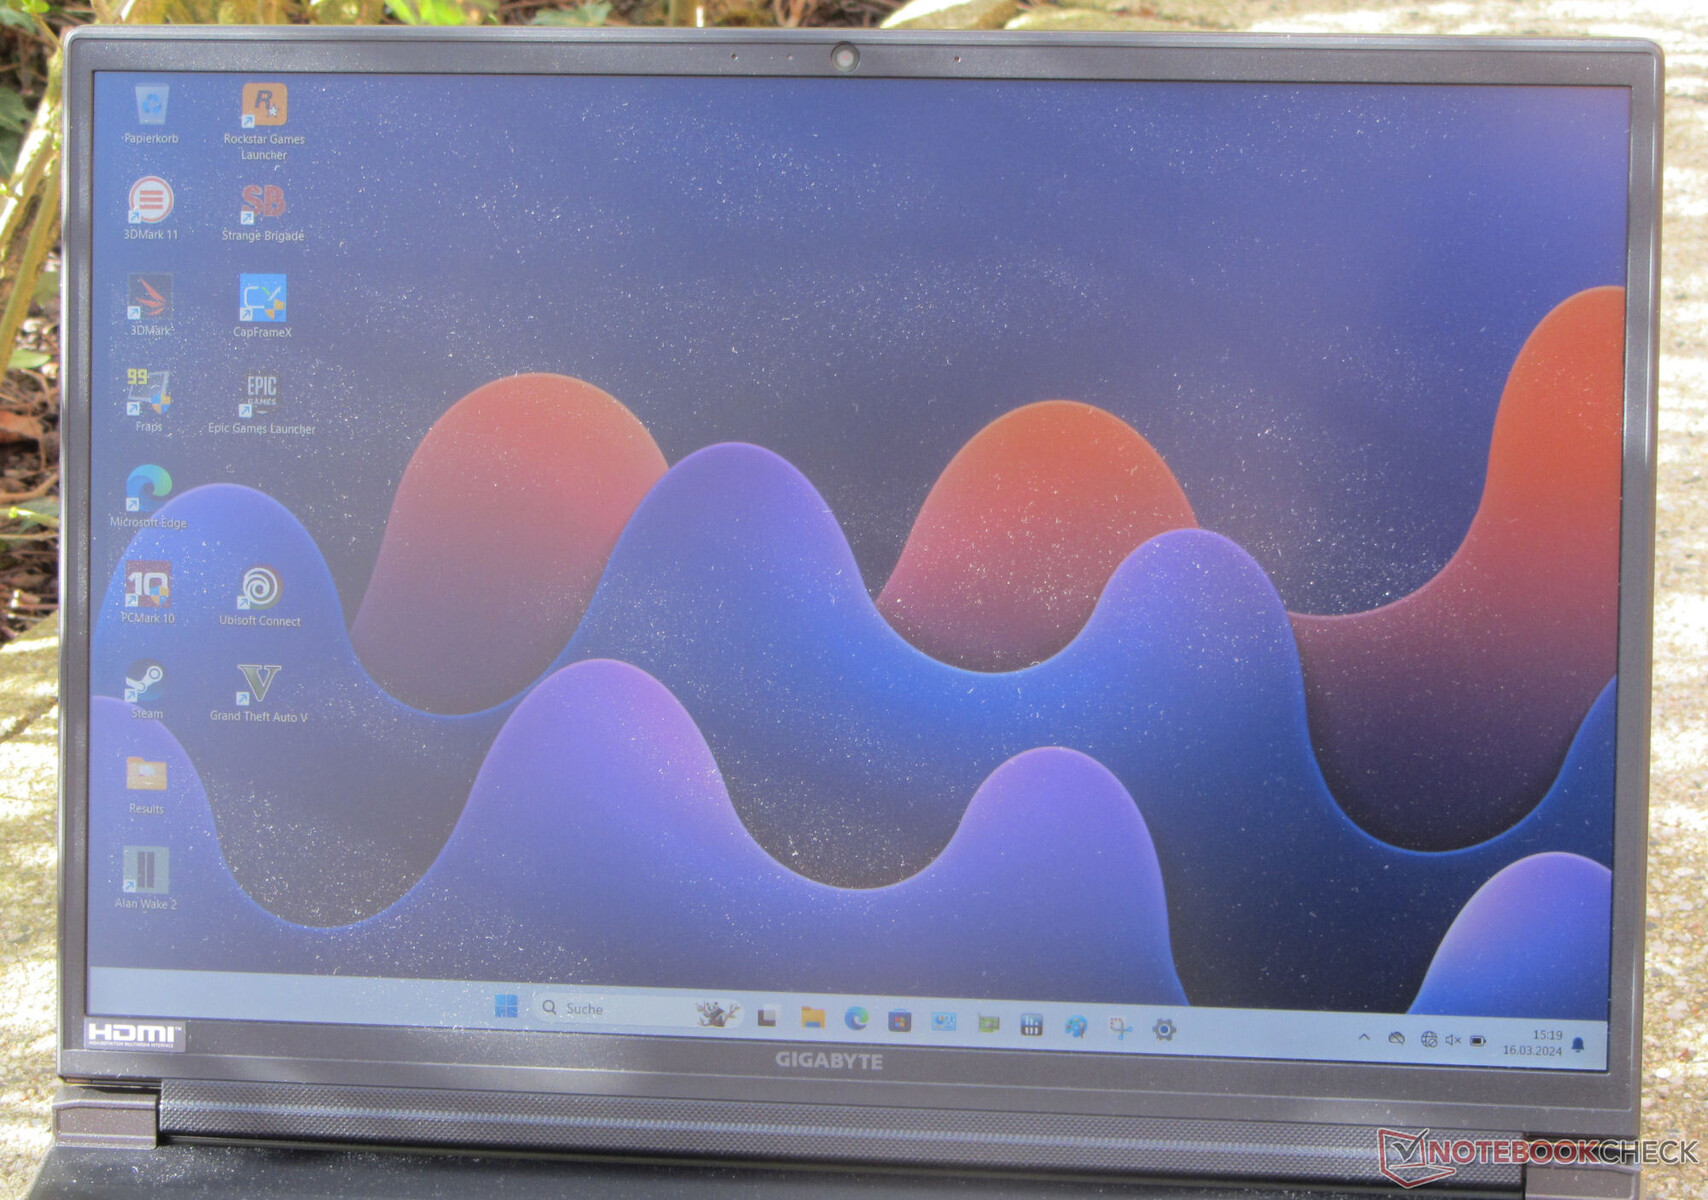
Display: FHD+ 165 Hz with no PWM
The responsive 165 Hz 16:10 panel with a 1920 x 1200 resolution does not show PWM flickering at any brightness setting.
The brightness and contrast of the matte 16-inch display meet the respective advertised targets (> 300 cd/m² and 1,000:1). Gigabyte does not offer other display options for the G6X.
| |||||||||||||||||||||||||
Brightness Distribution: 81 %
Center on Battery: 353 cd/m²
Contrast: 1681:1 (Black: 0.21 cd/m²)
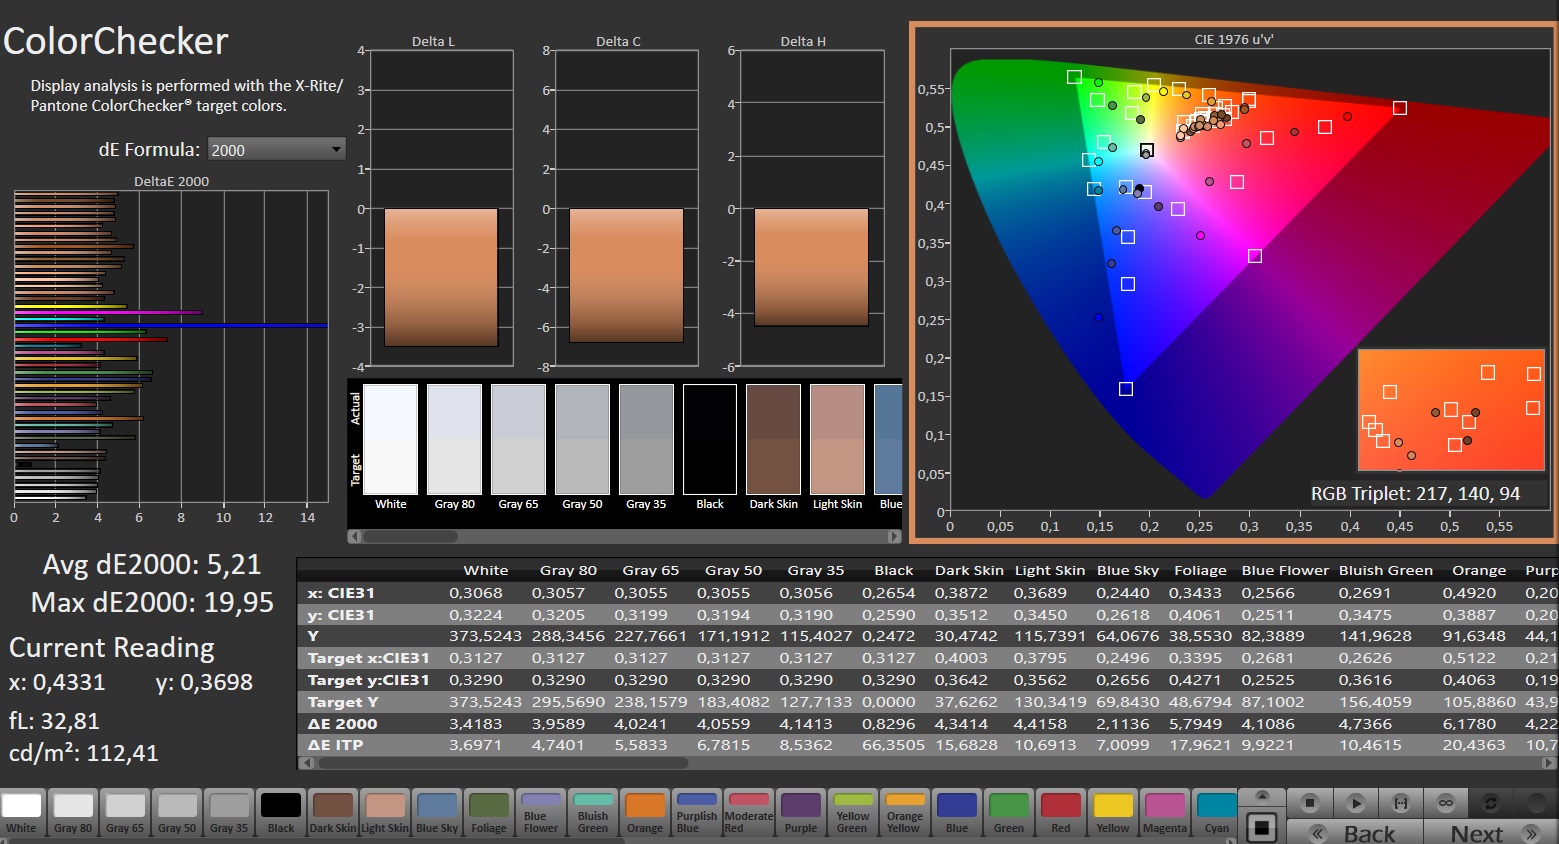
ΔE ColorChecker Calman: 5.21 | ∀{0.5-29.43 Ø4.72}
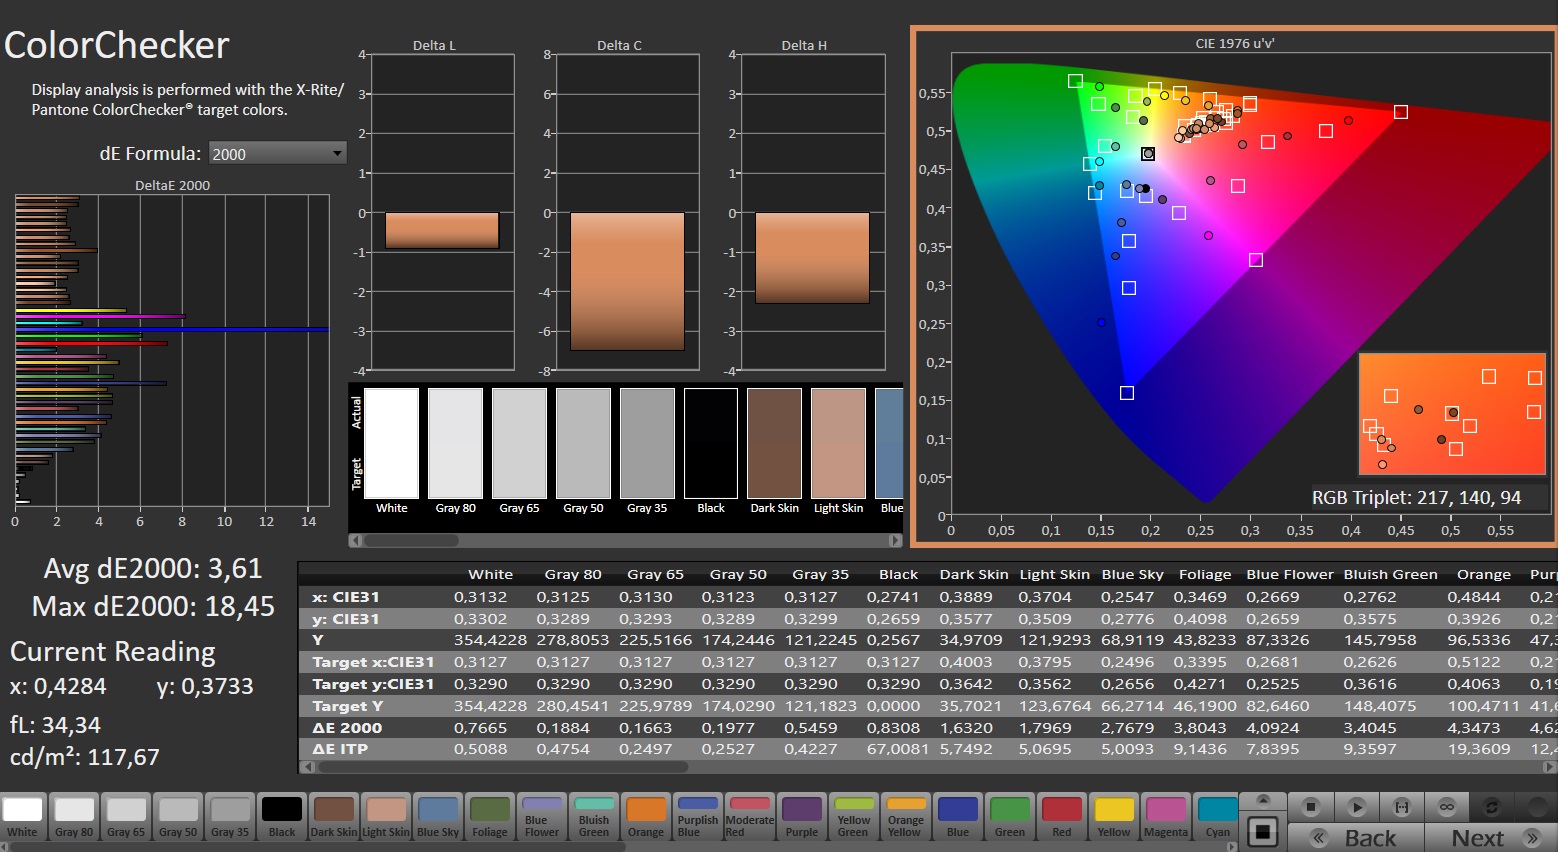
calibrated: 3.61
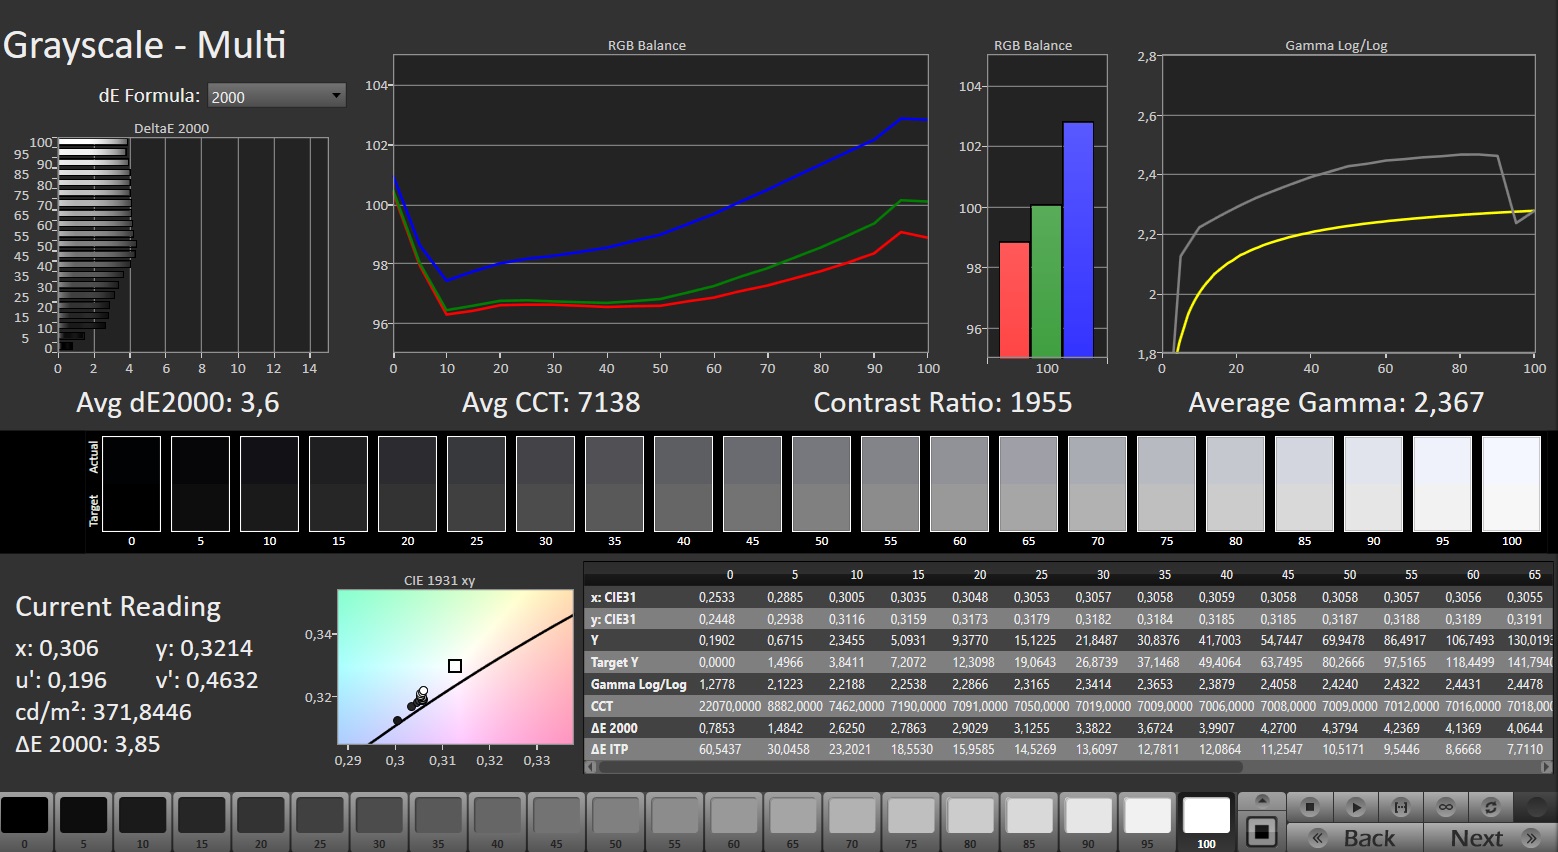
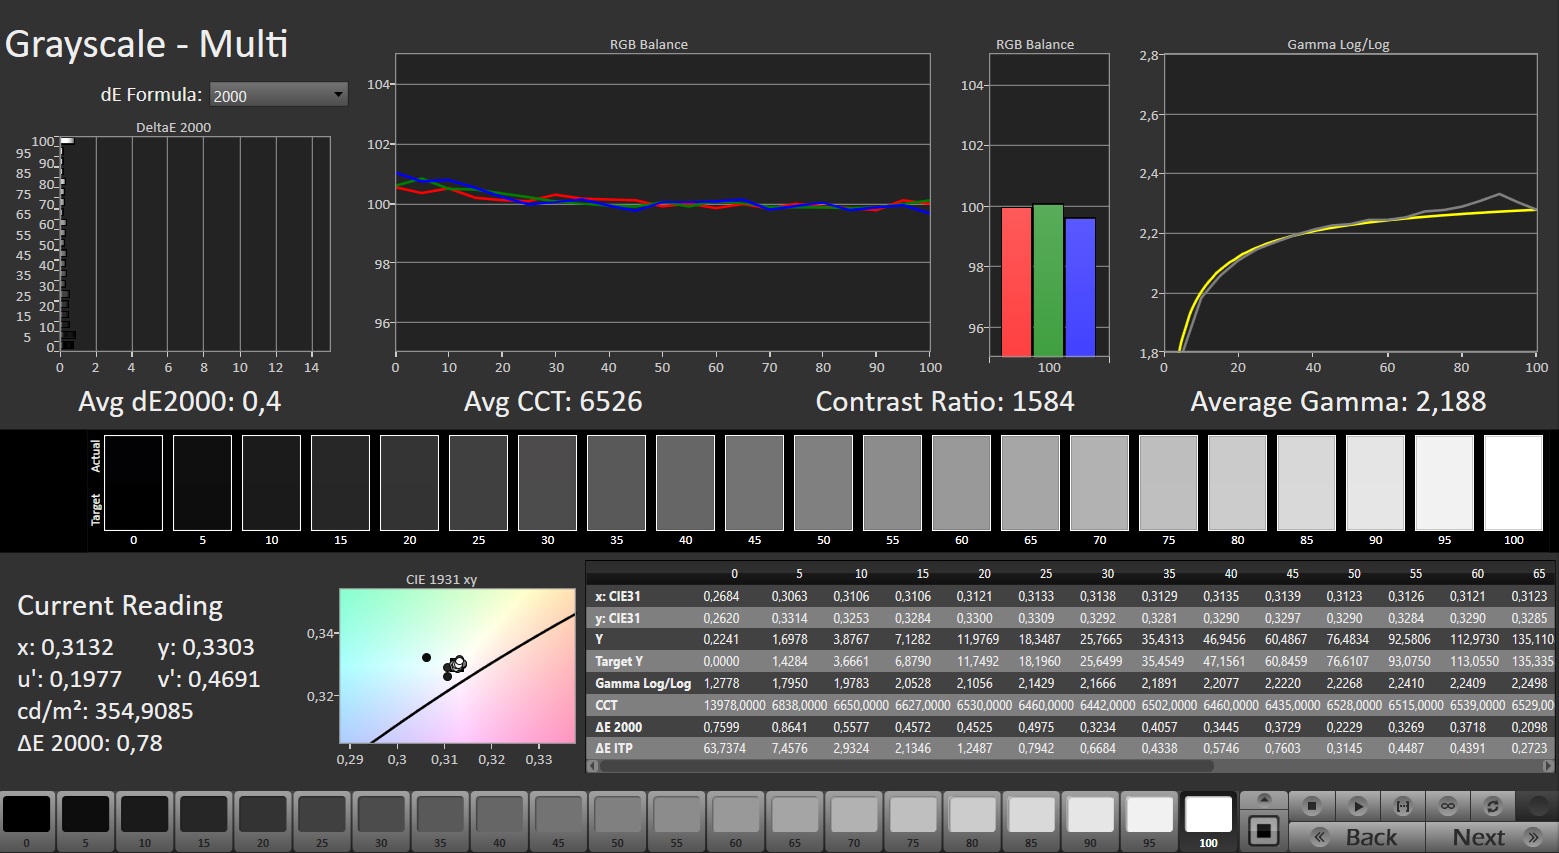
ΔE Greyscale Calman: 3.6 | ∀{0.09-98 Ø4.97}
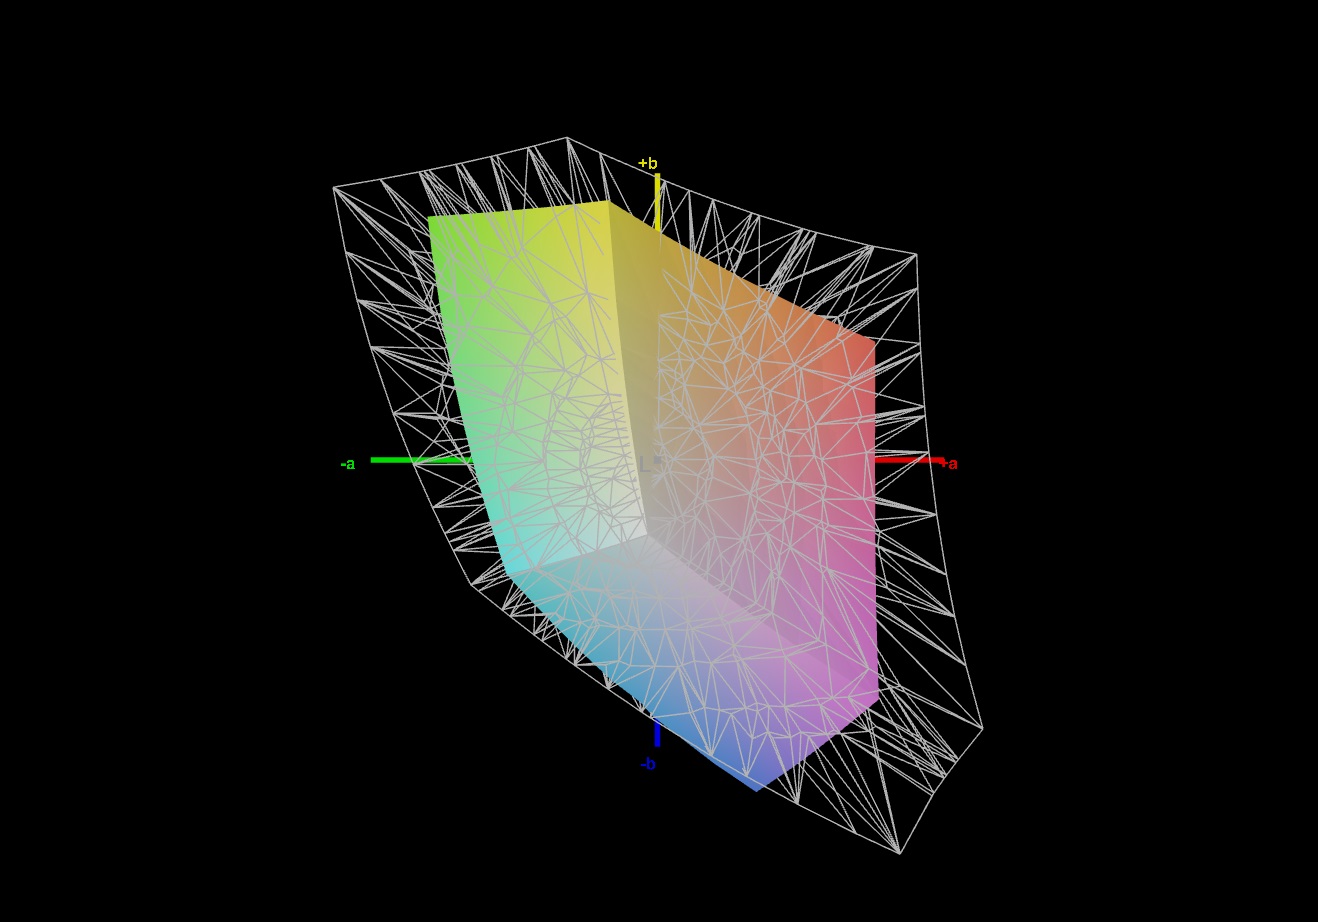
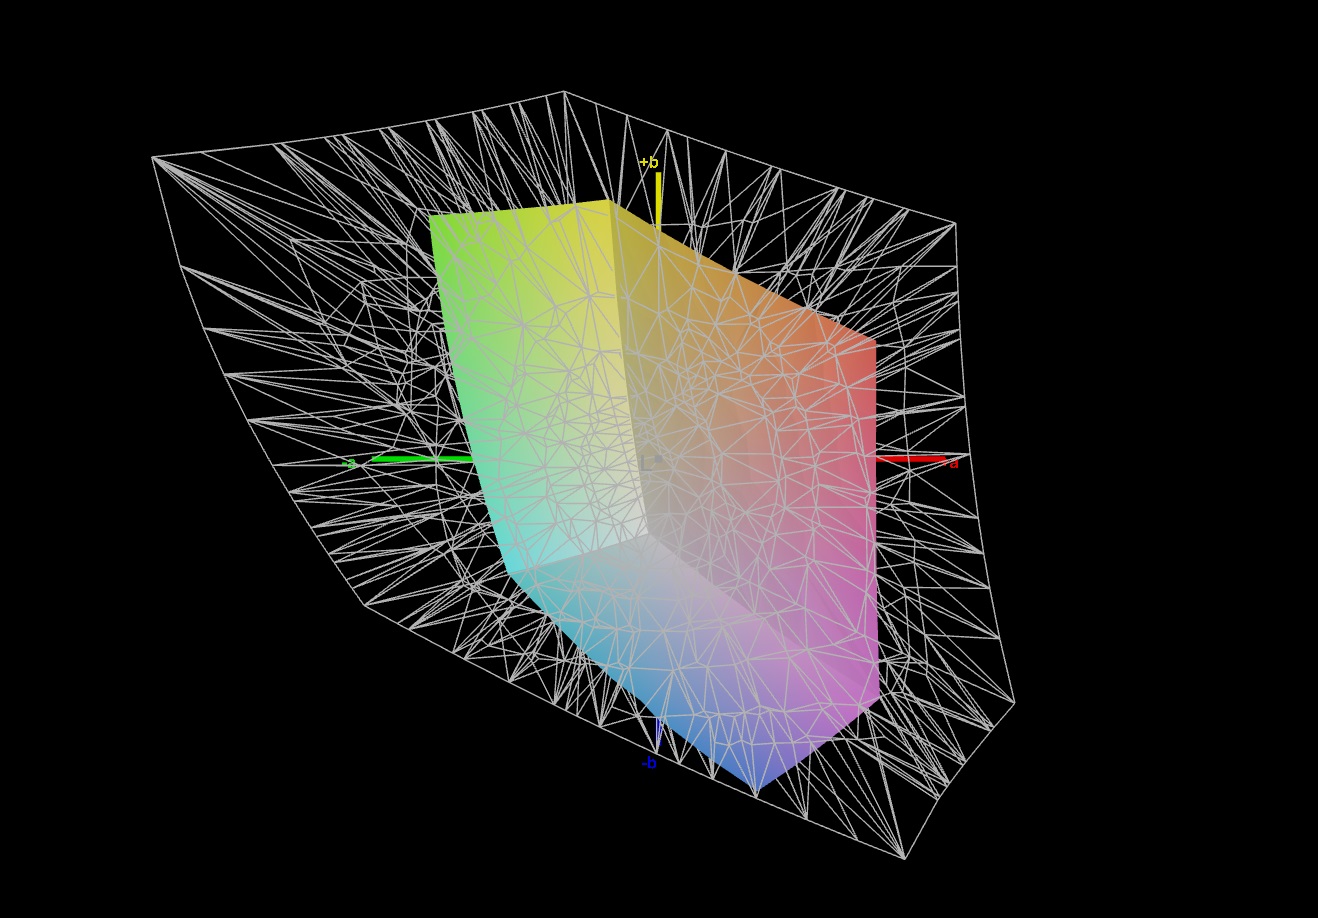
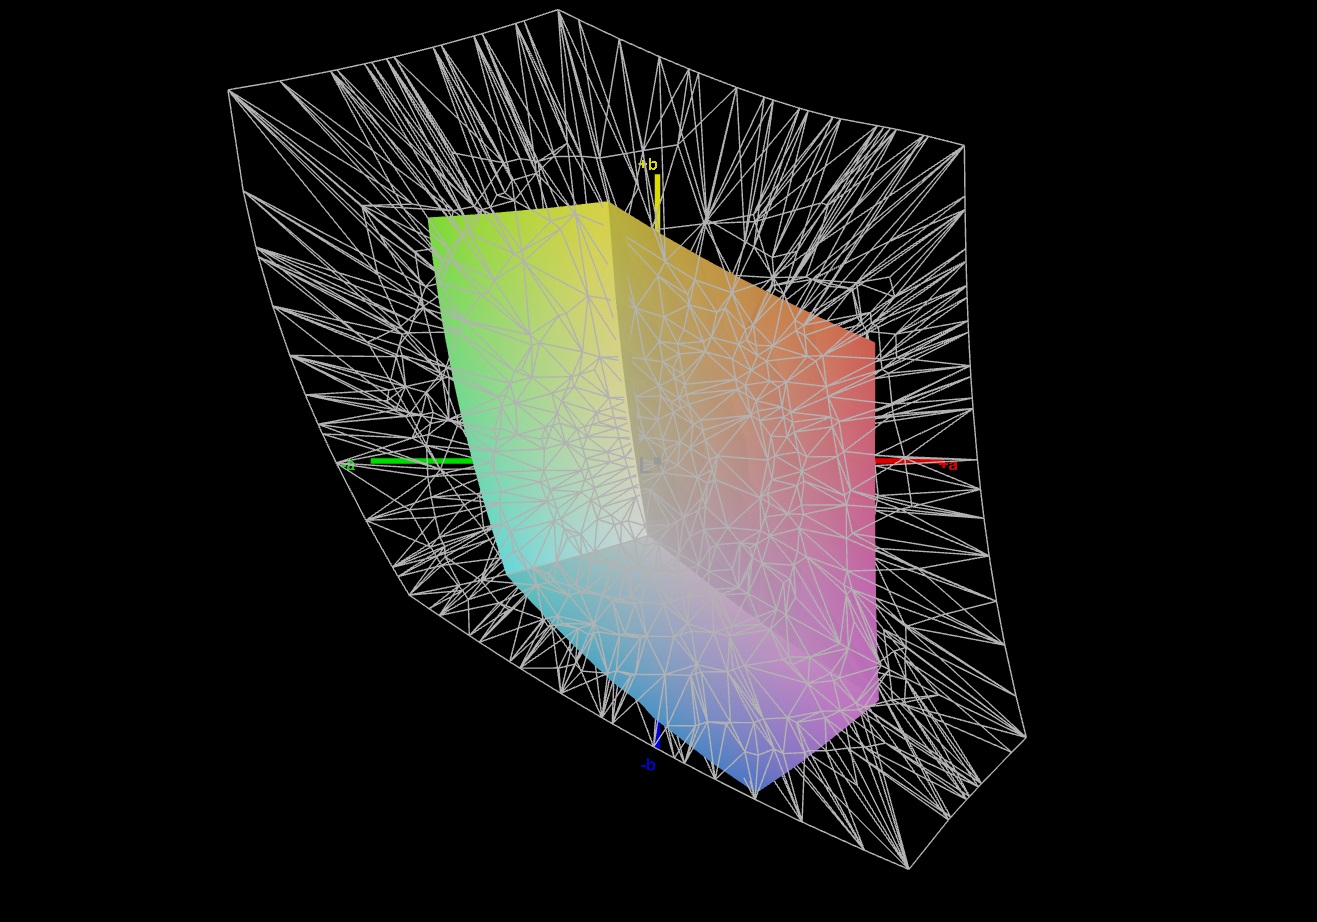
43.3% AdobeRGB 1998 (Argyll 3D)
62.4% sRGB (Argyll 3D)
41.8% Display P3 (Argyll 3D)
Gamma: 2.367
CCT: 7138 K
| Gigabyte G6X 9KG (2024) BOE NE160WUM-NX6, IPS, 1920x1200, 16" | Dell G16, i7-13650HX, RTX 4060 Chi Mei CMN161D (160GME), IPS, 2560x1600, 16" | Lenovo Legion 5 16IRX G9 NE160QDM-NZ3, IPS, 2560x1600, 16" | MSI Raider GE68HX 13VF Chi Mei N160JME-GTK, IPS, 1900x1200, 16" | Asus TUF Gaming A16 FA617XS BOE NE160WUM-NX2, IPS, 1920x1200, 16" | |
|---|---|---|---|---|---|
| Display | 60% | 68% | -0% | 62% | |
| Display P3 Coverage (%) | 41.8 | 67.5 61% | 72.4 73% | 41.6 0% | 69.3 66% |
| sRGB Coverage (%) | 62.4 | 98.5 58% | 100 60% | 62.2 0% | 97.3 56% |
| AdobeRGB 1998 Coverage (%) | 43.3 | 69.3 60% | 74.1 71% | 43 -1% | 70.7 63% |
| Response Times | 67% | 65% | 23% | 58% | |
| Response Time Grey 50% / Grey 80% * (ms) | 40.5 ? | 7.6 ? 81% | 12.5 ? 69% | 17.3 ? 57% | 15.6 ? 61% |
| Response Time Black / White * (ms) | 21.6 ? | 10.4 ? 52% | 8.7 ? 60% | 24.2 ? -12% | 10 ? 54% |
| PWM Frequency (Hz) | |||||
| Screen | 15% | 39% | -2% | 25% | |
| Brightness middle (cd/m²) | 353 | 369 5% | 526 49% | 300.9 -15% | 301 -15% |
| Brightness (cd/m²) | 318 | 344 8% | 500 57% | 302 -5% | 294 -8% |
| Brightness Distribution (%) | 81 | 89 10% | 87 7% | 93 15% | 94 16% |
| Black Level * (cd/m²) | 0.21 | 0.26 -24% | 0.33 -57% | 0.31 -48% | 0.21 -0% |
| Contrast (:1) | 1681 | 1419 -16% | 1594 -5% | 971 -42% | 1433 -15% |
| Colorchecker dE 2000 * | 5.21 | 3.04 42% | 1.2 77% | 4.6 12% | 1.79 66% |
| Colorchecker dE 2000 max. * | 19.95 | 5.56 72% | 2.1 89% | 17.6 12% | 3.48 83% |
| Colorchecker dE 2000 calibrated * | 3.61 | 2.35 35% | 1 72% | 2.04 43% | 1.2 67% |
| Greyscale dE 2000 * | 3.6 | 3.38 6% | 1.3 64% | 3.3 8% | 2.5 31% |
| Gamma | 2.367 93% | 2.47 89% | 2.23 99% | 2.09 105% | 2.265 97% |
| CCT | 7138 91% | 6040 108% | 6391 102% | 7151 91% | 6157 106% |
| Total Average (Program / Settings) | 47% /
32% | 57% /
49% | 7% /
2% | 48% /
38% |
* ... smaller is better
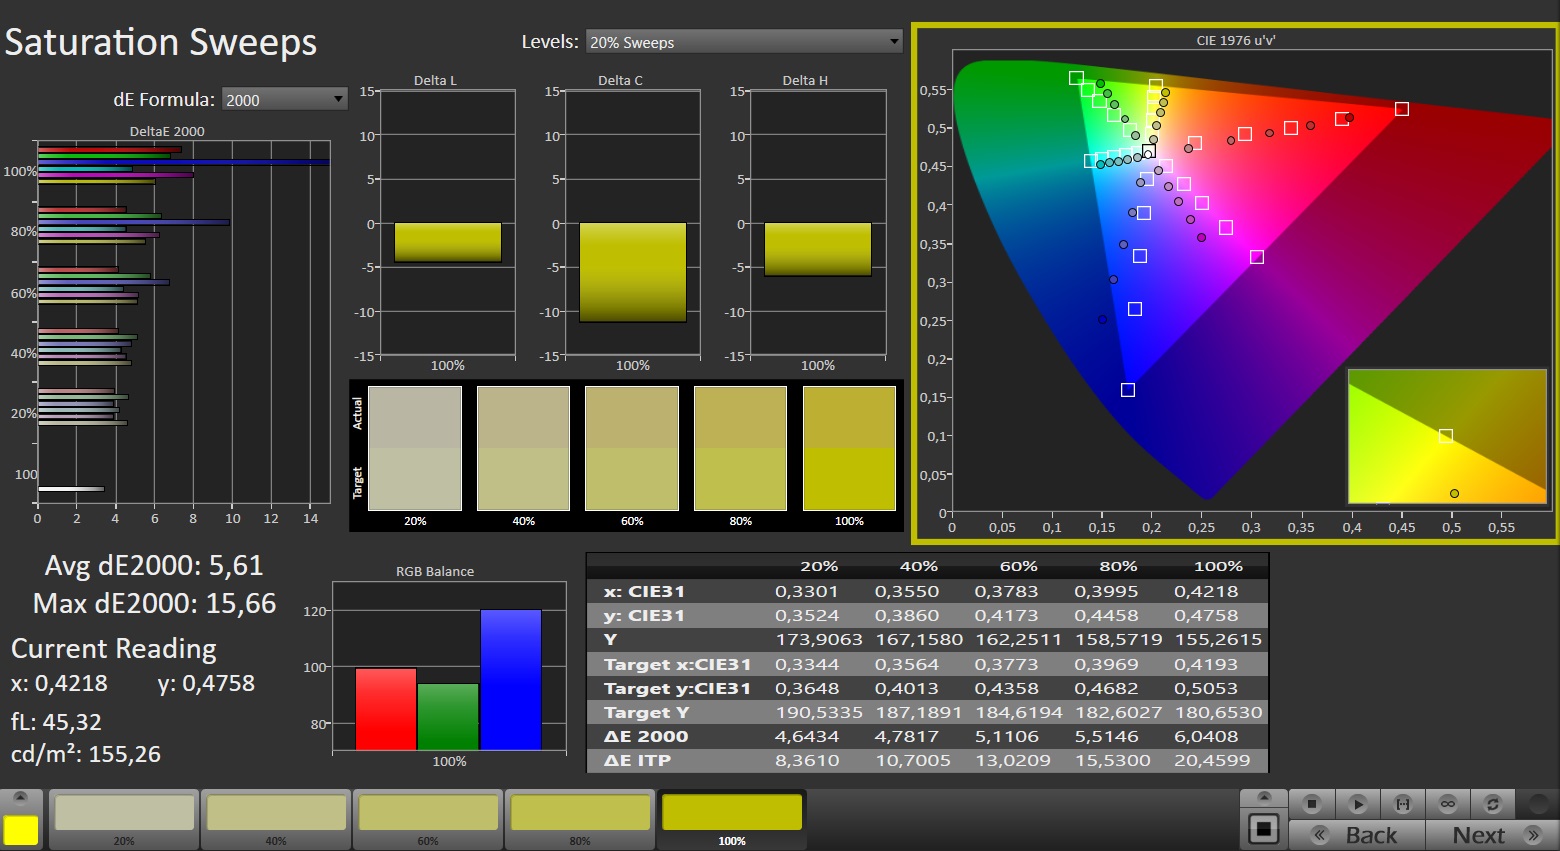
The display shows a mediocre color reproduction ex works: With a deviation of around 5.2, the deltaE 2000 target of < 3 is not met. Calibration reduces the deviation to 3.6 and ensures more balanced shades of gray.
The panel cannot fully reproduce the AdobeRGB, sRGB, and DCI-P3 color spaces. In this respect, the G6X's competitors offer better screens.

Display Response Times
| ↔ Response Time Black to White | ||
|---|---|---|
| 21.6 ms ... rise ↗ and fall ↘ combined | ↗ 11.1 ms rise | 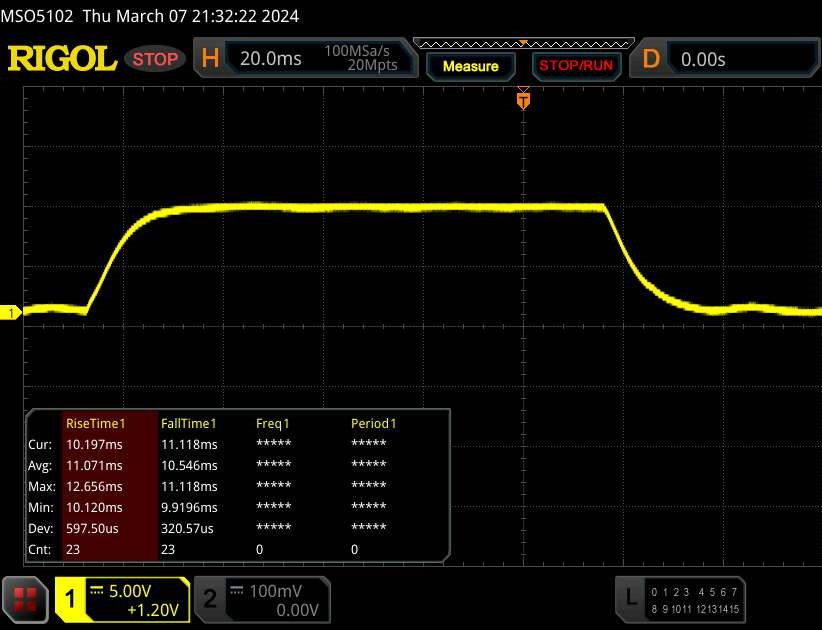 |
| ↘ 10.5 ms fall | ||
| The screen shows good response rates in our tests, but may be too slow for competitive gamers. In comparison, all tested devices range from 0.1 (minimum) to 240 (maximum) ms. » 48 % of all devices are better. This means that the measured response time is similar to the average of all tested devices (19.8 ms). | ||
| ↔ Response Time 50% Grey to 80% Grey | ||
| 40.5 ms ... rise ↗ and fall ↘ combined | ↗ 19 ms rise | 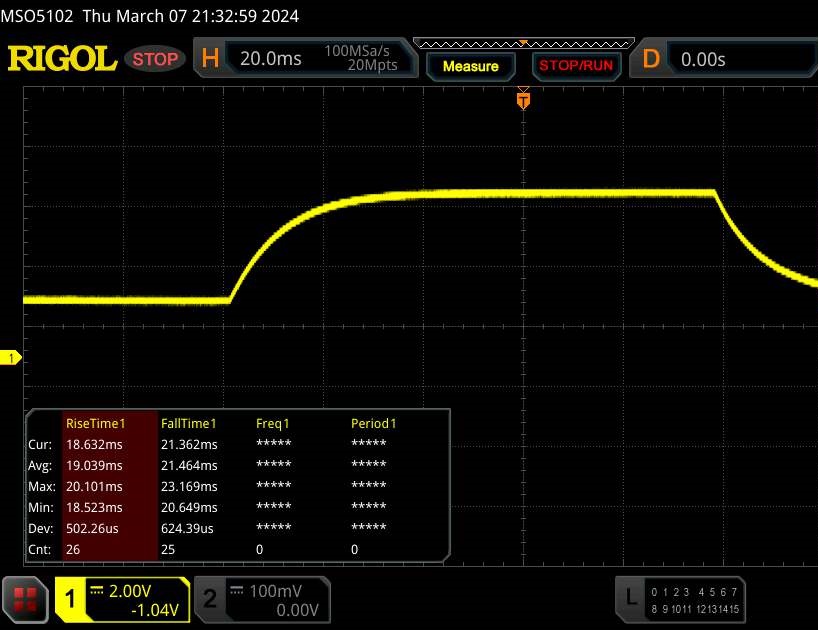 |
| ↘ 21.5 ms fall | ||
| The screen shows slow response rates in our tests and will be unsatisfactory for gamers. In comparison, all tested devices range from 0.165 (minimum) to 636 (maximum) ms. » 64 % of all devices are better. This means that the measured response time is worse than the average of all tested devices (31 ms). | ||
Screen Flickering / PWM (Pulse-Width Modulation)
| Screen flickering / PWM not detected |  | ||
In comparison: 52 % of all tested devices do not use PWM to dim the display. If PWM was detected, an average of 7763 (minimum: 5 - maximum: 343500) Hz was measured. | |||
The IPS panel offers relatively stable viewing angles that can be read from extreme positions. It is possible to use the display outdoors if the sun is not too bright.
Performance: Raptor Lake and Ada Lovelace power the 16-incher
Gigabyte delivers a mid-range gaming notebook with the G6X 9KG. Raptor Lake-HX and Ada Lovelace provide the necessary computing power.
Test conditions
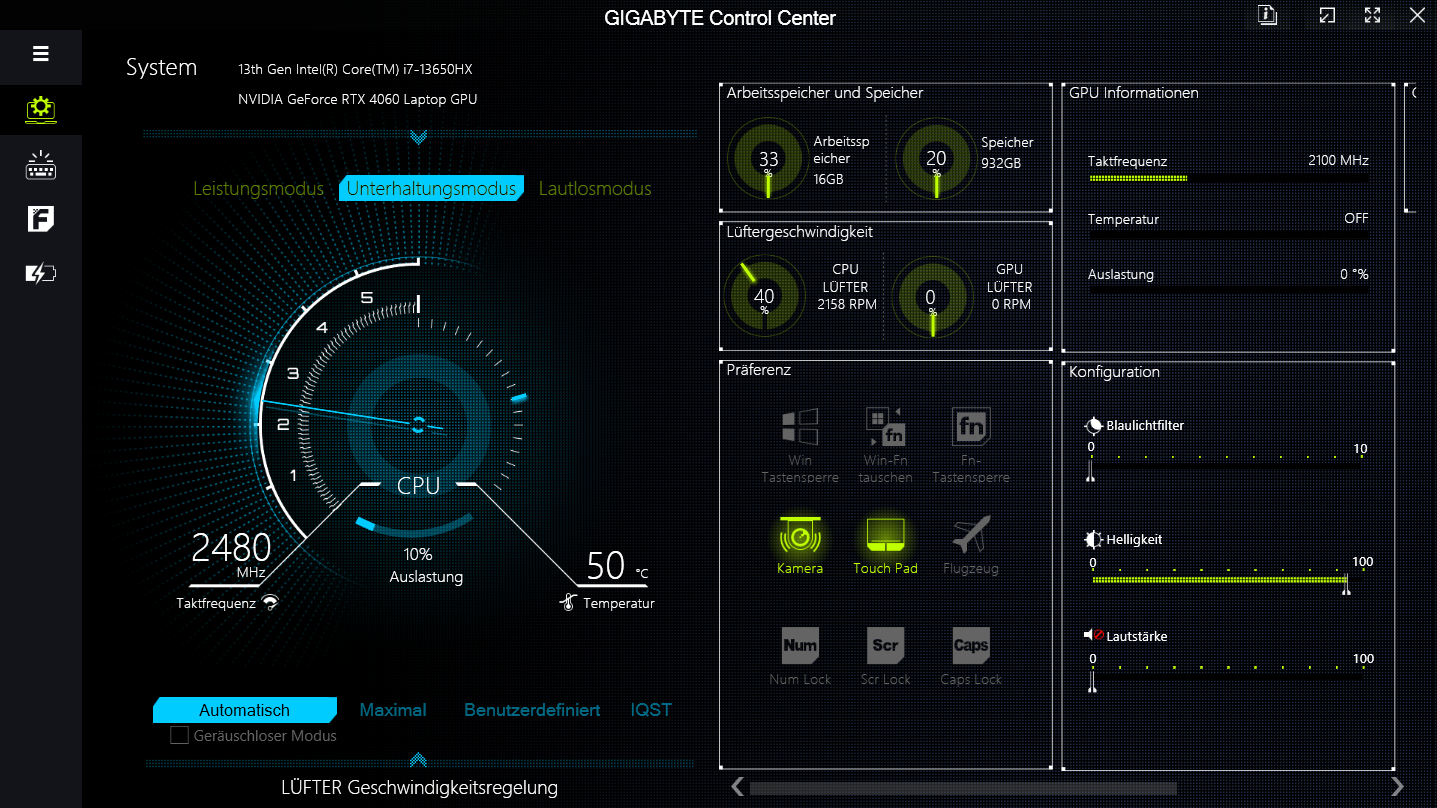
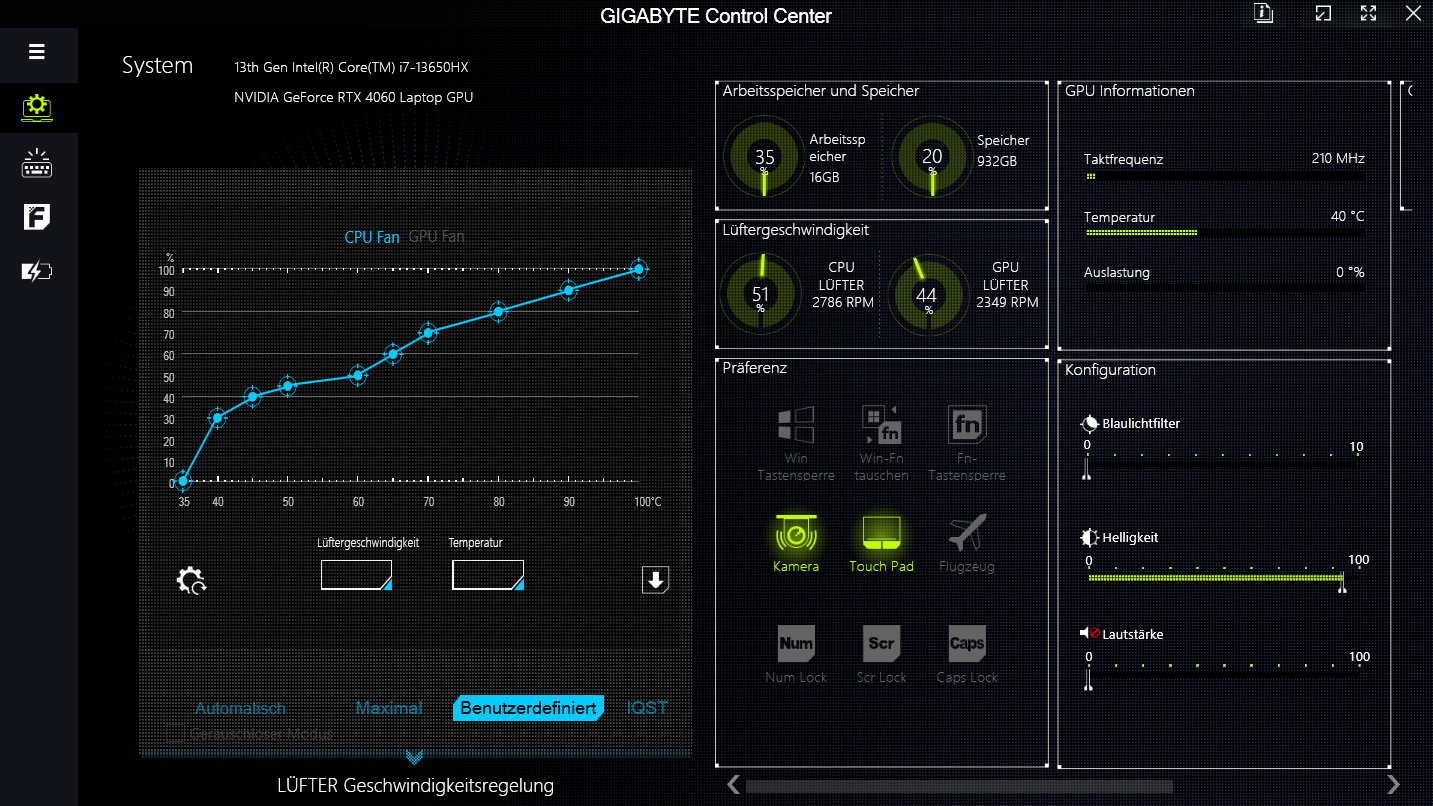
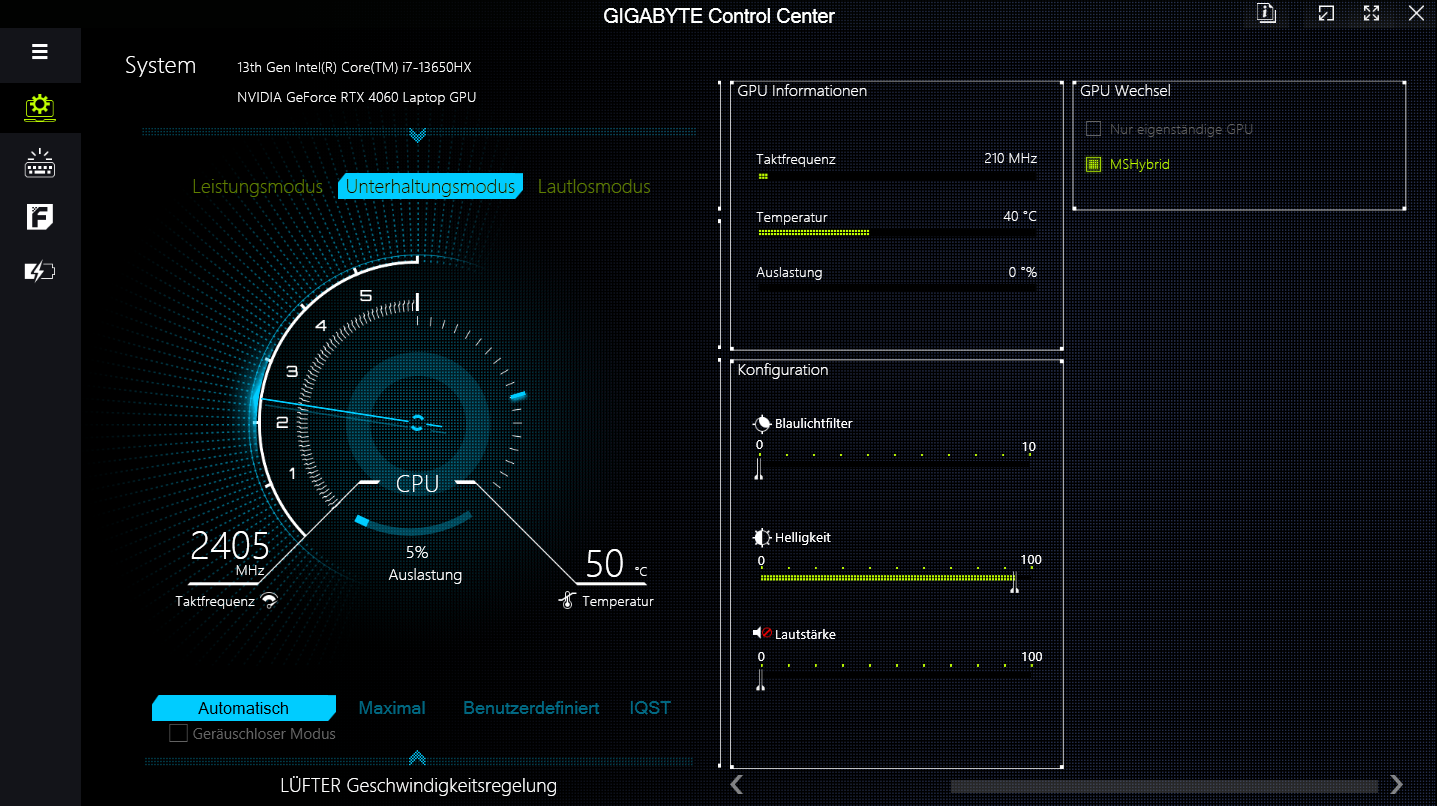
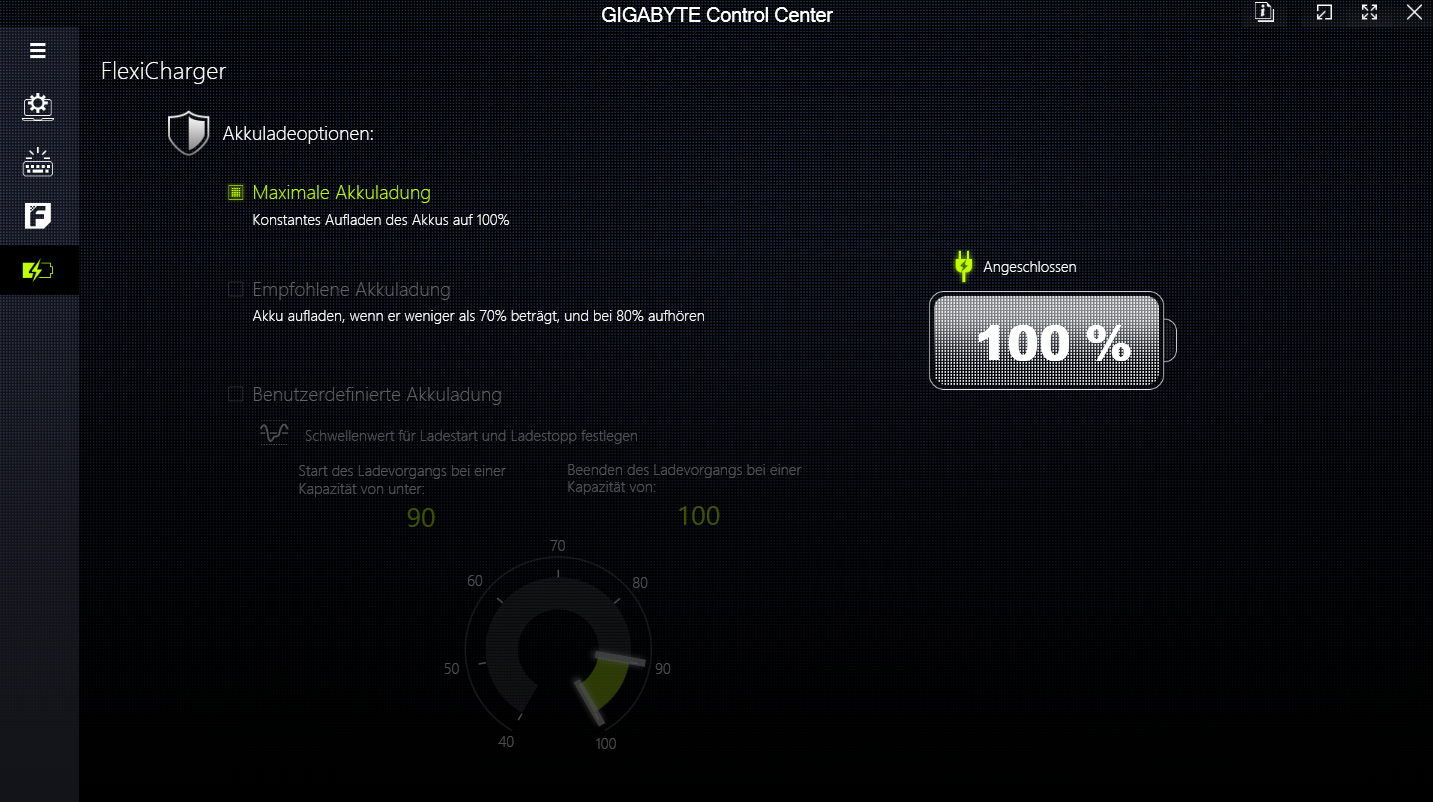
The G6X offers three manufacturer-specific performance modes (see table below), which can be switched between via the Control Center app. The "Entertainment mode" was used for benchmarks while "Silent mode" was employed for the battery tests. Both modes offer automatic fan control.
| Performance mode | Entertainment mode | Silent mode (= dGPU off) | |
|---|---|---|---|
| Power Limit 1 (HWInfo) | 135 W | 55 W | 25 W |
| Power Limit 2 (HWInfo) | 155 W | 115 W | 30 W |
| Noise (The Witcher 3 1080p Ultra) | 55 dB(A) | 51 dB(A) | 33 dB(A) |
| Performance (The Witcher 3 1080p Ultra) | ~102 fps | ~100 fps | 4 fps |
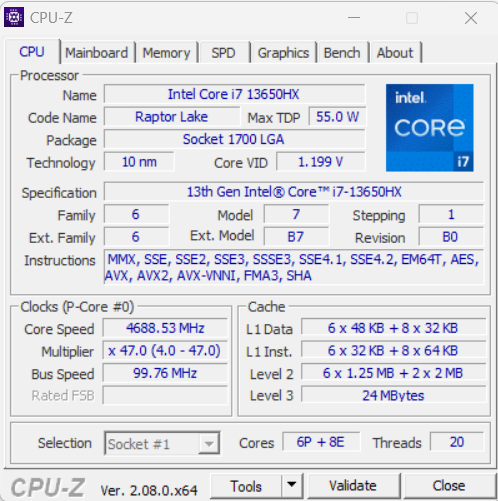
Processor
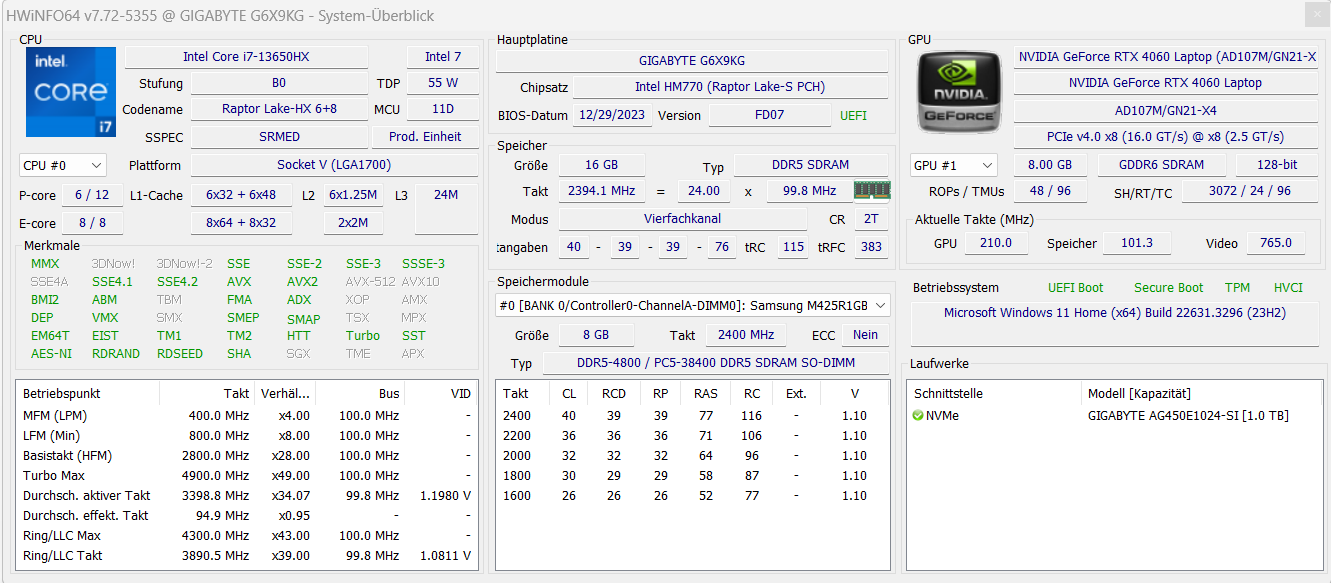
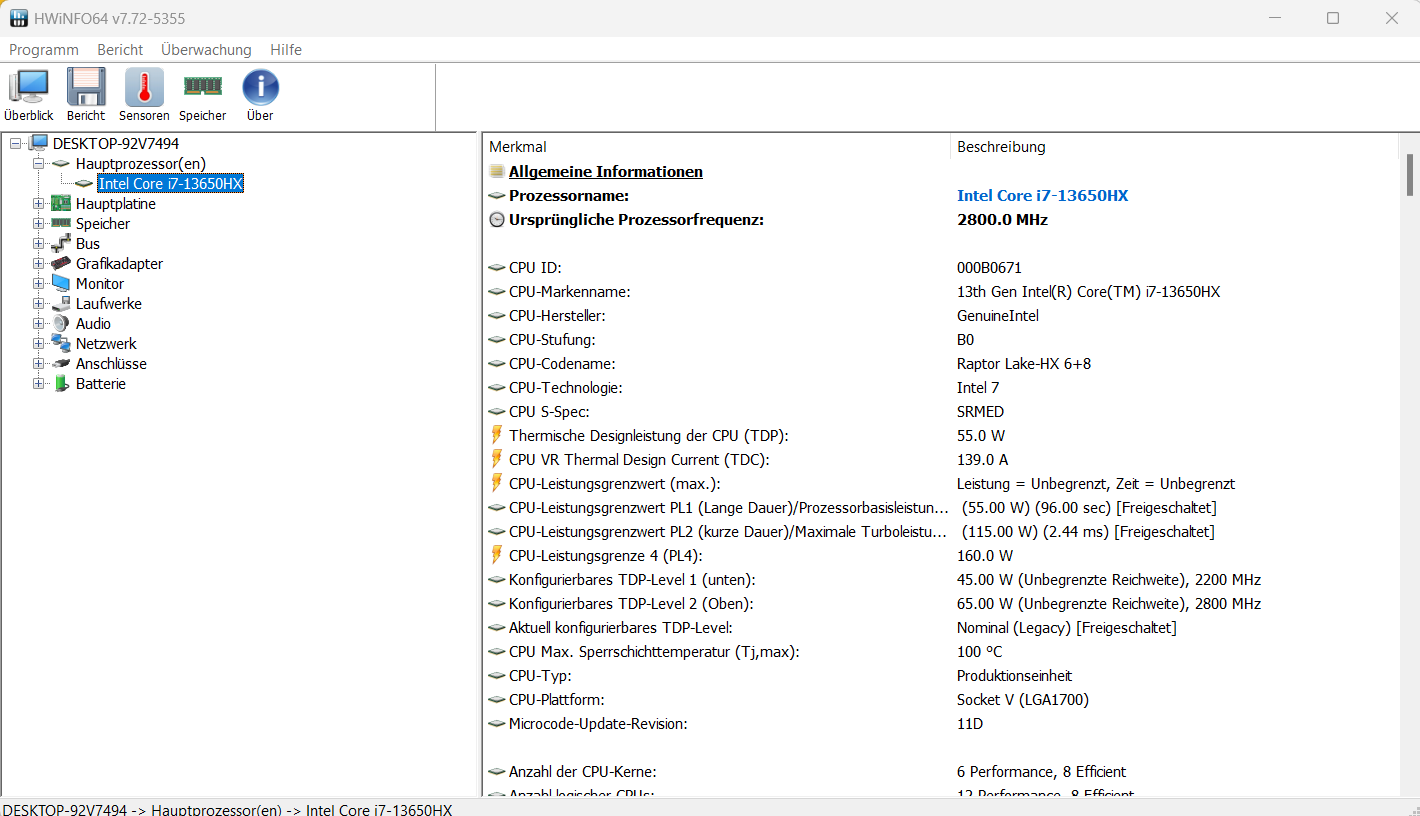
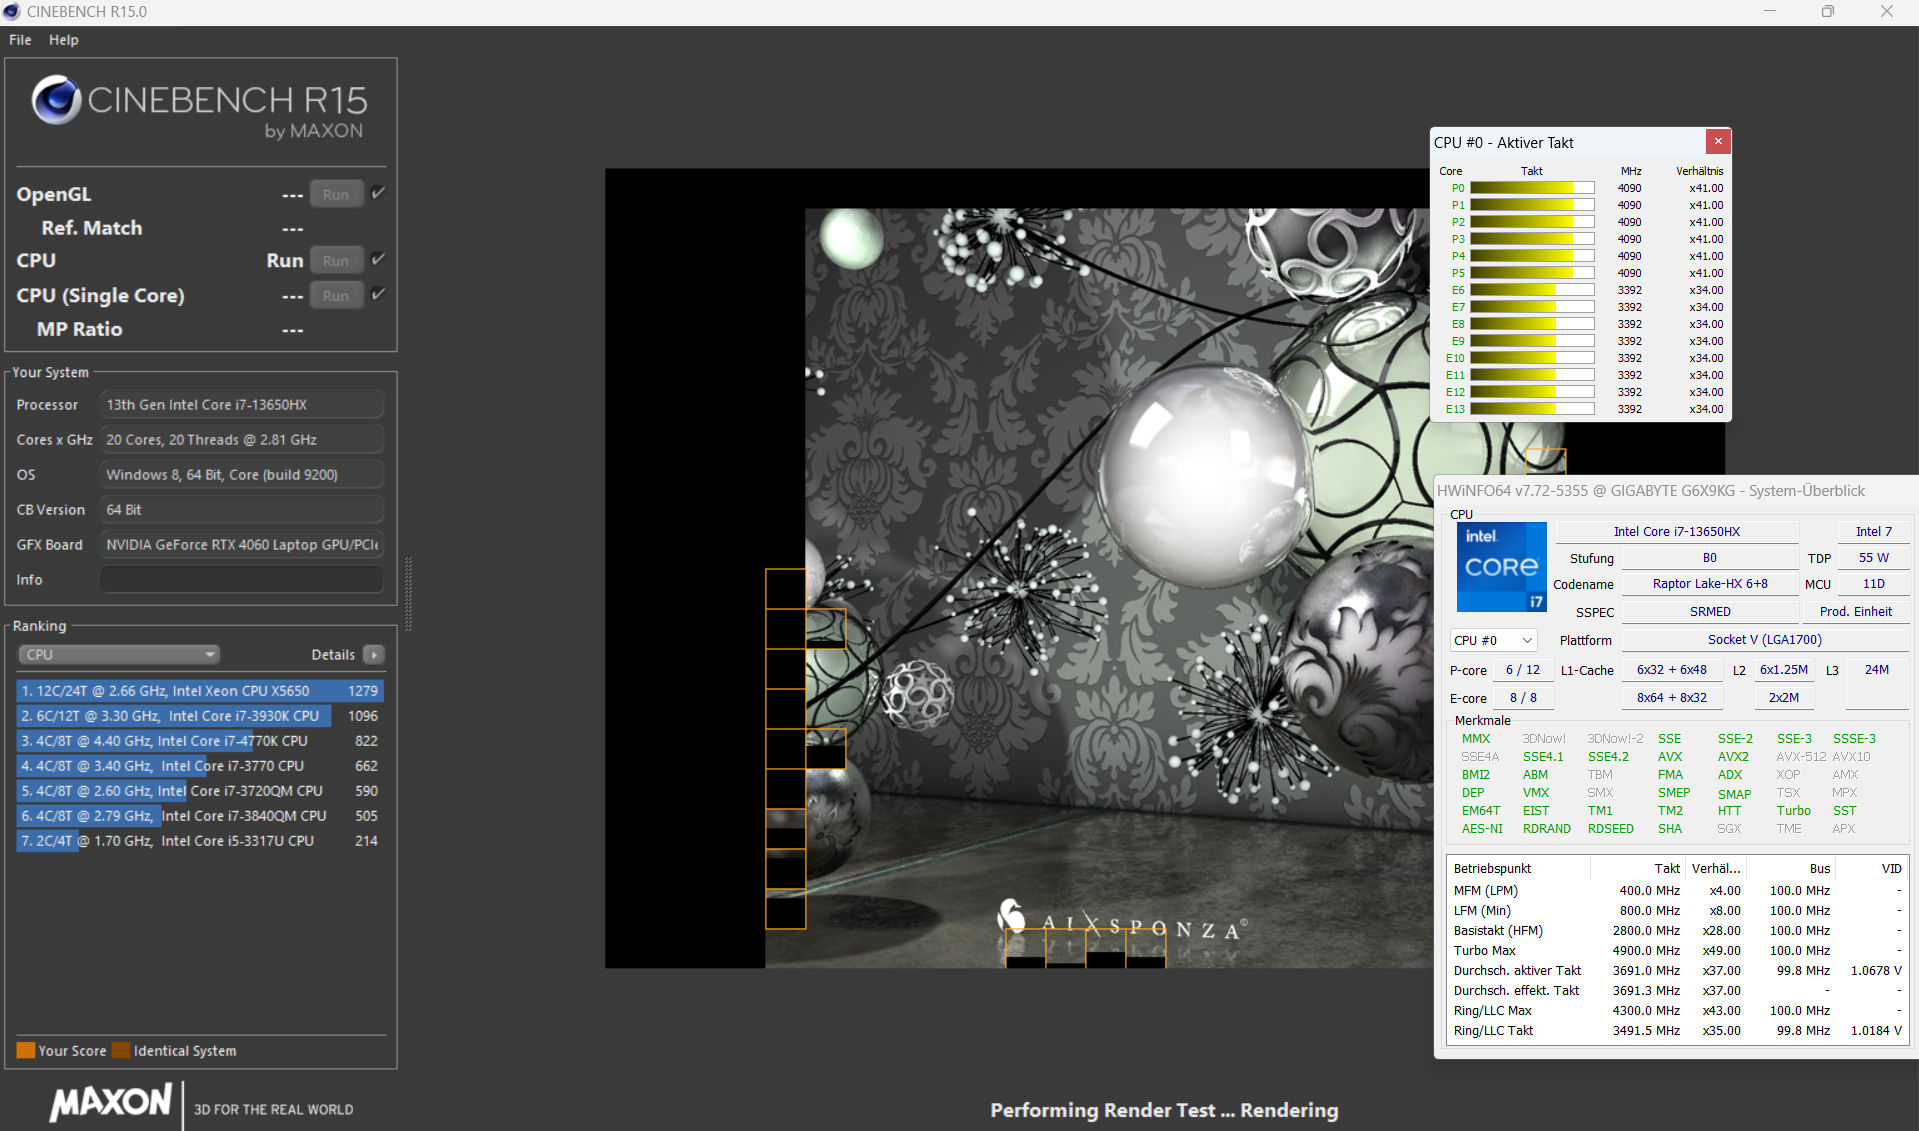
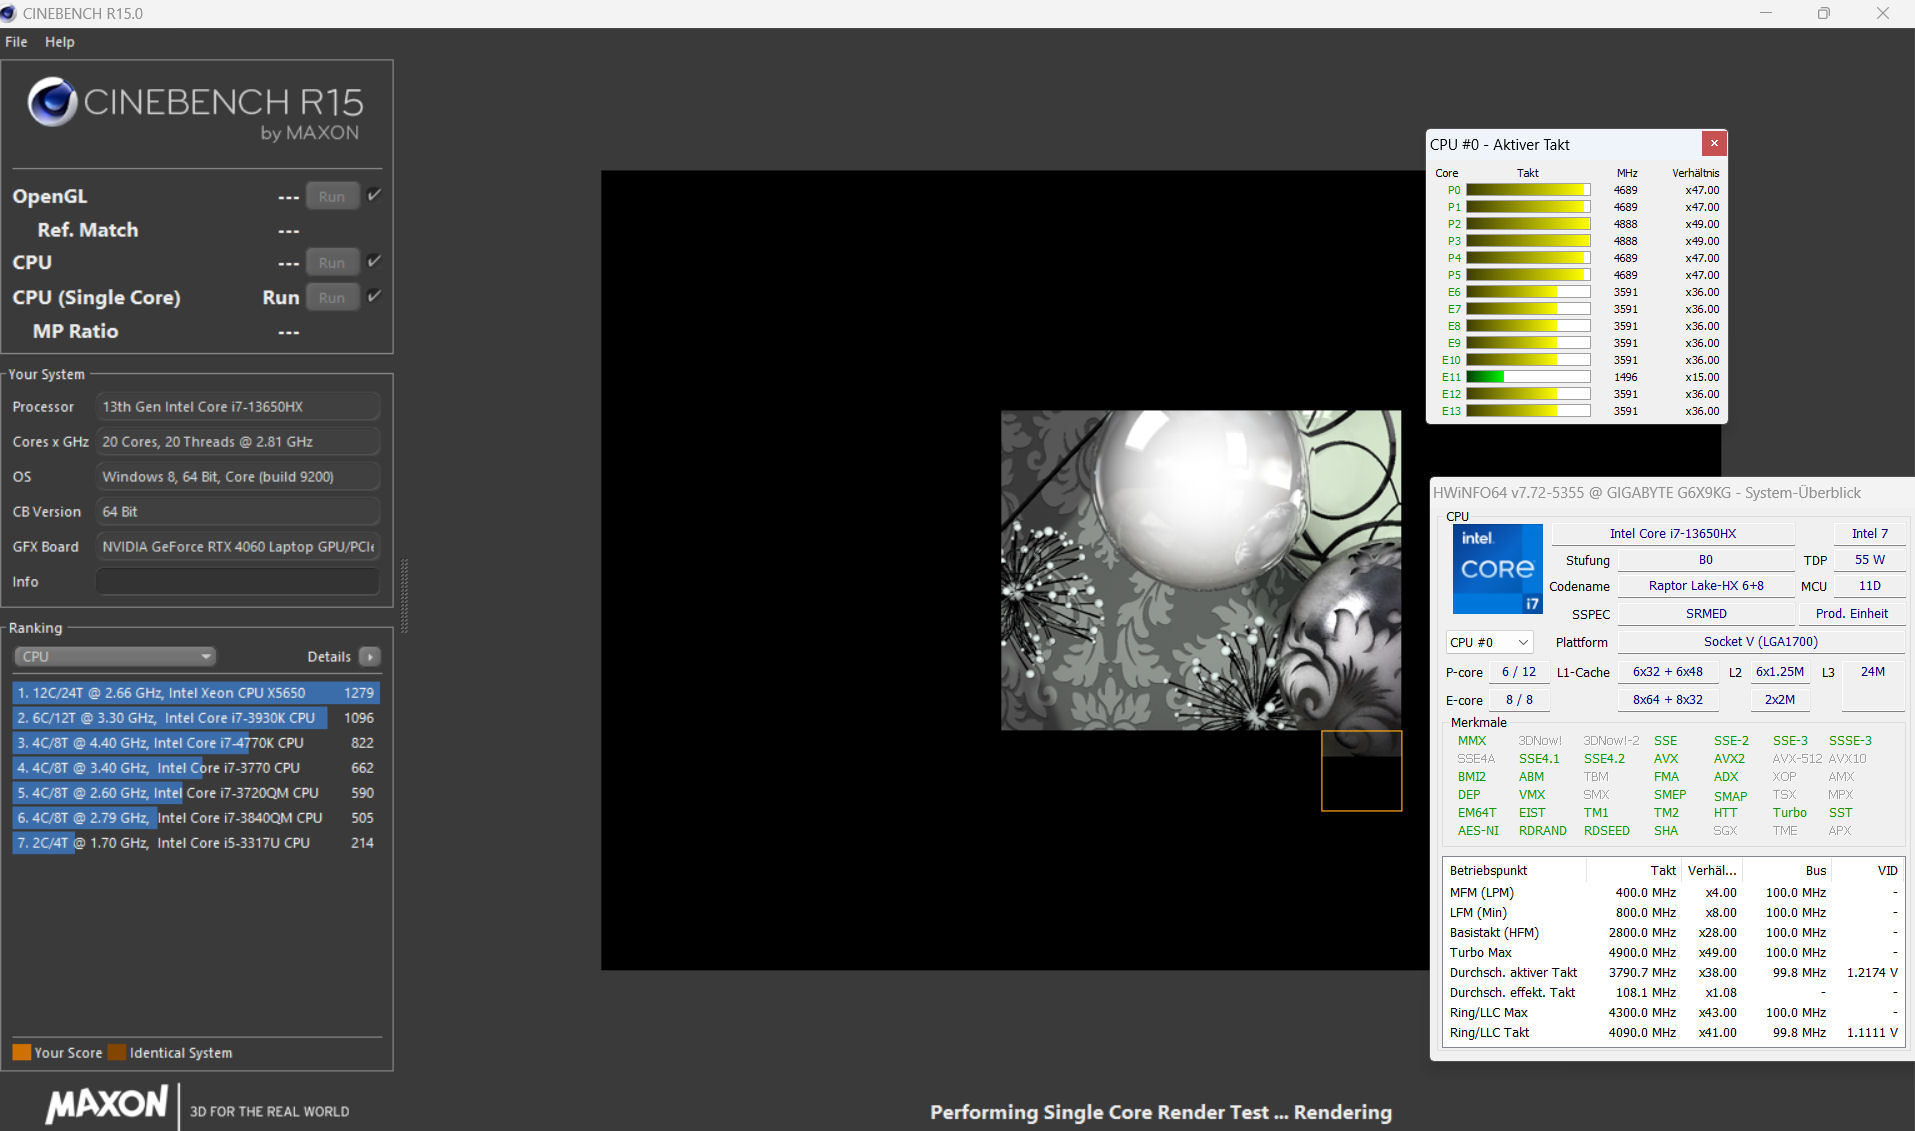
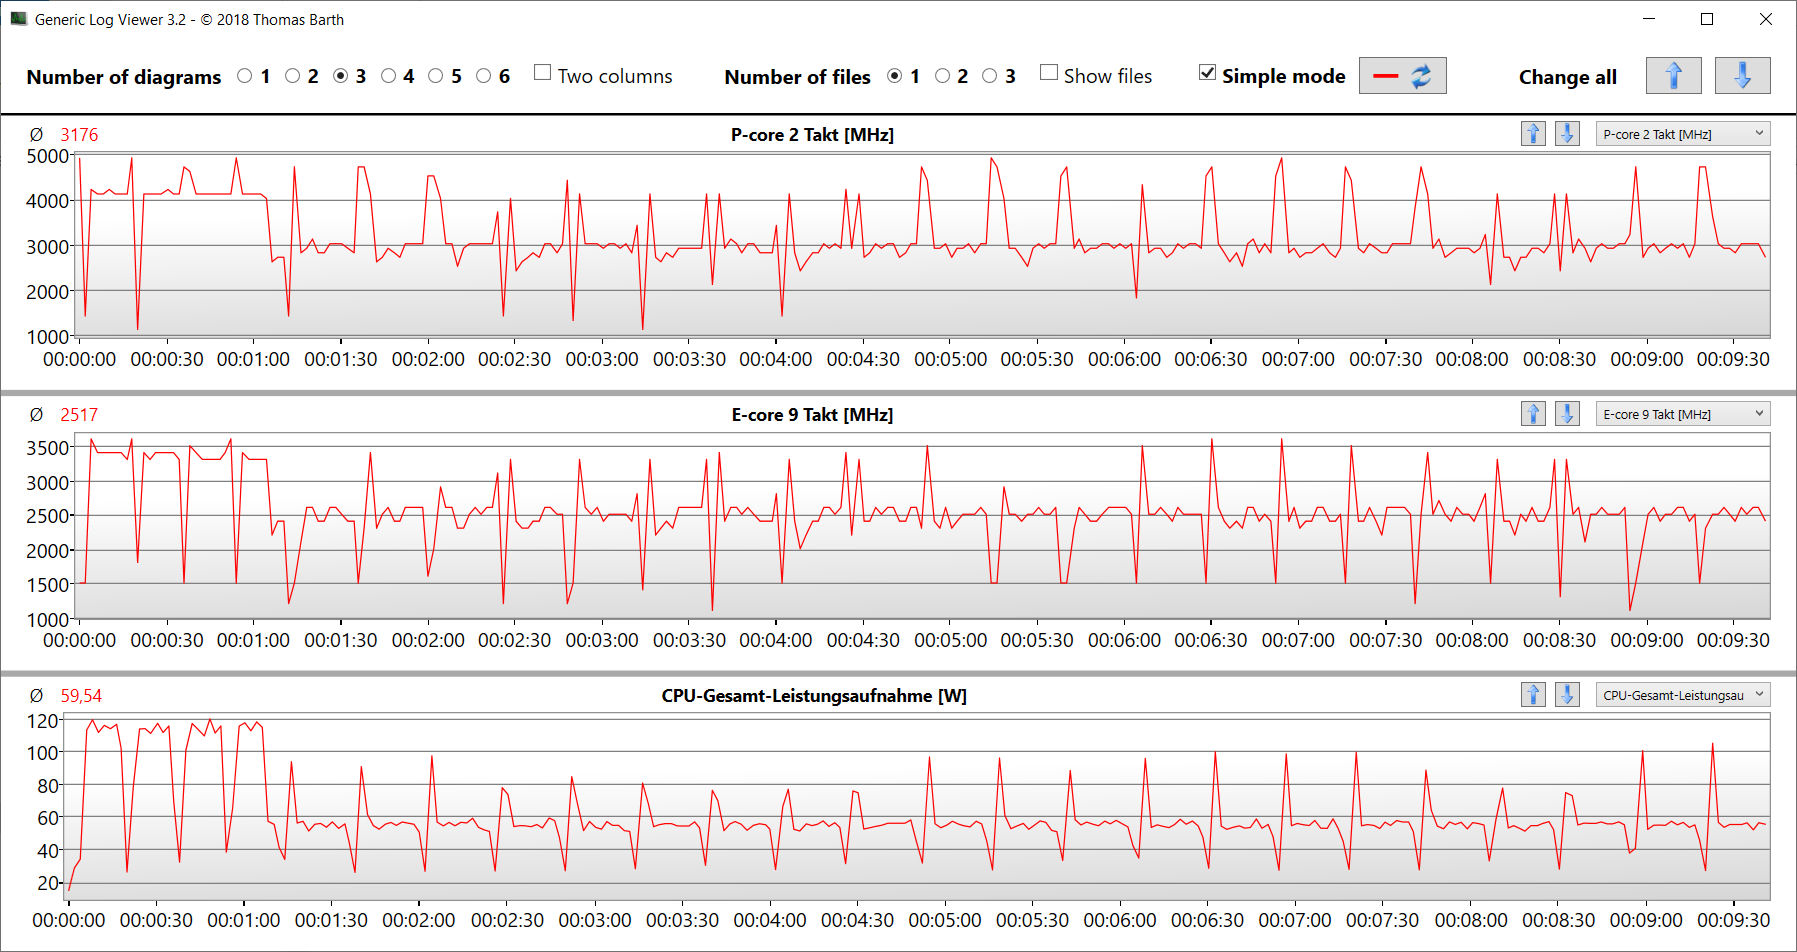
The 14 CPU cores of the Core i7-13650HX (6P+8E) reach maximum clock rates of 4.9 GHz (P) and 3.6 GHz (E). Continuous multi-thread load (Cinebench R15 multi-core loop) causes the clock rate to drop from the fourth to the fifth run. After that, a fairly constant level is maintained. The Performance mode ensures permanently higher values.
The benchmark values are slightly below the CPU average, but the Performance mode results in small gains. In battery mode, the more relevant single-thread performance in Cinebench R15 drops to a lesser extent (168 points) than the multi-thread performance (1,225 points).
Cinebench R15 Multi-core loop test
| LibreOffice - 20 Documents To PDF | |
| Dell G16, i7-13650HX, RTX 4060 (6.3.4.2) | |
| Average of class Gaming (19 - 88.8, n=108, last 2 years) | |
| Average Intel Core i7-13650HX (38.9 - 58.8, n=5) | |
| Lenovo Legion 5 16IRX G9 (6.3.4.2) | |
| Asus TUF Gaming A16 FA617XS | |
| Gigabyte G6X 9KG (2024) (6.3.4.2) | |
| MSI Raider GE68HX 13VF | |
* ... smaller is better
AIDA64: FP32 Ray-Trace | FPU Julia | CPU SHA3 | CPU Queen | FPU SinJulia | FPU Mandel | CPU AES | CPU ZLib | FP64 Ray-Trace | CPU PhotoWorxx
| Performance rating | |
| MSI Raider GE68HX 13VF | |
| Average of class Gaming | |
| Asus TUF Gaming A16 FA617XS | |
| Lenovo Legion 5 16IRX G9 | |
| Dell G16, i7-13650HX, RTX 4060 | |
| Average Intel Core i7-13650HX | |
| Gigabyte G6X 9KG (2024) | |
| AIDA64 / FP32 Ray-Trace | |
| Average of class Gaming (10227 - 85542, n=107, last 2 years) | |
| Asus TUF Gaming A16 FA617XS (v6.75.6100) | |
| MSI Raider GE68HX 13VF (v6.85.6300) | |
| Lenovo Legion 5 16IRX G9 (v6.92.6600) | |
| Dell G16, i7-13650HX, RTX 4060 (v6.92.6600) | |
| Average Intel Core i7-13650HX (13404 - 20012, n=5) | |
| Gigabyte G6X 9KG (2024) (v6.92.6600) | |
| AIDA64 / FPU Julia | |
| Average of class Gaming (51376 - 238426, n=107, last 2 years) | |
| MSI Raider GE68HX 13VF (v6.85.6300) | |
| Asus TUF Gaming A16 FA617XS (v6.75.6100) | |
| Lenovo Legion 5 16IRX G9 (v6.92.6600) | |
| Dell G16, i7-13650HX, RTX 4060 (v6.92.6600) | |
| Average Intel Core i7-13650HX (68241 - 97317, n=5) | |
| Gigabyte G6X 9KG (2024) (v6.92.6600) | |
| AIDA64 / CPU SHA3 | |
| MSI Raider GE68HX 13VF (v6.85.6300) | |
| Average of class Gaming (2180 - 9817, n=107, last 2 years) | |
| Asus TUF Gaming A16 FA617XS (v6.75.6100) | |
| Dell G16, i7-13650HX, RTX 4060 (v6.92.6600) | |
| Lenovo Legion 5 16IRX G9 (v6.92.6600) | |
| Average Intel Core i7-13650HX (3127 - 4487, n=5) | |
| Gigabyte G6X 9KG (2024) (v6.92.6600) | |
| AIDA64 / CPU Queen | |
| MSI Raider GE68HX 13VF (v6.85.6300) | |
| Asus TUF Gaming A16 FA617XS (v6.75.6100) | |
| Average of class Gaming (49785 - 173351, n=94, last 2 years) | |
| Gigabyte G6X 9KG (2024) (v6.92.6600) | |
| Average Intel Core i7-13650HX (108627 - 110589, n=5) | |
| Dell G16, i7-13650HX, RTX 4060 (v6.92.6600) | |
| Lenovo Legion 5 16IRX G9 (v6.92.6600) | |
| AIDA64 / FPU SinJulia | |
| MSI Raider GE68HX 13VF (v6.85.6300) | |
| Asus TUF Gaming A16 FA617XS (v6.75.6100) | |
| Average of class Gaming (4424 - 33636, n=107, last 2 years) | |
| Lenovo Legion 5 16IRX G9 (v6.92.6600) | |
| Dell G16, i7-13650HX, RTX 4060 (v6.92.6600) | |
| Average Intel Core i7-13650HX (9134 - 10887, n=5) | |
| Gigabyte G6X 9KG (2024) (v6.92.6600) | |
| AIDA64 / FPU Mandel | |
| Average of class Gaming (25115 - 128721, n=107, last 2 years) | |
| MSI Raider GE68HX 13VF (v6.85.6300) | |
| Asus TUF Gaming A16 FA617XS (v6.75.6100) | |
| Lenovo Legion 5 16IRX G9 (v6.92.6600) | |
| Dell G16, i7-13650HX, RTX 4060 (v6.92.6600) | |
| Average Intel Core i7-13650HX (33391 - 48323, n=5) | |
| Gigabyte G6X 9KG (2024) (v6.92.6600) | |
| AIDA64 / CPU AES | |
| MSI Raider GE68HX 13VF (v6.85.6300) | |
| Average of class Gaming (39258 - 247074, n=107, last 2 years) | |
| Lenovo Legion 5 16IRX G9 (v6.92.6600) | |
| Asus TUF Gaming A16 FA617XS (v6.75.6100) | |
| Dell G16, i7-13650HX, RTX 4060 (v6.92.6600) | |
| Average Intel Core i7-13650HX (64436 - 85343, n=5) | |
| Gigabyte G6X 9KG (2024) (v6.92.6600) | |
| AIDA64 / CPU ZLib | |
| MSI Raider GE68HX 13VF (v6.85.6300) | |
| Average of class Gaming (574 - 2531, n=107, last 2 years) | |
| Lenovo Legion 5 16IRX G9 (v6.92.6600) | |
| Dell G16, i7-13650HX, RTX 4060 (v6.92.6600) | |
| Average Intel Core i7-13650HX (1136 - 1285, n=5) | |
| Gigabyte G6X 9KG (2024) (v6.92.6600) | |
| Asus TUF Gaming A16 FA617XS (v6.75.6100) | |
| AIDA64 / FP64 Ray-Trace | |
| Average of class Gaming (5509 - 45446, n=107, last 2 years) | |
| Asus TUF Gaming A16 FA617XS (v6.75.6100) | |
| MSI Raider GE68HX 13VF (v6.85.6300) | |
| Dell G16, i7-13650HX, RTX 4060 (v6.92.6600) | |
| Lenovo Legion 5 16IRX G9 (v6.92.6600) | |
| Average Intel Core i7-13650HX (7270 - 10900, n=5) | |
| Gigabyte G6X 9KG (2024) (v6.92.6600) | |
| AIDA64 / CPU PhotoWorxx | |
| MSI Raider GE68HX 13VF (v6.85.6300) | |
| Average of class Gaming (12271 - 89891, n=107, last 2 years) | |
| Average Intel Core i7-13650HX (36170 - 43289, n=5) | |
| Gigabyte G6X 9KG (2024) (v6.92.6600) | |
| Dell G16, i7-13650HX, RTX 4060 (v6.92.6600) | |
| Lenovo Legion 5 16IRX G9 (v6.92.6600) | |
| Asus TUF Gaming A16 FA617XS (v6.75.6100) | |
System performance
The Gigabyte G6X runs smooth and does not lack computing power. The notebook handles gaming, streaming, and rendering without any problems.
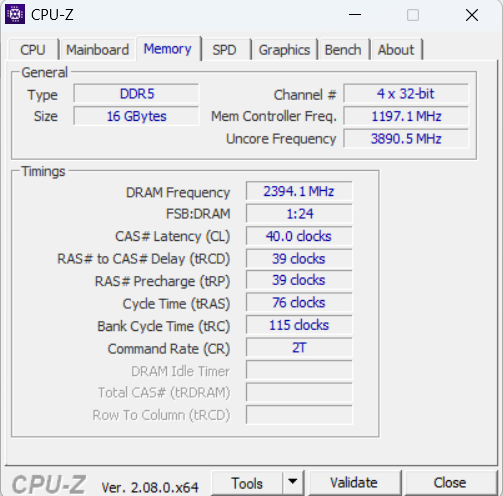
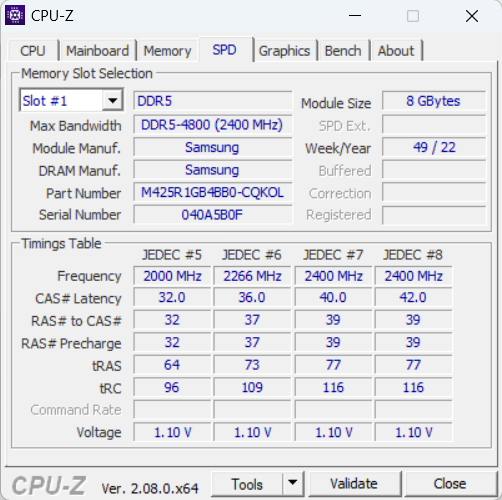
The transfer rates of the RAM are at a normal level for DDR5-4800 RAM.
CrossMark: Overall | Productivity | Creativity | Responsiveness
WebXPRT 3: Overall
WebXPRT 4: Overall
Mozilla Kraken 1.1: Total
| PCMark 10 / Score | |
| Average of class Gaming (5828 - 11574, n=95, last 2 years) | |
| MSI Raider GE68HX 13VF | |
| Asus TUF Gaming A16 FA617XS | |
| Lenovo Legion 5 16IRX G9 | |
| Gigabyte G6X 9KG (2024) | |
| Dell G16, i7-13650HX, RTX 4060 | |
| Average Intel Core i7-13650HX, NVIDIA GeForce RTX 4060 Laptop GPU (6984 - 7613, n=3) | |
| PCMark 10 / Essentials | |
| MSI Raider GE68HX 13VF | |
| Asus TUF Gaming A16 FA617XS | |
| Lenovo Legion 5 16IRX G9 | |
| Average of class Gaming (8810 - 12600, n=99, last 2 years) | |
| Average Intel Core i7-13650HX, NVIDIA GeForce RTX 4060 Laptop GPU (9532 - 11151, n=3) | |
| Gigabyte G6X 9KG (2024) | |
| Dell G16, i7-13650HX, RTX 4060 | |
| PCMark 10 / Productivity | |
| Average of class Gaming (6845 - 21327, n=97, last 2 years) | |
| Asus TUF Gaming A16 FA617XS | |
| Gigabyte G6X 9KG (2024) | |
| Average Intel Core i7-13650HX, NVIDIA GeForce RTX 4060 Laptop GPU (9961 - 10204, n=3) | |
| Dell G16, i7-13650HX, RTX 4060 | |
| MSI Raider GE68HX 13VF | |
| Lenovo Legion 5 16IRX G9 | |
| PCMark 10 / Digital Content Creation | |
| Average of class Gaming (7602 - 19657, n=97, last 2 years) | |
| MSI Raider GE68HX 13VF | |
| Lenovo Legion 5 16IRX G9 | |
| Asus TUF Gaming A16 FA617XS | |
| Dell G16, i7-13650HX, RTX 4060 | |
| Gigabyte G6X 9KG (2024) | |
| Average Intel Core i7-13650HX, NVIDIA GeForce RTX 4060 Laptop GPU (8323 - 11686, n=3) | |
| CrossMark / Overall | |
| Lenovo Legion 5 16IRX G9 | |
| Average of class Gaming (1366 - 2409, n=96, last 2 years) | |
| MSI Raider GE68HX 13VF | |
| Gigabyte G6X 9KG (2024) | |
| Average Intel Core i7-13650HX, NVIDIA GeForce RTX 4060 Laptop GPU (1839 - 1951, n=3) | |
| Dell G16, i7-13650HX, RTX 4060 | |
| Asus TUF Gaming A16 FA617XS | |
| CrossMark / Productivity | |
| Lenovo Legion 5 16IRX G9 | |
| Gigabyte G6X 9KG (2024) | |
| Average of class Gaming (1386 - 2254, n=96, last 2 years) | |
| MSI Raider GE68HX 13VF | |
| Average Intel Core i7-13650HX, NVIDIA GeForce RTX 4060 Laptop GPU (1730 - 1864, n=3) | |
| Dell G16, i7-13650HX, RTX 4060 | |
| Asus TUF Gaming A16 FA617XS | |
| CrossMark / Creativity | |
| Lenovo Legion 5 16IRX G9 | |
| MSI Raider GE68HX 13VF | |
| Average of class Gaming (1343 - 2729, n=96, last 2 years) | |
| Gigabyte G6X 9KG (2024) | |
| Average Intel Core i7-13650HX, NVIDIA GeForce RTX 4060 Laptop GPU (2020 - 2063, n=3) | |
| Dell G16, i7-13650HX, RTX 4060 | |
| Asus TUF Gaming A16 FA617XS | |
| CrossMark / Responsiveness | |
| Gigabyte G6X 9KG (2024) | |
| Lenovo Legion 5 16IRX G9 | |
| Average Intel Core i7-13650HX, NVIDIA GeForce RTX 4060 Laptop GPU (1544 - 1907, n=3) | |
| Average of class Gaming (1226 - 2334, n=96, last 2 years) | |
| Dell G16, i7-13650HX, RTX 4060 | |
| MSI Raider GE68HX 13VF | |
| Asus TUF Gaming A16 FA617XS | |
| WebXPRT 3 / Overall | |
| MSI Raider GE68HX 13VF | |
| Average of class Gaming (220 - 532, n=100, last 2 years) | |
| Lenovo Legion 5 16IRX G9 | |
| Gigabyte G6X 9KG (2024) | |
| Average Intel Core i7-13650HX, NVIDIA GeForce RTX 4060 Laptop GPU (268 - 302, n=3) | |
| Dell G16, i7-13650HX, RTX 4060 | |
| WebXPRT 4 / Overall | |
| MSI Raider GE68HX 13VF | |
| Lenovo Legion 5 16IRX G9 | |
| Average of class Gaming (165 - 354, n=101, last 2 years) | |
| Average Intel Core i7-13650HX, NVIDIA GeForce RTX 4060 Laptop GPU (260 - 276, n=2) | |
| Asus TUF Gaming A16 FA617XS | |
| Gigabyte G6X 9KG (2024) | |
| Mozilla Kraken 1.1 / Total | |
| Gigabyte G6X 9KG (2024) | |
| Average Intel Core i7-13650HX, NVIDIA GeForce RTX 4060 Laptop GPU (507 - 511, n=3) | |
| Dell G16, i7-13650HX, RTX 4060 | |
| Asus TUF Gaming A16 FA617XS | |
| Lenovo Legion 5 16IRX G9 | |
| Average of class Gaming (391 - 590, n=104, last 2 years) | |
| MSI Raider GE68HX 13VF | |
* ... smaller is better
| PCMark 10 Score | 7613 points | |
Help | ||
| AIDA64 / Memory Copy | |
| MSI Raider GE68HX 13VF | |
| Average of class Gaming (21750 - 129946, n=107, last 2 years) | |
| Average Intel Core i7-13650HX (59266 - 66372, n=5) | |
| Gigabyte G6X 9KG (2024) | |
| Lenovo Legion 5 16IRX G9 | |
| Asus TUF Gaming A16 FA617XS | |
| Dell G16, i7-13650HX, RTX 4060 | |
| AIDA64 / Memory Read | |
| MSI Raider GE68HX 13VF | |
| Average of class Gaming (22956 - 118858, n=107, last 2 years) | |
| Lenovo Legion 5 16IRX G9 | |
| Average Intel Core i7-13650HX (67305 - 71022, n=5) | |
| Gigabyte G6X 9KG (2024) | |
| Dell G16, i7-13650HX, RTX 4060 | |
| Asus TUF Gaming A16 FA617XS | |
| AIDA64 / Memory Write | |
| MSI Raider GE68HX 13VF | |
| Average of class Gaming (22297 - 135096, n=107, last 2 years) | |
| Asus TUF Gaming A16 FA617XS | |
| Average Intel Core i7-13650HX (58028 - 68225, n=5) | |
| Gigabyte G6X 9KG (2024) | |
| Dell G16, i7-13650HX, RTX 4060 | |
| Lenovo Legion 5 16IRX G9 | |
| AIDA64 / Memory Latency | |
| Average of class Gaming (75.3 - 259, n=107, last 2 years) | |
| Dell G16, i7-13650HX, RTX 4060 | |
| Asus TUF Gaming A16 FA617XS | |
| Gigabyte G6X 9KG (2024) | |
| Lenovo Legion 5 16IRX G9 | |
| Average Intel Core i7-13650HX (83.7 - 90.8, n=5) | |
| MSI Raider GE68HX 13VF | |
* ... smaller is better
DPC latency
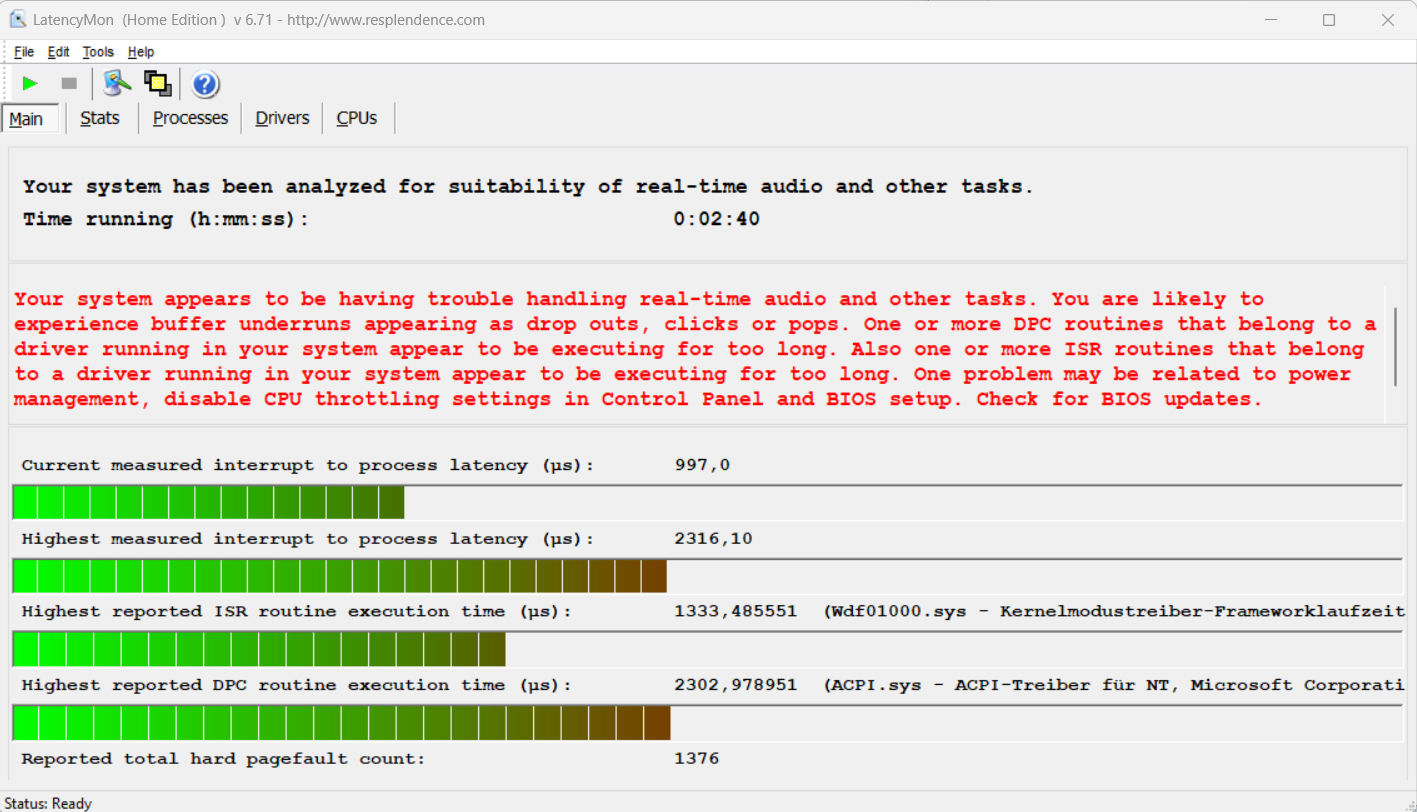
The standardized LatencyMon test (web surfing, 4k video playback, Prime95 High-Load) revealed anomalies. The system does not appear to be suitable for video and audio editing in real time. Future software updates could lead to improvements or even deteriorations.
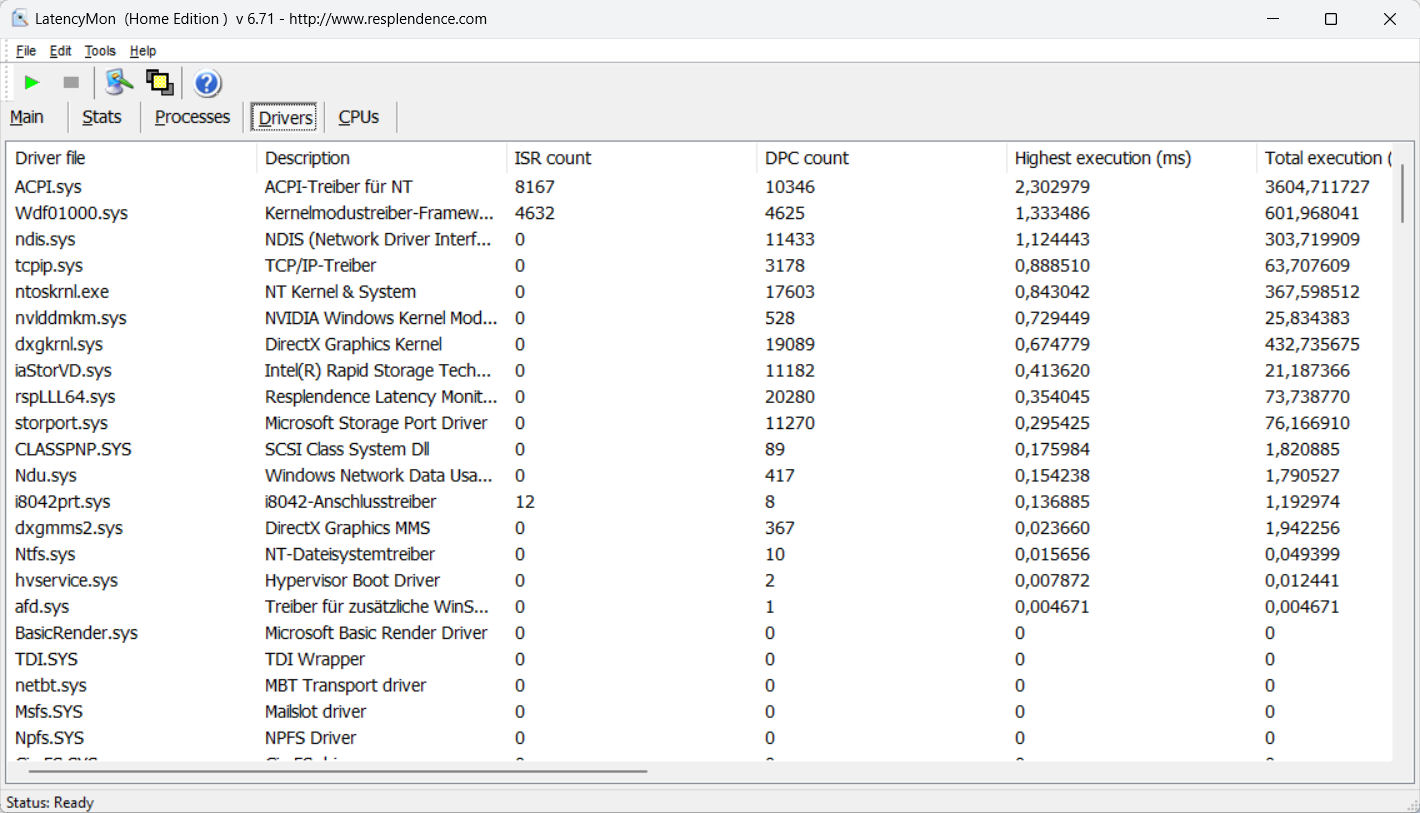
| DPC Latencies / LatencyMon - interrupt to process latency (max), Web, Youtube, Prime95 | |
| MSI Raider GE68HX 13VF | |
| Gigabyte G6X 9KG (2024) | |
| Lenovo Legion 5 16IRX G9 | |
| Asus TUF Gaming A16 FA617XS | |
| Dell G16, i7-13650HX, RTX 4060 | |
* ... smaller is better
Mass storage
The G6X can accommodate a total of two M.2 2280 PCIe Gen 4 SSDs. RAID is not supported. The 1 TB Gigabyte SSD in our test device delivers very good data rates.
We did not observe any thermal throttling issues, which is a good thing.

* ... smaller is better
Disk Throttling: DiskSpd Read Loop, Queue Depth 8
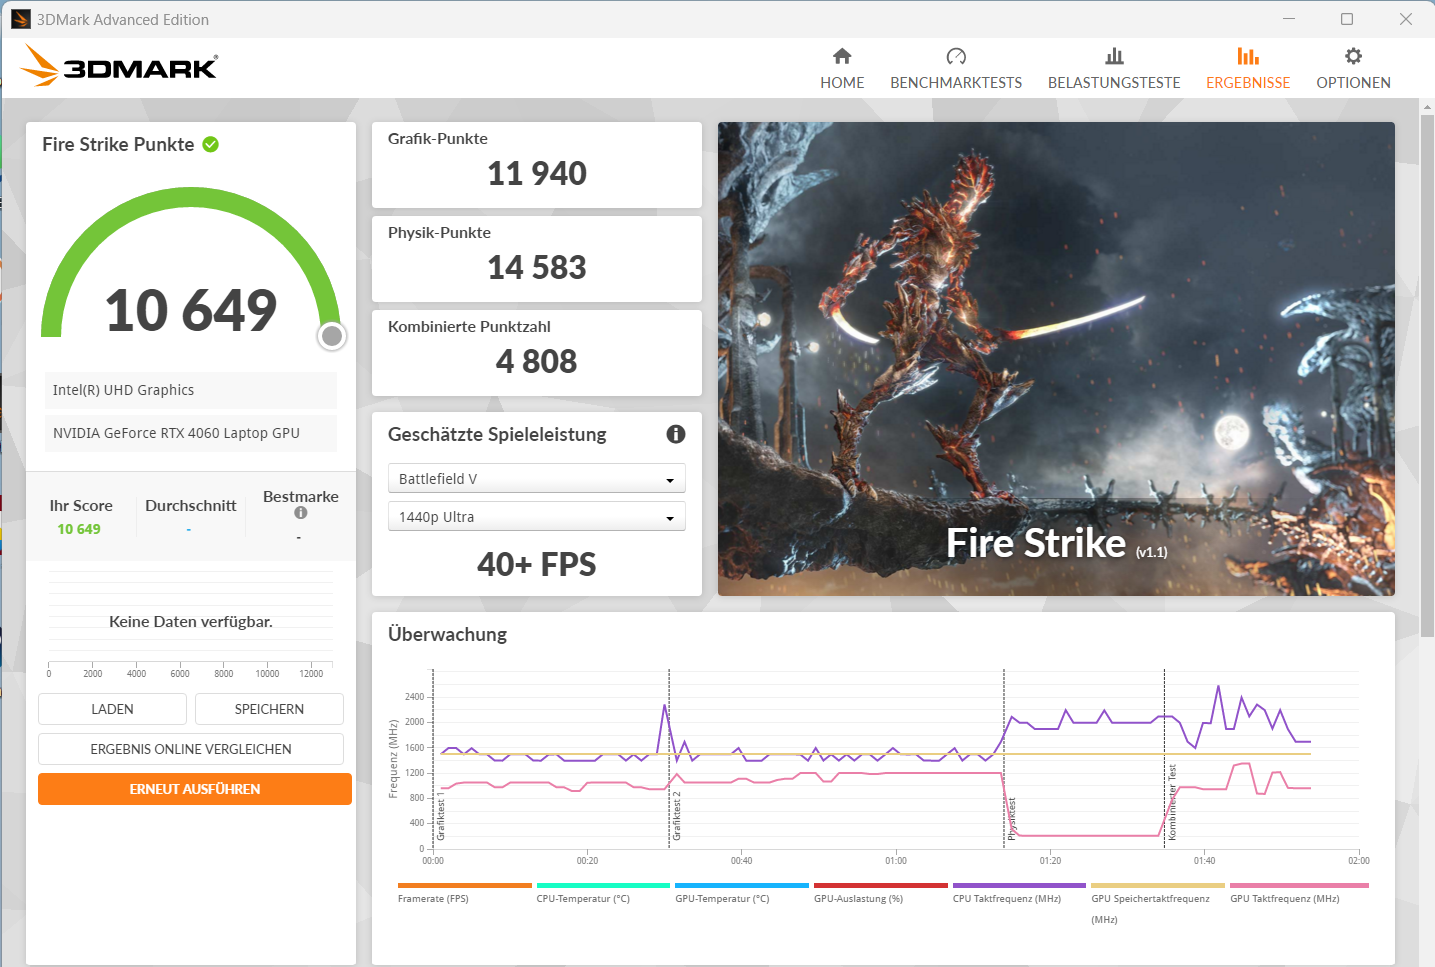
Graphics card
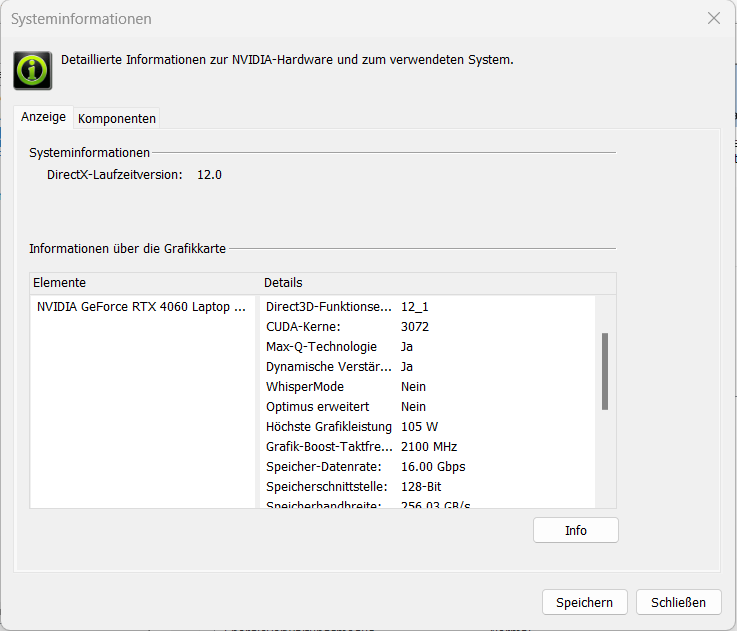
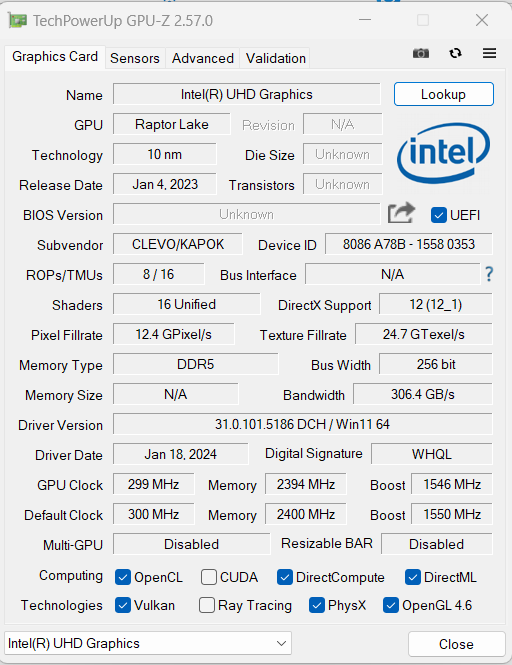
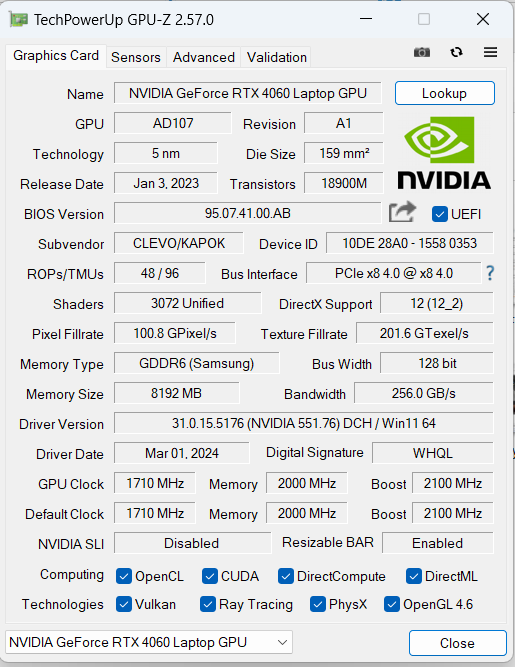
Gigabyte installs a 105 W GeForce RTX 4060 Laptop GPU (3,424 shaders, 128-bit bus, 8 GB GDDR6) in the G6X 9KG. The RTX 4060 is a mid-range model from Nvidia's current GPU range.
Benchmark values and frame rates are above the RTX 4060 average. The performance mode provides a small plus at best. Switching between dGPU and Optimus modes requires a restart as Advanced Optimus is not supported.
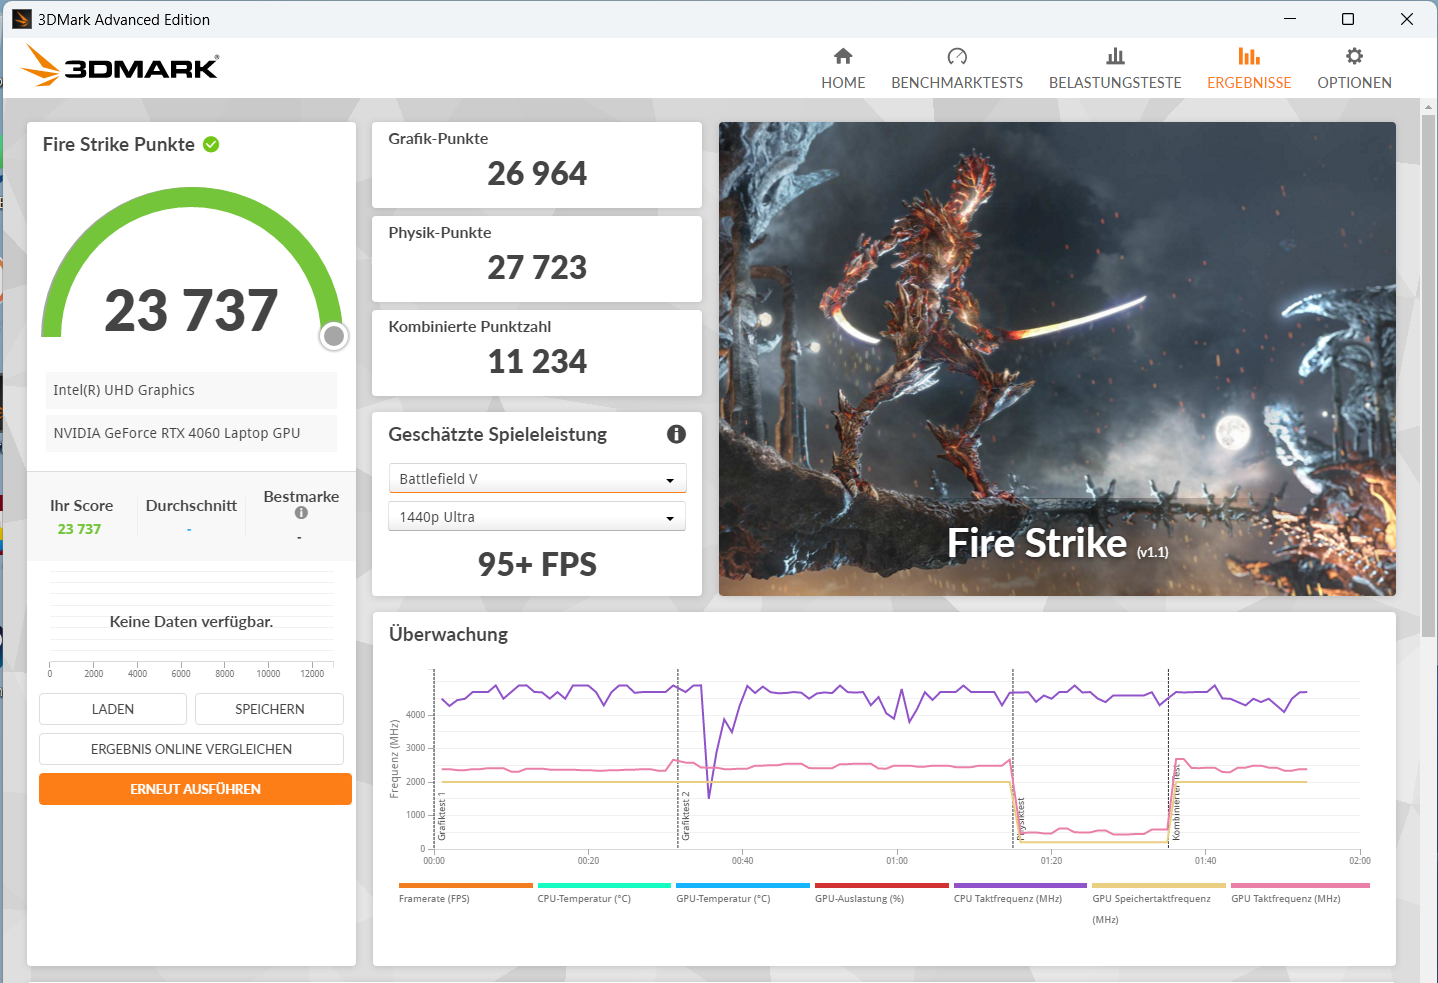
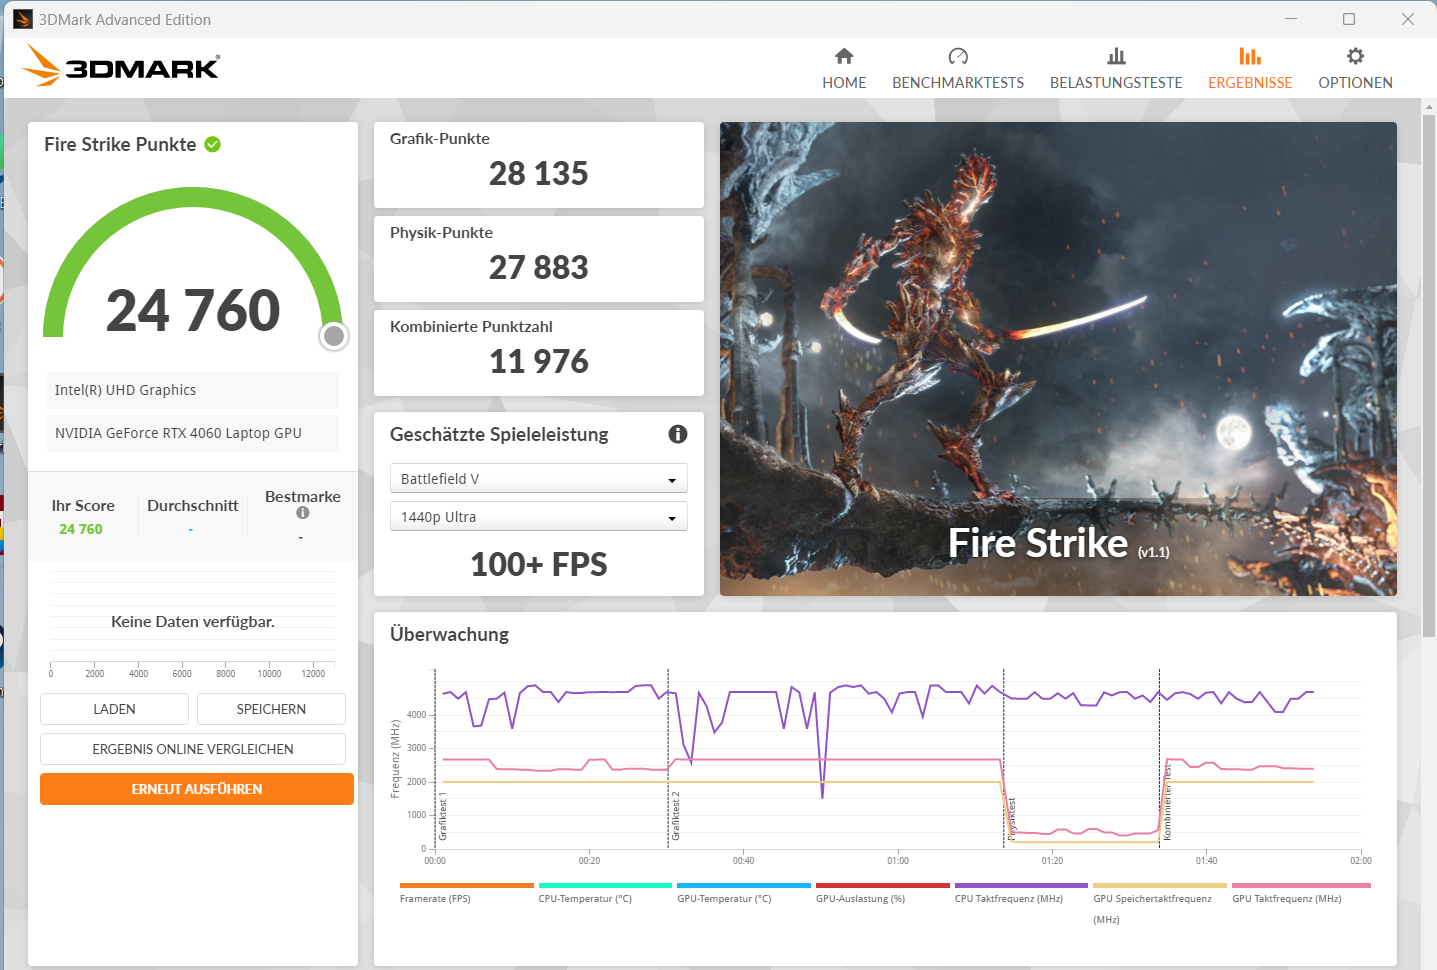

| 3DMark 11 Performance | 30293 points | |
| 3DMark Fire Strike Score | 23737 points | |
| 3DMark Time Spy Score | 10260 points | |
Help | ||
* ... smaller is better
| The Witcher 3 - 1920x1080 Ultra Graphics & Postprocessing (HBAO+) | |
| Average of class Gaming (95 - 240, n=7, last 2 years) | |
| Dell G16, i7-13650HX, RTX 4060 | |
| MSI Raider GE68HX 13VF | |
| Average NVIDIA GeForce RTX 4060 Laptop GPU (77 - 159.7, n=42) | |
| Gigabyte G6X 9KG (2024) | |
| Asus TUF Gaming A16 FA617XS (neu) | |
| Lenovo Legion 5 16IRX G9 | |
| Final Fantasy XV Benchmark - 1920x1080 High Quality | |
| Average of class Gaming (41 - 215, n=98, last 2 years) | |
| Lenovo Legion 5 16IRX G9 (1.3) | |
| Dell G16, i7-13650HX, RTX 4060 (1.3) | |
| MSI Raider GE68HX 13VF (1.3) | |
| Gigabyte G6X 9KG (2024) (1.3) | |
| Average NVIDIA GeForce RTX 4060 Laptop GPU (75.1 - 109.8, n=51) | |
| Asus TUF Gaming A16 FA617XS (1.3) | |
| Strange Brigade - 1920x1080 ultra AA:ultra AF:16 | |
| Average of class Gaming (76.3 - 456, n=88, last 2 years) | |
| Lenovo Legion 5 16IRX G9 | |
| Dell G16, i7-13650HX, RTX 4060 (1.47.22.14 D3D12) | |
| MSI Raider GE68HX 13VF (1.47.22.14 D3D12) | |
| Gigabyte G6X 9KG (2024) (1.47.22.14 D3D12) | |
| Average NVIDIA GeForce RTX 4060 Laptop GPU (135.3 - 210, n=50) | |
| Asus TUF Gaming A16 FA617XS (1.47.22.14 D3D12) | |
| Cyberpunk 2077 | |
| 1920x1080 Ultra Preset (FSR off) | |
| Average of class Gaming (17.7 - 169.9, n=118, last 2 years) | |
| Lenovo Legion 5 16IRX G9 | |
| Average NVIDIA GeForce RTX 4060 Laptop GPU (56.4 - 93.1, n=31) | |
| Dell G16, i7-13650HX, RTX 4060 | |
| Gigabyte G6X 9KG (2024) | |
| 1920x1080 Ray Tracing Ultra Preset (DLSS off) | |
| Average of class Gaming (19.1 - 84.9, n=38, last 2 years) | |
| Average NVIDIA GeForce RTX 4060 Laptop GPU (23.6 - 37.4, n=21) | |
| Gigabyte G6X 9KG (2024) | |
| 1920x1080 Ultra Preset (FSR2 on) | |
| Average of class Gaming (58 - 173.1, n=7, last 2 years) | |
| Gigabyte G6X 9KG (2024) | |
| Average NVIDIA GeForce RTX 4060 Laptop GPU (68.5 - 92.4, n=4) | |
| Skull & Bones - 1920x1080 Ultra High Preset AA:T | |
| Gigabyte G6X 9KG (2024) | |
| Average NVIDIA GeForce RTX 4060 Laptop GPU (65 - 73, n=5) | |
| Last Epoch - 1920x1080 Ultra Preset AA:T | |
| Gigabyte G6X 9KG (2024) | |
| Average NVIDIA GeForce RTX 4060 Laptop GPU (120.4 - 122.8, n=2) | |
| Average of class Gaming (n=1last 2 years) | |
| Helldivers 2 - 1920x1080 Ultra Preset | |
| Average of class Gaming (18.4 - 153.8, n=5, last 2 years) | |
| Gigabyte G6X 9KG (2024) | |
| Average NVIDIA GeForce RTX 4060 Laptop GPU (82.3 - 85.6, n=2) | |
| Ready or Not - 1920x1080 Epic Preset | |
| Average NVIDIA GeForce RTX 4060 Laptop GPU (131.5 - 133.7, n=2) | |
| Gigabyte G6X 9KG (2024) | |
The Witcher 3 FPS chart
| low | med. | high | ultra | |
|---|---|---|---|---|
| GTA V (2015) | 183.6 | 180.4 | 174.6 | 115.2 |
| The Witcher 3 (2015) | 400.9 | 306.6 | 186.5 | 100 |
| Dota 2 Reborn (2015) | 183.7 | 164.4 | 157.6 | 142.4 |
| Final Fantasy XV Benchmark (2018) | 186.5 | 139.3 | 101.5 | |
| X-Plane 11.11 (2018) | 155.1 | 132.7 | 107.1 | |
| Strange Brigade (2018) | 473 | 263 | 209 | 182.2 |
| Cyberpunk 2077 (2023) | 118.3 | 94.8 | 81.1 | 69.7 |
| Ready or Not (2023) | 218 | 152.4 | 147.6 | 131.5 |
| Helldivers 2 (2024) | 123.9 | 97.6 | 88.5 | 85.6 |
| Skull & Bones (2024) | 125 | 111 | 97 | 73 |
| Last Epoch (2024) | 195.5 | 184.6 | 164.1 | 122.8 |
Emissions and energy: G6X offers good runtimes
Noise emissions
The sound pressure level (SPL) rises to up to 54 dB(A) under full load (Entertainment mode). The SPL can go higher in Performance mode. A significantly quieter operation could be achieved with the Silent mode.
However, this is noticeably at the expense of performance as this is not how the dGPU works. In general, the Entertainment mode is recommended for everyday use. Beyond full load, the noise development remains at a moderate level.
Noise level
| Idle |
| 30 / 32 / 35 dB(A) |
| Load |
| 51 / 54 dB(A) |
 | ||
30 dB silent 40 dB(A) audible 50 dB(A) loud |
||
min: | ||
| Gigabyte G6X 9KG (2024) i7-13650HX, GeForce RTX 4060 Laptop GPU | Dell G16, i7-13650HX, RTX 4060 i7-13650HX, GeForce RTX 4060 Laptop GPU | Lenovo Legion 5 16IRX G9 i7-14650HX, GeForce RTX 4060 Laptop GPU | MSI Raider GE68HX 13VF i9-13950HX, GeForce RTX 4060 Laptop GPU | Asus TUF Gaming A16 FA617XS R9 7940HS, Radeon RX 7600S | |
|---|---|---|---|---|---|
| Noise | 21% | 7% | 2% | 11% | |
| off / environment * (dB) | 26 | 23 12% | 24 8% | 23.3 10% | 25 4% |
| Idle Minimum * (dB) | 30 | 23 23% | 24 20% | 25 17% | 25 17% |
| Idle Average * (dB) | 32 | 23 28% | 28.8 10% | 31.3 2% | 26 19% |
| Idle Maximum * (dB) | 35 | 27.96 20% | 32 9% | 37.5 -7% | 28 20% |
| Load Average * (dB) | 51 | 27.96 45% | 45.5 11% | 44 14% | 43 16% |
| Witcher 3 ultra * (dB) | 51 | 47.89 6% | 53.1 -4% | 57 -12% | 51 -0% |
| Load Maximum * (dB) | 54 | 47.89 11% | 55.7 -3% | 60.1 -11% | 53 2% |
* ... smaller is better
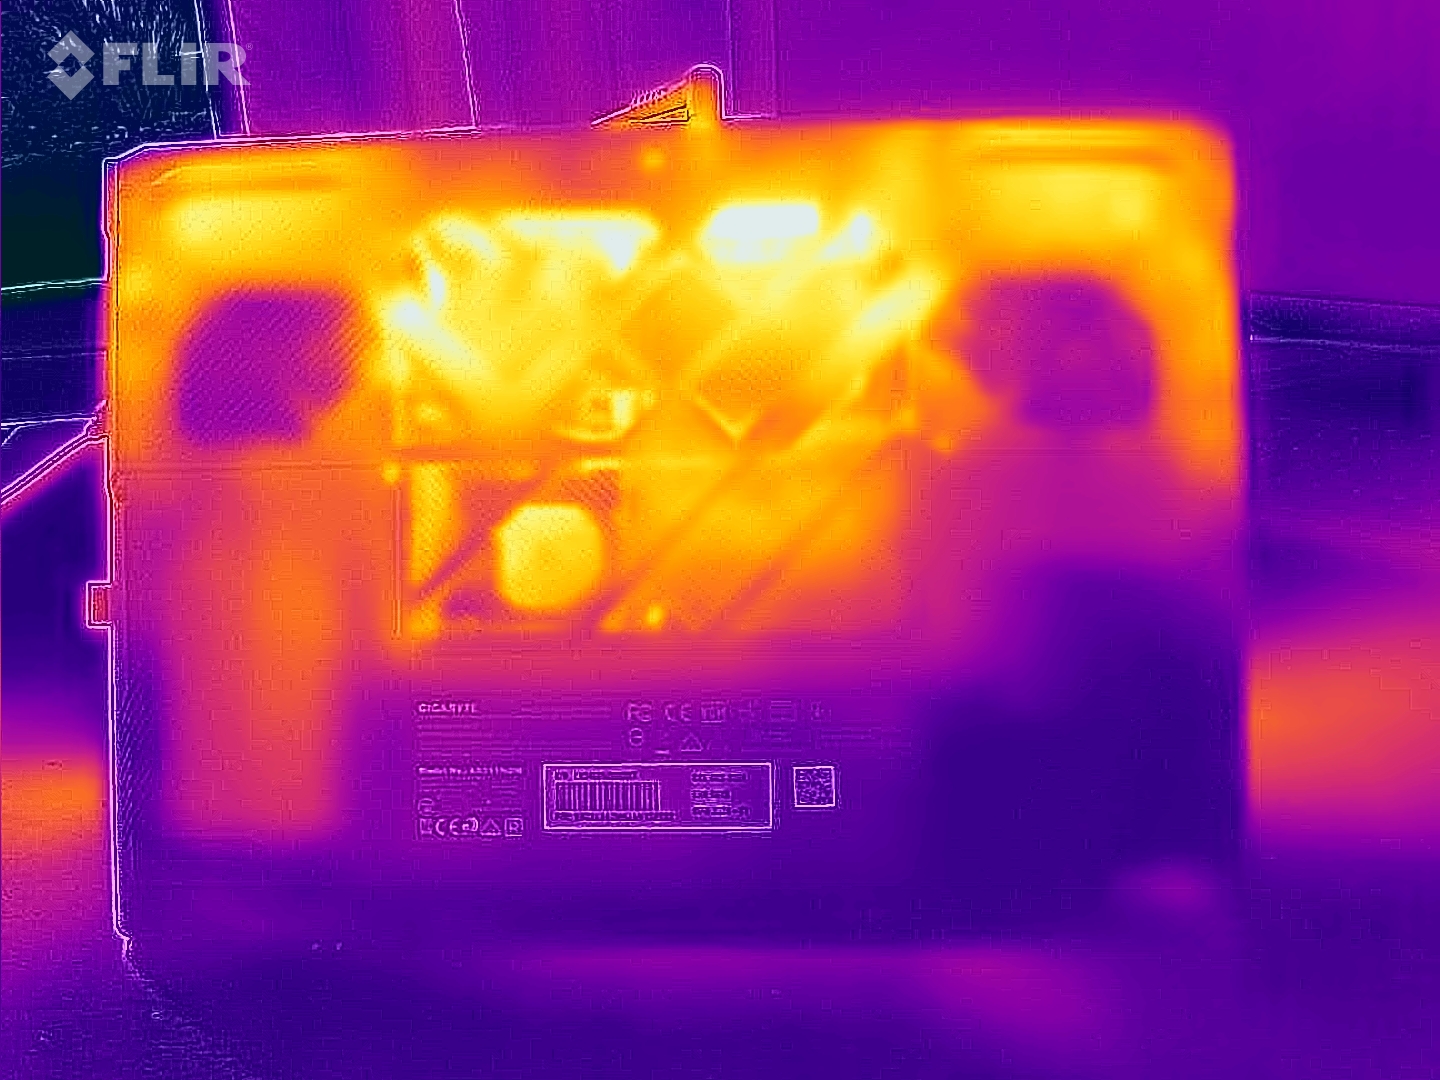
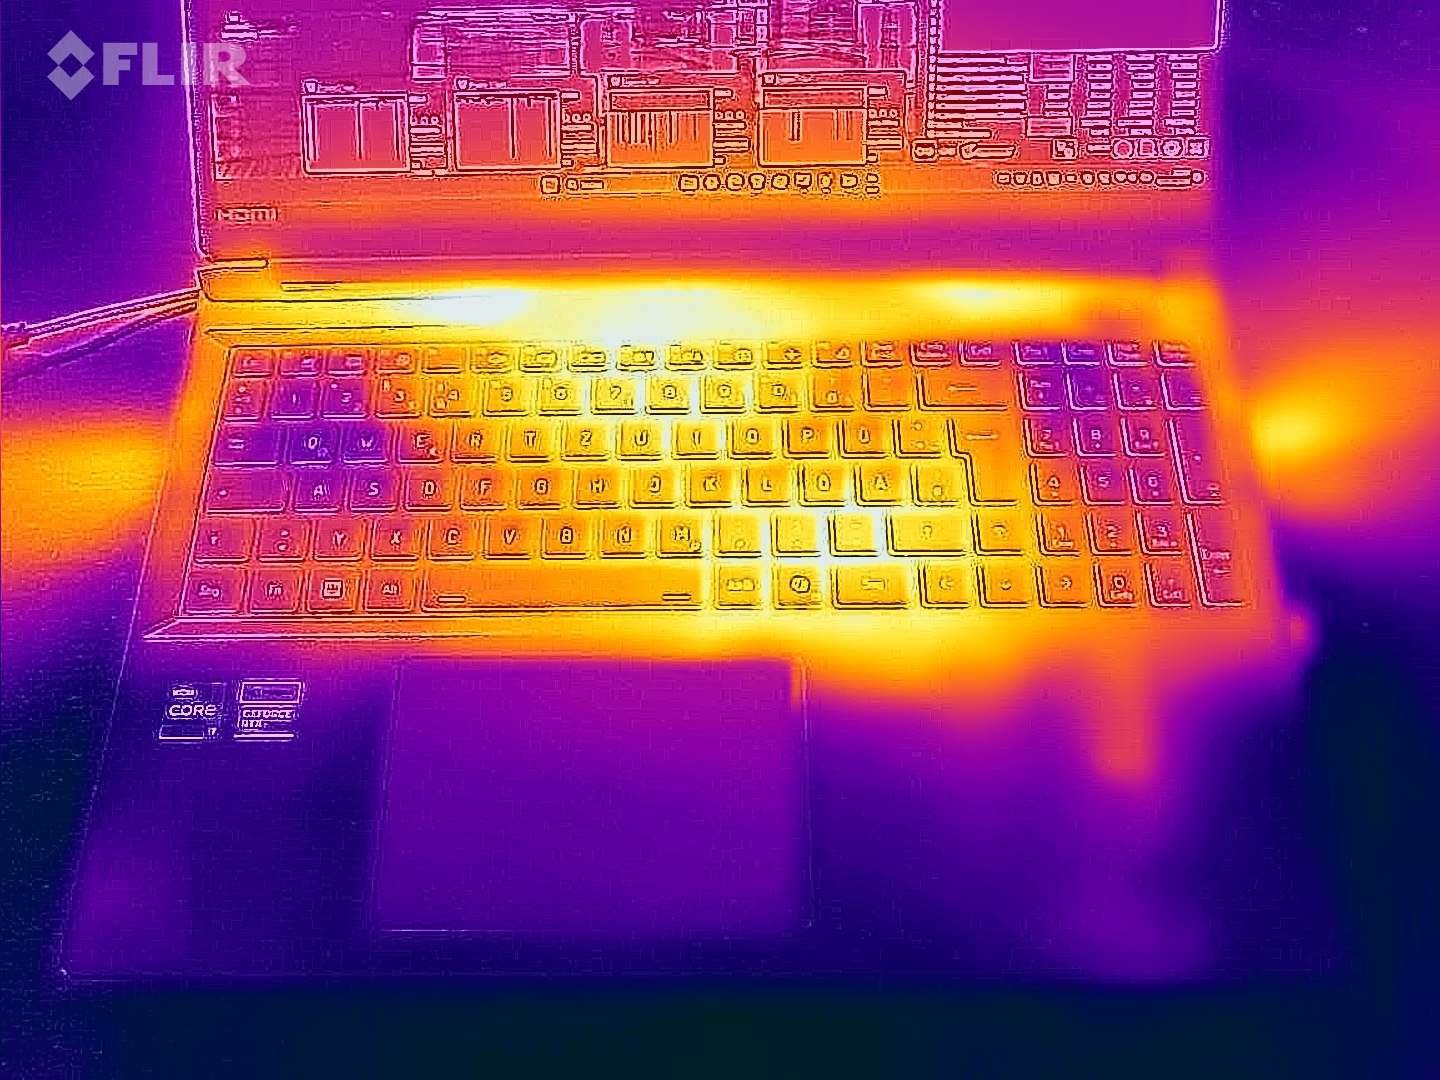
Temperature
The stress test and The Witcher 3 tests ensure moderate heating of the laptop at best. Values in the lower 40 °C range are occasionally reached. In everyday use (Office, internet browsing), the values remain in the green range.
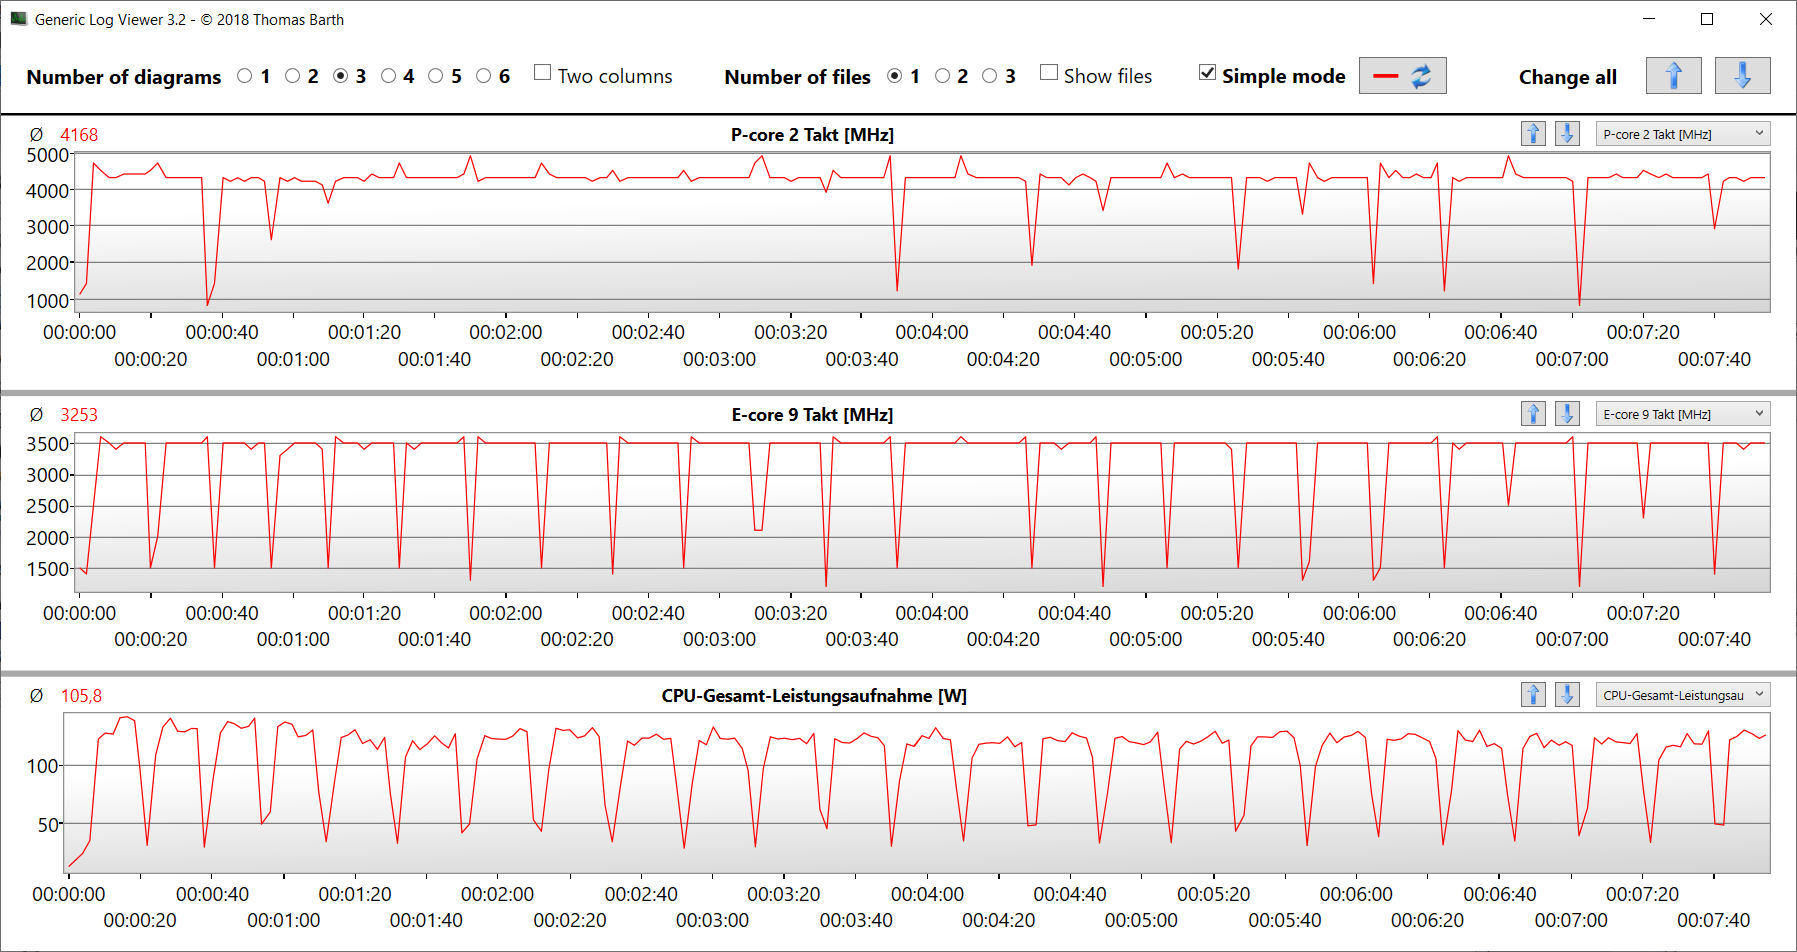
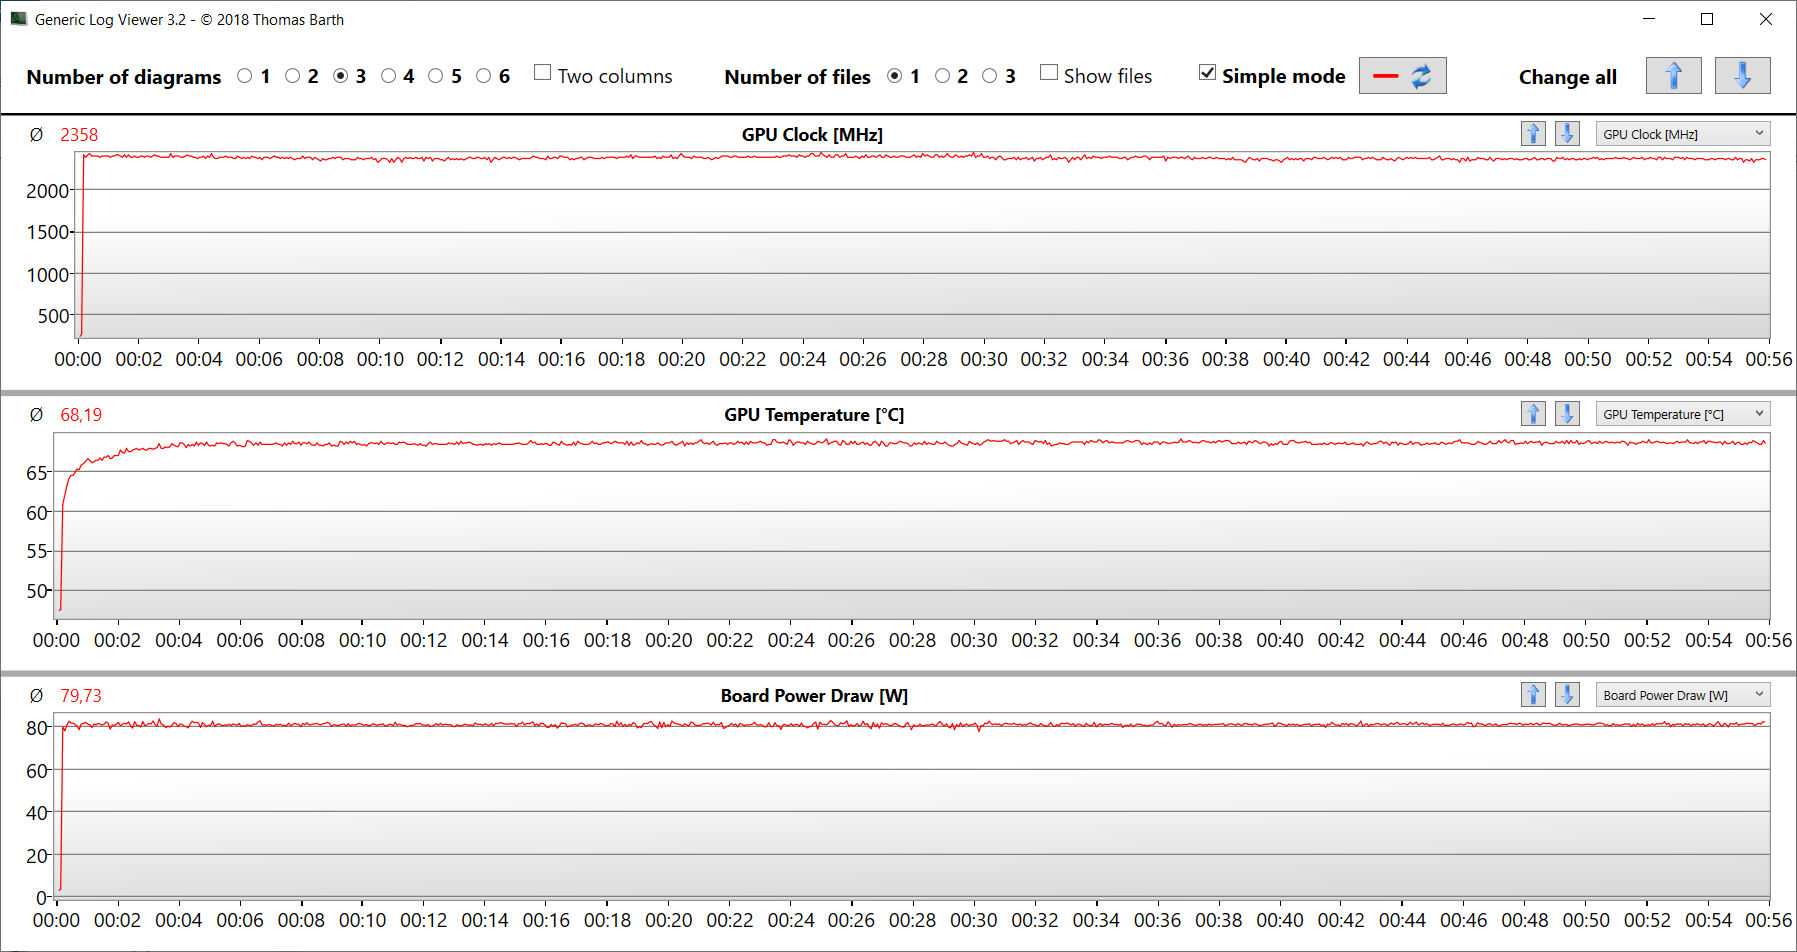
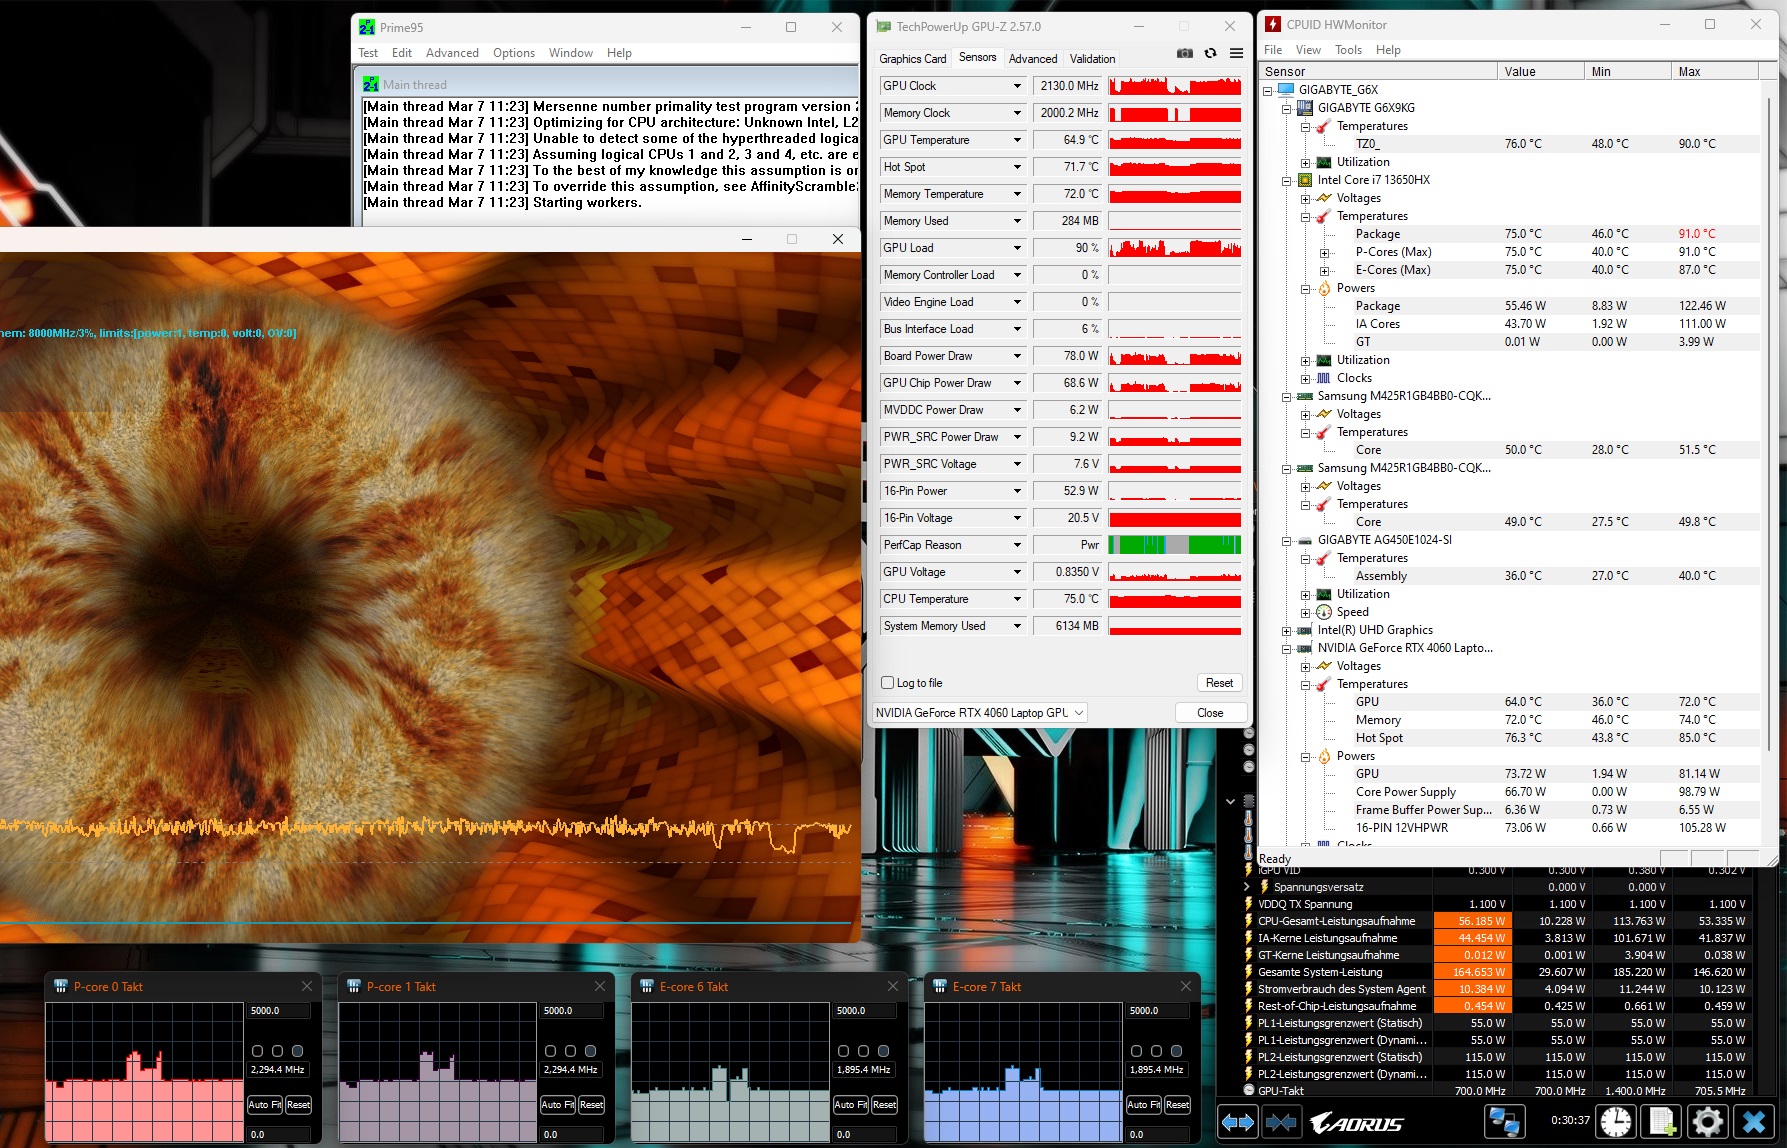
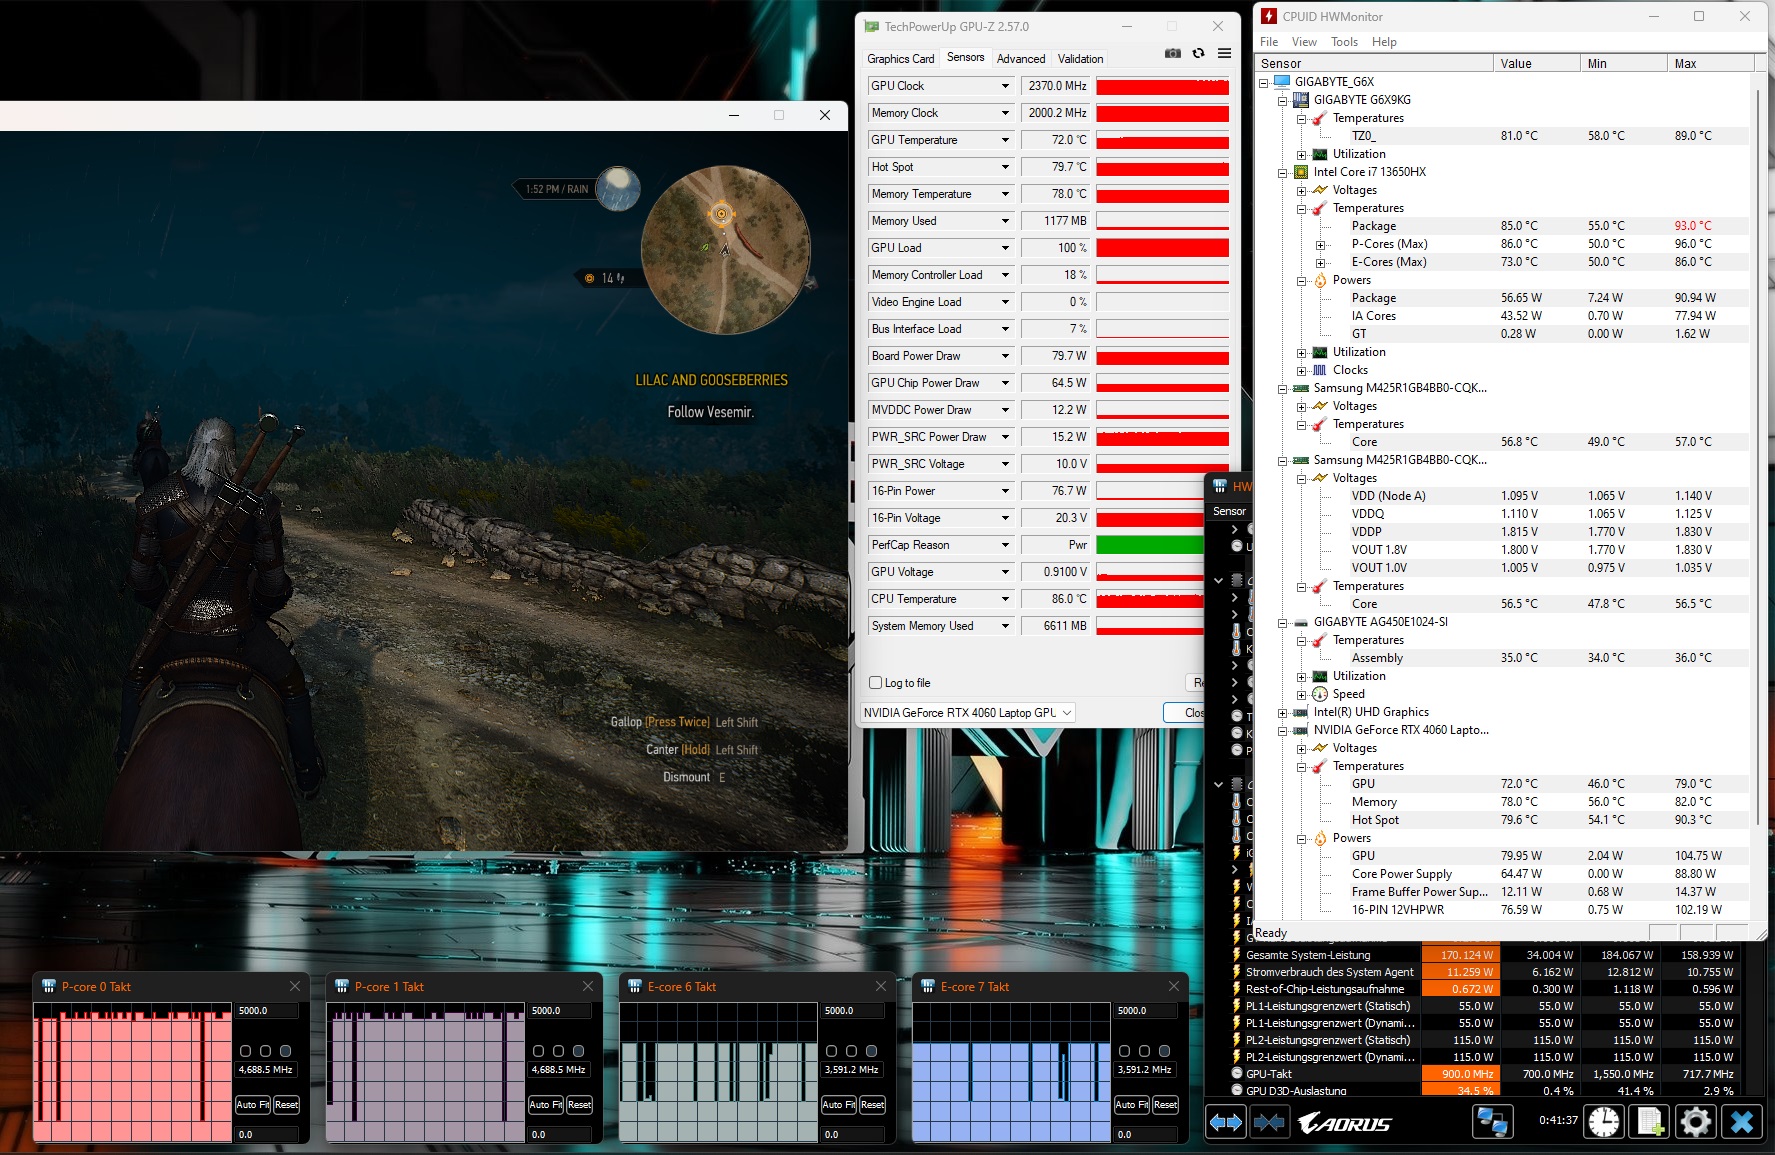
The extreme stress test scenario (Prime95 and FurMark in continuous operation) checks the system stability under full load. The CPU of the G6X initially works at full power, but quickly reduces the clock rate to base clock level. The GPU clock rate drops from 2.3 GHz-2.6 GHz to 1.9-2.1 GHz.
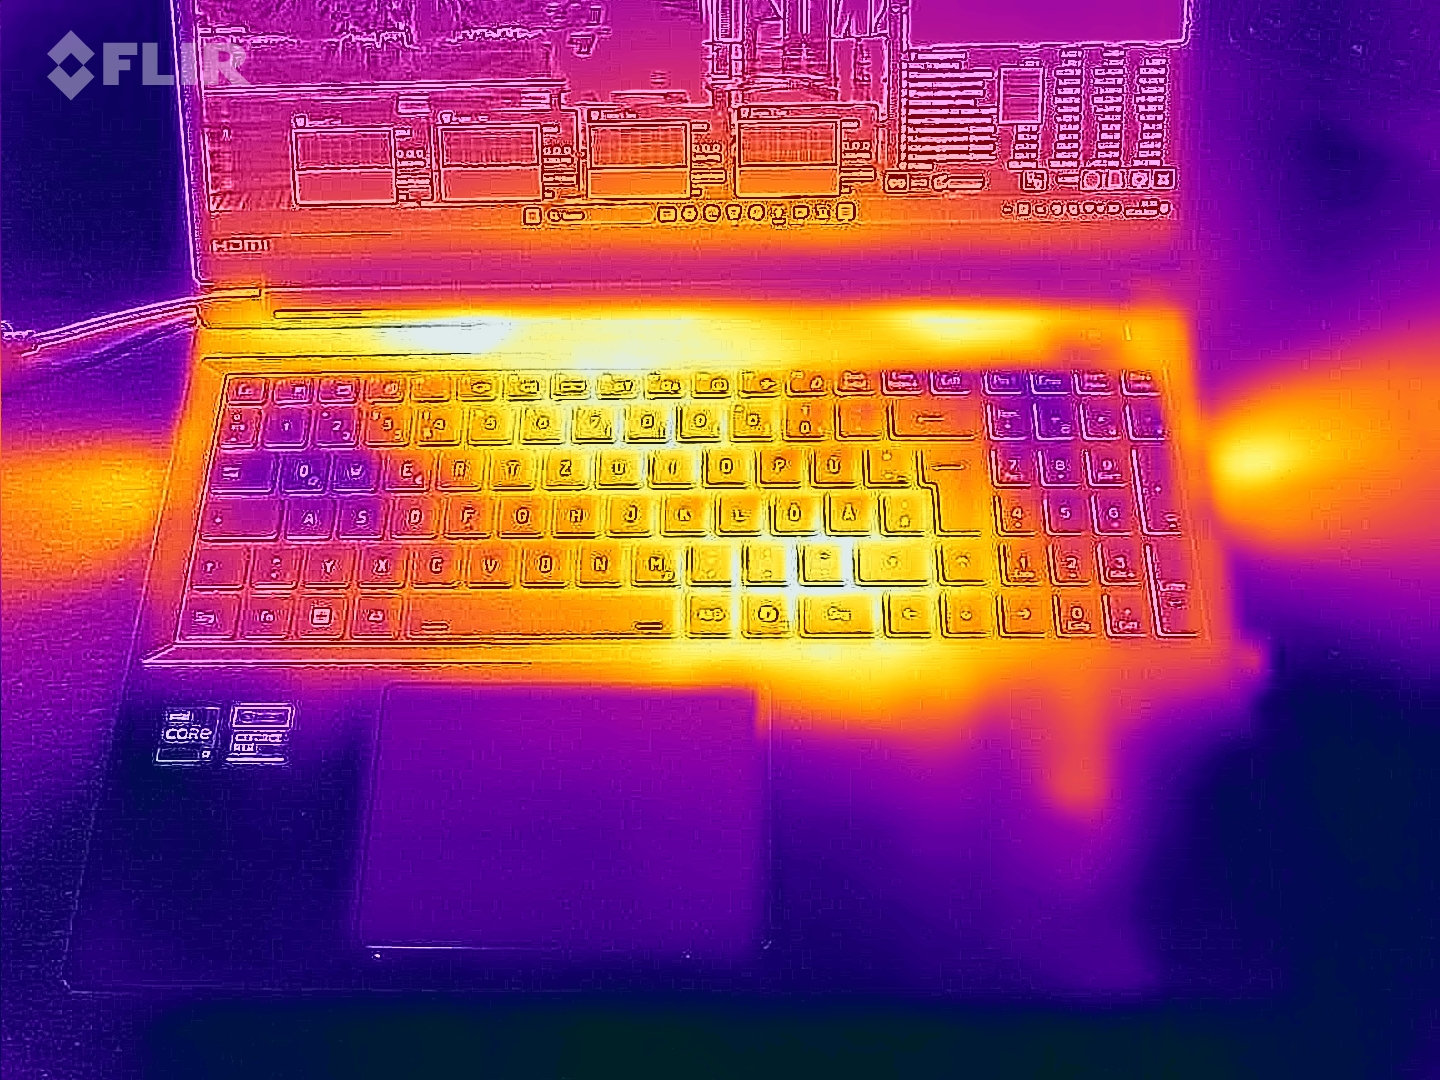
(±) The maximum temperature on the upper side is 41 °C / 106 F, compared to the average of 40.4 °C / 105 F, ranging from 21.2 to 68.8 °C for the class Gaming.
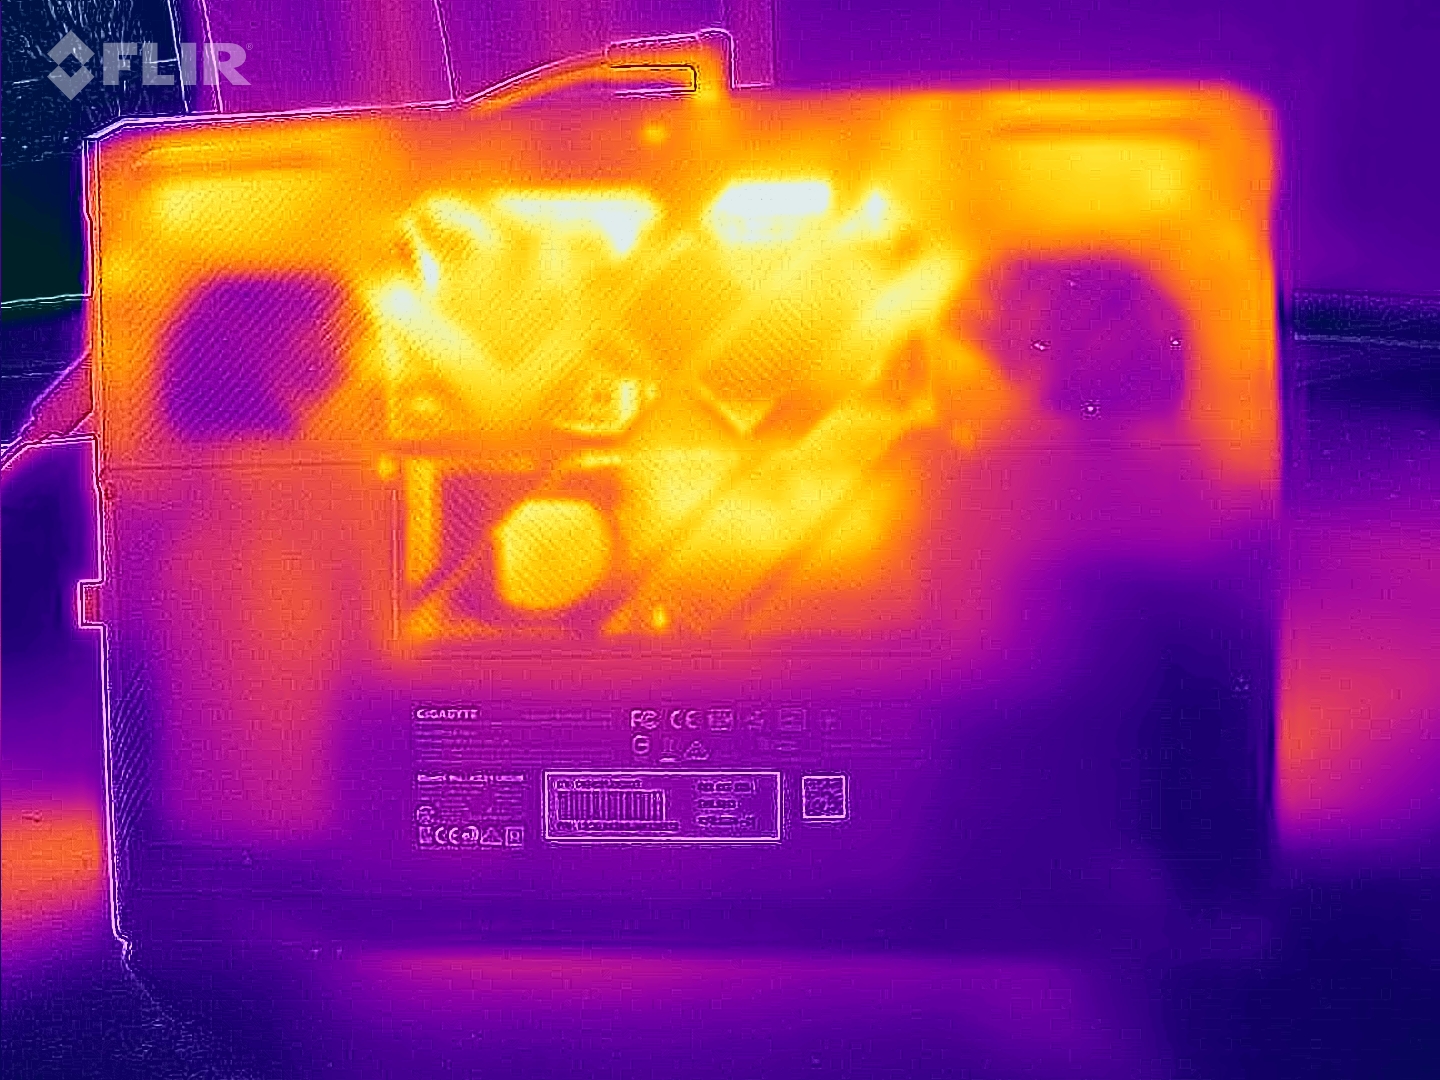
(±) The bottom heats up to a maximum of 43 °C / 109 F, compared to the average of 43.2 °C / 110 F
(+) In idle usage, the average temperature for the upper side is 29.6 °C / 85 F, compared to the device average of 33.9 °C / 93 F.
(±) Playing The Witcher 3, the average temperature for the upper side is 34.9 °C / 95 F, compared to the device average of 33.9 °C / 93 F.
(+) The palmrests and touchpad are cooler than skin temperature with a maximum of 28 °C / 82.4 F and are therefore cool to the touch.
(±) The average temperature of the palmrest area of similar devices was 28.8 °C / 83.8 F (+0.8 °C / 1.4 F).
| Gigabyte G6X 9KG (2024) i7-13650HX, GeForce RTX 4060 Laptop GPU | Dell G16, i7-13650HX, RTX 4060 i7-13650HX, GeForce RTX 4060 Laptop GPU | Lenovo Legion 5 16IRX G9 i7-14650HX, GeForce RTX 4060 Laptop GPU | MSI Raider GE68HX 13VF i9-13950HX, GeForce RTX 4060 Laptop GPU | Asus TUF Gaming A16 FA617XS R9 7940HS, Radeon RX 7600S | |
|---|---|---|---|---|---|
| Heat | -15% | 2% | 4% | -4% | |
| Maximum Upper Side * (°C) | 41 | 49 -20% | 40.4 1% | 41.4 -1% | 53 -29% |
| Maximum Bottom * (°C) | 43 | 58 -35% | 43.8 -2% | 45.4 -6% | 48 -12% |
| Idle Upper Side * (°C) | 32 | 35 -9% | 30.3 5% | 29.8 7% | 30 6% |
| Idle Bottom * (°C) | 37 | 35 5% | 35.3 5% | 31.4 15% | 30 19% |
* ... smaller is better
Loudspeaker
The stereo speakers produce a decent sound overall. However, there is a lack of bass.
Gigabyte G6X 9KG (2024) audio analysis
(+) | speakers can play relatively loud (82 dB)
Bass 100 - 315 Hz
(-) | nearly no bass - on average 24.9% lower than median
(±) | linearity of bass is average (13.7% delta to prev. frequency)
Mids 400 - 2000 Hz
(+) | balanced mids - only 4.1% away from median
(+) | mids are linear (5.4% delta to prev. frequency)
Highs 2 - 16 kHz
(+) | balanced highs - only 2.2% away from median
(±) | linearity of highs is average (7.4% delta to prev. frequency)
Overall 100 - 16.000 Hz
(±) | linearity of overall sound is average (17.2% difference to median)
Compared to same class
» 47% of all tested devices in this class were better, 11% similar, 42% worse
» The best had a delta of 6%, average was 18%, worst was 132%
Compared to all devices tested
» 32% of all tested devices were better, 8% similar, 60% worse
» The best had a delta of 4%, average was 23%, worst was 134%
Dell G16, i7-13650HX, RTX 4060 audio analysis
(±) | speaker loudness is average but good (80.55 dB)
Bass 100 - 315 Hz
(-) | nearly no bass - on average 25.1% lower than median
(-) | bass is not linear (18.9% delta to prev. frequency)
Mids 400 - 2000 Hz
(±) | higher mids - on average 8% higher than median
(+) | mids are linear (5.9% delta to prev. frequency)
Highs 2 - 16 kHz
(+) | balanced highs - only 3.5% away from median
(±) | linearity of highs is average (8.6% delta to prev. frequency)
Overall 100 - 16.000 Hz
(±) | linearity of overall sound is average (23.4% difference to median)
Compared to same class
» 85% of all tested devices in this class were better, 4% similar, 11% worse
» The best had a delta of 6%, average was 18%, worst was 132%
Compared to all devices tested
» 70% of all tested devices were better, 6% similar, 24% worse
» The best had a delta of 4%, average was 23%, worst was 134%
Energy consumption
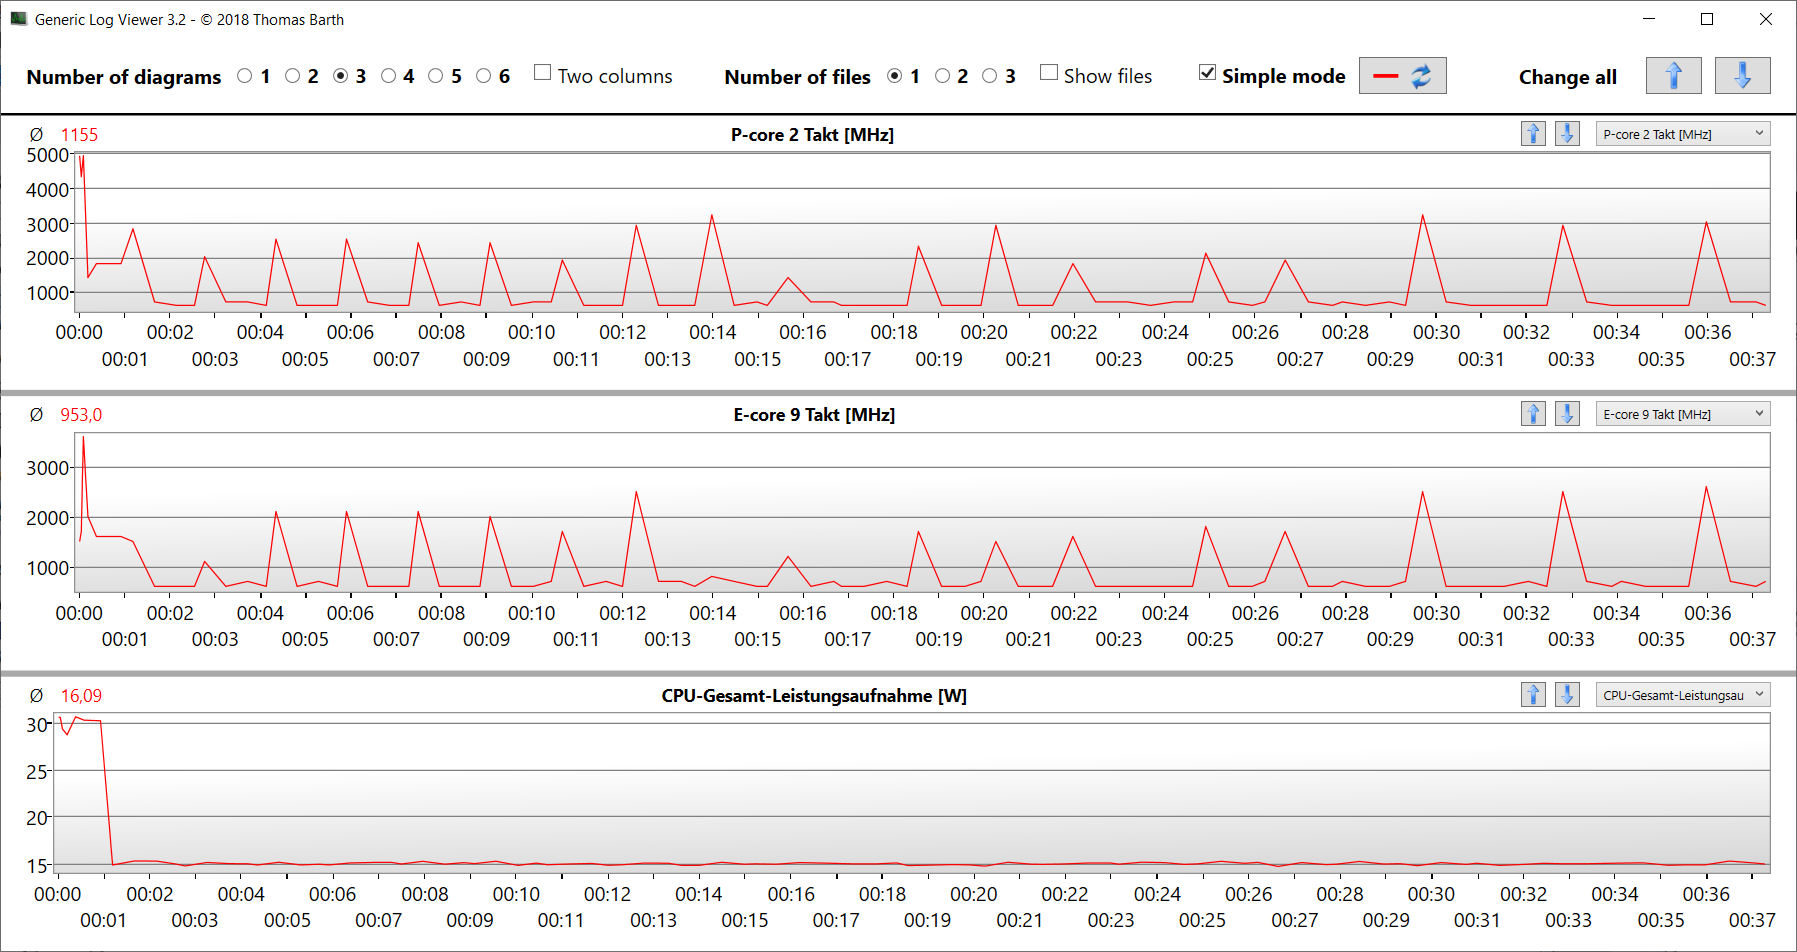
The power consumption is at a normal level for the hardware installed. While The Witcher 3 test is run at a constant energy consumption, the demand fluctuates slightly during the stress test.
The power output of the power supply is above the rated power (180 W) for a few minutes but is then reduced to the rated power level.
| Off / Standby | |
| Idle | |
| Load |
|
Key:
min: | |
Energieaufnahme Witcher 3 / Stresstest
Power consumption: External monitor
Battery life
The Gigabyte G6X achieves a runtime of 7:54 h in the practical WLAN test (mapping the load when accessing websites using a script), which is a good value and is the second-best runtime in the comparison.
Pros
Cons
Verdict: Well-rounded overall package
The Gigabyte G6X 9KG is designed for FHD gaming at high to maximum settings, but its Core i7-13650HX and GeForce RTX 4060 configuration should also be able to deliver in other areas such as video editing and rendering. A fast 1 TB PCIe Gen 4 SSD ensures short loading times.
Gigabyte delivers a coherent mid-range gaming notebook with the G6X 9KG (2024)."
The laptop does not heat up much under load but can produce a lot of noise. The Silent power profile can counteract this, but this results in the dGPU getting switched off. The good Wi-Fi runtime of just under 8 hours, therefore, comes as no surprise.
The G6X does not feature any modern Thunderbolt or USB4 ports. With one of the USB Type-C supporting Power Delivery, the proprietary power supply unit can stay at home for regular work. The two USB 3.2 Gen 2 Type-C ports also enable easy integration into existing workstation setups.
The matte 16-inch WUXGA 165 Hz IPS display makes a good impression overall but offers insufficient color space coverage.
As an alternative, the Lenovo Legion 5 16IRX G9 could be considered. It offers more GPU performance and a brighter screen with better color space coverage.
Price and availability
In the US, the Gigabyte G6X 9KG (2024) is available from Amazon for around $1,350.
Gigabyte G6X 9KG (2024)
- 03/22/2024 v7 (old)
Sascha Mölck
Transparency
The selection of devices to be reviewed is made by our editorial team. The test sample was provided to the author as a loan by the manufacturer or retailer for the purpose of this review. The lender had no influence on this review, nor did the manufacturer receive a copy of this review before publication. There was no obligation to publish this review. As an independent media company, Notebookcheck is not subjected to the authority of manufacturers, retailers or publishers.
This is how Notebookcheck is testing
Every year, Notebookcheck independently reviews hundreds of laptops and smartphones using standardized procedures to ensure that all results are comparable. We have continuously developed our test methods for around 20 years and set industry standards in the process. In our test labs, high-quality measuring equipment is utilized by experienced technicians and editors. These tests involve a multi-stage validation process. Our complex rating system is based on hundreds of well-founded measurements and benchmarks, which maintains objectivity. Further information on our test methods can be found here.
Price comparison

