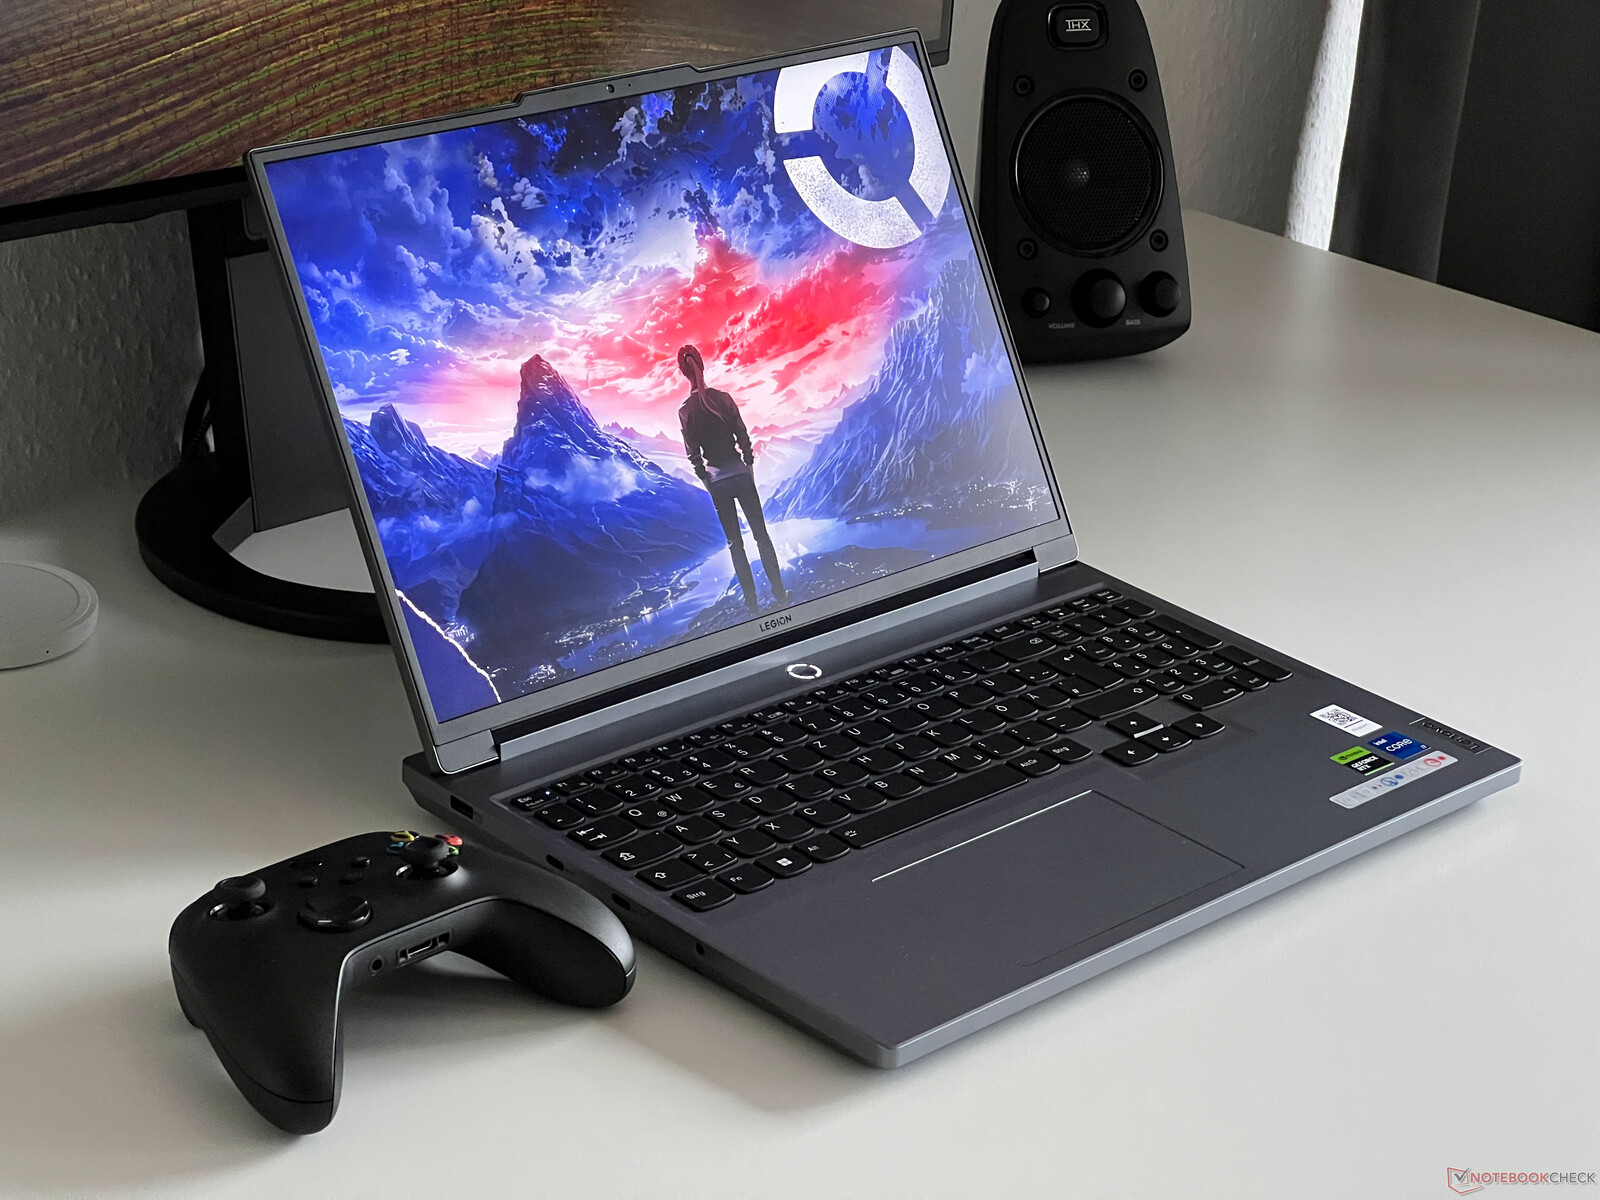
Lenovo Legion 5i 16 G9 review - The fast gaming laptop with Raptor Lake-HX and an AI engine
Lenovo only just unveiled its new gamer, the Legion 5i 16 G9, at this year's CES—and we have already had a chance to test it. Lenovo's mid-range gaming laptop comes right in between the cheaper LOQ series and the more expensive Legion 5 Pro. With its new Raptor-Lake-HX processor, the Core i7-14650HX, a 115-watt version of the RTX 4060 Laptop (including Advanced Optimus) and a fast 240-Hz WQXGA panel, the new Legion 5i 16 focuses entirely on performance, leaving out things such as extensive case lighting. Moreover, the manufacturer makes use of a special AI chip—supposedly, Lenovo's AI Engine+ will further improve users' gaming experience.
We tested the version of the Legion 5i 16IRX G9 with the Core-i7 processor, RTX 4060 Laptop, 240-Hz display, 16 GB RAM as well as a 1-TB PCIe SSD for US$1,610.
Possible competitors compared
Rating | Date | Model | Weight | Height | Size | Resolution | Price |
|---|---|---|---|---|---|---|---|
| 89.1 % v7 (old) | 01 / 2024 | Lenovo Legion 5 16IRX G9 i7-14650HX, GeForce RTX 4060 Laptop GPU | 2.4 kg | 25.2 mm | 16.00" | 2560x1600 | |
| 89.2 % v7 (old) | 10 / 2023 | Schenker XMG CORE 16 (L23) R7 7840HS, GeForce RTX 4070 Laptop GPU | 2.4 kg | 26.1 mm | 16.00" | 2560x1600 | |
| 85.1 % v7 (old) | 09 / 2023 | HP Victus 16-r0077ng i7-13700H, GeForce RTX 4070 Laptop GPU | 2.4 kg | 24 mm | 16.10" | 1920x1080 | |
| 87.3 % v7 (old) | 09 / 2023 | Lenovo LOQ 16IRH8 i7-13620H, GeForce RTX 4060 Laptop GPU | 2.7 kg | 25.9 mm | 16.00" | 2560x1600 | |
| 87.7 % v7 (old) | 08 / 2023 | Lenovo Legion Slim 5 16APH8 R7 7840HS, GeForce RTX 4060 Laptop GPU | 2.4 kg | 25.2 mm | 16.00" | 2560x1600 | |
| 85.6 % v7 (old) | 09 / 2023 | HP Victus 16-r0076TX i5-13500HX, GeForce RTX 4050 Laptop GPU | 2.3 kg | 22.9 mm | 16.10" | 1920x1080 | |
| 88.3 % v7 (old) | 09 / 2023 | Alienware m16 R1 Intel i7-13700HX, GeForce RTX 4060 Laptop GPU | 3 kg | 25.4 mm | 16.00" | 2560x1600 | |
| 87.9 % v7 (old) | 05 / 2023 | Lenovo Legion Pro 5 16IRX8 i7-13700HX, GeForce RTX 4060 Laptop GPU | 2.5 kg | 26.8 mm | 16.00" | 2560x1600 |
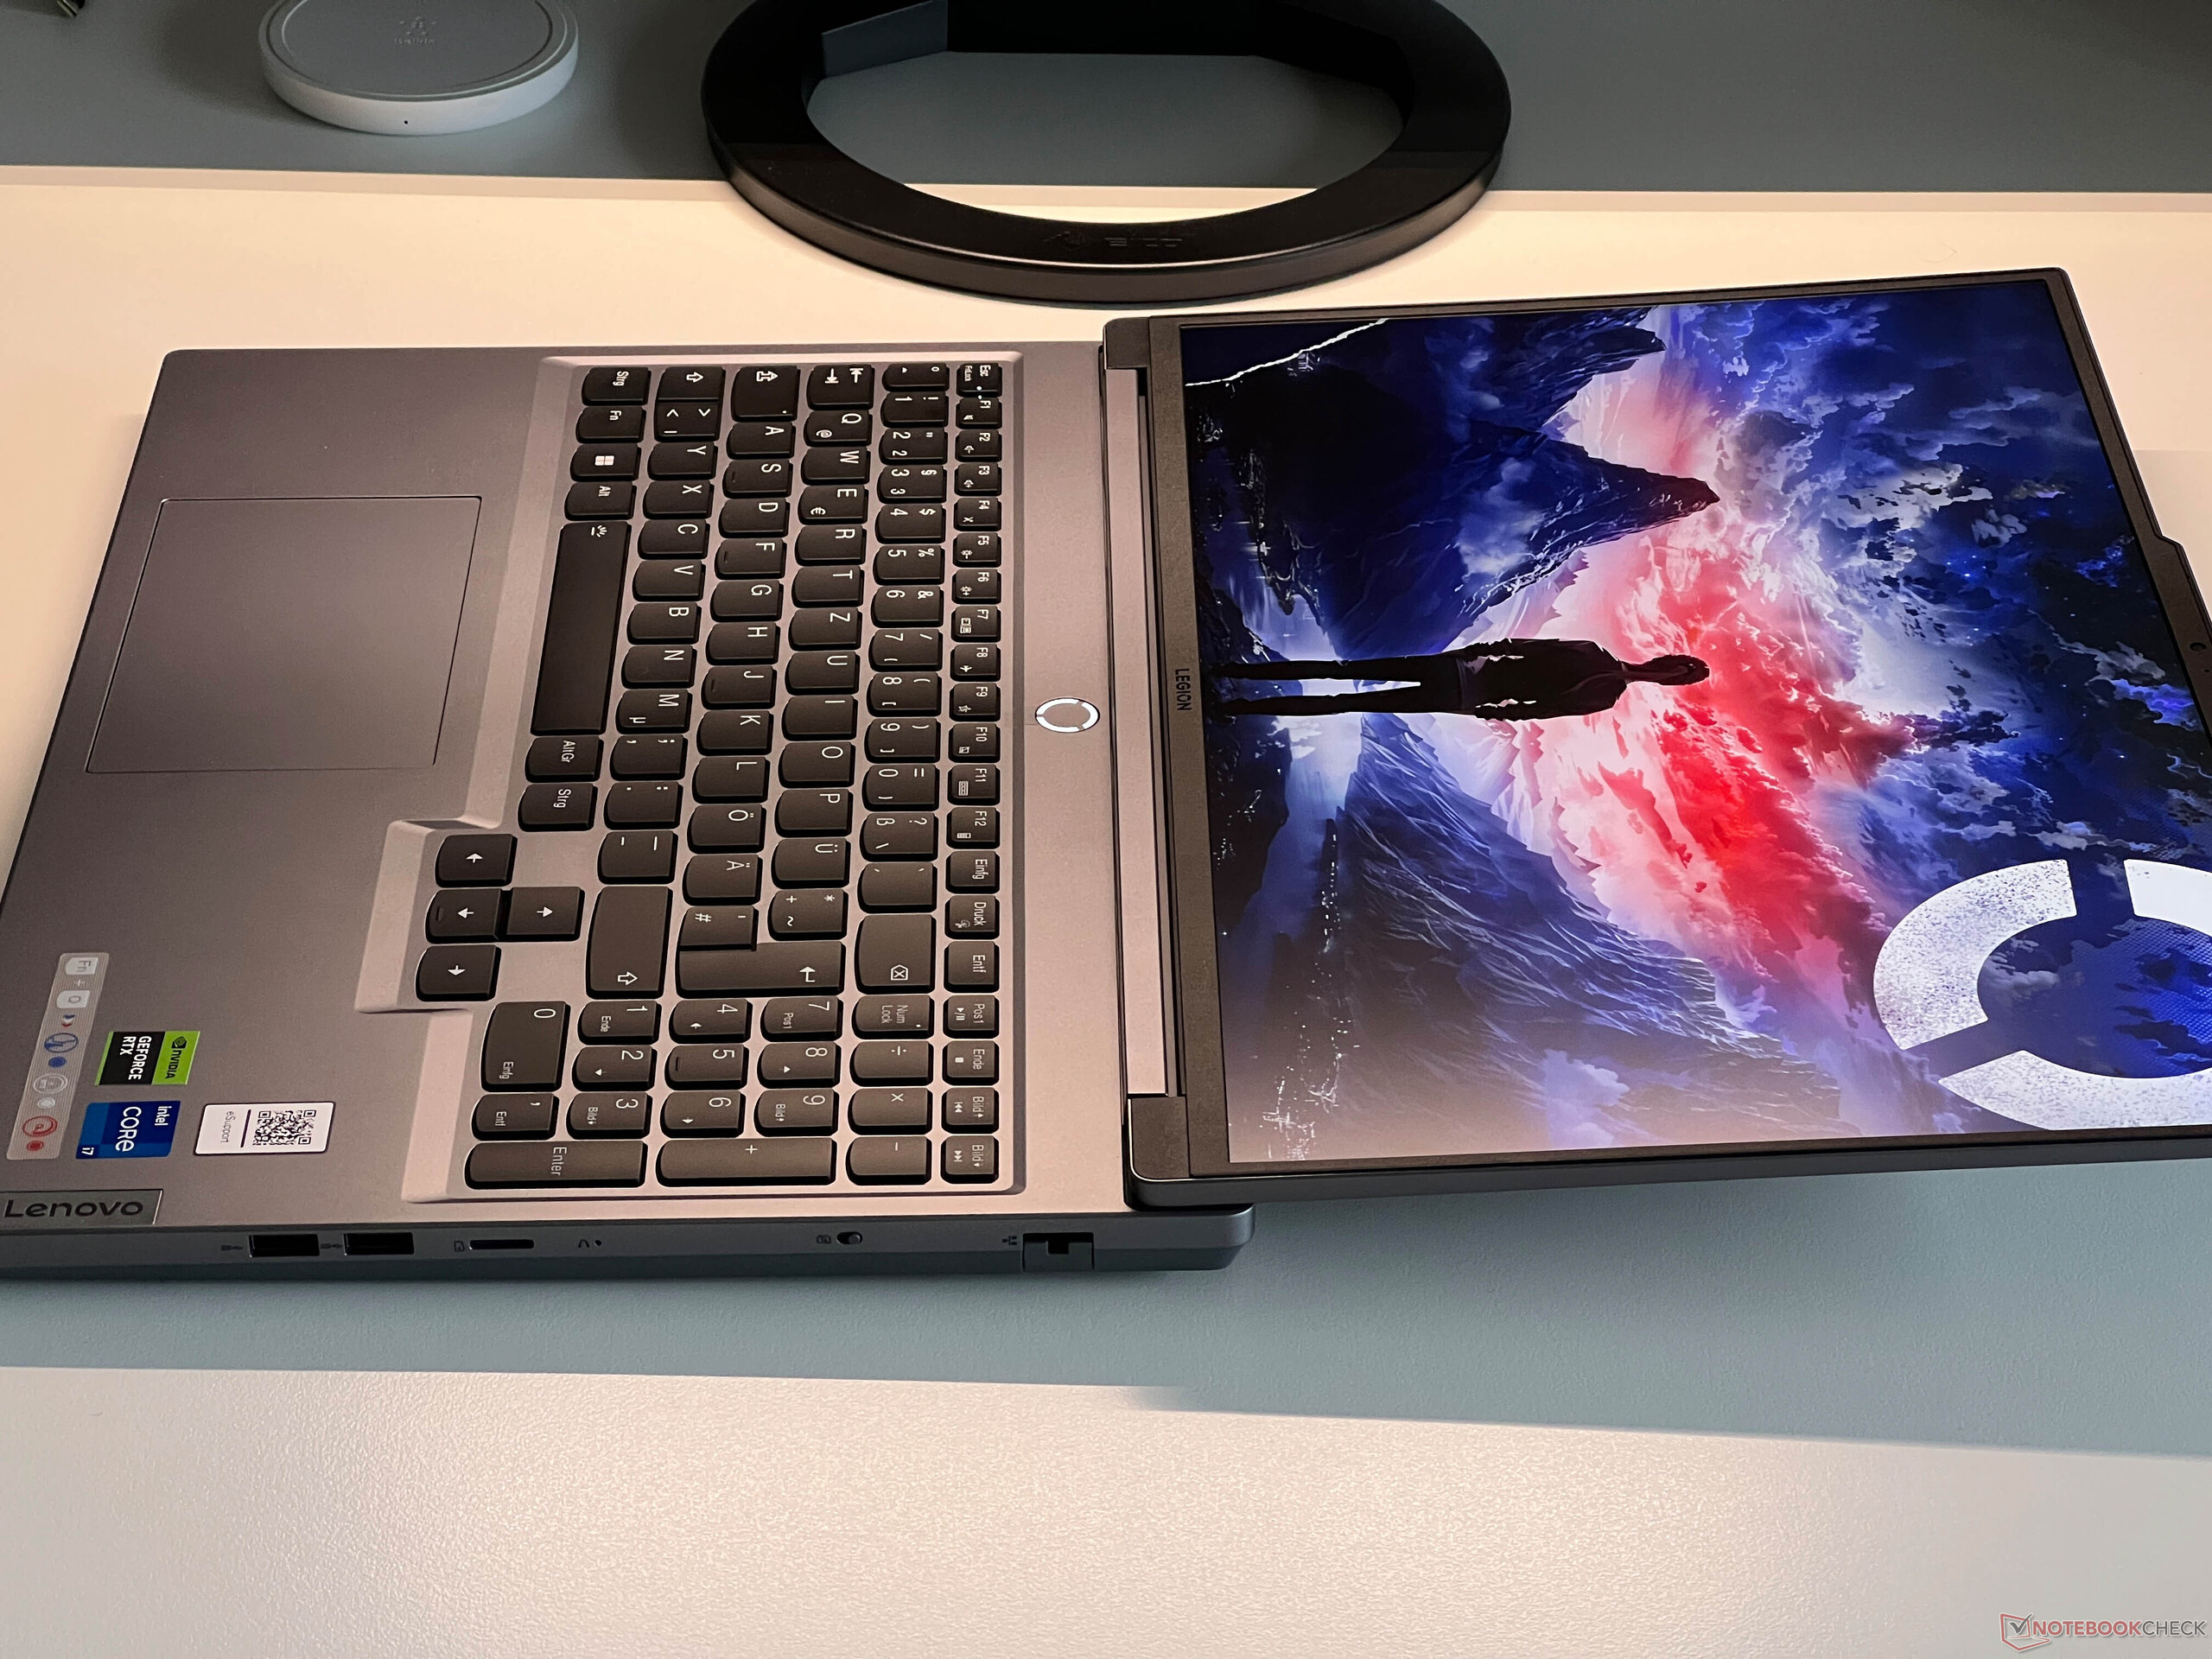
Case - The Legion partly features aluminum
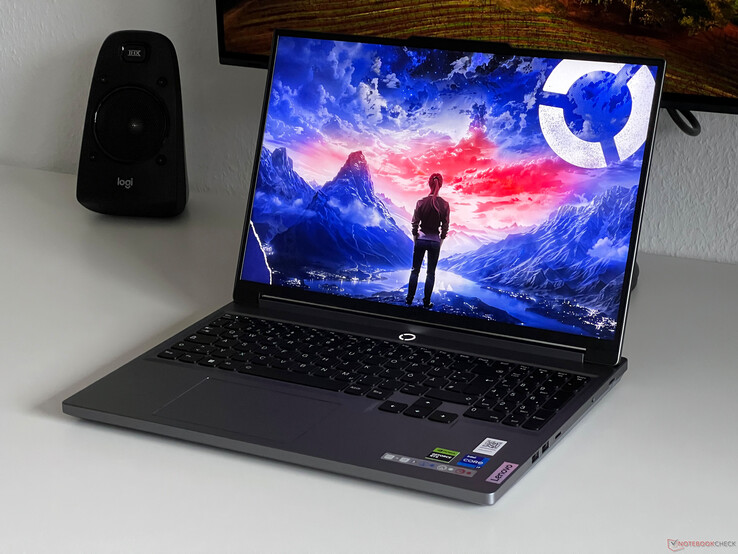
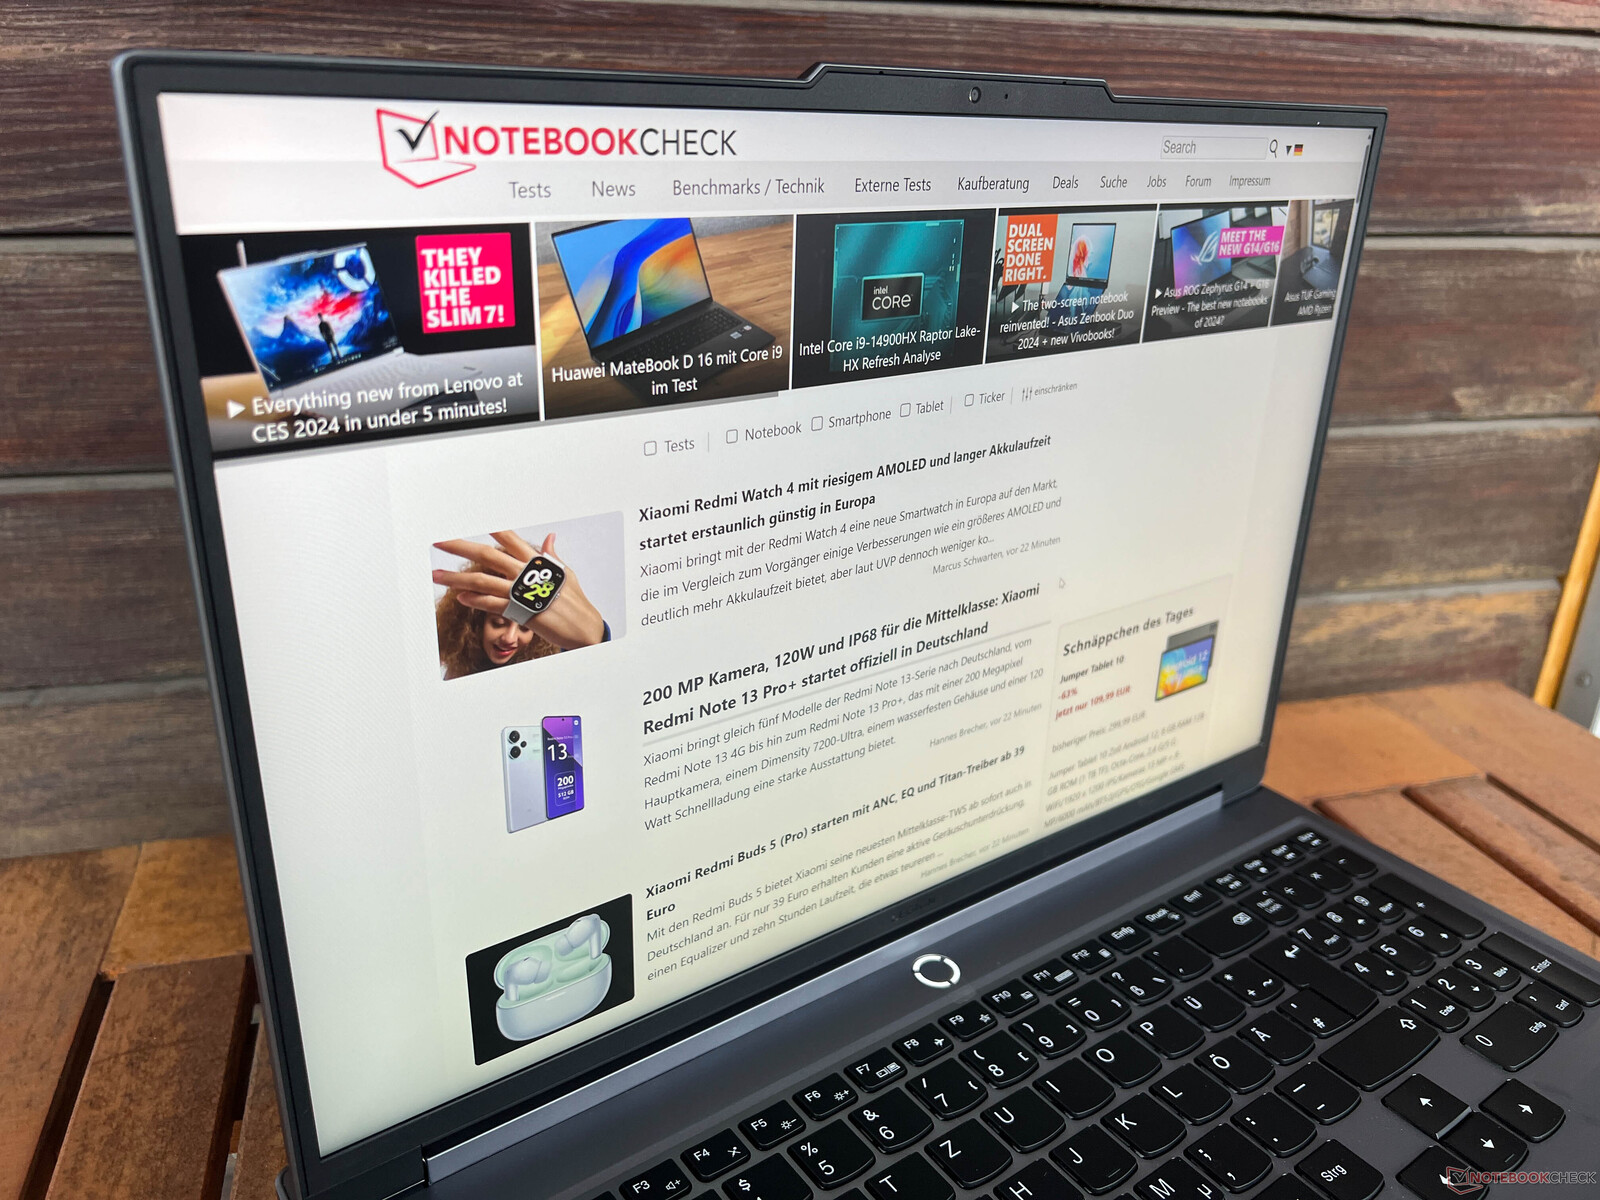
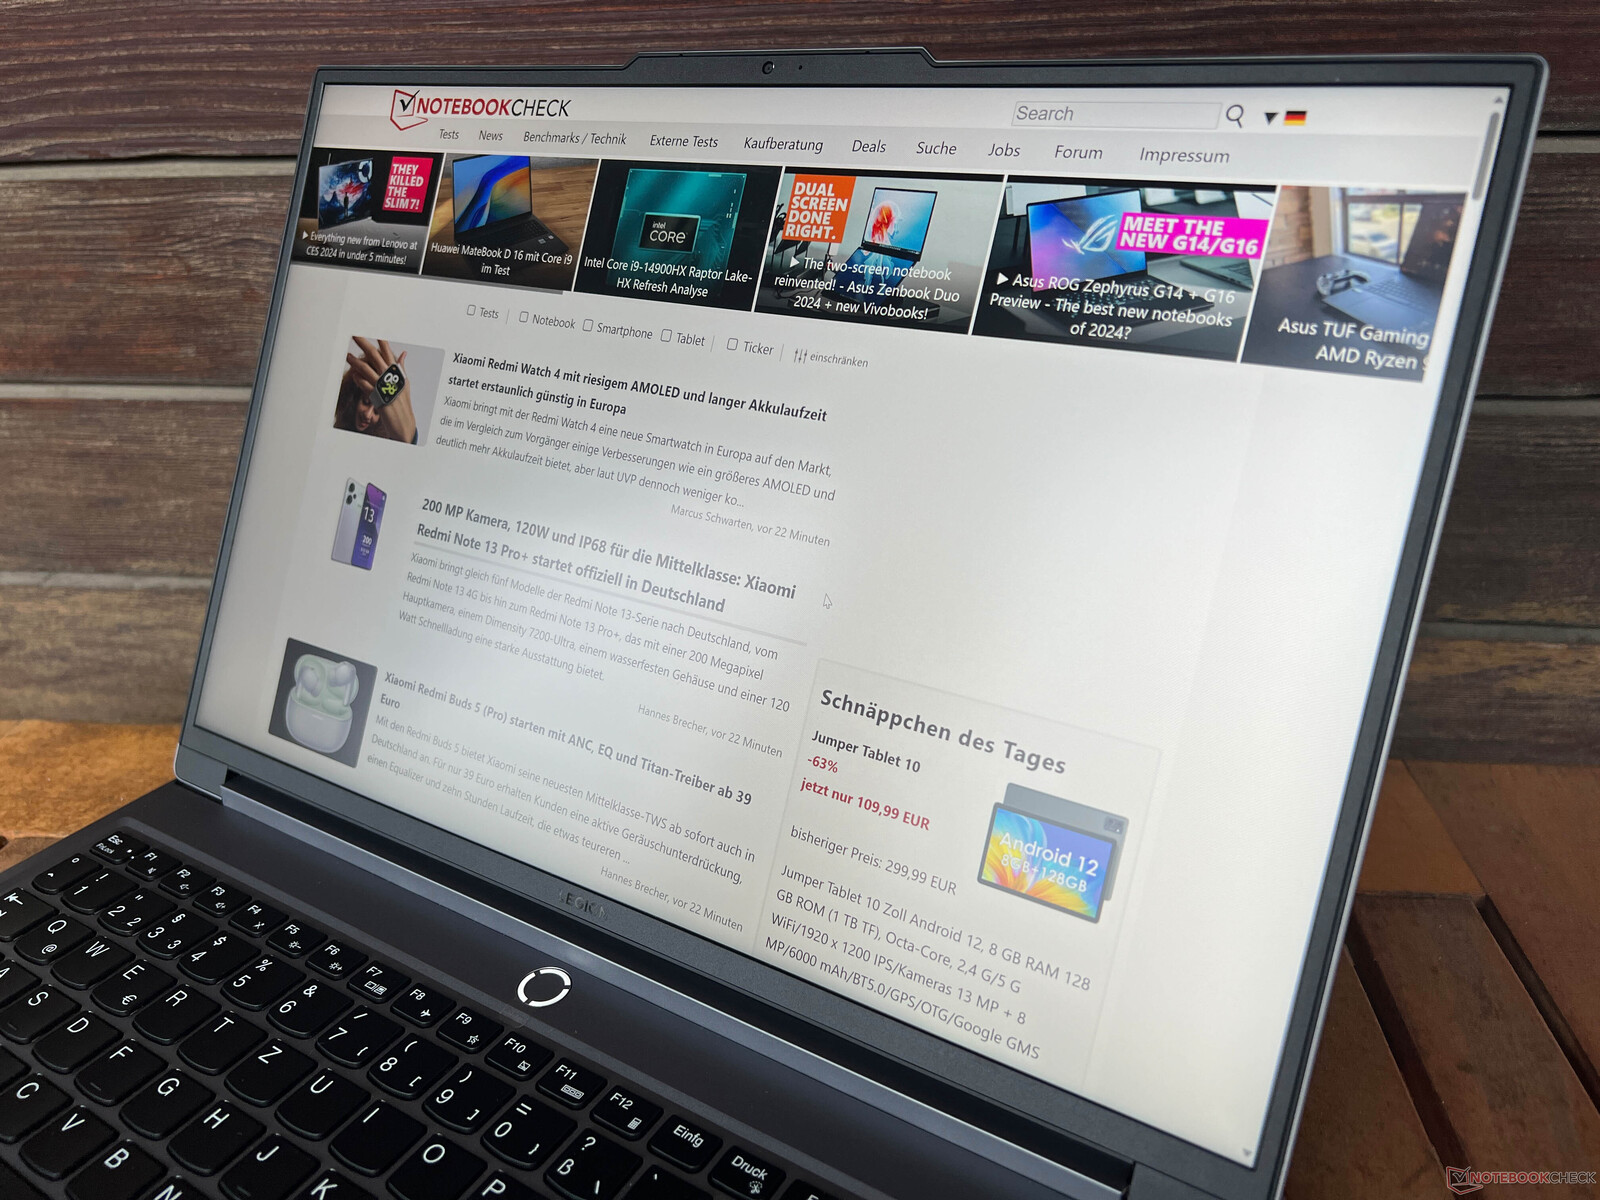
The device's case is very sleek for a gaming laptop and if you prefer things to be more eye-catching, then the Legion 5i may well disappoint you. Aside from its black keyboard and bezels, it features no further color contrasts and in addition, Lenovo has decided against installing any case lighting. Only the status LED surrounding the power button lights up in four colors that are dependent on which energy profile is in use. At least this means you can also use the laptop in more professional settings such as at university.
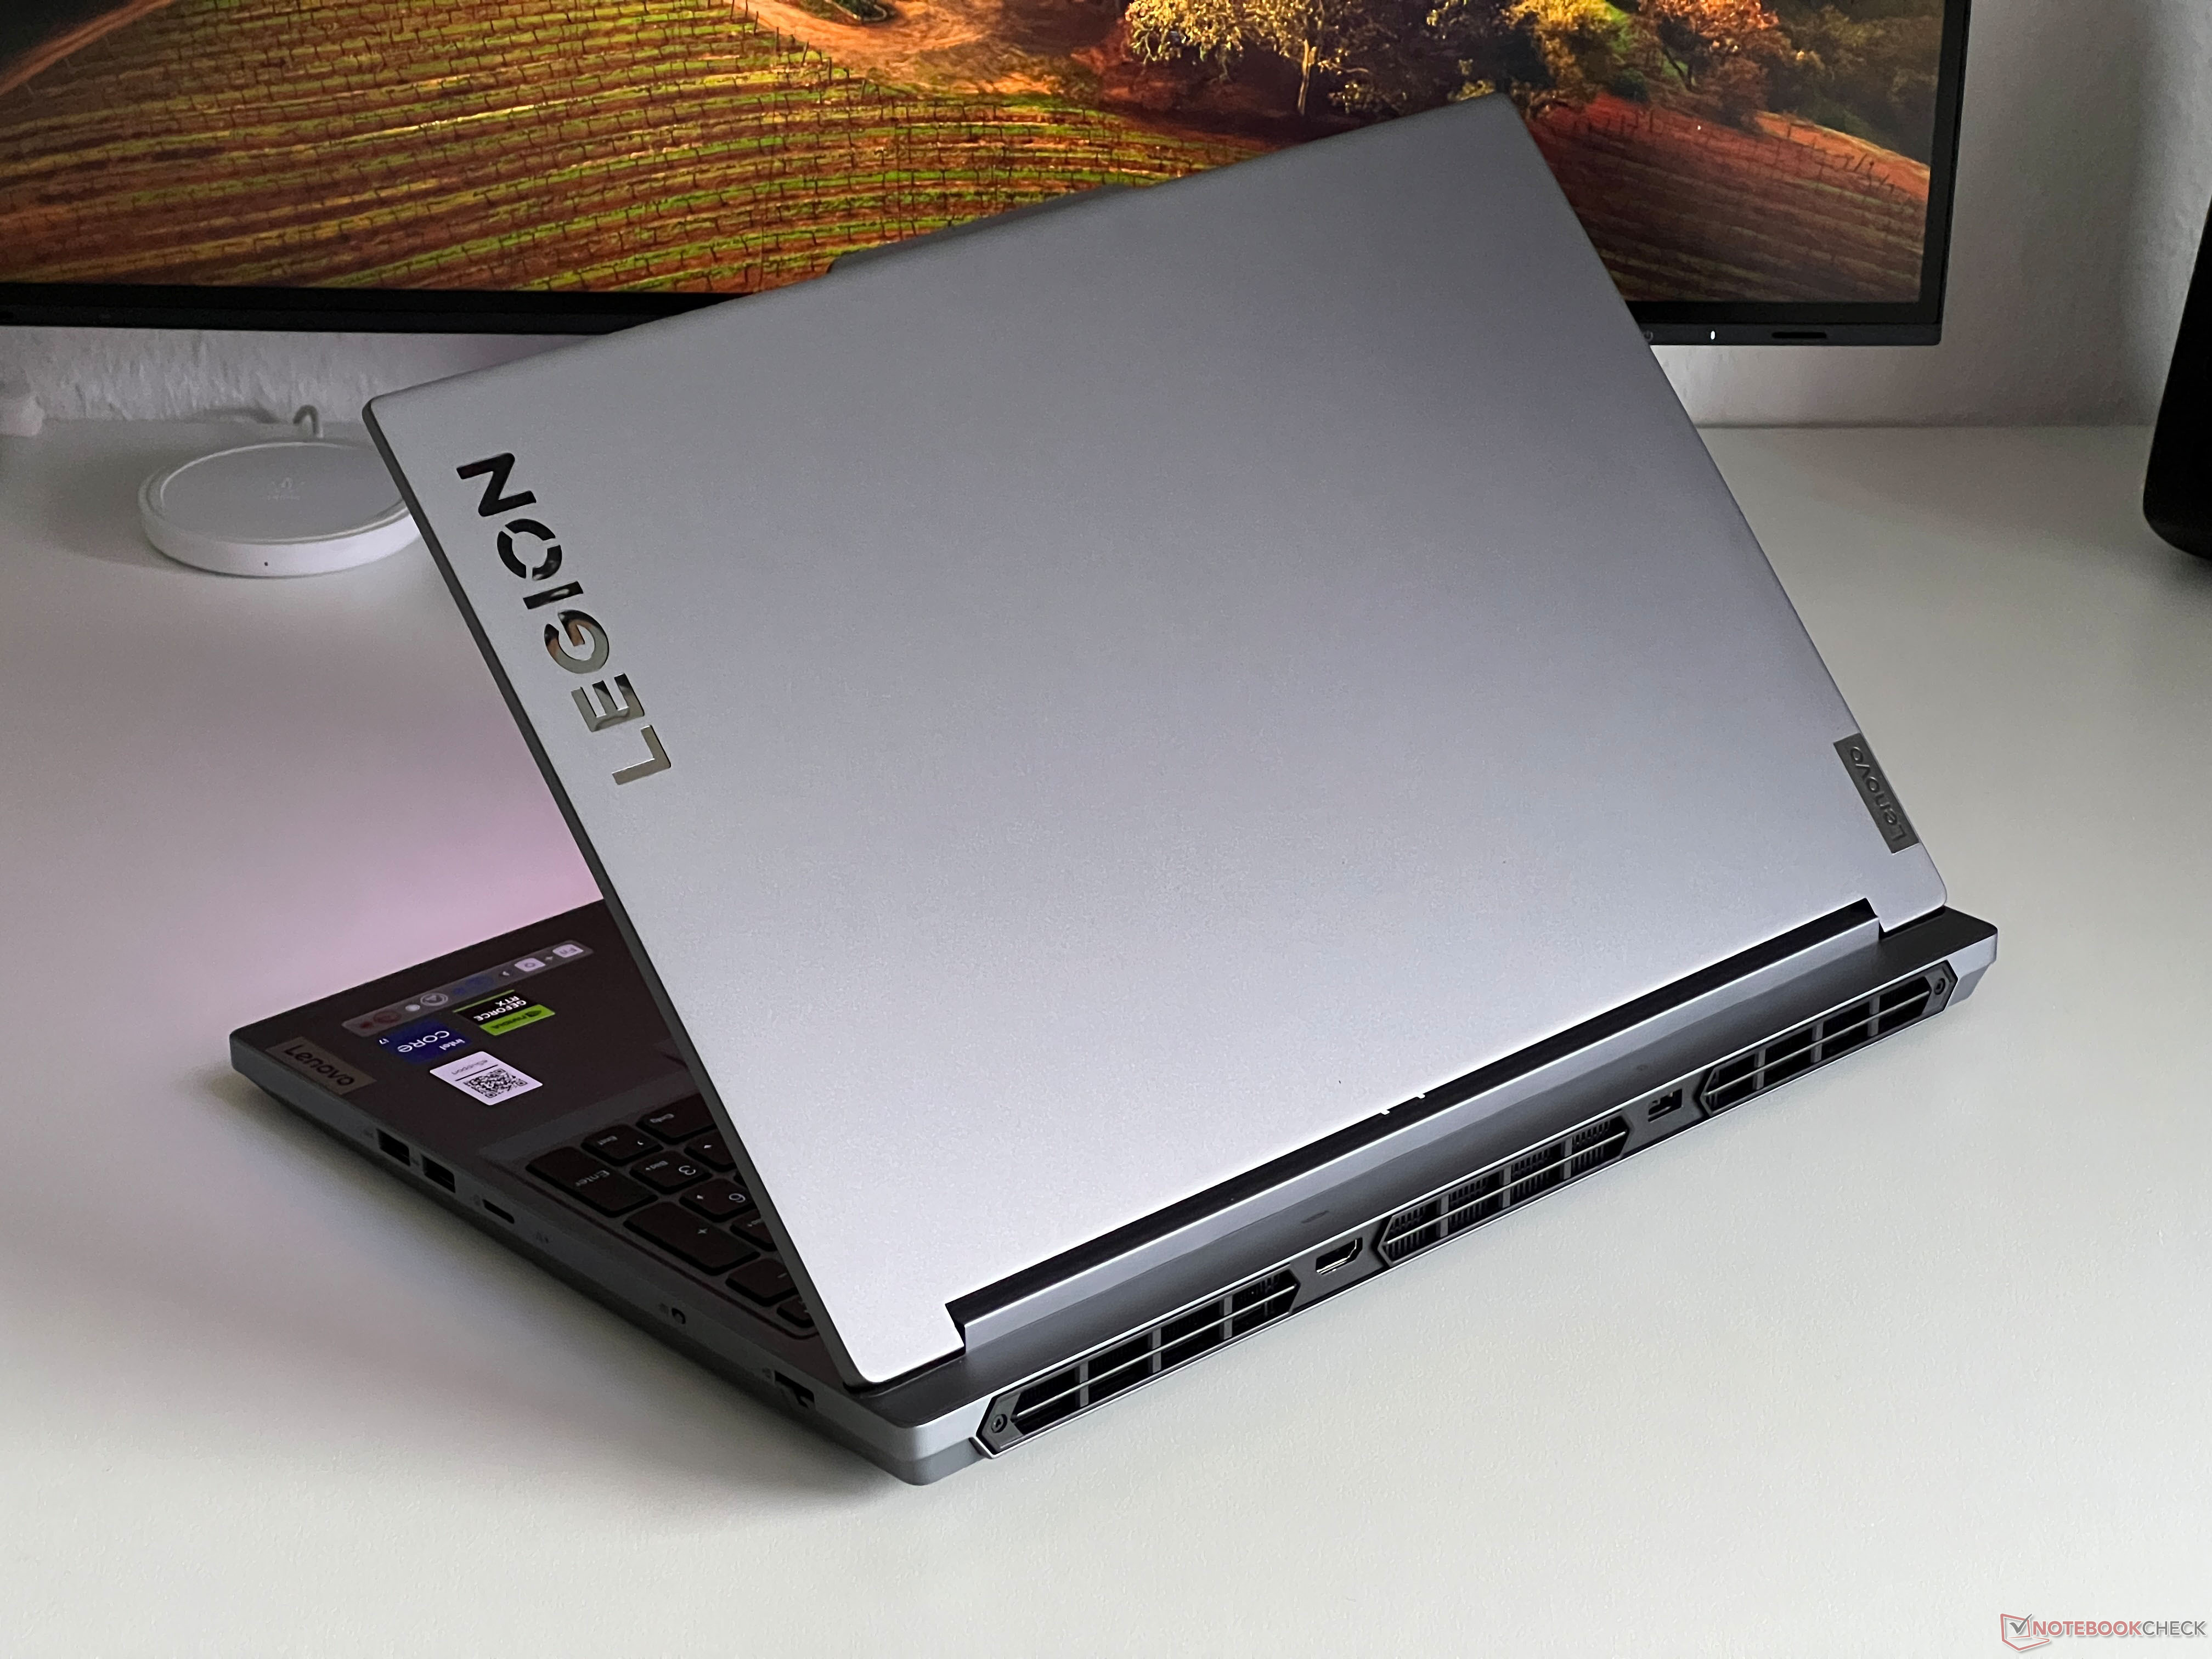
In terms of quality, the case has quite a high-end feel to it—even though only the lid is made from aluminum. The base unit is made entirely from plastic, but the top still feels really nice. Only the bottom of the case is a little rougher, giving it a bit of a cheaper feel. One advantage the case has is how little it attracts dirt and fingerprint marks. Its stability is good as a whole, but this isn't a surprise because of how thick the base unit is (max. 2 cm at the rear). The display hinges have been set well and allow you to open the laptop with one hand; its maximum opening angle is 180 degrees.
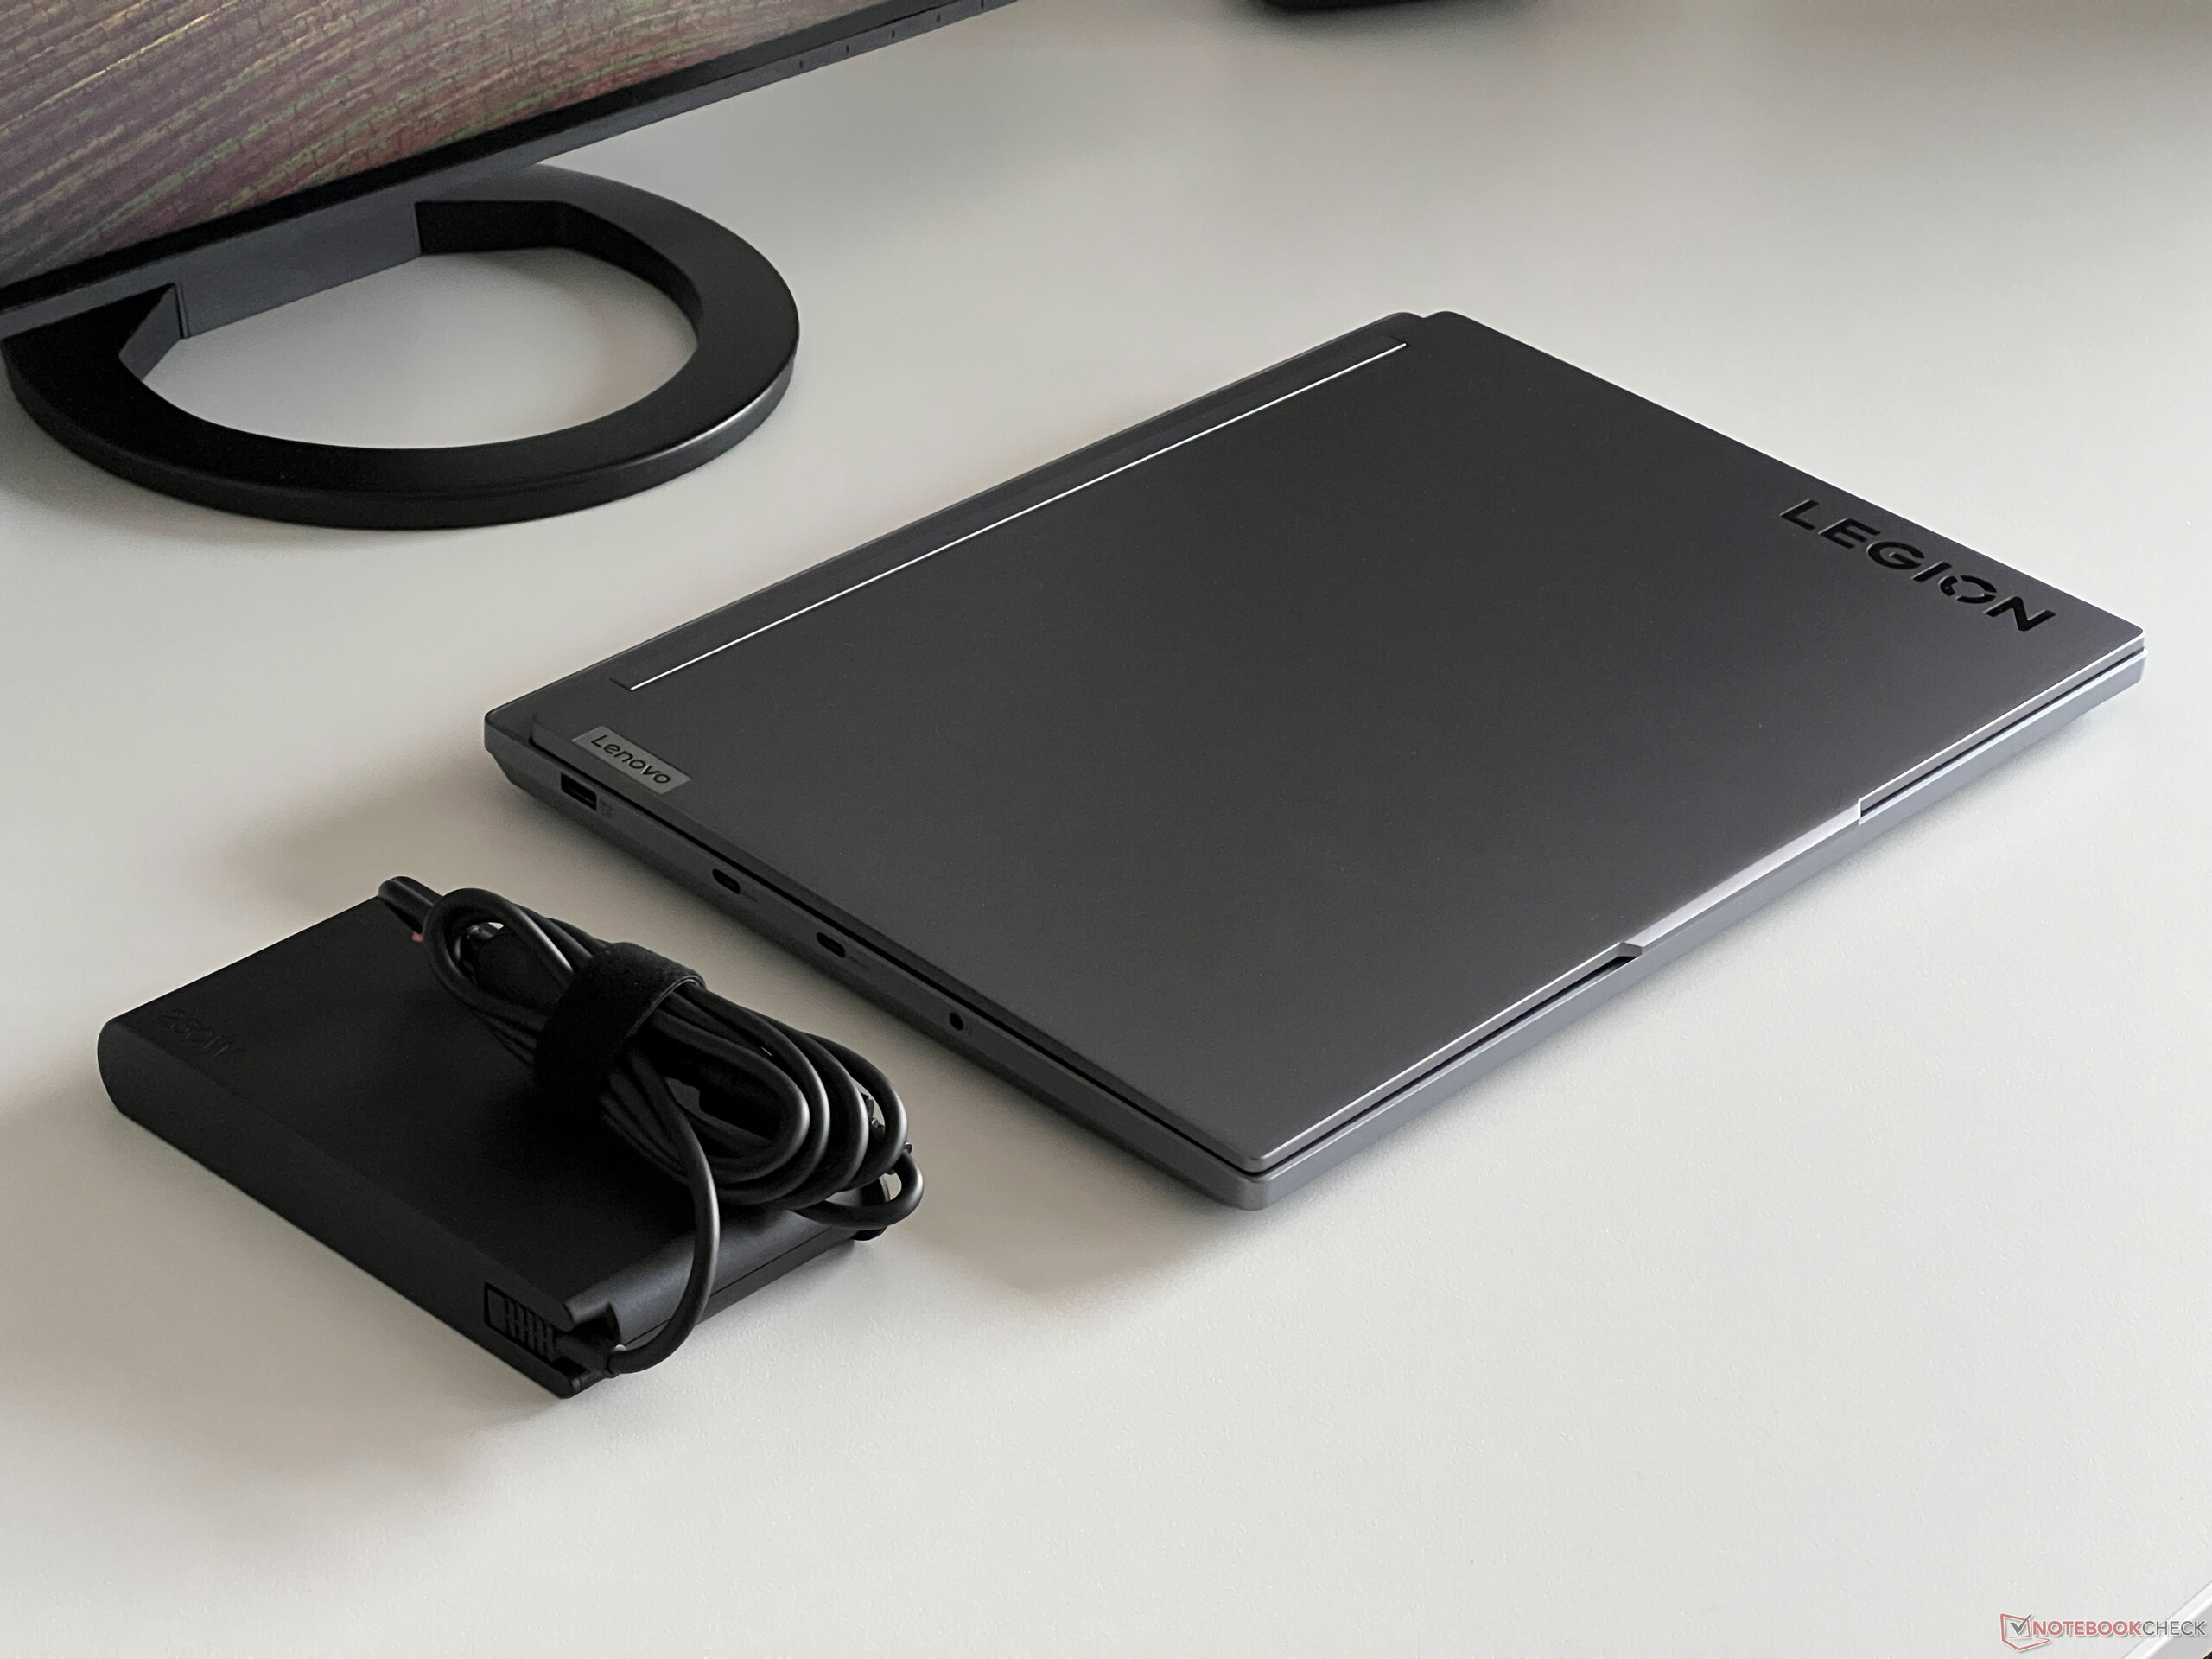
Weighing 2.4 kg, it is by no means as light as a feather but within the comparison field, our test sample performs well. Its footprint makes it one of the most compact models, too. You will have to plan in an additional 869 grams for the 230-watt power supply.
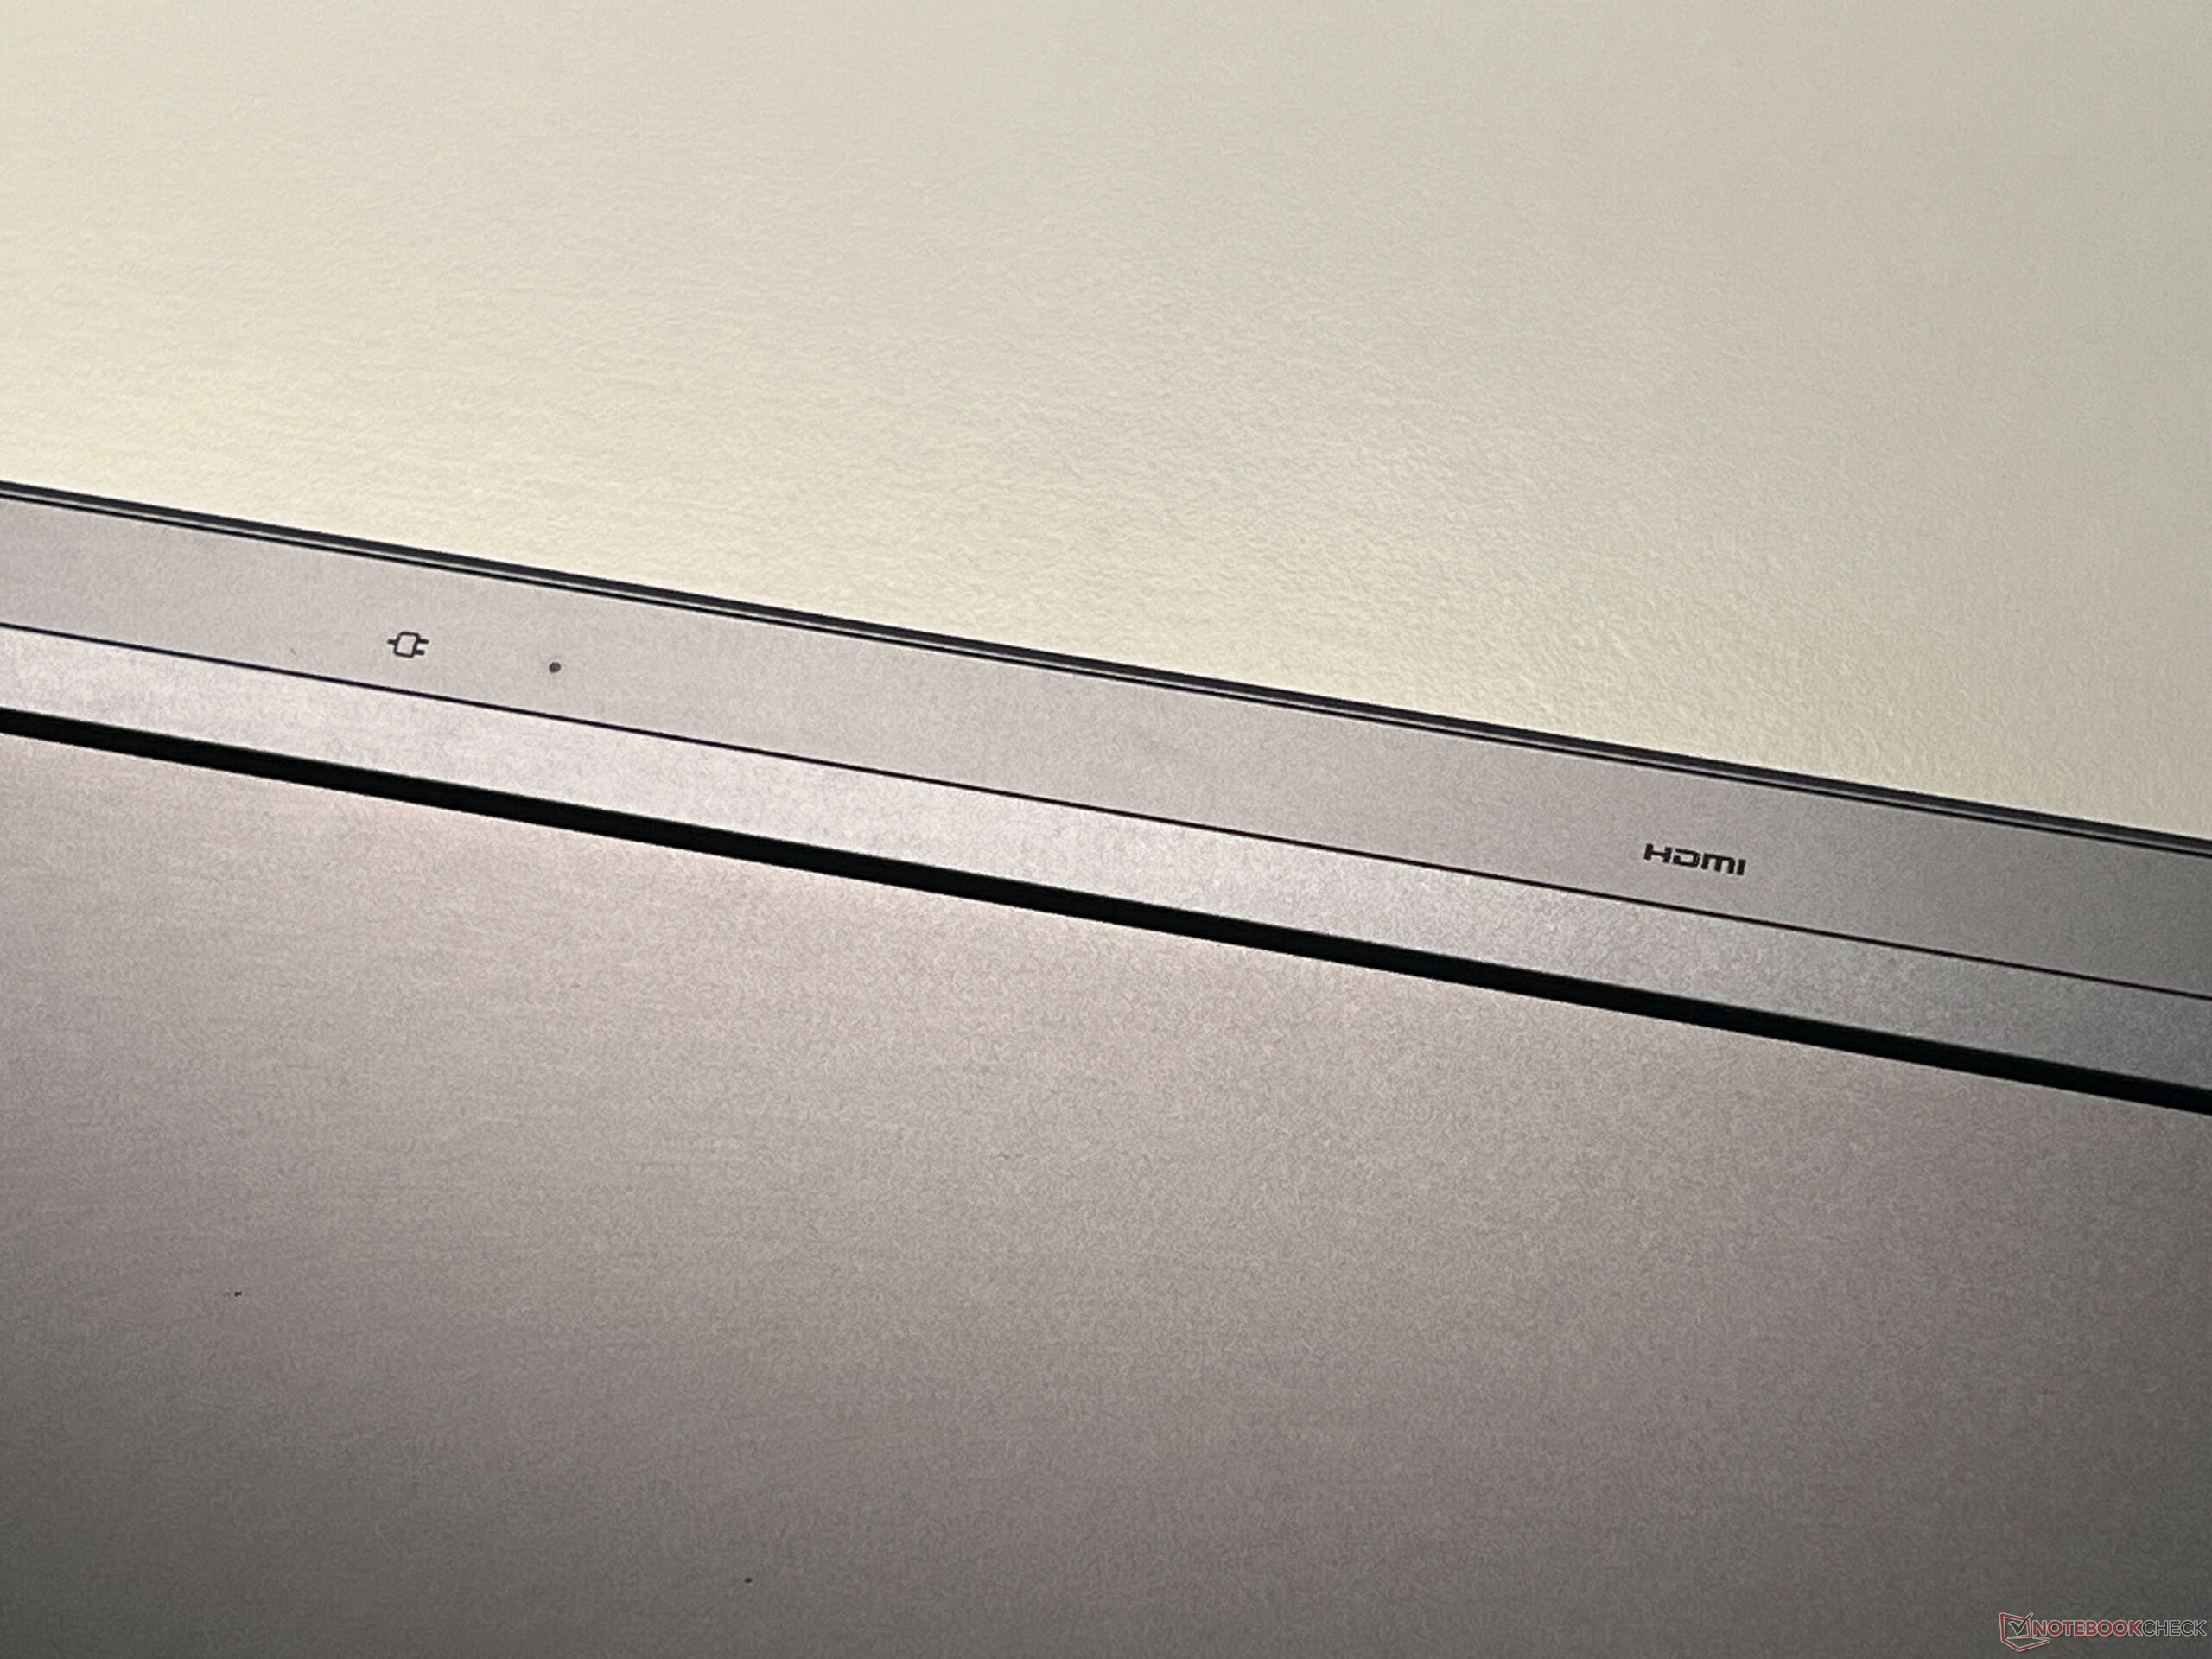
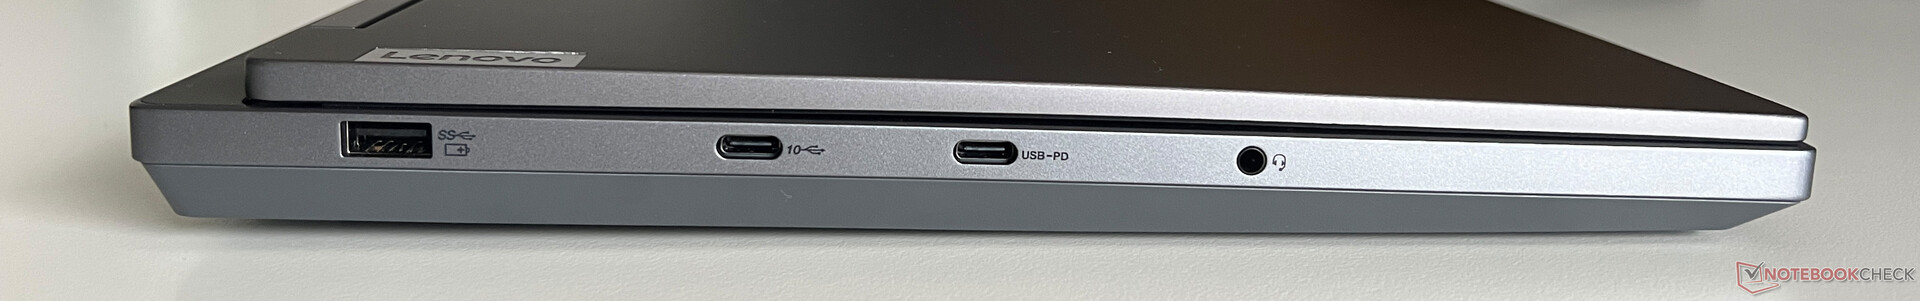
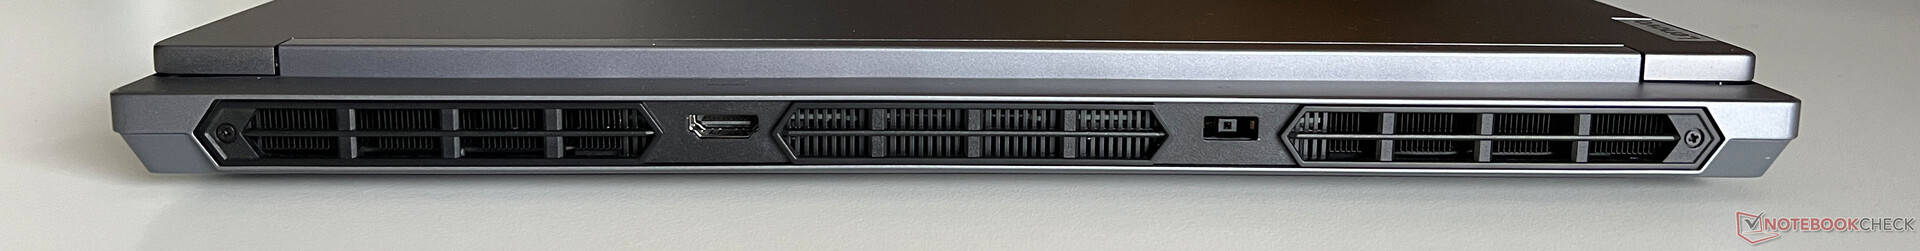
Connectivity - Lenovo has forgone Thunderbolt
On the Legion 5i 16 (as well as on the Legion Pro 5i), Lenovo has decided against installing Thunderbolt 4 but in turn, it features an otherwise good selection of ports spread out along all three sides. The back houses the power connection and HDMI port, the left features three USB ports and there are two further USB connections on the right side. All video outputs are connected via the dGPU, which means the Nvidia GPU is always active when an external monitor is connected.
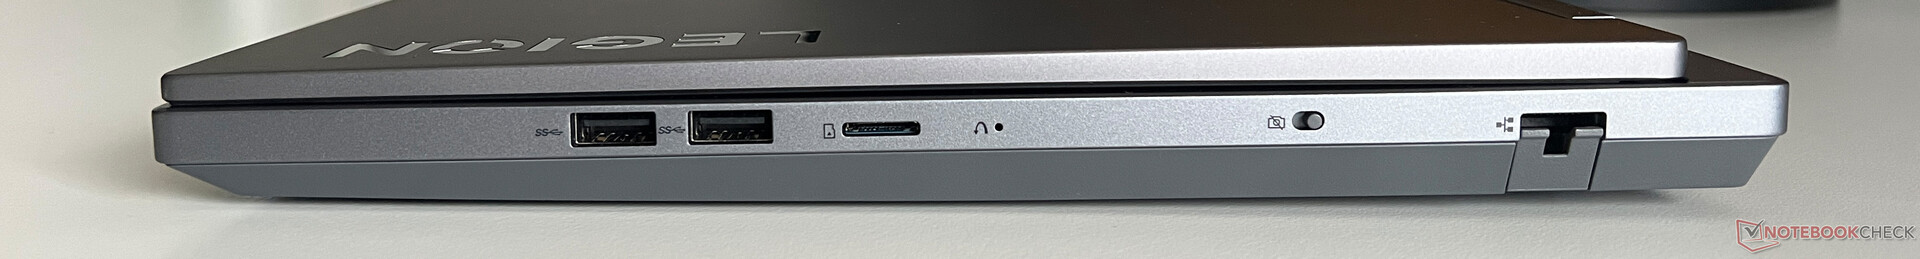
SD card reader
The microSD card reader on the right side of the device doesn't take in cards fully and it isn't particularly fast. In combination with our reference card (Angelibird AV Pro V60), we measured low transfer rates of about 30 MB/s.
| SD Card Reader | |
| average JPG Copy Test (av. of 3 runs) | |
| Alienware m16 R1 Intel (AV PRO microSD 128 GB V60) | |
| Average of class Gaming (20.9 - 210, n=54, last 2 years) | |
| Lenovo Legion Slim 5 16APH8 (PNY EliteX-Pro60 V60 256 GB) | |
| Schenker XMG CORE 16 (L23) | |
| Lenovo Legion 5 16IRX G9 | |
| maximum AS SSD Seq Read Test (1GB) | |
| Alienware m16 R1 Intel (AV PRO microSD 128 GB V60) | |
| Average of class Gaming (25.5 - 261, n=51, last 2 years) | |
| Lenovo Legion Slim 5 16APH8 (PNY EliteX-Pro60 V60 256 GB) | |
| Schenker XMG CORE 16 (L23) | |
| Lenovo Legion 5 16IRX G9 | |
Communication
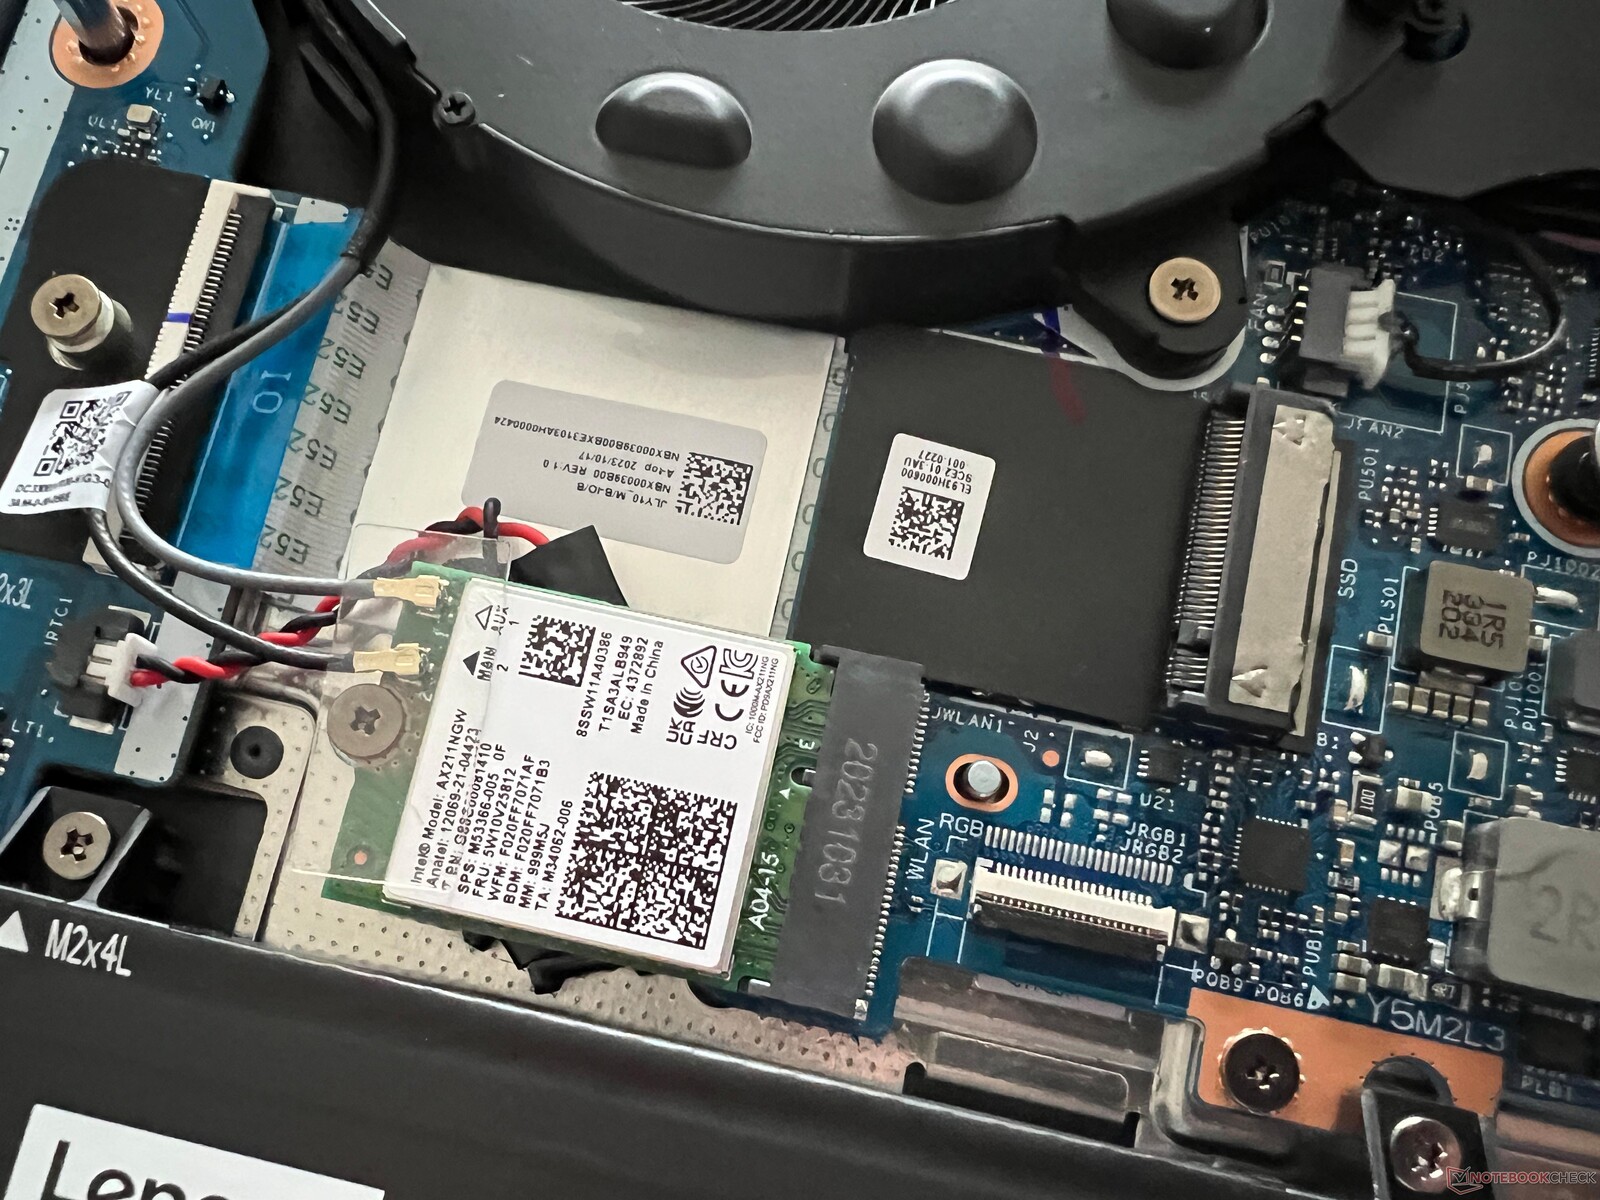
Lenovo has fitted the Legion with the AX211 WLAN module from Intel which, aside from Bluetooth 5.3, also masters the current Wi-Fi-6E standard for 6-GHz networks. In combination with our reference router from Asus, its transfer rates were great in total, although the competition was still faster at times. However, you shouldn't really be able to notice this in practical use and during our test, we never had any issues with signal quality. In addition, the laptop features a Gigabit-Ethernet port for wired connections.
| Networking | |
| Lenovo Legion 5 16IRX G9 | |
| iperf3 transmit AXE11000 | |
| iperf3 receive AXE11000 | |
| Schenker XMG CORE 16 (L23) | |
| iperf3 transmit AXE11000 | |
| iperf3 receive AXE11000 | |
| HP Victus 16-r0077ng | |
| iperf3 transmit AXE11000 | |
| iperf3 receive AXE11000 | |
| Lenovo LOQ 16IRH8 | |
| iperf3 transmit AXE11000 | |
| iperf3 receive AXE11000 | |
| Lenovo Legion Slim 5 16APH8 | |
| iperf3 transmit AXE11000 | |
| iperf3 receive AXE11000 | |
| iperf3 transmit AXE11000 6GHz | |
| iperf3 receive AXE11000 6GHz | |
| HP Victus 16-r0076TX | |
| iperf3 transmit AXE11000 | |
| iperf3 receive AXE11000 | |
| iperf3 transmit AXE11000 6GHz | |
| iperf3 receive AXE11000 6GHz | |
| Alienware m16 R1 Intel | |
| iperf3 transmit AXE11000 | |
| iperf3 receive AXE11000 | |
| Lenovo Legion Pro 5 16IRX8 | |
| iperf3 transmit AXE11000 | |
| iperf3 receive AXE11000 | |
| iperf3 transmit AXE11000 6GHz | |
| iperf3 receive AXE11000 6GHz | |
Webcam
The Legion 5i's 1080p webcam fulfils its job, taking decent photos in good lighting conditions. On the flip side, it doesn't support any additional studio effects and it doesn't have an IR sensor for facial recognition via Windows Hello. There is a switch on the right side which deactivates the webcam.


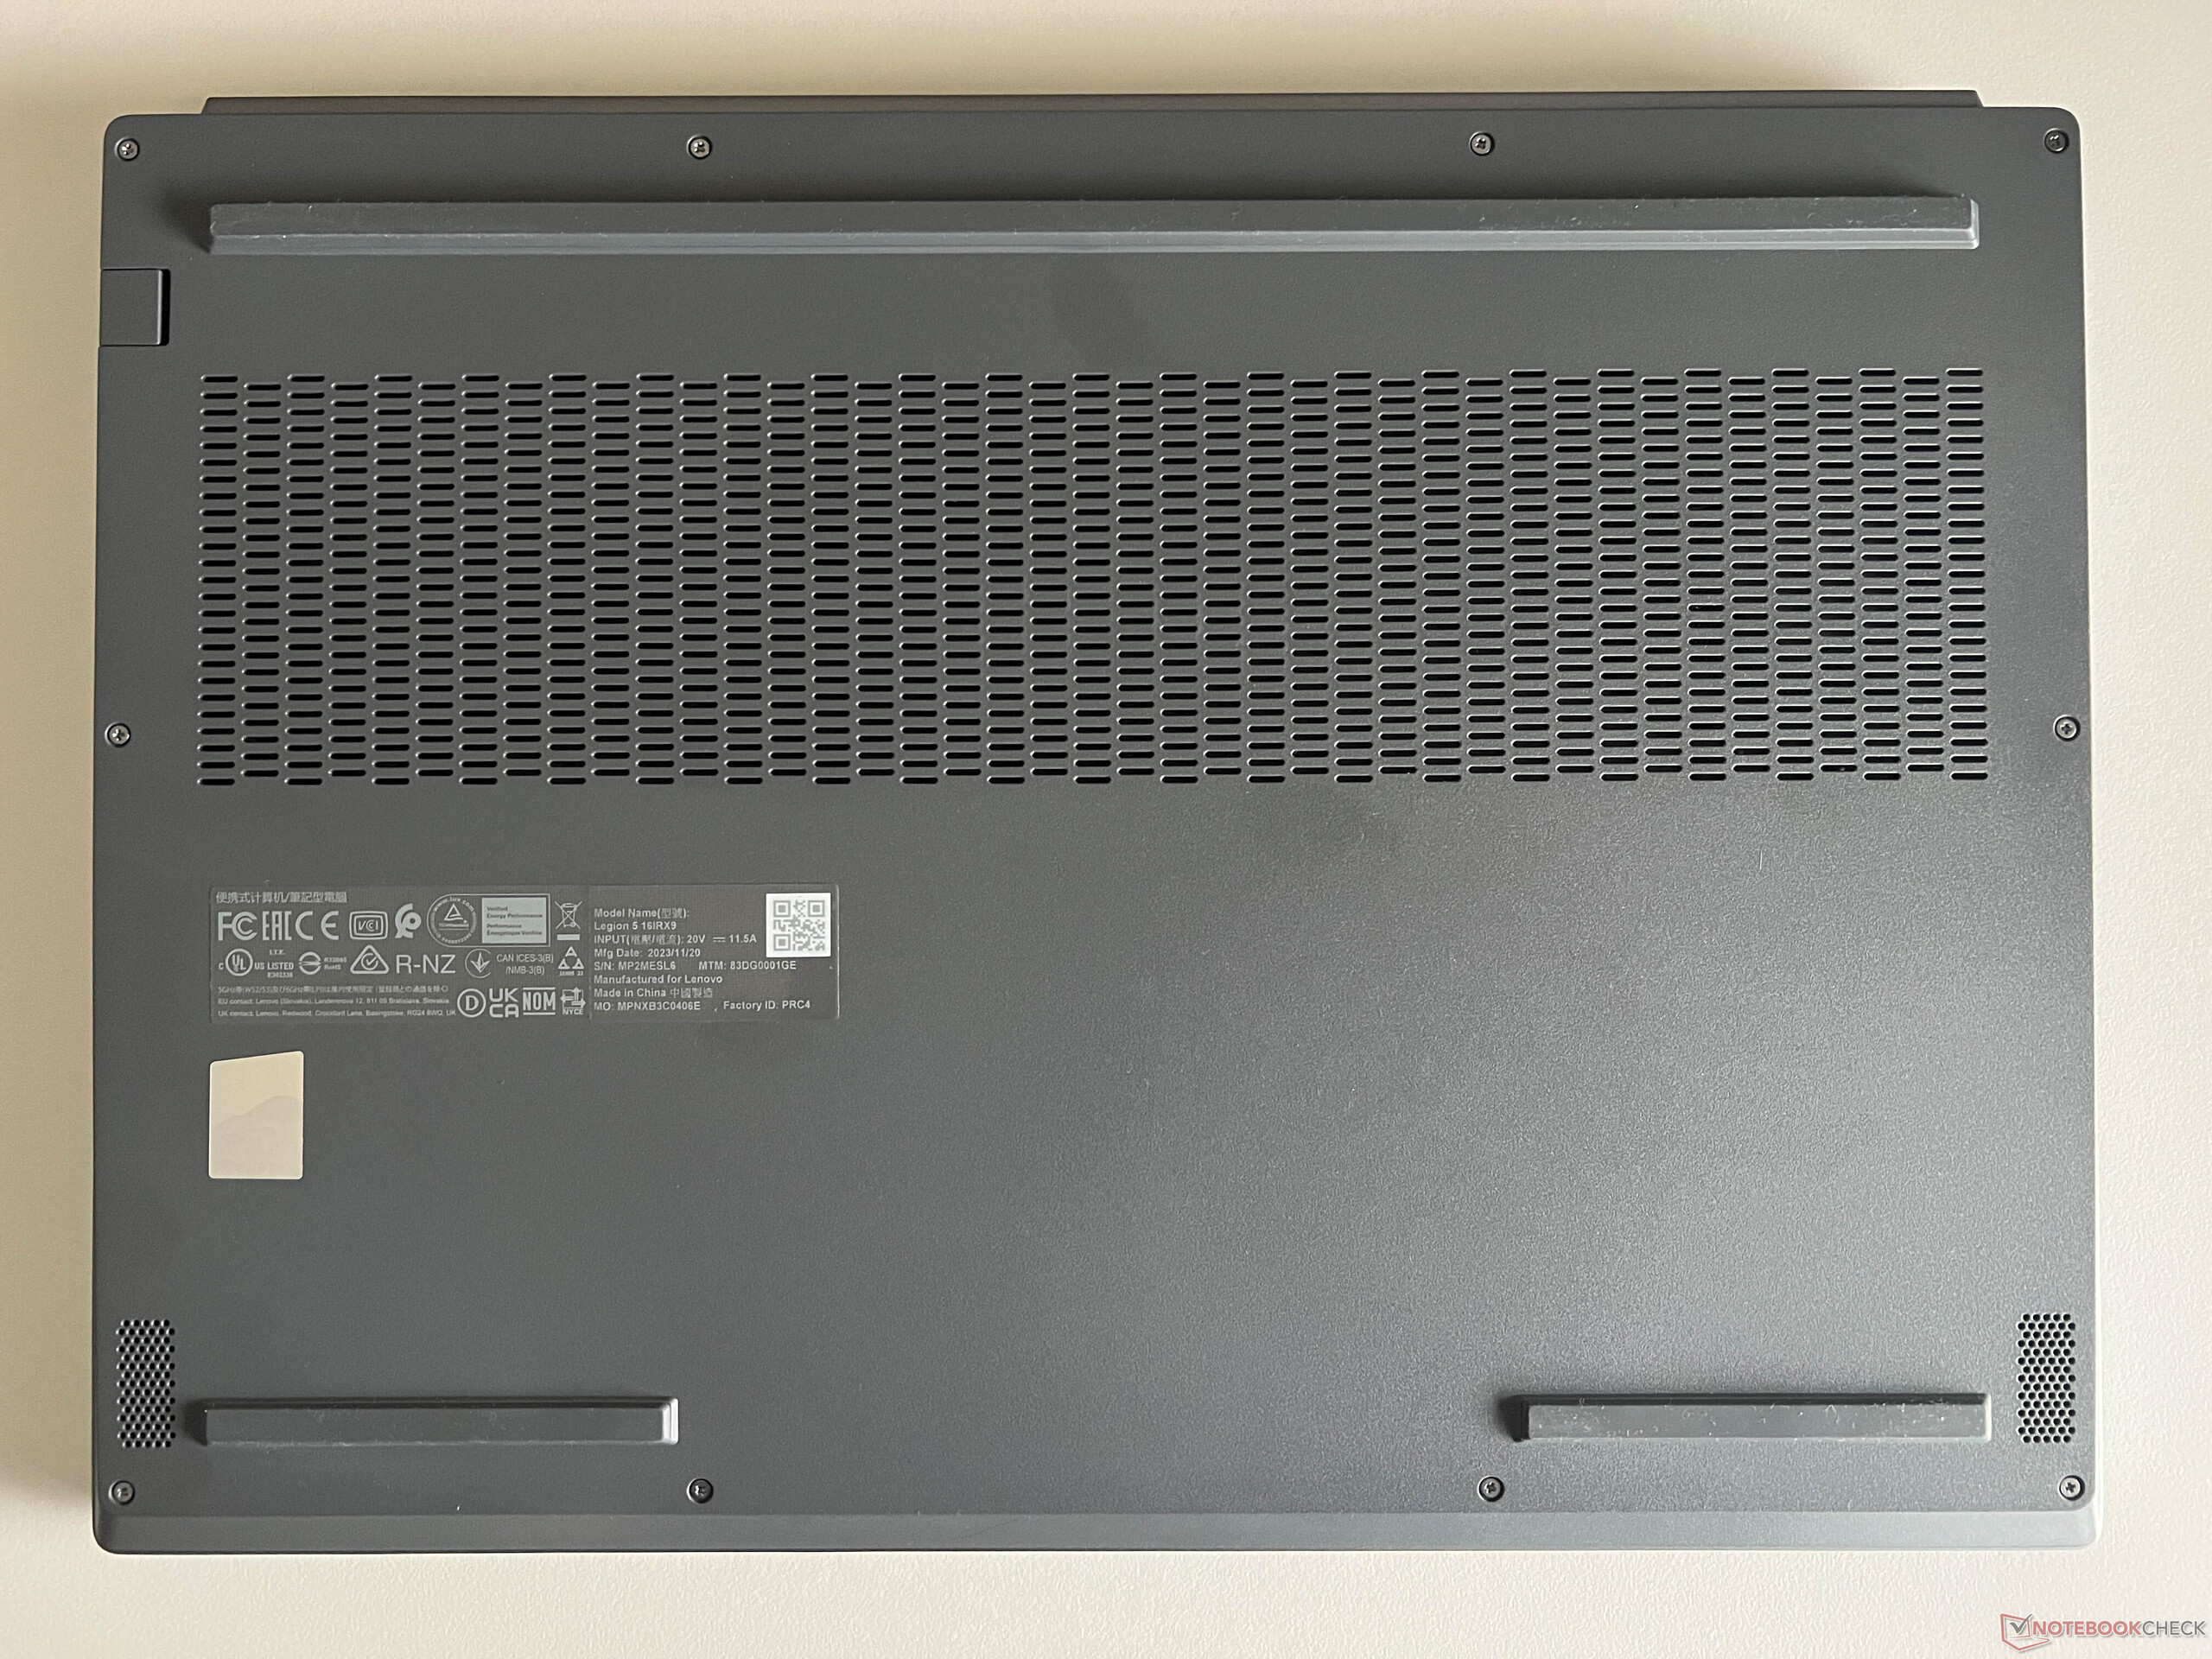
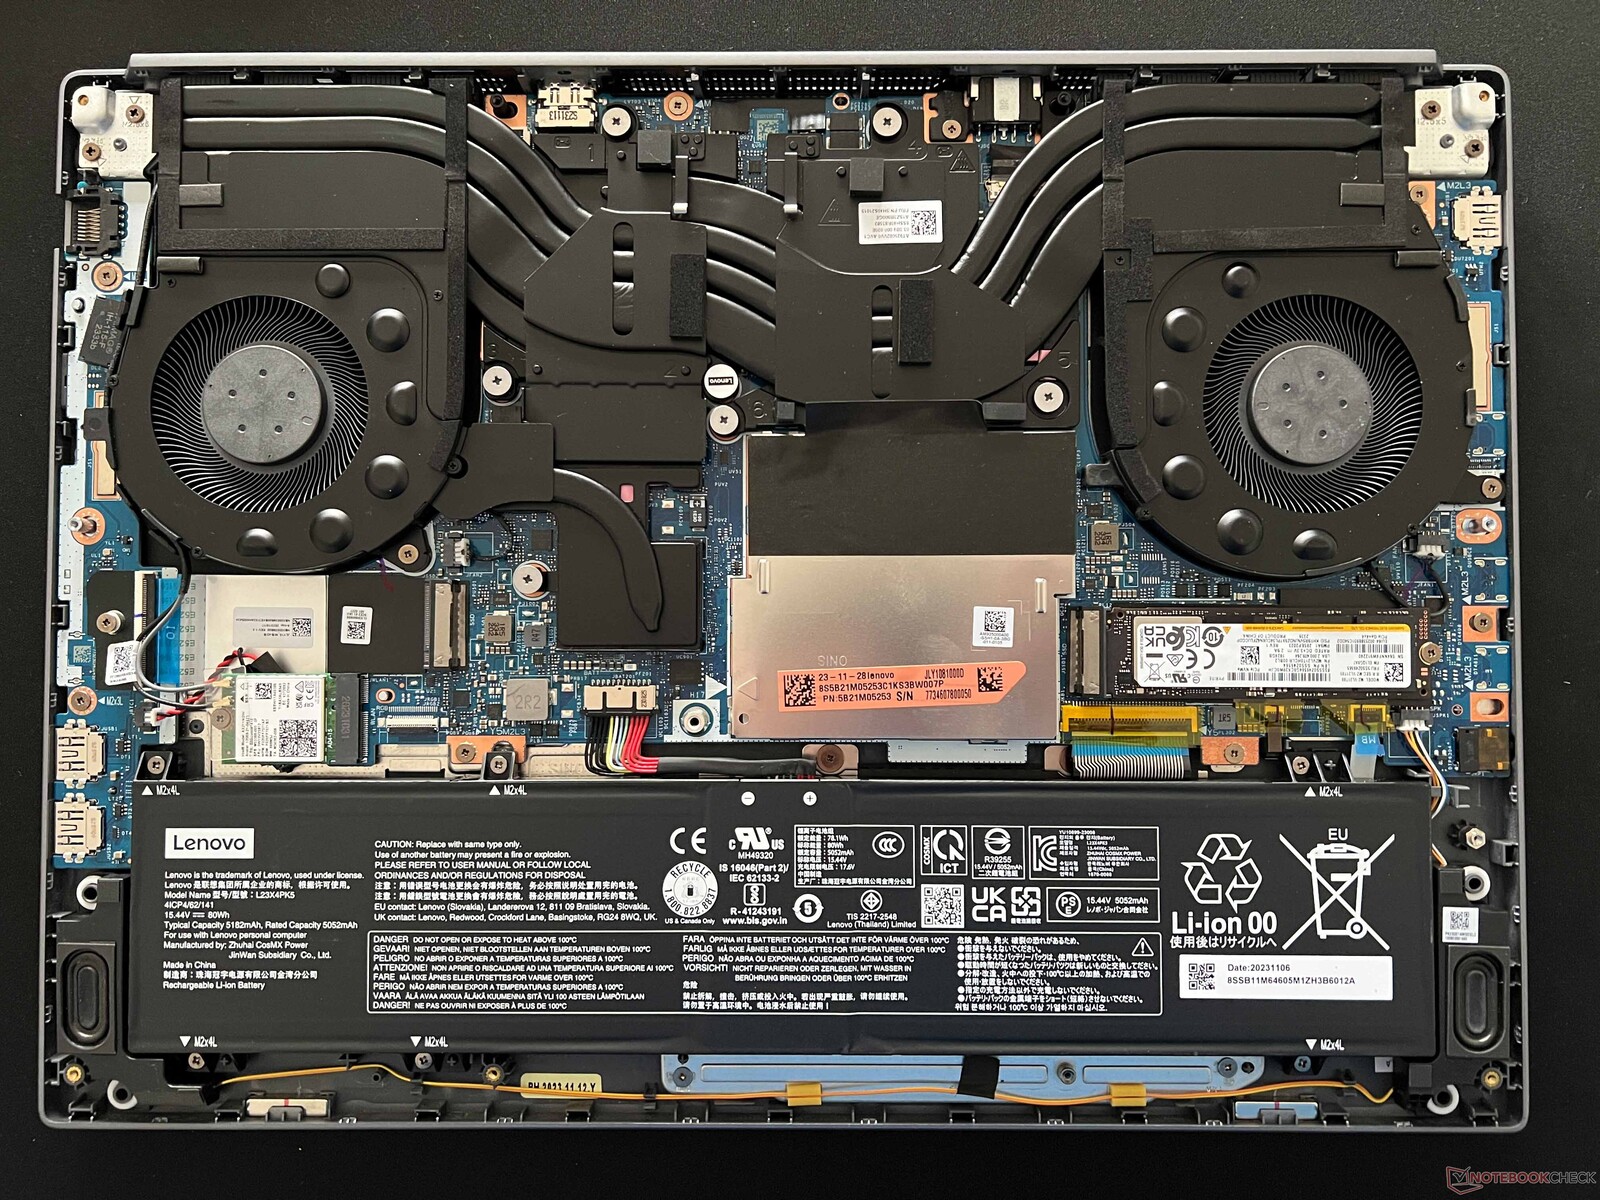
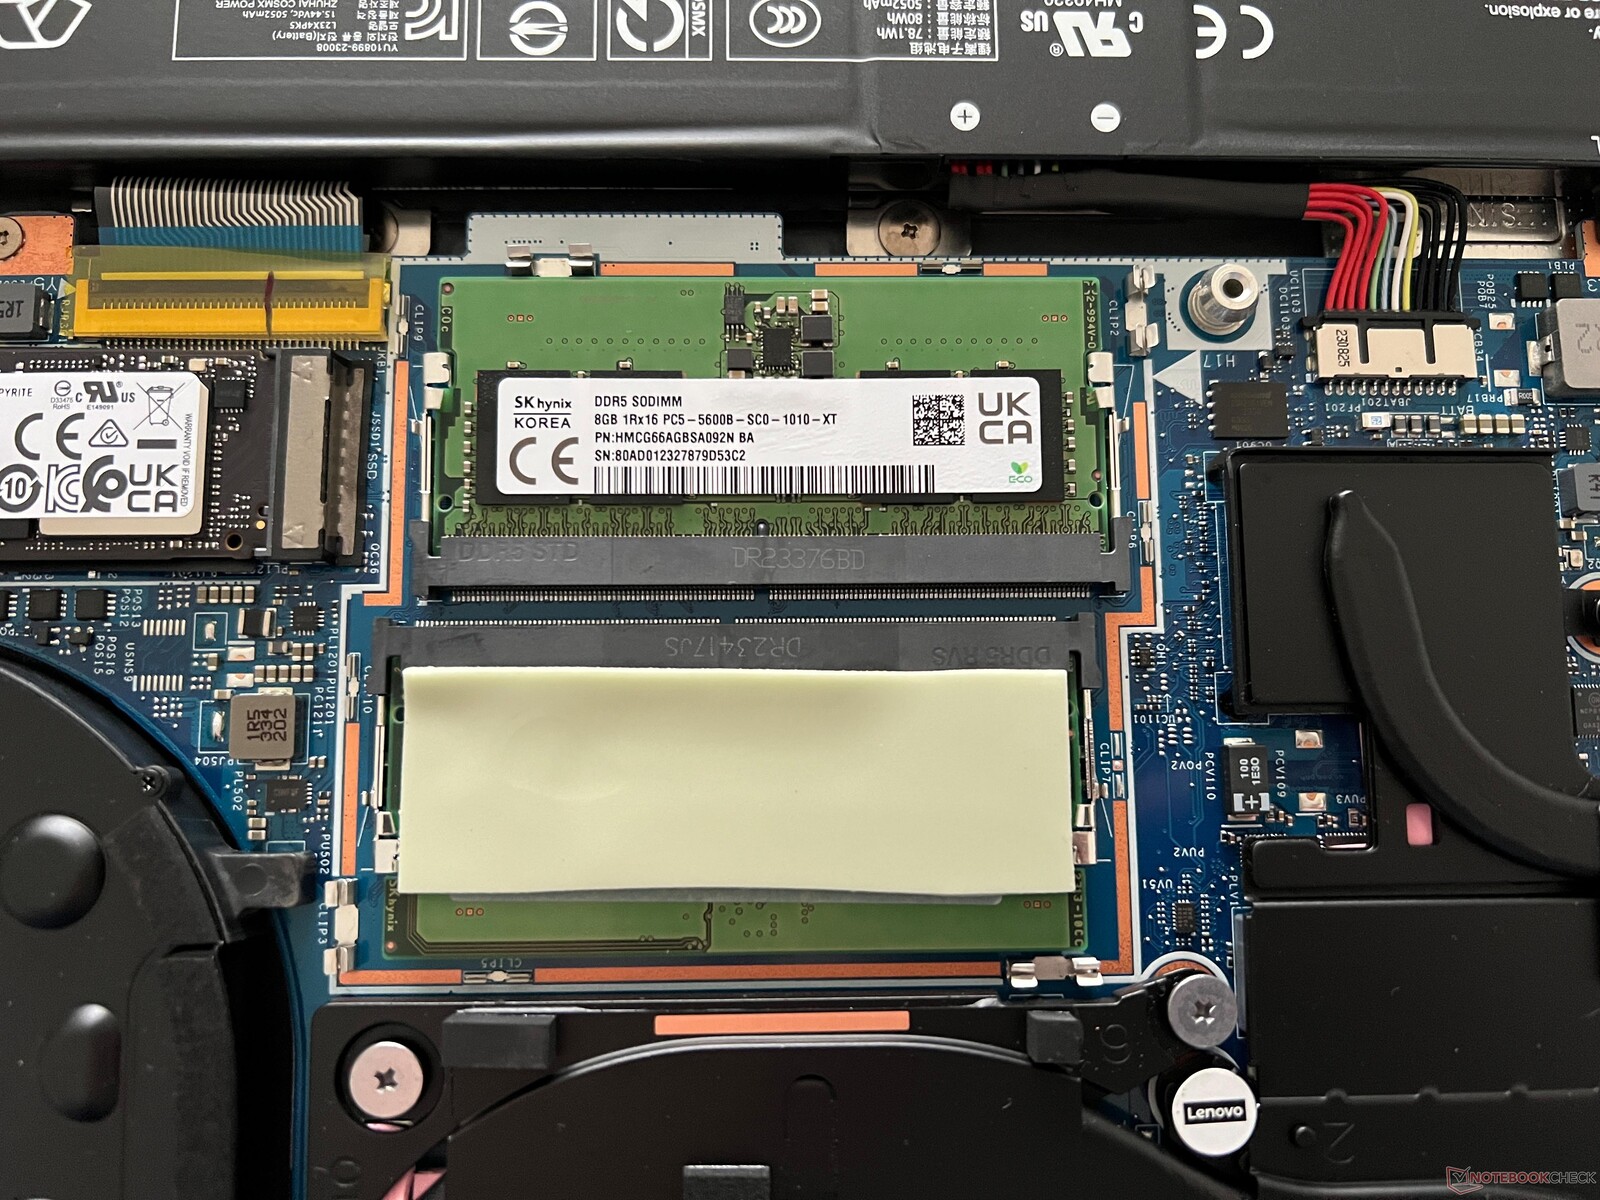
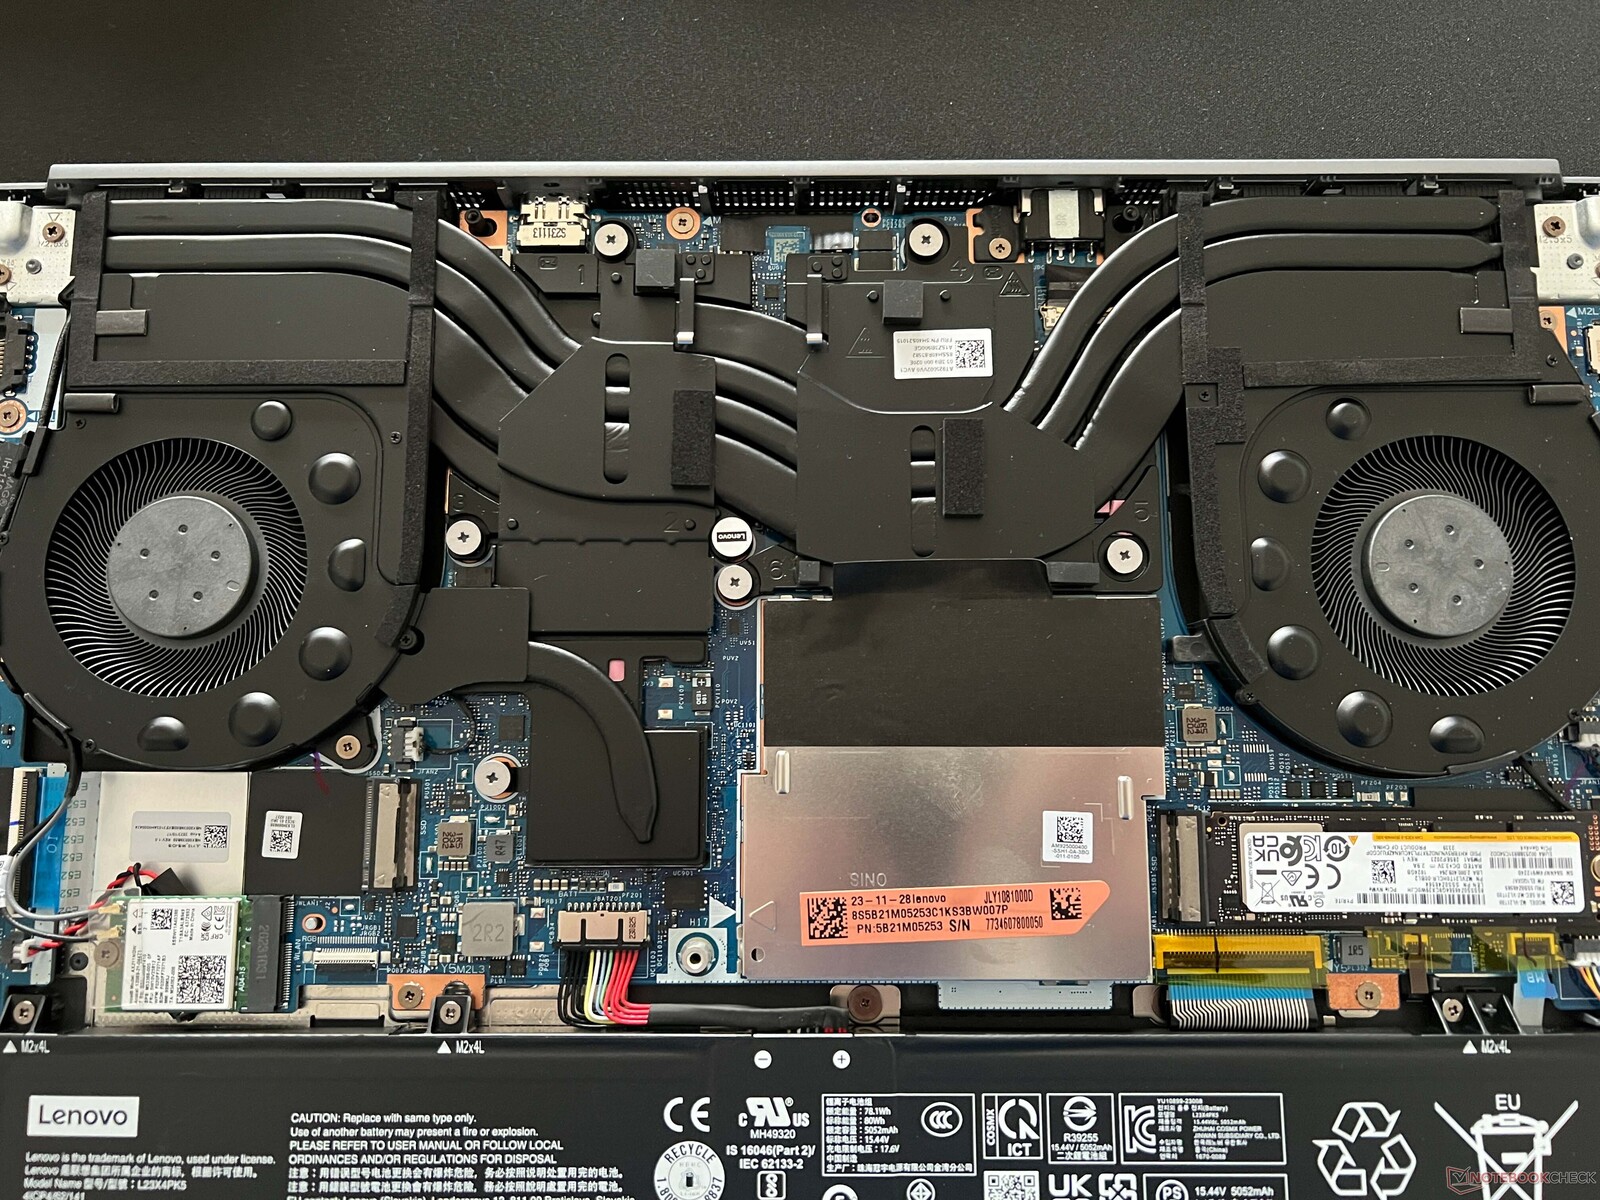
Maintenance
The bottom case part is connected using normal crosshead screws but it still sits securely when these are removed. You should use a suitable tool to help pry it open. Inside, the laptop's maintenance options are good, as aside from both RAM slots, it also features two slots for M.2-2280 SSDs. The WLAN module and battery (screwed in) can also be swapped out.
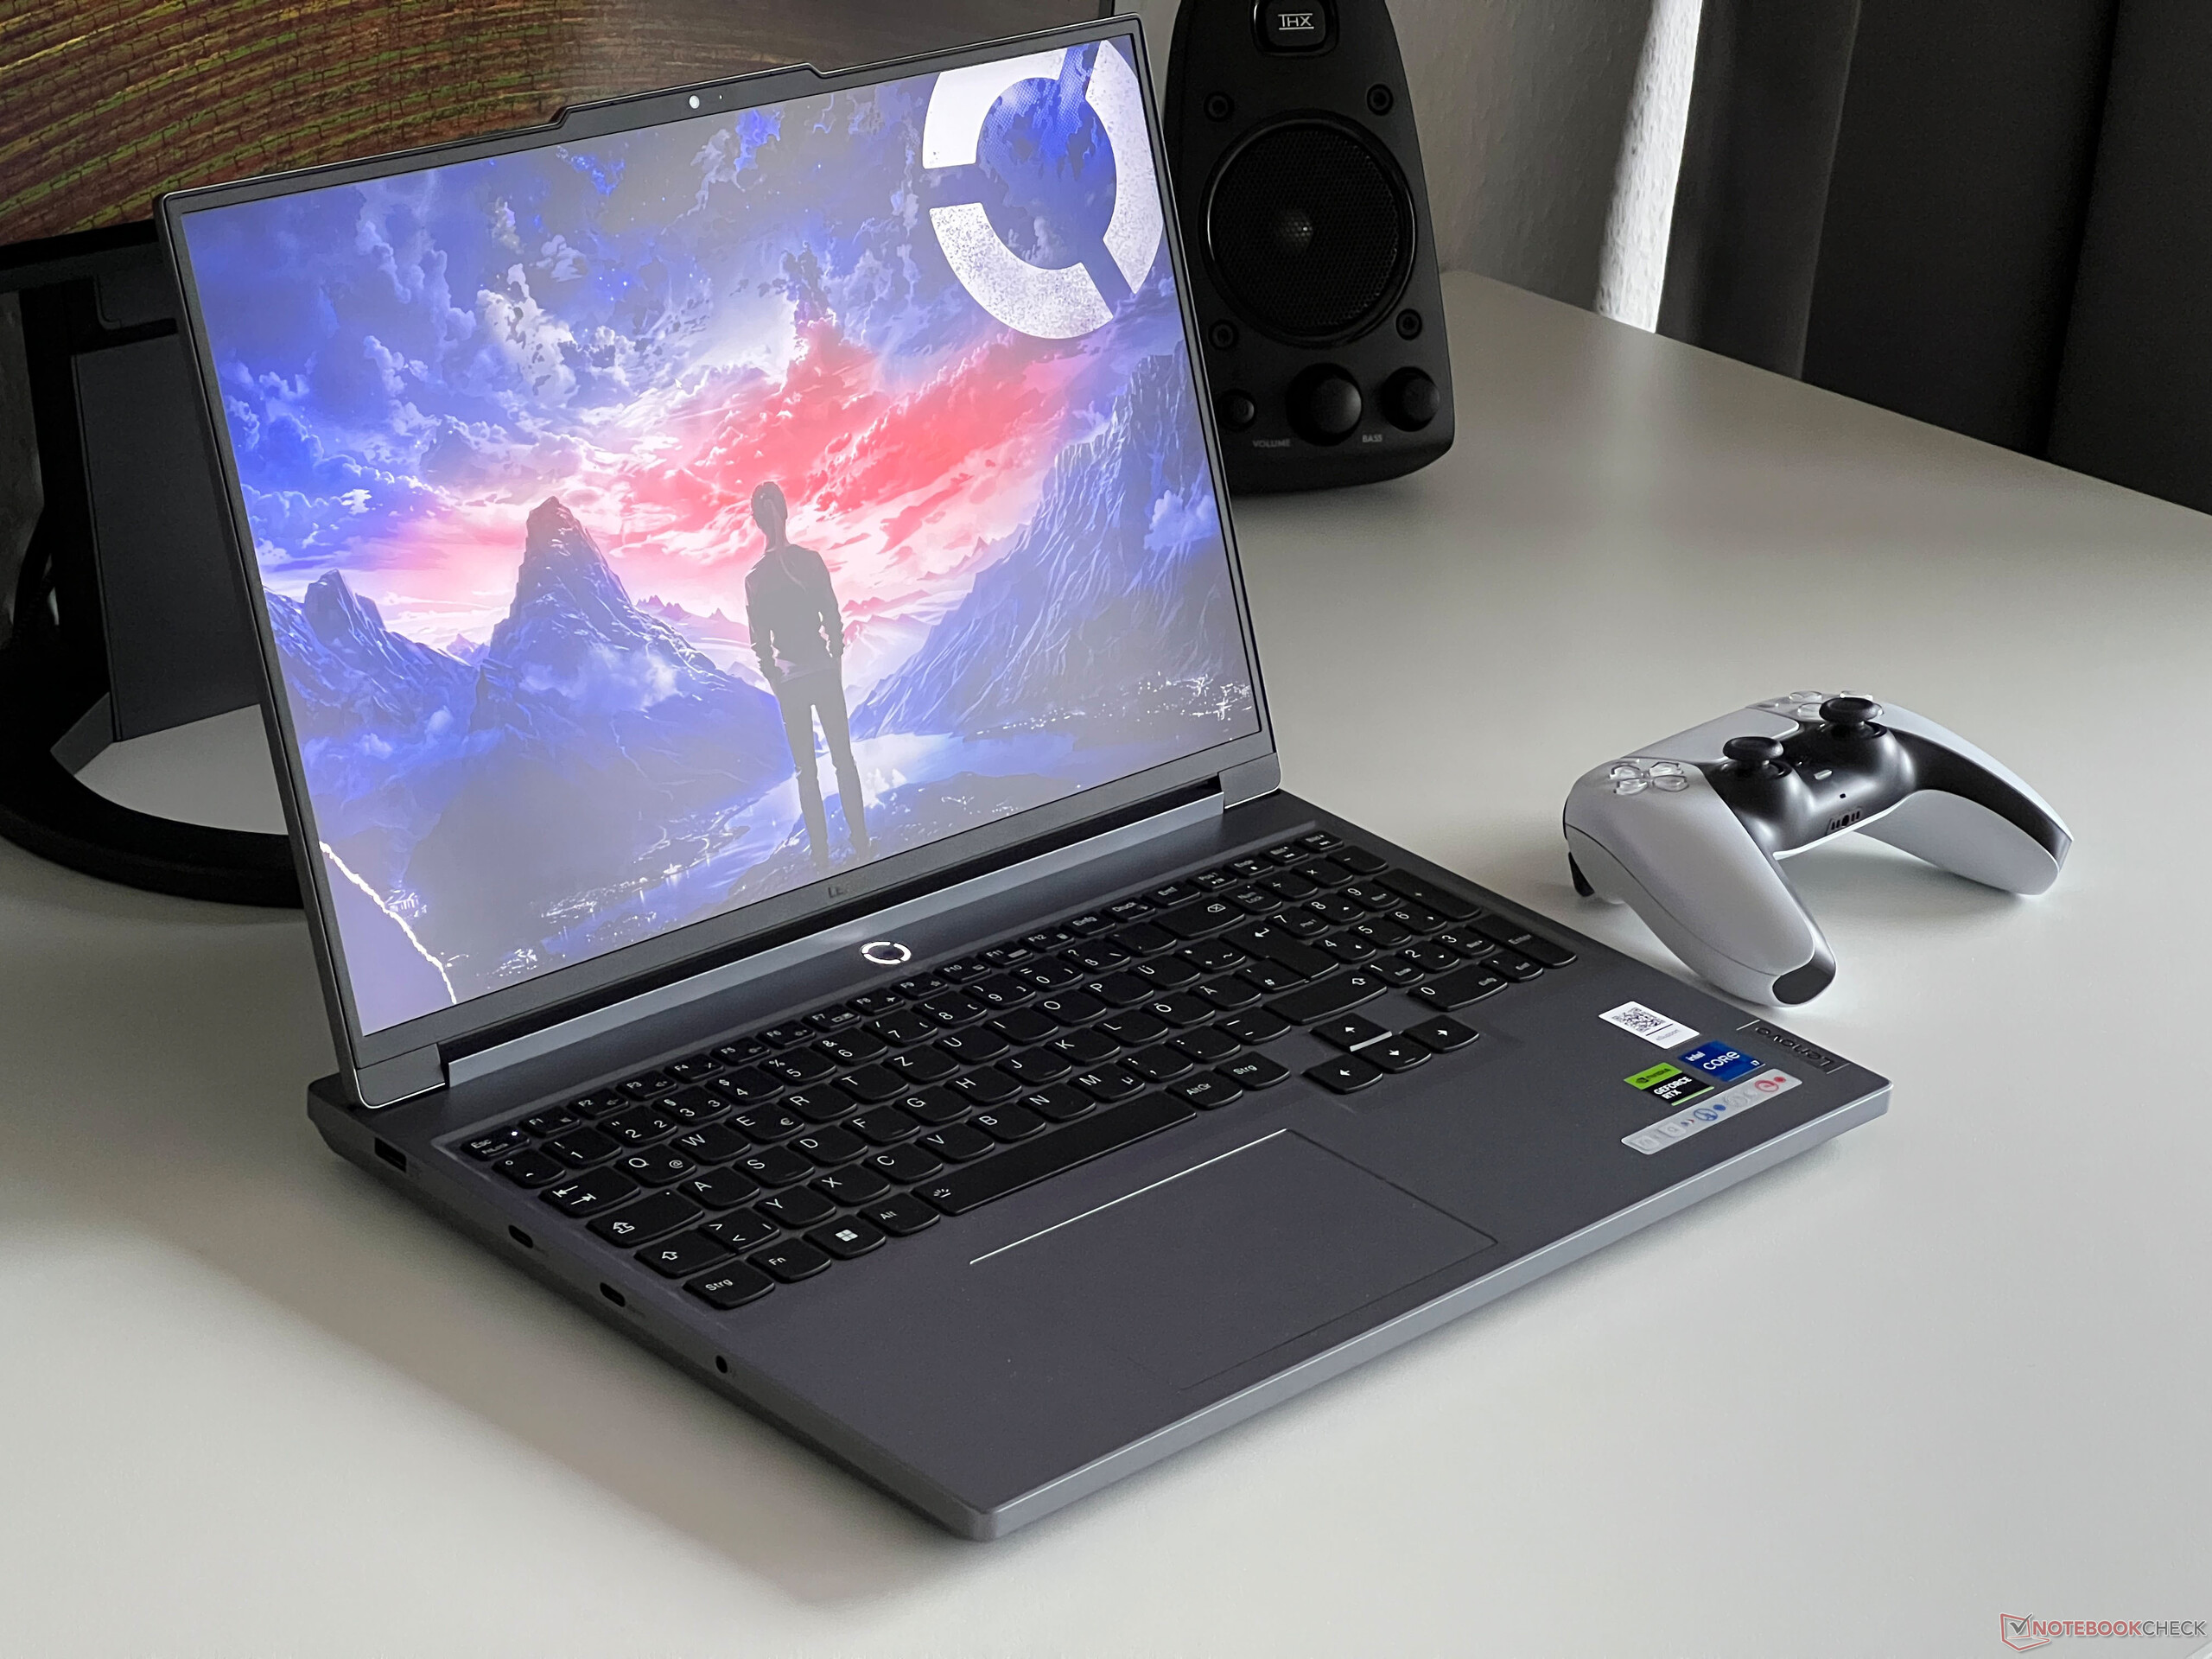
Input devices - 1.5-mm lift without RGB lighting
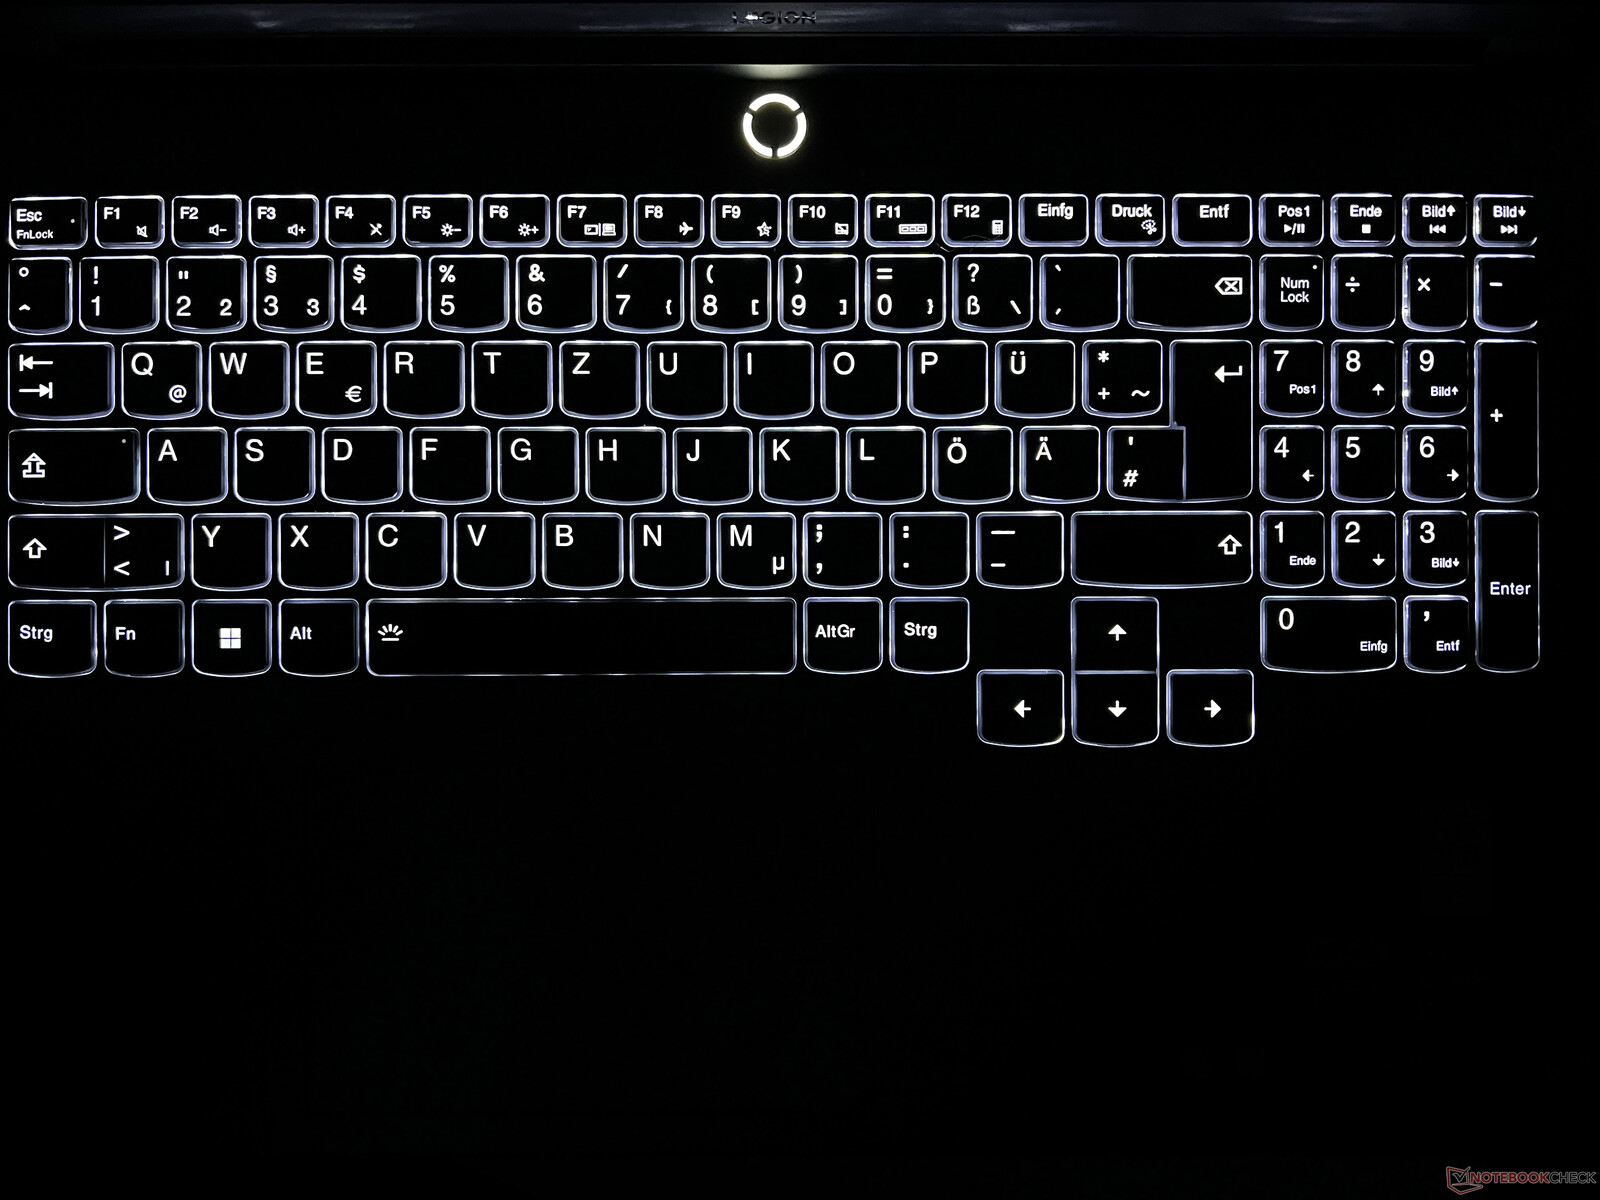
The black keyboard—including a dedicated numerical keypad and offset arrow keys—is one we already know from other Legion models. Its keys have a lift of 1.5 mm and in total, it feels comfortable to type on them. Aside from gaming, it is also no problem to type longer texts on this keyboard. Our test configuration is fitted with a backlit keyboard which has two brightness settings; you can additionally optionally go for one with colored 4-zone backlighting.
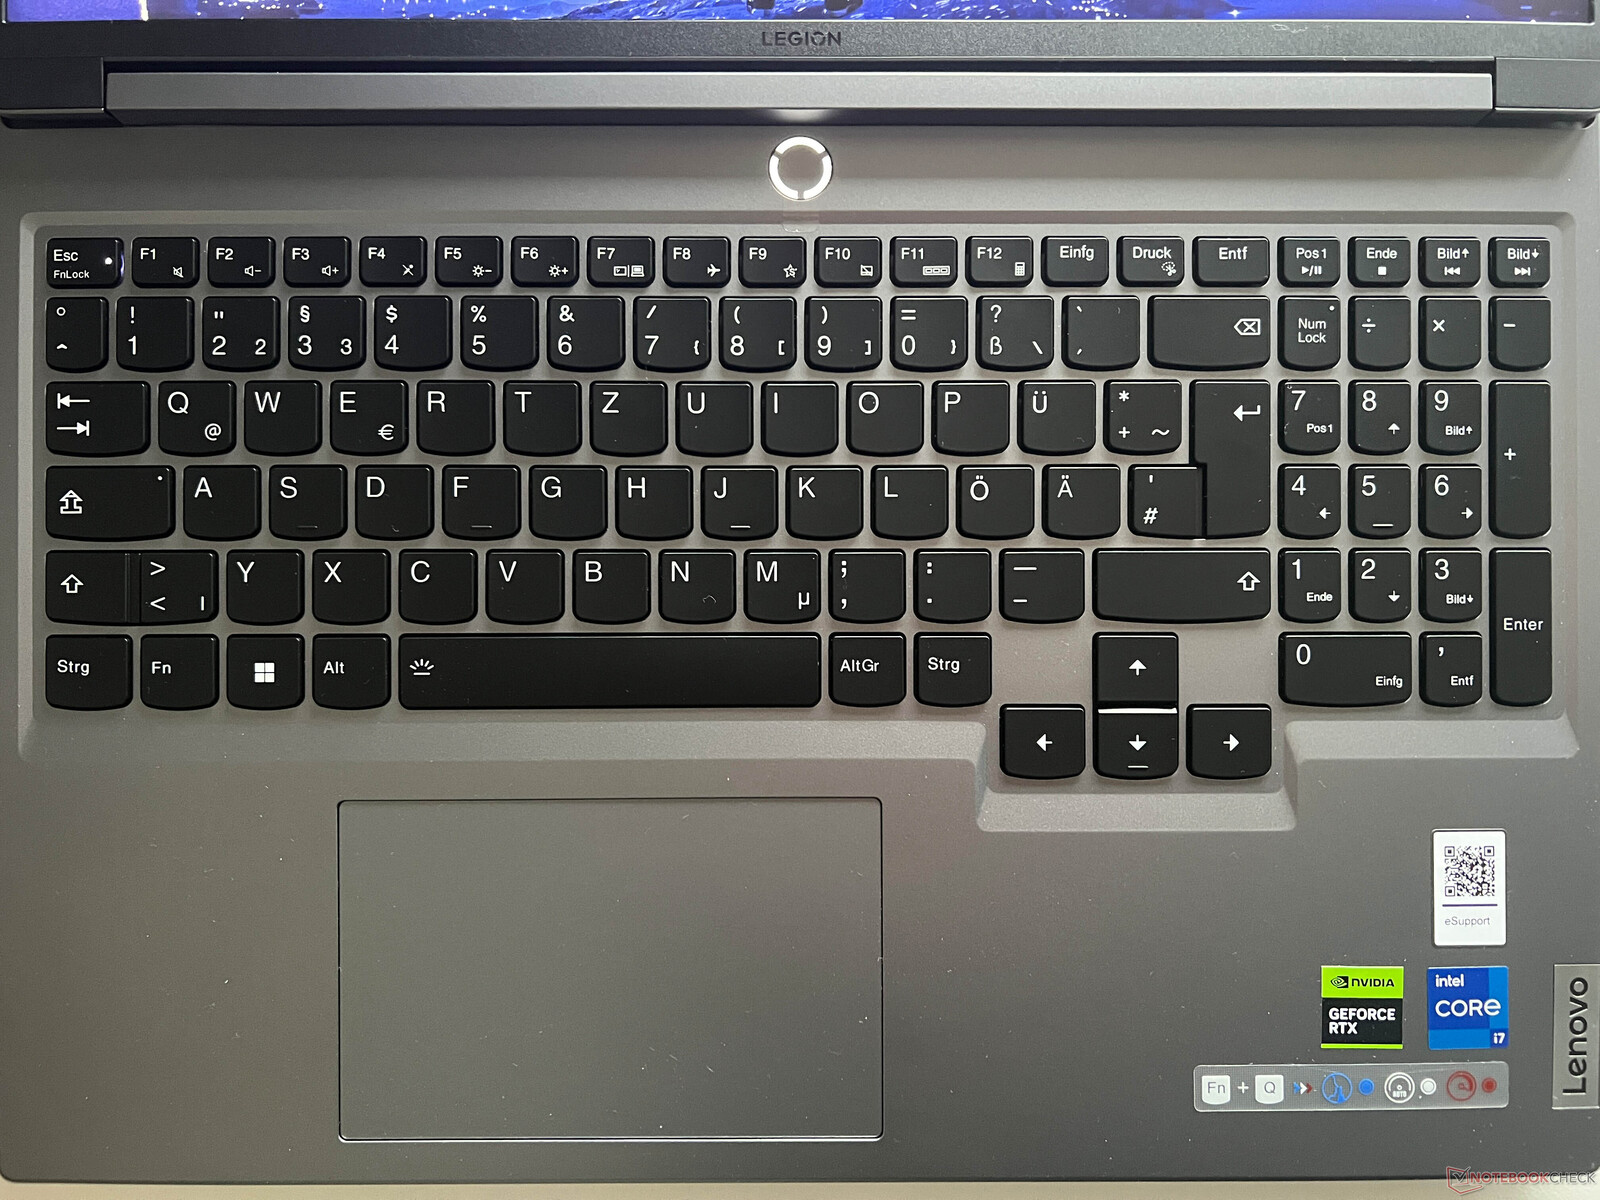
The clickpad is positioned slightly to the left and its size (12 x 7.5 cm) is perfect for normal pointer operation—which also works absolutely fine. The bottom of the pad can be pressed down which, unfortunately, is met with a loud noise. While gaming, most users will reach for a gamepad or a mouse anyway. These can be connected on both sides of the device.
Display - 240-Hz IPS


Lenovo offers two different matte WQXGA displays with a 2,560 x 1,600 pixel resolution. Next to a version with a 165-Hz refresh rate and a 300-nit brightness, you can also select a brighter 500-nit variant with a 240-Hz refresh rate. The latter additionally supports HDR and this is the one installed into our test device. Subjectively, the screen looks great; content looks very sharp, colors are vivid and even lighter areas don't appear grainy. However, you can notice some clear halos when looking at dark images with the brightness turned up.
Our panel achieved a maximum of 528 cd/m² and an average of 500 cd/m², meaning its target has been reached. Its black value of 0.33 is okay and its maximum contrast ratio is over 1,500:1. The display's reaction speeds are fast and on the same level as other IPS competitors. All-in-all, the screen is well-suited for gaming and its values are better than the competition. HDR content is also supported (but HDR has to be manually activated via the Windows settings).
| |||||||||||||||||||||||||
Brightness Distribution: 87 %
Center on Battery: 519 cd/m²
Contrast: 1594:1 (Black: 0.33 cd/m²)
ΔE ColorChecker Calman: 1.2 | ∀{0.5-29.43 Ø4.71}
calibrated: 1
ΔE Greyscale Calman: 1.3 | ∀{0.09-98 Ø4.96}
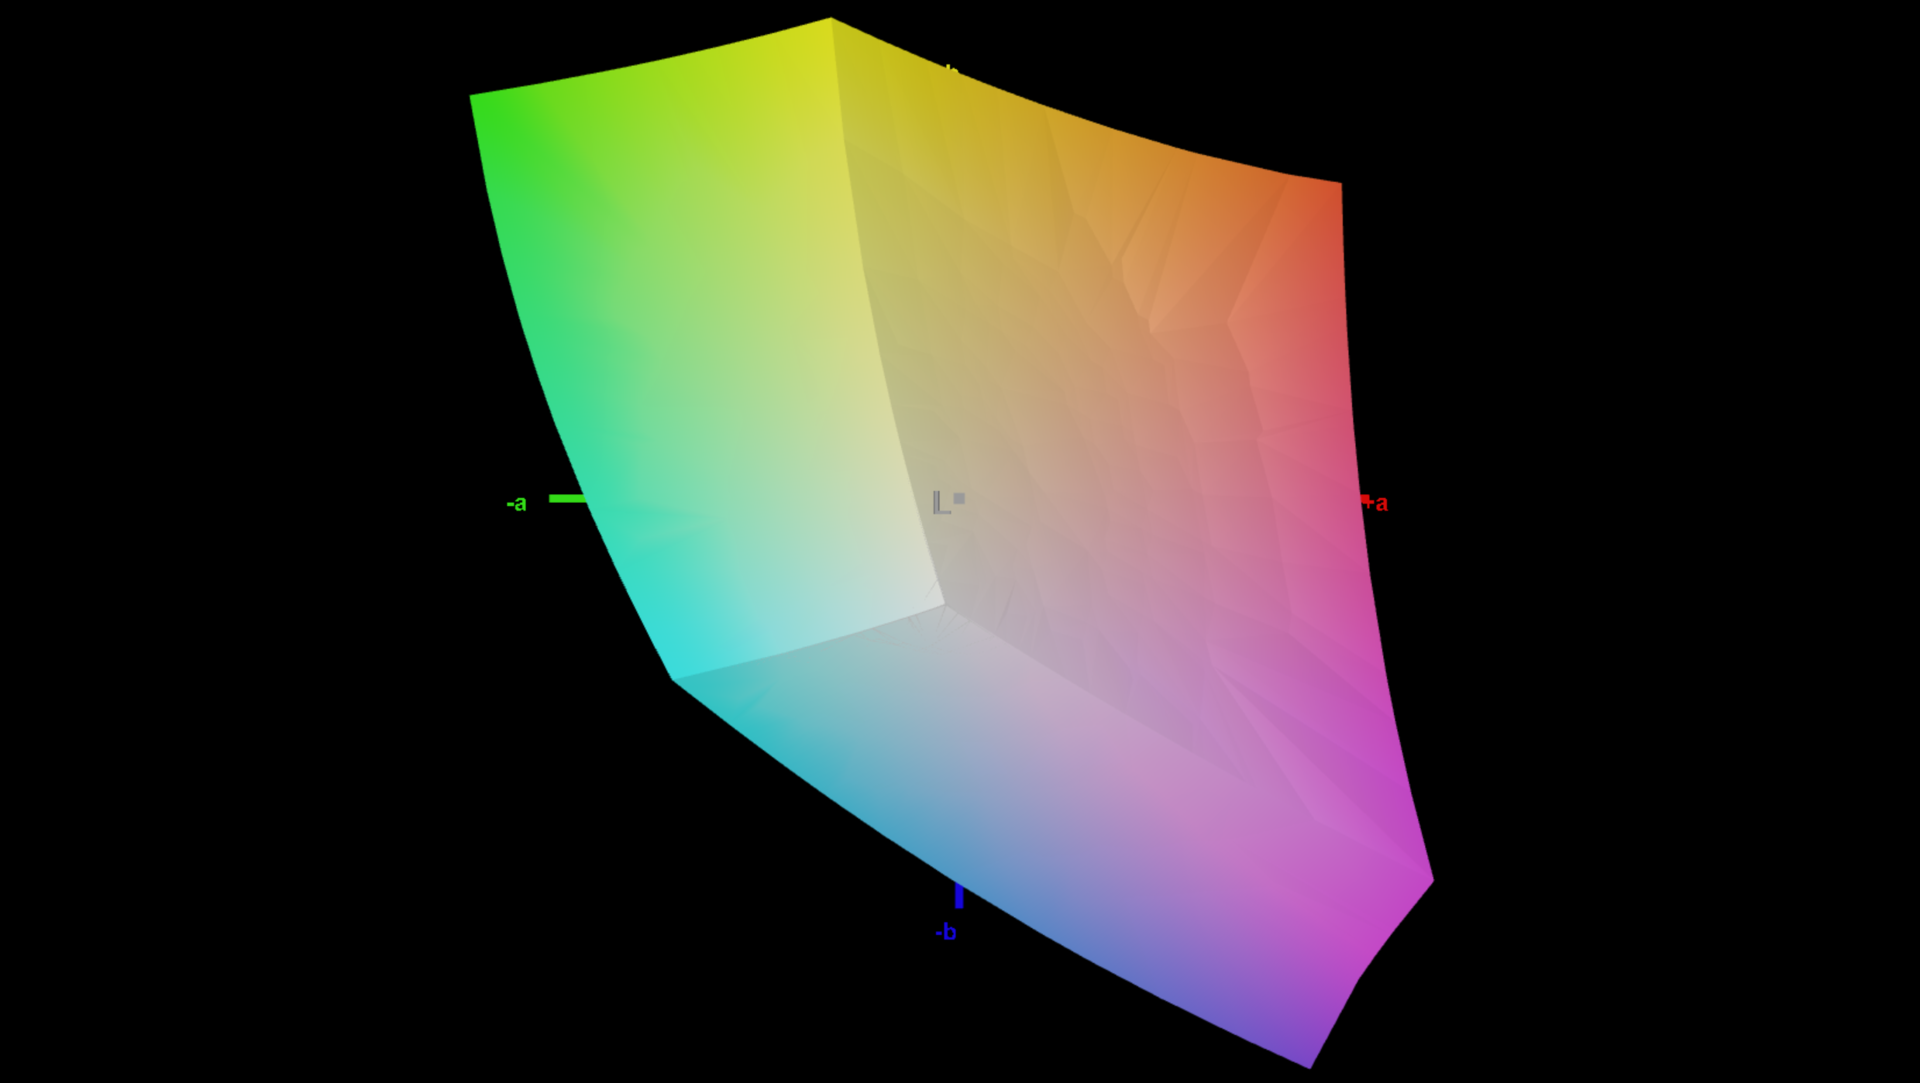
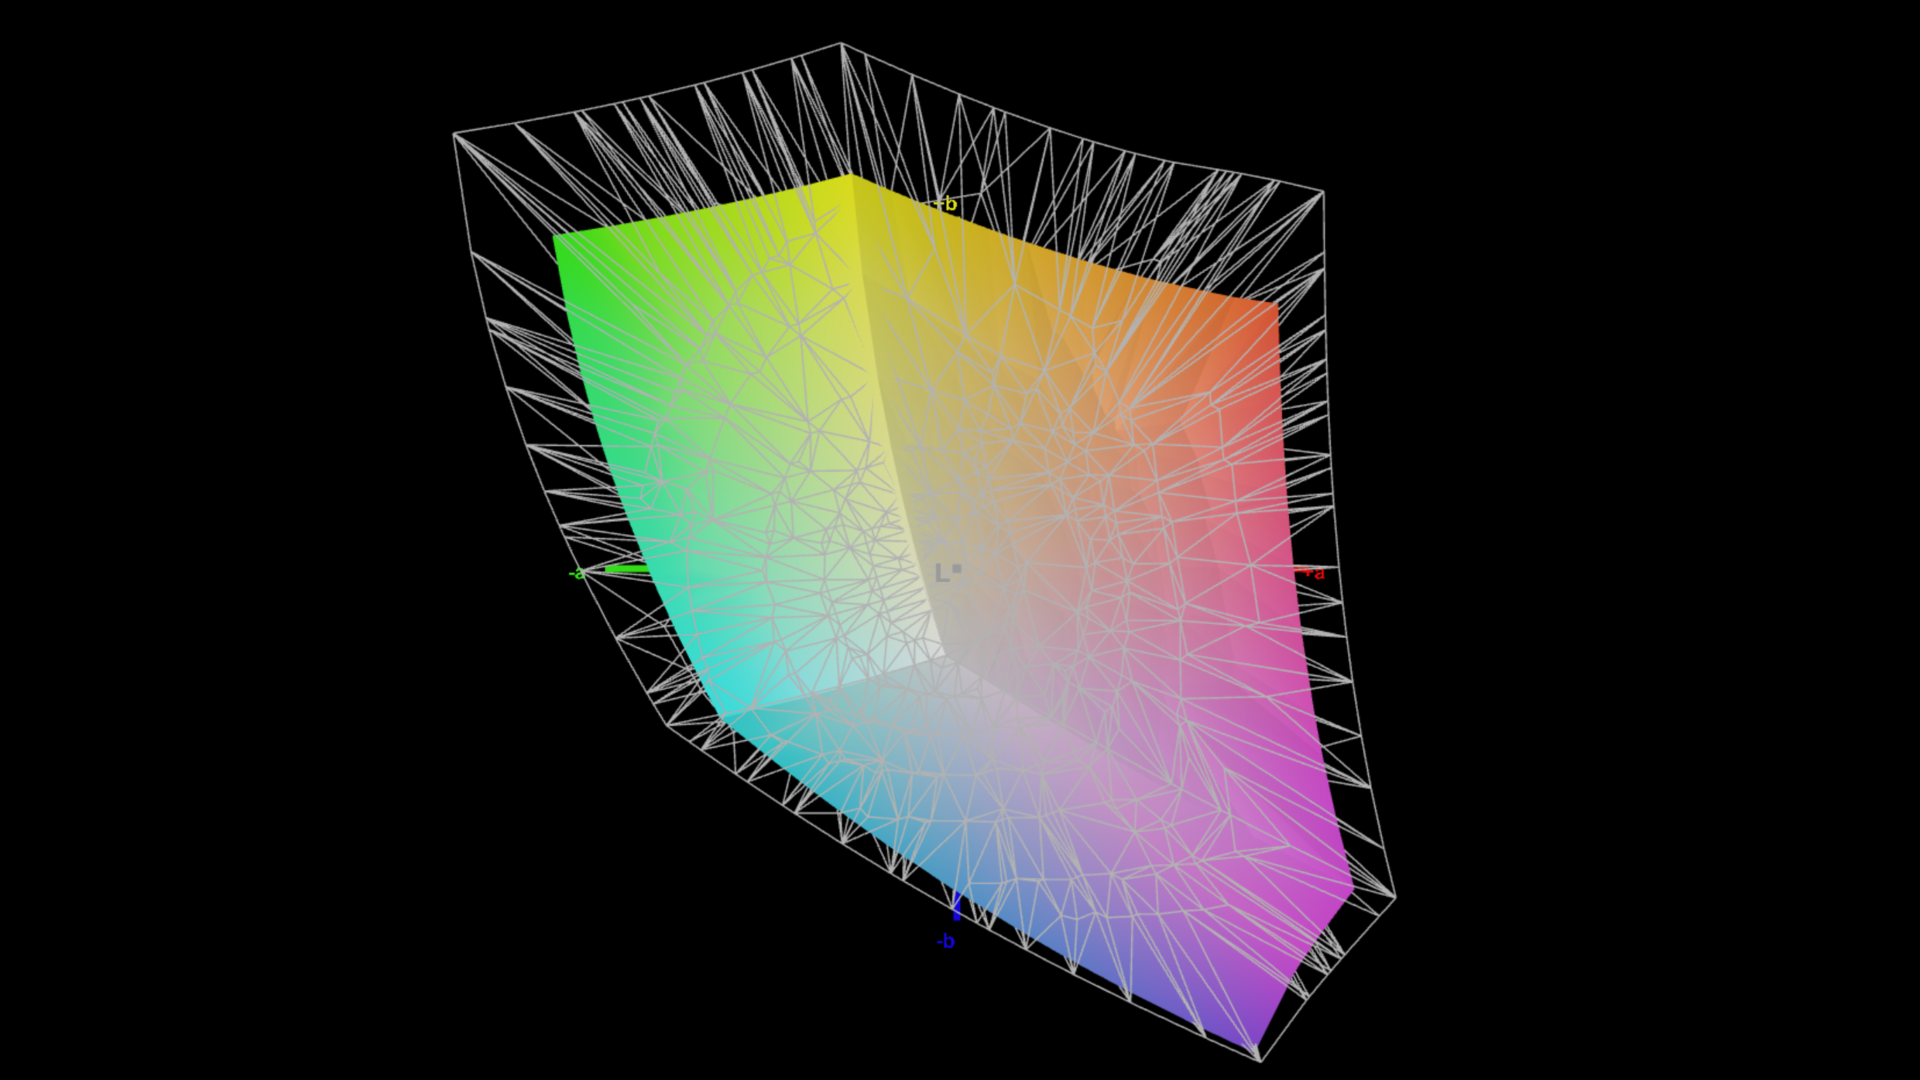
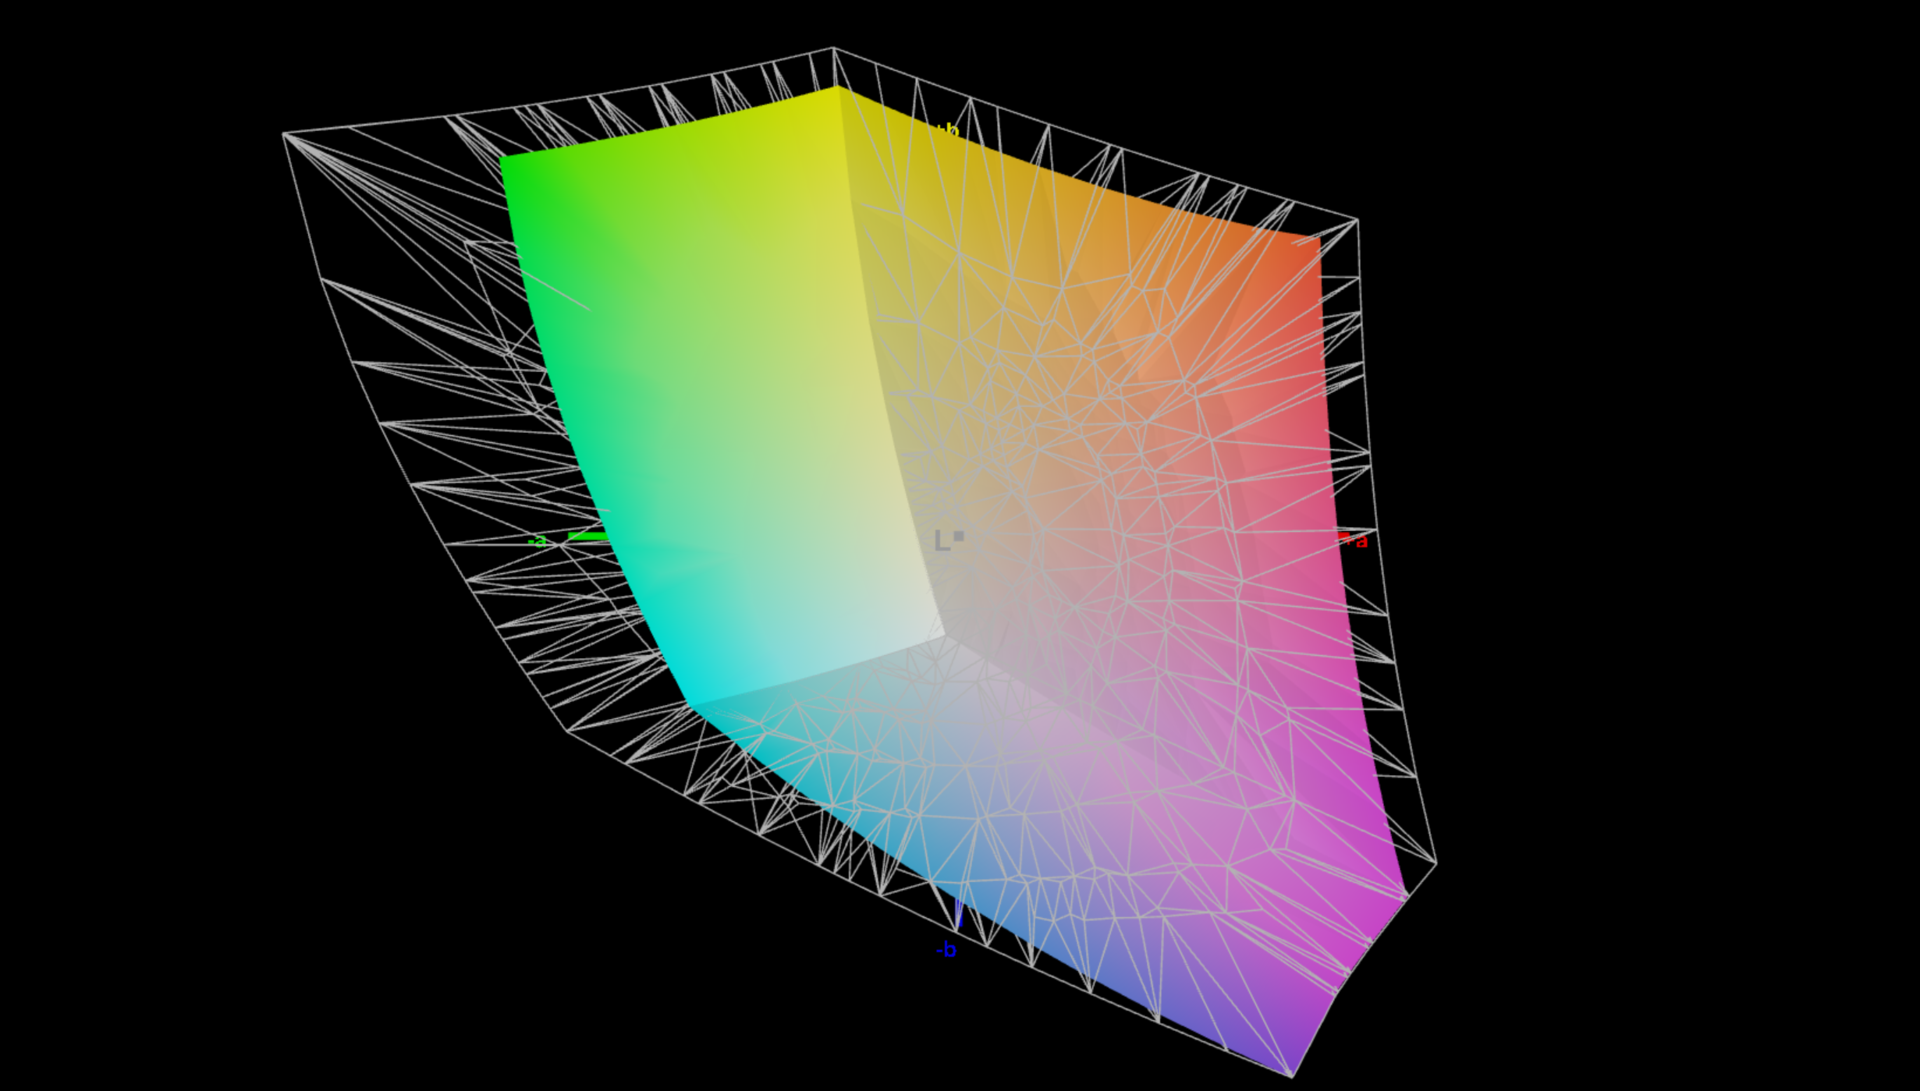
74.1% AdobeRGB 1998 (Argyll 3D)
100% sRGB (Argyll 3D)
72.4% Display P3 (Argyll 3D)
Gamma: 2.23
CCT: 6391 K
| Lenovo Legion 5 16IRX G9 NE160QDM-NZ3, IPS, 2560x1600, 16" | Schenker XMG CORE 16 (L23) BOE0AF0 (), IPS, 2560x1600, 16" | HP Victus 16-r0077ng CMN162D, IPS, 1920x1080, 16.1" | Lenovo LOQ 16IRH8 AUOC1A5 (B160QAN03.L), IPS, 2560x1600, 16" | Lenovo Legion Slim 5 16APH8 BOE NJ NE160QDM-NYC, IPS, 2560x1600, 16" | HP Victus 16-r0076TX Chi Mei CMN1629, IPS, 1920x1080, 16.1" | Alienware m16 R1 Intel BOE NE16NYB, IPS, 2560x1600, 16" | Lenovo Legion Pro 5 16IRX8 AU Optronics B160QAN03.1, IPS, 2560x1600, 16" | |
|---|---|---|---|---|---|---|---|---|
| Display | -4% | -6% | -2% | -3% | -5% | -5% | -1% | |
| Display P3 Coverage (%) | 72.4 | 68.3 -6% | 66.7 -8% | 70.5 -3% | 69.3 -4% | 67.5 -7% | 67.7 -6% | 71.2 -2% |
| sRGB Coverage (%) | 100 | 98.6 -1% | 98 -2% | 98.9 -1% | 100 0% | 97.5 -2% | 97.2 -3% | 98.8 -1% |
| AdobeRGB 1998 Coverage (%) | 74.1 | 69.6 -6% | 69 -7% | 72.6 -2% | 70 -6% | 69.7 -6% | 70 -6% | 73.3 -1% |
| Response Times | 9% | 0% | 29% | 12% | 32% | 42% | -18% | |
| Response Time Grey 50% / Grey 80% * (ms) | 12.5 ? | 13.2 ? -6% | 13.3 ? -6% | 7.2 ? 42% | 10.7 ? 14% | 6.18 ? 51% | 4 ? 68% | 14.5 ? -16% |
| Response Time Black / White * (ms) | 8.7 ? | 6.6 ? 24% | 8.2 ? 6% | 7.4 ? 15% | 7.8 ? 10% | 7.62 ? 12% | 7.3 ? 16% | 10.4 ? -20% |
| PWM Frequency (Hz) | ||||||||
| Screen | -67% | -16% | -24% | -14% | -21% | -51% | -20% | |
| Brightness middle (cd/m²) | 526 | 376 -29% | 308 -41% | 407 -23% | 371.6 -29% | 290 -45% | 306 -42% | 405.7 -23% |
| Brightness (cd/m²) | 500 | 358 -28% | 285 -43% | 369 -26% | 343 -31% | 275 -45% | 302 -40% | 368 -26% |
| Brightness Distribution (%) | 87 | 88 1% | 85 -2% | 85 -2% | 84 -3% | 82 -6% | 89 2% | 87 0% |
| Black Level * (cd/m²) | 0.33 | 0.33 -0% | 0.25 24% | 0.45 -36% | 0.44 -33% | 0.21 36% | 0.3 9% | 0.38 -15% |
| Contrast (:1) | 1594 | 1139 -29% | 1232 -23% | 904 -43% | 845 -47% | 1381 -13% | 1020 -36% | 1068 -33% |
| Colorchecker dE 2000 * | 1.2 | 2.74 -128% | 1.3 -8% | 1.43 -19% | 1.52 -27% | 1.7 -42% | 2.57 -114% | 1.65 -38% |
| Colorchecker dE 2000 max. * | 2.1 | 6.78 -223% | 2.76 -31% | 3.58 -70% | 2.68 -28% | 3.57 -70% | 4.26 -103% | 4.2 -100% |
| Colorchecker dE 2000 calibrated * | 1 | 0.88 12% | 0.92 8% | 1.07 -7% | 0.33 67% | 0.93 7% | 0.85 15% | 0.53 47% |
| Greyscale dE 2000 * | 1.3 | 3.57 -175% | 1.7 -31% | 1.13 13% | 1.2 8% | 1.5 -15% | 3.3 -154% | 1.2 8% |
| Gamma | 2.23 99% | 2.4 92% | 2.167 102% | 2.5 88% | 2.1 105% | 2.1 105% | 1.997 110% | 2.3 96% |
| CCT | 6391 102% | 7246 90% | 6767 96% | 6526 100% | 6503 100% | 6538 99% | 6895 94% | 6453 101% |
| Total Average (Program / Settings) | -21% /
-42% | -7% /
-12% | 1% /
-12% | -2% /
-8% | 2% /
-10% | -5% /
-28% | -13% /
-16% |
* ... smaller is better
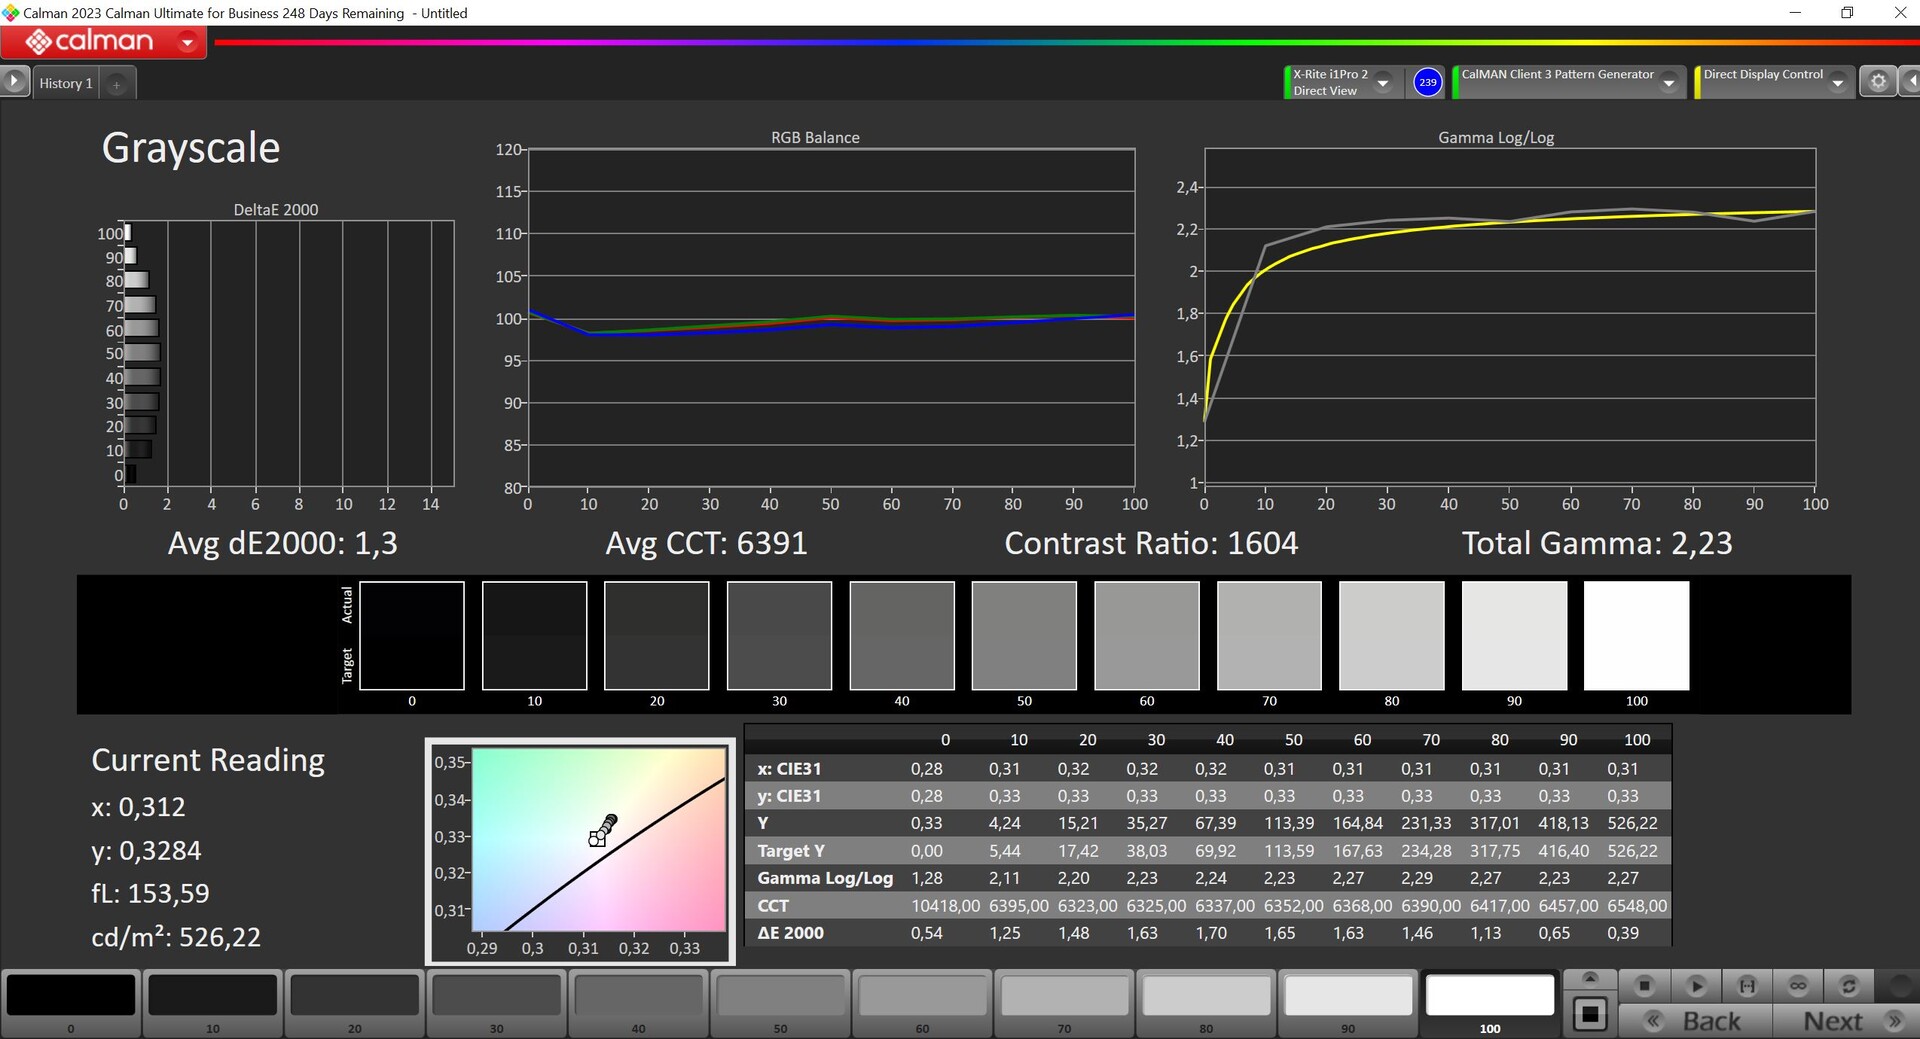

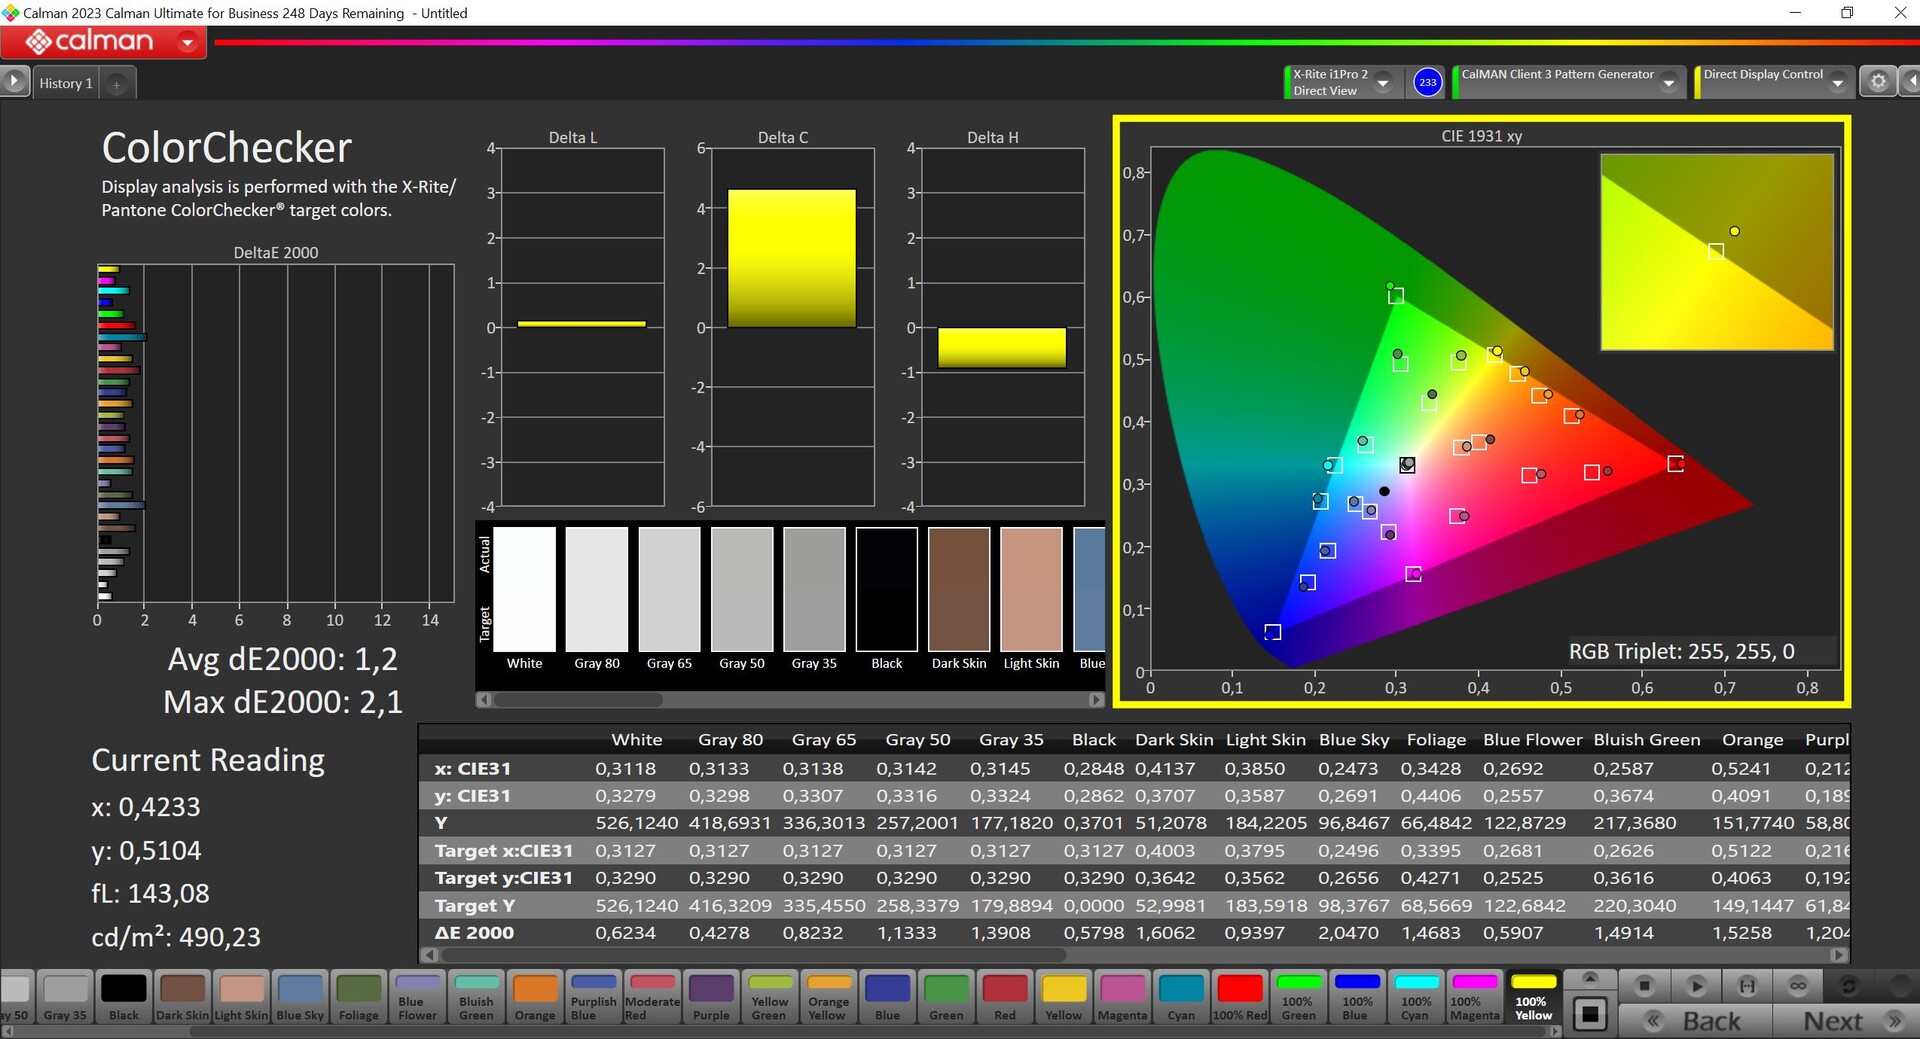

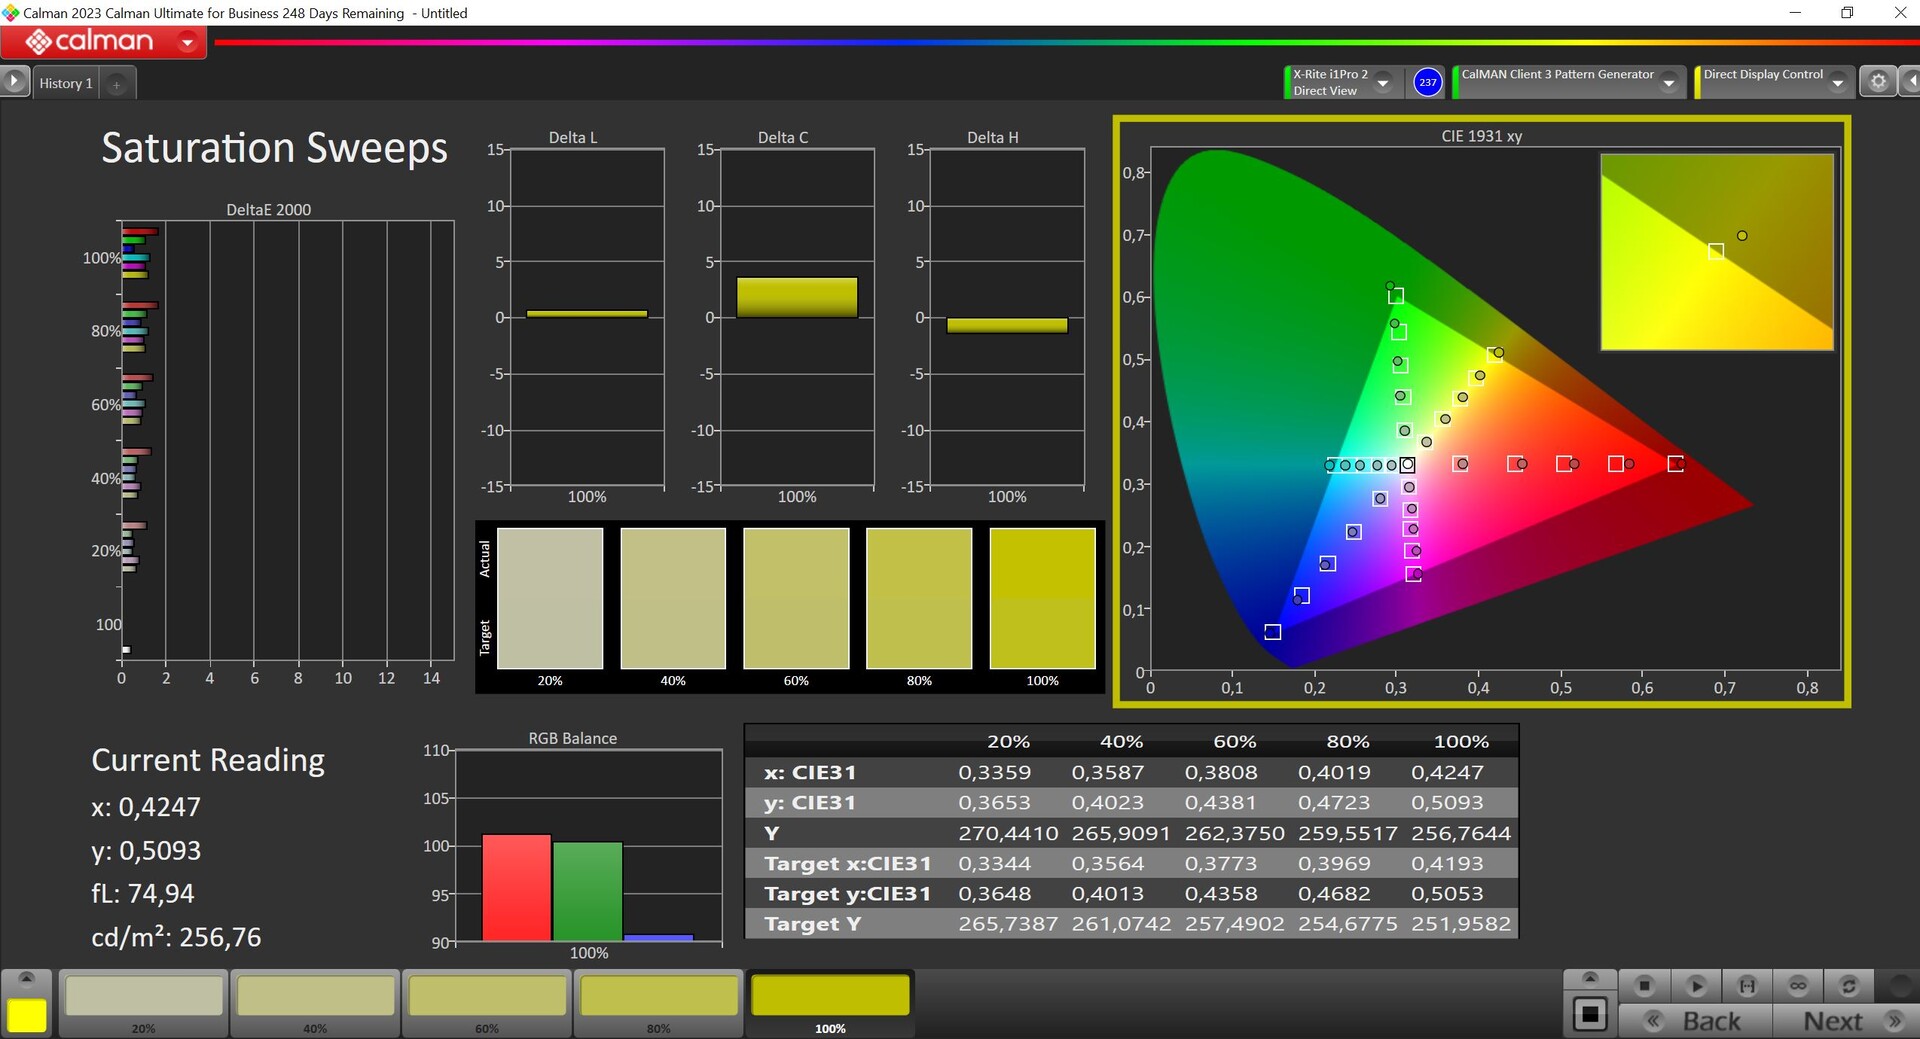

Ex works, the Legion 5i's display comes pre-calibrated and there are a few different color profiles available. We analyzed it using the professional CalMAN software (X-Rite i1 Pro2) using the profile "native". Its depiction is already superb, as neither grayscale nor colors show DeltaE-2000 deviations above 3. In addition, we didn't note a color tint and a user calibration could even be superfluous. We may have been able to improve depiction quality through our own calibration (can be downloaded for free further above), but this is only measurable—not visible. Together with its complete sRGB coverage, the panel can confidently be used to edit photos or video.
Display Response Times
| ↔ Response Time Black to White | ||
|---|---|---|
| 8.7 ms ... rise ↗ and fall ↘ combined | ↗ 4.6 ms rise | 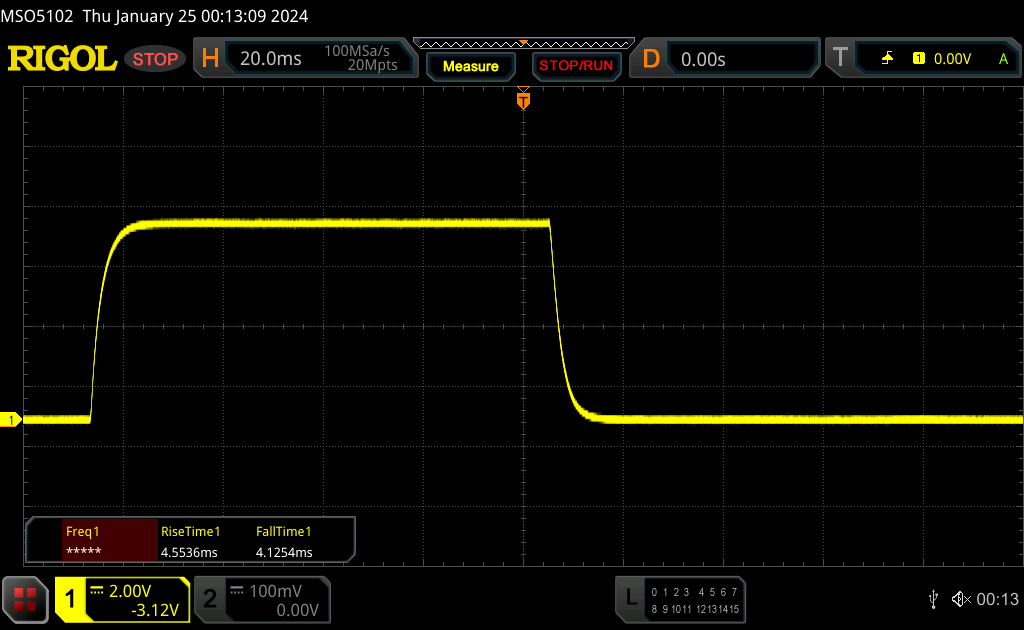 |
| ↘ 4.1 ms fall | ||
| The screen shows fast response rates in our tests and should be suited for gaming. In comparison, all tested devices range from 0.1 (minimum) to 240 (maximum) ms. » 24 % of all devices are better. This means that the measured response time is better than the average of all tested devices (19.8 ms). | ||
| ↔ Response Time 50% Grey to 80% Grey | ||
| 12.5 ms ... rise ↗ and fall ↘ combined | ↗ 6.1 ms rise | 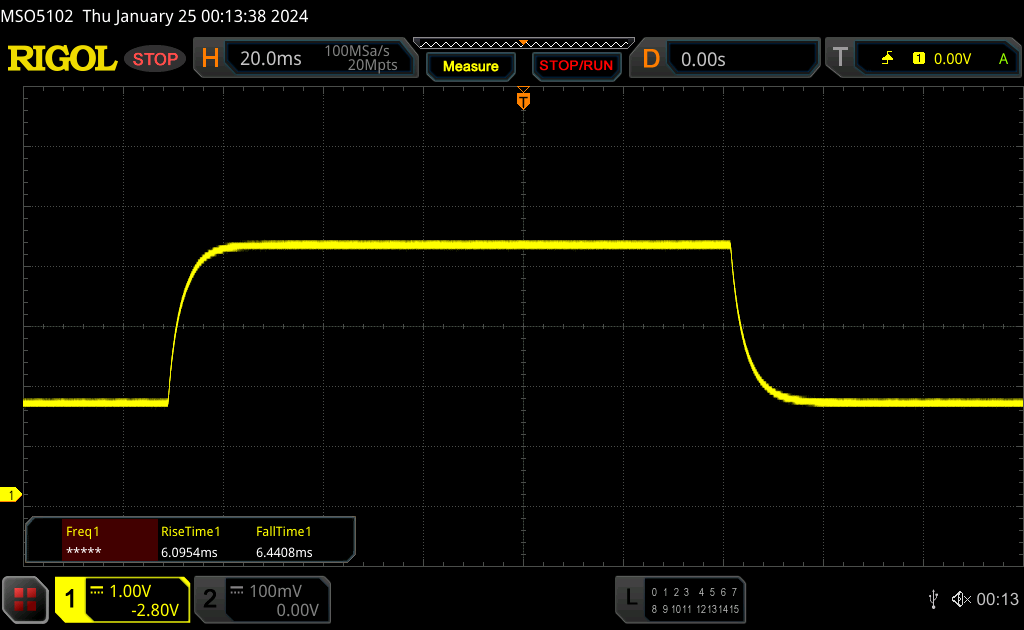 |
| ↘ 6.4 ms fall | ||
| The screen shows good response rates in our tests, but may be too slow for competitive gamers. In comparison, all tested devices range from 0.165 (minimum) to 636 (maximum) ms. » 26 % of all devices are better. This means that the measured response time is better than the average of all tested devices (31 ms). | ||
Screen Flickering / PWM (Pulse-Width Modulation)
| Screen flickering / PWM not detected | 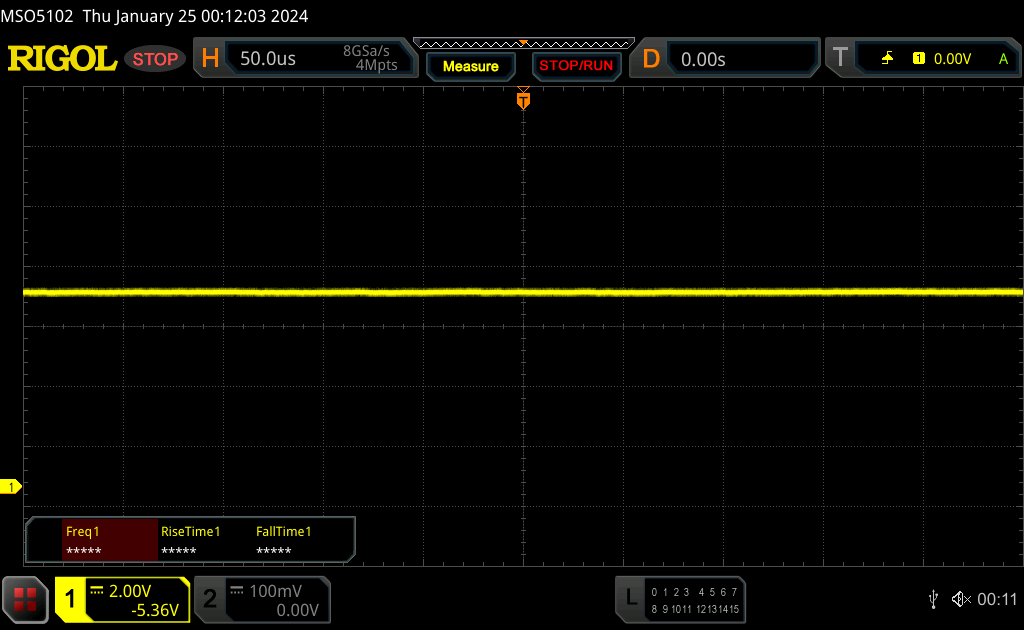 | ||
In comparison: 52 % of all tested devices do not use PWM to dim the display. If PWM was detected, an average of 7757 (minimum: 5 - maximum: 343500) Hz was measured. | |||

Thanks to the display's high brightness and matte surface, the Legion 5i 16 can be used very well outside or in bright surroundings. The IPS's viewing-angle stability is fine, but viewing it from diagonally above leads to the picture being lightened quite a bit.

Performance - Raptor Lake-HX Refresh & Ada Lovelace
Lenovo offers the Legion 5i 16 G9 with five different HX processors from Intel, although the two weaker variants still belong to last year's 13th generation. The flagship can be fitted with a Core i9-14900HX at best, and our test sample features the Core i7-14650HX. Available graphics cards include the current Nvidia models GeForce RTX 4050 Laptop, 4060 Laptop, and 4070 Laptop with a maximum TGP of 115 watts and a MUX switch for Advanced Optimus graphics switching.
Testing conditions
Lenovo offers three different performance modes within the pre-installed Vantage app as well as a customized mode that the user can adjust extensively (CPU/GPU power limits, CPU/GPU temperature limit, CPU/GPU dynamic boost). So, you can play about with these as much as you want. We have listed the three predefined settings' respective parameters in the table below (quiet mode, balanced mode and performance mode).
| Energy profile | CPU load | CB R23 Multi | GPU load | Time Spy graphics | Cyberpunk 2077 QHD Ultra | max. fan emissions |
|---|---|---|---|---|---|---|
| Quiet mode | 65->55 watts | 16,720 points | 65 watts | 8,443 points | 35.4 fps | 34.6 dB(A) |
| Balanced mode | 120->70 watts | 19,897 points | 80 watts | 9,749 points | 43.4 fps | 49.8 dB(A) |
| Performance mode | 140->100 watts | 24,455 points | 125 watts | 11,267 points | 49.7 fps | 55.7 dB(A) |
We carried out the following benchmarks and measurements using performance mode, as the device's gaming performance in particular is much higher using this mode. Of course, the fans also end up being louder but even in balanced mode, the fans can get very loud while gaming and you will likely need a headset regardless—so you might as well use performance mode. The profiles can be selected via the key combination Fn+Q, whereby the colored status LED on the power button shows what mode is currently in use (red: performance, white: balanced, blue: quiet, purple: adjusted). During simple everyday tasks, you can easily use quiet mode while often being able to enjoy a completely silent device. In battery use, you can't use performance mode.
Lenovo has given the Legion 5i 16's AI Engine+ its own LA1 AI chip which can be activated in conjunction with balanced mode. It supposedly automatically recognizes games and optimizes the laptop's performance, whereby the temperatures and fan noise emissions can increase. In general, however, this isn't really anything new and a similar function could already be seen on earlier models, where playing games triggered an automatic switch to performance mode. On the other hand, we didn't notice any difference compared to balanced mode when using this new AI Engine+, and the device's performance was often the same or even worse than in performance mode.
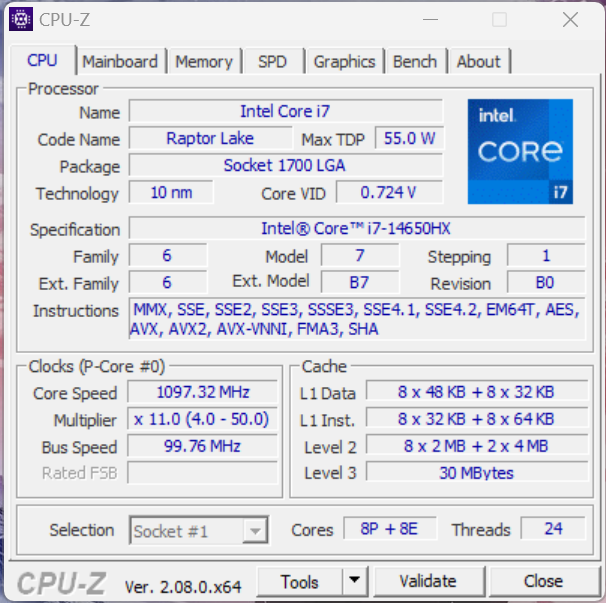
Processor - Core i7-14650HX
The new Core i7-14650HX is the successor to the old Core i7-13700HX, offering the same core configuration (8x performance + 8x efficiency) with slightly higher clock rates (up to 5.2 GHz)—but in terms of its general architecture, nothing has changed. Within the Legion 5i 16, the new HX CPU consumes 140 watts for a short period of time, before balancing out at 100 watts. The resulting performance is excellent, leading to an advantage of 10 % over the old 13700HX. The AMD models also did noticeably worse. During the single-core tests, the Legion came out on top, too. In battery use, its power consumption is limited to 50 watts, which is why its multi-core performance dropped by about 40 % (CB R23 Multi: 14,202 points).
Further CPU benchmarks can be found in our tech section.
Cinebench R15 Multi continuous test
Cinebench R23: Multi Core | Single Core
Cinebench R20: CPU (Multi Core) | CPU (Single Core)
Cinebench R15: CPU Multi 64Bit | CPU Single 64Bit
Blender: v2.79 BMW27 CPU
7-Zip 18.03: 7z b 4 | 7z b 4 -mmt1
Geekbench 6.7: Multi-Core | Single-Core
Geekbench 5.5: Multi-Core | Single-Core
HWBOT x265 Benchmark v2.2: 4k Preset
LibreOffice : 20 Documents To PDF
R Benchmark 2.5: Overall mean
| CPU Performance rating | |
| Average of class Gaming | |
| Lenovo Legion 5 16IRX G9 | |
| Alienware m16 R1 Intel | |
| Average Intel Core i7-14650HX | |
| Lenovo Legion Pro 5 16IRX8 -2! | |
| Lenovo Legion Slim 5 16APH8 -2! | |
| Schenker XMG CORE 16 (L23) | |
| HP Victus 16-r0076TX -3! | |
| Lenovo LOQ 16IRH8 | |
| HP Victus 16-r0077ng | |
| Cinebench R23 / Multi Core | |
| Average of class Gaming (10488 - 42661, n=107, last 2 years) | |
| Lenovo Legion 5 16IRX G9 | |
| Alienware m16 R1 Intel | |
| Average Intel Core i7-14650HX (16453 - 24455, n=2) | |
| Lenovo Legion Pro 5 16IRX8 | |
| HP Victus 16-r0076TX | |
| Schenker XMG CORE 16 (L23) | |
| Lenovo Legion Slim 5 16APH8 | |
| HP Victus 16-r0077ng | |
| Lenovo LOQ 16IRH8 | |
| Cinebench R23 / Single Core | |
| Average of class Gaming (1166 - 2415, n=107, last 2 years) | |
| Average Intel Core i7-14650HX (1963 - 1975, n=2) | |
| Lenovo Legion 5 16IRX G9 | |
| Alienware m16 R1 Intel | |
| Lenovo LOQ 16IRH8 | |
| Lenovo Legion Slim 5 16APH8 | |
| Schenker XMG CORE 16 (L23) | |
| HP Victus 16-r0076TX | |
| HP Victus 16-r0077ng | |
| Lenovo Legion Pro 5 16IRX8 | |
| Cinebench R20 / CPU (Multi Core) | |
| Average of class Gaming (4029 - 16433, n=106, last 2 years) | |
| Lenovo Legion 5 16IRX G9 | |
| Alienware m16 R1 Intel | |
| Average Intel Core i7-14650HX (6236 - 9349, n=2) | |
| HP Victus 16-r0076TX | |
| Lenovo Legion Pro 5 16IRX8 | |
| Lenovo Legion Slim 5 16APH8 | |
| Schenker XMG CORE 16 (L23) | |
| HP Victus 16-r0077ng | |
| Lenovo LOQ 16IRH8 | |
| Cinebench R20 / CPU (Single Core) | |
| Average of class Gaming (442 - 913, n=106, last 2 years) | |
| Average Intel Core i7-14650HX (754 - 762, n=2) | |
| Lenovo Legion 5 16IRX G9 | |
| Alienware m16 R1 Intel | |
| Lenovo LOQ 16IRH8 | |
| Lenovo Legion Slim 5 16APH8 | |
| Schenker XMG CORE 16 (L23) | |
| Lenovo Legion Pro 5 16IRX8 | |
| HP Victus 16-r0077ng | |
| HP Victus 16-r0076TX | |
| Cinebench R15 / CPU Multi 64Bit | |
| Average of class Gaming (1578 - 6330, n=105, last 2 years) | |
| Lenovo Legion 5 16IRX G9 | |
| Average Intel Core i7-14650HX (3142 - 3799, n=2) | |
| Lenovo Legion Pro 5 16IRX8 | |
| Alienware m16 R1 Intel | |
| HP Victus 16-r0076TX | |
| Lenovo Legion Slim 5 16APH8 | |
| Schenker XMG CORE 16 (L23) | |
| Lenovo LOQ 16IRH8 | |
| HP Victus 16-r0077ng | |
| Cinebench R15 / CPU Single 64Bit | |
| Average of class Gaming (188.8 - 350, n=106, last 2 years) | |
| Lenovo Legion 5 16IRX G9 | |
| Average Intel Core i7-14650HX (284 - 287, n=2) | |
| Lenovo Legion Slim 5 16APH8 | |
| Alienware m16 R1 Intel | |
| Schenker XMG CORE 16 (L23) | |
| Lenovo Legion Pro 5 16IRX8 | |
| Lenovo LOQ 16IRH8 | |
| HP Victus 16-r0077ng | |
| HP Victus 16-r0076TX | |
| Blender / v2.79 BMW27 CPU | |
| Lenovo LOQ 16IRH8 | |
| HP Victus 16-r0077ng | |
| HP Victus 16-r0076TX | |
| Schenker XMG CORE 16 (L23) | |
| Lenovo Legion Slim 5 16APH8 | |
| Average Intel Core i7-14650HX (141 - 206, n=2) | |
| Alienware m16 R1 Intel | |
| Lenovo Legion Pro 5 16IRX8 | |
| Average of class Gaming (79 - 330, n=104, last 2 years) | |
| Lenovo Legion 5 16IRX G9 | |
| 7-Zip 18.03 / 7z b 4 | |
| Lenovo Legion 5 16IRX G9 | |
| Average of class Gaming (33491 - 148086, n=105, last 2 years) | |
| Alienware m16 R1 Intel | |
| Average Intel Core i7-14650HX (68711 - 93686, n=2) | |
| Lenovo Legion Pro 5 16IRX8 | |
| Schenker XMG CORE 16 (L23) | |
| HP Victus 16-r0076TX | |
| Lenovo Legion Slim 5 16APH8 | |
| HP Victus 16-r0077ng | |
| Lenovo LOQ 16IRH8 | |
| 7-Zip 18.03 / 7z b 4 -mmt1 | |
| Lenovo Legion 5 16IRX G9 | |
| Schenker XMG CORE 16 (L23) | |
| Average Intel Core i7-14650HX (6364 - 6695, n=2) | |
| Lenovo Legion Slim 5 16APH8 | |
| Average of class Gaming (4199 - 7436, n=105, last 2 years) | |
| Alienware m16 R1 Intel | |
| Lenovo LOQ 16IRH8 | |
| Lenovo Legion Pro 5 16IRX8 | |
| HP Victus 16-r0077ng | |
| HP Victus 16-r0076TX | |
| Geekbench 6.7 / Multi-Core | |
| Lenovo Legion 5 16IRX G9 | |
| Average of class Gaming (6625 - 22850, n=106, last 2 years) | |
| Average Intel Core i7-14650HX (12892 - 16010, n=2) | |
| Alienware m16 R1 Intel | |
| Schenker XMG CORE 16 (L23) | |
| Lenovo LOQ 16IRH8 | |
| HP Victus 16-r0077ng | |
| Geekbench 6.7 / Single-Core | |
| Average of class Gaming (1490 - 3259, n=106, last 2 years) | |
| Lenovo Legion 5 16IRX G9 | |
| Average Intel Core i7-14650HX (2744 - 2761, n=2) | |
| Schenker XMG CORE 16 (L23) | |
| Alienware m16 R1 Intel | |
| Lenovo LOQ 16IRH8 | |
| HP Victus 16-r0077ng | |
| Geekbench 5.5 / Multi-Core | |
| Average of class Gaming (6460 - 28263, n=105, last 2 years) | |
| Lenovo Legion 5 16IRX G9 | |
| Average Intel Core i7-14650HX (12584 - 16810, n=2) | |
| Alienware m16 R1 Intel | |
| Lenovo Legion Pro 5 16IRX8 | |
| HP Victus 16-r0076TX | |
| Lenovo LOQ 16IRH8 | |
| Schenker XMG CORE 16 (L23) | |
| Lenovo Legion Slim 5 16APH8 | |
| HP Victus 16-r0077ng | |
| Geekbench 5.5 / Single-Core | |
| Average of class Gaming (986 - 2474, n=105, last 2 years) | |
| Lenovo Legion Slim 5 16APH8 | |
| Schenker XMG CORE 16 (L23) | |
| Average Intel Core i7-14650HX (1933 - 1940, n=2) | |
| Lenovo Legion 5 16IRX G9 | |
| Alienware m16 R1 Intel | |
| Lenovo LOQ 16IRH8 | |
| Lenovo Legion Pro 5 16IRX8 | |
| HP Victus 16-r0076TX | |
| HP Victus 16-r0077ng | |
| HWBOT x265 Benchmark v2.2 / 4k Preset | |
| Average of class Gaming (11.5 - 44.4, n=105, last 2 years) | |
| Lenovo Legion 5 16IRX G9 | |
| Lenovo Legion Pro 5 16IRX8 | |
| Alienware m16 R1 Intel | |
| Lenovo Legion Slim 5 16APH8 | |
| Schenker XMG CORE 16 (L23) | |
| HP Victus 16-r0076TX | |
| Average Intel Core i7-14650HX (12.6 - 25.6, n=2) | |
| Lenovo LOQ 16IRH8 | |
| HP Victus 16-r0077ng | |
| LibreOffice / 20 Documents To PDF | |
| Schenker XMG CORE 16 (L23) | |
| HP Victus 16-r0077ng | |
| Average Intel Core i7-14650HX (43.8 - 55.6, n=2) | |
| Average of class Gaming (33.2 - 88.8, n=105, last 2 years) | |
| Lenovo LOQ 16IRH8 | |
| Alienware m16 R1 Intel | |
| Lenovo Legion 5 16IRX G9 | |
| Lenovo Legion Slim 5 16APH8 | |
| Lenovo Legion Pro 5 16IRX8 | |
| R Benchmark 2.5 / Overall mean | |
| HP Victus 16-r0077ng | |
| HP Victus 16-r0076TX | |
| Lenovo Legion Pro 5 16IRX8 | |
| Lenovo LOQ 16IRH8 | |
| Alienware m16 R1 Intel | |
| Schenker XMG CORE 16 (L23) | |
| Lenovo Legion Slim 5 16APH8 | |
| Average of class Gaming (0.3439 - 0.759, n=106, last 2 years) | |
| Average Intel Core i7-14650HX (0.4195 - 0.4244, n=2) | |
| Lenovo Legion 5 16IRX G9 | |
* ... smaller is better
AIDA64: FP32 Ray-Trace | FPU Julia | CPU SHA3 | CPU Queen | FPU SinJulia | FPU Mandel | CPU AES | CPU ZLib | FP64 Ray-Trace | CPU PhotoWorxx
| Performance rating | |
| Average of class Gaming | |
| Schenker XMG CORE 16 (L23) | |
| Lenovo Legion Slim 5 16APH8 | |
| Alienware m16 R1 Intel | |
| Lenovo Legion Pro 5 16IRX8 | |
| Lenovo Legion 5 16IRX G9 | |
| HP Victus 16-r0076TX | |
| Average Intel Core i7-14650HX | |
| HP Victus 16-r0077ng | |
| Lenovo LOQ 16IRH8 | |
| AIDA64 / FP32 Ray-Trace | |
| Average of class Gaming (10227 - 85542, n=105, last 2 years) | |
| Lenovo Legion Slim 5 16APH8 | |
| Schenker XMG CORE 16 (L23) | |
| Lenovo Legion Pro 5 16IRX8 | |
| Alienware m16 R1 Intel | |
| Lenovo Legion 5 16IRX G9 | |
| Average Intel Core i7-14650HX (13096 - 19044, n=2) | |
| HP Victus 16-r0076TX | |
| HP Victus 16-r0077ng | |
| Lenovo LOQ 16IRH8 | |
| AIDA64 / FPU Julia | |
| Average of class Gaming (51376 - 238426, n=105, last 2 years) | |
| Lenovo Legion Slim 5 16APH8 | |
| Schenker XMG CORE 16 (L23) | |
| Lenovo Legion Pro 5 16IRX8 | |
| Alienware m16 R1 Intel | |
| Lenovo Legion 5 16IRX G9 | |
| HP Victus 16-r0076TX | |
| Average Intel Core i7-14650HX (67335 - 95271, n=2) | |
| HP Victus 16-r0077ng | |
| Lenovo LOQ 16IRH8 | |
| AIDA64 / CPU SHA3 | |
| Average of class Gaming (2180 - 10115, n=105, last 2 years) | |
| Schenker XMG CORE 16 (L23) | |
| Lenovo Legion Slim 5 16APH8 | |
| Alienware m16 R1 Intel | |
| Lenovo Legion Pro 5 16IRX8 | |
| Lenovo Legion 5 16IRX G9 | |
| HP Victus 16-r0076TX | |
| Average Intel Core i7-14650HX (3109 - 4214, n=2) | |
| HP Victus 16-r0077ng | |
| Lenovo LOQ 16IRH8 | |
| AIDA64 / CPU Queen | |
| Lenovo Legion Slim 5 16APH8 | |
| Average of class Gaming (49785 - 173351, n=90, last 2 years) | |
| Alienware m16 R1 Intel | |
| Lenovo Legion Pro 5 16IRX8 | |
| HP Victus 16-r0076TX | |
| Schenker XMG CORE 16 (L23) | |
| Lenovo Legion 5 16IRX G9 | |
| Average Intel Core i7-14650HX (89907 - 101500, n=2) | |
| HP Victus 16-r0077ng | |
| Lenovo LOQ 16IRH8 | |
| AIDA64 / FPU SinJulia | |
| Schenker XMG CORE 16 (L23) | |
| Lenovo Legion Slim 5 16APH8 | |
| Average of class Gaming (4424 - 33636, n=105, last 2 years) | |
| Alienware m16 R1 Intel | |
| Lenovo Legion Pro 5 16IRX8 | |
| Lenovo Legion 5 16IRX G9 | |
| Average Intel Core i7-14650HX (9159 - 11913, n=2) | |
| HP Victus 16-r0076TX | |
| HP Victus 16-r0077ng | |
| Lenovo LOQ 16IRH8 | |
| AIDA64 / FPU Mandel | |
| Average of class Gaming (25115 - 128721, n=105, last 2 years) | |
| Lenovo Legion Slim 5 16APH8 | |
| Schenker XMG CORE 16 (L23) | |
| Lenovo Legion Pro 5 16IRX8 | |
| Alienware m16 R1 Intel | |
| Lenovo Legion 5 16IRX G9 | |
| Average Intel Core i7-14650HX (32747 - 47097, n=2) | |
| HP Victus 16-r0076TX | |
| HP Victus 16-r0077ng | |
| Lenovo LOQ 16IRH8 | |
| AIDA64 / CPU AES | |
| Alienware m16 R1 Intel | |
| Average of class Gaming (39258 - 247074, n=105, last 2 years) | |
| Lenovo Legion Pro 5 16IRX8 | |
| Schenker XMG CORE 16 (L23) | |
| Lenovo Legion 5 16IRX G9 | |
| HP Victus 16-r0076TX | |
| Average Intel Core i7-14650HX (63627 - 86485, n=2) | |
| Lenovo Legion Slim 5 16APH8 | |
| HP Victus 16-r0077ng | |
| Lenovo LOQ 16IRH8 | |
| AIDA64 / CPU ZLib | |
| Average of class Gaming (574 - 2531, n=105, last 2 years) | |
| Alienware m16 R1 Intel | |
| Lenovo Legion Pro 5 16IRX8 | |
| Lenovo Legion 5 16IRX G9 | |
| Average Intel Core i7-14650HX (924 - 1289, n=2) | |
| Lenovo Legion Slim 5 16APH8 | |
| HP Victus 16-r0076TX | |
| Schenker XMG CORE 16 (L23) | |
| HP Victus 16-r0077ng | |
| Lenovo LOQ 16IRH8 | |
| AIDA64 / FP64 Ray-Trace | |
| Average of class Gaming (5509 - 45446, n=105, last 2 years) | |
| Lenovo Legion Slim 5 16APH8 | |
| Schenker XMG CORE 16 (L23) | |
| Lenovo Legion Pro 5 16IRX8 | |
| Alienware m16 R1 Intel | |
| Lenovo Legion 5 16IRX G9 | |
| Average Intel Core i7-14650HX (7064 - 10316, n=2) | |
| HP Victus 16-r0076TX | |
| HP Victus 16-r0077ng | |
| Lenovo LOQ 16IRH8 | |
| AIDA64 / CPU PhotoWorxx | |
| Average of class Gaming (12271 - 89891, n=105, last 2 years) | |
| Schenker XMG CORE 16 (L23) | |
| HP Victus 16-r0077ng | |
| HP Victus 16-r0076TX | |
| Lenovo Legion Pro 5 16IRX8 | |
| Alienware m16 R1 Intel | |
| Average Intel Core i7-14650HX (33763 - 34470, n=2) | |
| Lenovo Legion 5 16IRX G9 | |
| Lenovo LOQ 16IRH8 | |
| Lenovo Legion Slim 5 16APH8 | |
System performance
Unsurprisingly, the new Legion 5i 16 is a very fast-reacting device and all inputs are implemented without hesitation. The system just hangs briefly when booting up games, but this is to do with the Advanced Optimus graphics switching. You can avoid this by activating normal Optimus switching, but then you don't get the best performance. During the test, we never had any issues with our test device (crashes etc).
CrossMark: Overall | Productivity | Creativity | Responsiveness
WebXPRT 3: Overall
WebXPRT 4: Overall
Mozilla Kraken 1.1: Total
| PCMark 10 / Score | |
| Average of class Gaming (5828 - 12414, n=93, last 2 years) | |
| Schenker XMG CORE 16 (L23) | |
| Lenovo Legion Slim 5 16APH8 | |
| Lenovo Legion Pro 5 16IRX8 | |
| Lenovo Legion 5 16IRX G9 | |
| Average Intel Core i7-14650HX, NVIDIA GeForce RTX 4060 Laptop GPU (n=1) | |
| Alienware m16 R1 Intel | |
| HP Victus 16-r0077ng | |
| Lenovo LOQ 16IRH8 | |
| HP Victus 16-r0076TX | |
| PCMark 10 / Essentials | |
| Lenovo Legion Slim 5 16APH8 | |
| Schenker XMG CORE 16 (L23) | |
| Lenovo Legion Pro 5 16IRX8 | |
| Lenovo Legion 5 16IRX G9 | |
| Average Intel Core i7-14650HX, NVIDIA GeForce RTX 4060 Laptop GPU (n=1) | |
| Alienware m16 R1 Intel | |
| HP Victus 16-r0077ng | |
| Average of class Gaming (8810 - 11935, n=97, last 2 years) | |
| Lenovo LOQ 16IRH8 | |
| HP Victus 16-r0076TX | |
| PCMark 10 / Productivity | |
| Average of class Gaming (6845 - 25323, n=95, last 2 years) | |
| Schenker XMG CORE 16 (L23) | |
| Lenovo Legion Slim 5 16APH8 | |
| Alienware m16 R1 Intel | |
| Lenovo Legion 5 16IRX G9 | |
| Average Intel Core i7-14650HX, NVIDIA GeForce RTX 4060 Laptop GPU (n=1) | |
| Lenovo Legion Pro 5 16IRX8 | |
| HP Victus 16-r0077ng | |
| Lenovo LOQ 16IRH8 | |
| HP Victus 16-r0076TX | |
| PCMark 10 / Digital Content Creation | |
| Average of class Gaming (7602 - 19954, n=95, last 2 years) | |
| Schenker XMG CORE 16 (L23) | |
| Lenovo Legion Pro 5 16IRX8 | |
| Lenovo Legion 5 16IRX G9 | |
| Average Intel Core i7-14650HX, NVIDIA GeForce RTX 4060 Laptop GPU (n=1) | |
| Lenovo Legion Slim 5 16APH8 | |
| HP Victus 16-r0077ng | |
| Alienware m16 R1 Intel | |
| Lenovo LOQ 16IRH8 | |
| HP Victus 16-r0076TX | |
| CrossMark / Overall | |
| Lenovo Legion 5 16IRX G9 | |
| Average Intel Core i7-14650HX, NVIDIA GeForce RTX 4060 Laptop GPU (n=1) | |
| Alienware m16 R1 Intel | |
| Average of class Gaming (1366 - 2409, n=94, last 2 years) | |
| Lenovo LOQ 16IRH8 | |
| Lenovo Legion Slim 5 16APH8 | |
| HP Victus 16-r0076TX | |
| Schenker XMG CORE 16 (L23) | |
| Lenovo Legion Pro 5 16IRX8 | |
| CrossMark / Productivity | |
| Alienware m16 R1 Intel | |
| Lenovo Legion 5 16IRX G9 | |
| Average Intel Core i7-14650HX, NVIDIA GeForce RTX 4060 Laptop GPU (n=1) | |
| Lenovo LOQ 16IRH8 | |
| Average of class Gaming (1386 - 2254, n=94, last 2 years) | |
| Lenovo Legion Slim 5 16APH8 | |
| Schenker XMG CORE 16 (L23) | |
| Lenovo Legion Pro 5 16IRX8 | |
| HP Victus 16-r0076TX | |
| CrossMark / Creativity | |
| Lenovo Legion 5 16IRX G9 | |
| Average Intel Core i7-14650HX, NVIDIA GeForce RTX 4060 Laptop GPU (n=1) | |
| Average of class Gaming (1343 - 2786, n=94, last 2 years) | |
| Alienware m16 R1 Intel | |
| Lenovo LOQ 16IRH8 | |
| Lenovo Legion Slim 5 16APH8 | |
| HP Victus 16-r0076TX | |
| Schenker XMG CORE 16 (L23) | |
| Lenovo Legion Pro 5 16IRX8 | |
| CrossMark / Responsiveness | |
| Lenovo Legion 5 16IRX G9 | |
| Average Intel Core i7-14650HX, NVIDIA GeForce RTX 4060 Laptop GPU (n=1) | |
| Alienware m16 R1 Intel | |
| Lenovo LOQ 16IRH8 | |
| Average of class Gaming (1226 - 2334, n=94, last 2 years) | |
| Lenovo Legion Pro 5 16IRX8 | |
| Lenovo Legion Slim 5 16APH8 | |
| HP Victus 16-r0076TX | |
| Schenker XMG CORE 16 (L23) | |
| WebXPRT 3 / Overall | |
| Lenovo Legion Slim 5 16APH8 | |
| Lenovo LOQ 16IRH8 | |
| Lenovo LOQ 16IRH8 | |
| Average of class Gaming (220 - 532, n=98, last 2 years) | |
| Lenovo Legion 5 16IRX G9 | |
| Average Intel Core i7-14650HX, NVIDIA GeForce RTX 4060 Laptop GPU (n=1) | |
| Alienware m16 R1 Intel | |
| Schenker XMG CORE 16 (L23) | |
| HP Victus 16-r0077ng | |
| HP Victus 16-r0077ng | |
| HP Victus 16-r0076TX | |
| Lenovo Legion Pro 5 16IRX8 | |
| WebXPRT 4 / Overall | |
| Average of class Gaming (165 - 354, n=98, last 2 years) | |
| Lenovo Legion 5 16IRX G9 | |
| Average Intel Core i7-14650HX, NVIDIA GeForce RTX 4060 Laptop GPU (n=1) | |
| Alienware m16 R1 Intel | |
| Lenovo Legion Slim 5 16APH8 | |
| Lenovo Legion Pro 5 16IRX8 | |
| HP Victus 16-r0077ng | |
| HP Victus 16-r0077ng | |
| HP Victus 16-r0076TX | |
| Mozilla Kraken 1.1 / Total | |
| HP Victus 16-r0076TX | |
| HP Victus 16-r0077ng | |
| HP Victus 16-r0077ng | |
| Lenovo Legion Pro 5 16IRX8 | |
| Schenker XMG CORE 16 (L23) | |
| Lenovo LOQ 16IRH8 | |
| Lenovo LOQ 16IRH8 | |
| Alienware m16 R1 Intel | |
| Lenovo Legion Slim 5 16APH8 | |
| Lenovo Legion 5 16IRX G9 | |
| Average Intel Core i7-14650HX, NVIDIA GeForce RTX 4060 Laptop GPU (n=1) | |
| Average of class Gaming (391 - 590, n=100, last 2 years) | |
* ... smaller is better
| PCMark 10 Score | 7645 points | |
Help | ||
| AIDA64 / Memory Copy | |
| Average of class Gaming (21750 - 129946, n=105, last 2 years) | |
| Schenker XMG CORE 16 (L23) | |
| Lenovo Legion Slim 5 16APH8 | |
| HP Victus 16-r0077ng | |
| Lenovo Legion 5 16IRX G9 | |
| Average Intel Core i7-14650HX (58978 - 59727, n=2) | |
| Lenovo Legion Pro 5 16IRX8 | |
| Alienware m16 R1 Intel | |
| HP Victus 16-r0076TX | |
| Lenovo LOQ 16IRH8 | |
| AIDA64 / Memory Read | |
| Average of class Gaming (22956 - 118858, n=105, last 2 years) | |
| Lenovo Legion 5 16IRX G9 | |
| Average Intel Core i7-14650HX (70720 - 71455, n=2) | |
| HP Victus 16-r0077ng | |
| Lenovo Legion Pro 5 16IRX8 | |
| Alienware m16 R1 Intel | |
| HP Victus 16-r0076TX | |
| Lenovo LOQ 16IRH8 | |
| Lenovo Legion Slim 5 16APH8 | |
| Schenker XMG CORE 16 (L23) | |
| AIDA64 / Memory Write | |
| Schenker XMG CORE 16 (L23) | |
| Lenovo Legion Slim 5 16APH8 | |
| Average of class Gaming (22297 - 135096, n=105, last 2 years) | |
| Lenovo Legion Pro 5 16IRX8 | |
| HP Victus 16-r0077ng | |
| Alienware m16 R1 Intel | |
| HP Victus 16-r0076TX | |
| Average Intel Core i7-14650HX (51138 - 56811, n=2) | |
| Lenovo LOQ 16IRH8 | |
| Lenovo Legion 5 16IRX G9 | |
| AIDA64 / Memory Latency | |
| Lenovo LOQ 16IRH8 | |
| Average of class Gaming (75.3 - 259, n=105, last 2 years) | |
| HP Victus 16-r0076TX | |
| HP Victus 16-r0077ng | |
| Lenovo Legion Slim 5 16APH8 | |
| Average Intel Core i7-14650HX (89.8 - 95.2, n=2) | |
| Lenovo Legion 5 16IRX G9 | |
| Alienware m16 R1 Intel | |
| Schenker XMG CORE 16 (L23) | |
| Lenovo Legion Pro 5 16IRX8 | |
* ... smaller is better
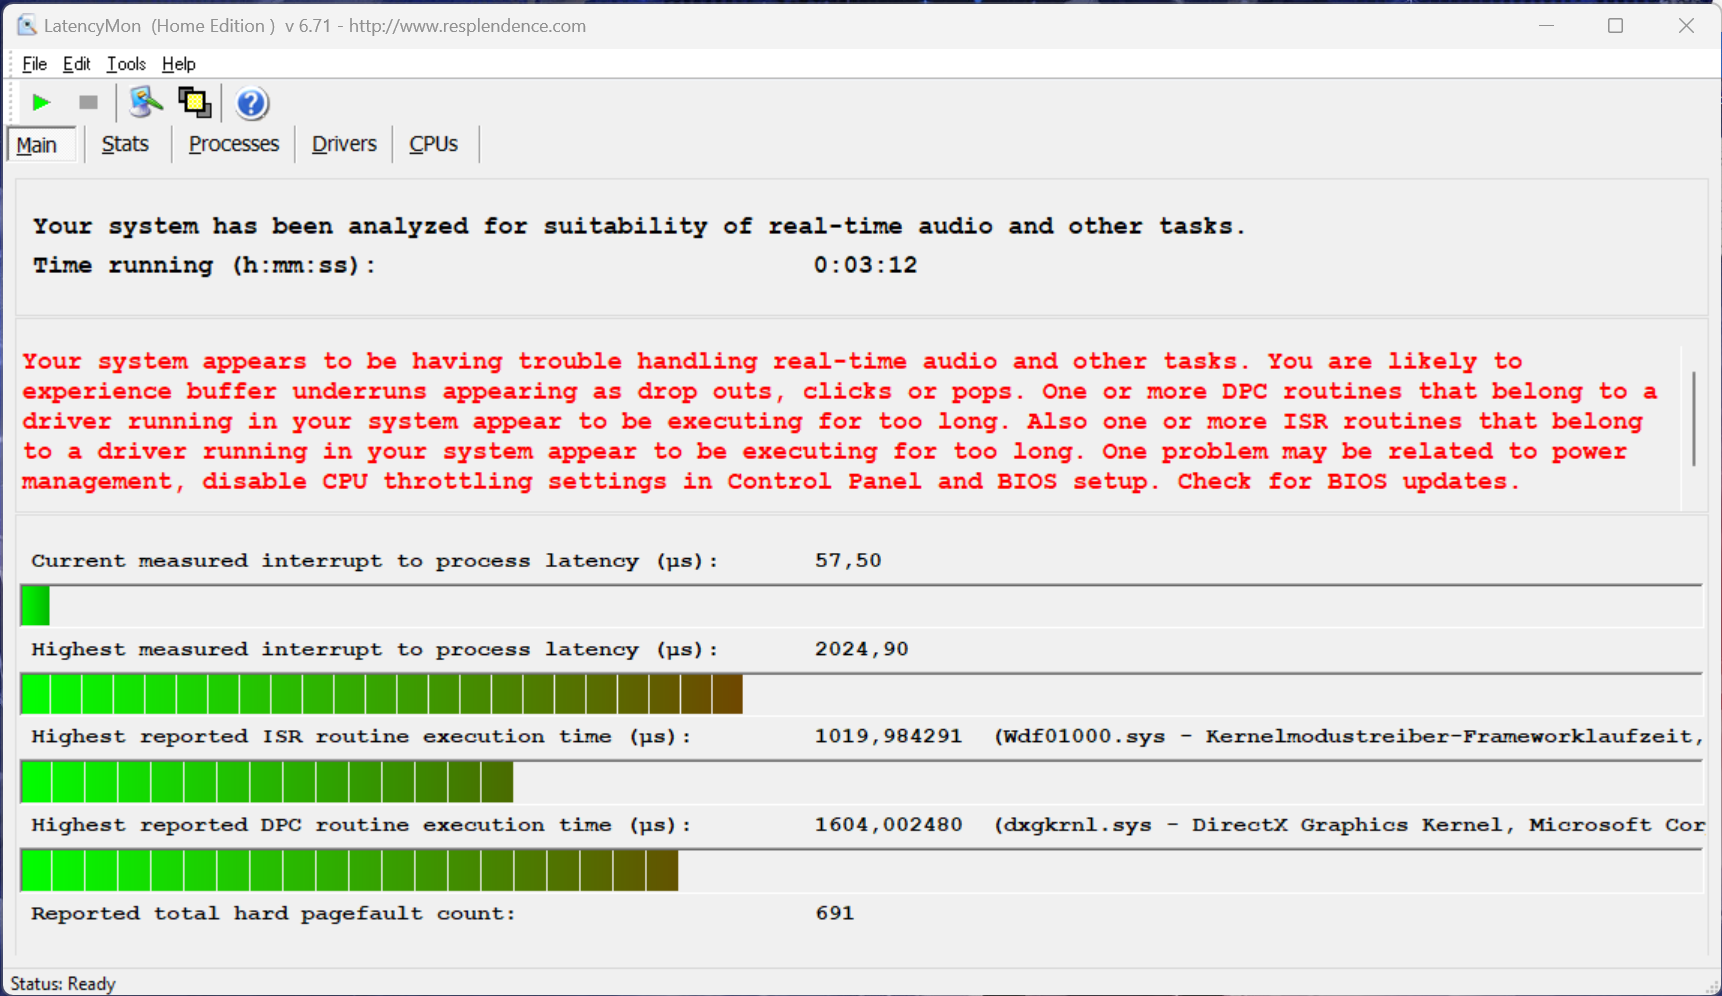
DPC latency
In our standardized latency test (surfing the web, 4K YouTube playback, CPU load), the test device with the current BIOS version showed some limitations when using real-time audio applications.
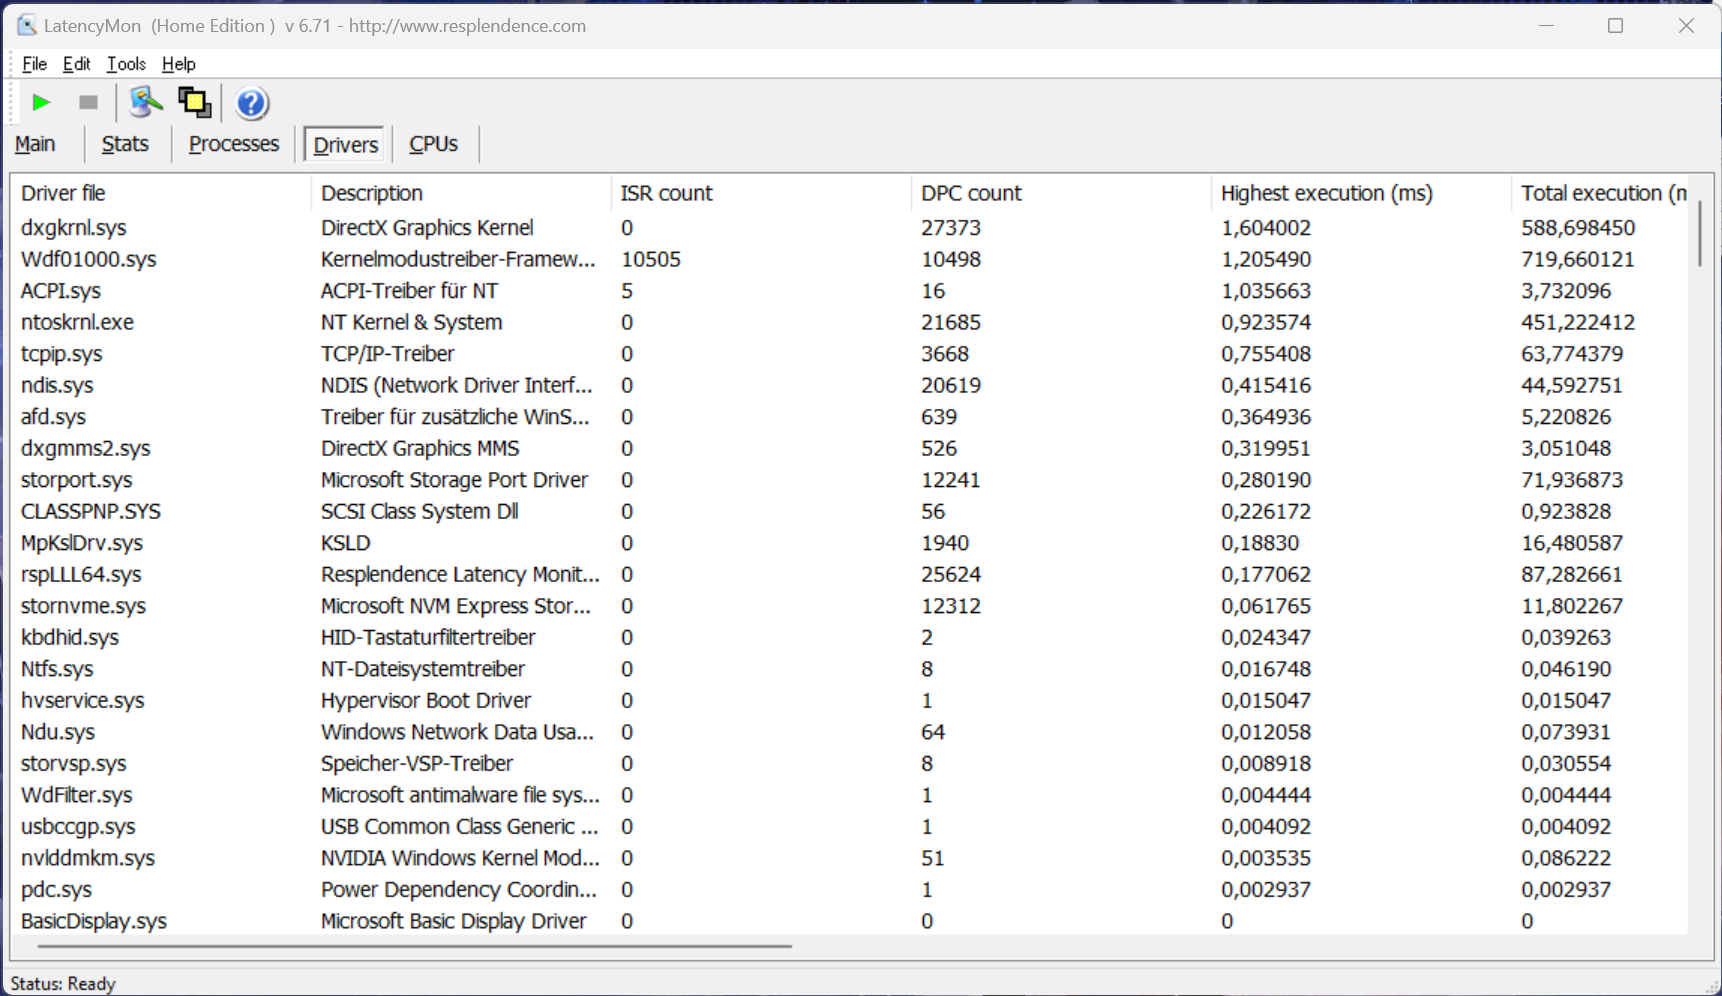
| DPC Latencies / LatencyMon - interrupt to process latency (max), Web, Youtube, Prime95 | |
| Alienware m16 R1 Intel | |
| Lenovo Legion 5 16IRX G9 | |
| HP Victus 16-r0076TX | |
| HP Victus 16-r0077ng | |
| Lenovo LOQ 16IRH8 | |
| Lenovo Legion Slim 5 16APH8 | |
| Lenovo Legion Pro 5 16IRX8 | |
| Schenker XMG CORE 16 (L23) | |
* ... smaller is better
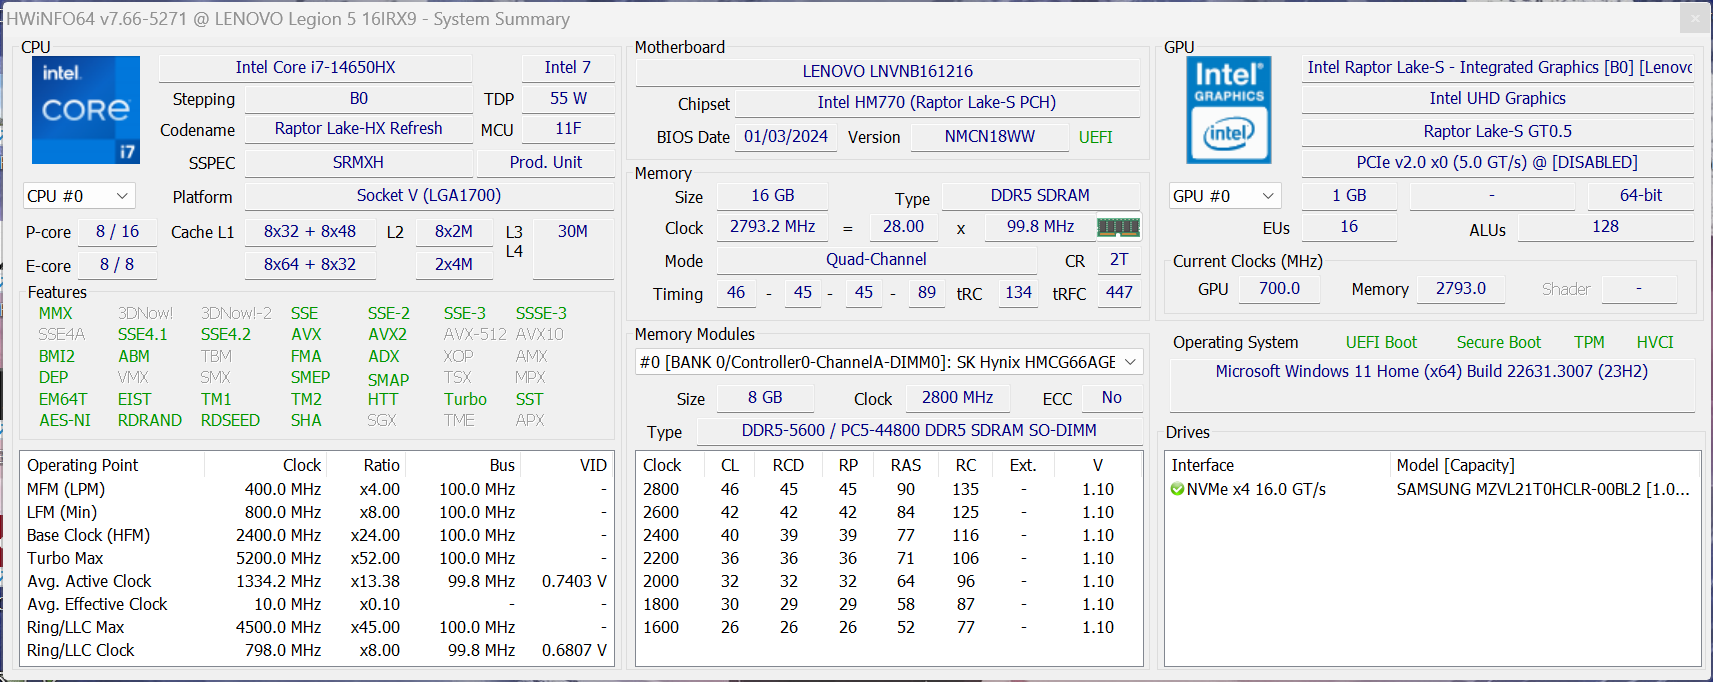
Storage devices
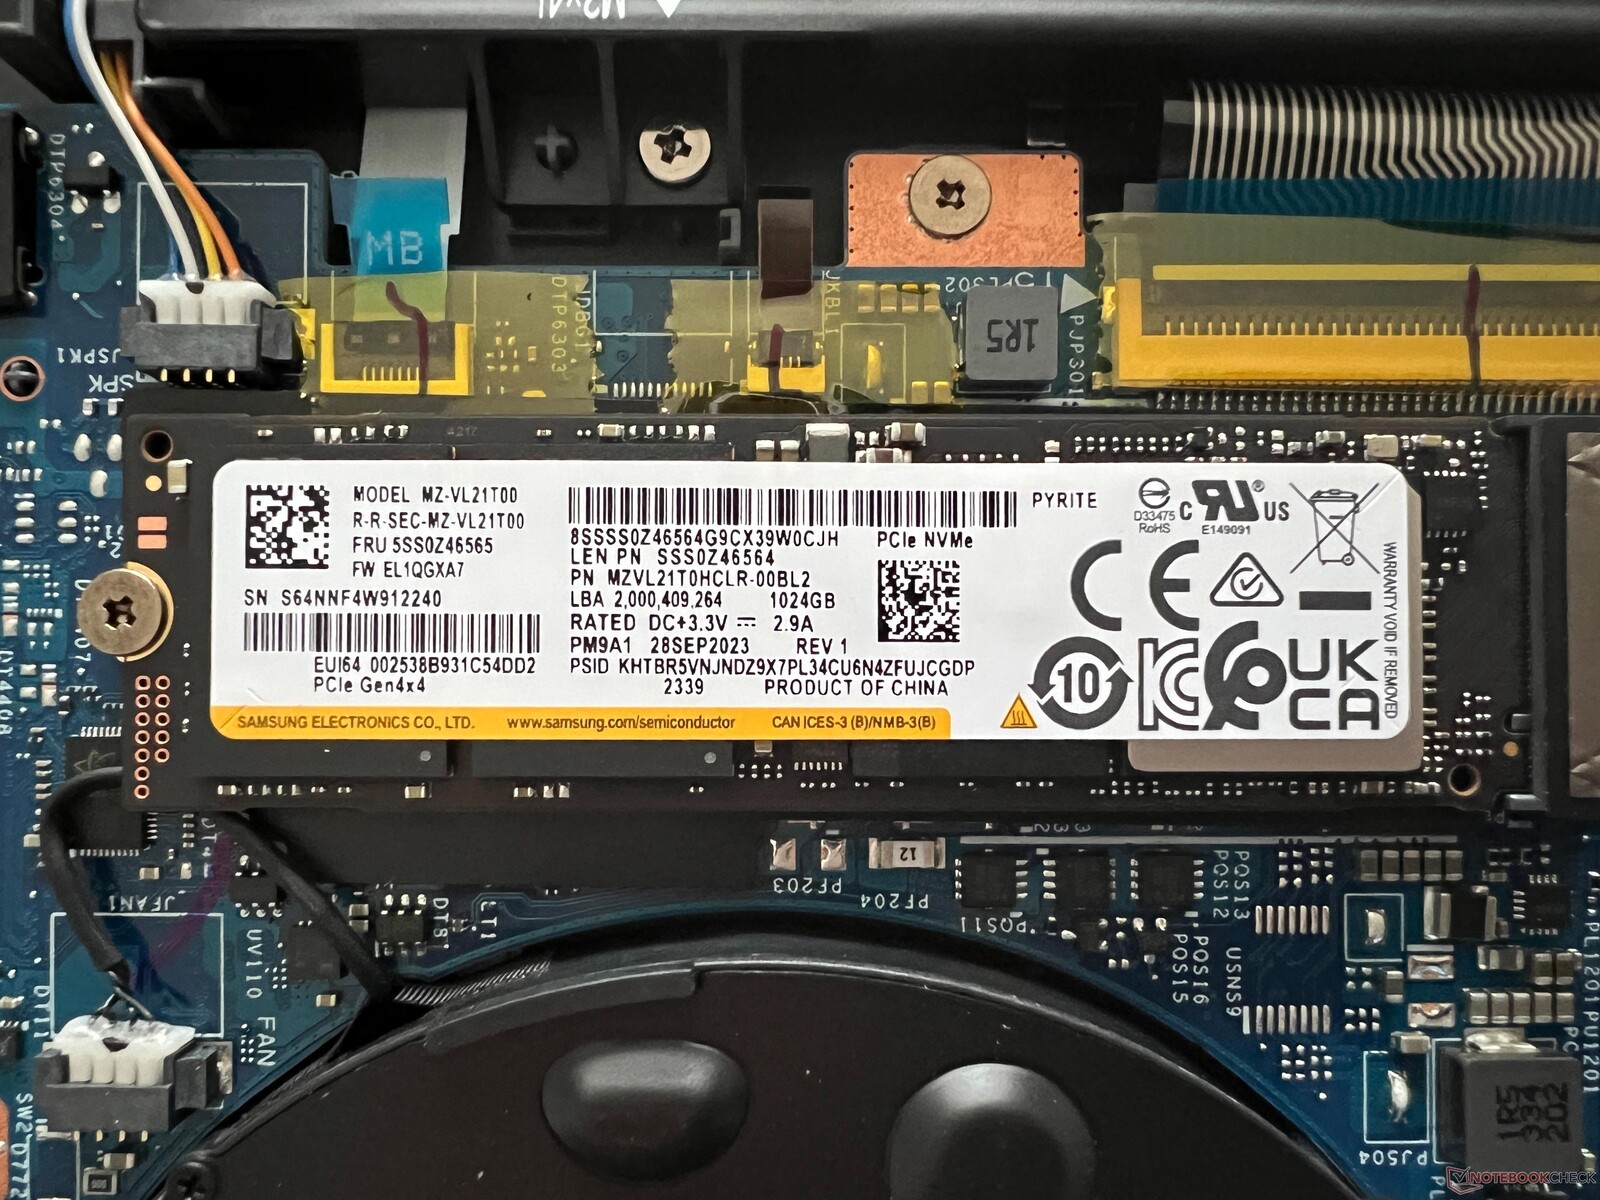
As already mentioned, the Legion has two SSD slots and our test device is fitted with the 1-TB version of the Samsung PM9A1 (OEM version of the 980 Pro), leaving users 888 GB free to use after first starting up the laptop. The PCIe-4.0 SSD's performance is great in general but under permanent load, it doesn't remain stable. In everyday use, this shouldn't cause any limitations but an additional cooler (or heat sink) could've solved this issue. Further SSD benchmarks can be found here.

* ... smaller is better
Reading continuous performance: DiskSpd Read Loop, Queue Depth 8
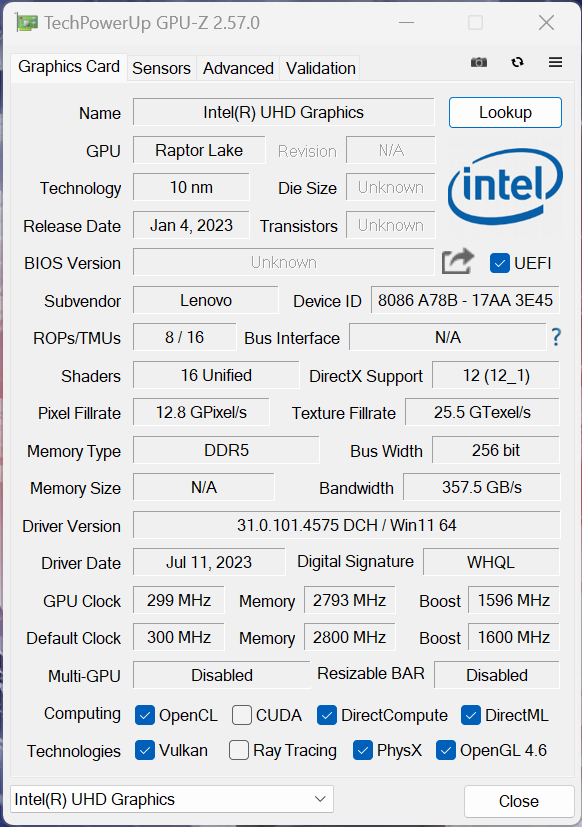
Graphics card
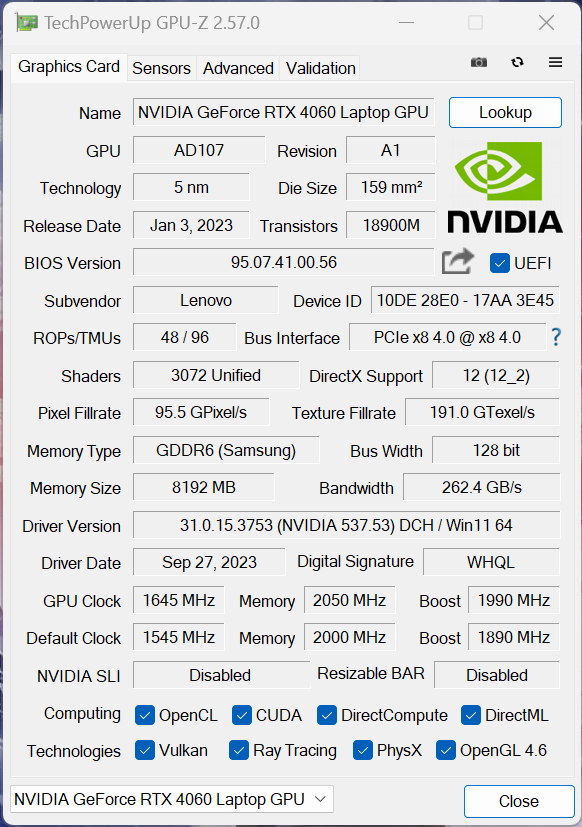
Within the test device, Lenovo has installed the current Nvidia GeForce RTX 4060 Laptop with a TGP of 115 watts—you can actually even overclock the GPU via the Vantage app. During our test, its maximum clock rate was 2,430 MHz. Advanced Optimus via a MUX switch is supported and this worked reliably during our test, but you can also completely deactivate the processor's iGPU.
The RTX 4060 Laptop did really well in the benchmarks, only losing out to both of the RTX-4070 models—although, the difference to the HP Victus isn't big at all. The GPU's performance remains totally stable under permanent load but in battery use, the GPU is only allowed to consume 50 watts. This leads to a performance loss of just over 30 %. Further GPU benchmarks can be found here.
| 3DMark 11 Performance | 32891 points | |
| 3DMark Fire Strike Score | 25376 points | |
| 3DMark Time Spy Score | 11731 points | |
Help | ||
| Blender / v3.3 Classroom OPTIX/RTX | |
| HP Victus 16-r0076TX | |
| Alienware m16 R1 Intel | |
| HP Victus 16-r0077ng | |
| Lenovo Legion 5 16IRX G9 | |
| Average NVIDIA GeForce RTX 4060 Laptop GPU (19 - 28, n=53) | |
| Lenovo Legion Slim 5 16APH8 | |
| Lenovo LOQ 16IRH8 | |
| Lenovo Legion Pro 5 16IRX8 | |
| Schenker XMG CORE 16 (L23) | |
| Average of class Gaming (9 - 32, n=106, last 2 years) | |
| Blender / v3.3 Classroom CUDA | |
| HP Victus 16-r0076TX | |
| Lenovo Legion Slim 5 16APH8 | |
| Average NVIDIA GeForce RTX 4060 Laptop GPU (39 - 53, n=53) | |
| Lenovo LOQ 16IRH8 | |
| Lenovo Legion 5 16IRX G9 | |
| Lenovo Legion Pro 5 16IRX8 | |
| Alienware m16 R1 Intel | |
| HP Victus 16-r0077ng | |
| Average of class Gaming (15 - 228, n=106, last 2 years) | |
| Schenker XMG CORE 16 (L23) | |
| Blender / v3.3 Classroom CPU | |
| Lenovo LOQ 16IRH8 | |
| HP Victus 16-r0077ng | |
| HP Victus 16-r0076TX | |
| Average NVIDIA GeForce RTX 4060 Laptop GPU (189 - 452, n=53) | |
| Lenovo Legion Slim 5 16APH8 | |
| Schenker XMG CORE 16 (L23) | |
| Lenovo Legion Pro 5 16IRX8 | |
| Alienware m16 R1 Intel | |
| Lenovo Legion 5 16IRX G9 | |
| Average of class Gaming (122 - 565, n=102, last 2 years) | |
* ... smaller is better
Gaming performance
In total, the laptop's gaming performance is great and at the upper end for an RTX 4060 Laptop. All current games can be run smoothly in QHD and with maximum details—even demanding games such as Cyberpunk 2077 or Modern Warfare 3. Only raytracing may lead to some issues and it would be wise to use upscaling technology like DLSS. In addition, its gaming performance remains entirely stable, even throughout longer sessions. Further gaming benchmarks can be found here.
| The Witcher 3 - 1920x1080 Ultra Graphics & Postprocessing (HBAO+) | |
| Average of class Gaming (104.7 - 240, n=7, last 2 years) | |
| Schenker XMG CORE 16 (L23) | |
| HP Victus 16-r0077ng | |
| Lenovo Legion Pro 5 16IRX8 | |
| Alienware m16 R1 Intel | |
| Lenovo LOQ 16IRH8 | |
| Lenovo Legion 5 16IRX G9 | |
| HP Victus 16-r0076TX | |
| Lenovo Legion Slim 5 16APH8 | |
| GTA V - 1920x1080 Highest AA:4xMSAA + FX AF:16x | |
| Average of class Gaming (48.3 - 186.9, n=94, last 2 years) | |
| Lenovo Legion 5 16IRX G9 | |
| Lenovo Legion Pro 5 16IRX8 | |
| Schenker XMG CORE 16 (L23) | |
| Lenovo LOQ 16IRH8 | |
| HP Victus 16-r0077ng | |
| Lenovo Legion Slim 5 16APH8 | |
Witcher 3 FPS diagram
| low | med. | high | ultra | QHD | |
|---|---|---|---|---|---|
| GTA V (2015) | 186 | 182.8 | 120.2 | 89 | |
| The Witcher 3 (2015) | 229 | 97.2 | 83 | ||
| Dota 2 Reborn (2015) | 209 | 189.7 | 179.9 | 168.7 | |
| Final Fantasy XV Benchmark (2018) | 154.2 | 106.3 | 77.5 | ||
| X-Plane 11.11 (2018) | 180.8 | 171 | 130.9 | ||
| Far Cry 5 (2018) | 161 | 155 | 147 | 111 | |
| Strange Brigade (2018) | 243 | 210 | 130 | ||
| F1 2021 (2021) | 464 | 380 | 292 | 146.7 | 104.6 |
| F1 22 (2022) | 296 | 287 | 217 | 71.4 | 45.2 |
| F1 23 (2023) | 306 | 292 | 207 | 63.7 | 39.4 |
| Cyberpunk 2077 (2023) | 133.1 | 110.4 | 95.3 | 81.8 | 49.7 |
| Assassin's Creed Mirage (2023) | 93 | 72 | |||
| Call of Duty Modern Warfare 3 2023 (2023) | 134 | 121 | 92 | 86 | 58 |
Emissions - Loud but cool
Noise emissions
Both of the Legion 5i 16's fans have a lot of work to do and if you don't use quiet mode, they will often spin during simple tasks. Under high load, the device gets very loud at 55 dB(A) but to be honest, the almost 50 dB(A) we measured using balanced mode is simply too loud to play games properly without a headset. So, depending on the game, it might make sense to check the performance in quiet mode, as its 35 dB(A) is a lot more comfortable. We didn't note any other electronic noises coming from our test device.
| Energy profile | 3DMark 06 | Witcher 3 | Cyberpunk 2077 Phantom Liberty | Stress test |
|---|---|---|---|---|
| Quiet mode | 34.6 dB(A) | 34.6 dB(A) | 30.4 dB(A) | 34.6 dB(A) |
| Balanced mode | 34.6 dB(A) | 49.8 dB(A) | 49.8 dB(A) | 49.8 dB(A) |
| Performance mode | 45.5 dB(A) | 55.7 dB(A) | 53.1 dB(A) | 55.7 dB(A) |
Noise level
| Idle |
| 24 / 28.8 / 32 dB(A) |
| Load |
| 45.5 / 55.7 dB(A) |
 | ||
30 dB silent 40 dB(A) audible 50 dB(A) loud |
||
min: | ||
| Lenovo Legion 5 16IRX G9 GeForce RTX 4060 Laptop GPU, i7-14650HX, Samsung PM9A1 MZVL21T0HCLR | Schenker XMG CORE 16 (L23) GeForce RTX 4070 Laptop GPU, R7 7840HS, Samsung 990 Pro 1 TB | HP Victus 16-r0077ng GeForce RTX 4070 Laptop GPU, i7-13700H, Kioxia XG8 KXG80ZNV1T02 | Lenovo LOQ 16IRH8 GeForce RTX 4060 Laptop GPU, i7-13620H, Solidigm SSDPFINW512GZL | Lenovo Legion Slim 5 16APH8 GeForce RTX 4060 Laptop GPU, R7 7840HS, SK hynix PC801 HFS512GEJ9X115N | HP Victus 16-r0076TX GeForce RTX 4050 Laptop GPU, i5-13500HX, SK hynix PC801 HFS512GEJ9X101N BF | Alienware m16 R1 Intel GeForce RTX 4060 Laptop GPU, i7-13700HX, Kioxia KXG70ZNV512G | Lenovo Legion Pro 5 16IRX8 GeForce RTX 4060 Laptop GPU, i7-13700HX, SK hynix PC801 HFS512GEJ9X115N | |
|---|---|---|---|---|---|---|---|---|
| Noise | 8% | 2% | 4% | 10% | 9% | 2% | 12% | |
| off / environment * (dB) | 24 | 23 4% | 25 -4% | 23 4% | 22.9 5% | 21.57 10% | 25 -4% | 23 4% |
| Idle Minimum * (dB) | 24 | 23 4% | 28 -17% | 23 4% | 23.1 4% | 23.68 1% | 25 -4% | 23.1 4% |
| Idle Average * (dB) | 28.8 | 28.48 1% | 29 -1% | 23 20% | 23.1 20% | 23.68 18% | 26 10% | 23.1 20% |
| Idle Maximum * (dB) | 32 | 28.48 11% | 30 6% | 27.66 14% | 27.7 13% | 23.68 26% | 27 16% | 26.6 17% |
| Load Average * (dB) | 45.5 | 30 34% | 43 5% | 53.62 -18% | 33.3 27% | 39.44 13% | 52 -14% | 34.7 24% |
| Witcher 3 ultra * (dB) | 53.1 | 54.12 -2% | 46 13% | 53.5 -1% | 54 -2% | 55.4 -4% | 51 4% | 47.6 10% |
| Load Maximum * (dB) | 55.7 | 54.12 3% | 48 14% | 53.5 4% | 54 3% | 55.37 1% | 53 5% | 54.8 2% |
* ... smaller is better
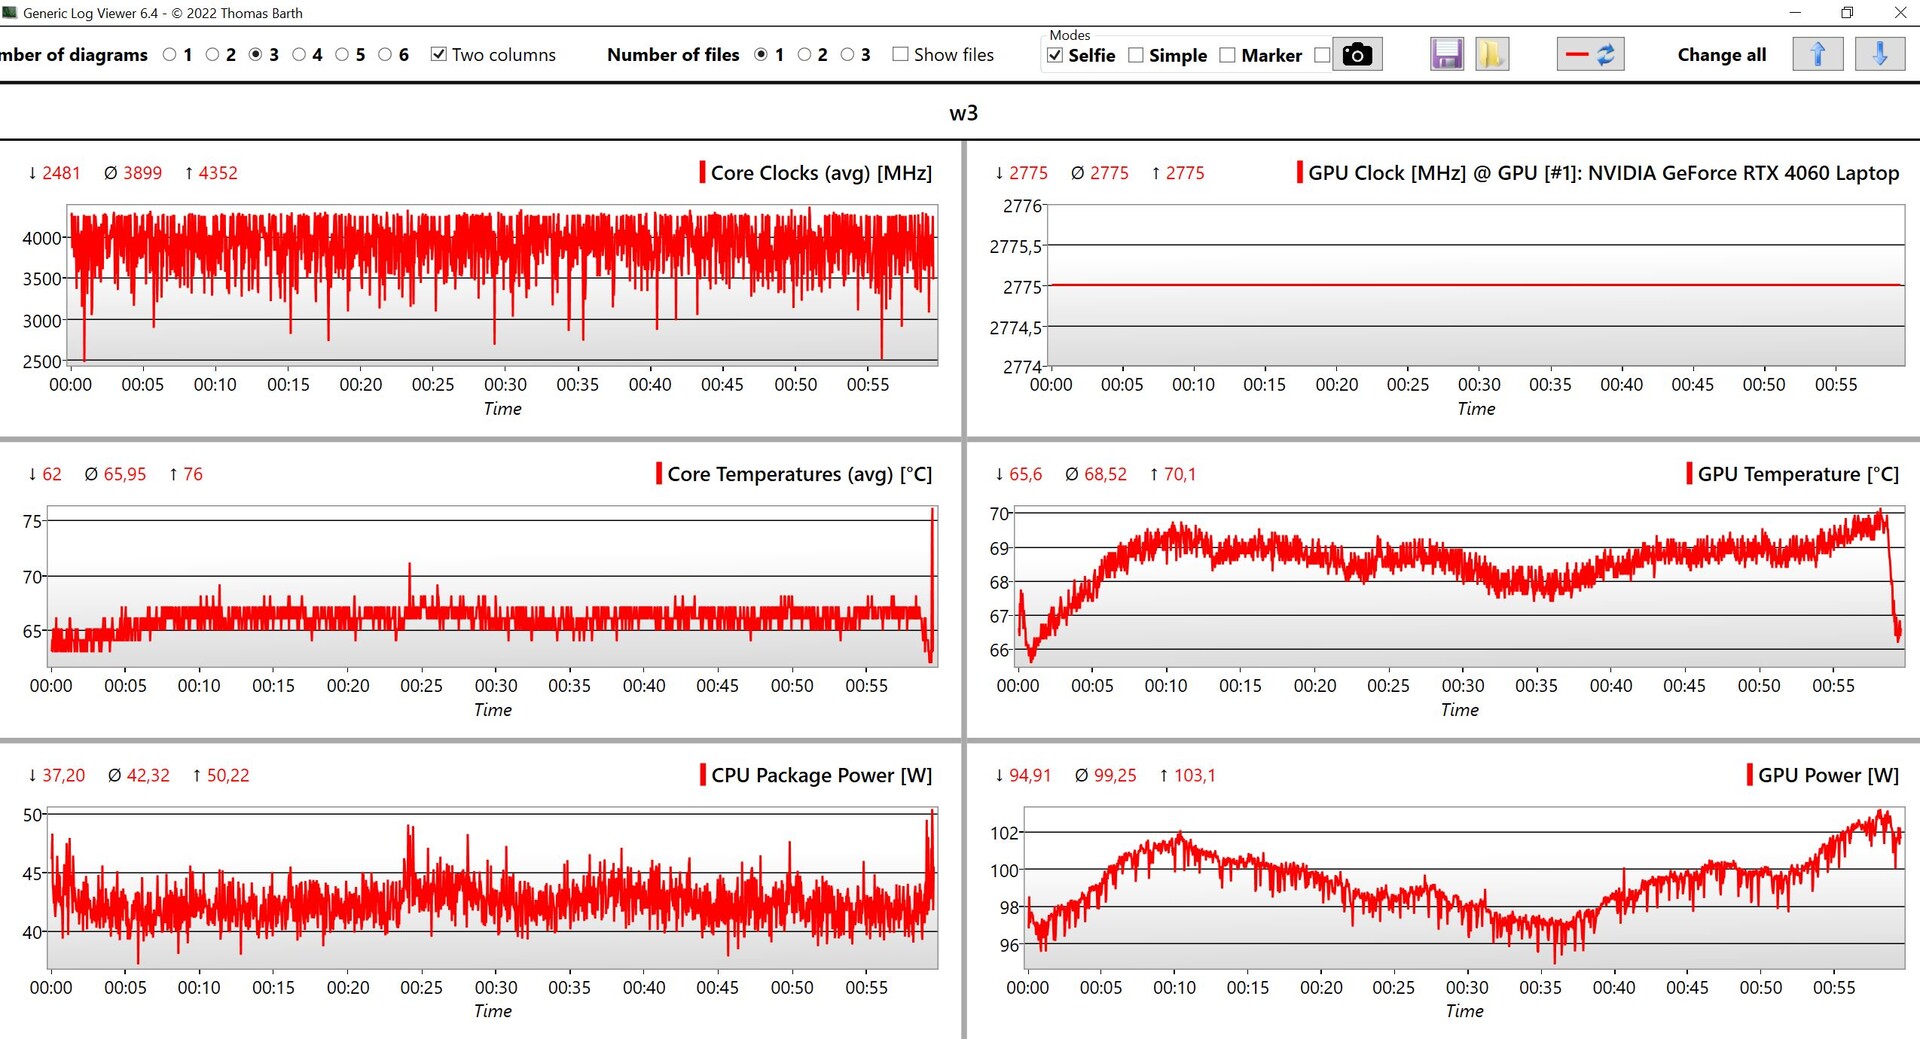
Temperature
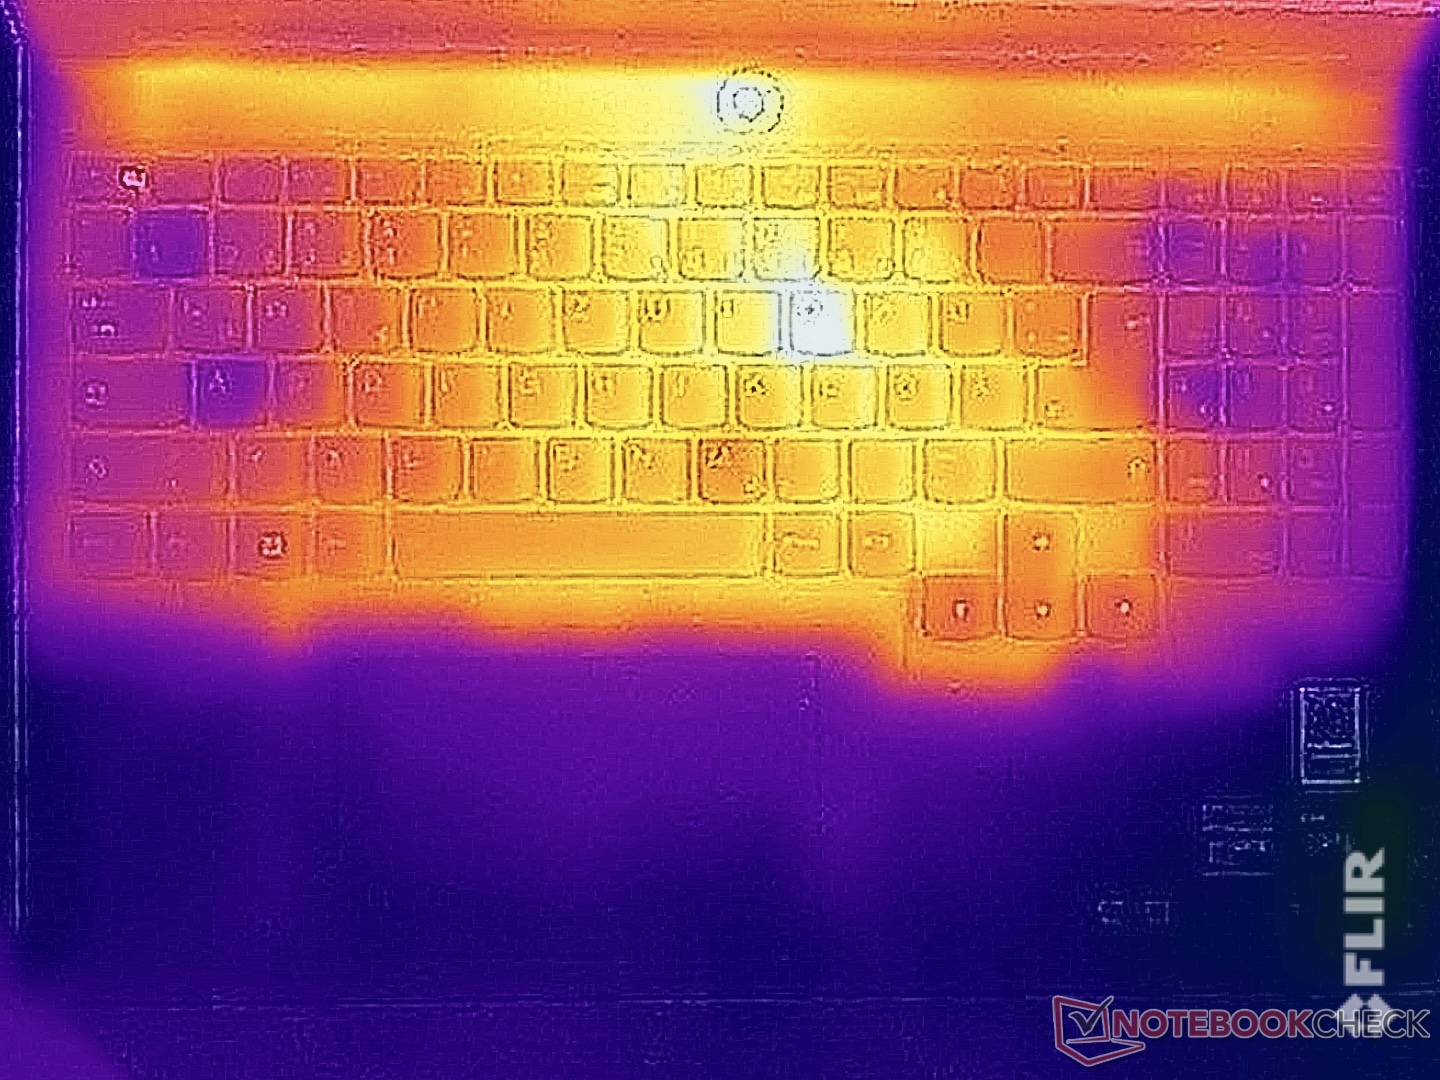
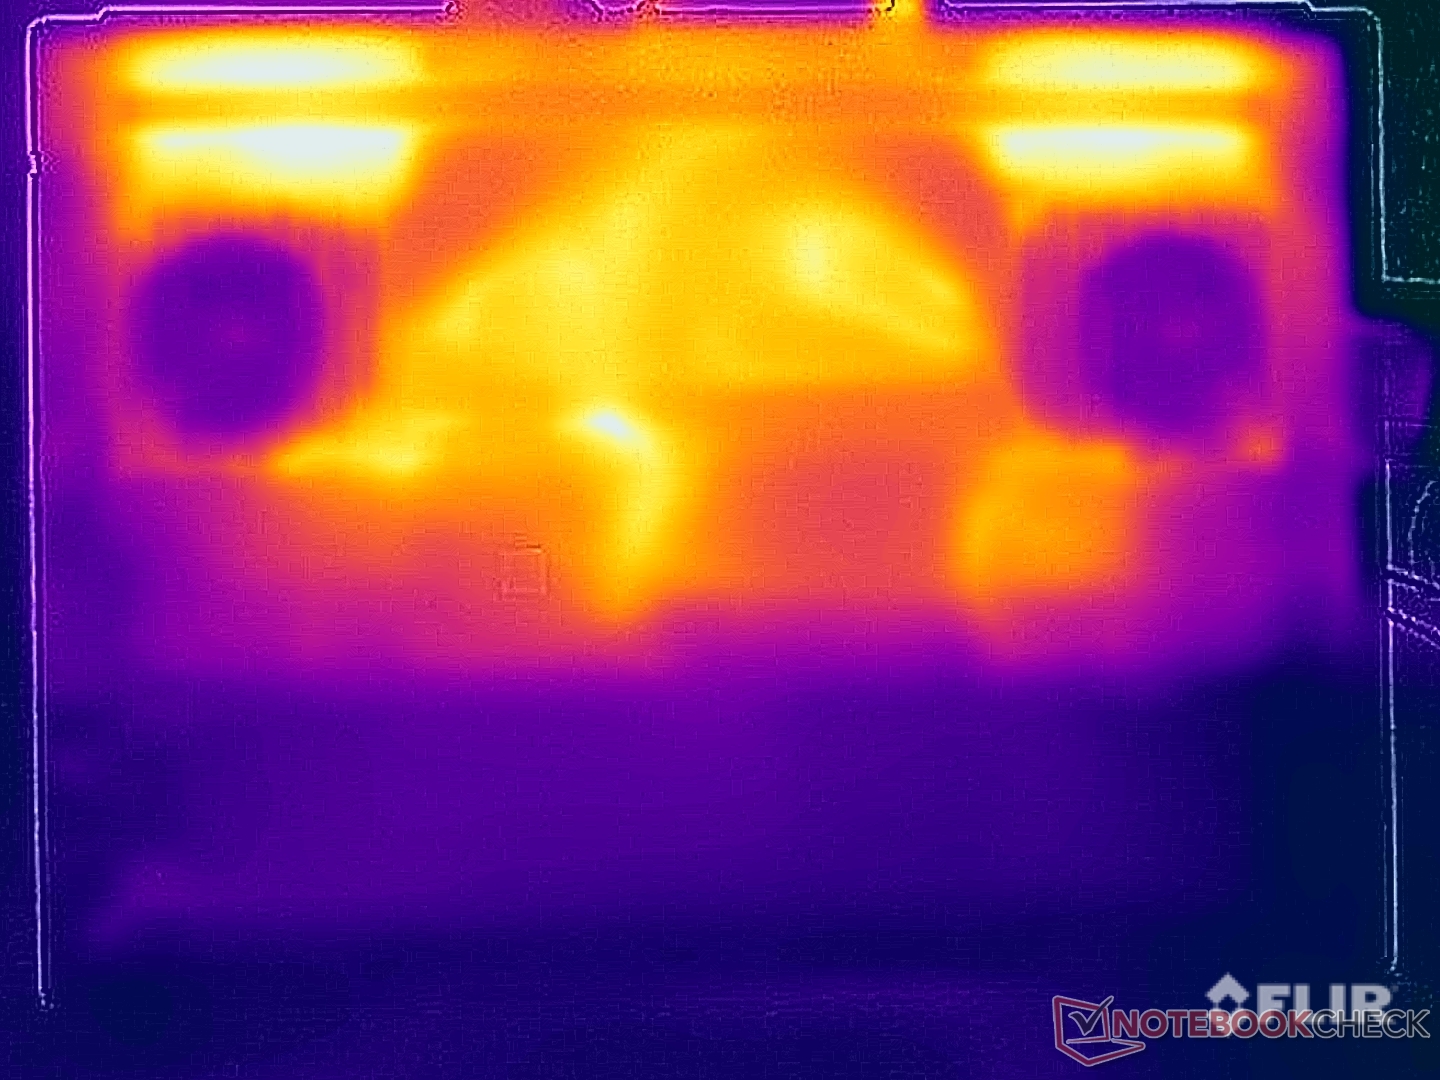
A few spots on the Legion already get noticeably warm in idle mode but in turn, its low surface temperatures under load surprised us. Even during the stress test, we only measured just over 40 °C on the top and on the bottom of the base unit, we noted just over 43 °C. These are superb results and there are no restrictions when it comes to handling the device.
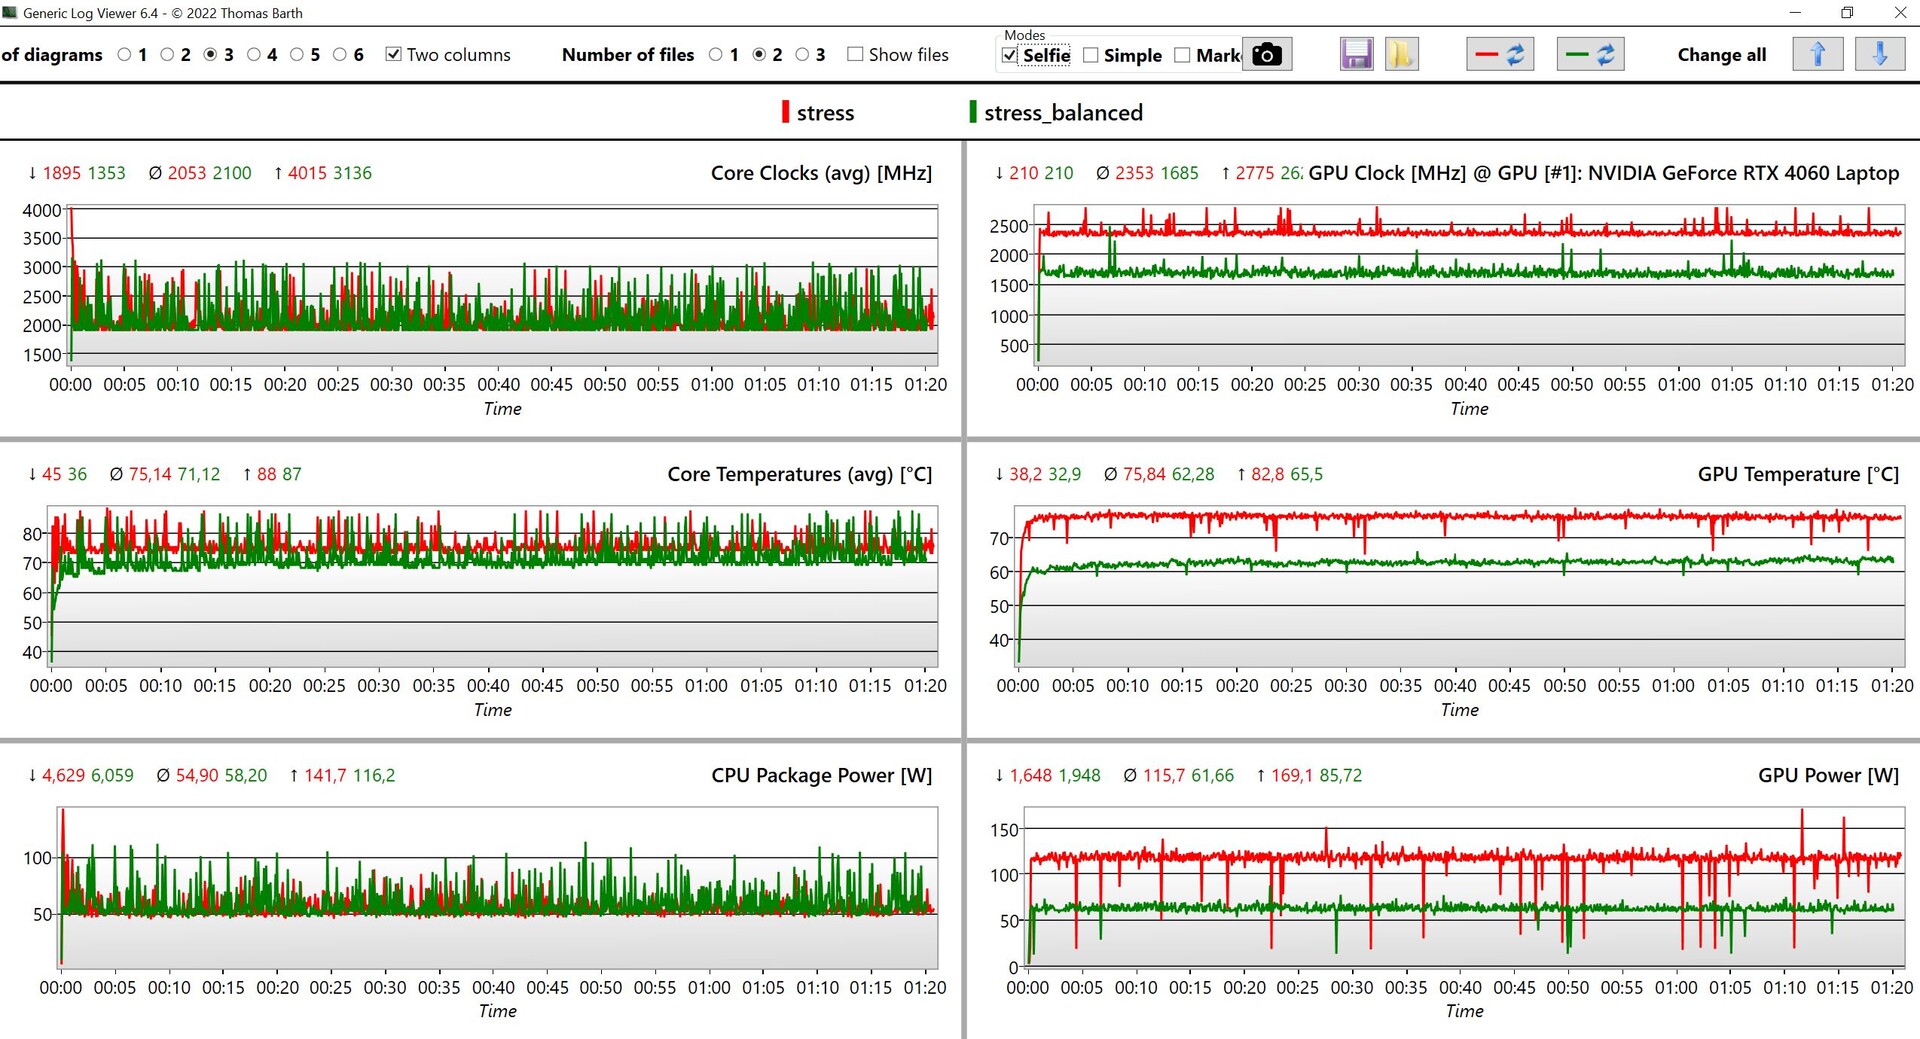
In addition to using performance mode, we also ran the stress test using balanced mode and have put together the results in the following diagram. In both profiles, you can see how much the processor's consumption fluctuates, but the GPU remains constant and this is where the clear difference between the two profiles can be seen. In performance mode, the GPU operates at 115 watts and in balanced mode we measured just over 60 watts.
(±) The maximum temperature on the upper side is 40.4 °C / 105 F, compared to the average of 40.4 °C / 105 F, ranging from 21.2 to 68.8 °C for the class Gaming.
(±) The bottom heats up to a maximum of 43.8 °C / 111 F, compared to the average of 43.2 °C / 110 F
(+) In idle usage, the average temperature for the upper side is 28 °C / 82 F, compared to the device average of 33.9 °C / 93 F.
(±) Playing The Witcher 3, the average temperature for the upper side is 33.2 °C / 92 F, compared to the device average of 33.9 °C / 93 F.
(+) The palmrests and touchpad are cooler than skin temperature with a maximum of 26.9 °C / 80.4 F and are therefore cool to the touch.
(±) The average temperature of the palmrest area of similar devices was 28.8 °C / 83.8 F (+1.9 °C / 3.4 F).
| Lenovo Legion 5 16IRX G9 Intel Core i7-14650HX, NVIDIA GeForce RTX 4060 Laptop GPU | Schenker XMG CORE 16 (L23) AMD Ryzen 7 7840HS, NVIDIA GeForce RTX 4070 Laptop GPU | HP Victus 16-r0077ng Intel Core i7-13700H, NVIDIA GeForce RTX 4070 Laptop GPU | Lenovo LOQ 16IRH8 Intel Core i7-13620H, NVIDIA GeForce RTX 4060 Laptop GPU | Lenovo Legion Slim 5 16APH8 AMD Ryzen 7 7840HS, NVIDIA GeForce RTX 4060 Laptop GPU | HP Victus 16-r0076TX Intel Core i5-13500HX, NVIDIA GeForce RTX 4050 Laptop GPU | Alienware m16 R1 Intel Intel Core i7-13700HX, NVIDIA GeForce RTX 4060 Laptop GPU | Lenovo Legion Pro 5 16IRX8 Intel Core i7-13700HX, NVIDIA GeForce RTX 4060 Laptop GPU | |
|---|---|---|---|---|---|---|---|---|
| Heat | -3% | -13% | -6% | 9% | -3% | -18% | -4% | |
| Maximum Upper Side * (°C) | 40.4 | 46 -14% | 51 -26% | 48 -19% | 40.6 -0% | 48 -19% | 49 -21% | 42.8 -6% |
| Maximum Bottom * (°C) | 43.8 | 44 -0% | 54 -23% | 59 -35% | 42 4% | 48 -10% | 48 -10% | 50 -14% |
| Idle Upper Side * (°C) | 30.3 | 32 -6% | 37 -22% | 28 8% | 27.8 8% | 29.6 2% | 40 -32% | 29.6 2% |
| Idle Bottom * (°C) | 35.3 | 33 7% | 29 18% | 28 21% | 26.6 25% | 30.2 14% | 39 -10% | 34 4% |
* ... smaller is better
Speakers
The two stereo speakers (2 watts each) only deliver an average sound sufficient for some videos and background music. However, you won't benefit from the speakers when playing games anyway, as the fans are too loud.
Lenovo Legion 5 16IRX G9 audio analysis
(+) | speakers can play relatively loud (84.4 dB)
Bass 100 - 315 Hz
(-) | nearly no bass - on average 25.7% lower than median
(±) | linearity of bass is average (8.3% delta to prev. frequency)
Mids 400 - 2000 Hz
(+) | balanced mids - only 4.3% away from median
(+) | mids are linear (5.2% delta to prev. frequency)
Highs 2 - 16 kHz
(+) | balanced highs - only 1.9% away from median
(+) | highs are linear (2.1% delta to prev. frequency)
Overall 100 - 16.000 Hz
(±) | linearity of overall sound is average (16.1% difference to median)
Compared to same class
» 39% of all tested devices in this class were better, 7% similar, 54% worse
» The best had a delta of 6%, average was 18%, worst was 132%
Compared to all devices tested
» 26% of all tested devices were better, 5% similar, 69% worse
» The best had a delta of 4%, average was 23%, worst was 134%
Schenker XMG CORE 16 (L23) audio analysis
(±) | speaker loudness is average but good (79.4 dB)
Bass 100 - 315 Hz
(-) | nearly no bass - on average 21.6% lower than median
(±) | linearity of bass is average (11.4% delta to prev. frequency)
Mids 400 - 2000 Hz
(±) | higher mids - on average 5.4% higher than median
(+) | mids are linear (6.7% delta to prev. frequency)
Highs 2 - 16 kHz
(+) | balanced highs - only 2.3% away from median
(+) | highs are linear (6.6% delta to prev. frequency)
Overall 100 - 16.000 Hz
(±) | linearity of overall sound is average (17.1% difference to median)
Compared to same class
» 46% of all tested devices in this class were better, 12% similar, 43% worse
» The best had a delta of 6%, average was 18%, worst was 132%
Compared to all devices tested
» 31% of all tested devices were better, 8% similar, 61% worse
» The best had a delta of 4%, average was 23%, worst was 134%
Alienware m16 R1 Intel audio analysis
(+) | speakers can play relatively loud (87 dB)
Bass 100 - 315 Hz
(-) | nearly no bass - on average 24% lower than median
(±) | linearity of bass is average (13.5% delta to prev. frequency)
Mids 400 - 2000 Hz
(+) | balanced mids - only 1.4% away from median
(+) | mids are linear (3.3% delta to prev. frequency)
Highs 2 - 16 kHz
(+) | balanced highs - only 3.5% away from median
(+) | highs are linear (4.6% delta to prev. frequency)
Overall 100 - 16.000 Hz
(+) | overall sound is linear (13.4% difference to median)
Compared to same class
» 19% of all tested devices in this class were better, 7% similar, 74% worse
» The best had a delta of 6%, average was 18%, worst was 132%
Compared to all devices tested
» 14% of all tested devices were better, 4% similar, 82% worse
» The best had a delta of 4%, average was 23%, worst was 134%
Power management
Power consumption
We noted no major surprises when it came to the device's consumption and measured a maximum of around 20 watts in idle mode—this is acceptable given its large display and high brightness. During the stress test, its maximum consumption was briefly ~247 watts, but this then immediately levelled off at 230 watts. As a result, the 230-watt power supply will be at its limit if you use performance mode. In balanced mode, the laptop's consumption evened out at around 180 watts.
| Off / Standby | |
| Idle | |
| Load |
|
Key:
min: | |
| Lenovo Legion 5 16IRX G9 i7-14650HX, GeForce RTX 4060 Laptop GPU, Samsung PM9A1 MZVL21T0HCLR, IPS, 2560x1600, 16" | Schenker XMG CORE 16 (L23) R7 7840HS, GeForce RTX 4070 Laptop GPU, Samsung 990 Pro 1 TB, IPS, 2560x1600, 16" | HP Victus 16-r0077ng i7-13700H, GeForce RTX 4070 Laptop GPU, Kioxia XG8 KXG80ZNV1T02, IPS, 1920x1080, 16.1" | Lenovo LOQ 16IRH8 i7-13620H, GeForce RTX 4060 Laptop GPU, Solidigm SSDPFINW512GZL, IPS, 2560x1600, 16" | Lenovo Legion Slim 5 16APH8 R7 7840HS, GeForce RTX 4060 Laptop GPU, SK hynix PC801 HFS512GEJ9X115N, IPS, 2560x1600, 16" | HP Victus 16-r0076TX i5-13500HX, GeForce RTX 4050 Laptop GPU, SK hynix PC801 HFS512GEJ9X101N BF, IPS, 1920x1080, 16.1" | Alienware m16 R1 Intel i7-13700HX, GeForce RTX 4060 Laptop GPU, Kioxia KXG70ZNV512G, IPS, 2560x1600, 16" | Lenovo Legion Pro 5 16IRX8 i7-13700HX, GeForce RTX 4060 Laptop GPU, SK hynix PC801 HFS512GEJ9X115N, IPS, 2560x1600, 16" | Average NVIDIA GeForce RTX 4060 Laptop GPU | Average of class Gaming | |
|---|---|---|---|---|---|---|---|---|---|---|
| Power Consumption | 18% | 21% | 4% | 21% | 2% | 3% | -27% | 14% | -2% | |
| Idle Minimum * (Watt) | 15.4 | 11 29% | 8 48% | 17.2 -12% | 9.4 39% | 16.12 -5% | 10 35% | 24.5 -59% | 11.5 ? 25% | 13 ? 16% |
| Idle Average * (Watt) | 19.7 | 15.2 23% | 13 34% | 19.3 2% | 15.5 21% | 20.47 -4% | 14 29% | 29.2 -48% | 16 ? 19% | 18.7 ? 5% |
| Idle Maximum * (Watt) | 20.7 | 16 23% | 22 -6% | 21.2 -2% | 24.4 -18% | 22.11 -7% | 21 -1% | 34.3 -66% | 20.3 ? 2% | 24.3 ? -17% |
| Load Average * (Watt) | 102.6 | 64 38% | 86 16% | 90 12% | 74.1 28% | 94.8 8% | 119 -16% | 98.7 4% | 92.9 ? 9% | 110.2 ? -7% |
| Witcher 3 ultra * (Watt) | 191.3 | 179 6% | 141.8 26% | 168 12% | 112.9 41% | 166.9 13% | 186.7 2% | 178.6 7% | ||
| Load Maximum * (Watt) | 246.6 | 280 -14% | 233 6% | 211 14% | 206.5 16% | 237 4% | 323 -31% | 249.6 -1% | 210 ? 15% | 258 ? -5% |
* ... smaller is better
Power consumption Witcher 3 / stress test
Power consumption with external monitor
Runtimes
The Legion 5i 16 has an 80-Wh battery which is the smallest capacity within our comparison field. In turn, its results aren't actually too bad and at 150 cd/m² (61 % of our test device's full brightness), a video ran for around 9.5 hours and our WLAN test lasted for about 7.5 hours (~5.5 hours at maximum brightness). Under load, the laptop already taps out after 46 minutes and an HDR video was only played back for 2:14 hours at maximum brightness. With 240 Hz selected, our WLAN test runtimes sank to 5:27 hours (150 cd/m²) and 4:33 hours (full brightness).
A full charge takes 106 minutes with the device switched on, whereby 80 % is reached after about 60 minutes. Within the Vantage app, you also have an option called "express charging" which results in the first 60 % being charged faster. One full charge only takes 69 minutes using this mode (80 % after 31 minutes).
| Lenovo Legion 5 16IRX G9 i7-14650HX, GeForce RTX 4060 Laptop GPU, 80 Wh | Schenker XMG CORE 16 (L23) R7 7840HS, GeForce RTX 4070 Laptop GPU, 99 Wh | HP Victus 16-r0077ng i7-13700H, GeForce RTX 4070 Laptop GPU, 83 Wh | Lenovo LOQ 16IRH8 i7-13620H, GeForce RTX 4060 Laptop GPU, 80 Wh | Lenovo Legion Slim 5 16APH8 R7 7840HS, GeForce RTX 4060 Laptop GPU, 80 Wh | HP Victus 16-r0076TX i5-13500HX, GeForce RTX 4050 Laptop GPU, 83 Wh | Alienware m16 R1 Intel i7-13700HX, GeForce RTX 4060 Laptop GPU, 86 Wh | Lenovo Legion Pro 5 16IRX8 i7-13700HX, GeForce RTX 4060 Laptop GPU, 80 Wh | Average of class Gaming | |
|---|---|---|---|---|---|---|---|---|---|
| Battery runtime | 73% | -4% | 13% | 23% | 17% | -17% | -34% | 24% | |
| H.264 (h) | 9.6 | 10.2 6% | 6.4 -33% | 7.7 -20% | 5.6 -42% | 8.32 ? -13% | |||
| WiFi v1.3 (h) | 7.4 | 8.4 14% | 7.1 -4% | 6.3 -15% | 7.1 -4% | 8.9 20% | 4.8 -35% | 3.4 -54% | 7.11 ? -4% |
| Load (h) | 0.8 | 2.4 200% | 1.5 88% | 1.2 50% | 1.2 50% | 1 25% | 0.7 -13% | 1.502 ? 88% | |
| Witcher 3 ultra (h) | 1.5 |
Pros
Cons
Verdict - The Legion 5i 16 is all about performance

All-in-all, the new Lenovo Legion 5i 16 made a very good impression during our test. Lenovo has concentrated on the most important features, offering fast components in combination with an excellent 240-Hz IPS display which already depicts colors accurately straight out of the box and makes do without PWM. Its gaming performance is great and you can run current games at the highest resolutions and settings—you just won't get around DLSS upscaling when it comes to ray tracing. The new Raptor-Lake-HX processor is by no means a miracle of efficiency, but its performance is good.
At the same time, the laptop's cooling unit assures that its performance can be made use of at all times. Furthermore, we liked the spread in all of the various energy profiles, and Lenovo gives users lots of customization options when it comes to the CPU and GPU's settings. While playing games, the device remains surprisingly cool but in turn, both of the fans get pretty loud, meaning a headset is a bit of a must-have for gaming sessions.
Great performance and an impressive 240-Hz display: Lenovo's Legion 5i 16 is a fast mid-range gamer which places performance at the forefront. However, its AI functions are just a gimmick so far.
Lenovo's new AI Engine+, which is supposed to improve gaming performance with the help of an AI chip, didn't work during our test. It may be improved through an update but for the time being, you might want to activate the manual performance mode. There are a few points which make it clear that Lenovo has saved some money, as the laptop doesn't feature Thunderbolt or a 2.5-GBit/s Ethernet port.
At US$1,610, the new Legion 5i 16 is no bargain and for this price, you can already get models featuring the RTX 4070 Laptop (especially laptops from 2023), but even in this case, you cannot avoid having to make certain display compromises.
Price and availability
The new Lenovo Legion 5i 16IRX G9 can be purchased directly from Lenovo's website for US$1,609.99.
Lenovo Legion 5 16IRX G9
- 01/29/2024 v7 (old)
Andreas Osthoff
Transparency
The selection of devices to be reviewed is made by our editorial team. The test sample was provided to the author as a loan by the manufacturer or retailer for the purpose of this review. The lender had no influence on this review, nor did the manufacturer receive a copy of this review before publication. There was no obligation to publish this review. As an independent media company, Notebookcheck is not subjected to the authority of manufacturers, retailers or publishers.
This is how Notebookcheck is testing
Every year, Notebookcheck independently reviews hundreds of laptops and smartphones using standardized procedures to ensure that all results are comparable. We have continuously developed our test methods for around 20 years and set industry standards in the process. In our test labs, high-quality measuring equipment is utilized by experienced technicians and editors. These tests involve a multi-stage validation process. Our complex rating system is based on hundreds of well-founded measurements and benchmarks, which maintains objectivity. Further information on our test methods can be found here.
Price comparison

