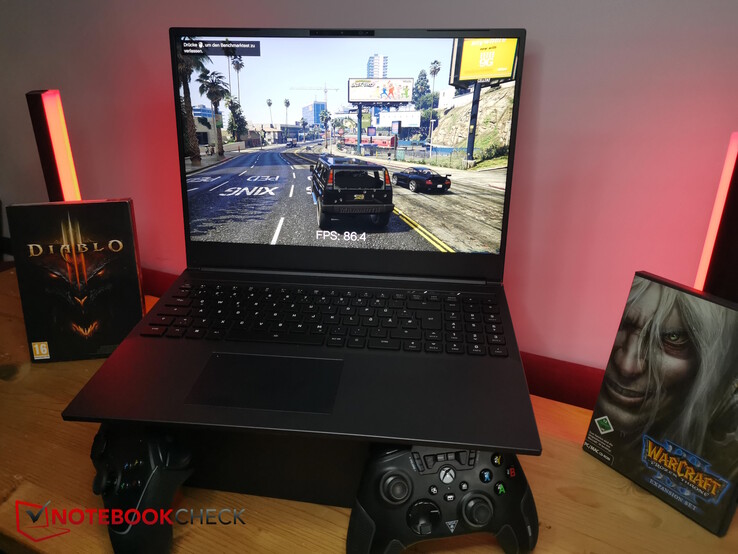
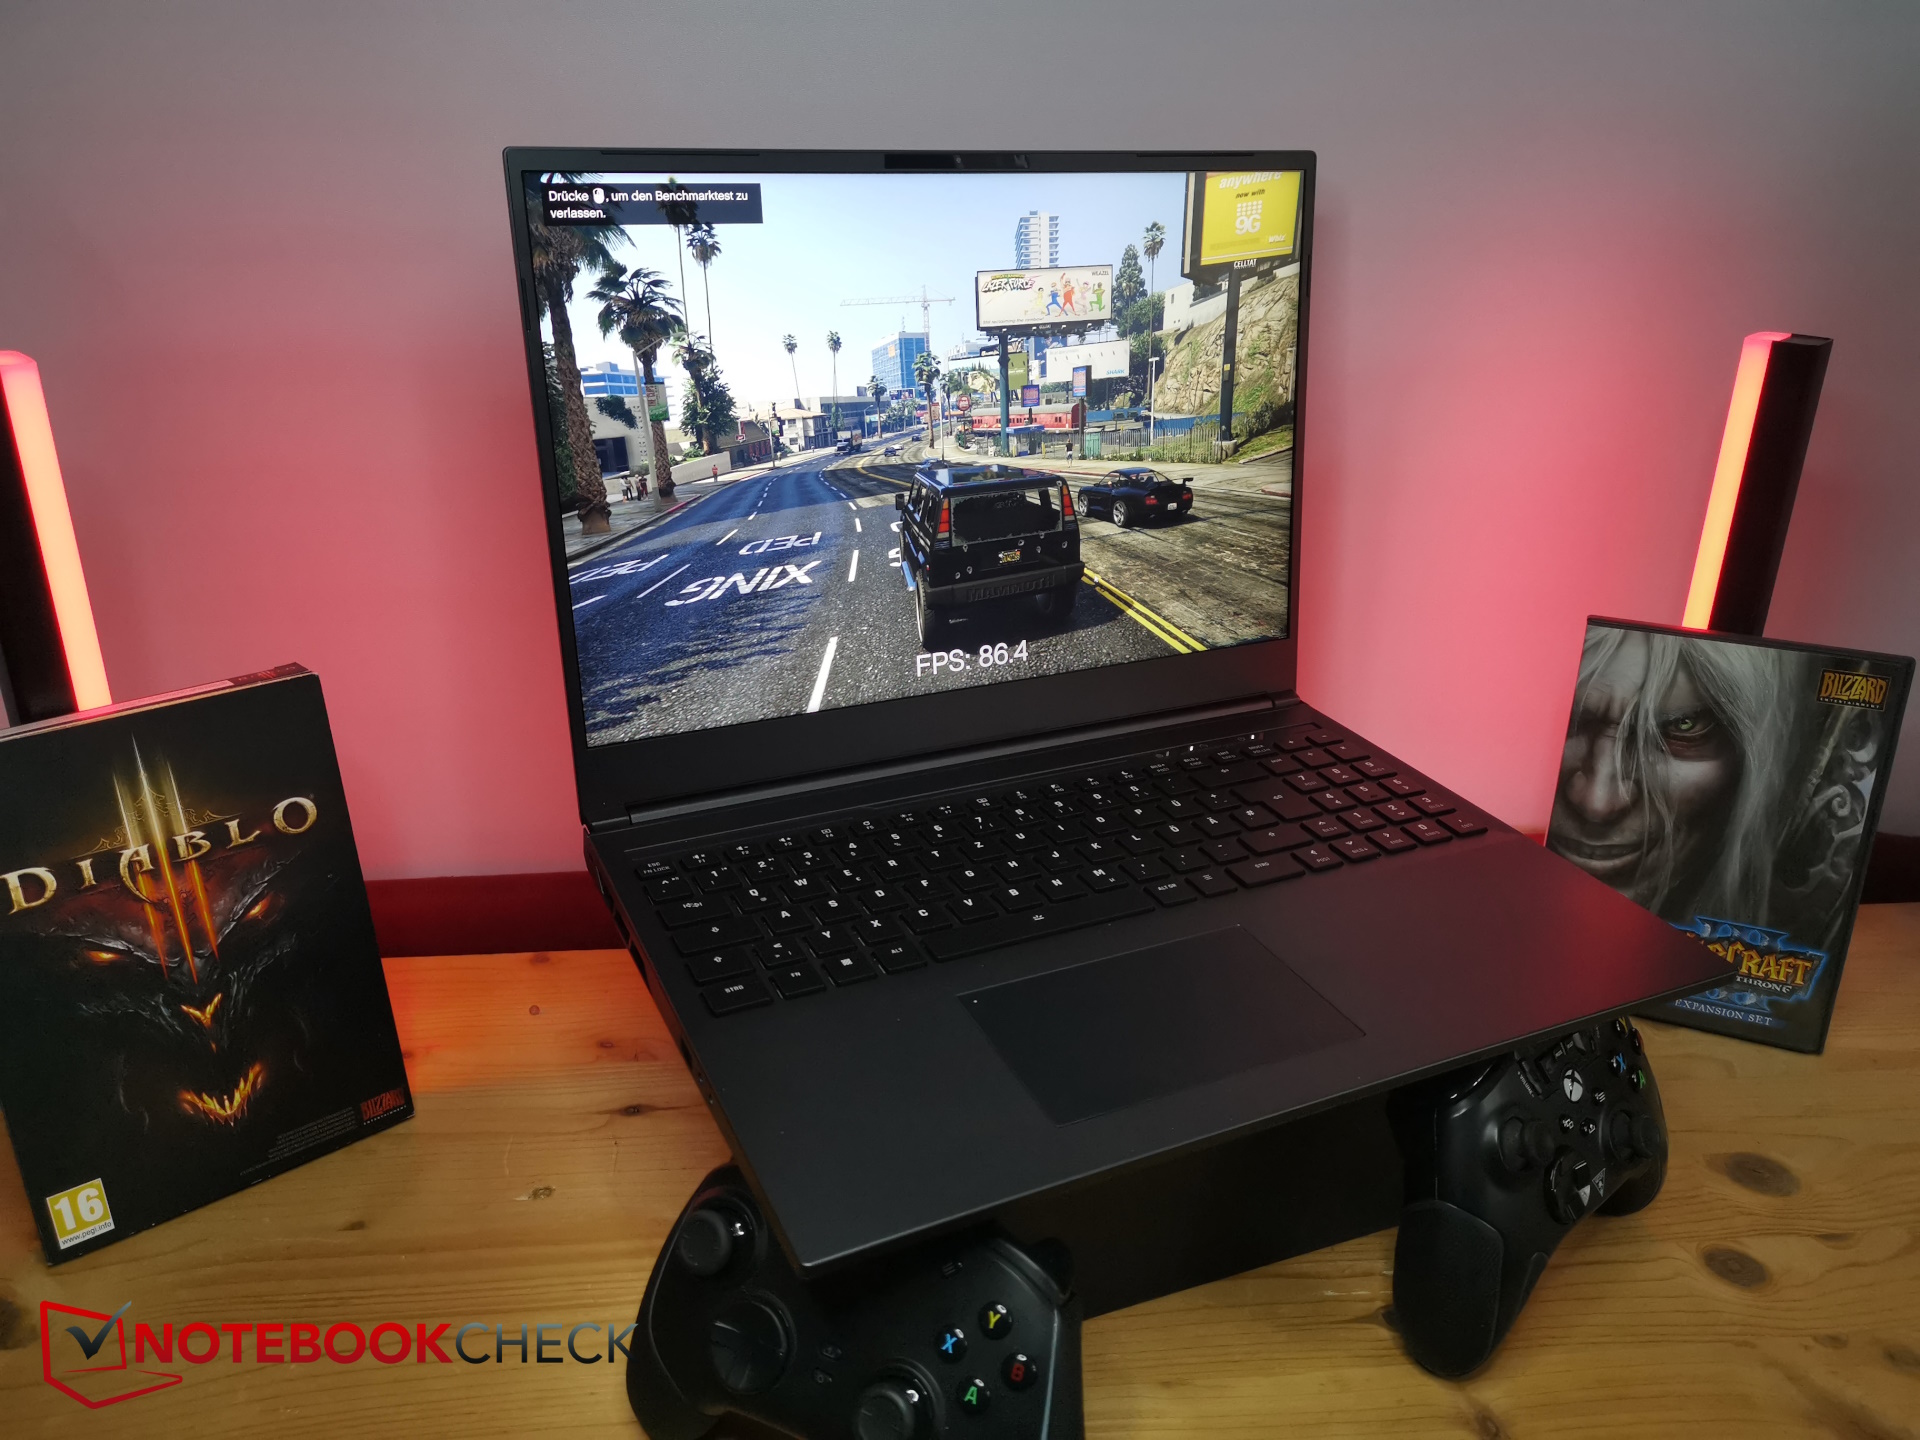
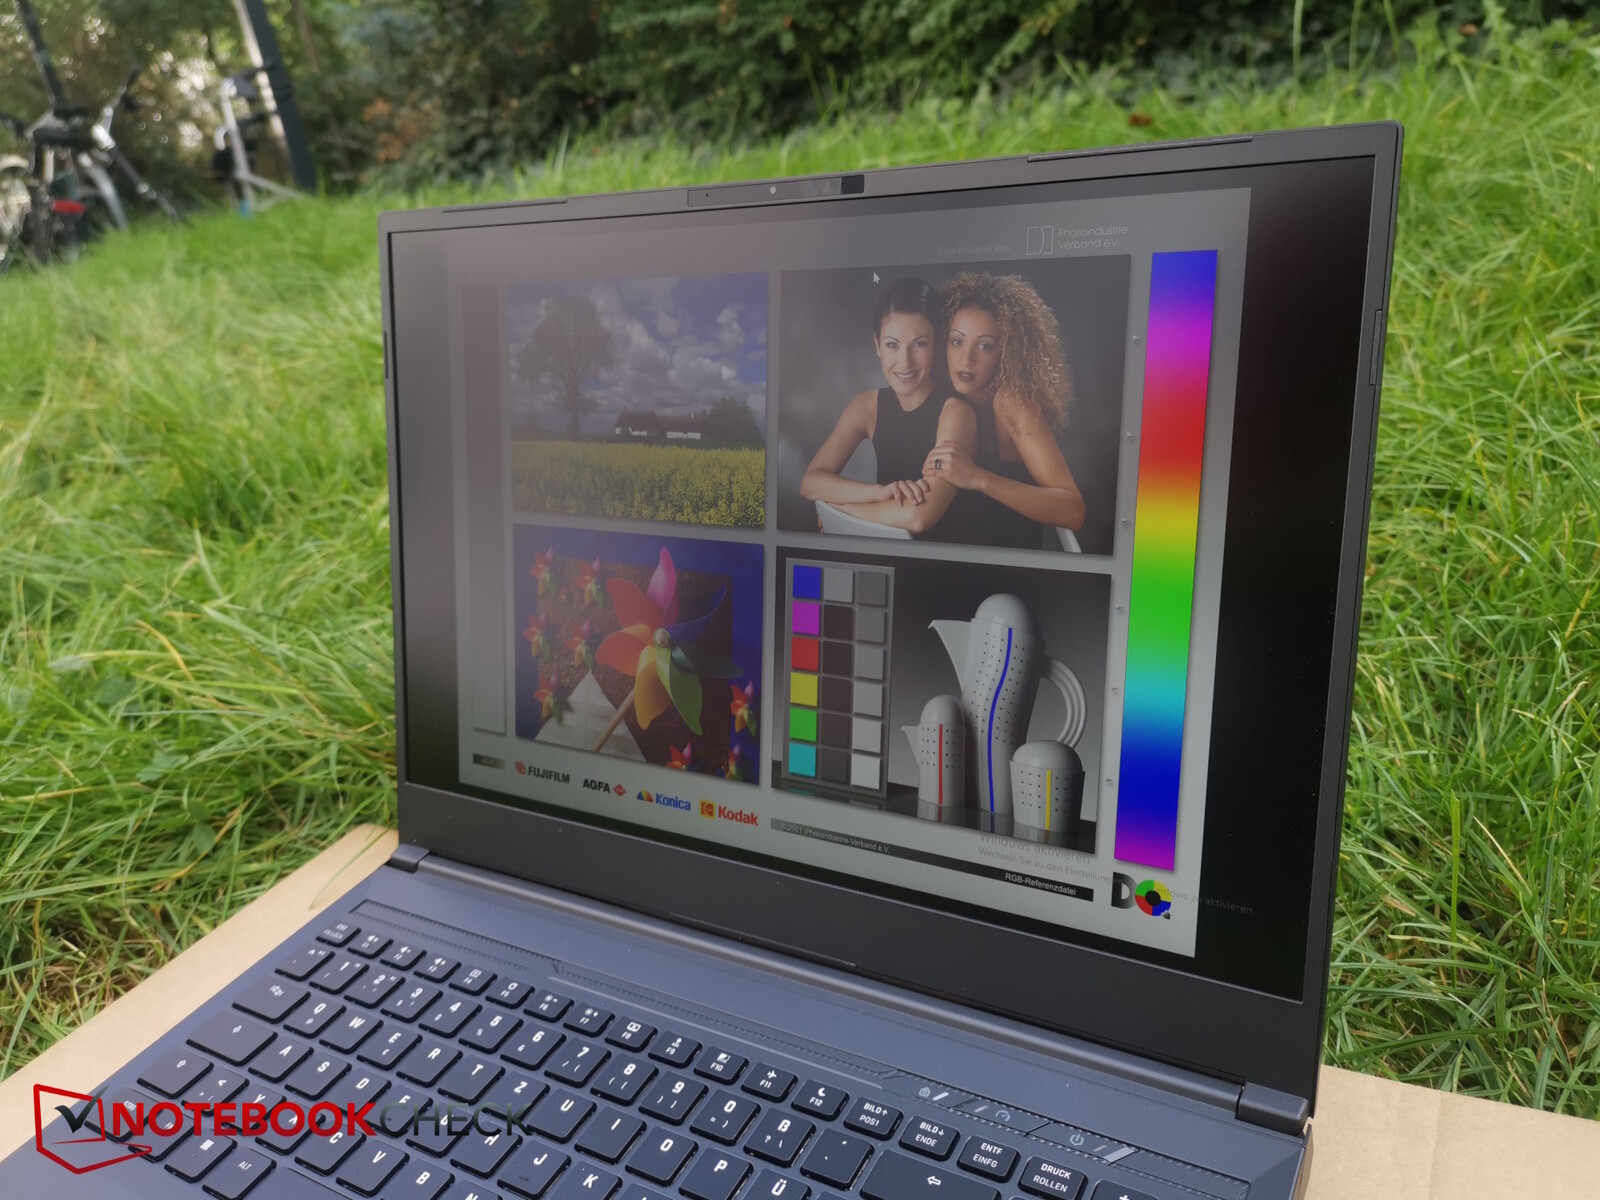
SCHENKER XMG Core 16 gaming laptop review - A real competitor to the Lenovo Legion Pro 5 16
The last XMG Core, which we also tested, was the XMG Core 15 (88 %) from a year ago - at the time, with an RTX 3060. Now, Schenker has brought out a 16-inch version of the Core. We will be taking a look at everything that has changed, aside from its screen size.
We will be comparing the Core 16 with the Lenovo Legion Pro 5 16 Gen 8, the Acer Nitro 16 AN16-41, the HP Omen Transcend 16, the MSI Stealth 16 Studio and the HP Victus 16.
Possible competitors compared
Rating | Date | Model | Weight | Height | Size | Resolution | Price |
|---|---|---|---|---|---|---|---|
| 89.2 % v7 (old) | 10 / 2023 | Schenker XMG CORE 16 (L23) R7 7840HS, GeForce RTX 4070 Laptop GPU | 2.4 kg | 26.1 mm | 16.00" | 2560x1600 | |
| 88.4 % v7 (old) | 05 / 2023 | Lenovo Legion Pro 5 16ARX8 R7 7745HX, GeForce RTX 4070 Laptop GPU | 2.5 kg | 26.8 mm | 16.00" | 2560x1600 | |
| 88.1 % v7 (old) | 06 / 2023 | Acer Nitro 16 AN16-41 R7 7735HS, GeForce RTX 4070 Laptop GPU | 2.7 kg | 27.9 mm | 16.00" | 2560x1600 | |
| 87.9 % v7 (old) | 08 / 2023 | HP Omen Transcend 16 i9-13900HX, GeForce RTX 4070 Laptop GPU | 2.3 kg | 19.8 mm | 16.00" | 2560x1600 | |
| 88.8 % v7 (old) | 07 / 2023 | MSI Stealth 16 Studio A13VG i7-13700H, GeForce RTX 4070 Laptop GPU | 2 kg | 19.95 mm | 16.00" | 2560x1600 | |
| 85.1 % v7 (old) | 09 / 2023 | HP Victus 16-r0077ng i7-13700H, GeForce RTX 4070 Laptop GPU | 2.4 kg | 24 mm | 16.10" | 1920x1080 |
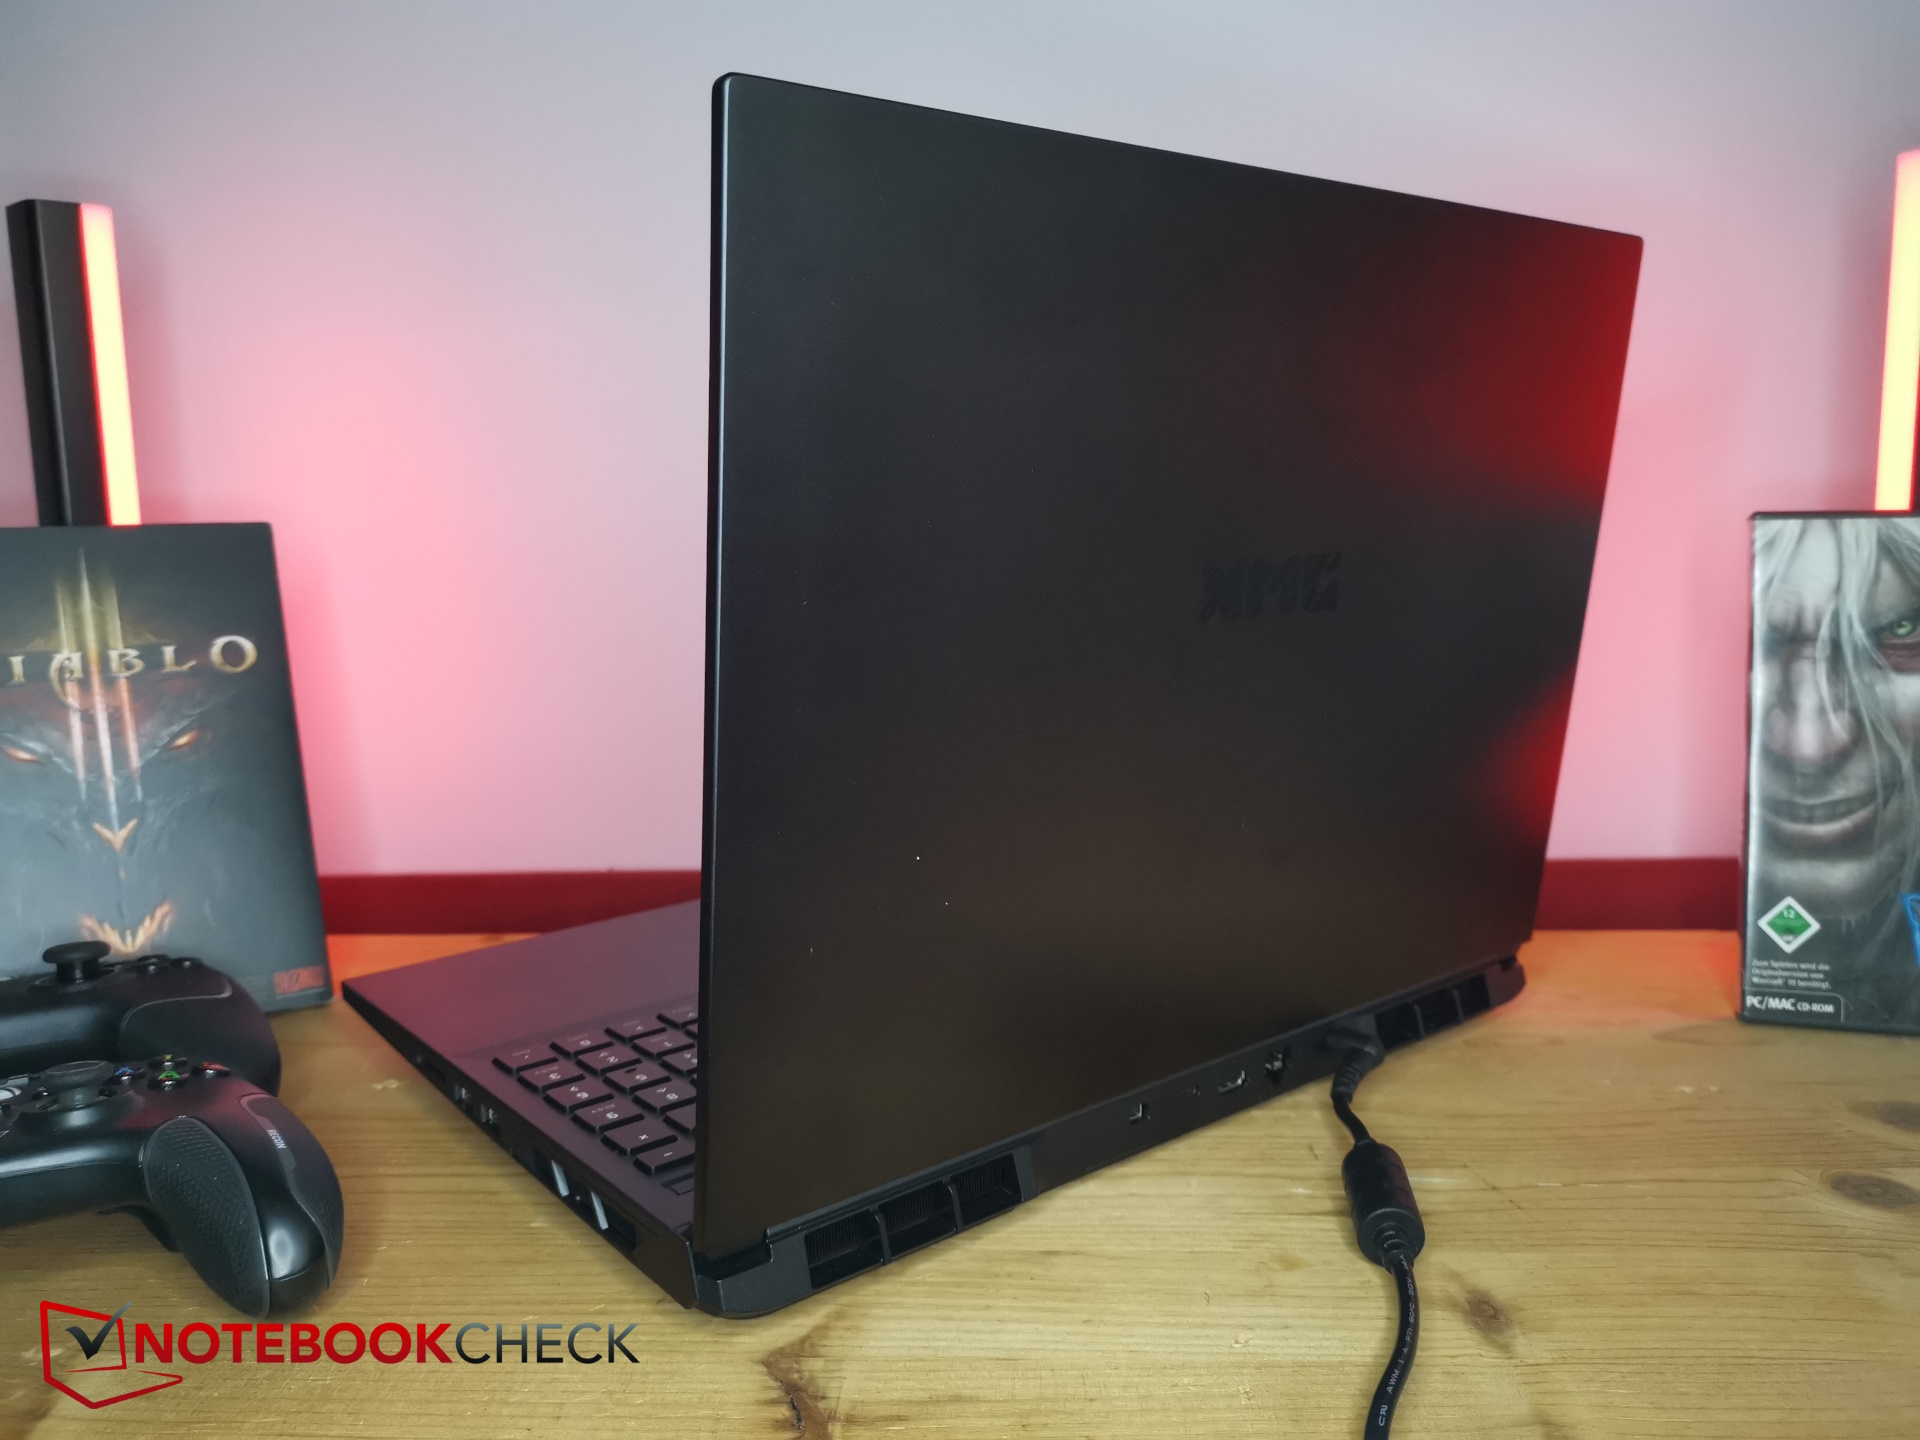
Case & connectivity - The sleek Core 16
This laptop has taken the Schenker-typical sleek approach - everything is kept in dark gray. The harder base and softer bottom plate are made from plastic, and the shiny display lid is made from metal. The latter is a bit of a fingerprint magnet. The lid can be opened up to 135 degrees.
Everything appears quite stable and its build is good. The left base side only creaked the first time we tried to twist it.
It has an average size and weight - comparable to the Lenovo Legion Pro 5 16.
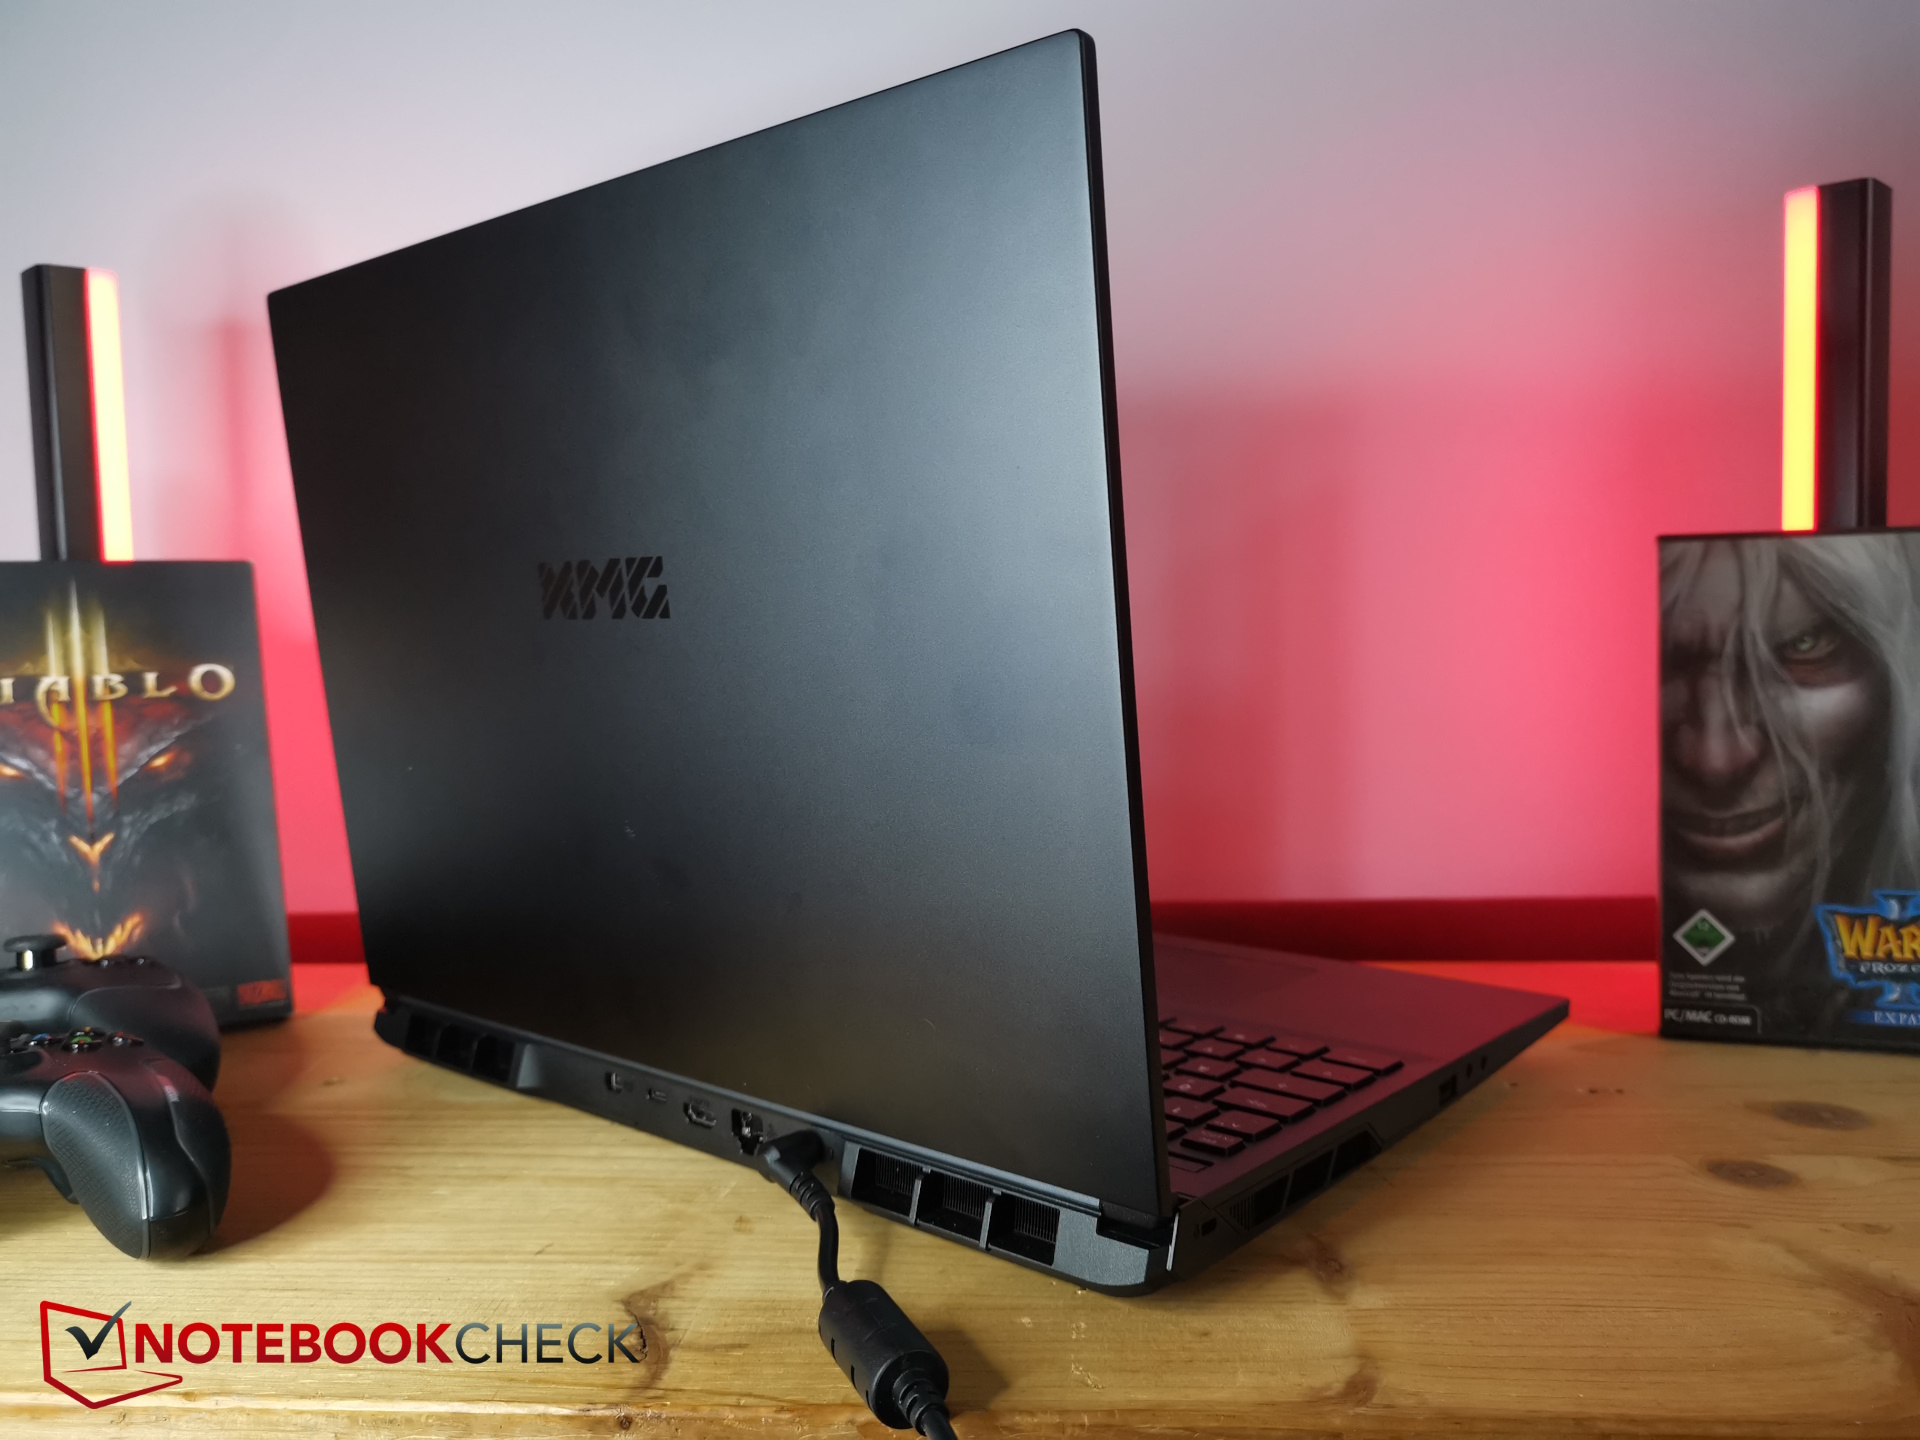

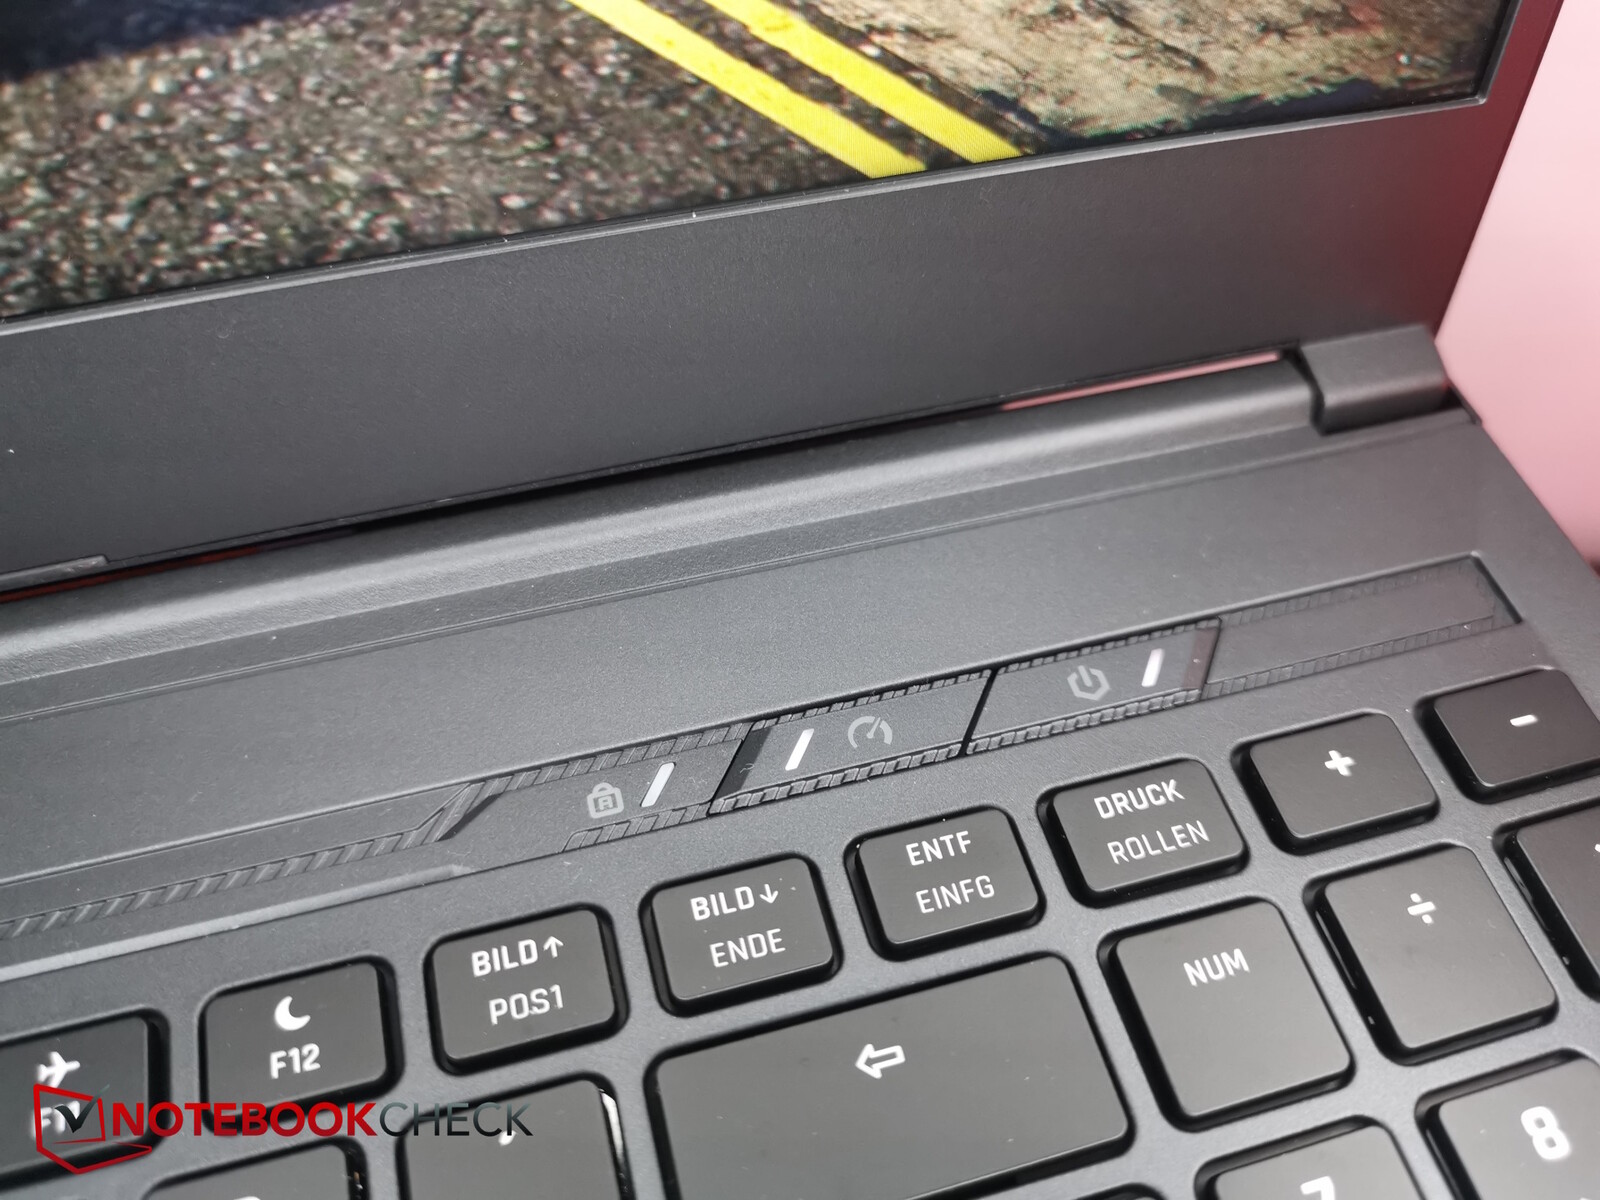
The gaming laptop includes all the most important ports, including a full SD card reader. Unfortunately, the USB-C port doesn't support Thunderbolt, Power Delivery or DisplayPort. For the latter, the laptop features a dedicated MiniDisplayPort. The device can't be charged via USB-C and the USB-A port on the left side is still type 2.0!
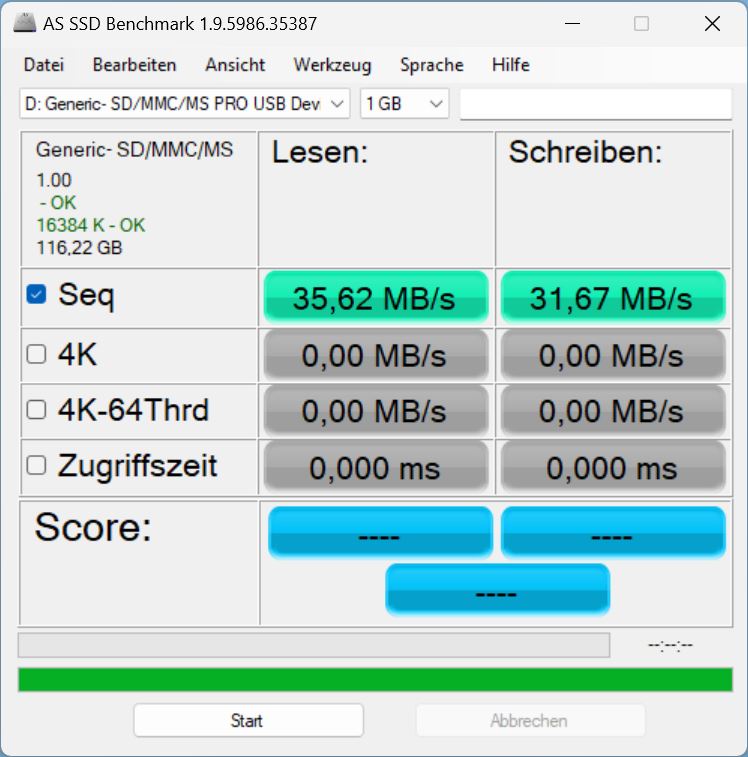
The previously mentioned SD card reader is unfortunately a very slow one - slower than on all predecessors and competitors. At least it features one at all.
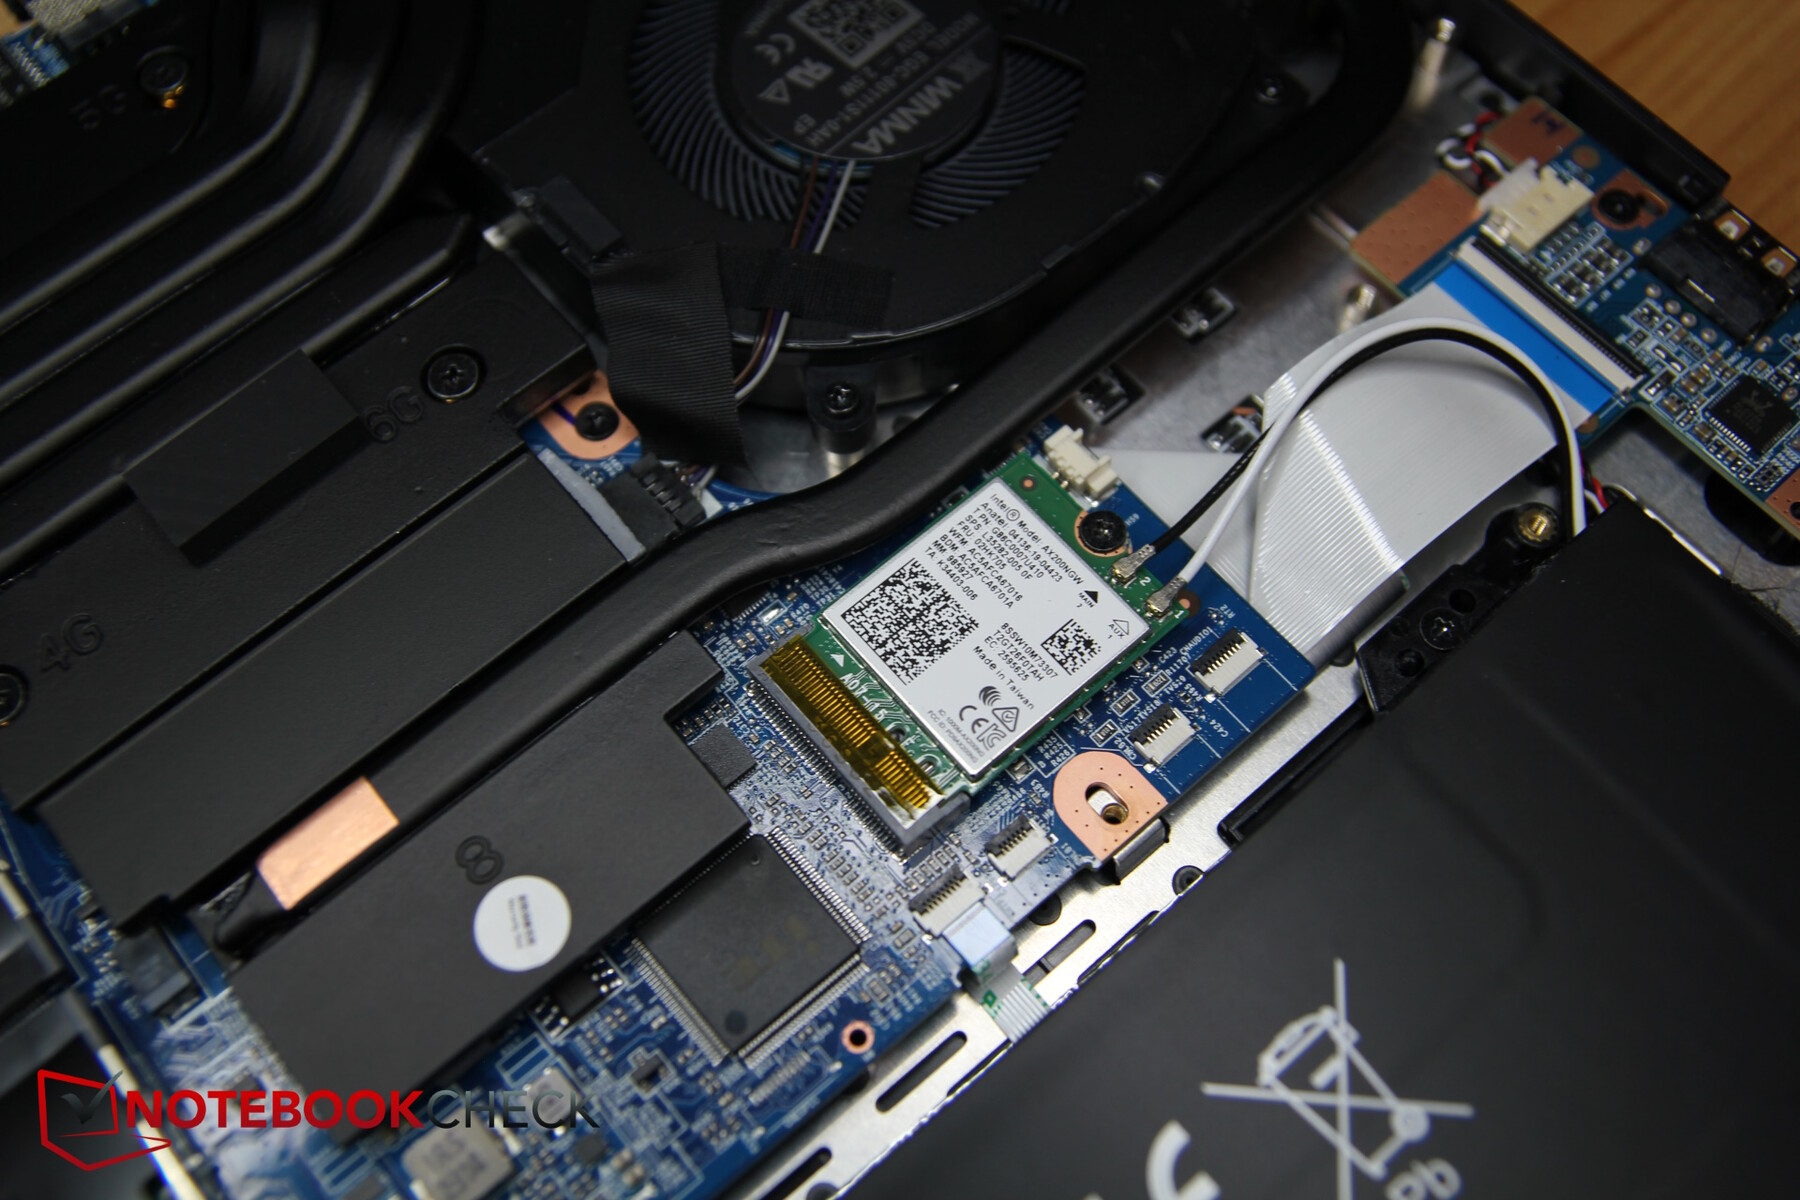
The Intel AX200 supports WiFi 6, but only within the 5 GHz frequency. Its transfer rates are good and relatively stable.
| SD Card Reader | |
| average JPG Copy Test (av. of 3 runs) | |
| MSI Stealth 16 Studio A13VG | |
| Average of class Gaming (20.9 - 210, n=54, last 2 years) | |
| Acer Nitro 16 AN16-41 (AV Pro SD microSD 128 GB V60) | |
| Schenker XMG CORE 16 (L23) | |
| maximum AS SSD Seq Read Test (1GB) | |
| MSI Stealth 16 Studio A13VG | |
| Average of class Gaming (25.5 - 261, n=51, last 2 years) | |
| Acer Nitro 16 AN16-41 (AV Pro SD microSD 128 GB V60) | |
| Schenker XMG CORE 16 (L23) | |

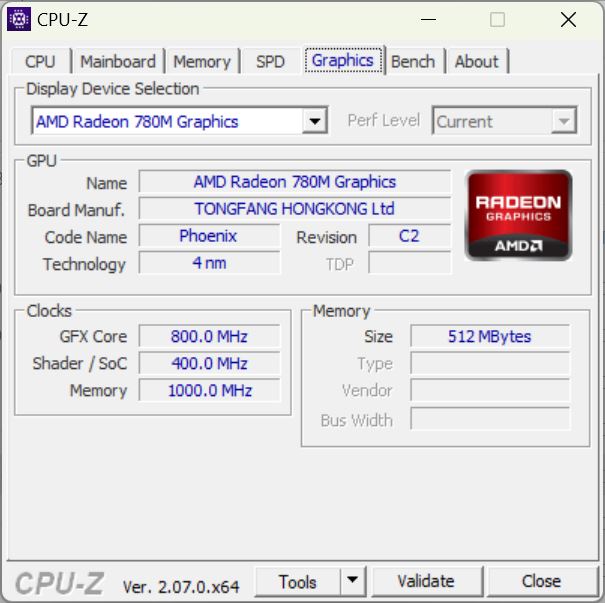
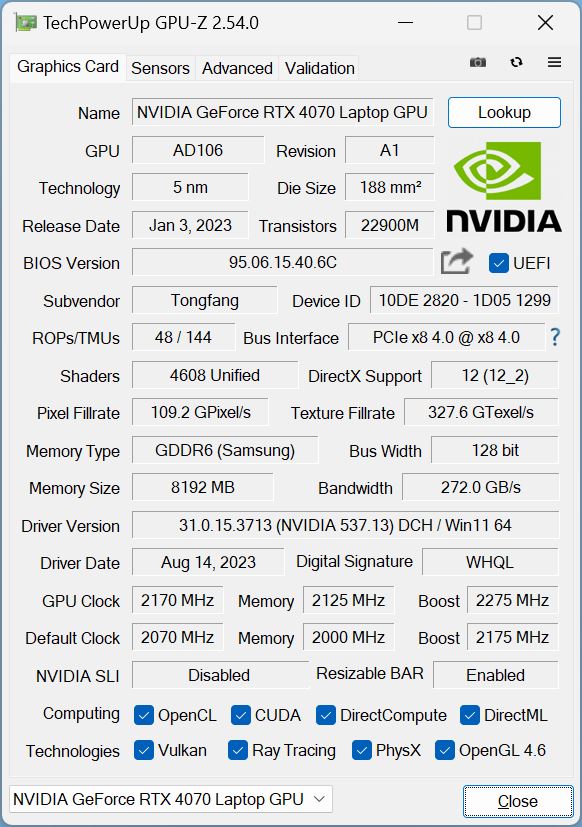
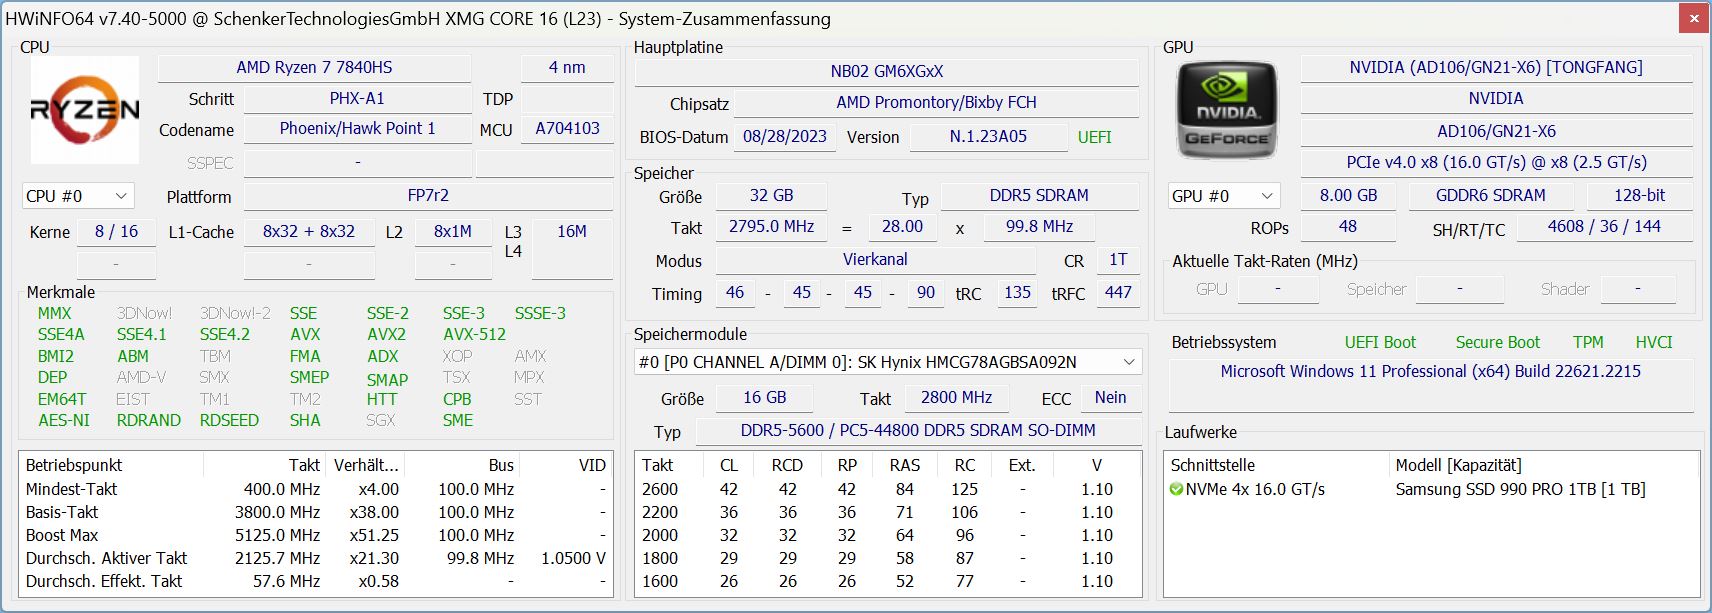
 GeForce RTX 4070 Laptop GPU, R7 7840HS, Samsung 990 Pro 1 TB")
 GeForce RTX 4070 Laptop GPU, R7 7840HS, Samsung 990 Pro 1 TB")
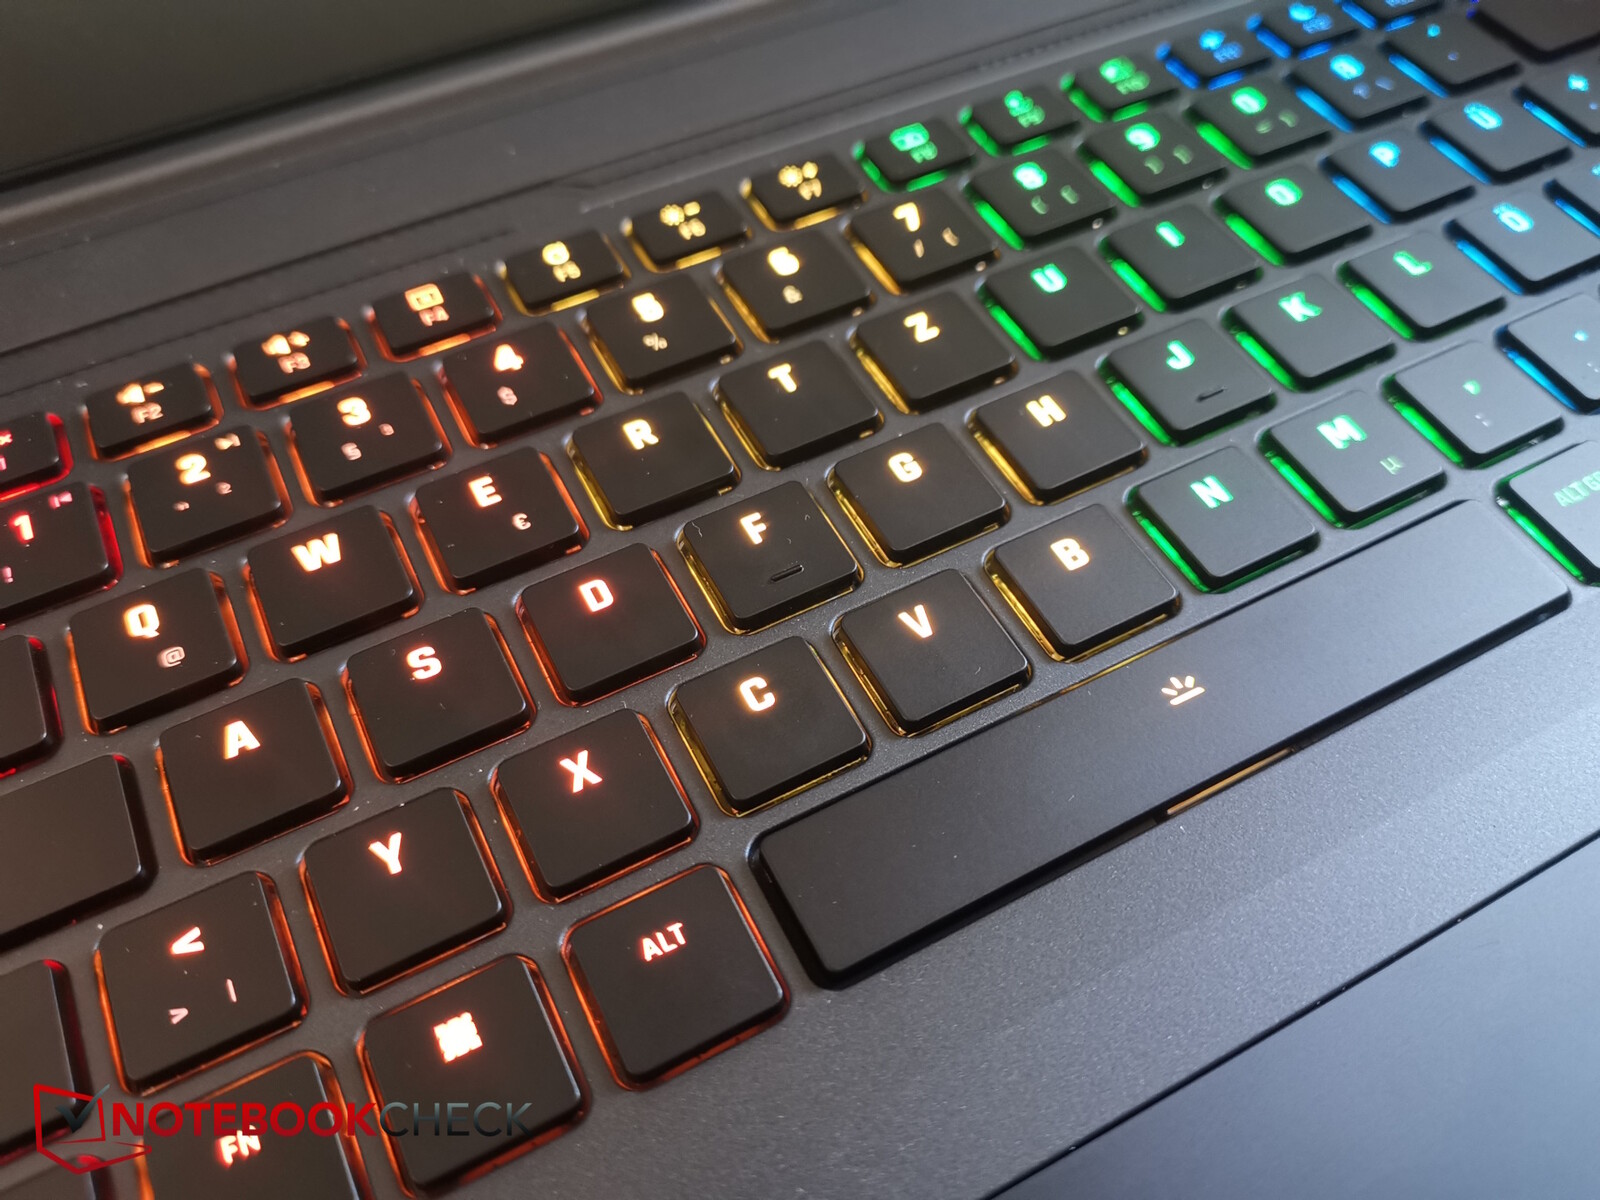
Input devices - Mechanical or membrane keys
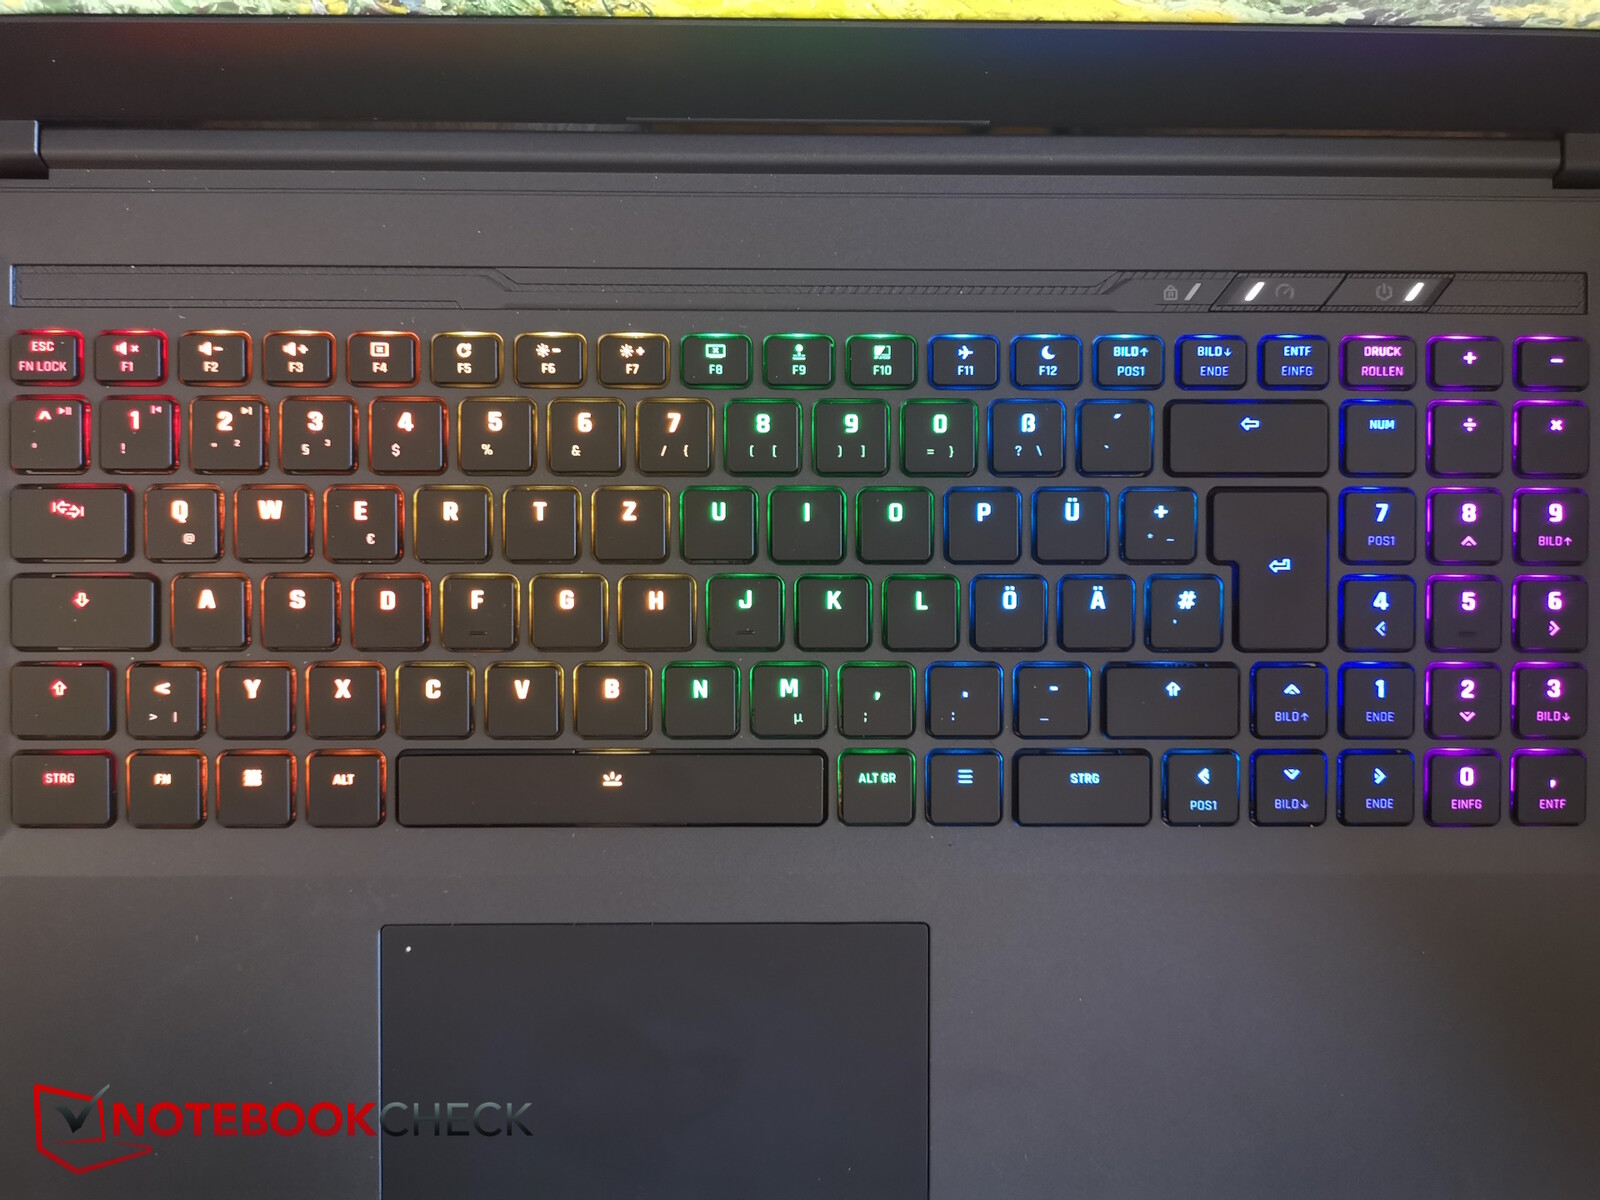
On this laptop, you get a choice between mechanical keys such as the ones our test model features, or a "silent membrane keyboard". Both come with RGB backlighting - but only the mechanical keyboard features individually RGB-lit keys. The quieter membrane version only has single-zone RGB lighting.
The mechanical keyboard only has quieter membrane switches when it comes to the function keys. All other keys have a great pressure point and give crisp feedback. You have to like the loud noise when typing and it's certainly not suitable to take with you into a library.
As usual, Schenker has implemented a very tidy layout without any accents. Everything fits into six straight key rows - including the numerical keypad. This means you can find everything super easily - usually, the keys are quite small (around 1.45 x 1.45 cm).
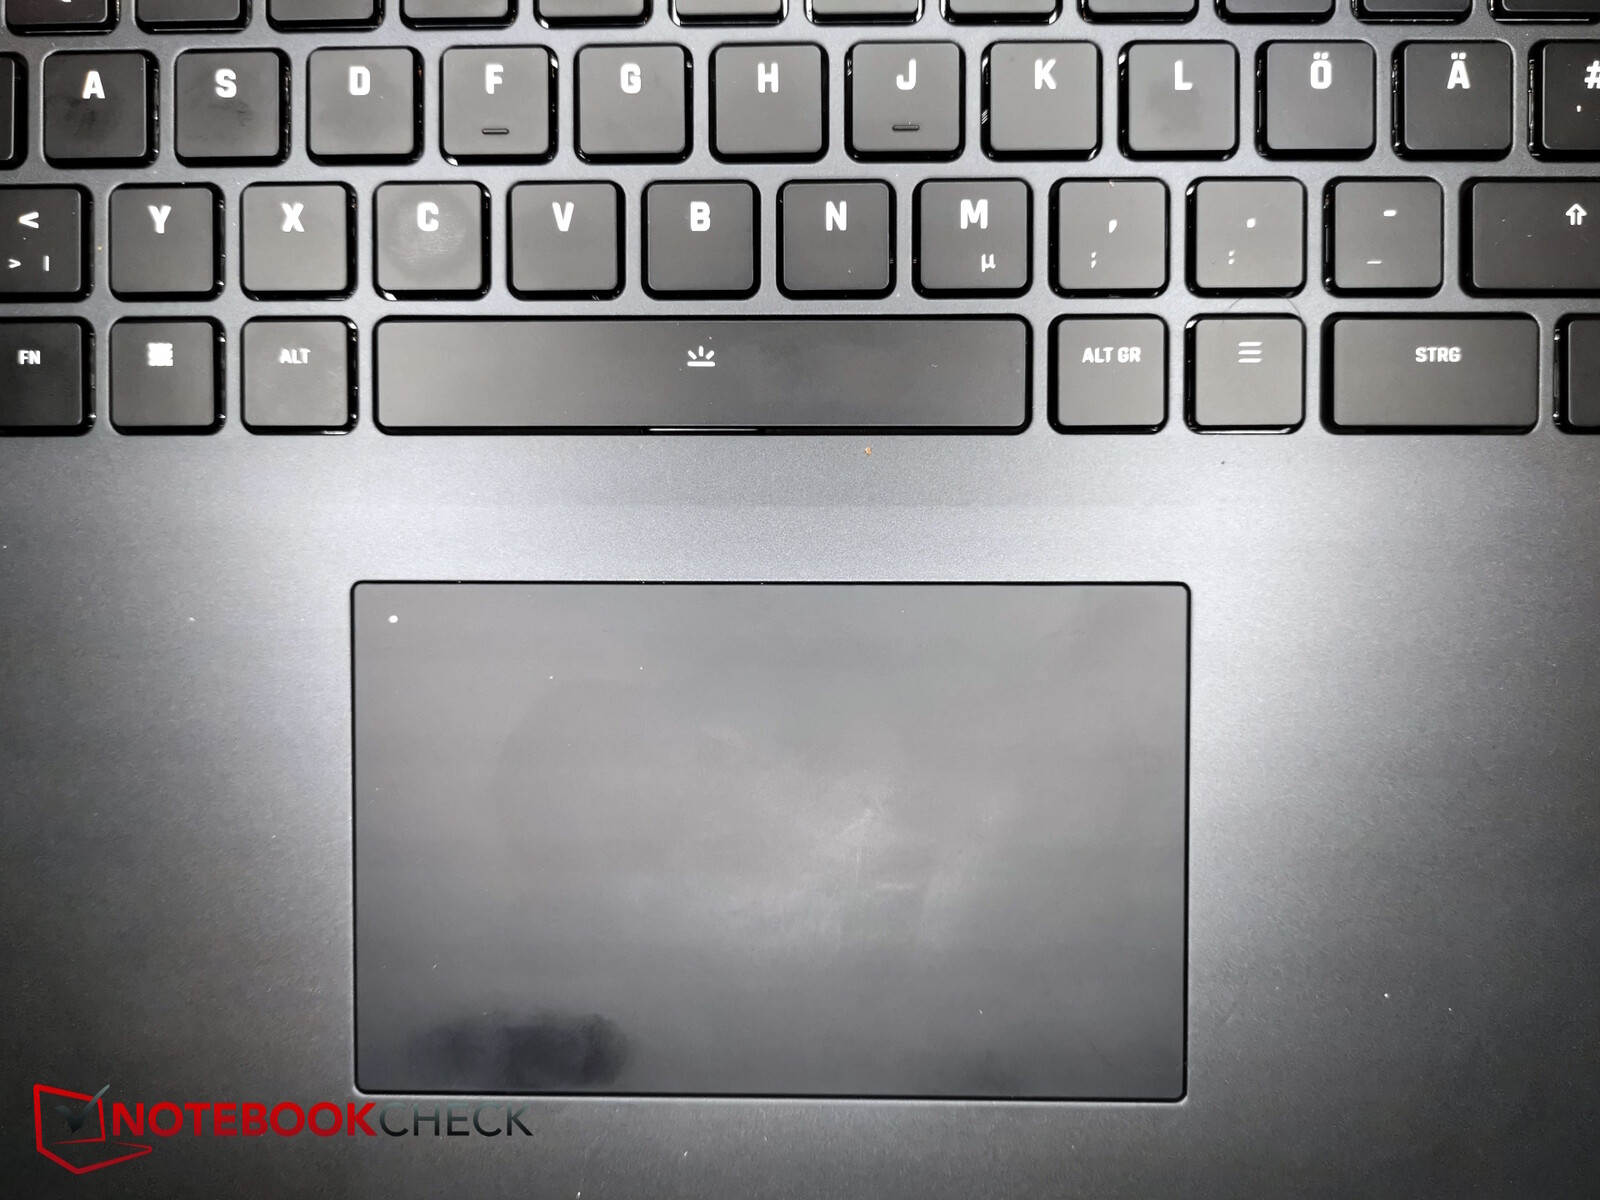
The touchpad is a bit on the small side (around 11.7 x 7.2 cm) but it is nice and smooth, even if your fingers aren't completely dry. You can (de)activate the pad by double-clicking the top left corner and a mini LED shows its current status. The integrated click buttons give you decent feedback but they are not too loud. Sometimes, the click gets a little stuck, meaning it isn't released immediately after you let go from dragging and dropping.

Display - Well-known 16:10 1,600p IPS panel
By the looks of it, Schenker uses the same matte 16:10 240-Hz display with a 1,600p resolution on all of its 16-inch models. This means we saw the same BOE panel on the Schenker Vision 16 Pro and the XMG Neo 16.
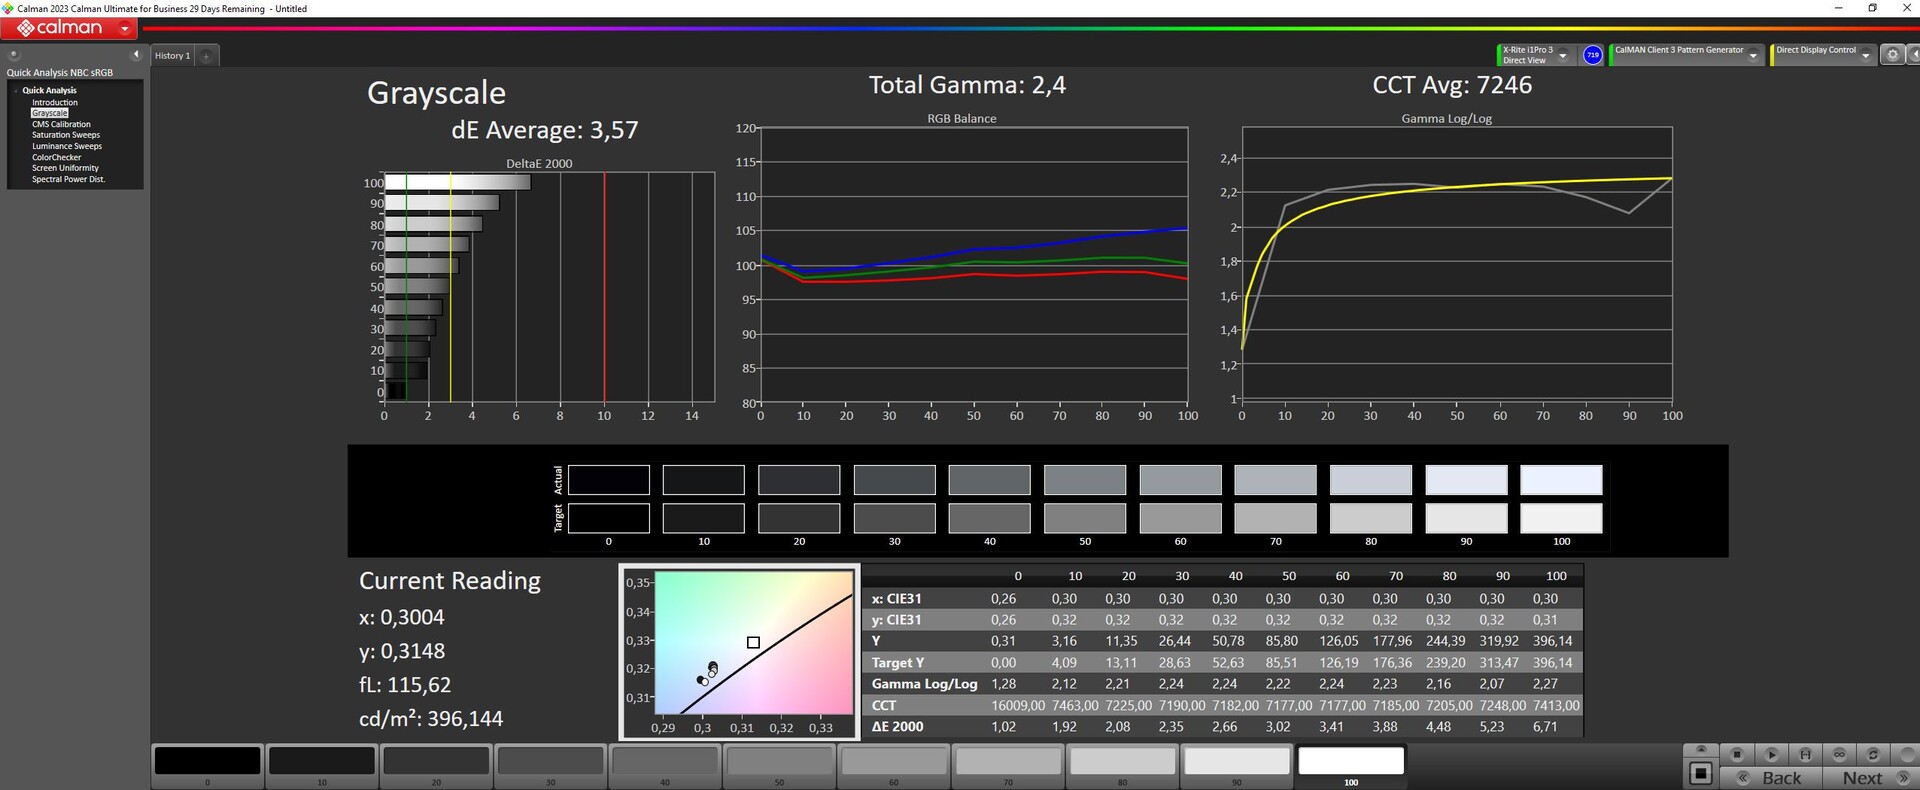
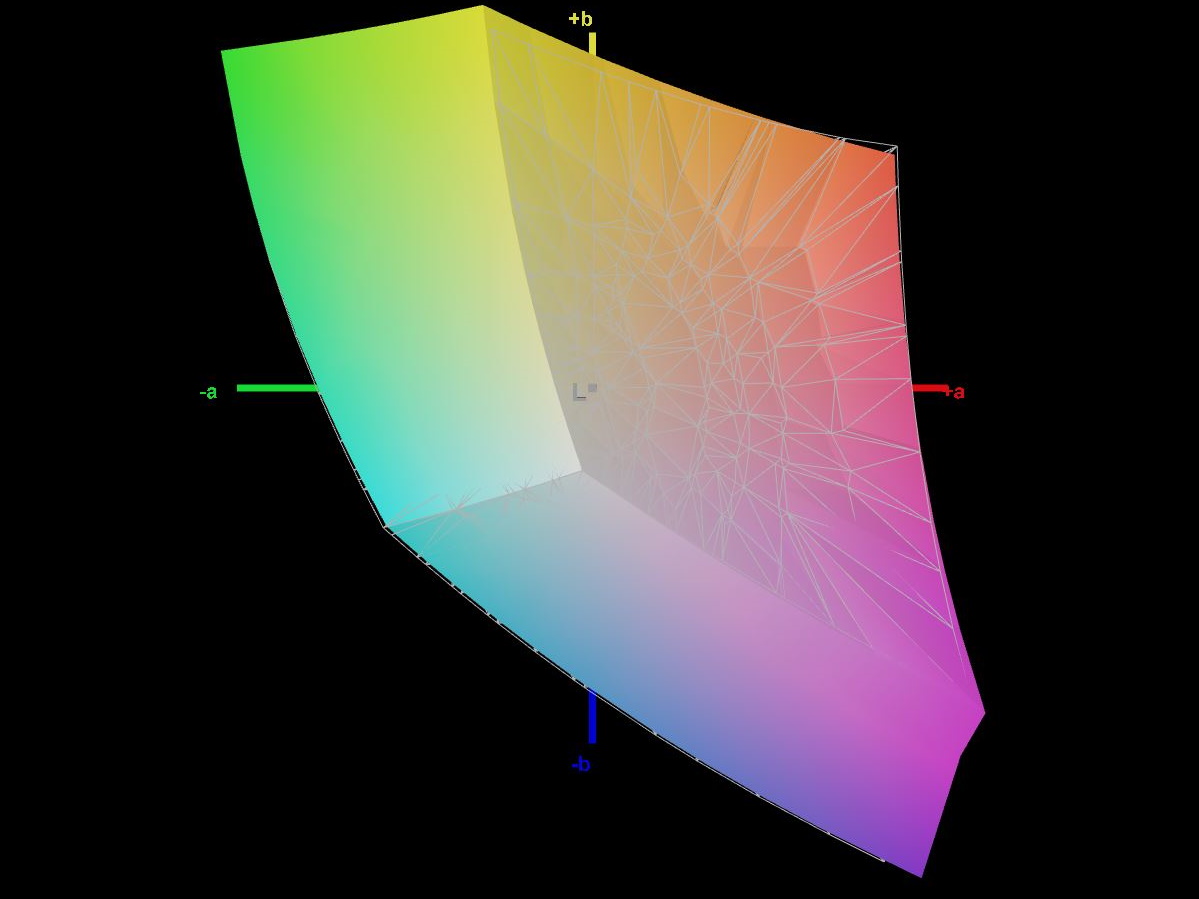
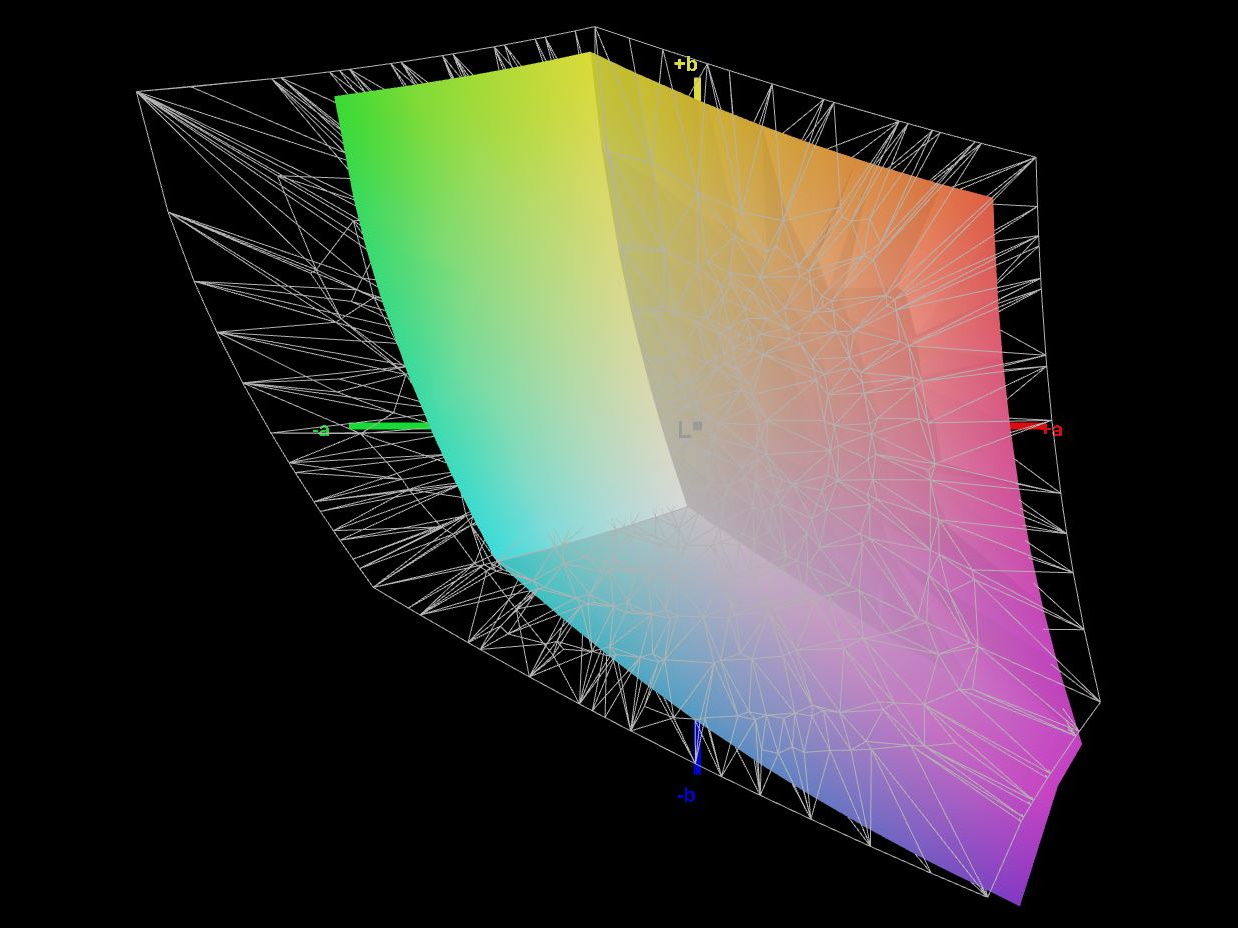
The screen certainly achieves good values. It has a brightness of 350 nits and a contrast value of just over 1,000:1. The sRGB display is fast enough and we didn't note any PWM. You can see some backlight bleeding, but nothing too bad.
One thing we noticed is that changing the brightness via the special keys only comes into effect when you let go of the keys again, which is a little annoying.
| |||||||||||||||||||||||||
Brightness Distribution: 88 %
Center on Battery: 372 cd/m²
Contrast: 1139:1 (Black: 0.33 cd/m²)
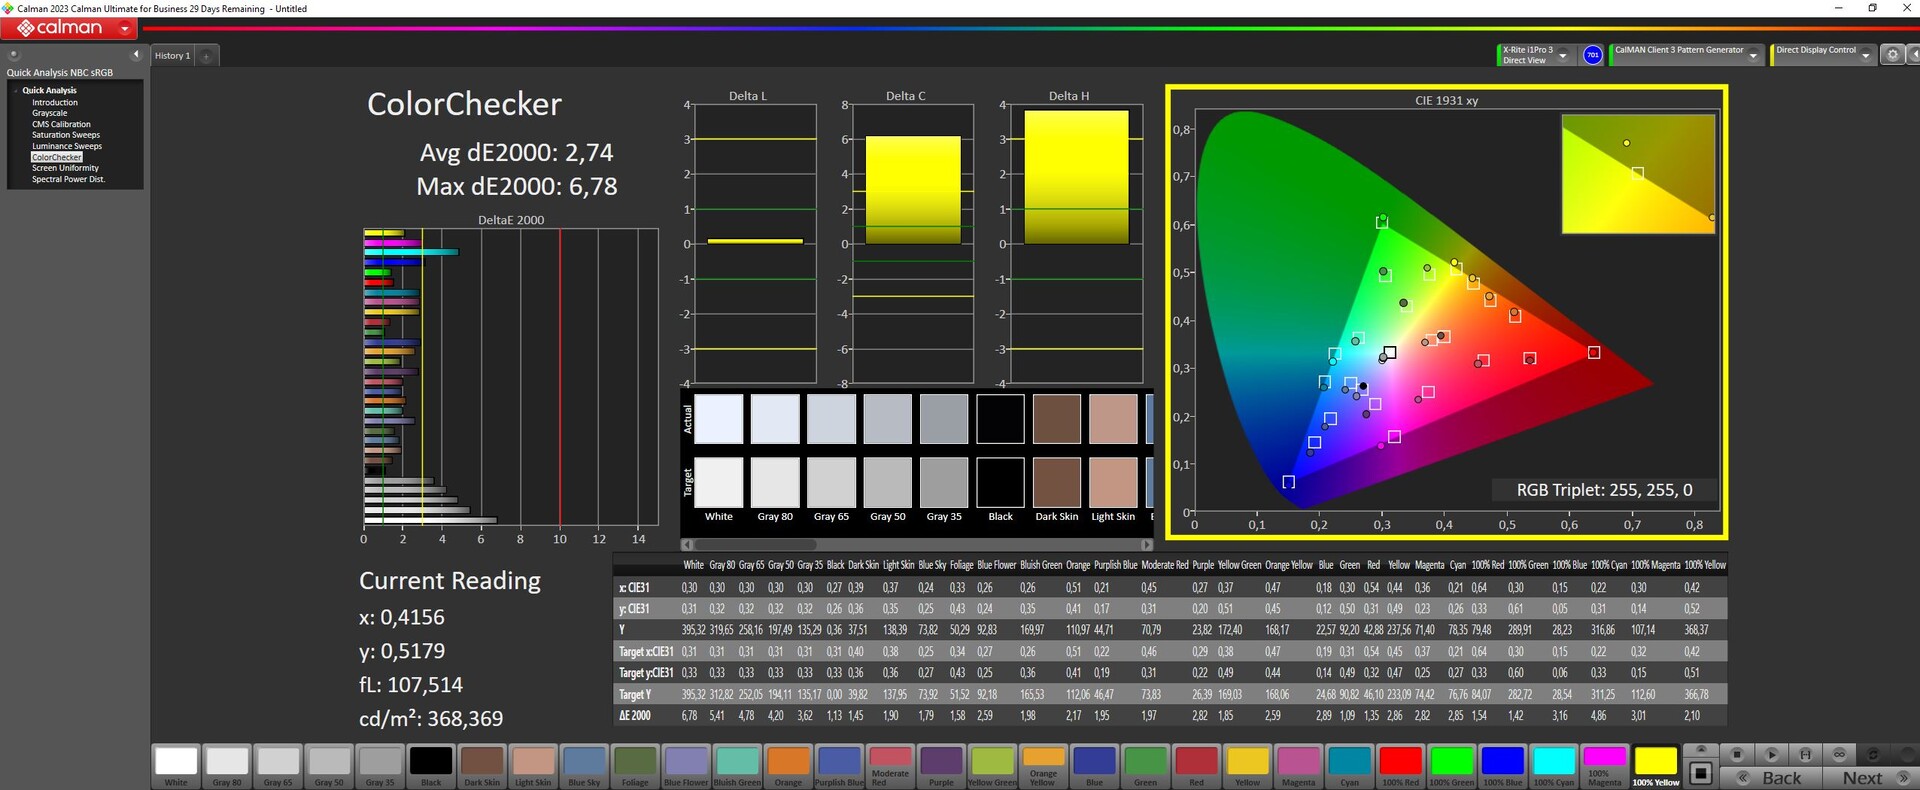
ΔE ColorChecker Calman: 2.74 | ∀{0.5-29.43 Ø4.73}
calibrated: 0.88
ΔE Greyscale Calman: 3.57 | ∀{0.09-98 Ø4.97}
69.6% AdobeRGB 1998 (Argyll 3D)
98.6% sRGB (Argyll 3D)
68.3% Display P3 (Argyll 3D)
Gamma: 2.4
CCT: 7246 K
| Schenker XMG CORE 16 (L23) BOE0AF0 (), IPS, 2560x1600, 16" | Lenovo Legion Pro 5 16ARX8 CSOT T3 MNG007DA1-Q, IPS, 2560x1600, 16" | Acer Nitro 16 AN16-41 BOE CQ NE16QDM-NY1, IPS, 2560x1600, 16" | HP Omen Transcend 16 AUOA3A6, Mini-LED, 2560x1600, 16" | MSI Stealth 16 Studio A13VG AUO26A9, IPS, 2560x1600, 16" | HP Victus 16-r0077ng CMN162D, IPS, 1920x1080, 16.1" | |
|---|---|---|---|---|---|---|
| Display | 3% | 0% | 24% | 21% | -1% | |
| Display P3 Coverage (%) | 68.3 | 70.4 3% | 67.9 -1% | 99.2 45% | 96.4 41% | 66.7 -2% |
| sRGB Coverage (%) | 98.6 | 99.6 1% | 99.1 1% | 100 1% | 99.7 1% | 98 -1% |
| AdobeRGB 1998 Coverage (%) | 69.6 | 72.6 4% | 69.9 0% | 87.6 26% | 84.8 22% | 69 -1% |
| Response Times | 5% | 21% | -214% | 41% | -13% | |
| Response Time Grey 50% / Grey 80% * (ms) | 13.2 ? | 7 ? 47% | 11 ? 17% | 26.4 ? -100% | 4.4 ? 67% | 13.3 ? -1% |
| Response Time Black / White * (ms) | 6.6 ? | 9.1 ? -38% | 5 ? 24% | 28.2 ? -327% | 5.6 ? 15% | 8.2 ? -24% |
| PWM Frequency (Hz) | 3506 ? | |||||
| Screen | 26% | 18% | 195% | -30% | 17% | |
| Brightness middle (cd/m²) | 376 | 355.3 -6% | 520 38% | 791.1 110% | 424 13% | 308 -18% |
| Brightness (cd/m²) | 358 | 340 -5% | 494 38% | 800 123% | 411 15% | 285 -20% |
| Brightness Distribution (%) | 88 | 91 3% | 91 3% | 95 8% | 88 0% | 85 -3% |
| Black Level * (cd/m²) | 0.33 | 0.32 3% | 0.39 -18% | 0.04 88% | 0.37 -12% | 0.25 24% |
| Contrast (:1) | 1139 | 1110 -3% | 1333 17% | 19778 1636% | 1146 1% | 1232 8% |
| Colorchecker dE 2000 * | 2.74 | 1.13 59% | 1.94 29% | 4.37 -59% | 3.04 -11% | 1.3 53% |
| Colorchecker dE 2000 max. * | 6.78 | 2.78 59% | 5.62 17% | 10.39 -53% | 7.5 -11% | 2.76 59% |
| Colorchecker dE 2000 calibrated * | 0.88 | 0.32 64% | 0.74 16% | 1.04 -18% | 3.04 -245% | 0.92 -5% |
| Greyscale dE 2000 * | 3.57 | 1.4 61% | 2.94 18% | 6.5 -82% | 4.34 -22% | 1.7 52% |
| Gamma | 2.4 92% | 2.24 98% | 2.37 93% | 2.28 96% | 2.32 95% | 2.167 102% |
| CCT | 7246 90% | 6372 102% | 6443 101% | 6000 108% | 6952 93% | 6767 96% |
| Total Average (Program / Settings) | 11% /
18% | 13% /
14% | 2% /
100% | 11% /
-9% | 1% /
9% |
* ... smaller is better
Using our X-Rite color measuring device and the CalMAN software suite, we were able to massively improve the screen's good (but not entirely optimal) color depiction straight out of the box, leading to the color and grayscale DeltaE values (norm deviations) to sink down to 1. This means the display is suitable for editing photos - at least in the sRGB color space.


Display Response Times
| ↔ Response Time Black to White | ||
|---|---|---|
| 6.6 ms ... rise ↗ and fall ↘ combined | ↗ 2.5 ms rise |  |
| ↘ 4.1 ms fall | ||
| The screen shows very fast response rates in our tests and should be very well suited for fast-paced gaming. In comparison, all tested devices range from 0.1 (minimum) to 240 (maximum) ms. » 21 % of all devices are better. This means that the measured response time is better than the average of all tested devices (19.9 ms). | ||
| ↔ Response Time 50% Grey to 80% Grey | ||
| 13.2 ms ... rise ↗ and fall ↘ combined | ↗ 6.1 ms rise |  |
| ↘ 7.1 ms fall | ||
| The screen shows good response rates in our tests, but may be too slow for competitive gamers. In comparison, all tested devices range from 0.165 (minimum) to 636 (maximum) ms. » 27 % of all devices are better. This means that the measured response time is better than the average of all tested devices (31.1 ms). | ||
Screen Flickering / PWM (Pulse-Width Modulation)
| Screen flickering / PWM not detected | 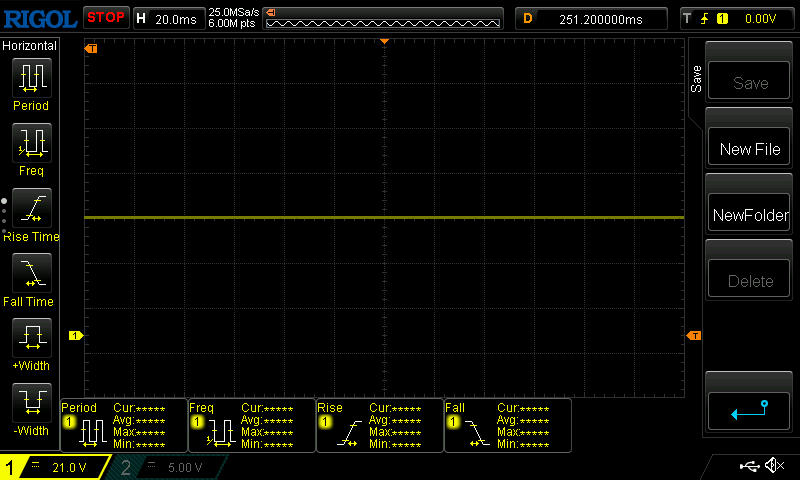 | ||
In comparison: 52 % of all tested devices do not use PWM to dim the display. If PWM was detected, an average of 7794 (minimum: 5 - maximum: 343500) Hz was measured. | |||
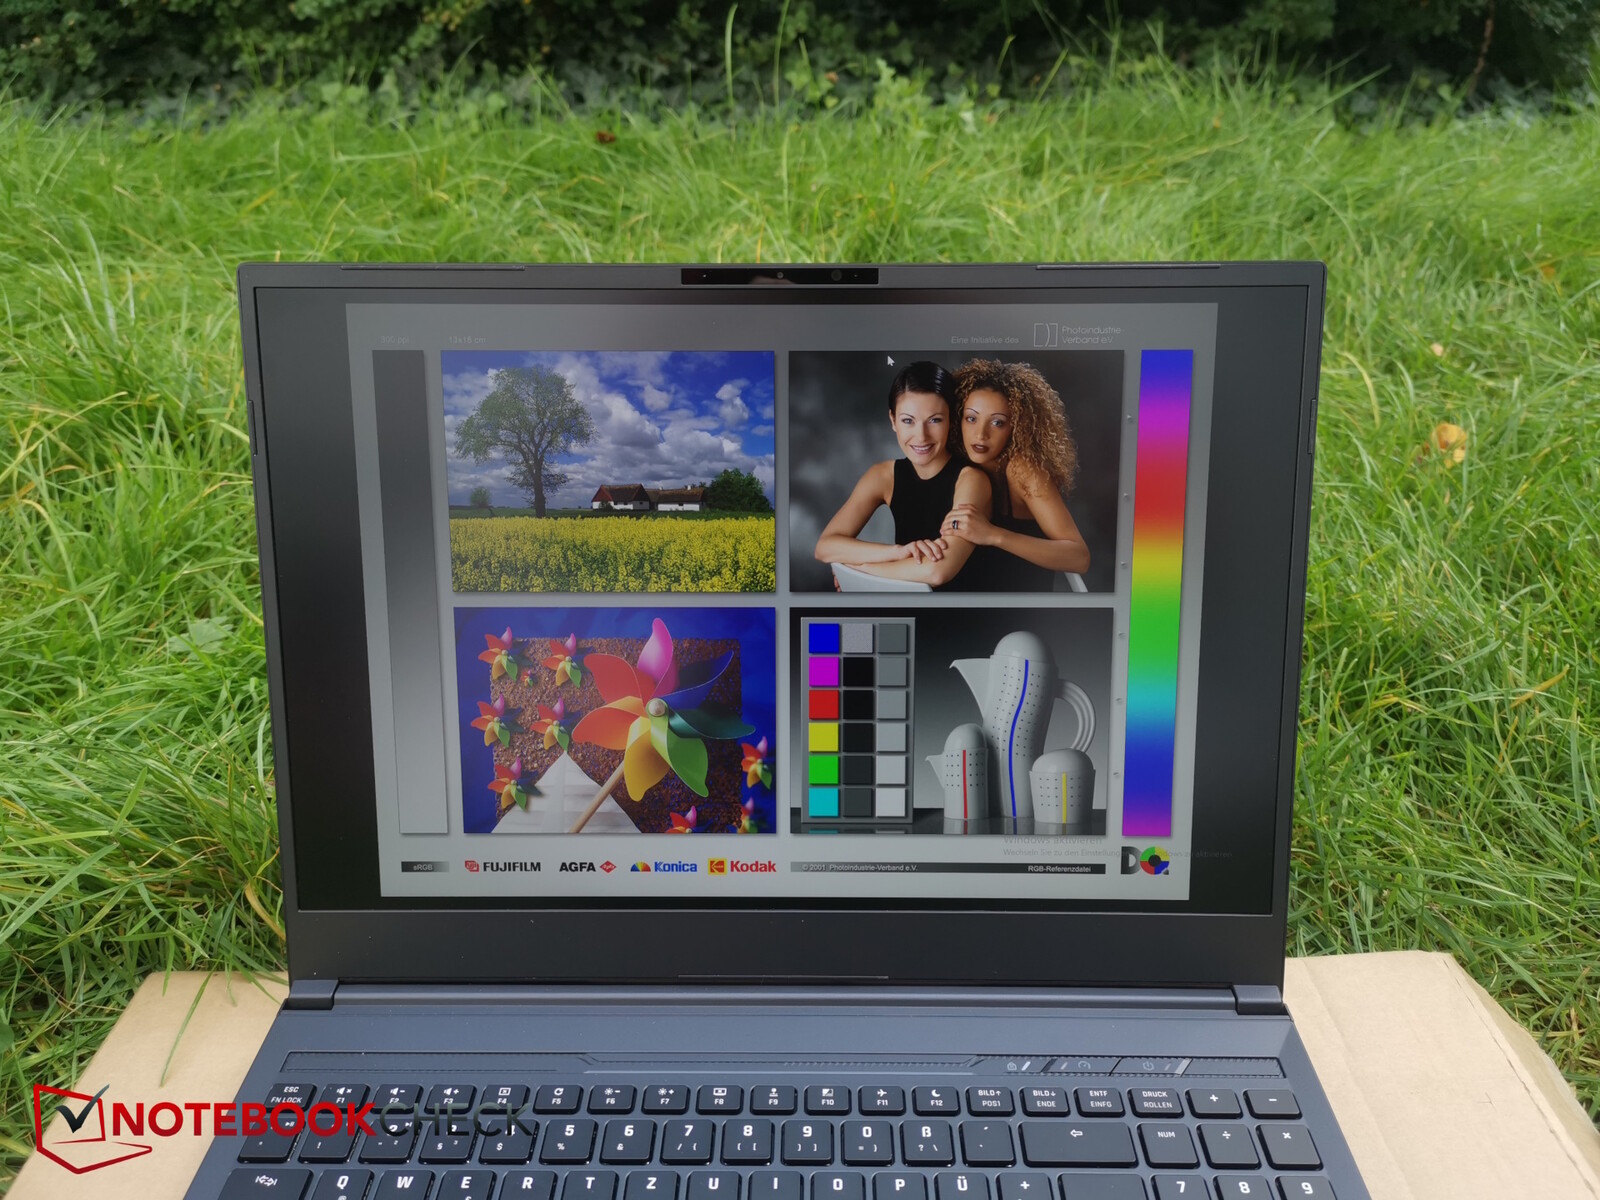
Outside, you can read well from the display in shaded areas when you are directly facing it.

Performance - Strong RTX 4070 with Ryzen 7
The RTX 4070 is what makes the Core 16 a gaming laptop. The device might also be of interest to professionals and creatives - however, the sRGB color space might not be enough for these people and DisplayP3 isn't covered.
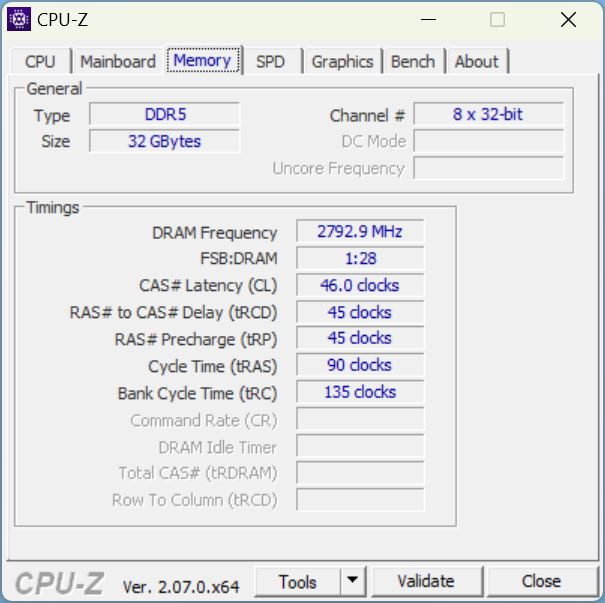
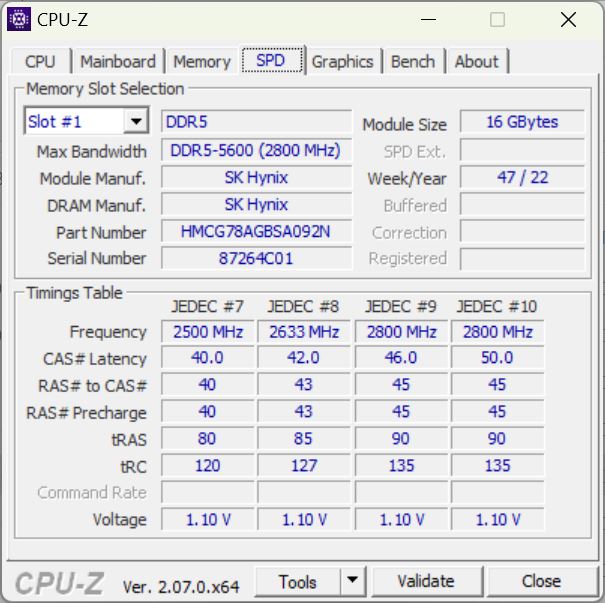
Compared to the more prevalent combination with an Intel CPU, this device has an AMD Ryzen 7 7840HS installed. The high-end CPU, together with its 32 GB RAM and graphics card, actually makes the device more of a high-end gaming laptop. Almost all current games can be played smoothly in its native 1,600p resolution and with maximum details.
On bestware.com, Schenker's ordering website, you can configure the laptop extensively, choose between various SSDs and RAM manufacturers, and much more. You need to keep this in mind, as our test only takes into account our specific configuration.

Testing conditions
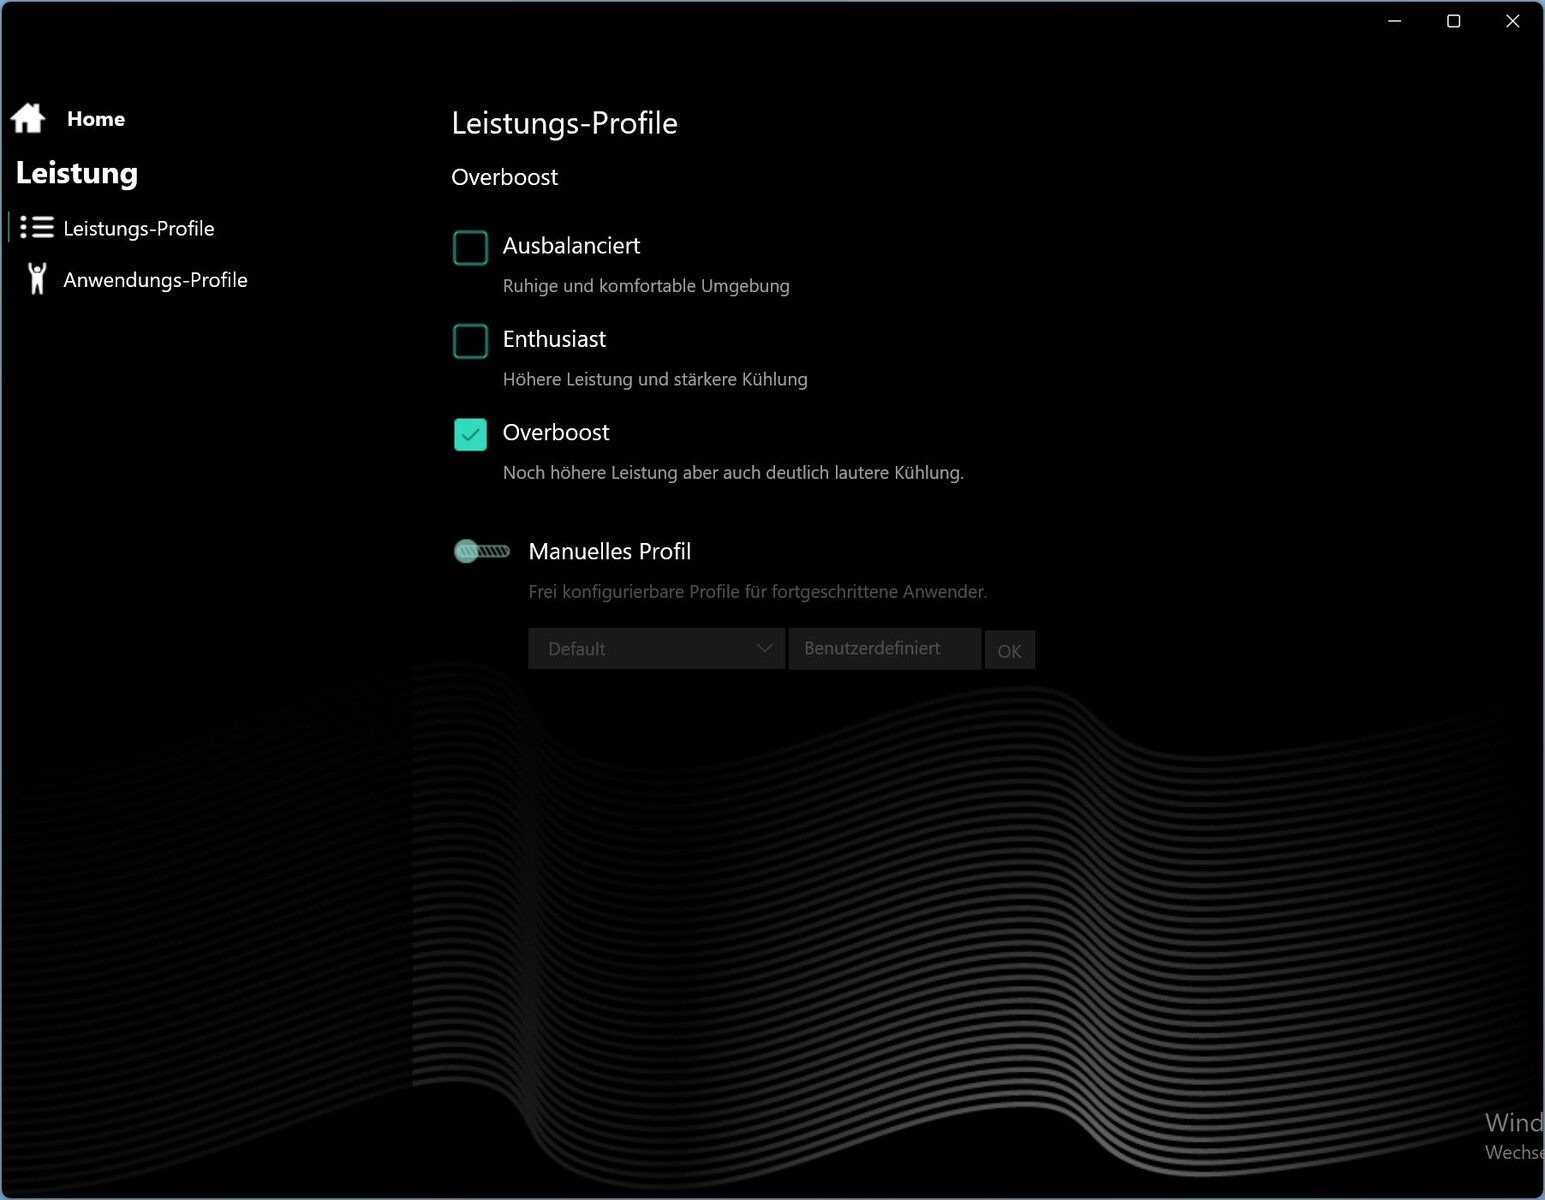
Schenker devices' Control Center lets you set performance presets as well as manually set individual performance parameters. This means you can change the gaming laptop's behavior to suit your individual needs. The same can be said for other settings, such as keyboard illumination, charging behavior and display.

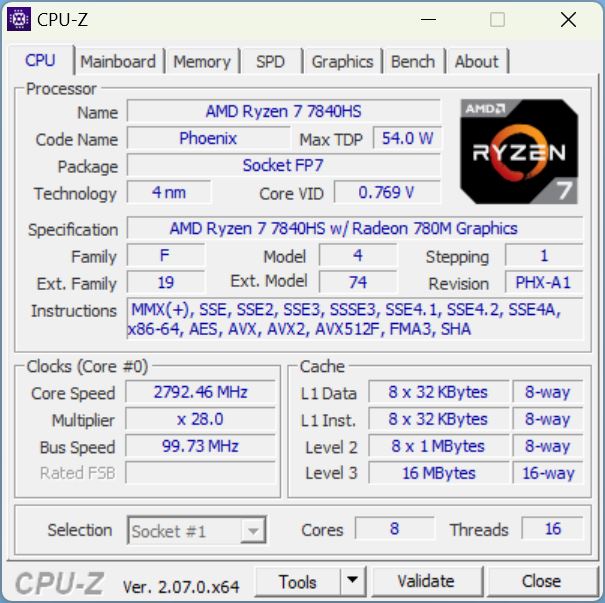
Processor
AMD's Ryzen 7 7840HS features 8 Zen 4 cores and, thanks to SMT, this adds up to 16 threads. The cores clock from 3.8 GHz (base clock) up to 5.1 GHz (single-core boost). This makes it the second fastest CPU from the Phoenix series, behind the Ryzen 9 7940HS.

In comparison, its performance is on a similar level to the Core i7-13700H. The HP Victus 16 is slower with this CPU and the MSI Stealth 16 Studio with the same CPU is faster. Intel's HX processors, especially the much more expensive i9-13900HX, clearly take the lead.
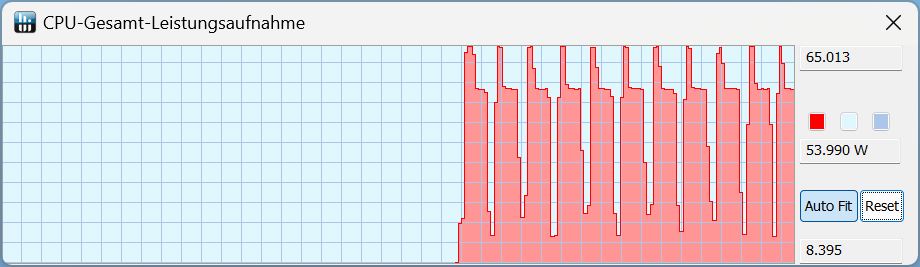
During the Cinebench R15 continuous test, we noted no performance loss - it remained consistently high even after the first runs. In doing so, the CPU reached a constant TDP of 80 watts.
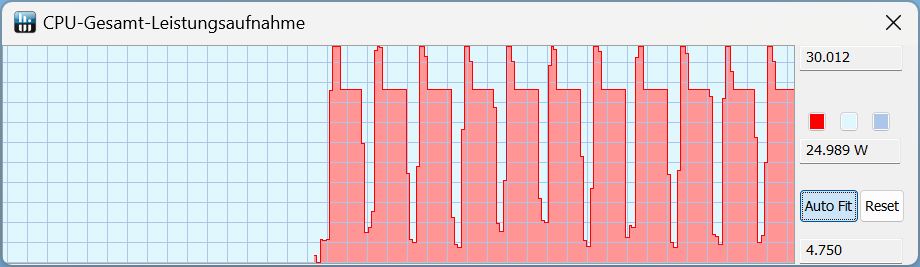
In Enthusiast mode, the runs were started at 65 watts and then fell to 55 watts. In Balanced mode, it only held 50 to 55 watts for a short amount of time, then it dropped down to 35 watts.
In battery mode, we measured 30 watts for a short space of time at the start, then 25 watts. Its Cinebench R15 score sank from 2,681 to 1,730 - a 35 per cent decline.
Cinebench R15 Multi continuous test
Cinebench R23: Multi Core | Single Core
Cinebench R20: CPU (Multi Core) | CPU (Single Core)
Cinebench R15: CPU Multi 64Bit | CPU Single 64Bit
Blender: v2.79 BMW27 CPU
7-Zip 18.03: 7z b 4 | 7z b 4 -mmt1
Geekbench 5.5: Multi-Core | Single-Core
HWBOT x265 Benchmark v2.2: 4k Preset
LibreOffice : 20 Documents To PDF
R Benchmark 2.5: Overall mean
| CPU Performance rating | |
| HP Omen Transcend 16 | |
| Average of class Gaming | |
| Lenovo Legion Pro 5 16ARX8 | |
| MSI Stealth 16 Studio A13VG | |
| Average AMD Ryzen 7 7840HS | |
| Schenker XMG CORE 16 (L23) | |
| HP Victus 16-r0077ng | |
| Acer Nitro 16 AN16-41 | |
| Cinebench R23 / Multi Core | |
| HP Omen Transcend 16 | |
| Average of class Gaming (10488 - 40970, n=112, last 2 years) | |
| MSI Stealth 16 Studio A13VG | |
| Lenovo Legion Pro 5 16ARX8 | |
| Schenker XMG CORE 16 (L23) | |
| Average AMD Ryzen 7 7840HS (14784 - 17214, n=19) | |
| HP Victus 16-r0077ng | |
| Acer Nitro 16 AN16-41 | |
| Cinebench R23 / Single Core | |
| HP Omen Transcend 16 | |
| Average of class Gaming (1166 - 2356, n=112, last 2 years) | |
| MSI Stealth 16 Studio A13VG | |
| Lenovo Legion Pro 5 16ARX8 | |
| Average AMD Ryzen 7 7840HS (1718 - 1812, n=19) | |
| Schenker XMG CORE 16 (L23) | |
| HP Victus 16-r0077ng | |
| Acer Nitro 16 AN16-41 | |
| Cinebench R20 / CPU (Multi Core) | |
| Average of class Gaming (4029 - 16108, n=111, last 2 years) | |
| HP Omen Transcend 16 | |
| MSI Stealth 16 Studio A13VG | |
| Lenovo Legion Pro 5 16ARX8 | |
| Schenker XMG CORE 16 (L23) | |
| Average AMD Ryzen 7 7840HS (5761 - 6744, n=19) | |
| HP Victus 16-r0077ng | |
| Acer Nitro 16 AN16-41 | |
| Cinebench R20 / CPU (Single Core) | |
| HP Omen Transcend 16 | |
| Average of class Gaming (442 - 895, n=111, last 2 years) | |
| MSI Stealth 16 Studio A13VG | |
| Lenovo Legion Pro 5 16ARX8 | |
| Schenker XMG CORE 16 (L23) | |
| Average AMD Ryzen 7 7840HS (661 - 705, n=19) | |
| HP Victus 16-r0077ng | |
| Acer Nitro 16 AN16-41 | |
| Cinebench R15 / CPU Multi 64Bit | |
| HP Omen Transcend 16 | |
| Average of class Gaming (1578 - 6271, n=111, last 2 years) | |
| Lenovo Legion Pro 5 16ARX8 | |
| MSI Stealth 16 Studio A13VG | |
| Schenker XMG CORE 16 (L23) | |
| Average AMD Ryzen 7 7840HS (2300 - 2729, n=19) | |
| Acer Nitro 16 AN16-41 | |
| HP Victus 16-r0077ng | |
| Cinebench R15 / CPU Single 64Bit | |
| HP Omen Transcend 16 | |
| Average of class Gaming (188.8 - 343, n=111, last 2 years) | |
| Lenovo Legion Pro 5 16ARX8 | |
| Average AMD Ryzen 7 7840HS (270 - 286, n=19) | |
| MSI Stealth 16 Studio A13VG | |
| Schenker XMG CORE 16 (L23) | |
| Acer Nitro 16 AN16-41 | |
| HP Victus 16-r0077ng | |
| Blender / v2.79 BMW27 CPU | |
| Acer Nitro 16 AN16-41 | |
| HP Victus 16-r0077ng | |
| Average AMD Ryzen 7 7840HS (185 - 231, n=20) | |
| Schenker XMG CORE 16 (L23) | |
| Lenovo Legion Pro 5 16ARX8 | |
| MSI Stealth 16 Studio A13VG | |
| Average of class Gaming (80 - 330, n=109, last 2 years) | |
| HP Omen Transcend 16 | |
| 7-Zip 18.03 / 7z b 4 | |
| HP Omen Transcend 16 | |
| Average of class Gaming (33491 - 148086, n=110, last 2 years) | |
| MSI Stealth 16 Studio A13VG | |
| Lenovo Legion Pro 5 16ARX8 | |
| Schenker XMG CORE 16 (L23) | |
| Average AMD Ryzen 7 7840HS (59538 - 73035, n=20) | |
| HP Victus 16-r0077ng | |
| Acer Nitro 16 AN16-41 | |
| 7-Zip 18.03 / 7z b 4 -mmt1 | |
| Lenovo Legion Pro 5 16ARX8 | |
| HP Omen Transcend 16 | |
| Schenker XMG CORE 16 (L23) | |
| Average AMD Ryzen 7 7840HS (6049 - 6754, n=20) | |
| Average of class Gaming (4199 - 7436, n=110, last 2 years) | |
| MSI Stealth 16 Studio A13VG | |
| Acer Nitro 16 AN16-41 | |
| HP Victus 16-r0077ng | |
| Geekbench 5.5 / Multi-Core | |
| HP Omen Transcend 16 | |
| Average of class Gaming (6460 - 27010, n=110, last 2 years) | |
| MSI Stealth 16 Studio A13VG | |
| Lenovo Legion Pro 5 16ARX8 | |
| Schenker XMG CORE 16 (L23) | |
| Average AMD Ryzen 7 7840HS (8446 - 12339, n=23) | |
| HP Victus 16-r0077ng | |
| Acer Nitro 16 AN16-41 | |
| Geekbench 5.5 / Single-Core | |
| HP Omen Transcend 16 | |
| Average of class Gaming (986 - 2474, n=110, last 2 years) | |
| Lenovo Legion Pro 5 16ARX8 | |
| Average AMD Ryzen 7 7840HS (1837 - 2017, n=23) | |
| Schenker XMG CORE 16 (L23) | |
| MSI Stealth 16 Studio A13VG | |
| HP Victus 16-r0077ng | |
| Acer Nitro 16 AN16-41 | |
| HWBOT x265 Benchmark v2.2 / 4k Preset | |
| Average of class Gaming (11.5 - 44.3, n=110, last 2 years) | |
| HP Omen Transcend 16 | |
| Lenovo Legion Pro 5 16ARX8 | |
| Schenker XMG CORE 16 (L23) | |
| Average AMD Ryzen 7 7840HS (11.7 - 21.8, n=20) | |
| MSI Stealth 16 Studio A13VG | |
| Acer Nitro 16 AN16-41 | |
| HP Victus 16-r0077ng | |
| LibreOffice / 20 Documents To PDF | |
| Schenker XMG CORE 16 (L23) | |
| HP Victus 16-r0077ng | |
| MSI Stealth 16 Studio A13VG | |
| Acer Nitro 16 AN16-41 | |
| Average of class Gaming (19 - 88.8, n=110, last 2 years) | |
| Average AMD Ryzen 7 7840HS (38.3 - 68.3, n=20) | |
| HP Omen Transcend 16 | |
| Lenovo Legion Pro 5 16ARX8 | |
| R Benchmark 2.5 / Overall mean | |
| HP Victus 16-r0077ng | |
| Acer Nitro 16 AN16-41 | |
| MSI Stealth 16 Studio A13VG | |
| Average AMD Ryzen 7 7840HS (0.4184 - 0.4739, n=20) | |
| Schenker XMG CORE 16 (L23) | |
| Average of class Gaming (0.3439 - 0.759, n=111, last 2 years) | |
| Lenovo Legion Pro 5 16ARX8 | |
| HP Omen Transcend 16 | |
* ... smaller is better
AIDA64: FP32 Ray-Trace | FPU Julia | CPU SHA3 | CPU Queen | FPU SinJulia | FPU Mandel | CPU AES | CPU ZLib | FP64 Ray-Trace | CPU PhotoWorxx
| Performance rating | |
| Average of class Gaming | |
| HP Omen Transcend 16 | |
| Average AMD Ryzen 7 7840HS | |
| Lenovo Legion Pro 5 16ARX8 | |
| Schenker XMG CORE 16 (L23) | |
| MSI Stealth 16 Studio A13VG | |
| Acer Nitro 16 AN16-41 | |
| HP Victus 16-r0077ng | |
| AIDA64 / FP32 Ray-Trace | |
| Average of class Gaming (10227 - 85542, n=109, last 2 years) | |
| Lenovo Legion Pro 5 16ARX8 | |
| Schenker XMG CORE 16 (L23) | |
| Average AMD Ryzen 7 7840HS (22845 - 28921, n=21) | |
| HP Omen Transcend 16 | |
| MSI Stealth 16 Studio A13VG | |
| Acer Nitro 16 AN16-41 | |
| HP Victus 16-r0077ng | |
| AIDA64 / FPU Julia | |
| Average of class Gaming (51376 - 238426, n=109, last 2 years) | |
| Lenovo Legion Pro 5 16ARX8 | |
| Schenker XMG CORE 16 (L23) | |
| HP Omen Transcend 16 | |
| Average AMD Ryzen 7 7840HS (97164 - 123167, n=21) | |
| Acer Nitro 16 AN16-41 | |
| MSI Stealth 16 Studio A13VG | |
| HP Victus 16-r0077ng | |
| AIDA64 / CPU SHA3 | |
| Average of class Gaming (2180 - 9817, n=109, last 2 years) | |
| HP Omen Transcend 16 | |
| Lenovo Legion Pro 5 16ARX8 | |
| Schenker XMG CORE 16 (L23) | |
| Average AMD Ryzen 7 7840HS (4293 - 5155, n=21) | |
| MSI Stealth 16 Studio A13VG | |
| Acer Nitro 16 AN16-41 | |
| HP Victus 16-r0077ng | |
| AIDA64 / CPU Queen | |
| Lenovo Legion Pro 5 16ARX8 | |
| HP Omen Transcend 16 | |
| Average of class Gaming (49785 - 173351, n=100, last 2 years) | |
| Average AMD Ryzen 7 7840HS (102271 - 125820, n=21) | |
| Acer Nitro 16 AN16-41 | |
| MSI Stealth 16 Studio A13VG | |
| Schenker XMG CORE 16 (L23) | |
| HP Victus 16-r0077ng | |
| AIDA64 / FPU SinJulia | |
| Lenovo Legion Pro 5 16ARX8 | |
| Schenker XMG CORE 16 (L23) | |
| Average AMD Ryzen 7 7840HS (13767 - 15525, n=21) | |
| Average of class Gaming (4424 - 33636, n=109, last 2 years) | |
| HP Omen Transcend 16 | |
| Acer Nitro 16 AN16-41 | |
| MSI Stealth 16 Studio A13VG | |
| HP Victus 16-r0077ng | |
| AIDA64 / FPU Mandel | |
| Average of class Gaming (25115 - 128721, n=109, last 2 years) | |
| Lenovo Legion Pro 5 16ARX8 | |
| Schenker XMG CORE 16 (L23) | |
| Average AMD Ryzen 7 7840HS (52084 - 65812, n=21) | |
| HP Omen Transcend 16 | |
| Acer Nitro 16 AN16-41 | |
| MSI Stealth 16 Studio A13VG | |
| HP Victus 16-r0077ng | |
| AIDA64 / CPU AES | |
| Average AMD Ryzen 7 7840HS (67389 - 177158, n=21) | |
| HP Omen Transcend 16 | |
| Average of class Gaming (39258 - 247074, n=109, last 2 years) | |
| Schenker XMG CORE 16 (L23) | |
| MSI Stealth 16 Studio A13VG | |
| Lenovo Legion Pro 5 16ARX8 | |
| HP Victus 16-r0077ng | |
| Acer Nitro 16 AN16-41 | |
| AIDA64 / CPU ZLib | |
| HP Omen Transcend 16 | |
| Average of class Gaming (574 - 2531, n=109, last 2 years) | |
| Lenovo Legion Pro 5 16ARX8 | |
| Schenker XMG CORE 16 (L23) | |
| Average AMD Ryzen 7 7840HS (944 - 1123, n=21) | |
| MSI Stealth 16 Studio A13VG | |
| HP Victus 16-r0077ng | |
| Acer Nitro 16 AN16-41 | |
| AIDA64 / FP64 Ray-Trace | |
| Average of class Gaming (5509 - 45446, n=109, last 2 years) | |
| Lenovo Legion Pro 5 16ARX8 | |
| Schenker XMG CORE 16 (L23) | |
| Average AMD Ryzen 7 7840HS (12248 - 15599, n=21) | |
| HP Omen Transcend 16 | |
| MSI Stealth 16 Studio A13VG | |
| Acer Nitro 16 AN16-41 | |
| HP Victus 16-r0077ng | |
| AIDA64 / CPU PhotoWorxx | |
| HP Omen Transcend 16 | |
| MSI Stealth 16 Studio A13VG | |
| Average of class Gaming (12271 - 89891, n=109, last 2 years) | |
| Schenker XMG CORE 16 (L23) | |
| HP Victus 16-r0077ng | |
| Average AMD Ryzen 7 7840HS (17615 - 41516, n=21) | |
| Lenovo Legion Pro 5 16ARX8 | |
| Acer Nitro 16 AN16-41 | |
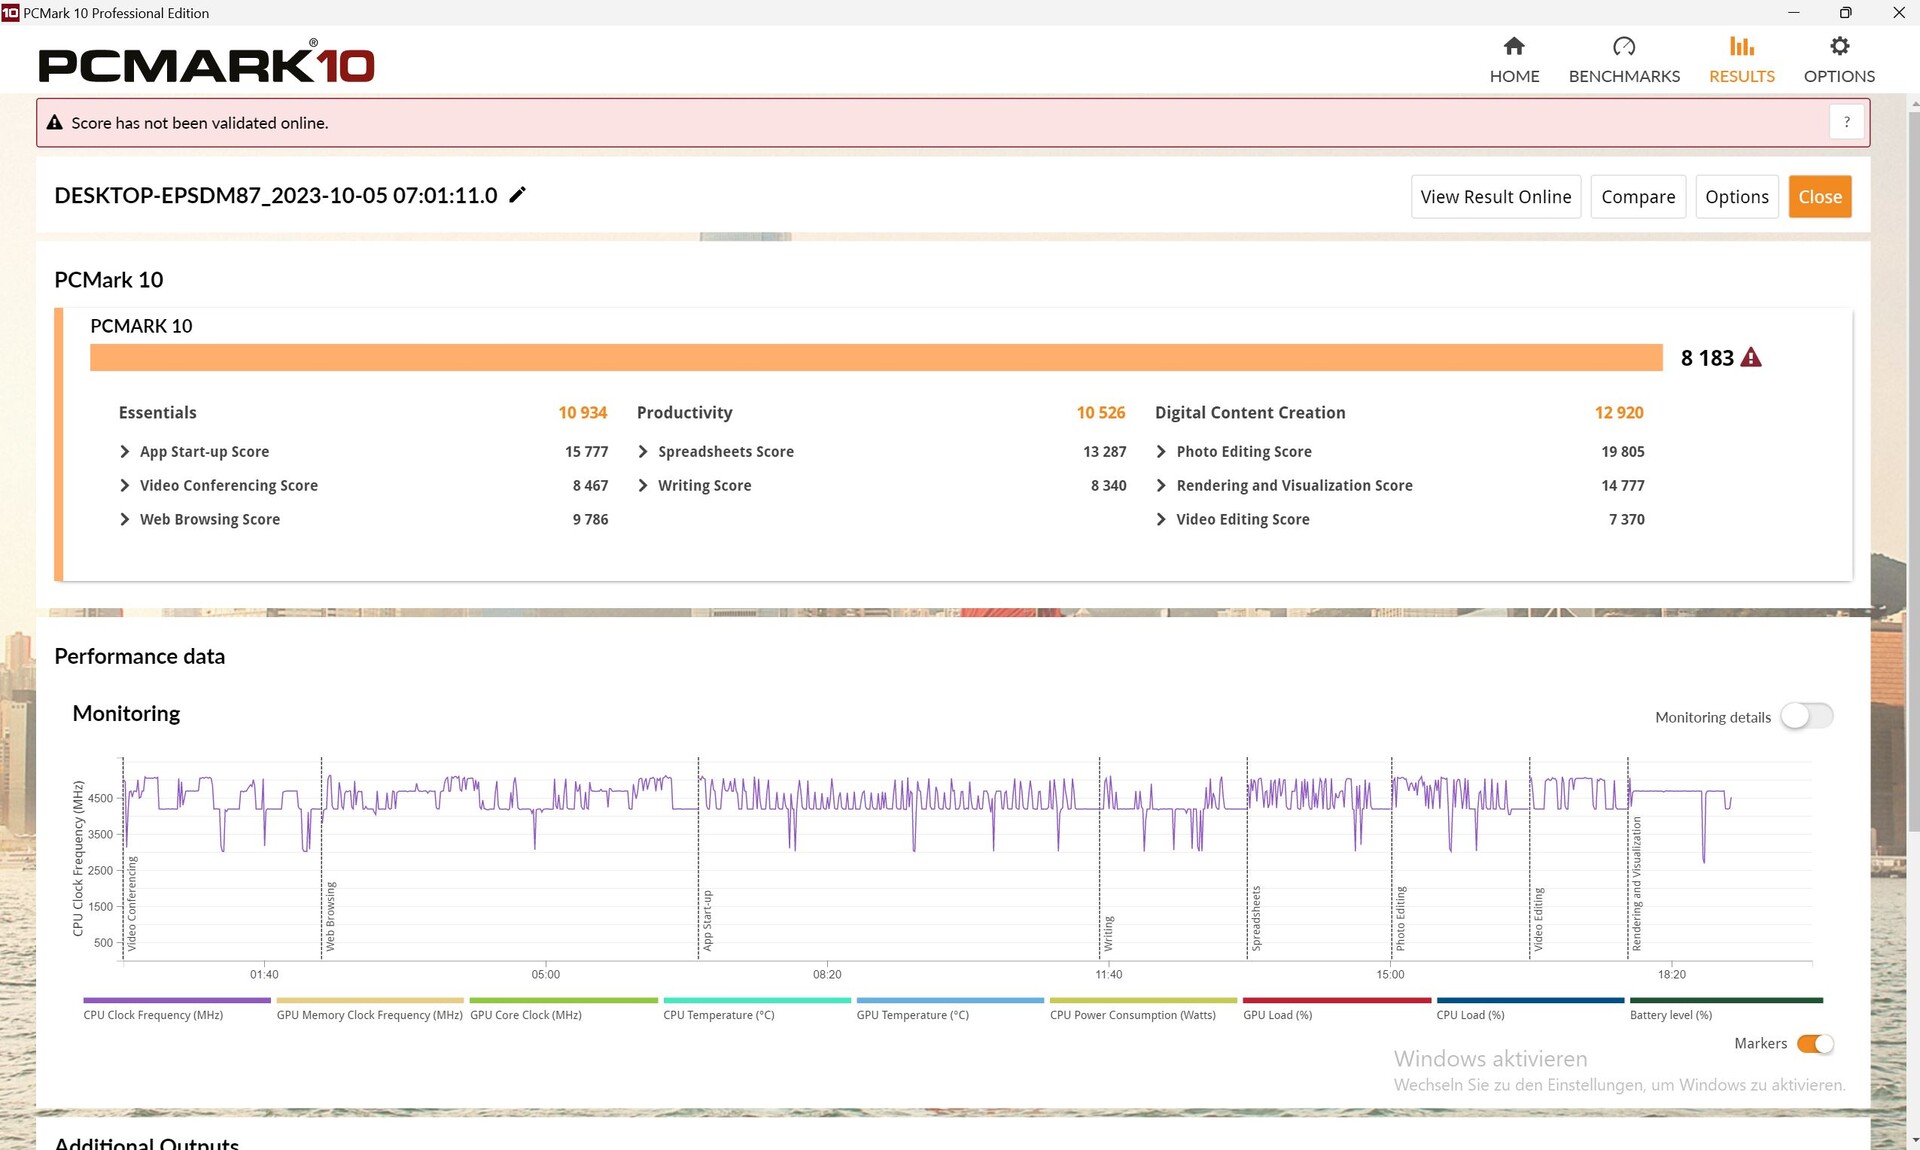
System performance
Together with the Lenovo Legion Pro 5 16 and the HP Omen Transcend 16, the Core 16 came out on top when it came to system performance. Subjectively, everything runs smoothly, too.
CrossMark: Overall | Productivity | Creativity | Responsiveness
| PCMark 10 / Score | |
| Average of class Gaming (5828 - 11574, n=95, last 2 years) | |
| Lenovo Legion Pro 5 16ARX8 | |
| Schenker XMG CORE 16 (L23) | |
| Average AMD Ryzen 7 7840HS, NVIDIA GeForce RTX 4070 Laptop GPU (8167 - 8183, n=2) | |
| HP Omen Transcend 16 | |
| MSI Stealth 16 Studio A13VG | |
| Acer Nitro 16 AN16-41 | |
| HP Victus 16-r0077ng | |
| PCMark 10 / Essentials | |
| HP Omen Transcend 16 | |
| Average AMD Ryzen 7 7840HS, NVIDIA GeForce RTX 4070 Laptop GPU (10934 - 11250, n=2) | |
| Lenovo Legion Pro 5 16ARX8 | |
| Schenker XMG CORE 16 (L23) | |
| HP Victus 16-r0077ng | |
| Average of class Gaming (8810 - 12600, n=99, last 2 years) | |
| Acer Nitro 16 AN16-41 | |
| MSI Stealth 16 Studio A13VG | |
| PCMark 10 / Productivity | |
| Average of class Gaming (6845 - 18766, n=97, last 2 years) | |
| Schenker XMG CORE 16 (L23) | |
| Average AMD Ryzen 7 7840HS, NVIDIA GeForce RTX 4070 Laptop GPU (10179 - 10526, n=2) | |
| Lenovo Legion Pro 5 16ARX8 | |
| HP Omen Transcend 16 | |
| MSI Stealth 16 Studio A13VG | |
| Acer Nitro 16 AN16-41 | |
| HP Victus 16-r0077ng | |
| PCMark 10 / Digital Content Creation | |
| Average of class Gaming (7602 - 19657, n=97, last 2 years) | |
| HP Omen Transcend 16 | |
| Lenovo Legion Pro 5 16ARX8 | |
| Schenker XMG CORE 16 (L23) | |
| Average AMD Ryzen 7 7840HS, NVIDIA GeForce RTX 4070 Laptop GPU (12908 - 12920, n=2) | |
| MSI Stealth 16 Studio A13VG | |
| Acer Nitro 16 AN16-41 | |
| HP Victus 16-r0077ng | |
| CrossMark / Overall | |
| Lenovo Legion Pro 5 16ARX8 | |
| Average of class Gaming (1366 - 2409, n=97, last 2 years) | |
| HP Omen Transcend 16 | |
| MSI Stealth 16 Studio A13VG | |
| Schenker XMG CORE 16 (L23) | |
| Average AMD Ryzen 7 7840HS, NVIDIA GeForce RTX 4070 Laptop GPU (n=1) | |
| Acer Nitro 16 AN16-41 | |
| CrossMark / Productivity | |
| Lenovo Legion Pro 5 16ARX8 | |
| Average of class Gaming (1386 - 2254, n=97, last 2 years) | |
| HP Omen Transcend 16 | |
| MSI Stealth 16 Studio A13VG | |
| Schenker XMG CORE 16 (L23) | |
| Average AMD Ryzen 7 7840HS, NVIDIA GeForce RTX 4070 Laptop GPU (n=1) | |
| Acer Nitro 16 AN16-41 | |
| CrossMark / Creativity | |
| HP Omen Transcend 16 | |
| Average of class Gaming (1343 - 2729, n=97, last 2 years) | |
| Lenovo Legion Pro 5 16ARX8 | |
| MSI Stealth 16 Studio A13VG | |
| Schenker XMG CORE 16 (L23) | |
| Average AMD Ryzen 7 7840HS, NVIDIA GeForce RTX 4070 Laptop GPU (n=1) | |
| Acer Nitro 16 AN16-41 | |
| CrossMark / Responsiveness | |
| Lenovo Legion Pro 5 16ARX8 | |
| Average of class Gaming (1226 - 2334, n=97, last 2 years) | |
| MSI Stealth 16 Studio A13VG | |
| HP Omen Transcend 16 | |
| Schenker XMG CORE 16 (L23) | |
| Average AMD Ryzen 7 7840HS, NVIDIA GeForce RTX 4070 Laptop GPU (n=1) | |
| Acer Nitro 16 AN16-41 | |
| PCMark 10 Score | 8183 points | |
Help | ||
| AIDA64 / Memory Copy | |
| HP Omen Transcend 16 | |
| Average of class Gaming (21750 - 129946, n=109, last 2 years) | |
| MSI Stealth 16 Studio A13VG | |
| Schenker XMG CORE 16 (L23) | |
| Average AMD Ryzen 7 7840HS (30937 - 72158, n=21) | |
| HP Victus 16-r0077ng | |
| Lenovo Legion Pro 5 16ARX8 | |
| Acer Nitro 16 AN16-41 | |
| AIDA64 / Memory Read | |
| HP Omen Transcend 16 | |
| MSI Stealth 16 Studio A13VG | |
| Average of class Gaming (22956 - 118858, n=109, last 2 years) | |
| HP Victus 16-r0077ng | |
| Schenker XMG CORE 16 (L23) | |
| Average AMD Ryzen 7 7840HS (30497 - 62147, n=21) | |
| Lenovo Legion Pro 5 16ARX8 | |
| Acer Nitro 16 AN16-41 | |
| AIDA64 / Memory Write | |
| Schenker XMG CORE 16 (L23) | |
| Average AMD Ryzen 7 7840HS (34590 - 93323, n=21) | |
| HP Omen Transcend 16 | |
| Average of class Gaming (22297 - 135096, n=109, last 2 years) | |
| MSI Stealth 16 Studio A13VG | |
| HP Victus 16-r0077ng | |
| Acer Nitro 16 AN16-41 | |
| Lenovo Legion Pro 5 16ARX8 | |
| AIDA64 / Memory Latency | |
| Average of class Gaming (75.3 - 259, n=109, last 2 years) | |
| HP Victus 16-r0077ng | |
| Acer Nitro 16 AN16-41 | |
| Average AMD Ryzen 7 7840HS (85.1 - 112, n=21) | |
| Schenker XMG CORE 16 (L23) | |
| HP Omen Transcend 16 | |
| MSI Stealth 16 Studio A13VG | |
| Lenovo Legion Pro 5 16ARX8 | |
* ... smaller is better
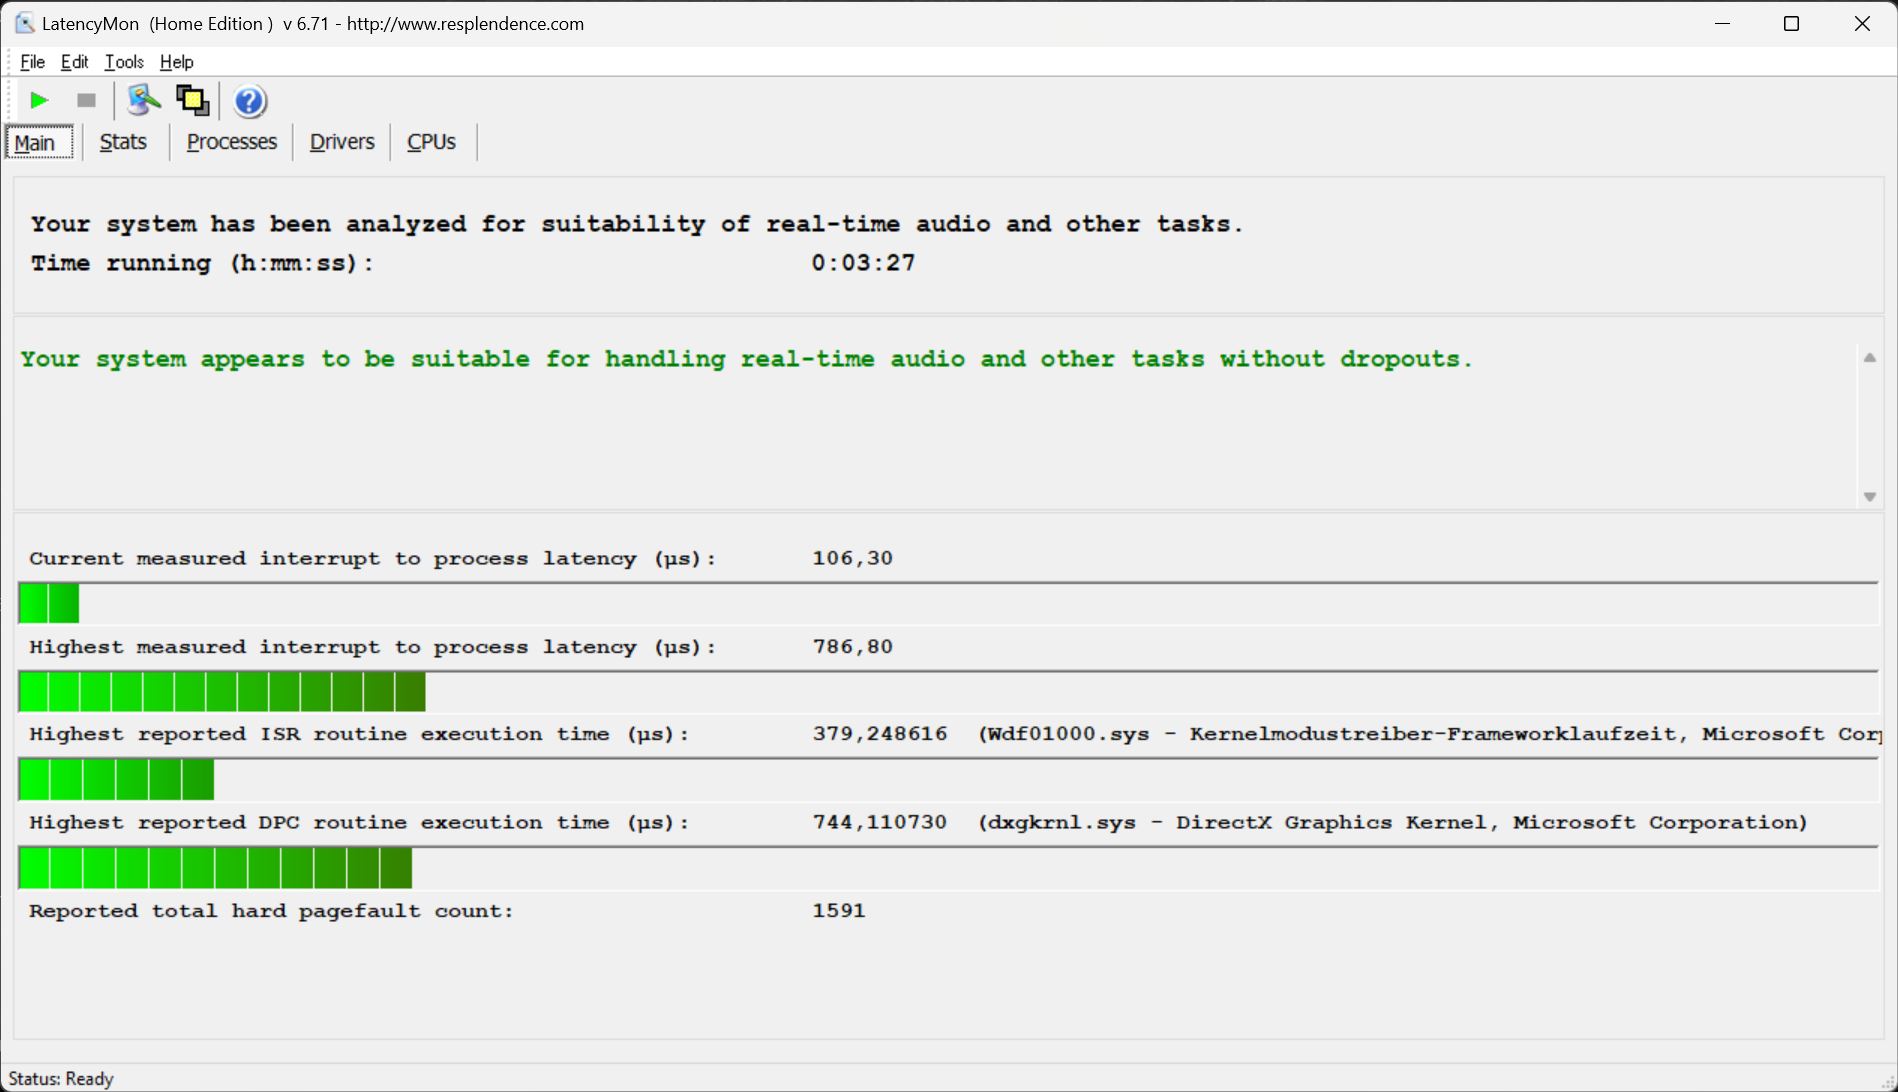
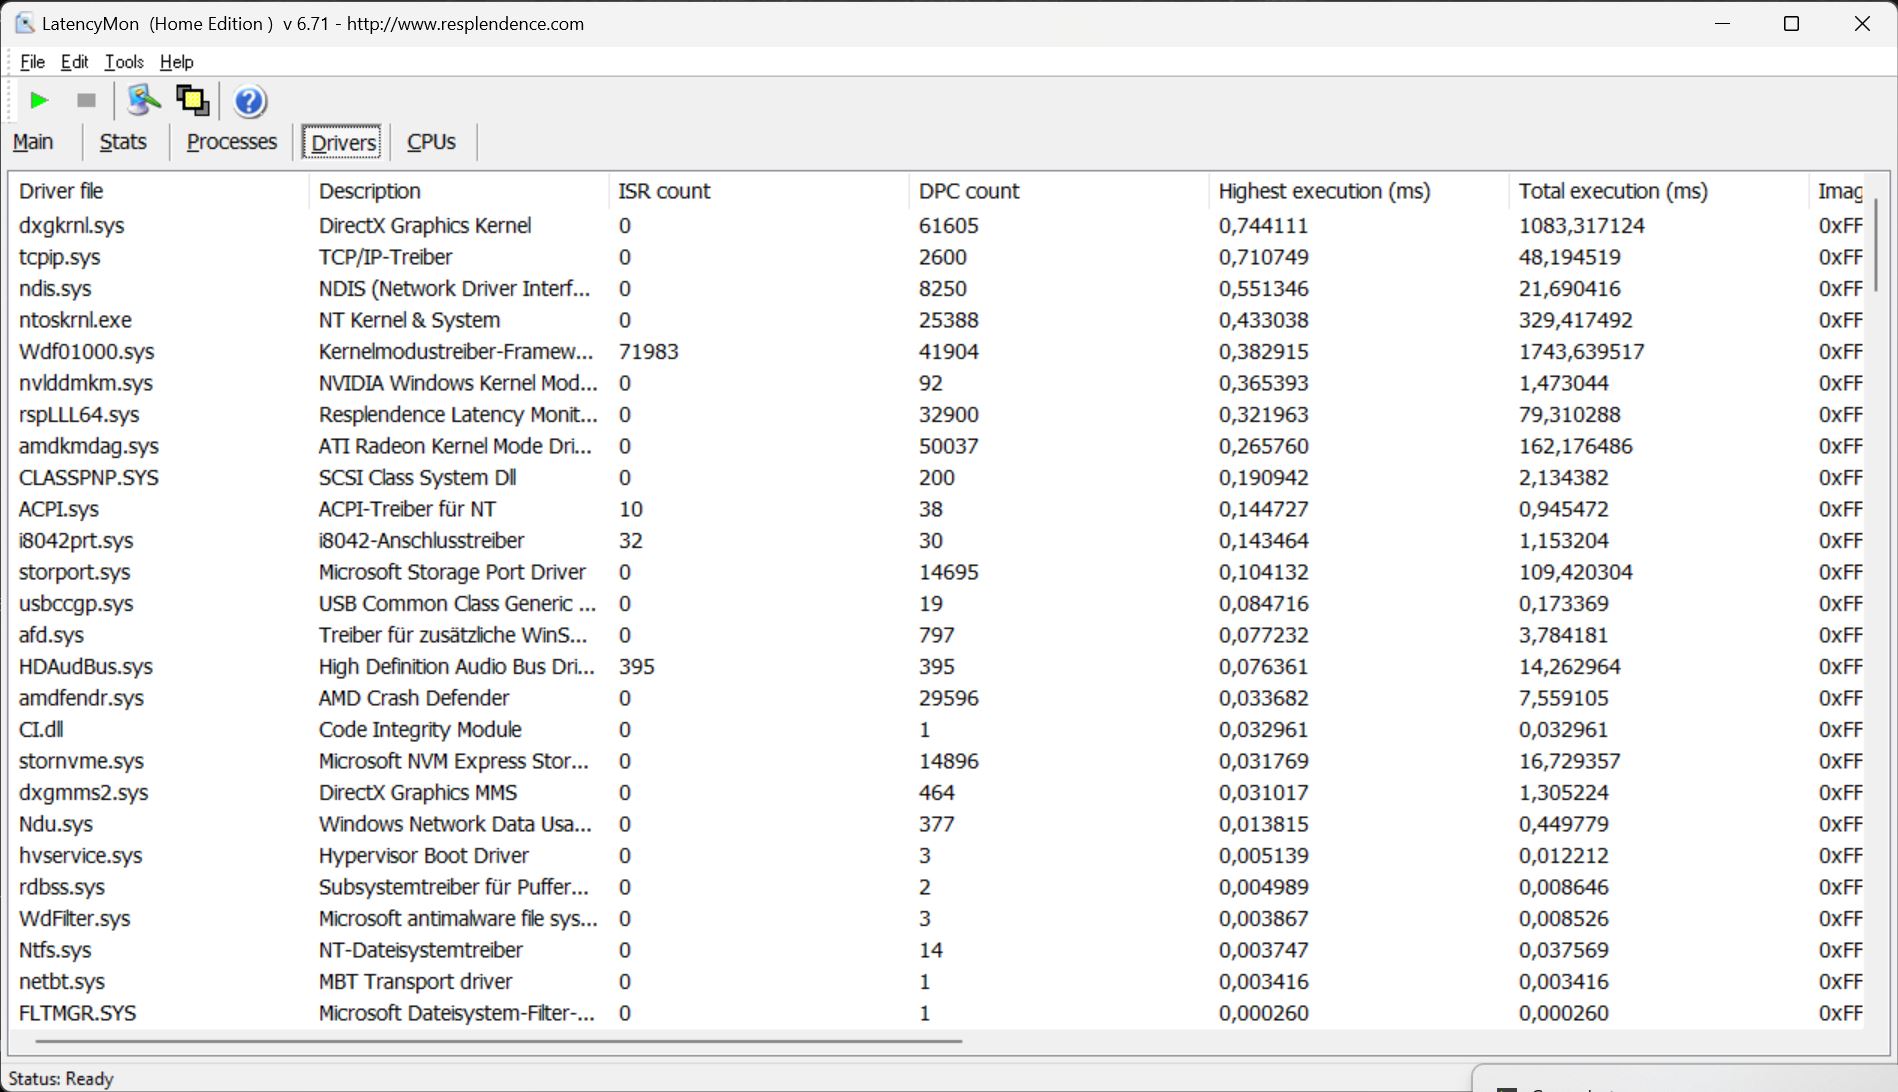
DPC latency
In comparison, the Core 16 is one of the few gaming laptops that doesn't have to fight any latencies according to LatencyMon. At least, the tool wasn't able to identify any unusually high latencies in our test - very good! Our 4K/60 fps YouTube video was played smoothly and with no dropped frames. Only the Lenovo Legion Pro 5 16 performed similarly well in this field.

| DPC Latencies / LatencyMon - interrupt to process latency (max), Web, Youtube, Prime95 | |
| MSI Stealth 16 Studio A13VG | |
| HP Victus 16-r0077ng | |
| HP Omen Transcend 16 | |
| Acer Nitro 16 AN16-41 | |
| Schenker XMG CORE 16 (L23) | |
| Lenovo Legion Pro 5 16ARX8 | |
* ... smaller is better
Storage devices
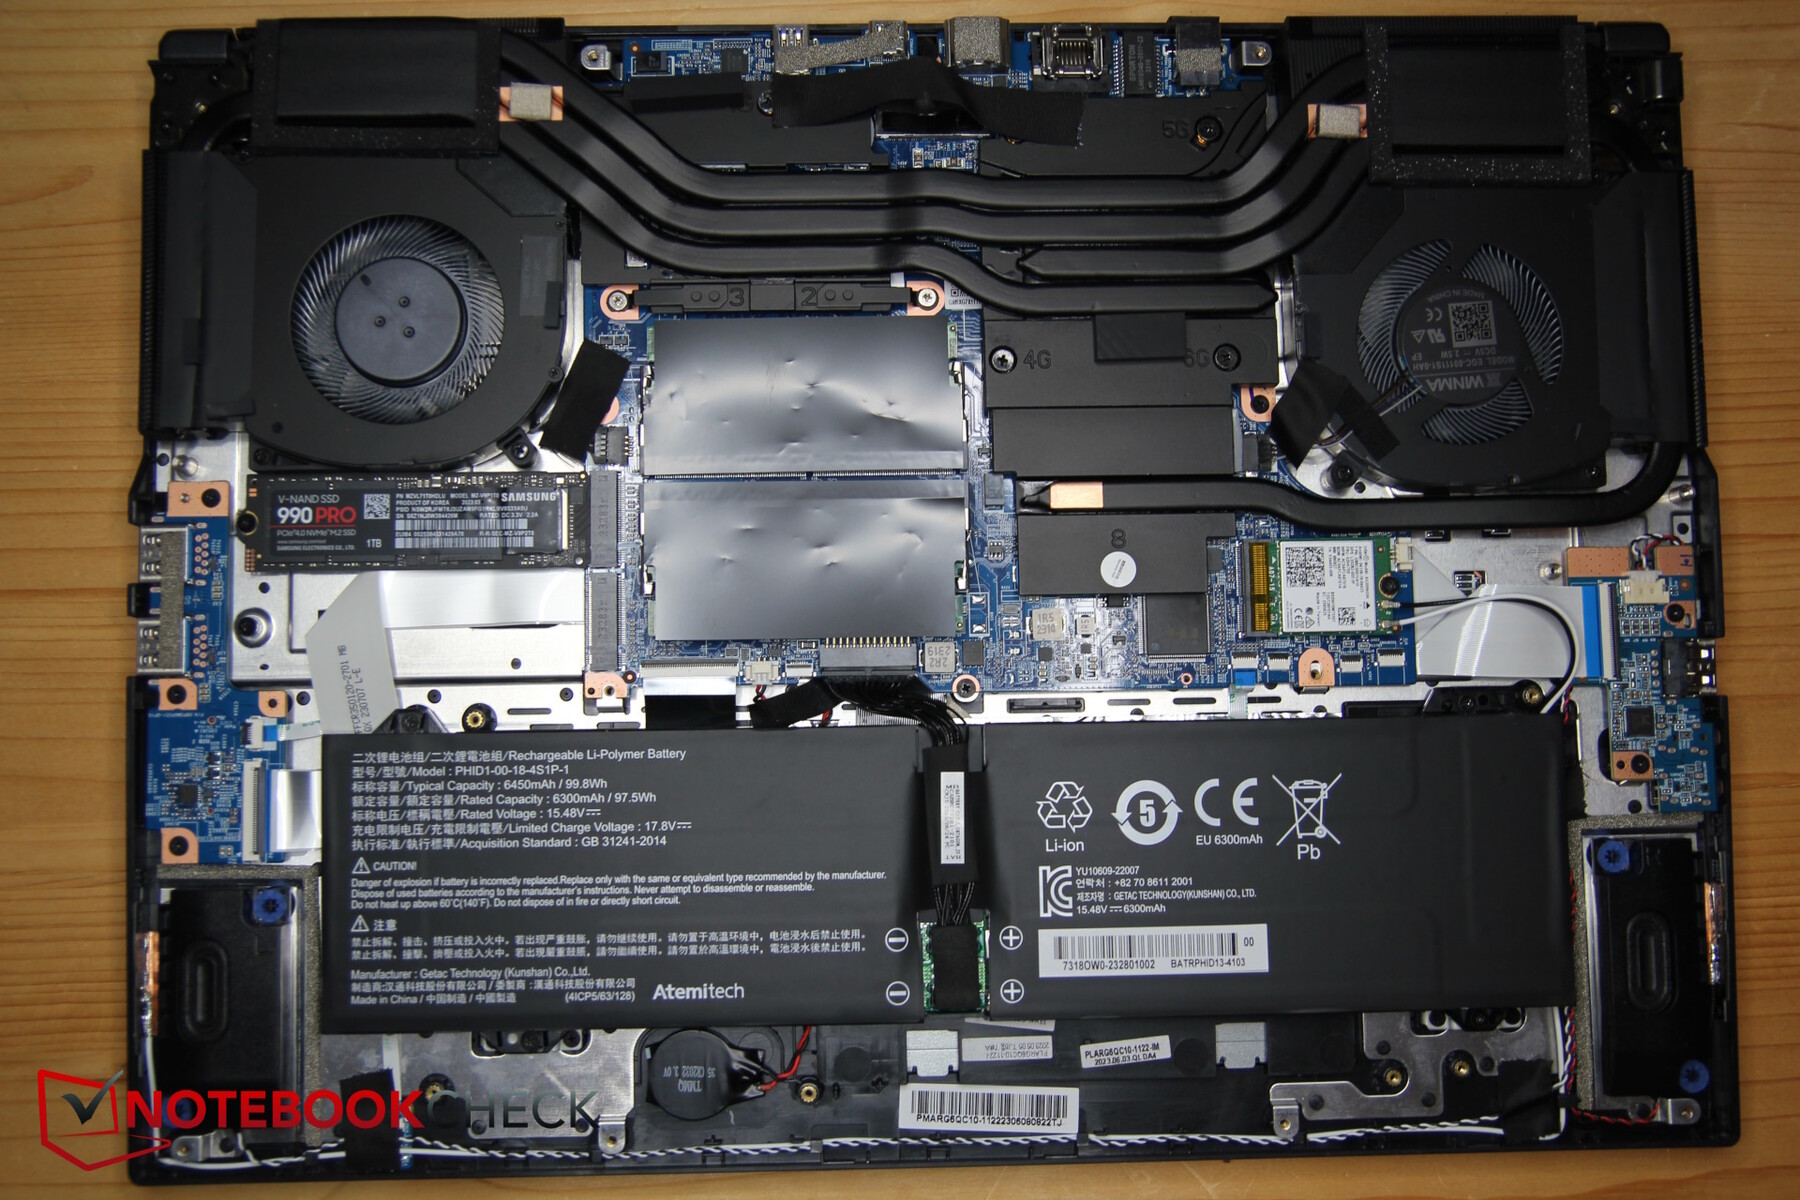
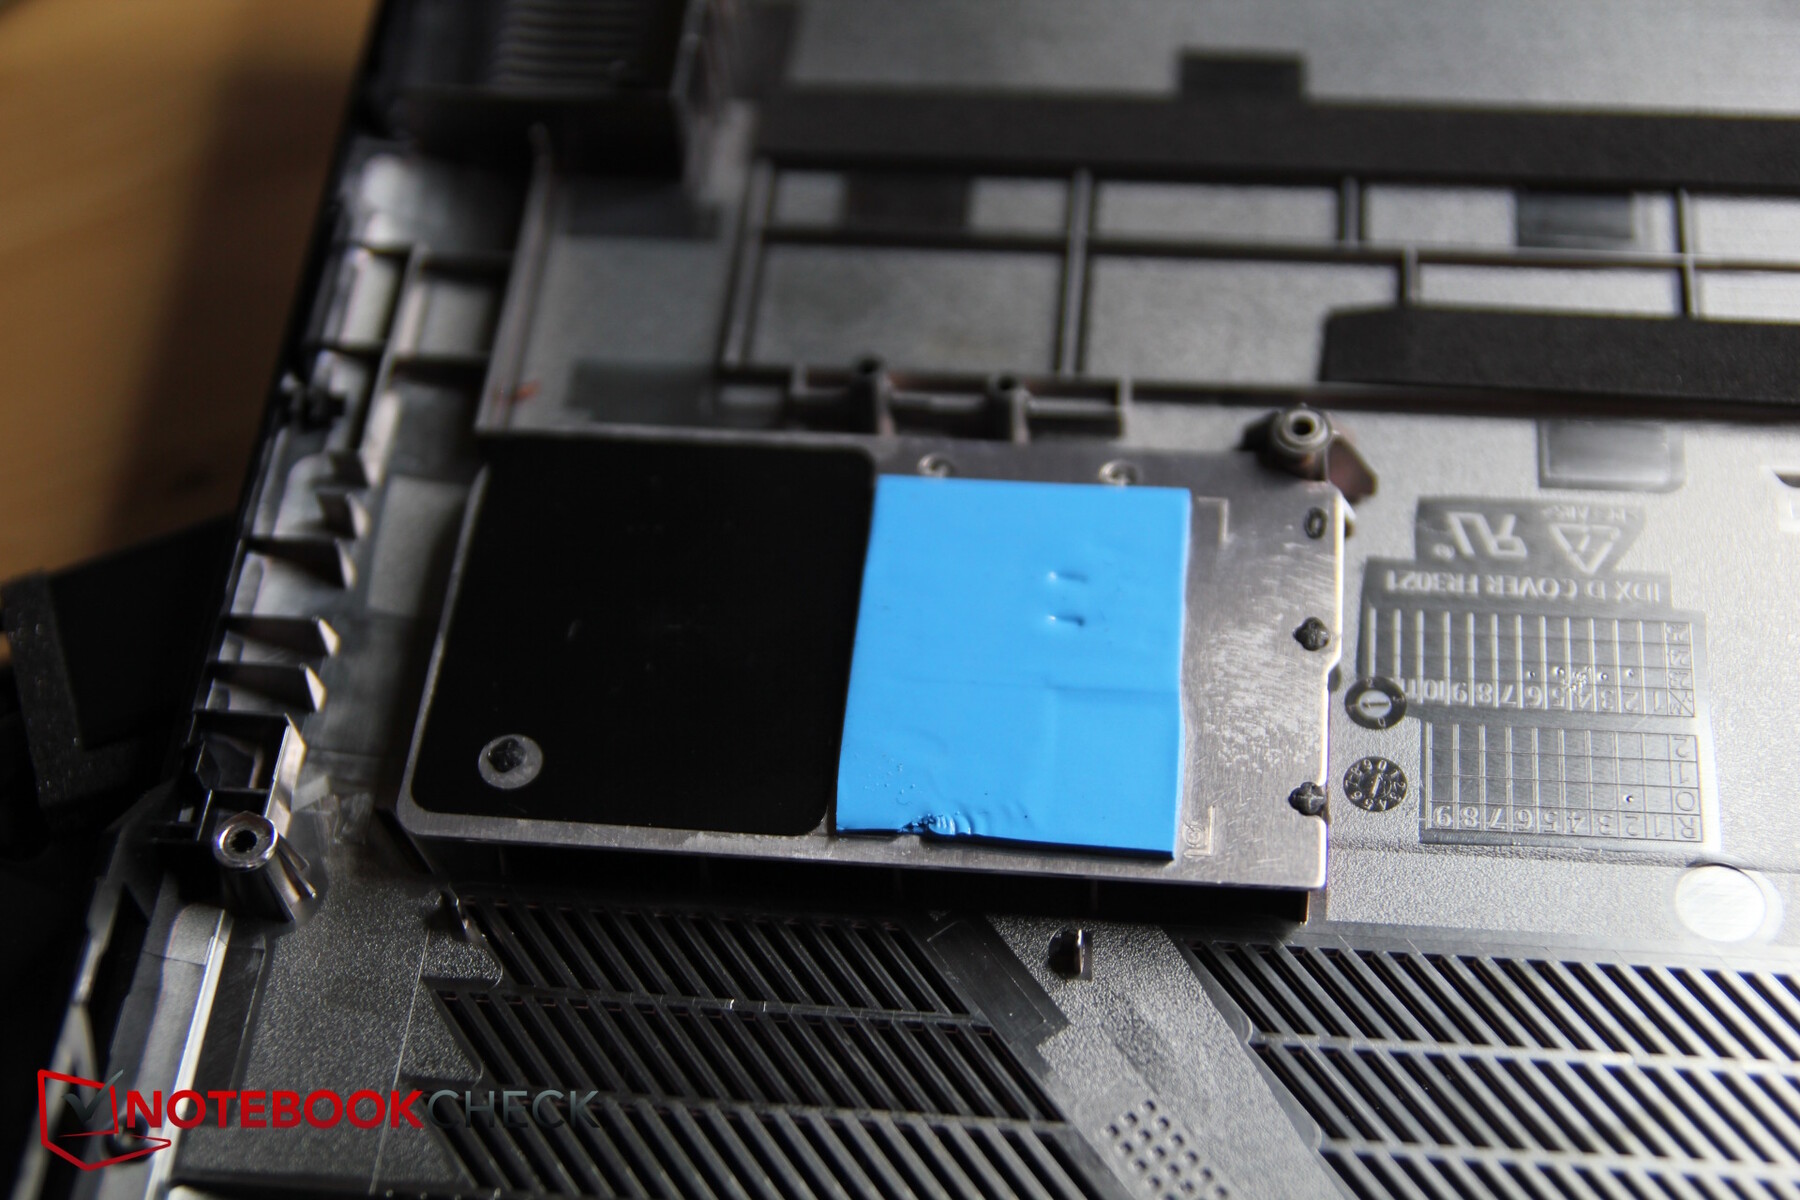
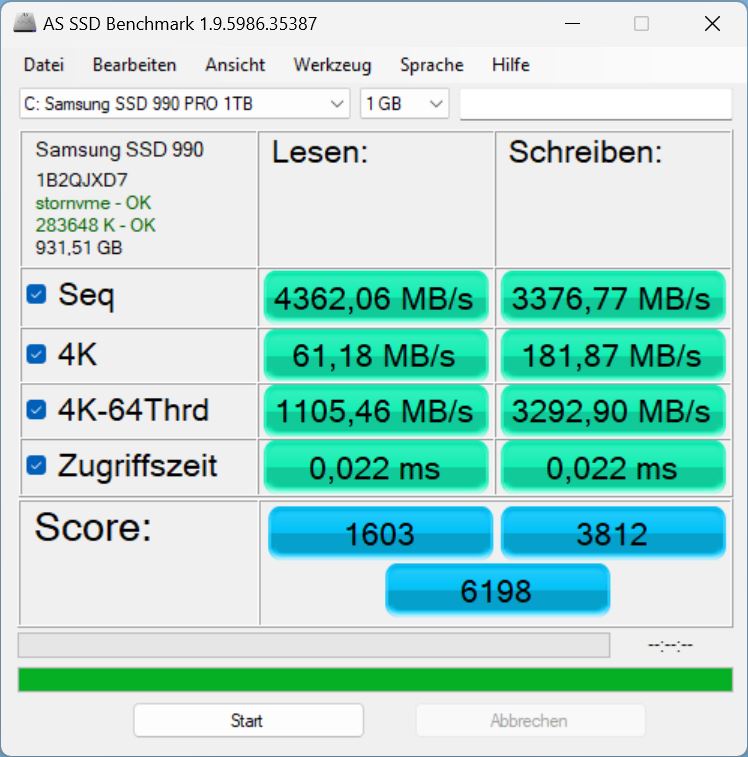
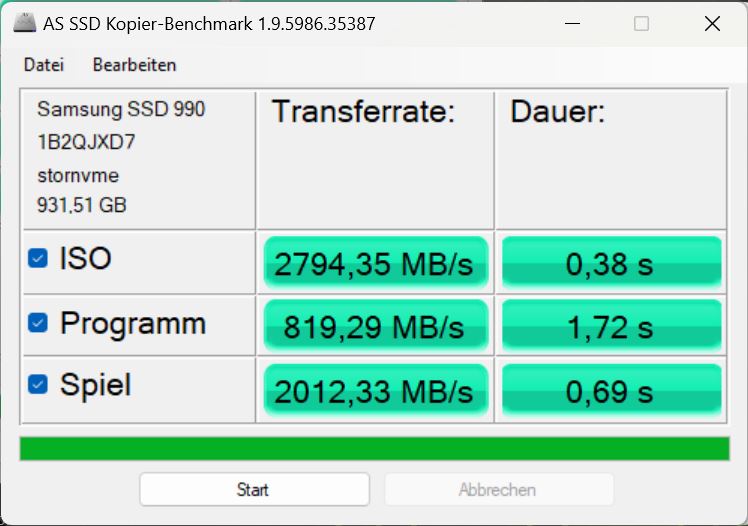
Schenker has installed a 1-TB Samsung 990 Pro into the device. This SSD is one of the fastest models available - in our best SSD list, it occupies 4th place. Within the Core 16, it isn't quite used to its full potential, but it is still extremely fast. Furthermore, its performance remains consistent over a long period of time, in contrast to the equally fast SSD within the Lenovo Legion Pro 5 16.


* ... smaller is better
Reading continuous performance: DiskSpd Read Loop, Queue Depth 8
Graphics
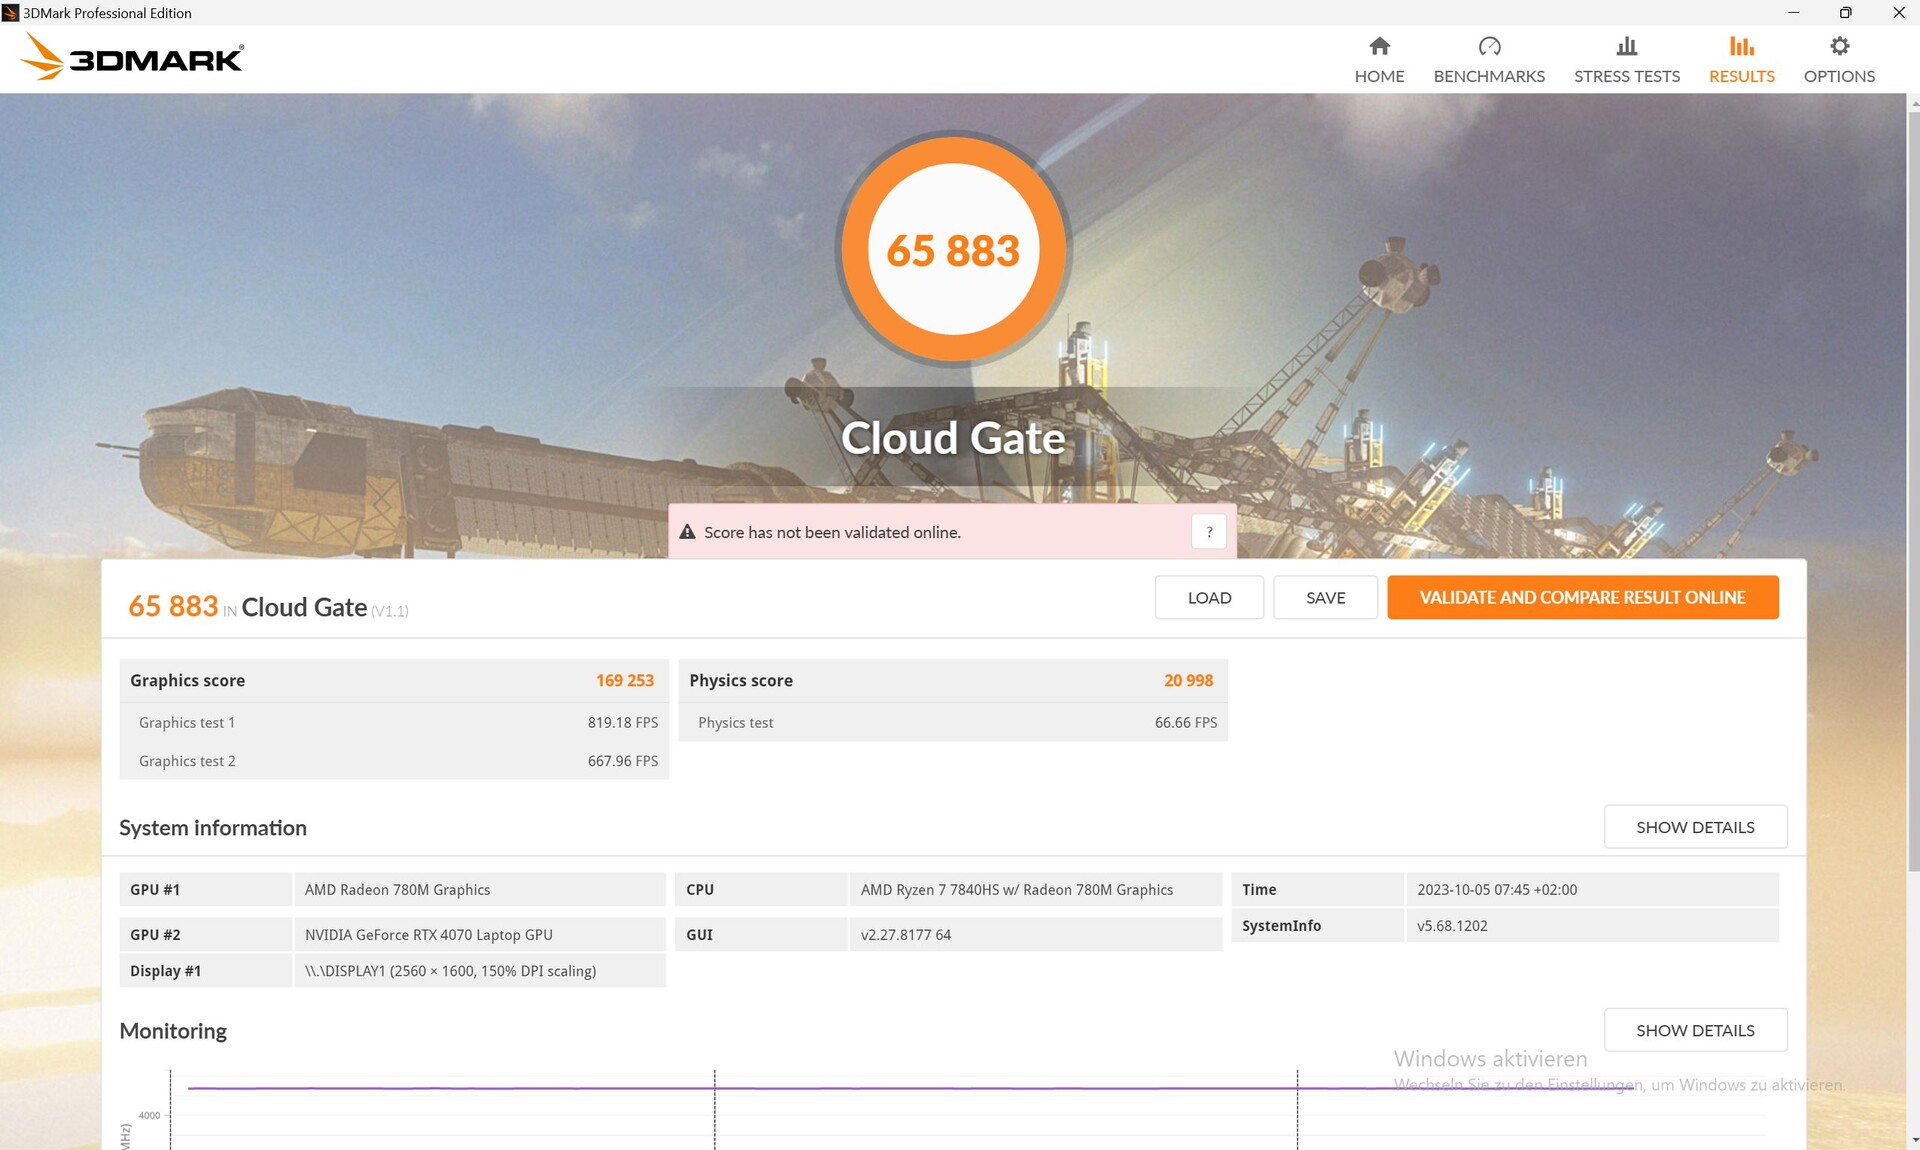
The NVIDIA GeForce RTX 4070 Laptop GPU is able to take advantage of the full 140 watts (115 watts + 25 watts Dynamic Boost). Alternatively, you can get the laptop for a bit less with an RTX 4060 Laptop. In the synthetic 3DMarks, the Core 16 took the lead over its competitors - its performance lay around 13 per cent above the typical RTX 4070 average in our database.
In battery mode, only 16,407 points remained from the original 32,810 points achieved when we ran Fire Strike again - a decline of 50 per cent.
The Core 16 is also fast while gaming - however, it didn't come out on top this time. This is likely due to the CPU-heavy games such as DOTA 2. Here, quite a few competitors achieved better CPU performances.
In Balanced mode, it behaved strangely when running The Witcher 3: The game ran at around 117 fps, which is almost as fast as in overdrive. This also meant that the fans didn't really run any quieter. After around a minute, the frame rate suddenly sank down to 30 and the fans only produced noise emissions of 28 dB. It seems that this mode isn't entirely optimized.
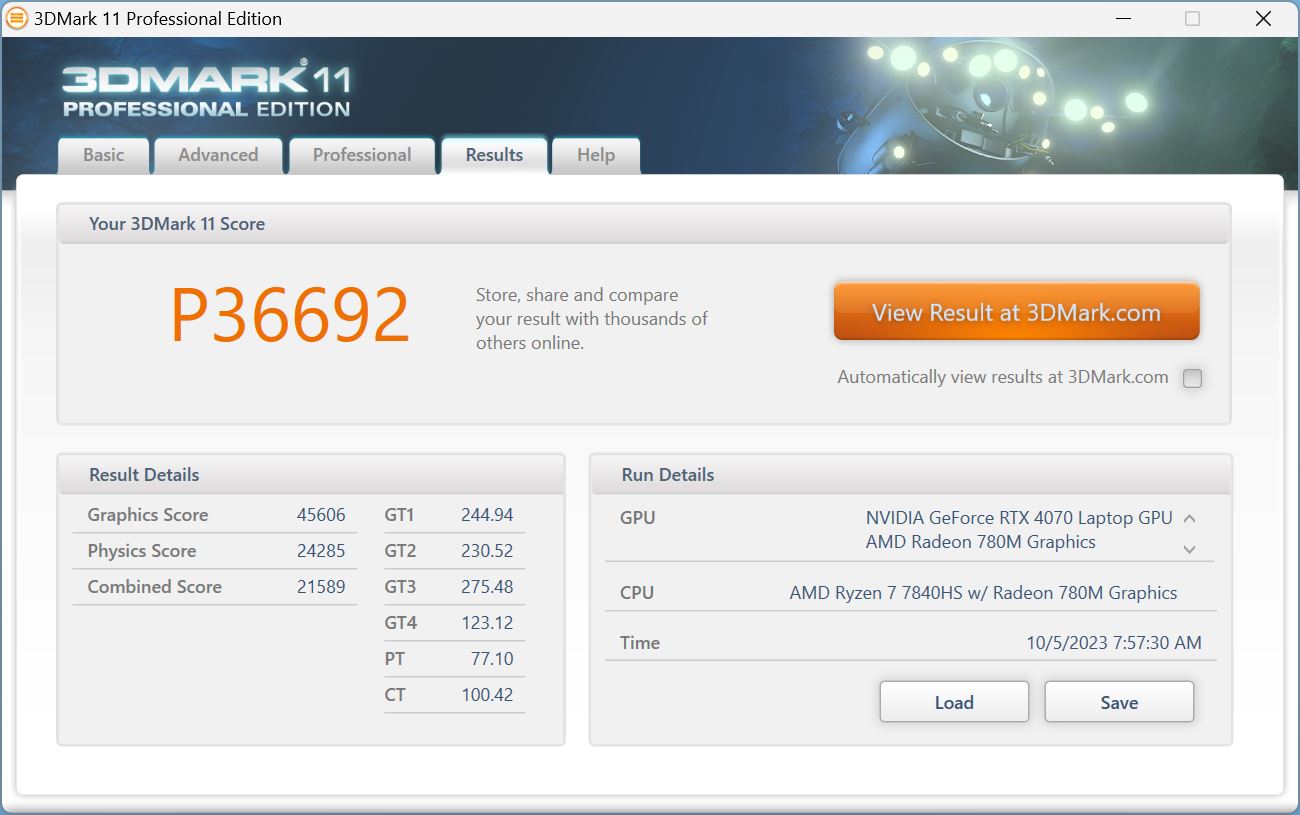


| 3DMark 11 Performance | 36692 points | |
| 3DMark Cloud Gate Standard Score | 65883 points | |
| 3DMark Fire Strike Score | 28810 points | |
| 3DMark Time Spy Score | 12909 points | |
Help | ||
* ... smaller is better
| Performance rating - Percent | |
| Average of class Gaming | |
| Lenovo Legion Pro 5 16ARX8 | |
| HP Omen Transcend 16 -2! | |
| MSI Stealth 16 Studio A13VG | |
| Schenker XMG CORE 16 (L23) | |
| HP Victus 16-r0077ng | |
| Acer Nitro 16 AN16-41 | |
| The Witcher 3 - 1920x1080 Ultra Graphics & Postprocessing (HBAO+) | |
| Average of class Gaming (95 - 240, n=8, last 2 years) | |
| Schenker XMG CORE 16 (L23) | |
| Lenovo Legion Pro 5 16ARX8 | |
| MSI Stealth 16 Studio A13VG | |
| HP Victus 16-r0077ng | |
| Acer Nitro 16 AN16-41 | |
| HP Omen Transcend 16 | |
| GTA V - 1920x1080 Highest AA:4xMSAA + FX AF:16x | |
| Average of class Gaming (48.3 - 186.9, n=102, last 2 years) | |
| Lenovo Legion Pro 5 16ARX8 | |
| MSI Stealth 16 Studio A13VG | |
| Schenker XMG CORE 16 (L23) | |
| HP Victus 16-r0077ng | |
| Acer Nitro 16 AN16-41 | |
| Final Fantasy XV Benchmark - 1920x1080 High Quality | |
| Average of class Gaming (41 - 215, n=103, last 2 years) | |
| Schenker XMG CORE 16 (L23) | |
| Lenovo Legion Pro 5 16ARX8 | |
| MSI Stealth 16 Studio A13VG | |
| HP Victus 16-r0077ng | |
| Acer Nitro 16 AN16-41 | |
| Strange Brigade - 1920x1080 ultra AA:ultra AF:16 | |
| Average of class Gaming (76.3 - 456, n=93, last 2 years) | |
| Lenovo Legion Pro 5 16ARX8 | |
| Schenker XMG CORE 16 (L23) | |
| HP Omen Transcend 16 | |
| MSI Stealth 16 Studio A13VG | |
| Acer Nitro 16 AN16-41 | |
| HP Victus 16-r0077ng | |
| Dota 2 Reborn - 1920x1080 ultra (3/3) best looking | |
| Lenovo Legion Pro 5 16ARX8 | |
| HP Omen Transcend 16 | |
| MSI Stealth 16 Studio A13VG | |
| Average of class Gaming (84.8 - 248, n=112, last 2 years) | |
| Schenker XMG CORE 16 (L23) | |
| HP Victus 16-r0077ng | |
| Acer Nitro 16 AN16-41 | |
Witcher 3 FPS diagram
| low | med. | high | ultra | QHD | 4K | |
|---|---|---|---|---|---|---|
| GTA V (2015) | 185.4 | 174.1 | 116.1 | |||
| The Witcher 3 (2015) | 364.2 | 291.5 | 245.2 | 120 | 92 | |
| Dota 2 Reborn (2015) | 161.2 | 153.5 | 142.2 | 134.8 | 136.9 | |
| Final Fantasy XV Benchmark (2018) | 215 | 171.4 | 124.8 | 91 | ||
| X-Plane 11.11 (2018) | 123.7 | 108.3 | 85.5 | 85.7 | ||
| Strange Brigade (2018) | 367 | 302 | 249 | 218 | ||
| Hogwarts Legacy (2023) | 77.2 | 55.3 |
Emissions & power - The cool Core 16 with stamina
Noise emissions
In idle mode, the fans often don't turn at all - especially in Balanced mode. Even in overdrive, this is often the case but here, the fans sometimes also spin rapidly.
Under load, the Core 16's noise levels rise steadily and not in big leaps. This means its noise levels remain relatively low under average load, such as in the first 3DMark06 benchmark scene.
During continuous gaming sessions, it can get quite a bit louder but the competition reaches similar noise levels - the Acer Nitro 16 actually gets unbearably loud. The MSI Stealth 16 Studio and especially the weaker HP Victus 16 remain quieter.
Noise level
| Idle |
| 23 / 28.48 / 28.48 dB(A) |
| Load |
| 30 / 54.12 dB(A) |
 | ||
30 dB silent 40 dB(A) audible 50 dB(A) loud |
||
min: | ||
| Schenker XMG CORE 16 (L23) GeForce RTX 4070 Laptop GPU, R7 7840HS, Samsung 990 Pro 1 TB | Lenovo Legion Pro 5 16ARX8 GeForce RTX 4070 Laptop GPU, R7 7745HX, Samsung PM9A1 MZVL21T0HCLR | Acer Nitro 16 AN16-41 GeForce RTX 4070 Laptop GPU, R7 7735HS, Samsung PM9A1 MZVL21T0HCLR | HP Omen Transcend 16 GeForce RTX 4070 Laptop GPU, i9-13900HX, SK hynix PC801 HFS002TEJ9X101N | MSI Stealth 16 Studio A13VG GeForce RTX 4070 Laptop GPU, i7-13700H, Micron 3400 2TB MTFDKBA2T0TFH | HP Victus 16-r0077ng GeForce RTX 4070 Laptop GPU, i7-13700H, Kioxia XG8 KXG80ZNV1T02 | |
|---|---|---|---|---|---|---|
| Noise | 5% | -6% | -12% | 5% | -8% | |
| off / environment * (dB) | 23 | 23.2 -1% | 25.7 -12% | 22.9 -0% | 24 -4% | 25 -9% |
| Idle Minimum * (dB) | 23 | 23.2 -1% | 25.7 -12% | 29.1 -27% | 24 -4% | 28 -22% |
| Idle Average * (dB) | 28.48 | 23.2 19% | 25.7 10% | 29.1 -2% | 24 16% | 29 -2% |
| Idle Maximum * (dB) | 28.48 | 26.2 8% | 26.3 8% | 29.1 -2% | 24 16% | 30 -5% |
| Load Average * (dB) | 30 | 31.4 -5% | 33.9 -13% | 45.7 -52% | 34.81 -16% | 43 -43% |
| Witcher 3 ultra * (dB) | 54.12 | 48.4 11% | 54.3 -0% | 44.05 19% | 46 15% | |
| Load Maximum * (dB) | 54.12 | 53.8 1% | 62 -15% | 54.3 -0% | 51.57 5% | 48 11% |
* ... smaller is better
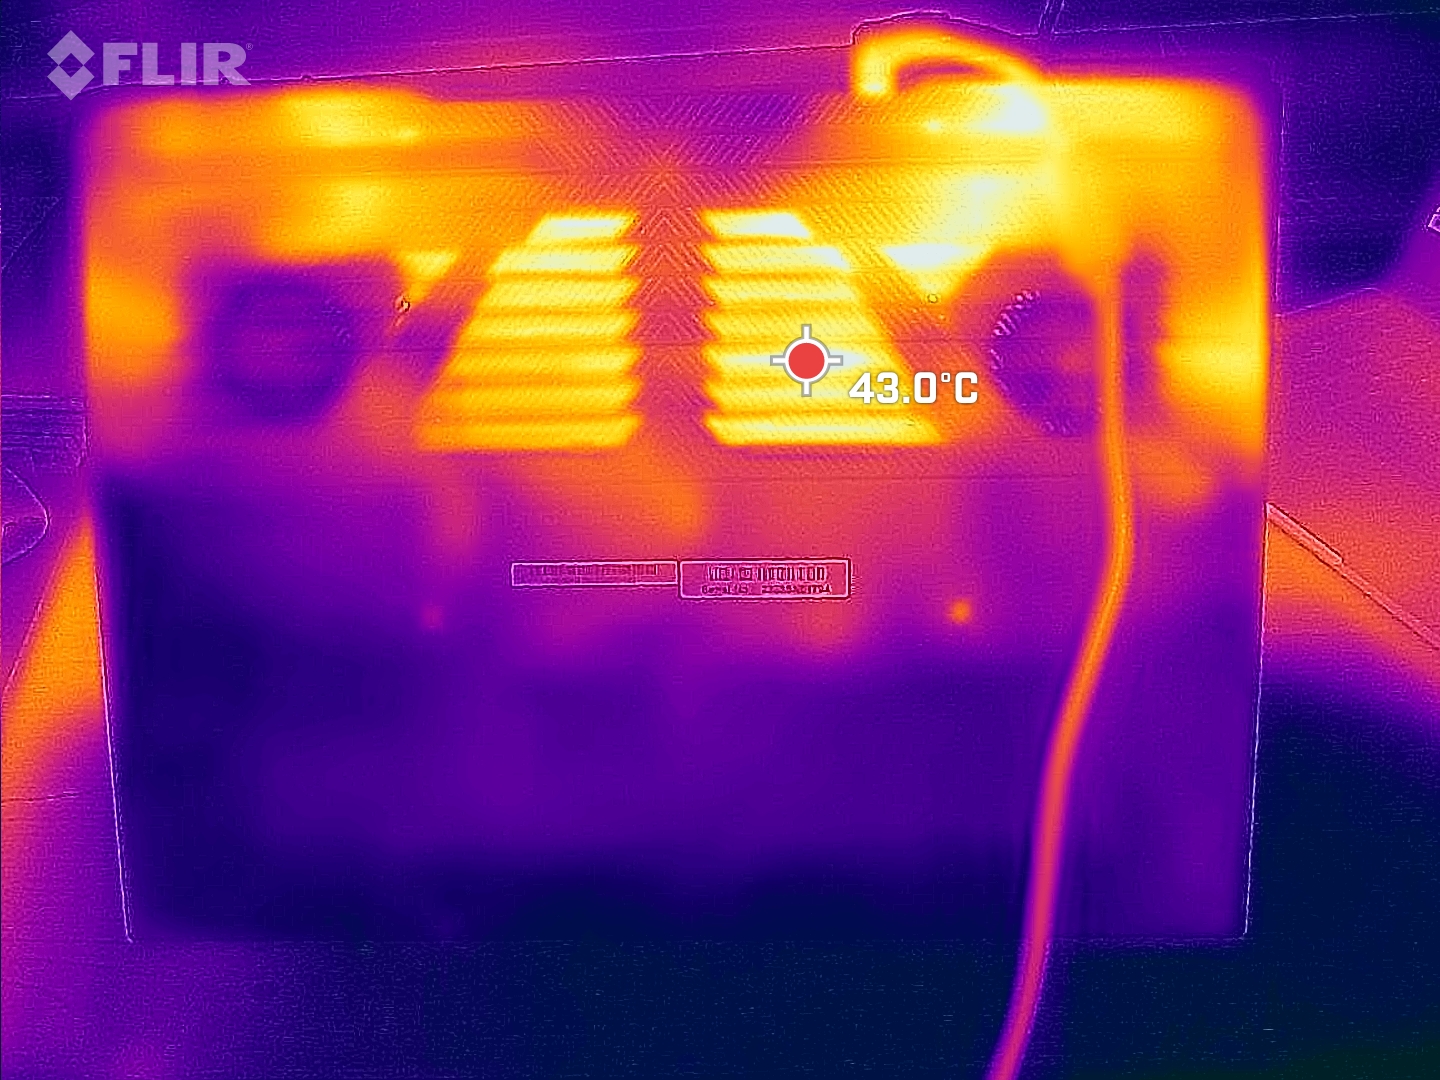
Temperature
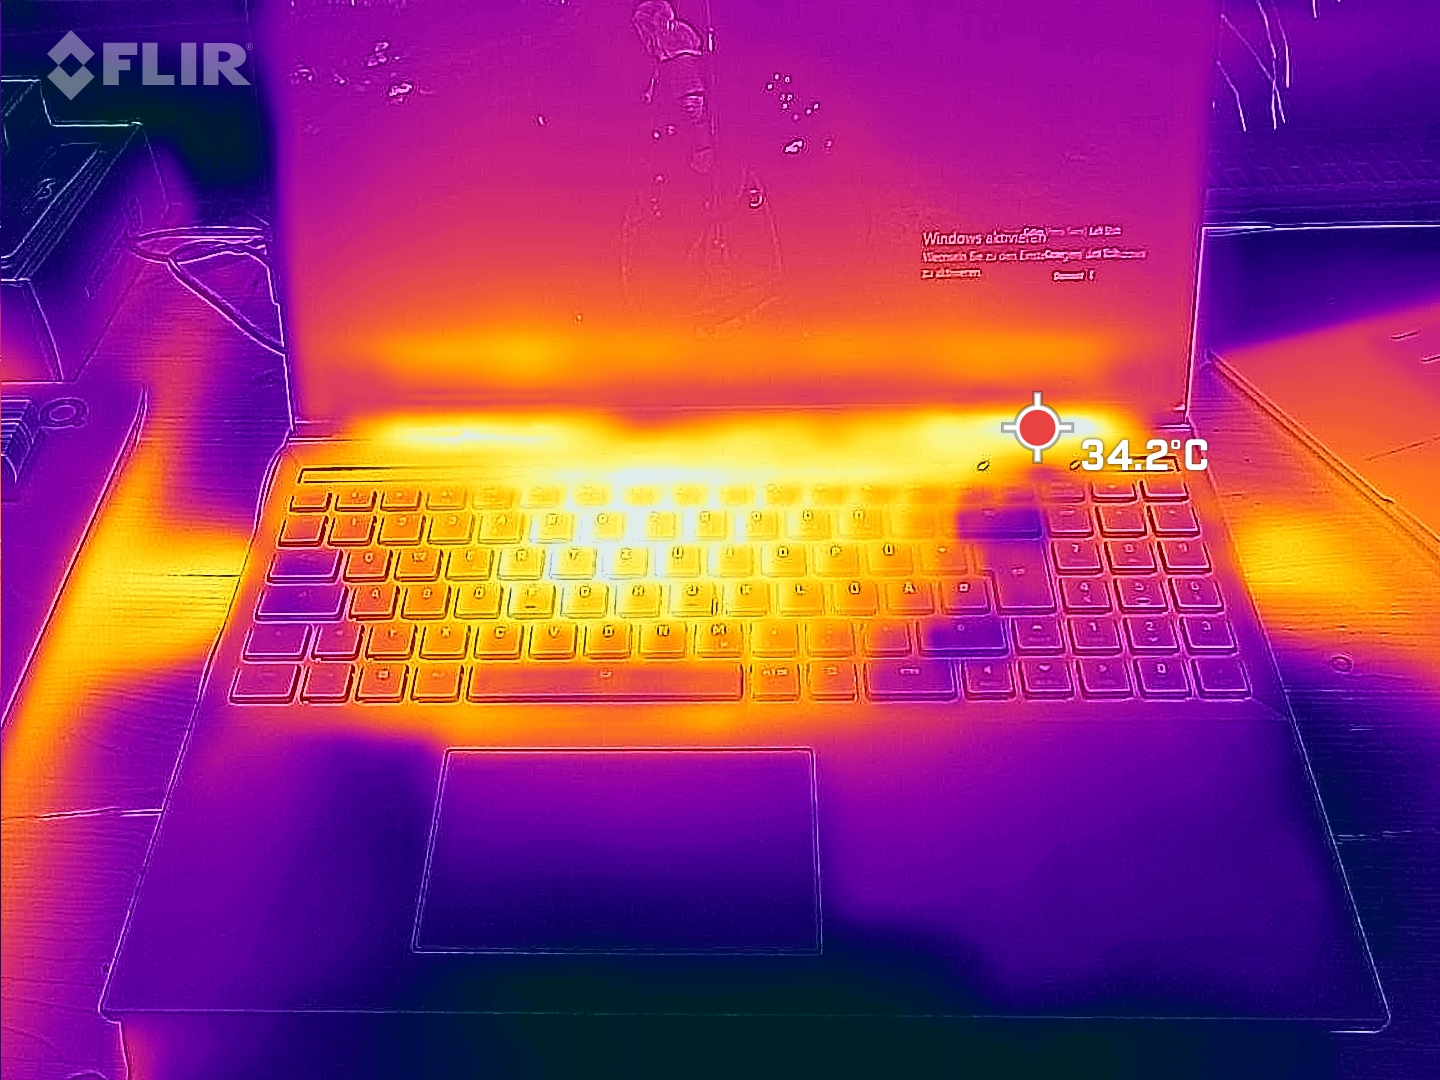
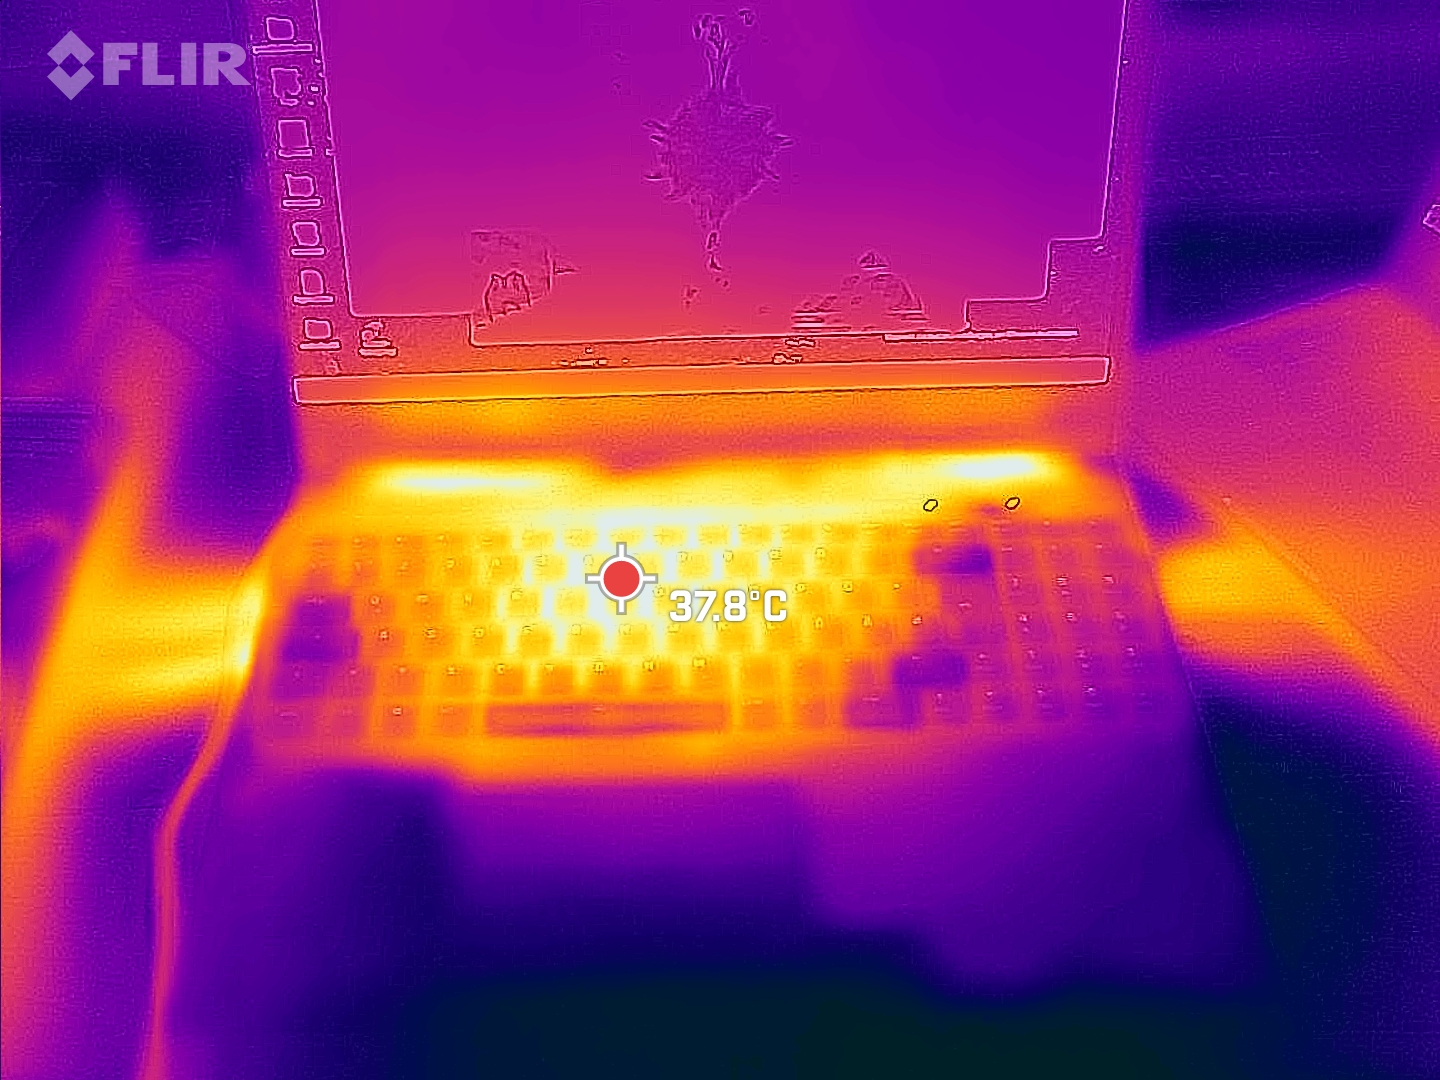
Schenker emphasizes that it uses liquid metal thermal paste. The Core 16 never gets properly hot - we measured hot spots of 46 °C around the centre of the back under continuous load. The left side and the WASD keys seem to get a little warmer than the right side. 39 °C under load is still fine.
(-) The maximum temperature on the upper side is 46 °C / 115 F, compared to the average of 40.4 °C / 105 F, ranging from 21.2 to 68.8 °C for the class Gaming.
(±) The bottom heats up to a maximum of 44 °C / 111 F, compared to the average of 43.2 °C / 110 F
(+) In idle usage, the average temperature for the upper side is 29.7 °C / 85 F, compared to the device average of 33.9 °C / 93 F.
(±) Playing The Witcher 3, the average temperature for the upper side is 35 °C / 95 F, compared to the device average of 33.9 °C / 93 F.
(+) The palmrests and touchpad are cooler than skin temperature with a maximum of 27 °C / 80.6 F and are therefore cool to the touch.
(±) The average temperature of the palmrest area of similar devices was 28.8 °C / 83.8 F (+1.8 °C / 3.2 F).

| Schenker XMG CORE 16 (L23) AMD Ryzen 7 7840HS, NVIDIA GeForce RTX 4070 Laptop GPU | Lenovo Legion Pro 5 16ARX8 AMD Ryzen 7 7745HX, NVIDIA GeForce RTX 4070 Laptop GPU | Acer Nitro 16 AN16-41 AMD Ryzen 7 7735HS, NVIDIA GeForce RTX 4070 Laptop GPU | HP Omen Transcend 16 Intel Core i9-13900HX, NVIDIA GeForce RTX 4070 Laptop GPU | MSI Stealth 16 Studio A13VG Intel Core i7-13700H, NVIDIA GeForce RTX 4070 Laptop GPU | HP Victus 16-r0077ng Intel Core i7-13700H, NVIDIA GeForce RTX 4070 Laptop GPU | |
|---|---|---|---|---|---|---|
| Heat | 8% | -3% | -1% | -26% | -10% | |
| Maximum Upper Side * (°C) | 46 | 41.8 9% | 41.5 10% | 47.4 -3% | 60 -30% | 51 -11% |
| Maximum Bottom * (°C) | 44 | 41.4 6% | 51.8 -18% | 54.4 -24% | 61 -39% | 54 -23% |
| Idle Upper Side * (°C) | 32 | 29 9% | 31.6 1% | 28.4 11% | 38.2 -19% | 37 -16% |
| Idle Bottom * (°C) | 33 | 30.4 8% | 34.5 -5% | 29.2 12% | 37.7 -14% | 29 12% |
* ... smaller is better
Speakers
The stereo speakers don't boast high volume, much bass or balanced lows and mids. Only the trebles are balanced and linear. Headphones or an external system should be used for a better audio experience. A headset jack and a microphone jack input are available are available for connecting the former.
Schenker XMG CORE 16 (L23) audio analysis
(±) | speaker loudness is average but good (79.4 dB)
Bass 100 - 315 Hz
(-) | nearly no bass - on average 21.6% lower than median
(±) | linearity of bass is average (11.4% delta to prev. frequency)
Mids 400 - 2000 Hz
(±) | higher mids - on average 5.4% higher than median
(+) | mids are linear (6.7% delta to prev. frequency)
Highs 2 - 16 kHz
(+) | balanced highs - only 2.3% away from median
(+) | highs are linear (6.6% delta to prev. frequency)
Overall 100 - 16.000 Hz
(±) | linearity of overall sound is average (17.1% difference to median)
Compared to same class
» 46% of all tested devices in this class were better, 12% similar, 43% worse
» The best had a delta of 6%, average was 18%, worst was 132%
Compared to all devices tested
» 31% of all tested devices were better, 8% similar, 61% worse
» The best had a delta of 4%, average was 24%, worst was 134%
Lenovo Legion Pro 5 16ARX8 audio analysis
(±) | speaker loudness is average but good (80.9 dB)
Bass 100 - 315 Hz
(-) | nearly no bass - on average 24% lower than median
(±) | linearity of bass is average (13.4% delta to prev. frequency)
Mids 400 - 2000 Hz
(+) | balanced mids - only 4.7% away from median
(+) | mids are linear (6.2% delta to prev. frequency)
Highs 2 - 16 kHz
(+) | balanced highs - only 2.5% away from median
(+) | highs are linear (6.2% delta to prev. frequency)
Overall 100 - 16.000 Hz
(±) | linearity of overall sound is average (21.9% difference to median)
Compared to same class
» 79% of all tested devices in this class were better, 6% similar, 16% worse
» The best had a delta of 6%, average was 18%, worst was 132%
Compared to all devices tested
» 63% of all tested devices were better, 7% similar, 31% worse
» The best had a delta of 4%, average was 24%, worst was 134%
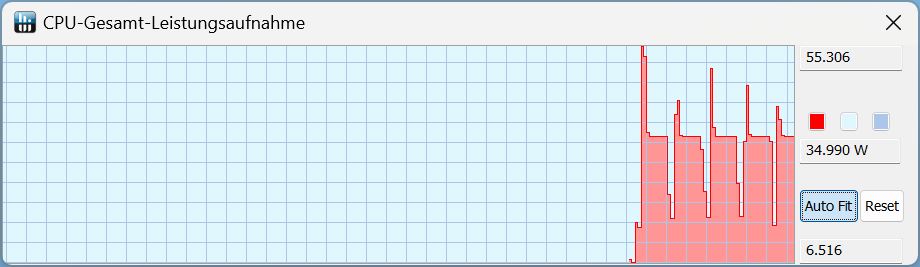
Power consumption
In idle mode, its power consumption is moderate - we are used to higher values from the last XMG models. While gaming, its consumption is tied to its performance, which is why this laptop sits between the Lenovo Legion Pro 5 and the HP Omen Transcend 16 on the one hand, and between the MSI Stealth 16 Studio and the HP Victus 16 on the other.
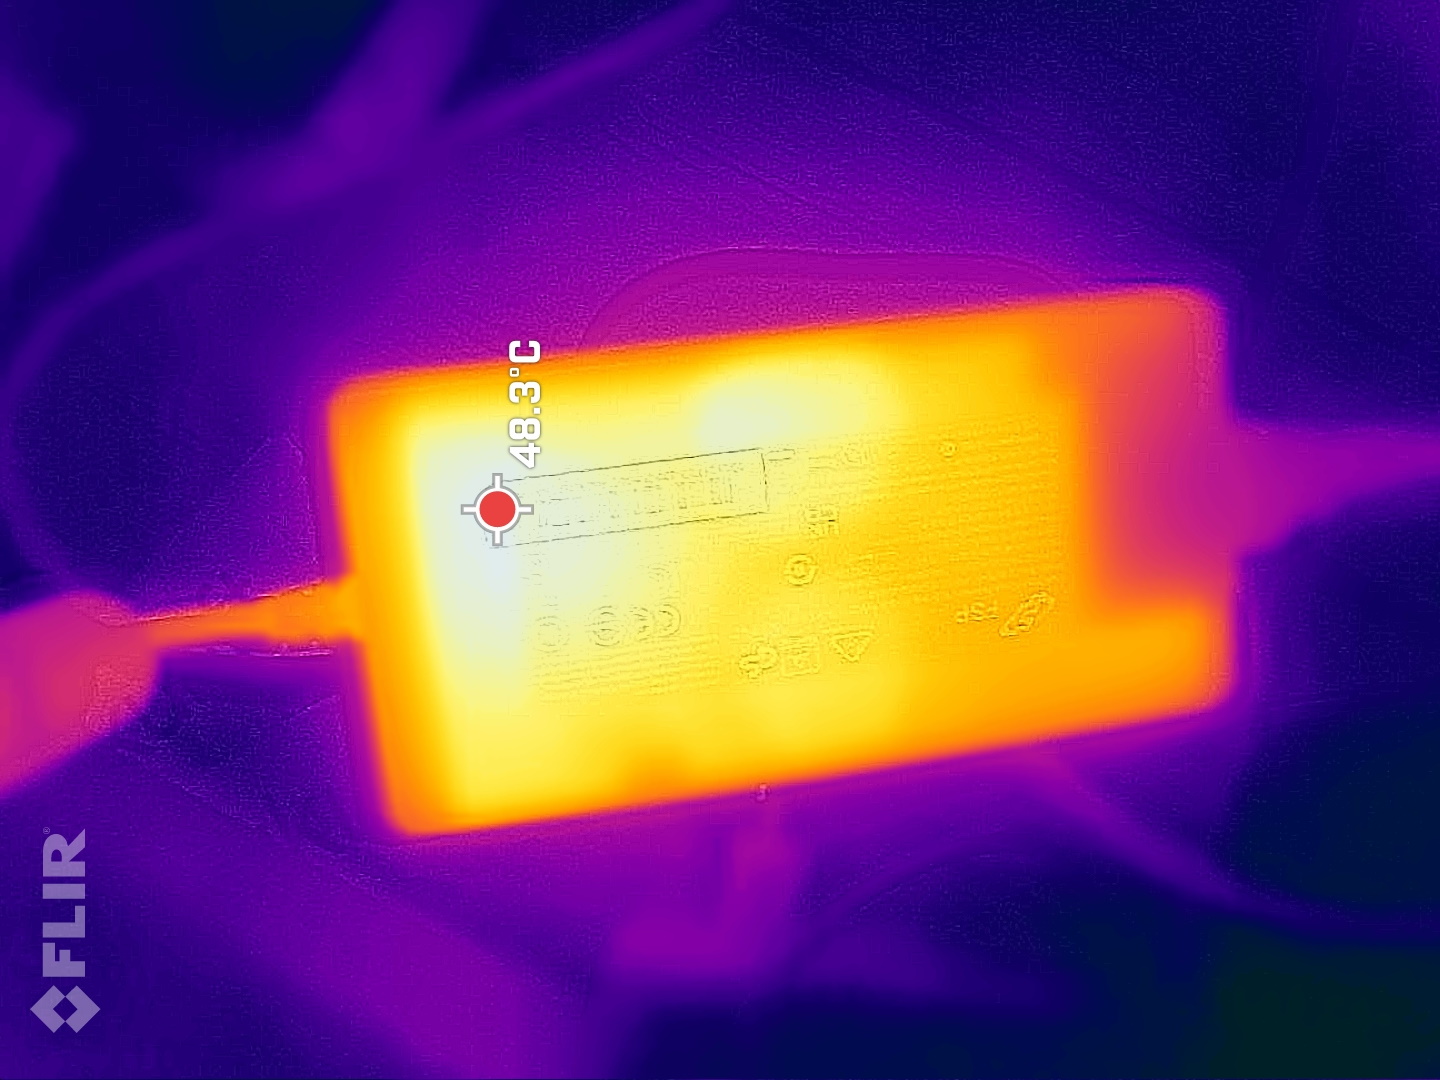
We measured a short-term maximum consumption of 280 watts - the 230-watt power supply (now FSP instead of LiteOn) might struggle quite a bit with this. However, the Core consumes an average of 179 watts when running The Witcher 3 in Full HD Ultra, meaning the power supply should have enough reserves for gaming and it can always charge the laptop reliably. However, we measured a consumption that was constantly above 230 watts over the first minutes of the stress test - see the curve below.
| Off / Standby | |
| Idle | |
| Load |
|
Key:
min: | |
| Schenker XMG CORE 16 (L23) R7 7840HS, GeForce RTX 4070 Laptop GPU, Samsung 990 Pro 1 TB, IPS, 2560x1600, 16" | Lenovo Legion Pro 5 16ARX8 R7 7745HX, GeForce RTX 4070 Laptop GPU, Samsung PM9A1 MZVL21T0HCLR, IPS, 2560x1600, 16" | Acer Nitro 16 AN16-41 R7 7735HS, GeForce RTX 4070 Laptop GPU, Samsung PM9A1 MZVL21T0HCLR, IPS, 2560x1600, 16" | HP Omen Transcend 16 i9-13900HX, GeForce RTX 4070 Laptop GPU, SK hynix PC801 HFS002TEJ9X101N, Mini-LED, 2560x1600, 16" | MSI Stealth 16 Studio A13VG i7-13700H, GeForce RTX 4070 Laptop GPU, Micron 3400 2TB MTFDKBA2T0TFH, IPS, 2560x1600, 16" | HP Victus 16-r0077ng i7-13700H, GeForce RTX 4070 Laptop GPU, Kioxia XG8 KXG80ZNV1T02, IPS, 1920x1080, 16.1" | Average NVIDIA GeForce RTX 4070 Laptop GPU | Average of class Gaming | |
|---|---|---|---|---|---|---|---|---|
| Power Consumption | -26% | -19% | -82% | -6% | 1% | -25% | -31% | |
| Idle Minimum * (Watt) | 11 | 8.1 26% | 11.6 -5% | 19.2 -75% | 11 -0% | 8 27% | 13.2 ? -20% | 13.2 ? -20% |
| Idle Average * (Watt) | 15.2 | 15.9 -5% | 15.6 -3% | 22.7 -49% | 18 -18% | 13 14% | 18.2 ? -20% | 18.9 ? -24% |
| Idle Maximum * (Watt) | 16 | 37.2 -133% | 16.5 -3% | 55.4 -246% | 19 -19% | 22 -38% | 24.6 ? -54% | 24.3 ? -52% |
| Load Average * (Watt) | 64 | 90.9 -42% | 155 -142% | 128.4 -101% | 91 -42% | 86 -34% | 97 ? -52% | 108 ? -69% |
| Witcher 3 ultra * (Watt) | 179 | 189.6 -6% | 154.8 14% | 206 -15% | 130 27% | 141.8 21% | ||
| Load Maximum * (Watt) | 280 | 263.5 6% | 205 27% | 292 -4% | 228 19% | 233 17% | 221 ? 21% | 254 ? 9% |
* ... smaller is better
Power consumption Witcher 3 / stress test
Power consumption with external monitor
Battery life
Schenker has installed a 99 Wh battery into the laptop. The Lenovo Legion Pro 5 16 only features an 80 Wh model, but some competitors like the MSI Stealth 16 or the HP Omen Transcend 16 have batteries equal in capacity.
Even so, we are missing a power-saving mode in the Control Center - Balanced mode is the lowest available mode. It still leads to good runtimes. Our H.264-encoded movie was played in a continuous loop for over 8 hours at reduced brightness. The Core achieved almost 8.5 hours in the WLAN test at 150 nits as well. Only the Acer Nitro 16 could keep up here.
| Schenker XMG CORE 16 (L23) R7 7840HS, GeForce RTX 4070 Laptop GPU, 99 Wh | Lenovo Legion Pro 5 16ARX8 R7 7745HX, GeForce RTX 4070 Laptop GPU, 80 Wh | Acer Nitro 16 AN16-41 R7 7735HS, GeForce RTX 4070 Laptop GPU, 90 Wh | HP Omen Transcend 16 i9-13900HX, GeForce RTX 4070 Laptop GPU, 97 Wh | MSI Stealth 16 Studio A13VG i7-13700H, GeForce RTX 4070 Laptop GPU, 99.9 Wh | HP Victus 16-r0077ng i7-13700H, GeForce RTX 4070 Laptop GPU, 83 Wh | Average of class Gaming | |
|---|---|---|---|---|---|---|---|
| Battery runtime | -55% | -6% | -50% | -11% | -15% | -25% | |
| H.264 (h) | 10.2 | 10.2 0% | 7.7 -25% | 8.26 ? -19% | |||
| WiFi v1.3 (h) | 8.4 | 4 -52% | 9 7% | 4.2 -50% | 7.8 -7% | 7.1 -15% | 7.02 ? -16% |
| Load (h) | 2.4 | 1 -58% | 1.8 -25% | 1.2 -50% | 2.4 0% | 1.47 ? -39% | |
| Reader / Idle (h) | 6.5 | 12.2 | 6.3 | 11 | 8.71 ? |
Pros
Cons
Verdict - A great gaming laptop without any major weaknesses

16-inch laptops with an RTX 4070 start from around US$1,600. This doesn't make the Core 16 entirely inexpensive (see below). In turn, it does deliver good 3D performance, one of the fastest SSDs on the market, an optional mechanical keyboard, a good 1,600p sRGB panel with low DeltaE values, and lots more. It is a well-rounded gaming laptop whose performance is just right. For even better performance levels, it would have to be an HX processor, as the RTX 4070 performs great.
You have to take a closer look at the device in order to find any critique-worthy points. Its 230-watt power supply may be overloaded in extreme scenarios - at least, it ran over its specifications for quite a few minutes during our stress test. While gaming, this proved to be no problem. Its balanced mode hasn't quite been perfected, which only really worked after a minute of gaming and the performance sank down to battery level.
The XMG Core 16 proved to be a good gaming laptop in all of our tests, with its powerful RTX 4070 and very well-calibrated sRGB display.
The Core 16's biggest competitor is the Lenovo Legion Pro 5 16ARX8, which did similarly well in a lot of areas but costs less. On the other hand, it doesn't have quite as good runtimes.
Price and availability
You can buy Schenker's laptops via bestware.com. Our configuration can be had for around US$2,360.
Schenker XMG CORE 16 (L23)
- 10/05/2023 v7 (old)
Christian Hintze
Transparency
The selection of devices to be reviewed is made by our editorial team. The test sample was provided to the author as a loan by the manufacturer or retailer for the purpose of this review. The lender had no influence on this review, nor did the manufacturer receive a copy of this review before publication. There was no obligation to publish this review. As an independent media company, Notebookcheck is not subjected to the authority of manufacturers, retailers or publishers.
This is how Notebookcheck is testing
Every year, Notebookcheck independently reviews hundreds of laptops and smartphones using standardized procedures to ensure that all results are comparable. We have continuously developed our test methods for around 20 years and set industry standards in the process. In our test labs, high-quality measuring equipment is utilized by experienced technicians and editors. These tests involve a multi-stage validation process. Our complex rating system is based on hundreds of well-founded measurements and benchmarks, which maintains objectivity. Further information on our test methods can be found here.
Price comparison

