Verdict
Although the XMG Core 16 VE is marketed as a Value Edition, this 16-inch gaming laptop is not exactly among the cheapest RTX 5060 models. With a starting price of €1,479 (approx. $1,711) and a configured price of over €1,900 (approx. $2,198 with 64 GB RAM, 2 TB SSD, Windows 11), it competes more in the price range of many RTX 5070 Ti devices. Based on our measurements and tests, the price is at least partly justified.
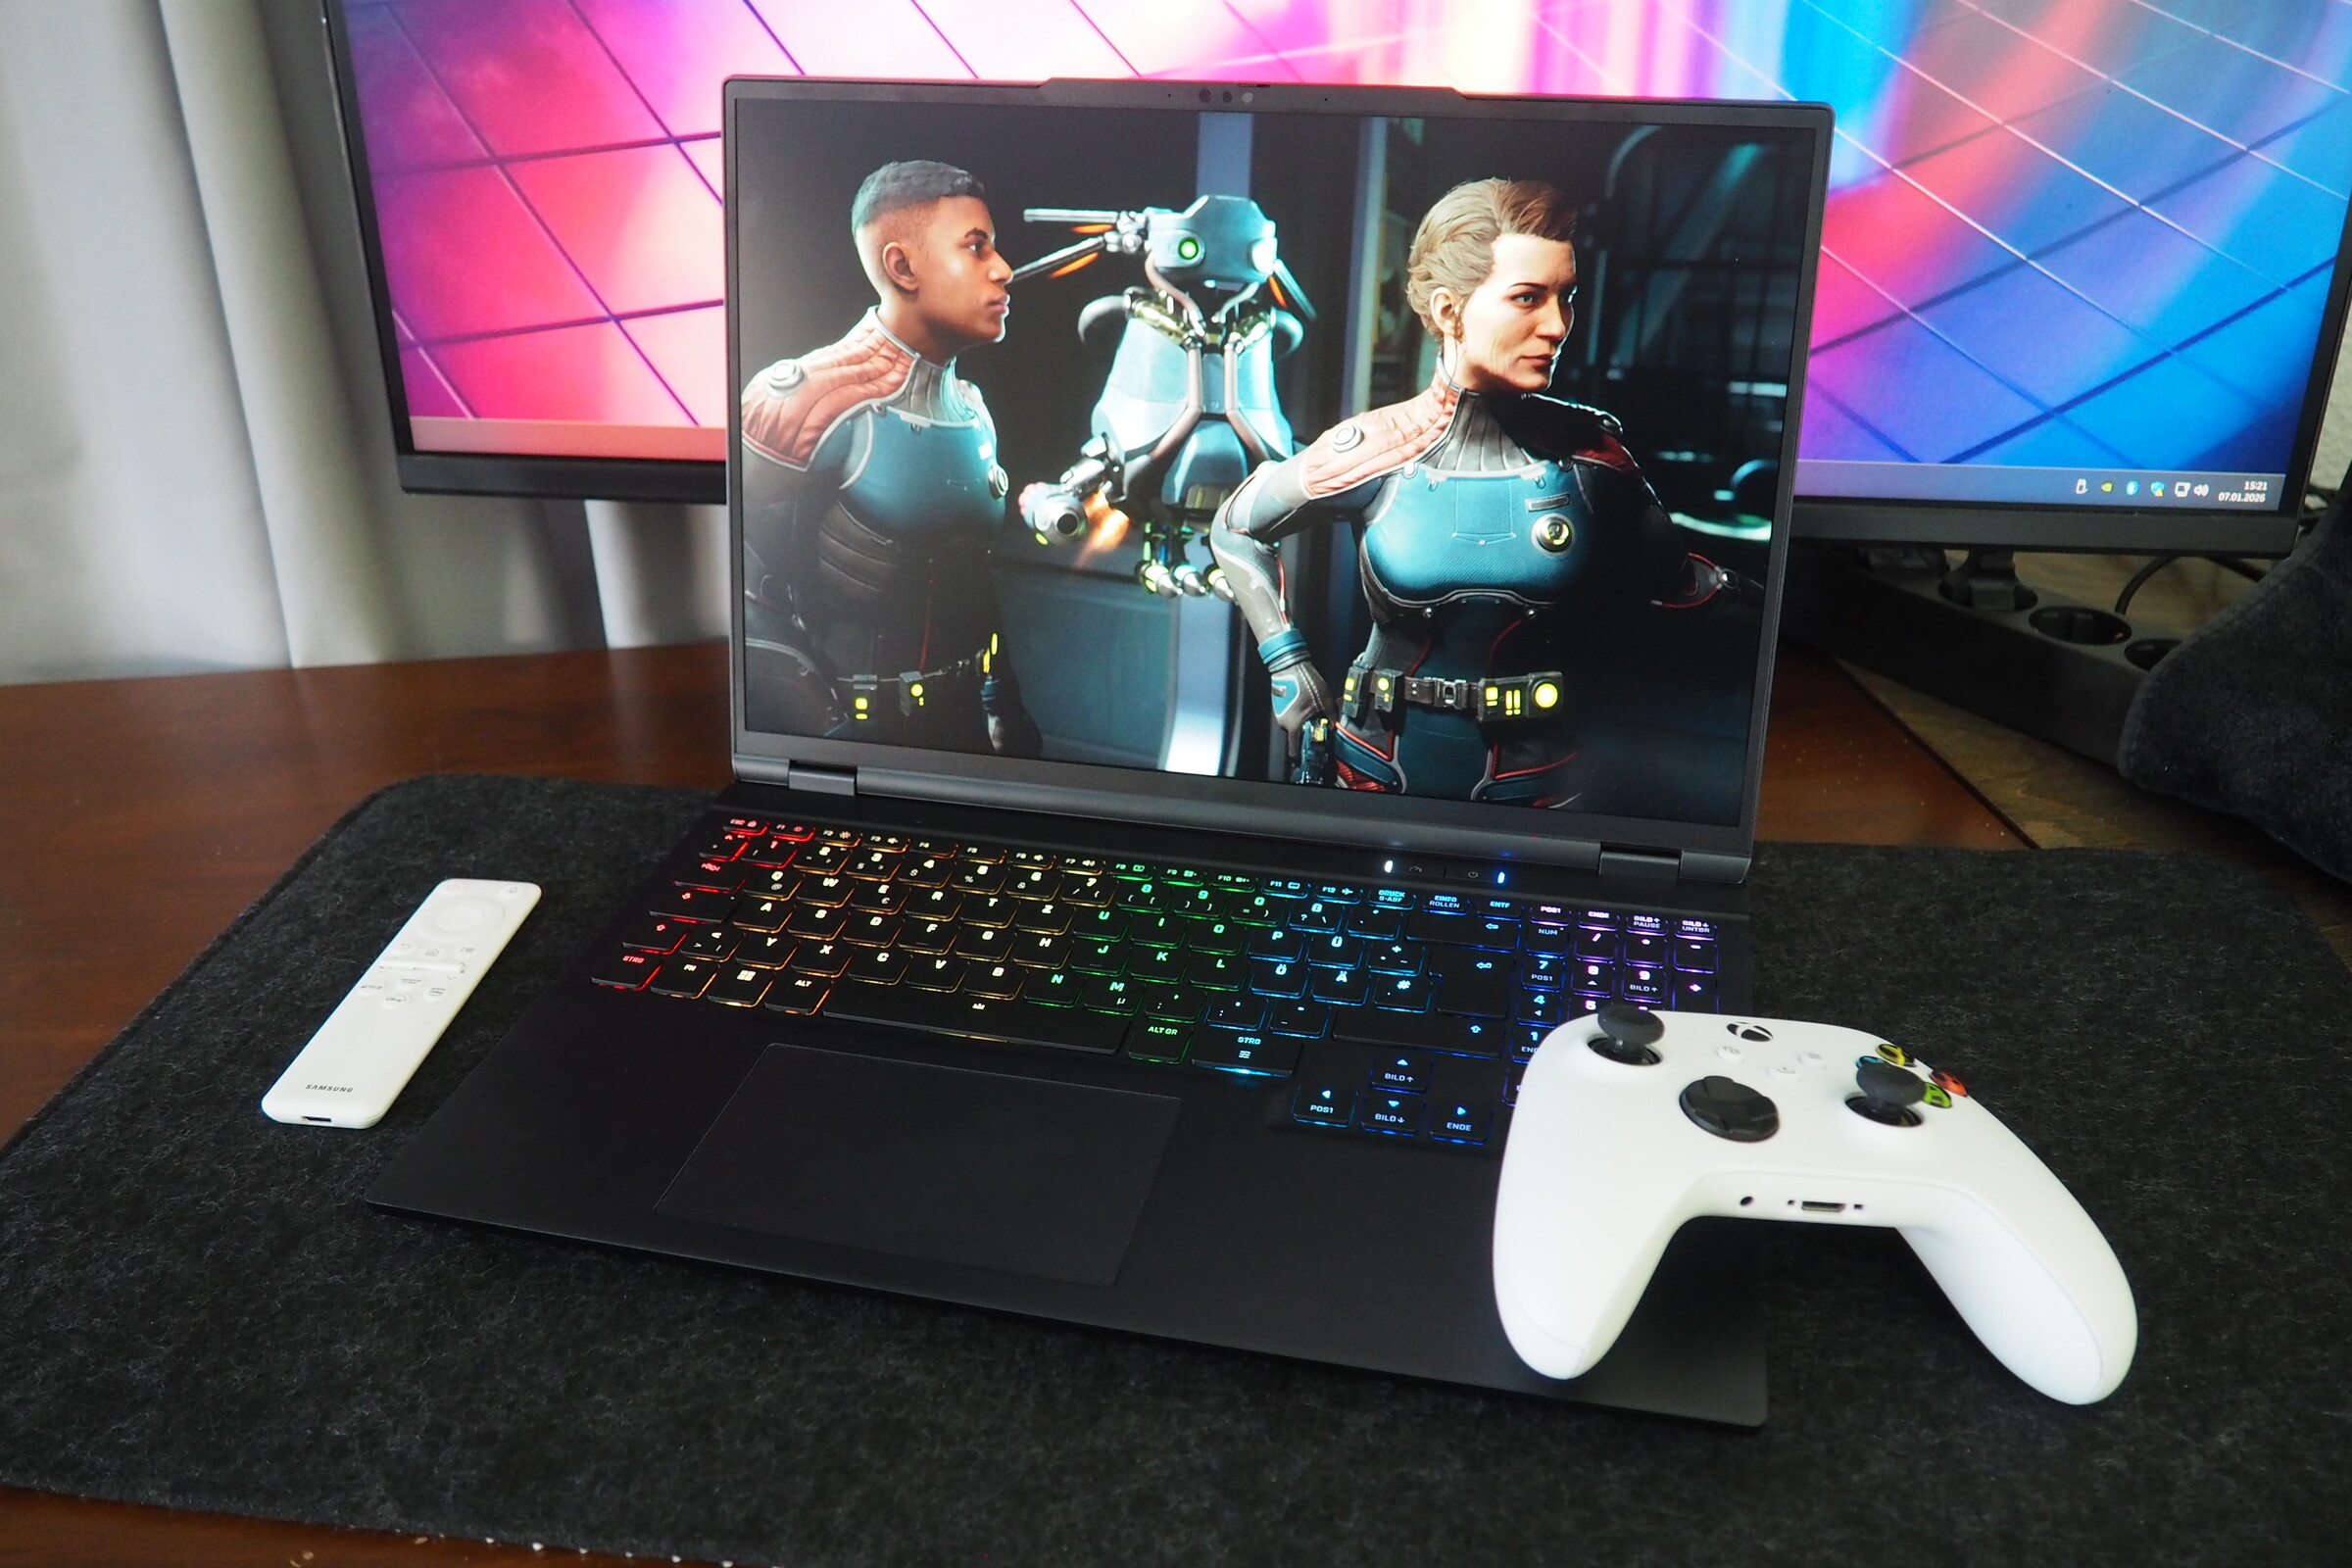
One of its biggest strengths is the elegant, largely sturdy metal chassis, which combines good input devices with a wide selection of ports and a fairly bright IPS display. Maintenance and upgrade options are also solid. CPU and GPU performance is convincing as well. While the Ryzen 7 255 is not a powerhouse compared to other gaming CPUs, the Zen 4 chip delivers consistent performance. The sound quality, however, could be improved. The built-in speakers offer rather modest audio.
Overall, the score does not quite match that of its main rival, the Lenovo Legion 7 16, but the XMG Core 16 VE outperforms many other RTX 5060 laptops, such as the Tulpar T6 V3.5 and the HP Omen 16. Our comparison tables also include a more powerful RTX 5070 or RTX 5070 Ti notebook for context.
Pros
Cons
Price and availability
As mentioned earlier, the XMG Core 16 VE (M25) is available directly from the manufacturer starting at €1,479 (approx. $1,711).
Translator’s note: XMG laptops are not officially available in North America.
Specifications
Case
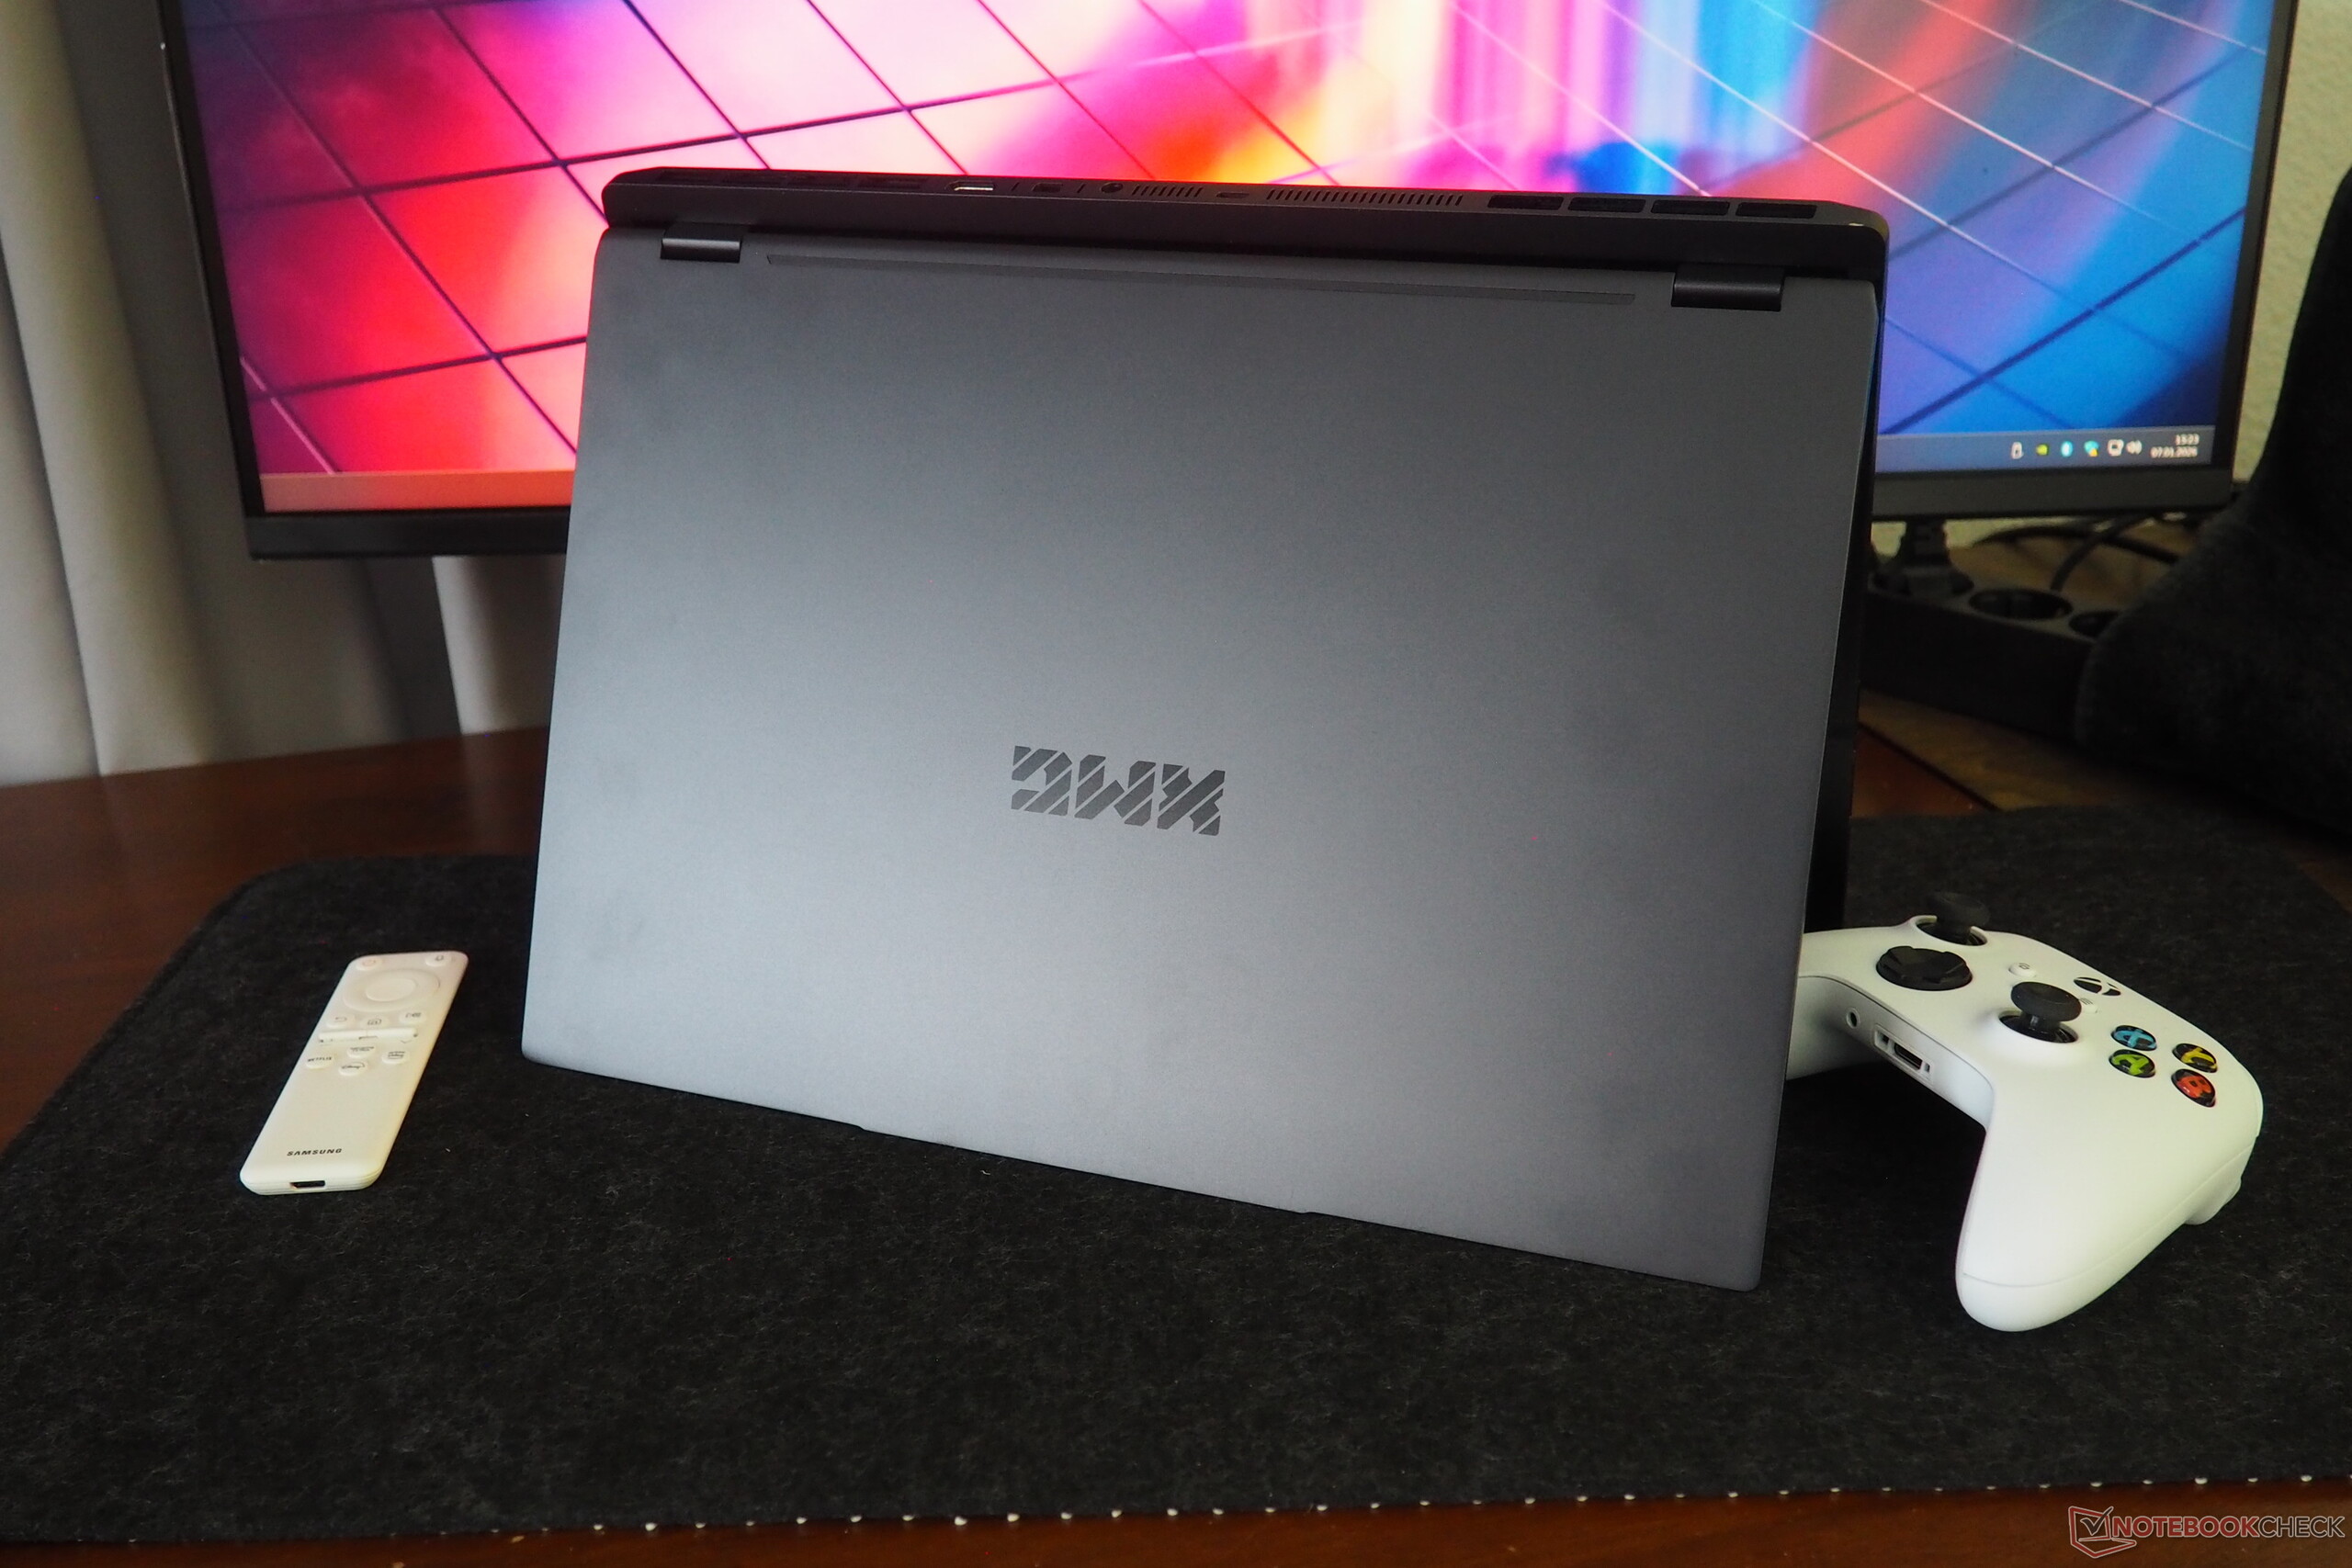
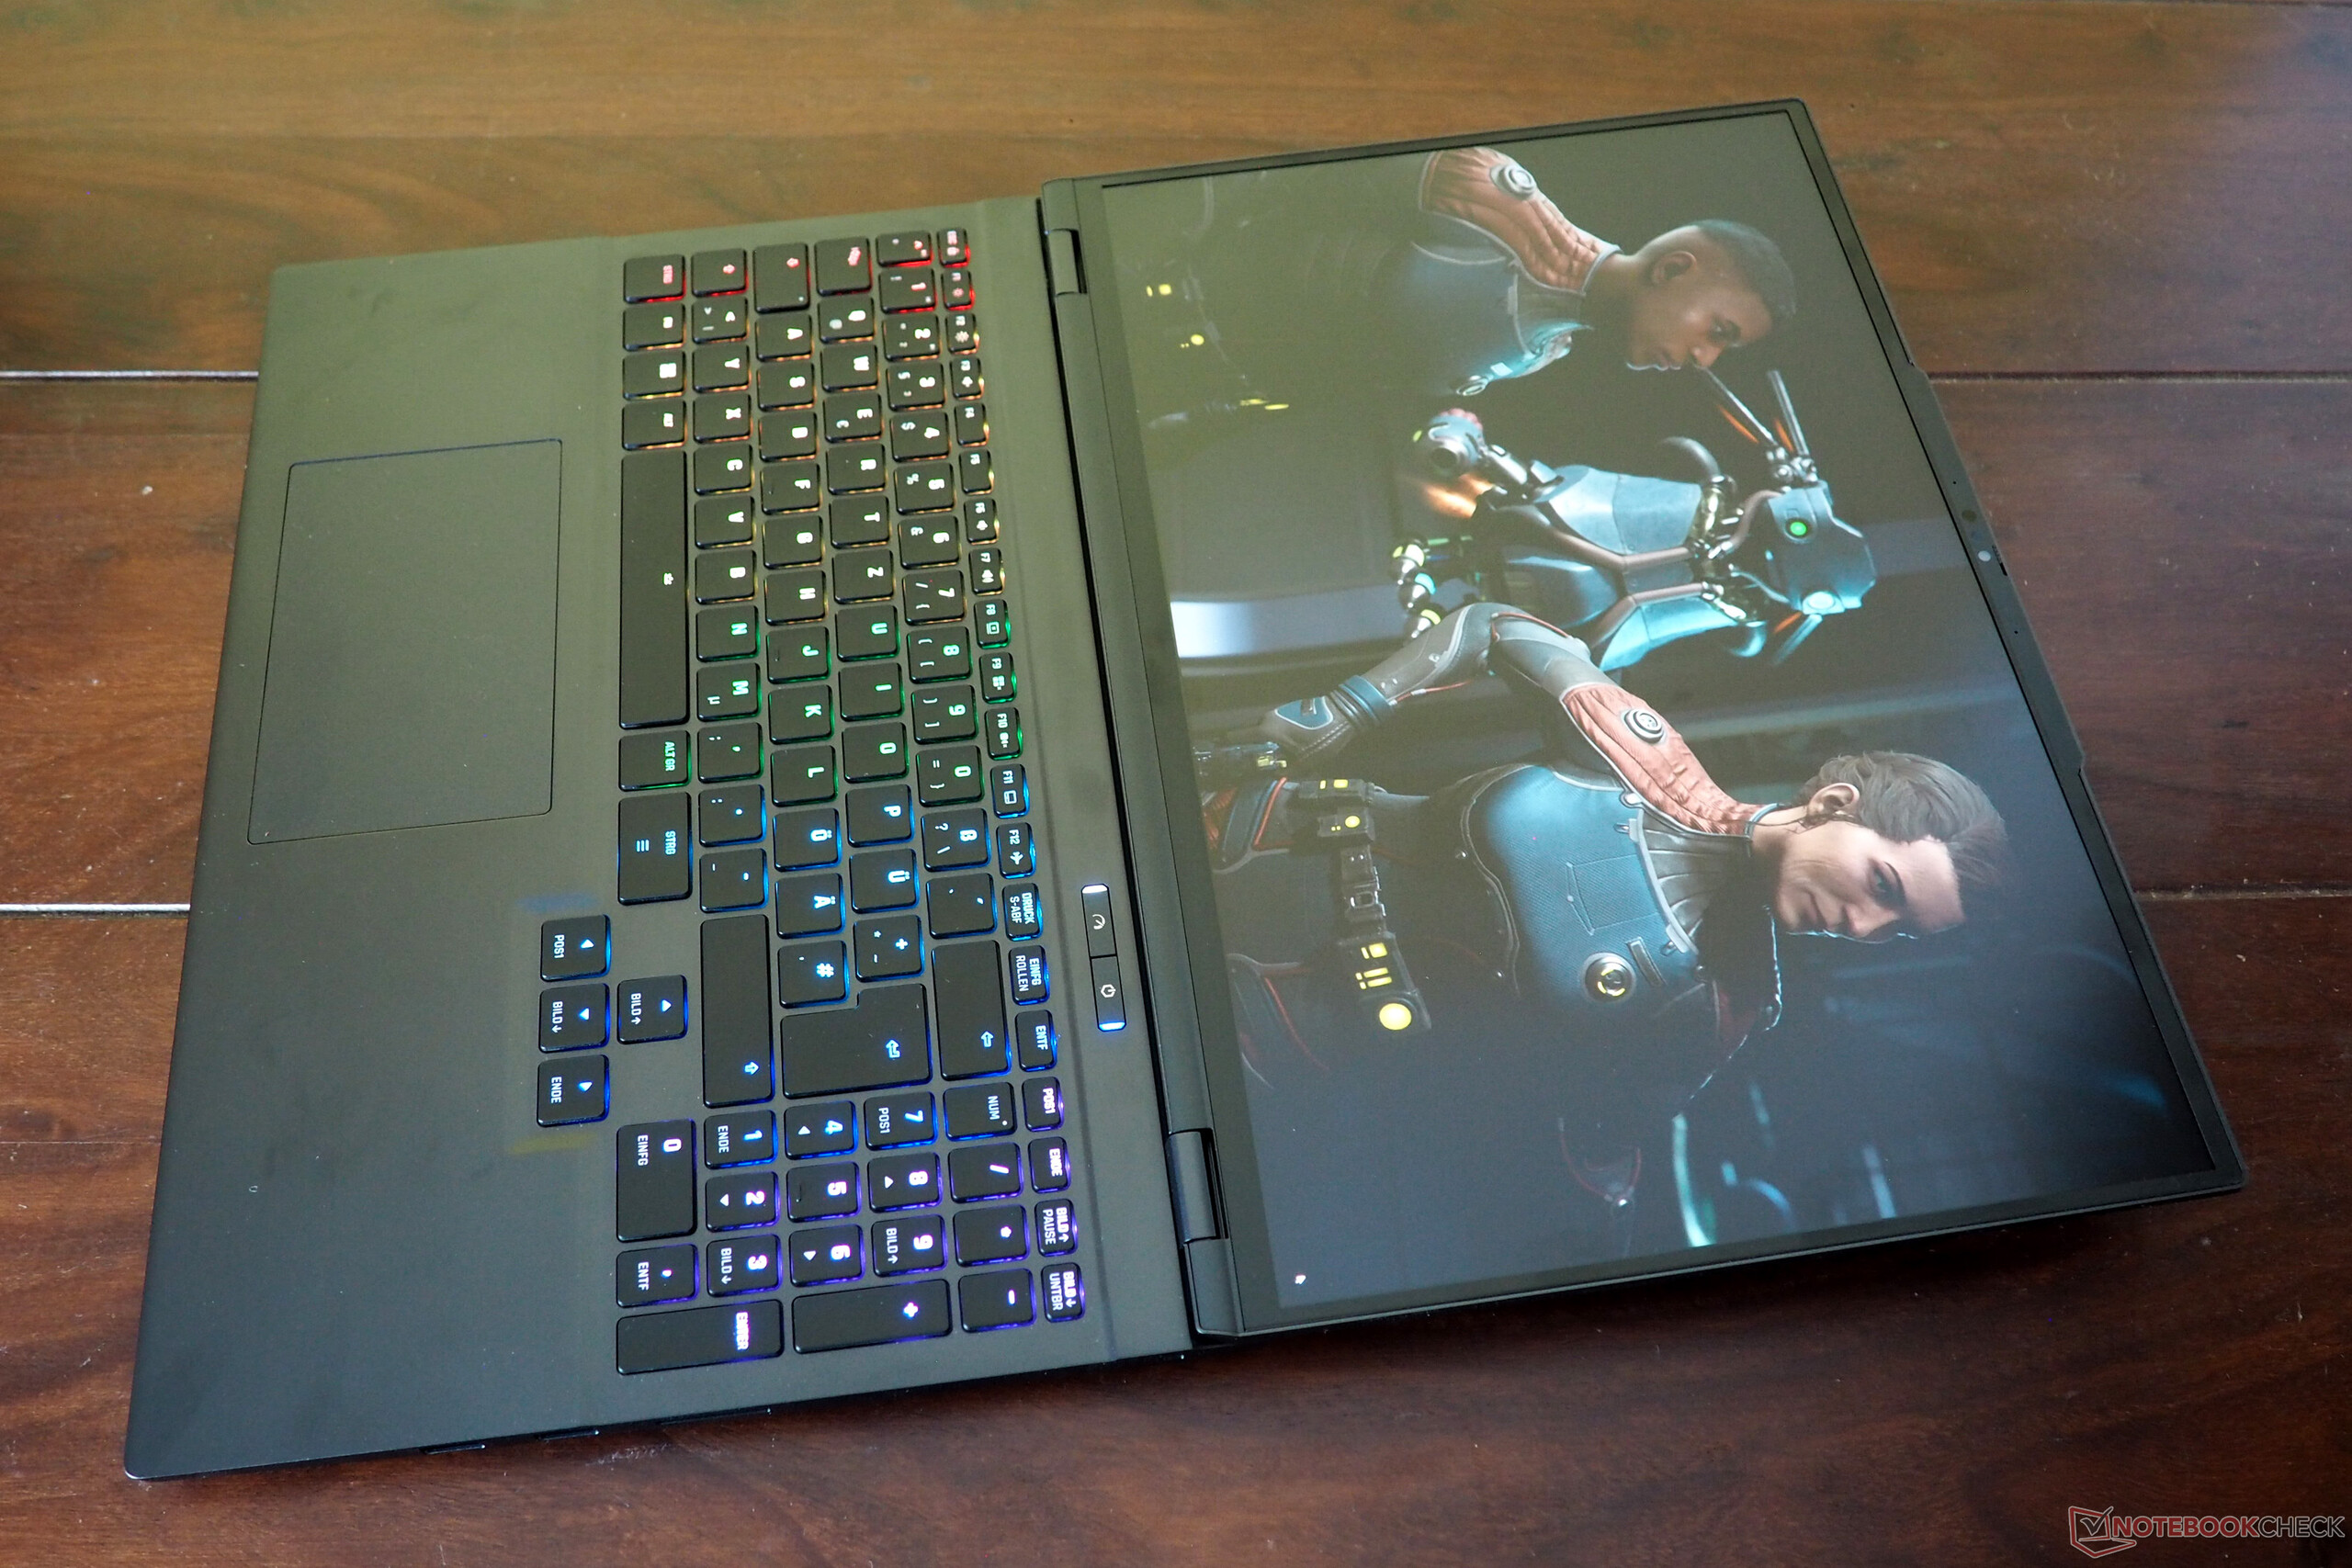
The chassis feels premium thanks to the use of metal components. While the dark surfaces are prone to fingerprints, rigidity is impressive across most areas. The generous 180° opening angle also deserves praise. At 2.1 kg, the XMG Core 16 VE sits toward the lower end of the comparison group and is therefore not overly heavy. At 2.3 cm thick, it also remains within reasonable limits.
Equipment
Schenker leaves little to complain about when it comes to connectivity. In addition to three USB-A ports and two USB-C ports, there are also two display outputs (HDMI and Mini DisplayPort). The laptop also includes an audio jack, a LAN port, a very fast card reader, and a Kensington lock slot.
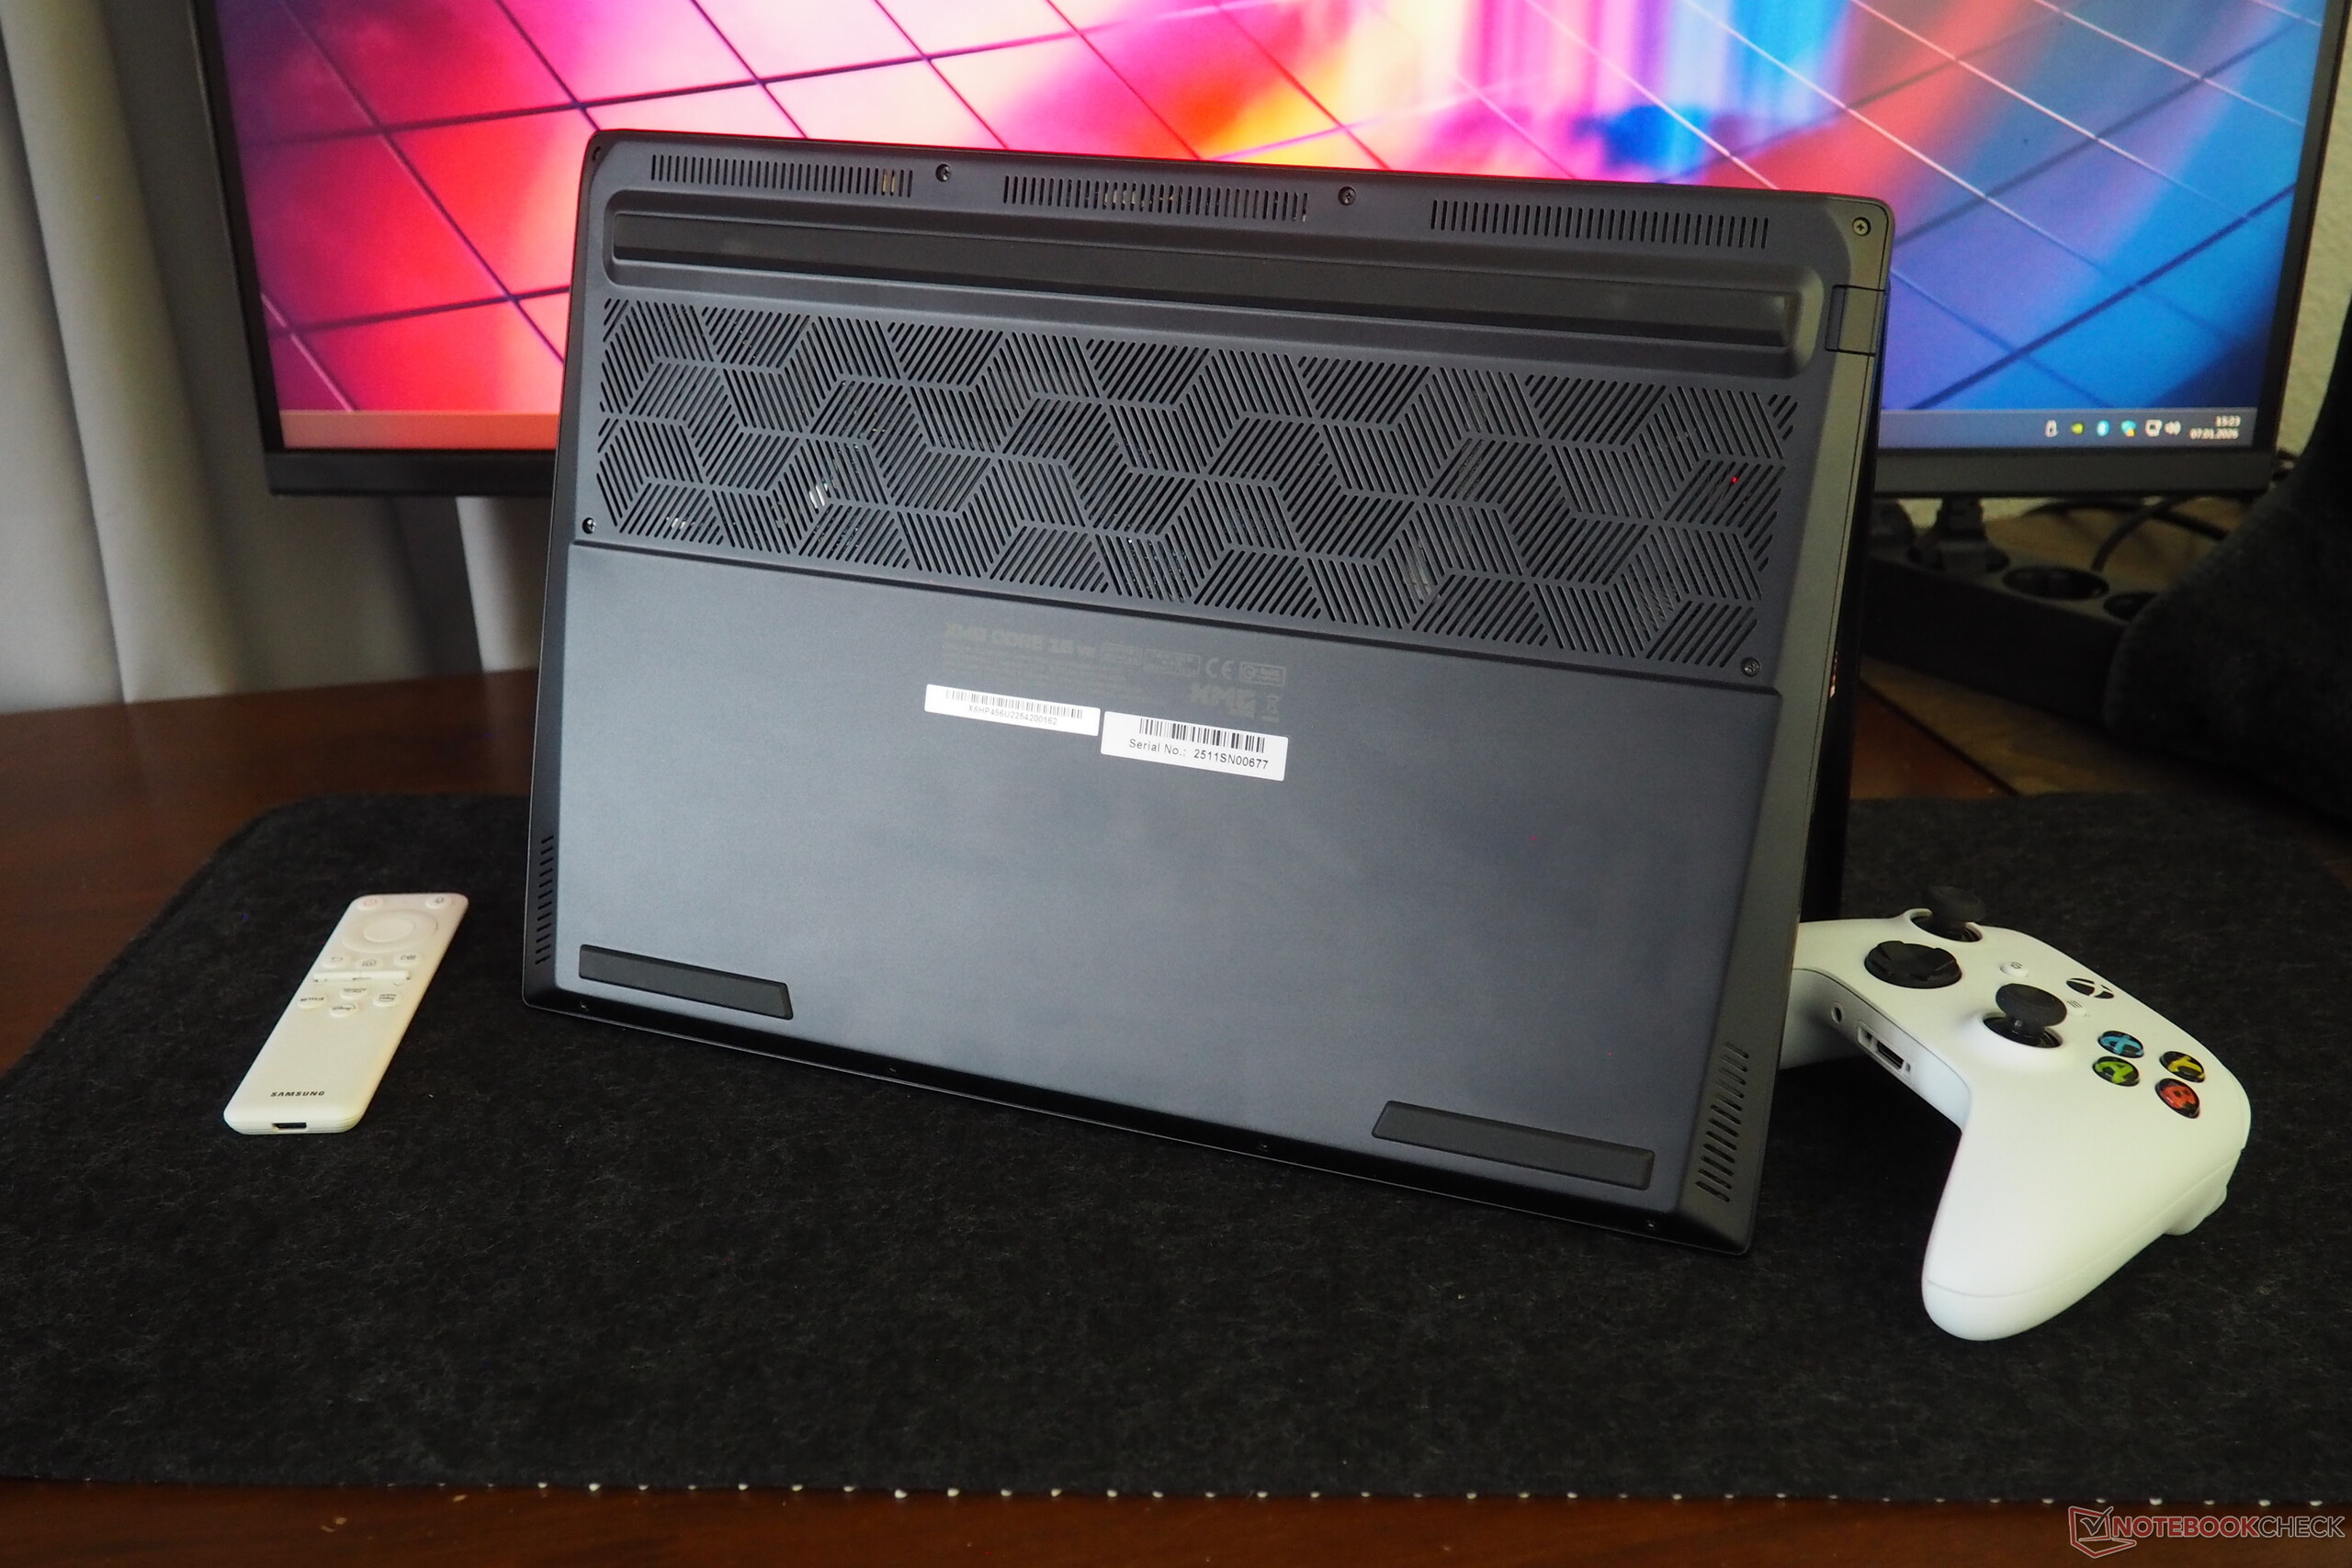
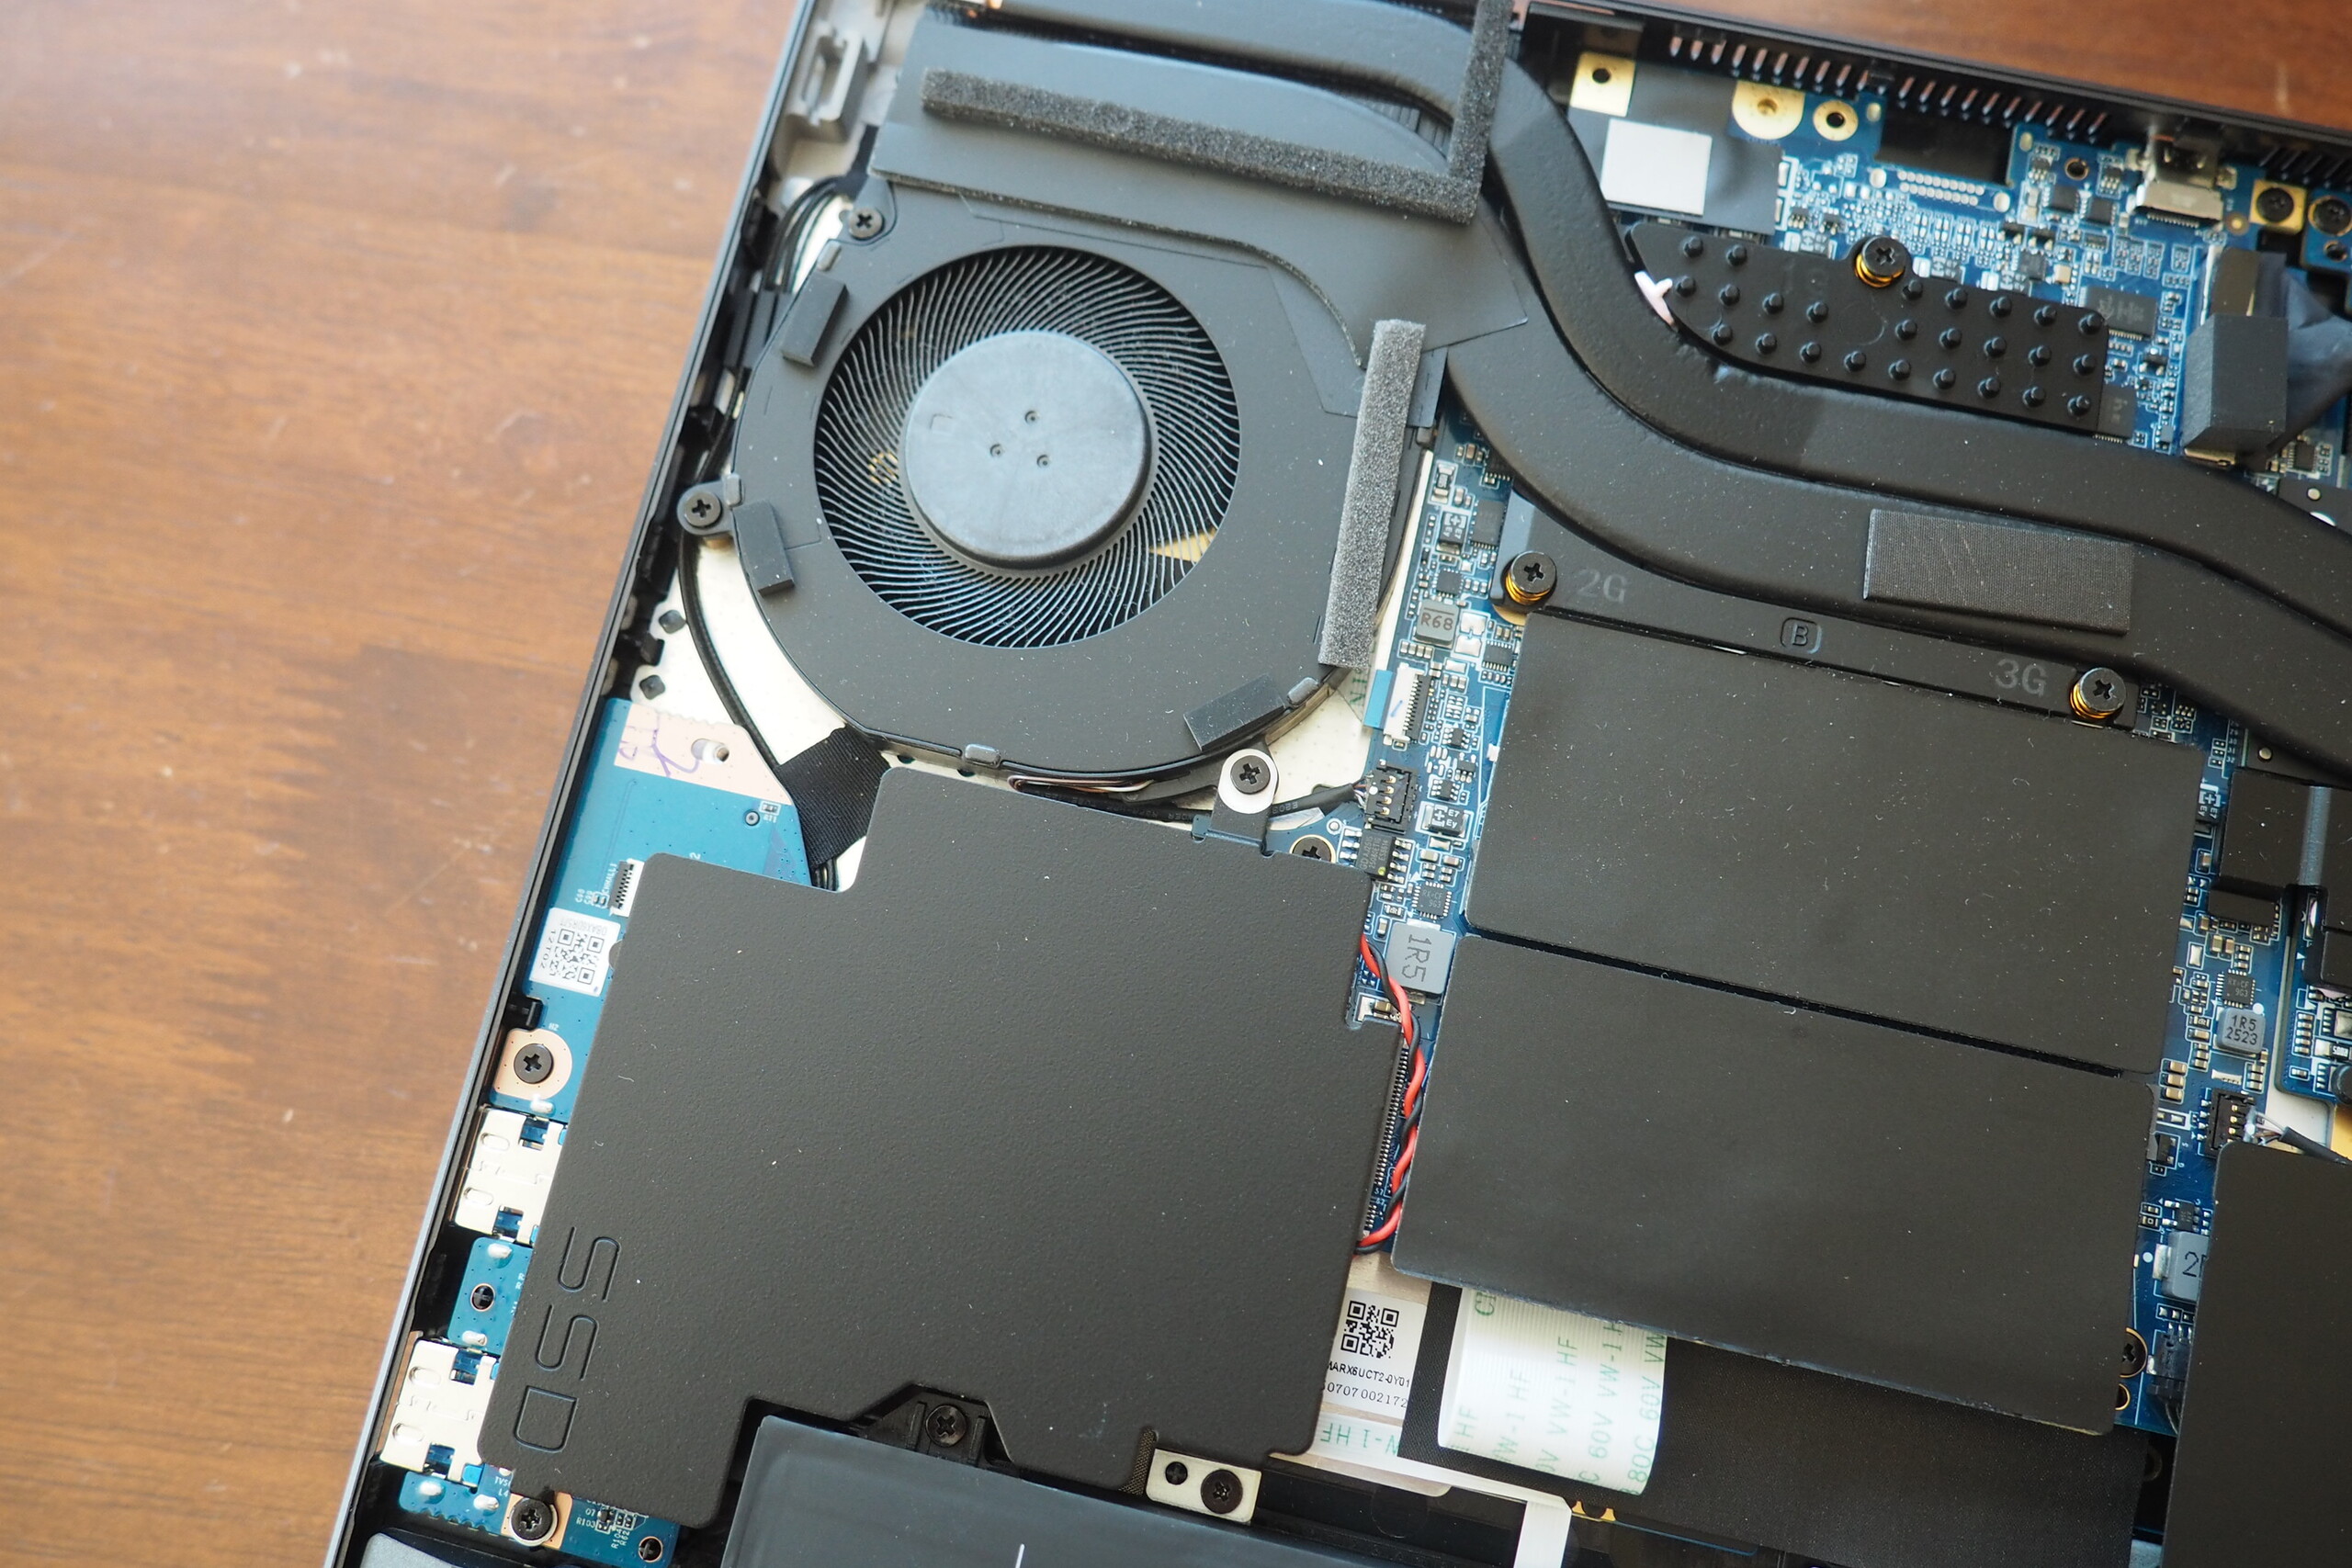
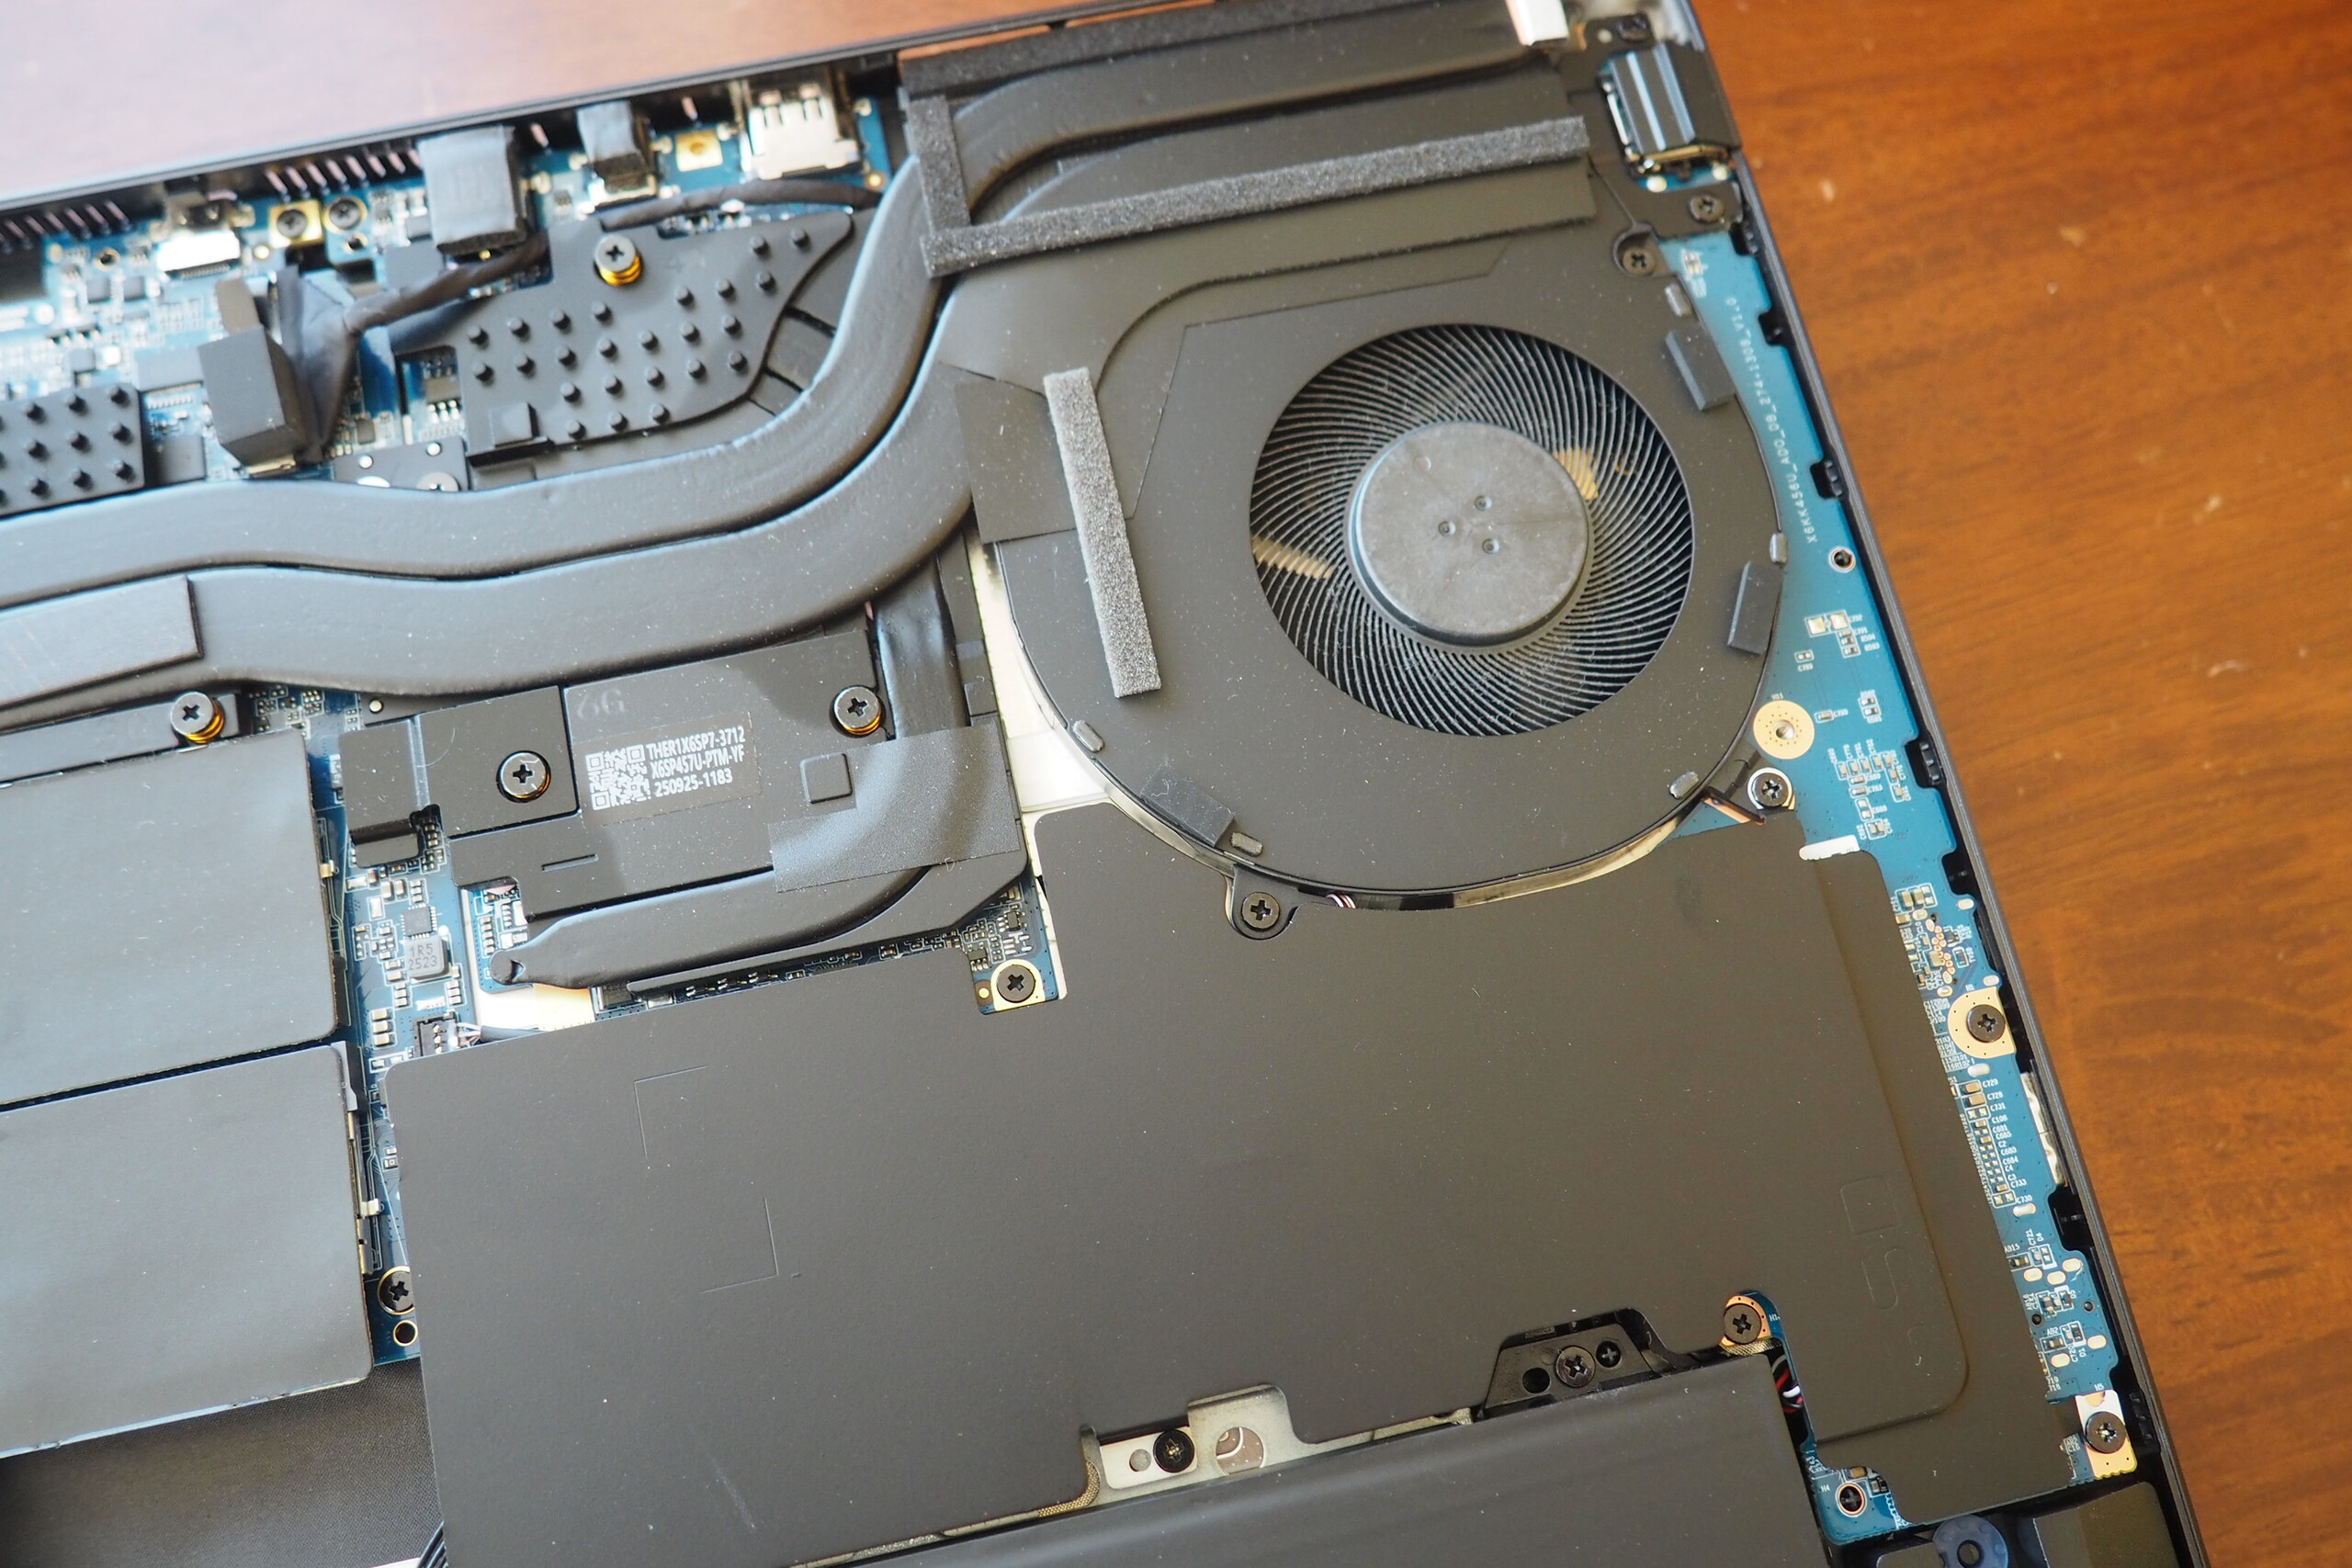
The MediaTek Wi-Fi module delivers decent upload speeds and very good download speeds. Next is the FHD webcam, which delivers fairly sharp images by laptop standards and includes a physical privacy shutter. Accessing the internals is easy after removing 10 Phillips-head screws; photos of the internals can be found below.


SD Card Reader
| SD Card Reader - average JPG Copy Test (av. of 3 runs) | |
| Schenker XMG Core 16 VE M25 (AV PRO microSD 128 GB V60) | |
| Schenker XMG Core 16 M25 (Angelbird AV Pro V60) | |
| Average of class Gaming (20.9 - 210, n=54, last 2 years) | |
| Lenovo Legion 7 16IAX10 (Toshiba Exceria Pro SDXC 64 GB UHS-II) | |
| Acer Predator Helios Neo 16S AI PHN16S-71-94L9 (AV PRO microSD 128 GB V60) | |
Communication
Webcam


Maintenance

Input devices
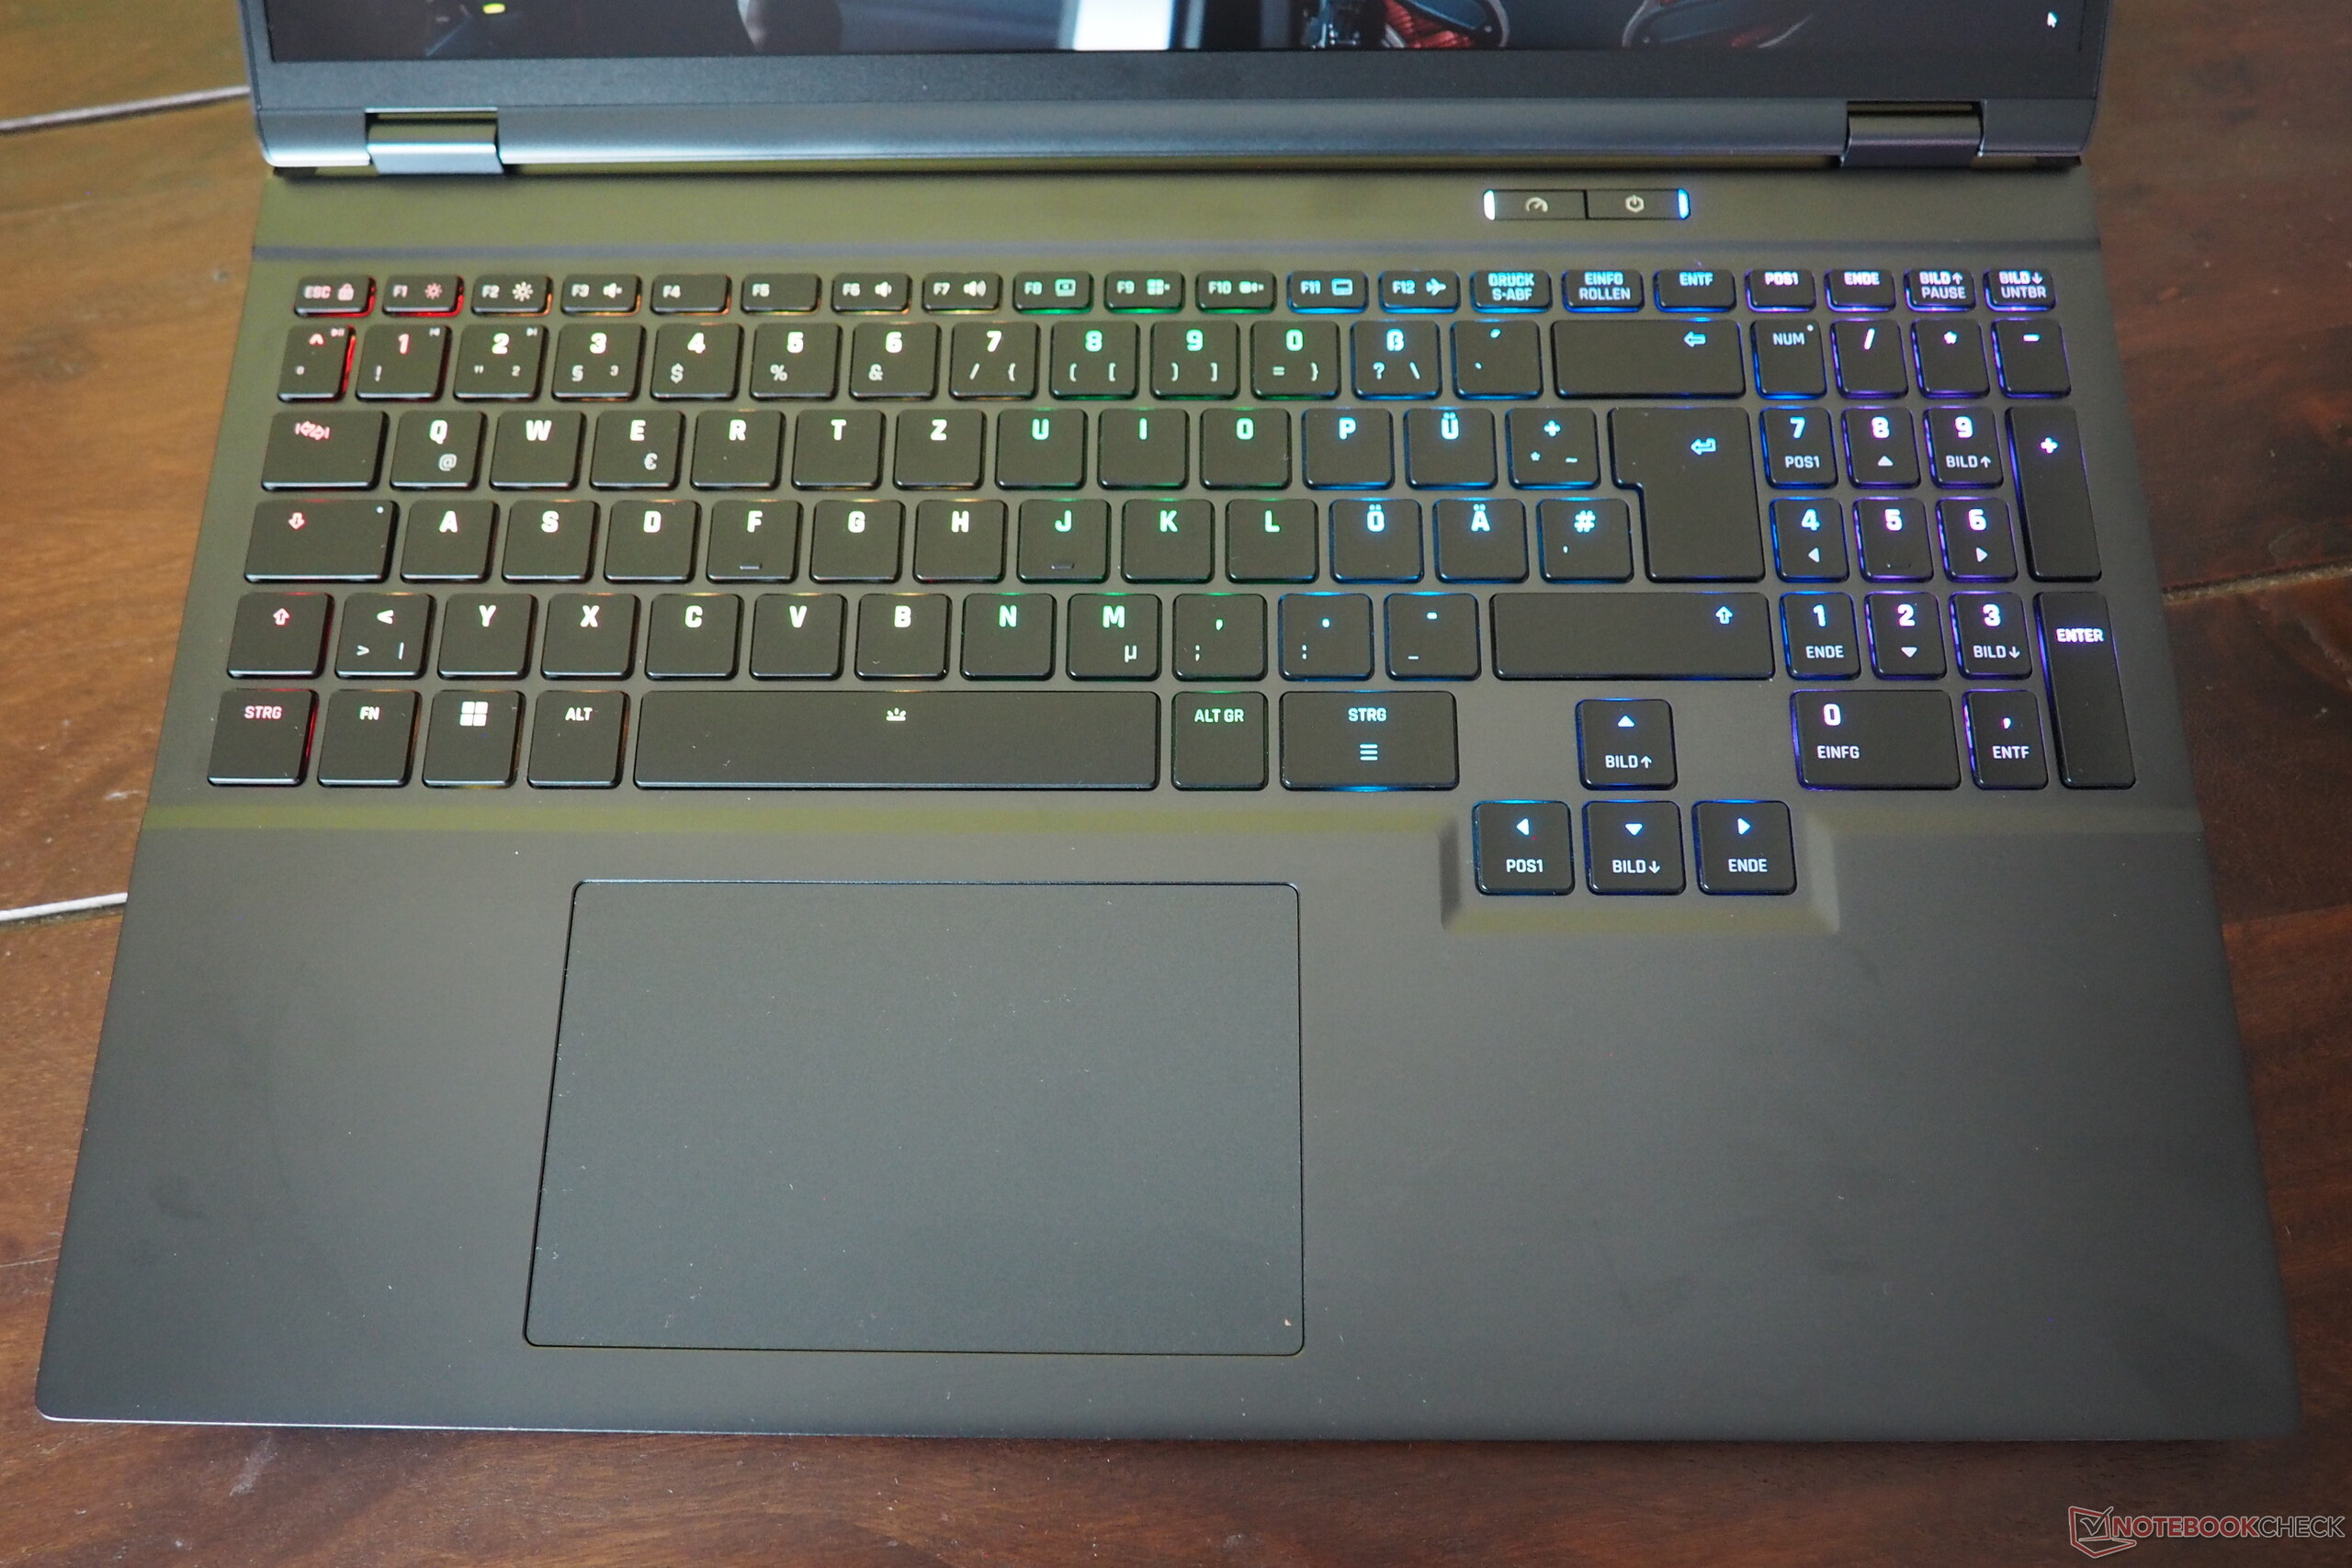
For a rubber-dome keyboard, the typing feel is relatively good. We were particularly impressed by the layout, which features full-size arrow keys and a well-executed key arrangement that largely follows standard conventions. Of course, RGB backlighting is included as well.
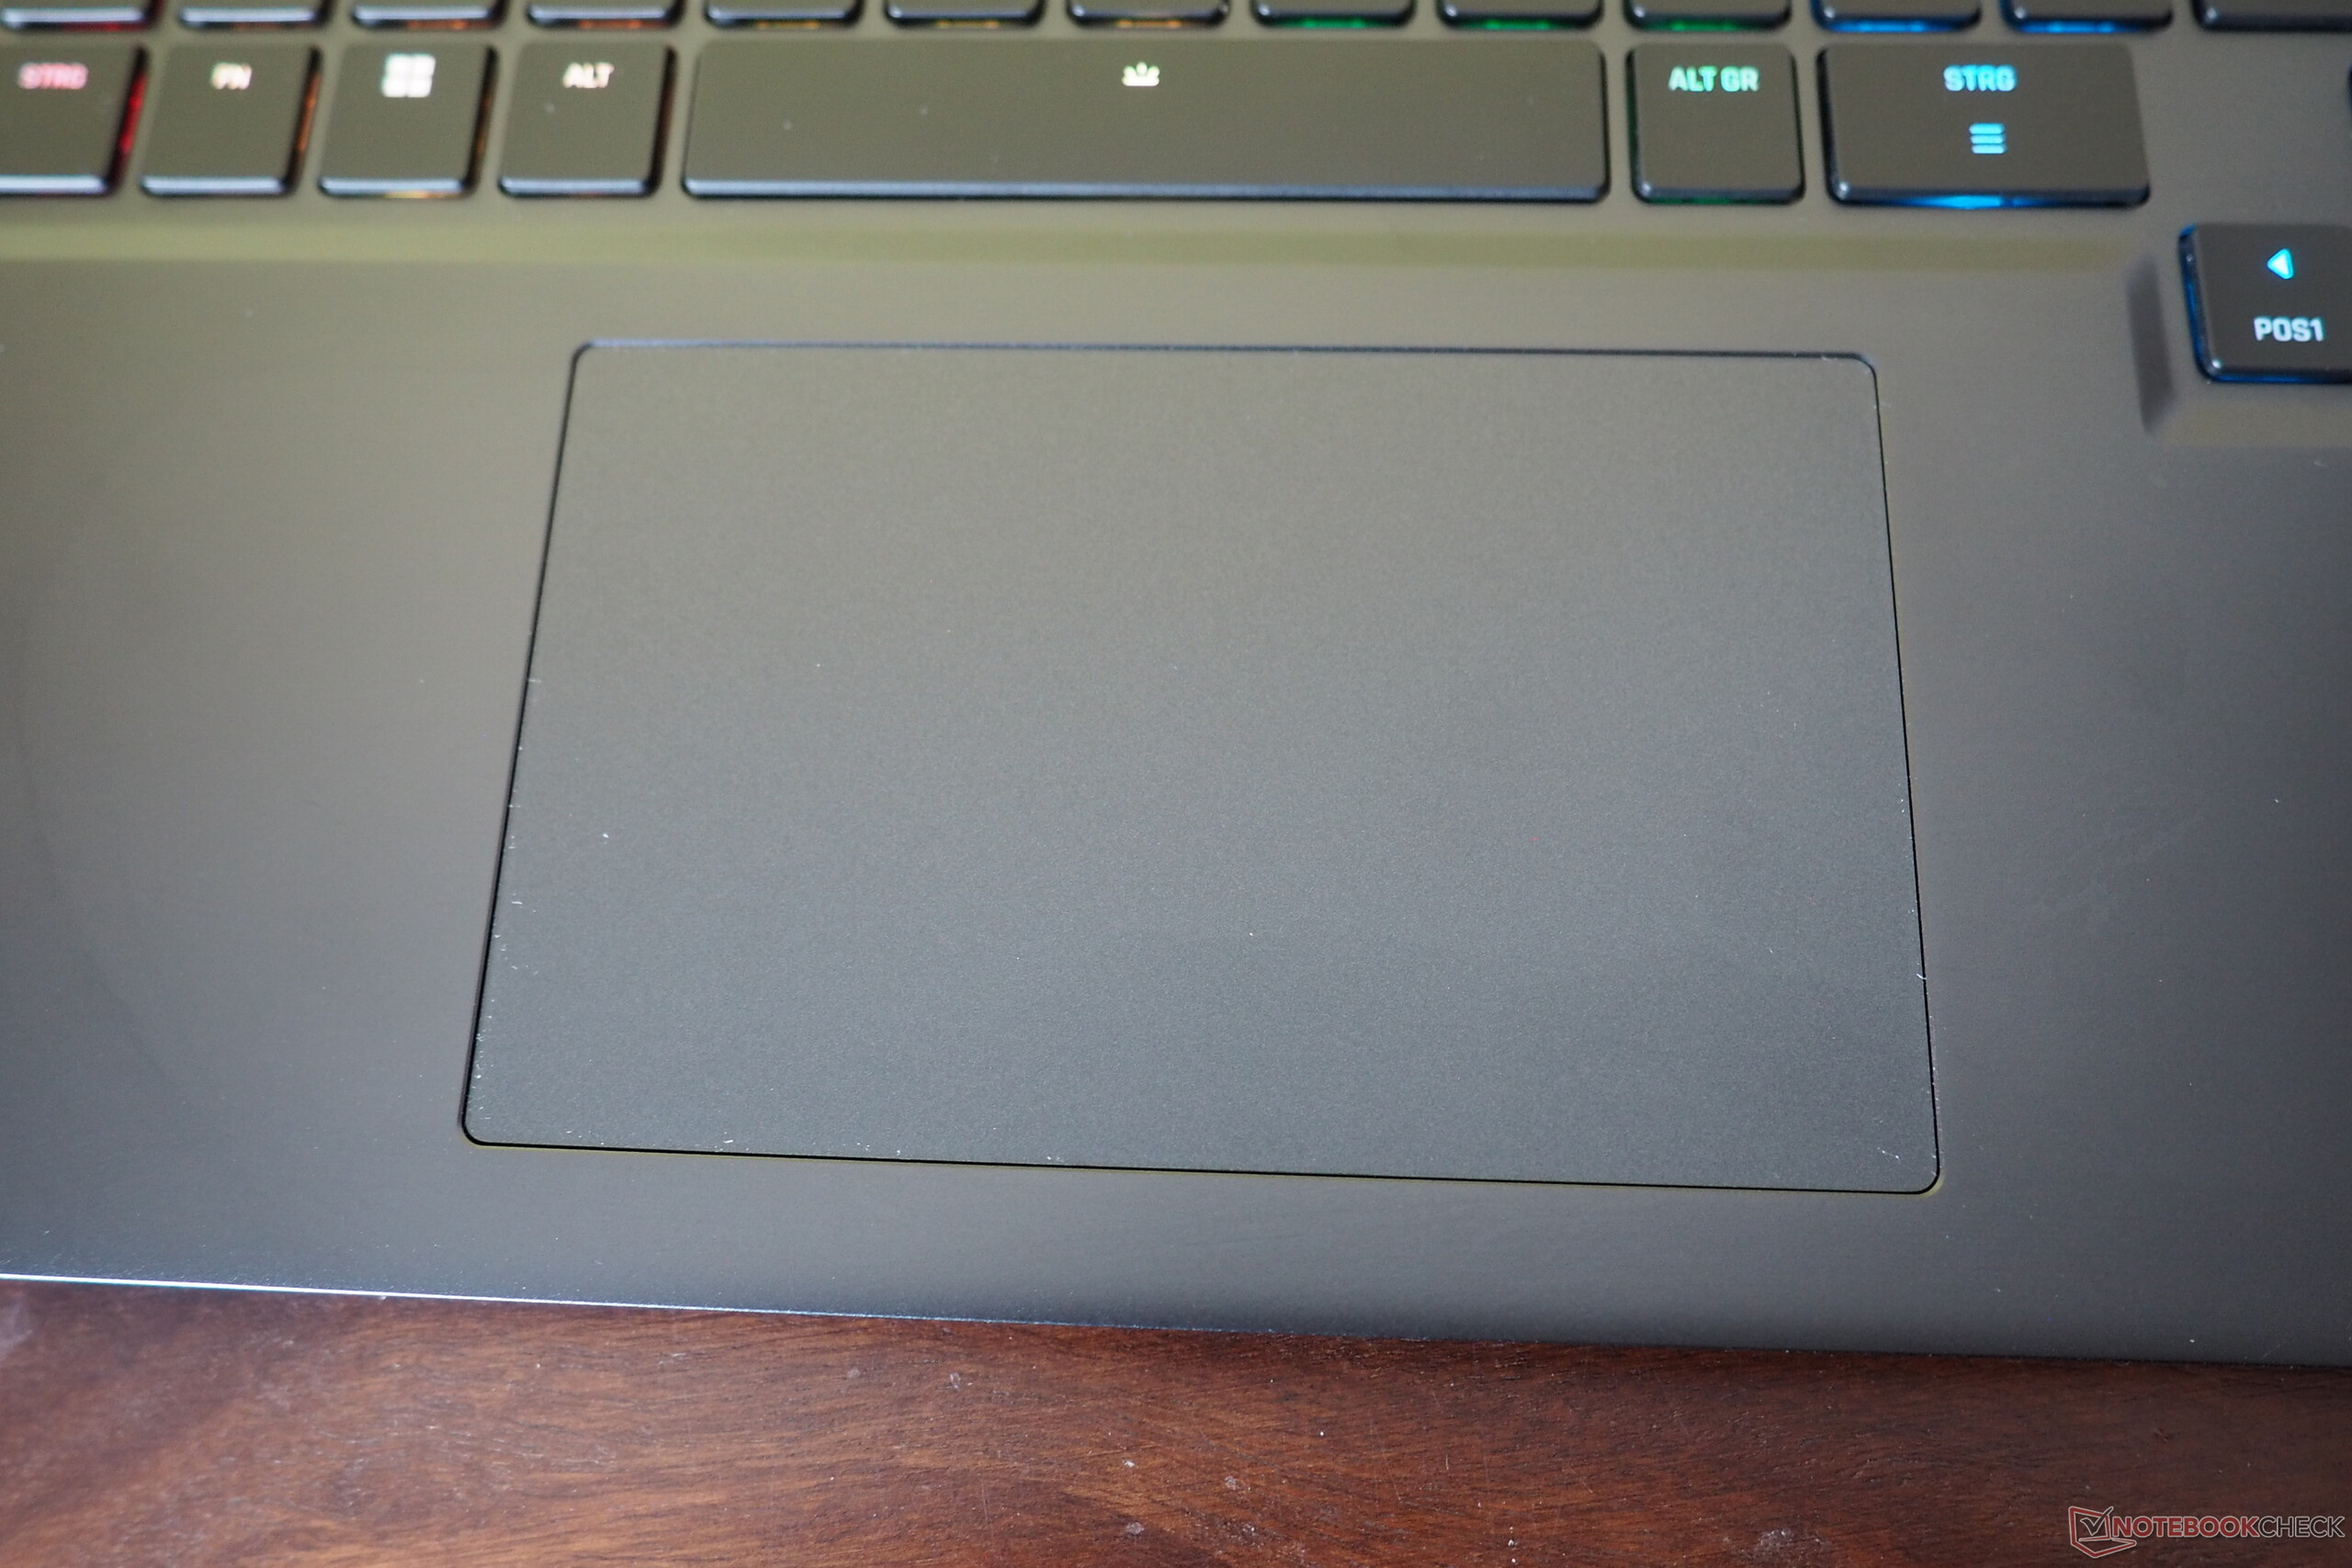
The touchpad measures roughly 12.3 × 7.6 cm, which is appropriate for a laptop of this size. One minor drawback: the click zones are quite loud and feel a bit rattly.

Display
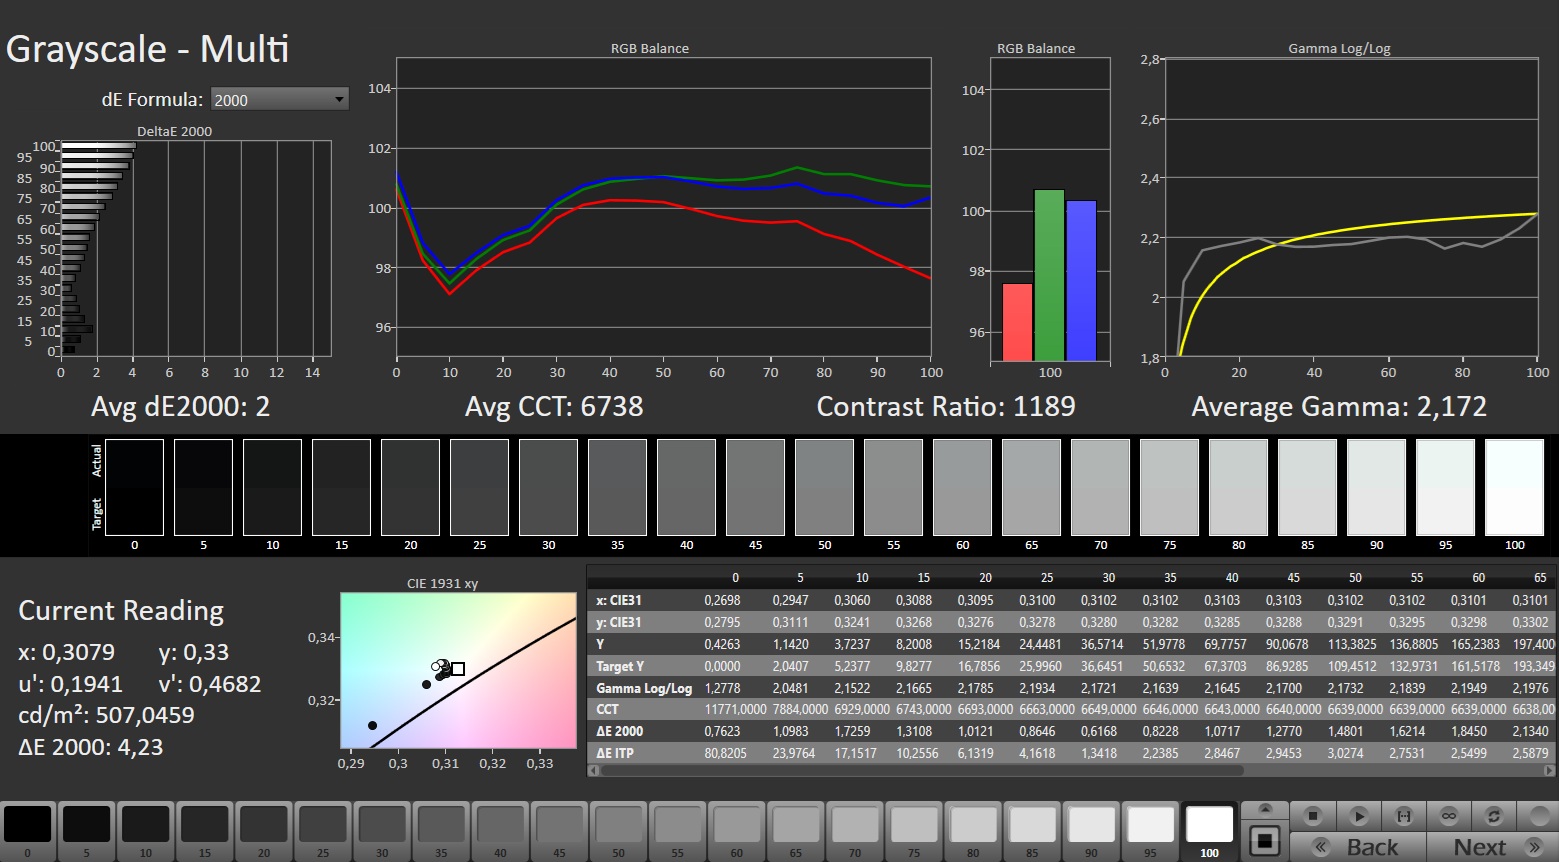
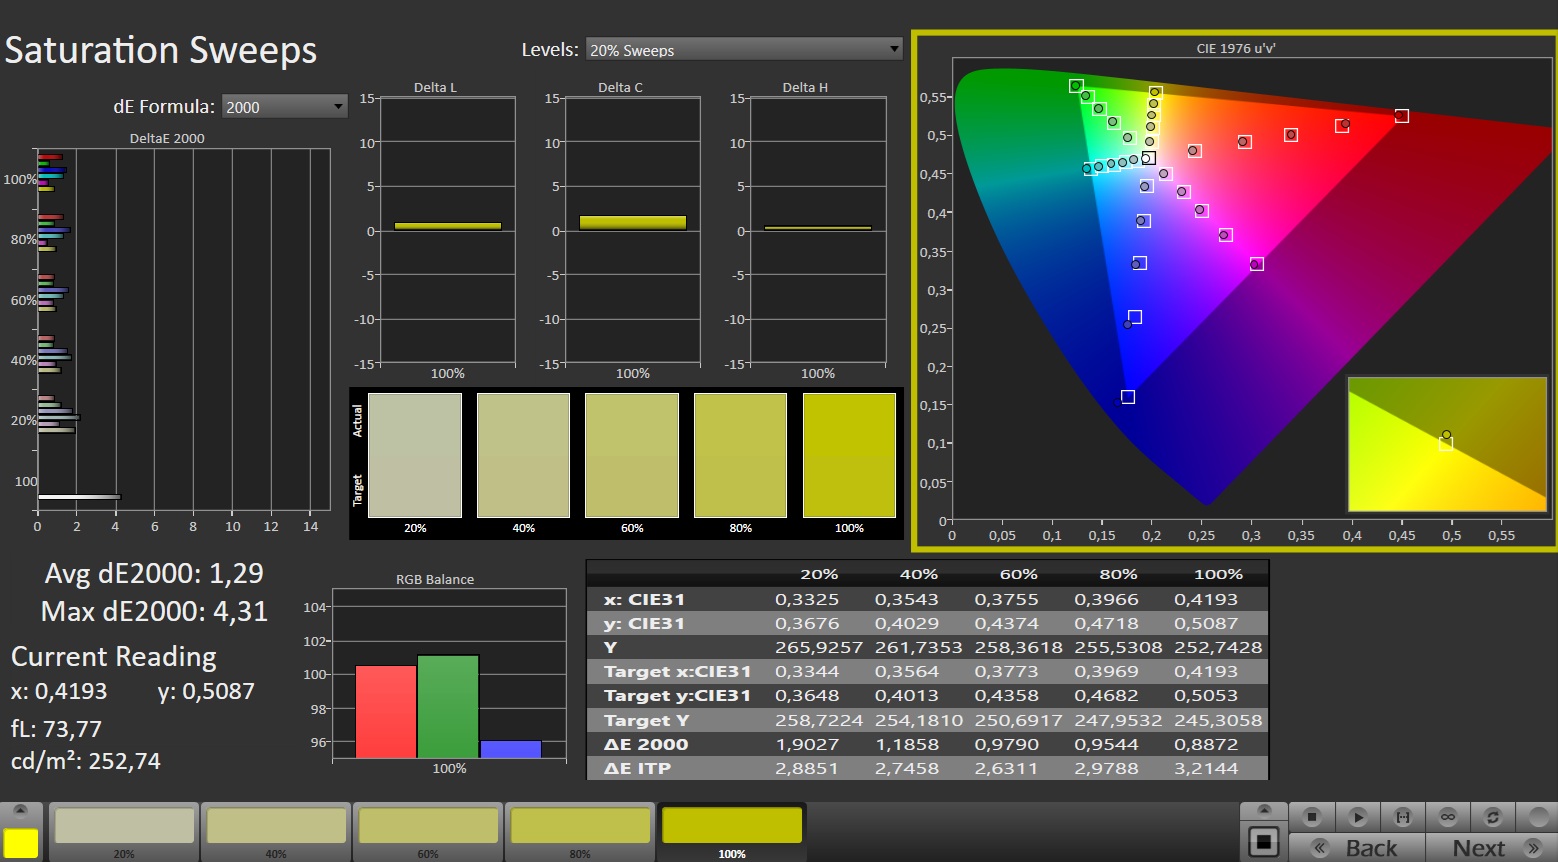
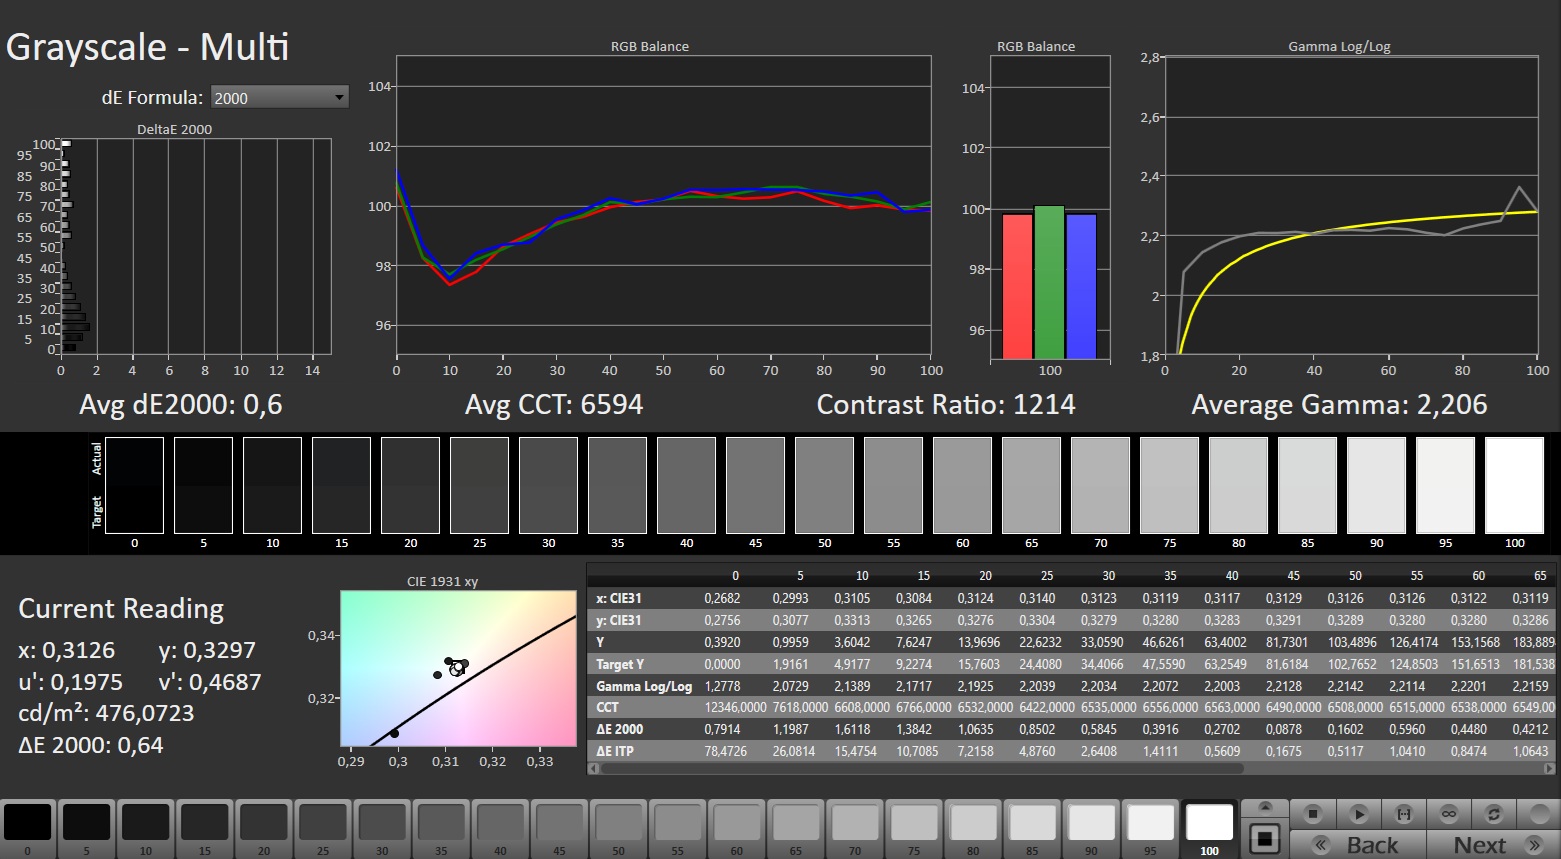
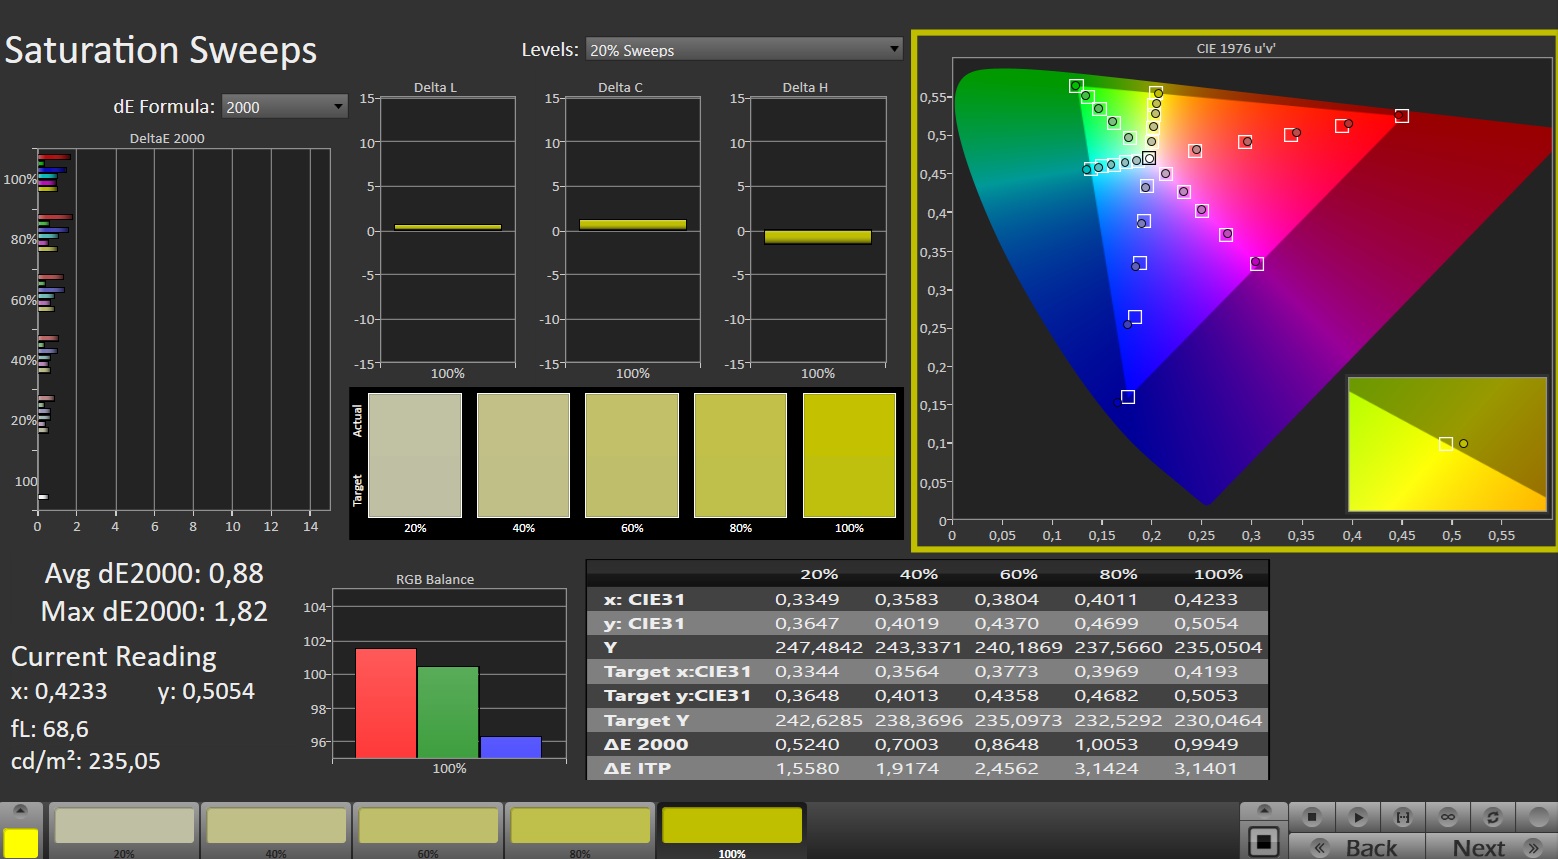
Schenker does without OLED and relies on a classic IPS panel, which is particularly pleasing in terms of brightness. An average of 488 cd/m² is pretty good and allows for outdoor use if required. 2б560 x 1,600 pixels and 180 Hz should also satisfy most buyers. The black level and contrast are based on the typical IPS level. The color space (full sRGB coverage) and viewing angles are similar. There is also little to complain about in terms of response time.
| |||||||||||||||||||||||||
Brightness Distribution: 95 %
Center on Battery: 490 cd/m²
Contrast: 1167:1 (Black: 0.42 cd/m²)
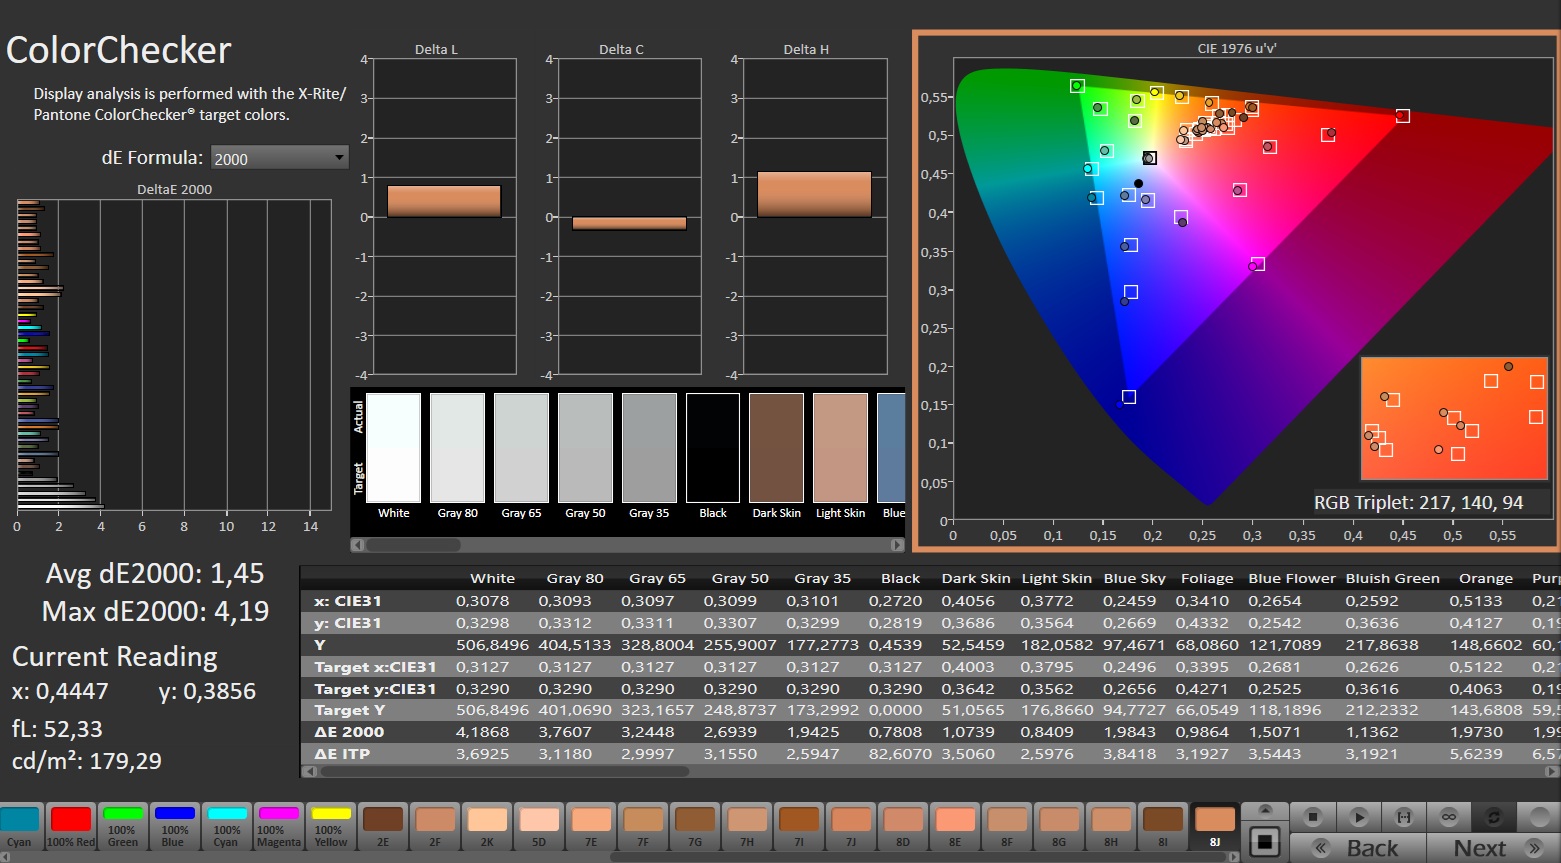
ΔE ColorChecker Calman: 1.45 | ∀{0.5-29.43 Ø4.72}
calibrated: 0.98
ΔE Greyscale Calman: 2 | ∀{0.09-98 Ø4.97}
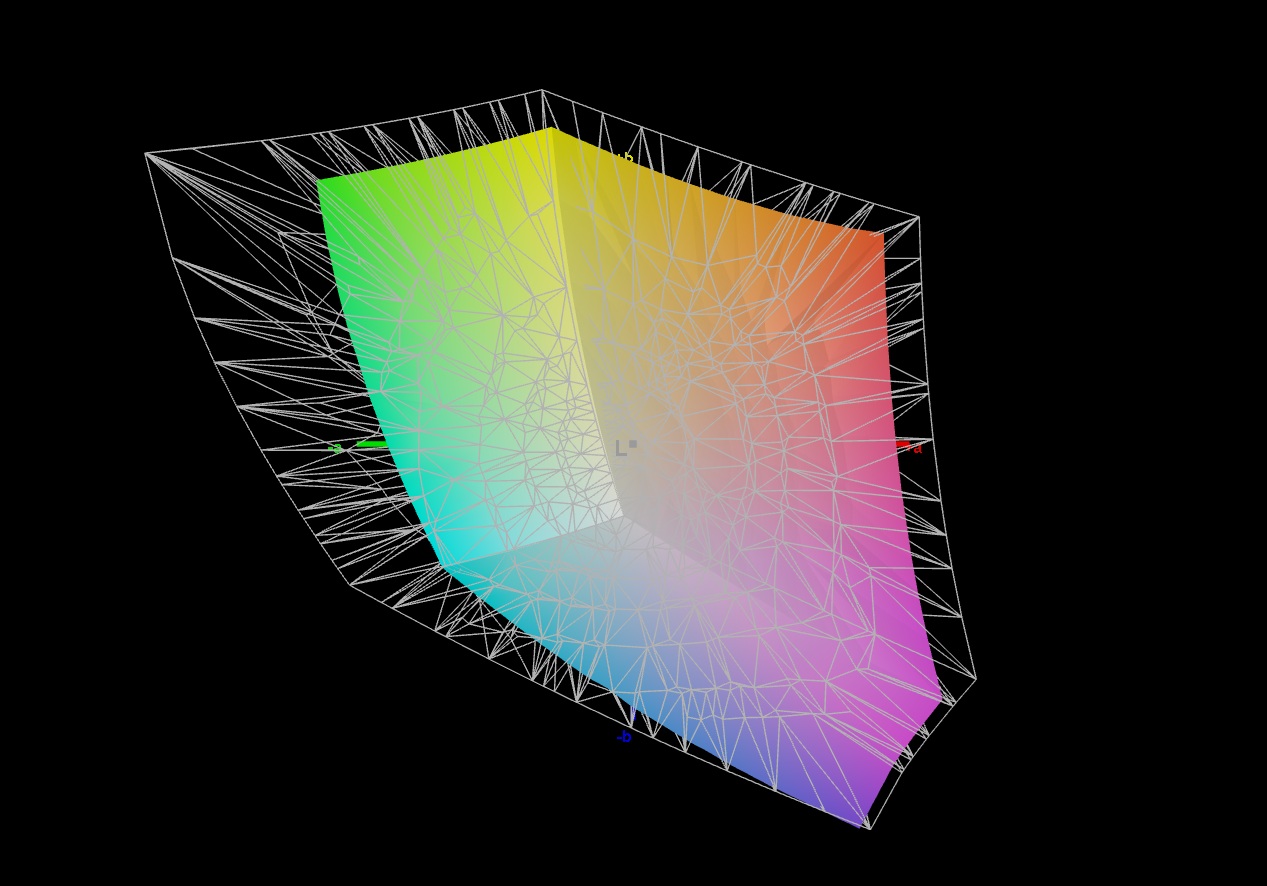
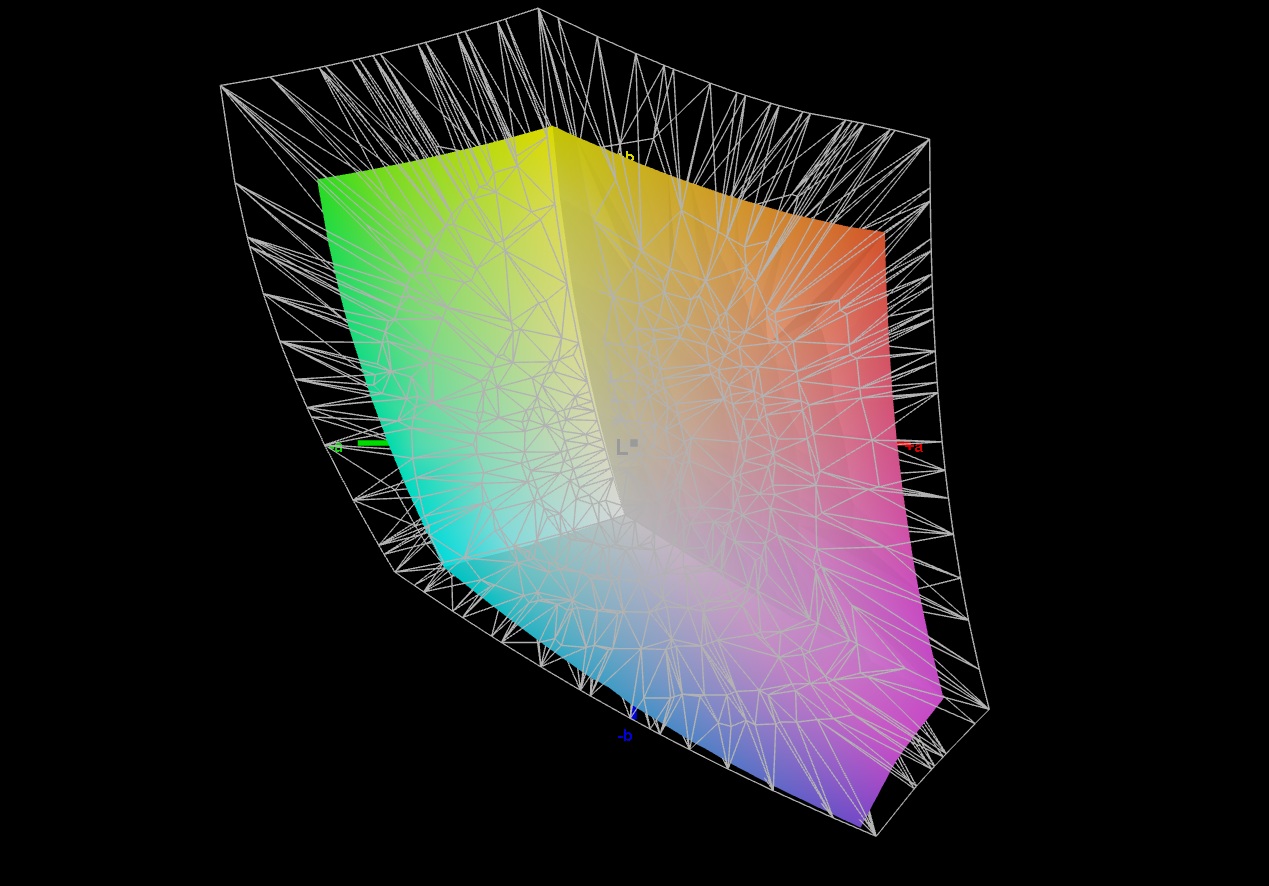
71.4% AdobeRGB 1998 (Argyll 3D)
98.7% sRGB (Argyll 3D)
69% Display P3 (Argyll 3D)
Gamma: 2.172
CCT: 6738 K
| Schenker XMG Core 16 VE M25 MNG007DA5-4, IPS, 2560x1600, 16", 180 Hz | Tulpar T6 V3.5 B160UANAC.J (AUO33B7), IPS, 1920x1200, 16", 165 Hz | HP Omen 16-ap0091ng AUODBB2, IPS, 1920x1200, 16", 144 Hz | Lenovo Legion 7 16IAX10 Samsung ATNA60HS01-0, OLED, 2560x1600, 16", 165 Hz | Schenker XMG Core 16 M25 MNG007DA6-4, IPS, 2560x1600, 16", 300 Hz | Acer Predator Helios Neo 16S AI PHN16S-71-94L9 Samsung ATNA60DL03-0, OLED, 2560x1600, 16", 240 Hz | |
|---|---|---|---|---|---|---|
| Display | -1% | -43% | 25% | 23% | 27% | |
| Display P3 Coverage (%) | 69 | 68.6 -1% | 40 -42% | 99.6 44% | 98.8 43% | 99.9 45% |
| sRGB Coverage (%) | 98.7 | 98.7 0% | 58.1 -41% | 100 1% | 100 1% | 100 1% |
| AdobeRGB 1998 Coverage (%) | 71.4 | 70.6 -1% | 38.7 -46% | 93.5 31% | 88.4 24% | 96.5 35% |
| Response Times | -32% | -208% | 90% | 7% | 97% | |
| Response Time Grey 50% / Grey 80% * (ms) | 12.1 ? | 12.4 ? -2% | 27.6 ? -128% | 0.6 ? 95% | 10.7 ? 12% | 0.2 ? 98% |
| Response Time Black / White * (ms) | 5 ? | 8.1 ? -62% | 19.4 ? -288% | 0.8 ? 84% | 4.9 ? 2% | 0.25 ? 95% |
| PWM Frequency (Hz) | 1317 ? | 960 | ||||
| PWM Amplitude * (%) | 23 | 50 | ||||
| Screen | -33% | -100% | -12% | -12% | 86% | |
| Brightness middle (cd/m²) | 490 | 456 -7% | 328 -33% | 477.6 -3% | 512 4% | 390 -20% |
| Brightness (cd/m²) | 488 | 403 -17% | 313 -36% | 483 -1% | 483 -1% | 394 -19% |
| Brightness Distribution (%) | 95 | 79 -17% | 91 -4% | 95 0% | 91 -4% | 98 3% |
| Black Level * (cd/m²) | 0.42 | 0.39 7% | 0.26 38% | 0.43 -2% | 0.04 90% | |
| Contrast (:1) | 1167 | 1169 0% | 1262 8% | 1191 2% | 9750 735% | |
| Colorchecker dE 2000 * | 1.45 | 3.05 -110% | 4.73 -226% | 3.11 -114% | 2.4 -66% | 1.61 -11% |
| Colorchecker dE 2000 max. * | 4.19 | 6.56 -57% | 17.47 -317% | 5.99 -43% | 3.8 9% | 3.49 17% |
| Colorchecker dE 2000 calibrated * | 0.98 | 1.03 -5% | 4.22 -331% | 0.79 19% | 0.9 8% | 1.59 -62% |
| Greyscale dE 2000 * | 2 | 3.9 -95% | 2.05 -2% | 0.9 55% | 3.1 -55% | 1.2 40% |
| Gamma | 2.172 101% | 2.279 97% | 2.63 84% | 2.18 101% | 2.41 91% | 2.235 98% |
| CCT | 6738 96% | 7198 90% | 6718 97% | 6405 101% | 6534 99% | 6580 99% |
| Total Average (Program / Settings) | -22% /
-26% | -117% /
-103% | 34% /
14% | 6% /
-2% | 70% /
75% |
* ... smaller is better


Screen Flickering / PWM (Pulse-Width Modulation)
| Screen flickering / PWM not detected |  | ||
In comparison: 52 % of all tested devices do not use PWM to dim the display. If PWM was detected, an average of 7747 (minimum: 5 - maximum: 343500) Hz was measured. | |||
Display Response Times
| ↔ Response Time Black to White | ||
|---|---|---|
| 5 ms ... rise ↗ and fall ↘ combined | ↗ 1.8 ms rise | 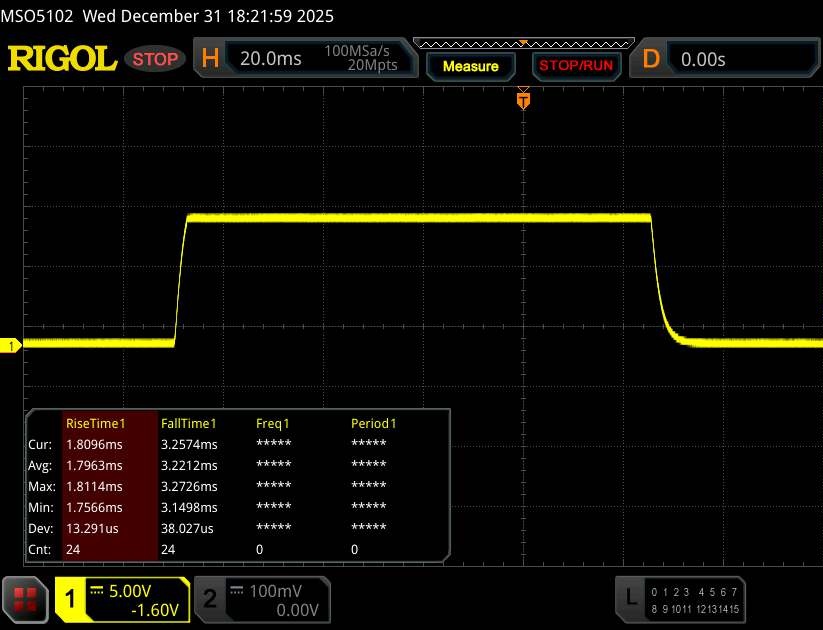 |
| ↘ 3.2 ms fall | ||
| The screen shows very fast response rates in our tests and should be very well suited for fast-paced gaming. In comparison, all tested devices range from 0.1 (minimum) to 240 (maximum) ms. » 18 % of all devices are better. This means that the measured response time is better than the average of all tested devices (19.8 ms). | ||
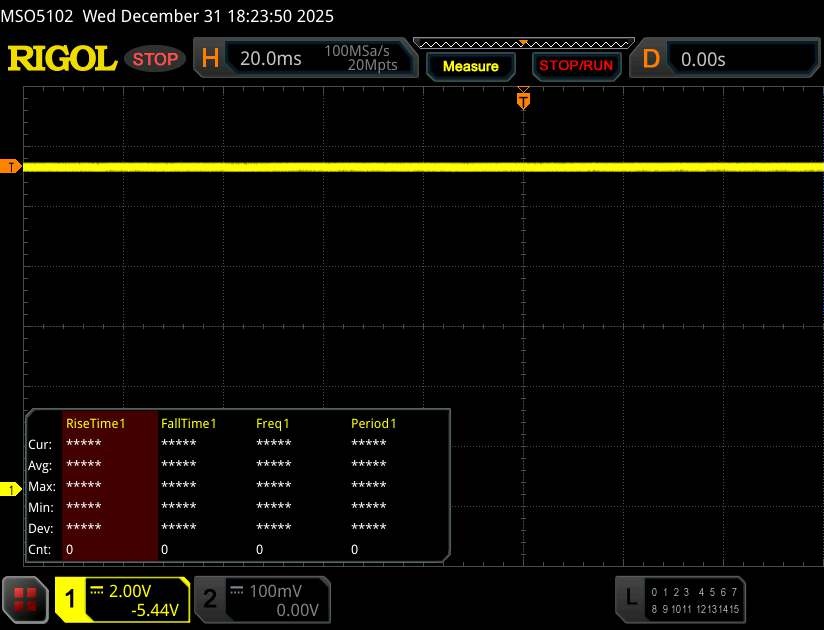
| ↔ Response Time 50% Grey to 80% Grey | ||
| 12.1 ms ... rise ↗ and fall ↘ combined | ↗ 5.9 ms rise |  |
| ↘ 6.2 ms fall | ||
| The screen shows good response rates in our tests, but may be too slow for competitive gamers. In comparison, all tested devices range from 0.165 (minimum) to 636 (maximum) ms. » 26 % of all devices are better. This means that the measured response time is better than the average of all tested devices (31 ms). | ||

Performance
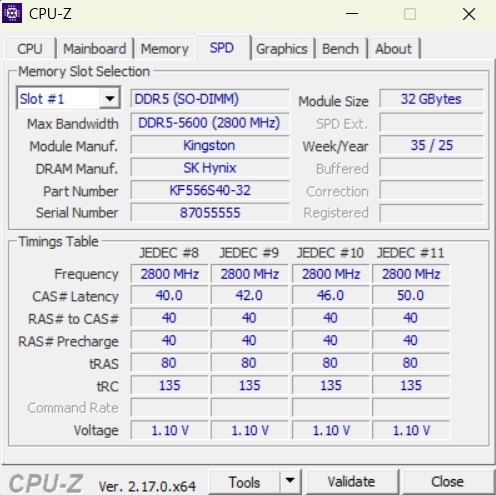
In terms of CPU and GPU performance, the XMG Core 16 VE falls into the mid-range. Two SO-DIMM slots and two M.2 slots make future upgrades easier.
Test conditions
In the Control Center, users can choose between three different modes (see the table for details). With the exception of the battery test, all measurements were taken in the “Normal” Overboost mode without GPU overclocking.
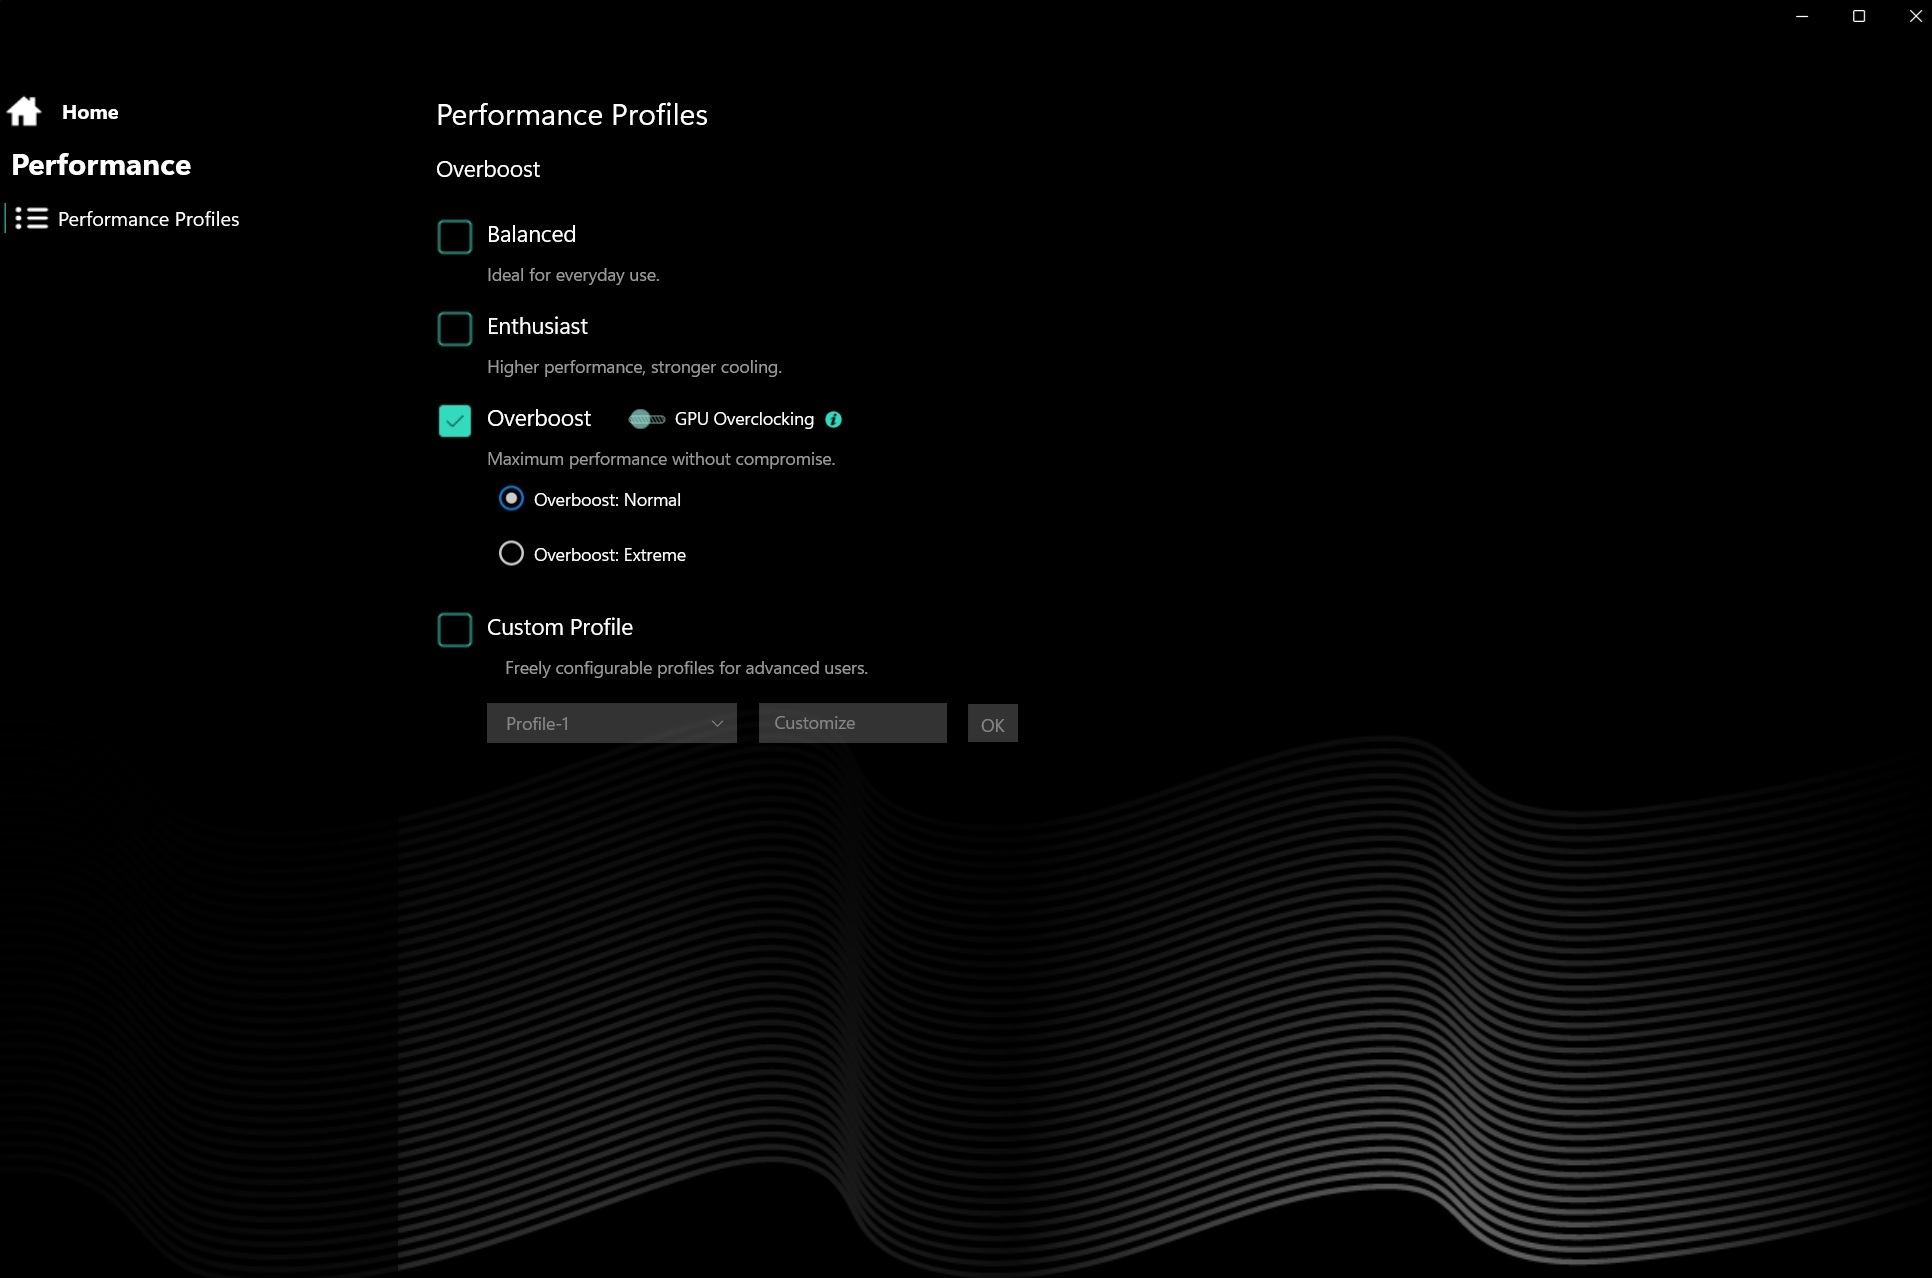
| Mode | Balanced | Enthusiast | Overboost |
| Cyberpunk 2077 Noise | 33 dB(A) | 46 dB(A) | 49 dB(A) |
| Cyberpunk 2077 Framerate (FHD/Ultra) | 35.4 fps | 78.6 fps | 85 fps |
| GPU Power Draw | ~30 W | ~80 W | ~110 W |
| CPU PL1 | 45 W | 54 W | 70 W |
| CPU PL2 | 65 W | 65 W | 105 W |
| Cinebench R15 Multi Score | 2075 Points | 2670 Points | 2815 Points |
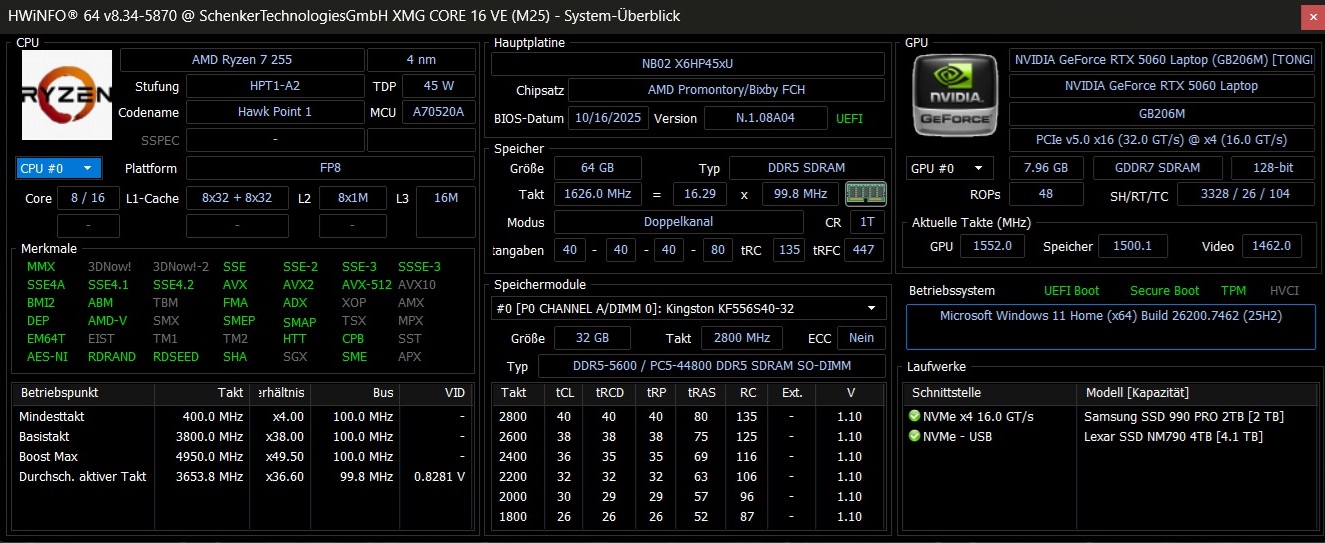
Processor
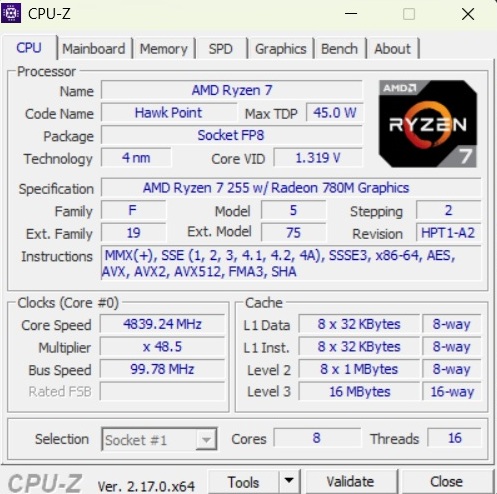
The Ryzen 7 255 is still rarely found in laptops. Built on a 4 nm process, the chip offers eight cores and can handle up to 16 threads. Unlike the Core i7-14700HX in the Tulpar T6 V3.5, performance remains consistent even under prolonged load - although it still falls short of processors such as the Core Ultra 7 255HX, Core Ultra 9 275HX, Ryzen 9 8940HX and Ryzen AI 9 HX 370.
Cinebench R15 Multi endurance test
* ... smaller is better
AIDA64: FP32 Ray-Trace | FPU Julia | CPU SHA3 | CPU Queen | FPU SinJulia | FPU Mandel | CPU AES | CPU ZLib | FP64 Ray-Trace | CPU PhotoWorxx
| Performance rating | |
| HP Omen 16-ap0091ng | |
| Schenker XMG Core 16 M25 | |
| Lenovo Legion 7 16IAX10 | |
| Acer Predator Helios Neo 16S AI PHN16S-71-94L9 | |
| Average of class Gaming | |
| Schenker XMG Core 16 VE M25 | |
| Average AMD Ryzen 7 255 | |
| Tulpar T6 V3.5 | |
| AIDA64 / FP32 Ray-Trace | |
| HP Omen 16-ap0091ng | |
| Schenker XMG Core 16 M25 | |
| Average of class Gaming (10227 - 85542, n=103, last 2 years) | |
| Lenovo Legion 7 16IAX10 | |
| Schenker XMG Core 16 VE M25 | |
| Acer Predator Helios Neo 16S AI PHN16S-71-94L9 | |
| Average AMD Ryzen 7 255 (27202 - 28101, n=2) | |
| Tulpar T6 V3.5 | |
| AIDA64 / FPU Julia | |
| HP Omen 16-ap0091ng | |
| Lenovo Legion 7 16IAX10 | |
| Schenker XMG Core 16 M25 | |
| Acer Predator Helios Neo 16S AI PHN16S-71-94L9 | |
| Average of class Gaming (51376 - 238426, n=103, last 2 years) | |
| Schenker XMG Core 16 VE M25 | |
| Average AMD Ryzen 7 255 (110760 - 114847, n=2) | |
| Tulpar T6 V3.5 | |
| AIDA64 / CPU SHA3 | |
| HP Omen 16-ap0091ng | |
| Lenovo Legion 7 16IAX10 | |
| Acer Predator Helios Neo 16S AI PHN16S-71-94L9 | |
| Average of class Gaming (2180 - 9817, n=103, last 2 years) | |
| Schenker XMG Core 16 M25 | |
| Schenker XMG Core 16 VE M25 | |
| Average AMD Ryzen 7 255 (4831 - 5045, n=2) | |
| Tulpar T6 V3.5 | |
| AIDA64 / CPU Queen | |
| HP Omen 16-ap0091ng | |
| Lenovo Legion 7 16IAX10 | |
| Tulpar T6 V3.5 | |
| Schenker XMG Core 16 VE M25 | |
| Acer Predator Helios Neo 16S AI PHN16S-71-94L9 | |
| Average AMD Ryzen 7 255 (118448 - 124528, n=2) | |
| Average of class Gaming (49785 - 173351, n=89, last 2 years) | |
| Schenker XMG Core 16 M25 | |
| AIDA64 / FPU SinJulia | |
| HP Omen 16-ap0091ng | |
| Schenker XMG Core 16 M25 | |
| Schenker XMG Core 16 VE M25 | |
| Average AMD Ryzen 7 255 (15213 - 15342, n=2) | |
| Average of class Gaming (4424 - 33636, n=103, last 2 years) | |
| Lenovo Legion 7 16IAX10 | |
| Acer Predator Helios Neo 16S AI PHN16S-71-94L9 | |
| Tulpar T6 V3.5 | |
| AIDA64 / FPU Mandel | |
| HP Omen 16-ap0091ng | |
| Schenker XMG Core 16 M25 | |
| Lenovo Legion 7 16IAX10 | |
| Acer Predator Helios Neo 16S AI PHN16S-71-94L9 | |
| Average of class Gaming (25115 - 128721, n=103, last 2 years) | |
| Schenker XMG Core 16 VE M25 | |
| Average AMD Ryzen 7 255 (59408 - 61675, n=2) | |
| Tulpar T6 V3.5 | |
| AIDA64 / CPU AES | |
| HP Omen 16-ap0091ng | |
| Schenker XMG Core 16 M25 | |
| Lenovo Legion 7 16IAX10 | |
| Average of class Gaming (39258 - 247074, n=103, last 2 years) | |
| Acer Predator Helios Neo 16S AI PHN16S-71-94L9 | |
| Schenker XMG Core 16 VE M25 | |
| Average AMD Ryzen 7 255 (88405 - 90655, n=2) | |
| Tulpar T6 V3.5 | |
| AIDA64 / CPU ZLib | |
| Lenovo Legion 7 16IAX10 | |
| HP Omen 16-ap0091ng | |
| Acer Predator Helios Neo 16S AI PHN16S-71-94L9 | |
| Average of class Gaming (574 - 2531, n=103, last 2 years) | |
| Schenker XMG Core 16 M25 | |
| Schenker XMG Core 16 VE M25 | |
| Average AMD Ryzen 7 255 (1088 - 1134, n=2) | |
| Tulpar T6 V3.5 | |
| AIDA64 / FP64 Ray-Trace | |
| HP Omen 16-ap0091ng | |
| Schenker XMG Core 16 M25 | |
| Average of class Gaming (5509 - 45446, n=103, last 2 years) | |
| Lenovo Legion 7 16IAX10 | |
| Acer Predator Helios Neo 16S AI PHN16S-71-94L9 | |
| Schenker XMG Core 16 VE M25 | |
| Average AMD Ryzen 7 255 (13661 - 14945, n=2) | |
| Tulpar T6 V3.5 | |
| AIDA64 / CPU PhotoWorxx | |
| Acer Predator Helios Neo 16S AI PHN16S-71-94L9 | |
| Schenker XMG Core 16 M25 | |
| Lenovo Legion 7 16IAX10 | |
| Tulpar T6 V3.5 | |
| Schenker XMG Core 16 VE M25 | |
| Average of class Gaming (12271 - 89891, n=103, last 2 years) | |
| Average AMD Ryzen 7 255 (39932 - 45359, n=2) | |
| HP Omen 16-ap0091ng | |
System performance
Overall system performance is unremarkable - in a positive sense. There were no outliers during testing.
PCMark 10: Score | Essentials | Productivity | Digital Content Creation
CrossMark: Overall | Productivity | Creativity | Responsiveness
WebXPRT 3: Overall
WebXPRT 4: Overall
Mozilla Kraken 1.1: Total
| Performance rating | |
| Acer Predator Helios Neo 16S AI PHN16S-71-94L9 | |
| Schenker XMG Core 16 M25 -4! | |
| Average of class Gaming | |
| Lenovo Legion 7 16IAX10 | |
| Schenker XMG Core 16 VE M25 | |
| Average AMD Ryzen 7 255, NVIDIA GeForce RTX 5060 Laptop | |
| HP Omen 16-ap0091ng | |
| Tulpar T6 V3.5 | |
| PCMark 10 / Score | |
| Average of class Gaming (5828 - 11730, n=92, last 2 years) | |
| Acer Predator Helios Neo 16S AI PHN16S-71-94L9 | |
| Schenker XMG Core 16 VE M25 | |
| Average AMD Ryzen 7 255, NVIDIA GeForce RTX 5060 Laptop (n=1) | |
| HP Omen 16-ap0091ng | |
| Lenovo Legion 7 16IAX10 | |
| Tulpar T6 V3.5 | |
| PCMark 10 / Essentials | |
| Lenovo Legion 7 16IAX10 | |
| Acer Predator Helios Neo 16S AI PHN16S-71-94L9 | |
| HP Omen 16-ap0091ng | |
| Average of class Gaming (8810 - 11935, n=96, last 2 years) | |
| Tulpar T6 V3.5 | |
| Schenker XMG Core 16 VE M25 | |
| Average AMD Ryzen 7 255, NVIDIA GeForce RTX 5060 Laptop (n=1) | |
| PCMark 10 / Productivity | |
| Schenker XMG Core 16 VE M25 | |
| Average AMD Ryzen 7 255, NVIDIA GeForce RTX 5060 Laptop (n=1) | |
| Average of class Gaming (6845 - 21327, n=94, last 2 years) | |
| Lenovo Legion 7 16IAX10 | |
| HP Omen 16-ap0091ng | |
| Acer Predator Helios Neo 16S AI PHN16S-71-94L9 | |
| Tulpar T6 V3.5 | |
| PCMark 10 / Digital Content Creation | |
| Acer Predator Helios Neo 16S AI PHN16S-71-94L9 | |
| Average of class Gaming (7602 - 19954, n=94, last 2 years) | |
| HP Omen 16-ap0091ng | |
| Tulpar T6 V3.5 | |
| Schenker XMG Core 16 VE M25 | |
| Average AMD Ryzen 7 255, NVIDIA GeForce RTX 5060 Laptop (n=1) | |
| Lenovo Legion 7 16IAX10 | |
| CrossMark / Overall | |
| Acer Predator Helios Neo 16S AI PHN16S-71-94L9 | |
| Lenovo Legion 7 16IAX10 | |
| Schenker XMG Core 16 M25 | |
| Average of class Gaming (1366 - 2409, n=93, last 2 years) | |
| Schenker XMG Core 16 VE M25 | |
| Average AMD Ryzen 7 255, NVIDIA GeForce RTX 5060 Laptop (n=1) | |
| HP Omen 16-ap0091ng | |
| Tulpar T6 V3.5 | |
| CrossMark / Productivity | |
| Acer Predator Helios Neo 16S AI PHN16S-71-94L9 | |
| Lenovo Legion 7 16IAX10 | |
| Average of class Gaming (1386 - 2254, n=93, last 2 years) | |
| HP Omen 16-ap0091ng | |
| Schenker XMG Core 16 M25 | |
| Schenker XMG Core 16 VE M25 | |
| Average AMD Ryzen 7 255, NVIDIA GeForce RTX 5060 Laptop (n=1) | |
| Tulpar T6 V3.5 | |
| CrossMark / Creativity | |
| Schenker XMG Core 16 M25 | |
| Acer Predator Helios Neo 16S AI PHN16S-71-94L9 | |
| Lenovo Legion 7 16IAX10 | |
| Tulpar T6 V3.5 | |
| Average of class Gaming (1343 - 2729, n=93, last 2 years) | |
| HP Omen 16-ap0091ng | |
| Schenker XMG Core 16 VE M25 | |
| Average AMD Ryzen 7 255, NVIDIA GeForce RTX 5060 Laptop (n=1) | |
| CrossMark / Responsiveness | |
| Lenovo Legion 7 16IAX10 | |
| Acer Predator Helios Neo 16S AI PHN16S-71-94L9 | |
| Average of class Gaming (1226 - 2334, n=93, last 2 years) | |
| Schenker XMG Core 16 VE M25 | |
| Average AMD Ryzen 7 255, NVIDIA GeForce RTX 5060 Laptop (n=1) | |
| Schenker XMG Core 16 M25 | |
| HP Omen 16-ap0091ng | |
| Tulpar T6 V3.5 | |
| WebXPRT 3 / Overall | |
| Schenker XMG Core 16 M25 | |
| Lenovo Legion 7 16IAX10 | |
| Acer Predator Helios Neo 16S AI PHN16S-71-94L9 | |
| HP Omen 16-ap0091ng | |
| Average of class Gaming (220 - 532, n=97, last 2 years) | |
| Tulpar T6 V3.5 | |
| Schenker XMG Core 16 VE M25 | |
| Average AMD Ryzen 7 255, NVIDIA GeForce RTX 5060 Laptop (n=1) | |
| WebXPRT 4 / Overall | |
| Schenker XMG Core 16 M25 | |
| Lenovo Legion 7 16IAX10 | |
| Acer Predator Helios Neo 16S AI PHN16S-71-94L9 | |
| Tulpar T6 V3.5 | |
| Average of class Gaming (165 - 354, n=97, last 2 years) | |
| Schenker XMG Core 16 VE M25 | |
| Average AMD Ryzen 7 255, NVIDIA GeForce RTX 5060 Laptop (n=1) | |
| HP Omen 16-ap0091ng | |
| Mozilla Kraken 1.1 / Total | |
| HP Omen 16-ap0091ng | |
| Schenker XMG Core 16 VE M25 | |
| Average AMD Ryzen 7 255, NVIDIA GeForce RTX 5060 Laptop (n=1) | |
| Tulpar T6 V3.5 | |
| Average of class Gaming (391 - 590, n=99, last 2 years) | |
| Lenovo Legion 7 16IAX10 | |
| Schenker XMG Core 16 M25 | |
| Acer Predator Helios Neo 16S AI PHN16S-71-94L9 | |
* ... smaller is better
| PCMark 10 Score | 8166 points | |
Help | ||
| AIDA64 / Memory Copy | |
| Lenovo Legion 7 16IAX10 | |
| Acer Predator Helios Neo 16S AI PHN16S-71-94L9 | |
| Tulpar T6 V3.5 | |
| Schenker XMG Core 16 M25 | |
| Average of class Gaming (21750 - 129946, n=103, last 2 years) | |
| Schenker XMG Core 16 VE M25 | |
| Average AMD Ryzen 7 255 (67909 - 69008, n=2) | |
| HP Omen 16-ap0091ng | |
| AIDA64 / Memory Read | |
| Acer Predator Helios Neo 16S AI PHN16S-71-94L9 | |
| Tulpar T6 V3.5 | |
| Lenovo Legion 7 16IAX10 | |
| Schenker XMG Core 16 M25 | |
| Average of class Gaming (22956 - 118858, n=103, last 2 years) | |
| Average AMD Ryzen 7 255 (60500 - 61434, n=2) | |
| Schenker XMG Core 16 VE M25 | |
| HP Omen 16-ap0091ng | |
| AIDA64 / Memory Write | |
| Acer Predator Helios Neo 16S AI PHN16S-71-94L9 | |
| Schenker XMG Core 16 VE M25 | |
| Average AMD Ryzen 7 255 (82539 - 83452, n=2) | |
| Schenker XMG Core 16 M25 | |
| Lenovo Legion 7 16IAX10 | |
| Tulpar T6 V3.5 | |
| Average of class Gaming (22297 - 135096, n=103, last 2 years) | |
| HP Omen 16-ap0091ng | |
| AIDA64 / Memory Latency | |
| Acer Predator Helios Neo 16S AI PHN16S-71-94L9 | |
| Average of class Gaming (75.3 - 259, n=103, last 2 years) | |
| Lenovo Legion 7 16IAX10 | |
| Average AMD Ryzen 7 255 (87 - 91.2, n=2) | |
| Schenker XMG Core 16 VE M25 | |
| Schenker XMG Core 16 M25 | |
| Tulpar T6 V3.5 | |
| HP Omen 16-ap0091ng | |
* ... smaller is better
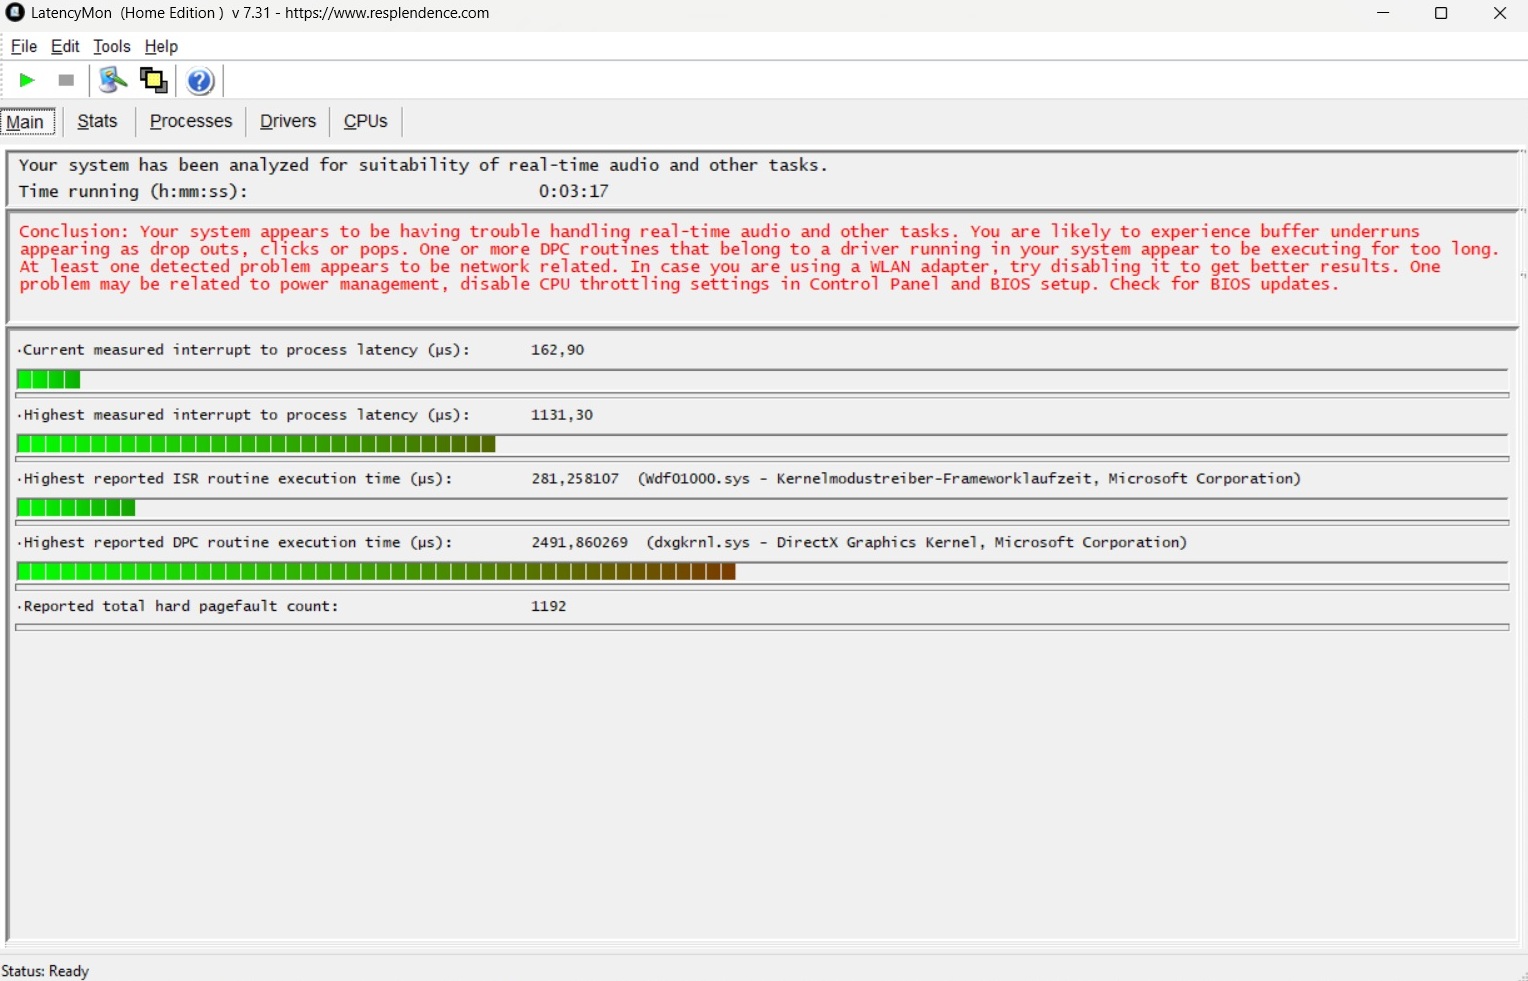
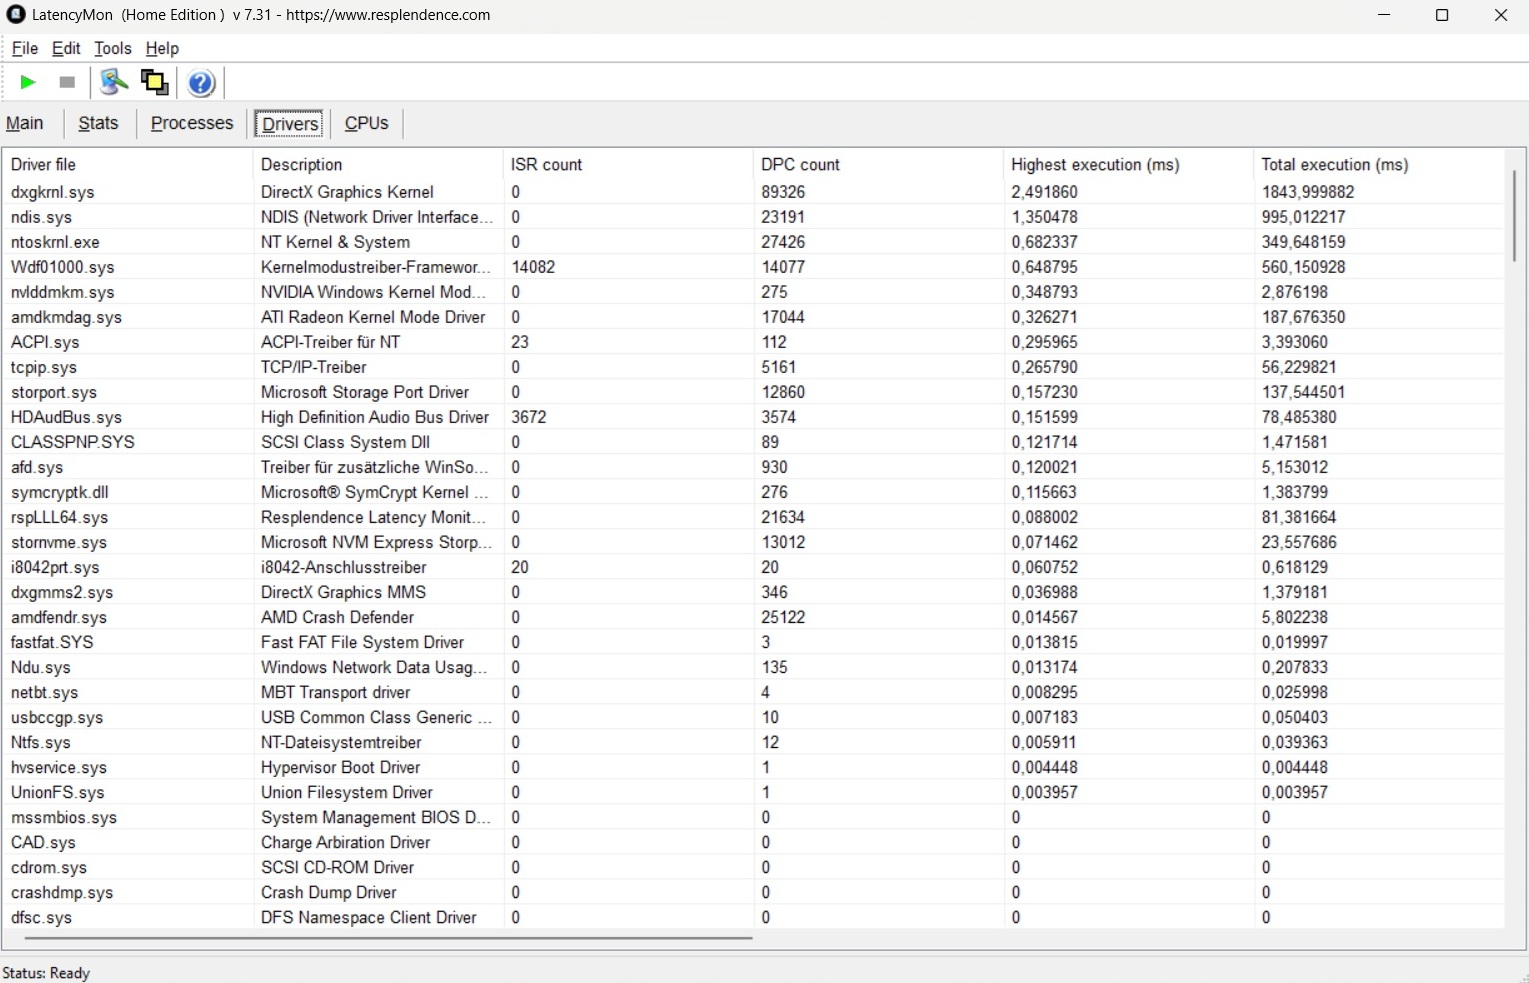
DPC latencies
In terms of latency, the XMG Core 16 VE sits squarely in the middle of the pack among its competitors.
| DPC Latencies / LatencyMon - interrupt to process latency (max), Web, Youtube, Prime95 | |
| Tulpar T6 V3.5 | |
| Acer Predator Helios Neo 16S AI PHN16S-71-94L9 | |
| HP Omen 16-ap0091ng | |
| Schenker XMG Core 16 VE M25 | |
| Lenovo Legion 7 16IAX10 | |
| Schenker XMG Core 16 M25 | |
* ... smaller is better
Storage devices
One highlight of our test unit was the relatively fast SSD. Samsung’s 990 Pro achieved an excellent overall score in the AS SSD benchmark.

* ... smaller is better
Read continuous performance: DiskSpd Read Loop, Queue Depth 8
GPU performance
| 3DMark 11 Performance | 33268 points | |
| 3DMark Cloud Gate Standard Score | 50474 points | |
| 3DMark Fire Strike Score | 25692 points | |
| 3DMark Time Spy Score | 11440 points | |
Help | ||
* ... smaller is better
Gaming performance
Without DLSS and similar technologies, running at the native resolution (2,560 × 1,440) can be a bit demanding at times. Very CPU-intensive titles such as The Outer Worlds 2, Anno 117 and Black Ops 7 only run smoothly with upscaling enabled or with reduced settings.
Things look better in ARC Raiders, for example: at maximum settings, the game delivers a solid 48 FPS. For comparison, DLSS Quality increases performance to a smooth 76 FPS, while 4× Frame Generation pushes it to 174 FPS on paper (real-world perceived smoothness may vary).
| Final Fantasy XV Benchmark - 1920x1080 High Quality | |
| Average of class Gaming (41 - 215, n=94, last 2 years) | |
| Schenker XMG Core 16 M25 | |
| Lenovo Legion 7 16IAX10 | |
| Average NVIDIA GeForce RTX 5060 Laptop (107 - 133.6, n=12) | |
| HP Omen 16-ap0091ng | |
| Tulpar T6 V3.5 | |
| Schenker XMG Core 16 VE M25 | |
| low | med. | high | ultra | QHD | |
|---|---|---|---|---|---|
| Dota 2 Reborn (2015) | 145.2 | 140.7 | 133.2 | ||
| Final Fantasy XV Benchmark (2018) | 143.9 | 107 | |||
| X-Plane 11.11 (2018) | 97.7 | 79.6 | |||
| Baldur's Gate 3 (2023) | 114.2 | 95.4 | 90.7 | ||
| Cyberpunk 2077 (2023) | 107.6 | 93.4 | 85 | ||
| The Outer Worlds 2 (2025) | 91.7 | 72.7 | 40.9 | 26.7 | |
| ARC Raiders (2025) | 136.7 | 104.9 | 70.2 | 47.8 | |
| Anno 117: Pax Romana (2025) | 91.3 | 67 | 33.9 | 23.4 | |
| Call of Duty Black Ops 7 (2025) | 138 | 103 | 38 | 18 |
| ARC Raiders | |
| 1920x1080 Epic Preset + Epic Raytracing AA:TSR | |
| Acer Predator Helios Neo 16S AI PHN16S-71-94L9 | |
| Schenker XMG Core 16 VE M25 | |
| Average of class Gaming (43.5 - 98.6, n=11, last 2 years) | |
| Average NVIDIA GeForce RTX 5060 Laptop (55 - 70.2, n=4) | |
| Tulpar T6 V3.5 | |
| 2560x1440 Epic Preset + Epic Raytracing AA:TSR | |
| Average of class Gaming (47.8 - 68.3, n=5, last 2 years) | |
| Acer Predator Helios Neo 16S AI PHN16S-71-94L9 | |
| Schenker XMG Core 16 VE M25 | |
| Average NVIDIA GeForce RTX 5060 Laptop (n=1) | |
| The Outer Worlds 2 | |
| 1920x1080 Very High Preset AA:T | |
| Acer Predator Helios Neo 16S AI PHN16S-71-94L9 | |
| Schenker XMG Core 16 VE M25 | |
| Average of class Gaming (26.4 - 58.4, n=11, last 2 years) | |
| Average NVIDIA GeForce RTX 5060 Laptop (31.1 - 40.9, n=4) | |
| Tulpar T6 V3.5 | |
| 2560x1440 Very High Preset AA:T | |
| Acer Predator Helios Neo 16S AI PHN16S-71-94L9 | |
| Average of class Gaming (21.5 - 37.8, n=6, last 2 years) | |
| Schenker XMG Core 16 VE M25 | |
| Average NVIDIA GeForce RTX 5060 Laptop (n=1) | |
| Call of Duty Black Ops 7 | |
| 1920x1080 Extreme Preset + Raytracing | |
| Acer Predator Helios Neo 16S AI PHN16S-71-94L9 | |
| Average of class Gaming (24 - 60, n=11, last 2 years) | |
| Schenker XMG Core 16 VE M25 | |
| Average NVIDIA GeForce RTX 5060 Laptop (32 - 38, n=4) | |
| Tulpar T6 V3.5 | |
| 2560x1440 Extreme Preset + Raytracing | |
| Acer Predator Helios Neo 16S AI PHN16S-71-94L9 | |
| Average of class Gaming (18 - 39, n=7, last 2 years) | |
| Average NVIDIA GeForce RTX 5060 Laptop (18 - 23, n=2) | |
| Schenker XMG Core 16 VE M25 | |
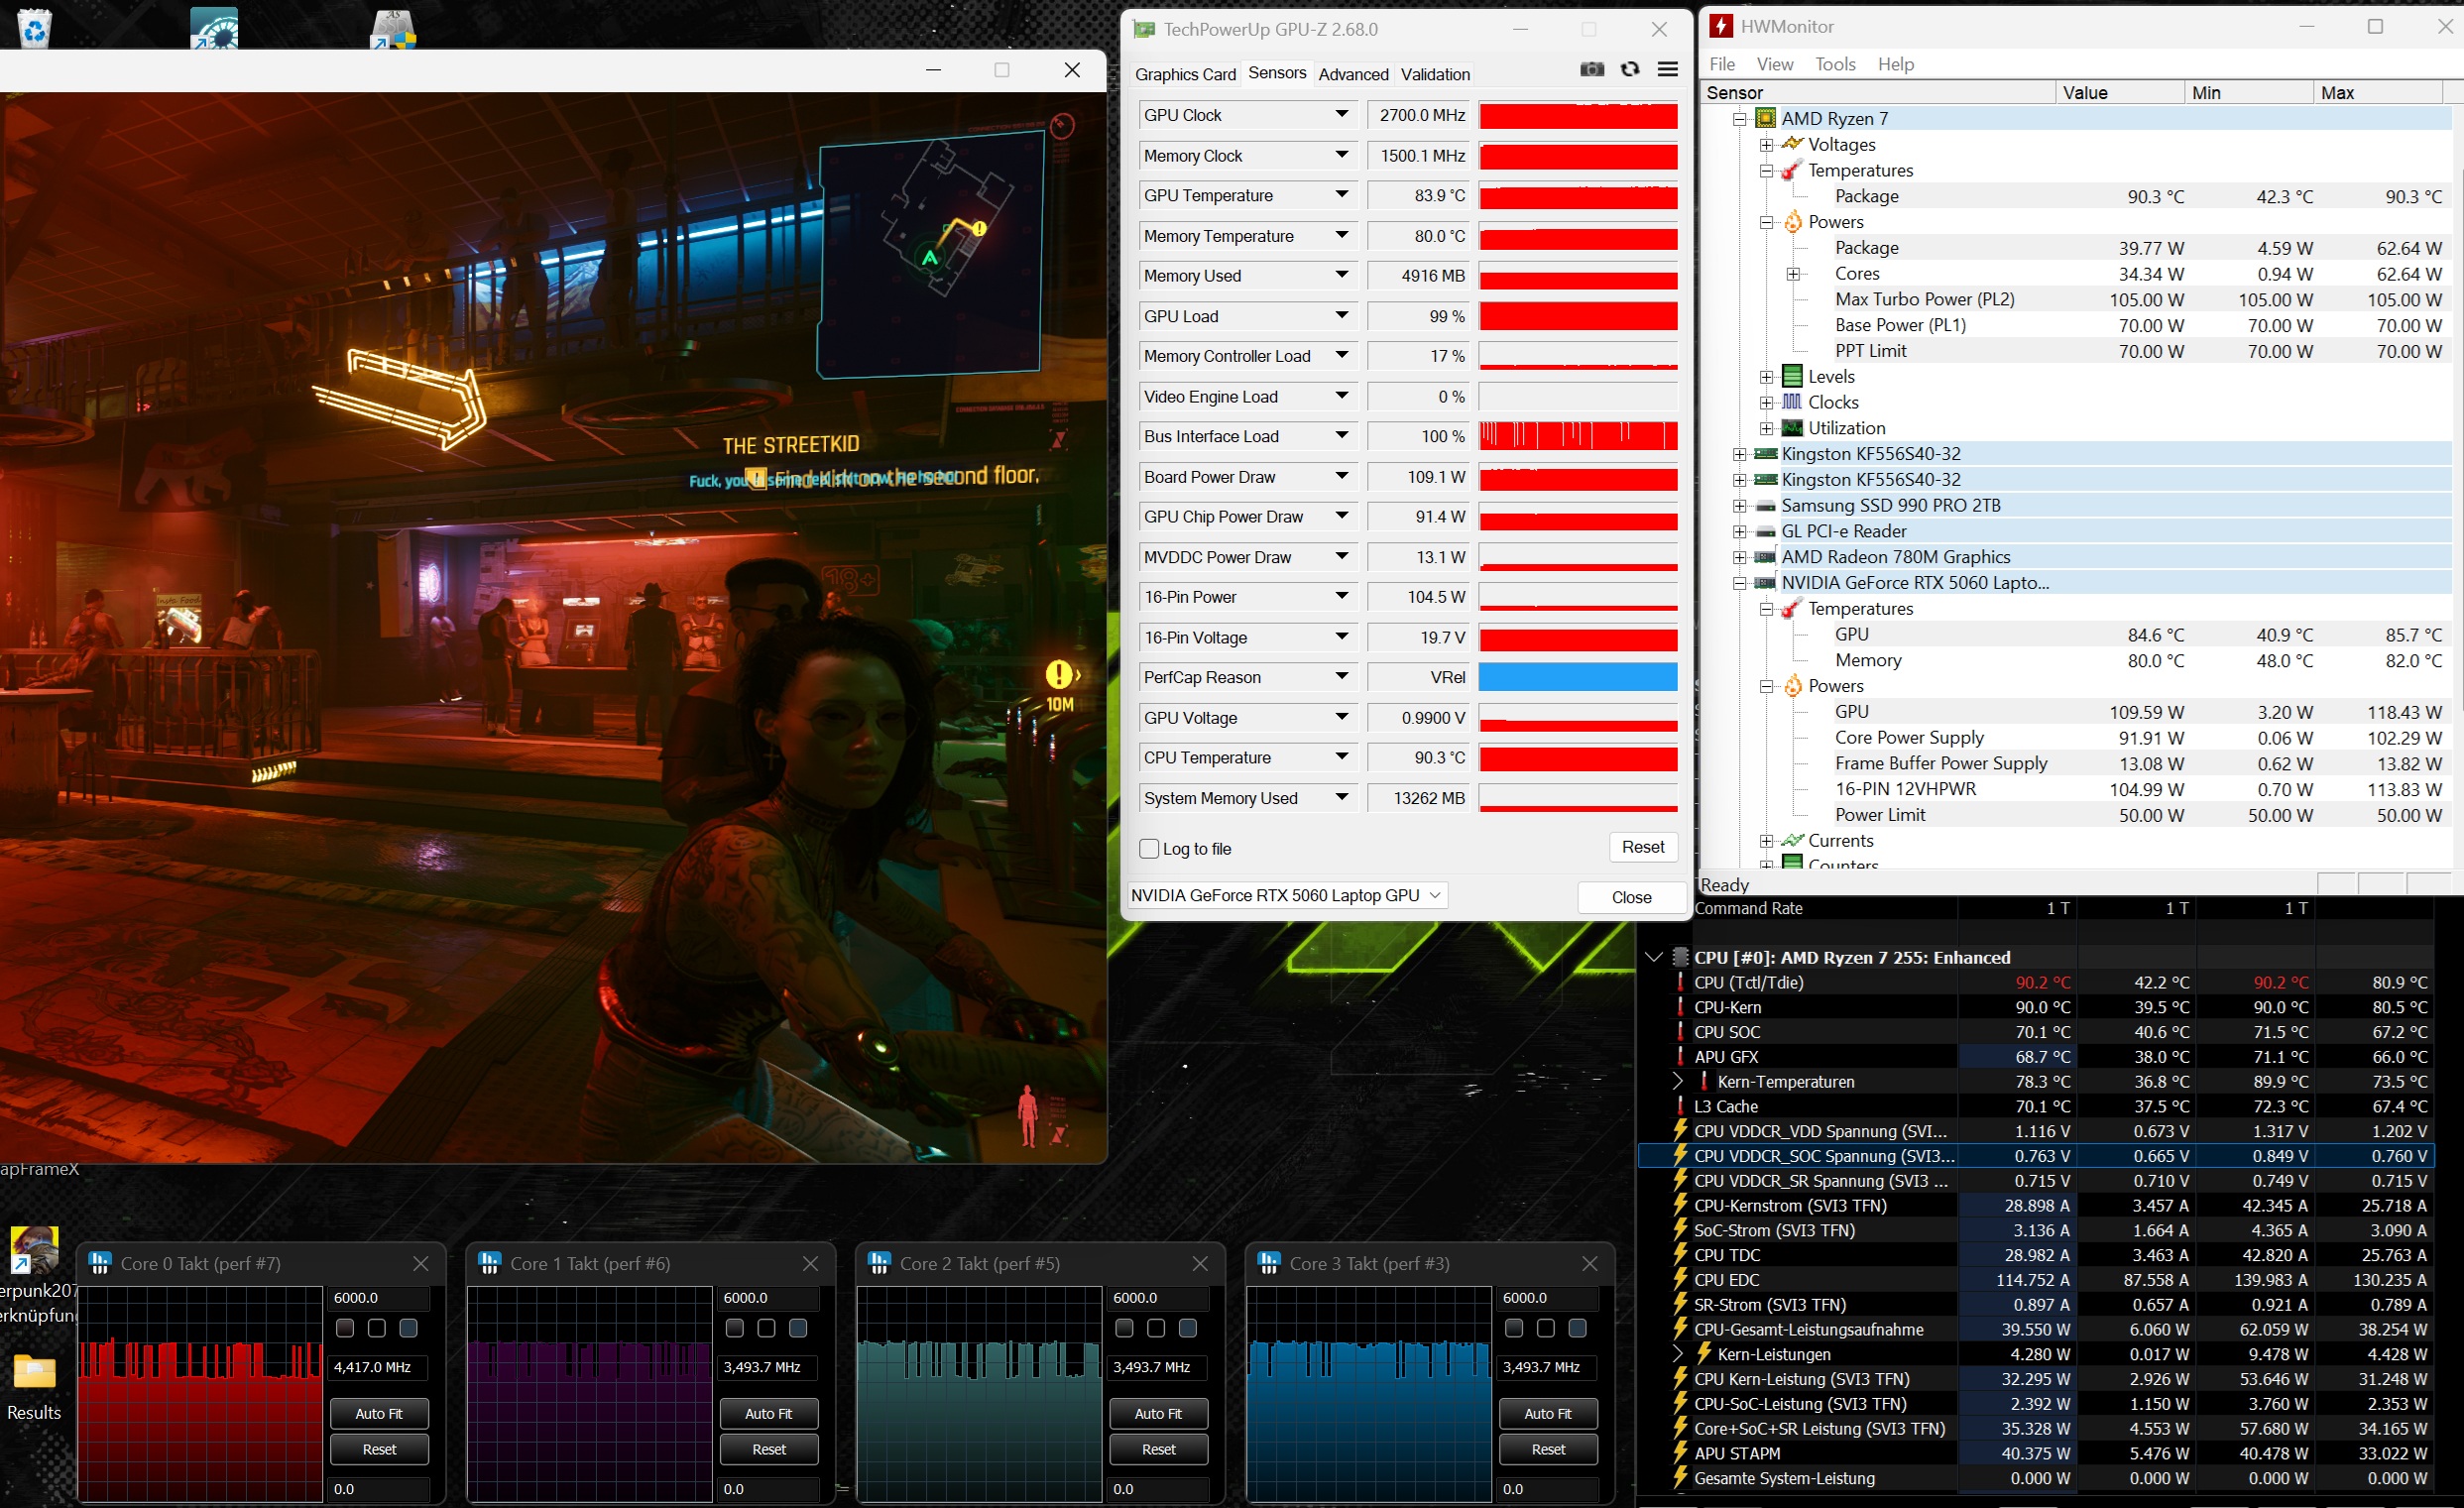
Cyberpunk 2077 ultra FPS chart
Emissions & Energy
Noise emissions
Under load, noise levels are similar to the HP Omen 16 and the “regular” Core 16. At 49 dB(A) in Cyberpunk 2077, the fans are clearly audible, but not excessively loud. At idle, the 16-inch laptop usually remains pleasantly quiet. The fans either shut off completely or run at a fairly unobtrusive level.
Noise level
| Idle |
| 24 / 27 / 32 dB(A) |
| Load |
| 41 / 50 dB(A) |
 | ||
30 dB silent 40 dB(A) audible 50 dB(A) loud |
||
min: | ||
| Schenker XMG Core 16 VE M25 Ryzen 7 255, GeForce RTX 5060 Laptop | Tulpar T6 V3.5 i7-14700HX, GeForce RTX 5060 Laptop | HP Omen 16-ap0091ng R9 8940HX, GeForce RTX 5060 Laptop | Lenovo Legion 7 16IAX10 Ultra 7 255HX, GeForce RTX 5060 Laptop | Schenker XMG Core 16 M25 Ryzen AI 9 HX 370, GeForce RTX 5070 Laptop | Acer Predator Helios Neo 16S AI PHN16S-71-94L9 Ultra 9 275HX, GeForce RTX 5070 Ti Laptop | |
|---|---|---|---|---|---|---|
| Noise | -7% | 1% | 1% | 3% | -9% | |
| off / environment * (dB) | 24 | 24 -0% | 23 4% | 23.9 -0% | 24.8 -3% | 24 -0% |
| Idle Minimum * (dB) | 24 | 26 -8% | 23 4% | 24 -0% | 24.8 -3% | 24 -0% |
| Idle Average * (dB) | 27 | 29 -7% | 23 15% | 26 4% | 24.8 8% | 30 -11% |
| Idle Maximum * (dB) | 32 | 31 3% | 27.64 14% | 29.4 8% | 27.1 15% | 35 -9% |
| Load Average * (dB) | 41 | 52 -27% | 49.5 -21% | 35.4 14% | 40.2 2% | 53 -29% |
| Cyberpunk 2077 ultra * (dB) | 49 | 52 -6% | 49.5 -1% | 54.6 -11% | 49.2 -0% | 52 -6% |
| Load Maximum * (dB) | 50 | 53 -6% | 52.73 -5% | 54.7 -9% | 49.2 2% | 54 -8% |
* ... smaller is better
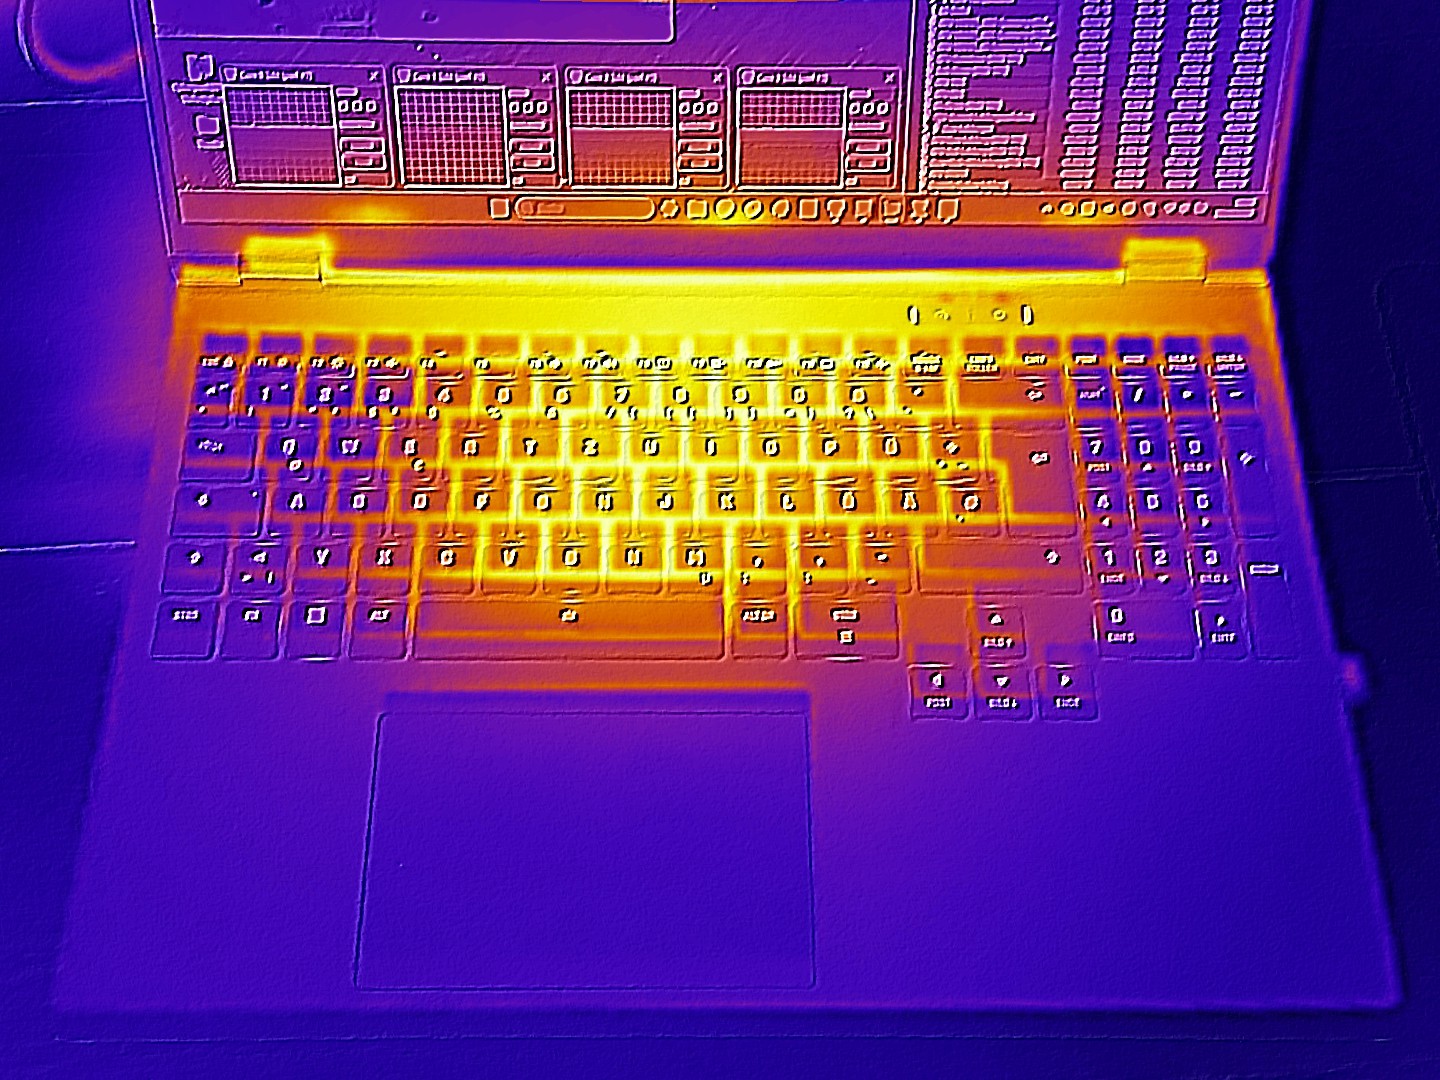
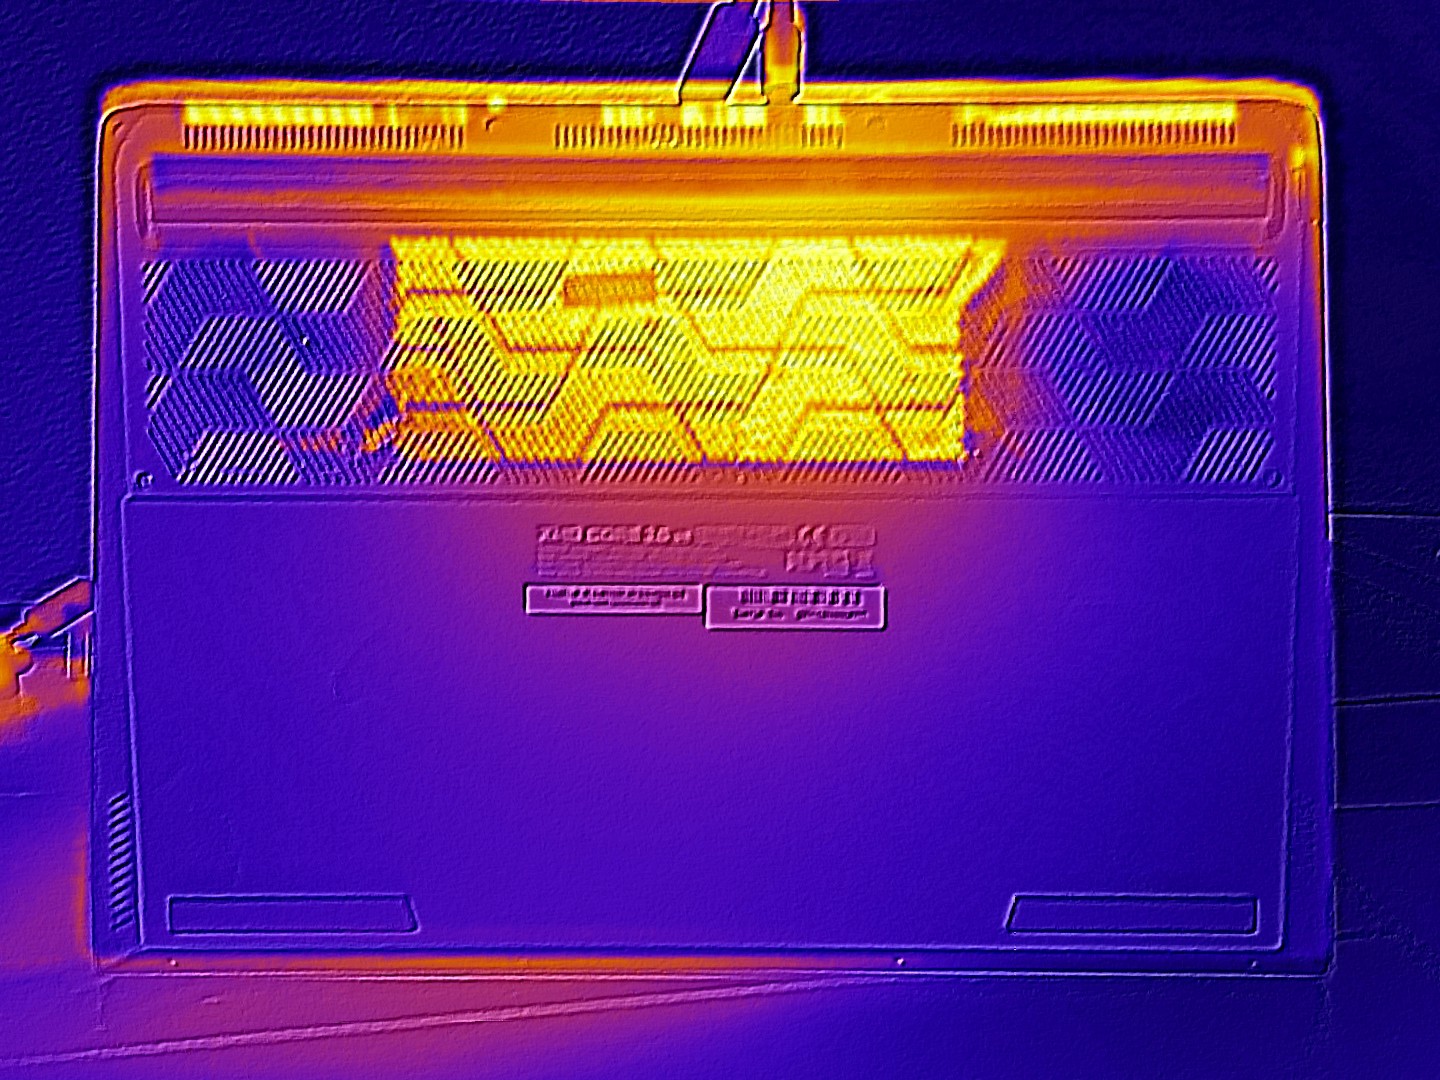
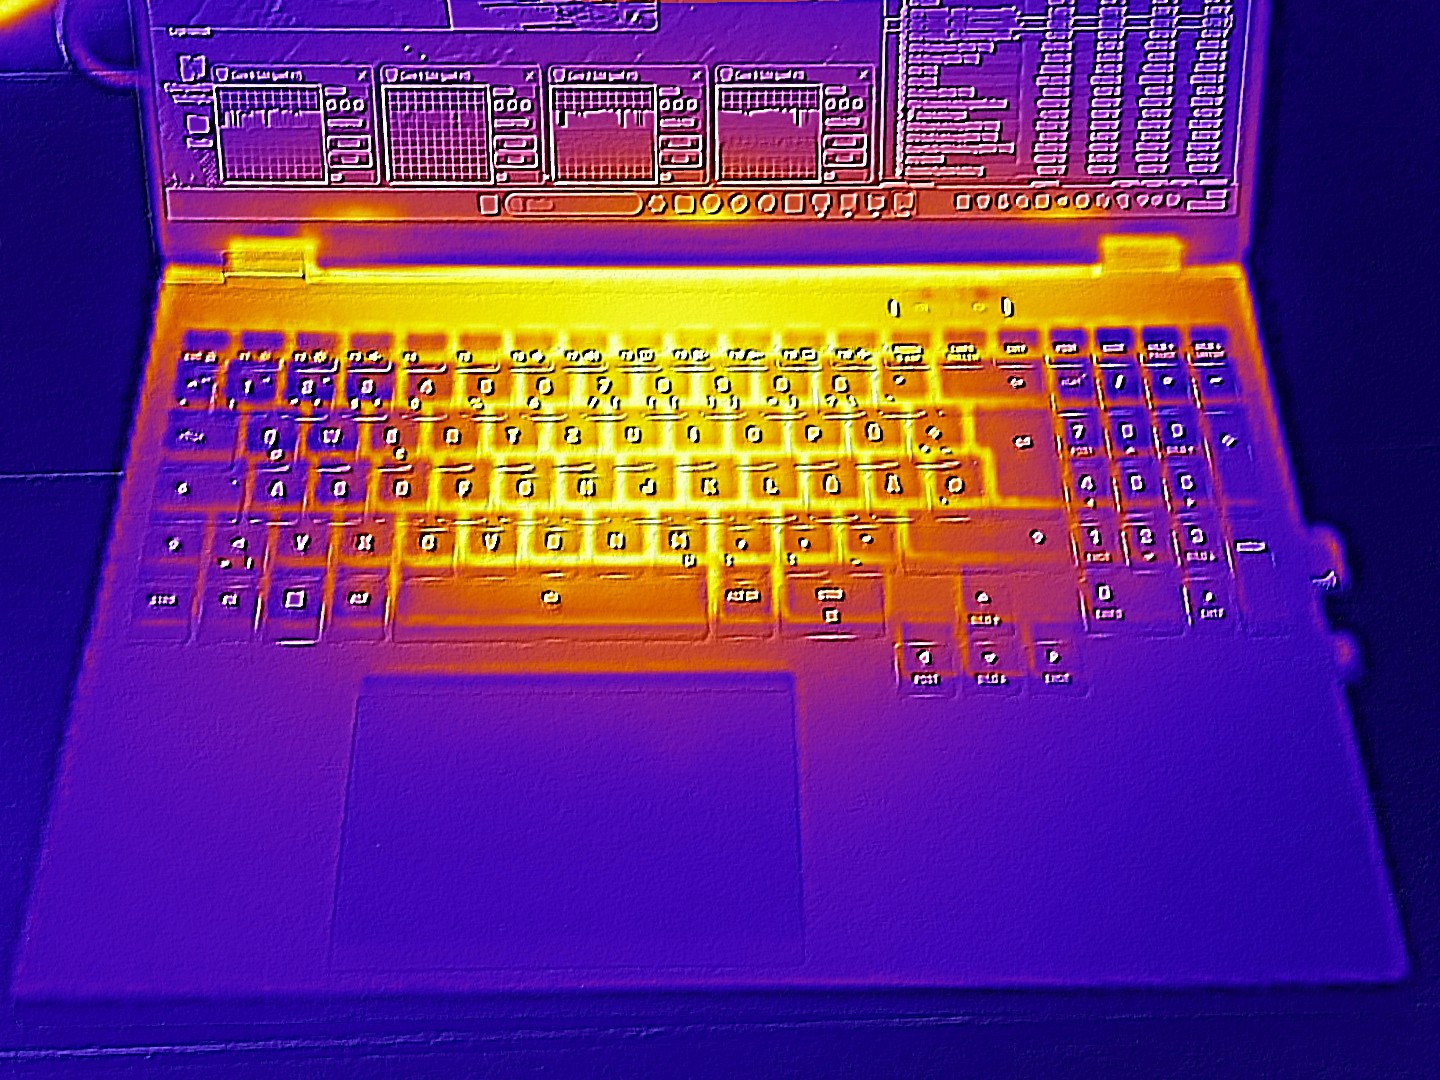
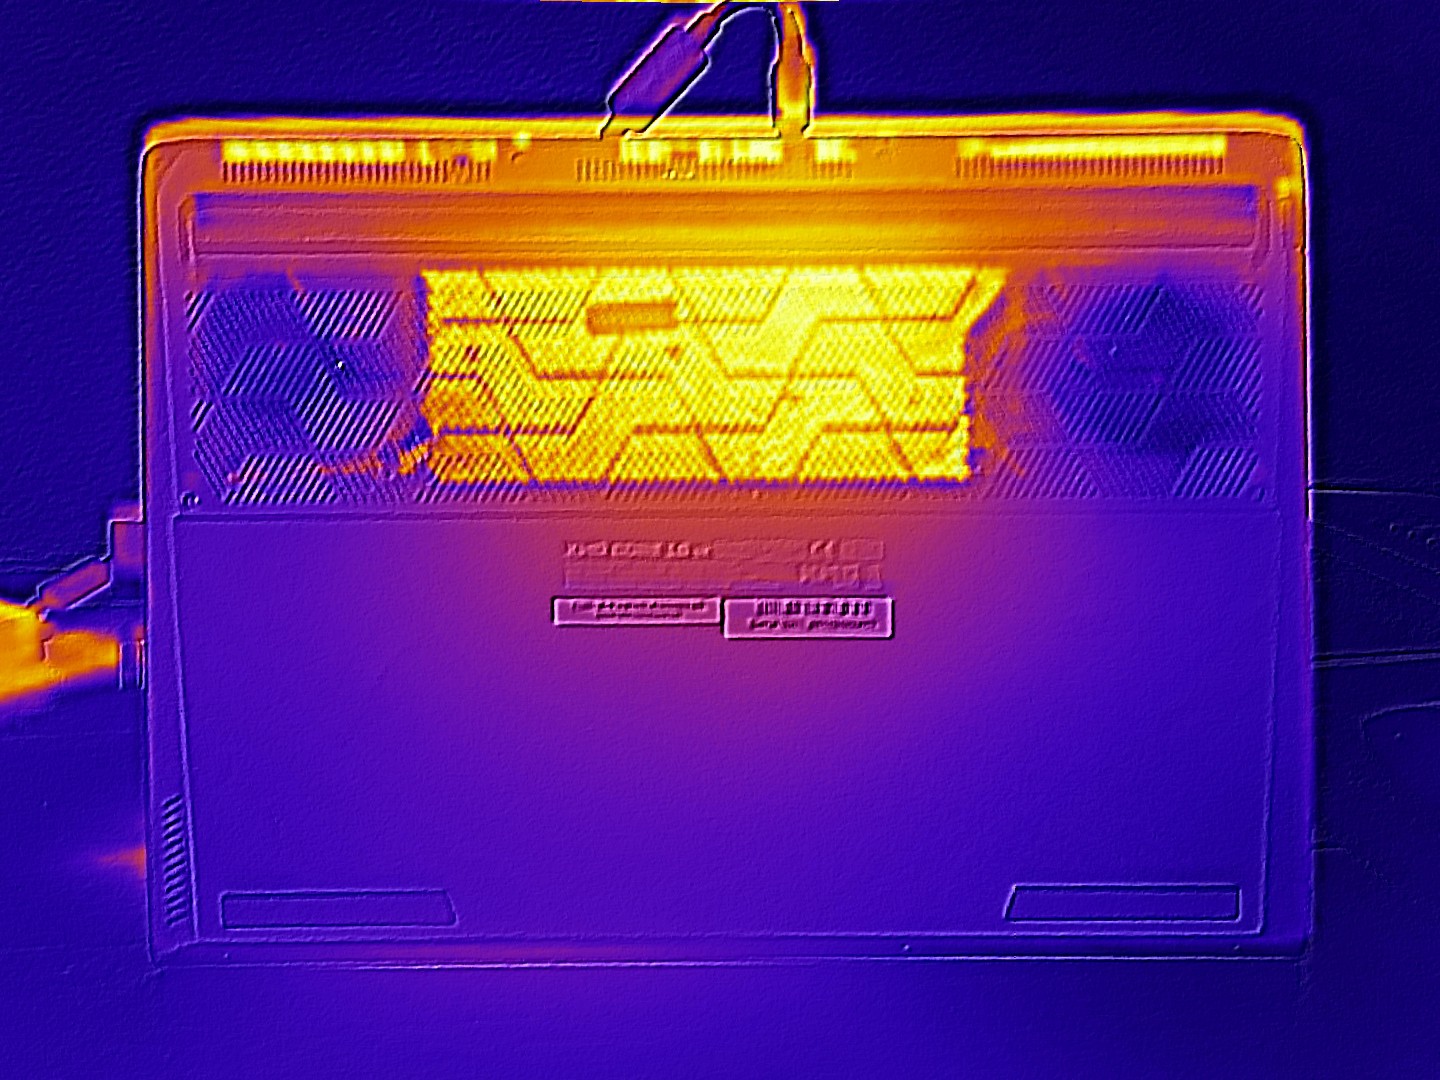
Temperature
Under load, the underside of the chassis heats up more, reaching a maximum of 57 °C, while the top peaks at 46 °C. In idle scenarios, the chassis settles at a moderate 25 to 31 °C.
(-) The maximum temperature on the upper side is 46 °C / 115 F, compared to the average of 40.4 °C / 105 F, ranging from 21.2 to 68.8 °C for the class Gaming.
(-) The bottom heats up to a maximum of 57 °C / 135 F, compared to the average of 43.2 °C / 110 F
(+) In idle usage, the average temperature for the upper side is 27.3 °C / 81 F, compared to the device average of 33.9 °C / 93 F.
(-) 3: The average temperature for the upper side is 39.7 °C / 103 F, compared to the average of 33.9 °C / 93 F for the class Gaming.
(+) The palmrests and touchpad are cooler than skin temperature with a maximum of 31 °C / 87.8 F and are therefore cool to the touch.
(-) The average temperature of the palmrest area of similar devices was 28.8 °C / 83.8 F (-2.2 °C / -4 F).
| Schenker XMG Core 16 VE M25 Ryzen 7 255, GeForce RTX 5060 Laptop | Tulpar T6 V3.5 i7-14700HX, GeForce RTX 5060 Laptop | HP Omen 16-ap0091ng R9 8940HX, GeForce RTX 5060 Laptop | Lenovo Legion 7 16IAX10 Ultra 7 255HX, GeForce RTX 5060 Laptop | Schenker XMG Core 16 M25 Ryzen AI 9 HX 370, GeForce RTX 5070 Laptop | Acer Predator Helios Neo 16S AI PHN16S-71-94L9 Ultra 9 275HX, GeForce RTX 5070 Ti Laptop | |
|---|---|---|---|---|---|---|
| Heat | 4% | 13% | -4% | 0% | 3% | |
| Maximum Upper Side * (°C) | 46 | 40 13% | 36 22% | 47 -2% | 46.7 -2% | 47 -2% |
| Maximum Bottom * (°C) | 57 | 47 18% | 37 35% | 44 23% | 58.5 -3% | 55 4% |
| Idle Upper Side * (°C) | 29 | 30 -3% | 30 -3% | 35.6 -23% | 28.3 2% | 28 3% |
| Idle Bottom * (°C) | 31 | 35 -13% | 32 -3% | 35.2 -14% | 29.9 4% | 29 6% |
* ... smaller is better
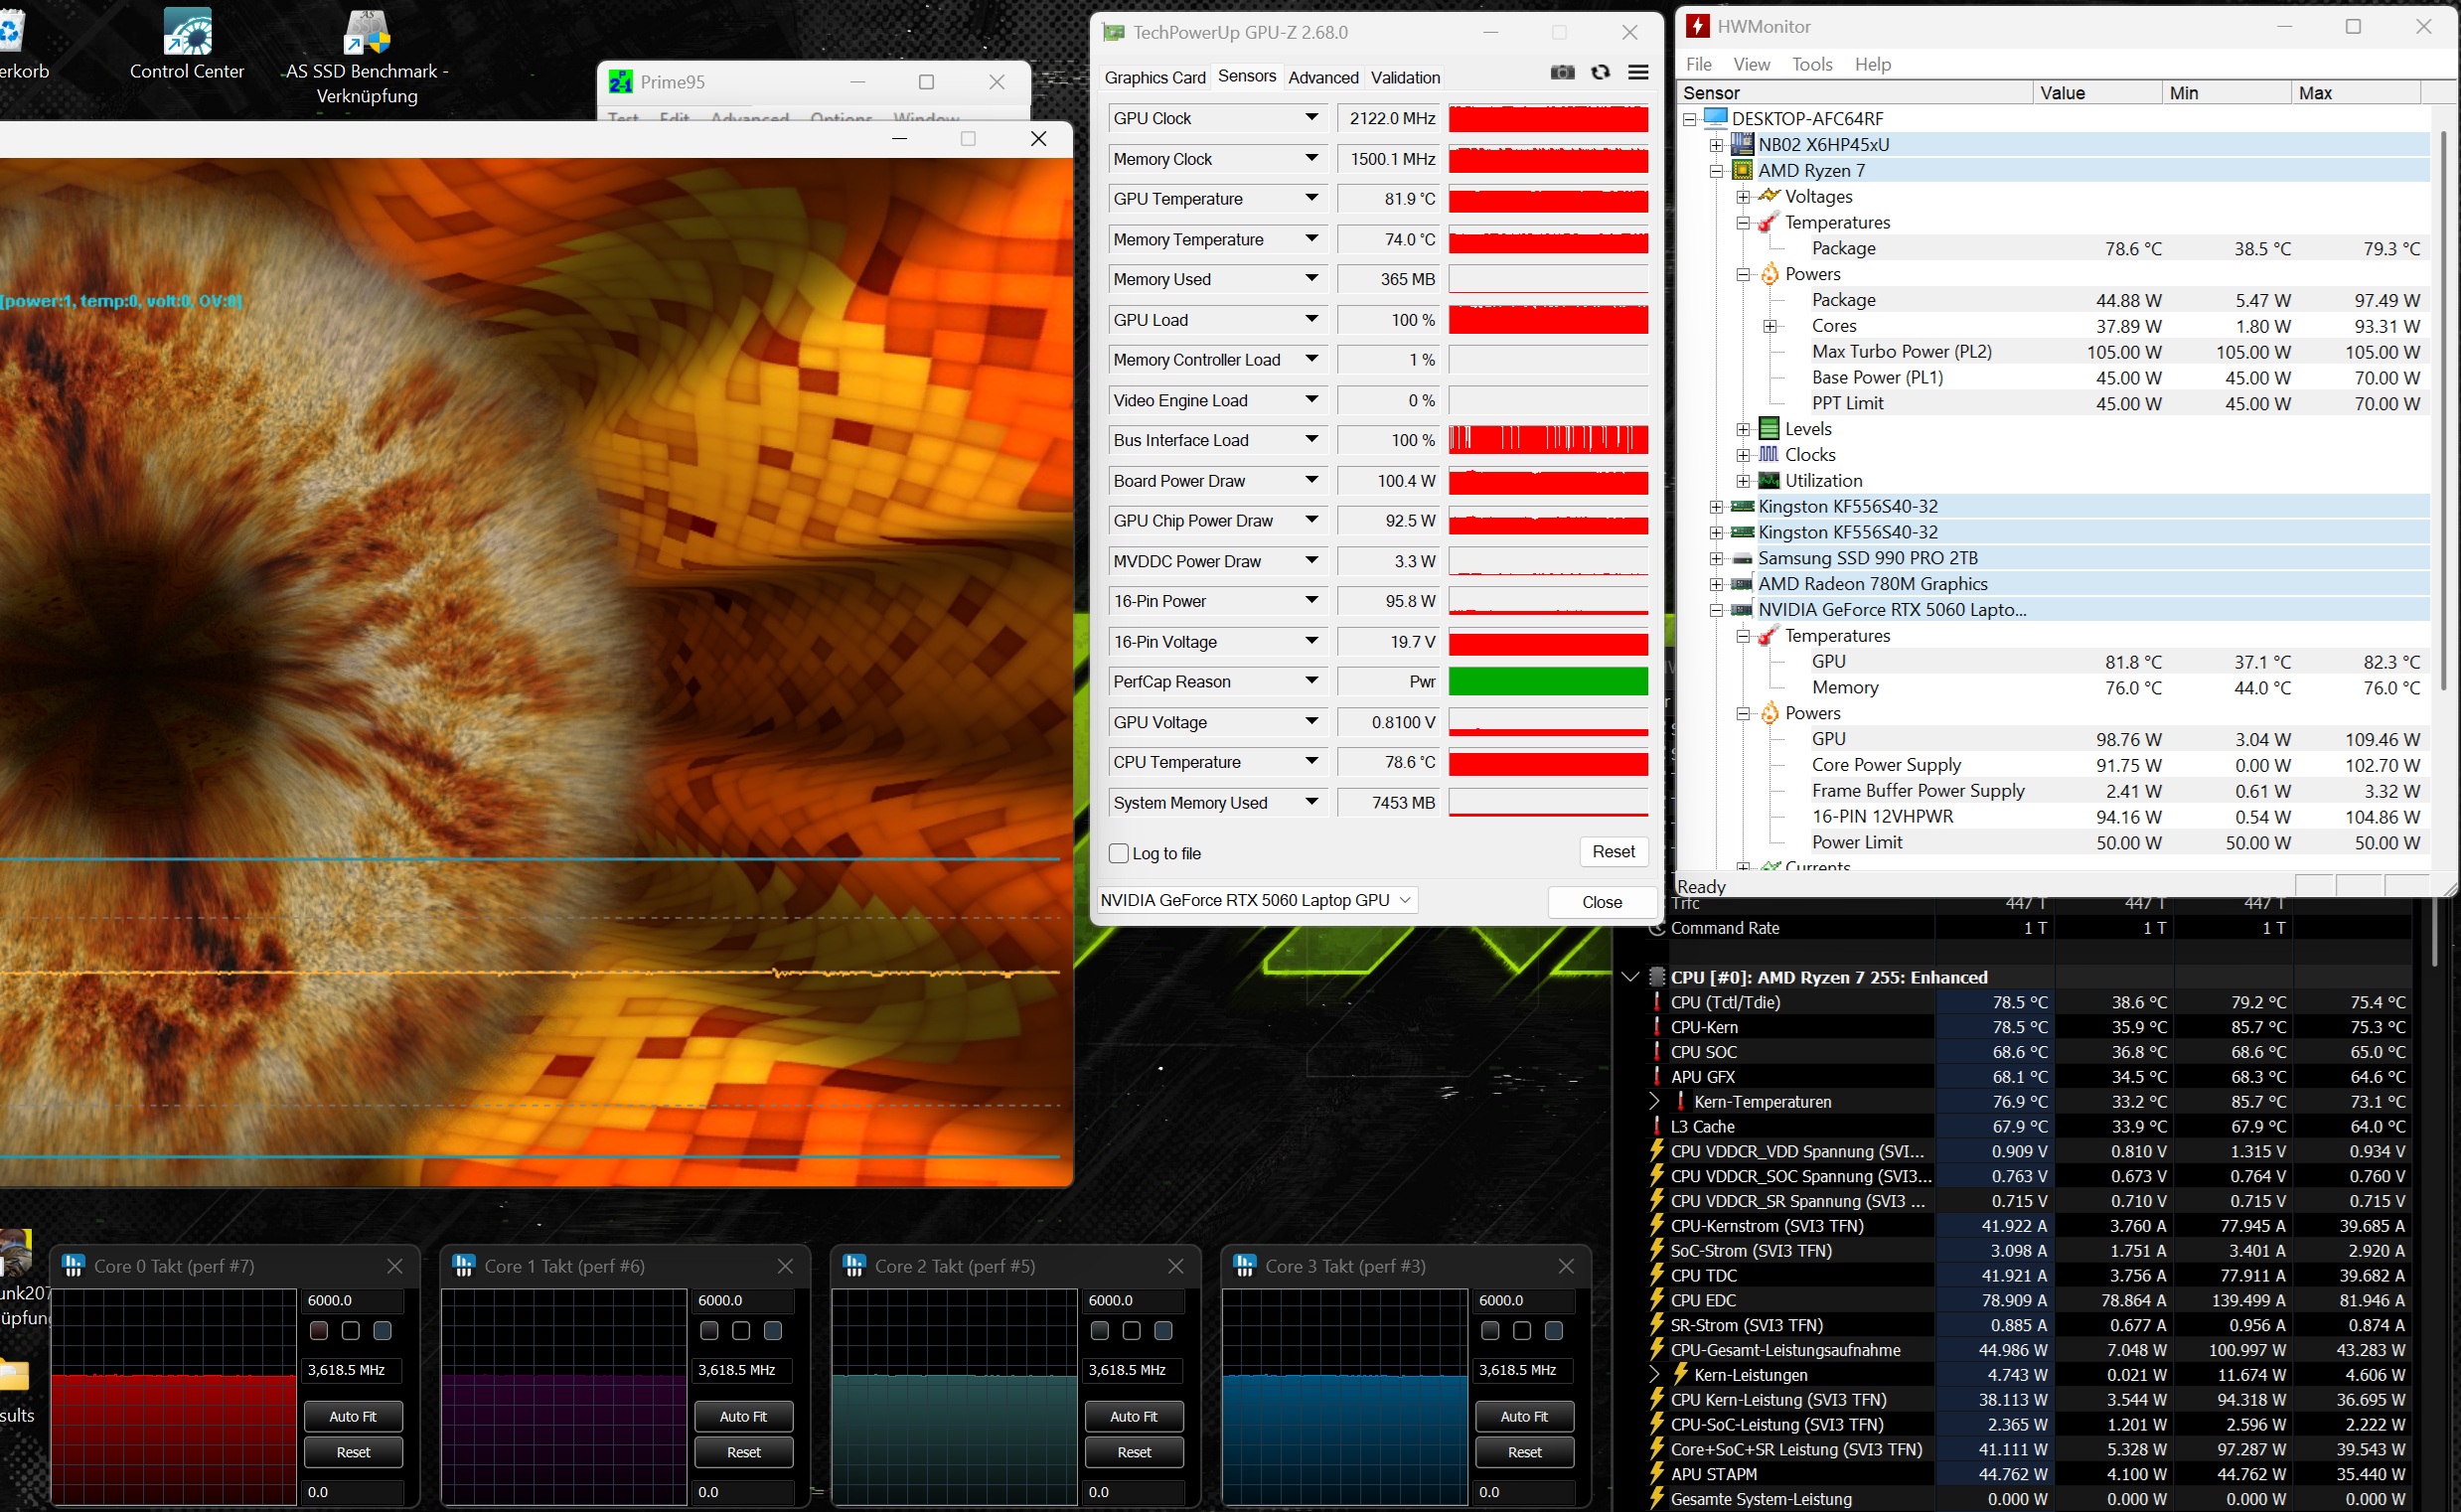
Stress test
The components don't die of heat death either. Our stress test with the Furmark and Prime tools brought the CPU and GPU to just under 80 °C.
Speakers
Sound quality is rather weak. The Lenovo Legion 7 performs noticeably better in this area.
Schenker XMG Core 16 VE M25 audio analysis
(±) | speaker loudness is average but good (76 dB)
Bass 100 - 315 Hz
(-) | nearly no bass - on average 19.1% lower than median
(±) | linearity of bass is average (10.5% delta to prev. frequency)
Mids 400 - 2000 Hz
(±) | higher mids - on average 6.3% higher than median
(±) | linearity of mids is average (7.2% delta to prev. frequency)
Highs 2 - 16 kHz
(+) | balanced highs - only 1.8% away from median
(+) | highs are linear (6% delta to prev. frequency)
Overall 100 - 16.000 Hz
(±) | linearity of overall sound is average (18.7% difference to median)
Compared to same class
» 62% of all tested devices in this class were better, 8% similar, 30% worse
» The best had a delta of 6%, average was 18%, worst was 132%
Compared to all devices tested
» 43% of all tested devices were better, 8% similar, 50% worse
» The best had a delta of 4%, average was 23%, worst was 134%
Lenovo Legion 7 16IAX10 audio analysis
(±) | speaker loudness is average but good (77.6 dB)
Bass 100 - 315 Hz
(±) | reduced bass - on average 9.5% lower than median
(±) | linearity of bass is average (9.8% delta to prev. frequency)
Mids 400 - 2000 Hz
(+) | balanced mids - only 1.5% away from median
(+) | mids are linear (4% delta to prev. frequency)
Highs 2 - 16 kHz
(+) | balanced highs - only 3% away from median
(+) | highs are linear (4.9% delta to prev. frequency)
Overall 100 - 16.000 Hz
(+) | overall sound is linear (11.5% difference to median)
Compared to same class
» 10% of all tested devices in this class were better, 3% similar, 87% worse
» The best had a delta of 6%, average was 18%, worst was 132%
Compared to all devices tested
» 8% of all tested devices were better, 2% similar, 90% worse
» The best had a delta of 4%, average was 23%, worst was 134%
Energy consumption
Energy consumption
With 10 to 19 watts at idle and 181 to 246 watts under load, power consumption is in line with expectations.
| Off / Standby | |
| Idle | |
| Load |
|
Key:
min: | |
| Schenker XMG Core 16 VE M25 Ryzen 7 255, GeForce RTX 5060 Laptop | Tulpar T6 V3.5 i7-14700HX, GeForce RTX 5060 Laptop | HP Omen 16-ap0091ng R9 8940HX, GeForce RTX 5060 Laptop | Lenovo Legion 7 16IAX10 Ultra 7 255HX, GeForce RTX 5060 Laptop | Schenker XMG Core 16 M25 Ryzen AI 9 HX 370, GeForce RTX 5070 Laptop | Acer Predator Helios Neo 16S AI PHN16S-71-94L9 Ultra 9 275HX, GeForce RTX 5070 Ti Laptop | Average of class Gaming | |
|---|---|---|---|---|---|---|---|
| Power Consumption | 8% | 11% | -12% | 5% | 22% | -26% | |
| Idle Minimum * (Watt) | 10.5 | 6.7 36% | 7.8 26% | 9.4 10% | 7.4 30% | 3.9 63% | 13 ? -24% |
| Idle Average * (Watt) | 13 | 13.7 -5% | 8.8 32% | 10.6 18% | 14.9 -15% | 11 15% | 18.7 ? -44% |
| Idle Maximum * (Watt) | 18.8 | 21.8 -16% | 21.5 -14% | 36.4 -94% | 15.2 19% | 16.9 10% | 24.3 ? -29% |
| Cyberpunk 2077 ultra * (Watt) | 182.5 | 156.7 14% | 192 -5% | 188 -3% | 184.8 -1% | 152.7 16% | |
| Cyberpunk 2077 ultra external monitor * (Watt) | 181.1 | 151.9 16% | 164.5 9% | 187.5 -4% | 181.4 -0% | 144.9 20% | |
| Load Maximum * (Watt) | 246 | 242 2% | 208 15% | 247 -0% | 251.1 -2% | 229 7% | 258 ? -5% |
| Load Average * (Watt) | 127 | 119 | 107.7 | 100.8 | 123 | 110.2 ? |
* ... smaller is better
energy consumption Cyberpunk / Stress test
energy consumption with external monitor
Battery life
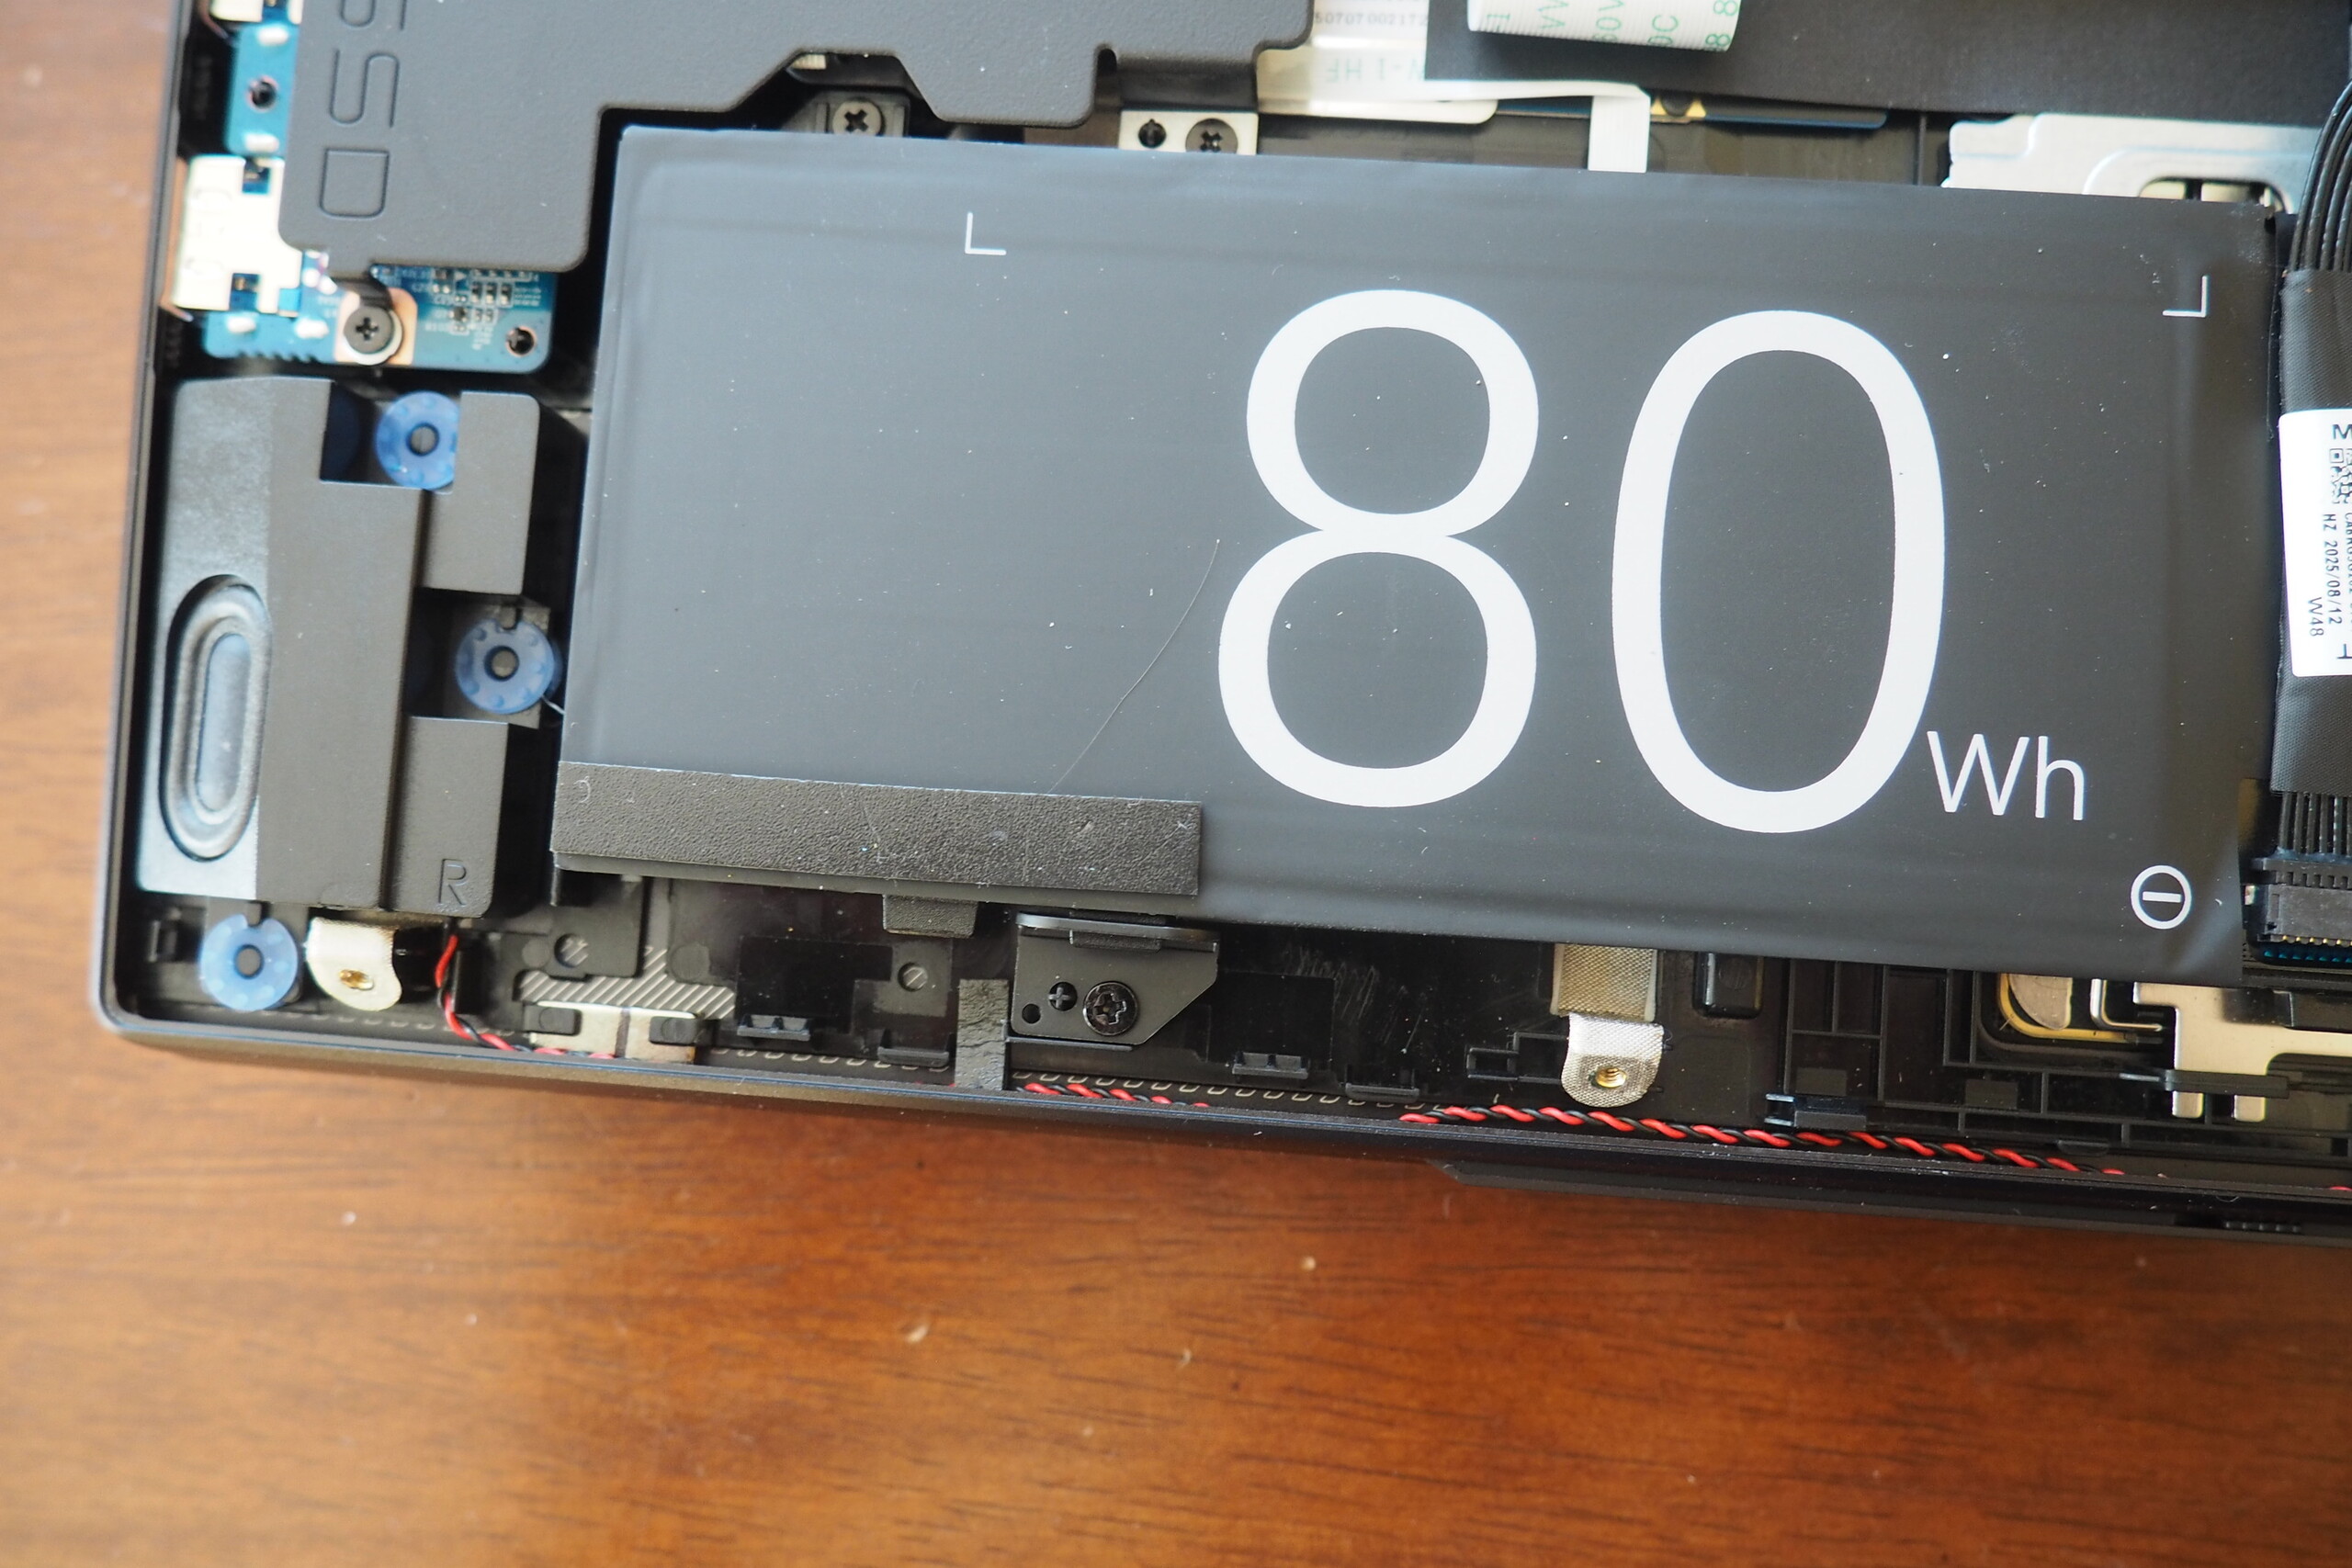
We would describe battery life as relatively good. Hardly any comparable device managed more than 7 hours in our Wi-Fi test (brightness reduced to 150 cd/m²). The regular Core 16, which comes with a 99 Wh battery instead of 80 Wh, even reaches around 11 hours.
| Schenker XMG Core 16 VE M25 Ryzen 7 255, GeForce RTX 5060 Laptop, 80 Wh | Tulpar T6 V3.5 i7-14700HX, GeForce RTX 5060 Laptop, 53.35 Wh | HP Omen 16-ap0091ng R9 8940HX, GeForce RTX 5060 Laptop, 70 Wh | Lenovo Legion 7 16IAX10 Ultra 7 255HX, GeForce RTX 5060 Laptop, 84 Wh | Schenker XMG Core 16 M25 Ryzen AI 9 HX 370, GeForce RTX 5070 Laptop, 99.8 Wh | Acer Predator Helios Neo 16S AI PHN16S-71-94L9 Ultra 9 275HX, GeForce RTX 5070 Ti Laptop, 76 Wh | Average of class Gaming | |
|---|---|---|---|---|---|---|---|
| Battery runtime | -40% | -32% | -36% | 49% | -32% | -2% | |
| WiFi v1.3 (h) | 7.3 | 4.4 -40% | 5 -32% | 4.7 -36% | 10.9 49% | 5 -32% | 7.15 ? -2% |
| H.264 (h) | 5.1 | 8.64 ? | |||||
| Load (h) | 1.3 | 1.502 ? |
Notebookcheck overall rating
Even if the XMG Core 16 VE narrowly falls short of Lenovo Legion 7 16, it still proves to be a well-rounded, high-quality gaming laptop with very few weaknesses.
Schenker XMG Core 16 VE M25
- 01/09/2026 v8
Florian Glaser
 Total Sustainability Score:
 Possible alternatives in comparison
Image | Model / Review | Price | Weight | Height | Display |
|---|---|---|---|---|---|
1. 83.9%  | Schenker XMG Core 16 VE M25 AMD Ryzen 7 255 ⎘ NVIDIA GeForce RTX 5060 Laptop ⎘ 64 GB Memory, 2048 GB SSD | Amazon: List Price: 1935 EUR | 2.1 kg | 23 mm | 16.00" 2560x1600 189 PPI IPS |
2. 77.8%  | Tulpar T6 V3.5 Intel Core i7-14700HX ⎘ NVIDIA GeForce RTX 5060 Laptop ⎘ 32 GB Memory, 1000 GB SSD | Amazon: List Price: 1160 EUR | 2.4 kg | 25 mm | 16.00" 1920x1200 142 PPI IPS |
3. 82.5%  | HP Omen 16-ap0091ng AMD Ryzen 9 8940HX ⎘ NVIDIA GeForce RTX 5060 Laptop ⎘ 16 GB Memory, 1000 GB SSD | Amazon: List Price: 1500 Euro | 2.4 kg | 23.7 mm | 16.00" 1920x1200 162 PPI IPS |
4. 86.6%  | Lenovo Legion 7 16IAX10 Intel Core Ultra 7 255HX ⎘ NVIDIA GeForce RTX 5060 Laptop ⎘ 32 GB Memory, 1024 GB SSD | Amazon: List Price: 1650 USD | 2 kg | 17.9 mm | 16.00" 2560x1600 189 PPI OLED |
5. 86.2%  | Schenker XMG Core 16 M25 AMD Ryzen AI 9 HX 370 ⎘ NVIDIA GeForce RTX 5070 Laptop ⎘ 64 GB Memory, 2048 GB SSD | Amazon: List Price: 2100€ | 2.1 kg | 23 mm | 16.00" 2560x1600 189 PPI IPS |
6. 82%  | Acer Predator Helios Neo 16S AI PHN16S-71-94L9 Intel Core Ultra 9 275HX ⎘ NVIDIA GeForce RTX 5070 Ti Laptop ⎘ 32 GB Memory, 1024 GB SSD | Amazon: List Price: 2400 EUR | 2.2 kg | 19.9 mm | 16.00" 2560x1600 189 PPI OLED |
Transparency
The selection of devices to be reviewed is made by our editorial team. The test sample was provided to the author as a loan by the manufacturer or retailer for the purpose of this review. The lender had no influence on this review, nor did the manufacturer receive a copy of this review before publication. There was no obligation to publish this review. As an independent media company, Notebookcheck is not subjected to the authority of manufacturers, retailers or publishers.
This is how Notebookcheck is testing
Every year, Notebookcheck independently reviews hundreds of laptops and smartphones using standardized procedures to ensure that all results are comparable. We have continuously developed our test methods for around 20 years and set industry standards in the process. In our test labs, high-quality measuring equipment is utilized by experienced technicians and editors. These tests involve a multi-stage validation process. Our complex rating system is based on hundreds of well-founded measurements and benchmarks, which maintains objectivity. Further information on our test methods can be found here.

