Verdict — Finely-Tuned And Under 2 Kg
The Legion 7 16IAX10 is an interesting model to judge. It's one of the few 16-inch gaming laptops with an Arrow Lake-HX CPU yet no GPU options beyond the RTX 5070. On the other hand, it's one of the lightest and fastest gaming laptops we've tested with the same RTX 5060 GPU due to its high 115 W TGP target. The system maximizes portability while squeezing as much performance as possible from its high-end CPU and midrange GPU. For gamers or power users who like to travel, the Legion 7 16 Gen 10 is both a lighter and less expensive alternative to the RTX 5060 Razer Blade 16 especially for scenarios where an integrated numpad can come in handy.
The main drawback to the model is its aforementioned RTX 5070 limit. The RTX 5070 Ti is significantly faster than the RTX 5070, but its high power requirements have likely excluded it from the system. Users demanding more powerful graphics will then have to look beyond the Legion 7 16 such as the aforementioned Blade 16 or the larger and heavier Legion Pro 5 16 instead.
Other drawbacks to the model are par for the course when it comes to ultrathin high-performance gaming laptops. Core temperatures are relatively high, battery life is average at best, and loud fans are unavoidable if playing on Performance mode. These negatives are more pronounced on the Legion 7 16 due to it being lighter than most other ultralight competitors.
Users who may not need the extra performance of Arrow Lake-HX may want to consider the Lenovo Yoga Pro 9i 16IAH G10 Aura which offers similar RTX 5060 graphics and 1800p OLED display but with Arrow Lake-H processors instead.
Pros
Cons
Price and Availability
Best Buy is now shipping the Lenovo Legion 7 16 exactly as configured for $1650 USD. The model is also available directly from Lenovo but only with the higher-end Core Ultra 9 CPU and RTX 5070 GPU for $1770.
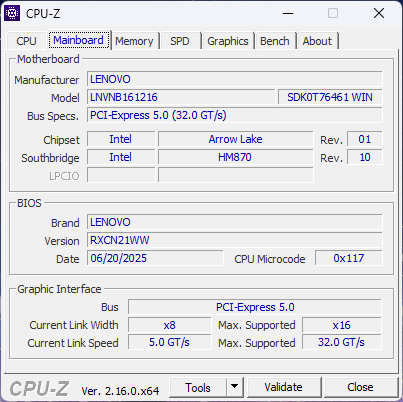
The Legion 7 16IAX10 (otherwise known as the Legion 7i 16 Gen 10) is one of Lenovo's thinnest and lightest gaming laptops in the Legion series. It's a direct successor to the 2024 Legion 7 16IRX9 with both new Arrow Lake-HX processor options and a refreshed chassis design.
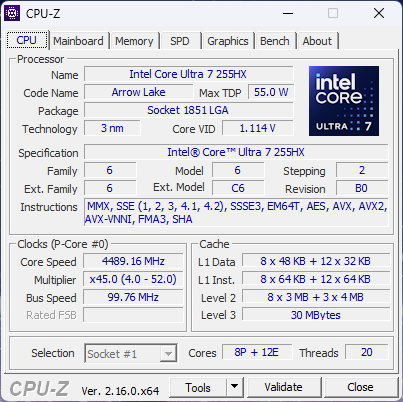
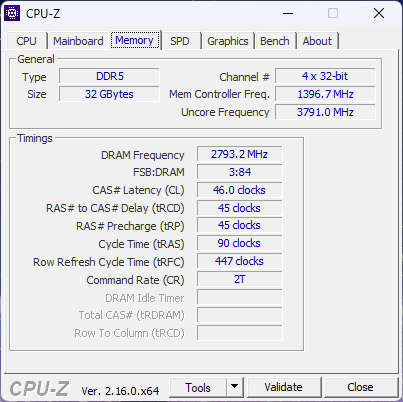
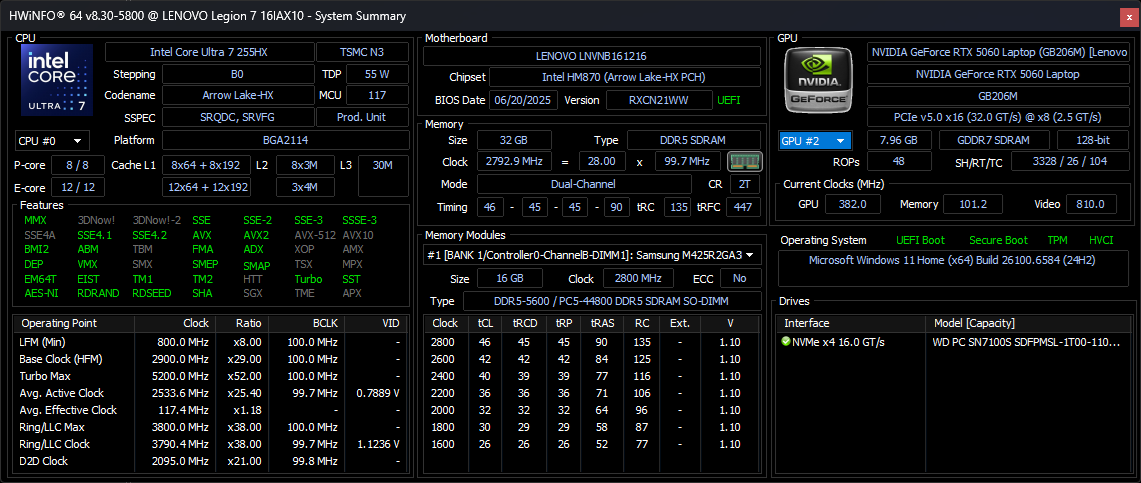
Our test unit is a lower configuration with the Core Ultra 7 255HX CPU, 115 W GeForce RTX 5060 GPU, and 165 Hz 1600p glossy OLED display for approximately $1650. Higher-end SKUs come with the Core Ultra 9 275HX, RTX 5070, and 240 Hz OLED instead.
Alternatives to the Legion 7 16IAX10 include other 16-inch midrange or ultrathin gaming laptops like the Alienware 16X Aurora, base configuration Razer Blade 16, or Asus TUF Gaming A16, or Zephyrus G16. The Legion 7 16 should not be confused with the larger and heavier Legion Pro 7 16. A less expensive 15-inch version of this model is available called the Legion 5 15AHP10 with similar 115 W RTX 5060 graphics.
More Lenovo reviews:
Specifications
Case
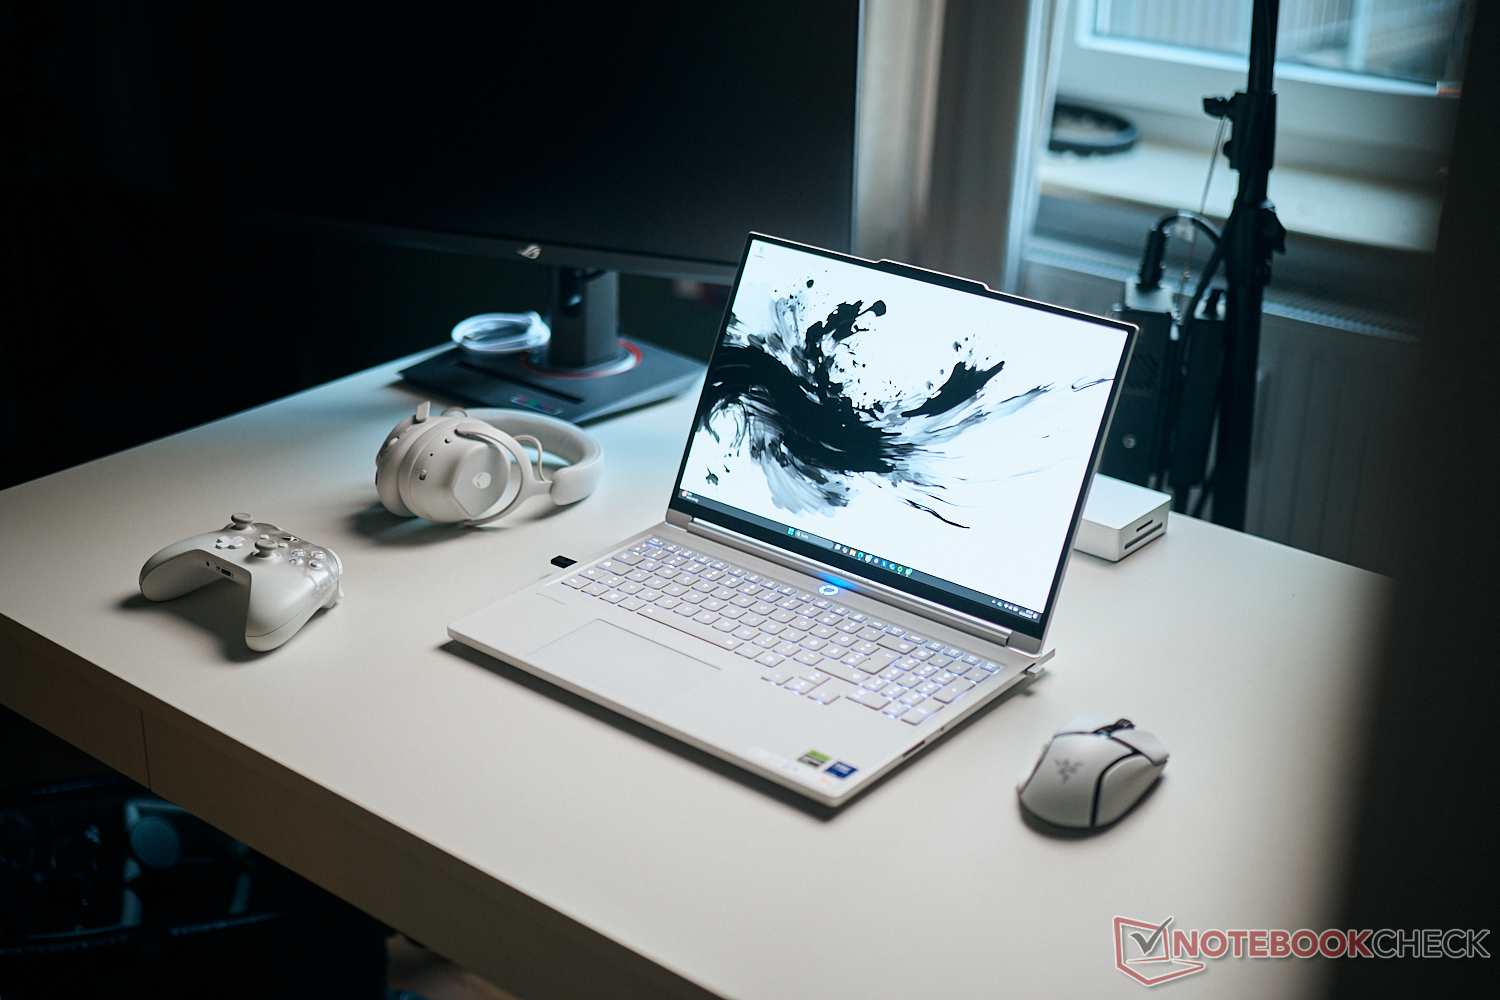
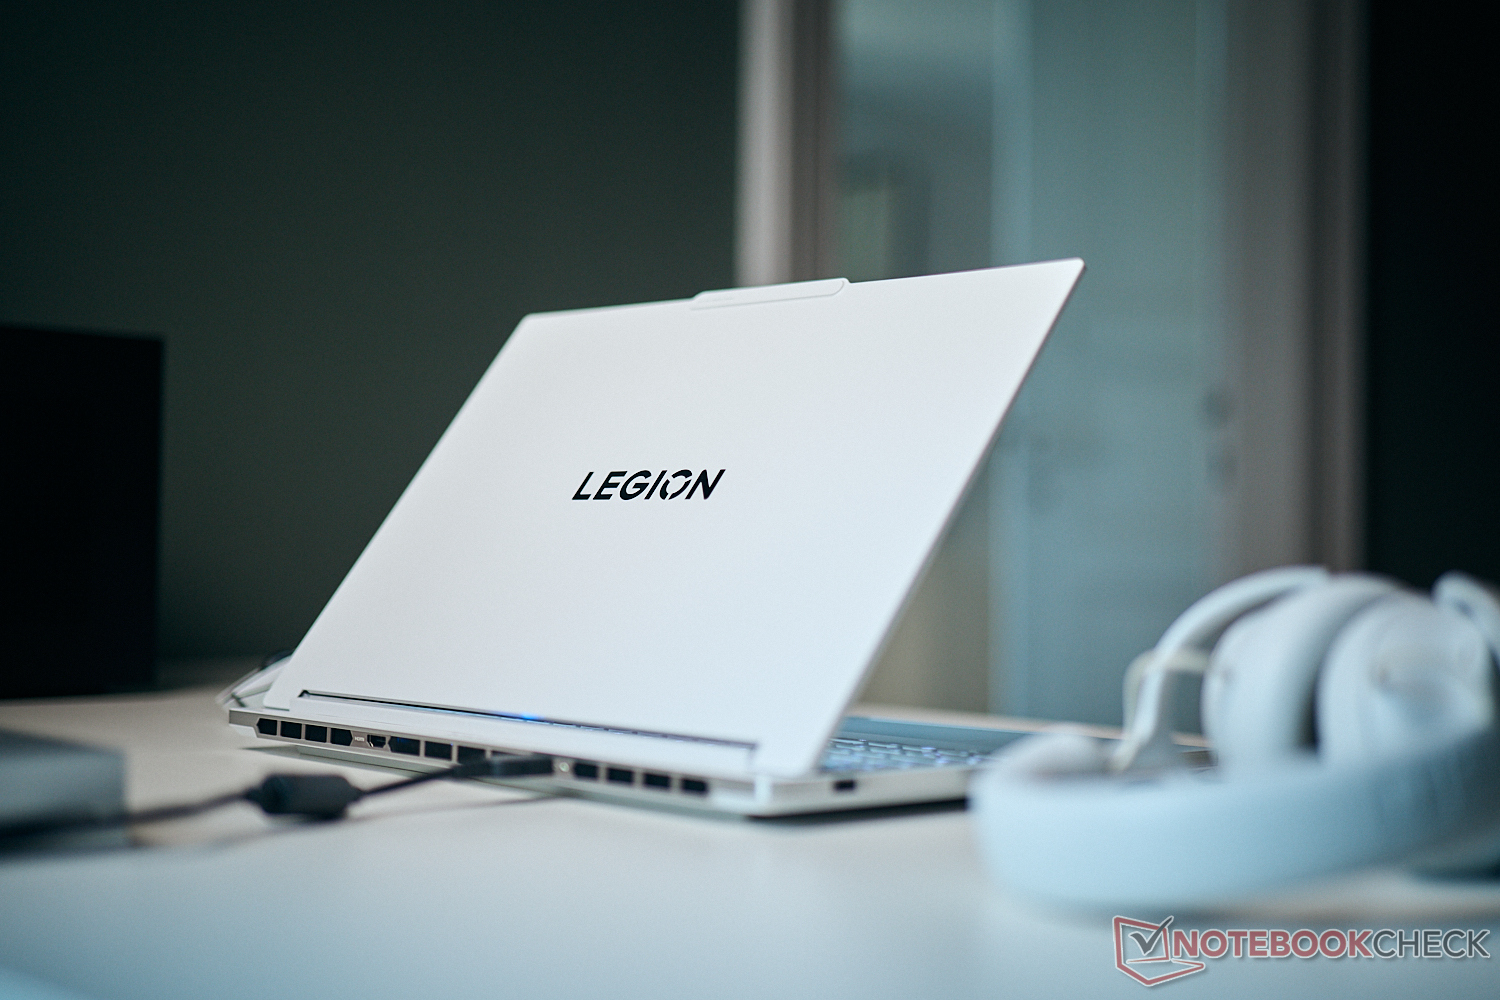
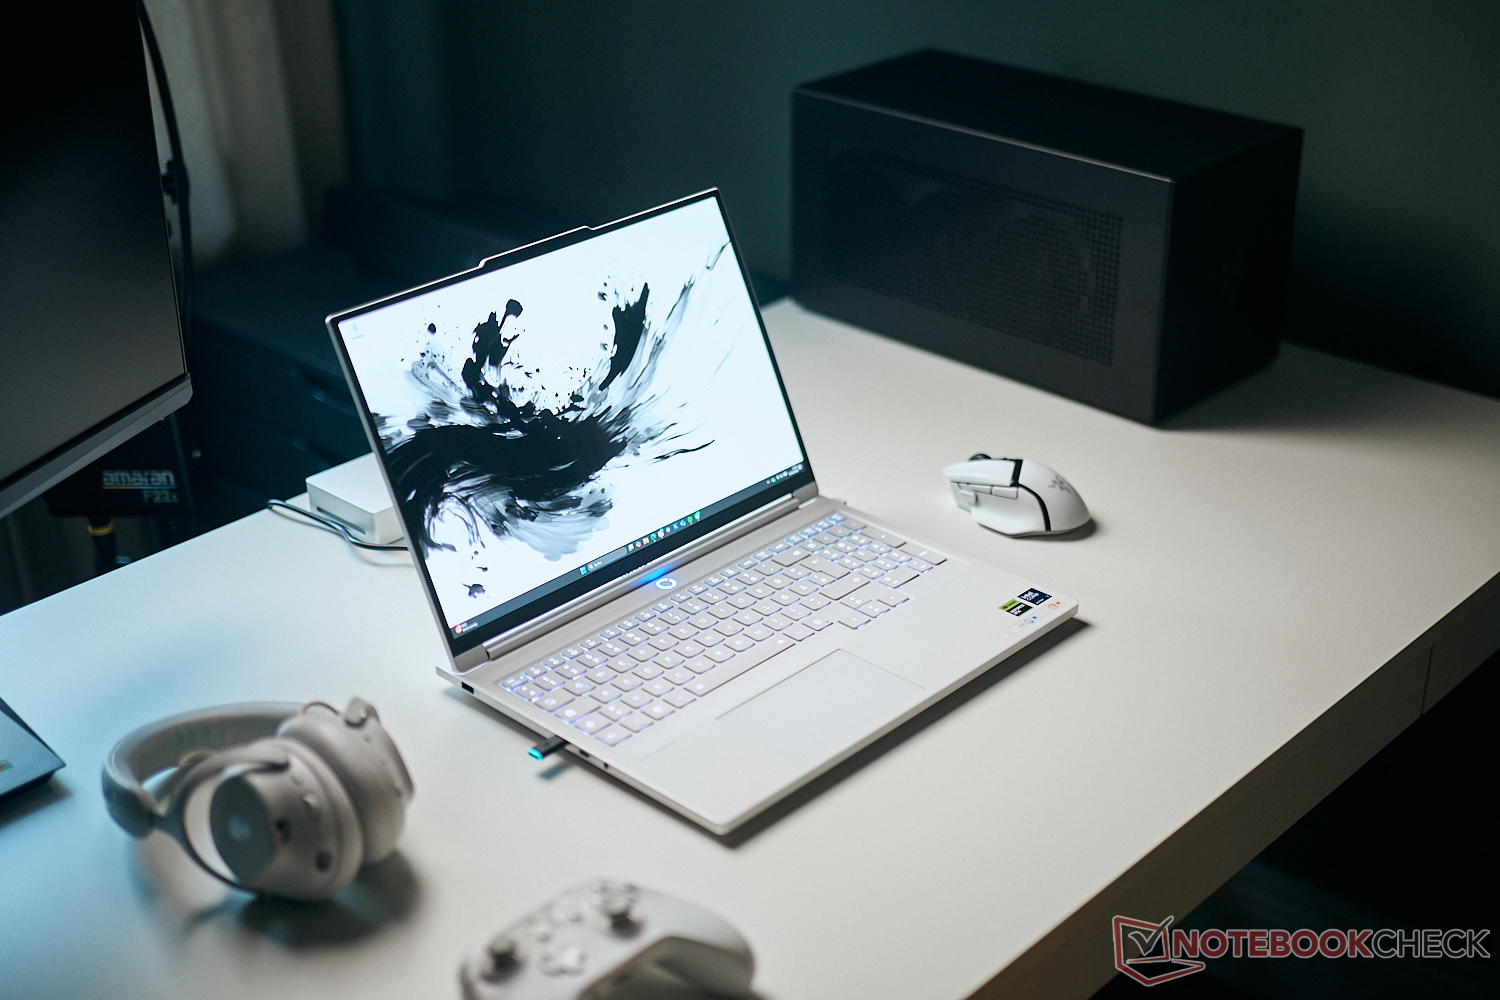
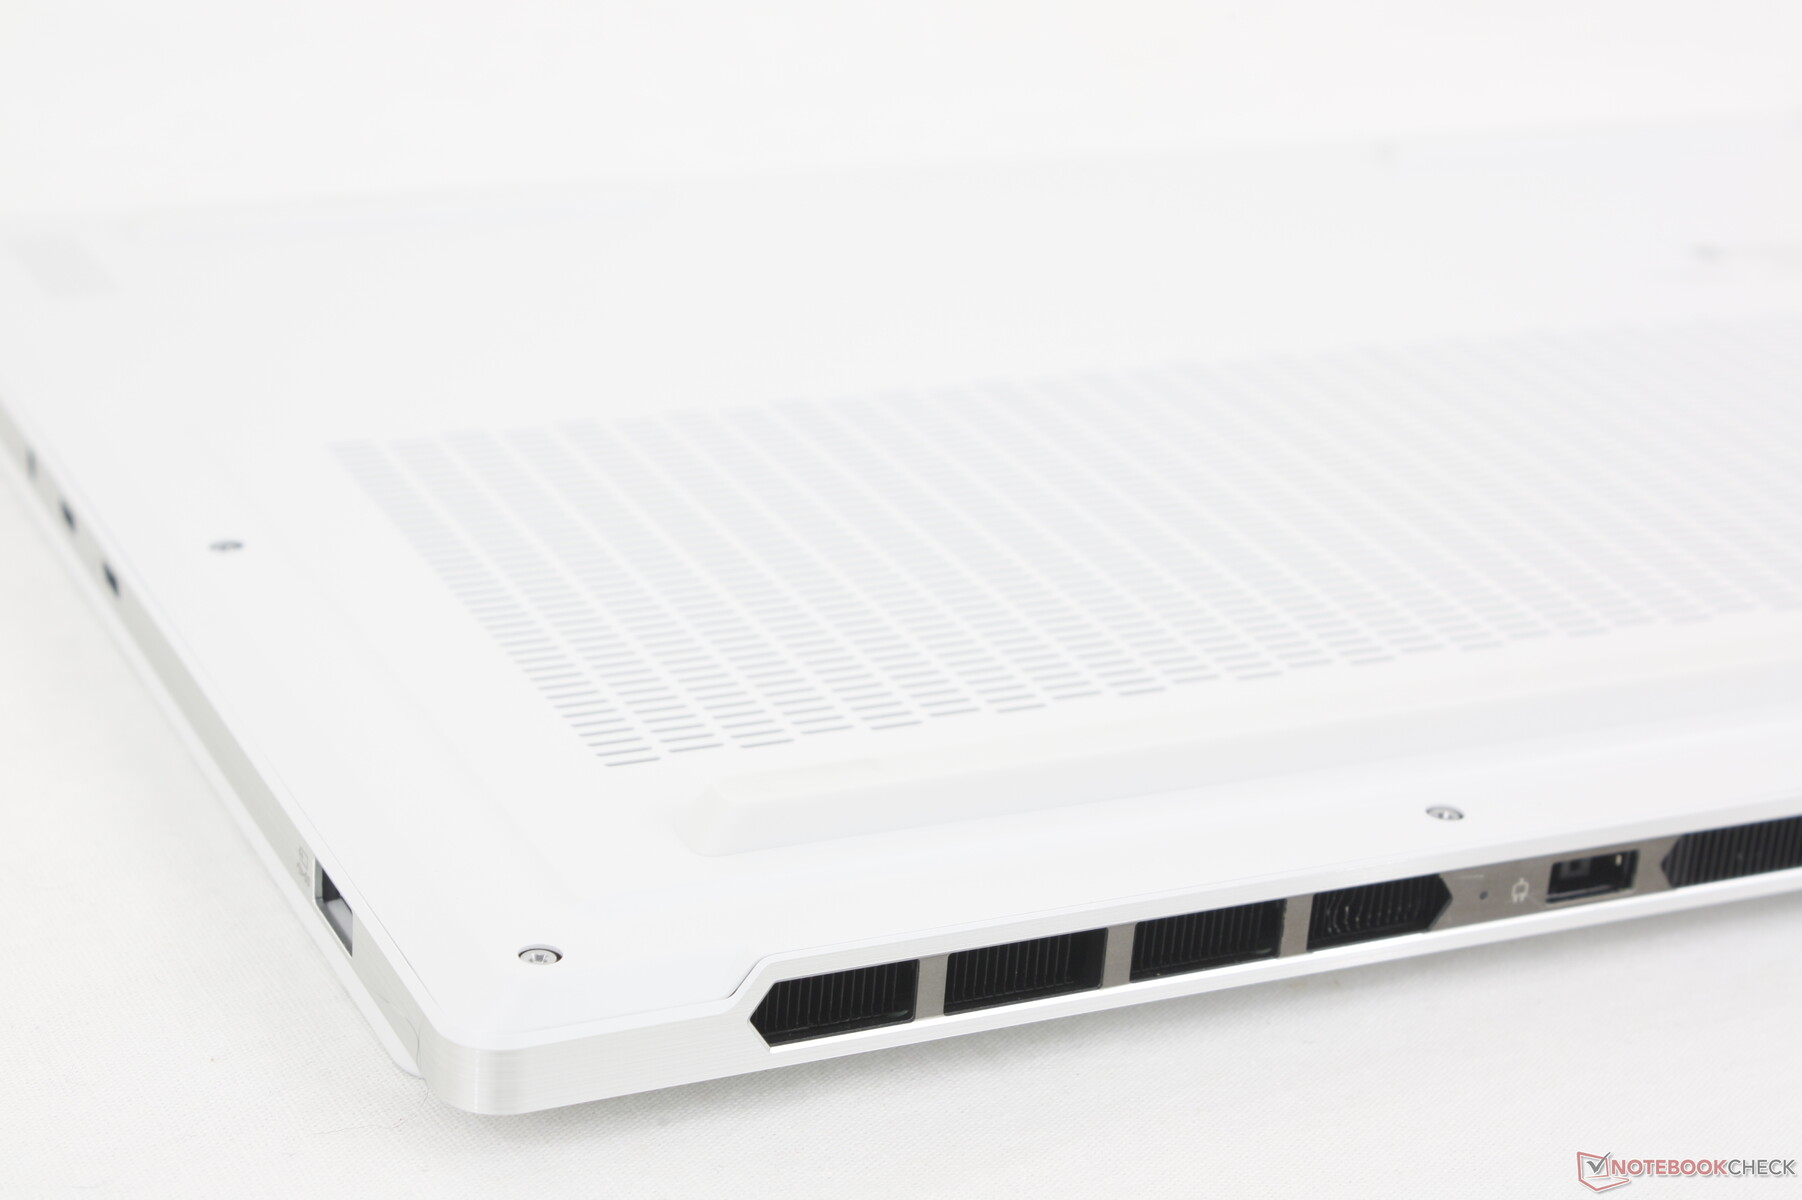
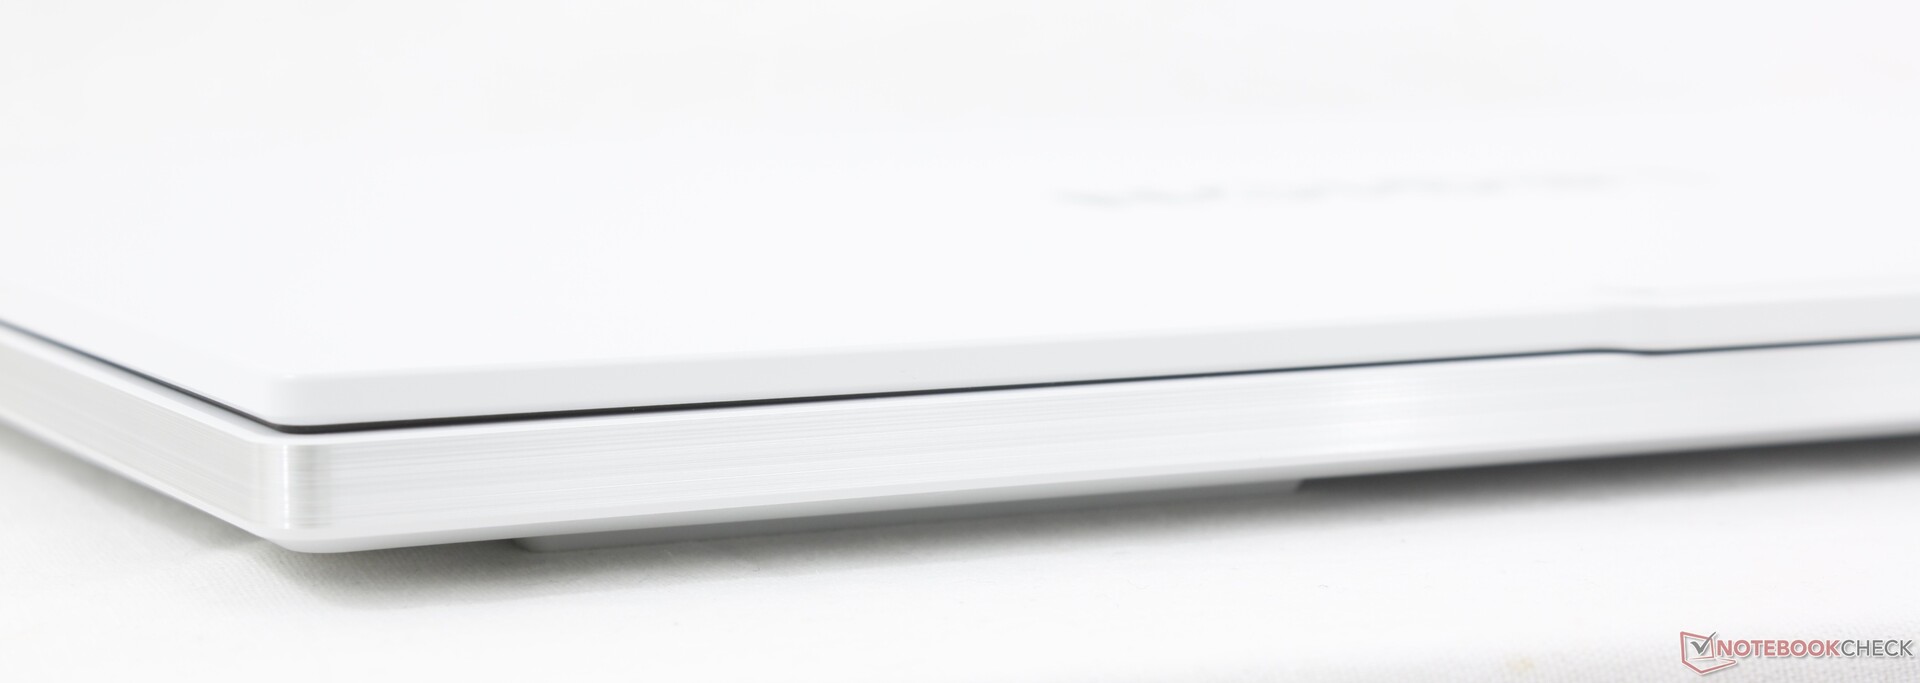
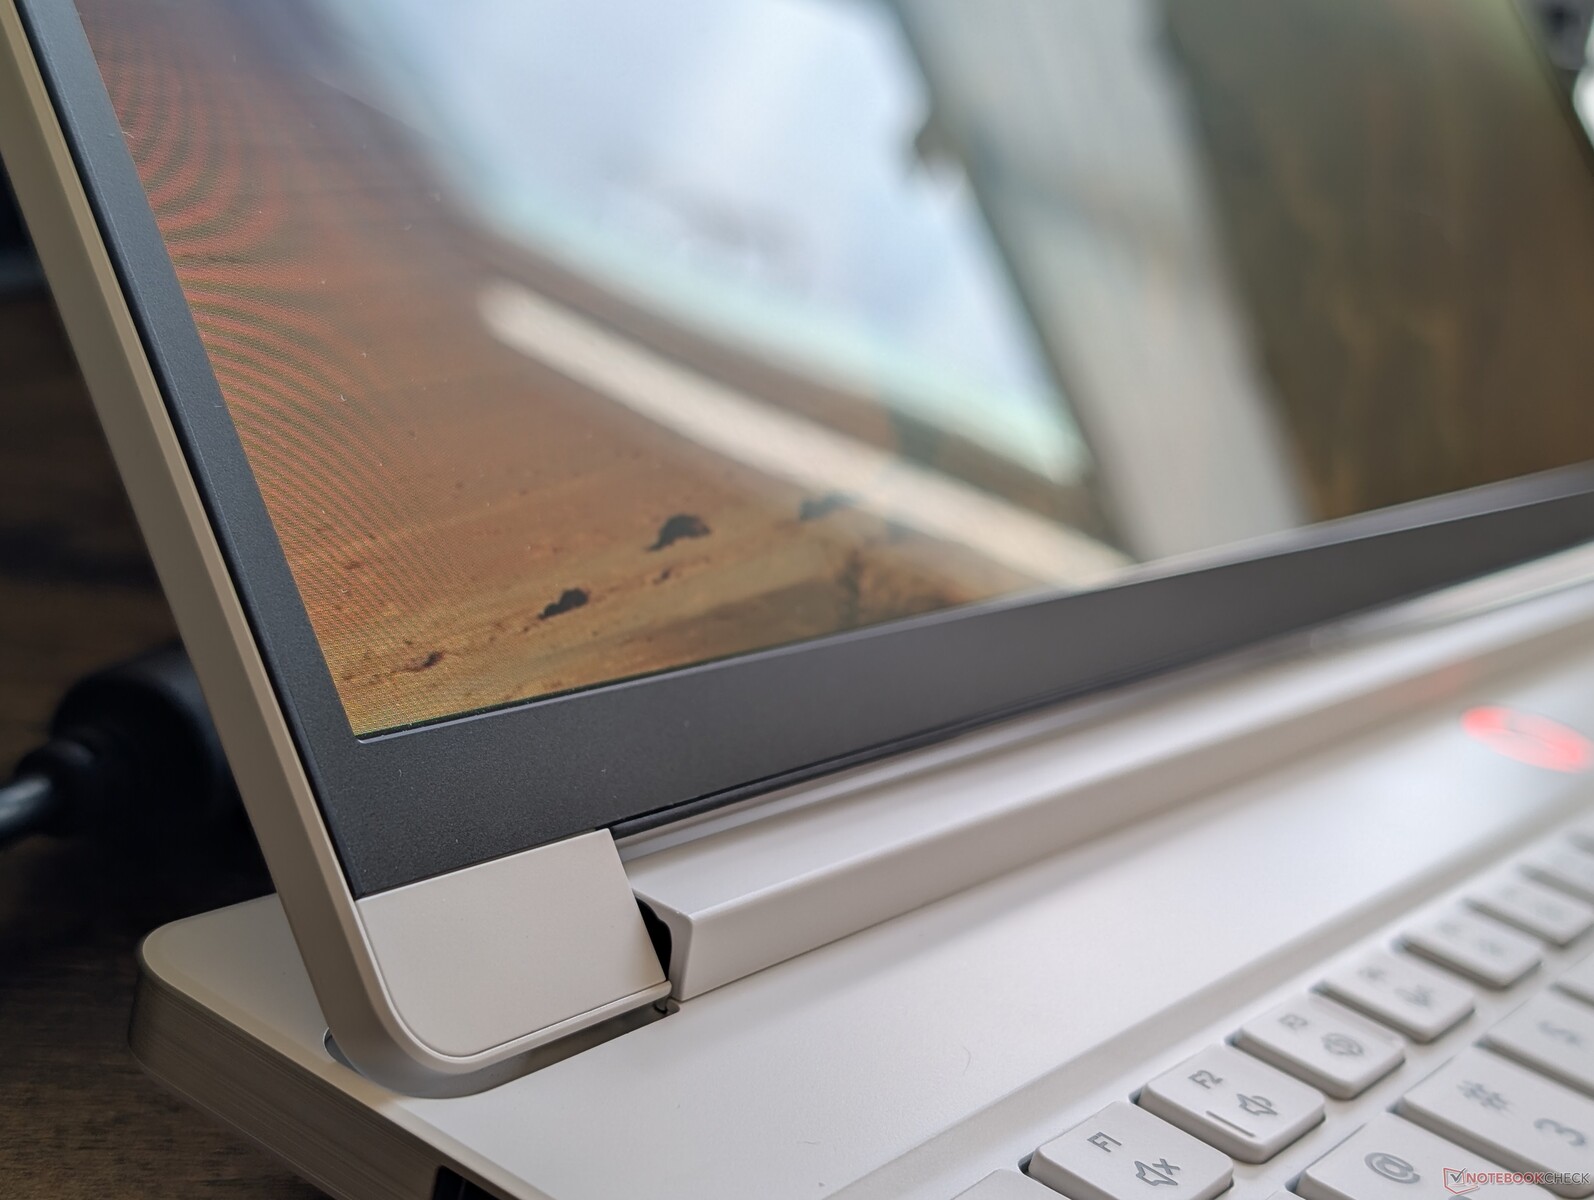
The chassis is notable for its matte white color scheme in contrast to the normally darker tones of most other gaming laptops. Aesthetically, the white color is excellent at hiding fingerprints, but scratches and knicks may appear more readily. The casing otherwise consists of similar aluminum alloy materials and anodized outer texture as most other Legion laptops.
Chassis rigidity is excellent along the base with almost no warping or bending. The hinges are small but nonetheless satisfactory; they open the full 180 degrees but feel slightly weaker than the hinges of the Blade 16.
The light weight of just under 2 kg is arguably the most notable aspect of the Legion 7 16IAX10. This is much lighter than most 16-inch gaming laptops including even the ultralight HP Omen Transcend 16 or Razer Blade 16 by up to 200 g each. Nonetheless, the recent Zephyrus G16 is even lighter by 100 g and the Lenovo is still slightly larger or thicker than some competitors including the aforementioned Razer or Alienware.
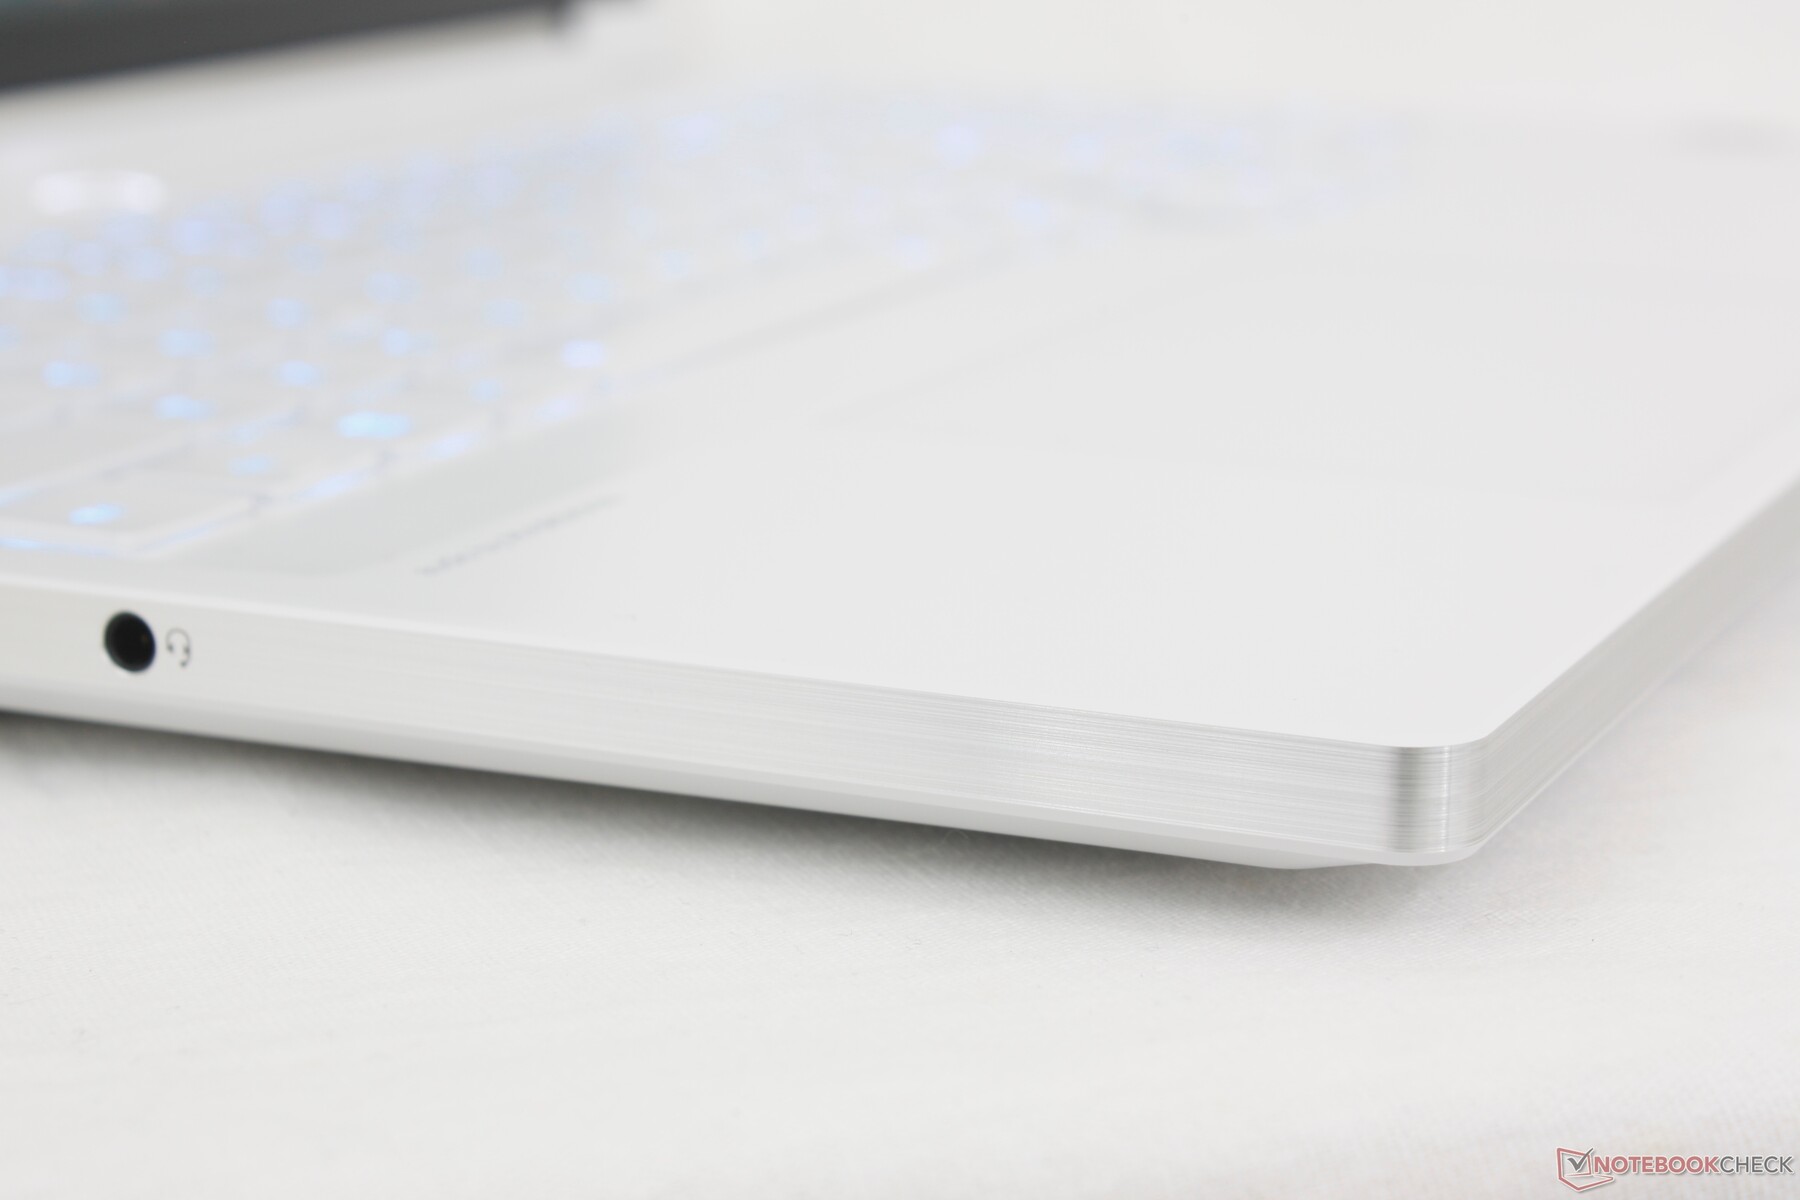
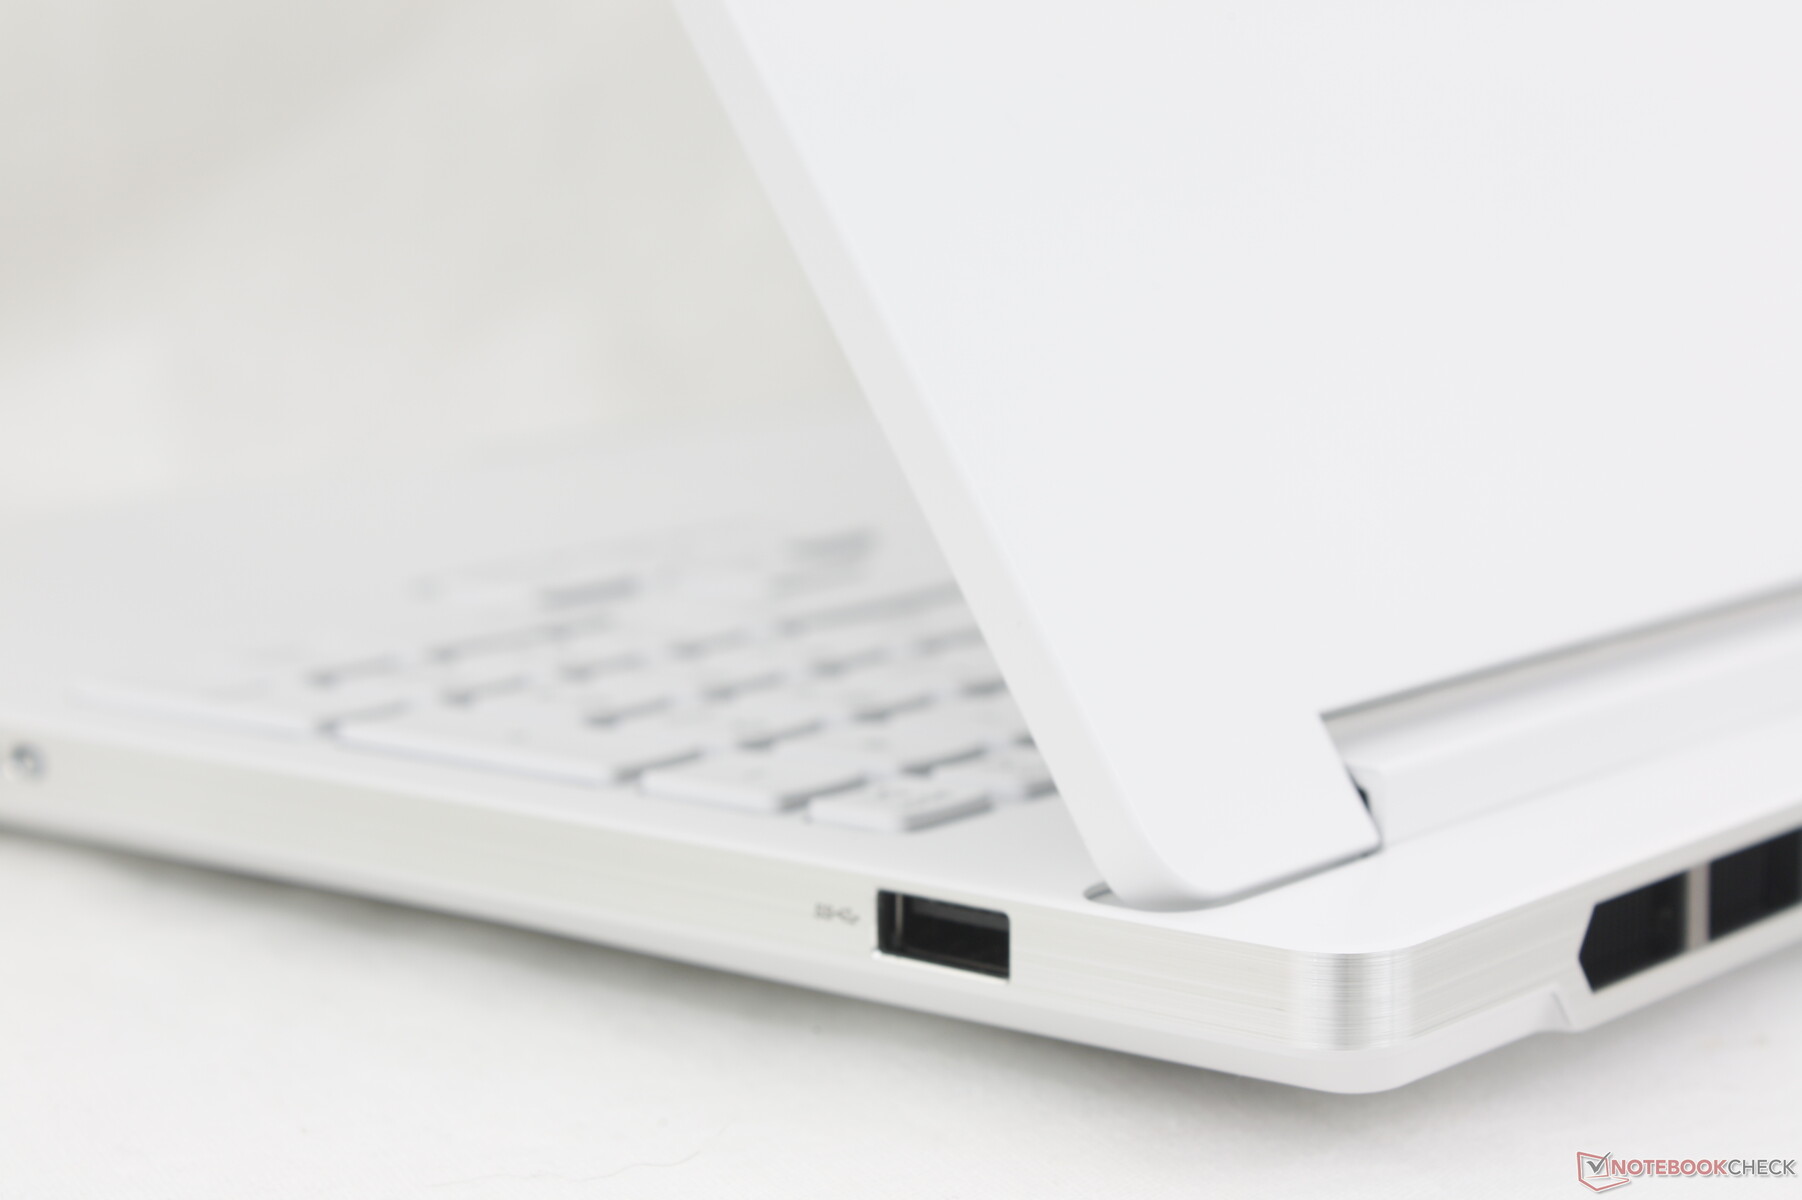
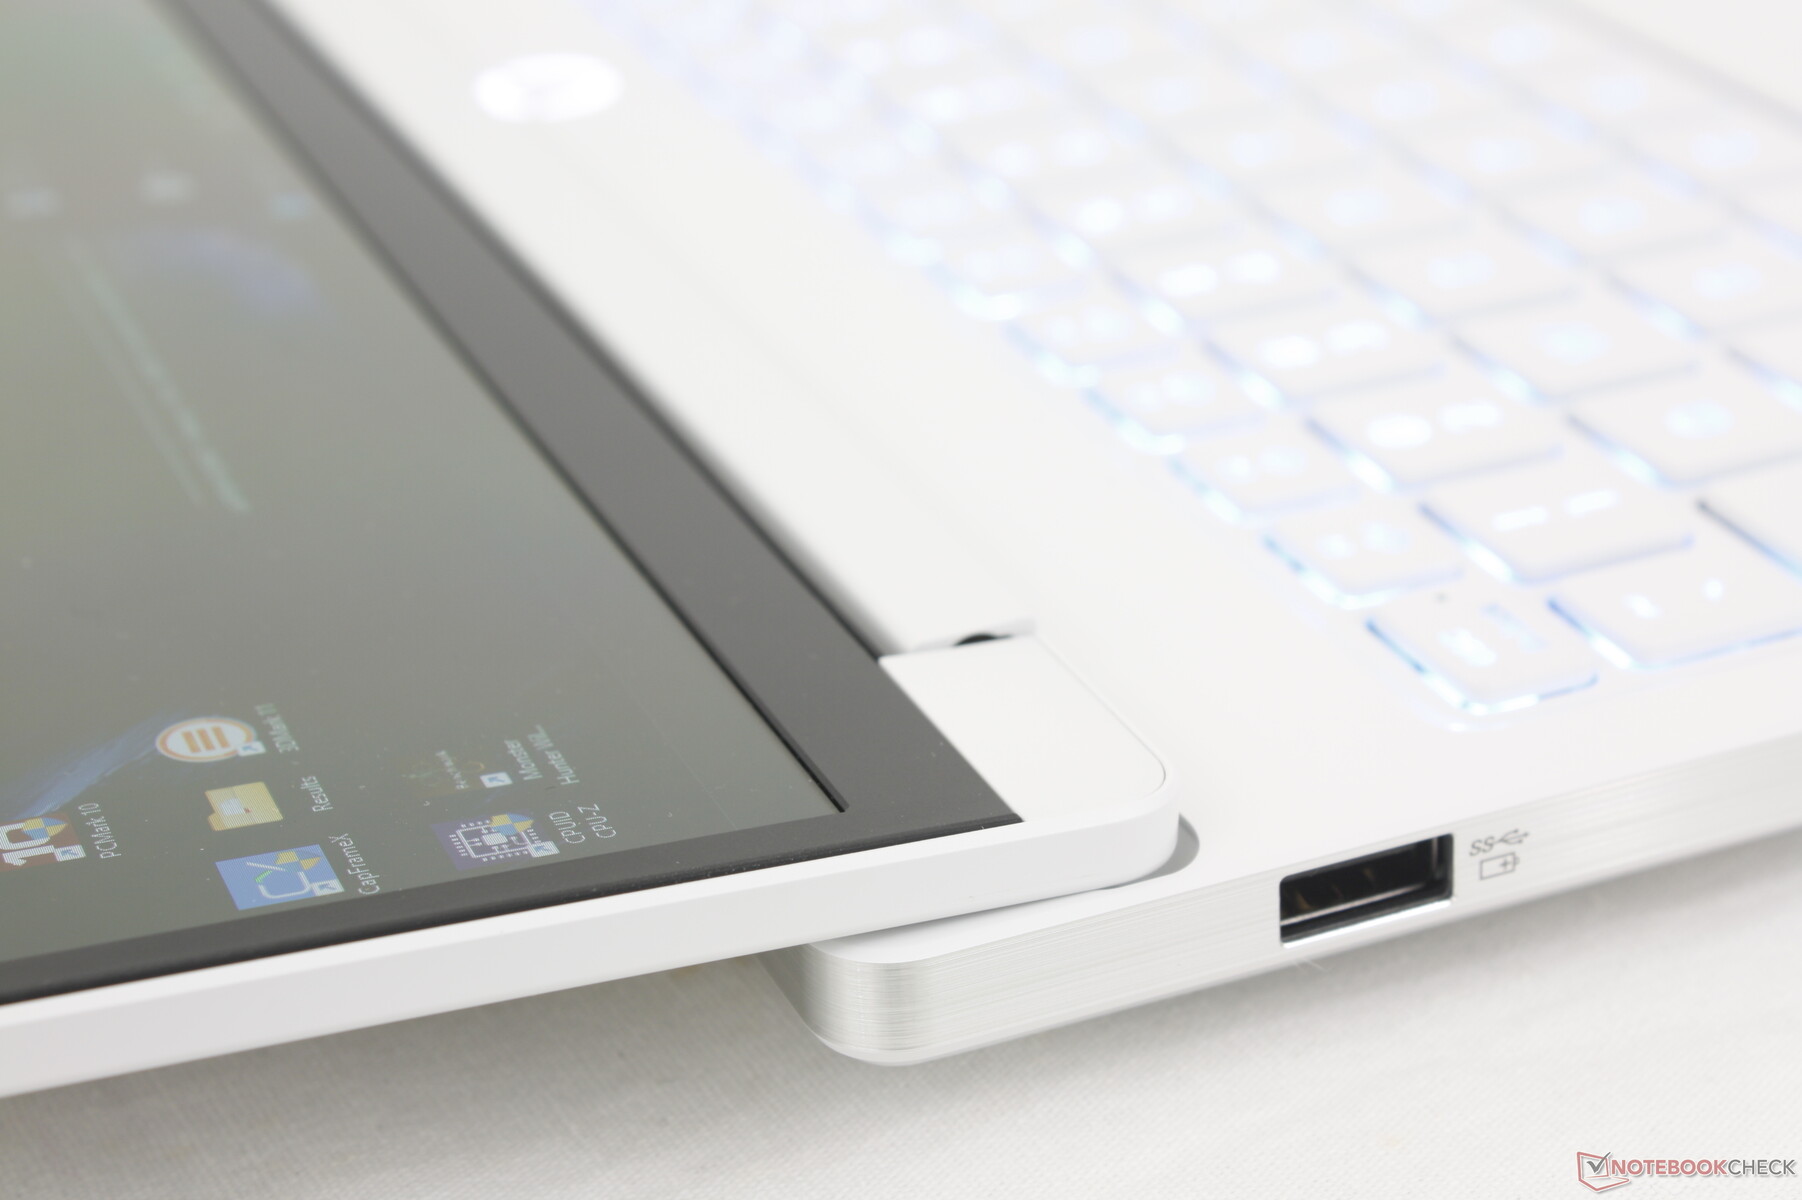
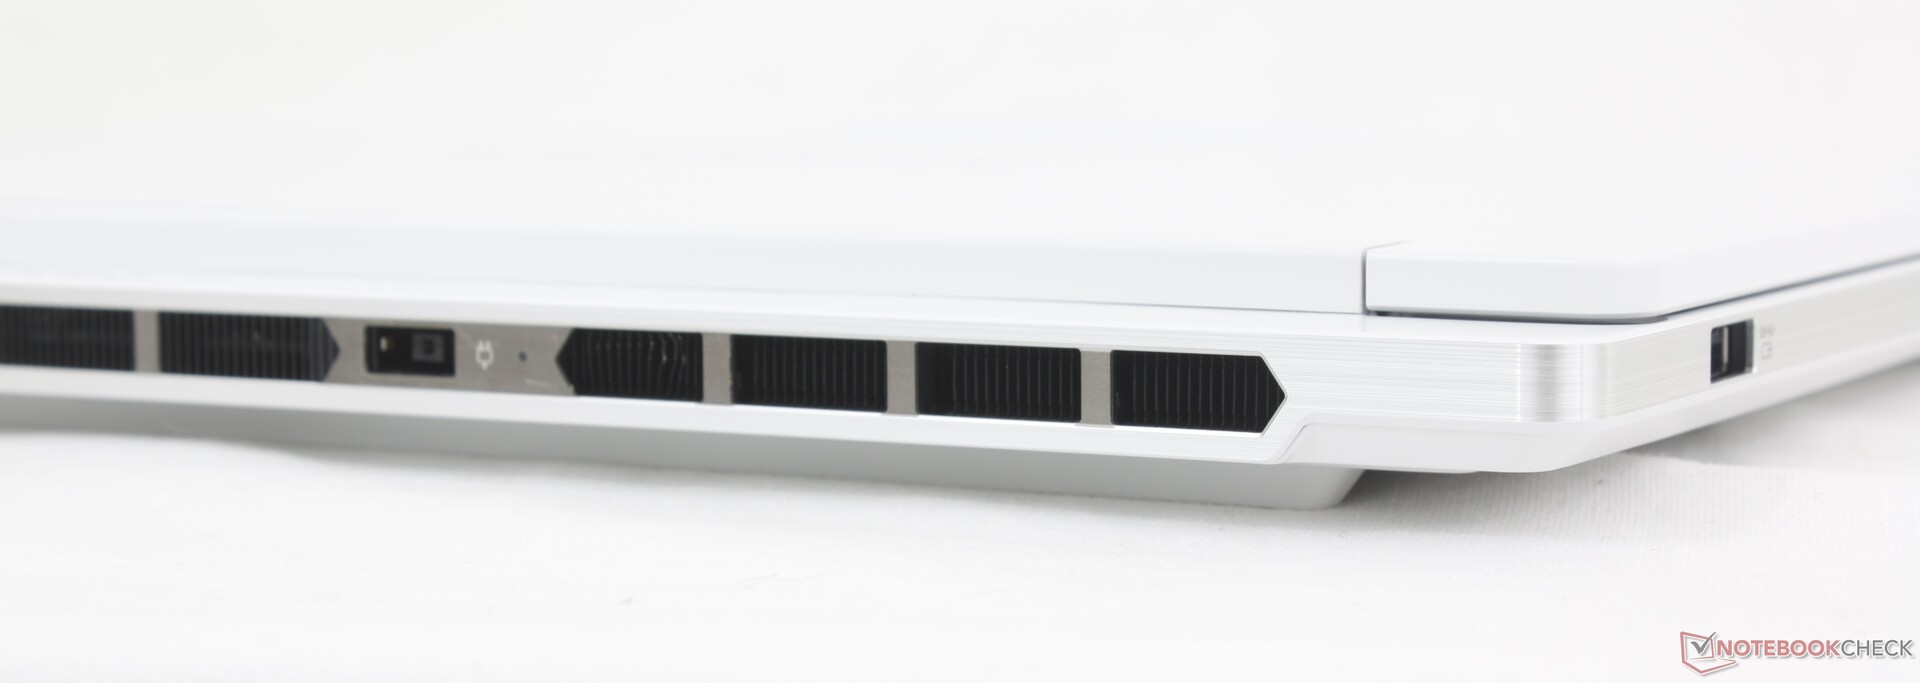
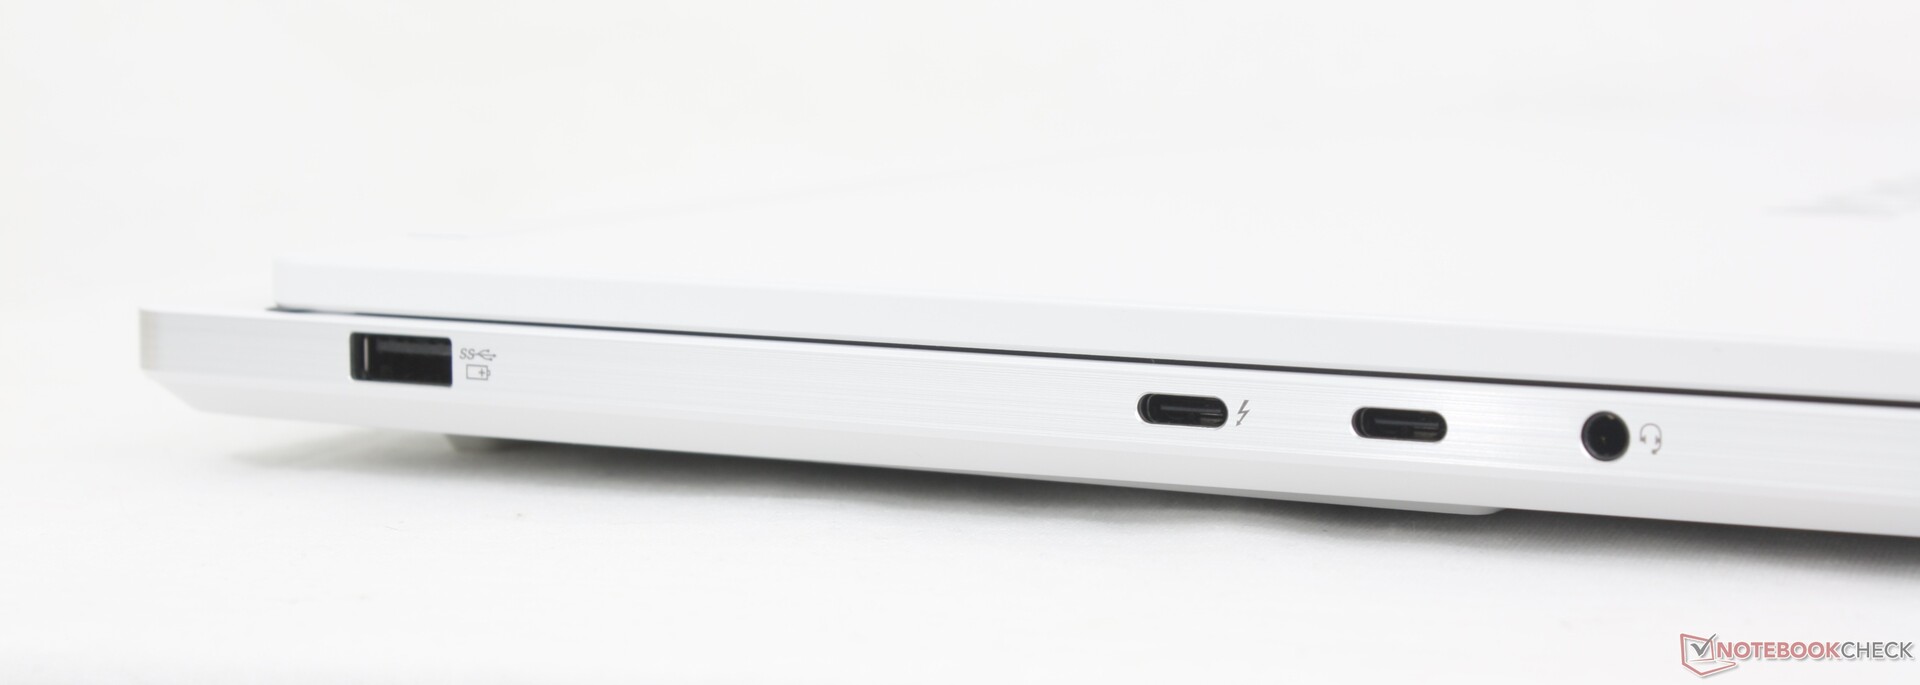
Connectivity
The system inherits all ports found on last year's Legion 7 16IRX9 except for the third USB-C port along the right edge. When compared to competing models like the Asus TUF Gaming A16, the Lenovo has fewer USB-A ports and no RJ-45 port.
Keep in mind that only one of the two USB-C ports supports USB4 or Thunderbolt 4 accessories.
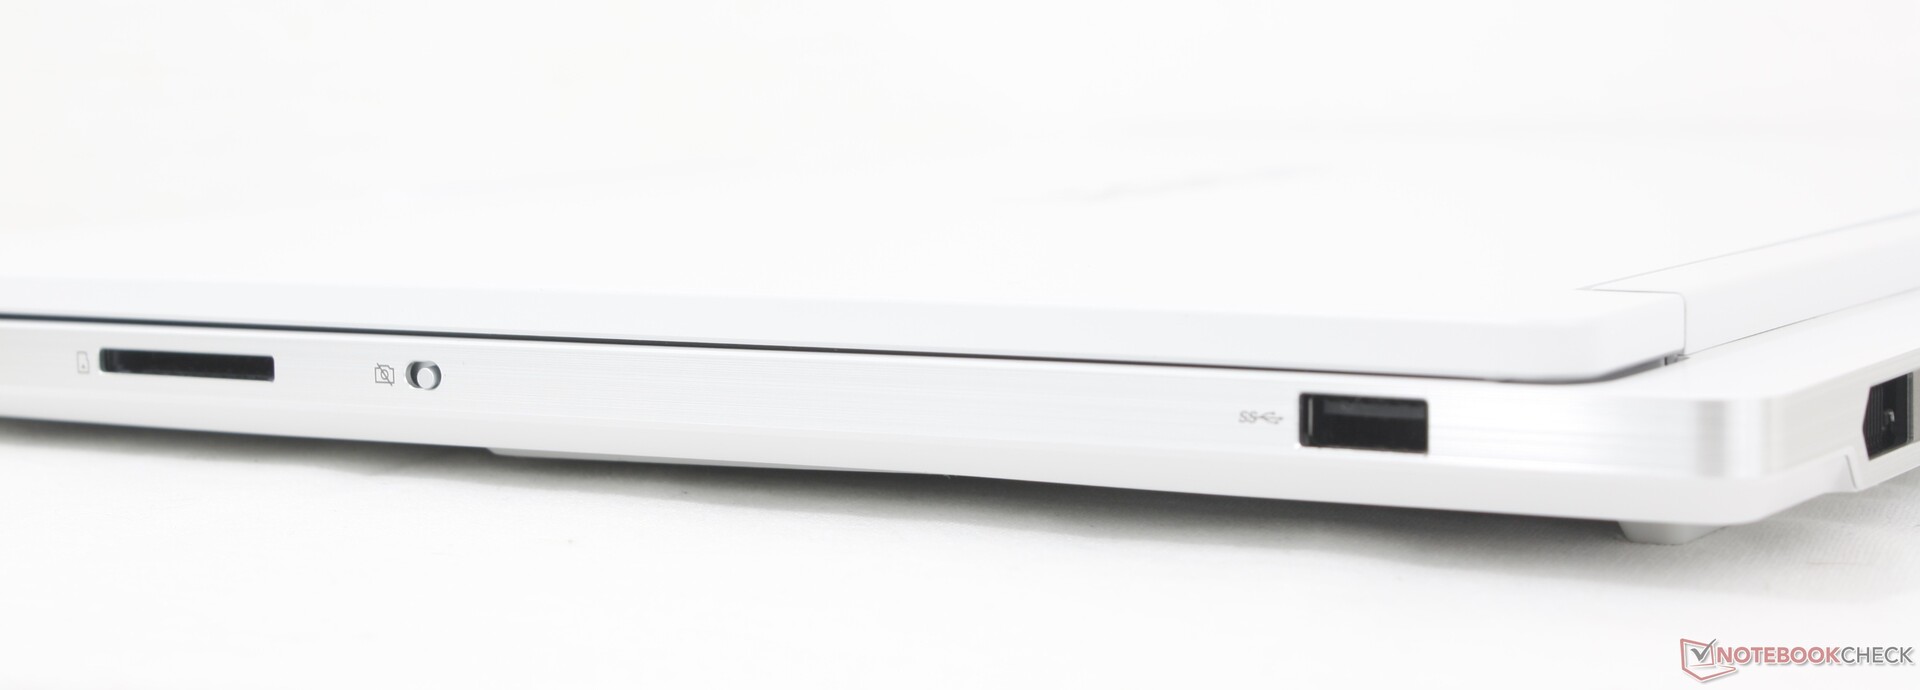
SD Card Reader
| SD Card Reader | |
| average JPG Copy Test (av. of 3 runs) | |
| Lenovo Legion 7 16IAX10 (Toshiba Exceria Pro SDXC 64 GB UHS-II) | |
| MSI Vector 16 HX AI A2XWHG (AV PRO microSD 128 GB V60) | |
| maximum AS SSD Seq Read Test (1GB) | |
| Lenovo Legion 7 16IAX10 (Toshiba Exceria Pro SDXC 64 GB UHS-II) | |
| MSI Vector 16 HX AI A2XWHG (AV PRO microSD 128 GB V60) | |
Communication
| Networking | |
| iperf3 transmit AXE11000 | |
| Asus TUF Gaming A16 FA608UP | |
| Gigabyte Gaming A16 GA6H | |
| Lenovo Legion 7 16IAX10 | |
| MSI Vector 16 HX AI A2XWHG | |
| Lenovo Legion 5 Pro 16IAX10H | |
| iperf3 receive AXE11000 | |
| Asus TUF Gaming A16 FA608UP | |
| MSI Vector 16 HX AI A2XWHG | |
| Gigabyte Gaming A16 GA6H | |
| Lenovo Legion 7 16IAX10 | |
| Lenovo Legion 5 Pro 16IAX10H | |
| iperf3 transmit AXE11000 6GHz | |
| Lenovo Legion 7 16IAX10 | |
| iperf3 receive AXE11000 6GHz | |
| Lenovo Legion 7 16IAX10 | |
Webcam
A 5 MP webcam comes standard with IR and an electronic shutter.


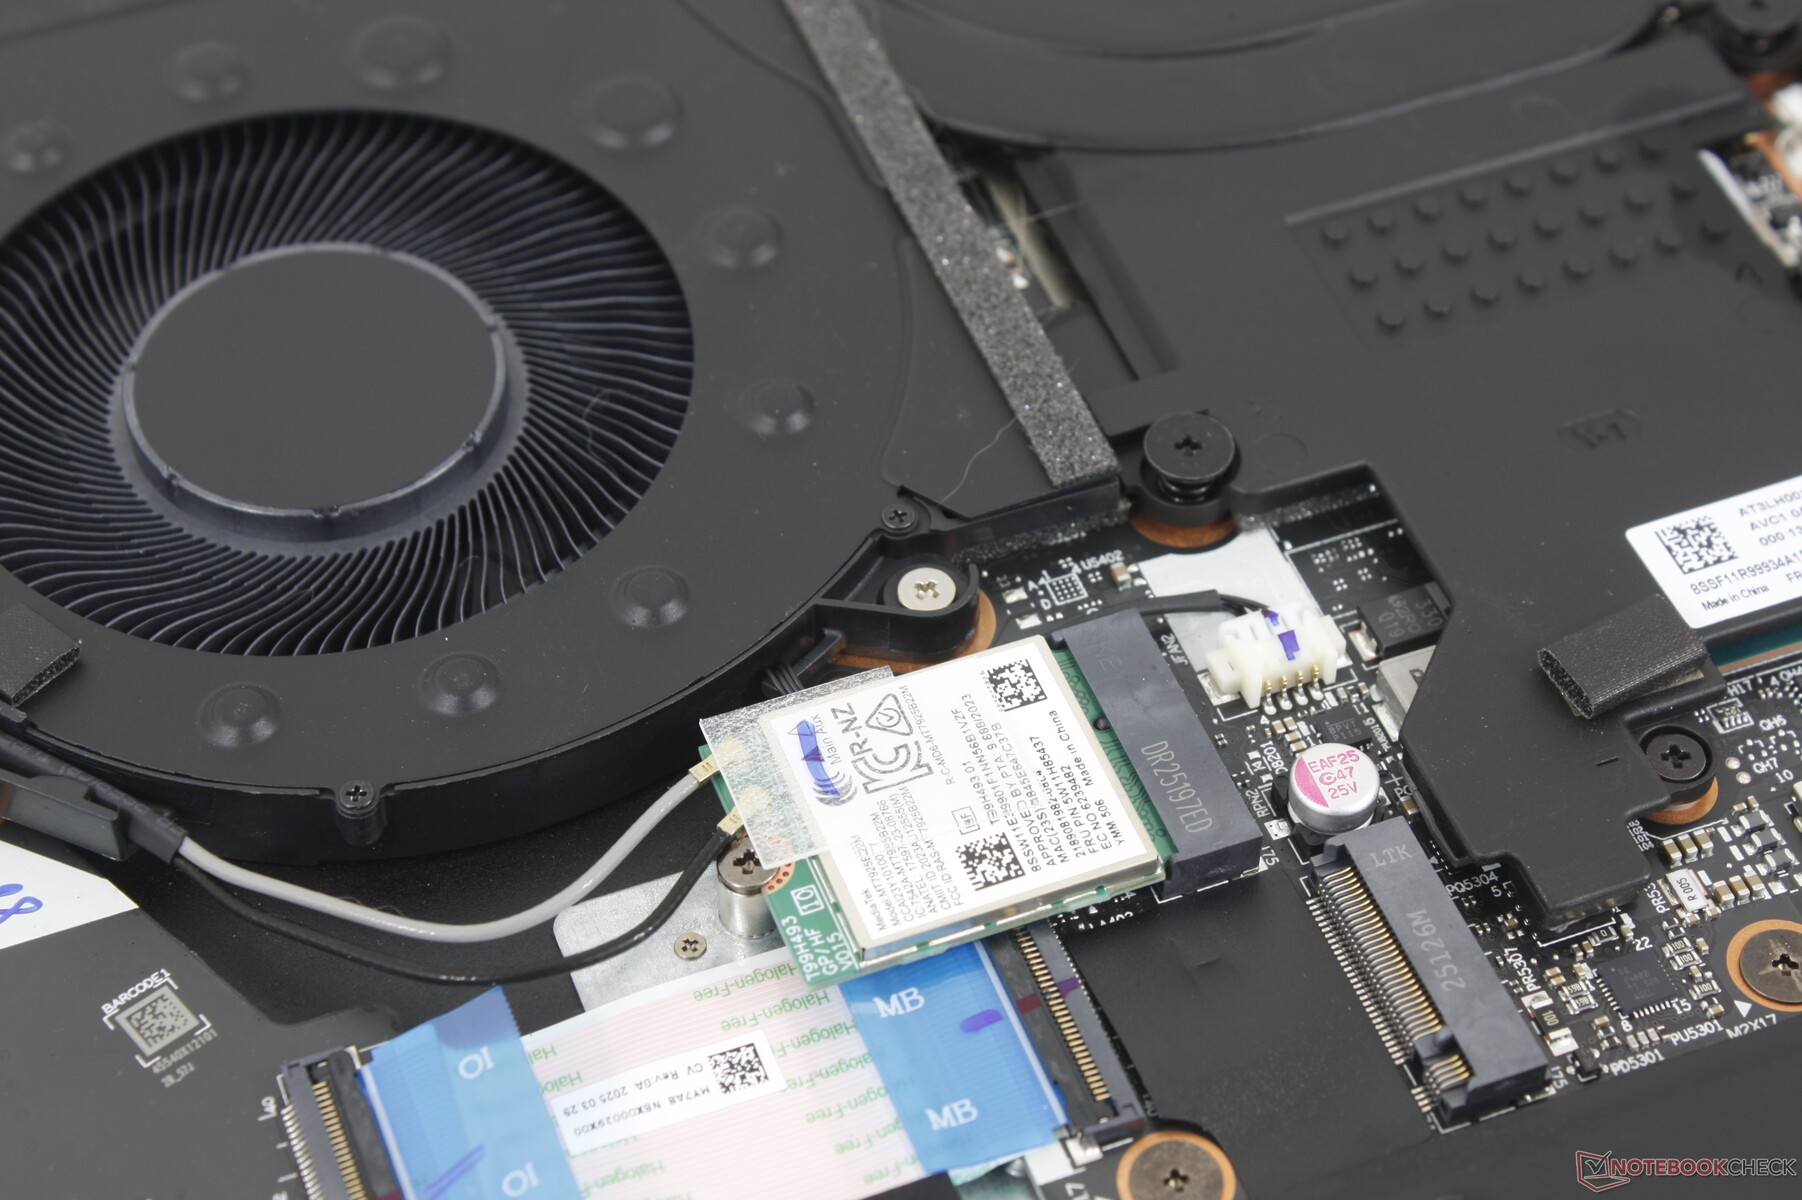
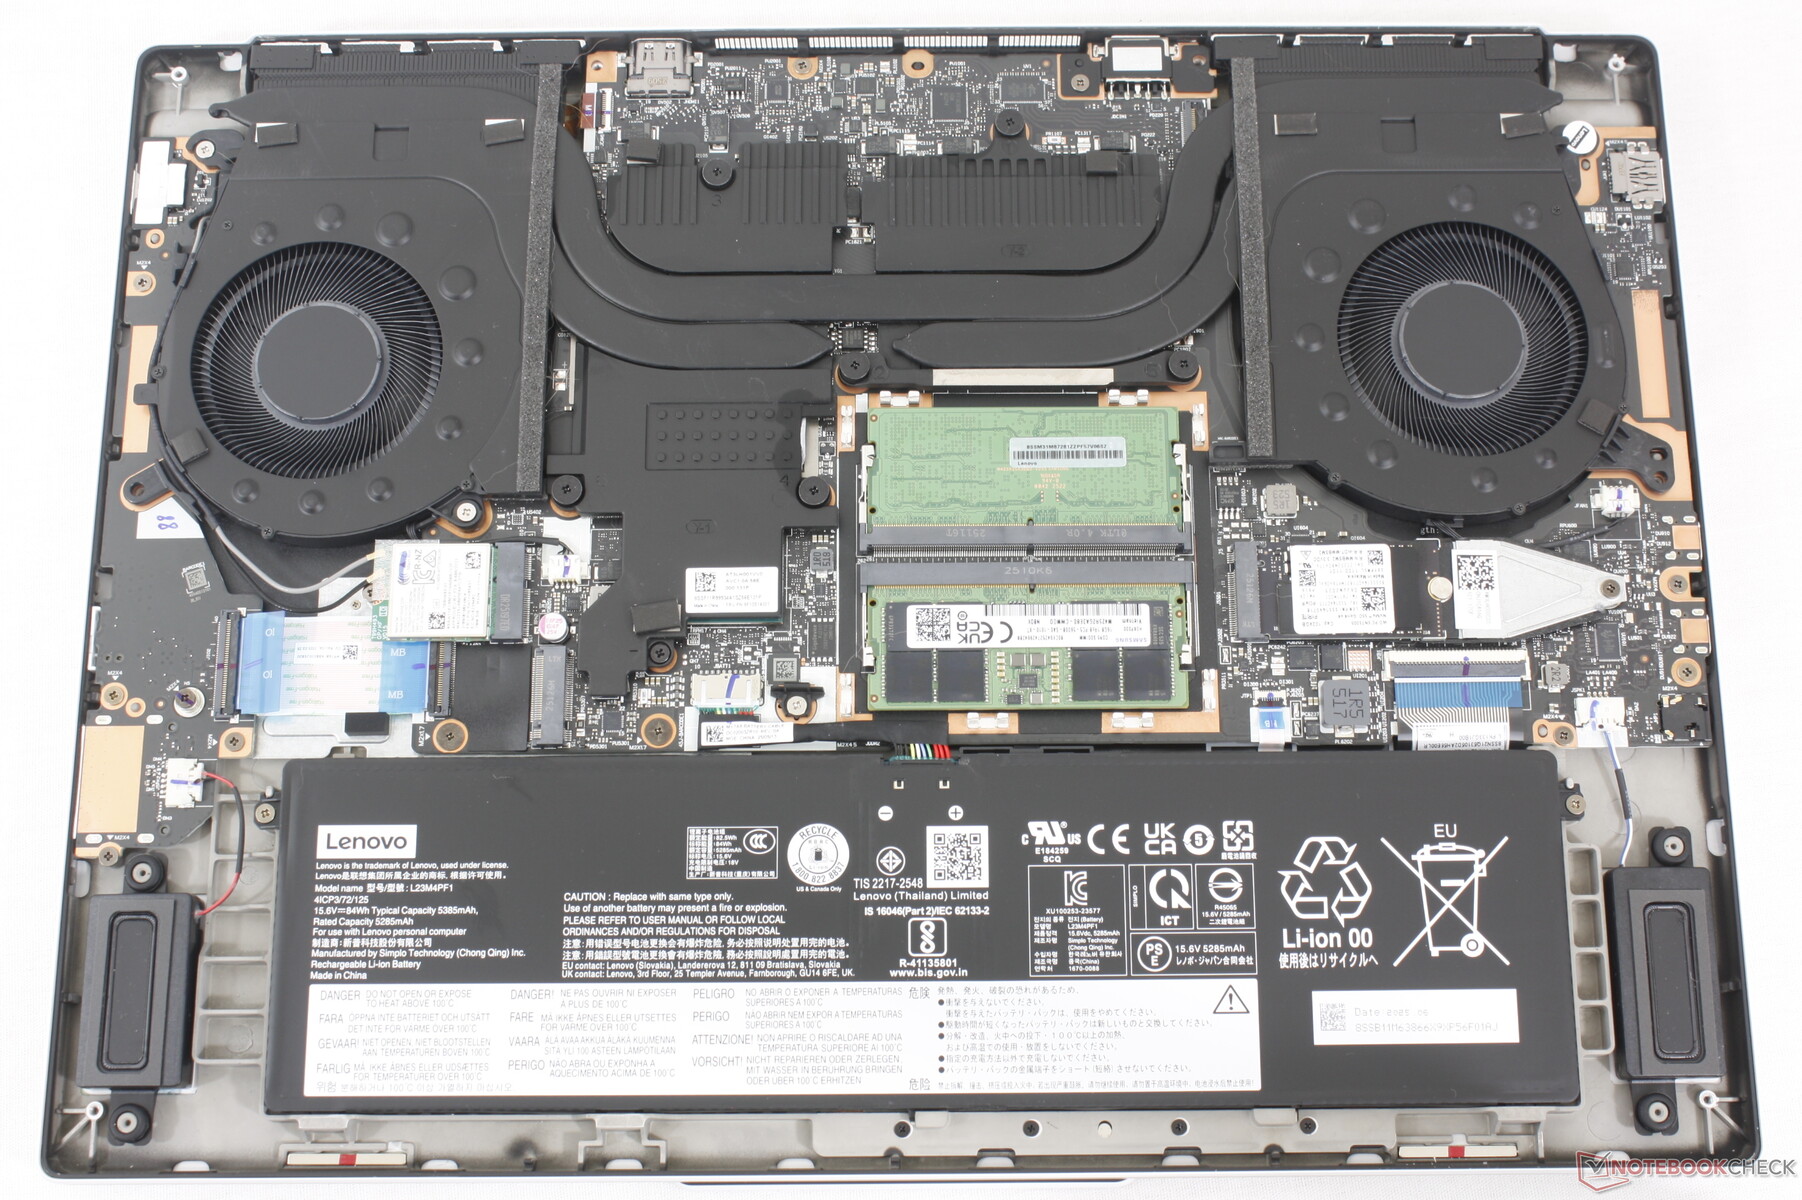
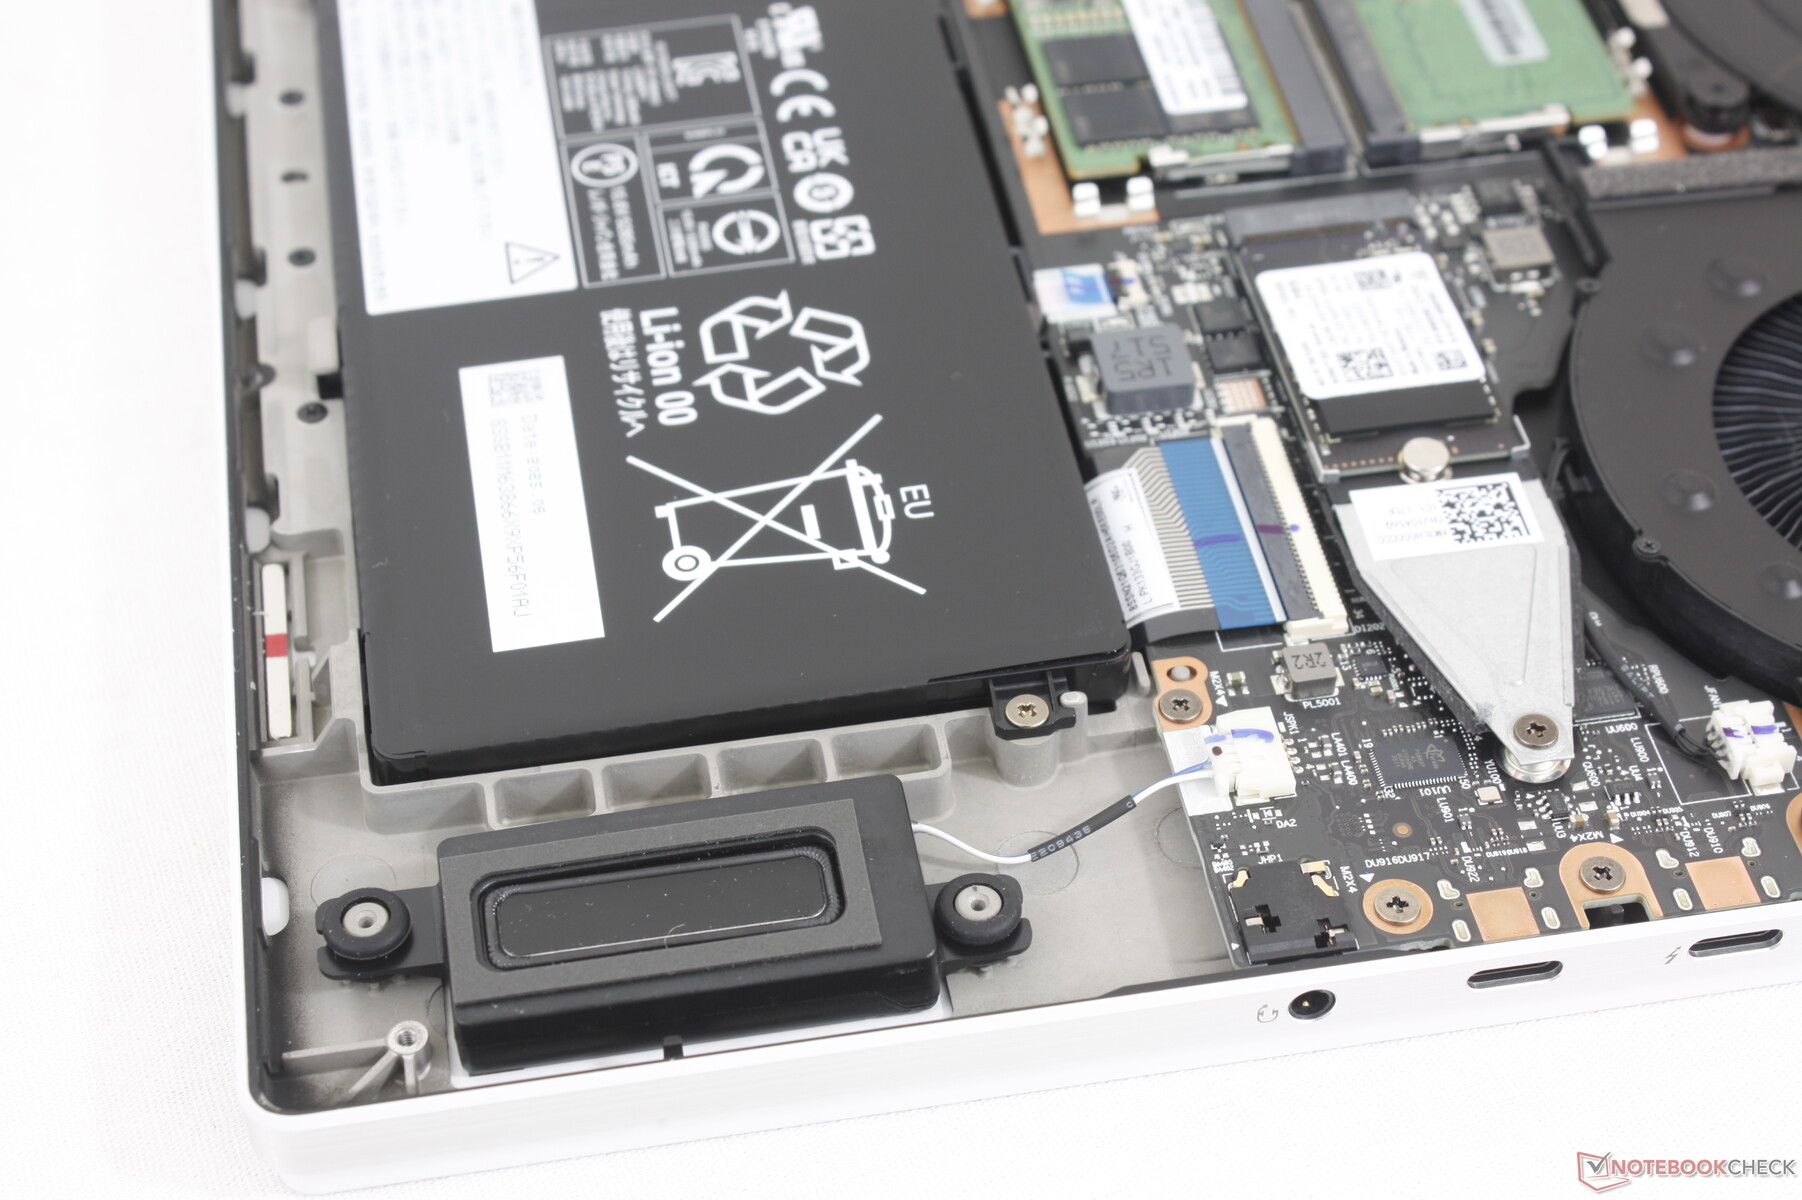
Maintenance
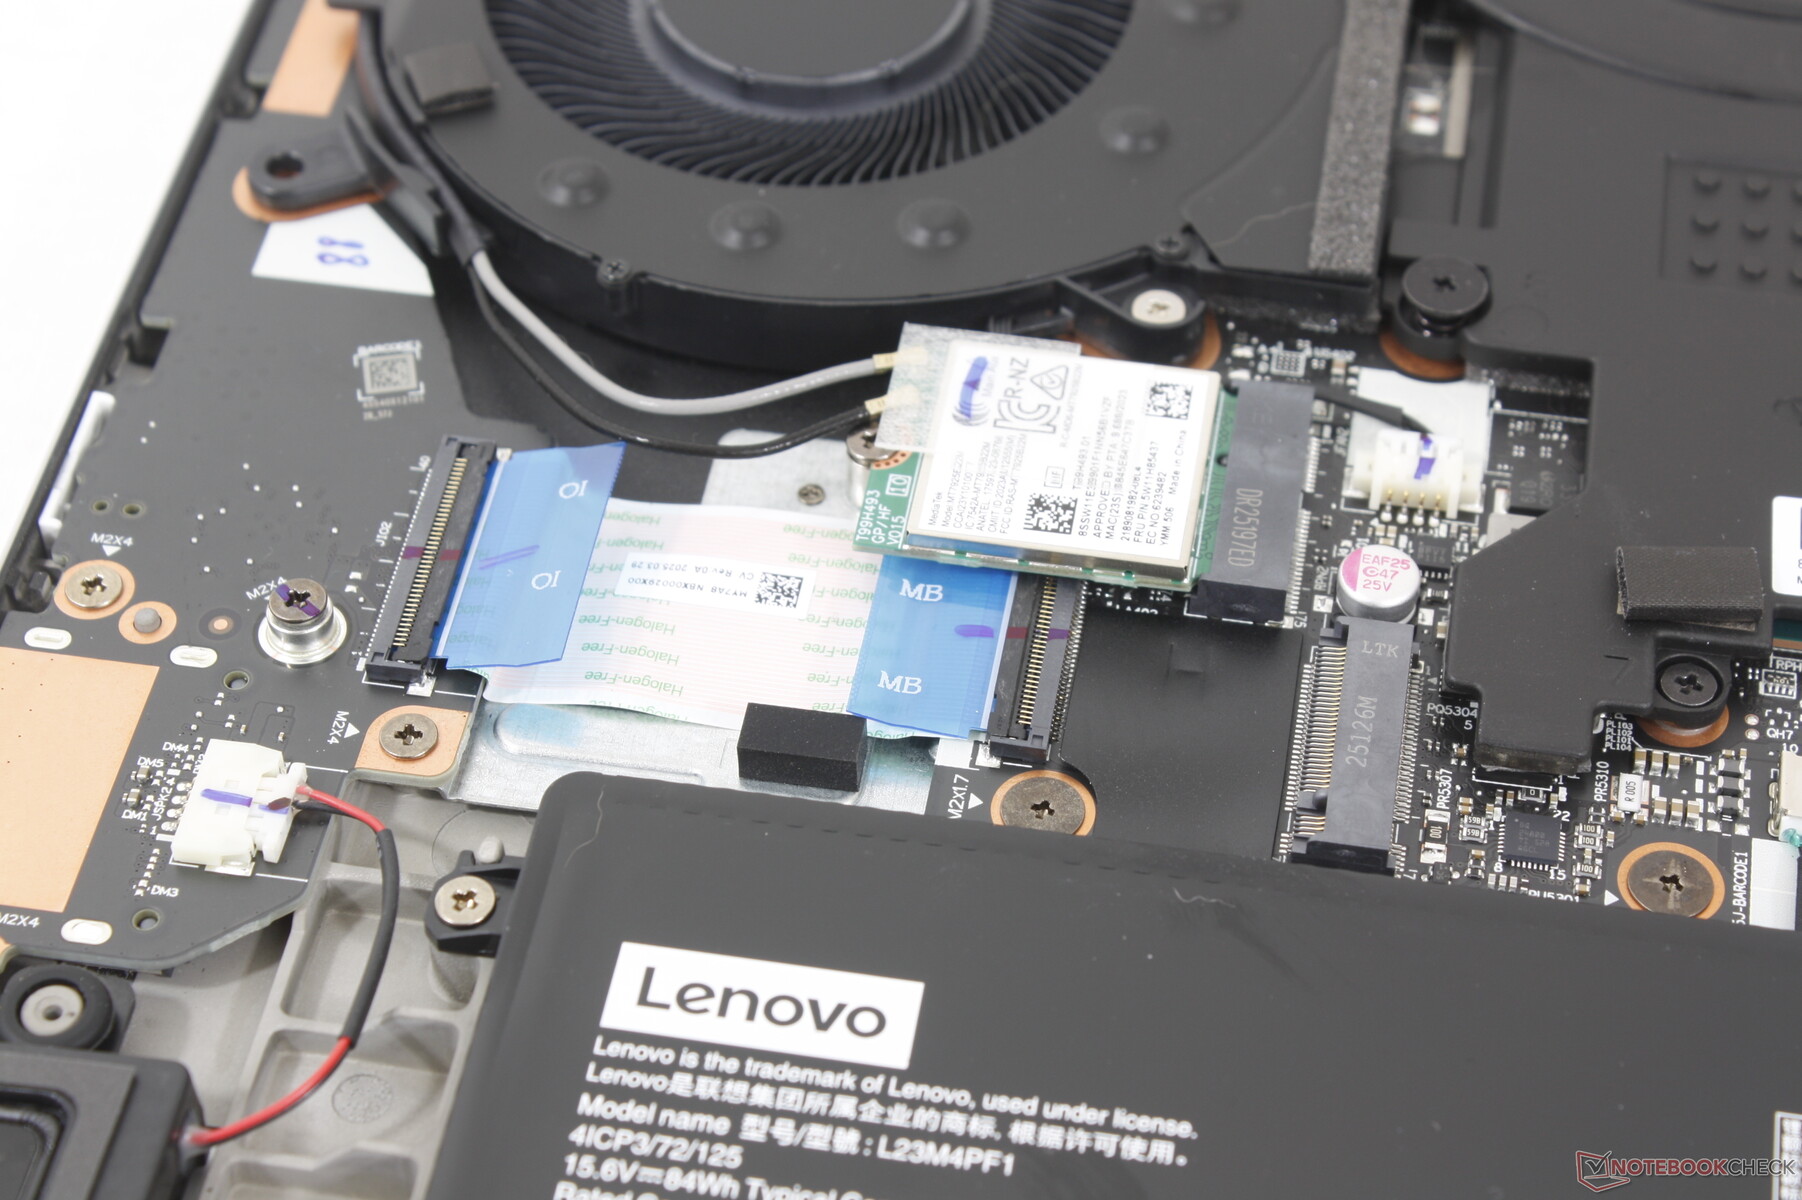
Bottom panel can be easily removed with a Phillips screwdriver to reveal two DDR5 SODIMM slots and two M.2 2280 PCIe4 x4 SSD slots.
Sustainability
Lenovo makes no mention of recycled materials used during manufacturing of the model. The retail box consists of both paper and plastic wrapping with the latter consisting of 90 percent ocean-bound plastics.
Accessories And Warranty
There are no extras in the retail box beyond the AC adapter and paperwork. The usual one-year limited manufacturer warranty applies if purchased in the US.
Input Devices
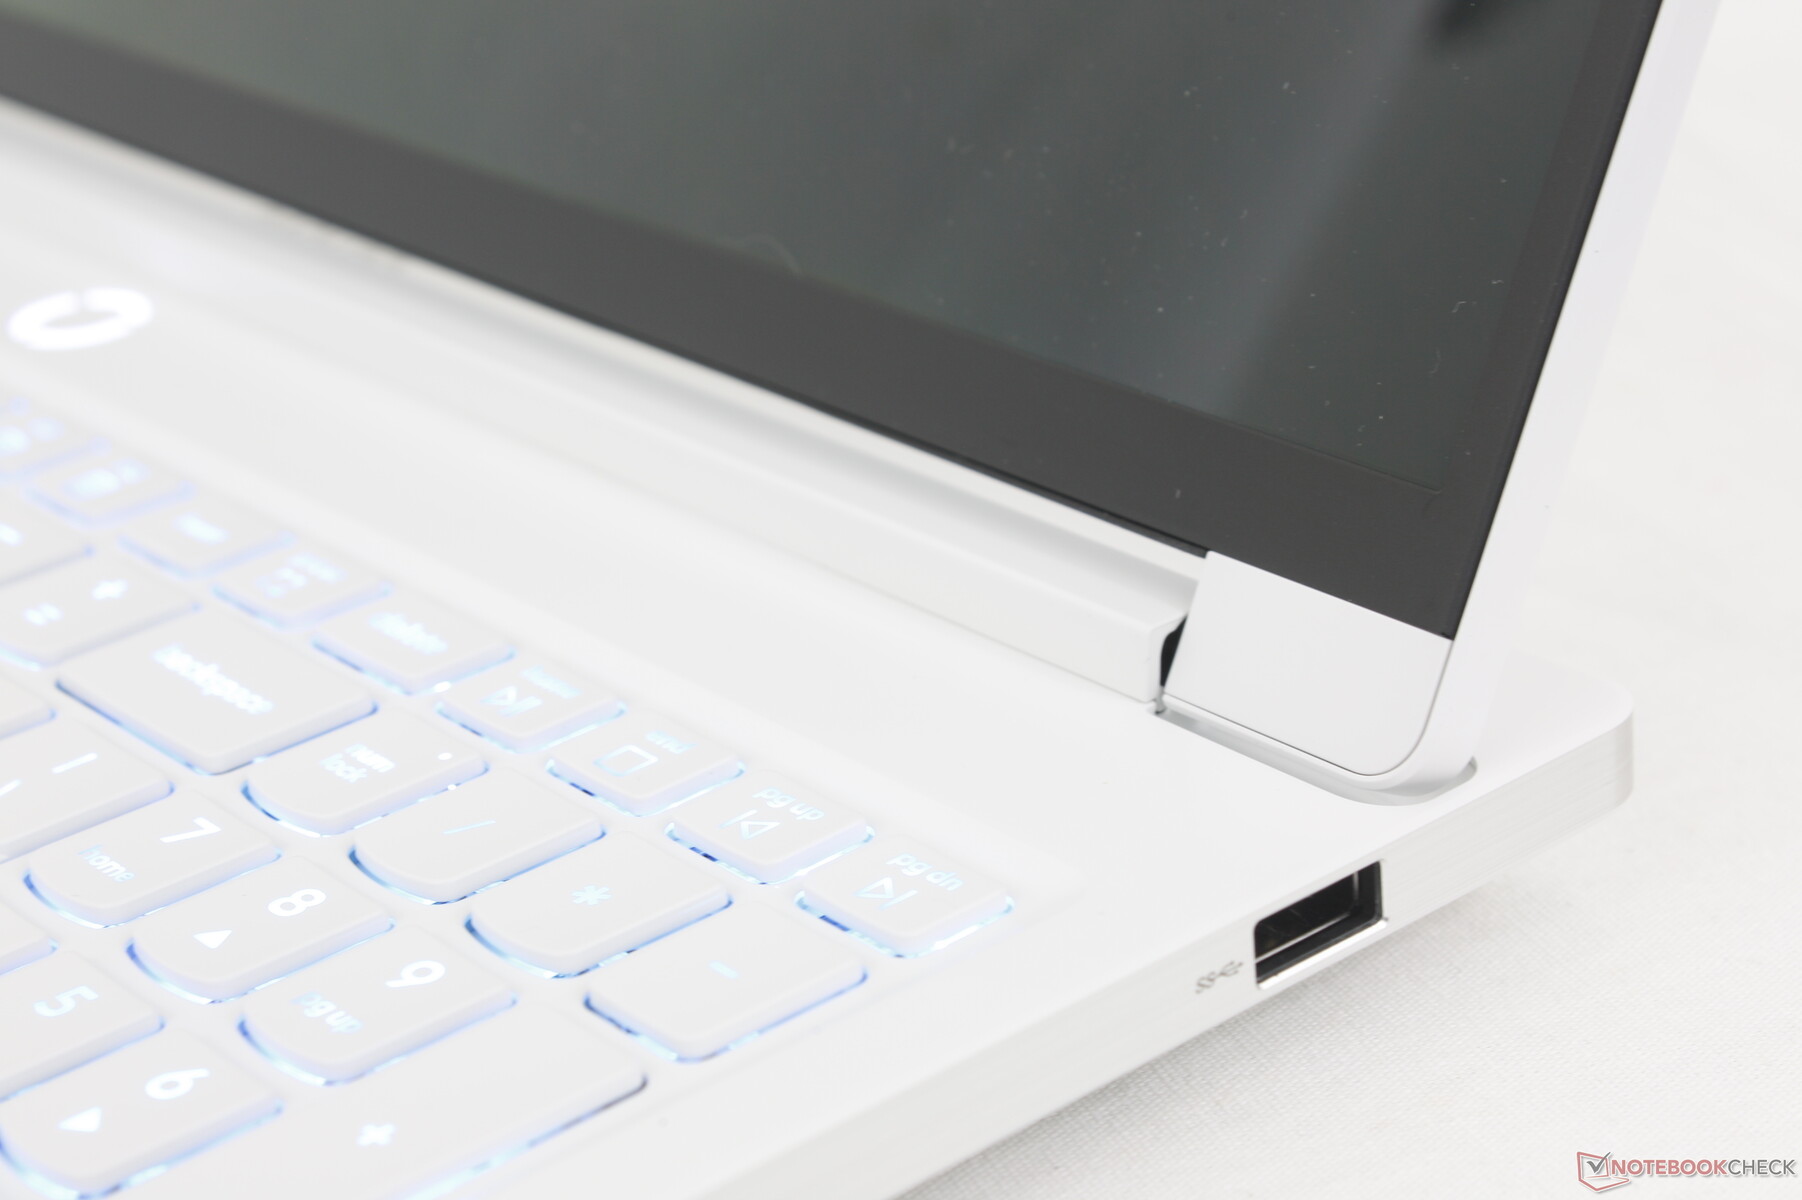
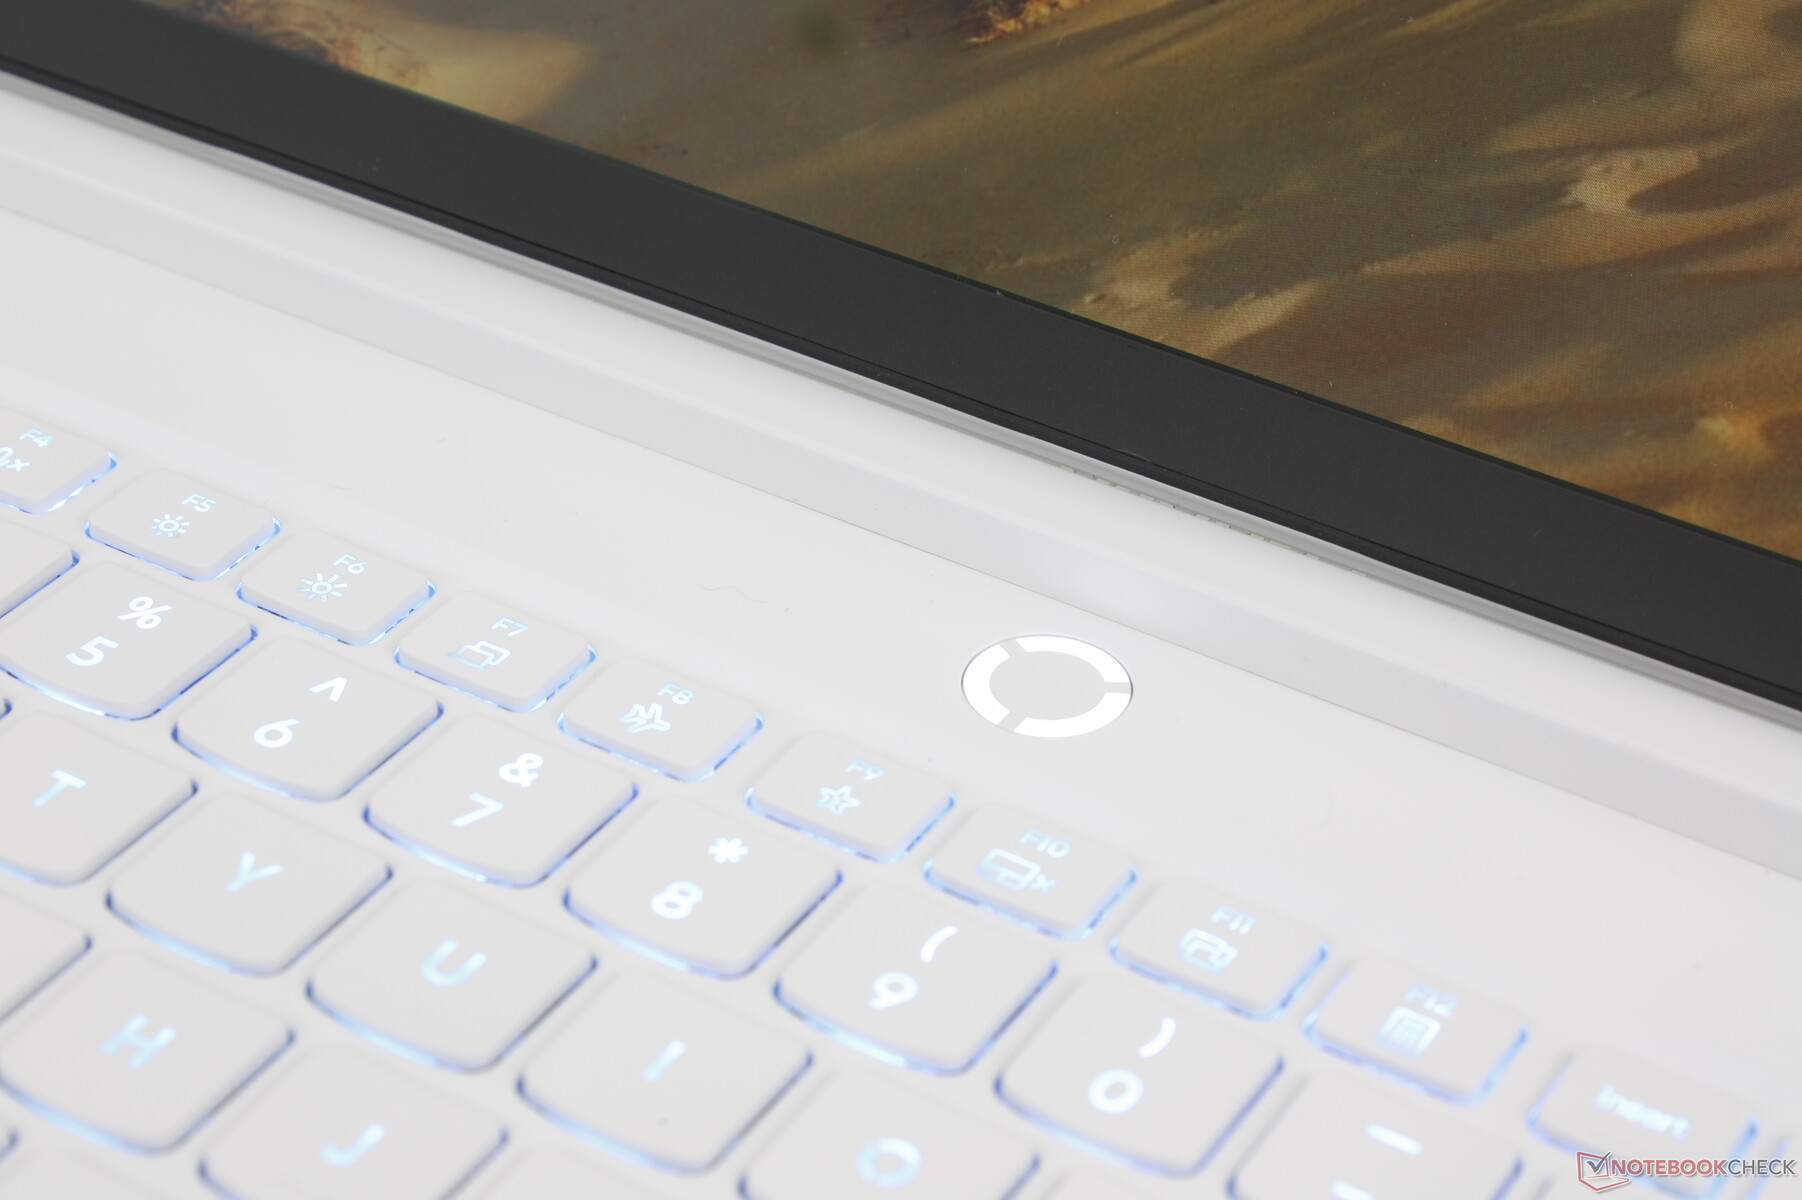
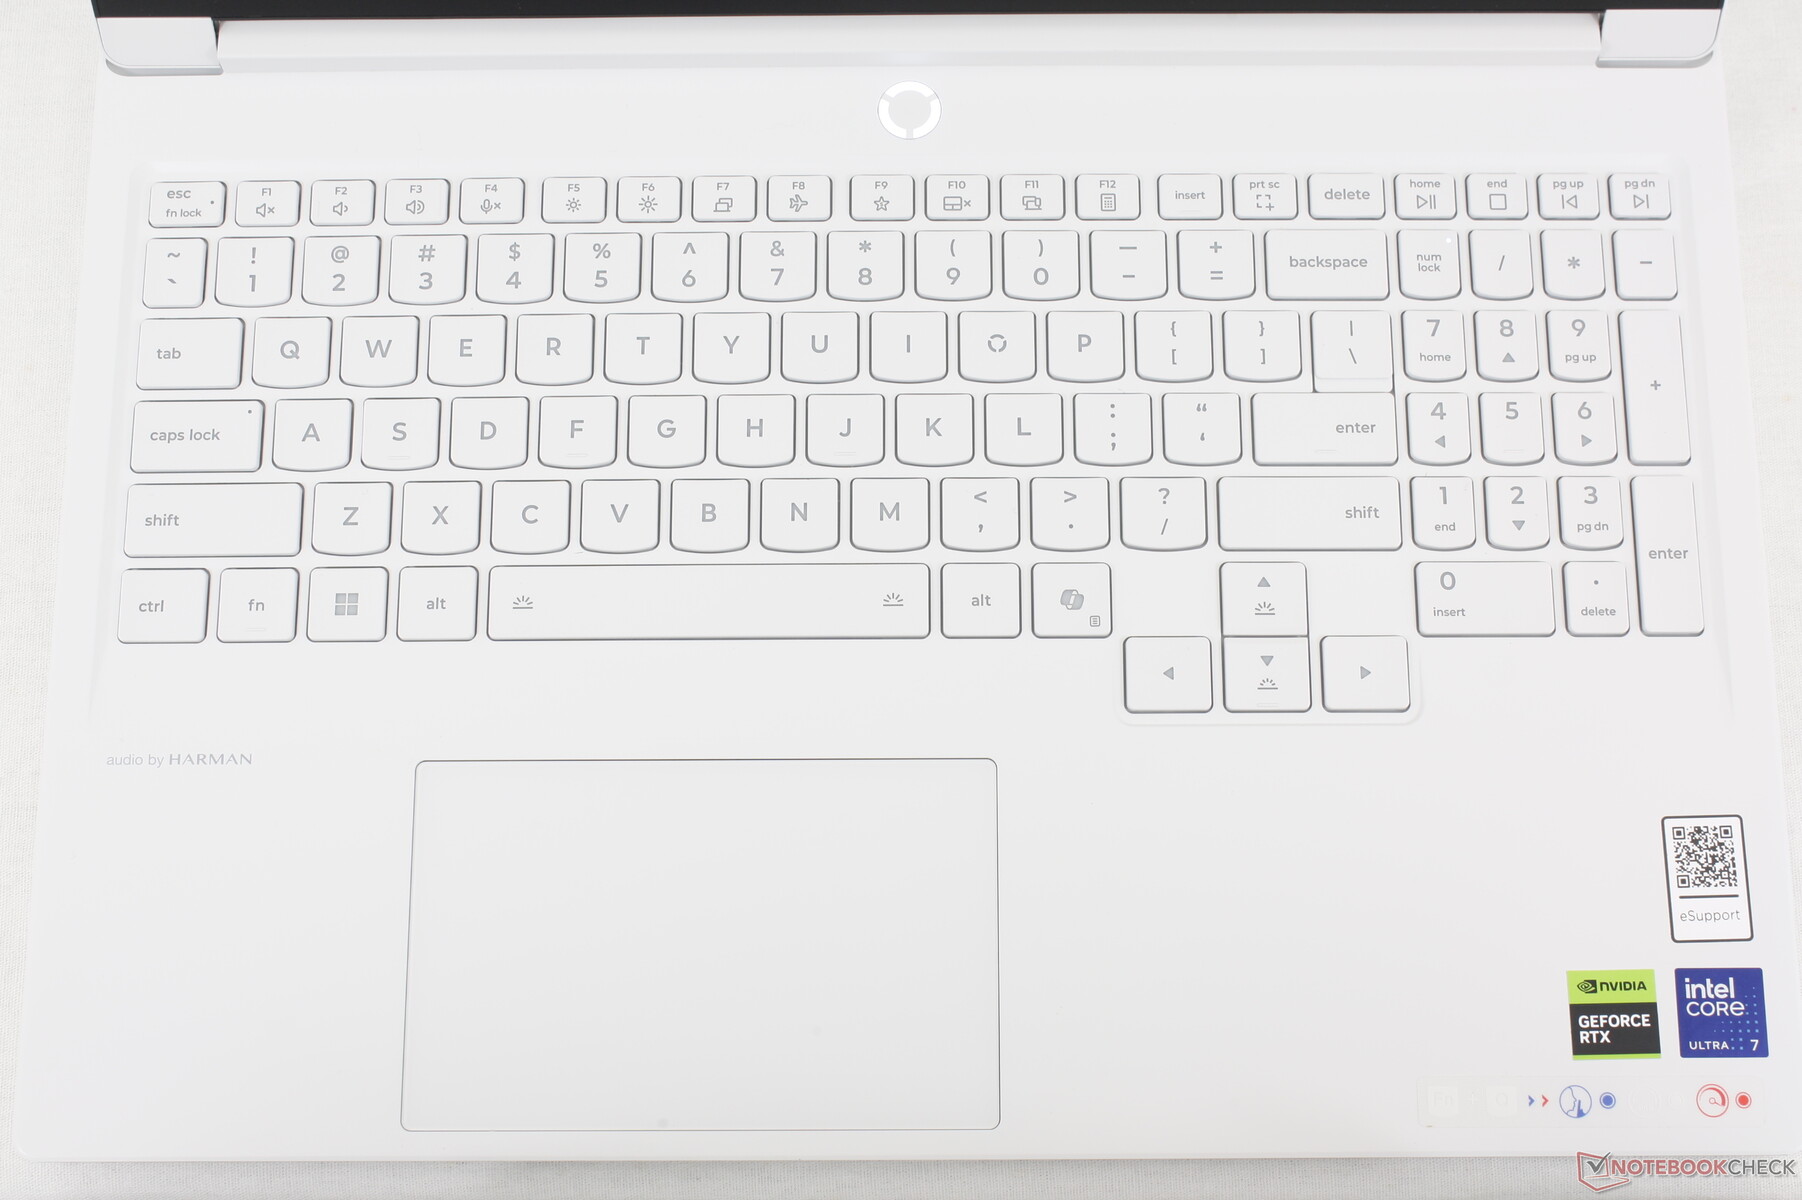
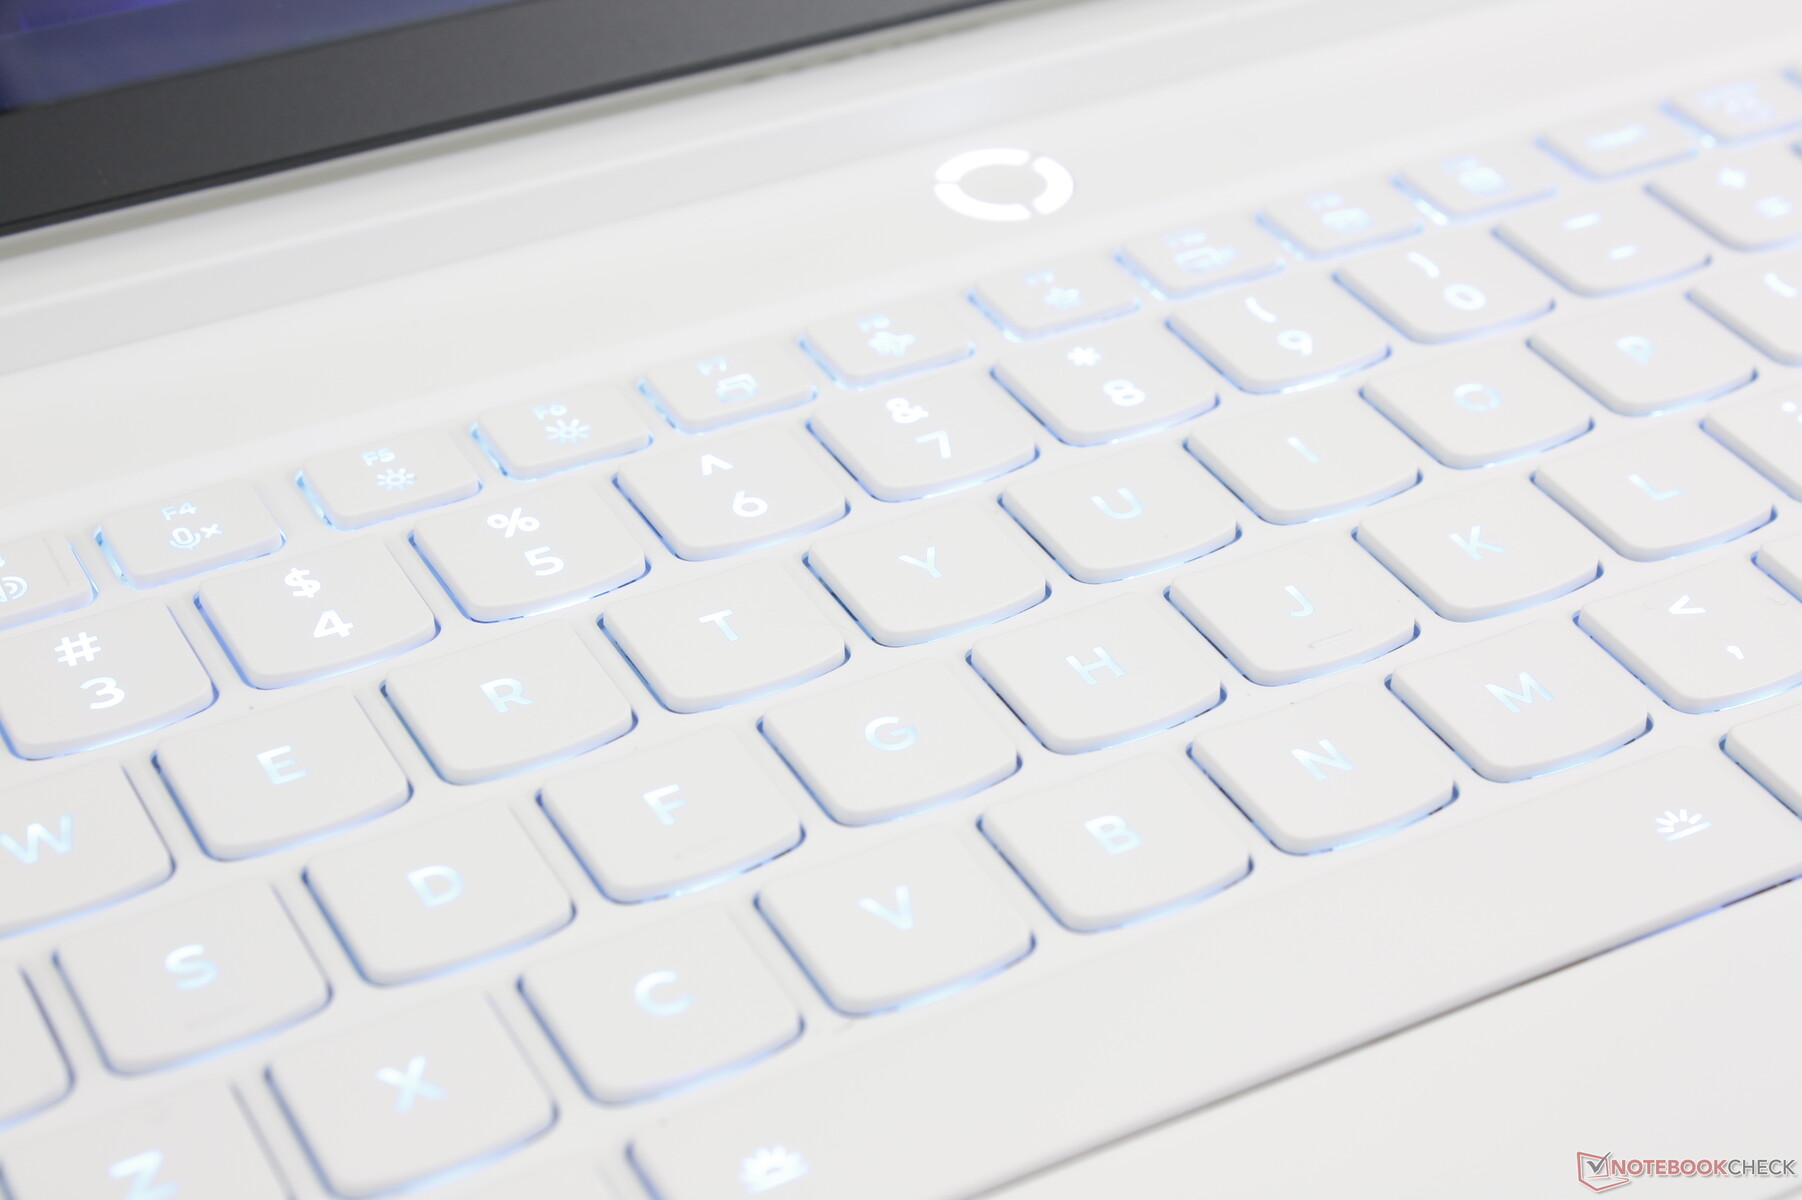
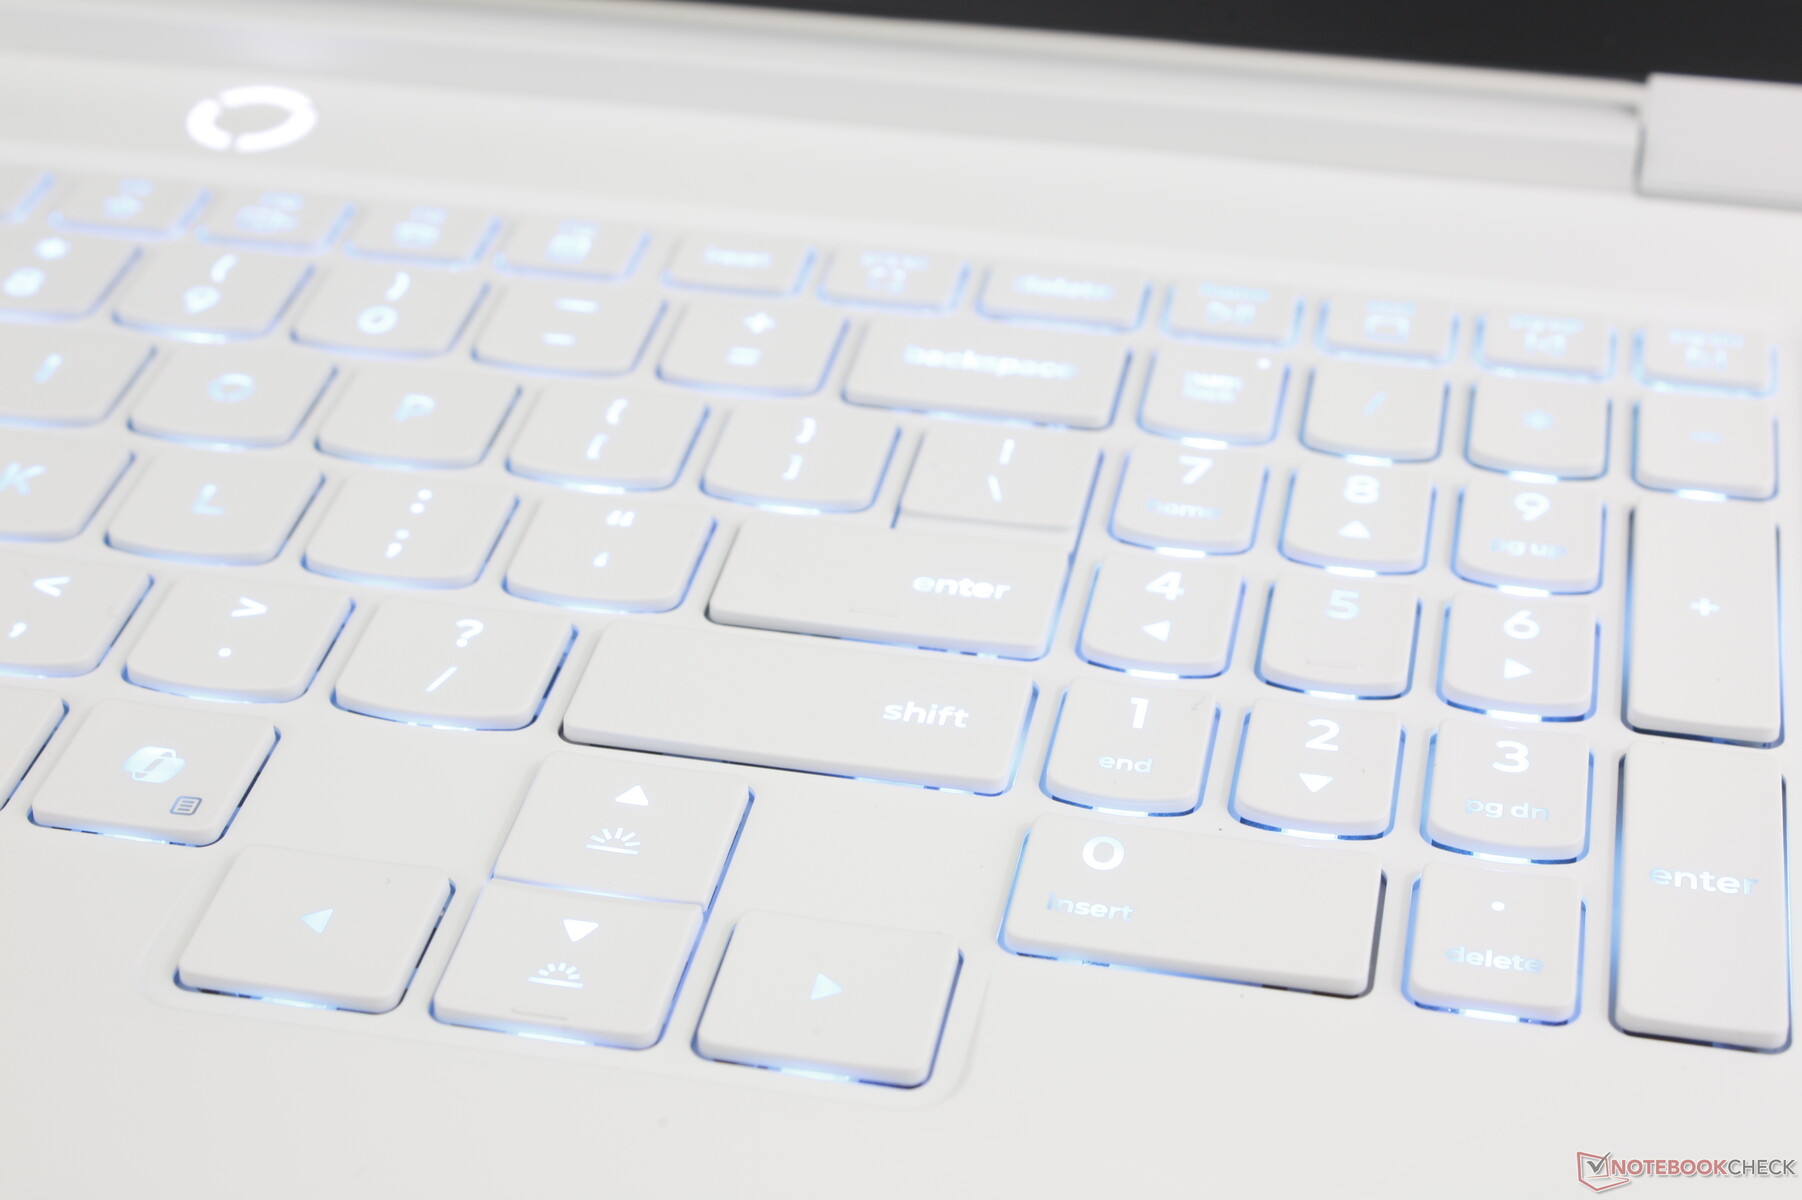
Keyboard
The typing experience is identical to the recent 18-inch Legion 9 18 flagship despite their size and price differences. In fact, the keyboard and layout are exactly the same between the two models. The keys are crisper in feedback than on most other gaming laptops at the cost of louder clatter.
Touchpad
At 12 x 7.5 cm, the clickpad is identical in size to the clickpad on the Legion 5 Pro 16 while being just slightly larger than the clickpad on the Alienware 16X Aurora. It's nonetheless on the small size especially for vertical cursor control. There is significant unused space between the Space key and clickpad that could have been used for a more spacious clickpad.

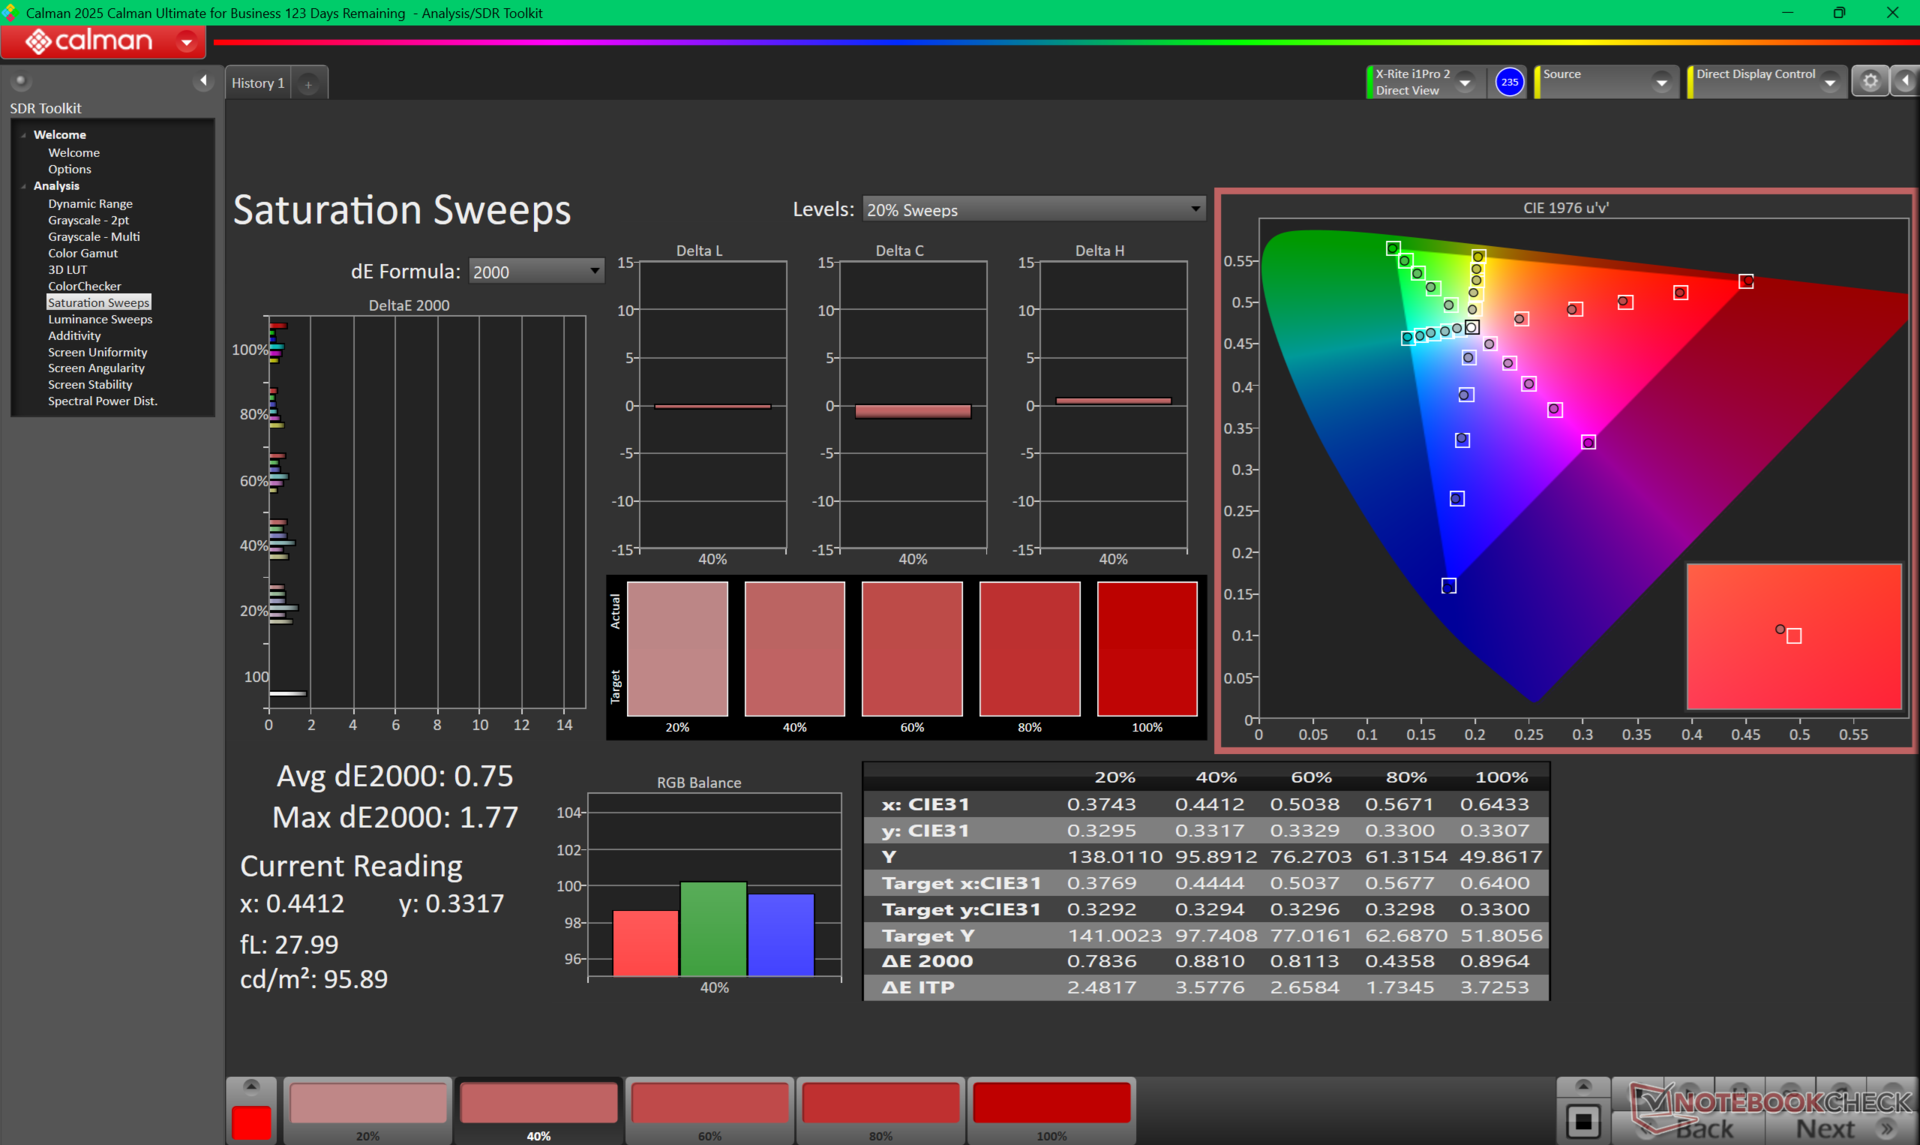
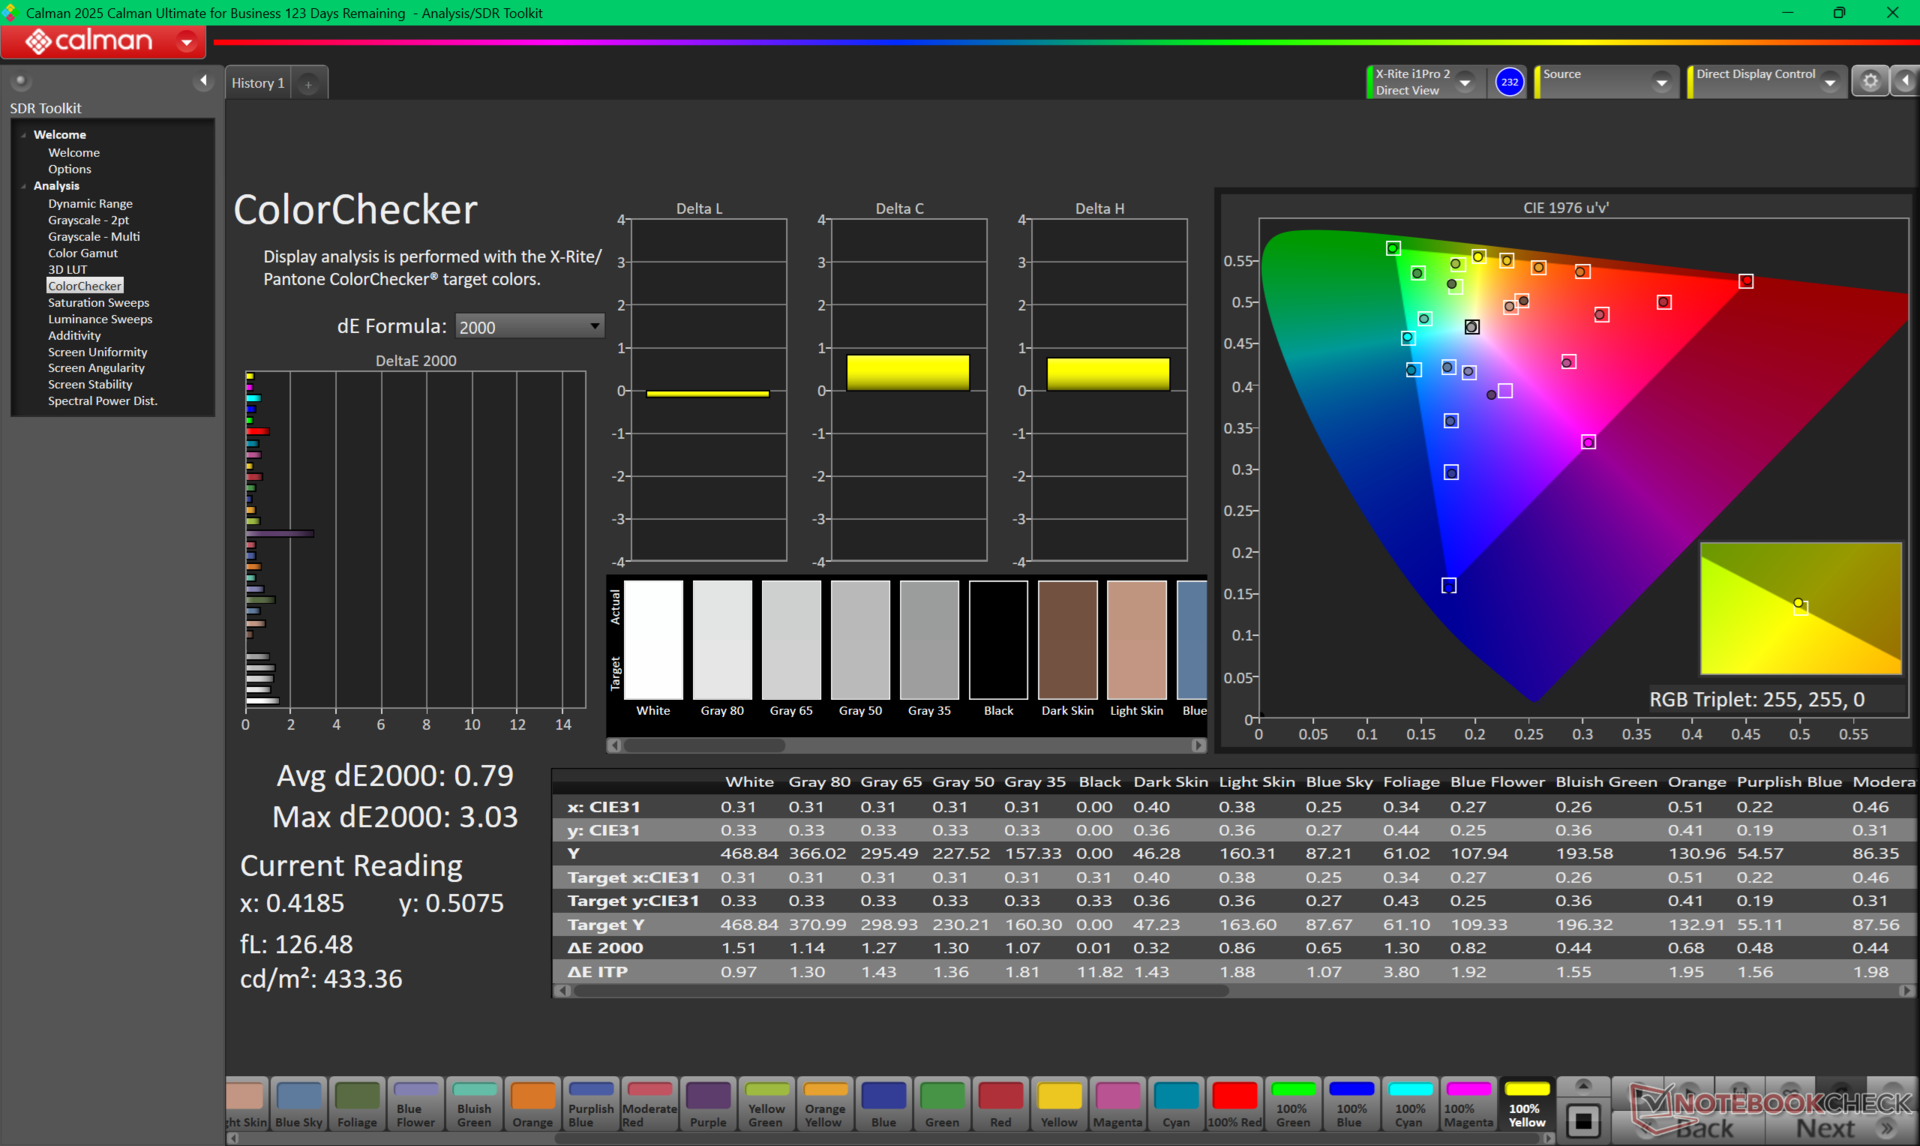
Display — OLED Only

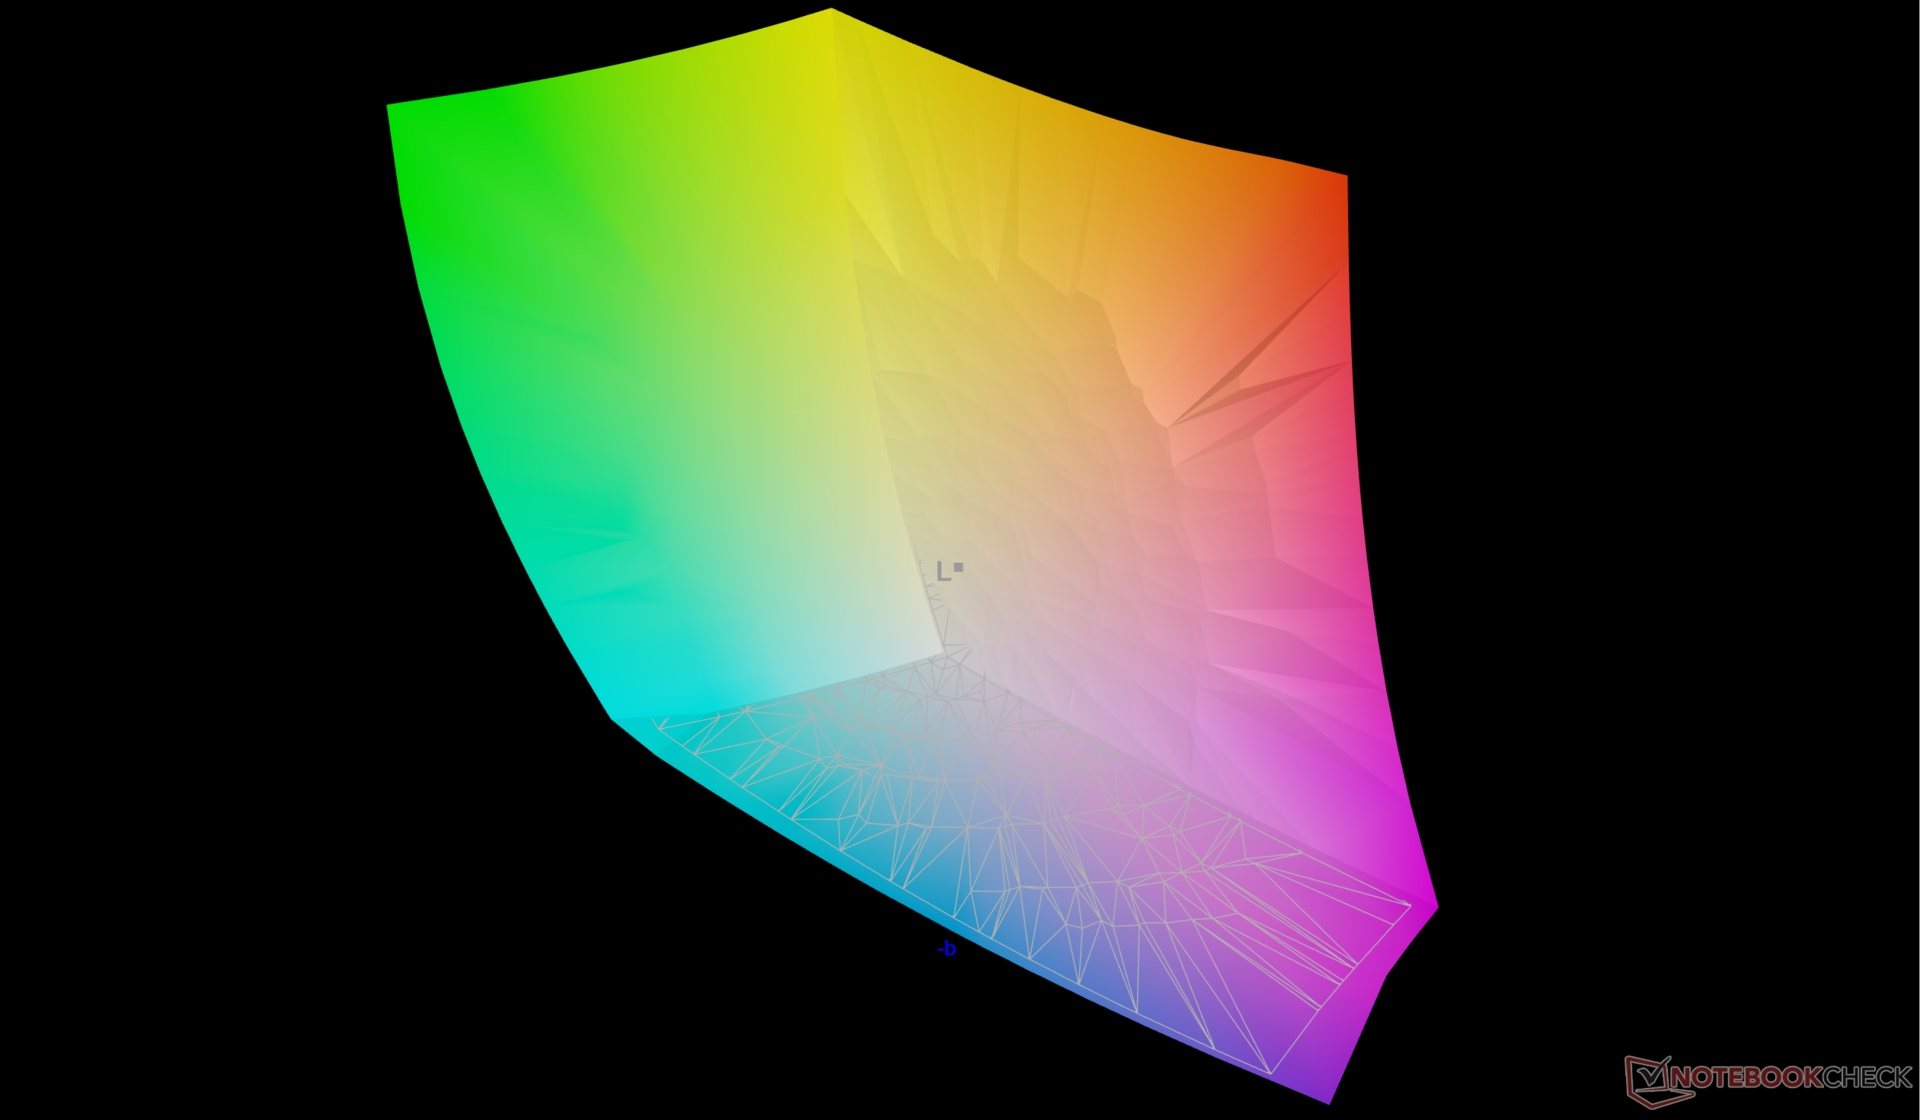
Lenovo is one of the few major manufacturers to force glossy OLED for many of its gaming laptops including for our Legion 7 16IAX10. When compared to traditional IPS, OLED offers superior HDR support, brighter lighting, P3 colors, and faster black-white response times at the cost of higher power consumption and price. The 165 Hz panel on our particular test unit happens to be the same Samsung ATNA60HS01-0 panel as found on the Legion 5 Pro 16IAX10H for a similar viewing experience between them. The second OLED option offers an even faster 240 Hz refresh rate which is likely the same Samsung panel that Razer uses for its Blade 16.
Maximum brightness peaks at ~867 nits when on HDR mode or ~495 nits when on SDR mode.
G-Sync is supported albeit only when set to dGPU mode. Switching between graphics modes requires a soft reboot.

| |||||||||||||||||||||||||
Brightness Distribution: 95 %
Center on Battery: 477.6 cd/m²
Contrast: ∞:1 (Black: 0 cd/m²)
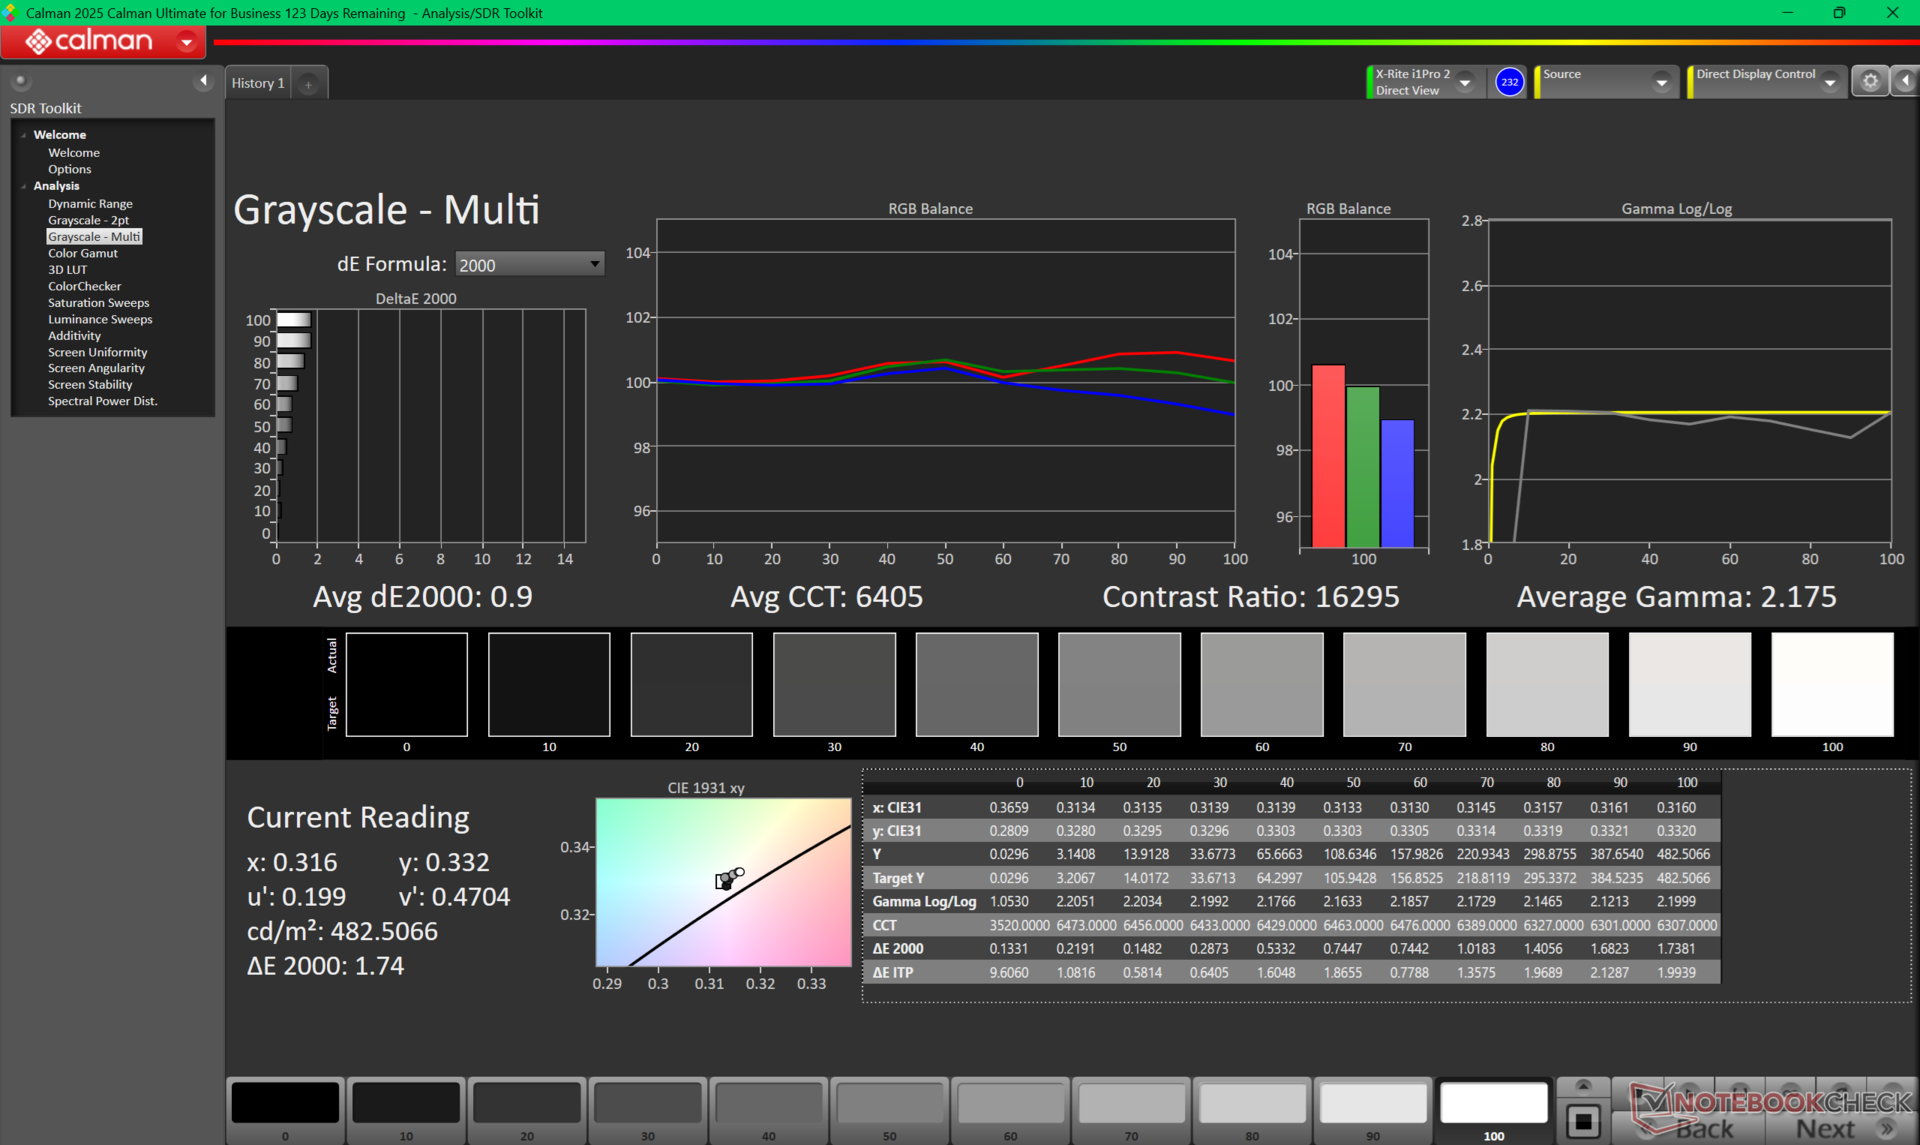
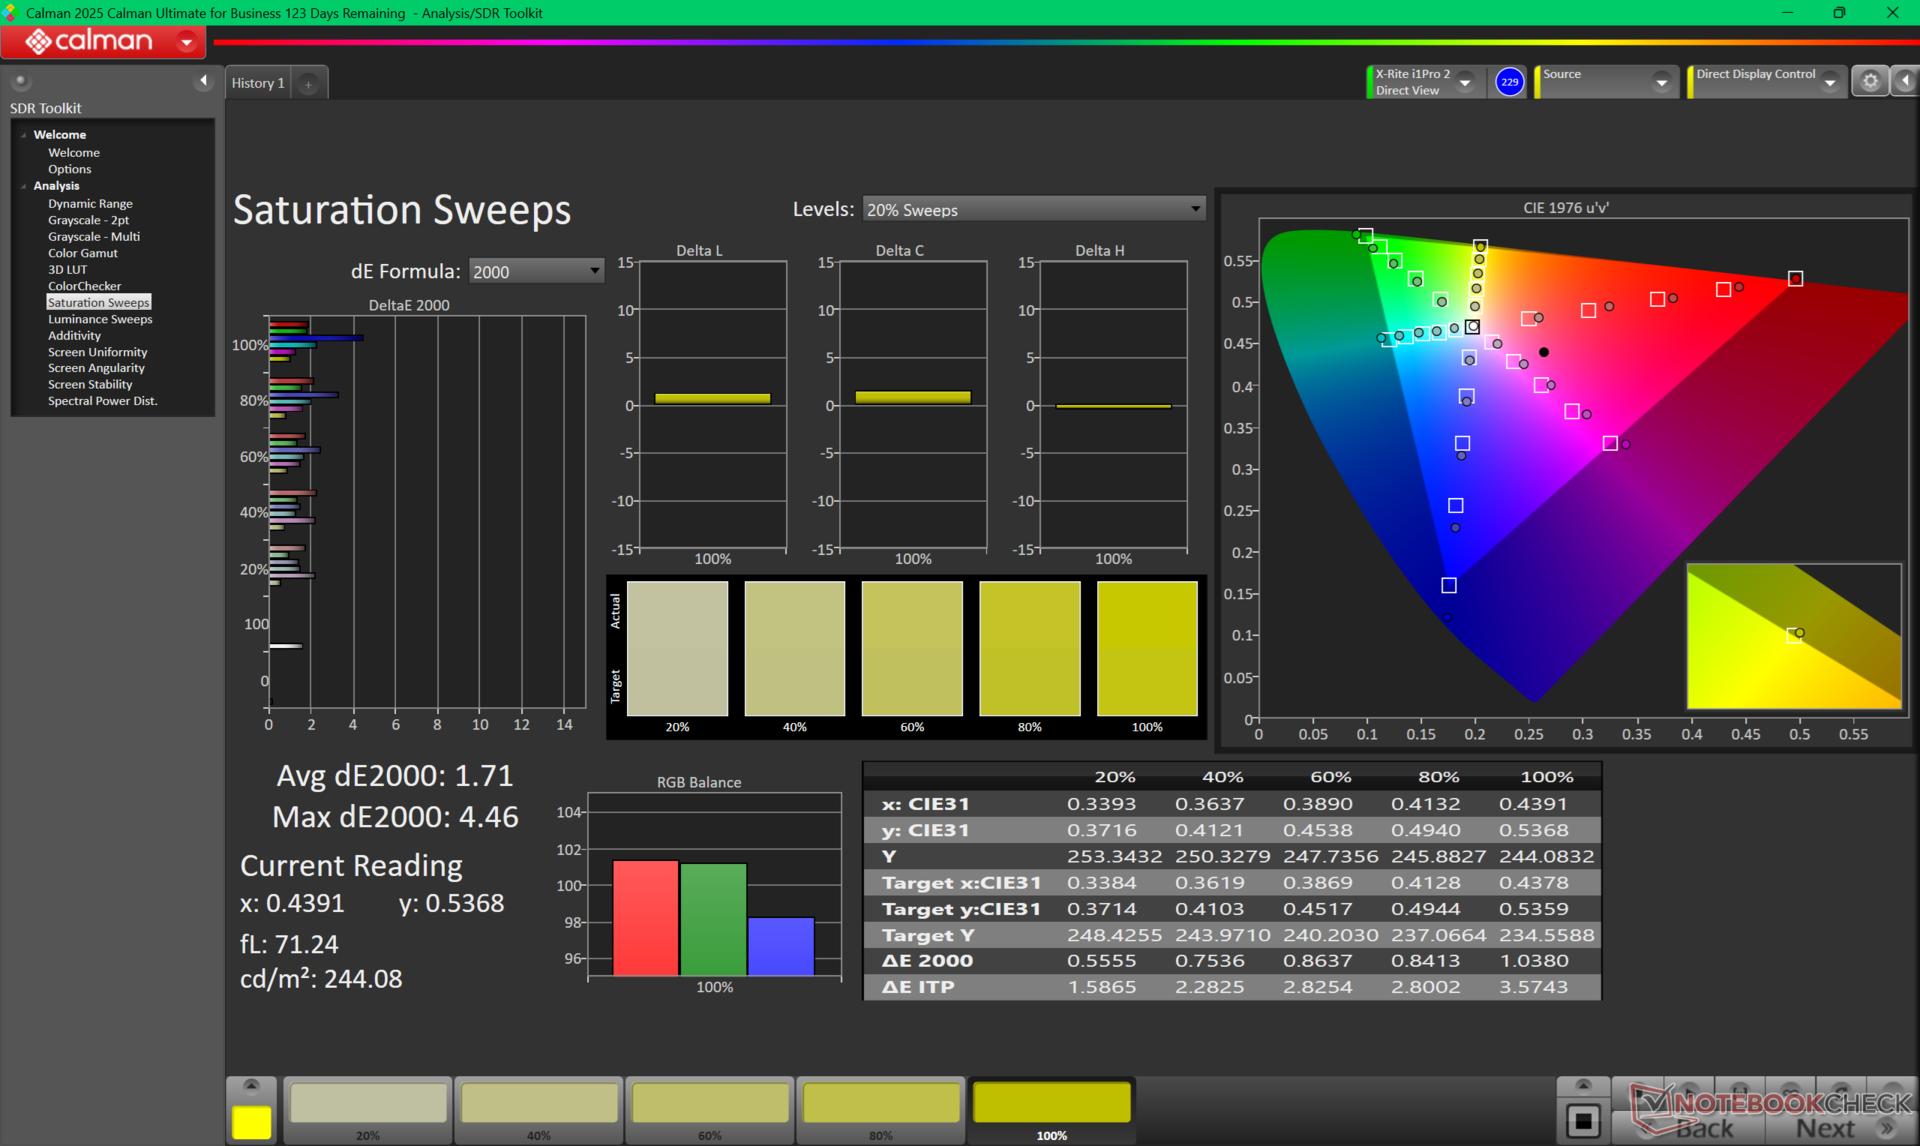
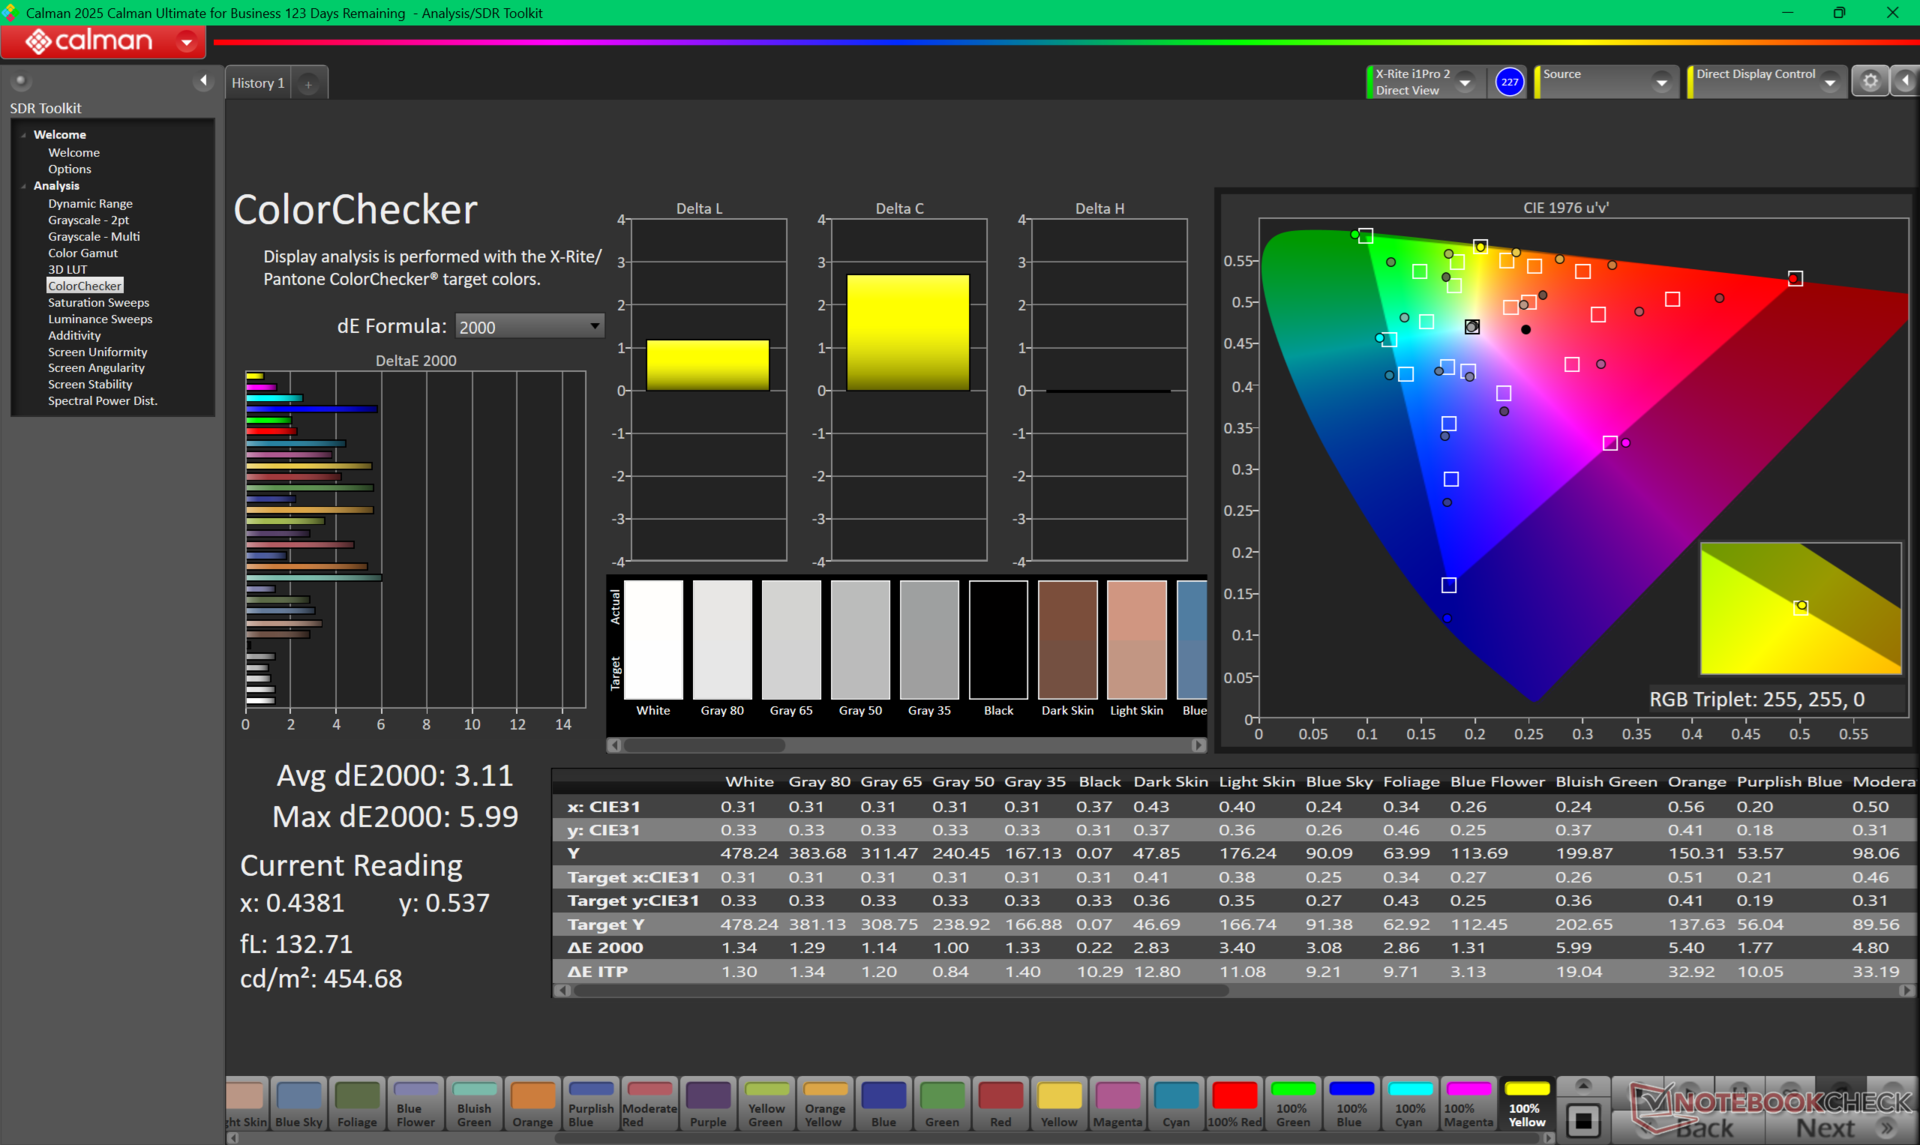
ΔE ColorChecker Calman: 3.11 | ∀{0.5-29.43 Ø4.72}
calibrated: 0.79
ΔE Greyscale Calman: 0.9 | ∀{0.09-98 Ø4.97}
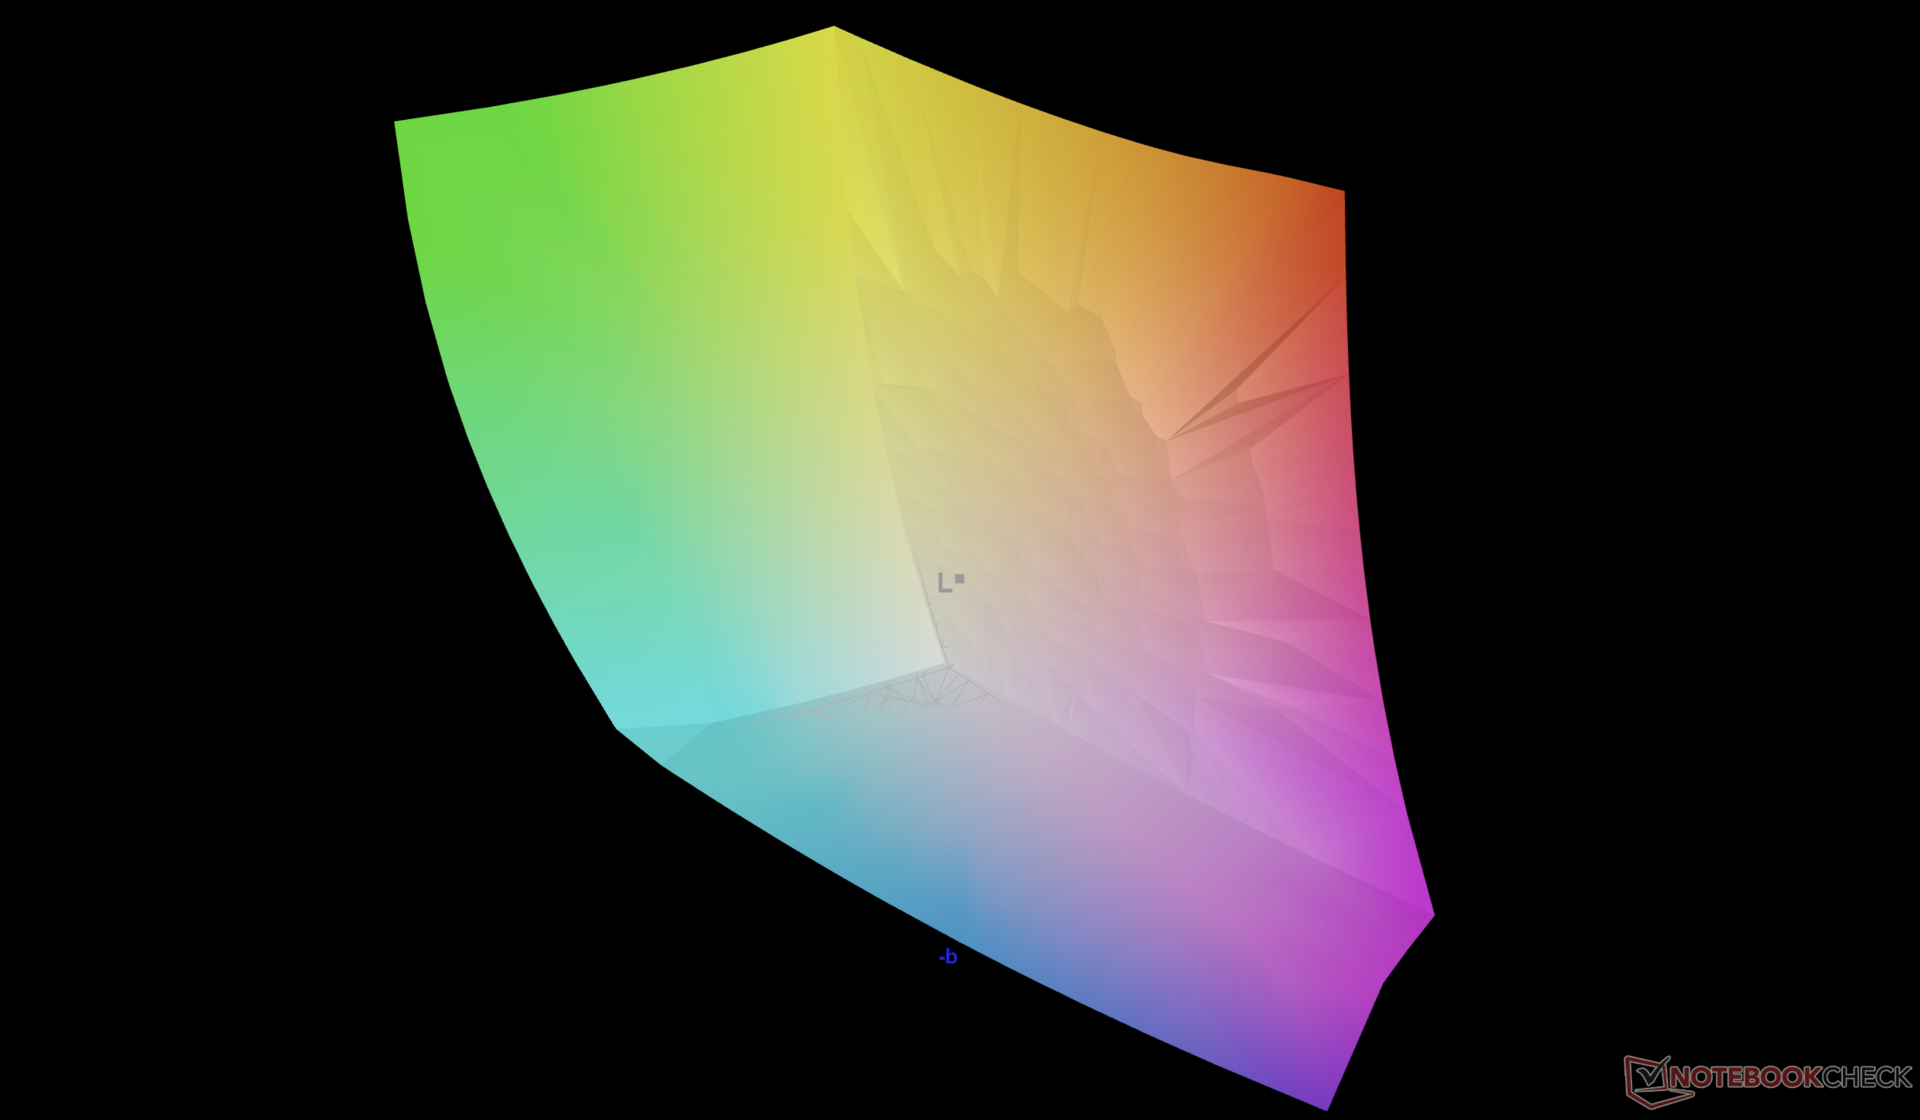
93.5% AdobeRGB 1998 (Argyll 3D)
100% sRGB (Argyll 3D)
99.6% Display P3 (Argyll 3D)
Gamma: 2.18
CCT: 6405 K
| Lenovo Legion 7 16IAX10 Samsung ATNA60HS01-0, OLED, 2560x1600, 16", 165 Hz | Alienware 16 Aurora BOE NE16N41, IPS, 2560x1600, 16", 120 Hz | Asus TUF Gaming A16 FA608UP MNG007DA5-3, IPS, 2560x1600, 16", 165 Hz | Gigabyte Gaming A16 GA6H NE160QDM-NYJ (BOE0C80), IPS, 2560x1600, 16", 165 Hz | MSI Vector 16 HX AI A2XWHG B160QAN02.3 (AUO7DB2), IPS, 2560x1600, 16", 240 Hz | Lenovo Legion 5 Pro 16IAX10H ATNA60HS01-0 (Samsung SDC420A), OLED, 2560x1600, 16", 165 Hz | |
|---|---|---|---|---|---|---|
| Display | -17% | -19% | -18% | -4% | 0% | |
| Display P3 Coverage (%) | 99.6 | 70.8 -29% | 69.4 -30% | 69.4 -30% | 96.6 -3% | 99.9 0% |
| sRGB Coverage (%) | 100 | 99.9 0% | 97.2 -3% | 99.5 0% | 99.8 0% | 100 0% |
| AdobeRGB 1998 Coverage (%) | 93.5 | 72.1 -23% | 71.9 -23% | 71.6 -23% | 84.4 -10% | 94.1 1% |
| Response Times | -5857% | -725% | -1529% | -634% | -94% | |
| Response Time Grey 50% / Grey 80% * (ms) | 0.6 ? | 49.5 ? -8150% | 6.3 ? -950% | 14.3 ? -2283% | 4.3 ? -617% | 2 ? -233% |
| Response Time Black / White * (ms) | 0.8 ? | 29.3 ? -3563% | 4.8 ? -500% | 7 ? -775% | 6 ? -650% | 1.4 ? -75% |
| PWM Frequency (Hz) | 1317 ? | 1300 | ||||
| PWM Amplitude * (%) | 23 | 16.7 27% | ||||
| Screen | -69% | 1% | -109% | -53% | -51% | |
| Brightness middle (cd/m²) | 477.6 | 345.3 -28% | 480 1% | 432 -10% | 473 -1% | 518 8% |
| Brightness (cd/m²) | 483 | 324 -33% | 456 -6% | 425 -12% | 426 -12% | 522 8% |
| Brightness Distribution (%) | 95 | 88 -7% | 91 -4% | 91 -4% | 85 -11% | 97 2% |
| Black Level * (cd/m²) | 0.23 | 0.32 | 0.37 | 0.42 | ||
| Colorchecker dE 2000 * | 3.11 | 3.22 -4% | 1.4 55% | 4.76 -53% | 3.47 -12% | 2.49 20% |
| Colorchecker dE 2000 max. * | 5.99 | 5.68 5% | 2.5 58% | 8.59 -43% | 7.24 -21% | 5.25 12% |
| Colorchecker dE 2000 calibrated * | 0.79 | 0.93 -18% | 1.3 -65% | 1.18 -49% | 1.36 -72% | 2.15 -172% |
| Greyscale dE 2000 * | 0.9 | 4.5 -400% | 1.2 -33% | 6.2 -589% | 3.1 -244% | 3.02 -236% |
| Gamma | 2.18 101% | 2.1 105% | 2.16 102% | 2.079 106% | 2.486 88% | 2.37 93% |
| CCT | 6405 101% | 7041 92% | 6620 98% | 6690 97% | 6832 95% | 6426 101% |
| Contrast (:1) | 1501 | 1500 | 1168 | 1126 | ||
| Total Average (Program / Settings) | -1981% /
-1021% | -248% /
-125% | -552% /
-323% | -230% /
-138% | -48% /
-49% |
* ... smaller is better

Display Response Times
| ↔ Response Time Black to White | ||
|---|---|---|
| 0.8 ms ... rise ↗ and fall ↘ combined | ↗ 0.3 ms rise | 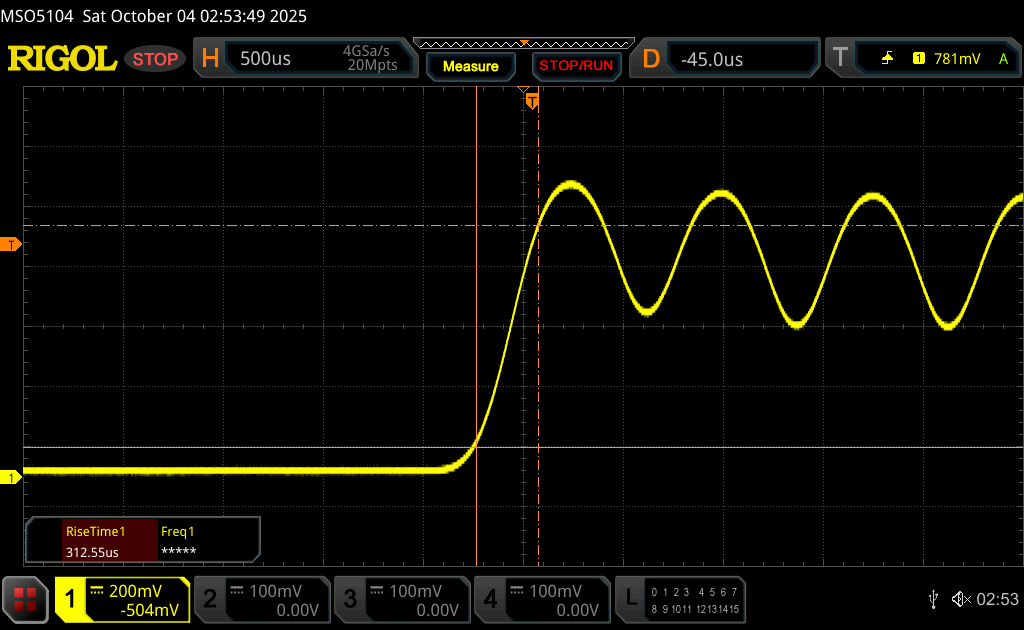 |
| ↘ 0.5 ms fall | ||
| The screen shows very fast response rates in our tests and should be very well suited for fast-paced gaming. In comparison, all tested devices range from 0.1 (minimum) to 240 (maximum) ms. » 2 % of all devices are better. This means that the measured response time is better than the average of all tested devices (19.8 ms). | ||
| ↔ Response Time 50% Grey to 80% Grey | ||
| 0.6 ms ... rise ↗ and fall ↘ combined | ↗ 0.2 ms rise | 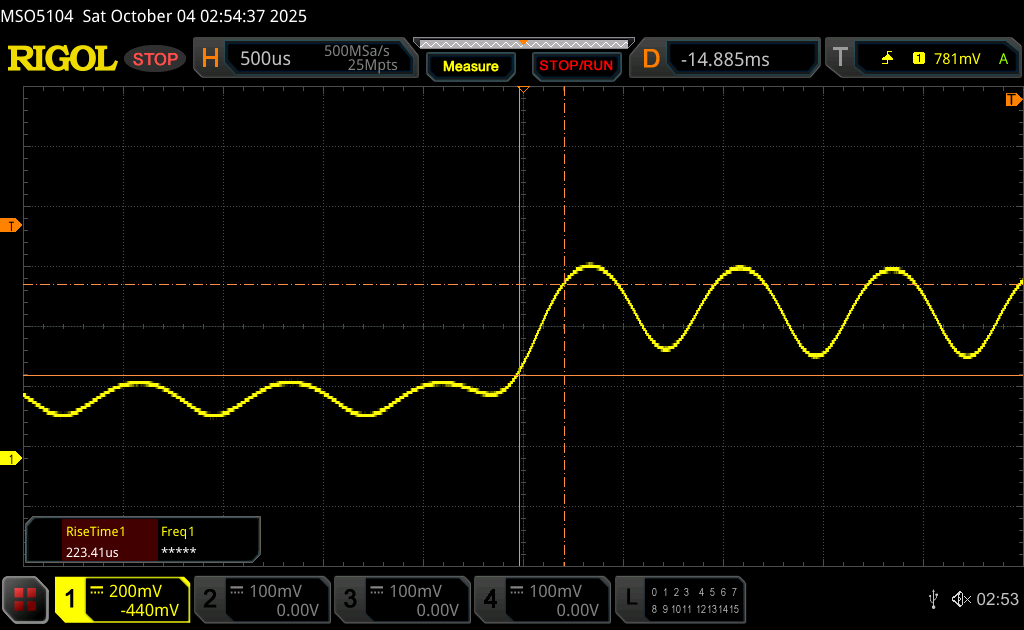 |
| ↘ 0.4 ms fall | ||
| The screen shows very fast response rates in our tests and should be very well suited for fast-paced gaming. In comparison, all tested devices range from 0.165 (minimum) to 636 (maximum) ms. » 1 % of all devices are better. This means that the measured response time is better than the average of all tested devices (31 ms). | ||
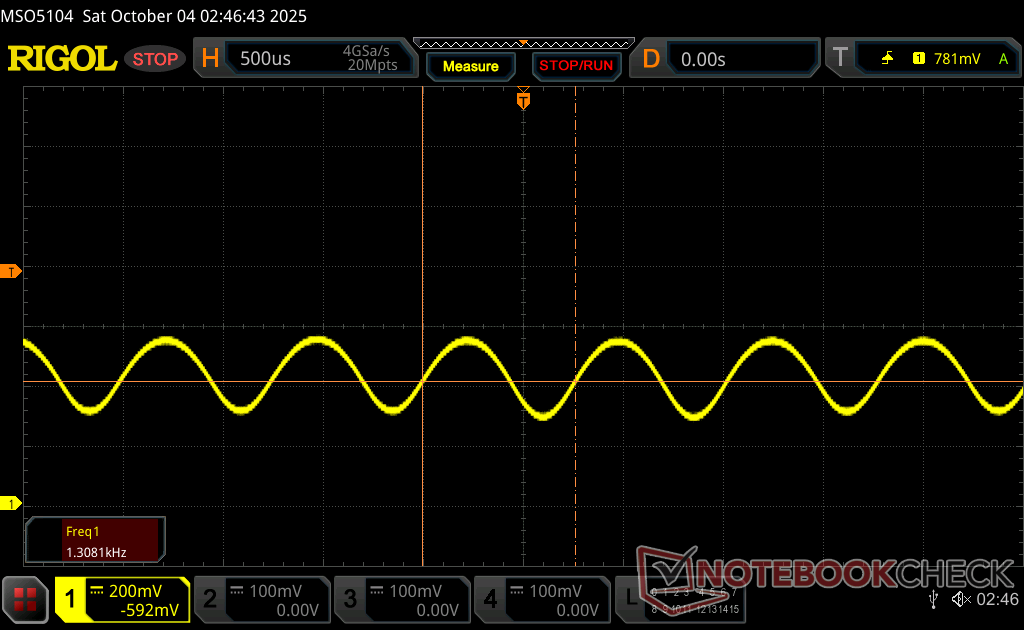
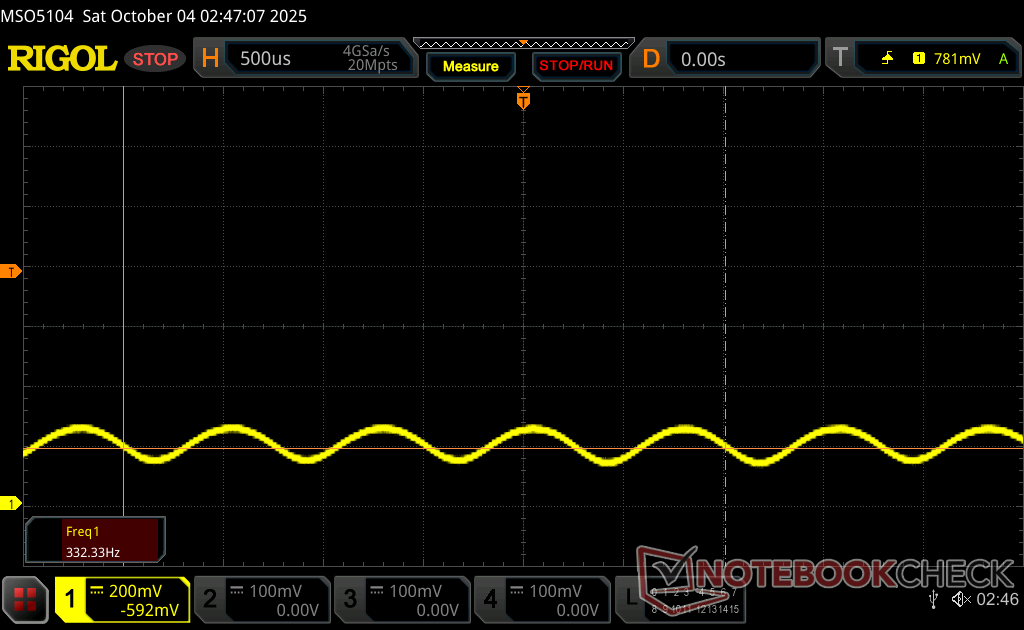
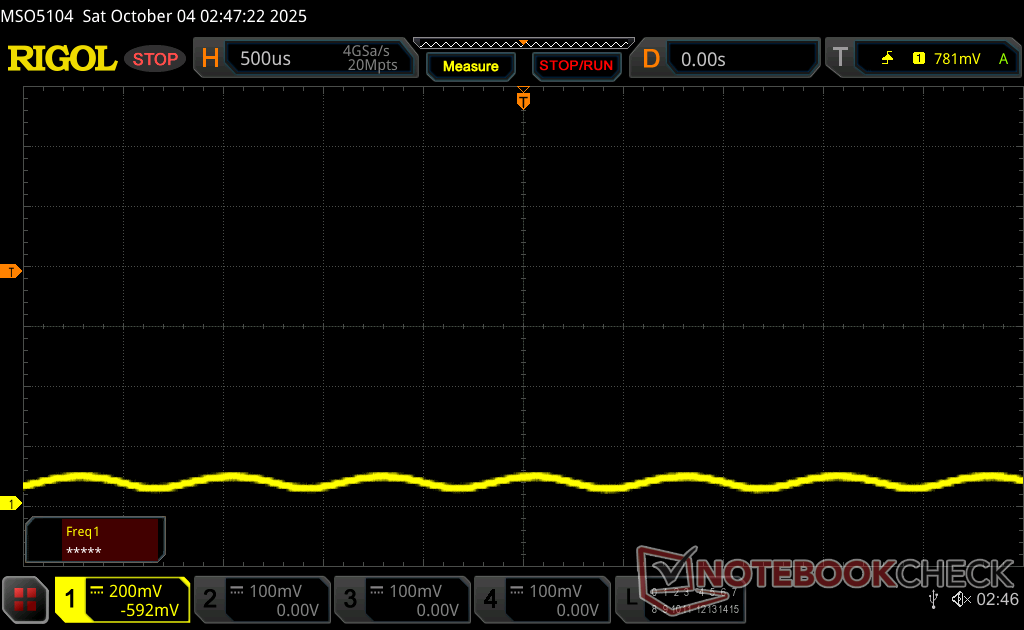
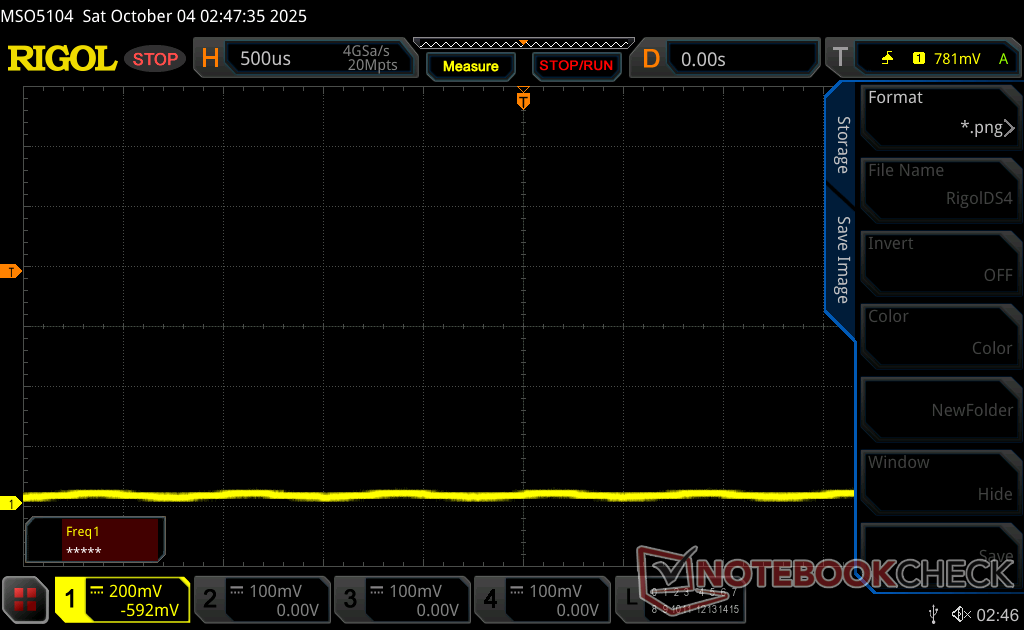
Screen Flickering / PWM (Pulse-Width Modulation)
| Screen flickering / PWM detected | 1317 Hz Amplitude: 23 % | ≤ 100 % brightness setting | 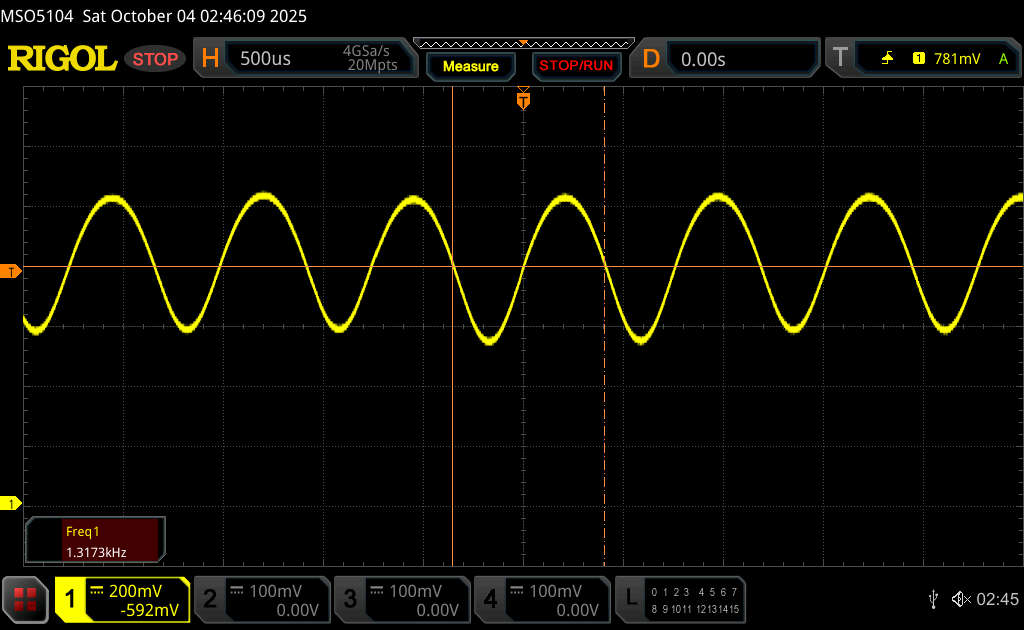 |
The display backlight flickers at 1317 Hz (worst case, e.g., utilizing PWM) Flickering detected at a brightness setting of 100 % and below. There should be no flickering or PWM above this brightness setting. The frequency of 1317 Hz is quite high, so most users sensitive to PWM should not notice any flickering. In comparison: 52 % of all tested devices do not use PWM to dim the display. If PWM was detected, an average of 7763 (minimum: 5 - maximum: 343500) Hz was measured. | |||
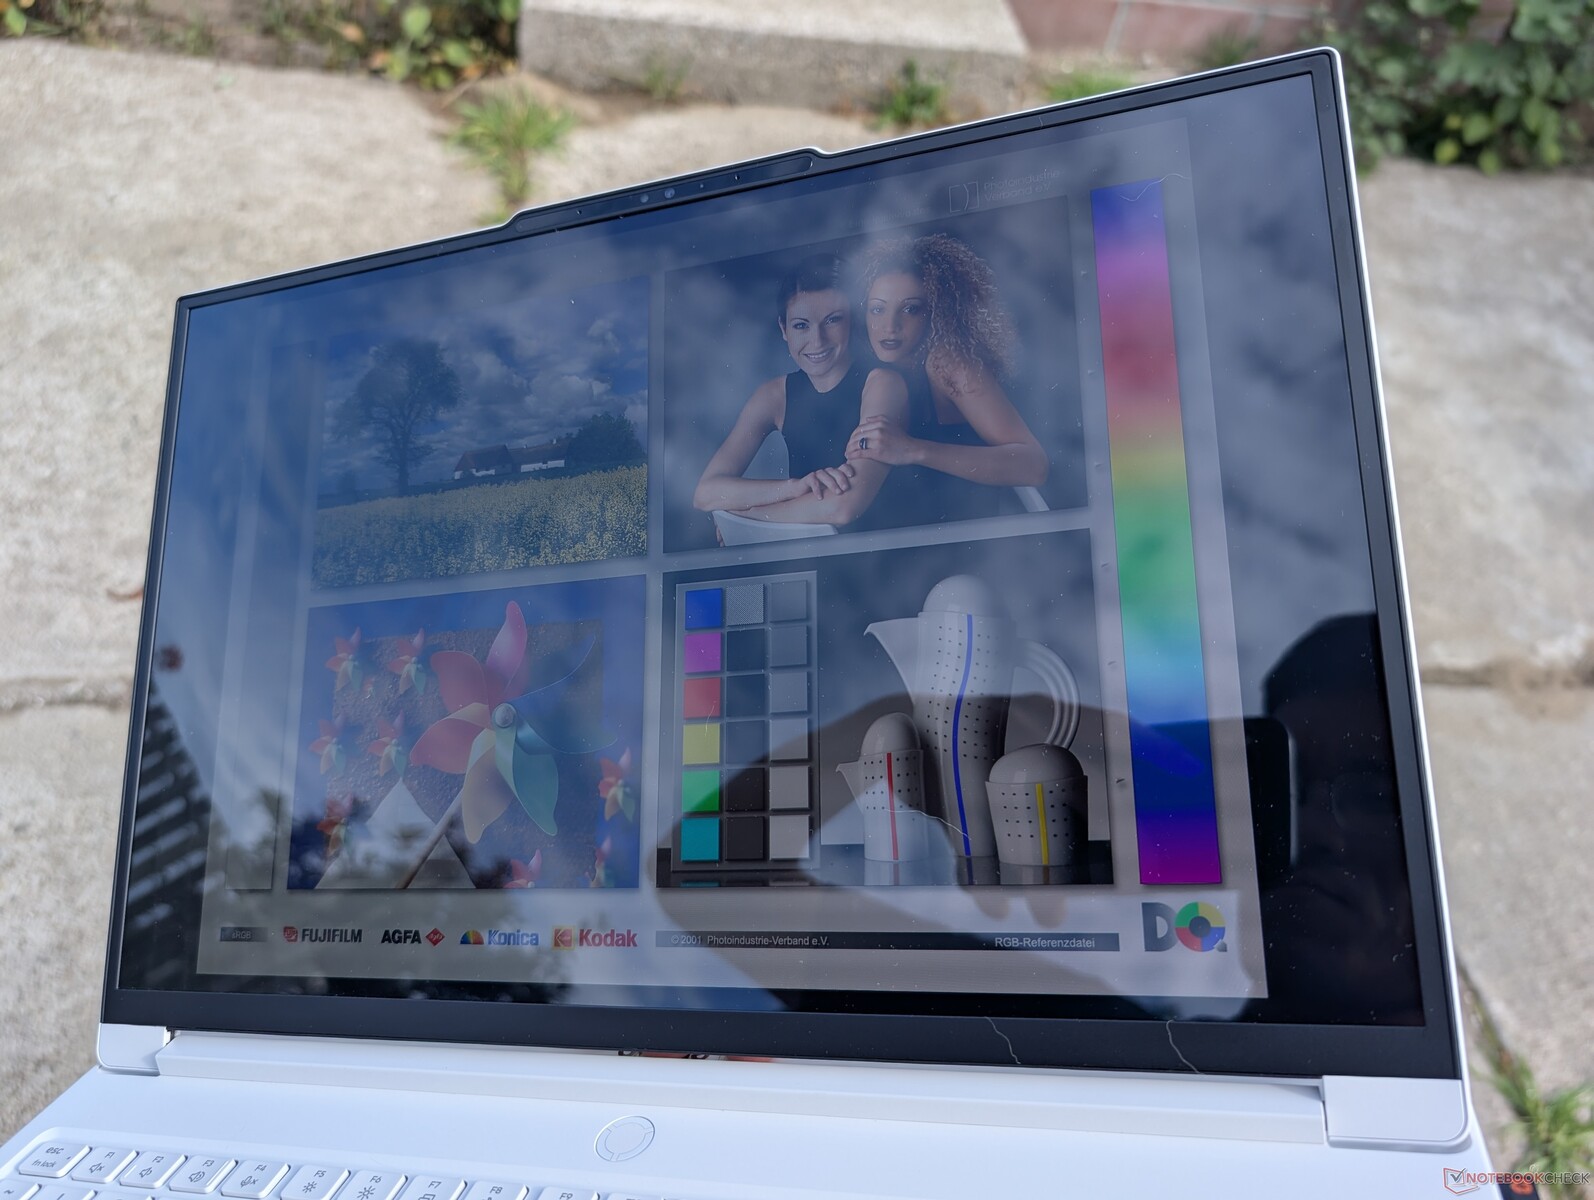
Outdoor visibility is tricky due to the glossy overlay despite the relatively bright OLED screen. The Gigabyte Gaming A16 or MSI Vector 16 HX may be slightly dimmer, but they are nonetheless easier to view outdoors since glare won't be so prevalent.


Performance
Testing Conditions
We set LegionSpace to Performance mode and discrete GPU mode prior to running the benchmarks below.
Processor
The Core Ultra 7 255HX is a significant performance upgrade over last year's Core i7-14700HX by almost 50 percent and the Core Ultra 9 285H in the Zephyrus G16 by similar margins. It also handily outperforms most mobile AMD CPUs including the Ryzen AI 9 HX 370 in the Razer Blade 16. The most notable AMD CPU that's faster than our Core Ultra 7 255HX is the Ryzen 9 9955HX, but this particular processor is only found on thicker and heavier gaming laptops like the MSI Vector A18 HX for now.
Upgrading to the Core Ultra 9 275HX configuration is expected to improve performance by up to 10 percent based on our time with the Alienware 16X Aurora.
Performance sustainability is good but not perfect. CineBench R15 xT scores would fall by about 9 percent after several cycles into our stress test as shown by the graph below.
Cinebench R15 Multi Loop
Cinebench R23: Multi Core | Single Core
Cinebench R20: CPU (Multi Core) | CPU (Single Core)
Cinebench R15: CPU Multi 64Bit | CPU Single 64Bit
Blender: v2.79 BMW27 CPU
7-Zip 18.03: 7z b 4 | 7z b 4 -mmt1
Geekbench 6.7: Multi-Core | Single-Core
Geekbench 5.5: Multi-Core | Single-Core
HWBOT x265 Benchmark v2.2: 4k Preset
LibreOffice : 20 Documents To PDF
R Benchmark 2.5: Overall mean
| CPU Performance rating | |
| Alienware 16X Aurora, RTX 5070 | |
| Lenovo Legion 7 16IAX10 | |
| Average Intel Core Ultra 7 255HX | |
| Razer Blade 16 2025 RTX 5090 | |
| MSI Sword 16 HX B14VGKG | |
| Asus ROG Zephyrus G16 GU605CX | |
| Razer Blade 16 RTX 5080 | |
| Asus TUF Gaming A16 FA608UP | |
| Alienware 16 Aurora | |
| Dell G16 7620 -2! | |
| Asus TUF Gaming A16 FA617 -2! | |
| Cinebench R20 / CPU (Multi Core) | |
| Alienware 16X Aurora, RTX 5070 | |
| Lenovo Legion 7 16IAX10 | |
| Average Intel Core Ultra 7 255HX (10626 - 13056, n=5) | |
| Razer Blade 16 2025 RTX 5090 | |
| MSI Sword 16 HX B14VGKG | |
| Asus ROG Zephyrus G16 GU605CX | |
| Razer Blade 16 RTX 5080 | |
| Asus TUF Gaming A16 FA608UP | |
| Dell G16 7620 | |
| Alienware 16 Aurora | |
| Asus TUF Gaming A16 FA617 | |
| Cinebench R20 / CPU (Single Core) | |
| Alienware 16X Aurora, RTX 5070 | |
| Lenovo Legion 7 16IAX10 | |
| Average Intel Core Ultra 7 255HX (822 - 835, n=5) | |
| Asus ROG Zephyrus G16 GU605CX | |
| MSI Sword 16 HX B14VGKG | |
| Razer Blade 16 2025 RTX 5090 | |
| Razer Blade 16 RTX 5080 | |
| Alienware 16 Aurora | |
| Asus TUF Gaming A16 FA608UP | |
| Dell G16 7620 | |
| Asus TUF Gaming A16 FA617 | |
| Cinebench R15 / CPU Multi 64Bit | |
| Alienware 16X Aurora, RTX 5070 | |
| Lenovo Legion 7 16IAX10 | |
| Average Intel Core Ultra 7 255HX (4114 - 5190, n=5) | |
| Razer Blade 16 2025 RTX 5090 | |
| Asus ROG Zephyrus G16 GU605CX | |
| MSI Sword 16 HX B14VGKG | |
| Razer Blade 16 RTX 5080 | |
| Asus TUF Gaming A16 FA608UP | |
| Dell G16 7620 | |
| Alienware 16 Aurora | |
| Asus TUF Gaming A16 FA617 | |
| Cinebench R15 / CPU Single 64Bit | |
| Alienware 16X Aurora, RTX 5070 | |
| Lenovo Legion 7 16IAX10 | |
| Average Intel Core Ultra 7 255HX (322 - 328, n=5) | |
| Asus ROG Zephyrus G16 GU605CX | |
| Razer Blade 16 2025 RTX 5090 | |
| Razer Blade 16 RTX 5080 | |
| MSI Sword 16 HX B14VGKG | |
| Asus TUF Gaming A16 FA608UP | |
| Alienware 16 Aurora | |
| Asus TUF Gaming A16 FA617 | |
| Dell G16 7620 | |
| Geekbench 6.7 / Multi-Core | |
| Alienware 16X Aurora, RTX 5070 | |
| Average Intel Core Ultra 7 255HX (16396 - 19623, n=6) | |
| Lenovo Legion 7 16IAX10 | |
| Asus ROG Zephyrus G16 GU605CX | |
| Razer Blade 16 2025 RTX 5090 | |
| MSI Sword 16 HX B14VGKG | |
| Razer Blade 16 RTX 5080 | |
| Alienware 16 Aurora | |
| Asus TUF Gaming A16 FA608UP | |
| Geekbench 6.7 / Single-Core | |
| Alienware 16X Aurora, RTX 5070 | |
| Average Intel Core Ultra 7 255HX (2917 - 3028, n=6) | |
| Razer Blade 16 2025 RTX 5090 | |
| Lenovo Legion 7 16IAX10 | |
| Asus ROG Zephyrus G16 GU605CX | |
| Razer Blade 16 RTX 5080 | |
| MSI Sword 16 HX B14VGKG | |
| Asus TUF Gaming A16 FA608UP | |
| Alienware 16 Aurora | |
| HWBOT x265 Benchmark v2.2 / 4k Preset | |
| Alienware 16X Aurora, RTX 5070 | |
| Lenovo Legion 7 16IAX10 | |
| Average Intel Core Ultra 7 255HX (30.4 - 36.9, n=5) | |
| Razer Blade 16 2025 RTX 5090 | |
| Asus ROG Zephyrus G16 GU605CX | |
| Razer Blade 16 RTX 5080 | |
| MSI Sword 16 HX B14VGKG | |
| Asus TUF Gaming A16 FA608UP | |
| Alienware 16 Aurora | |
| Dell G16 7620 | |
| Asus TUF Gaming A16 FA617 | |
| LibreOffice / 20 Documents To PDF | |
| Razer Blade 16 RTX 5080 | |
| Asus TUF Gaming A16 FA617 | |
| Asus TUF Gaming A16 FA608UP | |
| Dell G16 7620 | |
| Alienware 16 Aurora | |
| Razer Blade 16 2025 RTX 5090 | |
| MSI Sword 16 HX B14VGKG | |
| Asus ROG Zephyrus G16 GU605CX | |
| Average Intel Core Ultra 7 255HX (35.4 - 45.9, n=5) | |
| Alienware 16X Aurora, RTX 5070 | |
| Lenovo Legion 7 16IAX10 | |
| R Benchmark 2.5 / Overall mean | |
| Dell G16 7620 | |
| Asus TUF Gaming A16 FA617 | |
| Alienware 16 Aurora | |
| Asus TUF Gaming A16 FA608UP | |
| Asus ROG Zephyrus G16 GU605CX | |
| Lenovo Legion 7 16IAX10 | |
| Average Intel Core Ultra 7 255HX (0.4209 - 0.4287, n=5) | |
| Alienware 16X Aurora, RTX 5070 | |
| Razer Blade 16 RTX 5080 | |
| Razer Blade 16 2025 RTX 5090 | |
| MSI Sword 16 HX B14VGKG | |
* ... smaller is better
AIDA64: FP32 Ray-Trace | FPU Julia | CPU SHA3 | CPU Queen | FPU SinJulia | FPU Mandel | CPU AES | CPU ZLib | FP64 Ray-Trace | CPU PhotoWorxx
| Performance rating | |
| Lenovo Legion 5 Pro 16IAX10H | |
| Average Intel Core Ultra 7 255HX | |
| Lenovo Legion 7 16IAX10 | |
| MSI Vector 16 HX AI A2XWHG | |
| Asus TUF Gaming A16 FA608UP | |
| Alienware 16 Aurora | |
| Gigabyte Gaming A16 GA6H | |
| AIDA64 / FP32 Ray-Trace | |
| Lenovo Legion 5 Pro 16IAX10H | |
| Average Intel Core Ultra 7 255HX (27732 - 34250, n=5) | |
| Lenovo Legion 7 16IAX10 | |
| Asus TUF Gaming A16 FA608UP | |
| MSI Vector 16 HX AI A2XWHG | |
| Alienware 16 Aurora | |
| Gigabyte Gaming A16 GA6H | |
| AIDA64 / FPU Julia | |
| Lenovo Legion 5 Pro 16IAX10H | |
| Average Intel Core Ultra 7 255HX (140290 - 167758, n=5) | |
| Lenovo Legion 7 16IAX10 | |
| MSI Vector 16 HX AI A2XWHG | |
| Asus TUF Gaming A16 FA608UP | |
| Alienware 16 Aurora | |
| Gigabyte Gaming A16 GA6H | |
| AIDA64 / CPU SHA3 | |
| Lenovo Legion 5 Pro 16IAX10H | |
| Average Intel Core Ultra 7 255HX (6445 - 7694, n=5) | |
| Lenovo Legion 7 16IAX10 | |
| MSI Vector 16 HX AI A2XWHG | |
| Asus TUF Gaming A16 FA608UP | |
| Alienware 16 Aurora | |
| Gigabyte Gaming A16 GA6H | |
| AIDA64 / CPU Queen | |
| Lenovo Legion 5 Pro 16IAX10H | |
| Lenovo Legion 7 16IAX10 | |
| Average Intel Core Ultra 7 255HX (115802 - 135237, n=5) | |
| Asus TUF Gaming A16 FA608UP | |
| MSI Vector 16 HX AI A2XWHG | |
| Alienware 16 Aurora | |
| Gigabyte Gaming A16 GA6H | |
| AIDA64 / FPU SinJulia | |
| Asus TUF Gaming A16 FA608UP | |
| Lenovo Legion 5 Pro 16IAX10H | |
| Lenovo Legion 7 16IAX10 | |
| Average Intel Core Ultra 7 255HX (11066 - 12286, n=5) | |
| MSI Vector 16 HX AI A2XWHG | |
| Alienware 16 Aurora | |
| Gigabyte Gaming A16 GA6H | |
| AIDA64 / FPU Mandel | |
| Lenovo Legion 5 Pro 16IAX10H | |
| Average Intel Core Ultra 7 255HX (72938 - 87947, n=5) | |
| Lenovo Legion 7 16IAX10 | |
| MSI Vector 16 HX AI A2XWHG | |
| Asus TUF Gaming A16 FA608UP | |
| Alienware 16 Aurora | |
| Gigabyte Gaming A16 GA6H | |
| AIDA64 / CPU AES | |
| Lenovo Legion 5 Pro 16IAX10H | |
| Lenovo Legion 7 16IAX10 | |
| Average Intel Core Ultra 7 255HX (96832 - 116158, n=5) | |
| MSI Vector 16 HX AI A2XWHG | |
| Asus TUF Gaming A16 FA608UP | |
| Alienware 16 Aurora | |
| Gigabyte Gaming A16 GA6H | |
| AIDA64 / CPU ZLib | |
| Lenovo Legion 5 Pro 16IAX10H | |
| Lenovo Legion 7 16IAX10 | |
| Average Intel Core Ultra 7 255HX (1510 - 1850, n=5) | |
| MSI Vector 16 HX AI A2XWHG | |
| Asus TUF Gaming A16 FA608UP | |
| Alienware 16 Aurora | |
| Gigabyte Gaming A16 GA6H | |
| AIDA64 / FP64 Ray-Trace | |
| Lenovo Legion 5 Pro 16IAX10H | |
| Average Intel Core Ultra 7 255HX (15137 - 18315, n=5) | |
| Lenovo Legion 7 16IAX10 | |
| Asus TUF Gaming A16 FA608UP | |
| MSI Vector 16 HX AI A2XWHG | |
| Alienware 16 Aurora | |
| Gigabyte Gaming A16 GA6H | |
| AIDA64 / CPU PhotoWorxx | |
| Lenovo Legion 7 16IAX10 | |
| Lenovo Legion 5 Pro 16IAX10H | |
| Average Intel Core Ultra 7 255HX (39697 - 54070, n=5) | |
| Asus TUF Gaming A16 FA608UP | |
| Alienware 16 Aurora | |
| MSI Vector 16 HX AI A2XWHG | |
| Gigabyte Gaming A16 GA6H | |
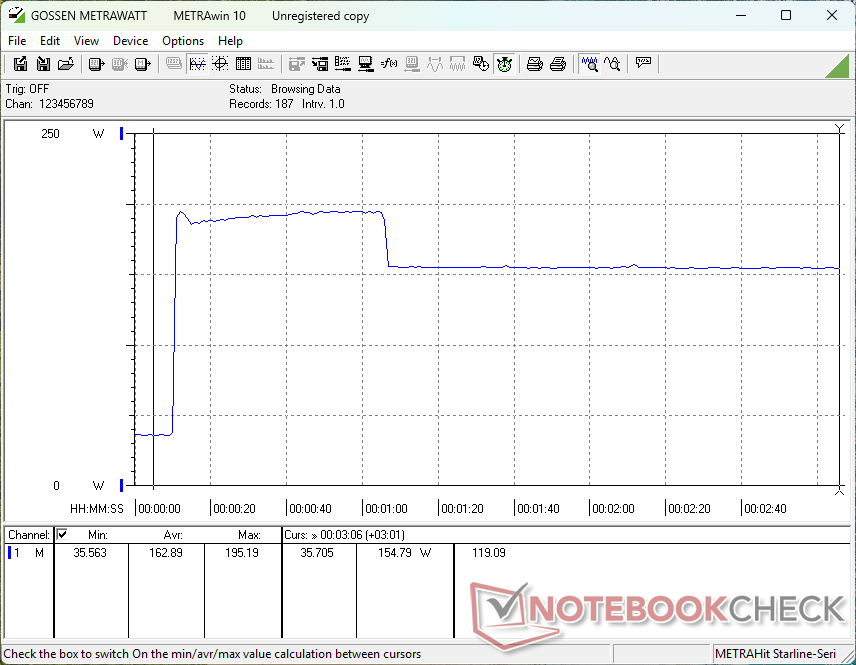
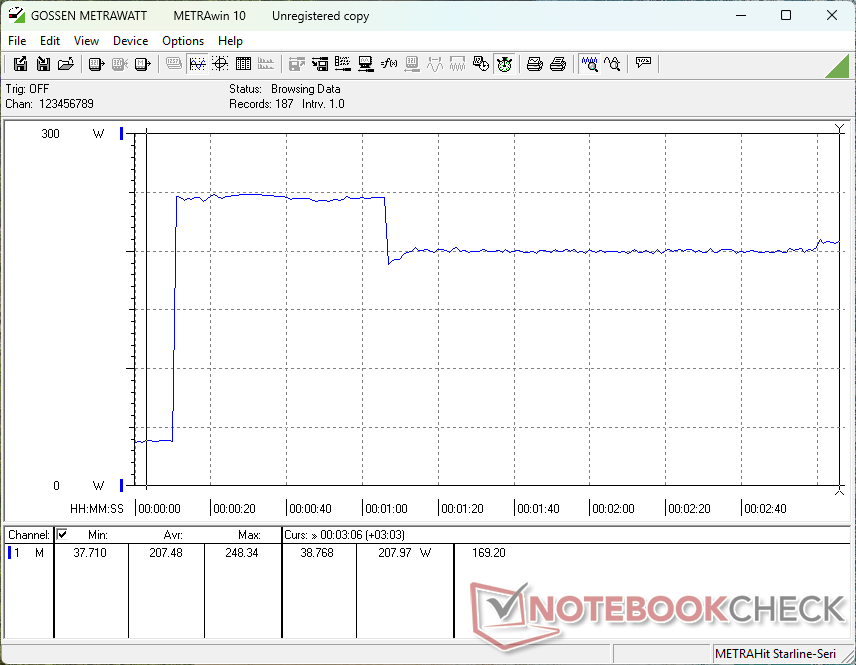
Stress Test
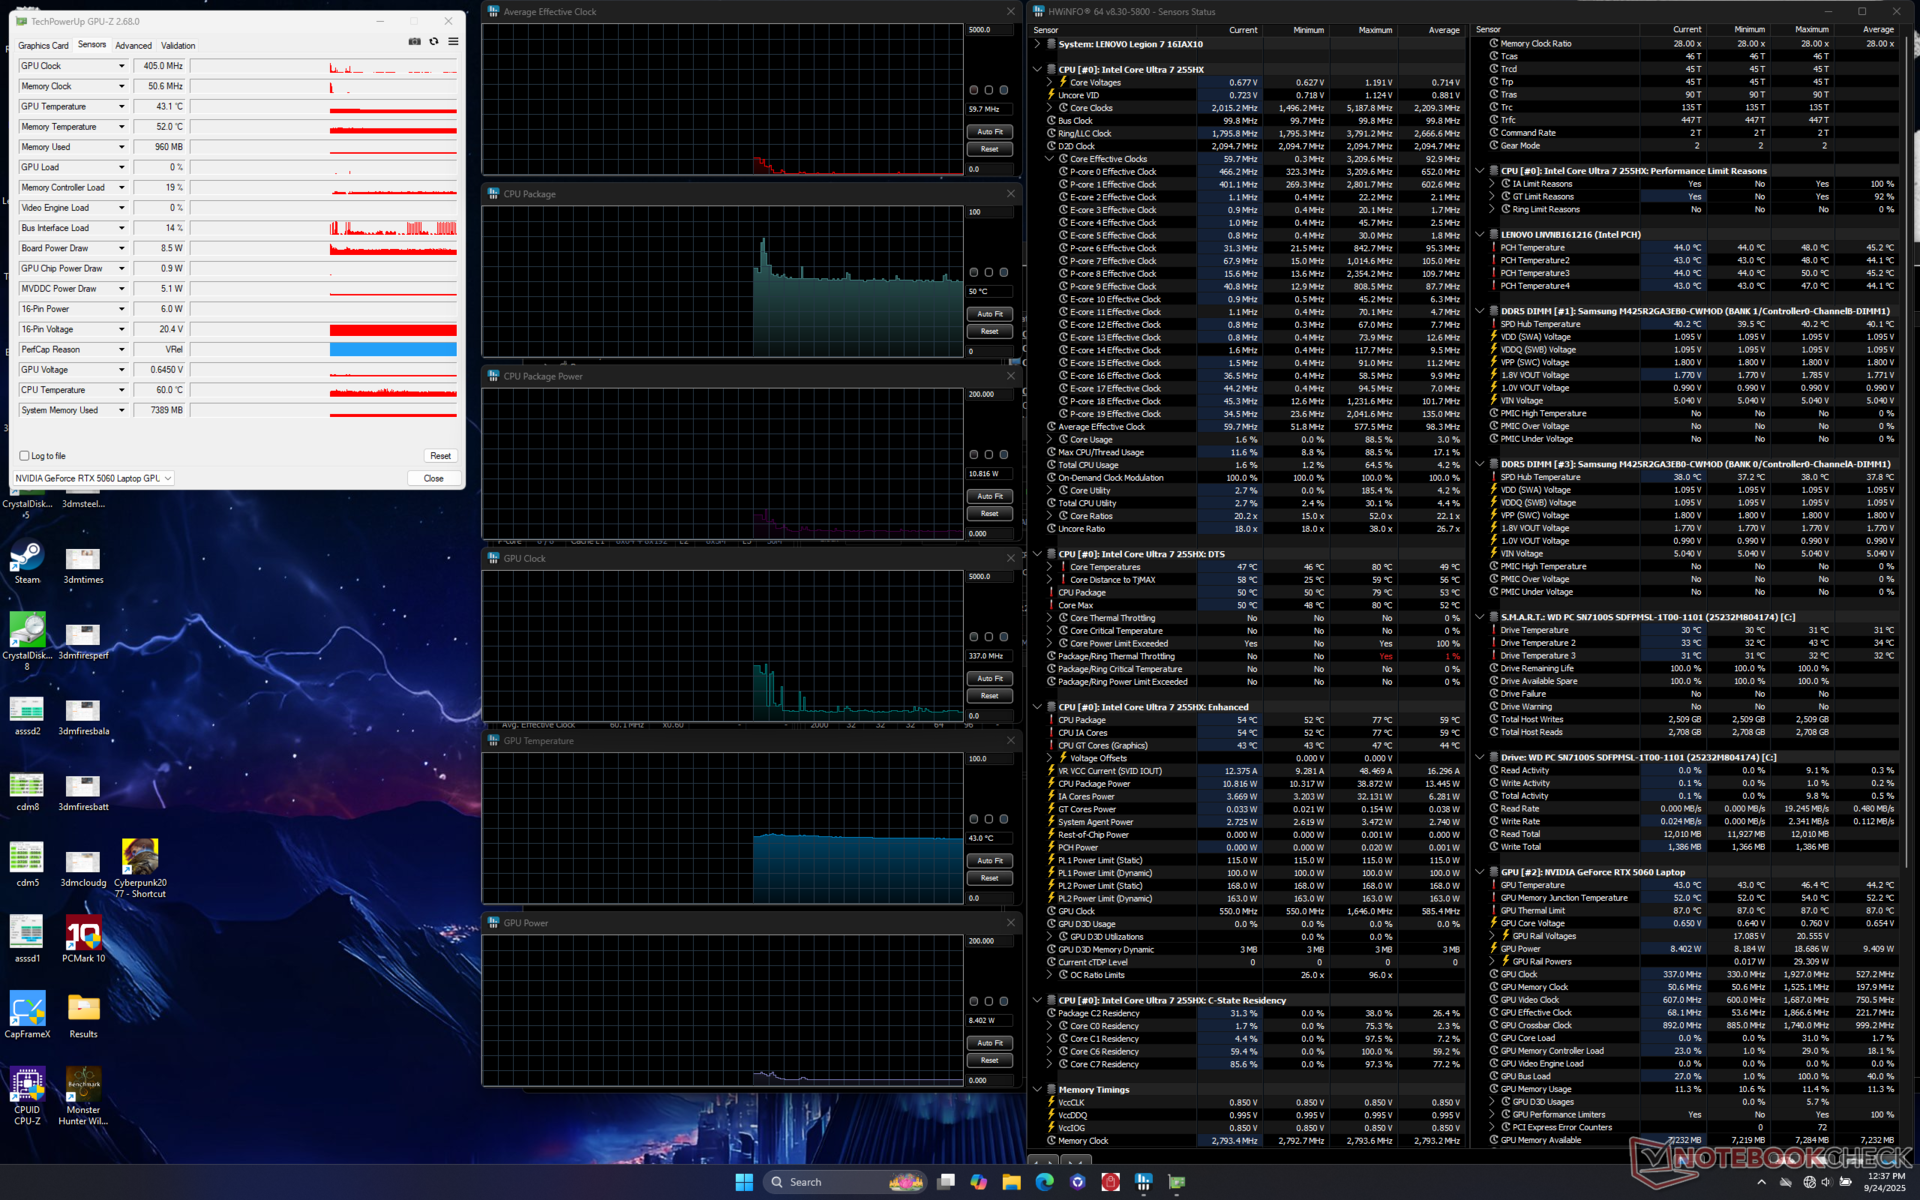
The CPU would boost to 3 GHz, 164 W, and a toasty 105 C when initiating Prime95 stress before falling and stabilizing at 3.3 GHz and 105 W about 60 seconds later in order to maintain a more reasonable core temperature of 82 C. It's clear that the Arrow Lake-HX CPU is pushing the lightweight cooling solution to its limits. Maximum Turbo Boost clock rates are unsustainable for long periods which aligns with our CineBench R15 xT loop observations mentioned above.
The GPU would stabilize at 2722 MHz, 105 W, and 82 C when running Cyberpunk 2077 on Performance mode compared to 2085 MHz and 74 C on the Alienware 16 Aurora. GPU clock rate and temperature would drop if gaming on Balanced mode as shown by our screenshots and table below.
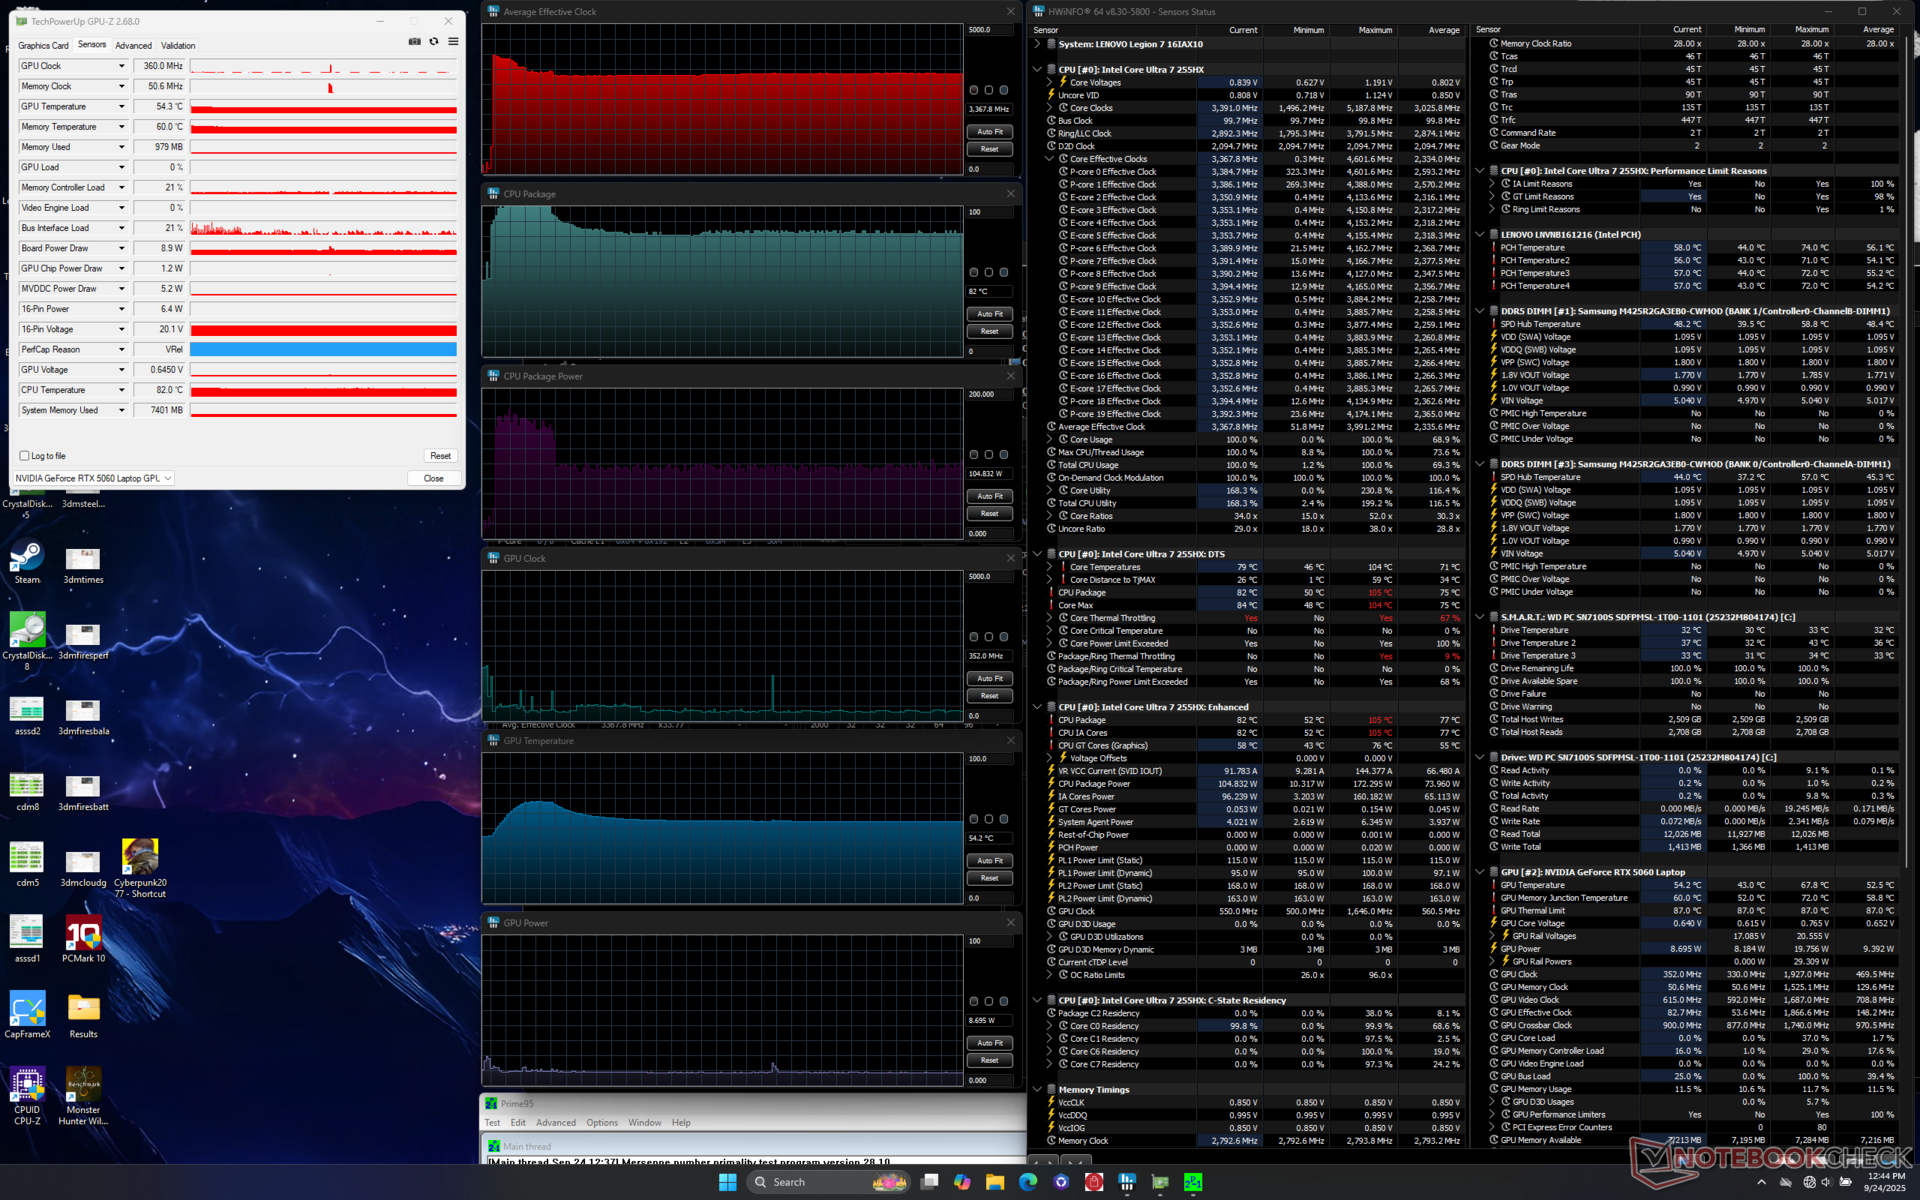
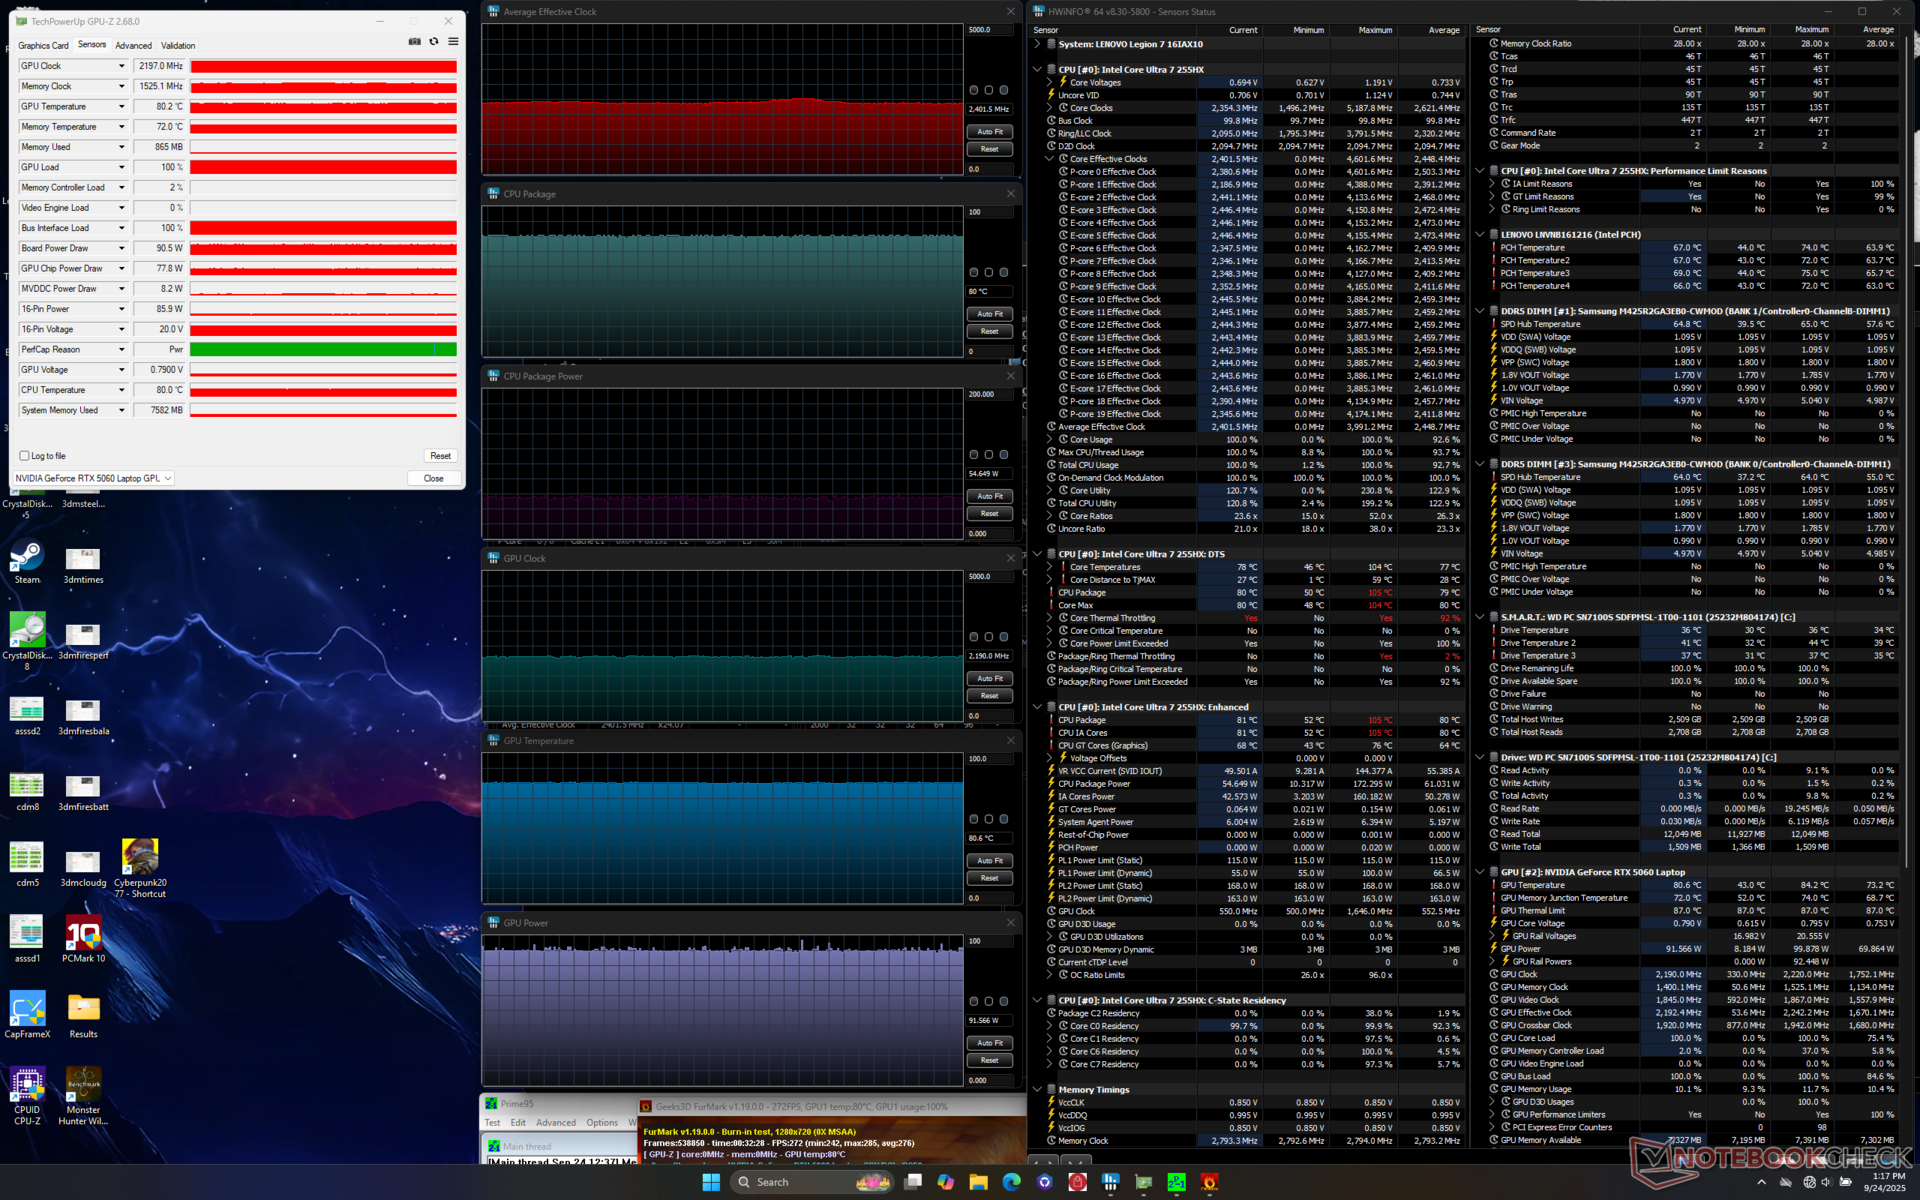
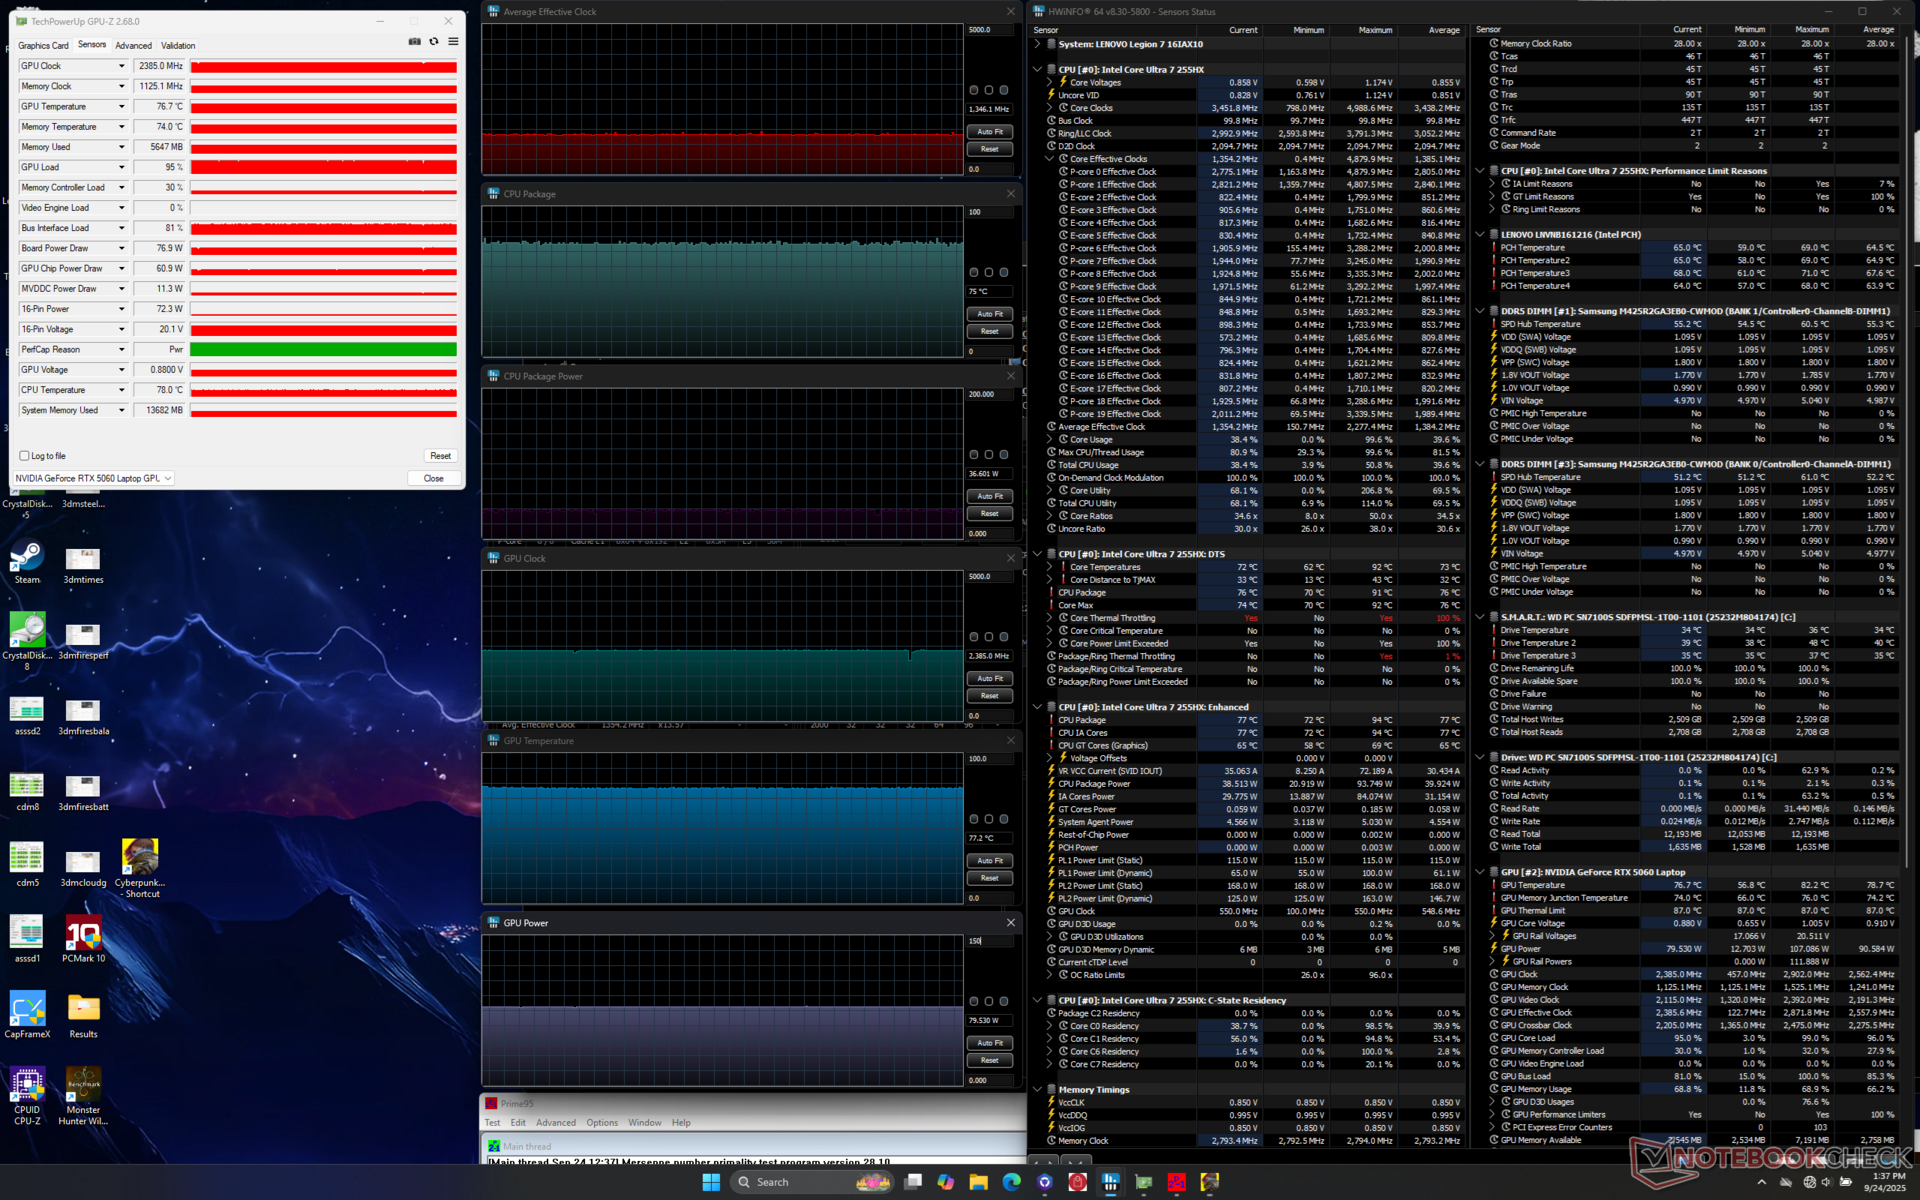
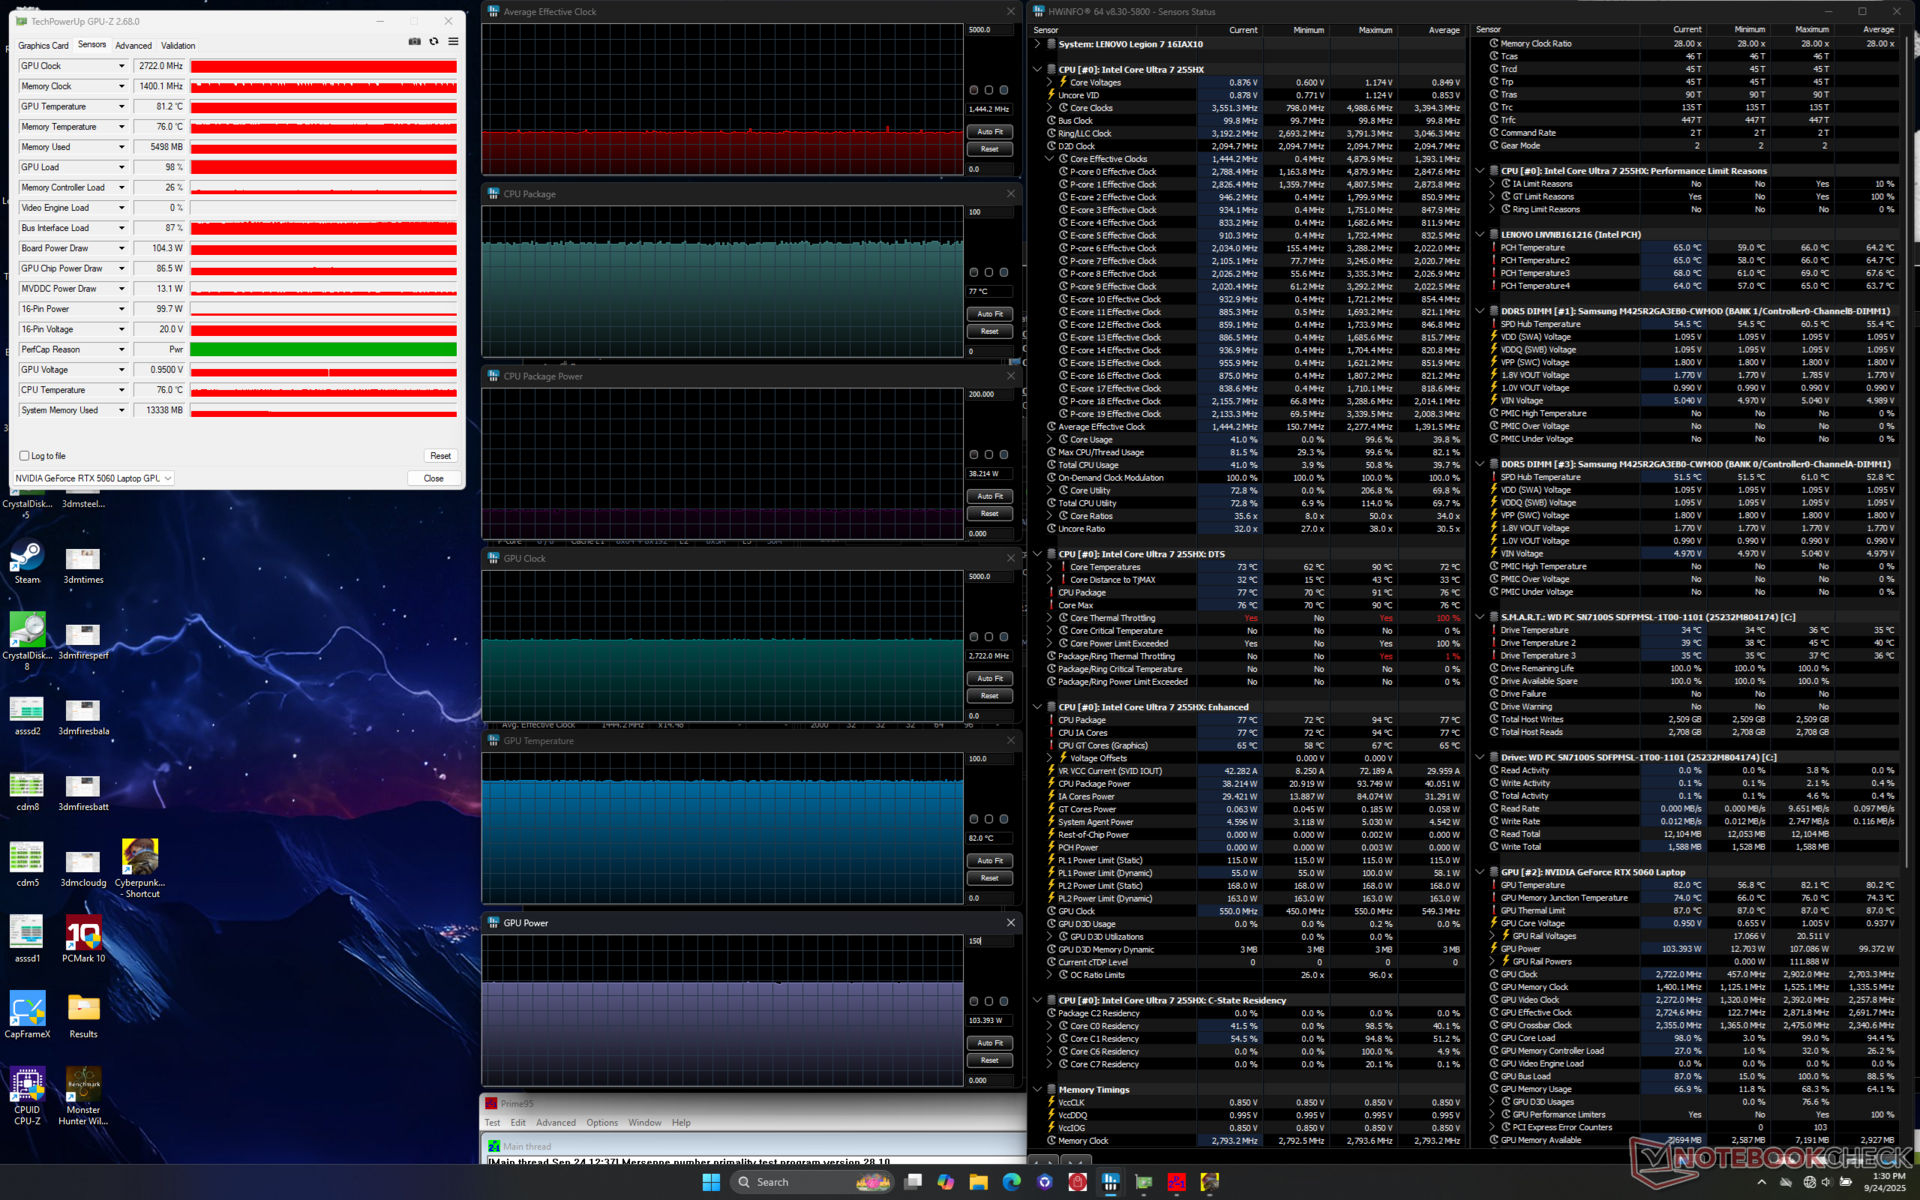
| Average CPU Clock (GHz) | GPU Clock (MHz) | Average CPU Temperature (°C) | Average GPU Temperature (°C) | |
| System Idle | -- | -- | 50 | 43 |
| Prime95 Stress | 3.4 | -- | 82 | 54 |
| Prime95 + FurMark Stress | 2.4 | 2197 | 80 | 81 |
| Cyberpunk 2077 Stress (Balanced mode) | 1.3 | 2385 | 75 | 77 |
| Cyberpunk 2077 Stress (Performance mode) | 1.4 | 2722 | 77 | 82 |
System Performance
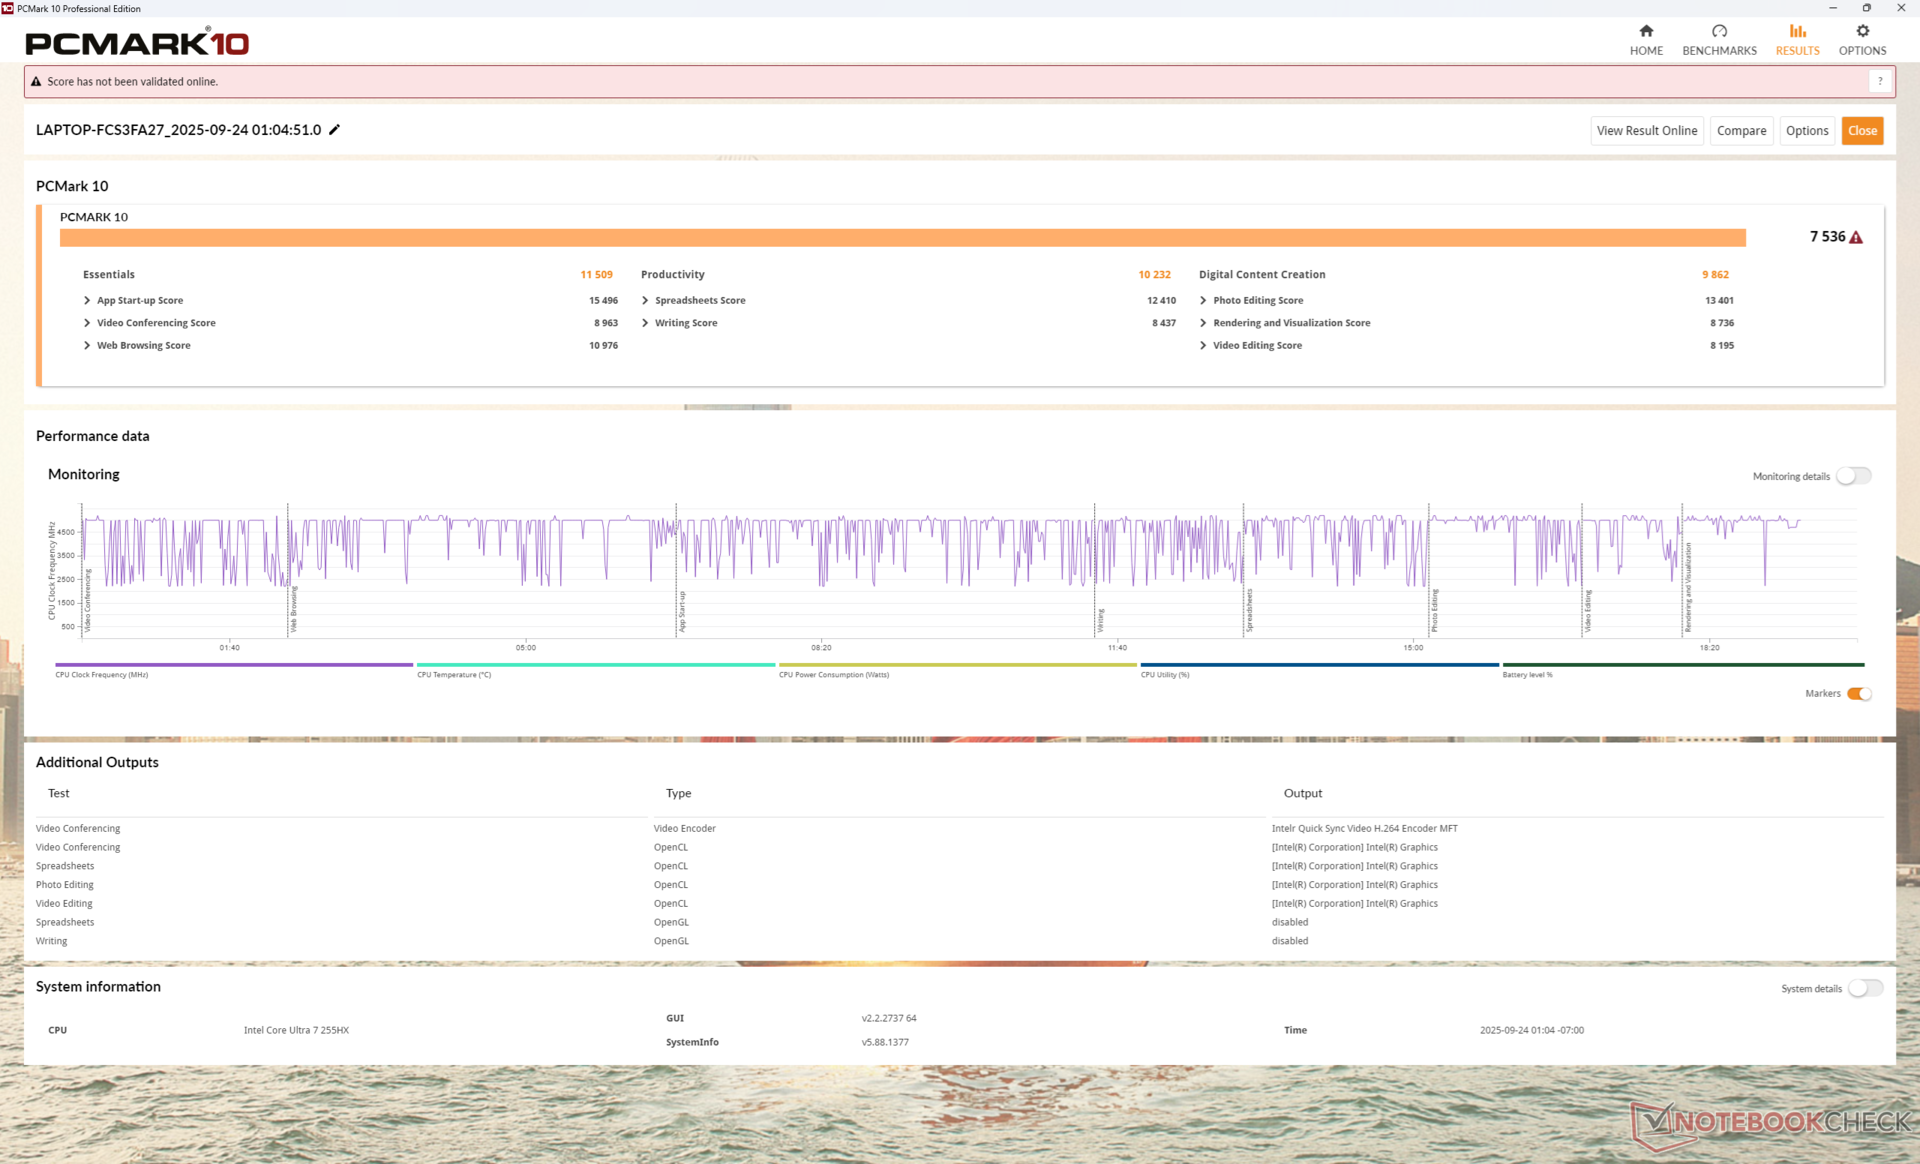
PCMark 10 would only run on iGPU mode as it otherwise crashes and so our Digital Content Creation score is underreported. Apart from that, CPU-heavy benchmarks like PCMark Essentials or Productivity are higher than on most other 16-inch gaming laptops due to the fast Arrow Lake-HX CPU.
PCMark 10: Score | Essentials | Productivity | Digital Content Creation
CrossMark: Overall | Productivity | Creativity | Responsiveness
WebXPRT 3: Overall
WebXPRT 4: Overall
Mozilla Kraken 1.1: Total
| Performance rating | |
| Lenovo Legion 5 Pro 16IAX10H | |
| Average Intel Core Ultra 7 255HX, NVIDIA GeForce RTX 5060 Laptop | |
| Lenovo Legion 7 16IAX10 | |
| MSI Vector 16 HX AI A2XWHG | |
| Alienware 16 Aurora -4! | |
| Gigabyte Gaming A16 GA6H | |
| Asus TUF Gaming A16 FA608UP -4! | |
| PCMark 10 / Score | |
| Average Intel Core Ultra 7 255HX, NVIDIA GeForce RTX 5060 Laptop (7536 - 10386, n=2) | |
| Lenovo Legion 5 Pro 16IAX10H | |
| MSI Vector 16 HX AI A2XWHG | |
| Lenovo Legion 7 16IAX10 | |
| Gigabyte Gaming A16 GA6H | |
| PCMark 10 / Essentials | |
| Average Intel Core Ultra 7 255HX, NVIDIA GeForce RTX 5060 Laptop (11509 - 11664, n=2) | |
| Lenovo Legion 7 16IAX10 | |
| Lenovo Legion 5 Pro 16IAX10H | |
| MSI Vector 16 HX AI A2XWHG | |
| Gigabyte Gaming A16 GA6H | |
| PCMark 10 / Productivity | |
| Average Intel Core Ultra 7 255HX, NVIDIA GeForce RTX 5060 Laptop (10232 - 16048, n=2) | |
| Lenovo Legion 7 16IAX10 | |
| Lenovo Legion 5 Pro 16IAX10H | |
| MSI Vector 16 HX AI A2XWHG | |
| Gigabyte Gaming A16 GA6H | |
| PCMark 10 / Digital Content Creation | |
| Lenovo Legion 5 Pro 16IAX10H | |
| Average Intel Core Ultra 7 255HX, NVIDIA GeForce RTX 5060 Laptop (9862 - 16240, n=2) | |
| MSI Vector 16 HX AI A2XWHG | |
| Gigabyte Gaming A16 GA6H | |
| Lenovo Legion 7 16IAX10 | |
| CrossMark / Overall | |
| Lenovo Legion 5 Pro 16IAX10H | |
| Average Intel Core Ultra 7 255HX, NVIDIA GeForce RTX 5060 Laptop (2059 - 2066, n=2) | |
| Lenovo Legion 7 16IAX10 | |
| Alienware 16 Aurora | |
| MSI Vector 16 HX AI A2XWHG | |
| Gigabyte Gaming A16 GA6H | |
| Asus TUF Gaming A16 FA608UP | |
| CrossMark / Productivity | |
| Lenovo Legion 5 Pro 16IAX10H | |
| Lenovo Legion 7 16IAX10 | |
| Average Intel Core Ultra 7 255HX, NVIDIA GeForce RTX 5060 Laptop (1943 - 1951, n=2) | |
| Alienware 16 Aurora | |
| MSI Vector 16 HX AI A2XWHG | |
| Gigabyte Gaming A16 GA6H | |
| Asus TUF Gaming A16 FA608UP | |
| CrossMark / Creativity | |
| Lenovo Legion 5 Pro 16IAX10H | |
| Average Intel Core Ultra 7 255HX, NVIDIA GeForce RTX 5060 Laptop (2288 - 2384, n=2) | |
| Lenovo Legion 7 16IAX10 | |
| MSI Vector 16 HX AI A2XWHG | |
| Alienware 16 Aurora | |
| Asus TUF Gaming A16 FA608UP | |
| Gigabyte Gaming A16 GA6H | |
| CrossMark / Responsiveness | |
| Alienware 16 Aurora | |
| Lenovo Legion 5 Pro 16IAX10H | |
| Gigabyte Gaming A16 GA6H | |
| Lenovo Legion 7 16IAX10 | |
| Average Intel Core Ultra 7 255HX, NVIDIA GeForce RTX 5060 Laptop (1617 - 1765, n=2) | |
| MSI Vector 16 HX AI A2XWHG | |
| Asus TUF Gaming A16 FA608UP | |
| WebXPRT 3 / Overall | |
| Lenovo Legion 5 Pro 16IAX10H | |
| Lenovo Legion 7 16IAX10 | |
| Average Intel Core Ultra 7 255HX, NVIDIA GeForce RTX 5060 Laptop (317 - 344, n=2) | |
| MSI Vector 16 HX AI A2XWHG | |
| Asus TUF Gaming A16 FA608UP | |
| Alienware 16 Aurora | |
| Gigabyte Gaming A16 GA6H | |
| WebXPRT 4 / Overall | |
| Lenovo Legion 5 Pro 16IAX10H | |
| Lenovo Legion 7 16IAX10 | |
| Average Intel Core Ultra 7 255HX, NVIDIA GeForce RTX 5060 Laptop (313 - 317, n=2) | |
| MSI Vector 16 HX AI A2XWHG | |
| Alienware 16 Aurora | |
| Gigabyte Gaming A16 GA6H | |
| Asus TUF Gaming A16 FA608UP | |
| Mozilla Kraken 1.1 / Total | |
| Asus TUF Gaming A16 FA608UP | |
| Alienware 16 Aurora | |
| Gigabyte Gaming A16 GA6H | |
| Lenovo Legion 7 16IAX10 | |
| Average Intel Core Ultra 7 255HX, NVIDIA GeForce RTX 5060 Laptop (423 - 436, n=2) | |
| MSI Vector 16 HX AI A2XWHG | |
| Lenovo Legion 5 Pro 16IAX10H | |
* ... smaller is better
| PCMark 10 Score | 7536 points | |
Help | ||
| AIDA64 / Memory Copy | |
| Lenovo Legion 7 16IAX10 | |
| Average Intel Core Ultra 7 255HX (68939 - 104987, n=5) | |
| Lenovo Legion 5 Pro 16IAX10H | |
| MSI Vector 16 HX AI A2XWHG | |
| Asus TUF Gaming A16 FA608UP | |
| Alienware 16 Aurora | |
| Gigabyte Gaming A16 GA6H | |
| AIDA64 / Memory Read | |
| Average Intel Core Ultra 7 255HX (82336 - 95821, n=5) | |
| Lenovo Legion 5 Pro 16IAX10H | |
| Lenovo Legion 7 16IAX10 | |
| MSI Vector 16 HX AI A2XWHG | |
| Alienware 16 Aurora | |
| Asus TUF Gaming A16 FA608UP | |
| Gigabyte Gaming A16 GA6H | |
| AIDA64 / Memory Write | |
| Average Intel Core Ultra 7 255HX (66479 - 133486, n=5) | |
| Asus TUF Gaming A16 FA608UP | |
| Lenovo Legion 5 Pro 16IAX10H | |
| Lenovo Legion 7 16IAX10 | |
| MSI Vector 16 HX AI A2XWHG | |
| Alienware 16 Aurora | |
| Gigabyte Gaming A16 GA6H | |
| AIDA64 / Memory Latency | |
| Lenovo Legion 5 Pro 16IAX10H | |
| Average Intel Core Ultra 7 255HX (104.2 - 110, n=5) | |
| Lenovo Legion 7 16IAX10 | |
| Alienware 16 Aurora | |
| MSI Vector 16 HX AI A2XWHG | |
| Gigabyte Gaming A16 GA6H | |
| Asus TUF Gaming A16 FA608UP | |
* ... smaller is better
DPC Latency
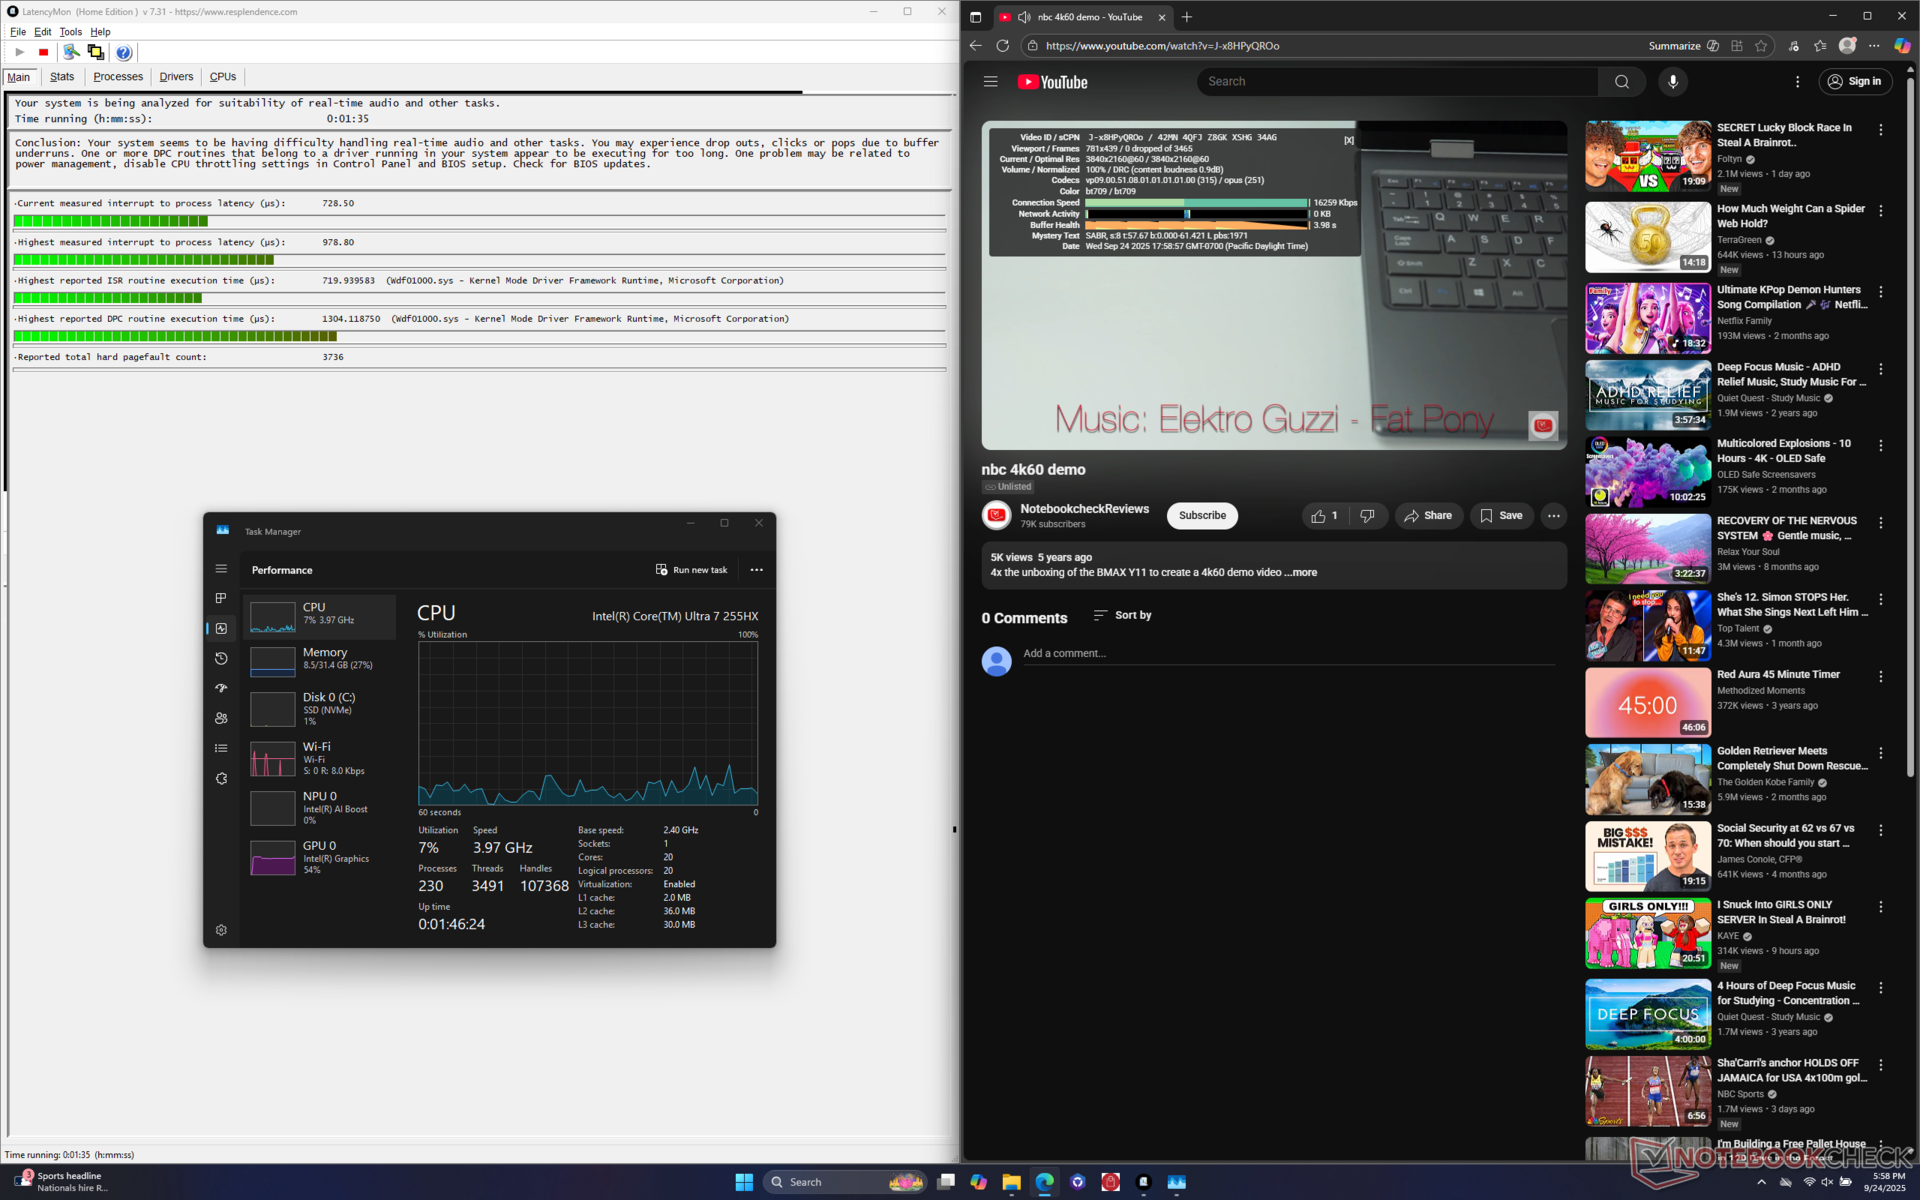
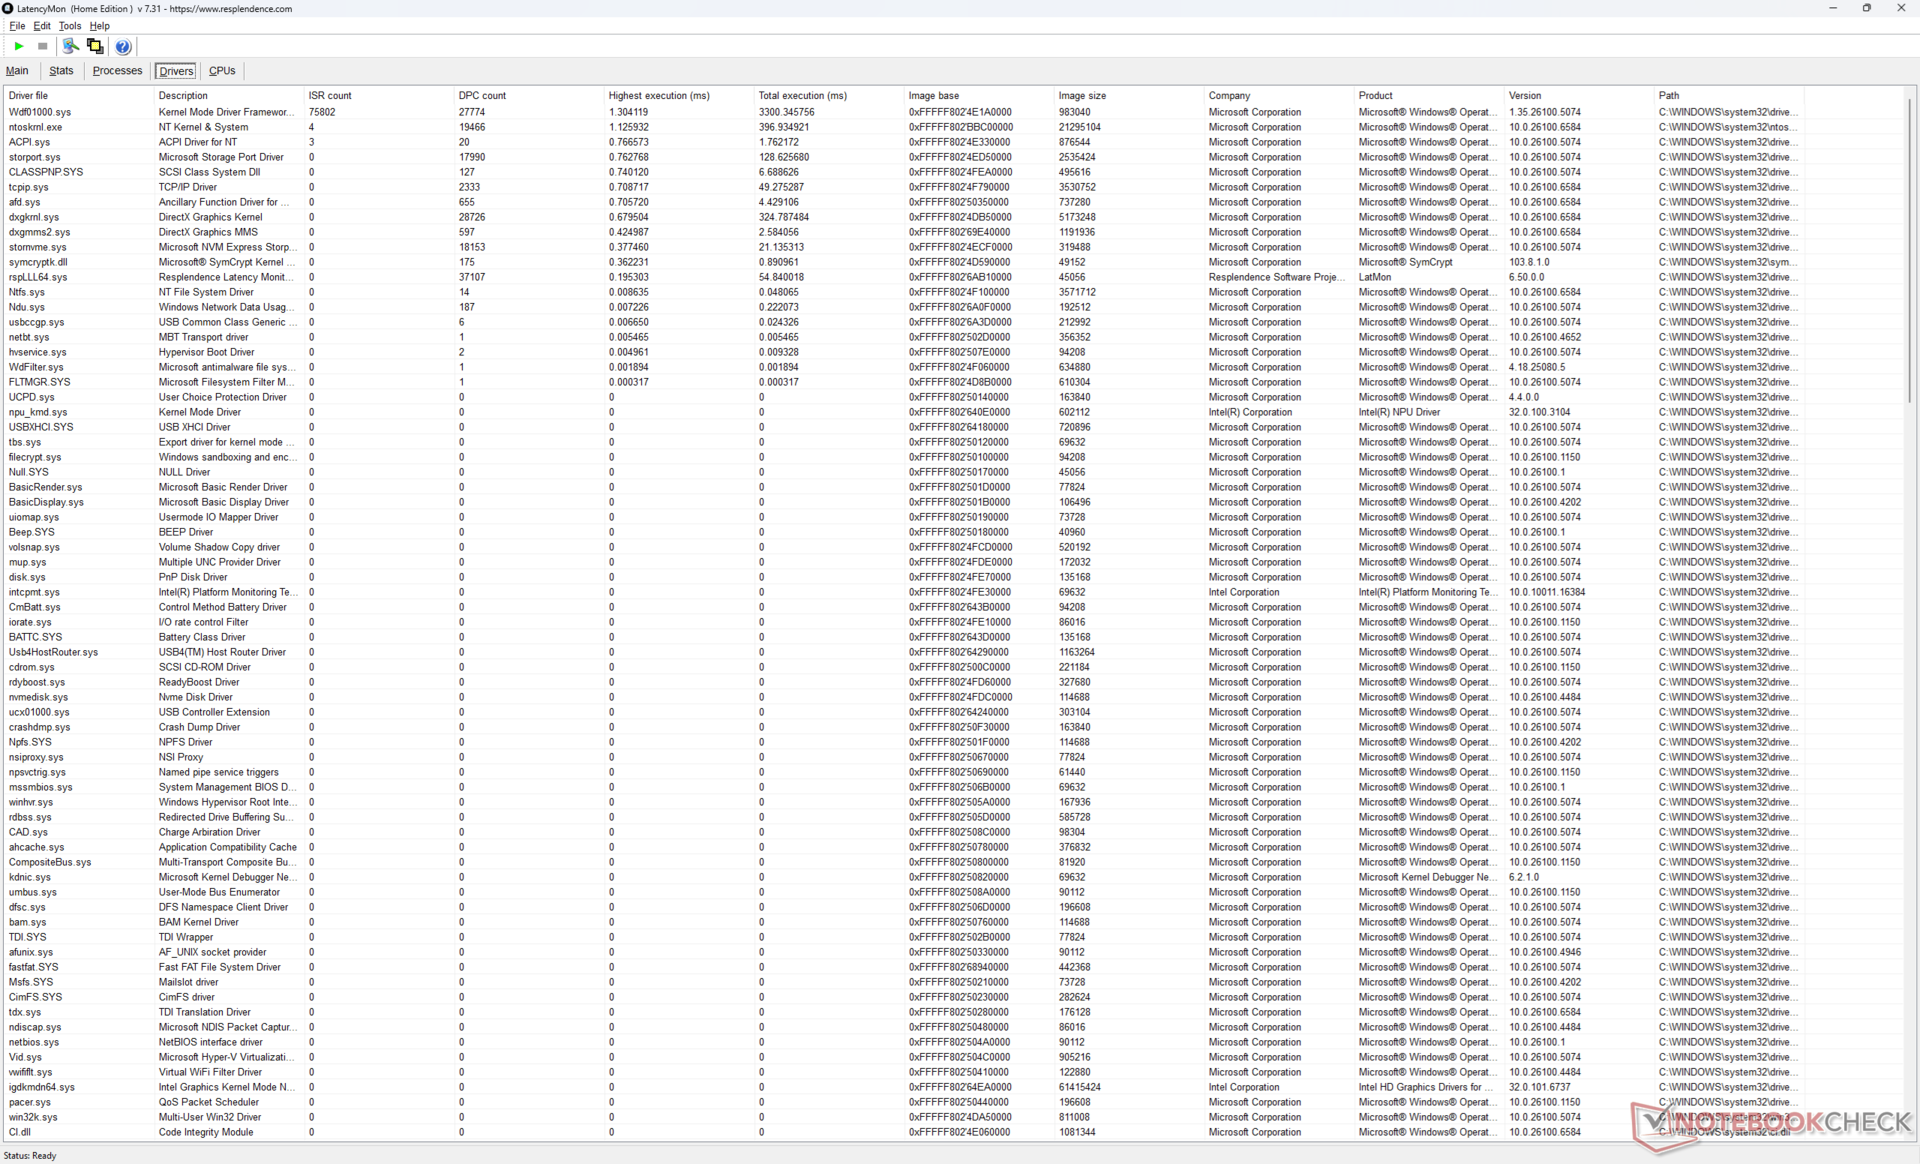
LatencyMon shows just minor DPC issues and no dropped frames recorded during our 4K60 video playback test.
| DPC Latencies / LatencyMon - interrupt to process latency (max), Web, Youtube, Prime95 | |
| MSI Vector 16 HX AI A2XWHG | |
| Gigabyte Gaming A16 GA6H | |
| Lenovo Legion 5 Pro 16IAX10H | |
| Lenovo Legion 7 16IAX10 | |
| Asus TUF Gaming A16 FA608UP | |
* ... smaller is better
Storage Devices
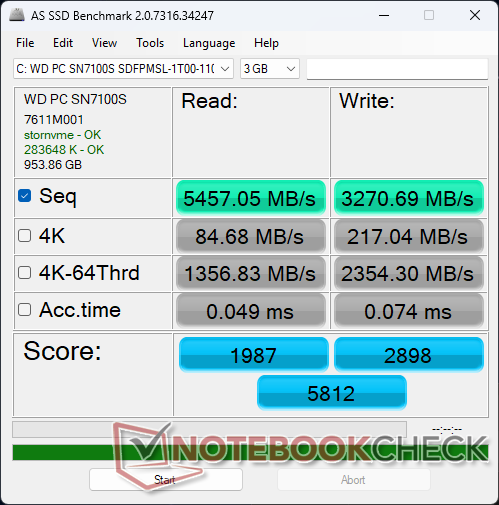
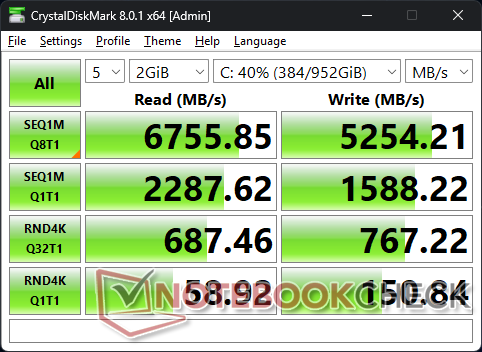
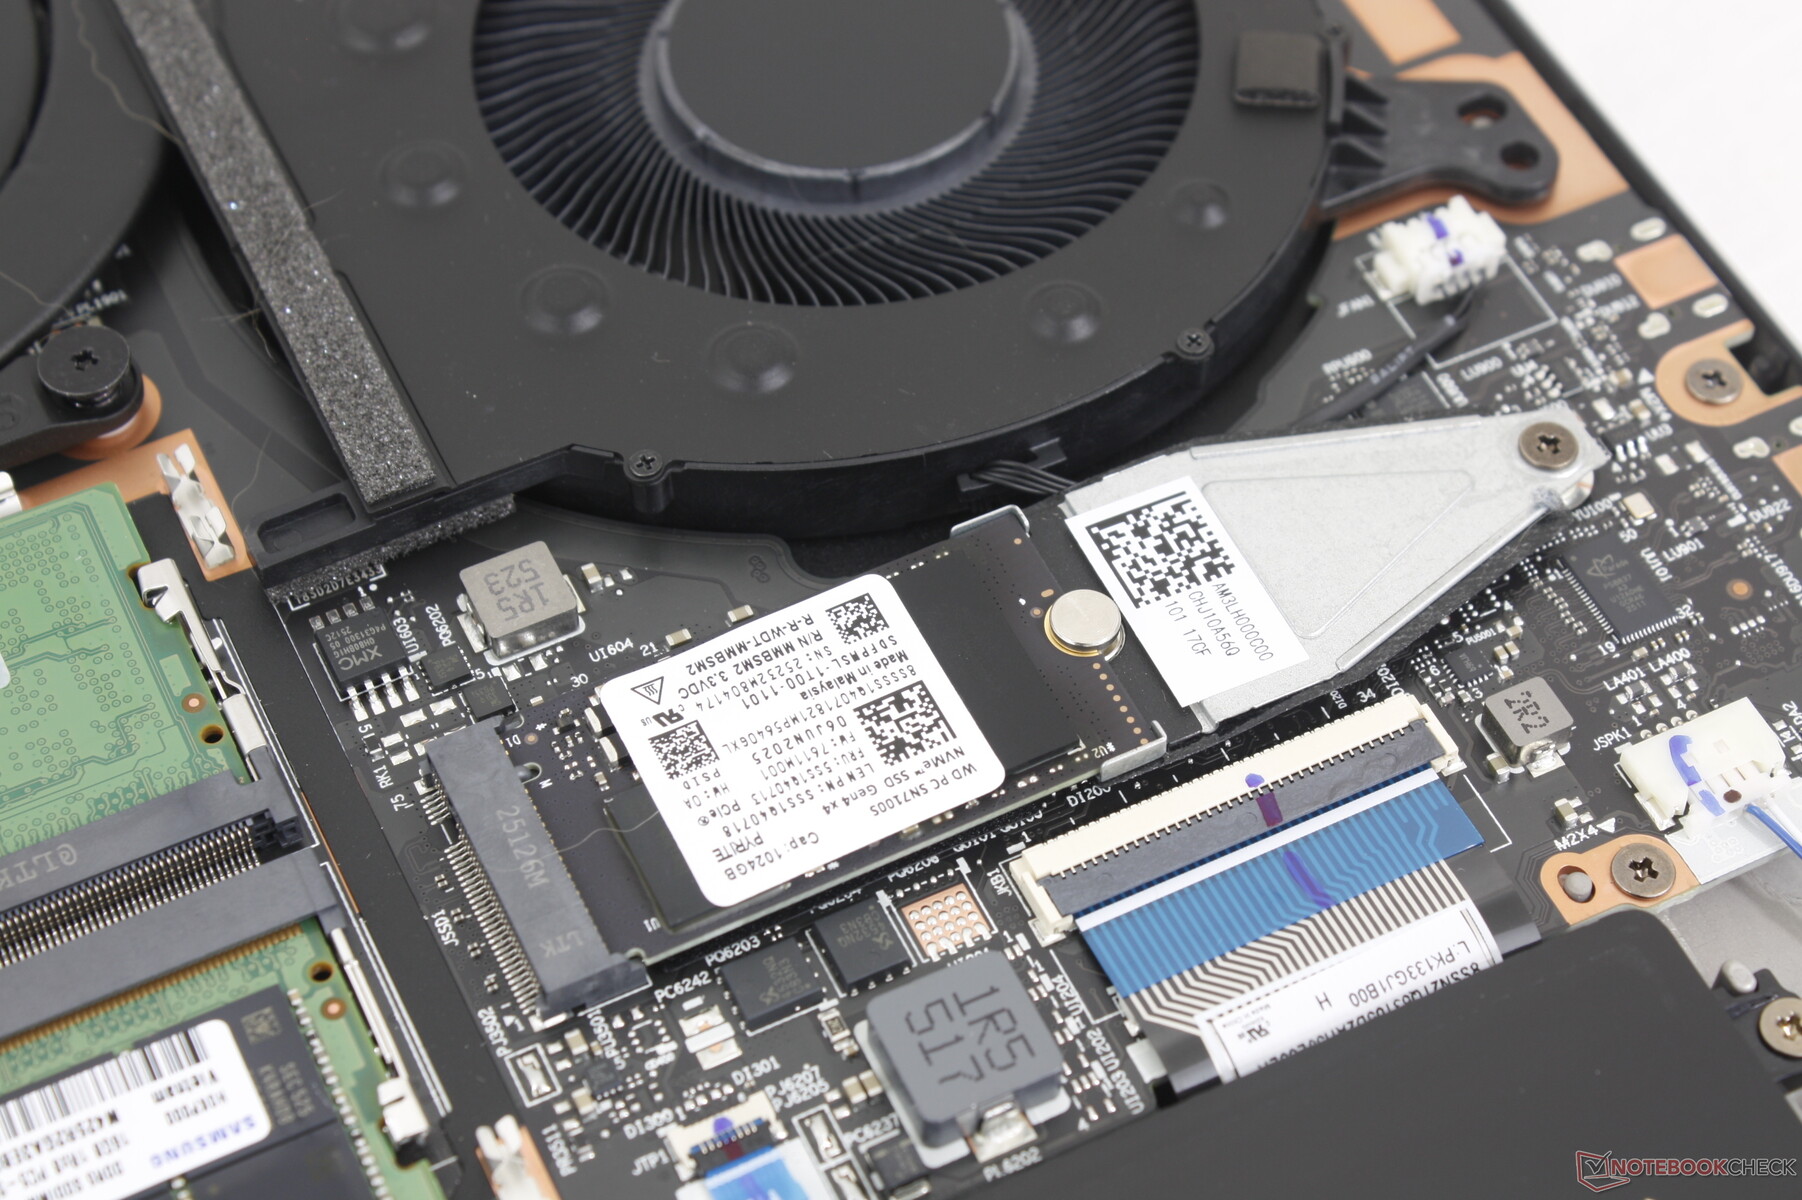
A thermal pad and heat spreader is included with the primary SSD. Transfer rates are constant at 6900 MB/s when stressed to represent no throttling issues.

| Drive Performance rating - Percent | |
| Gigabyte Gaming A16 GA6H | |
| Lenovo Legion 5 Pro 16IAX10H | |
| Lenovo Legion 7 16IAX10 | |
| Asus TUF Gaming A16 FA608UP | |
| MSI Vector 16 HX AI A2XWHG | |
* ... smaller is better
Disk Throttling: DiskSpd Read Loop, Queue Depth 8
GPU Performance
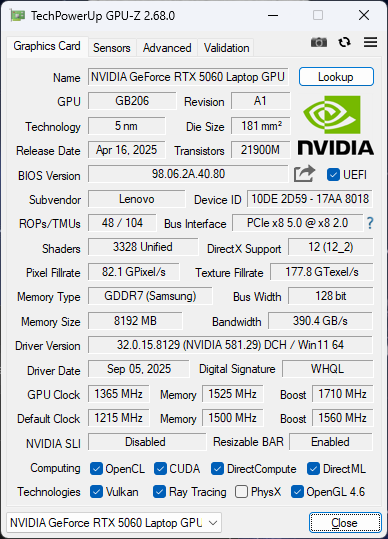
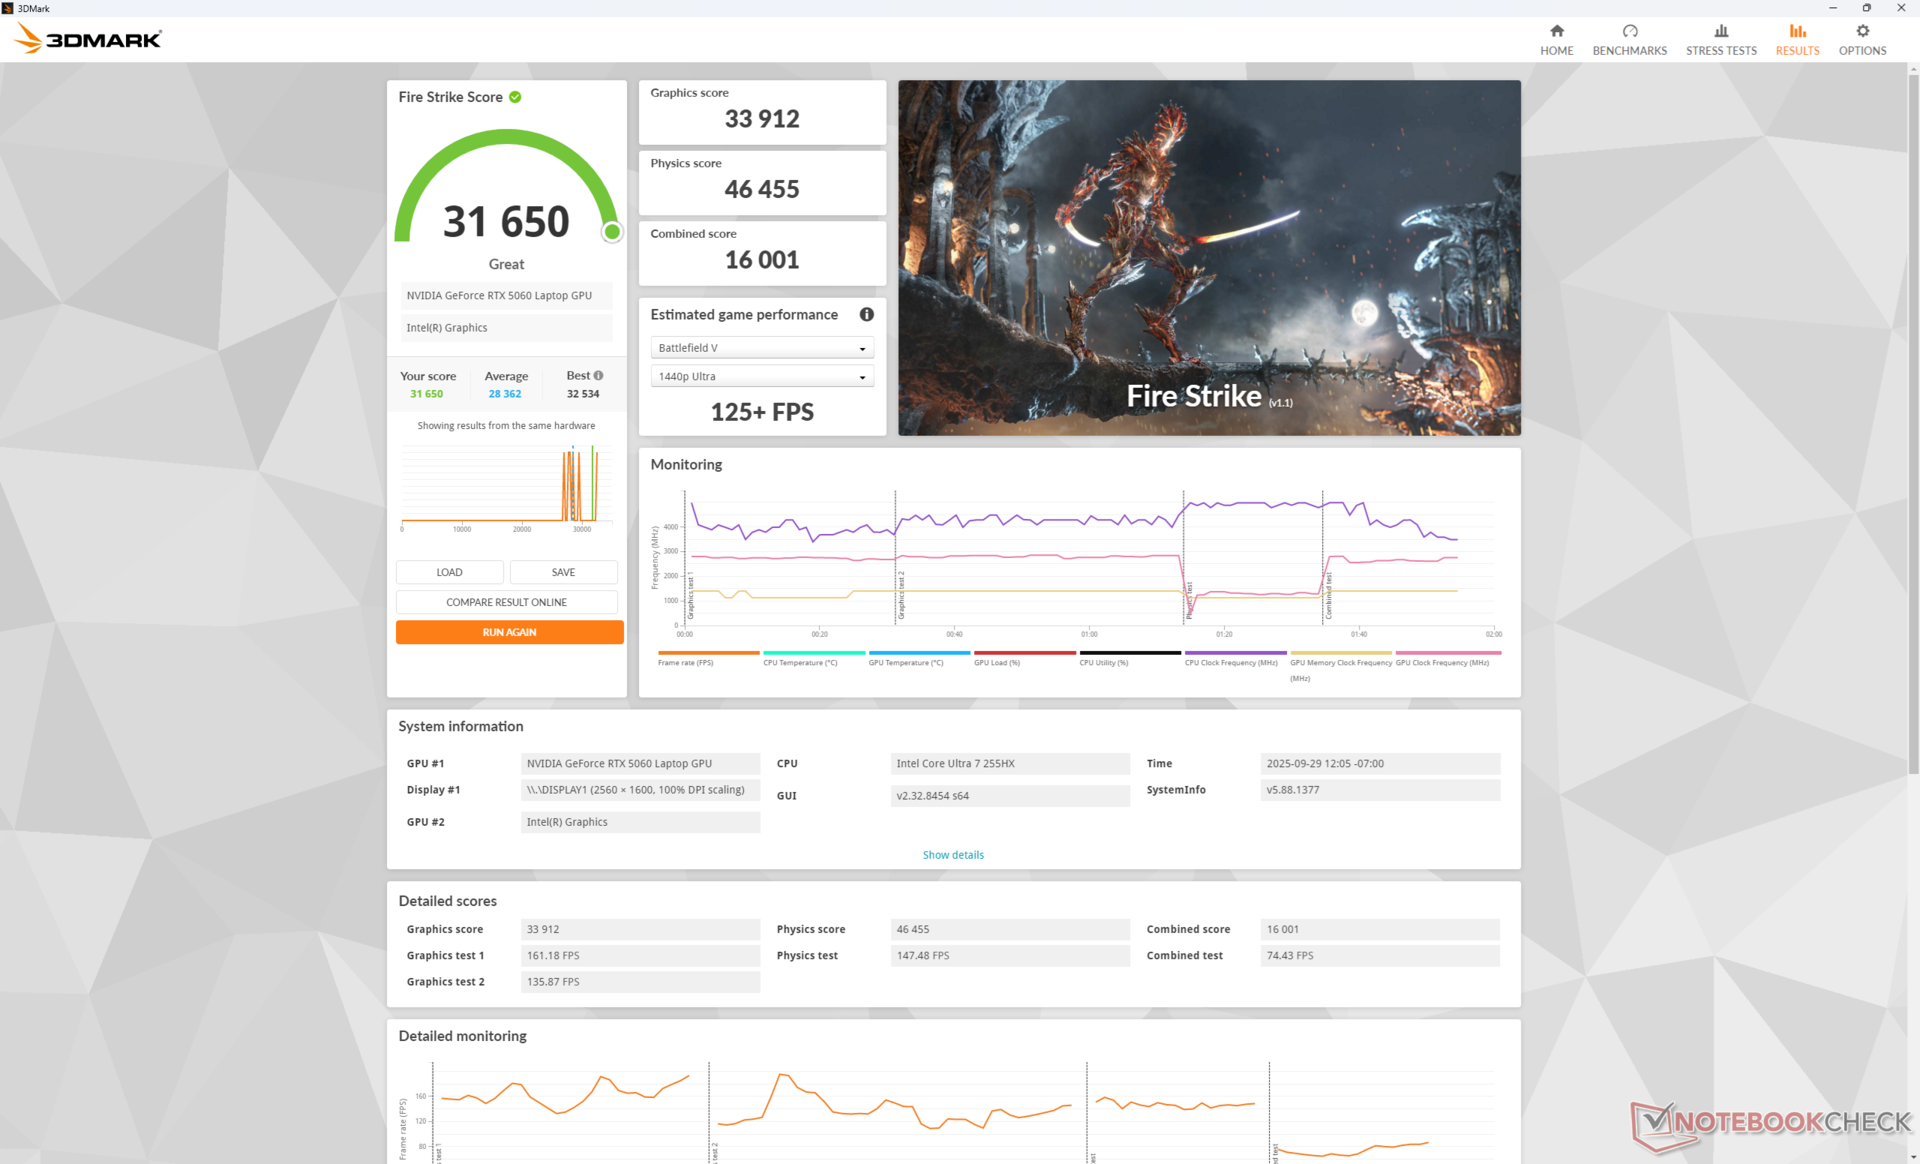
The mobile GeForce RTX 5060 has been extensively benchmarked as shown by our dedicated GPU page here. For the Legion 7 16IAX10, the GPU stabilizes at 105 W if on Performance mode or just 77 W if on Balanced mode which entails a performance deficit of about 10 percent according to 3DMark Fire Strike.
Upgrading to the mobile RTX 5070 configuration will increase graphics performance by about 15 percent. There are unfortunately no RTX 5070 Ti options.
Users upgrading from an older RTX 3060 laptop will see a more significant raw performance increase of 30 to 40 percent before applying DLSS upscaling or frame generation features.
| Power Profile | Graphics Score | Physics Score | Combined Score |
| Performance Mode (105 W GPU) | 33912 | 46455 | 16001 |
| Balanced Mode (77 W GPU) | 30456 (-10%) | 44872 (-3%) | 14652 (-8%) |
| Battery Power | 24709 (-27%) | 26926 (-42%) | 11171 (-30%) |
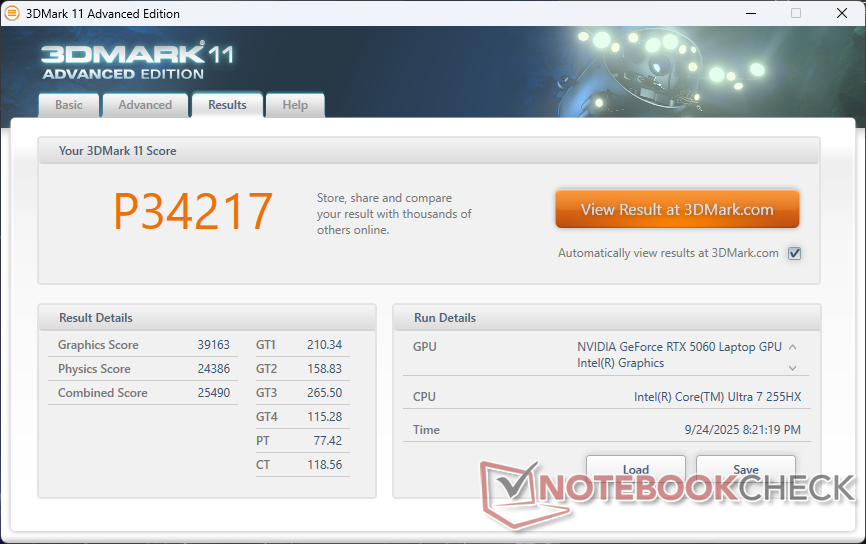
| 3DMark 11 Performance | 34217 points | |
| 3DMark Cloud Gate Standard Score | 69955 points | |
| 3DMark Fire Strike Score | 31650 points | |
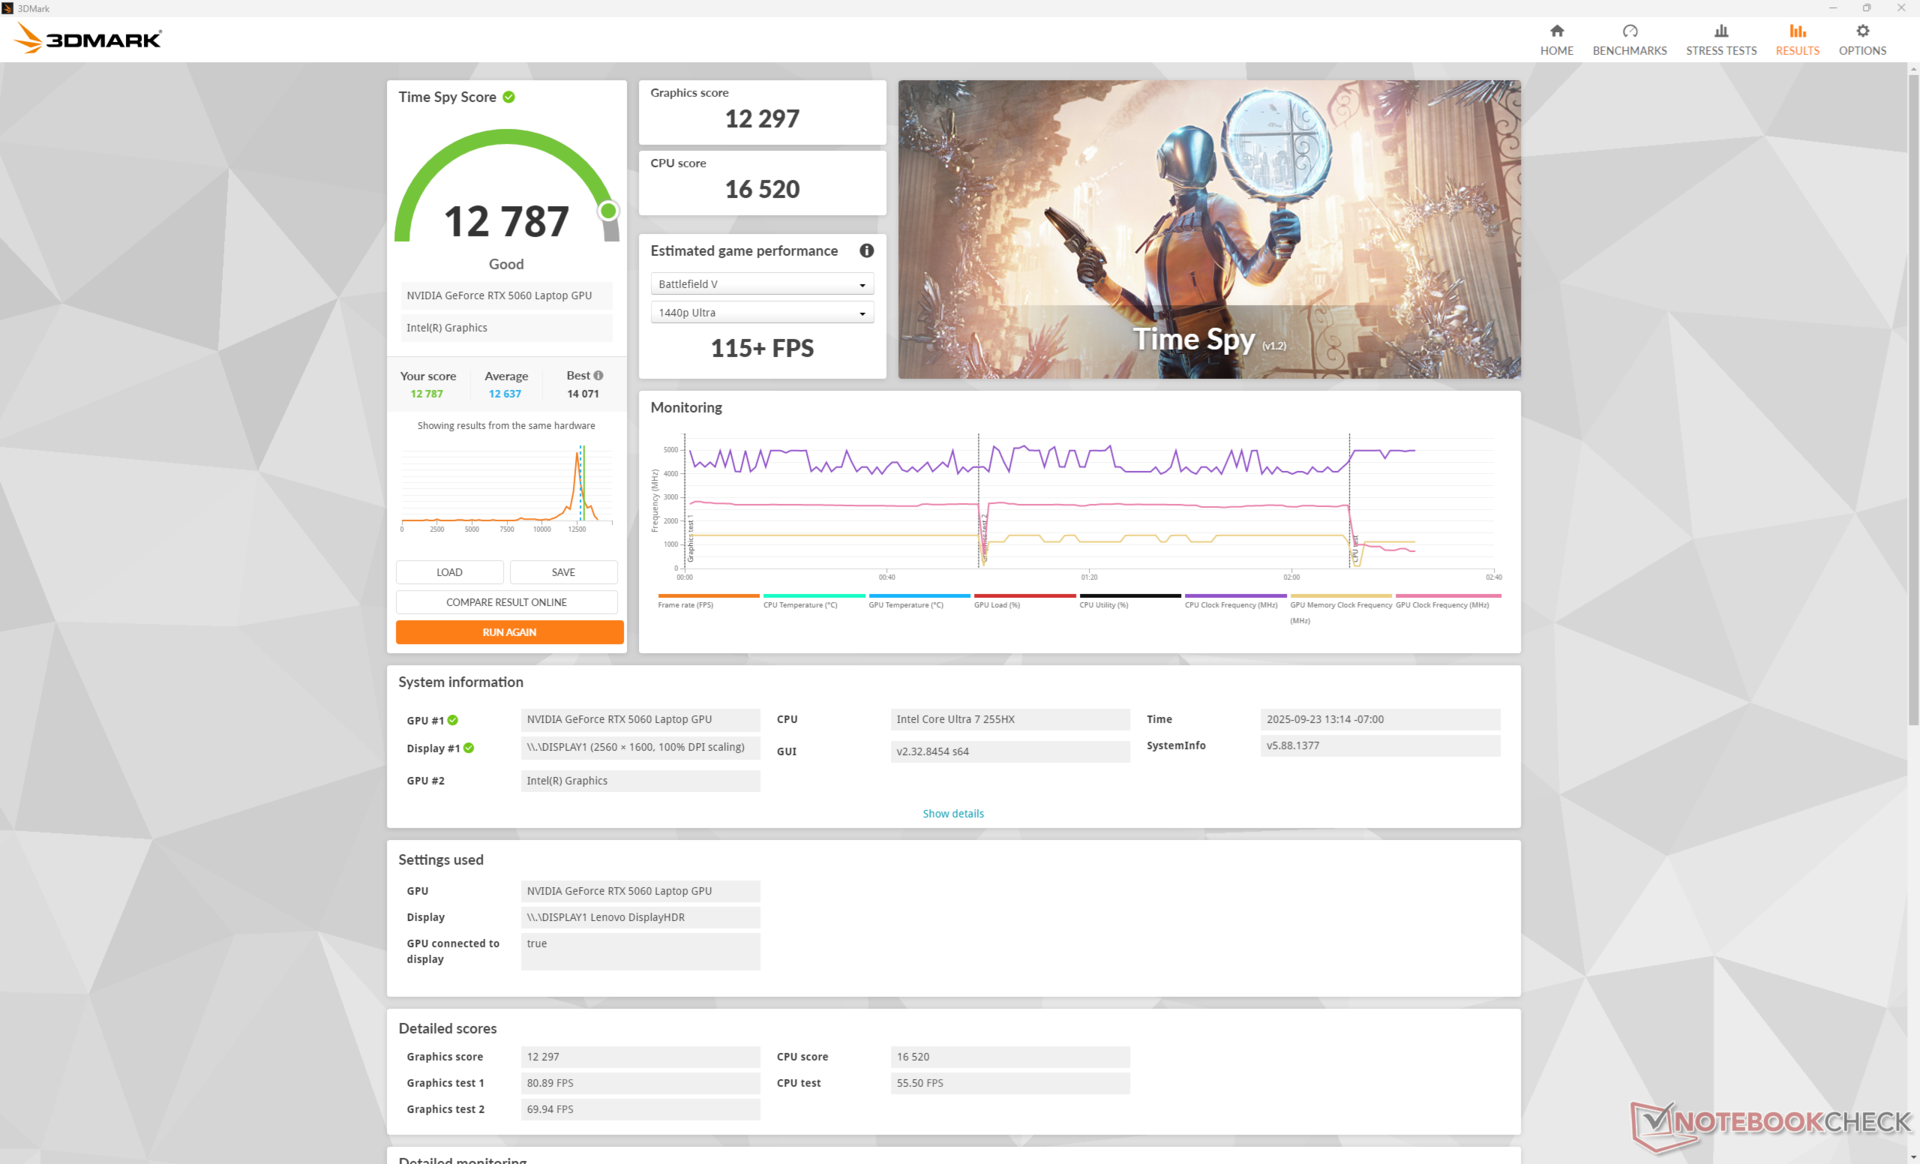
| 3DMark Time Spy Score | 12787 points | |
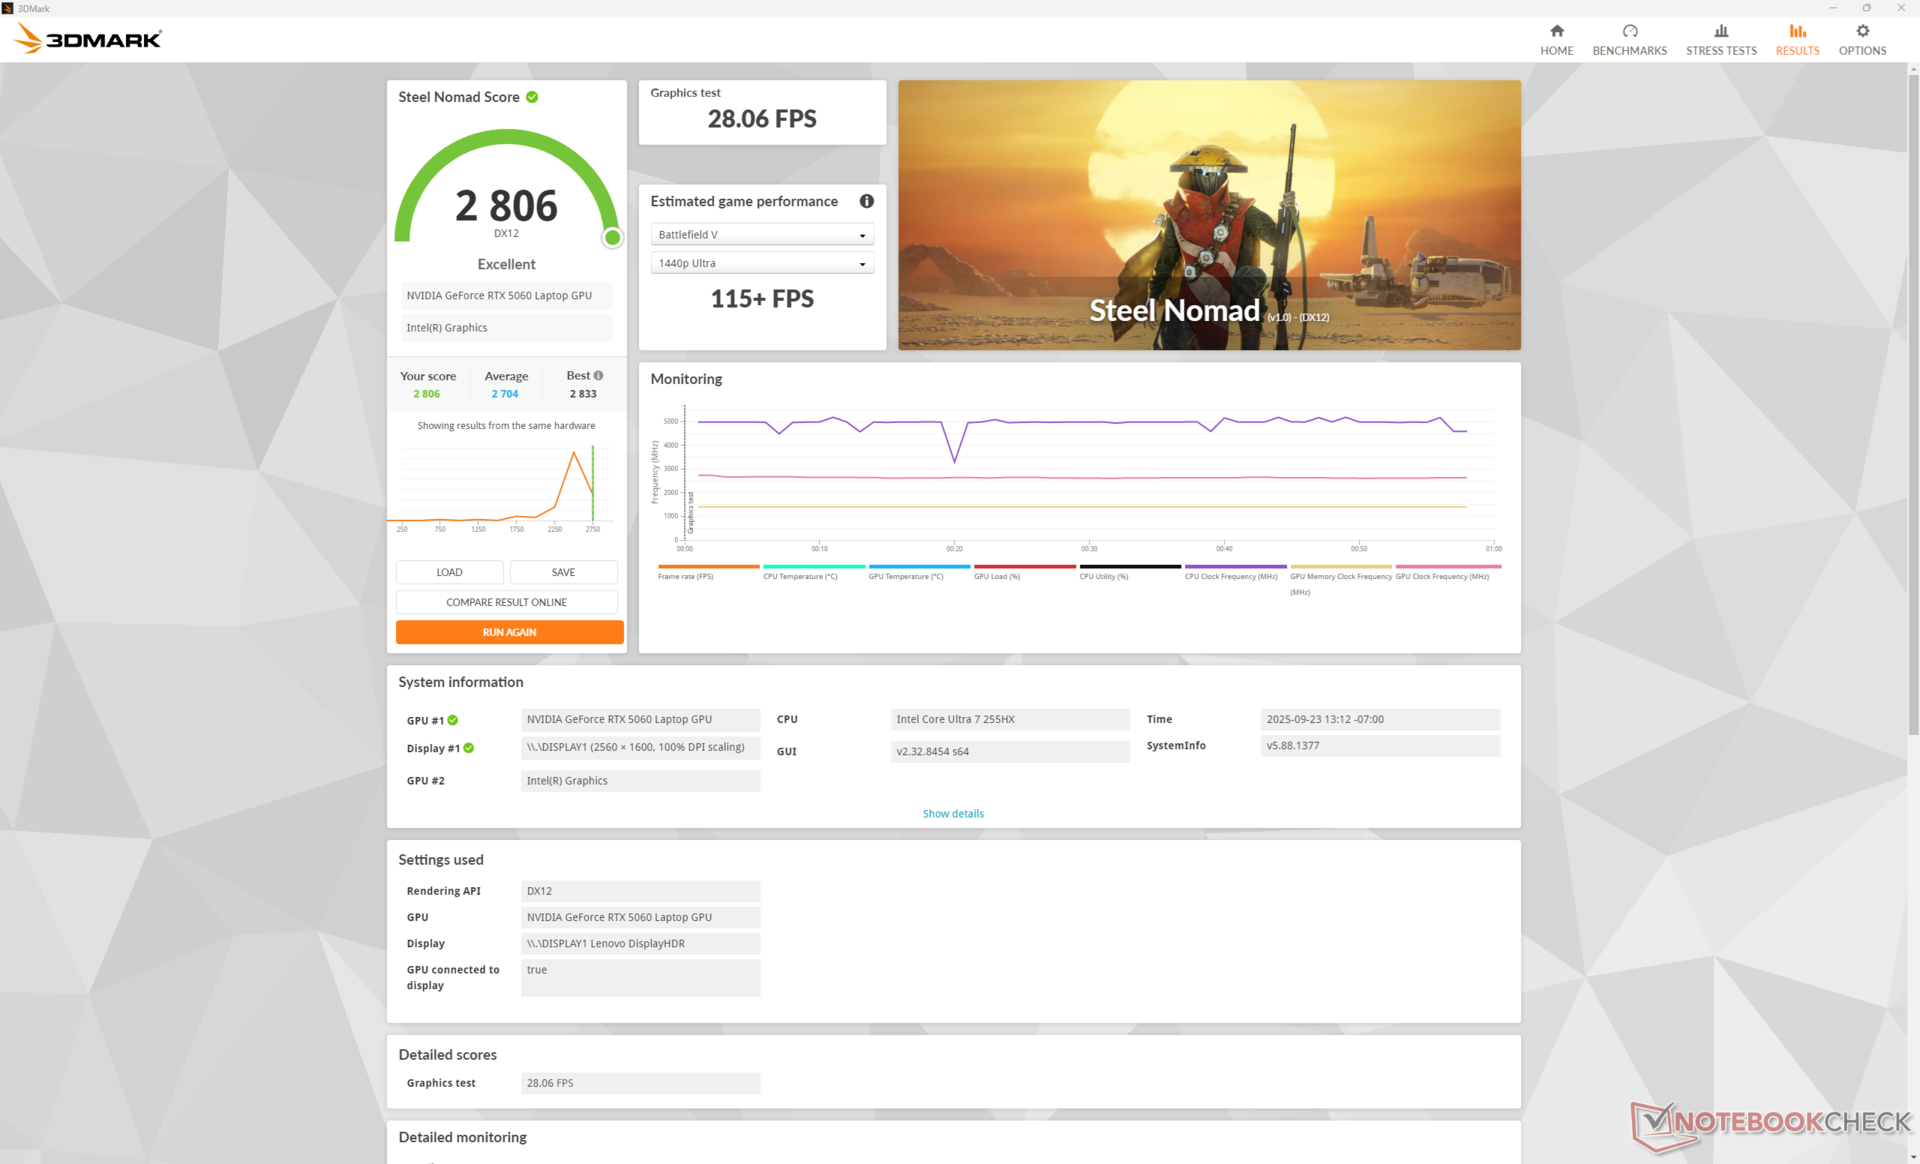
| 3DMark Steel Nomad Score | 2806 points | |
Help | ||
* ... smaller is better
Gaming Performance
Our Lenovo would consistently outperform the Alienware 16 Aurora with the same RTX 5060 GPU running at a lower 80 W TGP target. The advantage can be quite significant at roughly 20 percent on titles like Cyberpunk 2077 or even 30 percent on Assassin's Creed Shadows depending on the settings. Our much faster Arrow Lake-HX CPU plays an important part in improving gaming performance as well.
Nonetheless, the 8 GB of VRAM still limits the system from running most demanding titles at very high settings. Alan Wake 2, for example, averages only 19.3 FPS at 2K resolution and high RT settings. Enabling DLSS Quality mode and 2x Frame Generation would boost the low 19.3 FPS average to a smoother 61 FPS, but the high input latency would remain noticeable even with Reflex active.
| Monster Hunter Wilds | |
| 1920x1080 lowest, no upscaling | |
| Zotac GeForce RTX 5060 AMP | |
| Lenovo Legion 7 16IAX10 | |
| Average NVIDIA GeForce RTX 5060 Laptop (49.4 - 80.1, n=3) | |
| Alienware 16 Aurora | |
| 1920x1080 medium, no upscaling | |
| Alienware 16X Aurora, RTX 5070 | |
| Zotac GeForce RTX 5060 AMP | |
| Lenovo Legion 7 16IAX10 | |
| Average NVIDIA GeForce RTX 5060 Laptop (45.2 - 68.3, n=4) | |
| Alienware 16 Aurora | |
| 1920x1080 ultra, RT: high, no upscaling | |
| Razer Blade 16 RTX 5080 | |
| Zotac GeForce RTX 5060 AMP | |
| Alienware 16X Aurora, RTX 5070 | |
| Alienware 16 Aurora | |
| Average NVIDIA GeForce RTX 5060 Laptop (16.6 - 36.5, n=4) | |
| Lenovo Legion 7 16IAX10 | |
| 2560x1440 ultra, RT: high, no upscaling | |
| Razer Blade 16 RTX 5080 | |
| Alienware 16X Aurora, RTX 5070 | |
| Alienware 16 Aurora | |
| Average NVIDIA GeForce RTX 5060 Laptop (13.9 - 20.9, n=3) | |
| Lenovo Legion 7 16IAX10 | |
| 2560x1440 ultra, RT: high, DLSS3 quality | |
| Razer Blade 16 RTX 5080 | |
| Lenovo Legion 7 16IAX10 | |
| Average NVIDIA GeForce RTX 5060 Laptop (n=1) | |
Cyberpunk 2077 ultra FPS Chart
| low | med. | high | ultra | QHD DLSS | QHD | |
|---|---|---|---|---|---|---|
| GTA V (2015) | 184.7 | 181.9 | 142.9 | 115.2 | ||
| Dota 2 Reborn (2015) | 206 | 182.1 | 176.6 | 163.7 | ||
| Final Fantasy XV Benchmark (2018) | 228 | 177.6 | 133.6 | 95.8 | ||
| X-Plane 11.11 (2018) | 142.5 | 126.8 | 105.6 | |||
| Strange Brigade (2018) | 610 | 343 | 275 | 239 | 165 | |
| Baldur's Gate 3 (2023) | 173.3 | 144.6 | 112.8 | 111.2 | 119.1 | 78.4 |
| Cyberpunk 2077 (2023) | 153.3 | 125.1 | 104.4 | 94.9 | 69.6 | 59.2 |
| Alan Wake 2 (2023) | 79 | 71.6 | 66.6 | 36.7 | ||
| F1 24 (2024) | 273 | 268 | 219 | 71.6 | 71.4 | 45.7 |
| Black Myth: Wukong (2024) | 100 | 73 | 58 | 32 | 36 | 23 |
| Indiana Jones and the Great Circle (2024) | 127.7 | 52.8 | 6.3 | 4.2 | ||
| Monster Hunter Wilds (2025) | 80.1 | 68.3 | 16.6 | 25.1 | 13.9 | |
| Assassin's Creed Shadows (2025) | 66 | 61 | 53 | 40 | 41 | 34 |
| Battlefield 6 (2025) | 70.1 | 47.8 | 36 |
Emissions
System Noise
Fan noise is low and lethargic when on the Quiet power profile. If on Balanced or Performance modes, however, pulsing would occur more frequently up to almost 30 dB(A) against a silent background of 24 dB(A) when simply web browsing or streaming.
Fan noise when gaming on Balanced mode or Performance mode would stabilize at 45.9 dB(A) or 54.6 dB(A), respectively. This delta is massive meaning that users may want to consider gaming on Balanced mode for a quieter experience even though it entails a 10 percent performance deficit. Otherwise, headphones are recommended if gaming on Performance mode. The mid 50 dB(A) range is similar to what we experienced on the Asus TUF Gaming A16 while being much louder than on the thicker MSI Vector 16 HX.
Noise level
| Idle |
| 24 / 26 / 29.4 dB(A) |
| Load |
| 35.4 / 54.7 dB(A) |
 | ||
30 dB silent 40 dB(A) audible 50 dB(A) loud |
||
min: | ||
| Lenovo Legion 7 16IAX10 GeForce RTX 5060 Laptop, Ultra 7 255HX, WD PC SN7100S SDFPMSL-1T00-1101 | Alienware 16 Aurora GeForce RTX 5060 Laptop, Core 7 240H | Asus TUF Gaming A16 FA608UP GeForce RTX 5070 Laptop, R7 260, Western Digital PC SN5000S SDEQNSJ-1T00 | Gigabyte Gaming A16 GA6H GeForce RTX 5070 Laptop, i7-13620H, Kingston OM8PGP41024Q-A0 | MSI Vector 16 HX AI A2XWHG GeForce RTX 5070 Ti Laptop, Ultra 7 255HX, Micron 2400 MTFDKBA512QFM | Lenovo Legion 5 Pro 16IAX10H GeForce RTX 5070 Ti Laptop, Ultra 9 275HX, Western Digital PC SN8000S SDEPNRK-1T00 | Lenovo Legion 5 15AHP G10 GeForce RTX 5060 Laptop, R7 260, SK hynix PVC10 HFS001TEM4X182N | Alienware 16X Aurora, RTX 5070 GeForce RTX 5070 Laptop, Ultra 9 275HX | |
|---|---|---|---|---|---|---|---|---|
| Noise | -1% | -12% | -7% | -16% | -9% | 2% | 6% | |
| off / environment * (dB) | 23.9 | 22.9 4% | 25.1 -5% | 24 -0% | 25 -5% | 24 -0% | 25.5 -7% | 23.7 1% |
| Idle Minimum * (dB) | 24 | 24 -0% | 32.2 -34% | 25 -4% | 33 -38% | 24 -0% | 25.5 -6% | 23.9 -0% |
| Idle Average * (dB) | 26 | 25.6 2% | 32.2 -24% | 26 -0% | 34 -31% | 24 8% | 25.5 2% | 23.9 8% |
| Idle Maximum * (dB) | 29.4 | 25.6 13% | 32.2 -10% | 27 8% | 38 -29% | 30.9 -5% | 26.9 9% | 26.1 11% |
| Load Average * (dB) | 35.4 | 46.8 -32% | 38.1 -8% | 54 -53% | 46 -30% | 55.9 -58% | 34.6 2% | 26.8 24% |
| Cyberpunk 2077 ultra * (dB) | 54.6 | 49.9 9% | 53.9 1% | 54 1% | 47 14% | 56.72 -4% | 50.1 8% | 51.8 5% |
| Load Maximum * (dB) | 54.7 | 55.6 -2% | 57.1 -4% | 55 -1% | 49 10% | 56.72 -4% | 50.1 8% | 58 -6% |
* ... smaller is better
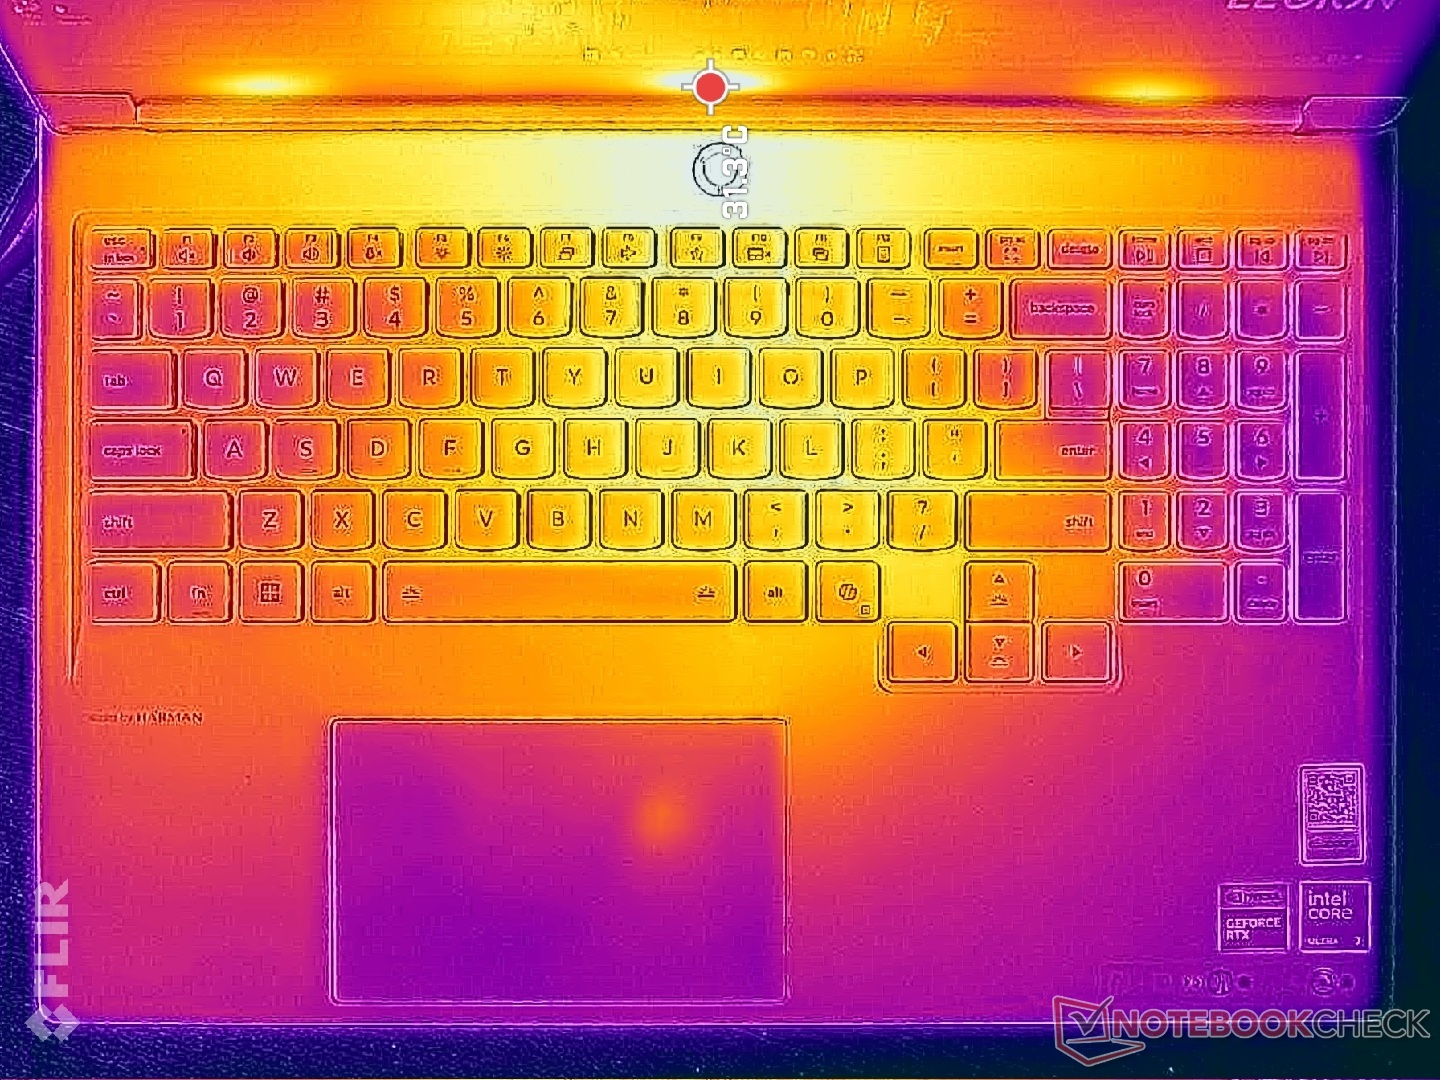
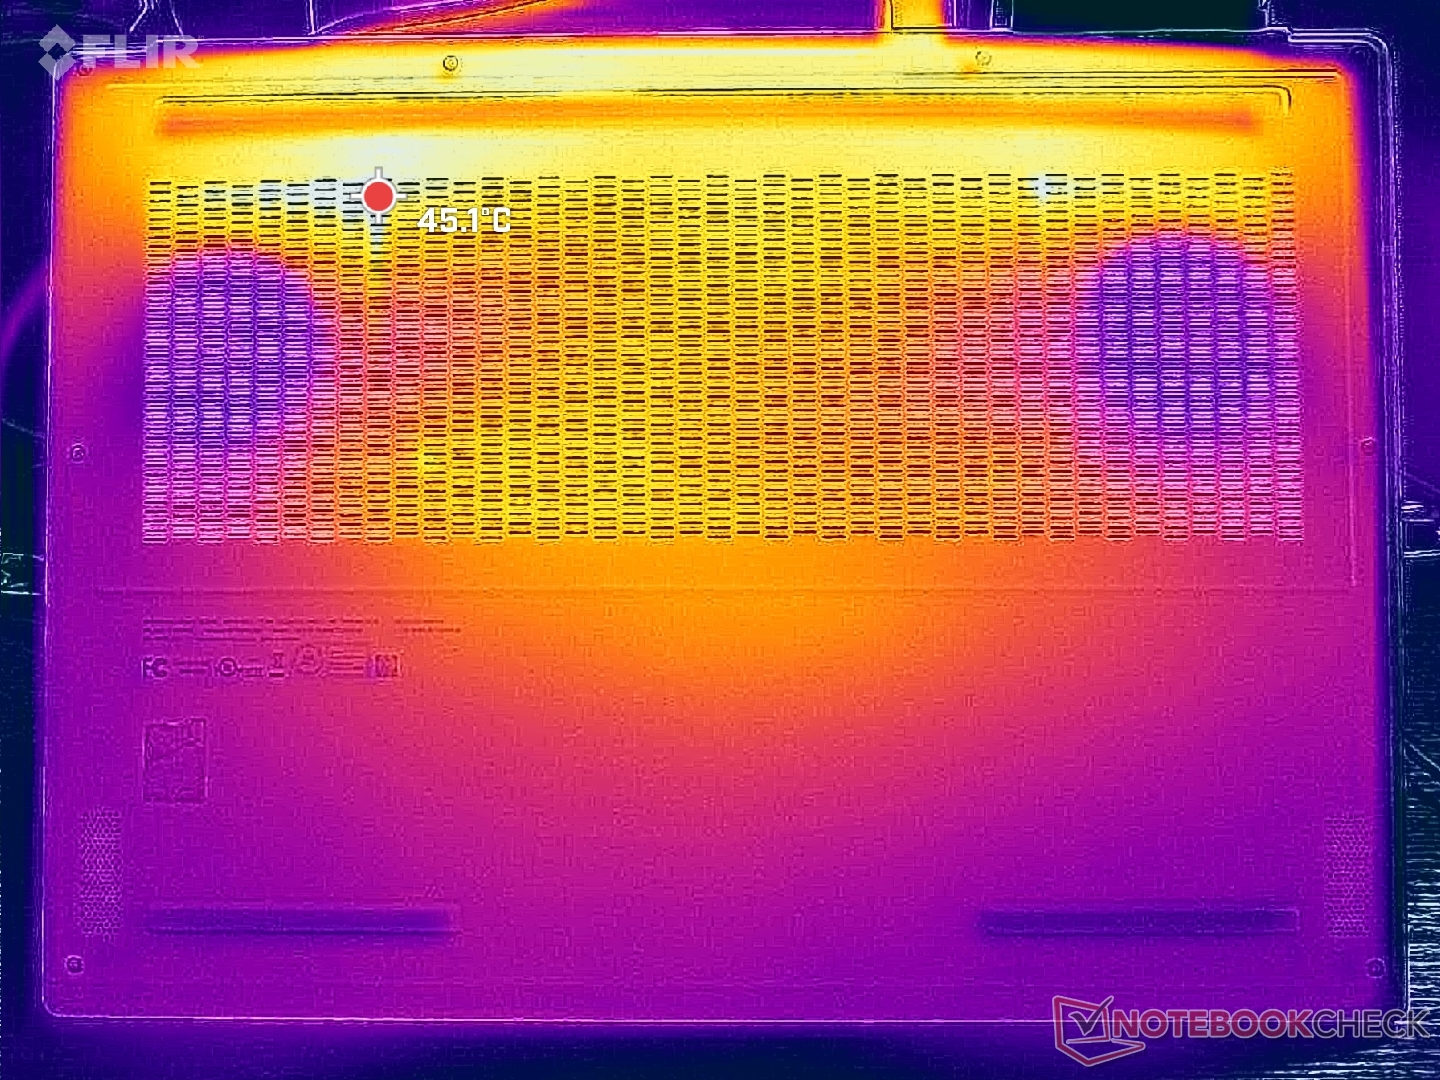
Temperature
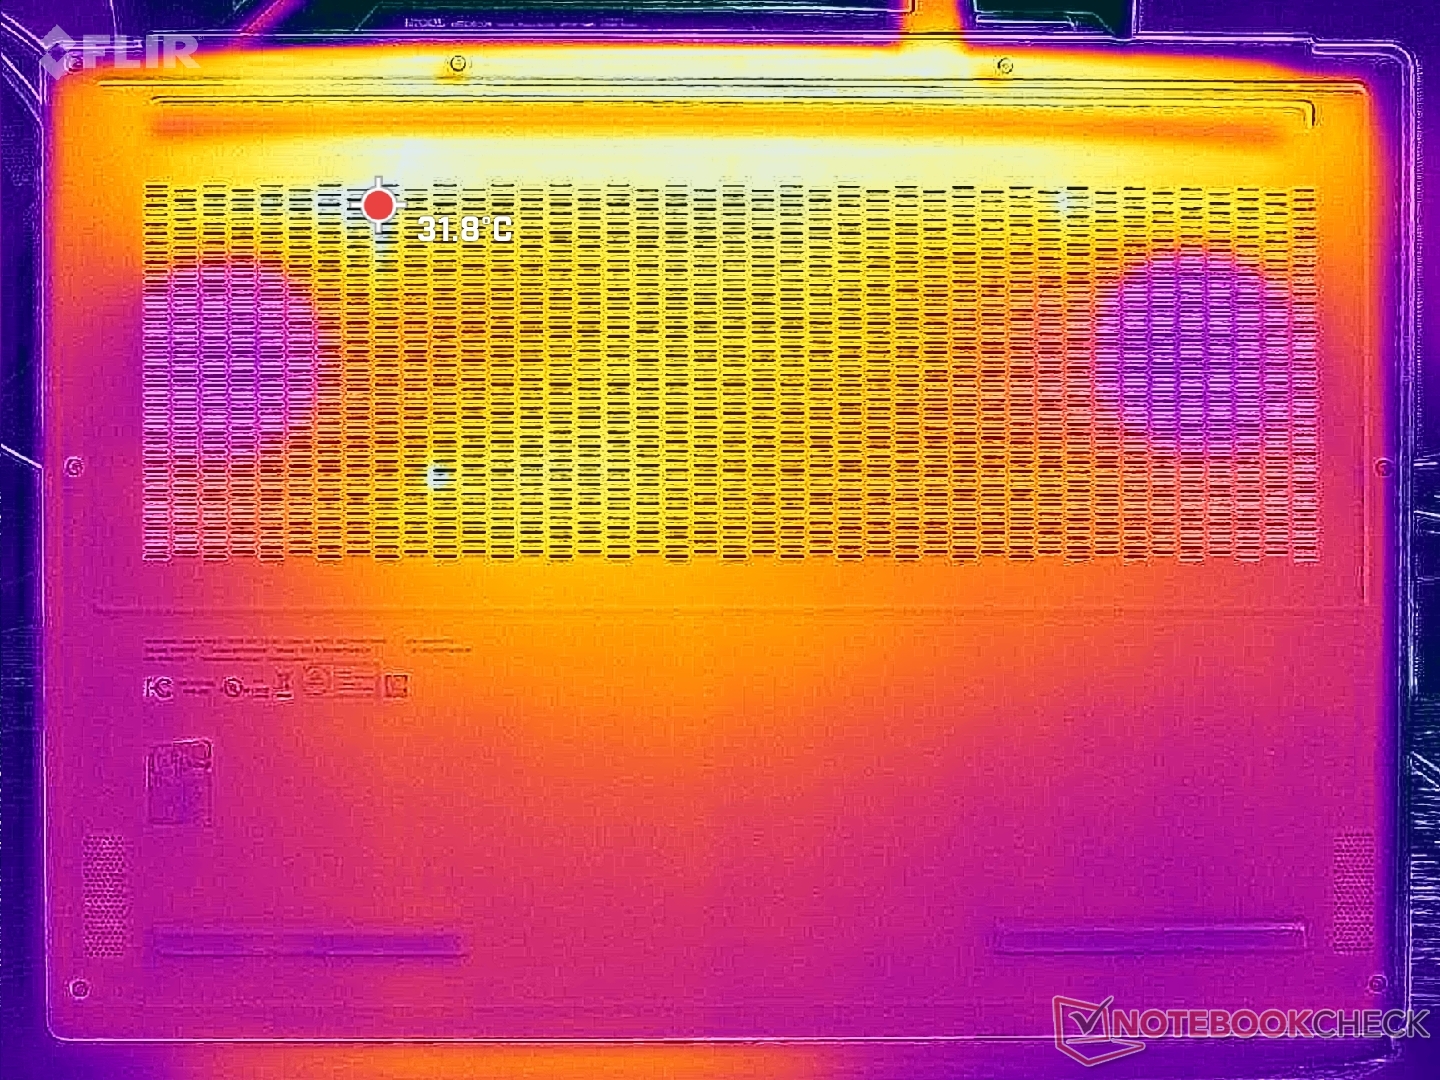
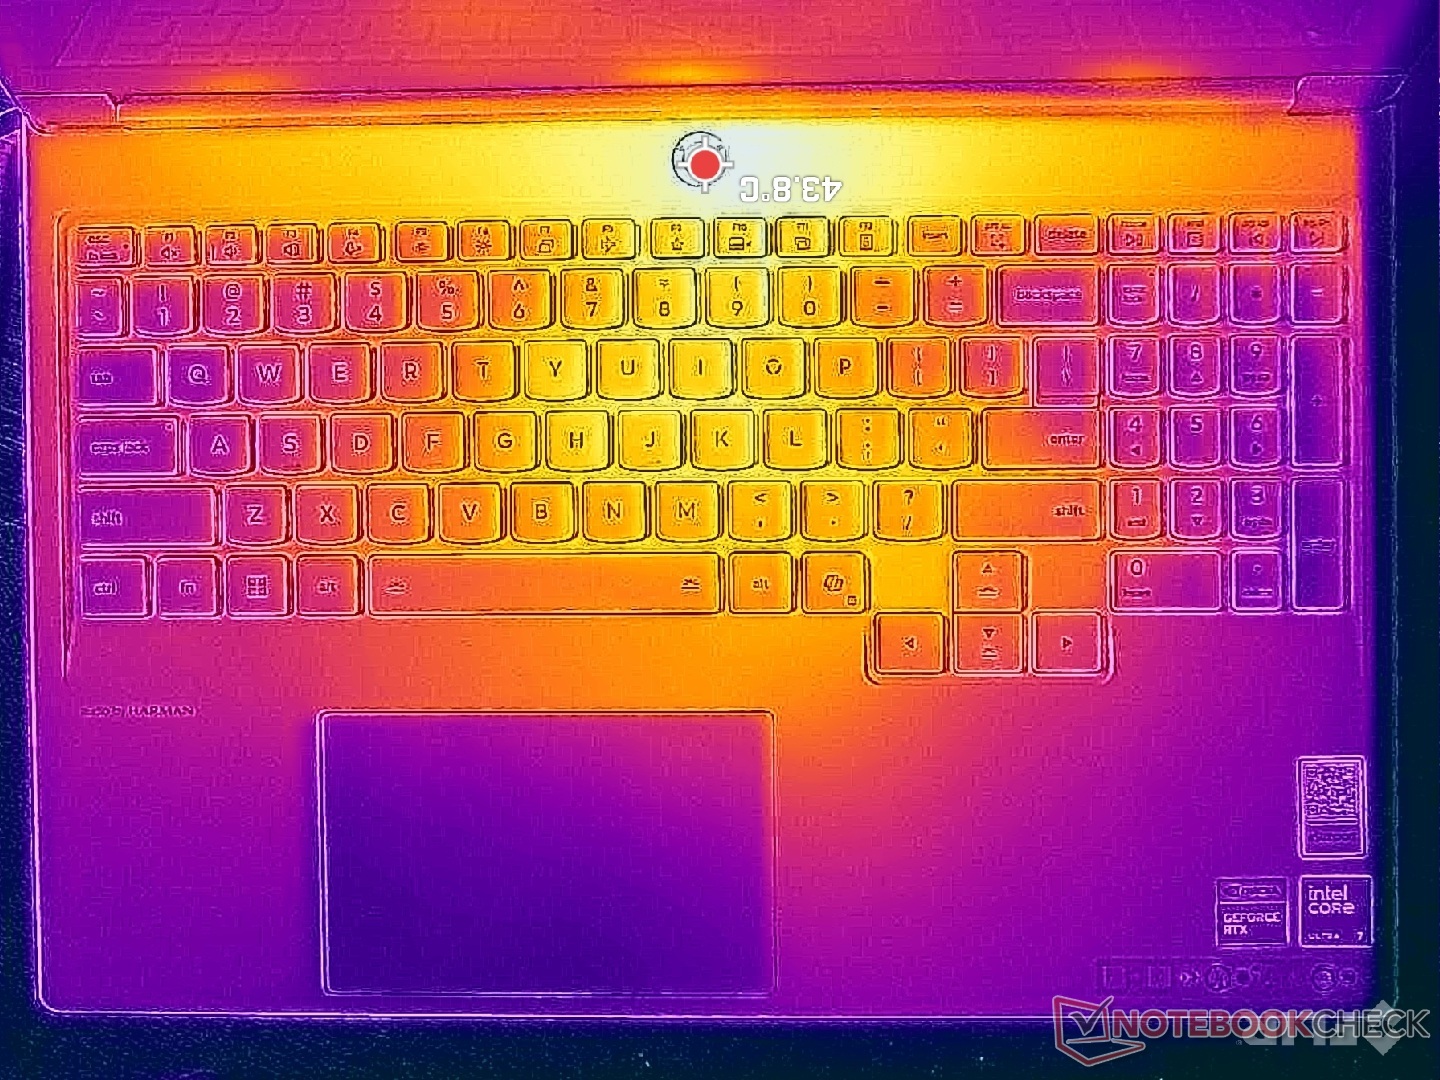
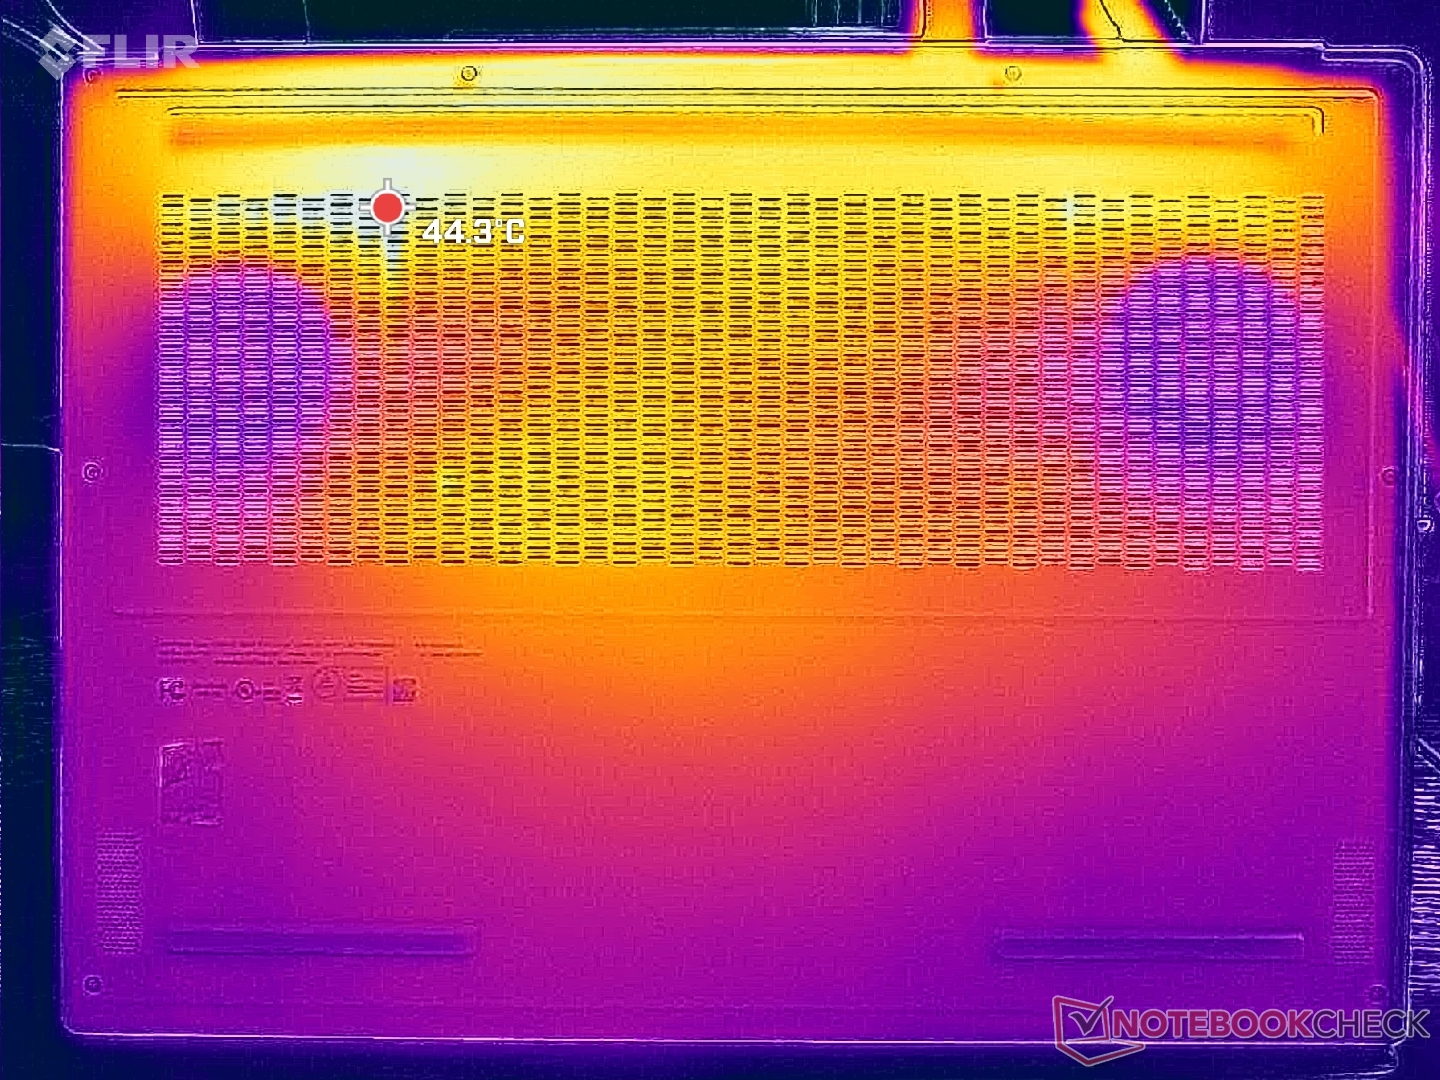
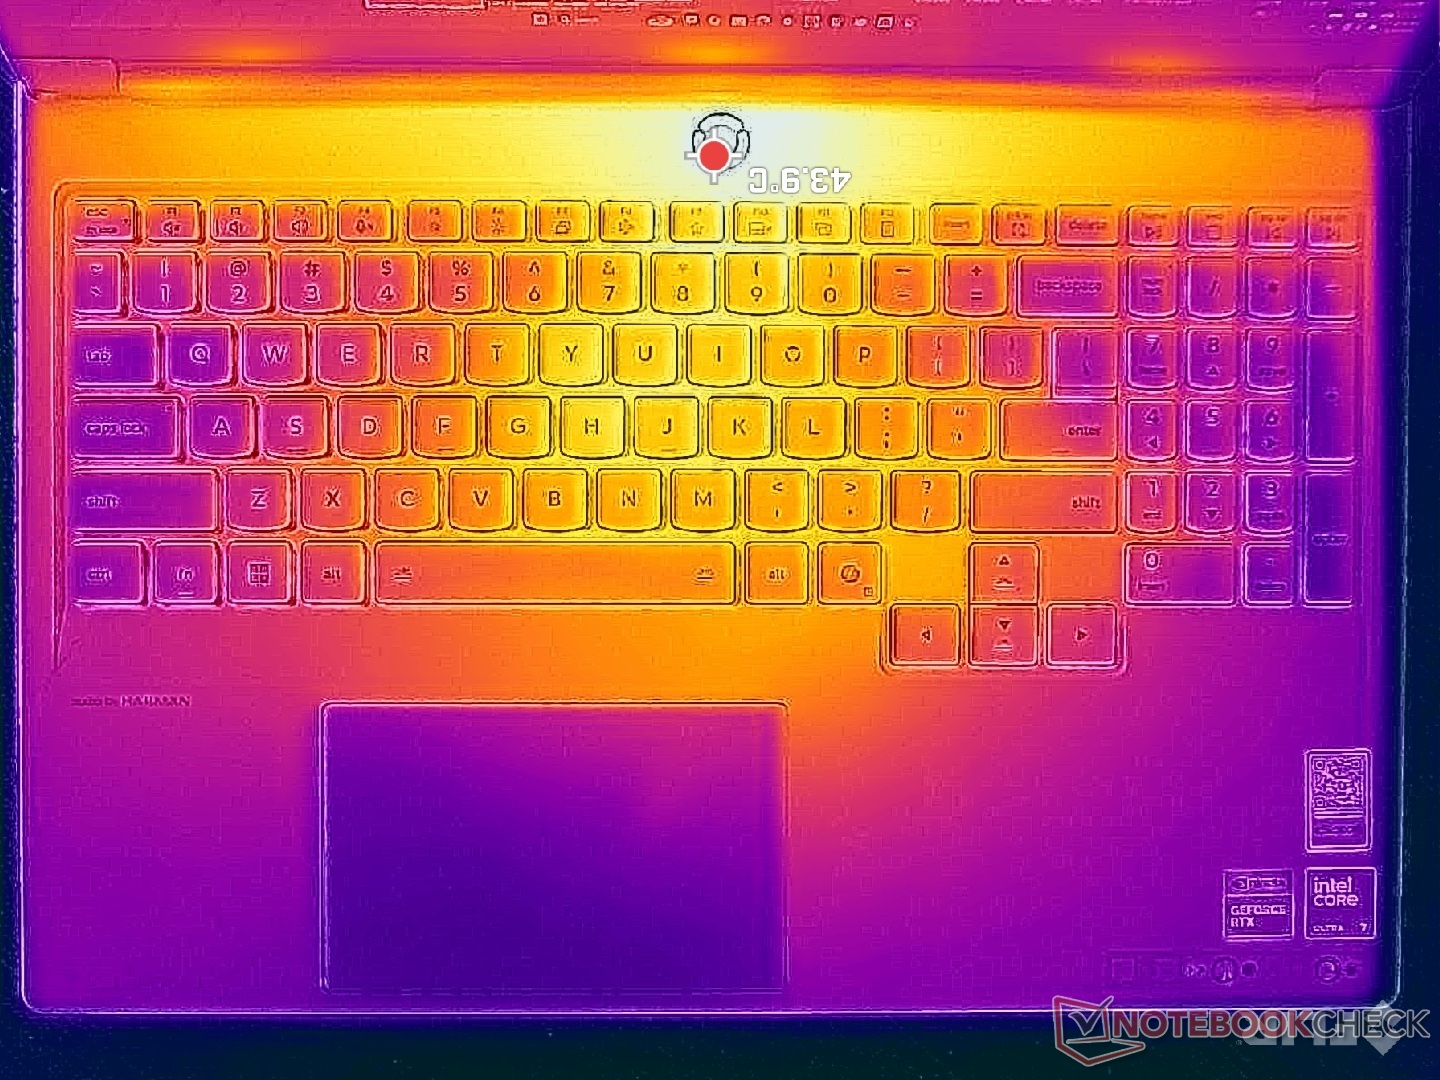
Surface temperatures are warm even when simply idling on desktop. Hot spots when gaming can reach over 47 C and 41 C on the top and bottom sides of the base, respectively, but these areas are thankfully toward the Power button where fingers are less likely to touch. Average temperatures are nonetheless warmer than what we experienced on the Asus TUF Gaming A16.
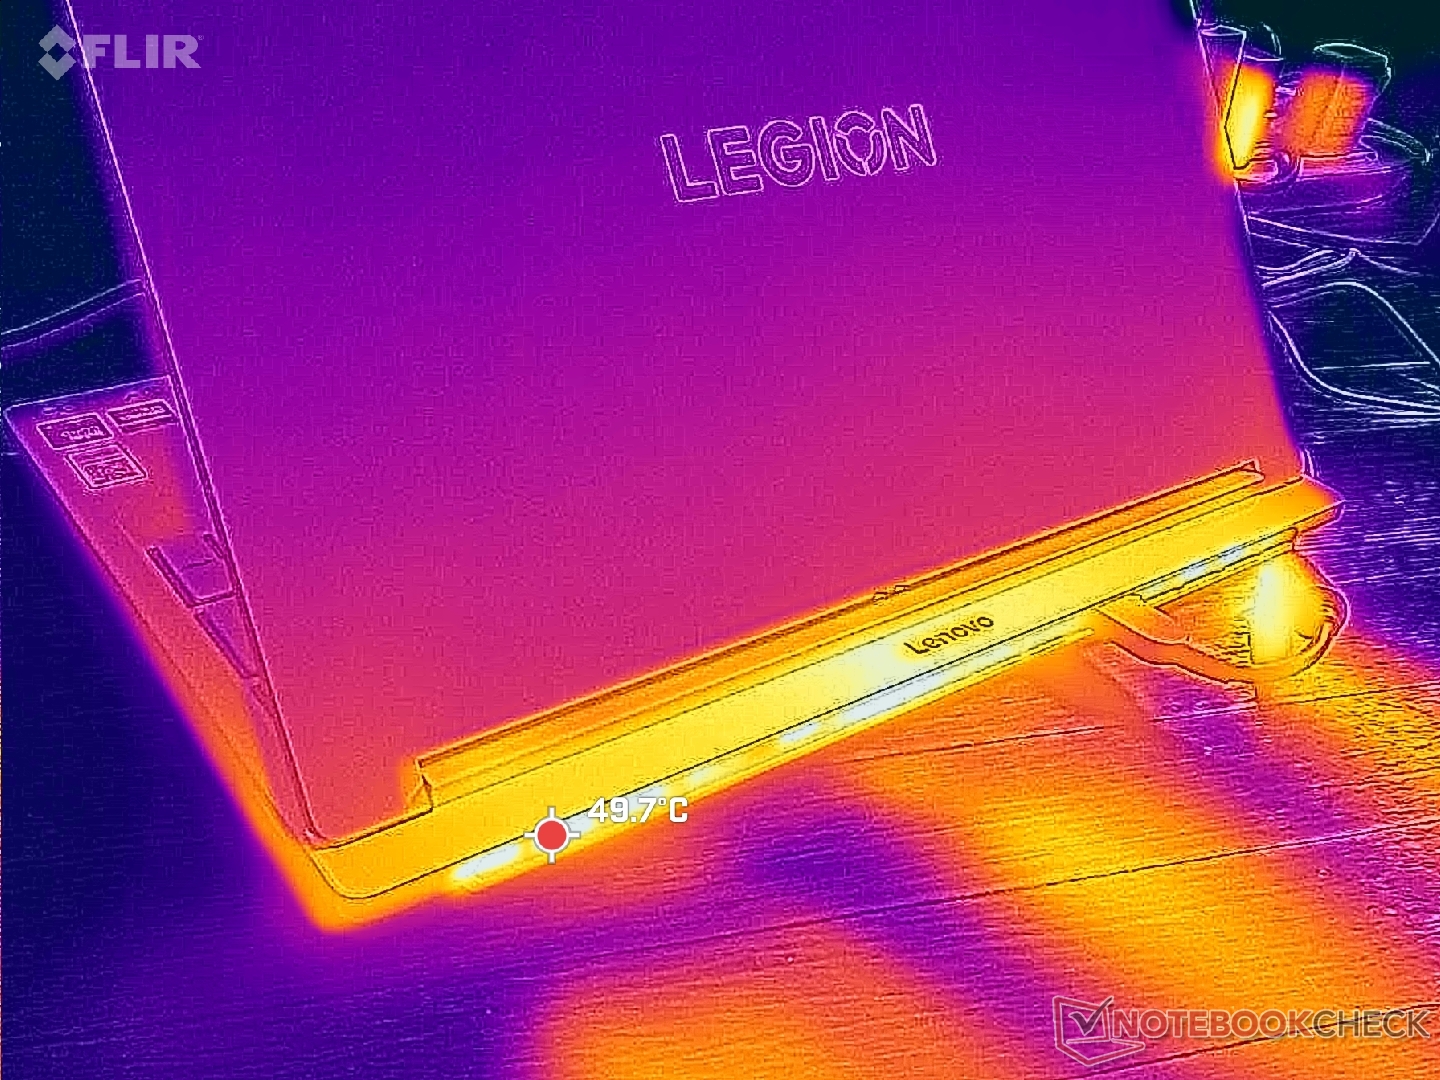
(-) The maximum temperature on the upper side is 47 °C / 117 F, compared to the average of 40.4 °C / 105 F, ranging from 21.2 to 68.8 °C for the class Gaming.
(±) The bottom heats up to a maximum of 44 °C / 111 F, compared to the average of 43.2 °C / 110 F
(+) In idle usage, the average temperature for the upper side is 30.5 °C / 87 F, compared to the device average of 33.9 °C / 93 F.
(±) 3: The average temperature for the upper side is 36.3 °C / 97 F, compared to the average of 33.9 °C / 93 F for the class Gaming.
(+) The palmrests and touchpad are cooler than skin temperature with a maximum of 31.4 °C / 88.5 F and are therefore cool to the touch.
(-) The average temperature of the palmrest area of similar devices was 28.8 °C / 83.8 F (-2.6 °C / -4.7 F).
| Lenovo Legion 7 16IAX10 Intel Core Ultra 7 255HX, NVIDIA GeForce RTX 5060 Laptop | Alienware 16X Aurora, RTX 5070 Intel Core Ultra 9 275HX, NVIDIA GeForce RTX 5070 Laptop | Asus TUF Gaming A16 FA608UP AMD Ryzen 7 260, NVIDIA GeForce RTX 5070 Laptop | Gigabyte Gaming A16 GA6H Intel Core i7-13620H, NVIDIA GeForce RTX 5070 Laptop | MSI Vector 16 HX AI A2XWHG Intel Core Ultra 7 255HX, NVIDIA GeForce RTX 5070 Ti Laptop | Lenovo Legion 5 Pro 16IAX10H Intel Core Ultra 9 275HX, NVIDIA GeForce RTX 5070 Ti Laptop | |
|---|---|---|---|---|---|---|
| Heat | 6% | 17% | -3% | -2% | -11% | |
| Maximum Upper Side * (°C) | 47 | 51 -9% | 39.5 16% | 50 -6% | 53 -13% | 48 -2% |
| Maximum Bottom * (°C) | 44 | 45.6 -4% | 45.1 -3% | 49 -11% | 52 -18% | 50 -14% |
| Idle Upper Side * (°C) | 35.6 | 29.8 16% | 25.7 28% | 35 2% | 33 7% | 38 -7% |
| Idle Bottom * (°C) | 35.2 | 27.4 22% | 25.5 28% | 34 3% | 29 18% | 42 -19% |
* ... smaller is better
Speakers
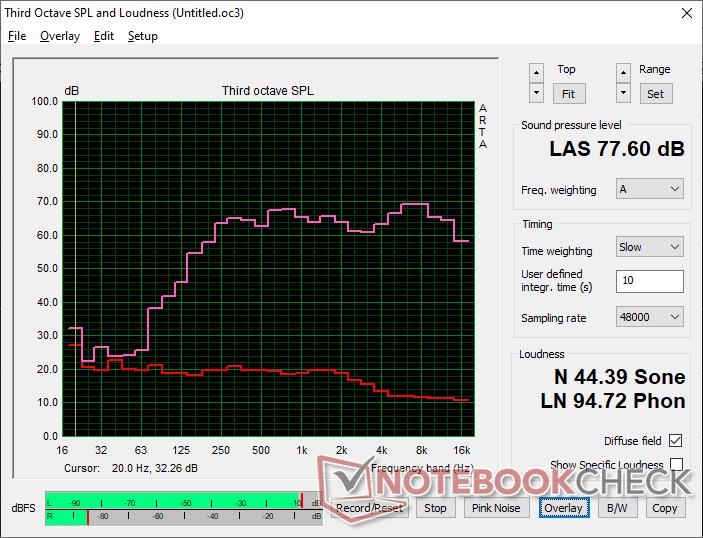
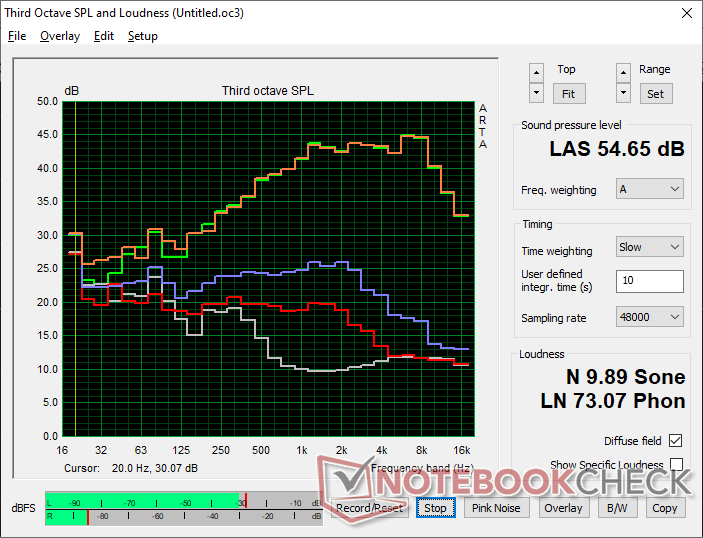
Lenovo Legion 7 16IAX10 audio analysis
(±) | speaker loudness is average but good (77.6 dB)
Bass 100 - 315 Hz
(±) | reduced bass - on average 9.5% lower than median
(±) | linearity of bass is average (9.8% delta to prev. frequency)
Mids 400 - 2000 Hz
(+) | balanced mids - only 1.5% away from median
(+) | mids are linear (4% delta to prev. frequency)
Highs 2 - 16 kHz
(+) | balanced highs - only 3% away from median
(+) | highs are linear (4.9% delta to prev. frequency)
Overall 100 - 16.000 Hz
(+) | overall sound is linear (11.5% difference to median)
Compared to same class
» 10% of all tested devices in this class were better, 3% similar, 87% worse
» The best had a delta of 6%, average was 18%, worst was 132%
Compared to all devices tested
» 8% of all tested devices were better, 2% similar, 90% worse
» The best had a delta of 4%, average was 24%, worst was 134%
Apple MacBook Pro 16 2021 M1 Pro audio analysis
(+) | speakers can play relatively loud (84.7 dB)
Bass 100 - 315 Hz
(+) | good bass - only 3.8% away from median
(+) | bass is linear (5.2% delta to prev. frequency)
Mids 400 - 2000 Hz
(+) | balanced mids - only 1.3% away from median
(+) | mids are linear (2.1% delta to prev. frequency)
Highs 2 - 16 kHz
(+) | balanced highs - only 1.9% away from median
(+) | highs are linear (2.7% delta to prev. frequency)
Overall 100 - 16.000 Hz
(+) | overall sound is linear (4.6% difference to median)
Compared to same class
» 0% of all tested devices in this class were better, 0% similar, 100% worse
» The best had a delta of 5%, average was 17%, worst was 45%
Compared to all devices tested
» 0% of all tested devices were better, 0% similar, 100% worse
» The best had a delta of 4%, average was 24%, worst was 134%
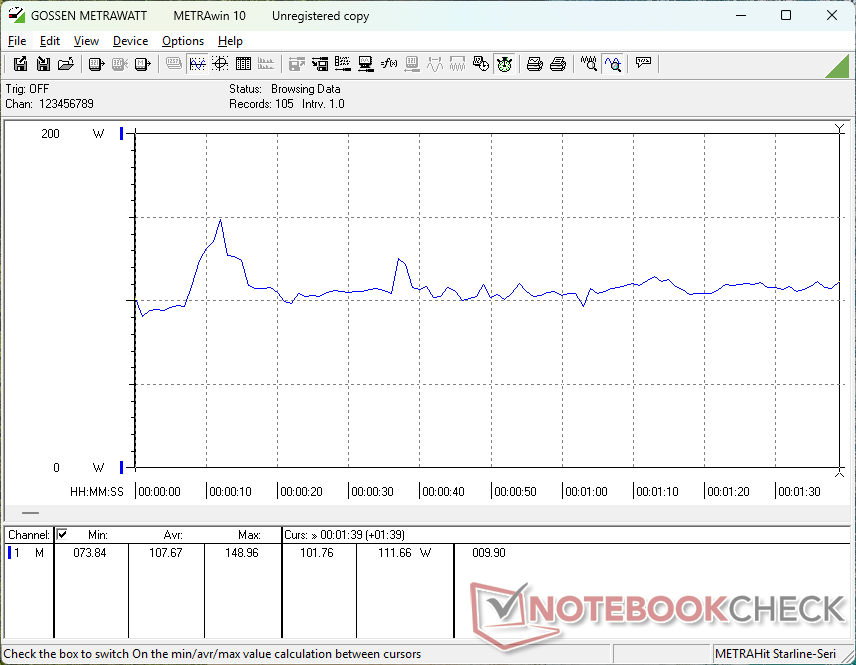
Energy Management
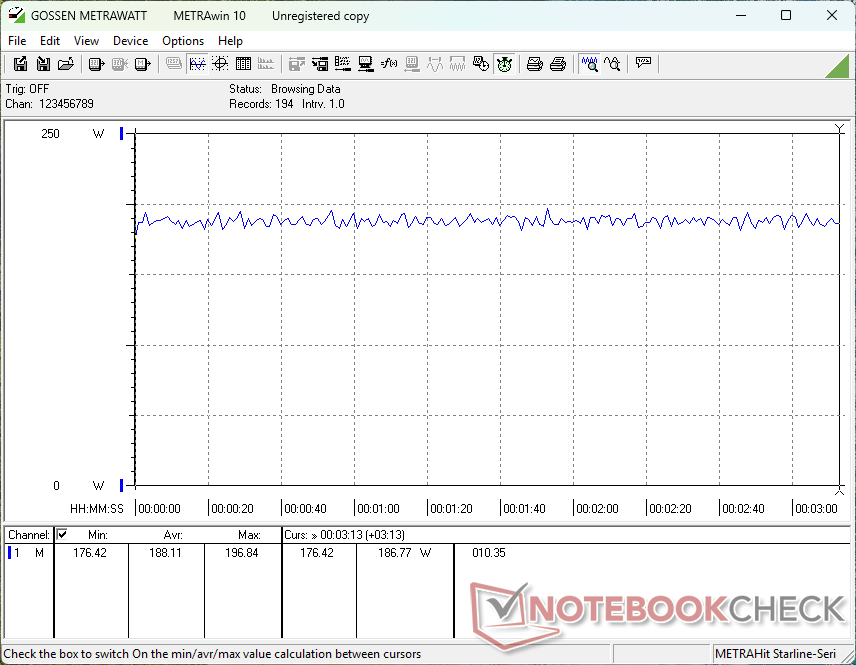
Power Consumption
Overall consumption is quite demanding for an RTX 5060 laptop as most other laptops with the same GPU don't typically ship with Core-HX series CPUs. The Alienware 16 Aurora, for example, demands just 123 W when running Cyberpunk 2077 compared to our 188 W. Even the AMD-powered Razer Blade 16 with its much more capable RTX 5080 GPU would demand just 4 percent more power for a massive 60 to 90 percent gaming performance boost over our Legion 7 16.
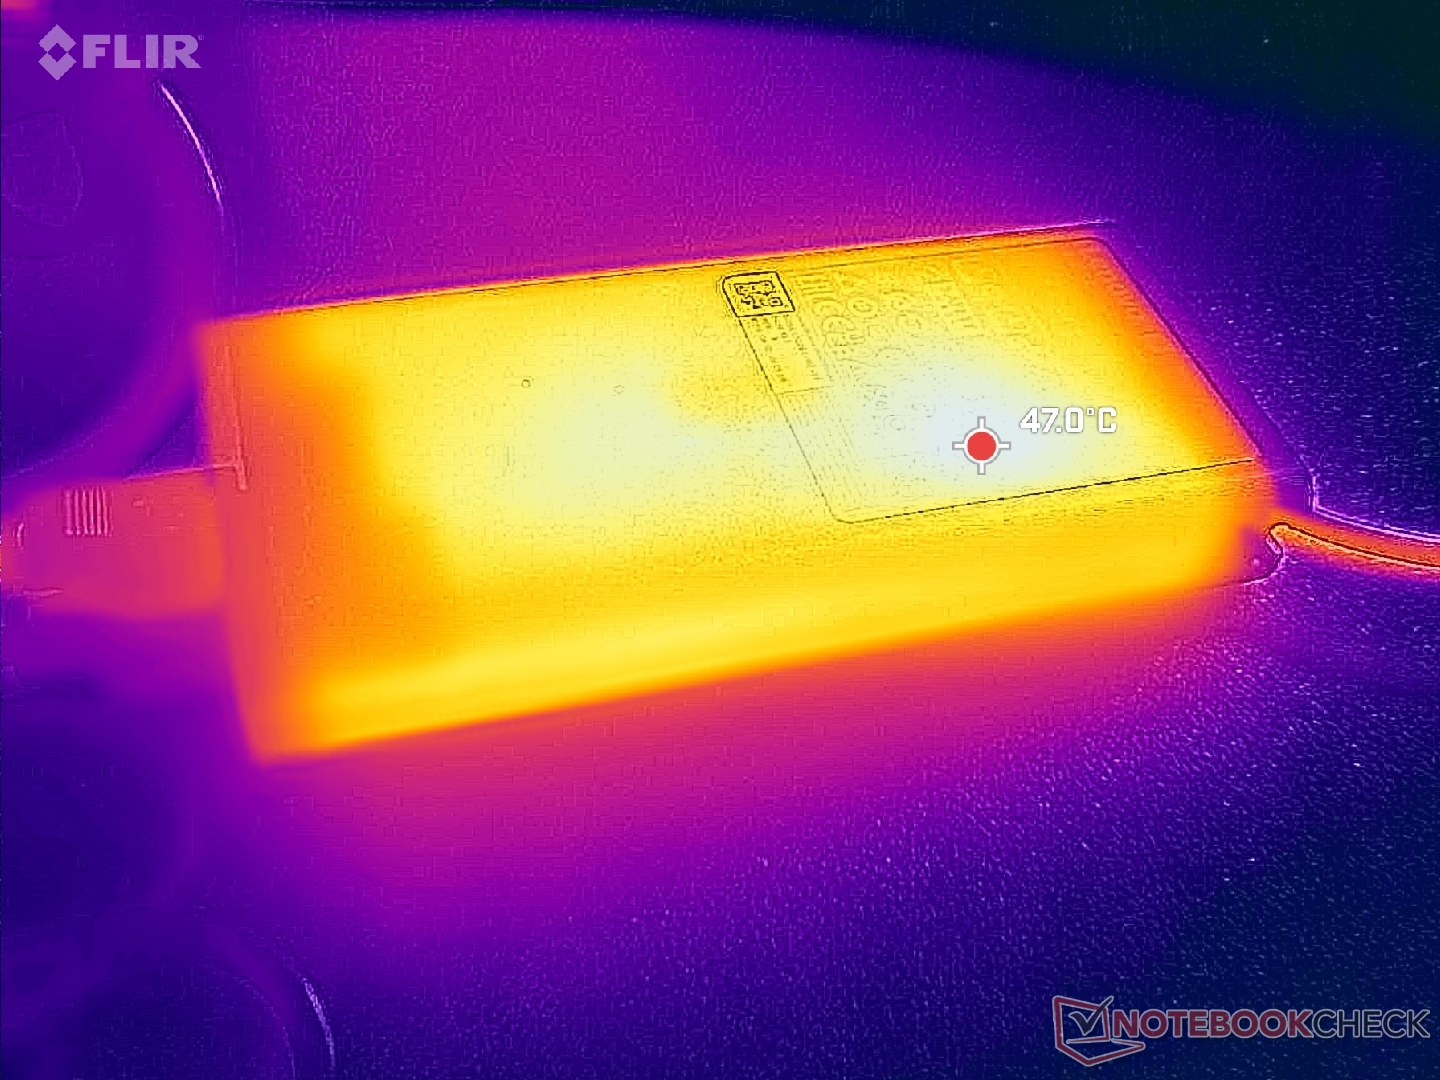
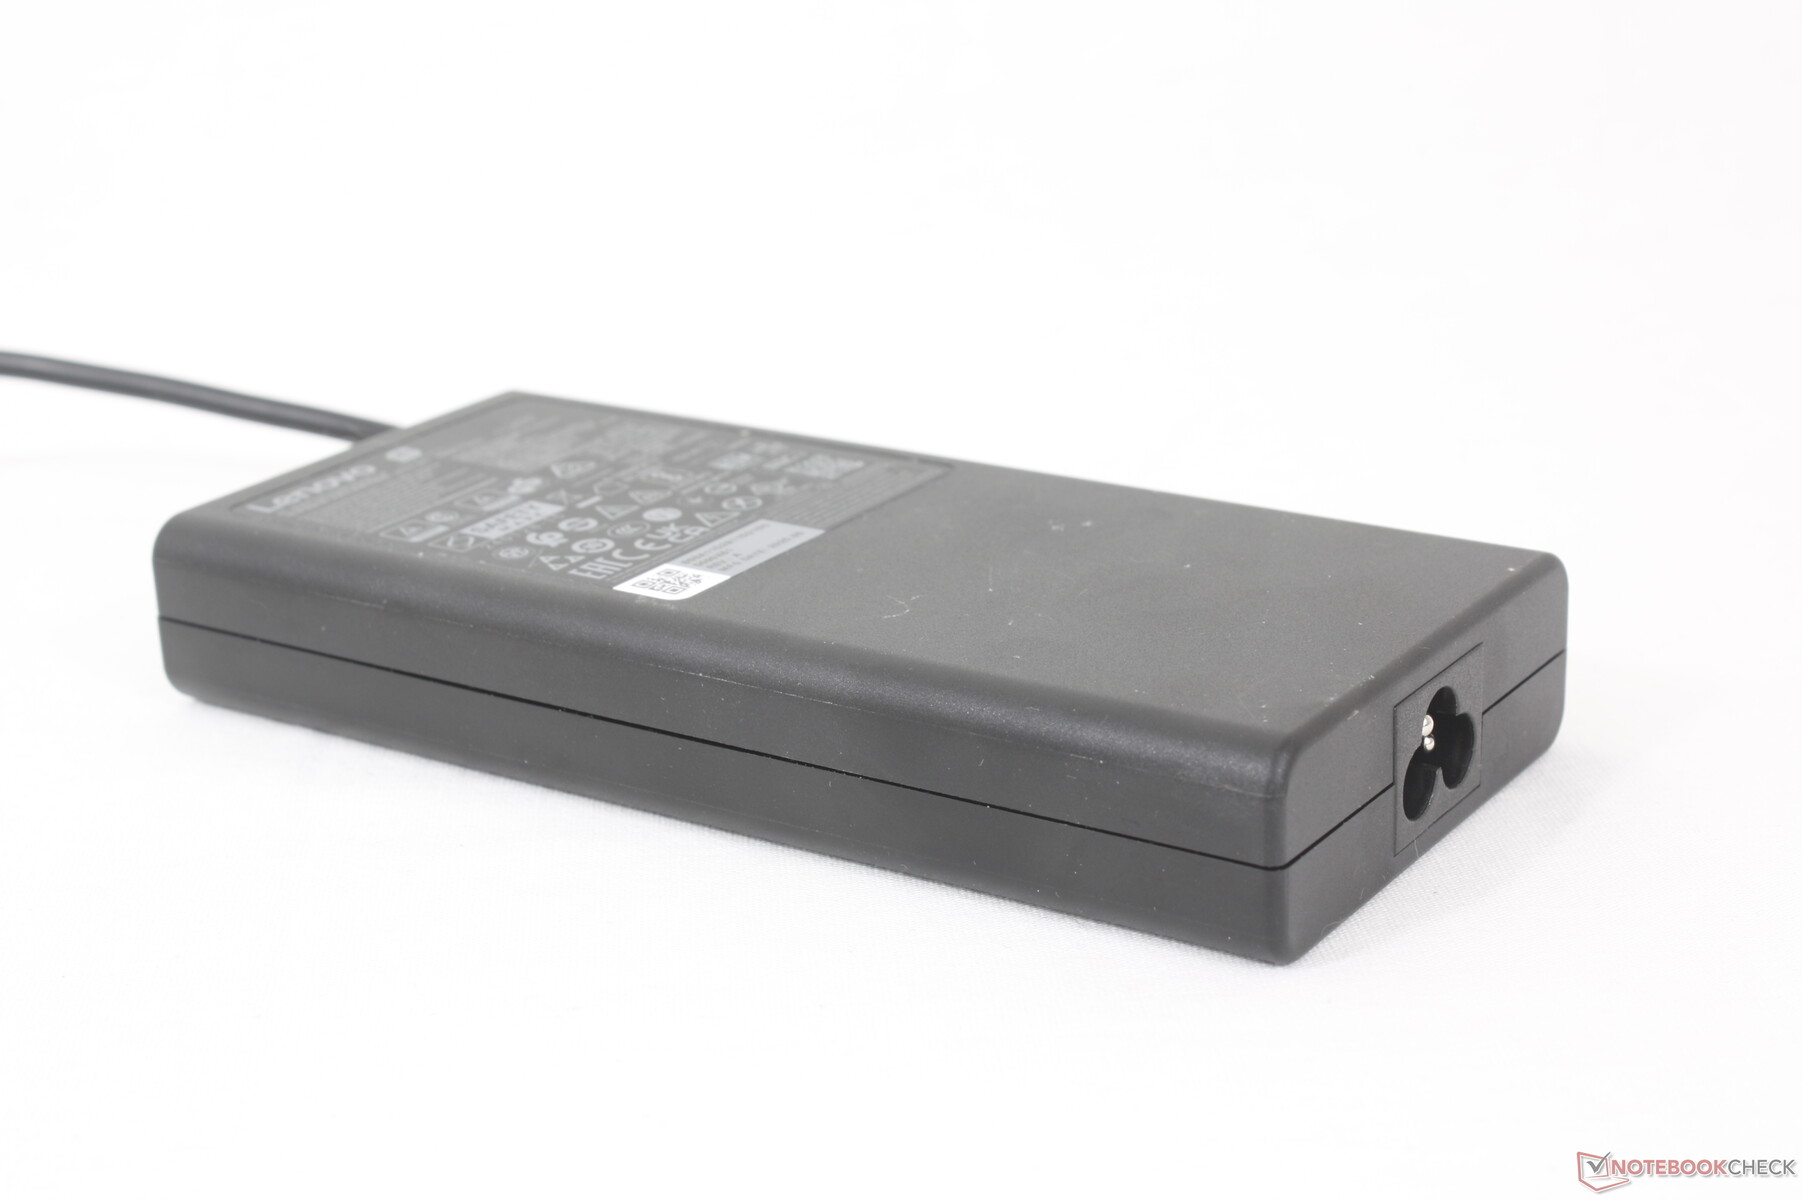
The system ships with a relatively compact 245 W AC adapter just ~16.5 x 7.5 x 2.5 cm in size. Maximum consumption is notably higher than on the Alienware 16 Aurora, Asus TUF Gaming A16, or Gigabyte Gaming A16 even though the Asus also ships with a similar 240 W adapter.
| Off / Standby | |
| Idle | |
| Load |
|
Key:
min: | |
| Lenovo Legion 7 16IAX10 Ultra 7 255HX, GeForce RTX 5060 Laptop, WD PC SN7100S SDFPMSL-1T00-1101, OLED, 2560x1600, 16" | Alienware 16 Aurora Core 7 240H, GeForce RTX 5060 Laptop, , IPS, 2560x1600, 16" | Asus TUF Gaming A16 FA608UP R7 260, GeForce RTX 5070 Laptop, Western Digital PC SN5000S SDEQNSJ-1T00, IPS, 2560x1600, 16" | Gigabyte Gaming A16 GA6H i7-13620H, GeForce RTX 5070 Laptop, Kingston OM8PGP41024Q-A0, IPS, 2560x1600, 16" | MSI Vector 16 HX AI A2XWHG Ultra 7 255HX, GeForce RTX 5070 Ti Laptop, Micron 2400 MTFDKBA512QFM, IPS, 2560x1600, 16" | Lenovo Legion 5 Pro 16IAX10H Ultra 9 275HX, GeForce RTX 5070 Ti Laptop, Western Digital PC SN8000S SDEPNRK-1T00, OLED, 2560x1600, 16" | |
|---|---|---|---|---|---|---|
| Power Consumption | 21% | 22% | 22% | -13% | -28% | |
| Idle Minimum * (Watt) | 9.4 | 4.4 53% | 4.6 51% | 9 4% | 7.1 24% | 14 -49% |
| Idle Average * (Watt) | 10.6 | 18 -70% | 9.8 8% | 11 -4% | 15.9 -50% | 14.3 -35% |
| Idle Maximum * (Watt) | 36.4 | 18.2 50% | 10.2 72% | 23 37% | 29.5 19% | 20.1 45% |
| Load Average * (Watt) | 107.7 | 87.1 19% | 76.1 29% | 91 16% | 124 -15% | 177 -64% |
| Cyberpunk 2077 ultra external monitor * (Watt) | 187.5 | 120.6 36% | 198.1 -6% | 130 31% | 217 -16% | 255 -36% |
| Cyberpunk 2077 ultra * (Watt) | 188 | 123 35% | 198.9 -6% | 132.5 30% | 222 -18% | 255 -36% |
| Load Maximum * (Watt) | 247 | 183 26% | 235.2 5% | 155 37% | 336 -36% | 294 -19% |
* ... smaller is better
Power Consumption Cyberpunk / Stress Test
Power Consumption external Monitor
Battery Life
The combination of an HX-series CPU, OLED display, and a slightly smaller battery for the category has contributed to shorter runtimes. WLAN browsing on Balanced and iGPU mode lasts just a little over 4.5 hours compared to 7+ hours on alternatives like the Alienware 16 Aurora or Gigabyte Gaming A16.
Charging from empty to full capacity is otherwise fast at under 90 minutes.
| Lenovo Legion 7 16IAX10 Ultra 7 255HX, GeForce RTX 5060 Laptop, 84 Wh | Alienware 16 Aurora Core 7 240H, GeForce RTX 5060 Laptop, 96 Wh | Asus TUF Gaming A16 FA608UP R7 260, GeForce RTX 5070 Laptop, 90 Wh | Gigabyte Gaming A16 GA6H i7-13620H, GeForce RTX 5070 Laptop, 76 Wh | MSI Vector 16 HX AI A2XWHG Ultra 7 255HX, GeForce RTX 5070 Ti Laptop, 90 Wh | Lenovo Legion 5 Pro 16IAX10H Ultra 9 275HX, GeForce RTX 5070 Ti Laptop, 80 Wh | |
|---|---|---|---|---|---|---|
| Battery runtime | 60% | 177% | 64% | 49% | 4% | |
| WiFi v1.3 (h) | 4.7 | 7.5 60% | 13 177% | 7.7 64% | 7 49% | 4.9 4% |
| H.264 (h) | 4.8 | |||||
| Load (h) | 1.7 |
Notebookcheck Rating
Ultralight 16-inch gaming laptop that pairs a fast Arrow Lake-HX series CPU with a midrange GeForce RTX 5060 or 5070 GPU.
Lenovo Legion 7 16IAX10
- 10/03/2025 v8
Allen Ngo
 Total Sustainability Score:
 Potential Competitors in Comparison
Image | Model / Review | Price | Weight | Height | Display |
|---|---|---|---|---|---|
1. 86.6%  | Lenovo Legion 7 16IAX10 Intel Core Ultra 7 255HX ⎘ NVIDIA GeForce RTX 5060 Laptop ⎘ 32 GB Memory, 1024 GB SSD | Amazon: List Price: 1650 USD | 2 kg | 17.9 mm | 16.00" 2560x1600 189 PPI OLED |
2. 76.2%  | Alienware 16 Aurora Intel Core 7 240H ⎘ NVIDIA GeForce RTX 5060 Laptop ⎘ 32 GB Memory | Amazon: List Price: 1100 USD | 2.6 kg | 15.2 mm | 16.00" 2560x1600 189 PPI IPS |
3. 83.8% 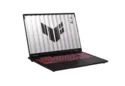 | Asus TUF Gaming A16 FA608UP AMD Ryzen 7 260 ⎘ NVIDIA GeForce RTX 5070 Laptop ⎘ 32 GB Memory, 1024 GB SSD | Amazon: List Price: 2199€ | 2.2 kg | 25.7 mm | 16.00" 2560x1600 189 PPI IPS |
4. 80.1%  | Gigabyte Gaming A16 GA6H Intel Core i7-13620H ⎘ NVIDIA GeForce RTX 5070 Laptop ⎘ 16 GB Memory, 1024 GB SSD | Amazon: 1. $1,598.77 GIGABYTE - Gaming A16 Gaming... 2. $1,085.33 GIGABYTE - Gaming A16 Gaming... 3. $1,224.02 GIGABYTE - Gaming A16 Gaming... List Price: 1700 EUR | 2.3 kg | 23 mm | 16.00" 2560x1600 189 PPI IPS |
5. 84%  | MSI Vector 16 HX AI A2XWHG Intel Core Ultra 7 255HX ⎘ NVIDIA GeForce RTX 5070 Ti Laptop ⎘ 16 GB Memory, 512 GB SSD | Amazon: List Price: 2000 EUR | 2.6 kg | 28.6 mm | 16.00" 2560x1600 189 PPI IPS |
6. 84.5%  | Lenovo Legion 5 Pro 16IAX10H Intel Core Ultra 9 275HX ⎘ NVIDIA GeForce RTX 5070 Ti Laptop ⎘ 32 GB Memory, 1024 GB SSD | Amazon: 1. $2,602.46 Lenovo Legion Pro 7 16IAX10H... 2. $1,809.99 Lenovo Legion Pro 5 AI Gamin... 3. $2,449.00 Lenovo Legion Pro 5i Gen 10 ... List Price: 2500 Euro | 2.4 kg | 25.95 mm | 16.00" 2560x1600 189 PPI OLED |
Transparency
The selection of devices to be reviewed is made by our editorial team. The test sample was provided to the author as a loan by the manufacturer or retailer for the purpose of this review. The lender had no influence on this review, nor did the manufacturer receive a copy of this review before publication. There was no obligation to publish this review. As an independent media company, Notebookcheck is not subjected to the authority of manufacturers, retailers or publishers.
This is how Notebookcheck is testing
Every year, Notebookcheck independently reviews hundreds of laptops and smartphones using standardized procedures to ensure that all results are comparable. We have continuously developed our test methods for around 20 years and set industry standards in the process. In our test labs, high-quality measuring equipment is utilized by experienced technicians and editors. These tests involve a multi-stage validation process. Our complex rating system is based on hundreds of well-founded measurements and benchmarks, which maintains objectivity. Further information on our test methods can be found here.
