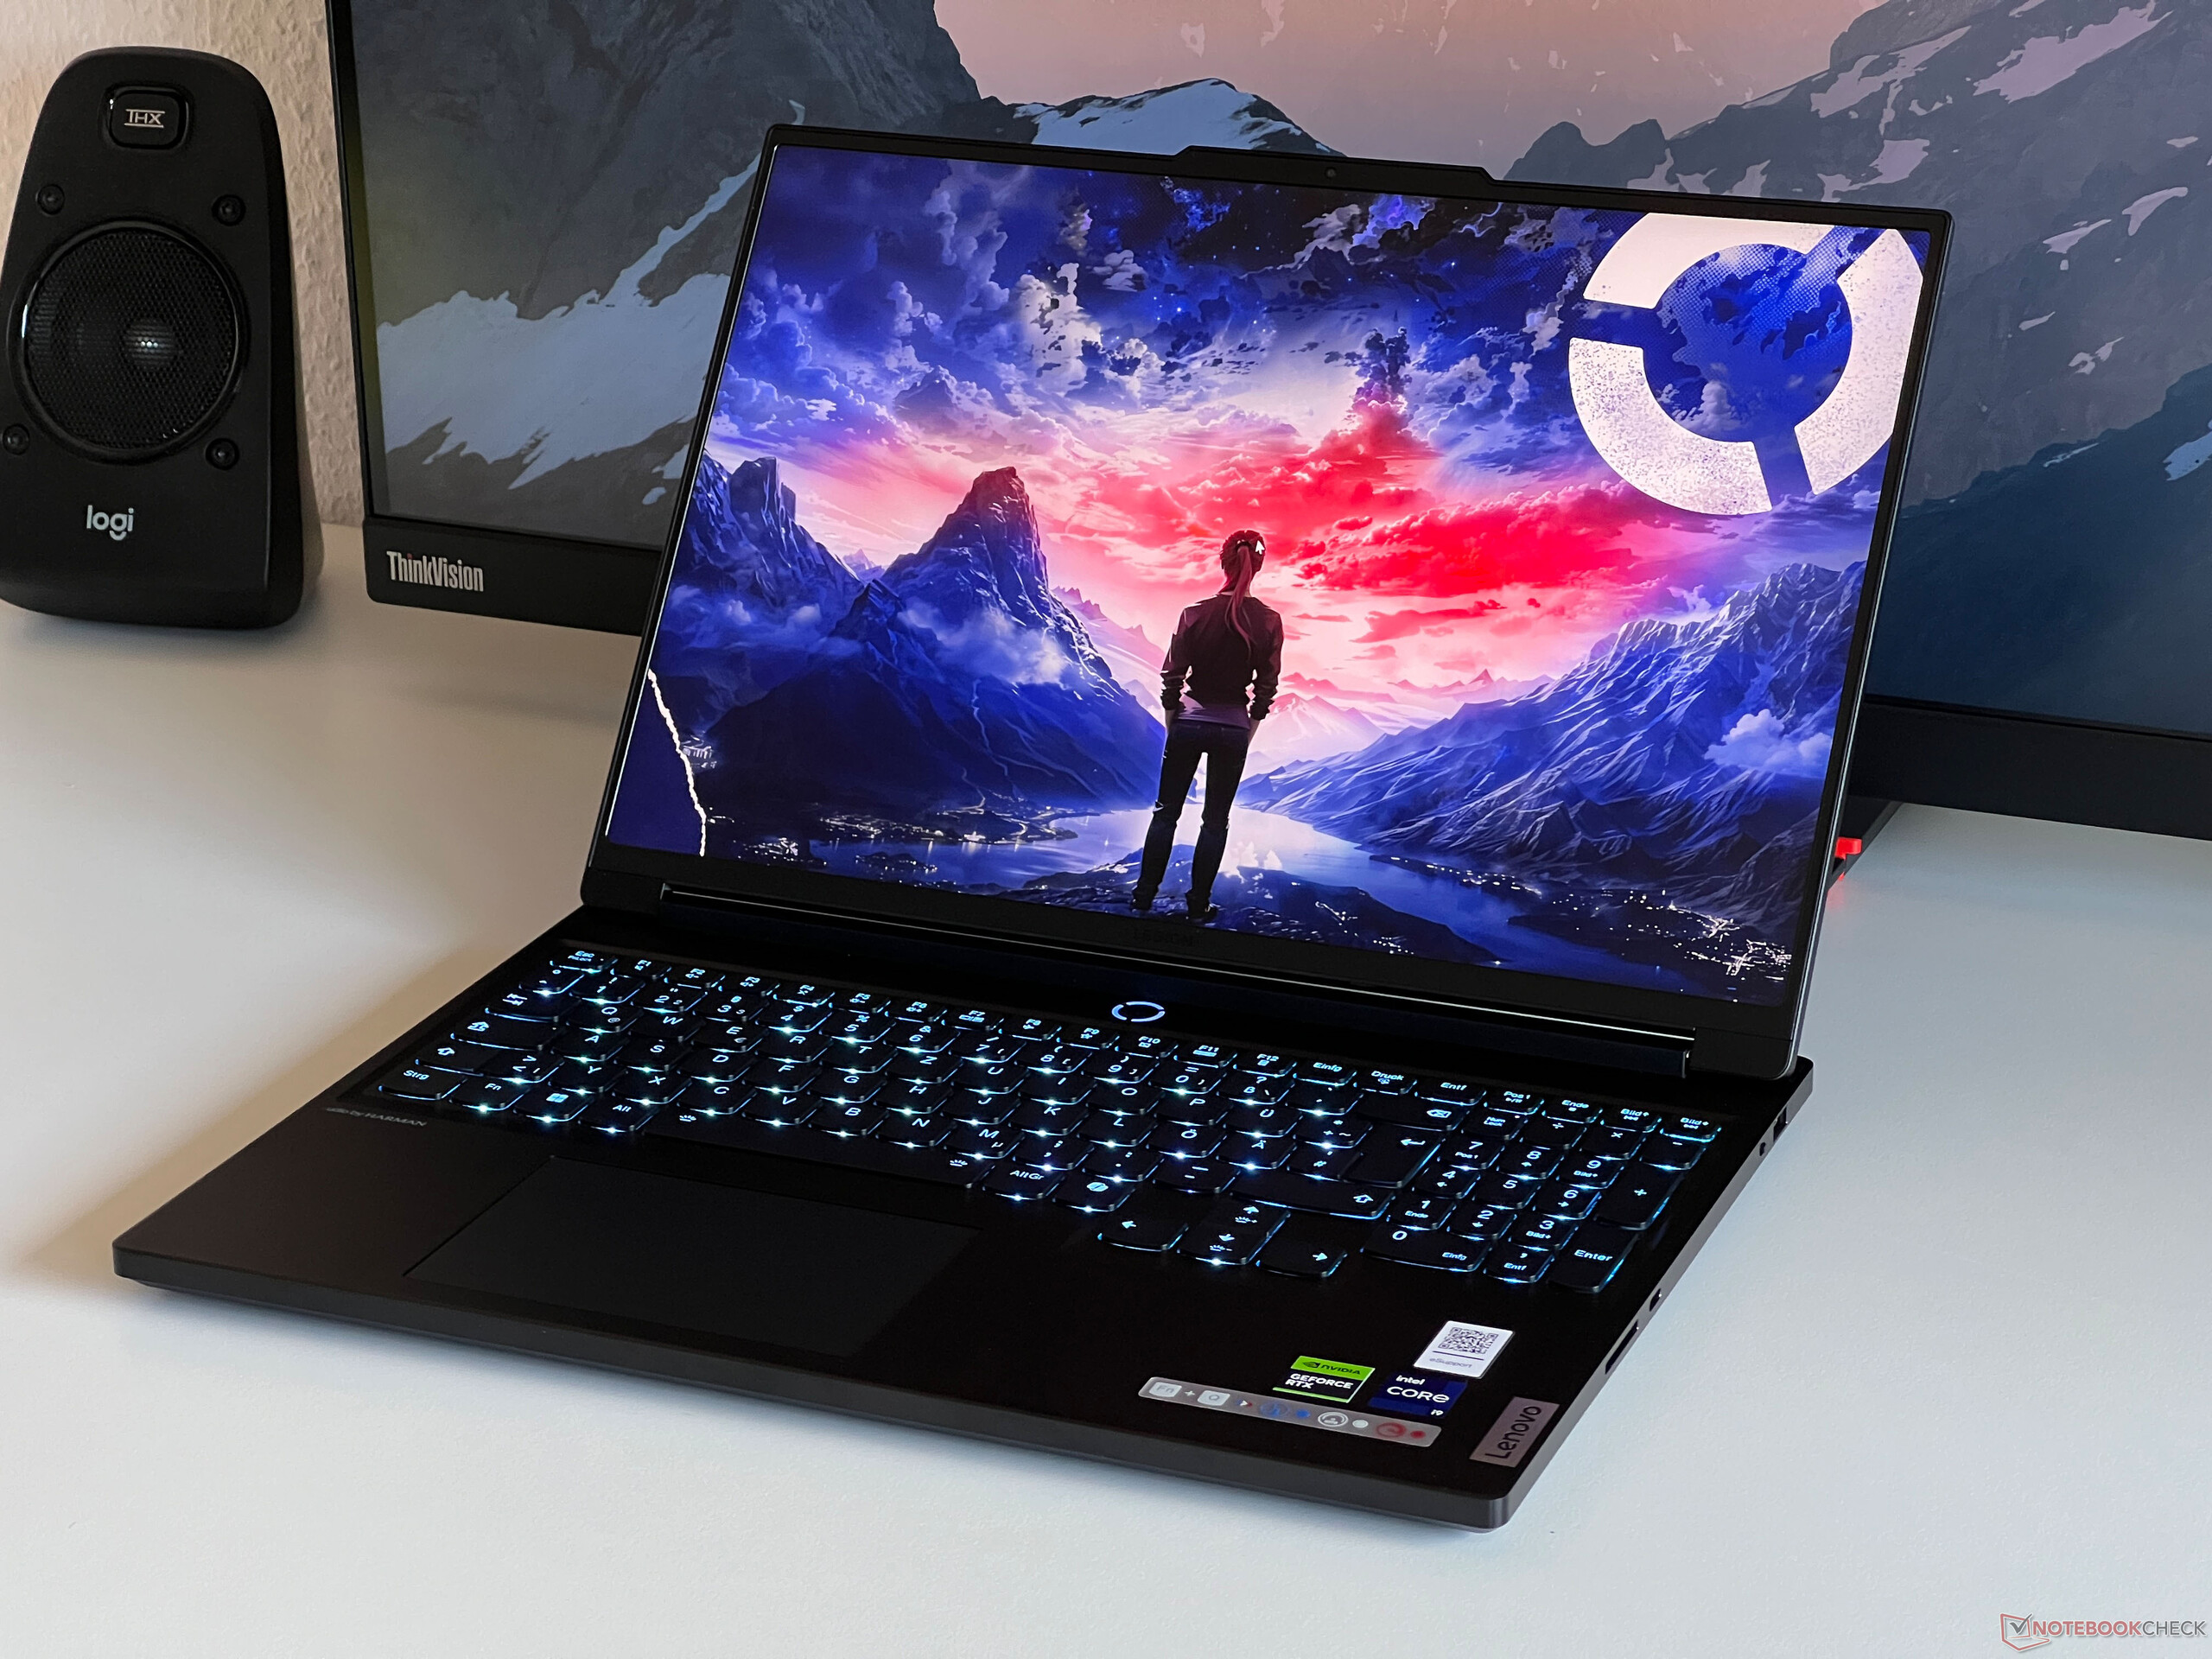
Lenovo Legion 7 16 G9 laptop review - A gaming machine with a 3.2K display, HX CPU and an overclocked RTX 4070 laptop
The Legion 7 16 is the Legion Pro 7 16's cheaper and slimmer brother which we only just recently reviewed. There are differences, especially when it comes to the graphics cards with the normal Legion 7's maximum available GPU being the RTX 4070 laptop. However, in terms of the processor, the same Intel HX chips are used and, in addition to the WQHD panels, there is an optional high-resolution, 165 Hz 3.2K IPS panel.
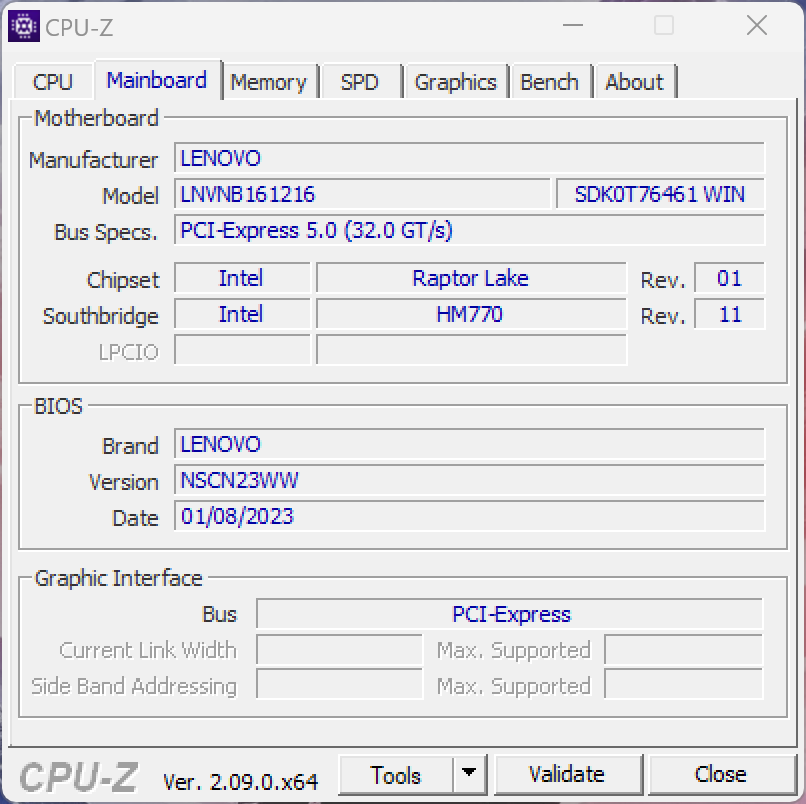
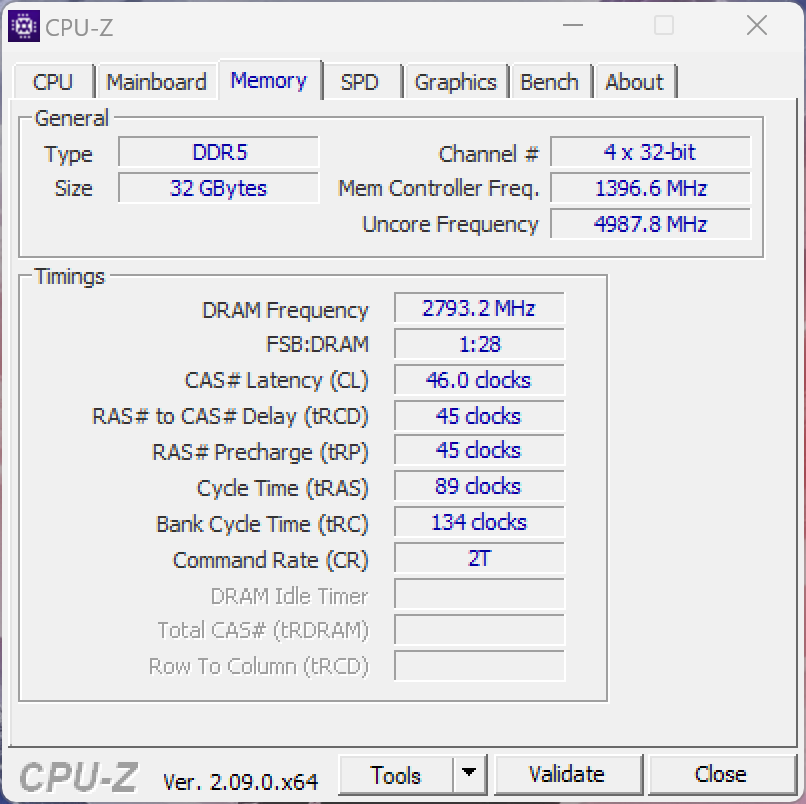
Our review device is the $2,249 Campus variant which comes with a Core i9-14900HX, GeForce RTX 4070 laptop, 32 GB of RAM, a 1 TB SSD as well as a 3.2K panel. Currently, there are still no corresponding variants for regular customers but the price ought to be around $250-300 higher.
Possible competitors compared
Rating | Date | Model | Weight | Height | Size | Resolution | Price |
|---|---|---|---|---|---|---|---|
| 90.8 % v7 (old) | 04 / 2024 | Lenovo Legion 7 16 IRX G9 i9-14900HX, GeForce RTX 4070 Laptop GPU | 2.3 kg | 19.8 mm | 16.00" | 3200x2000 | |
| 89.3 % v7 (old) | 03 / 2024 | Lenovo Legion Pro 5 16IRX9 i9-14900HX, GeForce RTX 4070 Laptop GPU | 2.5 kg | 26.95 mm | 16.00" | 2560x1600 | |
| 87.4 % v7 (old) | 04 / 2024 | Aorus 16X 2024 i9-14900HX, GeForce RTX 4070 Laptop GPU | 2.3 kg | 20 mm | 16.00" | 2560x1600 | |
| 88.4 % v7 (old) | 02 / 2024 | HP Omen Transcend 16-u1095ng i9-14900HX, GeForce RTX 4070 Laptop GPU | 2.3 kg | 20 mm | 16.00" | 2560x1600 | |
| 90.2 % v7 (old) | 03 / 2024 | Alienware m16 R2 Ultra 7 155H, GeForce RTX 4070 Laptop GPU | 2.5 kg | 23.5 mm | 16.00" | 2560x1600 | |
| 89.2 % v7 (old) | 10 / 2023 | Schenker XMG CORE 16 (L23) R7 7840HS, GeForce RTX 4070 Laptop GPU | 2.4 kg | 26.1 mm | 16.00" | 2560x1600 | |
| 89.5 % v7 (old) | 03 / 2024 | Lenovo Legion Pro 7 16IRX9H i9-14900HX, GeForce RTX 4080 Laptop GPU | 2.7 kg | 21.95 mm | 16.00" | 2560x1600 |
Case - A black aluminum fingerprint magnet
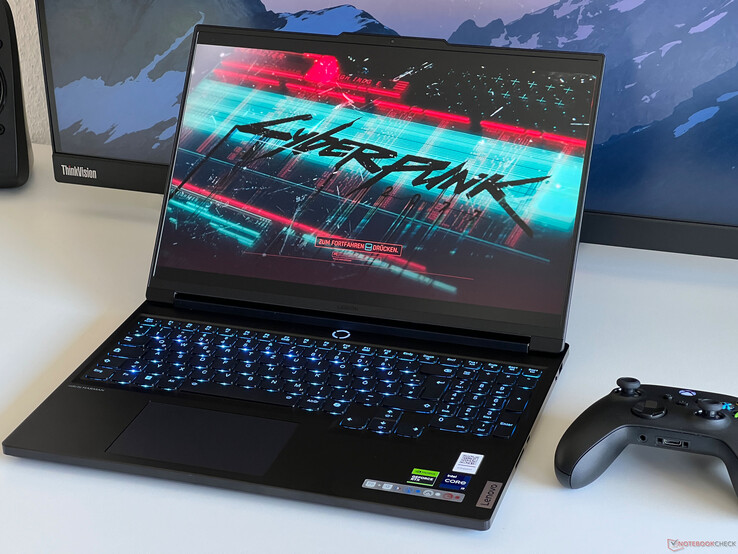
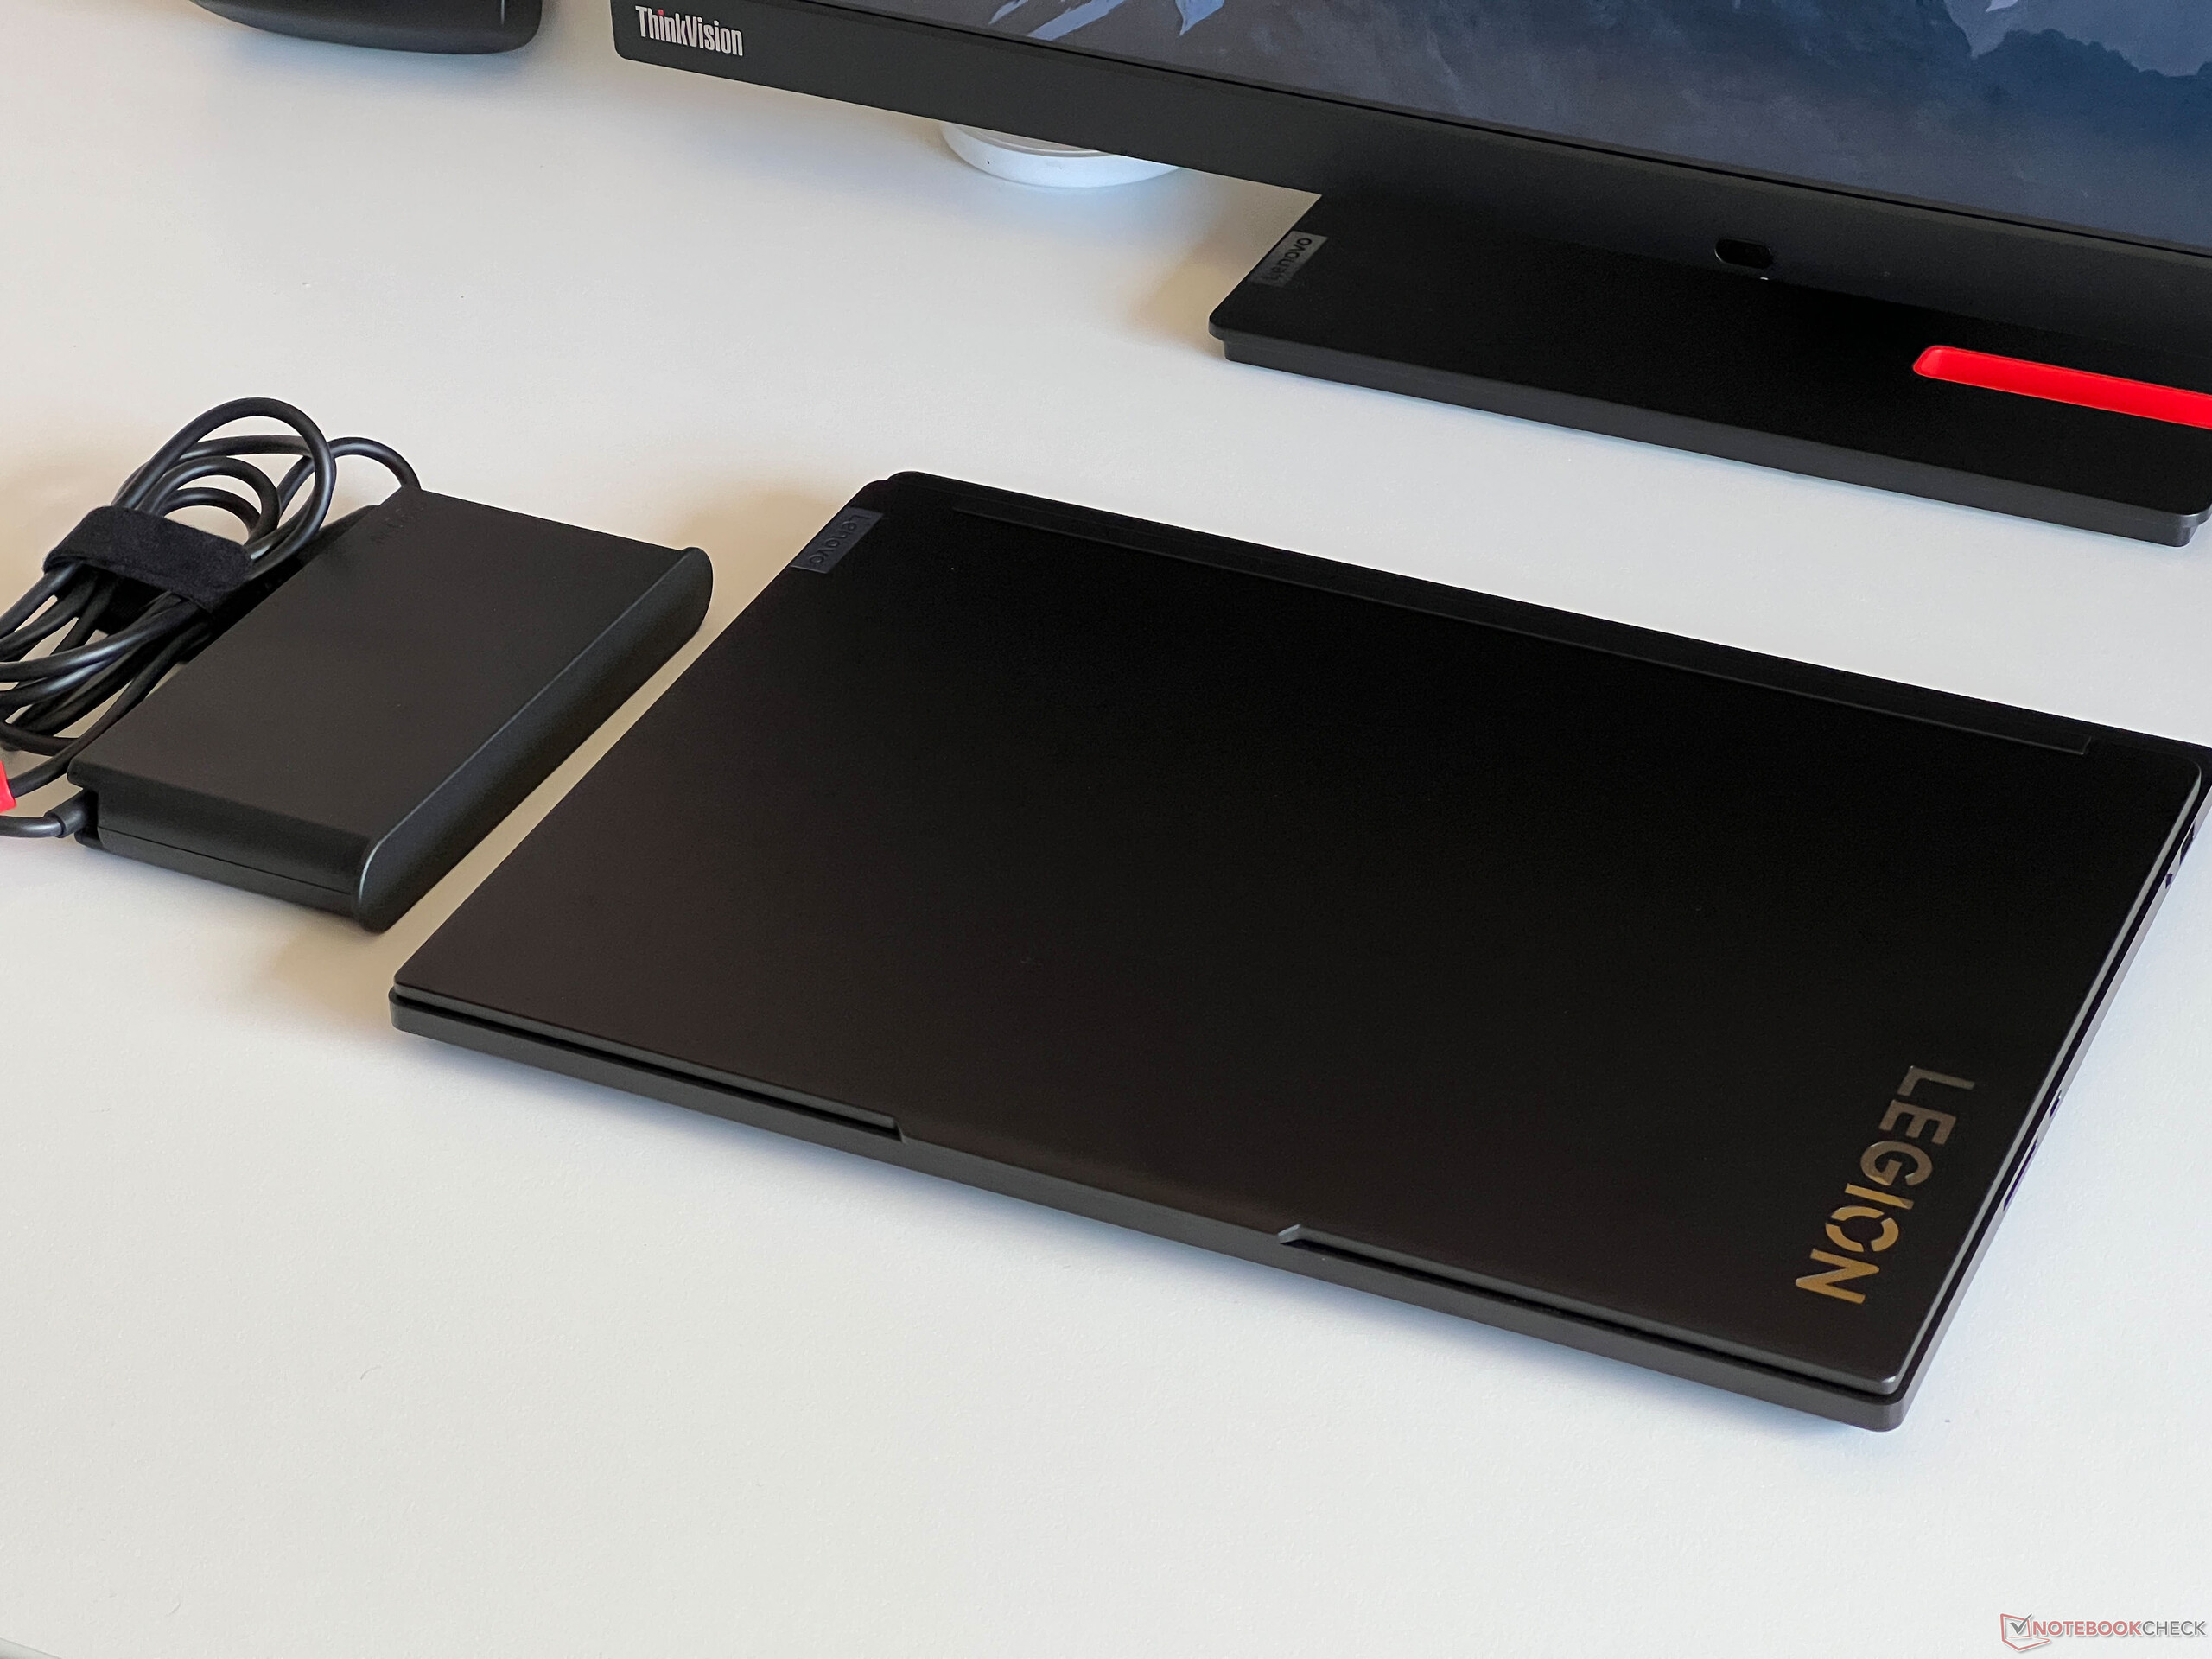
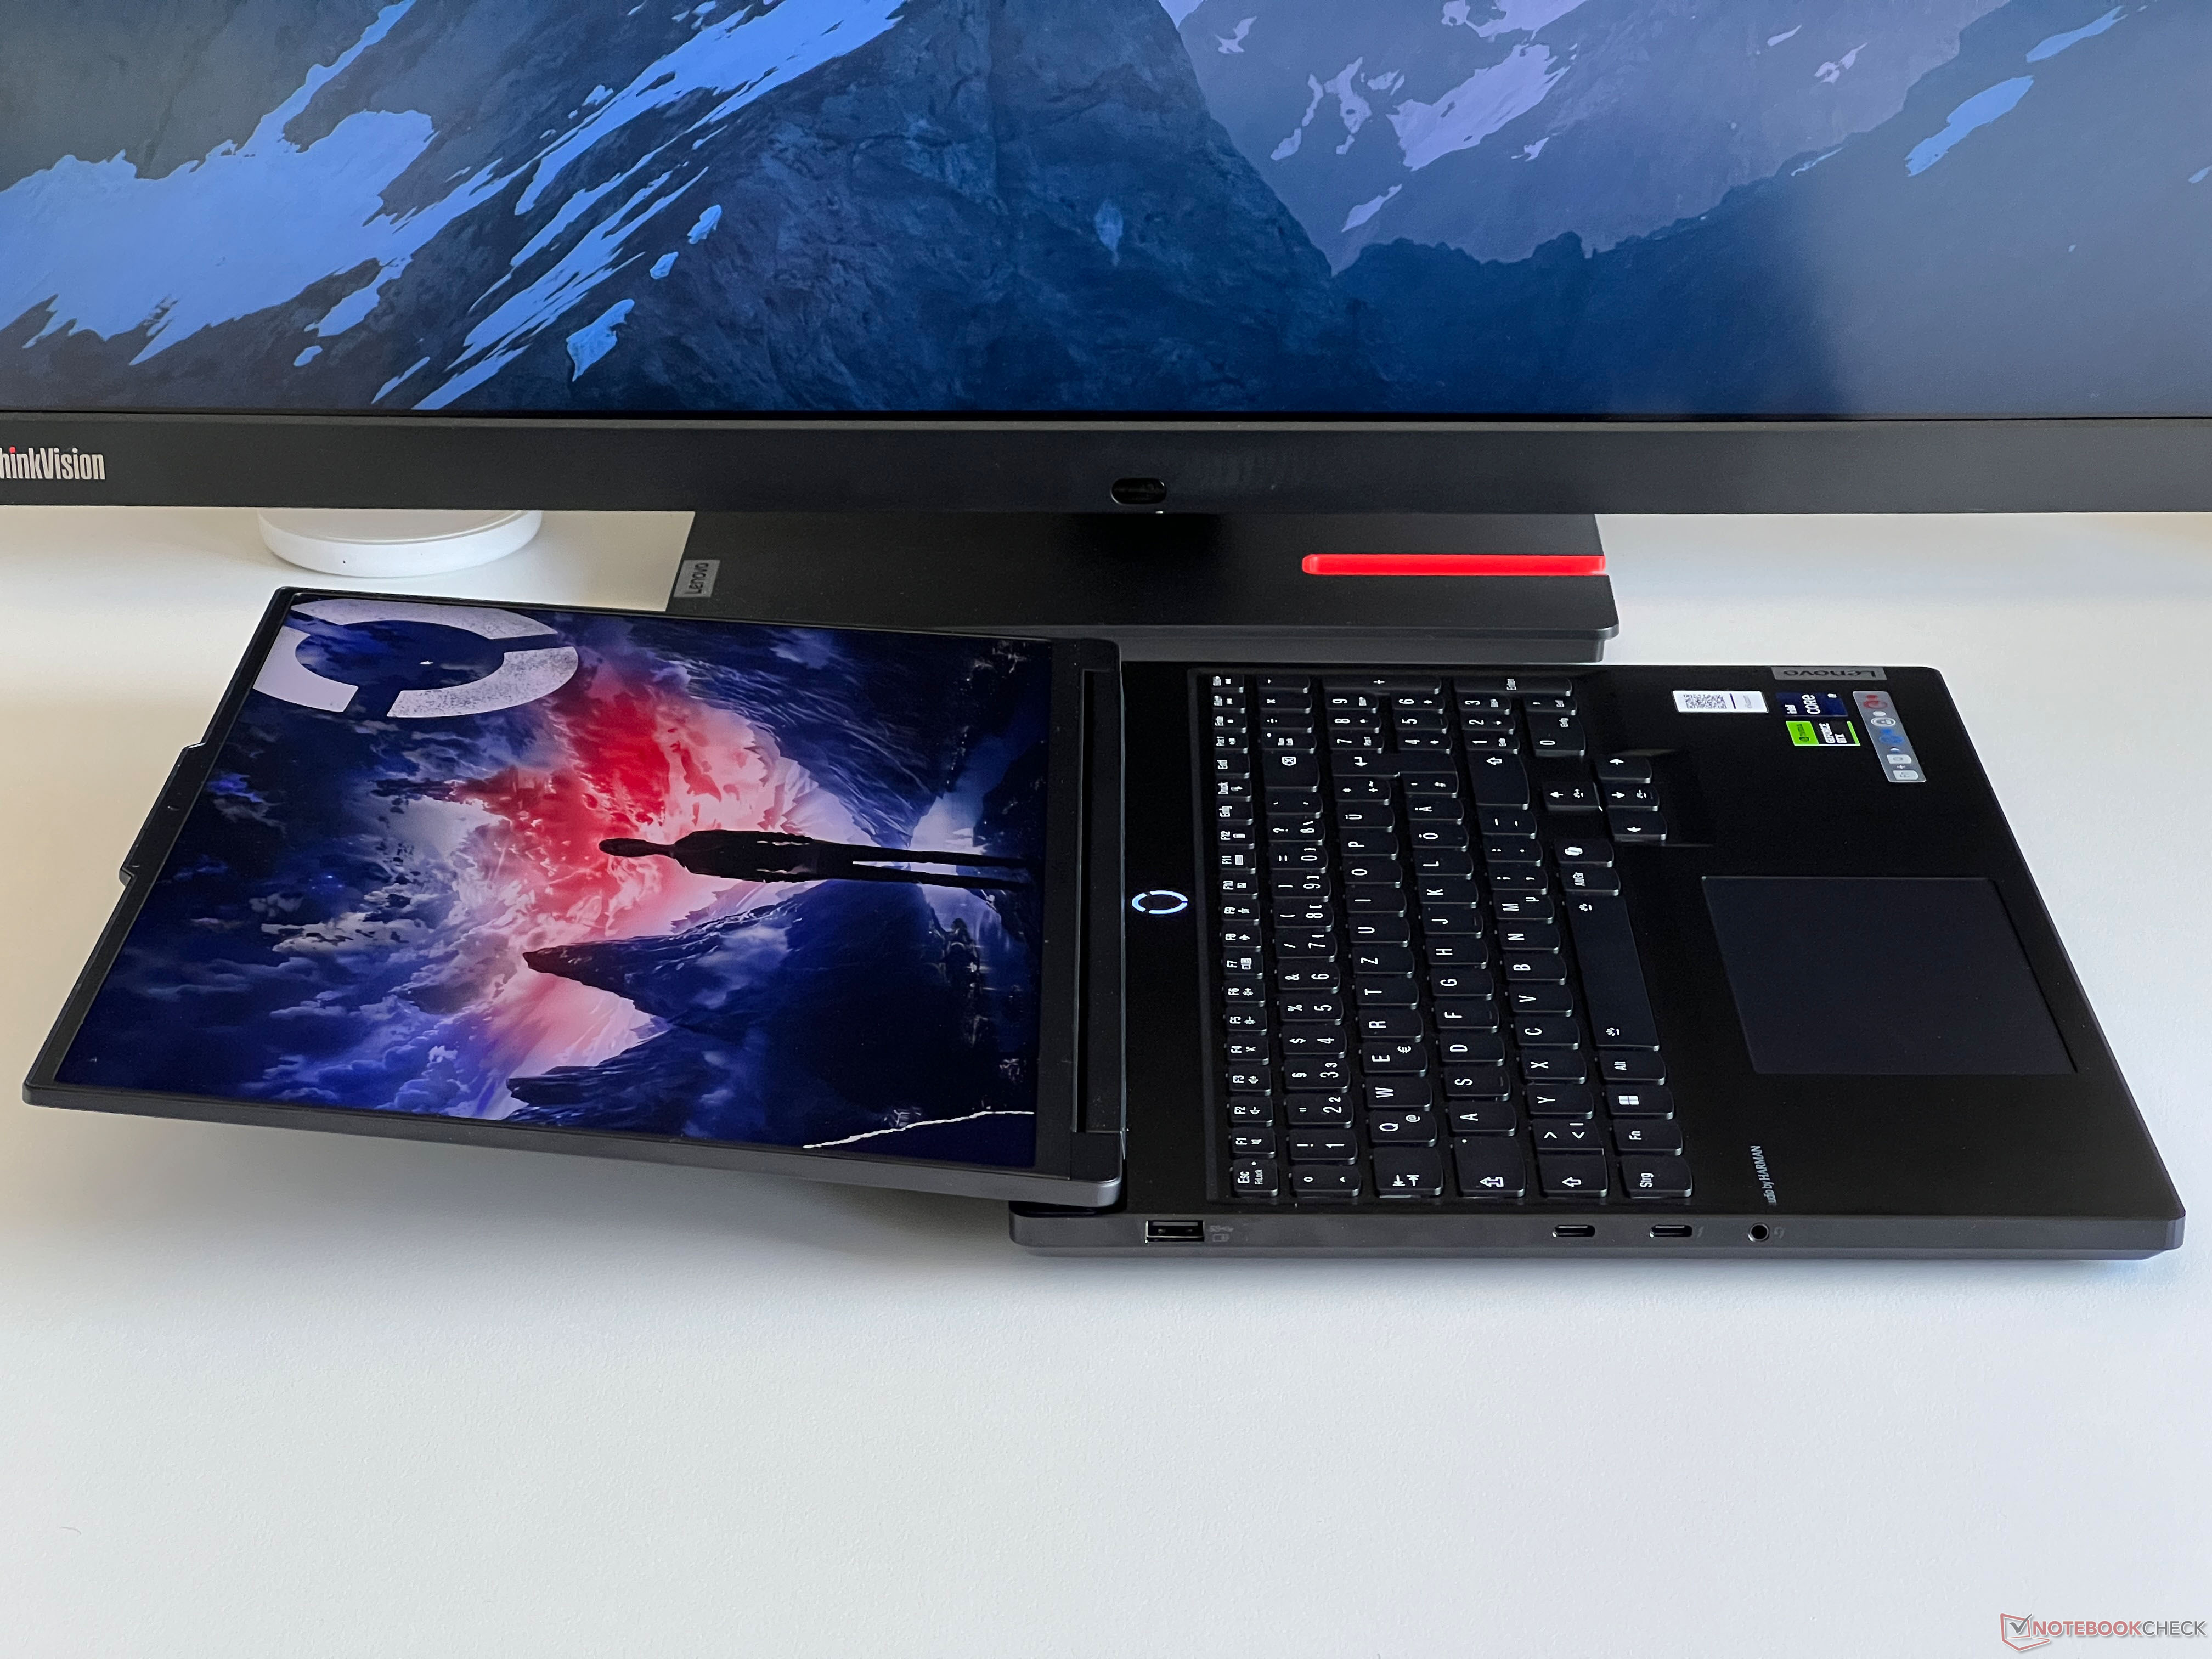
The Legion 7 16 is a comparably thin gaming laptop that is also very understated due to its black aluminum case. Unlike the Legion Pro 7, there are no protruding cooling elements on the sides of the device. Visually, the case looks very good, but only for a short time since the smooth surfaces magically attract fingerprints. For this reason, you should always have a cloth handy to clean the case. The screen bezels are very thin with only the camera bump spoiling the look, although this does make it easier to open the case.
Both the case's stability and build quality are very good and we were unable to provoke creaking noises of any kind. Additionally, it is practically impossible to flex the keyboard when pressure is applied. The thin display lid is a touch more flexible but this is also an area where we were unable to cause any image distortions. For our taste, the hinges could be a little firmer because there is a visible rocking motion when adjusting the opening angle (maximum ~170 degrees).
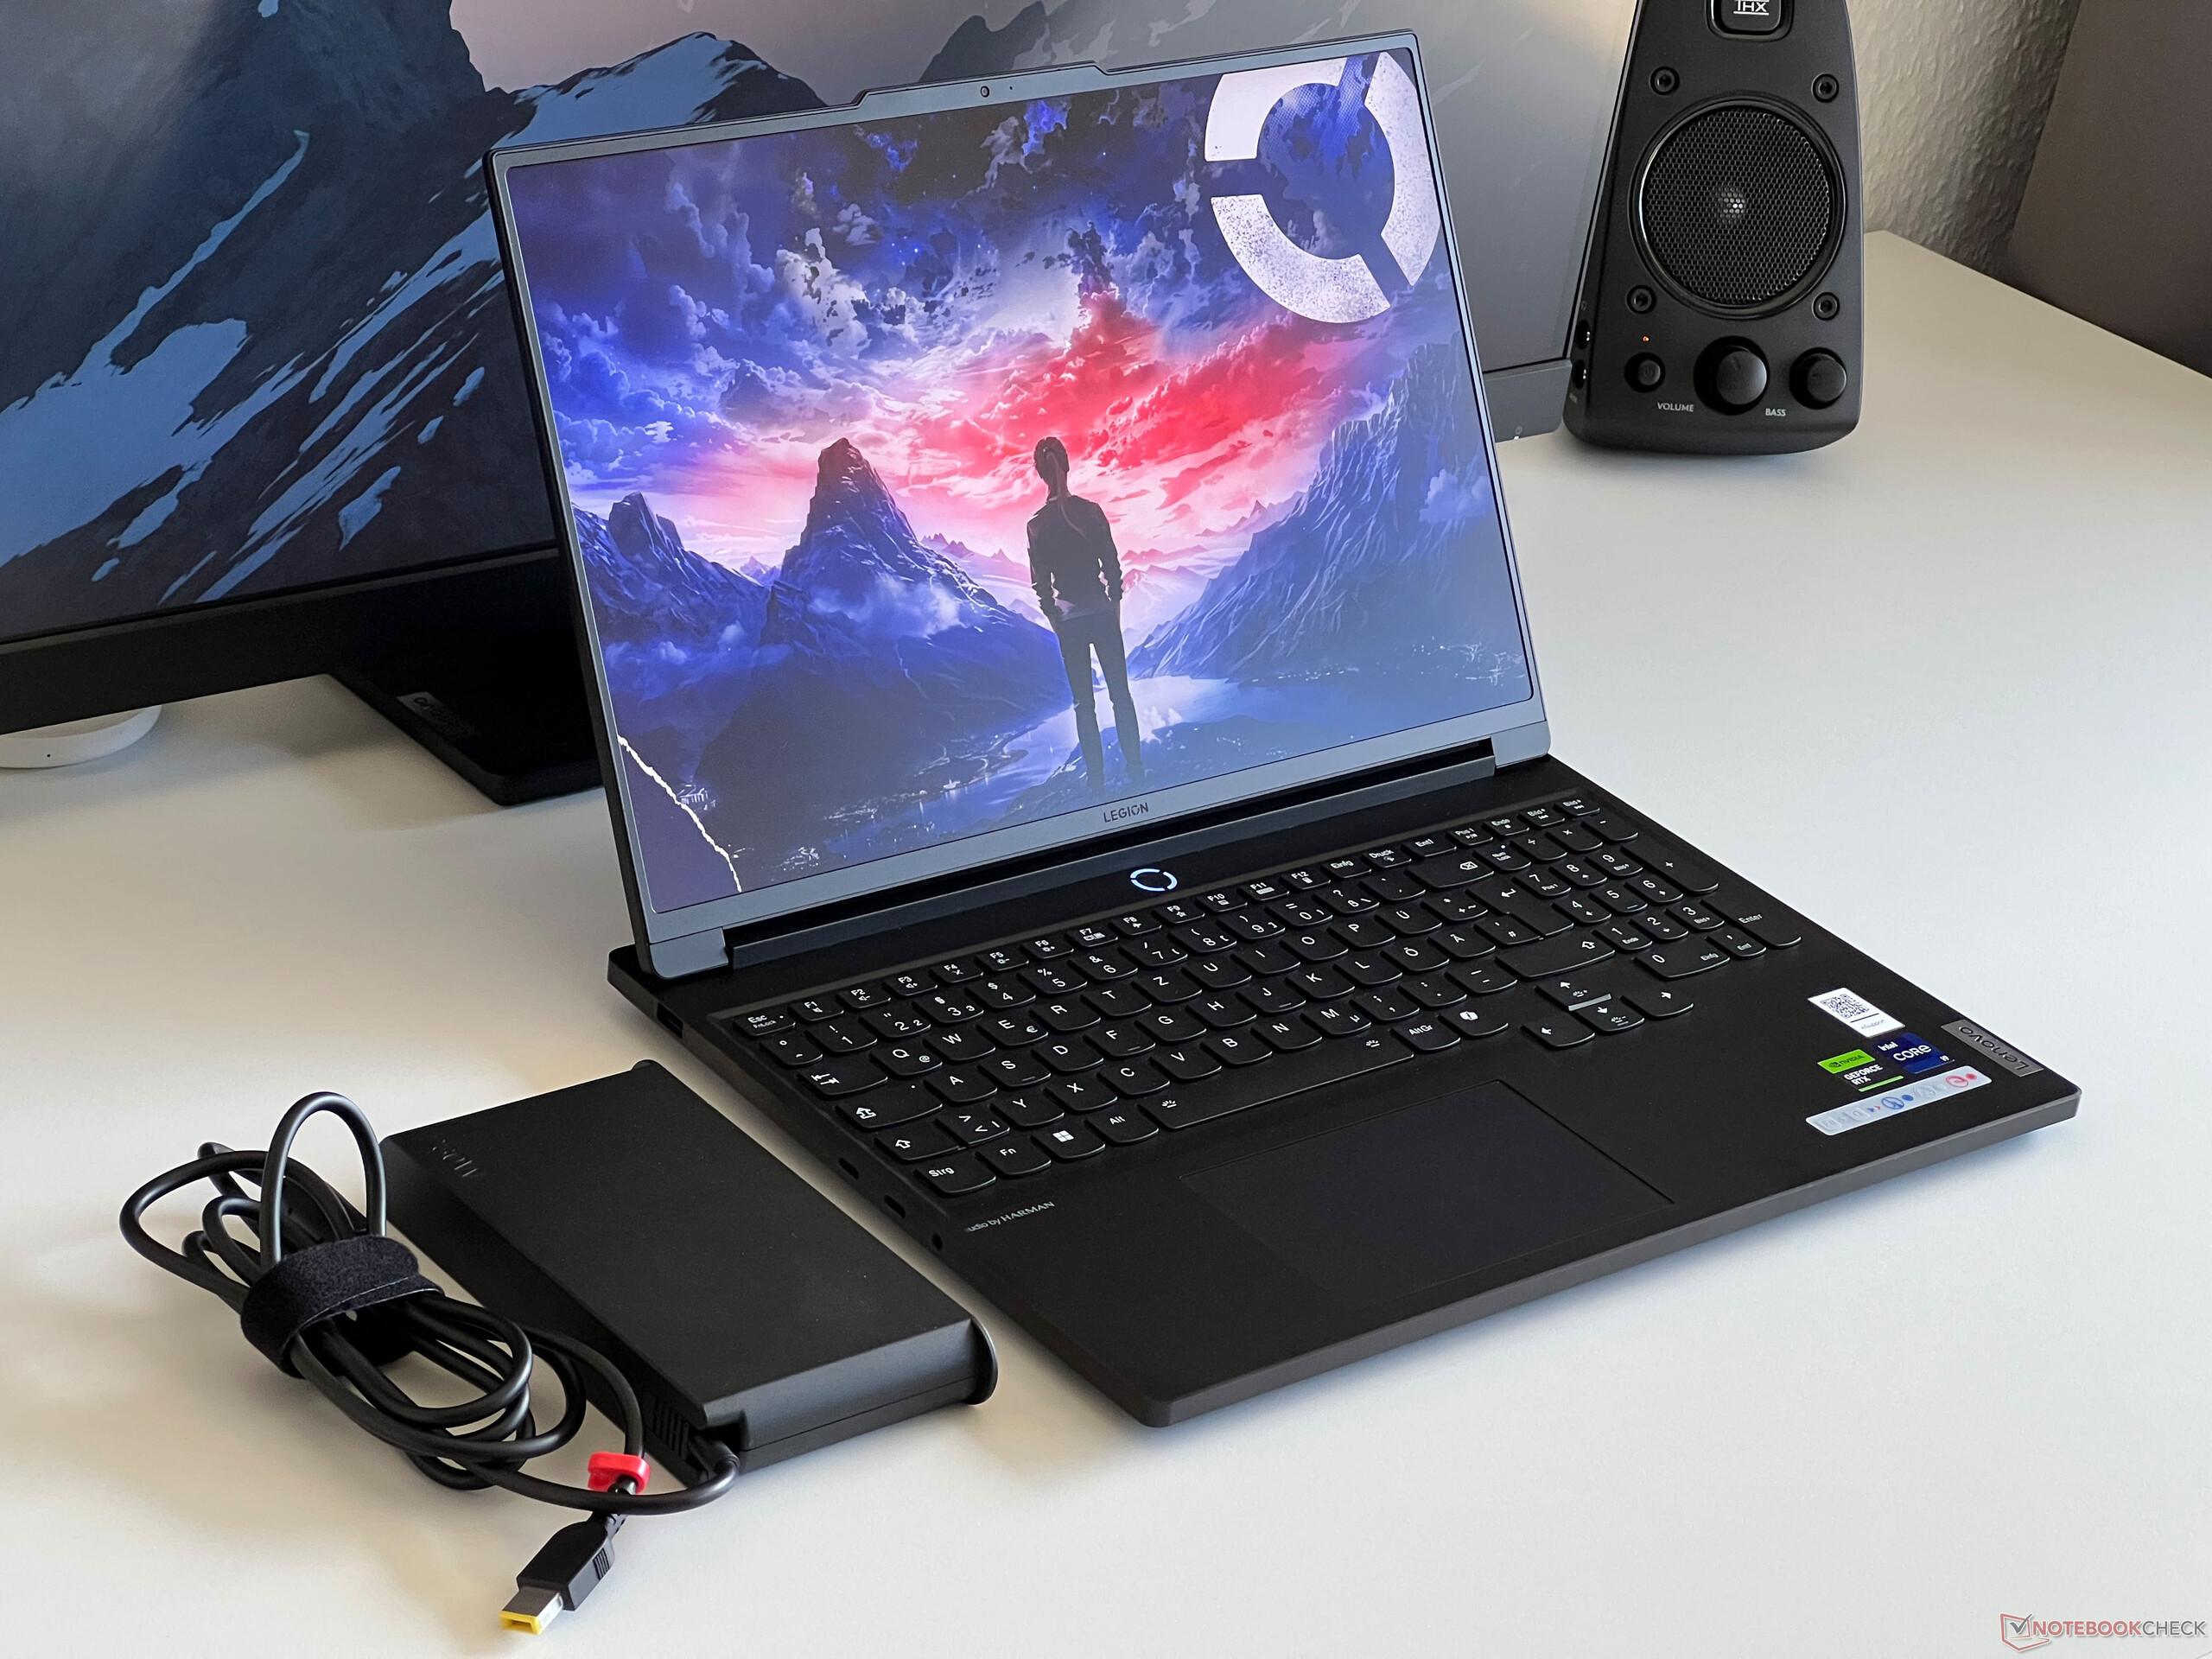
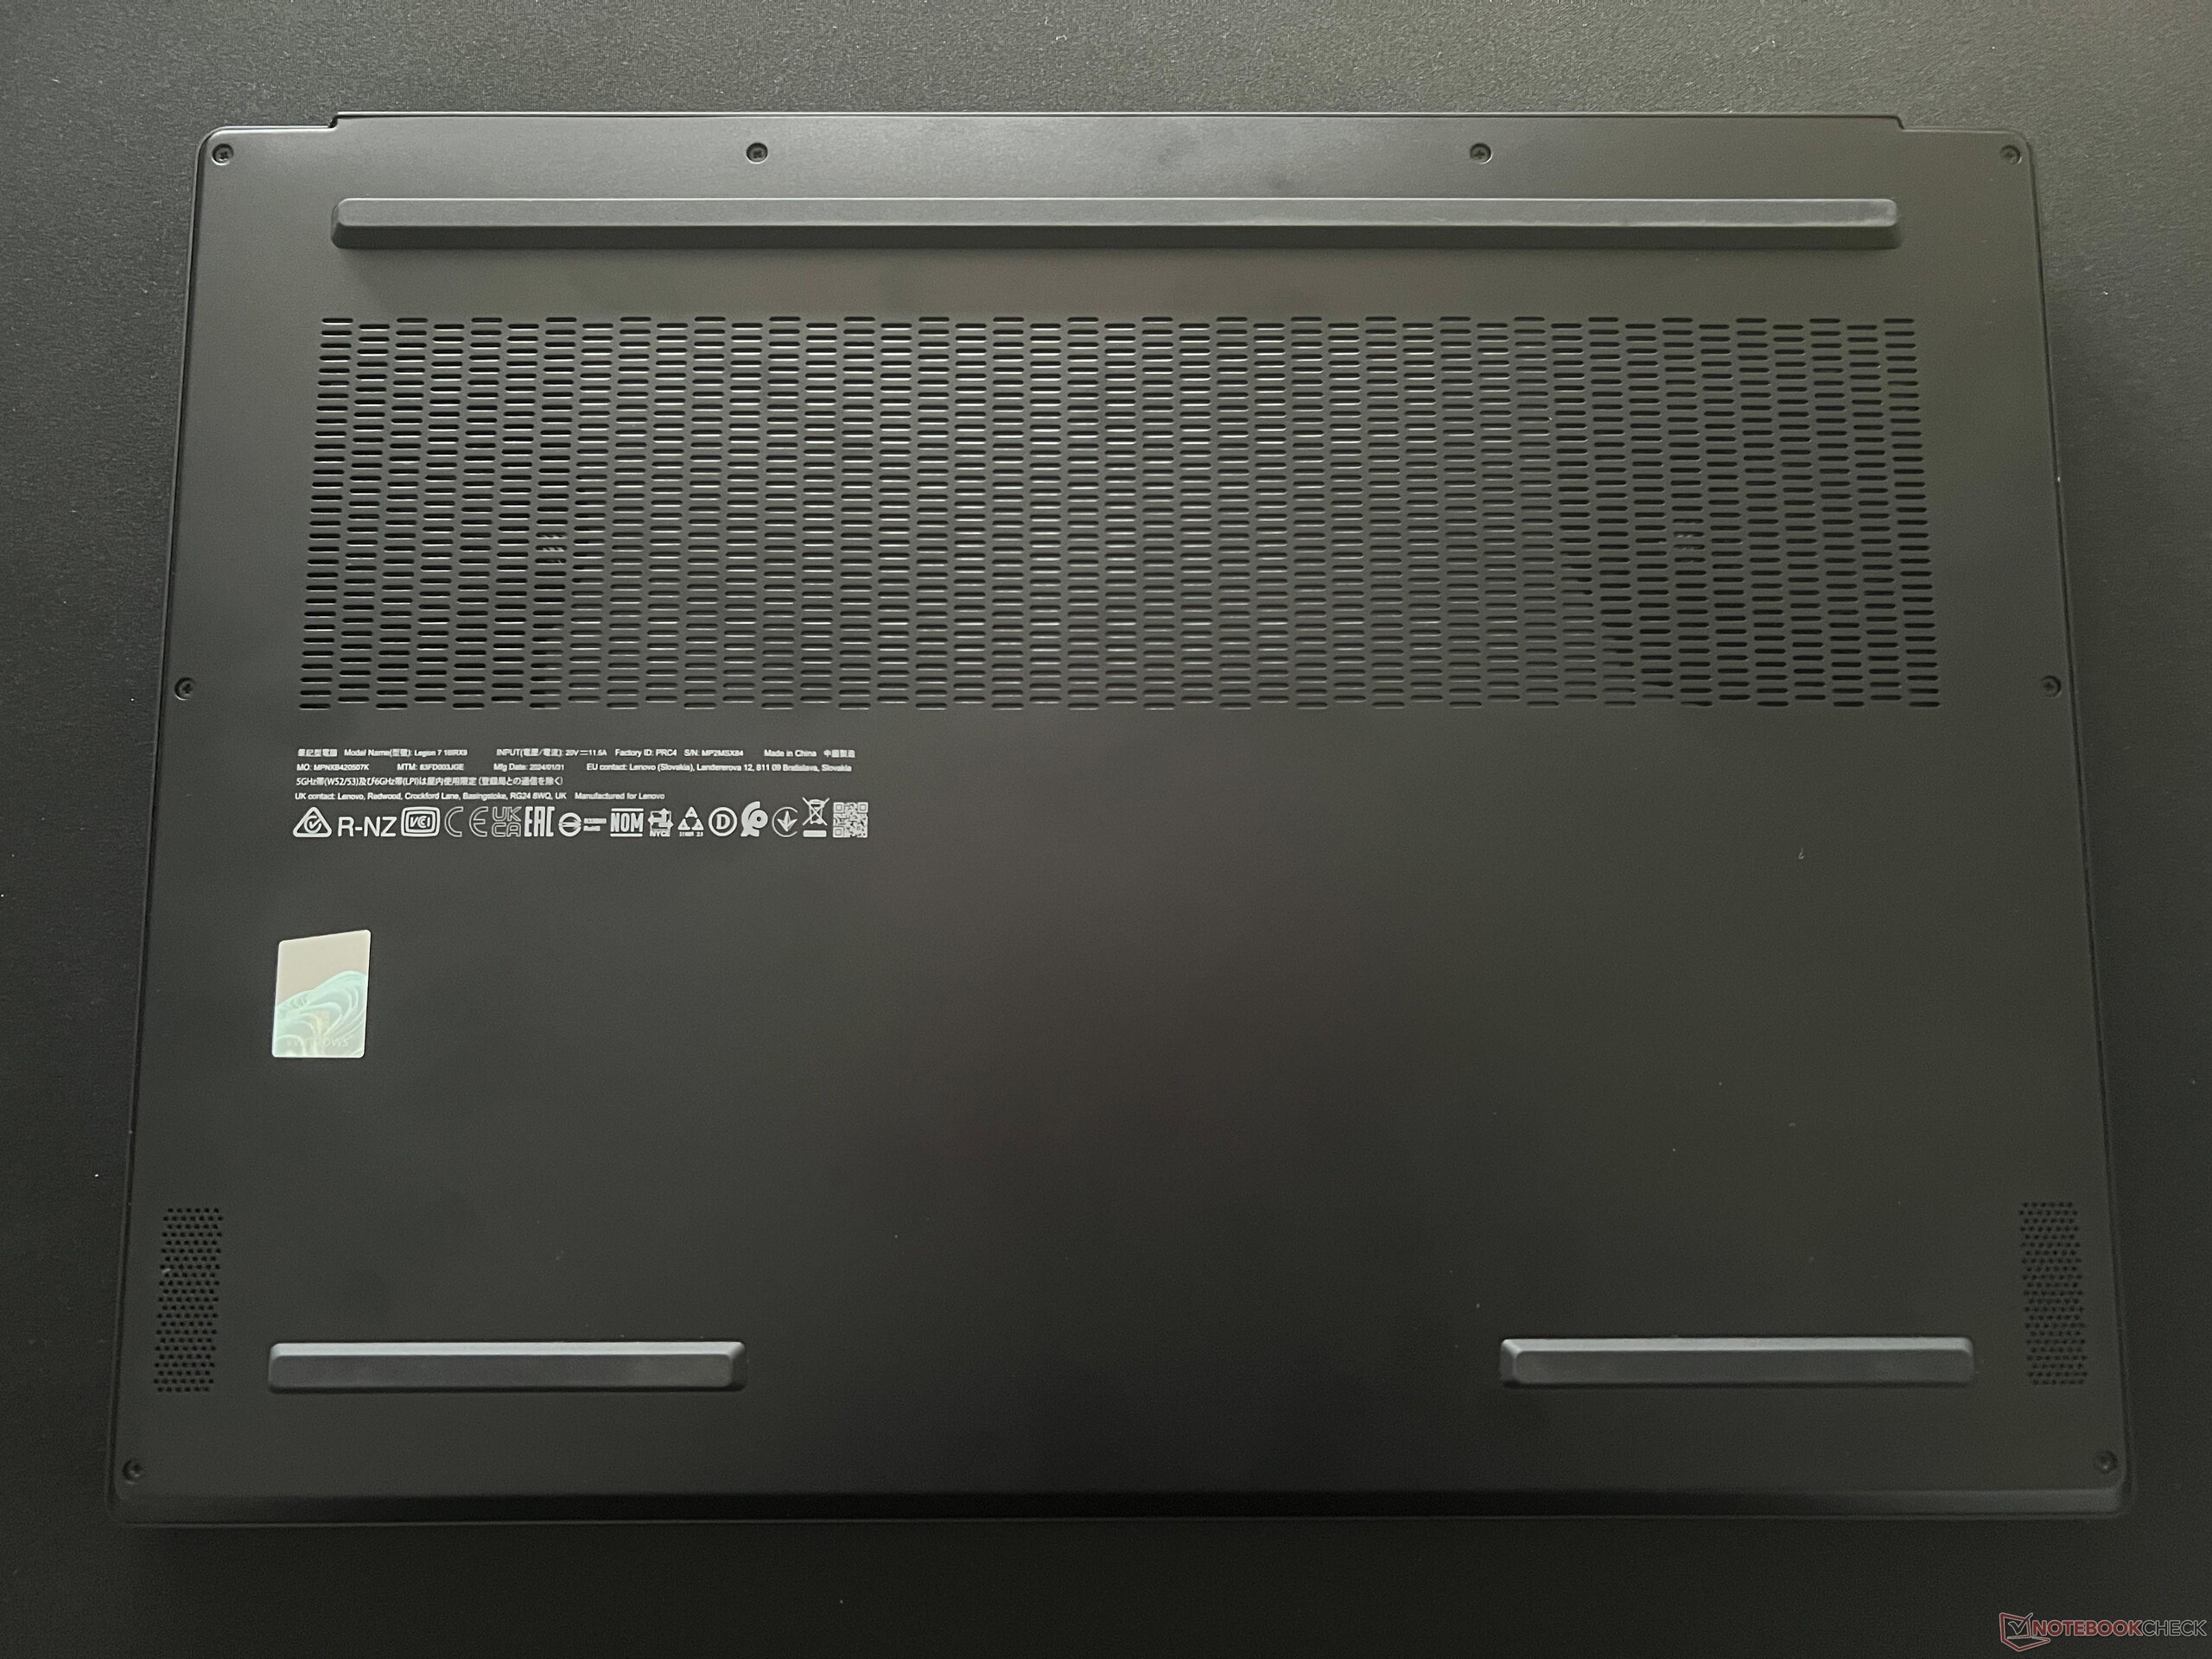
The Legion 7 16 is one of the slimmest devices in our comparison group, however, in terms of weight and overall footprint, there aren't any huge differences. The 230-watt PSU tips the scales at 948 grams.
Features - Thunderbolt but no Ethernet
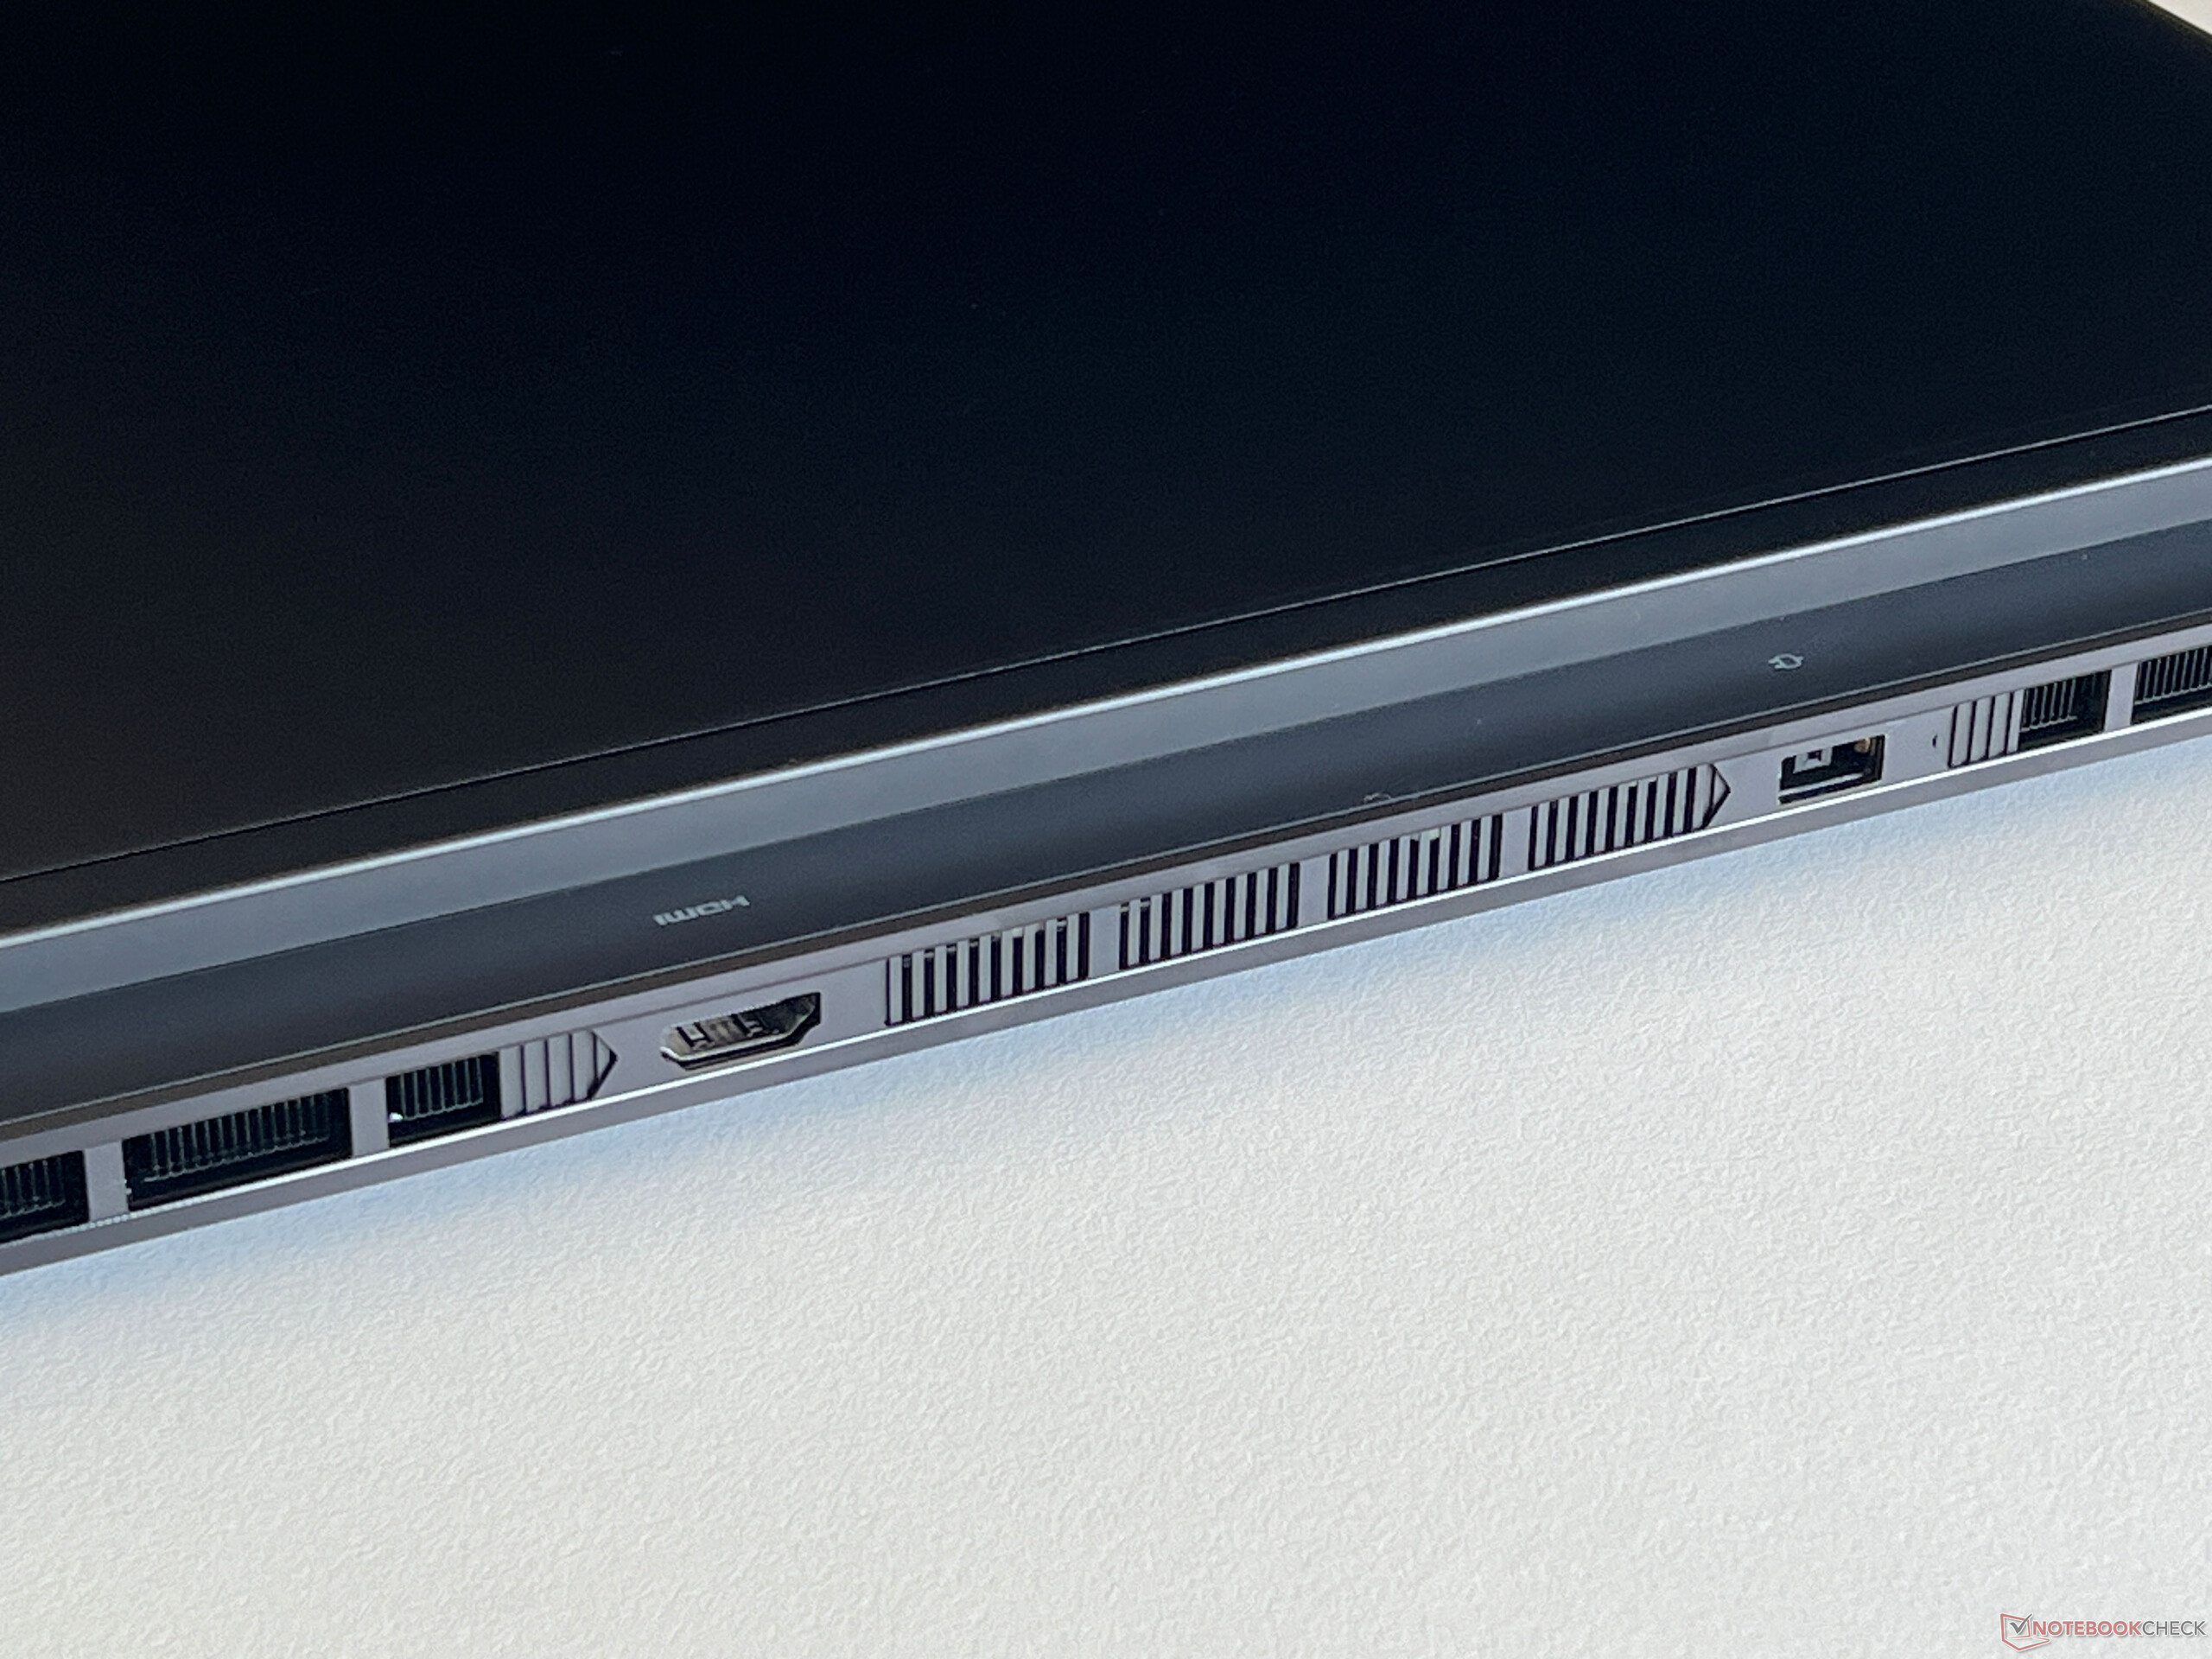
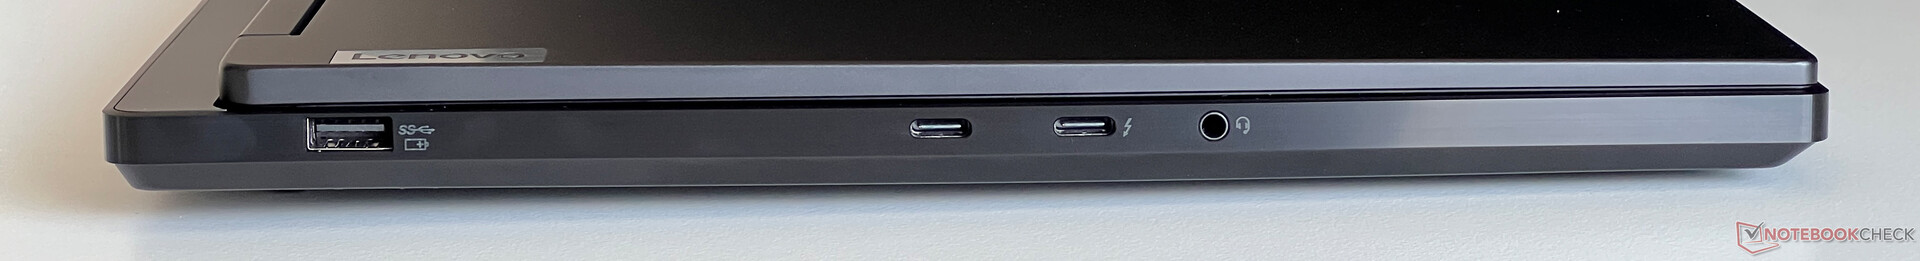
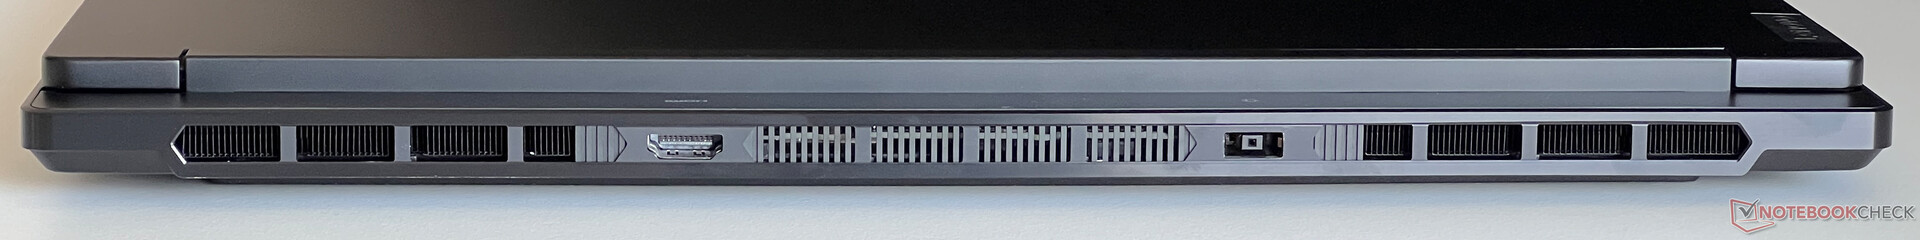
The ports are distributed both at the sides and also on the rear of the laptop. In this area, the normal Legion 7 does somewhat better than the more expensive Legion Pro 7 because the cooling vents are only located at the back. All of the important standards are here apart from an Ethernet port and this is not ideal for gamers. The Thunderbolt port is connected via the iGPU and this means when you connect an external display, the Nvidia GPU doesn't always have to be active. All other video outputs run directly via the dGPU.
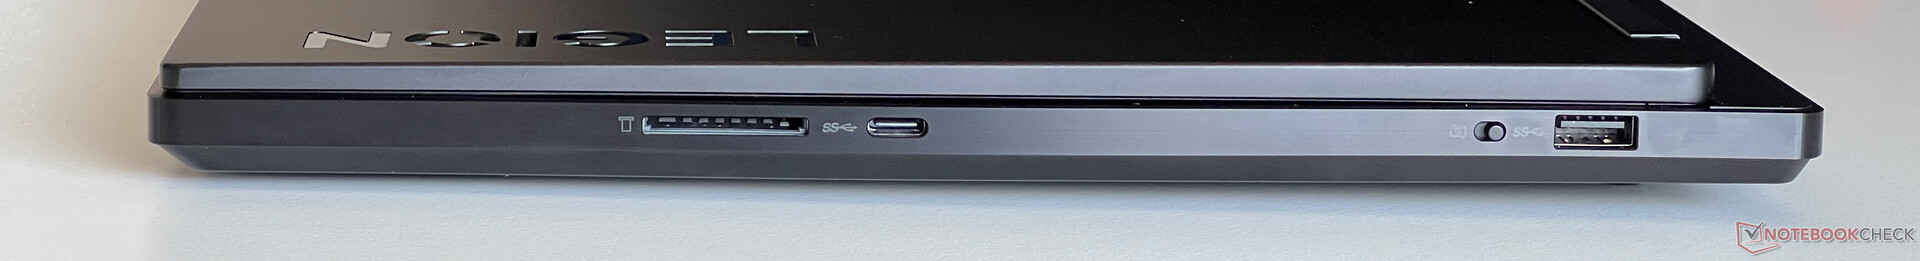
SD Card Reader
Paired with our reference card (Angelbird AV Pro V60), the card reader on the right-hand side can achieve average transfer speeds of 75-90 MB/s. However, inserted cards protrude clearly from the case.
| SD Card Reader | |
| average JPG Copy Test (av. of 3 runs) | |
| Aorus 16X 2024 (AV PRO microSD 128 GB V60) | |
| Average of class Gaming (20.9 - 210, n=54, last 2 years) | |
| Lenovo Legion 7 16 IRX G9 (Angelbird AV Pro V60) | |
| Alienware m16 R2 (AV PRO microSD 128 GB V60) | |
| Schenker XMG CORE 16 (L23) | |
| maximum AS SSD Seq Read Test (1GB) | |
| Alienware m16 R2 (AV PRO microSD 128 GB V60) | |
| Aorus 16X 2024 (AV PRO microSD 128 GB V60) | |
| Average of class Gaming (25.5 - 261, n=51, last 2 years) | |
| Lenovo Legion 7 16 IRX G9 (Angelbird AV Pro V60) | |
| Schenker XMG CORE 16 (L23) | |
Communication
A Realtek Wi-Fi 6E module is installed inside the Legion. It performs well and, combined with our Asus reference router, it managed both high and stable transfer speeds. Bluetooth 5.1 is supported but the laptop doesn't offer an Ethernet port.
| Networking | |
| Lenovo Legion 7 16 IRX G9 | |
| iperf3 transmit AXE11000 | |
| iperf3 receive AXE11000 | |
| Lenovo Legion Pro 5 16IRX9 | |
| iperf3 transmit AXE11000 | |
| iperf3 receive AXE11000 | |
| iperf3 transmit AXE11000 6GHz | |
| iperf3 receive AXE11000 6GHz | |
| Aorus 16X 2024 | |
| iperf3 transmit AXE11000 | |
| iperf3 receive AXE11000 | |
| HP Omen Transcend 16-u1095ng | |
| iperf3 transmit AXE11000 | |
| iperf3 receive AXE11000 | |
| Alienware m16 R2 | |
| iperf3 transmit AXE11000 | |
| iperf3 receive AXE11000 | |
| iperf3 transmit AXE11000 6GHz | |
| iperf3 receive AXE11000 6GHz | |
| Schenker XMG CORE 16 (L23) | |
| iperf3 transmit AXE11000 | |
| iperf3 receive AXE11000 | |
| Lenovo Legion Pro 7 16IRX9H | |
| iperf3 transmit AXE11000 | |
| iperf3 receive AXE11000 | |
Webcam
The 1080p webcam is housed inside the upper screen bezel and offers an electronic shutter (the switch is on the right-hand side) but, even under good lighting conditions, it only captures average images. The webcam doesn't support Windows Studio Effects, unlike the current Meteor Lake devices.


Maintenance
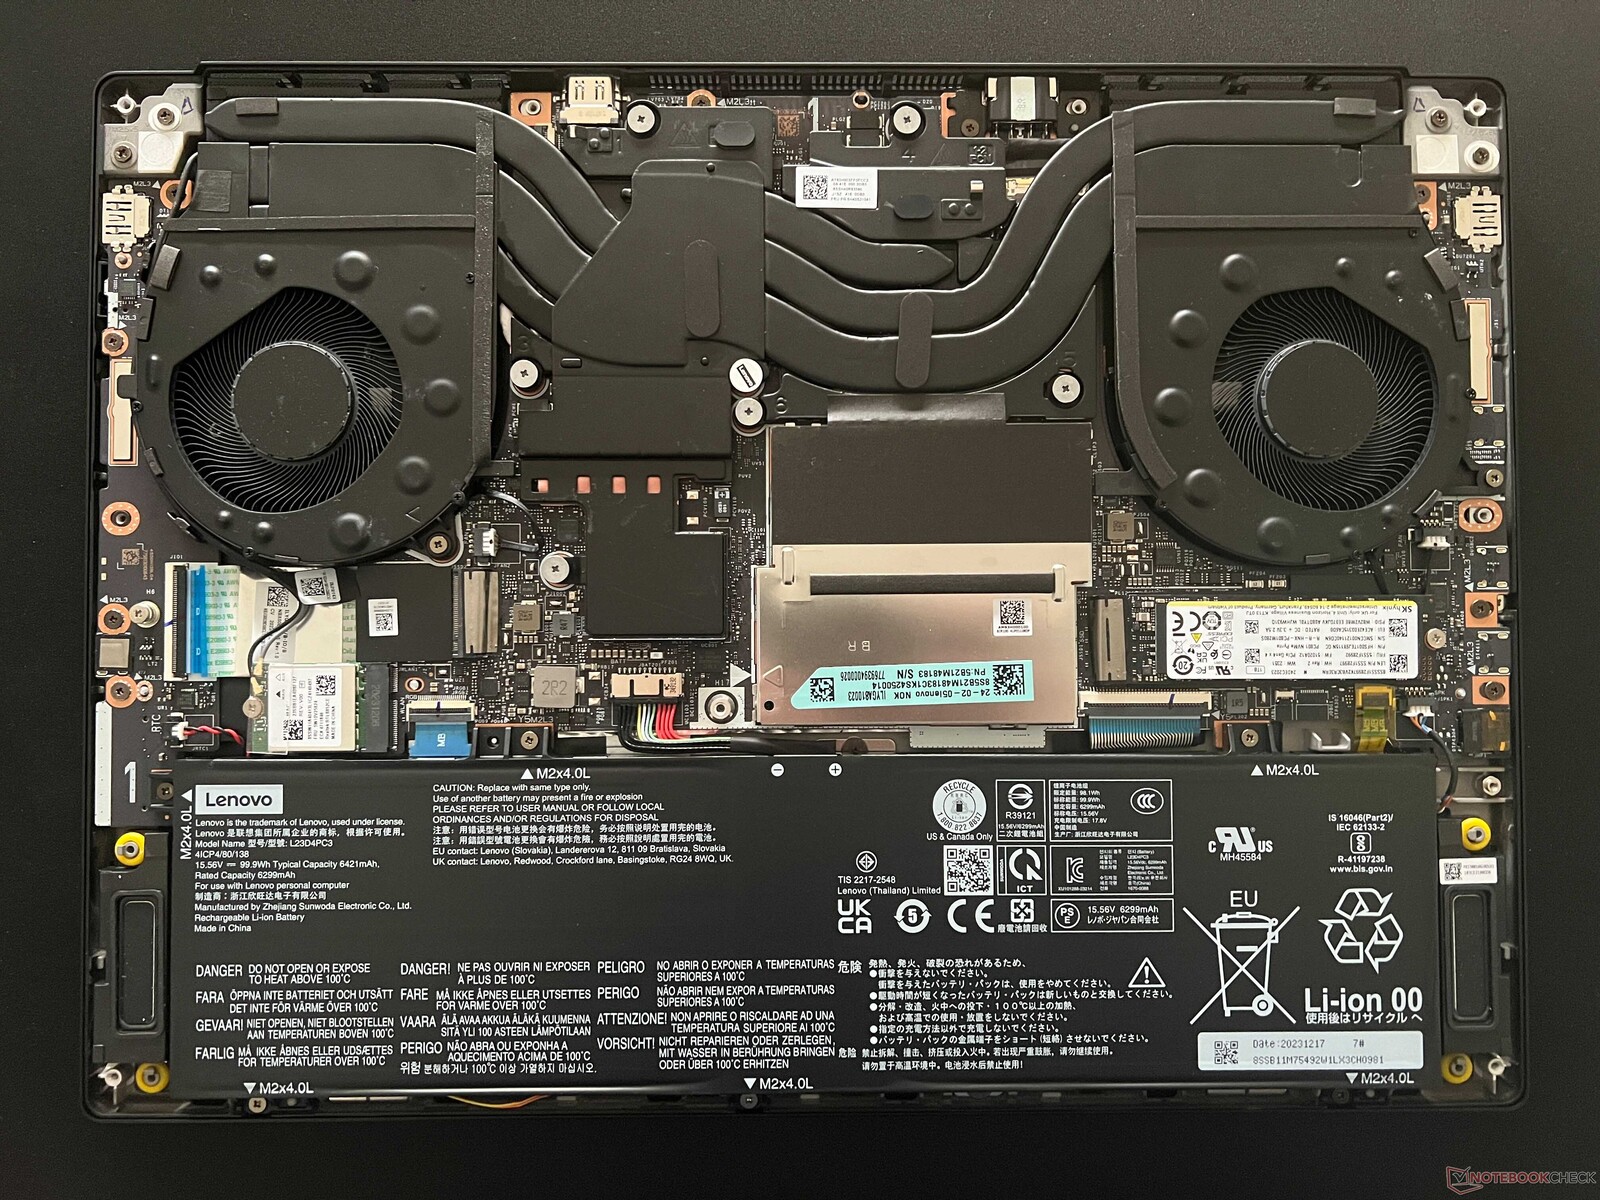
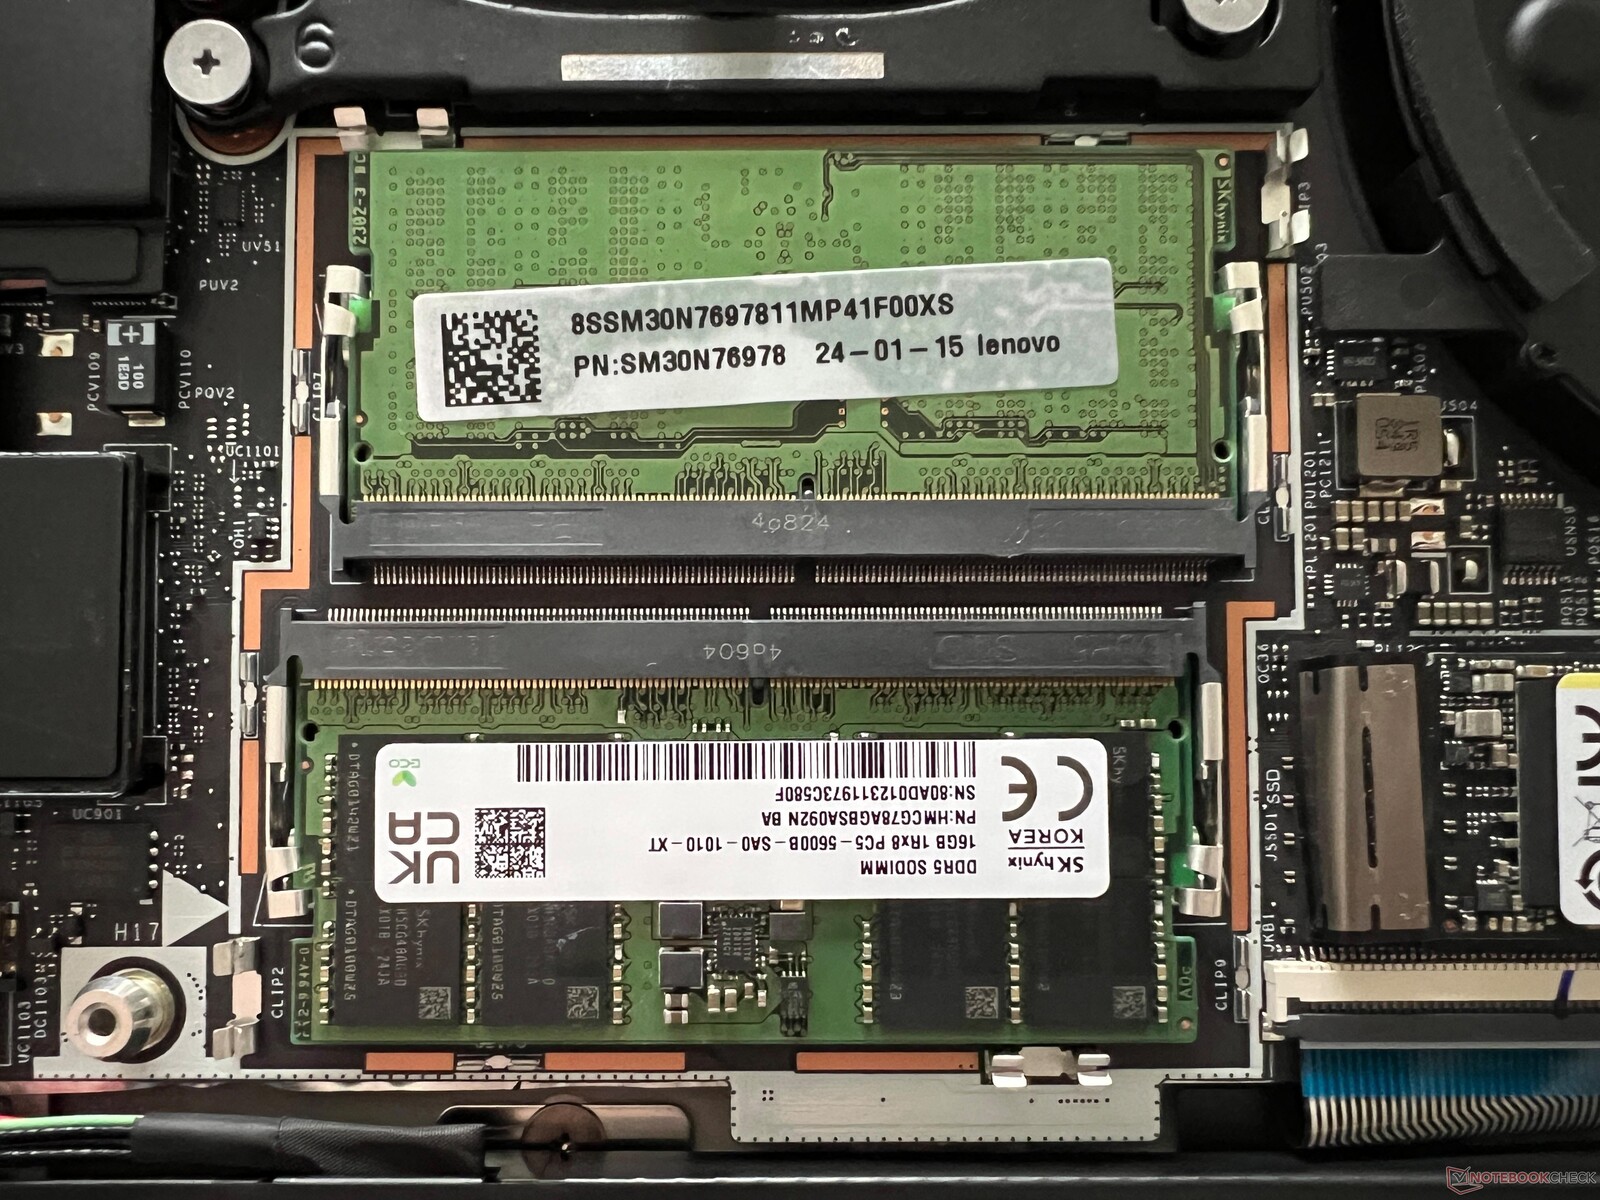
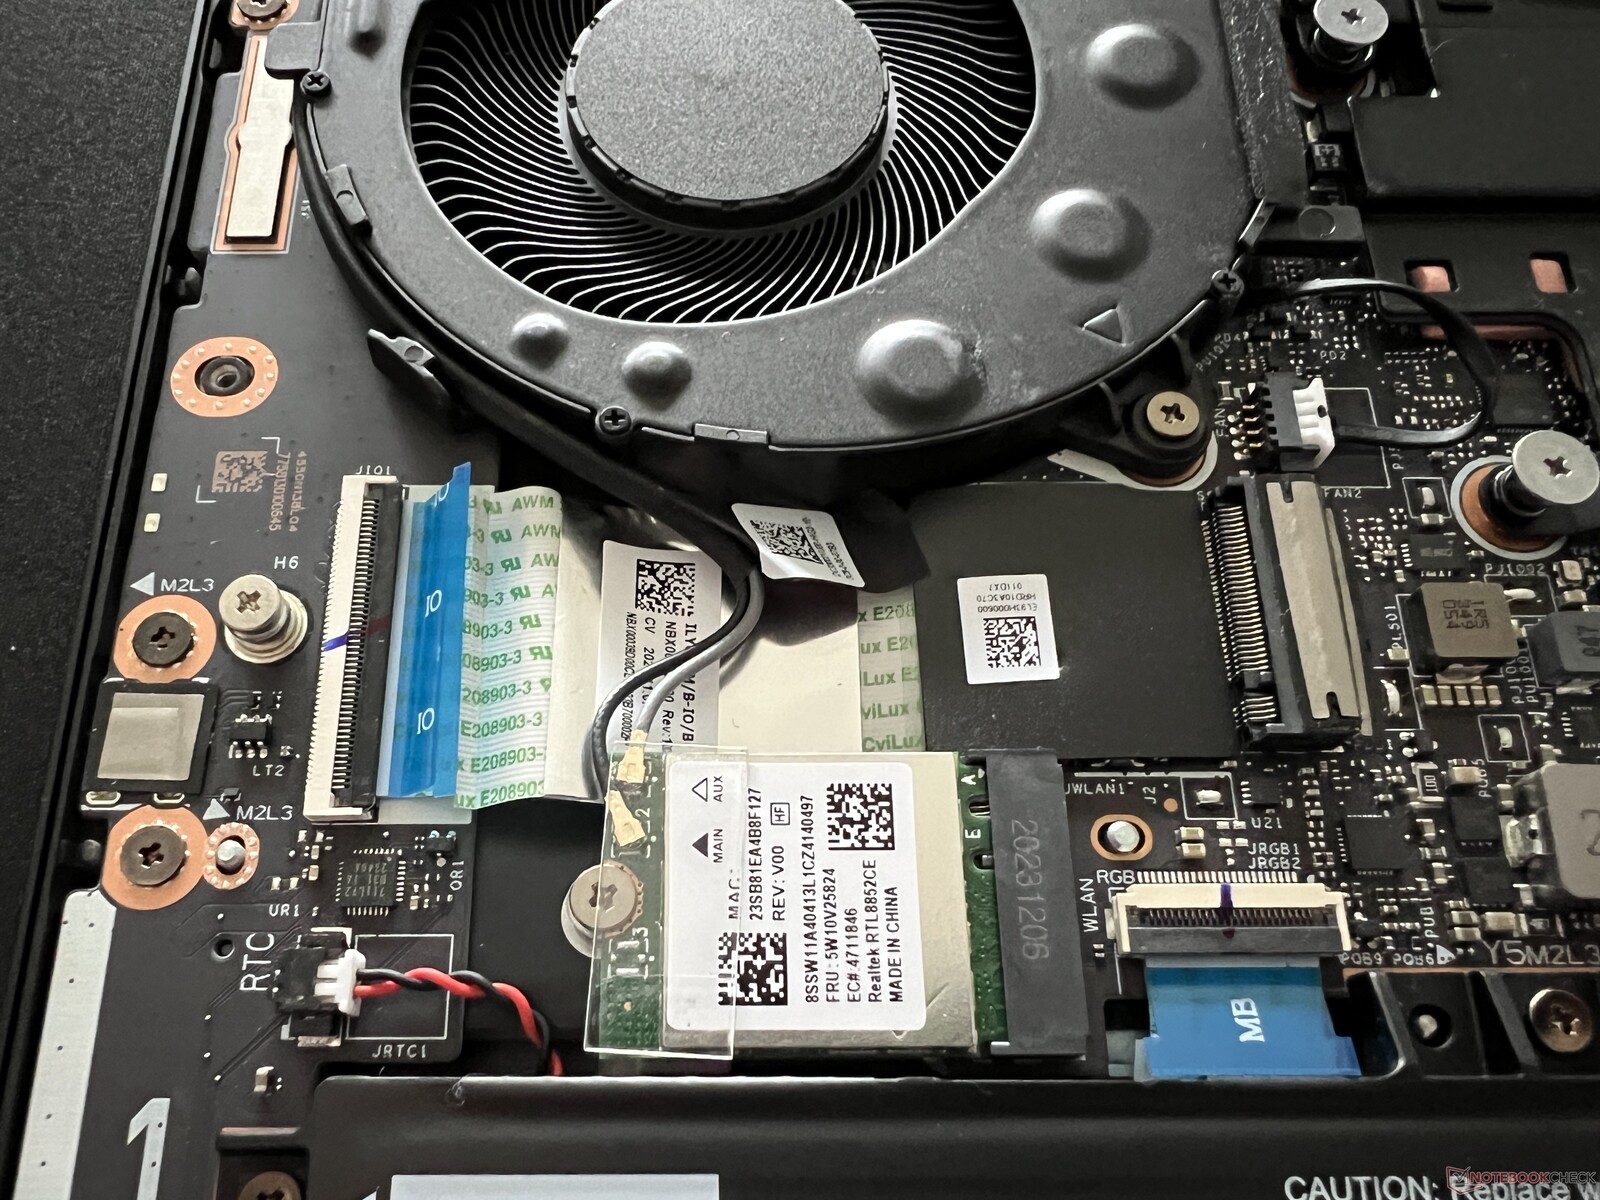
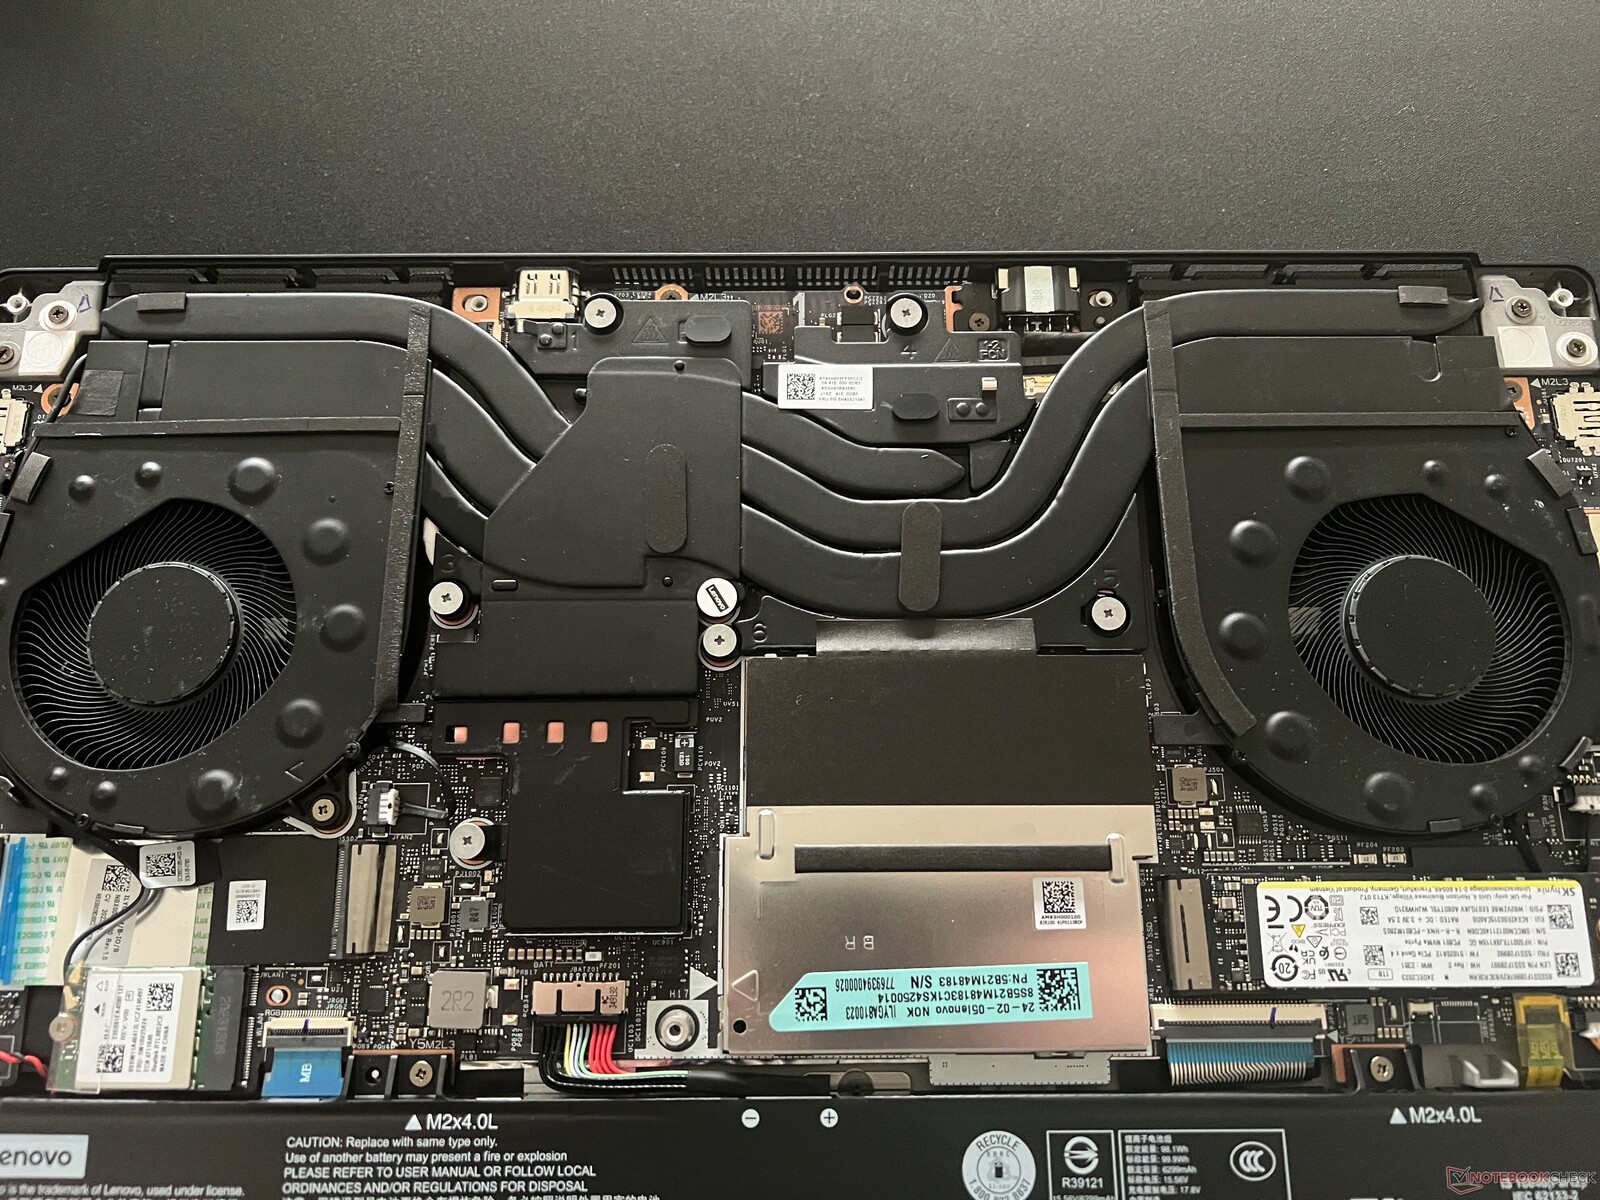
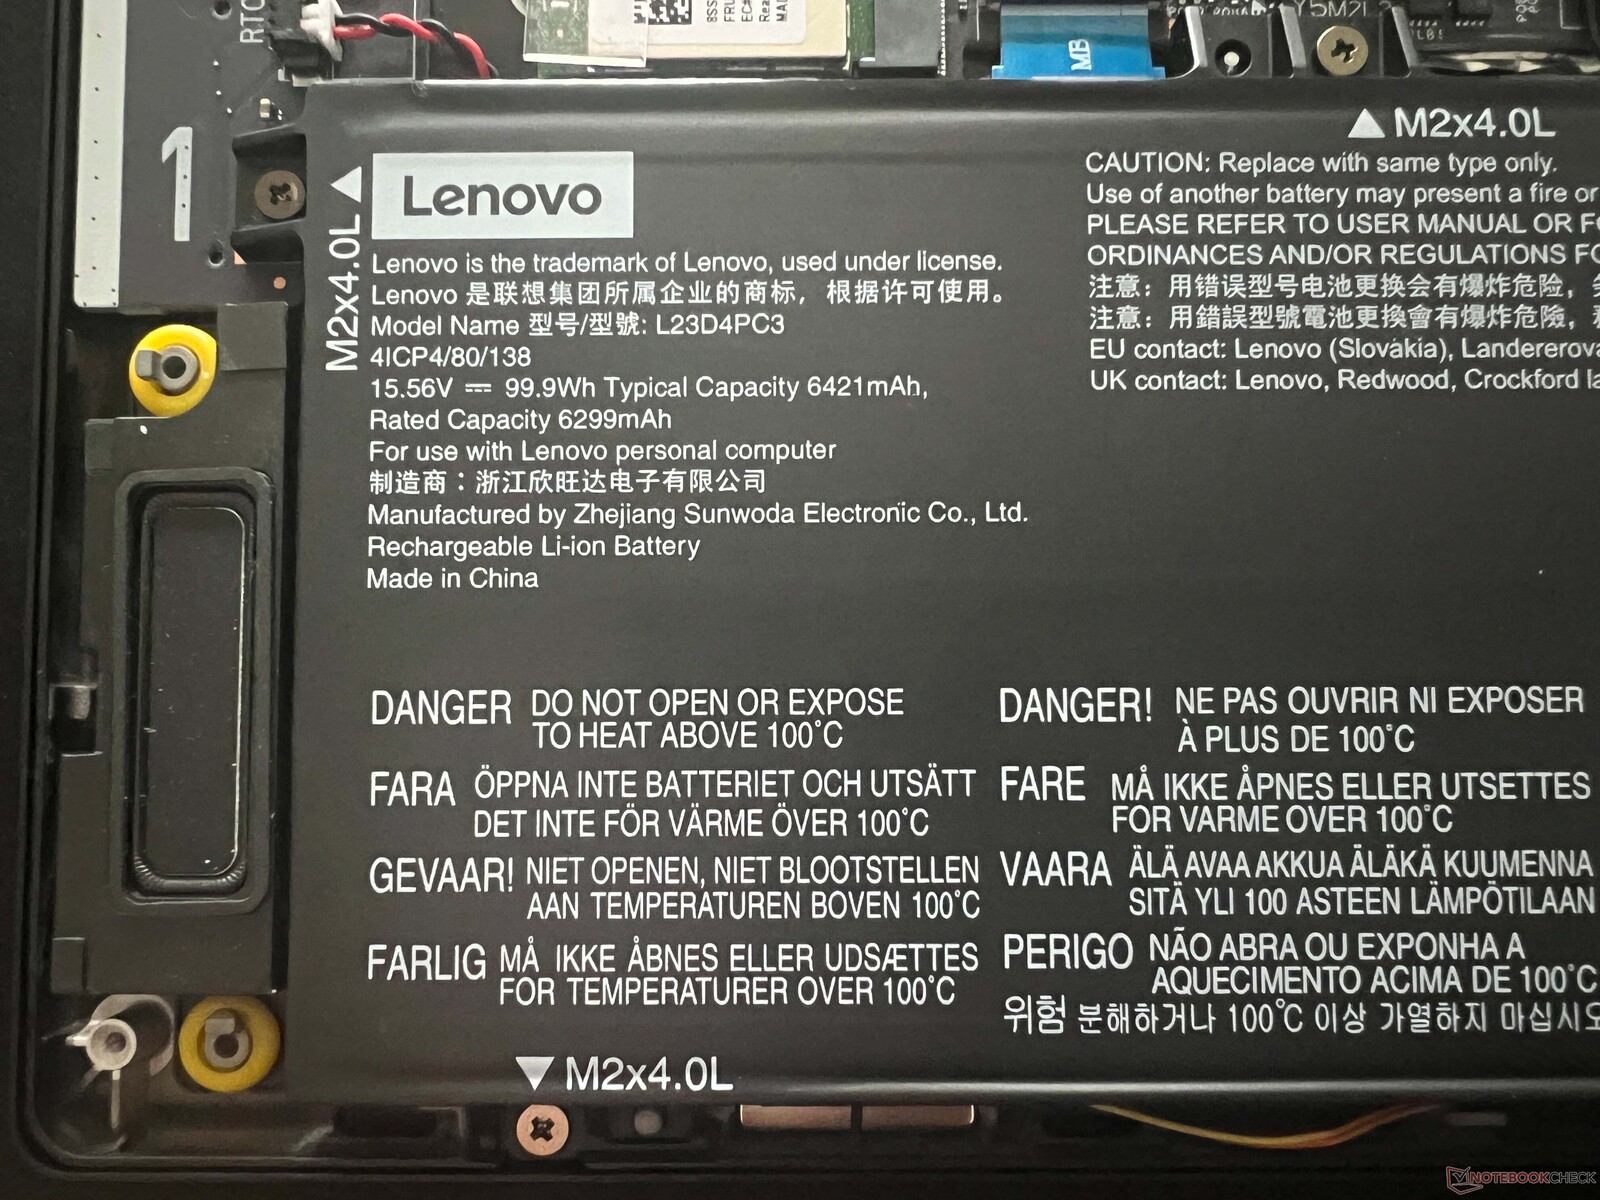
The base cover is secured by normal cross-head screws and is very easy to remove. In addition to the two RAM modules, there are also two M.2 2280 slots although access to the second slot is somewhat impeded by the Wi-Fi cable. Likewise, both the Wi-Fi module and the battery can be replaced.
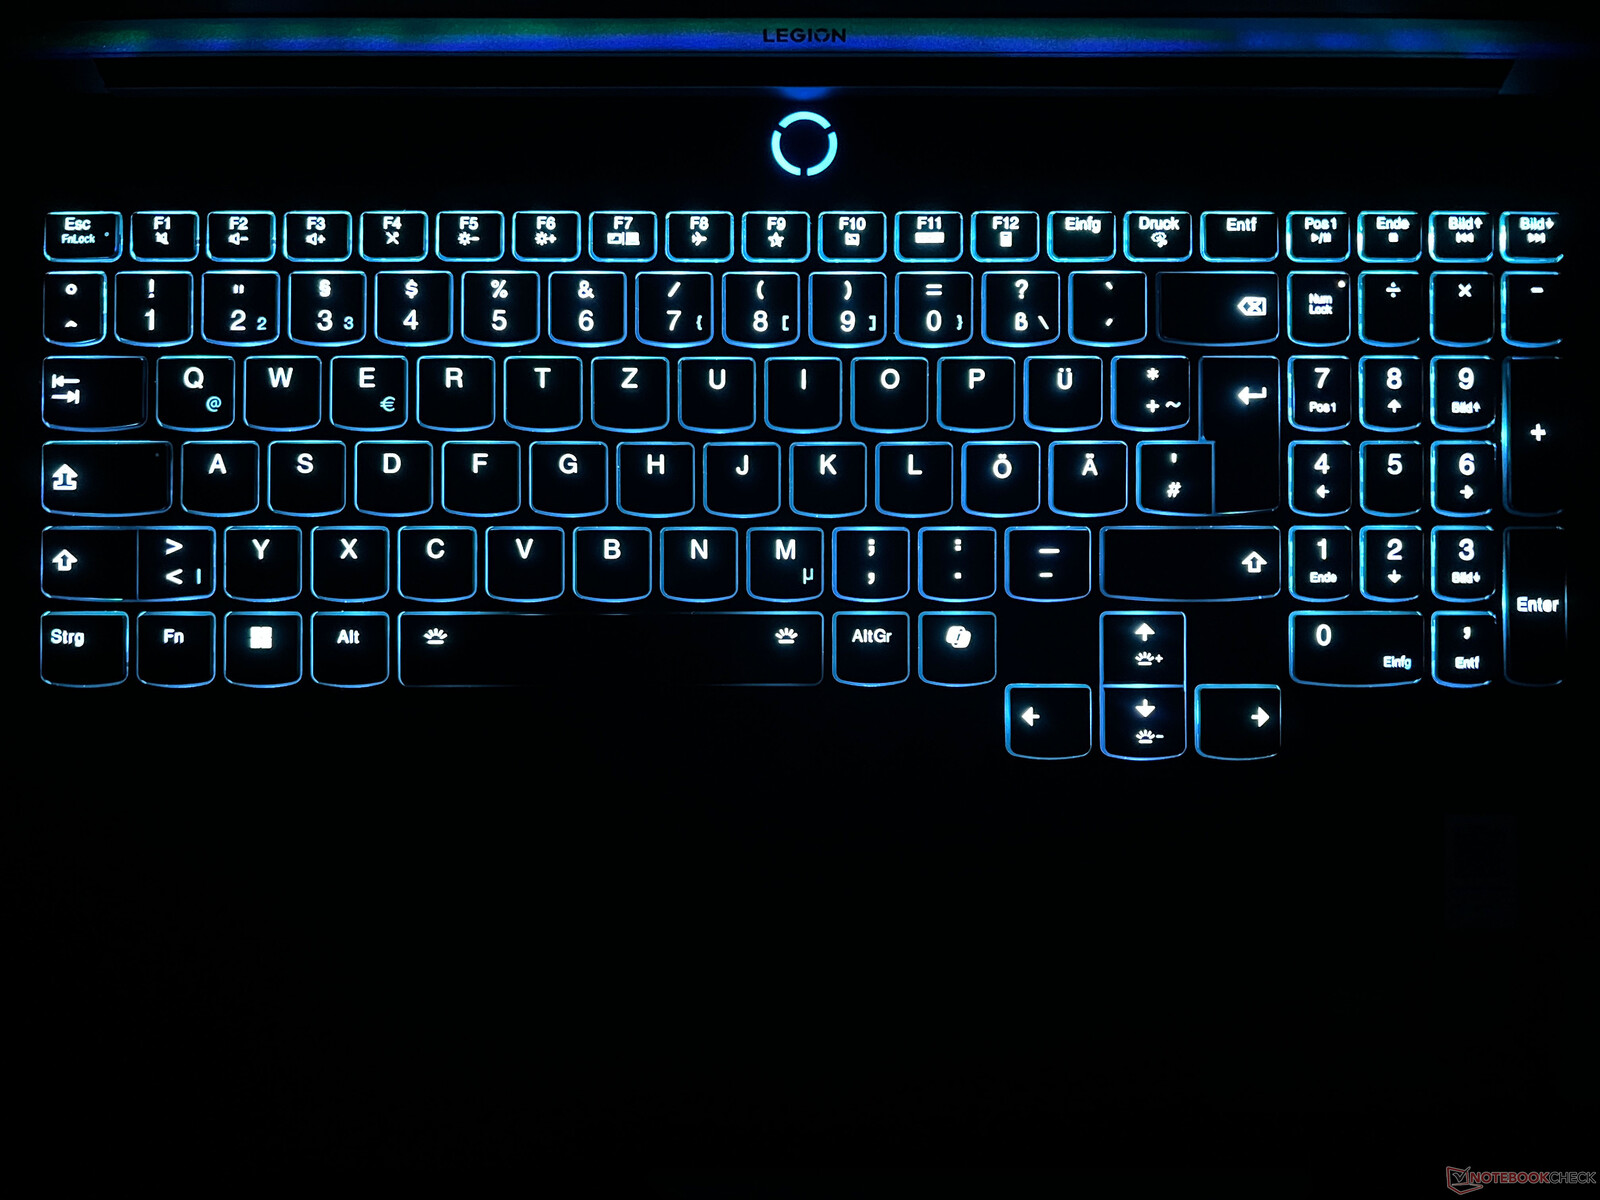
Input devices - Numerical pad and individual key lighting
Lenovo has treated the Legion 7 16 to a very comfortable membrane keyboard which comes complete with a dedicated numerical pad and individual key lighting. Overall, the accurate and pleasantly quiet key strikes give no grounds for complaint. Even longer texts can be typed effortlessly. The numerical pad's keys are a little narrower but that doesn't present any problems in real-life situations. The arrow keys are pleasingly large and a fingerprint scanner is integrated into the power button.
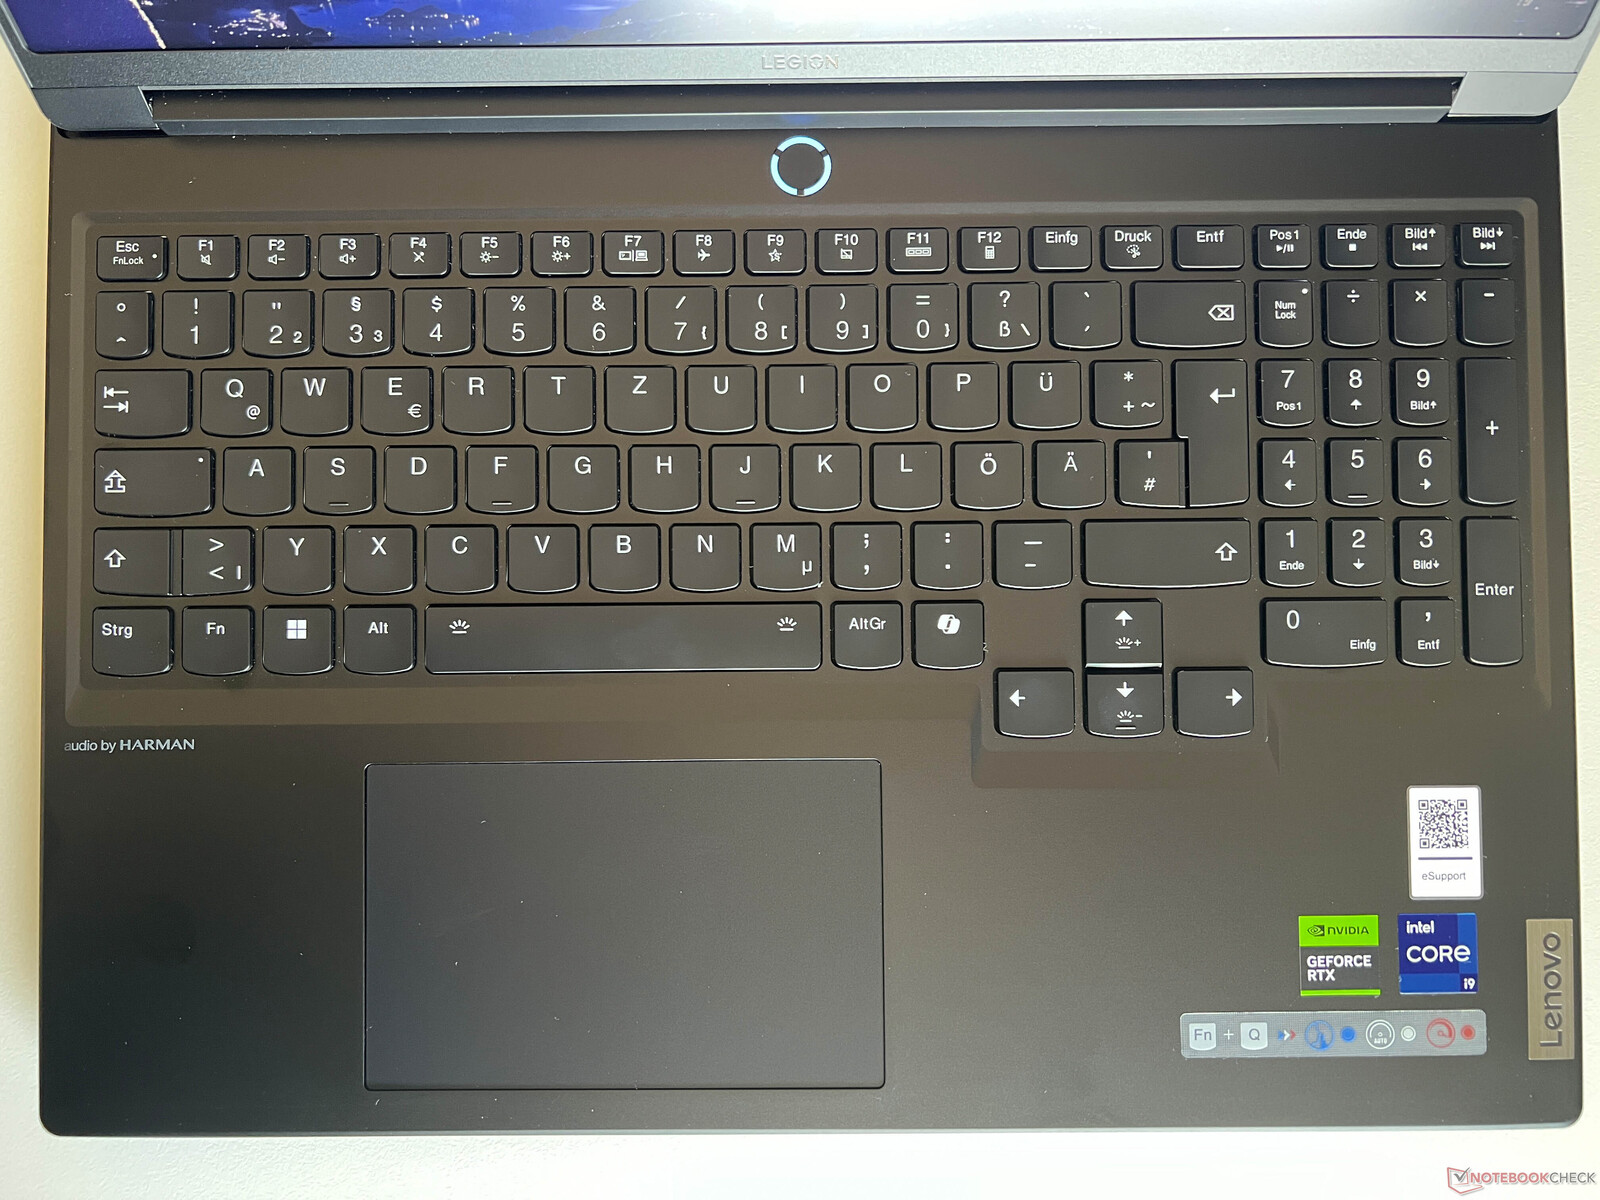
The clickpad is positioned slightly to the left of center and, at 12 x 7.5 cm, it is well-proportioned. Swiping actions are translated very nicely and the lower area of the pad can be clicked - albeit rather loudly. For this reason, you should only touch the pad lightly. The Legion Speed Mouse Mad M is also included.
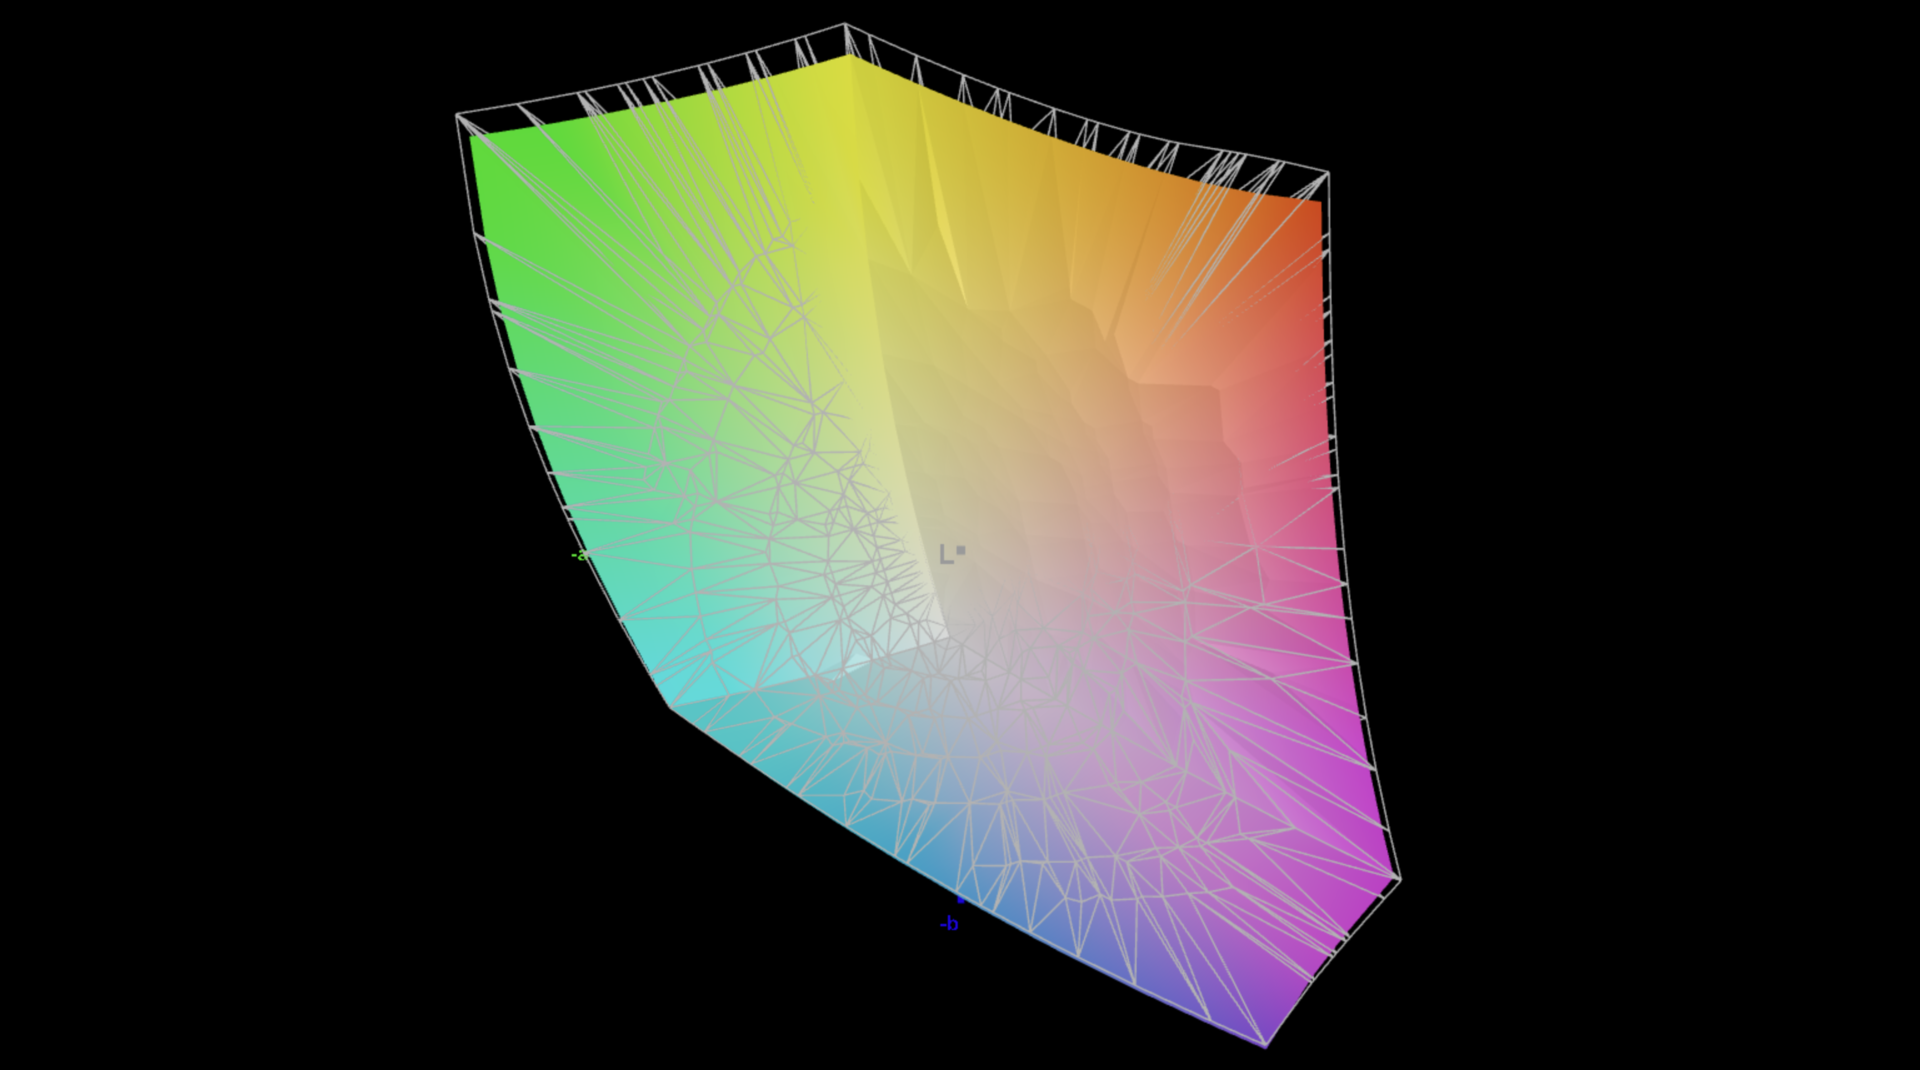
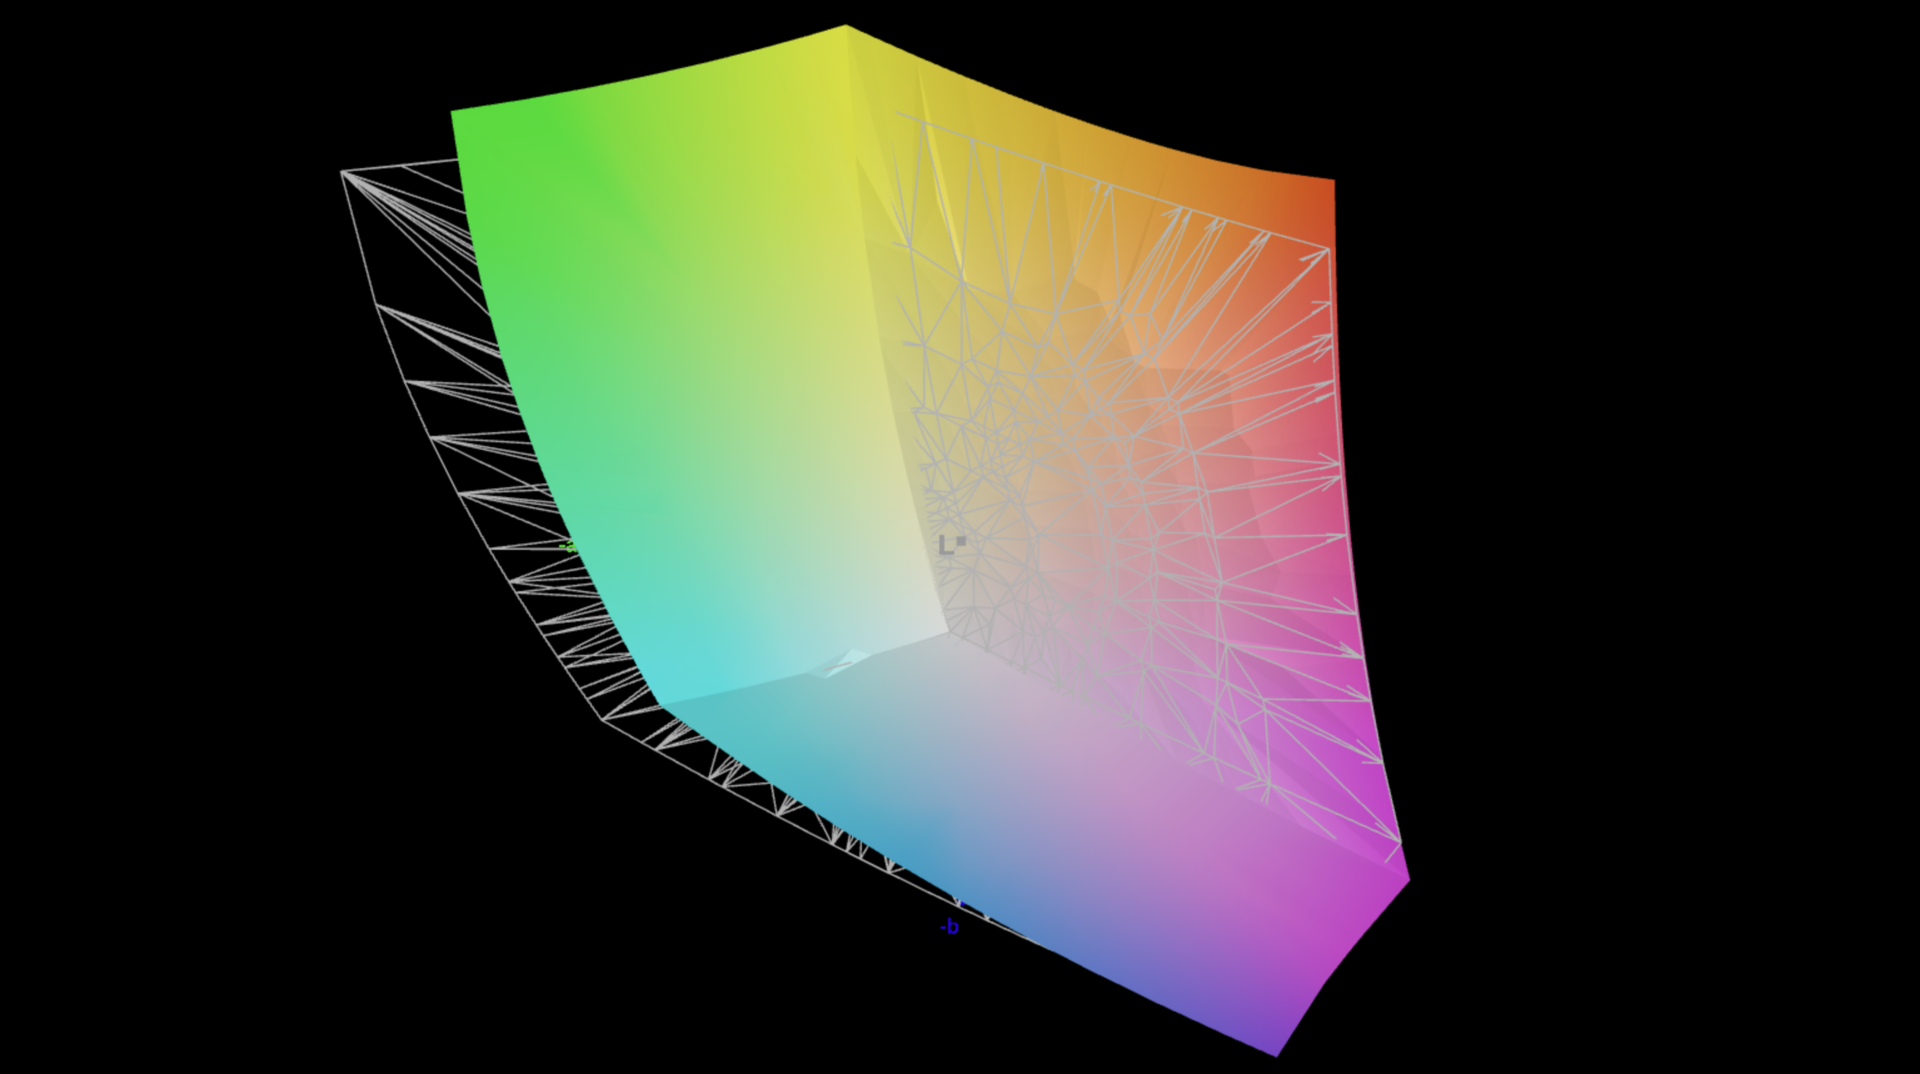
Display - A 3.2K, 165 Hz, IPS panel & G-Sync

Our Legion 7 16 review device is equipped with a high-resolution, 16:10 aspect ratio, IPS display (3,200 x 2,000 pixels). The subjective image quality is good with content appearing very sharp thanks to the display's high resolution. Likewise, colors are also vibrant but current OLED panels offer more vivid images. When it comes to brighter content, the surfaces appear slightly grainy, however, Lenovo mostly manages to avoid that problem by using Windows dark mode as standard. Movements are very smooth thanks to the 165 Hz refresh rate and response times are fast. PWM flickering is not used.
The average brightness sits at around 400 cd/m², but, at 0.43 cd/m², the black value is fairly high and explains why the maximum contrast ratio is only just short of 1,000:1. Additionally, at full brightness and with dark content, there is visible light bleed.
| |||||||||||||||||||||||||
Brightness Distribution: 89 %
Center on Battery: 412 cd/m²
Contrast: 958:1 (Black: 0.43 cd/m²)
ΔE ColorChecker Calman: 0.9 | ∀{0.5-29.43 Ø4.72}
calibrated: 0.6
ΔE Greyscale Calman: 1.4 | ∀{0.09-98 Ø4.97}
87.2% AdobeRGB 1998 (Argyll 3D)
100% sRGB (Argyll 3D)
95% Display P3 (Argyll 3D)
Gamma: 2.23
CCT: 6731 K
| Lenovo Legion 7 16 IRX G9 MNG007ZA1-2, IPS, 3200x2000, 16" | Lenovo Legion Pro 7 16IRX9H BOE CQ NE16QDM-NZB, IPS, 2560x1600, 16" | Lenovo Legion Pro 5 16IRX9 BOE NE160QDM-NYC, IPS, 2560x1600, 16" | Aorus 16X 2024 BOE CQ NE160QDM-NY1, IPS, 2560x1600, 16" | HP Omen Transcend 16-u1095ng ATNA60DL02-0 (SDC41A4), OLED, 2560x1600, 16" | Alienware m16 R2 BOE NE16NYH, IPS, 2560x1600, 16" | Schenker XMG CORE 16 (L23) BOE0AF0 (), IPS, 2560x1600, 16" | |
|---|---|---|---|---|---|---|---|
| Display | 1% | -16% | -18% | 5% | -14% | -16% | |
| Display P3 Coverage (%) | 95 | 98.5 4% | 69.3 -27% | 67.2 -29% | 99.8 5% | 71 -25% | 68.3 -28% |
| sRGB Coverage (%) | 100 | 99.9 0% | 99.4 -1% | 96.7 -3% | 100 0% | 100 0% | 98.6 -1% |
| AdobeRGB 1998 Coverage (%) | 87.2 | 86.7 -1% | 70.1 -20% | 69.3 -21% | 97 11% | 71.4 -18% | 69.6 -20% |
| Response Times | 16% | -4% | 37% | 98% | 20% | 8% | |
| Response Time Grey 50% / Grey 80% * (ms) | 14.4 ? | 12.6 ? 12% | 11.9 ? 17% | 7.5 ? 48% | 0.2 ? 99% | 5.7 ? 60% | 13.2 ? 8% |
| Response Time Black / White * (ms) | 7.2 ? | 5.8 ? 19% | 8.9 ? -24% | 5.4 ? 25% | 0.2 ? 97% | 8.7 ? -21% | 6.6 ? 8% |
| PWM Frequency (Hz) | 120 ? | ||||||
| Screen | 3% | -11% | -58% | 133% | -26% | -69% | |
| Brightness middle (cd/m²) | 412 | 487 18% | 384 -7% | 542 32% | 390 -5% | 345.8 -16% | 376 -9% |
| Brightness (cd/m²) | 396 | 460 16% | 366 -8% | 504 27% | 392 -1% | 337 -15% | 358 -10% |
| Brightness Distribution (%) | 89 | 88 -1% | 91 2% | 86 -3% | 98 10% | 87 -2% | 88 -1% |
| Black Level * (cd/m²) | 0.43 | 0.42 2% | 0.35 19% | 0.45 -5% | 0.02 95% | 0.3 30% | 0.33 23% |
| Contrast (:1) | 958 | 1160 21% | 1097 15% | 1204 26% | 19500 1935% | 1153 20% | 1139 19% |
| Colorchecker dE 2000 * | 0.9 | 1.12 -24% | 0.97 -8% | 2.73 -203% | 1.94 -116% | 1.99 -121% | 2.74 -204% |
| Colorchecker dE 2000 max. * | 2 | 2.26 -13% | 3.57 -79% | 5.29 -165% | 4.26 -113% | 3.52 -76% | 6.78 -239% |
| Colorchecker dE 2000 calibrated * | 0.6 | 0.54 10% | 0.77 -28% | 1.32 -120% | 4.21 -602% | 0.62 -3% | 0.88 -47% |
| Greyscale dE 2000 * | 1.4 | 1.4 -0% | 1.5 -7% | 2.9 -107% | 1.5 -7% | 2.1 -50% | 3.57 -155% |
| Gamma | 2.23 99% | 2.242 98% | 2.24 98% | 2.192 100% | 2.221 99% | 2.32 95% | 2.4 92% |
| CCT | 6731 97% | 6809 95% | 6709 97% | 6173 105% | 6395 102% | 6369 102% | 7246 90% |
| Total Average (Program / Settings) | 7% /
5% | -10% /
-11% | -13% /
-36% | 79% /
101% | -7% /
-17% | -26% /
-47% |
* ... smaller is better
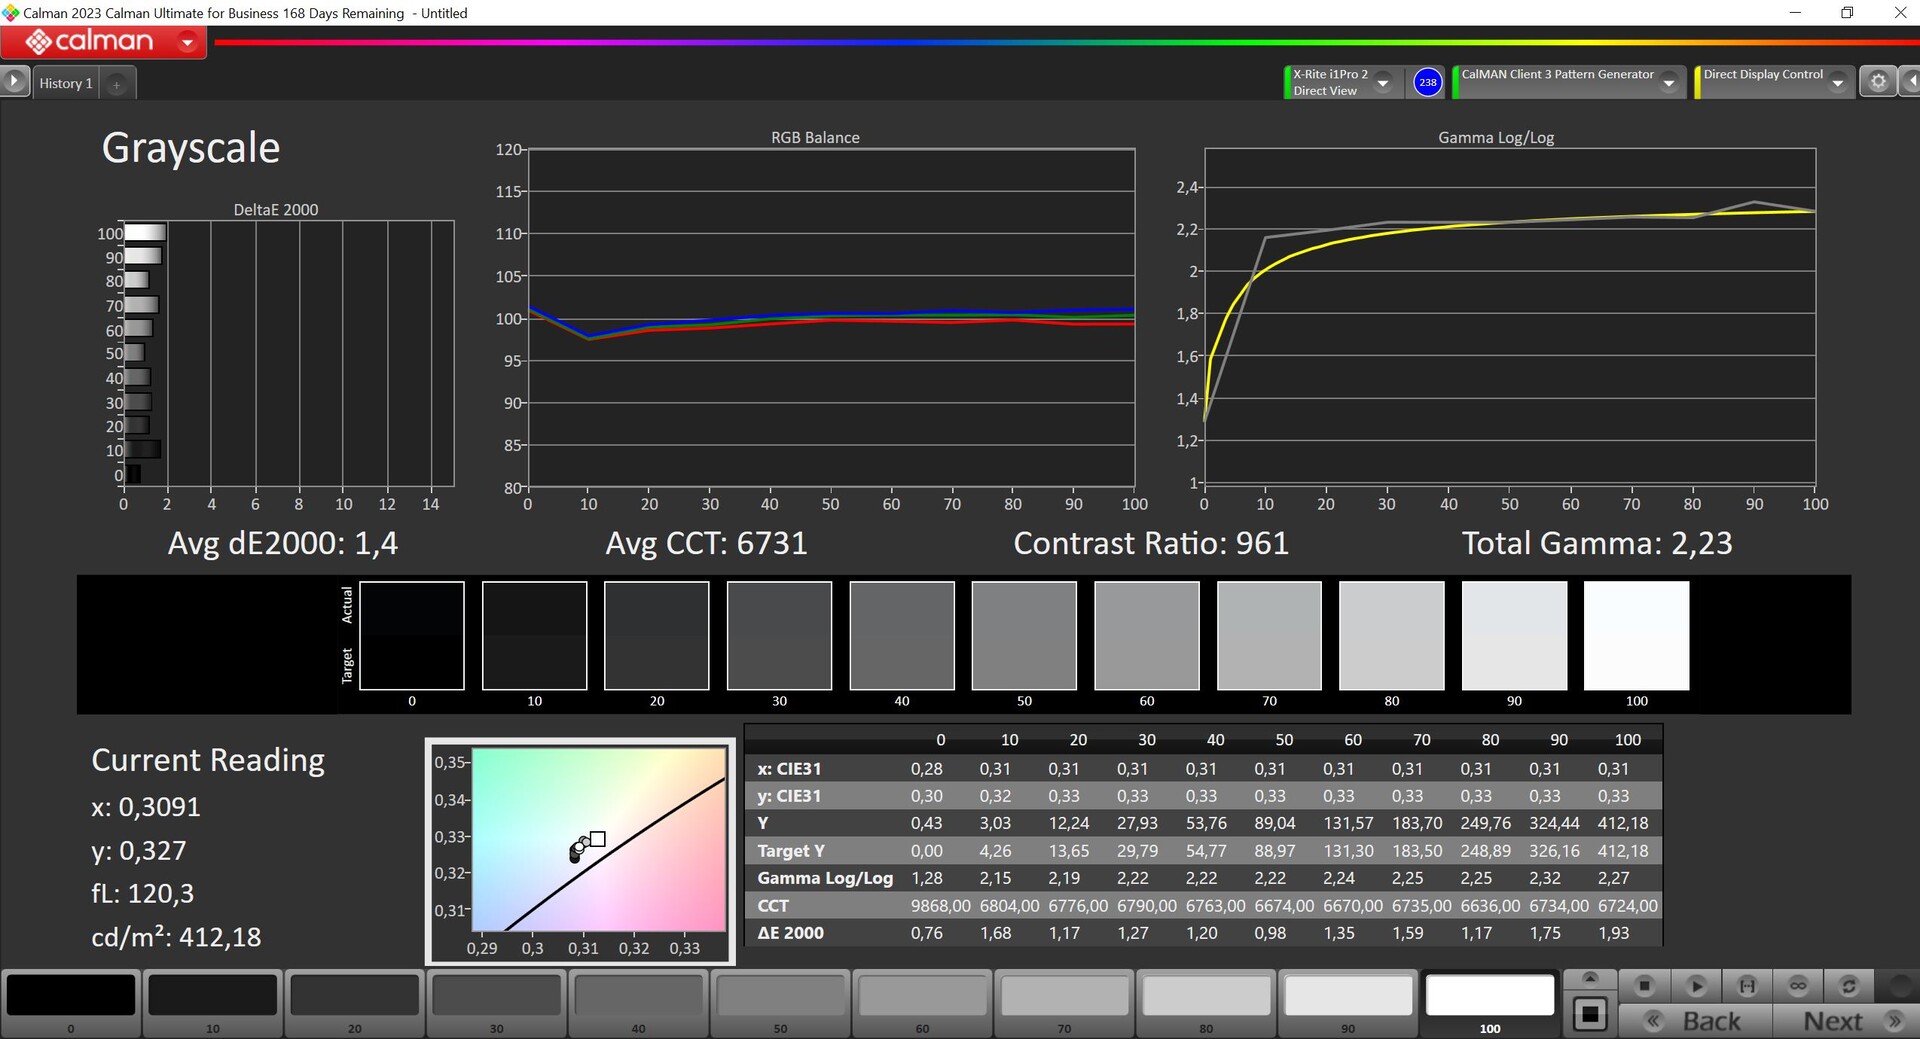
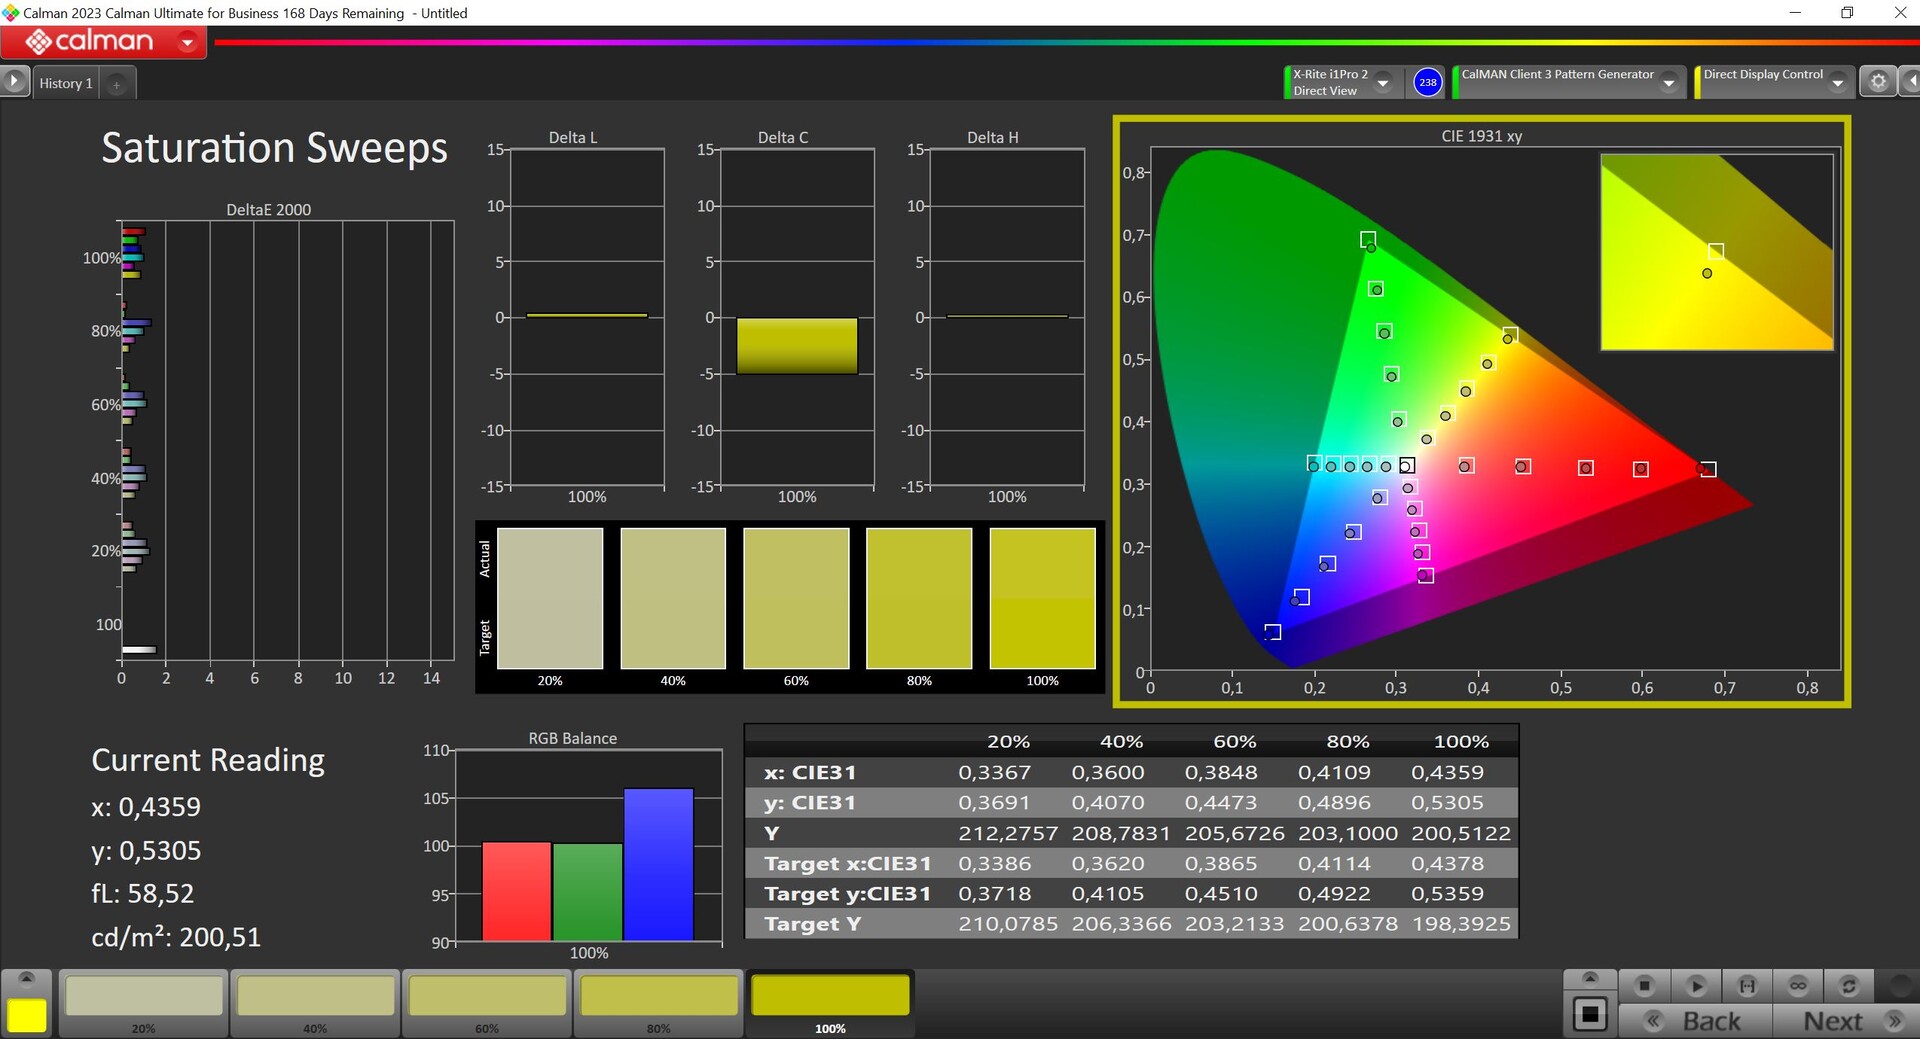
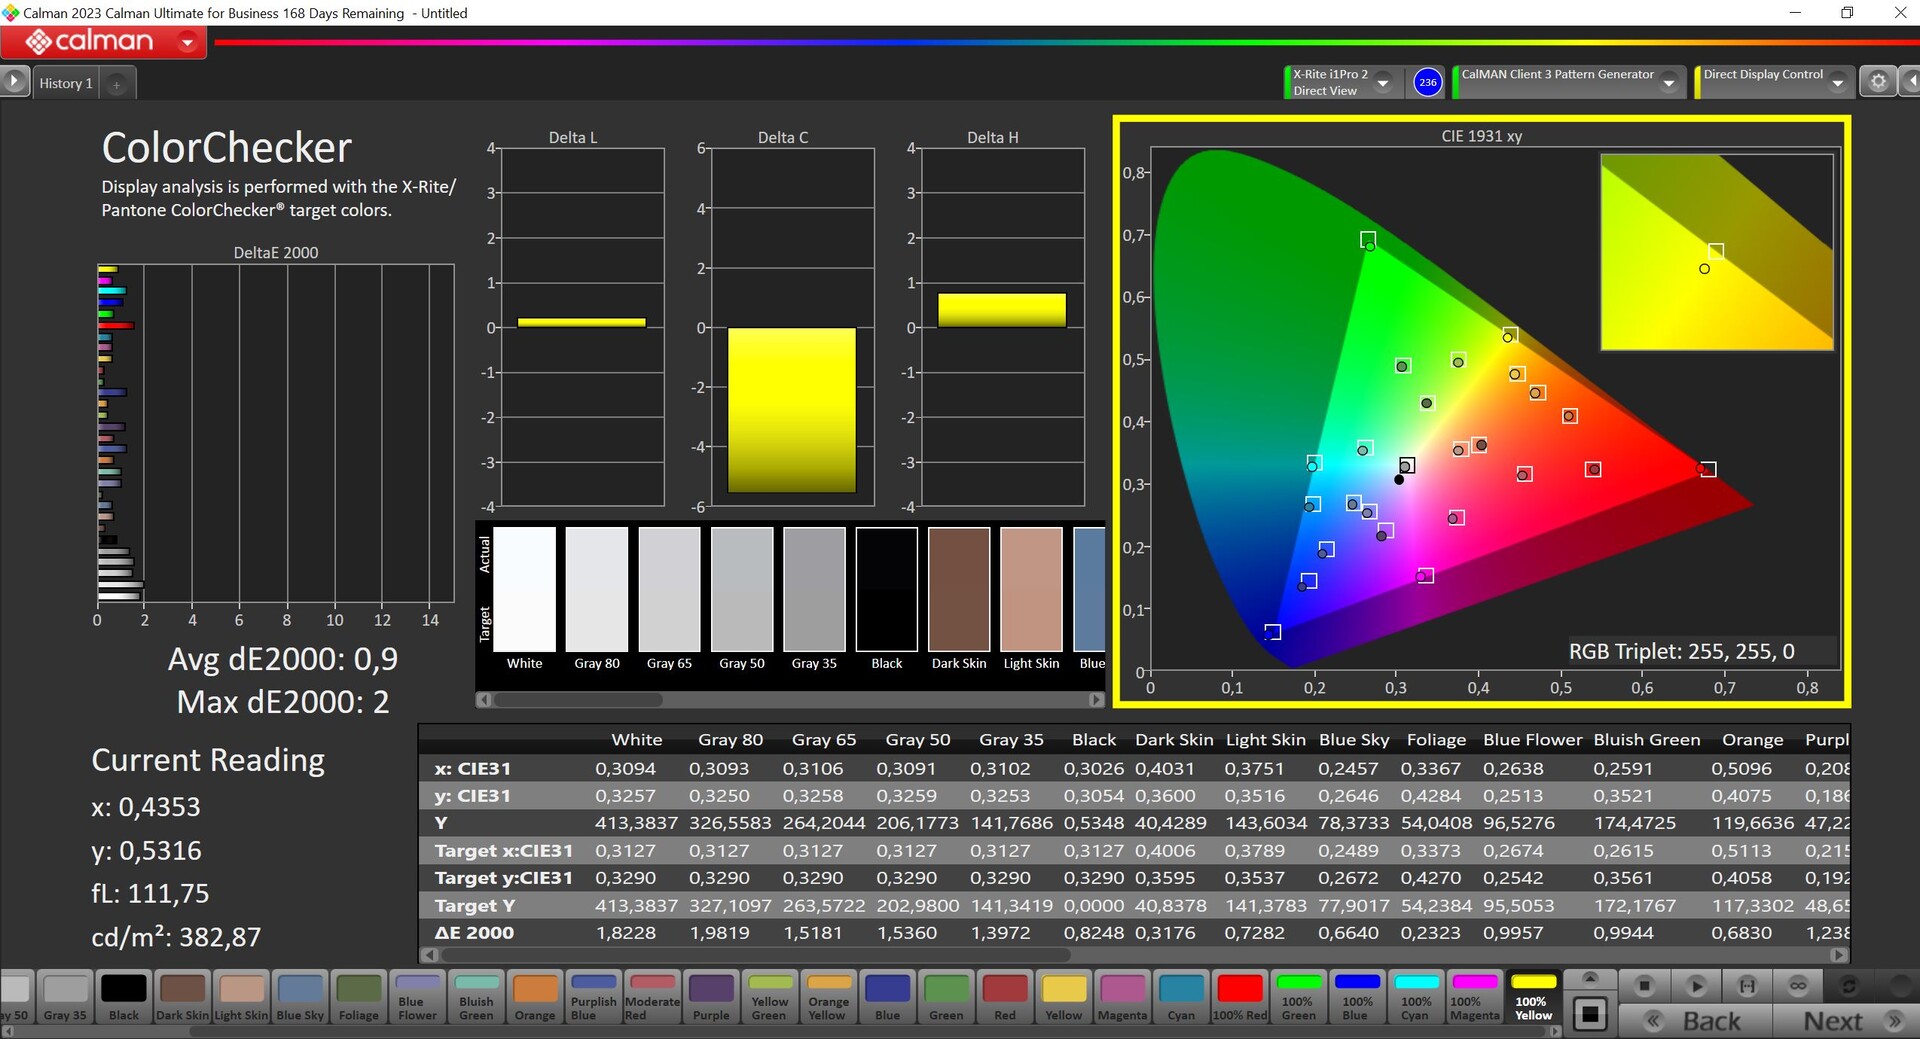


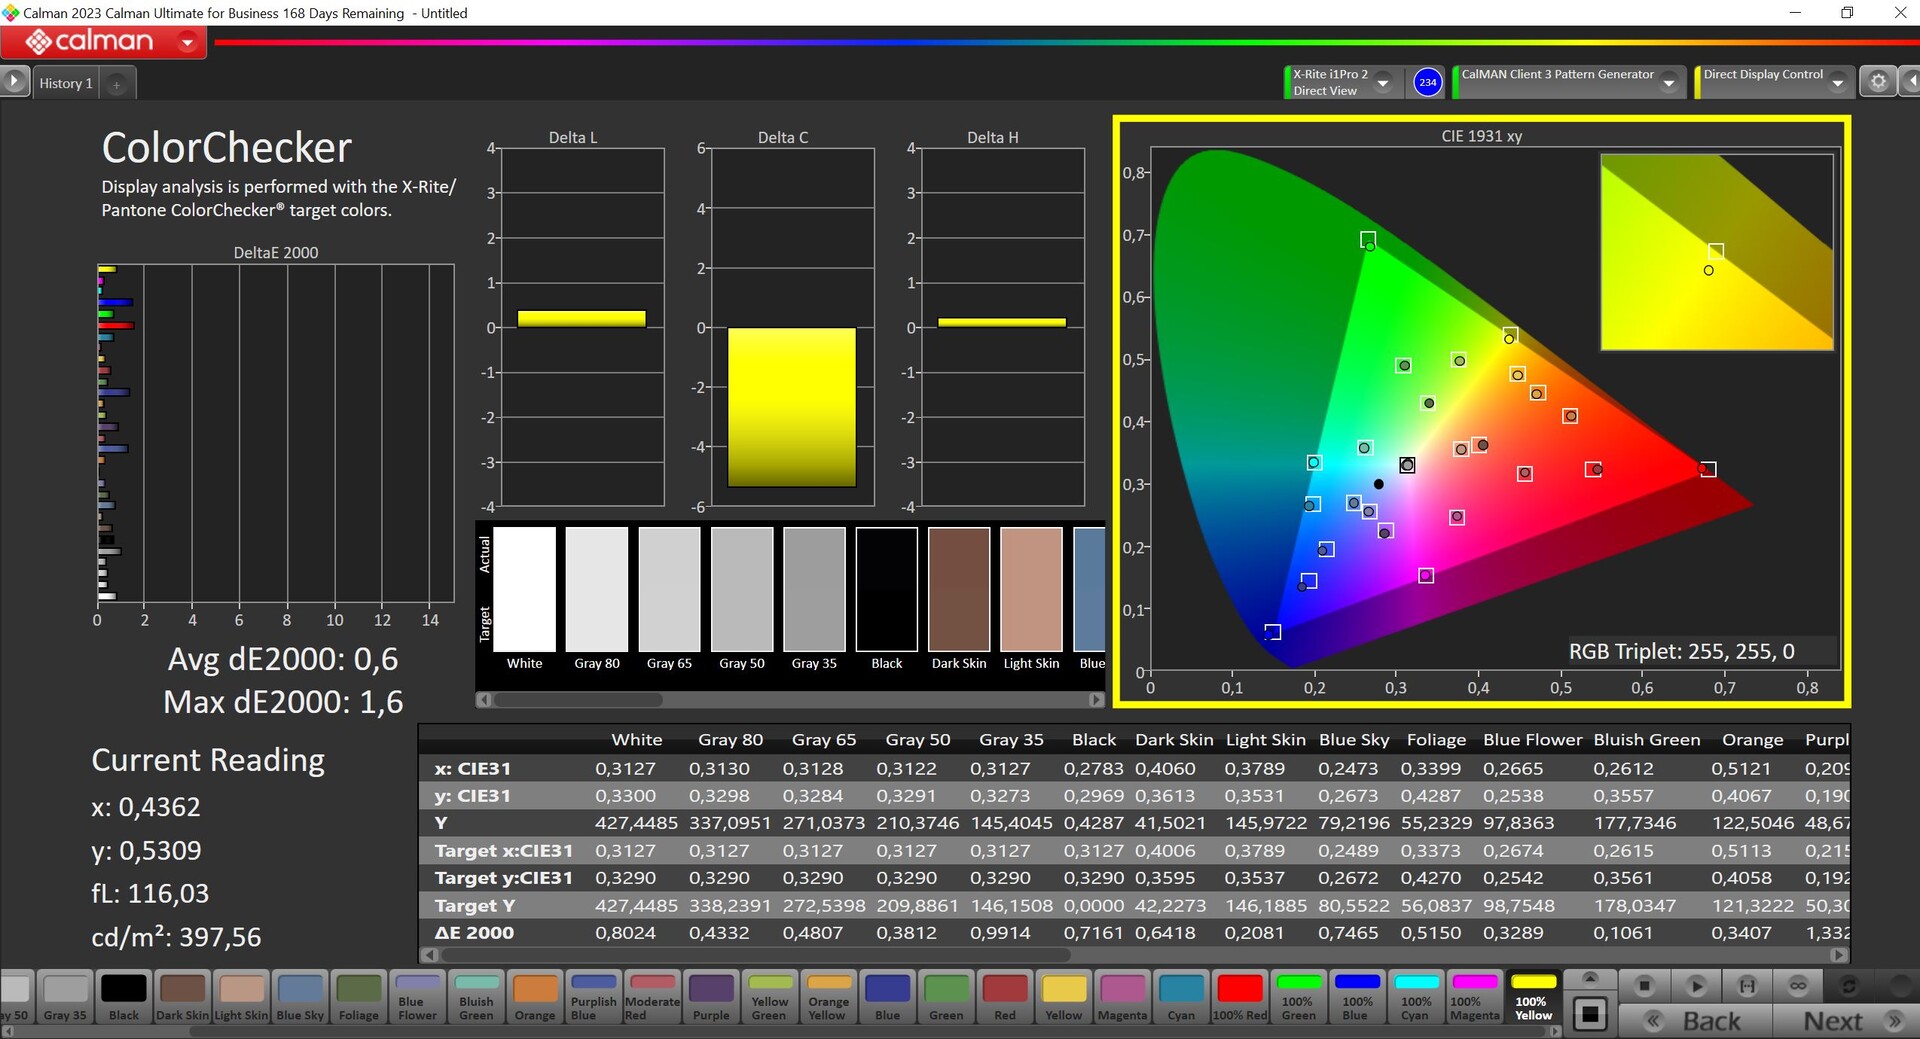
We analyzed the panel using the professional CalMAN software (X-Rite i1 Pro 2). Lenovo offers various profiles and, out of the box, the default profile offers accurate images. Optionally, there is also a native profile with a higher maximum brightness (~455 cd/m²) but also a color temperature that is much too warm and also has higher color deviations. With our calibration, we were able to further improve the images and a free download of the according profile is available above. Likewise, Lenovo offers a very accurate sRGB mode which is particularly important for editing images. The sRGB color space is covered completely; P3 to 95 %.

Display Response Times
| ↔ Response Time Black to White | ||
|---|---|---|
| 7.2 ms ... rise ↗ and fall ↘ combined | ↗ 2.9 ms rise | 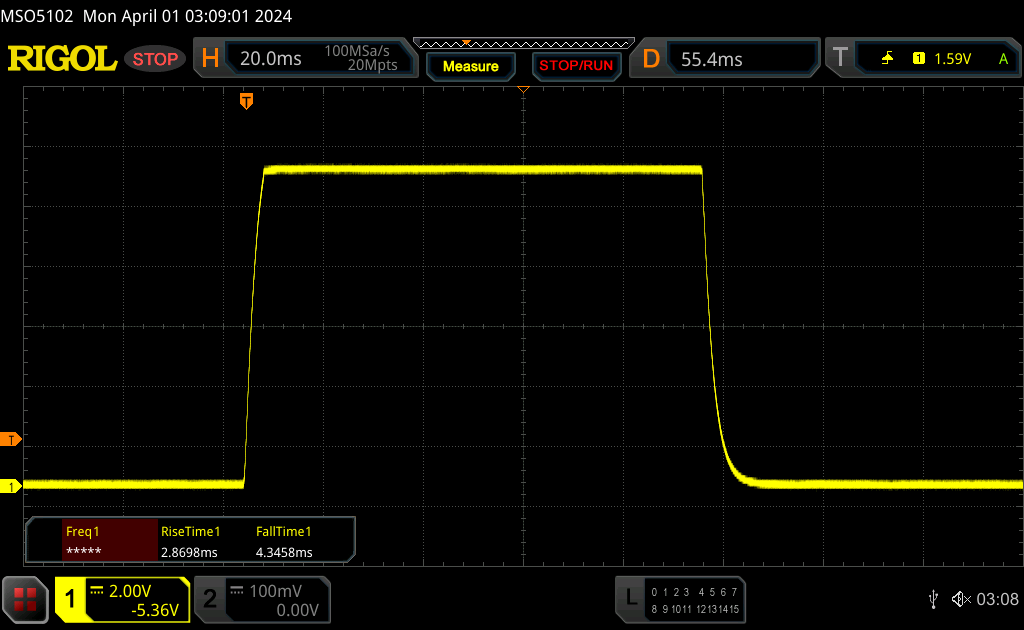 |
| ↘ 4.3 ms fall | ||
| The screen shows very fast response rates in our tests and should be very well suited for fast-paced gaming. In comparison, all tested devices range from 0.1 (minimum) to 240 (maximum) ms. » 21 % of all devices are better. This means that the measured response time is better than the average of all tested devices (19.8 ms). | ||
| ↔ Response Time 50% Grey to 80% Grey | ||
| 14.4 ms ... rise ↗ and fall ↘ combined | ↗ 6.9 ms rise | 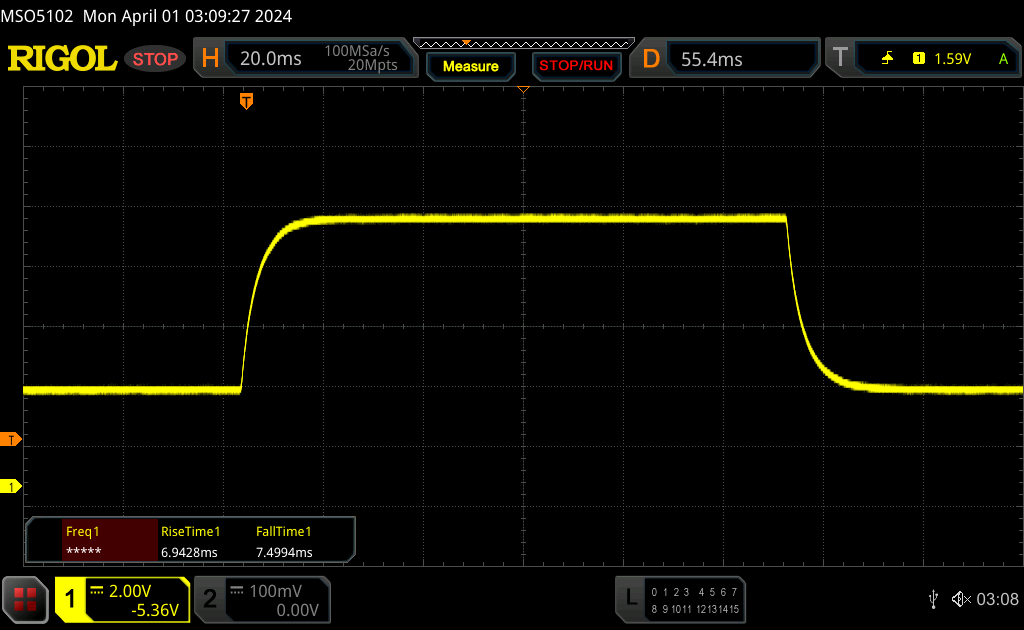 |
| ↘ 7.5 ms fall | ||
| The screen shows good response rates in our tests, but may be too slow for competitive gamers. In comparison, all tested devices range from 0.165 (minimum) to 636 (maximum) ms. » 28 % of all devices are better. This means that the measured response time is better than the average of all tested devices (31 ms). | ||
Screen Flickering / PWM (Pulse-Width Modulation)
| Screen flickering / PWM not detected | 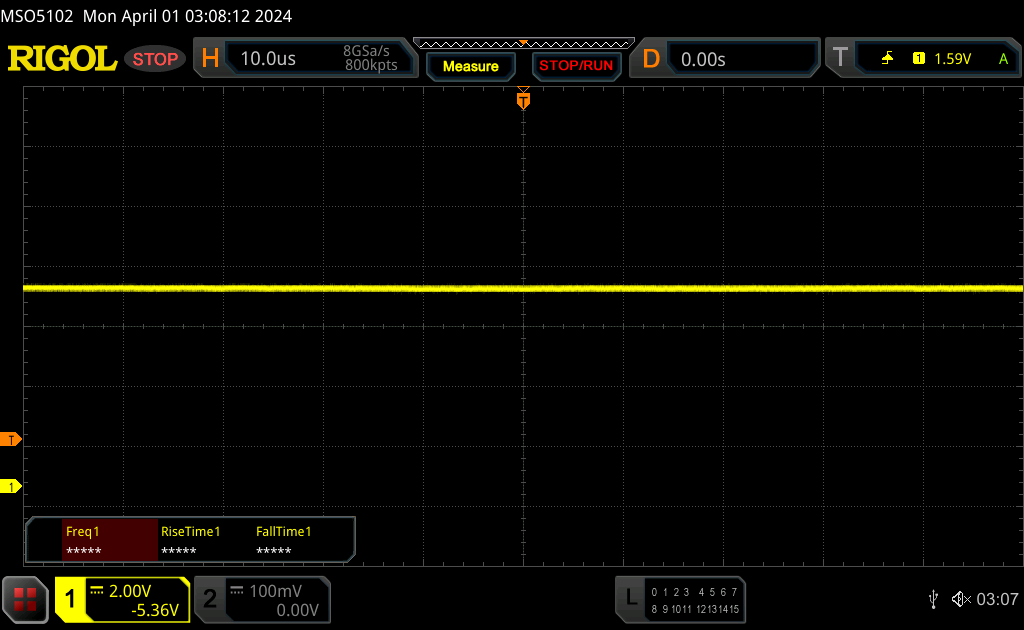 | ||
In comparison: 52 % of all tested devices do not use PWM to dim the display. If PWM was detected, an average of 7763 (minimum: 5 - maximum: 343500) Hz was measured. | |||


Thanks to the matte display, the panel can also be used outdoors but, on bright days, the brightness could be even higher. The IPS panel's viewing angle stability is very good.

Performance - Raptor Lake HX and an overclocked RTX 4070 laptop
Test conditions
As usual, Lenovo offers various energy profiles and we have compiled a summarized list of the according performance data in the following table. The current profile is also displayed via the power button's LED. We carried out the benchmarks and measurements in performance mode in which the GPU is automatically slightly overclocked (+100 MHz core, +200 MHz VRAM). Performance mode is unavailable using battery mode.
| Energy profile | CPU load | CB R23 Multi | GPU load | Time Spy Graphics | Cyberpunk 2077 QHD Ultra |
max. fan volume |
|---|---|---|---|---|---|---|
| Quiet mode | 65 -> 54 watts | 20,203 points | 65 watts | 8,239 points | 35 FPS | 38.4 dB(A) |
| Balanced | 120 -> 85 watts | 24,142 points | 95 watts | 9,853 points | 41.5 FPS | 50.7 dB(A) |
| Performance mode | 154 -> 90 watts | 31,127 points | 115 watts | 12,174 points | 51.4 FPS | 54.1 dB(A) |
Note: Unsuccessfully, we tried updating the Nvidia drivers. The official driver ended the installation with a compatibility problem. Up to now, Lenovo itself has only made the preinstalled 537.70 driver available and this is the one we inevitably used.
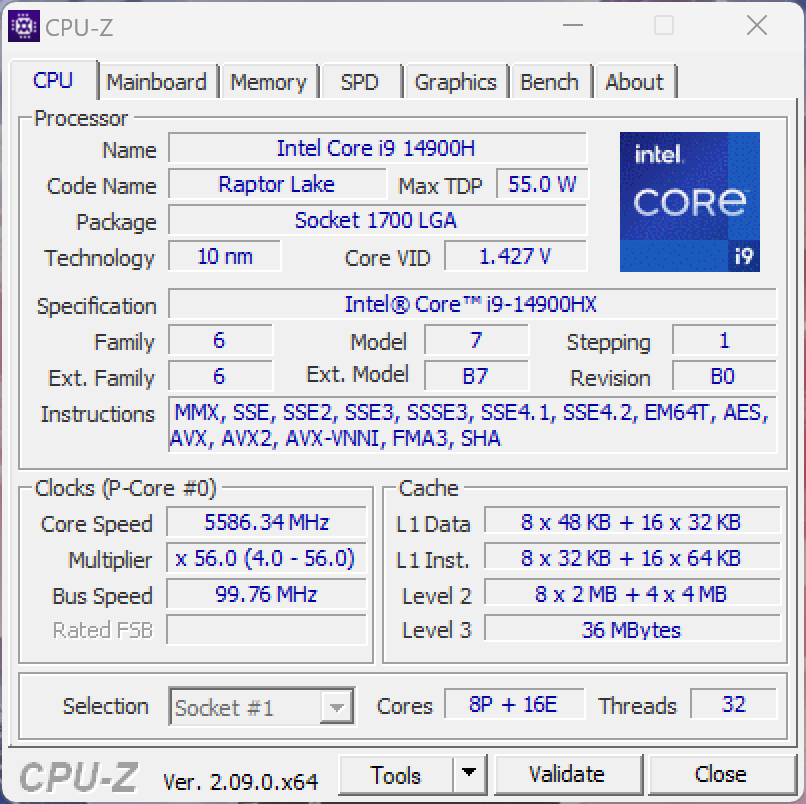
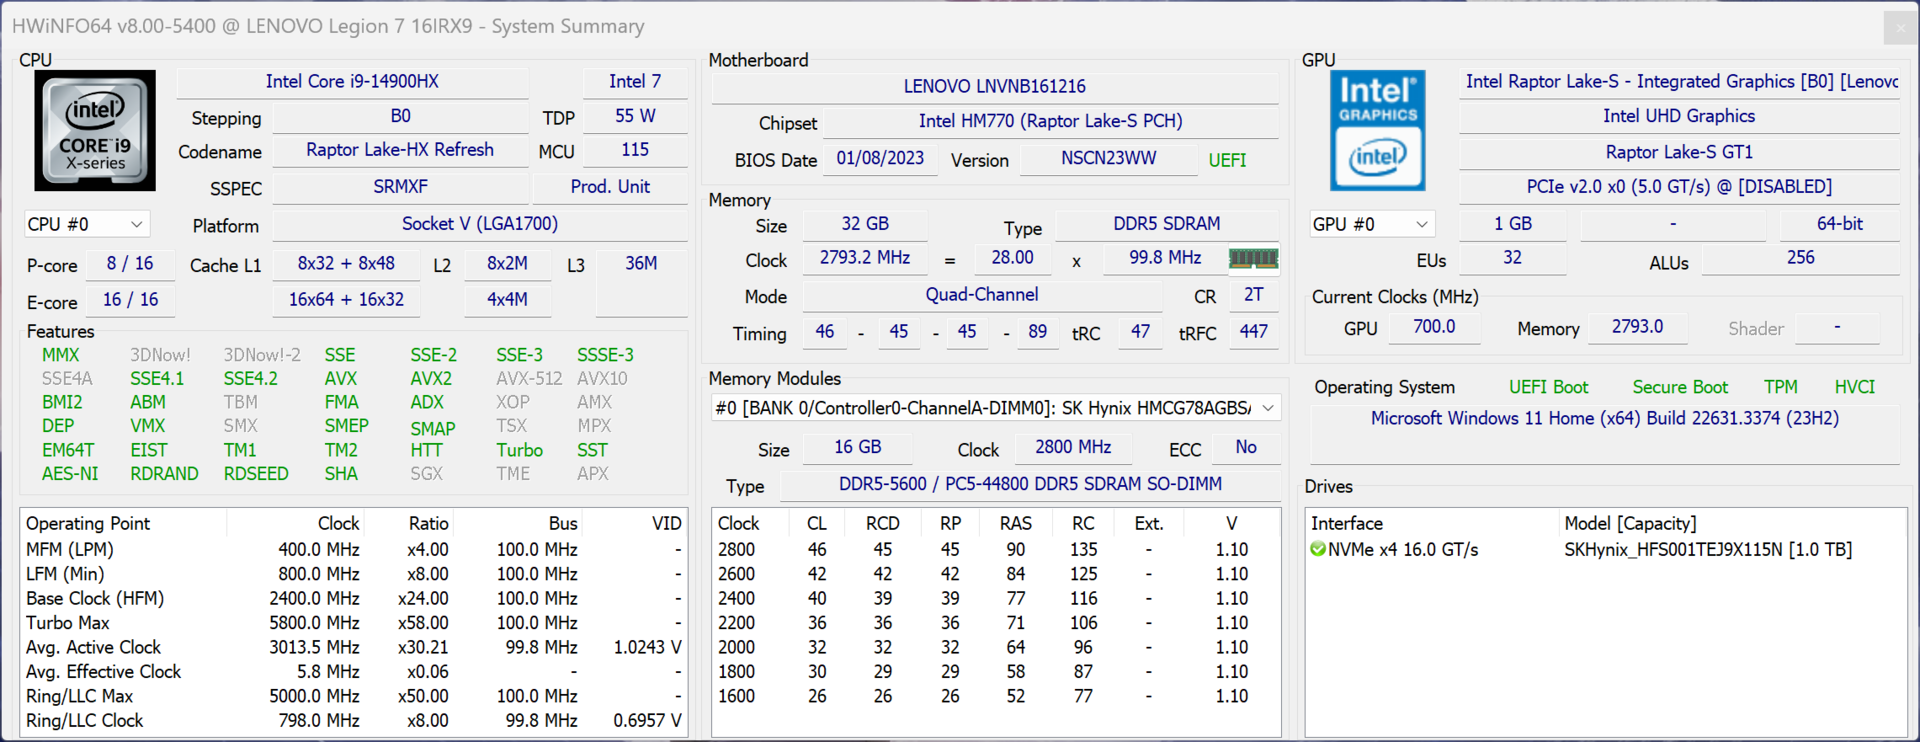
Processor - Core i9-14900HX
Lenovo has also equipped the normal Legion 7 16 with the Core i9-14900HX, the fastest Raptor Lake mobile processor which can also be found in the more expensive Legion Pro 7. Compared to both of the thicker Legion Pro 7/5 16 models, the slimmer case has an impact when it comes to the power limits, dropping to 90 watts after having briefly hit 154 watts. All in all, performance was wonderful both in the multi-core and single-core tests. In battery mode, the processor is allowed to consume a maximum of 60 watts which is why the multi-core performance is around 40 % lower here. Additional CPU benchmarks can be found in our technology section.
Cinebench R15 Multi Continuous Test
Cinebench R23: Multi Core | Single Core
Cinebench R20: CPU (Multi Core) | CPU (Single Core)
Cinebench R15: CPU Multi 64Bit | CPU Single 64Bit
Blender: v2.79 BMW27 CPU
7-Zip 18.03: 7z b 4 | 7z b 4 -mmt1
Geekbench 6.7: Multi-Core | Single-Core
Geekbench 5.5: Multi-Core | Single-Core
HWBOT x265 Benchmark v2.2: 4k Preset
LibreOffice : 20 Documents To PDF
R Benchmark 2.5: Overall mean
| CPU Performance rating | |
| Lenovo Legion Pro 7 16IRX9H | |
| Lenovo Legion 7 16 IRX G9 | |
| Lenovo Legion Pro 5 16IRX9 | |
| Aorus 16X 2024 | |
| Average Intel Core i9-14900HX | |
| Average of class Gaming | |
| HP Omen Transcend 16-u1095ng | |
| Alienware m16 R2 -1! | |
| Schenker XMG CORE 16 (L23) | |
| Cinebench R23 / Multi Core | |
| Lenovo Legion Pro 7 16IRX9H | |
| Lenovo Legion 7 16 IRX G9 | |
| Lenovo Legion Pro 5 16IRX9 | |
| Average Intel Core i9-14900HX (17078 - 36249, n=37) | |
| Aorus 16X 2024 | |
| Average of class Gaming (10488 - 40970, n=110, last 2 years) | |
| HP Omen Transcend 16-u1095ng | |
| Alienware m16 R2 | |
| Schenker XMG CORE 16 (L23) | |
| Cinebench R23 / Single Core | |
| Lenovo Legion Pro 7 16IRX9H | |
| Lenovo Legion 7 16 IRX G9 | |
| Aorus 16X 2024 | |
| HP Omen Transcend 16-u1095ng | |
| Average Intel Core i9-14900HX (1720 - 2245, n=37) | |
| Lenovo Legion Pro 5 16IRX9 | |
| Average of class Gaming (1166 - 2356, n=110, last 2 years) | |
| Schenker XMG CORE 16 (L23) | |
| Alienware m16 R2 | |
| Cinebench R20 / CPU (Multi Core) | |
| Lenovo Legion Pro 7 16IRX9H | |
| Lenovo Legion 7 16 IRX G9 | |
| Lenovo Legion Pro 5 16IRX9 | |
| Average Intel Core i9-14900HX (6579 - 13832, n=37) | |
| Aorus 16X 2024 | |
| Average of class Gaming (4029 - 16108, n=109, last 2 years) | |
| HP Omen Transcend 16-u1095ng | |
| Alienware m16 R2 | |
| Schenker XMG CORE 16 (L23) | |
| Cinebench R20 / CPU (Single Core) | |
| Lenovo Legion 7 16 IRX G9 | |
| Aorus 16X 2024 | |
| HP Omen Transcend 16-u1095ng | |
| Lenovo Legion Pro 7 16IRX9H | |
| Average Intel Core i9-14900HX (657 - 859, n=37) | |
| Lenovo Legion Pro 5 16IRX9 | |
| Average of class Gaming (442 - 895, n=109, last 2 years) | |
| Schenker XMG CORE 16 (L23) | |
| Alienware m16 R2 | |
| Cinebench R15 / CPU Multi 64Bit | |
| Lenovo Legion Pro 7 16IRX9H | |
| Lenovo Legion 7 16 IRX G9 | |
| Lenovo Legion Pro 5 16IRX9 | |
| Average Intel Core i9-14900HX (3263 - 5589, n=38) | |
| Aorus 16X 2024 | |
| Average of class Gaming (1578 - 6271, n=108, last 2 years) | |
| HP Omen Transcend 16-u1095ng | |
| Alienware m16 R2 | |
| Schenker XMG CORE 16 (L23) | |
| Cinebench R15 / CPU Single 64Bit | |
| Lenovo Legion Pro 7 16IRX9H | |
| Aorus 16X 2024 | |
| Lenovo Legion 7 16 IRX G9 | |
| Average Intel Core i9-14900HX (247 - 323, n=37) | |
| Lenovo Legion Pro 5 16IRX9 | |
| HP Omen Transcend 16-u1095ng | |
| Average of class Gaming (188.8 - 343, n=109, last 2 years) | |
| Schenker XMG CORE 16 (L23) | |
| Alienware m16 R2 | |
| Blender / v2.79 BMW27 CPU | |
| Schenker XMG CORE 16 (L23) | |
| HP Omen Transcend 16-u1095ng | |
| Average of class Gaming (80 - 330, n=107, last 2 years) | |
| Aorus 16X 2024 | |
| Lenovo Legion 7 16 IRX G9 | |
| Average Intel Core i9-14900HX (91 - 206, n=37) | |
| Lenovo Legion Pro 5 16IRX9 | |
| Lenovo Legion Pro 7 16IRX9H | |
| 7-Zip 18.03 / 7z b 4 | |
| Lenovo Legion Pro 7 16IRX9H | |
| Lenovo Legion Pro 5 16IRX9 | |
| Average Intel Core i9-14900HX (66769 - 136645, n=37) | |
| Lenovo Legion 7 16 IRX G9 | |
| Aorus 16X 2024 | |
| Average of class Gaming (33491 - 148086, n=108, last 2 years) | |
| HP Omen Transcend 16-u1095ng | |
| Schenker XMG CORE 16 (L23) | |
| Alienware m16 R2 | |
| 7-Zip 18.03 / 7z b 4 -mmt1 | |
| Lenovo Legion Pro 7 16IRX9H | |
| Aorus 16X 2024 | |
| Lenovo Legion 7 16 IRX G9 | |
| HP Omen Transcend 16-u1095ng | |
| Average Intel Core i9-14900HX (5452 - 7545, n=37) | |
| Lenovo Legion Pro 5 16IRX9 | |
| Schenker XMG CORE 16 (L23) | |
| Average of class Gaming (4199 - 7436, n=108, last 2 years) | |
| Alienware m16 R2 | |
| Geekbench 6.7 / Multi-Core | |
| Lenovo Legion Pro 7 16IRX9H | |
| Lenovo Legion Pro 5 16IRX9 | |
| Lenovo Legion 7 16 IRX G9 | |
| Aorus 16X 2024 | |
| Average Intel Core i9-14900HX (13158 - 19665, n=37) | |
| HP Omen Transcend 16-u1095ng | |
| Average of class Gaming (6625 - 22104, n=109, last 2 years) | |
| Schenker XMG CORE 16 (L23) | |
| Alienware m16 R2 | |
| Geekbench 6.7 / Single-Core | |
| Aorus 16X 2024 | |
| Lenovo Legion Pro 7 16IRX9H | |
| Lenovo Legion 7 16 IRX G9 | |
| Average Intel Core i9-14900HX (2419 - 3129, n=37) | |
| Lenovo Legion Pro 5 16IRX9 | |
| Average of class Gaming (1490 - 3259, n=109, last 2 years) | |
| HP Omen Transcend 16-u1095ng | |
| Schenker XMG CORE 16 (L23) | |
| Alienware m16 R2 | |
| Geekbench 5.5 / Multi-Core | |
| Lenovo Legion Pro 5 16IRX9 | |
| Lenovo Legion Pro 7 16IRX9H | |
| Lenovo Legion 7 16 IRX G9 | |
| Aorus 16X 2024 | |
| Average Intel Core i9-14900HX (8618 - 23194, n=37) | |
| HP Omen Transcend 16-u1095ng | |
| Average of class Gaming (6460 - 27010, n=108, last 2 years) | |
| Alienware m16 R2 | |
| Schenker XMG CORE 16 (L23) | |
| Geekbench 5.5 / Single-Core | |
| Aorus 16X 2024 | |
| Lenovo Legion Pro 7 16IRX9H | |
| Lenovo Legion 7 16 IRX G9 | |
| Average Intel Core i9-14900HX (1669 - 2210, n=37) | |
| HP Omen Transcend 16-u1095ng | |
| Average of class Gaming (986 - 2474, n=108, last 2 years) | |
| Lenovo Legion Pro 5 16IRX9 | |
| Schenker XMG CORE 16 (L23) | |
| Alienware m16 R2 | |
| HWBOT x265 Benchmark v2.2 / 4k Preset | |
| Lenovo Legion Pro 7 16IRX9H | |
| Lenovo Legion Pro 5 16IRX9 | |
| Average Intel Core i9-14900HX (16.8 - 38.9, n=37) | |
| Lenovo Legion 7 16 IRX G9 | |
| Average of class Gaming (11.5 - 44.3, n=108, last 2 years) | |
| Aorus 16X 2024 | |
| HP Omen Transcend 16-u1095ng | |
| Schenker XMG CORE 16 (L23) | |
| Alienware m16 R2 | |
| LibreOffice / 20 Documents To PDF | |
| Schenker XMG CORE 16 (L23) | |
| HP Omen Transcend 16-u1095ng | |
| Alienware m16 R2 | |
| Average of class Gaming (19 - 88.8, n=108, last 2 years) | |
| Lenovo Legion 7 16 IRX G9 | |
| Average Intel Core i9-14900HX (19 - 85.1, n=37) | |
| Lenovo Legion Pro 5 16IRX9 | |
| Aorus 16X 2024 | |
| Lenovo Legion Pro 7 16IRX9H | |
| R Benchmark 2.5 / Overall mean | |
| Alienware m16 R2 | |
| Schenker XMG CORE 16 (L23) | |
| Average of class Gaming (0.3439 - 0.759, n=109, last 2 years) | |
| HP Omen Transcend 16-u1095ng | |
| Lenovo Legion 7 16 IRX G9 | |
| Lenovo Legion Pro 5 16IRX9 | |
| Lenovo Legion Pro 7 16IRX9H | |
| Average Intel Core i9-14900HX (0.3604 - 0.4859, n=37) | |
| Aorus 16X 2024 | |
* ... smaller is better
AIDA64: FP32 Ray-Trace | FPU Julia | CPU SHA3 | CPU Queen | FPU SinJulia | FPU Mandel | CPU AES | CPU ZLib | FP64 Ray-Trace | CPU PhotoWorxx
| Performance rating | |
| Lenovo Legion Pro 7 16IRX9H | |
| Lenovo Legion Pro 5 16IRX9 | |
| Average of class Gaming | |
| Average Intel Core i9-14900HX | |
| Aorus 16X 2024 | |
| Lenovo Legion 7 16 IRX G9 | |
| Schenker XMG CORE 16 (L23) | |
| HP Omen Transcend 16-u1095ng | |
| Alienware m16 R2 | |
| AIDA64 / FP32 Ray-Trace | |
| Average of class Gaming (10227 - 85542, n=107, last 2 years) | |
| Lenovo Legion Pro 7 16IRX9H | |
| Schenker XMG CORE 16 (L23) | |
| Lenovo Legion 7 16 IRX G9 | |
| Lenovo Legion Pro 5 16IRX9 | |
| Average Intel Core i9-14900HX (13098 - 33474, n=36) | |
| Aorus 16X 2024 | |
| Alienware m16 R2 | |
| HP Omen Transcend 16-u1095ng | |
| AIDA64 / FPU Julia | |
| Lenovo Legion Pro 7 16IRX9H | |
| Average of class Gaming (51376 - 238426, n=107, last 2 years) | |
| Lenovo Legion Pro 5 16IRX9 | |
| Average Intel Core i9-14900HX (67573 - 166040, n=36) | |
| Schenker XMG CORE 16 (L23) | |
| Lenovo Legion 7 16 IRX G9 | |
| Aorus 16X 2024 | |
| Alienware m16 R2 | |
| HP Omen Transcend 16-u1095ng | |
| AIDA64 / CPU SHA3 | |
| Lenovo Legion Pro 7 16IRX9H | |
| Lenovo Legion Pro 5 16IRX9 | |
| Average of class Gaming (2180 - 9817, n=107, last 2 years) | |
| Average Intel Core i9-14900HX (3589 - 7979, n=36) | |
| Aorus 16X 2024 | |
| Lenovo Legion 7 16 IRX G9 | |
| Schenker XMG CORE 16 (L23) | |
| HP Omen Transcend 16-u1095ng | |
| Alienware m16 R2 | |
| AIDA64 / CPU Queen | |
| Lenovo Legion Pro 7 16IRX9H | |
| Lenovo Legion Pro 5 16IRX9 | |
| Lenovo Legion 7 16 IRX G9 | |
| Aorus 16X 2024 | |
| Average Intel Core i9-14900HX (118405 - 148966, n=36) | |
| HP Omen Transcend 16-u1095ng | |
| Average of class Gaming (49785 - 173351, n=94, last 2 years) | |
| Schenker XMG CORE 16 (L23) | |
| Alienware m16 R2 | |
| AIDA64 / FPU SinJulia | |
| Lenovo Legion Pro 7 16IRX9H | |
| Lenovo Legion Pro 5 16IRX9 | |
| Average Intel Core i9-14900HX (10475 - 18517, n=36) | |
| Schenker XMG CORE 16 (L23) | |
| Aorus 16X 2024 | |
| Average of class Gaming (4424 - 33636, n=107, last 2 years) | |
| Lenovo Legion 7 16 IRX G9 | |
| HP Omen Transcend 16-u1095ng | |
| Alienware m16 R2 | |
| AIDA64 / FPU Mandel | |
| Average of class Gaming (25115 - 128721, n=107, last 2 years) | |
| Lenovo Legion Pro 7 16IRX9H | |
| Schenker XMG CORE 16 (L23) | |
| Lenovo Legion Pro 5 16IRX9 | |
| Average Intel Core i9-14900HX (32543 - 83662, n=36) | |
| Aorus 16X 2024 | |
| Alienware m16 R2 | |
| Lenovo Legion 7 16 IRX G9 | |
| HP Omen Transcend 16-u1095ng | |
| AIDA64 / CPU AES | |
| Average Intel Core i9-14900HX (86964 - 241777, n=36) | |
| Lenovo Legion Pro 7 16IRX9H | |
| Lenovo Legion Pro 5 16IRX9 | |
| Aorus 16X 2024 | |
| Lenovo Legion 7 16 IRX G9 | |
| Average of class Gaming (39258 - 247074, n=107, last 2 years) | |
| Schenker XMG CORE 16 (L23) | |
| HP Omen Transcend 16-u1095ng | |
| Alienware m16 R2 | |
| AIDA64 / CPU ZLib | |
| Lenovo Legion Pro 7 16IRX9H | |
| Lenovo Legion Pro 5 16IRX9 | |
| Average Intel Core i9-14900HX (1054 - 2292, n=36) | |
| Aorus 16X 2024 | |
| Lenovo Legion 7 16 IRX G9 | |
| Average of class Gaming (574 - 2531, n=107, last 2 years) | |
| HP Omen Transcend 16-u1095ng | |
| Alienware m16 R2 | |
| Schenker XMG CORE 16 (L23) | |
| AIDA64 / FP64 Ray-Trace | |
| Average of class Gaming (5509 - 45446, n=107, last 2 years) | |
| Lenovo Legion Pro 7 16IRX9H | |
| Schenker XMG CORE 16 (L23) | |
| Lenovo Legion Pro 5 16IRX9 | |
| Average Intel Core i9-14900HX (6809 - 18349, n=36) | |
| Lenovo Legion 7 16 IRX G9 | |
| Aorus 16X 2024 | |
| Alienware m16 R2 | |
| HP Omen Transcend 16-u1095ng | |
| AIDA64 / CPU PhotoWorxx | |
| Lenovo Legion Pro 5 16IRX9 | |
| HP Omen Transcend 16-u1095ng | |
| Aorus 16X 2024 | |
| Lenovo Legion 7 16 IRX G9 | |
| Lenovo Legion Pro 7 16IRX9H | |
| Average Intel Core i9-14900HX (23903 - 54702, n=36) | |
| Average of class Gaming (12271 - 89891, n=107, last 2 years) | |
| Schenker XMG CORE 16 (L23) | |
| Alienware m16 R2 | |
System Performance
The subjective performance impression is excellent and the benchmarks also didn't highlight any problems. There was only occasional stuttering when switching between graphic modes, for example, when a game was booting. That is quite the norm for laptops using Advanced Optimus.
CrossMark: Overall | Productivity | Creativity | Responsiveness
WebXPRT 3: Overall
WebXPRT 4: Overall
Mozilla Kraken 1.1: Total
| PCMark 10 / Score | |
| Lenovo Legion Pro 7 16IRX9H | |
| Lenovo Legion Pro 5 16IRX9 | |
| Aorus 16X 2024 | |
| Average of class Gaming (5828 - 11574, n=95, last 2 years) | |
| Average Intel Core i9-14900HX, NVIDIA GeForce RTX 4070 Laptop GPU (7768 - 8550, n=8) | |
| Schenker XMG CORE 16 (L23) | |
| Lenovo Legion 7 16 IRX G9 | |
| HP Omen Transcend 16-u1095ng | |
| Alienware m16 R2 | |
| PCMark 10 / Essentials | |
| Lenovo Legion Pro 7 16IRX9H | |
| Lenovo Legion Pro 5 16IRX9 | |
| Aorus 16X 2024 | |
| Lenovo Legion 7 16 IRX G9 | |
| Schenker XMG CORE 16 (L23) | |
| Average Intel Core i9-14900HX, NVIDIA GeForce RTX 4070 Laptop GPU (10104 - 11815, n=8) | |
| Average of class Gaming (8810 - 12600, n=99, last 2 years) | |
| HP Omen Transcend 16-u1095ng | |
| Alienware m16 R2 | |
| PCMark 10 / Productivity | |
| Lenovo Legion Pro 7 16IRX9H | |
| Aorus 16X 2024 | |
| Average of class Gaming (6845 - 21327, n=97, last 2 years) | |
| Schenker XMG CORE 16 (L23) | |
| Average Intel Core i9-14900HX, NVIDIA GeForce RTX 4070 Laptop GPU (9577 - 11103, n=8) | |
| HP Omen Transcend 16-u1095ng | |
| Lenovo Legion Pro 5 16IRX9 | |
| Lenovo Legion 7 16 IRX G9 | |
| Alienware m16 R2 | |
| PCMark 10 / Digital Content Creation | |
| Lenovo Legion Pro 5 16IRX9 | |
| Lenovo Legion Pro 7 16IRX9H | |
| Average of class Gaming (7602 - 19657, n=97, last 2 years) | |
| Lenovo Legion 7 16 IRX G9 | |
| Average Intel Core i9-14900HX, NVIDIA GeForce RTX 4070 Laptop GPU (12114 - 14827, n=8) | |
| Aorus 16X 2024 | |
| Alienware m16 R2 | |
| Schenker XMG CORE 16 (L23) | |
| HP Omen Transcend 16-u1095ng | |
| CrossMark / Overall | |
| Lenovo Legion Pro 7 16IRX9H | |
| Aorus 16X 2024 | |
| Lenovo Legion 7 16 IRX G9 | |
| Average Intel Core i9-14900HX, NVIDIA GeForce RTX 4070 Laptop GPU (2002 - 2312, n=7) | |
| Lenovo Legion Pro 5 16IRX9 | |
| Average of class Gaming (1366 - 2409, n=96, last 2 years) | |
| Alienware m16 R2 | |
| Schenker XMG CORE 16 (L23) | |
| CrossMark / Productivity | |
| Lenovo Legion Pro 7 16IRX9H | |
| Aorus 16X 2024 | |
| Lenovo Legion 7 16 IRX G9 | |
| Average Intel Core i9-14900HX, NVIDIA GeForce RTX 4070 Laptop GPU (1827 - 2191, n=7) | |
| Average of class Gaming (1386 - 2254, n=96, last 2 years) | |
| Lenovo Legion Pro 5 16IRX9 | |
| Alienware m16 R2 | |
| Schenker XMG CORE 16 (L23) | |
| CrossMark / Creativity | |
| Lenovo Legion Pro 7 16IRX9H | |
| Aorus 16X 2024 | |
| Lenovo Legion 7 16 IRX G9 | |
| Average Intel Core i9-14900HX, NVIDIA GeForce RTX 4070 Laptop GPU (2258 - 2458, n=7) | |
| Lenovo Legion Pro 5 16IRX9 | |
| Average of class Gaming (1343 - 2729, n=96, last 2 years) | |
| Alienware m16 R2 | |
| Schenker XMG CORE 16 (L23) | |
| CrossMark / Responsiveness | |
| Lenovo Legion 7 16 IRX G9 | |
| Aorus 16X 2024 | |
| Lenovo Legion Pro 7 16IRX9H | |
| Average Intel Core i9-14900HX, NVIDIA GeForce RTX 4070 Laptop GPU (1734 - 2330, n=7) | |
| Lenovo Legion Pro 5 16IRX9 | |
| Average of class Gaming (1226 - 2334, n=96, last 2 years) | |
| Alienware m16 R2 | |
| Schenker XMG CORE 16 (L23) | |
| WebXPRT 3 / Overall | |
| Lenovo Legion Pro 7 16IRX9H | |
| HP Omen Transcend 16-u1095ng | |
| Lenovo Legion 7 16 IRX G9 | |
| Aorus 16X 2024 | |
| Lenovo Legion Pro 5 16IRX9 | |
| Average Intel Core i9-14900HX, NVIDIA GeForce RTX 4070 Laptop GPU (269 - 342, n=8) | |
| Average of class Gaming (220 - 532, n=100, last 2 years) | |
| Alienware m16 R2 | |
| Schenker XMG CORE 16 (L23) | |
| WebXPRT 4 / Overall | |
| Lenovo Legion Pro 7 16IRX9H | |
| Average Intel Core i9-14900HX, NVIDIA GeForce RTX 4070 Laptop GPU (291 - 304, n=6) | |
| Lenovo Legion 7 16 IRX G9 | |
| Lenovo Legion Pro 5 16IRX9 | |
| Average of class Gaming (165 - 354, n=101, last 2 years) | |
| Alienware m16 R2 | |
| Mozilla Kraken 1.1 / Total | |
| Alienware m16 R2 | |
| Schenker XMG CORE 16 (L23) | |
| Average of class Gaming (391 - 590, n=104, last 2 years) | |
| Lenovo Legion Pro 5 16IRX9 | |
| Average Intel Core i9-14900HX, NVIDIA GeForce RTX 4070 Laptop GPU (431 - 469, n=8) | |
| Lenovo Legion 7 16 IRX G9 | |
| Lenovo Legion Pro 7 16IRX9H | |
| HP Omen Transcend 16-u1095ng | |
| Aorus 16X 2024 | |
* ... smaller is better
| PCMark 10 Score | 8023 points | |
Help | ||
| AIDA64 / Memory Copy | |
| Lenovo Legion Pro 5 16IRX9 | |
| Lenovo Legion 7 16 IRX G9 | |
| Aorus 16X 2024 | |
| Lenovo Legion Pro 7 16IRX9H | |
| HP Omen Transcend 16-u1095ng | |
| Average Intel Core i9-14900HX (38028 - 83392, n=36) | |
| Average of class Gaming (21750 - 129946, n=107, last 2 years) | |
| Schenker XMG CORE 16 (L23) | |
| Alienware m16 R2 | |
| AIDA64 / Memory Read | |
| Aorus 16X 2024 | |
| Lenovo Legion Pro 5 16IRX9 | |
| Lenovo Legion Pro 7 16IRX9H | |
| Lenovo Legion 7 16 IRX G9 | |
| HP Omen Transcend 16-u1095ng | |
| Average Intel Core i9-14900HX (43306 - 87568, n=36) | |
| Alienware m16 R2 | |
| Average of class Gaming (22956 - 118858, n=107, last 2 years) | |
| Schenker XMG CORE 16 (L23) | |
| AIDA64 / Memory Write | |
| Schenker XMG CORE 16 (L23) | |
| HP Omen Transcend 16-u1095ng | |
| Aorus 16X 2024 | |
| Lenovo Legion Pro 5 16IRX9 | |
| Average of class Gaming (22297 - 135096, n=107, last 2 years) | |
| Lenovo Legion 7 16 IRX G9 | |
| Average Intel Core i9-14900HX (37146 - 80589, n=36) | |
| Lenovo Legion Pro 7 16IRX9H | |
| Alienware m16 R2 | |
| AIDA64 / Memory Latency | |
| Alienware m16 R2 | |
| Average of class Gaming (75.3 - 259, n=107, last 2 years) | |
| Schenker XMG CORE 16 (L23) | |
| HP Omen Transcend 16-u1095ng | |
| Average Intel Core i9-14900HX (76.1 - 105, n=36) | |
| Lenovo Legion 7 16 IRX G9 | |
| Lenovo Legion Pro 5 16IRX9 | |
| Aorus 16X 2024 | |
| Lenovo Legion Pro 7 16IRX9H | |
* ... smaller is better
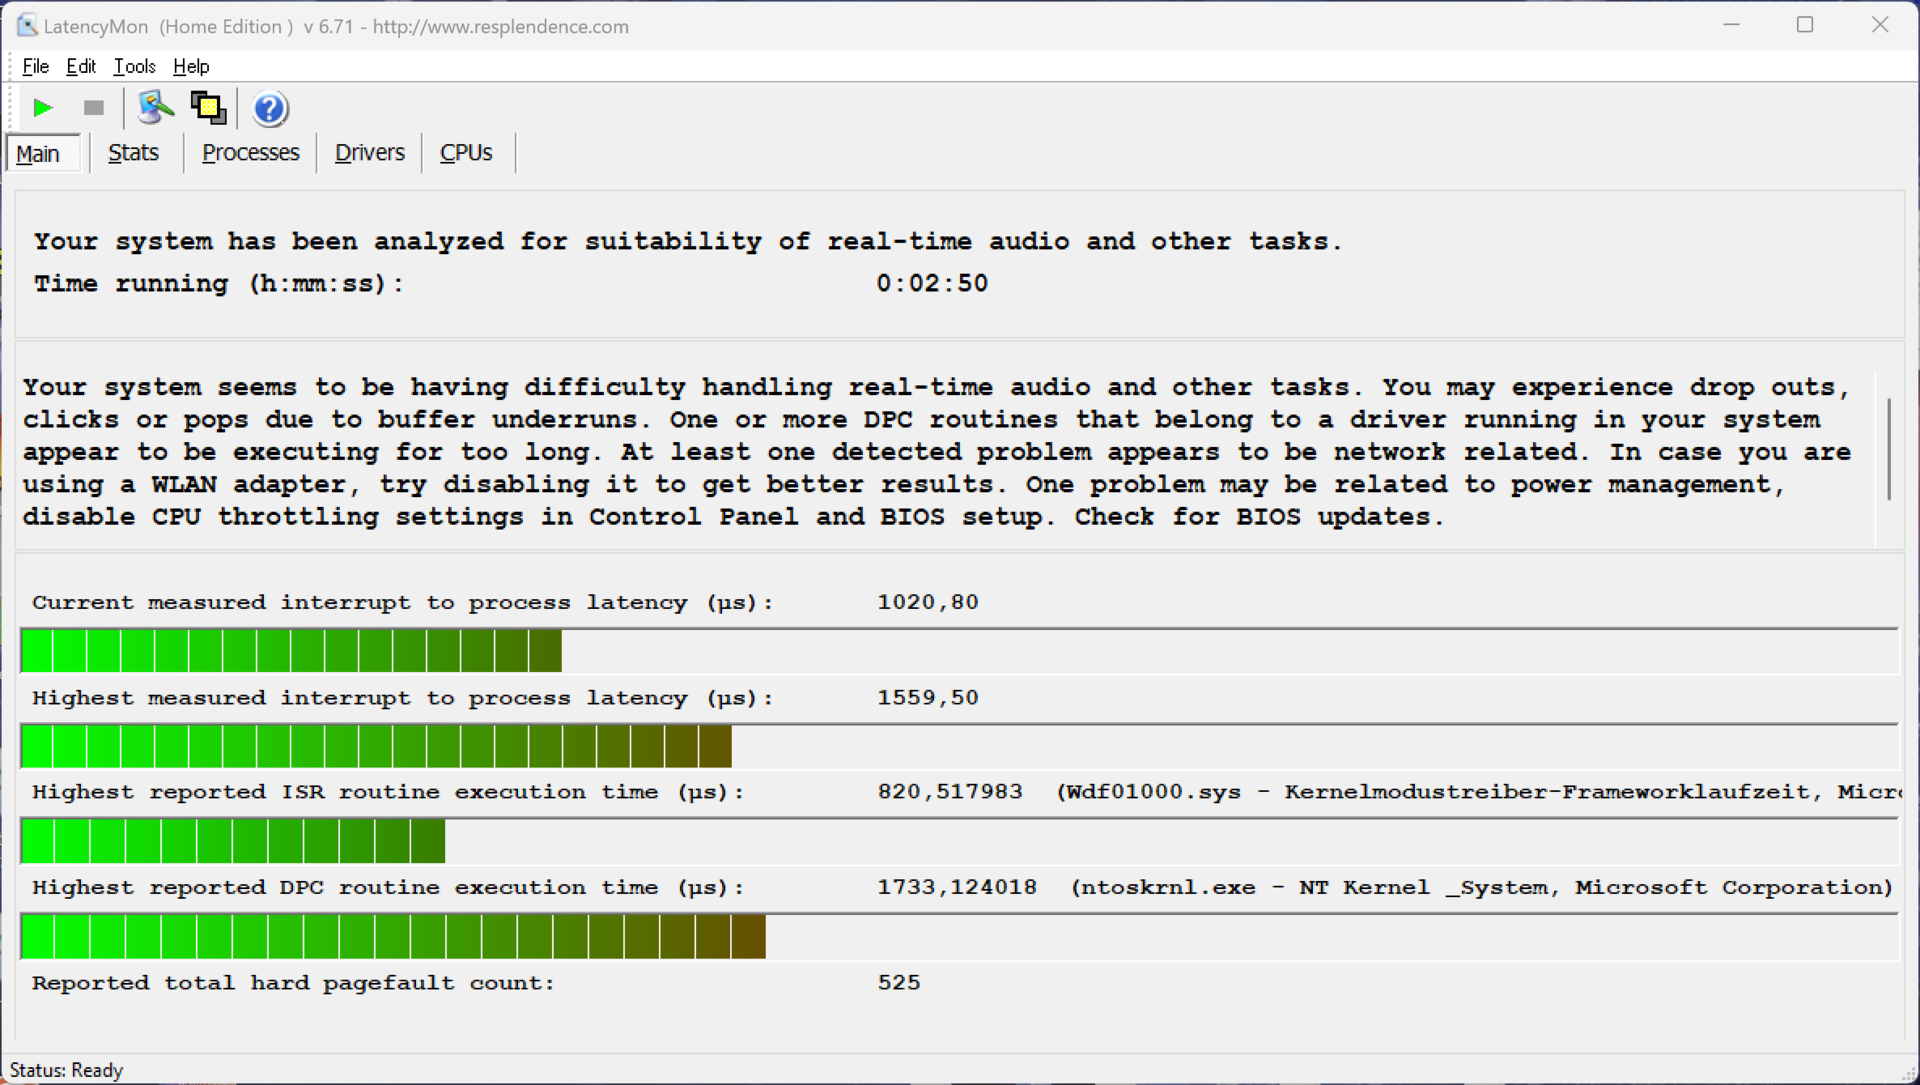
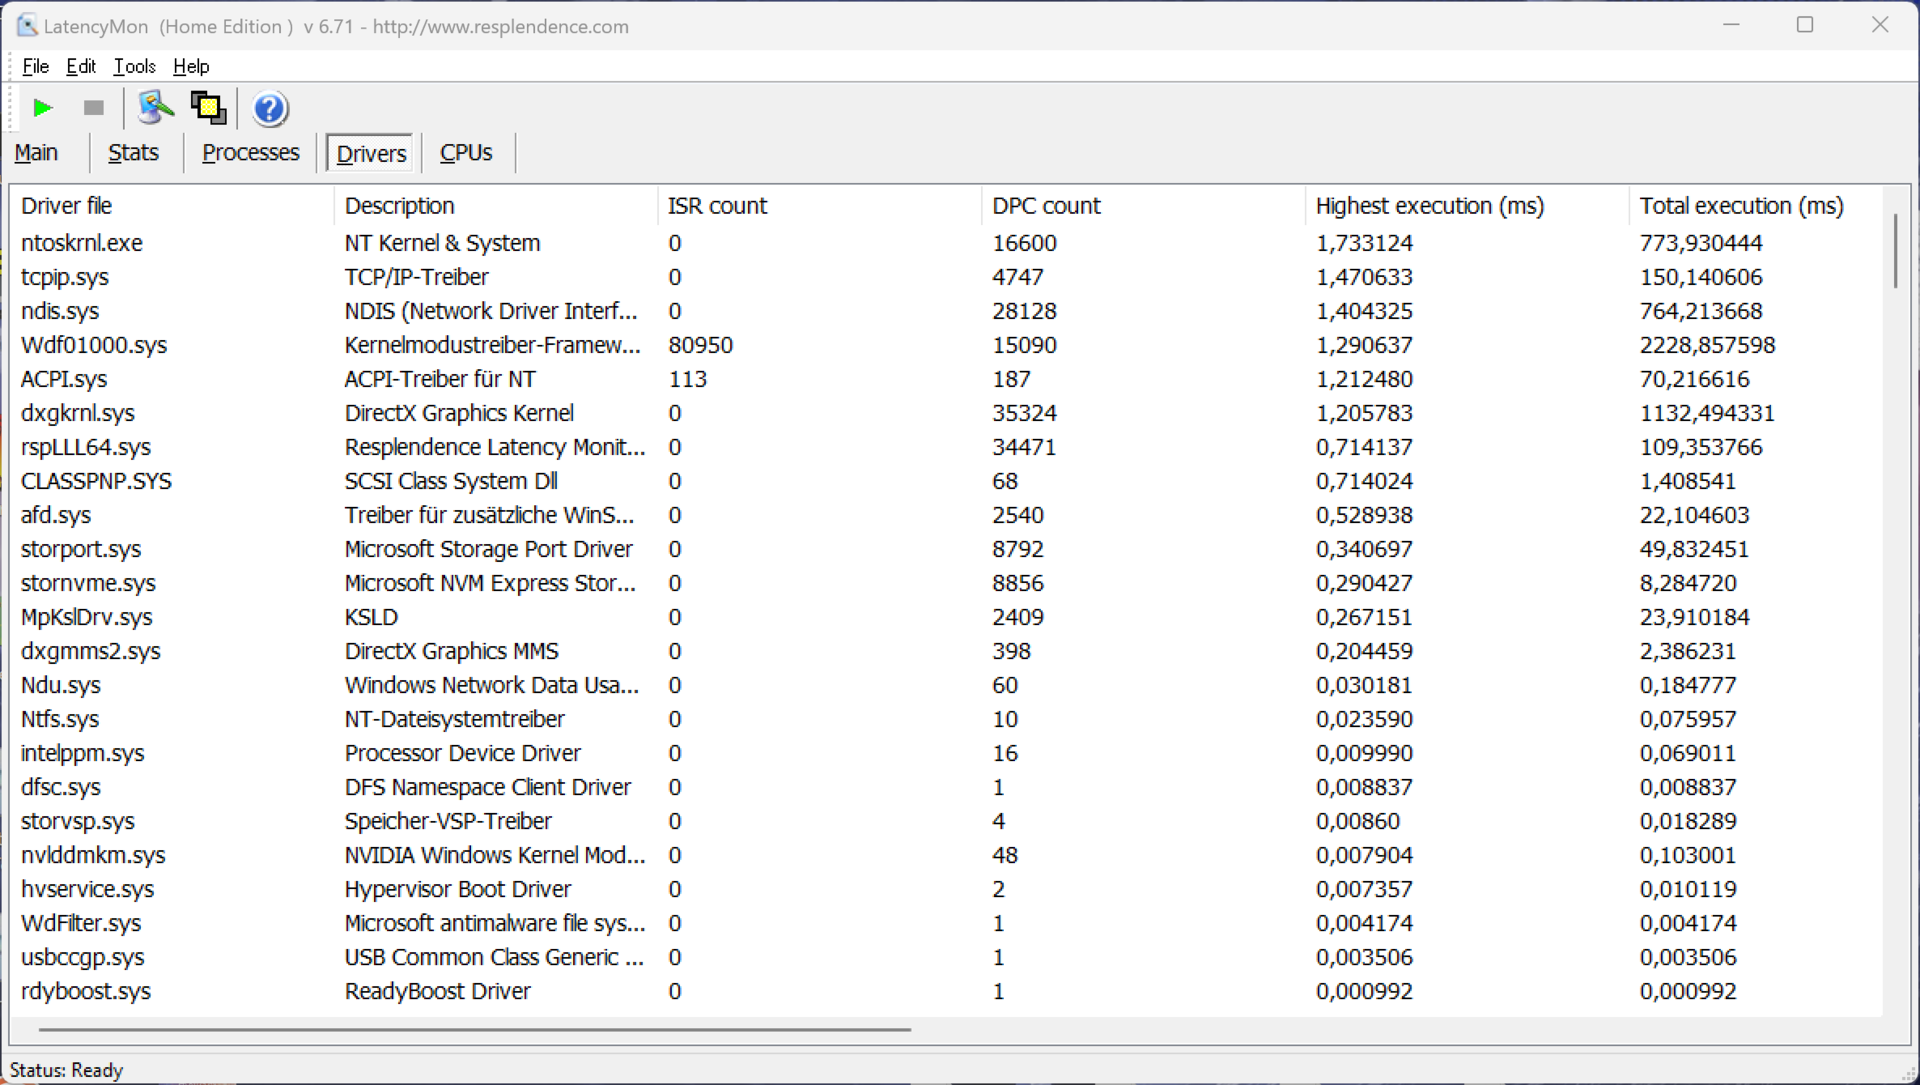
DPC latencies
In our standardized latency test (surfing the internet, 4K YouTube playback, CPU load) using the current BIOS version, the review device showed some limitations when it comes to using real-time audio applications.
| DPC Latencies / LatencyMon - interrupt to process latency (max), Web, Youtube, Prime95 | |
| Alienware m16 R2 | |
| HP Omen Transcend 16-u1095ng | |
| Lenovo Legion 7 16 IRX G9 | |
| Lenovo Legion Pro 7 16IRX9H | |
| Aorus 16X 2024 | |
| Lenovo Legion Pro 5 16IRX9 | |
| Schenker XMG CORE 16 (L23) | |
* ... smaller is better
Mass storage
In the review device, Lenovo has installed an SK Hynix 1 TB PCIe 4.0 SSD, but, after the first startup, 877 GB are available to the user. At up to 7 GB/s, the transfer speeds are very high and, overall, the SSD is a touch faster than the competition. However, although the performance doesn't always remain stable under sustained load, this isn't something you'll notice in everyday situations. Additional SSD benchmarks are listed here.

* ... smaller is better
Continuous Performance Read: DiskSpd Read Loop, Queue Depth 8
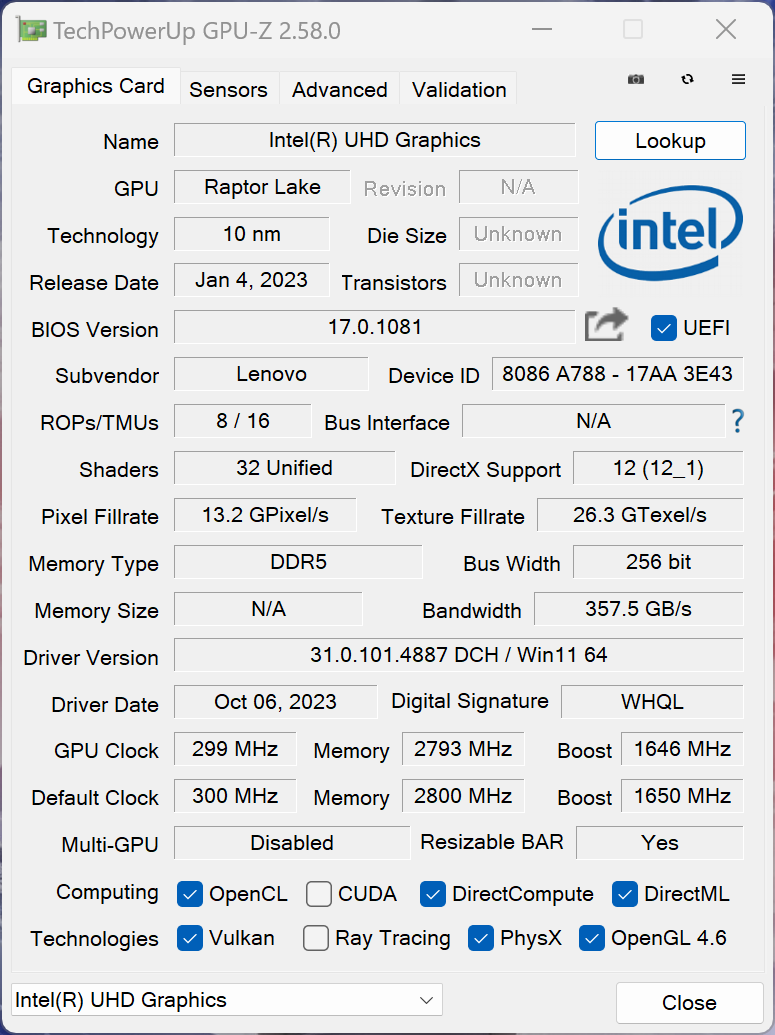
Graphics card - GeForce RTX 4070 laptop
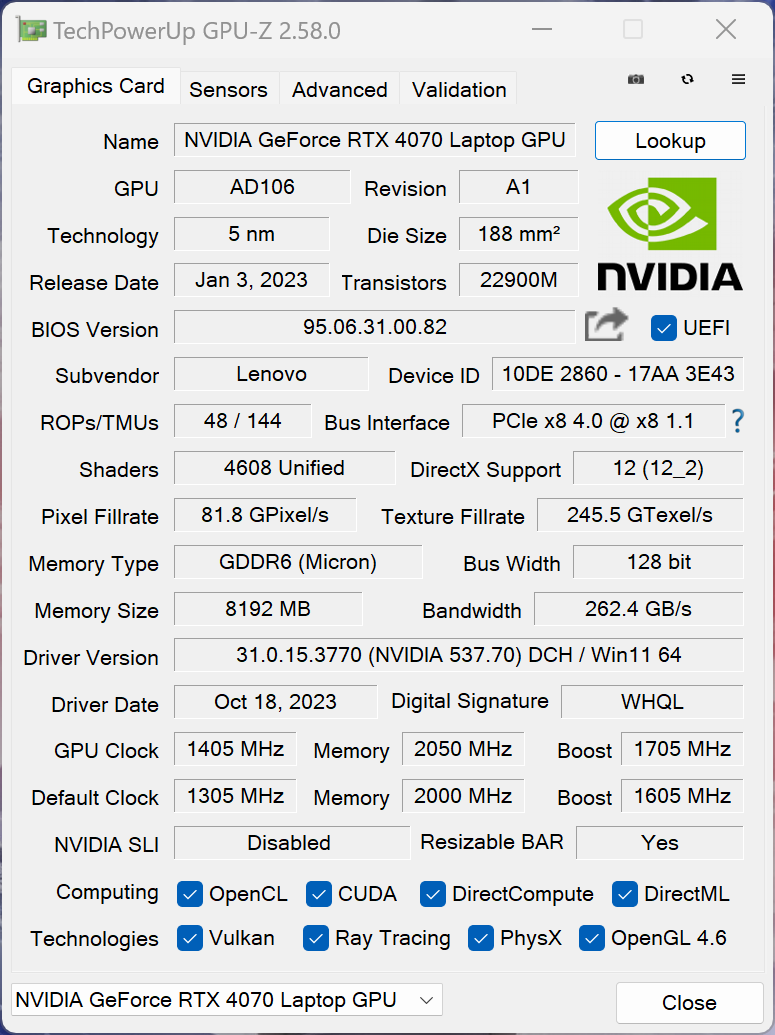
Our review device comes with the RTX 4070 laptop although we are actually dealing with the 115-watt version. On top of this, in performance mode, the GPU is slightly overclocked. In the synthetic benchmarks, equipped with its 140-watt variant, the Legion 7 16 lags a little behind the competition. However, as we are about to see, this isn't relevant for gaming benchmarks since the RTX 4070 laptop is unable to consume the full 140 watts anyway. The Legion supports the Advanced Optimus graphics switch.
Under sustained load, the GPU remains completely stable and, in battery mode, the power consumption is limited to 50 watts. This is why the performance here is around 35 % lower. Additional GPU benchmarks are listed here.
| 3DMark 11 Performance | 35070 points | |
| 3DMark Fire Strike Score | 25692 points | |
| 3DMark Time Spy Score | 12844 points | |
Help | ||
| Blender / v3.3 Classroom OPTIX/RTX | |
| HP Omen Transcend 16-u1095ng | |
| Average NVIDIA GeForce RTX 4070 Laptop GPU (18 - 30, n=68) | |
| Schenker XMG CORE 16 (L23) | |
| Alienware m16 R2 | |
| Aorus 16X 2024 | |
| Lenovo Legion 7 16 IRX G9 | |
| Lenovo Legion Pro 5 16IRX9 | |
| Average of class Gaming (9 - 32, n=109, last 2 years) | |
| Lenovo Legion Pro 7 16IRX9H | |
| Blender / v3.3 Classroom CUDA | |
| HP Omen Transcend 16-u1095ng | |
| Average NVIDIA GeForce RTX 4070 Laptop GPU (32 - 50, n=67) | |
| Average of class Gaming (15 - 233, n=110, last 2 years) | |
| Alienware m16 R2 | |
| Schenker XMG CORE 16 (L23) | |
| Lenovo Legion Pro 5 16IRX9 | |
| Aorus 16X 2024 | |
| Lenovo Legion 7 16 IRX G9 | |
| Lenovo Legion Pro 7 16IRX9H | |
| Blender / v3.3 Classroom CPU | |
| Schenker XMG CORE 16 (L23) | |
| HP Omen Transcend 16-u1095ng | |
| Alienware m16 R2 | |
| Average NVIDIA GeForce RTX 4070 Laptop GPU (158 - 440, n=67) | |
| Average of class Gaming (122 - 565, n=105, last 2 years) | |
| Aorus 16X 2024 | |
| Lenovo Legion 7 16 IRX G9 | |
| Lenovo Legion Pro 5 16IRX9 | |
| Lenovo Legion Pro 7 16IRX9H | |
* ... smaller is better
Gaming Performance
The Legion 7 16's gaming performance is very good and all modern titles can be played smoothly at QHD resolution and maximum details. Even in native resolution, performance should be sufficient and, if desired, DLSS upscaling can be activated. In the gaming test comparison, the review device scored a touch better than in the synthetic tests and the performance remained totally stable even during lengthier gaming sessions. Additional gaming benchmarks can be found here.
| The Witcher 3 - 1920x1080 Ultra Graphics & Postprocessing (HBAO+) | |
| Lenovo Legion Pro 7 16IRX9H | |
| Average of class Gaming (95 - 240, n=7, last 2 years) | |
| Lenovo Legion Pro 5 16IRX9 | |
| Aorus 16X 2024 | |
| Alienware m16 R2 | |
| Schenker XMG CORE 16 (L23) | |
| HP Omen Transcend 16-u1095ng | |
| Lenovo Legion 7 16 IRX G9 | |
| GTA V - 1920x1080 Highest AA:4xMSAA + FX AF:16x | |
| Lenovo Legion Pro 7 16IRX9H | |
| Average of class Gaming (48.3 - 186.9, n=97, last 2 years) | |
| Lenovo Legion Pro 5 16IRX9 | |
| Lenovo Legion 7 16 IRX G9 | |
| Schenker XMG CORE 16 (L23) | |
| HP Omen Transcend 16-u1095ng | |
| Aorus 16X 2024 | |
| Final Fantasy XV Benchmark - 1920x1080 High Quality | |
| Lenovo Legion Pro 7 16IRX9H | |
| Average of class Gaming (41 - 215, n=98, last 2 years) | |
| Lenovo Legion Pro 5 16IRX9 | |
| Schenker XMG CORE 16 (L23) | |
| Lenovo Legion 7 16 IRX G9 | |
| Alienware m16 R2 | |
| Aorus 16X 2024 | |
| HP Omen Transcend 16-u1095ng | |
| Dota 2 Reborn - 1920x1080 ultra (3/3) best looking | |
| Lenovo Legion Pro 5 16IRX9 | |
| Lenovo Legion Pro 7 16IRX9H | |
| Aorus 16X 2024 | |
| Lenovo Legion 7 16 IRX G9 | |
| HP Omen Transcend 16-u1095ng | |
| Average of class Gaming (84.8 - 248, n=110, last 2 years) | |
| Alienware m16 R2 | |
| Schenker XMG CORE 16 (L23) | |
| Horizon Forbidden West | |
| 1920x1080 Very High Preset AA:T | |
| Lenovo Legion Pro 7 16IRX9H | |
| Average of class Gaming (14.7 - 140.3, n=13, last 2 years) | |
| Aorus 16X 2024 | |
| Lenovo Legion 7 16 IRX G9 | |
| Average NVIDIA GeForce RTX 4070 Laptop GPU (53.2 - 76.7, n=10) | |
| 2560x1440 Very High Preset AA:T | |
| Lenovo Legion Pro 7 16IRX9H | |
| Average of class Gaming (39.6 - 100.9, n=10, last 2 years) | |
| Aorus 16X 2024 | |
| Average NVIDIA GeForce RTX 4070 Laptop GPU (40.3 - 59.1, n=9) | |
| Lenovo Legion 7 16 IRX G9 | |
Witcher 3 FPS diagram
| low | med. | high | ultra | QHD | |
|---|---|---|---|---|---|
| GTA V (2015) | 182.4 | 124.1 | 94.2 | ||
| The Witcher 3 (2015) | 246 | 113.1 | 92 | ||
| Dota 2 Reborn (2015) | 230 | 205 | 193.4 | 179.5 | |
| Final Fantasy XV Benchmark (2018) | 223 | 166.8 | 119.8 | 89.1 | |
| X-Plane 11.11 (2018) | 198 | 180.6 | 138.2 | ||
| Far Cry 5 (2018) | 193 | 166 | 157 | 146 | 115 |
| Strange Brigade (2018) | 436 | 311 | 250 | 220 | 143 |
| F1 23 (2023) | 287 | 284 | 222 | 70.1 | 43.9 |
| Baldur's Gate 3 (2023) | 155.6 | 127.9 | 115.7 | 115 | 71.9 |
| Cyberpunk 2077 (2023) | 129.7 | 117.1 | 99.6 | 85.2 | 51.4 |
| Horizon Forbidden West (2024) | 107.1 | 103.4 | 73.2 | 64.4 | 49.9 |
Emissions - Loud but effective cooling
Noise emissions
When it comes to simple tasks, the Legion 7 16's cooling often remains deactivated, even in performance mode and in everyday situations you can confidently turn to quiet mode to minimize the fan noise. At a maximum of 38.4 dB(A) in quiet mode, it is also still possible to play without headphones, however, in both of the other modes, 50 and 54 dB(A) are too loud. Despite this, both the Legion Pro 5 and the Legion Pro 7 are even a little louder. After periods of load, the fans also quickly reduce their speed. No other electronic noises were present in the review device.
Noise level
| Idle |
| 24.5 / 24.5 / 24.5 dB(A) |
| Load |
| 34.8 / 54.1 dB(A) |
 | ||
30 dB silent 40 dB(A) audible 50 dB(A) loud |
||
min: | ||
| Lenovo Legion 7 16 IRX G9 GeForce RTX 4070 Laptop GPU, i9-14900HX, SK Hynix HFS001TEJ9X115N | Lenovo Legion Pro 5 16IRX9 GeForce RTX 4070 Laptop GPU, i9-14900HX, Samsung PM9A1 MZVL21T0HCLR | Aorus 16X 2024 GeForce RTX 4070 Laptop GPU, i9-14900HX, Gigabyte AG450E1024-SI | HP Omen Transcend 16-u1095ng GeForce RTX 4070 Laptop GPU, i9-14900HX, Kioxia XG8 KXG80ZNV1T02 | Alienware m16 R2 GeForce RTX 4070 Laptop GPU, Ultra 7 155H, Samsung PM9A1 MZVL21T0HCLR | Schenker XMG CORE 16 (L23) GeForce RTX 4070 Laptop GPU, R7 7840HS, Samsung 990 Pro 1 TB | Lenovo Legion Pro 7 16IRX9H GeForce RTX 4080 Laptop GPU, i9-14900HX, SK Hynix HFS001TEJ9X115N | |
|---|---|---|---|---|---|---|---|
| Noise | -6% | -21% | -9% | -2% | -1% | -22% | |
| off / environment * (dB) | 24.5 | 23.9 2% | 26 -6% | 24 2% | 24.7 -1% | 23 6% | 24 2% |
| Idle Minimum * (dB) | 24.5 | 24.3 1% | 26 -6% | 29 -18% | 25.3 -3% | 23 6% | 25 -2% |
| Idle Average * (dB) | 24.5 | 24.3 1% | 32 -31% | 30 -22% | 25.3 -3% | 28.48 -16% | 30 -22% |
| Idle Maximum * (dB) | 24.5 | 28.9 -18% | 38 -55% | 31 -27% | 25.3 -3% | 28.48 -16% | 45 -84% |
| Load Average * (dB) | 34.8 | 45.8 -32% | 54 -55% | 45 -29% | 31.7 9% | 30 14% | 50 -44% |
| Witcher 3 ultra * (dB) | 54.1 | 51 6% | 50 8% | 44 19% | 53.8 1% | 54.12 -0% | 54 -0% |
| Load Maximum * (dB) | 54.1 | 56.6 -5% | 55 -2% | 47 13% | 62 -15% | 54.12 -0% | 56 -4% |
* ... smaller is better
Temperature
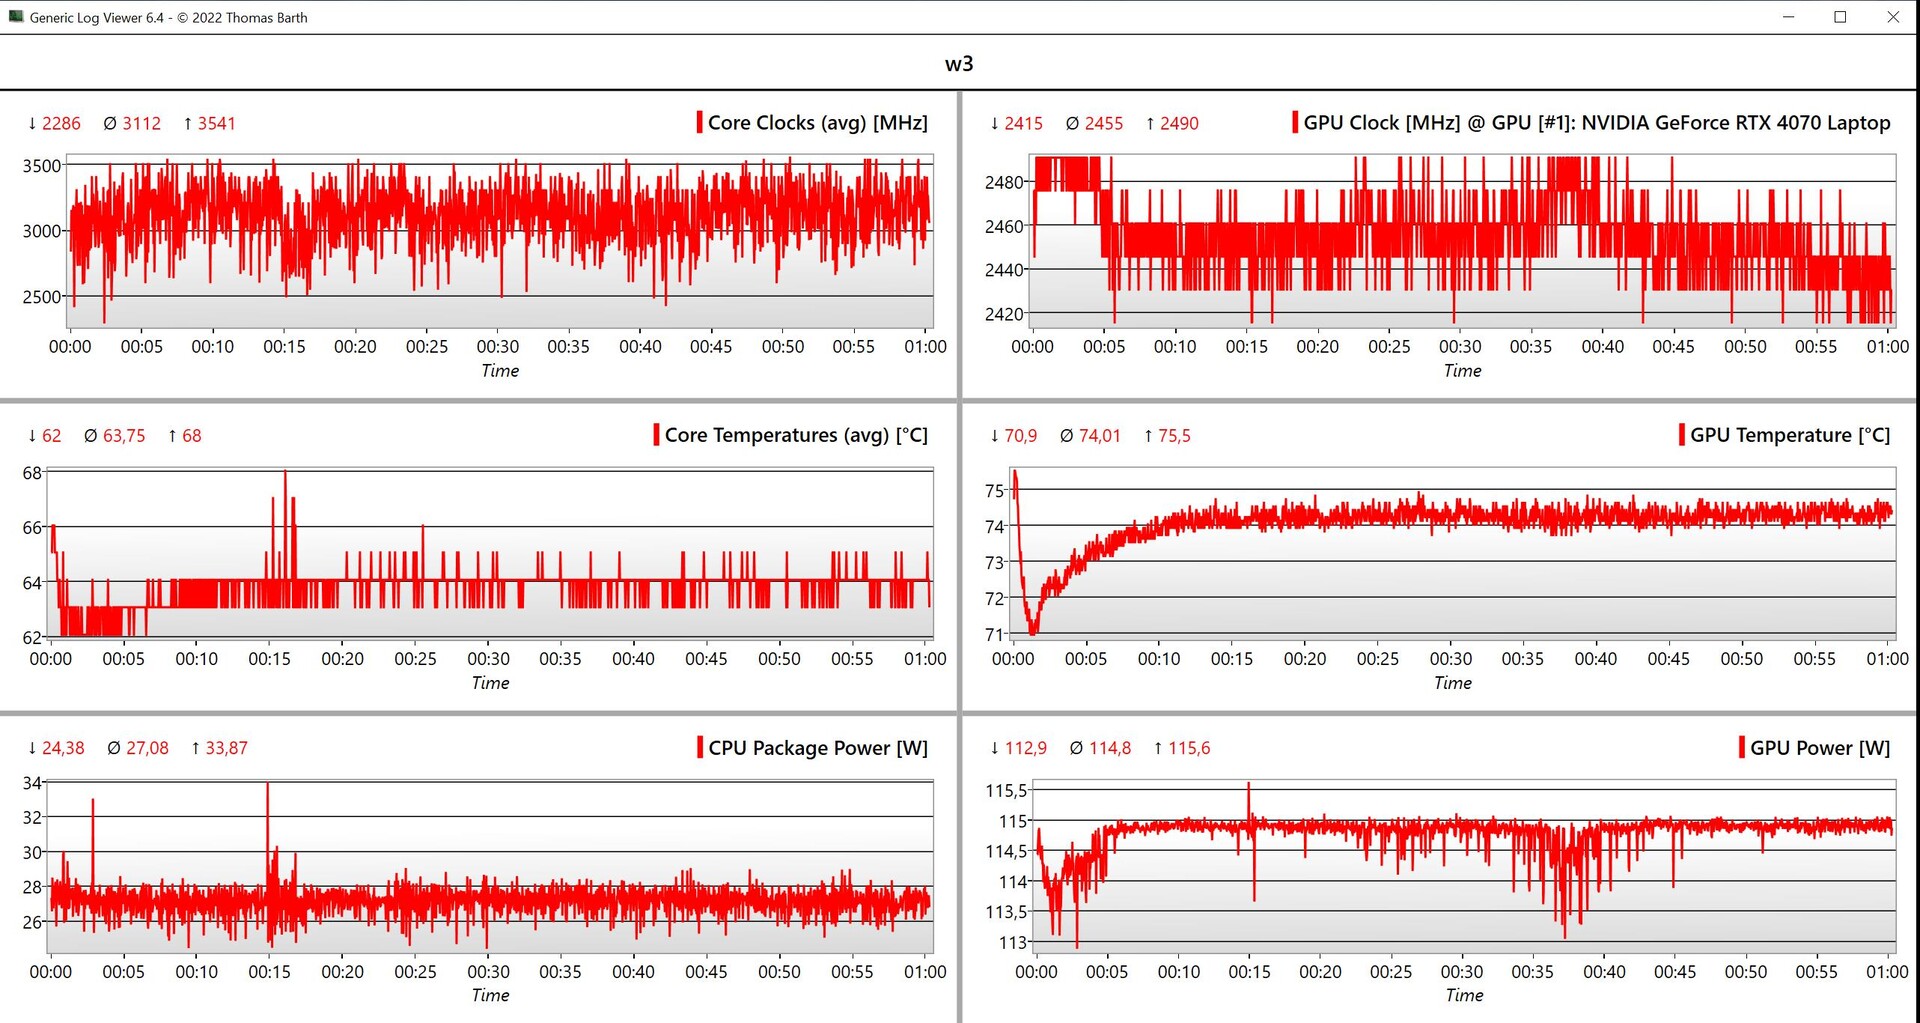
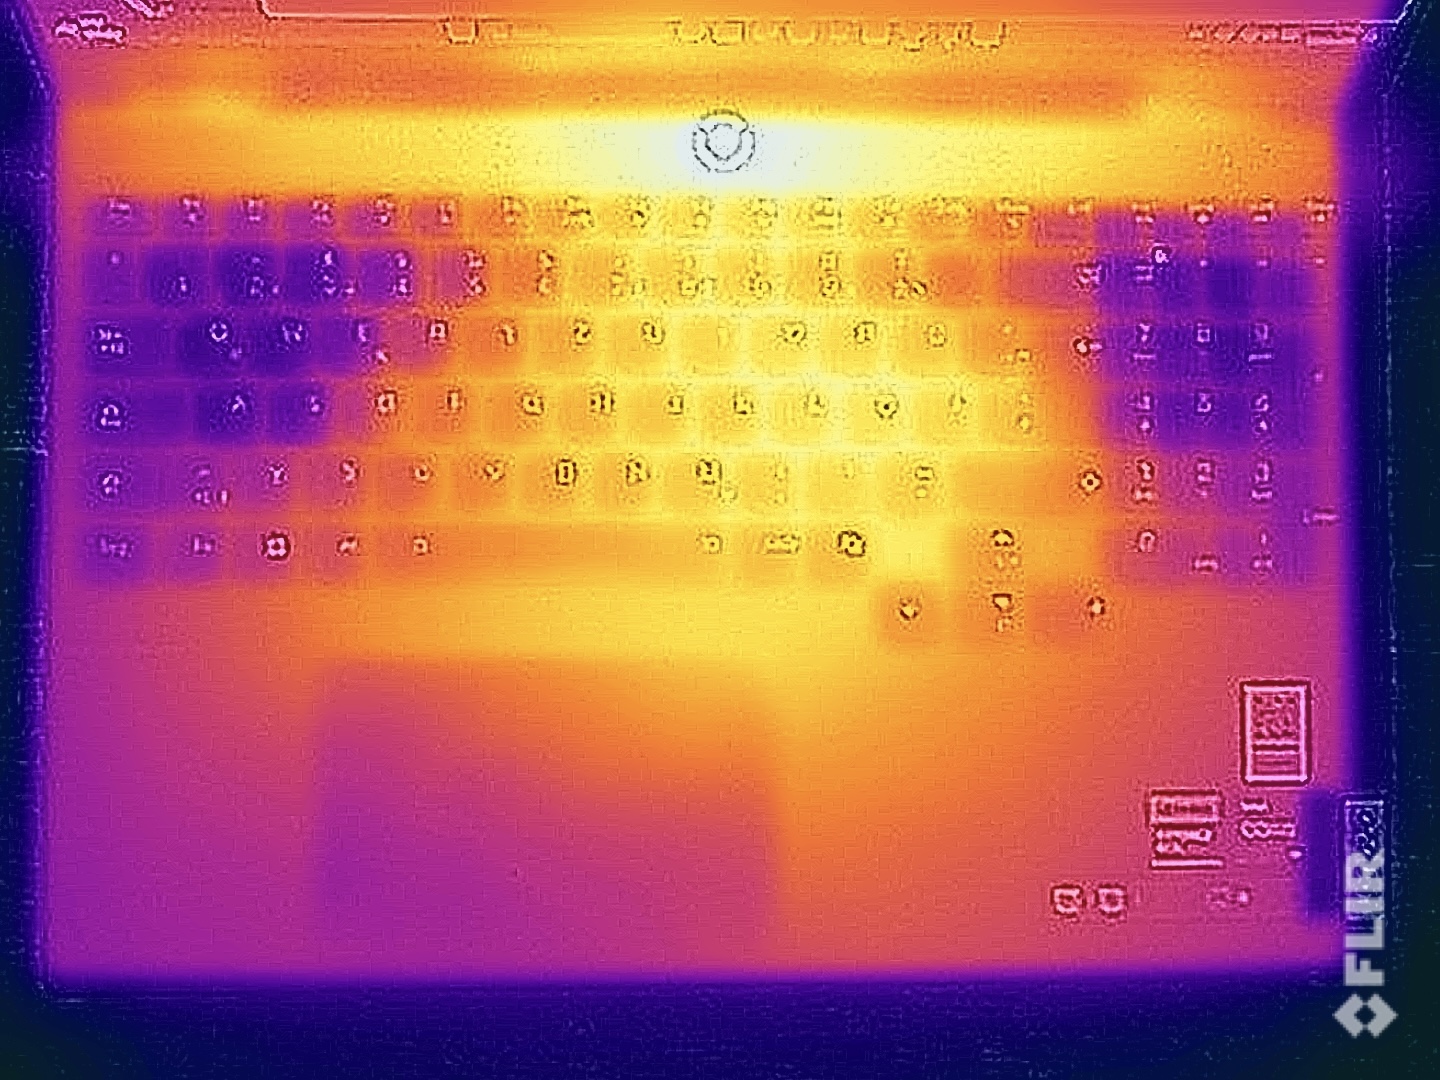
Running idle and under low load, the aluminum case remains pleasantly cool and even when gaming it does better than expected. In some places, we measured values ranging from 42 to 43 °C and although this is something you also notice when using the keyboard, it doesn't result in a restricted user experience and, once again, the Legion 7 performs better than both competing pro models despite its slimmer base unit. In the stress test with combined CPU/GPU load, the GPU runs at 90 watts and the CPU at around 54 watts.
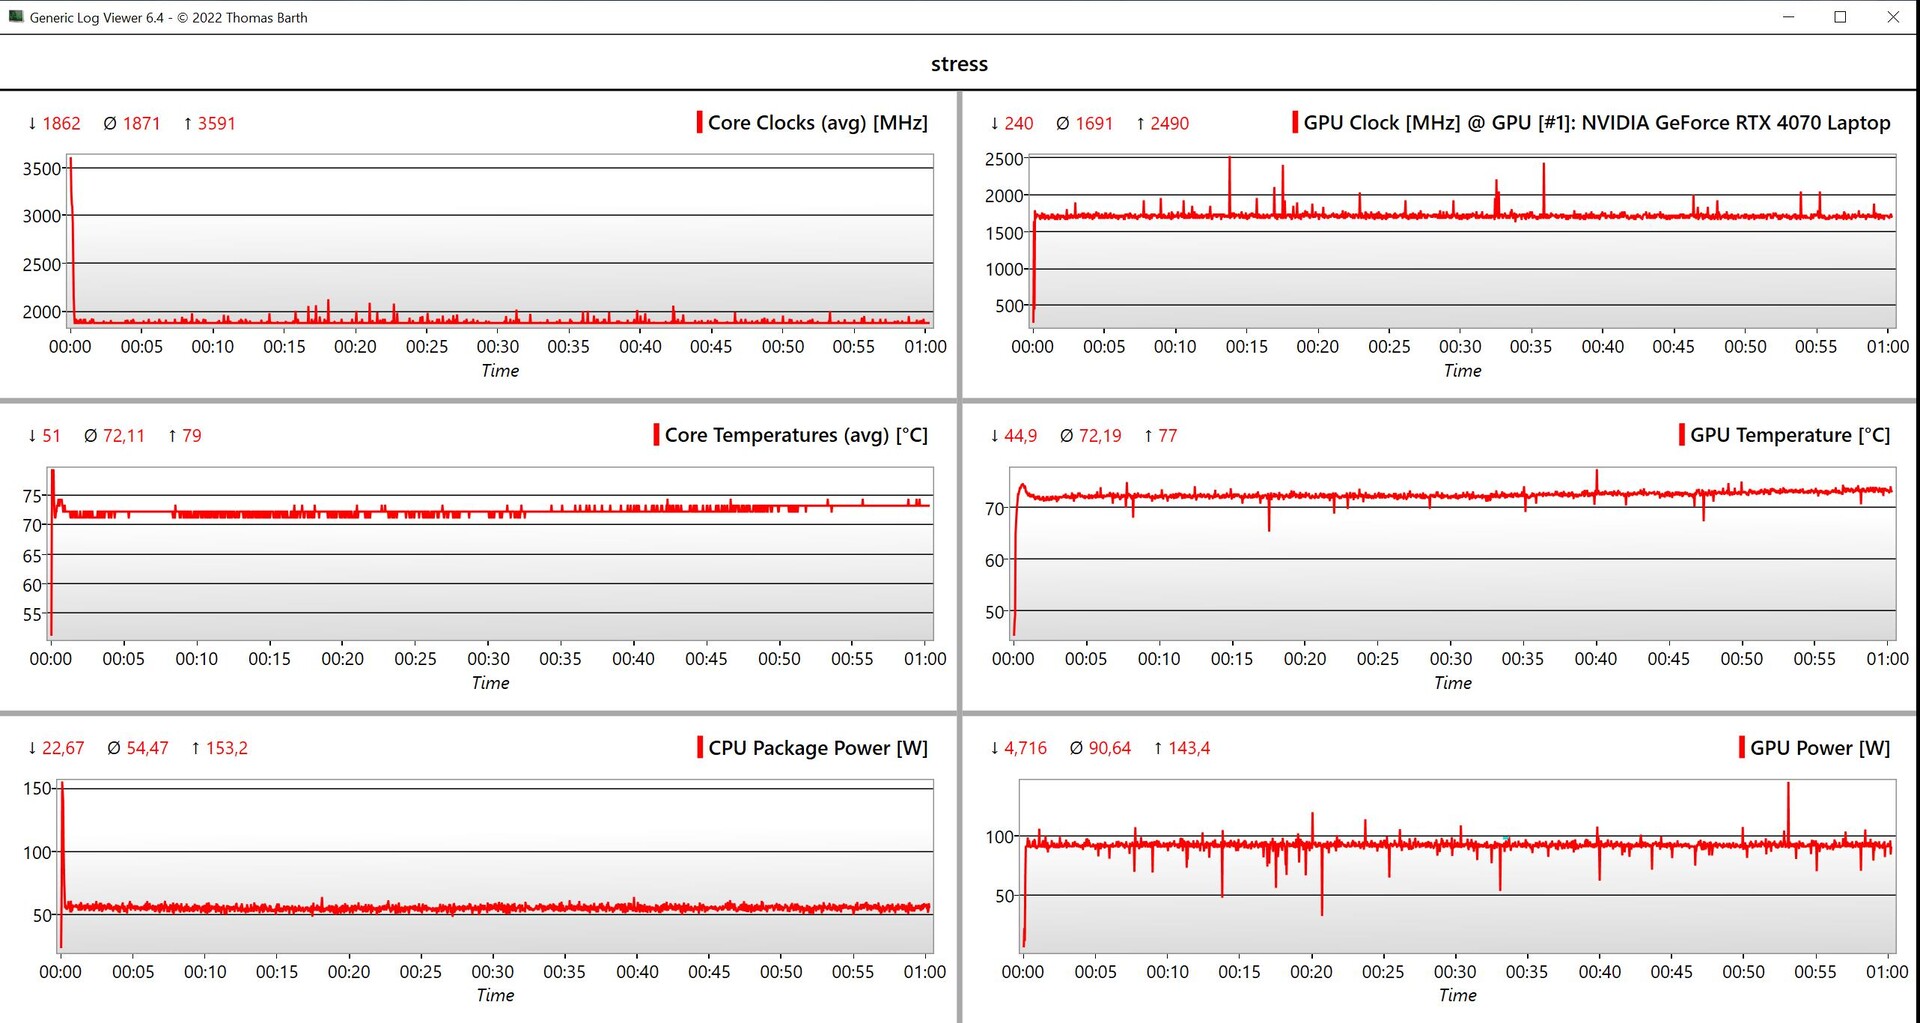
(±) The maximum temperature on the upper side is 43.7 °C / 111 F, compared to the average of 40.4 °C / 105 F, ranging from 21.2 to 68.8 °C for the class Gaming.
(±) The bottom heats up to a maximum of 42.9 °C / 109 F, compared to the average of 43.2 °C / 110 F
(+) In idle usage, the average temperature for the upper side is 27 °C / 81 F, compared to the device average of 33.9 °C / 93 F.
(±) Playing The Witcher 3, the average temperature for the upper side is 37.2 °C / 99 F, compared to the device average of 33.9 °C / 93 F.
(±) The palmrests and touchpad can get very hot to the touch with a maximum of 38.7 °C / 101.7 F.
(-) The average temperature of the palmrest area of similar devices was 28.8 °C / 83.8 F (-9.9 °C / -17.9 F).
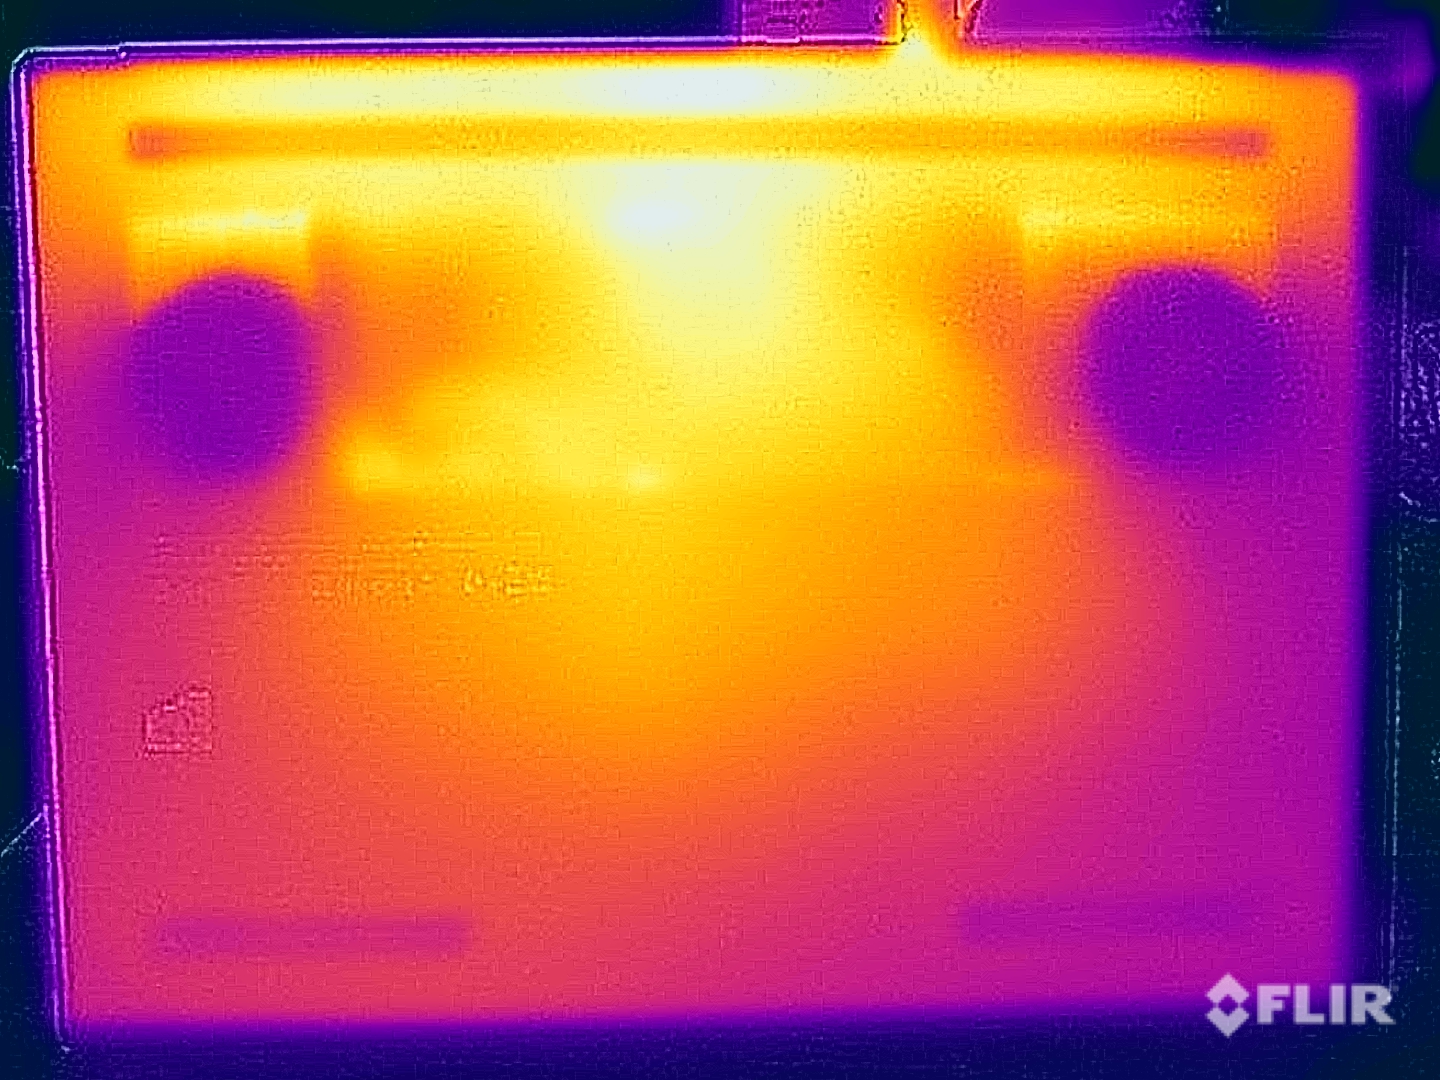
| Lenovo Legion 7 16 IRX G9 Intel Core i9-14900HX, NVIDIA GeForce RTX 4070 Laptop GPU | Lenovo Legion Pro 5 16IRX9 Intel Core i9-14900HX, NVIDIA GeForce RTX 4070 Laptop GPU | Aorus 16X 2024 Intel Core i9-14900HX, NVIDIA GeForce RTX 4070 Laptop GPU | HP Omen Transcend 16-u1095ng Intel Core i9-14900HX, NVIDIA GeForce RTX 4070 Laptop GPU | Alienware m16 R2 Intel Core Ultra 7 155H, NVIDIA GeForce RTX 4070 Laptop GPU | Schenker XMG CORE 16 (L23) AMD Ryzen 7 7840HS, NVIDIA GeForce RTX 4070 Laptop GPU | Lenovo Legion Pro 7 16IRX9H Intel Core i9-14900HX, NVIDIA GeForce RTX 4080 Laptop GPU | |
|---|---|---|---|---|---|---|---|
| Heat | -15% | -10% | -14% | -20% | -7% | -18% | |
| Maximum Upper Side * (°C) | 43.7 | 43.8 -0% | 41 6% | 49 -12% | 44.8 -3% | 46 -5% | 46 -5% |
| Maximum Bottom * (°C) | 42.9 | 55.4 -29% | 41 4% | 63 -47% | 48 -12% | 44 -3% | 49 -14% |
| Idle Upper Side * (°C) | 29.1 | 32.8 -13% | 37 -27% | 30 -3% | 37.2 -28% | 32 -10% | 38 -31% |
| Idle Bottom * (°C) | 30.6 | 36 -18% | 38 -24% | 29 5% | 42 -37% | 33 -8% | 37 -21% |
* ... smaller is better
Speakers
Both stereo speakers do a decent job but there is a noticeable difference between them and the more expensive Legion Pro 7 16. However, the modules are good enough for occasional movies/series or background music. When gaming, we would recommend using a headset due to the loud fans.
Lenovo Legion 7 16 IRX G9 audio analysis
(+) | speakers can play relatively loud (82.1 dB)
Bass 100 - 315 Hz
(±) | reduced bass - on average 13.1% lower than median
(±) | linearity of bass is average (9.7% delta to prev. frequency)
Mids 400 - 2000 Hz
(+) | balanced mids - only 2.8% away from median
(+) | mids are linear (3.7% delta to prev. frequency)
Highs 2 - 16 kHz
(+) | balanced highs - only 4.7% away from median
(±) | linearity of highs is average (7% delta to prev. frequency)
Overall 100 - 16.000 Hz
(+) | overall sound is linear (12.6% difference to median)
Compared to same class
» 15% of all tested devices in this class were better, 4% similar, 81% worse
» The best had a delta of 6%, average was 18%, worst was 132%
Compared to all devices tested
» 11% of all tested devices were better, 3% similar, 86% worse
» The best had a delta of 4%, average was 23%, worst was 134%
Lenovo Legion Pro 7 16IRX9H audio analysis
(+) | speakers can play relatively loud (84 dB)
Bass 100 - 315 Hz
(±) | reduced bass - on average 8.9% lower than median
(±) | linearity of bass is average (7.4% delta to prev. frequency)
Mids 400 - 2000 Hz
(+) | balanced mids - only 2.8% away from median
(+) | mids are linear (4% delta to prev. frequency)
Highs 2 - 16 kHz
(+) | balanced highs - only 3% away from median
(+) | highs are linear (5% delta to prev. frequency)
Overall 100 - 16.000 Hz
(+) | overall sound is linear (8.4% difference to median)
Compared to same class
» 2% of all tested devices in this class were better, 1% similar, 97% worse
» The best had a delta of 6%, average was 18%, worst was 132%
Compared to all devices tested
» 2% of all tested devices were better, 1% similar, 97% worse
» The best had a delta of 4%, average was 23%, worst was 134%
Energy management - Average battery runtimes
Power consumption
In the consumption measurements, the review device didn't surprise us and, in idle use, we recorded a maximum of almost 22 watts. In performance mode, the 230-watt PSU is briefly the limiting factor but it quickly stabilized and the consumption swiftly settled to 200 watts. All in all, the 230-watt PSU is well-sized. Nevertheless, Lenovo could improve the standby consumption of over 1.1 watts.
| Off / Standby | |
| Idle | |
| Load |
|
Key:
min: | |
| Lenovo Legion 7 16 IRX G9 i9-14900HX, GeForce RTX 4070 Laptop GPU, SK Hynix HFS001TEJ9X115N, IPS, 3200x2000, 16" | Aorus 16X 2024 i9-14900HX, GeForce RTX 4070 Laptop GPU, Gigabyte AG450E1024-SI, IPS, 2560x1600, 16" | HP Omen Transcend 16-u1095ng i9-14900HX, GeForce RTX 4070 Laptop GPU, Kioxia XG8 KXG80ZNV1T02, OLED, 2560x1600, 16" | Alienware m16 R2 Ultra 7 155H, GeForce RTX 4070 Laptop GPU, Samsung PM9A1 MZVL21T0HCLR, IPS, 2560x1600, 16" | Schenker XMG CORE 16 (L23) R7 7840HS, GeForce RTX 4070 Laptop GPU, Samsung 990 Pro 1 TB, IPS, 2560x1600, 16" | Lenovo Legion Pro 7 16IRX9H i9-14900HX, GeForce RTX 4080 Laptop GPU, SK Hynix HFS001TEJ9X115N, IPS, 2560x1600, 16" | Average NVIDIA GeForce RTX 4070 Laptop GPU | Average of class Gaming | |
|---|---|---|---|---|---|---|---|---|
| Power Consumption | -4% | 4% | 6% | 20% | -27% | 10% | 5% | |
| Idle Minimum * (Watt) | 15.4 | 13 16% | 10 35% | 8.1 47% | 11 29% | 16 -4% | 13.2 ? 14% | 13 ? 16% |
| Idle Average * (Watt) | 21.2 | 18 15% | 18 15% | 13 39% | 15.2 28% | 21 1% | 18.2 ? 14% | 18.7 ? 12% |
| Idle Maximum * (Watt) | 21.9 | 35 -60% | 32 -46% | 40.3 -84% | 16 27% | 36 -64% | 24.6 ? -12% | 24.3 ? -11% |
| Load Average * (Watt) | 128.5 | 138 -7% | 128 -0% | 79 39% | 64 50% | 132 -3% | 97 ? 25% | 108.2 ? 16% |
| Witcher 3 ultra * (Watt) | 188.4 | 172.6 8% | 148.4 21% | 188.1 -0% | 179 5% | 267 -42% | ||
| Load Maximum * (Watt) | 239.1 | 222 7% | 242 -1% | 254.9 -7% | 280 -17% | 360 -51% | 221 ? 8% | 254 ? -6% |
* ... smaller is better
Power consumption Witcher 3 / stress test
Power consumption with an external monitor
Battery life
Lenovo has installed a 99.9 Wh battery in its Legion 7 16 and, overall, the runtimes can be considered quite average. At 150 cd/m² (representing 63 % of the review device's maximum brightness) and 60 Hz, our Wi-Fi test ran for more than 7 hours (~6.5 hours at 165 Hz) and around 5.5 hours at full brightness and 60 Hz (~5 hours at 165 Hz). In the video test at 150 cd/m², we recorded a little over 10 hours, and under load, in the worst case, the lights go out after 50 minutes.
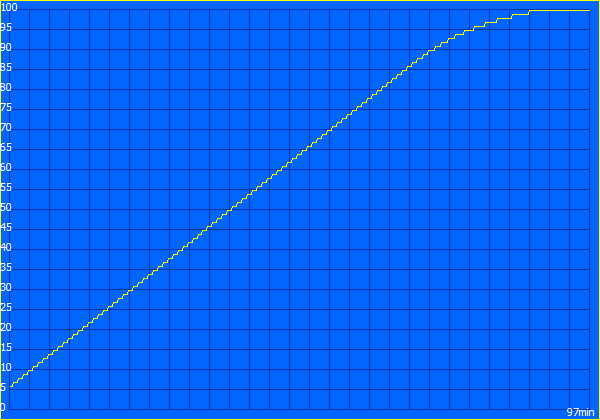
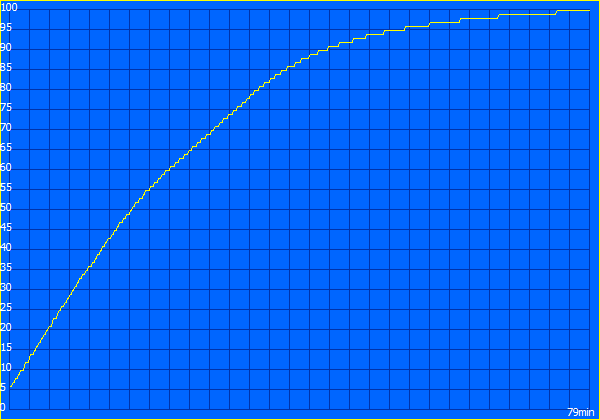
The Legion offers two charging modes with a full charging cycle taking 97 minutes (80 % after ~64 minutes) using normal mode. With express mode, it takes 79 minutes (80 % after just 34 minutes).
| Lenovo Legion 7 16 IRX G9 i9-14900HX, GeForce RTX 4070 Laptop GPU, 99.9 Wh | Lenovo Legion Pro 5 16IRX9 i9-14900HX, GeForce RTX 4070 Laptop GPU, 80 Wh | Aorus 16X 2024 i9-14900HX, GeForce RTX 4070 Laptop GPU, 99 Wh | HP Omen Transcend 16-u1095ng i9-14900HX, GeForce RTX 4070 Laptop GPU, 97 Wh | Alienware m16 R2 Ultra 7 155H, GeForce RTX 4070 Laptop GPU, 90 Wh | Schenker XMG CORE 16 (L23) R7 7840HS, GeForce RTX 4070 Laptop GPU, 99 Wh | Lenovo Legion Pro 7 16IRX9H i9-14900HX, GeForce RTX 4080 Laptop GPU, 99.9 Wh | Average of class Gaming | |
|---|---|---|---|---|---|---|---|---|
| Battery runtime | 3% | 37% | -32% | 19% | 72% | -14% | 24% | |
| H.264 (h) | 10.3 | 9 -13% | 10.2 -1% | 8.9 ? -14% | ||||
| WiFi v1.3 (h) | 7.2 | 4.8 -33% | 8 11% | 4.9 -32% | 8.1 13% | 8.4 17% | 6.2 -14% | 7 ? -3% |
| Load (h) | 0.8 | 1.1 38% | 1.7 113% | 1 25% | 2.4 200% | 1.51 ? 89% | ||
| Reader / Idle (h) | 6.7 | 12.6 | 12.6 | 8.71 ? |
Pros
Cons
Verdict - An understated, high-performing gaming laptop

With the new Legion 7i 16 G9, Lenovo is offering a comparatively slim gaming laptop that didn't reveal any glaring weaknesses during tests. Compared to the more expensive Legion Pro 7, you have to accept limitations when it comes to lengthy periods of CPU performance as well as the equipped GPU (the Legion 7 tops out at the RTX 4070 laptop) but, compared to the Pro, the aluminum case remains cooler and, overall, the cooling does a very good job. The fans are still problematic because you will require a headset when gaming, using either of the fast energy modes. However, that also applies to the competition and, using silent mode, it is possible to have tolerable sound levels at the expense of some performance.
In addition, the thinner case is much less of a stand-out than the Legion Pro. Anyone on the hunt for extensive lighting options will be disappointed but, on the other hand, this also makes the Legion 7 16 suitable for other target groups. The only annoying thing is the fingerprint-sensitive surfaces. Apart from the missing Ethernet port, all of the important connectors are on board and there are no problems when it comes to the input devices.
The new Lenovo Legion 7i 16 G9 is an eye-catching gaming laptop with bags of performance and a good feature set. The high-resolution IPS display is also suitable for viewing and editing images and no PWM is implemented.
Overall, the optional IPS display and its 3,200 x 2,000-pixel resolution do a good job, even though the subjective image impression and the response times are unable to keep pace with OLED panels. The upside is a lack of PWM and annoying reflections are also absent. Likewise, the battery runtimes are only average with the platform and its HX processor simply requiring too much power.
The new Legion 7 16 also performs well when pitted against its peers. In particular, the Legion Pro 7 is suitable if you want a GPU faster than the RTX 4070 laptop. With comparable power, the Legion Pro 5 is, by contrast, significantly bulkier and also offers a poorer screen. The HP Omen Transcend comes with a 240 Hz OLED but also offers somewhat lower performance and a higher price.
Price and availability
The Legion 7i 16 G9 can be bought directly from Lenovo for around $2,099.
Lenovo Legion 7 16 IRX G9
- 04/13/2024 v7 (old)
Andreas Osthoff
Transparency
The selection of devices to be reviewed is made by our editorial team. The test sample was provided to the author as a loan by the manufacturer or retailer for the purpose of this review. The lender had no influence on this review, nor did the manufacturer receive a copy of this review before publication. There was no obligation to publish this review. As an independent media company, Notebookcheck is not subjected to the authority of manufacturers, retailers or publishers.
This is how Notebookcheck is testing
Every year, Notebookcheck independently reviews hundreds of laptops and smartphones using standardized procedures to ensure that all results are comparable. We have continuously developed our test methods for around 20 years and set industry standards in the process. In our test labs, high-quality measuring equipment is utilized by experienced technicians and editors. These tests involve a multi-stage validation process. Our complex rating system is based on hundreds of well-founded measurements and benchmarks, which maintains objectivity. Further information on our test methods can be found here.
Price comparison

