Lenovo Legion Pro 7 16 (2024) review: Cream of the crop amongst RTX 4080 laptops
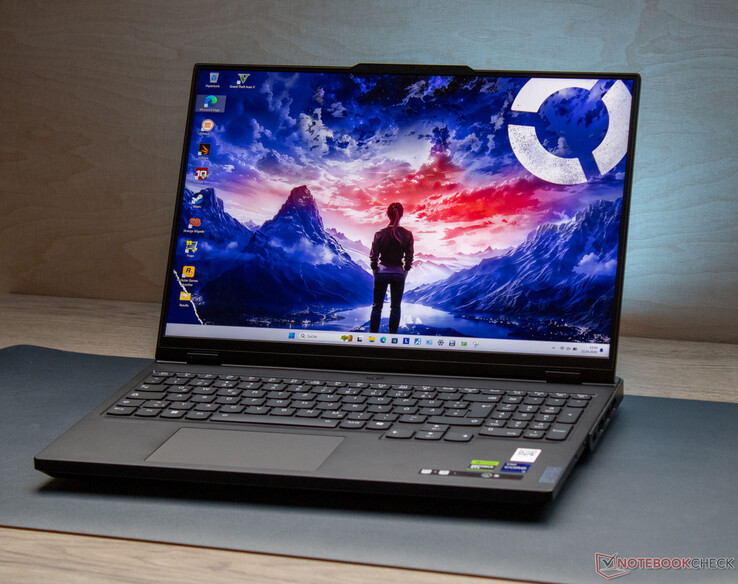
The Legion Pro 7 – a 16-inch laptop aimed at gamers and creators – is at the top end of the performance spectrum. And it comes with fittingly potent hardware, featuring a Core i9-14900HX, a GeForce RTX 4080, 32 GB of RAM, and a bright colour-accurate IPS display (DCI-P3 coverage, Dolby Vision, G-Sync) with a 16:10 aspect ratio. The Legion Pro is competing with the likes of the MSI Vector 16 HX A14V, the Alienware m16 R1 AMD, the HP Omen 16 (2024).
The Legion Pro 7 16IRX9H is the successor to the Legion Pro 7 16IRX8H and shares the same outer design. Please refer to our 16IRX8H review for more details on the chassis, features and input devices.
Comparison with possible competitors
Rating | Date | Model | Weight | Height | Size | Resolution | Price |
|---|---|---|---|---|---|---|---|
| 89.5 % v7 (old) | 03 / 2024 | Lenovo Legion Pro 7 16IRX9H i9-14900HX, GeForce RTX 4080 Laptop GPU | 2.7 kg | 21.95 mm | 16.00" | 2560x1600 | |
| 89.2 % v7 (old) | 08 / 2023 | Alienware m16 R1 AMD R9 7845HX, GeForce RTX 4080 Laptop GPU | 3.1 kg | 25.4 mm | 16.00" | 2560x1600 | |
| 88 % v7 (old) | 02 / 2024 | MSI Vector 16 HX A14V i9-14900HX, GeForce RTX 4080 Laptop GPU | 2.7 kg | 28.55 mm | 16.00" | 2560x1600 | |
| 86.7 % v7 (old) | 02 / 2024 | HP Omen 16 (2024) i9-14900HX, GeForce RTX 4080 Laptop GPU | 2.4 kg | 23.5 mm | 16.10" | 2560x1440 |
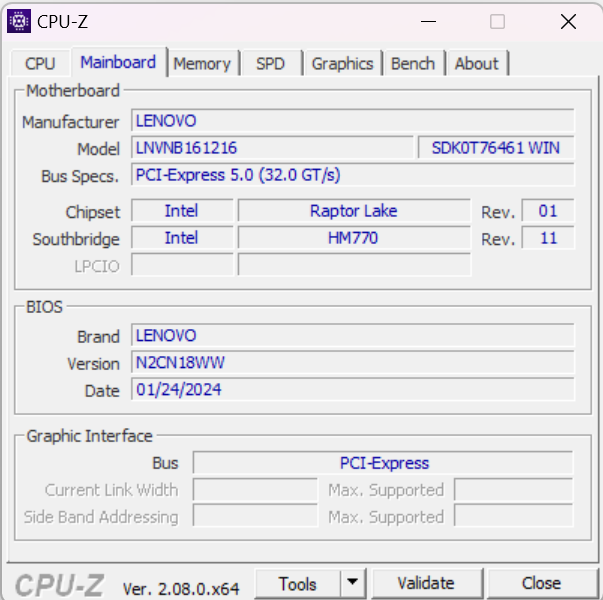
Chassis & specifications - Comes with Thunderbolt 4
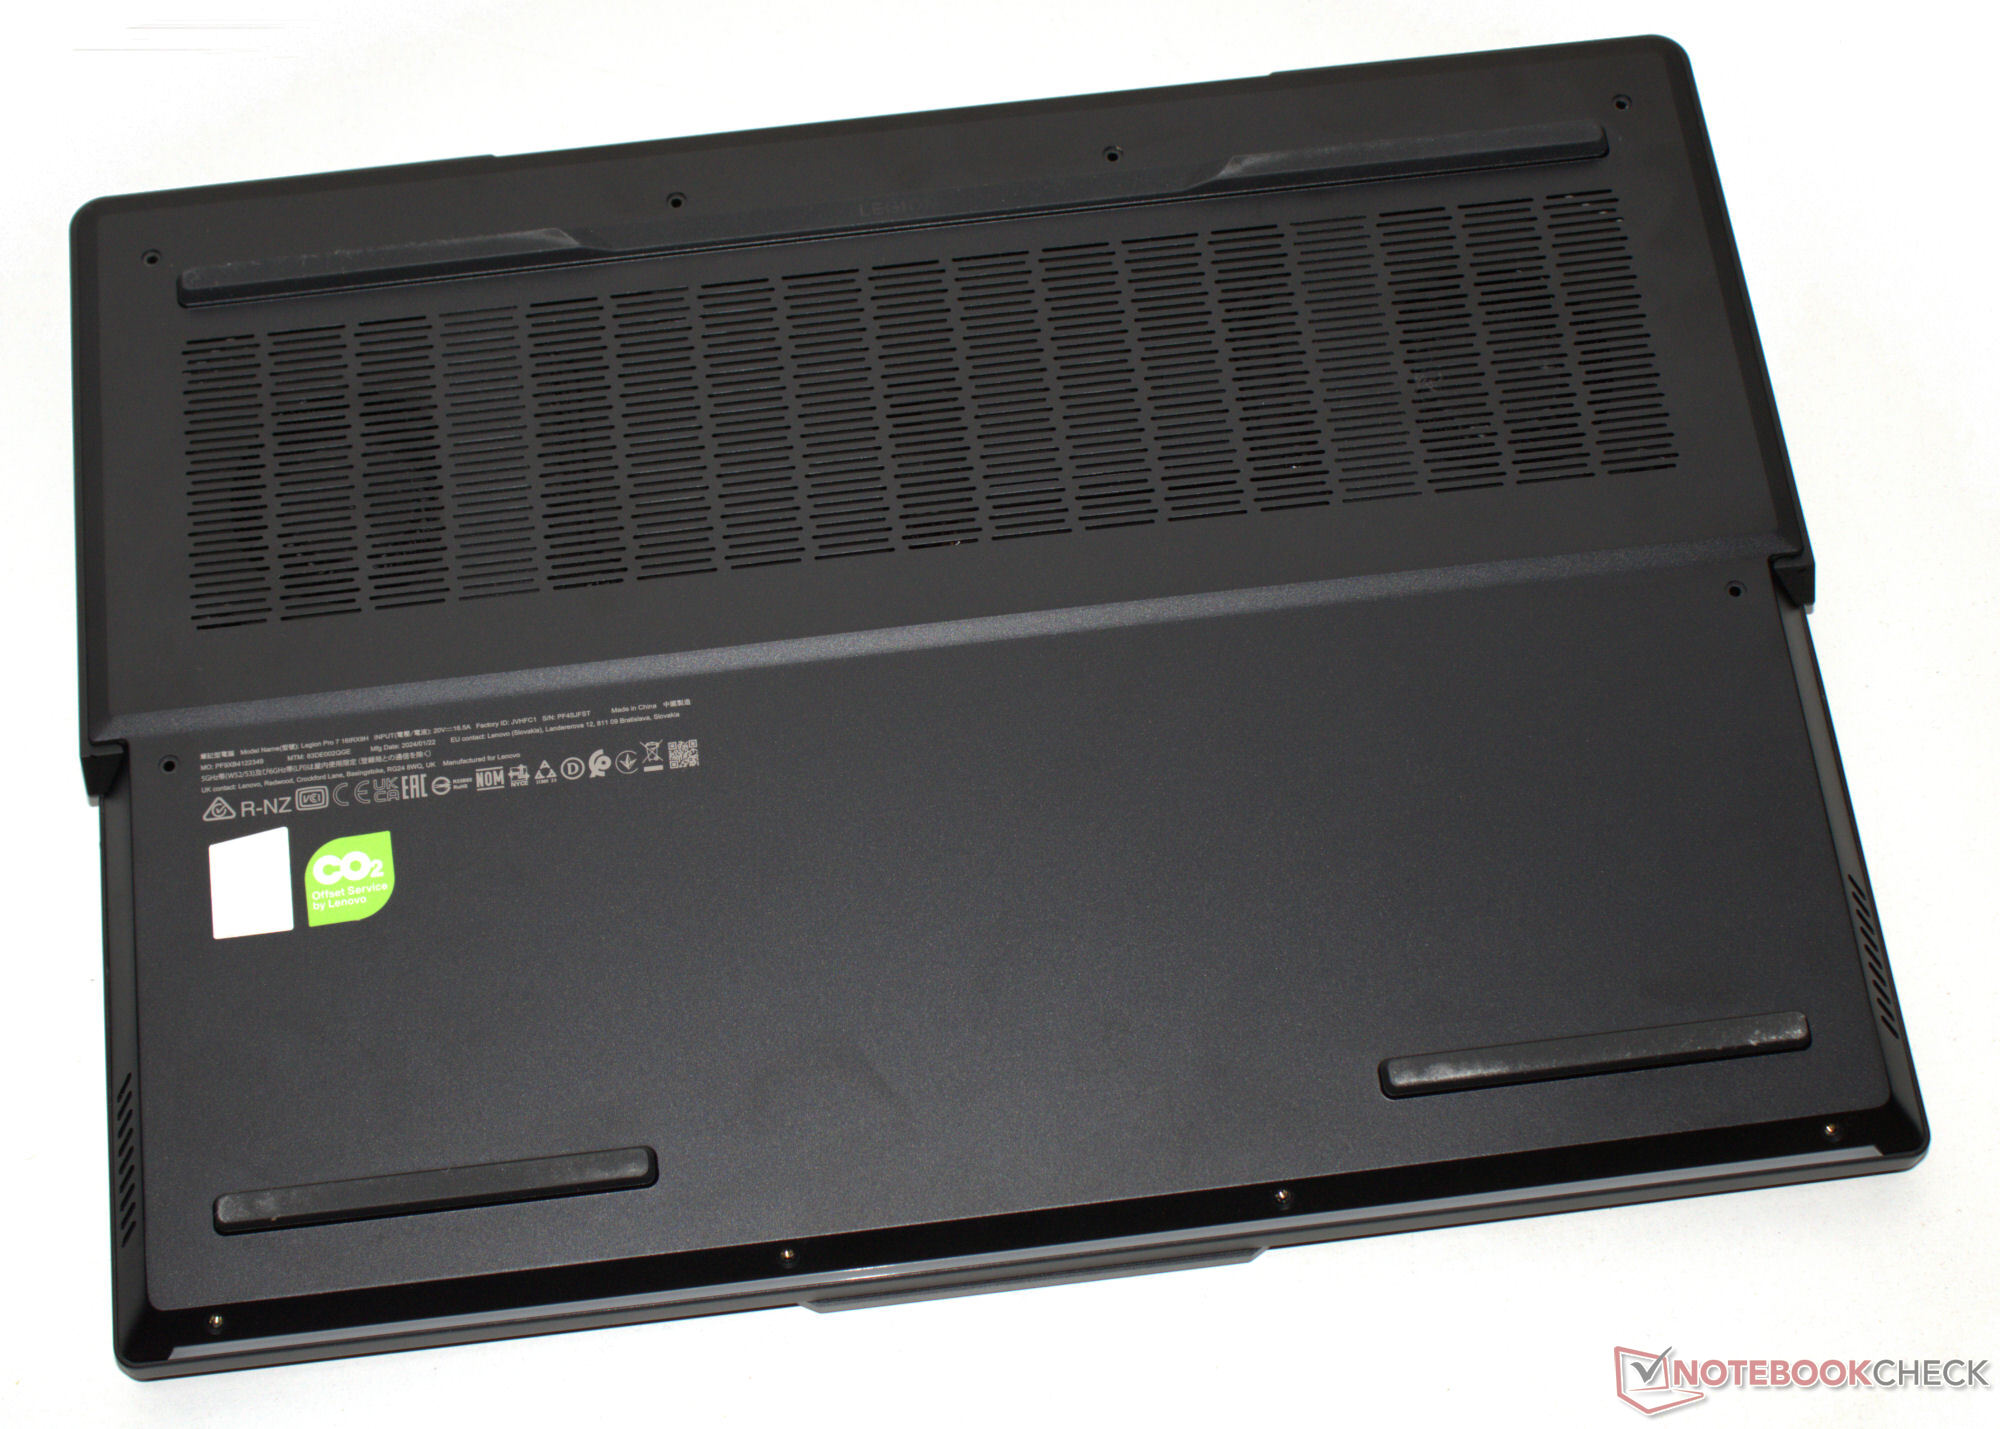
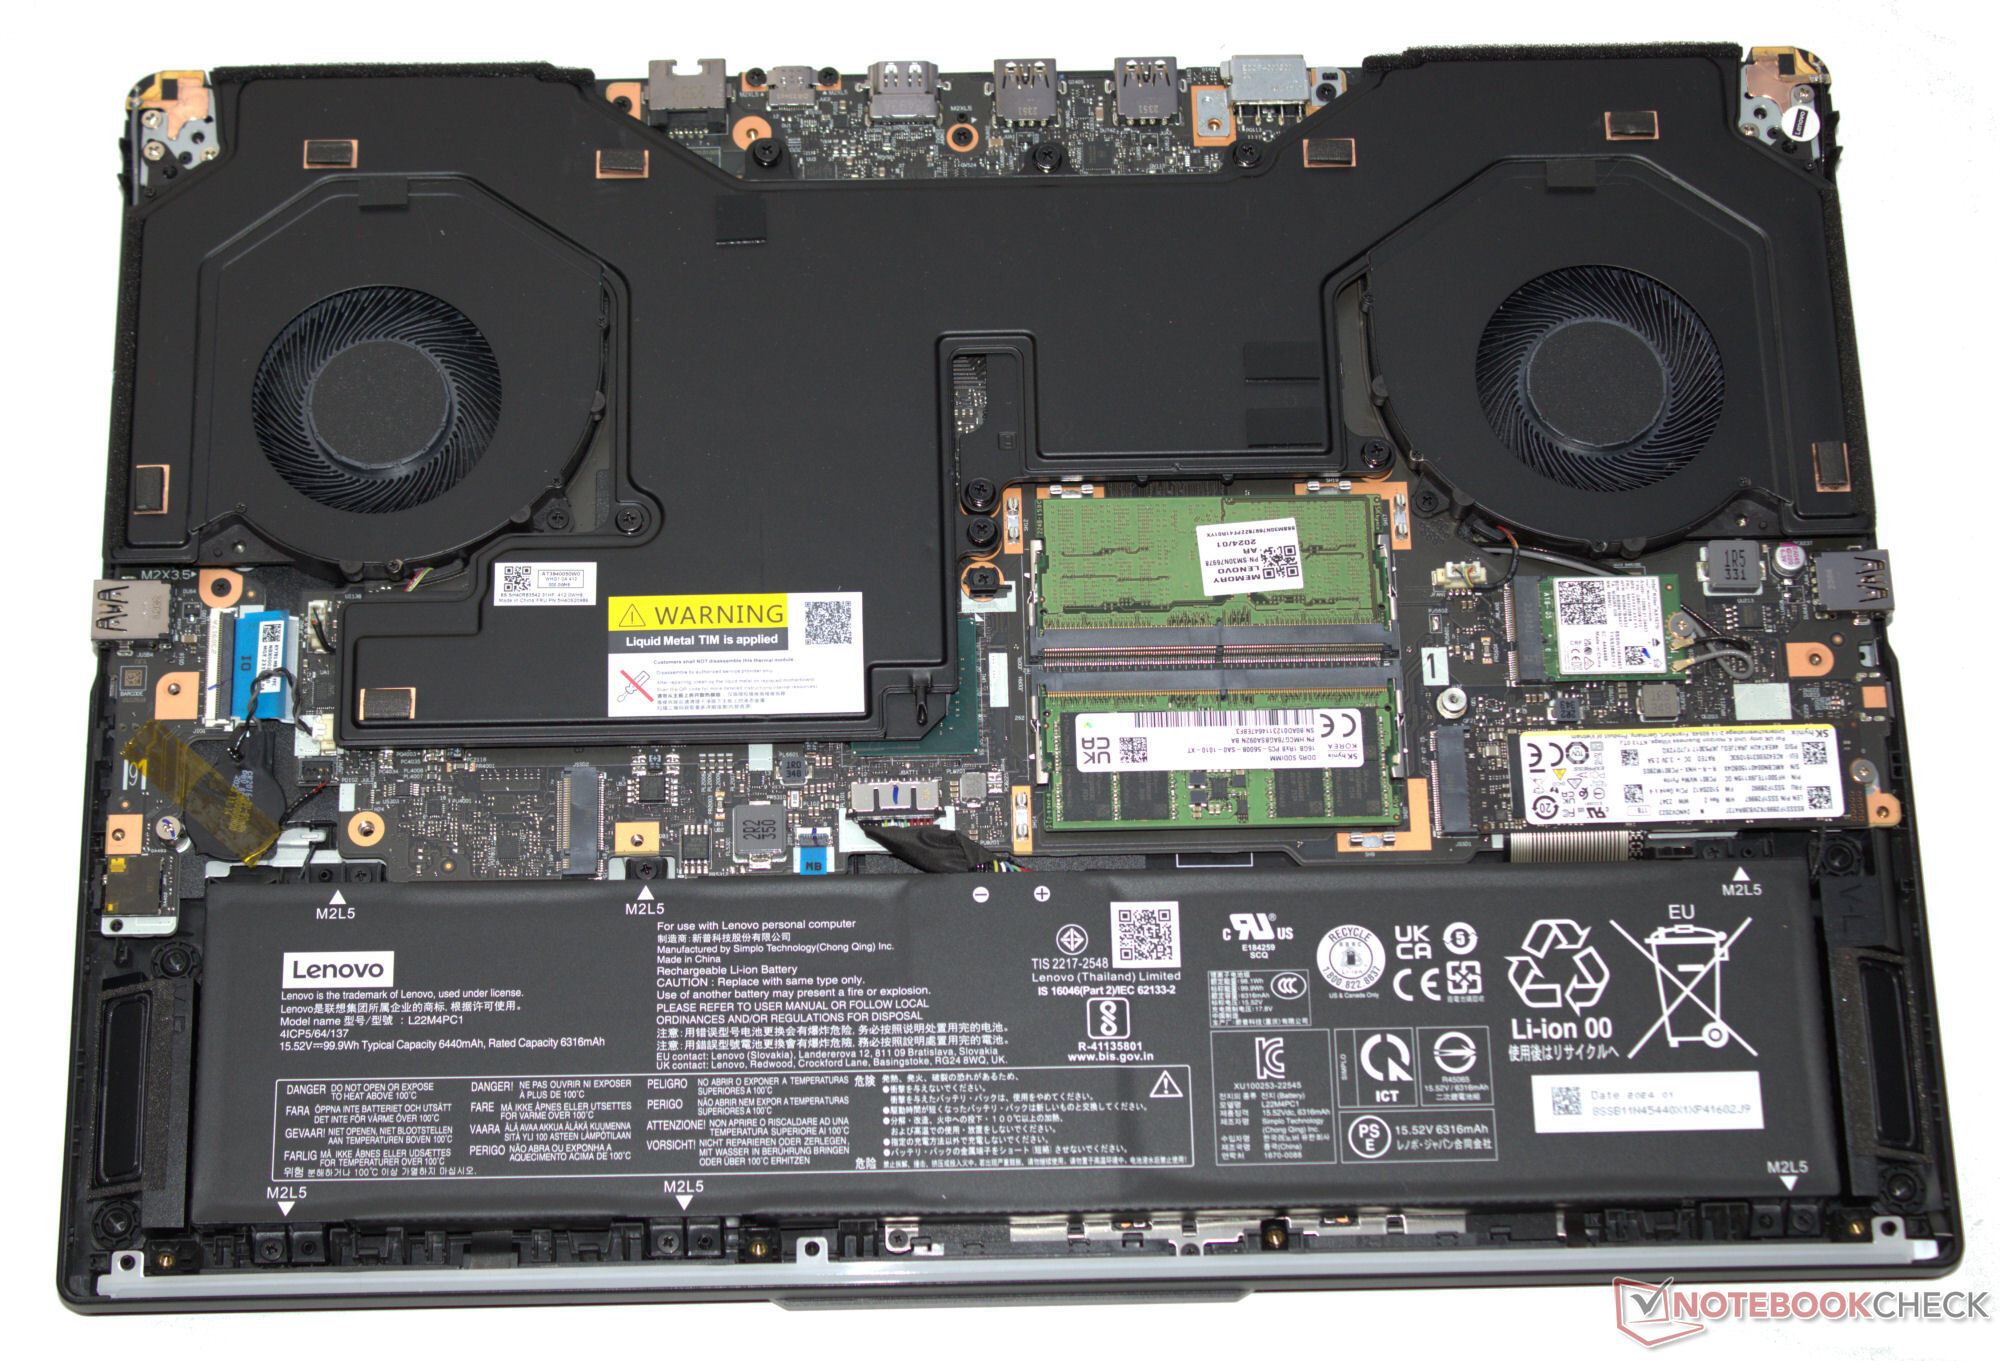
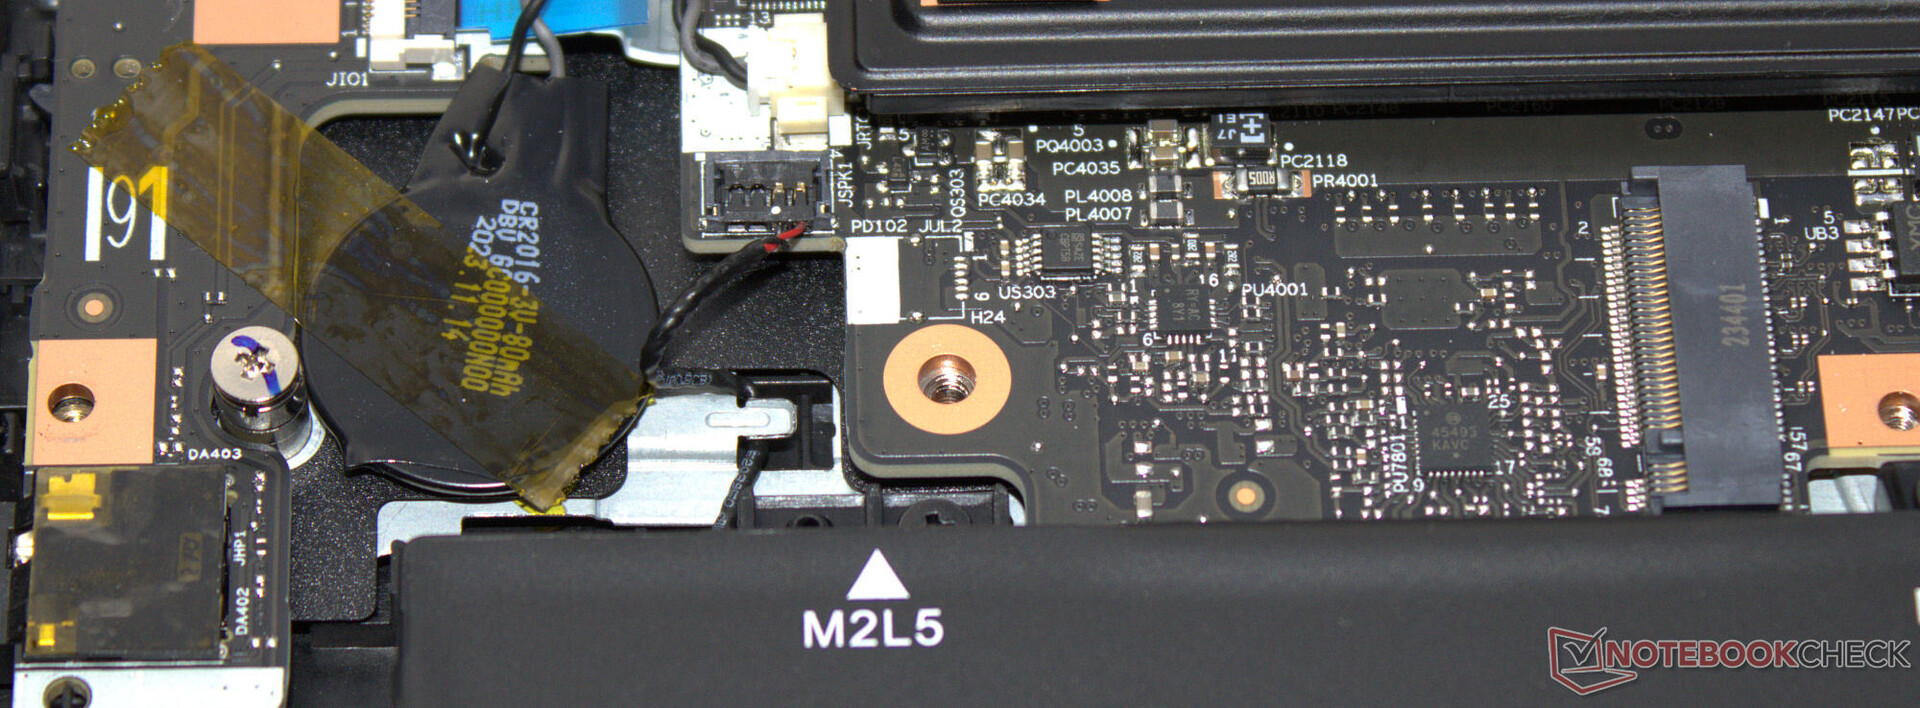
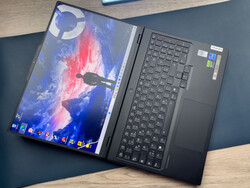
The Legion’s hardware is packed inside a sturdy, matt-black aluminium chassis with a smooth surface. A keyboard backlight and an LED strip facing the user add some colourful pizazz. The stiff hinges with a max opening angle of 180 degrees deserve a thumbs-up. The battery (screwed down, not glued on) and the rest of the internals are accessible once the bottom cover is removed.
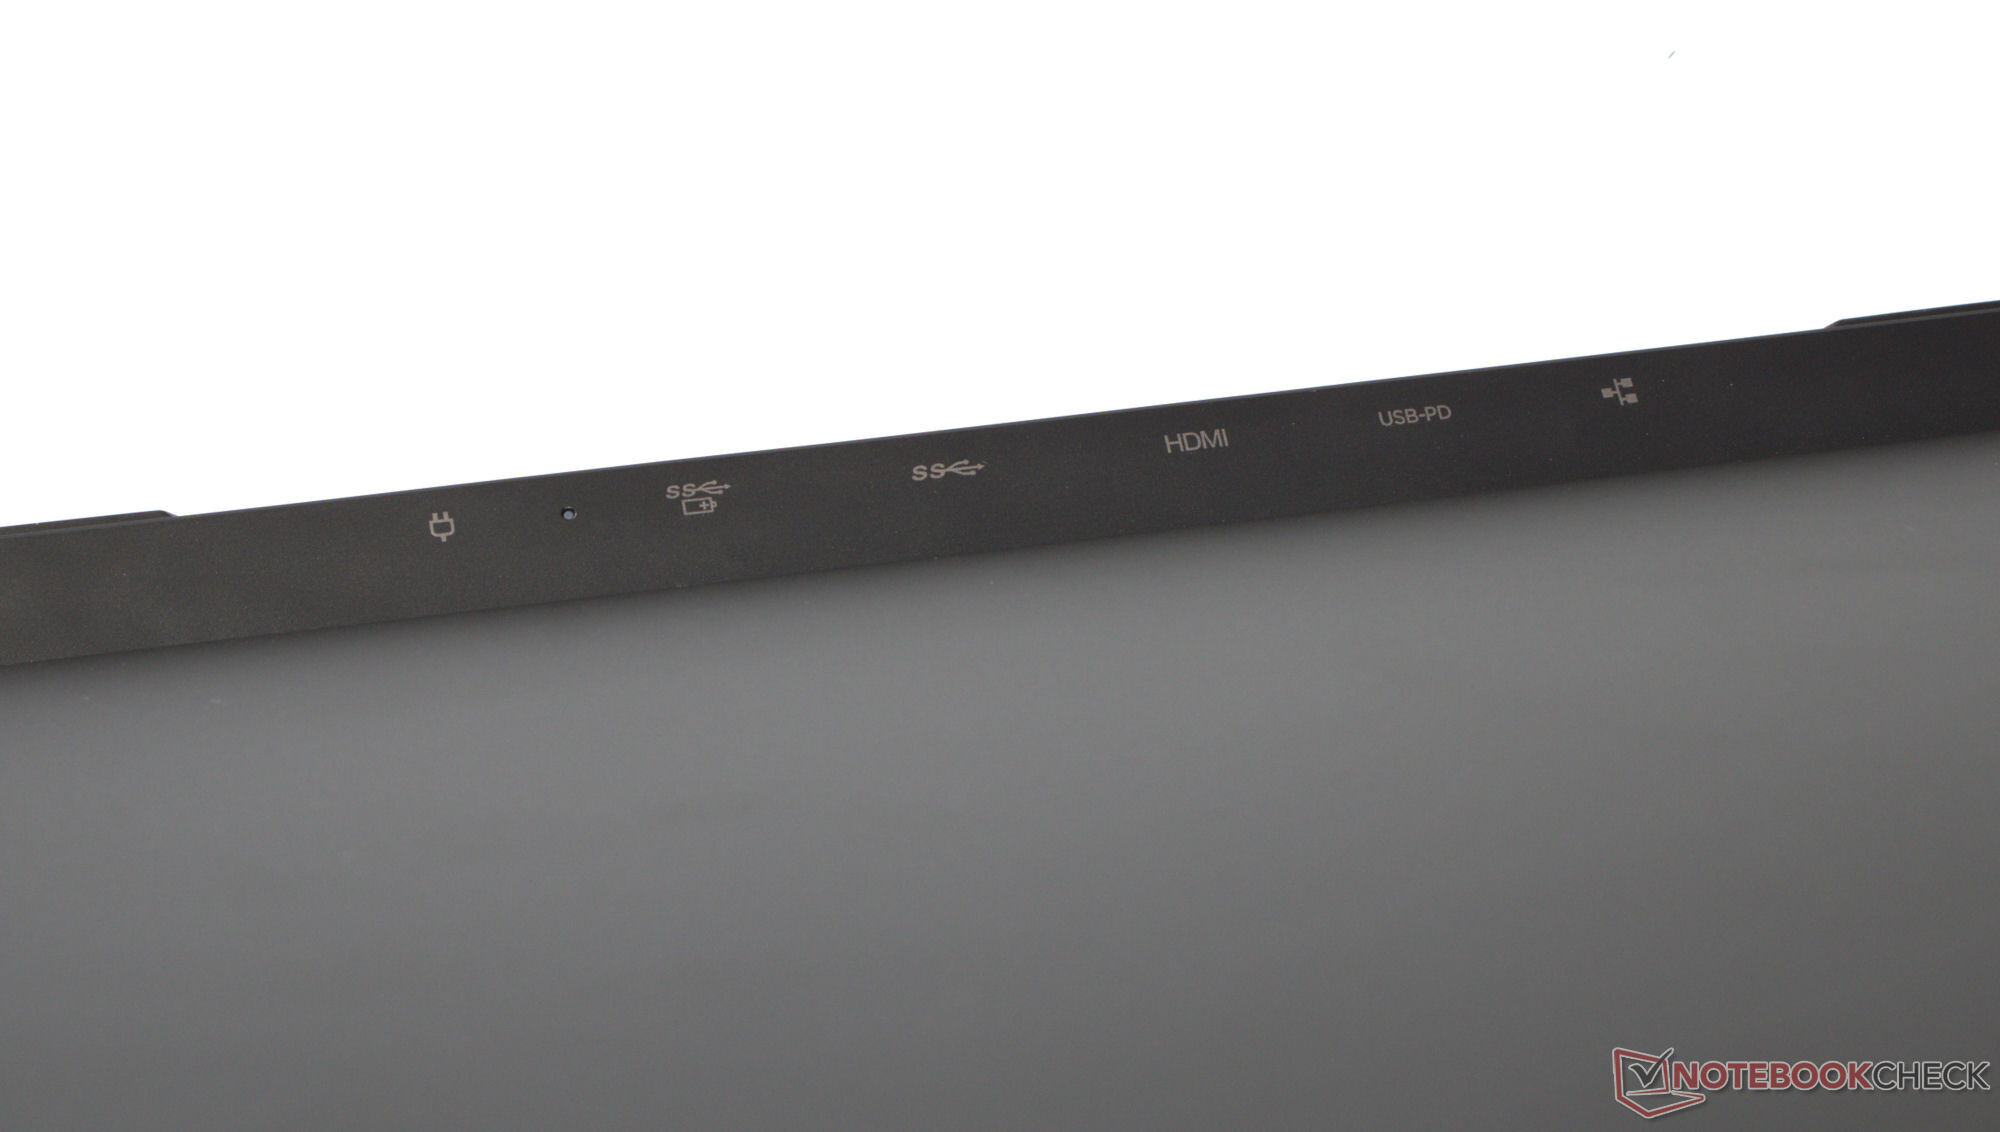
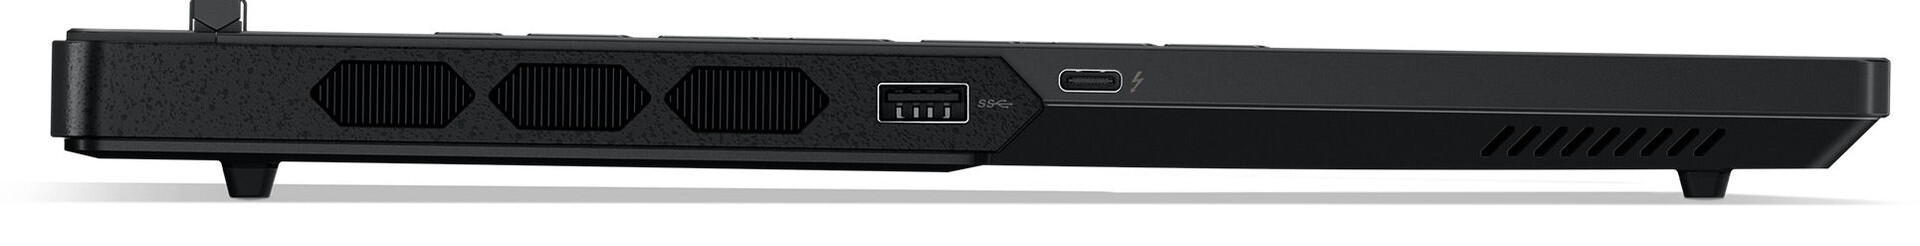
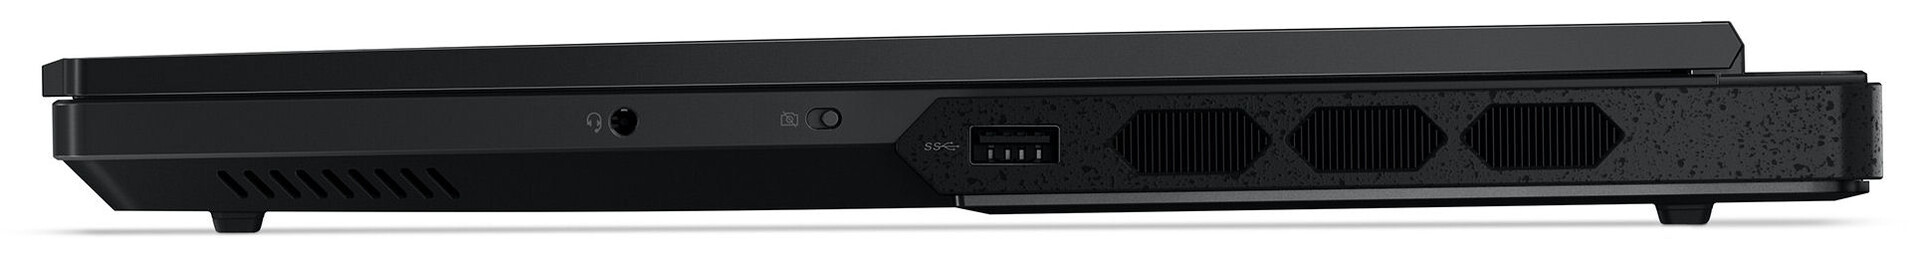
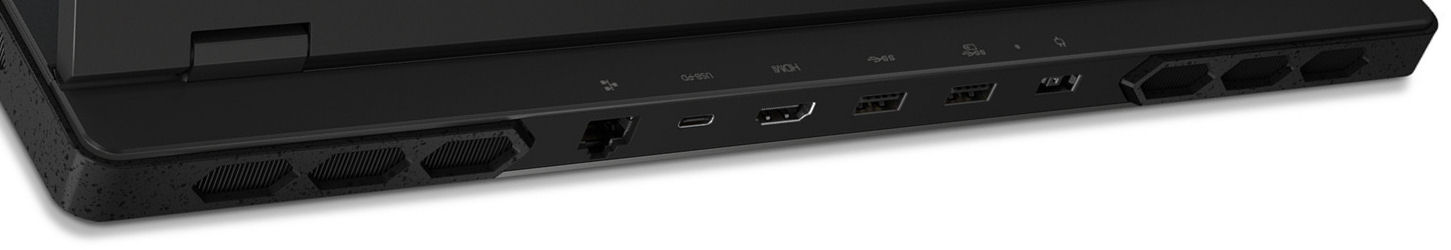
The laptop isn’t lacking in the I/O department, featuring four USB-A ports (USB 3.2 Gen 1) and two USB-C ports (1x Thunderbolt 4, 1 x USB 3.2 Gen 2; 1x PD, 2x DP). It offers a total of three video outputs (1x HDMI, 2x DP). The 2.1MP 1080p webcam is fitted with a privacy shutter and produces very decent results. There isn’t any memory card reader on board.
Under optimal conditions (i.e. no other Wi-Fi devices nearby, short distance between the laptop and server PC), the Legion Pro 7 hit superb Wi-Fi data rates. The notebook uses a Killer AX1675i Wi-Fi 6E chip (aka Intel AX211). Wired connectivity is handled by a Realtek RTL8168/8111 controller.
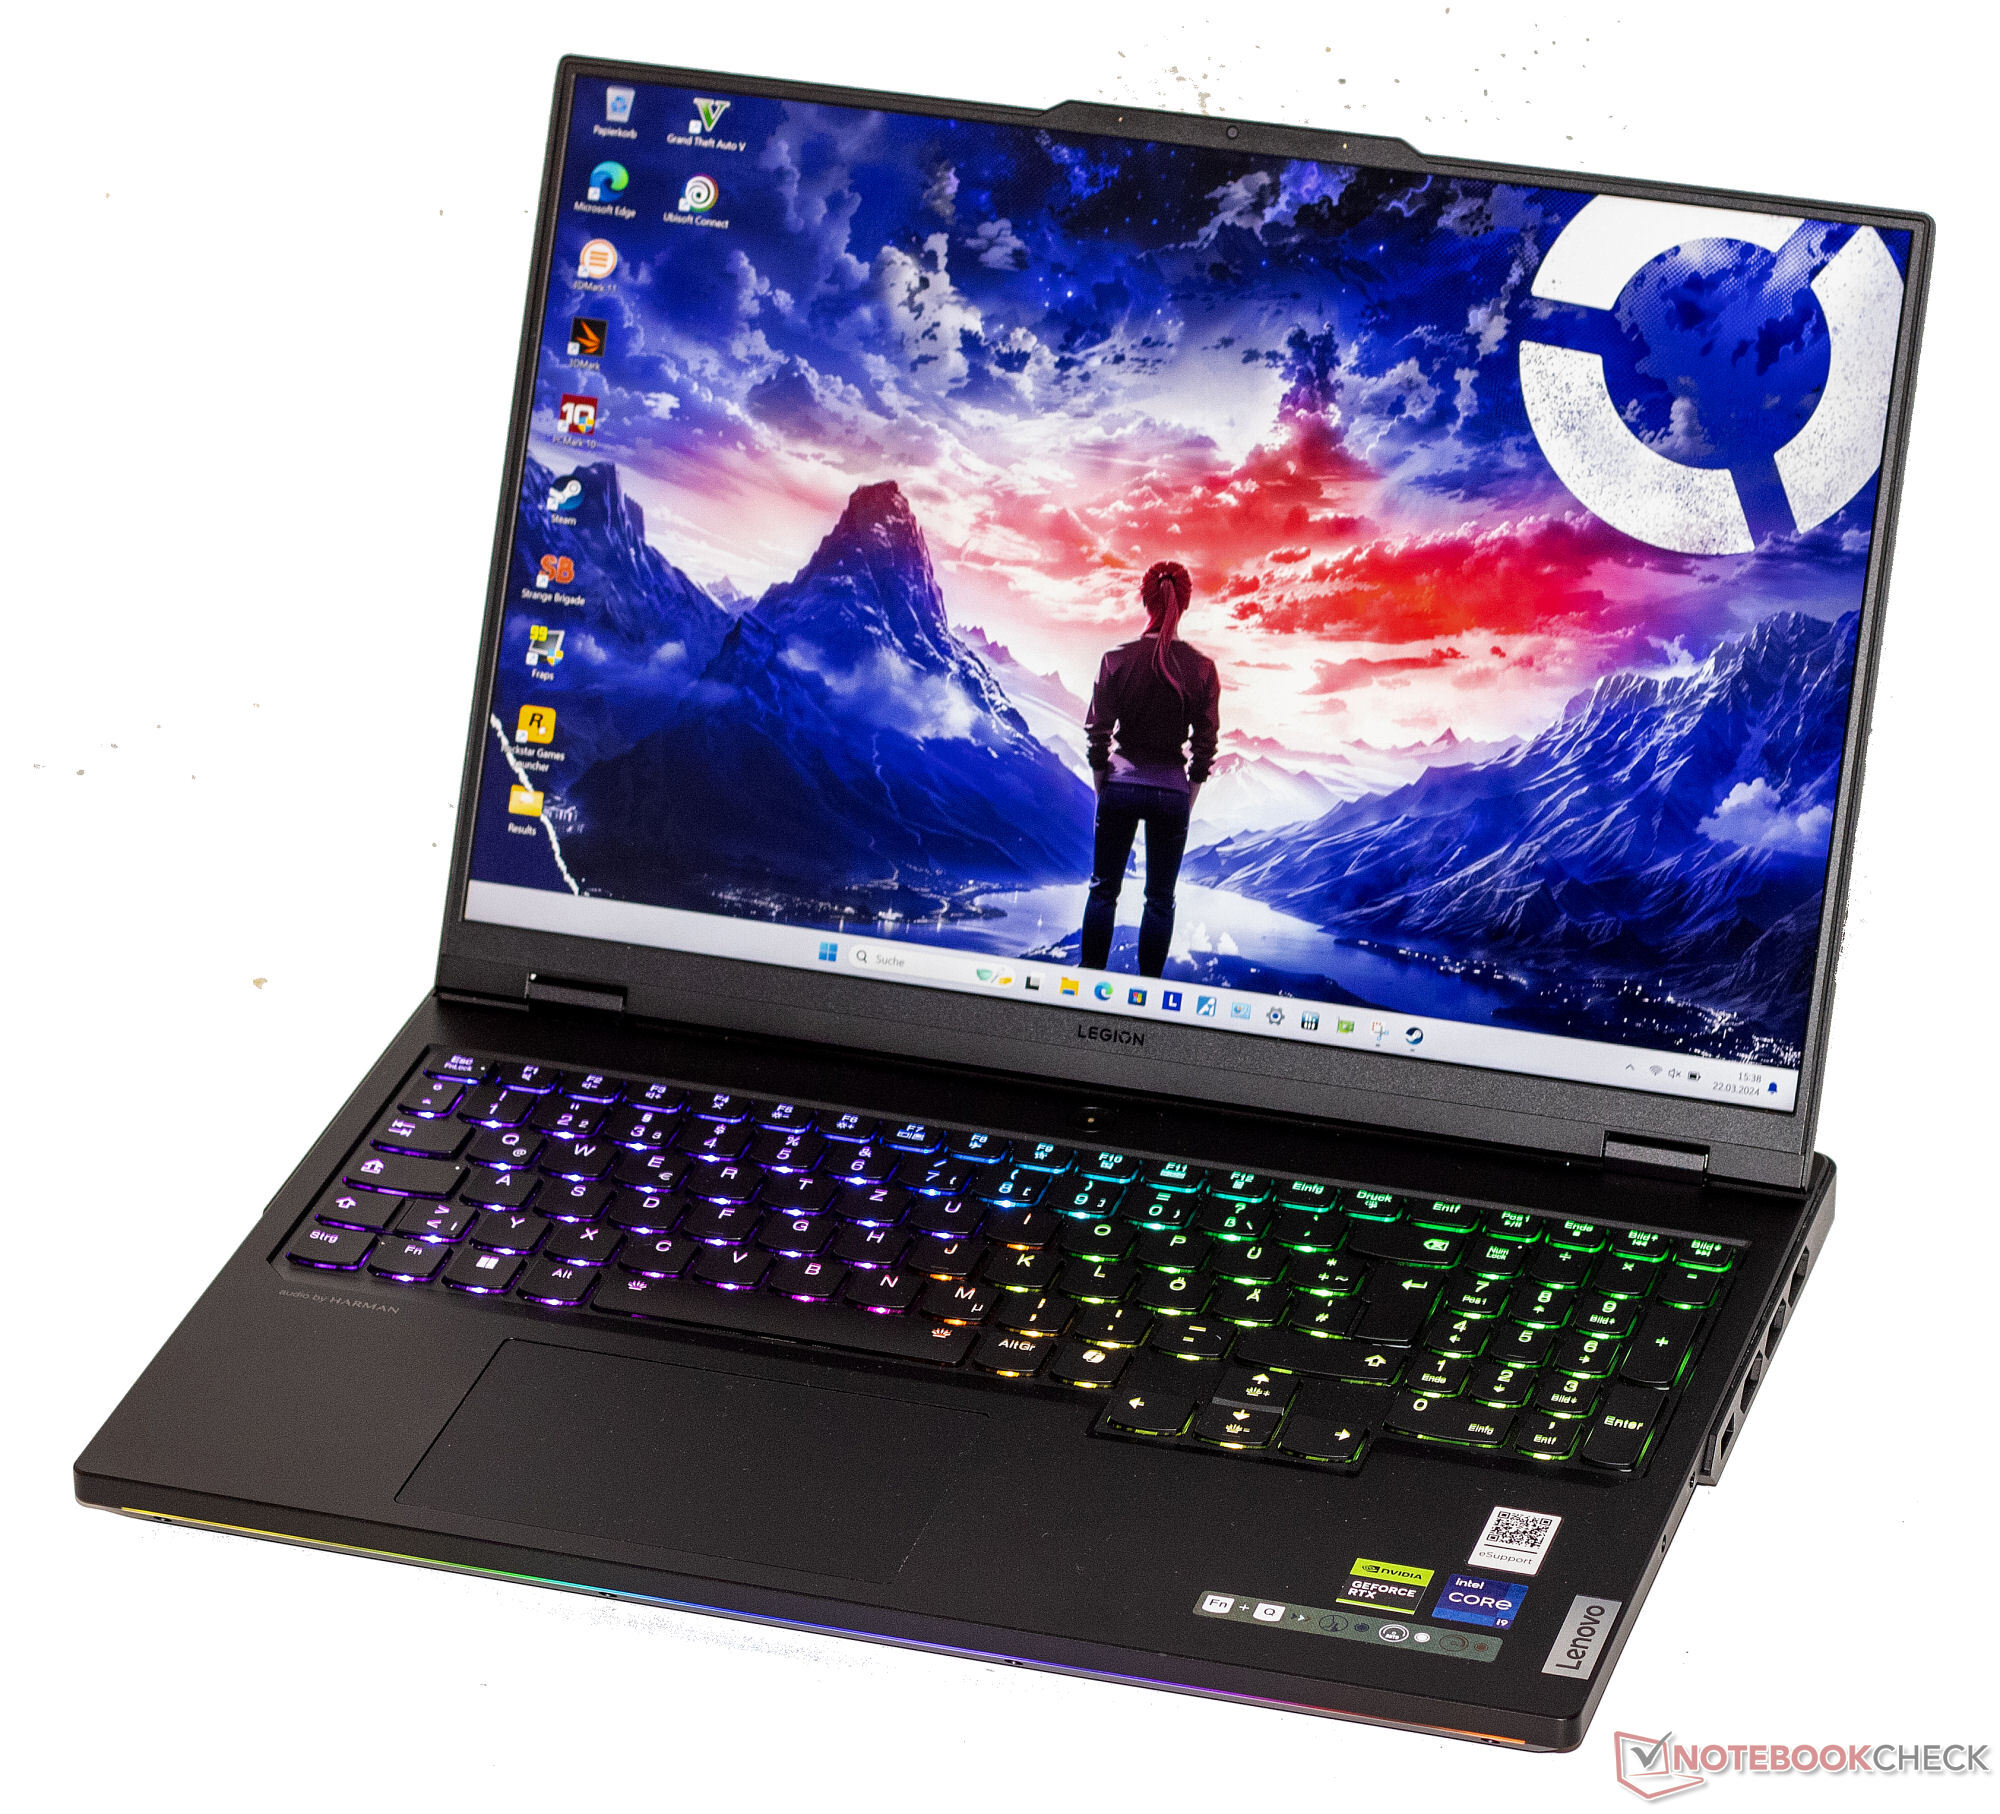
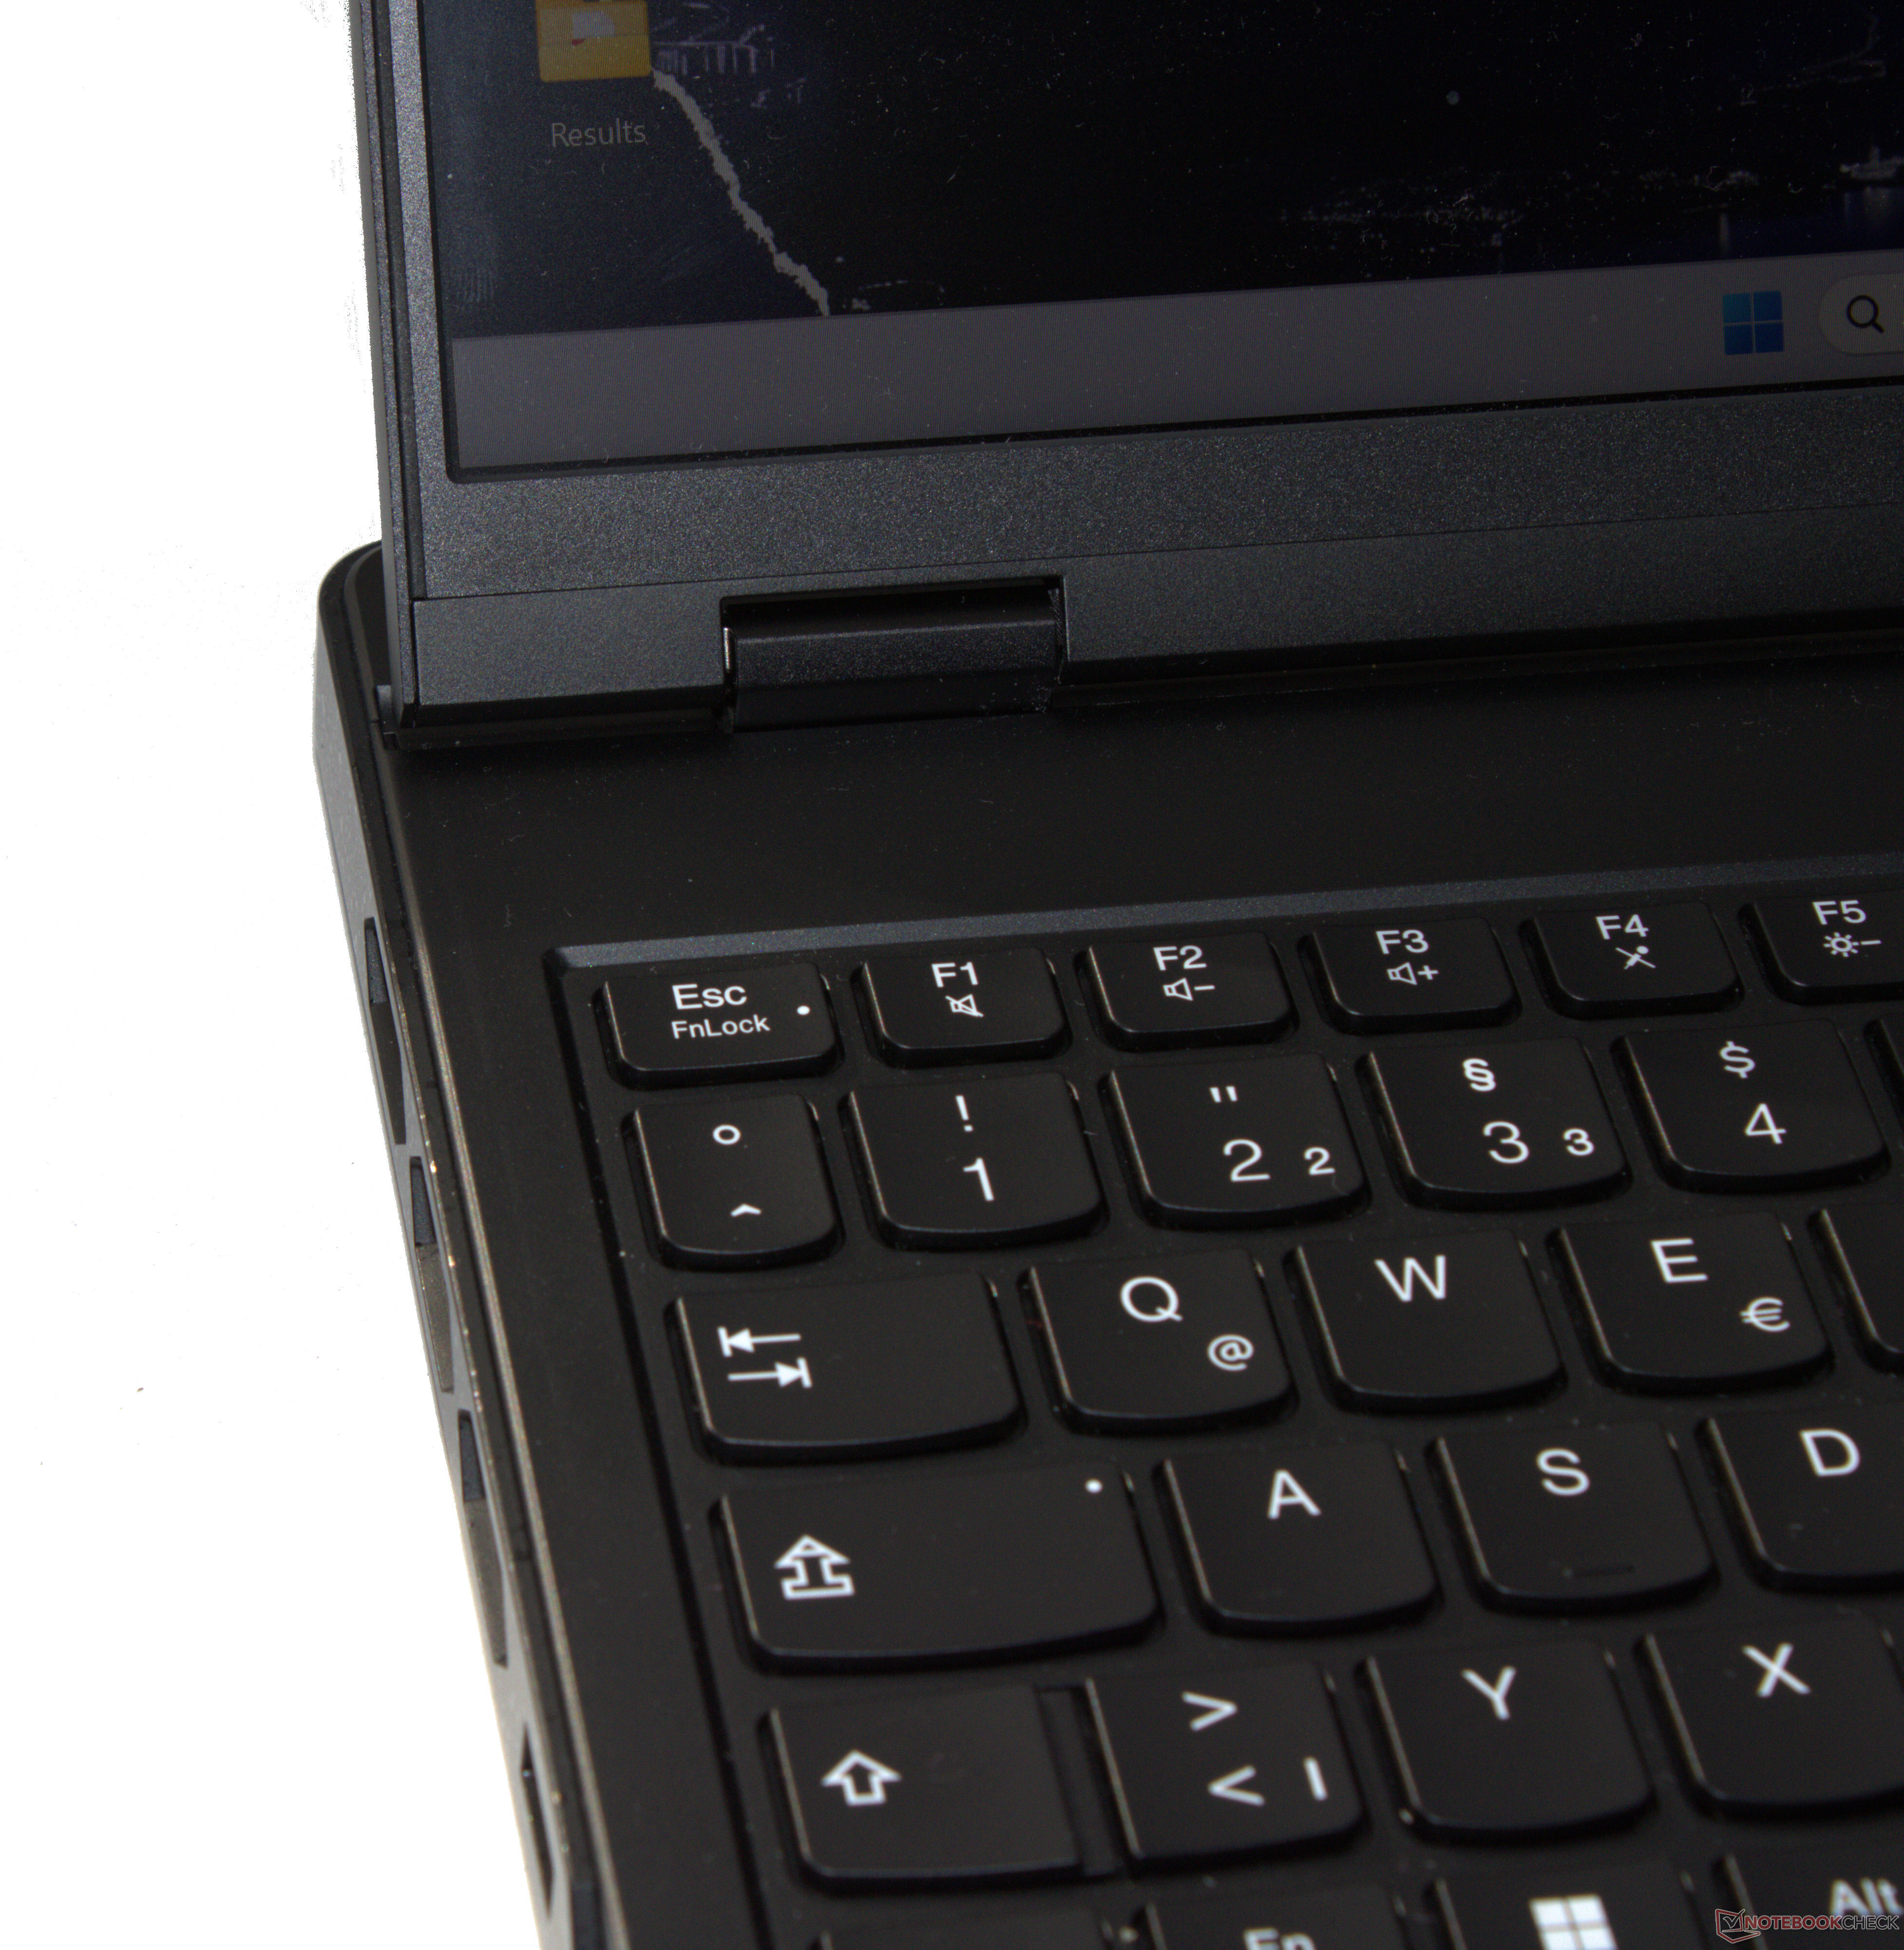
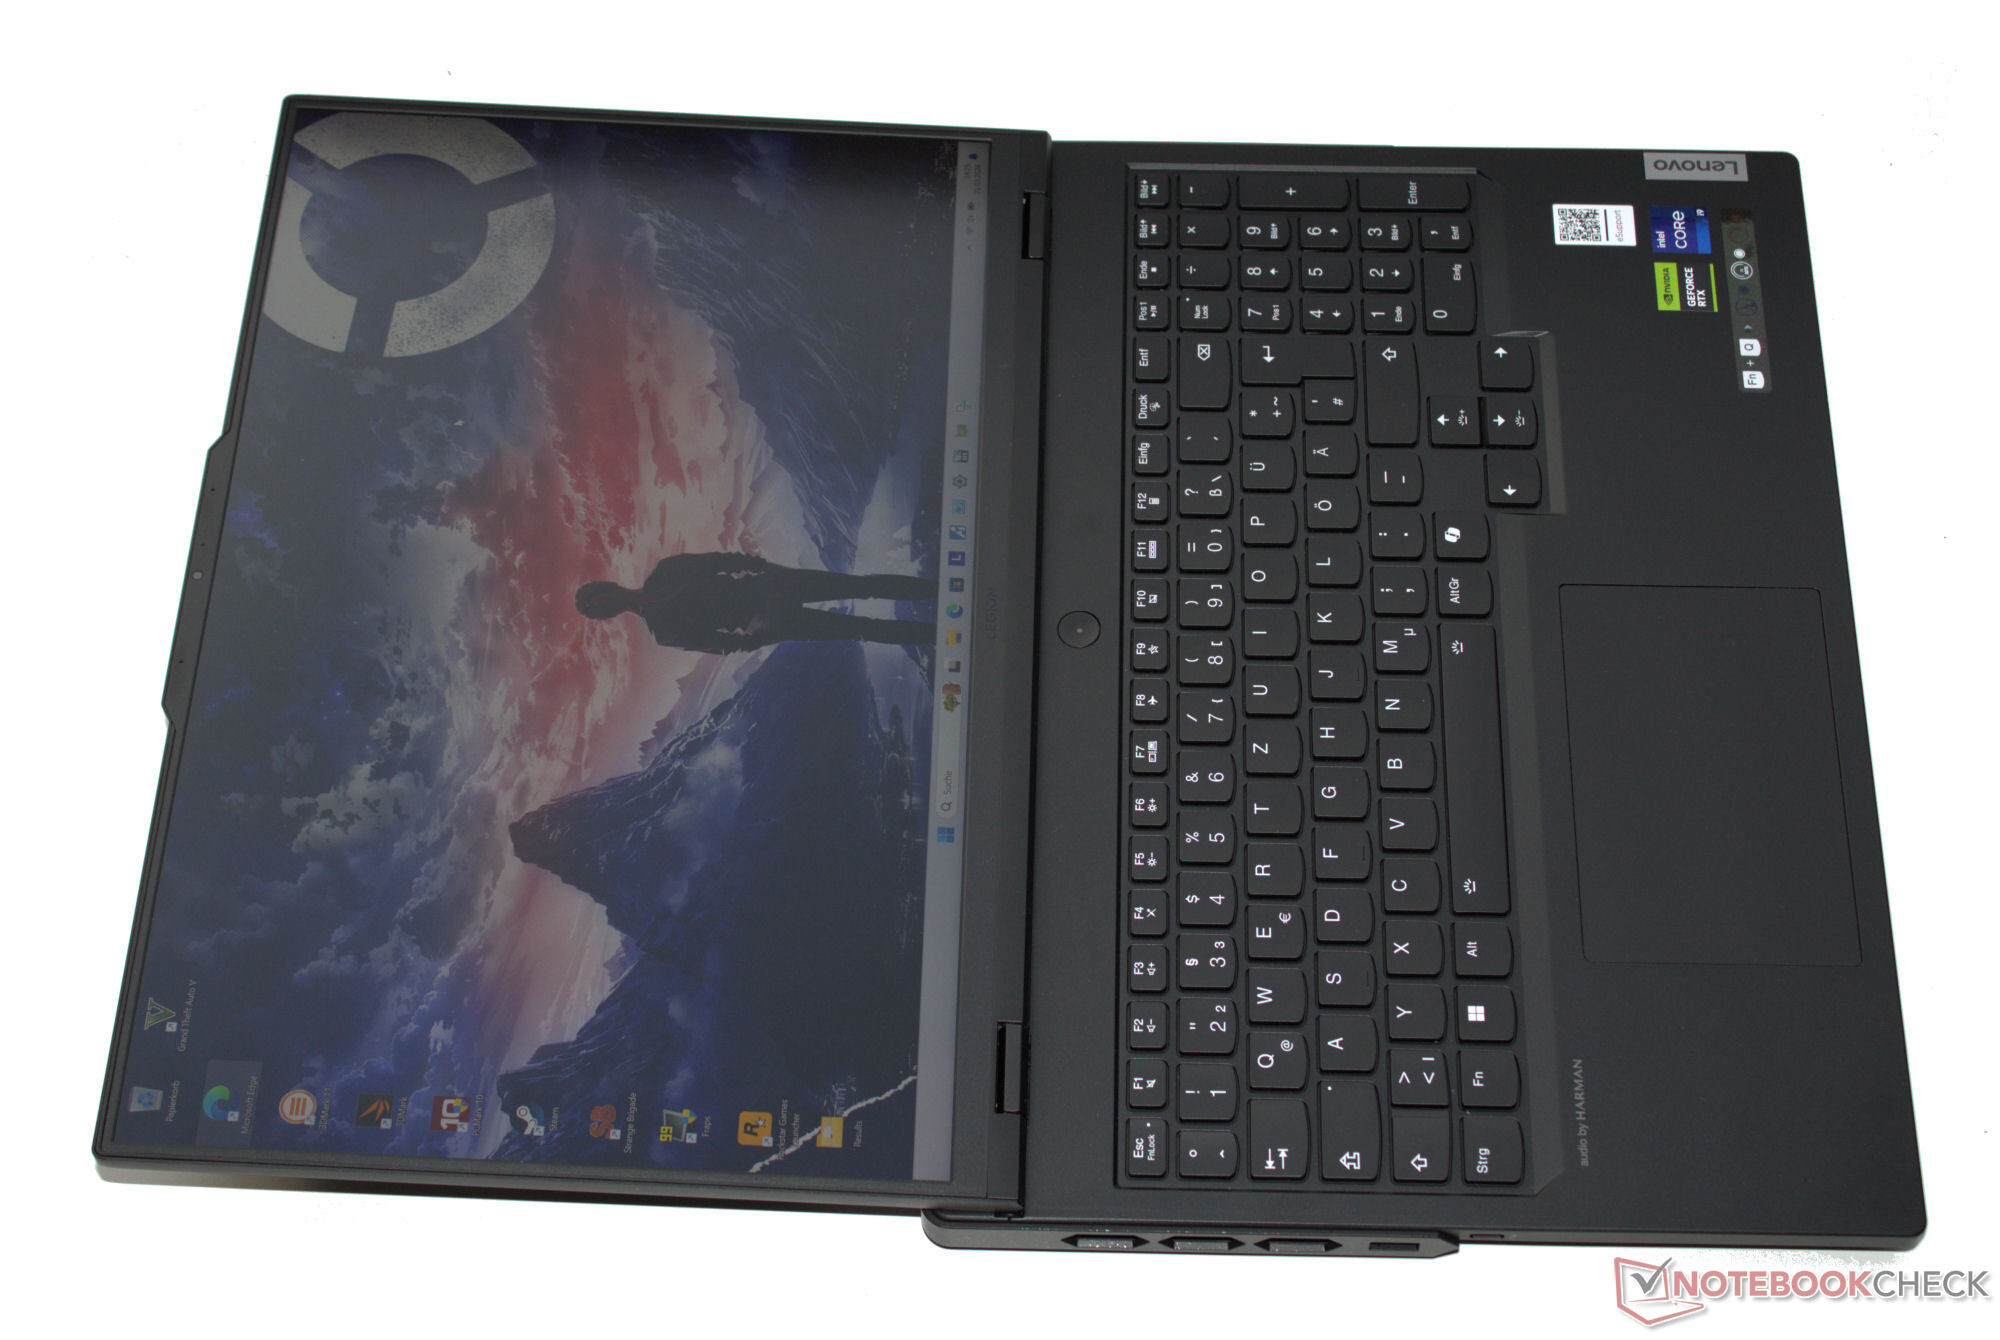


Input devices - Equipped with a crisp keyboard
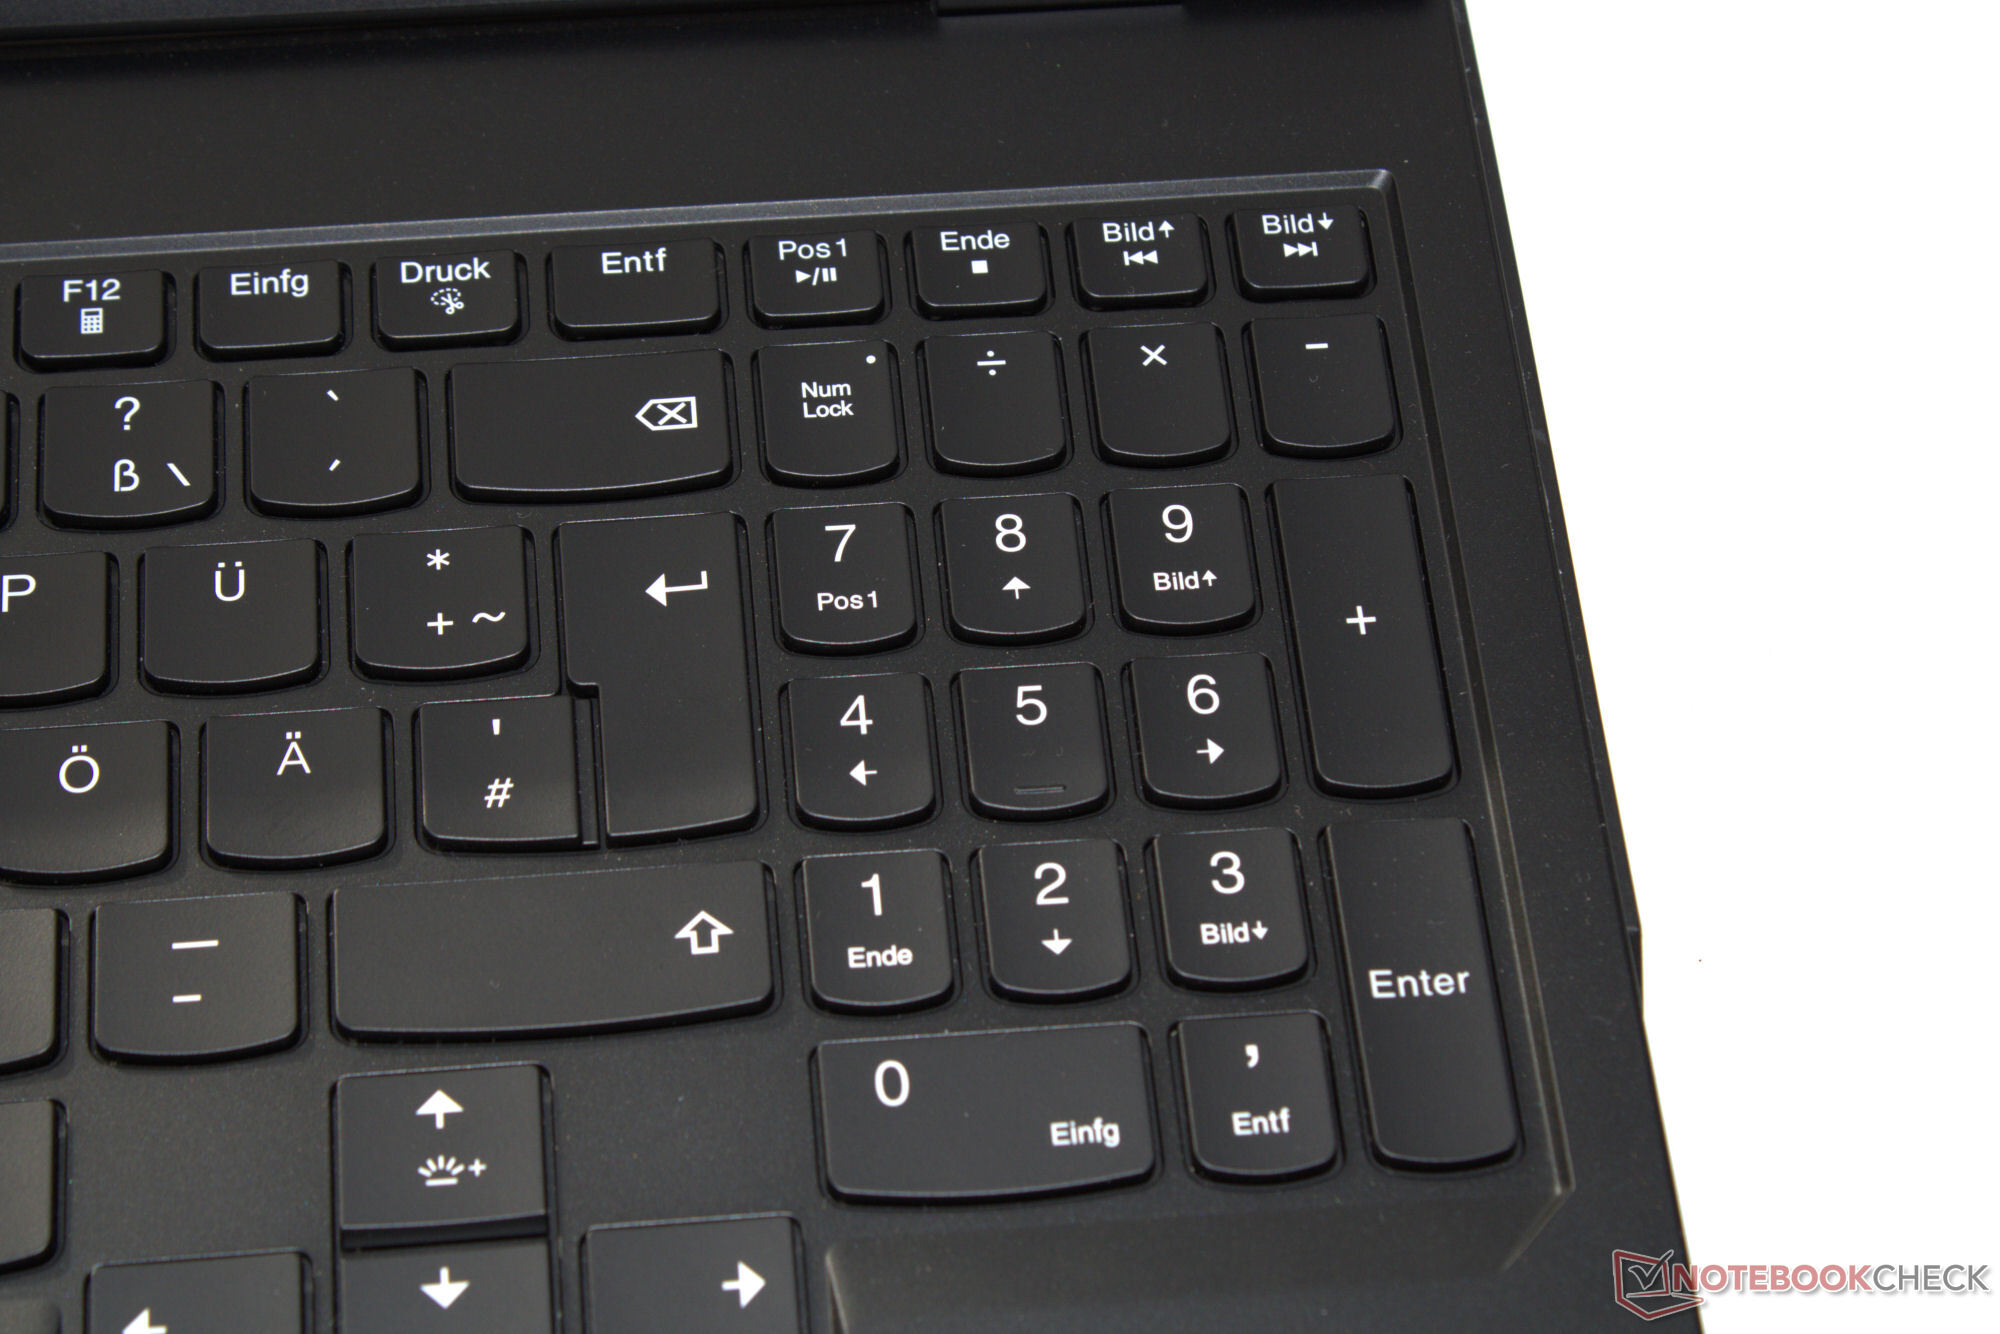
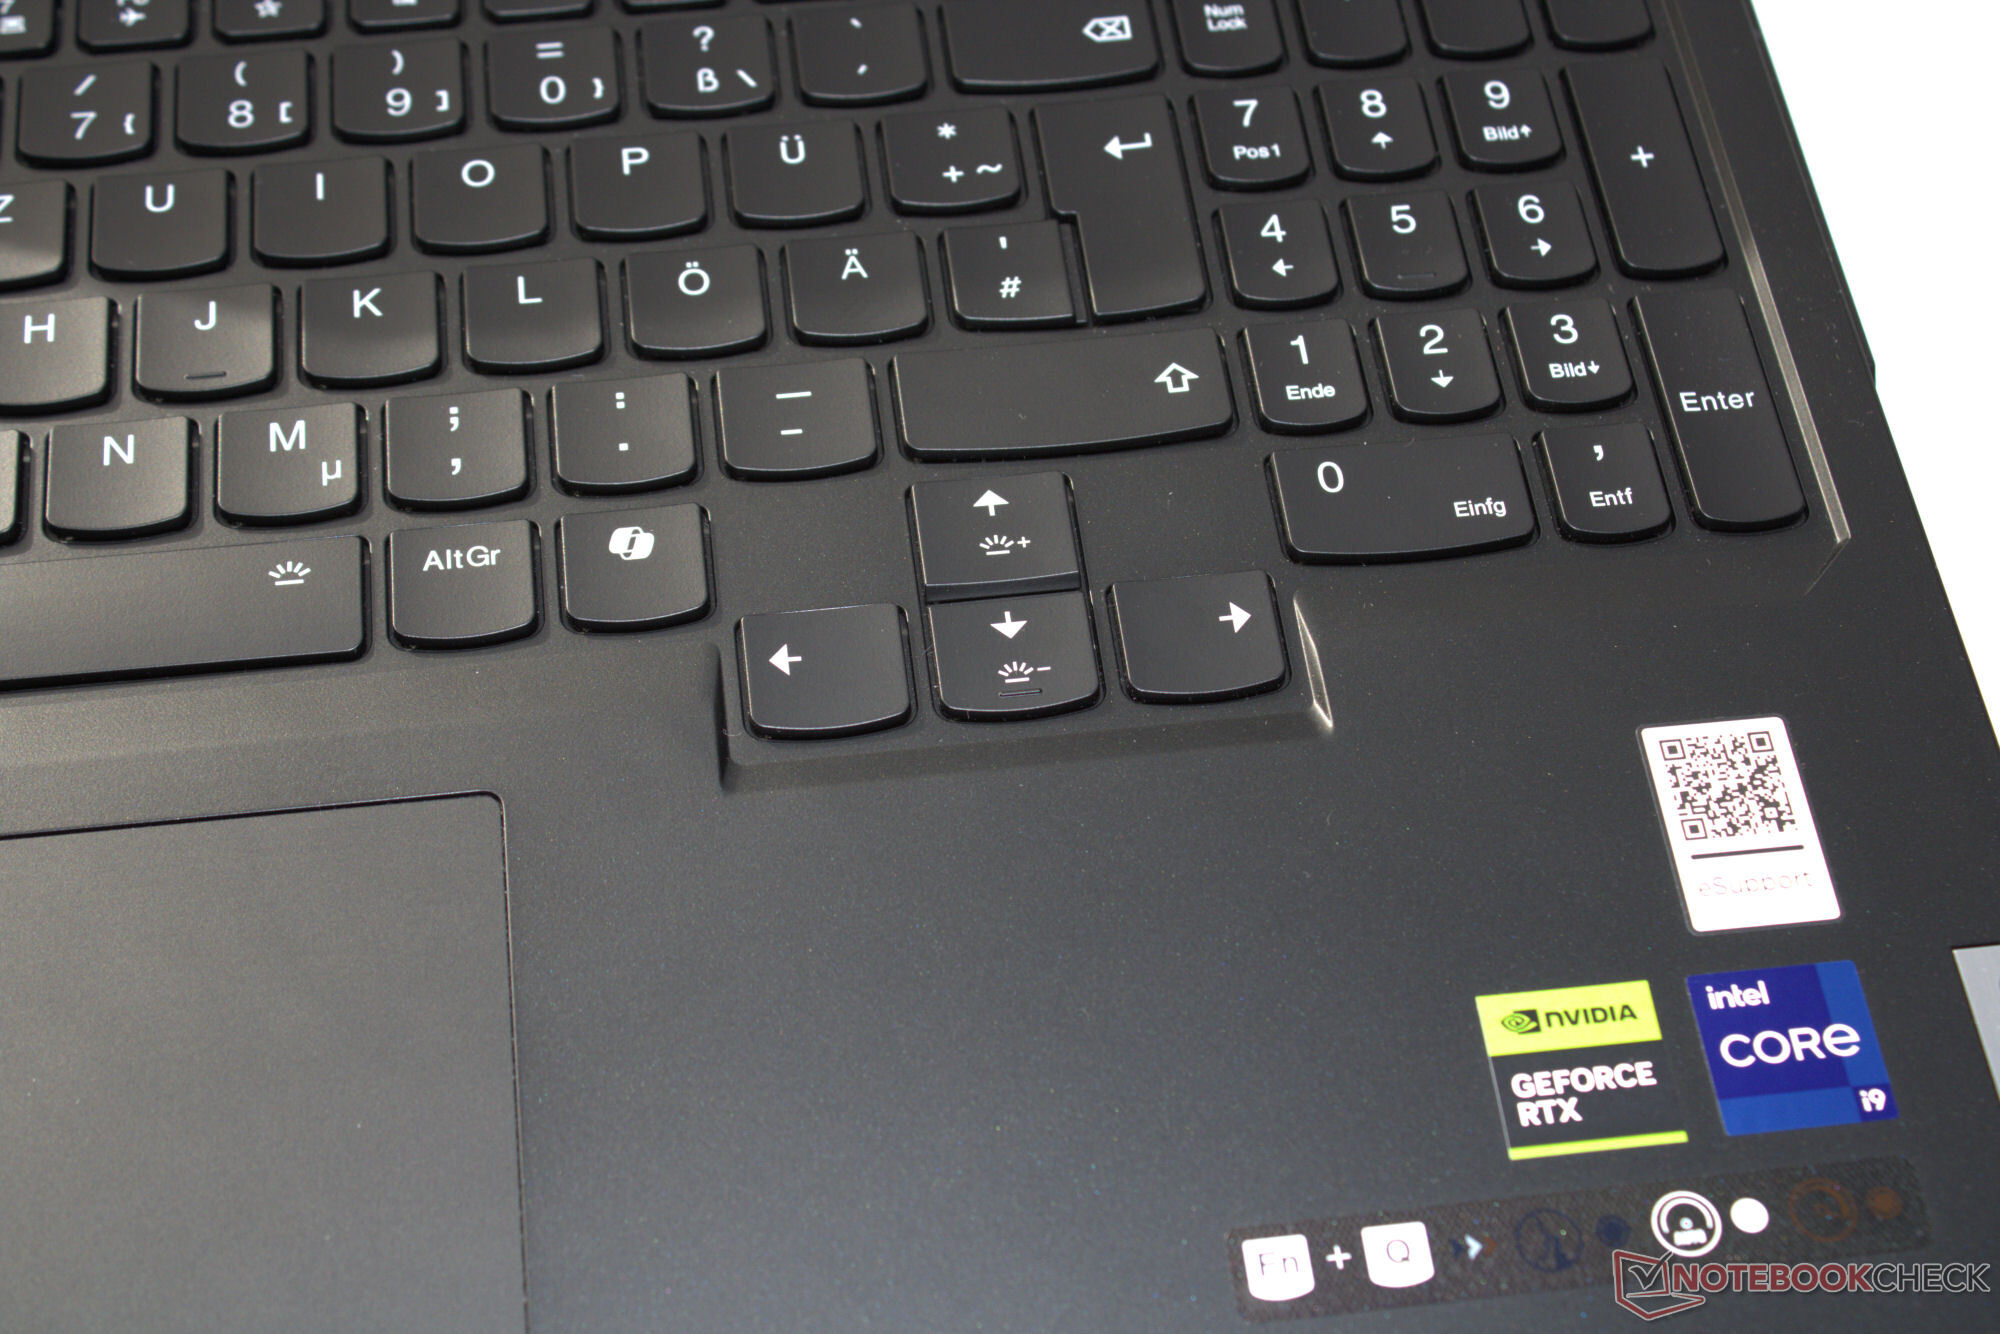
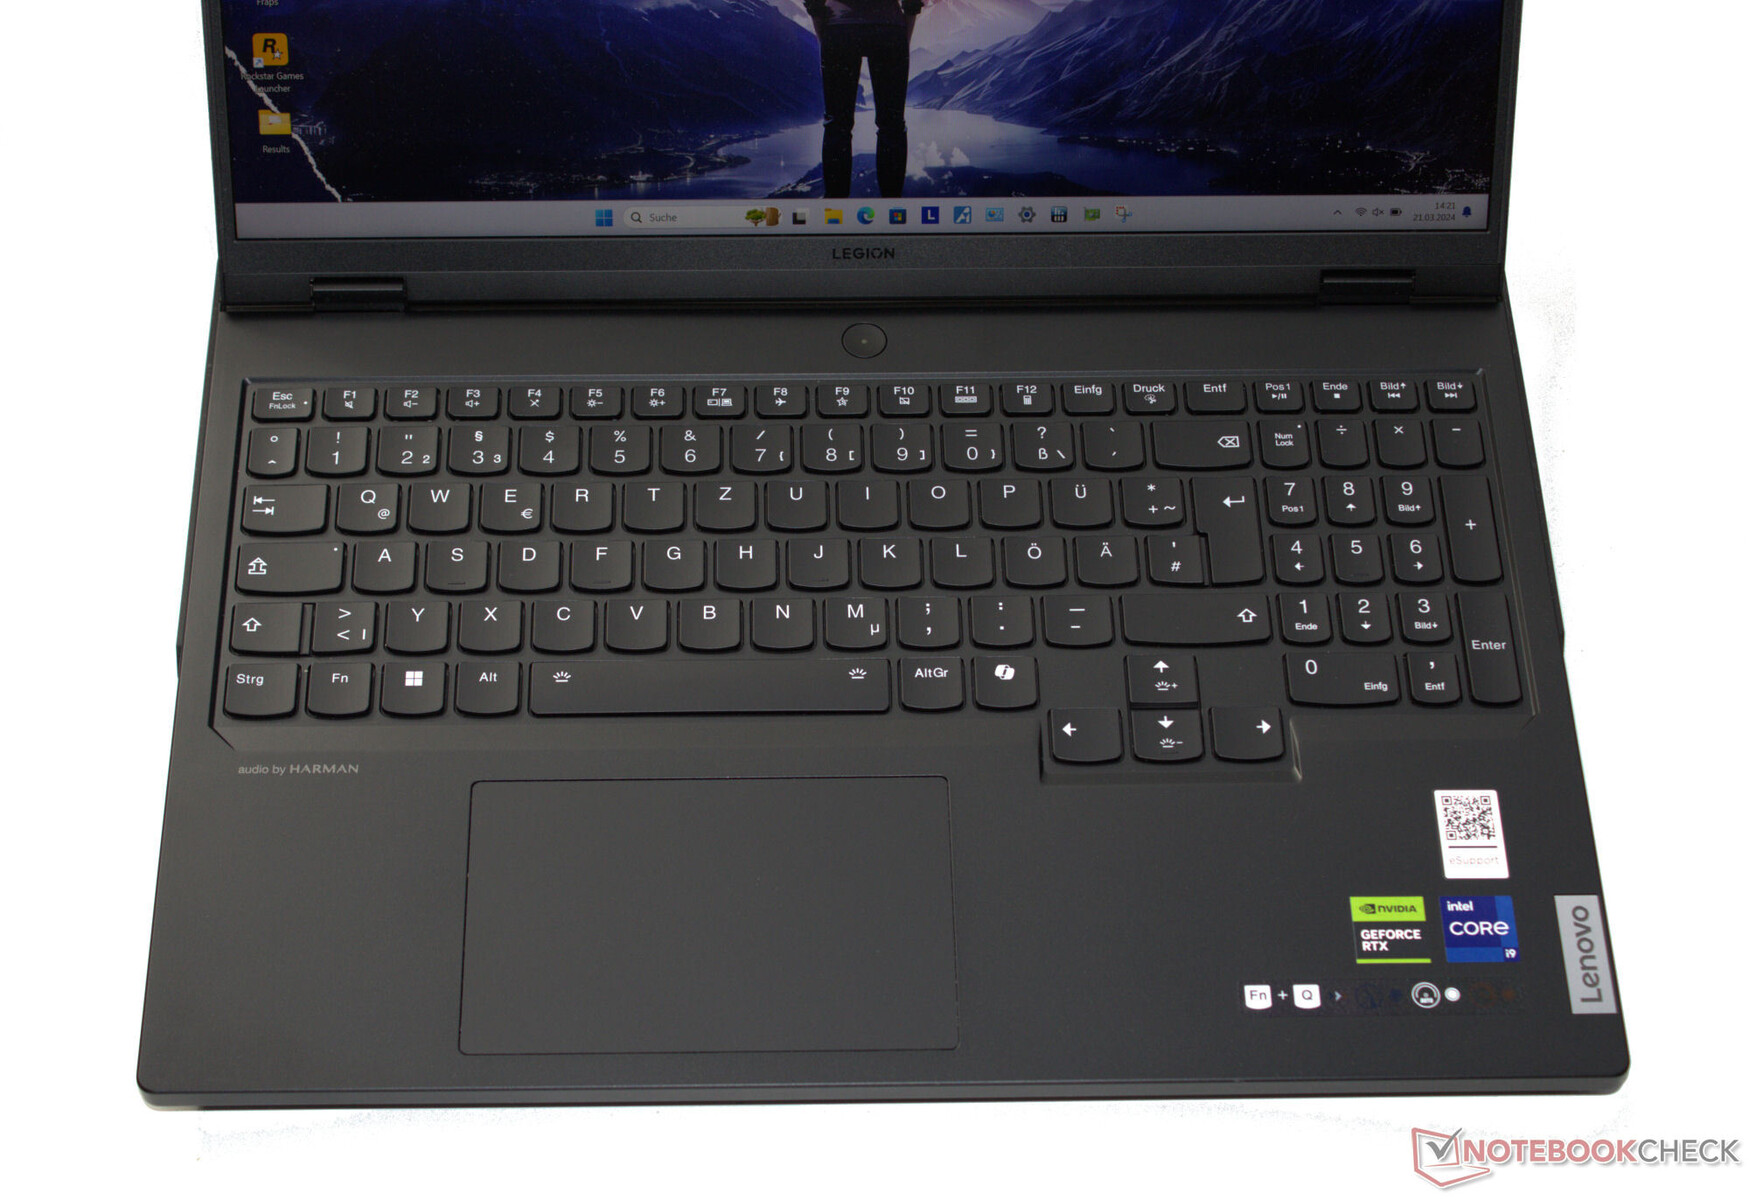
The concave chiclet keys with per-key RGB lighting have a pleasantly firm resistance and a clear actuation point. The keyboard flexes very slightly when you’re typing, but this doesn’t affect the typing experience otherwise. The arrow keys are full size. For mouse control, the laptop has a multitouch-enabled clickpad (measuring approx. 12 x 7.5 cm, or 4.7 x 3.0 in) with a short travel and a distinct click point.
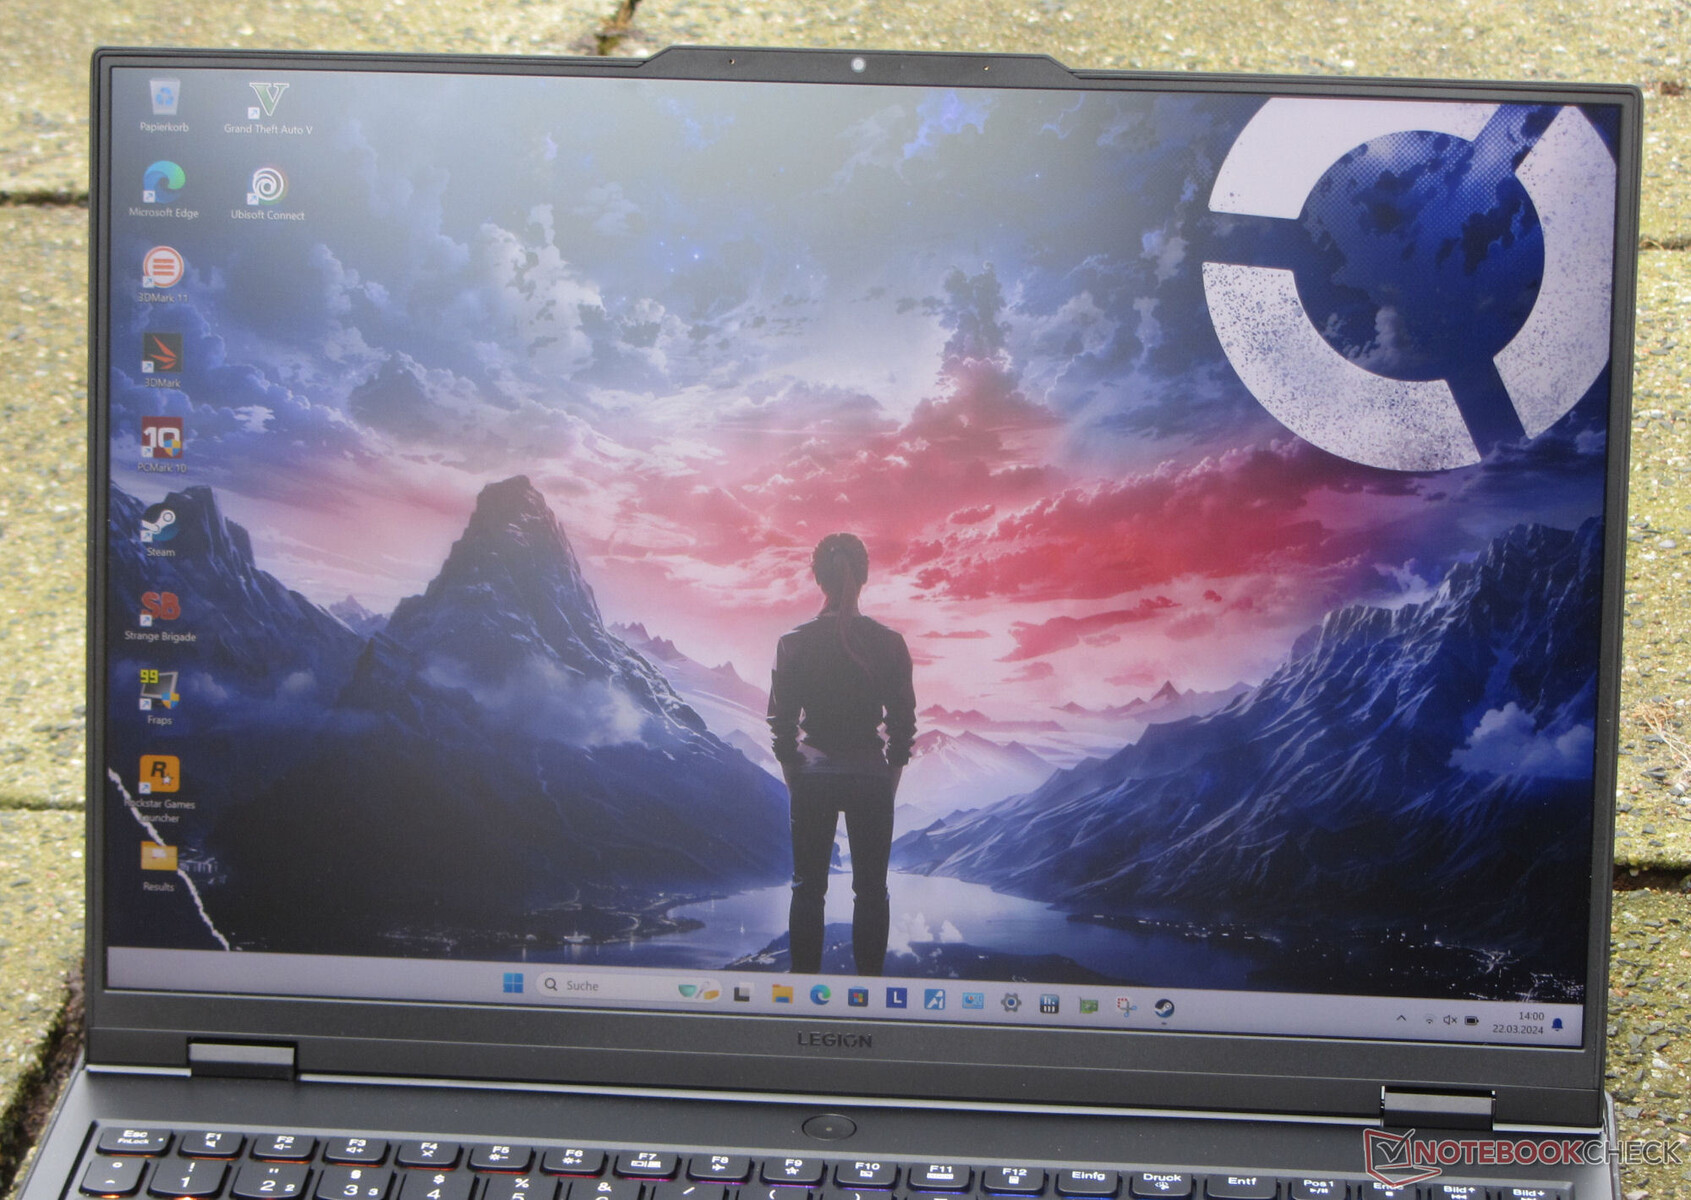
Display - 16:10, DCI-P3, Dolby Vision
The 16-inch matt IPS display (2,560 x 1,600 resolution) with a 16:10 aspect ratio boasts G-Sync support, Dolby Vision, fast response time and the absence of PWM flicker. The brightness and contrast of the 240Hz panel also reached levels that can be considered good (> 300 cd/m² and 1,000:1 respectively). Lenovo doesn’t offer any other display options.
| |||||||||||||||||||||||||
Brightness Distribution: 88 %
Center on Battery: 487 cd/m²
Contrast: 1160:1 (Black: 0.42 cd/m²)
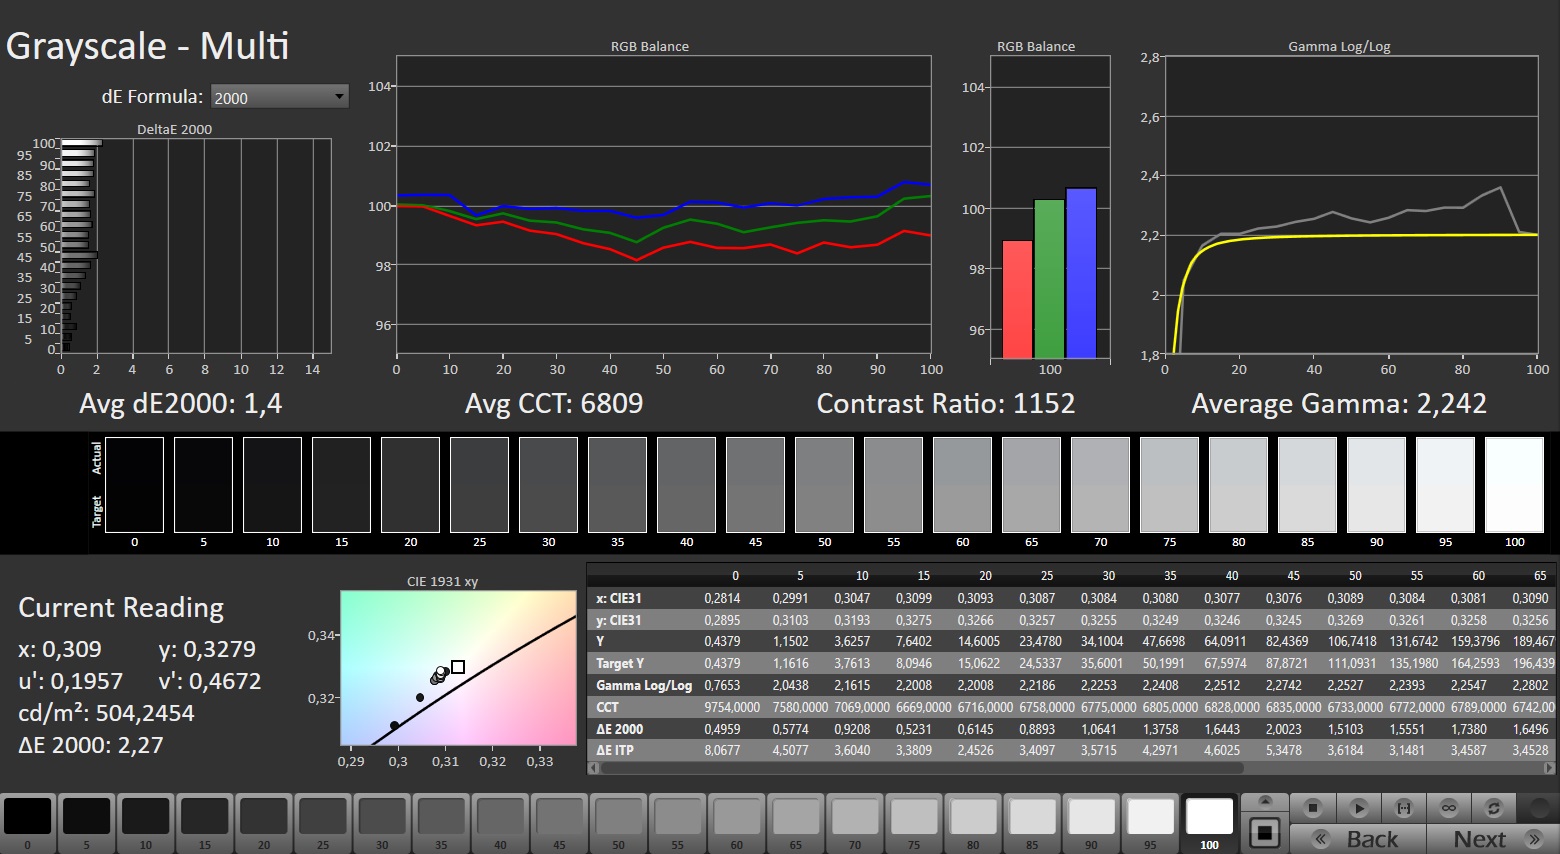
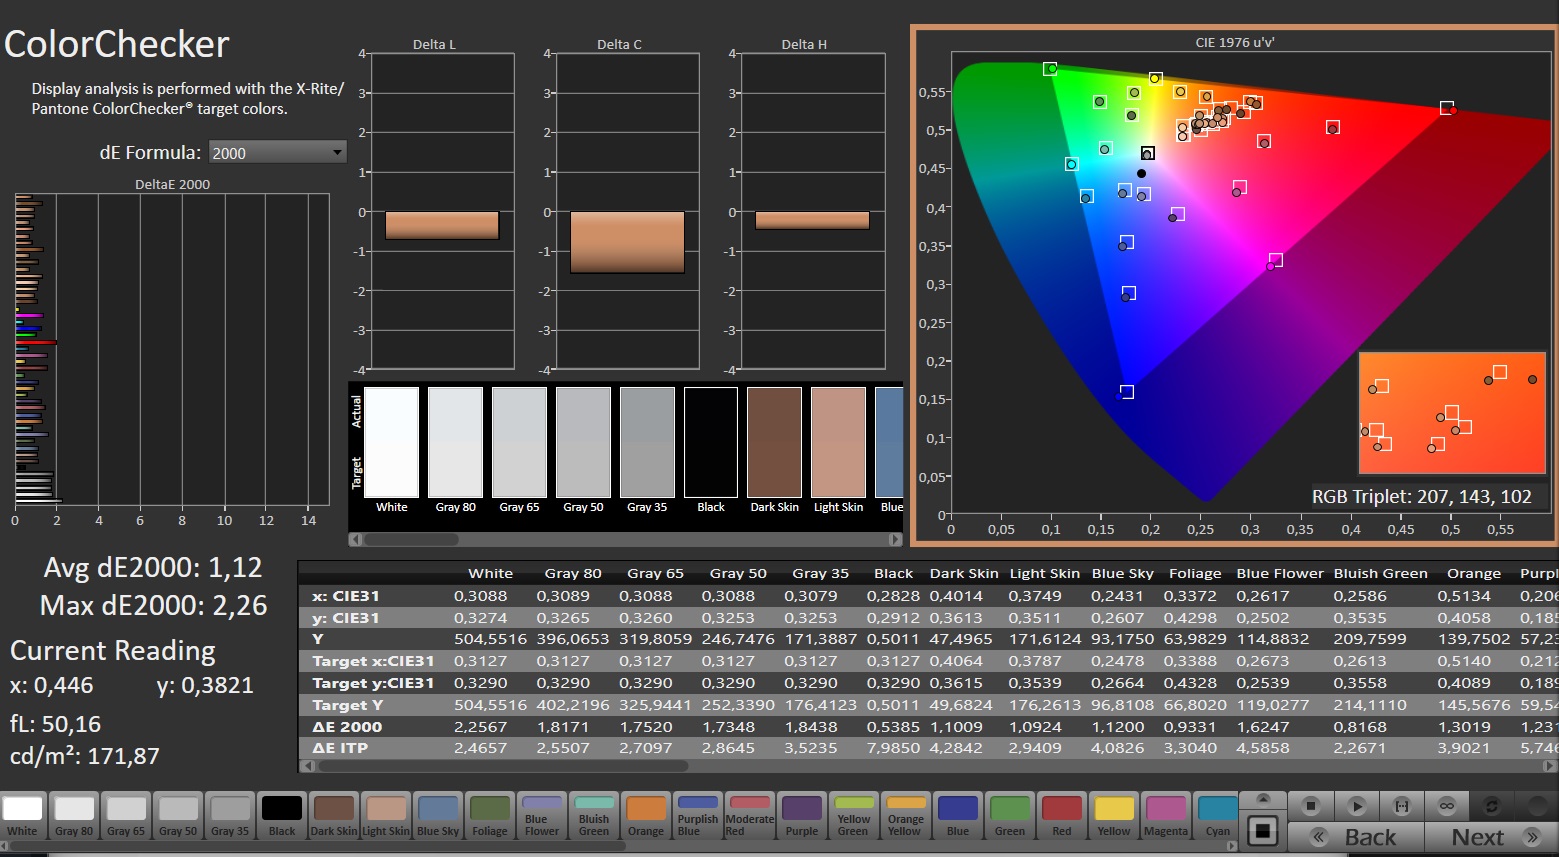
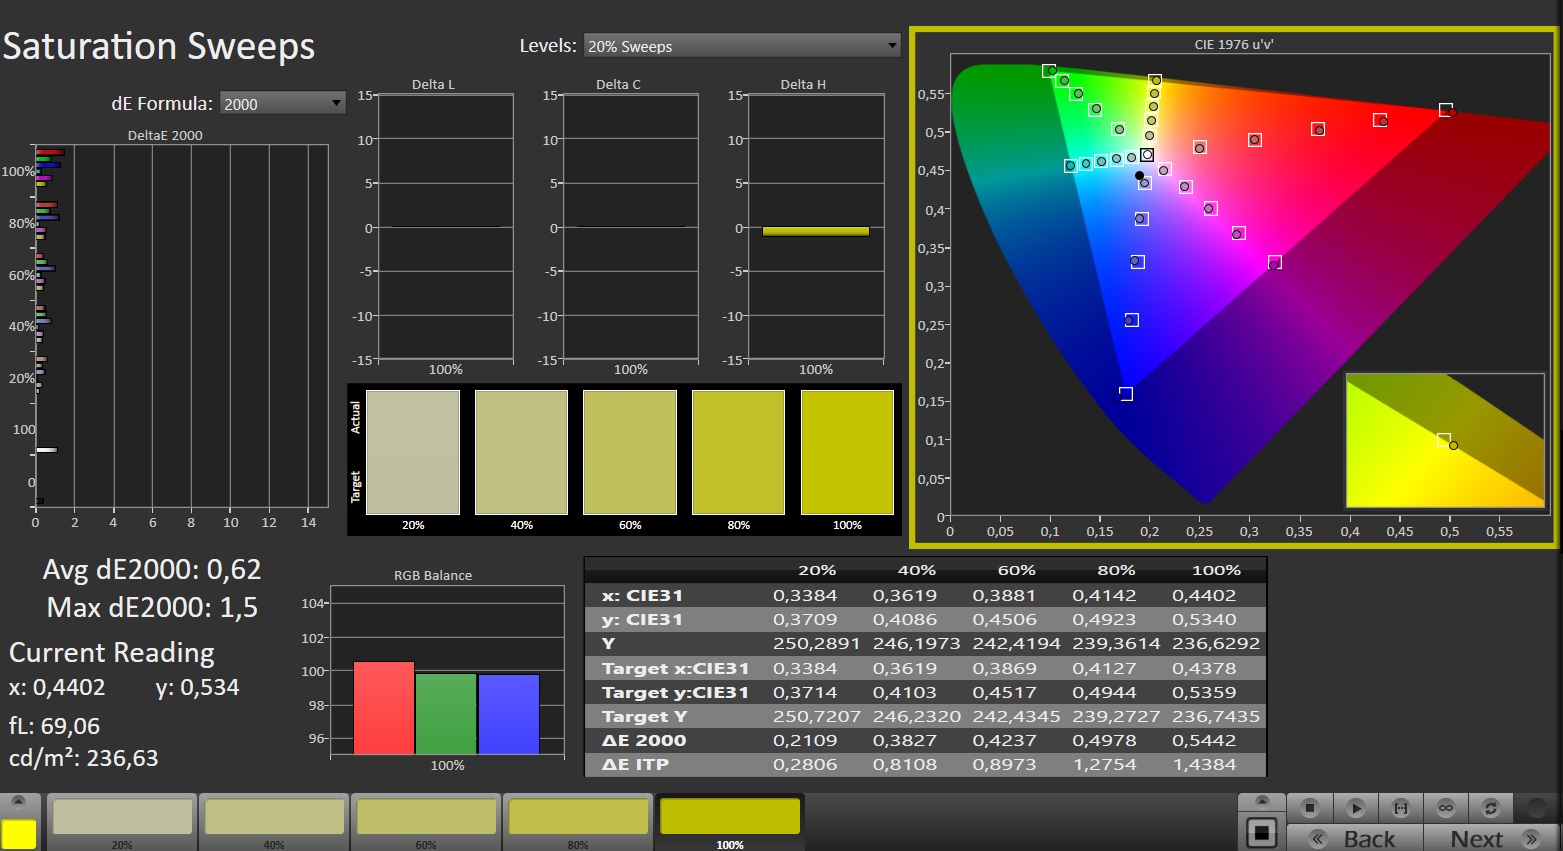
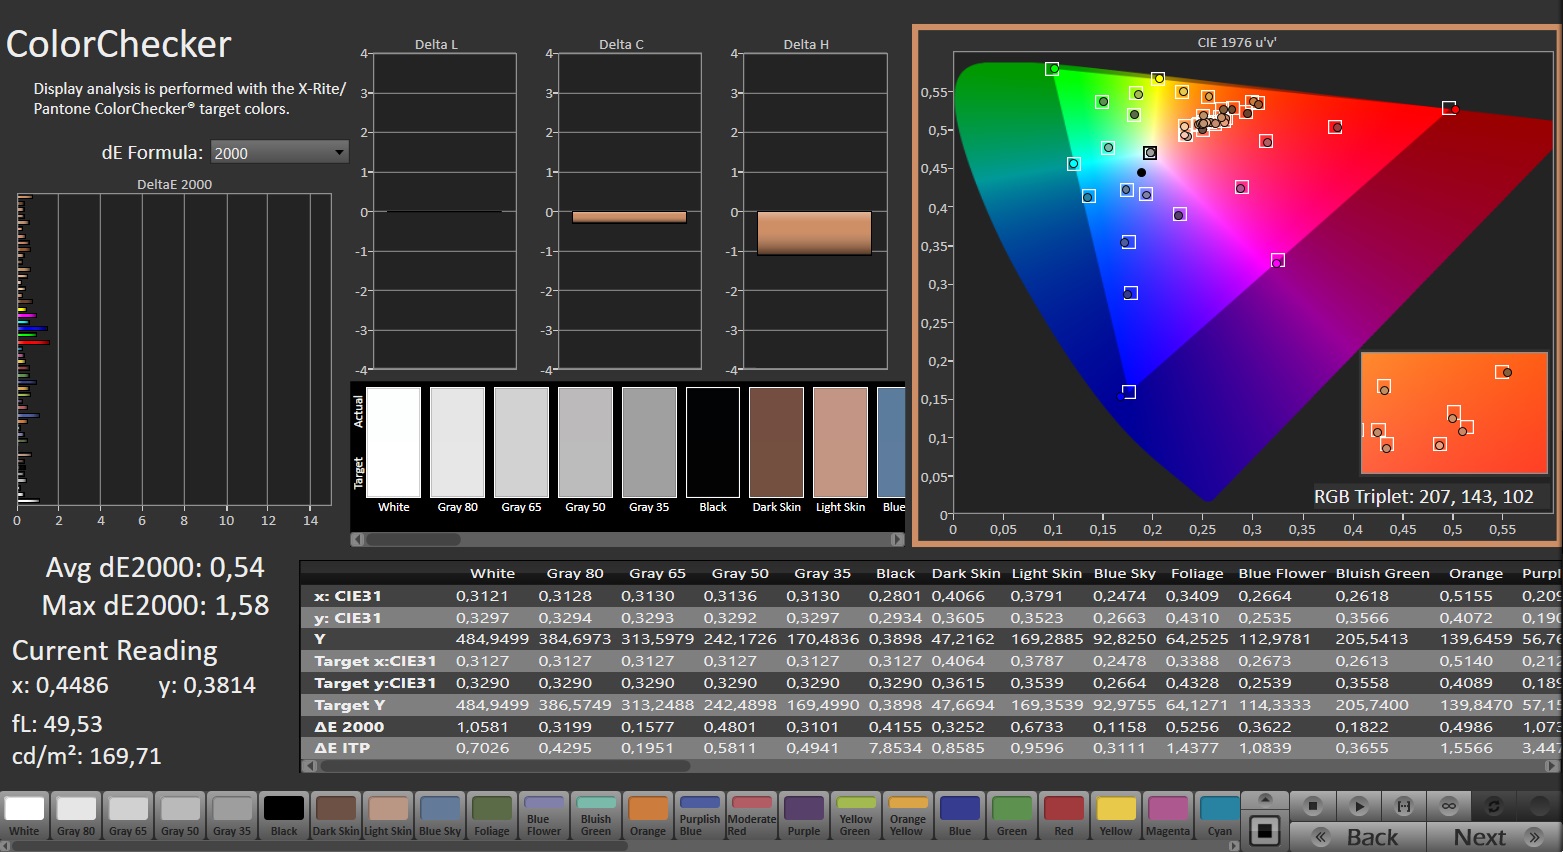
ΔE ColorChecker Calman: 1.12 | ∀{0.5-29.43 Ø4.71}
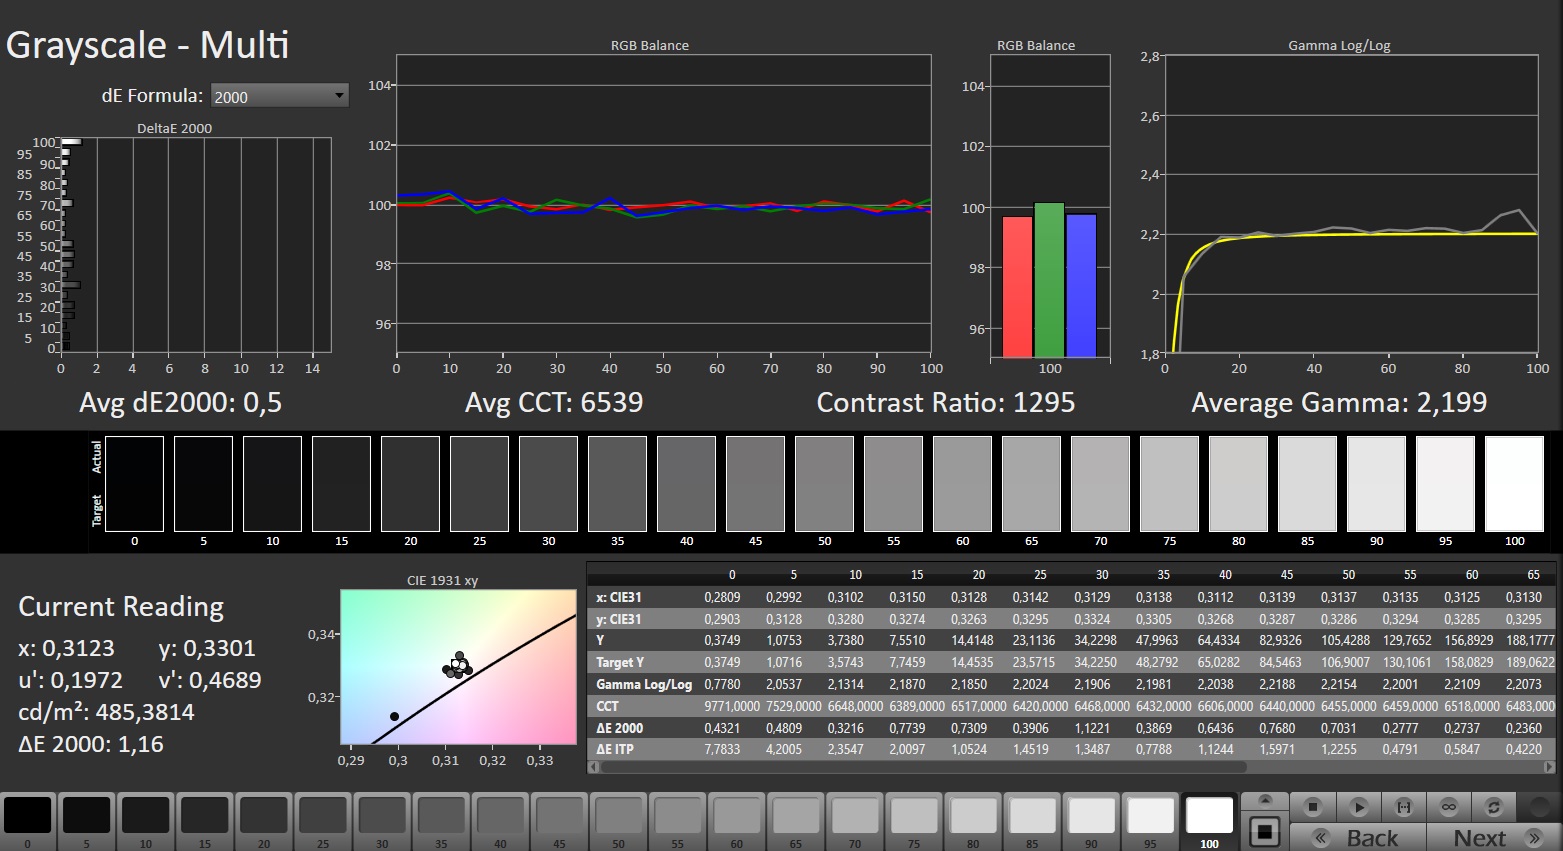
calibrated: 0.54
ΔE Greyscale Calman: 1.4 | ∀{0.09-98 Ø4.96}
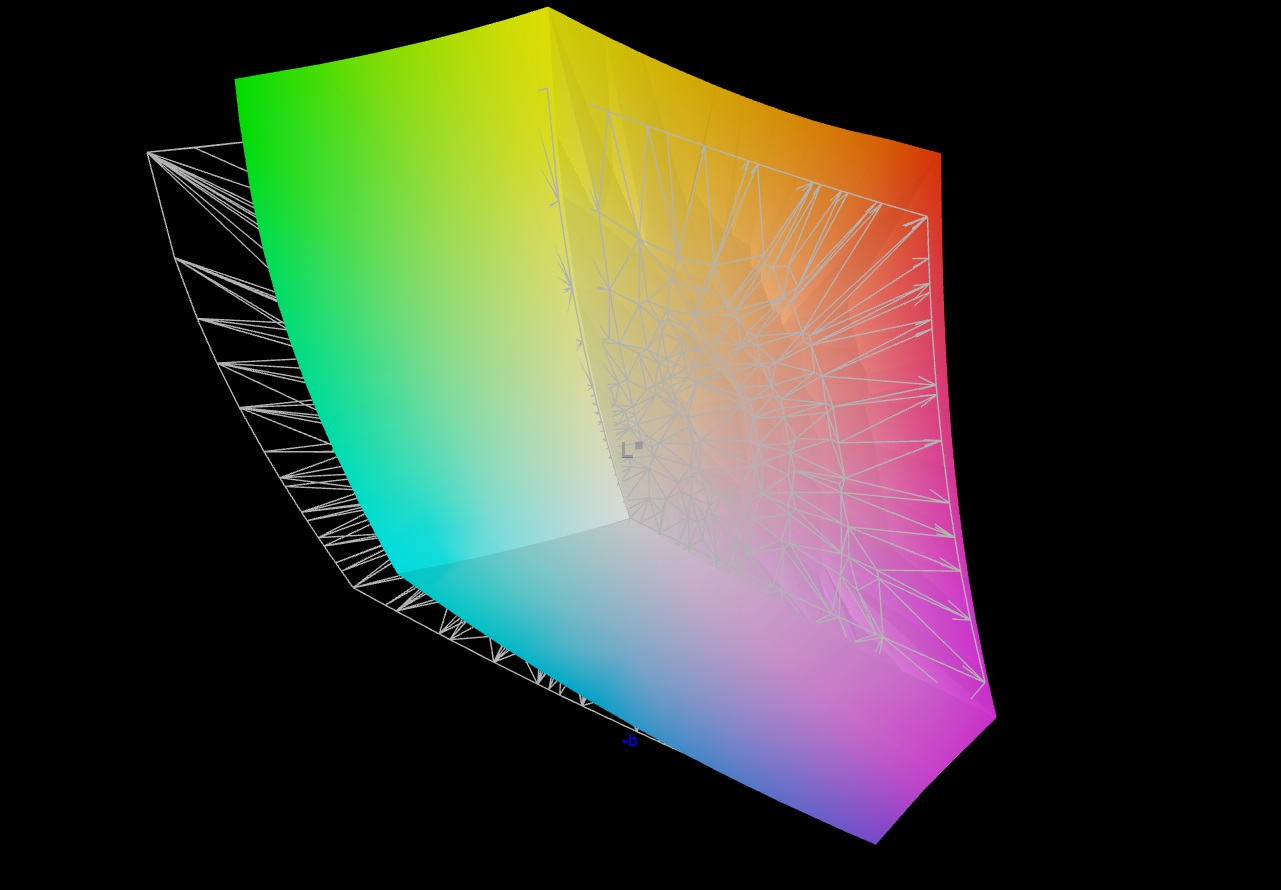
86.7% AdobeRGB 1998 (Argyll 3D)
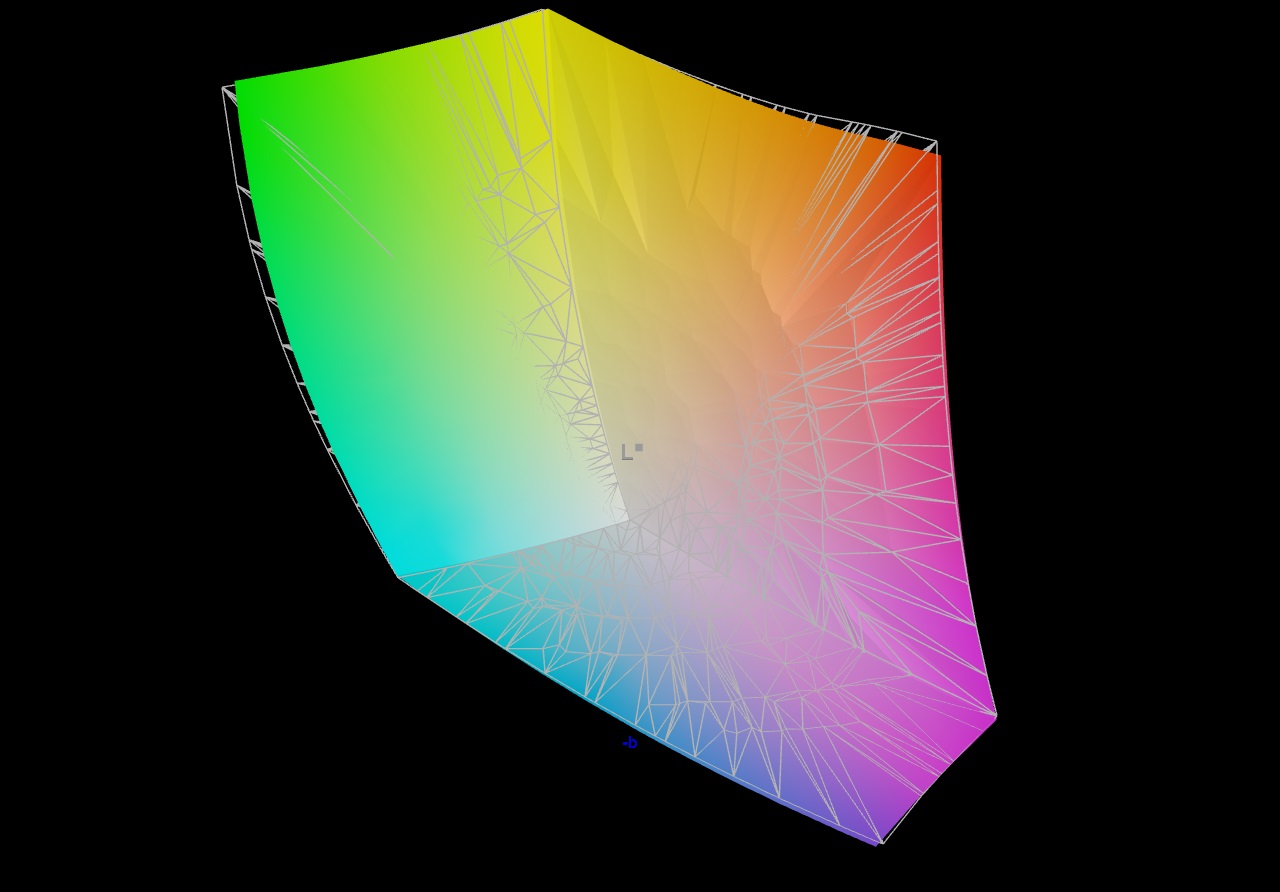
99.9% sRGB (Argyll 3D)
98.5% Display P3 (Argyll 3D)
Gamma: 2.242
CCT: 6809 K
| Lenovo Legion Pro 7 16IRX9H BOE CQ NE16QDM-NZB, IPS, 2560x1600, 16" | Alienware m16 R1 AMD BOE NE16NZ4, IPS, 2560x1600, 16" | MSI Vector 16 HX A14V Chi Mei N160GME-GTB, IPS, 2560x1600, 16" | HP Omen 16 (2024) BOE BOE0B7D, IPS, 2560x1440, 16.1" | Lenovo Legion Pro 7 16IRX8H MNG007DA2-3 (CSO1628), IPS, 2560x1600, 16" | |
|---|---|---|---|---|---|
| Display | 1% | -1% | -17% | -16% | |
| Display P3 Coverage (%) | 98.5 | 98.6 0% | 95.4 -3% | 68.6 -30% | 69.1 -30% |
| sRGB Coverage (%) | 99.9 | 99.9 0% | 99.7 0% | 98.6 -1% | 99.7 0% |
| AdobeRGB 1998 Coverage (%) | 86.7 | 88.9 3% | 85.4 -1% | 70.6 -19% | 71.2 -18% |
| Response Times | 3% | -21% | -36% | 0% | |
| Response Time Grey 50% / Grey 80% * (ms) | 12.6 ? | 5.1 ? 60% | 5.7 ? 55% | 14.1 ? -12% | 12.3 ? 2% |
| Response Time Black / White * (ms) | 5.8 ? | 9 ? -55% | 11.4 ? -97% | 9.3 ? -60% | 5.9 ? -2% |
| PWM Frequency (Hz) | |||||
| Screen | -109% | -73% | -46% | 3% | |
| Brightness middle (cd/m²) | 487 | 329 -32% | 557.2 14% | 292 -40% | 511 5% |
| Brightness (cd/m²) | 460 | 317 -31% | 506 10% | 291 -37% | 469 2% |
| Brightness Distribution (%) | 88 | 89 1% | 83 -6% | 85 -3% | 86 -2% |
| Black Level * (cd/m²) | 0.42 | 0.32 24% | 0.41 2% | 0.24 43% | 0.4 5% |
| Contrast (:1) | 1160 | 1028 -11% | 1359 17% | 1217 5% | 1278 10% |
| Colorchecker dE 2000 * | 1.12 | 3.71 -231% | 2.91 -160% | 2.36 -111% | 0.95 15% |
| Colorchecker dE 2000 max. * | 2.26 | 7.23 -220% | 5.94 -163% | 4.08 -81% | 2.07 8% |
| Colorchecker dE 2000 calibrated * | 0.54 | 2.82 -422% | 1.63 -202% | 0.93 -72% | 0.91 -69% |
| Greyscale dE 2000 * | 1.4 | 2.2 -57% | 3.8 -171% | 3 -114% | 0.6 57% |
| Gamma | 2.242 98% | 2.3 96% | 2.23 99% | 2.101 105% | 2.176 101% |
| CCT | 6809 95% | 6270 104% | 6408 101% | 5976 109% | 6545 99% |
| Total Average (Program / Settings) | -35% /
-69% | -32% /
-50% | -33% /
-38% | -4% /
-1% |
* ... smaller is better
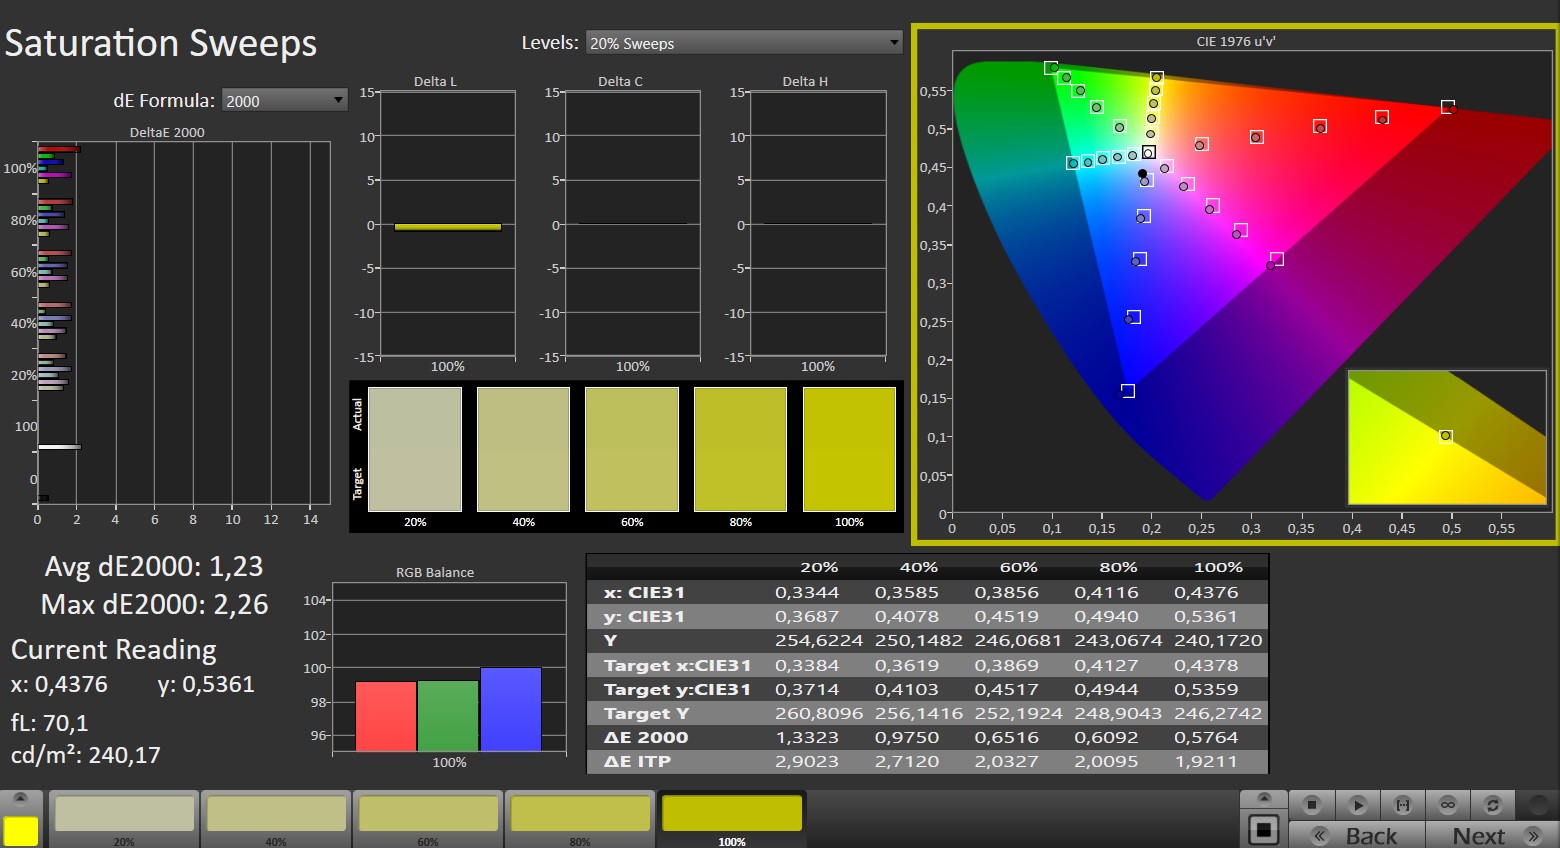
The screen already had fantastic colour reproduction right out of the box. It gave a Delta E of about 1.1, meeting the target level of below 3. Calibrating the display reduced the average colour difference to 0.54 and yielded a more balanced greyscale. The panel is able to fully cover the sRGB and DCI-P3 gamuts, but not the AdobeRGB colour space. This is similar to what is offered by the displays on most competing laptops.

Display Response Times
| ↔ Response Time Black to White | ||
|---|---|---|
| 5.8 ms ... rise ↗ and fall ↘ combined | ↗ 2.1 ms rise | 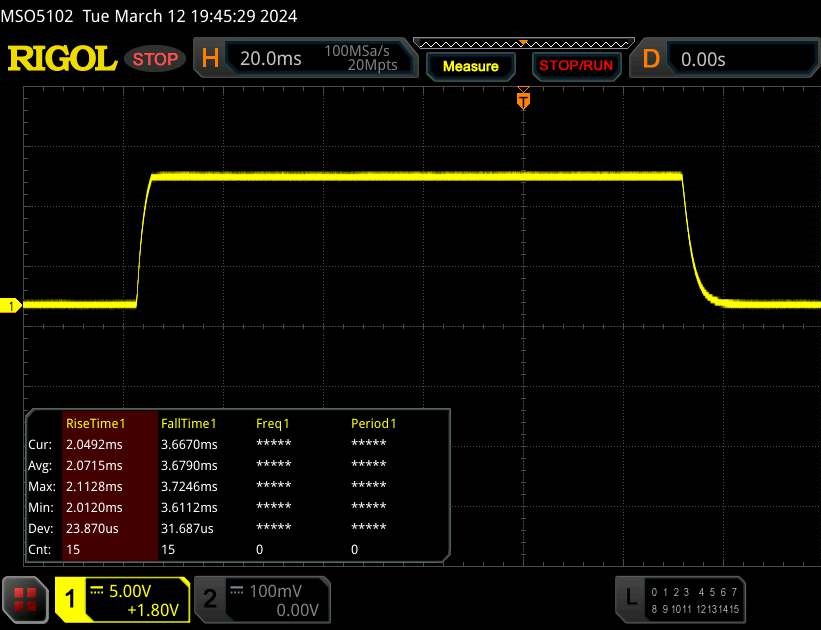 |
| ↘ 3.7 ms fall | ||
| The screen shows very fast response rates in our tests and should be very well suited for fast-paced gaming. In comparison, all tested devices range from 0.1 (minimum) to 240 (maximum) ms. » 18 % of all devices are better. This means that the measured response time is better than the average of all tested devices (19.8 ms). | ||
| ↔ Response Time 50% Grey to 80% Grey | ||
| 12.6 ms ... rise ↗ and fall ↘ combined | ↗ 6 ms rise | 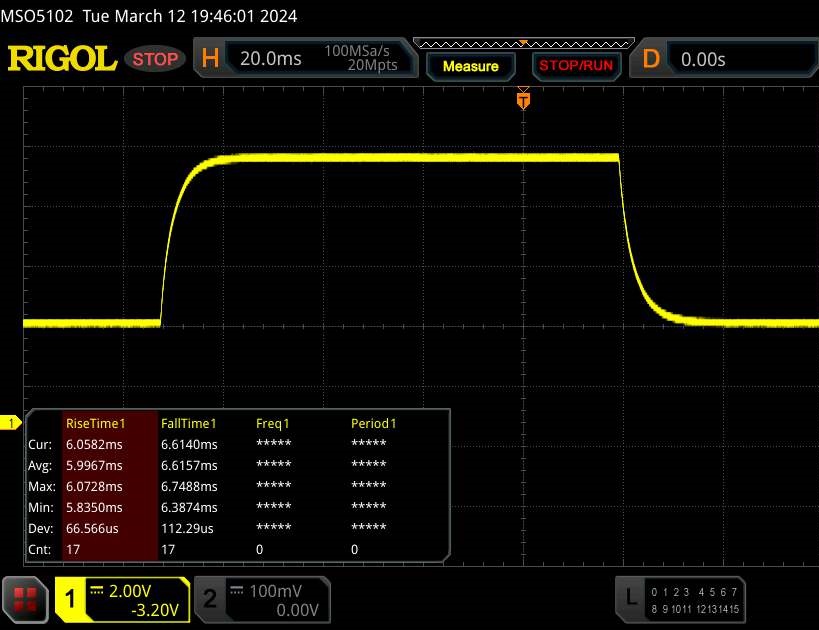 |
| ↘ 6.6 ms fall | ||
| The screen shows good response rates in our tests, but may be too slow for competitive gamers. In comparison, all tested devices range from 0.165 (minimum) to 636 (maximum) ms. » 26 % of all devices are better. This means that the measured response time is better than the average of all tested devices (30.9 ms). | ||
Screen Flickering / PWM (Pulse-Width Modulation)
| Screen flickering / PWM not detected | 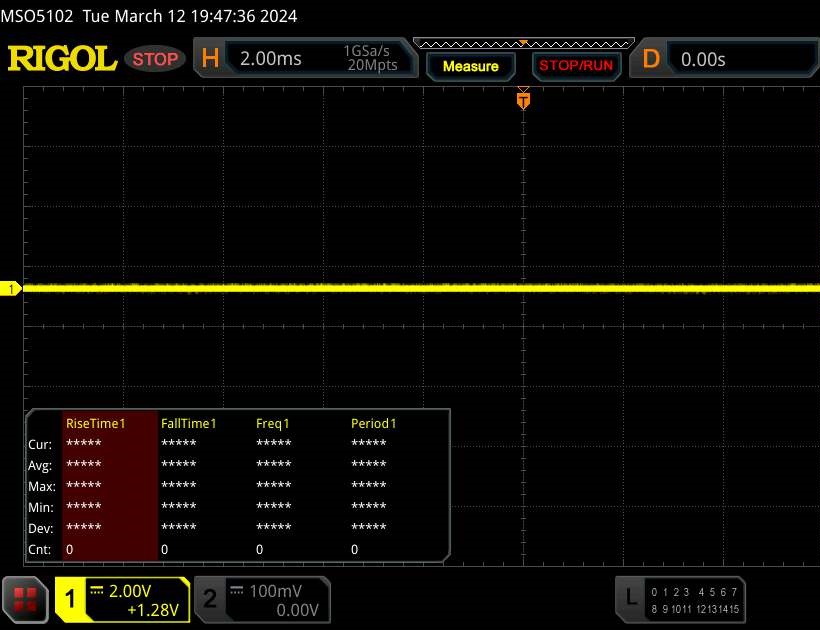 | ||
In comparison: 52 % of all tested devices do not use PWM to dim the display. If PWM was detected, an average of 7748 (minimum: 5 - maximum: 343500) Hz was measured. | |||
The IPS panel has a wide viewing angle and is readable from any position. It is possible to use the screen outdoors, provided the sun isn’t overly bright.
Performance - High-end hardware from Intel and Nvidia
The Lenovo Legion Pro 7 is a high-performance 16-inch notebook created for gamers and creators. The necessary computing power is provided by Raptor Lake and Ada Lovelace. Our review model can be had for slightly under €3,000 (approx. US$3,245) with an education discount. No other variants are yet available at the time of this review.
Test conditions
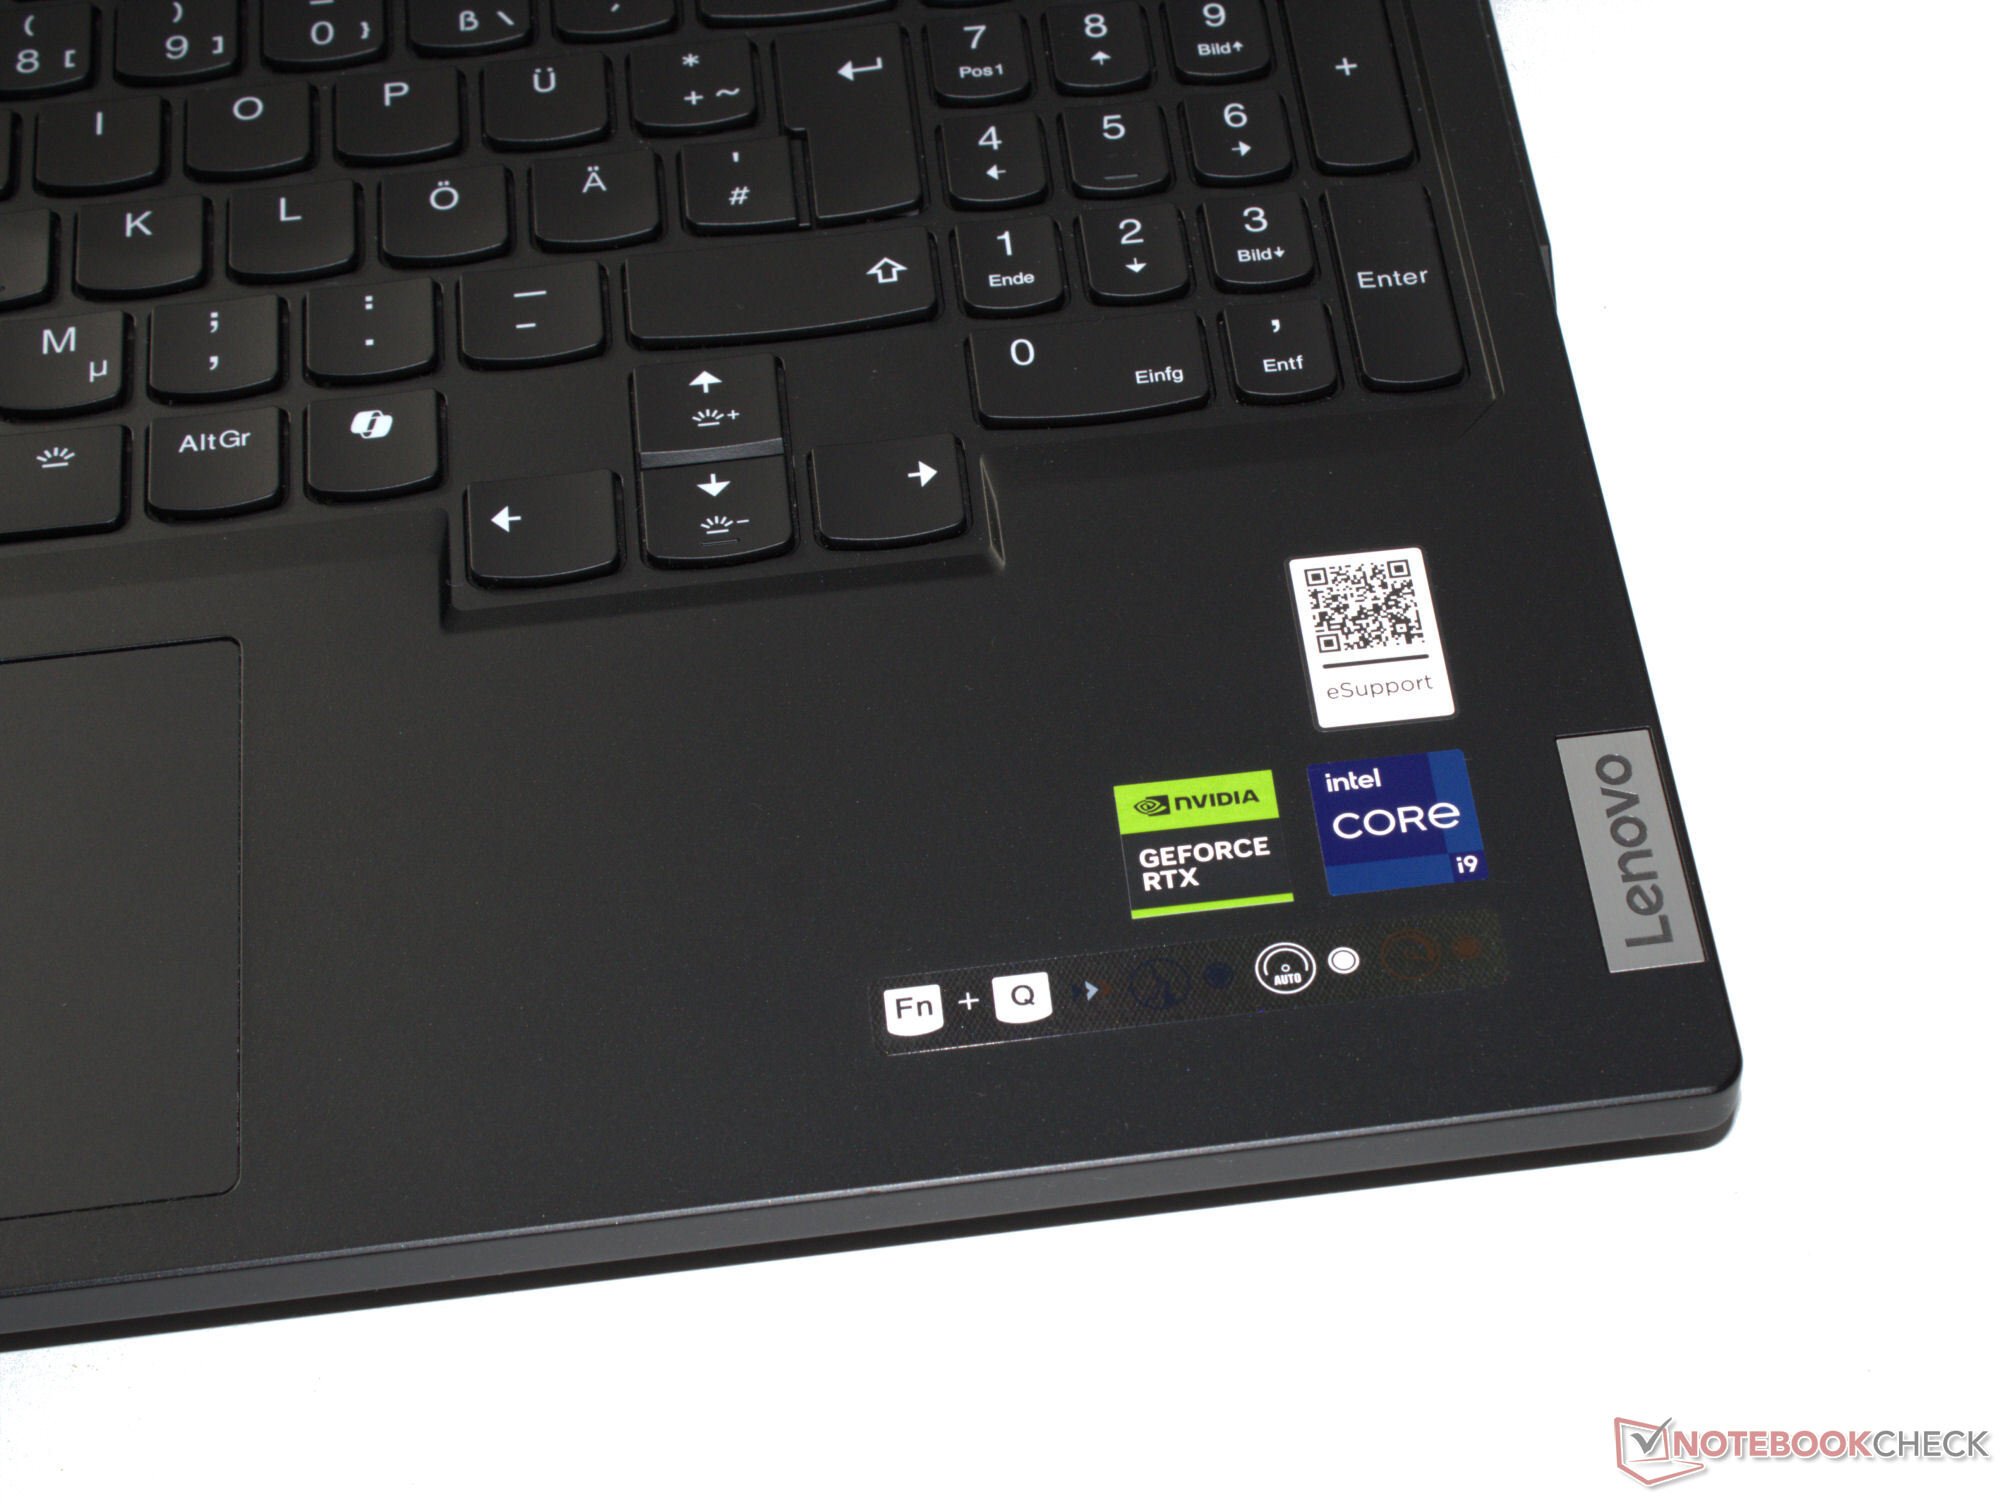
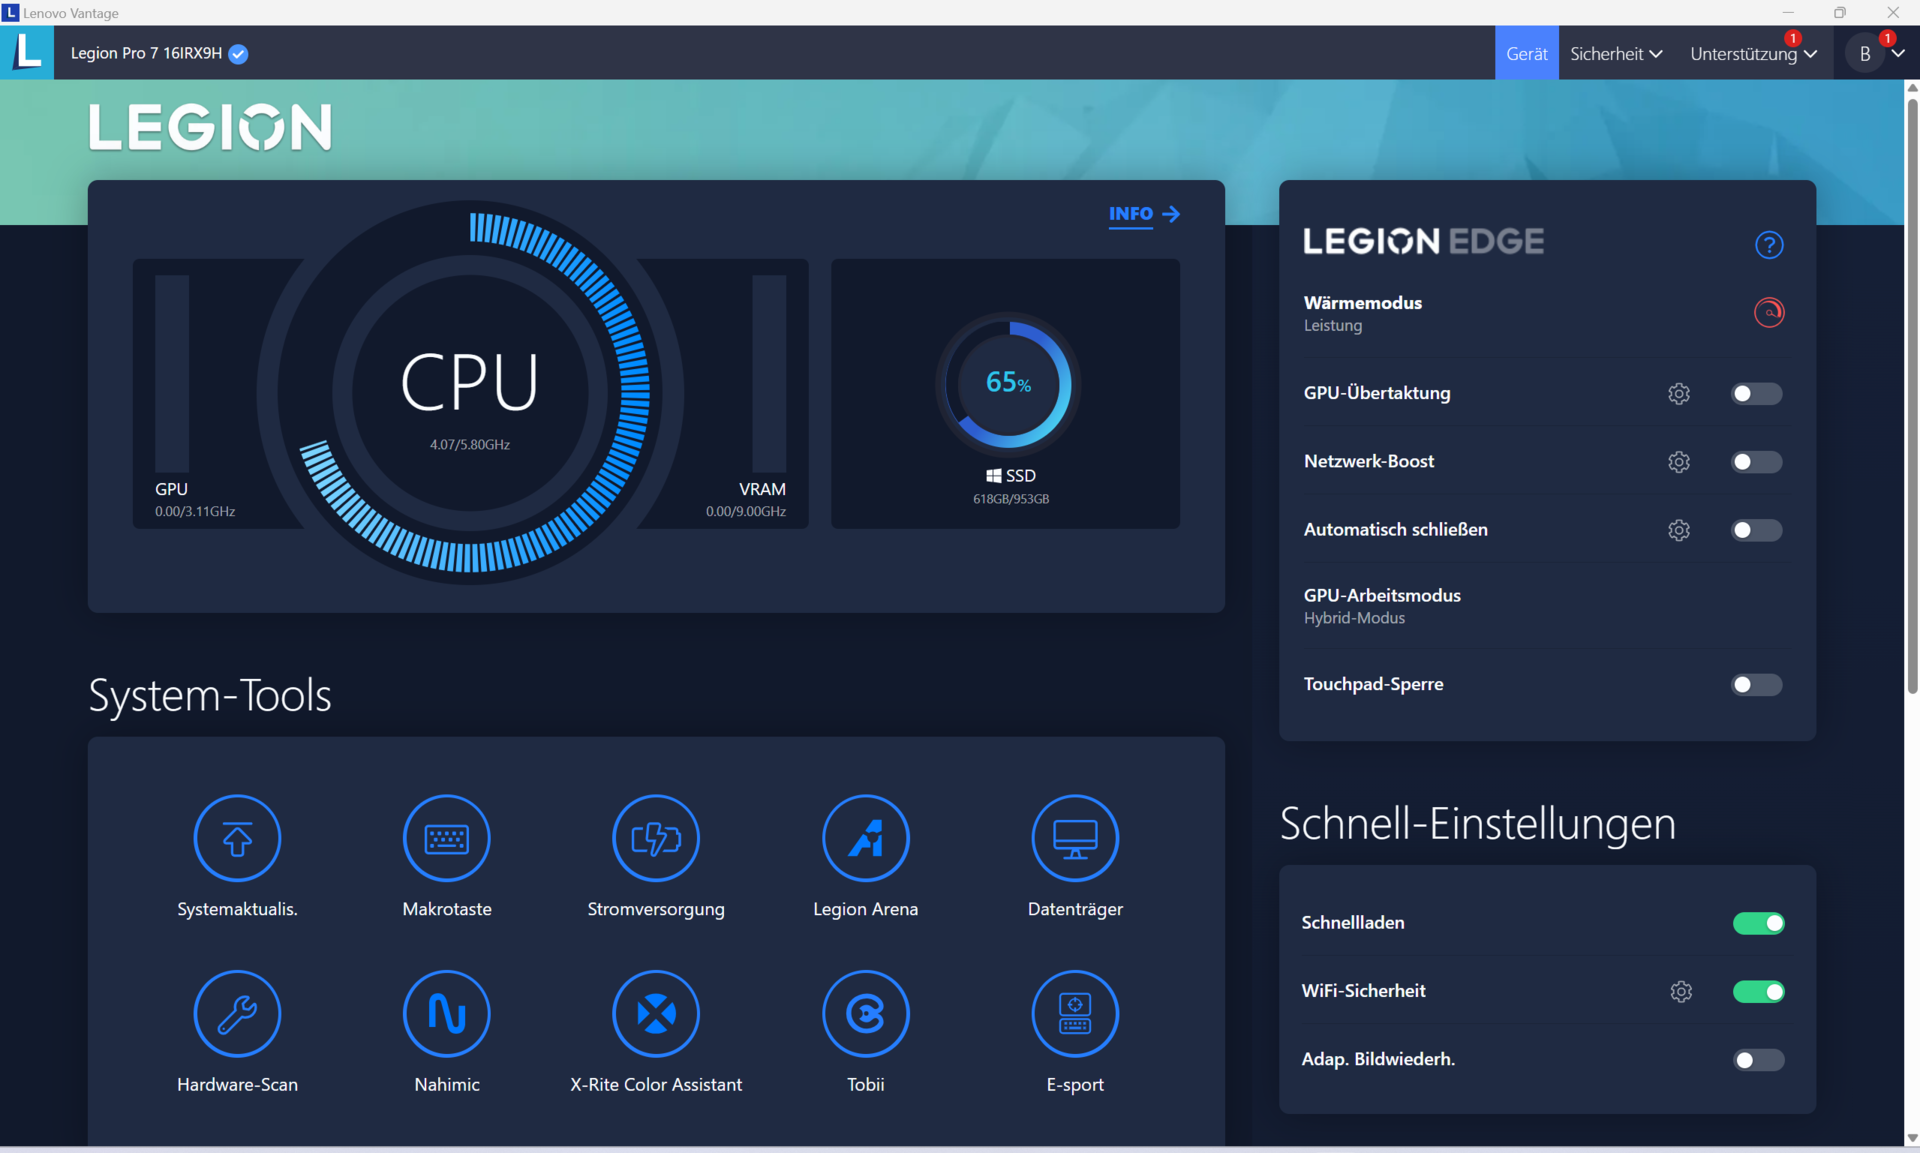
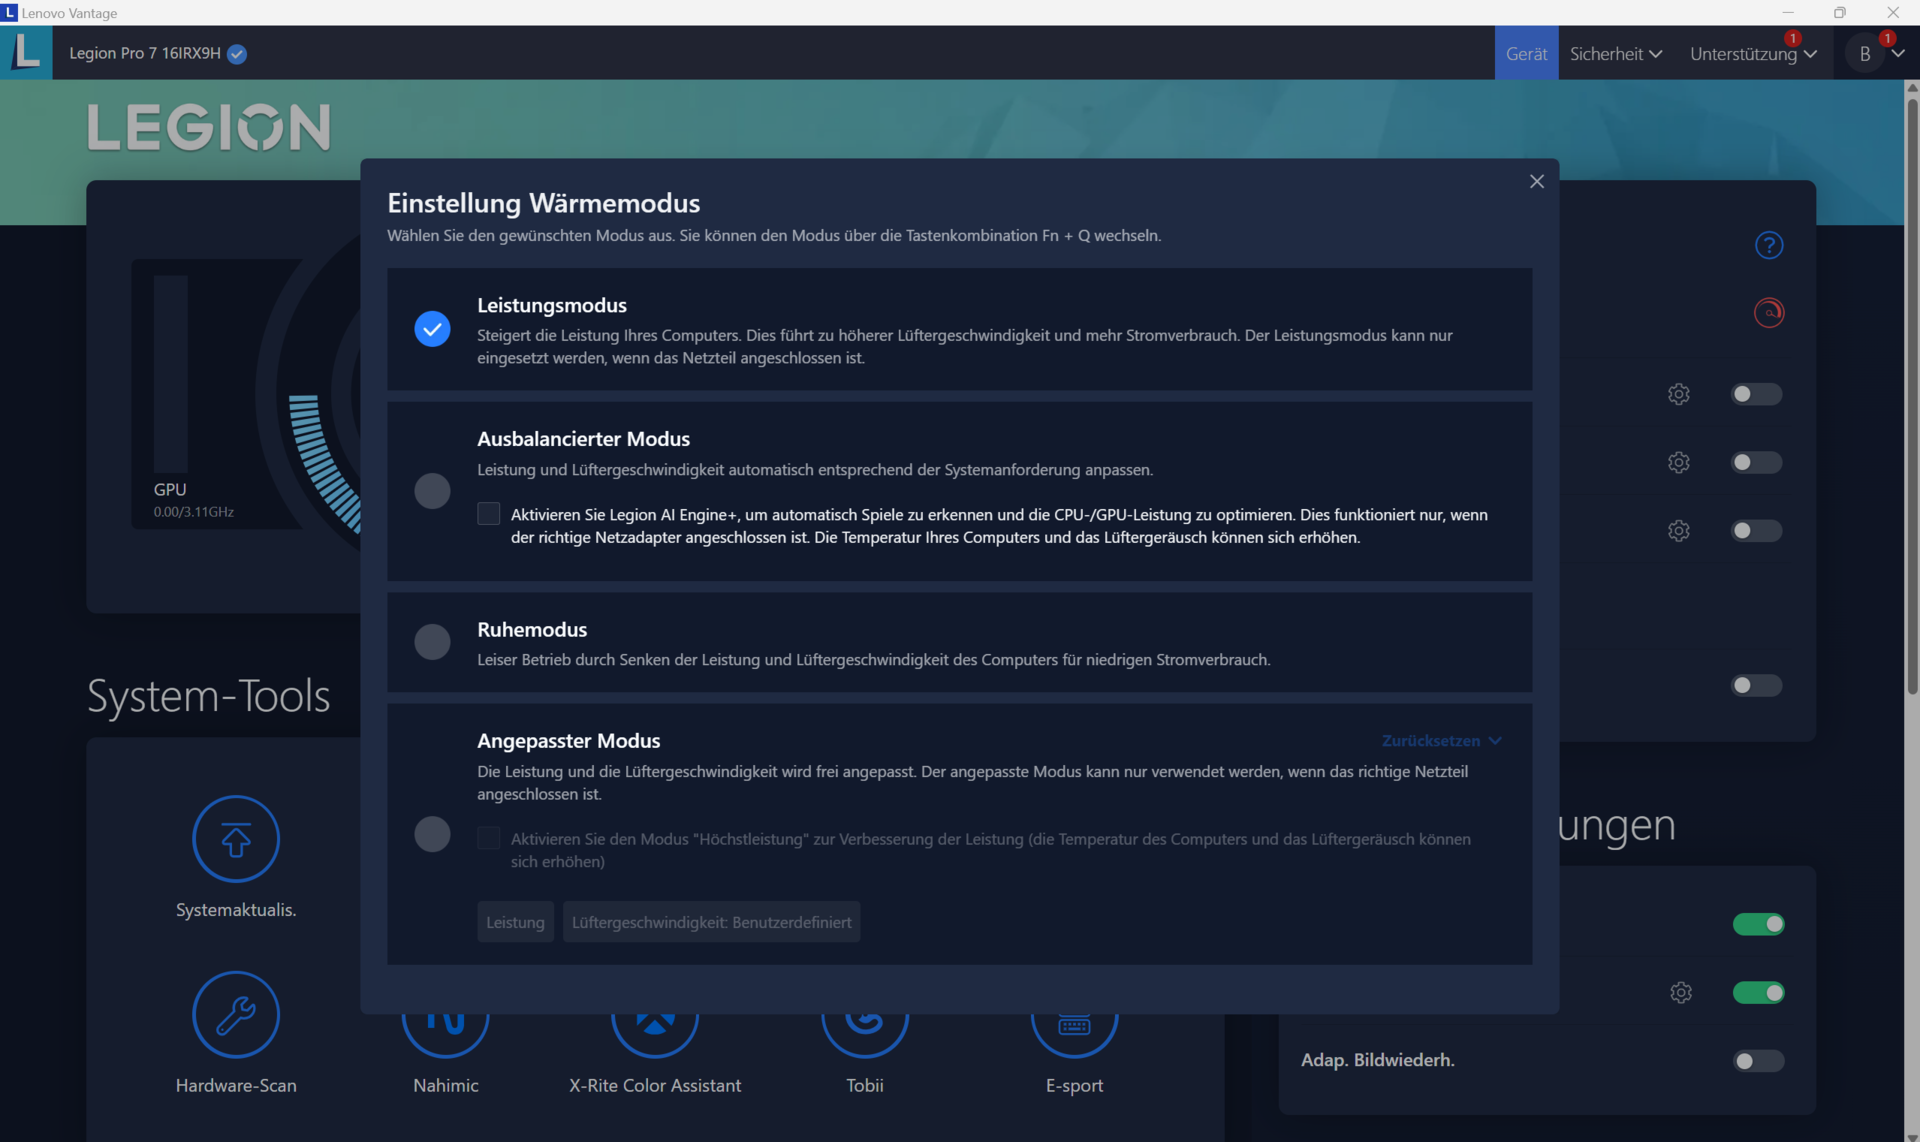
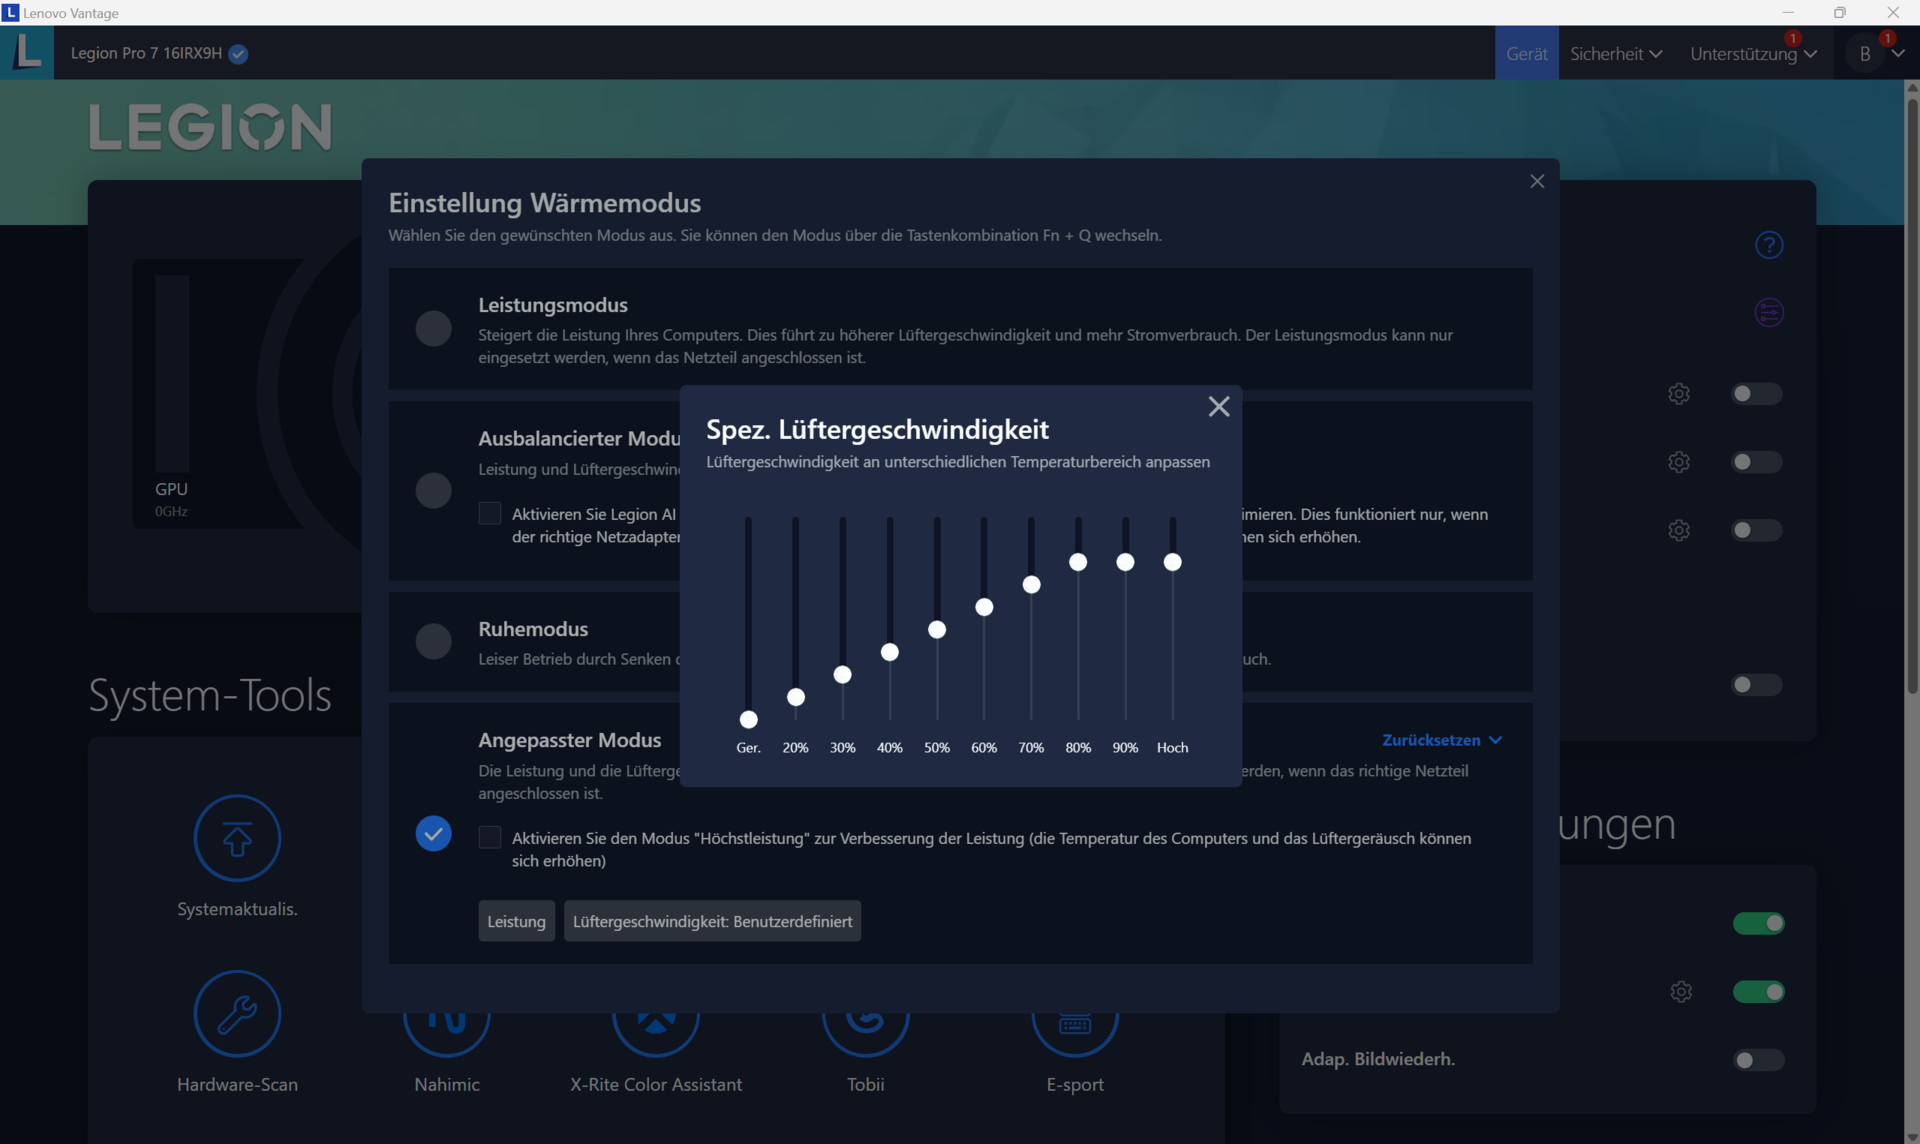
The notebook offers three manufacturer-specific performance modes (see table). You can toggle between them using the Fn + Q key combination. We used Performance and Quiet mode for our benchmarks and battery test respectively.
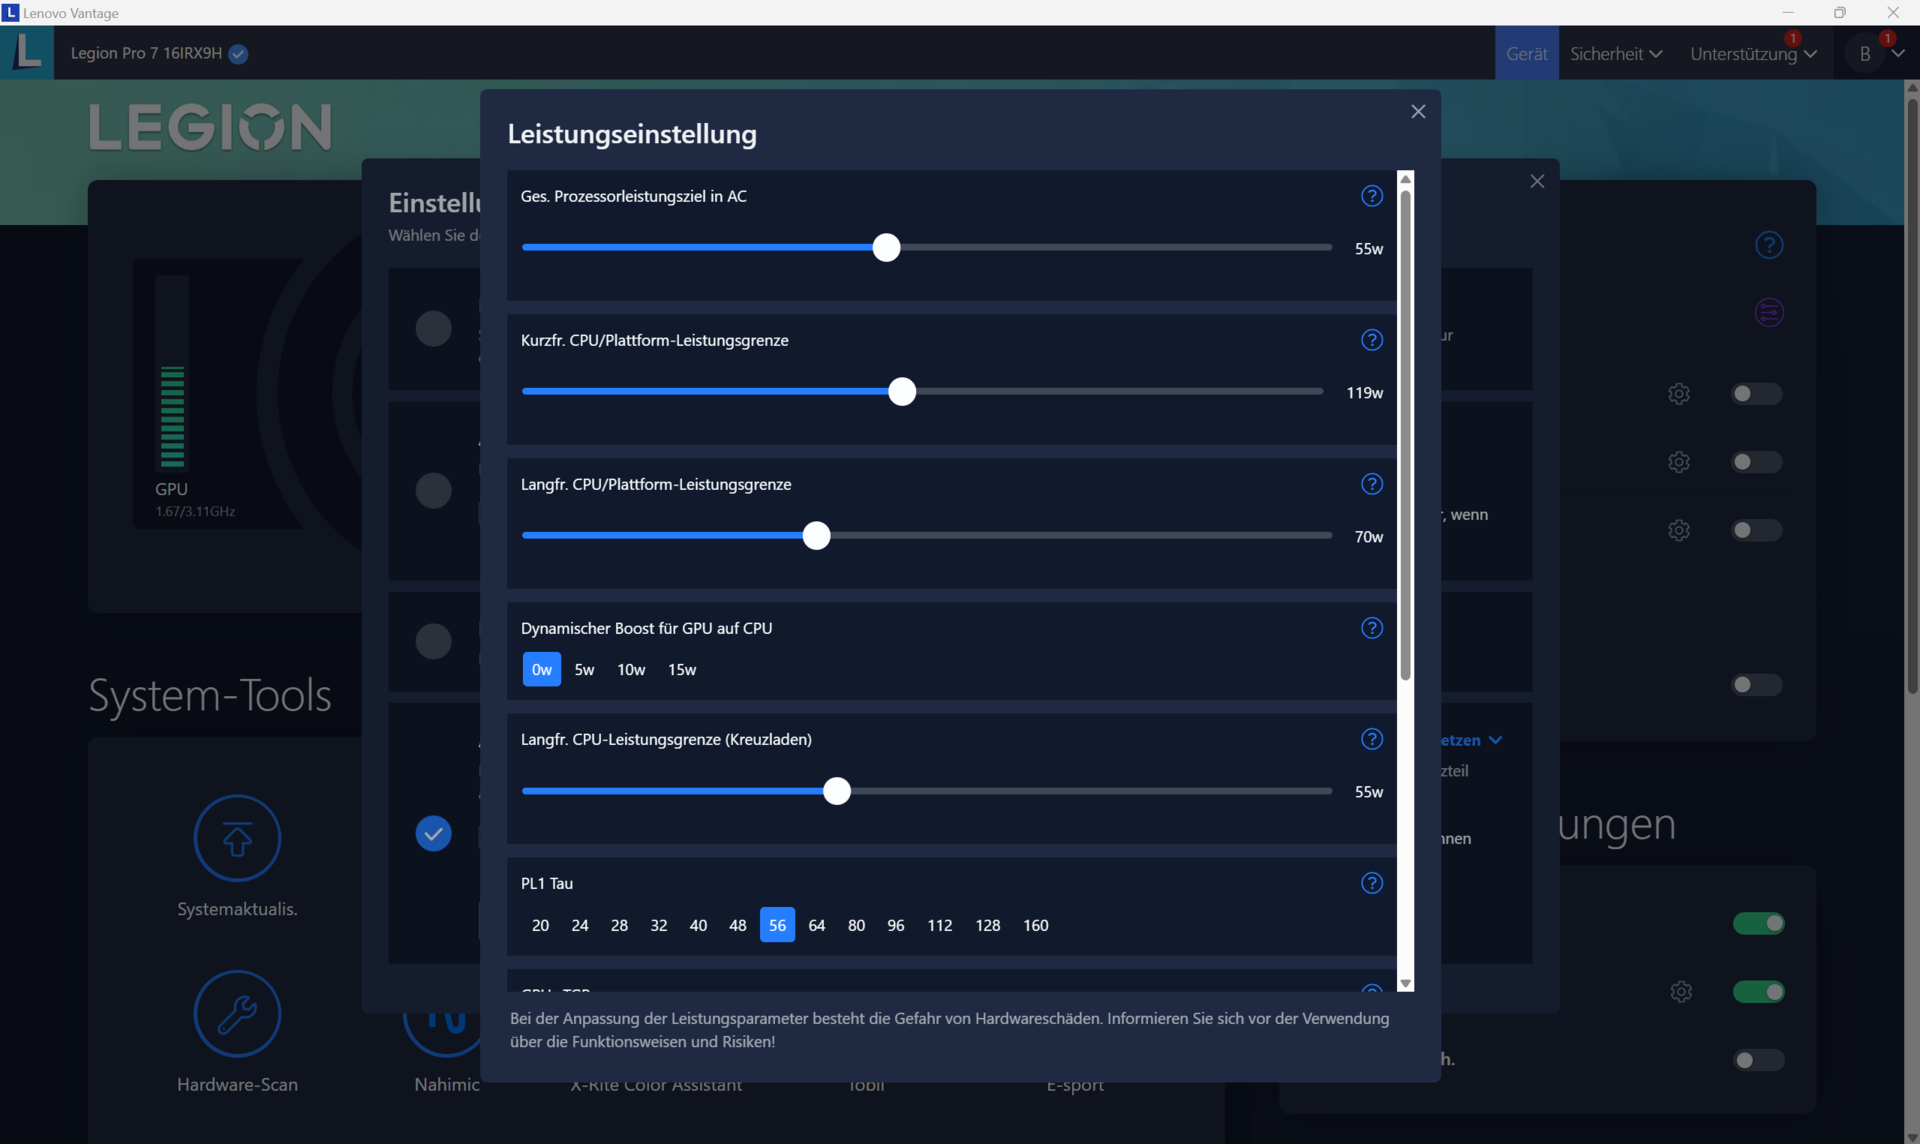
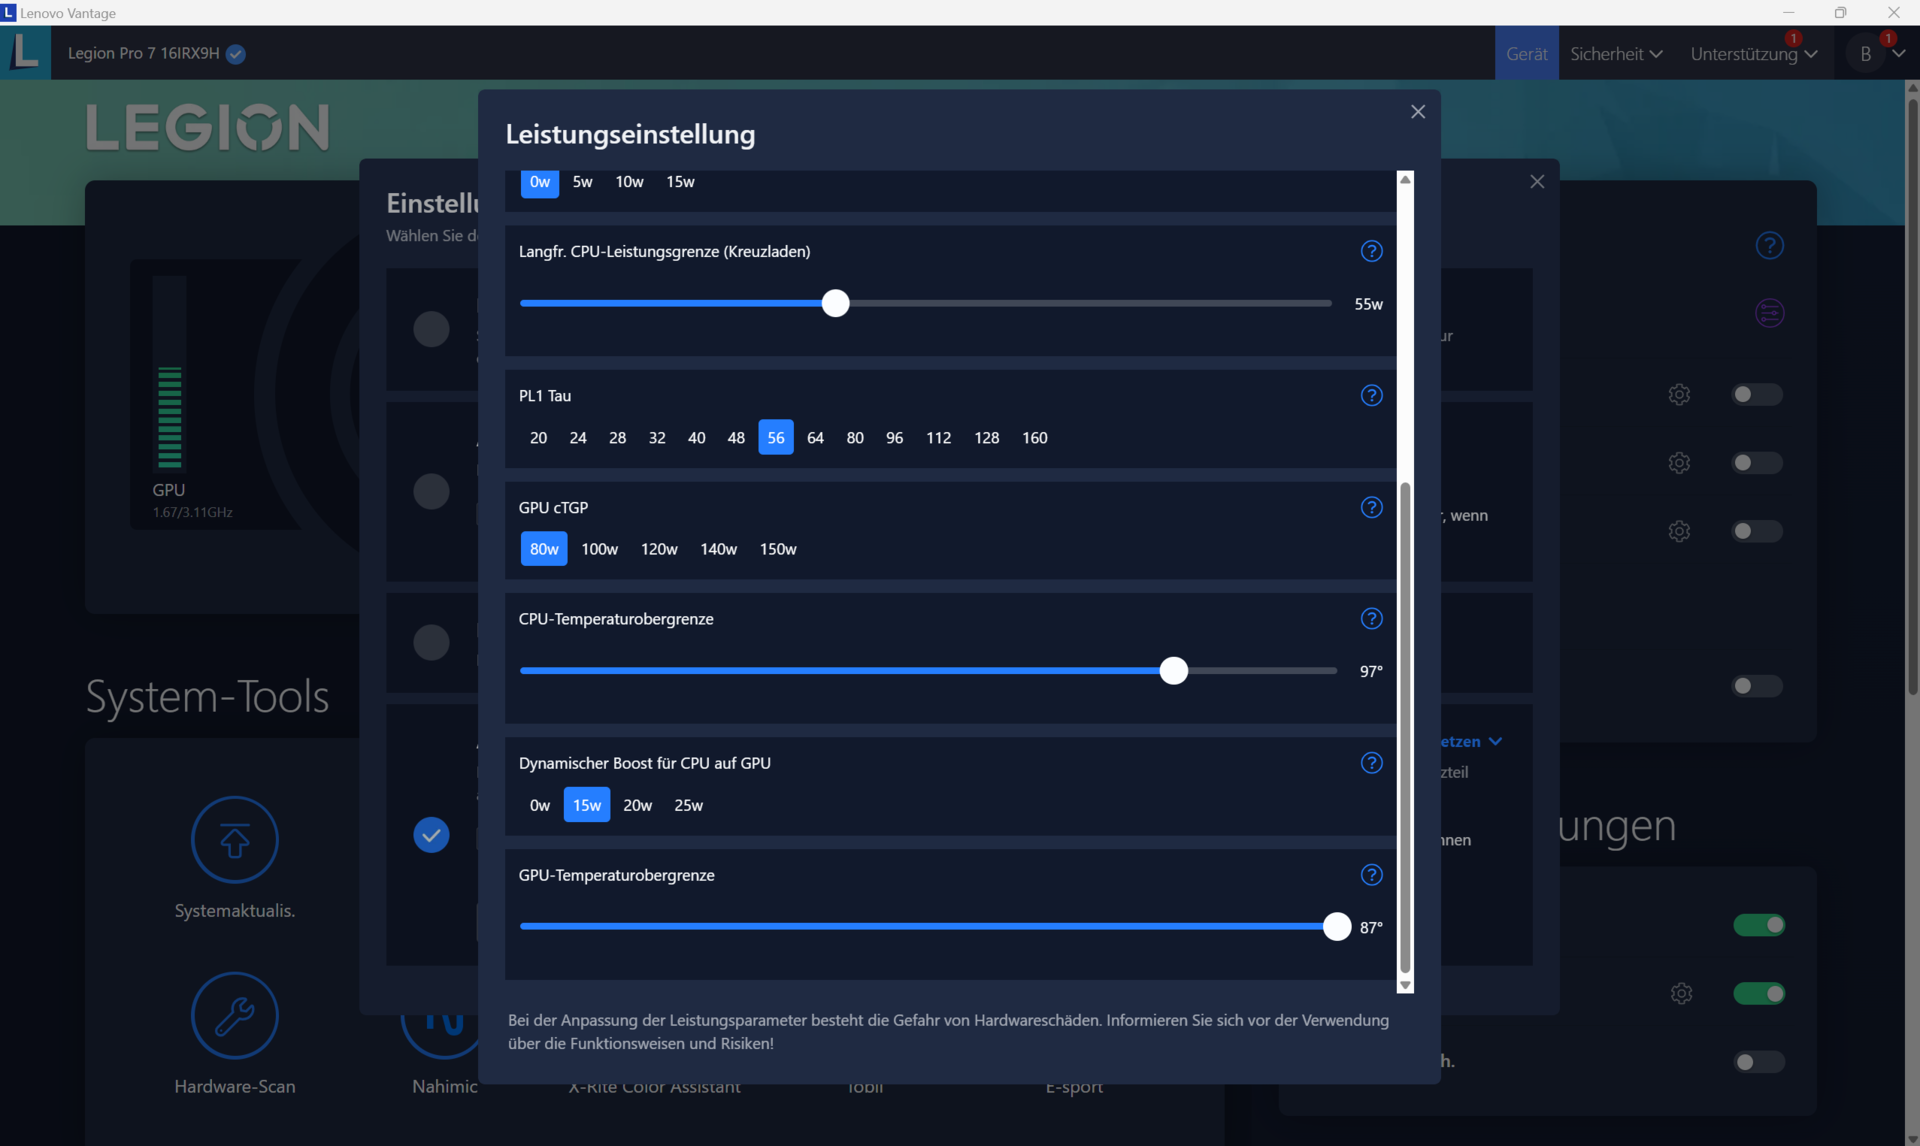
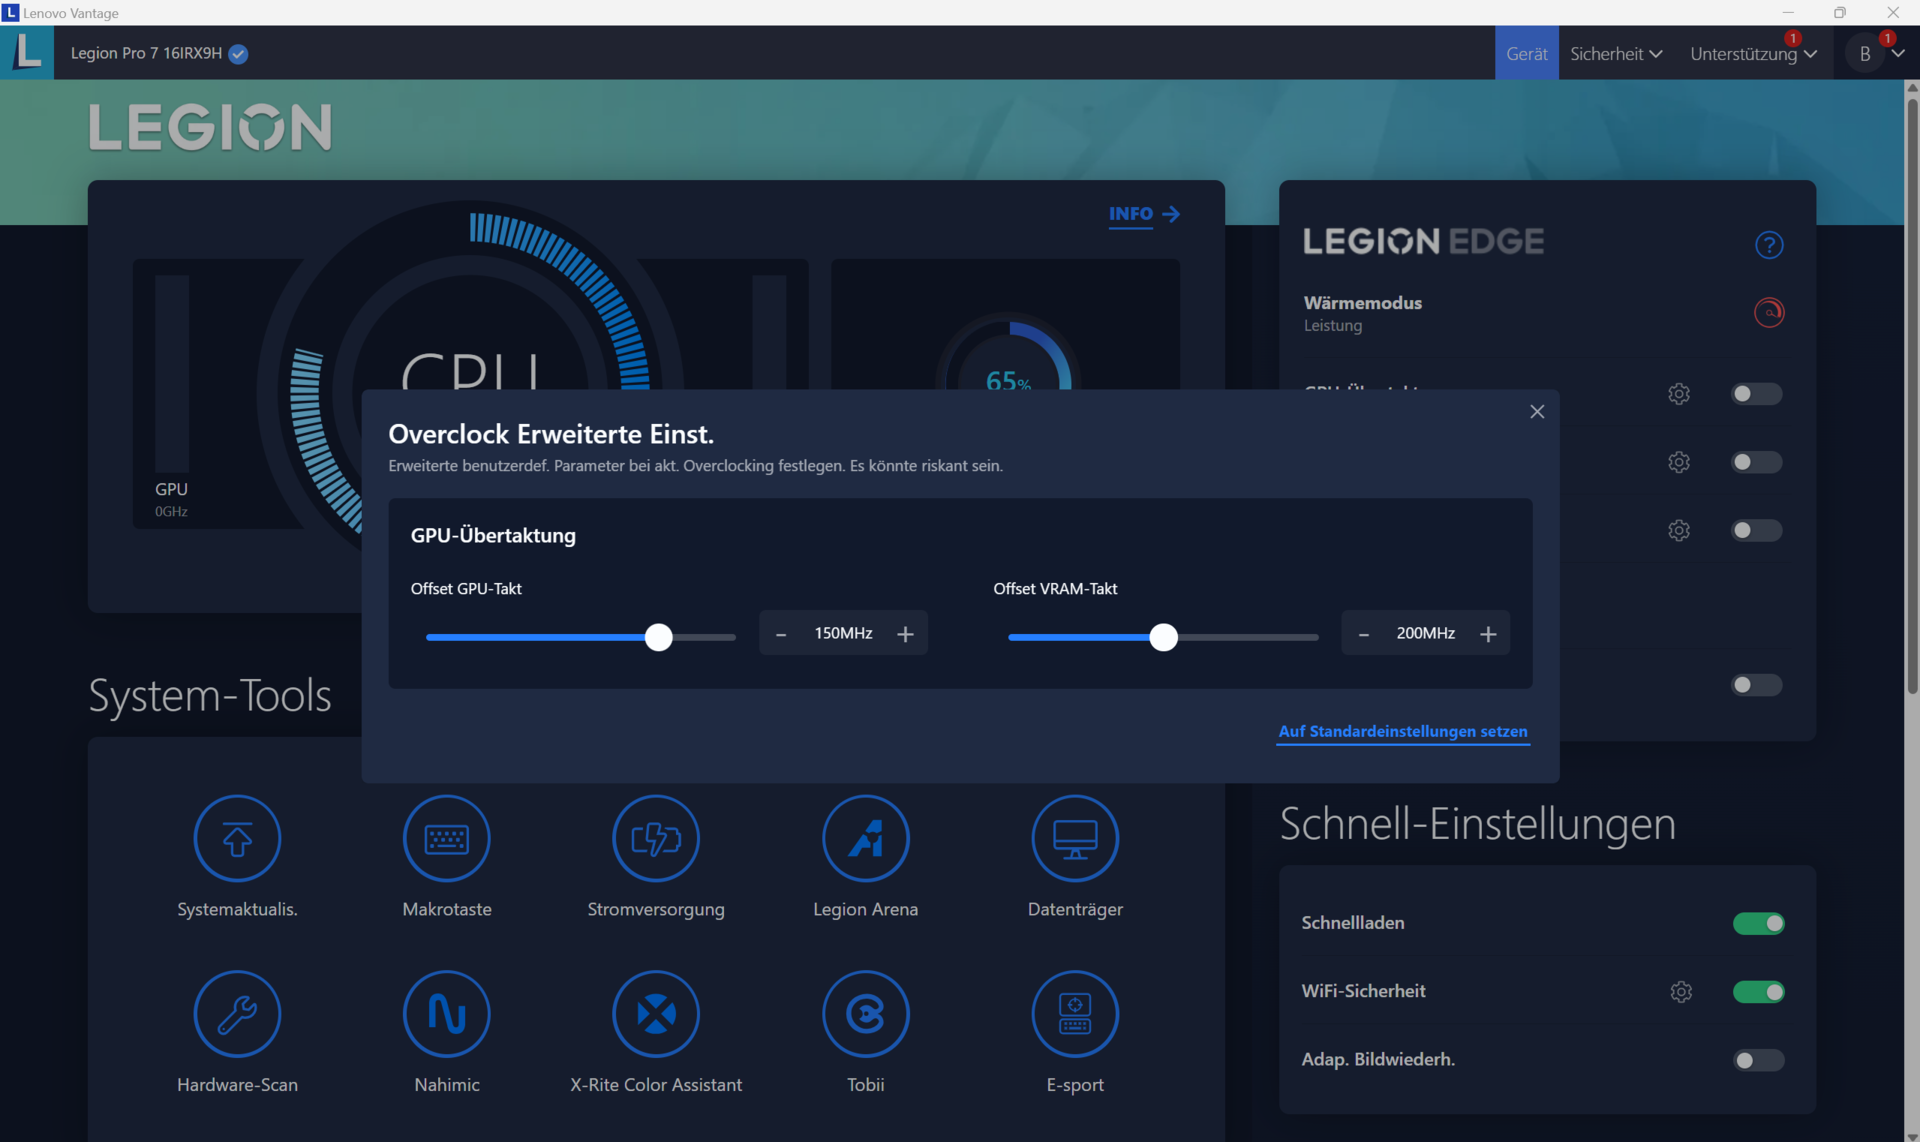
There is also a fourth mode available in Lenovo Vantage (the laptop’s control centre): Custom mode. This mode lets you specify the performance settings of the processor (power limit) and graphics card (TGP, Dynamic Boost and temperature limit) as well as adjust fan speed. Furthermore, it is possible to overclock the GPU and graphics memory independently of the profile selected.
| Performance mode | Balanced mode | Quiet mode | |
|---|---|---|---|
| Power Limit 1 (HWInfo) | 130 Watt | 80 Watt | 55 Watt |
| Power Limit 2 (HWInfo) | 185 Watt | 119 Watt | 65 Watt |
| Noise (Witcher 3) | 54 dB(A) | 45 dB(A) | 33 dB(A) |
| Performance (Witcher 3) | ~184 fps | ~160 fps | 40 fps (locked) |

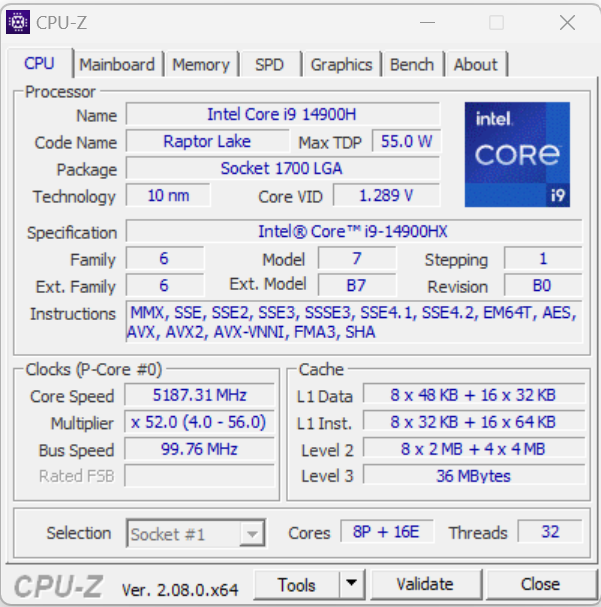
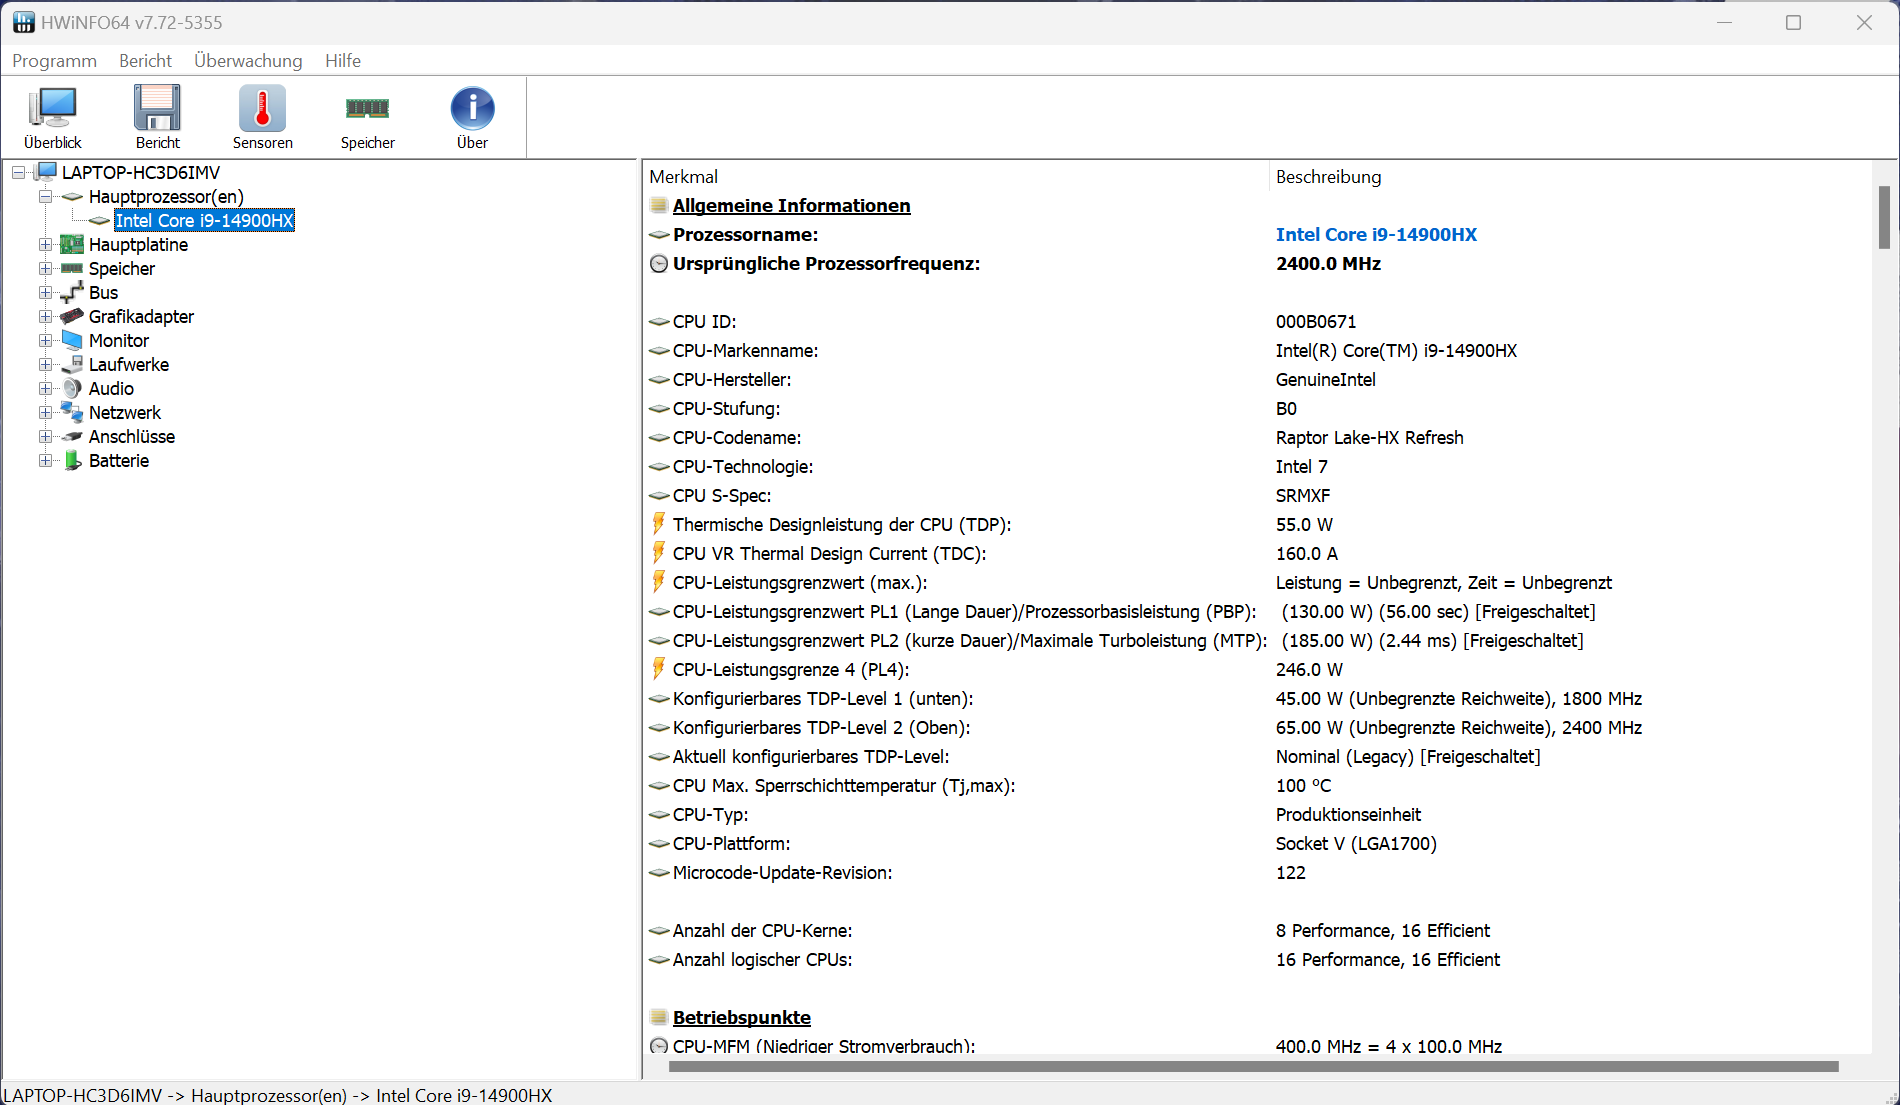
Processor
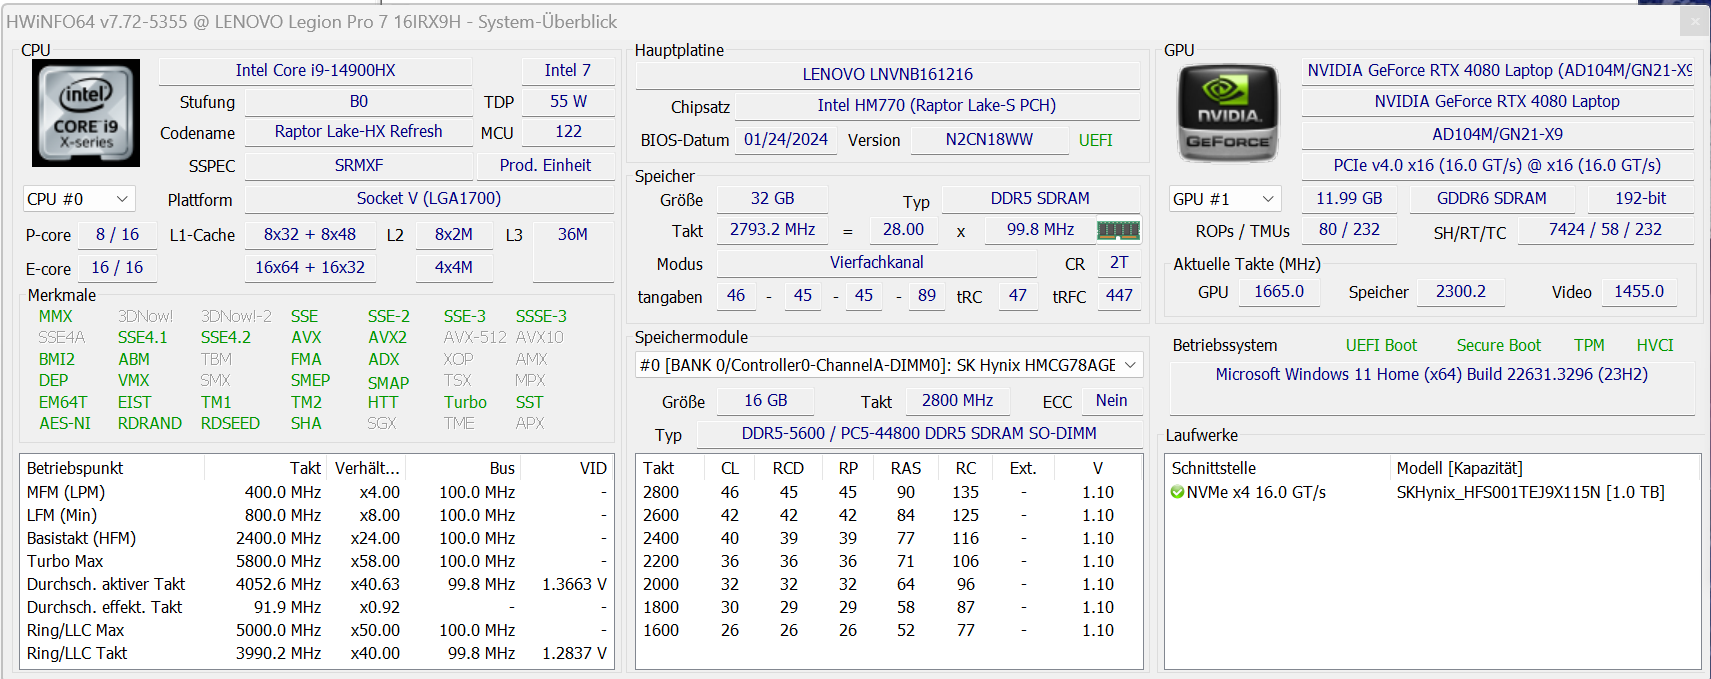
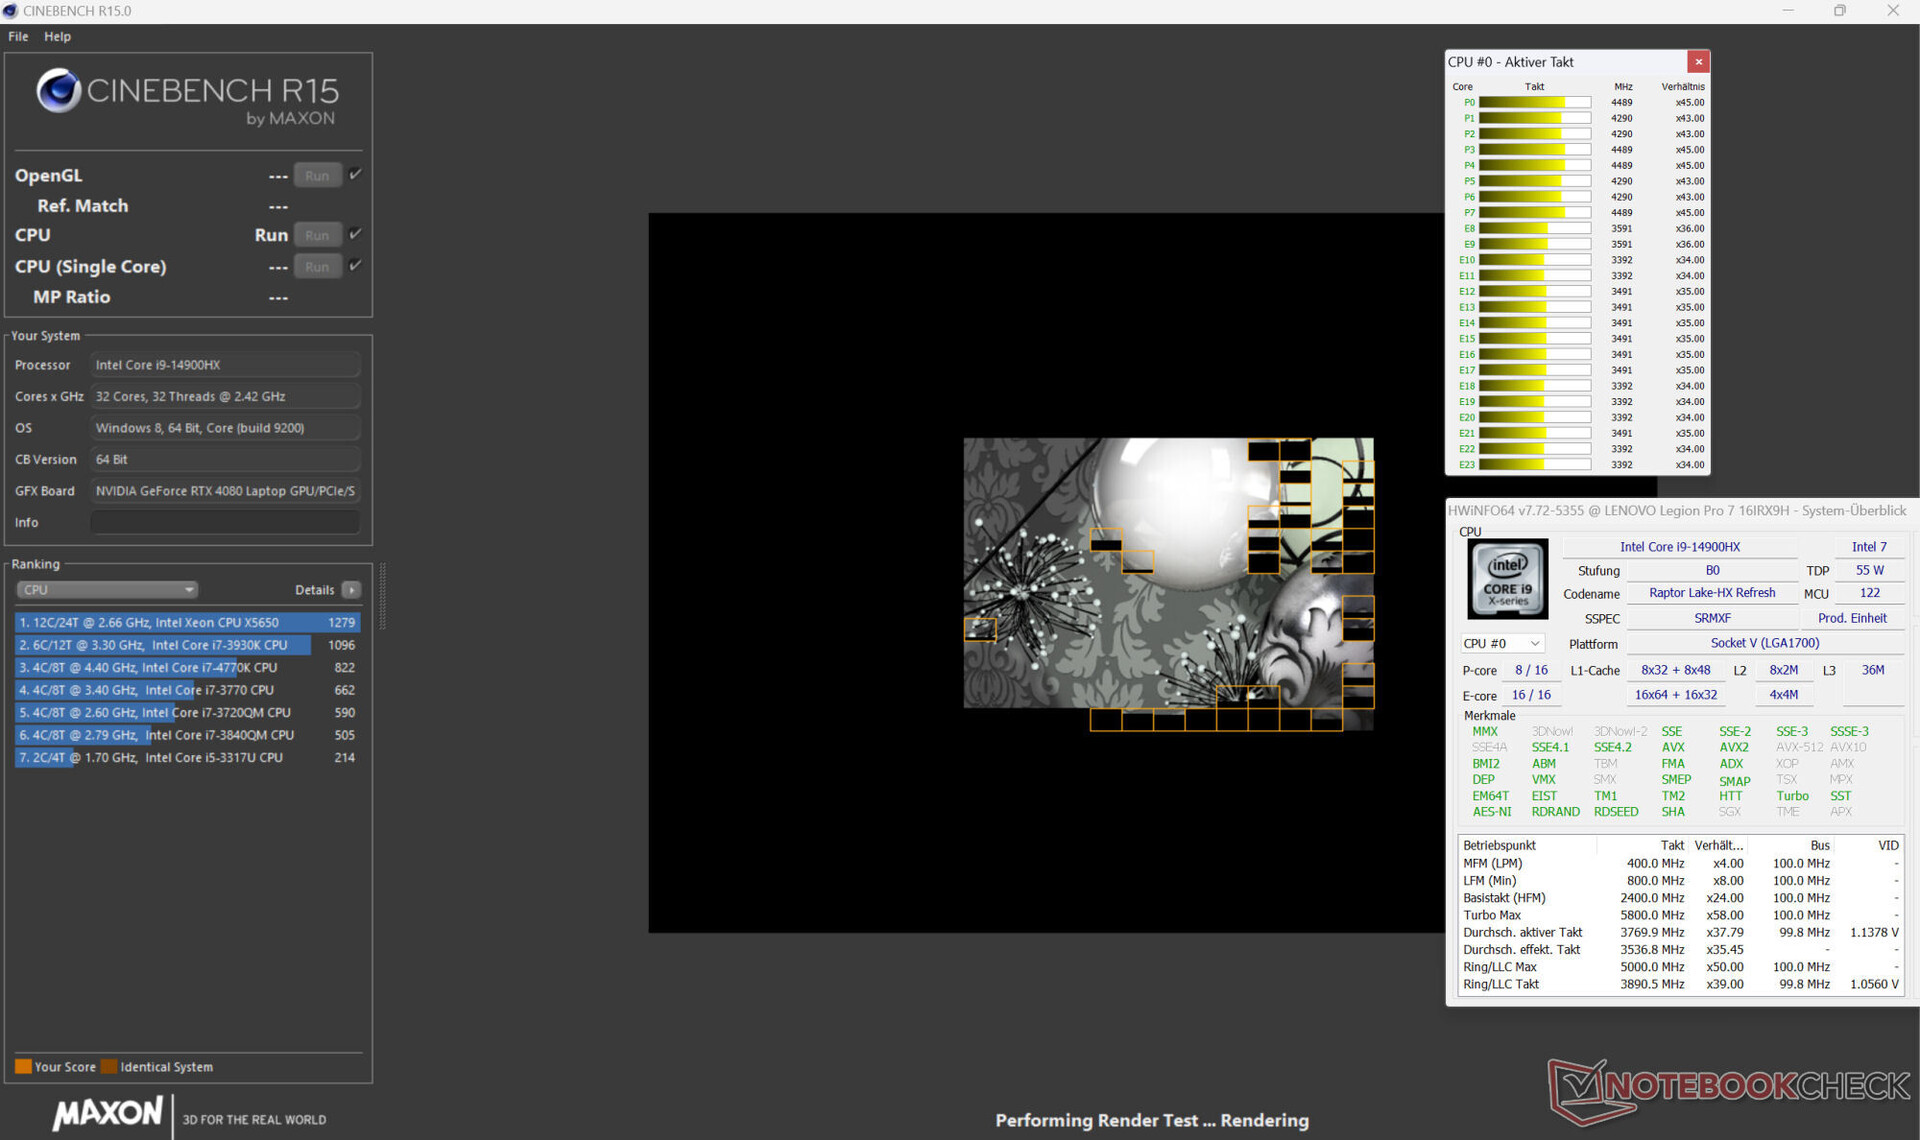
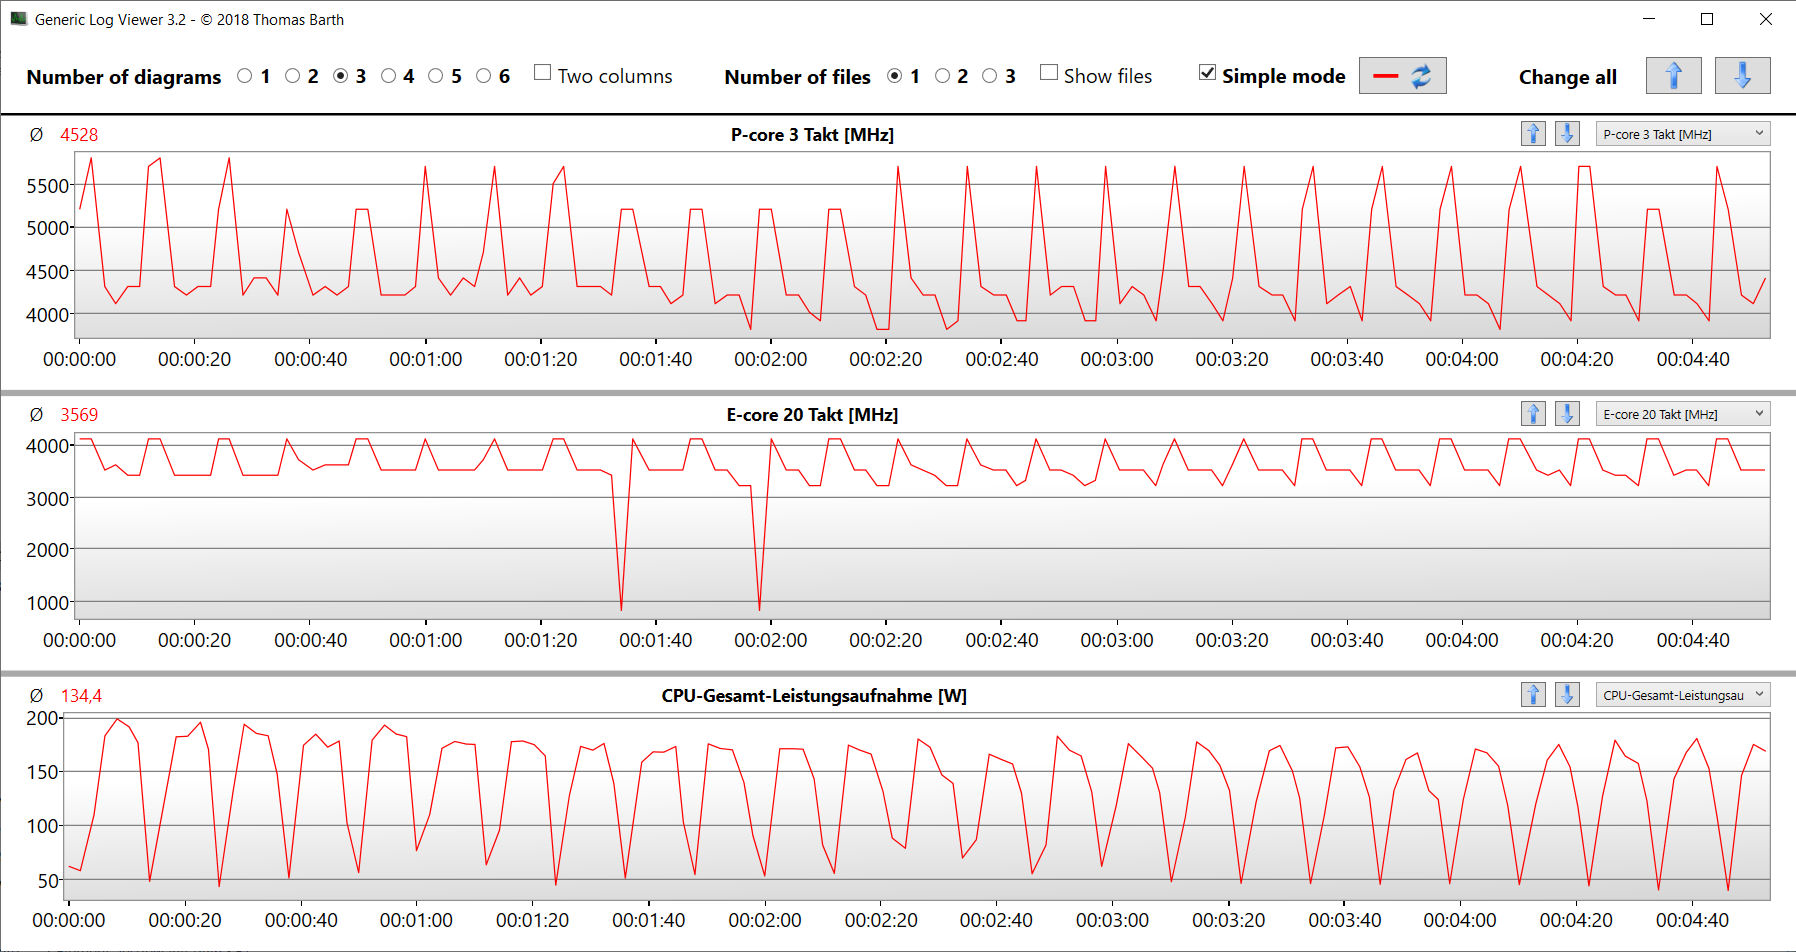
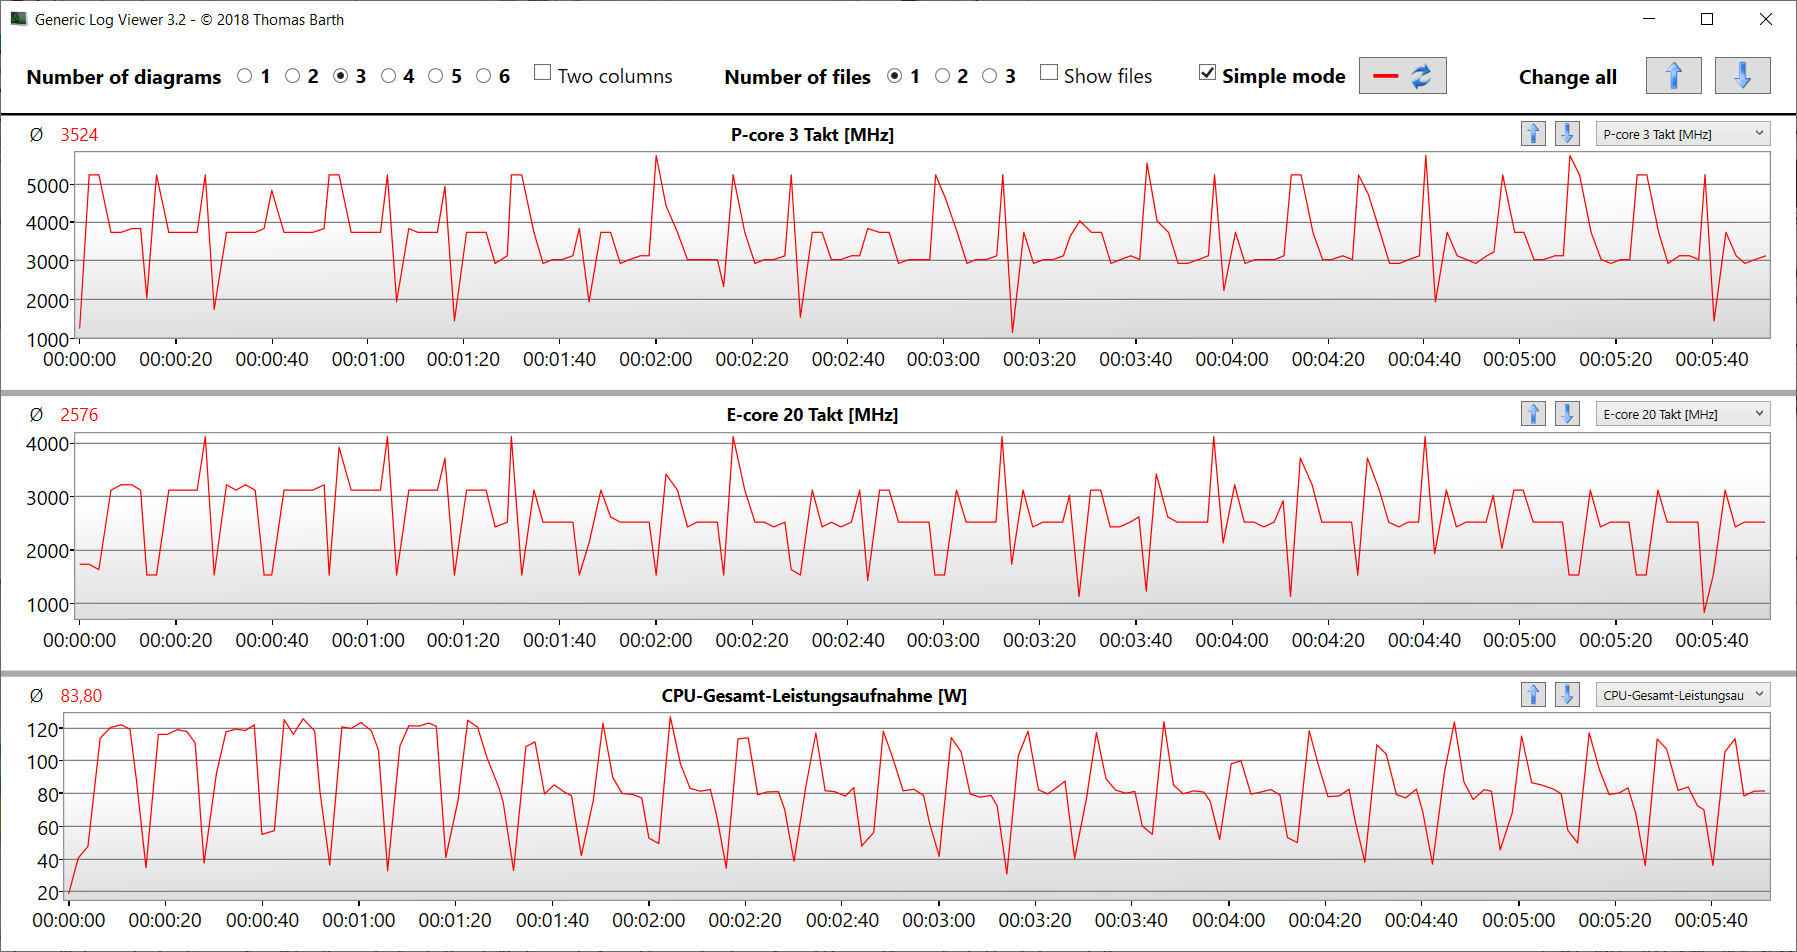
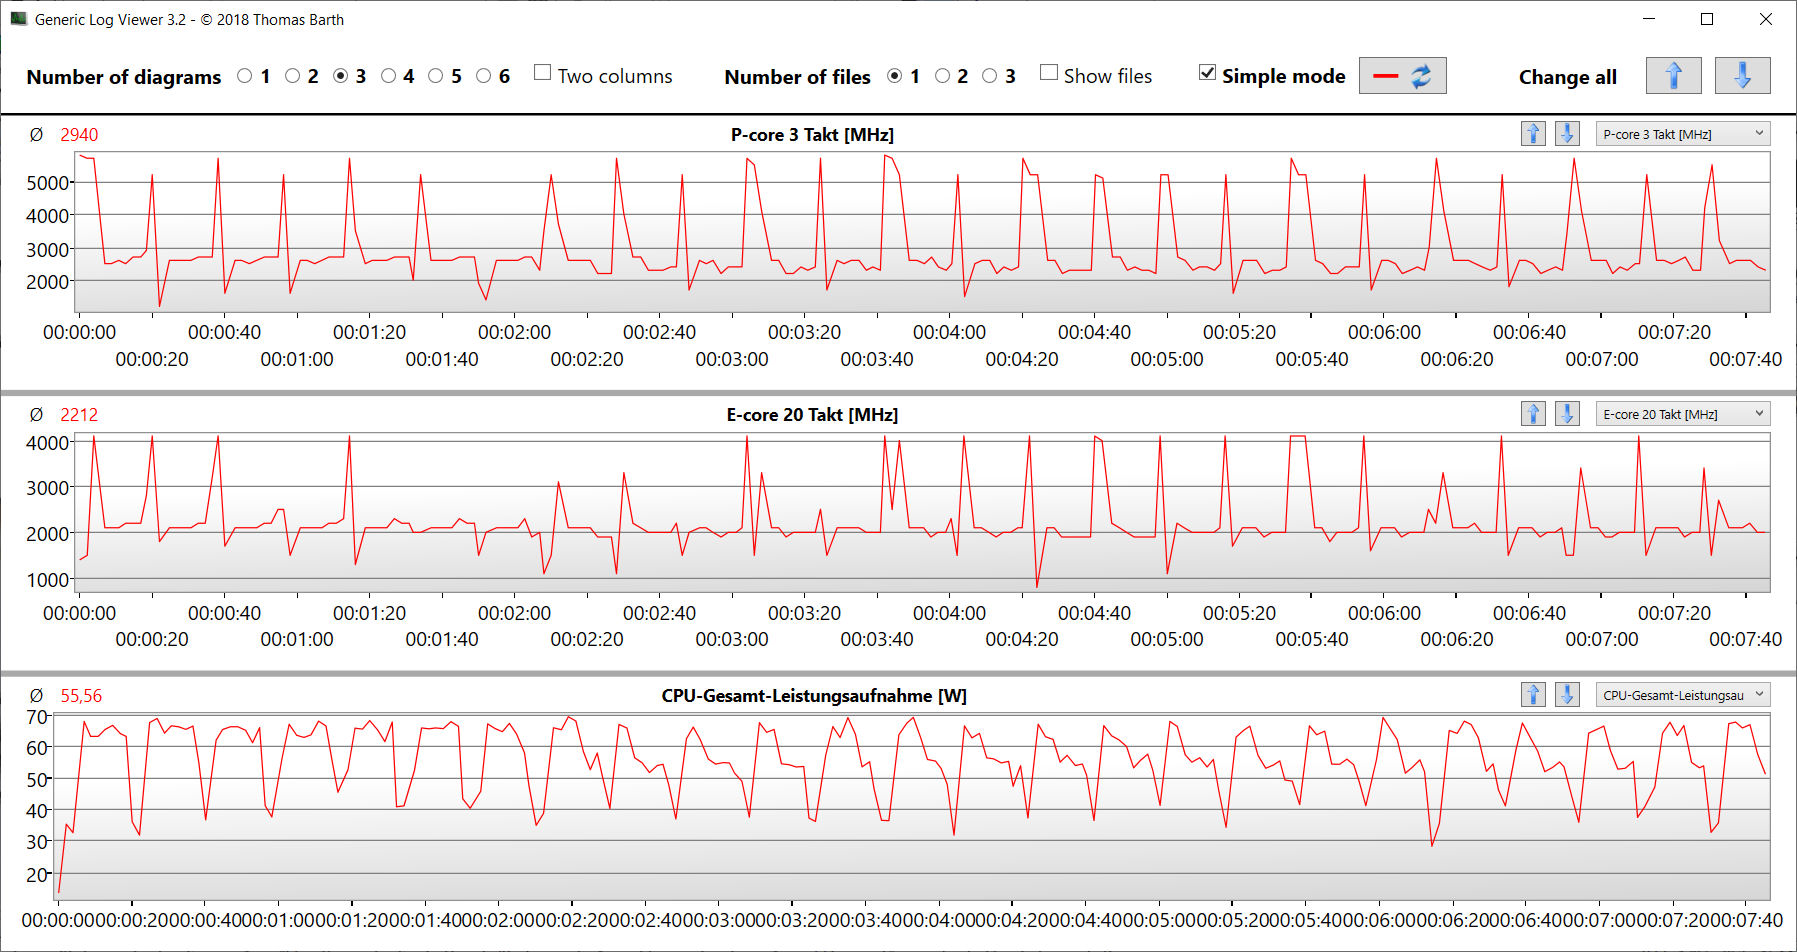
The 24 CPU cores (8P + 16E = 32 threads) on the Core i9-14900HX (Raptor Lake) hit peak clock speeds of 5.8 GHz (P) and 4.1 GHz (E). The processor handled sustained multi-thread load (running Cinebench 15 in a loop) at consistently high clock speeds. In Performance mode, the benchmark scores obtained are above what the CPU can do on average. On battery power, single-thread performance didn’t decrease much (307 points in CB15), but multi-thread performance took a significant hit (2,482 points in CB15).
You can refer to this analysis for more information on the Core i9.

Cinebench R15 Multi Sustained load
* ... smaller is better
AIDA64: FP32 Ray-Trace | FPU Julia | CPU SHA3 | CPU Queen | FPU SinJulia | FPU Mandel | CPU AES | CPU ZLib | FP64 Ray-Trace | CPU PhotoWorxx
| Performance rating | |
| Alienware m16 R1 AMD | |
| MSI Vector 16 HX A14V | |
| Lenovo Legion Pro 7 16IRX9H | |
| Lenovo Legion Pro 7 16IRX8H | |
| Average of class Gaming | |
| Average Intel Core i9-14900HX | |
| HP Omen 16 (2024) | |
| AIDA64 / FP32 Ray-Trace | |
| Alienware m16 R1 AMD | |
| Average of class Gaming (10227 - 85542, n=106, last 2 years) | |
| MSI Vector 16 HX A14V | |
| Lenovo Legion Pro 7 16IRX9H | |
| Lenovo Legion Pro 7 16IRX8H | |
| Average Intel Core i9-14900HX (13098 - 33474, n=36) | |
| HP Omen 16 (2024) | |
| AIDA64 / FPU Julia | |
| Alienware m16 R1 AMD | |
| MSI Vector 16 HX A14V | |
| Average of class Gaming (51376 - 372155, n=106, last 2 years) | |
| Lenovo Legion Pro 7 16IRX9H | |
| Lenovo Legion Pro 7 16IRX8H | |
| Average Intel Core i9-14900HX (67573 - 166040, n=36) | |
| HP Omen 16 (2024) | |
| AIDA64 / CPU SHA3 | |
| Alienware m16 R1 AMD | |
| Lenovo Legion Pro 7 16IRX9H | |
| MSI Vector 16 HX A14V | |
| Lenovo Legion Pro 7 16IRX8H | |
| Average of class Gaming (2180 - 10115, n=106, last 2 years) | |
| Average Intel Core i9-14900HX (3589 - 7979, n=36) | |
| HP Omen 16 (2024) | |
| AIDA64 / CPU Queen | |
| Alienware m16 R1 AMD | |
| Lenovo Legion Pro 7 16IRX9H | |
| MSI Vector 16 HX A14V | |
| Average Intel Core i9-14900HX (118405 - 148966, n=36) | |
| Lenovo Legion Pro 7 16IRX8H | |
| HP Omen 16 (2024) | |
| Average of class Gaming (49785 - 173351, n=90, last 2 years) | |
| AIDA64 / FPU SinJulia | |
| Alienware m16 R1 AMD | |
| Lenovo Legion Pro 7 16IRX9H | |
| MSI Vector 16 HX A14V | |
| Lenovo Legion Pro 7 16IRX8H | |
| Average Intel Core i9-14900HX (10475 - 18517, n=36) | |
| Average of class Gaming (4424 - 33636, n=106, last 2 years) | |
| HP Omen 16 (2024) | |
| AIDA64 / FPU Mandel | |
| Alienware m16 R1 AMD | |
| Average of class Gaming (25115 - 196829, n=106, last 2 years) | |
| MSI Vector 16 HX A14V | |
| Lenovo Legion Pro 7 16IRX9H | |
| Lenovo Legion Pro 7 16IRX8H | |
| Average Intel Core i9-14900HX (32543 - 83662, n=36) | |
| HP Omen 16 (2024) | |
| AIDA64 / CPU AES | |
| Average Intel Core i9-14900HX (86964 - 241777, n=36) | |
| Lenovo Legion Pro 7 16IRX9H | |
| MSI Vector 16 HX A14V | |
| Lenovo Legion Pro 7 16IRX8H | |
| Alienware m16 R1 AMD | |
| Average of class Gaming (39258 - 247074, n=106, last 2 years) | |
| HP Omen 16 (2024) | |
| AIDA64 / CPU ZLib | |
| Lenovo Legion Pro 7 16IRX9H | |
| MSI Vector 16 HX A14V | |
| Lenovo Legion Pro 7 16IRX8H | |
| Average Intel Core i9-14900HX (1054 - 2292, n=36) | |
| Alienware m16 R1 AMD | |
| Average of class Gaming (574 - 2531, n=106, last 2 years) | |
| HP Omen 16 (2024) | |
| AIDA64 / FP64 Ray-Trace | |
| Alienware m16 R1 AMD | |
| Average of class Gaming (5509 - 45446, n=106, last 2 years) | |
| MSI Vector 16 HX A14V | |
| Lenovo Legion Pro 7 16IRX9H | |
| Lenovo Legion Pro 7 16IRX8H | |
| Average Intel Core i9-14900HX (6809 - 18349, n=36) | |
| HP Omen 16 (2024) | |
| AIDA64 / CPU PhotoWorxx | |
| HP Omen 16 (2024) | |
| MSI Vector 16 HX A14V | |
| Lenovo Legion Pro 7 16IRX8H | |
| Lenovo Legion Pro 7 16IRX9H | |
| Average Intel Core i9-14900HX (23903 - 54702, n=36) | |
| Average of class Gaming (12271 - 89891, n=106, last 2 years) | |
| Alienware m16 R1 AMD | |
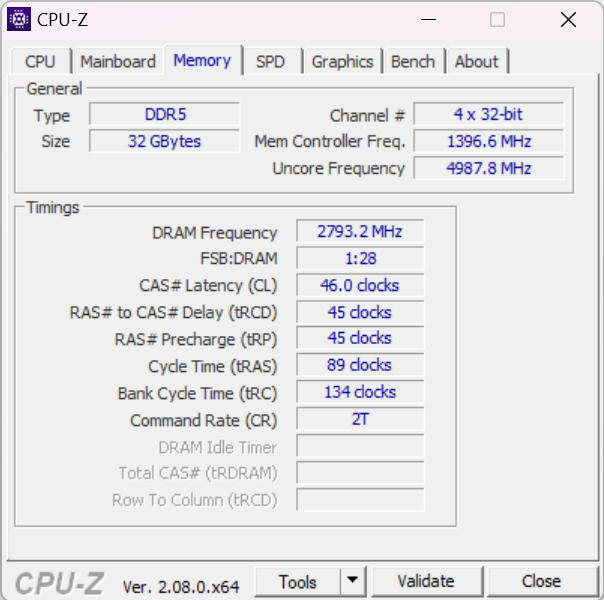
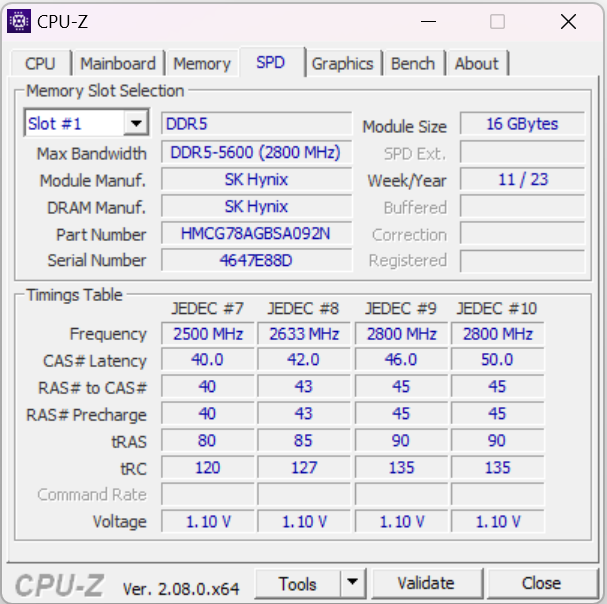
System performance
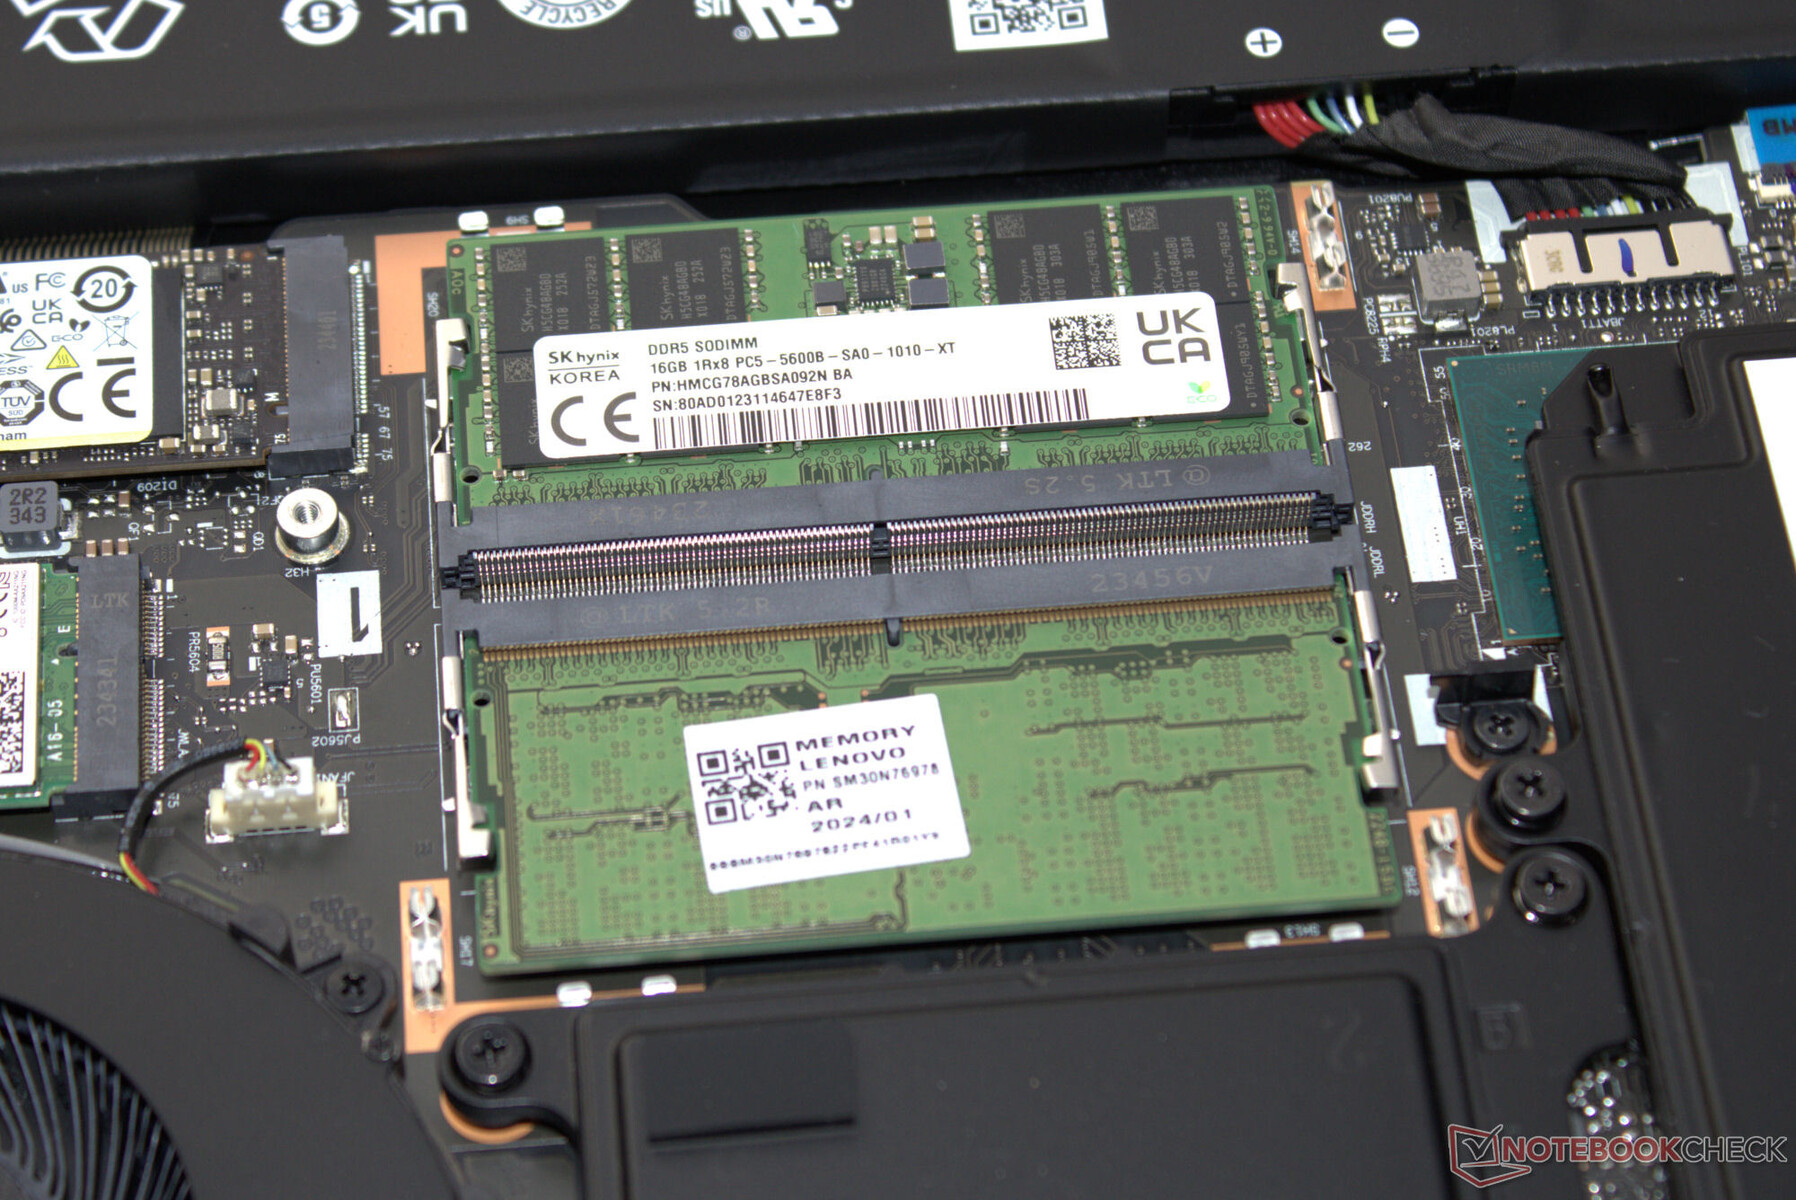
The smooth-running system doesn’t lack computing performance. The Legion Pro 7 can effortlessly handle things like gaming, streaming and rendering. The memory’s transfer rates are at a normal level for DDR5-5600 RAM.
CrossMark: Overall | Productivity | Creativity | Responsiveness
WebXPRT 3: Overall
WebXPRT 4: Overall
Mozilla Kraken 1.1: Total
| PCMark 10 / Score | |
| Lenovo Legion Pro 7 16IRX9H | |
| HP Omen 16 (2024) | |
| Alienware m16 R1 AMD | |
| Average Intel Core i9-14900HX, NVIDIA GeForce RTX 4080 Laptop GPU (7703 - 9223, n=7) | |
| MSI Vector 16 HX A14V | |
| Average of class Gaming (5828 - 12414, n=94, last 2 years) | |
| Lenovo Legion Pro 7 16IRX8H | |
| PCMark 10 / Essentials | |
| Lenovo Legion Pro 7 16IRX9H | |
| Lenovo Legion Pro 7 16IRX8H | |
| Average Intel Core i9-14900HX, NVIDIA GeForce RTX 4080 Laptop GPU (11255 - 12600, n=7) | |
| Alienware m16 R1 AMD | |
| MSI Vector 16 HX A14V | |
| HP Omen 16 (2024) | |
| Average of class Gaming (8810 - 11935, n=98, last 2 years) | |
| PCMark 10 / Productivity | |
| HP Omen 16 (2024) | |
| Lenovo Legion Pro 7 16IRX9H | |
| Average of class Gaming (6845 - 25323, n=96, last 2 years) | |
| Lenovo Legion Pro 7 16IRX8H | |
| Alienware m16 R1 AMD | |
| Average Intel Core i9-14900HX, NVIDIA GeForce RTX 4080 Laptop GPU (6662 - 11410, n=7) | |
| MSI Vector 16 HX A14V | |
| PCMark 10 / Digital Content Creation | |
| MSI Vector 16 HX A14V | |
| Alienware m16 R1 AMD | |
| Average Intel Core i9-14900HX, NVIDIA GeForce RTX 4080 Laptop GPU (14211 - 16246, n=7) | |
| HP Omen 16 (2024) | |
| Lenovo Legion Pro 7 16IRX9H | |
| Average of class Gaming (7602 - 19954, n=96, last 2 years) | |
| Lenovo Legion Pro 7 16IRX8H | |
| CrossMark / Overall | |
| Lenovo Legion Pro 7 16IRX9H | |
| HP Omen 16 (2024) | |
| MSI Vector 16 HX A14V | |
| Average Intel Core i9-14900HX, NVIDIA GeForce RTX 4080 Laptop GPU (1992 - 2334, n=7) | |
| Alienware m16 R1 AMD | |
| Average of class Gaming (1366 - 2409, n=95, last 2 years) | |
| CrossMark / Productivity | |
| Lenovo Legion Pro 7 16IRX9H | |
| HP Omen 16 (2024) | |
| MSI Vector 16 HX A14V | |
| Average Intel Core i9-14900HX, NVIDIA GeForce RTX 4080 Laptop GPU (1812 - 2204, n=7) | |
| Alienware m16 R1 AMD | |
| Average of class Gaming (1386 - 2254, n=95, last 2 years) | |
| CrossMark / Creativity | |
| Lenovo Legion Pro 7 16IRX9H | |
| MSI Vector 16 HX A14V | |
| Average Intel Core i9-14900HX, NVIDIA GeForce RTX 4080 Laptop GPU (2327 - 2500, n=7) | |
| HP Omen 16 (2024) | |
| Average of class Gaming (1343 - 2786, n=95, last 2 years) | |
| Alienware m16 R1 AMD | |
| CrossMark / Responsiveness | |
| Lenovo Legion Pro 7 16IRX9H | |
| HP Omen 16 (2024) | |
| MSI Vector 16 HX A14V | |
| Average Intel Core i9-14900HX, NVIDIA GeForce RTX 4080 Laptop GPU (1520 - 2254, n=7) | |
| Alienware m16 R1 AMD | |
| Average of class Gaming (1226 - 2334, n=95, last 2 years) | |
| WebXPRT 3 / Overall | |
| Lenovo Legion Pro 7 16IRX8H | |
| Lenovo Legion Pro 7 16IRX8H | |
| Alienware m16 R1 AMD | |
| Lenovo Legion Pro 7 16IRX9H | |
| Average Intel Core i9-14900HX, NVIDIA GeForce RTX 4080 Laptop GPU (310 - 345, n=7) | |
| HP Omen 16 (2024) | |
| MSI Vector 16 HX A14V | |
| Average of class Gaming (220 - 532, n=99, last 2 years) | |
| WebXPRT 4 / Overall | |
| Lenovo Legion Pro 7 16IRX9H | |
| Average Intel Core i9-14900HX, NVIDIA GeForce RTX 4080 Laptop GPU (300 - 321, n=7) | |
| HP Omen 16 (2024) | |
| Lenovo Legion Pro 7 16IRX8H | |
| MSI Vector 16 HX A14V | |
| Average of class Gaming (165 - 354, n=99, last 2 years) | |
| Alienware m16 R1 AMD | |
| Mozilla Kraken 1.1 / Total | |
| Alienware m16 R1 AMD | |
| Lenovo Legion Pro 7 16IRX8H | |
| Lenovo Legion Pro 7 16IRX8H | |
| Average of class Gaming (391 - 590, n=101, last 2 years) | |
| MSI Vector 16 HX A14V | |
| Average Intel Core i9-14900HX, NVIDIA GeForce RTX 4080 Laptop GPU (437 - 446, n=7) | |
| Lenovo Legion Pro 7 16IRX9H | |
| HP Omen 16 (2024) | |
* ... smaller is better
| PCMark 10 Score | 8923 points | |
Help | ||
| AIDA64 / Memory Copy | |
| HP Omen 16 (2024) | |
| Lenovo Legion Pro 7 16IRX9H | |
| MSI Vector 16 HX A14V | |
| Average Intel Core i9-14900HX (38028 - 83392, n=36) | |
| Average of class Gaming (21750 - 129946, n=106, last 2 years) | |
| Alienware m16 R1 AMD | |
| AIDA64 / Memory Read | |
| HP Omen 16 (2024) | |
| Lenovo Legion Pro 7 16IRX9H | |
| MSI Vector 16 HX A14V | |
| Average Intel Core i9-14900HX (43306 - 87568, n=36) | |
| Average of class Gaming (22956 - 118858, n=106, last 2 years) | |
| Alienware m16 R1 AMD | |
| AIDA64 / Memory Write | |
| HP Omen 16 (2024) | |
| MSI Vector 16 HX A14V | |
| Average of class Gaming (22297 - 135096, n=106, last 2 years) | |
| Average Intel Core i9-14900HX (37146 - 80589, n=36) | |
| Lenovo Legion Pro 7 16IRX9H | |
| Alienware m16 R1 AMD | |
| AIDA64 / Memory Latency | |
| Average of class Gaming (75.3 - 259, n=106, last 2 years) | |
| Alienware m16 R1 AMD | |
| Average Intel Core i9-14900HX (76.1 - 105, n=36) | |
| HP Omen 16 (2024) | |
| MSI Vector 16 HX A14V | |
| Lenovo Legion Pro 7 16IRX9H | |
* ... smaller is better
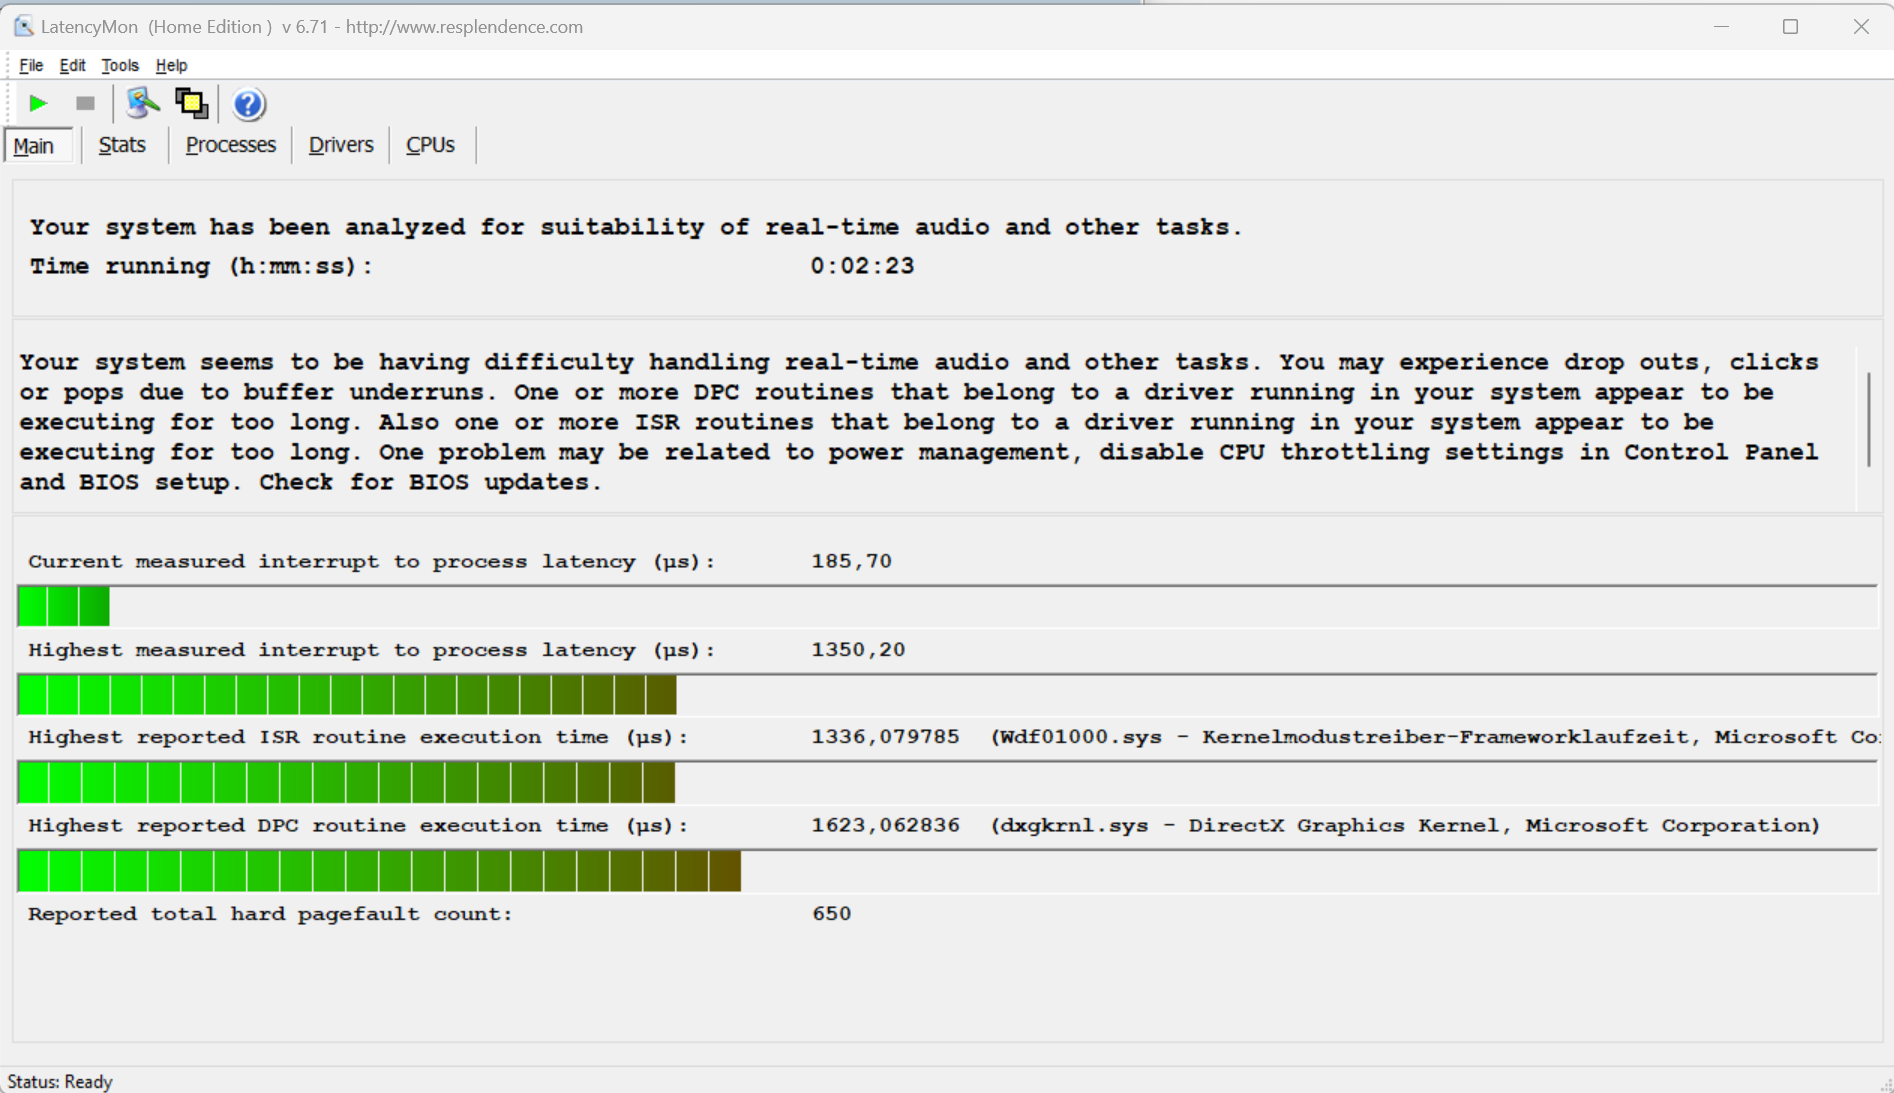
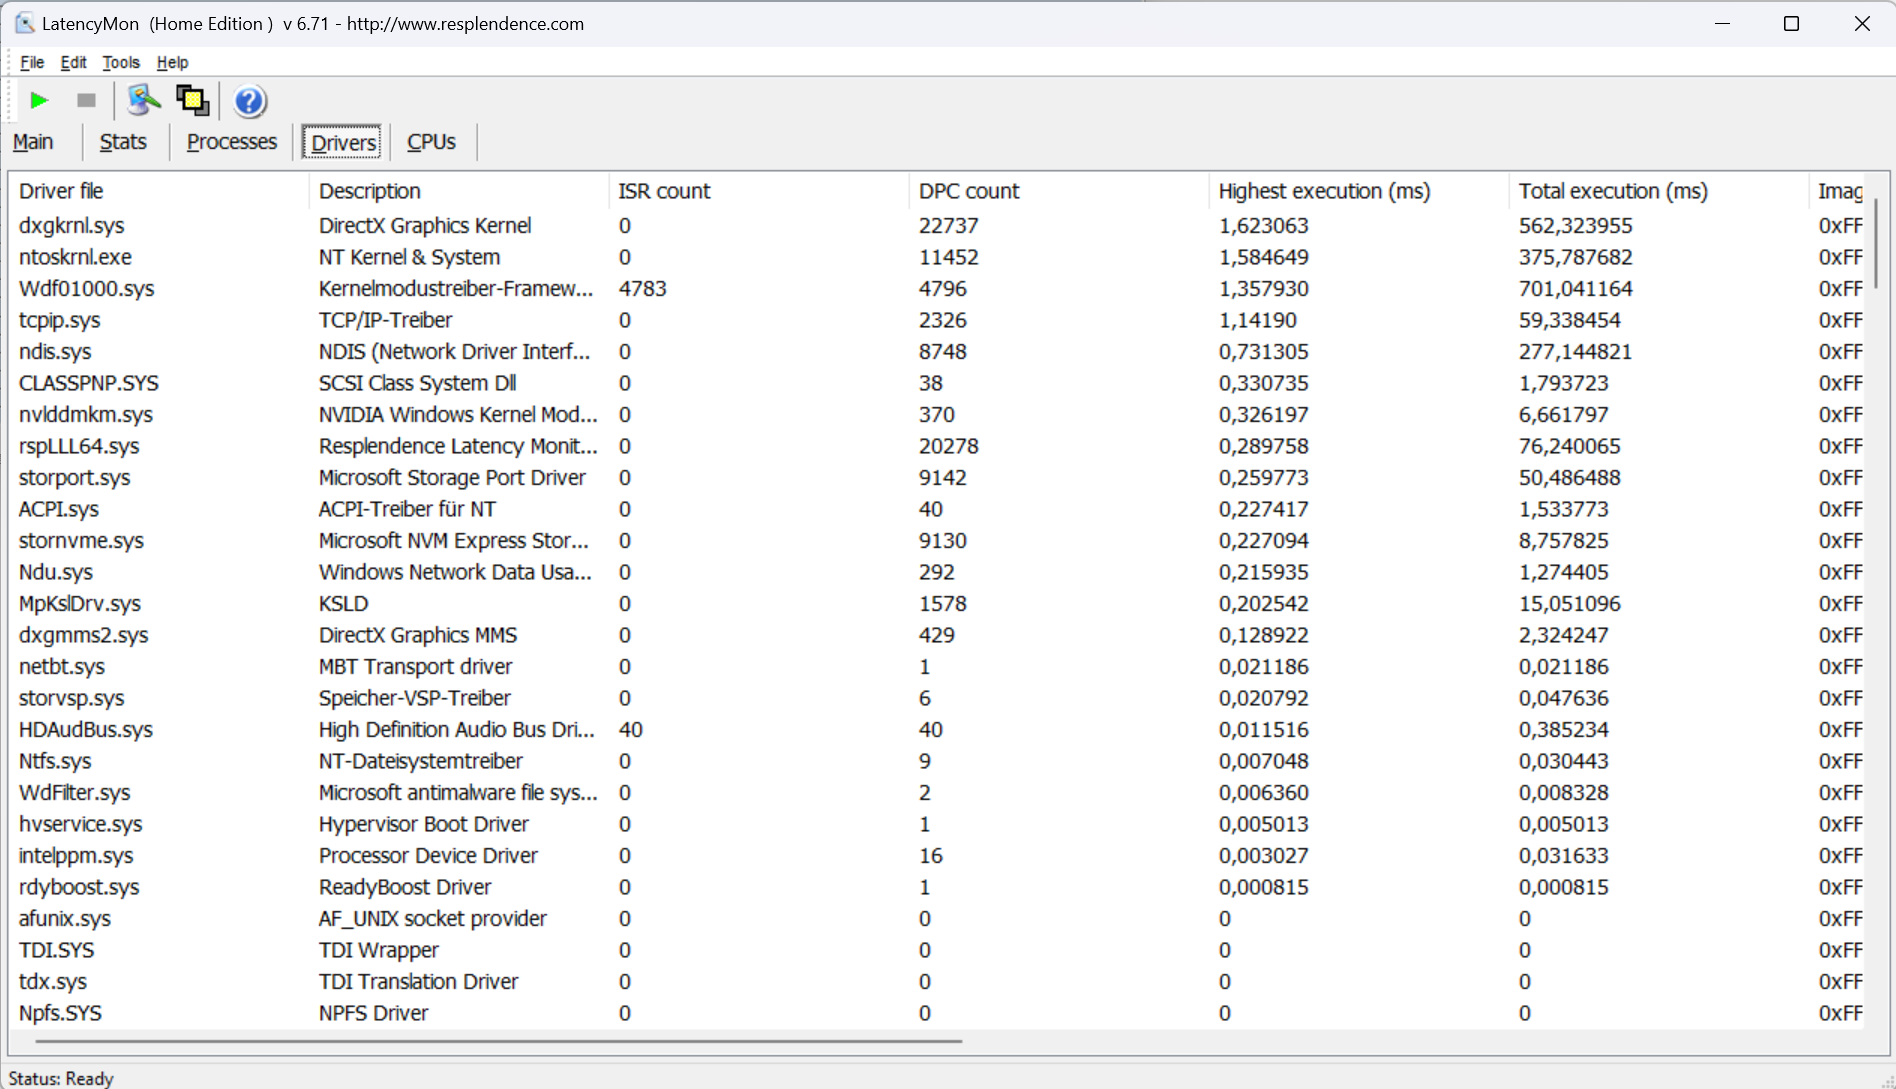
DPC latency
Latency Monitor uncovered some issues during the latency test (web browsing, 4K video playback, Prime95 high load). The system doesn’t seem to be suitable for real-time video and audio tasks. Hopefully, future software updates would be able to improve the situation.
| DPC Latencies / LatencyMon - interrupt to process latency (max), Web, Youtube, Prime95 | |
| Alienware m16 R1 AMD | |
| MSI Vector 16 HX A14V | |
| Lenovo Legion Pro 7 16IRX9H | |
| HP Omen 16 (2024) | |
| Lenovo Legion Pro 7 16IRX8H | |
* ... smaller is better
Mass storage
The Legion has room for a total of two PCIe 4.0 SSDs. The SK Hynix M.2 2280 SSD (1TB) in our review unit delivered excellent read and write speeds. On another positive note, thermal throttling didn't occur during our testing.


* ... smaller is better
Sustained load Read: DiskSpd Read Loop, Queue Depth 8
Graphics card
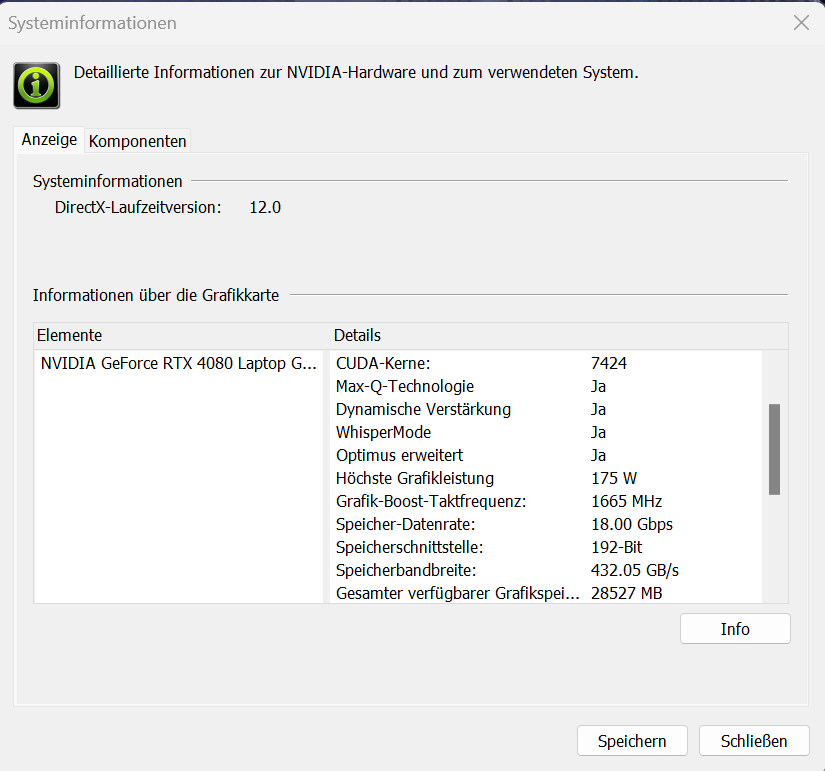
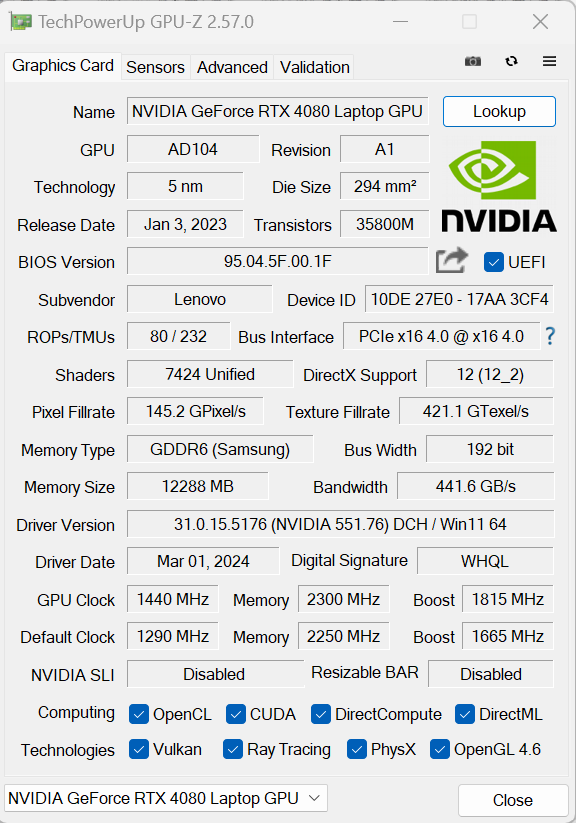
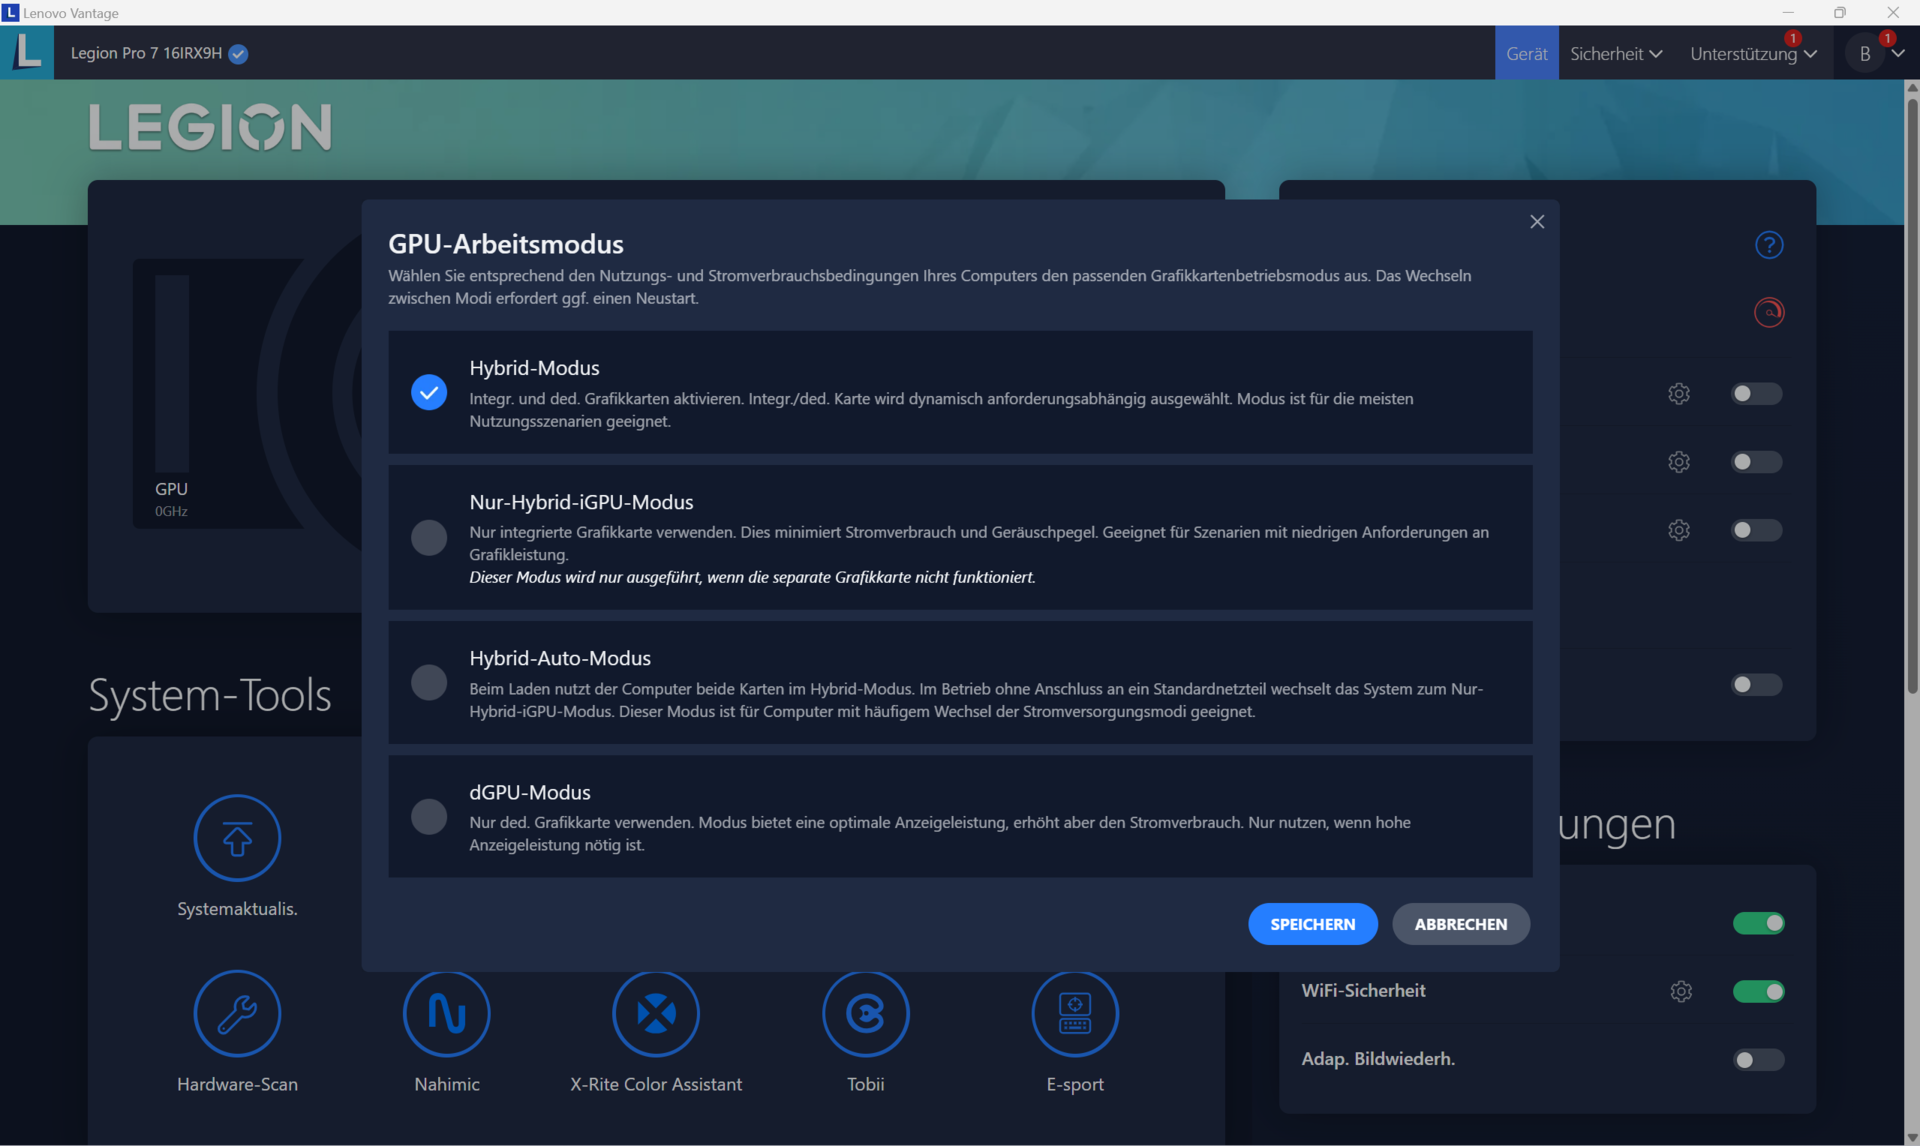
Lenovo has equipped the Legion Pro 7 with a GeForce RTX 4080 (7,424 shading units, a 192-bit memory bus, 12 GB of GDDR6, 175 watts), which is the current number two in Nvidia’s mobile GPU lineup. The benchmark scores and frame rates obtained in our testing are above what the RTX 4080 Laptop can do on average. Some of these results are the best we’ve seen from an RTX 4080 so far. Switching between dGPU-only and Optimus mode doesn’t require a restart; Advanced Optimus is also supported.
The graphics card is powerful enough for QHD gaming at high to max settings. With the help of DLSS 3 and Frame Generation, you can also go for higher resolutions at max settings and with ray tracing enabled – but only in games that support these features.
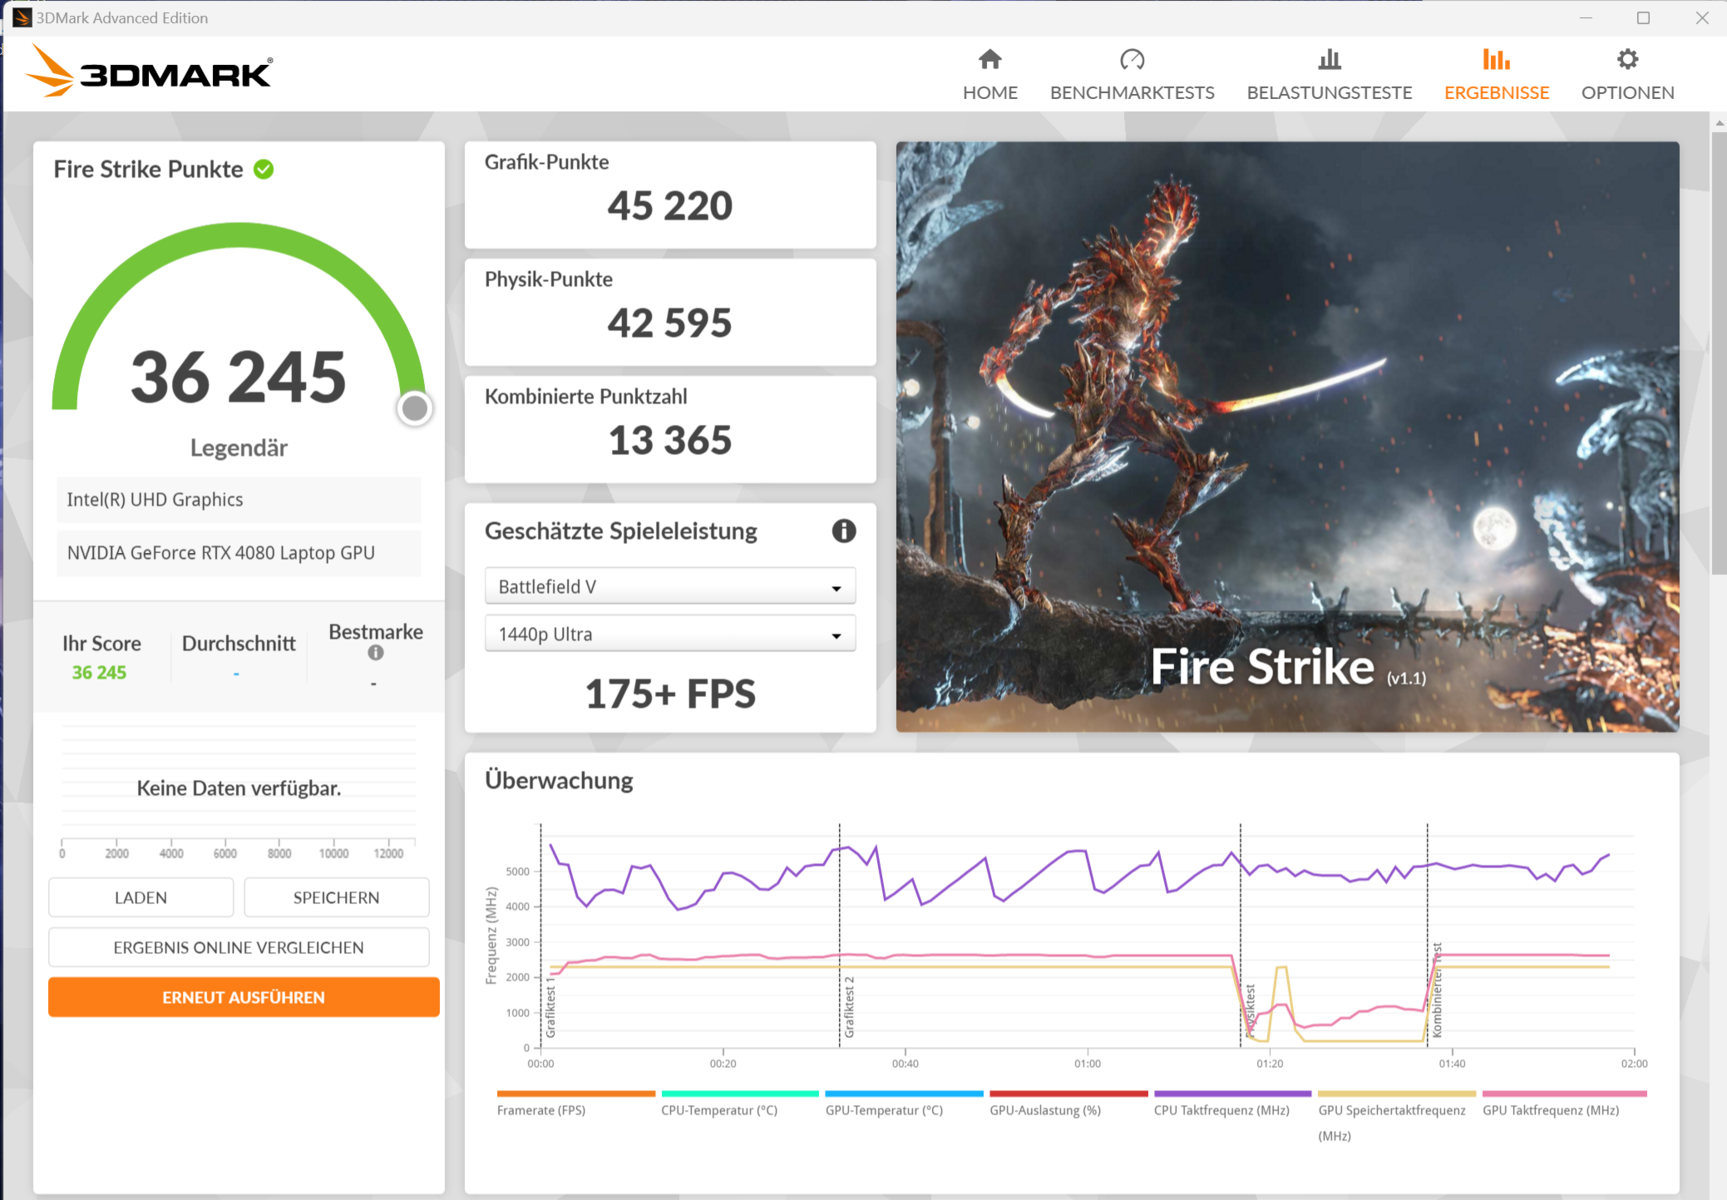
| 3DMark 11 Performance | 46847 points | |
| 3DMark Fire Strike Score | 36245 points | |
| 3DMark Time Spy Score | 19518 points | |
Help | ||
* ... smaller is better
| Performance rating - Percent | |
| Lenovo Legion Pro 7 16IRX9H | |
| MSI Vector 16 HX A14V | |
| Alienware m16 R1 AMD -1! | |
| Average NVIDIA GeForce RTX 4080 Laptop GPU | |
| Average of class Gaming | |
| HP Omen 16 (2024) | |
| The Witcher 3 - 1920x1080 Ultra Graphics & Postprocessing (HBAO+) | |
| Average of class Gaming (104.7 - 240, n=7, last 2 years) | |
| Lenovo Legion Pro 7 16IRX9H | |
| MSI Vector 16 HX A14V | |
| Alienware m16 R1 AMD | |
| Average NVIDIA GeForce RTX 4080 Laptop GPU (130.4 - 186.1, n=20) | |
| HP Omen 16 (2024) | |
| GTA V - 1920x1080 Highest AA:4xMSAA + FX AF:16x | |
| Lenovo Legion Pro 7 16IRX9H | |
| MSI Vector 16 HX A14V | |
| Average of class Gaming (48.3 - 186.9, n=94, last 2 years) | |
| Average NVIDIA GeForce RTX 4080 Laptop GPU (102.9 - 152.7, n=21) | |
| HP Omen 16 (2024) | |
| Final Fantasy XV Benchmark - 1920x1080 High Quality | |
| MSI Vector 16 HX A14V | |
| Lenovo Legion Pro 7 16IRX9H | |
| Alienware m16 R1 AMD | |
| Average NVIDIA GeForce RTX 4080 Laptop GPU (129 - 182.1, n=23) | |
| Average of class Gaming (41 - 215, n=95, last 2 years) | |
| HP Omen 16 (2024) | |
| Strange Brigade - 1920x1080 ultra AA:ultra AF:16 | |
| Alienware m16 R1 AMD | |
| MSI Vector 16 HX A14V | |
| Lenovo Legion Pro 7 16IRX9H | |
| Average NVIDIA GeForce RTX 4080 Laptop GPU (239 - 357, n=22) | |
| Average of class Gaming (76.3 - 458, n=87, last 2 years) | |
| HP Omen 16 (2024) | |
| Dota 2 Reborn - 1920x1080 ultra (3/3) best looking | |
| Lenovo Legion Pro 7 16IRX9H | |
| MSI Vector 16 HX A14V | |
| Alienware m16 R1 AMD | |
| Average NVIDIA GeForce RTX 4080 Laptop GPU (133 - 194.7, n=23) | |
| HP Omen 16 (2024) | |
| Average of class Gaming (84.8 - 252, n=108, last 2 years) | |
| Cyberpunk 2077 | |
| 1920x1080 Ray Tracing Ultra Preset (DLSS off) | |
| Lenovo Legion Pro 7 16IRX9H | |
| MSI Vector 16 HX A14V | |
| Average NVIDIA GeForce RTX 4080 Laptop GPU (43.8 - 67.2, n=12) | |
| Average of class Gaming (19.1 - 84.9, n=36, last 2 years) | |
| HP Omen 16 (2024) | |
| 2560x1440 Ultra Preset (FSR off) | |
| Average of class Gaming (24.8 - 122.8, n=94, last 2 years) | |
| MSI Vector 16 HX A14V | |
| Lenovo Legion Pro 7 16IRX9H | |
| Average NVIDIA GeForce RTX 4080 Laptop GPU (56.2 - 86.3, n=15) | |
| HP Omen 16 (2024) | |
| 1920x1080 Ultra Preset (FSR off) | |
| MSI Vector 16 HX A14V | |
| Lenovo Legion Pro 7 16IRX9H | |
| Average NVIDIA GeForce RTX 4080 Laptop GPU (83.9 - 127.1, n=15) | |
| Average of class Gaming (17.7 - 169.9, n=116, last 2 years) | |
| HP Omen 16 (2024) | |
| 1920x1080 Ultra Preset (FSR2 on) | |
| Average of class Gaming (58 - 173.1, n=7, last 2 years) | |
| Lenovo Legion Pro 7 16IRX9H | |
| MSI Vector 16 HX A14V | |
| Average NVIDIA GeForce RTX 4080 Laptop GPU (94.6 - 128, n=8) | |
| HP Omen 16 (2024) | |
| Call of Duty Modern Warfare 3 2023 - 1920x1080 Extreme Preset | |
| Average NVIDIA GeForce RTX 4080 Laptop GPU (153 - 171, n=3) | |
| Lenovo Legion Pro 7 16IRX9H | |
| Average of class Gaming (27 - 95, n=2, last 2 years) | |
| Skull & Bones | |
| 1920x1080 Ultra High Preset AA:T | |
| Lenovo Legion Pro 7 16IRX9H | |
| Average NVIDIA GeForce RTX 4080 Laptop GPU (96 - 115, n=3) | |
| 2560x1440 Ultra High Preset AA:T | |
| Lenovo Legion Pro 7 16IRX9H | |
| Average NVIDIA GeForce RTX 4080 Laptop GPU (76 - 91, n=3) | |
| Assassin's Creed Mirage | |
| 1920x1080 Ultra High Preset (Adaptive Quality Off) | |
| Lenovo Legion Pro 7 16IRX9H | |
| Average NVIDIA GeForce RTX 4080 Laptop GPU (129 - 157, n=3) | |
| 2560x1440 Ultra High Preset (Adaptive Quality Off) | |
| Lenovo Legion Pro 7 16IRX9H | |
| Average NVIDIA GeForce RTX 4080 Laptop GPU (112 - 136, n=3) | |
| Avatar Frontiers of Pandora | |
| 1920x1080 Ultra Preset AA:T | |
| Average NVIDIA GeForce RTX 4080 Laptop GPU (87 - 97, n=4) | |
| Lenovo Legion Pro 7 16IRX9H | |
| Average of class Gaming (n=1last 2 years) | |
| 2560x1440 Ultra Preset AA:T | |
| Average NVIDIA GeForce RTX 4080 Laptop GPU (59 - 66, n=4) | |
| Lenovo Legion Pro 7 16IRX9H | |
| Average of class Gaming (n=1last 2 years) | |
| Last Epoch | |
| 1920x1080 Ultra Preset AA:T | |
| Lenovo Legion Pro 7 16IRX9H | |
| Average NVIDIA GeForce RTX 4080 Laptop GPU (156.5 - 204, n=2) | |
| Average of class Gaming (n=1last 2 years) | |
| 2560x1440 Ultra Preset AA:T | |
| Lenovo Legion Pro 7 16IRX9H | |
| Average NVIDIA GeForce RTX 4080 Laptop GPU (127.4 - 139, n=2) | |
| Average of class Gaming (n=1last 2 years) | |
| Alone in the Dark | |
| 1920x1080 Cinematic Preset | |
| Lenovo Legion Pro 7 16IRX9H | |
| Average NVIDIA GeForce RTX 4080 Laptop GPU (120 - 176.4, n=2) | |
| 2560x1440 Cinematic Preset | |
| Lenovo Legion Pro 7 16IRX9H | |
| Average NVIDIA GeForce RTX 4080 Laptop GPU (86 - 91.6, n=2) | |
| Horizon Forbidden West | |
| 1920x1080 Very High Preset AA:T | |
| Lenovo Legion Pro 7 16IRX9H | |
| Average NVIDIA GeForce RTX 4080 Laptop GPU (89.2 - 103.5, n=2) | |
| Average of class Gaming (14.7 - 140.3, n=12, last 2 years) | |
| 2560x1440 Very High Preset AA:T | |
| Lenovo Legion Pro 7 16IRX9H | |
| Average NVIDIA GeForce RTX 4080 Laptop GPU (71 - 83.7, n=2) | |
| Average of class Gaming (45.7 - 100.9, n=9, last 2 years) | |
Witcher 3 FPS chart
| low | med. | high | ultra | QHD | |
|---|---|---|---|---|---|
| GTA V (2015) | 187.2 | 186.6 | 186.5 | 152 | 135.3 |
| The Witcher 3 (2015) | 628.4 | 518.3 | 342.2 | 186.1 | 142.6 |
| Dota 2 Reborn (2015) | 229 | 211 | 197.3 | 183.5 | |
| Final Fantasy XV Benchmark (2018) | 232 | 211 | 173.1 | 139.3 | |
| X-Plane 11.11 (2018) | 196.4 | 162.3 | 127.5 | ||
| Strange Brigade (2018) | 538 | 446 | 377 | 339 | 243 |
| Cyberpunk 2077 (2023) | 152.3 | 137.2 | 126.7 | 118.3 | 79.1 |
| Assassin's Creed Mirage (2023) | 208 | 207 | 199 | 157 | 136 |
| Call of Duty Modern Warfare 3 2023 (2023) | 224 | 205 | 164 | 153 | 110 |
| Avatar Frontiers of Pandora (2023) | 141 | 130 | 114 | 89 | 59 |
| Skull & Bones (2024) | 161 | 151 | 135 | 112 | 89 |
| Last Epoch (2024) | 248 | 237 | 229 | 204 | 139 |
| Alone in the Dark (2024) | 249 | 230 | 214 | 176.4 | 91.6 |
| Horizon Forbidden West (2024) | 153.3 | 145.5 | 108.1 | 103.5 | 83.7 |
Emissions & Power management - The Lenovo laptop can run quietly
Noise emissions
Noise level reached as high as 56 dB(A) under load in Performance mode. Balanced mode offers a nice trade-off between noise and performance; Quiet mode spares your nerves but causes a considerable drop in performance. The laptop is usually quiet and sometimes even silent at idle and in everyday use (e.g. office applications, Internet browsing). It’s too bad that we noticed an (soft) electronic whining noise occasionally coming from the inside of our review unit.
Noise level
| Idle |
| 25 / 30 / 45 dB(A) |
| Load |
| 50 / 56 dB(A) |
 | ||
30 dB silent 40 dB(A) audible 50 dB(A) loud |
||
min: | ||
| Lenovo Legion Pro 7 16IRX9H i9-14900HX, GeForce RTX 4080 Laptop GPU | Alienware m16 R1 AMD R9 7845HX, GeForce RTX 4080 Laptop GPU | MSI Vector 16 HX A14V i9-14900HX, GeForce RTX 4080 Laptop GPU | HP Omen 16 (2024) i9-14900HX, GeForce RTX 4080 Laptop GPU | Lenovo Legion Pro 7 16IRX8H i9-13900HX, GeForce RTX 4080 Laptop GPU | |
|---|---|---|---|---|---|
| Noise | 13% | -7% | 7% | 4% | |
| off / environment * (dB) | 24 | 22.9 5% | 23.2 3% | 25 -4% | 24 -0% |
| Idle Minimum * (dB) | 25 | 22.9 8% | 33.5 -34% | 29 -16% | 26 -4% |
| Idle Average * (dB) | 30 | 29.7 1% | 33.5 -12% | 30 -0% | 28 7% |
| Idle Maximum * (dB) | 45 | 29.7 34% | 33.5 26% | 31 31% | 34 24% |
| Load Average * (dB) | 50 | 29.8 40% | 52.1 -4% | 46 8% | 47 6% |
| Witcher 3 ultra * (dB) | 54 | 54.7 -1% | 62 -15% | 47 13% | 55 -2% |
| Load Maximum * (dB) | 56 | 54.7 2% | 62 -11% | 47 16% | 56 -0% |
* ... smaller is better
Temperature
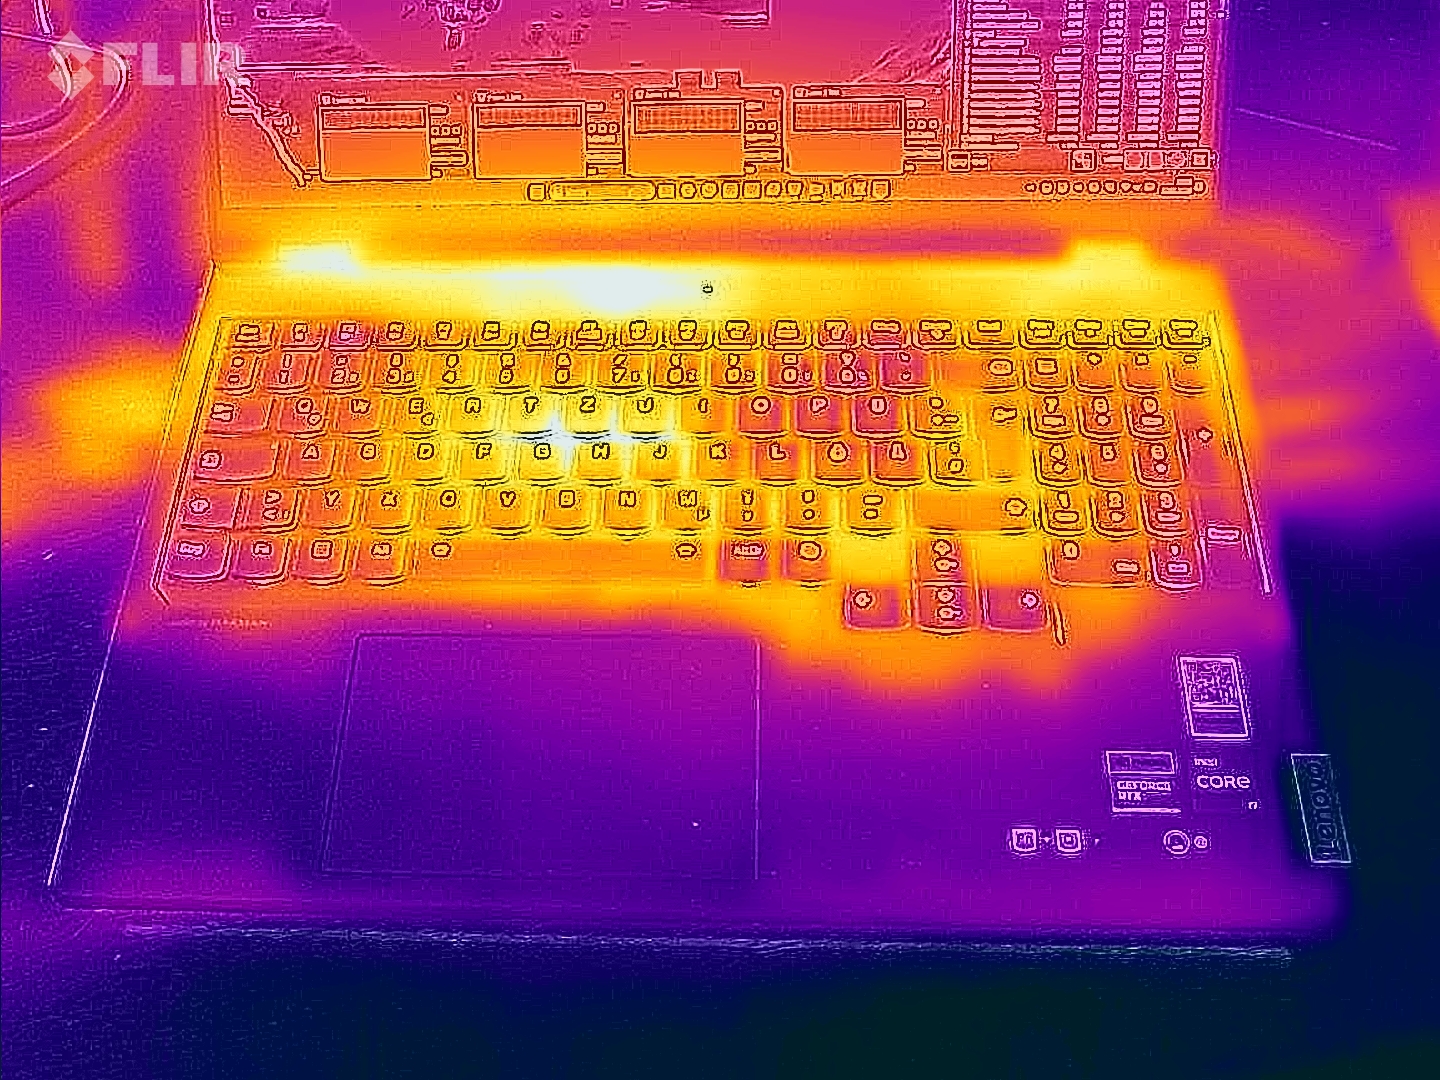
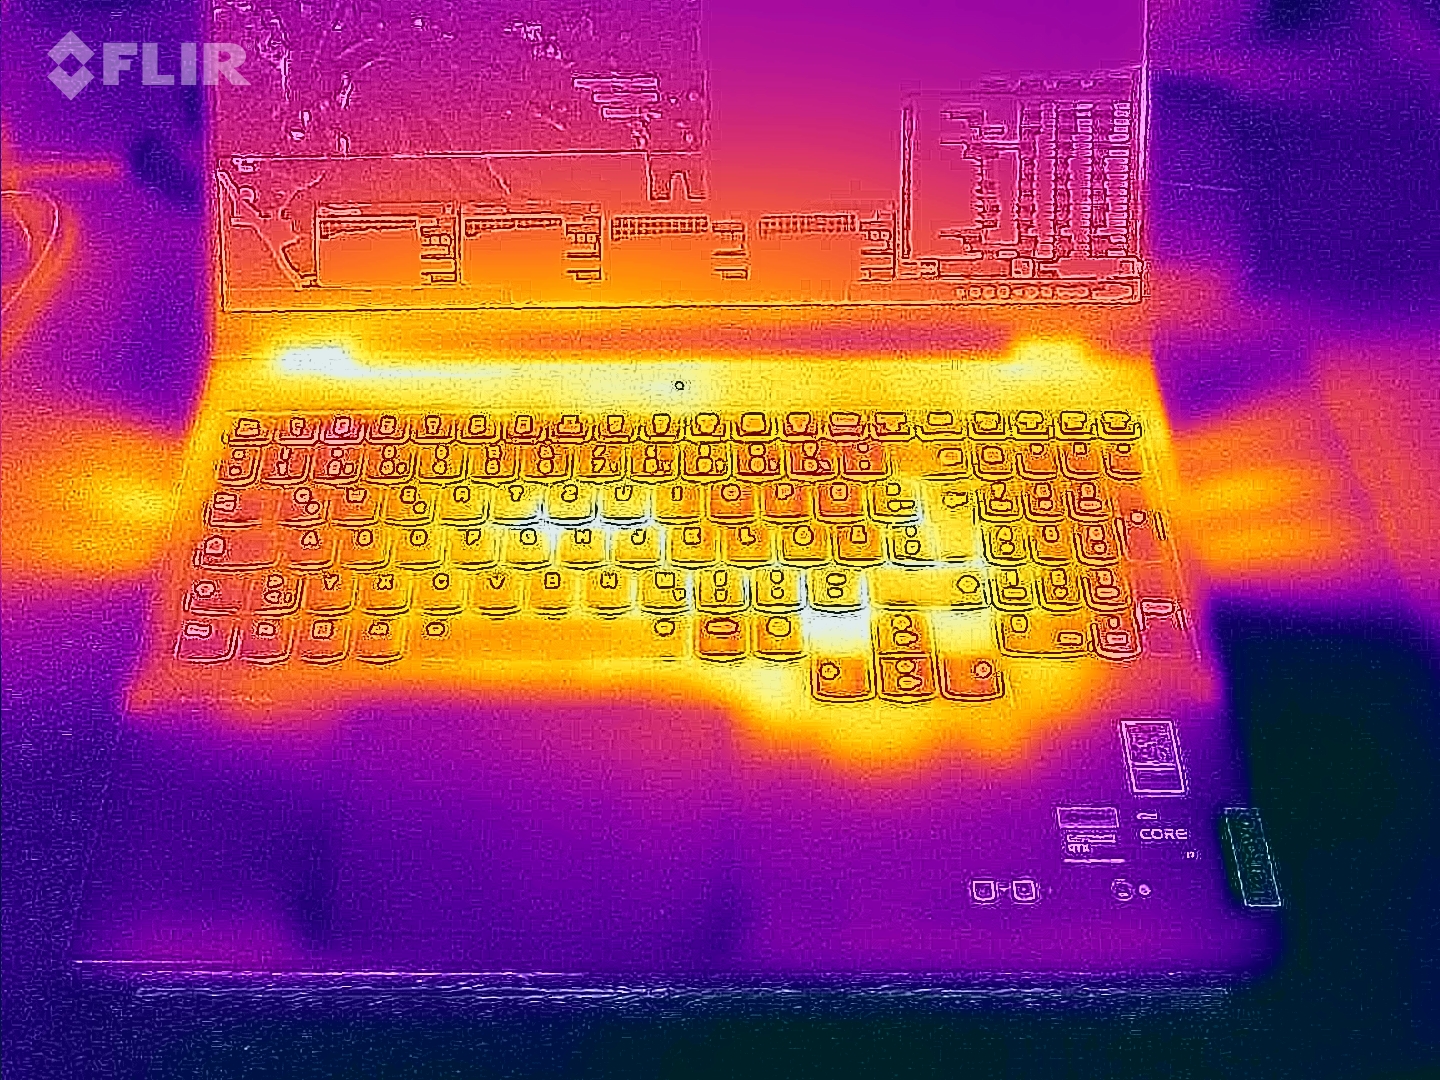
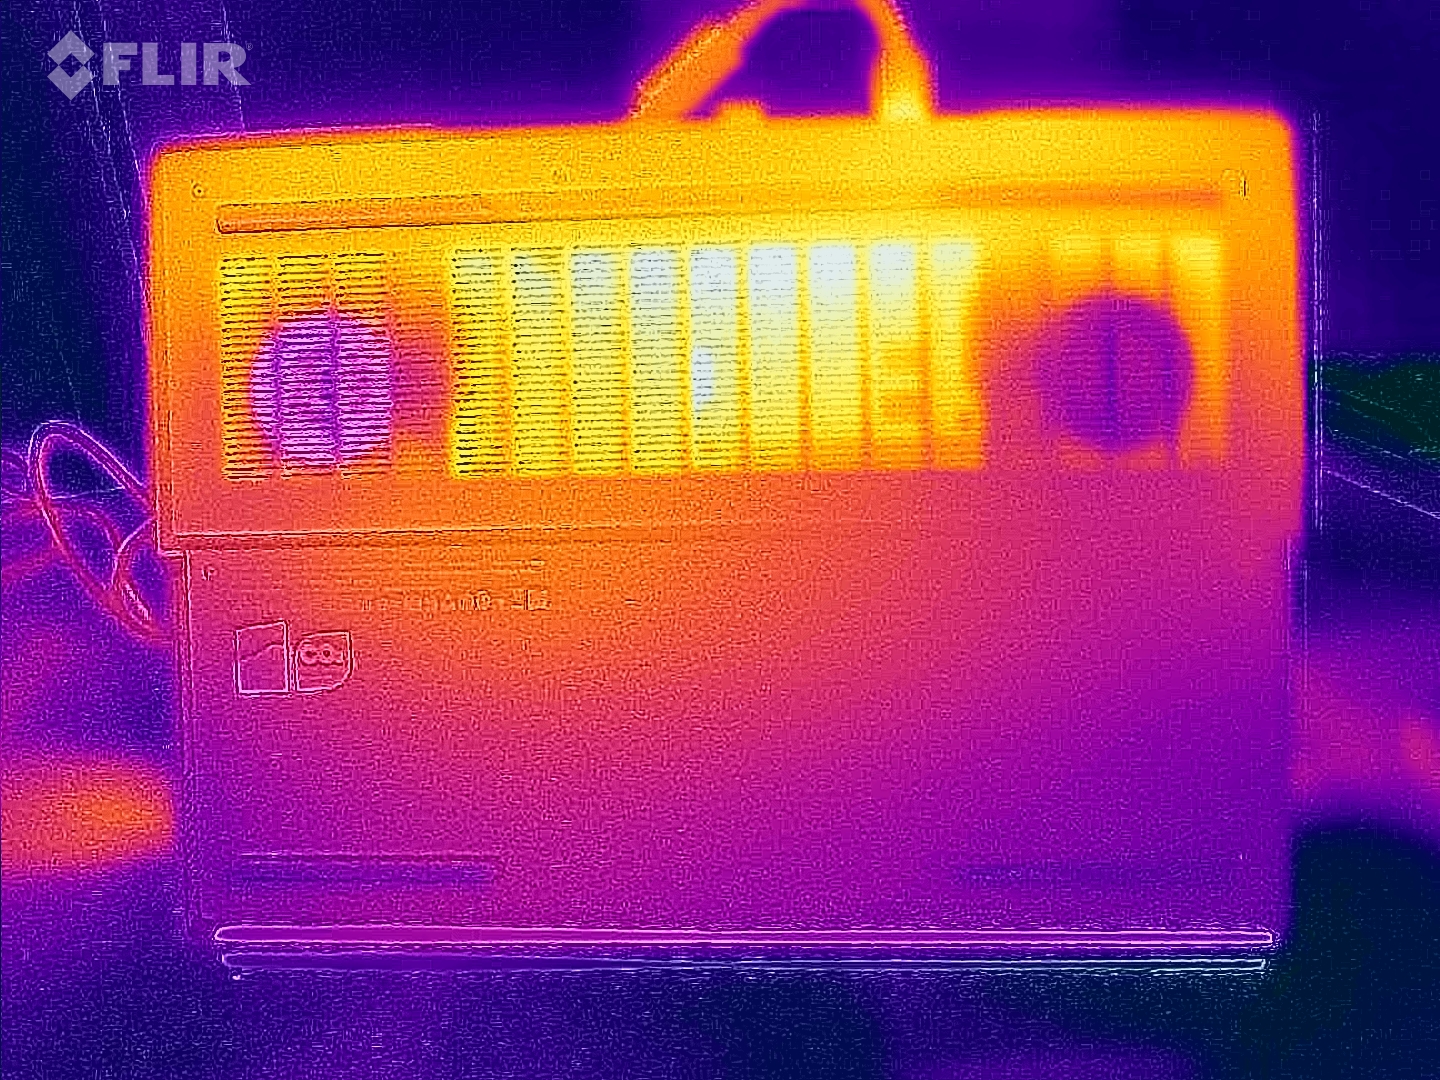
The notebook became noticeably warmer during the stress test and Witcher 3 test. Some spots on the chassis even went beyond 50°C (122°F). Chassis temperatures stayed within a comfortable range in day-to-day use, such as office applications and Internet browsing.
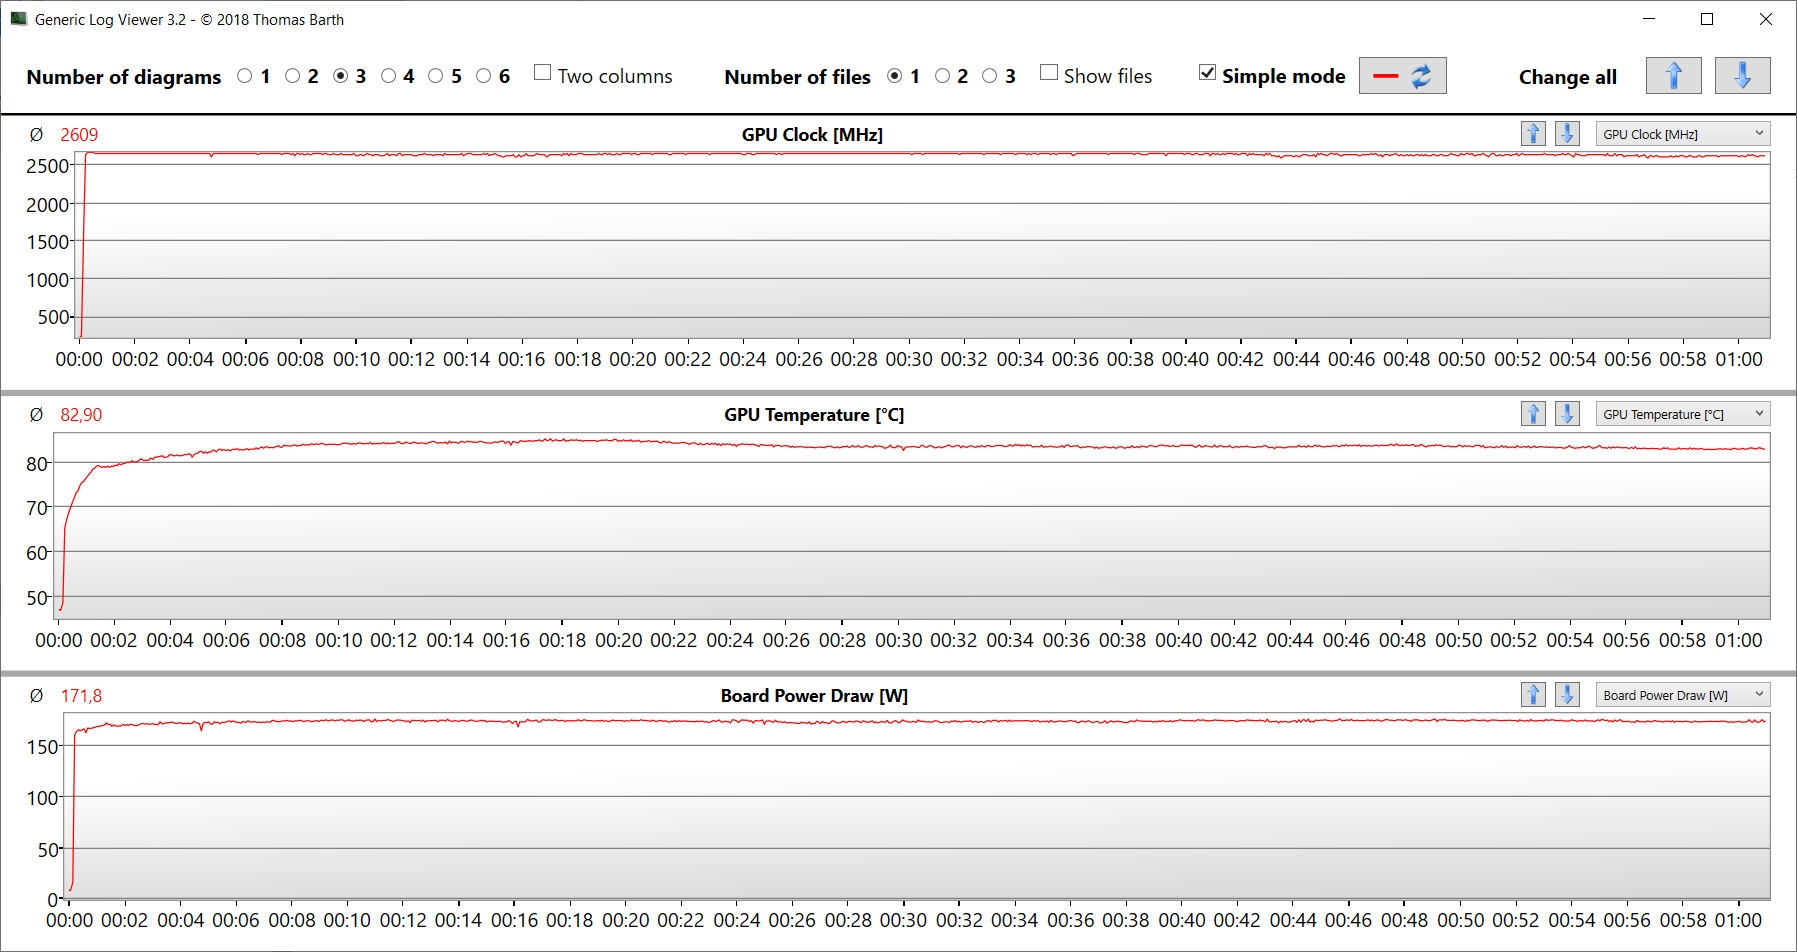
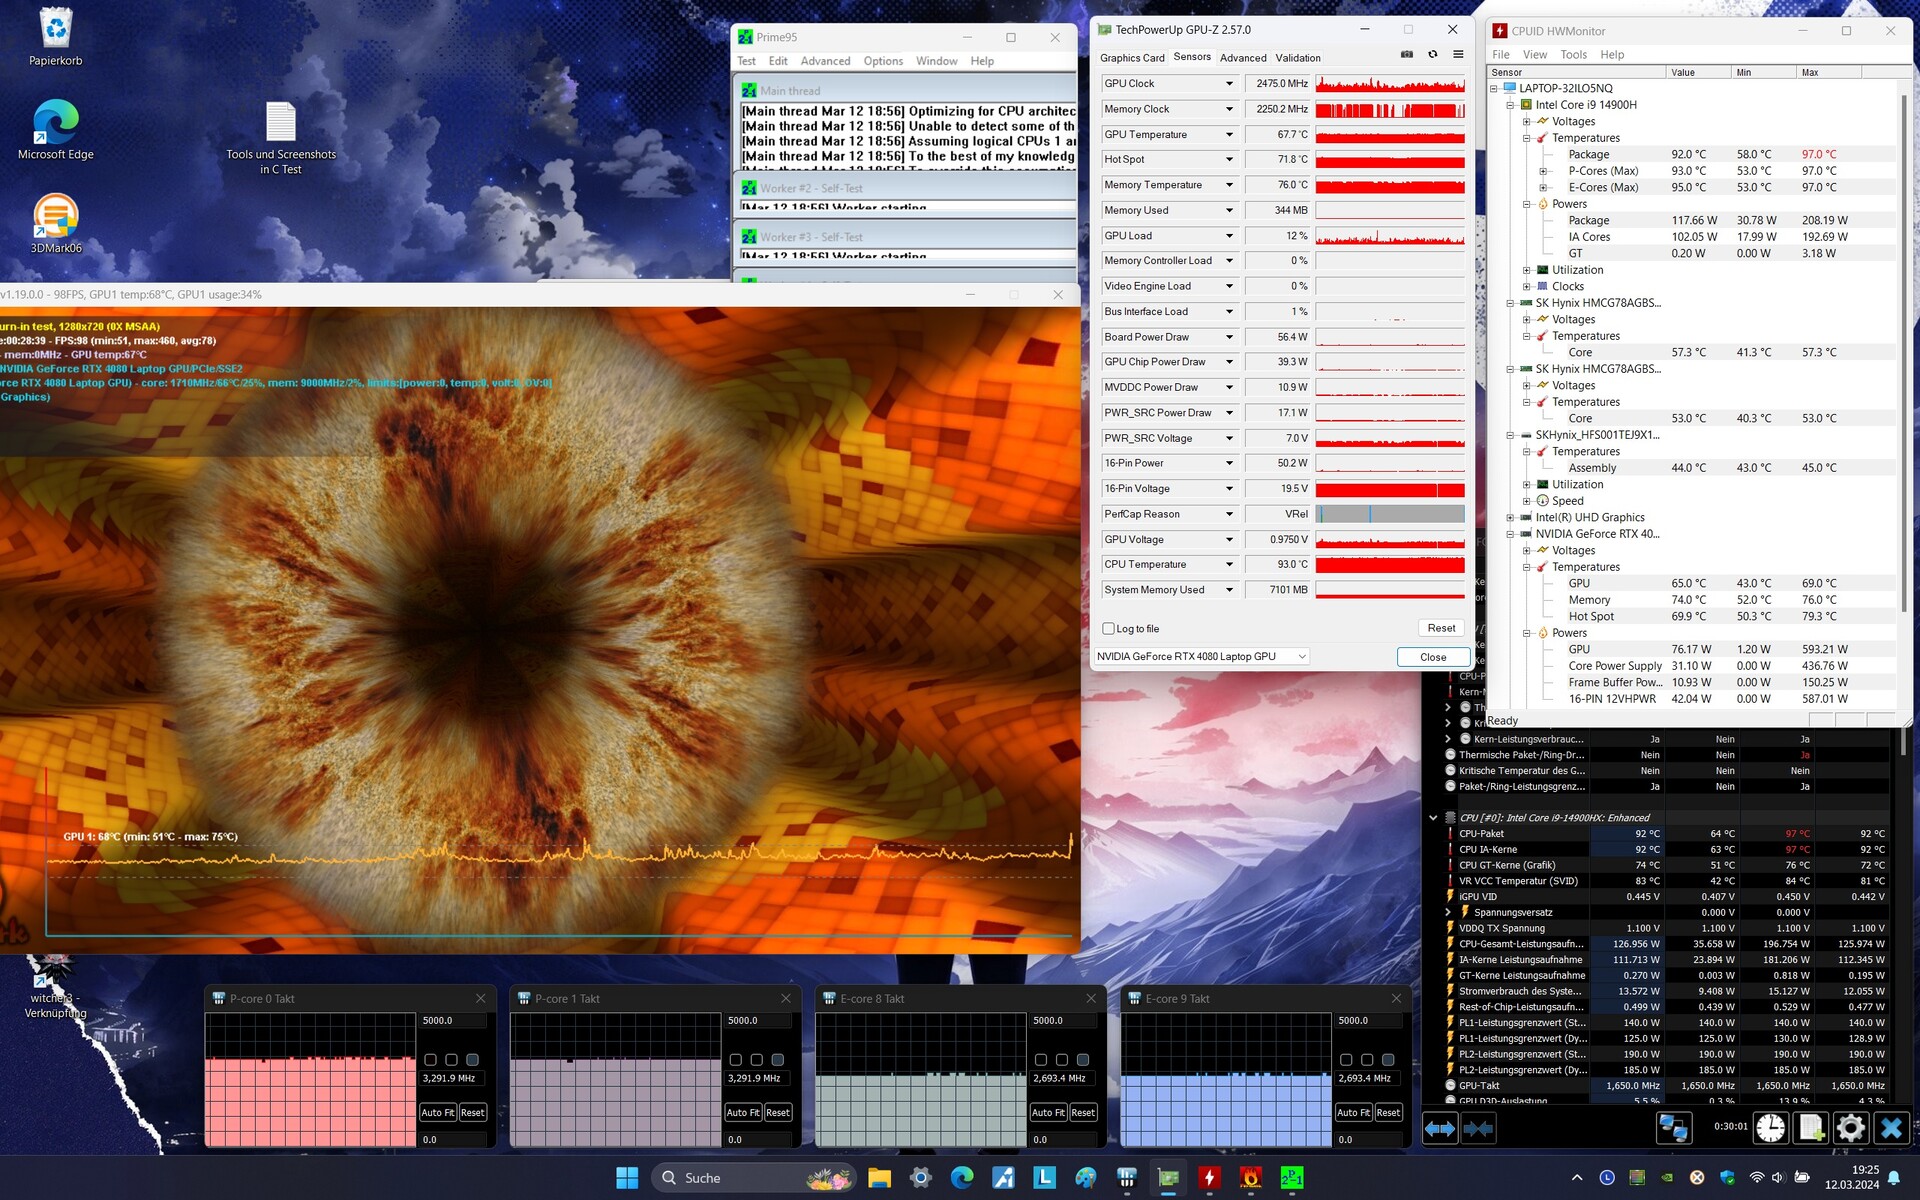
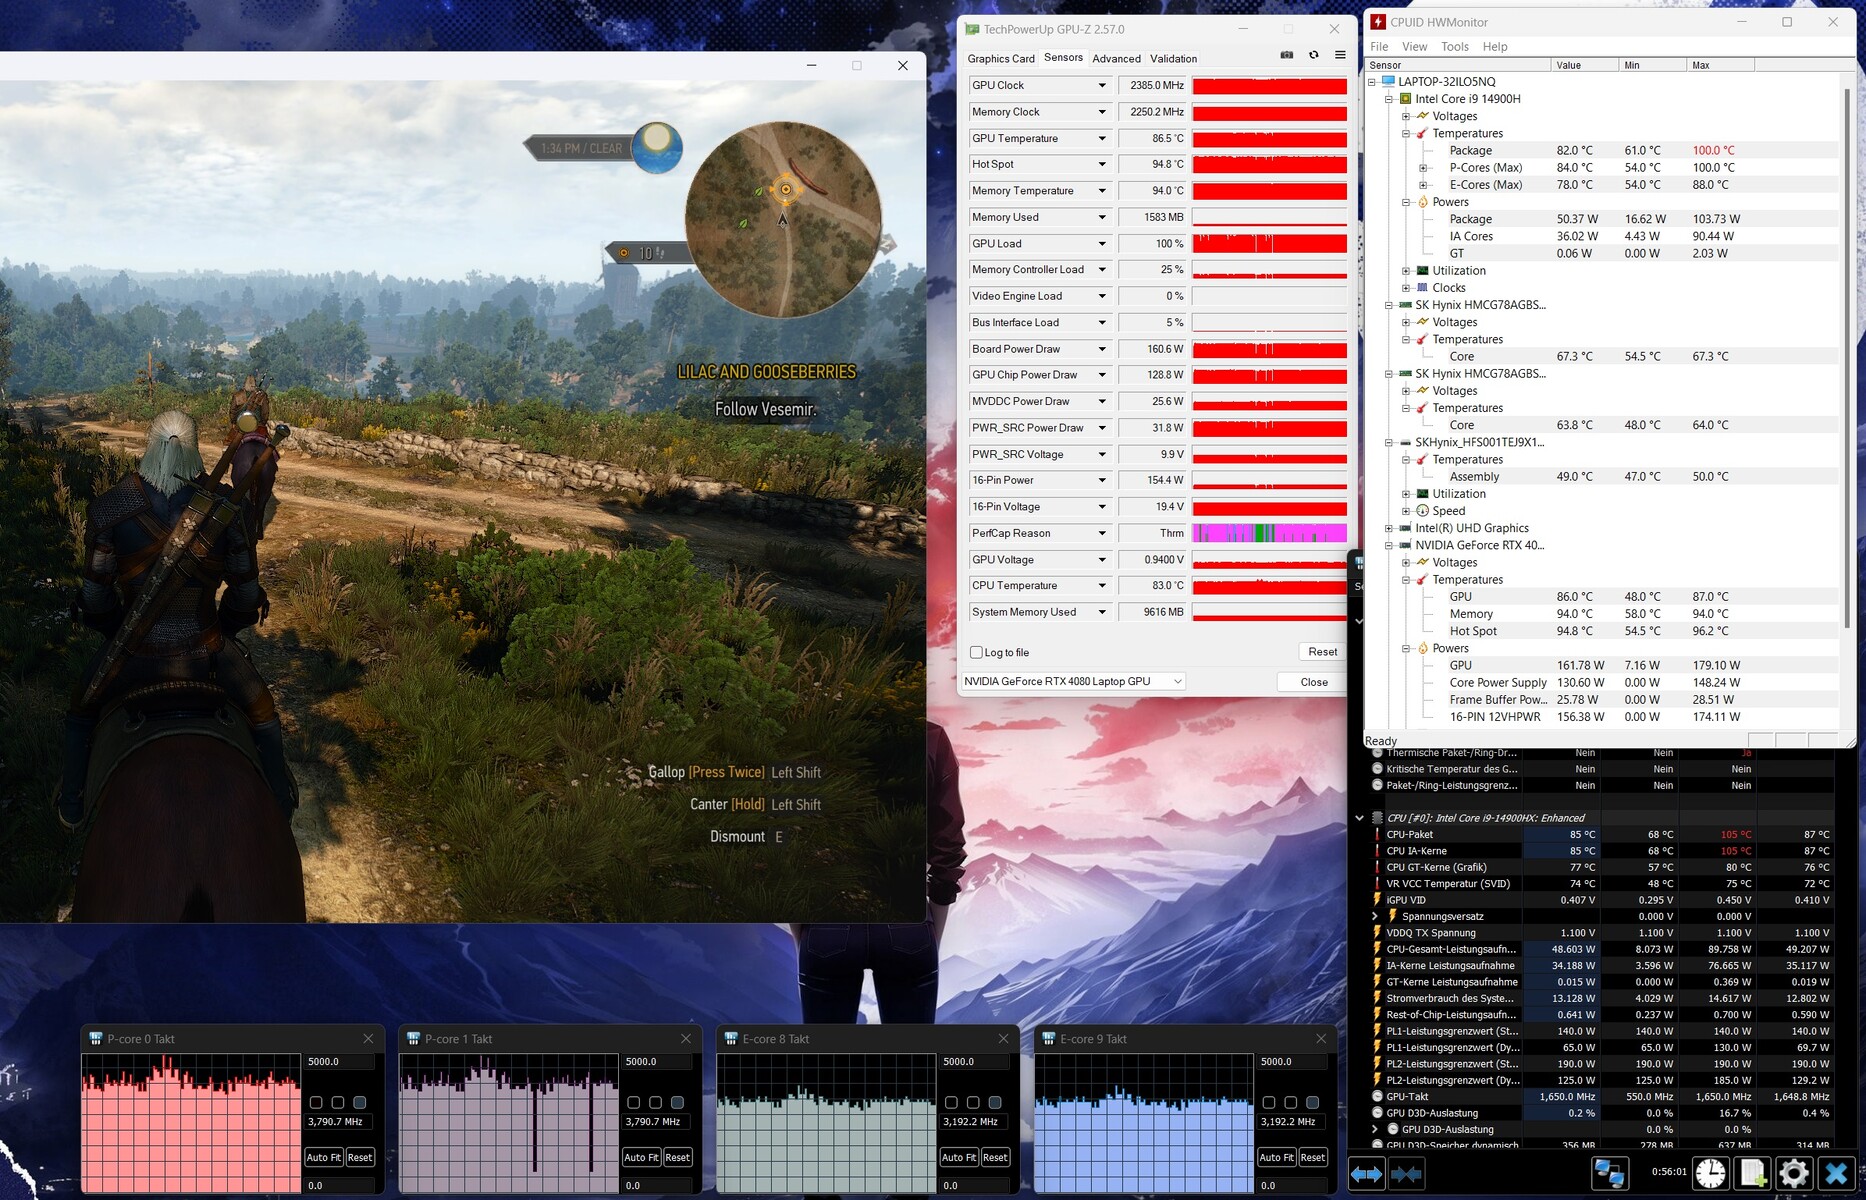
Our stress test involves running Prime95 and FurMark simultaneously for a prolonged period and is designed to determine a system’s stability under full load. Both the CPU and GPU were able to maintain high clock speeds during the test.
(-) The maximum temperature on the upper side is 46 °C / 115 F, compared to the average of 40.4 °C / 105 F, ranging from 21.2 to 68.8 °C for the class Gaming.
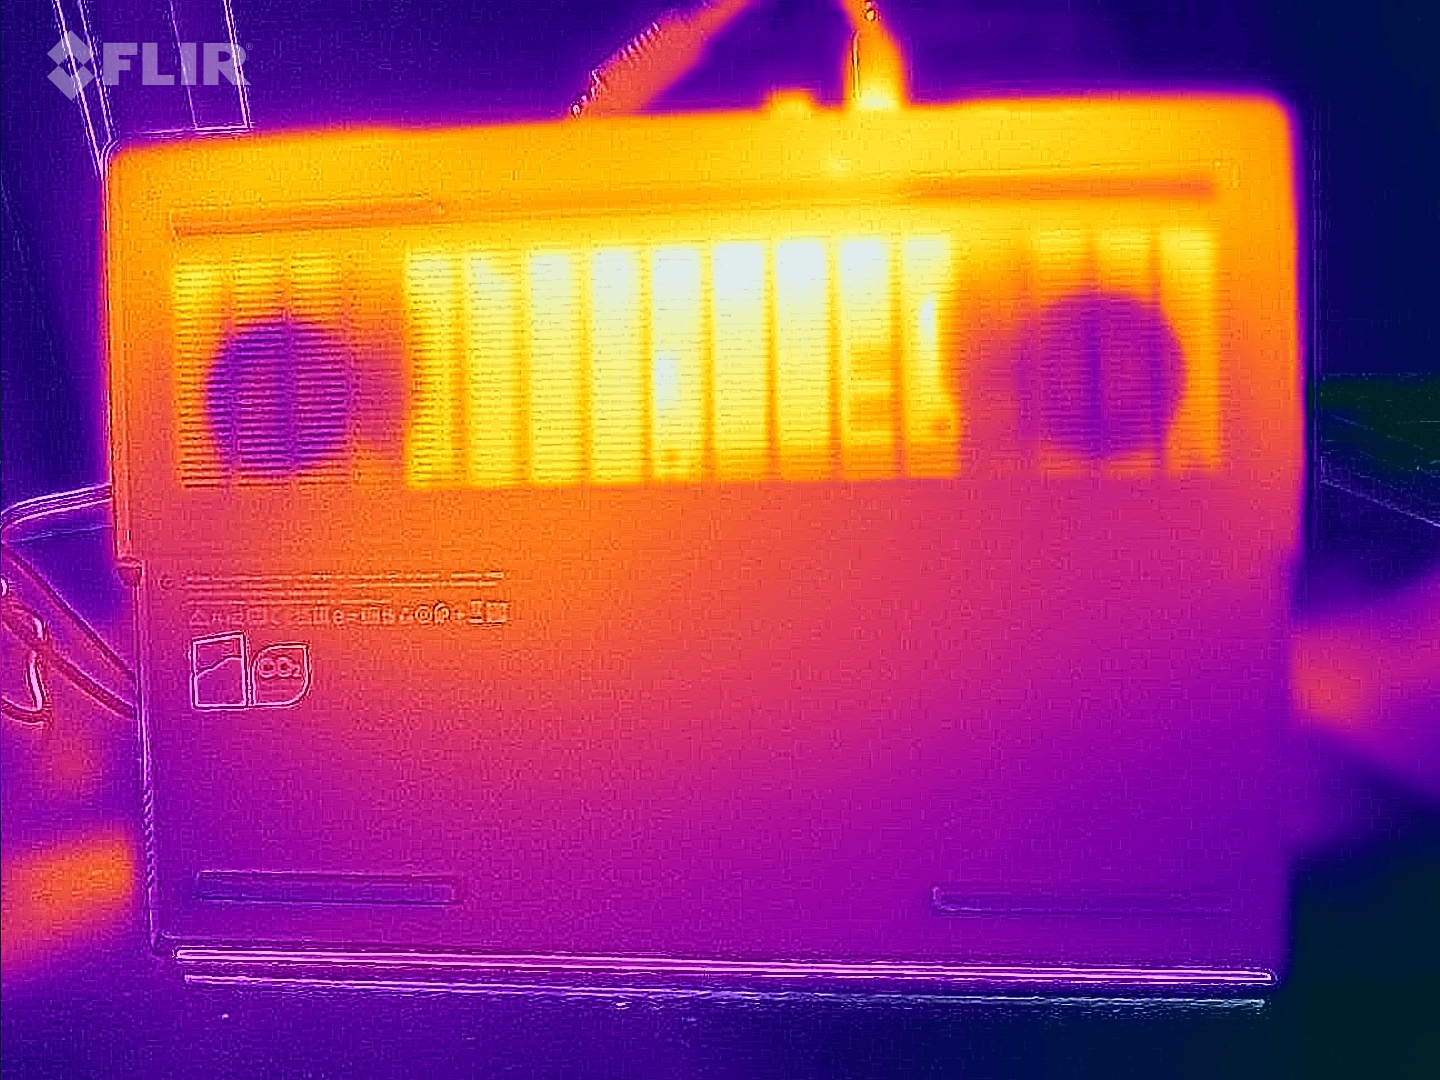
(-) The bottom heats up to a maximum of 49 °C / 120 F, compared to the average of 43.2 °C / 110 F
(±) In idle usage, the average temperature for the upper side is 33.3 °C / 92 F, compared to the device average of 33.9 °C / 93 F.
(-) Playing The Witcher 3, the average temperature for the upper side is 42.7 °C / 109 F, compared to the device average of 33.9 °C / 93 F.
(-) The palmrests and touchpad can get very hot to the touch with a maximum of 40 °C / 104 F.
(-) The average temperature of the palmrest area of similar devices was 28.8 °C / 83.8 F (-11.2 °C / -20.2 F).
| Lenovo Legion Pro 7 16IRX9H i9-14900HX, GeForce RTX 4080 Laptop GPU | Alienware m16 R1 AMD R9 7845HX, GeForce RTX 4080 Laptop GPU | MSI Vector 16 HX A14V i9-14900HX, GeForce RTX 4080 Laptop GPU | HP Omen 16 (2024) i9-14900HX, GeForce RTX 4080 Laptop GPU | Lenovo Legion Pro 7 16IRX8H i9-13900HX, GeForce RTX 4080 Laptop GPU | |
|---|---|---|---|---|---|
| Heat | 5% | 26% | 12% | 1% | |
| Maximum Upper Side * (°C) | 46 | 48 -4% | 36.4 21% | 47 -2% | 48 -4% |
| Maximum Bottom * (°C) | 49 | 39 20% | 35.6 27% | 57 -16% | 49 -0% |
| Idle Upper Side * (°C) | 38 | 37 3% | 26.6 30% | 25 34% | 40 -5% |
| Idle Bottom * (°C) | 37 | 36.2 2% | 27 27% | 26 30% | 33 11% |
* ... smaller is better
Speakers
The stereo speakers produce great sound all things considered.
Lenovo Legion Pro 7 16IRX9H audio analysis
(+) | speakers can play relatively loud (84 dB)
Bass 100 - 315 Hz
(±) | reduced bass - on average 8.9% lower than median
(±) | linearity of bass is average (7.4% delta to prev. frequency)
Mids 400 - 2000 Hz
(+) | balanced mids - only 2.8% away from median
(+) | mids are linear (4% delta to prev. frequency)
Highs 2 - 16 kHz
(+) | balanced highs - only 3% away from median
(+) | highs are linear (5% delta to prev. frequency)
Overall 100 - 16.000 Hz
(+) | overall sound is linear (8.4% difference to median)
Compared to same class
» 2% of all tested devices in this class were better, 1% similar, 97% worse
» The best had a delta of 6%, average was 18%, worst was 132%
Compared to all devices tested
» 2% of all tested devices were better, 1% similar, 97% worse
» The best had a delta of 4%, average was 23%, worst was 134%
HP Omen 16 (2024) audio analysis
(±) | speaker loudness is average but good (78 dB)
Bass 100 - 315 Hz
(-) | nearly no bass - on average 15.2% lower than median
(±) | linearity of bass is average (14.3% delta to prev. frequency)
Mids 400 - 2000 Hz
(+) | balanced mids - only 4.8% away from median
(+) | mids are linear (5% delta to prev. frequency)
Highs 2 - 16 kHz
(+) | balanced highs - only 2% away from median
(+) | highs are linear (4.1% delta to prev. frequency)
Overall 100 - 16.000 Hz
(+) | overall sound is linear (14.7% difference to median)
Compared to same class
» 29% of all tested devices in this class were better, 7% similar, 64% worse
» The best had a delta of 6%, average was 18%, worst was 132%
Compared to all devices tested
» 19% of all tested devices were better, 4% similar, 77% worse
» The best had a delta of 4%, average was 23%, worst was 134%
Power consumption
There are no surprises when it comes to power consumption. The usage levels are at a typical level for the hardware inside. The Legion Pro 7 completed our Witcher 3 test and stress test with a consistent level of power usage. The included 330-watt charger is sufficiently powerful for the laptop.
| Off / Standby | |
| Idle | |
| Load |
|
Key:
min: | |
Power consumption Witcher 3 / Stress test
Power consumption with external monitor
Battery life
The 16-inch laptop lasted 6h 13min in our realistic Wi-Fi test, which simulates a load by accessing websites using a script. The Legion has the best battery life amongst all the devices in our comparison.
Pros
Cons
Verdict - Potent high-end laptop

With the Legion Pro 7, Lenovo has delivered a potent 16-inch notebook for gamers and creators. On board the laptop is a fitting 16-inch QHD+ display (2,560 x 1,600 pixels, DCI-P3, G-Sync, HDR, 240Hz) with a work-friendly 16:10 aspect ratio.
The Lenovo Legion Pro 7 16IRX9H offers a great deal of power at a reasonable price.
The GeForce RTX 4080 and Core i9-14900HX inside managed to achieve their new best results in some of the tests – both chips are undoubtedly able to run at full throttle constantly. There is no getting around the high amounts of heat and noise common to this class of laptop. However, there is a Quiet mode to alleviate this – at the cost of performance.
Two USB-C ports (1x Thunderbolt 4, 1x USB 3.2 Gen 2) make it easier for you to integrate the laptop into an existing work setup and open up expansion options (e.g. external GPU, docks). Both ports are capable of outputting a DisplayPort signal, and one of them even supports Power Delivery. Battery life is pretty decent.
The MSI Vector 16 HX A14V is an alternative worth considering. It is on a par with the Legion performance-wise, but has a slightly poorer battery life.
Price and availability
In Europe, the Lenovo Legion Pro 7 model featured here is available starting from €2,999 (US$3,245) Campuspoint.de und Notebooksbilliger.de after factoring in special discounts for students and educators.
Though the new Legion Pro 7 is not yet available in the US, you can find its predecessor for around US$2,490 on Amazon US. This particular model has a last-gen Core i9-13900HX, but is otherwise largely the same.
Lenovo Legion Pro 7 16IRX9H
- 03/25/2024 v7 (old)
Sascha Mölck
Transparency
The selection of devices to be reviewed is made by our editorial team. The test sample was provided to the author as a loan by the manufacturer or retailer for the purpose of this review. The lender had no influence on this review, nor did the manufacturer receive a copy of this review before publication. There was no obligation to publish this review. As an independent media company, Notebookcheck is not subjected to the authority of manufacturers, retailers or publishers.
This is how Notebookcheck is testing
Every year, Notebookcheck independently reviews hundreds of laptops and smartphones using standardized procedures to ensure that all results are comparable. We have continuously developed our test methods for around 20 years and set industry standards in the process. In our test labs, high-quality measuring equipment is utilized by experienced technicians and editors. These tests involve a multi-stage validation process. Our complex rating system is based on hundreds of well-founded measurements and benchmarks, which maintains objectivity. Further information on our test methods can be found here.
Price comparison

