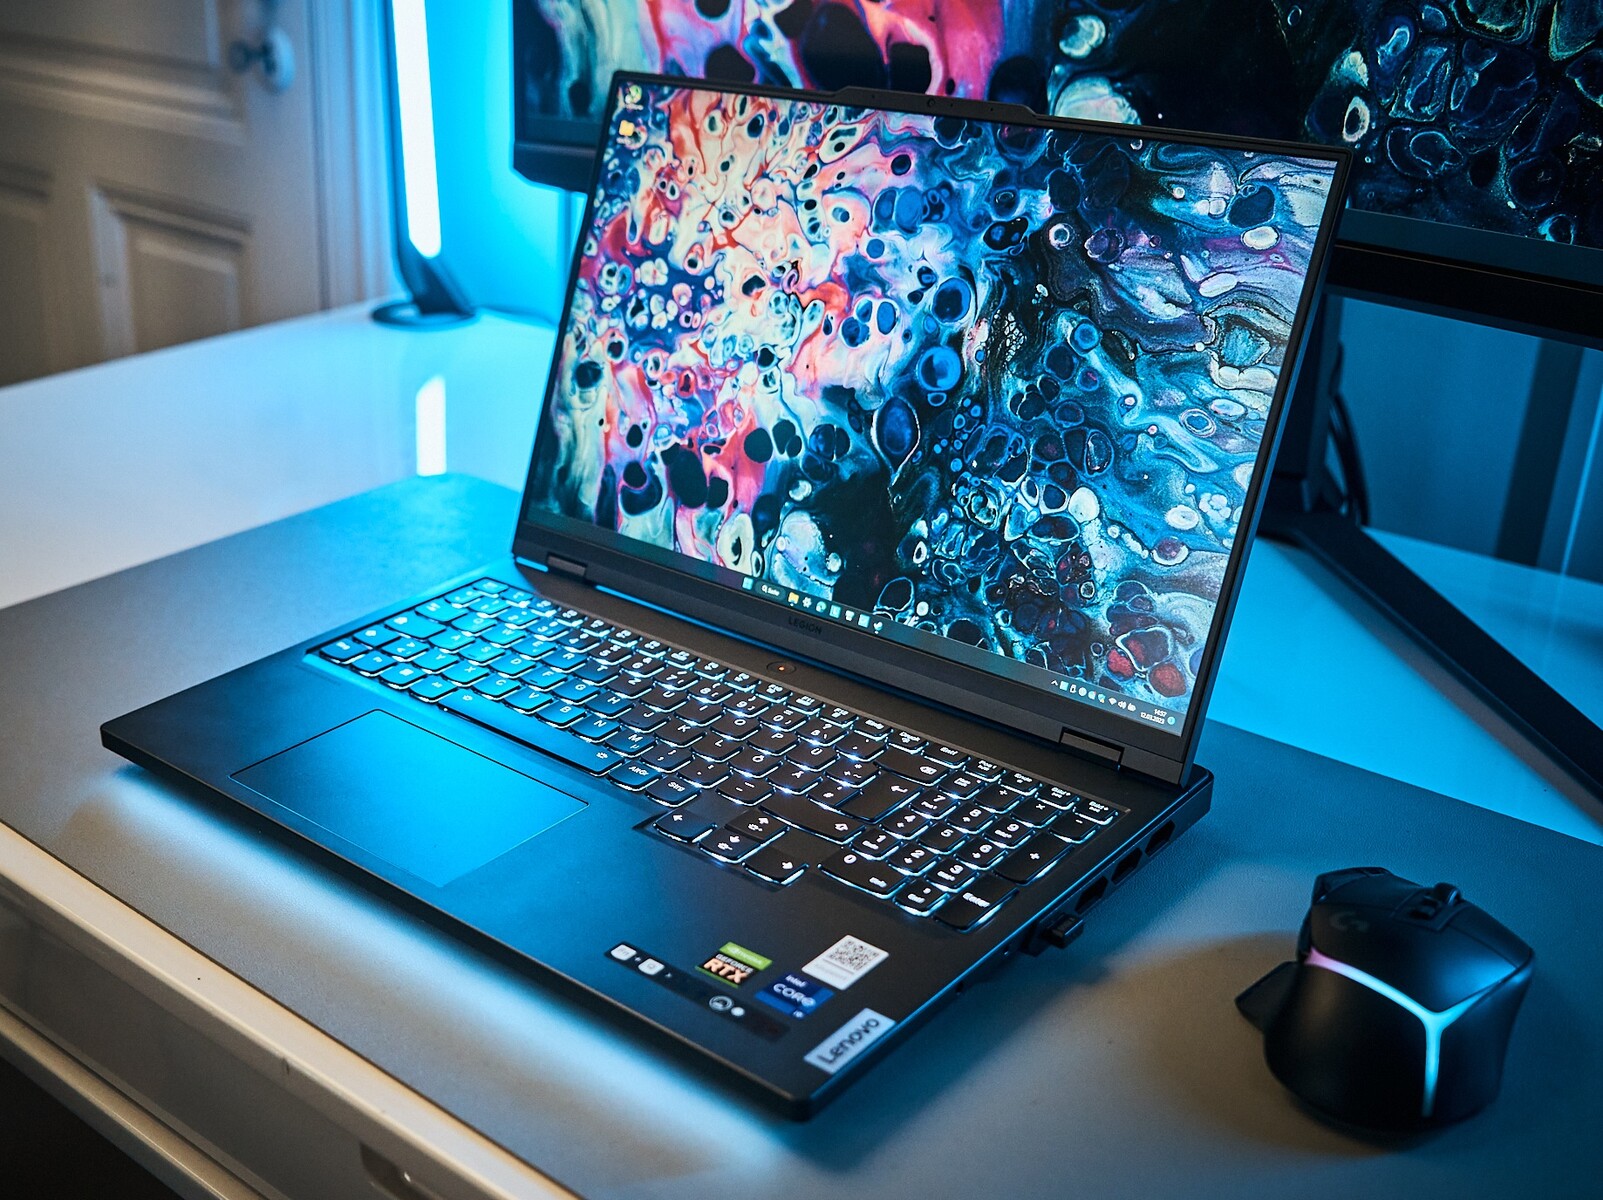
Lenovo Legion Pro 7 16 laptop review: Full gaming power thanks to RTX 4090

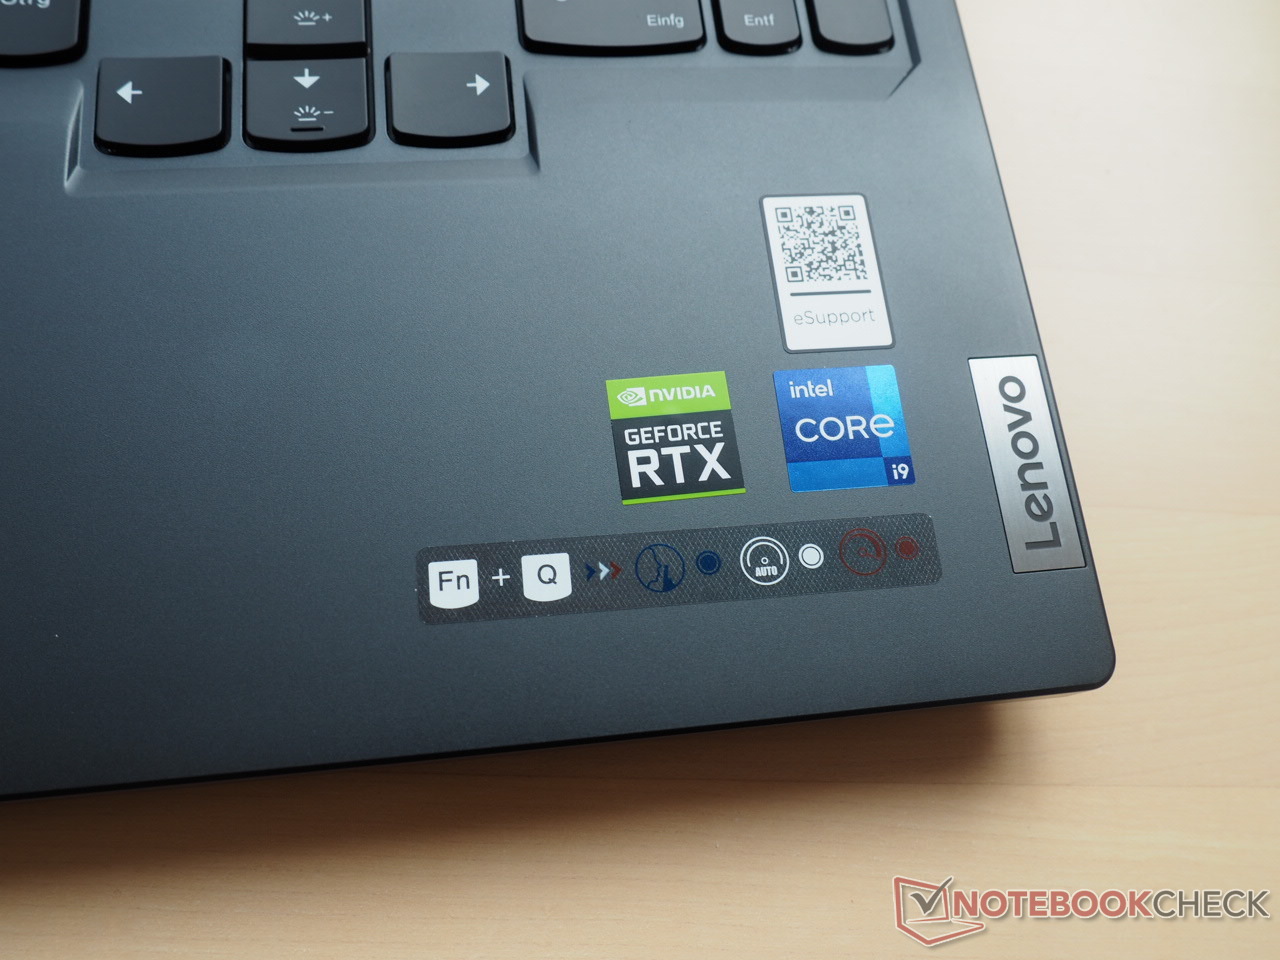
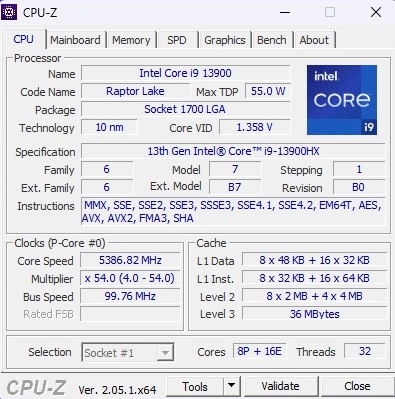
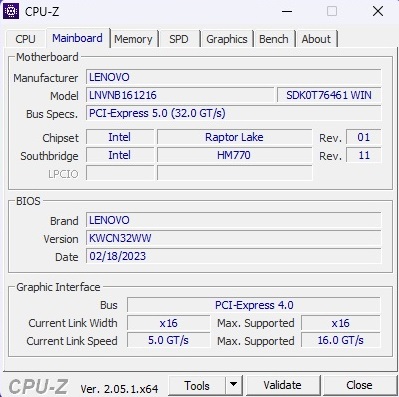
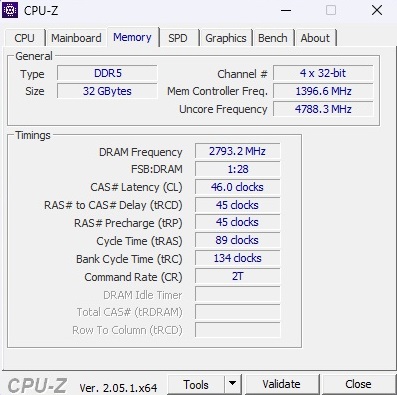
This Legion Pro 7 16IRX8H is not only one of the strongest but also one of the most expensive gaming notebooks. You currently have to pay at least 4,500 Euros for the combination of the Core i9-13900HX, GeForce RTX 4090, 32 GB RAM (2x 16 GB DDR5-5600), 2 TB mass storage (2x 1 TB NVMe SSD) and 240 Hz display (2660 x 1600 pixels). Every gamer has to decide whether or not he wants to support the manufacturer's current pricing policy, which seems to be unrelated to any inflation.
Competitors of the Legion Pro 7 include other high-end gamers with RTX 4090 from the 16- and 17-inch range, like the Razer Blade 16, the XMG Neo 16, the Asus Strix Scar 17 and the MSI Titan GT77. The cheaper sister model with RTX 4080 also appears in the tables as a comparison device.
Possible competitors in comparison
Rating | Date | Model | Weight | Height | Size | Resolution | Price |
|---|---|---|---|---|---|---|---|
| 88.8 % v7 (old) | 06 / 2023 | Lenovo Legion Pro 7 RTX4090 i9-13900HX, GeForce RTX 4090 Laptop GPU | 2.7 kg | 26 mm | 16.00" | 2560x1600 | |
| 89.8 % v7 (old) | 03 / 2023 | Razer Blade 16 Early 2023 RTX 4090 i9-13950HX, GeForce RTX 4090 Laptop GPU | 2.5 kg | 21.99 mm | 16.00" | 3840x2400 | |
| 88.3 % v7 (old) | 04 / 2023 | Asus ROG Strix Scar 17 G733PY-XS96 R9 7945HX, GeForce RTX 4090 Laptop GPU | 2.9 kg | 28.3 mm | 17.30" | 2560x1440 | |
| 87.7 % v7 (old) | 04 / 2023 | Schenker XMG Neo 16 E23 i9-13900HX, GeForce RTX 4090 Laptop GPU | 2.5 kg | 29.9 mm | 16.00" | 2560x1600 | |
| 89 % v7 (old) | 02 / 2023 | MSI Titan GT77 HX 13VI i9-13950HX, GeForce RTX 4090 Laptop GPU | 3.5 kg | 23 mm | 17.30" | 3840x2160 | |
| 89.4 % v7 (old) | 02 / 2023 | Lenovo Legion Pro 7 16IRX8H i9-13900HX, GeForce RTX 4080 Laptop GPU | 2.7 kg | 26 mm | 16.00" | 2560x1600 |
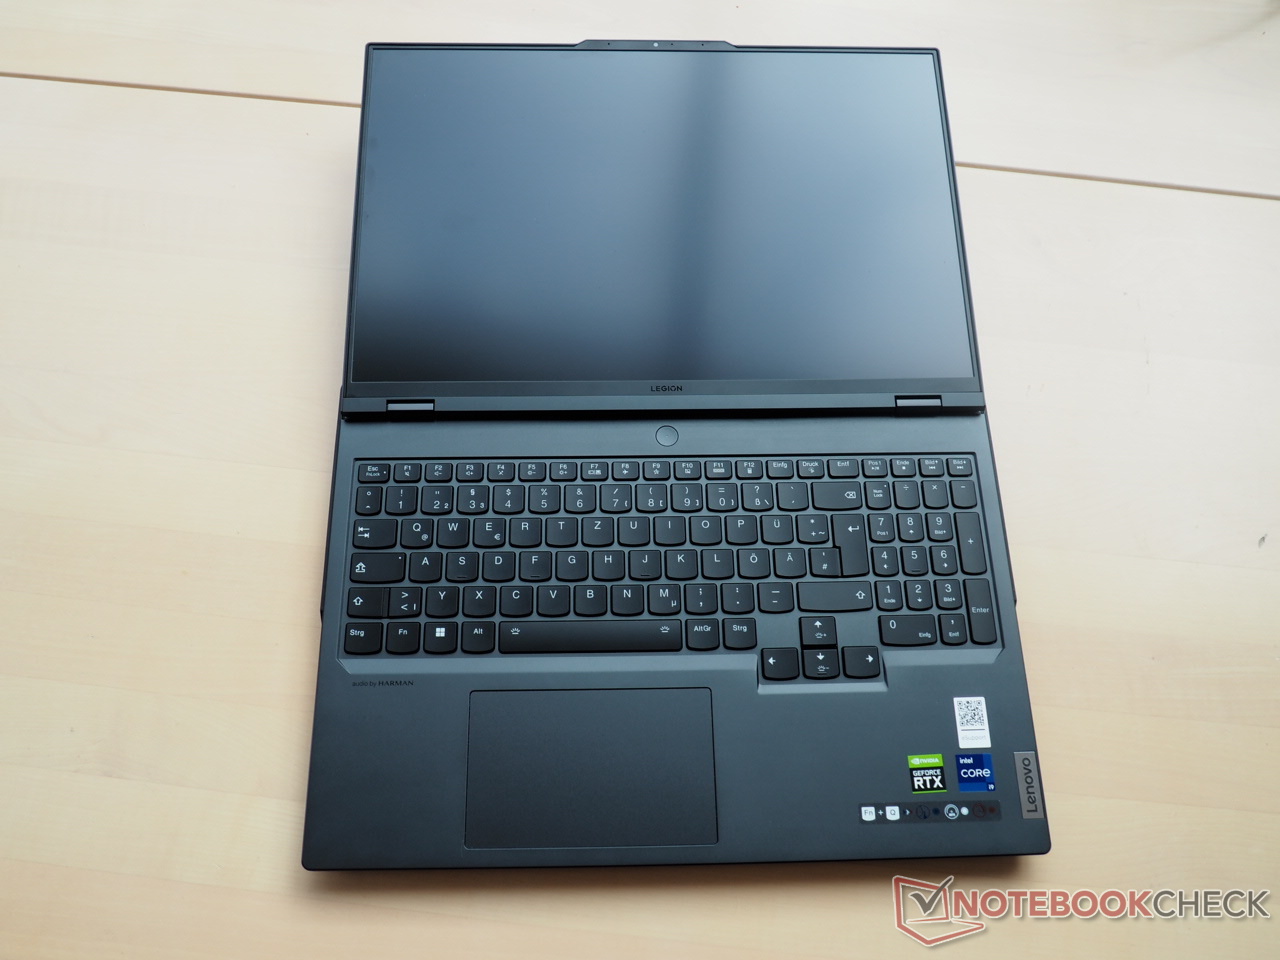
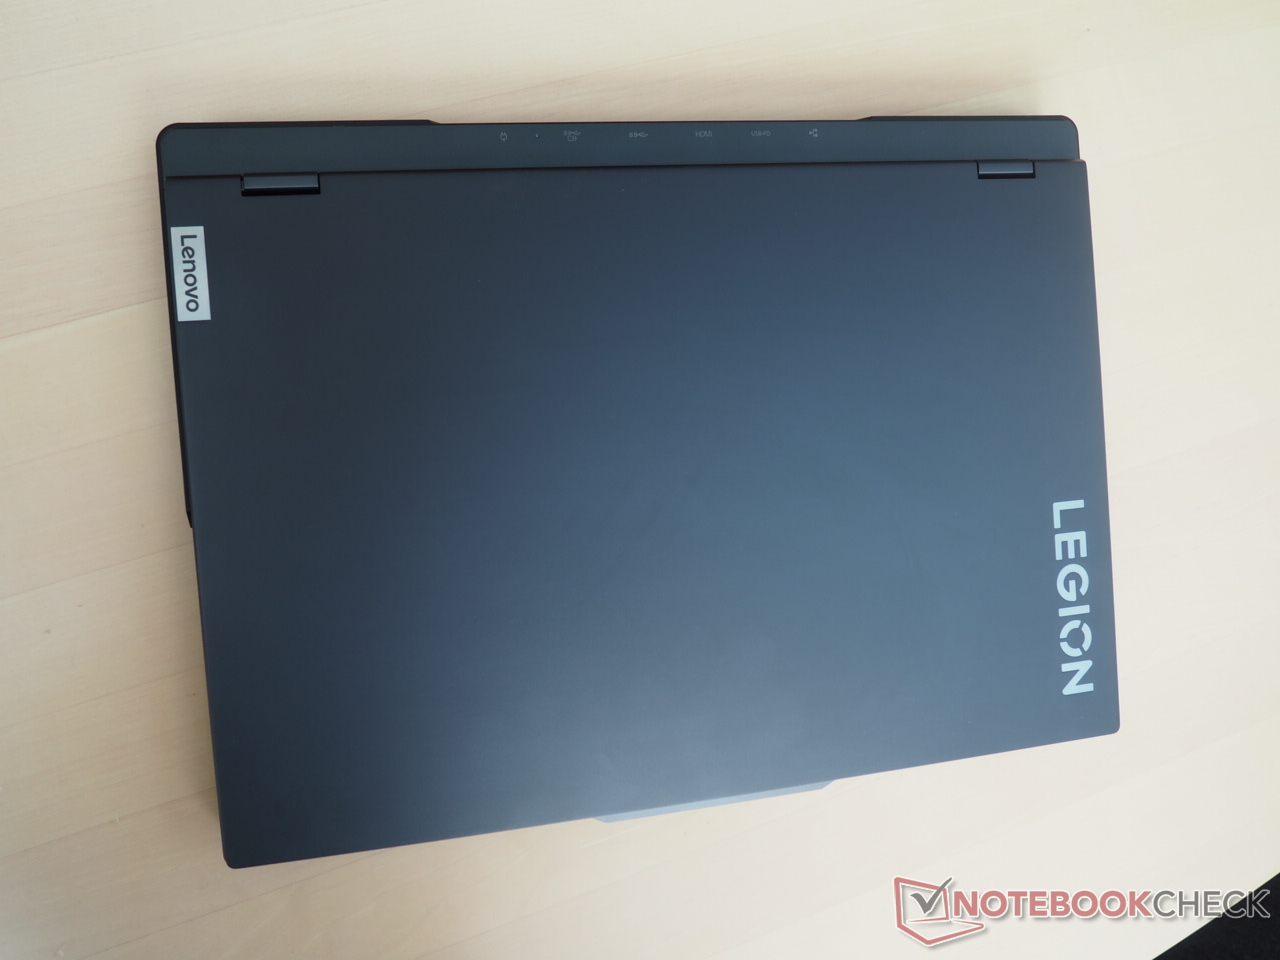
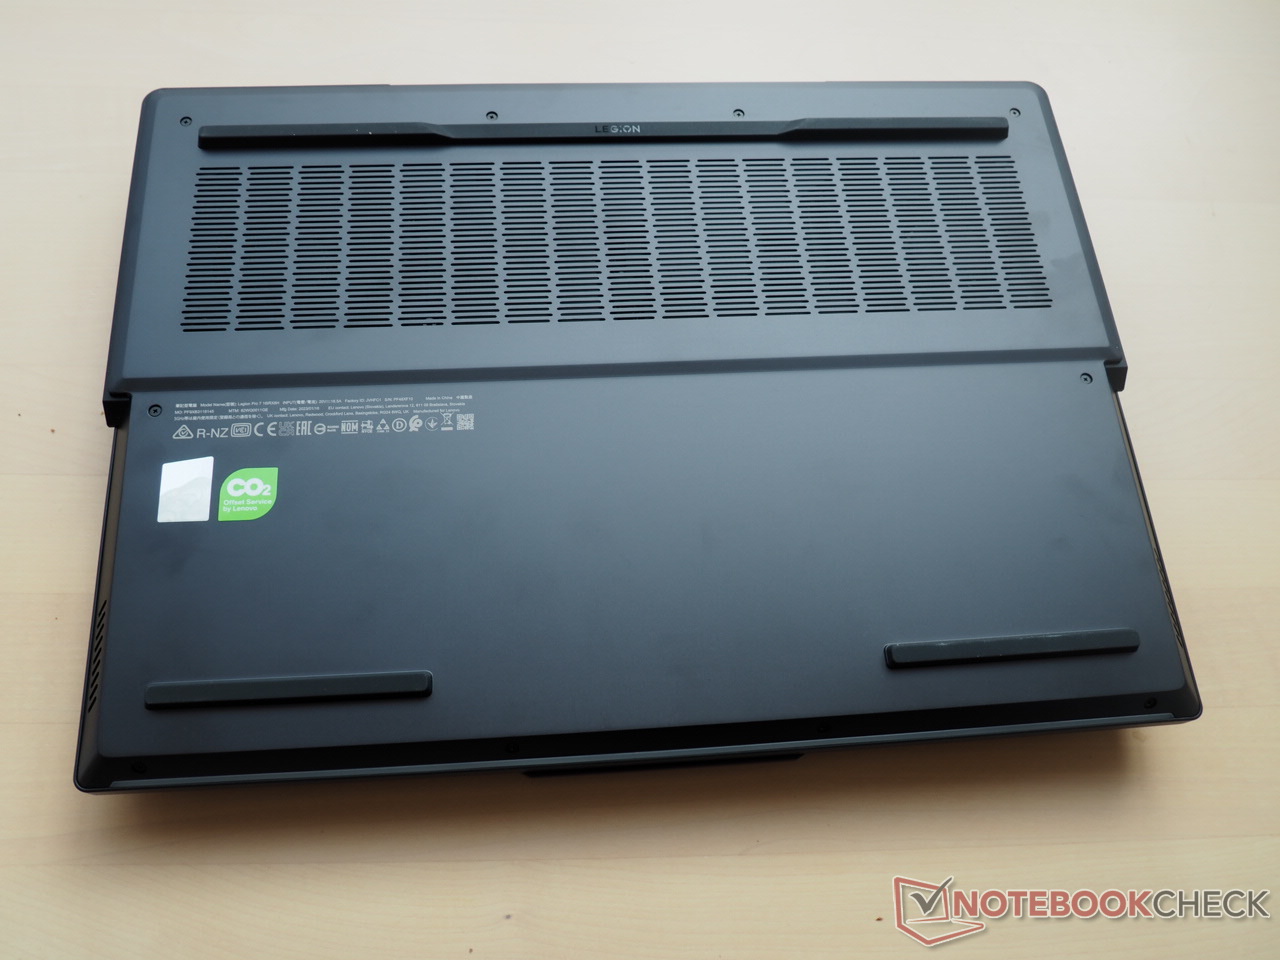
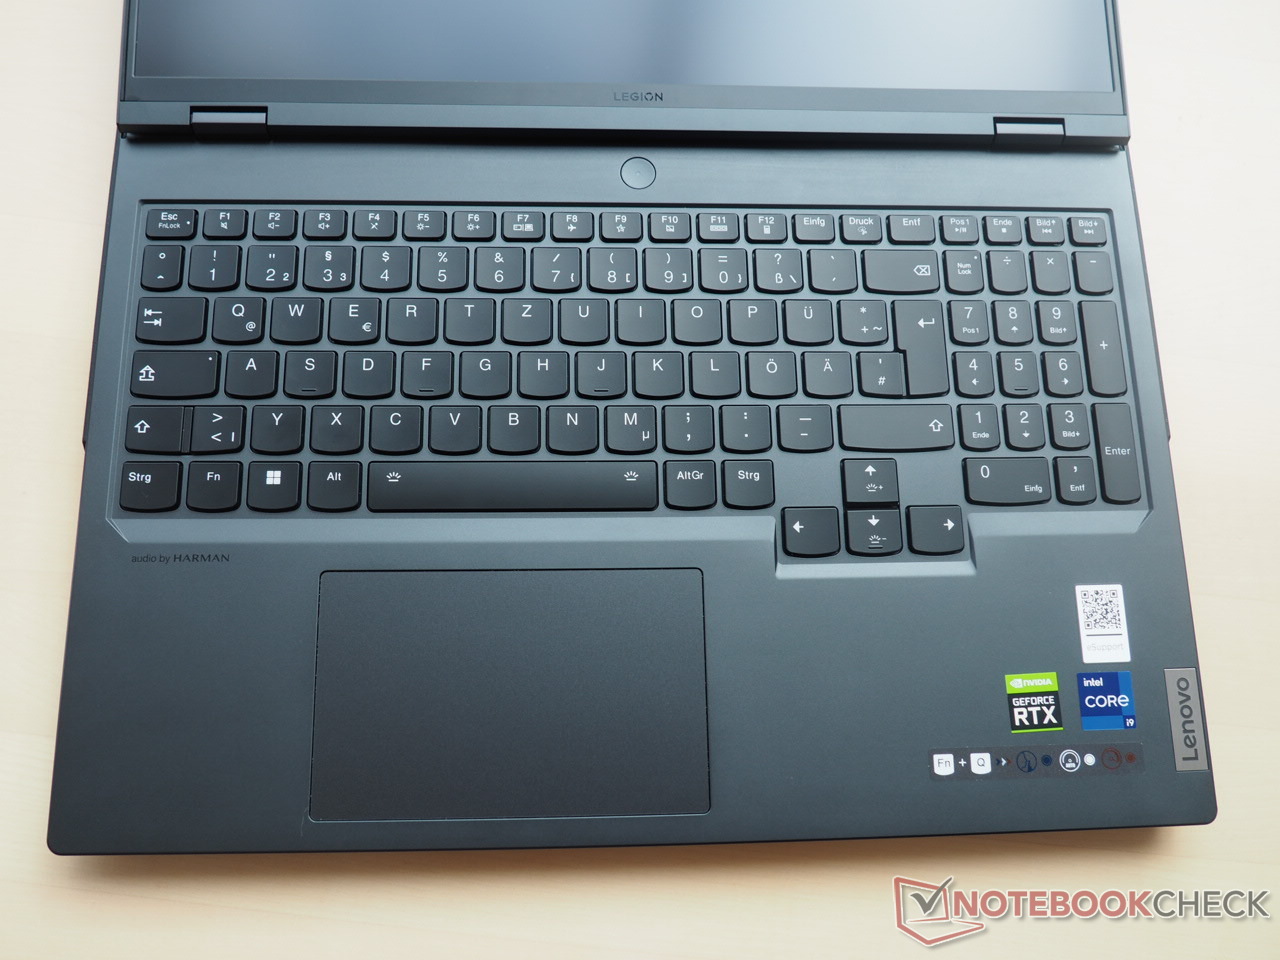
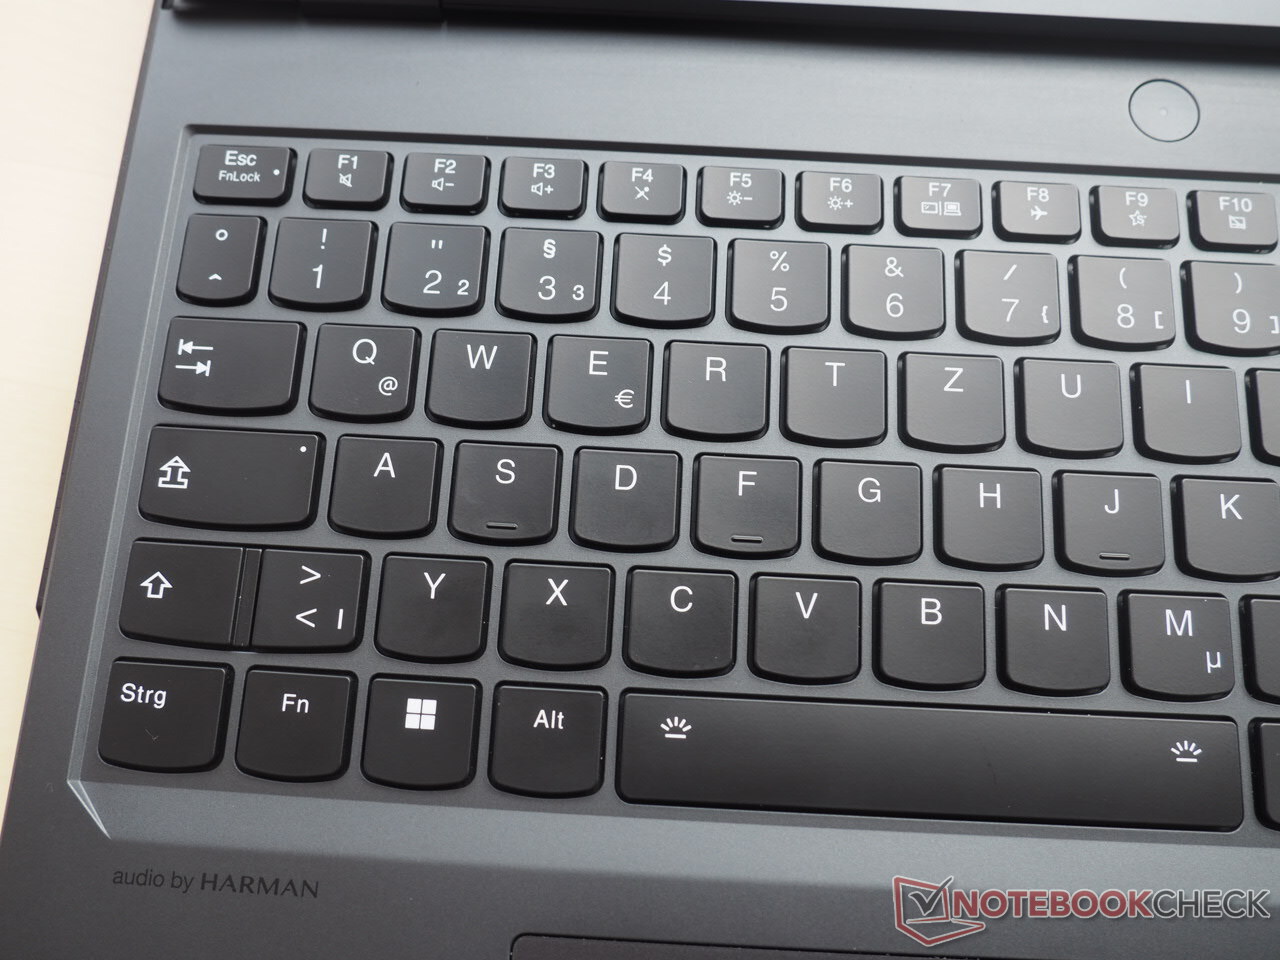
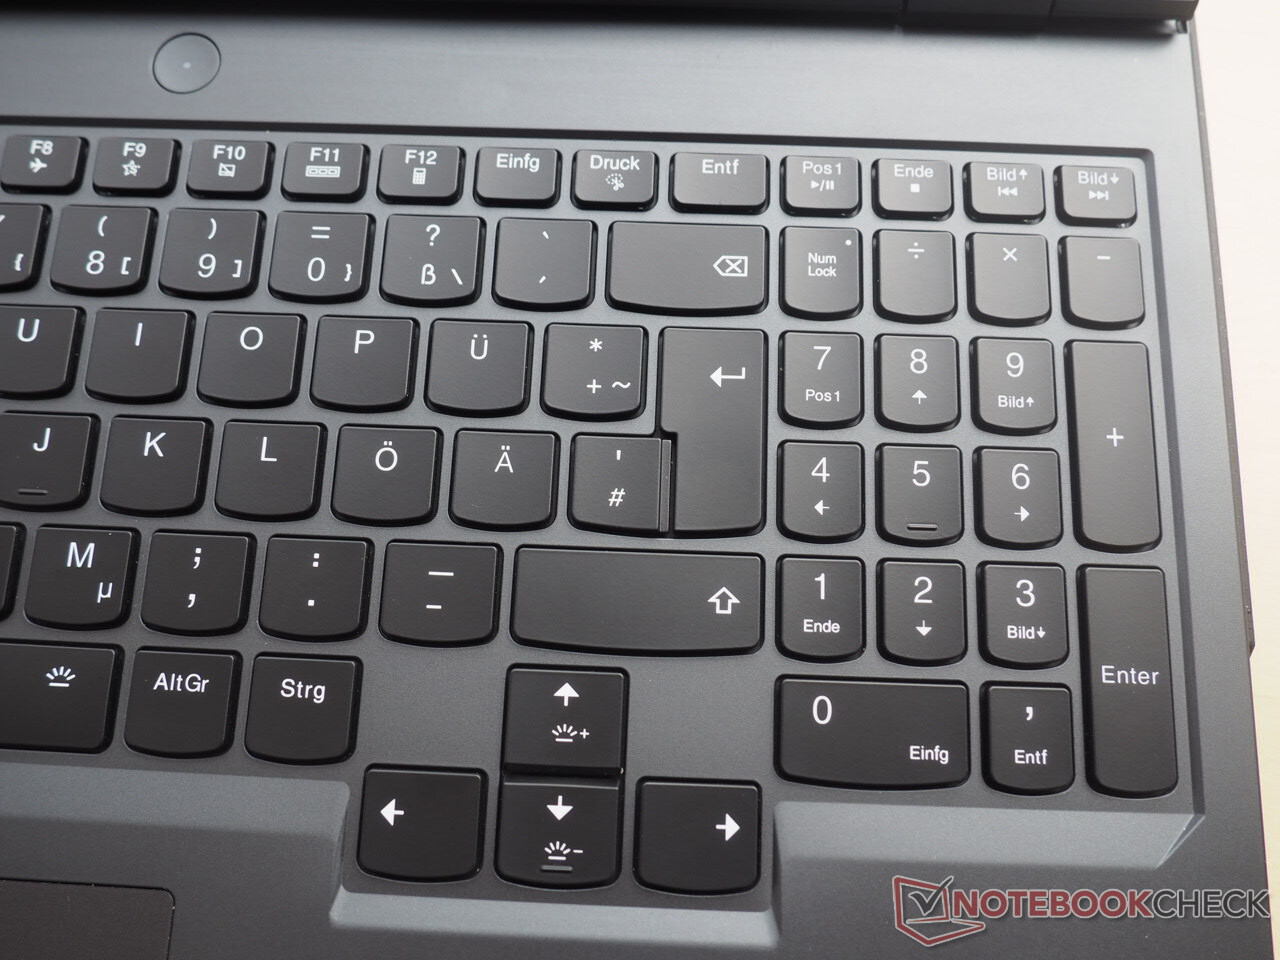
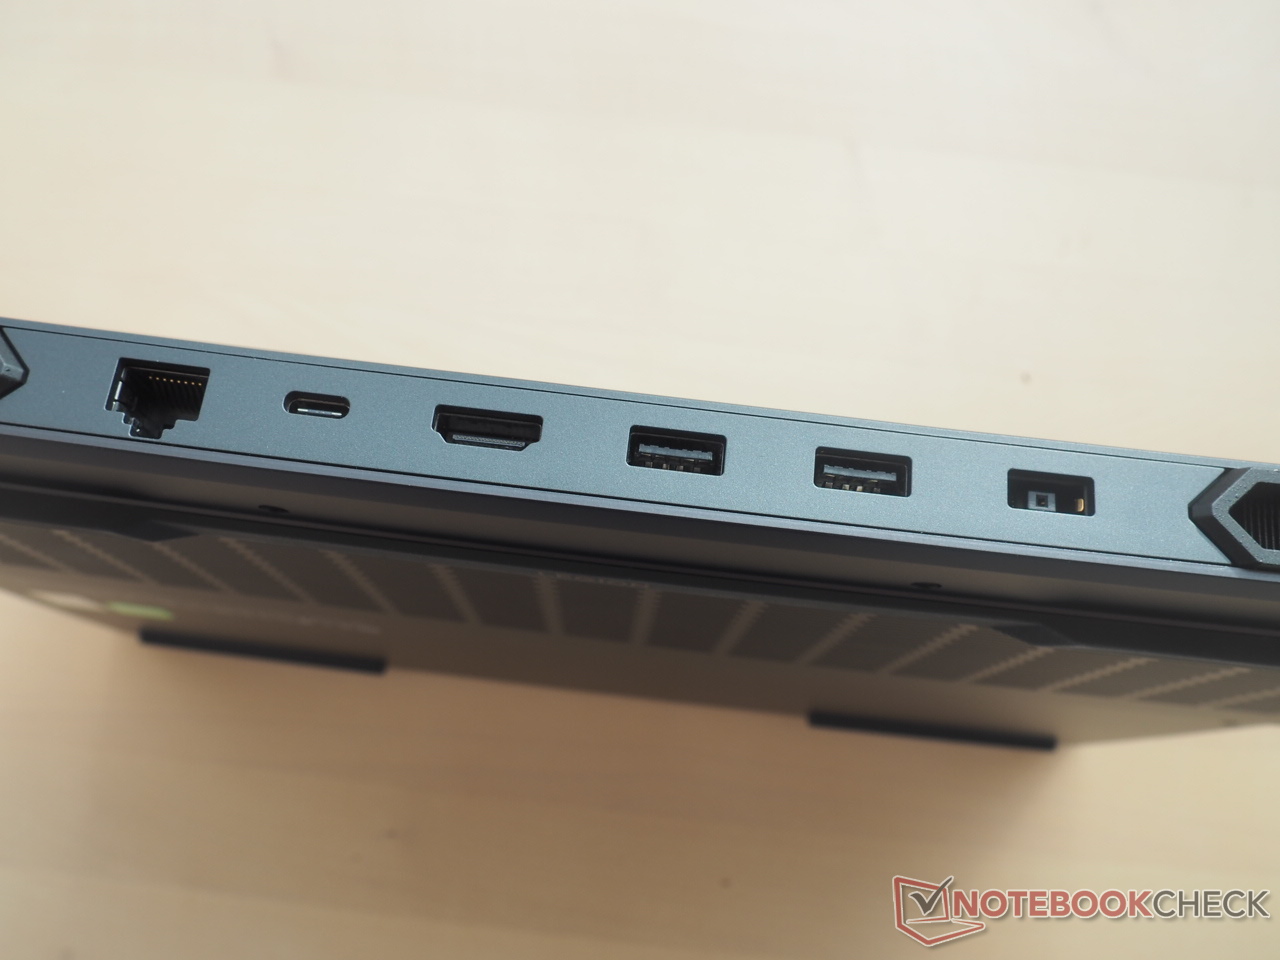
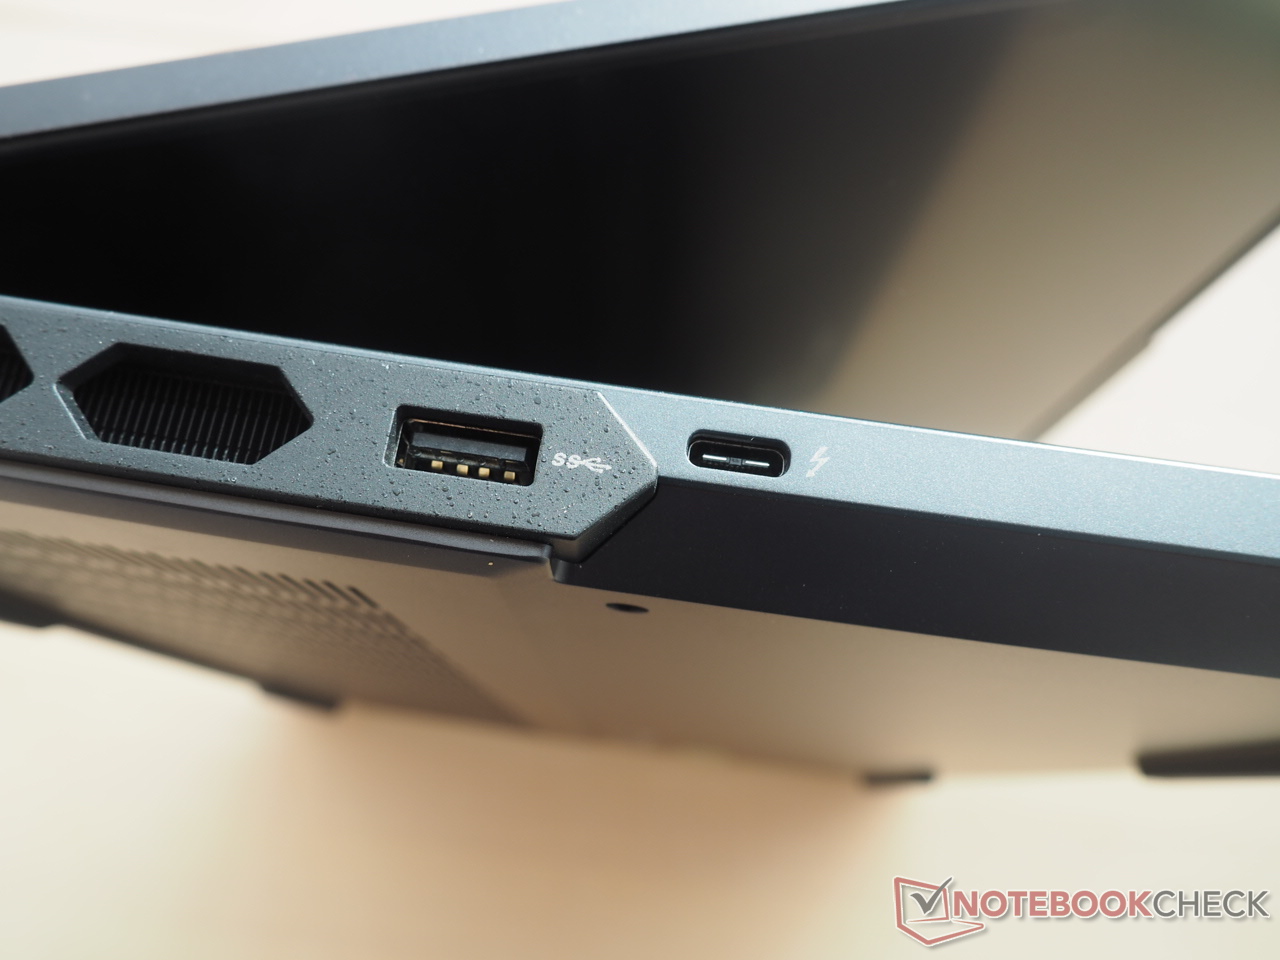
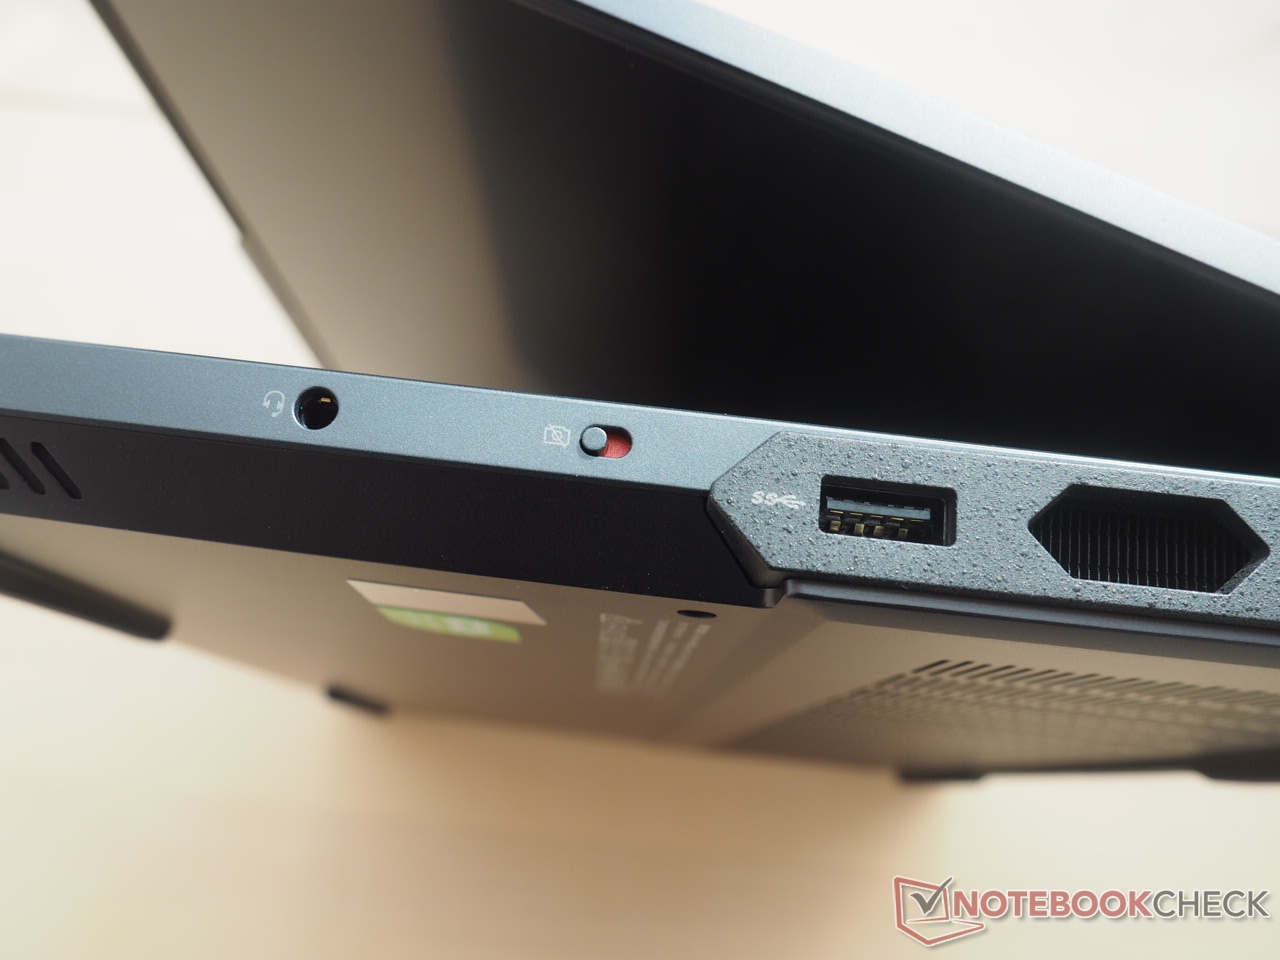
Since the case is identical in construction to the already tested variant, we will not go into the details about the chassis, the ports and the input devices again in this article. You can find the corresponding information in the linked review.
Communication
Webcam


Display
Besides the casing, the display is also identical to the 4080 version. This is great news since our last test confirmed that the WQXGA screen is impressive in nearly every aspect.
| |||||||||||||||||||||||||
Brightness Distribution: 91 %
Center on Battery: 491 cd/m²
Contrast: 1228:1 (Black: 0.4 cd/m²)
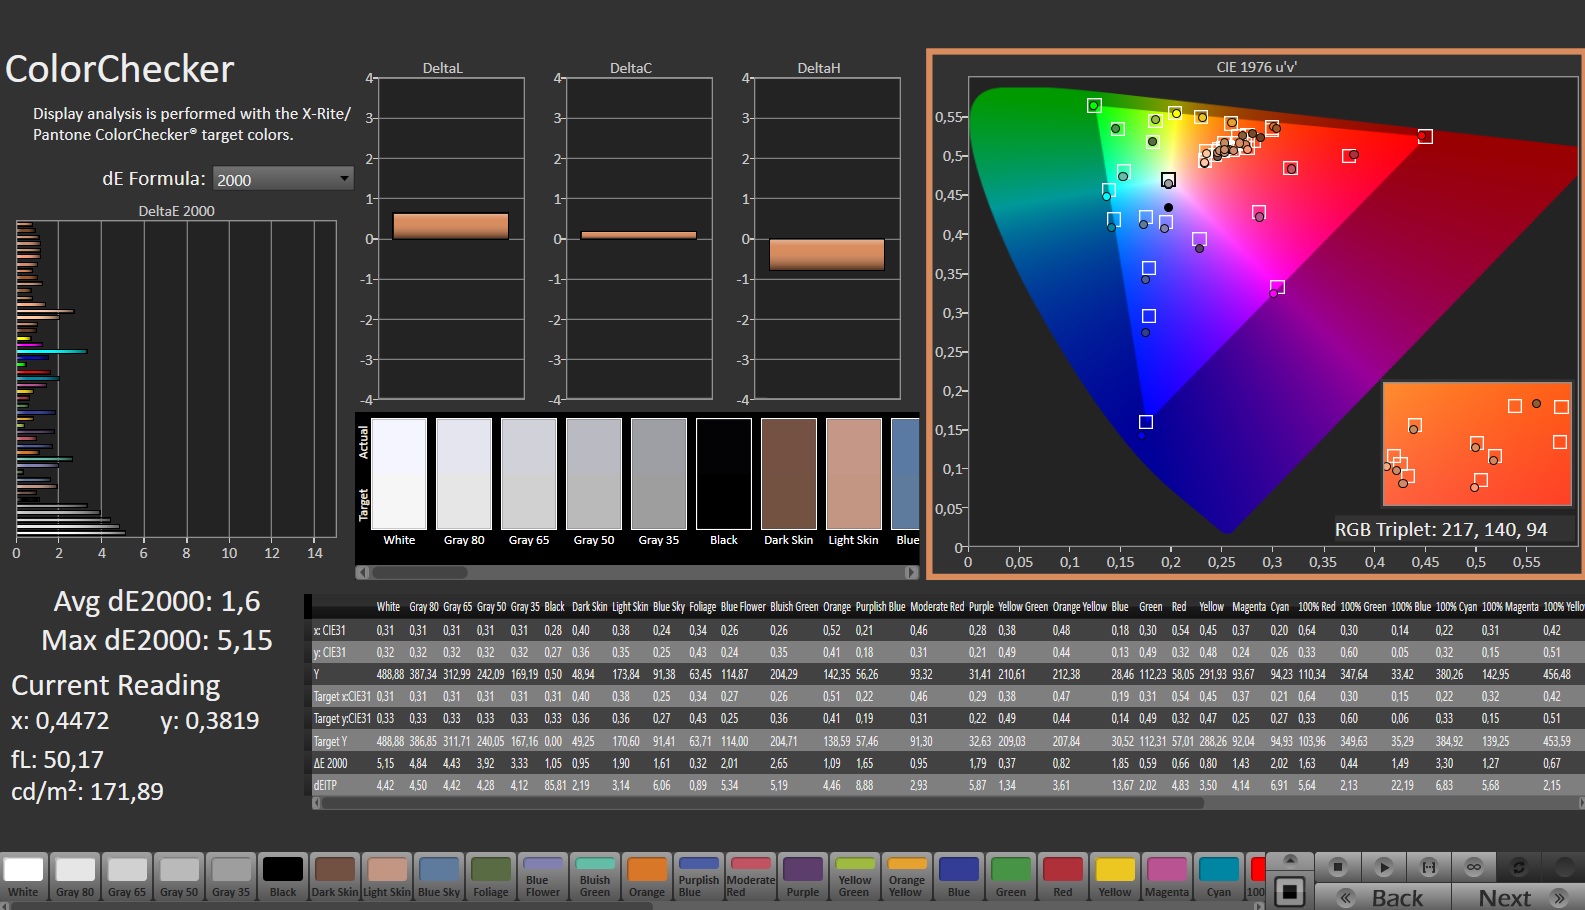
ΔE ColorChecker Calman: 1.6 | ∀{0.5-29.43 Ø4.72}
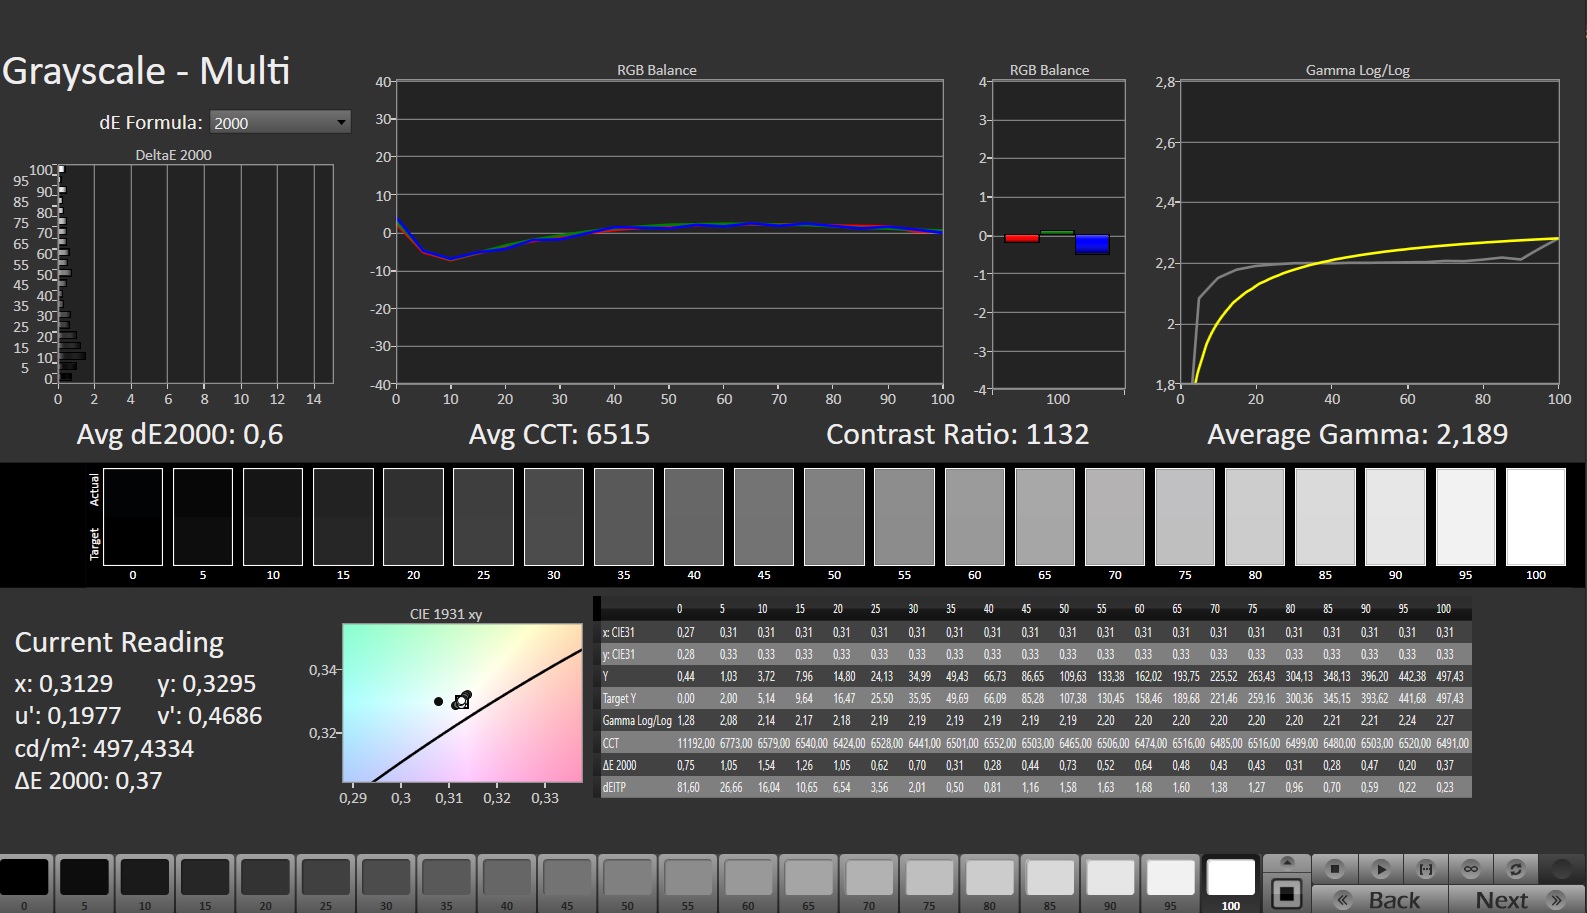
calibrated: 0.97
ΔE Greyscale Calman: 3 | ∀{0.09-98 Ø4.97}
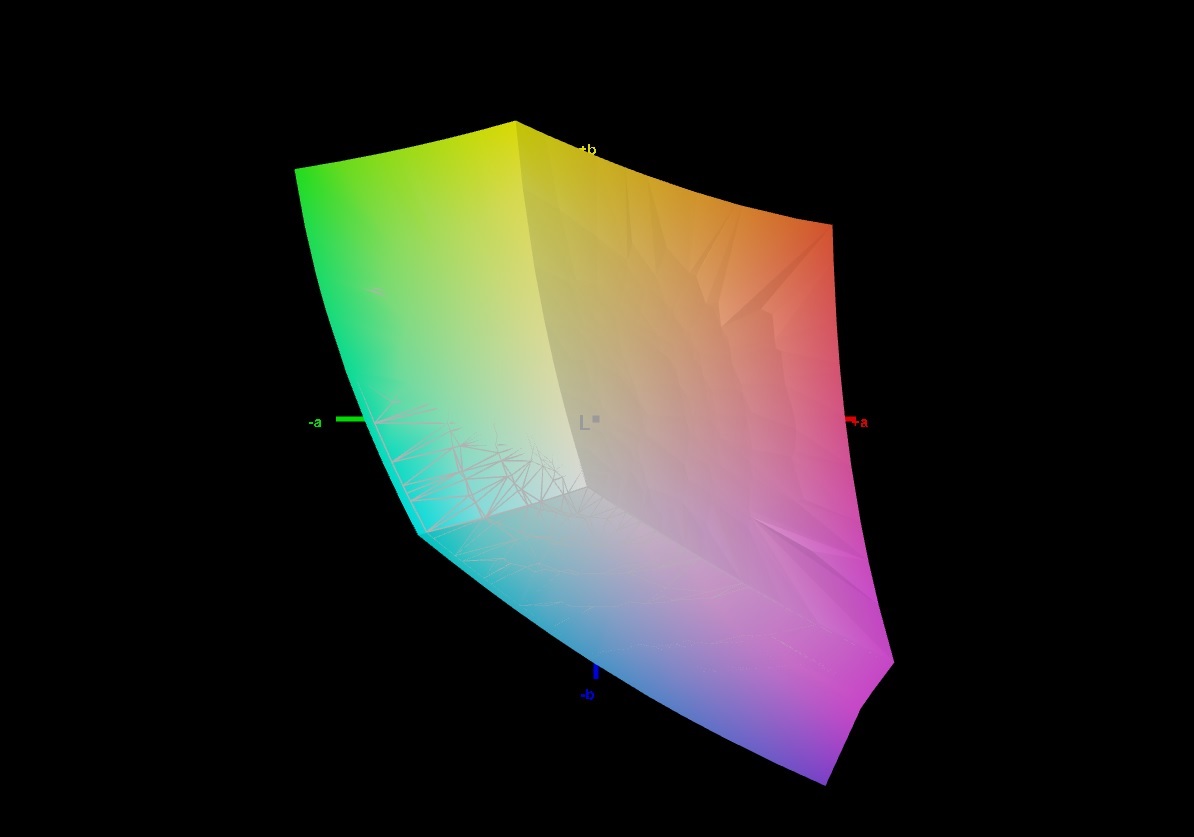
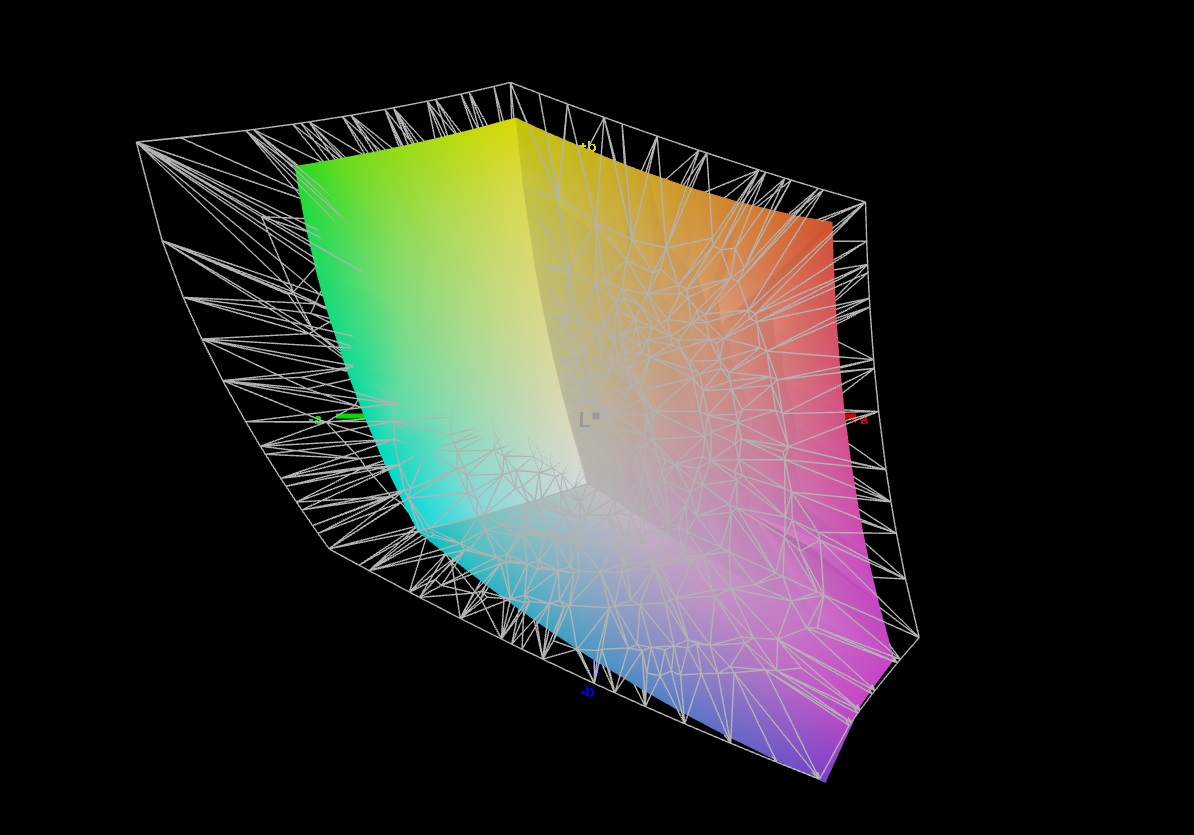
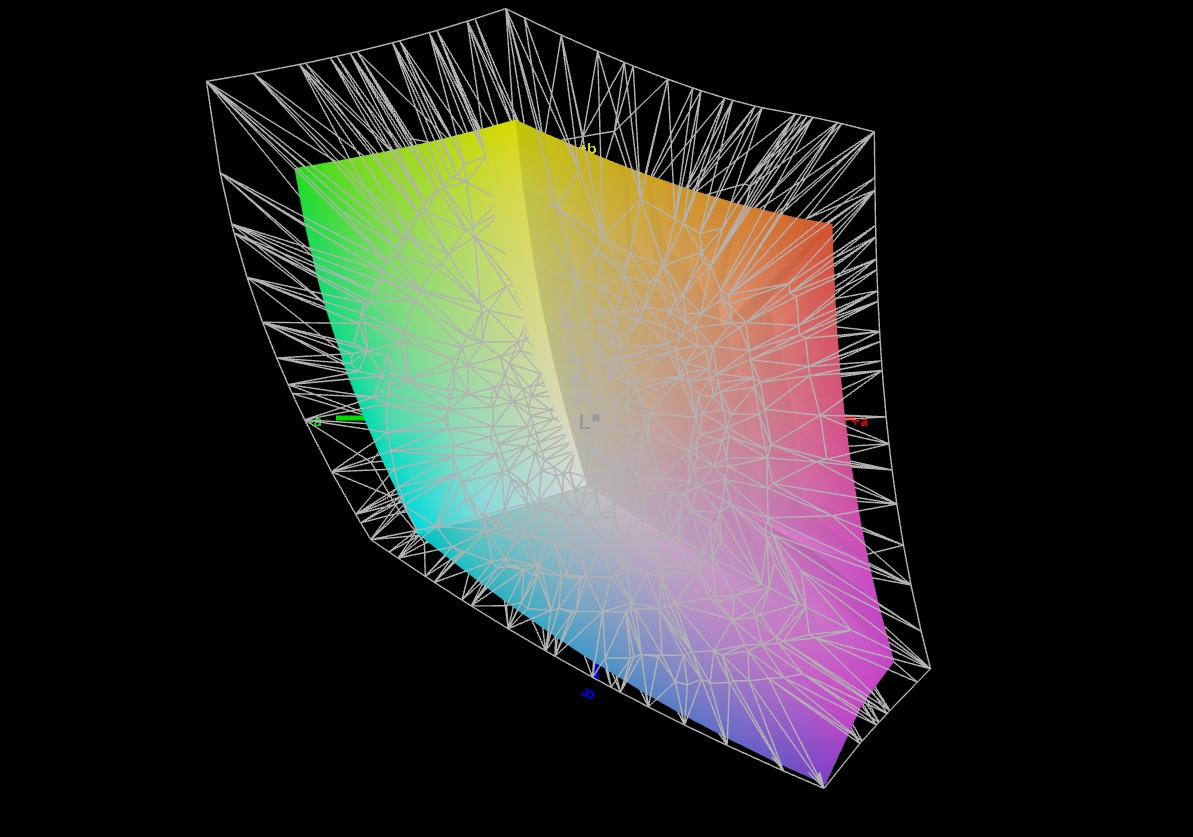
71.6% AdobeRGB 1998 (Argyll 3D)
99.8% sRGB (Argyll 3D)
69.5% Display P3 (Argyll 3D)
Gamma: 2.211
CCT: 6979 K
| Lenovo Legion Pro 7 RTX4090 MNG007DA2-3 (CSO1628), IPS, 2560x1600, 16" | Razer Blade 16 Early 2023 RTX 4090 AUO B160ZAN01.U, mini-LED, 3840x2400, 16" | Asus ROG Strix Scar 17 G733PY-XS96 NE173QHM-NZ2, IPS, 2560x1440, 17.3" | Schenker XMG Neo 16 E23 BOE0AF0 NE160QDM-NZ1, IPS, 2560x1600, 16" | MSI Titan GT77 HX 13VI B173ZAN06.C, Mini-LED, 3840x2160, 17.3" | Lenovo Legion Pro 7 16IRX8H MNG007DA2-3 (CSO1628), IPS, 2560x1600, 16" | |
|---|---|---|---|---|---|---|
| Display | 24% | 20% | -3% | 22% | -1% | |
| Display P3 Coverage (%) | 69.5 | 99.9 44% | 98 41% | 67.3 -3% | 94.9 37% | 69.1 -1% |
| sRGB Coverage (%) | 99.8 | 100 0% | 100 0% | 96.7 -3% | 99.9 0% | 99.7 0% |
| AdobeRGB 1998 Coverage (%) | 71.6 | 90.9 27% | 85.6 20% | 68.9 -4% | 92.4 29% | 71.2 -1% |
| Response Times | -622% | -53% | -60% | -365% | -21% | |
| Response Time Grey 50% / Grey 80% * (ms) | 10.9 ? | 10.2 ? 6% | 6.2 ? 43% | 14.5 ? -33% | 38.4 ? -252% | 12.3 ? -13% |
| Response Time Black / White * (ms) | 4.6 ? | 62.04 ? -1249% | 11.4 ? -148% | 8.6 ? -87% | 26.6 ? -478% | 5.9 ? -28% |
| PWM Frequency (Hz) | 2420 ? | 2380 ? | ||||
| Screen | 1412% | 11% | -5% | 54786% | 21% | |
| Brightness middle (cd/m²) | 491 | 730 49% | 322.5 -34% | 372 -24% | 606 23% | 511 4% |
| Brightness (cd/m²) | 472 | 729 54% | 317 -33% | 349 -26% | 602 28% | 469 -1% |
| Brightness Distribution (%) | 91 | 94 3% | 86 -5% | 88 -3% | 93 2% | 86 -5% |
| Black Level * (cd/m²) | 0.4 | 0.0045 99% | 0.29 28% | 0.32 20% | 0.0001 100% | 0.4 -0% |
| Contrast (:1) | 1228 | 162222 13110% | 1112 -9% | 1163 -5% | 6060000 493385% | 1278 4% |
| Colorchecker dE 2000 * | 1.6 | 5.65 -253% | 1.15 28% | 2.06 -29% | 4.8 -200% | 0.95 41% |
| Colorchecker dE 2000 max. * | 5.15 | 10.11 -96% | 3.03 41% | 3 42% | 8.2 -59% | 2.07 60% |
| Colorchecker dE 2000 calibrated * | 0.97 | 1.85 -91% | 0.56 42% | 1.5 -55% | 1.8 -86% | 0.91 6% |
| Greyscale dE 2000 * | 3 | 8.1 -170% | 1.7 43% | 1.9 37% | 6.5 -117% | 0.6 80% |
| Gamma | 2.211 100% | 1.98 111% | 2.27 97% | 2.312 95% | 2.63 84% | 2.176 101% |
| CCT | 6979 93% | 5874 111% | 6299 103% | 6747 96% | 6596 99% | 6545 99% |
| Total Average (Program / Settings) | 271% /
824% | -7% /
4% | -23% /
-12% | 18148% /
35172% | -0% /
10% |
* ... smaller is better
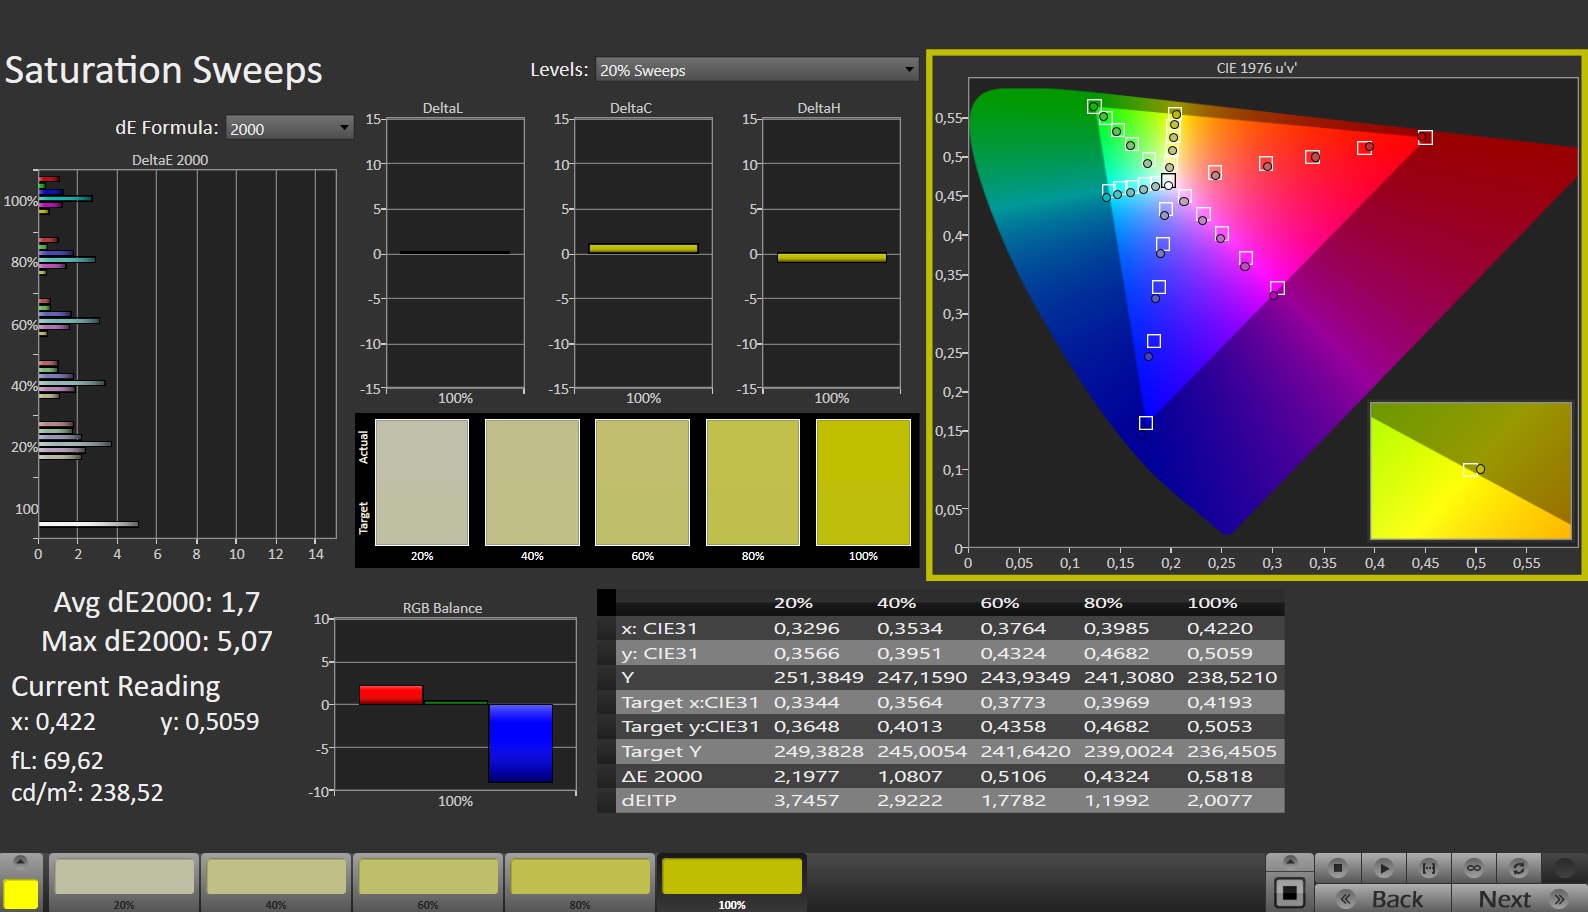
No matter if brightness (~470 cd/m²), contrast (~1,230:1) or color accuracy (avg. DeltaE 1.6): The measured values more than do justice to an IPS panel. The response time is also pleasing, not least thanks to the 240 Hz refresh rate. There is room for improvement in the color space. Although 100% sRGB is sufficient for a gaming notebook, around 72% AdobeRGB coverage and 70% DCI-P3 are a bit poor for professional users. Other competitors deliver more here (see table).
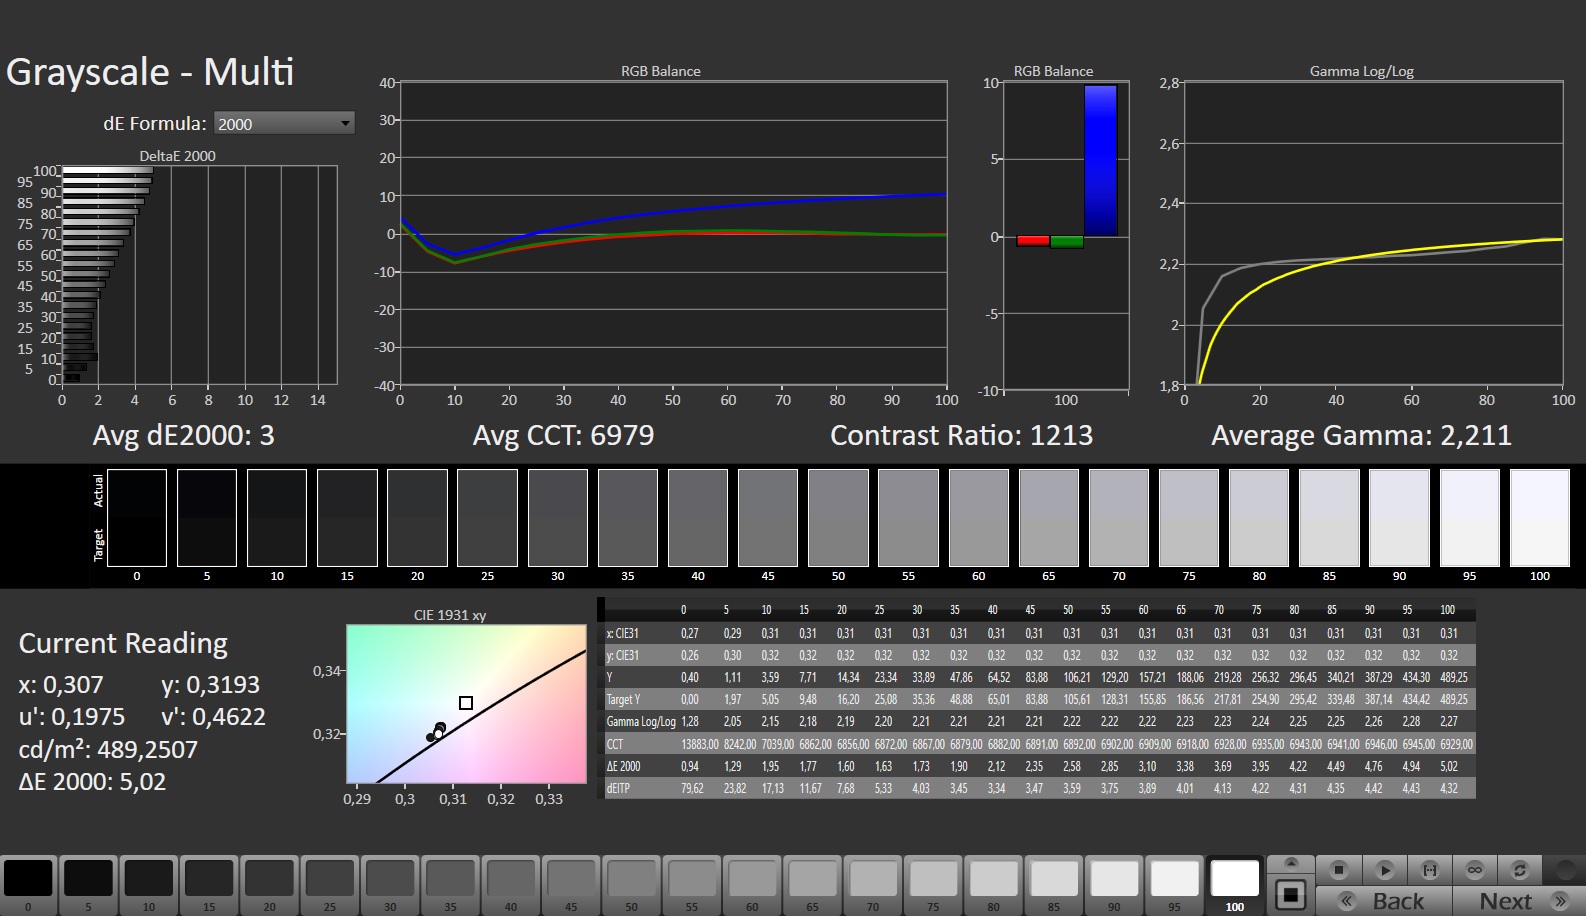
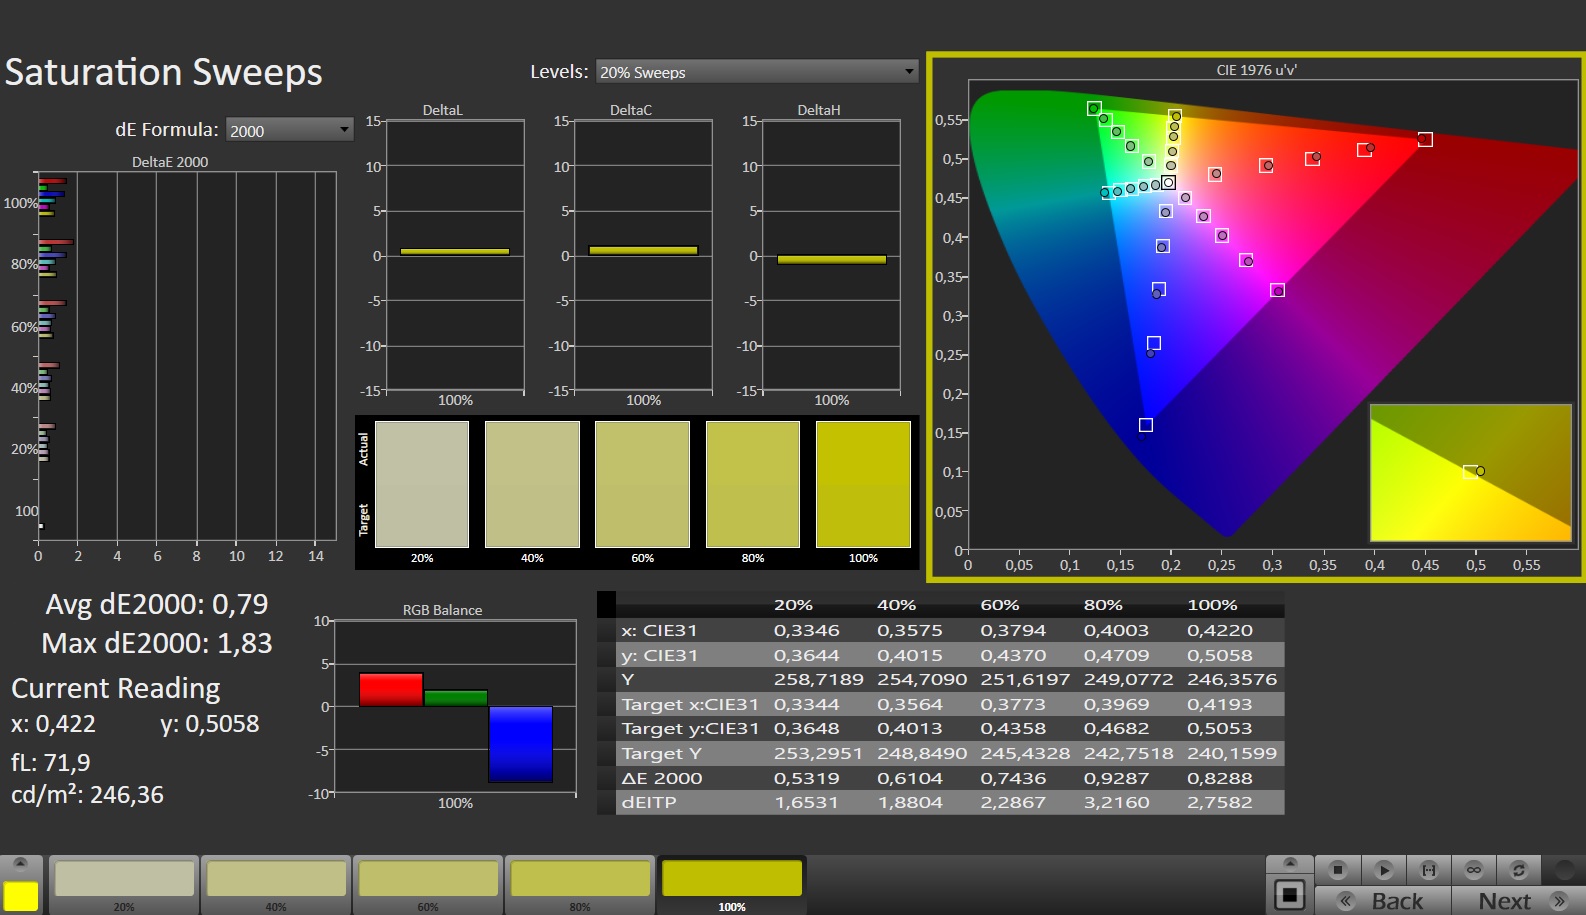
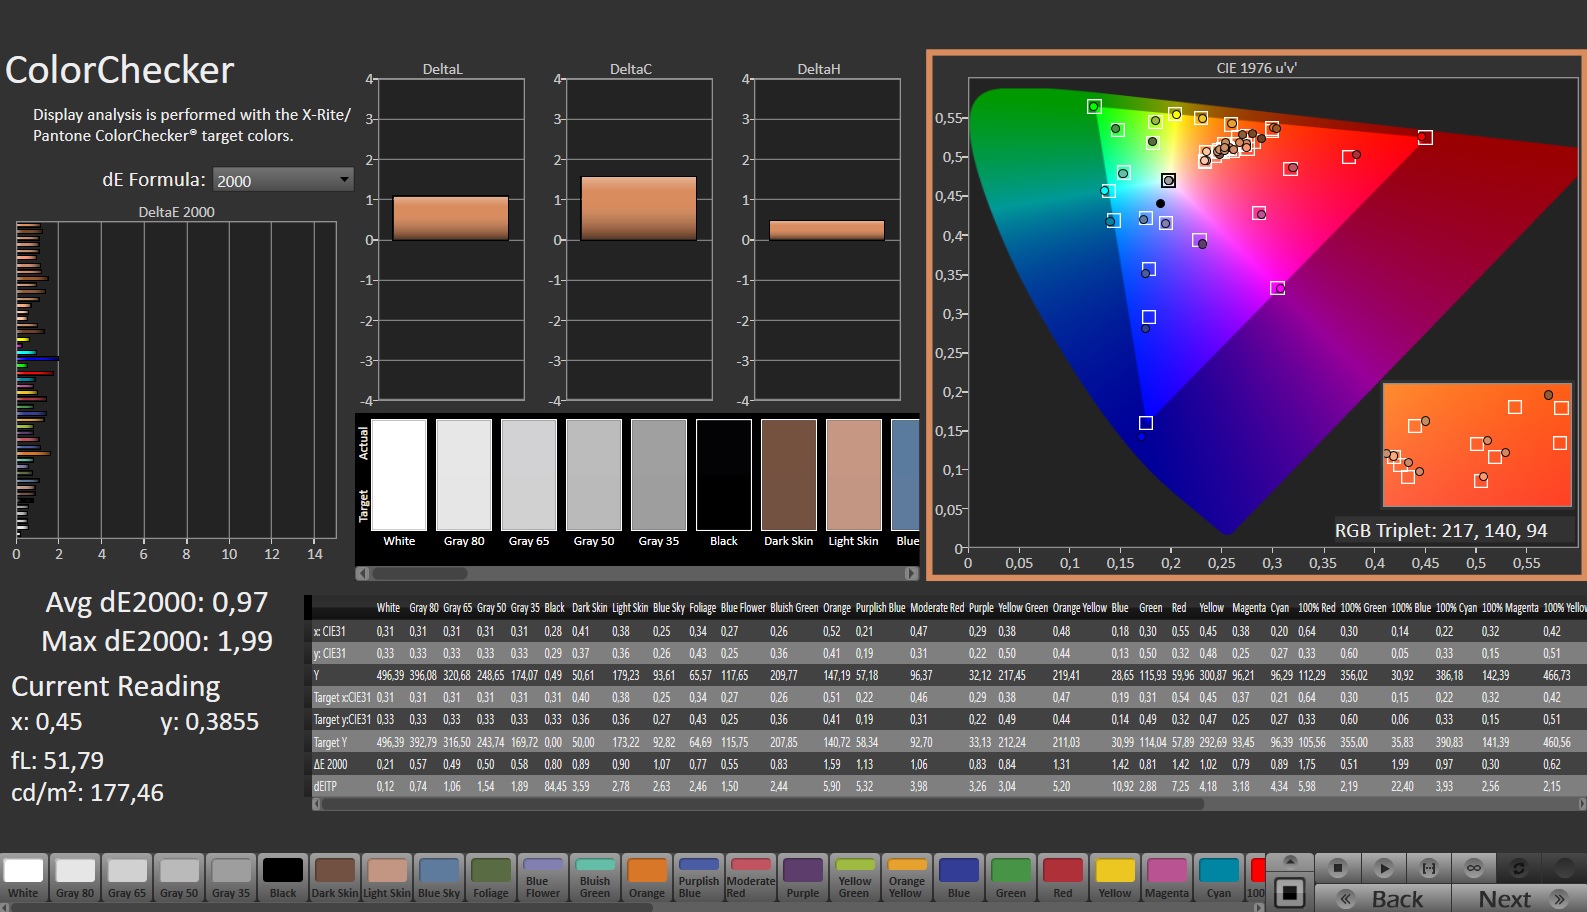
Overall, the display makes a good to a very good impression, although it is not technically up to the level of a mini-LED panel like in the Razer Blade 16 and MSI Titan GT 77.
Display Response Times
| ↔ Response Time Black to White | ||
|---|---|---|
| 4.6 ms ... rise ↗ and fall ↘ combined | ↗ 1.6 ms rise | 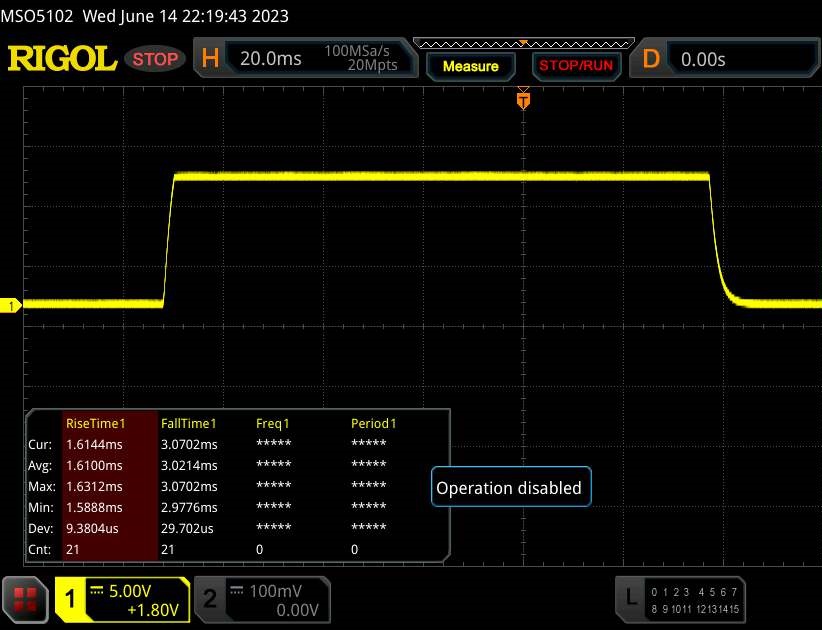 |
| ↘ 3 ms fall | ||
| The screen shows very fast response rates in our tests and should be very well suited for fast-paced gaming. In comparison, all tested devices range from 0.1 (minimum) to 240 (maximum) ms. » 17 % of all devices are better. This means that the measured response time is better than the average of all tested devices (19.8 ms). | ||
| ↔ Response Time 50% Grey to 80% Grey | ||
| 10.9 ms ... rise ↗ and fall ↘ combined | ↗ 5.1 ms rise | 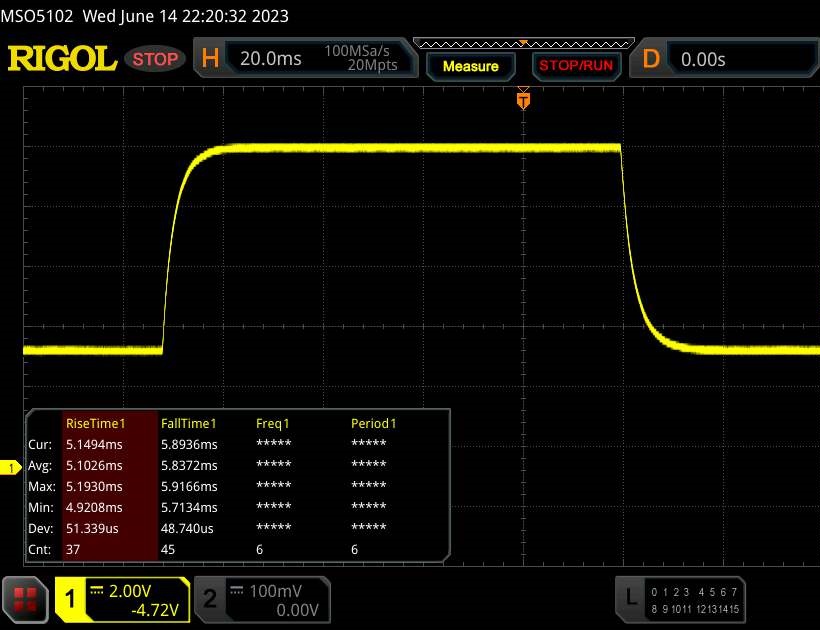 |
| ↘ 5.8 ms fall | ||
| The screen shows good response rates in our tests, but may be too slow for competitive gamers. In comparison, all tested devices range from 0.165 (minimum) to 636 (maximum) ms. » 25 % of all devices are better. This means that the measured response time is better than the average of all tested devices (31 ms). | ||
Screen Flickering / PWM (Pulse-Width Modulation)
| Screen flickering / PWM not detected | 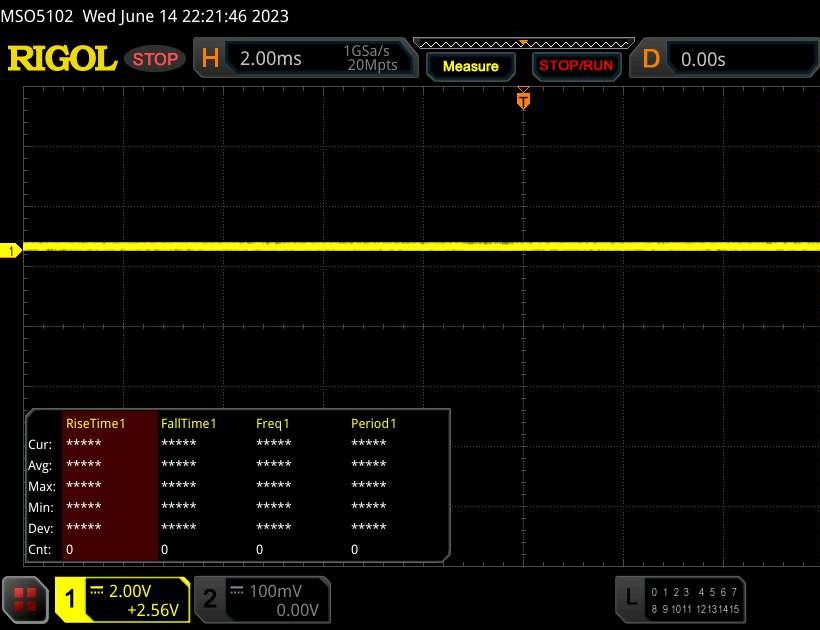 | ||
In comparison: 52 % of all tested devices do not use PWM to dim the display. If PWM was detected, an average of 7763 (minimum: 5 - maximum: 343500) Hz was measured. | |||
Performance
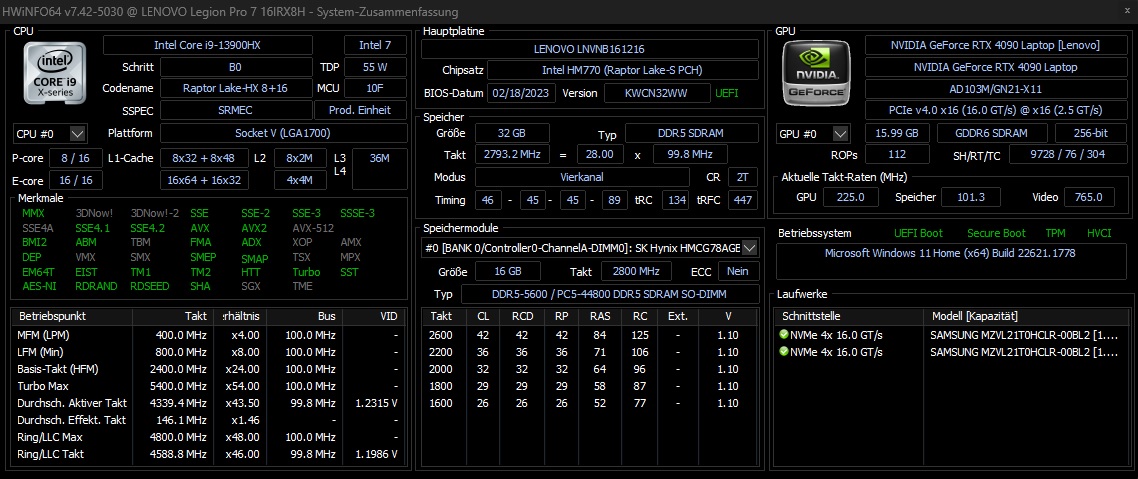
The Legion Pro 7 16IRX8H is in the absolute upper league in terms of price and performance. The 16-incher offers enough reserves to be well-prepared for new games in the coming years. While the CPU and GPU are soldered (which is usual in modern laptops), the working memory and mass storage could be replaced if required.

Test conditions
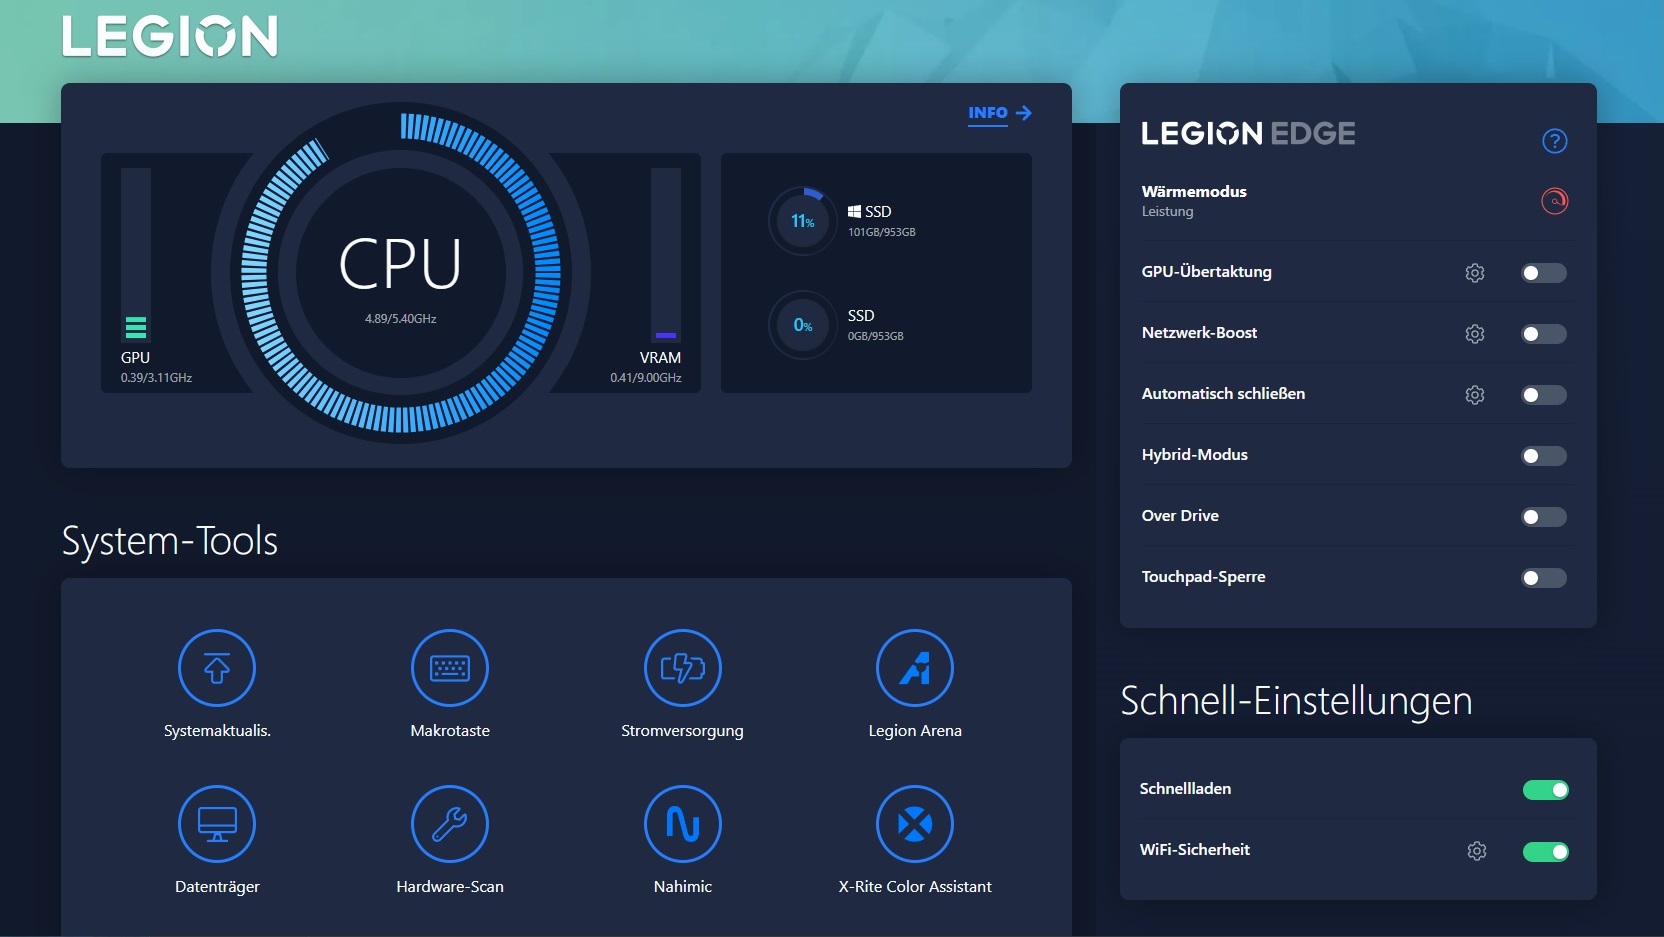
The preloaded Lenovo Vantage software contains many options for customizing the system. The Heat mode and the optional Hybrid mode are particularly relevant. With the exception of the battery measurements (Balanced with graphics switching), all our tests were performed in Performance mode with a permanently active dGPU.
| Silent Mode | Balanced Mode | Performance Mode | |
| CPU PL1 (HWiNFO) | 55 W | 80 W | 130 W |
| CPU PL2 (HWiNFO) | 65 W | 119 W | 185 W |
| Noise (Witcher 3 @FHD/Ultra) | ~37 dB(A) | ~47 dB(A) | ~53 dB(A) |
| Performance (Witcher 3 @FHD/Ultra) | 40 FPS (Locked) | ~160 FPS | ~200 FPS |
Processor
As expected, the Core i9-13900HX delivers very similar performance to the RTX 4080 model. The performance of the Raptor Lake chip is also quite constant over longer periods (see Cinebench loop). In general, the CPU performs slightly above the 13900HX average determined so far. Intel combines 8 performance cores with Hyper-Threading and 16 efficiency cores without HT, which means 32 parallel threads in total.
Cinebench R15 Multi Loop
* ... smaller is better
AIDA64: FP32 Ray-Trace | FPU Julia | CPU SHA3 | CPU Queen | FPU SinJulia | FPU Mandel | CPU AES | CPU ZLib | FP64 Ray-Trace | CPU PhotoWorxx
| Performance rating | |
| Asus ROG Strix Scar 17 G733PY-XS96 | |
| MSI Titan GT77 HX 13VI | |
| Lenovo Legion Pro 7 RTX4090 | |
| Lenovo Legion Pro 7 16IRX8H | |
| Schenker XMG Neo 16 E23 | |
| Average Intel Core i9-13900HX | |
| Average of class Gaming | |
| Razer Blade 16 Early 2023 RTX 4090 | |
| AIDA64 / FP32 Ray-Trace | |
| Asus ROG Strix Scar 17 G733PY-XS96 | |
| Average of class Gaming (10227 - 85542, n=106, last 2 years) | |
| MSI Titan GT77 HX 13VI | |
| Lenovo Legion Pro 7 RTX4090 | |
| Lenovo Legion Pro 7 16IRX8H | |
| Average Intel Core i9-13900HX (17589 - 27615, n=22) | |
| Schenker XMG Neo 16 E23 | |
| Razer Blade 16 Early 2023 RTX 4090 | |
| AIDA64 / FPU Julia | |
| Asus ROG Strix Scar 17 G733PY-XS96 | |
| MSI Titan GT77 HX 13VI | |
| Average of class Gaming (51376 - 238426, n=106, last 2 years) | |
| Lenovo Legion Pro 7 RTX4090 | |
| Lenovo Legion Pro 7 16IRX8H | |
| Average Intel Core i9-13900HX (88686 - 137015, n=22) | |
| Schenker XMG Neo 16 E23 | |
| Razer Blade 16 Early 2023 RTX 4090 | |
| AIDA64 / CPU SHA3 | |
| Asus ROG Strix Scar 17 G733PY-XS96 | |
| MSI Titan GT77 HX 13VI | |
| Lenovo Legion Pro 7 16IRX8H | |
| Lenovo Legion Pro 7 RTX4090 | |
| Average of class Gaming (2180 - 9817, n=106, last 2 years) | |
| Schenker XMG Neo 16 E23 | |
| Average Intel Core i9-13900HX (4362 - 7029, n=22) | |
| Razer Blade 16 Early 2023 RTX 4090 | |
| AIDA64 / CPU Queen | |
| Asus ROG Strix Scar 17 G733PY-XS96 | |
| MSI Titan GT77 HX 13VI | |
| Razer Blade 16 Early 2023 RTX 4090 | |
| Schenker XMG Neo 16 E23 | |
| Lenovo Legion Pro 7 RTX4090 | |
| Lenovo Legion Pro 7 16IRX8H | |
| Average Intel Core i9-13900HX (125644 - 141385, n=22) | |
| Average of class Gaming (49785 - 173351, n=93, last 2 years) | |
| AIDA64 / FPU SinJulia | |
| Asus ROG Strix Scar 17 G733PY-XS96 | |
| MSI Titan GT77 HX 13VI | |
| Lenovo Legion Pro 7 16IRX8H | |
| Lenovo Legion Pro 7 RTX4090 | |
| Average Intel Core i9-13900HX (12334 - 17179, n=22) | |
| Schenker XMG Neo 16 E23 | |
| Average of class Gaming (4424 - 33636, n=106, last 2 years) | |
| Razer Blade 16 Early 2023 RTX 4090 | |
| AIDA64 / FPU Mandel | |
| Asus ROG Strix Scar 17 G733PY-XS96 | |
| Average of class Gaming (25115 - 128721, n=106, last 2 years) | |
| MSI Titan GT77 HX 13VI | |
| Lenovo Legion Pro 7 RTX4090 | |
| Lenovo Legion Pro 7 16IRX8H | |
| Average Intel Core i9-13900HX (43850 - 69202, n=22) | |
| Schenker XMG Neo 16 E23 | |
| Razer Blade 16 Early 2023 RTX 4090 | |
| AIDA64 / CPU AES | |
| Schenker XMG Neo 16 E23 | |
| Razer Blade 16 Early 2023 RTX 4090 | |
| Asus ROG Strix Scar 17 G733PY-XS96 | |
| Average Intel Core i9-13900HX (89413 - 237881, n=22) | |
| MSI Titan GT77 HX 13VI | |
| Lenovo Legion Pro 7 RTX4090 | |
| Lenovo Legion Pro 7 16IRX8H | |
| Average of class Gaming (39258 - 247074, n=106, last 2 years) | |
| AIDA64 / CPU ZLib | |
| Asus ROG Strix Scar 17 G733PY-XS96 | |
| MSI Titan GT77 HX 13VI | |
| Lenovo Legion Pro 7 16IRX8H | |
| Lenovo Legion Pro 7 RTX4090 | |
| Schenker XMG Neo 16 E23 | |
| Average Intel Core i9-13900HX (1284 - 1958, n=22) | |
| Razer Blade 16 Early 2023 RTX 4090 | |
| Average of class Gaming (574 - 2531, n=106, last 2 years) | |
| AIDA64 / FP64 Ray-Trace | |
| Asus ROG Strix Scar 17 G733PY-XS96 | |
| Average of class Gaming (5509 - 45446, n=106, last 2 years) | |
| MSI Titan GT77 HX 13VI | |
| Lenovo Legion Pro 7 16IRX8H | |
| Lenovo Legion Pro 7 RTX4090 | |
| Average Intel Core i9-13900HX (9481 - 15279, n=22) | |
| Schenker XMG Neo 16 E23 | |
| Razer Blade 16 Early 2023 RTX 4090 | |
| AIDA64 / CPU PhotoWorxx | |
| Razer Blade 16 Early 2023 RTX 4090 | |
| Lenovo Legion Pro 7 RTX4090 | |
| Schenker XMG Neo 16 E23 | |
| Lenovo Legion Pro 7 16IRX8H | |
| Average Intel Core i9-13900HX (42994 - 51994, n=22) | |
| Average of class Gaming (12271 - 89891, n=106, last 2 years) | |
| MSI Titan GT77 HX 13VI | |
| Asus ROG Strix Scar 17 G733PY-XS96 | |
System performance
The system power is also at a very high level: 8,158 points in PCMark 10 are a few percent higher than the result of the RTX 4080 model. The benchmark results of the DDR5 working memory are also impressive in comparison.
CrossMark: Overall | Productivity | Creativity | Responsiveness
| PCMark 10 / Score | |
| MSI Titan GT77 HX 13VI | |
| Asus ROG Strix Scar 17 G733PY-XS96 | |
| Average Intel Core i9-13900HX, NVIDIA GeForce RTX 4090 Laptop GPU (7690 - 9331, n=8) | |
| Schenker XMG Neo 16 E23 | |
| Average of class Gaming (5828 - 11574, n=94, last 2 years) | |
| Lenovo Legion Pro 7 RTX4090 | |
| Lenovo Legion Pro 7 16IRX8H | |
| Razer Blade 16 Early 2023 RTX 4090 | |
| PCMark 10 / Essentials | |
| MSI Titan GT77 HX 13VI | |
| Lenovo Legion Pro 7 16IRX8H | |
| Average Intel Core i9-13900HX, NVIDIA GeForce RTX 4090 Laptop GPU (10972 - 11983, n=8) | |
| Asus ROG Strix Scar 17 G733PY-XS96 | |
| Lenovo Legion Pro 7 RTX4090 | |
| Schenker XMG Neo 16 E23 | |
| Razer Blade 16 Early 2023 RTX 4090 | |
| Average of class Gaming (8810 - 11935, n=98, last 2 years) | |
| PCMark 10 / Productivity | |
| Average of class Gaming (6845 - 21327, n=96, last 2 years) | |
| Lenovo Legion Pro 7 16IRX8H | |
| Average Intel Core i9-13900HX, NVIDIA GeForce RTX 4090 Laptop GPU (9038 - 11680, n=8) | |
| Asus ROG Strix Scar 17 G733PY-XS96 | |
| MSI Titan GT77 HX 13VI | |
| Schenker XMG Neo 16 E23 | |
| Lenovo Legion Pro 7 RTX4090 | |
| Razer Blade 16 Early 2023 RTX 4090 | |
| PCMark 10 / Digital Content Creation | |
| MSI Titan GT77 HX 13VI | |
| Asus ROG Strix Scar 17 G733PY-XS96 | |
| Schenker XMG Neo 16 E23 | |
| Lenovo Legion Pro 7 RTX4090 | |
| Average Intel Core i9-13900HX, NVIDIA GeForce RTX 4090 Laptop GPU (10605 - 16395, n=8) | |
| Average of class Gaming (7602 - 19657, n=96, last 2 years) | |
| Razer Blade 16 Early 2023 RTX 4090 | |
| Lenovo Legion Pro 7 16IRX8H | |
| CrossMark / Overall | |
| MSI Titan GT77 HX 13VI | |
| Schenker XMG Neo 16 E23 | |
| Average Intel Core i9-13900HX, NVIDIA GeForce RTX 4090 Laptop GPU (1825 - 2295, n=8) | |
| Razer Blade 16 Early 2023 RTX 4090 | |
| Asus ROG Strix Scar 17 G733PY-XS96 | |
| Average of class Gaming (1366 - 2409, n=95, last 2 years) | |
| CrossMark / Productivity | |
| MSI Titan GT77 HX 13VI | |
| Average Intel Core i9-13900HX, NVIDIA GeForce RTX 4090 Laptop GPU (1666 - 2166, n=8) | |
| Schenker XMG Neo 16 E23 | |
| Razer Blade 16 Early 2023 RTX 4090 | |
| Average of class Gaming (1386 - 2254, n=95, last 2 years) | |
| Asus ROG Strix Scar 17 G733PY-XS96 | |
| CrossMark / Creativity | |
| Schenker XMG Neo 16 E23 | |
| MSI Titan GT77 HX 13VI | |
| Average Intel Core i9-13900HX, NVIDIA GeForce RTX 4090 Laptop GPU (2162 - 2514, n=8) | |
| Asus ROG Strix Scar 17 G733PY-XS96 | |
| Average of class Gaming (1343 - 2729, n=95, last 2 years) | |
| Razer Blade 16 Early 2023 RTX 4090 | |
| CrossMark / Responsiveness | |
| MSI Titan GT77 HX 13VI | |
| Average Intel Core i9-13900HX, NVIDIA GeForce RTX 4090 Laptop GPU (1441 - 2275, n=8) | |
| Razer Blade 16 Early 2023 RTX 4090 | |
| Schenker XMG Neo 16 E23 | |
| Average of class Gaming (1226 - 2334, n=95, last 2 years) | |
| Asus ROG Strix Scar 17 G733PY-XS96 | |
| PCMark 10 Score | 8158 points | |
Help | ||
| AIDA64 / Memory Copy | |
| Razer Blade 16 Early 2023 RTX 4090 | |
| Lenovo Legion Pro 7 RTX4090 | |
| Lenovo Legion Pro 7 16IRX8H | |
| Schenker XMG Neo 16 E23 | |
| Average Intel Core i9-13900HX (67716 - 79193, n=22) | |
| Average of class Gaming (21750 - 129946, n=106, last 2 years) | |
| MSI Titan GT77 HX 13VI | |
| Asus ROG Strix Scar 17 G733PY-XS96 | |
| AIDA64 / Memory Read | |
| Lenovo Legion Pro 7 RTX4090 | |
| Razer Blade 16 Early 2023 RTX 4090 | |
| Lenovo Legion Pro 7 16IRX8H | |
| Schenker XMG Neo 16 E23 | |
| Average Intel Core i9-13900HX (73998 - 88462, n=22) | |
| Average of class Gaming (22956 - 118858, n=106, last 2 years) | |
| MSI Titan GT77 HX 13VI | |
| Asus ROG Strix Scar 17 G733PY-XS96 | |
| AIDA64 / Memory Write | |
| Lenovo Legion Pro 7 RTX4090 | |
| Razer Blade 16 Early 2023 RTX 4090 | |
| Average of class Gaming (22297 - 135096, n=106, last 2 years) | |
| Average Intel Core i9-13900HX (65472 - 77045, n=22) | |
| Schenker XMG Neo 16 E23 | |
| Lenovo Legion Pro 7 16IRX8H | |
| MSI Titan GT77 HX 13VI | |
| Asus ROG Strix Scar 17 G733PY-XS96 | |
| AIDA64 / Memory Latency | |
| Average of class Gaming (75.3 - 259, n=106, last 2 years) | |
| MSI Titan GT77 HX 13VI | |
| Razer Blade 16 Early 2023 RTX 4090 | |
| Schenker XMG Neo 16 E23 | |
| Average Intel Core i9-13900HX (75.3 - 91.1, n=22) | |
| Lenovo Legion Pro 7 RTX4090 | |
| Lenovo Legion Pro 7 16IRX8H | |
| Asus ROG Strix Scar 17 G733PY-XS96 | |
* ... smaller is better
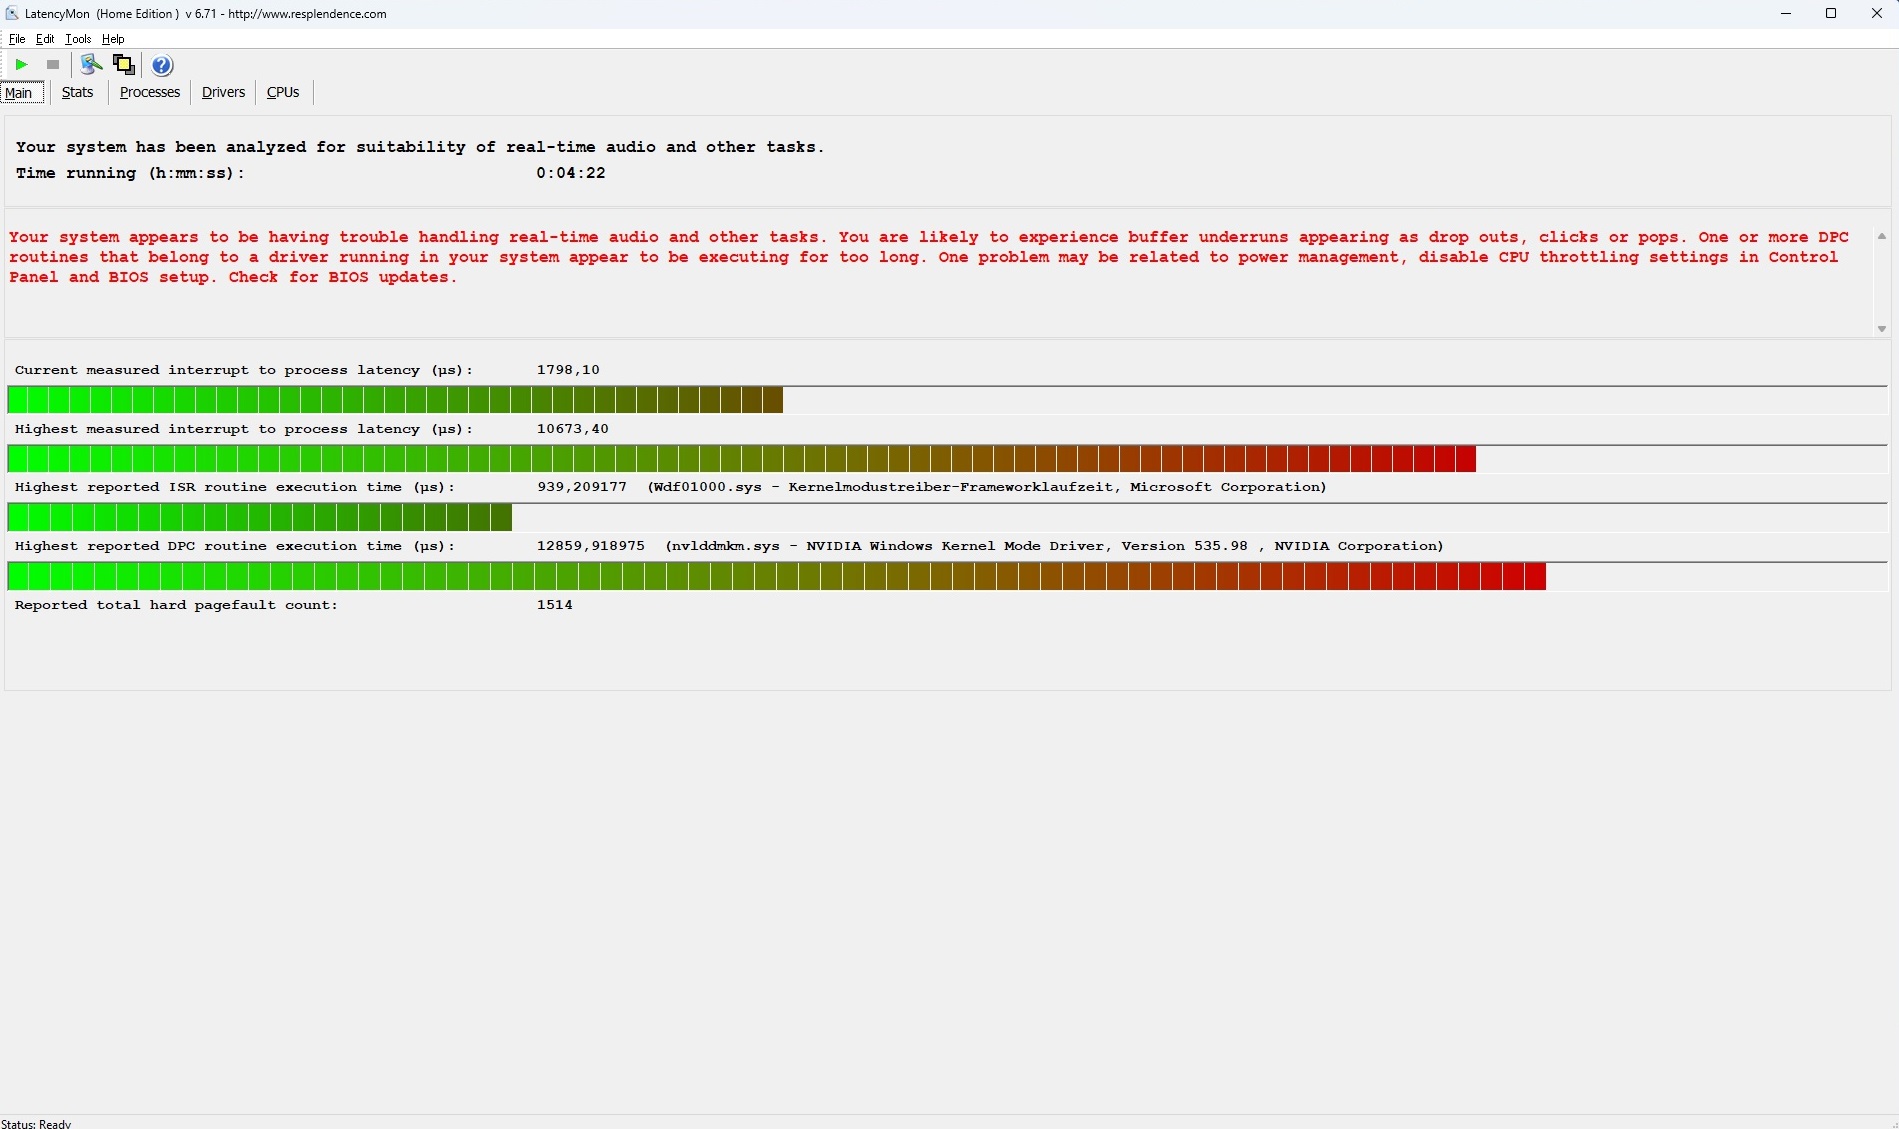
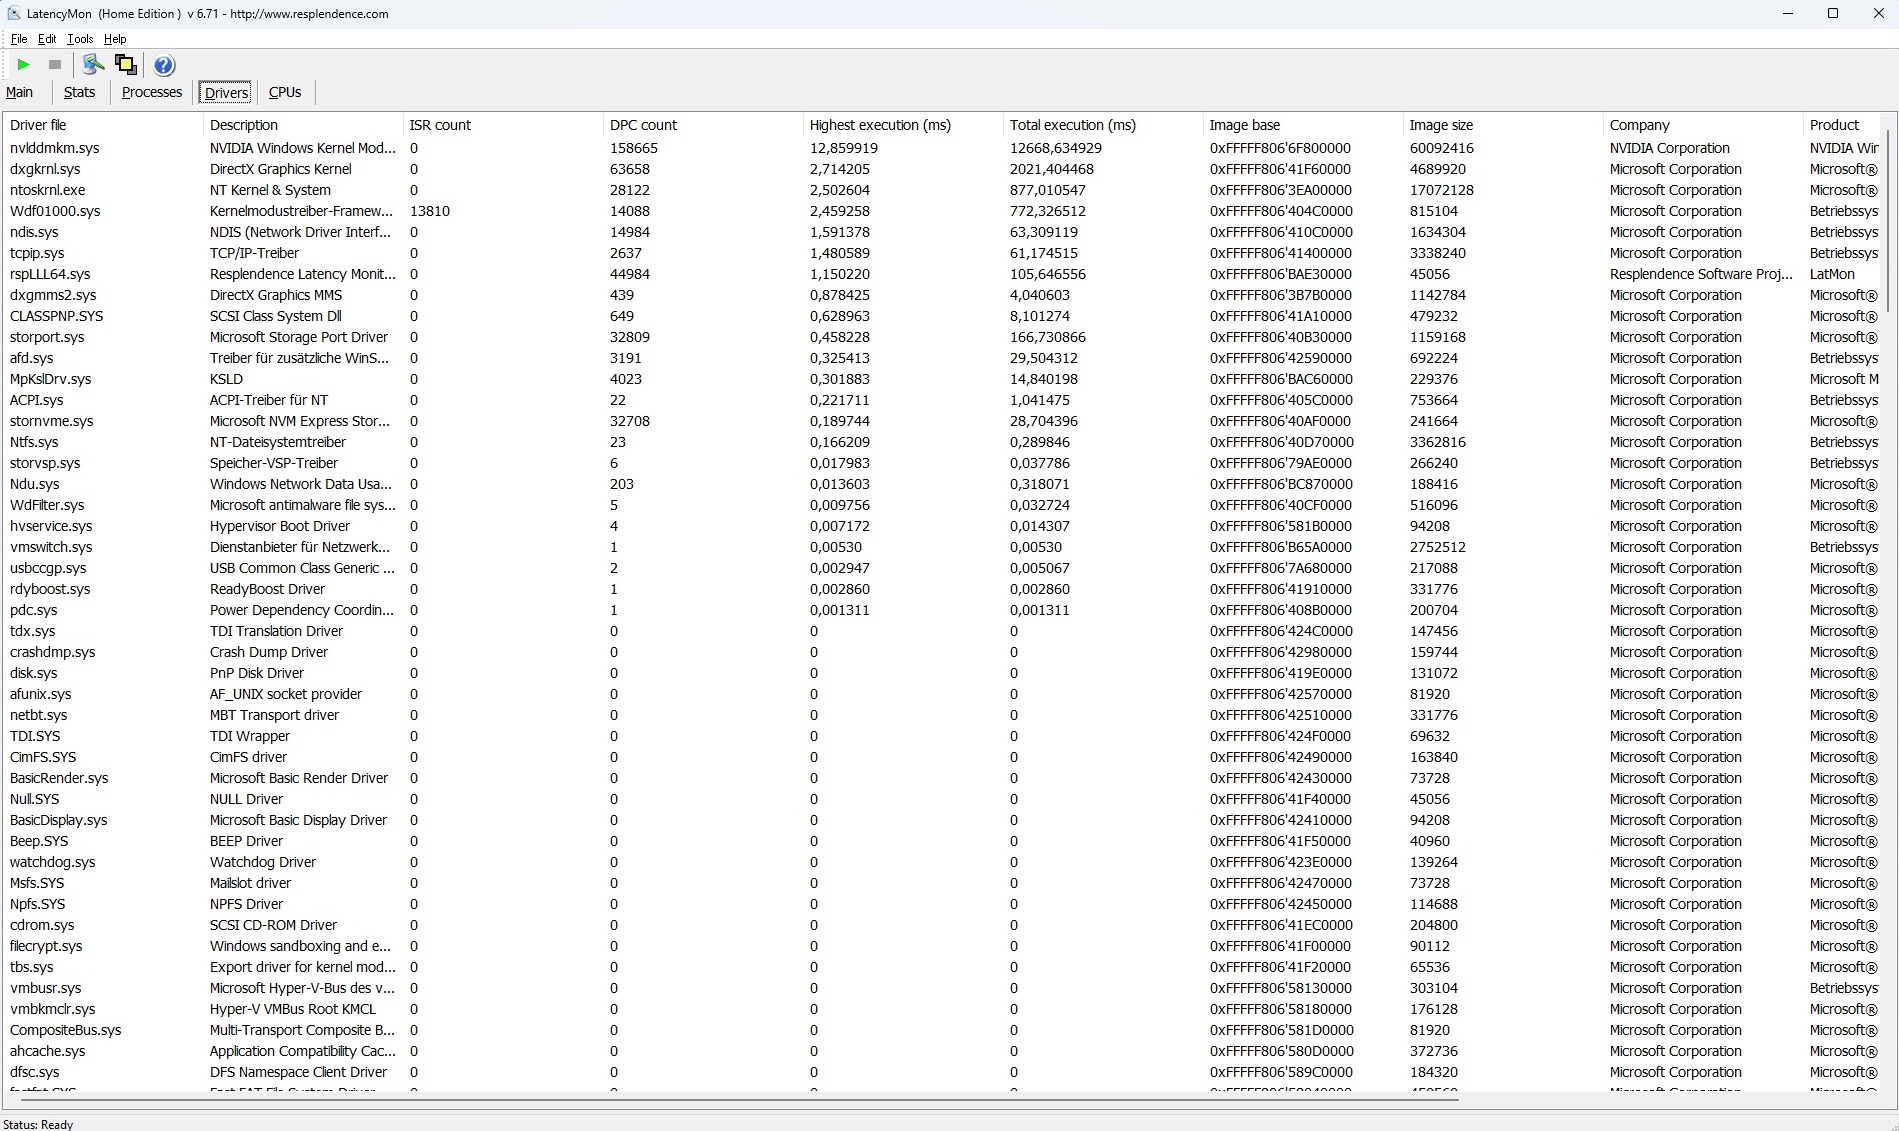
DPC latencies
The test configuration does not perform quite as well in terms of latencies. According to the LatencyMon tool, the 16-incher is not suitable for real-time audio and video editing in its state of delivery due to extremely high values. Interestingly, the latencies were significantly lower in the RTX 4080 version.
| DPC Latencies / LatencyMon - interrupt to process latency (max), Web, Youtube, Prime95 | |
| Lenovo Legion Pro 7 RTX4090 | |
| Schenker XMG Neo 16 E23 | |
| MSI Titan GT77 HX 13VI | |
| Asus ROG Strix Scar 17 G733PY-XS96 | |
| Lenovo Legion Pro 7 16IRX8H | |
* ... smaller is better
Mass storage
Instead of installing a larger SSD, Lenovo simply uses two 1-TB SSDs from the cheaper Legion model, which completely occupies the M.2 slots. The popular Samsung PM9A1 achieves very good results but often has to deal with stronger fluctuations or drops during longer periods of load - as in the case of the Pro 7. However, this phenomenon also affects NVMe SSDs from other manufacturers (see graph).

* ... smaller is better
Continuous read: DiskSpd Read Loop, Queue Depth 8
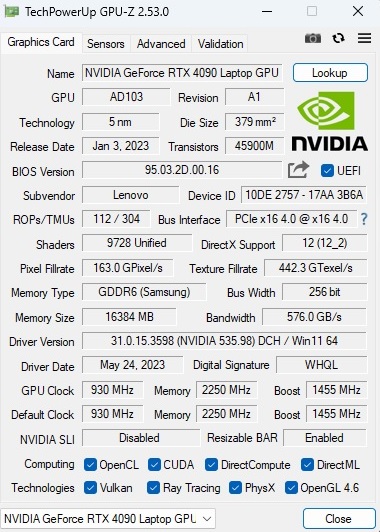
Graphics card
The GeForce RTX 4090 is currently the fastest mobile gaming graphics card. The top model from Nvidia's Ada-Lovelace generation comes with 9,728 shaders and 16 GB GDDR6 memory. When it comes to synthetic benchmarks, the Legion Pro 7 ranks midway between the RTX 4090 competition, which also relies on the maximum TGP of 175 watts (including Dynamic Boost).
| 3DMark 11 Performance | 44779 points | |
| 3DMark Fire Strike Score | 34742 points | |
| 3DMark Time Spy Score | 20039 points | |
Help | ||
* ... smaller is better
Gaming performance
The 16-incher especially flexes its muscles in the gaming tests. Current titles run smoothly in the native resolution (our QHD benchmarks were created with 2,560 x 1,440 instead of 2,560 x 1,600 pixels) even in maximum details, and more than 60 FPS are almost always achieved. Even on 4K displays, full settings would usually not be a problem - even without the help of DLSS or Frame Generation.
| The Witcher 3 - 1920x1080 Ultra Graphics & Postprocessing (HBAO+) | |
| Schenker XMG Neo 16 E23 | |
| Asus ROG Strix Scar 17 G733PY-XS96 | |
| Lenovo Legion Pro 7 RTX4090 | |
| MSI Titan GT77 HX 13VI | |
| Average NVIDIA GeForce RTX 4090 Laptop GPU (139.2 - 216, n=35) | |
| Lenovo Legion Pro 7 16IRX8H | |
| Average of class Gaming (95 - 240, n=7, last 2 years) | |
| Razer Blade 16 Early 2023 RTX 4090 | |
| Call of Duty Modern Warfare 2 2022 | |
| 3840x2160 Extreme Quality Preset AA:T2X Filmic SM | |
| MSI Titan GT77 HX 13VI | |
| Asus ROG Strix Scar 17 G733PY-XS96 | |
| Lenovo Legion Pro 7 RTX4090 | |
| Average NVIDIA GeForce RTX 4090 Laptop GPU (63 - 86, n=12) | |
| Razer Blade 16 Early 2023 RTX 4090 | |
| Lenovo Legion Pro 7 16IRX8H | |
| 2560x1440 Extreme Quality Preset AA:T2X Filmic SM | |
| MSI Titan GT77 HX 13VI | |
| Asus ROG Strix Scar 17 G733PY-XS96 | |
| Lenovo Legion Pro 7 RTX4090 | |
| Average NVIDIA GeForce RTX 4090 Laptop GPU (104 - 137, n=14) | |
| Razer Blade 16 Early 2023 RTX 4090 | |
| Lenovo Legion Pro 7 16IRX8H | |
| A Plague Tale Requiem | |
| 3840x2160 Ultra Preset | |
| Lenovo Legion Pro 7 RTX4090 | |
| Average NVIDIA GeForce RTX 4090 Laptop GPU (33.1 - 43.8, n=3) | |
| Lenovo Legion Pro 7 16IRX8H | |
| 2560x1440 Ultra Preset | |
| Lenovo Legion Pro 7 RTX4090 | |
| Average NVIDIA GeForce RTX 4090 Laptop GPU (58.9 - 77.2, n=3) | |
| Lenovo Legion Pro 7 16IRX8H | |
| The Witcher 3 v4 | |
| 3840x2160 Ultra Preset / On AA:FX | |
| Average NVIDIA GeForce RTX 4090 Laptop GPU (41.6 - 84.4, n=7) | |
| MSI Titan GT77 HX 13VI | |
| Lenovo Legion Pro 7 RTX4090 | |
| Lenovo Legion Pro 7 16IRX8H | |
| Razer Blade 16 Early 2023 RTX 4090 | |
| 2560x1440 Ultra Preset / On AA:FX | |
| Average NVIDIA GeForce RTX 4090 Laptop GPU (83.3 - 165.7, n=8) | |
| MSI Titan GT77 HX 13VI | |
| Lenovo Legion Pro 7 RTX4090 | |
| Razer Blade 16 Early 2023 RTX 4090 | |
| Lenovo Legion Pro 7 16IRX8H | |
| Spider-Man Miles Morales | |
| 3840x2160 Very High Preset AA:T | |
| MSI Titan GT77 HX 13VI | |
| Lenovo Legion Pro 7 RTX4090 | |
| Average NVIDIA GeForce RTX 4090 Laptop GPU (65.7 - 84.3, n=7) | |
| Lenovo Legion Pro 7 16IRX8H | |
| 2560x1440 Very High Preset AA:T | |
| MSI Titan GT77 HX 13VI | |
| Lenovo Legion Pro 7 RTX4090 | |
| Average NVIDIA GeForce RTX 4090 Laptop GPU (93.3 - 119.8, n=7) | |
| Lenovo Legion Pro 7 16IRX8H | |
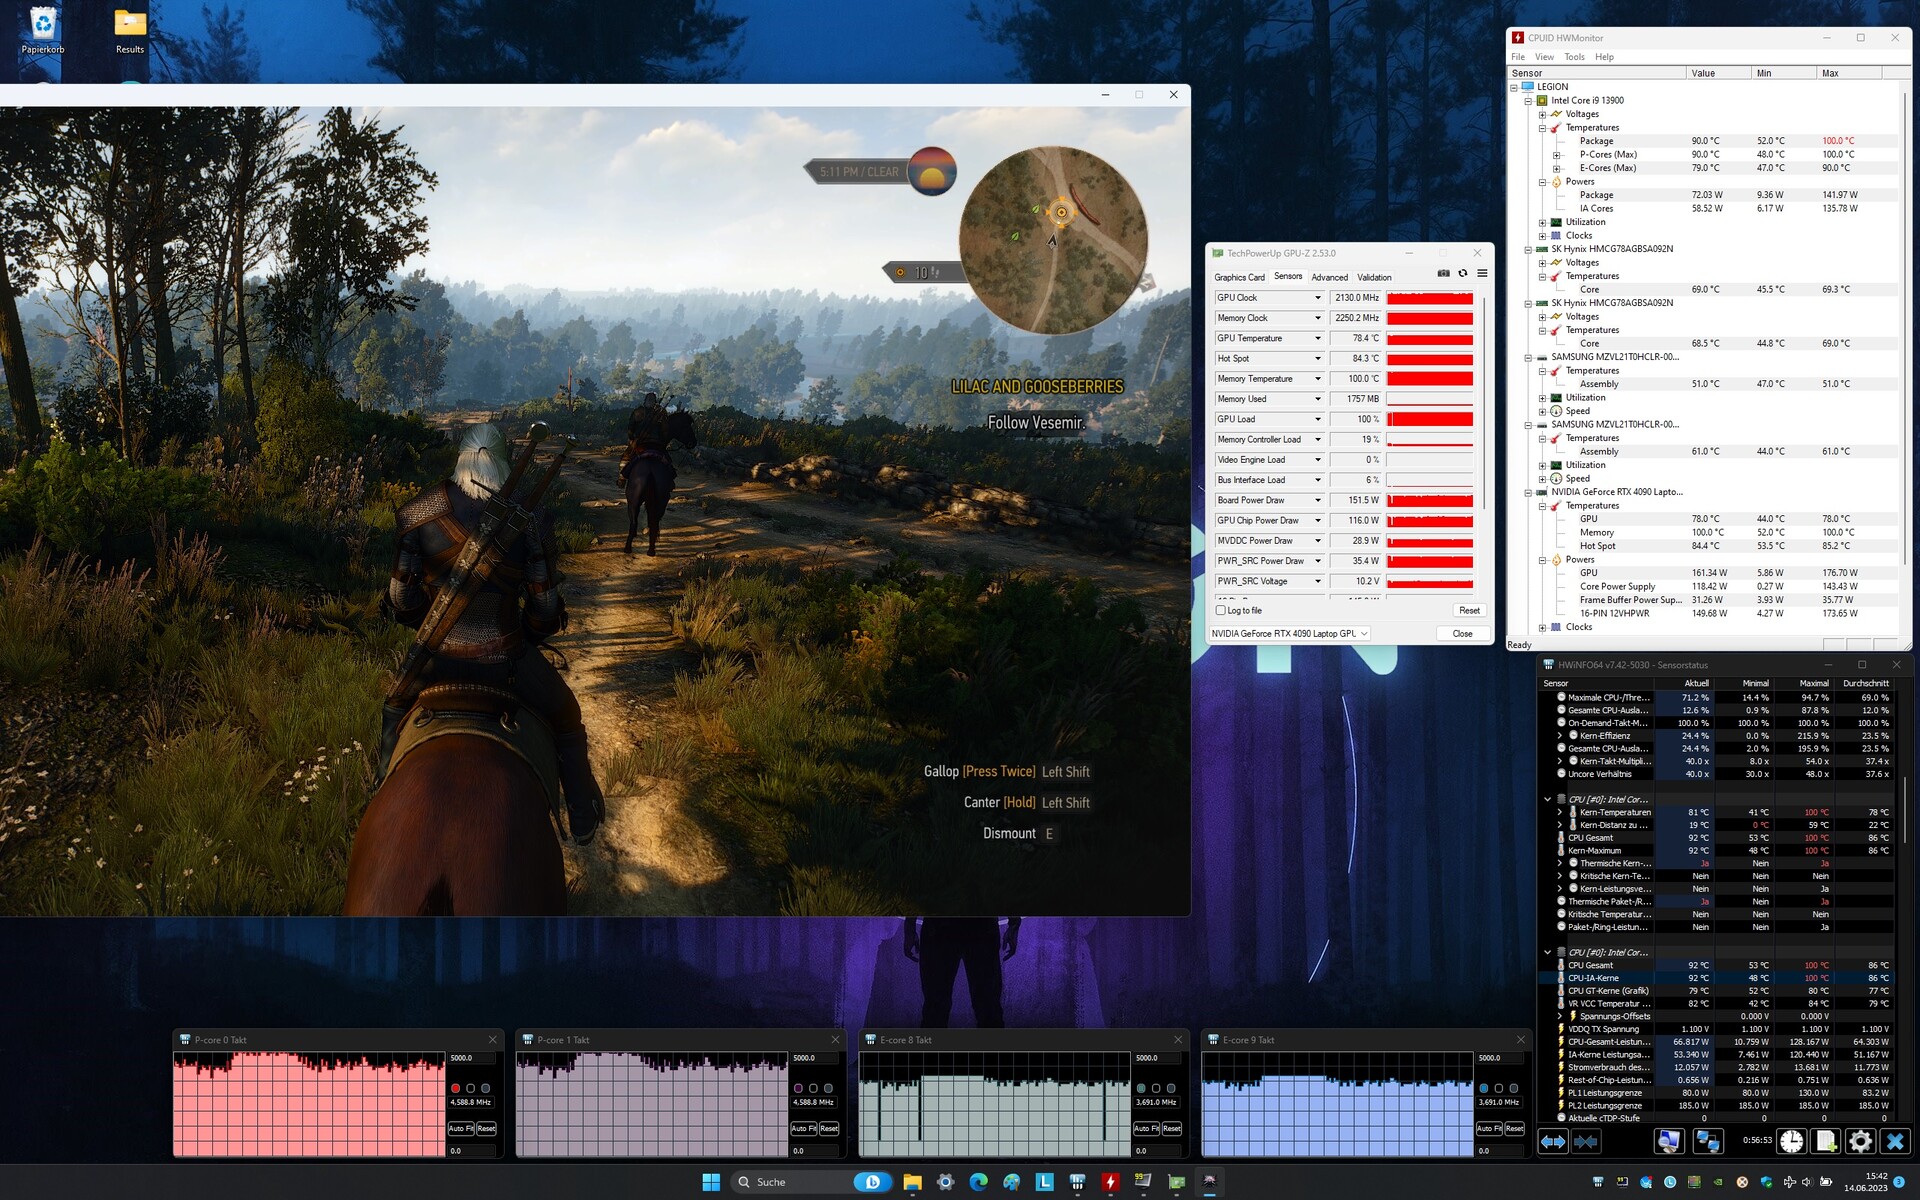
As usual, we tested whether the GPU performance remains constant under a longer load with The Witcher 3. Similar to the competition, we did not notice any performance drops or the like apart from minor fluctuations.
Witcher 3 FPS Chart
| low | med. | high | ultra | QHD | 4K | |
|---|---|---|---|---|---|---|
| GTA V (2015) | 186.3 | 186.9 | 184.9 | 143.6 | 137.7 | 173.6 |
| The Witcher 3 (2015) | 200 | |||||
| Dota 2 Reborn (2015) | 230 | 204 | 193.9 | 182.1 | 175.1 | |
| Final Fantasy XV Benchmark (2018) | 223 | 212 | 181.2 | 154 | 91.7 | |
| X-Plane 11.11 (2018) | 201 | 177.7 | 136.4 | 111.7 | ||
| Strange Brigade (2018) | 439 | 369 | 359 | 347 | 302 | 158.4 |
| Shadow of the Tomb Raider (2018) | 185 | 120 | ||||
| Cyberpunk 2077 1.6 (2022) | 100.93 | 50.05 | ||||
| F1 22 (2022) | 301 | 303 | 279 | 129.2 | 85.2 | 45.9 |
| A Plague Tale Requiem (2022) | 77.2 | 43.8 | ||||
| Call of Duty Modern Warfare 2 2022 (2022) | 132 | 82 | ||||
| Spider-Man Miles Morales (2022) | 108.1 | 80 | ||||
| The Witcher 3 v4 (2023) | 101.2 | 48.7 | ||||
| The Last of Us (2023) | 85.8 | 45.7 |
Emissions
Noise emissions
The big drawback of such potent high-end components is unsurprisingly the noise development. In Performance mode, the 16-incher gets loud in 3D applications between 48 dB(A) (average 3DMark 06) and 55 dB(A) (maximum stress test). In games, you can expect about 53 dB(A), which is also very unpleasant without a headset. The situation is much more relaxed in idle. Although the fans occasionally get a bit loud (e.g. during booting), an average of 28 to 30 dB(A) is acceptable, especially since the Silent or Balanced mode can be used if desired.
Noise level
| Idle |
| 28 / 30 / 38 dB(A) |
| Load |
| 48 / 55 dB(A) |
 | ||
30 dB silent 40 dB(A) audible 50 dB(A) loud |
||
min: | ||
| Lenovo Legion Pro 7 RTX4090 i9-13900HX, GeForce RTX 4090 Laptop GPU | Razer Blade 16 Early 2023 RTX 4090 i9-13950HX, GeForce RTX 4090 Laptop GPU | Asus ROG Strix Scar 17 G733PY-XS96 R9 7945HX, GeForce RTX 4090 Laptop GPU | Schenker XMG Neo 16 E23 i9-13900HX, GeForce RTX 4090 Laptop GPU | MSI Titan GT77 HX 13VI i9-13950HX, GeForce RTX 4090 Laptop GPU | Lenovo Legion Pro 7 16IRX8H i9-13900HX, GeForce RTX 4080 Laptop GPU | |
|---|---|---|---|---|---|---|
| Noise | 18% | 14% | -10% | 1% | 4% | |
| off / environment * (dB) | 25 | 20.84 17% | 22.7 9% | 25 -0% | 24.6 2% | 24 4% |
| Idle Minimum * (dB) | 28 | 23.65 16% | 23.5 16% | 31 -11% | 29.2 -4% | 26 7% |
| Idle Average * (dB) | 30 | 23.65 21% | 27.7 8% | 33 -10% | 29.2 3% | 28 7% |
| Idle Maximum * (dB) | 38 | 23.65 38% | 27.7 27% | 42 -11% | 29.2 23% | 34 11% |
| Load Average * (dB) | 48 | 43.35 10% | 30.5 36% | 58 -21% | 50.7 -6% | 47 2% |
| Witcher 3 ultra * (dB) | 53 | 46.7 12% | 51.4 3% | 57 -8% | 53.3 -1% | 55 -4% |
| Load Maximum * (dB) | 55 | 46.72 15% | 54.1 2% | 59 -7% | 61 -11% | 56 -2% |
* ... smaller is better
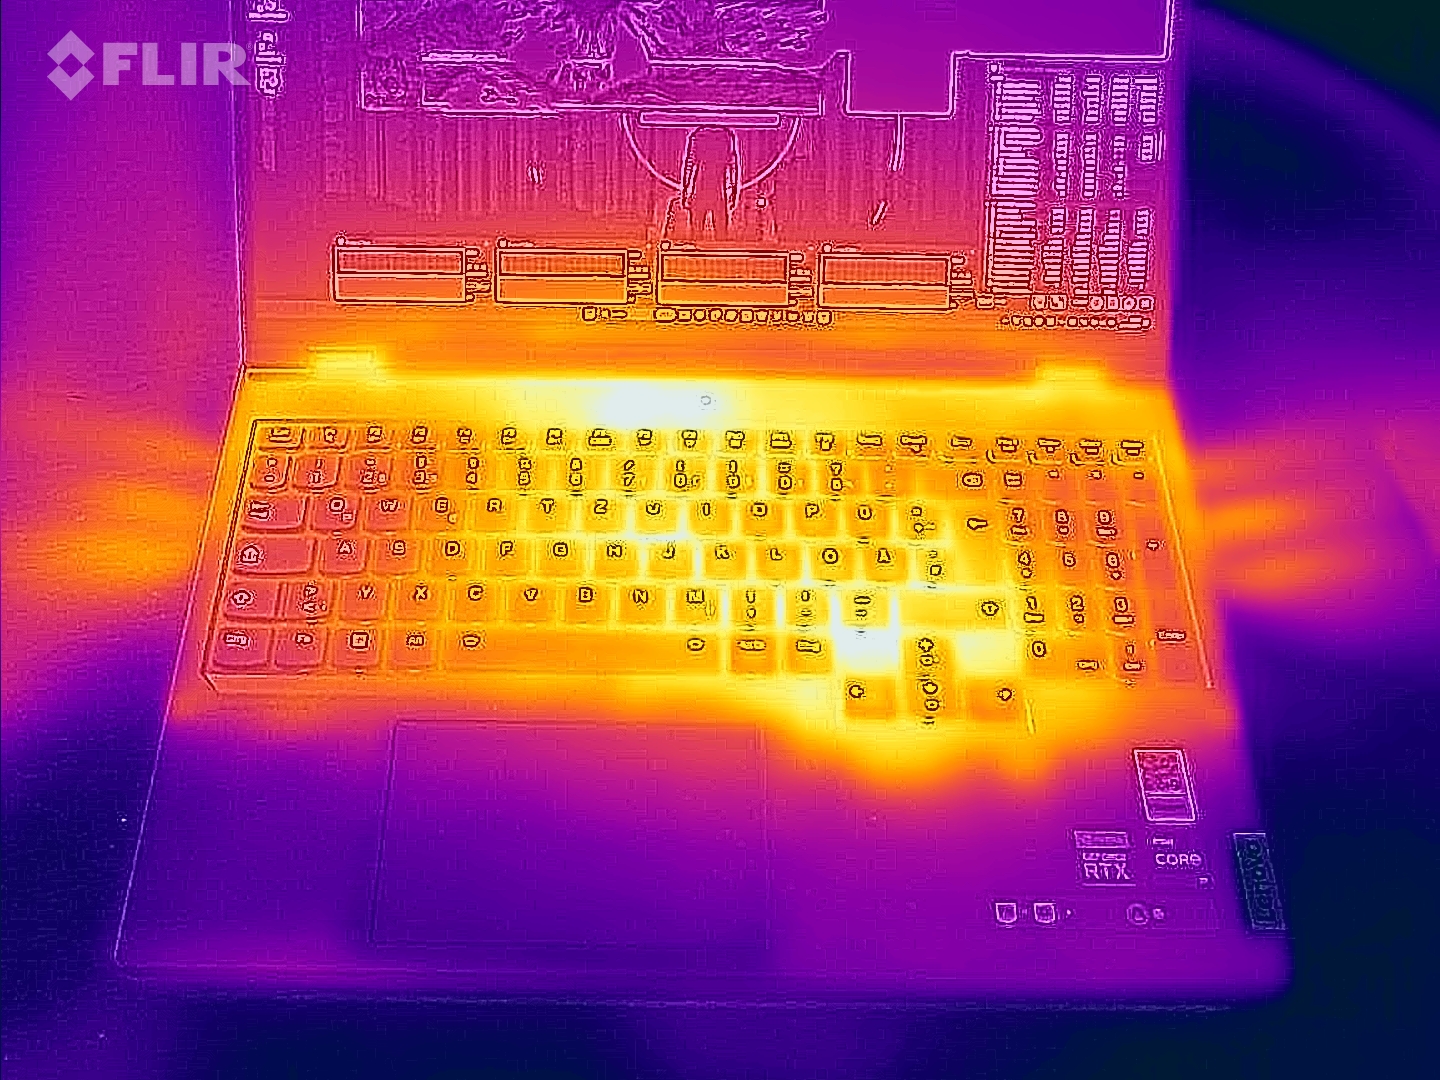
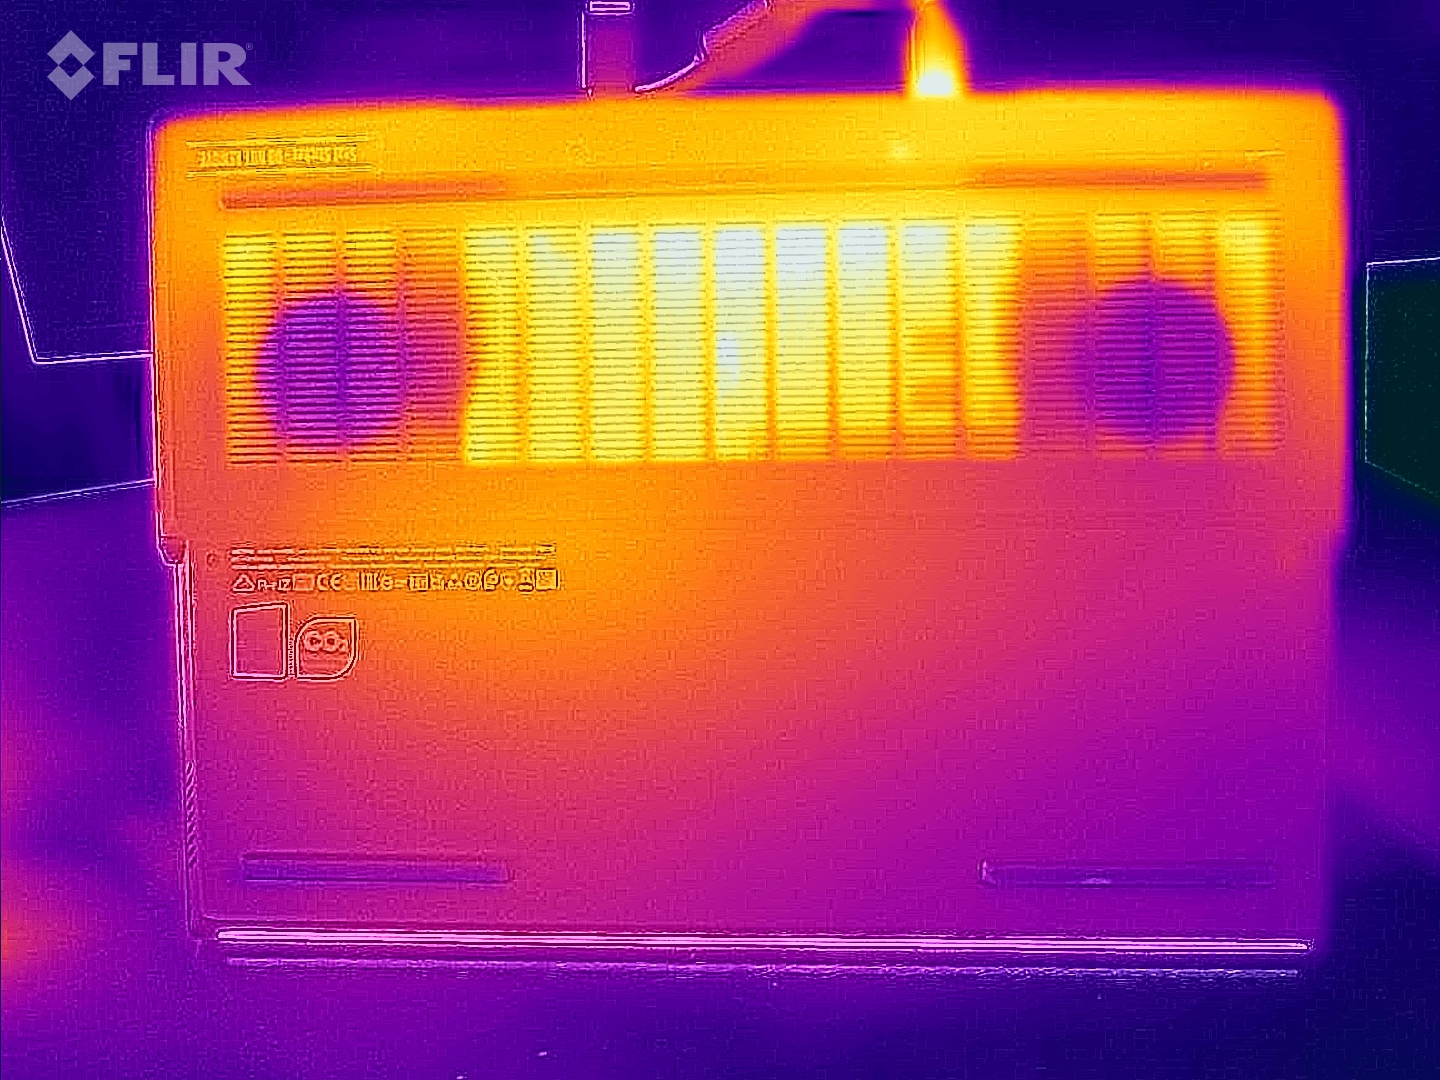
Temperature
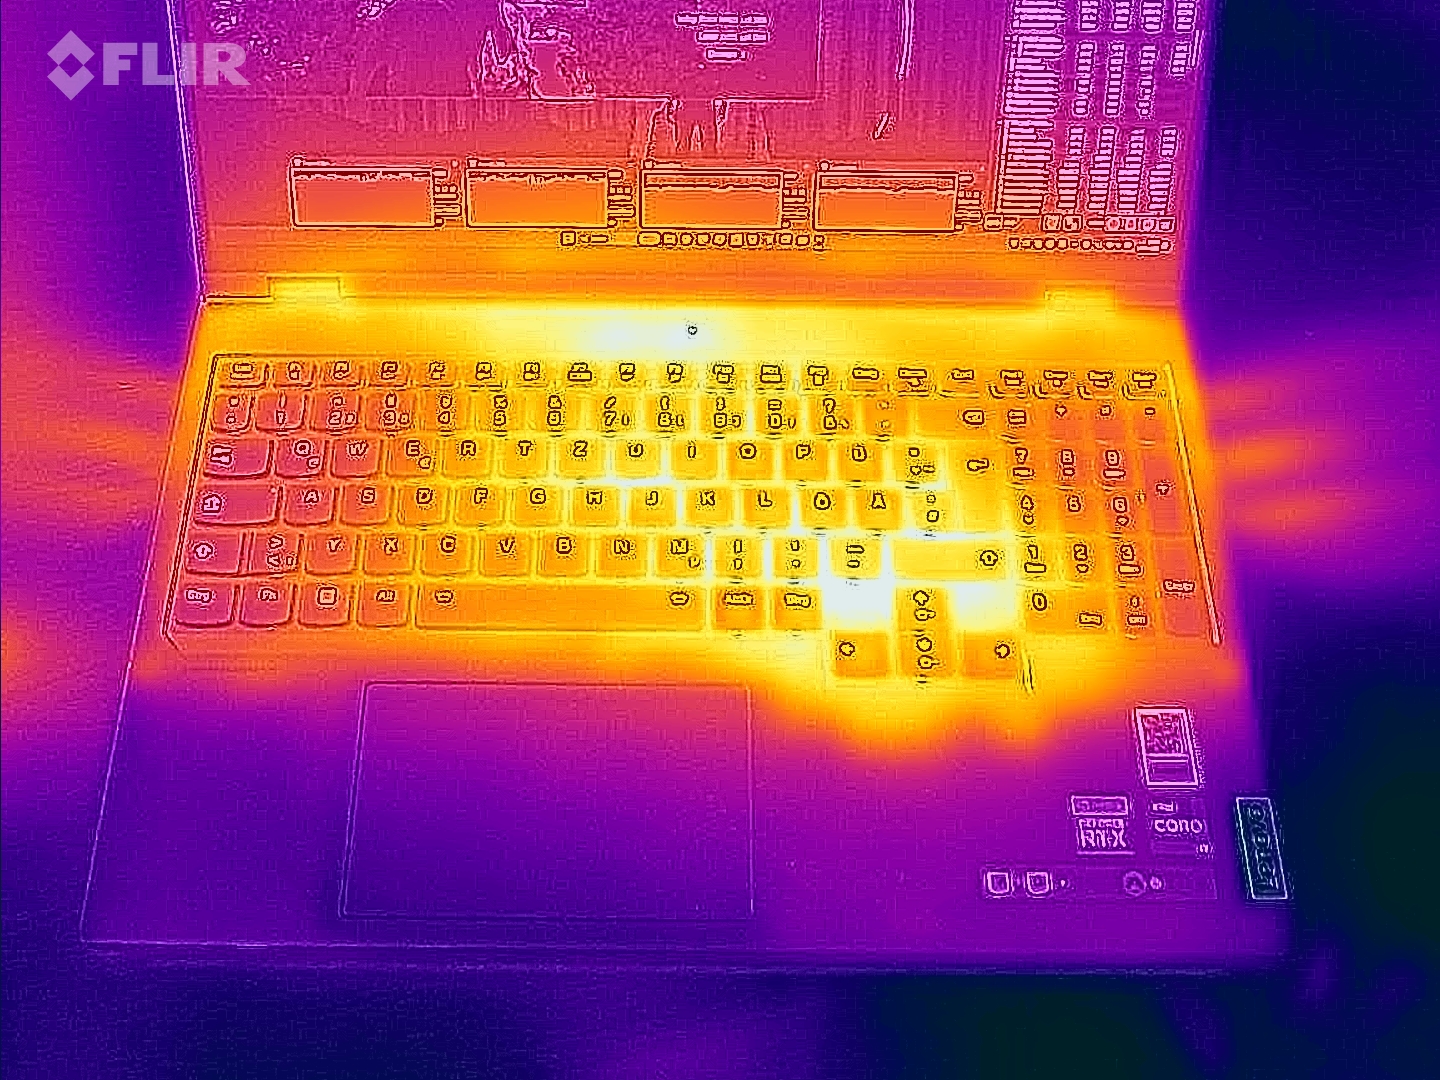
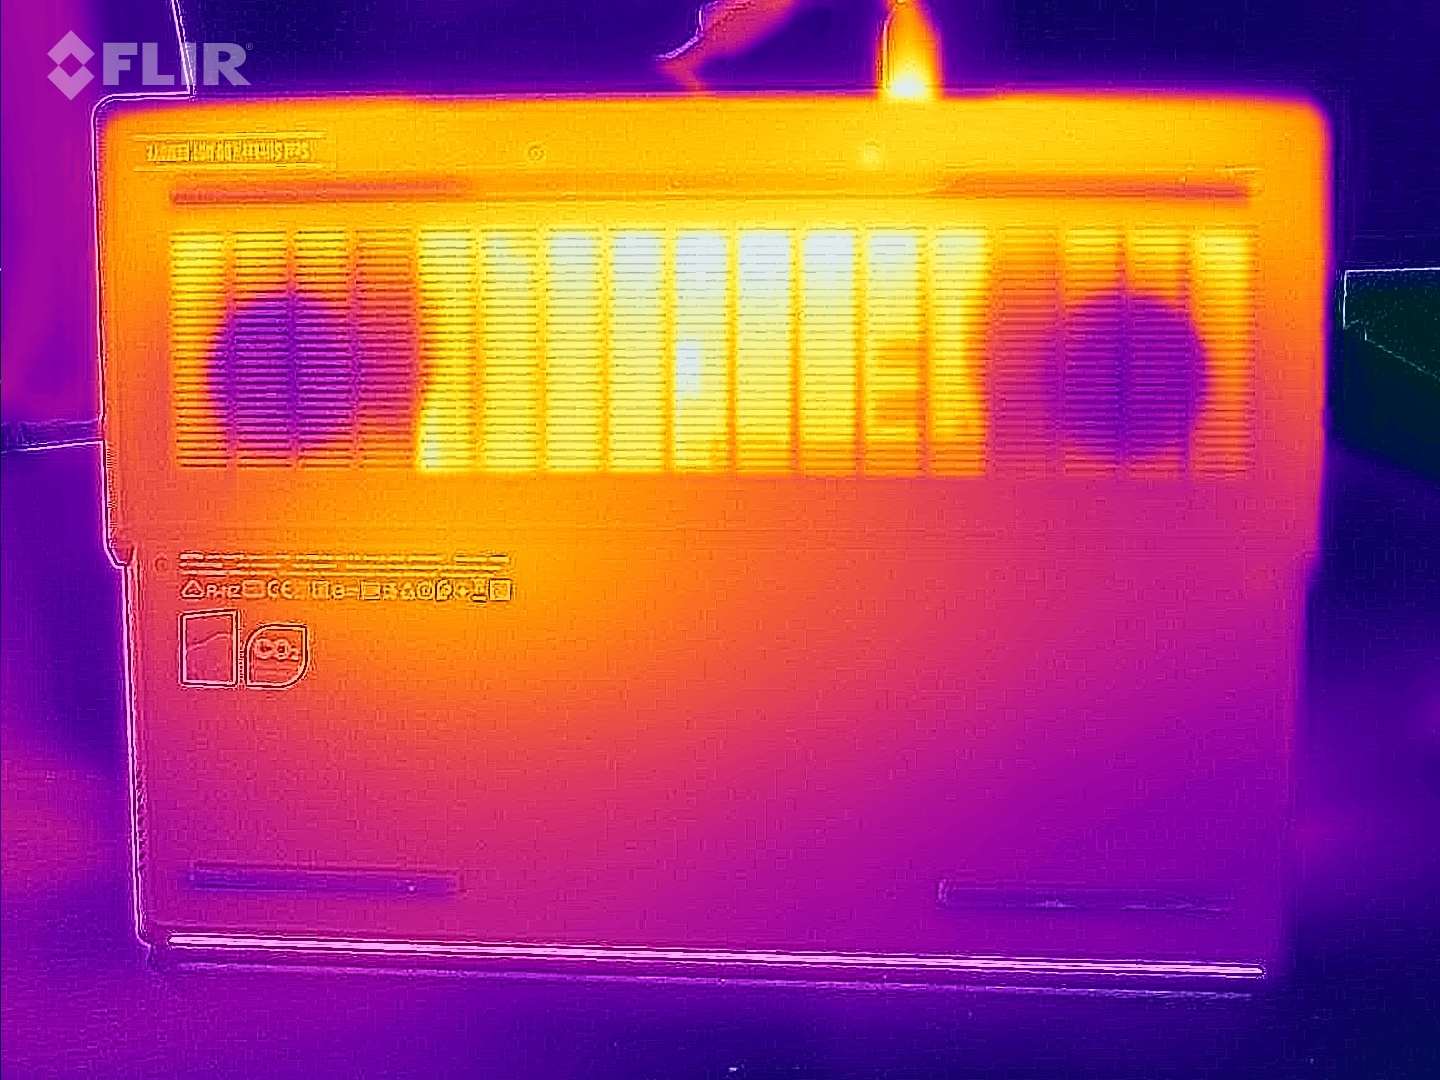
The case gets warmer than the competition with a maximum of 53 °C on the top and up to 59 °C on the bottom. The temperature development remains within limits in idle mode. The palm rest, for example, reaches around 29 °C - a moderate rate.
(-) The maximum temperature on the upper side is 53 °C / 127 F, compared to the average of 40.4 °C / 105 F, ranging from 21.2 to 68.8 °C for the class Gaming.
(-) The bottom heats up to a maximum of 59 °C / 138 F, compared to the average of 43.2 °C / 110 F
(+) In idle usage, the average temperature for the upper side is 31 °C / 88 F, compared to the device average of 33.9 °C / 93 F.
(-) Playing The Witcher 3, the average temperature for the upper side is 45.4 °C / 114 F, compared to the device average of 33.9 °C / 93 F.
(-) The palmrests and touchpad can get very hot to the touch with a maximum of 45 °C / 113 F.
(-) The average temperature of the palmrest area of similar devices was 28.8 °C / 83.8 F (-16.2 °C / -29.2 F).
| Lenovo Legion Pro 7 RTX4090 Intel Core i9-13900HX, NVIDIA GeForce RTX 4090 Laptop GPU | Razer Blade 16 Early 2023 RTX 4090 Intel Core i9-13950HX, NVIDIA GeForce RTX 4090 Laptop GPU | Asus ROG Strix Scar 17 G733PY-XS96 AMD Ryzen 9 7945HX, NVIDIA GeForce RTX 4090 Laptop GPU | Schenker XMG Neo 16 E23 Intel Core i9-13900HX, NVIDIA GeForce RTX 4090 Laptop GPU | MSI Titan GT77 HX 13VI Intel Core i9-13950HX, NVIDIA GeForce RTX 4090 Laptop GPU | Lenovo Legion Pro 7 16IRX8H Intel Core i9-13900HX, NVIDIA GeForce RTX 4080 Laptop GPU | |
|---|---|---|---|---|---|---|
| Heat | 7% | 25% | 14% | 20% | 1% | |
| Maximum Upper Side * (°C) | 53 | 52 2% | 34.6 35% | 50 6% | 40.6 23% | 48 9% |
| Maximum Bottom * (°C) | 59 | 47.6 19% | 35.6 40% | 51 14% | 41.1 30% | 49 17% |
| Idle Upper Side * (°C) | 34 | 33 3% | 27.2 20% | 28 18% | 26.2 23% | 40 -18% |
| Idle Bottom * (°C) | 32 | 30.6 4% | 30 6% | 26 19% | 30.3 5% | 33 -3% |
* ... smaller is better
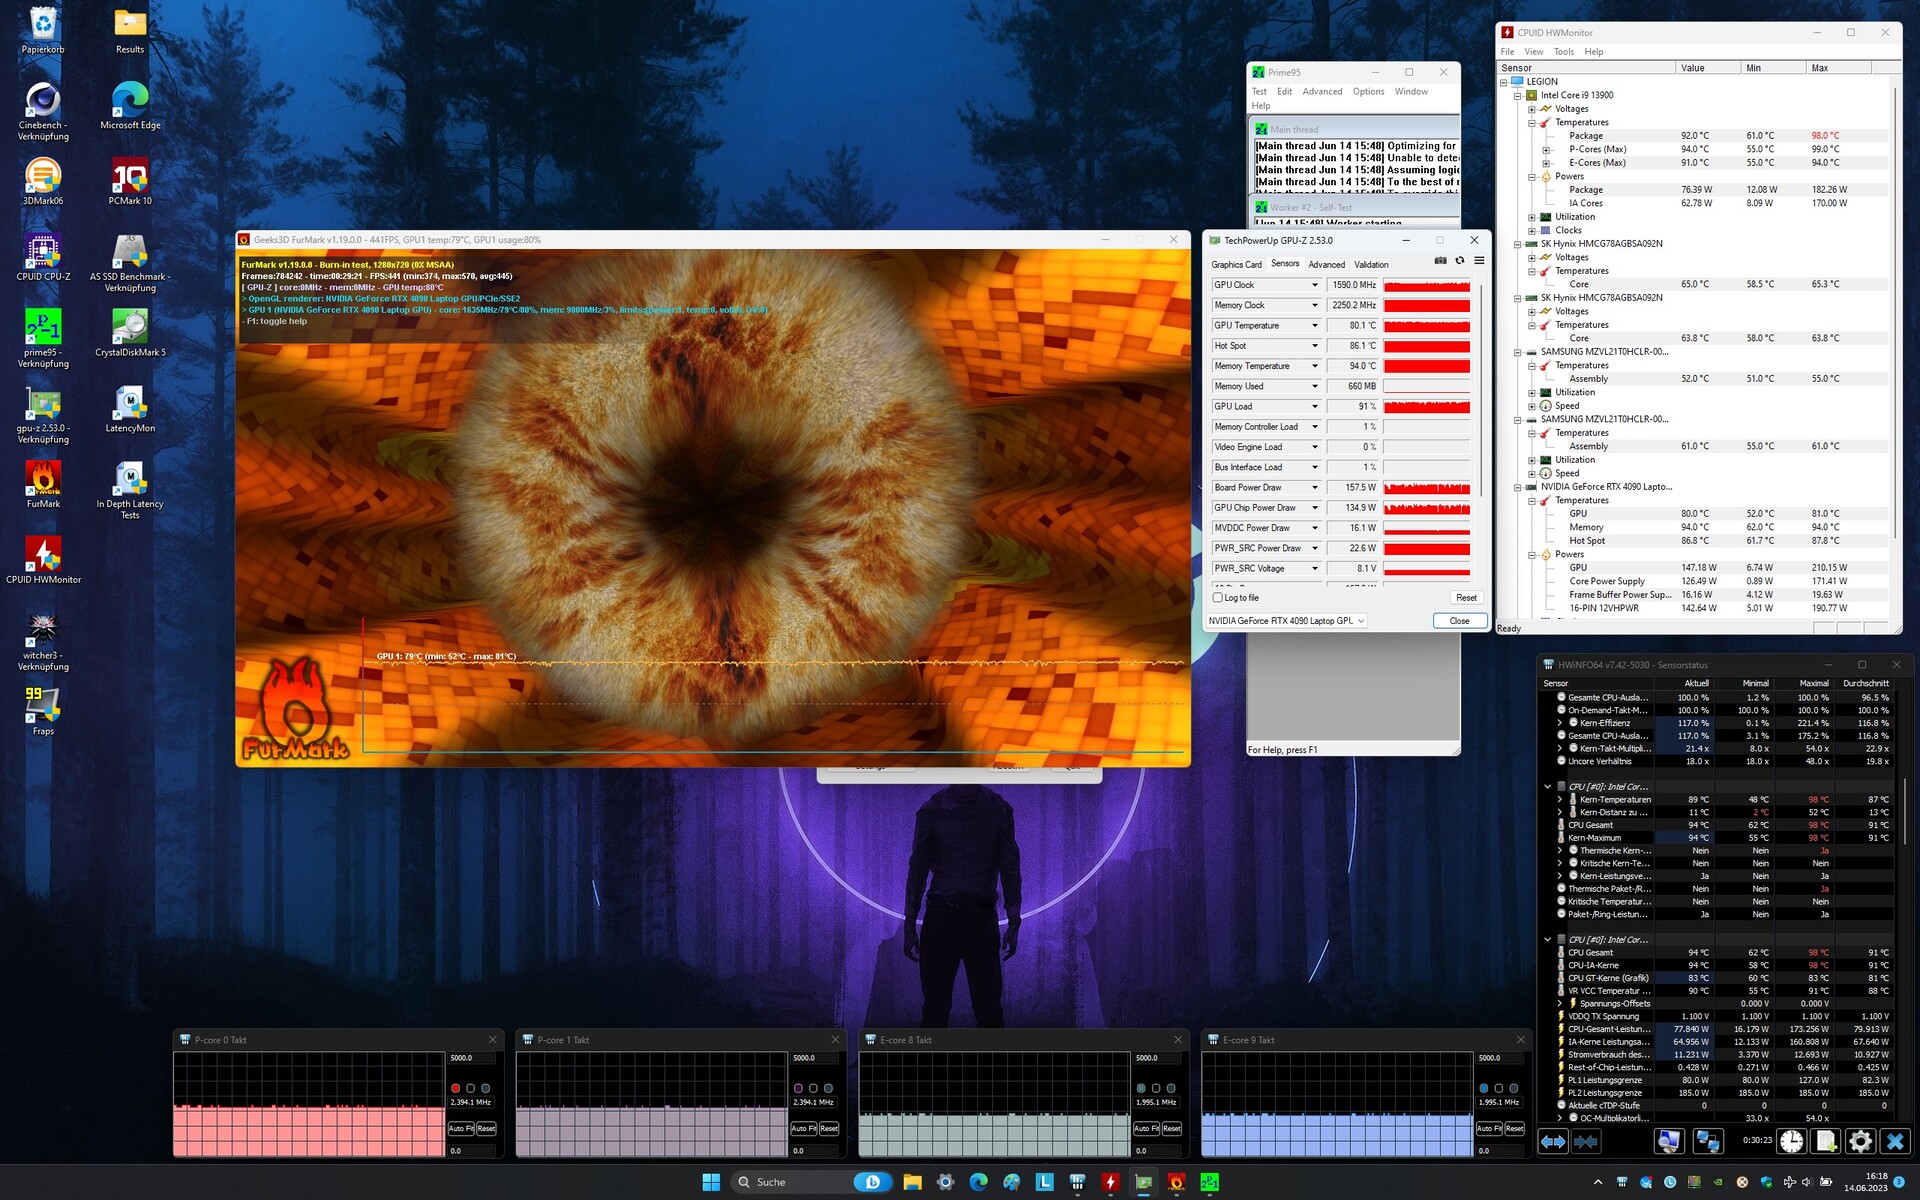
Stress test
There were no problems in the stress test with the tools FurMark and Prime95. Although the CPU got relatively hot at over 90 °C, it did not throttle below the base clock. The GPU (~80 °C) behaved similarly.
Speaker
Lenovo Legion Pro 7 RTX4090 audio analysis
(+) | speakers can play relatively loud (82 dB)
Bass 100 - 315 Hz
(±) | reduced bass - on average 5.6% lower than median
(+) | bass is linear (6.8% delta to prev. frequency)
Mids 400 - 2000 Hz
(+) | balanced mids - only 4.8% away from median
(+) | mids are linear (5.1% delta to prev. frequency)
Highs 2 - 16 kHz
(+) | balanced highs - only 1.7% away from median
(+) | highs are linear (4% delta to prev. frequency)
Overall 100 - 16.000 Hz
(+) | overall sound is linear (8.7% difference to median)
Compared to same class
» 3% of all tested devices in this class were better, 1% similar, 97% worse
» The best had a delta of 6%, average was 18%, worst was 132%
Compared to all devices tested
» 3% of all tested devices were better, 1% similar, 97% worse
» The best had a delta of 4%, average was 23%, worst was 134%
Razer Blade 16 Early 2023 RTX 4090 audio analysis
(±) | speaker loudness is average but good (75 dB)
Bass 100 - 315 Hz
(±) | reduced bass - on average 13.4% lower than median
(±) | linearity of bass is average (14.8% delta to prev. frequency)
Mids 400 - 2000 Hz
(±) | higher mids - on average 5.3% higher than median
(+) | mids are linear (3.8% delta to prev. frequency)
Highs 2 - 16 kHz
(+) | balanced highs - only 3.4% away from median
(+) | highs are linear (4.2% delta to prev. frequency)
Overall 100 - 16.000 Hz
(±) | linearity of overall sound is average (15.6% difference to median)
Compared to same class
» 36% of all tested devices in this class were better, 6% similar, 58% worse
» The best had a delta of 6%, average was 18%, worst was 132%
Compared to all devices tested
» 23% of all tested devices were better, 5% similar, 72% worse
» The best had a delta of 4%, average was 23%, worst was 134%
Power management
Power consumption
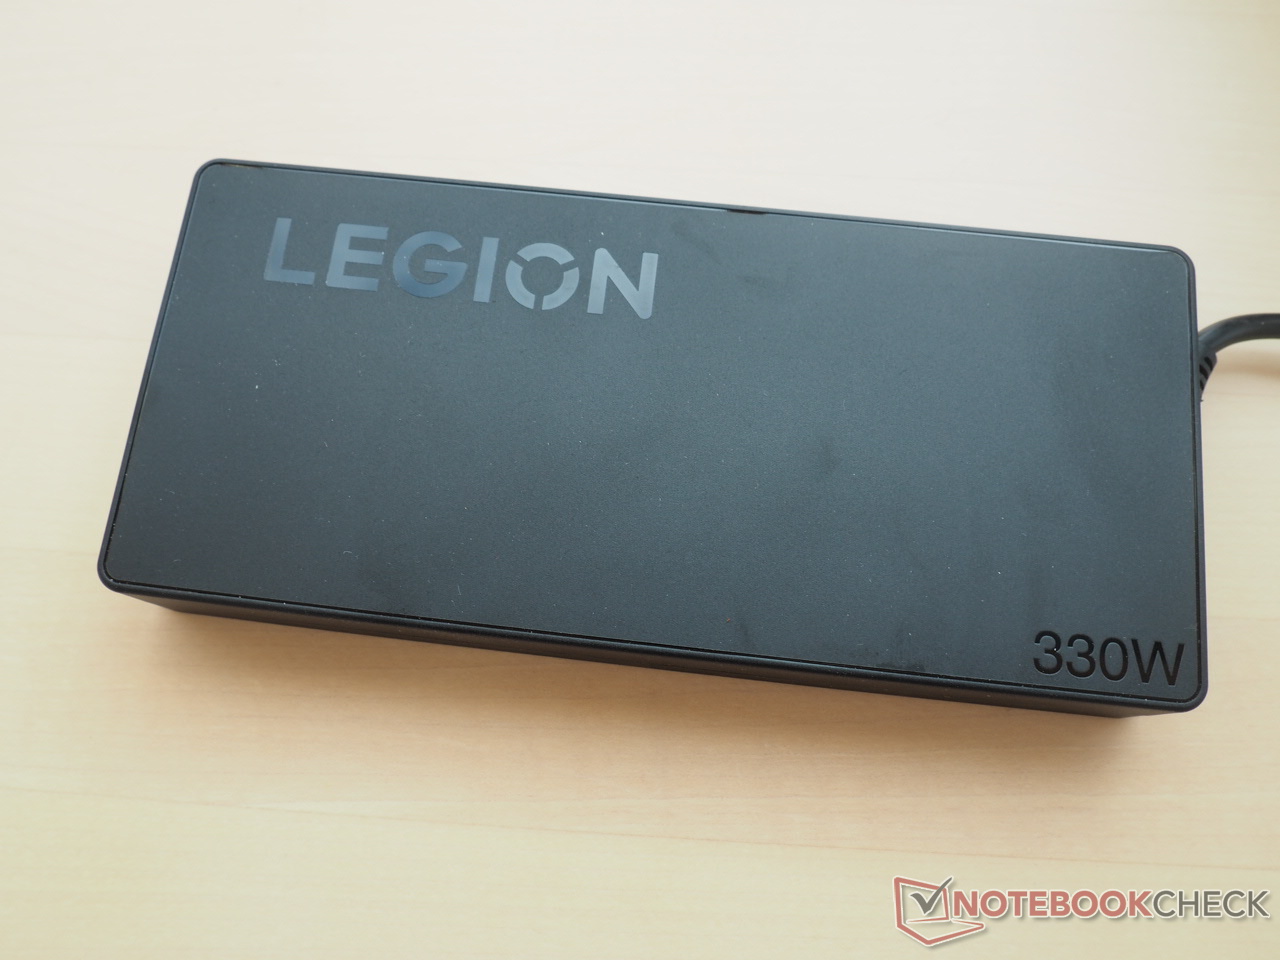
Even though some rivals consume less, the power consumption is typical for an RTX 4090 device. While we measured 20 to 35 watts in idle mode, it was between 136 and 320 watts under load. Thus, the included 330-watt power supply is sufficiently sized.
| Off / Standby | |
| Idle | |
| Load |
|
Key:
min: | |
| Lenovo Legion Pro 7 RTX4090 i9-13900HX, GeForce RTX 4090 Laptop GPU | Razer Blade 16 Early 2023 RTX 4090 i9-13950HX, GeForce RTX 4090 Laptop GPU | Asus ROG Strix Scar 17 G733PY-XS96 R9 7945HX, GeForce RTX 4090 Laptop GPU | Schenker XMG Neo 16 E23 i9-13900HX, GeForce RTX 4090 Laptop GPU | MSI Titan GT77 HX 13VI i9-13950HX, GeForce RTX 4090 Laptop GPU | Lenovo Legion Pro 7 16IRX8H i9-13900HX, GeForce RTX 4080 Laptop GPU | Average of class Gaming | |
|---|---|---|---|---|---|---|---|
| Power Consumption | -11% | 8% | 14% | 10% | 6% | 27% | |
| Idle Minimum * (Watt) | 20 | 27.5 -38% | 14.5 27% | 8 60% | 14 30% | 18 10% | 12.8 ? 36% |
| Idle Average * (Watt) | 25 | 34.4 -38% | 21.1 16% | 18 28% | 21.6 14% | 24 4% | 18.5 ? 26% |
| Idle Maximum * (Watt) | 35 | 35.4 -1% | 42.8 -22% | 28 20% | 24.8 29% | 32 9% | 24 ? 31% |
| Load Average * (Watt) | 136 | 147.8 -9% | 116.7 14% | 133 2% | 122.5 10% | 130 4% | 108.2 ? 20% |
| Witcher 3 ultra * (Watt) | 282 | 256 9% | 278 1% | 294 -4% | 265 6% | 260 8% | |
| Load Maximum * (Watt) | 320 | 286.7 10% | 279.6 13% | 399 -25% | 418 -31% | 320 -0% | 254 ? 21% |
* ... smaller is better
Power consumption Witcher 3 / Stresstest
Power consumption external monitor
Battery life
The battery life of the Legion Pro 7 is neither bad nor particularly good. The 16-incher managed our practical WLAN test with reduced display brightness to 150 cd/m² for around 5 hours.
| Lenovo Legion Pro 7 RTX4090 i9-13900HX, GeForce RTX 4090 Laptop GPU, 99.9 Wh | Razer Blade 16 Early 2023 RTX 4090 i9-13950HX, GeForce RTX 4090 Laptop GPU, 95.2 Wh | Asus ROG Strix Scar 17 G733PY-XS96 R9 7945HX, GeForce RTX 4090 Laptop GPU, 90 Wh | Schenker XMG Neo 16 E23 i9-13900HX, GeForce RTX 4090 Laptop GPU, 99 Wh | MSI Titan GT77 HX 13VI i9-13950HX, GeForce RTX 4090 Laptop GPU, 99.9 Wh | Lenovo Legion Pro 7 16IRX8H i9-13900HX, GeForce RTX 4080 Laptop GPU, 99.9 Wh | Average of class Gaming | |
|---|---|---|---|---|---|---|---|
| Battery runtime | 14% | -20% | 31% | 4% | 0% | 39% | |
| WiFi v1.3 (h) | 5.1 | 5.8 14% | 4.1 -20% | 6.7 31% | 5.3 4% | 5.1 0% | 7.09 ? 39% |
| H.264 (h) | 8.4 | 5.8 | 6 | 8.9 ? | |||
| Witcher 3 ultra (h) | 1.6 | 1.4 | |||||
| Load (h) | 1.4 | 1.4 | 2.1 | 1.51 ? | |||
| Reader / Idle (h) | 6.4 | 8.71 ? |
Pros
Cons
Verdict
Those who are able to accept the exorbitant price of at least 4,500 Euros will find an almost thoroughly successful high-end gamer in the 16-inch format in the Legion Pro 7.
Lenovo not only relies on a stable and high-quality-looking chassis but also on good input devices. The connectivity (including Thunderbolt 4) and the WQXGA display will also satisfy most buyers. The 16:10 screen (240 Hz) offers, among other things, good brightness, convincing color accuracy, and short response times for IPS standards.
On the negative side, we would have - as is unfortunately common for high-end notebooks - a very high temperature and noise development under load. Without a headset, the performance mode is no joy. We recommend using the Silent or Balanced mode here.
Overall, the Legion Pro 7 with RTX 4090 - like the RTX 4080 model - still gets a very good rating and thus belongs to the best high-end laptops on the market.
If you want it quieter and/or lighter, you should check out the Blade 16. The competitor from Razer scored even slightly better in the test.
Price and availability
Lenovo Legion Pro 7 RTX4090
- 06/16/2023 v7 (old)
Florian Glaser
Transparency
The selection of devices to be reviewed is made by our editorial team. The test sample was provided to the author as a loan by the manufacturer or retailer for the purpose of this review. The lender had no influence on this review, nor did the manufacturer receive a copy of this review before publication. There was no obligation to publish this review. As an independent media company, Notebookcheck is not subjected to the authority of manufacturers, retailers or publishers.
This is how Notebookcheck is testing
Every year, Notebookcheck independently reviews hundreds of laptops and smartphones using standardized procedures to ensure that all results are comparable. We have continuously developed our test methods for around 20 years and set industry standards in the process. In our test labs, high-quality measuring equipment is utilized by experienced technicians and editors. These tests involve a multi-stage validation process. Our complex rating system is based on hundreds of well-founded measurements and benchmarks, which maintains objectivity. Further information on our test methods can be found here.
Price comparison

