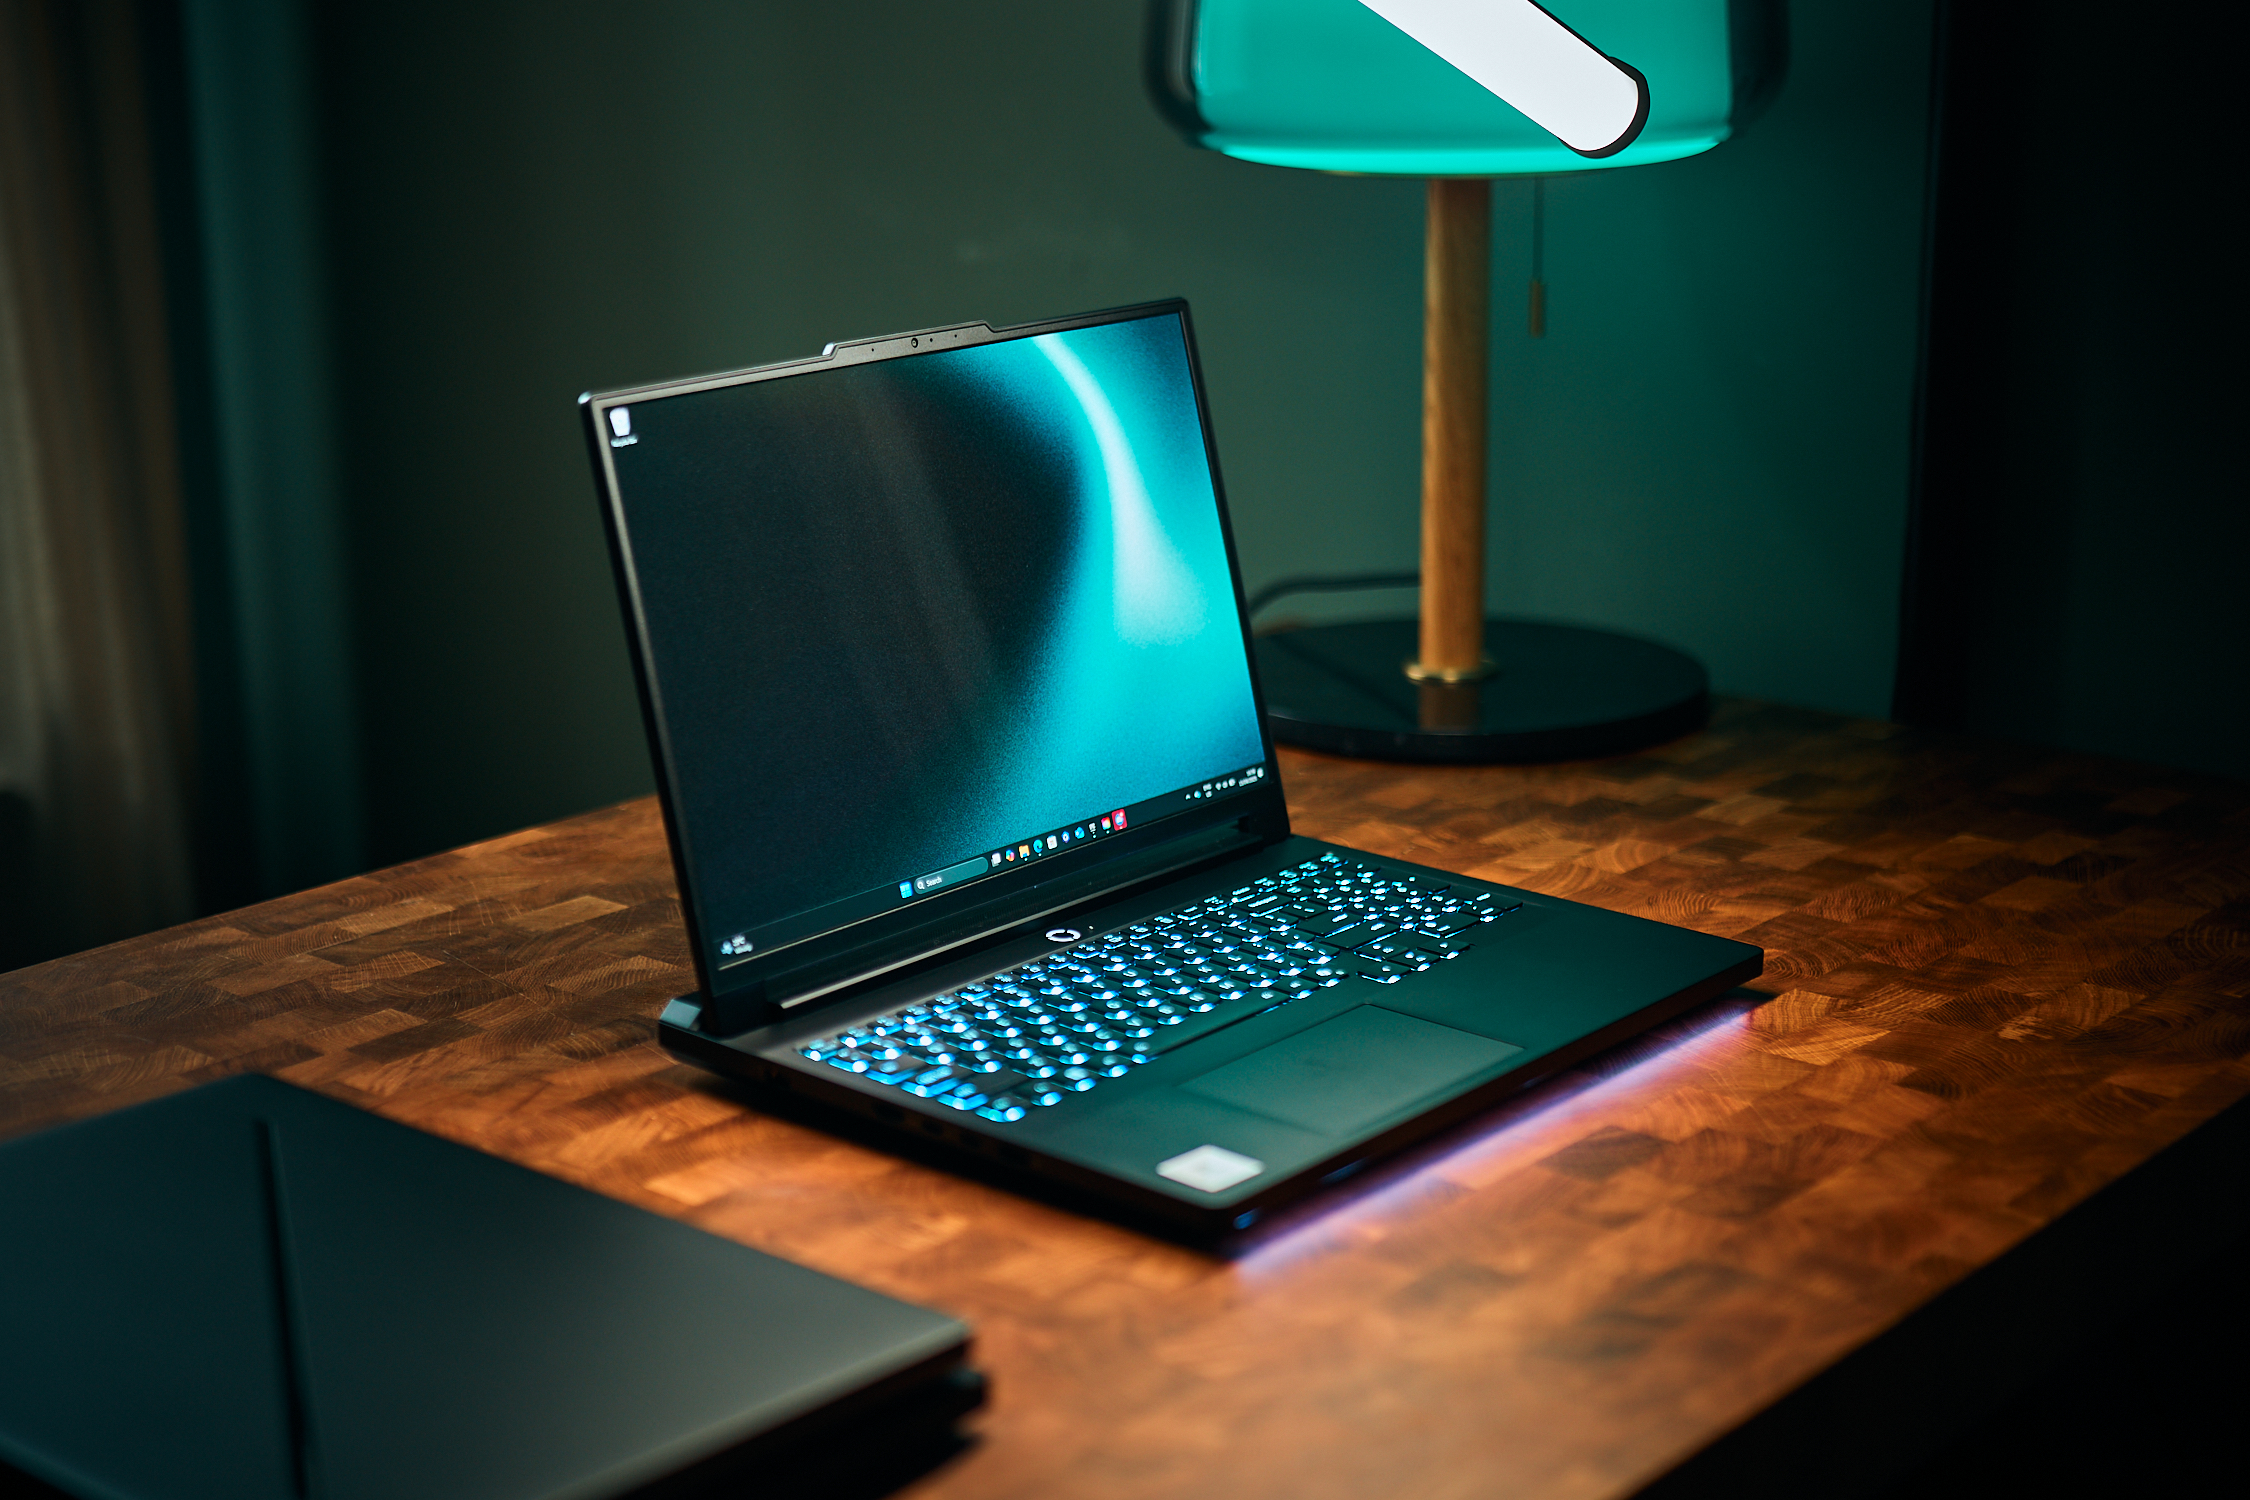
Lenovo Legion Pro 7i 16 Gen 10 laptop review: 400 W power supply with almost no compromises
Verdict — Arrow Lake Makes A Strong Comeback For Intel
The 10th gen Legion Pro 7 16 is the most refined model in the series yet. Unlike the latest Razer Blade 16, this Lenovo is not afraid to be bigger or thicker than its predecessor in order to support higher power envelopes and stronger cooling solutions. Performance hunters in particular may appreciate this approach over the ever-thinning designs of competitors who must balance CPU and GPU performance levels much more delicately.
The display deserves praise as well for being one of the few OLED panels to support high native refresh rates, Windows VRR, DisplayHDR1000, and G-Sync all in one. The 1000-nit maximum brightness on HDR mode is more commonly found on laptops with Mini-LED whereas most other OLED panels are only HDR600 or lower. The viewing experience is subsequently one of the best in the 16-inch gaming category.
Pumping 400 W into a 16-inch laptop has its disadvantages. Aside from the higher power consumption, thinner and lighter alternatives like the Asus ROG Zephyrus G16 or Razer Blade 16 may be more appealing to travelers even if they are slightly slower. Core temperatures on the Lenovo can be quite high when gaming despite the large cooling solution while fan noise isn't any quieter than competitors when on Performance mode.
Buyers who know what they're getting themselves into — maximum performance at the cost of a larger size — will find the Legion Pro 7i Gen 10 to be a powerhouse option.
Pros
Cons
Price and Availability
The RTX 5080 configuration is now shipping directly from Lenovo starting at $3400 while the RTX 5090 configuration is coming at a later date.
Table of Contents
- Verdict — Arrow Lake Makes A Strong Comeback For Intel
- Specifications
- Case
- Connectivity
- Input Devices — Spacious And Nothing Fancy
- Display — Almost Everything You Could Want
- Performance — Arrow Lake With 175 W TGP Graphics
- Emissions — Loud Only When It Needs To Be
- Energy Management
- Notebookcheck Rating
- Potential Competitors in Comparison
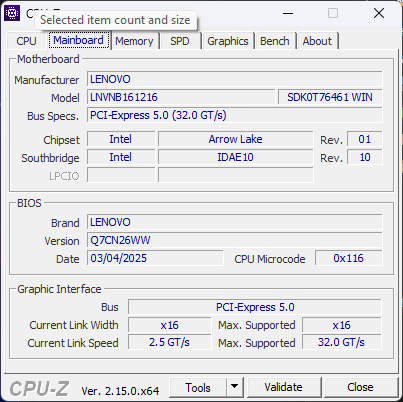
The Legion Pro 7i 16 Gen 10 (or Legion Pro 7 16 G10) succeeds last year's Legion Pro 7i 16 Gen 9 with a fully revised design both inside and out. Almost everything about the updated model is new including the CPU upgrade from Raptor Lake-HX to Arrow Lake-HX, Nvidia Ada Lovelace to Blackwell, and the external look and display.
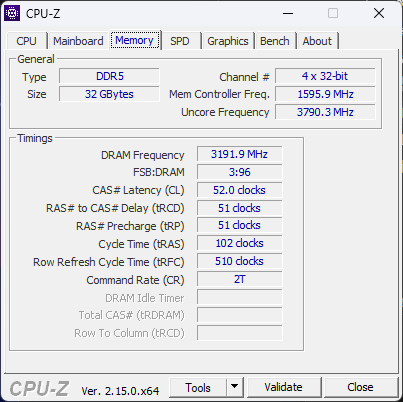
Our test unit is a high-end configuration with the Core Ultra 9 275HX CPU, 175 W GeForce RTX 5080 GPU, and 1600p 240 Hz 16:10 OLED display for approximately $3400 USD retail. Other SKUs may come with the RTX 5090, RTX 5080, or RTX 5070 Ti instead while the CPU and display are the same across the board.
Competitors to the Legion Pro 7 16 G10 include other high-end 16-inch gaming laptops like the MSI Vector 16 HX, Asus ROG Zephyrus G16, or Razer Blade 16. Lenovo offers an even costlier enthusiast series called the Legion Pro 9 16 with additional features over the Legion Pro 7 16, but that has yet to be refreshed for 2025 as of this writing.
More Lenovo reviews:
Specifications
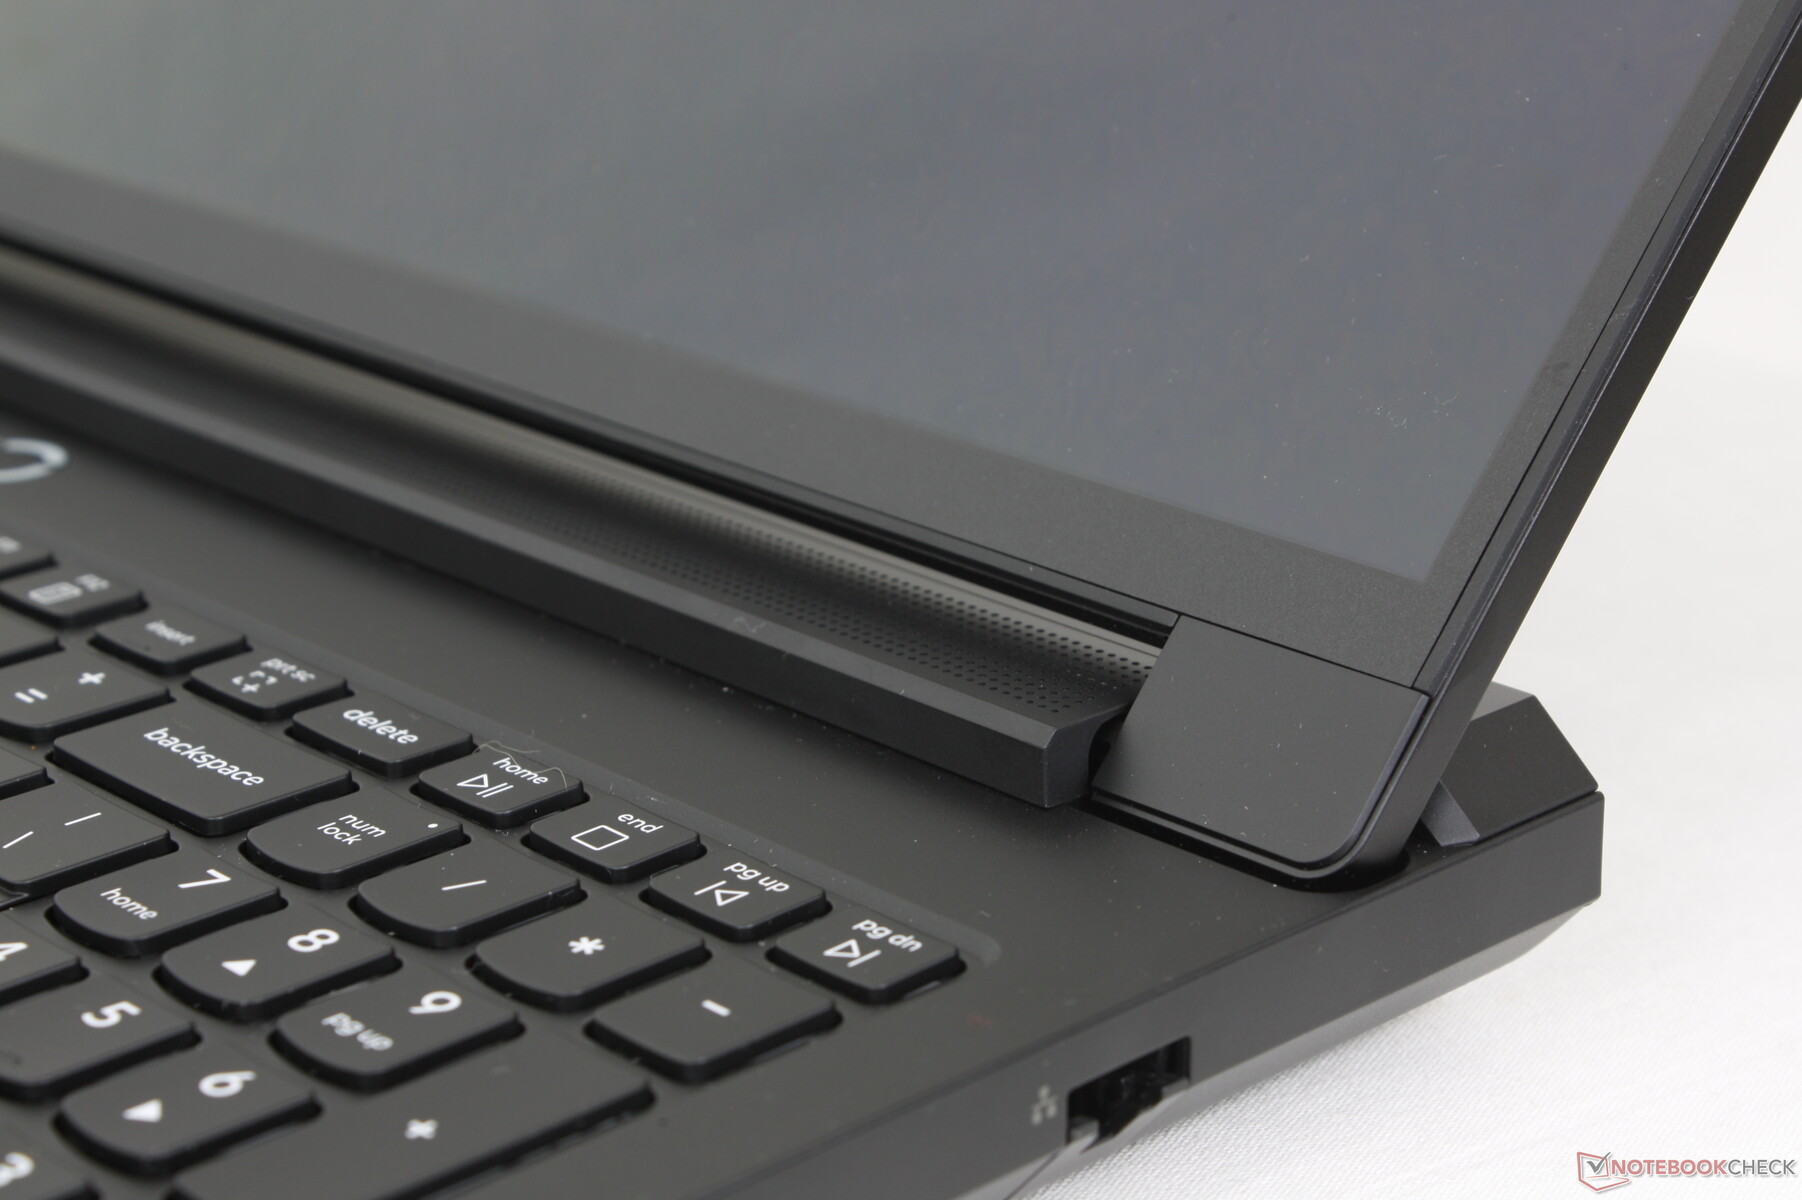
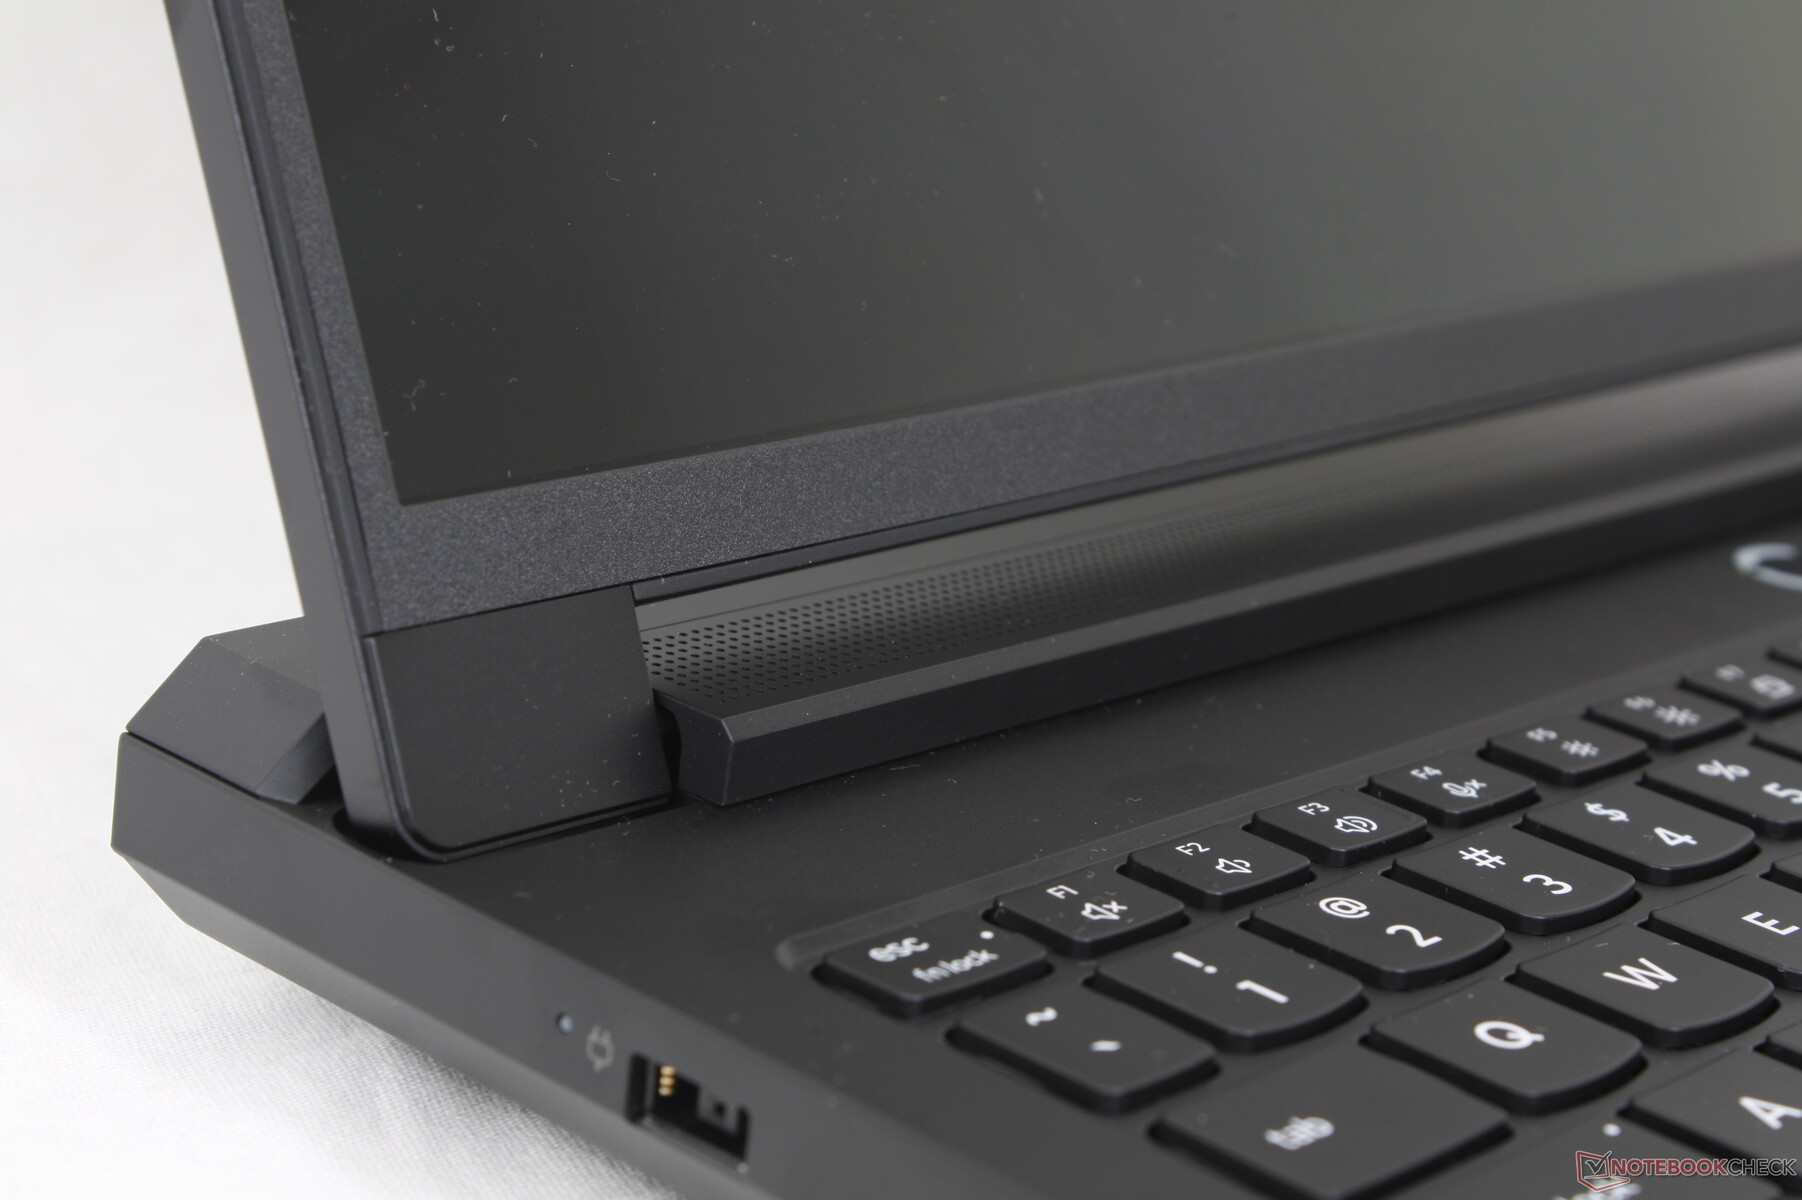
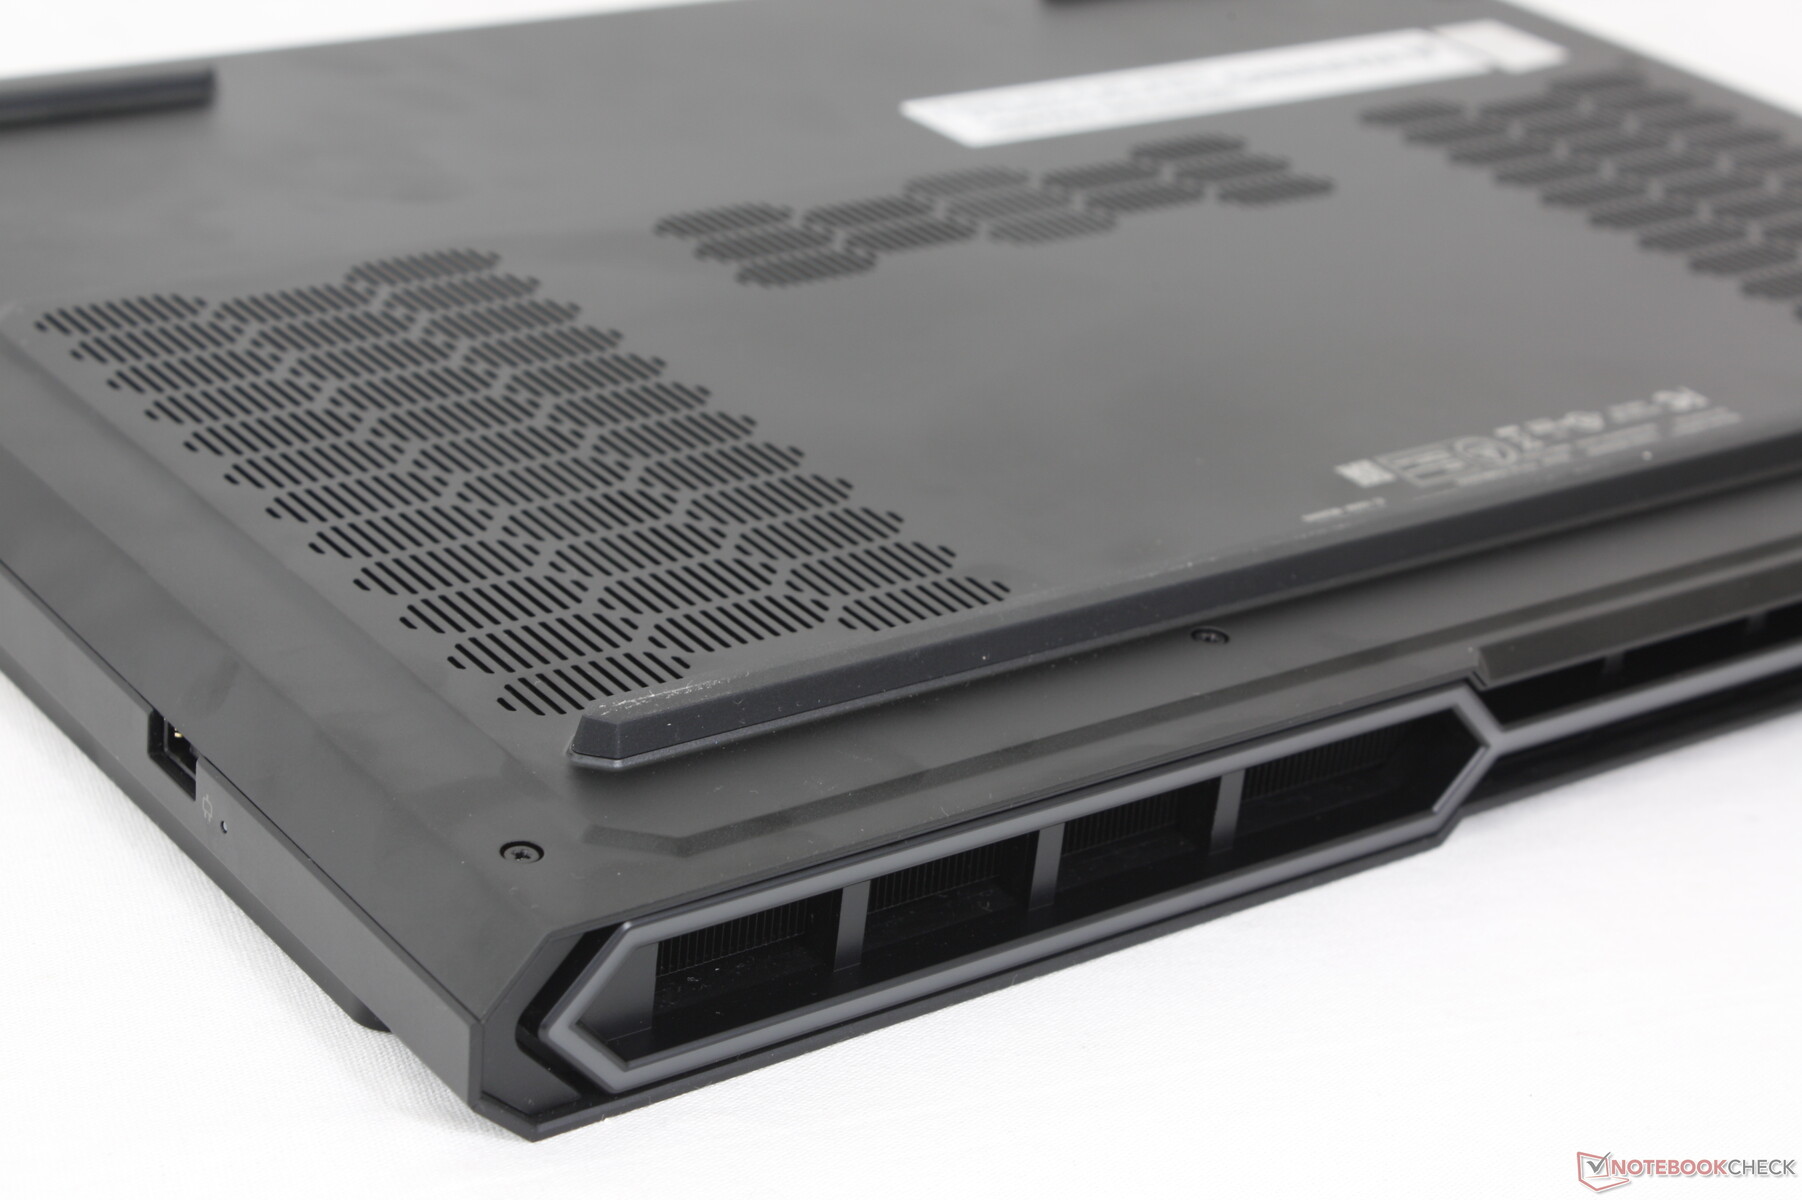
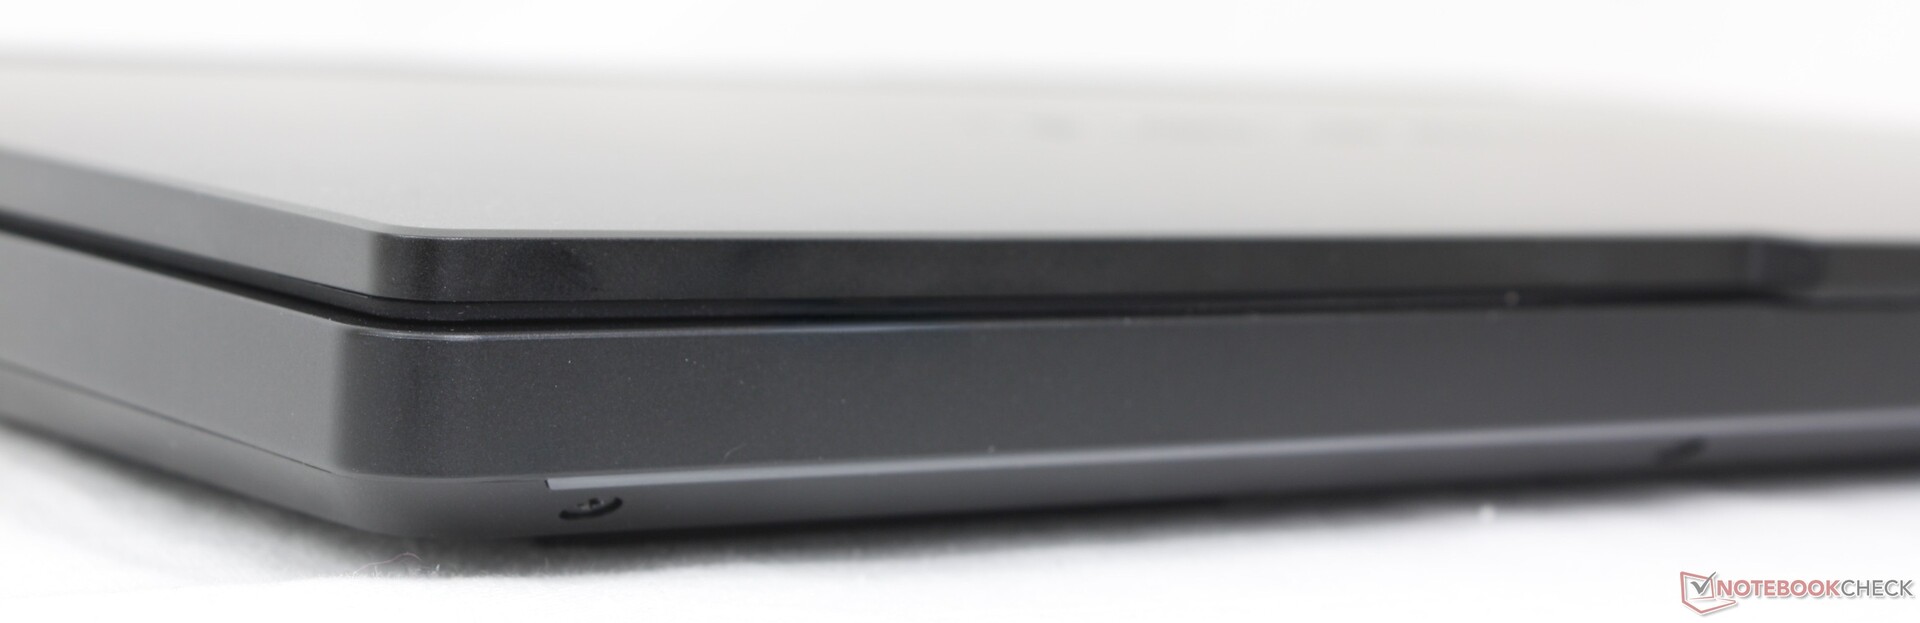
Case
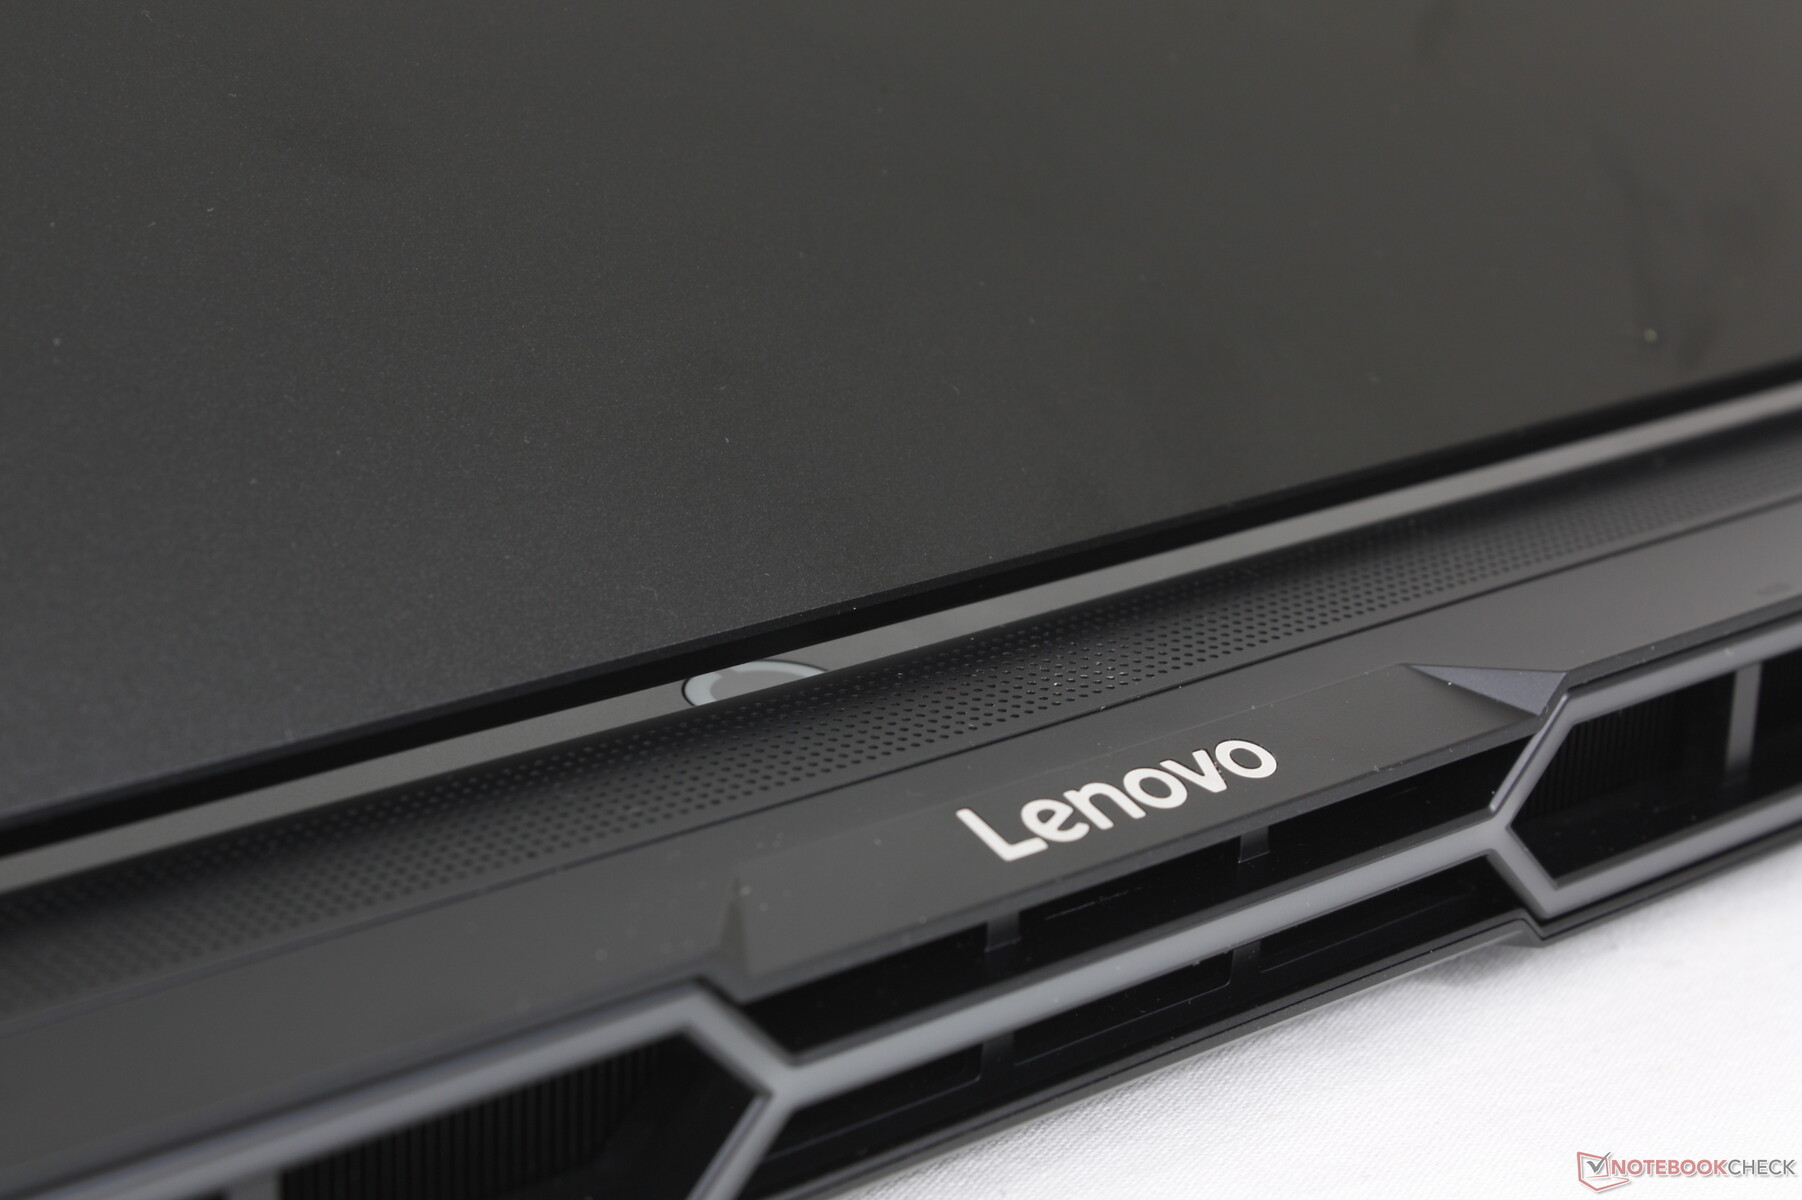
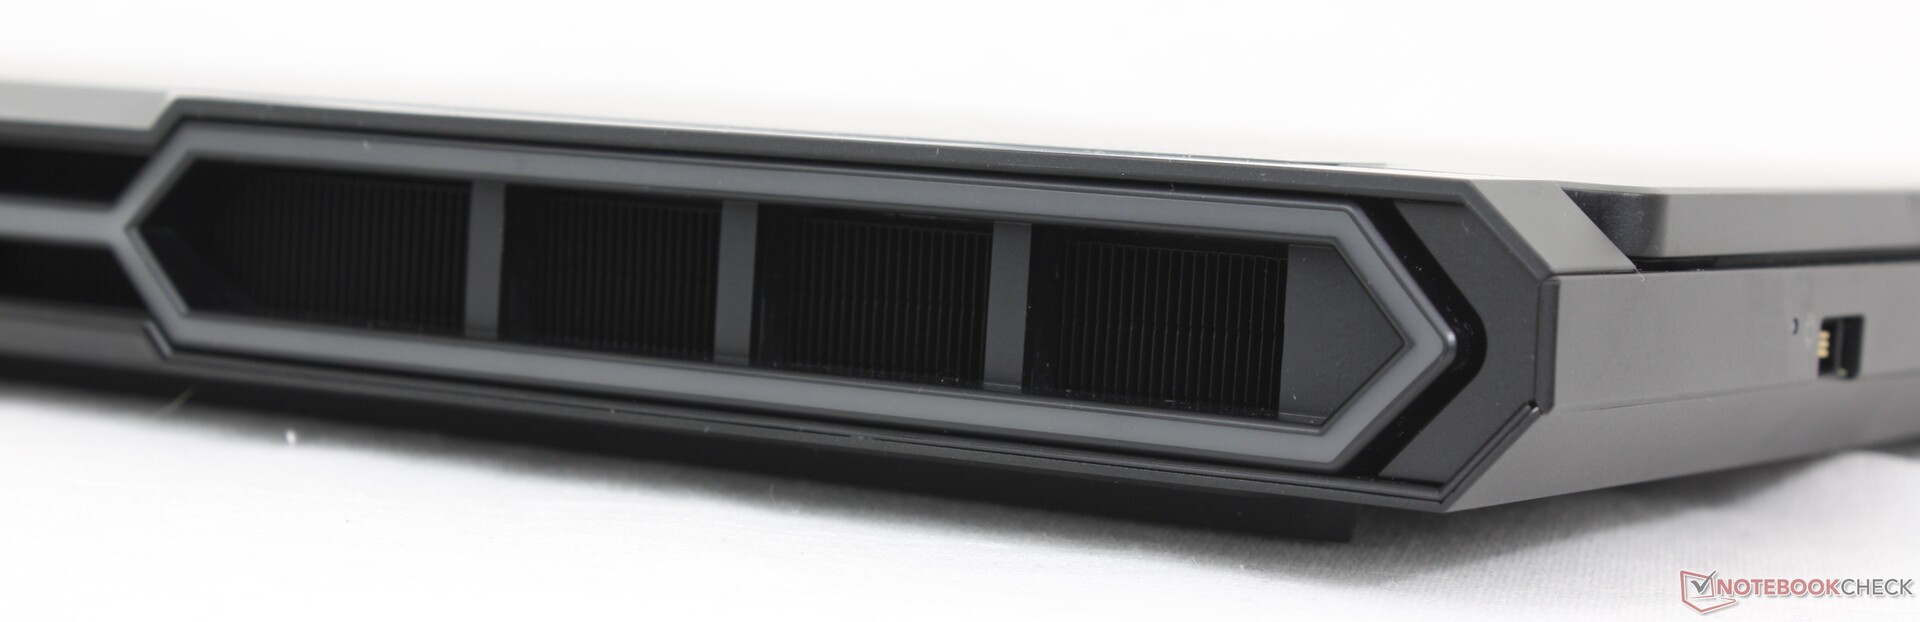
The redesigned chassis is sharper, firmer, and more "gamer" than before with its new LED bars along the front and rear edges. However, the otherwise dark jet black approach avoids the gaudiness of some brighter competitors such as the multicolored Alienware or MSI models. It's one of the better designed gaming laptops from Lenovo to date all things considered.
Fingerprints unfortunately accumulate very easily almost everywhere on the all-black laptop much like on the Razer Blade 16.
The model has a bigger footprint than last year's design because of the enlarged cooling solution along the rear while overall weight and thickness remain almost the same as before. It's certainly not a thin-and-light gaming machine like the Blade 16 or Zephyrus G16, but it is still smaller and lighter than some other 16-inch alternatives like the MSI Vector 16 HX.
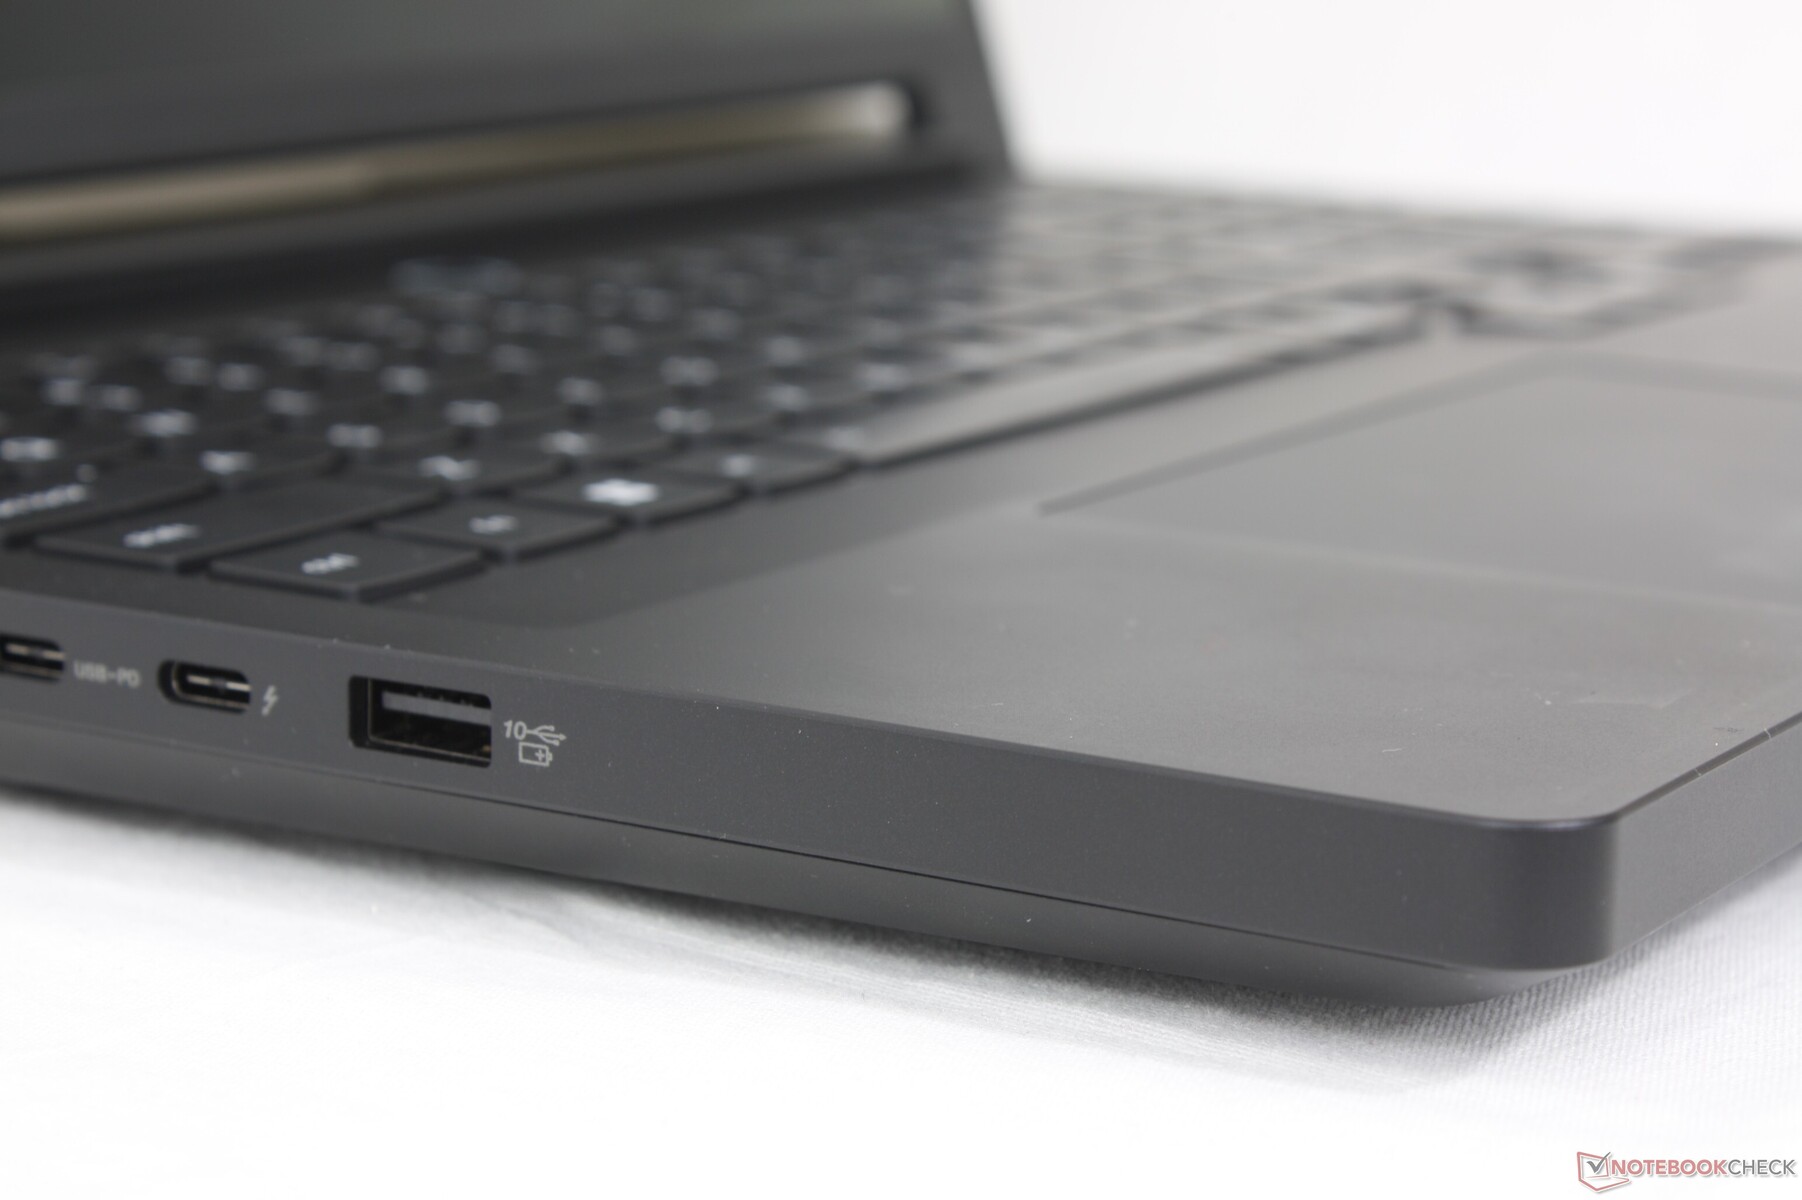
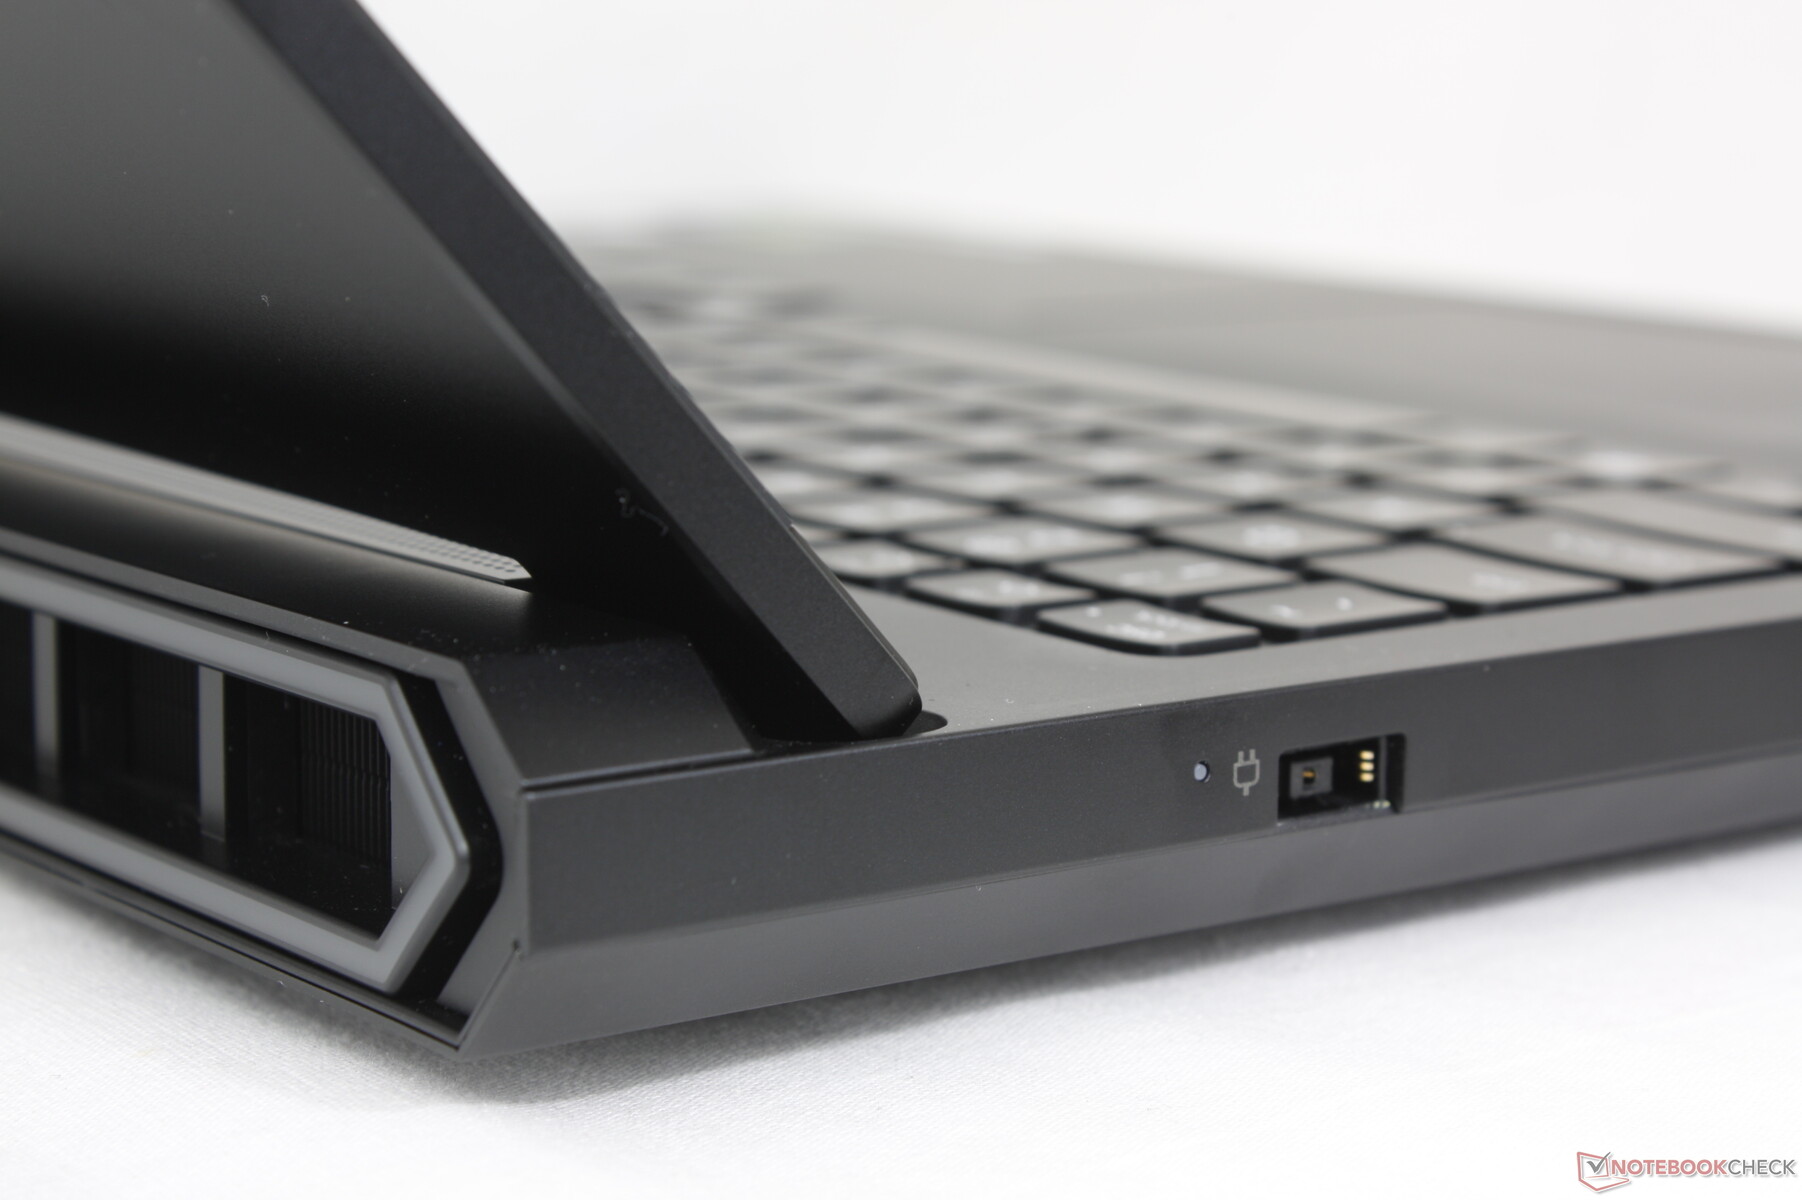
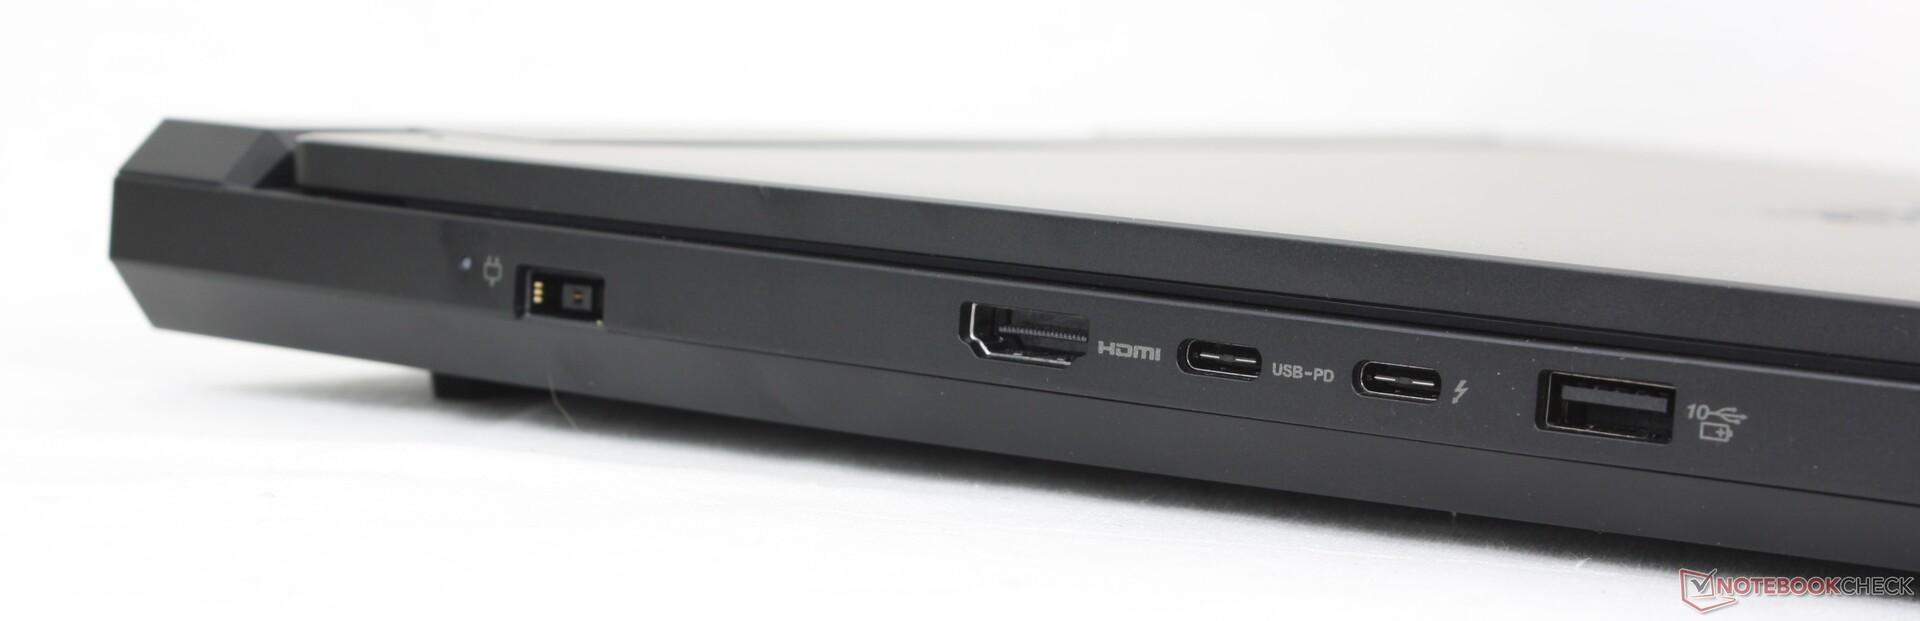
Connectivity
Port options and positioning have been completely revised when compared to last year's Legion 9 16IRX9 or the Legion 7 16 G9. Gone are the integrated SD card reader and third USB-C port in favor of an RJ-45 port and an additional USB-A port. There are no ports along the rear this time for easier access.
Keep in mind that only one of the two USB-C ports supports DisplayPort 2.1 and Thunderbolt 4 connectivity while the other USB-C port (the one furthest from the user) supports 140 W PD charging.
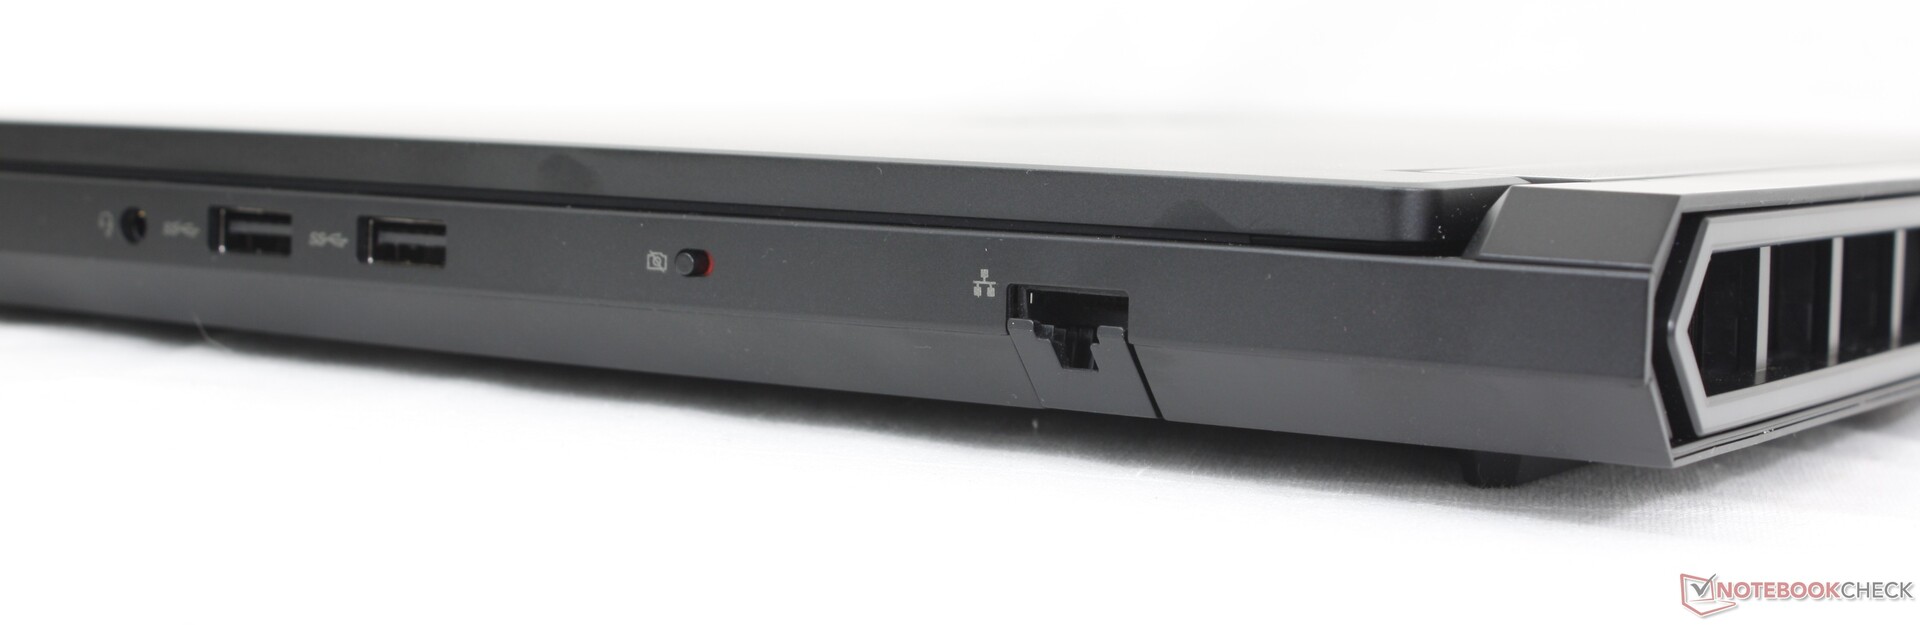
Communication
The Intel BE200 comes standard for Wi-Fi 7 and Bluetooth 5.4 connectivity.
Webcam
A 5 MP webcam comes standard with an electronic shutter and no IR sensor.


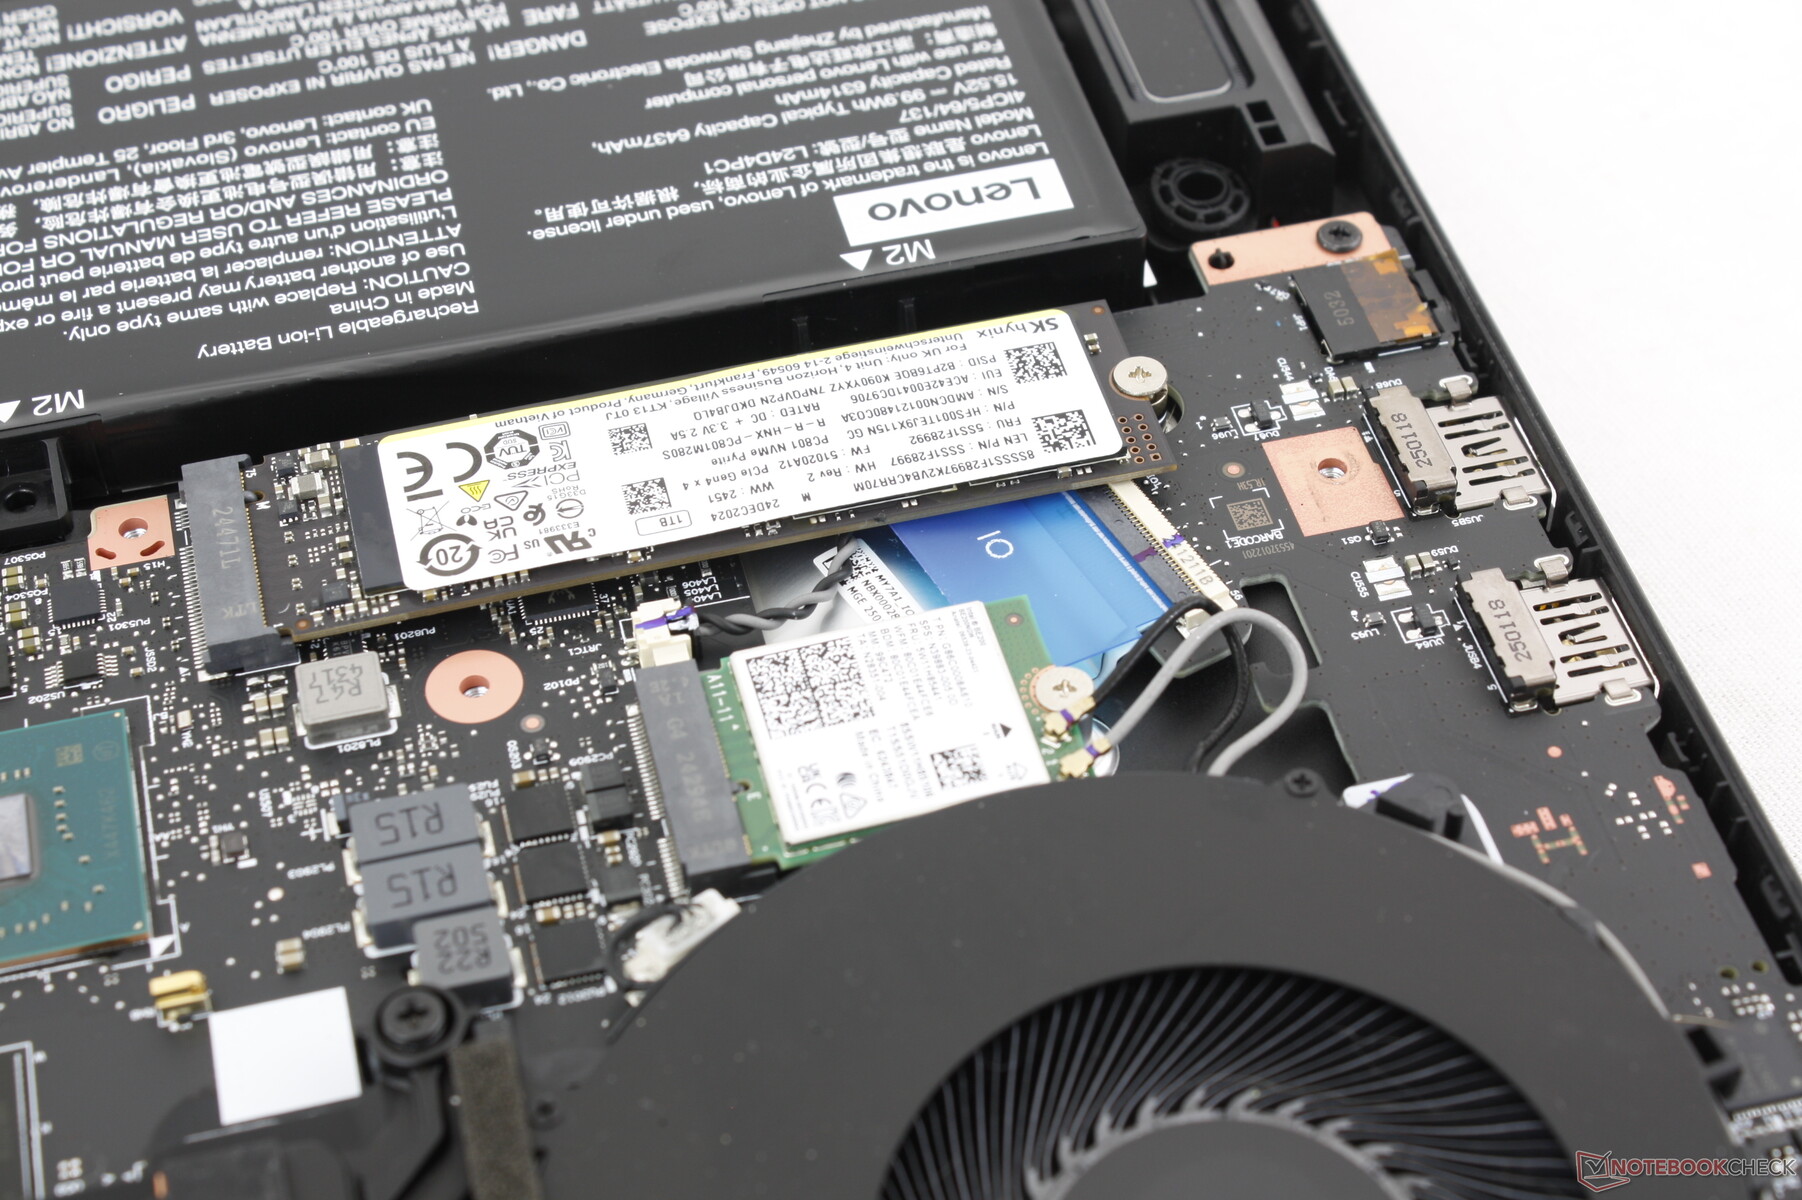
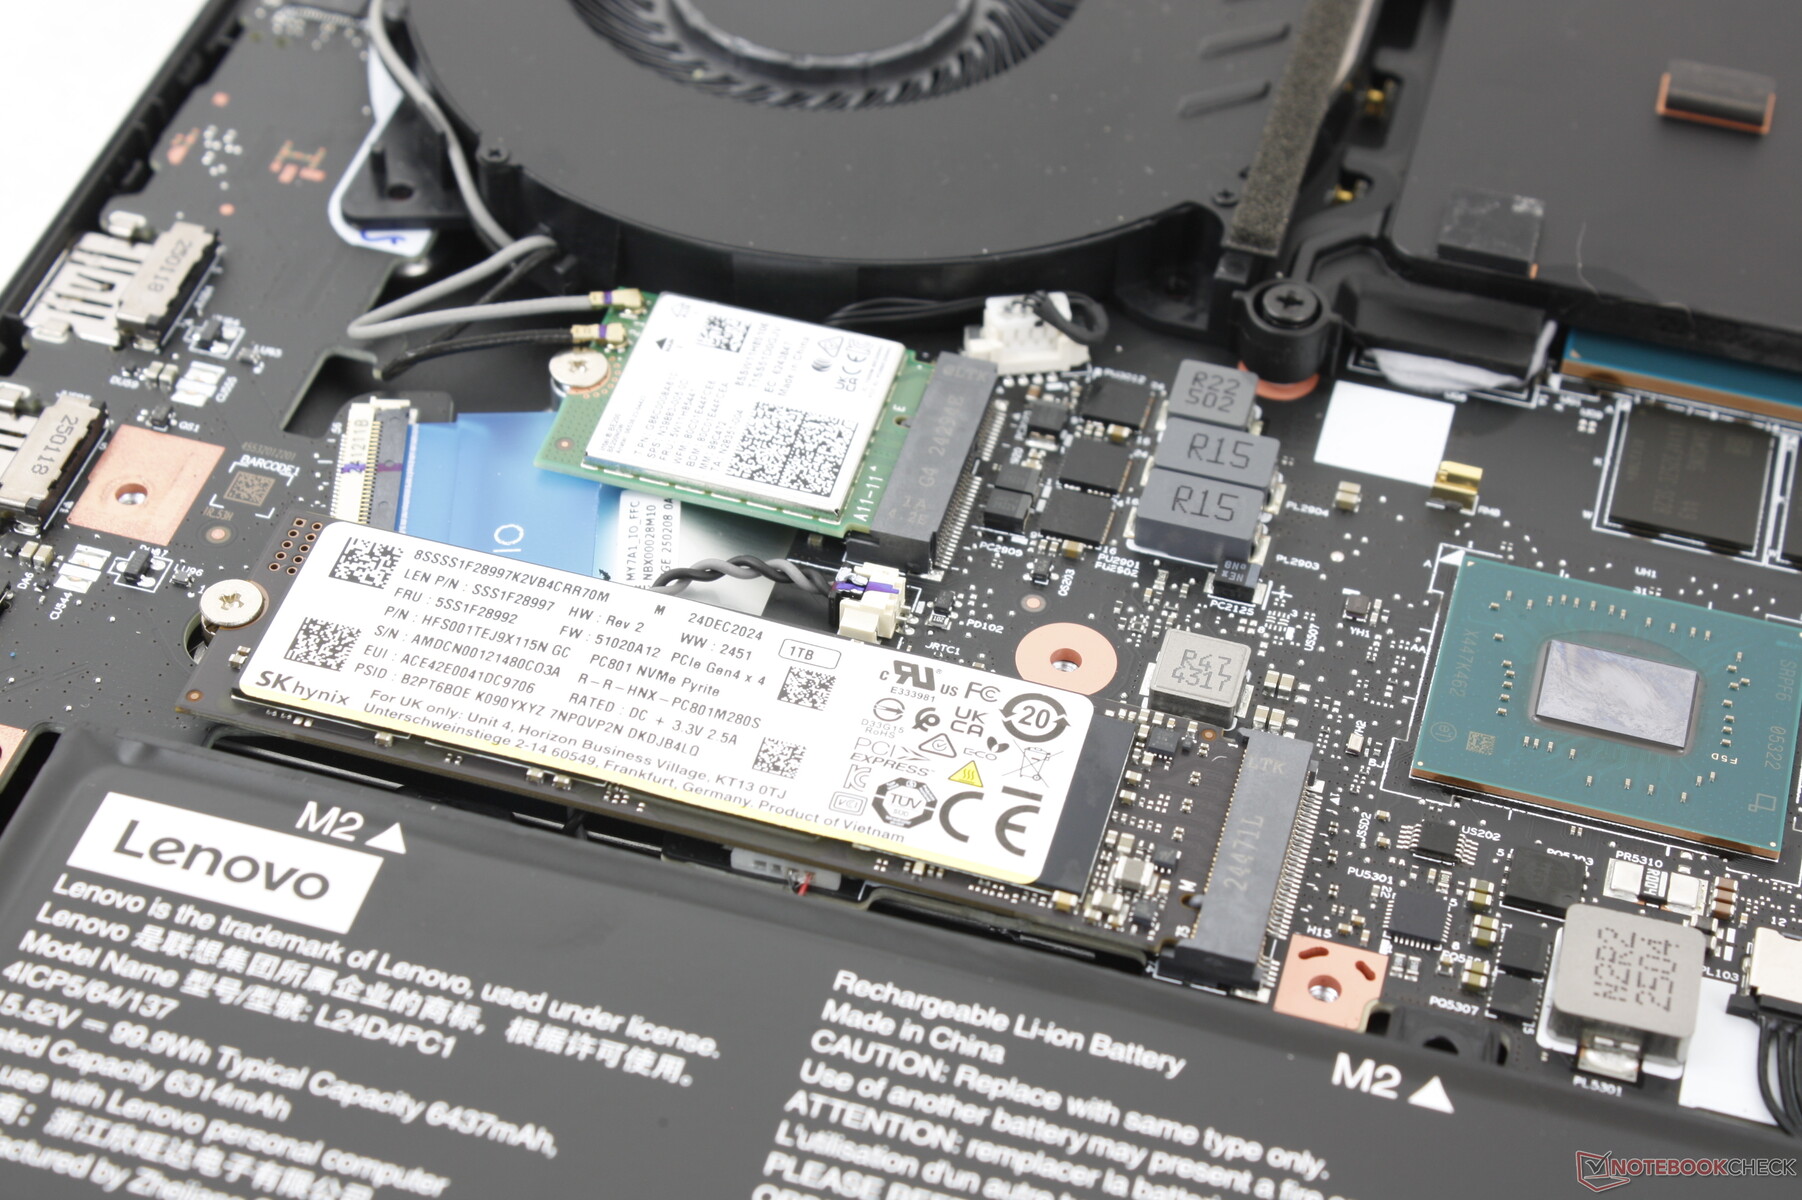
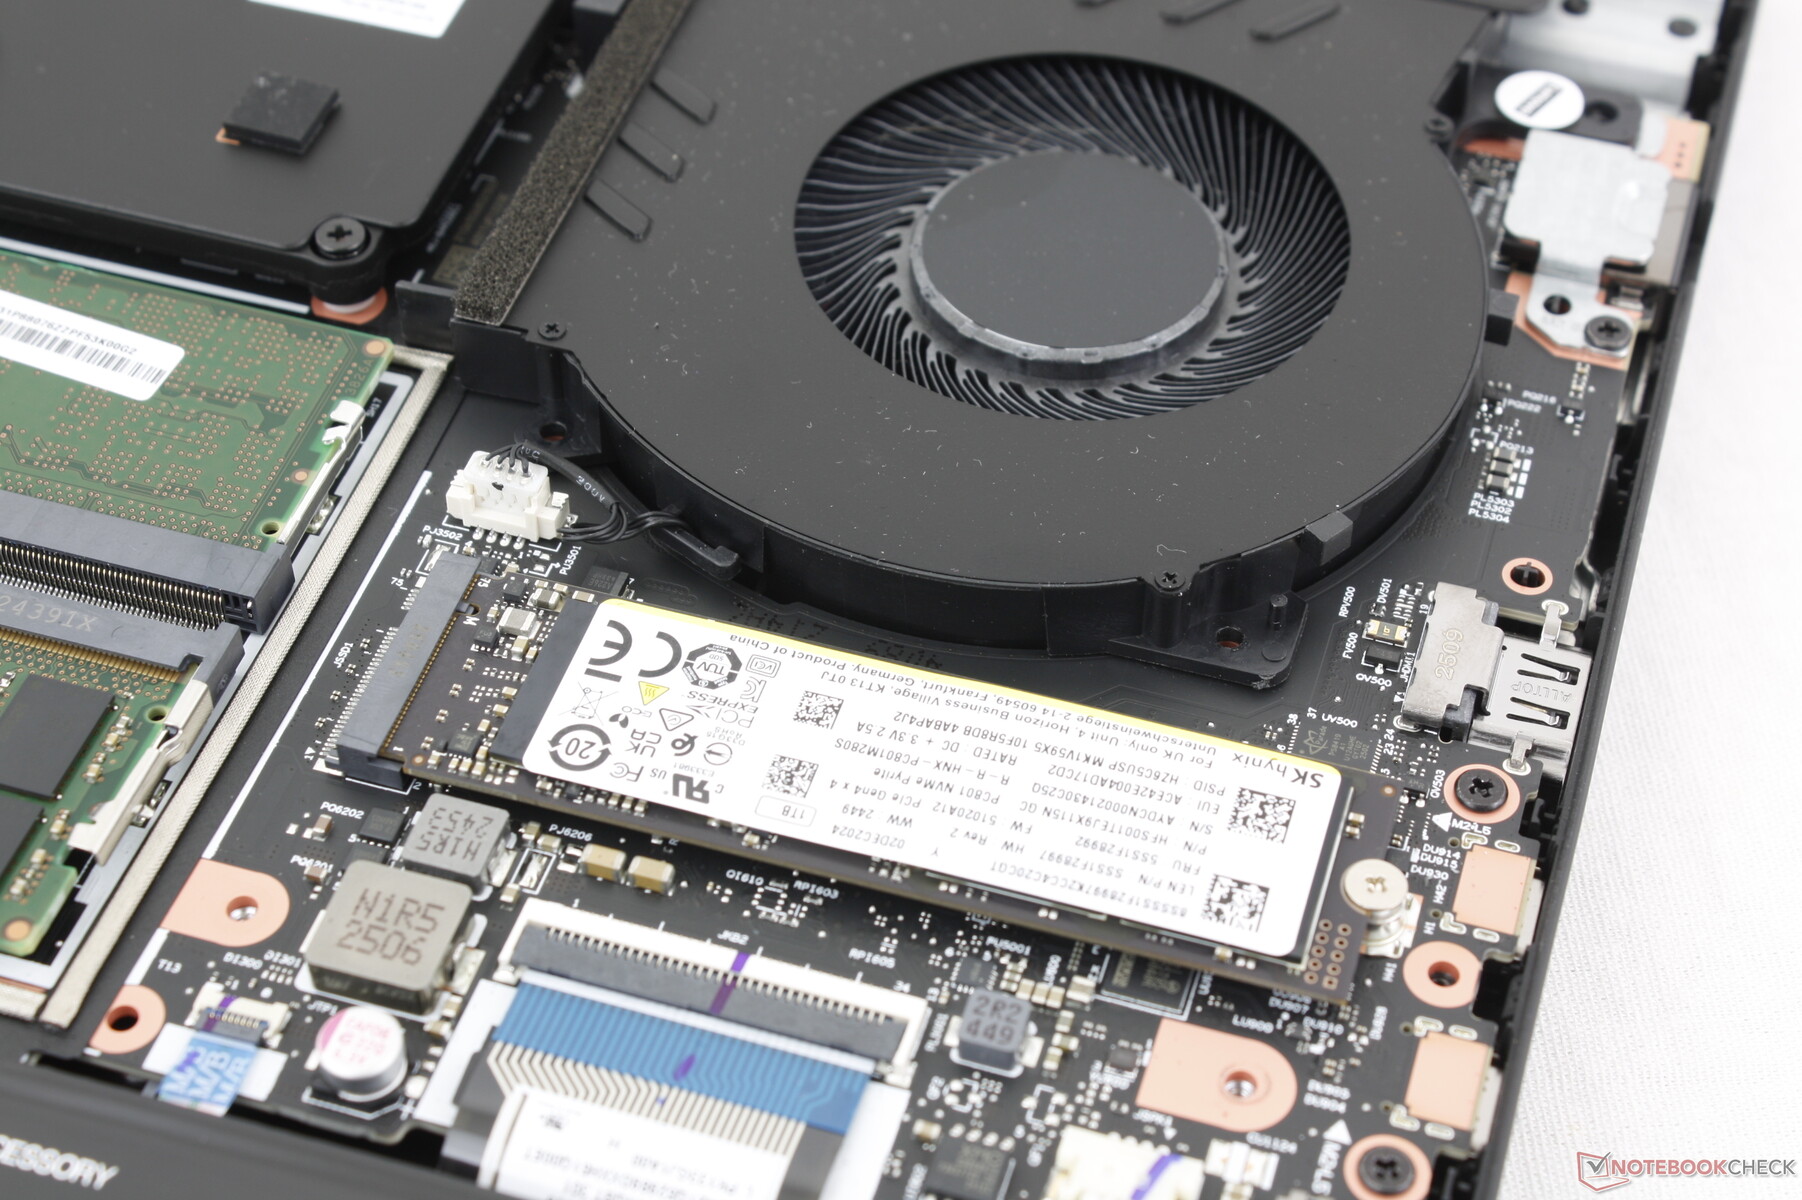
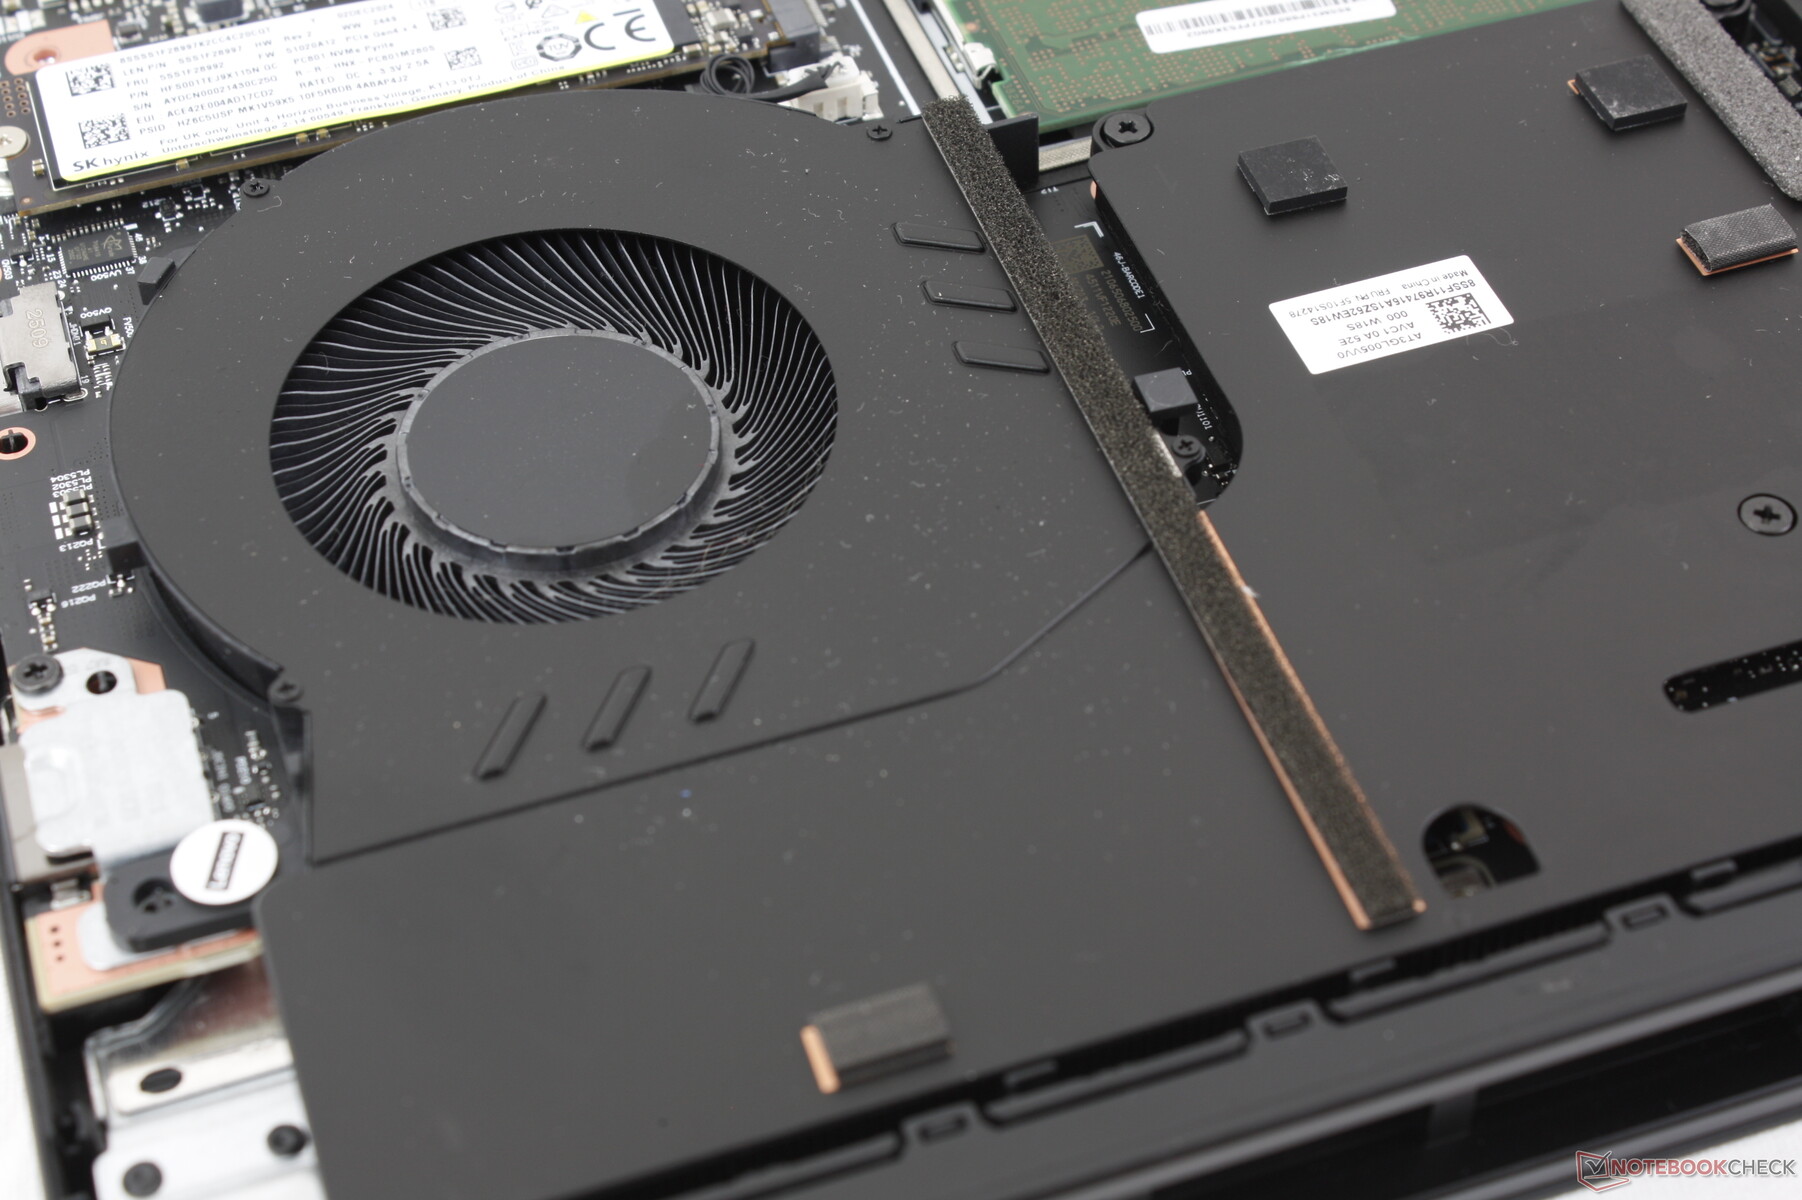
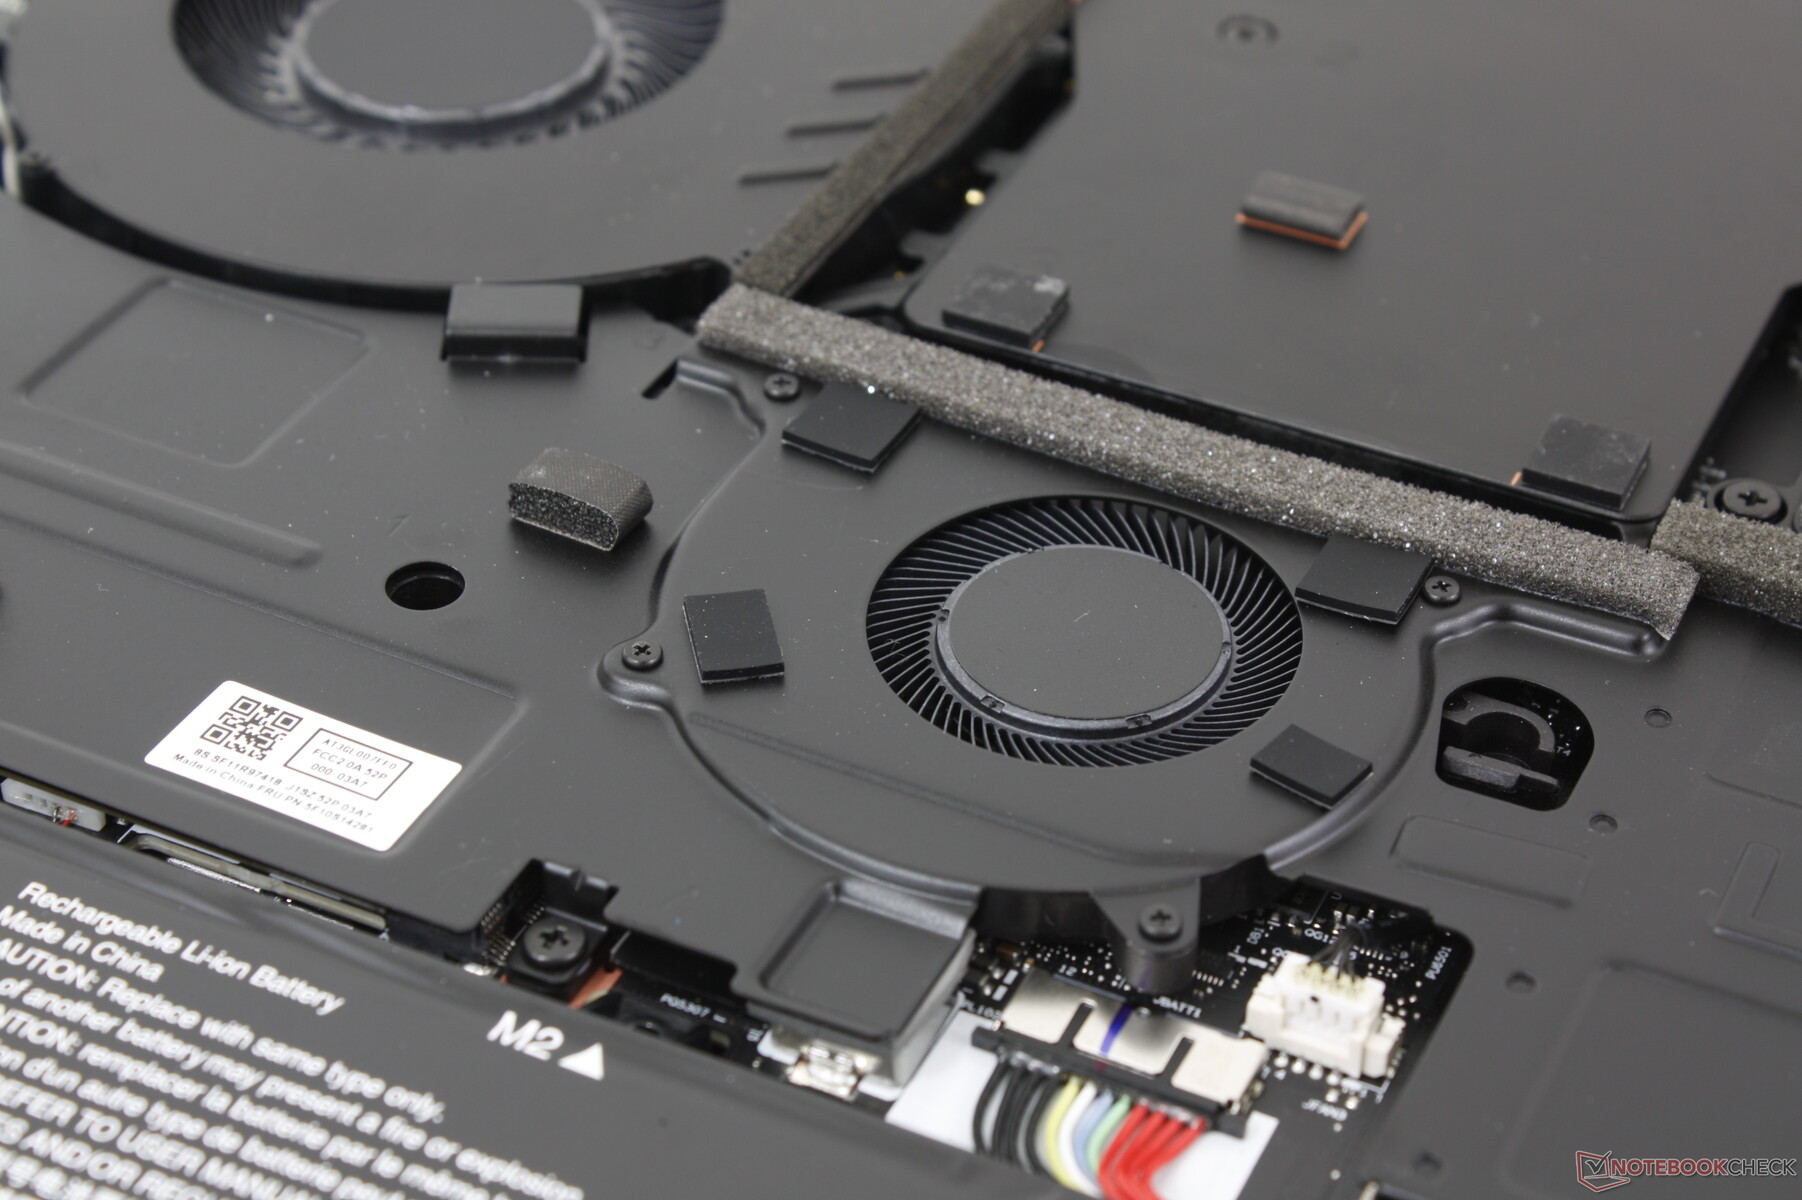
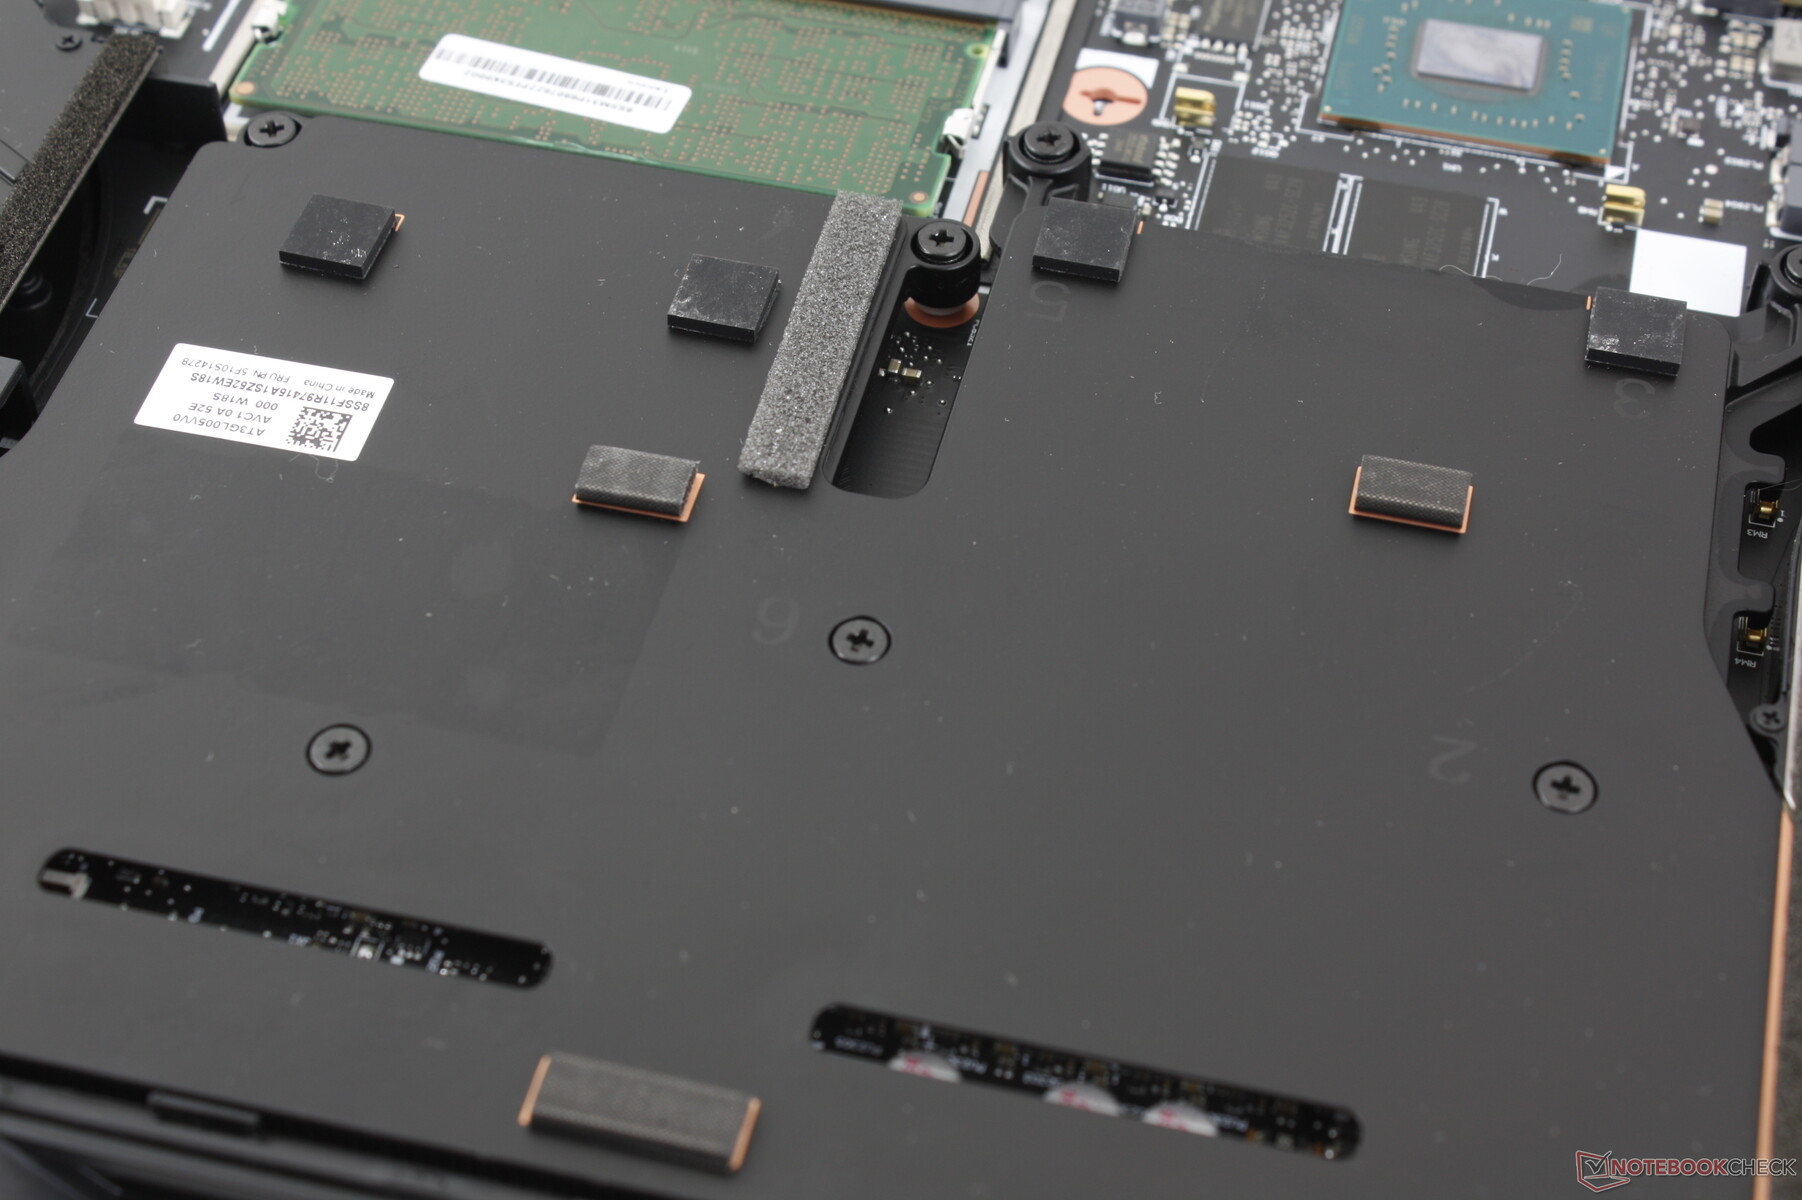
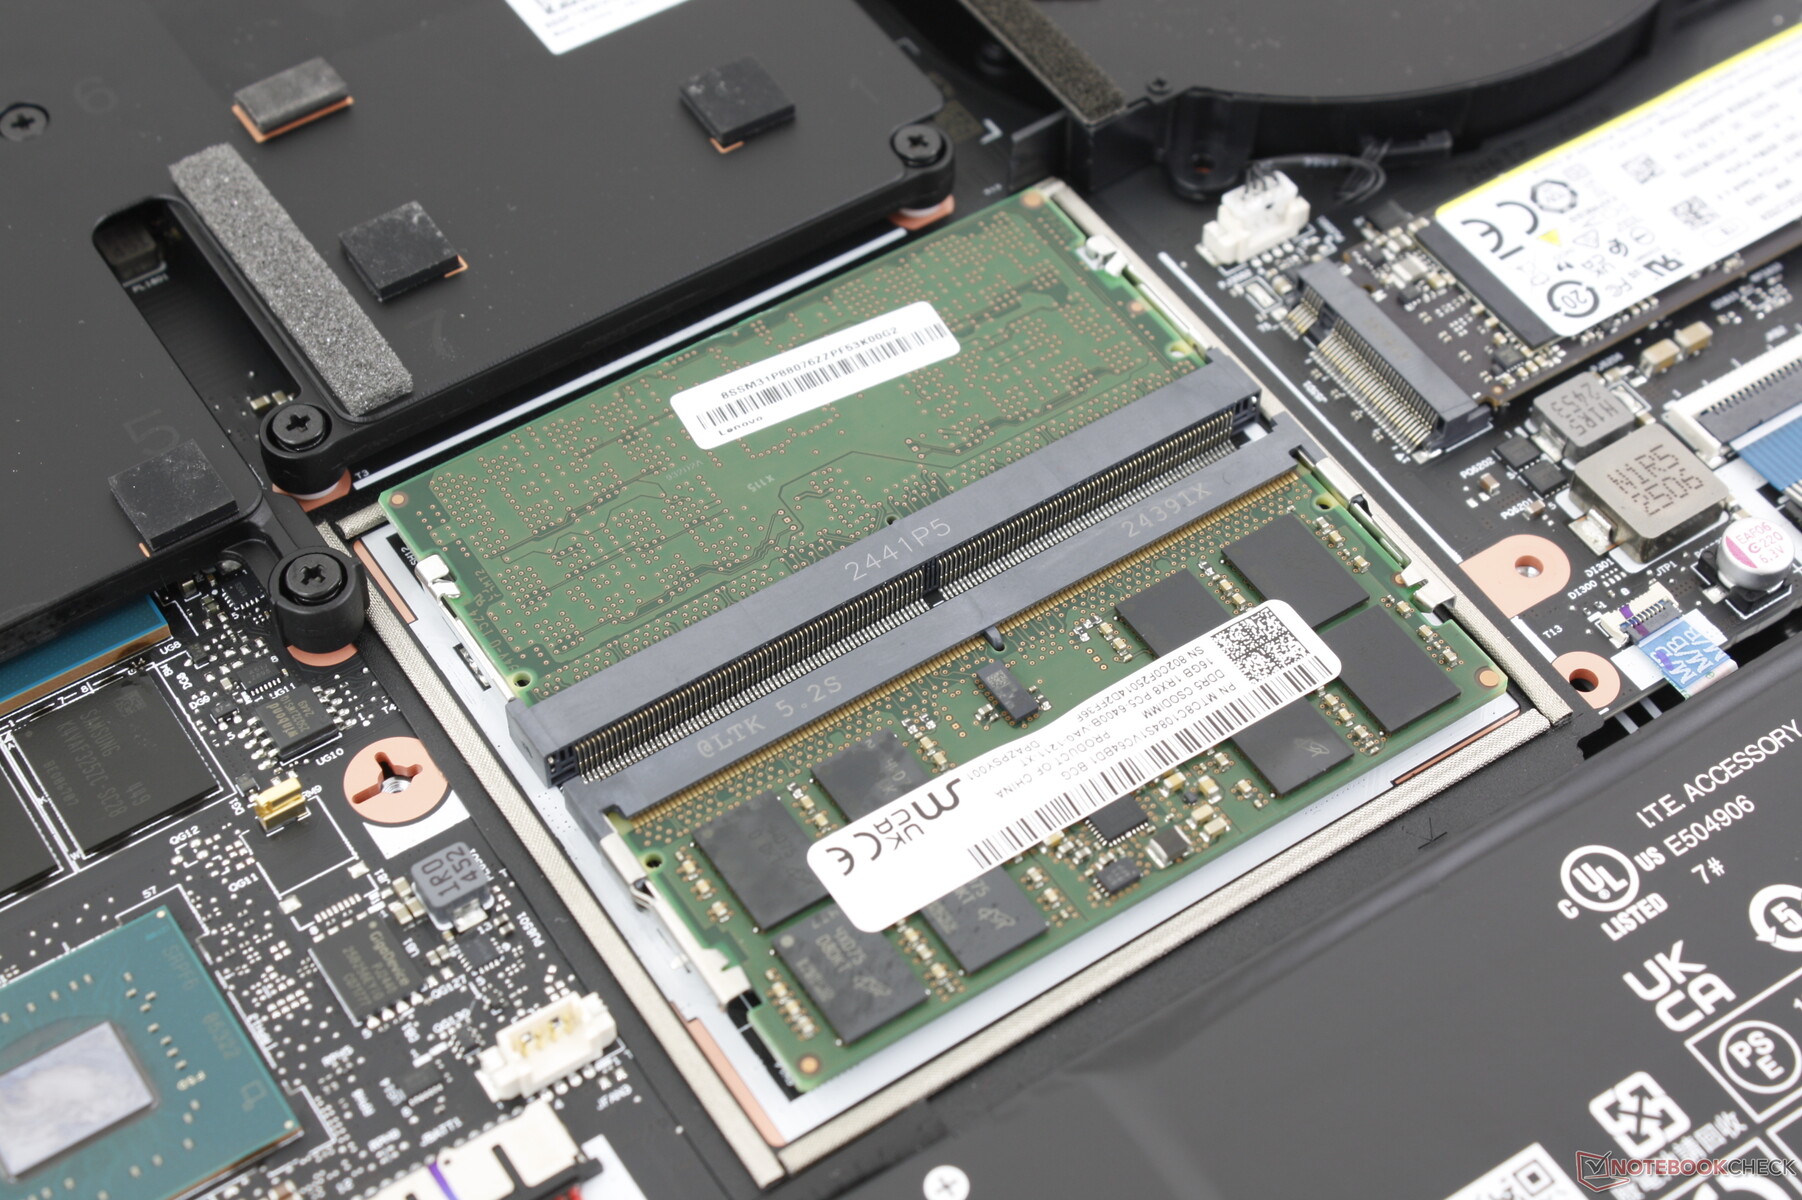
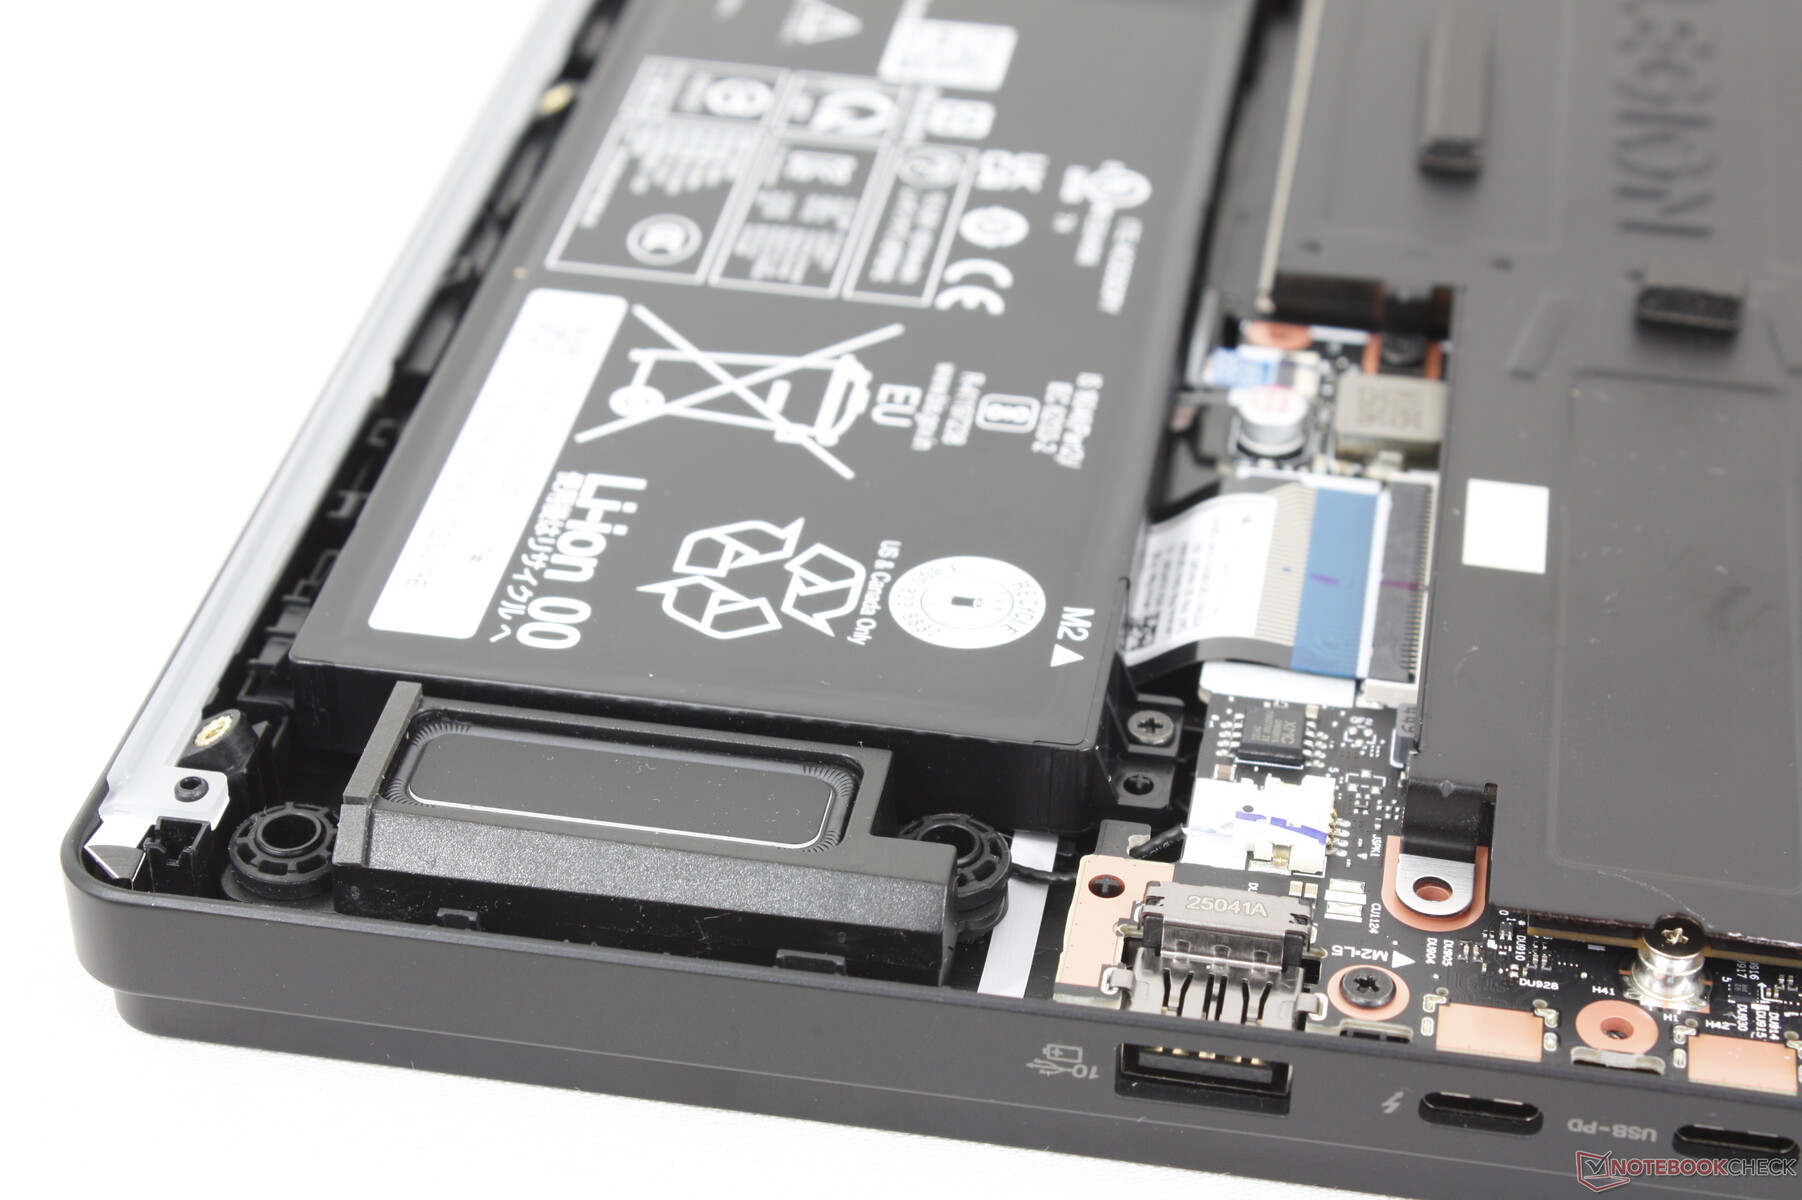
Maintenance
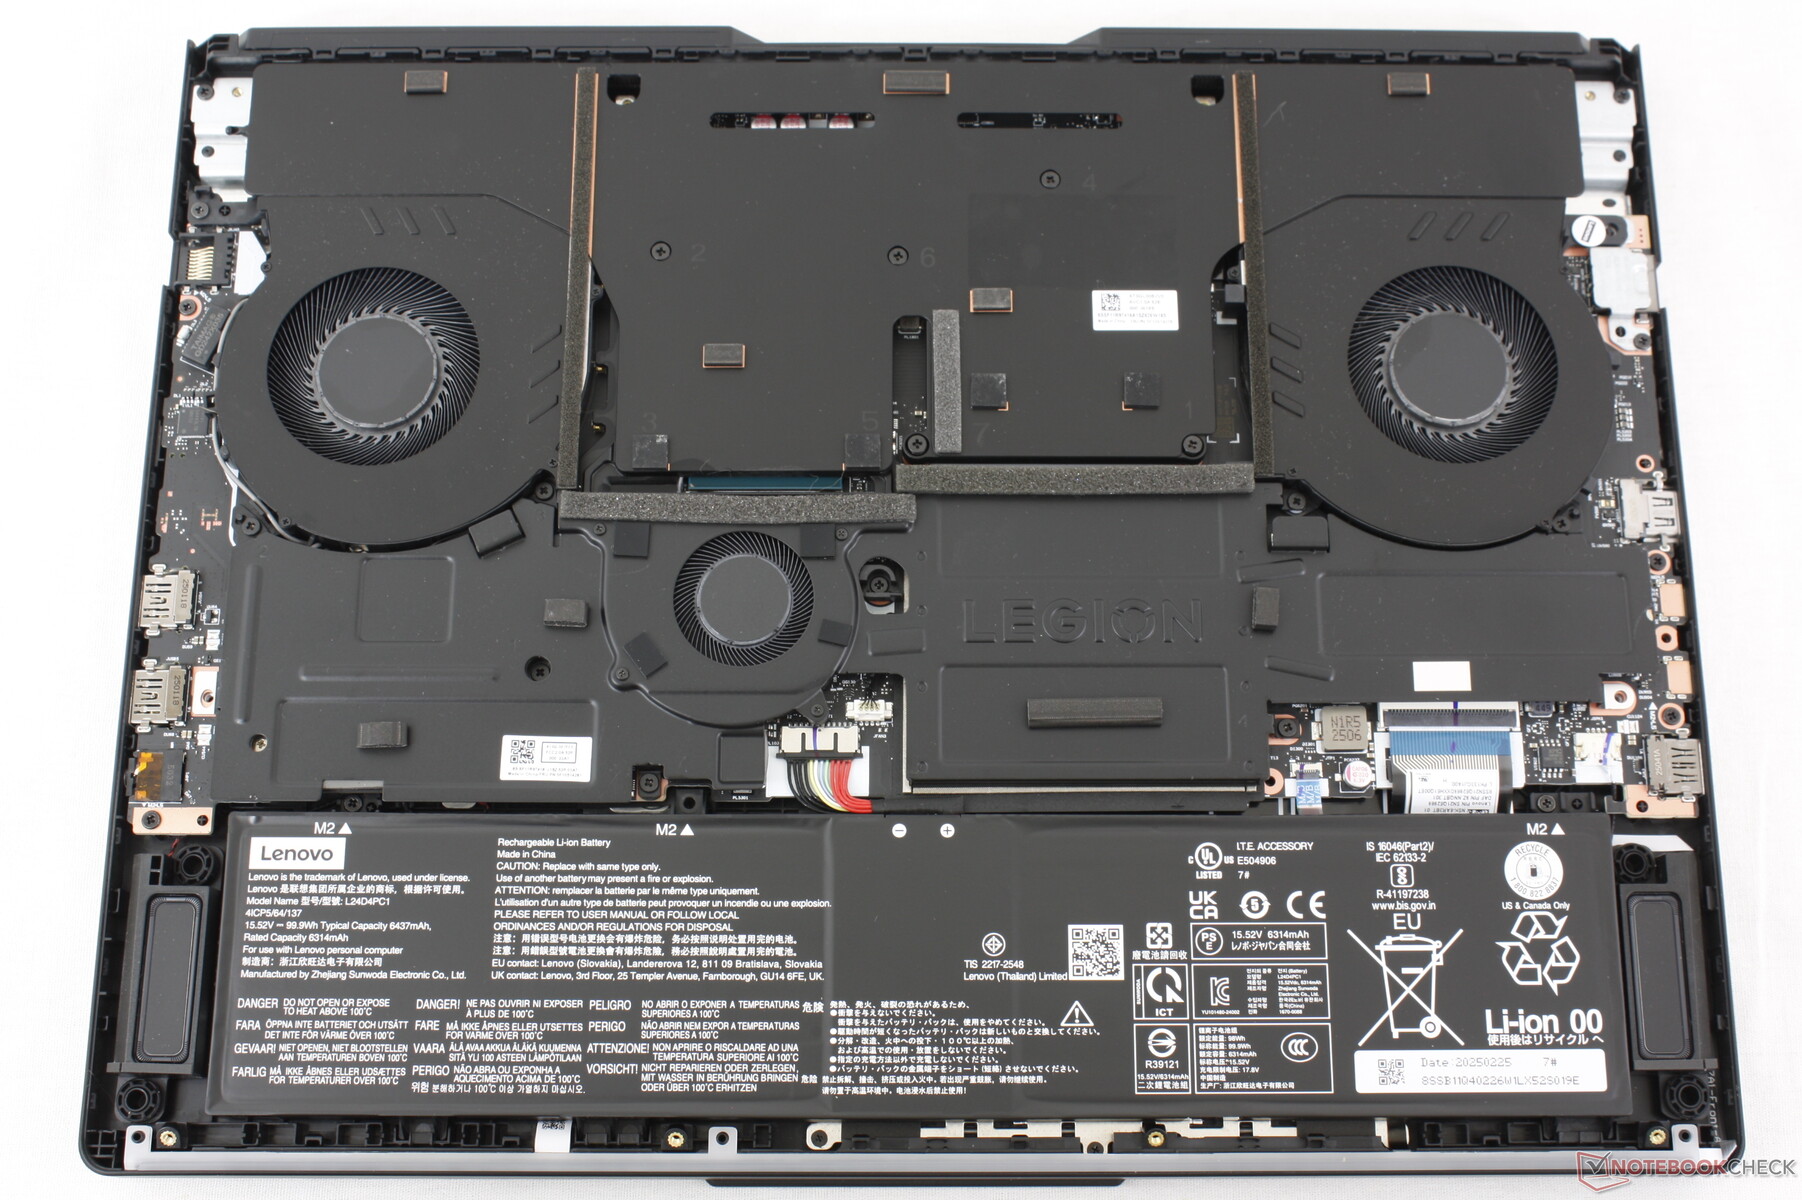
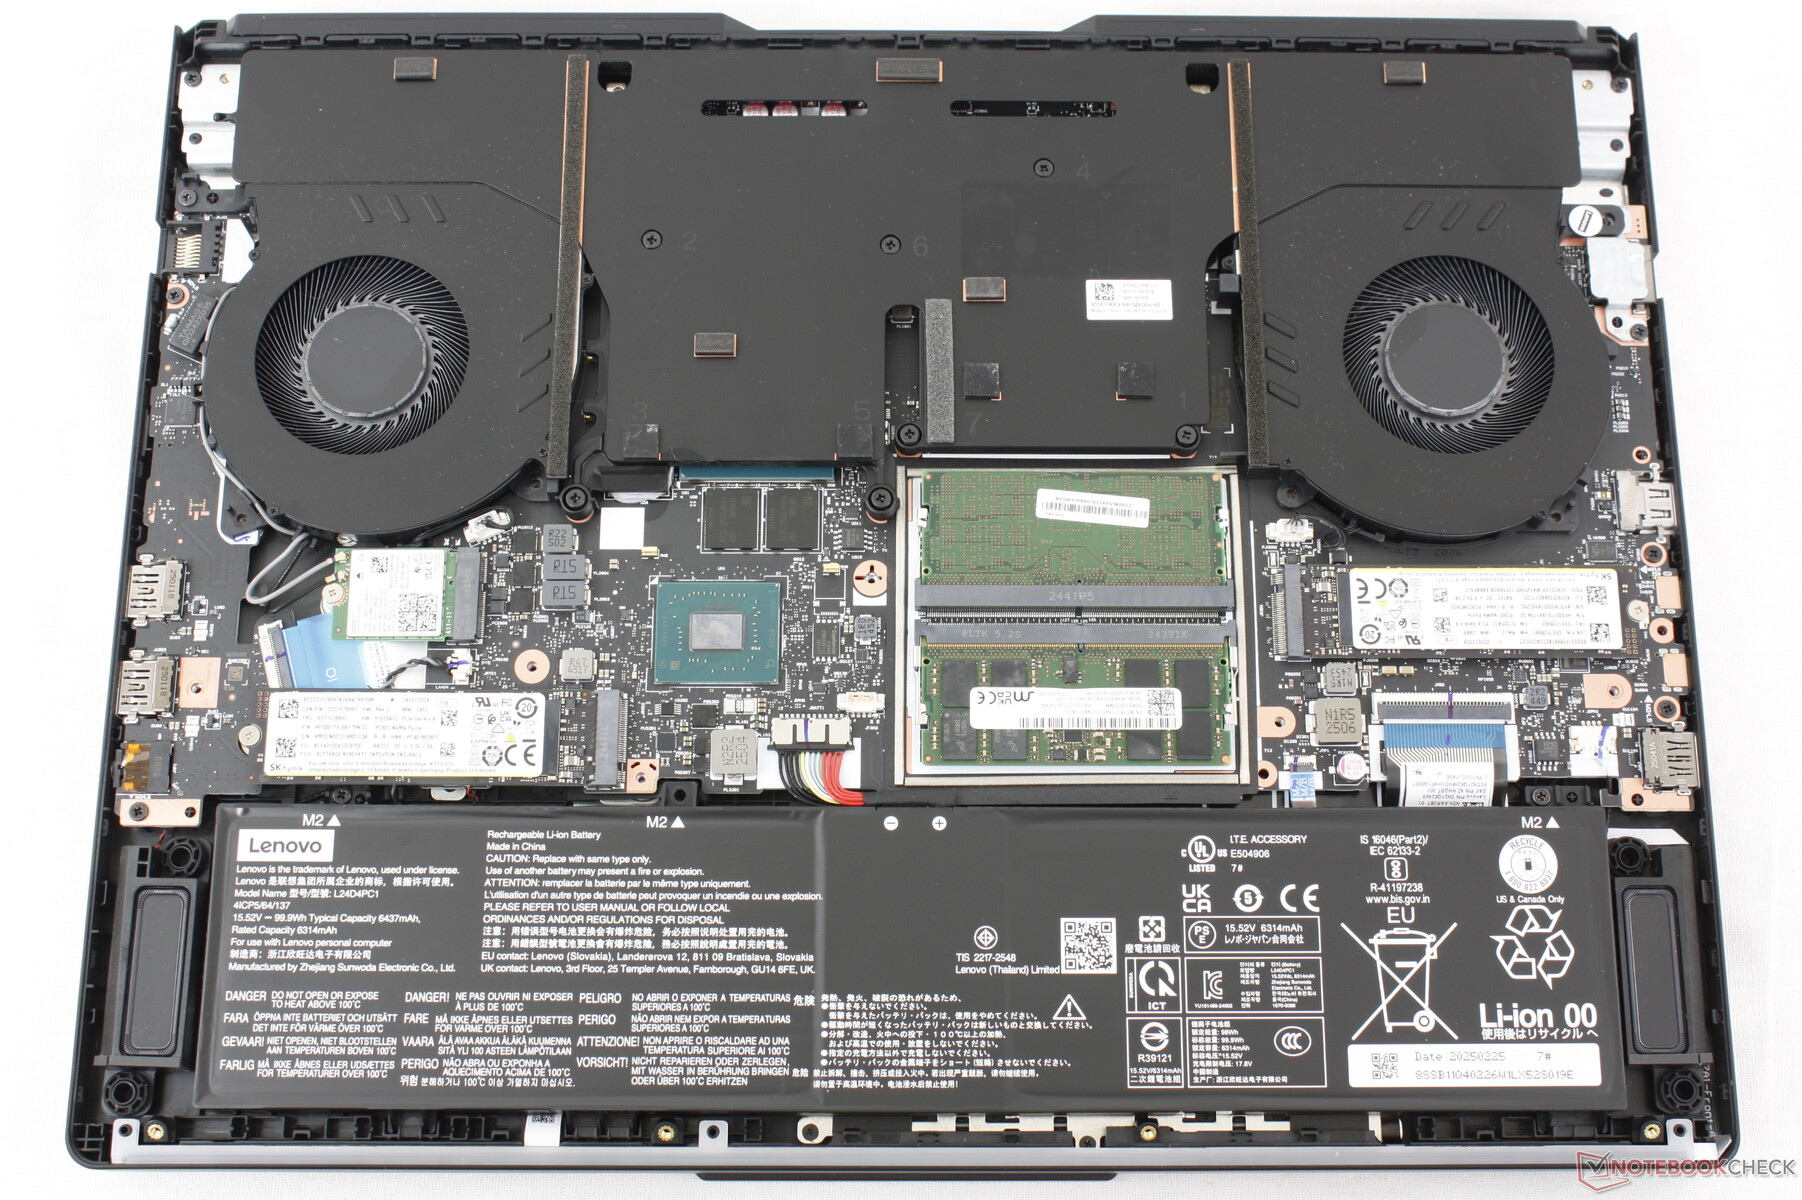
Servicing is slightly more involved than usual. Unlike on most other laptops, the two SODIMM slots, two M.2 SSD slots, and WLAN module are covered by a large aluminum plate as shown below in addition to the outer cover. The apparatus is simple to remove so long as users are careful to not tear the ribbon cable connecting the third fan to the motherboard.
Sustainability
While Lenovo has a CO2 sustainability program, we can find no information on how much recycled material was used to manufacture the Legion Pro 7i 16 Gen 10, if any. The retail box is otherwise mostly paper and cardboard with wrapping consisting of 90 percent ocean-bound plastic.
Accessories And Warranty
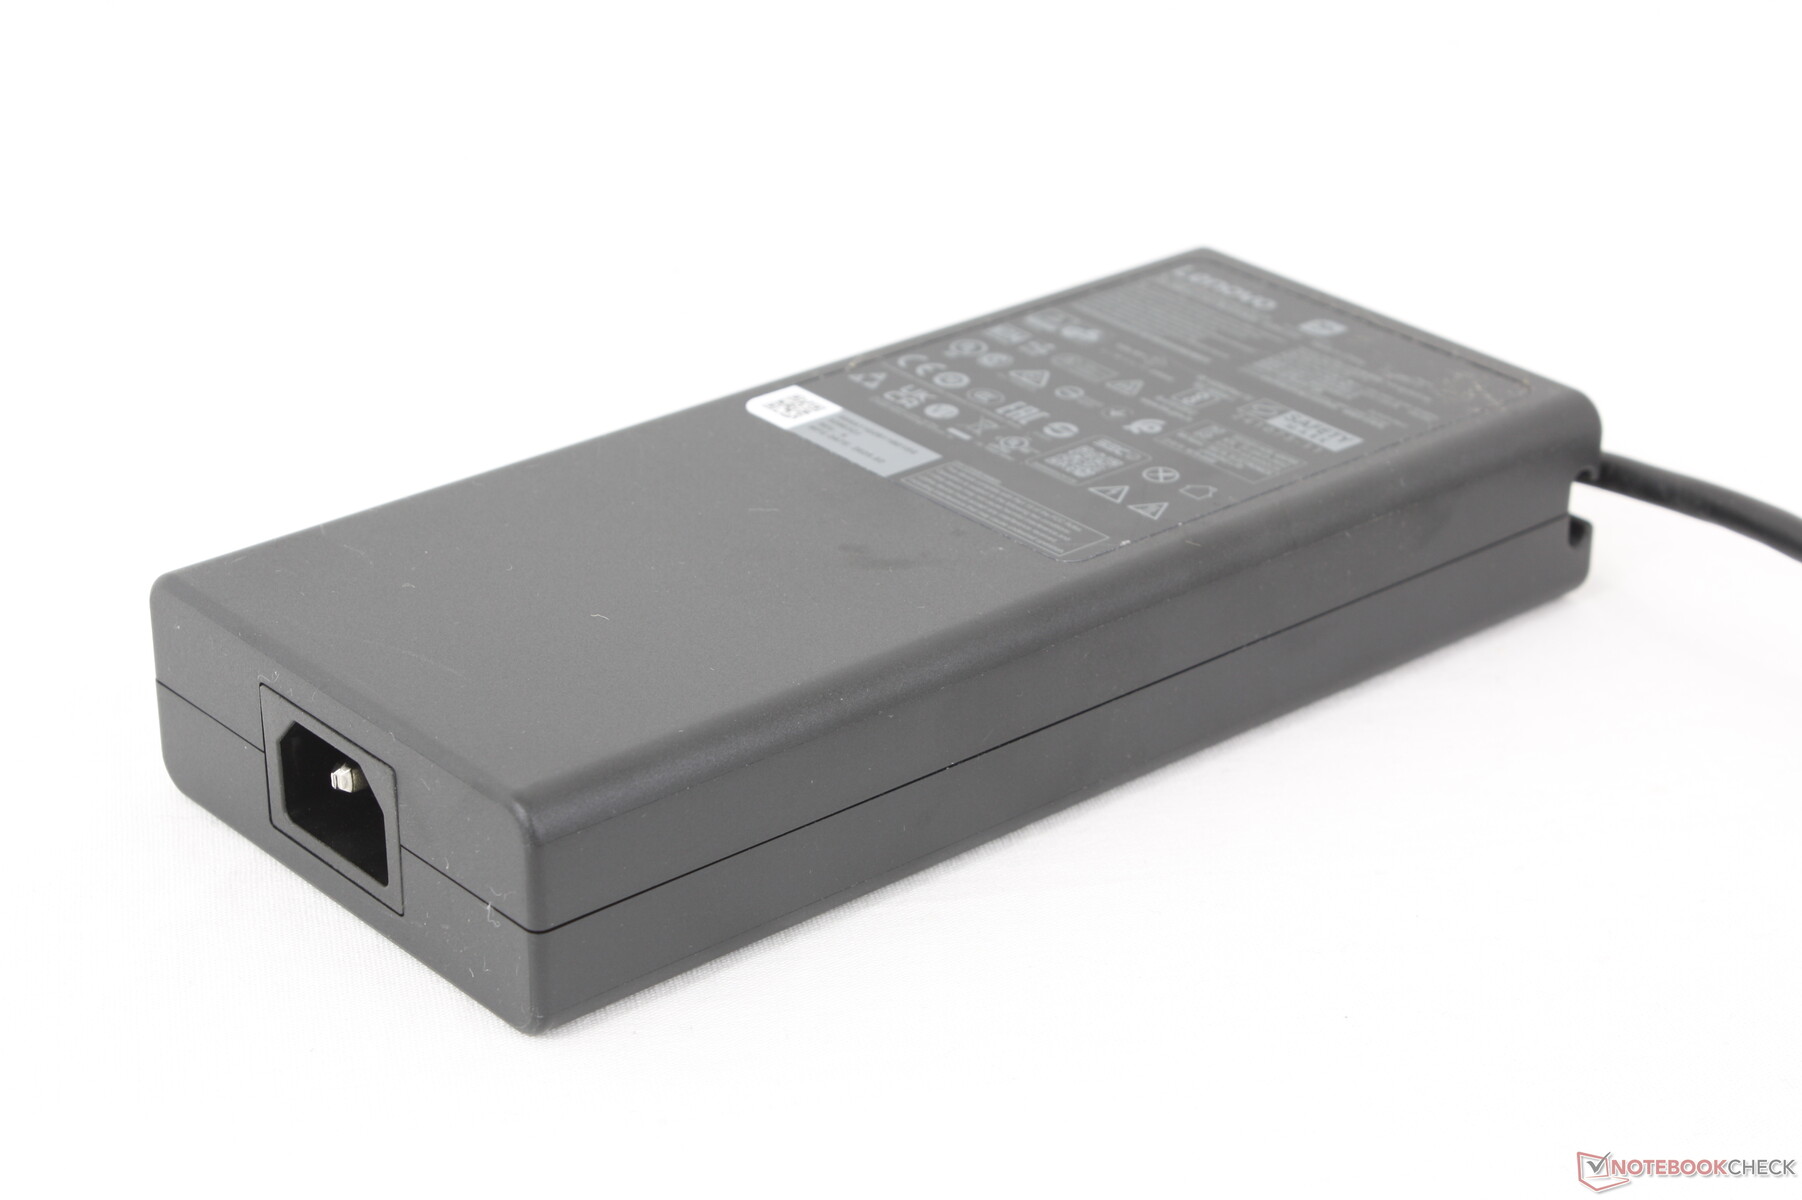
The box includes no extras outside of the 400 W (!) AC adapter and paperwork. The usual one-year limited manufacturer warranty applies.
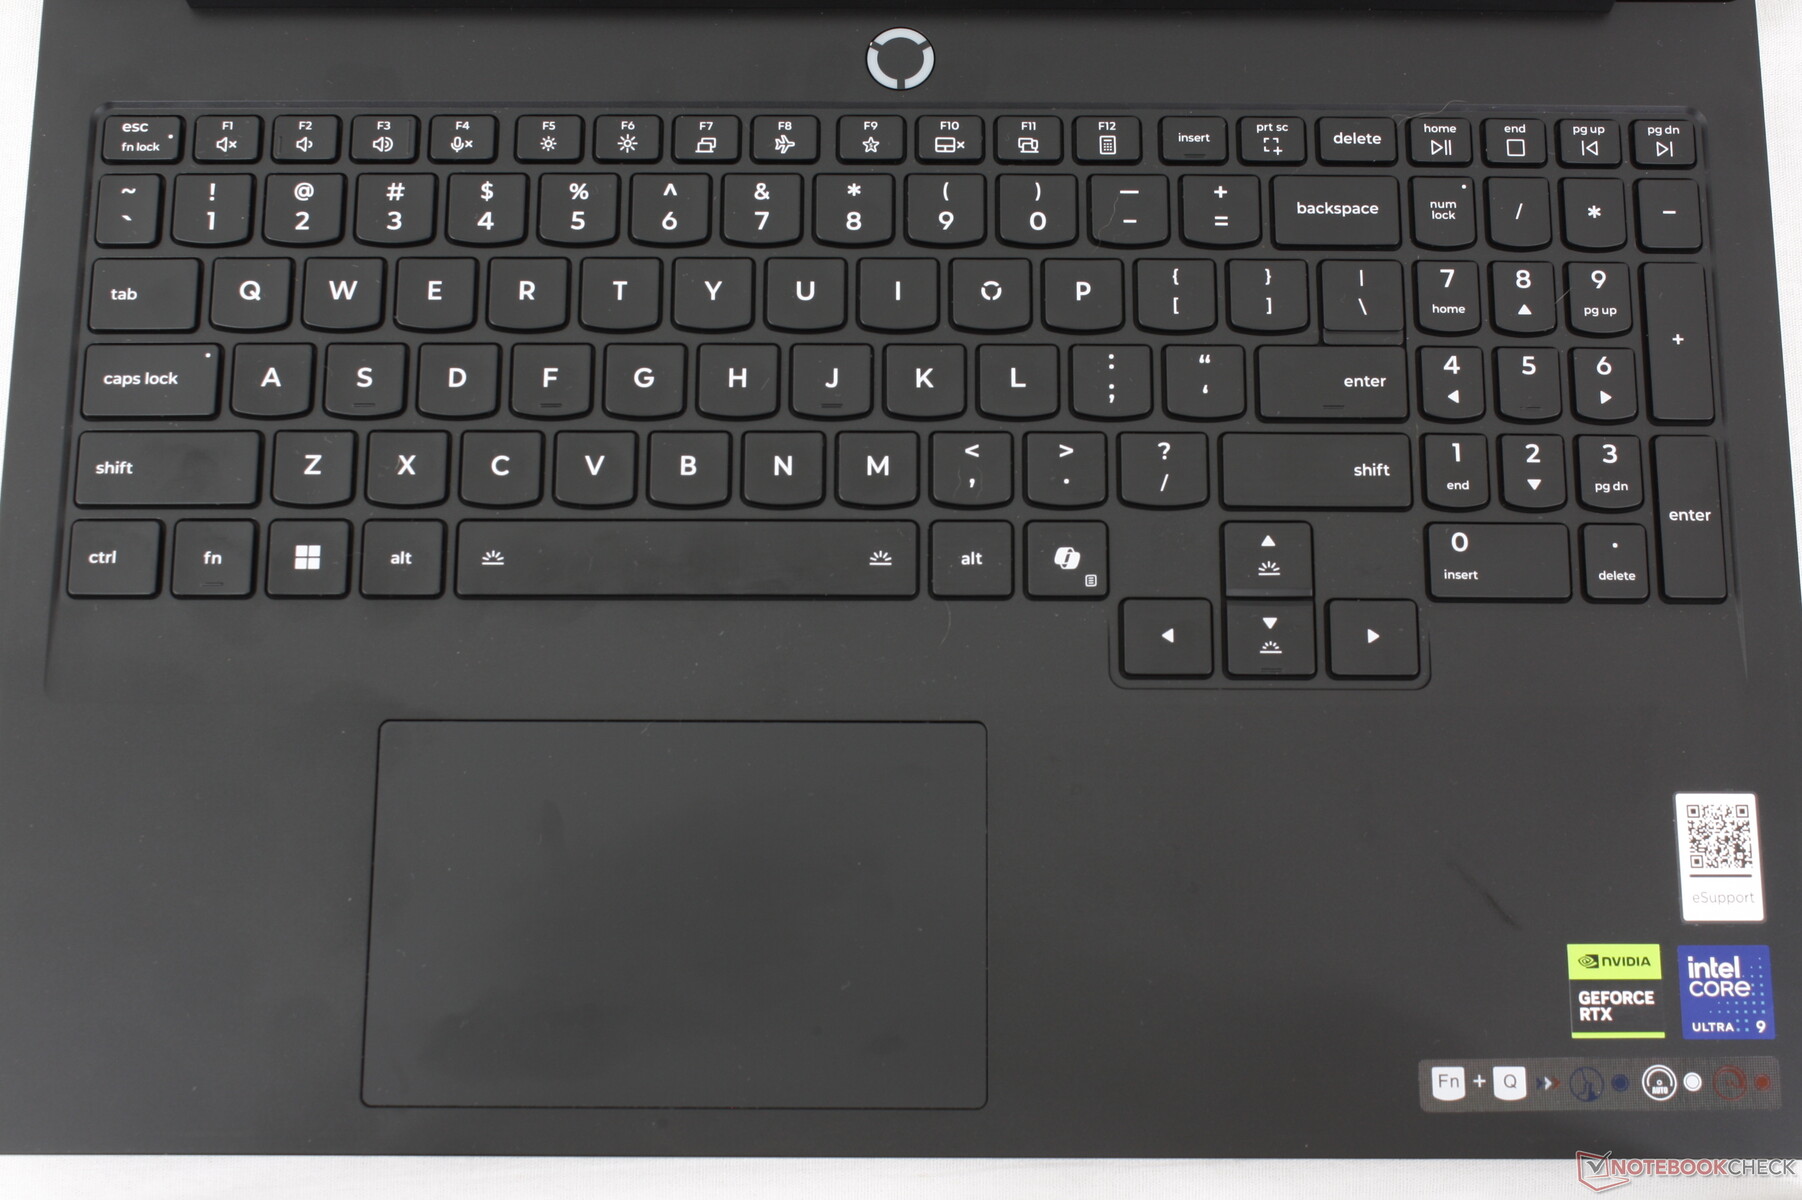
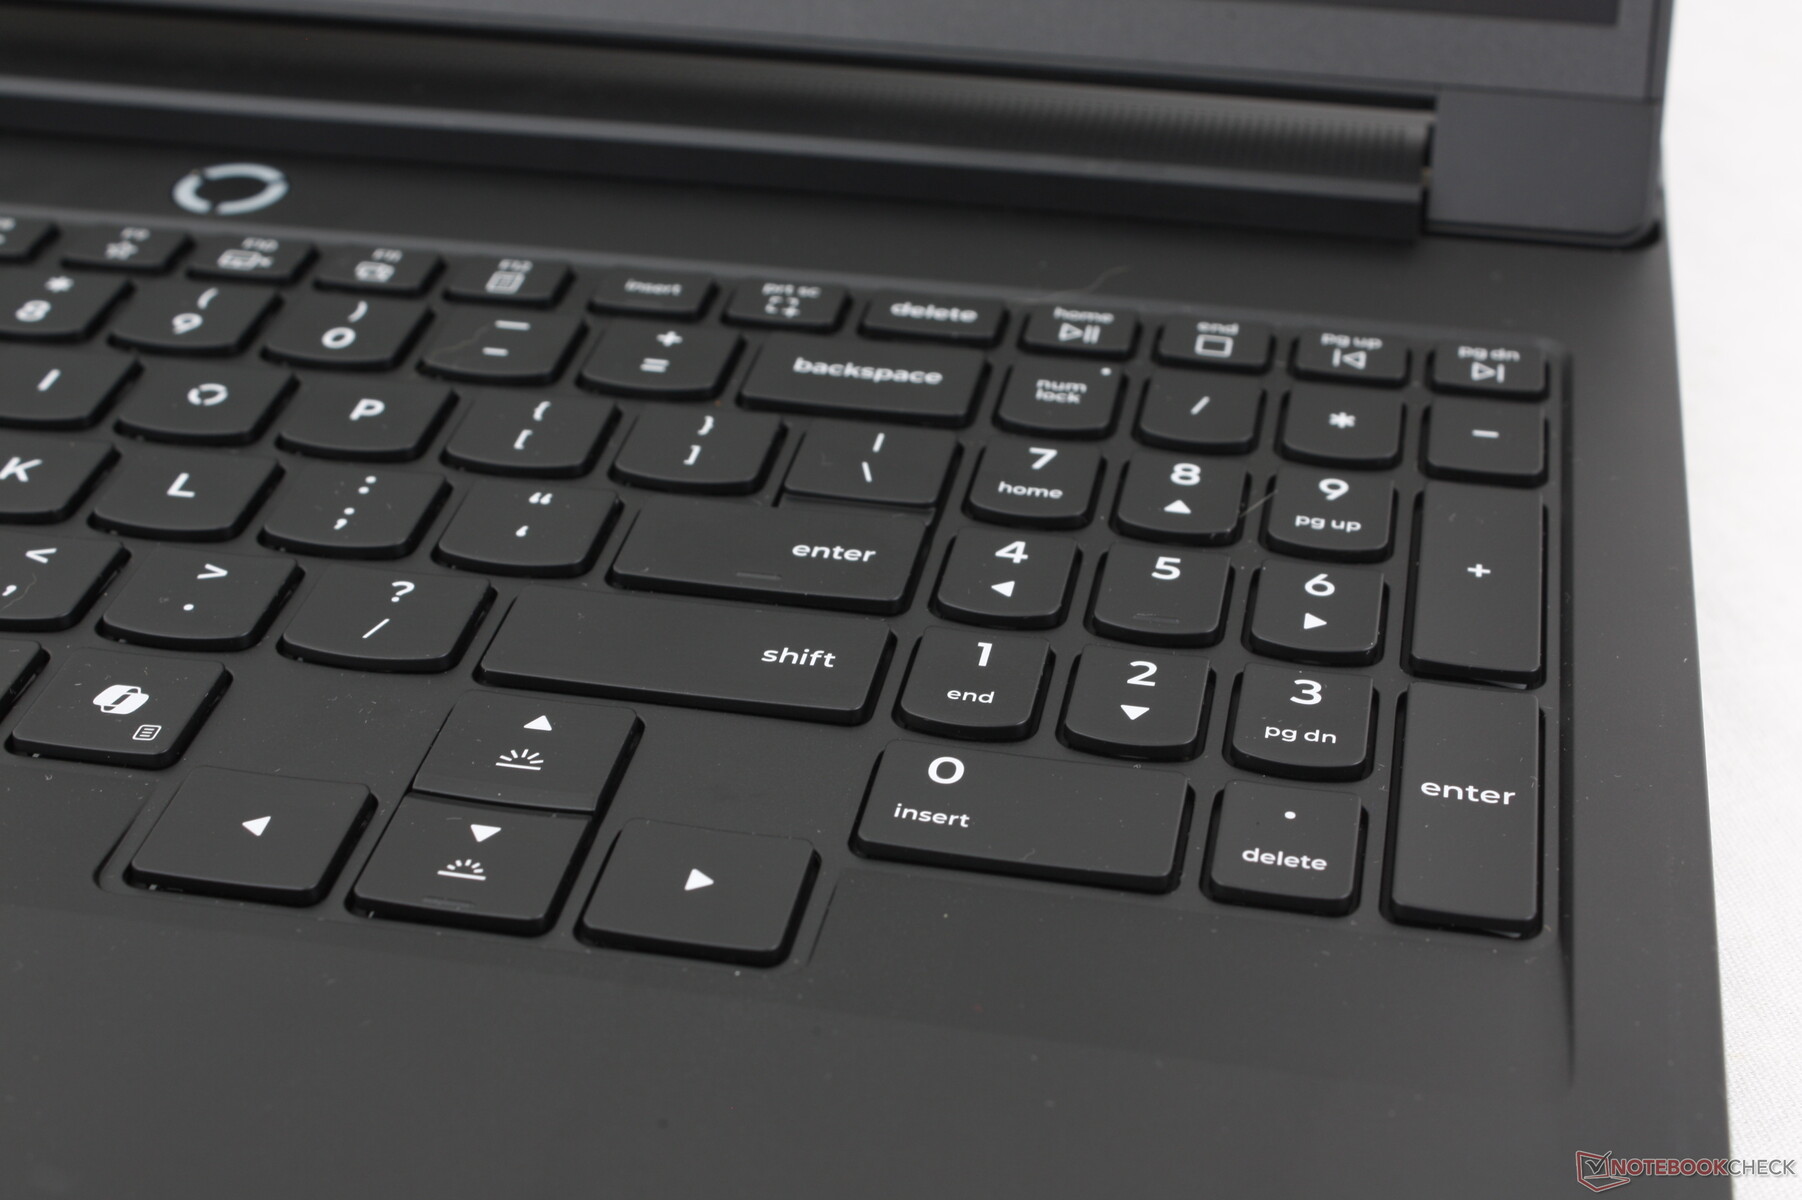
Input Devices — Spacious And Nothing Fancy
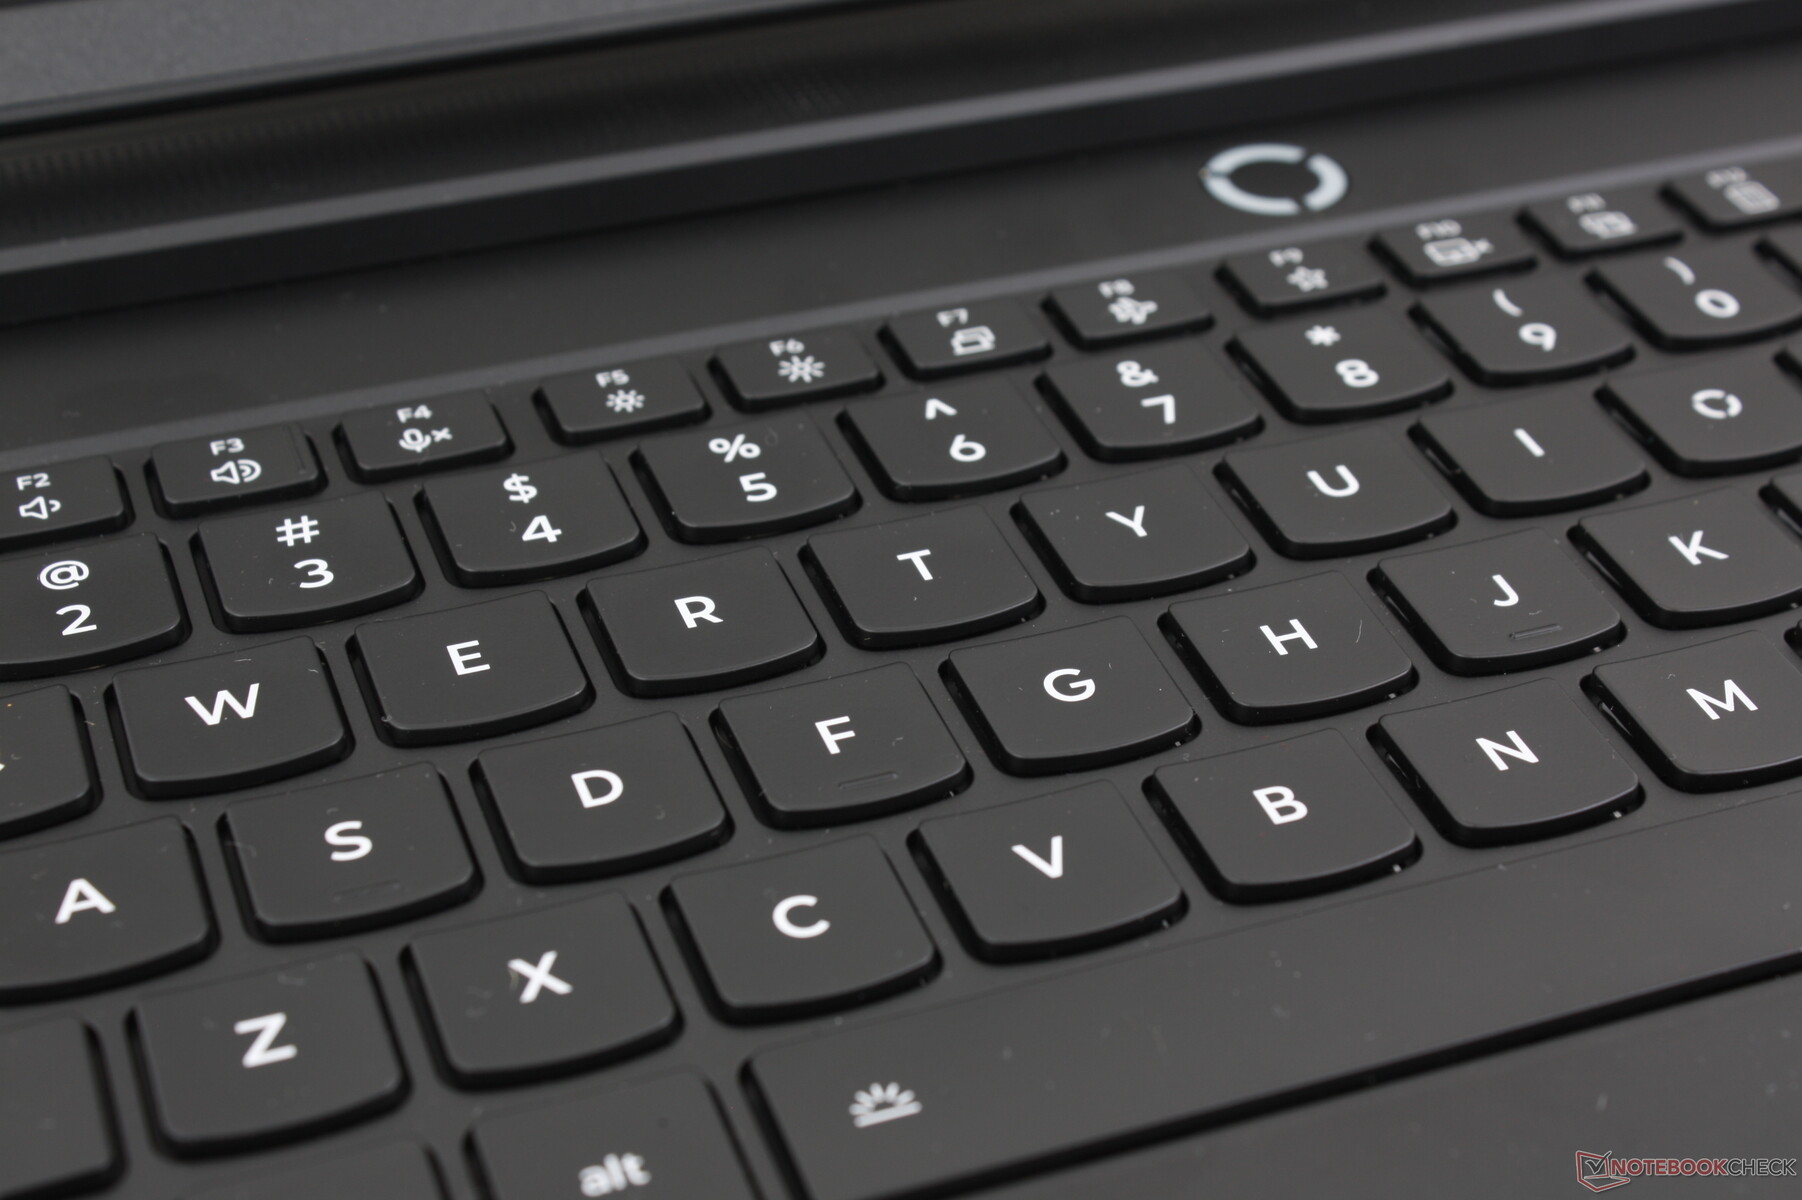
Keyboard
Other than some slight changes to the font, the membrane keys remain essentially the same as on last year's Legion 7 16 G9 or Legion 9i 16 for a familiar typing experience. Travel feels deeper and with firmer feedback than the keys on most thinner laptops including the Blade 16.
We appreciate the full-size arrow keys as they are usually smaller and more cramped on many other gaming laptops including on the Omen Max 16.
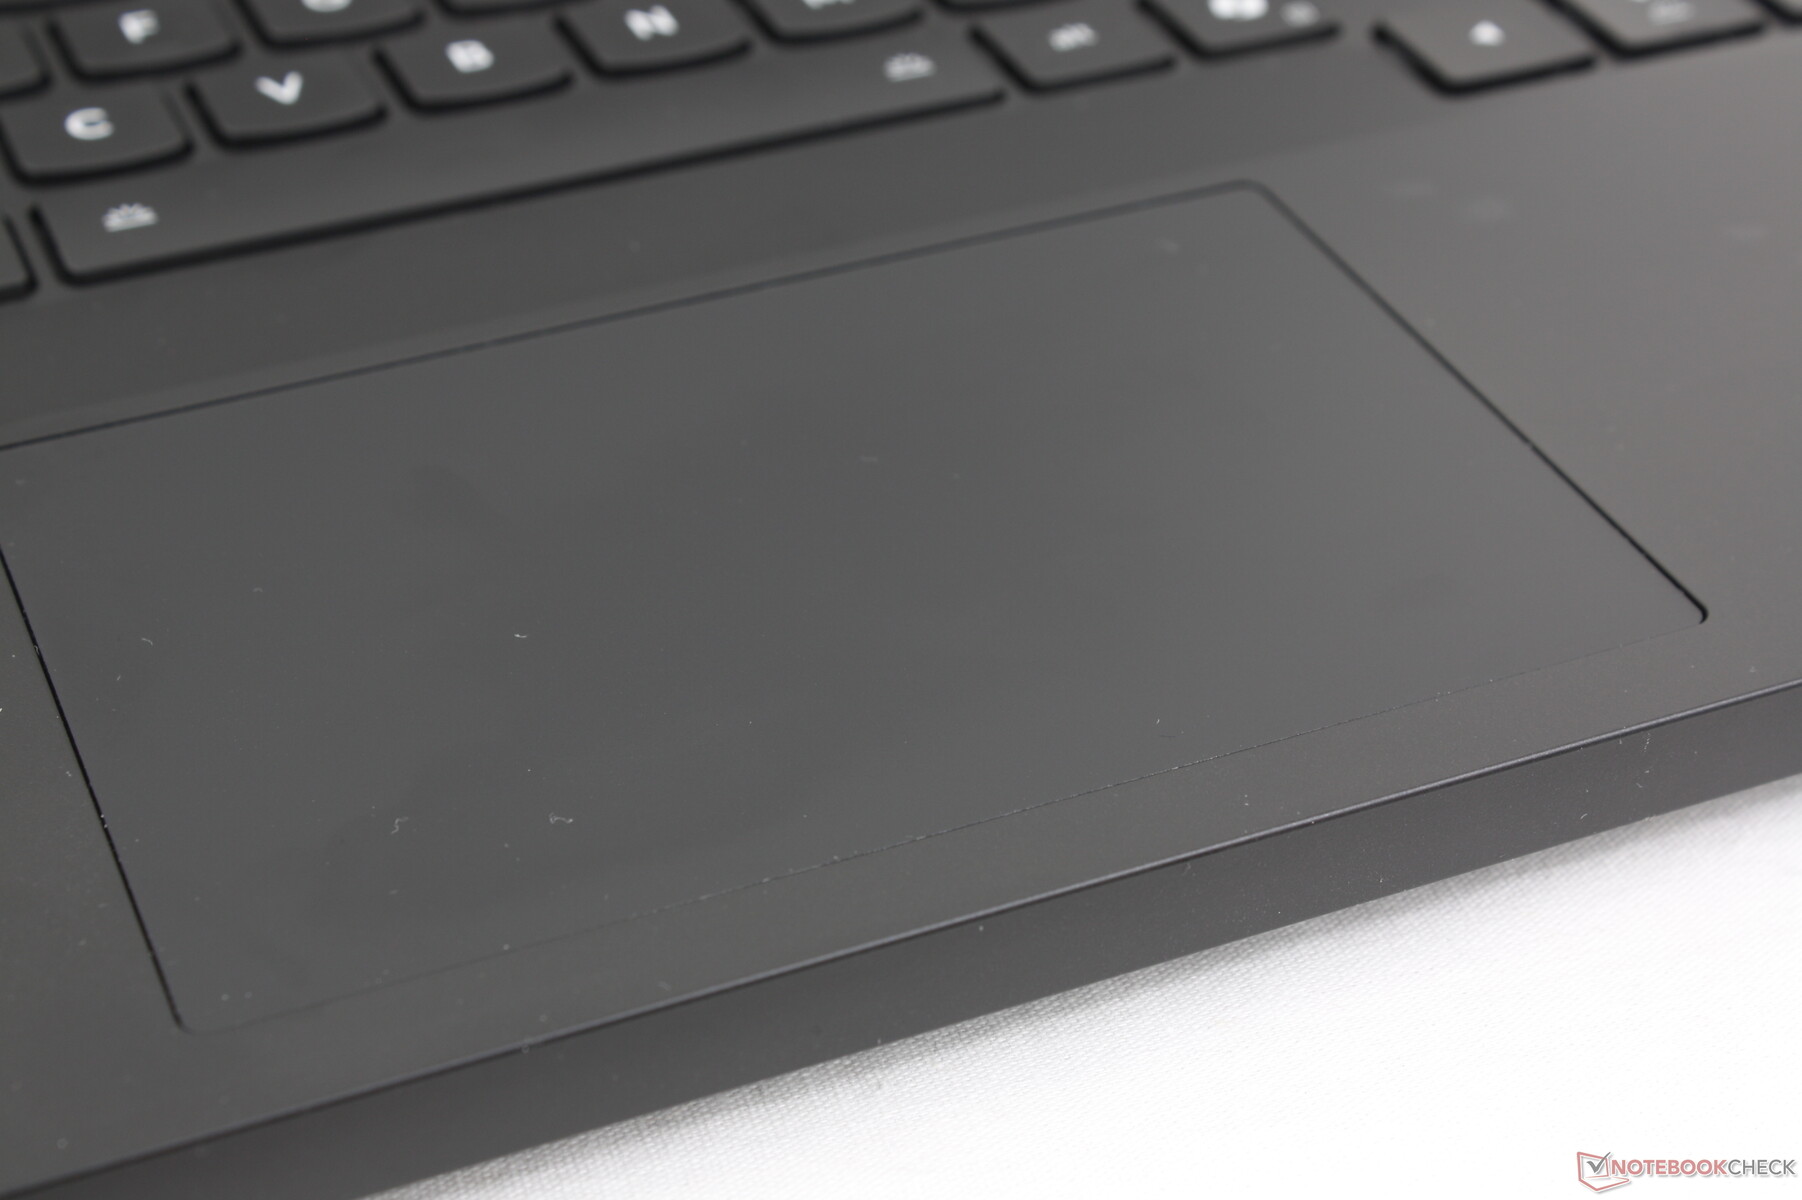
Touchpad
Clickpad size is identical to the one on last year's model at 12 x 7.5 cm. We wish it could have been taller for better vertical cursor control, but movements are nonetheless smooth and accurate without any reliability issues. Clicking on the clickpad is unfortunately still on the shallow and softer side.
Display — Almost Everything You Could Want

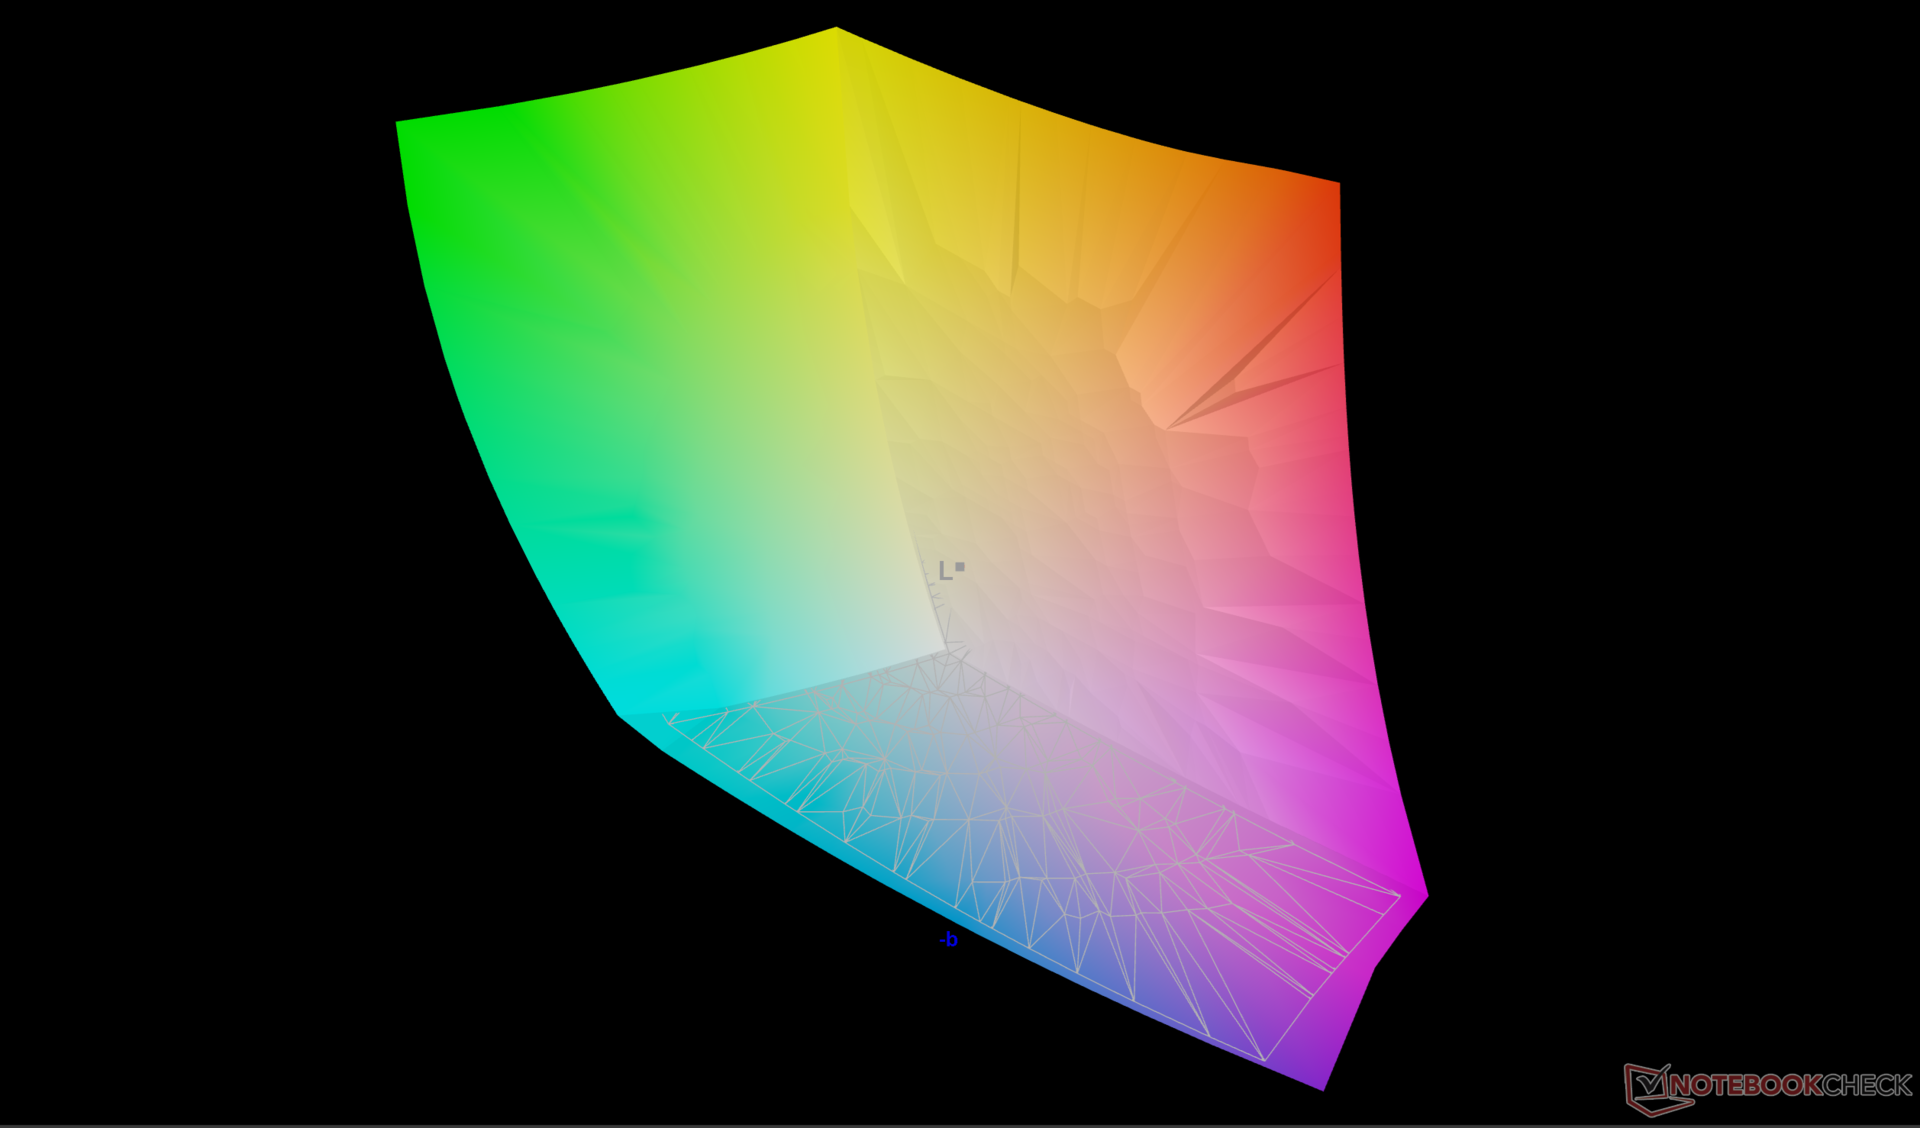
The Samsung ATNA60HU01-0 OLED panel on our Lenovo unit is very similar to the ATNA60DL01-0 OLED panel on the competing Zephyrus G16. Both panels offer 240 Hz native refresh, 1600p native resolution, and P3 colors. Both G-Sync and Advanced Optimus are supported as well to be a high-end panel fit for both gaming and graphics editing alike. It's subjectively very sharp despite not offering any 4K options.
Windows VRR is supported to save on power albeit only down to 60 Hz. We can confirm DisplayHDR1000 support as well with a measured maximum brightness level of 970 nits when on HDR mode. If on SDR mode, maximum brightness reaches 500 nits instead which is still brighter than many IPS panels and even the aforementioned Zephyrus G16.

| |||||||||||||||||||||||||
Brightness Distribution: 97 %
Center on Battery: 490.4 cd/m²
Contrast: ∞:1 (Black: 0 cd/m²)
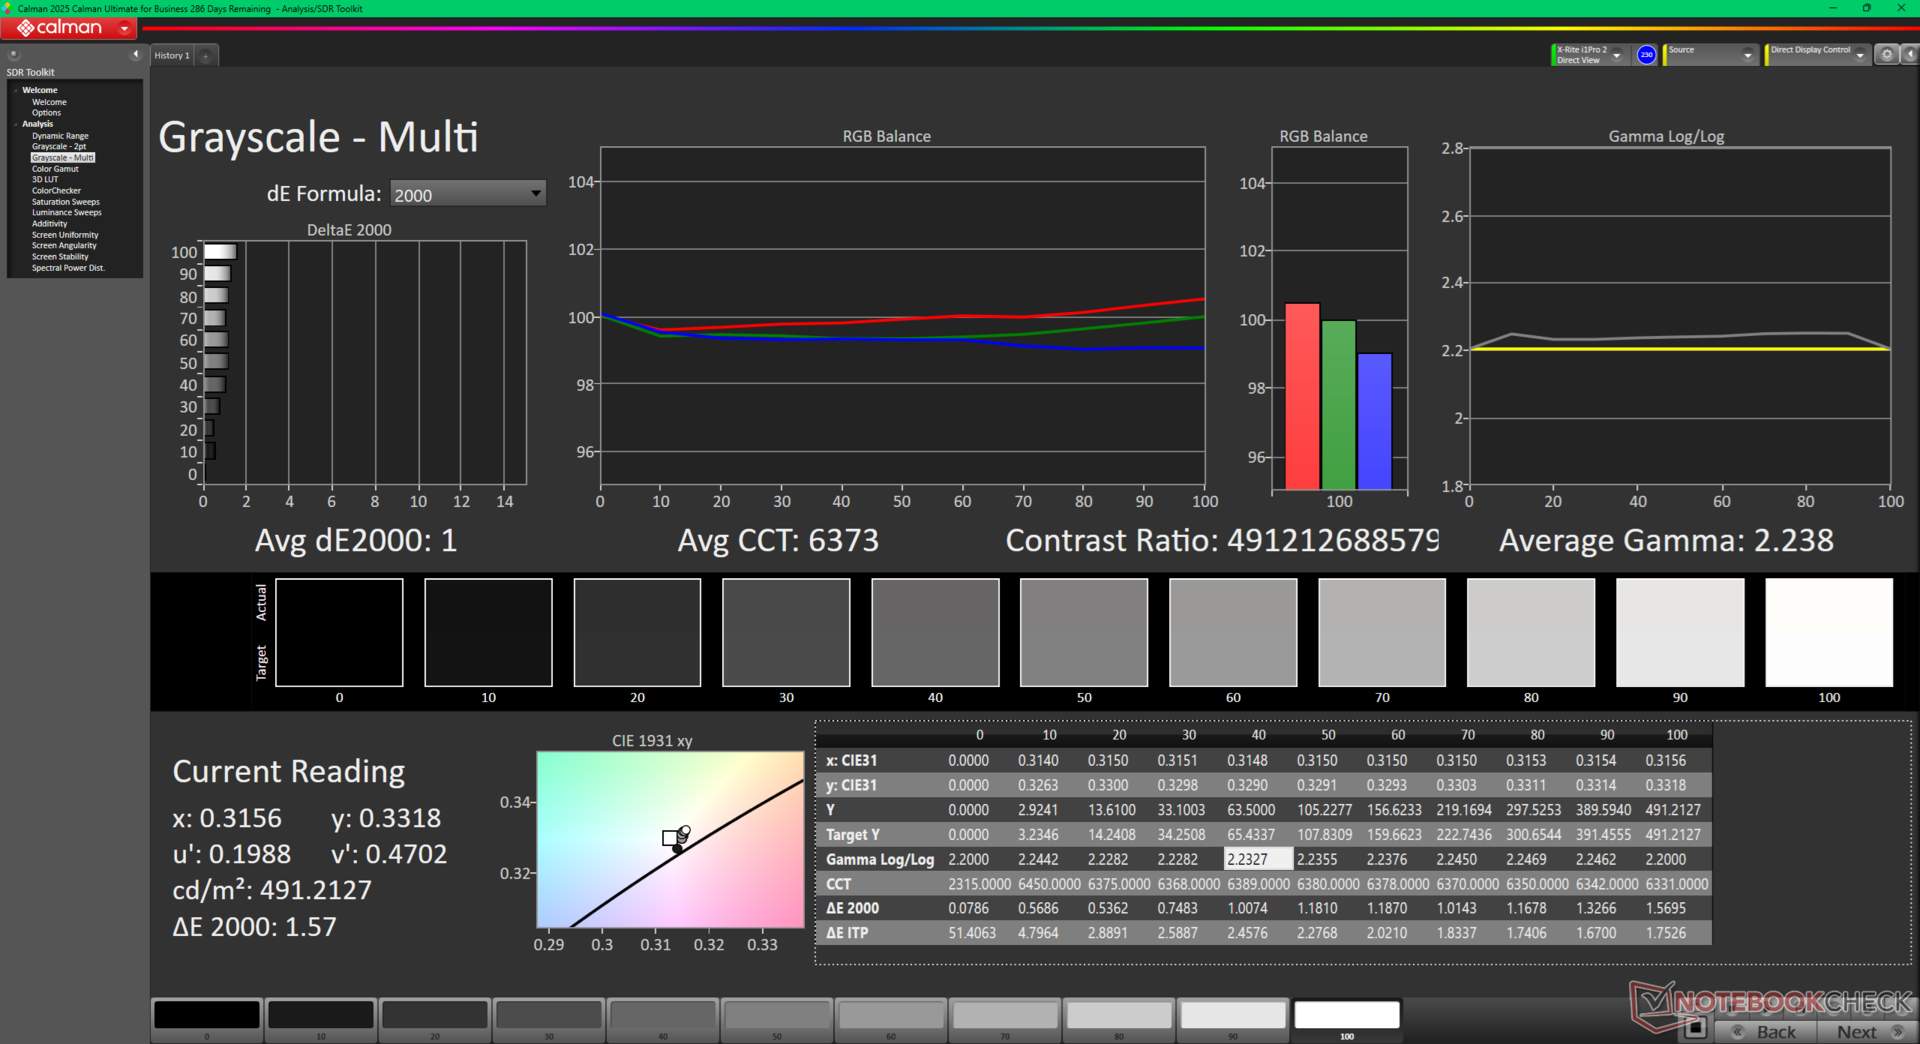
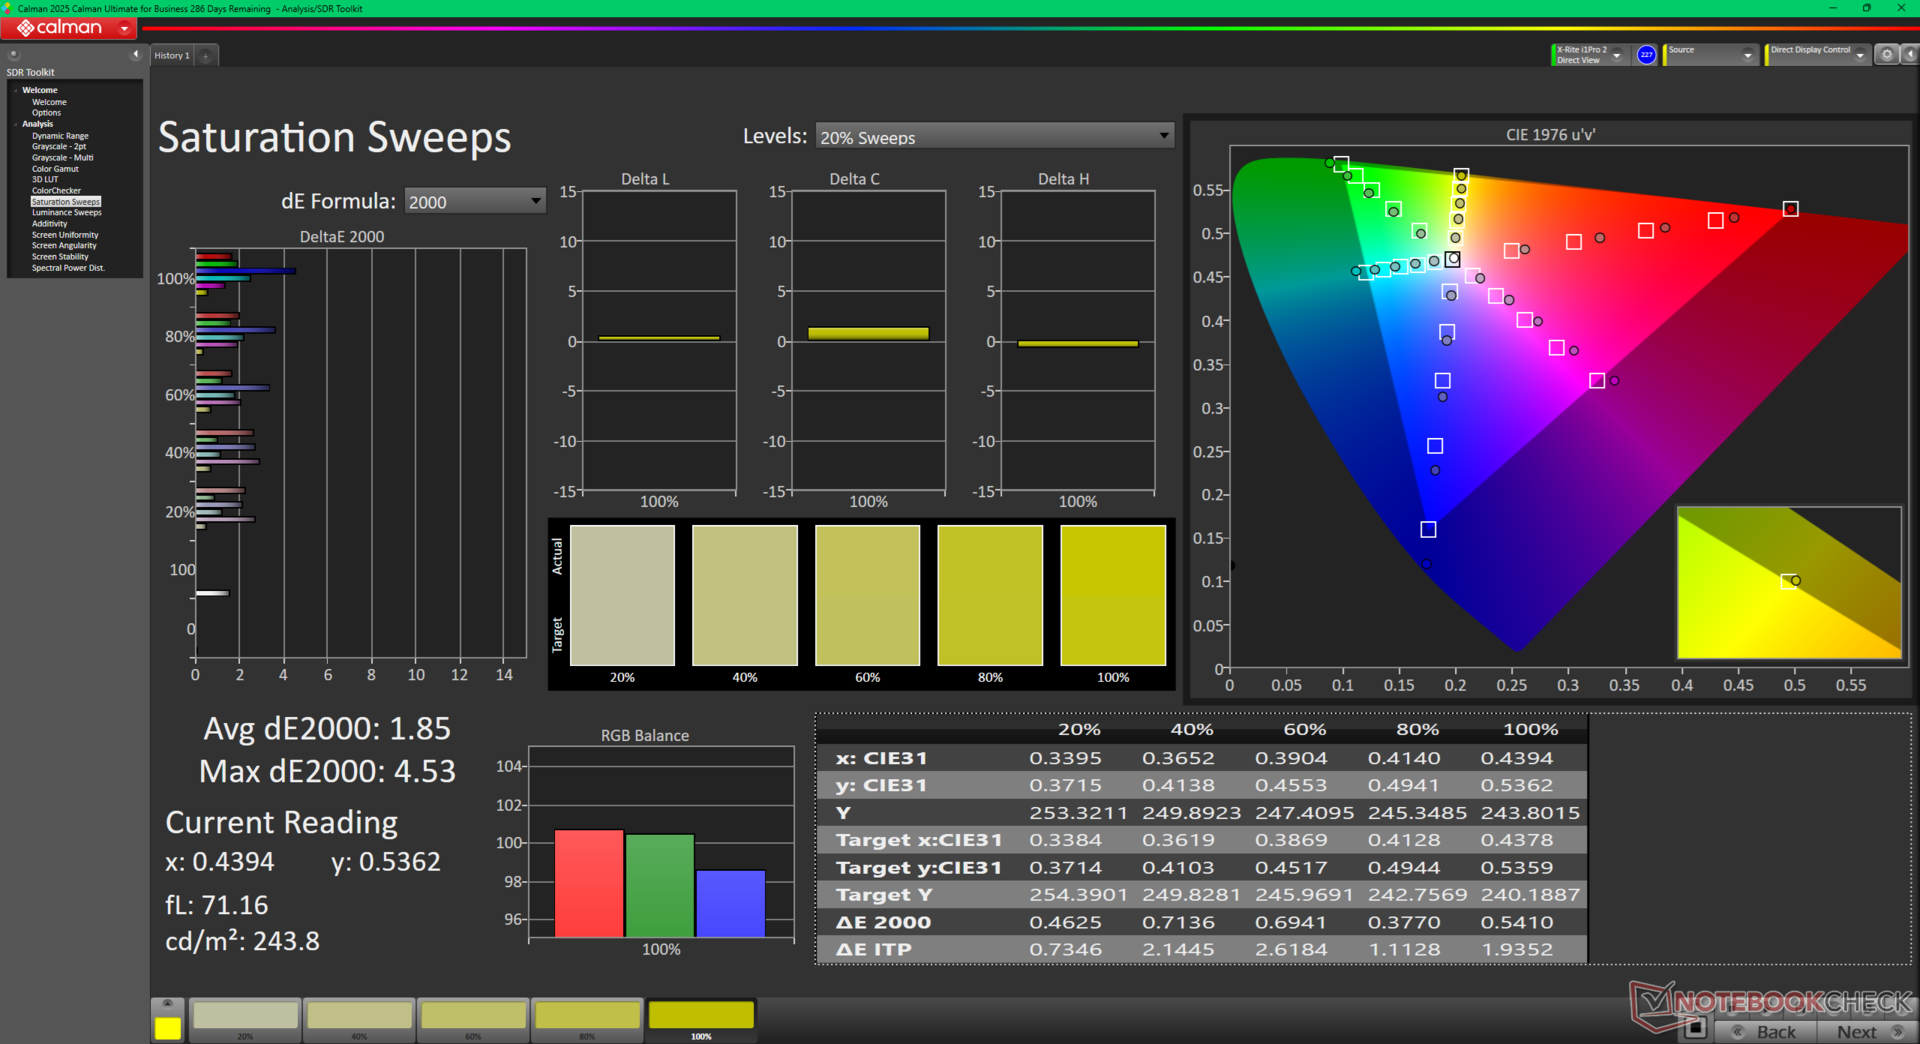
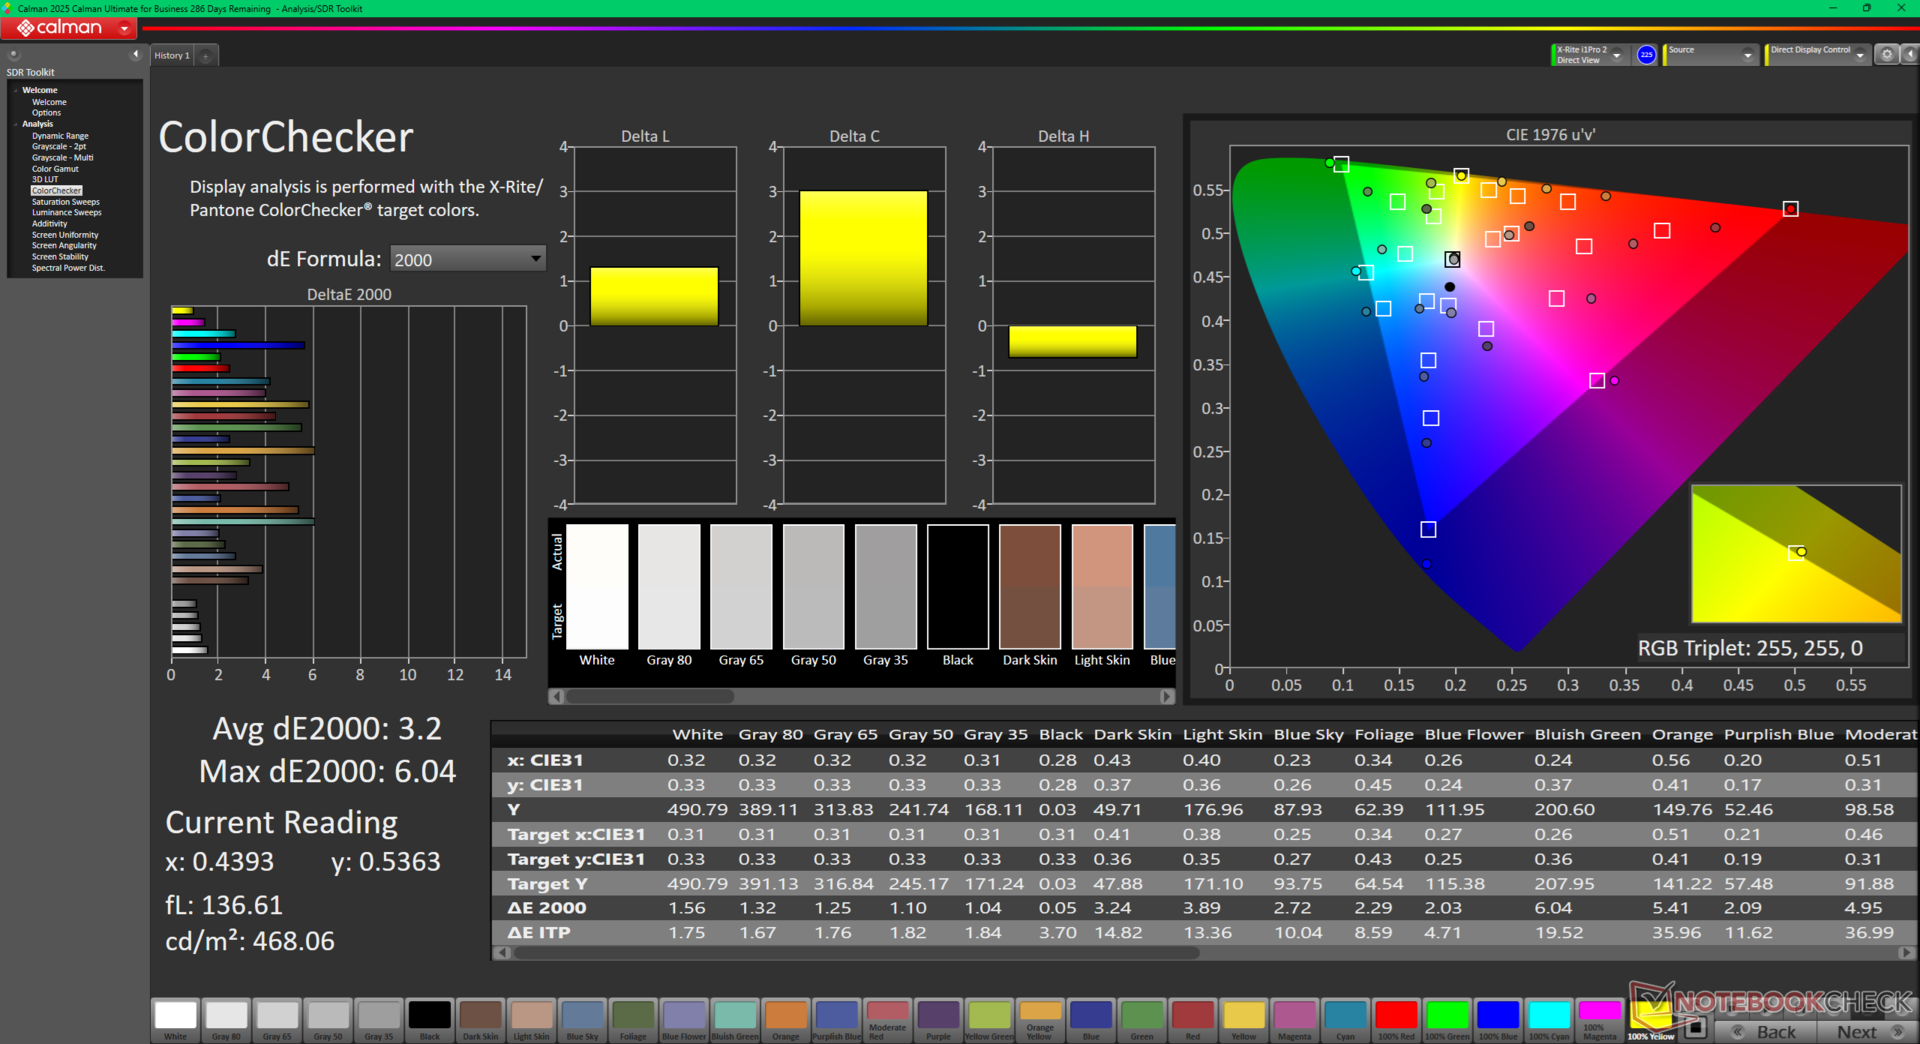
ΔE ColorChecker Calman: 3.2 | ∀{0.5-29.43 Ø4.71}
calibrated: 0.84
ΔE Greyscale Calman: 1 | ∀{0.09-98 Ø4.96}
94.4% AdobeRGB 1998 (Argyll 3D)
100% sRGB (Argyll 3D)
99.5% Display P3 (Argyll 3D)
Gamma: 2.24
CCT: 6373 K
| Lenovo Legion Pro 7i 16 Gen 10 Samsung ATNA60HU01-0, OLED, 2560x1600, 16", 240 Hz | Lenovo Legion 9 16IRX9, RTX 4090 CSOT T3 MNG007ZA2-2, MiniLED, 3200x2000, 16", 165 Hz | Razer Blade 16 2025 RTX 5090 ATNA60DL04-0, OLED, 2560x1600, 16", 240 Hz | Asus ROG Zephyrus G16 GU605MY ATNA60DL01-0, OLED, 2560x1600, 16", 240 Hz | MSI Vector 16 HX A14V Chi Mei N160GME-GTB, IPS, 2560x1600, 16", 240 Hz | Alienware x16 R2 P120F BOE B160QAN, IPS, 2560x1600, 16", 240 Hz | |
|---|---|---|---|---|---|---|
| Display | -4% | -4% | 1% | -5% | -2% | |
| Display P3 Coverage (%) | 99.5 | 95.3 -4% | 96.1 -3% | 99.9 0% | 95.4 -4% | 98.3 -1% |
| sRGB Coverage (%) | 100 | 99.9 0% | 99.9 0% | 100 0% | 99.7 0% | 100 0% |
| AdobeRGB 1998 Coverage (%) | 94.4 | 86.6 -8% | 85 -10% | 96.9 3% | 85.4 -10% | 88.8 -6% |
| Response Times | -2185% | 6% | -3% | -2244% | -1504% | |
| Response Time Grey 50% / Grey 80% * (ms) | 0.28 ? | 12.6 ? -4400% | 0.2 ? 29% | 0.22 ? 21% | 5.7 ? -1936% | 3.9 ? -1293% |
| Response Time Black / White * (ms) | 0.43 ? | 10 ? -2226% | 0.25 ? 42% | 0.25 ? 42% | 11.4 ? -2551% | 7.8 ? -1714% |
| PWM Frequency (Hz) | 1438 ? | 5430 | 960 ? | 960 ? | ||
| PWM Amplitude * (%) | 29 | 8 72% | 44 -52% | 50 -72% | ||
| Screen | -46% | -2% | -15% | -52% | -30% | |
| Brightness middle (cd/m²) | 490.4 | 631 29% | 391 -20% | 416 -15% | 557.2 14% | 348.4 -29% |
| Brightness (cd/m²) | 498 | 664 33% | 393 -21% | 418 -16% | 506 2% | 340 -32% |
| Brightness Distribution (%) | 97 | 91 -6% | 98 1% | 96 -1% | 83 -14% | 90 -7% |
| Black Level * (cd/m²) | 0.03 | 0.41 | 0.33 | |||
| Colorchecker dE 2000 * | 3.2 | 2.68 16% | 1.2 63% | 1.6 50% | 2.91 9% | 2.68 16% |
| Colorchecker dE 2000 max. * | 6.04 | 6.41 -6% | 3.2 47% | 2.1 65% | 5.94 2% | 4.14 31% |
| Colorchecker dE 2000 calibrated * | 0.84 | 2.68 -219% | 1.63 -94% | 0.42 50% | ||
| Greyscale dE 2000 * | 1 | 2.71 -171% | 1.8 -80% | 2.7 -170% | 3.8 -280% | 3.4 -240% |
| Gamma | 2.24 98% | 2.27 97% | 2.2 100% | 2.16 102% | 2.23 99% | 2.41 91% |
| CCT | 6373 102% | 6135 106% | 6493 100% | 6331 103% | 6408 101% | 6083 107% |
| Contrast (:1) | 21033 | 1359 | 1056 | |||
| Total Average (Program / Settings) | -745% /
-530% | 0% /
-0% | -6% /
-8% | -767% /
-405% | -512% /
-269% |
* ... smaller is better
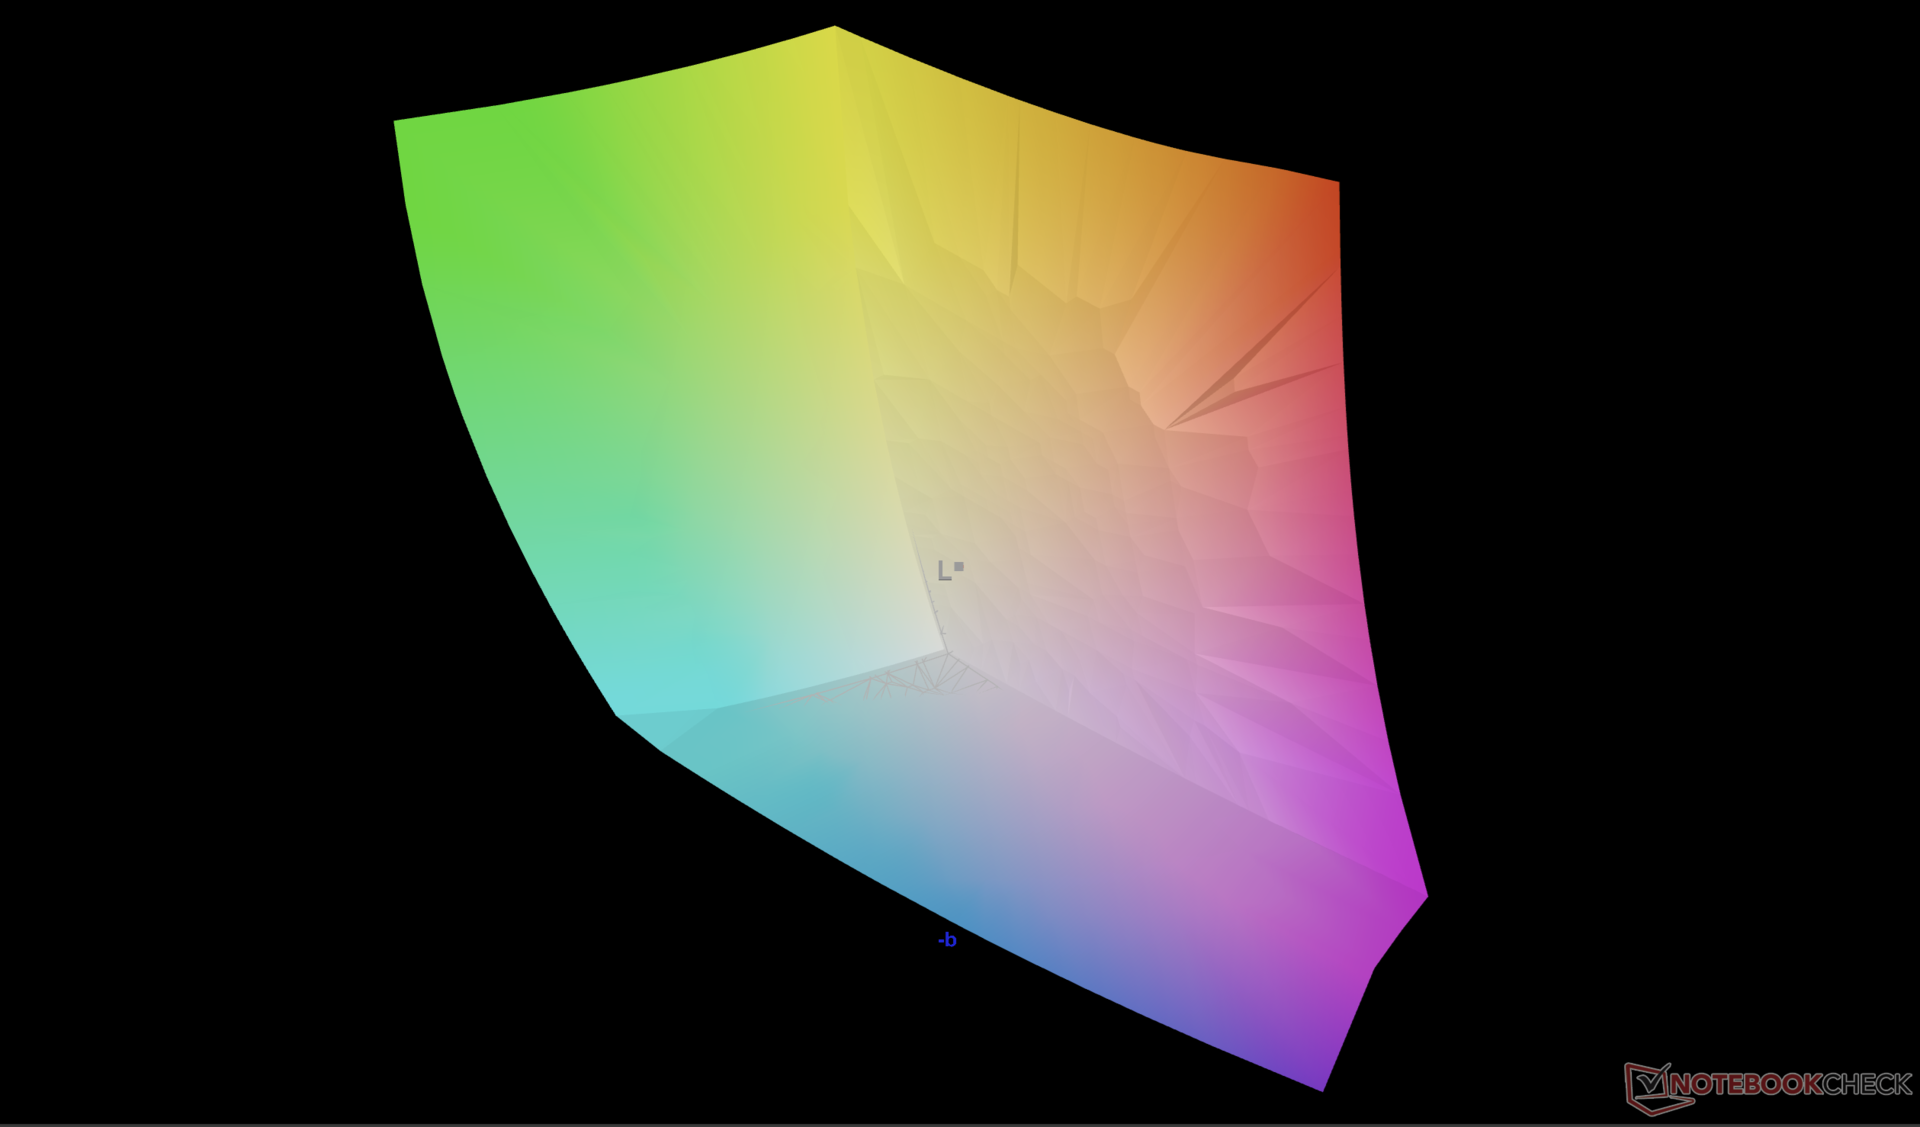
The display is decently calibrated against the P3 standard with average grayscale and color deltaE values of just 1.0 and 3.2, respectively, meaning an end-user calibration is not necessary for most.
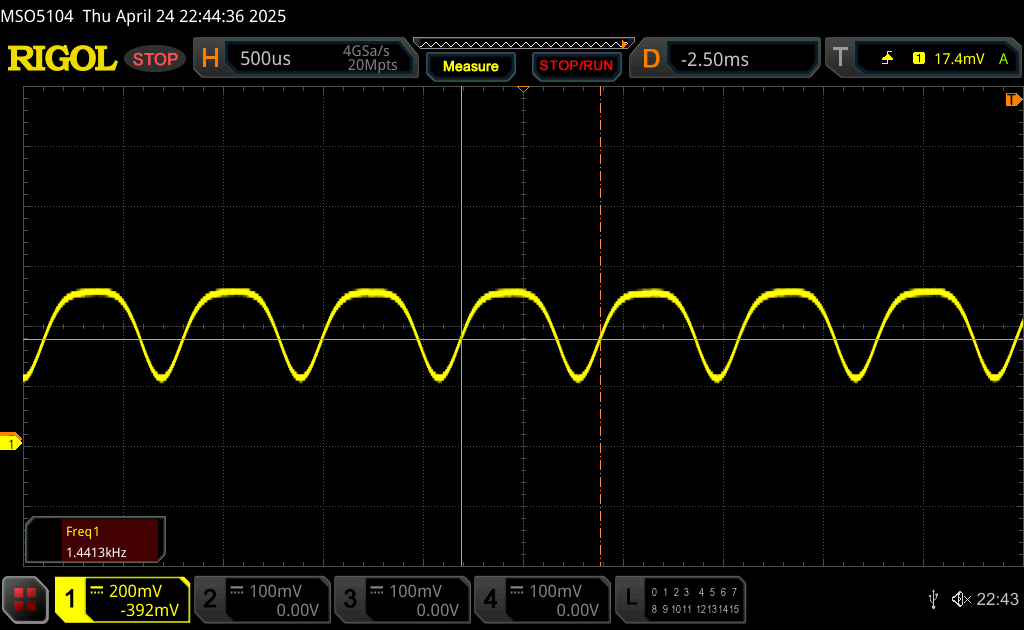
Display Response Times
| ↔ Response Time Black to White | ||
|---|---|---|
| 0.43 ms ... rise ↗ and fall ↘ combined | ↗ 0.22 ms rise | 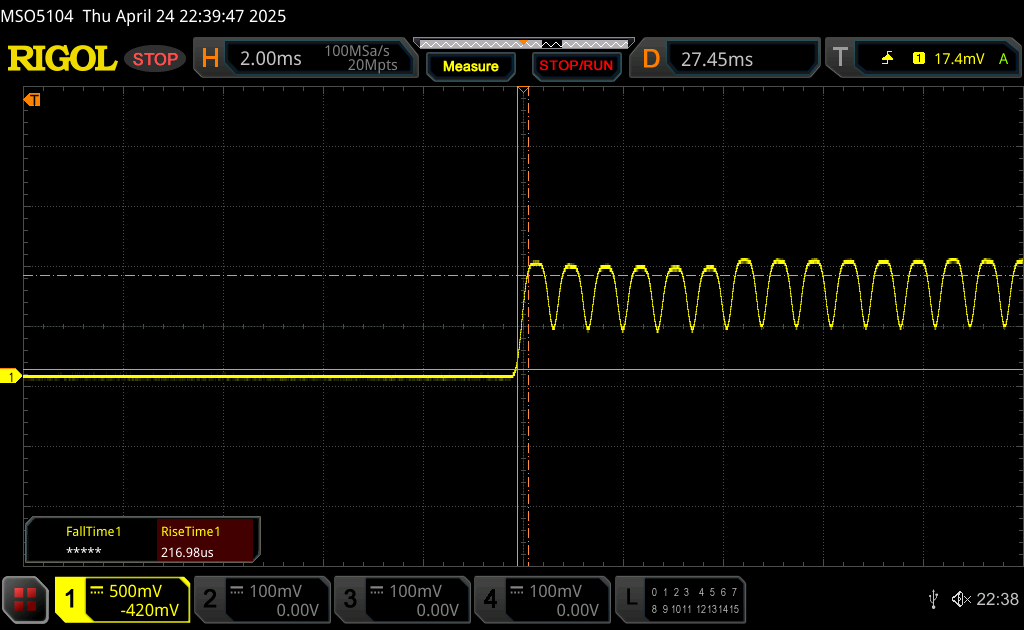 |
| ↘ 0.21 ms fall | ||
| The screen shows very fast response rates in our tests and should be very well suited for fast-paced gaming. In comparison, all tested devices range from 0.1 (minimum) to 240 (maximum) ms. » 1 % of all devices are better. This means that the measured response time is better than the average of all tested devices (19.8 ms). | ||
| ↔ Response Time 50% Grey to 80% Grey | ||
| 0.28 ms ... rise ↗ and fall ↘ combined | ↗ 0.14 ms rise | 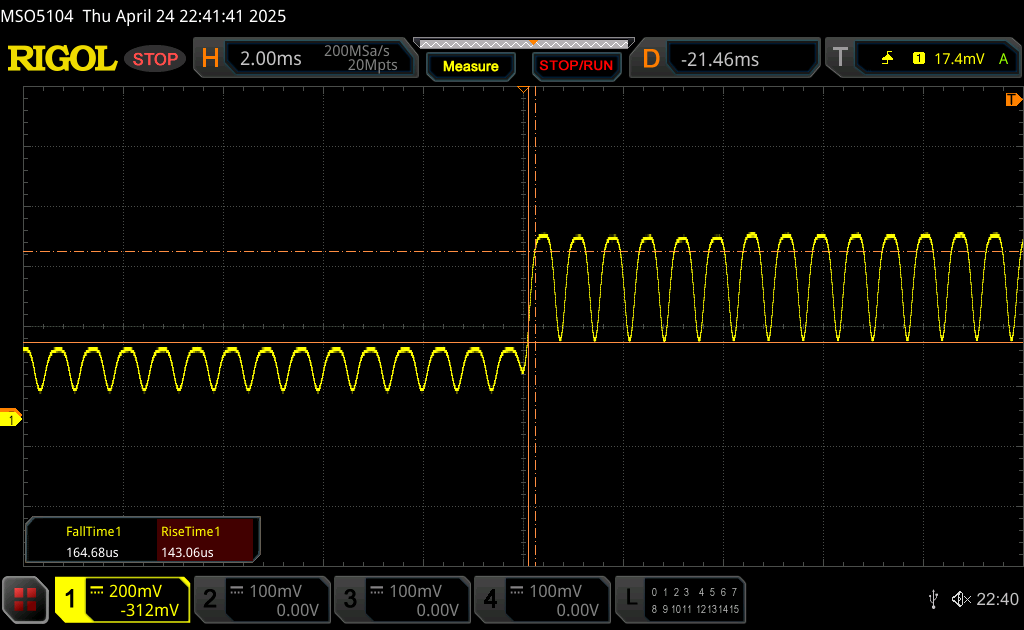 |
| ↘ 0.14 ms fall | ||
| The screen shows very fast response rates in our tests and should be very well suited for fast-paced gaming. In comparison, all tested devices range from 0.165 (minimum) to 636 (maximum) ms. » 0 % of all devices are better. This means that the measured response time is better than the average of all tested devices (31 ms). | ||
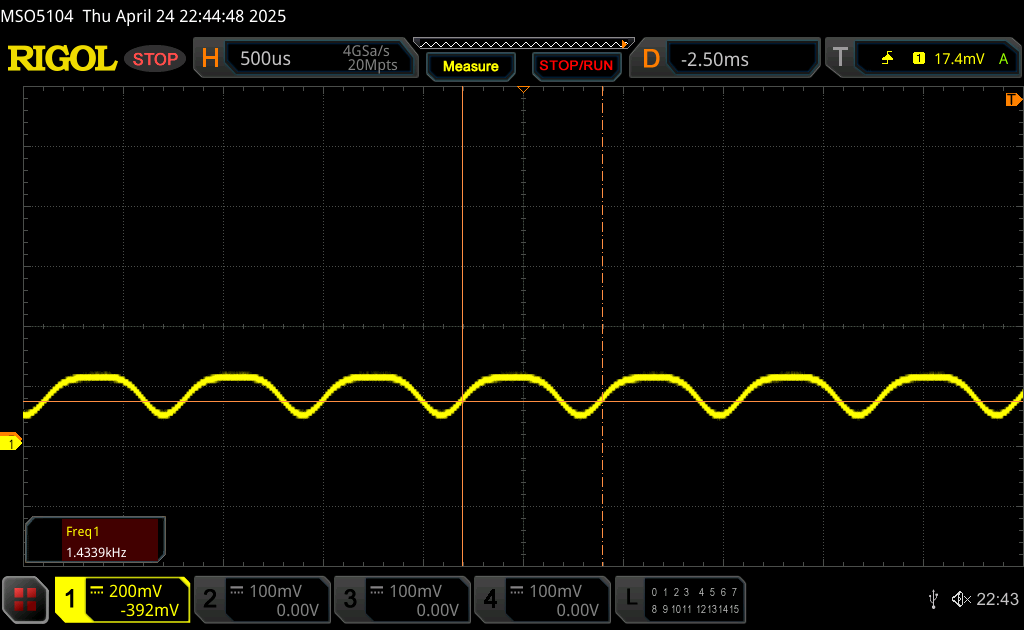
Screen Flickering / PWM (Pulse-Width Modulation)
| Screen flickering / PWM detected | 1438 Hz Amplitude: 29 % | ≤ 100 % brightness setting | 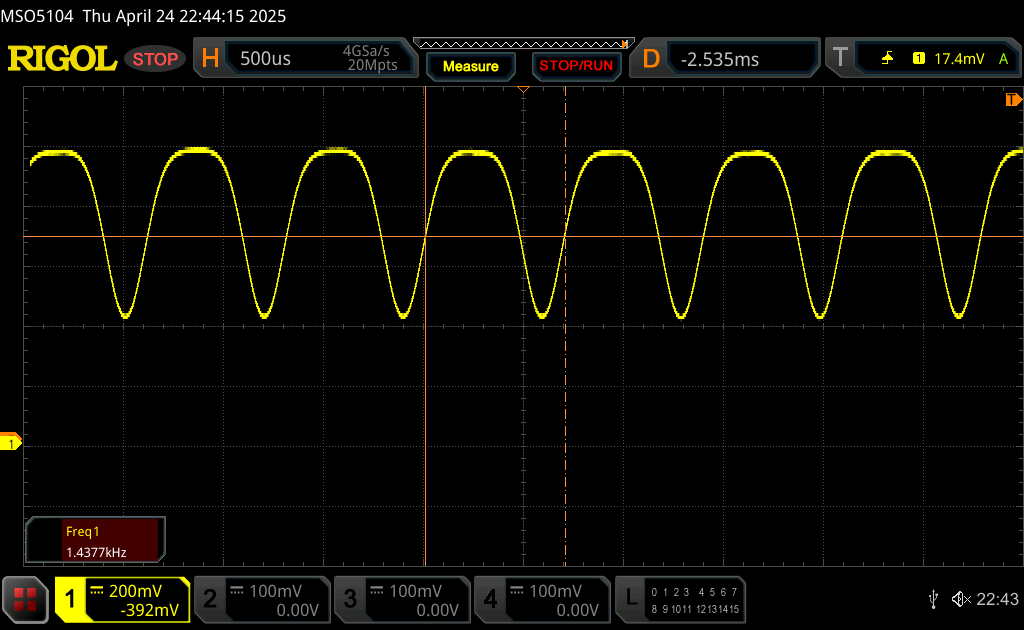 |
The display backlight flickers at 1438 Hz (worst case, e.g., utilizing PWM) Flickering detected at a brightness setting of 100 % and below. There should be no flickering or PWM above this brightness setting. The frequency of 1438 Hz is quite high, so most users sensitive to PWM should not notice any flickering. In comparison: 52 % of all tested devices do not use PWM to dim the display. If PWM was detected, an average of 7754 (minimum: 5 - maximum: 343500) Hz was measured. | |||

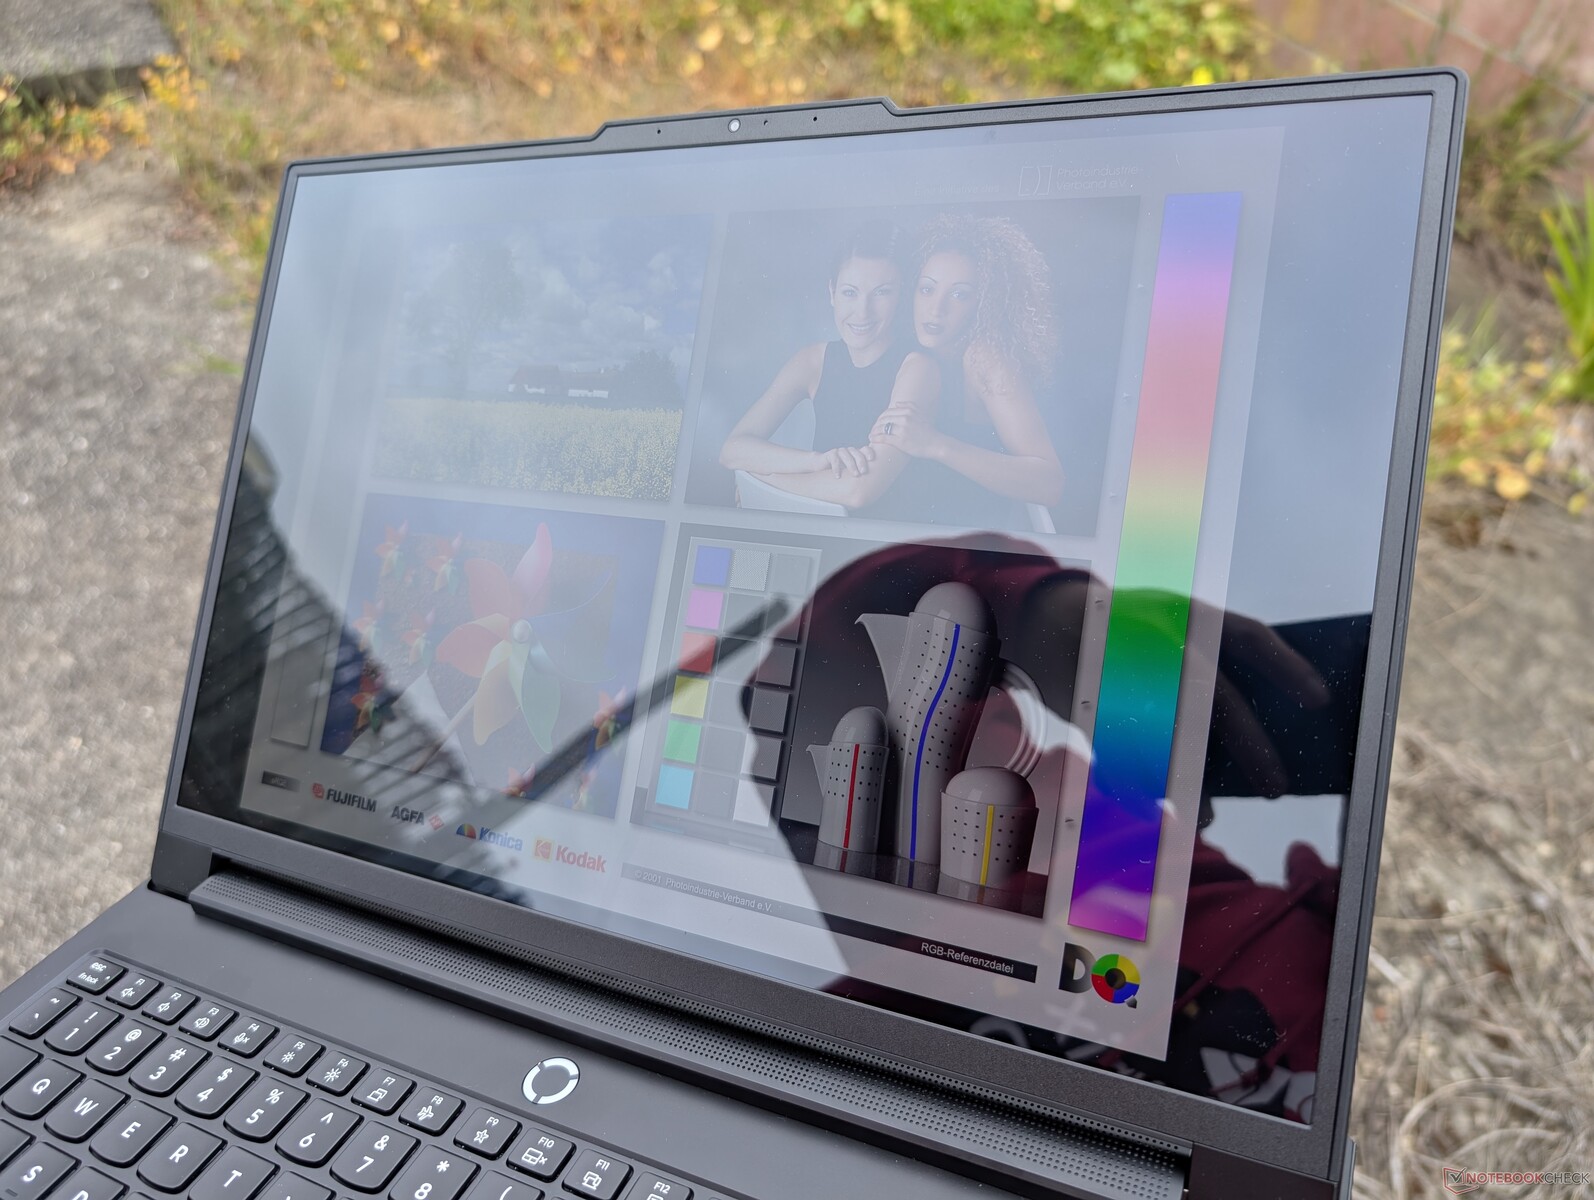
The 500-nit display may be bright when indoors, but it wasn't designed for outdoor conditions. Glare from the glossy display remain unavoidable here.


Performance — Arrow Lake With 175 W TGP Graphics
Testing Conditions
We set LegionSpace to Performance mode and the GPU to discrete mode prior to running the benchmarks below. Owners are recommended to become familiar with LegionSpace for tweaking aspects of the system related to performance, GPU, or the LED effects. Meanwhile, Lenovo Vantage still comes pre-installed for adjusting non-gaming features such as battery charging, webcam, or keyboard behavior.
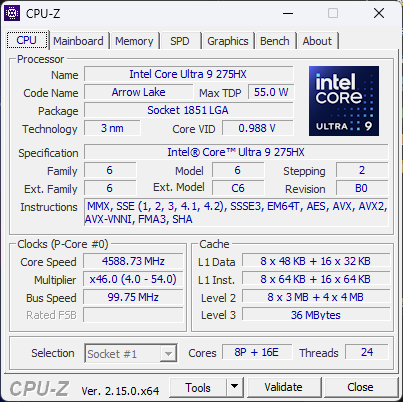
Processor
The Core Ultra 9 275HX is one of Intel's fastest processors available in the Arrow Lake-HX family. It integrates the NPU of the Meteor Lake-H series (such as the Core Ultra 9 185H) with the performance of the Raptor Lake-HX series (such as the Core i9-14900HX) to be the best of both worlds whereas buyers had to previously sacrifice one for the other. Raw multi-thread performance is significantly faster than the Core Ultra 9 285H or Ryzen AI 9 HX 370 to be neck-to-neck with the flagship Ryzen 9 9955HX.
Arguably the most notable downside to the new processor is its hefty power requirements as our Energy Management section below will show.
Cinebench R15 Multi Loop
Cinebench R23: Multi Core | Single Core
Cinebench R20: CPU (Multi Core) | CPU (Single Core)
Cinebench R15: CPU Multi 64Bit | CPU Single 64Bit
Blender: v2.79 BMW27 CPU
7-Zip 18.03: 7z b 4 | 7z b 4 -mmt1
Geekbench 6.7: Multi-Core | Single-Core
Geekbench 5.5: Multi-Core | Single-Core
HWBOT x265 Benchmark v2.2: 4k Preset
LibreOffice : 20 Documents To PDF
R Benchmark 2.5: Overall mean
* ... smaller is better
AIDA64: FP32 Ray-Trace | FPU Julia | CPU SHA3 | CPU Queen | FPU SinJulia | FPU Mandel | CPU AES | CPU ZLib | FP64 Ray-Trace | CPU PhotoWorxx
| Performance rating | |
| Lenovo Legion Pro 7i 16 Gen 10 | |
| Average Intel Core Ultra 9 275HX | |
| MSI Vector 16 HX A14V | |
| Lenovo Legion 9 16IRX9, RTX 4090 | |
| Razer Blade 16 2025 RTX 5090 | |
| Asus ROG Zephyrus G16 GU605CX | |
| Alienware x16 R2 P120F | |
| AIDA64 / FP32 Ray-Trace | |
| Razer Blade 16 2025 RTX 5090 | |
| Lenovo Legion Pro 7i 16 Gen 10 | |
| Average Intel Core Ultra 9 275HX (28039 - 39895, n=30) | |
| MSI Vector 16 HX A14V | |
| Lenovo Legion 9 16IRX9, RTX 4090 | |
| Asus ROG Zephyrus G16 GU605CX | |
| Alienware x16 R2 P120F | |
| AIDA64 / FPU Julia | |
| Lenovo Legion Pro 7i 16 Gen 10 | |
| Average Intel Core Ultra 9 275HX (140254 - 200744, n=30) | |
| MSI Vector 16 HX A14V | |
| Razer Blade 16 2025 RTX 5090 | |
| Lenovo Legion 9 16IRX9, RTX 4090 | |
| Asus ROG Zephyrus G16 GU605CX | |
| Alienware x16 R2 P120F | |
| AIDA64 / CPU SHA3 | |
| Lenovo Legion Pro 7i 16 Gen 10 | |
| Average Intel Core Ultra 9 275HX (6710 - 9817, n=30) | |
| MSI Vector 16 HX A14V | |
| Lenovo Legion 9 16IRX9, RTX 4090 | |
| Razer Blade 16 2025 RTX 5090 | |
| Asus ROG Zephyrus G16 GU605CX | |
| Alienware x16 R2 P120F | |
| AIDA64 / CPU Queen | |
| MSI Vector 16 HX A14V | |
| Lenovo Legion Pro 7i 16 Gen 10 | |
| Average Intel Core Ultra 9 275HX (113887 - 140937, n=30) | |
| Lenovo Legion 9 16IRX9, RTX 4090 | |
| Alienware x16 R2 P120F | |
| Razer Blade 16 2025 RTX 5090 | |
| Asus ROG Zephyrus G16 GU605CX | |
| AIDA64 / FPU SinJulia | |
| Razer Blade 16 2025 RTX 5090 | |
| MSI Vector 16 HX A14V | |
| Lenovo Legion 9 16IRX9, RTX 4090 | |
| Lenovo Legion Pro 7i 16 Gen 10 | |
| Average Intel Core Ultra 9 275HX (11172 - 14425, n=30) | |
| Alienware x16 R2 P120F | |
| Asus ROG Zephyrus G16 GU605CX | |
| AIDA64 / FPU Mandel | |
| Lenovo Legion Pro 7i 16 Gen 10 | |
| Average Intel Core Ultra 9 275HX (72596 - 104508, n=30) | |
| Razer Blade 16 2025 RTX 5090 | |
| MSI Vector 16 HX A14V | |
| Lenovo Legion 9 16IRX9, RTX 4090 | |
| Asus ROG Zephyrus G16 GU605CX | |
| Alienware x16 R2 P120F | |
| AIDA64 / CPU AES | |
| MSI Vector 16 HX A14V | |
| Lenovo Legion Pro 7i 16 Gen 10 | |
| Lenovo Legion 9 16IRX9, RTX 4090 | |
| Average Intel Core Ultra 9 275HX (105608 - 247074, n=30) | |
| Alienware x16 R2 P120F | |
| Razer Blade 16 2025 RTX 5090 | |
| Asus ROG Zephyrus G16 GU605CX | |
| AIDA64 / CPU ZLib | |
| MSI Vector 16 HX A14V | |
| Lenovo Legion Pro 7i 16 Gen 10 | |
| Lenovo Legion 9 16IRX9, RTX 4090 | |
| Average Intel Core Ultra 9 275HX (1582 - 2263, n=30) | |
| Razer Blade 16 2025 RTX 5090 | |
| Alienware x16 R2 P120F | |
| Asus ROG Zephyrus G16 GU605CX | |
| AIDA64 / FP64 Ray-Trace | |
| Razer Blade 16 2025 RTX 5090 | |
| Lenovo Legion Pro 7i 16 Gen 10 | |
| Average Intel Core Ultra 9 275HX (14847 - 21854, n=30) | |
| MSI Vector 16 HX A14V | |
| Lenovo Legion 9 16IRX9, RTX 4090 | |
| Asus ROG Zephyrus G16 GU605CX | |
| Alienware x16 R2 P120F | |
| AIDA64 / CPU PhotoWorxx | |
| Asus ROG Zephyrus G16 GU605CX | |
| Lenovo Legion 9 16IRX9, RTX 4090 | |
| Lenovo Legion Pro 7i 16 Gen 10 | |
| Alienware x16 R2 P120F | |
| Razer Blade 16 2025 RTX 5090 | |
| Average Intel Core Ultra 9 275HX (37482 - 62916, n=30) | |
| MSI Vector 16 HX A14V | |
Stress Test
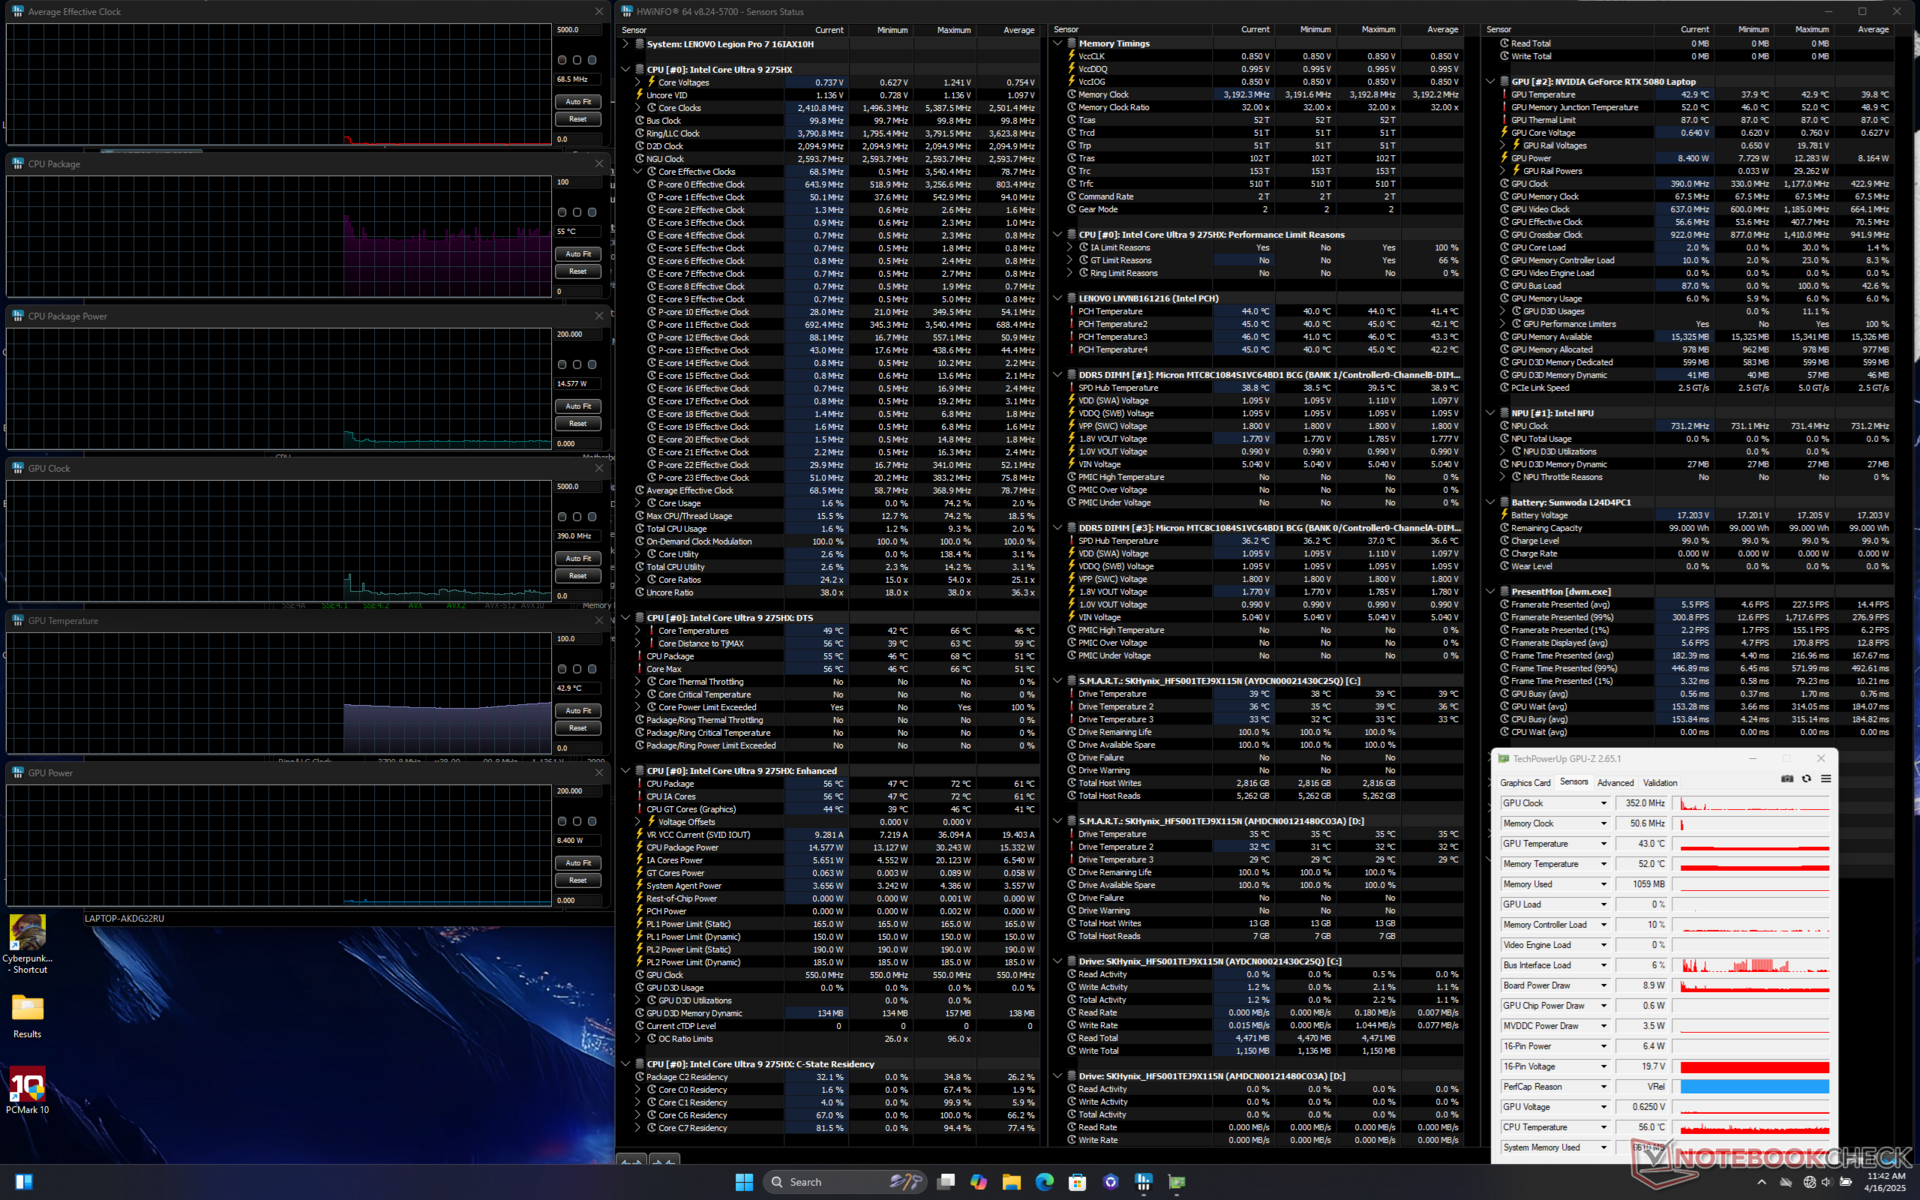
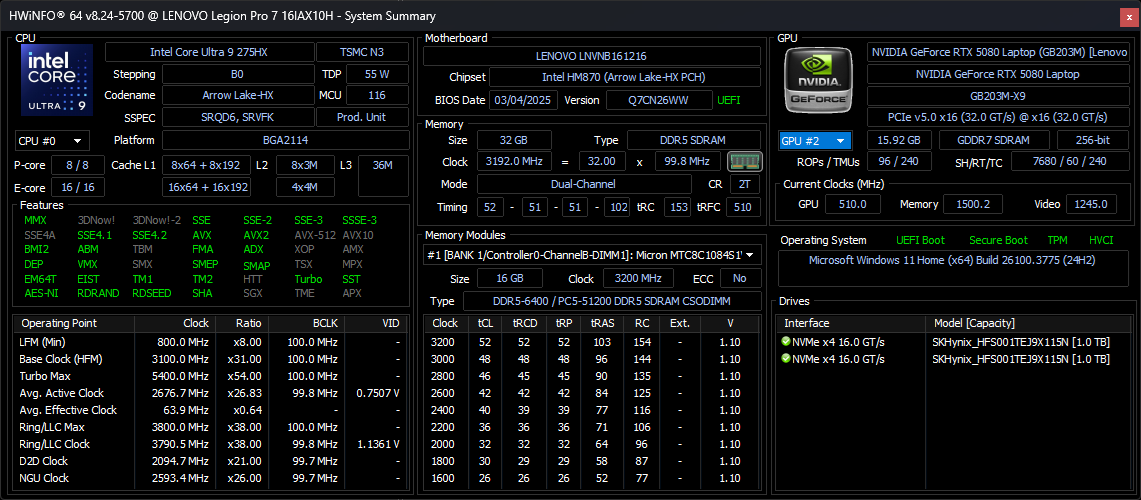
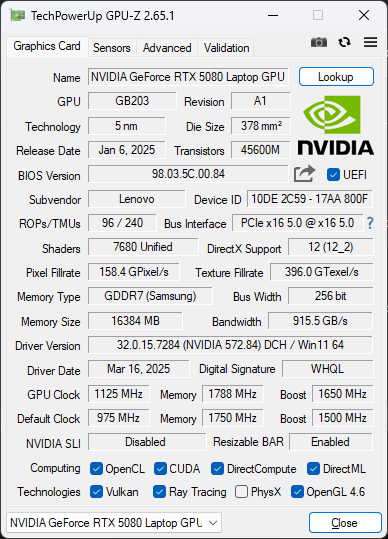
Core temperatures can be very warm particularly for the CPU despite the oversized vapor chamber cooling solution. The CPU would stabilize at 3.9 GHz, ~156 W, and 95 C when running Prime95 stress which is even warmer than the already warm Legion Pro 5 16IRX9 under similar conditions.
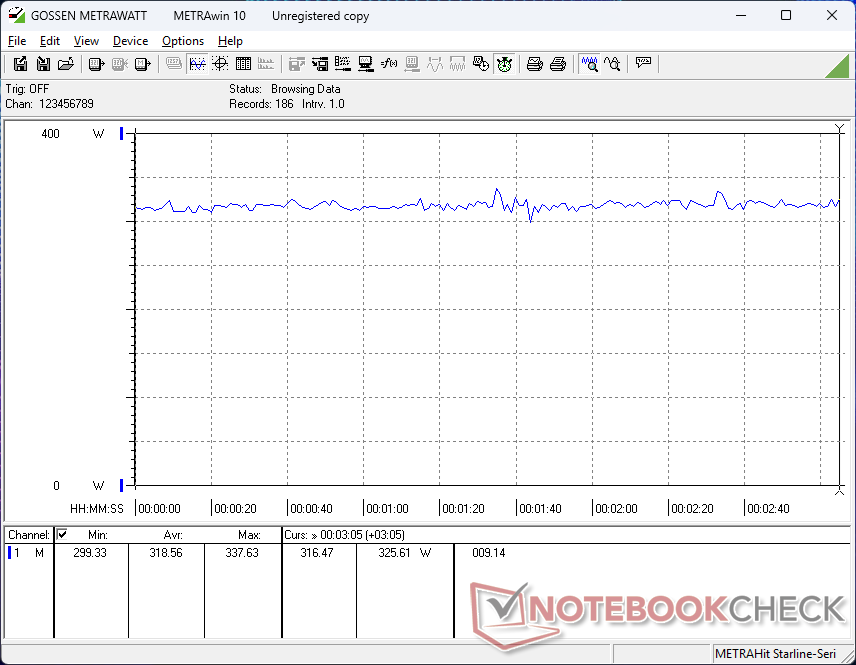
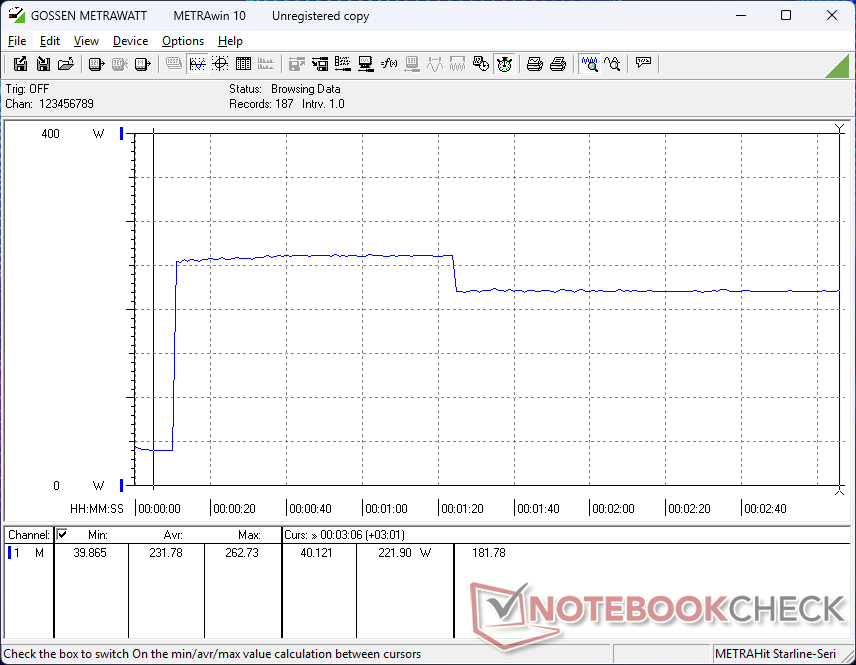
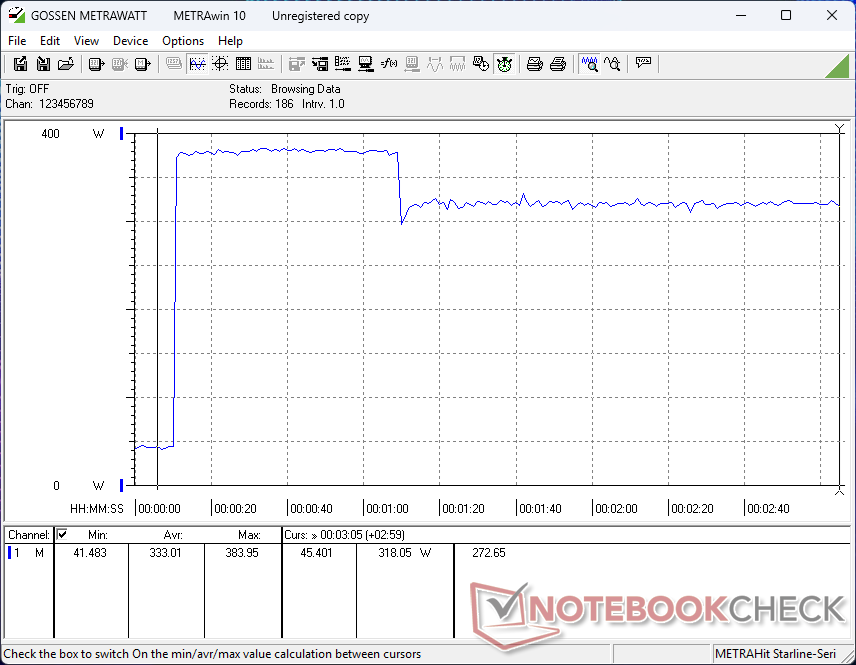
When running Cyberpunk 2077 on Performance mode to represent typical gaming stress, the Nvidia GPU would stabilize at 80 C and 155 W while the CPU would stabilize at 90 C and 76 W. Dropping down to Balanced mode decreases the GPU to just 65 C and 95 W and the CPU to just 70 C and 40 W with slower processor and memory clocks across the board as shown by our screenshots below. The power savings are therefore quite significant between the Balanced and Performance power profiles.
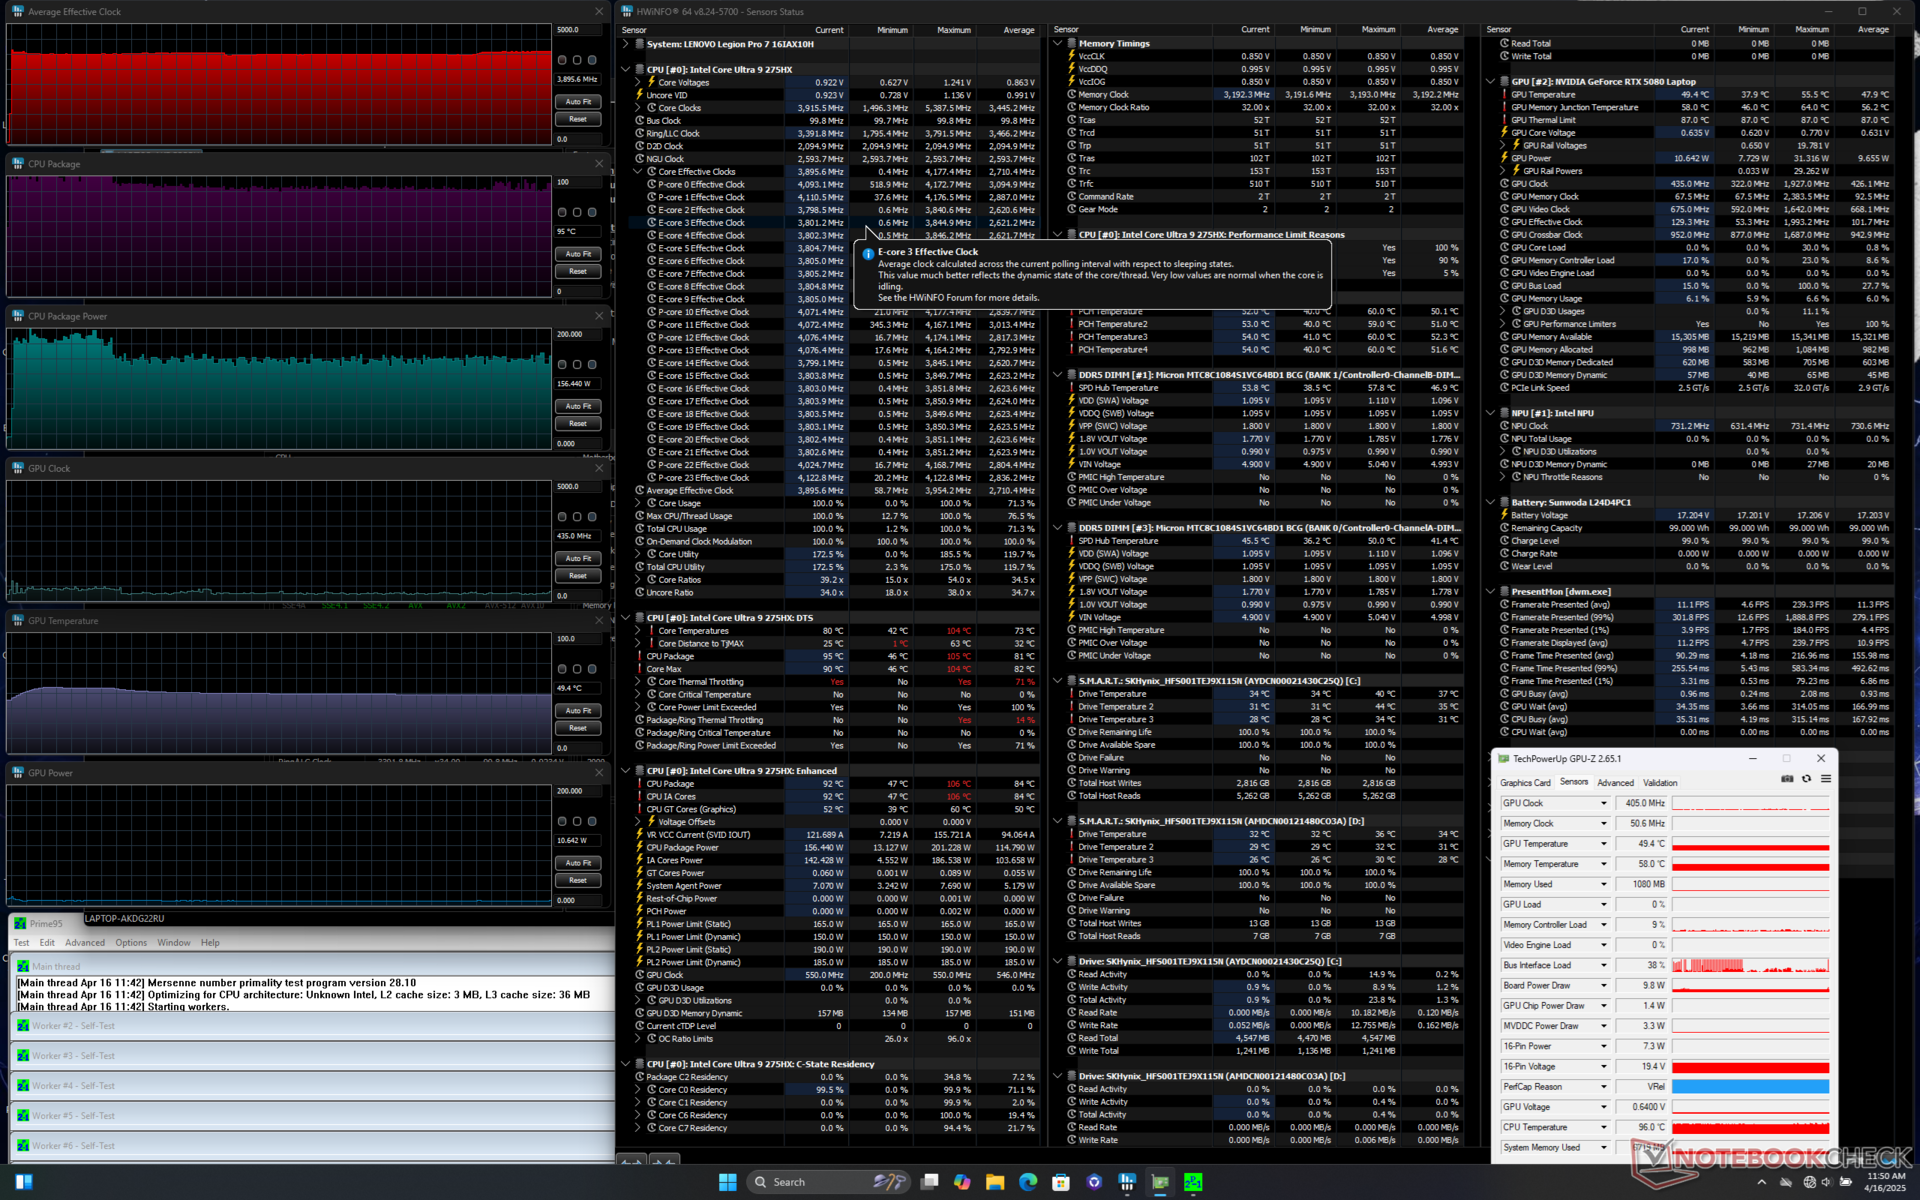
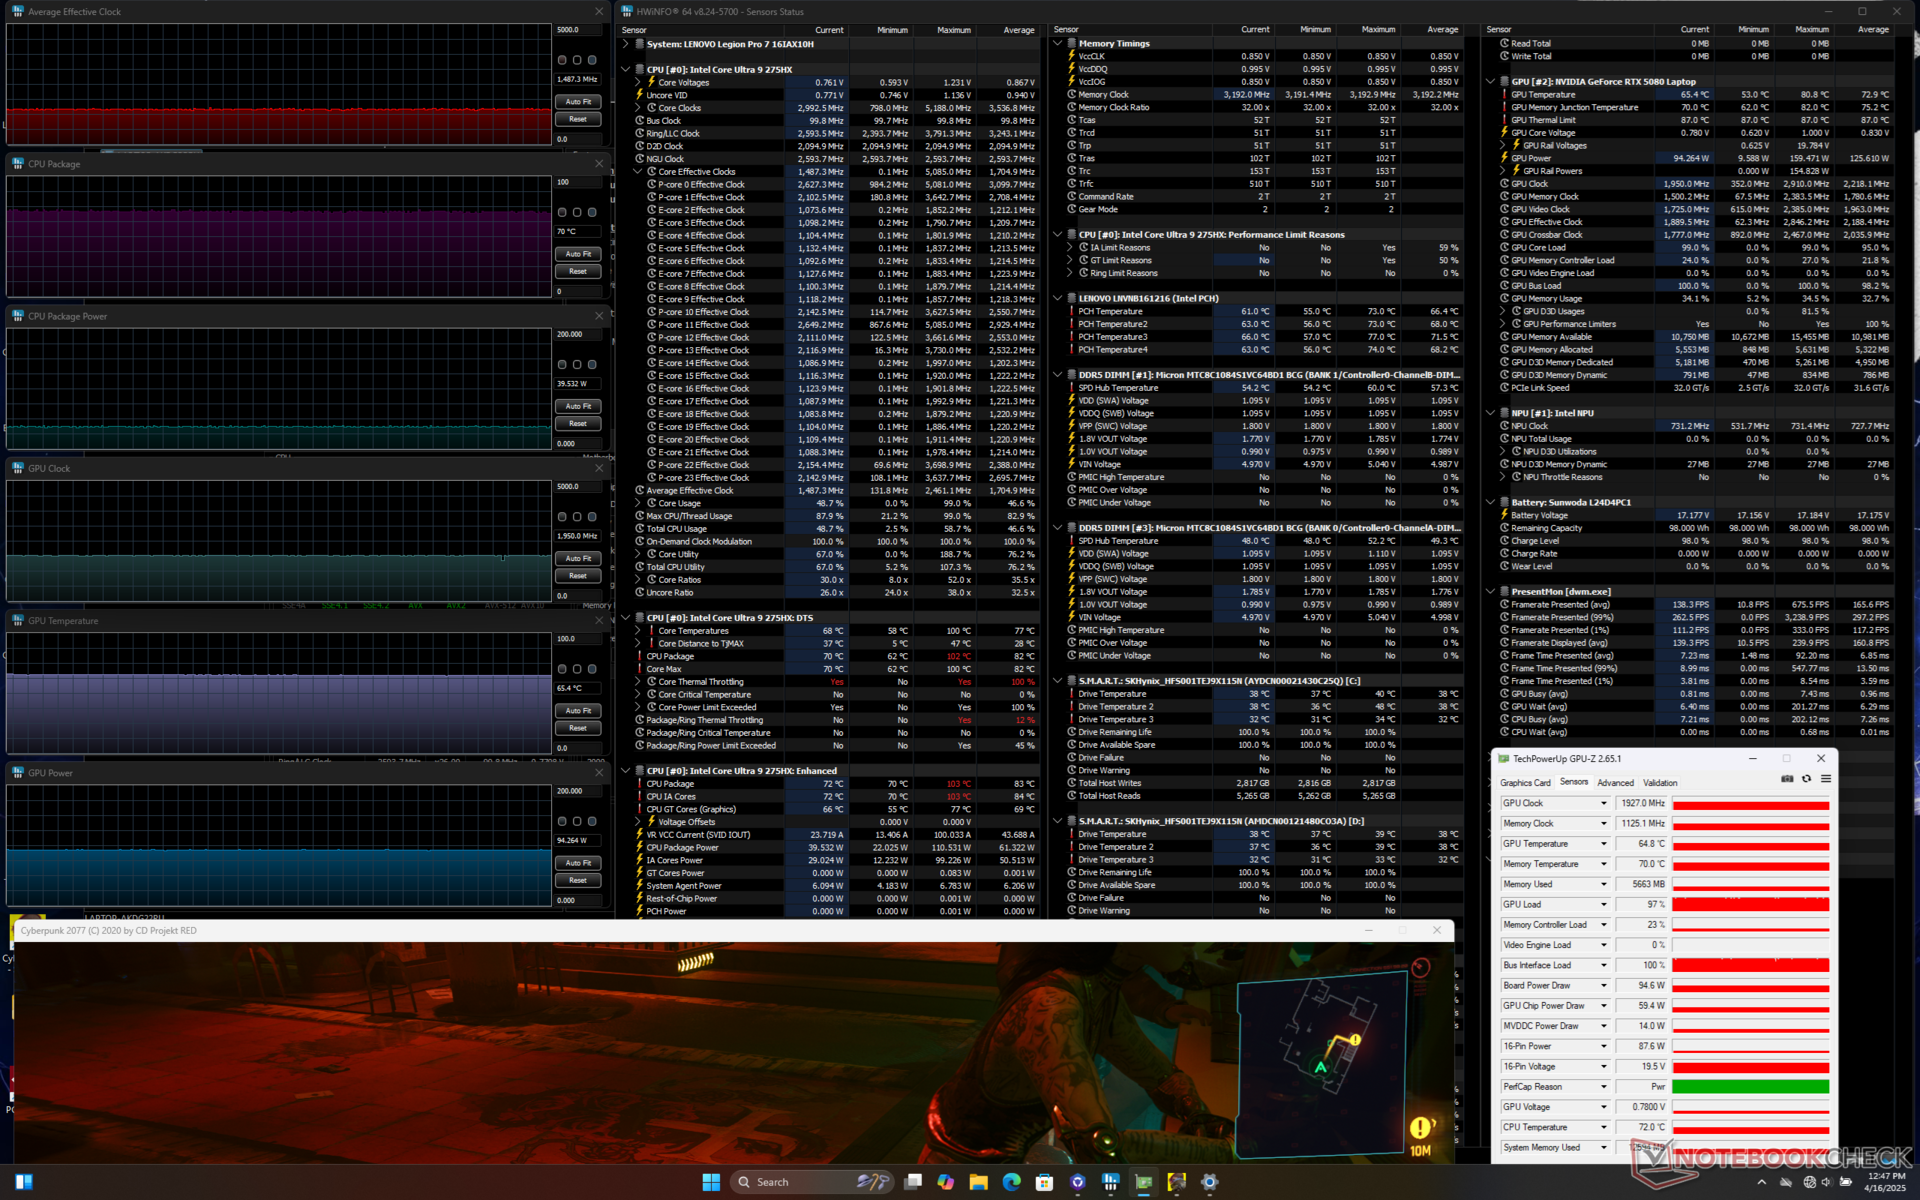
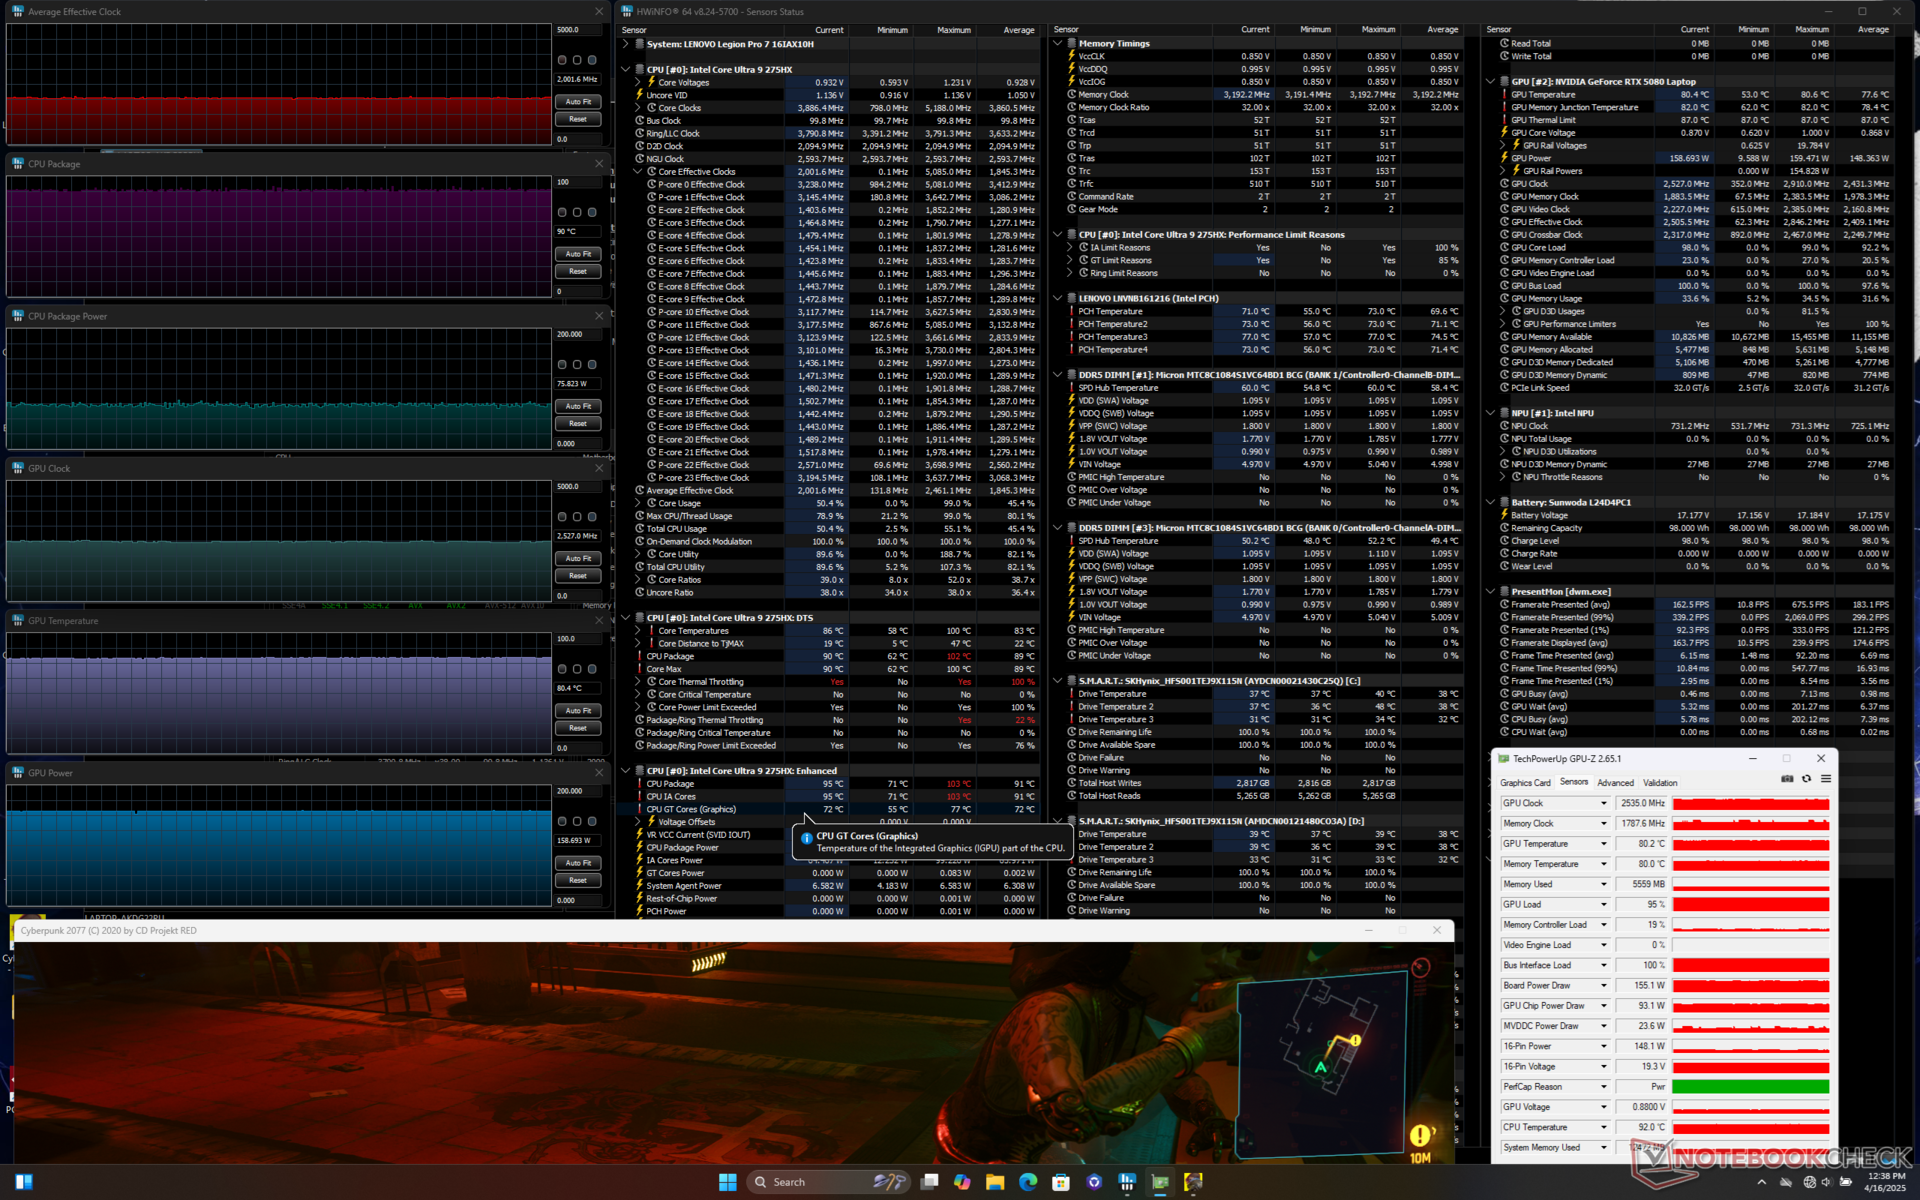
| Average CPU Clock (GHz) | GPU Clock (MHz) | Average CPU Temperature (°C) | Average GPU Temperature (°C) | |
| System Idle | -- | -- | 55 | 43 |
| Prime95 Stress | 3.9 | -- | 95 | 49 |
| Prime95 + FurMark Stress | 2.9 | 2190 | 87 | 76 |
| Cyberpunk 2077 Stress (Performance mode) | 2.0 | 2535 | 90 | 80 |
| Cyberpunk 2077 Stress (Balanced mode) | 1.5 | 1927 | 70 | 65 |
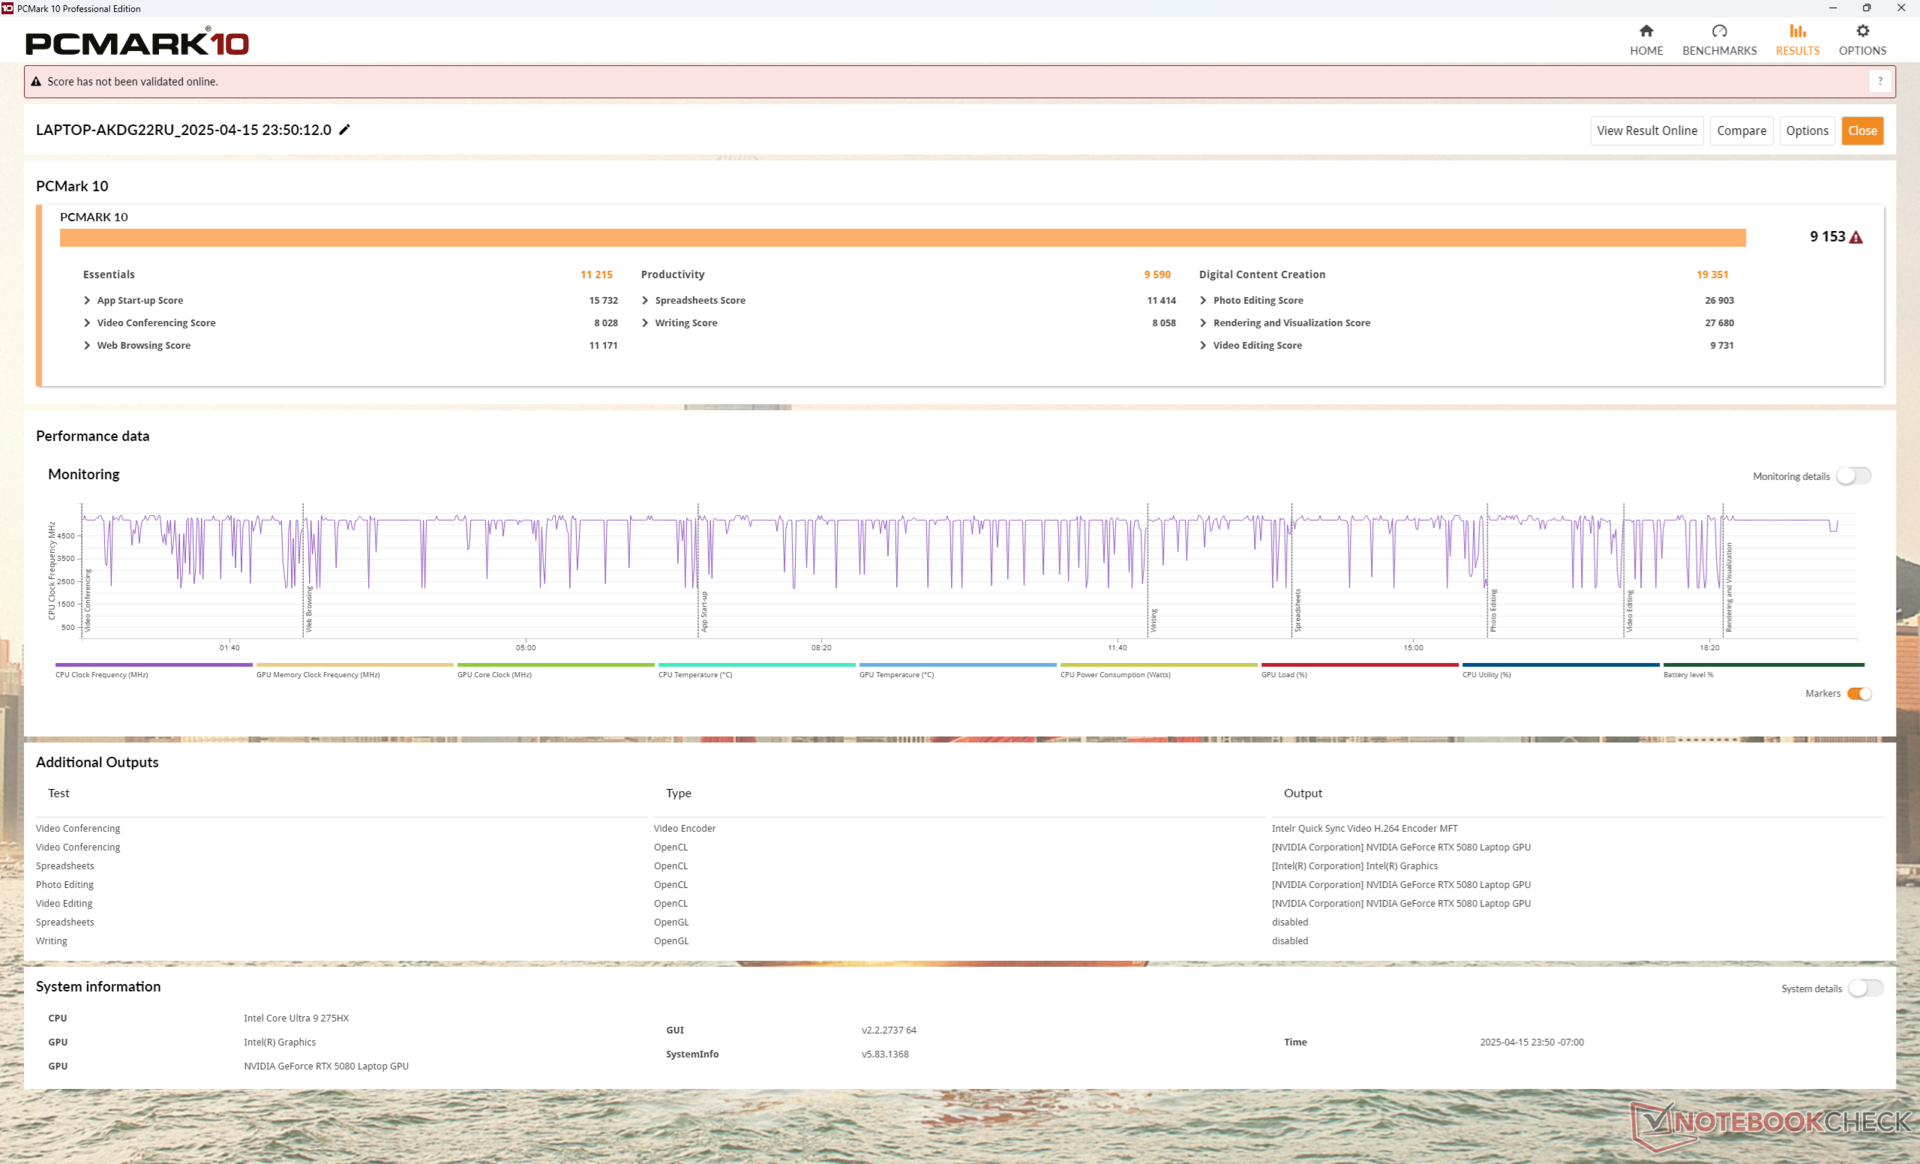
System Performance
The average PCMark score is higher than most other 16-inch RTX 5090 laptops we've tested thus far including the Razer Blade 16 and Asus ROG Zephyrus G16. Only the Schenker Neo 16 A25 is able to top our Lenovo system due in part to its Ryzen 9 9955HX CPU and PCIe5 Samsung 9100 Pro SSD.
CrossMark: Overall | Productivity | Creativity | Responsiveness
WebXPRT 3: Overall
WebXPRT 4: Overall
Mozilla Kraken 1.1: Total
| PCMark 10 / Score | |
| Lenovo Legion Pro 7i 16 Gen 10 | |
| Asus ROG Zephyrus G16 GU605CX | |
| Average Intel Core Ultra 9 275HX, NVIDIA GeForce RTX 5080 Laptop (7805 - 10409, n=9) | |
| MSI Vector 16 HX A14V | |
| Razer Blade 16 2025 RTX 5090 | |
| Lenovo Legion 9 16IRX9, RTX 4090 | |
| Alienware x16 R2 P120F | |
| PCMark 10 / Essentials | |
| MSI Vector 16 HX A14V | |
| Lenovo Legion Pro 7i 16 Gen 10 | |
| Lenovo Legion 9 16IRX9, RTX 4090 | |
| Average Intel Core Ultra 9 275HX, NVIDIA GeForce RTX 5080 Laptop (10206 - 11472, n=9) | |
| Asus ROG Zephyrus G16 GU605CX | |
| Razer Blade 16 2025 RTX 5090 | |
| Alienware x16 R2 P120F | |
| PCMark 10 / Productivity | |
| Asus ROG Zephyrus G16 GU605CX | |
| Average Intel Core Ultra 9 275HX, NVIDIA GeForce RTX 5080 Laptop (8319 - 20616, n=9) | |
| Razer Blade 16 2025 RTX 5090 | |
| Lenovo Legion 9 16IRX9, RTX 4090 | |
| MSI Vector 16 HX A14V | |
| Lenovo Legion Pro 7i 16 Gen 10 | |
| Alienware x16 R2 P120F | |
| PCMark 10 / Digital Content Creation | |
| Lenovo Legion Pro 7i 16 Gen 10 | |
| Average Intel Core Ultra 9 275HX, NVIDIA GeForce RTX 5080 Laptop (10505 - 19351, n=9) | |
| MSI Vector 16 HX A14V | |
| Asus ROG Zephyrus G16 GU605CX | |
| Razer Blade 16 2025 RTX 5090 | |
| Lenovo Legion 9 16IRX9, RTX 4090 | |
| Alienware x16 R2 P120F | |
| CrossMark / Overall | |
| MSI Vector 16 HX A14V | |
| Average Intel Core Ultra 9 275HX, NVIDIA GeForce RTX 5080 Laptop (1857 - 2244, n=9) | |
| Asus ROG Zephyrus G16 GU605CX | |
| Lenovo Legion Pro 7i 16 Gen 10 | |
| Lenovo Legion 9 16IRX9, RTX 4090 | |
| Alienware x16 R2 P120F | |
| CrossMark / Productivity | |
| MSI Vector 16 HX A14V | |
| Average Intel Core Ultra 9 275HX, NVIDIA GeForce RTX 5080 Laptop (1764 - 2122, n=9) | |
| Lenovo Legion Pro 7i 16 Gen 10 | |
| Asus ROG Zephyrus G16 GU605CX | |
| Lenovo Legion 9 16IRX9, RTX 4090 | |
| Alienware x16 R2 P120F | |
| CrossMark / Creativity | |
| MSI Vector 16 HX A14V | |
| Asus ROG Zephyrus G16 GU605CX | |
| Average Intel Core Ultra 9 275HX, NVIDIA GeForce RTX 5080 Laptop (2115 - 2498, n=9) | |
| Lenovo Legion Pro 7i 16 Gen 10 | |
| Lenovo Legion 9 16IRX9, RTX 4090 | |
| Alienware x16 R2 P120F | |
| CrossMark / Responsiveness | |
| MSI Vector 16 HX A14V | |
| Average Intel Core Ultra 9 275HX, NVIDIA GeForce RTX 5080 Laptop (1466 - 2096, n=9) | |
| Lenovo Legion 9 16IRX9, RTX 4090 | |
| Alienware x16 R2 P120F | |
| Asus ROG Zephyrus G16 GU605CX | |
| Lenovo Legion Pro 7i 16 Gen 10 | |
| WebXPRT 3 / Overall | |
| Lenovo Legion Pro 7i 16 Gen 10 | |
| Average Intel Core Ultra 9 275HX, NVIDIA GeForce RTX 5080 Laptop (306 - 378, n=9) | |
| Asus ROG Zephyrus G16 GU605CX | |
| MSI Vector 16 HX A14V | |
| Razer Blade 16 2025 RTX 5090 | |
| Lenovo Legion 9 16IRX9, RTX 4090 | |
| Alienware x16 R2 P120F | |
| WebXPRT 4 / Overall | |
| Lenovo Legion Pro 7i 16 Gen 10 | |
| Average Intel Core Ultra 9 275HX, NVIDIA GeForce RTX 5080 Laptop (285 - 336, n=9) | |
| Asus ROG Zephyrus G16 GU605CX | |
| MSI Vector 16 HX A14V | |
| Razer Blade 16 2025 RTX 5090 | |
| Lenovo Legion 9 16IRX9, RTX 4090 | |
| Alienware x16 R2 P120F | |
| Mozilla Kraken 1.1 / Total | |
| Alienware x16 R2 P120F | |
| Lenovo Legion 9 16IRX9, RTX 4090 | |
| Asus ROG Zephyrus G16 GU605CX | |
| MSI Vector 16 HX A14V | |
| Razer Blade 16 2025 RTX 5090 | |
| Average Intel Core Ultra 9 275HX, NVIDIA GeForce RTX 5080 Laptop (405 - 432, n=9) | |
| Lenovo Legion Pro 7i 16 Gen 10 | |
* ... smaller is better
| PCMark 10 Score | 9153 points | |
Help | ||
| AIDA64 / Memory Copy | |
| Asus ROG Zephyrus G16 GU605CX | |
| Razer Blade 16 2025 RTX 5090 | |
| Alienware x16 R2 P120F | |
| Lenovo Legion Pro 7i 16 Gen 10 | |
| Lenovo Legion 9 16IRX9, RTX 4090 | |
| Average Intel Core Ultra 9 275HX (56003 - 94460, n=30) | |
| MSI Vector 16 HX A14V | |
| AIDA64 / Memory Read | |
| Razer Blade 16 2025 RTX 5090 | |
| Lenovo Legion Pro 7i 16 Gen 10 | |
| MSI Vector 16 HX A14V | |
| Alienware x16 R2 P120F | |
| Average Intel Core Ultra 9 275HX (55795 - 97151, n=30) | |
| Lenovo Legion 9 16IRX9, RTX 4090 | |
| Asus ROG Zephyrus G16 GU605CX | |
| AIDA64 / Memory Write | |
| Razer Blade 16 2025 RTX 5090 | |
| Lenovo Legion Pro 7i 16 Gen 10 | |
| Lenovo Legion 9 16IRX9, RTX 4090 | |
| Average Intel Core Ultra 9 275HX (55663 - 116129, n=30) | |
| MSI Vector 16 HX A14V | |
| Asus ROG Zephyrus G16 GU605CX | |
| Alienware x16 R2 P120F | |
| AIDA64 / Memory Latency | |
| Alienware x16 R2 P120F | |
| Asus ROG Zephyrus G16 GU605CX | |
| Average Intel Core Ultra 9 275HX (105.8 - 161.6, n=30) | |
| Lenovo Legion Pro 7i 16 Gen 10 | |
| Razer Blade 16 2025 RTX 5090 | |
| Lenovo Legion 9 16IRX9, RTX 4090 | |
| MSI Vector 16 HX A14V | |
* ... smaller is better
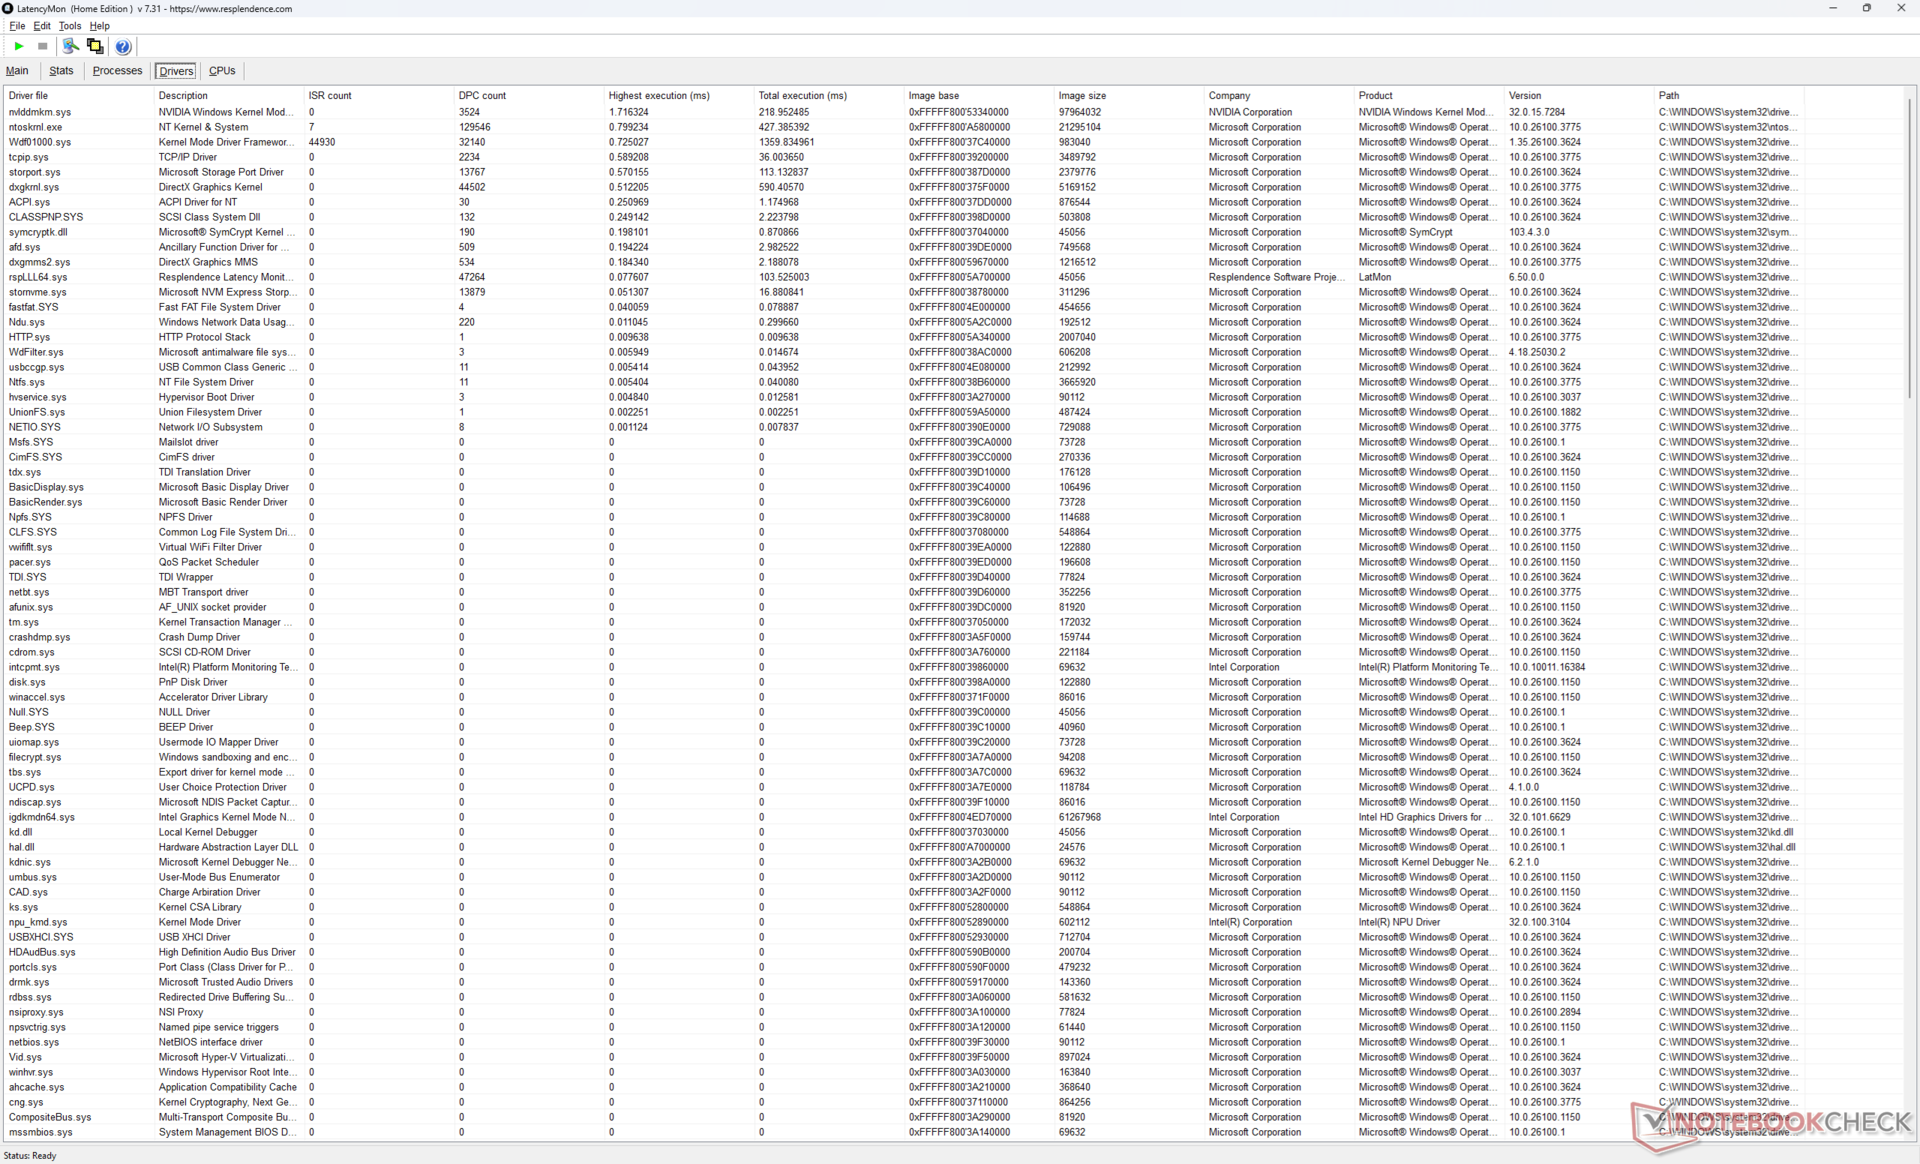
DPC Latency
LatencyMon shows only minor DPC issues when opening multiple browser tabs of our homepage and only a single dropped frame recorded during our 4K60 video playtest.

| DPC Latencies / LatencyMon - interrupt to process latency (max), Web, Youtube, Prime95 | |
| Alienware x16 R2 P120F | |
| Asus ROG Zephyrus G16 GU605CX | |
| Lenovo Legion 9 16IRX9, RTX 4090 | |
| MSI Vector 16 HX A14V | |
| Razer Blade 16 2025 RTX 5090 | |
| Lenovo Legion Pro 7i 16 Gen 10 | |
* ... smaller is better
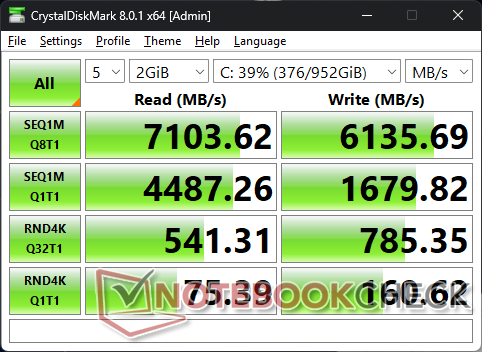
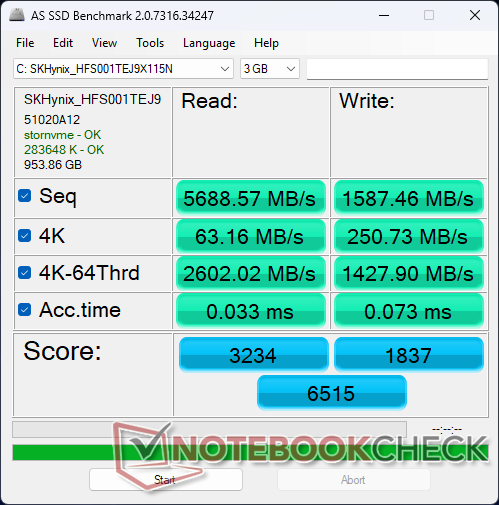
Storage Devices
The model supports up to two M.2 2280 SSDs with one slot supporting PCIe5 drives. Our test unit, however, would ship with PCIe4 drives only and so we're unable to test how effective a PCIe5 drive can run. Our PCIe4 SK Hynix drive would nonetheless run more stably and at higher speeds than the Micron 3400 on last year's Legion 9 16IRX9.

| Drive Performance rating - Percent | |
| Alienware x16 R2 P120F | |
| Razer Blade 16 2025 RTX 5090 | |
| Lenovo Legion Pro 7i 16 Gen 10 | |
| Lenovo Legion 9 16IRX9, RTX 4090 | |
| Asus ROG Zephyrus G16 GU605CX | |
| MSI Vector 16 HX A14V | |
* ... smaller is better
Disk Throttling: DiskSpd Read Loop, Queue Depth 8
GPU Performance
Our full review on the mobile GeForce RTX 5080 can be found here for more information on the GPU and its expected performance. It's only about 10 to 20 percent faster than the outgoing mobile RTX 4080 in the MSI Vector 16 HX when it comes to rasterization meaning that its main benefits instead lie in its more efficient Tensor cores, support for multi-frame generation, and 4:2:2 encoding/decoding.
| Power Profile | Graphics Score | Physics Score | Combined Score |
| Performance Mode | 49153 | 47850 | 13127 |
| Balanced Mode | 42534 (-13%) | 47090 (-2%) | 13080 (-0%) |
| Battery Power | 28253 (-43%) | 26031 (-46%) | 7548 (-43%) |
Gaming on Balanced mode instead of Performance mode would reduce graphics performance by about 13 percent.
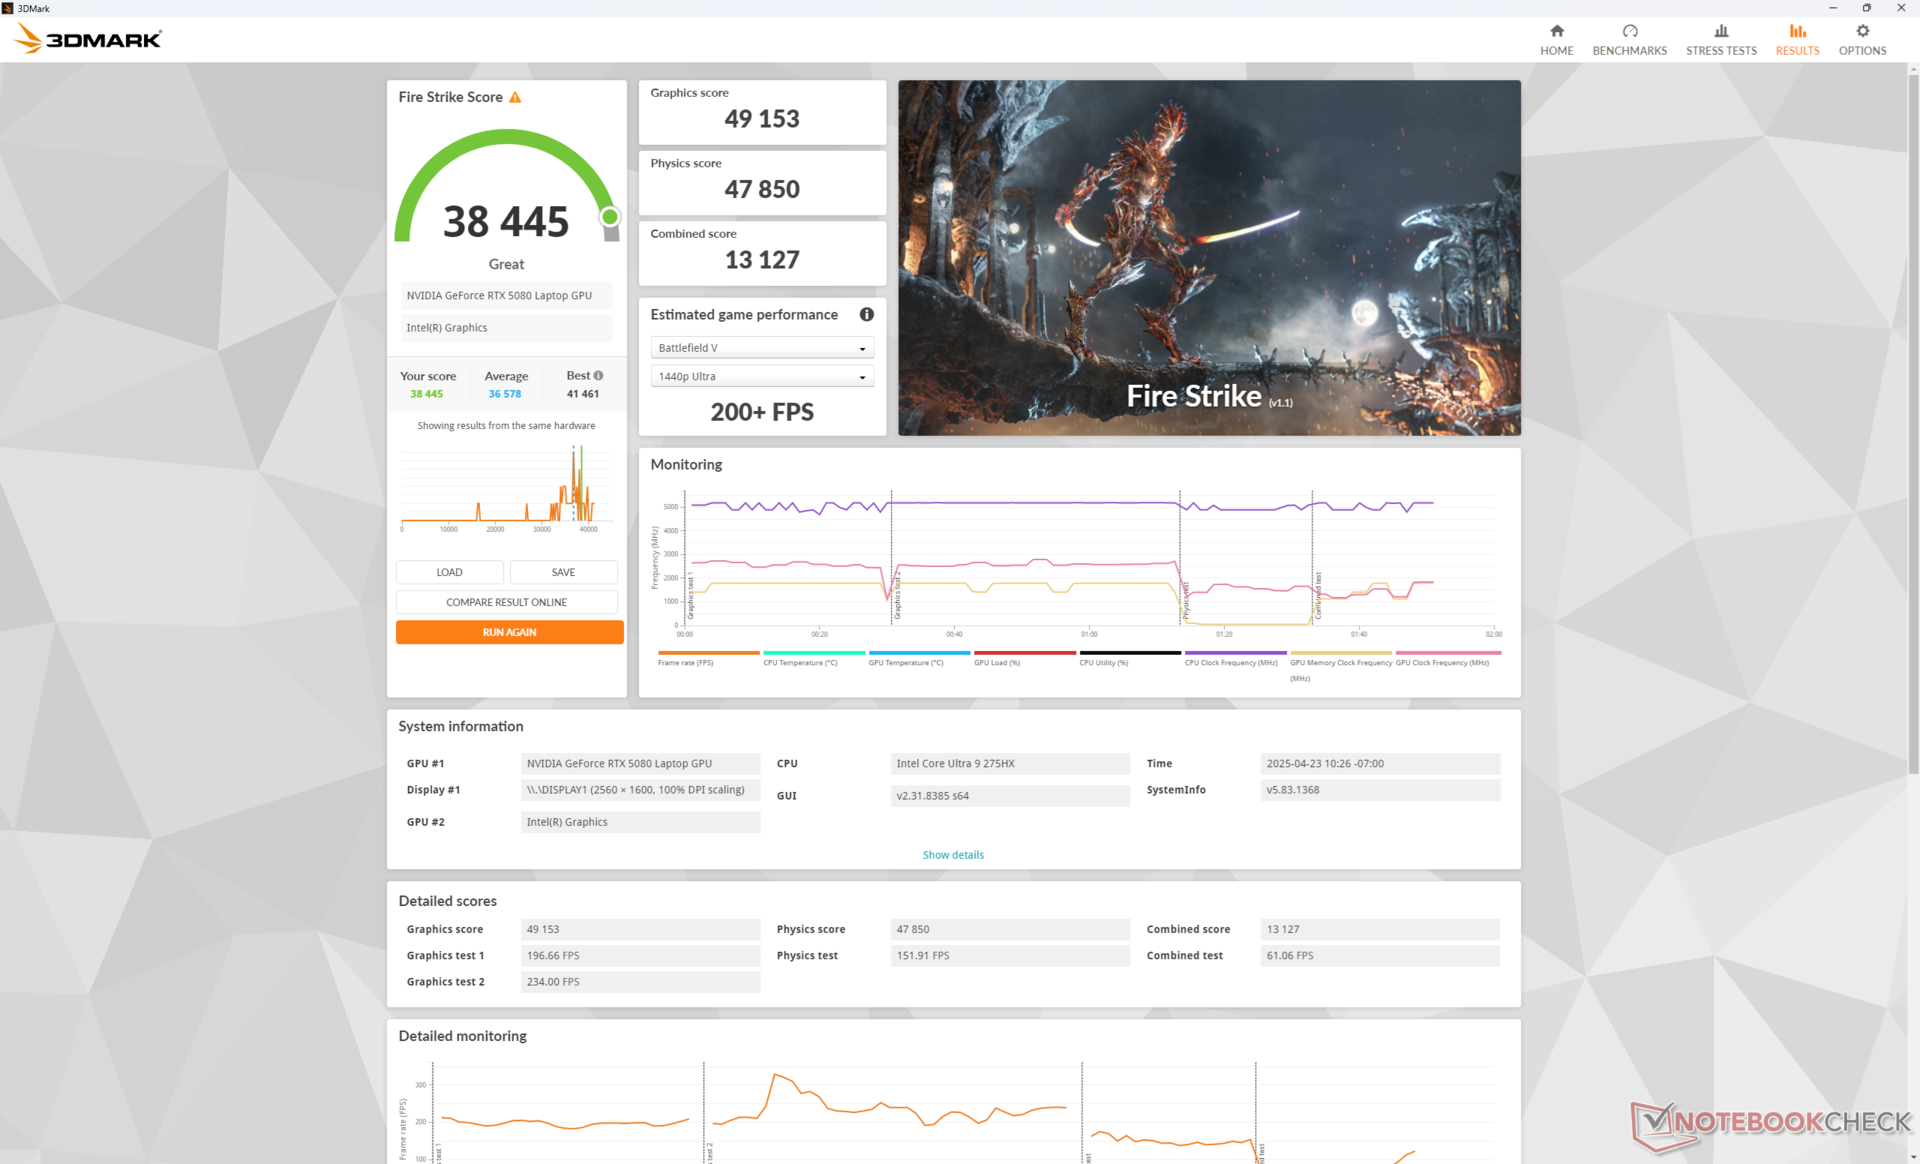
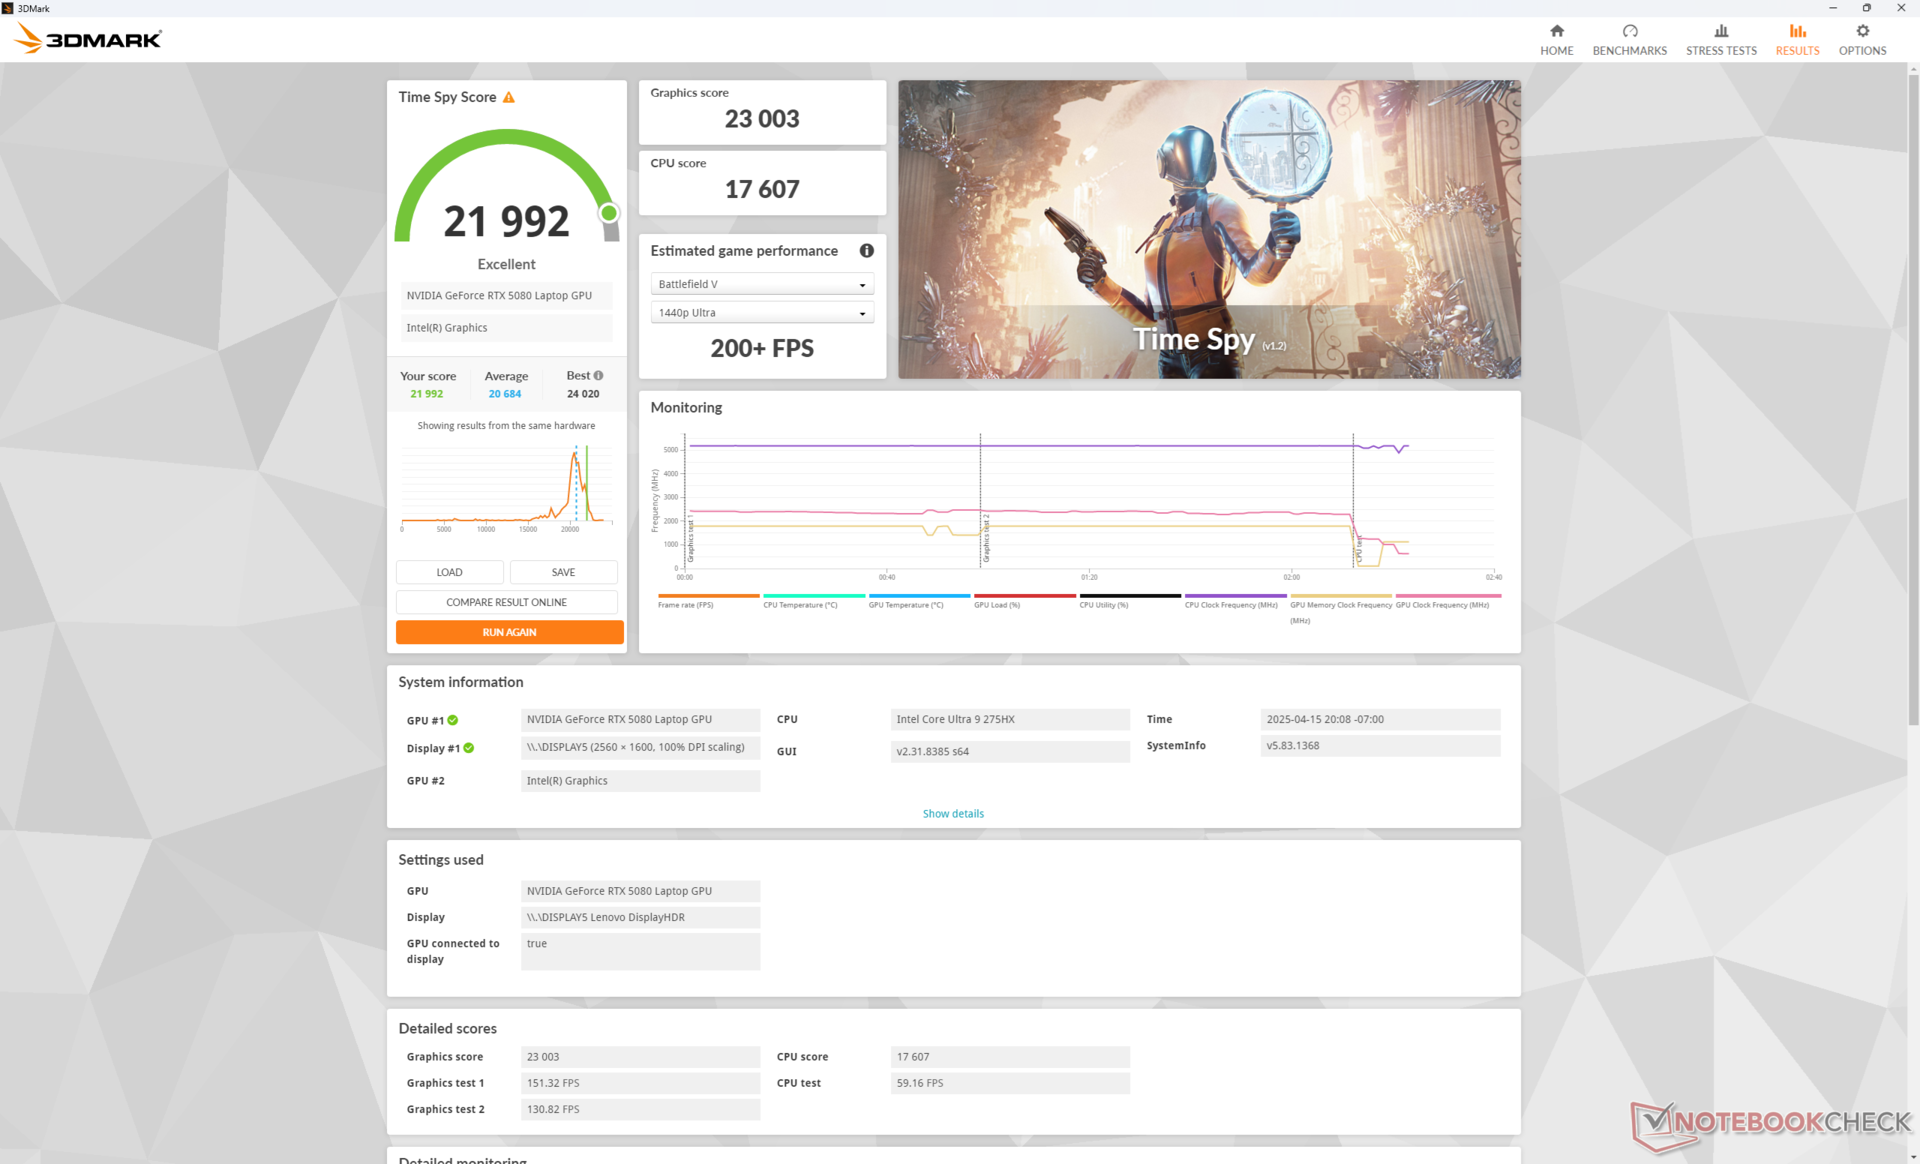
| 3DMark 11 Performance | 51894 points | |
| 3DMark Fire Strike Score | 38445 points | |
| 3DMark Time Spy Score | 21992 points | |
Help | ||
* ... smaller is better
Gaming Performance
The mobile RTX 5080 is nowhere near as powerful as the desktop RTX 5080 which can handle 4K gaming at maximum settings with ease. Our mobile version can struggle at gaming on external 4K monitors even with DLSS active; Black Myth Wukong, for example, averages only 45 FPS at maximum 4K settings on DLSS Quality mode. For the native 2K OLED display, however, the mobile RTX 5080 is a perfect fit.
| Cyberpunk 2077 Phantom Liberty Settings (Maximum Quick Preset at native 1600p) | DLSS Quality | DLSS Performance | DLSS Quality w/ 2x Frame Generation | DLSS Quality w/ 4x Frame Generation | DLAA |
| Average FPS | 47.4 | 69.1 | 83.4 | 151 | 23 |
Cyberpunk 2077 ultra FPS Chart
| low | med. | high | ultra | QHD DLSS | QHD | 4K DLSS | 4K FSR | 4K | |
|---|---|---|---|---|---|---|---|---|---|
| Dota 2 Reborn (2015) | 240 | 216 | 203 | 188.9 | 182.1 | ||||
| Final Fantasy XV Benchmark (2018) | 210 | 173.1 | 101.3 | ||||||
| X-Plane 11.11 (2018) | 156.6 | 153.7 | 124.5 | 100.7 | |||||
| Strange Brigade (2018) | 481 | 434 | 304 | 169.7 | |||||
| Baldur's Gate 3 (2023) | 276.1 | 250.5 | 220.1 | 211.5 | 155.8 | 132.4 | 81.1 | ||
| Cyberpunk 2077 (2023) | 198.4 | 192 | 172.5 | 156.2 | 119 | 99.8 | 43 | 47.1 | |
| Alan Wake 2 (2023) | 135.6 | 131.9 | 124.2 | 83.8 | 43.1 | ||||
| Black Myth: Wukong (2024) | 171 | 128 | 99 | 58 | 62 | 44 | 45 | 26 | |
| Indiana Jones and the Great Circle (2024) | 187.9 | 145.9 | 129.2 | 120.1 | 102.4 | 63.2 | |||
| Monster Hunter Wilds (2025) | 110.1 | 104.4 | 90 | 87.7 | 73.2 | 61.8 | 45.2 | ||
| Assassin's Creed Shadows (2025) | 111 | 104 | 90 | 64 | 65 | 55 | 55 | 40 |
Emissions — Loud Only When It Needs To Be
System Noise
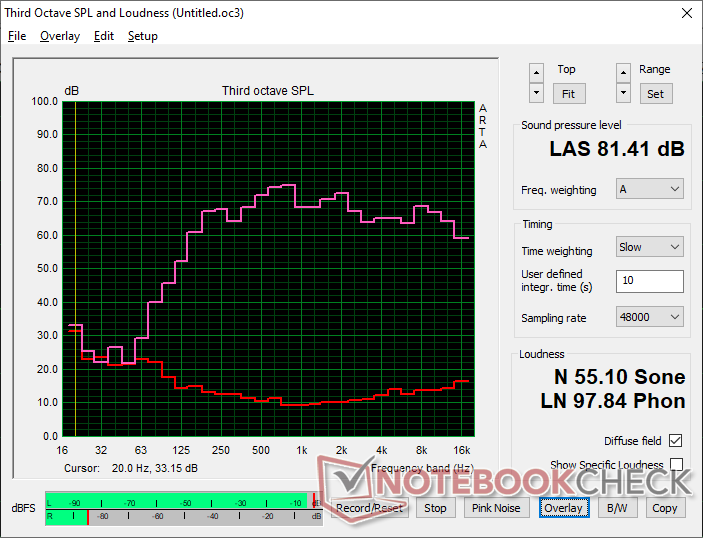
Fan noise reaches almost the same maximum as on the Legion 9 16IRX9 when gaming on Performance mode. It's therefore not any quieter than most other gaming laptops despite the relatively large size. On the other hand, the fans die down quickly and will remain at low RPMs when running undemanding loads to avoid any pulsing behavior even on Performance mode. In other words, the fans are only loud when they need to be.
Note that gaming on Balanced mode reduces fan noise significantly from 54 dB(A) to just 40 dB(A) for just a 15 percent cut to graphics performance as mentioned above.
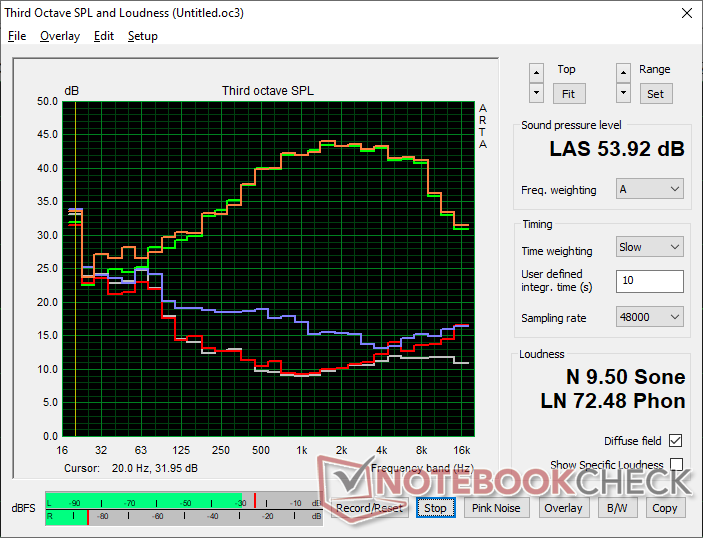
Noise level
| Idle |
| 22.9 / 22.9 / 26.3 dB(A) |
| Load |
| 27.8 / 53.9 dB(A) |
 | ||
30 dB silent 40 dB(A) audible 50 dB(A) loud |
||
min: | ||
| Lenovo Legion Pro 7i 16 Gen 10 GeForce RTX 5080 Laptop, Ultra 9 275HX, SK Hynix HFS001TEJ9X115N | Lenovo Legion 9 16IRX9, RTX 4090 GeForce RTX 4090 Laptop GPU, i9-14900HX, Micron 3400 2TB MTFDKBA2T0TFH | Asus ROG Zephyrus G16 GU605CX GeForce RTX 5090 Laptop, Ultra 9 285H, Western Digital PC SN5000S SDEPNSJ-2T00-1006 | Razer Blade 16 2025 RTX 5090 GeForce RTX 5090 Laptop, Ryzen AI 9 HX 370, SSSTC CA6-8D2048 | MSI Vector 16 HX A14V GeForce RTX 4080 Laptop GPU, i9-14900HX, WD PC SN560 SDDPNQE-1T00 | Alienware x16 R2 P120F GeForce RTX 4080 Laptop GPU, Ultra 9 185H, WDC PC SN810 1TB | |
|---|---|---|---|---|---|---|
| Noise | -5% | -16% | -16% | -37% | -7% | |
| off / environment * (dB) | 22.9 | 23 -0% | 23.8 -4% | 24.1 -5% | 23.2 -1% | 23.4 -2% |
| Idle Minimum * (dB) | 22.9 | 23 -0% | 23.8 -4% | 24.1 -5% | 33.5 -46% | 23.8 -4% |
| Idle Average * (dB) | 22.9 | 23 -0% | 27.2 -19% | 30.6 -34% | 33.5 -46% | 28.5 -24% |
| Idle Maximum * (dB) | 26.3 | 23 13% | 31.3 -19% | 30.6 -16% | 33.5 -27% | 28.5 -8% |
| Load Average * (dB) | 27.8 | 39 -40% | 47.6 -71% | 45.5 -64% | 52.1 -87% | 28.8 -4% |
| Cyberpunk 2077 ultra * (dB) | 54.2 | 51.3 5% | 48.2 11% | |||
| Load Maximum * (dB) | 53.9 | 55.56 -3% | 53.3 1% | 53.4 1% | 62 -15% | 54.2 -1% |
| Witcher 3 ultra * (dB) | 55.32 | 62 | 49.5 |
* ... smaller is better
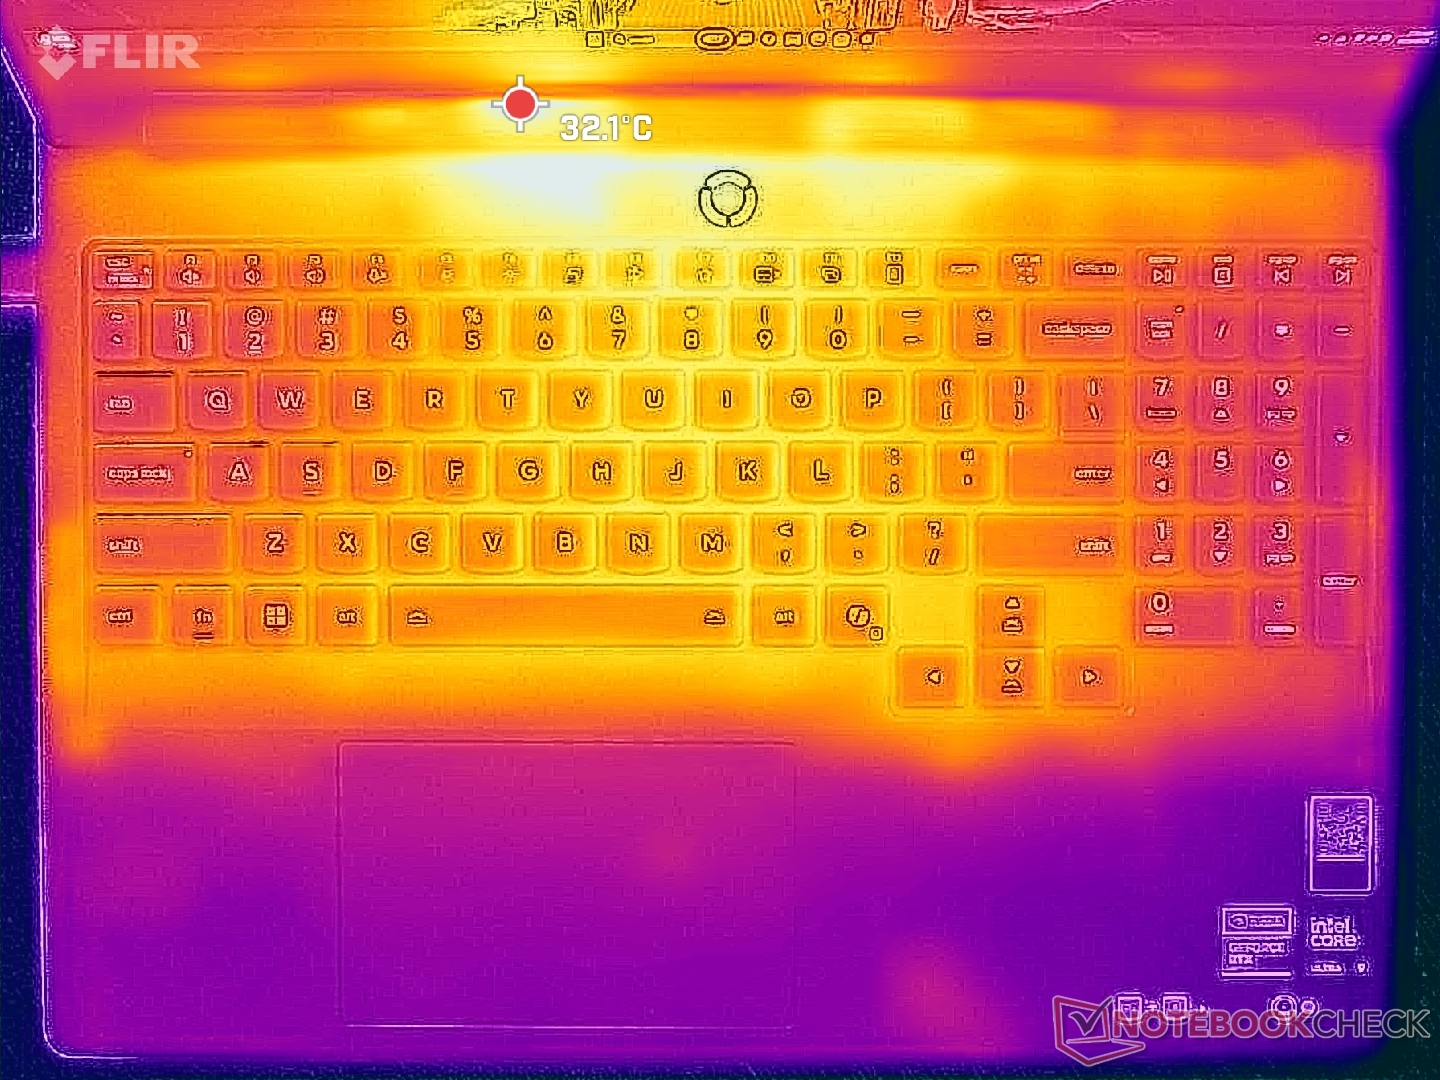
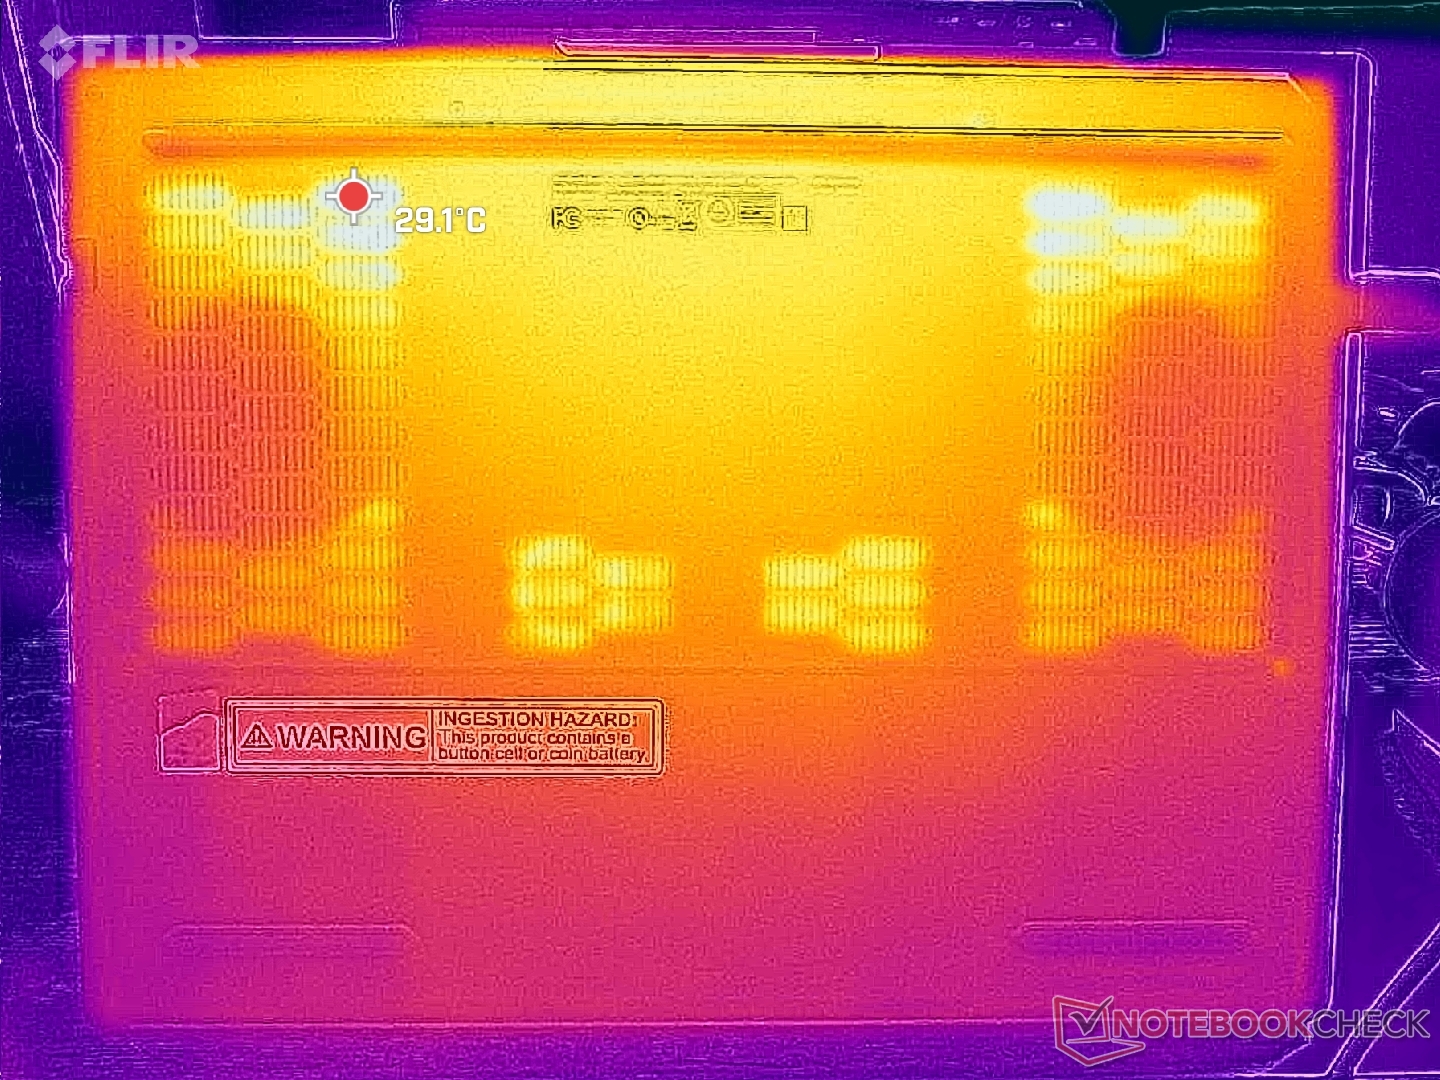
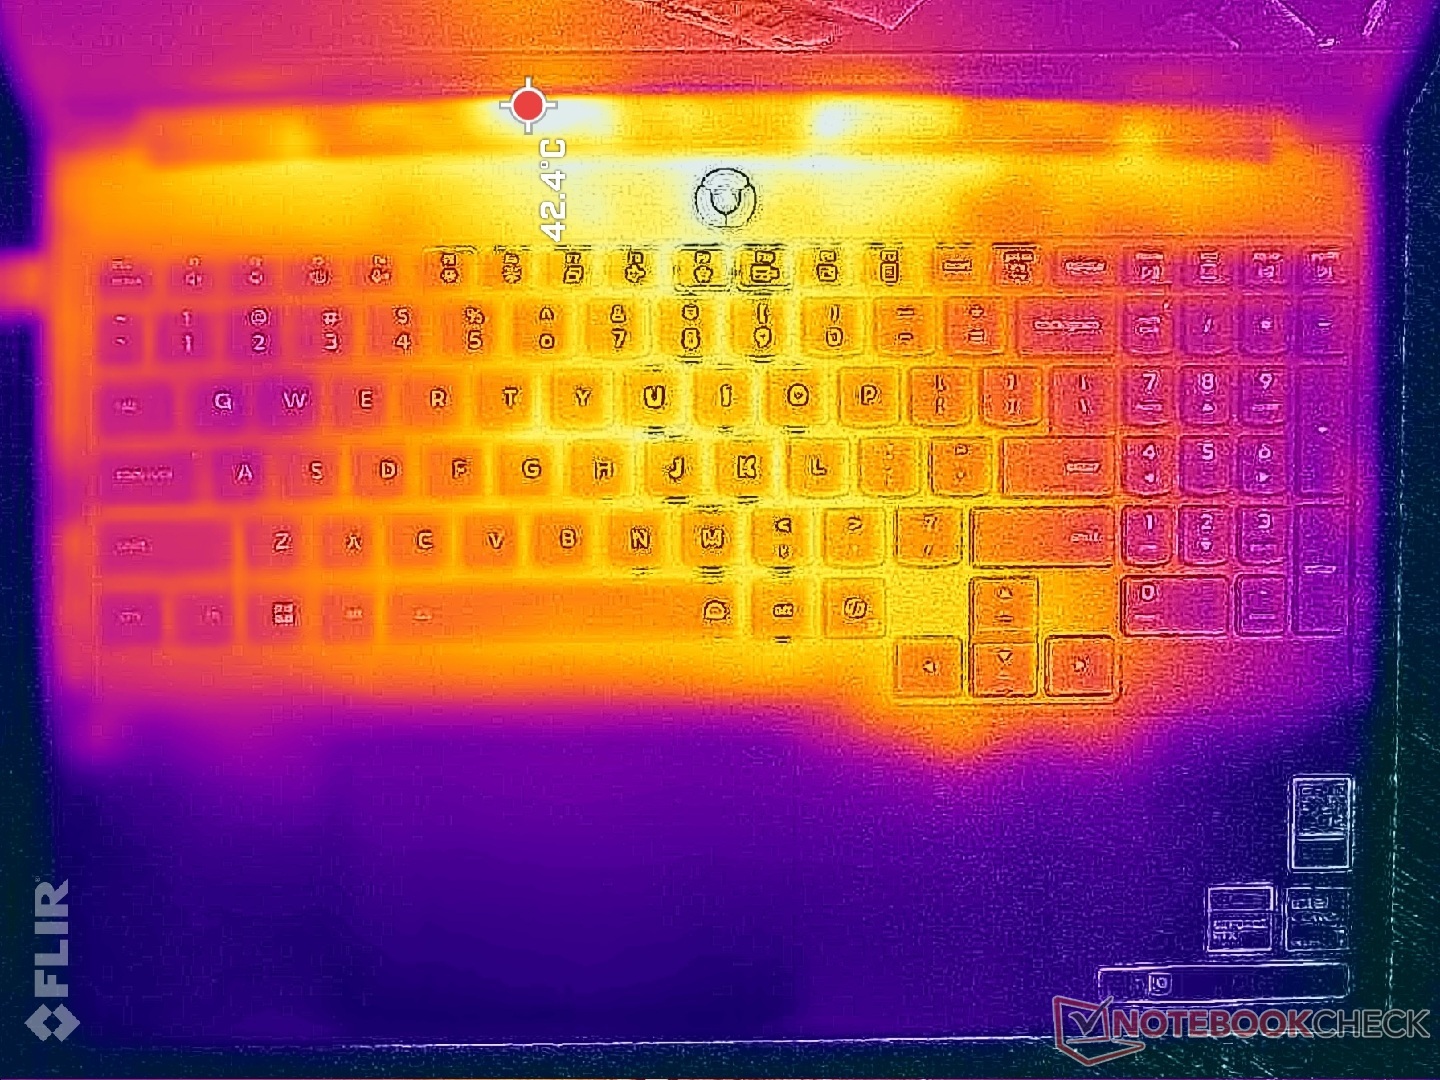
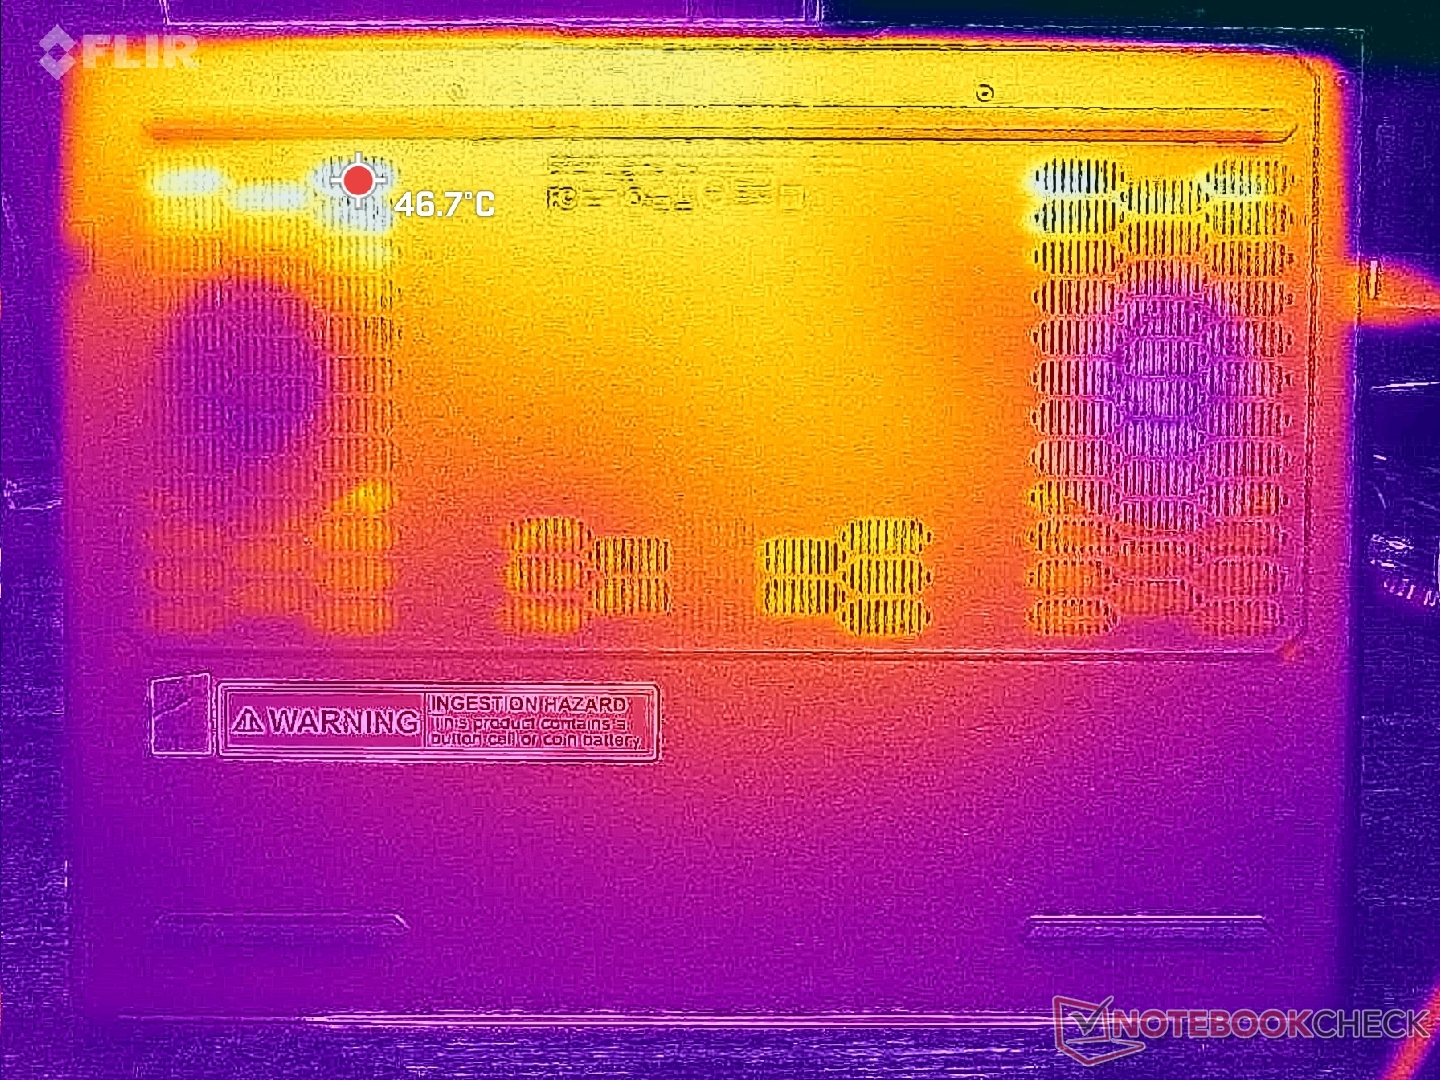
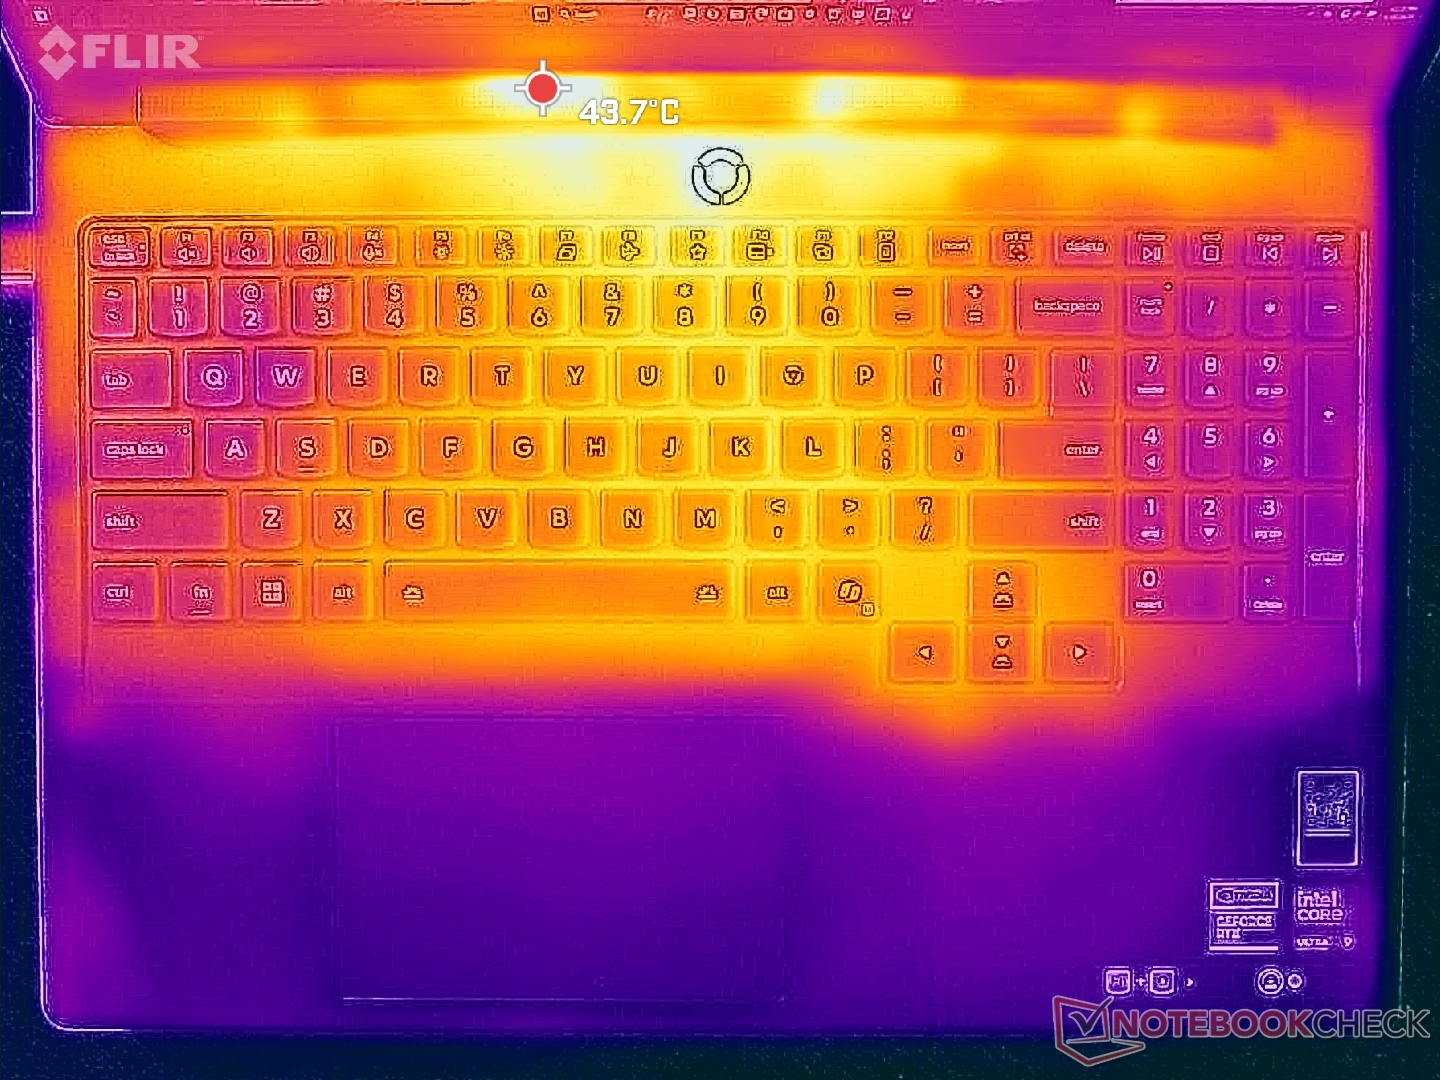
Temperature
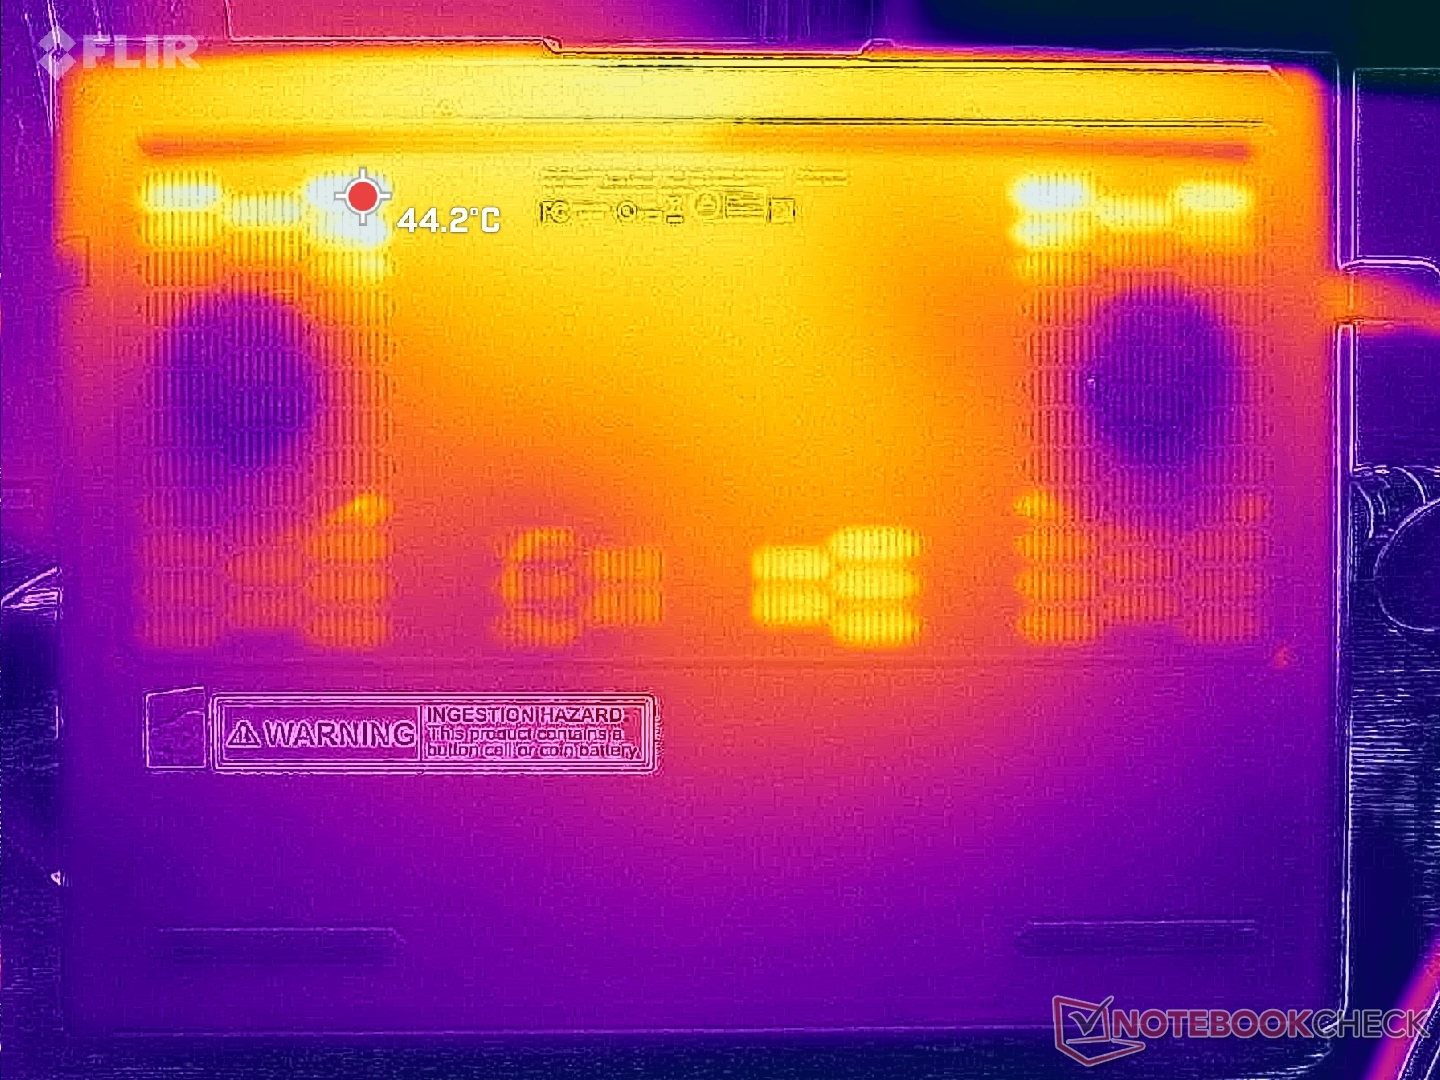
Surface temperatures are not as warm as on the Blade 16 due to the larger ventilation grilles and the extended rear design of the Lenovo. Hot spots on the keyboard center can reach up to 40 C while the WASD keys, arrow keys, and palm rests all remain cooler for more comfortable gaming.
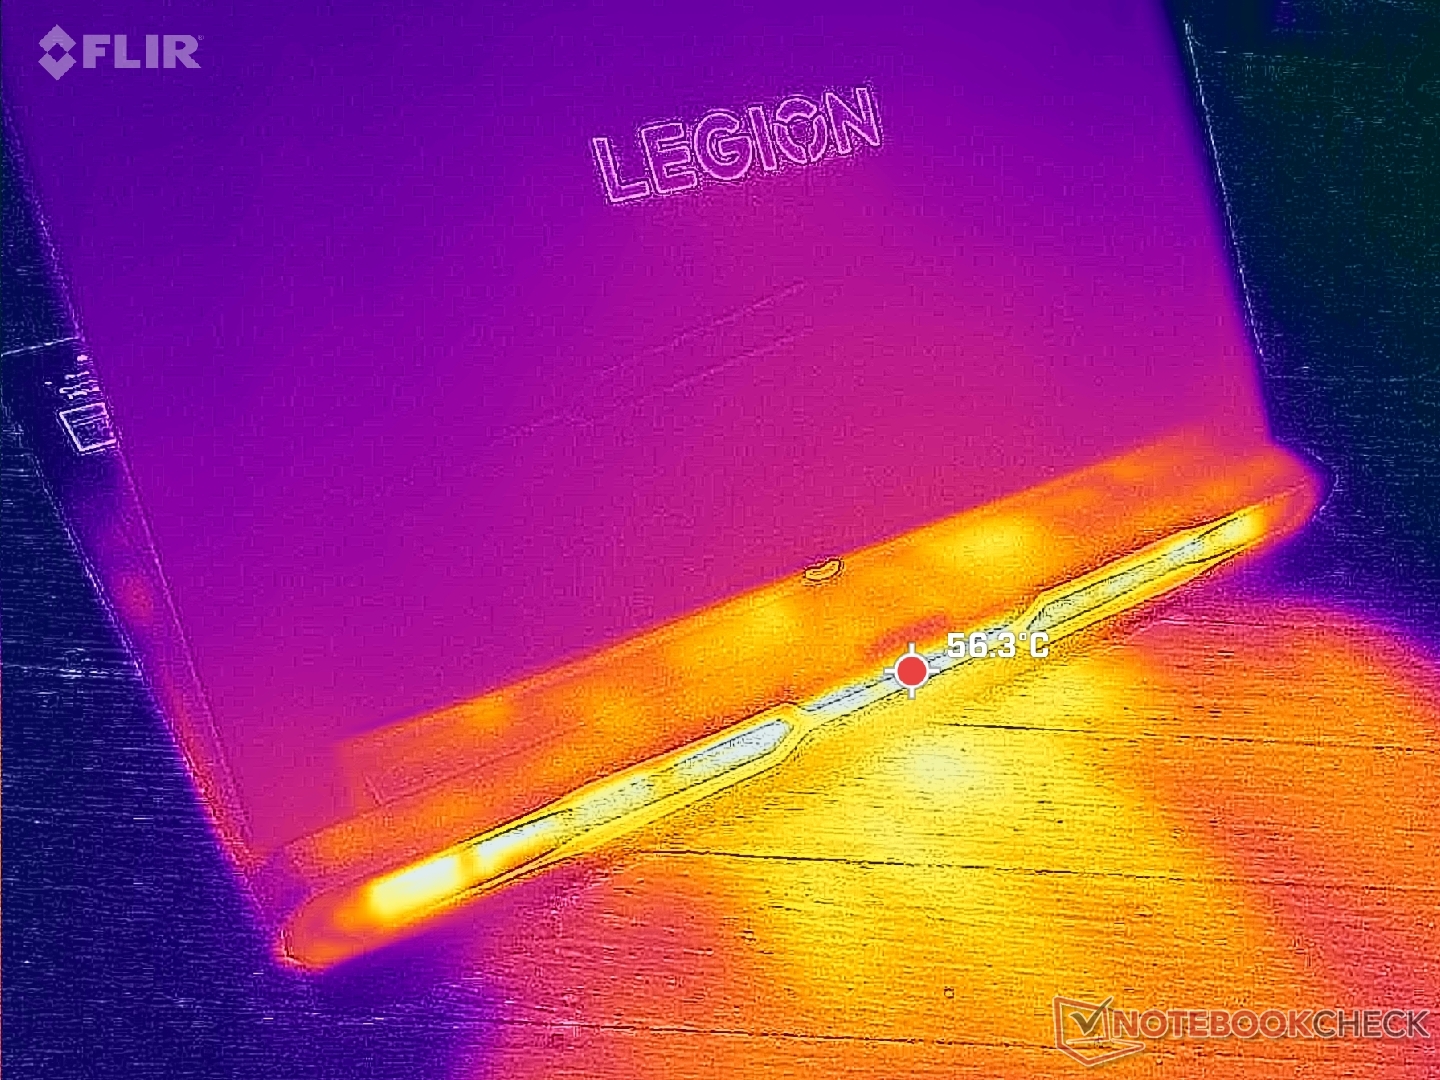
(±) The maximum temperature on the upper side is 42.6 °C / 109 F, compared to the average of 40.4 °C / 105 F, ranging from 21.2 to 68.8 °C for the class Gaming.
(±) The bottom heats up to a maximum of 41.2 °C / 106 F, compared to the average of 43.2 °C / 110 F
(+) In idle usage, the average temperature for the upper side is 27.4 °C / 81 F, compared to the device average of 33.9 °C / 93 F.
(±) 3: The average temperature for the upper side is 33.4 °C / 92 F, compared to the average of 33.9 °C / 93 F for the class Gaming.
(+) The palmrests and touchpad are cooler than skin temperature with a maximum of 25.4 °C / 77.7 F and are therefore cool to the touch.
(+) The average temperature of the palmrest area of similar devices was 28.8 °C / 83.8 F (+3.4 °C / 6.1 F).
| Lenovo Legion Pro 7i 16 Gen 10 Intel Core Ultra 9 275HX, NVIDIA GeForce RTX 5080 Laptop | Lenovo Legion 9 16IRX9, RTX 4090 Intel Core i9-14900HX, NVIDIA GeForce RTX 4090 Laptop GPU | Asus ROG Zephyrus G16 GU605CX Intel Core Ultra 9 285H, NVIDIA GeForce RTX 5090 Laptop | Razer Blade 16 2025 RTX 5090 AMD Ryzen AI 9 HX 370, NVIDIA GeForce RTX 5090 Laptop | MSI Vector 16 HX A14V Intel Core i9-14900HX, NVIDIA GeForce RTX 4080 Laptop GPU | Alienware x16 R2 P120F Intel Core Ultra 9 185H, NVIDIA GeForce RTX 4080 Laptop GPU | |
|---|---|---|---|---|---|---|
| Heat | -24% | 8% | -6% | 16% | -16% | |
| Maximum Upper Side * (°C) | 42.6 | 56 -31% | 44 -3% | 48.3 -13% | 36.4 15% | 51 -20% |
| Maximum Bottom * (°C) | 41.2 | 53 -29% | 44.1 -7% | 53.3 -29% | 35.6 14% | 50.8 -23% |
| Idle Upper Side * (°C) | 32.6 | 38 -17% | 26.1 20% | 28.3 13% | 26.6 18% | 36.6 -12% |
| Idle Bottom * (°C) | 32.4 | 39 -20% | 25.5 21% | 30.3 6% | 27 17% | 35.2 -9% |
* ... smaller is better
Speakers
Lenovo Legion Pro 7i 16 Gen 10 audio analysis
(±) | speaker loudness is average but good (81.4 dB)
Bass 100 - 315 Hz
(±) | reduced bass - on average 7.6% lower than median
(±) | linearity of bass is average (9.4% delta to prev. frequency)
Mids 400 - 2000 Hz
(+) | balanced mids - only 4.1% away from median
(+) | mids are linear (4.8% delta to prev. frequency)
Highs 2 - 16 kHz
(+) | balanced highs - only 1.9% away from median
(+) | highs are linear (4.8% delta to prev. frequency)
Overall 100 - 16.000 Hz
(+) | overall sound is linear (9.4% difference to median)
Compared to same class
» 3% of all tested devices in this class were better, 2% similar, 95% worse
» The best had a delta of 6%, average was 18%, worst was 132%
Compared to all devices tested
» 3% of all tested devices were better, 1% similar, 96% worse
» The best had a delta of 4%, average was 23%, worst was 134%
Apple MacBook Pro 16 2021 M1 Pro audio analysis
(+) | speakers can play relatively loud (84.7 dB)
Bass 100 - 315 Hz
(+) | good bass - only 3.8% away from median
(+) | bass is linear (5.2% delta to prev. frequency)
Mids 400 - 2000 Hz
(+) | balanced mids - only 1.3% away from median
(+) | mids are linear (2.1% delta to prev. frequency)
Highs 2 - 16 kHz
(+) | balanced highs - only 1.9% away from median
(+) | highs are linear (2.7% delta to prev. frequency)
Overall 100 - 16.000 Hz
(+) | overall sound is linear (4.6% difference to median)
Compared to same class
» 0% of all tested devices in this class were better, 0% similar, 100% worse
» The best had a delta of 5%, average was 17%, worst was 45%
Compared to all devices tested
» 0% of all tested devices were better, 0% similar, 100% worse
» The best had a delta of 4%, average was 23%, worst was 134%
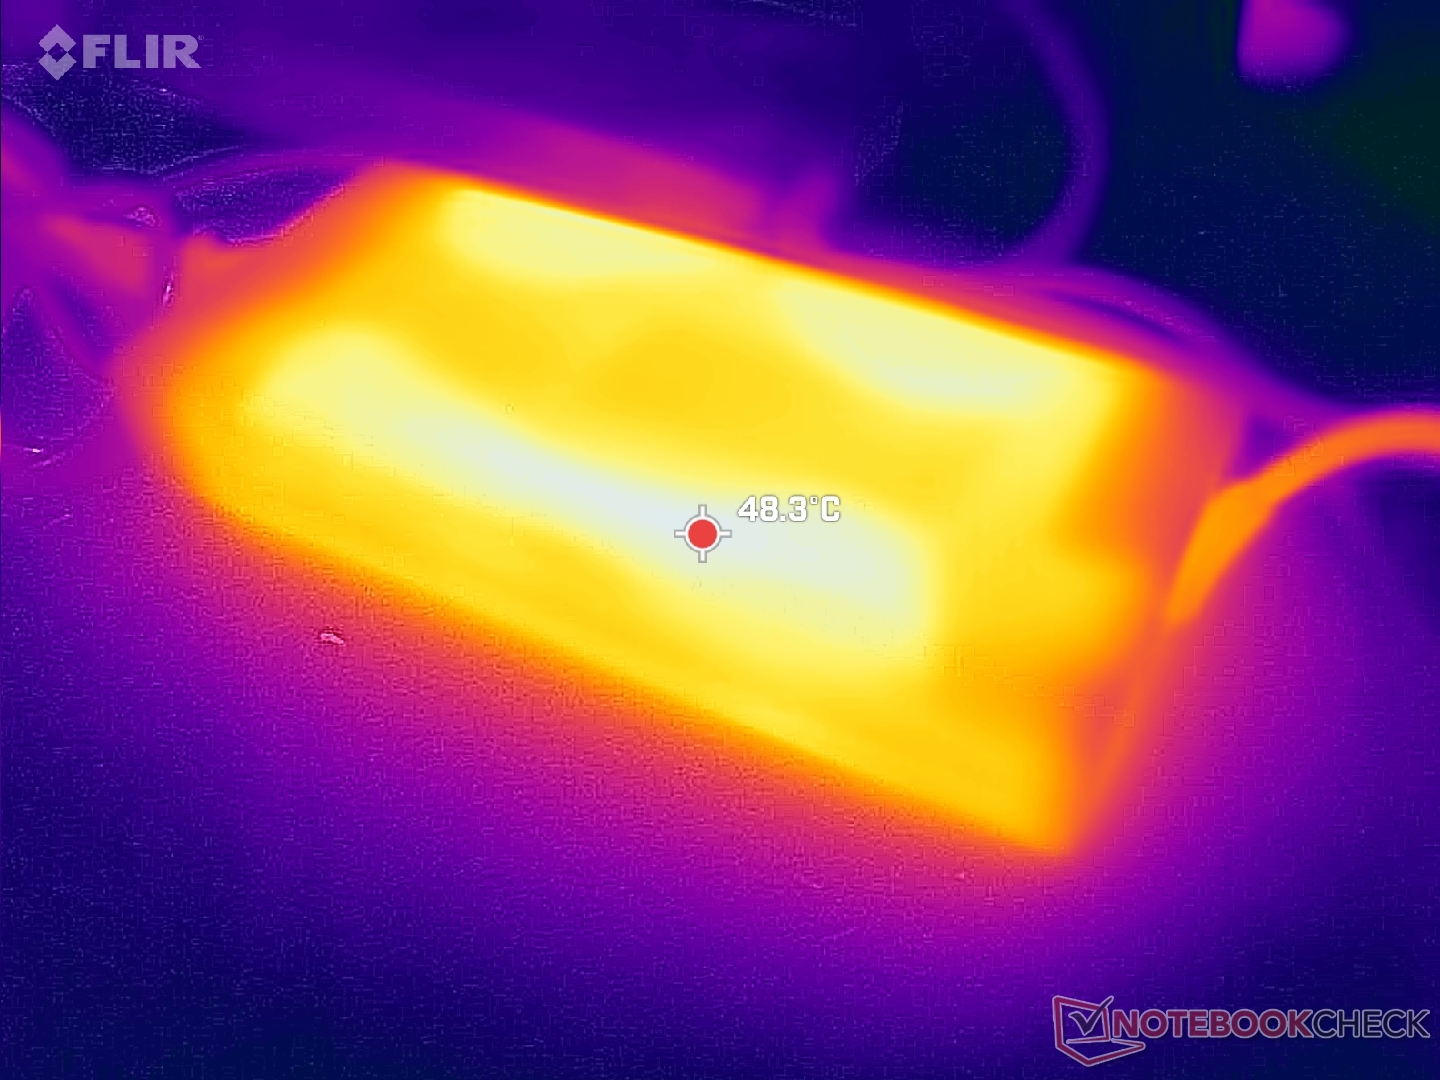
Energy Management
Power Consumption
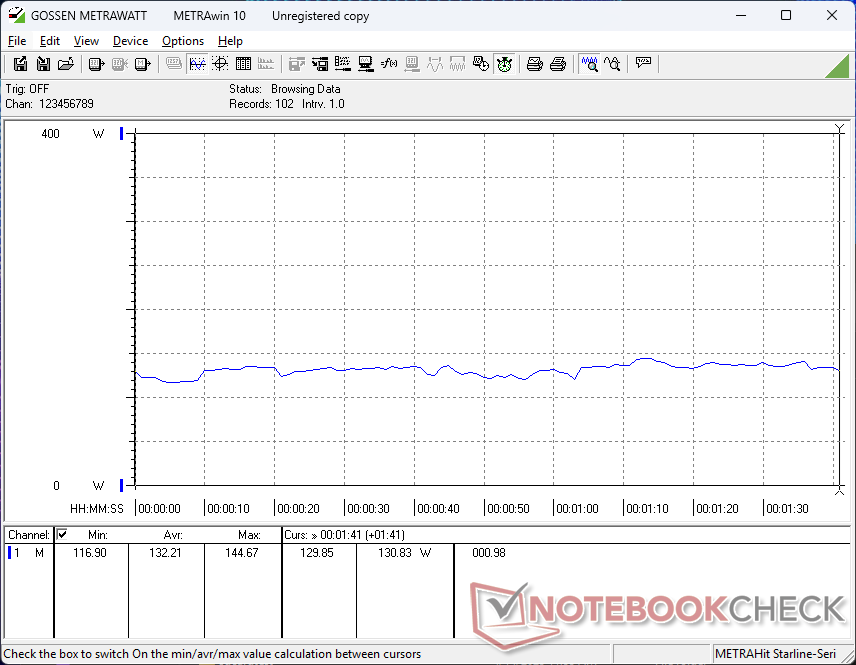
The Legion Pro 7i G10 is one of the few gaming laptops to ship with a 400 W power brick as most others typically max out at 280 W or 300 W. Power consumption is unsurprisingly quite high and more demanding than most other gaming laptops even when idling on desktop at the lowest brightness setting as shwon by the comparison table below.
Running Prime95 consumes about 222 W compared to only 98 W on the AMD-powered Razer Blade 16. In other words, our Intel system is over 2.2x more demanding over the Razer while providing a 1.5x boost in multi-thread performance for generally lower performance-per-watt. This wide delta continues when running games like Cyberpunk 2077 where our Lenovo would draw around 320 W compared to just 178 W on the aforementioned Razer.
The 400 W AC adapter is expectedly large (19.5 x 8.8 x 3.3 cm) and heavier (1206 g) than many thin-and-light laptops.
| Off / Standby | |
| Idle | |
| Load |
|
Key:
min: | |
| Lenovo Legion Pro 7i 16 Gen 10 Ultra 9 275HX, GeForce RTX 5080 Laptop, SK Hynix HFS001TEJ9X115N, OLED, 2560x1600, 16" | Lenovo Legion 9 16IRX9, RTX 4090 i9-14900HX, GeForce RTX 4090 Laptop GPU, Micron 3400 2TB MTFDKBA2T0TFH, MiniLED, 3200x2000, 16" | Asus ROG Zephyrus G16 GU605CX Ultra 9 285H, GeForce RTX 5090 Laptop, Western Digital PC SN5000S SDEPNSJ-2T00-1006, OLED, 2560x1600, 16" | Razer Blade 16 2025 RTX 5090 Ryzen AI 9 HX 370, GeForce RTX 5090 Laptop, SSSTC CA6-8D2048, OLED, 2560x1600, 16" | MSI Vector 16 HX A14V i9-14900HX, GeForce RTX 4080 Laptop GPU, WD PC SN560 SDDPNQE-1T00, IPS, 2560x1600, 16" | Alienware x16 R2 P120F Ultra 9 185H, GeForce RTX 4080 Laptop GPU, WDC PC SN810 1TB, IPS, 2560x1600, 16" | |
|---|---|---|---|---|---|---|
| Power Consumption | 25% | 50% | 47% | 29% | 40% | |
| Idle Minimum * (Watt) | 28.5 | 20.5 28% | 9.4 67% | 10.9 62% | 15.8 45% | 9.9 65% |
| Idle Average * (Watt) | 38.8 | 27.7 29% | 13.6 65% | 13.5 65% | 23.3 40% | 14.5 63% |
| Idle Maximum * (Watt) | 45.6 | 32.1 30% | 15.8 65% | 13.7 70% | 30 34% | 33.5 27% |
| Load Average * (Watt) | 132.2 | 105 21% | 115.4 13% | 120.2 9% | 123.9 6% | 97.5 26% |
| Cyberpunk 2077 ultra external monitor * (Watt) | 319 | 160.4 50% | 177.6 44% | |||
| Cyberpunk 2077 ultra * (Watt) | 318 | 164.5 48% | 178.2 44% | |||
| Load Maximum * (Watt) | 384 | 323 16% | 216.7 44% | 246.1 36% | 306 20% | 315.2 18% |
| Witcher 3 ultra * (Watt) | 246 | 285 | 230 |
* ... smaller is better
Power Consumption Cyberpunk / Stress Test
Power Consumption external Monitor
Battery Life
WLAN runtime is only slightly better than on last year's Legion 9 16IRX9 even when set to Balanced and iGPU mode. Longer runtimes can be achieved with the Razer Blade 16 or Zephyrus G16 by at least an hour or two each.
Charging from empty to full takes just 90 minutes with the included AC adapter. Charging more slowly via third-party USB-C is supported.
| Lenovo Legion Pro 7i 16 Gen 10 Ultra 9 275HX, GeForce RTX 5080 Laptop, 99 Wh | Lenovo Legion 9 16IRX9, RTX 4090 i9-14900HX, GeForce RTX 4090 Laptop GPU, 99.99 Wh | Asus ROG Zephyrus G16 GU605CX Ultra 9 285H, GeForce RTX 5090 Laptop, 90 Wh | Razer Blade 16 2025 RTX 5090 Ryzen AI 9 HX 370, GeForce RTX 5090 Laptop, 90 Wh | MSI Vector 16 HX A14V i9-14900HX, GeForce RTX 4080 Laptop GPU, 90 Wh | Alienware x16 R2 P120F Ultra 9 185H, GeForce RTX 4080 Laptop GPU, 90 Wh | |
|---|---|---|---|---|---|---|
| Battery runtime | 82% | 67% | 46% | 39% | -41% | |
| WiFi v1.3 (h) | 5.4 | 4.8 -11% | 9 67% | 7.9 46% | 5.5 2% | 3.2 -41% |
| Load (h) | 0.8 | 2.2 175% | 1.4 75% | |||
| H.264 (h) | 4.9 | 9.9 | ||||
| Cyberpunk 2077 ultra 150cd (h) | 1.2 | |||||
| Reader / Idle (h) | 10.7 |
Notebookcheck Rating
Lenovo Legion Pro 7i 16 Gen 10
- 04/25/2025 v8
Allen Ngo
 Total Sustainability Score:
 Potential Competitors in Comparison
Image | Model / Review | Price | Weight | Height | Display |
|---|---|---|---|---|---|
1. 87.5%  | Lenovo Legion Pro 7i 16 Gen 10 Intel Core Ultra 9 275HX ⎘ NVIDIA GeForce RTX 5080 Laptop ⎘ 32 GB Memory, 1024 GB SSD | Amazon: List Price: 4200 USD | 2.6 kg | 26.65 mm | 16.00" 2560x1600 189 PPI OLED |
2. 83.9%  | Lenovo Legion 9 16IRX9, RTX 4090 Intel Core i9-14900HX ⎘ NVIDIA GeForce RTX 4090 Laptop GPU ⎘ 64 GB Memory, 2048 GB SSD | Amazon: List Price: 4899 Euro | 2.5 kg | 22.7 mm | 16.00" 3200x2000 236 PPI MiniLED |
3. 90%  | Asus ROG Zephyrus G16 GU605CX Intel Core Ultra 9 285H ⎘ NVIDIA GeForce RTX 5090 Laptop ⎘ 64 GB Memory, 2048 GB SSD | Amazon: List Price: 4799€ | 1.9 kg | 17.4 mm | 16.00" 2560x1600 189 PPI OLED |
4. 87%  | Razer Blade 16 2025 RTX 5090 AMD Ryzen AI 9 HX 370 ⎘ NVIDIA GeForce RTX 5090 Laptop ⎘ 32 GB Memory, 2048 GB SSD | Amazon: List Price: 4399€ | 2.1 kg | 17.4 mm | 16.00" 2560x1600 189 PPI OLED |
5. 88% v7 (old) 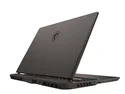 | MSI Vector 16 HX A14V Intel Core i9-14900HX ⎘ NVIDIA GeForce RTX 4080 Laptop GPU ⎘ 32 GB Memory, 1024 GB SSD | Amazon: 1. msi Vector 16 HX AI 16” 24... 2. $2,108.74 msi Vector 16 HX AI Gaming L... 3. $1,649.00 MSI Vector 16 HX AI A2XWHG-2... List Price: 2700 USD | 2.7 kg | 28.55 mm | 16.00" 2560x1600 189 PPI IPS |
6. 88.4% v7 (old)  | Alienware x16 R2 P120F Intel Core Ultra 9 185H ⎘ NVIDIA GeForce RTX 4080 Laptop GPU ⎘ 32 GB Memory, 1024 GB SSD | Amazon: List Price: 3200 USD | 2.7 kg | 18.57 mm | 16.00" 2560x1600 189 PPI IPS |
Transparency
The selection of devices to be reviewed is made by our editorial team. The test sample was provided to the author as a loan by the manufacturer or retailer for the purpose of this review. The lender had no influence on this review, nor did the manufacturer receive a copy of this review before publication. There was no obligation to publish this review. As an independent media company, Notebookcheck is not subjected to the authority of manufacturers, retailers or publishers.
This is how Notebookcheck is testing
Every year, Notebookcheck independently reviews hundreds of laptops and smartphones using standardized procedures to ensure that all results are comparable. We have continuously developed our test methods for around 20 years and set industry standards in the process. In our test labs, high-quality measuring equipment is utilized by experienced technicians and editors. These tests involve a multi-stage validation process. Our complex rating system is based on hundreds of well-founded measurements and benchmarks, which maintains objectivity. Further information on our test methods can be found here.
