
Verdict — One Of The Most Efficient Subnotebooks Available
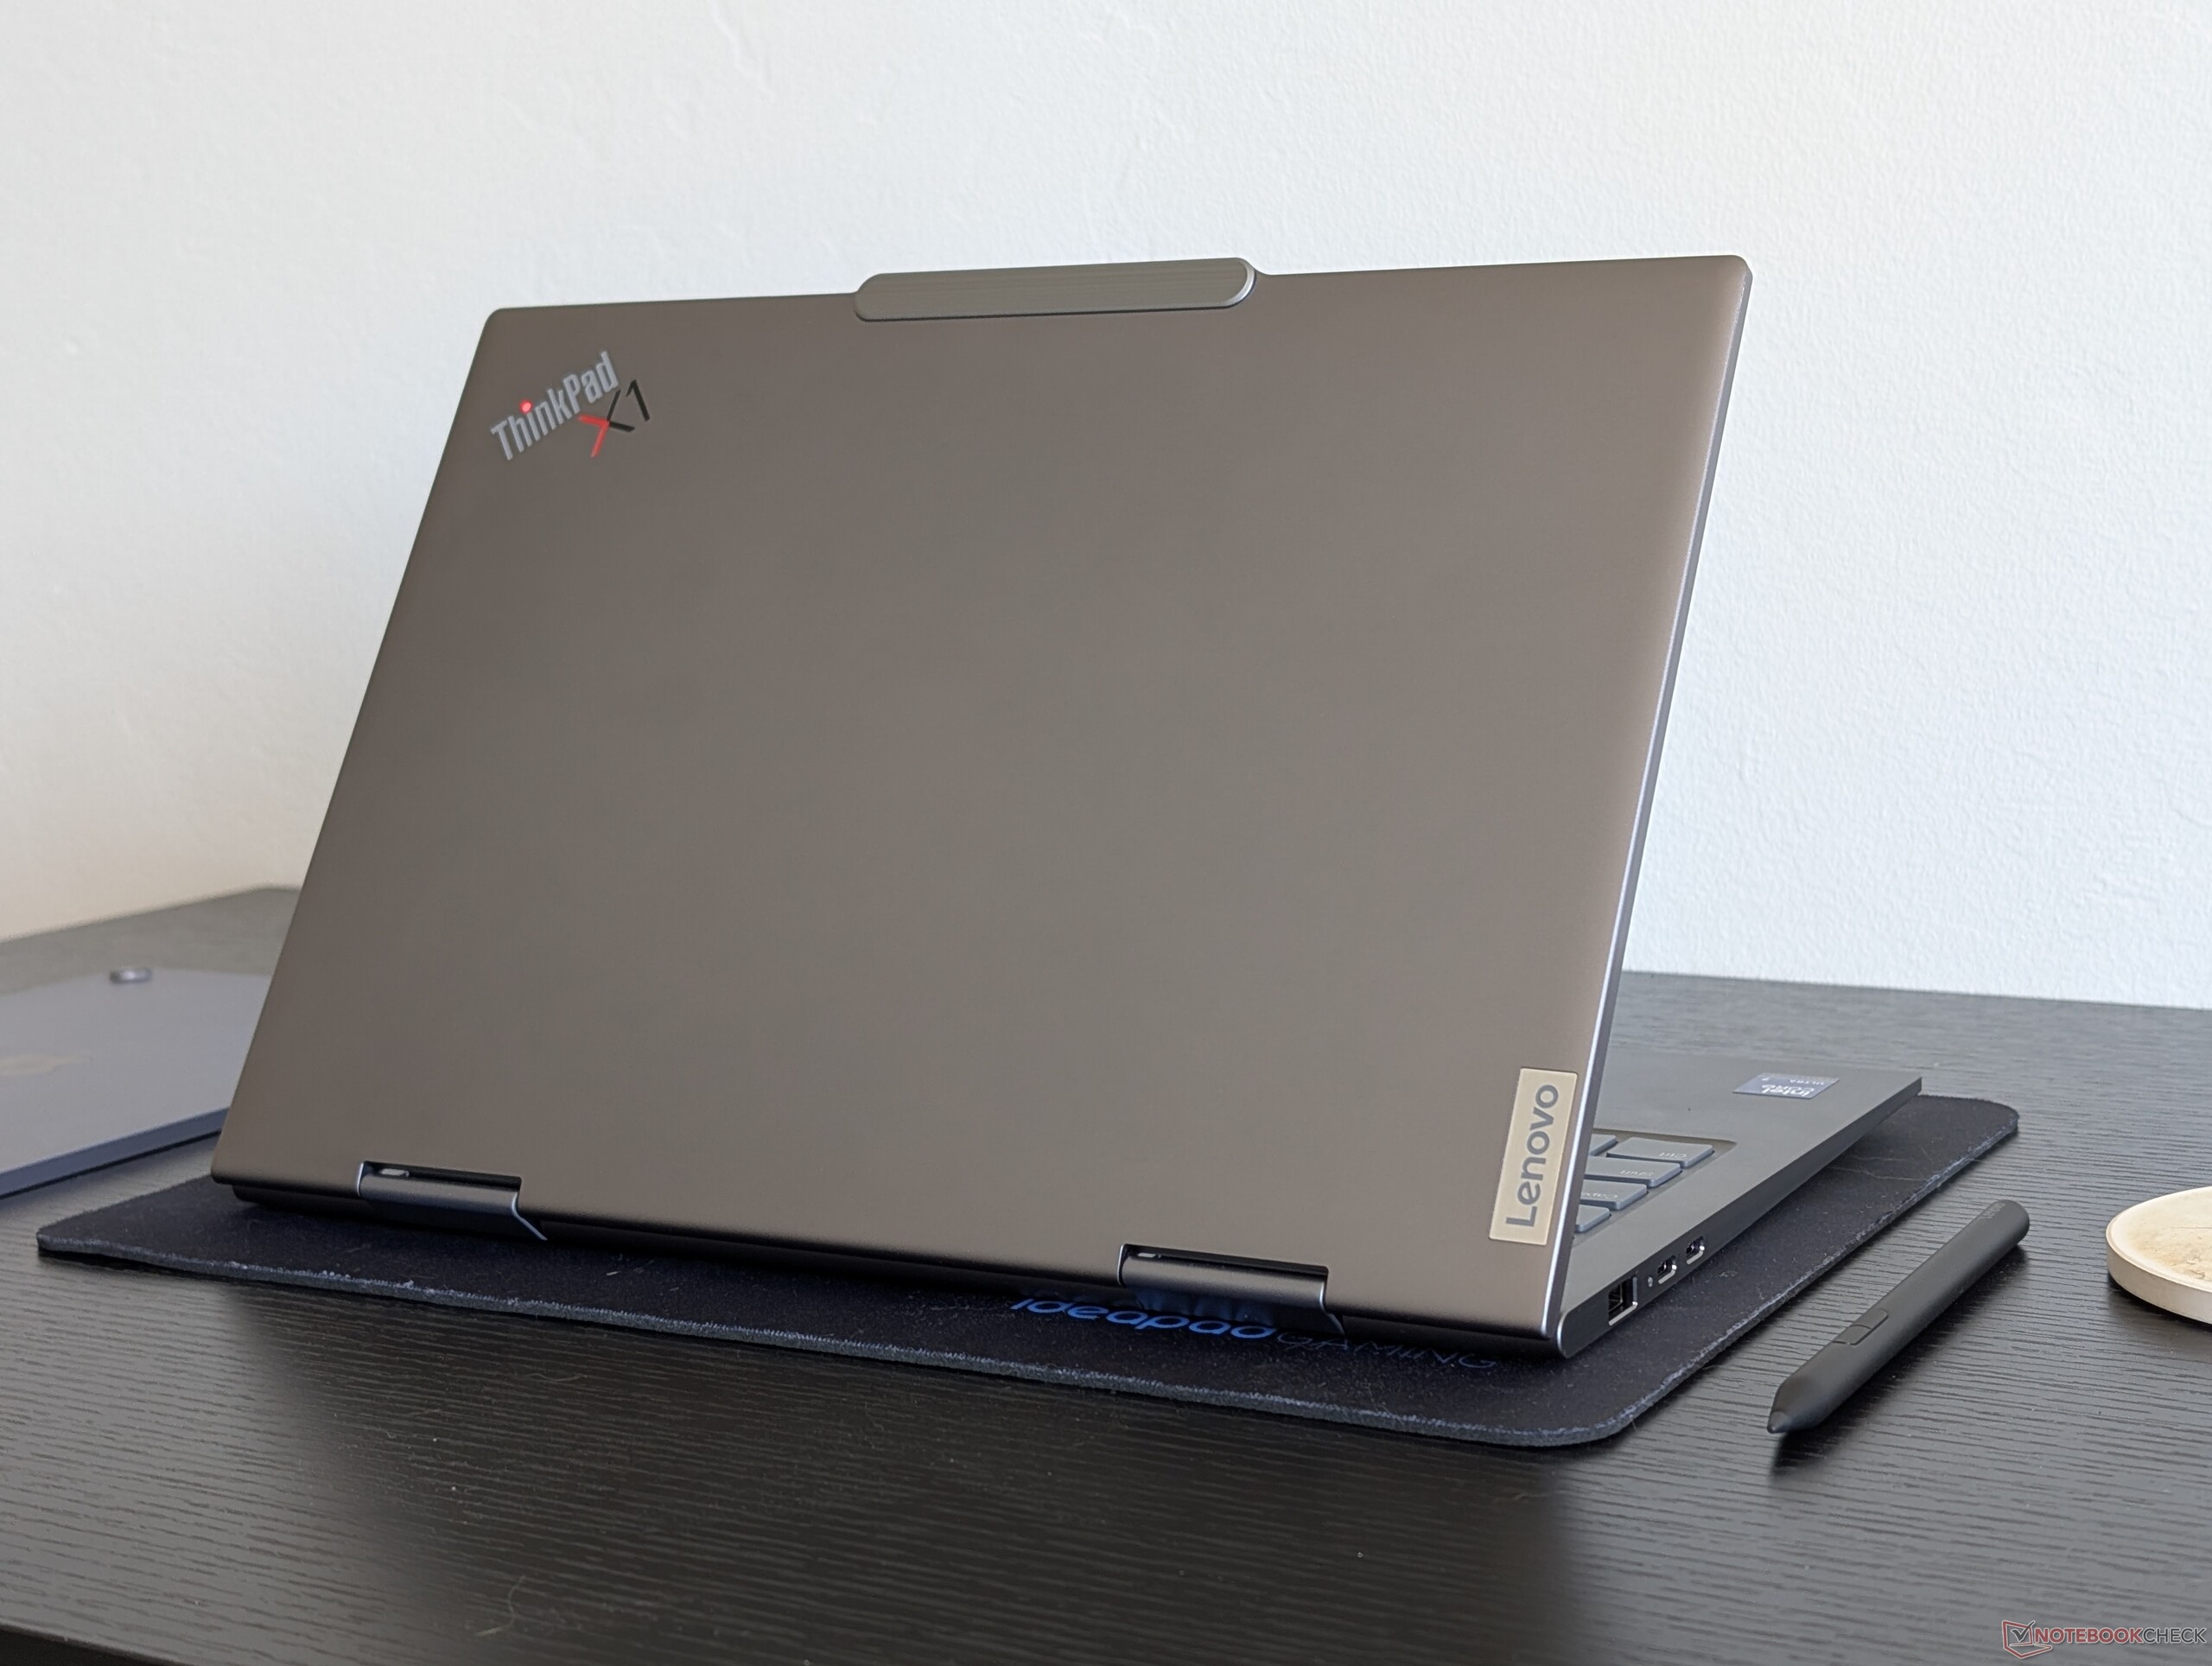
It may not look different from the outside, but the ThinkPad X1 2-in-1 Gen 10 offers significant upgrades over the ThinkPad X1 2-in-1 Gen 9 in several ways. Battery life is the most notable as it can be several hours longer than before all while running quieter and with much faster graphics performance. These upgrades are largely attributed to the new Lunar Lake CPU.
The main drawback to the latest model is its inability to maintain high Turbo Boost clock rates for extended periods as core temperature can reach a toasty 96 C when under load. Clock rates would cycle as a result leading to unsteady frame rates or slightly slower encoding times. The consequences are minor for general purpose activities like web browsing or video playback, but power users who frequently stress the CPU or GPU may want to consider larger models with better cooling solutions like the HP EliteBook x360 1040 G11 or the consumer-centric Asus ZenBook Duo.
Pros
Cons
Price and Availability
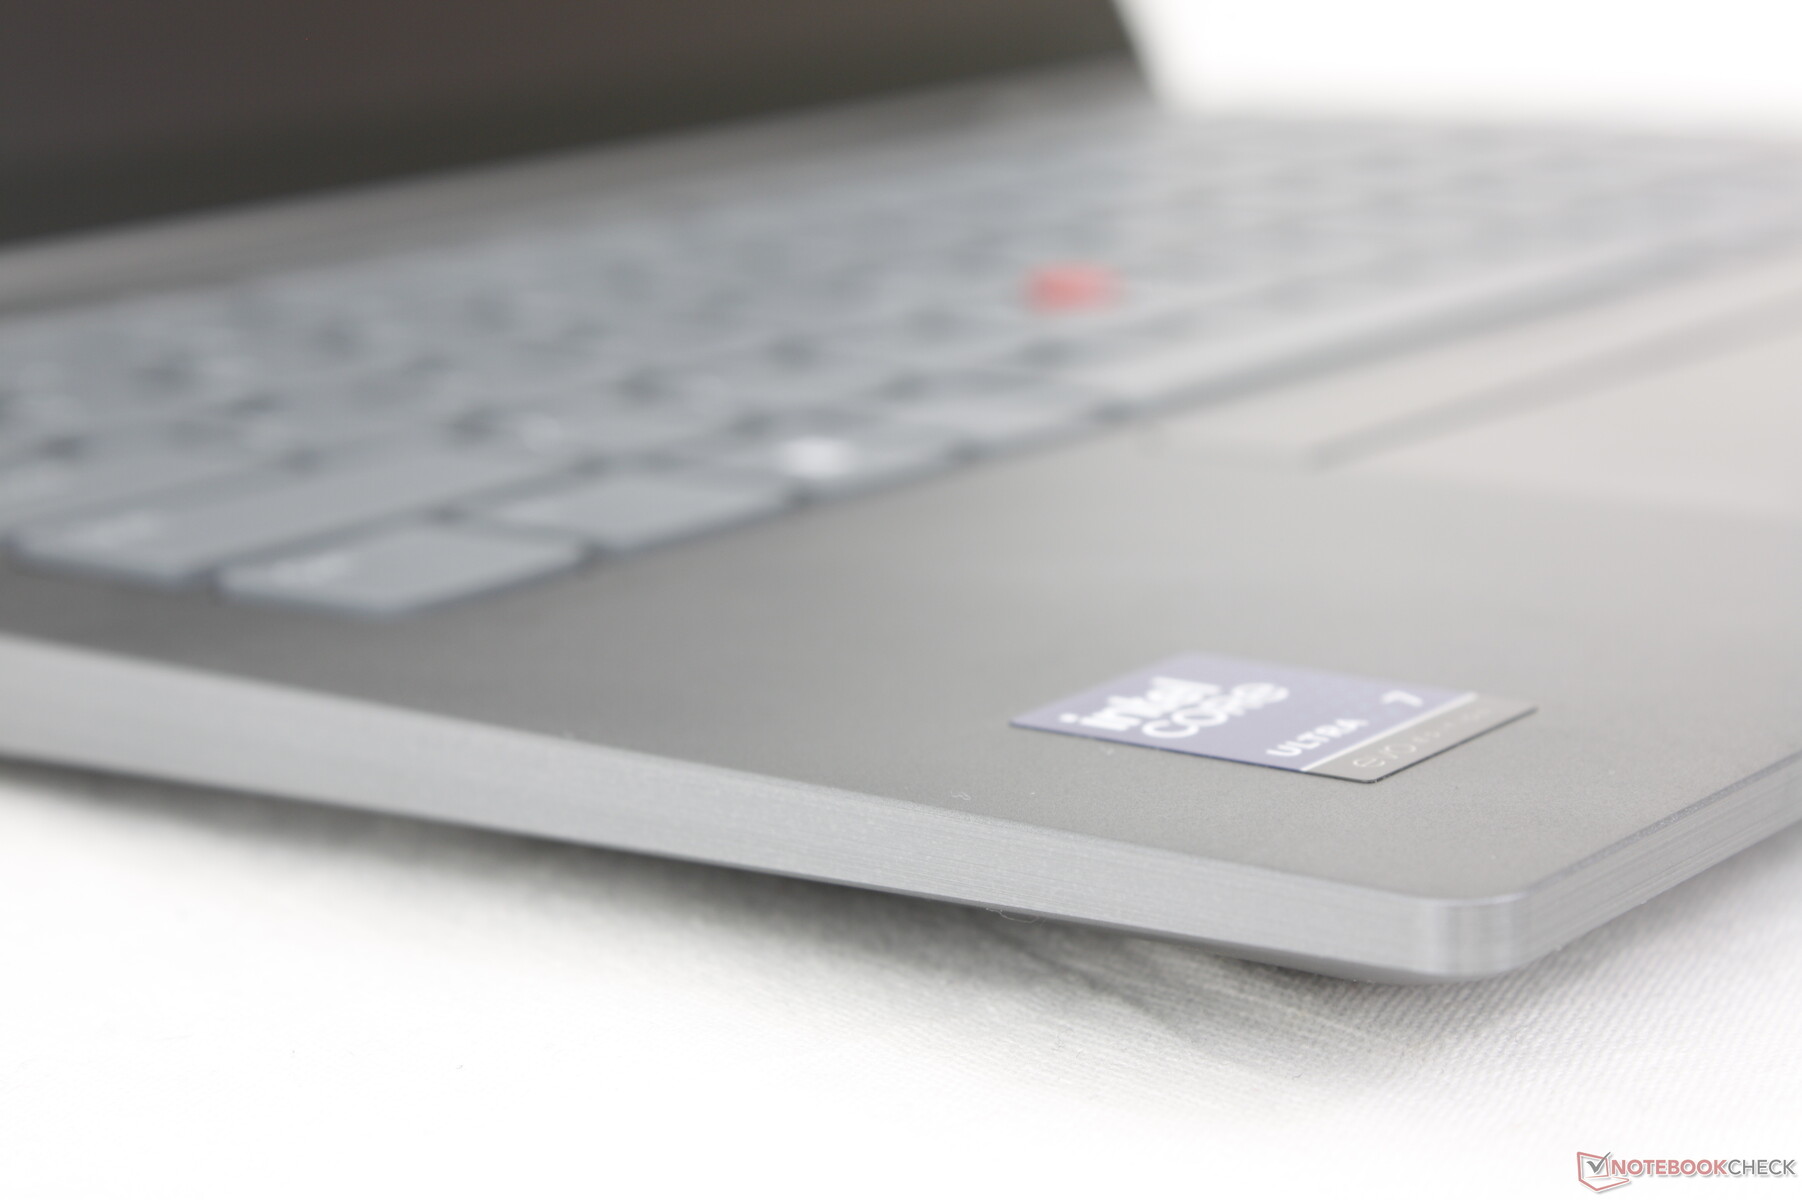
Lenovo is now shipping the ThinkPad X1 2-in-1 Gen 10 configuration with the Core Ultra 7 258V and 1200p touchscreen as reviewed for $2300 USD.
- $1,999.99Lenovo ThinkPad X1 2-in-1 Gen 10 Aura Edition Laptop with Intel Core Ultra 7 268V vPro Processor, 14” WUXGA IPS Touchscreen Display, 32GB LPDDR5X-8533MT/s Memory, 1TB SSD, Wi-Fi 7 and Windows 11 Pro
- $2,399.99Lenovo ThinkPad X1 2-in-1 Gen 10 Aura Edition Laptop with Intel Core Ultra 7 268V vPro Processor, 14” WUXGA 2.8K OLED Touchscreen Display, 32GB LPDDR5X-8533MT/s, 1TB SSD, 8MP IR Cam, Pen, and Win11Pro
- $1,699.99Lenovo ThinkPad X1 2-in-1 Gen 10 Aura Edition Laptop with Intel Core Ultra 7 255U Processor, 14” WUXGA 500nits Touchscreen Display, 32GB LPDDR5X-8400MT/s, 1TB SSD, FHD RGB+IR Cam, Pen, and Win 11 Pro
The 2025 ThinkPad X1 2-in-1 Gen 10 succeeds last year's 2024 ThinkPad X1 2-in-1 Gen 9 by swapping out the older Meteor Lake-U processor options for newer Lunar Lake-V ones. While there are otherwise no external differences between the two models, the processor update alone has changed several aspects of the model which we will detail in this review.
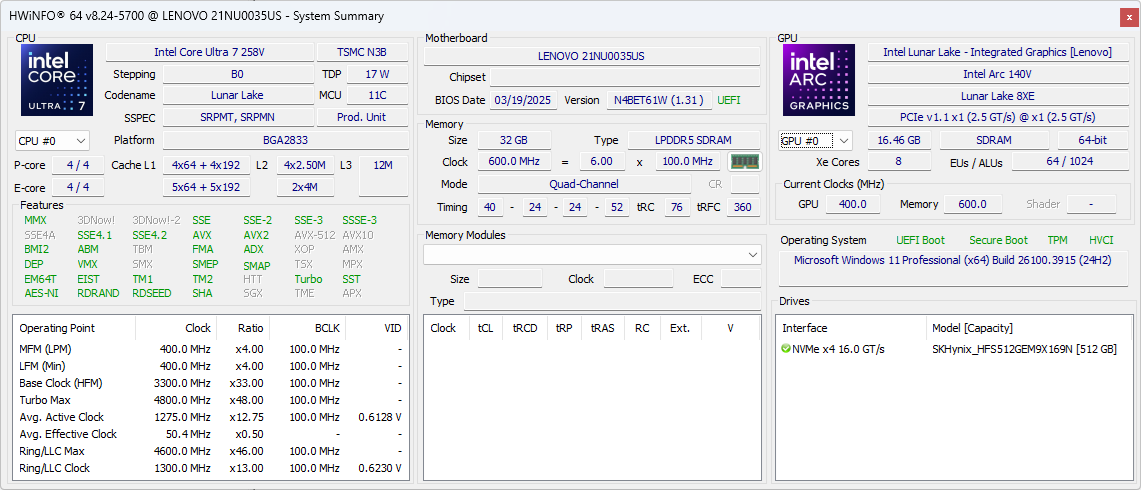
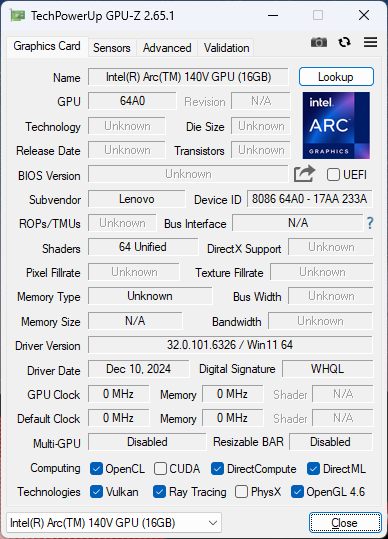
Our test unit is a middle configuration equipped with the Core Ultra 7 258V, Arc 140V integrated graphics, and 1200p IPS touchscreen for approximately $2300 retail. Other SKUs start with the Core Ultra 5 225U up to the Core Ultra 7 265H with an 1800p OLED touchscreen instead. This is one of the few 14-inch convertibles to come with Core Ultra-U, Core Ultra-H, and Core Ultra-U options.
Alternatives to the ThinkPad X1 2-in-1 Gen 10 include other business convertibles like the Dell Latitude 9440 2-in-1, HP EliteBook X Flip G1i 14 AI, or the Acer TravelMate P4 14.
More Lenovo reviews:
Specifications
Case
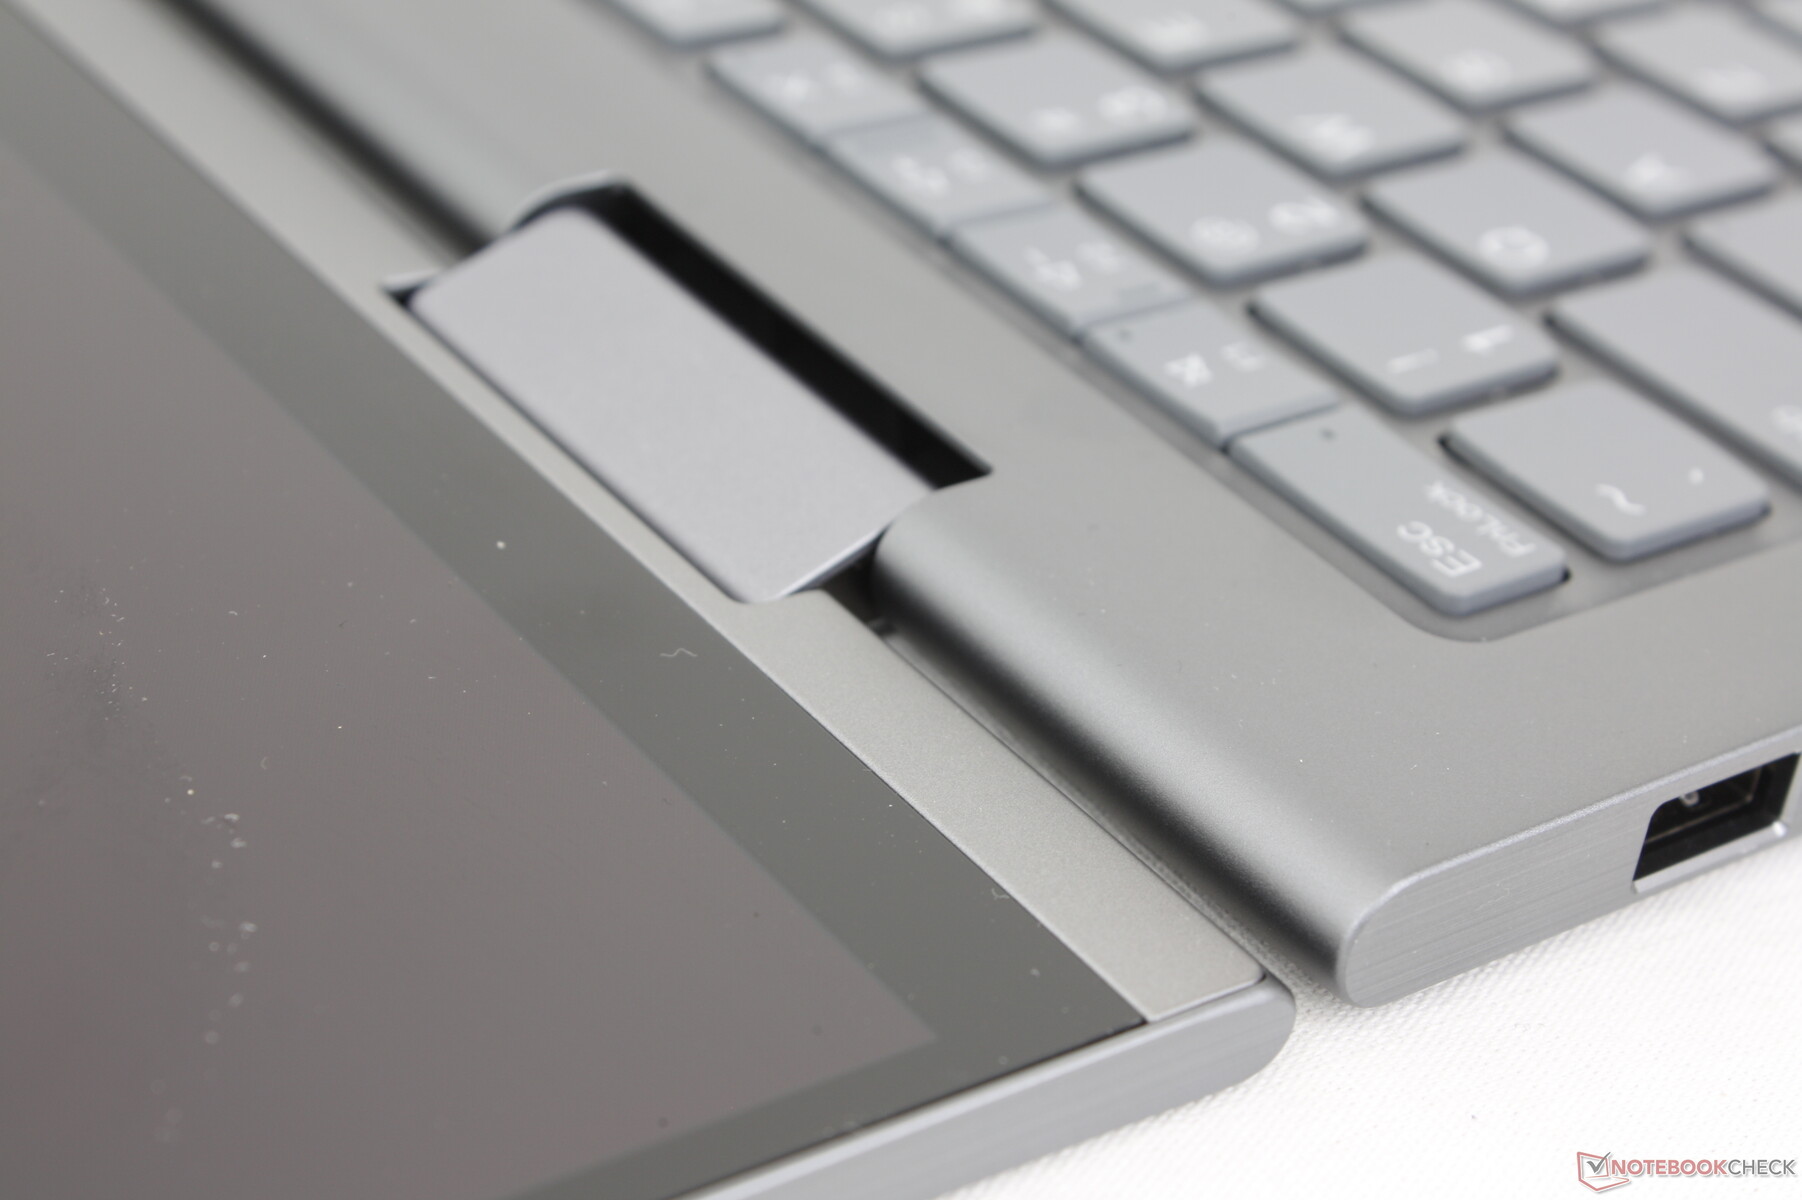
There are no external differences between the 2024 and 2025 models and so our existing comments on the 2024 model apply here. This isn't necessarily a bad thing as we found the 2024 design to be excellent from top to bottom save for the lack of a handy pen garage for storing the stylus. Even so, we much prefer the new larger pen as it no longer needs to be small enough to fit inside of the chassis.
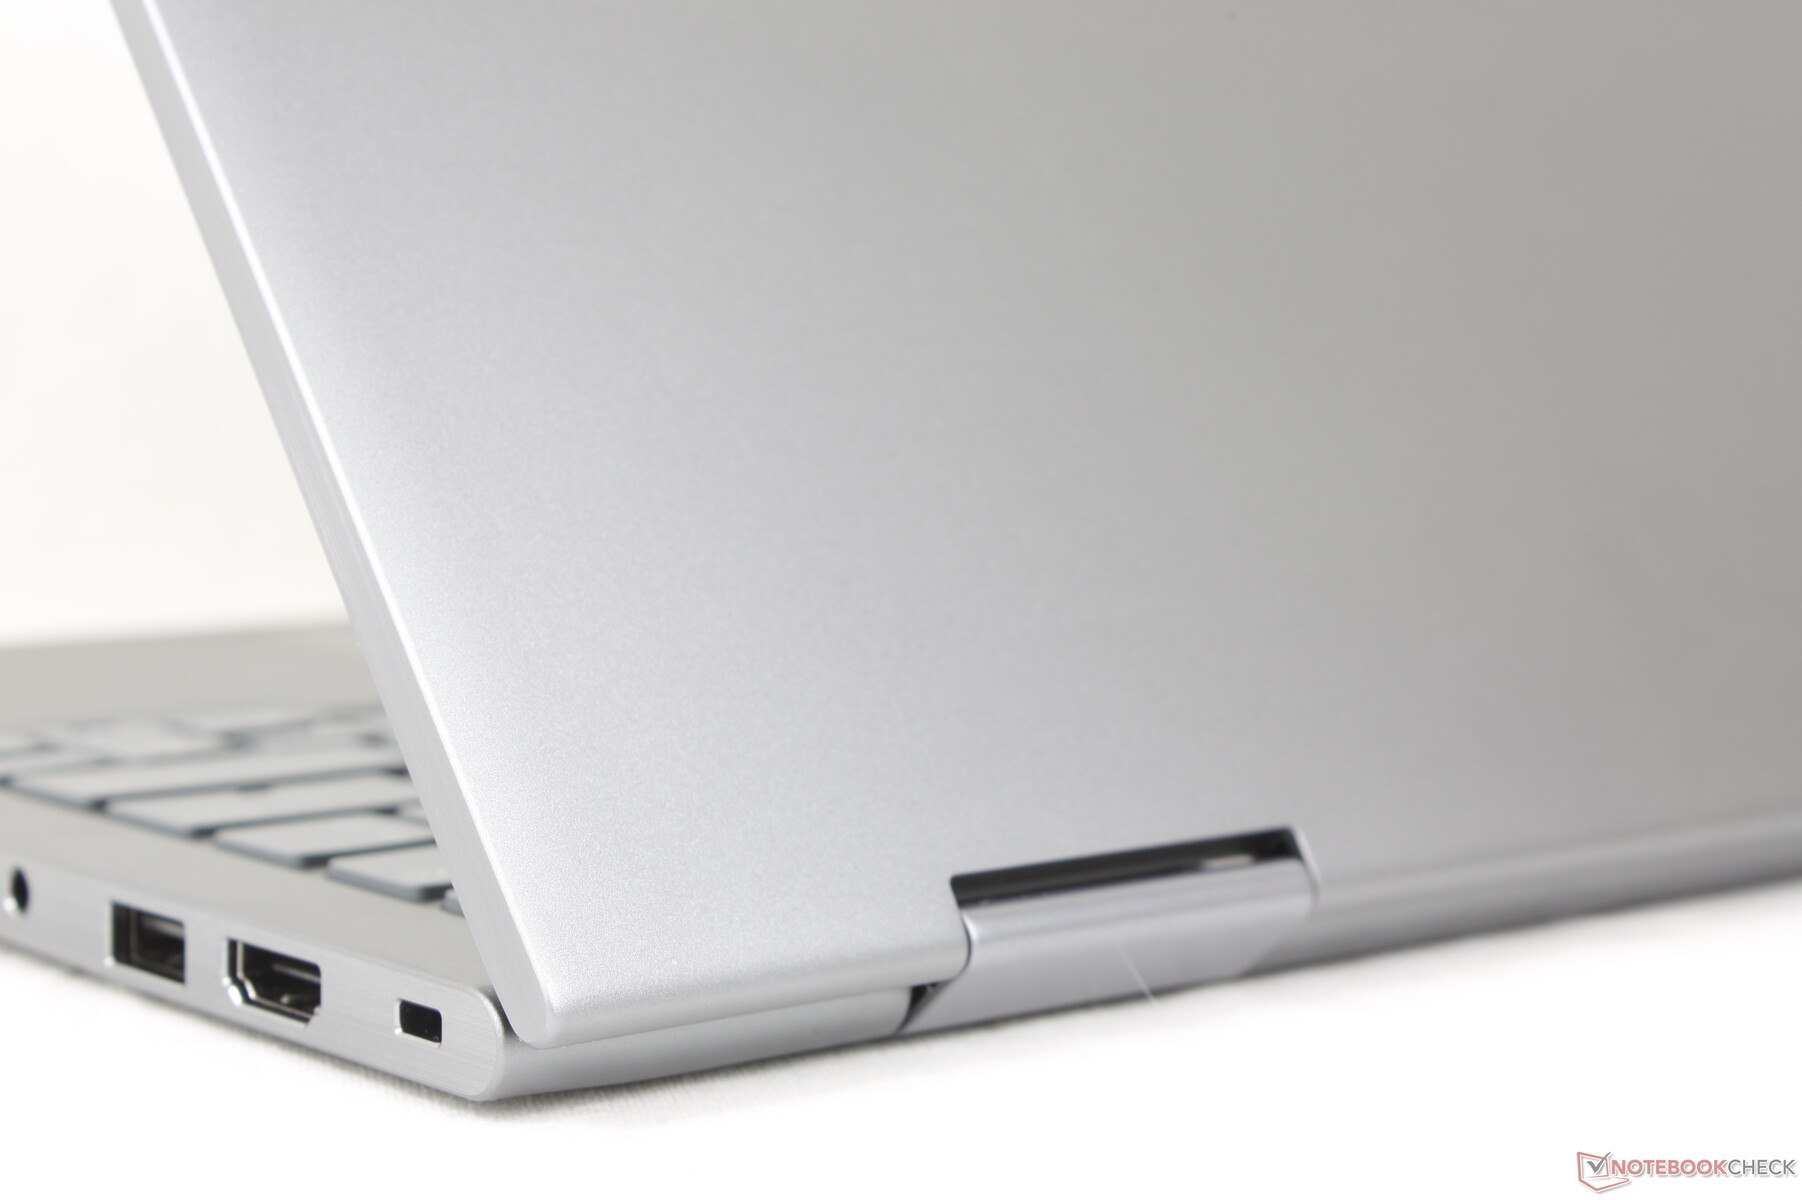
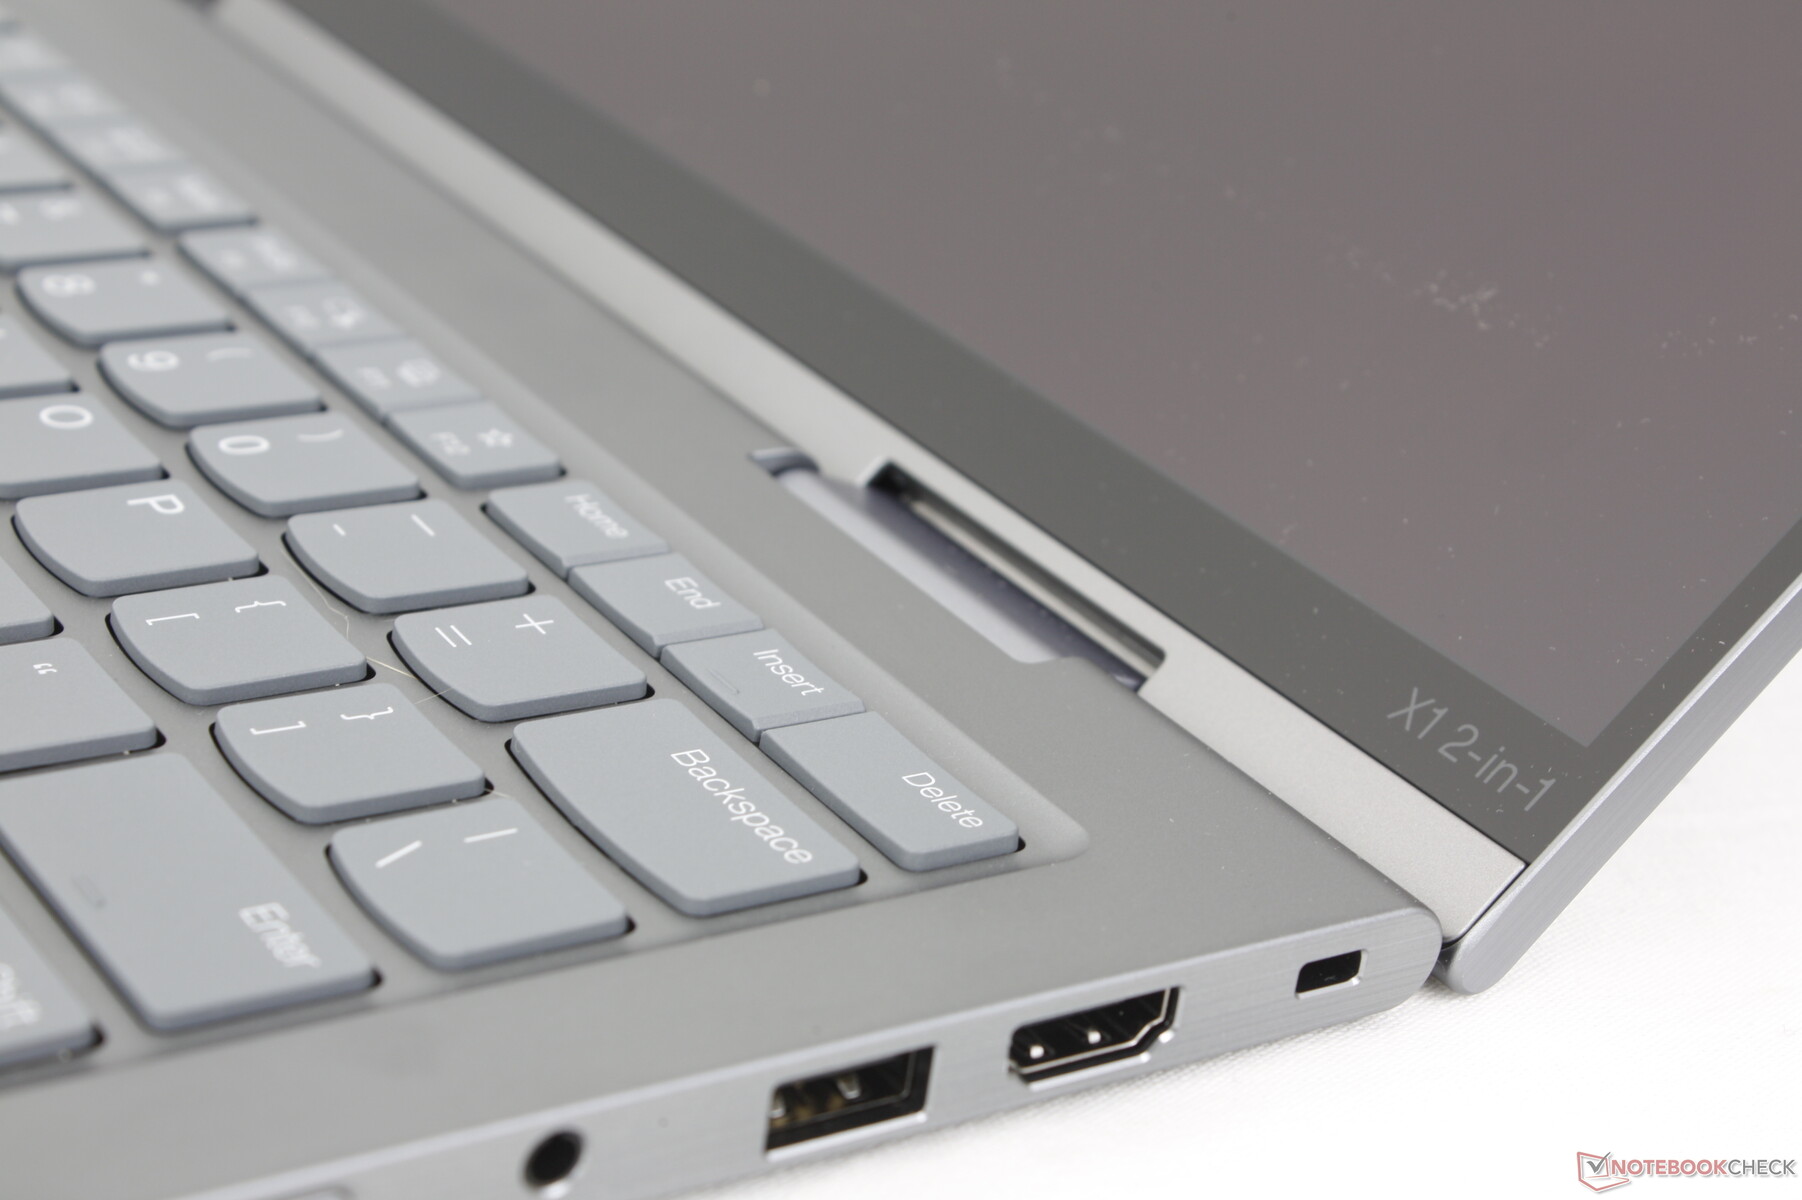
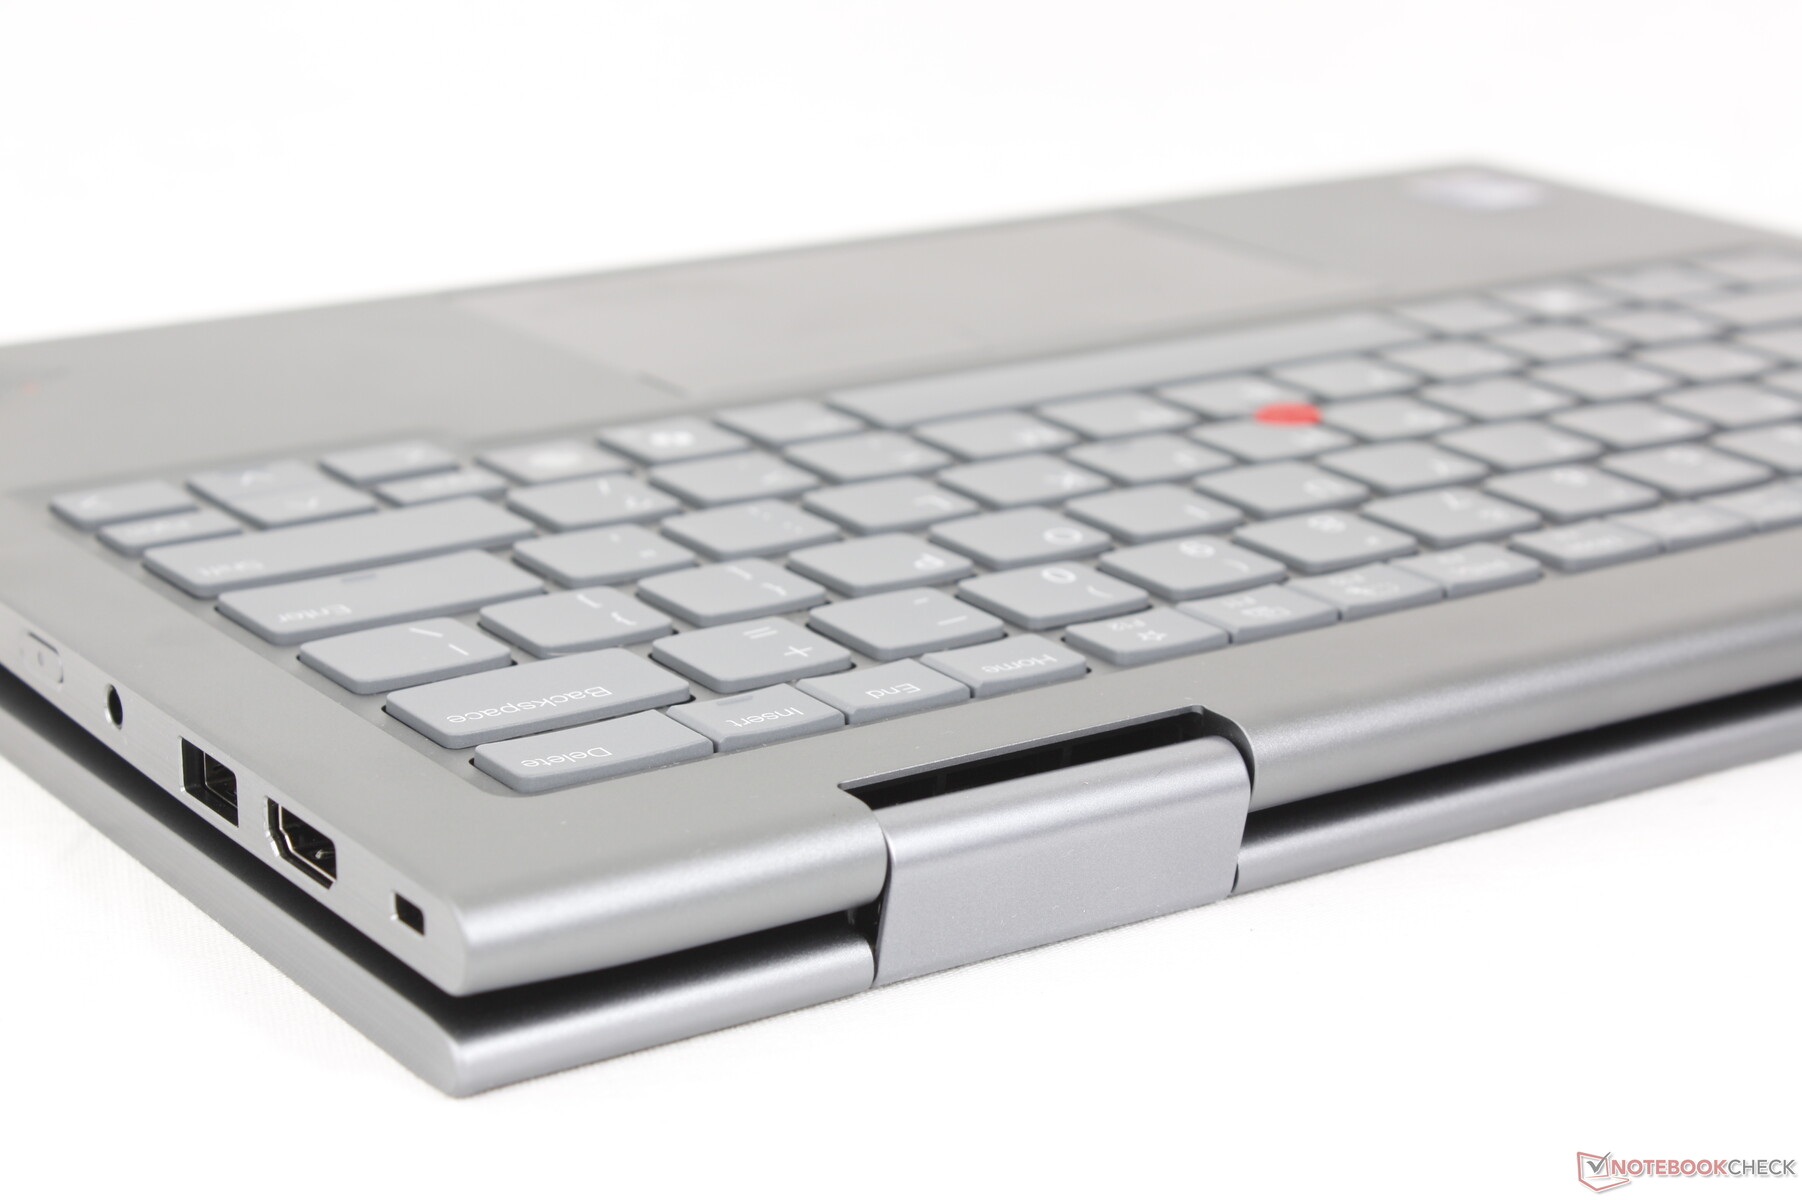
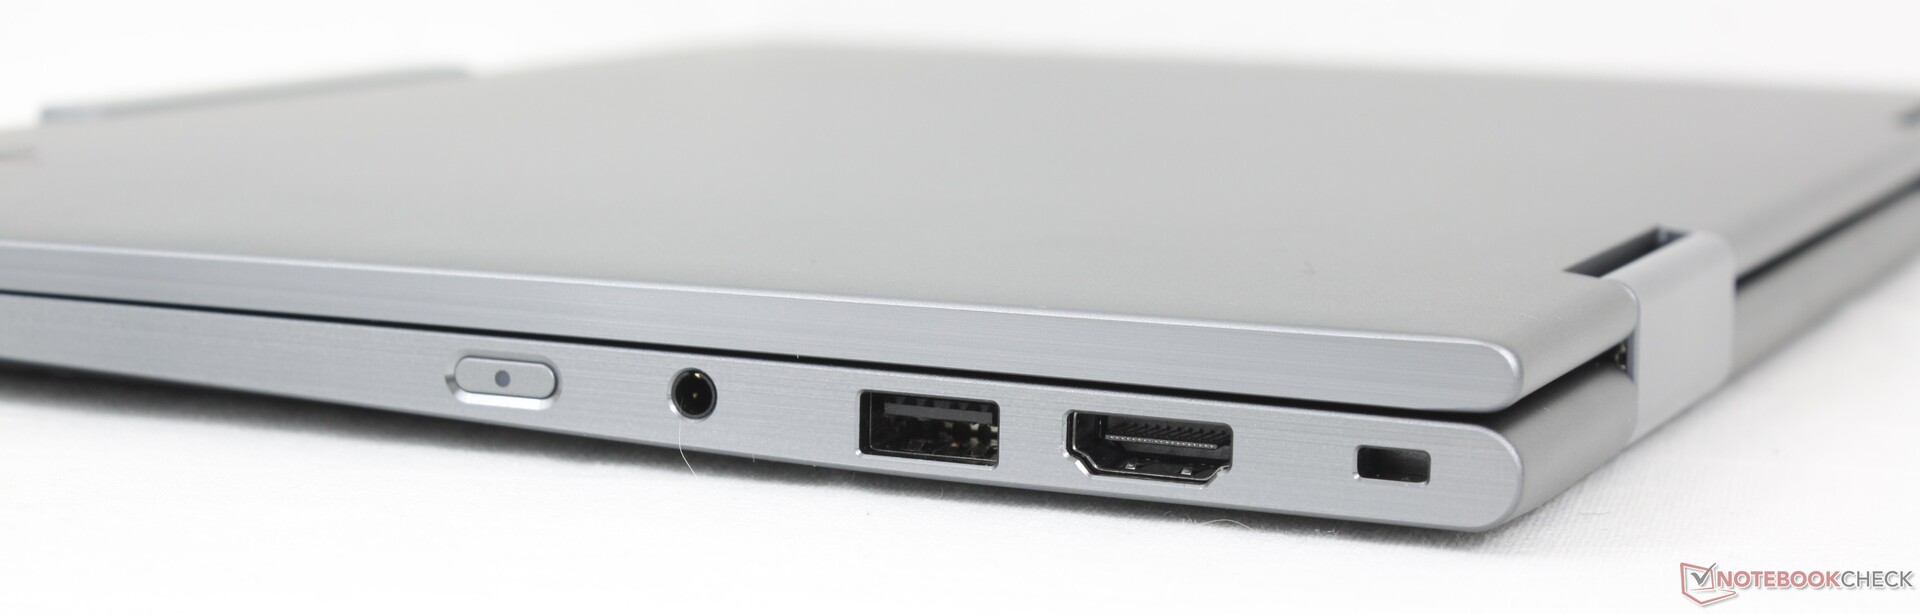
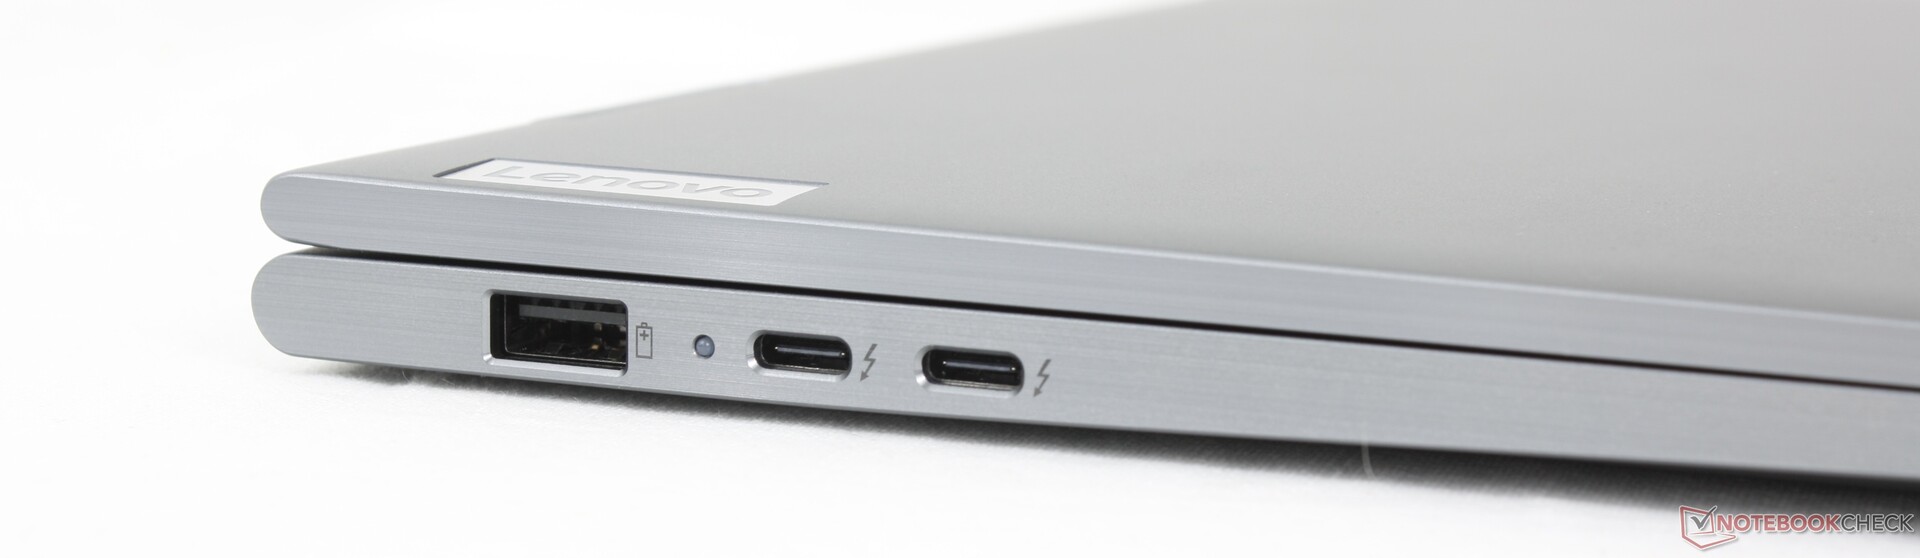
Connectivity
Port options and positioning have not changed from last year's model. It would have nevertheless been preferable to move one of the two USB-C ports to the right edge of the unit for increased versatility when it comes to charging and connecting devices. The recent Yoga 7 16 2-in-1, for example, made this exact change.

Communication
Users can configure between the Intel AX211 Wi-Fi 6E with Bluetooth 5.3 or BE201 Wi-Fi 7 with Bluetooth 5.4. WAN is also optional with up to 5G sub 6 GHz eSIM to help distinguish the model from the consumer-centric Yoga series.
Webcam
A 2 MP webcam comes standard with an option to upgrade to 8 MP. IR and a physical shutter are otherwise standard.


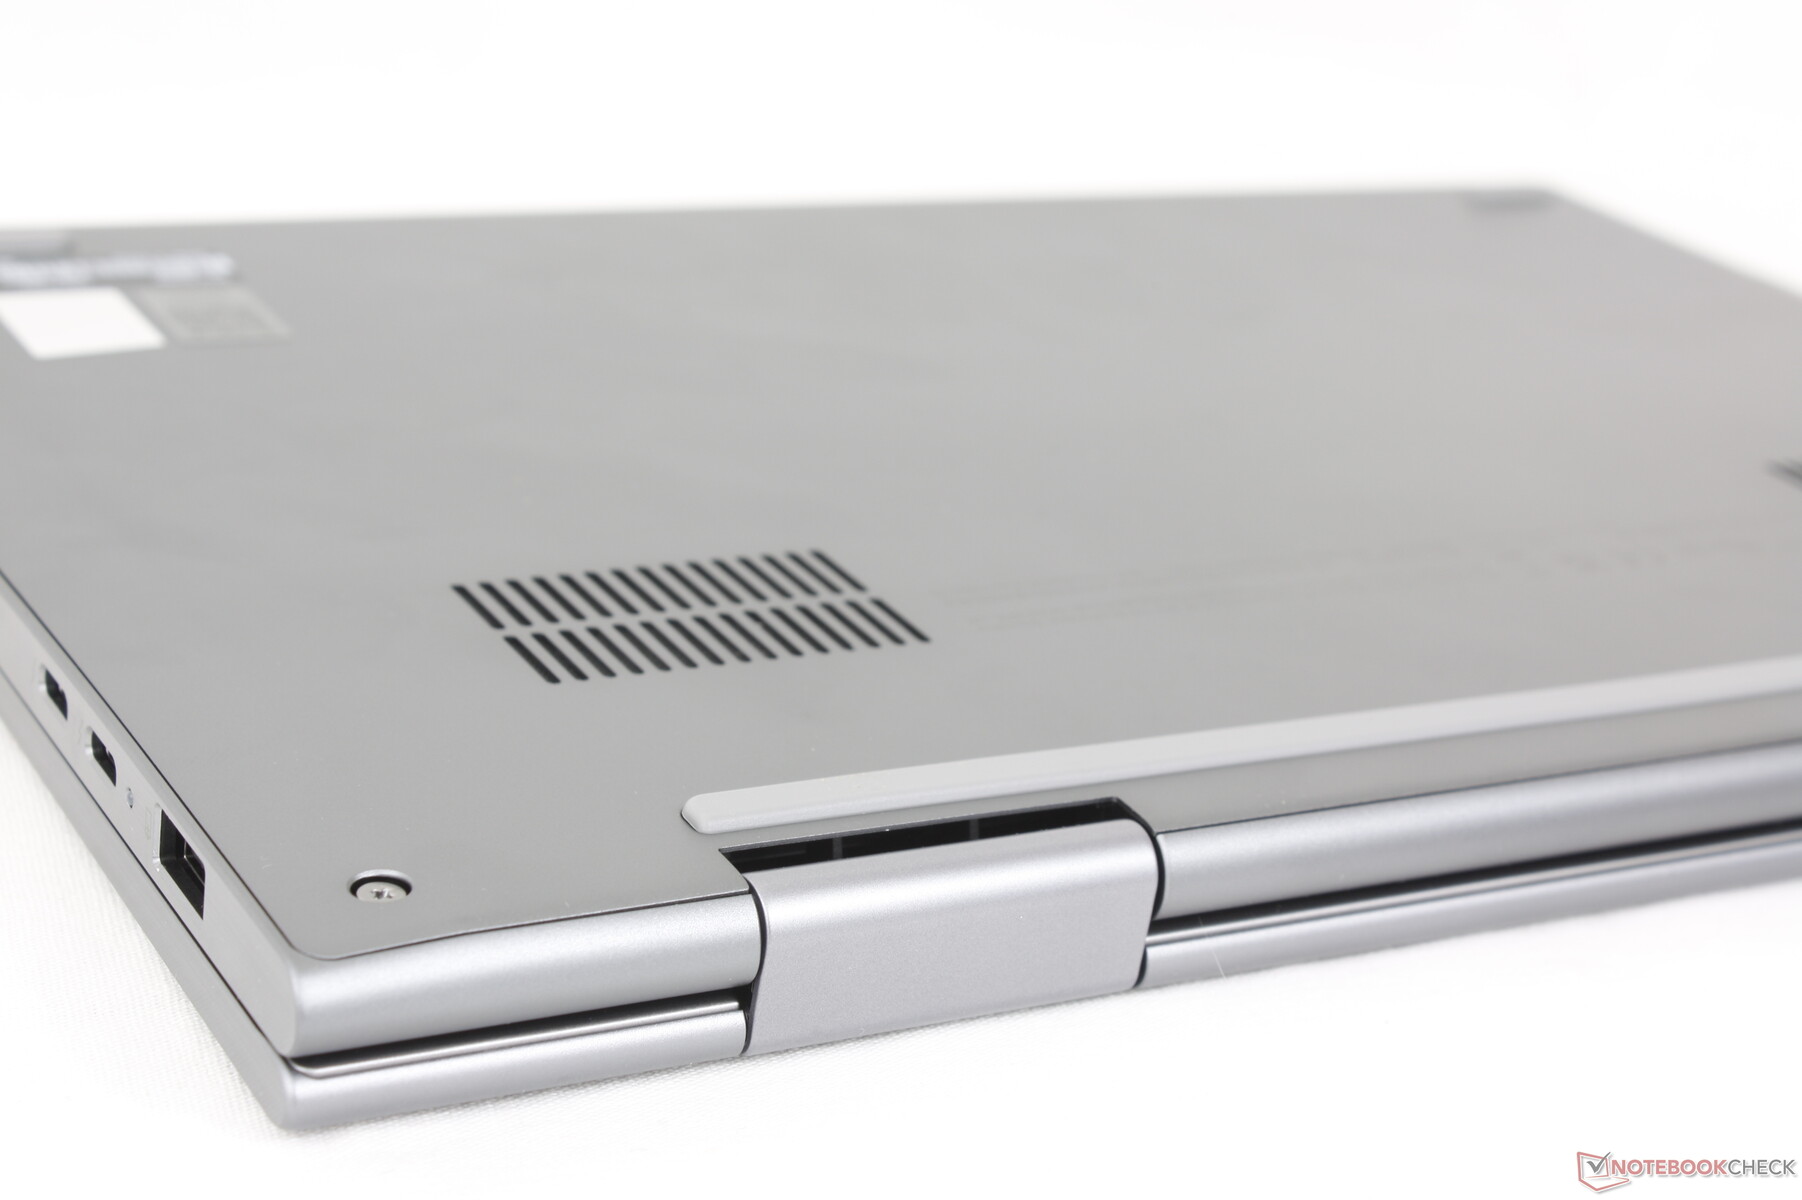
Maintenance
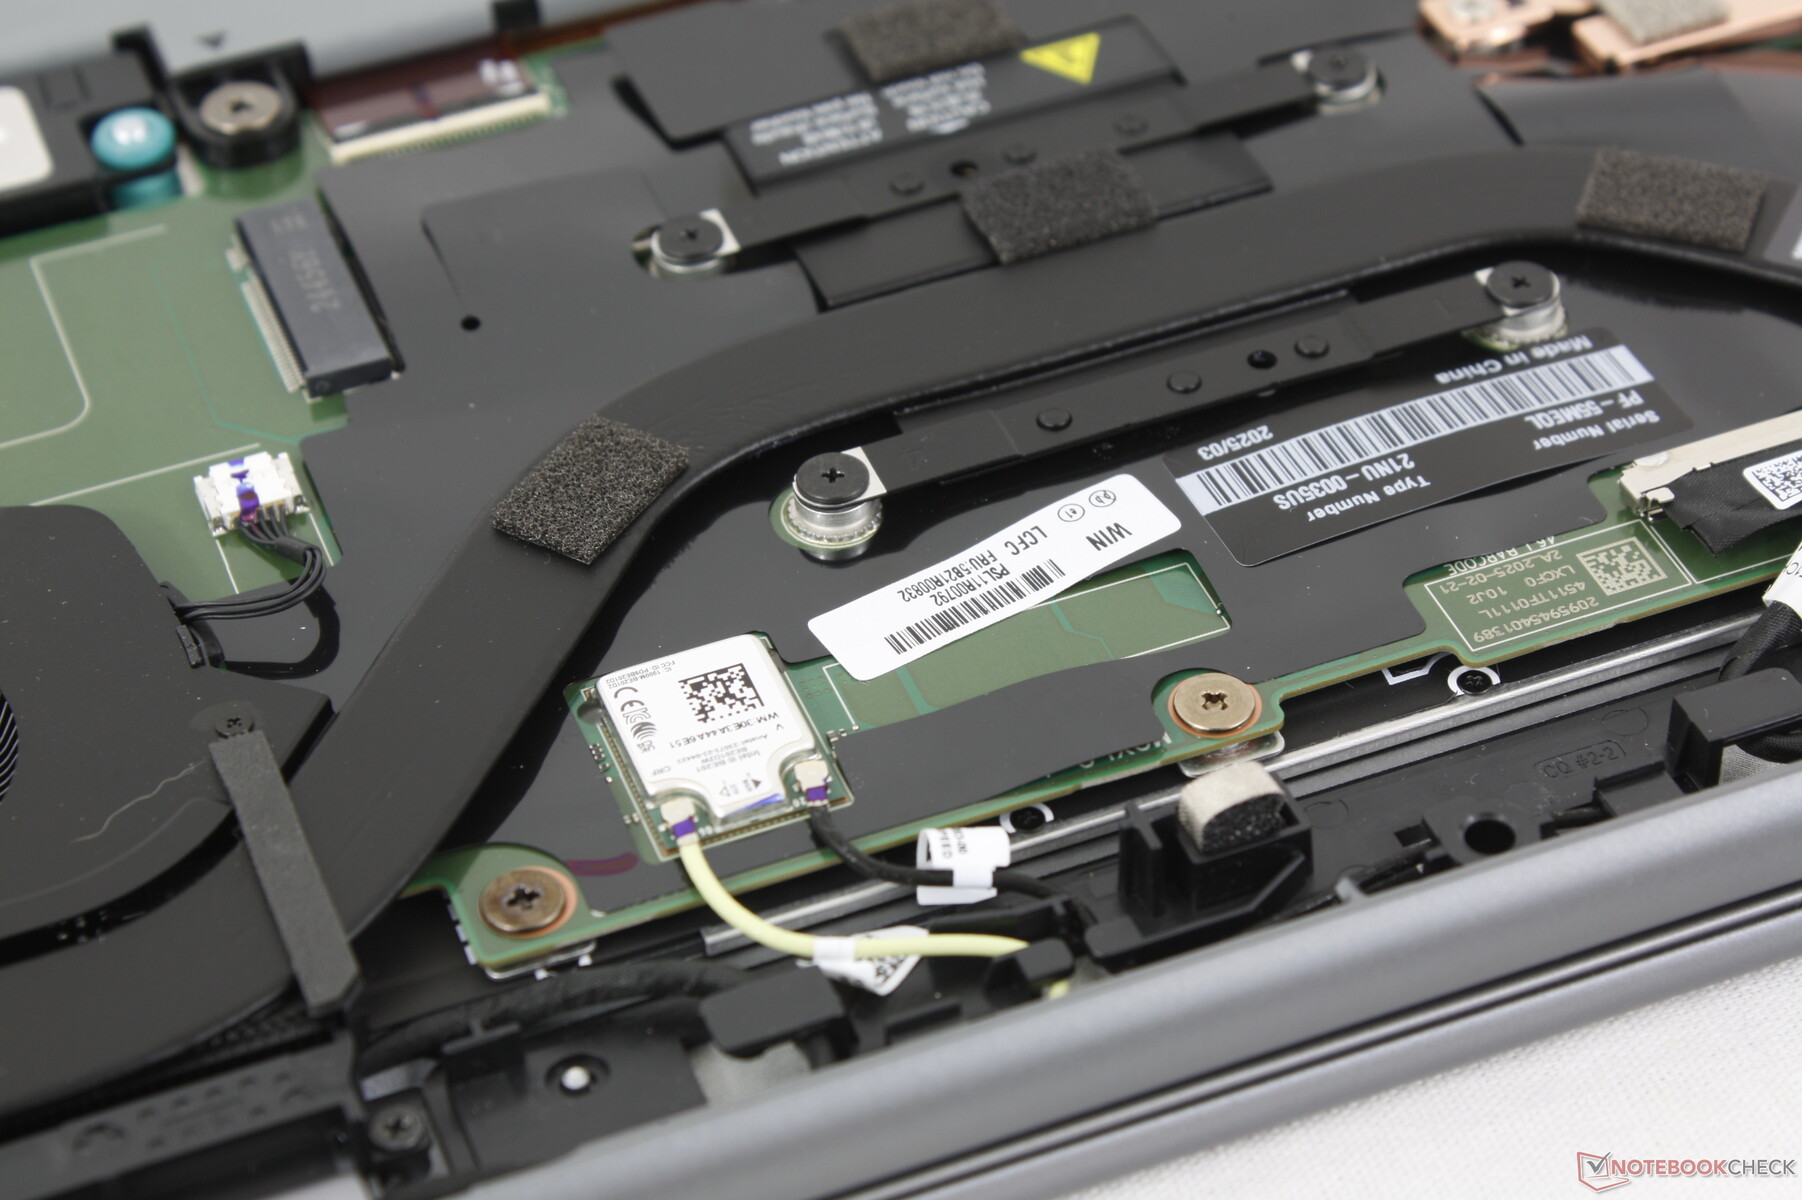
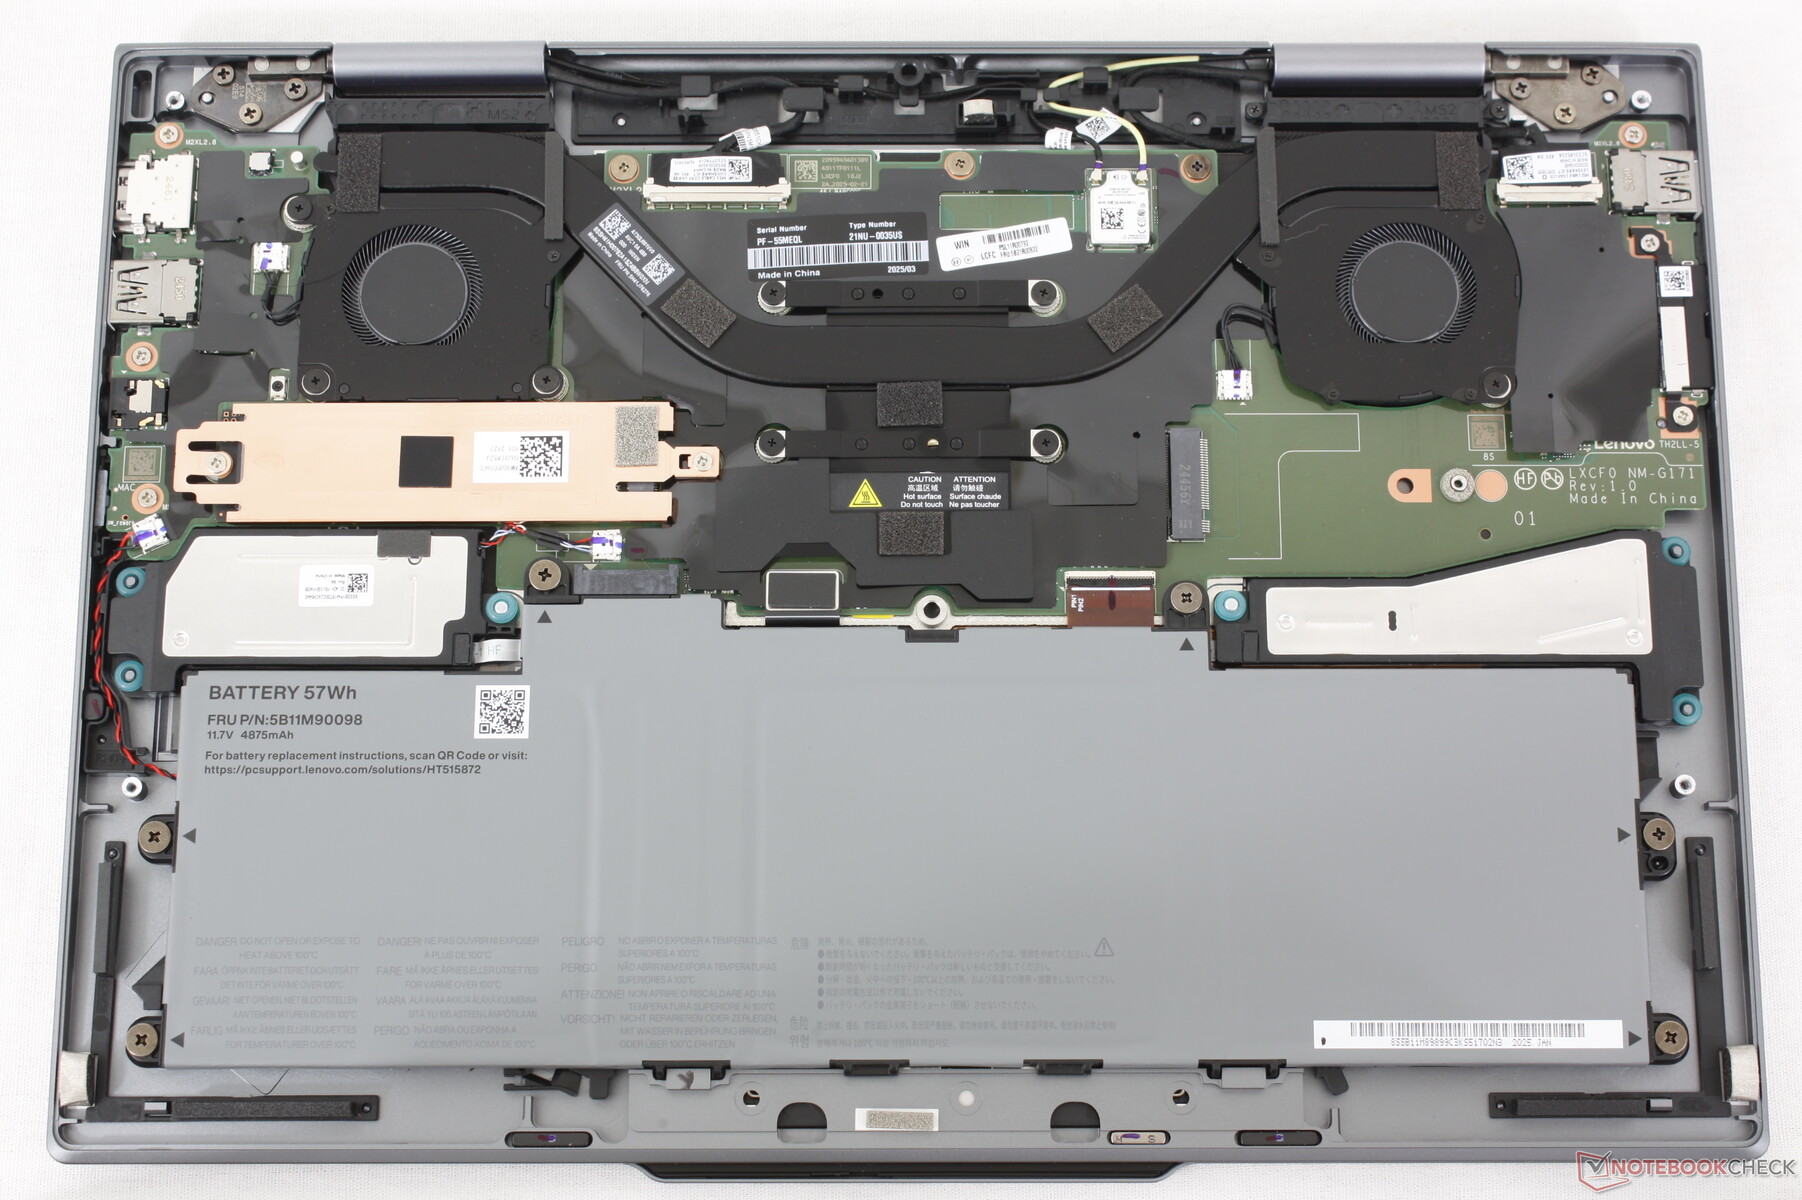
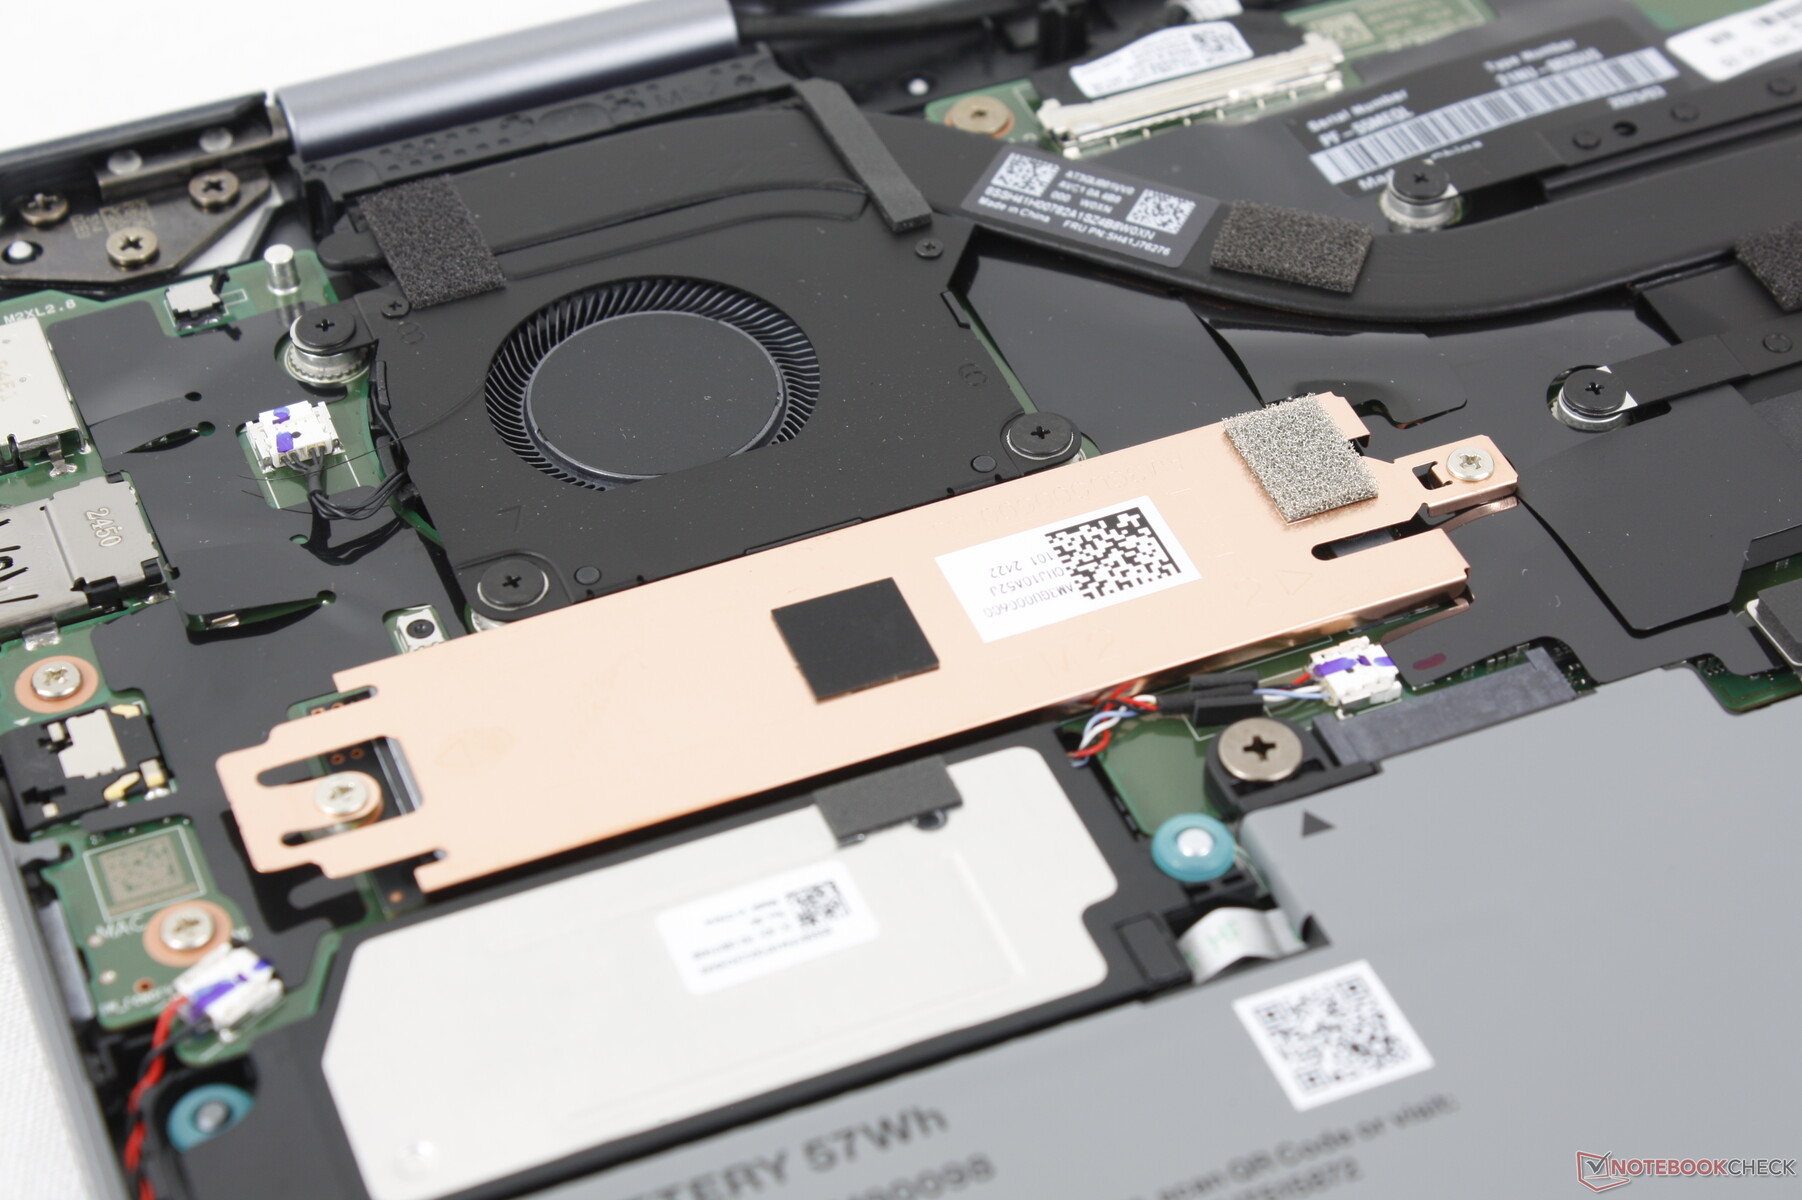
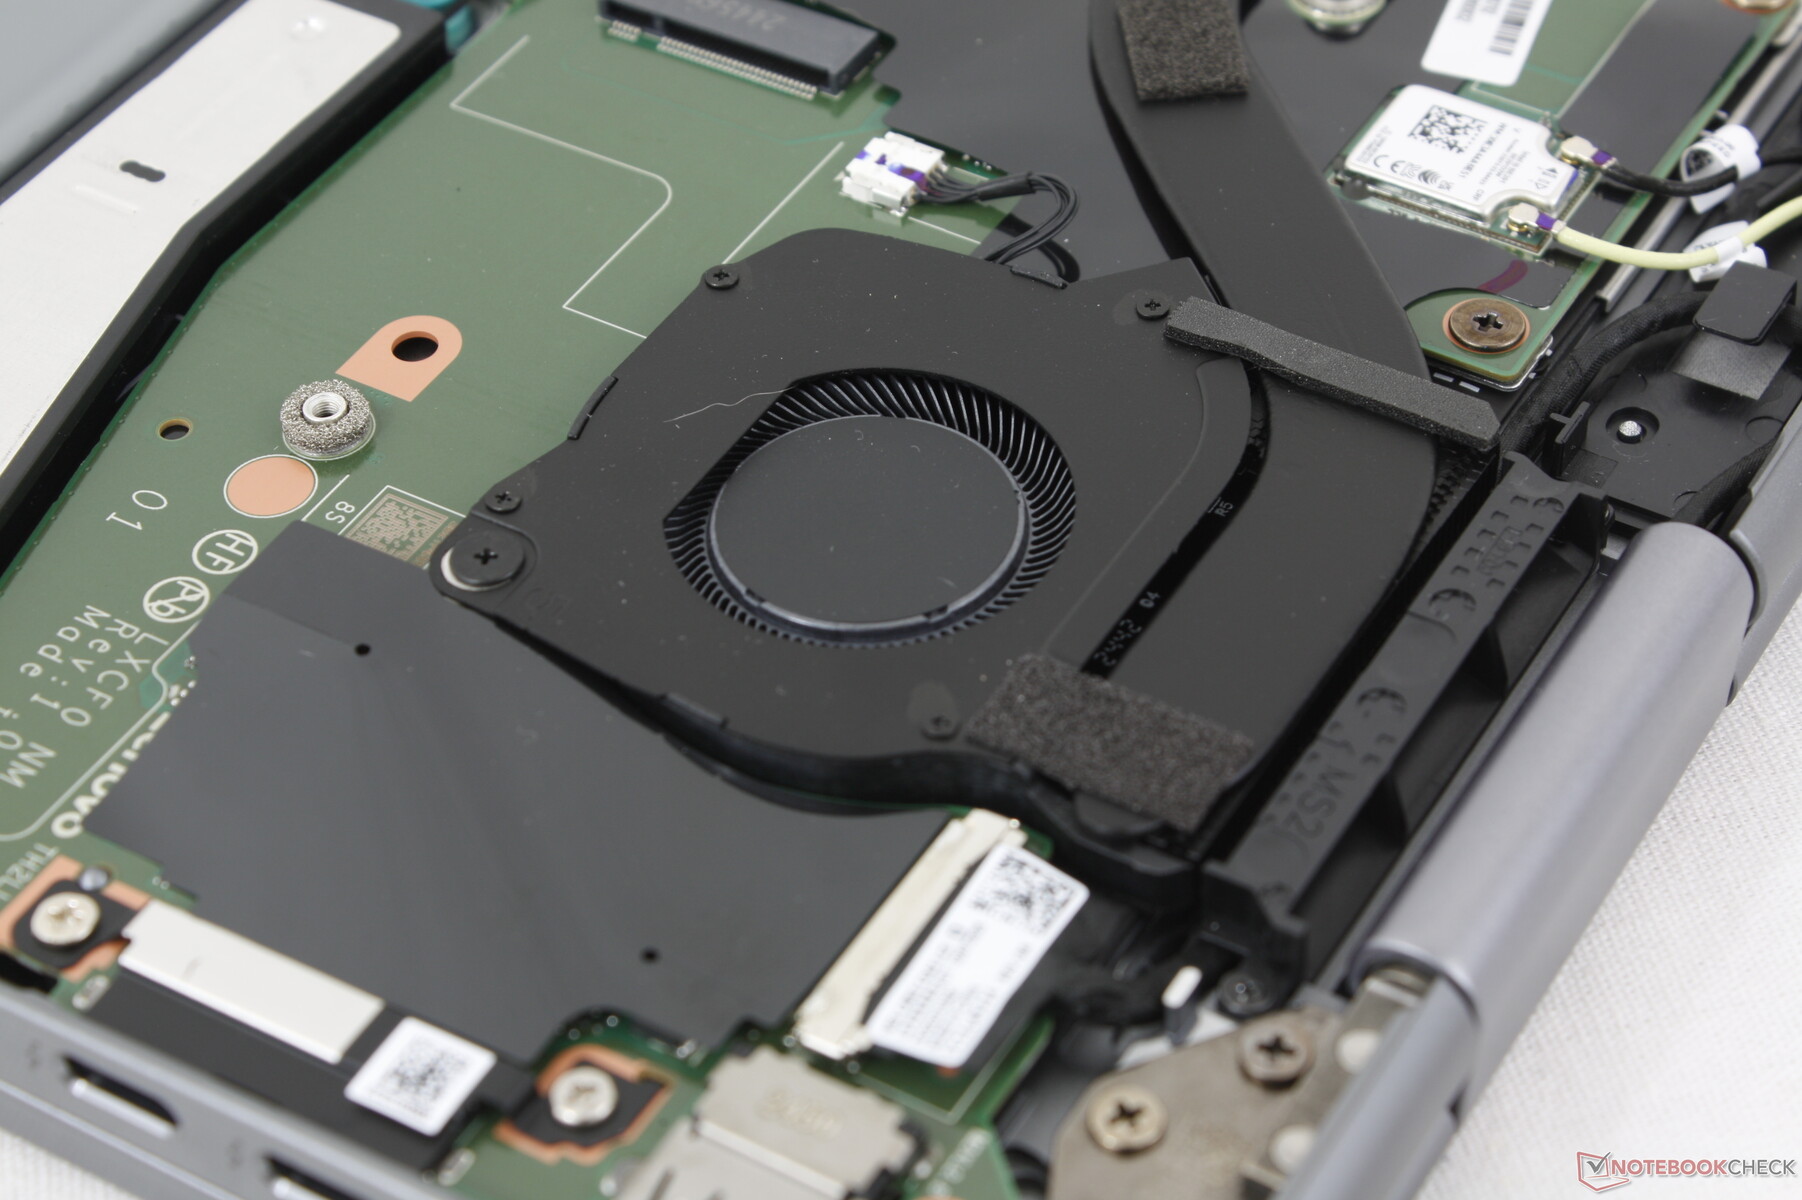
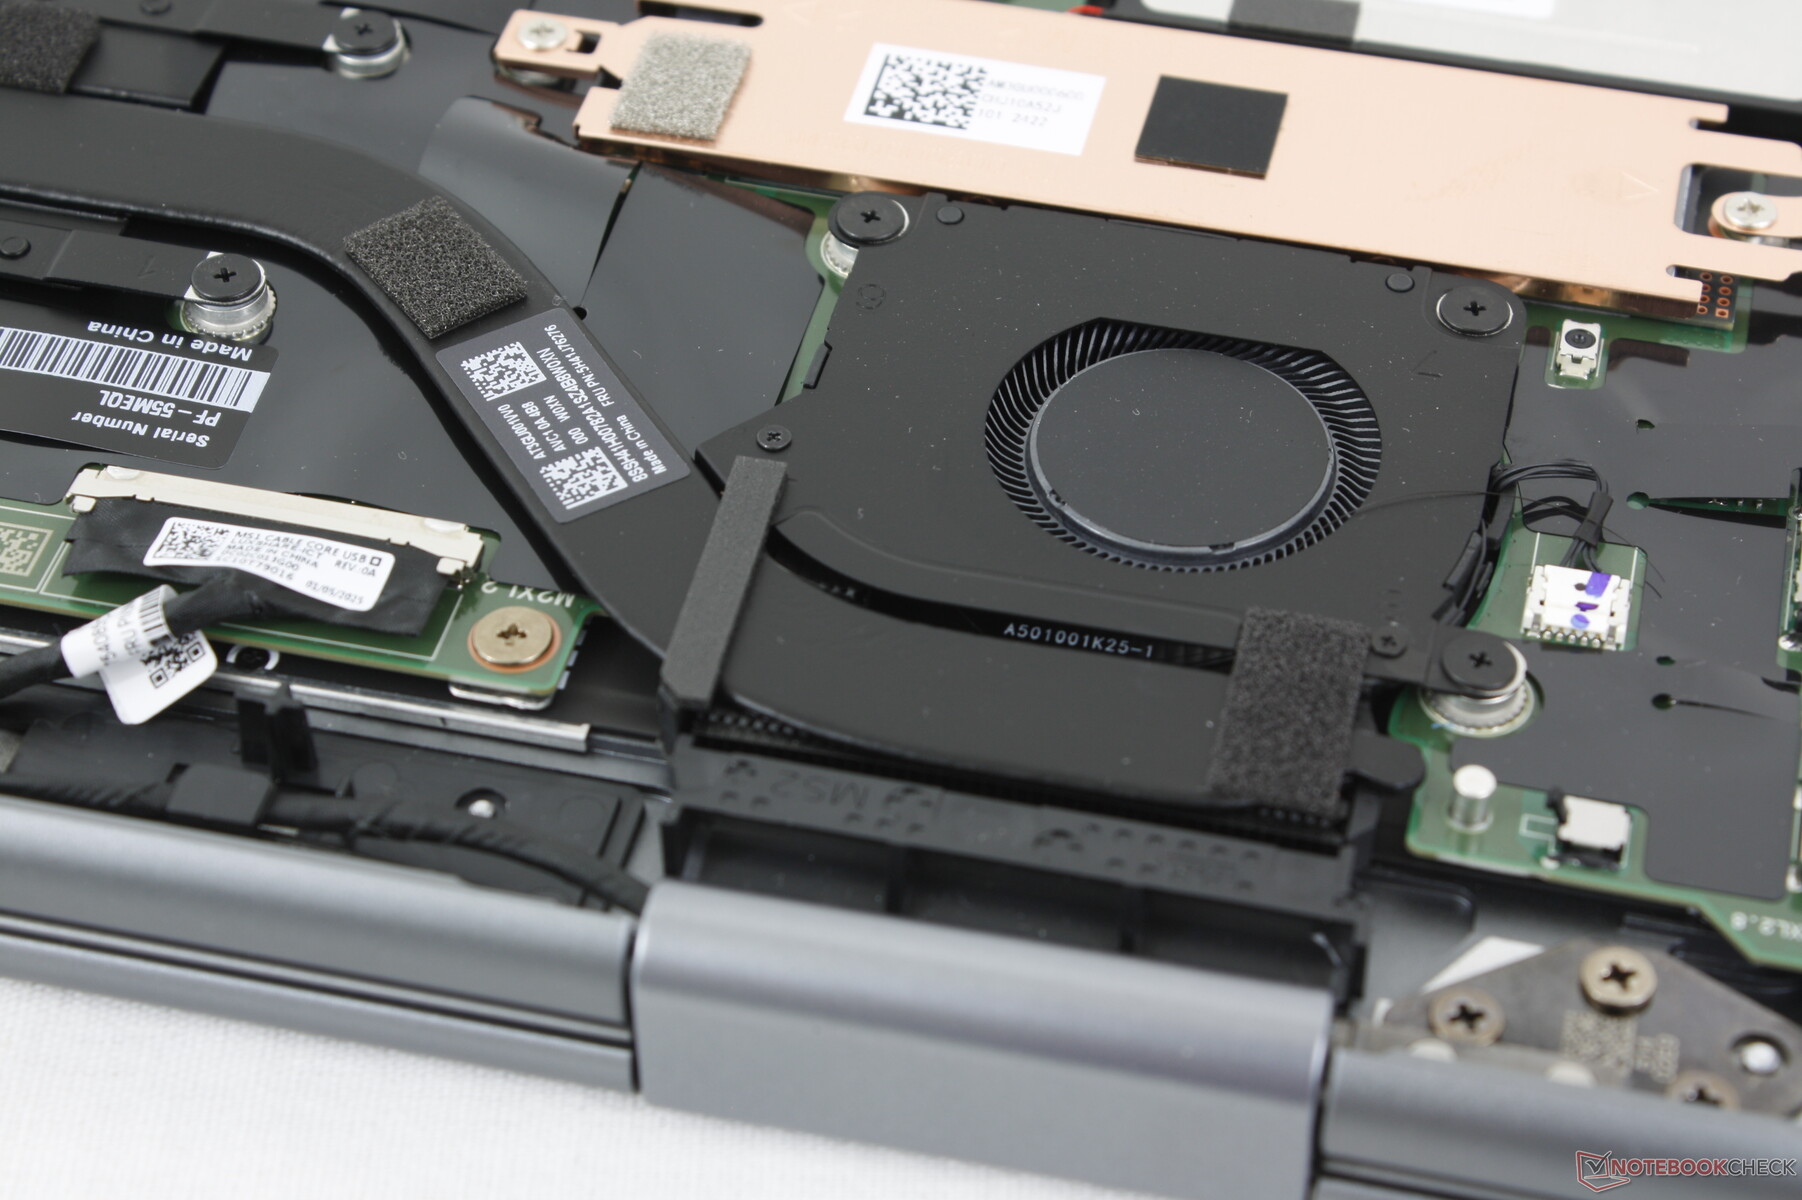
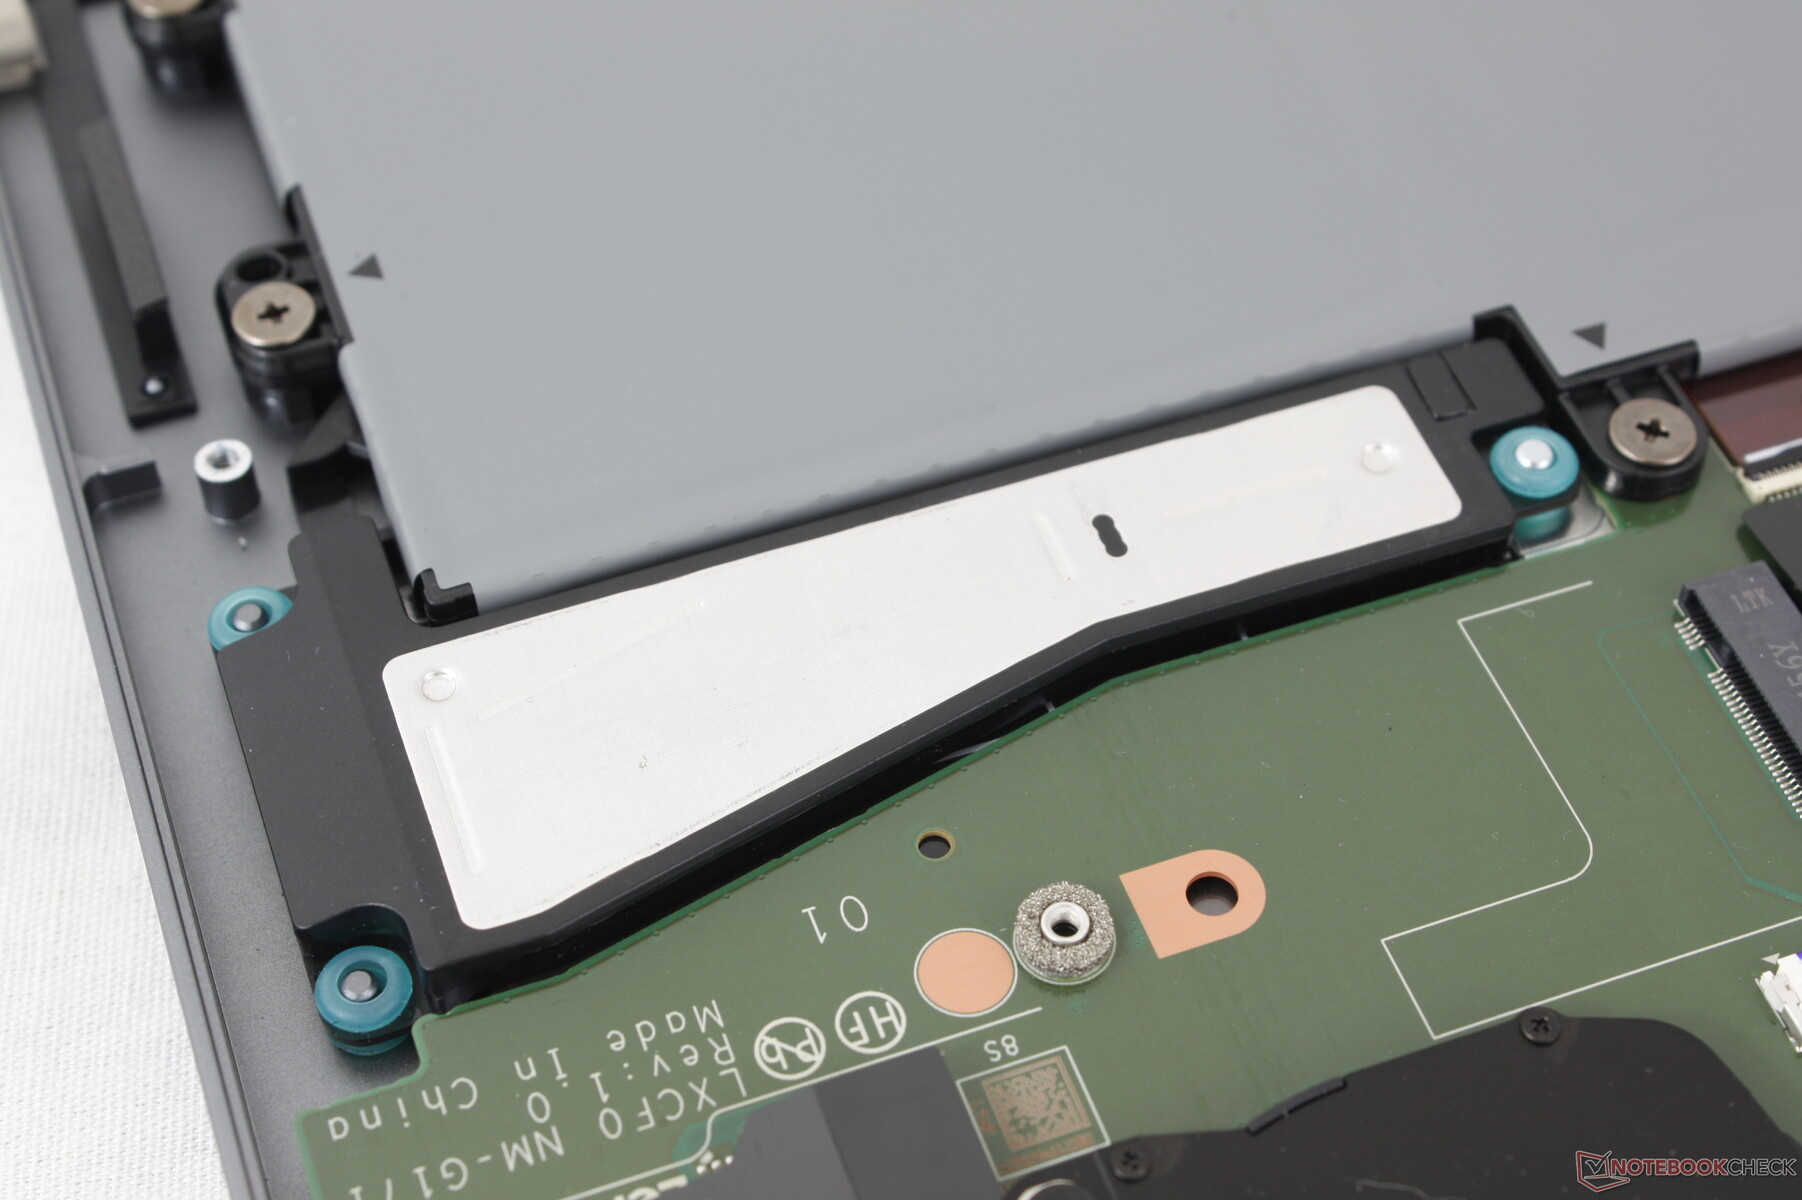
The bottom panel is secured by just four Phillips screws for easy servicing. While there are minimal differences between the 2024 and 2025 ThinkPad X1 2-in-1 models, our WAN-less test unit lacks the necessary antennae for WAN connectivity as shown by the picture below. Secondary SSDs can potentially be installed here in place of a WAN card.
Sustainability
The model is manufactured with more recycled materials than most other laptops including 55 to 75 percent recycled aluminum for the top cover, keyboard frame, and bottom cover and 25 to 90 percent post-consumer content recycled plastic for the AC adapter, speaker enclosure, keycaps, cables, and more.
The packaging is completely plastic free.
Accessories And Warranty
The retail box includes a Yoga Pen active stylus in addition to the usual paperwork and AC adapter. While the pen is not uncomfortable to grip, its integrated buttons are difficult to press.
The base warranty is only 12 months if purchased in the US instead of the usual 36 months we've come to expect from most other high-end business systems.
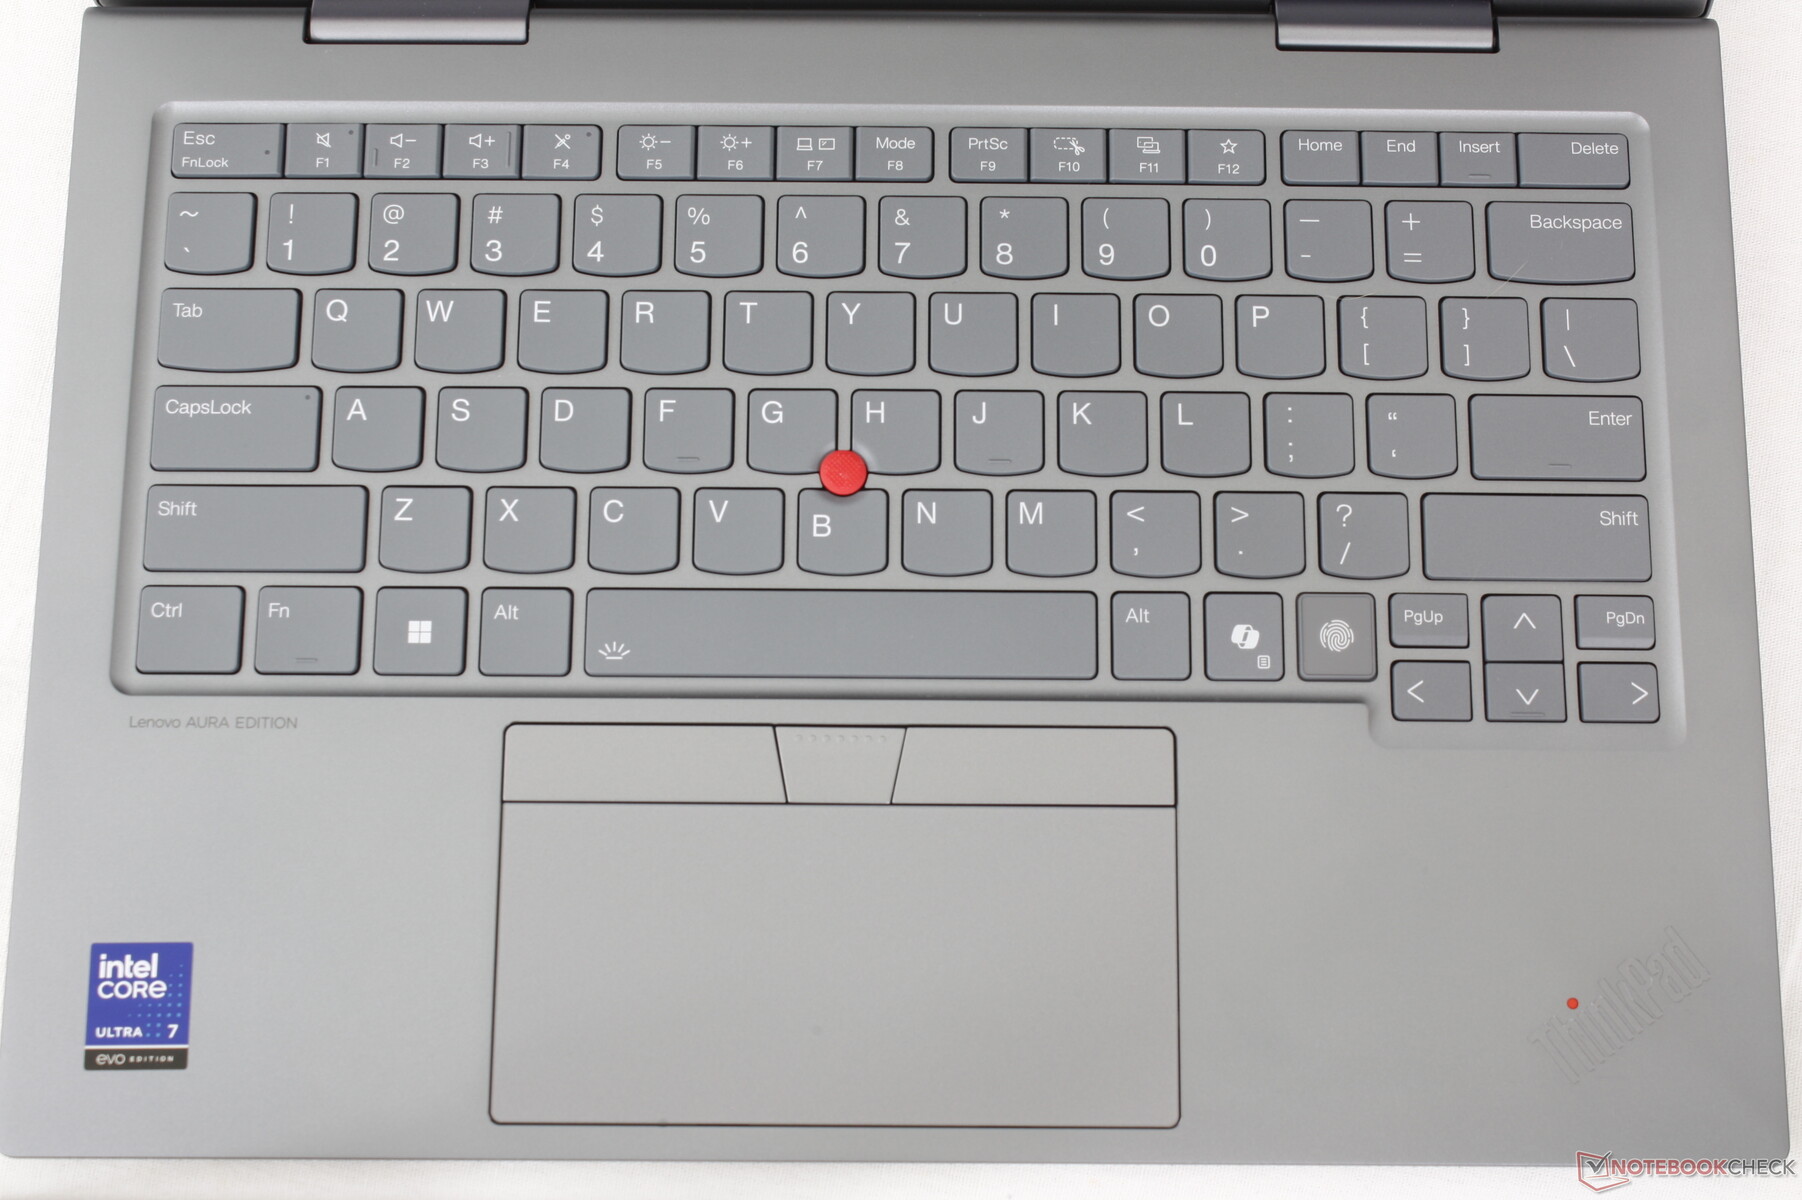
Input Devices
Keyboard And Touchpad
The 2025 model carries two distinct touchpad options just like on the 2024 model: haptic-only touchpad or three-button touchpad. While our 2024 test unit would come with the former, our 2025 unit comes with the latter. Surface area for cursor control is slightly smaller as a result (12 x 5.6 cm vs. 12 x 7.5 cm), but the dedicated buttons may be preferable for more accurate multi-touch inputs. Lenovo is offering both options to appeal to users who may prefer one touchpad style over the other. There are otherwise no changes to the keyboard or clickpad.


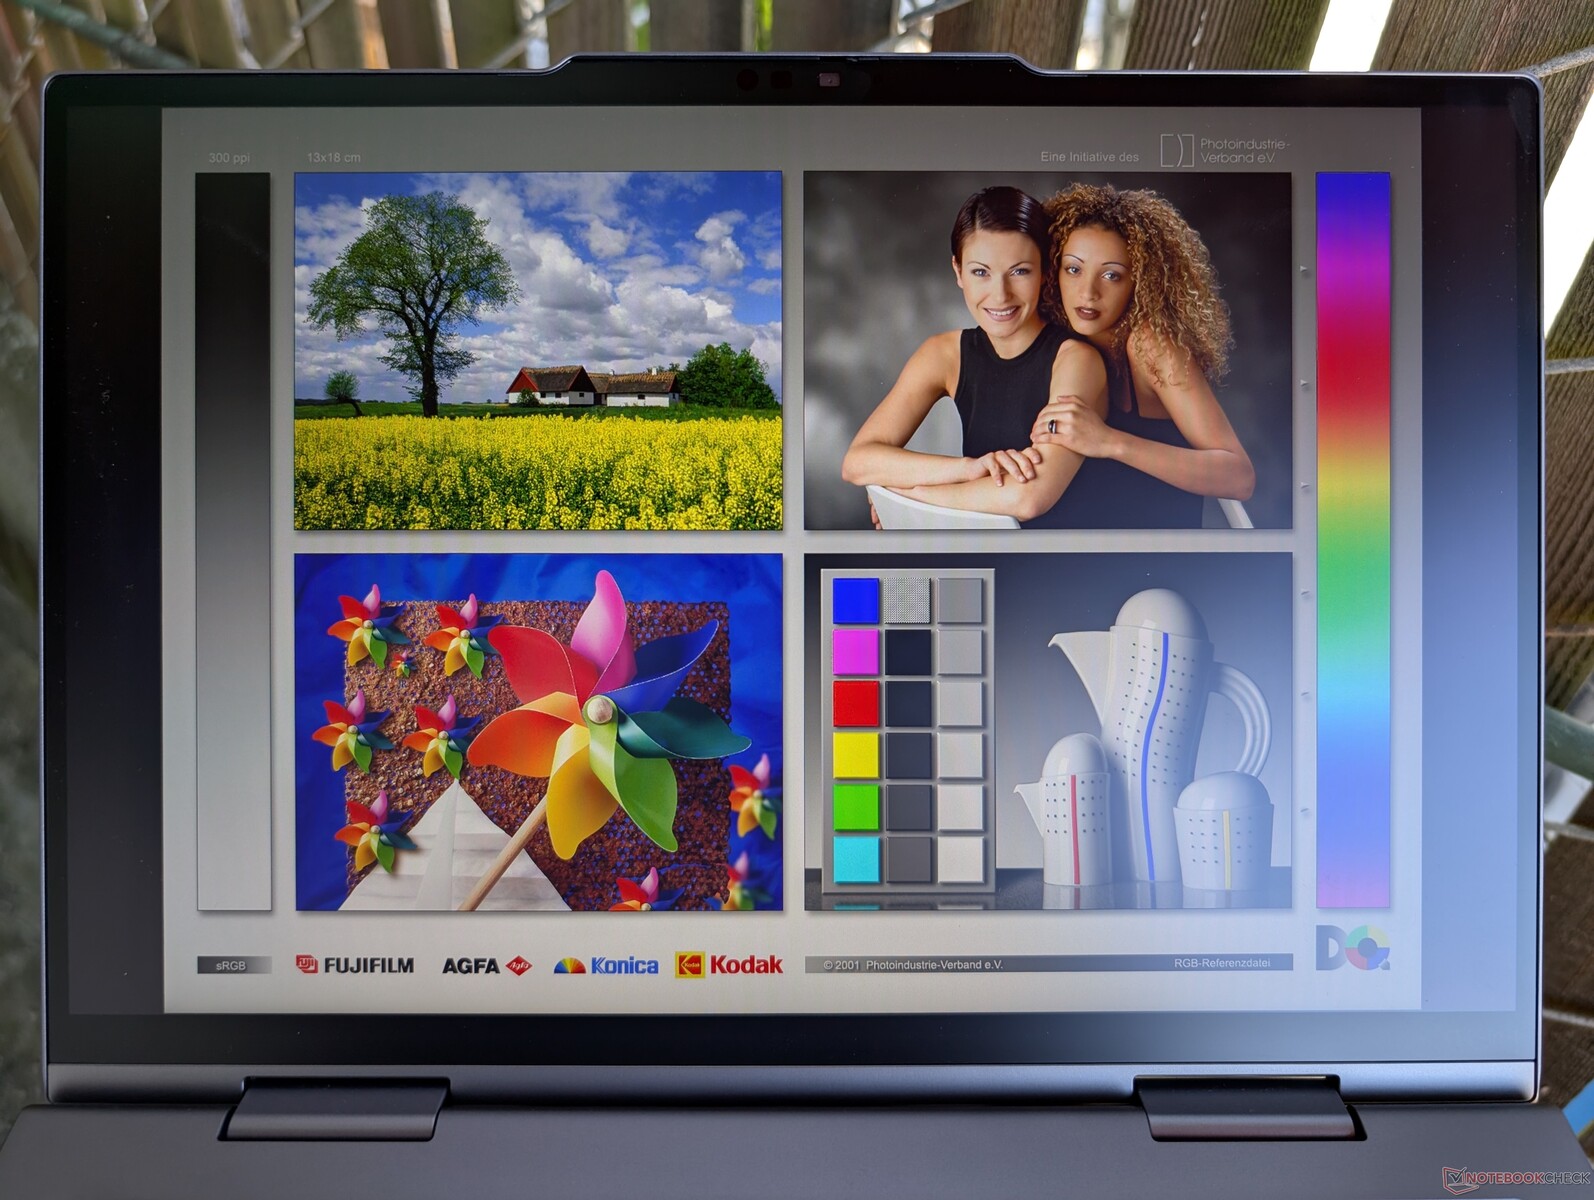
Display
Four touchscreen options are available as follows. Our test unit comes with the bolded panel below.
- 1920 x 1200, IPS, 100% sRGB, 60 Hz, 1000:1 contrast ratio, matte
- 1920 x 1200, IPS, 100% sRGB, 60 Hz, 1000:1 contrast ratio, glossy
- 1920 x 1200, IPS, 100% sRGB, 60 Hz, 1500:1 contrast ratio, matte
- 2880 x 1800, OLED, 100% DCI-P3, 120 Hz, DisplayHDR 500, glossy
There are thankfully no cheap 60% sRGB options here meaning that every ThinkPad X1 2-in-1 Gen 10 configuration can offer at least full sRGB colors. P3 and higher refresh rates are limited to the OLED option, however. The OLED option this year is likely the same panel we saw on the 2024 model.
Black-white response times are on the slower side for noticeable ghosting especially if gaming. Of course, this shouldn't be a huge sticking point for the target ThinkPad audience.


| |||||||||||||||||||||||||
Brightness Distribution: 89 %
Center on Battery: 459 cd/m²
Contrast: 1913:1 (Black: 0.24 cd/m²)
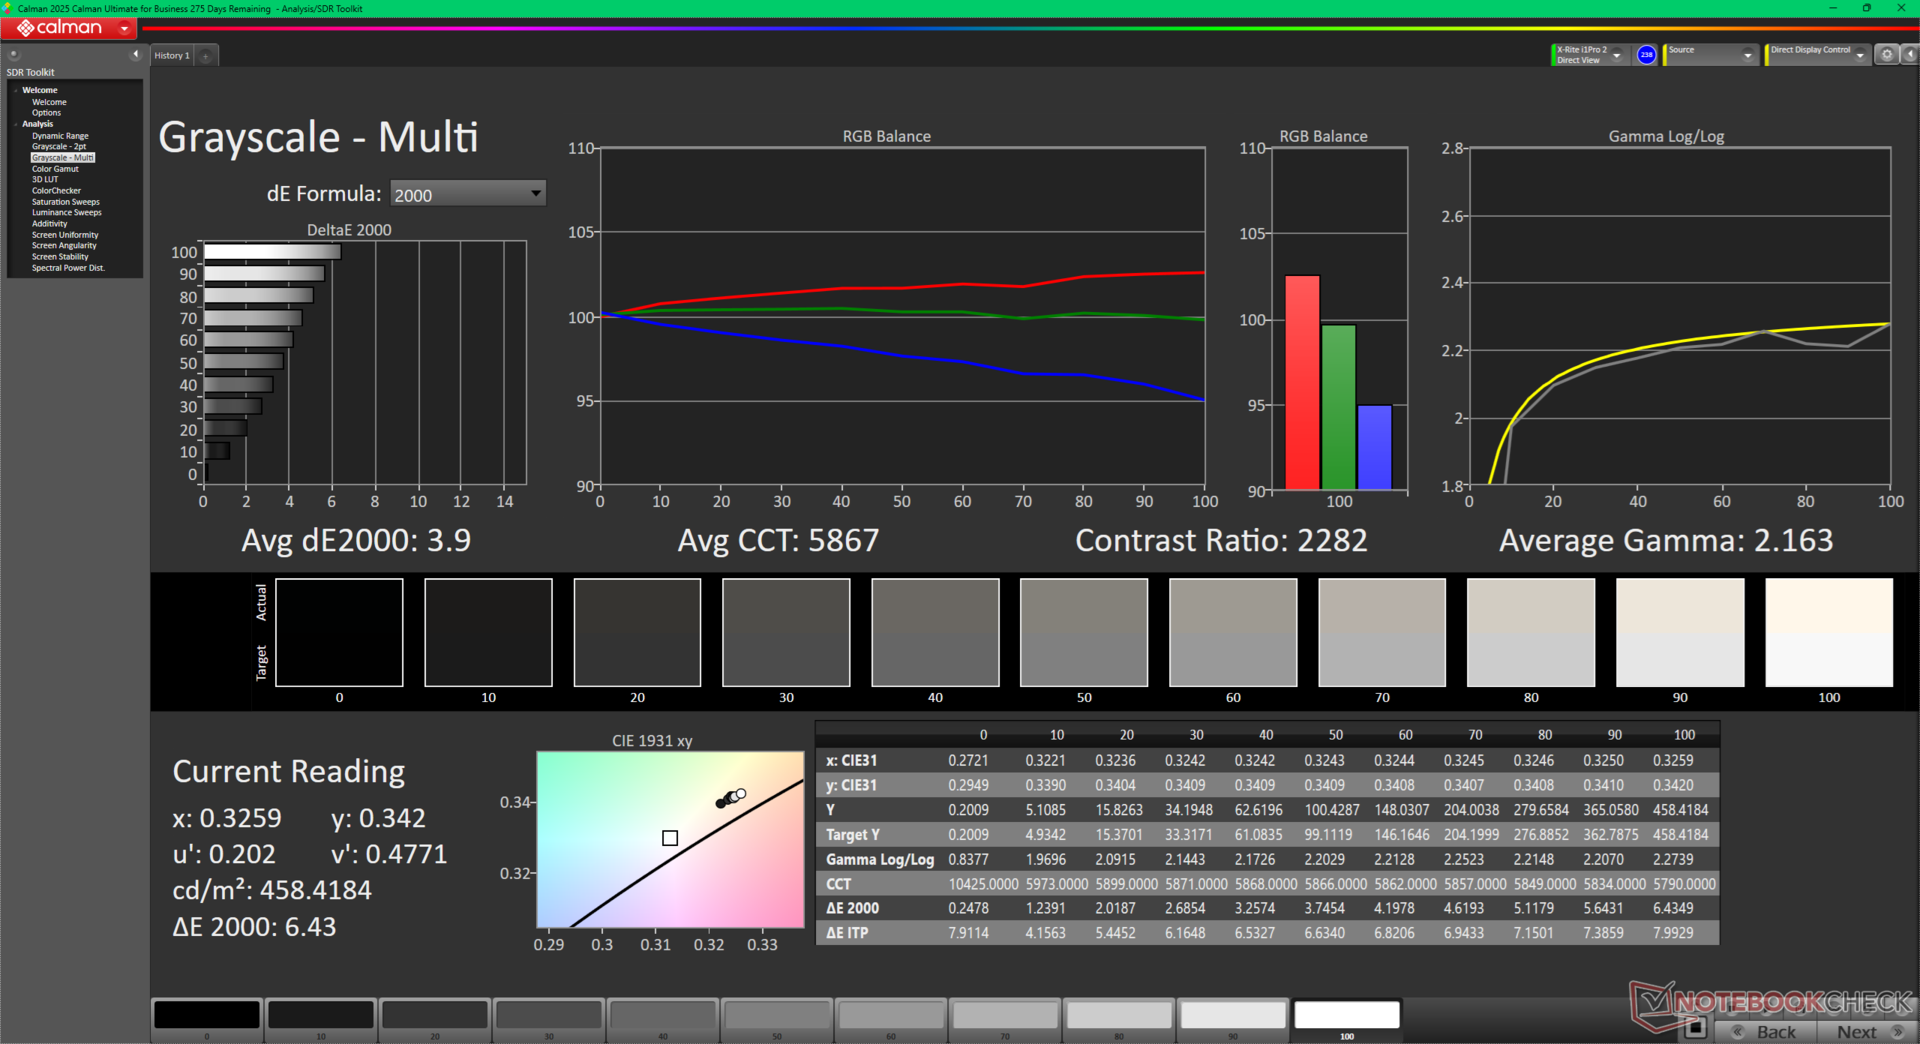
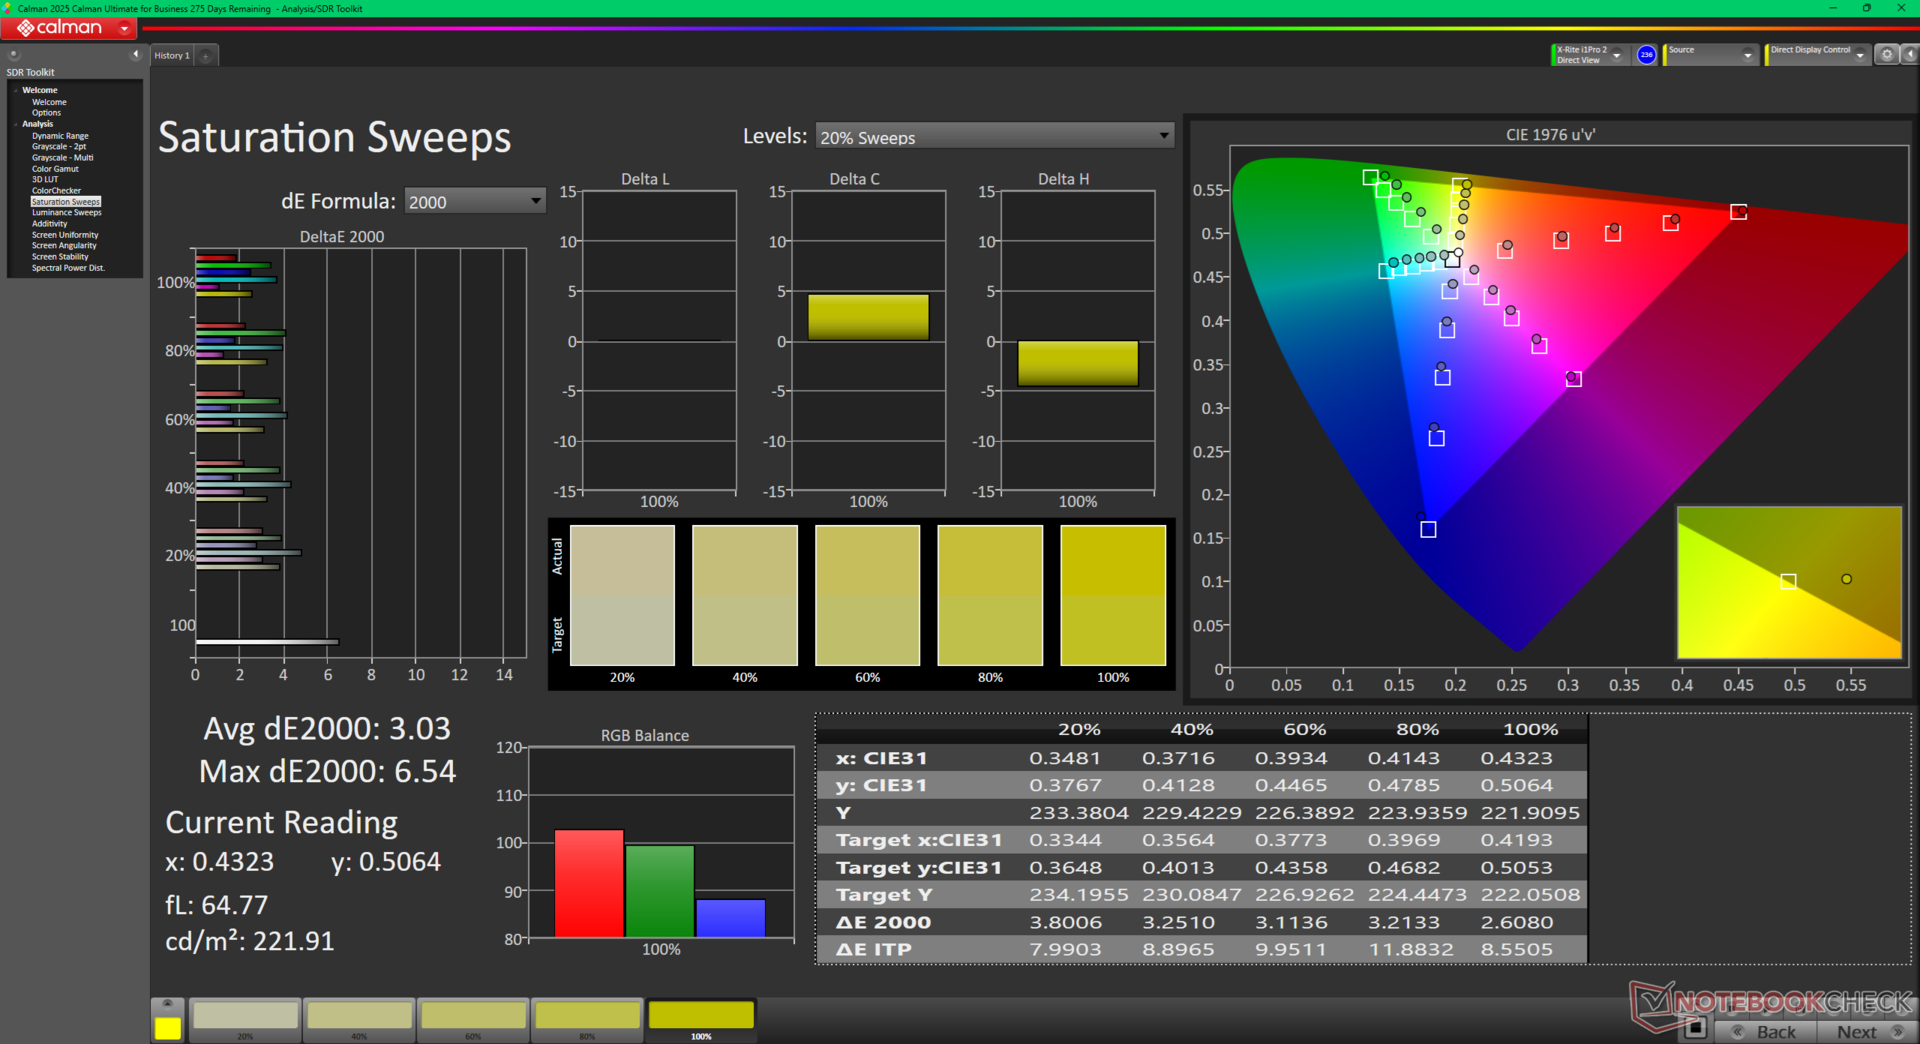
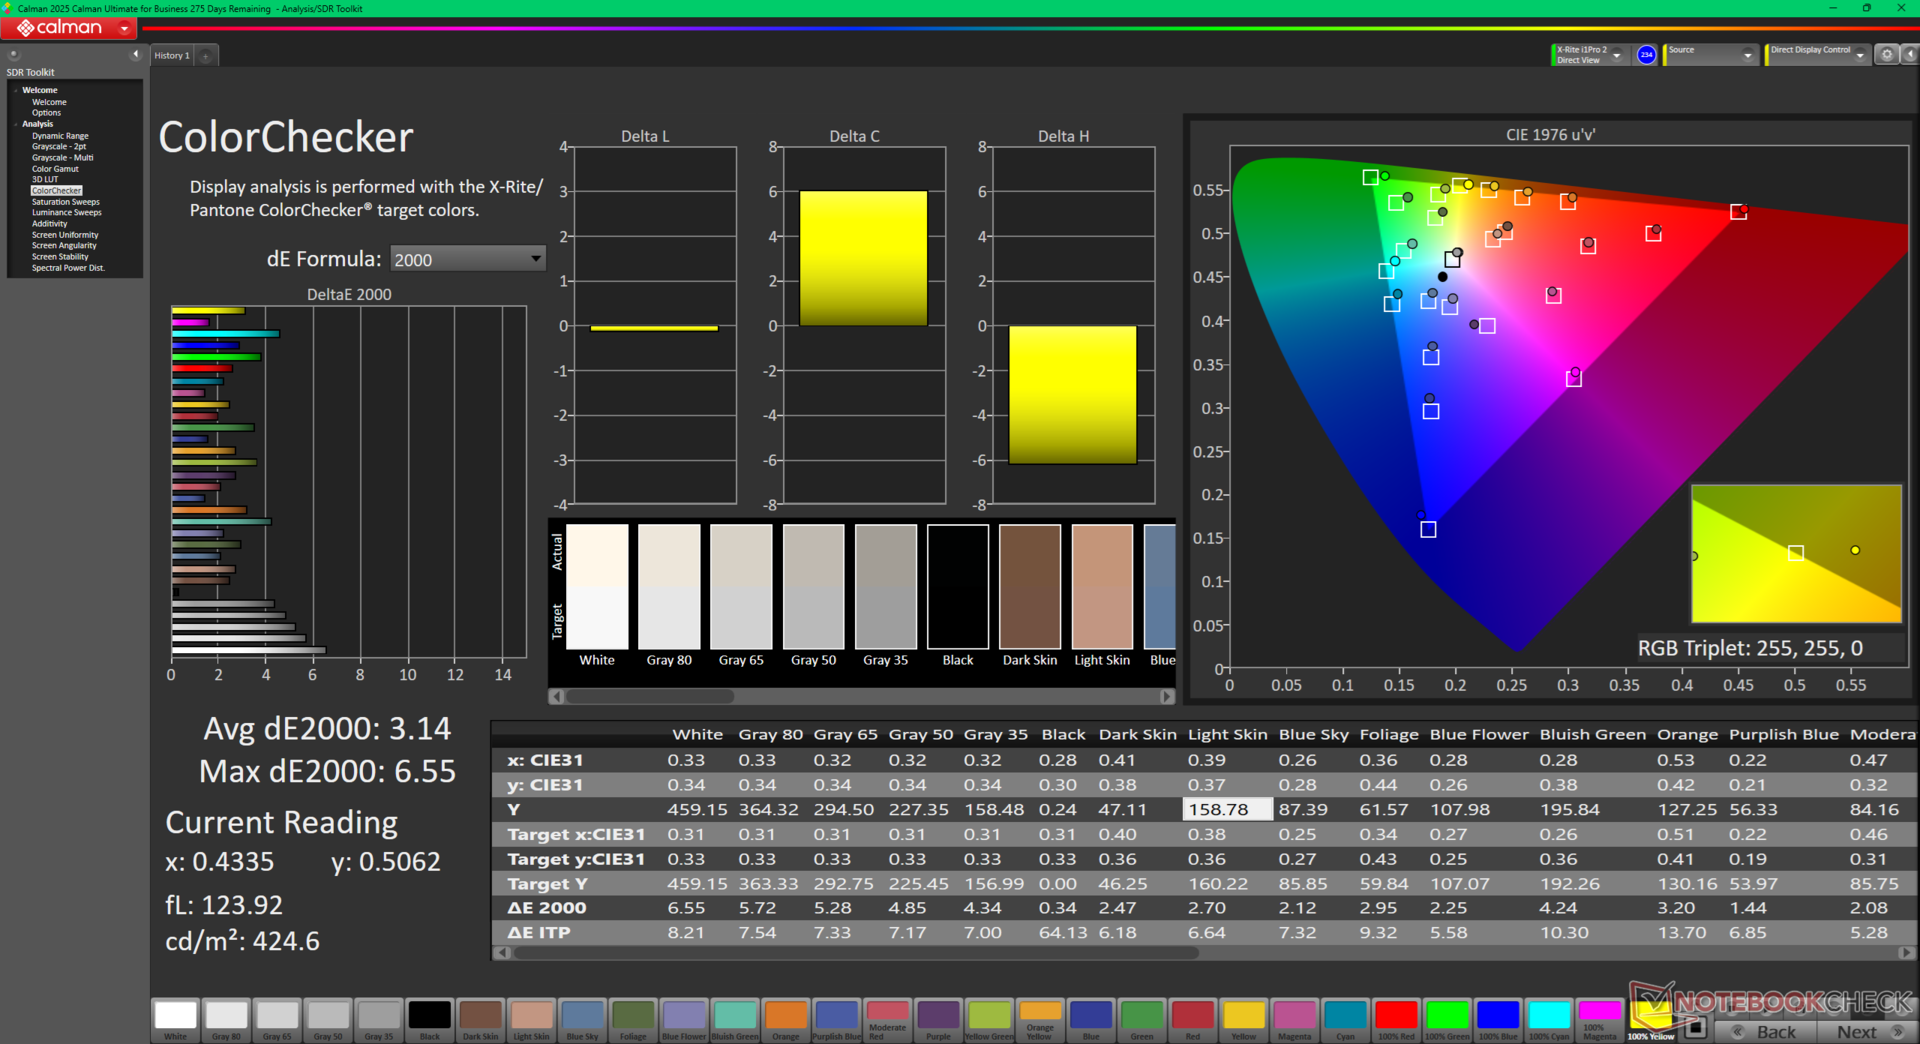
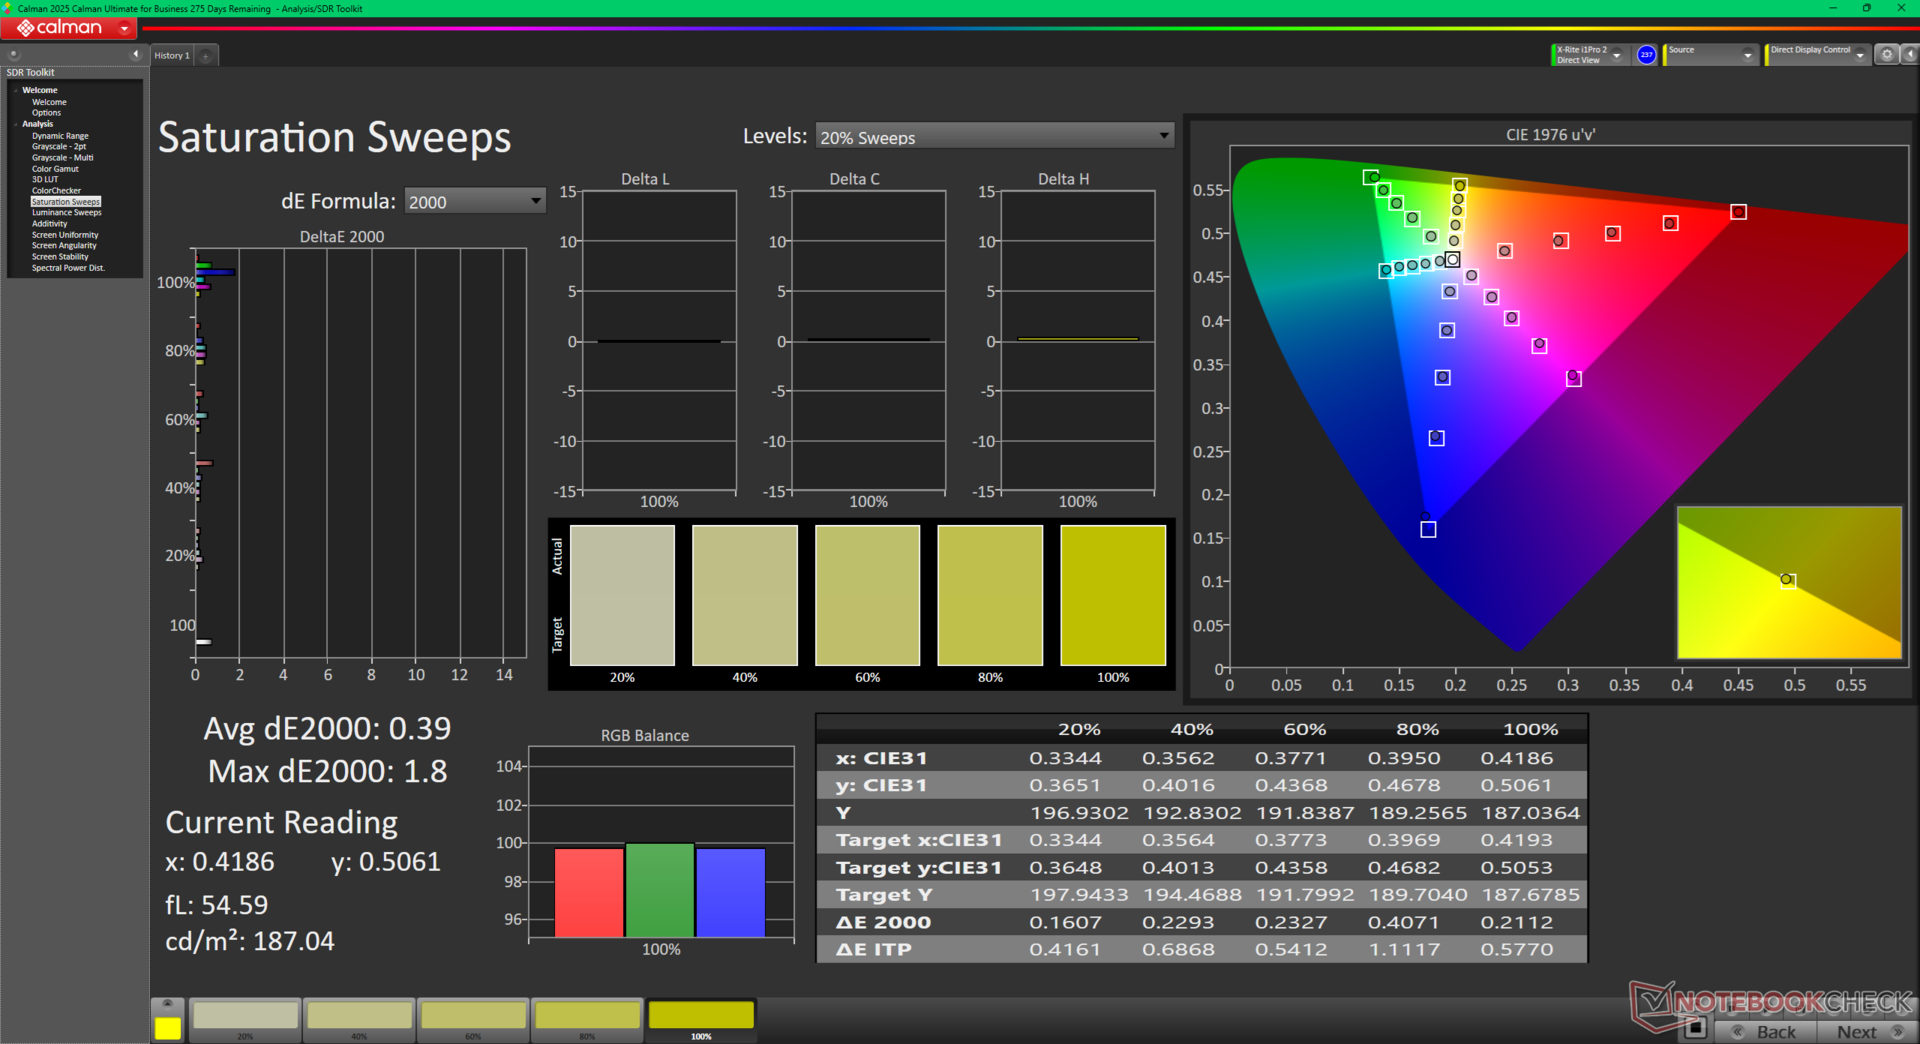
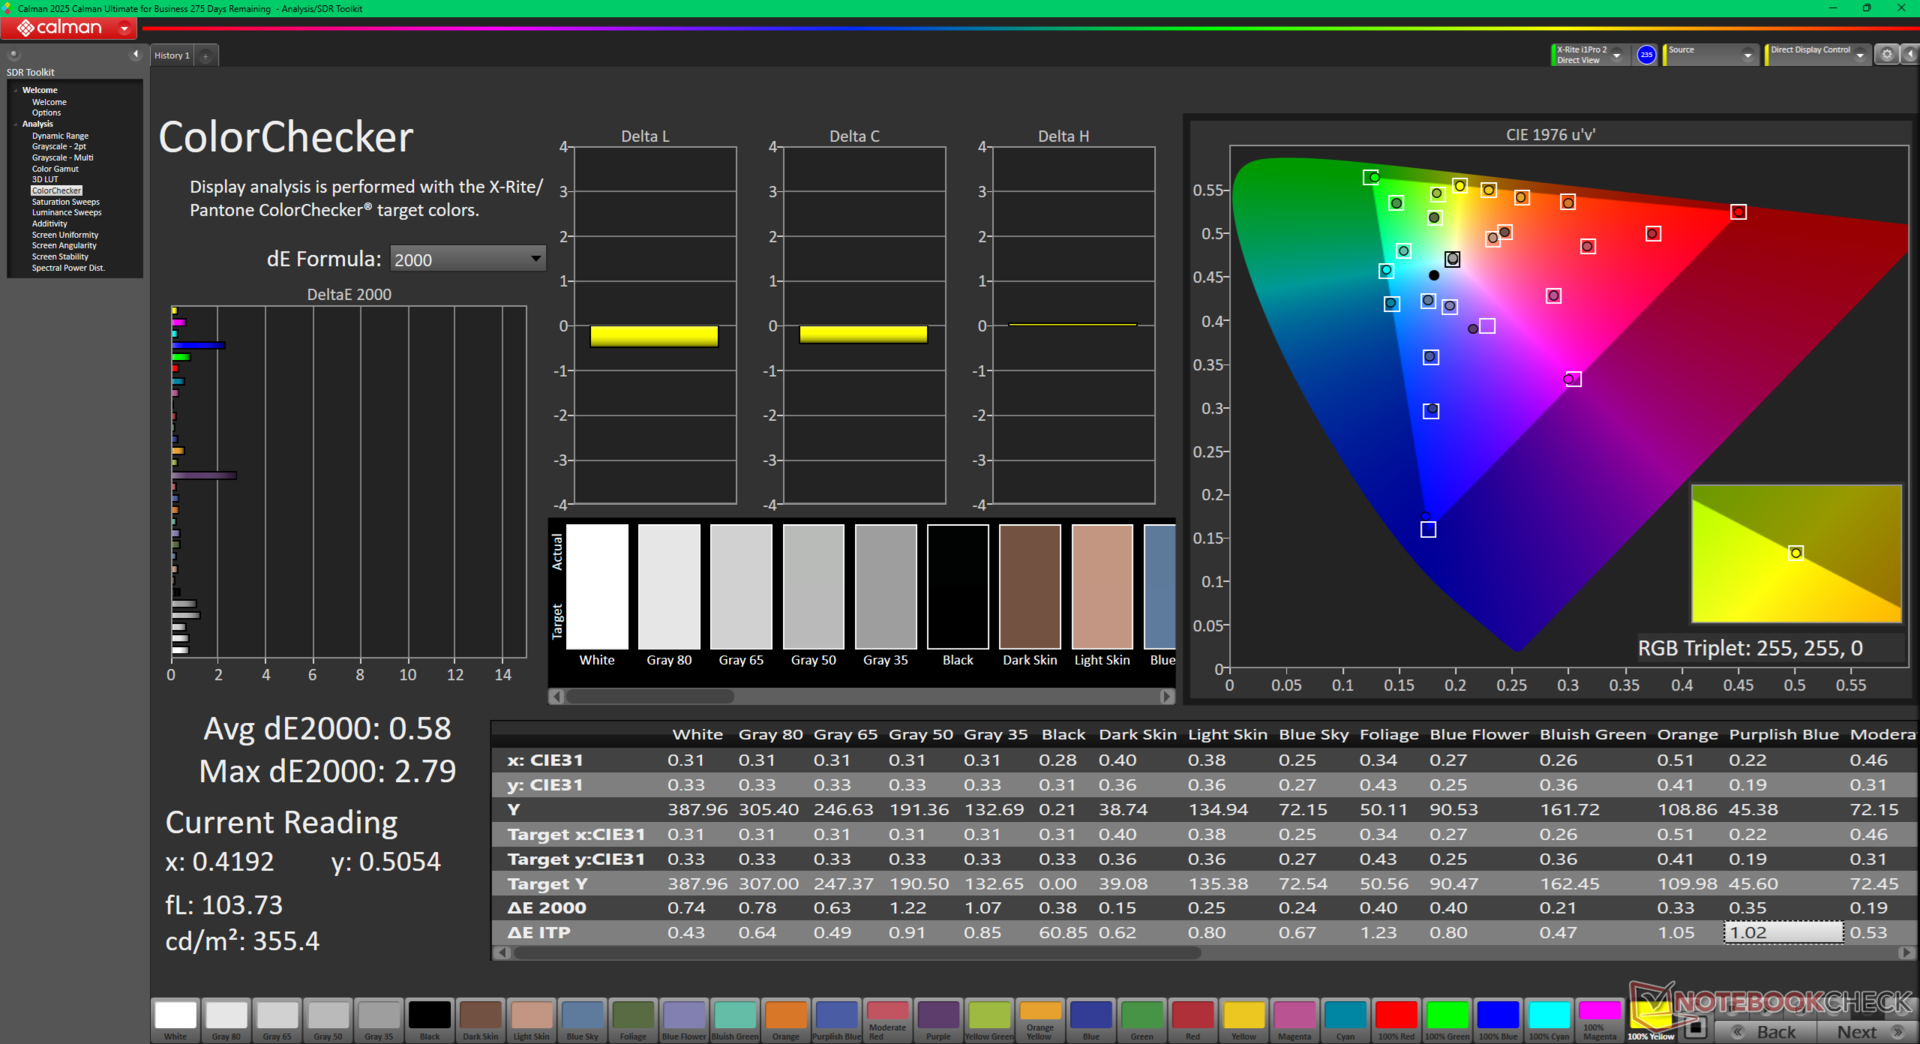
ΔE ColorChecker Calman: 3.14 | ∀{0.5-29.43 Ø4.72}
calibrated: 0.58
ΔE Greyscale Calman: 3.9 | ∀{0.09-98 Ø4.97}
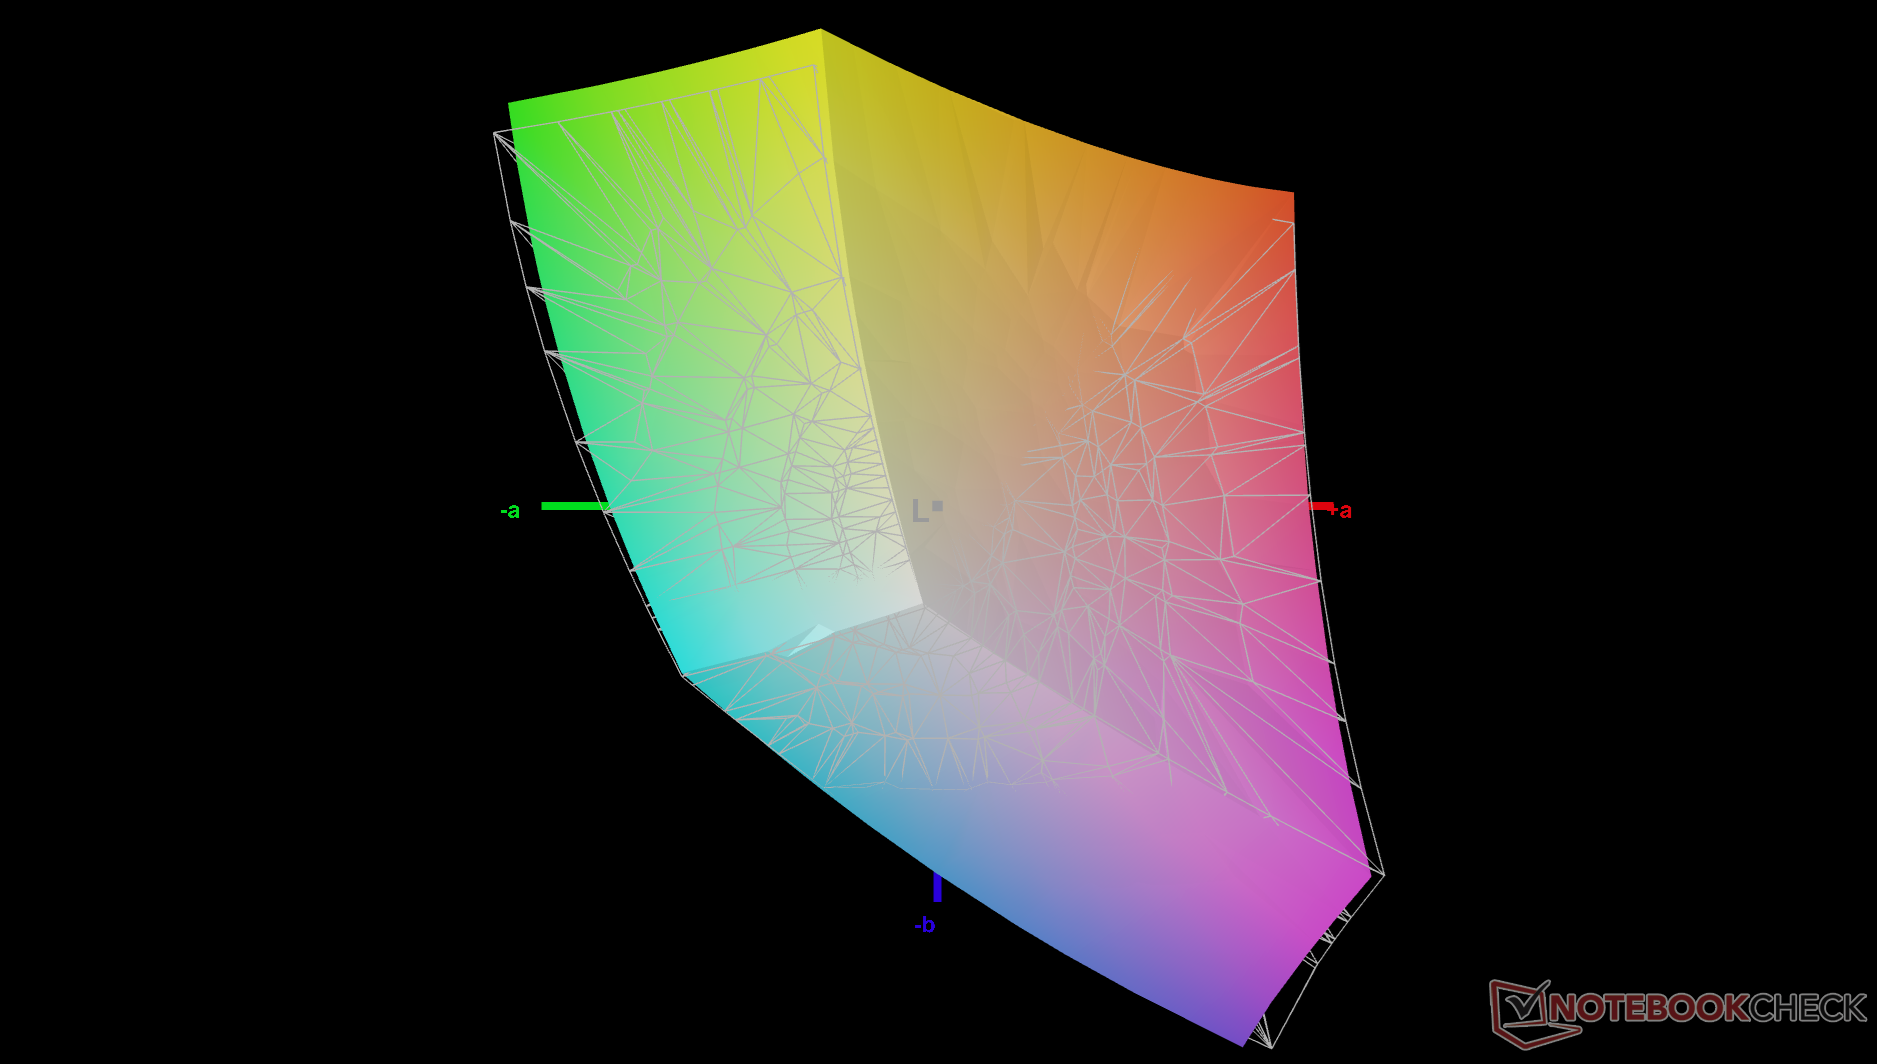
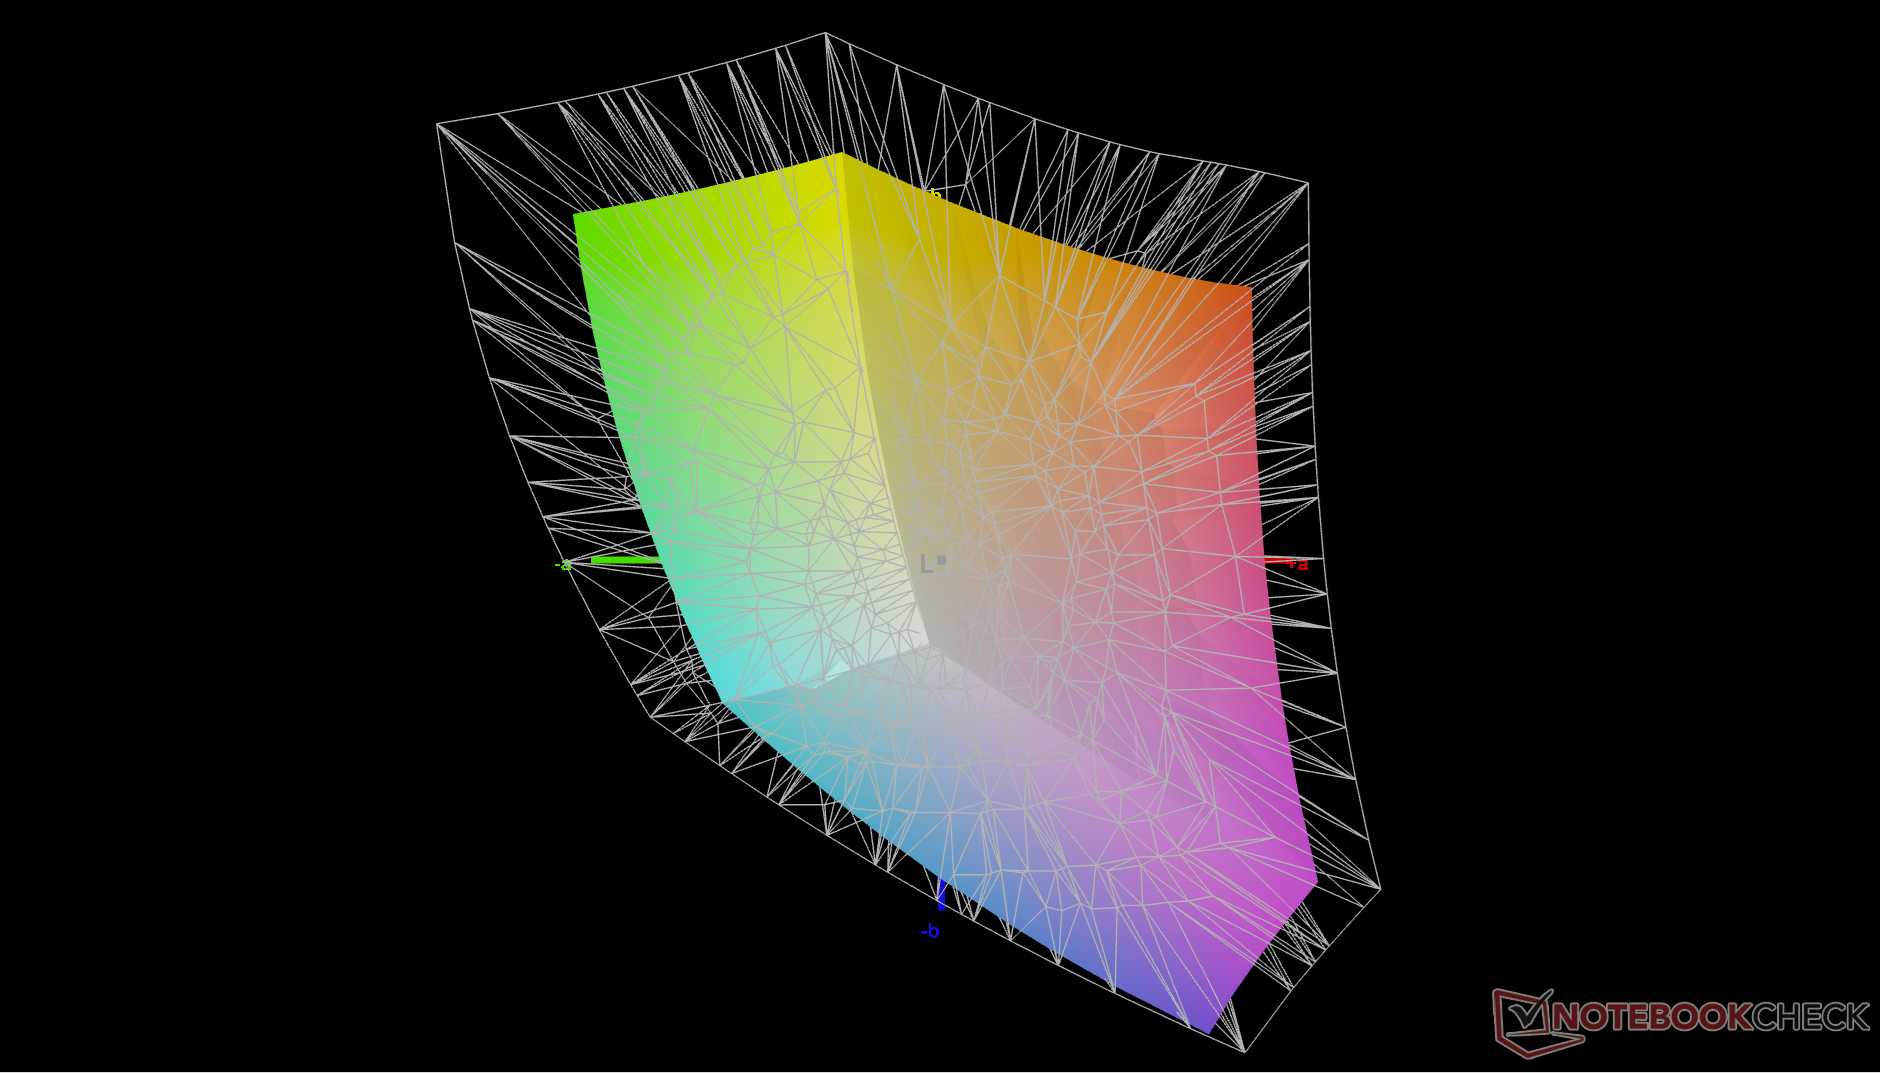
69.8% AdobeRGB 1998 (Argyll 3D)
97.2% sRGB (Argyll 3D)
67.8% Display P3 (Argyll 3D)
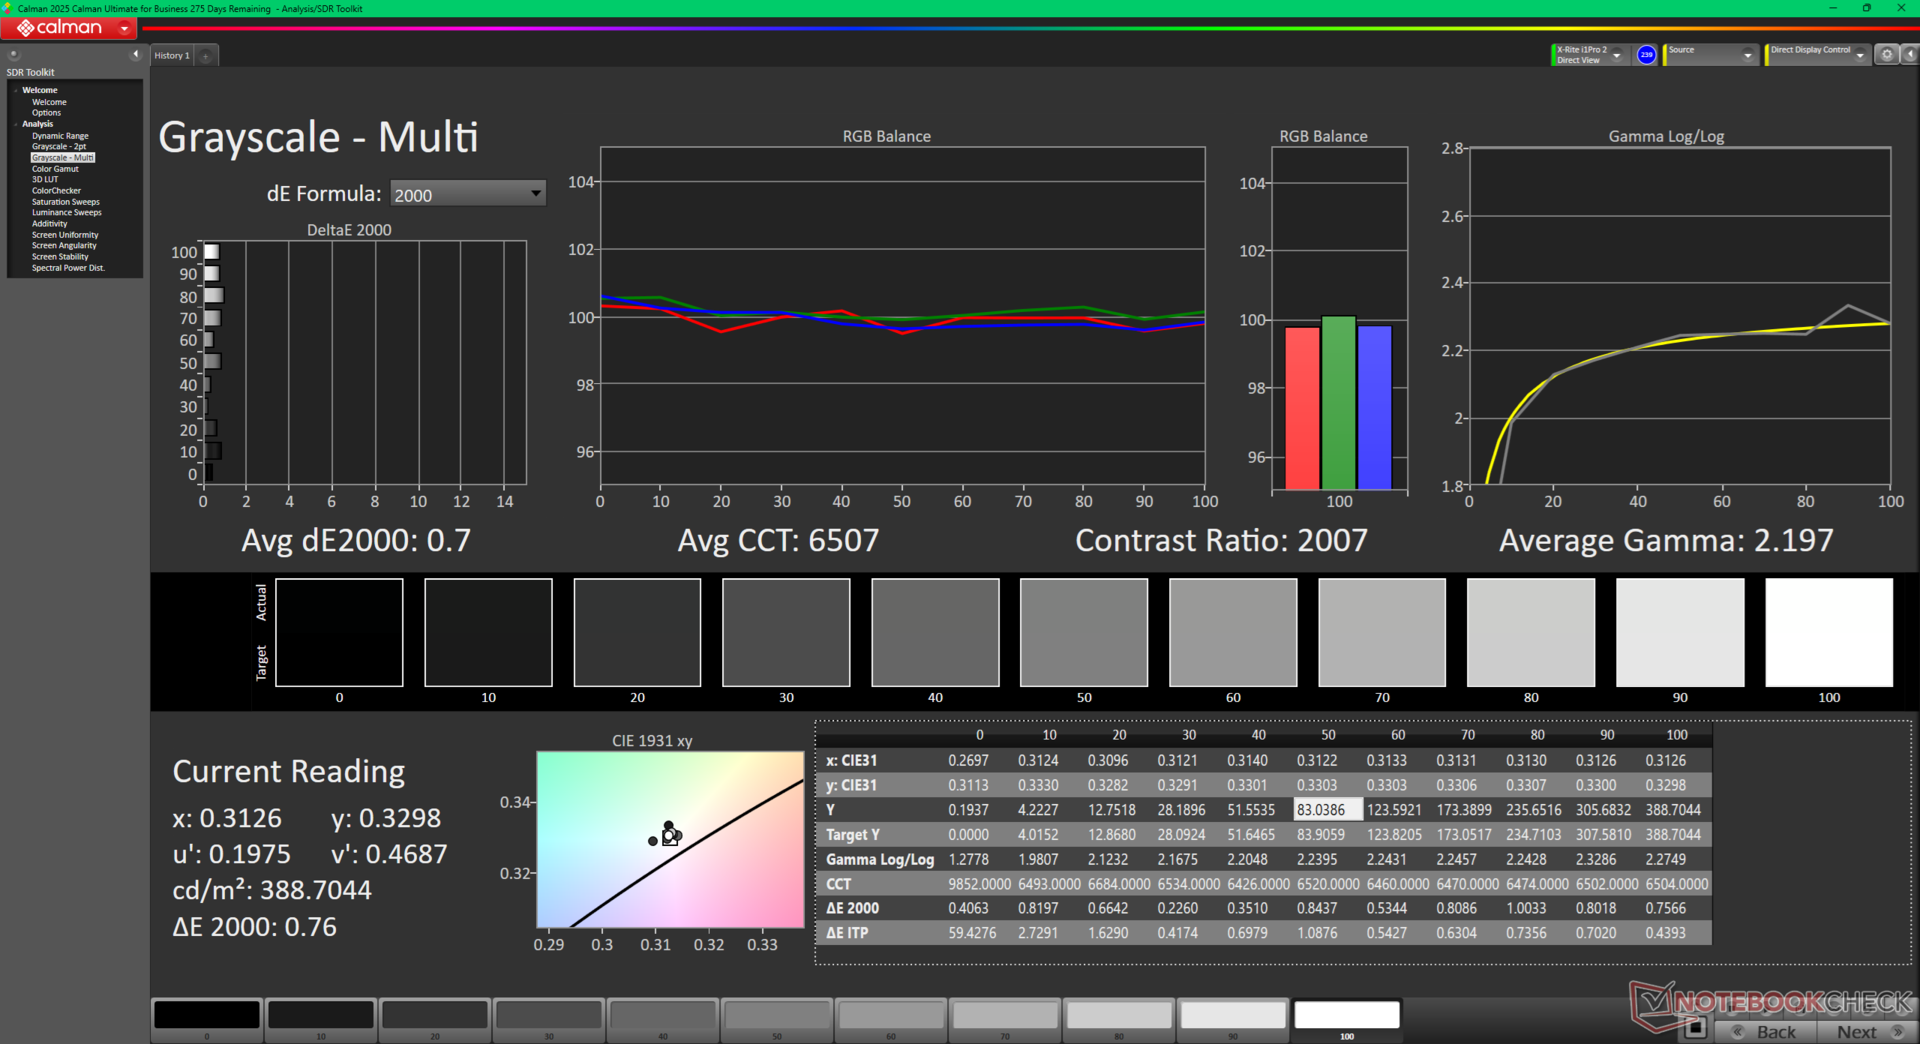
Gamma: 2.16
CCT: 5867 K
| Lenovo ThinkPad X1 2-in-1 Gen 10 N140JLG-GT3, IPS, 1920x1200, 14", 60 Hz | Lenovo ThinkPad X1 2in1 G9 21KE004AGE ATNA4ßYK20-0, OLED, 2880x1800, 14", 120 Hz | Lenovo Yoga 7 2-in-1 14AKP10 Lenovo LEN140WUXGA, OLED, 1920x1200, 14", 60 Hz | Dell Latitude 9440 2-in-1 AU Optronics B140QAN, IPS, 2560x1600, 14", 60 Hz | HP EliteBook X Flip G1i 14 AI AUO8FB5, IPS, 1920x1200, 14", 60 Hz | Asus ZenBook Duo OLED UX8406CA ATNA40CT02-0, OLED, 1920x1200, 14", 60 Hz | |
|---|---|---|---|---|---|---|
| Display | 30% | 30% | 9% | 9% | 24% | |
| Display P3 Coverage (%) | 67.8 | 99.9 47% | 98.5 45% | 77.2 14% | 76.7 13% | 98.4 45% |
| sRGB Coverage (%) | 97.2 | 100 3% | 100 3% | 99.6 2% | 98.2 1% | 99.8 3% |
| AdobeRGB 1998 Coverage (%) | 69.8 | 97.6 40% | 99.9 43% | 77.4 11% | 78.2 12% | 86.7 24% |
| Response Times | 98% | 96% | -21% | -1% | 96% | |
| Response Time Grey 50% / Grey 80% * (ms) | 44.6 ? | 0.61 ? 99% | 1.5 ? 97% | 53.5 ? -20% | 49.2 ? -10% | 1.51 ? 97% |
| Response Time Black / White * (ms) | 27.1 ? | 0.69 ? 97% | 1.4 ? 95% | 33 ? -22% | 24.8 ? 8% | 1.36 ? 95% |
| PWM Frequency (Hz) | 240 ? | 240 ? | 480 ? | |||
| PWM Amplitude * (%) | 20 | 14 | ||||
| Screen | -12% | 2076% | -9% | -31% | 21% | |
| Brightness middle (cd/m²) | 459 | 412 -10% | 360 -22% | 532.4 16% | 572 25% | 359 -22% |
| Brightness (cd/m²) | 455 | 411 -10% | 357 -22% | 502 10% | 541 19% | 362 -20% |
| Brightness Distribution (%) | 89 | 98 10% | 97 9% | 91 2% | 78 -12% | 98 10% |
| Black Level * (cd/m²) | 0.24 | 0.001 100% | 0.48 -100% | 0.2 17% | ||
| Contrast (:1) | 1913 | 360000 18719% | 1109 -42% | 2860 50% | ||
| Colorchecker dE 2000 * | 3.14 | 1.9 39% | 2.12 32% | 2.33 26% | 4.19 -33% | 1.2 62% |
| Colorchecker dE 2000 max. * | 6.55 | 3.9 40% | 4.59 30% | 5.99 9% | 8.65 -32% | 3.2 51% |
| Colorchecker dE 2000 calibrated * | 0.58 | 1.9 -228% | 1.9 -228% | 0.92 -59% | 2.11 -264% | |
| Greyscale dE 2000 * | 3.9 | 1 74% | 1.4 64% | 1.6 59% | 5.65 -45% | 2.1 46% |
| Gamma | 2.16 102% | 2.21 100% | 2.187 101% | 2.17 101% | 2.45 90% | 2.24 98% |
| CCT | 5867 111% | 6361 102% | 6366 102% | 6314 103% | 5959 109% | 6433 101% |
| Total Average (Program / Settings) | 39% /
17% | 734% /
1355% | -7% /
-7% | -8% /
-18% | 47% /
36% |
* ... smaller is better
Although the display doesn't come calibrated out of the box, average grayscale and color deltaE values are still reasonably low at 3.9 and 3.14 respectively. An end-user calibration can nonetheless improve the averages even further down to just <0.1 each as shown by the screenshots below. Our calibrated ICM profile is available to download for free above.
Display Response Times
| ↔ Response Time Black to White | ||
|---|---|---|
| 27.1 ms ... rise ↗ and fall ↘ combined | ↗ 13.1 ms rise | 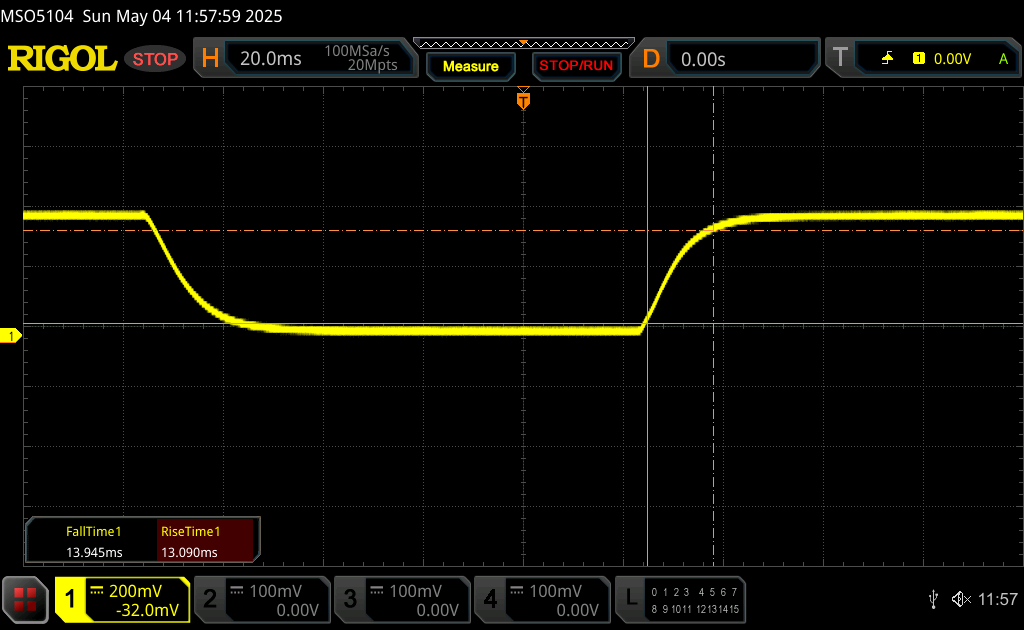 |
| ↘ 14 ms fall | ||
| The screen shows relatively slow response rates in our tests and may be too slow for gamers. In comparison, all tested devices range from 0.1 (minimum) to 240 (maximum) ms. » 69 % of all devices are better. This means that the measured response time is worse than the average of all tested devices (19.8 ms). | ||
| ↔ Response Time 50% Grey to 80% Grey | ||
| 44.6 ms ... rise ↗ and fall ↘ combined | ↗ 19.2 ms rise | 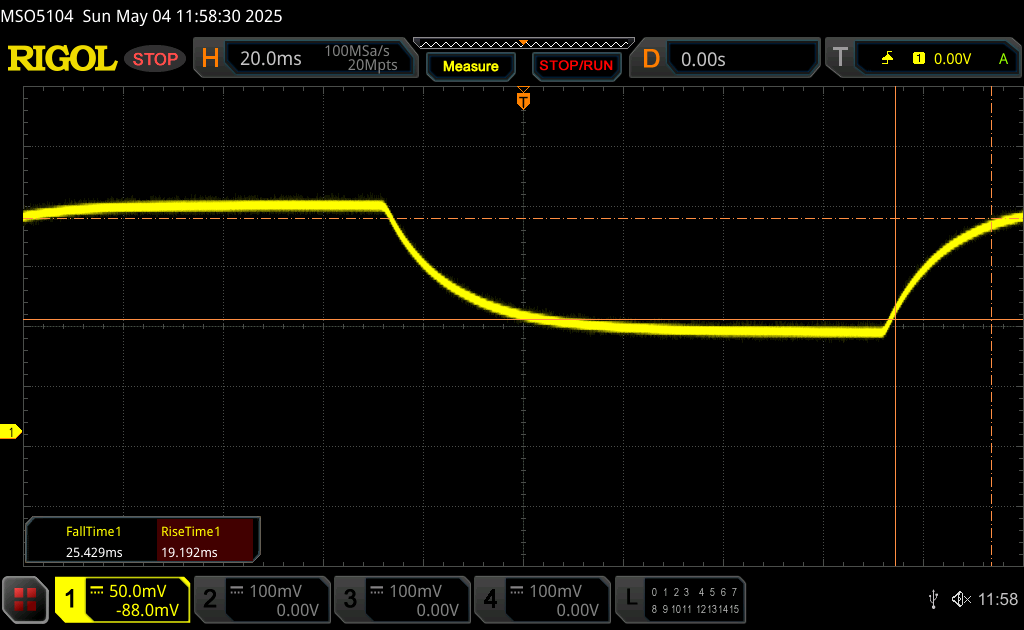 |
| ↘ 25.4 ms fall | ||
| The screen shows slow response rates in our tests and will be unsatisfactory for gamers. In comparison, all tested devices range from 0.165 (minimum) to 636 (maximum) ms. » 76 % of all devices are better. This means that the measured response time is worse than the average of all tested devices (31 ms). | ||
Screen Flickering / PWM (Pulse-Width Modulation)
| Screen flickering / PWM not detected | 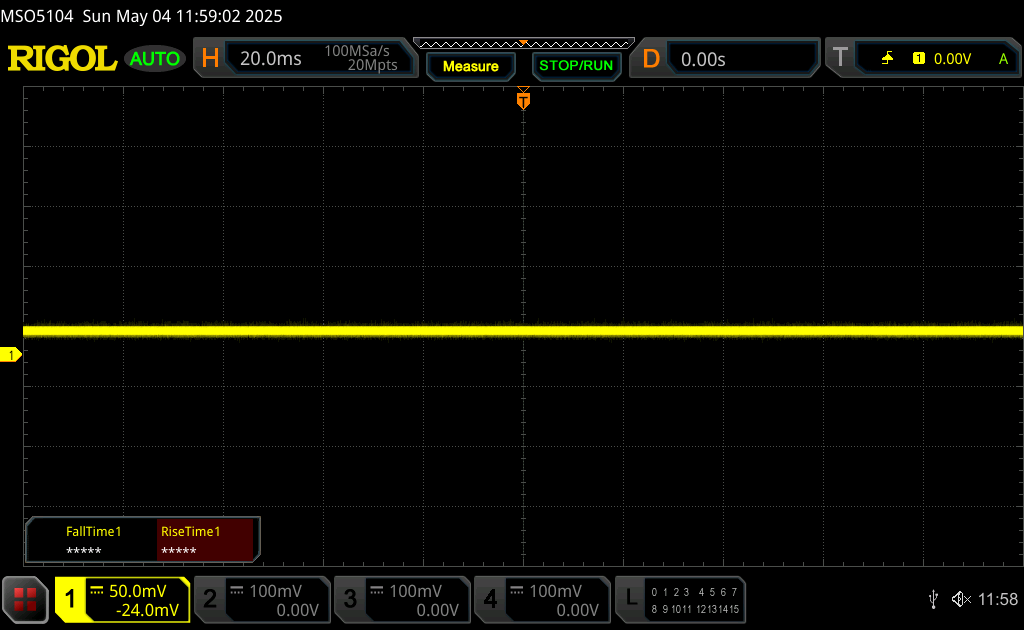 | ||
In comparison: 52 % of all tested devices do not use PWM to dim the display. If PWM was detected, an average of 7763 (minimum: 5 - maximum: 343500) Hz was measured. | |||
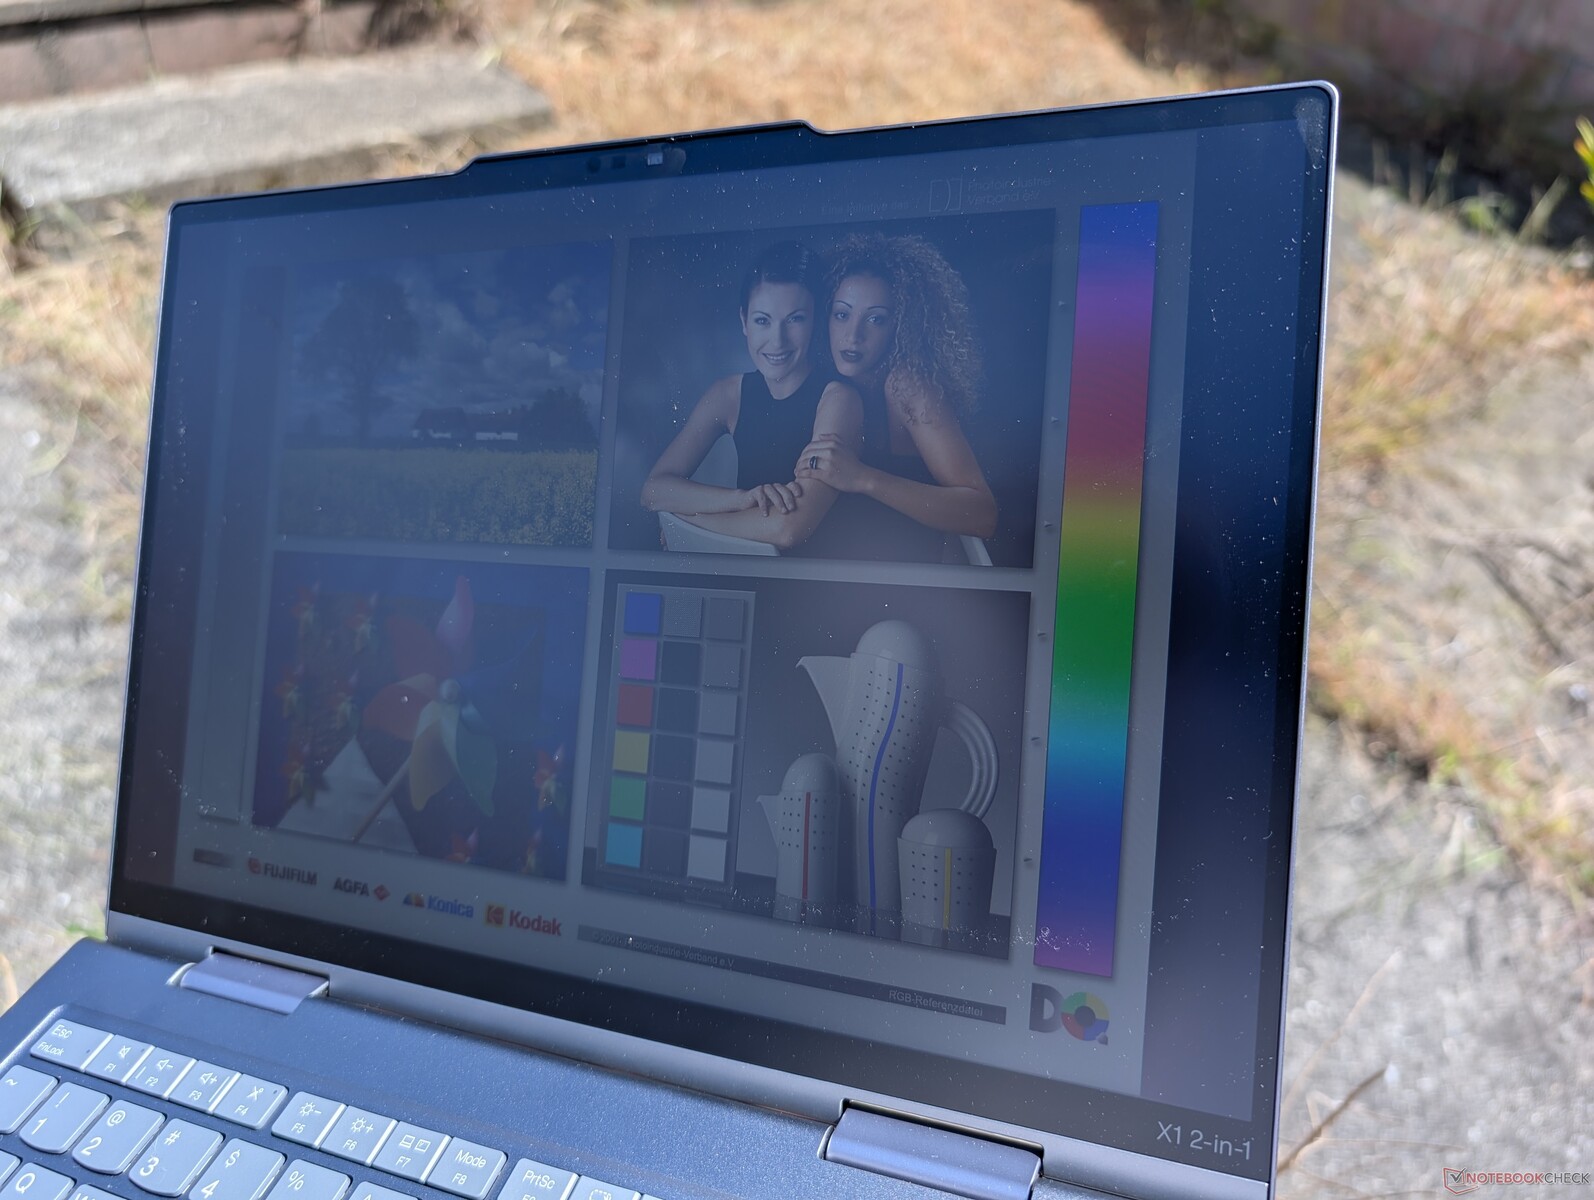
Outdoor visibility is decent under shade with our 500-nit display but otherwise below average if under sunlight. For something significantly brighter, HP offers 1000-nit panel options for some of its EliteBook models if outdoor visibility is paramount.


Performance
Testing Conditions
We set Windows to Performance mode prior to running the benchmarks below. Lenovo Commercial Advantage does not have additional power modes to keep the selection simple.
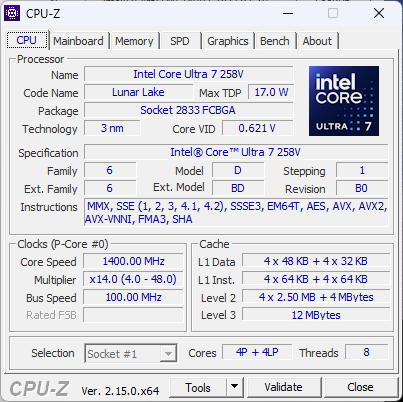
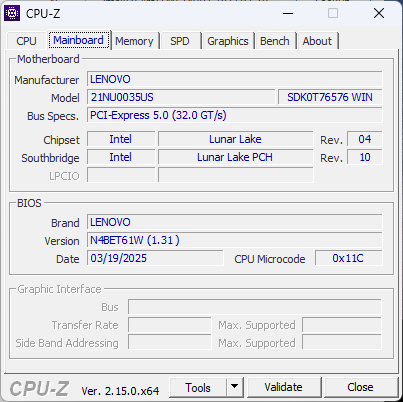
Processor
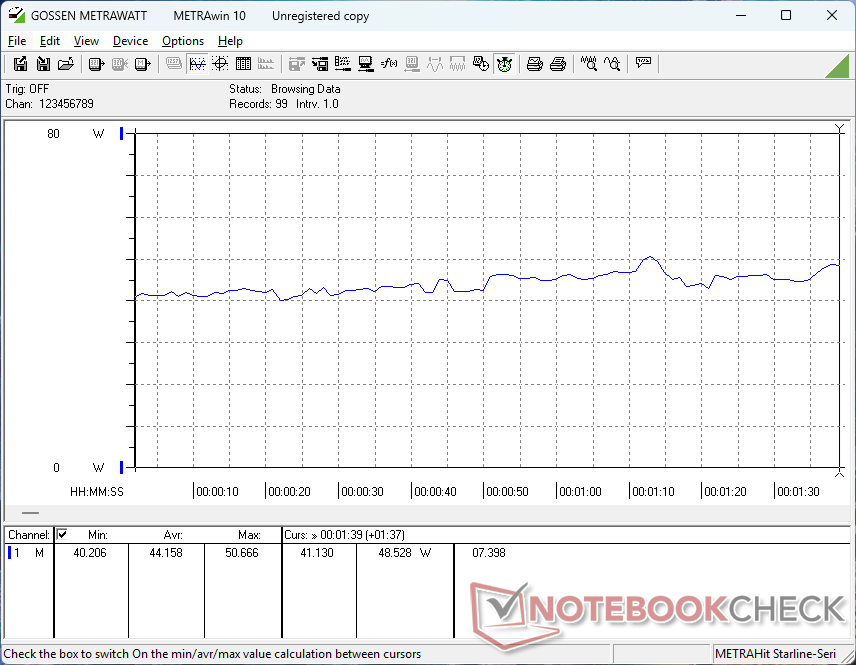
The Core Ultra 7 258V in our Lenovo performs where we expect it to be when compared to the average laptop in our database with the same processor. The key difference, however, is that clock rates tend to fluctuate more readily on the Lenovo which is reflected by the wave-like performance results in our CineBench R15 xT loop test below. This behavior would carry consequences involving gaming and power consumption.
The fluctuating processor performance on our V-series configuration also casts doubt on how well the ThinkPad X1 2-in-1 Gen 10 can perform if equipped with the more demanding H-series processor. If the cooling solution is already struggling to run the Core Ultra 7 258V on Turbo Boost clock rates, then the Core Ultra 7 265H may likely struggle as well leading to slower-than-average performance.
Raw CPU performance from the Core Ultra 7 258V is otherwise quite similar to the years old Core i7-1365U as the Lunar Lake platform was designed to maximize performance-per-watt over raw horsepower.
Cinebench R15 Multi Loop
Cinebench R23: Multi Core | Single Core
Cinebench R20: CPU (Multi Core) | CPU (Single Core)
Cinebench R15: CPU Multi 64Bit | CPU Single 64Bit
Blender: v2.79 BMW27 CPU
7-Zip 18.03: 7z b 4 | 7z b 4 -mmt1
Geekbench 6.7: Multi-Core | Single-Core
Geekbench 5.5: Multi-Core | Single-Core
HWBOT x265 Benchmark v2.2: 4k Preset
LibreOffice : 20 Documents To PDF
R Benchmark 2.5: Overall mean
* ... smaller is better
AIDA64: FP32 Ray-Trace | FPU Julia | CPU SHA3 | CPU Queen | FPU SinJulia | FPU Mandel | CPU AES | CPU ZLib | FP64 Ray-Trace | CPU PhotoWorxx
| Performance rating | |
| Asus ZenBook Duo OLED UX8406CA | |
| Lenovo Yoga 7 2-in-1 14AKP10 | |
| Lenovo ThinkPad X1 2-in-1 Gen 10 | |
| Average Intel Core Ultra 7 258V | |
| HP EliteBook X Flip G1i 14 AI | |
| Lenovo ThinkPad X1 2in1 G9 21KE004AGE | |
| Dell Latitude 9440 2-in-1 | |
| AIDA64 / FP32 Ray-Trace | |
| Lenovo Yoga 7 2-in-1 14AKP10 | |
| Asus ZenBook Duo OLED UX8406CA | |
| Lenovo ThinkPad X1 2-in-1 Gen 10 | |
| HP EliteBook X Flip G1i 14 AI | |
| Average Intel Core Ultra 7 258V (8454 - 12781, n=26) | |
| Lenovo ThinkPad X1 2in1 G9 21KE004AGE | |
| Dell Latitude 9440 2-in-1 | |
| AIDA64 / FPU Julia | |
| Asus ZenBook Duo OLED UX8406CA | |
| Lenovo Yoga 7 2-in-1 14AKP10 | |
| Lenovo ThinkPad X1 2-in-1 Gen 10 | |
| Average Intel Core Ultra 7 258V (40875 - 63401, n=26) | |
| HP EliteBook X Flip G1i 14 AI | |
| Lenovo ThinkPad X1 2in1 G9 21KE004AGE | |
| Dell Latitude 9440 2-in-1 | |
| AIDA64 / CPU SHA3 | |
| Asus ZenBook Duo OLED UX8406CA | |
| Lenovo Yoga 7 2-in-1 14AKP10 | |
| Lenovo ThinkPad X1 2-in-1 Gen 10 | |
| Lenovo ThinkPad X1 2in1 G9 21KE004AGE | |
| Average Intel Core Ultra 7 258V (1930 - 2817, n=26) | |
| HP EliteBook X Flip G1i 14 AI | |
| Dell Latitude 9440 2-in-1 | |
| AIDA64 / CPU Queen | |
| Dell Latitude 9440 2-in-1 | |
| Asus ZenBook Duo OLED UX8406CA | |
| Lenovo Yoga 7 2-in-1 14AKP10 | |
| Lenovo ThinkPad X1 2-in-1 Gen 10 | |
| Average Intel Core Ultra 7 258V (48816 - 49818, n=24) | |
| HP EliteBook X Flip G1i 14 AI | |
| Lenovo ThinkPad X1 2in1 G9 21KE004AGE | |
| AIDA64 / FPU SinJulia | |
| Lenovo Yoga 7 2-in-1 14AKP10 | |
| Asus ZenBook Duo OLED UX8406CA | |
| Lenovo ThinkPad X1 2in1 G9 21KE004AGE | |
| Dell Latitude 9440 2-in-1 | |
| Lenovo ThinkPad X1 2-in-1 Gen 10 | |
| HP EliteBook X Flip G1i 14 AI | |
| Average Intel Core Ultra 7 258V (3817 - 4440, n=26) | |
| AIDA64 / FPU Mandel | |
| Asus ZenBook Duo OLED UX8406CA | |
| Lenovo Yoga 7 2-in-1 14AKP10 | |
| Average Intel Core Ultra 7 258V (21670 - 33565, n=26) | |
| HP EliteBook X Flip G1i 14 AI | |
| Lenovo ThinkPad X1 2-in-1 Gen 10 | |
| Lenovo ThinkPad X1 2in1 G9 21KE004AGE | |
| Dell Latitude 9440 2-in-1 | |
| AIDA64 / CPU AES | |
| Lenovo Yoga 7 2-in-1 14AKP10 | |
| Asus ZenBook Duo OLED UX8406CA | |
| Lenovo ThinkPad X1 2in1 G9 21KE004AGE | |
| Dell Latitude 9440 2-in-1 | |
| Lenovo ThinkPad X1 2-in-1 Gen 10 | |
| Average Intel Core Ultra 7 258V (30957 - 40753, n=26) | |
| HP EliteBook X Flip G1i 14 AI | |
| AIDA64 / CPU ZLib | |
| Asus ZenBook Duo OLED UX8406CA | |
| Lenovo Yoga 7 2-in-1 14AKP10 | |
| Lenovo ThinkPad X1 2in1 G9 21KE004AGE | |
| Dell Latitude 9440 2-in-1 | |
| Lenovo ThinkPad X1 2-in-1 Gen 10 | |
| Average Intel Core Ultra 7 258V (422 - 632, n=26) | |
| HP EliteBook X Flip G1i 14 AI | |
| AIDA64 / FP64 Ray-Trace | |
| Lenovo Yoga 7 2-in-1 14AKP10 | |
| Asus ZenBook Duo OLED UX8406CA | |
| Lenovo ThinkPad X1 2-in-1 Gen 10 | |
| Average Intel Core Ultra 7 258V (4258 - 6930, n=26) | |
| HP EliteBook X Flip G1i 14 AI | |
| Lenovo ThinkPad X1 2in1 G9 21KE004AGE | |
| Dell Latitude 9440 2-in-1 | |
| AIDA64 / CPU PhotoWorxx | |
| Asus ZenBook Duo OLED UX8406CA | |
| Lenovo ThinkPad X1 2-in-1 Gen 10 | |
| HP EliteBook X Flip G1i 14 AI | |
| Average Intel Core Ultra 7 258V (44223 - 59245, n=26) | |
| Lenovo ThinkPad X1 2in1 G9 21KE004AGE | |
| Dell Latitude 9440 2-in-1 | |
| Lenovo Yoga 7 2-in-1 14AKP10 | |
Stress Test
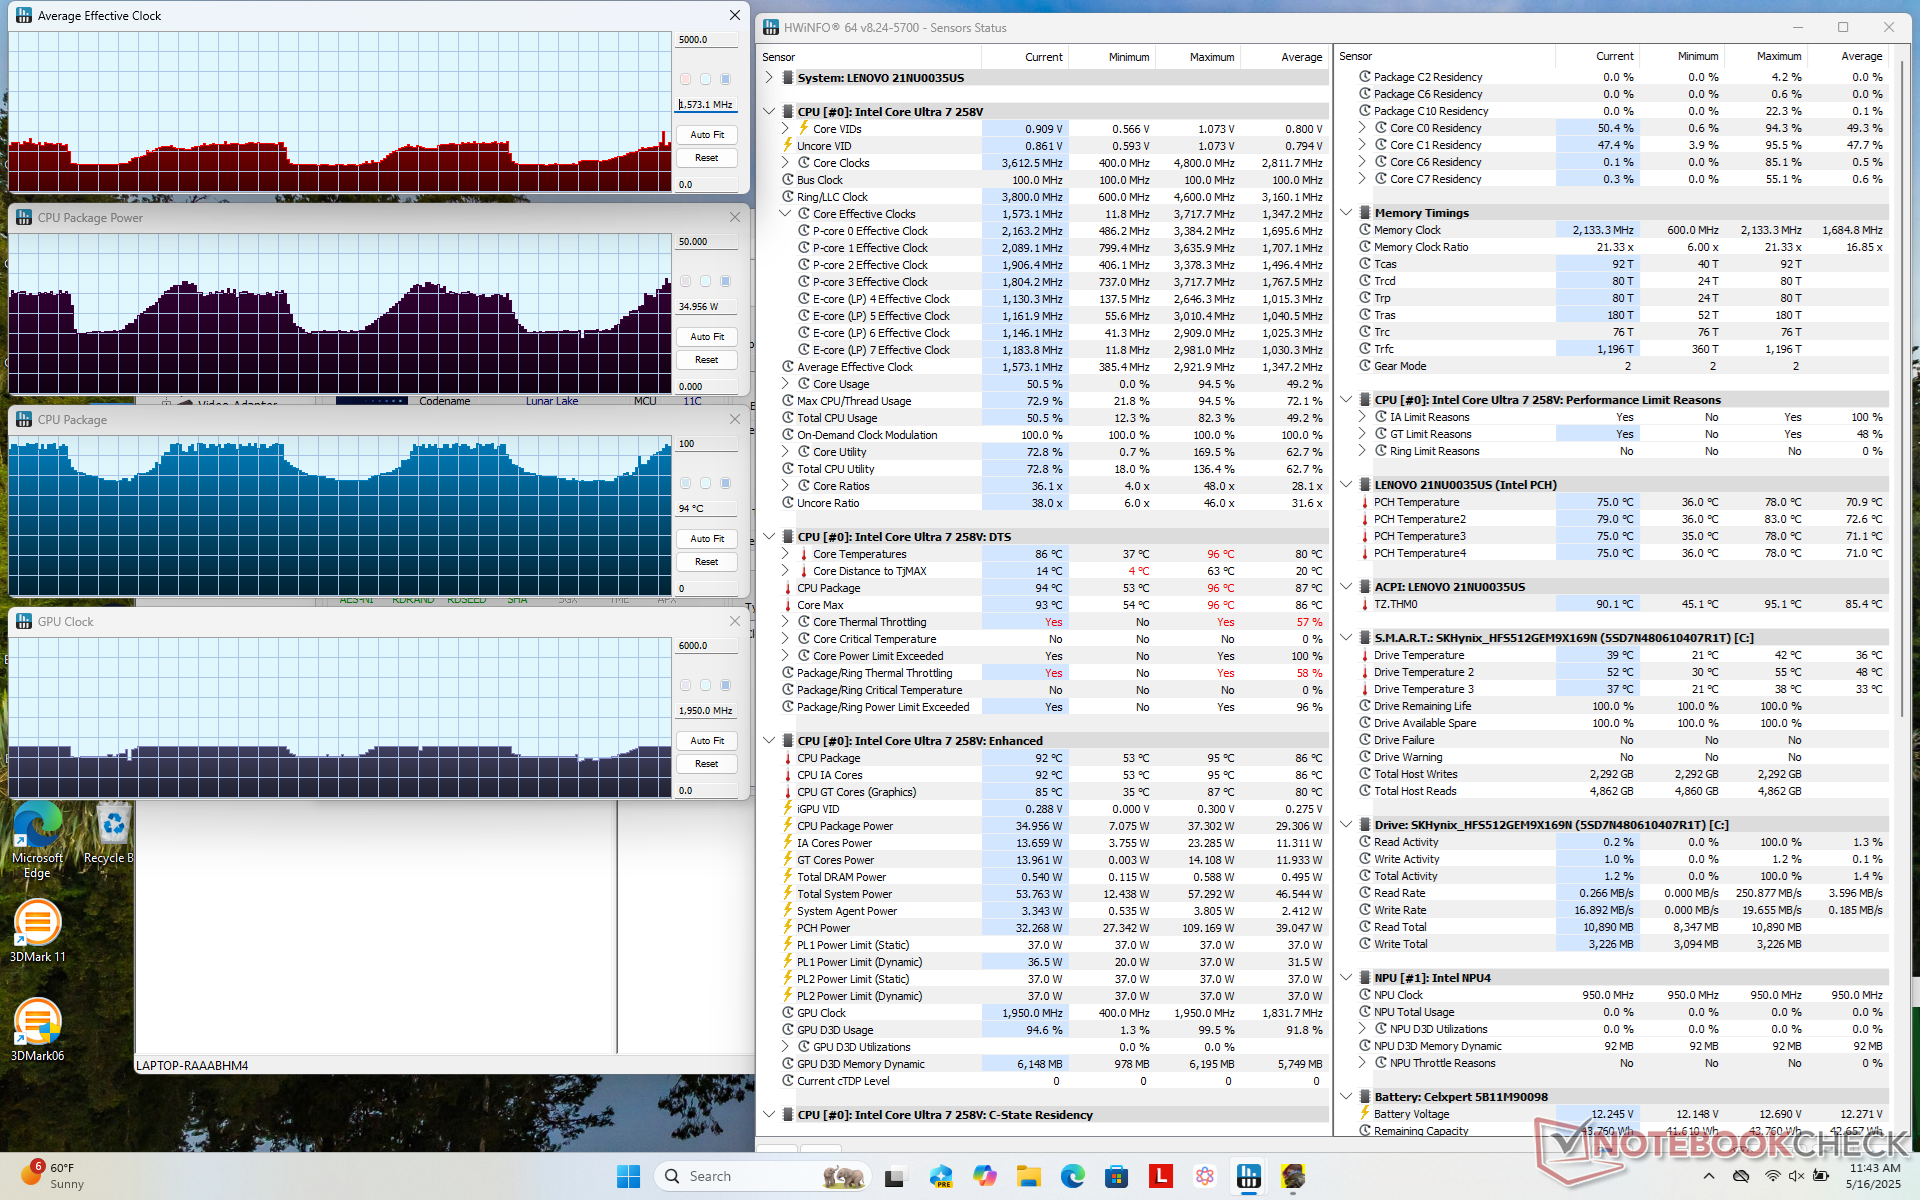
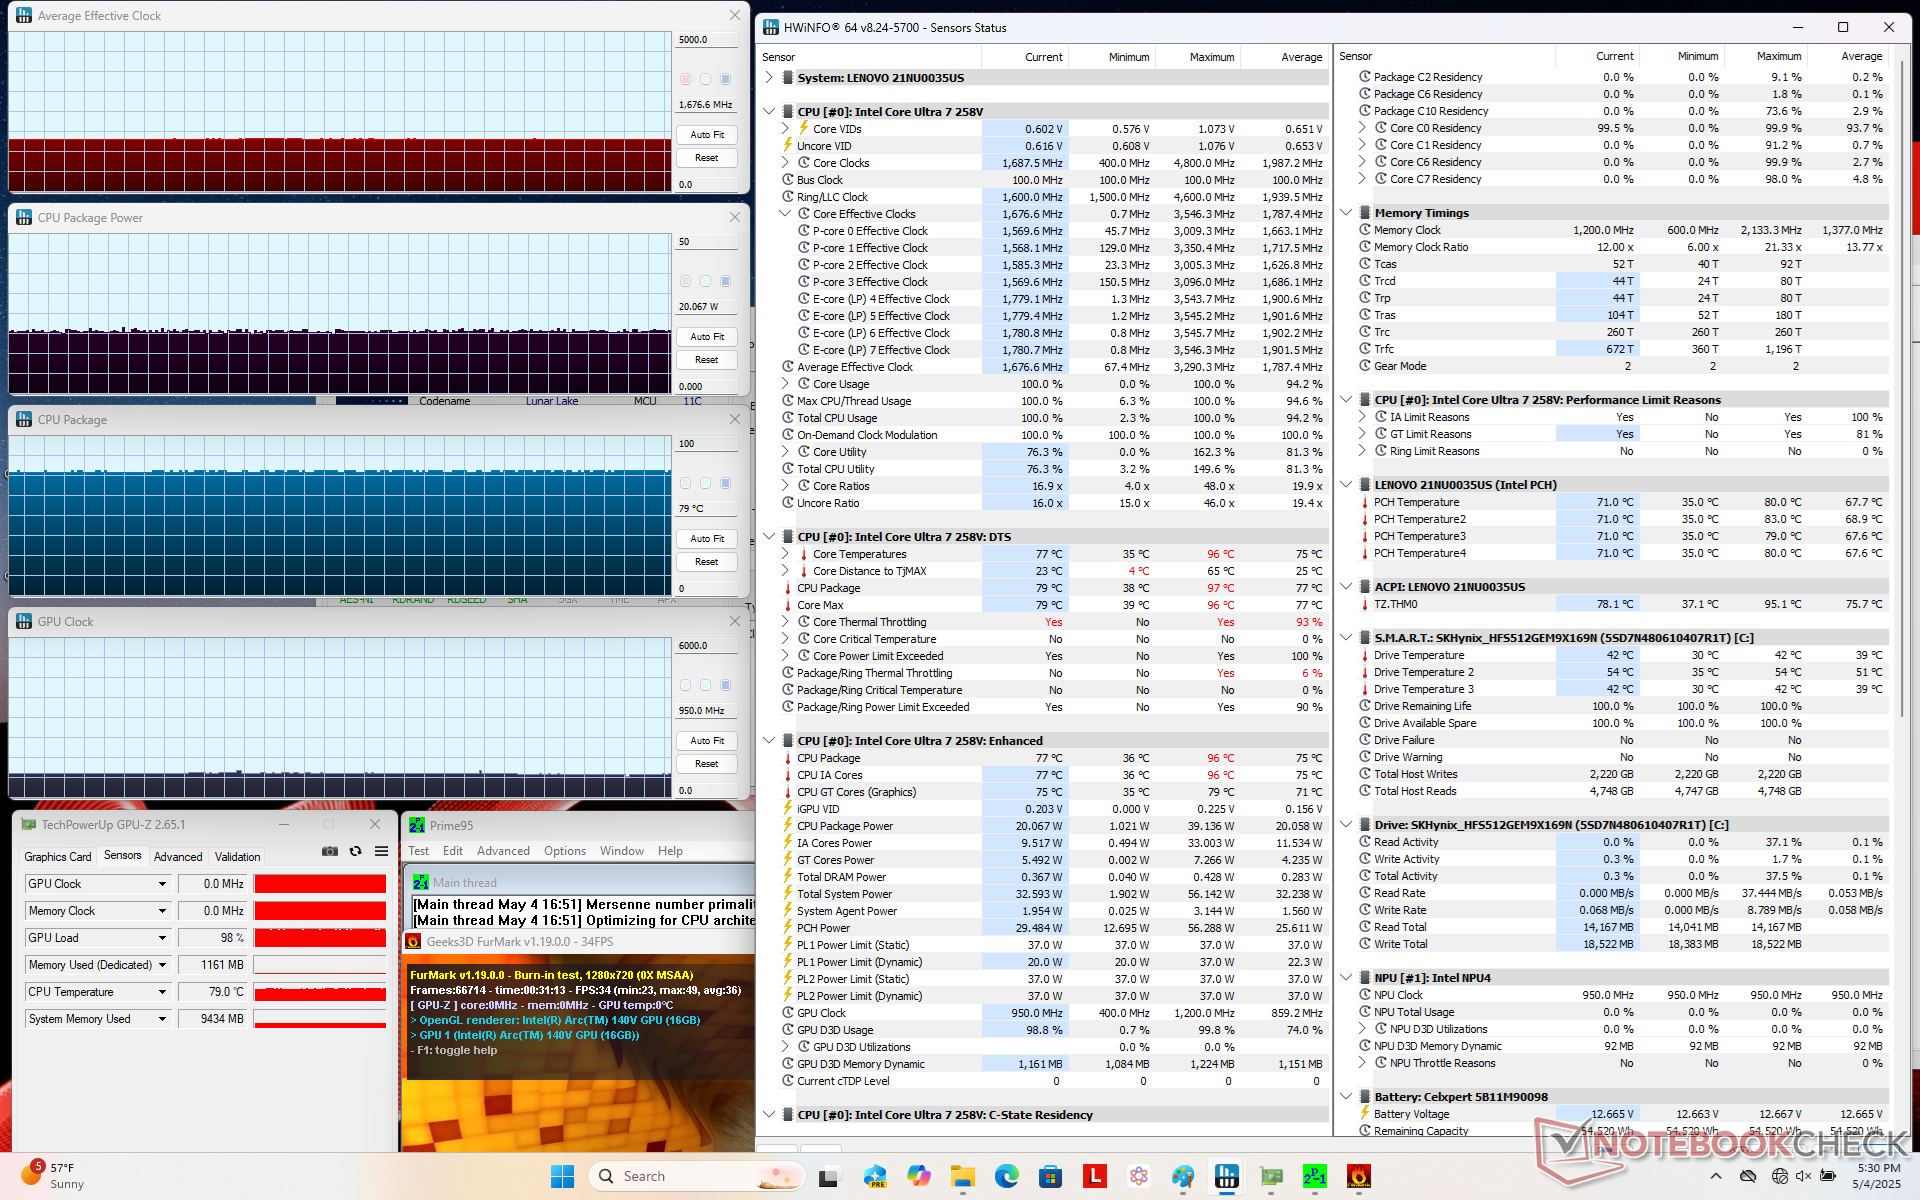
When running Prime95 stress, the CPU would spike to 39 W and 3.3 GHz before reaching a core temperature of 96 C a few moments later. It would then cycle slowly between 2.3 to 32 GHz, 20 W to 39 , and 77 C to 96 C as shown by the screenshot below. This behavior mimics our CineBench R15 xT observations above. In contrast, our 2024 unit with the older Meteor Lake-U platform did not exhibit any cycling behavior.
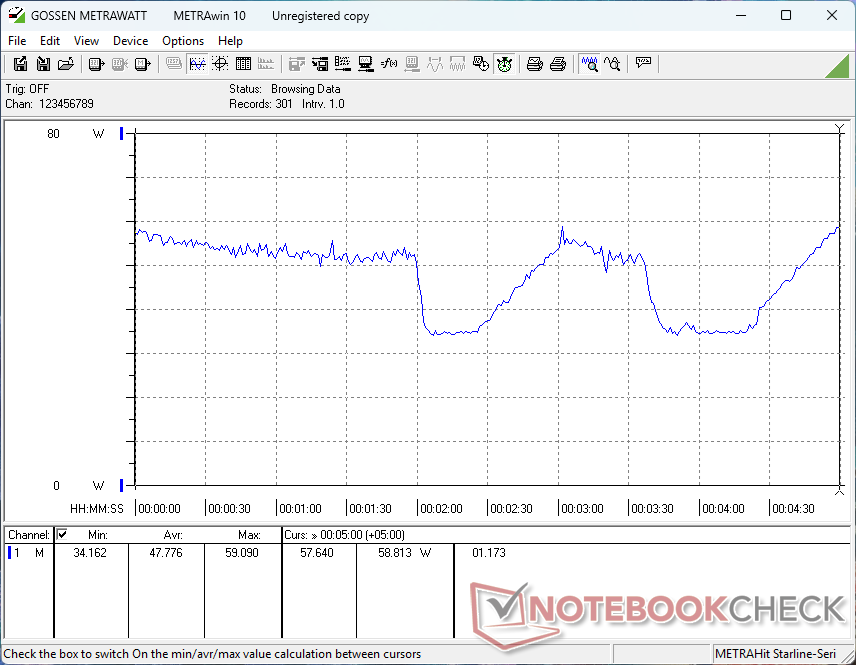
The CPU and GPU would continue to cycle when running Cyberpunk 2077 which contributes to fluctuating frame rates. The CPU would run between 0.9 GHz to 1.6 GHz, 20 W to 35 W, and 72 C to 96 C while the GPU would cycle between 1600 MHz and 1950 MHz. Steadier performance would have been preferable.
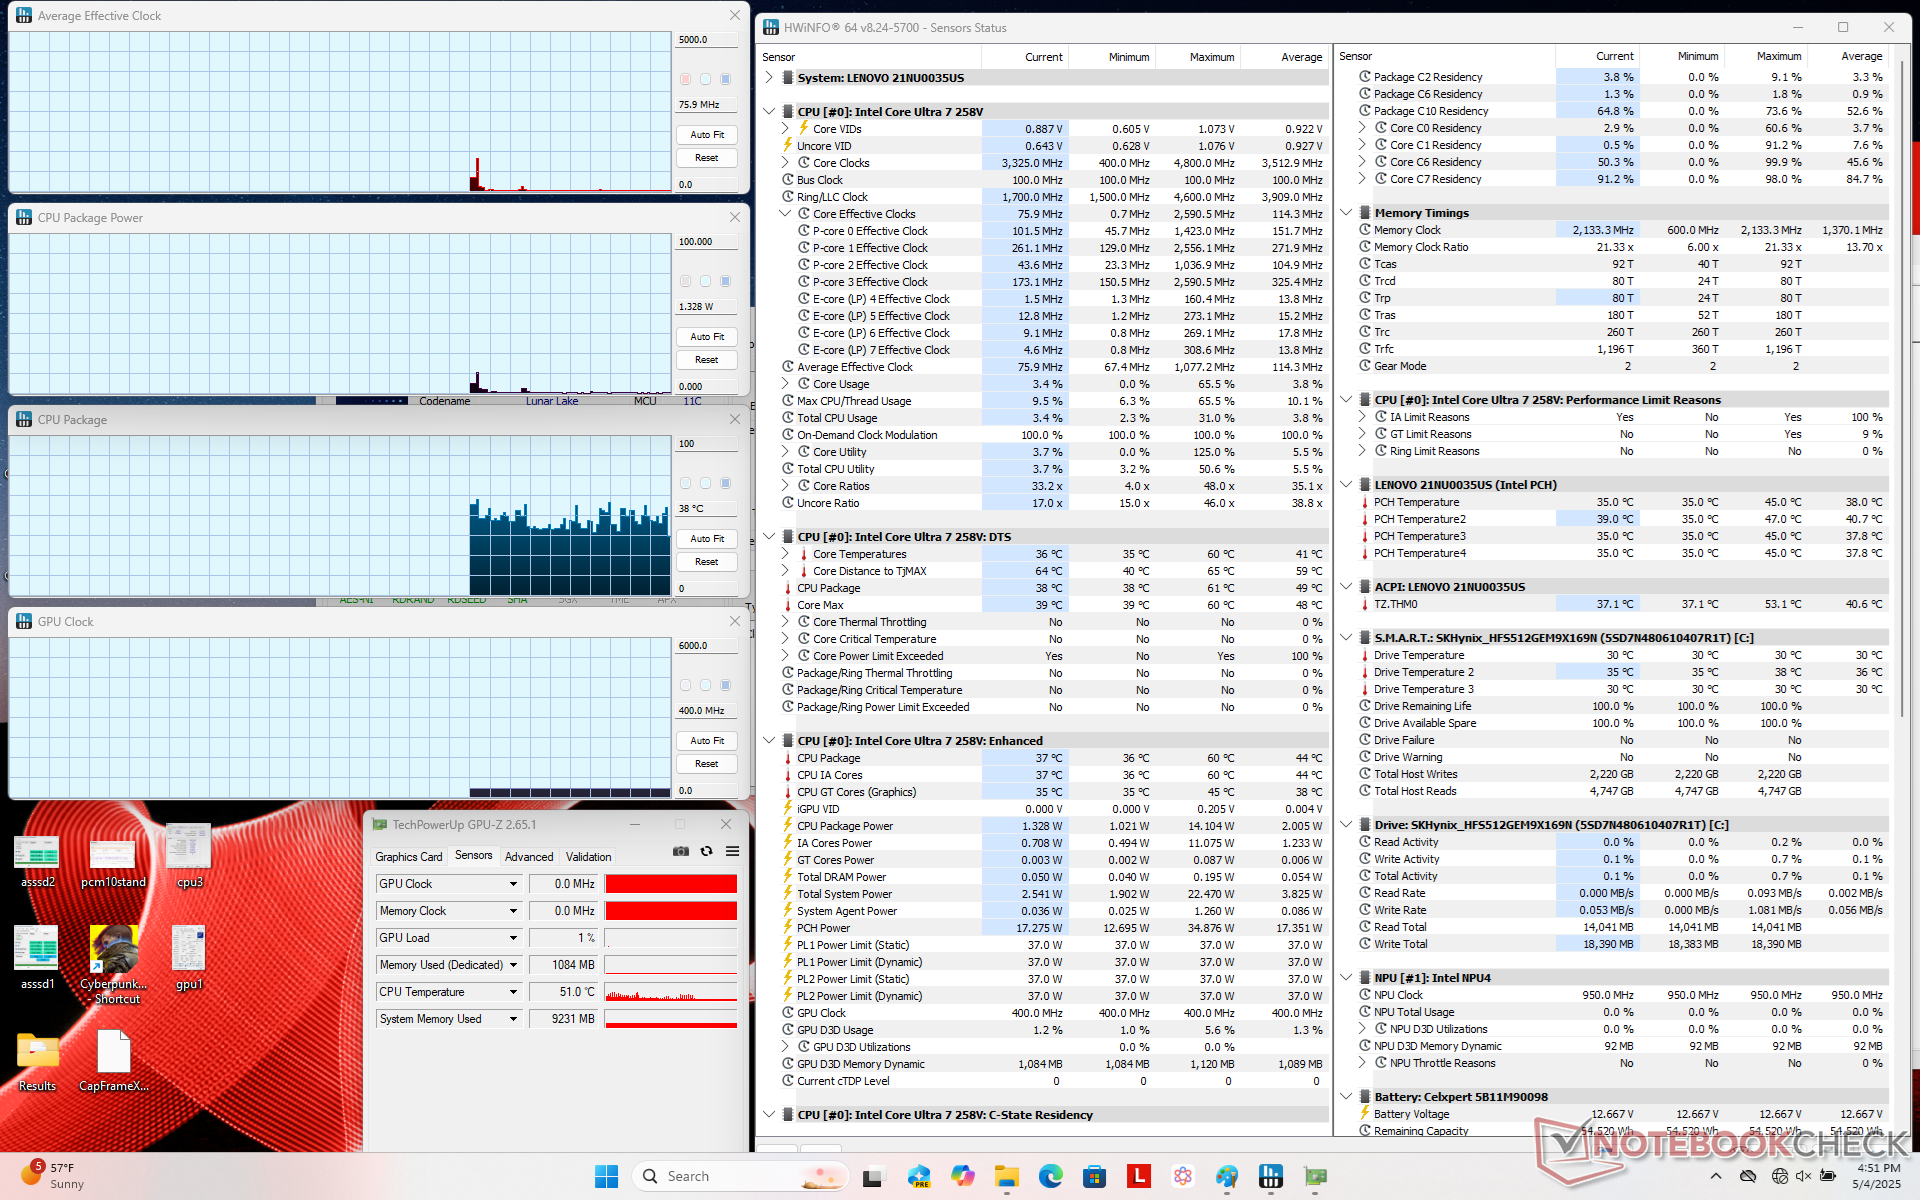
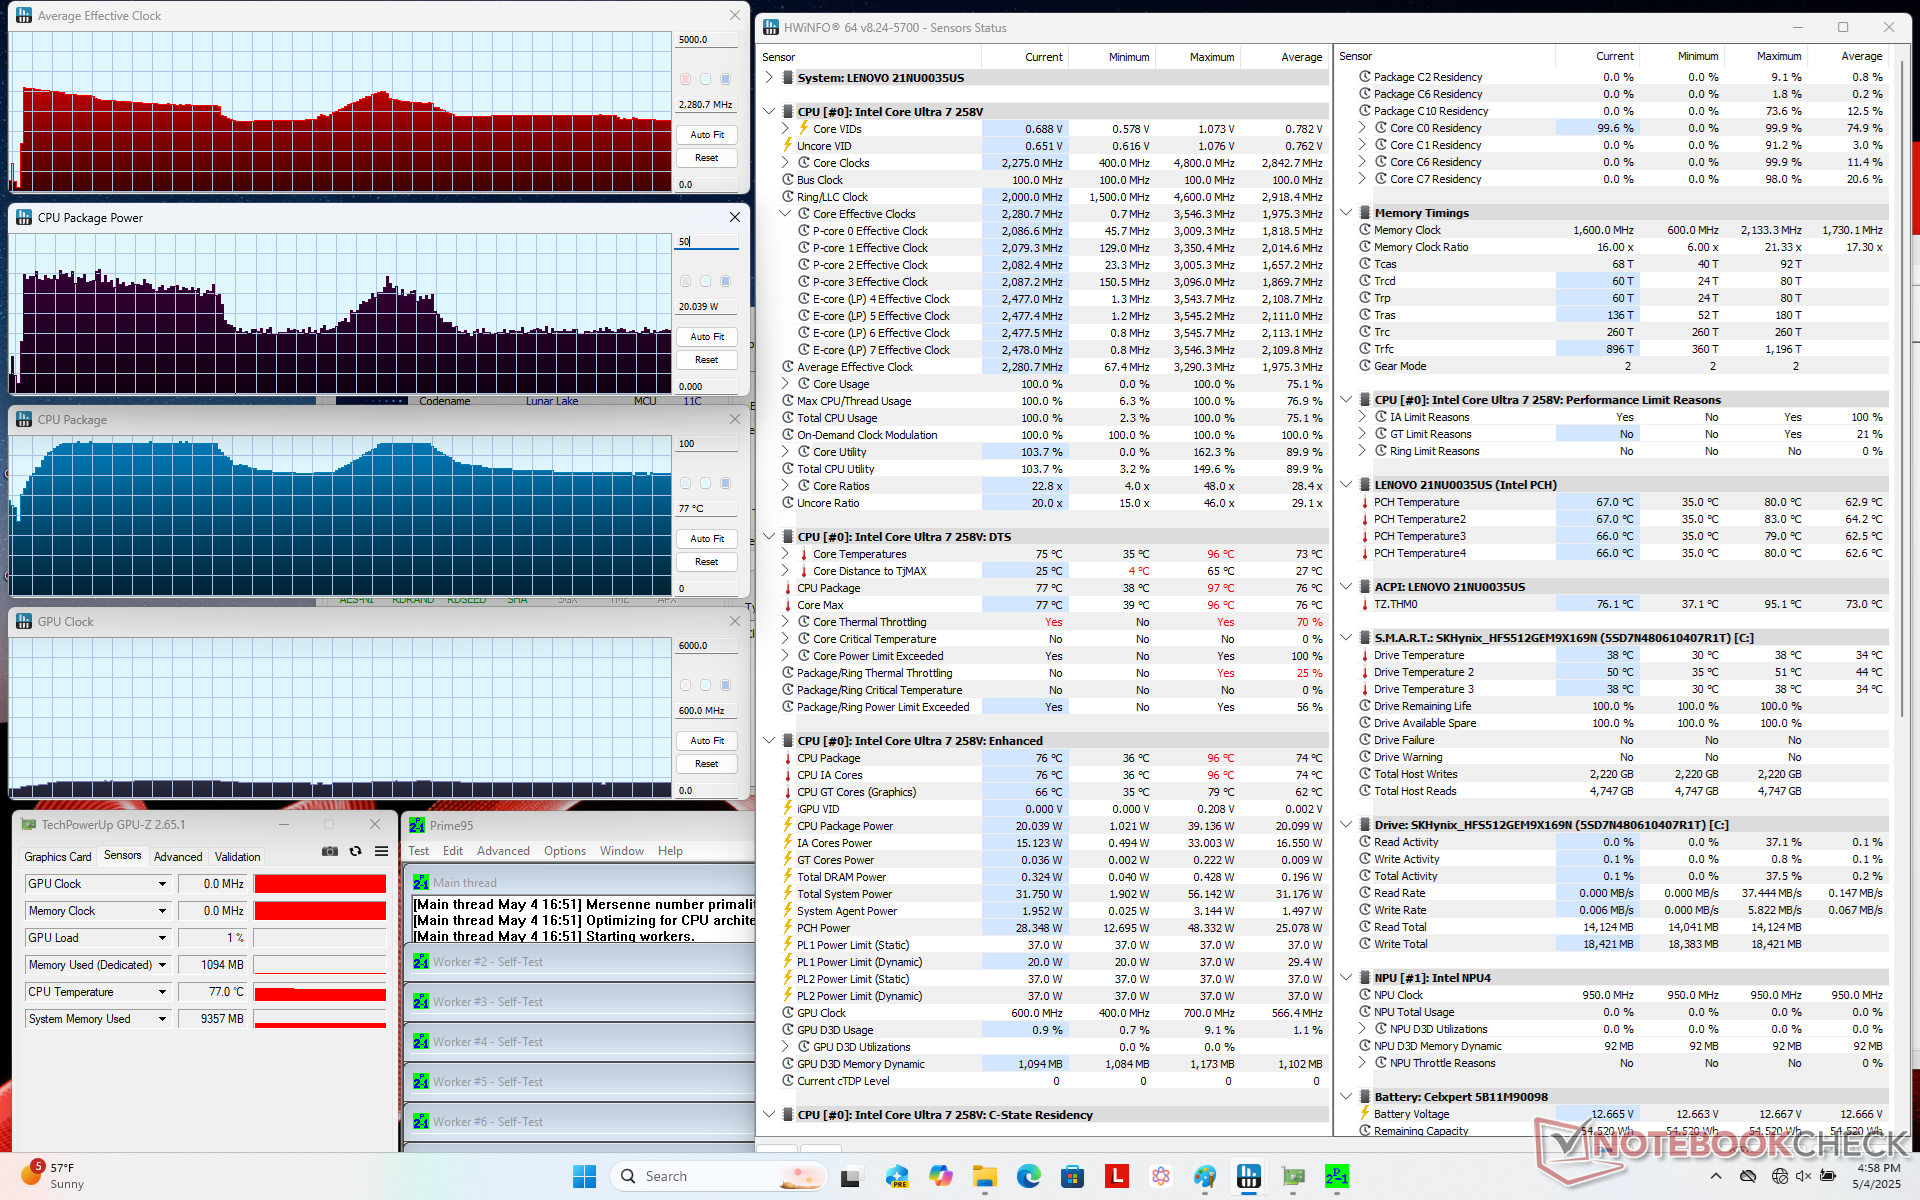
| Average CPU Clock (GHz) | GPU Clock (MHz) | Average CPU Temperature (°C) | |
| System Idle | -- | -- | 39 |
| Prime95 Stress | 2.2 - 3.1 | 600 | 77 |
| Prime95 + FurMark Stress | 1.7 | 950 | 79 |
| Cyberpunk 2077 Stress | 0.9 - 1.6 | 1600 - 1950 | 72 - 96 |
System Performance
PCMark scores are consistently higher than on last year's ThinkPad X1 2-in-1 Gen 9 despite the fluctuating processor performance mentioned above. This suggests that the unsteady clock rates should have minimal impact on most day-to-day office workloads or light editing activities. Of course, the much-improved integrated GPU and faster RAM over last year's Meteor Lake-U platform also play huge roles for the better PCMark results.
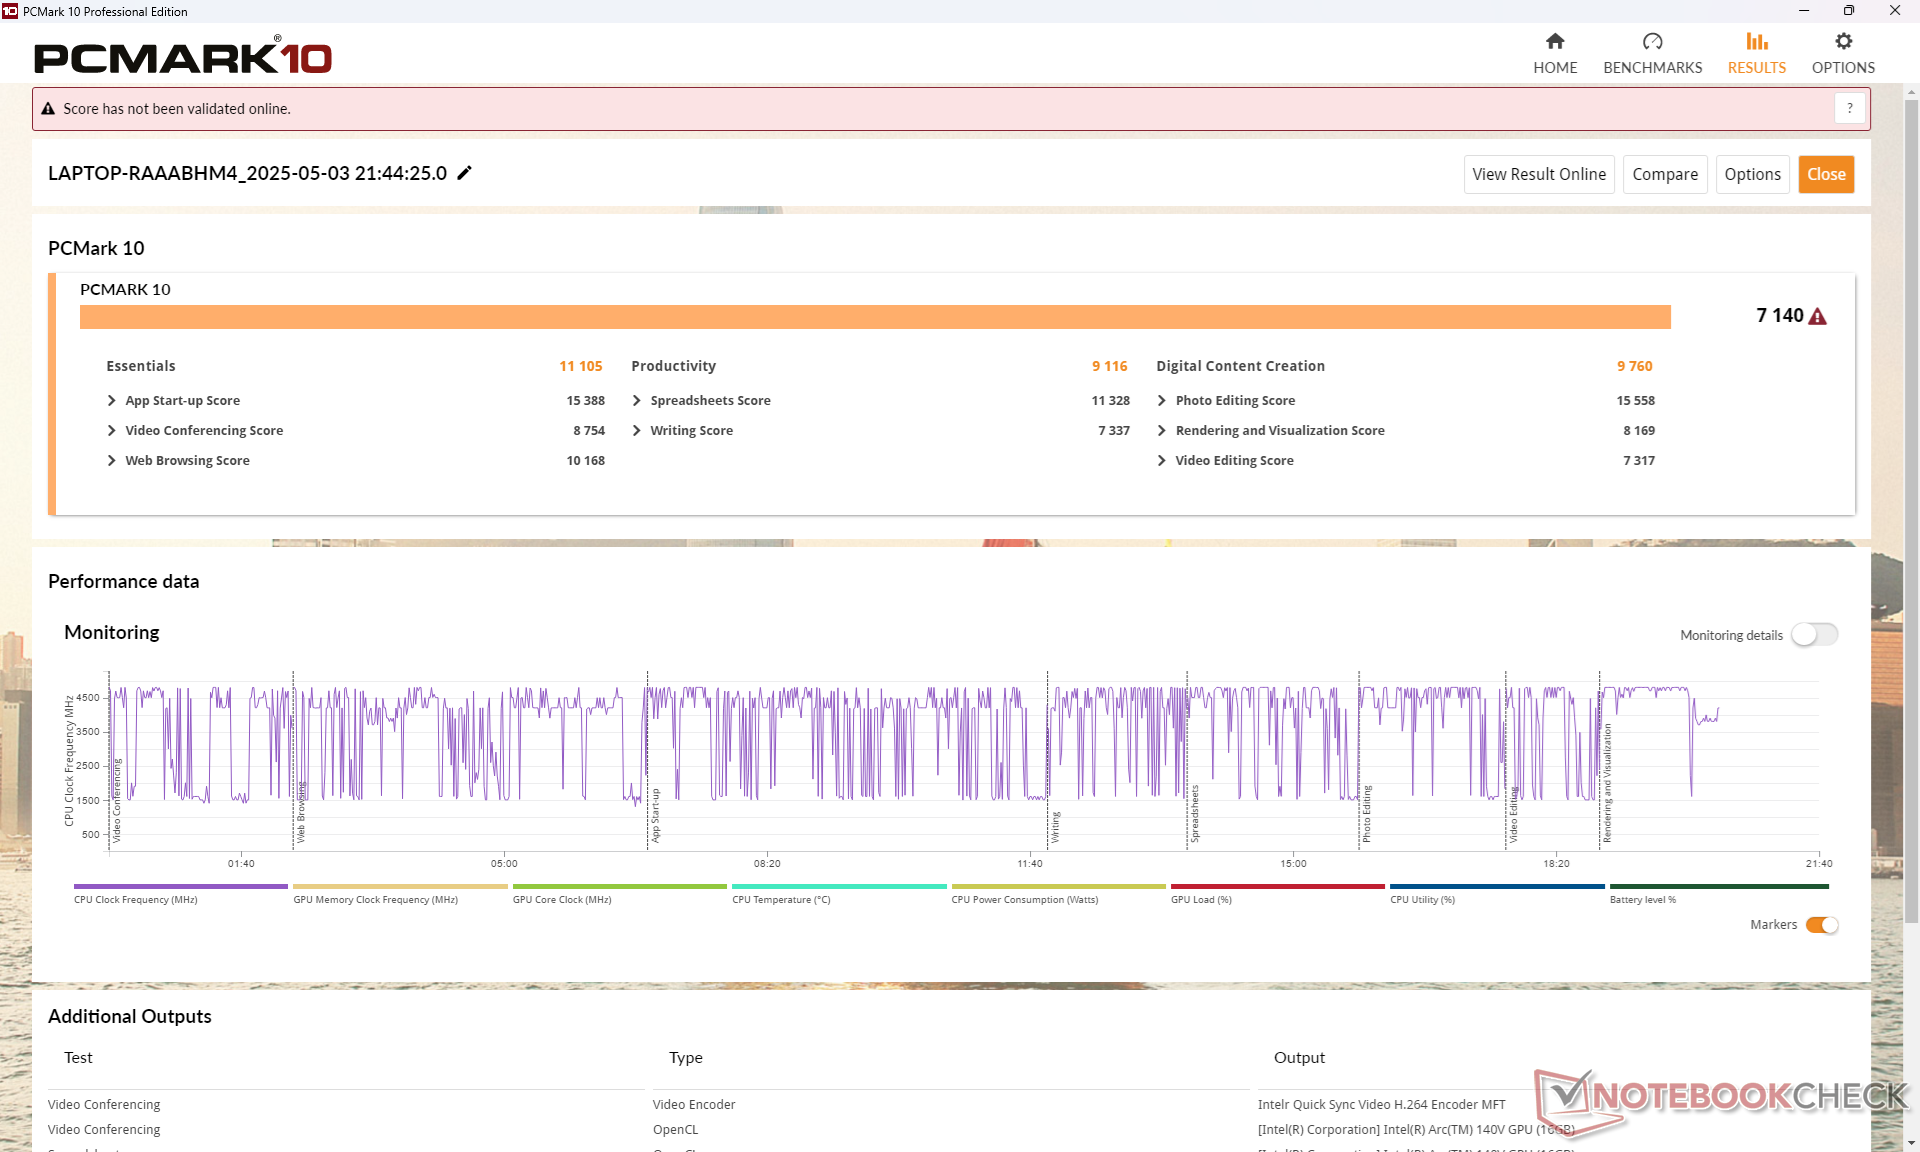
PCMark 10: Score | Essentials | Productivity | Digital Content Creation
CrossMark: Overall | Productivity | Creativity | Responsiveness
WebXPRT 3: Overall
WebXPRT 4: Overall
Mozilla Kraken 1.1: Total
| Performance rating | |
| Asus ZenBook Duo OLED UX8406CA | |
| Lenovo ThinkPad X1 2-in-1 Gen 10 -1! | |
| Average Intel Core Ultra 7 258V, Intel Arc Graphics 140V | |
| Lenovo Yoga 7 2-in-1 14AKP10 -2! | |
| Dell Latitude 9440 2-in-1 | |
| HP EliteBook X Flip G1i 14 AI | |
| Lenovo ThinkPad X1 2in1 G9 21KE004AGE | |
| PCMark 10 / Score | |
| Asus ZenBook Duo OLED UX8406CA | |
| Lenovo ThinkPad X1 2-in-1 Gen 10 | |
| Average Intel Core Ultra 7 258V, Intel Arc Graphics 140V (6265 - 7420, n=23) | |
| HP EliteBook X Flip G1i 14 AI | |
| Lenovo Yoga 7 2-in-1 14AKP10 | |
| Dell Latitude 9440 2-in-1 | |
| Lenovo ThinkPad X1 2in1 G9 21KE004AGE | |
| PCMark 10 / Essentials | |
| Dell Latitude 9440 2-in-1 | |
| Lenovo Yoga 7 2-in-1 14AKP10 | |
| Lenovo ThinkPad X1 2-in-1 Gen 10 | |
| Lenovo ThinkPad X1 2in1 G9 21KE004AGE | |
| Asus ZenBook Duo OLED UX8406CA | |
| HP EliteBook X Flip G1i 14 AI | |
| Average Intel Core Ultra 7 258V, Intel Arc Graphics 140V (9295 - 11467, n=23) | |
| PCMark 10 / Productivity | |
| Lenovo Yoga 7 2-in-1 14AKP10 | |
| HP EliteBook X Flip G1i 14 AI | |
| Average Intel Core Ultra 7 258V, Intel Arc Graphics 140V (7357 - 13600, n=23) | |
| Lenovo ThinkPad X1 2-in-1 Gen 10 | |
| Asus ZenBook Duo OLED UX8406CA | |
| Lenovo ThinkPad X1 2in1 G9 21KE004AGE | |
| Dell Latitude 9440 2-in-1 | |
| PCMark 10 / Digital Content Creation | |
| Asus ZenBook Duo OLED UX8406CA | |
| Lenovo ThinkPad X1 2-in-1 Gen 10 | |
| Average Intel Core Ultra 7 258V, Intel Arc Graphics 140V (8160 - 10308, n=23) | |
| HP EliteBook X Flip G1i 14 AI | |
| Lenovo Yoga 7 2-in-1 14AKP10 | |
| Lenovo ThinkPad X1 2in1 G9 21KE004AGE | |
| Dell Latitude 9440 2-in-1 | |
| CrossMark / Overall | |
| Asus ZenBook Duo OLED UX8406CA | |
| Lenovo ThinkPad X1 2-in-1 Gen 10 | |
| Average Intel Core Ultra 7 258V, Intel Arc Graphics 140V (1275 - 1742, n=22) | |
| Lenovo Yoga 7 2-in-1 14AKP10 | |
| Dell Latitude 9440 2-in-1 | |
| HP EliteBook X Flip G1i 14 AI | |
| Lenovo ThinkPad X1 2in1 G9 21KE004AGE | |
| CrossMark / Productivity | |
| Asus ZenBook Duo OLED UX8406CA | |
| Lenovo ThinkPad X1 2-in-1 Gen 10 | |
| Dell Latitude 9440 2-in-1 | |
| Average Intel Core Ultra 7 258V, Intel Arc Graphics 140V (1267 - 1684, n=22) | |
| HP EliteBook X Flip G1i 14 AI | |
| Lenovo Yoga 7 2-in-1 14AKP10 | |
| Lenovo ThinkPad X1 2in1 G9 21KE004AGE | |
| CrossMark / Creativity | |
| Asus ZenBook Duo OLED UX8406CA | |
| Lenovo ThinkPad X1 2-in-1 Gen 10 | |
| Average Intel Core Ultra 7 258V, Intel Arc Graphics 140V (1393 - 1977, n=22) | |
| Lenovo Yoga 7 2-in-1 14AKP10 | |
| Dell Latitude 9440 2-in-1 | |
| HP EliteBook X Flip G1i 14 AI | |
| Lenovo ThinkPad X1 2in1 G9 21KE004AGE | |
| CrossMark / Responsiveness | |
| Dell Latitude 9440 2-in-1 | |
| Asus ZenBook Duo OLED UX8406CA | |
| Lenovo Yoga 7 2-in-1 14AKP10 | |
| Lenovo ThinkPad X1 2-in-1 Gen 10 | |
| Lenovo ThinkPad X1 2in1 G9 21KE004AGE | |
| Average Intel Core Ultra 7 258V, Intel Arc Graphics 140V (999 - 1411, n=22) | |
| HP EliteBook X Flip G1i 14 AI | |
| WebXPRT 3 / Overall | |
| Lenovo ThinkPad X1 2-in-1 Gen 10 | |
| Dell Latitude 9440 2-in-1 | |
| Average Intel Core Ultra 7 258V, Intel Arc Graphics 140V (219 - 317, n=22) | |
| Asus ZenBook Duo OLED UX8406CA | |
| Lenovo ThinkPad X1 2in1 G9 21KE004AGE | |
| HP EliteBook X Flip G1i 14 AI | |
| WebXPRT 4 / Overall | |
| Average Intel Core Ultra 7 258V, Intel Arc Graphics 140V (199.5 - 291, n=22) | |
| Dell Latitude 9440 2-in-1 | |
| Asus ZenBook Duo OLED UX8406CA | |
| Lenovo ThinkPad X1 2in1 G9 21KE004AGE | |
| HP EliteBook X Flip G1i 14 AI | |
| Mozilla Kraken 1.1 / Total | |
| Lenovo ThinkPad X1 2in1 G9 21KE004AGE | |
| Dell Latitude 9440 2-in-1 | |
| Average Intel Core Ultra 7 258V, Intel Arc Graphics 140V (468 - 559, n=24) | |
| HP EliteBook X Flip G1i 14 AI | |
| Lenovo ThinkPad X1 2-in-1 Gen 10 | |
| Asus ZenBook Duo OLED UX8406CA | |
| Lenovo Yoga 7 2-in-1 14AKP10 | |
* ... smaller is better
| PCMark 10 Score | 7140 points | |
Help | ||
| AIDA64 / Memory Copy | |
| HP EliteBook X Flip G1i 14 AI | |
| Lenovo ThinkPad X1 2-in-1 Gen 10 | |
| Average Intel Core Ultra 7 258V (104408 - 114336, n=24) | |
| Asus ZenBook Duo OLED UX8406CA | |
| Lenovo Yoga 7 2-in-1 14AKP10 | |
| Lenovo ThinkPad X1 2in1 G9 21KE004AGE | |
| Dell Latitude 9440 2-in-1 | |
| AIDA64 / Memory Read | |
| Lenovo ThinkPad X1 2-in-1 Gen 10 | |
| Average Intel Core Ultra 7 258V (82846 - 89417, n=24) | |
| HP EliteBook X Flip G1i 14 AI | |
| Asus ZenBook Duo OLED UX8406CA | |
| Lenovo Yoga 7 2-in-1 14AKP10 | |
| Lenovo ThinkPad X1 2in1 G9 21KE004AGE | |
| Dell Latitude 9440 2-in-1 | |
| AIDA64 / Memory Write | |
| Lenovo ThinkPad X1 2-in-1 Gen 10 | |
| Average Intel Core Ultra 7 258V (108824 - 117989, n=24) | |
| HP EliteBook X Flip G1i 14 AI | |
| Lenovo Yoga 7 2-in-1 14AKP10 | |
| Dell Latitude 9440 2-in-1 | |
| Asus ZenBook Duo OLED UX8406CA | |
| Lenovo ThinkPad X1 2in1 G9 21KE004AGE | |
| AIDA64 / Memory Latency | |
| Lenovo ThinkPad X1 2in1 G9 21KE004AGE | |
| Asus ZenBook Duo OLED UX8406CA | |
| Lenovo Yoga 7 2-in-1 14AKP10 | |
| HP EliteBook X Flip G1i 14 AI | |
| Average Intel Core Ultra 7 258V (95 - 101.7, n=24) | |
| Lenovo ThinkPad X1 2-in-1 Gen 10 | |
| Dell Latitude 9440 2-in-1 | |
* ... smaller is better
DPC Latency
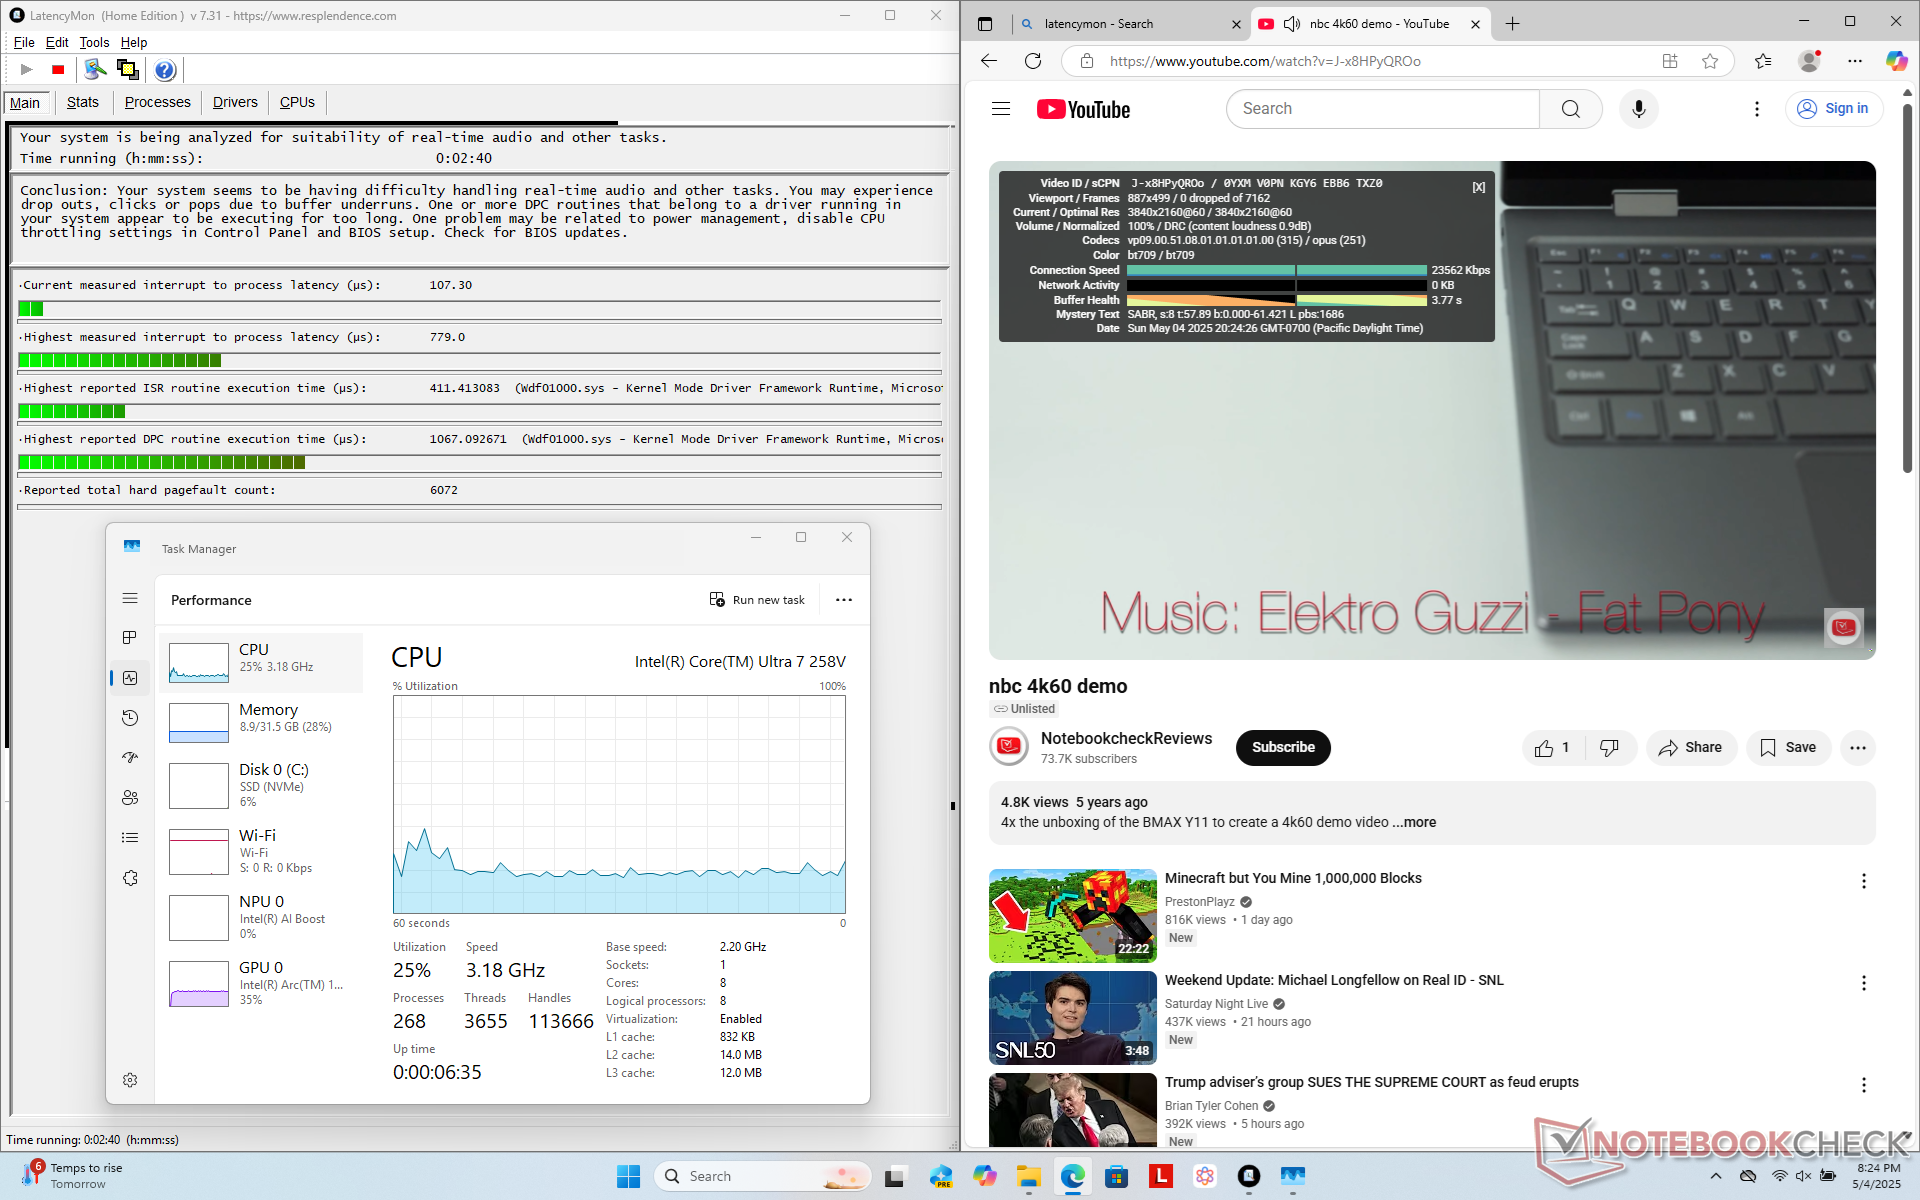
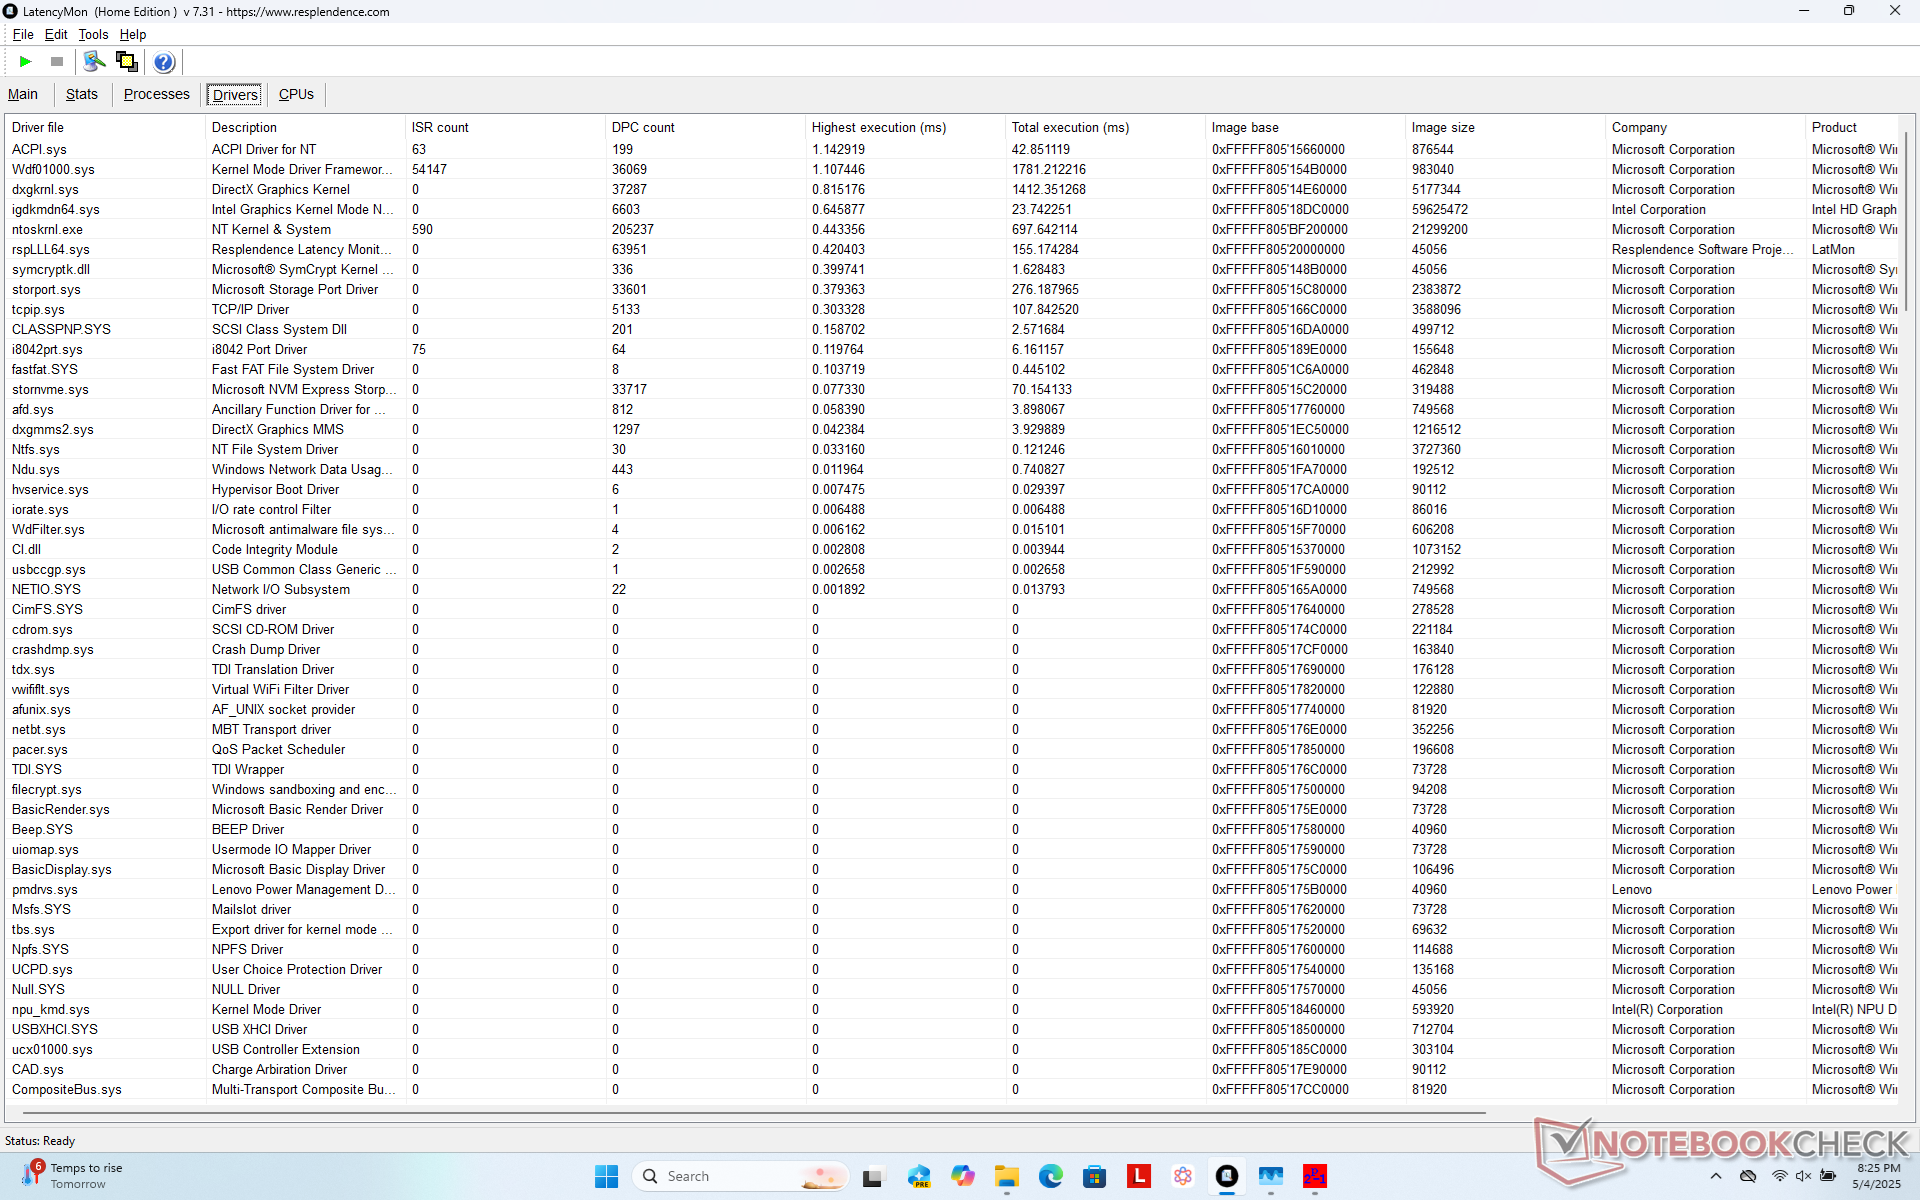
LatencyMon shows only minor DPC issues and no dropped frames whatsoever during our 4K60 video test.
| DPC Latencies / LatencyMon - interrupt to process latency (max), Web, Youtube, Prime95 | |
| Lenovo Yoga 7 2-in-1 14AKP10 | |
| Dell Latitude 9440 2-in-1 | |
| HP EliteBook X Flip G1i 14 AI | |
| Lenovo ThinkPad X1 2in1 G9 21KE004AGE | |
| Lenovo ThinkPad X1 2-in-1 Gen 10 | |
| Asus ZenBook Duo OLED UX8406CA | |
* ... smaller is better
Storage Devices
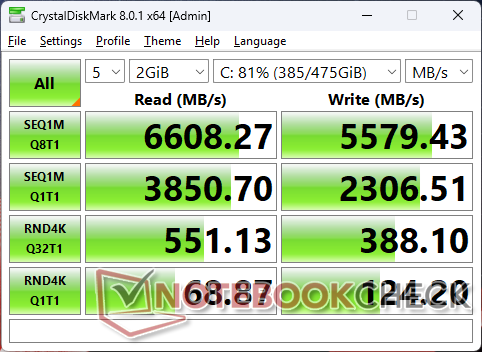
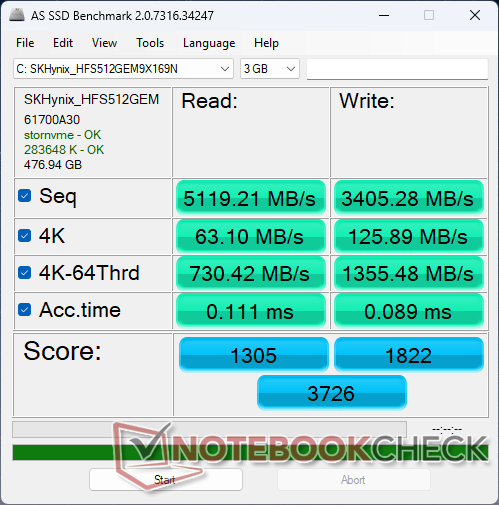
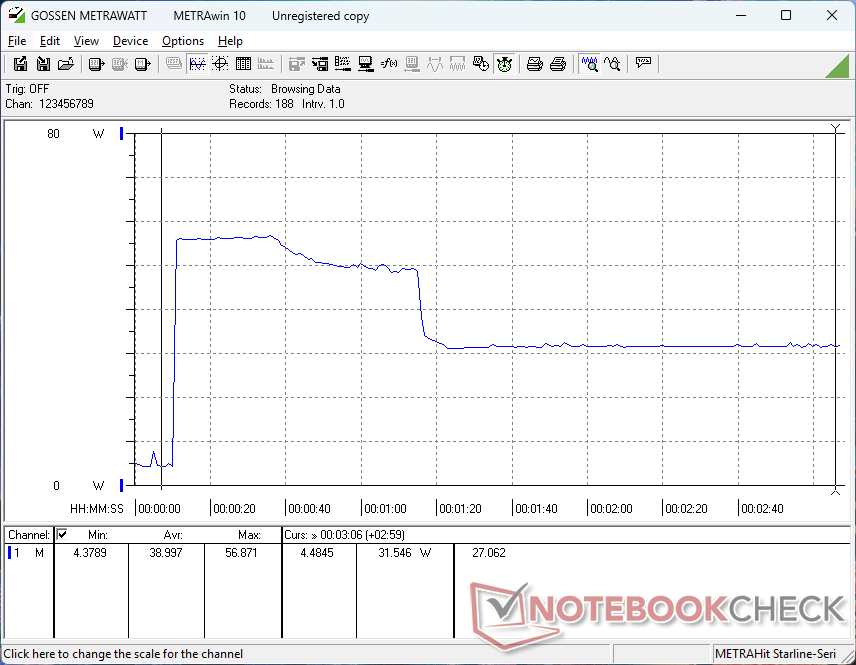
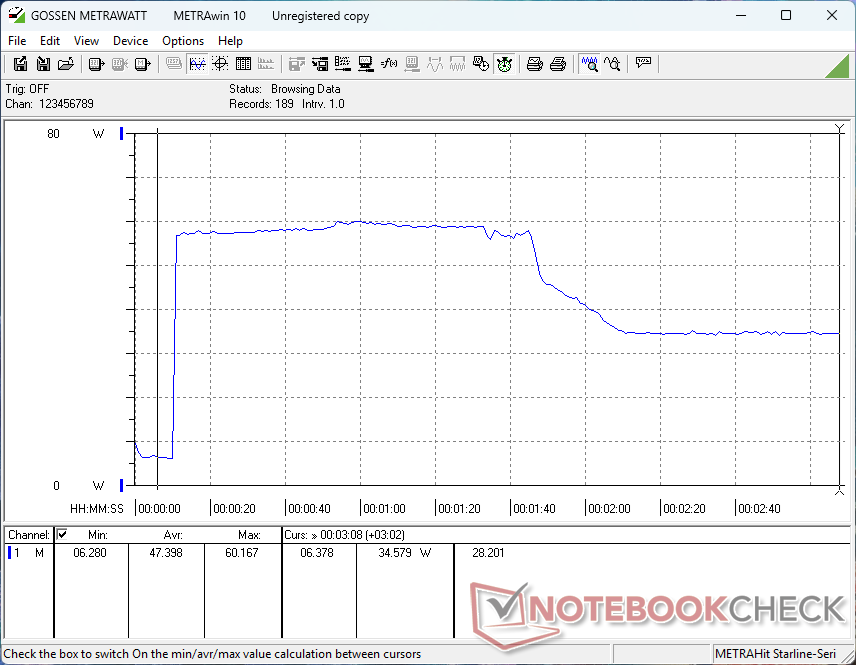
Our test unit ships with an SK Hynix HFS512GEM9X169N instead of the Kioxia as found on our 2024 model. Performance is steady with no throttling when stressed as shown our DiskSpd loop results below, but write rates are nonetheless slower than the Kioxia.
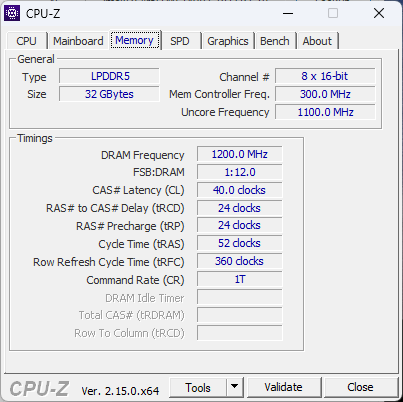
Core Ultra-H configurations have full support for PCIe5 x4 drives. Otherwise, our Core Ultra-V configuration supports up to PCIe4 x4 only.

* ... smaller is better
Disk Throttling: DiskSpd Read Loop, Queue Depth 8
GPU Performance
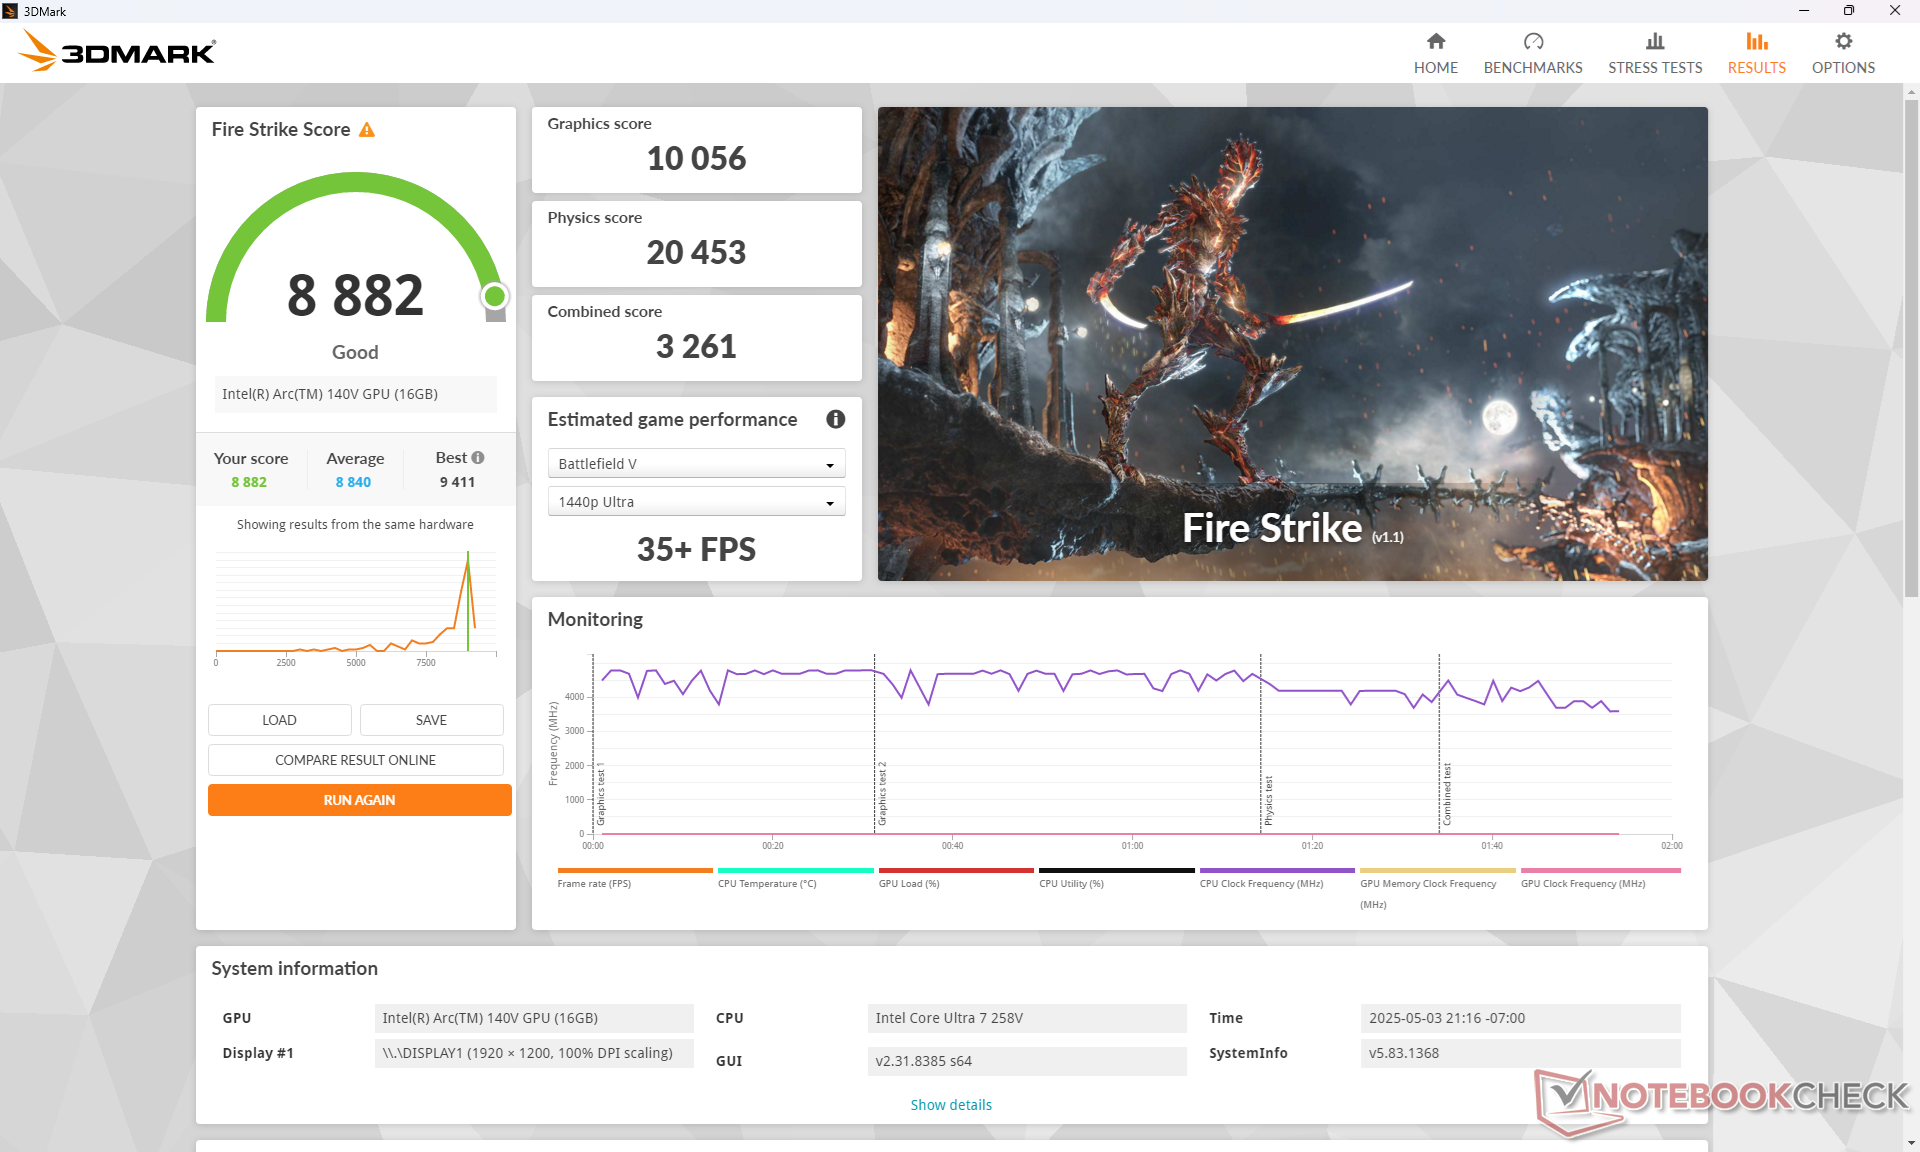
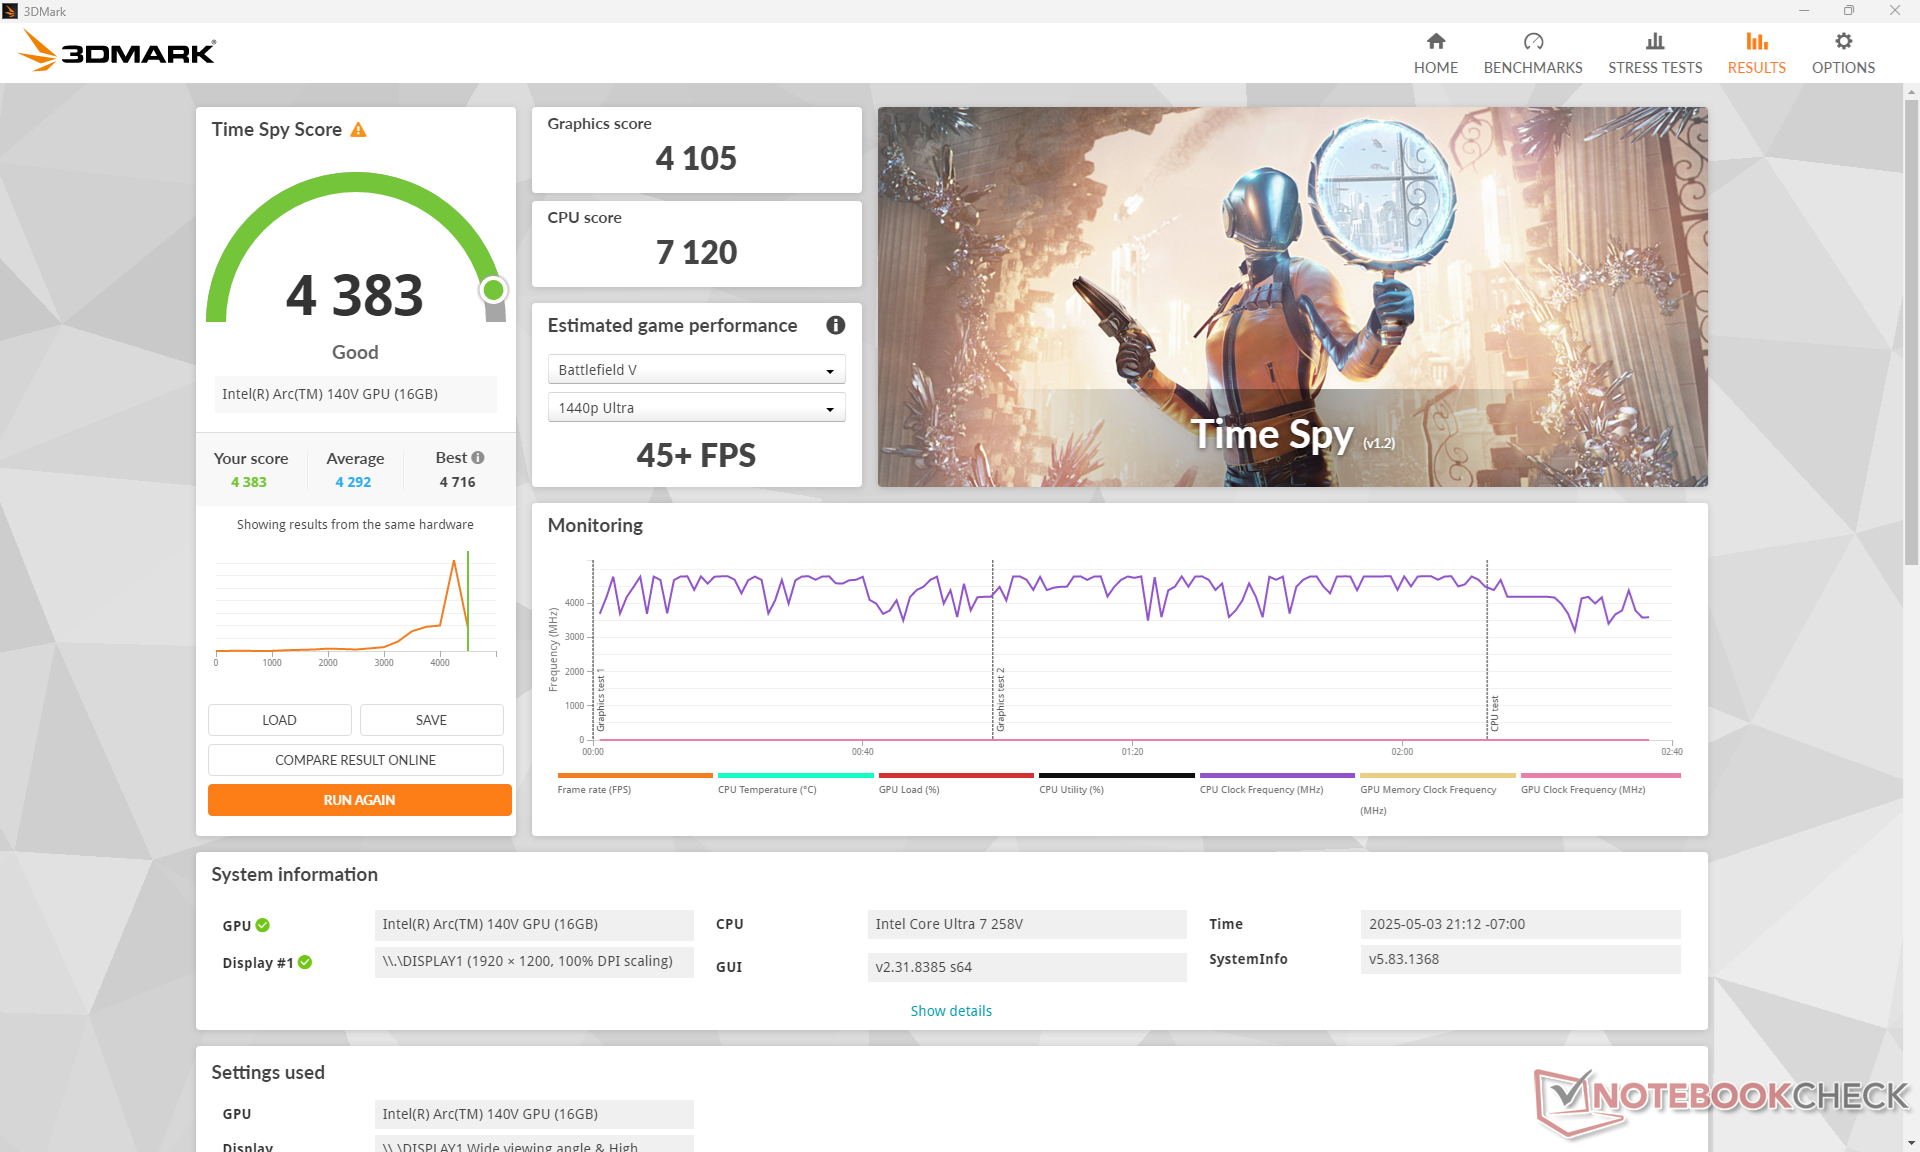
While raw processor performance remains flat over the ThinkPad X1 2-in-1 Gen 9, graphics performance has increased substantially when jumping from the Arc 4 to the Arc 140V. 3DMark results show up to 2x the performance boost or roughly 10 to 20 percent over the one-year old Arc 8. This is one of the fastest integrated solutions available for a 14-inch convertible form factor.
The main caveat, however, is that GPU performance can be unsteady much like the CPU performance mentioned above. When running Fire Strike, for example, the graphics score can fluctuate regardless of the power profile as shown by our table below.
| Power Profile | Graphics Score | Physics Score | Combined Score |
| Performance mode | 10056 | 20453 | 3261 |
| Balanced mode | 6736 (-33%) | 16281 (-20%) | 2236 (-31%) |
| Battery Power | 9701 (-4%) | 20608 (-0%) | 3474 (-0%) |
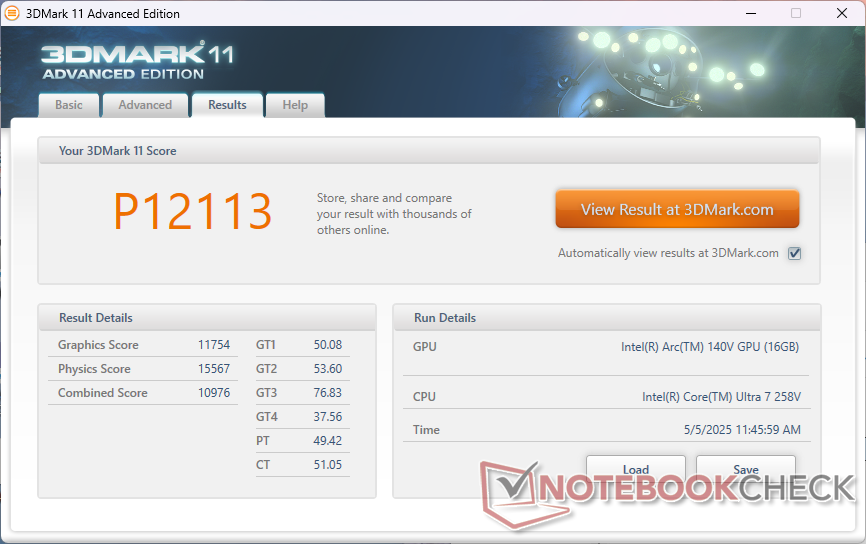
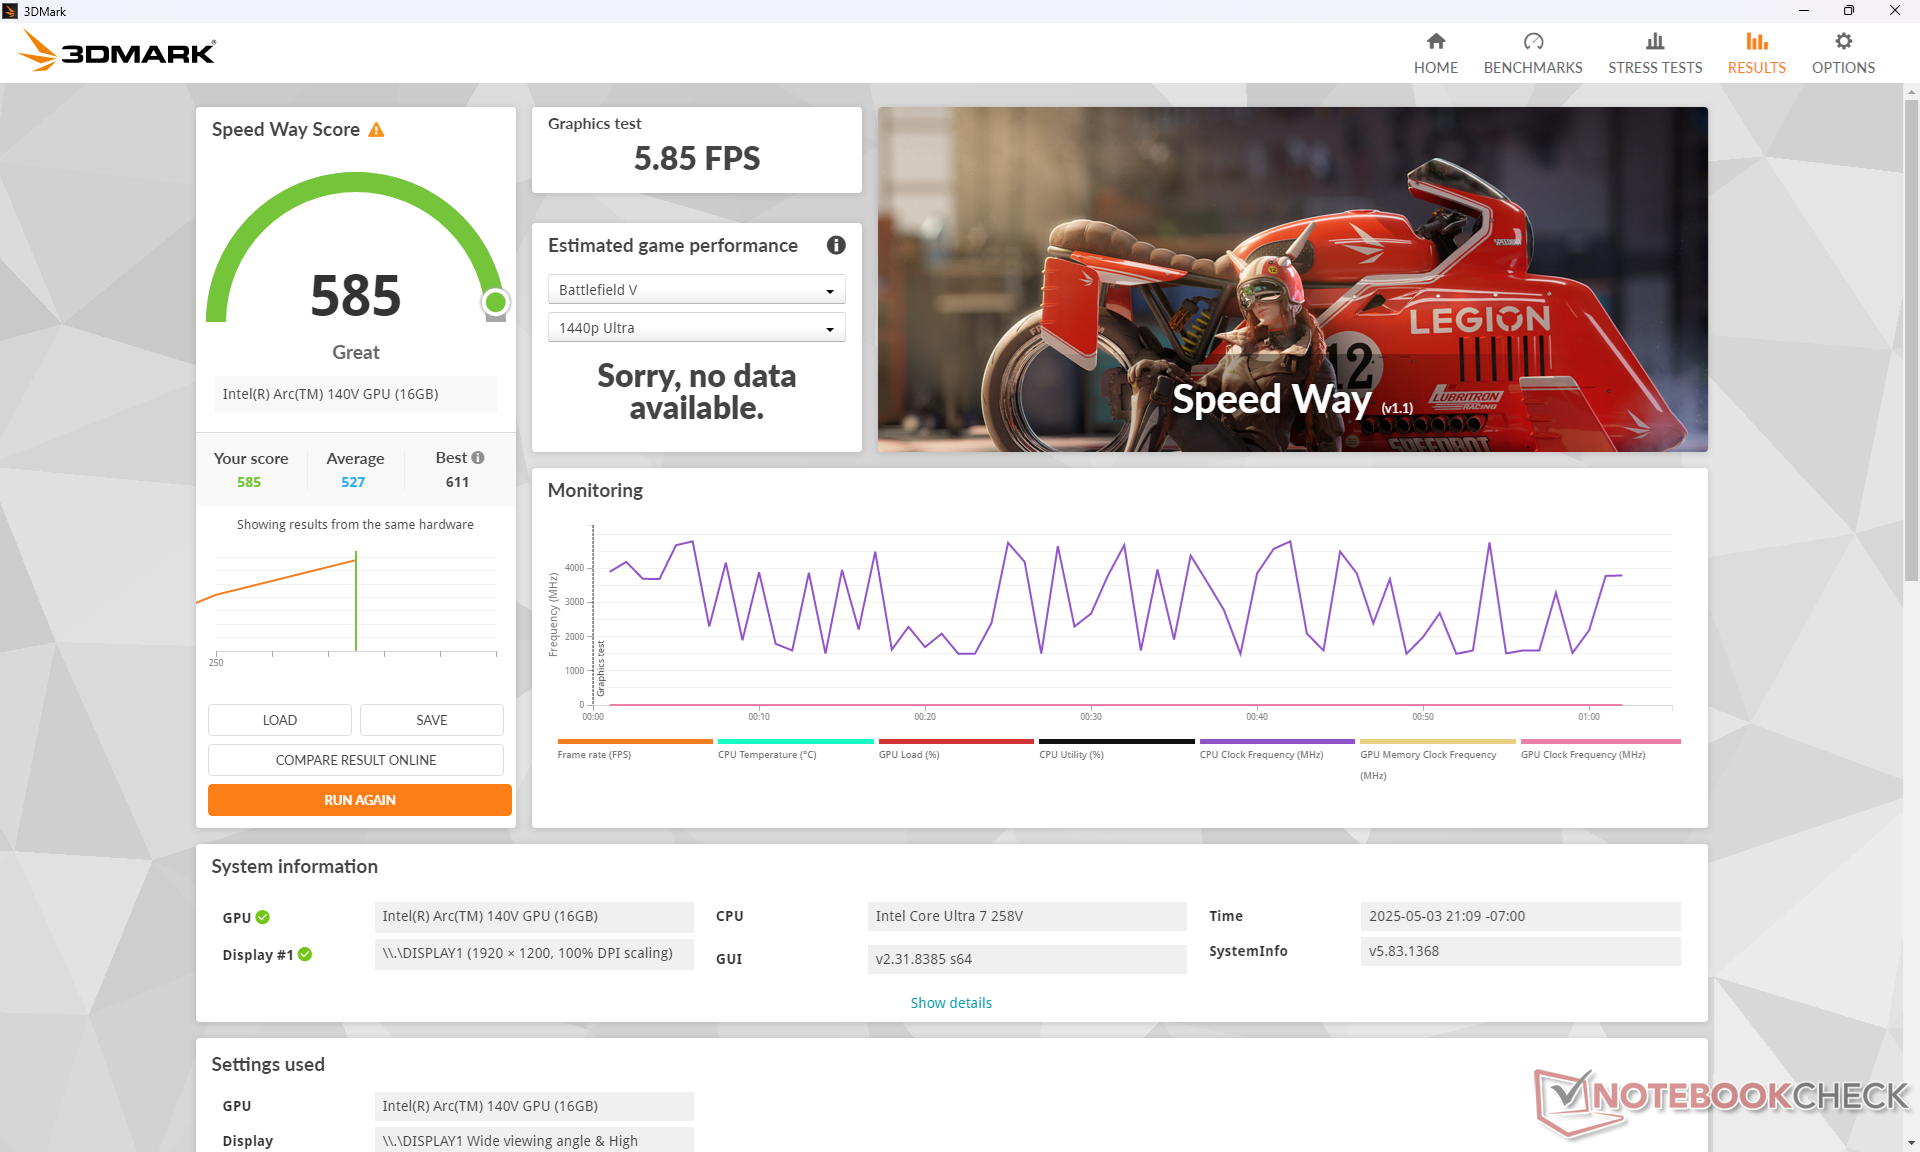
| 3DMark 11 Performance | 12113 points | |
| 3DMark Fire Strike Score | 8882 points | |
| 3DMark Time Spy Score | 4383 points | |
Help | ||
* ... smaller is better
Gaming Performance
The fluctuating GPU performance as mentioned above unfortunately leads to fluctuating frame rates. When idling on Cyberpunk 2077 at 1080p Ultra settings, for example, frame rates would cycle between 22 and 26 FPS compared to a steady 26 FPS on the Lenovo Yoga 7 14 2-in-1 G10 equipped with the exact same processor and GPU. The ThinkPad X1 2-in-1 Gen 10 is therefore not ideal for gaming even though its iGPU is wholly capable of running most titles.
Cyberpunk 2077 ultra FPS Chart
| low | med. | high | ultra | |
|---|---|---|---|---|
| Dota 2 Reborn (2015) | 96 | 64.4 | 66.2 | 65.6 |
| Final Fantasy XV Benchmark (2018) | 72.3 | 41.5 | 30.3 | |
| X-Plane 11.11 (2018) | 44.1 | 35.6 | 37.1 | |
| Strange Brigade (2018) | 225 | 86.8 | 72.8 | 60.5 |
| Baldur's Gate 3 (2023) | 41.8 | 30.3 | 28.8 | 25.8 |
| Cyberpunk 2077 (2023) | 41.3 | 35.6 | 31.7 | 26.5 |
| F1 24 (2024) | 75.7 | 76.8 | 56.7 | 17.6 |
Emissions
System Noise
Fan noise is noticeably quieter than on last year's model despite having no major changes to the cooling solution. The internal fans idle for longer when higher loads are introduced meaning reduced pulsing behavior when browsing the web or playing video. The fan noise ceiling is otherwise similar to last year's model at about 41 dB(A) when running very demanding loads — it simply takes longer to reach that ceiling with the newer model.
The Lenovo is generally quieter when compared to other 14-inch convertibles as well including the Latitude 9440 2-in-1.
Noise level
| Idle |
| 23.3 / 23.3 / 23.3 dB(A) |
| Load |
| 38 / 40.6 dB(A) |
 | ||
30 dB silent 40 dB(A) audible 50 dB(A) loud |
||
min: | ||
| Lenovo ThinkPad X1 2-in-1 Gen 10 Arc 140V, Core Ultra 7 258V | Lenovo ThinkPad X1 2in1 G9 21KE004AGE Graphics 4-Core iGPU (Arrow Lake), Ultra 7 165U, Kioxia XG8 KXG8AZNV1T02 | Lenovo Yoga 7 2-in-1 14AKP10 Radeon 840M, Ryzen AI 5 340, WD PC SN7100S SDFPMSL-512G-1101 | Dell Latitude 9440 2-in-1 Iris Xe G7 96EUs, i7-1365U, Samsung PM9B1 1024GB MZAL41T0HBLB | HP EliteBook X Flip G1i 14 AI Arc 140V, Core Ultra 7 258V, Western Digital PC SN5000S SDEPNSJ-1T00-1006 | Asus ZenBook Duo OLED UX8406CA Arc 140T, Ultra 9 285H, Western Digital PC SN5000S SDEQNSJ-1T00 | |
|---|---|---|---|---|---|---|
| Noise | -12% | -13% | -4% | 10% | -2% | |
| off / environment * (dB) | 23.3 | 24.5 -5% | 25 -7% | 24.1 -3% | 23 1% | 23.6 -1% |
| Idle Minimum * (dB) | 23.3 | 24.5 -5% | 25 -7% | 24.3 -4% | 23 1% | 23.6 -1% |
| Idle Average * (dB) | 23.3 | 28 -20% | 27 -16% | 24.3 -4% | 23 1% | 23.6 -1% |
| Idle Maximum * (dB) | 23.3 | 29.8 -28% | 30 -29% | 24.3 -4% | 23 1% | 23.6 -1% |
| Load Average * (dB) | 38 | 41.7 -10% | 43 -13% | 36.3 4% | 27.14 29% | 39.8 -5% |
| Cyberpunk 2077 ultra * (dB) | 37.8 | 42 -11% | 31.65 16% | 39.8 -5% | ||
| Load Maximum * (dB) | 40.6 | 41.7 -3% | 44 -8% | 44.5 -10% | 31.65 22% | 39.8 2% |
| Witcher 3 ultra * (dB) | 41.7 | 44.5 |
* ... smaller is better
Temperature
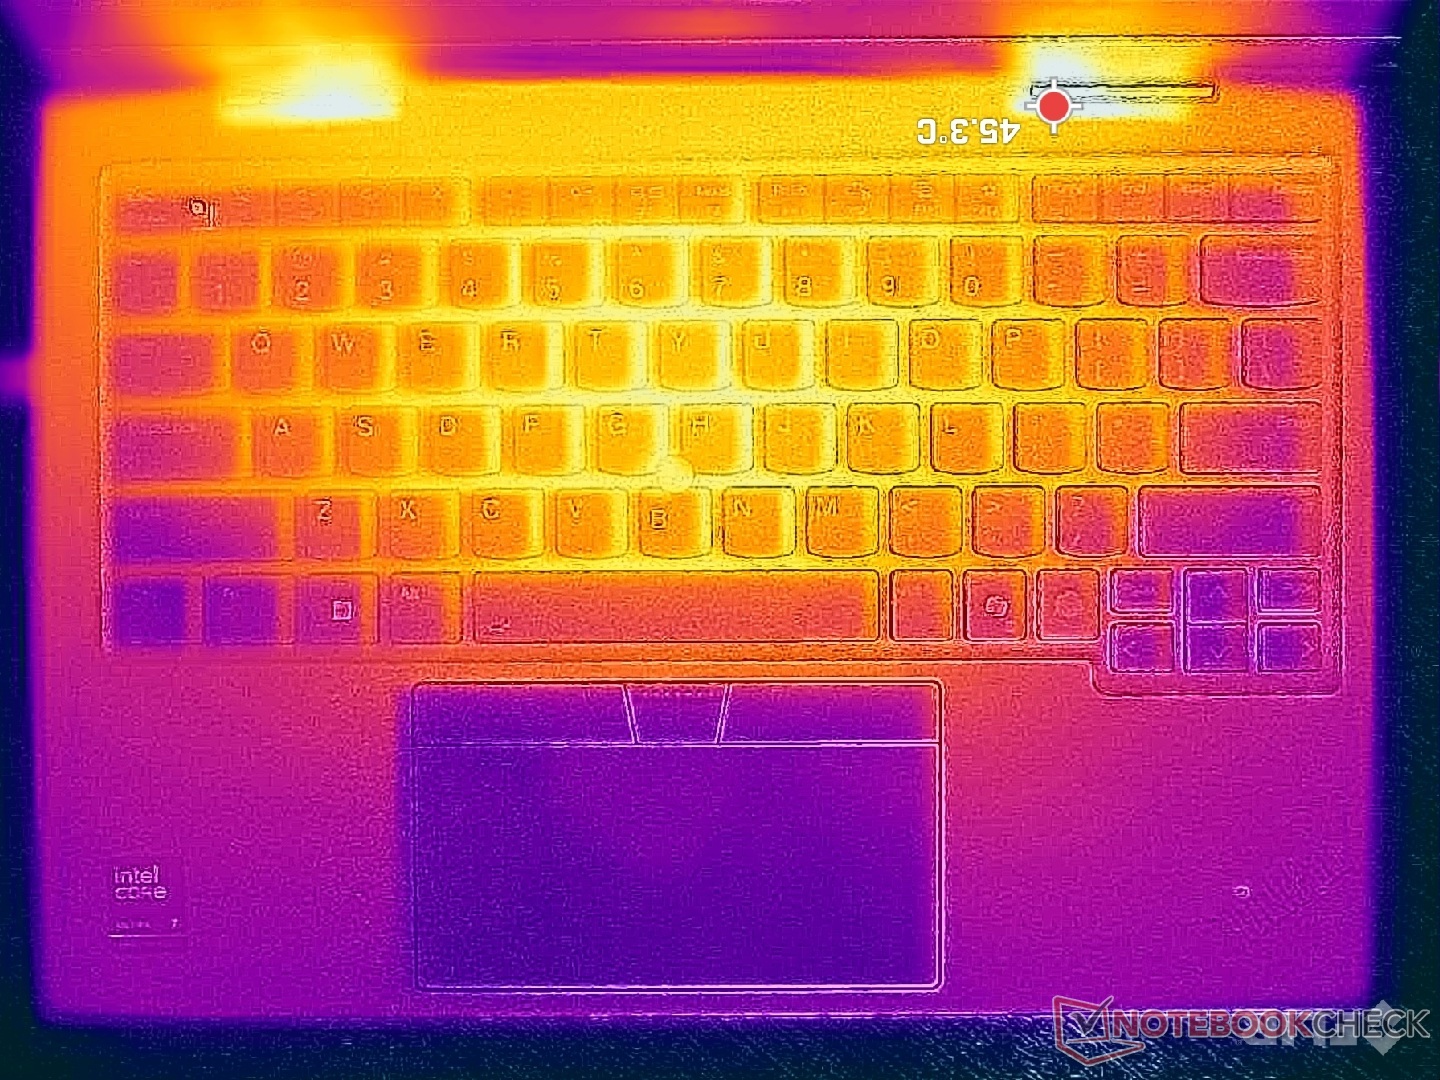
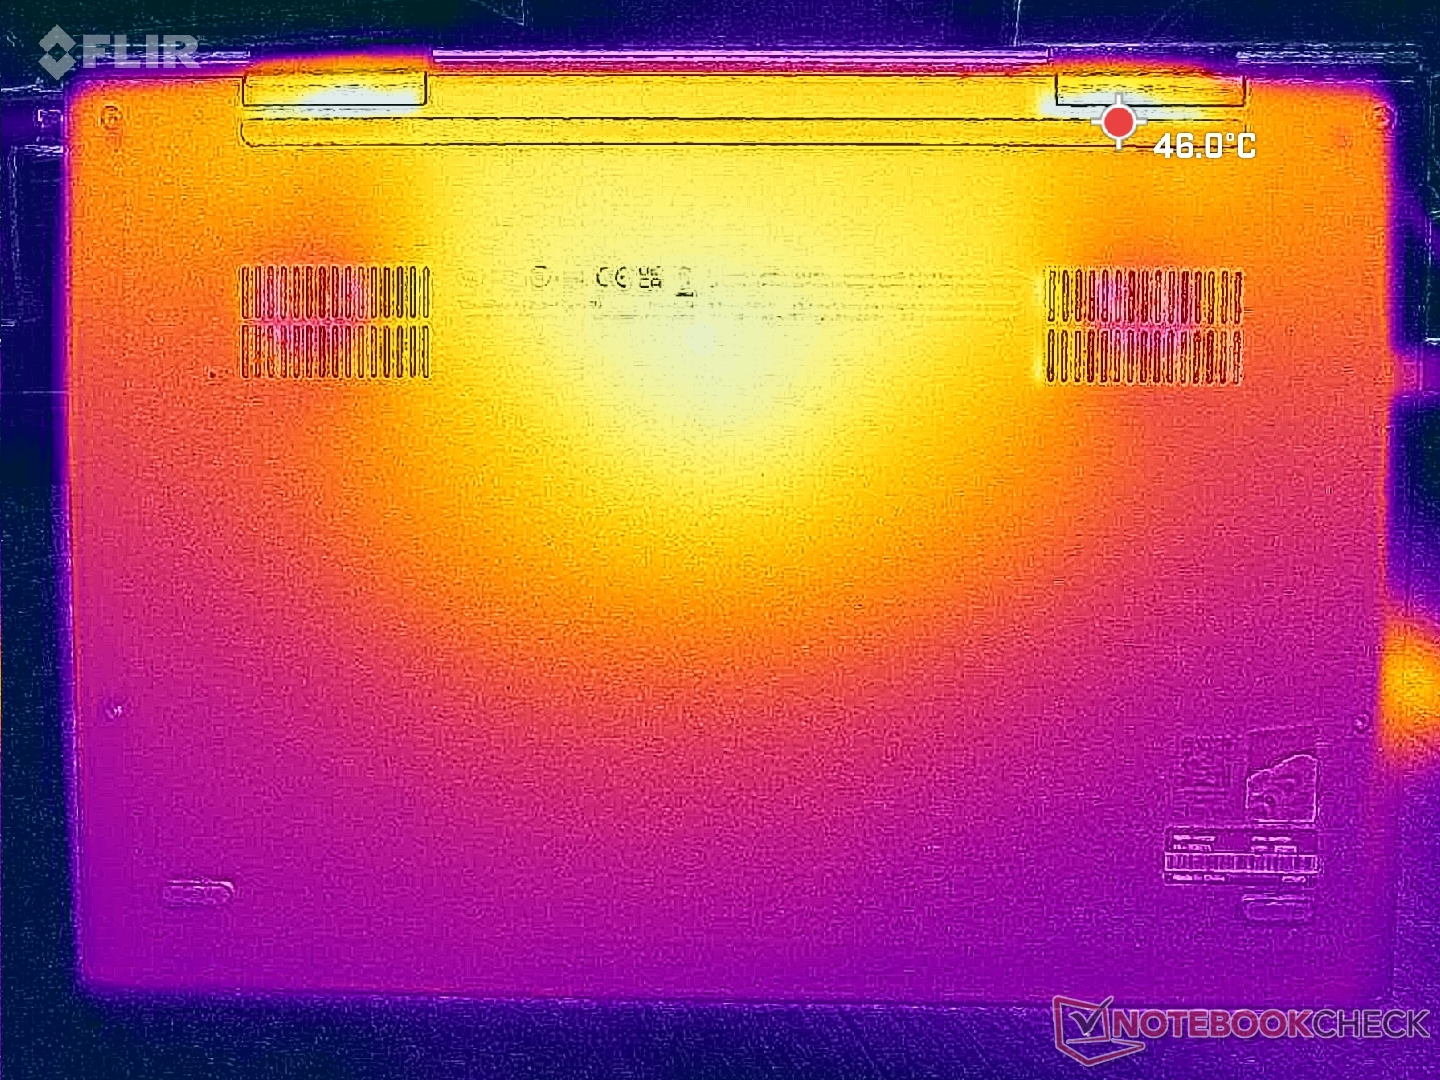
Surface temperature is warmest toward the center where hot spots can reach 39 C or a few degrees cooler on average than what we recorded on the 2024 model. The cooler surfaces are welcomed as we found the outgoing model to be warmer than we would like when running demanding loads.
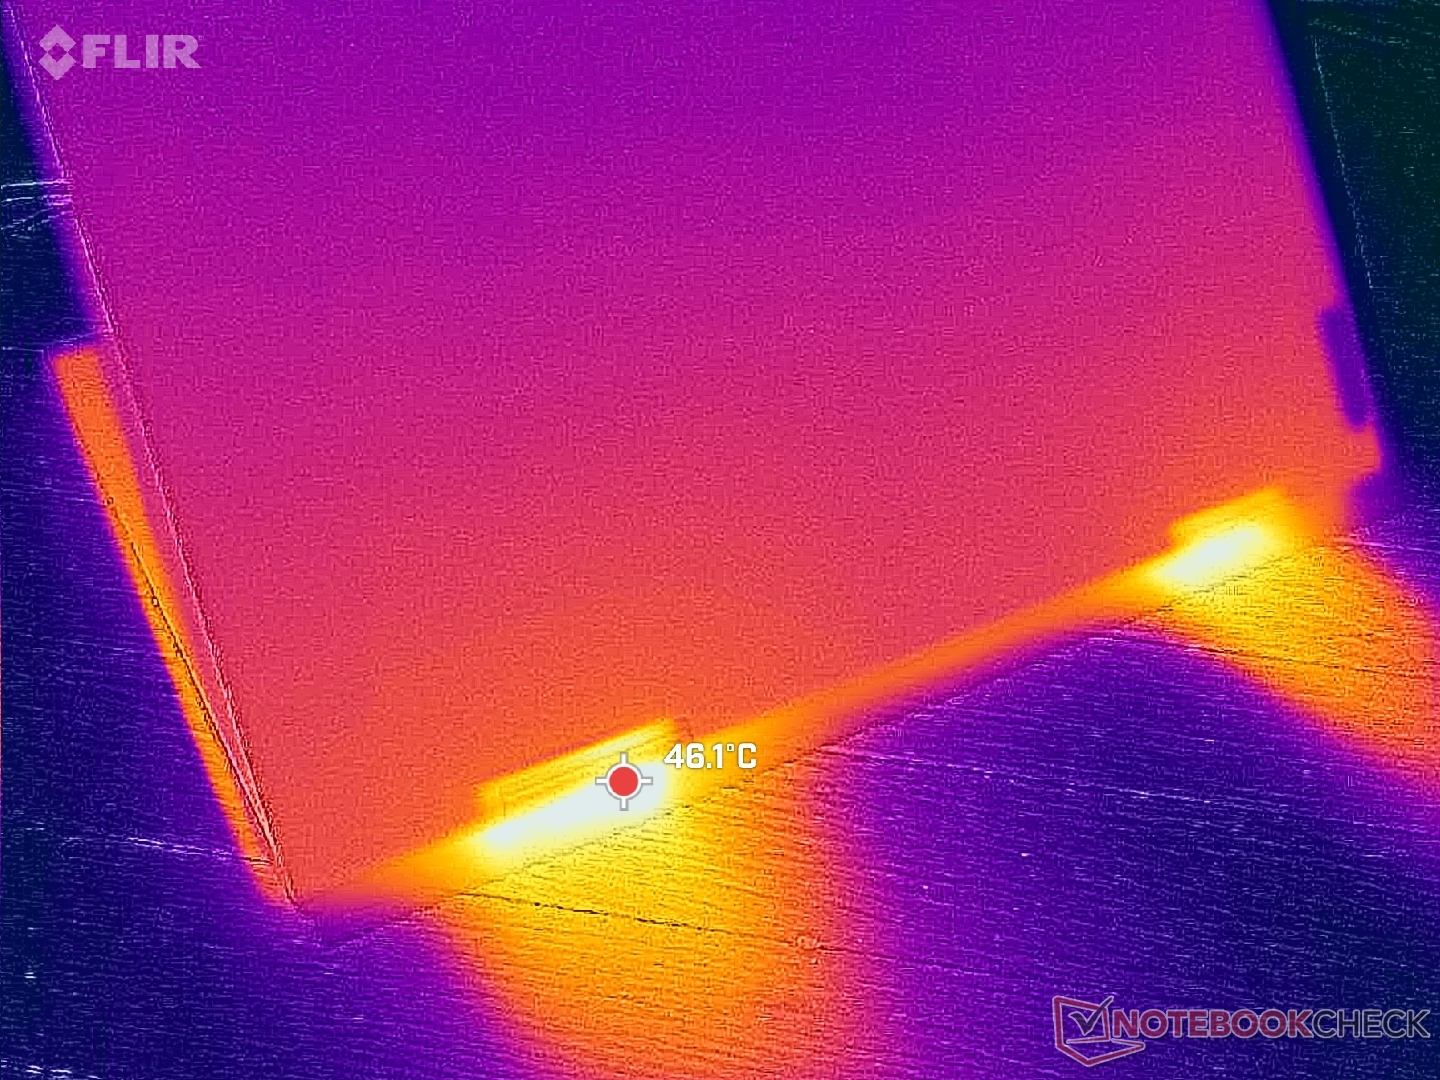
(±) The maximum temperature on the upper side is 40 °C / 104 F, compared to the average of 35.4 °C / 96 F, ranging from 19.6 to 60 °C for the class Convertible.
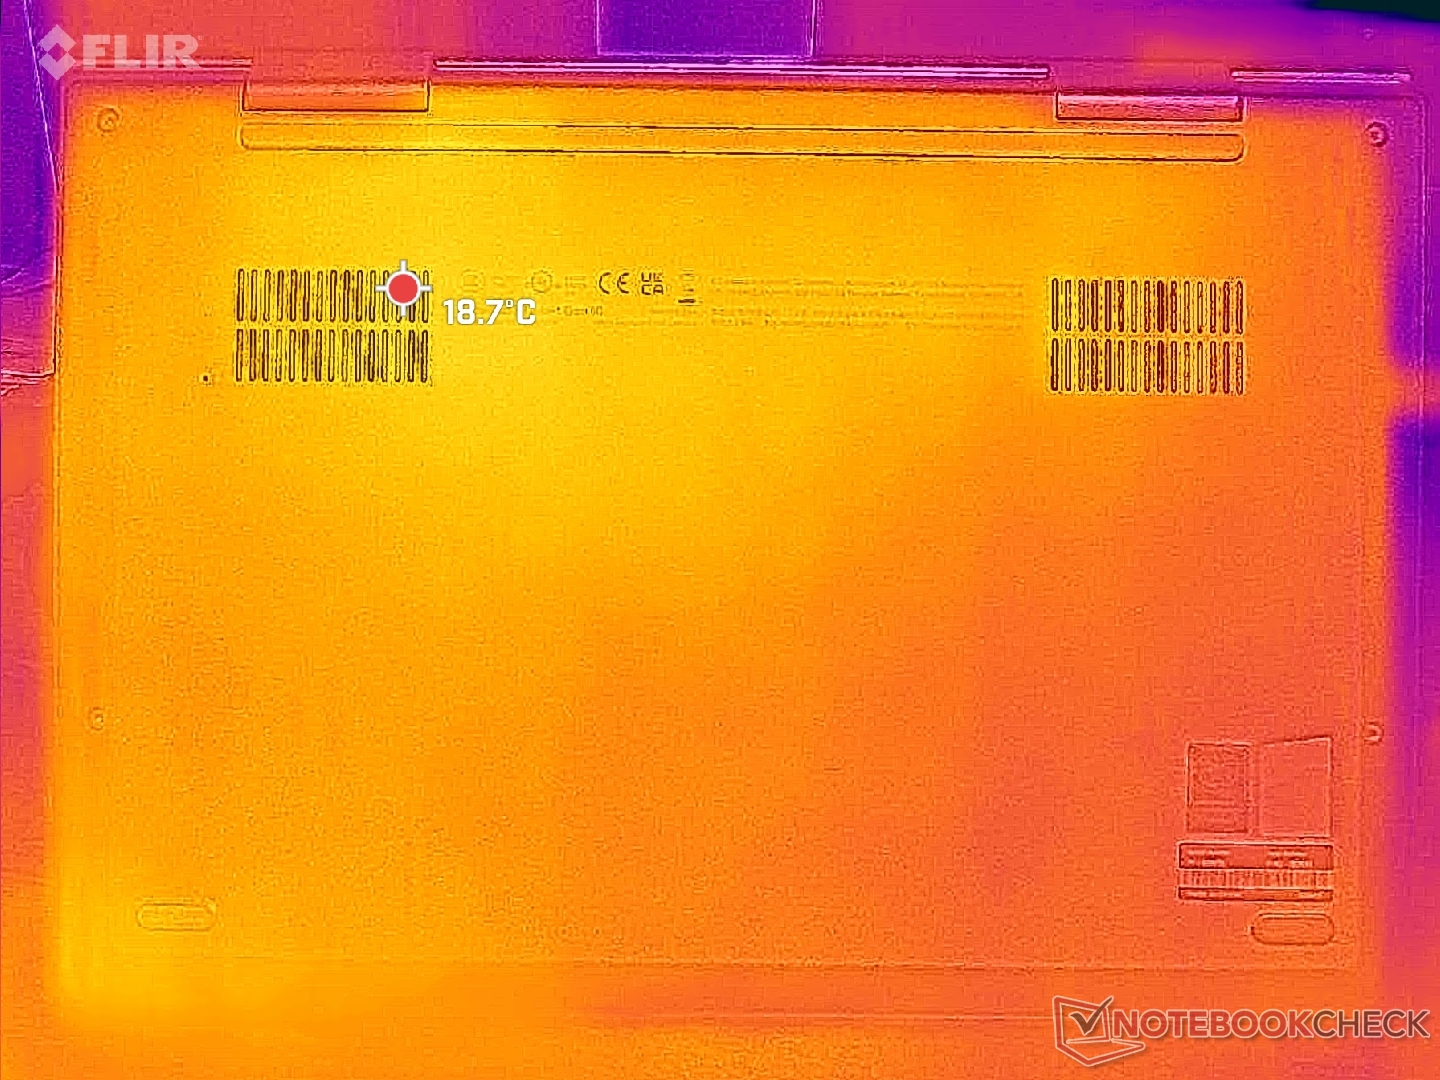
(+) The bottom heats up to a maximum of 38.6 °C / 101 F, compared to the average of 36.9 °C / 98 F
(+) In idle usage, the average temperature for the upper side is 24.4 °C / 76 F, compared to the device average of 30.3 °C / 87 F.
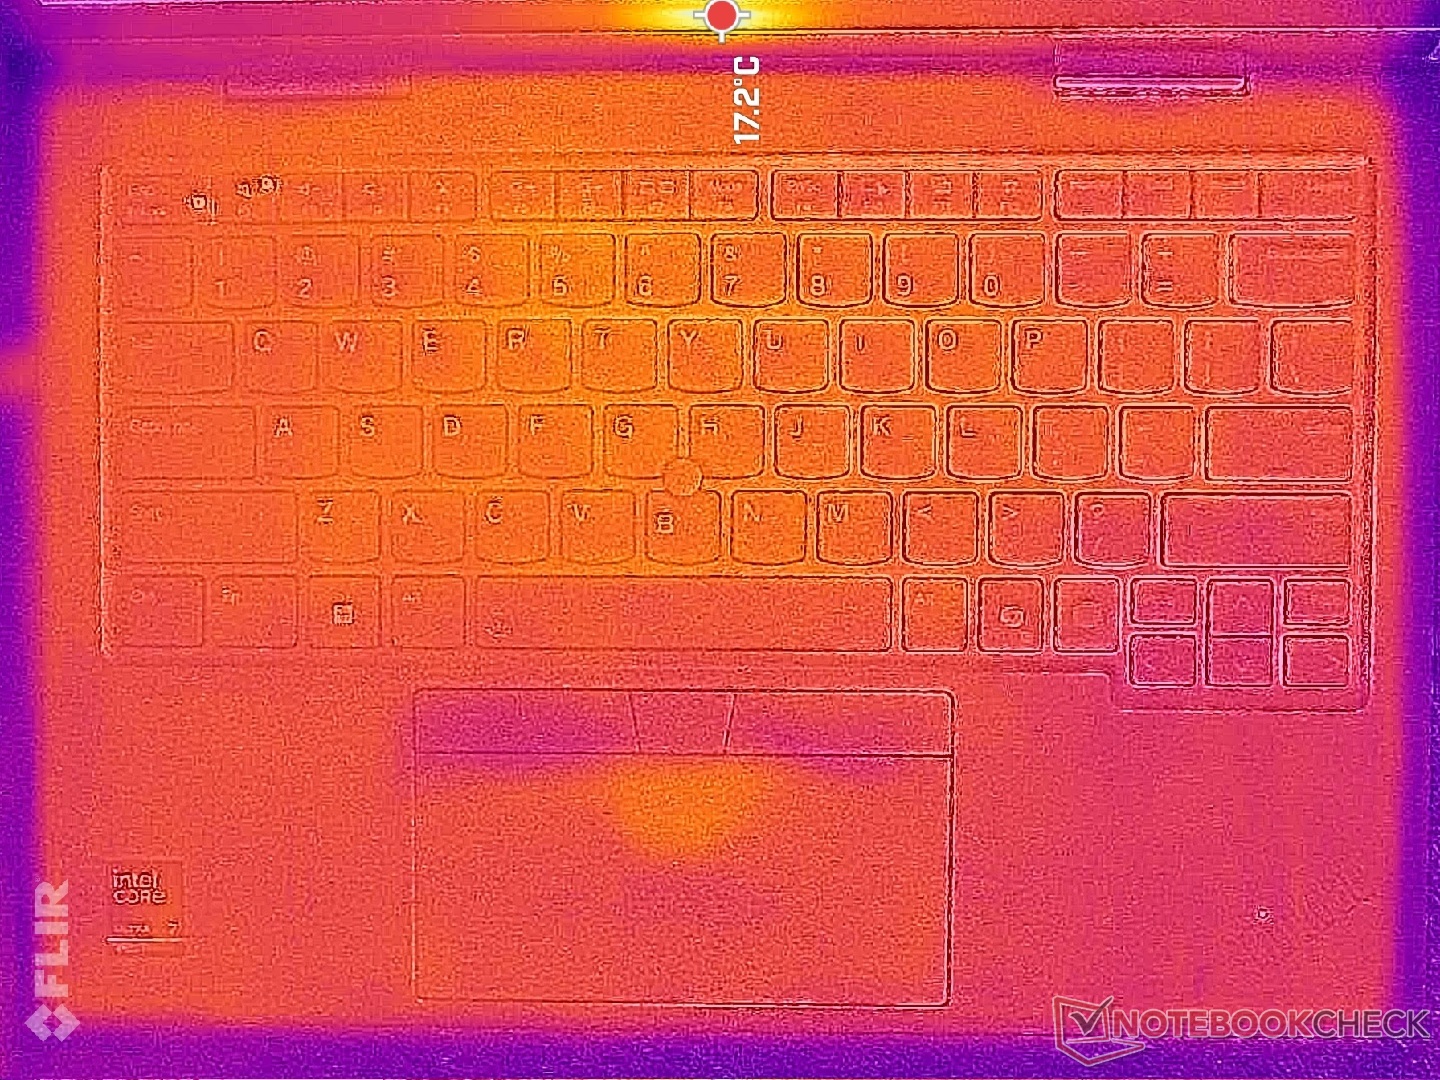
(+) The palmrests and touchpad are cooler than skin temperature with a maximum of 28.4 °C / 83.1 F and are therefore cool to the touch.
(±) The average temperature of the palmrest area of similar devices was 28 °C / 82.4 F (-0.4 °C / -0.7 F).
| Lenovo ThinkPad X1 2-in-1 Gen 10 Intel Core Ultra 7 258V, Intel Arc Graphics 140V | Lenovo ThinkPad X1 2in1 G9 21KE004AGE Intel Core Ultra 7 165U, Intel Graphics 4-Core iGPU (Meteor / Arrow Lake) | Lenovo Yoga 7 2-in-1 14AKP10 AMD Ryzen AI 5 340, AMD Radeon 840M | Dell Latitude 9440 2-in-1 Intel Core i7-1365U, Intel Iris Xe Graphics G7 96EUs | HP EliteBook X Flip G1i 14 AI Intel Core Ultra 7 258V, Intel Arc Graphics 140V | Asus ZenBook Duo OLED UX8406CA Intel Core Ultra 9 285H, Intel Arc Graphics 140T | |
|---|---|---|---|---|---|---|
| Heat | -3% | -17% | -13% | -1% | -2% | |
| Maximum Upper Side * (°C) | 40 | 42.9 -7% | 47 -18% | 40.8 -2% | 36 10% | 35.3 12% |
| Maximum Bottom * (°C) | 38.6 | 43.6 -13% | 49 -27% | 40 -4% | 41 -6% | 47.2 -22% |
| Idle Upper Side * (°C) | 25 | 24.4 2% | 28 -12% | 30.4 -22% | 26 -4% | 24.8 1% |
| Idle Bottom * (°C) | 26.6 | 24.9 6% | 29 -9% | 32.8 -23% | 27 -2% | 26.2 2% |
* ... smaller is better
Speakers
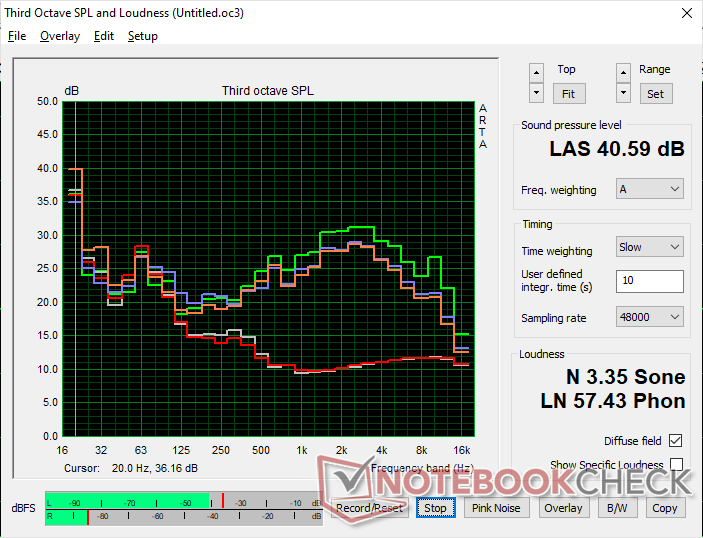
Lenovo ThinkPad X1 2-in-1 Gen 10 audio analysis
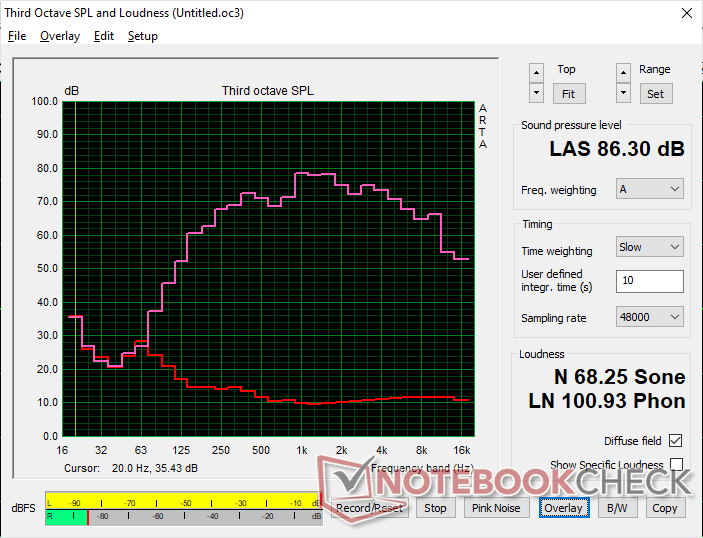
(+) | speakers can play relatively loud (86.3 dB)
Bass 100 - 315 Hz
(±) | reduced bass - on average 9.2% lower than median
(±) | linearity of bass is average (9.2% delta to prev. frequency)
Mids 400 - 2000 Hz
(±) | higher mids - on average 5.3% higher than median
(+) | mids are linear (4.7% delta to prev. frequency)
Highs 2 - 16 kHz
(+) | balanced highs - only 3.4% away from median
(+) | highs are linear (4.3% delta to prev. frequency)
Overall 100 - 16.000 Hz
(+) | overall sound is linear (11.9% difference to median)
Compared to same class
» 11% of all tested devices in this class were better, 3% similar, 85% worse
» The best had a delta of 6%, average was 20%, worst was 57%
Compared to all devices tested
» 9% of all tested devices were better, 2% similar, 89% worse
» The best had a delta of 4%, average was 24%, worst was 134%
Apple MacBook Pro 16 2021 M1 Pro audio analysis
(+) | speakers can play relatively loud (84.7 dB)
Bass 100 - 315 Hz
(+) | good bass - only 3.8% away from median
(+) | bass is linear (5.2% delta to prev. frequency)
Mids 400 - 2000 Hz
(+) | balanced mids - only 1.3% away from median
(+) | mids are linear (2.1% delta to prev. frequency)
Highs 2 - 16 kHz
(+) | balanced highs - only 1.9% away from median
(+) | highs are linear (2.7% delta to prev. frequency)
Overall 100 - 16.000 Hz
(+) | overall sound is linear (4.6% difference to median)
Compared to same class
» 0% of all tested devices in this class were better, 0% similar, 100% worse
» The best had a delta of 5%, average was 17%, worst was 45%
Compared to all devices tested
» 0% of all tested devices were better, 0% similar, 100% worse
» The best had a delta of 4%, average was 24%, worst was 134%
Energy Management
Power Consumption
The system demands only between 1.5 W to 5 W when idling on desktop to be much lower than competitors and even last year's Meteor Lake-U model. This high level of efficiency is largely responsible for the extended battery life in the section below.
When running Prime95, the system draws slightly less power than its predecessor while providing slightly faster CPU performance for increased performance-per-watt. On the other hand, running FurMark demands a few watts more than its predecessor, but the raw gains in graphics performance more than makes up for it.
Consumption would range between 35 W and 60 W when running Cyberpunk 2077 instead of remaining steady like on most other laptops.
| Off / Standby | |
| Idle | |
| Load |
|
Key:
min: | |
| Lenovo ThinkPad X1 2-in-1 Gen 10 Core Ultra 7 258V, Arc 140V, , IPS, 1920x1200, 14" | Lenovo ThinkPad X1 2in1 G9 21KE004AGE Ultra 7 165U, Graphics 4-Core iGPU (Arrow Lake), Kioxia XG8 KXG8AZNV1T02, OLED, 2880x1800, 14" | Lenovo Yoga 7 2-in-1 14AKP10 Ryzen AI 5 340, Radeon 840M, WD PC SN7100S SDFPMSL-512G-1101, OLED, 1920x1200, 14" | Dell Latitude 9440 2-in-1 i7-1365U, Iris Xe G7 96EUs, Samsung PM9B1 1024GB MZAL41T0HBLB, IPS, 2560x1600, 14" | HP EliteBook X Flip G1i 14 AI Core Ultra 7 258V, Arc 140V, Western Digital PC SN5000S SDEPNSJ-1T00-1006, IPS, 1920x1200, 14" | Asus ZenBook Duo OLED UX8406CA Ultra 9 285H, Arc 140T, Western Digital PC SN5000S SDEQNSJ-1T00, OLED, 1920x1200, 14" | |
|---|---|---|---|---|---|---|
| Power Consumption | -123% | -42% | -59% | -32% | -54% | |
| Idle Minimum * (Watt) | 1.5 | 7.3 -387% | 4 -167% | 4.2 -180% | 2.9 -93% | 4.1 -173% |
| Idle Average * (Watt) | 4.8 | 10.1 -110% | 5 -4% | 6.9 -44% | 8.2 -71% | 8.2 -71% |
| Idle Maximum * (Watt) | 5 | 10.4 -108% | 7 -40% | 7.8 -56% | 8.6 -72% | 8.7 -74% |
| Load Average * (Watt) | 44.2 | 45.7 -3% | 52 -18% | 46 -4% | 39.6 10% | 56.7 -28% |
| Cyberpunk 2077 ultra external monitor * (Watt) | 39.3 | 52.6 -34% | 36.4 7% | 47 -20% | ||
| Cyberpunk 2077 ultra * (Watt) | 47.8 | 54.8 -15% | 41.9 12% | 48.7 -2% | ||
| Load Maximum * (Watt) | 60.2 | 64.1 -6% | 68 -13% | 68.2 -13% | 70 -16% | 65.1 -8% |
| Witcher 3 ultra * (Watt) | 35.2 | 51.9 |
* ... smaller is better
Power Consumption Cyberpunk / Stress Test
Power Consumption external Monitor
Battery Life

Runtimes have been vastly improved mostly thanks to the new Lunar Lake architecture. We're able to record almost 22 hours of constant WLAN browsing compared to "only" 8.5 hours on last year's model even though battery capacity has remained constant. Upgrading to the OLED configuration will decrease battery life but it would still be significantly longer than what we recorded on our 2024 OLED unit.
Competing models with Lunar Lake like the HP EliteBook X Flip G1i 14 AI are able to offer similarly long runtimes as well.
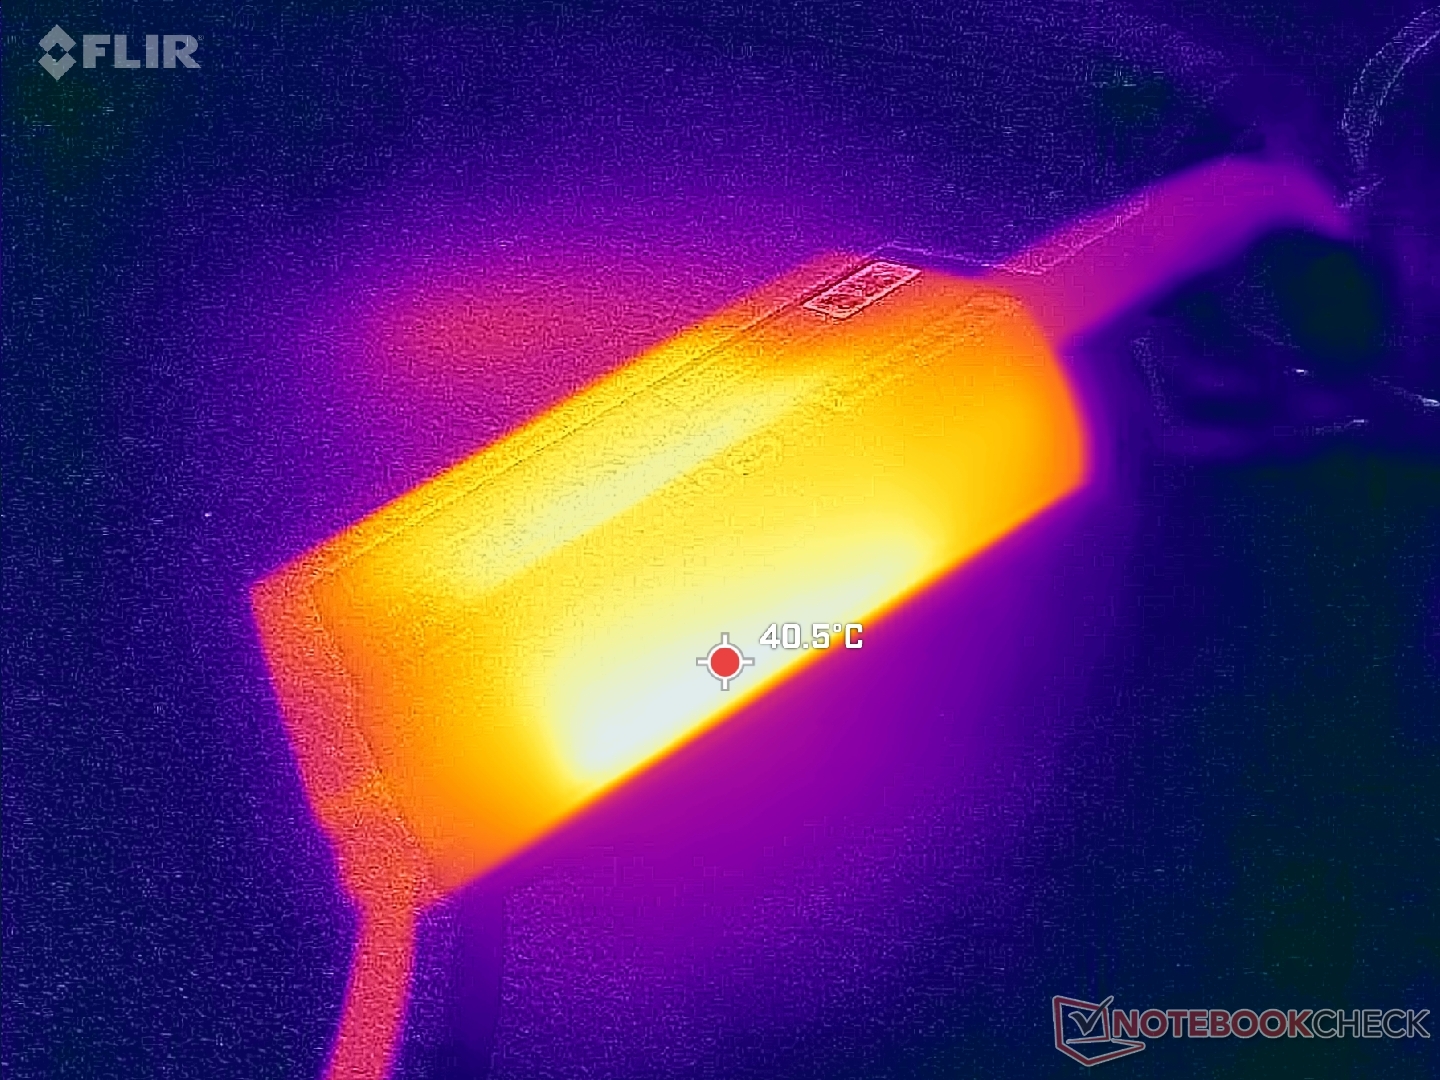
Charging from empty to full capacity takes between 90 to 120 minutes.
| Lenovo ThinkPad X1 2-in-1 Gen 10 Core Ultra 7 258V, Arc 140V, 57 Wh | Lenovo ThinkPad X1 2in1 G9 21KE004AGE Ultra 7 165U, Graphics 4-Core iGPU (Arrow Lake), 57 Wh | Lenovo Yoga 7 2-in-1 14AKP10 Ryzen AI 5 340, Radeon 840M, 70 Wh | Dell Latitude 9440 2-in-1 i7-1365U, Iris Xe G7 96EUs, 60 Wh | HP EliteBook X Flip G1i 14 AI Core Ultra 7 258V, Arc 140V, 68 Wh | Asus ZenBook Duo OLED UX8406CA Ultra 9 285H, Arc 140T, 75 Wh | |
|---|---|---|---|---|---|---|
| Battery runtime | -61% | -48% | -58% | -16% | -50% | |
| WiFi v1.3 (h) | 22 | 8.5 -61% | 11.4 -48% | 9.3 -58% | 18.4 -16% | 11.1 -50% |
| H.264 (h) | 9 | 20.6 | 16.9 | |||
| Load (h) | 1.5 | 1.2 | 2.1 | |||
| Reader / Idle (h) | 23.7 |
Notebookcheck Rating
Lenovo ThinkPad X1 2-in-1 Gen 10
- 05/16/2025 v8
Allen Ngo
 Total Sustainability Score:
 Potential Competitors in Comparison
Image | Model / Review | Price | Weight | Height | Display |
|---|---|---|---|---|---|
1. 88.8%  | Lenovo ThinkPad X1 2-in-1 Gen 10 Intel Core Ultra 7 258V ⎘ Intel Arc Graphics 140V ⎘ 32 GB Memory | Amazon: List Price: 2300 USD | 1.4 kg | 18.3 mm | 14.00" 1920x1200 162 PPI IPS |
2. 88.4% v7 (old)  | Lenovo ThinkPad X1 2in1 G9 21KE004AGE Intel Core Ultra 7 165U ⎘ Intel Graphics 4-Core iGPU (Meteor / Arrow Lake) ⎘ 32 GB Memory, 1024 GB SSD | Amazon: List Price: 3350€ | 1.3 kg | 15.5 mm | 14.00" 2880x1800 243 PPI OLED |
3. 84.8%  | Lenovo Yoga 7 2-in-1 14AKP10 AMD Ryzen AI 5 340 ⎘ AMD Radeon 840M ⎘ 16 GB Memory, 512 GB SSD | Amazon: List Price: 1000 EUR | 1.4 kg | 16.5 mm | 14.00" 1920x1200 162 PPI OLED |
4. 87.9% v7 (old)  | Dell Latitude 9440 2-in-1 Intel Core i7-1365U ⎘ Intel Iris Xe Graphics G7 96EUs ⎘ 32 GB Memory, 1024 GB SSD | Amazon: 1. $699.00 Dell Latitude 9000 9440 2-in... 2. $1,296.99 Dell Latitude 9000 9440 14" ... 3. $1,075.63 Dell Latitude 9440 2-in-1 La... List Price: 2900 USD | 1.6 kg | 16.28 mm | 14.00" 2560x1600 216 PPI IPS |
5. 89.9%  | HP EliteBook X Flip G1i 14 AI Intel Core Ultra 7 258V ⎘ Intel Arc Graphics 140V ⎘ 32 GB Memory, 1000 GB SSD | Amazon: List Price: 2889 Euro | 1.5 kg | 14.7 mm | 14.00" 1920x1200 162 PPI IPS |
6. 86.5%  | Asus ZenBook Duo OLED UX8406CA Intel Core Ultra 9 285H ⎘ Intel Arc Graphics 140T ⎘ 32 GB Memory, 1024 GB SSD | Amazon: List Price: 2099€ | 1.8 kg | 19.9 mm | 14.00" 1920x1200 162 PPI OLED |
Transparency
The selection of devices to be reviewed is made by our editorial team. The test sample was provided to the author as a loan by the manufacturer or retailer for the purpose of this review. The lender had no influence on this review, nor did the manufacturer receive a copy of this review before publication. There was no obligation to publish this review. As an independent media company, Notebookcheck is not subjected to the authority of manufacturers, retailers or publishers.
This is how Notebookcheck is testing
Every year, Notebookcheck independently reviews hundreds of laptops and smartphones using standardized procedures to ensure that all results are comparable. We have continuously developed our test methods for around 20 years and set industry standards in the process. In our test labs, high-quality measuring equipment is utilized by experienced technicians and editors. These tests involve a multi-stage validation process. Our complex rating system is based on hundreds of well-founded measurements and benchmarks, which maintains objectivity. Further information on our test methods can be found here.
