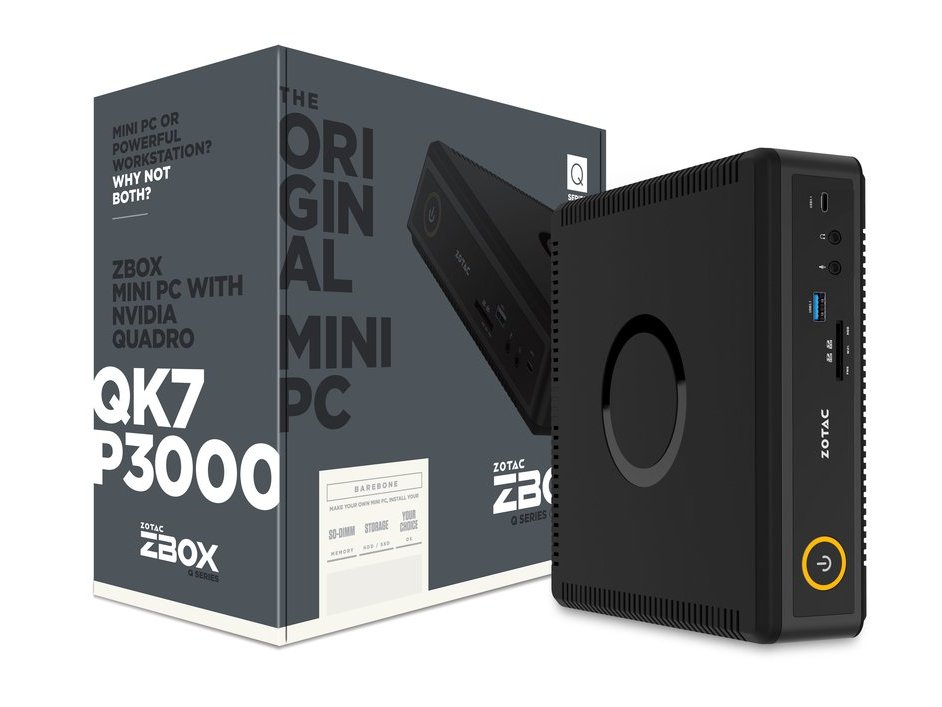
Zotac ZBOX QK7P3000 (i7-7700T, Quadro P3000) Mini PC Review
The wide-reaching Zotac ZBox family of mini PCs ranges from very small HTPCs like the P series up to larger gaming solutions like the Magnus E series. One of its newest additions is the Q series based on Nvidia Quadro GPUs for workstation users. Current SKUs include the QK5P1000, QK7P3000, and QK7P5000 with Quadro P1000, P3000, and P5000 Pascal GPUs, respectively.
Our test unit today is the mid-range QK7P3000 barebone configuration with the Core i7-7700T CPU and Quadro P3000 GPU for $1400 USD. We've outfitted the system with a 512 GB Samsung SSD Pro 960 NVMe SSD and a single 8 GB DDR4-2666 RAM module from Kingston for reviewing purposes. Other than the CPU and GPU swap, however, the QK7P3000 utilizes the exact same chassis design as the mid-range ZBox Magnus EN51050 gaming mini PC and so we recommend checking out our existing review for more information on the case and its internals. The visual similarities are unsurprising since the power envelopes between the EN51050 and QK7P3000 are nearly the same.
Connectivity
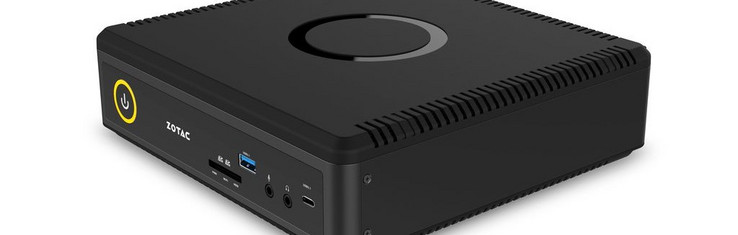
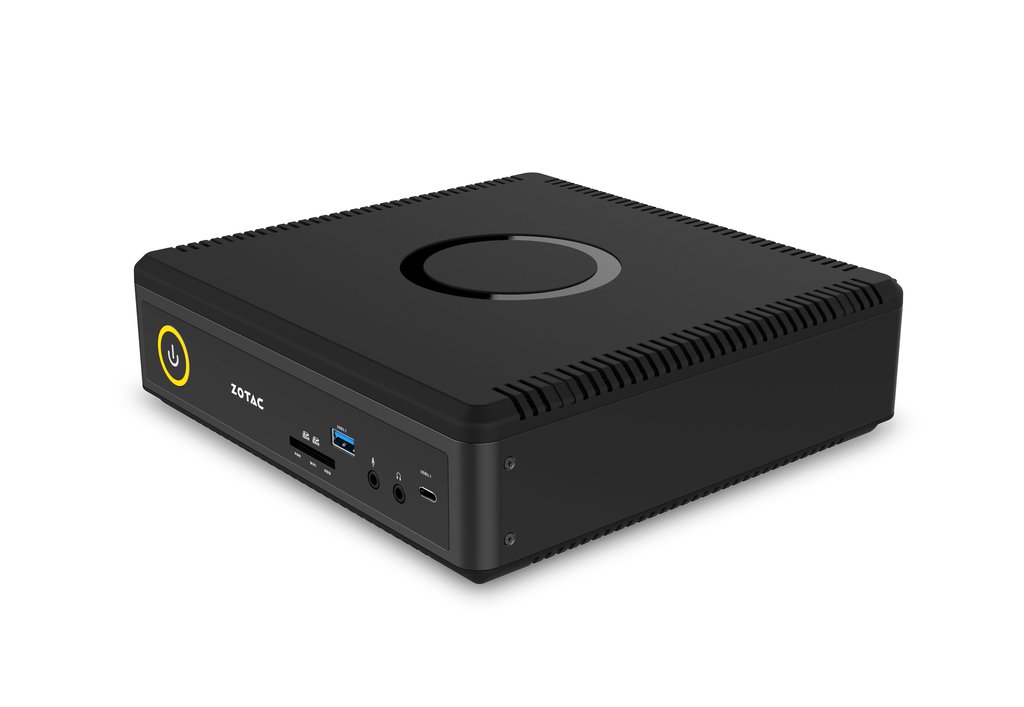
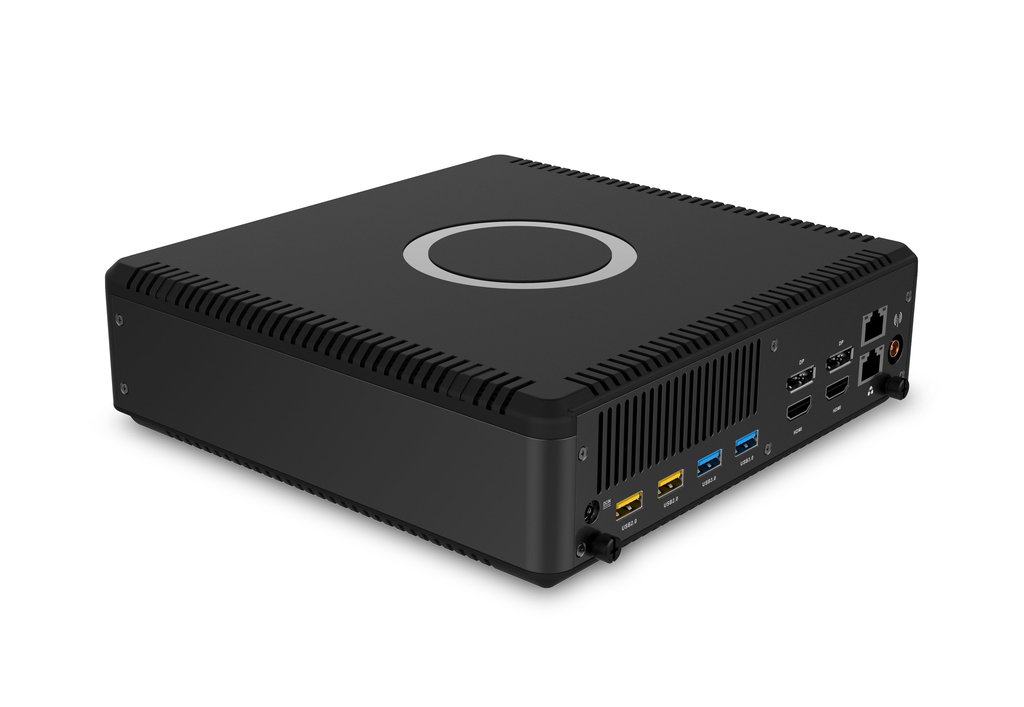
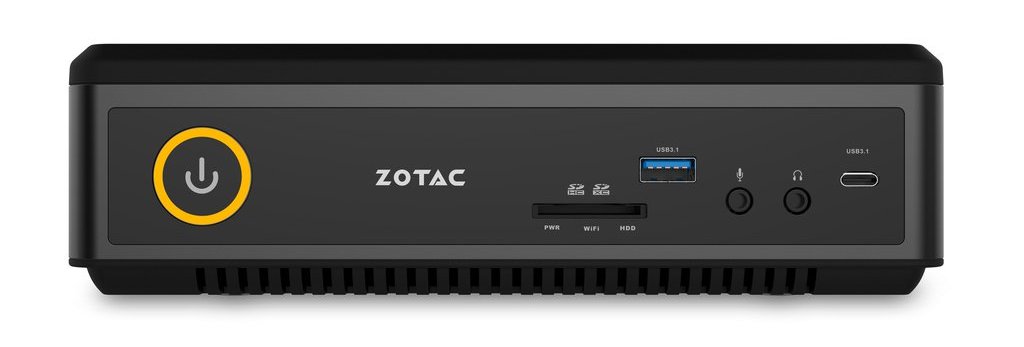
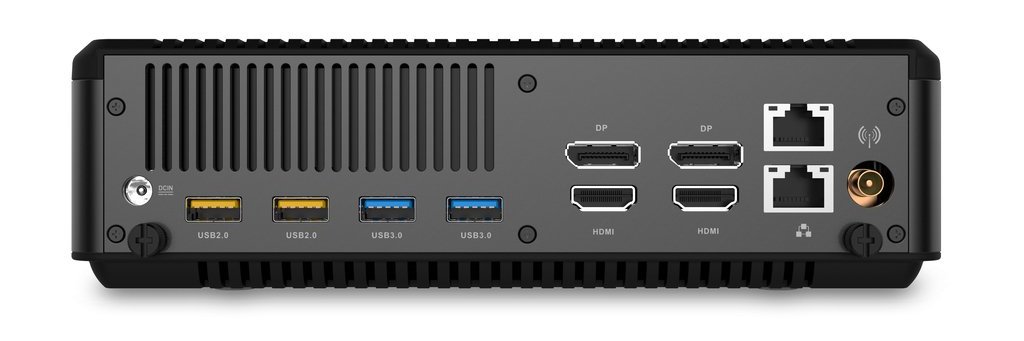
Port selection is a strong point for the QK7P3000. Nonetheless, competing mini PCs like the Intel Hades Canyon NUC offer Thunderbolt 3 for potentially more connectivity options. An IR receiver is absent on the Zotac.
| SD Card Reader | |
| average JPG Copy Test (av. of 3 runs) | |
| Intel Hades Canyon NUC8i7HVK (Toshiba Exceria Pro SDXC 64 GB UHS-II) | |
| Zotac ZBOX Magnus EK71080 (Toshiba Exceria Pro SDXC 64 GB UHS-II) | |
| Zotac ZBOX-QK7P3000 (Toshiba Exceria Pro SDXC 64 GB UHS-II) | |
| maximum AS SSD Seq Read Test (1GB) | |
| Intel Hades Canyon NUC8i7HVK (Toshiba Exceria Pro SDXC 64 GB UHS-II) | |
| Zotac ZBOX-QK7P3000 (Toshiba Exceria Pro SDXC 64 GB UHS-II) | |
| Zotac ZBOX Magnus EK71080 (Toshiba Exceria Pro SDXC 64 GB UHS-II) | |
| Networking | |
| iperf3 transmit AX12 | |
| Intel Hades Canyon NUC8i7HVK | |
| Zotac ZBOX-QK7P3000 | |
| Zotac ZBOX Magnus EK71080 | |
| iperf3 receive AX12 | |
| Intel Hades Canyon NUC8i7HVK | |
| Zotac ZBOX Magnus EK71080 | |
| Zotac ZBOX-QK7P3000 | |
Accessories
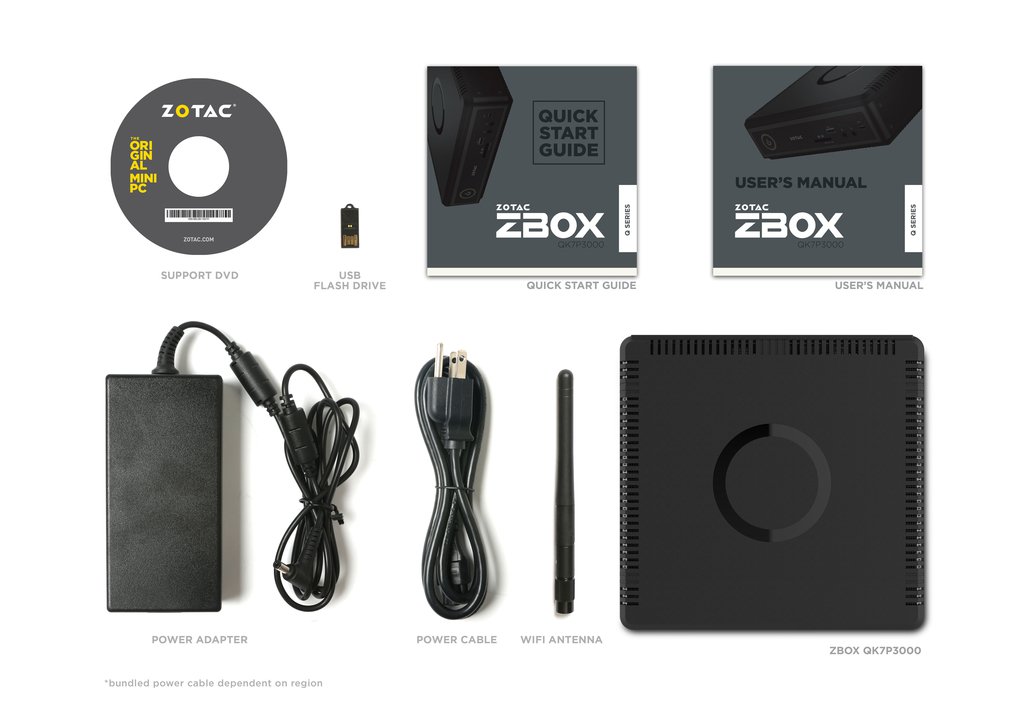
Unlike the larger and bulkier Magnus EN980, the QK7P3000 uses just one external antenna and one AC adapter. It's good to see both a USB stick and DVD included as many OEMs ship with DVDs only even if the product has no optical drive.
Warranty
The standard one to two year warranty applies depending on region with no extended warranty options available. Owners must register the product first before claiming warranty. Please see our Guarantees, Return policies and Warranties FAQ for country-specific information.
Performance
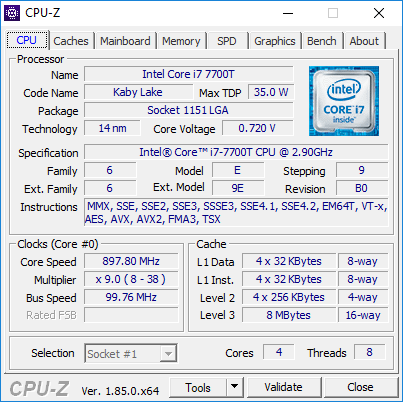
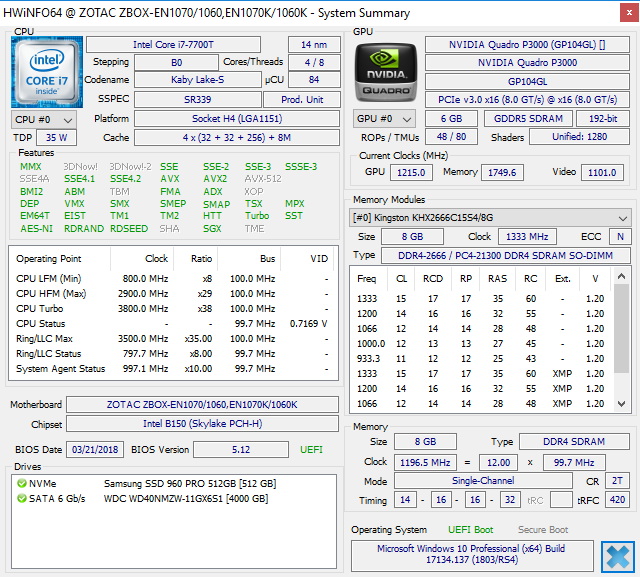
The 35 W Core i7-7700T is not commonly found on laptops since it is a socketed FCLGA1151 desktop CPU. Unlike the quad-core i5-7500T, the quad-core i7-7700T includes Hyper-Threading to boost multi-thread performance. The CPU in the QK7P3000 can be removed and upgraded, though warranty will be voided in the process. The smaller and less expensive QK5P1000 SKU utilizes an i5-7200U instead.
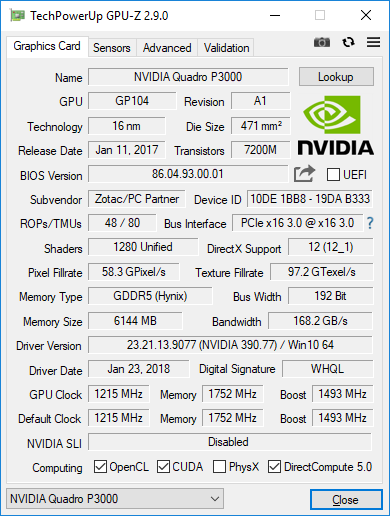
Meanwhile, graphics is powered by the Quadro P3000 GPU with the same TMUs, ROPs, and shaders as the GTX 1060 albeit at slower base clock rates (1215 vs. 1405 MHz) and memory rates (1752 vs. 2002 MHz). The integrated HD Graphics 630 GPU is disabled with no Optimus graphics switching available.
Processor
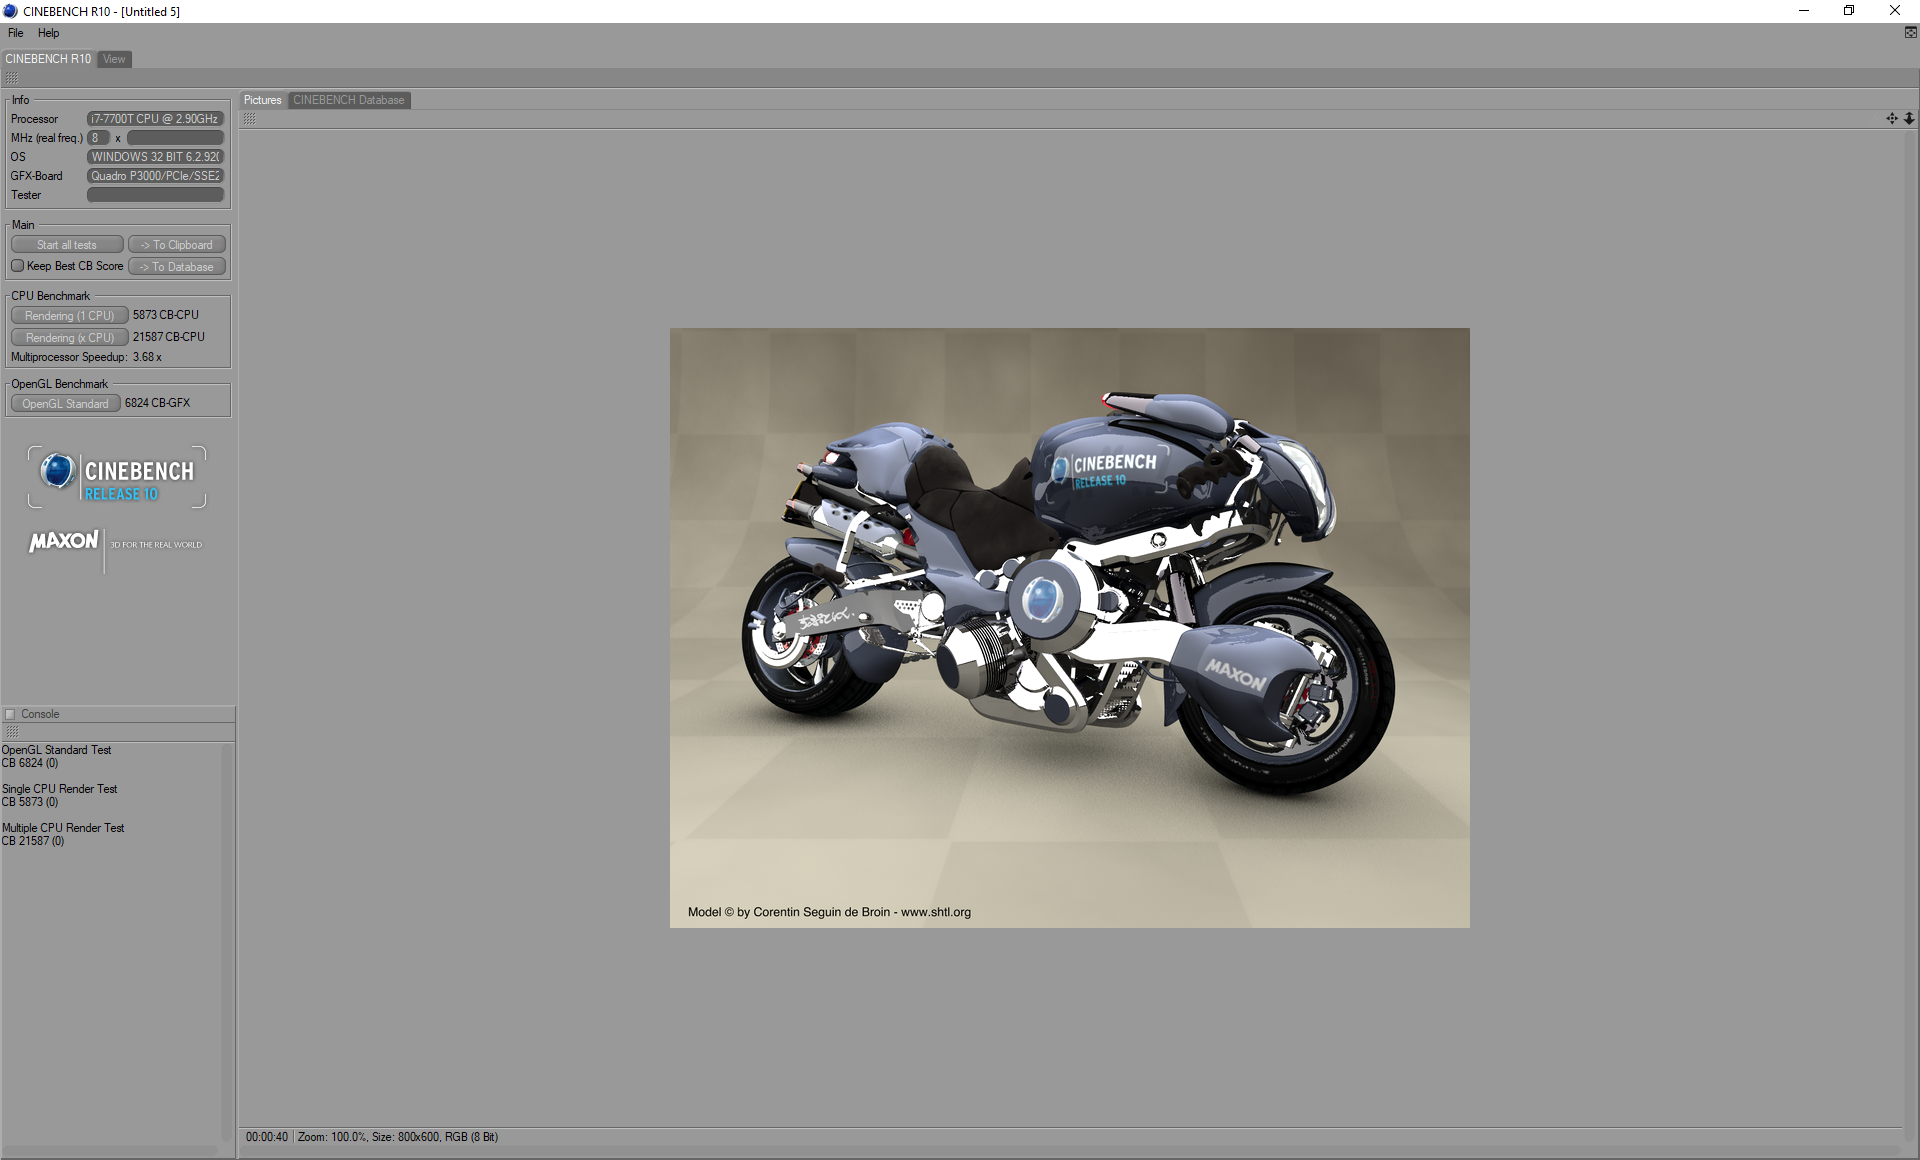
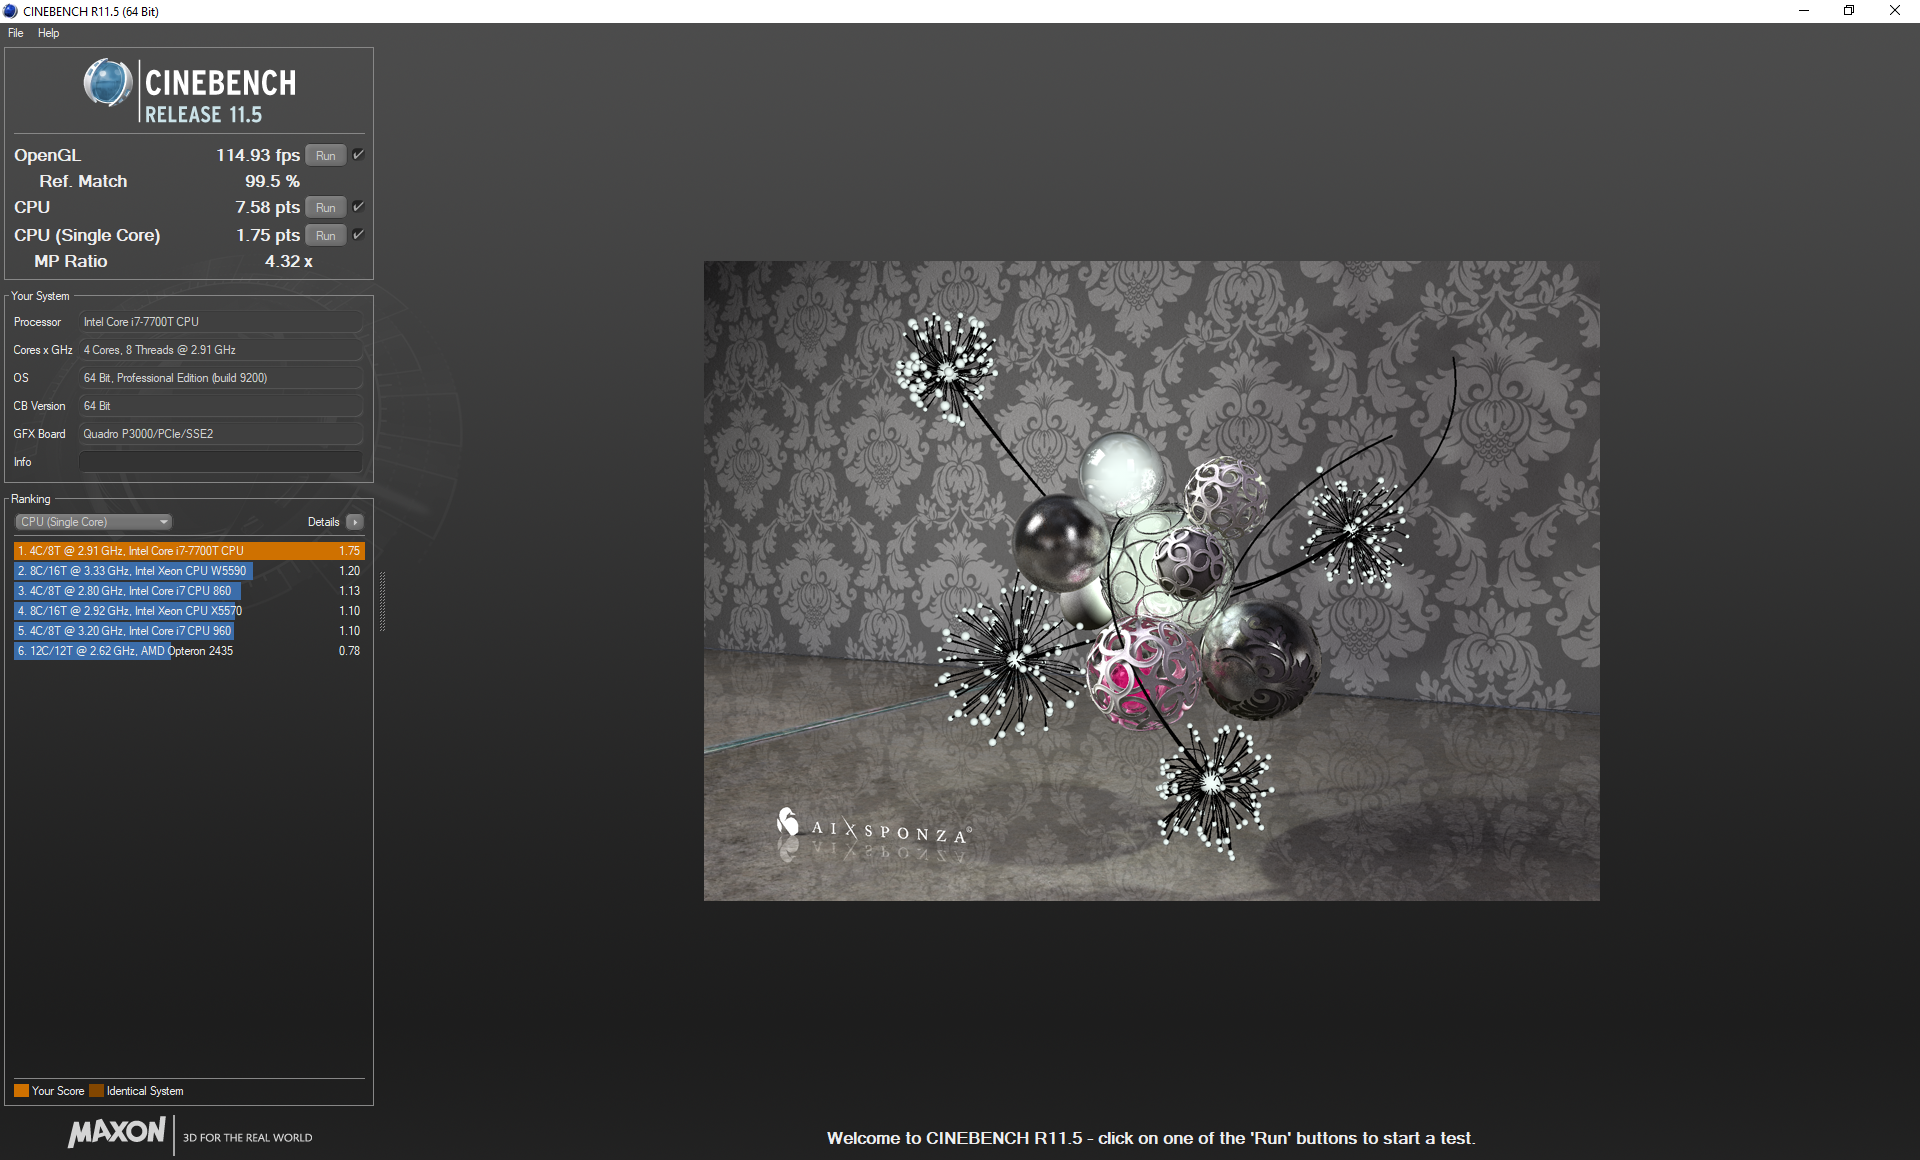
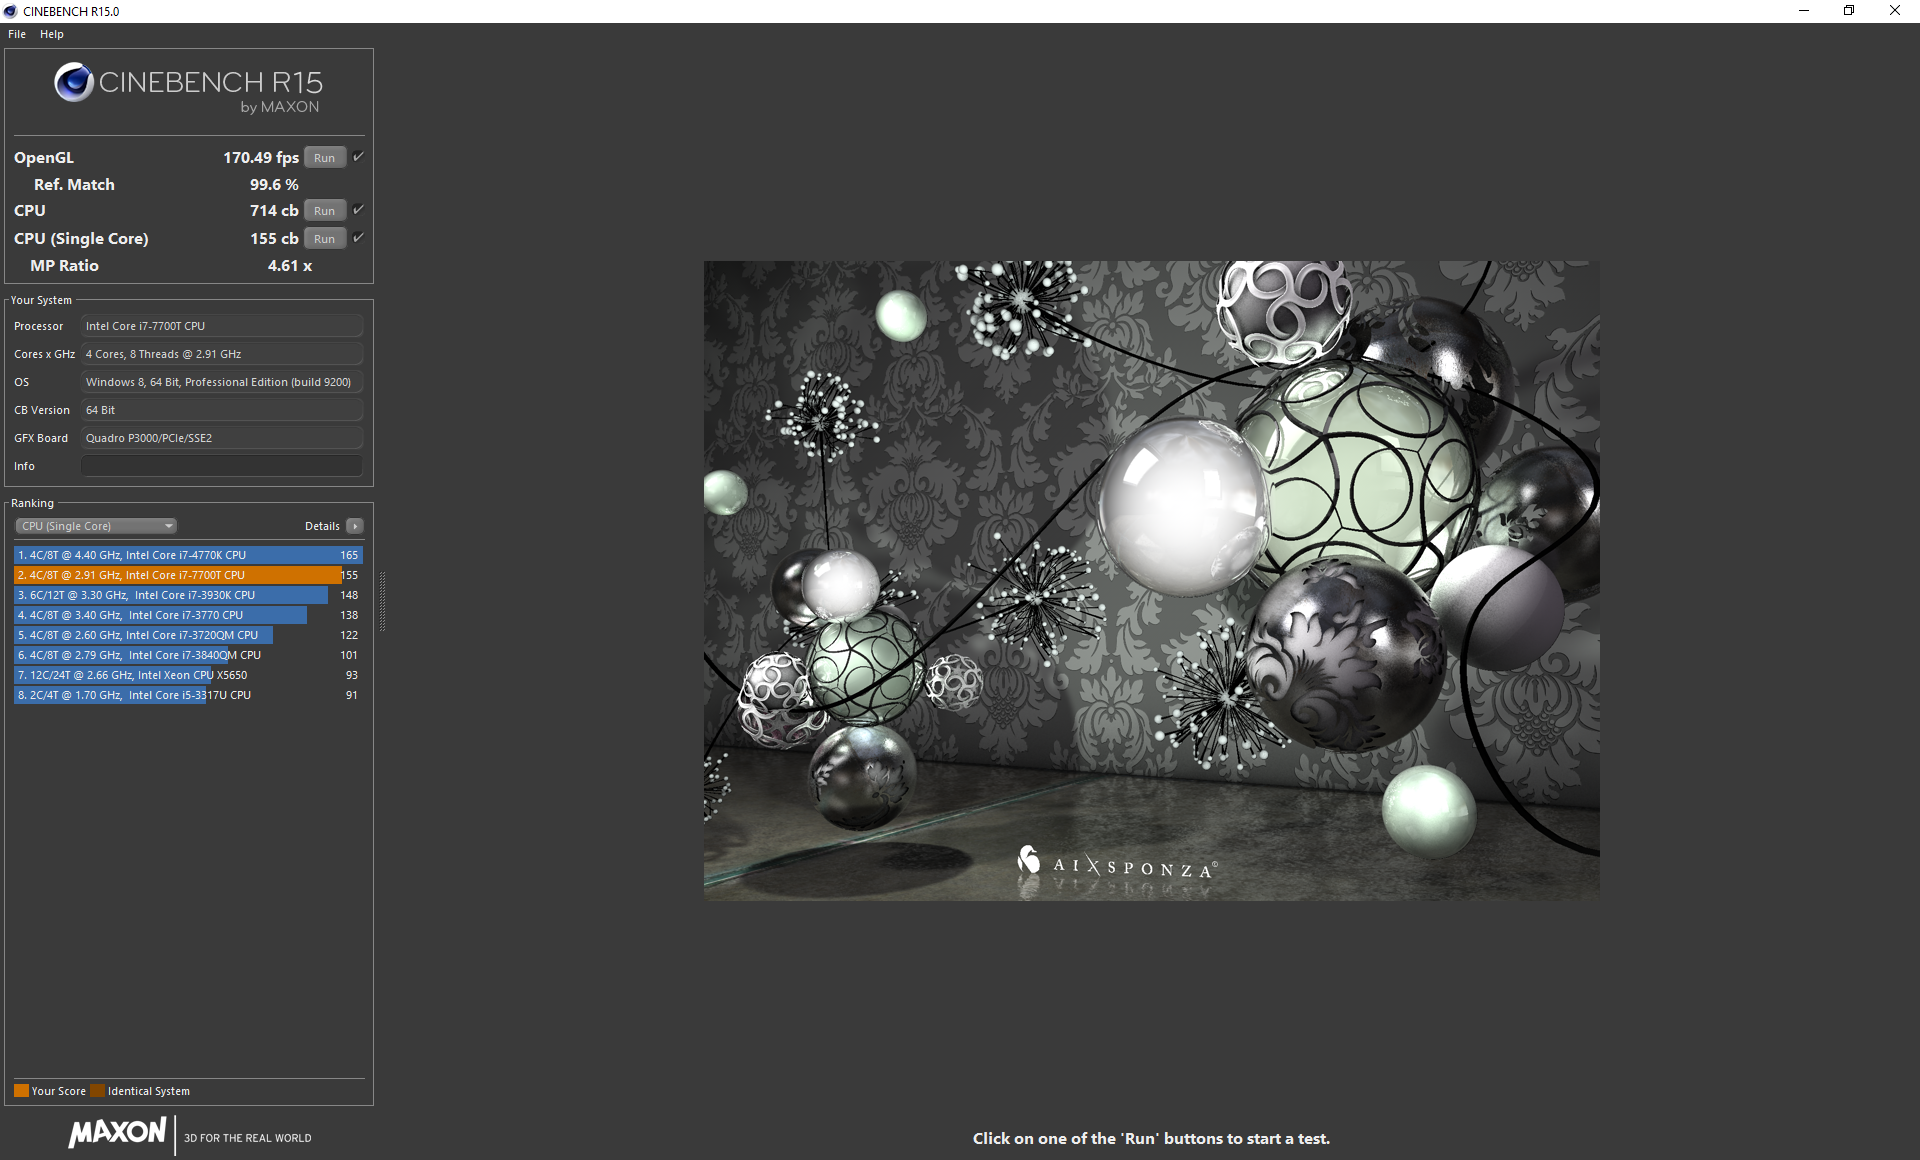
CPU performance is roughly 20 to 40 percent faster than the Core i5-7500T found on the ZBox EN51050. The relatively wide performance delta can be attributed to the inclusion of Hyper-Threading to bring raw performance very close to that of the ubiquitous Core i7-7700HQ. Users who can benefit from having even more simultaneous threads may want to consider other systems with Intel 8th gen CPUs where hexa-core SKUs are common.
Running CineBench R15 Multi-Thread in a loop results in a performance drop of only 3 to 4 percent.
System Performance
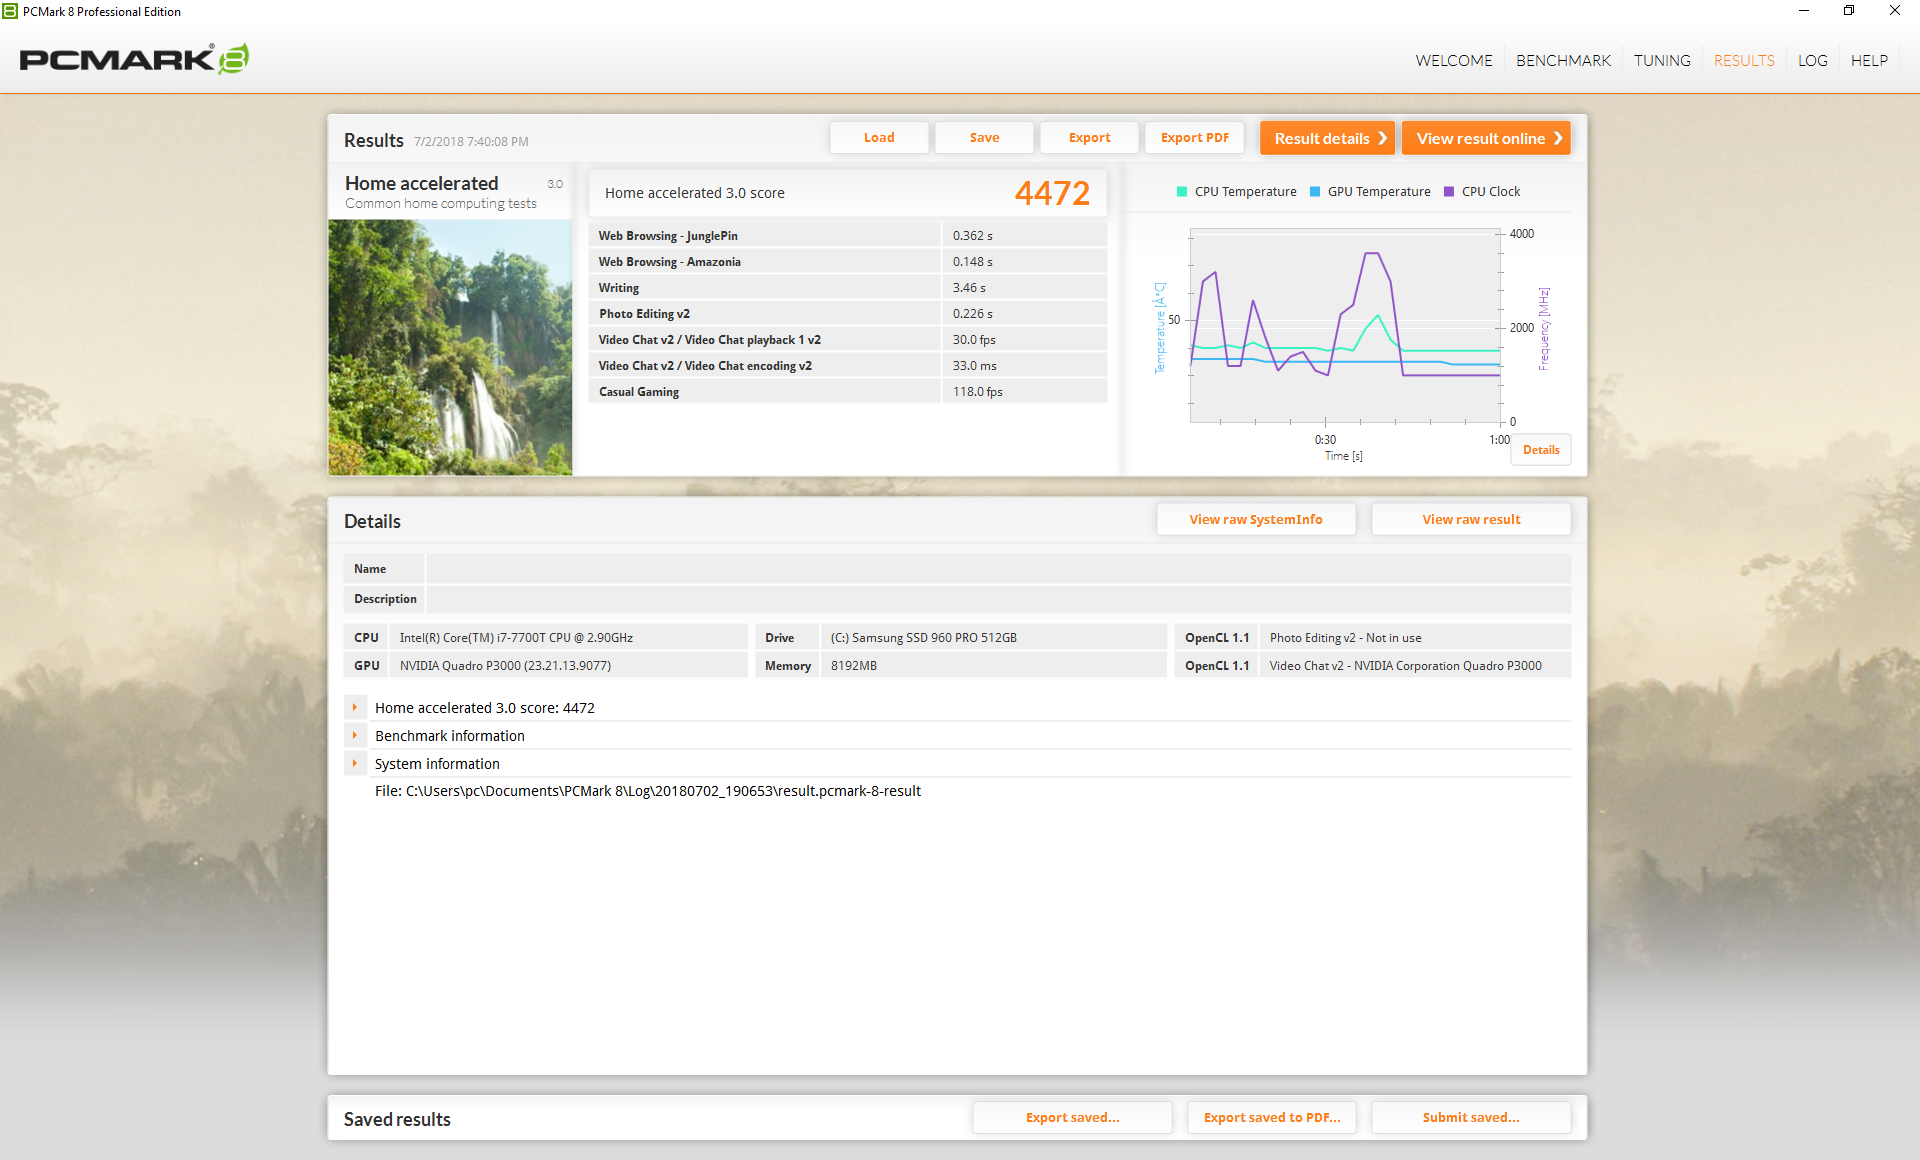
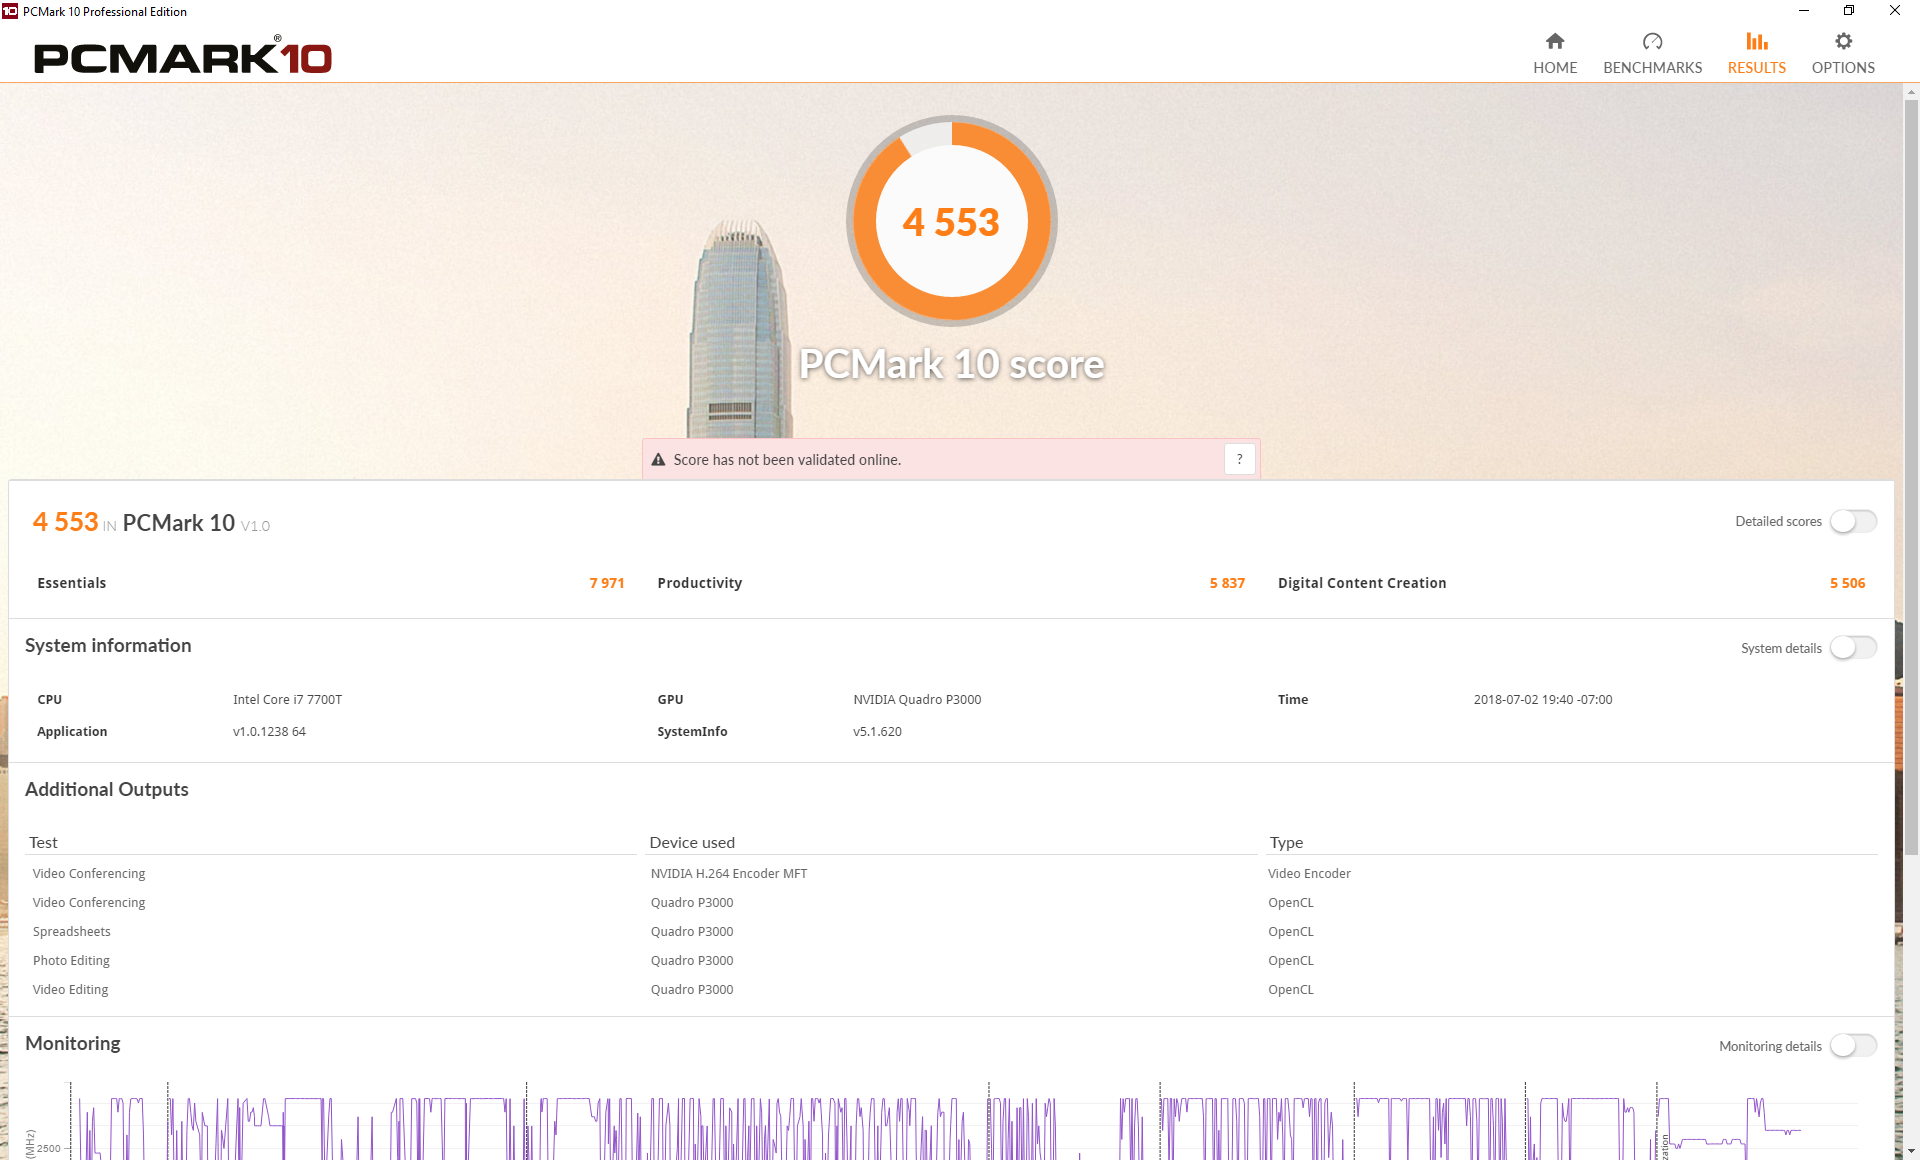
PCMark 8 benchmarks rank our ZBox very similarly to the MSI WS63 workstation and just slightly below the Intel Hades Canyon NUC. Perhaps not coincidentally, these systems share similar GPU and CPU performances. We can report no abnormal software or hardware behavior during our time with the test unit.
| PCMark 8 - Home Score Accelerated v2 | |
| Zotac ZBOX Magnus EK71080 | |
| Intel Hades Canyon NUC8i7HVK | |
| Dell XPS 15 9575 i5-8305G | |
| Zotac ZBOX-QK7P3000 | |
| HP ZBook 14u G5-2ZB99EA | |
| MSI WS63 7RF-290US | |
| PCMark 10 - Score | |
| Intel Hades Canyon NUC8i7HVK | |
| Zotac ZBOX Magnus EK71080 | |
| Dell XPS 15 9575 i5-8305G | |
| Zotac ZBOX-QK7P3000 | |
| HP ZBook 14u G5-2ZB99EA | |
| PCMark 8 Home Score Accelerated v2 | 4472 points | |
| PCMark 10 Score | 4553 points | |
Help | ||
Storage Devices
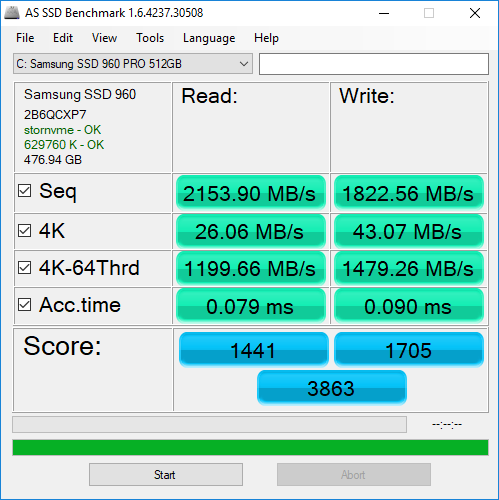
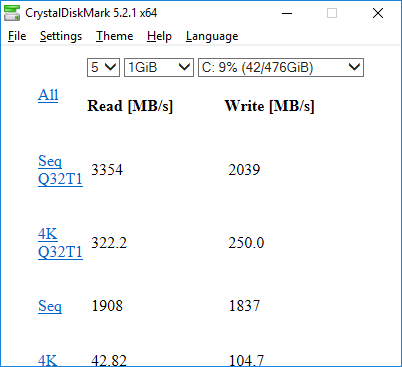
Sequential read and write rates from our 512 GB Samsung SSD 960 Pro are roughly comparable to the same SSD in the Eurocom Q8 to suggest a PCIe x4 interface. Secondary 2.5-inch SATA III drives are supported.
See our table of HDDs and SSDs for more benchmark comparisons.
| Zotac ZBOX-QK7P3000 Samsung SSD 960 Pro 512 GB m.2 | Intel Hades Canyon NUC8i7HVK Intel Optane 120 GB SSDPEK1W120GA | Zotac ZBOX Magnus EK71080 Samsung PM961 MZVLW256HEHP | Dell XPS 15 9575 i5-8305G Toshiba XG5 KXG50ZNV256G | MSI WS63 7RF-290US Samsung SM961 MZVKW512HMJP m.2 PCI-e | |
|---|---|---|---|---|---|
| AS SSD | 38% | 26% | -37% | 49% | |
| Copy Game MB/s (MB/s) | 583 | 768 32% | 1010 73% | 250.5 -57% | 1121 92% |
| Copy Program MB/s (MB/s) | 234.6 | 342.4 46% | 468 99% | 174.9 -25% | 447.3 91% |
| Copy ISO MB/s (MB/s) | 871 | 1125 29% | 1649 89% | 392.7 -55% | 1760 102% |
| Score Total (Points) | 3863 | 3023 -22% | 2791 -28% | 1113 -71% | 3759 -3% |
| Score Write (Points) | 1705 | 714 -58% | 669 -61% | 307 -82% | 1440 -16% |
| Score Read (Points) | 1441 | 1524 6% | 1429 -1% | 595 -59% | 1568 9% |
| Access Time Write * (ms) | 0.09 | 0.033 63% | 0.04 56% | 0.056 38% | 0.028 69% |
| Access Time Read * (ms) | 0.079 | 0.025 68% | 0.06 24% | 0.146 -85% | 0.036 54% |
| 4K-64 Write (MB/s) | 1479 | 556 -62% | 443.8 -70% | 181.2 -88% | 1151 -22% |
| 4K-64 Read (MB/s) | 1200 | 1258 5% | 1170 -2% | 337.1 -72% | 1244 4% |
| 4K Write (MB/s) | 43.07 | 103.5 140% | 105.2 144% | 92.7 115% | 128.5 198% |
| 4K Read (MB/s) | 26.06 | 127.9 391% | 46.69 79% | 24.78 -5% | 49.02 88% |
| Seq Write (MB/s) | 1823 | 553 -70% | 1205 -34% | 334.3 -82% | 1603 -12% |
| Seq Read (MB/s) | 2154 | 1379 -36% | 2119 -2% | 2335 8% | 2750 28% |
* ... smaller is better

GPU Performance
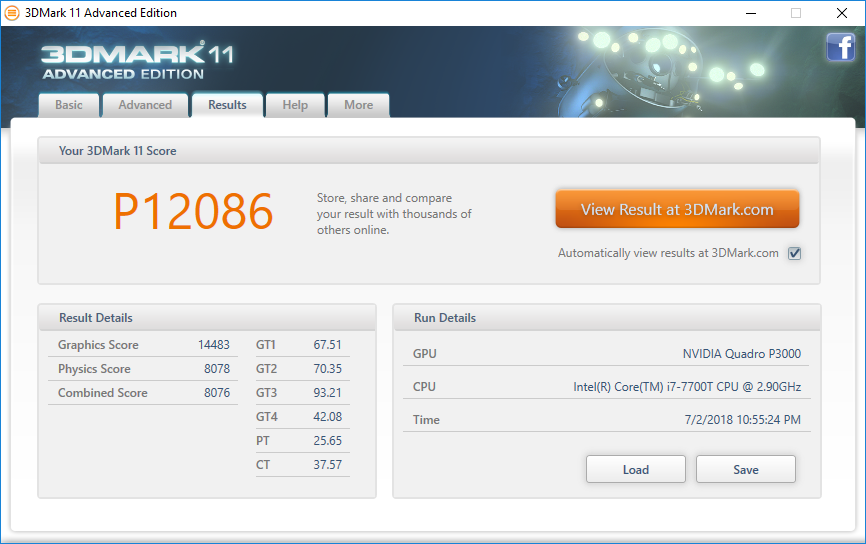
Graphics performance is unsurprisingly very similar to a gaming laptop equipped with GTX 1060 graphics. The MSI GV62, for example, scores just a few percentage points higher than our Zotac ZBox in 3DMark benchmarks. Performance is surprisingly very close to the Quadro P4000 Max-Q with scores just 10 percent behind on average.
See our page on the Quadro P3000 for more technical information and benchmark comparisons.
| 3DMark 11 Performance | 12086 points | |
Help | ||
| low | med. | high | ultra | |
|---|---|---|---|---|
| BioShock Infinite (2013) | 291.2 | 242.1 | 233.2 | 107.9 |
| The Witcher 3 (2015) | 34 |
Stress Test
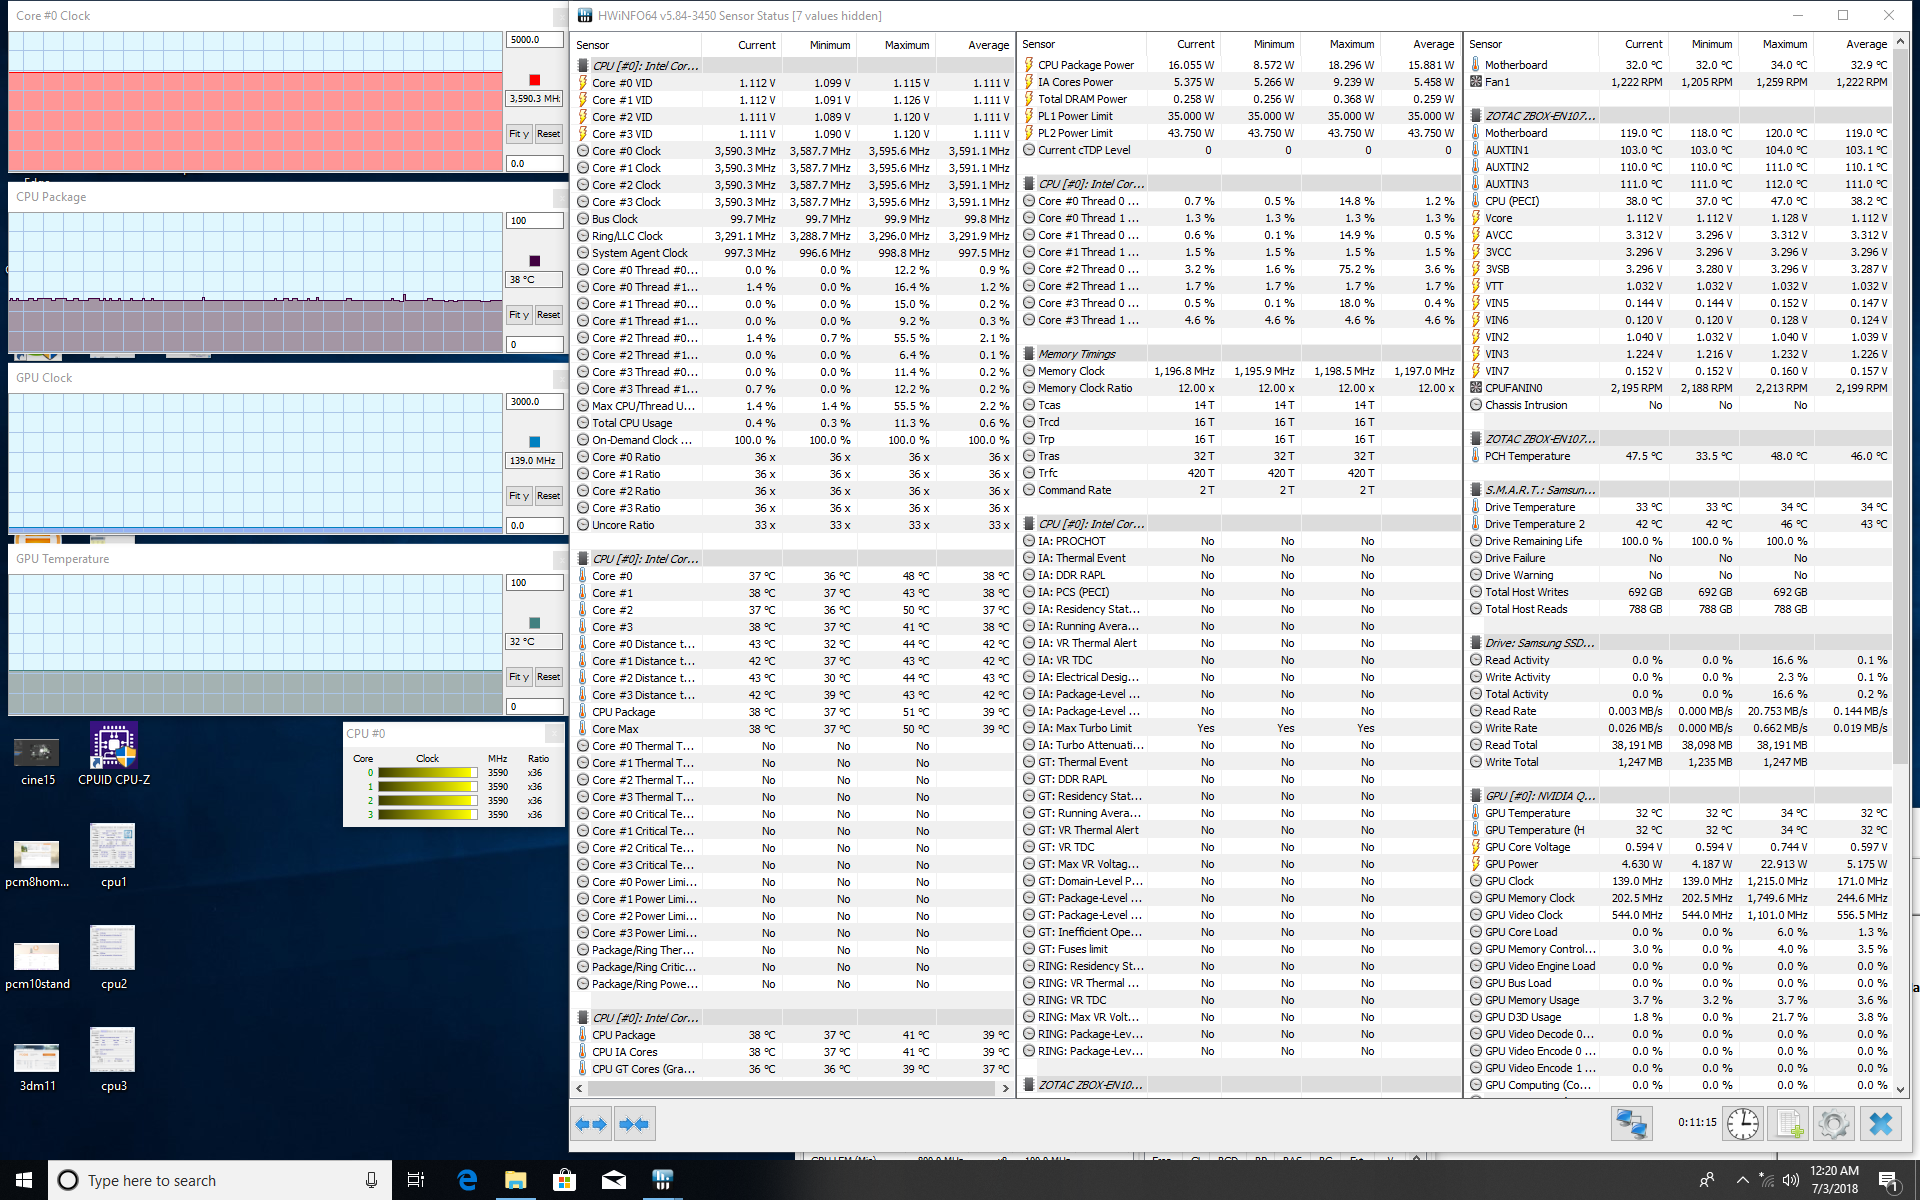
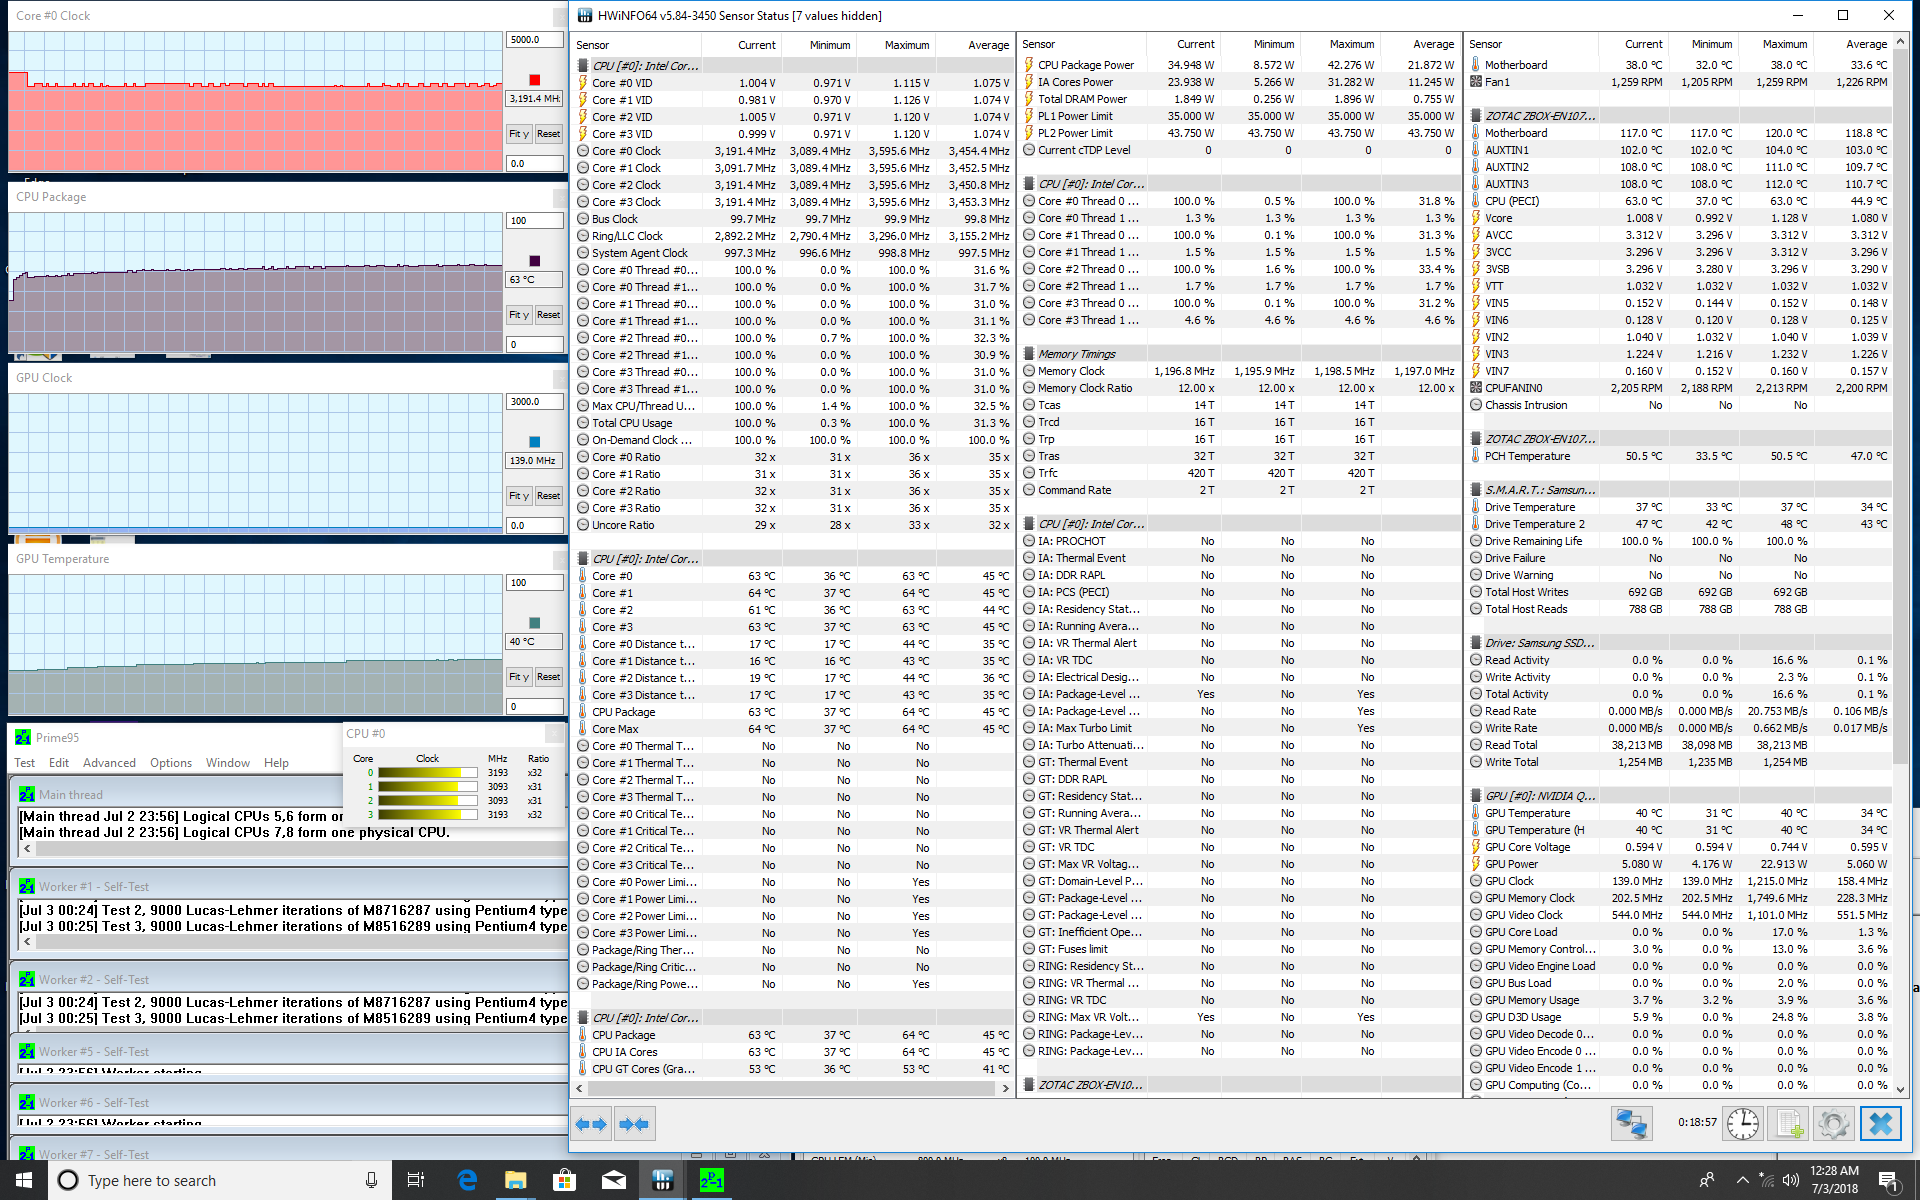
We stress the mini PC to identify for any potential throttling issues. When running Prime95, the CPU can be observed operating at 3.6 GHz for the first few seconds before dropping to a steady 3.1 to 3.2 GHz range. The results match with our power consumption readings where consumption is highest only during the first few seconds of the benchmark test. Core temperature plateaus at the mid 60 C range. Running Prime95 and FurMark simultaneously results in CPU and GPU temperatures of 75 C and 54 C, respectively. The relatively cool GPU temperature can be attributed to performance throttling when subjected to such extreme loads.
Running Witcher 3 is more representative of real-world stressful loads. The CPU and GPU can be observed operating at steady clock rates of 3.6 GHz and 1493 MHz, respectively. Idling on the Witcher 3 world map results in no major frame rate dips over time. GPU clock rates can reach up to 1771.5 MHz only during the first minute or so before stabilizing at the aforementioned 1493 MHz.
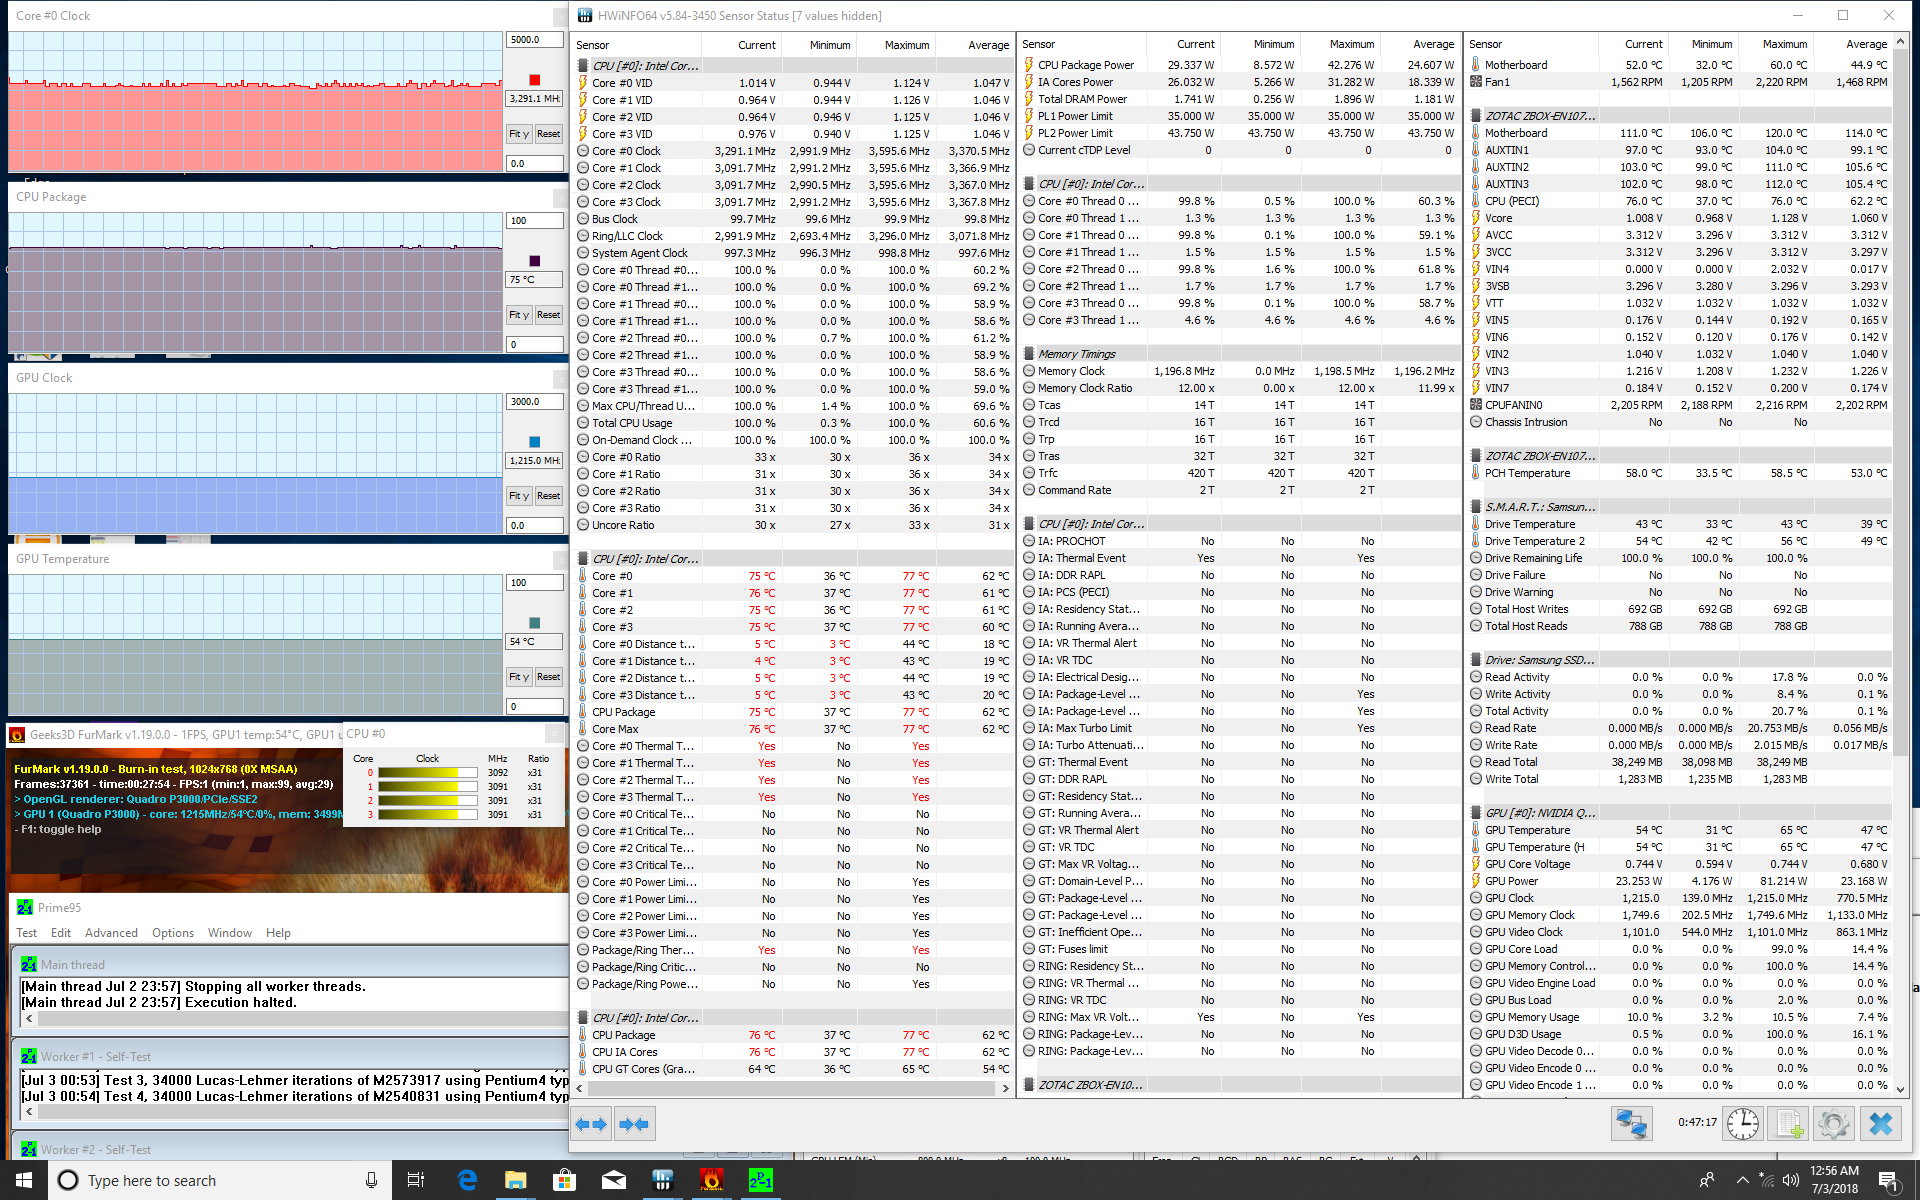
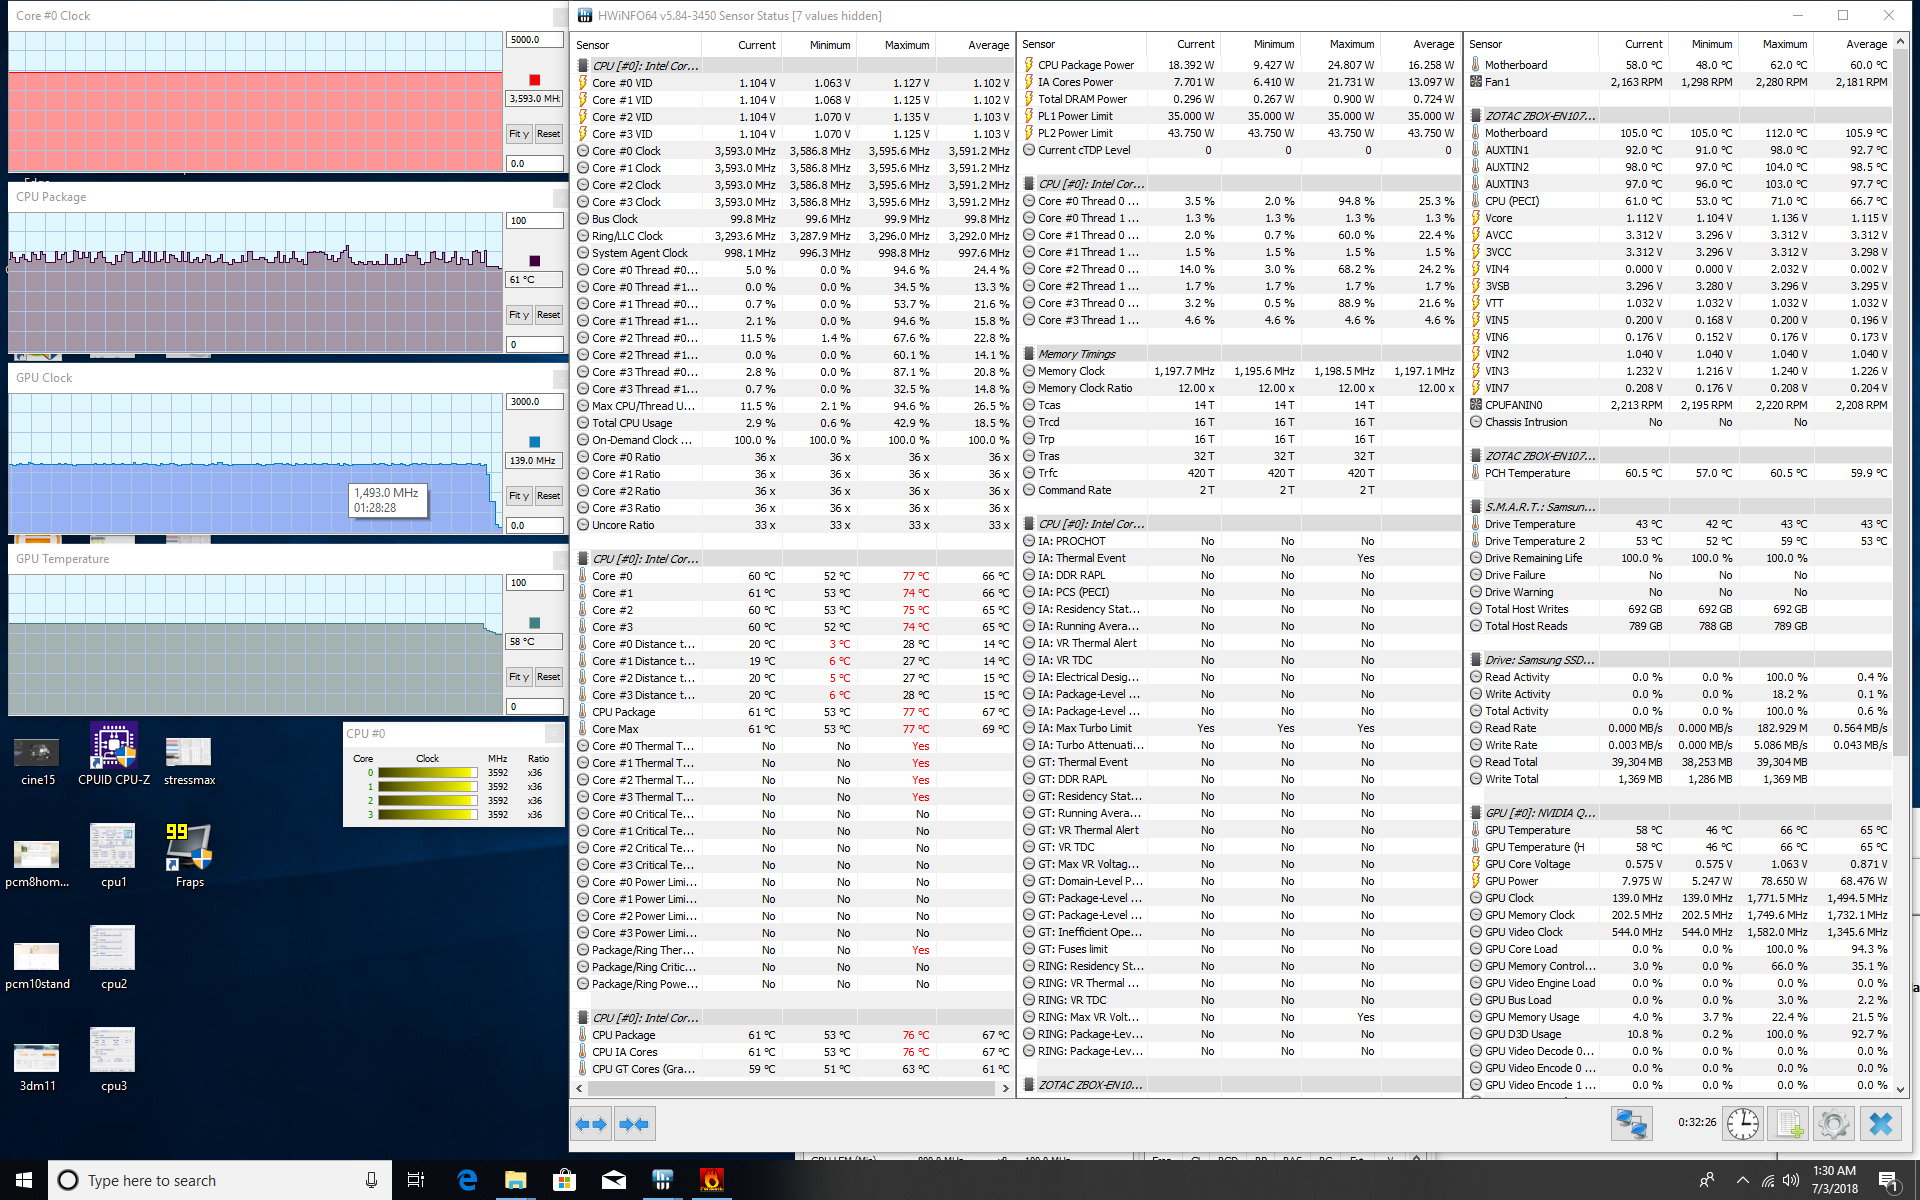
| CPU Clock (GHz) | GPU Clock (MHz) | Average CPU Temperature (°C) | Average GPU Temperature (°C) | |
| Prime95 Stress | 3.1 - 3.2 | -- | 63 | -- |
| FurMark Stress | -- | 961 | -- | 65 |
| Prime95 + FurMark Stress | 3.1 - 3.2 | 1215 | 75 | 54 |
| Witcher 3 Stress | 3.6 | 1493 | 63 | 66 |
Emissions
System Noise
Unlike many Ultrabooks, the system fan in the QK7P3000 is always active no matter the load. Simply idling on desktop can be as loud as 41 dB(A) compared to just 30 or 31 dB(A) on the HP ZBook 17 or ThinkPad P52s. The whirring is of much lower frequency from the ZBox, however, so it's not a distraction during regular use. Noise from laptops is more noticeable since the fans are generally smaller and higher pitched.
Fan noise barely changes when subjected to higher loads. Gaming, for example, induces a fan noise a slightly louder fan noise of just 41.6 dB(A). Users can set the fan speed in the BIOS much like on the Magnus EN51050. The maximum is set to 80 percent by default and so an even louder system is attainable if desired.
Noise level
| Idle |
| 40.9 / 40.9 / 40.9 dB(A) |
| Load |
| 40.9 / 41.6 dB(A) |
 | ||
30 dB silent 40 dB(A) audible 50 dB(A) loud |
||
min: | ||
| Zotac ZBOX-QK7P3000 Quadro P3000, i7-7700T, Samsung SSD 960 Pro 512 GB m.2 | Intel Hades Canyon NUC8i7HVK Vega M GH, i7-8809G, Intel Optane 120 GB SSDPEK1W120GA | Zotac ZBOX Magnus EK71080 GeForce GTX 1080 (Desktop), i7-7700HQ, Samsung PM961 MZVLW256HEHP | Apple iMac Pro Pro Vega 56, W-2145 | HP ZBook 17 G3 TZV66eA Quadro M3000M, E3-1535M v5, Samsung SM951 MZVPV256HDGL m.2 PCI-e | Lenovo ThinkPad P52s-20LB000HGE Quadro P500, i5-8550U, Samsung PM961 MZVLW256HEHP | |
|---|---|---|---|---|---|---|
| Noise | 12% | 1% | 12% | 7% | 20% | |
| off / environment * (dB) | 29.6 | 28.7 3% | 29.9 -1% | 29.1 2% | 30 -1% | 29 2% |
| Idle Minimum * (dB) | 40.9 | 29 29% | 38.6 6% | 29.8 27% | 30 27% | 29 29% |
| Idle Average * (dB) | 40.9 | 29 29% | 38.6 6% | 29.8 27% | 30 27% | 29 29% |
| Idle Maximum * (dB) | 40.9 | 29 29% | 39 5% | 29.8 27% | 30 27% | 31.2 24% |
| Load Average * (dB) | 40.9 | 36 12% | 40.6 1% | 39.7 3% | 48.9 -20% | 32.5 21% |
| Witcher 3 ultra * (dB) | 41.6 | 42 -1% | 41.7 -0% | 32.5 22% | ||
| Load Maximum * (dB) | 41.6 | 49.4 -19% | 47 -13% | 47.9 -15% | 48.9 -18% | 37.5 10% |
* ... smaller is better
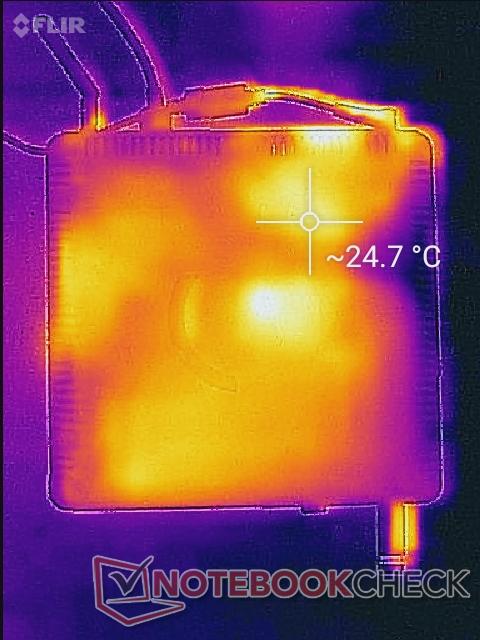
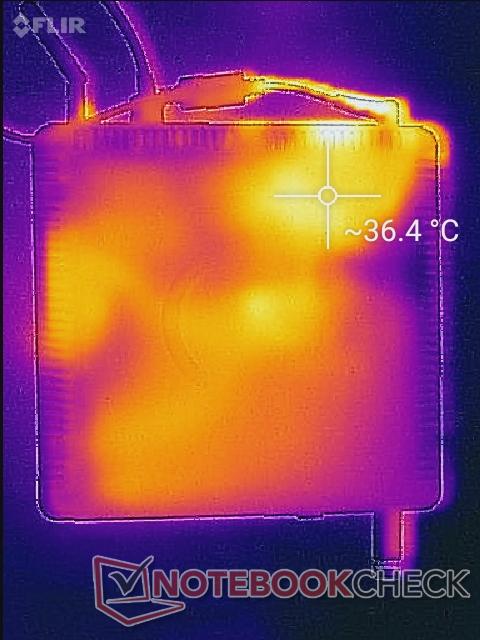
Temperature
Zotac ZBox mini PCs run relatively cool in terms of surface temperature. The top cover can be as warm as 36 C when gaming while super-thin laptops like the MSI GS63VR will run much warmer.
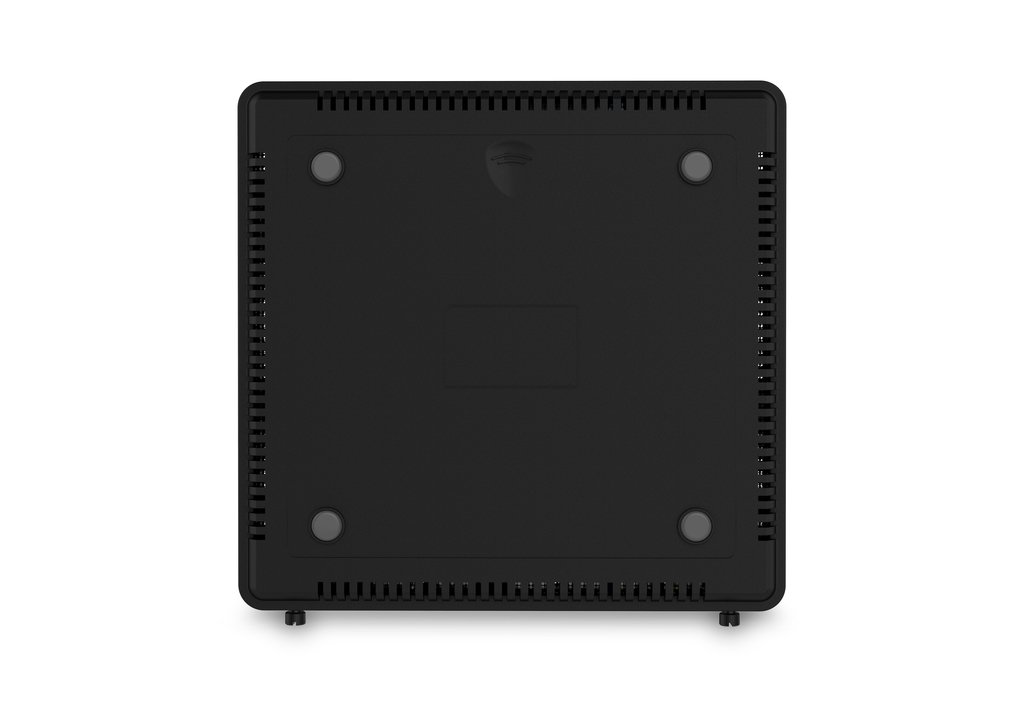
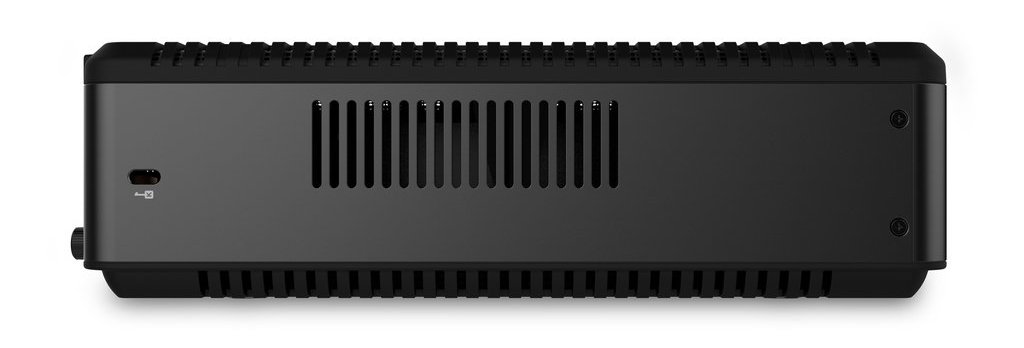
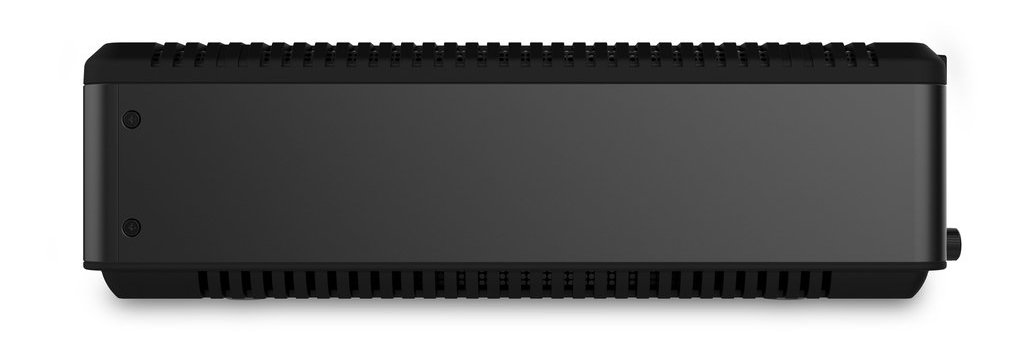
It's possible to position the unit vertically because one of the four sides includes no ventilation grilles. There is no official stand, however, and so stability may be an issue.
Energy Management
Power Consumption
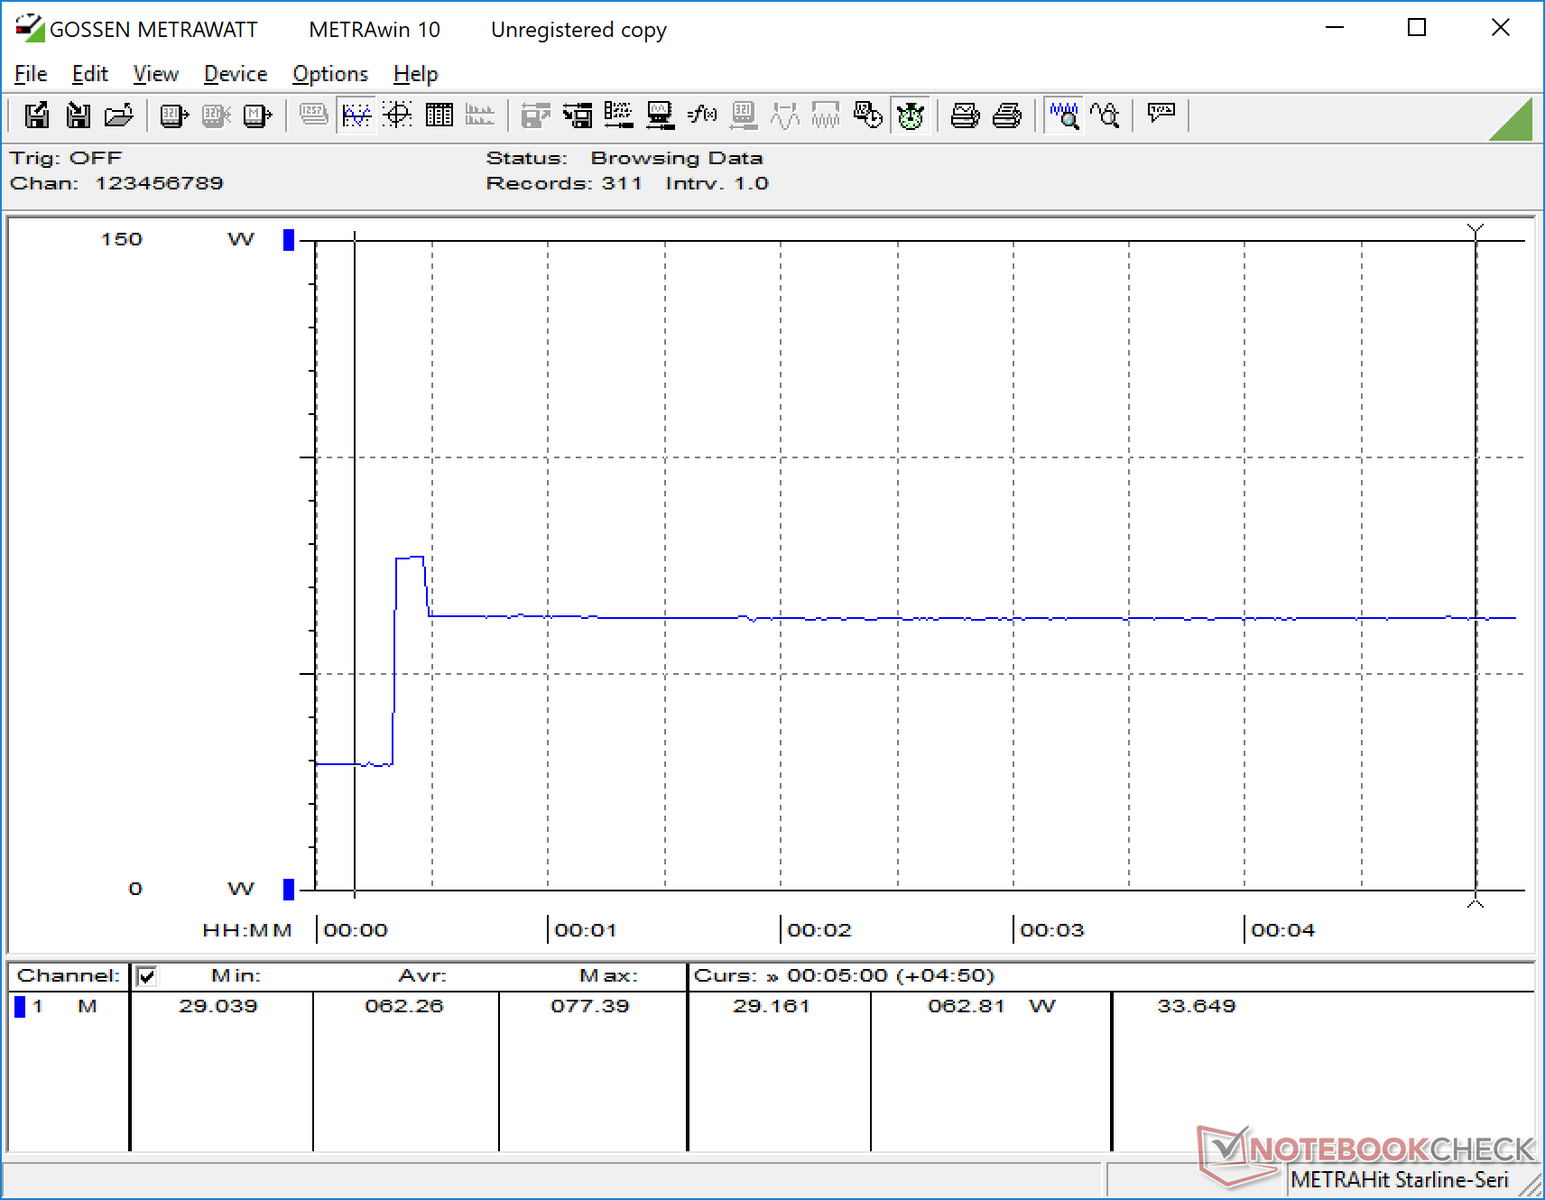
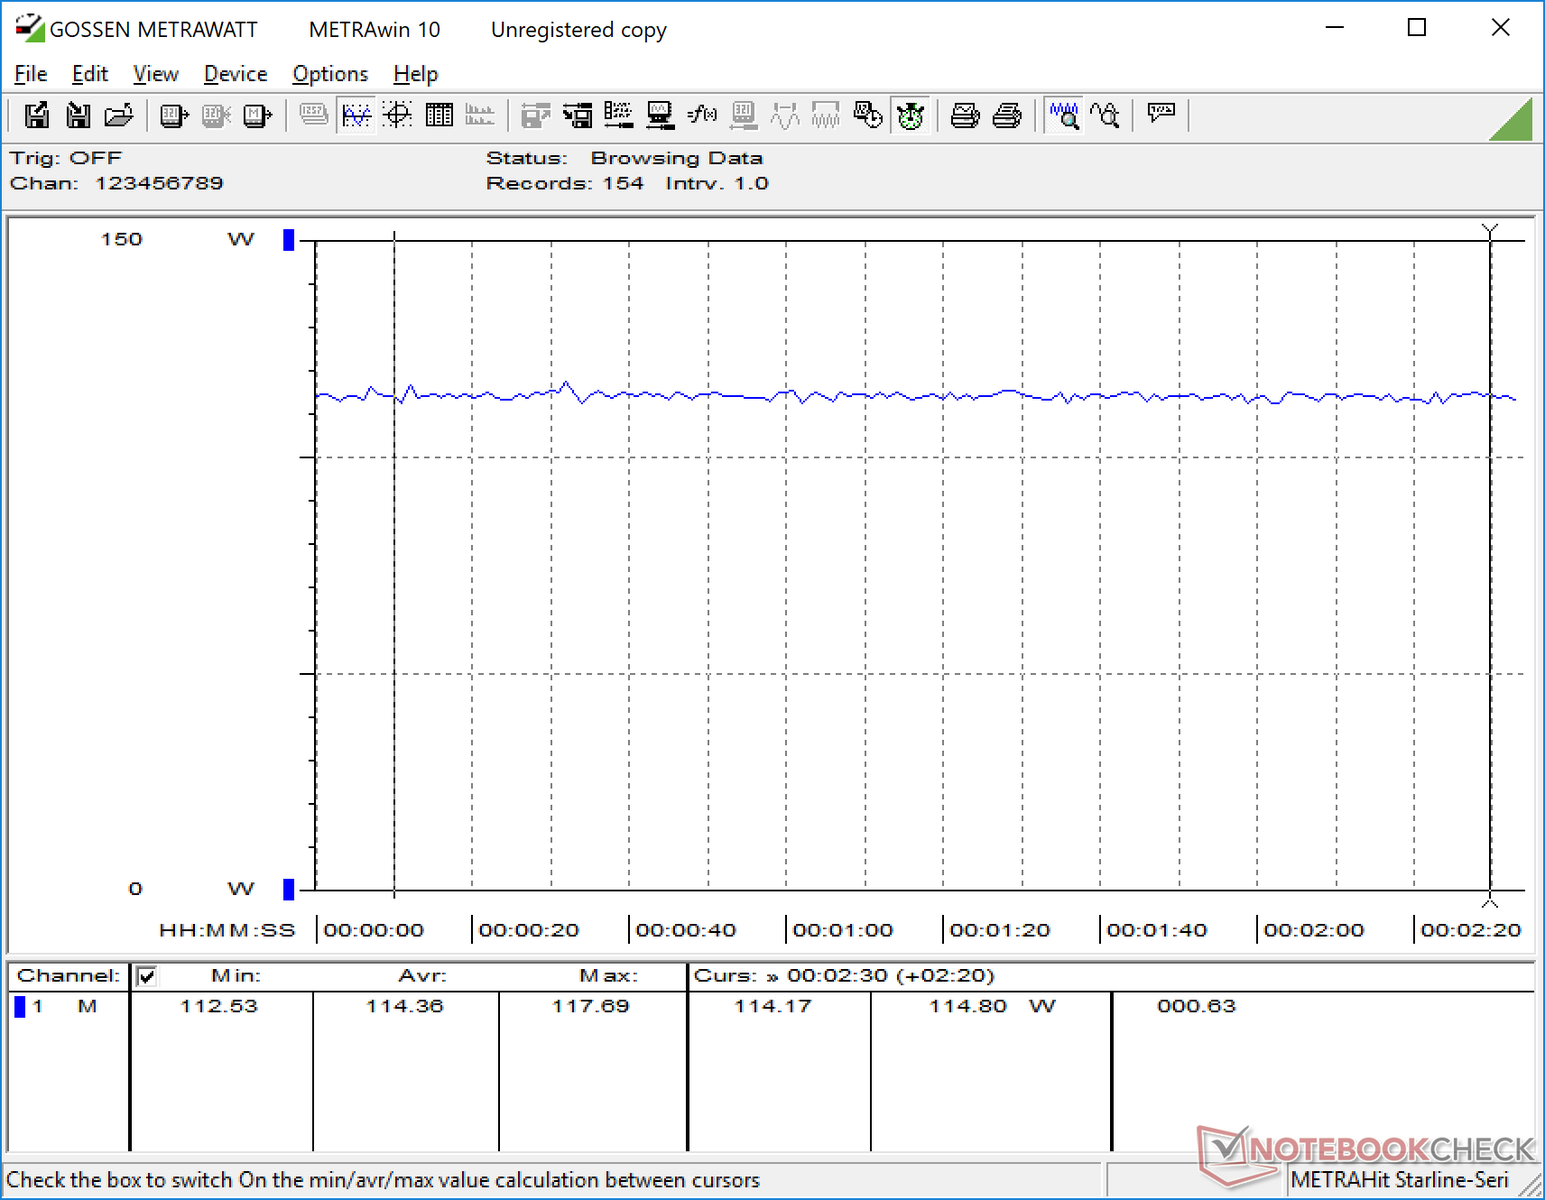
Idling on desktop will demand anywhere from 20 W to 28 W depending on the power profile selected. Its range is slightly higher than most notebooks since the i7-7700T is not a mobile HQ series CPU. Gaming loads will demand about 114 W to be similar to a GTX 1060-powered laptop.
Maximum load will demand an average of 96 W from the medium-sized (~15.3 x 7.4 x 3 cm) 180 W AC adapter. Consumption is lower when compared to gaming load because of throttling.
| Off / Standby | |
| Idle | |
| Load |
|
Key:
min: | |
| Zotac ZBOX-QK7P3000 i7-7700T, Quadro P3000, Samsung SSD 960 Pro 512 GB m.2, , x, | Intel Hades Canyon NUC8i7HVK i7-8809G, Vega M GH, Intel Optane 120 GB SSDPEK1W120GA, , x, | Zotac ZBOX Magnus EK71080 i7-7700HQ, GeForce GTX 1080 (Desktop), Samsung PM961 MZVLW256HEHP, , x, 0" | Apple iMac Pro W-2145, Pro Vega 56, , , 5120x2880, 27" | Lenovo ThinkPad P52s-20LB000HGE i5-8550U, Quadro P500, Samsung PM961 MZVLW256HEHP, IPS LED, 1920x1080, 15.6" | MSI WS63 7RF-290US i7-7700HQ, Quadro P3000, Samsung SM961 MZVKW512HMJP m.2 PCI-e, IPS, 1920x1080, 15.6" | |
|---|---|---|---|---|---|---|
| Power Consumption | -0% | -50% | -240% | 57% | 14% | |
| Idle Minimum * (Watt) | 19.9 | 15.5 22% | 27.1 -36% | 49.5 -149% | 4.1 79% | 11 45% |
| Idle Average * (Watt) | 20.3 | 16.2 20% | 27.4 -35% | 86.7 -327% | 7.7 62% | 14.2 30% |
| Idle Maximum * (Watt) | 27.6 | 16.5 40% | 28.8 -4% | 88.9 -222% | 10.7 61% | 14.6 47% |
| Load Average * (Watt) | 86.2 | 83.4 3% | 100.4 -16% | 150.1 -74% | 52 40% | 77.7 10% |
| Witcher 3 ultra * (Watt) | 114.4 | 121.7 -6% | 243.1 -113% | 38.8 66% | 89.1 22% | |
| Load Maximum * (Watt) | 96.3 | 173.5 -80% | 186.7 -94% | 508.5 -428% | 65 33% | 161.7 -68% |
* ... smaller is better
Pros
Cons
Verdict
We're delighted to see the popular gaming-centric Magnus EN51050 converted into a workstation for professional users. Much like how the MSI WT and WS families are derivatives of the gaming GT and GS families, the Zotac Q series brings the best of what the ZBox gaming models offer including relatively quiet operation under load, reasonably cool core temperatures, and high performance for the small volume.
Unfortunately, the same drawbacks remain. Zotac has not bothered upgrading the WLAN or adding any additional features to further distinguish the Q series. WiFi speeds are still limited by a 1x1 433 Mbps Intel 3165 module whereas most newer laptops are already beginning to ship with the 1.73 Gbps Intel 9560. Thunderbolt 3 is still missing and transfer rates from the SD card reader are a fraction of what UHS-II promises. The GPU is unable to maintain its maximum Boost clock rate by default which is baffling considering that its core temperature has plenty of overhead available when under stress.
Many of these drawbacks could have been easier to forgive if it weren't for the high MSRP. At $1400 USD for a barebones kit without any storage drives or RAM, we feel that the QK7P3000 could have offered more for the price. At the same time, however, it's one of the very few mini PCs - if not the first - to ship with Quadro Pascal graphics and so alternatives are currently limited. We're hoping that future revisions will update some lacking components to better reflect the price range.
The power available in such a small form factor shouldn't be understated. Workstation users can now exploit the same Pascal-powered ultra-small form factor PCs that gamers have been enjoying for quite some time. It offers high performance-per-volume, albeit not necessarily the highest performance-per-Dollar.
Price comparison
