Eurocom Tornado F5W (Xeon E3-1280 v5, Quadro P5000) Workstation Review
Early this year, we reviewed the Eurocom Tornado F5, an absolute powerhouse of a gaming notebook with a no-nonsense design, but also practical supplementary features such as standard LGA 1151 and MXM 3.0 sockets (for CPU/GPU upgradeability) and straightforward serviceability. Today, we’re taking a look at the workstation counterpart to that machine, the Tornado F5W—which by appearances may seem quite similar, but whose internals have changed quite a bit.
Compromise is an unknown concept to this Eurocom notebook; it features an Intel Xeon E3-1280 v5 CPU and NVIDIA Quadro P5000 GPU alongside an NVMe SSD and 64 GB of RAM. It should come as no surprise, then, that the retail cost for our review unit is close to $6,000—among the most expensive notebooks we’ve evaluated to date. Can the Tornado F5W’s performance match its towering expense?
Case
The Tornado F5W’s case is identical to that of the F5 we reviewed back in January. It’s a derivative of the MSI GT62VR case—minus the branding, of course—and we’ve already covered it on multiple occasions, so we’ll just briefly recap our previous findings in these next few sections.
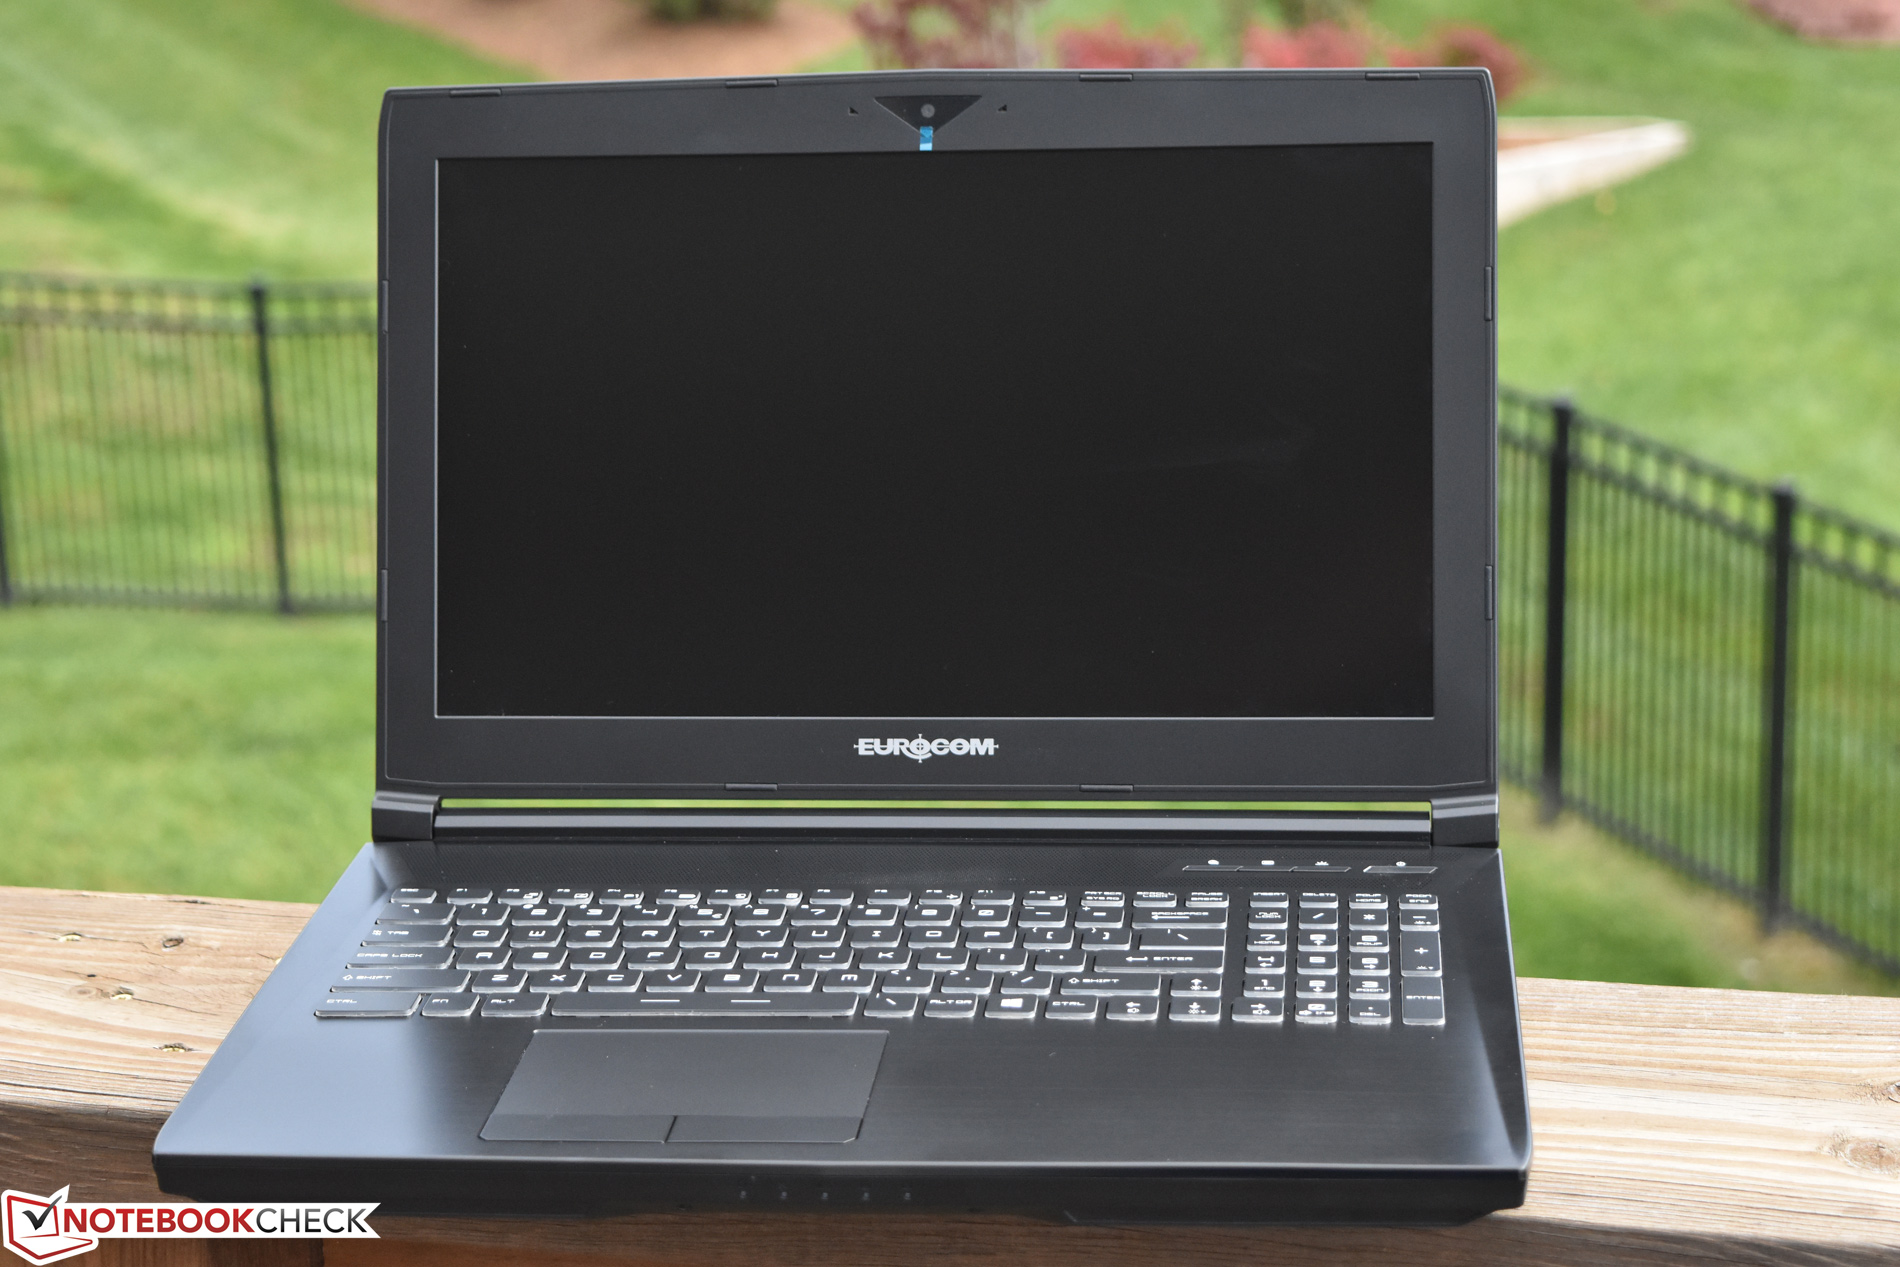
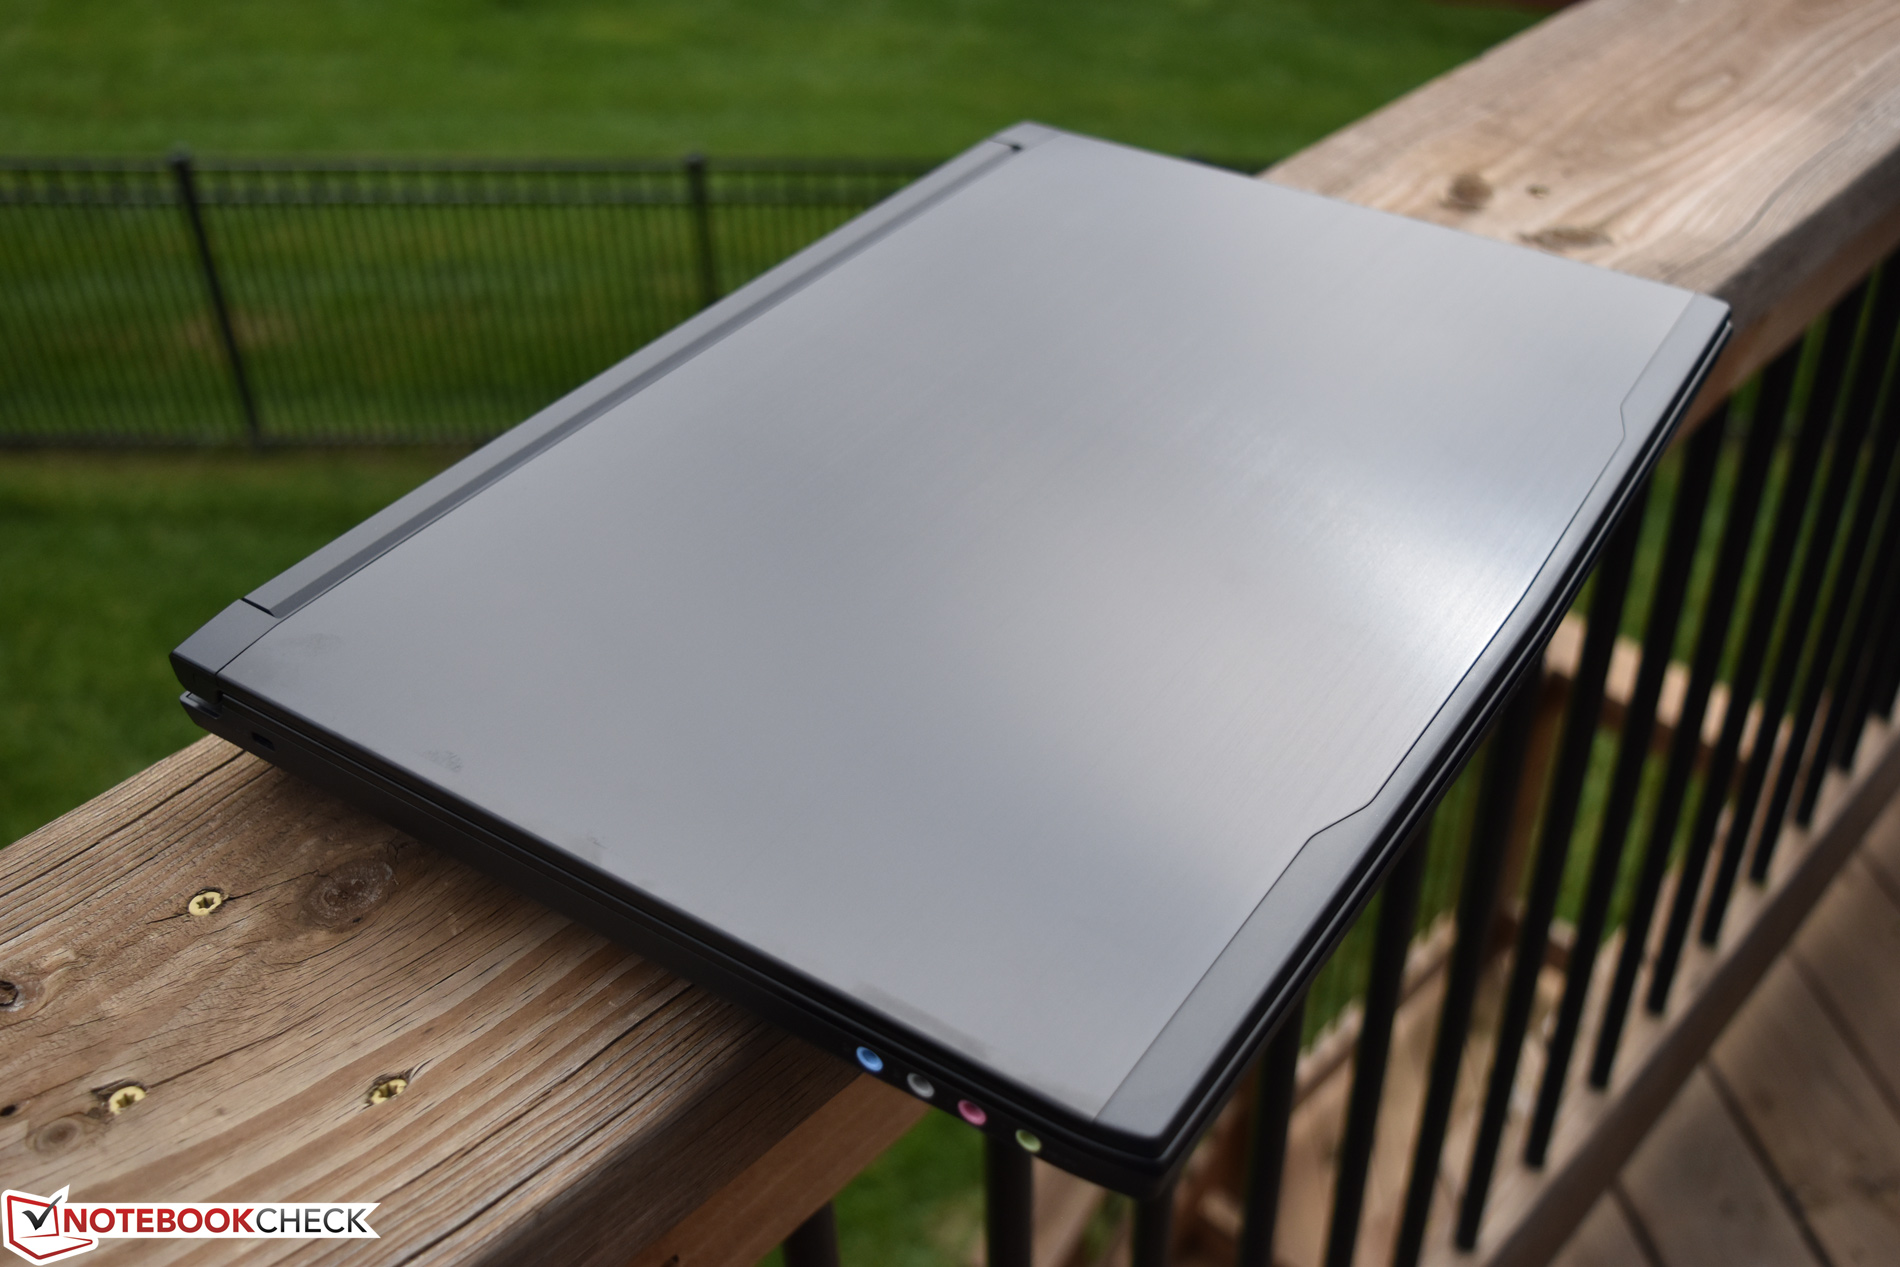
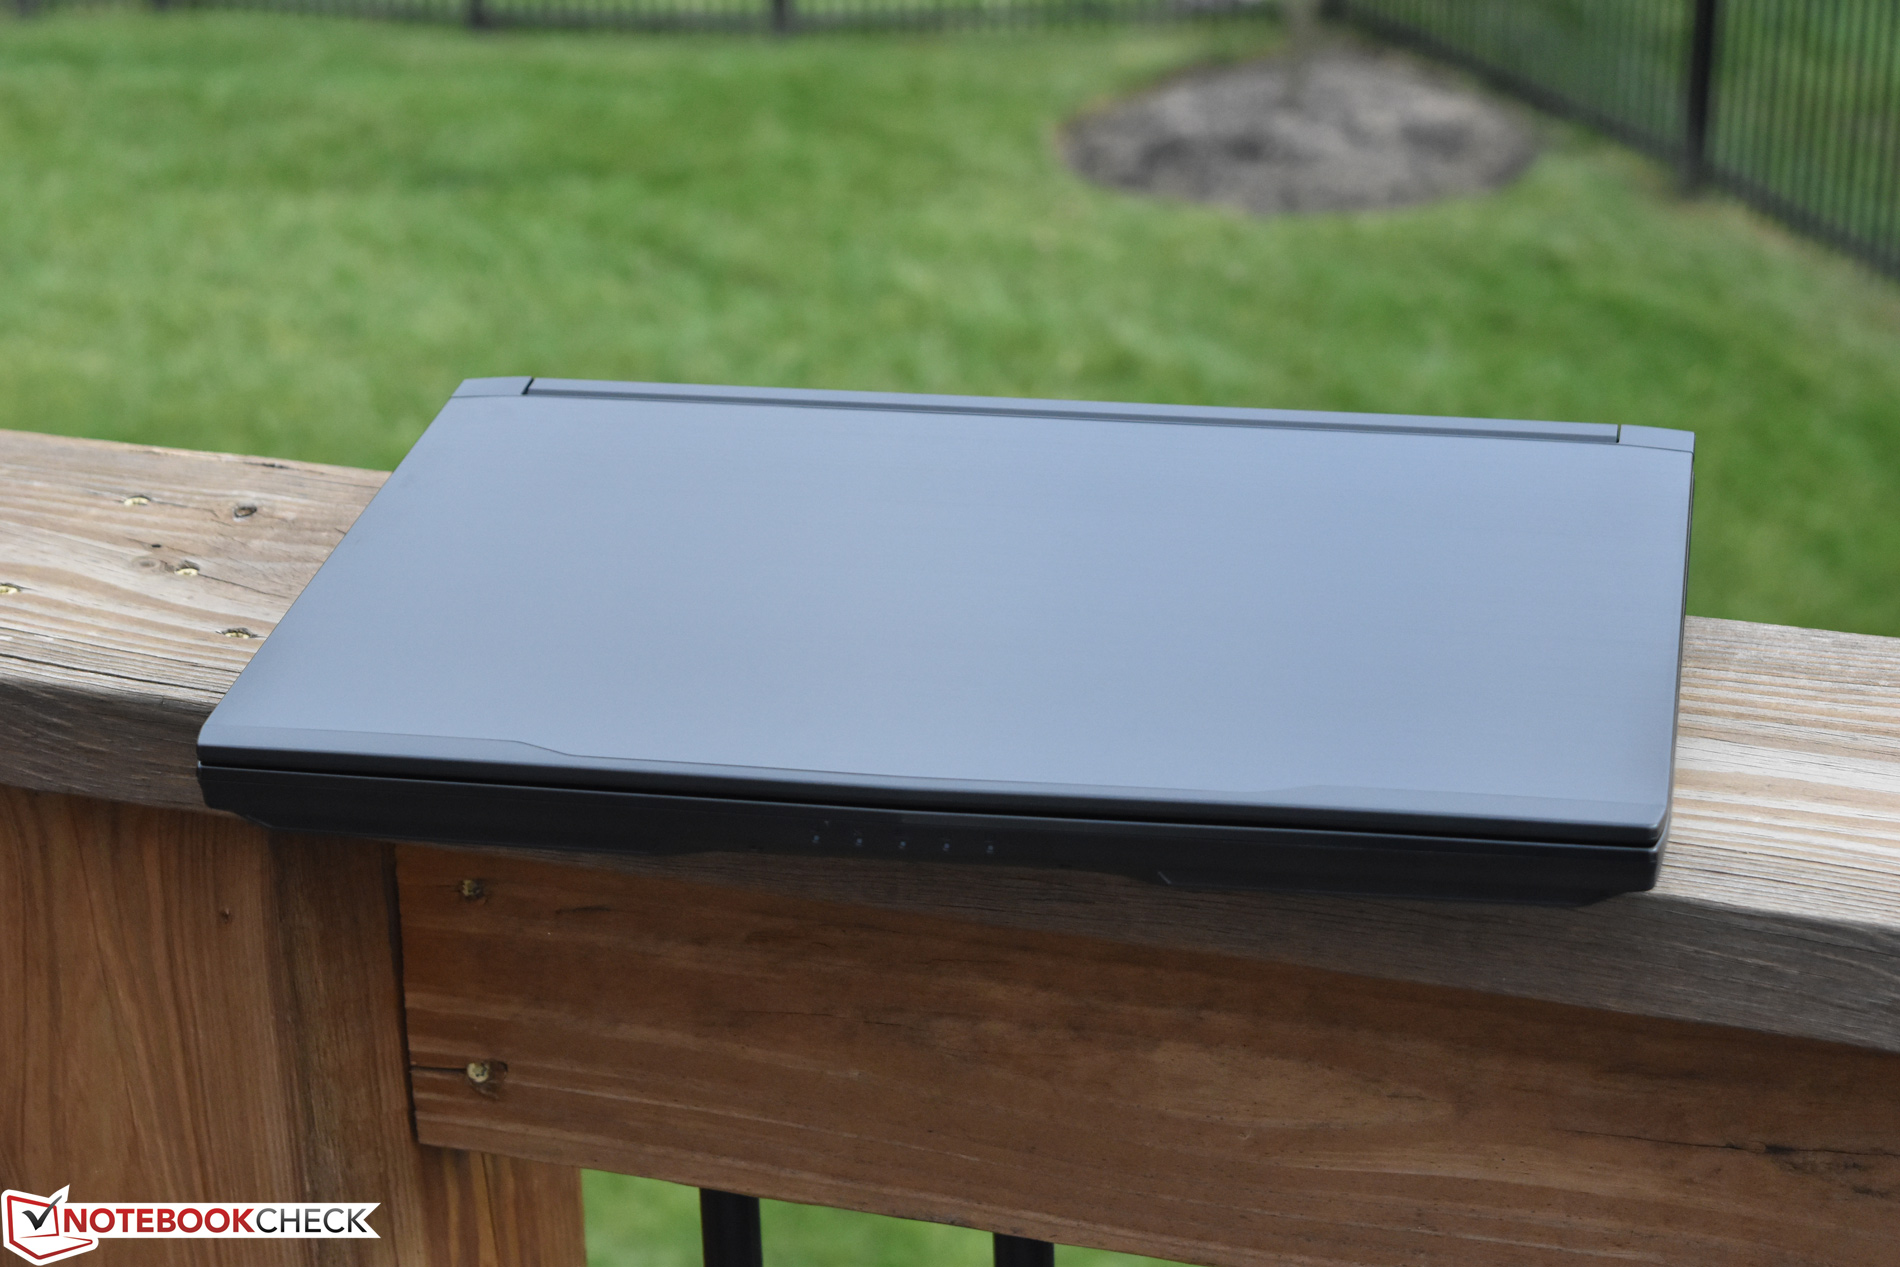

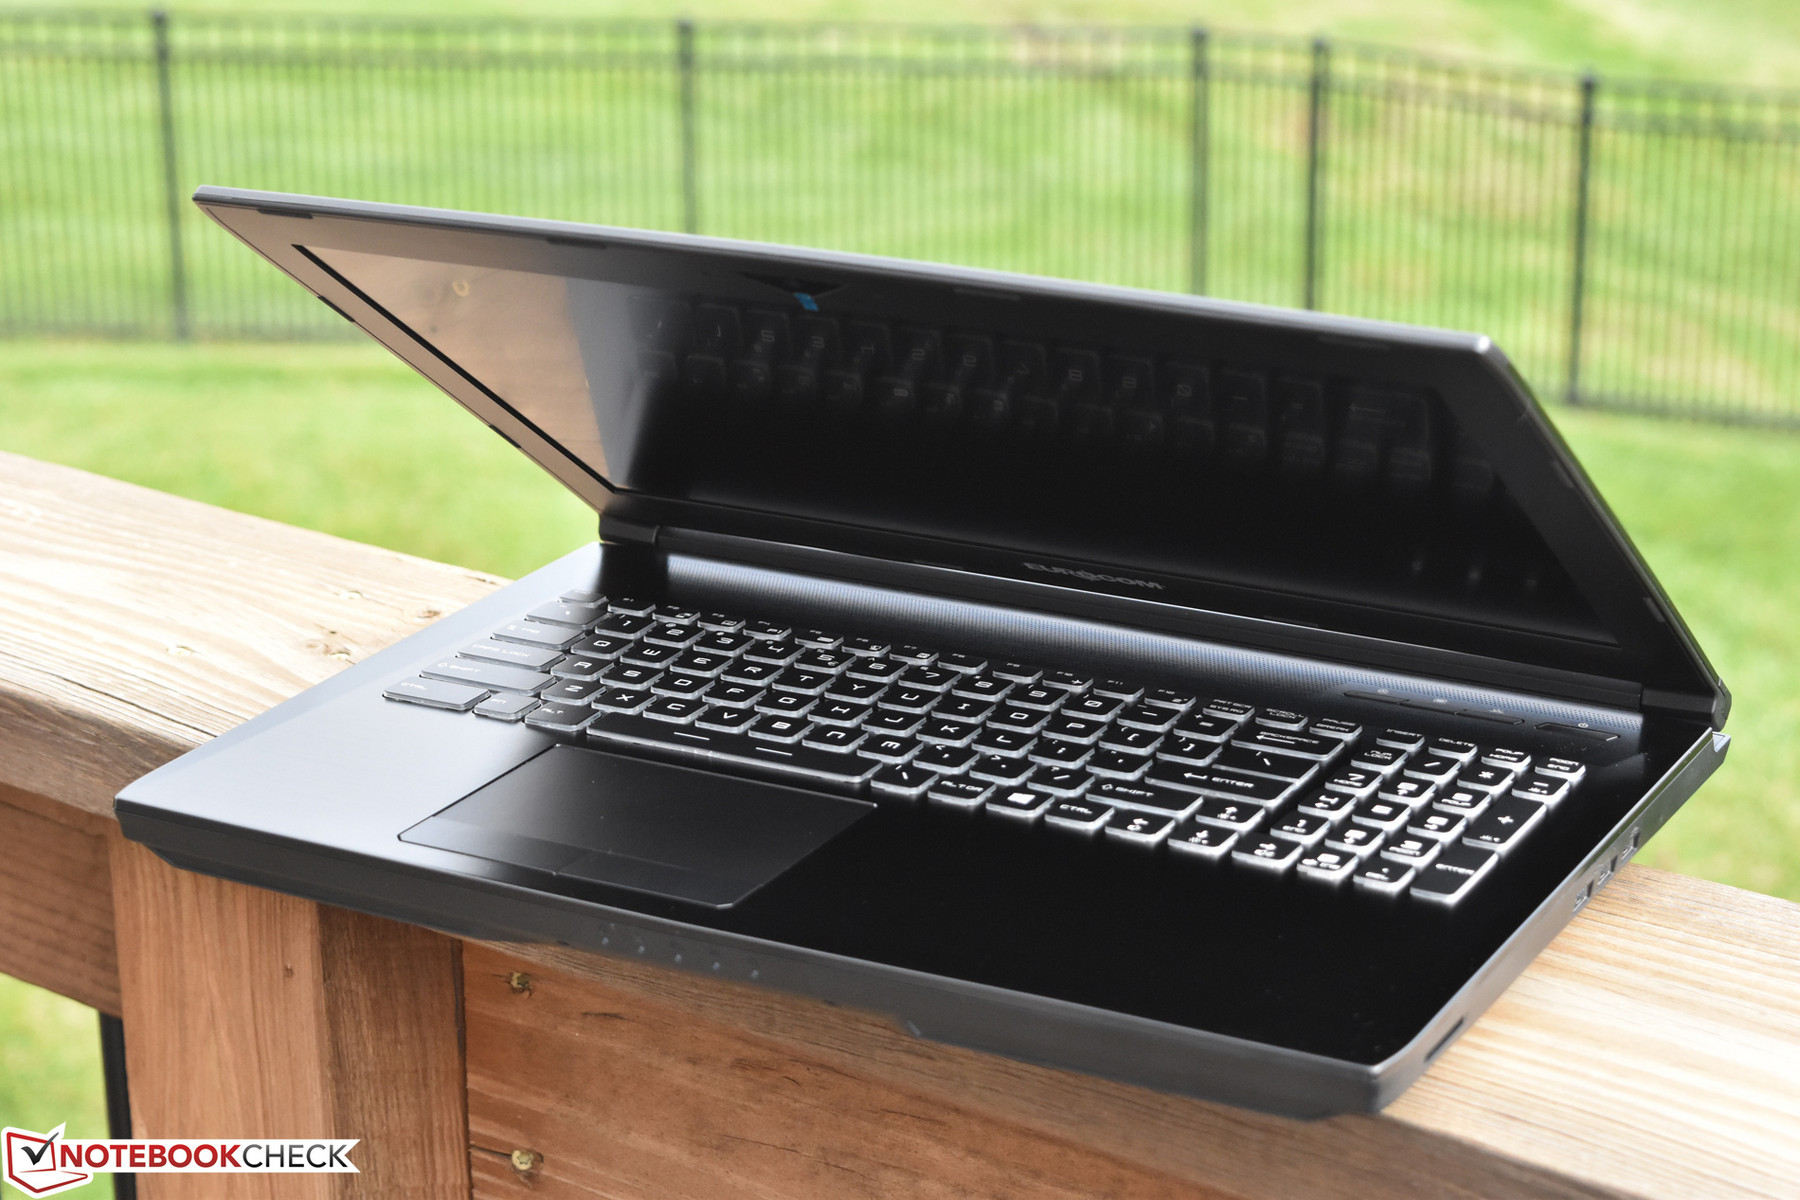
The Tornado F5W’s case is constructed from aluminium alloy (back cover and top case) and German-manufactured resins (front cover and bottom case). Barring some flex in the center of the keyboard, the base is generally stable and feels sturdy enough. The display lid is considerably more flexible/fragile, but the hinges do their job well, and workmanship overall is very good. It’s a larger and heavier notebook than most others in its class, but this is hardly a surprise given the extremely power-hungry internal components (which we’ll get to in a bit). In fact, it’s currently the smallest 15-inch workstation which offers a P5000 GPU.
Connectivity
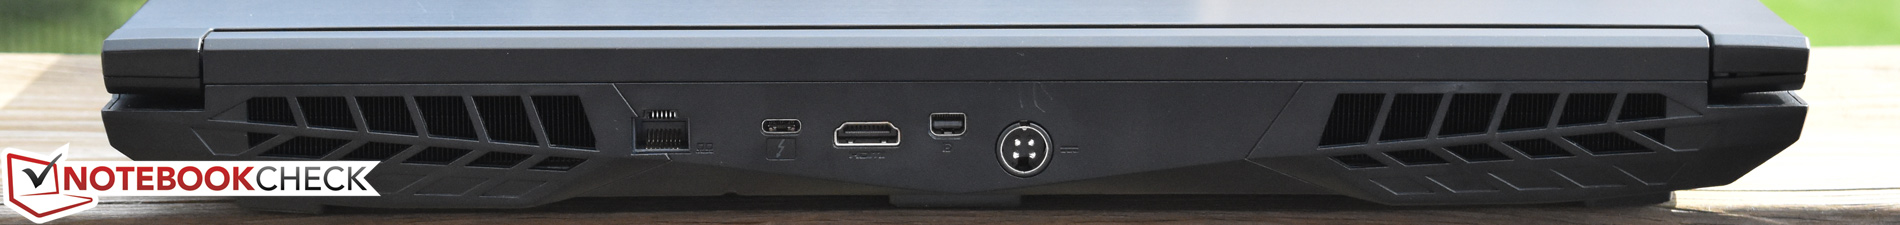
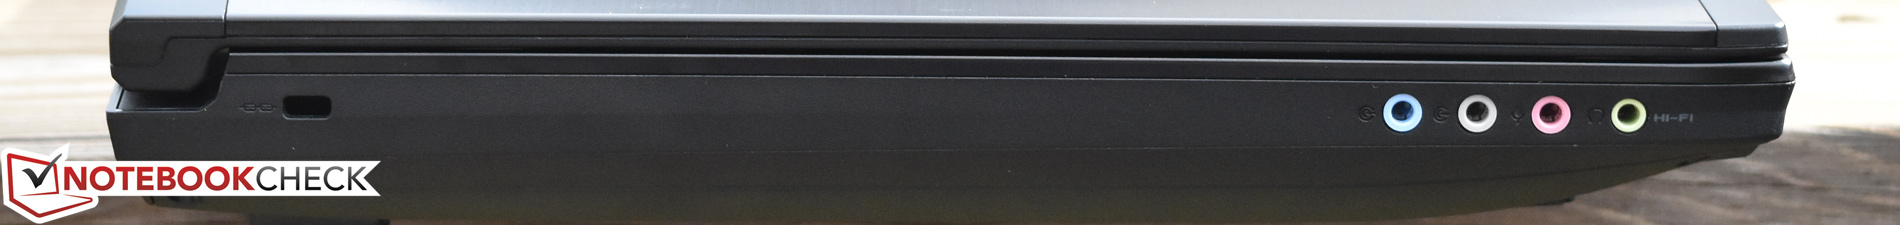
The Tornado comes equipped with four total USB ports, one of which is USB Type-C/Thunderbolt 3. There are also myriad video and audio output options; selection overall is good, but positioning leaves a lot to be desired, with many ports lining the back (and thus difficult to access) and others crammed together in odd locations on the sides. The machine supports output to up to four 4K displays, a capability which is far beyond many competitors.

SD Card Reader
The Tornado’s integrated SD card reader provides good performance (better than the F5 version’s results), though its read performance is a step below the fastest models in our test field.
| SD Card Reader | |
| average JPG Copy Test (av. of 3 runs) | |
| HP ZBook 15 G4-Y4E80AV | |
| Eurocom Tornado F5W | |
| Dell Precision 5520 UHD | |
| Lenovo ThinkPad P51 20HH0016GE | |
| MSI WS63VR 7RL-023US | |
| Fujitsu Celsius H970 | |
| maximum AS SSD Seq Read Test (1GB) | |
| Dell Precision 5520 UHD | |
| Lenovo ThinkPad P51 20HH0016GE | |
| MSI WS63VR 7RL-023US | |
| HP ZBook 15 G4-Y4E80AV | |
| Eurocom Tornado F5W | |
| Fujitsu Celsius H970 | |
Communication
A slight downgrade from the F5’s Killer 1535 wireless, the F5W instead includes the venerable Intel Dual Band Wireless-AC 8265. This is a popular choice in modern notebooks, and while it lacks the options and customizability of the Killer chip, its performance is more than adequate for practically any purpose: with receive/transmit speeds in our wireless tests of 567 Mb/s and 523 Mb/s, respectively, the results were congruent with those of the Killer 1535 adapter.
Accessories
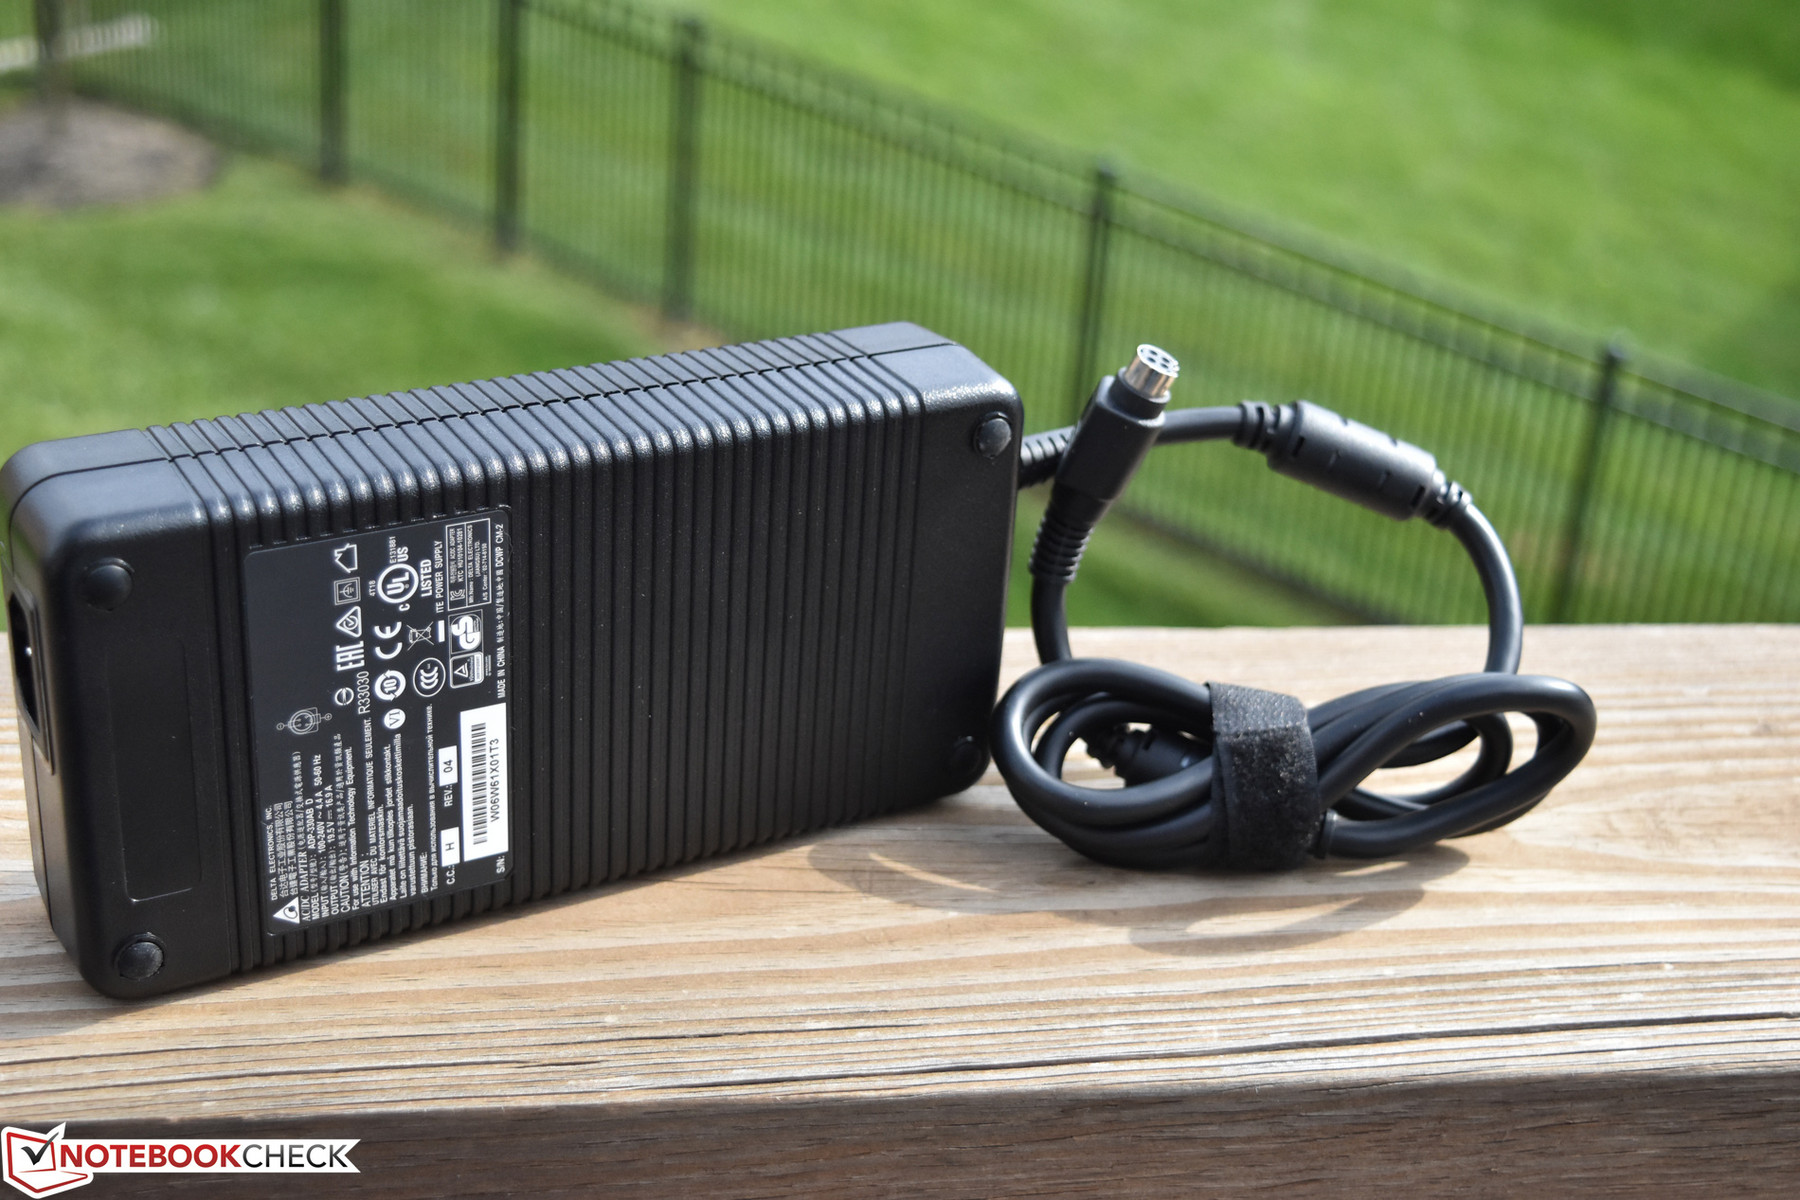
Apart from the higher-wattage 330 W power adapter, our Tornado F5W was supplied with a few additional items: a 2.5-inch SATA storage drive mounting bracket (with screws), as well as two thermal pads meant for (optional) use on M.2 SSDs.

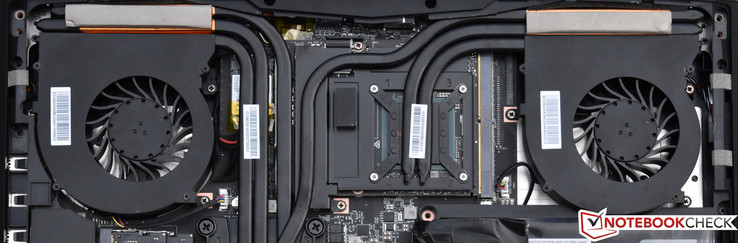
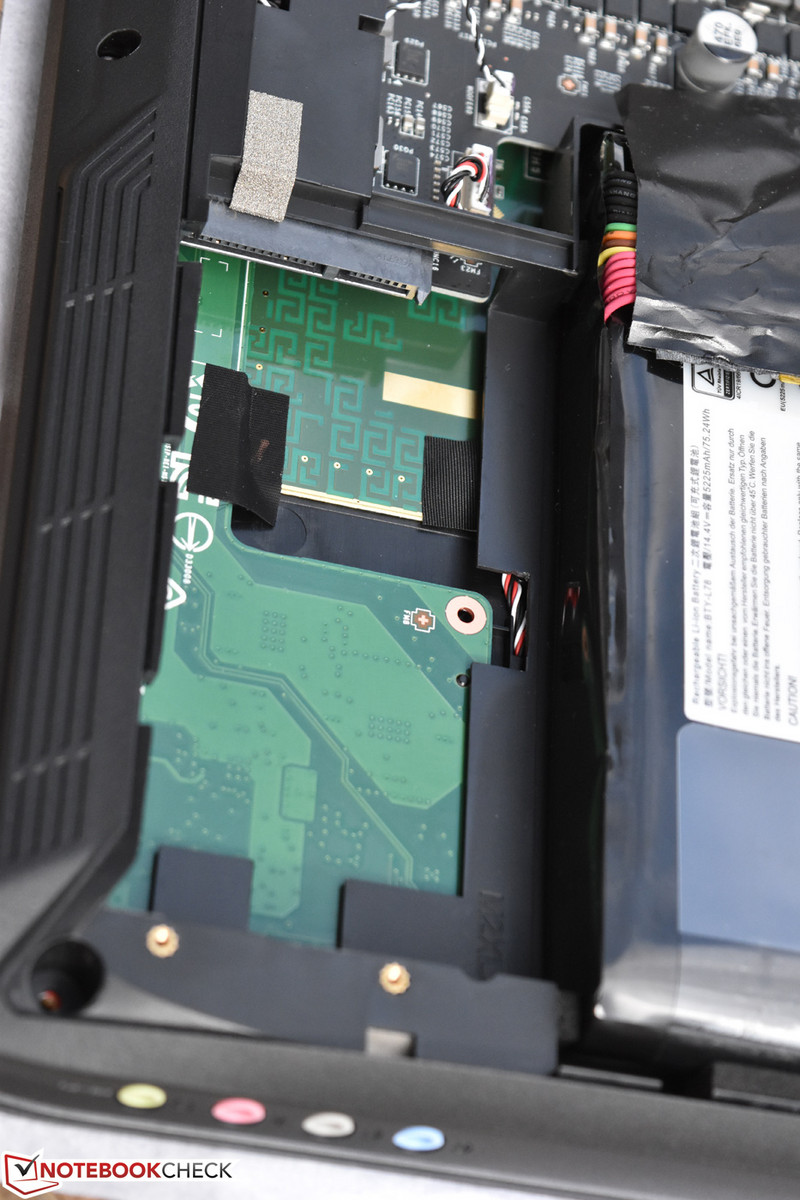
Maintenance
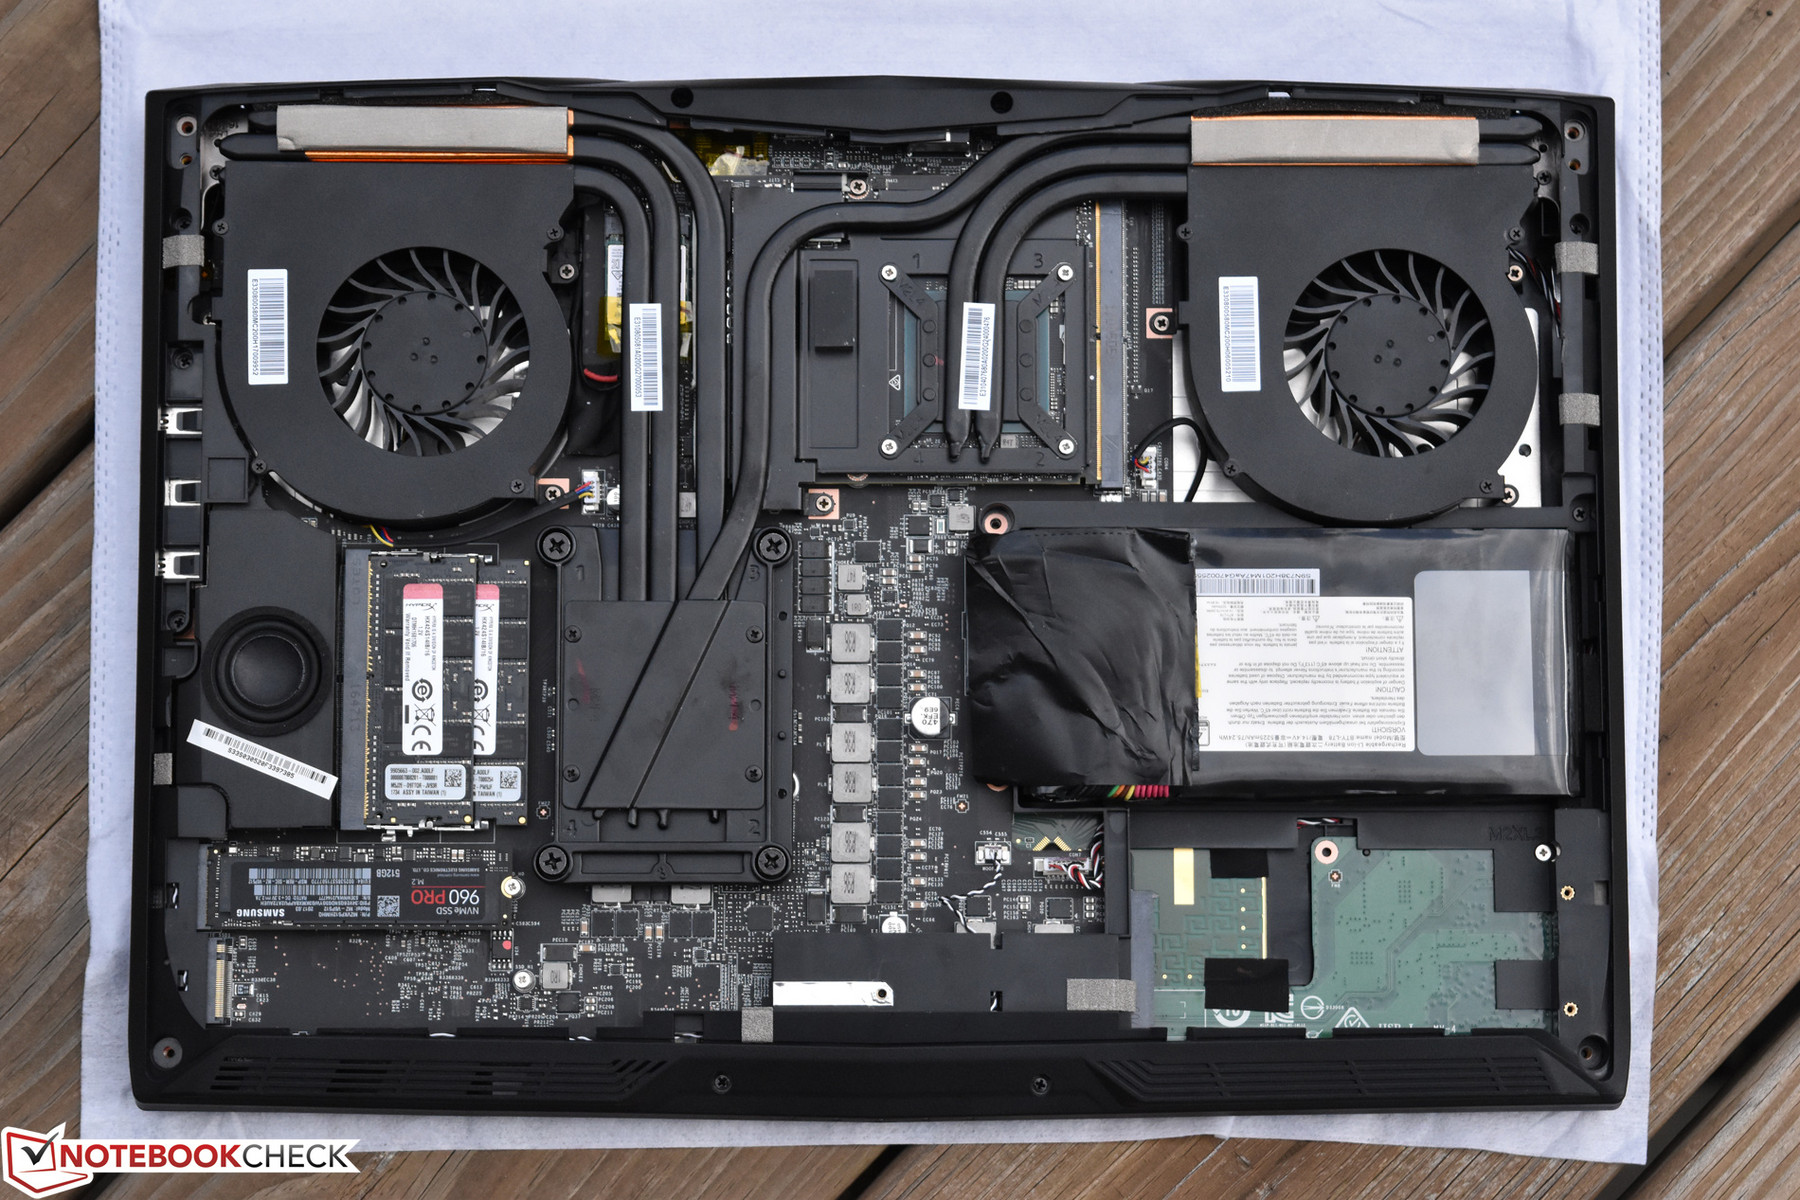
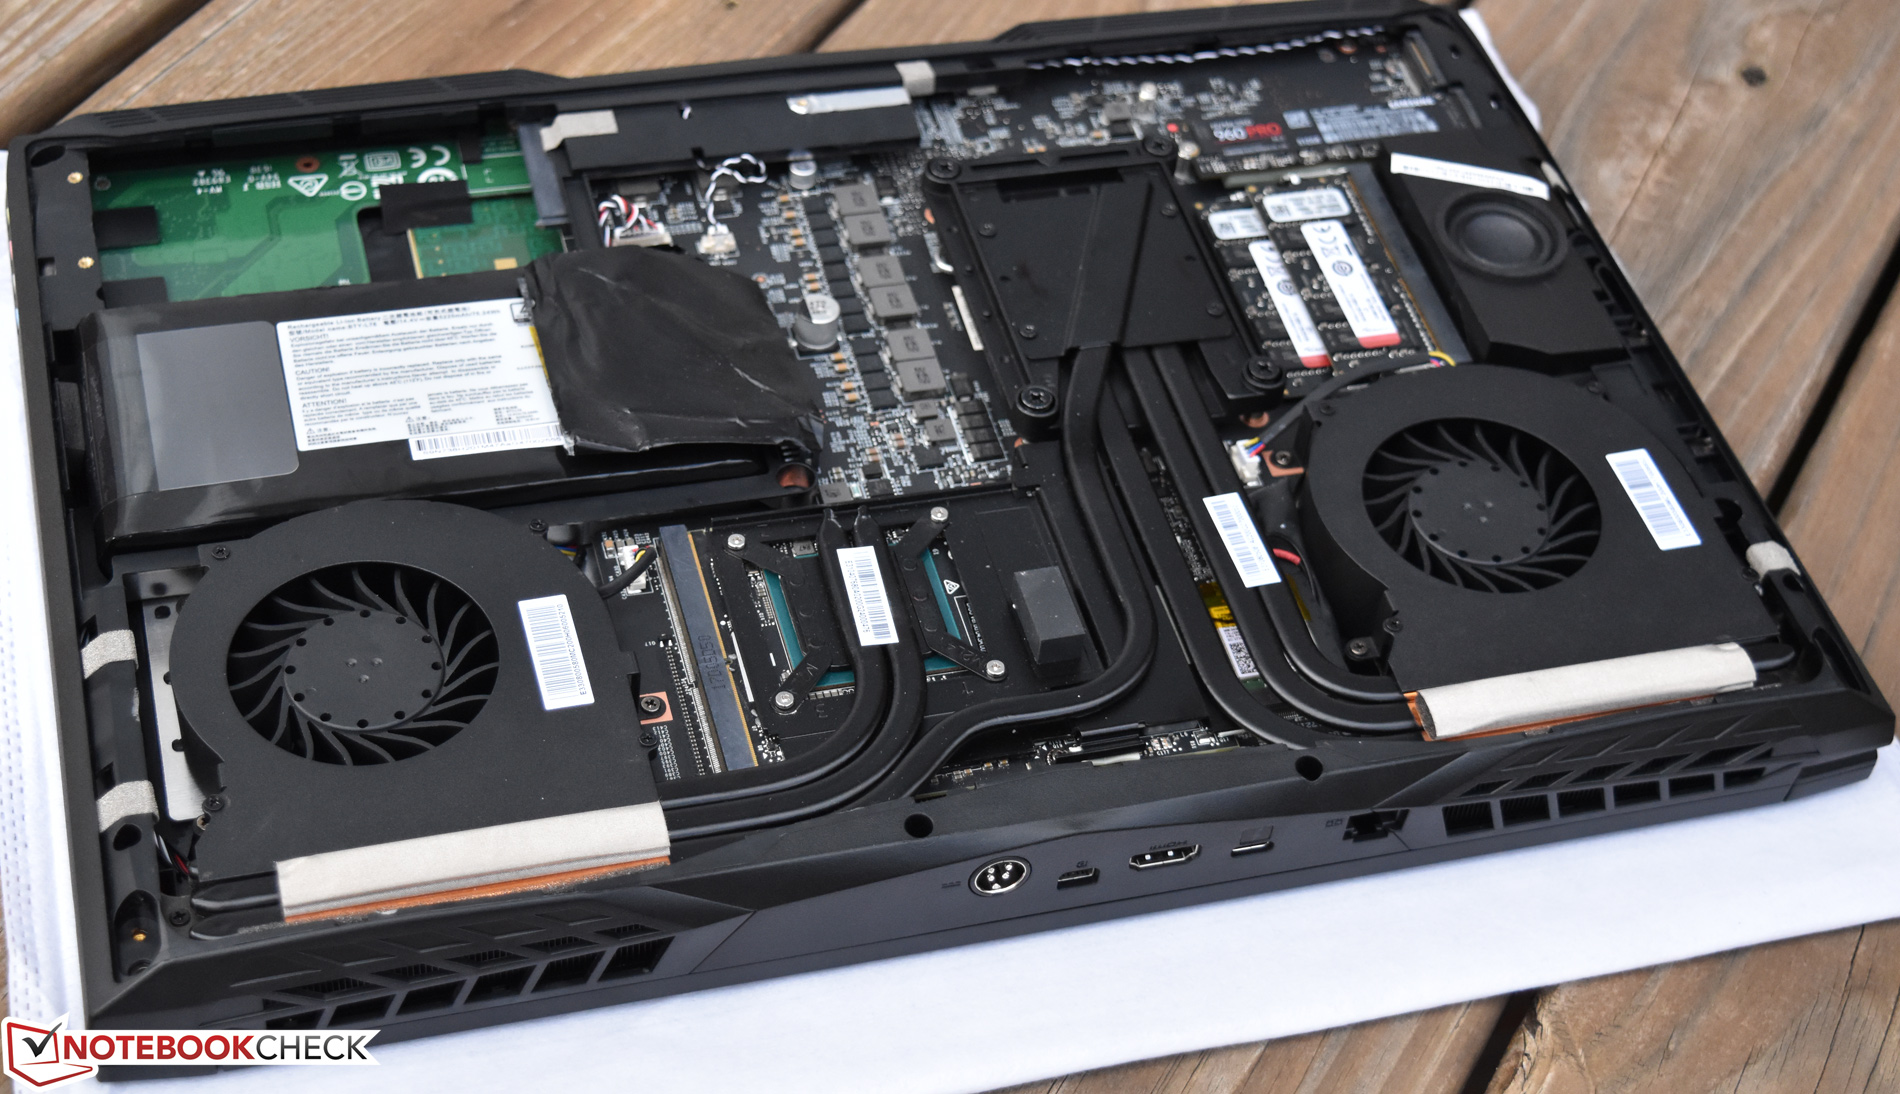
Once again, the Tornado F5W is identical to the F5 in the category of maintenance. Just a few screws secure the bottom cover of the notebook, beneath which the user will find easy access to most every replaceable component within. A unique benefit of this machine which is rarely seen in the mobile sector is the ability to replace or upgrade both the CPU and GPU, which are socketed as opposed to soldered to the board.
Warranty
The Eurocom Tornado F5W includes a 1-year depot warranty standard; upgrades to 2 and 3-year plans are available, but no on-site service is offered. Please see our Guarantees, Return Policies & Warranties FAQ for country-specific information.
Input Devices
Keyboard
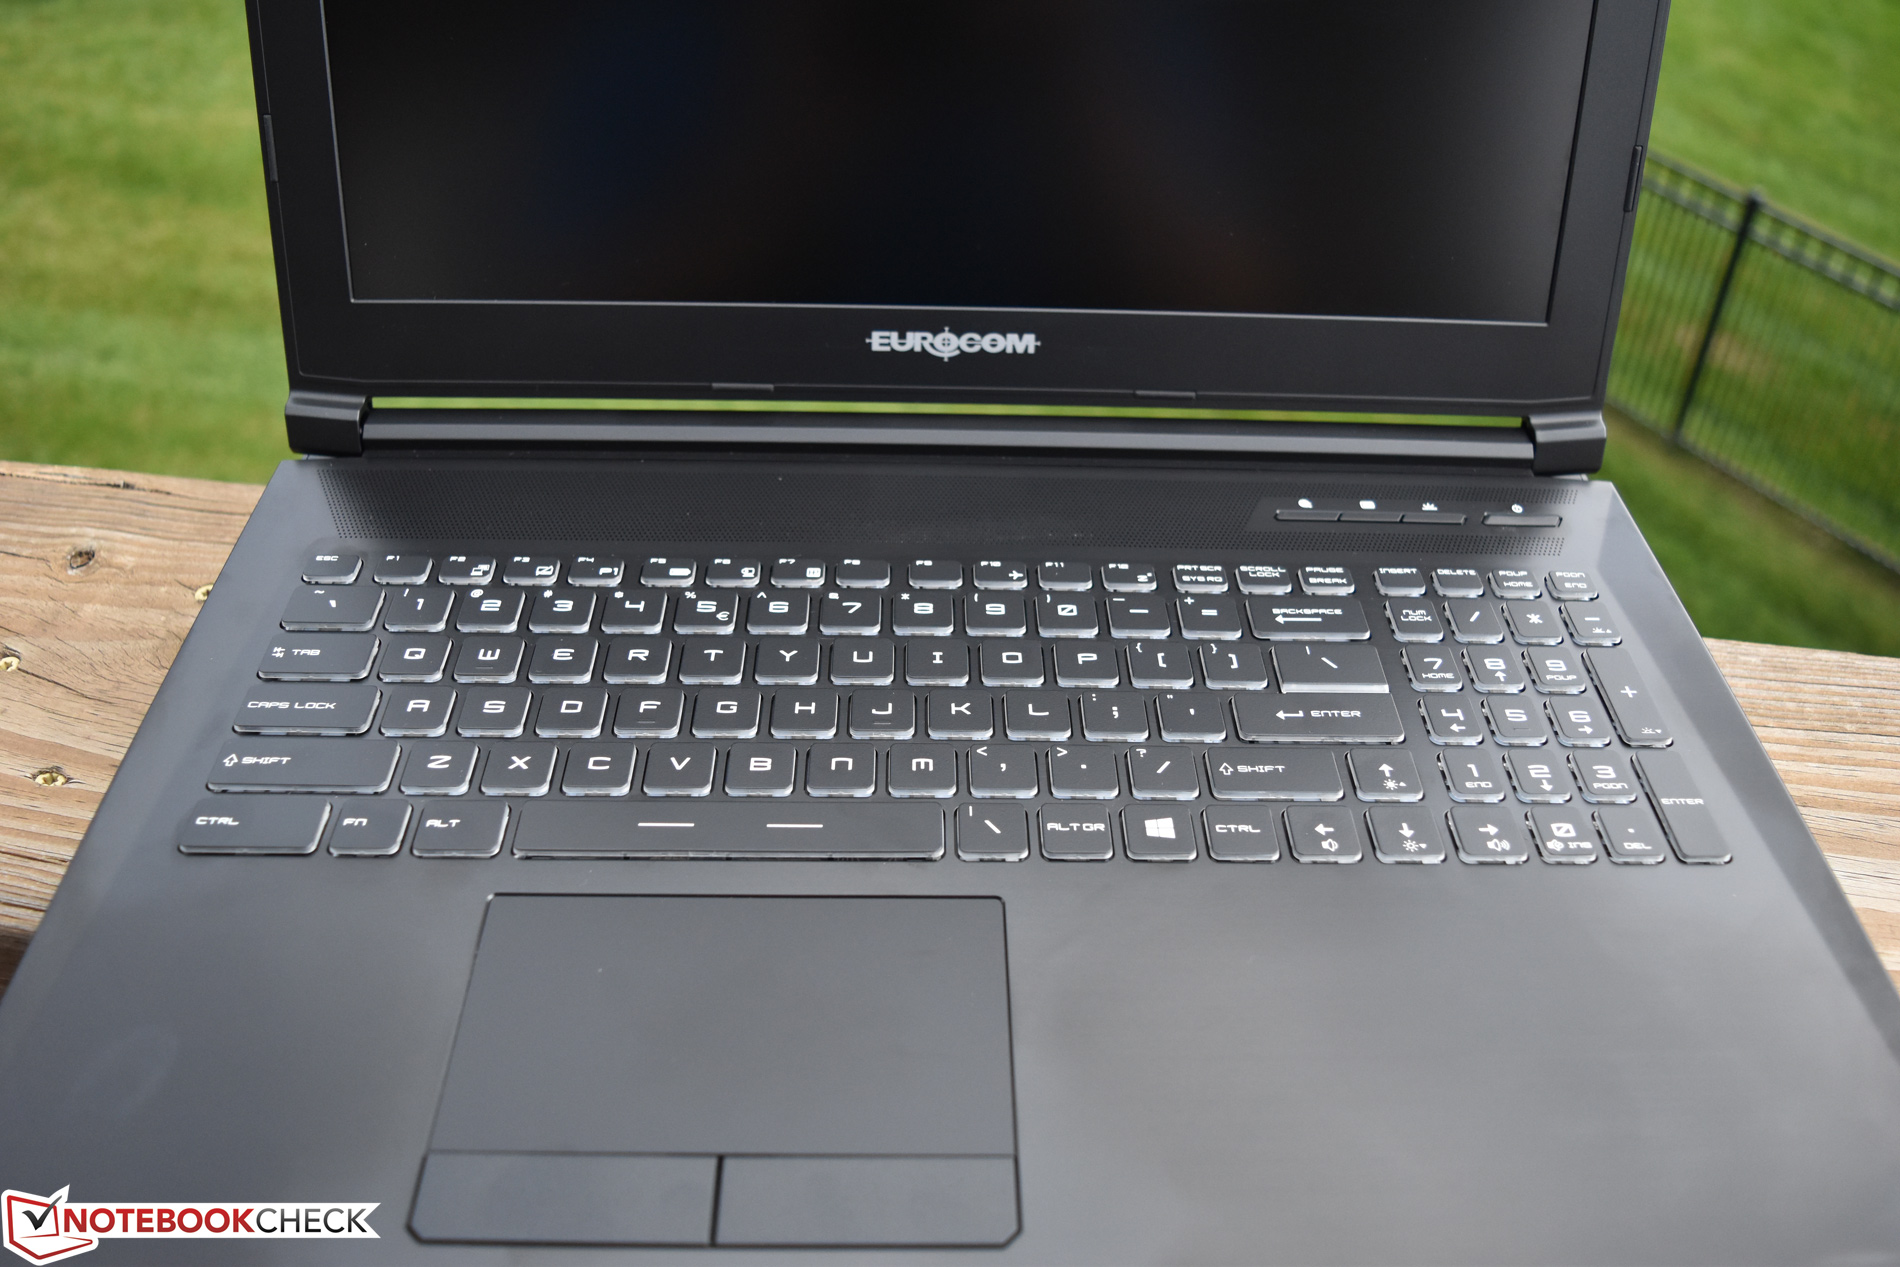
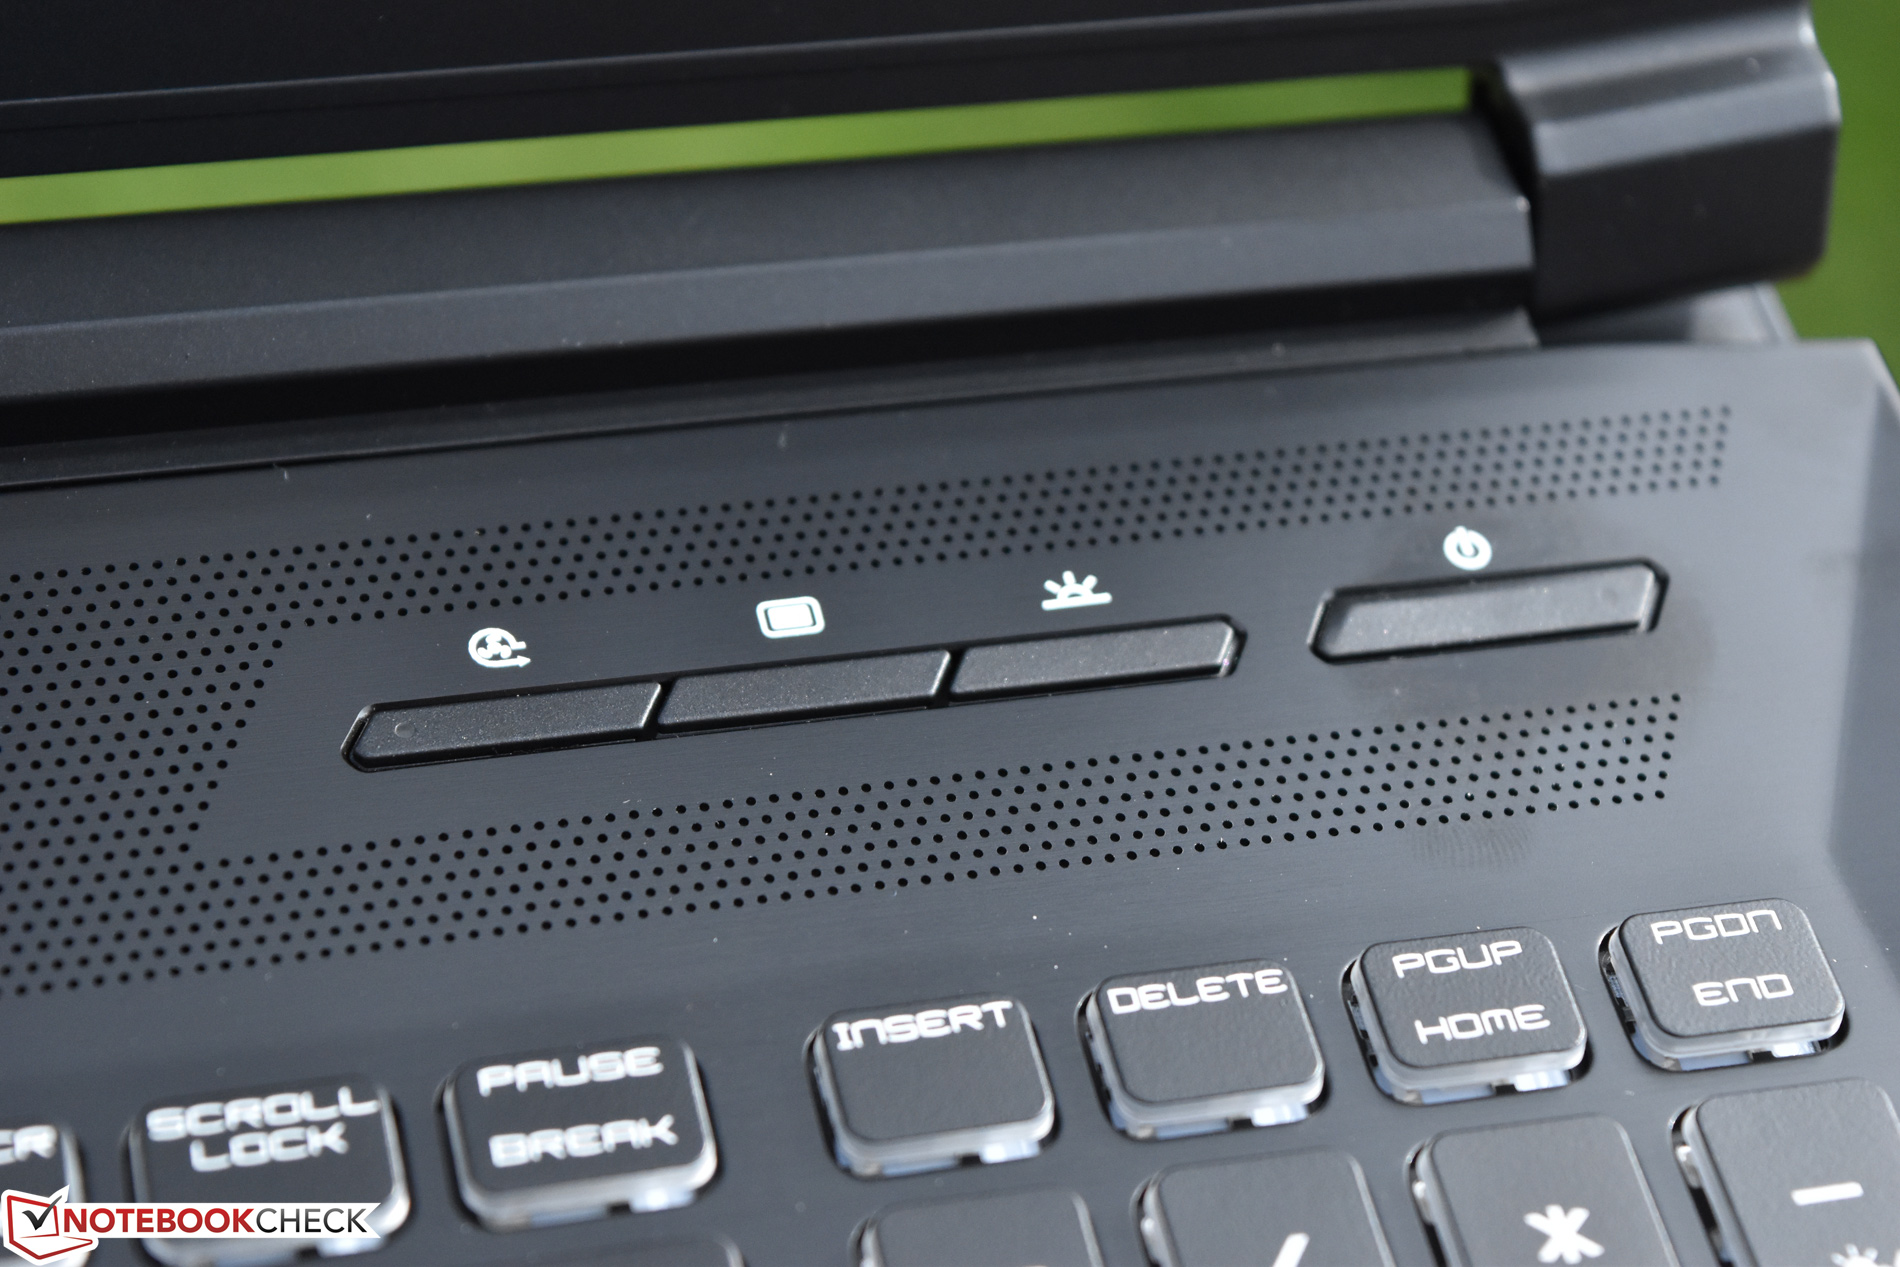
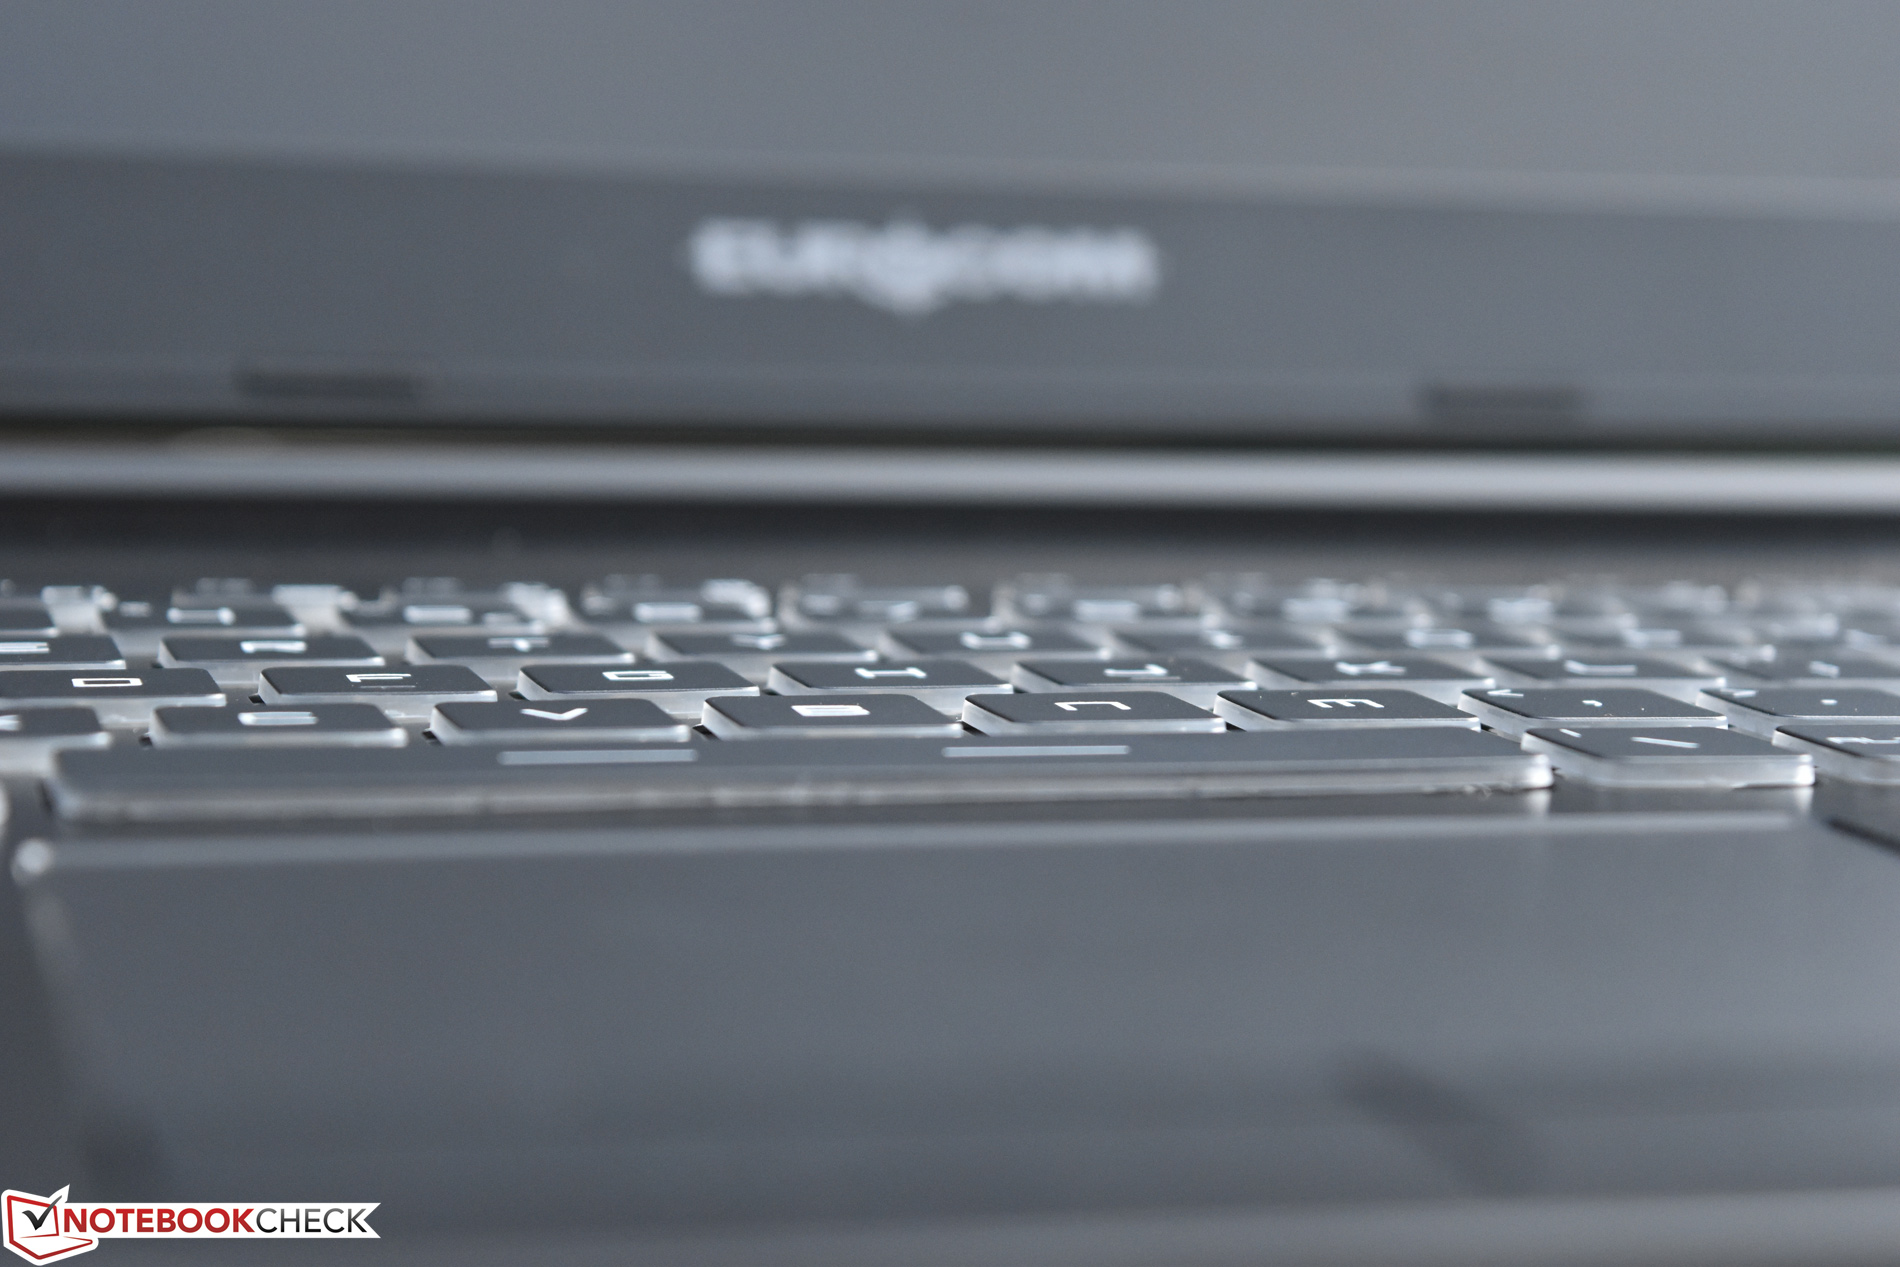
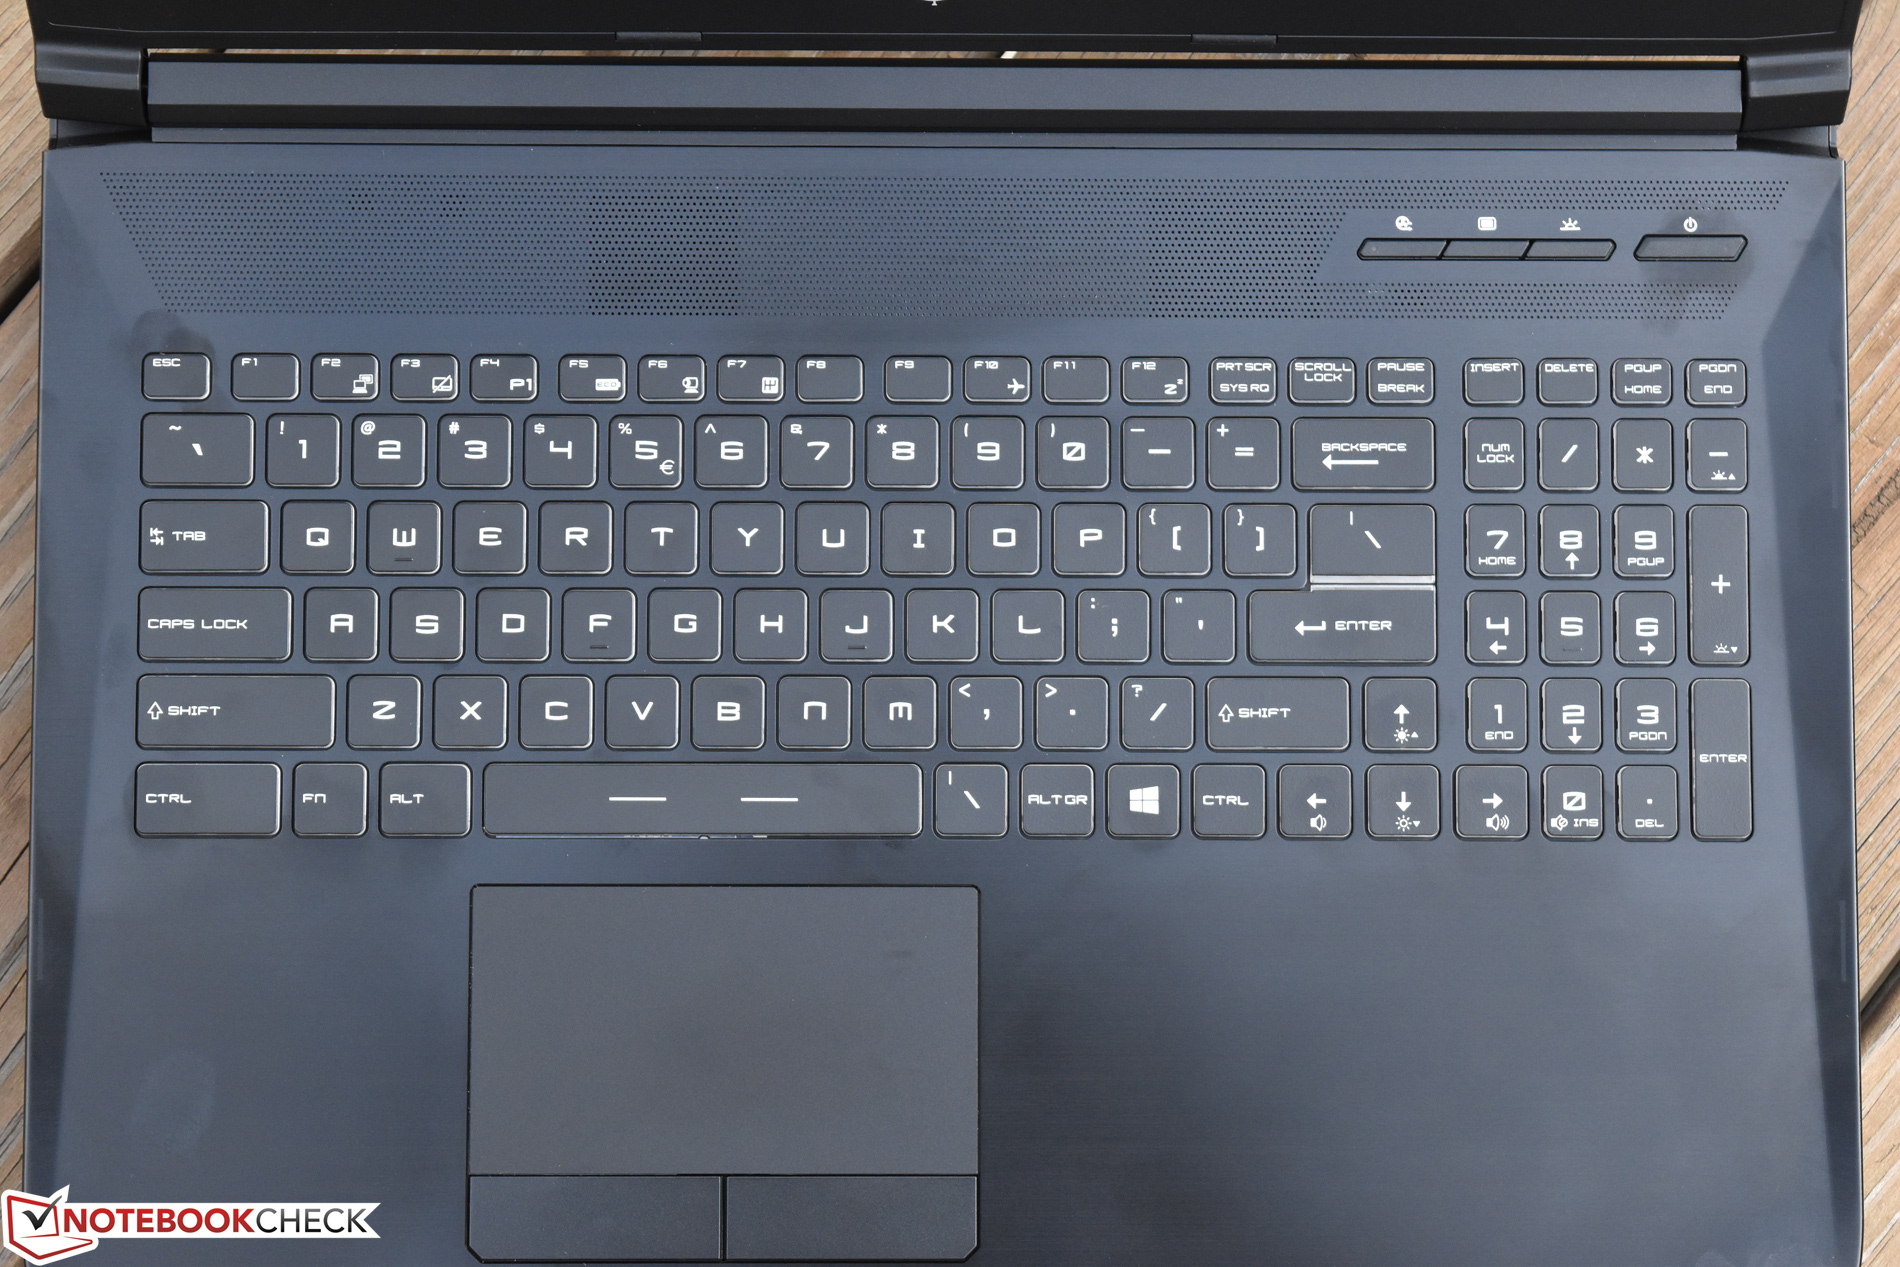
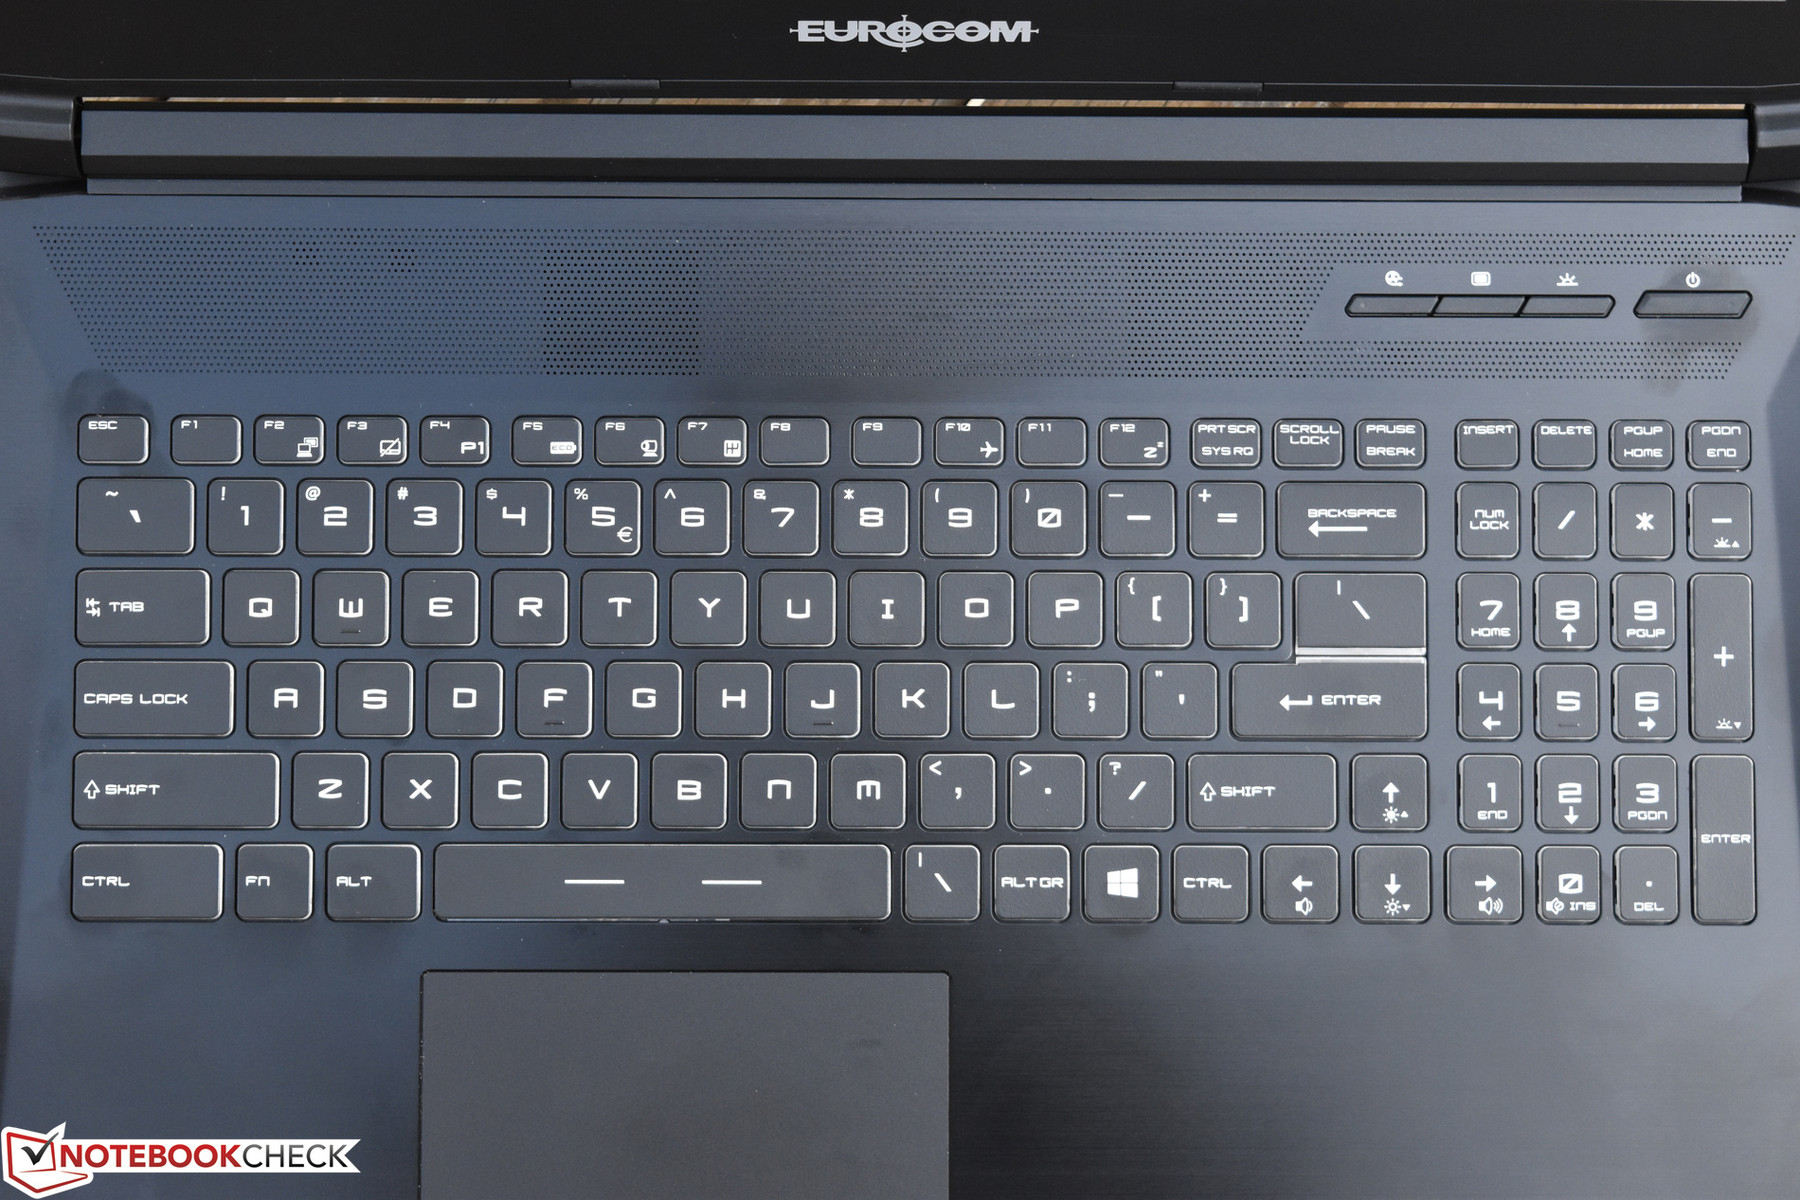
Not only has the keyboard not changed since our review of the Tornado F5, but it’s also identical—both in layout and function—to that of the MSI SteelSeries keyboards that ship with corresponding models. As a result, the typing experience is excellent, with medium key travel, consistent and well-defined (though quiet) feedback and operation, medium actuation force, and minimal clatter throughout. There is a number pad to the right side, though it is horizontally compressed in the interest of space. The keyboard is backlit and ships with the KLM software for RGB lighting control (in three separate zones) across the keyboard.
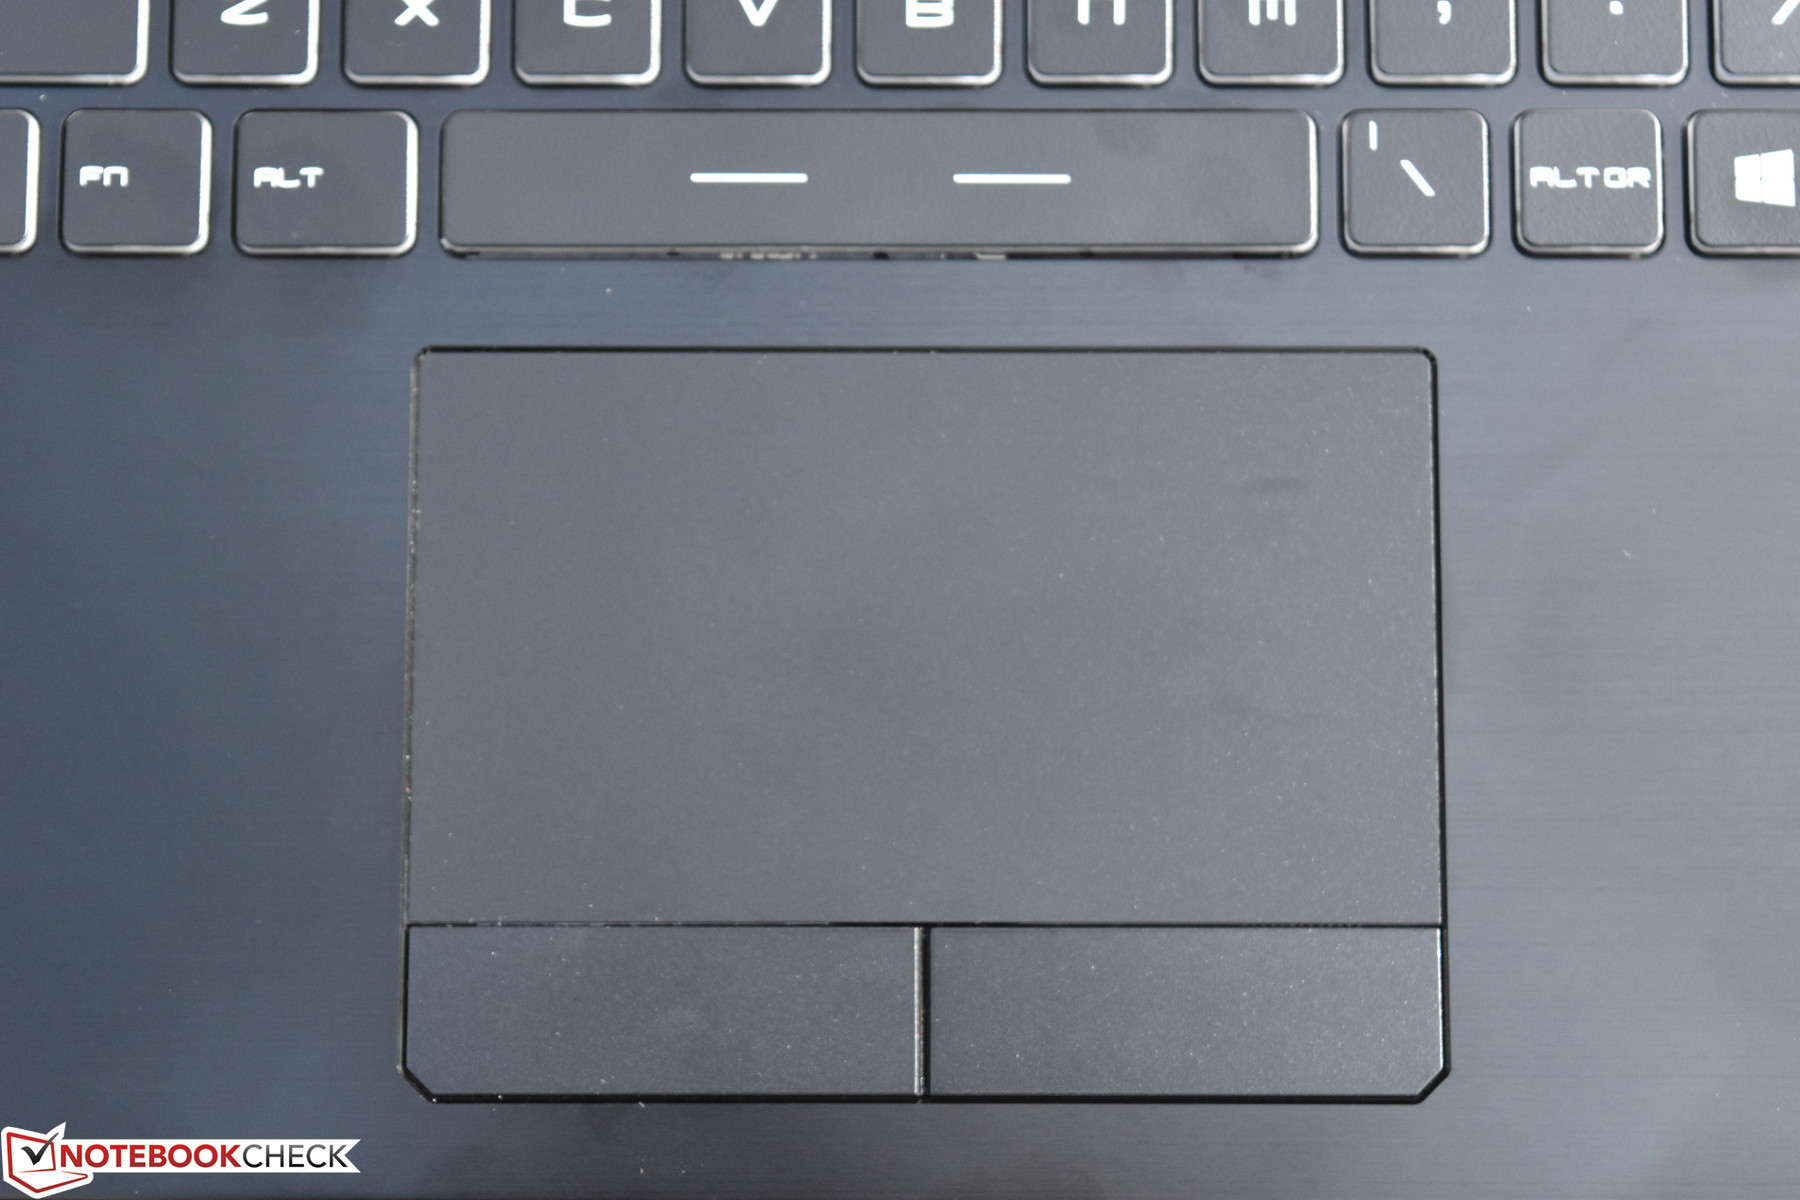
Touchpad
The sufficiently-sized touchpad also manages comfortable and accurate operation, with separate physical buttons below the pad that offer palpable—but also quite loud—clicks. Gestures also worked well during our testing.
Display
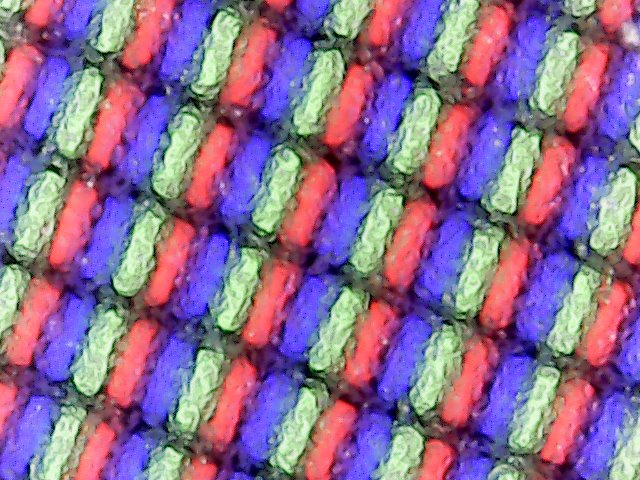
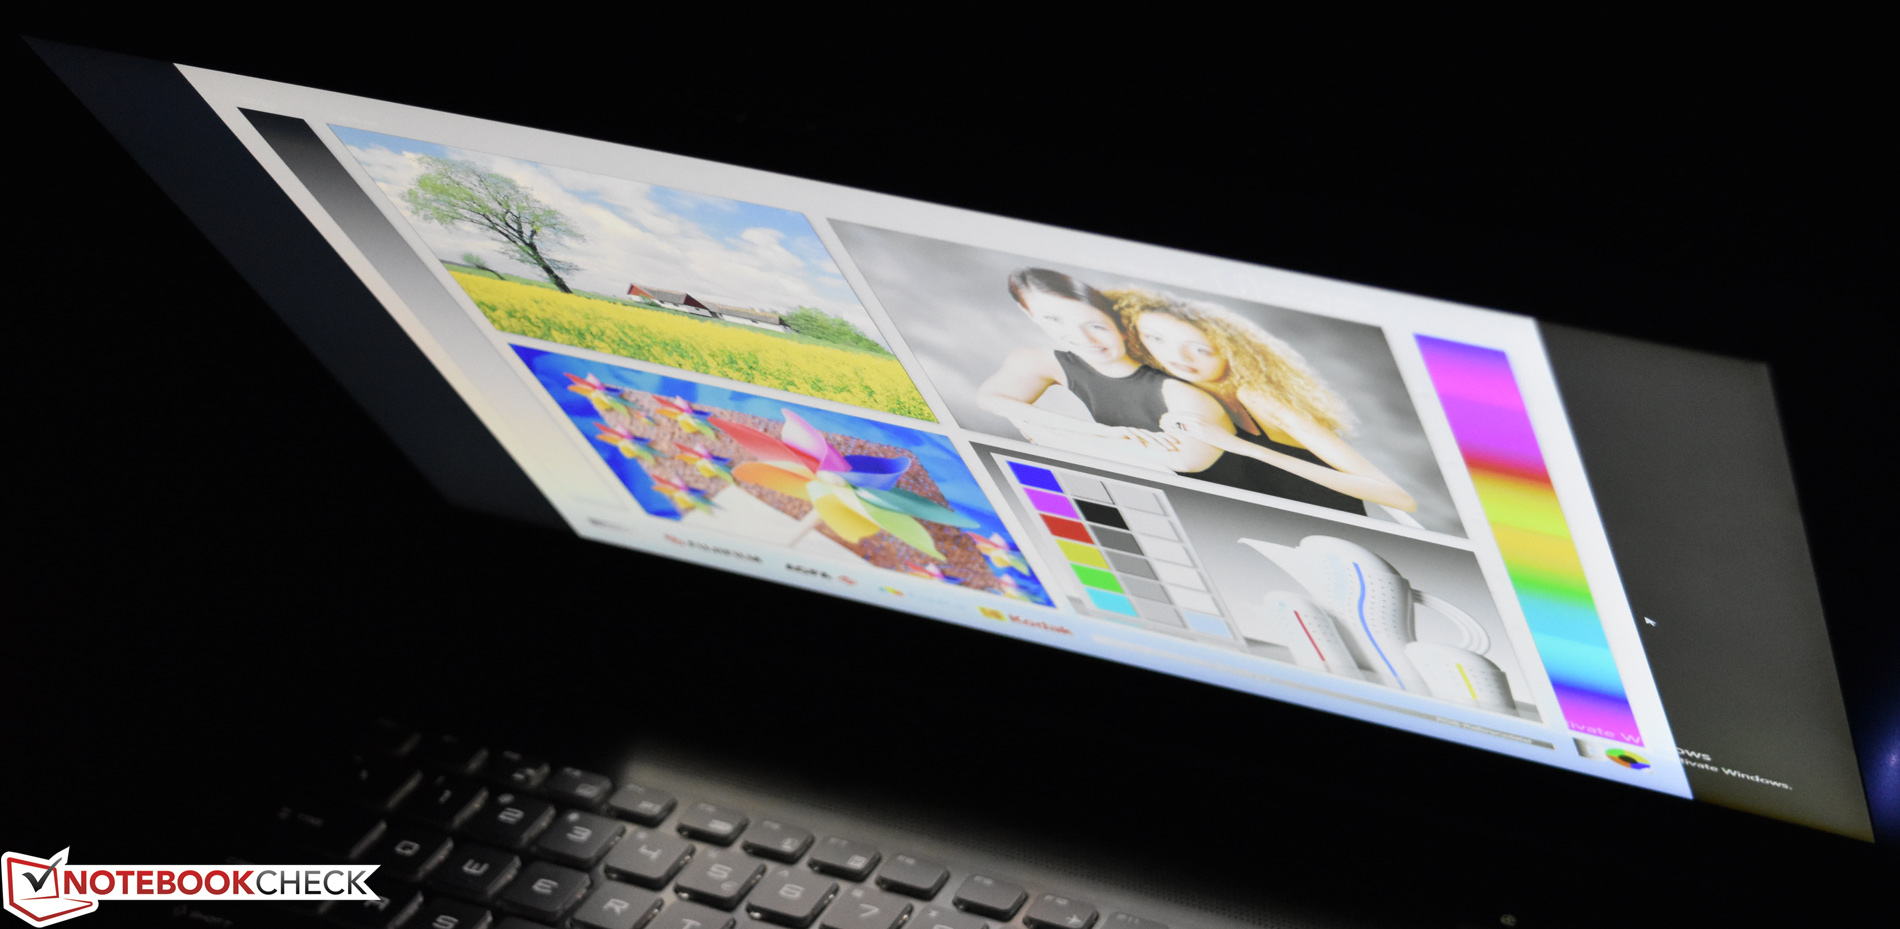
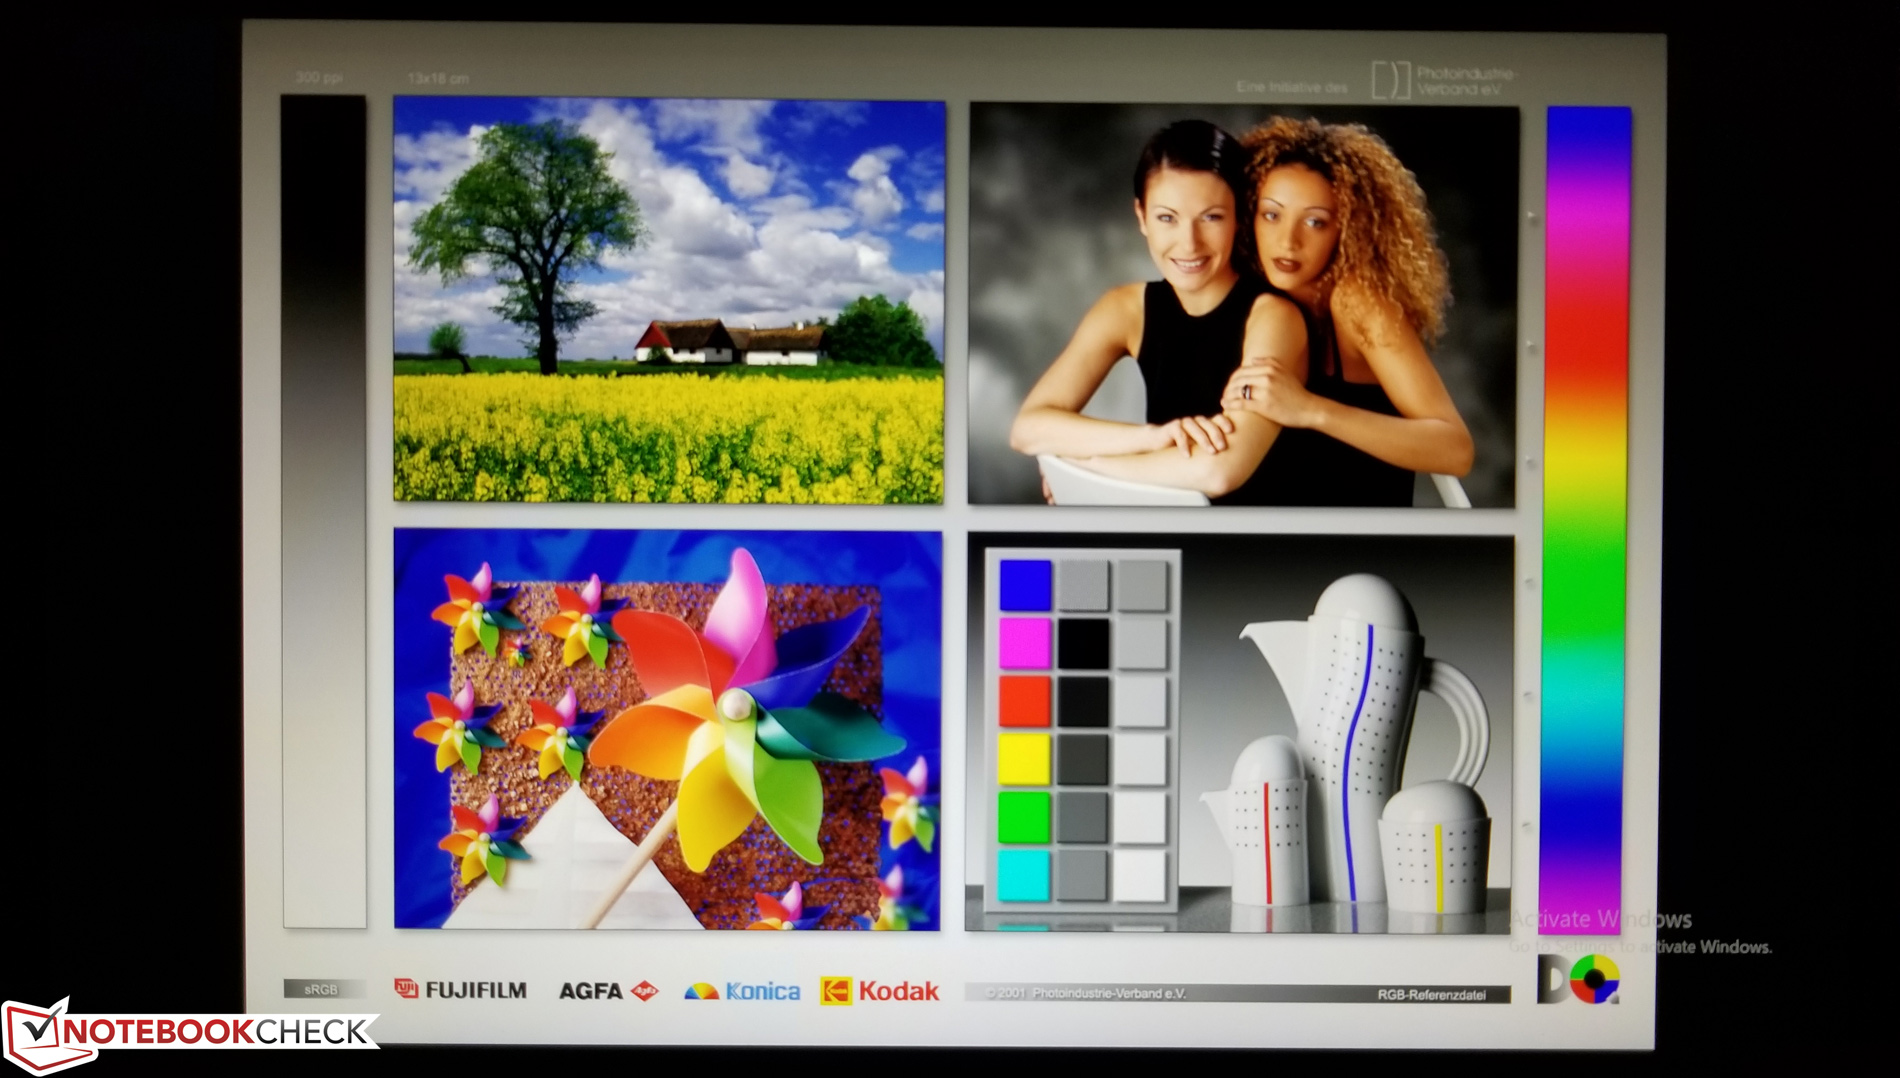
A variety of different 15.6-inch panels are available for configuration, beginning with a standard 1080p 60 Hz IPS display (matte finish) and ranging all the way to a 4K UHD 60 Hz IPS/PLS option. Our review unit was outfitted with a 1080p matte 120 Hz (AUO brand) TN panel, which interestingly enough isn’t listed in the configurable options on Eurocom’s website. Subjectively, colors appear vivid enough and brightness and contrast seem good.
| |||||||||||||||||||||||||
Brightness Distribution: 92 %
Center on Battery: 405.7 cd/m²
Contrast: 624:1 (Black: 0.65 cd/m²)
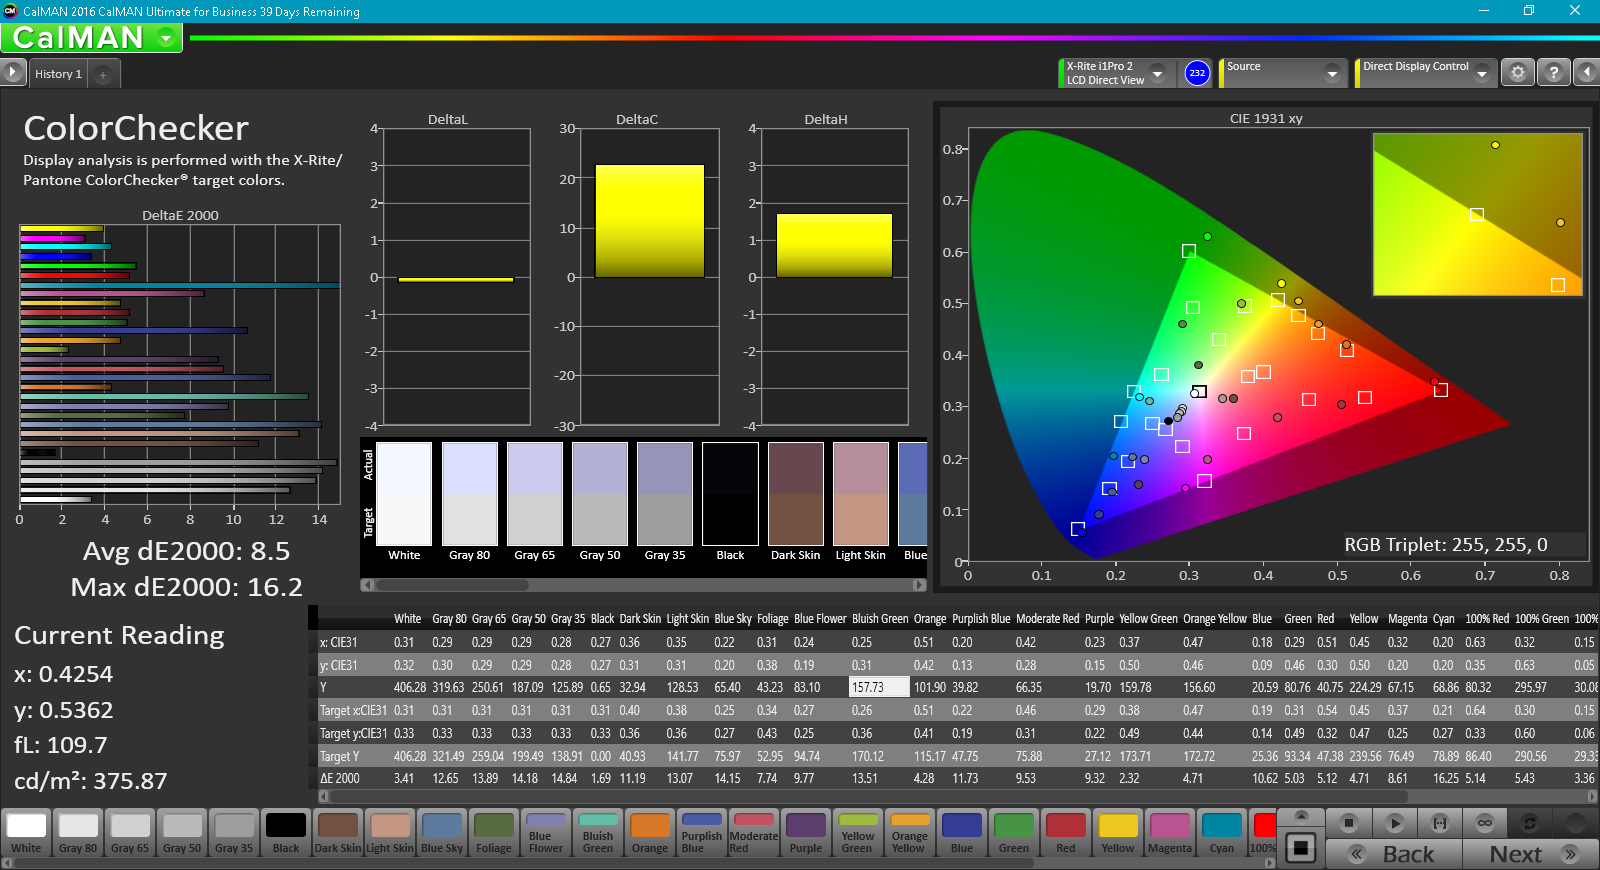
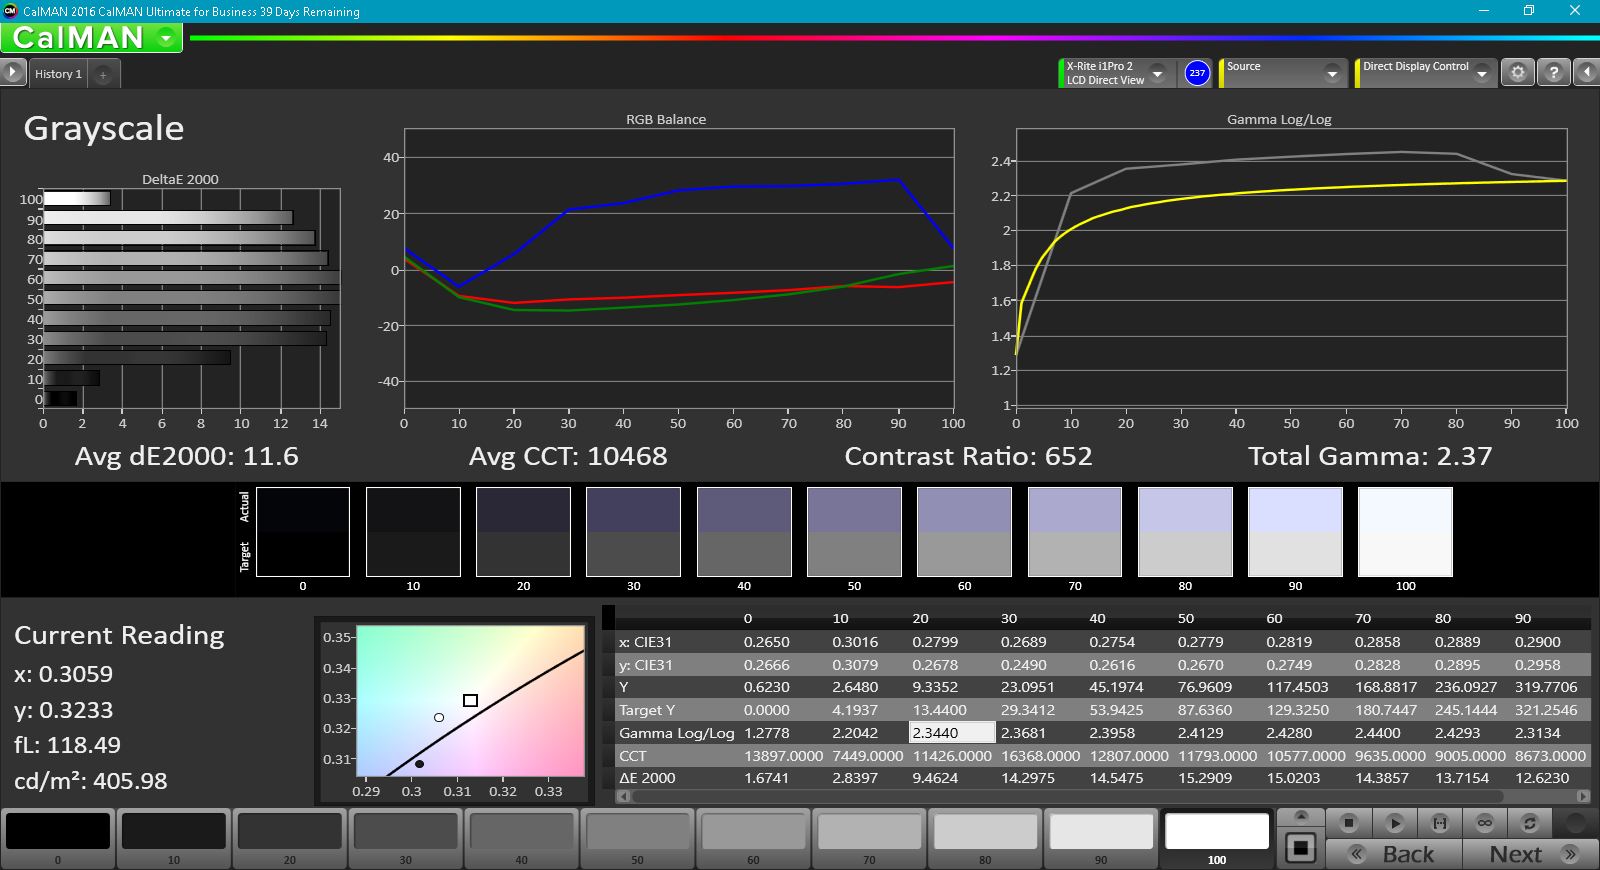
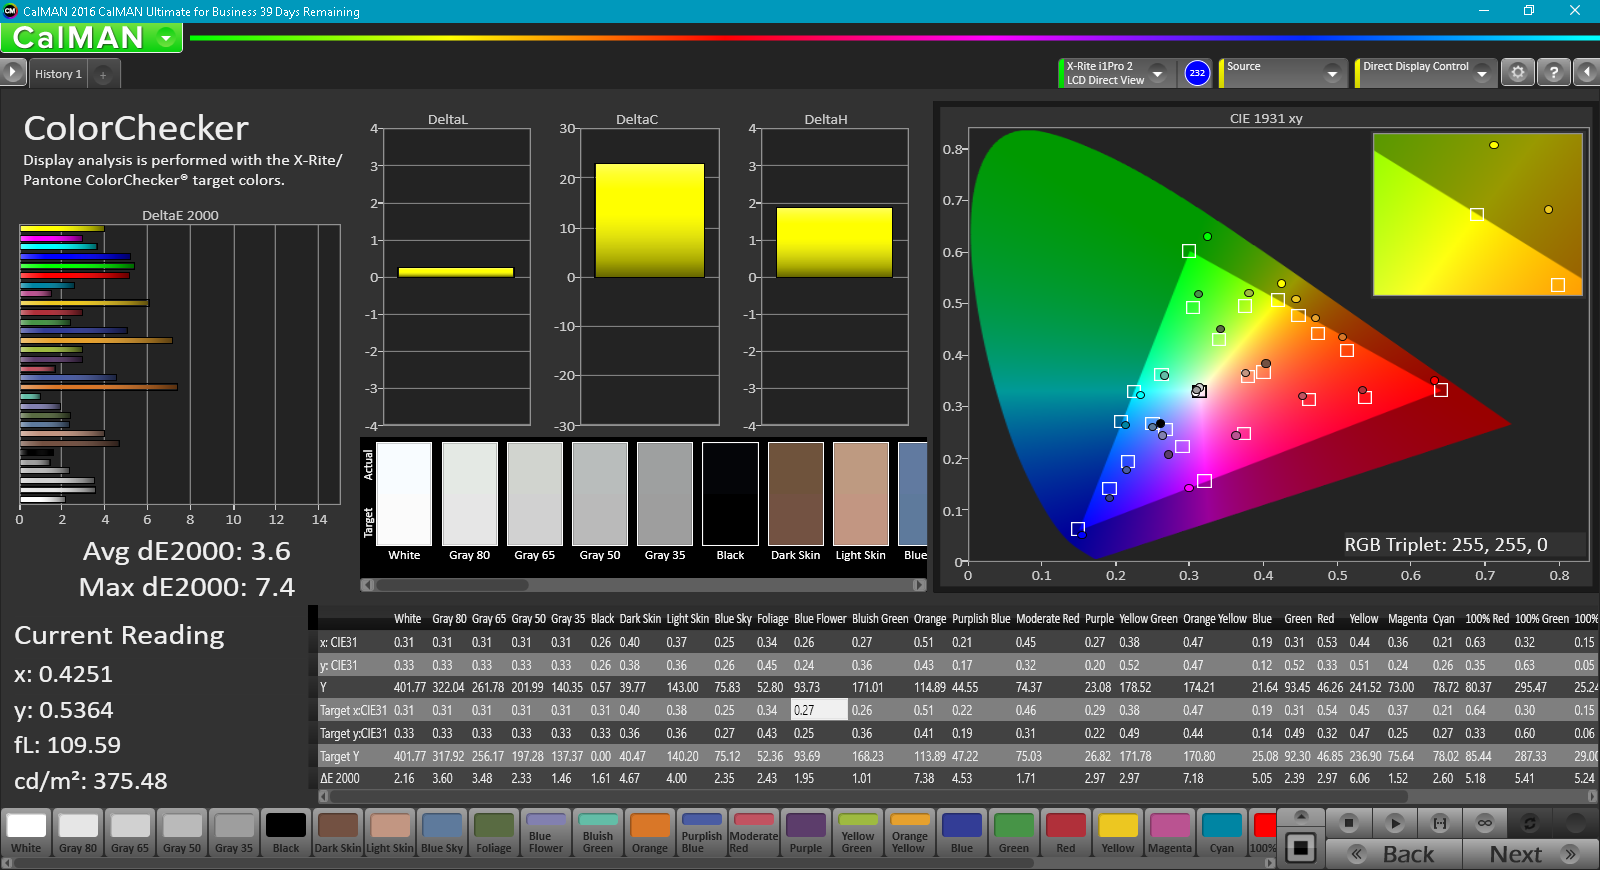
ΔE ColorChecker Calman: 8.5 | ∀{0.5-29.43 Ø4.72}
ΔE Greyscale Calman: 11.6 | ∀{0.09-98 Ø4.97}
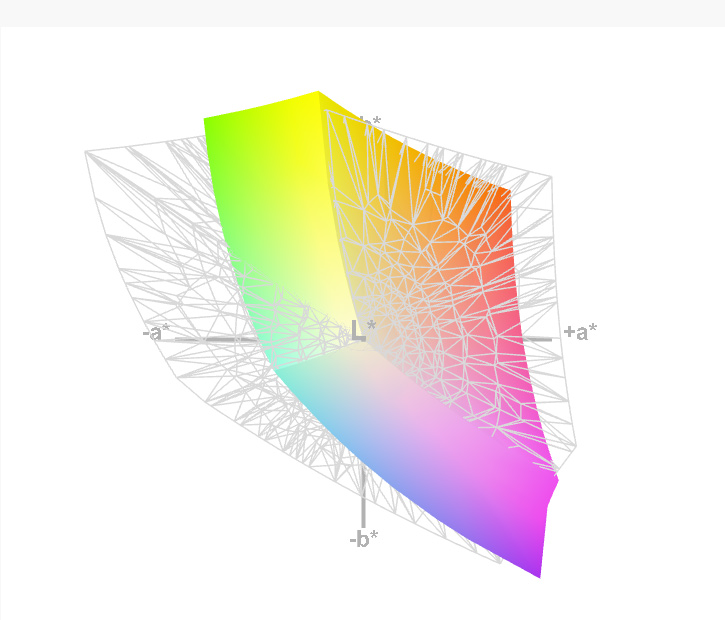
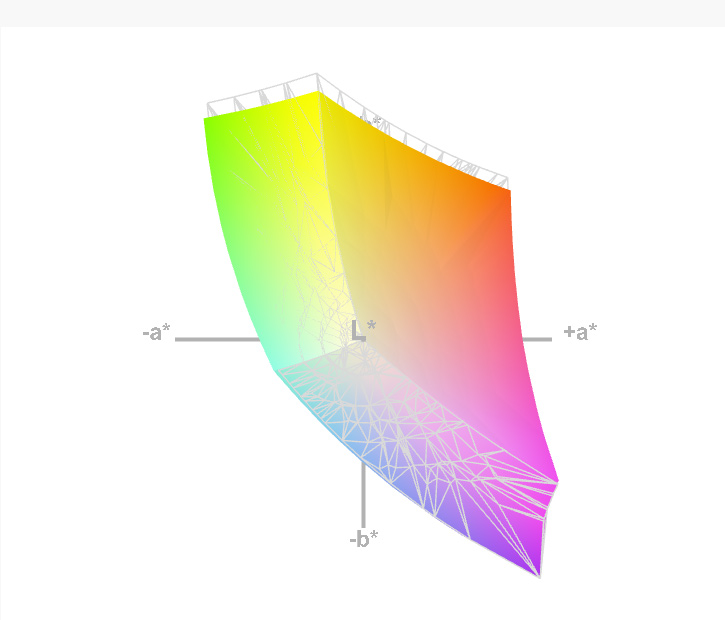
87% sRGB (Argyll 1.6.3 3D)
57% AdobeRGB 1998 (Argyll 1.6.3 3D)
64.2% AdobeRGB 1998 (Argyll 3D)
87.7% sRGB (Argyll 3D)
66.1% Display P3 (Argyll 3D)
Gamma: 2.37
CCT: 10468 K
| Eurocom Tornado F5W AUO52ED B156HTN05.2, TN, 15.6", 1920x1080 | Fujitsu Celsius H970 LP173WF4-SPF3, IPS LED, 17.3", 1920x1080 | HP ZBook 15 G4-Y4E80AV LG Philips LGD057E, IPS, 15.6", 1920x1080 | MSI WS63VR 7RL-023US SAMSUNG LƒFL156FL02-101 , IPS, 15.6", 3840x2160 | Lenovo ThinkPad P51 20HH0016GE LEN40BD, B156ZAN02.1, IPS, 15.6", 3840x2160 | Dell Precision 5520 UHD SHP1476, IPS, 15.6", 3840x2160 | |
|---|---|---|---|---|---|---|
| Display | -2% | -5% | -24% | 33% | 7% | |
| Display P3 Coverage (%) | 66.1 | 66.8 1% | 64 -3% | 47.43 -28% | 86.3 31% | 67.4 2% |
| sRGB Coverage (%) | 87.7 | 84.6 -4% | 82.7 -6% | 71.4 -19% | 99.5 13% | 98.5 12% |
| AdobeRGB 1998 Coverage (%) | 64.2 | 61.8 -4% | 60.4 -6% | 49 -24% | 99.3 55% | 68.9 7% |
| Response Times | -125% | -135% | -147% | -136% | -272% | |
| Response Time Grey 50% / Grey 80% * (ms) | 23.2 ? | 32 ? -38% | 39.2 ? -69% | 36.8 ? -59% | 40.8 ? -76% | 59.2 ? -155% |
| Response Time Black / White * (ms) | 8.5 ? | 26.4 ? -211% | 25.6 ? -201% | 28.4 ? -234% | 25.2 ? -196% | 41.6 ? -389% |
| PWM Frequency (Hz) | 20830 ? | 1351 ? | ||||
| Screen | 23% | 24% | 4% | 32% | 26% | |
| Brightness middle (cd/m²) | 405.7 | 368 -9% | 321 -21% | 259.4 -36% | 317 -22% | 372.4 -8% |
| Brightness (cd/m²) | 397 | 360 -9% | 320 -19% | 247 -38% | 309 -22% | 368 -7% |
| Brightness Distribution (%) | 92 | 91 -1% | 89 -3% | 85 -8% | 89 -3% | 90 -2% |
| Black Level * (cd/m²) | 0.65 | 0.3 54% | 0.29 55% | 0.43 34% | 0.36 45% | 0.48 26% |
| Contrast (:1) | 624 | 1227 97% | 1107 77% | 603 -3% | 881 41% | 776 24% |
| Colorchecker dE 2000 * | 8.5 | 6.4 25% | 4.5 47% | 5.5 35% | 2.7 68% | 2.6 69% |
| Colorchecker dE 2000 max. * | 16.2 | 10.1 38% | 9.5 41% | 12.7 22% | 4.1 75% | 5.6 65% |
| Greyscale dE 2000 * | 11.6 | 7.2 38% | 2.9 75% | 3.6 69% | 3 74% | 3.7 68% |
| Gamma | 2.37 93% | 2.02 109% | 2.27 97% | 2.24 98% | 2.27 97% | 2.14 103% |
| CCT | 10468 62% | 6882 94% | 6519 100% | 7163 91% | 6077 107% | 7096 92% |
| Color Space (Percent of AdobeRGB 1998) (%) | 57 | 55.5 -3% | 54.2 -5% | 45 -21% | 87.6 54% | 63 11% |
| Color Space (Percent of sRGB) (%) | 87 | 84.4 -3% | 82.6 -5% | 71 -18% | 99.5 14% | 99 14% |
| Total Average (Program / Settings) | -35% /
-2% | -39% /
-3% | -56% /
-22% | -24% /
10% | -80% /
-18% |
* ... smaller is better
Our measurements agreed with our initial impressions; we recorded a very good average brightness of 397 cd/m² (max: 412.7 cd/m²) with a corresponding brightness distribution of 92% (also a strong result). Contrast was a more than sufficient 624:1 thanks to a reasonably good black value of 0.65 cd/m² (in context with the high brightness).
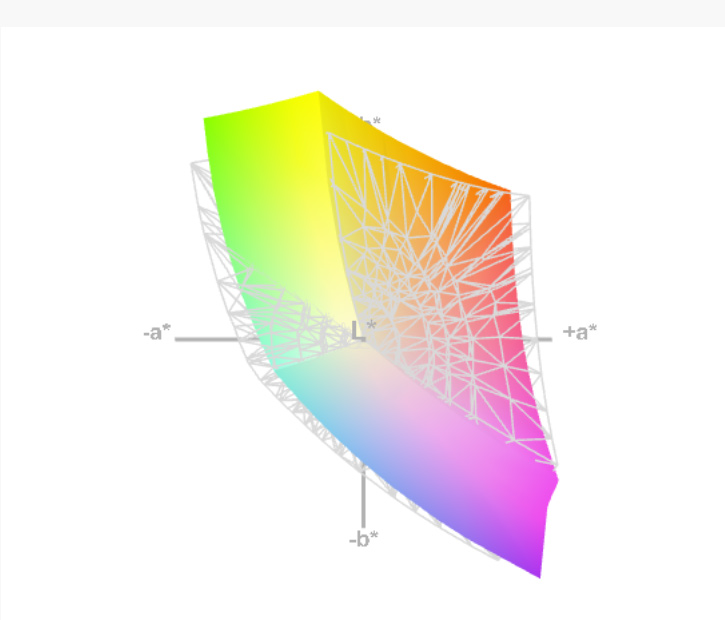
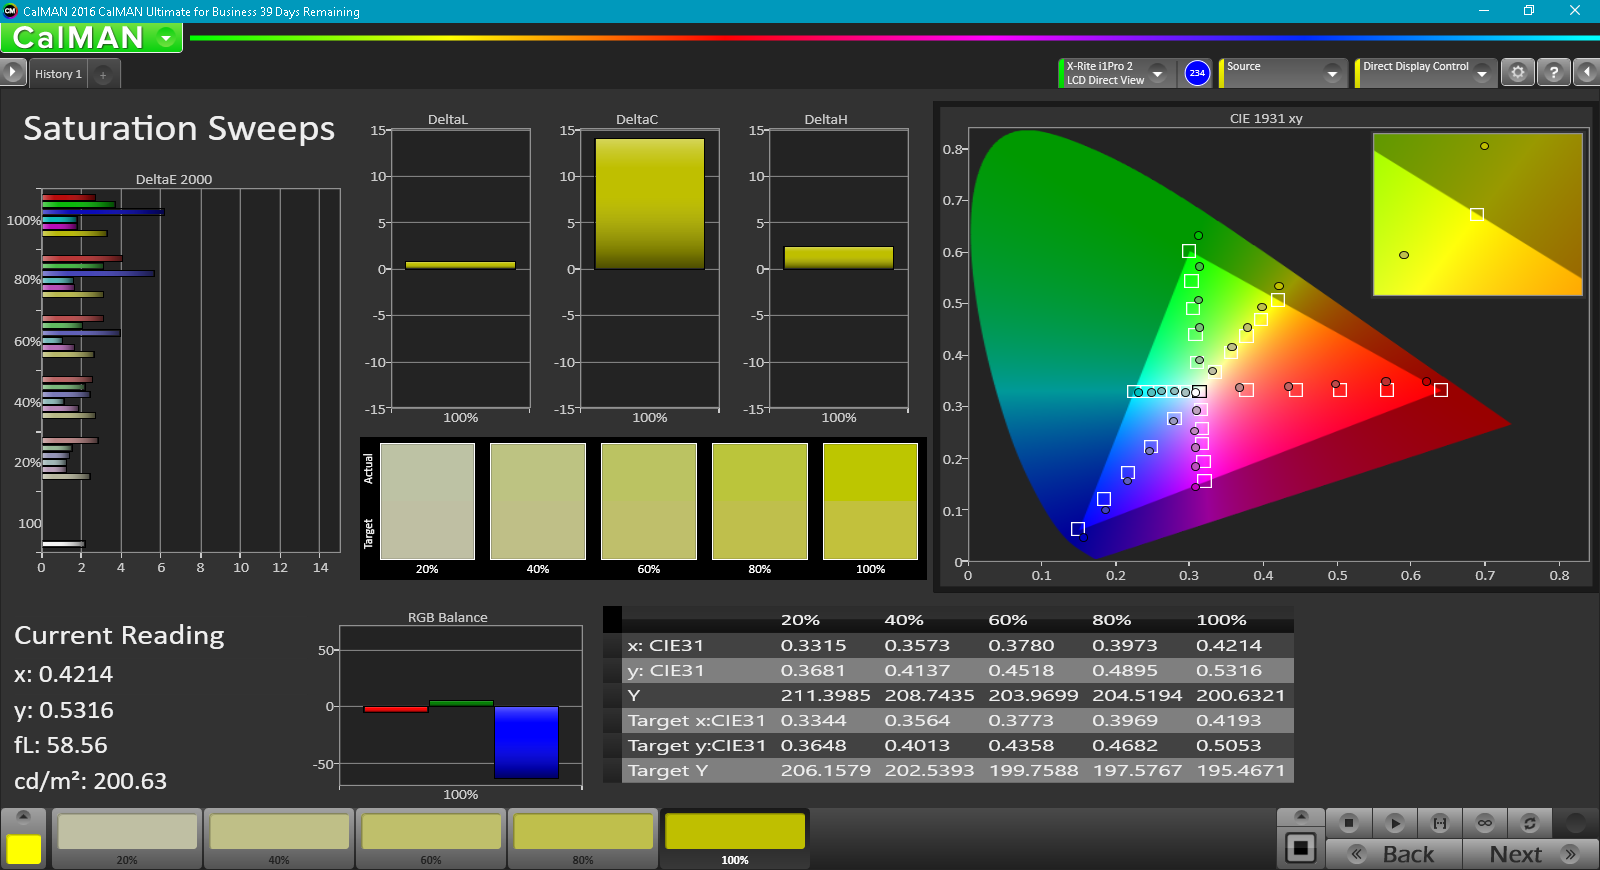
Color coverage was decent overall with 87 percent of the sRGB and 57 of the AdobeRGB spectrums covered.
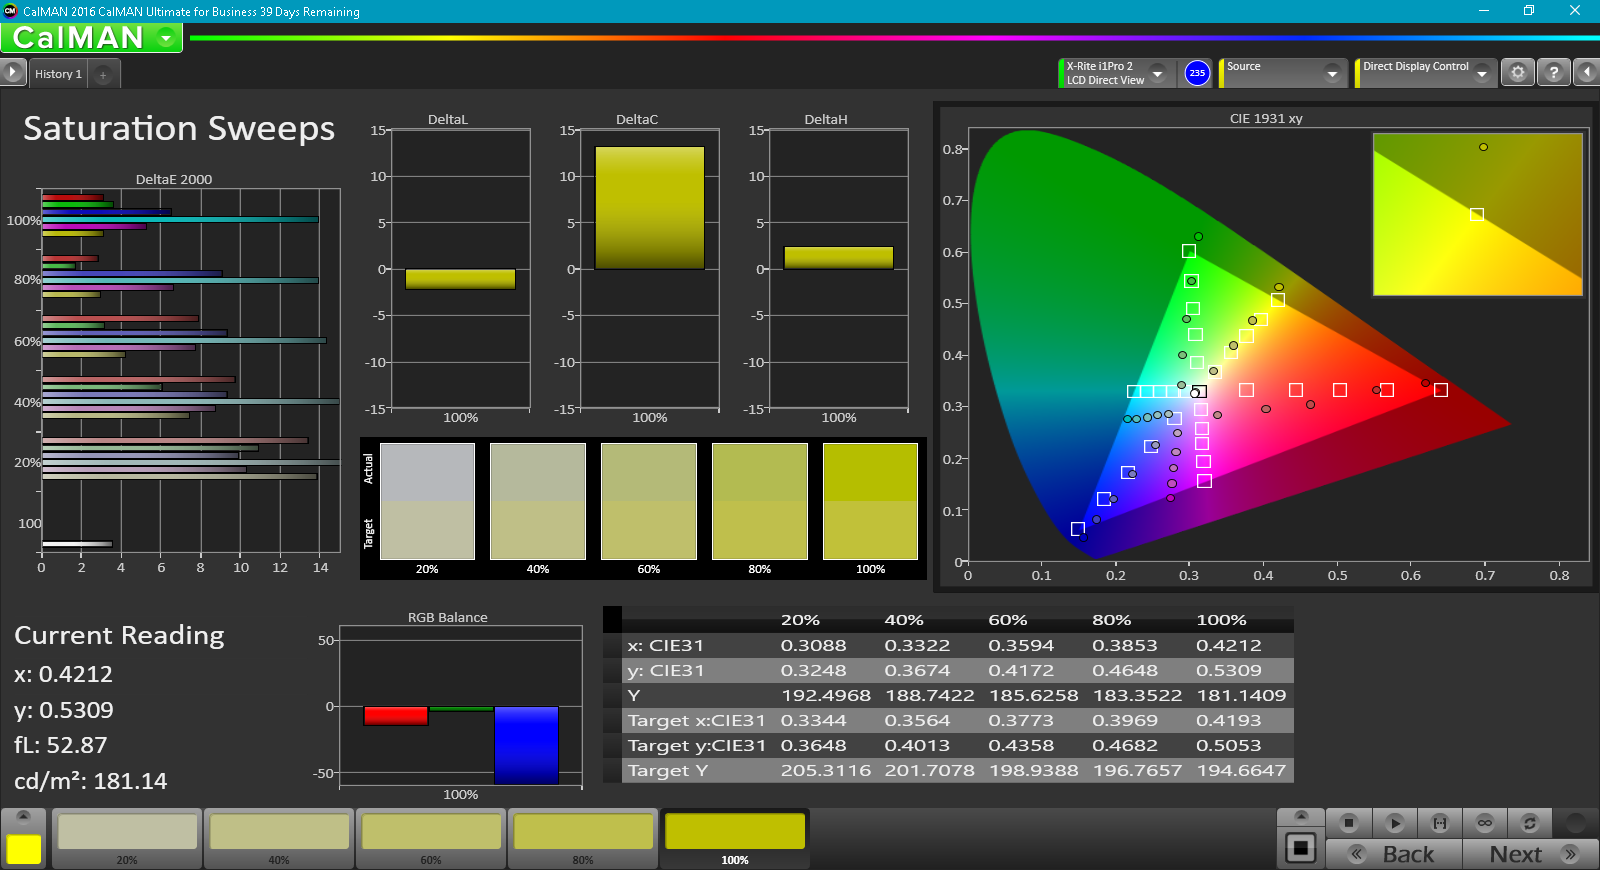
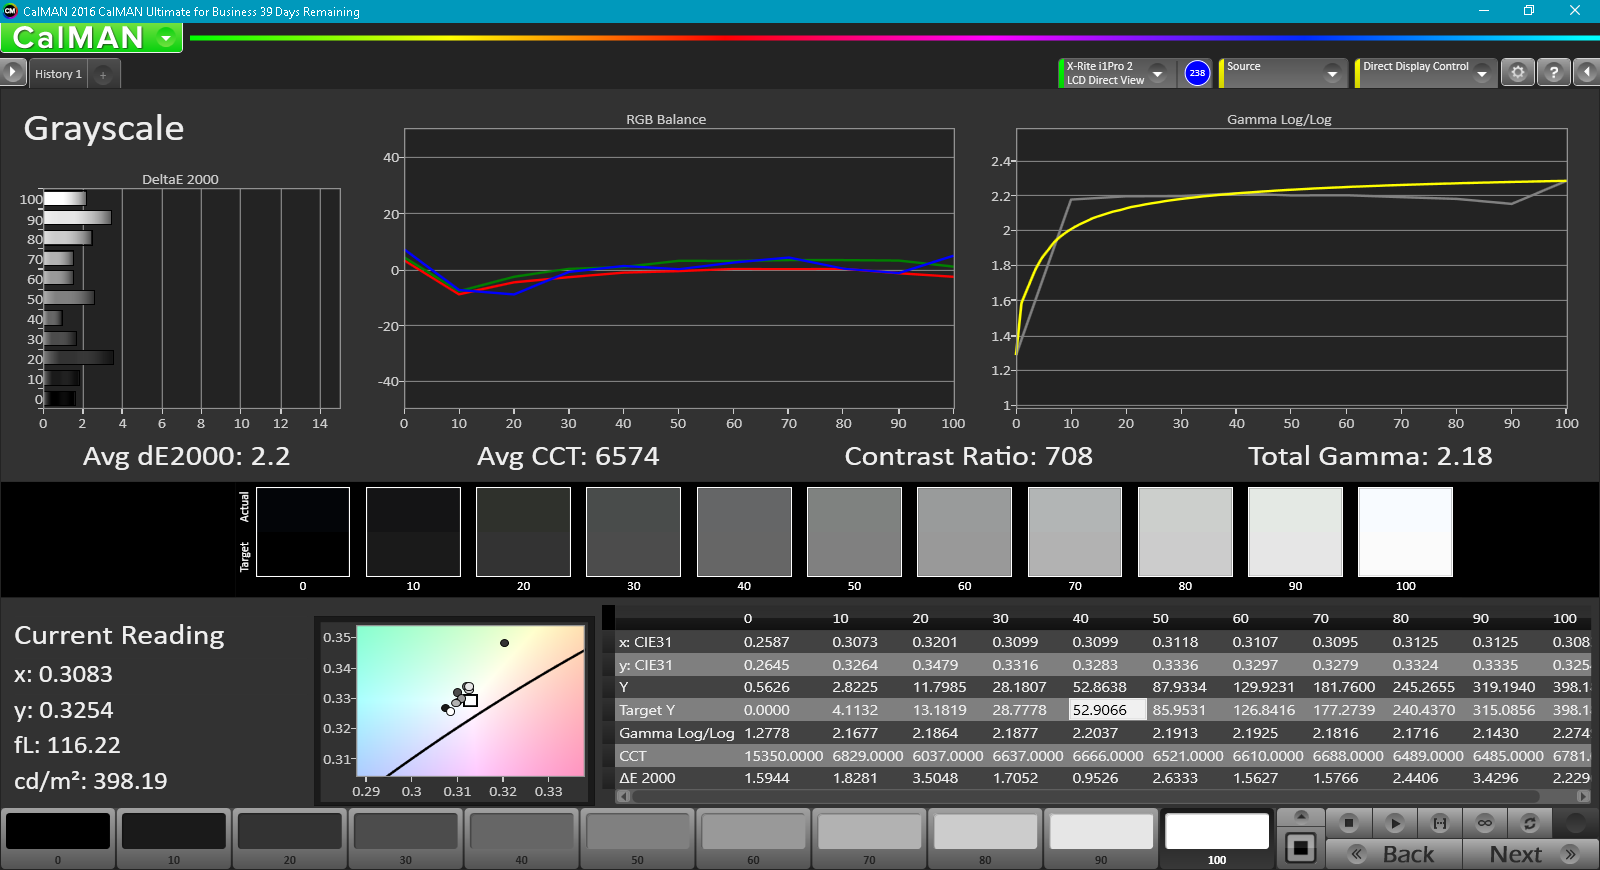
Data from CalMAN 5 revealed some pre-calibration shortfalls, such as ColorChecker/Greyscale DeltaE values of 8.5 / 11 respectively and a CCT Average of 10468 (significantly cooler than ideal). Post-calibration, however, these values evened out nicely to much closer to ideal; the panel benefits greatly from a bit of calibration work.
Display Response Times
| ↔ Response Time Black to White | ||
|---|---|---|
| 8.5 ms ... rise ↗ and fall ↘ combined | ↗ 6.8 ms rise | 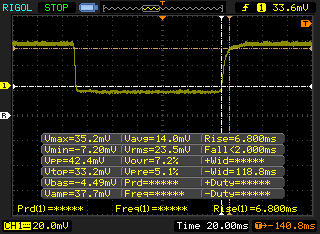 |
| ↘ 1.7 ms fall | ||
| The screen shows fast response rates in our tests and should be suited for gaming. In comparison, all tested devices range from 0.1 (minimum) to 240 (maximum) ms. » 24 % of all devices are better. This means that the measured response time is better than the average of all tested devices (19.8 ms). | ||
| ↔ Response Time 50% Grey to 80% Grey | ||
| 23.2 ms ... rise ↗ and fall ↘ combined | ↗ 18.8 ms rise | 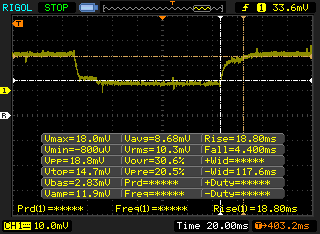 |
| ↘ 4.4 ms fall | ||
| The screen shows good response rates in our tests, but may be too slow for competitive gamers. In comparison, all tested devices range from 0.165 (minimum) to 636 (maximum) ms. » 34 % of all devices are better. This means that the measured response time is better than the average of all tested devices (31 ms). | ||
Screen Flickering / PWM (Pulse-Width Modulation)
| Screen flickering / PWM not detected | 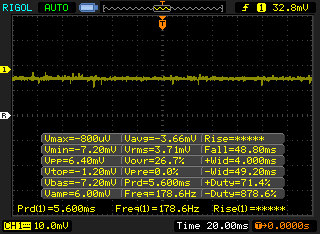 | ||
In comparison: 52 % of all tested devices do not use PWM to dim the display. If PWM was detected, an average of 7750 (minimum: 5 - maximum: 343500) Hz was measured. | |||
Response times are overall not bad, though they may be a bit on the slow side for competitive gamers. We did not measure any PWM from the display.
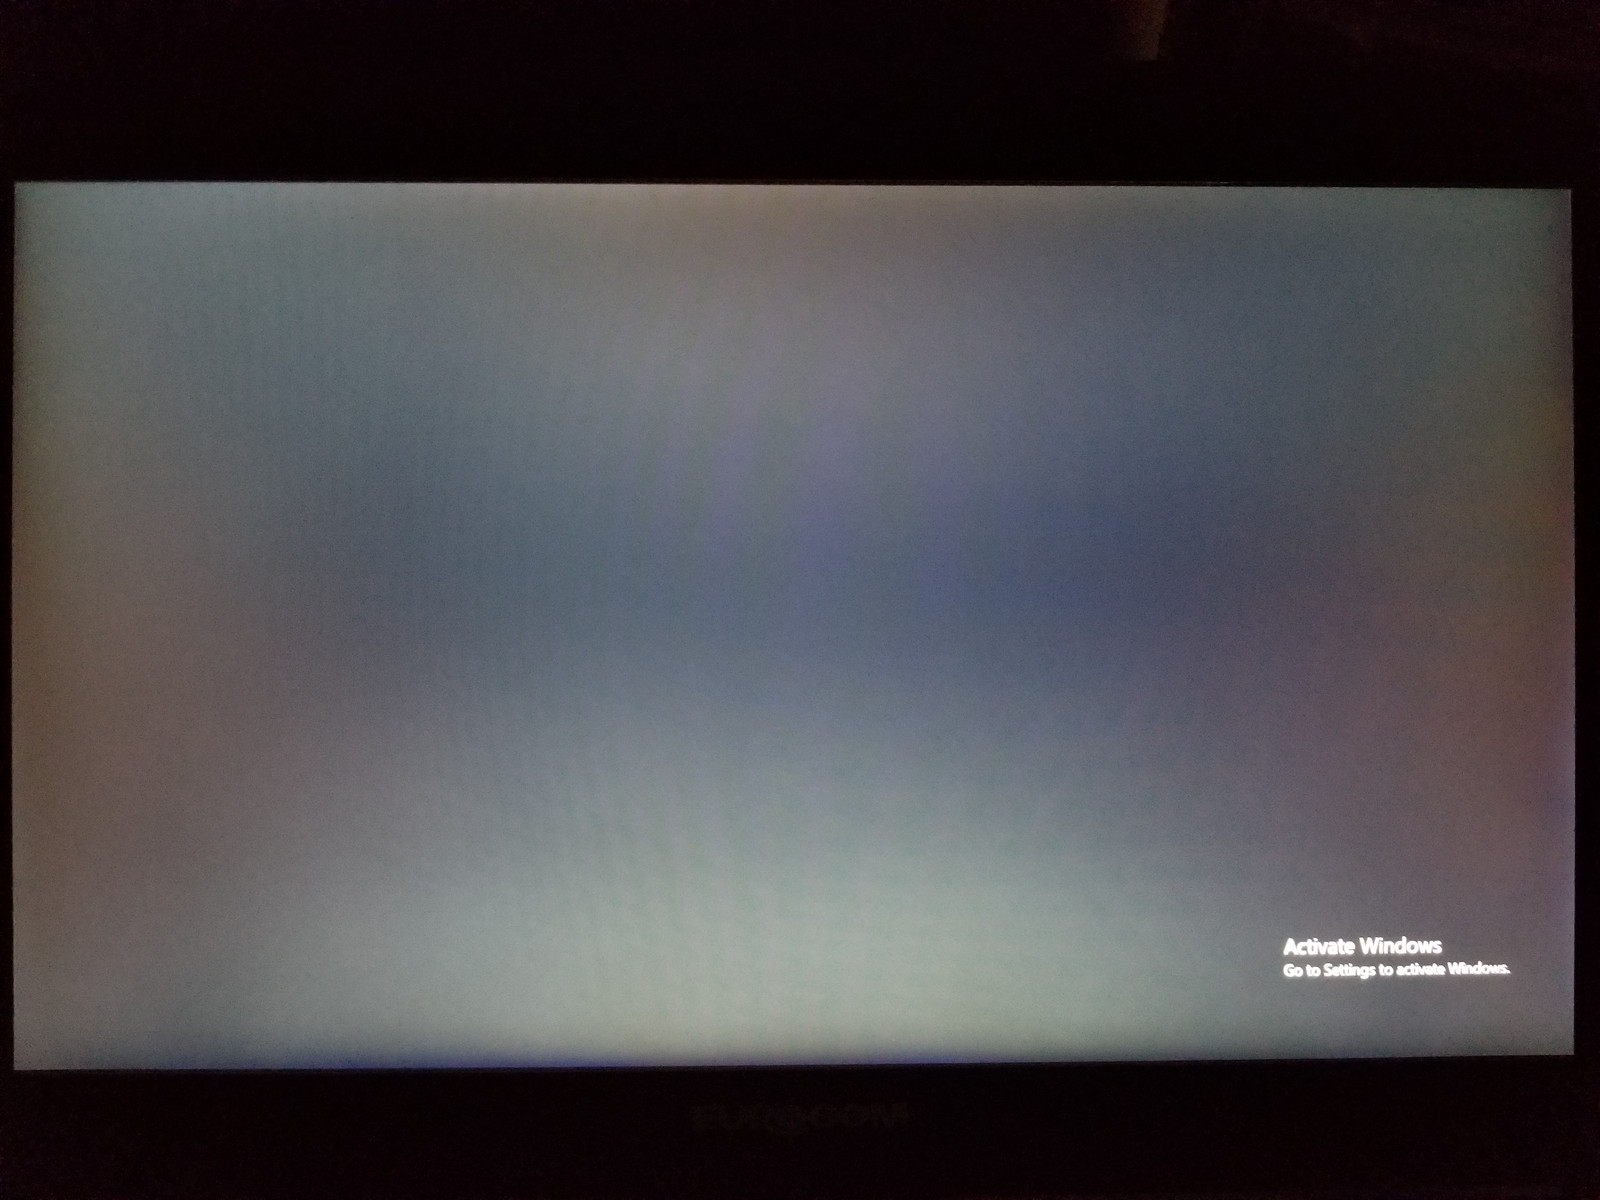
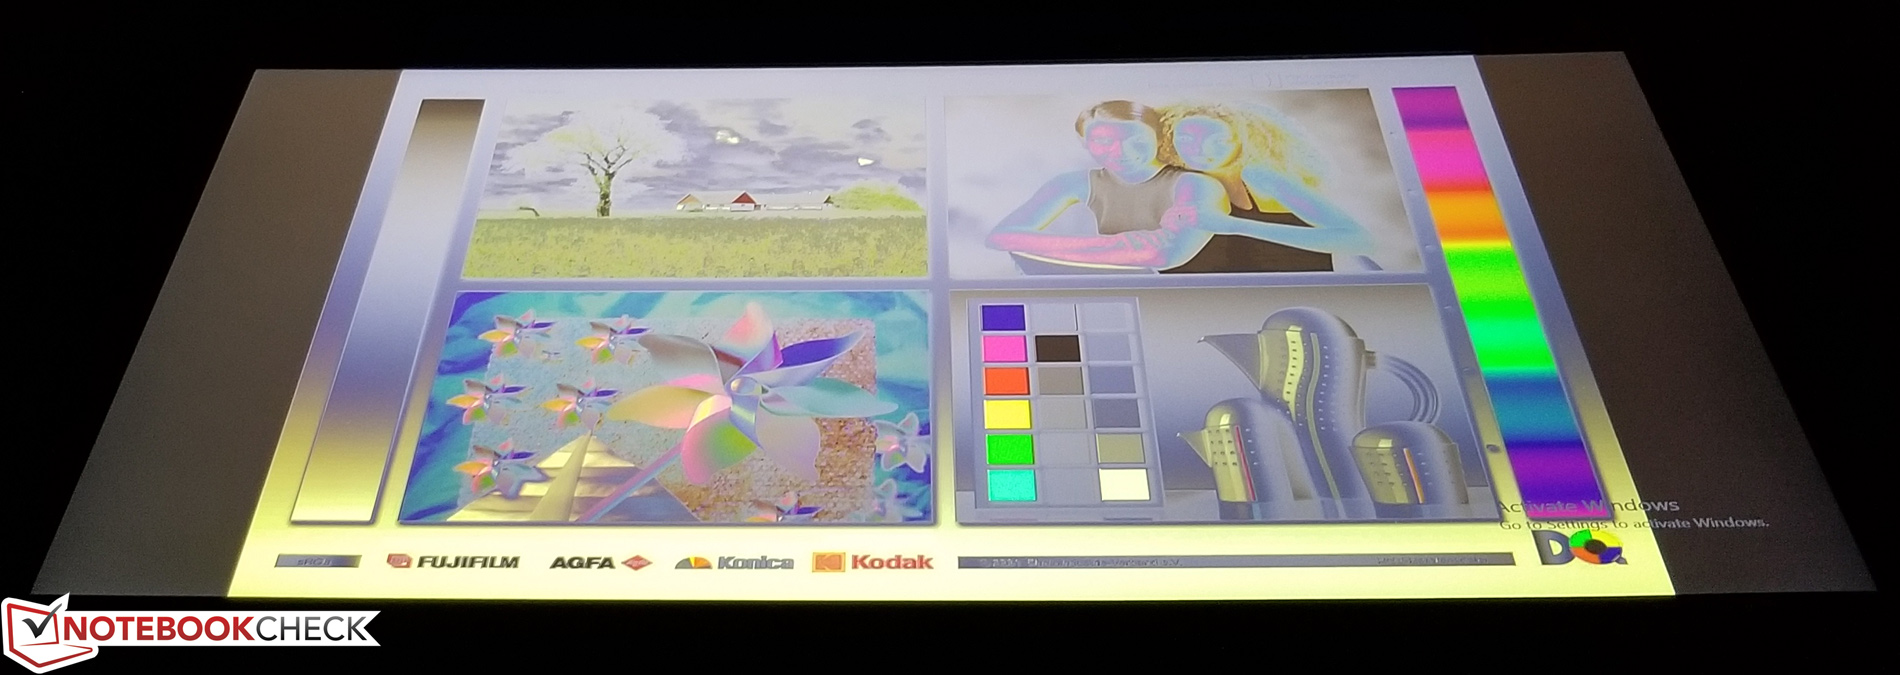
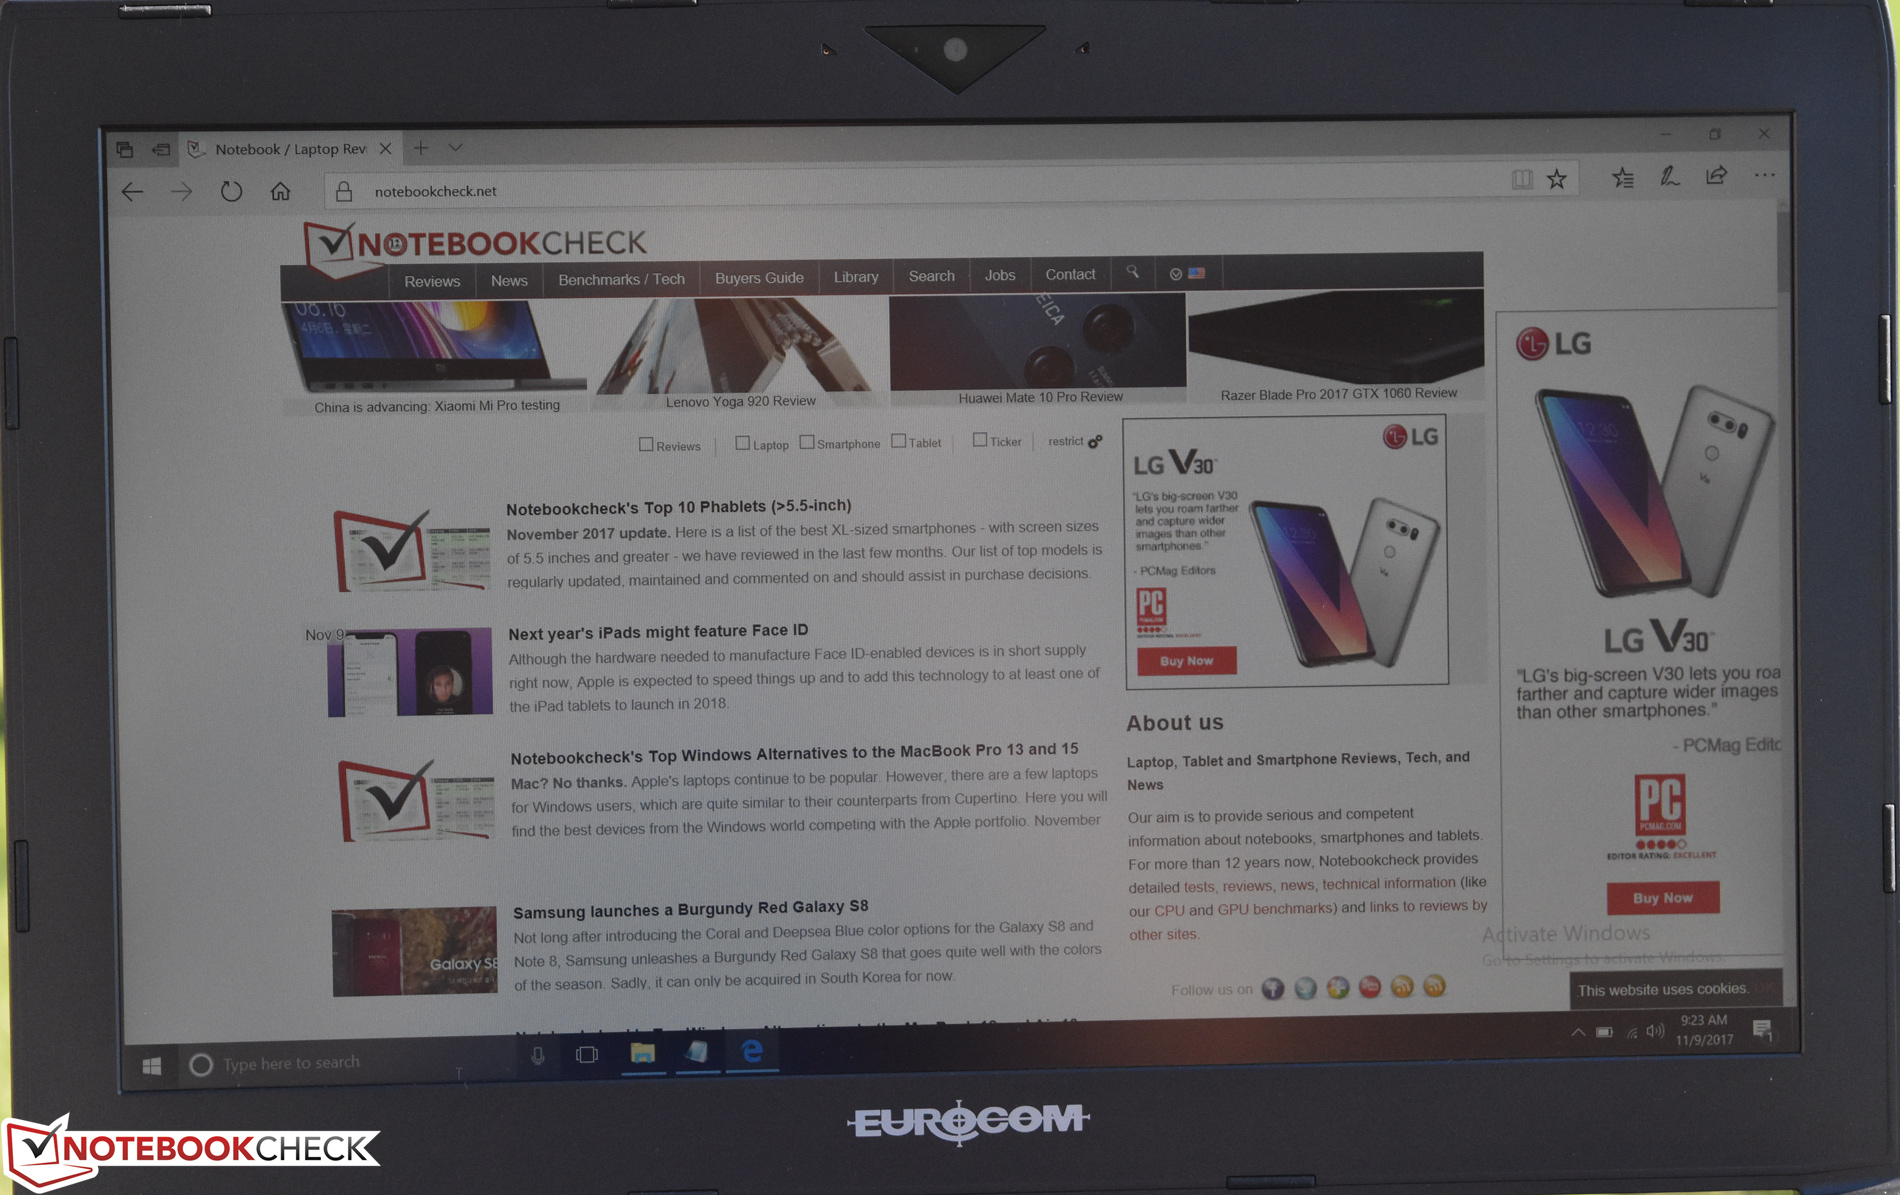
Viewing angles are good on the horizontal axis, but vertical deviations of even a slight amount soon result in reduced and inverted contrast and washed-out color; this is a factor of the TN panel technology as opposed to the IPS panels offered in all other configuration options. Outdoors, the screen is easy to read in all but the brightest of environments thanks to its matte finish, high brightness, and good contrast.
Performance
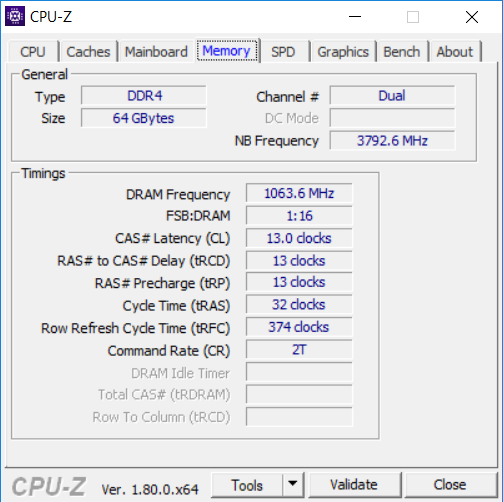
In spite of the previously-mentioned replaceability of the CPU and GPU, a bevy of different configurable options are available directly from the factory. CPUs range from the Core i7-6700K to the Intel Xeon E3-1280 v5, GPUs from the low-end Quadro M1000M up to the Quadro P5000, and RAM all the way up to 64 GB DDR4. Our review unit was equipped with the highest-end available of all of these—so we should expect great things.
The benefits of choosing a desktop processor for inclusion in a mobile PC are obviously centered primarily on performance (with little to say of efficiency or power savings), but sustained performance capability depends on the machine’s ability to effectively cool the chip. It will therefore be interesting to see how the Eurocom Tornado F5W handles this hungry CPU alongside its high-end Quadro P5000 GPU. Essentially, the two chips feature a combined effective power demand of close to 175 W under heavy stress.
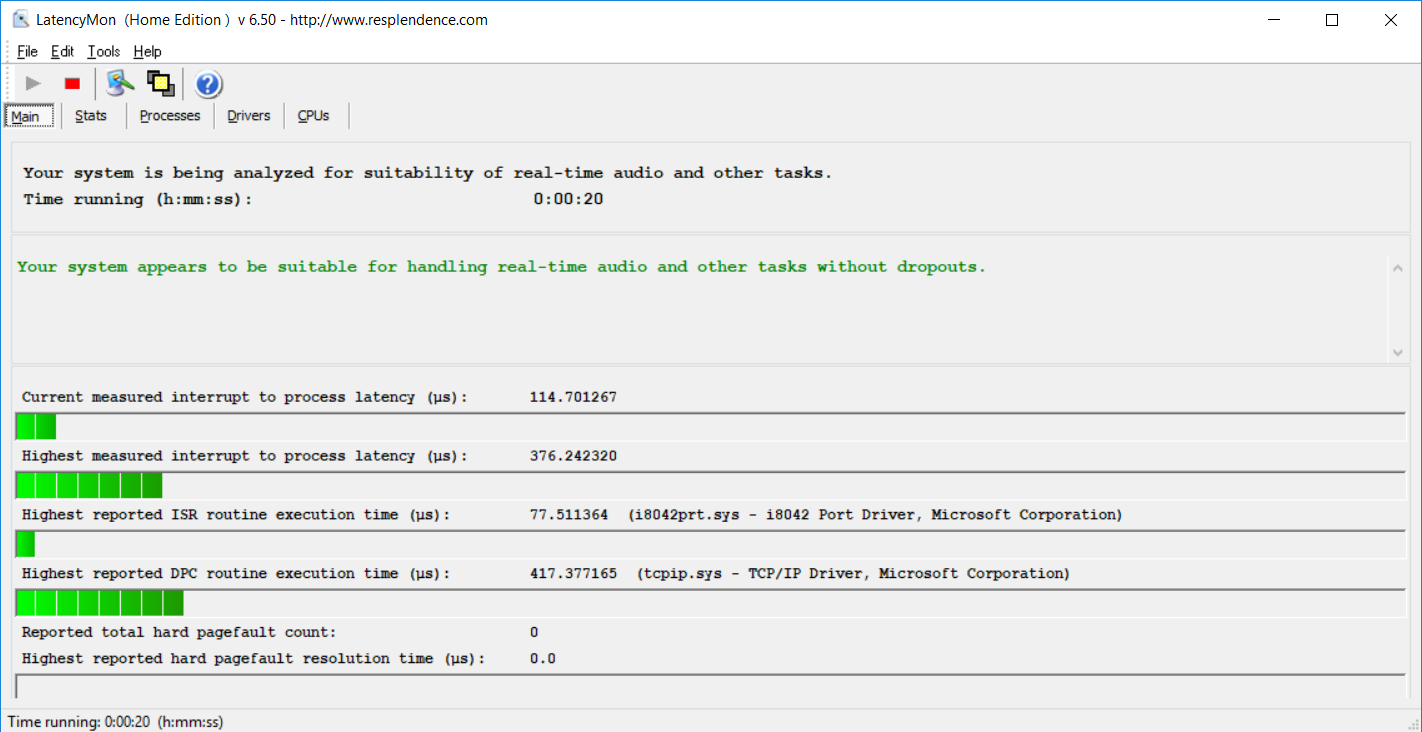
Before we continue, we should mention that we performed a 3DMark 11 run while unplugged and noted that, with a result of just 11365, performance is (as expected) below that while plugged in. LatencyMon, meanwhile, reported no latency concerns—so streaming real-time audio and video should not be an issue on the Tornado F5W.
Processor
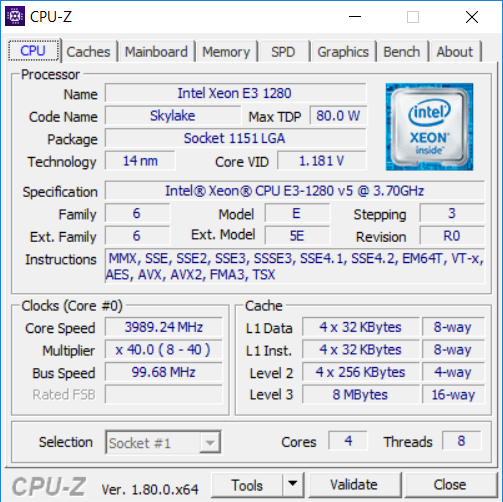
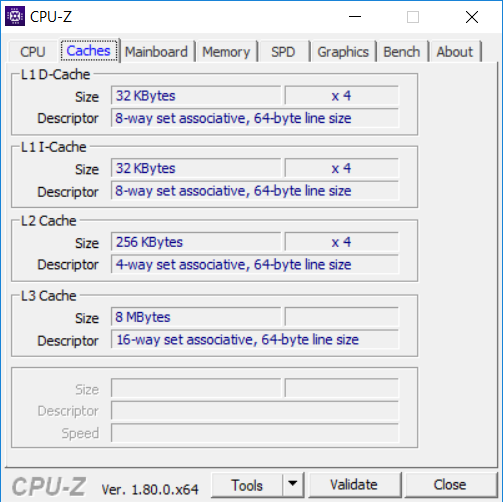
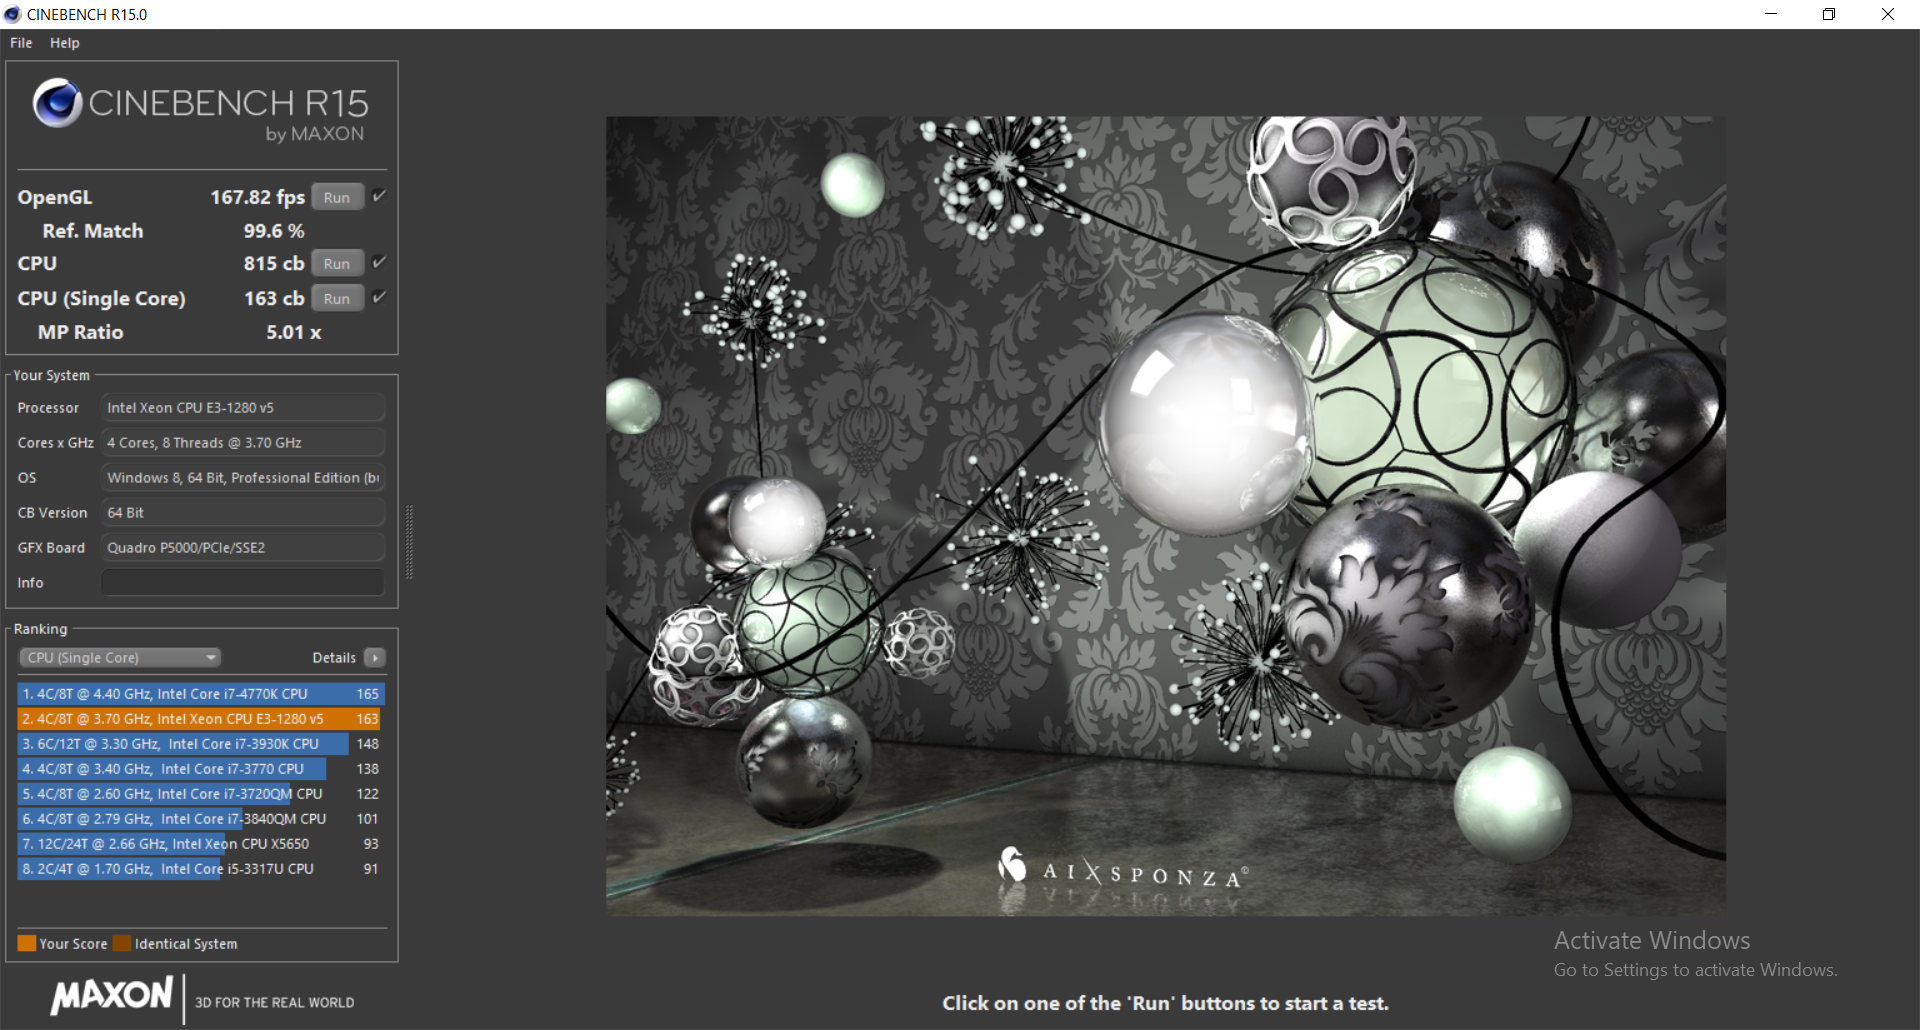
The CPU installed in our testing unit is the quad-core Intel Xeon E3-1280 v5. This is the first time we’ve tested a machine with this processor, but its specs are impressive. It’s a high-end, quad-core desktop CPU based on the Skylake architecture with a base frequency of 3.7 GHz and a Turbo clock rate of up to 4.0 GHz (four cores: 3.7 GHz). TDP is specified at 80 W, but since the integrated GPU will not be in use in the Tornado F5W, the actual consumption is somewhat closer to 65 W.
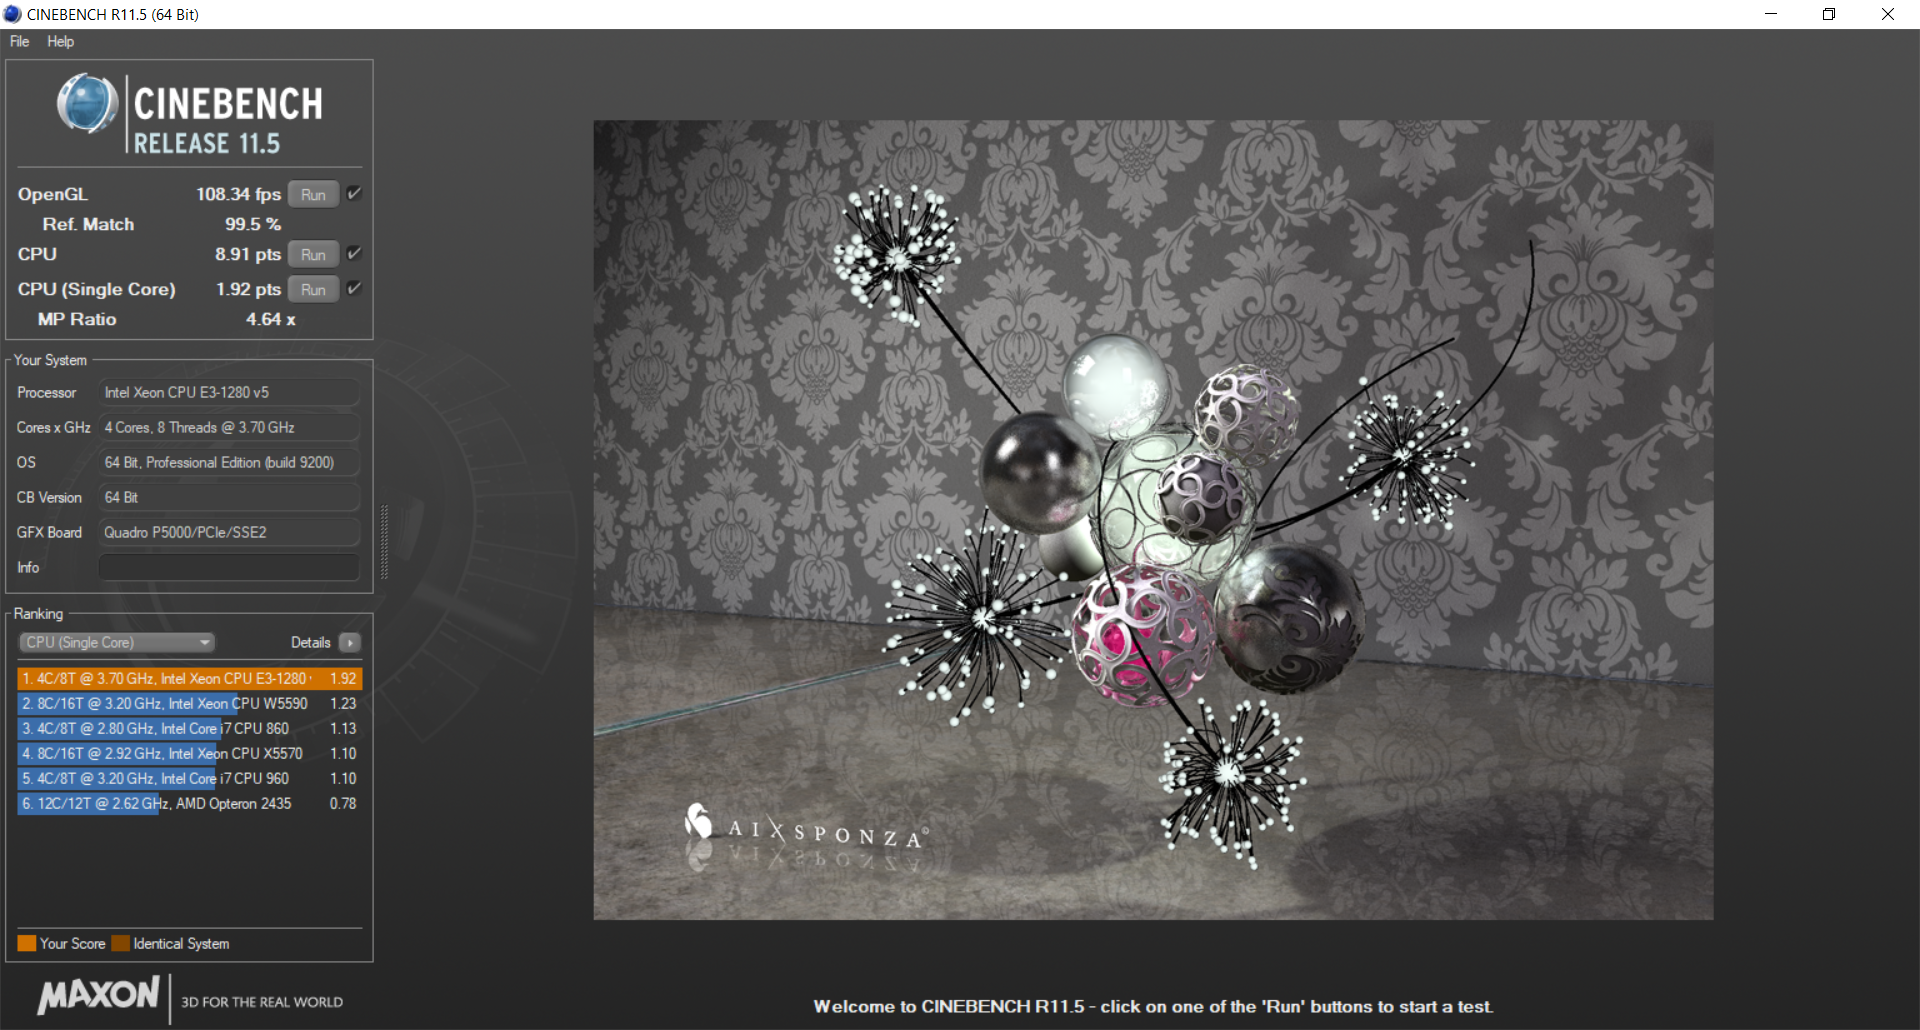
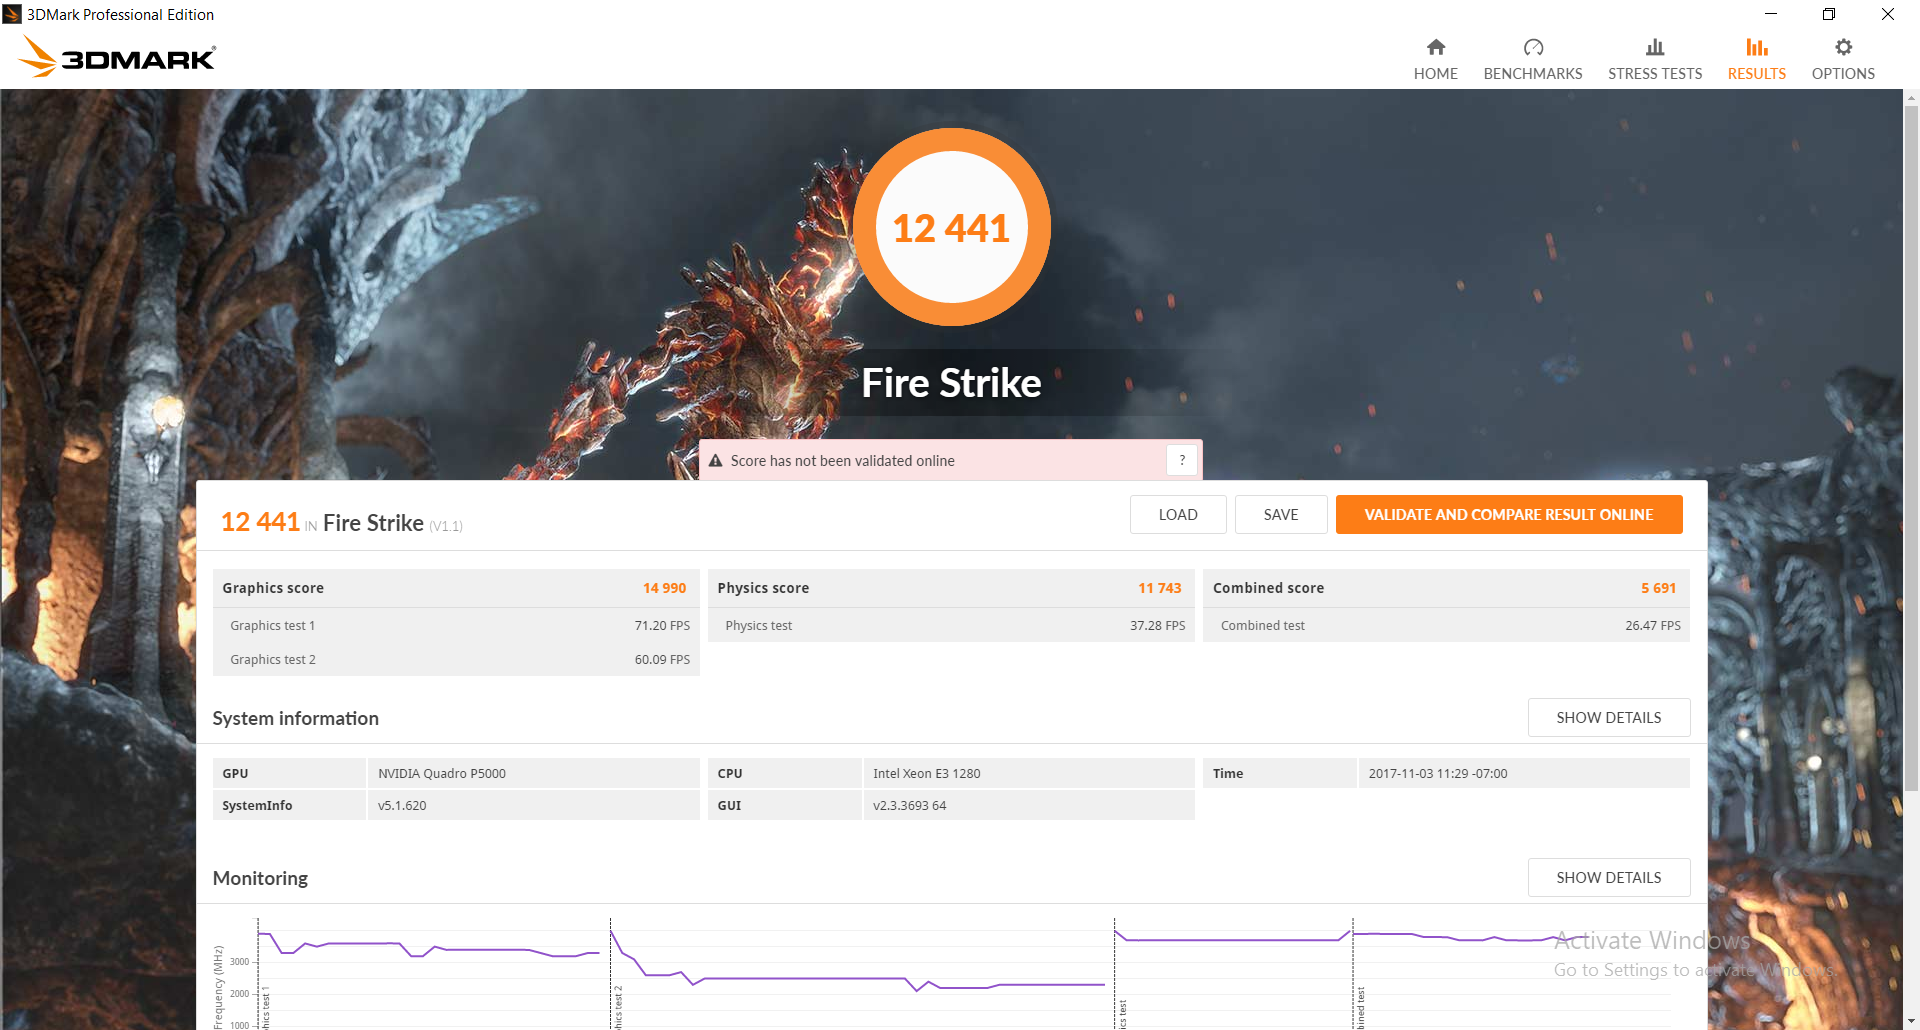
Our first-ever benchmarks place the processor someplace between the Core i7-6700 and Core i7-6700K. We recorded scores of 815 points and 163 points in Cinebench R15 multi-CPU and single-CPU, respectively, which makes this the fastest multi-core CPU in today’s test field as judged by that benchmark. Cinebench R11.5 agrees, with a result of 8.91 points beating the next competitor (the ThinkPad P51) by around 3%. Still other benchmarks reinforce these findings: x264 reports Pass 1 / Pass 2 average frame rates of 187.5 / 50.7 respectively, which yet again leaves the Xeon in the company of the Core i7-6700 desktop CPU. The Fire Strike Physics score of 11743 is around 3% better than the Core i7-6700, and around 9% below the i7-6700K.
Meanwhile, single-core performance is more grounded; the Tornado is around 8 percent below the HP ZBook in this regard (the ZBook’s CPU features a single-core clock rate of 4.2 GHz, 200 MHz higher than that of the Xeon E3-1280 v5). That places the Tornado’s Xeon E3-1280 v5 between the Core i7-7820HK and the Core i5-6600K desktop processor.
Our Cinebench R15 multi-core loop test revealed no problems with sustained performance over around a half hour’s time, with scores all falling within the range of 807 – 814. This suggests that the Tornado F5W’s cooling solution is sufficient to support heavy-duty real-world processor loads.
| wPrime 2.10 - 1024m | |
| Fujitsu Celsius H970 | |
| Lenovo ThinkPad P51 20HH0016GE | |
| Dell Precision 5520 UHD | |
| Eurocom Tornado F5W | |
| MSI WS63VR 7RL-023US | |
* ... smaller is better
System Performance
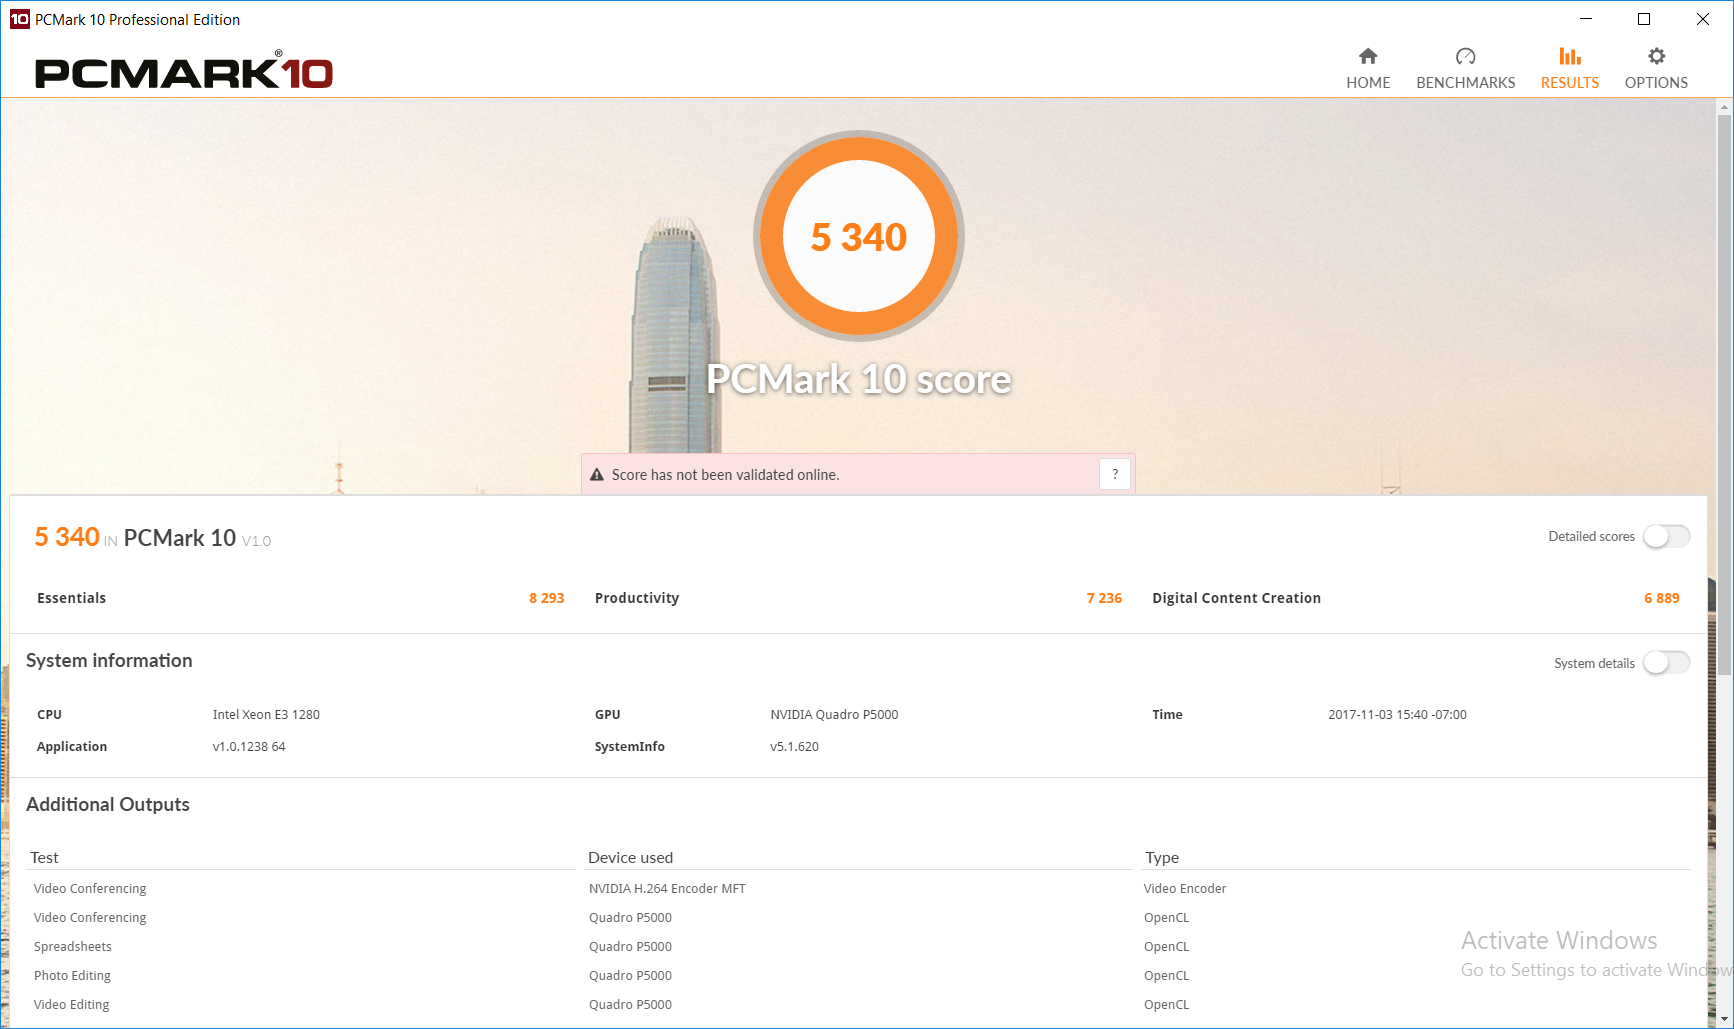
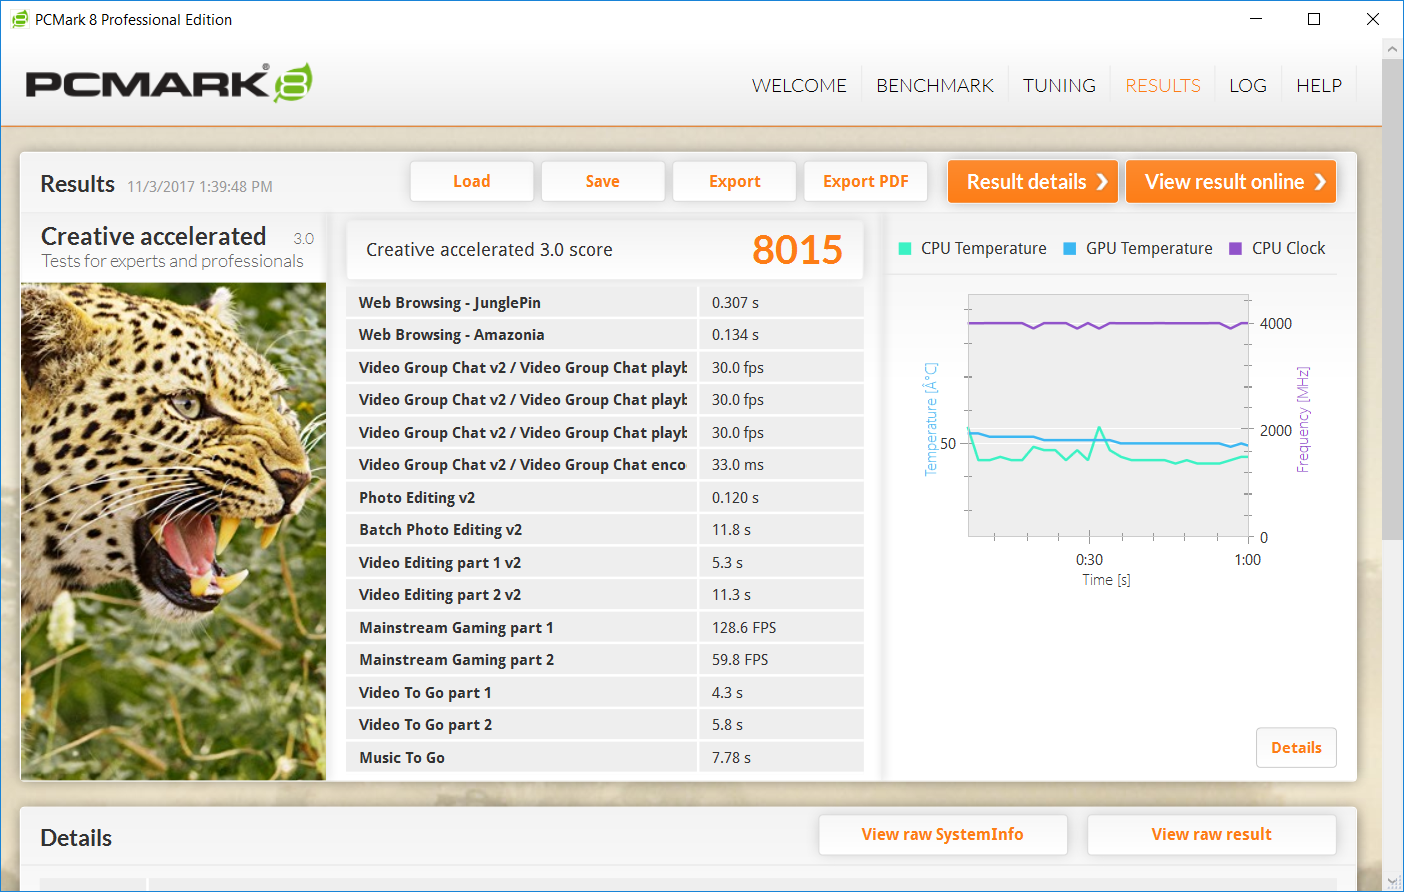
Any doubts about the general system performance of the Tornado F5W are quickly dispelled after examining the PCMark results we received from the machine. The PCMark 10 score of 5340 is impressive enough already, placing the device in the top 7 percent of machines in our database as of this writing. The PCMark 8 suite of tests reveals similarly convincing results: the relatively GPU-agnostic Work Score Accelerated score of 5433 is virtually identical to that of the HP ZBook 15 G4 (both of which are at the top of today’s comparison list), but in the Creative and Home tests, the Tornado is a decisive 11 and 17 percent faster than the second-place competitors in each. The Eurocom Tornado F5W is thus one of the fastest mobile workstations we’ve evaluated to date when it comes to general application performance.
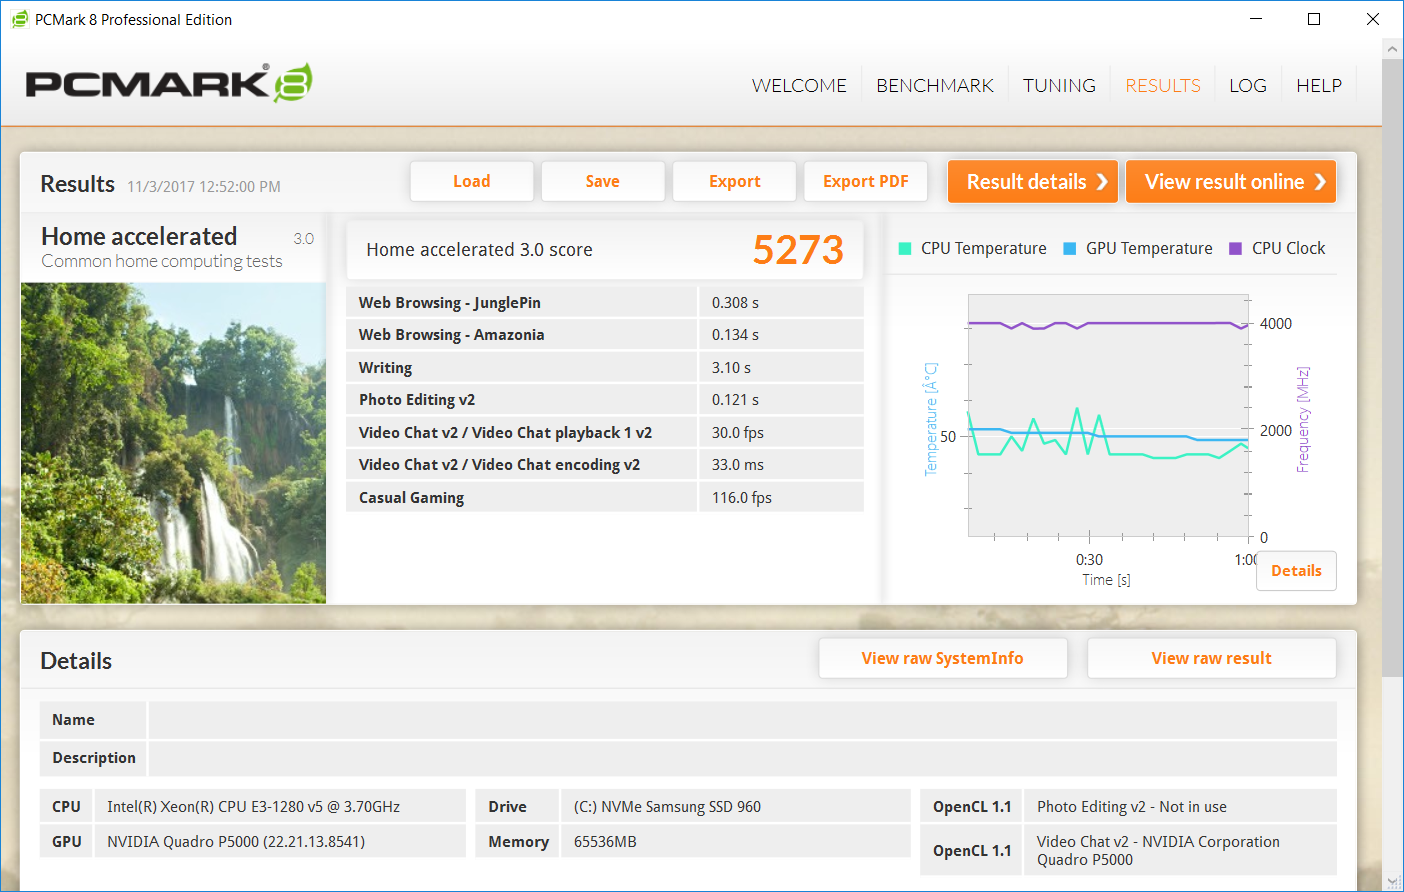
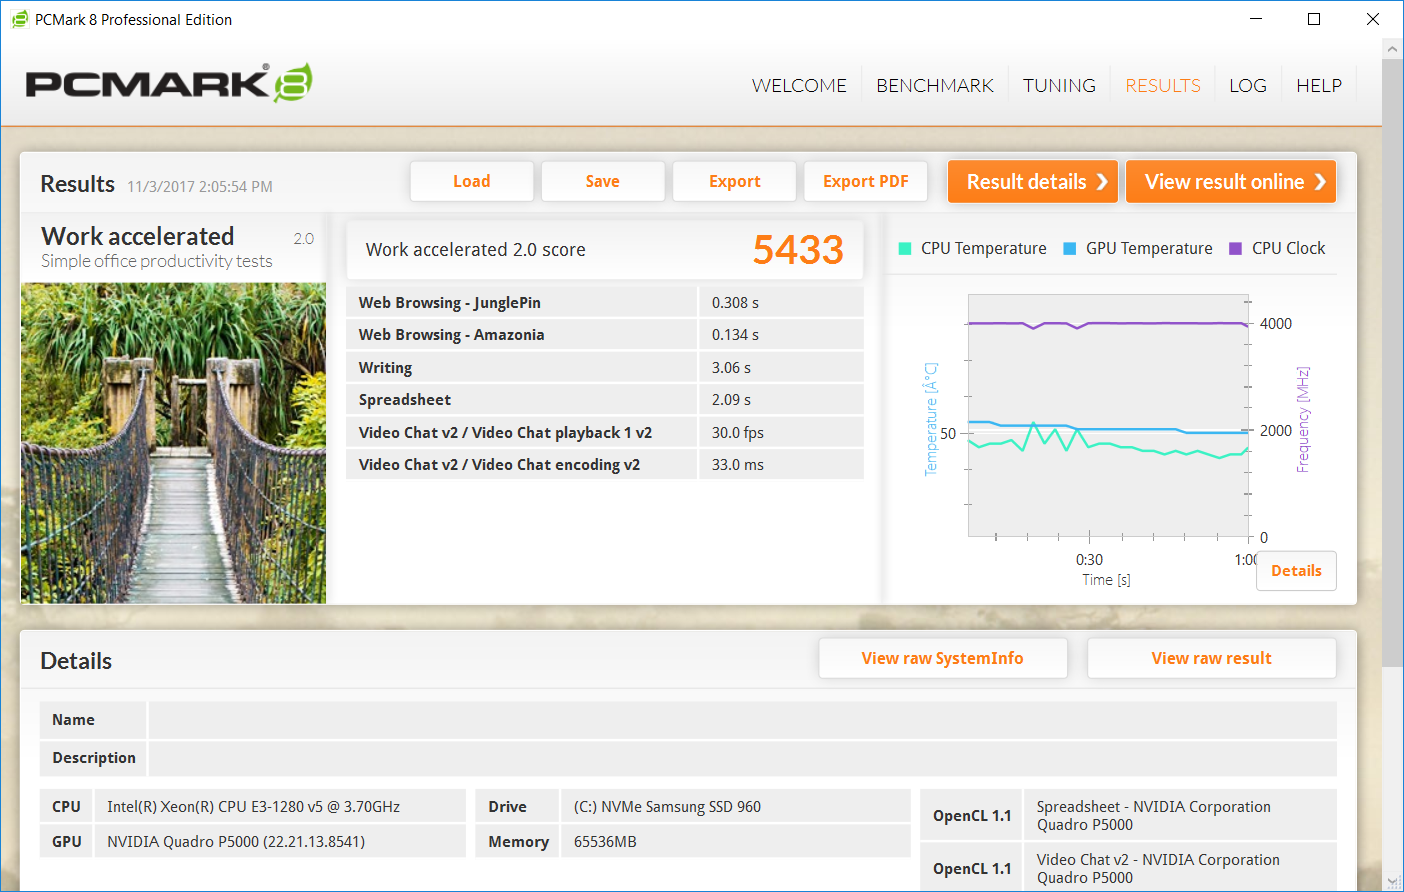
| PCMark 8 Home Score Accelerated v2 | 5273 points | |
| PCMark 8 Creative Score Accelerated v2 | 8015 points | |
| PCMark 8 Work Score Accelerated v2 | 5433 points | |
| PCMark 10 Score | 5340 points | |
Help | ||
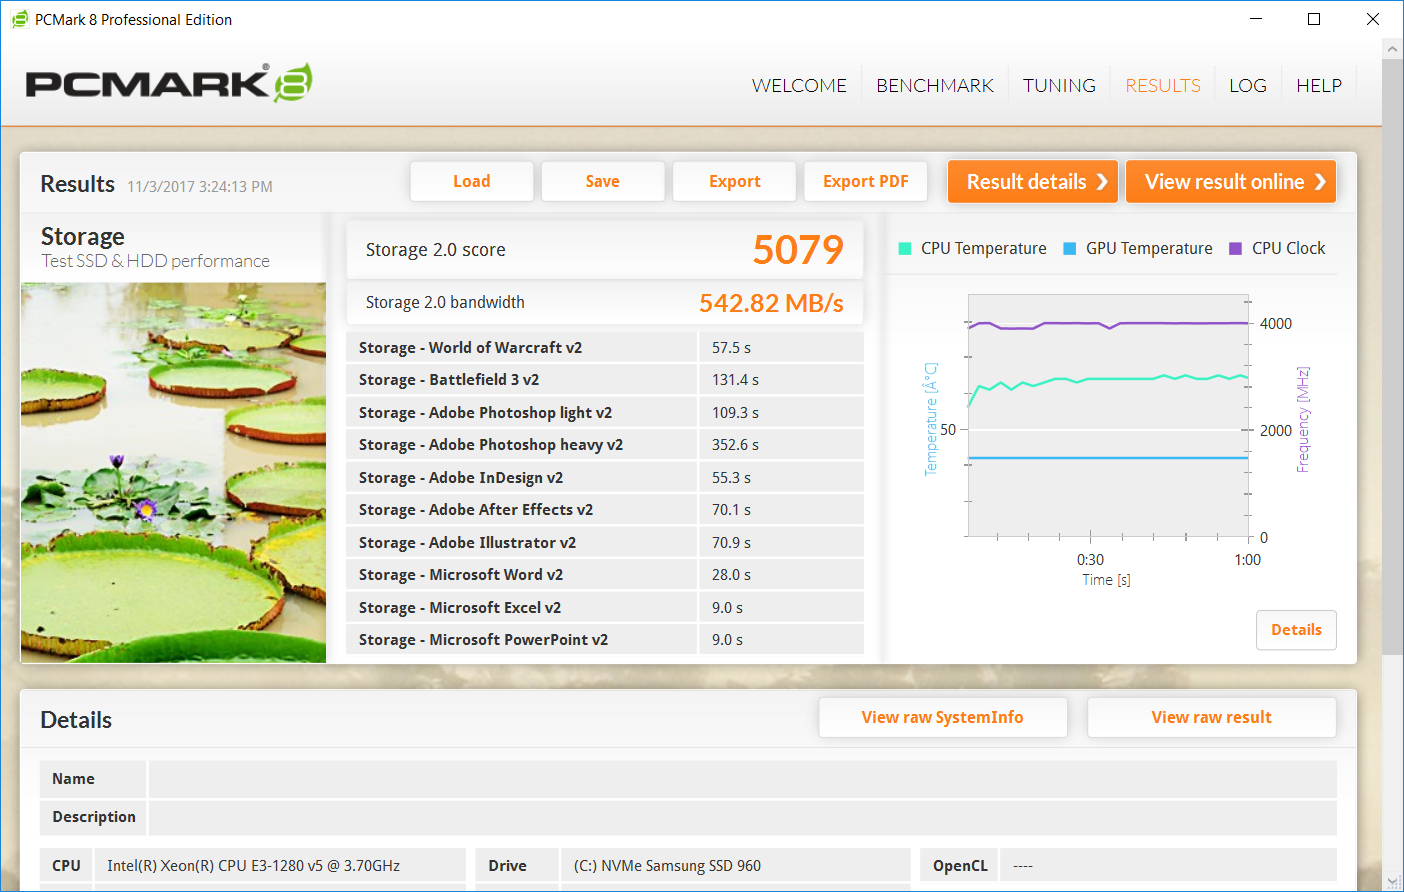
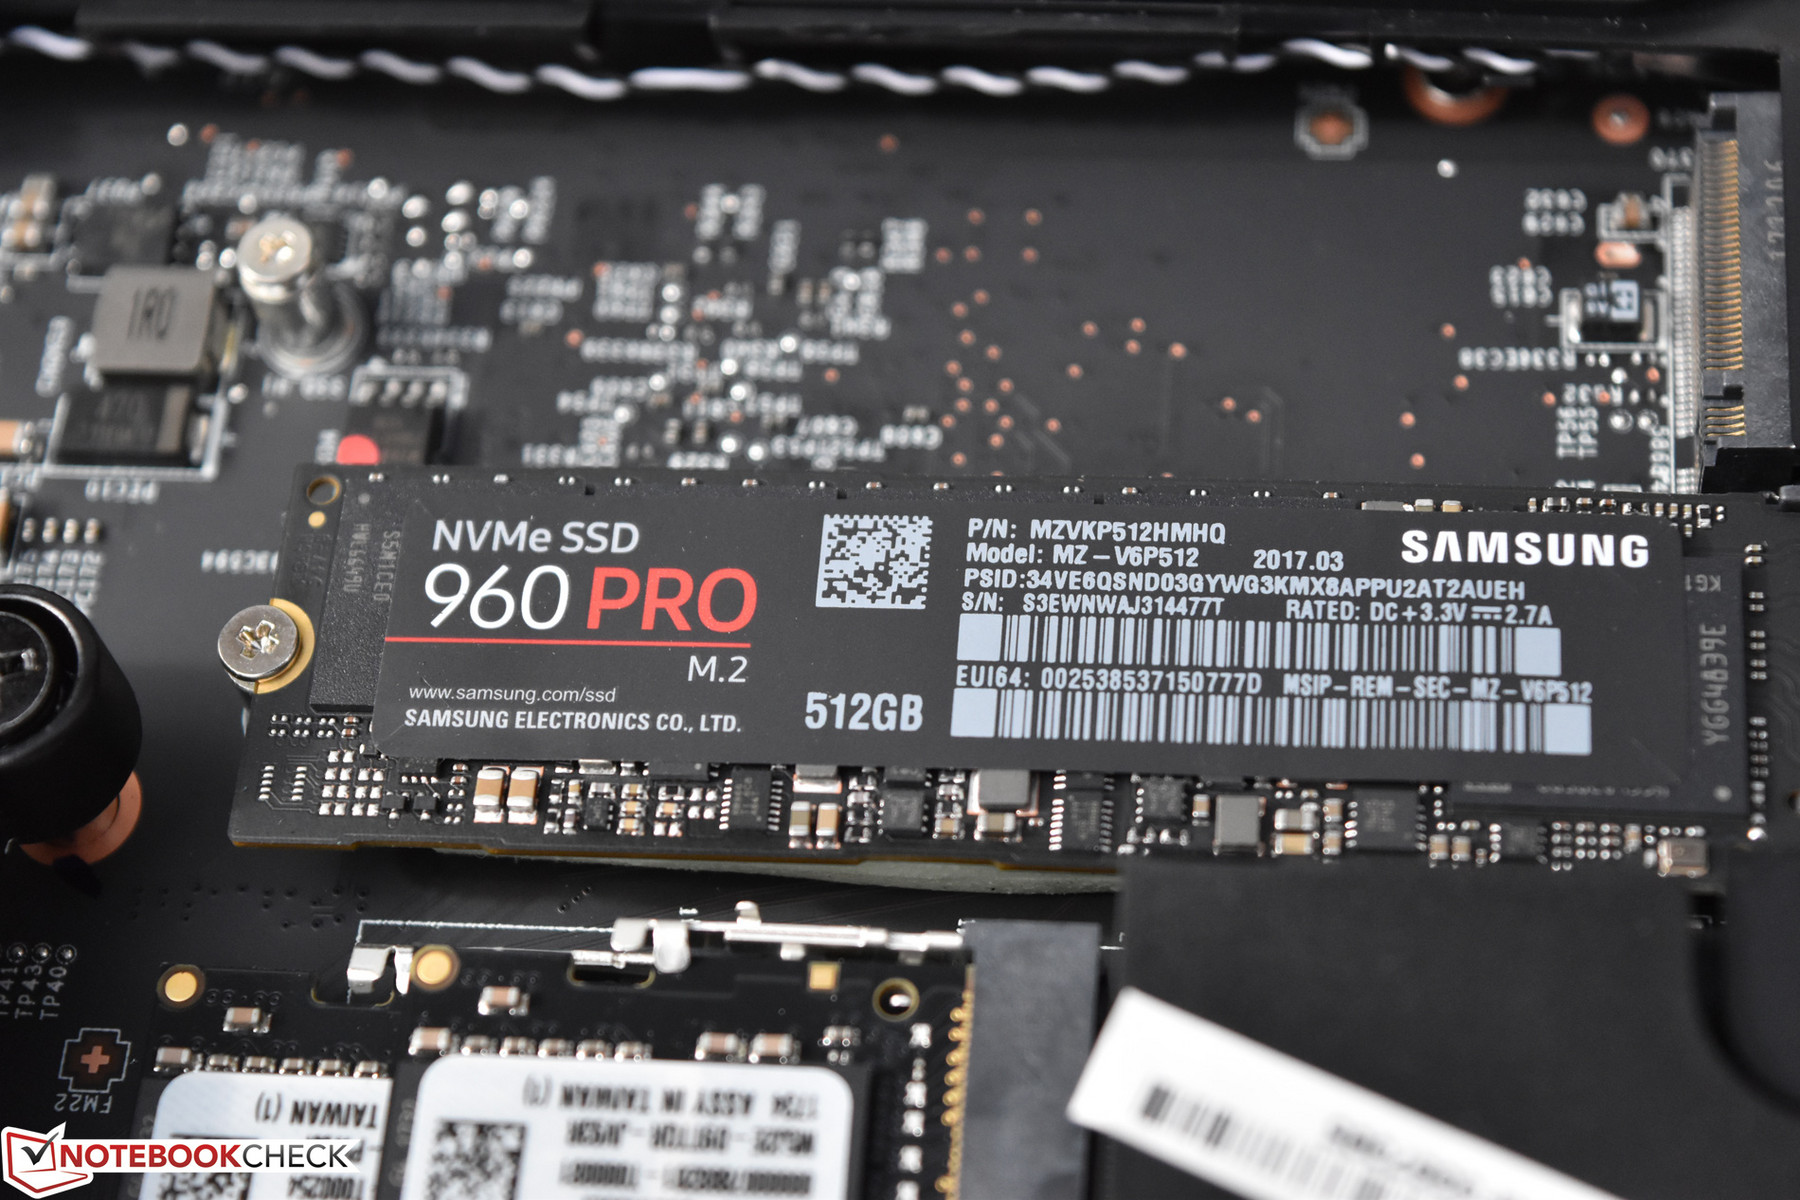
Storage Devices
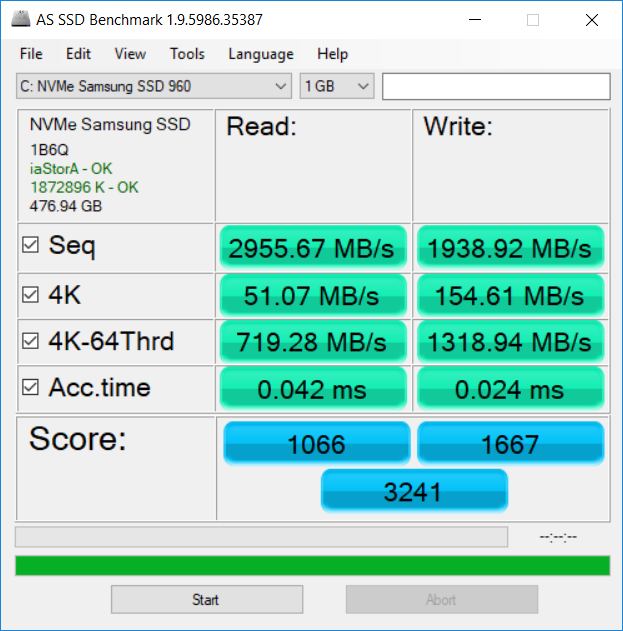
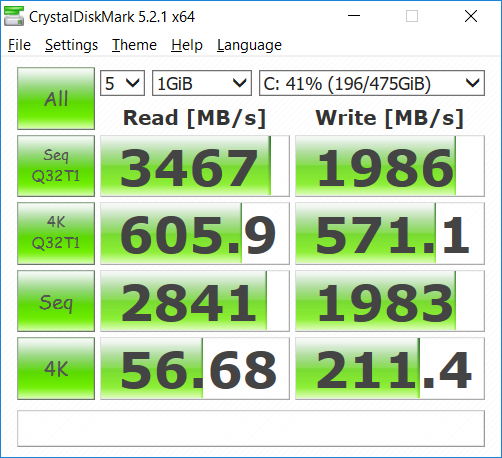
As usual, a significant component of this blistering performance is the ultra-fast NVMe SSD installed in our review unit: the Samsung 960 Pro 512 GB. Other, less expensive options are available, such as smaller capacity NVMe drives as well as SATA M.2 options as small as 250 GB in capacity. Another $1,000 (as of this writing) can also buy you a 2 TB Samsung 960 Pro NVMe SSD. A second M.2/NVMe drive can also be added pulling from those same options, and the two can be configured in RAID from the factory for an additional $63. Apart from that, there is also a conventional 2.5-inch SATA drive bay, which can be preconfigured with a vast array of optional drives ranging from inexpensive mechanical drives all the way to a 4 TB Samsung 850 EVO SSD.
The 960 Pro we received in our review unit leaves few doubts about its capabilities. We have tested it on numerous occasions, and the only significant variance in performance we’ve discovered is generally related to driver choice. For our testing, we left the stock driver installed on today’s system, though users may be able to extract some additional performance by leveraging Samsung’s own NVMe driver. Nevertheless, as evidenced by our AS SSD table below, there is little to be concerned about in either case.
| Eurocom Tornado F5W Samsung SSD 960 Pro 512 GB m.2 | Fujitsu Celsius H970 Samsung SM961 MZVKW512HMJP m.2 PCI-e | HP ZBook 15 G4-Y4E80AV Samsung SSD SM961 1TB M.2 MZVKW1T0HMLH | Lenovo ThinkPad P51 20HH0016GE Samsung PM961 NVMe MZVLW512HMJP | Dell Precision 5520 UHD Samsung SM961 MZVKW512HMJP m.2 PCI-e | |
|---|---|---|---|---|---|
| AS SSD | -15% | 11% | 3% | 4% | |
| Copy Game MB/s (MB/s) | 1094 | 839 -23% | 982 -10% | 1140 4% | 921 -16% |
| Copy Program MB/s (MB/s) | 419.8 | 297.5 -29% | 325.4 -22% | 425.6 1% | 372.8 -11% |
| Copy ISO MB/s (MB/s) | 1905 | 1722 -10% | 1486 -22% | 1607 -16% | 1659 -13% |
| Score Total (Points) | 3241 | 3509 8% | 4303 33% | 3424 6% | 3681 14% |
| Score Write (Points) | 1667 | 1210 -27% | 1472 -12% | 917 -45% | 1379 -17% |
| Score Read (Points) | 1066 | 1557 46% | 1902 78% | 1690 59% | 1554 46% |
| Access Time Write * (ms) | 0.024 | 0.048 -100% | 0.023 4% | 0.025 -4% | 0.023 4% |
| Access Time Read * (ms) | 0.042 | 0.05 -19% | 0.034 19% | 0.032 24% | 0.038 10% |
| 4K-64 Write (MB/s) | 1319 | 971 -26% | 1136 -14% | 623 -53% | 1055 -20% |
| 4K-64 Read (MB/s) | 719 | 1246 73% | 1578 119% | 1372 91% | 1223 70% |
| 4K Write (MB/s) | 154.6 | 78.1 -49% | 158 2% | 143.1 -7% | 155.3 0% |
| 4K Read (MB/s) | 51.1 | 38.88 -24% | 51.7 1% | 55.6 9% | 51.5 1% |
| Seq Write (MB/s) | 1939 | 1609 -17% | 1777 -8% | 1506 -22% | 1694 -13% |
| Seq Read (MB/s) | 2956 | 2726 -8% | 2719 -8% | 2624 -11% | 2799 -5% |
* ... smaller is better

GPU/Workstation Performance
The Tornado F5W can be configured with several different mobile GPUs, starting with the NVIDIA Quadro M1000M at the low end and extending all the way up to the extremely powerful NVIDIA Quadro P5000 at the opposite end. The two options are separated in price by $2,253 currently, but the performance difference could not be more pronounced.
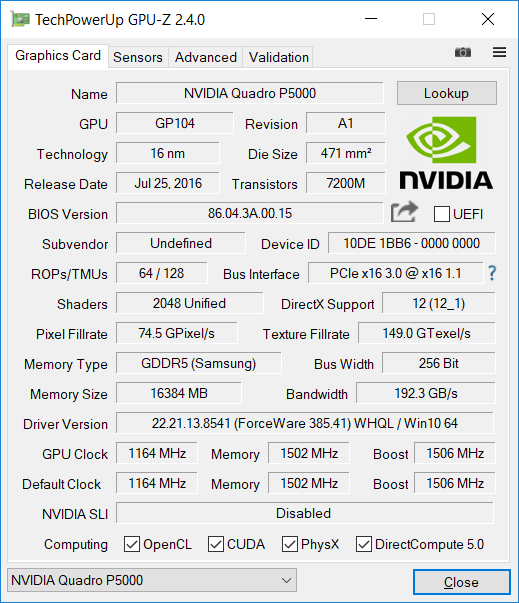
Our test machine was equipped with the aforementioned P5000, which is a high-end workstation GPU based on the GP104 chip with 2048 shaders—similar to its Pascal-based consumer-grade counterpart, the NVIDIA GeForce GTX 1070. The P5000 succeeds the Maxwell-based Quadro M5000M, and it packs a massive 16 GB of GDDR5X video memory, double that of the GTX 1070. Clock rates range from 1164 MHz all the way to 1506 – 1657, given thermal headroom and sufficient power. Speaking of power, the Quadro P5000 is quoted as carrying a 100 W TGP which translates roughly to a 73.4 W TDP.
Our benchmarks leave little for concern, with the Tornado F5W and its Quadro P5000 managing scores anywhere between 30% and 71% faster than the next closest competitor (which is always the Quadro P4000). See below for the full breakdown of all of the tests we ran during our evaluation.
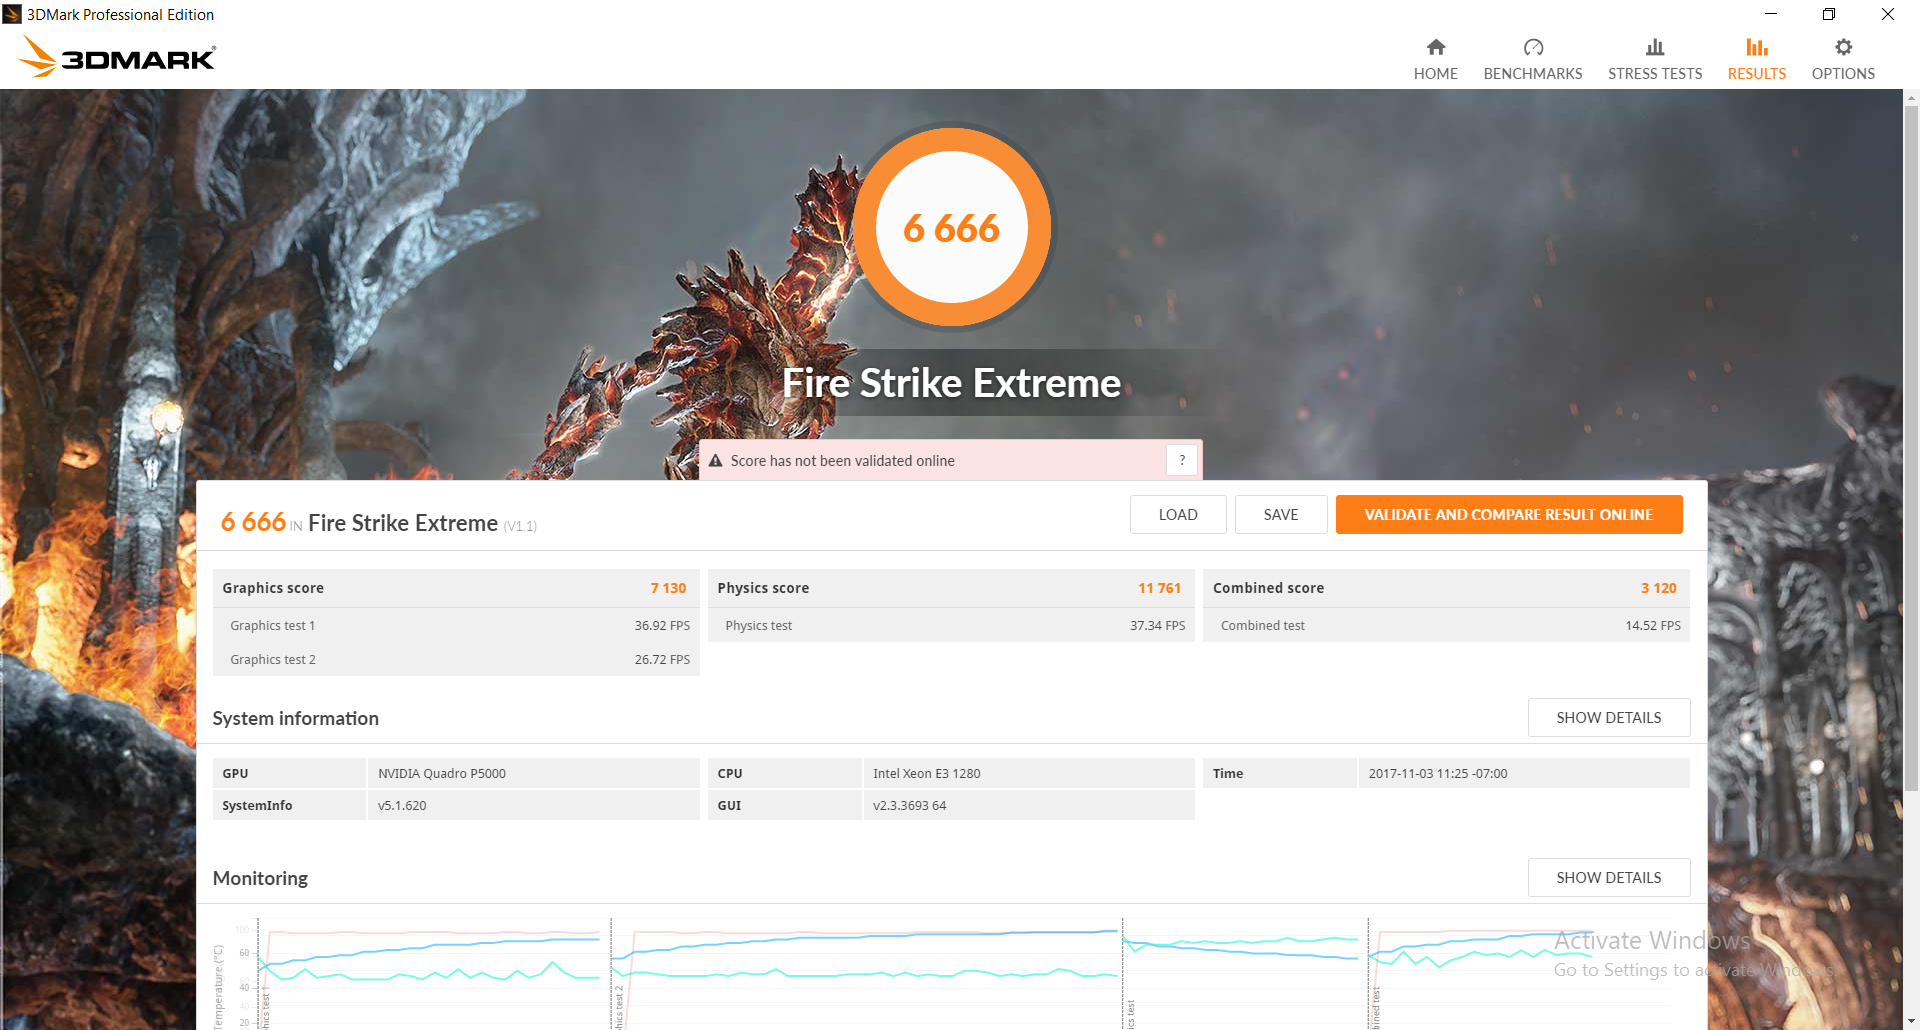
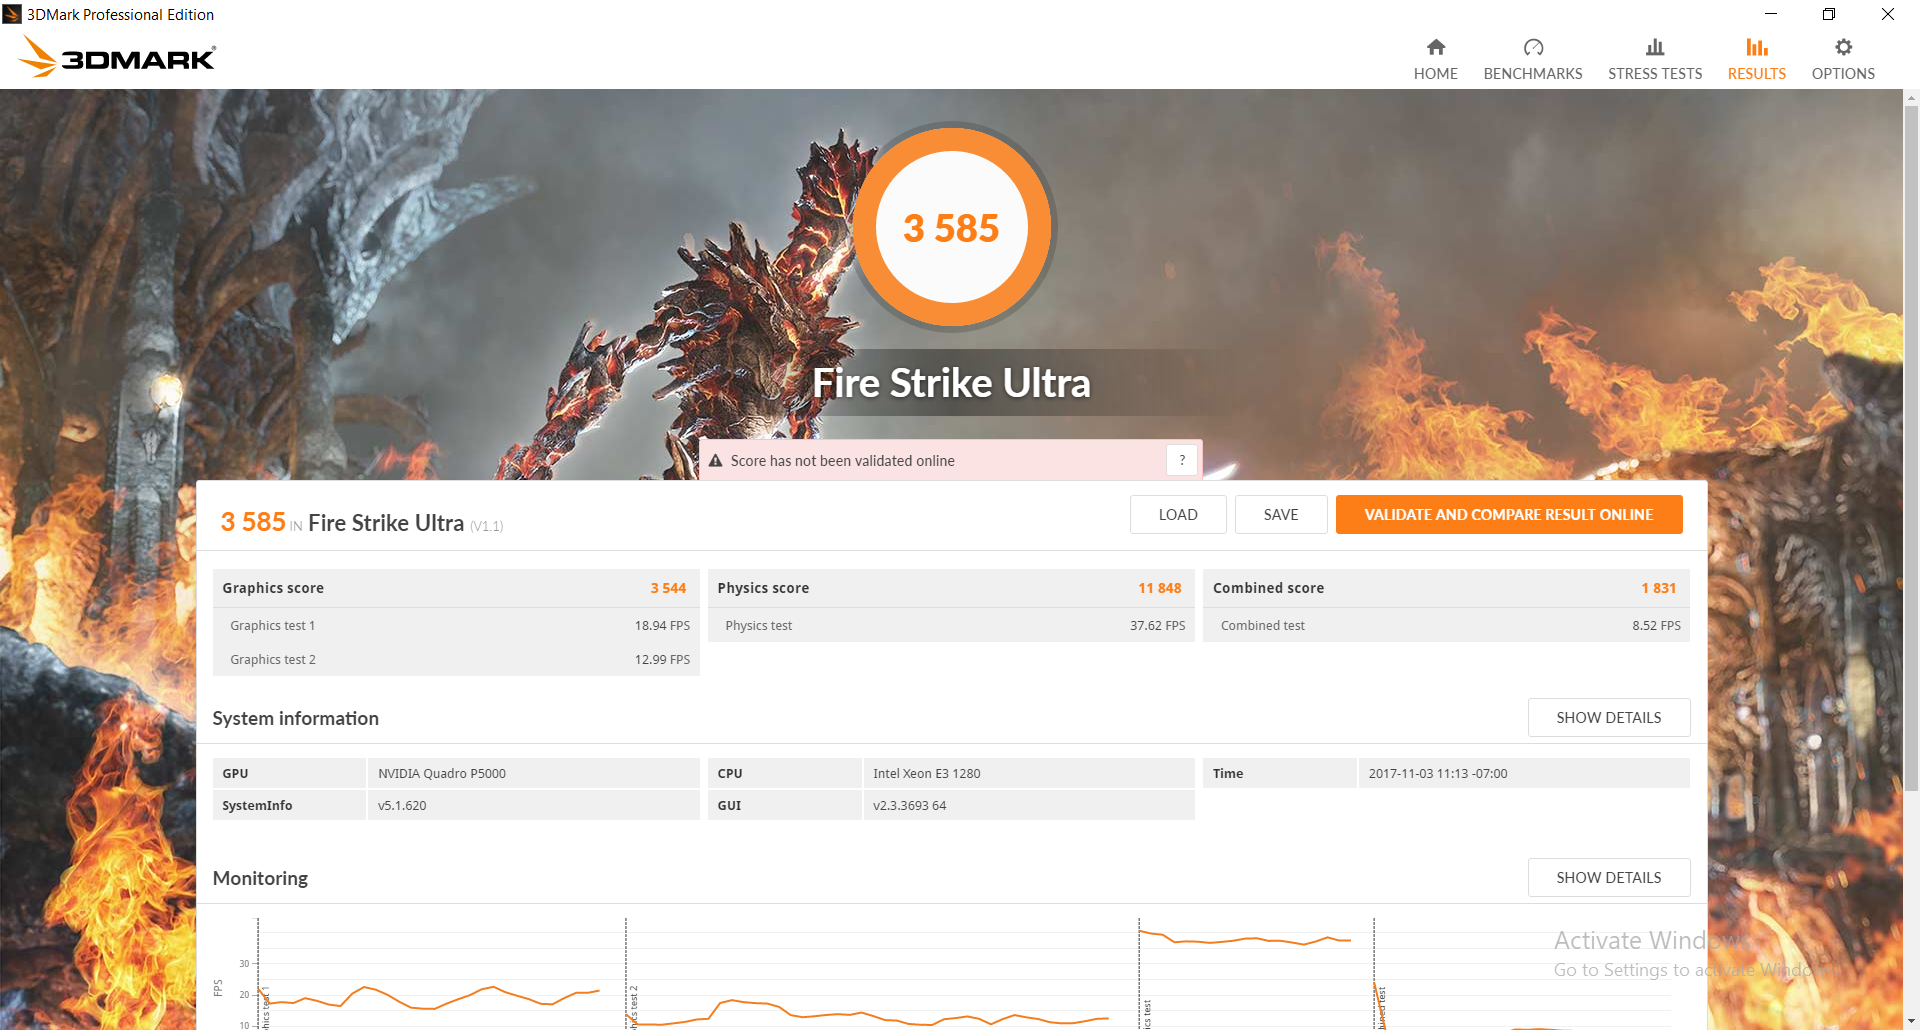
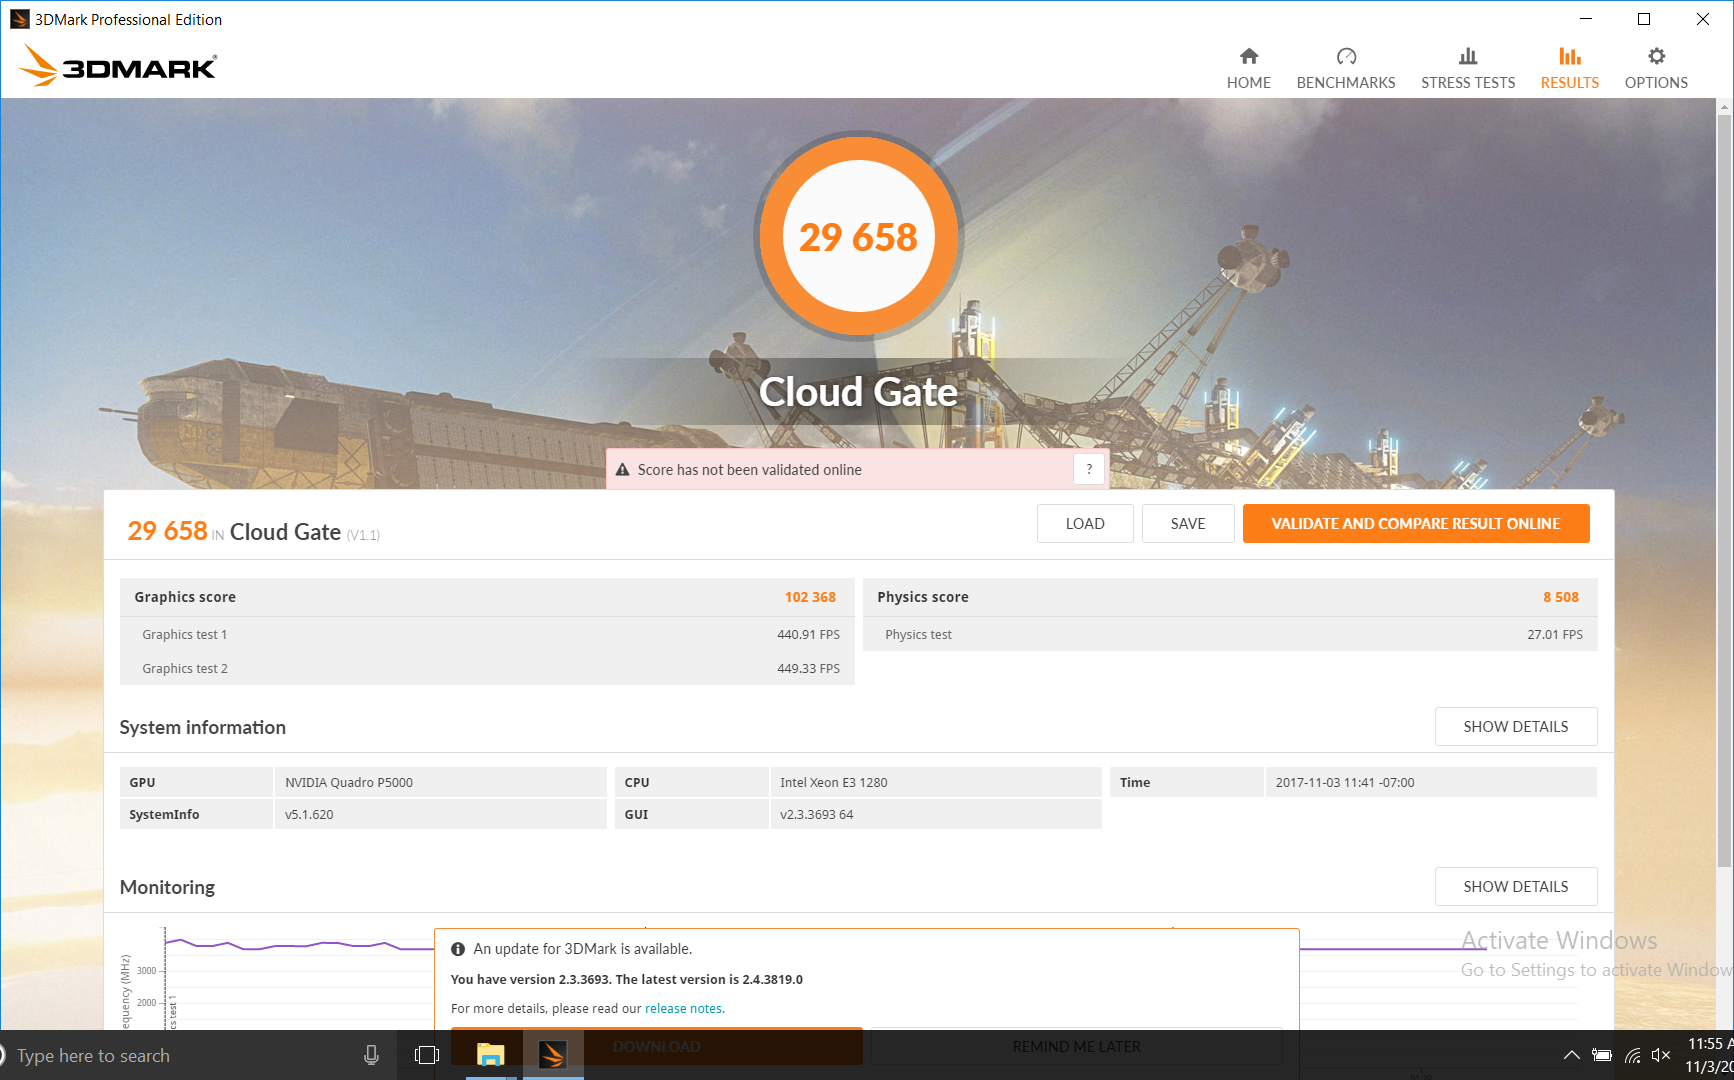
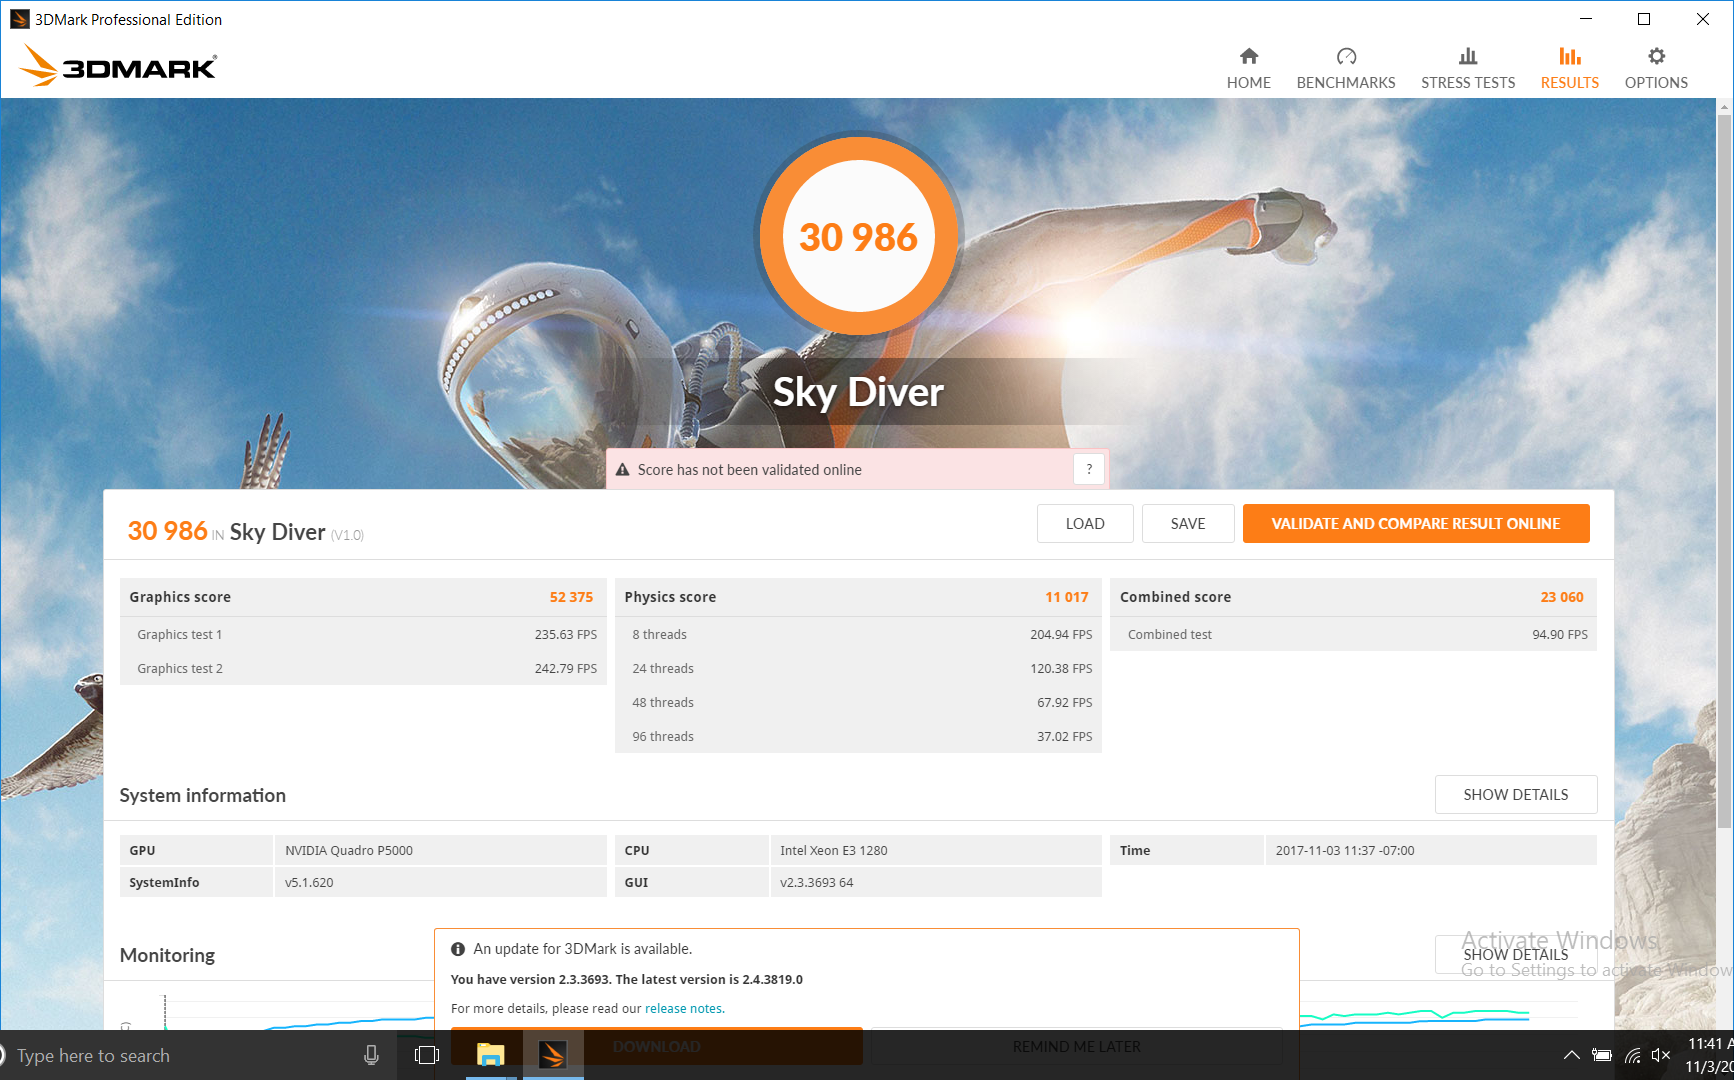
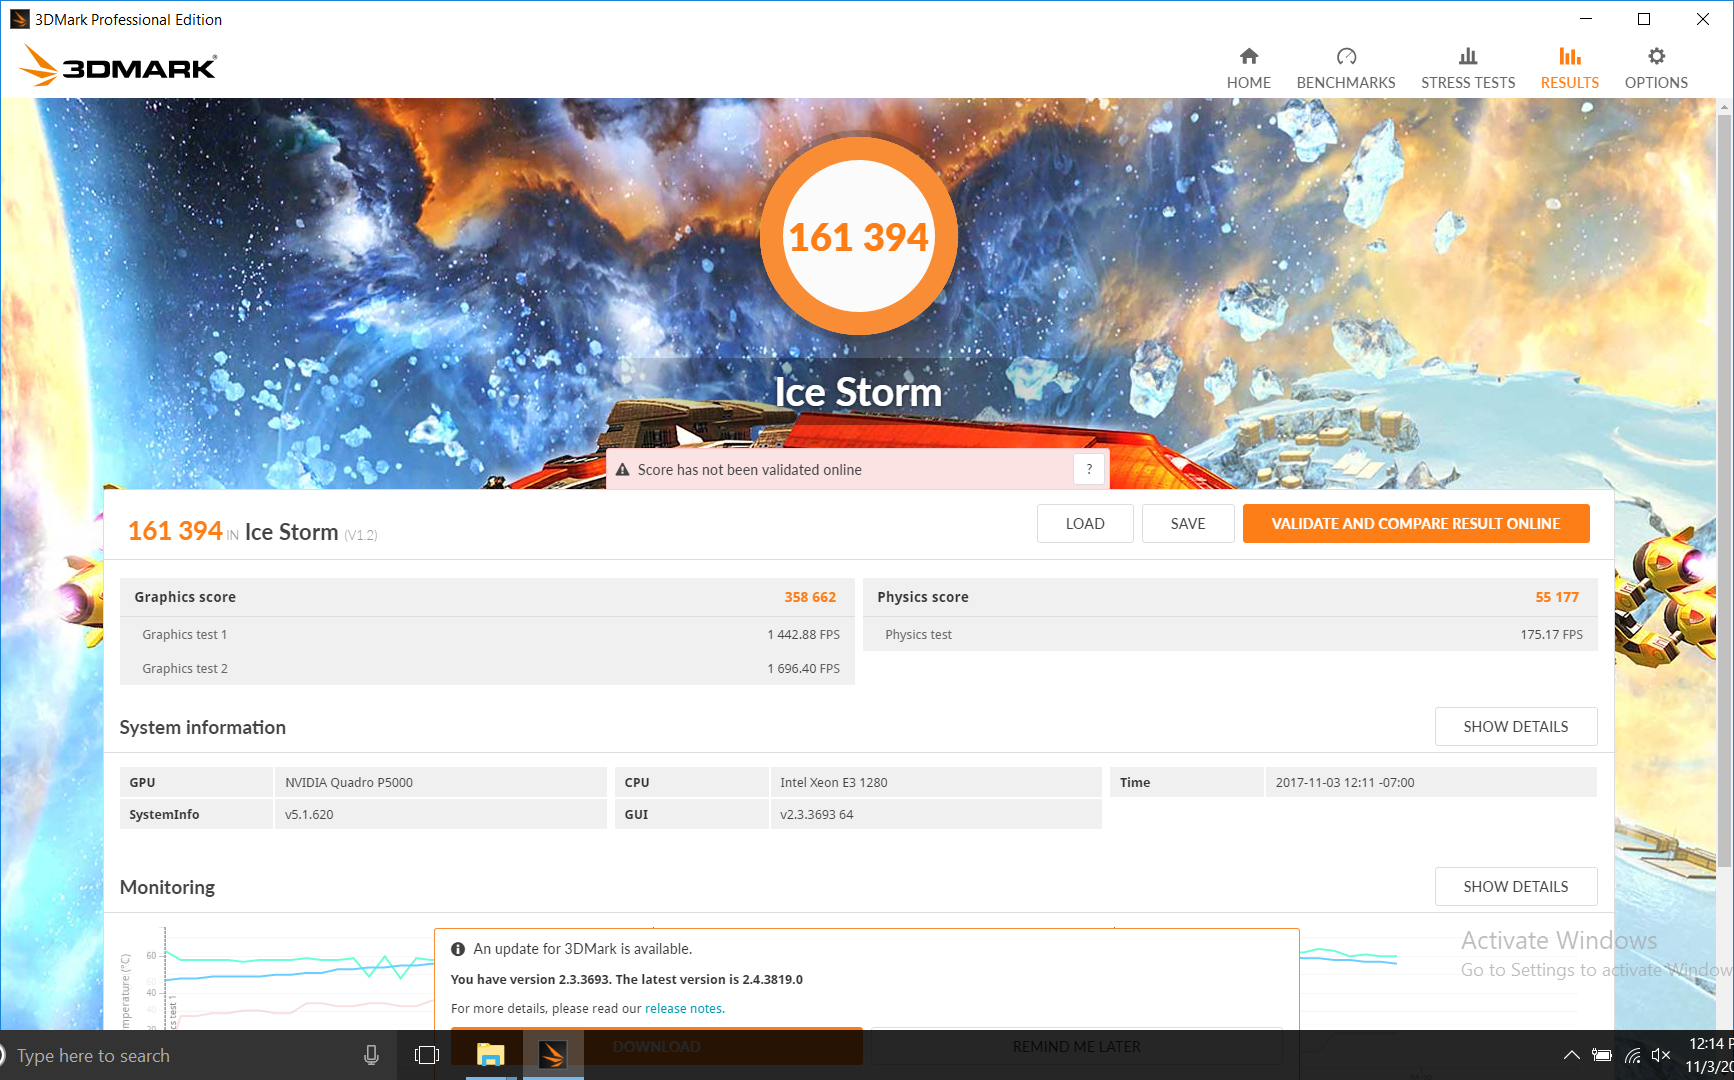
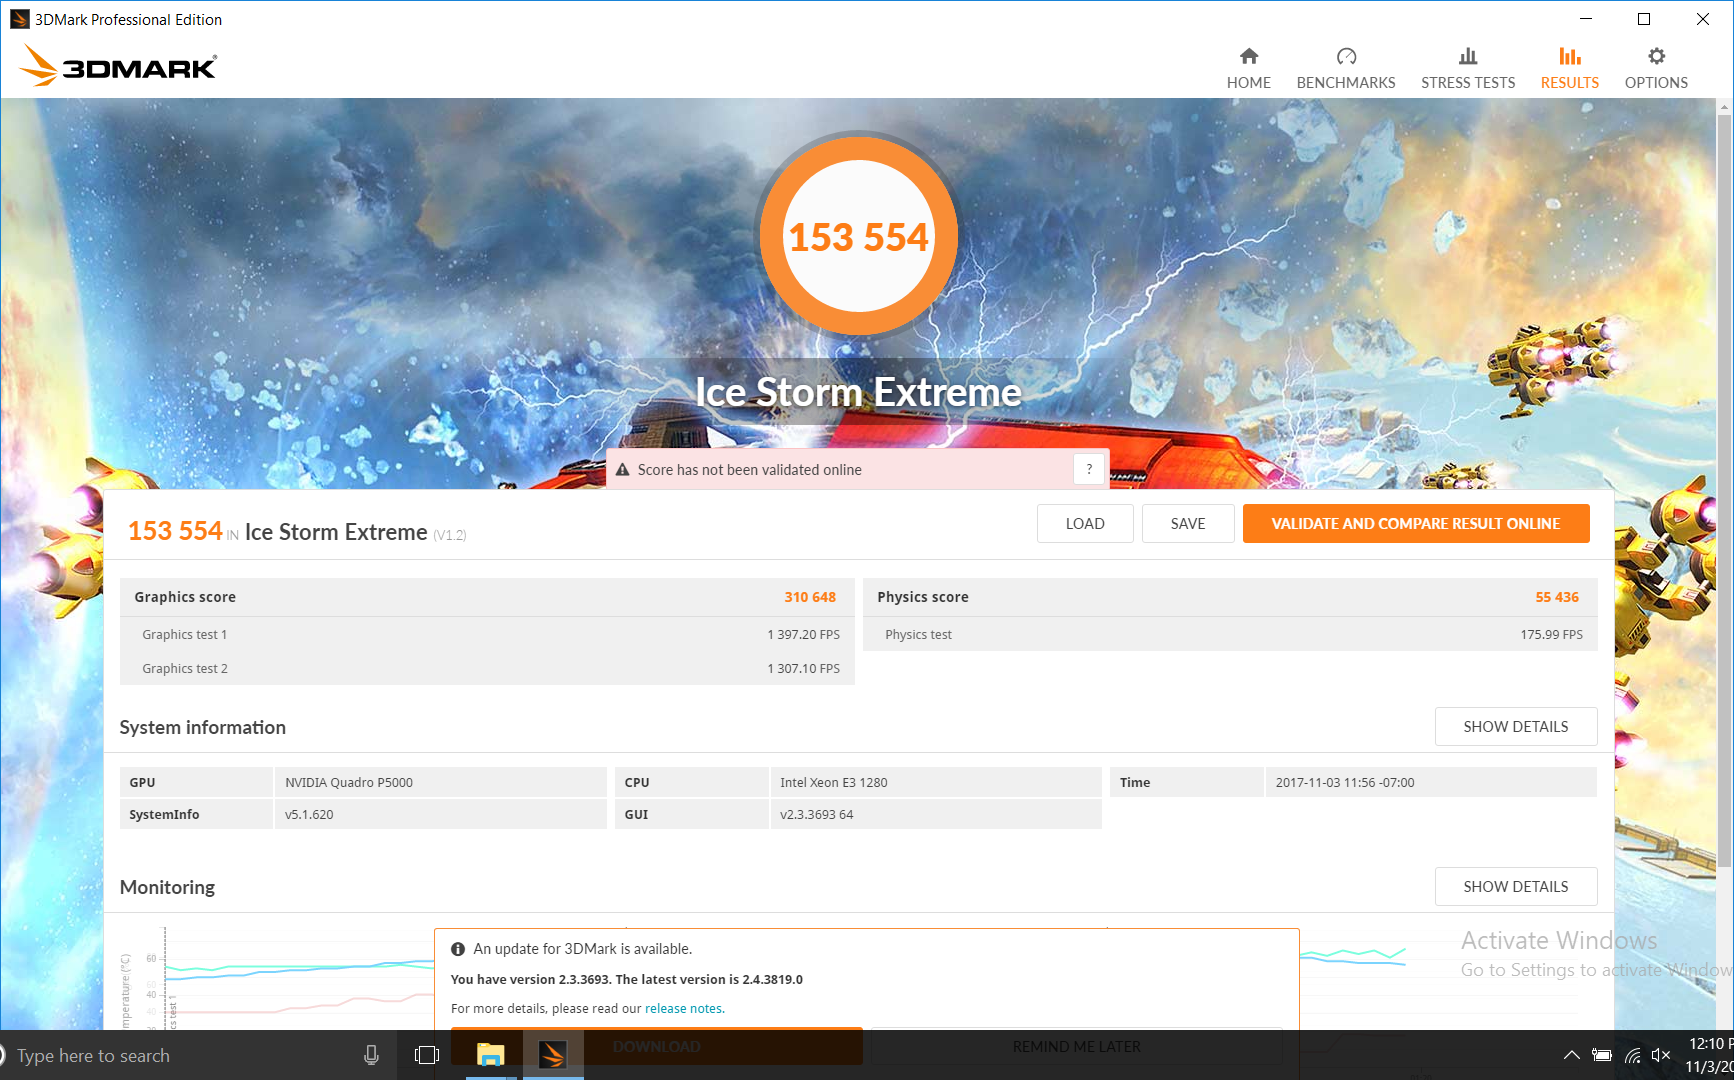
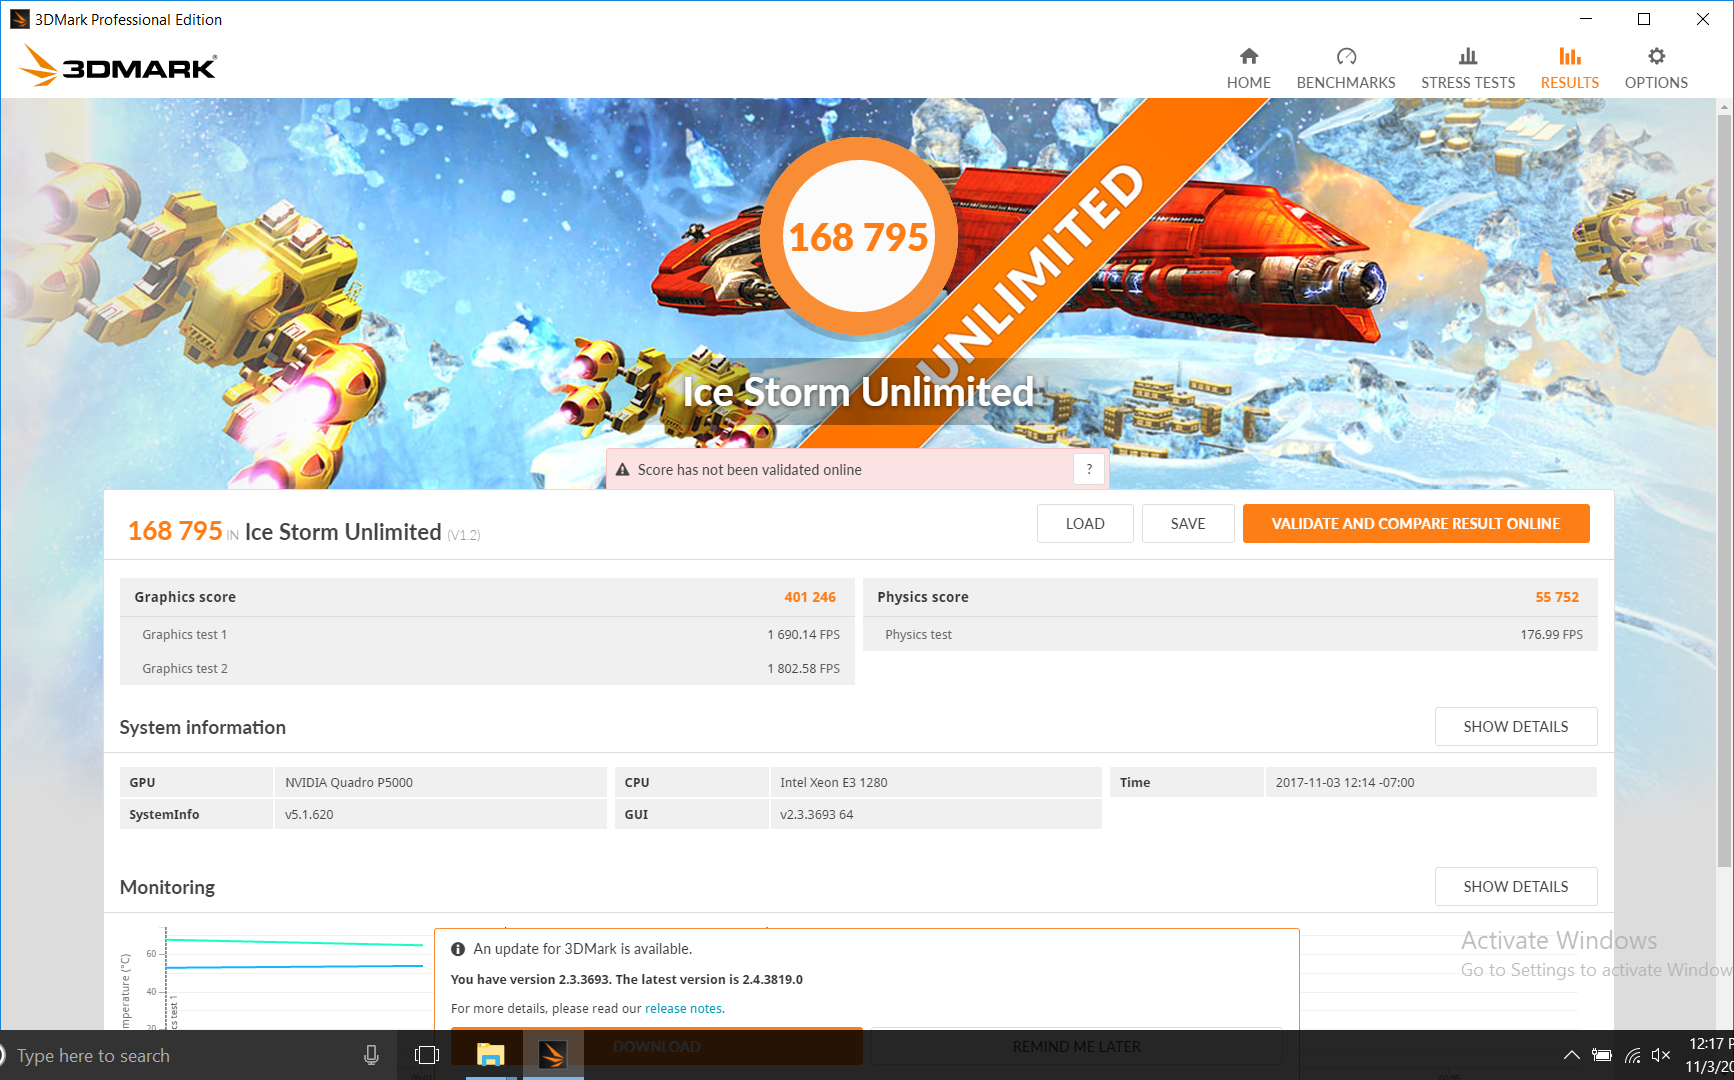
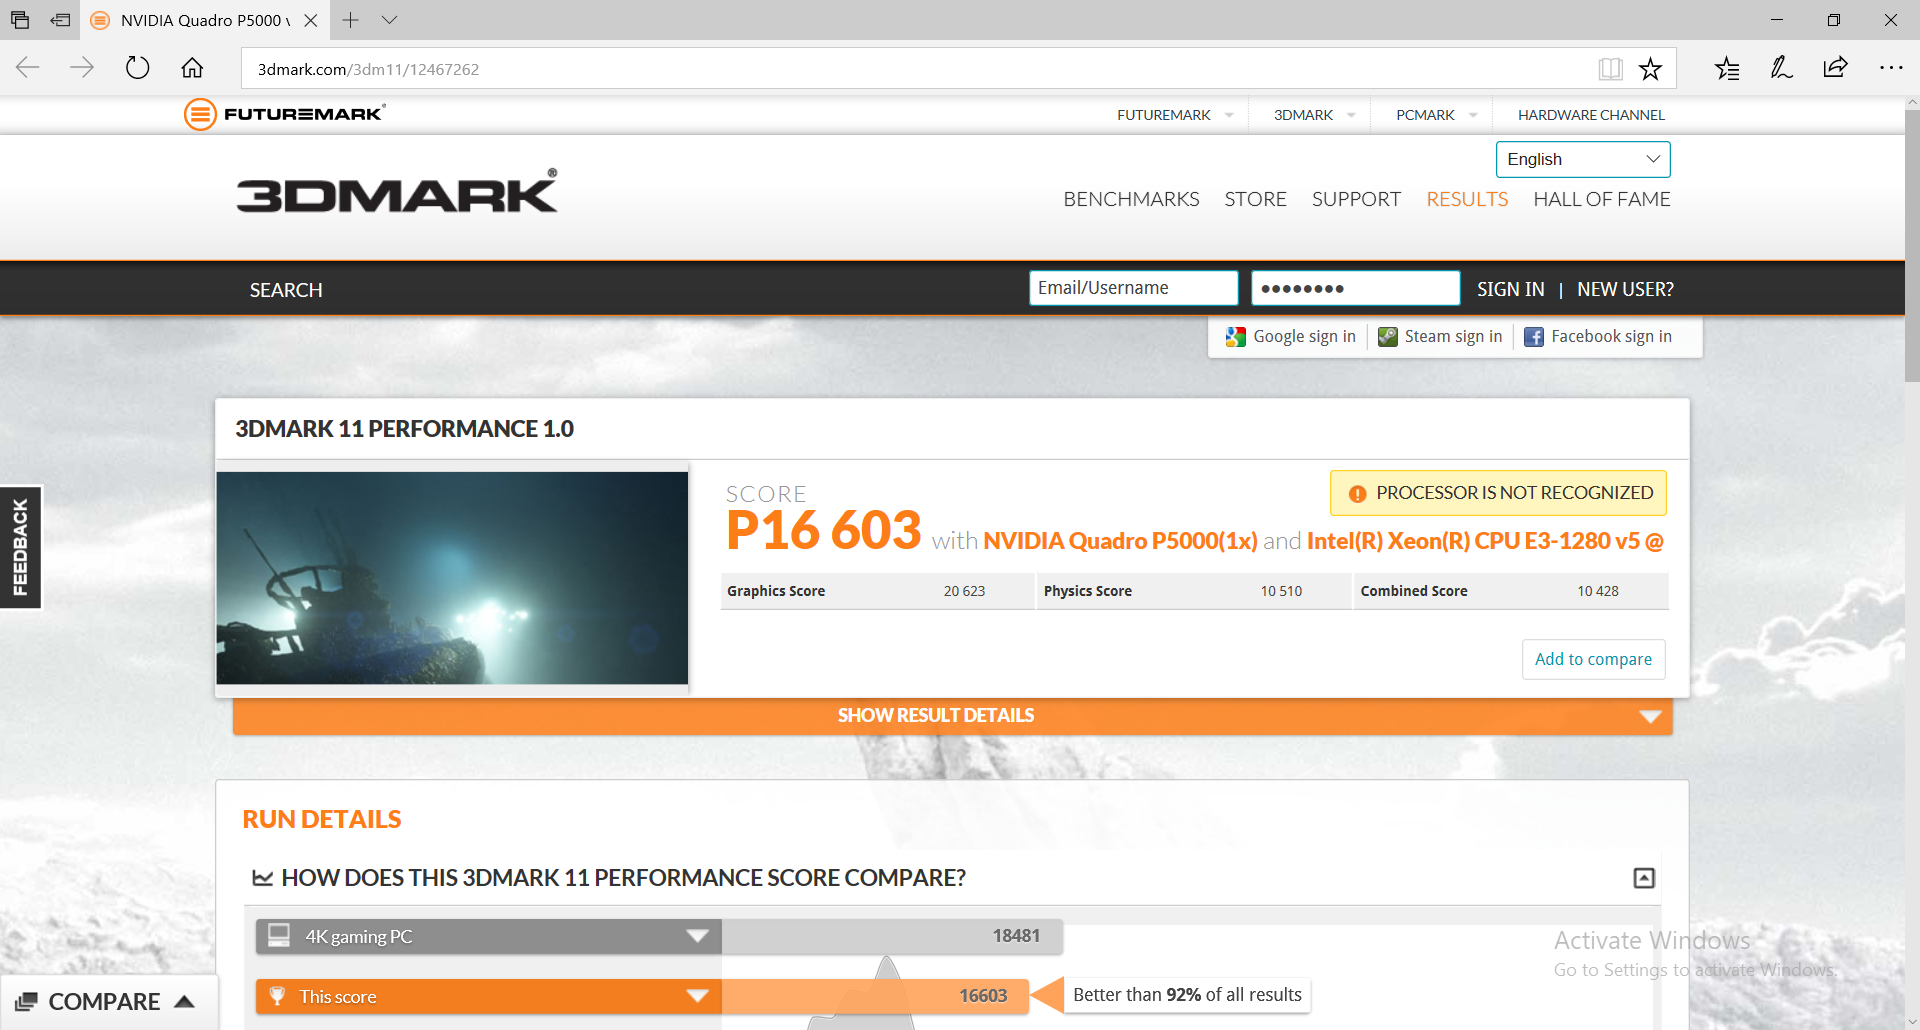
3DMark scores aren’t all that relevant as it applies to workstation graphics adapters since they are optimized instead for—unsurprisingly—workstation applications. Still, users can take solace in the fact that the scores we received from the Tornado F5W’s P5000 were generally in between those typical of a GTX 1060 and GTX 1070—so occasional gaming should prove no challenge for the notebook.
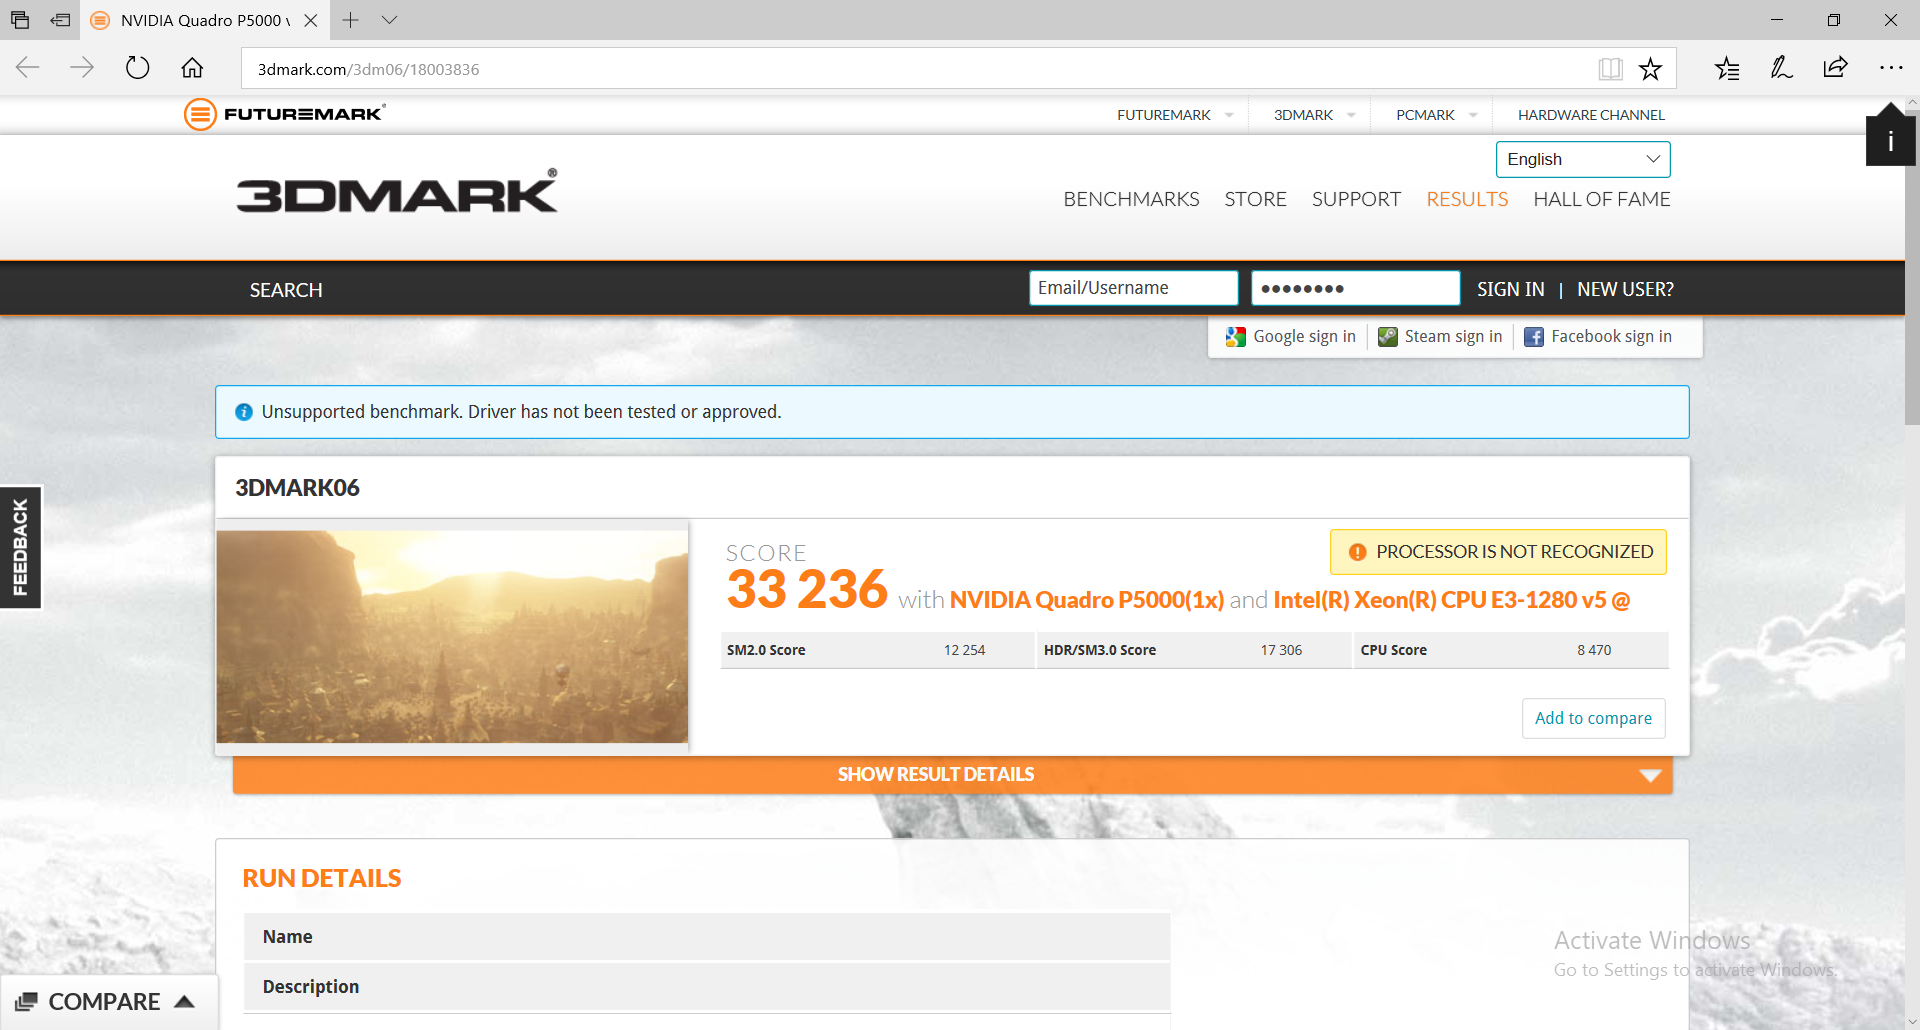
| 3DMark 06 Standard Score | 33236 points | |
| 3DMark 11 Performance | 16603 points | |
| 3DMark Ice Storm Standard Score | 161394 points | |
| 3DMark Cloud Gate Standard Score | 29658 points | |
| 3DMark Fire Strike Score | 12441 points | |
| 3DMark Fire Strike Extreme Score | 6666 points | |
Help | ||
| BioShock Infinite - 1920x1080 Ultra Preset, DX11 (DDOF) (sort by value) | |
| Eurocom Tornado F5W | |
| Fujitsu Celsius H970 | |
| HP ZBook 15 G4-Y4E80AV | |
| MSI WS63VR 7RL-023US | |
| Dell Precision 5520 UHD | |
| Eurocom Tornado F5 | |
| Eurocom Tornado F5 Killer Edition | |
| Alienware 17 R4 | |
| Metro: Last Light - 1920x1080 Very High (DX11) AF:16x (sort by value) | |
| Eurocom Tornado F5W | |
| MSI WS63VR 7RL-023US | |
| Eurocom Tornado F5 | |
| Eurocom Tornado F5 Killer Edition | |
| Alienware 17 R4 | |
| Thief - 1920x1080 Very High Preset AA:FXAA & High SS AF:8x (sort by value) | |
| Eurocom Tornado F5W | |
| MSI WS63VR 7RL-023US | |
| Eurocom Tornado F5 Killer Edition | |
| Alienware 17 R4 | |
| The Witcher 3 - 1920x1080 Ultra Graphics & Postprocessing (HBAO+) (sort by value) | |
| Eurocom Tornado F5W | |
| Fujitsu Celsius H970 | |
| HP ZBook 15 G4-Y4E80AV | |
| MSI WS63VR 7RL-023US | |
| Lenovo ThinkPad P51 20HH0016GE | |
| Eurocom Tornado F5 Killer Edition | |
| Alienware 17 R4 | |
| Batman: Arkham Knight - 1920x1080 High / On AA:SM AF:16x (sort by value) | |
| Eurocom Tornado F5W | |
| MSI WS63VR 7RL-023US | |
| Dell Precision 5520 UHD | |
| Eurocom Tornado F5 | |
| Eurocom Tornado F5 Killer Edition | |
| Alienware 17 R4 | |
| Rise of the Tomb Raider - 1920x1080 Very High Preset AA:FX AF:16x (sort by value) | |
| Eurocom Tornado F5W | |
| Fujitsu Celsius H970 | |
| HP ZBook 15 G4-Y4E80AV | |
| MSI WS63VR 7RL-023US | |
| Lenovo ThinkPad P51 20HH0016GE | |
| Eurocom Tornado F5 | |
| Eurocom Tornado F5 Killer Edition | |
| Alienware 17 R4 | |
| low | med. | high | ultra | |
|---|---|---|---|---|
| BioShock Infinite (2013) | 129 | |||
| Metro: Last Light (2013) | 99 | |||
| Thief (2014) | 98 | |||
| The Witcher 3 (2015) | 54 | |||
| Batman: Arkham Knight (2015) | 79 | |||
| Rise of the Tomb Raider (2016) | 90 |
During our Witcher 3 Ultra stability/stress test, we also encountered nothing of concern. Frame rates were stable between roughly 51 and 58 frames per second on average (some variation is to be expected due to day/night cycles and other changes during the benchmark period), and GPU temperatures never exceeded 84 °C—high, but not problematic.
Stress Test
For a more intensive evaluation of the machine’s stability, we turn to our synthetic stress testing, which involves subjecting it to maximal loads of both CPU and GPU (separately and simultaneously). To a greater degree than other notebooks, we expect workstations to be able to handle such grueling conditions, however unrealistic they may be in practice (for a more realistic look at this computer’s handling of stressful conditions, refer to our sustained CPU and GPU stress tests in the respective sections above).
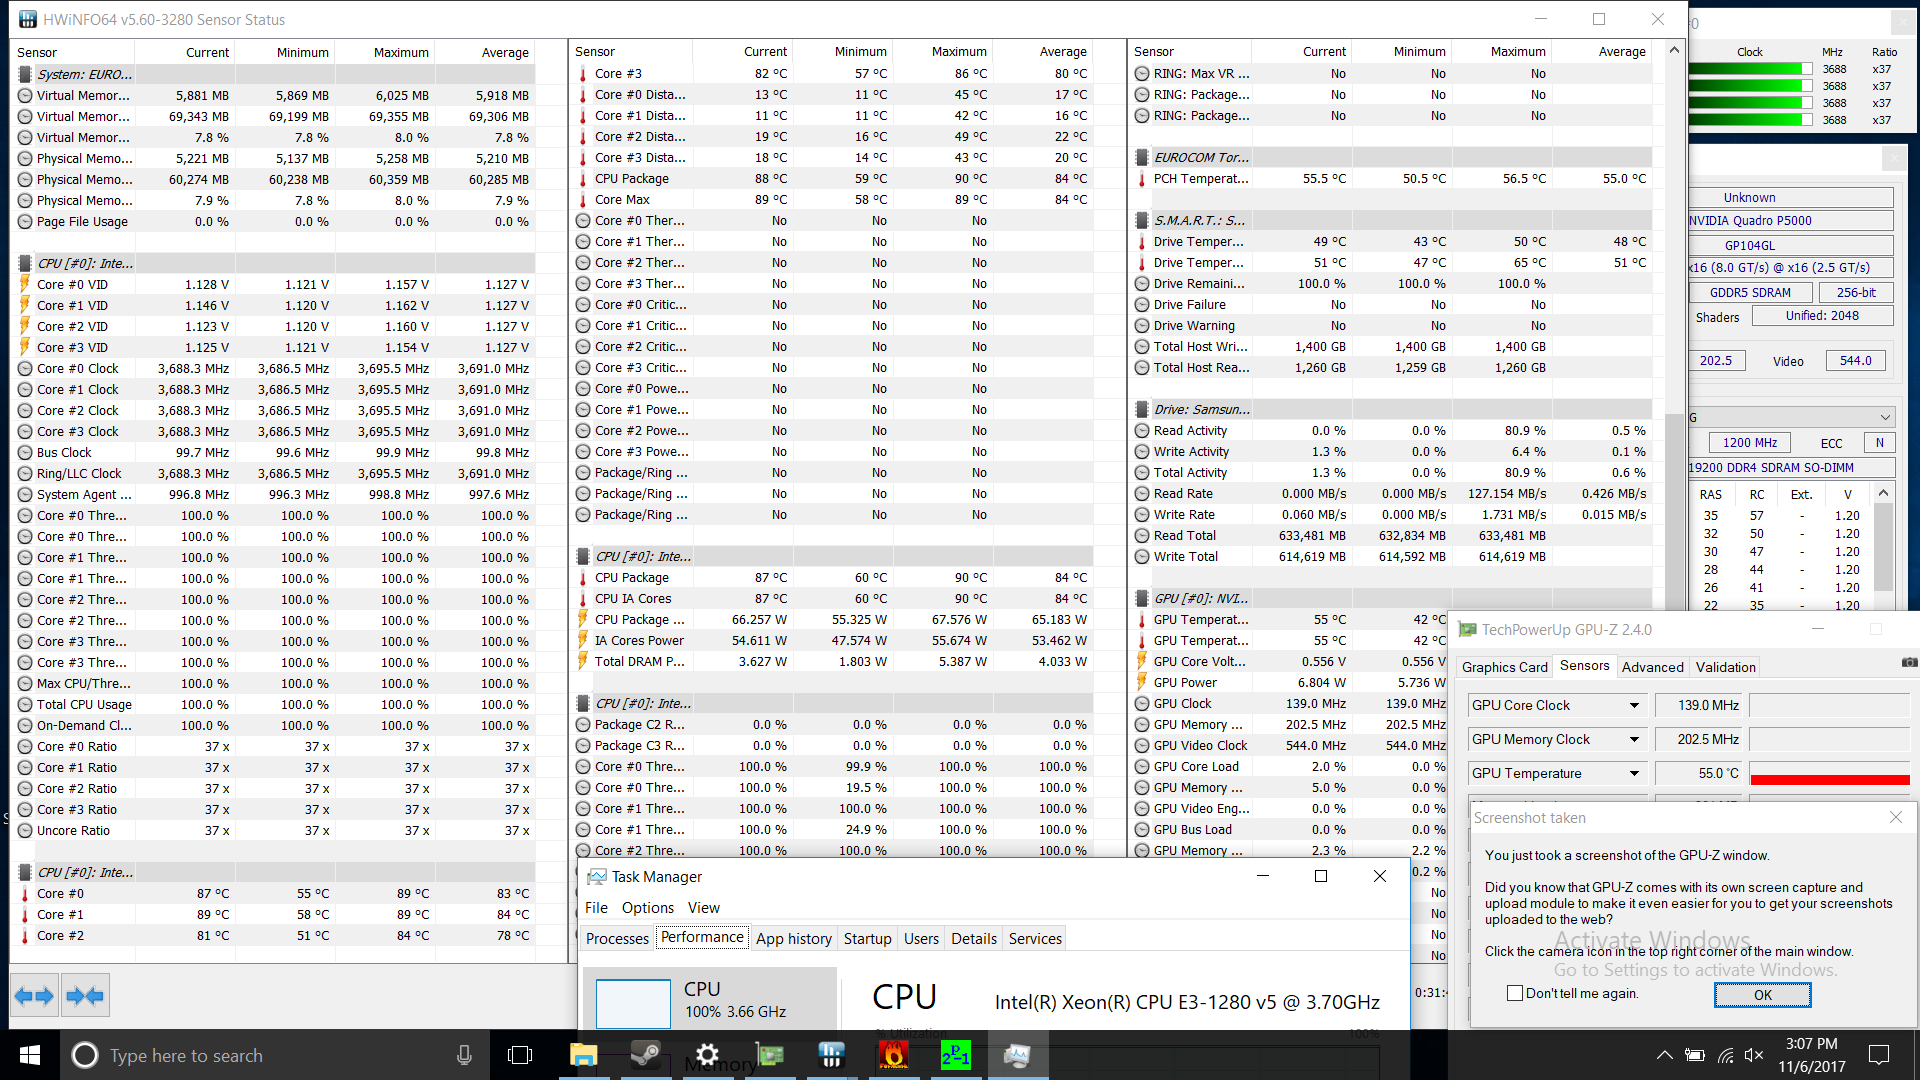
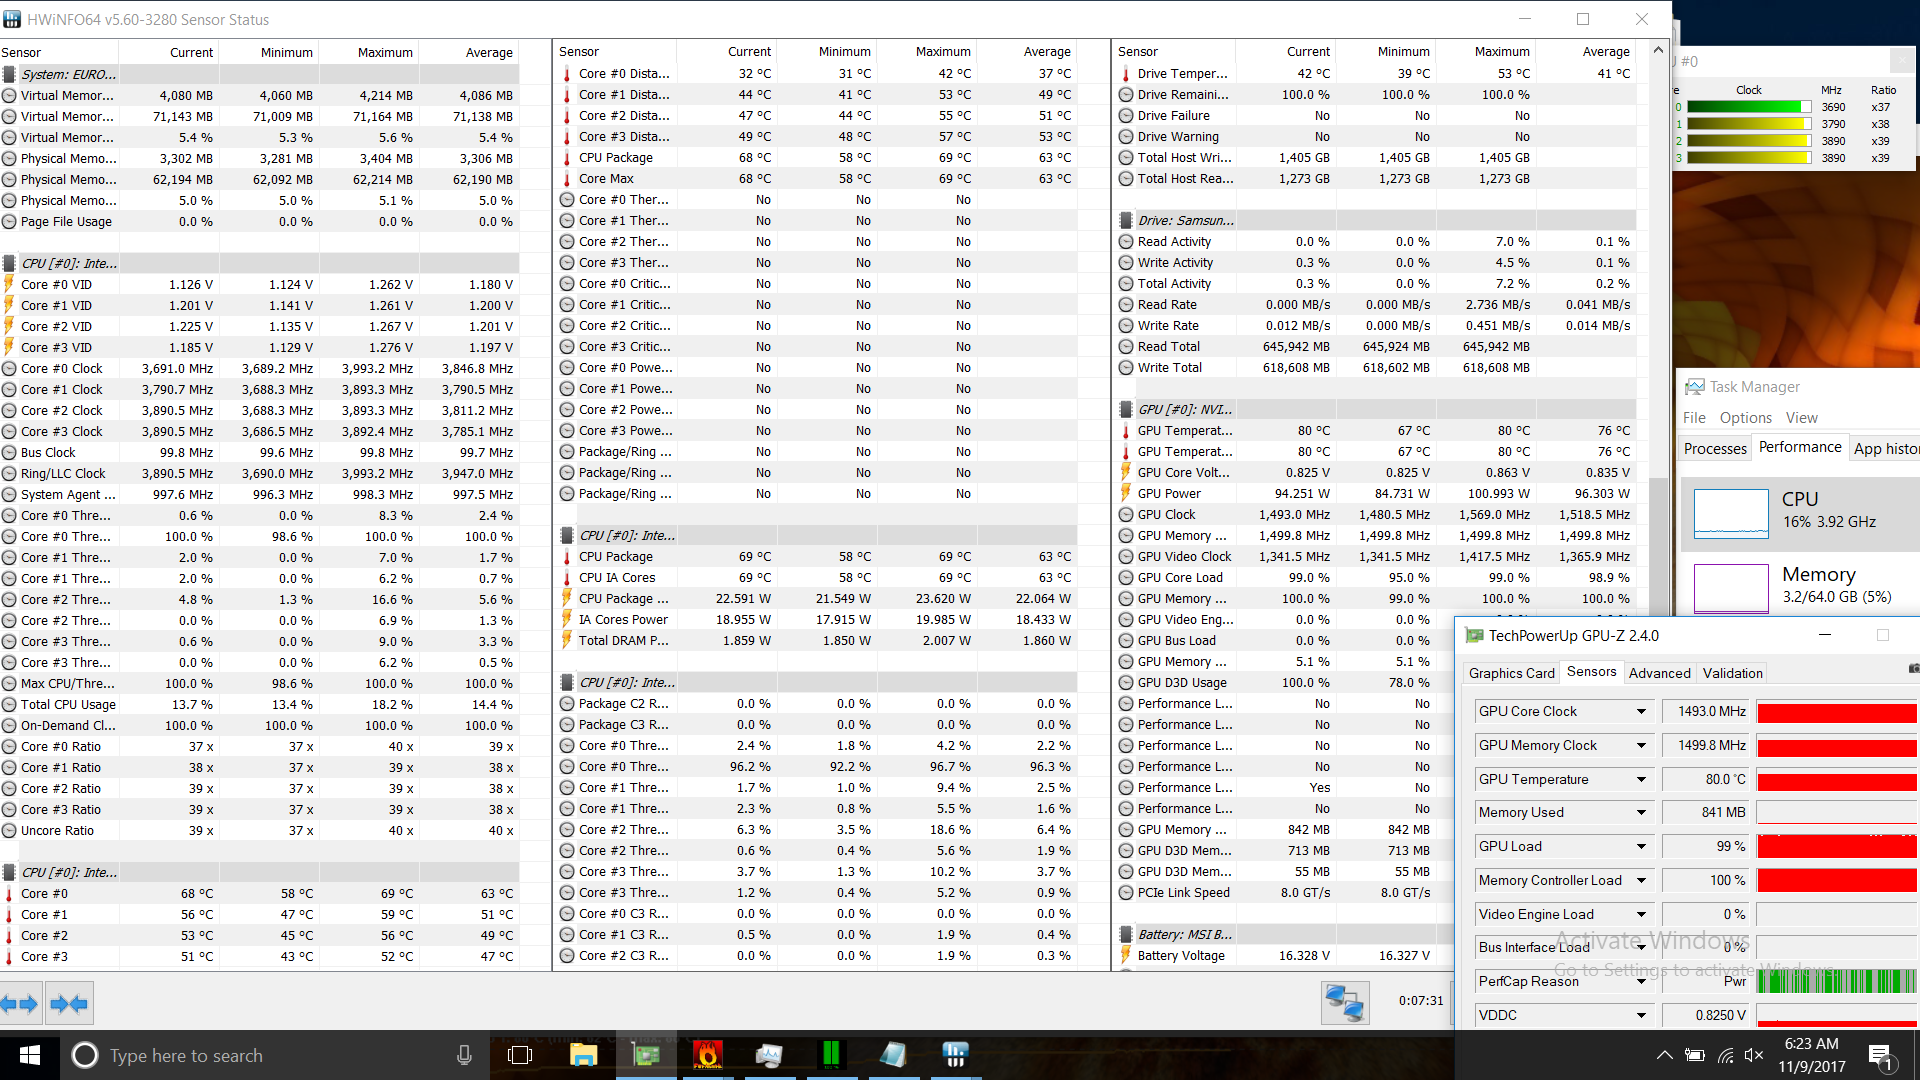
On its own, CPU (Prime95) stress creates no problems for the Eurocom. Clock rates remained stable at 3.7 GHz across all four cores during the entirety of the test, with temperatures settling down at around 87 °C. GPU (FurMark) stress, meanwhile, provokes normal boost frequencies in the upper 1500s MHz before eventually reducing to 1468 – 1518 MHz after temperatures exceed 80 °C. This reduction can be mitigated through the use of Turbo Fan to more aggressively cool the chip, a strategy which reduced GPU temperatures in our tests by roughly 7 to 8 degrees and correspondingly increased frequencies to between 1518 and 1556 MHz.
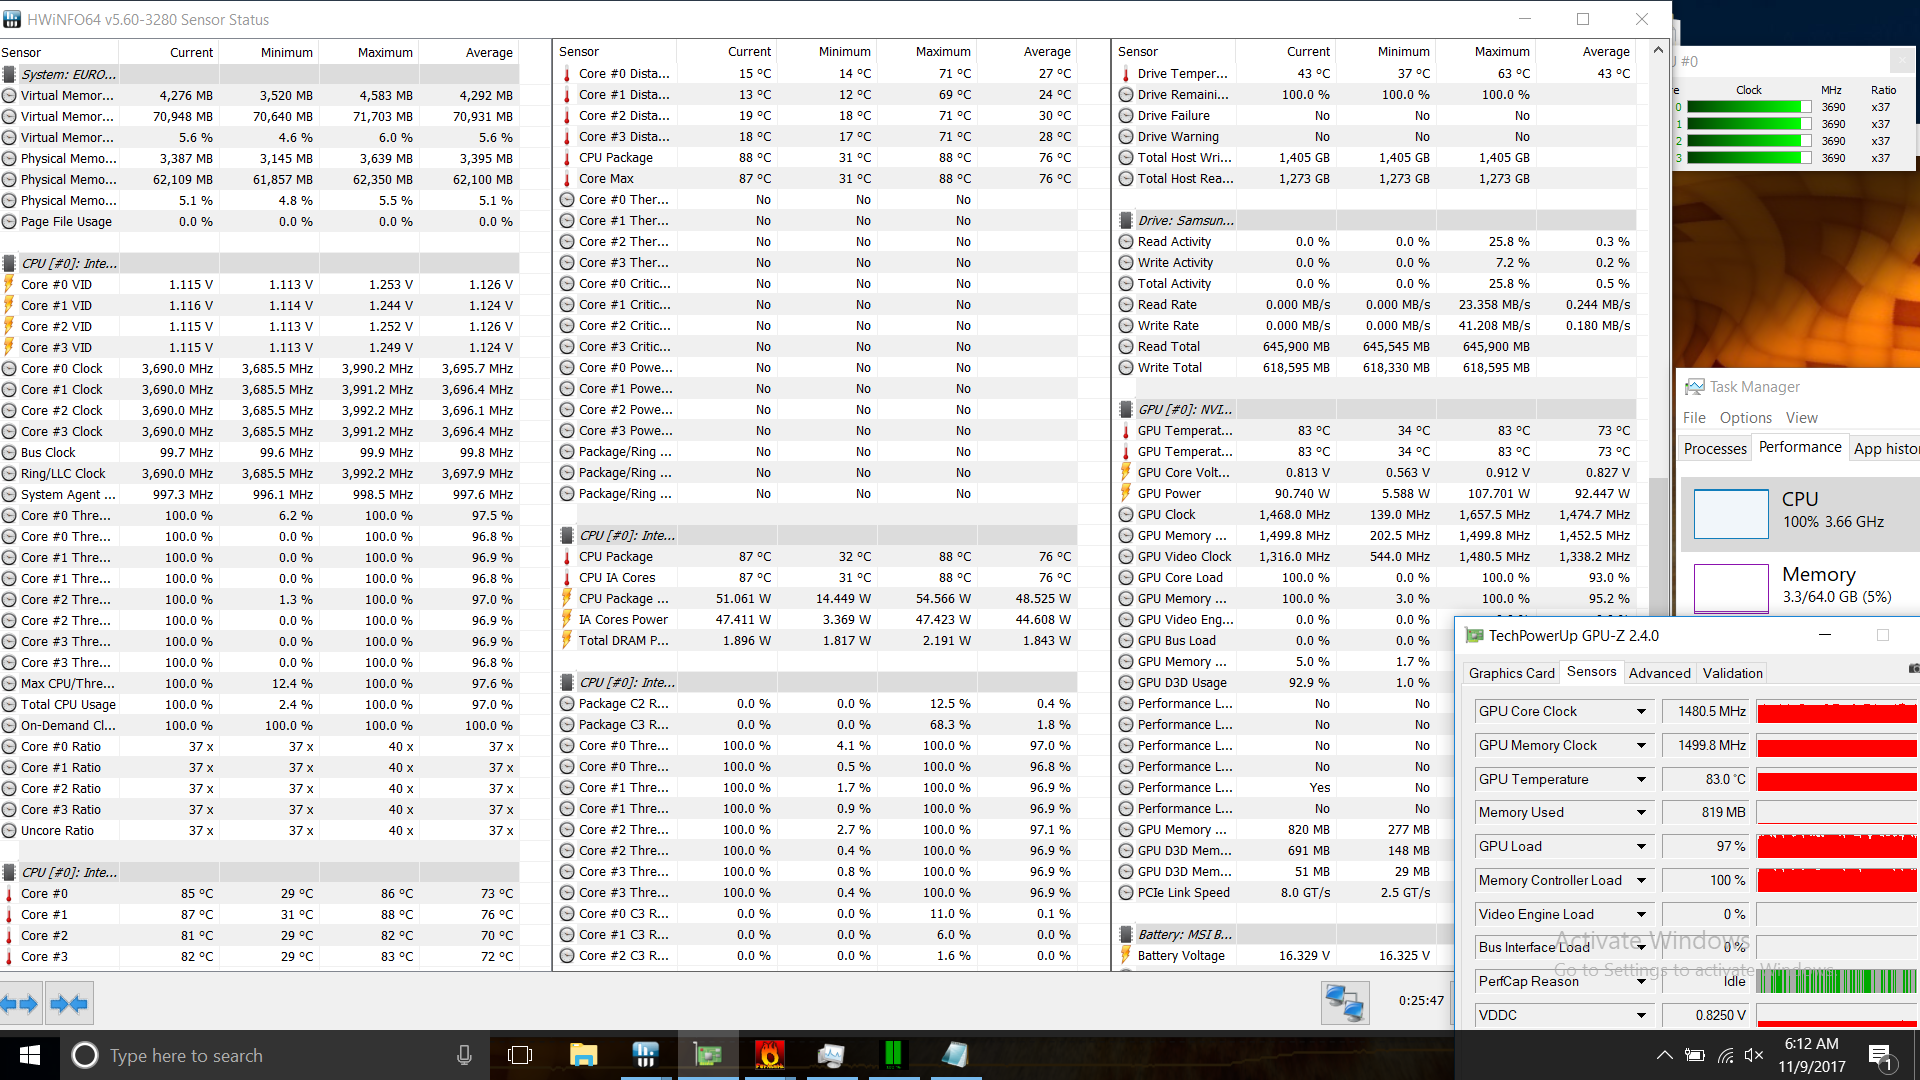
Combined CPU and GPU stress at first produced odd behavior where the GPU would not accept more than 30 percent of the load. After powering off and cold booting, however, normal behavior was restored—and the Tornado passed the test with flying colors thereafter. We recorded clock rates of 3.7 GHz for the CPU and 1468 – 1556 MHz for the GPU—therefore, no reduction in performance even under the harshest of conditions. Temperatures were 85 °C and 83 °C, respectively. After turning on Turbo Fan, those temperatures dropped to 73 °C and 74 °C, and GPU clock rates saw a slight boost to between 1518 – 1556 MHz on average. Immediately following the combined stress test, a subsequent run of 3DMark 11 resulted in the same scores as usual.
In summary: the Tornado F5W is not a victim of throttling under any conditions, whether or not Turbo Fan is employed. In exchange for some additional noise, the latter can also reduce temperatures notably and squeeze a slight bit of extra performance out of the GPU. The CPU’s performance remains at maximum regardless of cooling tweaks.

| CPU Clock (GHz) | GPU Clock (MHz) | Average CPU Temperature (°C) | Average GPU Temperature (°C) | |
| Prime95 Stress | 3.7 | - | 87 | - |
| FurMark Stress | - | 1468 - 1518 | - | 80 |
| FurMark Stress + Turbo Fan | - | 1518 - 1556 | - | 73 |
| Prime95 + FurMark Stress | 3.7 | 1468 - 1556 | 85 | 83 |
| Prime95 + FurMark Stress + Turbo Fan | 3.7 | 1518 - 1556 | 73 | 74 |
Emissions
System Noise
Despite the suggestion one might derive from its name, the Tornado F5W actually isn’t all that loud—at least, no more so than its brethren. While idling, we measured just a couple of decibels above environmental noise levels at 31.2 dB(A). Under moderate loads, the machine still averaged around 32.6 dB(A), which is indeed rather quiet—though it peaked at 43.3 dB(A), which is closer to the rest of its competitors.
Noise level
| Idle |
| 31.2 / 31.2 / 32.6 dB(A) |
| Load |
| 32.6 / 43.3 dB(A) |
 | ||
30 dB silent 40 dB(A) audible 50 dB(A) loud |
||
min: | ||
| Eurocom Tornado F5W Quadro P5000, E3-1280 v5, Samsung SSD 960 Pro 512 GB m.2 | Fujitsu Celsius H970 Quadro P4000, E3-1535M v6, Samsung SM961 MZVKW512HMJP m.2 PCI-e | HP ZBook 15 G4-Y4E80AV Quadro M2200, E3-1535M v6, Samsung SSD SM961 1TB M.2 MZVKW1T0HMLH | MSI WS63VR 7RL-023US Quadro P4000 Max-Q, i7-7700HQ, Toshiba NVMe THNSN5512GPU7 | Lenovo ThinkPad P51 20HH0016GE Quadro M2200, E3-1505M v6, Samsung PM961 NVMe MZVLW512HMJP | Dell Precision 5520 UHD Quadro M1200, E3-1505M v6, Samsung SM961 MZVKW512HMJP m.2 PCI-e | |
|---|---|---|---|---|---|---|
| Noise | -10% | 3% | -4% | 6% | -4% | |
| off / environment * (dB) | 29.6 | 30.2 -2% | 29.5 -0% | 28 5% | 29.6 -0% | 28.7 3% |
| Idle Minimum * (dB) | 31.2 | 30.2 3% | 29.5 5% | 33.2 -6% | 29.6 5% | 28.7 8% |
| Idle Average * (dB) | 31.2 | 32.8 -5% | 29.5 5% | 33.2 -6% | 29.6 5% | 32.1 -3% |
| Idle Maximum * (dB) | 32.6 | 32.8 -1% | 30 8% | 33.2 -2% | 29.6 9% | 32.1 2% |
| Load Average * (dB) | 32.6 | 47.3 -45% | 39.5 -21% | 41.4 -27% | 32.2 1% | 41.3 -27% |
| Witcher 3 ultra * (dB) | 43.1 | 39.5 8% | 38.4 11% | 45.5 -6% | ||
| Load Maximum * (dB) | 43.3 | 47.3 -9% | 36 17% | 43.5 -0% | 36.6 15% | 45.5 -5% |
* ... smaller is better
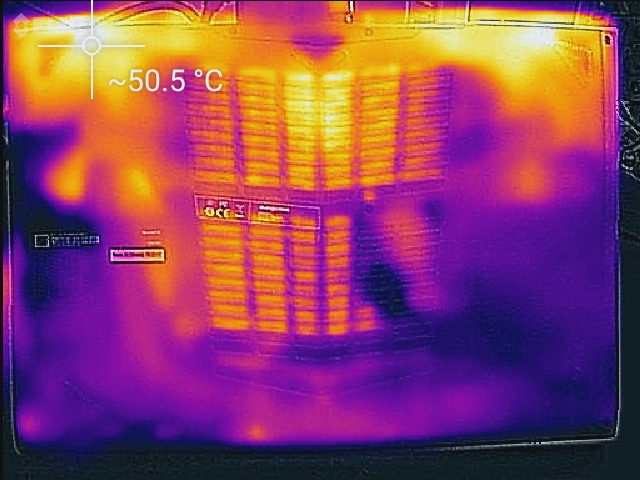
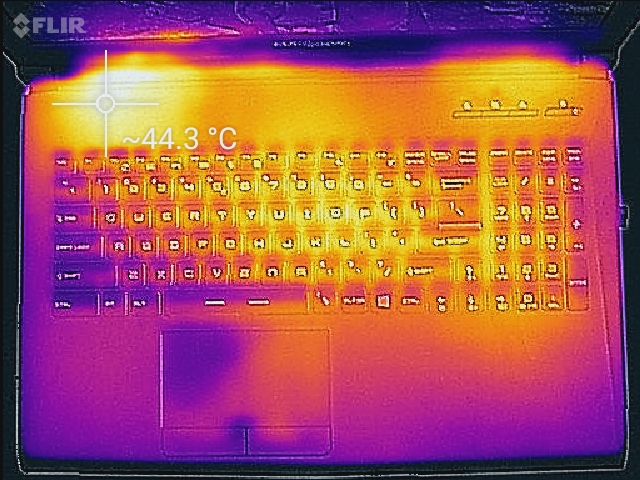
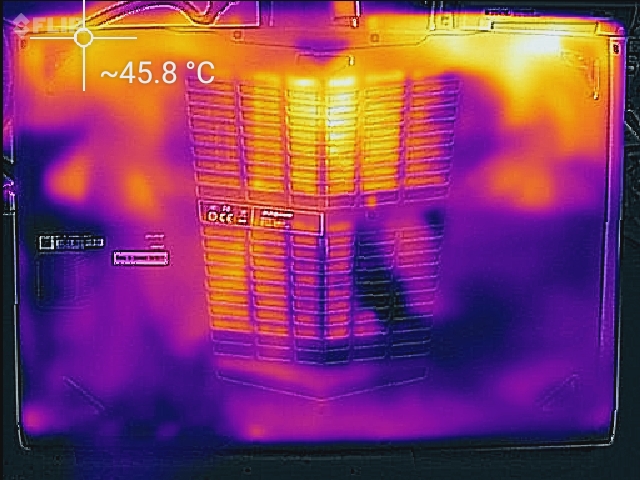
Temperature
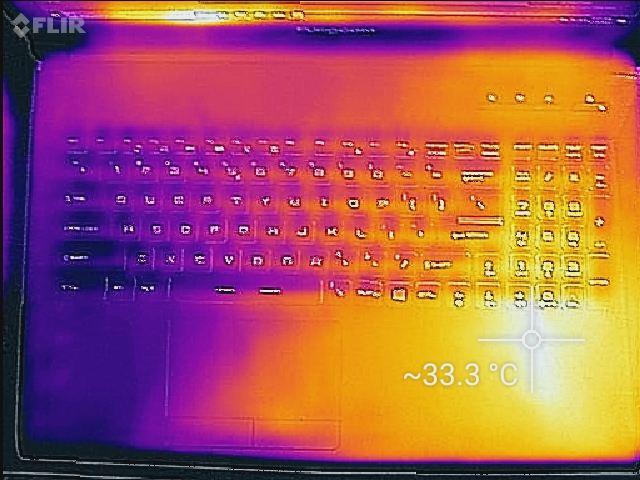
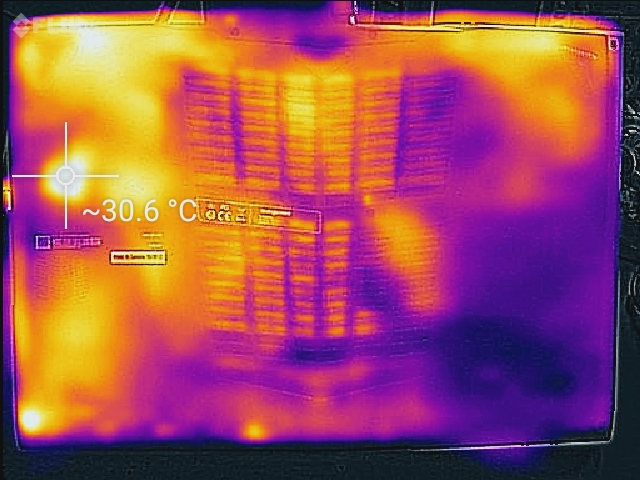
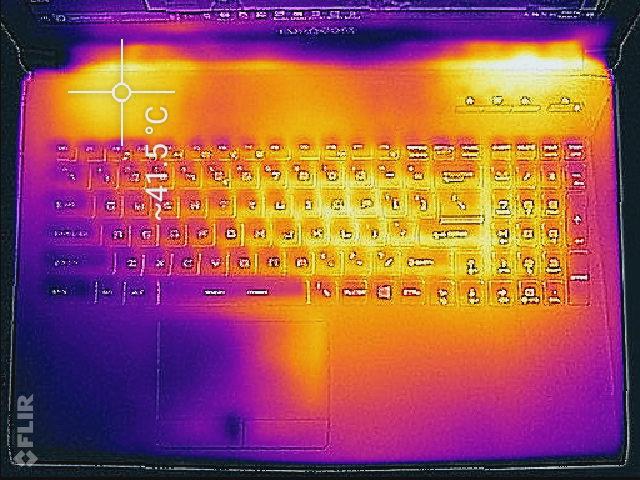
The machine also handles surface temperatures extremely well, with averages of 38.5 °C and 39 °C on top and bottom, respectively. Conspicuous hot spots (48.2 °C / 51.4 °C) were located on the underside of the machine near the two exhaust vents on either side, which is perhaps to be expected. Since the machine should be resting on a surface during such stressful operations, we’re much more interested, however, in temperatures on the top of the base unit anyway, and fortunately, the device becomes merely warm in those regions. It should be noted that, under load, the right palm rest does become notably warmer (roughly 5 °C difference) than the left side. This is because the NVMe SSD rests beneath this surface, a recognition which also suggests that, if the user had actually opted for a dual-SSD configuration, the discrepancy would have been even greater. The inconsistency in temperatures can become annoying over time, so it might have been nice to see a copper heat spreader or other mitigating solution employed on this side of the device.
(±) The maximum temperature on the upper side is 42.4 °C / 108 F, compared to the average of 38.2 °C / 101 F, ranging from 22.2 to 69.8 °C for the class Workstation.
(-) The bottom heats up to a maximum of 51.4 °C / 125 F, compared to the average of 41.1 °C / 106 F
(+) In idle usage, the average temperature for the upper side is 30.7 °C / 87 F, compared to the device average of 32 °C / 90 F.
(-) Playing The Witcher 3, the average temperature for the upper side is 40.3 °C / 105 F, compared to the device average of 32 °C / 90 F.
(±) The palmrests and touchpad can get very hot to the touch with a maximum of 39.8 °C / 103.6 F.
(-) The average temperature of the palmrest area of similar devices was 27.8 °C / 82 F (-12 °C / -21.6 F).
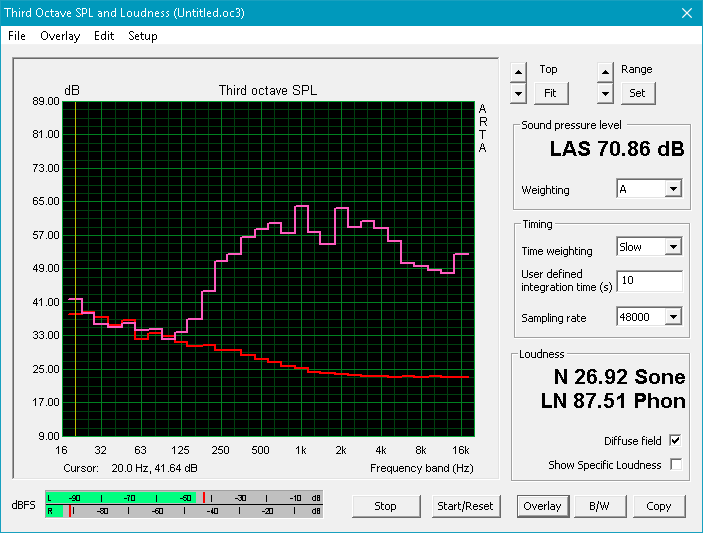
Speakers
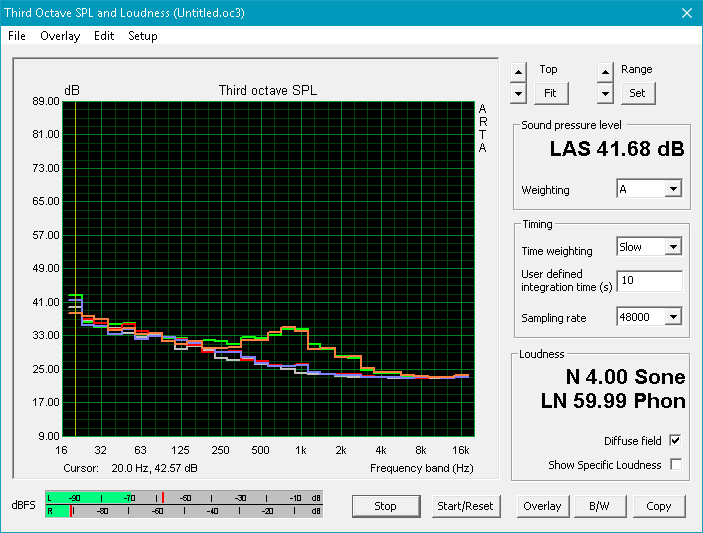
The Tornado F5W’s dual speakers are not all that loud; we recorded just 70.86 dB of volume from them. The sound profile is also rather unbalanced and flat/muffled overall; some post-processing would probably improve the situation, but the provided Realtek software is mediocre to say the least.
Eurocom Tornado F5W audio analysis
(-) | not very loud speakers (70.9 dB)
Bass 100 - 315 Hz
(±) | reduced bass - on average 13.2% lower than median
(±) | linearity of bass is average (12.4% delta to prev. frequency)
Mids 400 - 2000 Hz
(+) | balanced mids - only 4.2% away from median
(±) | linearity of mids is average (13.8% delta to prev. frequency)
Highs 2 - 16 kHz
(+) | balanced highs - only 4.3% away from median
(±) | linearity of highs is average (8.4% delta to prev. frequency)
Overall 100 - 16.000 Hz
(±) | linearity of overall sound is average (25.7% difference to median)
Compared to same class
» 87% of all tested devices in this class were better, 6% similar, 7% worse
» The best had a delta of 7%, average was 17%, worst was 35%
Compared to all devices tested
» 79% of all tested devices were better, 4% similar, 17% worse
» The best had a delta of 4%, average was 23%, worst was 134%
Dell Precision 5520 UHD audio analysis
(±) | speaker loudness is average but good (79.6 dB)
Bass 100 - 315 Hz
(±) | reduced bass - on average 12.8% lower than median
(±) | linearity of bass is average (14.2% delta to prev. frequency)
Mids 400 - 2000 Hz
(+) | balanced mids - only 4% away from median
(±) | linearity of mids is average (9.9% delta to prev. frequency)
Highs 2 - 16 kHz
(+) | balanced highs - only 3.3% away from median
(±) | linearity of highs is average (12% delta to prev. frequency)
Overall 100 - 16.000 Hz
(±) | linearity of overall sound is average (16.7% difference to median)
Compared to same class
» 46% of all tested devices in this class were better, 9% similar, 45% worse
» The best had a delta of 7%, average was 17%, worst was 35%
Compared to all devices tested
» 29% of all tested devices were better, 7% similar, 64% worse
» The best had a delta of 4%, average was 23%, worst was 134%
Frequency Comparison (Checkbox selectable!)
Graph 1: Pink Noise 100% Vol.; Graph 2: Audio off
Energy Management
Power Consumption
The Tornado F5W demanded some 136.8 W of power during our load maximum test and an even greater 145.9 W while running Witcher 3 Ultra. Both the HP ZBook 15 G4 and Fujitsu Celsius H970 are not far off from this mark despite featuring weaker GPUs, possibly as a result of the aforementioned (apparent) power limits afflicting the Tornado under extremely heavy combined loads.
| Off / Standby | |
| Idle | |
| Load |
|
Key:
min: | |
| Eurocom Tornado F5W E3-1280 v5, Quadro P5000, Samsung SSD 960 Pro 512 GB m.2, TN, 1920x1080, 15.6" | Fujitsu Celsius H970 E3-1535M v6, Quadro P4000, Samsung SM961 MZVKW512HMJP m.2 PCI-e, IPS LED, 1920x1080, 17.3" | HP ZBook 15 G4-Y4E80AV E3-1535M v6, Quadro M2200, Samsung SSD SM961 1TB M.2 MZVKW1T0HMLH, IPS, 1920x1080, 15.6" | MSI WS63VR 7RL-023US i7-7700HQ, Quadro P4000 Max-Q, Toshiba NVMe THNSN5512GPU7, IPS, 3840x2160, 15.6" | Lenovo ThinkPad P51 20HH0016GE E3-1505M v6, Quadro M2200, Samsung PM961 NVMe MZVLW512HMJP, IPS, 3840x2160, 15.6" | Dell Precision 5520 UHD E3-1505M v6, Quadro M1200, Samsung SM961 MZVKW512HMJP m.2 PCI-e, IPS, 3840x2160, 15.6" | |
|---|---|---|---|---|---|---|
| Power Consumption | 28% | 38% | 30% | 29% | 33% | |
| Idle Minimum * (Watt) | 23.7 | 10.7 55% | 5.9 75% | 13.3 44% | 8.6 64% | 8.9 62% |
| Idle Average * (Watt) | 24.9 | 15.8 37% | 8.9 64% | 17.2 31% | 15.9 36% | 13.6 45% |
| Idle Maximum * (Watt) | 28.4 | 17.8 37% | 12.7 55% | 17.9 37% | 22.1 22% | 14.1 50% |
| Load Average * (Watt) | 104.1 | 92 12% | 95.2 9% | 83.7 20% | 84.4 19% | 100.3 4% |
| Witcher 3 ultra * (Watt) | 145.9 | 87.7 40% | 101.9 30% | 100.2 31% | ||
| Load Maximum * (Watt) | 136.8 | 137 -0% | 154 -13% | 114.3 16% | 130.6 5% | 126.3 8% |
* ... smaller is better
Battery Life
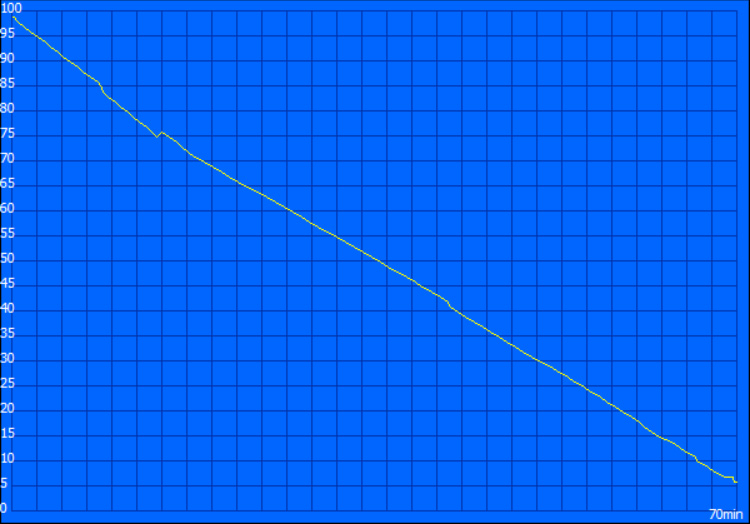

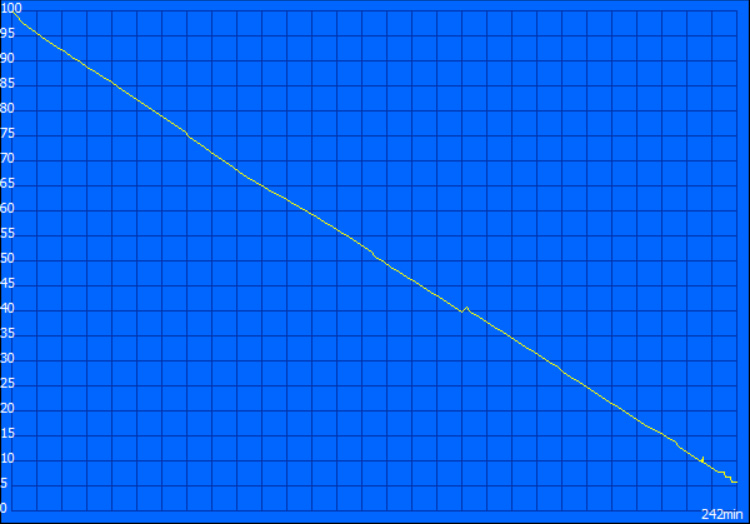
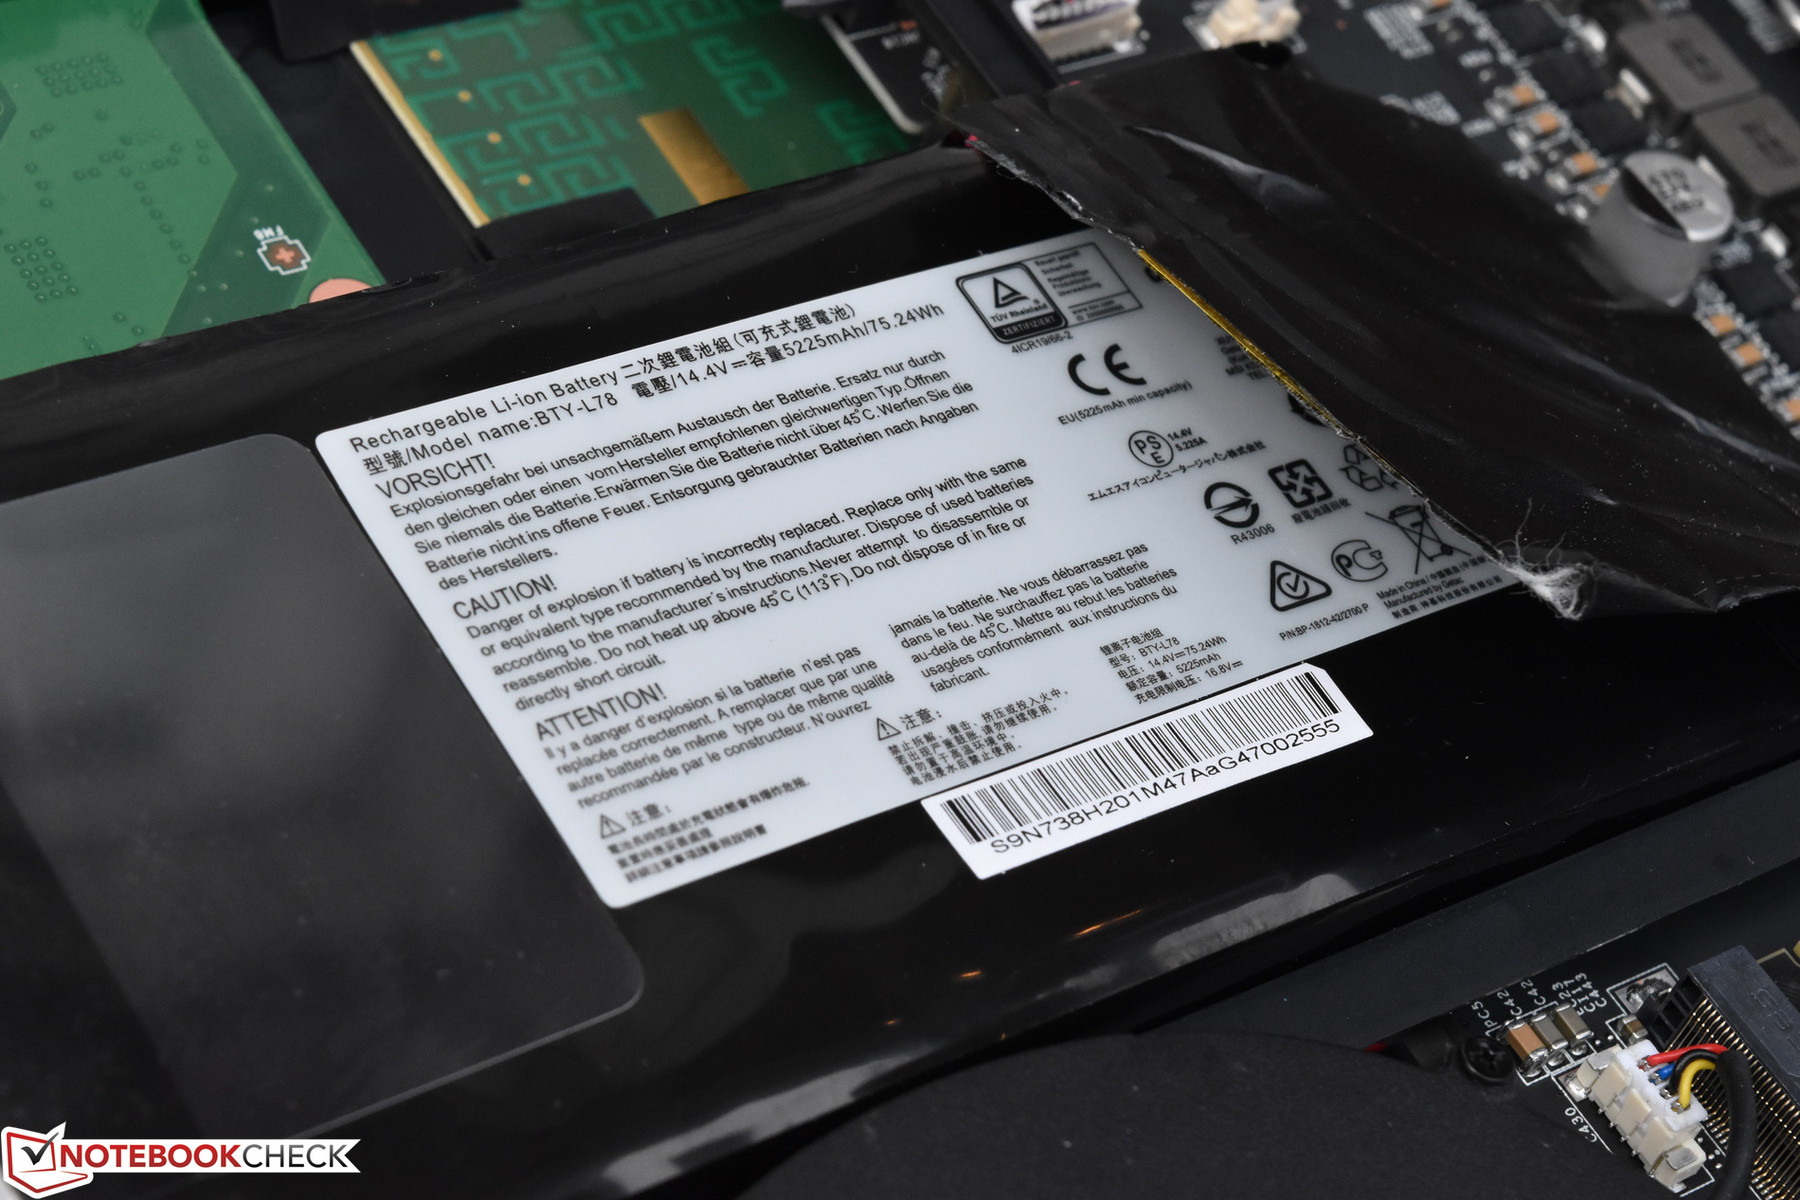
Battery life is arguably of minimal importance when evaluating a mobile workstation—and that’s good for the Tornado F5W, because its lack of switchable graphics support means that it’s always running on high-end components. The very best-case scenario—our Readers’ Test, with brightness at a minimum, wireless radios disabled, and essentially zero load—still only resulted in 4 hours and 44 minutes of life, and that’s with the help of a 75.24 Wh 8-cell battery. Under load, the machine expired after 1 hour and 10 minutes of use, and our Wi-Fi Surfing benchmark lasted for 4 hours and 2 minutes.
| Eurocom Tornado F5W E3-1280 v5, Quadro P5000, 75.24 Wh | Fujitsu Celsius H970 E3-1535M v6, Quadro P4000, 96 Wh | HP ZBook 15 G4-Y4E80AV E3-1535M v6, Quadro M2200, 90 Wh | MSI WS63VR 7RL-023US i7-7700HQ, Quadro P4000 Max-Q, 48 Wh | Lenovo ThinkPad P51 20HH0016GE E3-1505M v6, Quadro M2200, 90 Wh | Dell Precision 5520 UHD E3-1505M v6, Quadro M1200, 97 Wh | |
|---|---|---|---|---|---|---|
| Battery runtime | 127% | 158% | -23% | 118% | 48% | |
| Reader / Idle (h) | 4.7 | 16.7 255% | 18.3 289% | 3.9 -17% | 16.4 249% | 12.1 157% |
| WiFi v1.3 (h) | 4 | 9 125% | 9.1 128% | 2.9 -27% | 6.9 73% | 4.2 5% |
| Load (h) | 1.2 | 1.2 0% | 1.9 58% | 0.9 -25% | 1.6 33% | 1 -17% |
Pros
Cons
Verdict
At nearly $6,000, there’s nothing inexpensive about it, but today’s configuration of the Eurocom Tornado F5W proves that desktop-grade performance is more than possible in a 15.6-inch mobile workstation. With a powerful CPU and a GPU which is (in some tests) 70% faster than the closest competitor, if raw processing capability is what you’re after, there are few other machines which can compete. Best of all, the Tornado handles all of this without any semblance of performance throttling, with thermals in check under all conditions and an optional Turbo Fan mode (a la MSI notebooks) to further increase cooling potential and squeeze out an additional bit of extra performance.
Forgiving portability, weight, and cost, the Eurocom Tornado F5W is a workstation to reckoned with, boasting desktop-grade performance and very few compromises anywhere across the board.
Prospective buyers will appreciate the ease of maintenance and upgrades; even the CPU and GPU are replaceable in the Tornado F5W. Storage speeds and general system performance are also terrific, with a Samsung 960 Pro SSD (and optional RAID-0 configurations) proving more than capable. Noise levels are reasonable from the dual-fan cooling system and surface temperatures are nothing to worry about. We weren’t impressed by the integrated speakers or the machine’s battery life, but neither of those two categories makes or breaks a workstation.
The 120 Hz display in our review unit, while good overall, benefits greatly from professional calibration work and is woefully inaccurate out of the box. Still, plenty of other options exist, and the same applies to the other components—including the CPU and GPU, where no fewer than a half dozen other (less expensive) options also exist. The price can therefore be a few thousand dollars lower and the user can still wind up with a very capable workstation.
The bottom line as we see it: forgiving portability, weight, and cost, the Eurocom Tornado F5W is a workstation to reckoned with, boasting desktop-grade performance and very few compromises anywhere across the board.
Eurocom Tornado F5W
- 11/10/2017 v6 (old)
Steve Schardein
