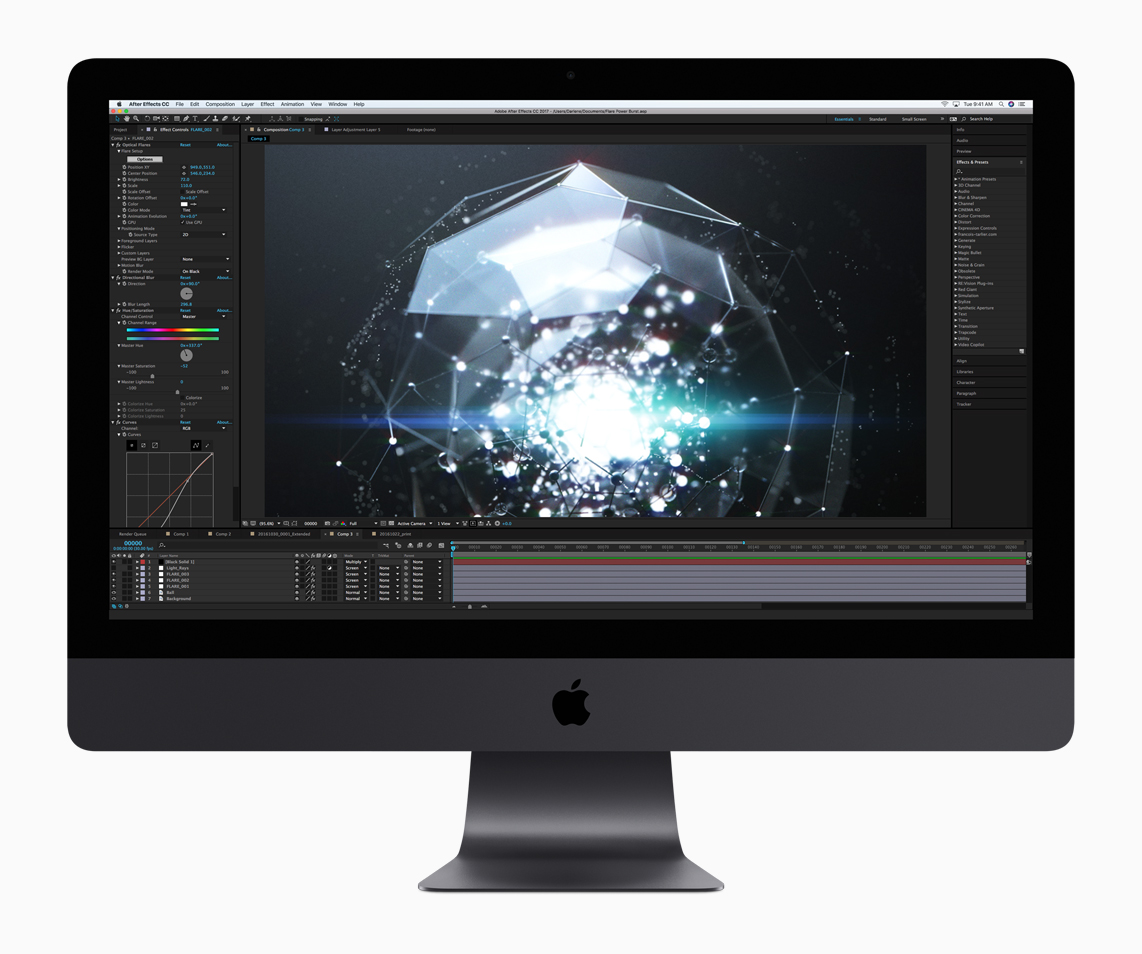
Apple iMac Pro (Xeon W-2140B, Radeon Pro Vega 56) Review
Professionals looking for a dedicated Apple system could only choose the Mac Pro so far. This desktop system is available with workstation components like Intel’s Xeon processors. The all-in-one system iMac has now got a professional sibling as well, which is called iMac Pro corresponding to Apple’s usual nomenclature.
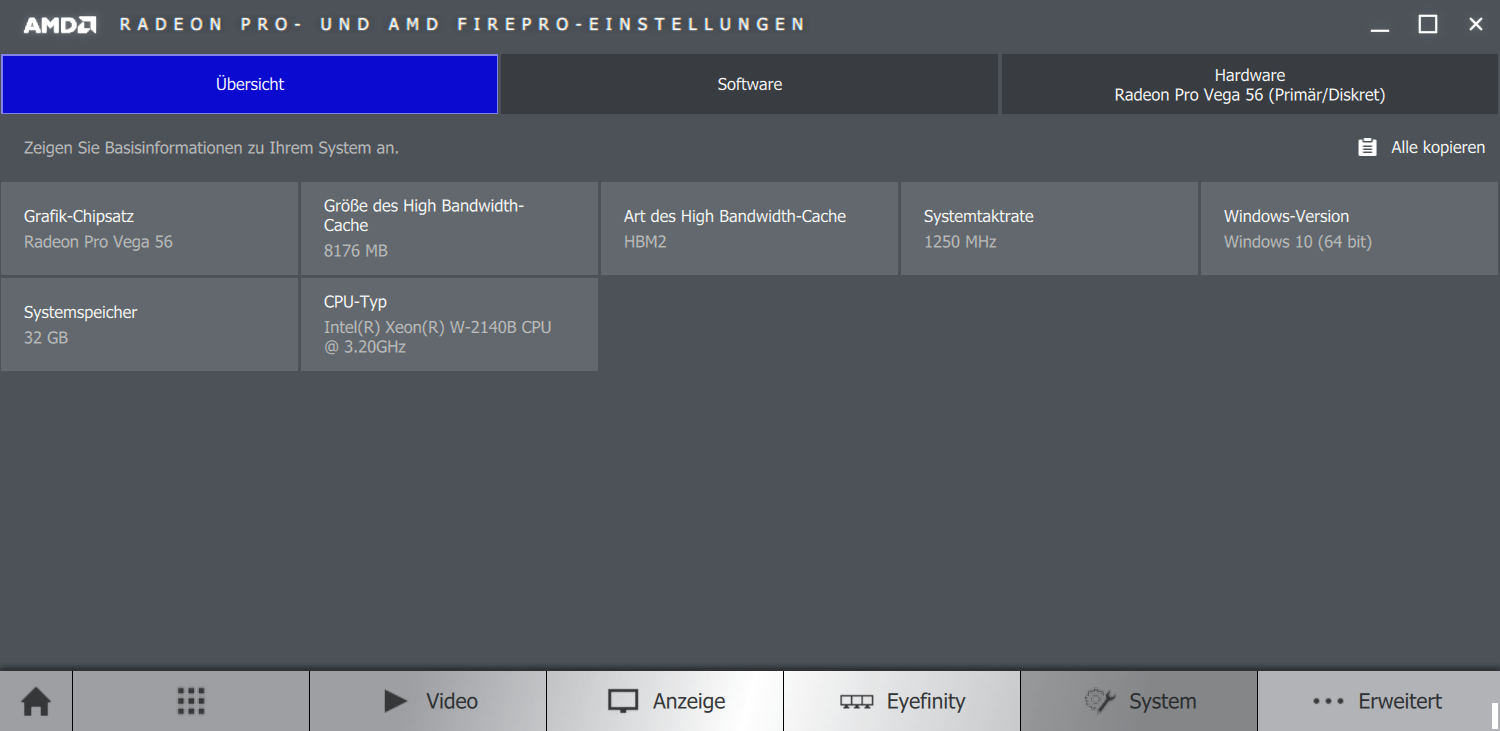
The iMac Pro is actually a version of the regular 27-inch iMac with professional components. They have a big effect on the price, because the entry-level model of the iMac Pro retails for 5,500 Euros (~$6359), while the regular iMac is available for about 2100 Euros (~$2428) in Apple’s online store. The entry-level model ships with an 8-core Intel Xeon processor, 32 GB of ECC-RAM (DDR4-2666), 1 TB SSD storage, and the professional AMD Radeon Pro Vega 56 GPU with 8 GB HBM2 video memory. You can obviously upgrade the components based on your requirements, but this will quickly increase the price. A fully-optioned iMac Pro will exceed 15,000 Euros (~$17343), and especially the prices for more memory are extremely high (as per usual for Apple). All SKUs are equipped with the same 27-inch 5K screen with P3 color gamut.
There are no direct competitors for the iMac Pro, so we will use different comparison devices in each section to have a better idea of the performance and the benchmark results. We are particularly interested to see how the cooling solution of the slim iMac Pro handles the heat from the components.
Case
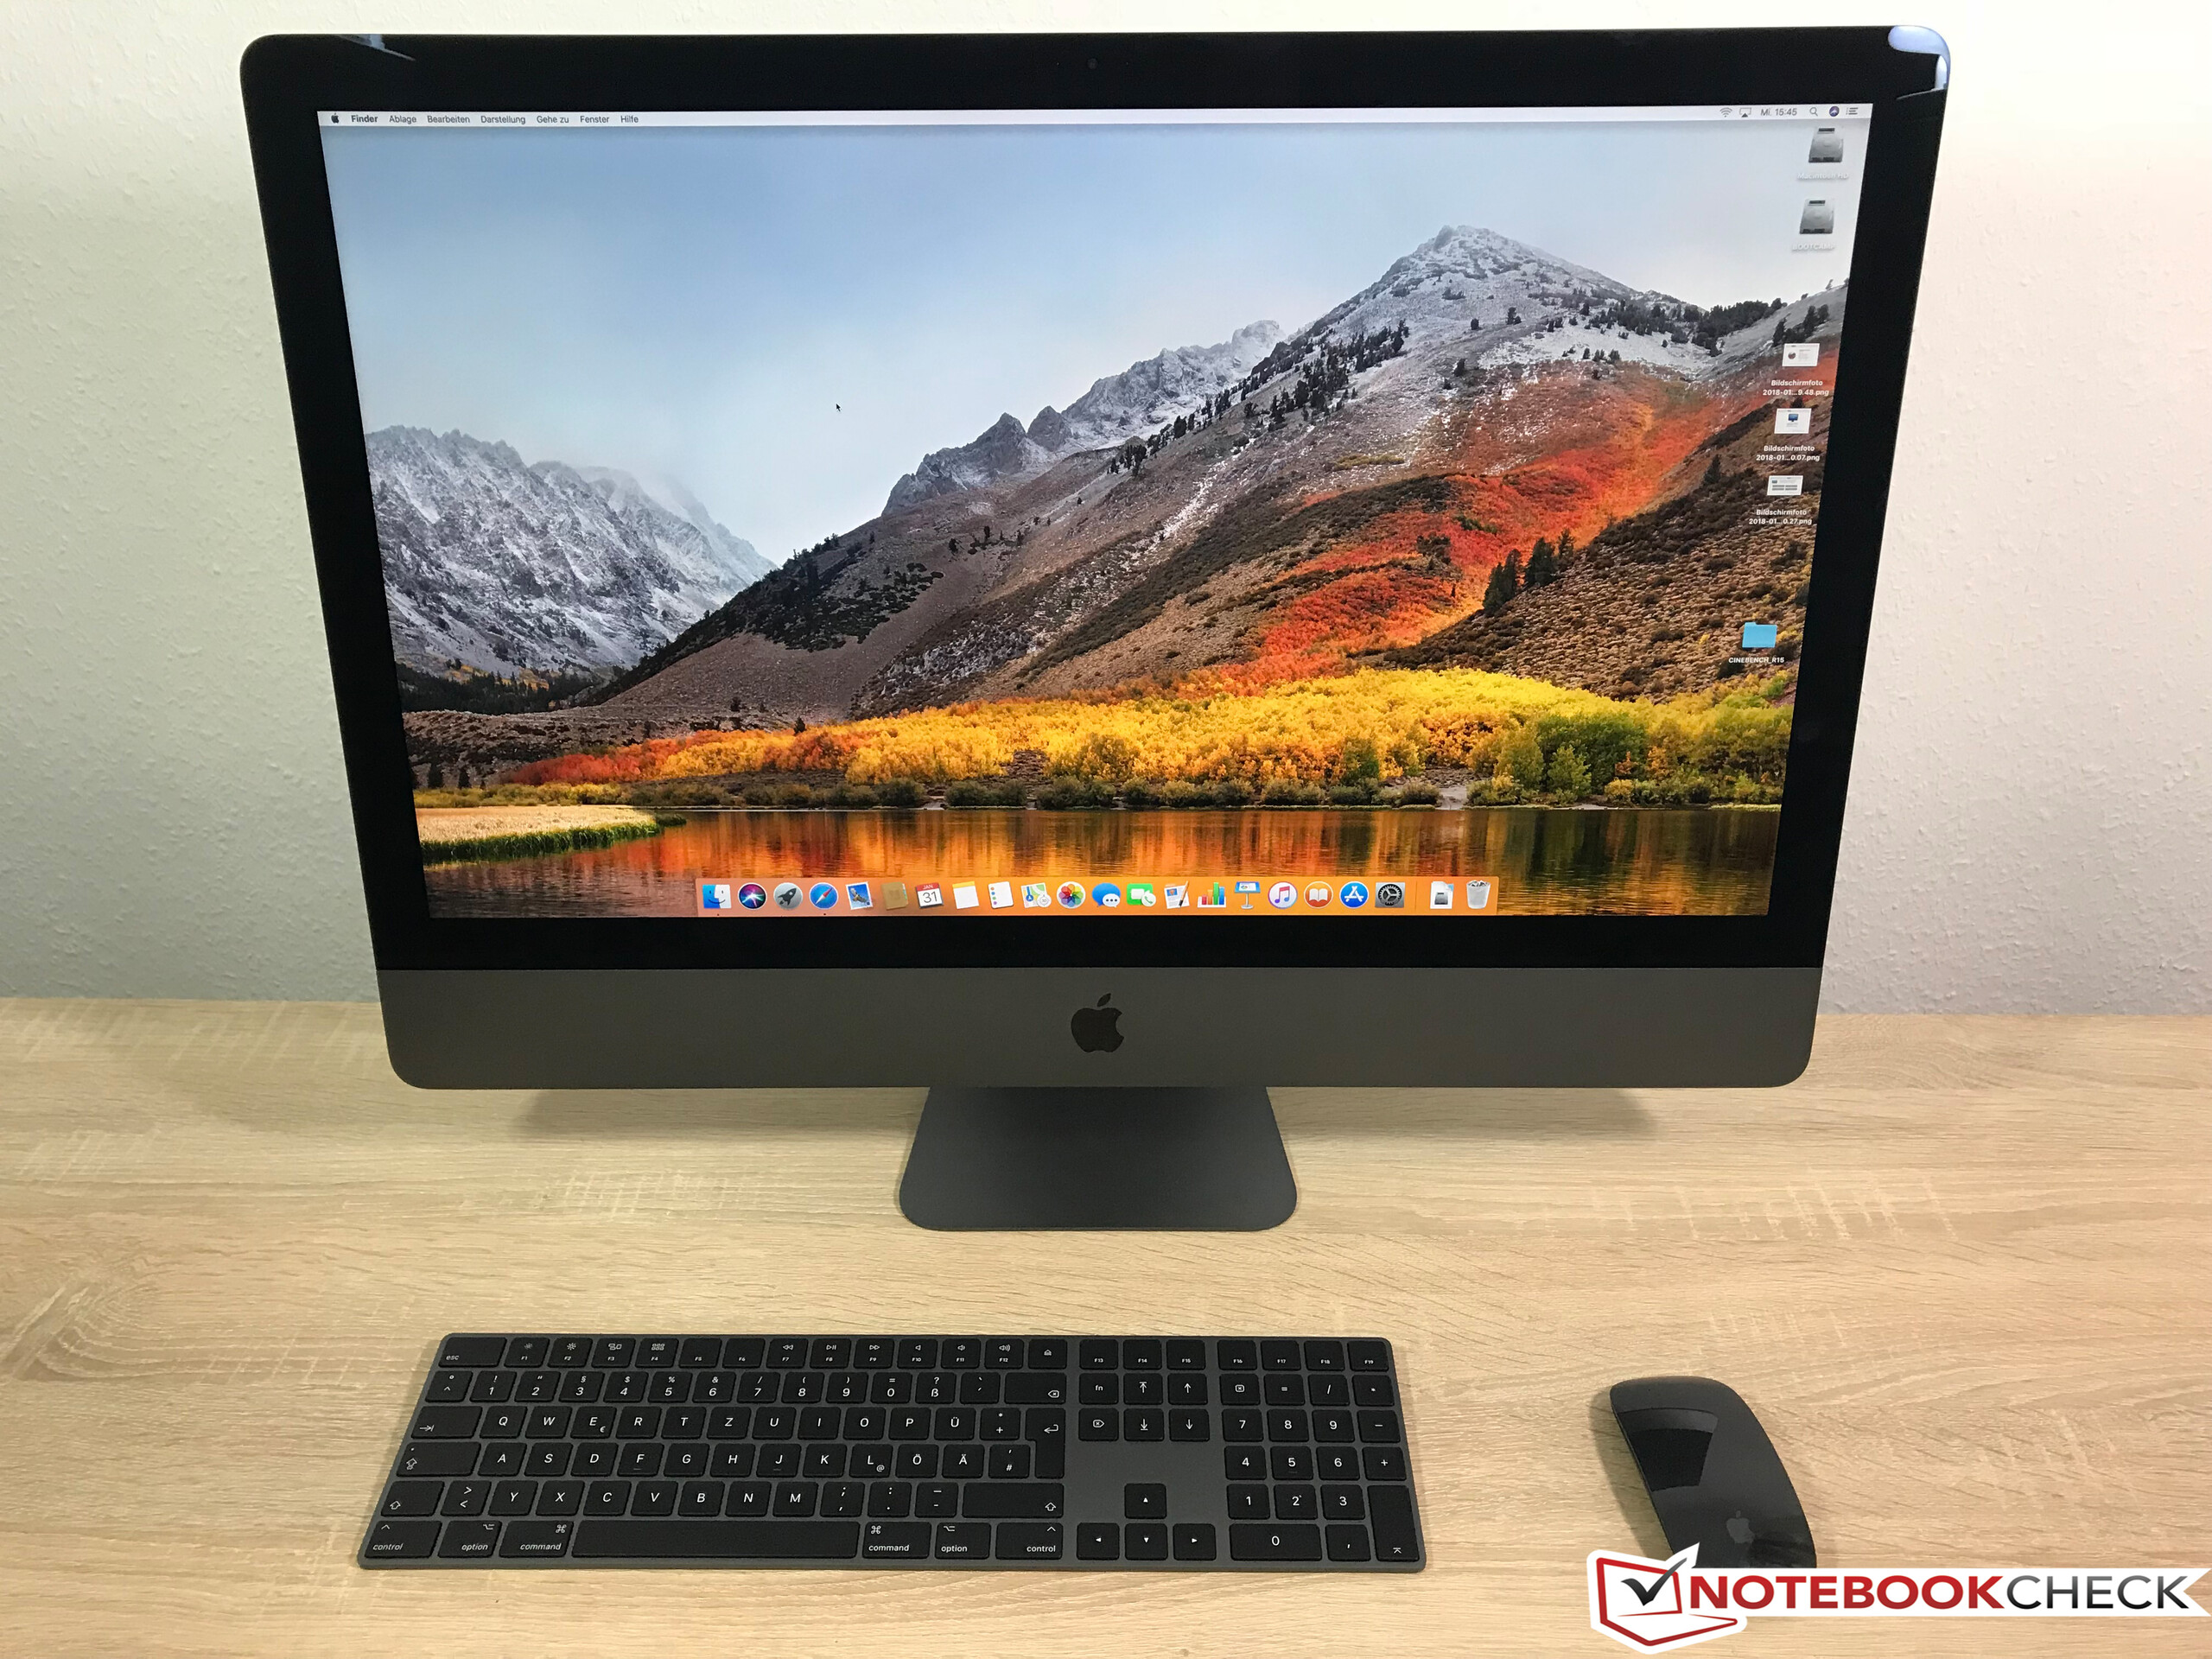
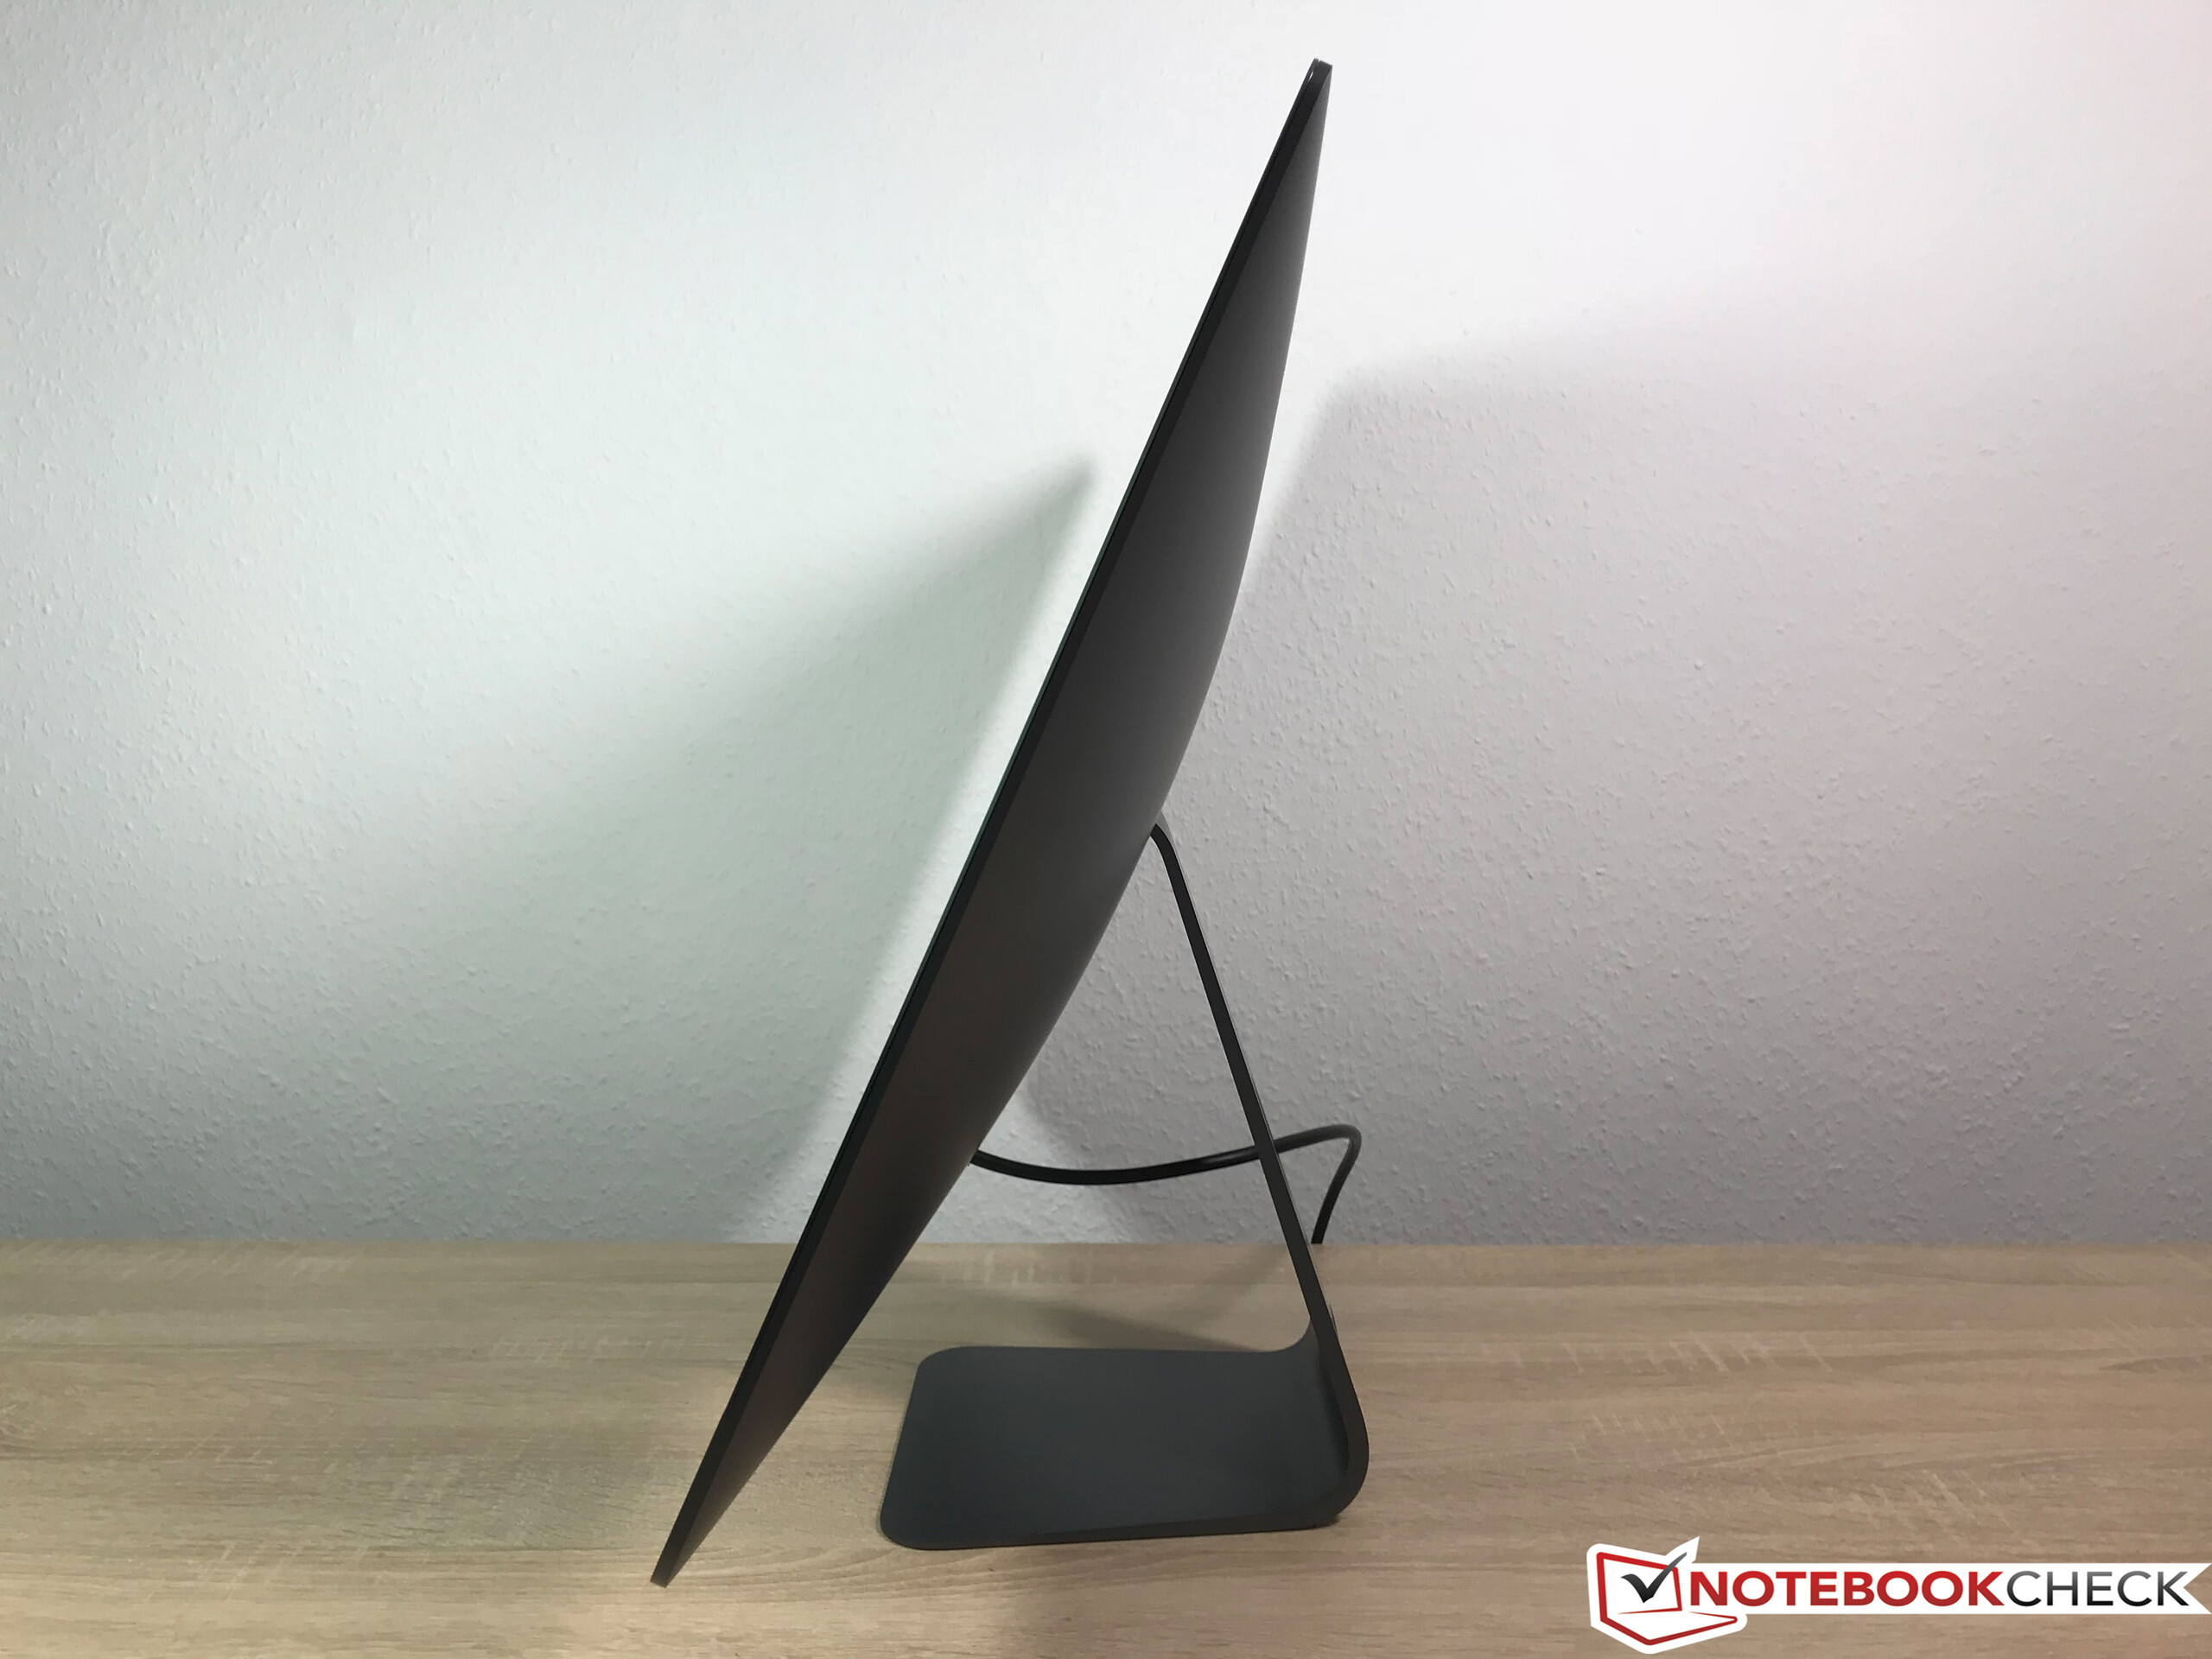
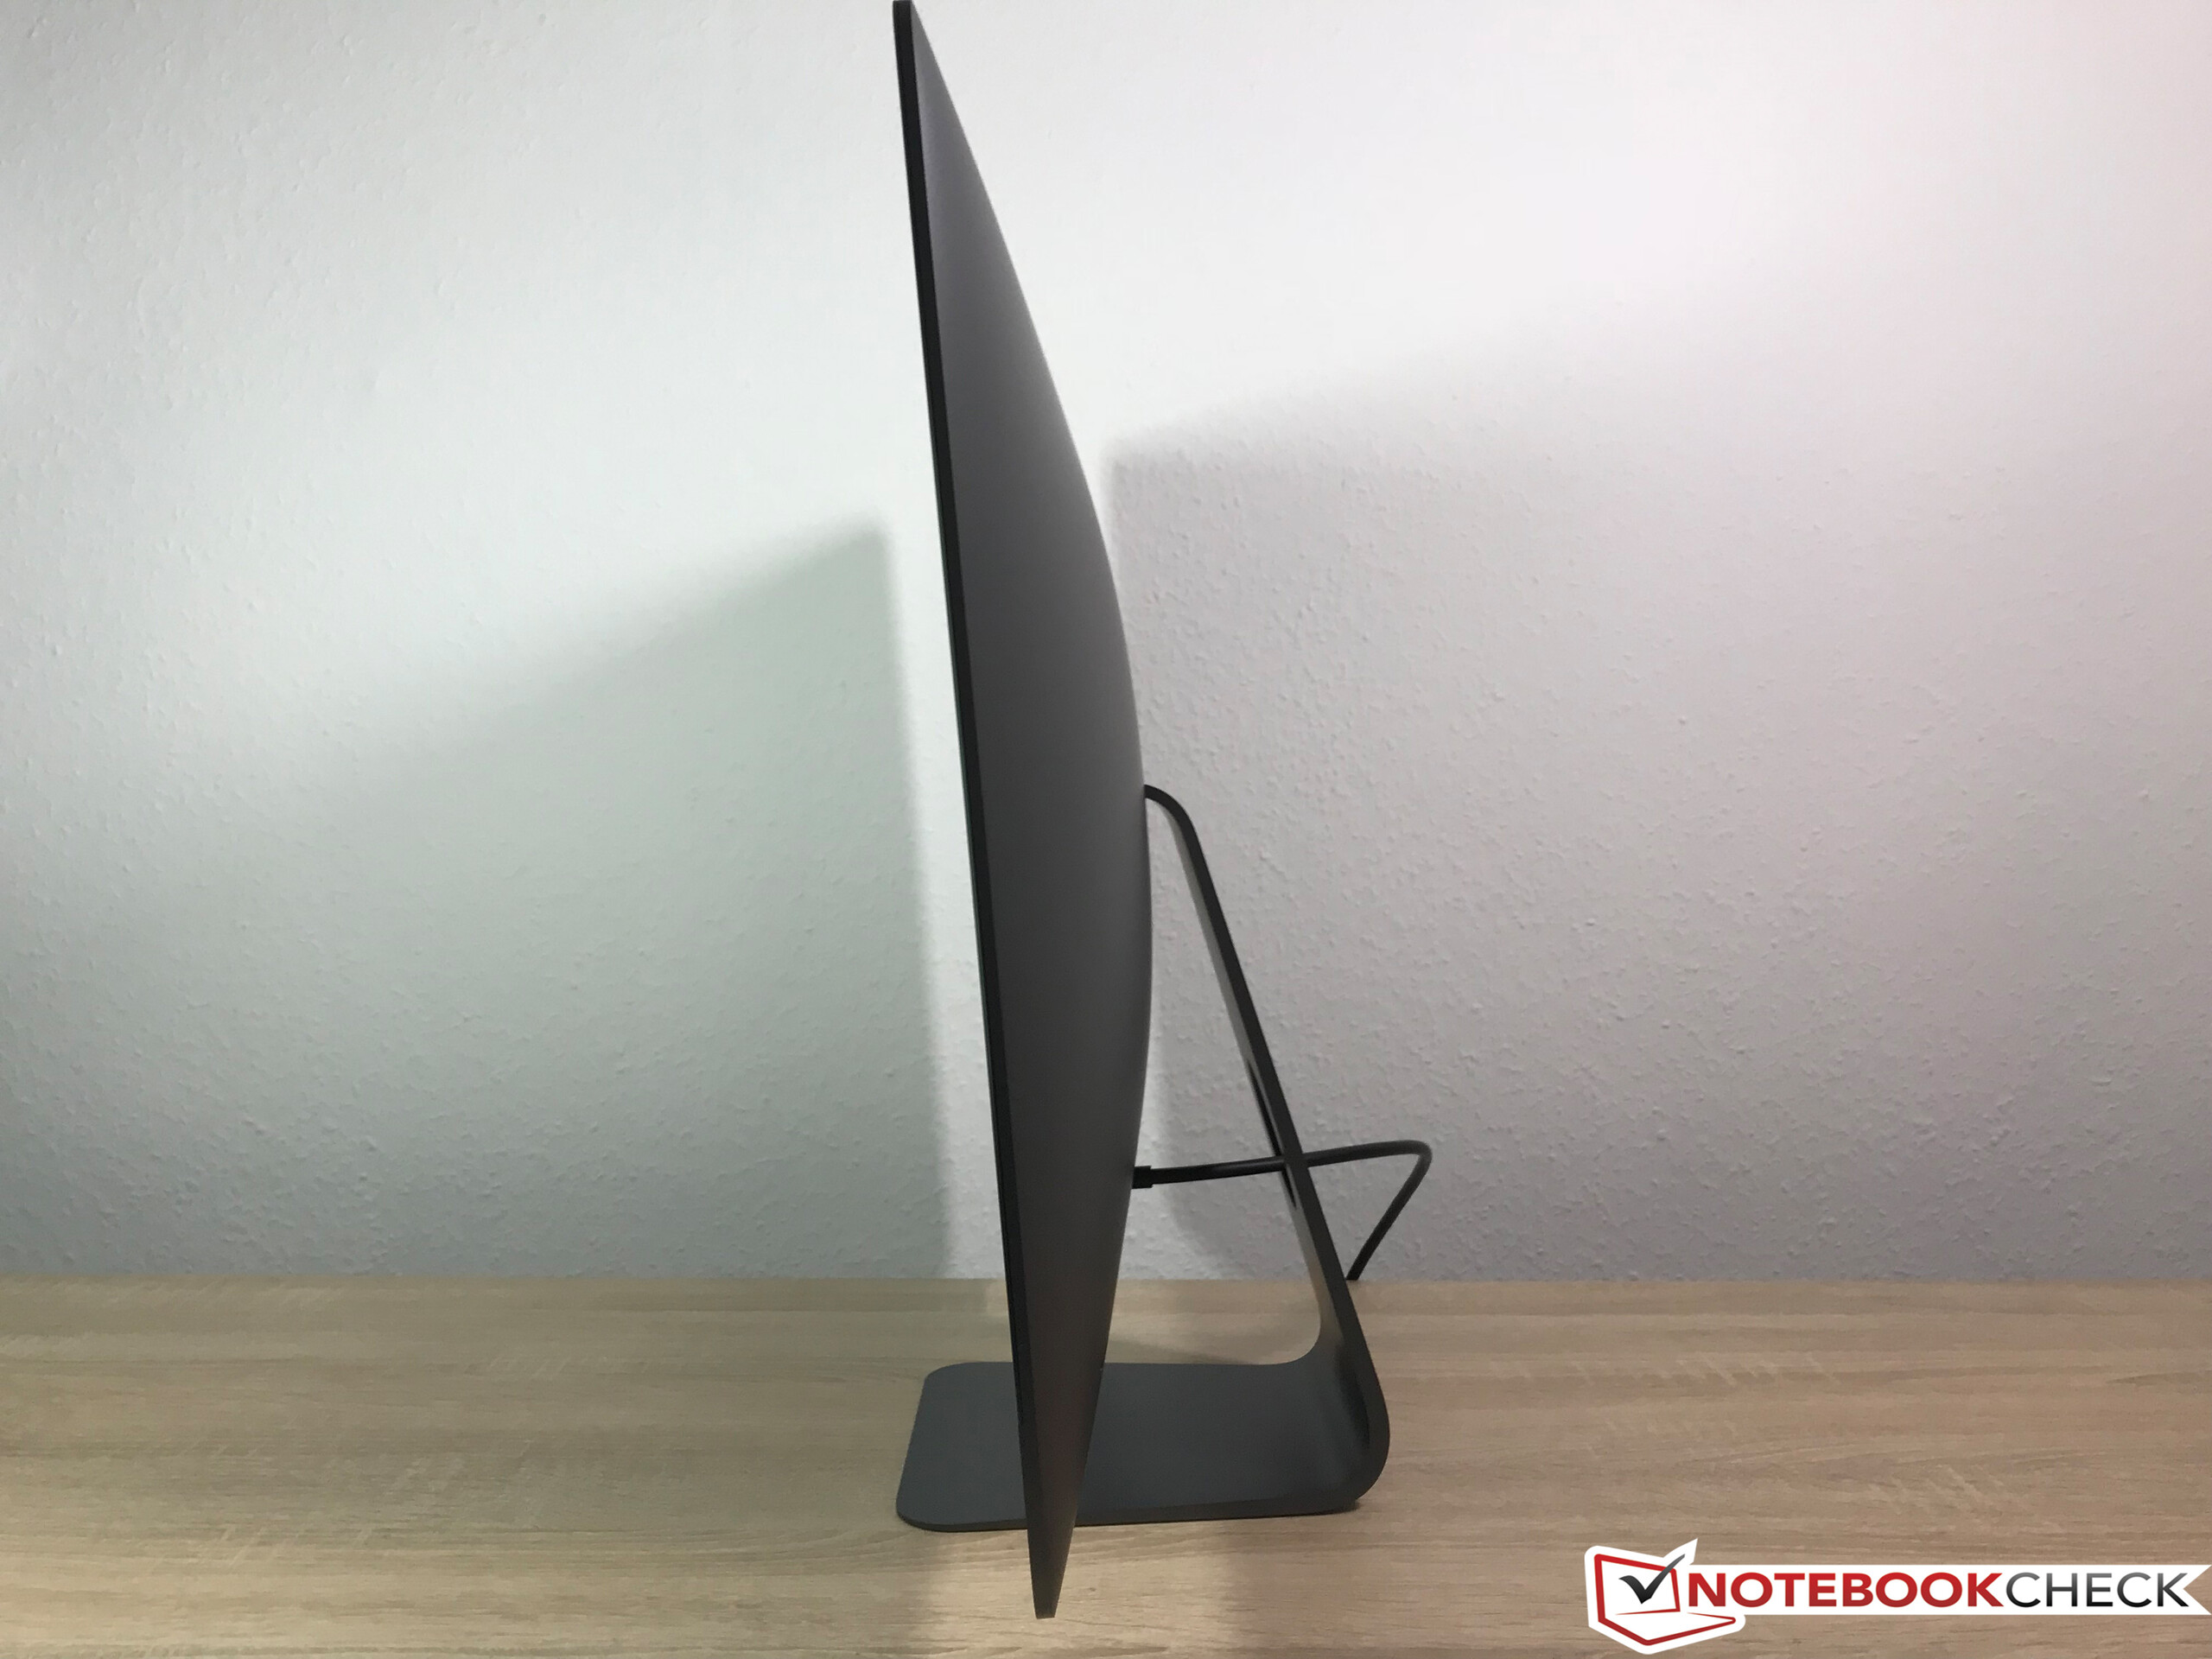
The case is pretty similar to the regular Apple iMac except for the color scheme. While consumer iMacs are white, the professional model gets a dark gray design (Space Gray). The iMac pro is certainly not a light device at almost 10 kg (~22 lb), but you have to consider the integrated 27-inch panel as well as the 500-W power adapter. The build quality of the system is excellent and the darker iMac Pro certainly leaves a very elegant impression.
Connectivity - 4x Thunderbolt 3
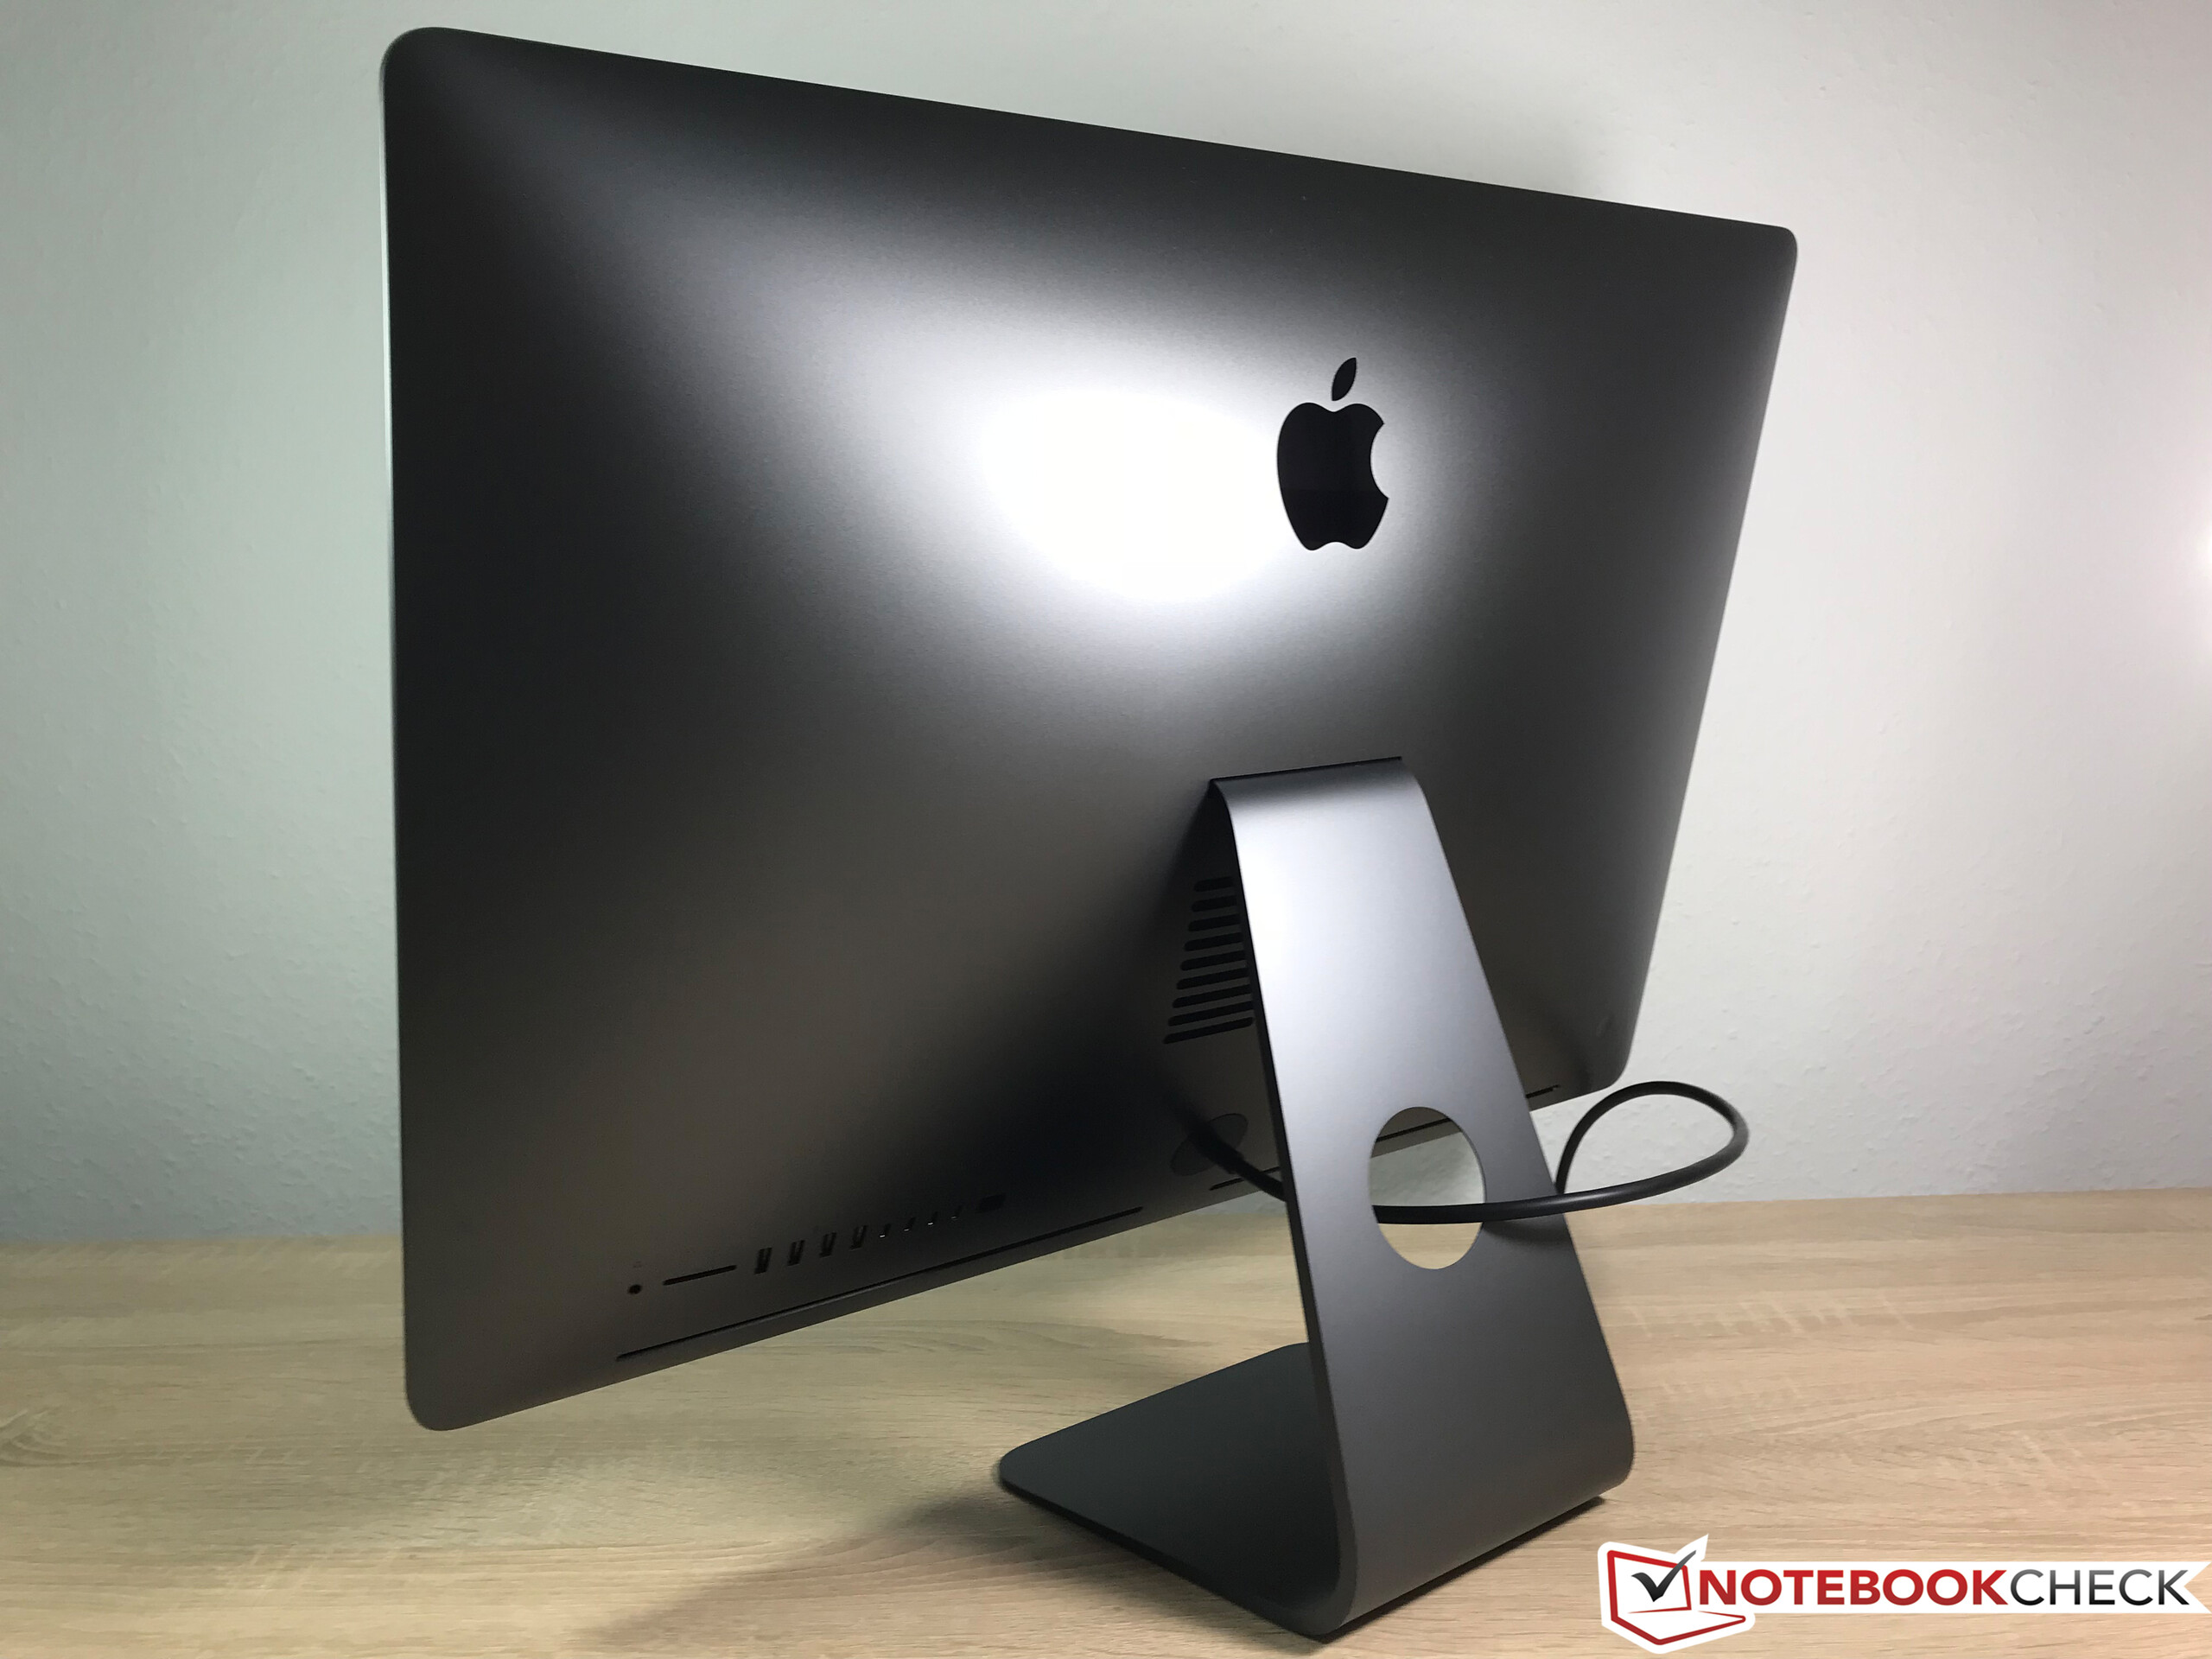
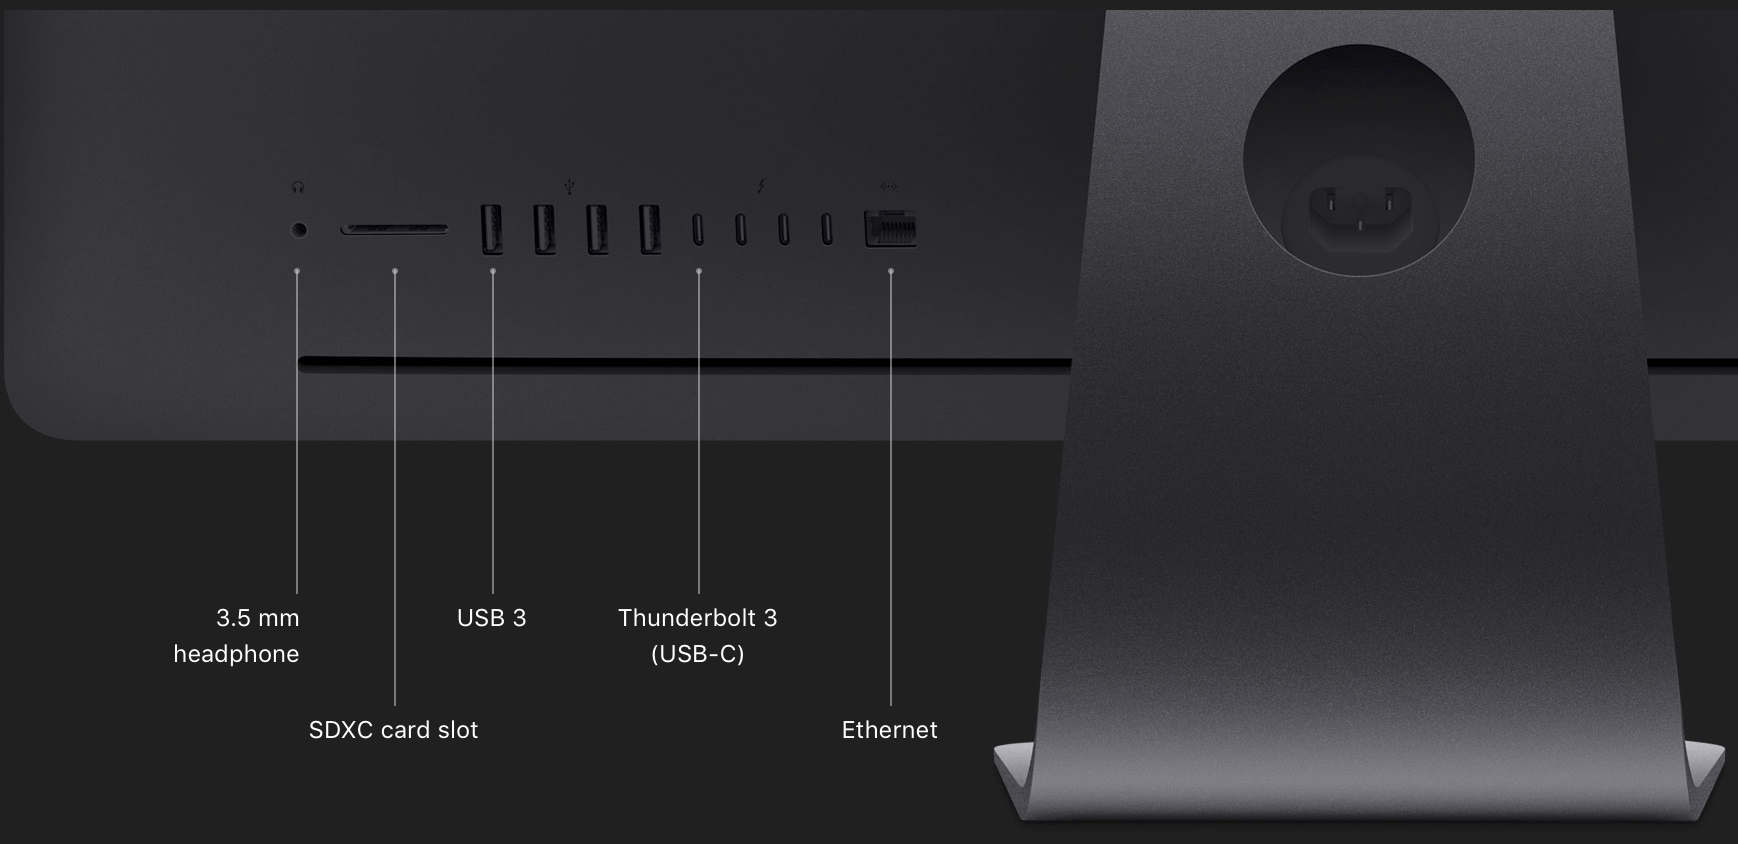
The port selection is very comprehensive and should not leave anything to be desired, but the port placement is not ideal. There is no room on the edges due to the slim profile, so all ports are at the back. You will most certainly have to turn the whole device when you attach USB devices or insert SD cards. We definitely recommend the use of a USB hub.
Otherwise, however, there is not much to criticize with four regular USB and four Thunderbolt 3 ports (USB-C). The Thunderbolt 3 ports also support video out: As well as the integrated 5K panel, you can either drive two more 5K panels at 60 Hz or four external 4K UHD screens at 60 Hz. All older formats like DVI or VGA can be realized via optional adapters.
SD Card Reader
We have already talked about the position of the full-size SD card reader at the back. It supports the UHS-II standard and we can determine very high transfer rates of 230 MB/s in combination with our reference card from Toshiba (Exceria Pro SDXC 64 GB UHS-II). At least with macOS, because the performance is much lower when you use BootCamp Windows (more details in the Performance section). Both AS SSD and our copy test resulted in about 85 MB/s.
| SD Card Reader | |
| average JPG Copy Test (av. of 3 runs) | |
| Dell Precision 5520 UHD (Toshiba Exceria Pro SDXC 64 GB UHS-II) | |
| Lenovo ThinkPad P71-20HK0004GE | |
| Apple iMac Pro (Toshiba Exceria Pro SDXC 64 GB UHS-II) | |
| maximum AS SSD Seq Read Test (1GB) | |
| Dell Precision 5520 UHD (Toshiba Exceria Pro SDXC 64 GB UHS-II) | |
| Lenovo ThinkPad P71-20HK0004GE | |
| Apple iMac Pro (Toshiba Exceria Pro SDXC 64 GB UHS-II) | |
Communication
The iMac Pro is a desktop system and obviously features an Ethernet port. Unlike the usual Gigabit-connector on laptops, Apple has implemented a 10 Gbps port, but wireless networks are supported as well. The Wi-Fi module supports all modern standards and we determine transfer rates of more than 700 Mbps in our standardized test with the Router Linksys EA8500. This is a good result, but the current MacBook Pro lineup performs even better. Bluetooth is supported in version 4.2.
Security
Apple has also thought about the security with its own T2 processor, which combines several chips and handles multiple tasks. This includes the Secure Enclave Processor that takes care of the storage encryption as well as the secure boot functionality. The T2 chip also prevents reduced SSD performance in terms of AES encryption. Other security features such as for the login like Apple’s Touch-ID or Face-ID, for example, are not available on the iMac Pro.
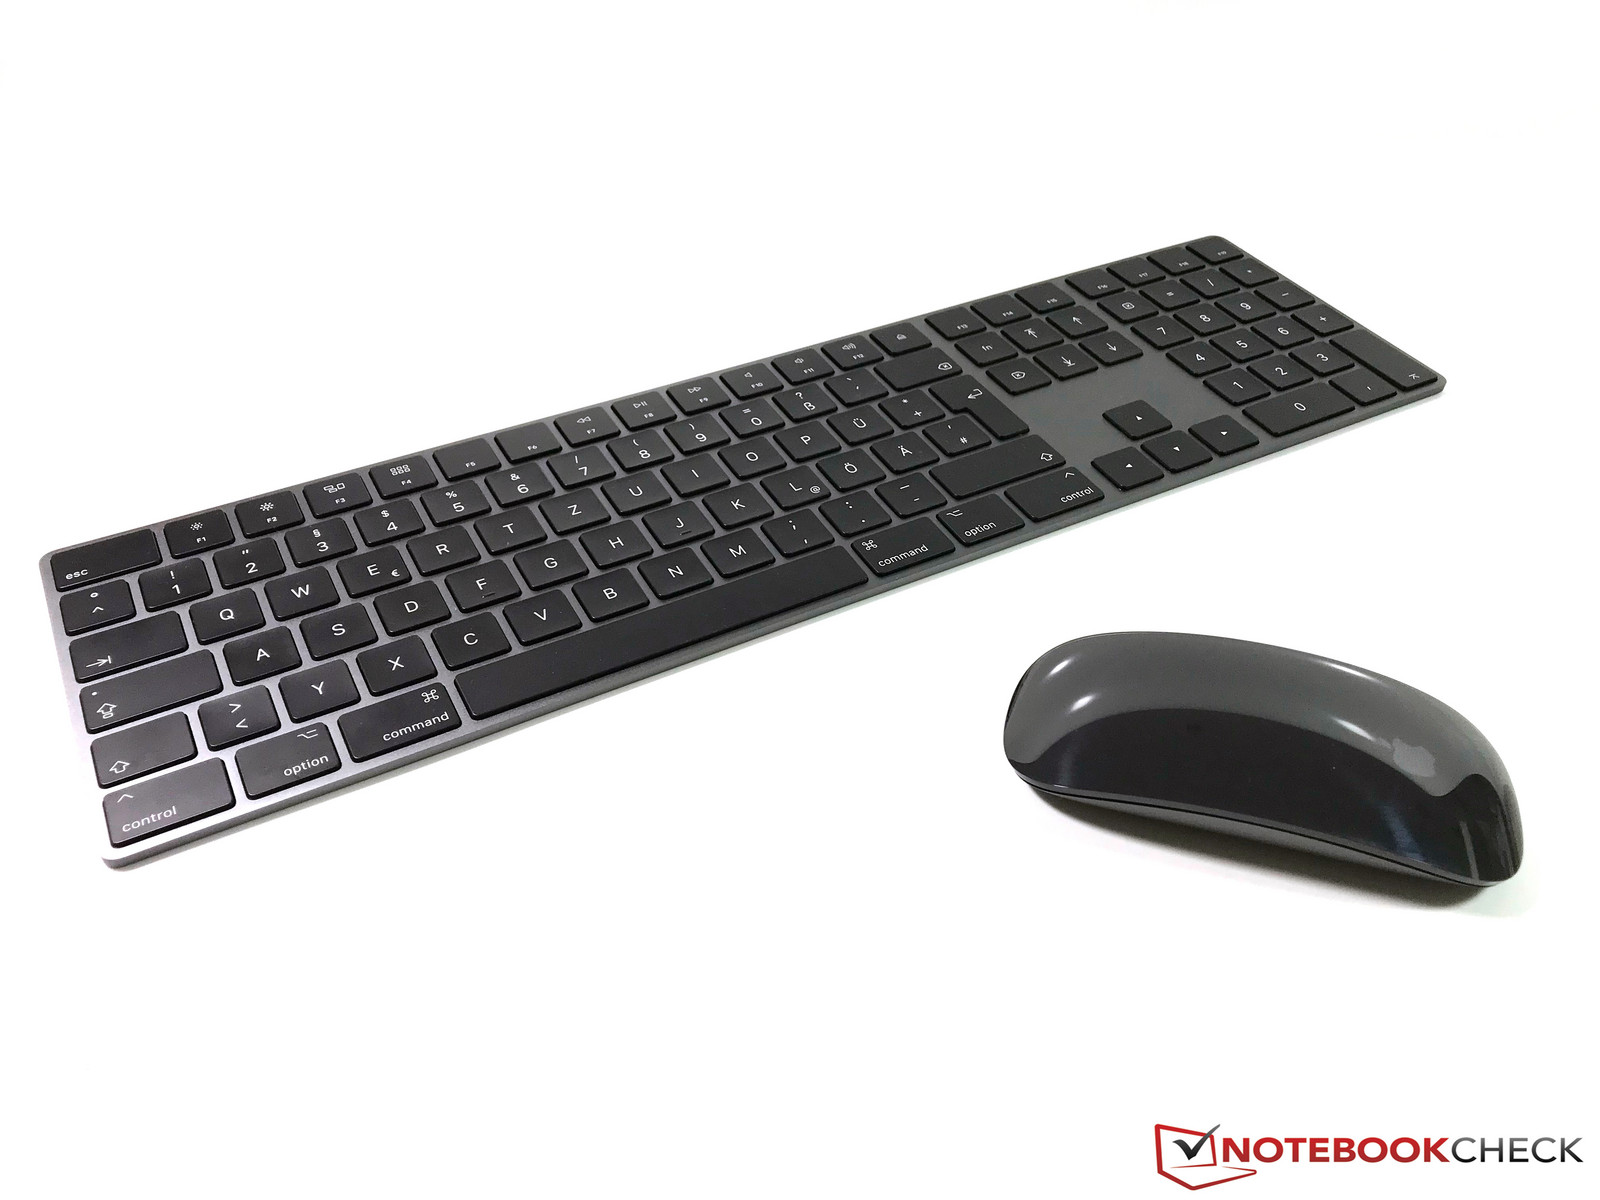
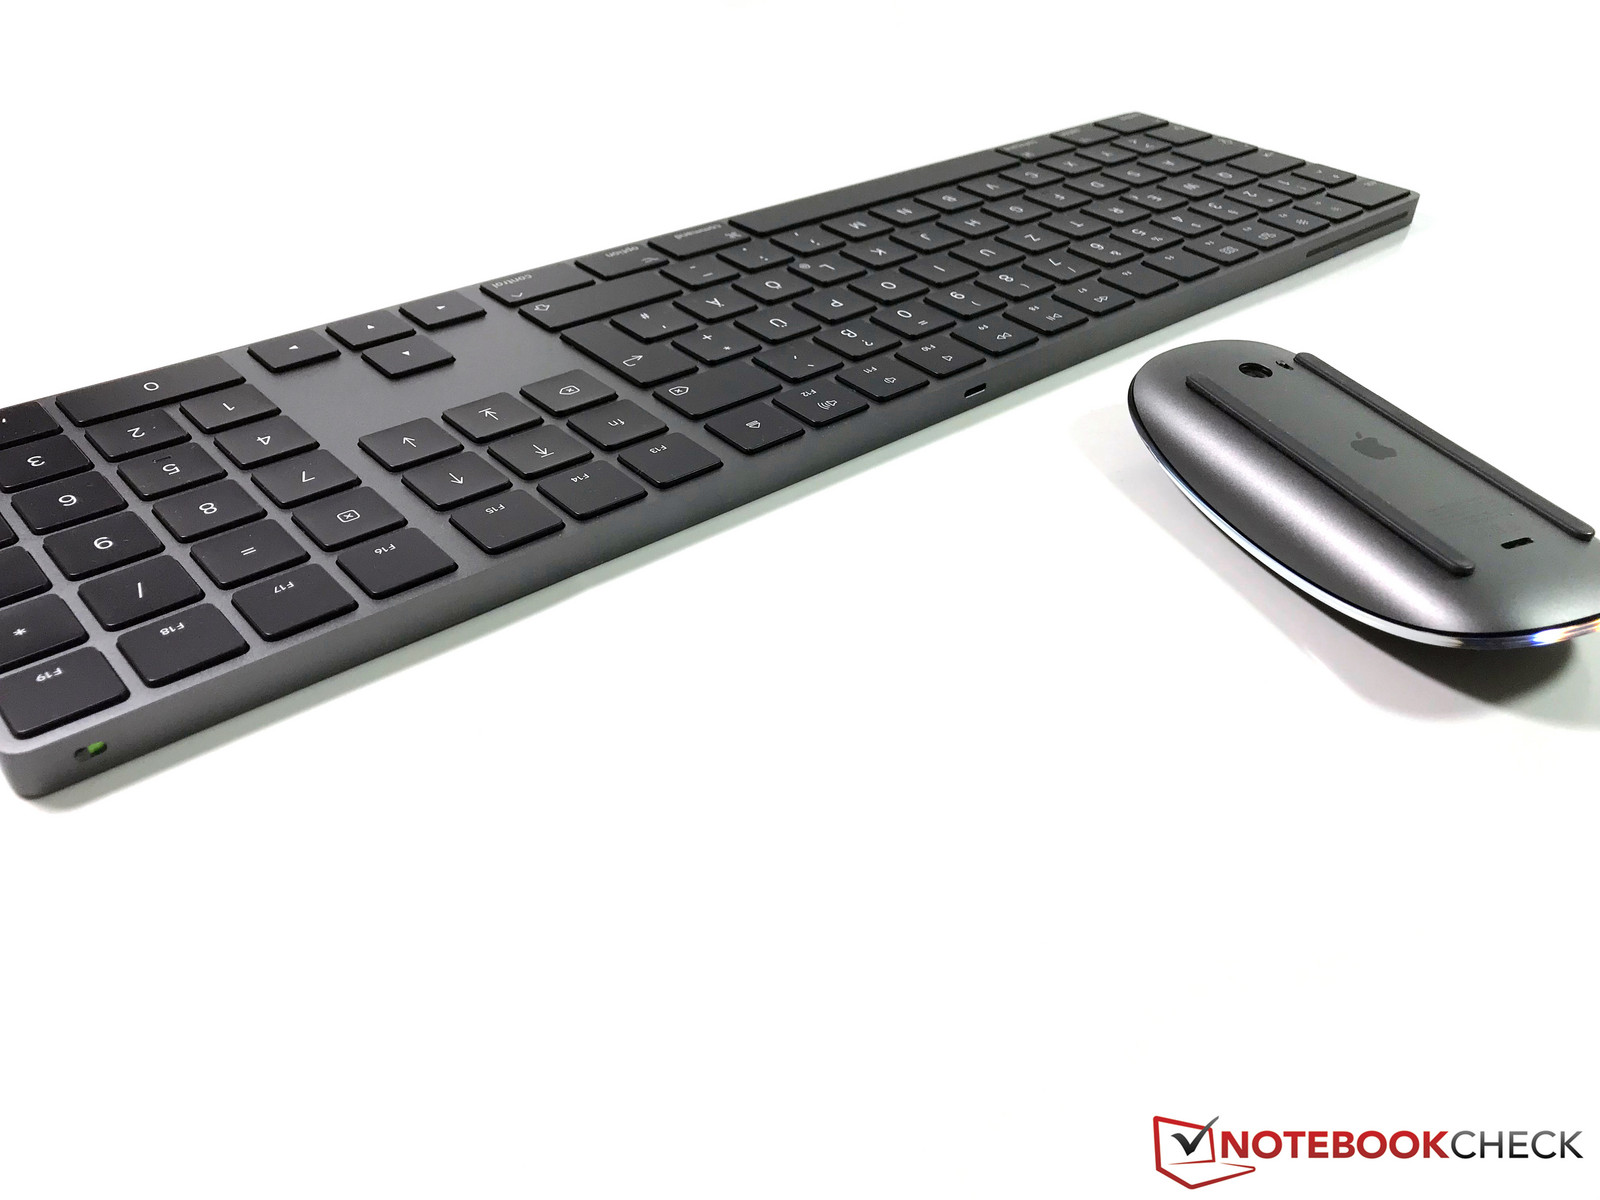
Accessories
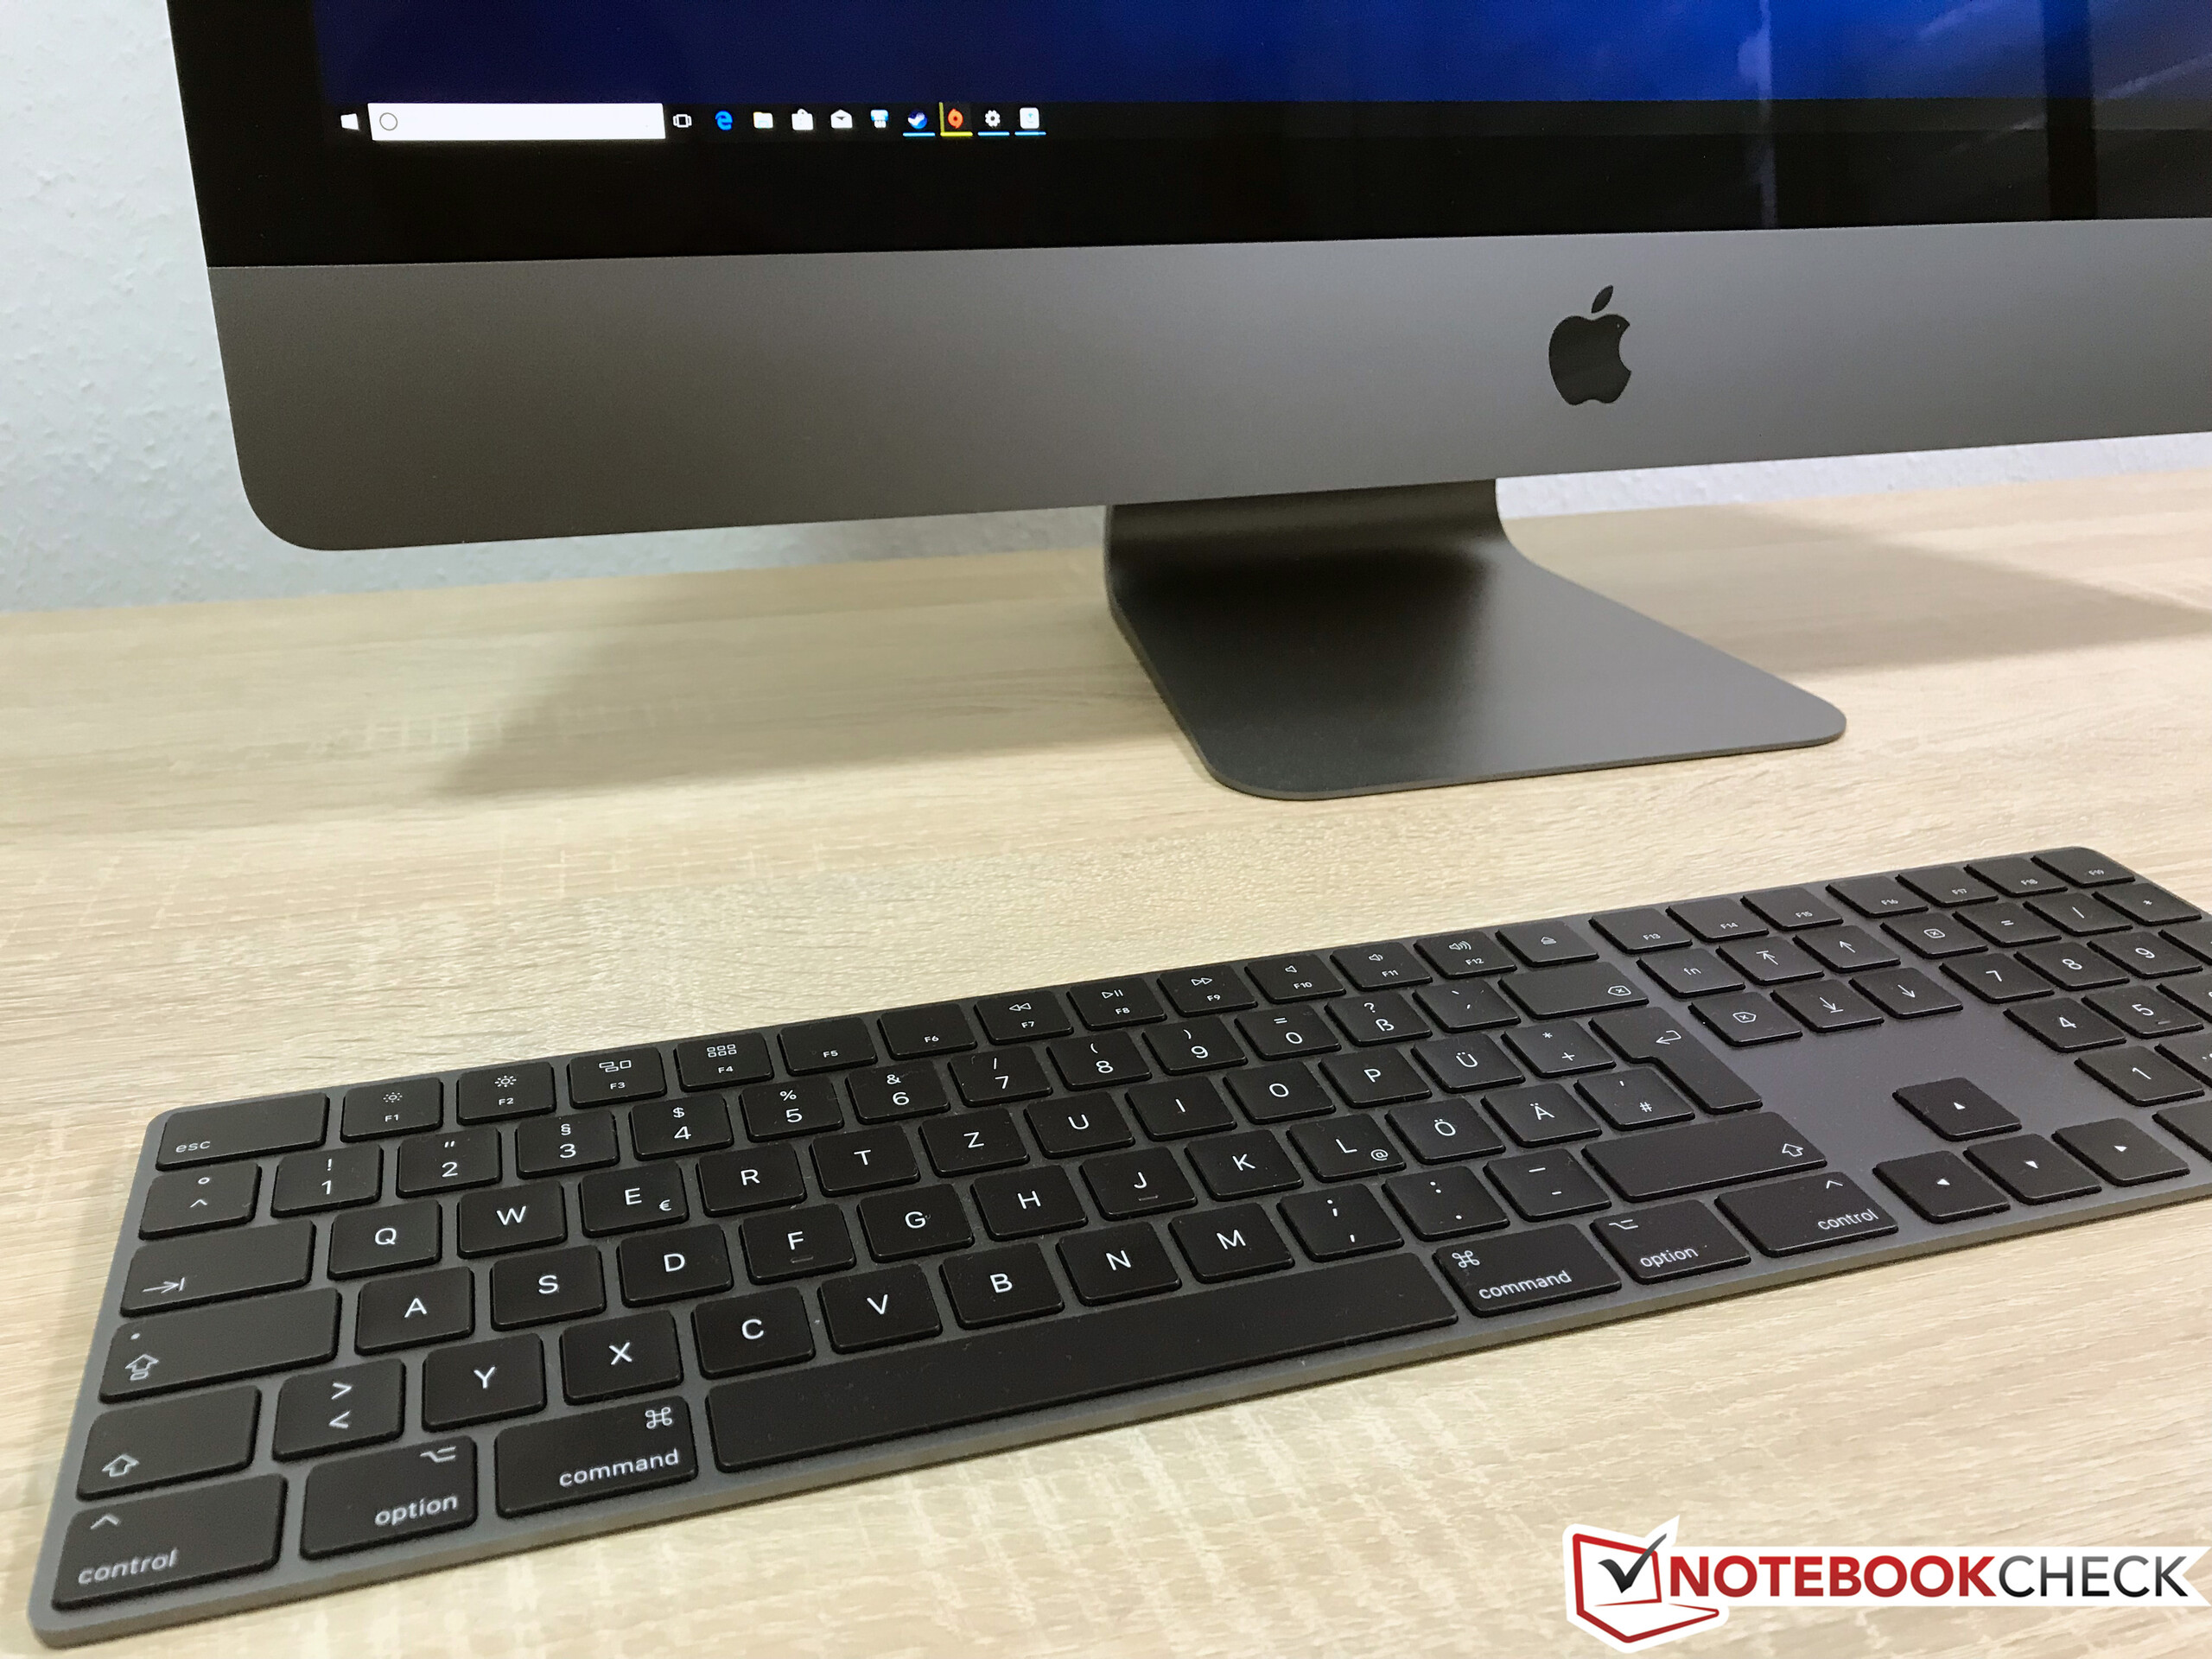
As well as the iMac Pro itself, the box also includes the Magic Mouse 2 and the Magic Keyboard (with numpad), which match the color of the iMac Pro. You also get a USB-to-Lightning cable to charge the peripherals. Apple also offers additional accessories such as the Magic TrackPad.
One interesting accessory is the optional VESA mount (about 90 Euros/~$104). Unlike the current iMacs, this solution is flexible, so you can just attach the regular mount or vice versa.
Maintenance
We want to refer to the in-depth teardown from our colleagues at iFixit for more information about the maintenance. They disassembled the iMac Pro and you can basically upgrade both the RAM as well as the processor (not soldered). However, there is no maintenance hatch, so the whole process is very complicated and requires special tools. The SSD can, in theory, be replaced as well, but Apple does not use common M.2 modules.
Warranty
The iMac Pro is shipped with a two-year warranty, including a 90-day phone support by default. This is a difference compared to the regular Apple devices with a one-year warranty. Apple also sells AppleCare for an extension to three years, which retails for 179 Euros (~$207). Most professional devices are available with warranty extensions up to 5 years and additional services such as on-site repair or keep your drive, but not the Apple. Please see our Guarantees, Return policies and Warranties FAQ for country-specific information.
Input Devices
The input devices consist of the Magic Mouse 2 and the Magic Mouse keyboard with an integrated numpad. Both peripherals are wireless and can be charged via Lightning connector. Their quality is decent, but there are some drawbacks. The keyboard is slightly slanted, but the key travel is very shallow, even though the feedback is decent. This is okay if you do not type a lot, but you will not be happy if you are used to very good desktop keyboards. Another major disadvantage is the lack of a background illumination.
The wireless connection always worked flawlessly under macOS, but there were problems running Windows via BootCamp, so we switched to a different set of input devices.
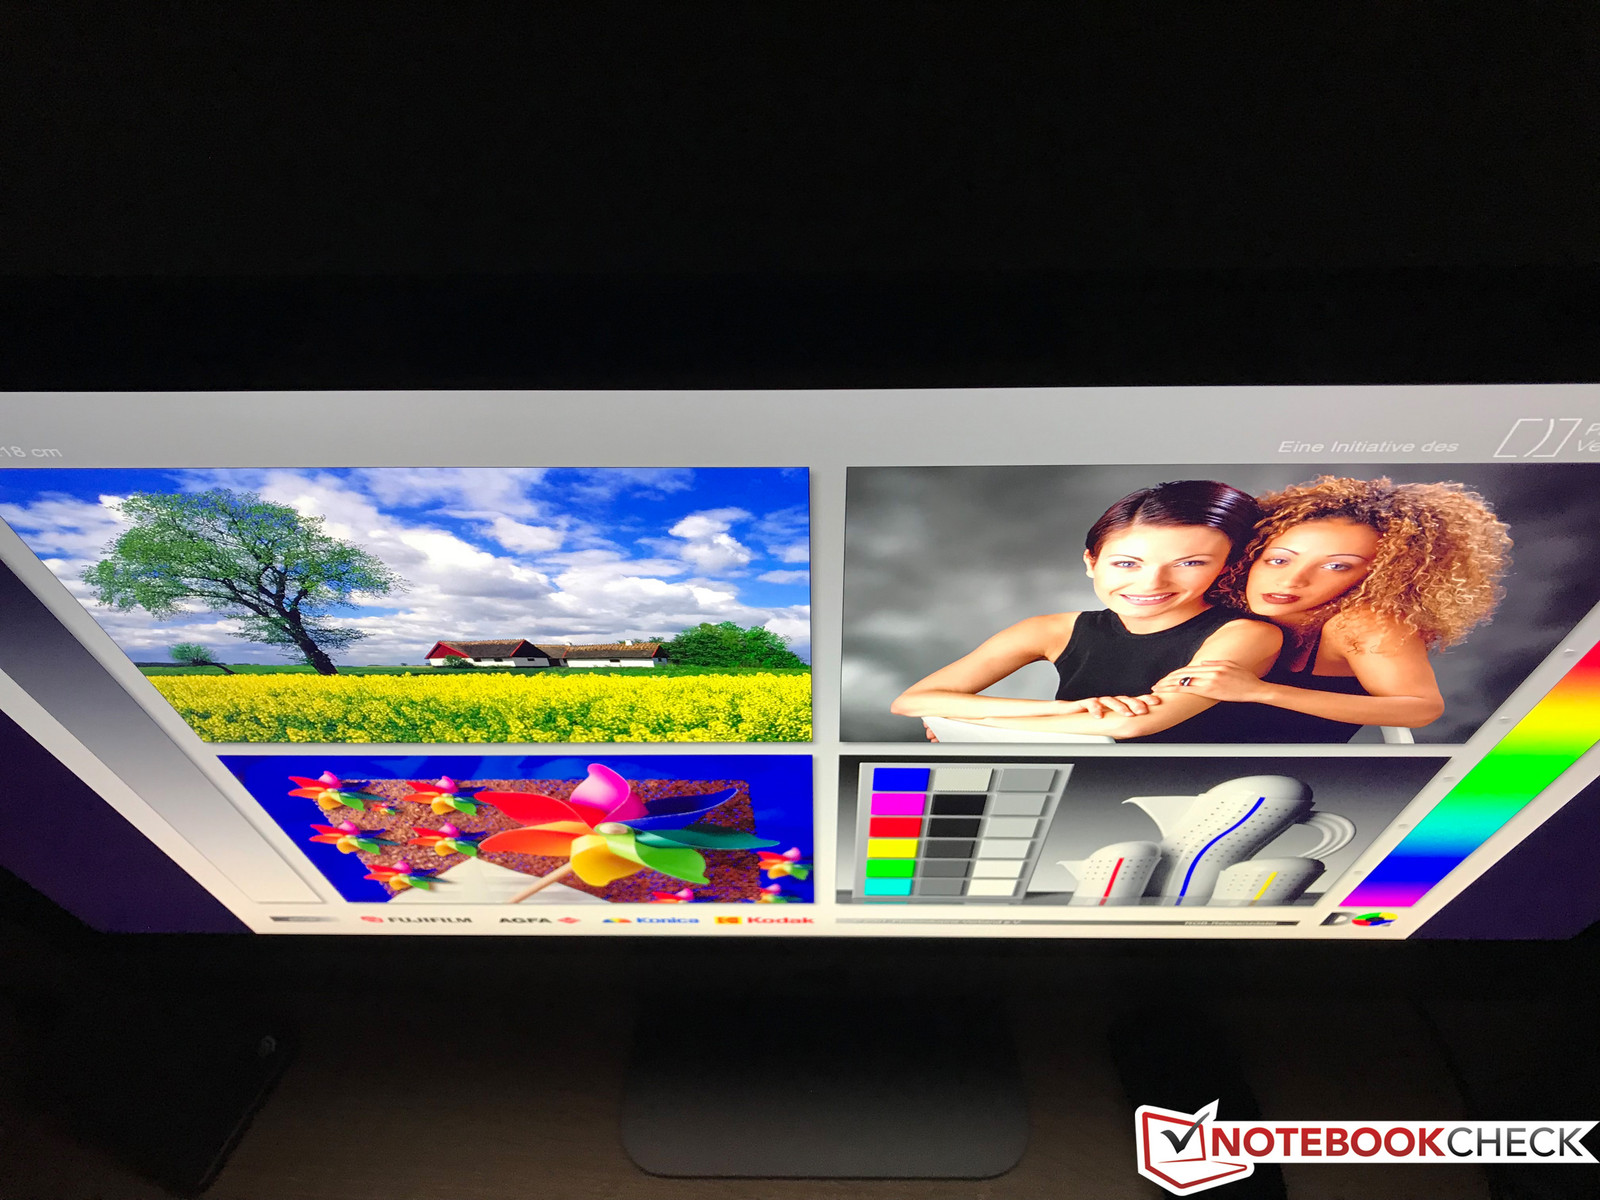
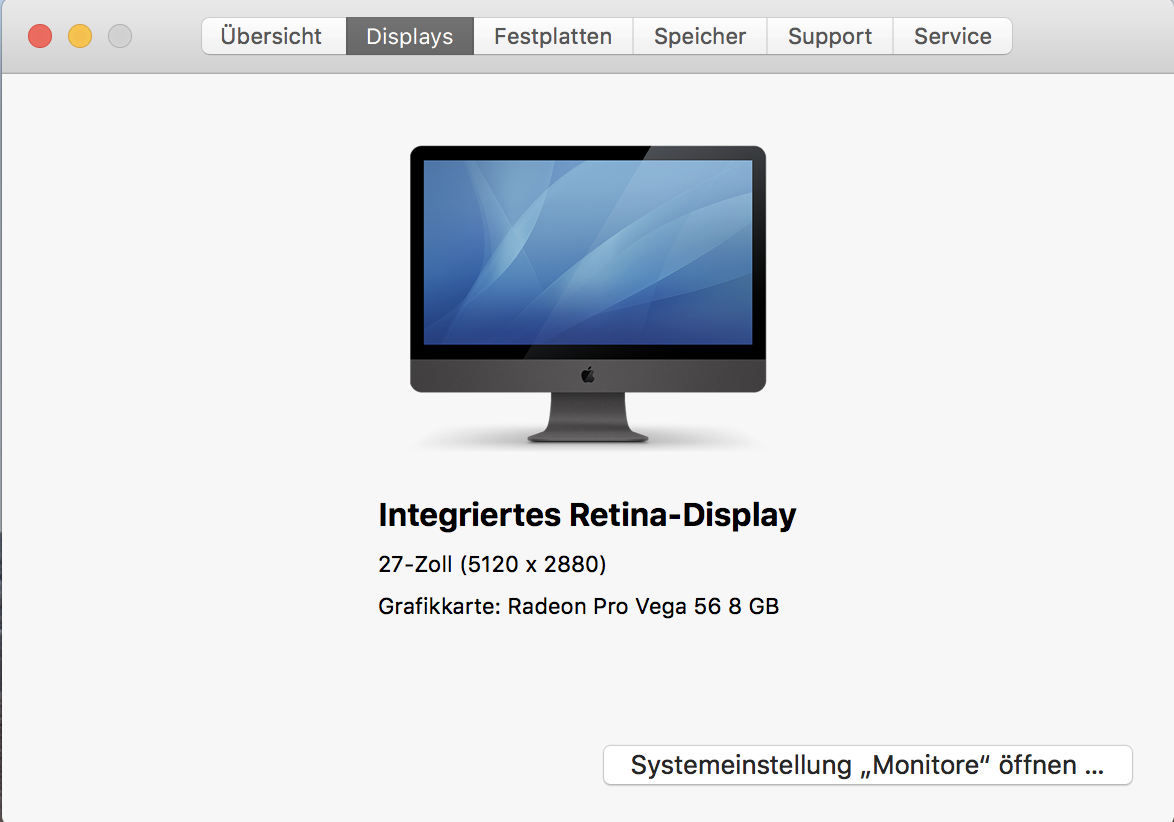
Display - 5K-Retina
The 27-inch 5K panel (5120x2880 pixels) carries the designation APPAE1E and it is the same LG panel (LM270QQ1) you get in the iMac 5K according to our colleagues from iFixit. Apple advertises a luminance of 500 nits, but our measurements are just shy of that at up to 469 nits in the center of the screen and still about 470 nits on average. This is still an excellent result since you will hardly use the iMac Pro outdoors. However, it can still be tricky to use in offices due to the semi-glossy (similar to MacBooks) surface if there are reflections from light sources or windows.
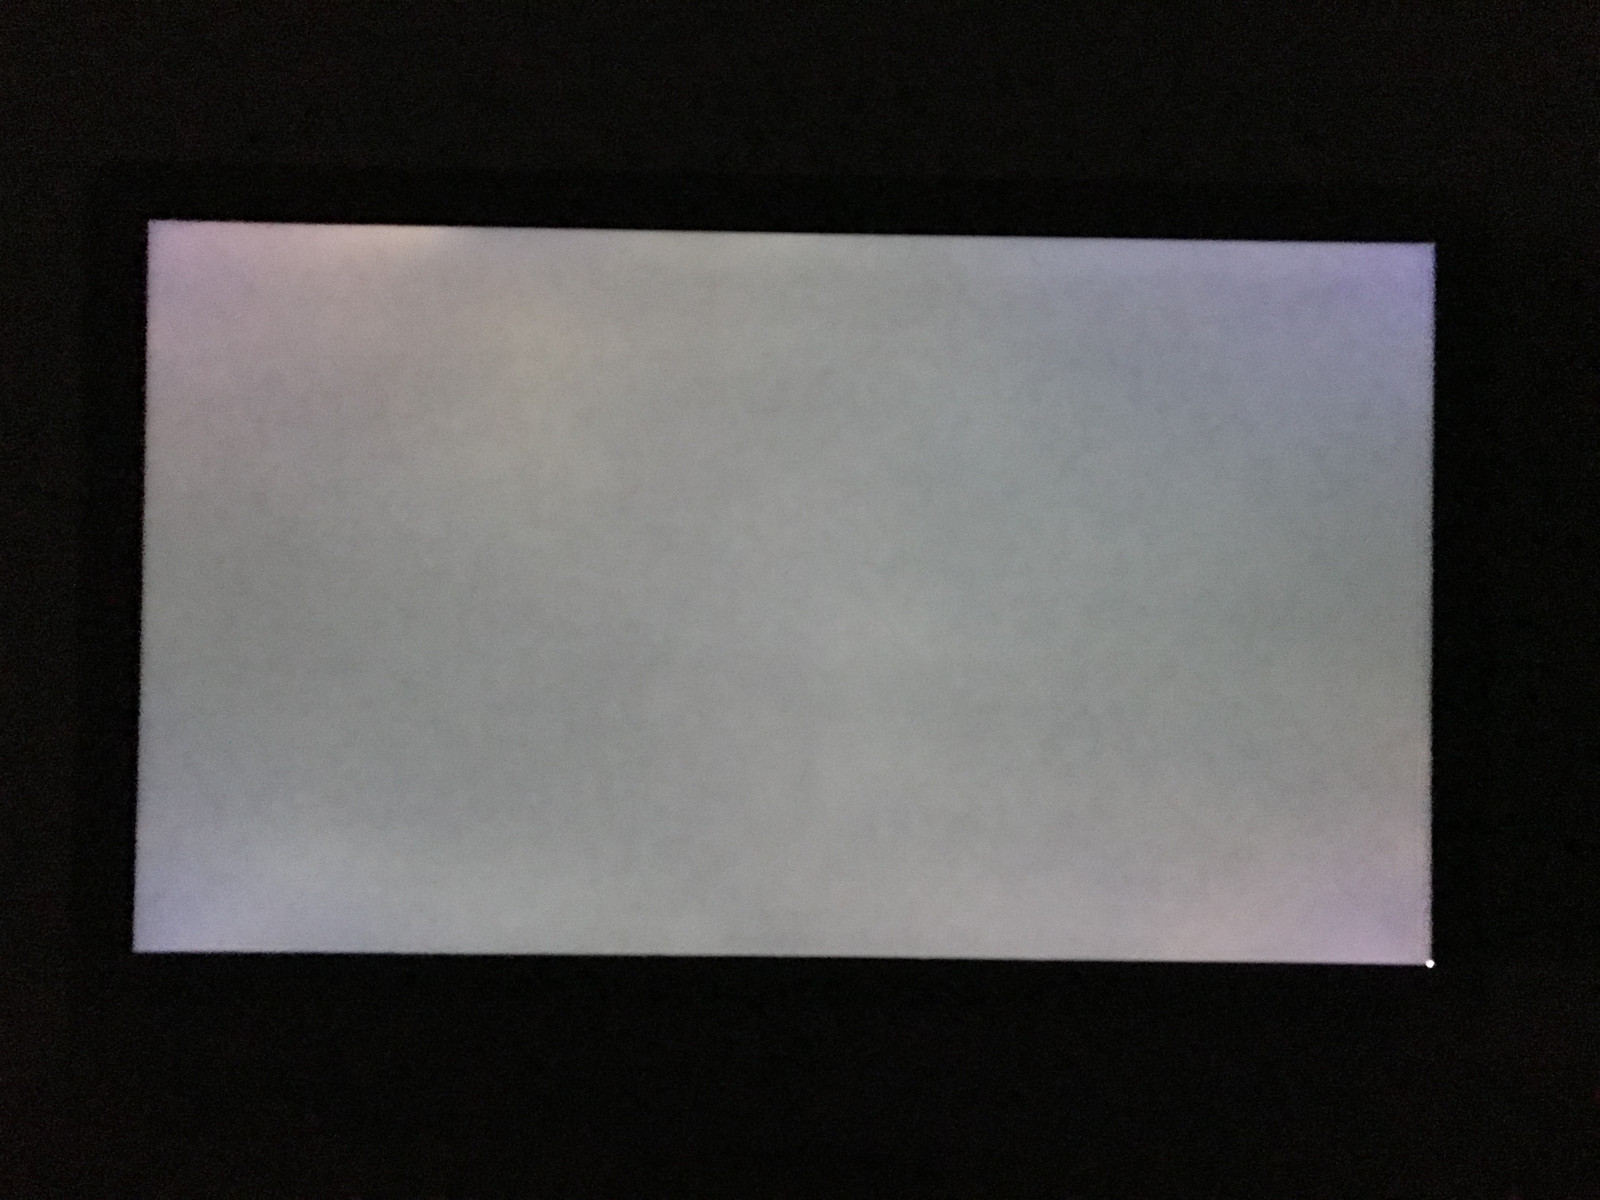
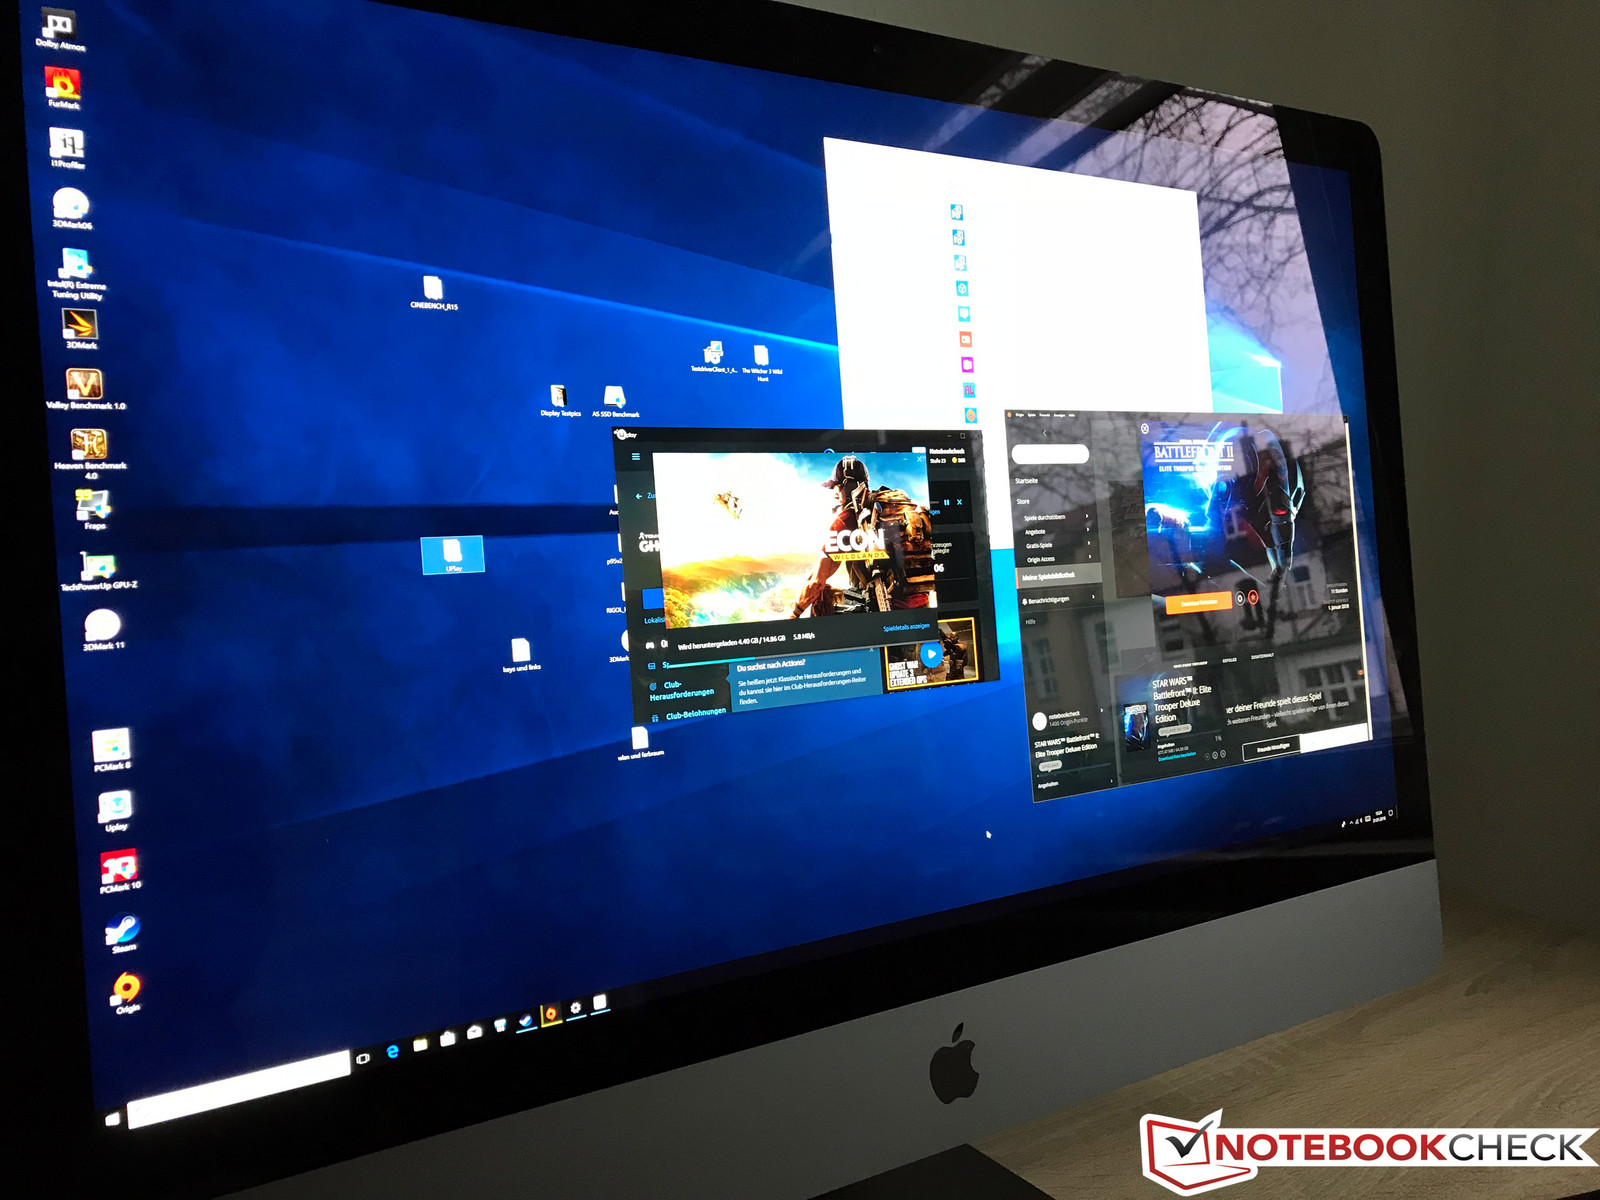
The subjective picture impression is excellent. Images are crisp with brilliant colors. Apple has implemented a brightness sensor that does the job well, and we did not detect a PWM regulation of the backlight. macOS always provided great scaling of the high resolution and this does not change here. Windows on the other hand can still be tricky. The default scaling setting is 450% and Windows itself does a good job, but there are still apps without the necessary optimizations. We encountered problems with our calibration tool and the gaming platform Origin, for example.
| |||||||||||||||||||||||||
Brightness Distribution: 87 %
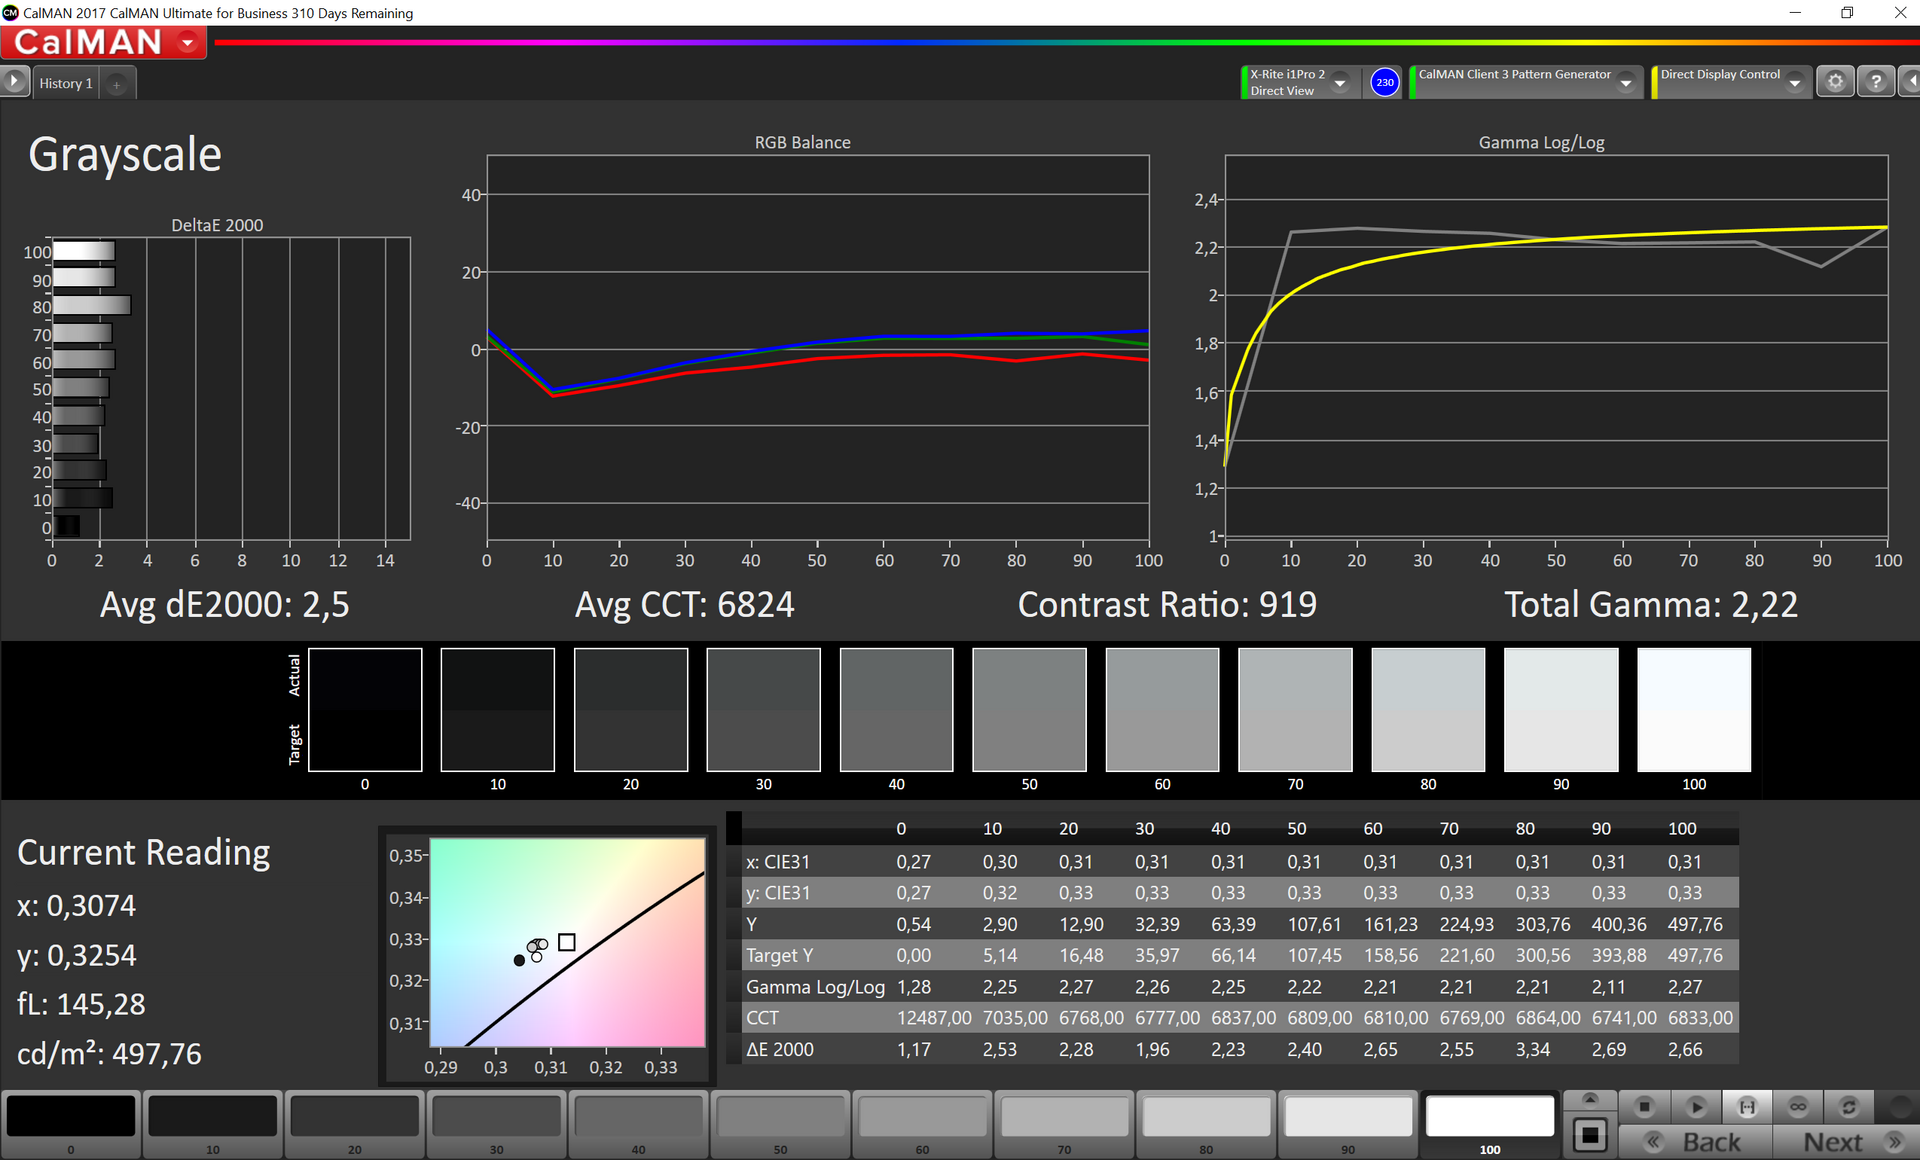
Contrast: 919:1 (Black: 0.54 cd/m²)
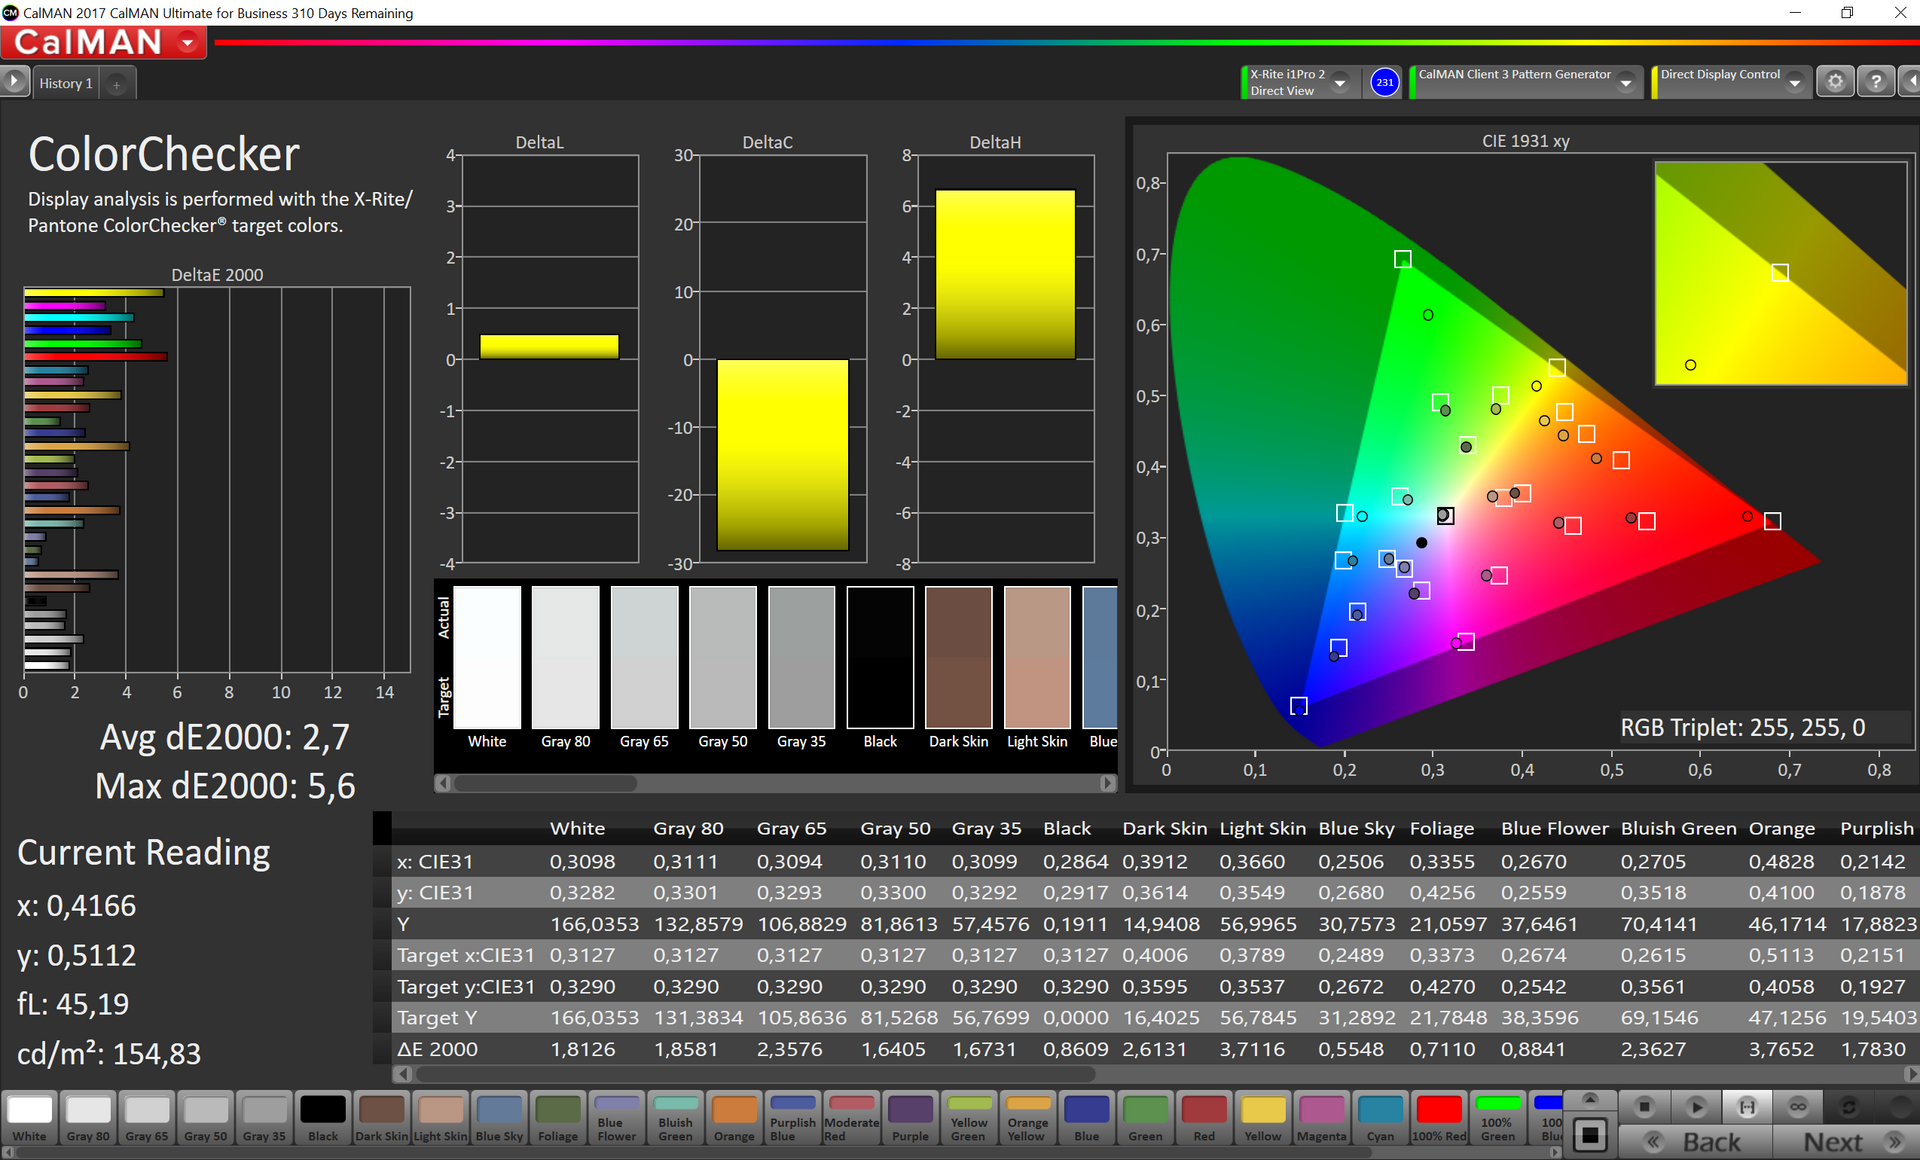
ΔE ColorChecker Calman: 3 | ∀{0.5-29.43 Ø4.72}
calibrated: 0.9
ΔE Greyscale Calman: 2.5 | ∀{0.09-98 Ø4.97}
100% sRGB (Argyll 1.6.3 3D)
79.4% AdobeRGB 1998 (Argyll 1.6.3 3D)
88.8% AdobeRGB 1998 (Argyll 3D)
100% sRGB (Argyll 3D)
99% Display P3 (Argyll 3D)
Gamma: 2.22
CCT: 6824 K
| Apple iMac Pro APPAE1E, , 5120x2880, 27" | Apple iMac Retina 5K 27 Late 2015 3.2 GHz M390 MK472D/A 5120x2880, 27" | Apple MacBook Pro 15 2017 (2.8 GHz, 555) APPA031, , 2880x1800, 15.4" | Lenovo ThinkPad P71-20HK0004GE LEN4123, VVX17P051J00, , 3840x2160, 17.3" | Dell Precision 5520 UHD SHP1476, , 3840x2160, 15.6" | Dell Precision 7720 SHP1446 (LQ173D1), , 3840x2160, 17.3" | HP ZBook 17 G4-Y3J82AV Sharp SHP144C, , 3840x2160, 17.3" | |
|---|---|---|---|---|---|---|---|
| Display | -0% | -1% | -18% | 0% | 0% | ||
| Display P3 Coverage (%) | 99 | 99.3 0% | 97.9 -1% | 67.4 -32% | 87.6 -12% | 88 -11% | |
| sRGB Coverage (%) | 100 | 100 0% | 99.9 0% | 98.5 -1% | 100 0% | 100 0% | |
| AdobeRGB 1998 Coverage (%) | 88.8 | 88.2 -1% | 85.9 -3% | 68.9 -22% | 99.2 12% | 99.6 12% | |
| Response Times | -6% | -69% | -26% | -108% | -122% | -96% | |
| Response Time Grey 50% / Grey 80% * (ms) | 30.4 ? | 30.4 ? -0% | 48 ? -58% | 39.2 ? -29% | 59.2 ? -95% | 60 ? -97% | 56.8 ? -87% |
| Response Time Black / White * (ms) | 18.8 ? | 20.8 ? -11% | 33.8 ? -80% | 23.2 ? -23% | 41.6 ? -121% | 46.4 ? -147% | 38.4 ? -104% |
| PWM Frequency (Hz) | 208.3 ? | 119000 ? | 1412 ? | 1020 ? | 1020 ? | ||
| Screen | -1% | 23% | 9% | -10% | -5% | 17% | |
| Brightness middle (cd/m²) | 496 | 429 -14% | 545 10% | 358 -28% | 372.4 -25% | 464 -6% | 391 -21% |
| Brightness (cd/m²) | 468 | 424 -9% | 523 12% | 338 -28% | 368 -21% | 441 -6% | 360 -23% |
| Brightness Distribution (%) | 87 | 95 9% | 86 -1% | 83 -5% | 90 3% | 89 2% | 87 0% |
| Black Level * (cd/m²) | 0.54 | 0.58 -7% | 0.44 19% | 0.31 43% | 0.48 11% | 0.45 17% | 0.35 35% |
| Contrast (:1) | 919 | 740 -19% | 1239 35% | 1155 26% | 776 -16% | 1031 12% | 1117 22% |
| Colorchecker dE 2000 * | 3 | 2.8 7% | 1.6 47% | 2.1 30% | 2.6 13% | 3.2 -7% | 1.3 57% |
| Colorchecker dE 2000 max. * | 5.8 | 3.8 34% | 3.6 38% | 5.6 3% | 6.1 -5% | 2.5 57% | |
| Colorchecker dE 2000 calibrated * | 0.9 | ||||||
| Greyscale dE 2000 * | 2.5 | 1.97 21% | 1.9 24% | 2 20% | 3.7 -48% | 4.2 -68% | 1.8 28% |
| Gamma | 2.22 99% | 2.13 103% | 2.26 97% | 2.16 102% | 2.14 103% | 2.01 109% | 2.11 104% |
| CCT | 6824 95% | 6889 94% | 6834 95% | 6216 105% | 7096 92% | 6736 96% | 6461 101% |
| Color Space (Percent of AdobeRGB 1998) (%) | 79.4 | 79 -1% | 77 -3% | 63 -21% | 88.1 11% | 87.9 11% | |
| Color Space (Percent of sRGB) (%) | 100 | 99.97 0% | 99.97 0% | 99 -1% | 100 0% | 100 0% | |
| Total Average (Program / Settings) | -2% /
-2% | -16% /
3% | -9% /
3% | -45% /
-25% | -42% /
-20% | -26% /
-2% |
* ... smaller is better
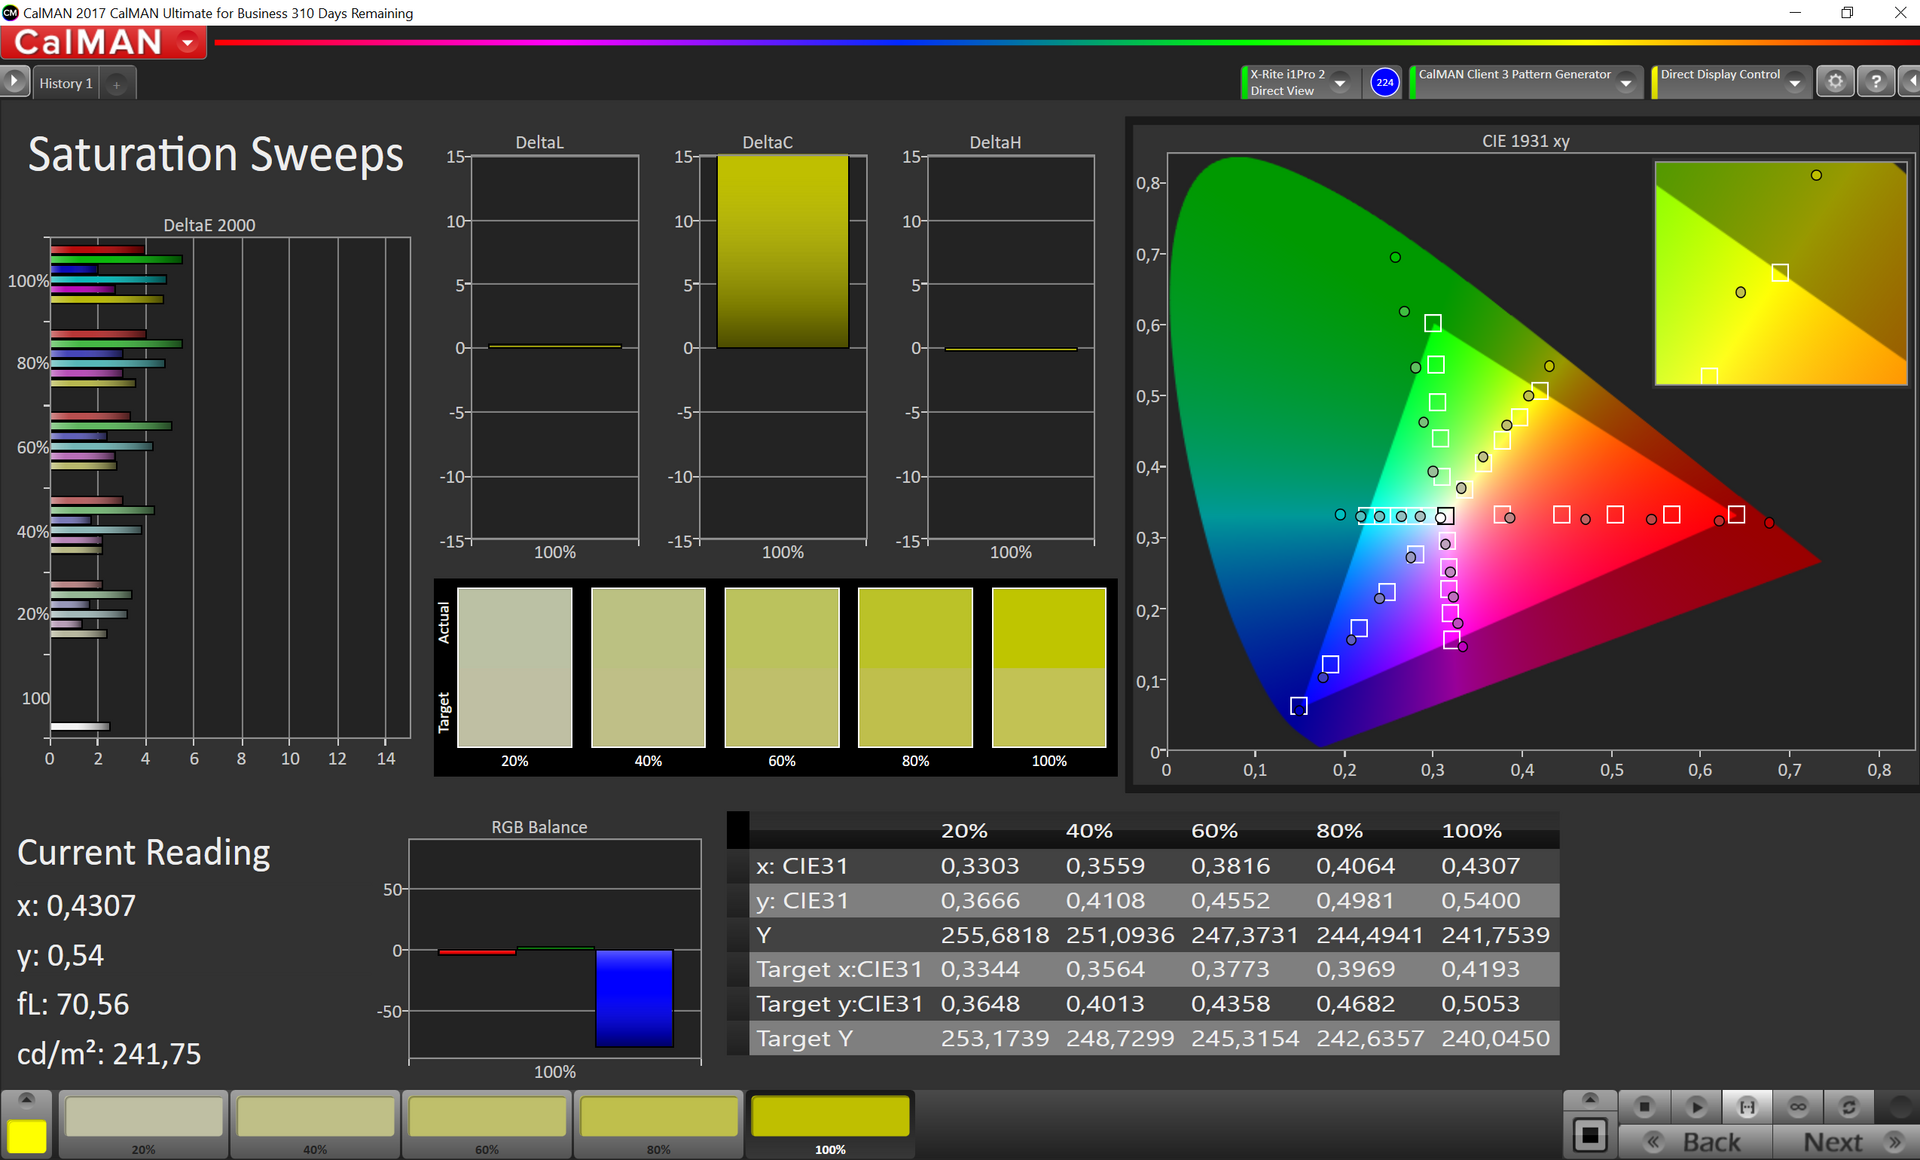
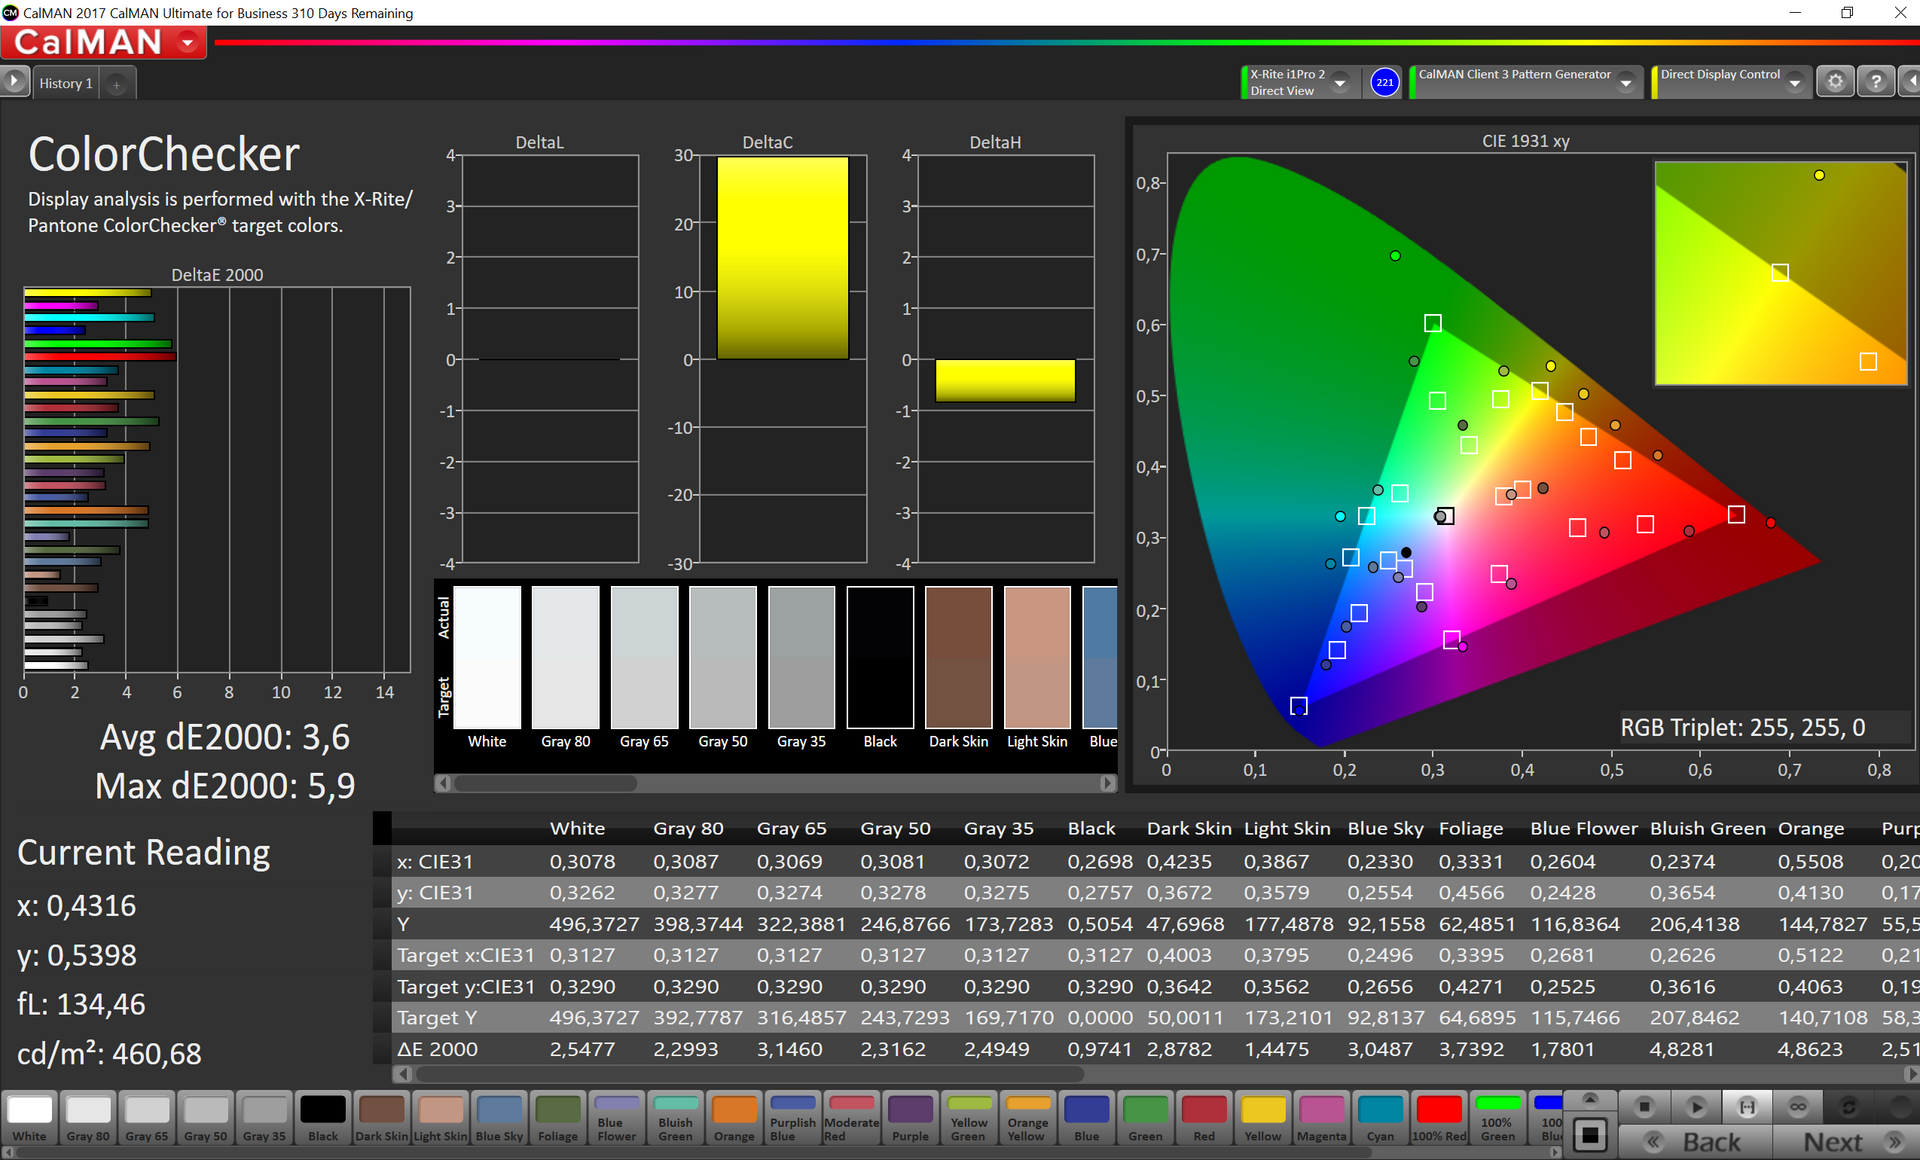
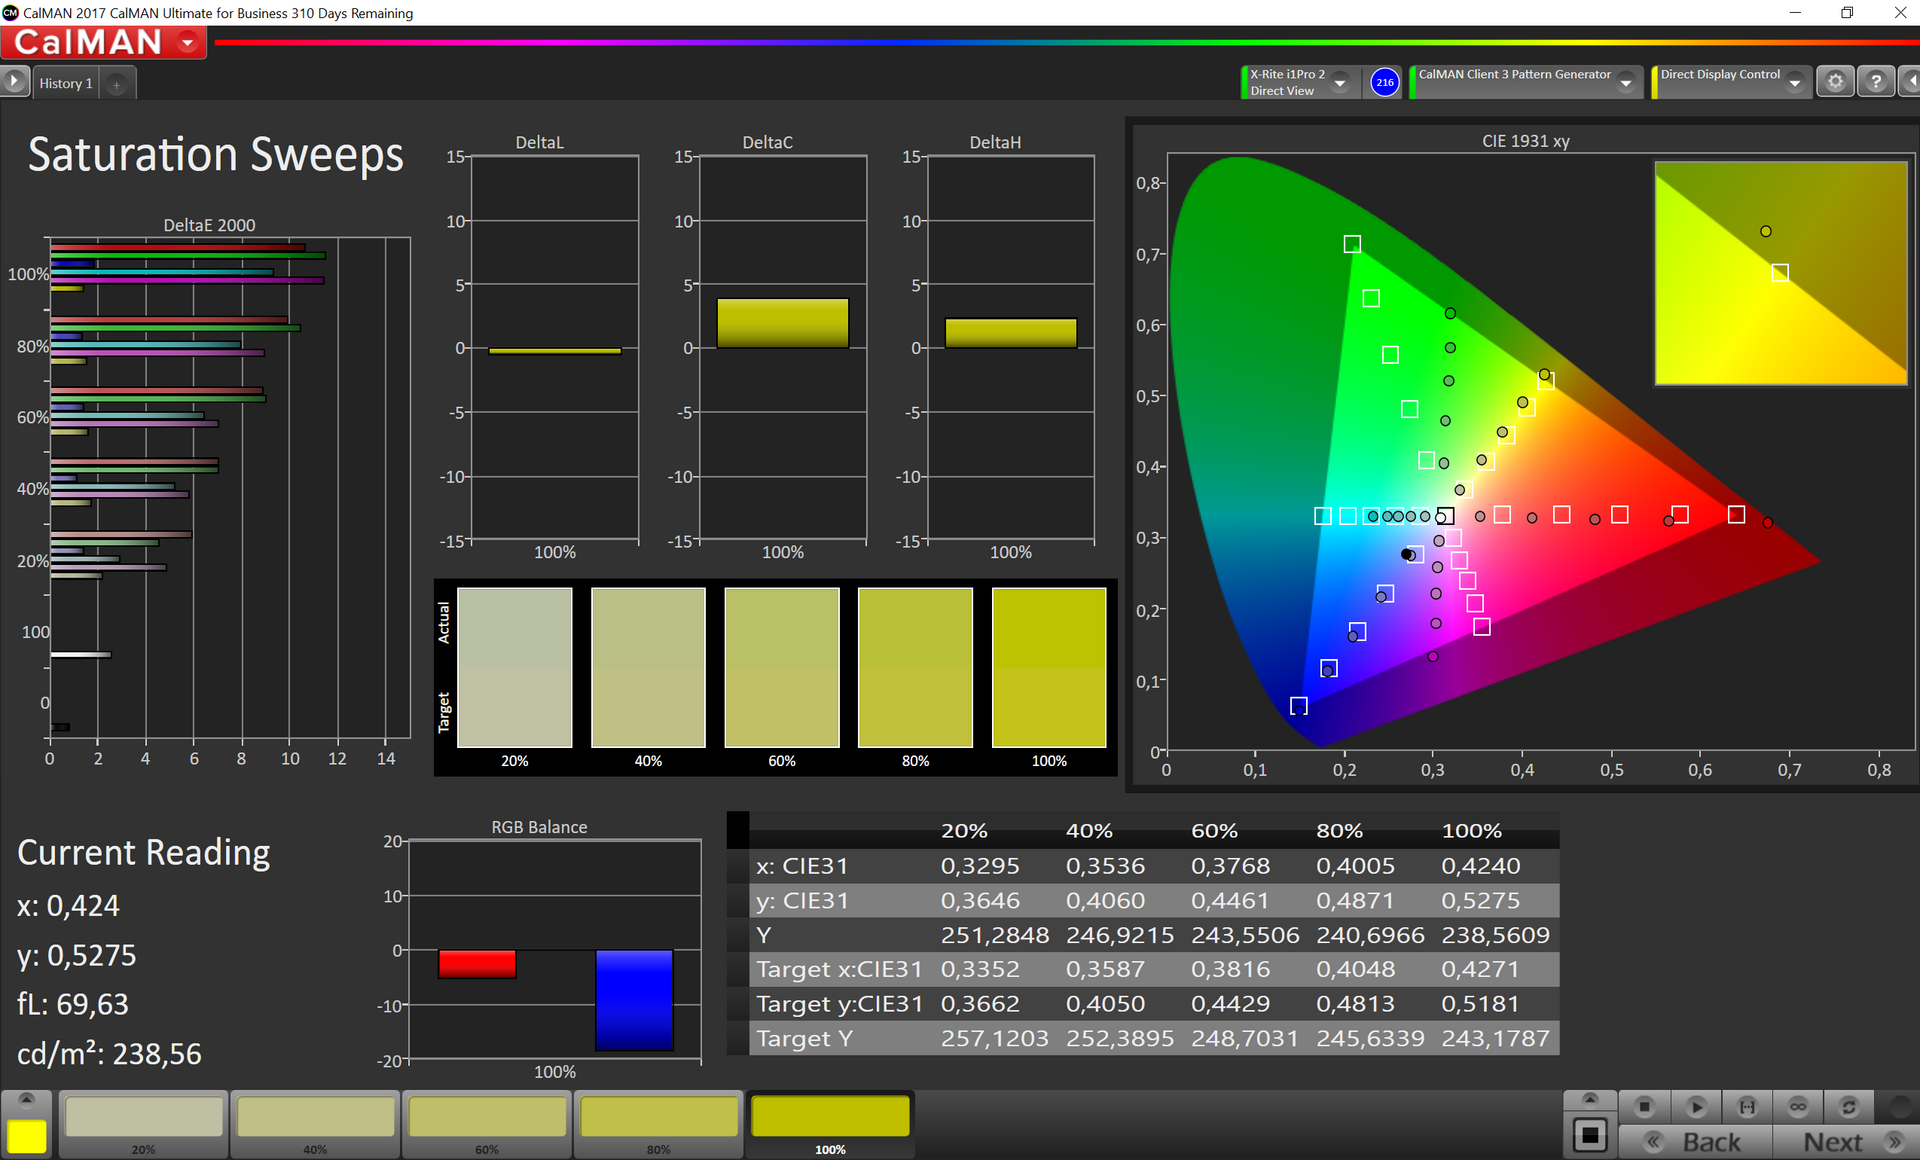
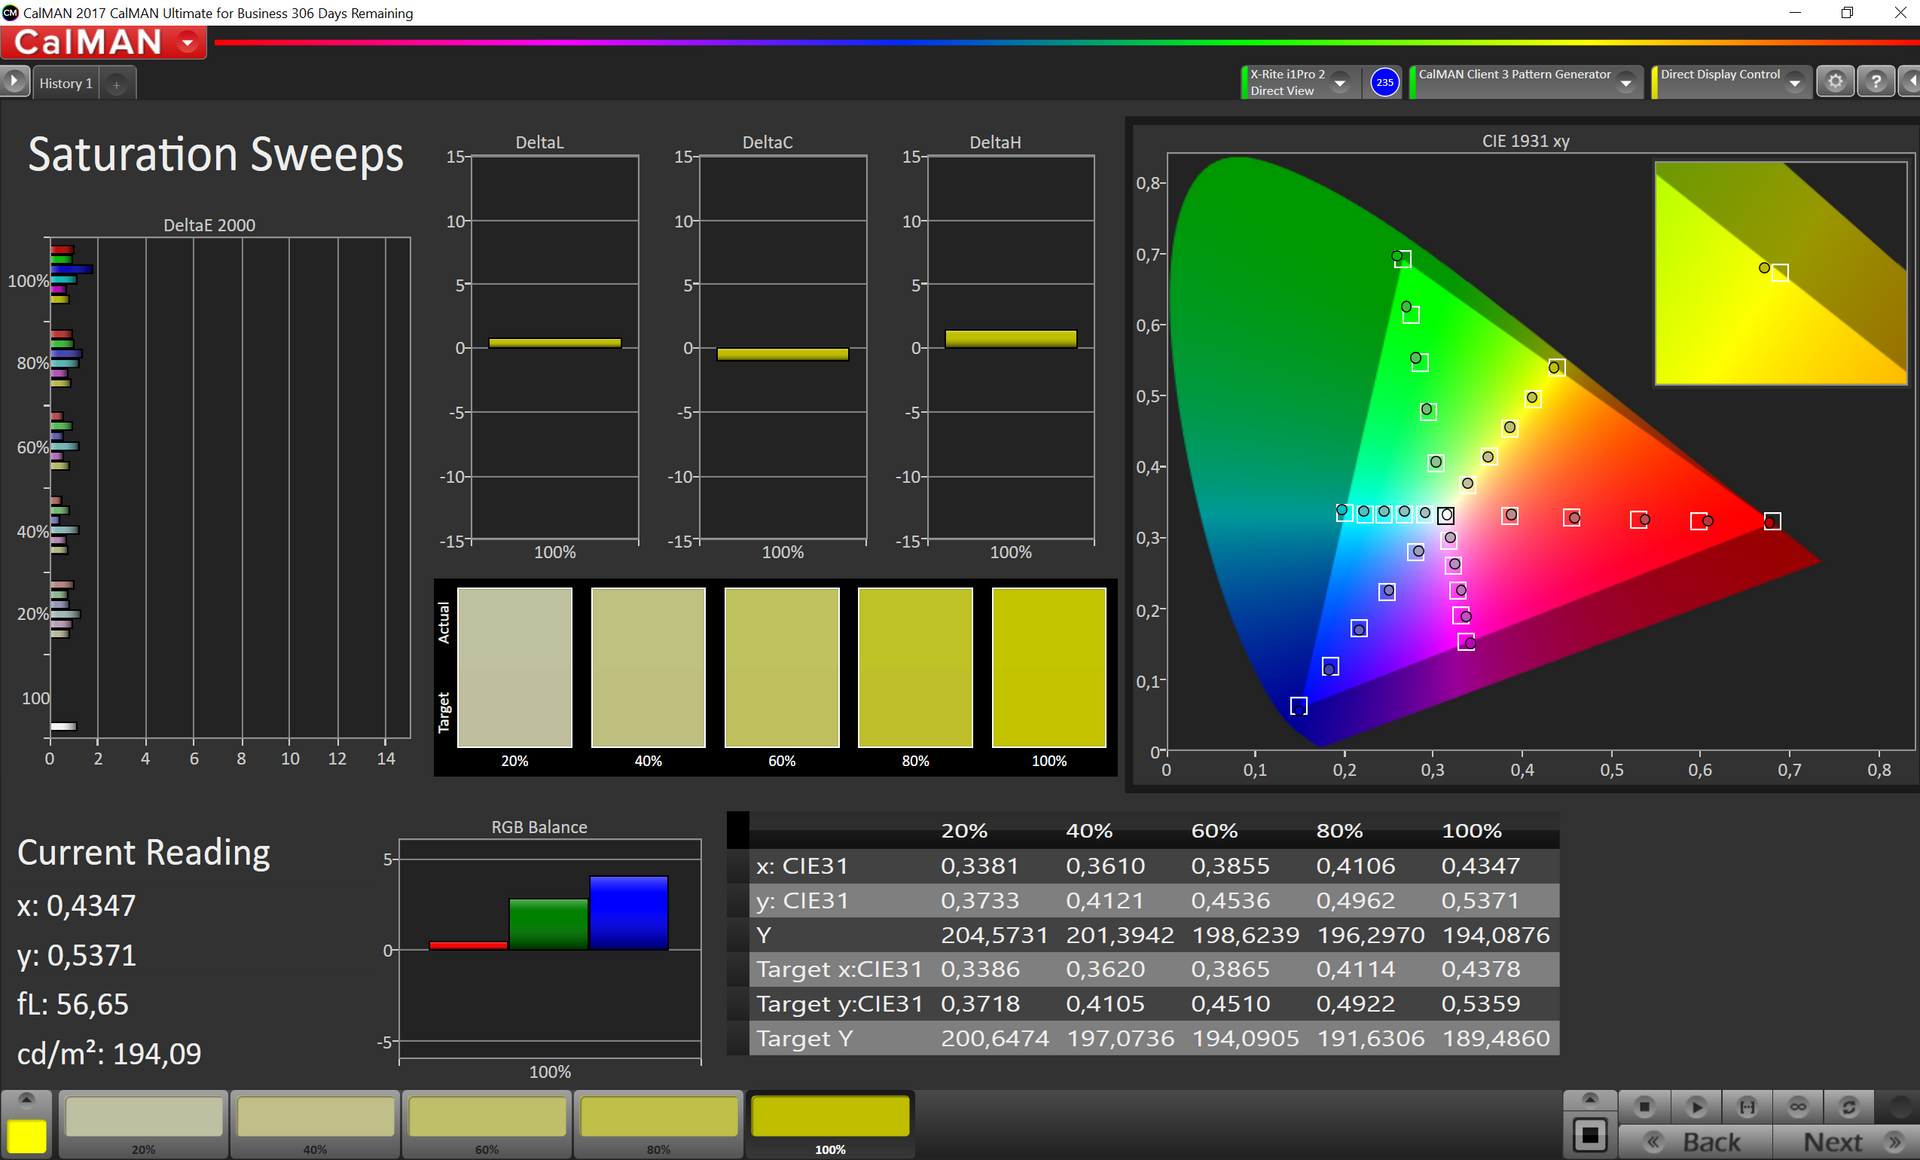
Apple includes different color profiles, including sRGB, AdobeRGB and P3. We checked all three and determined the best results with the P3 profile, but our measurements show that there is still room for improvements, especially for a workstation. We also tested the P3 profile at a lower luminance, which improved the accuracy slightly. Still, the colors in particular have some major outliers.
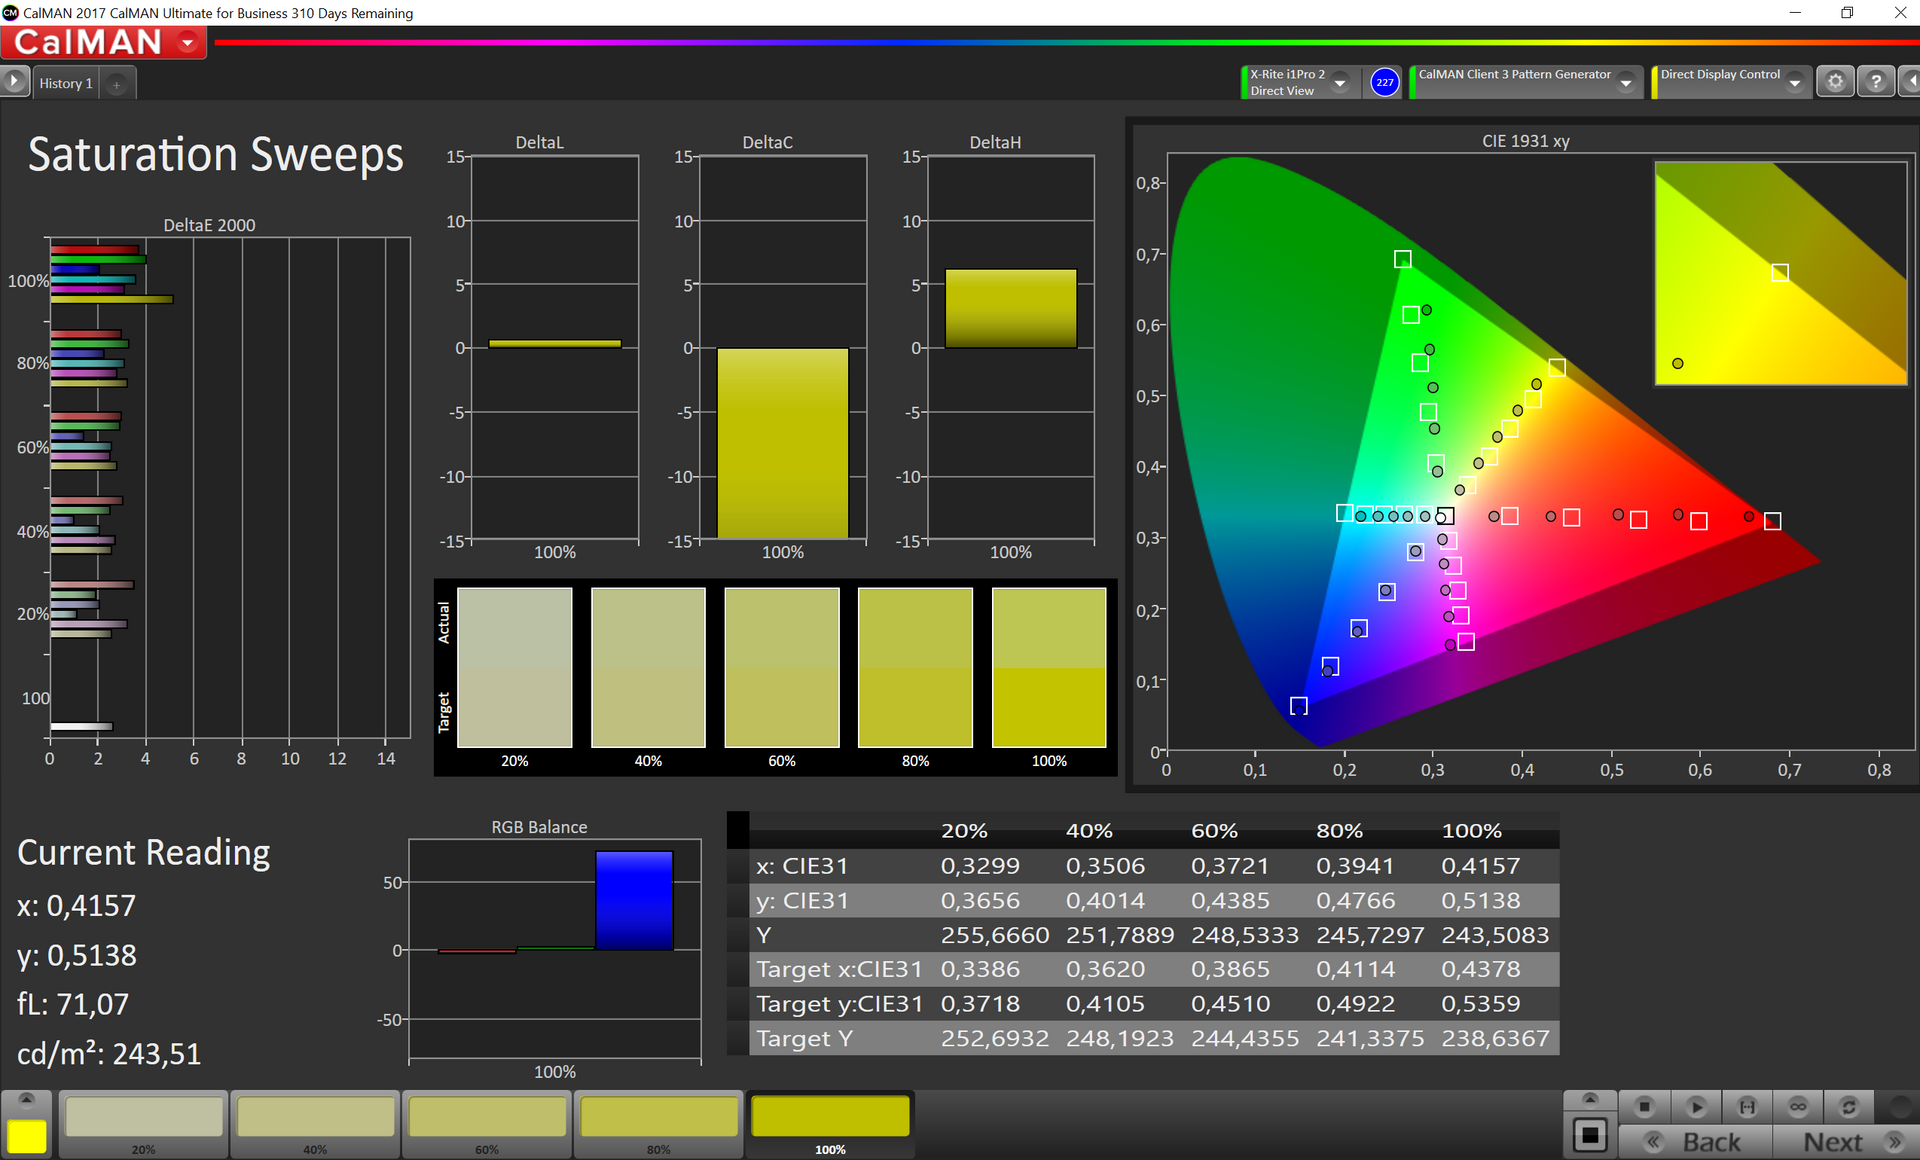

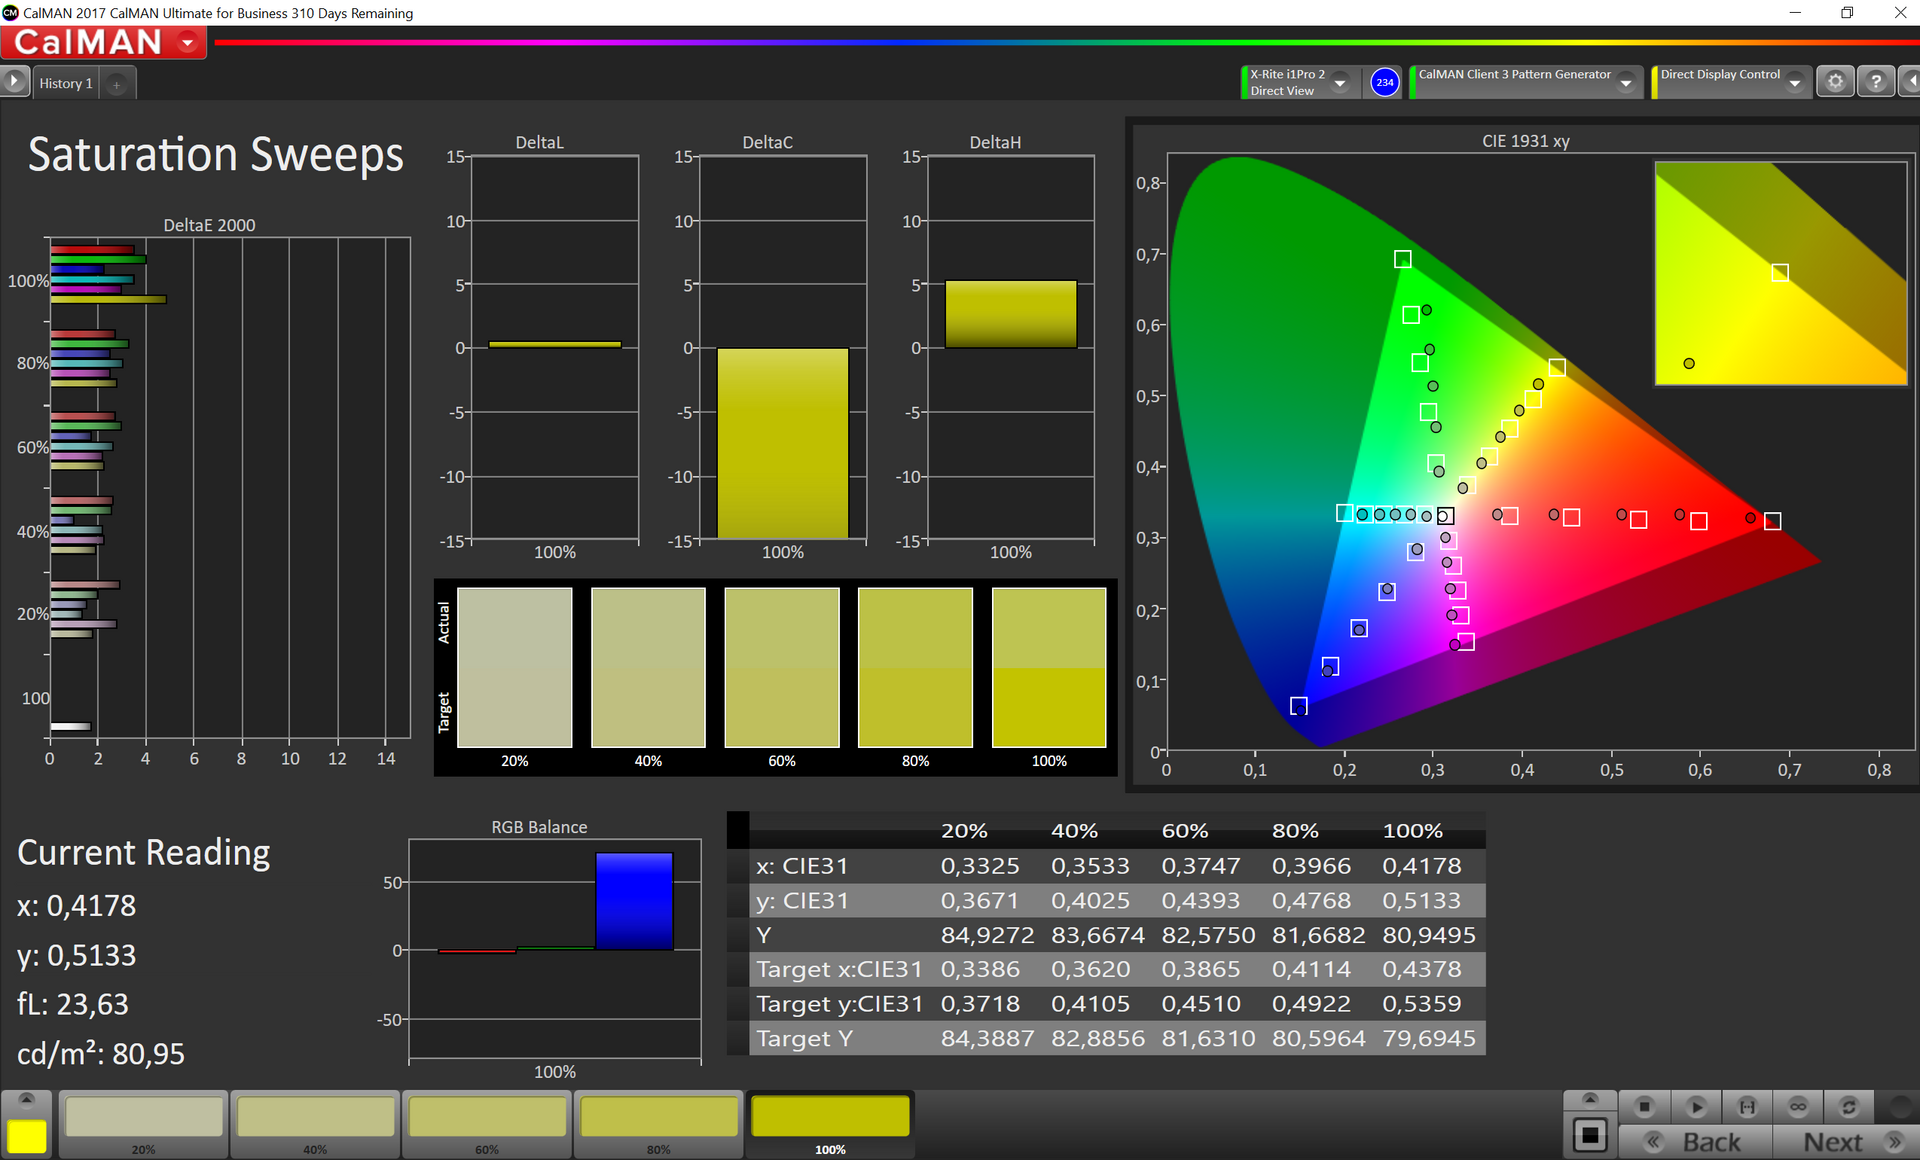
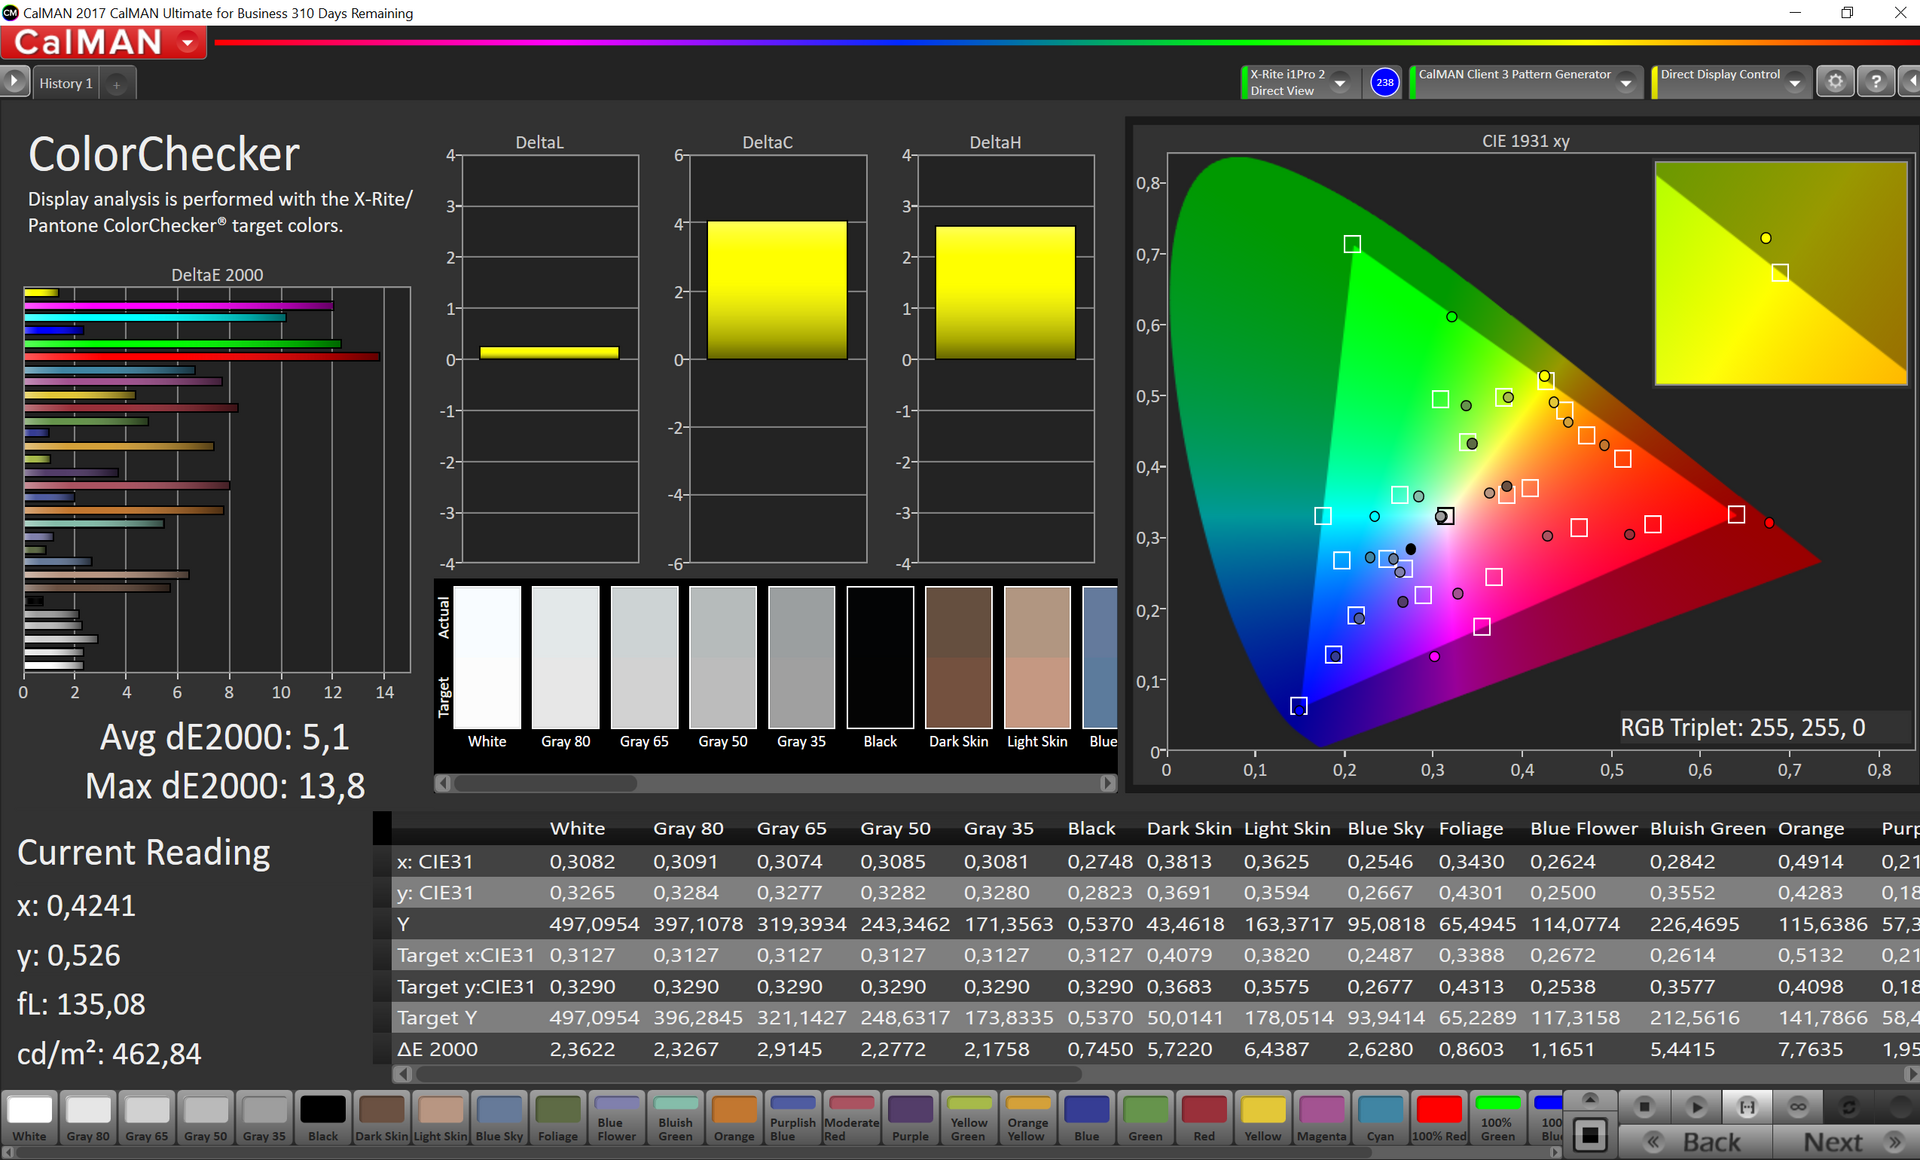
The grayscale performance with the other two profiles is very similar, but we see very high color deviations compared to the AdobeRGB reference. This is a clear indicator for the optimization towards the P3 color space and the iMac Pro is not perfect for graphics work in the AdobeRGB reference.
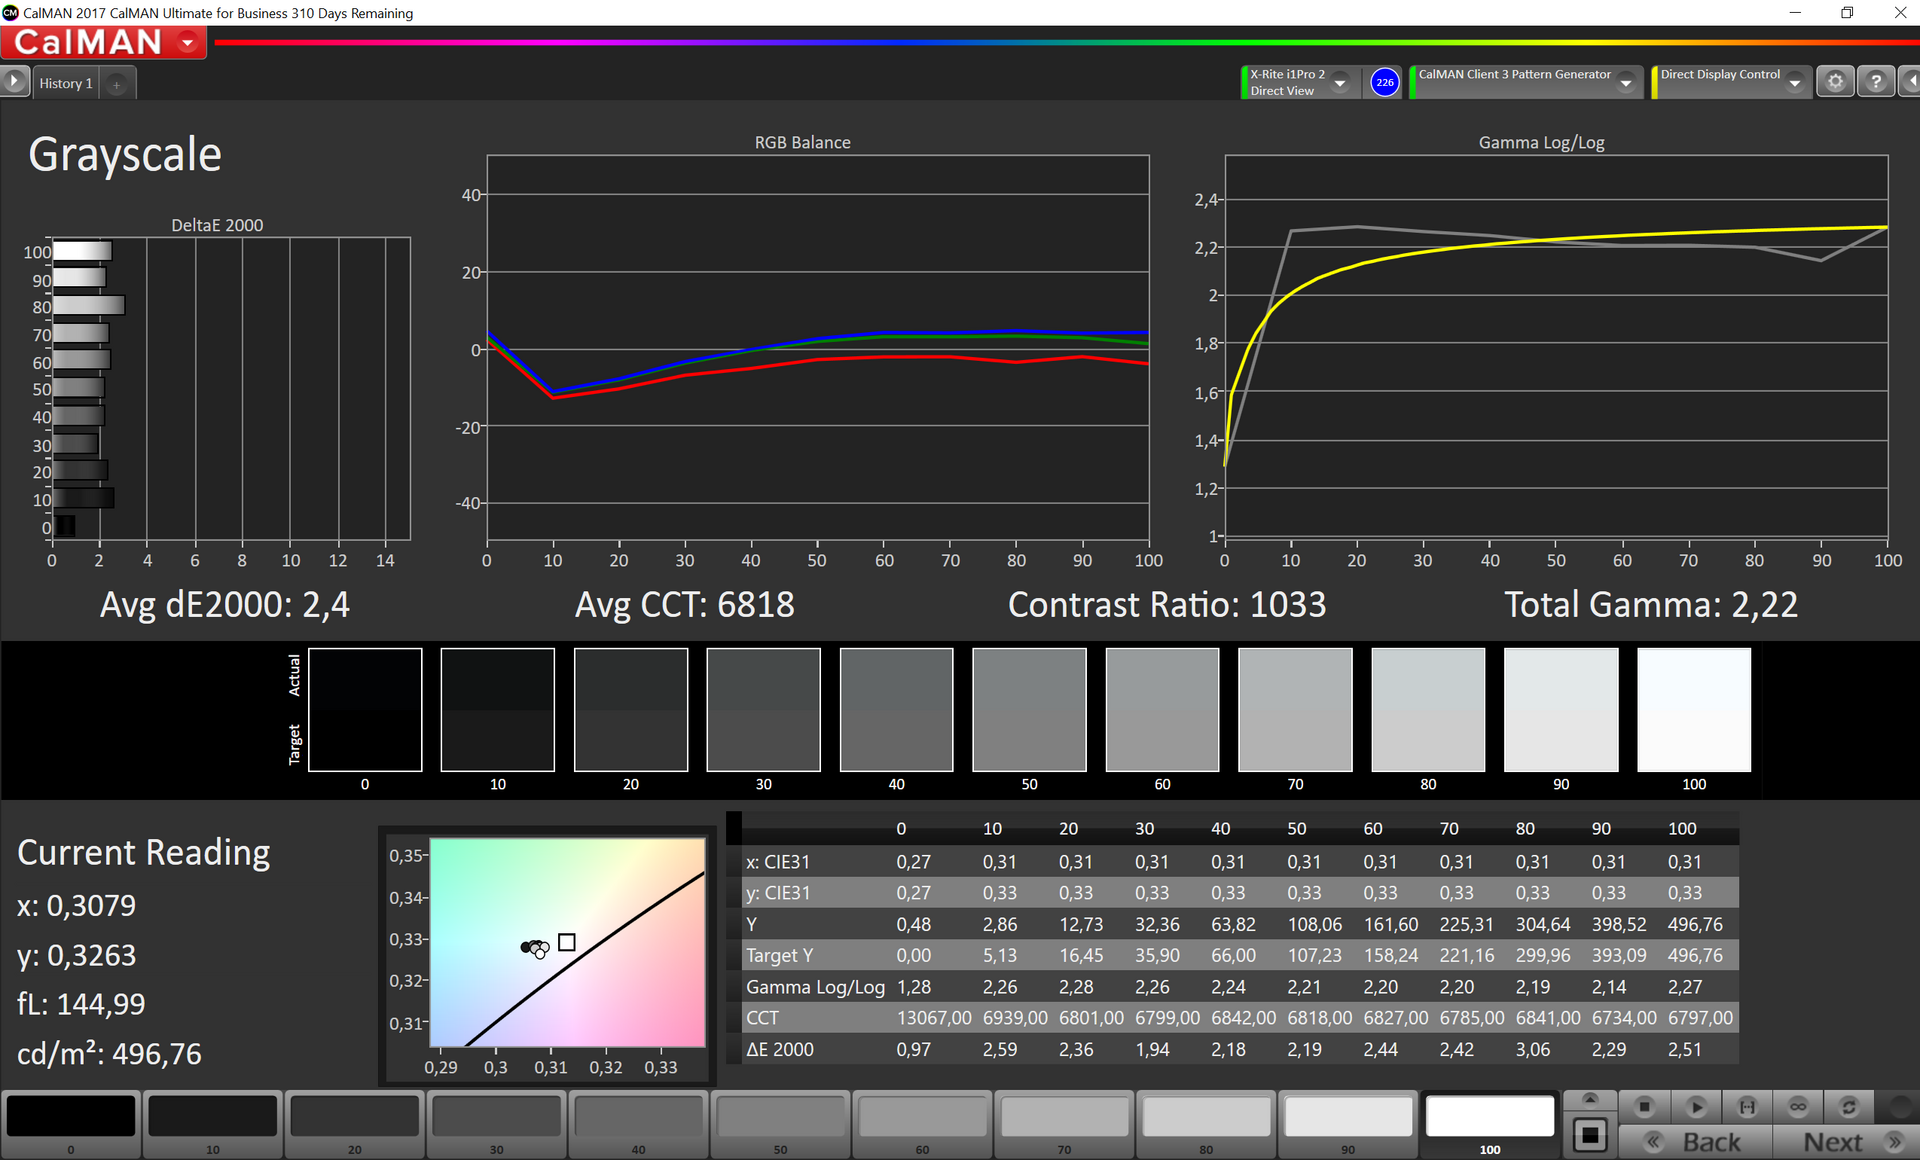

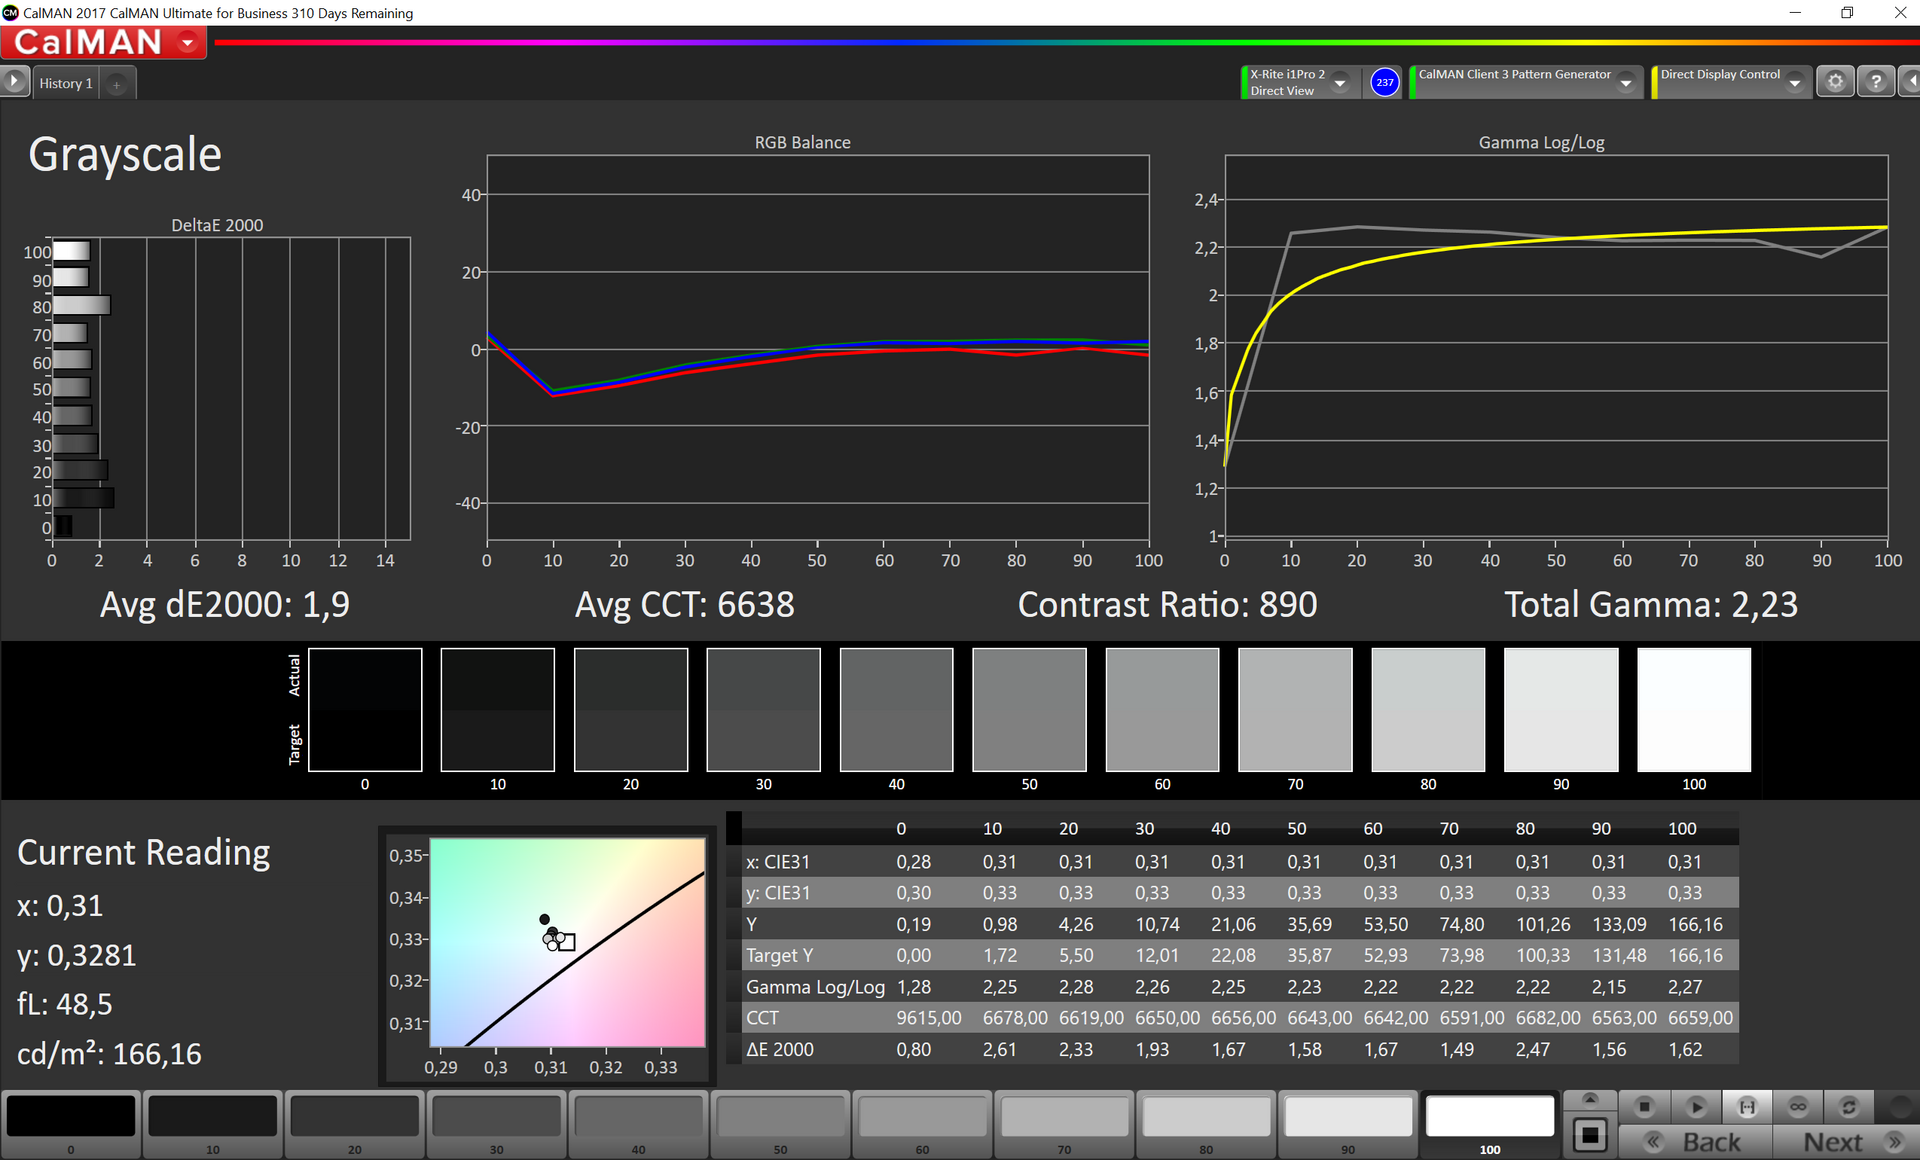
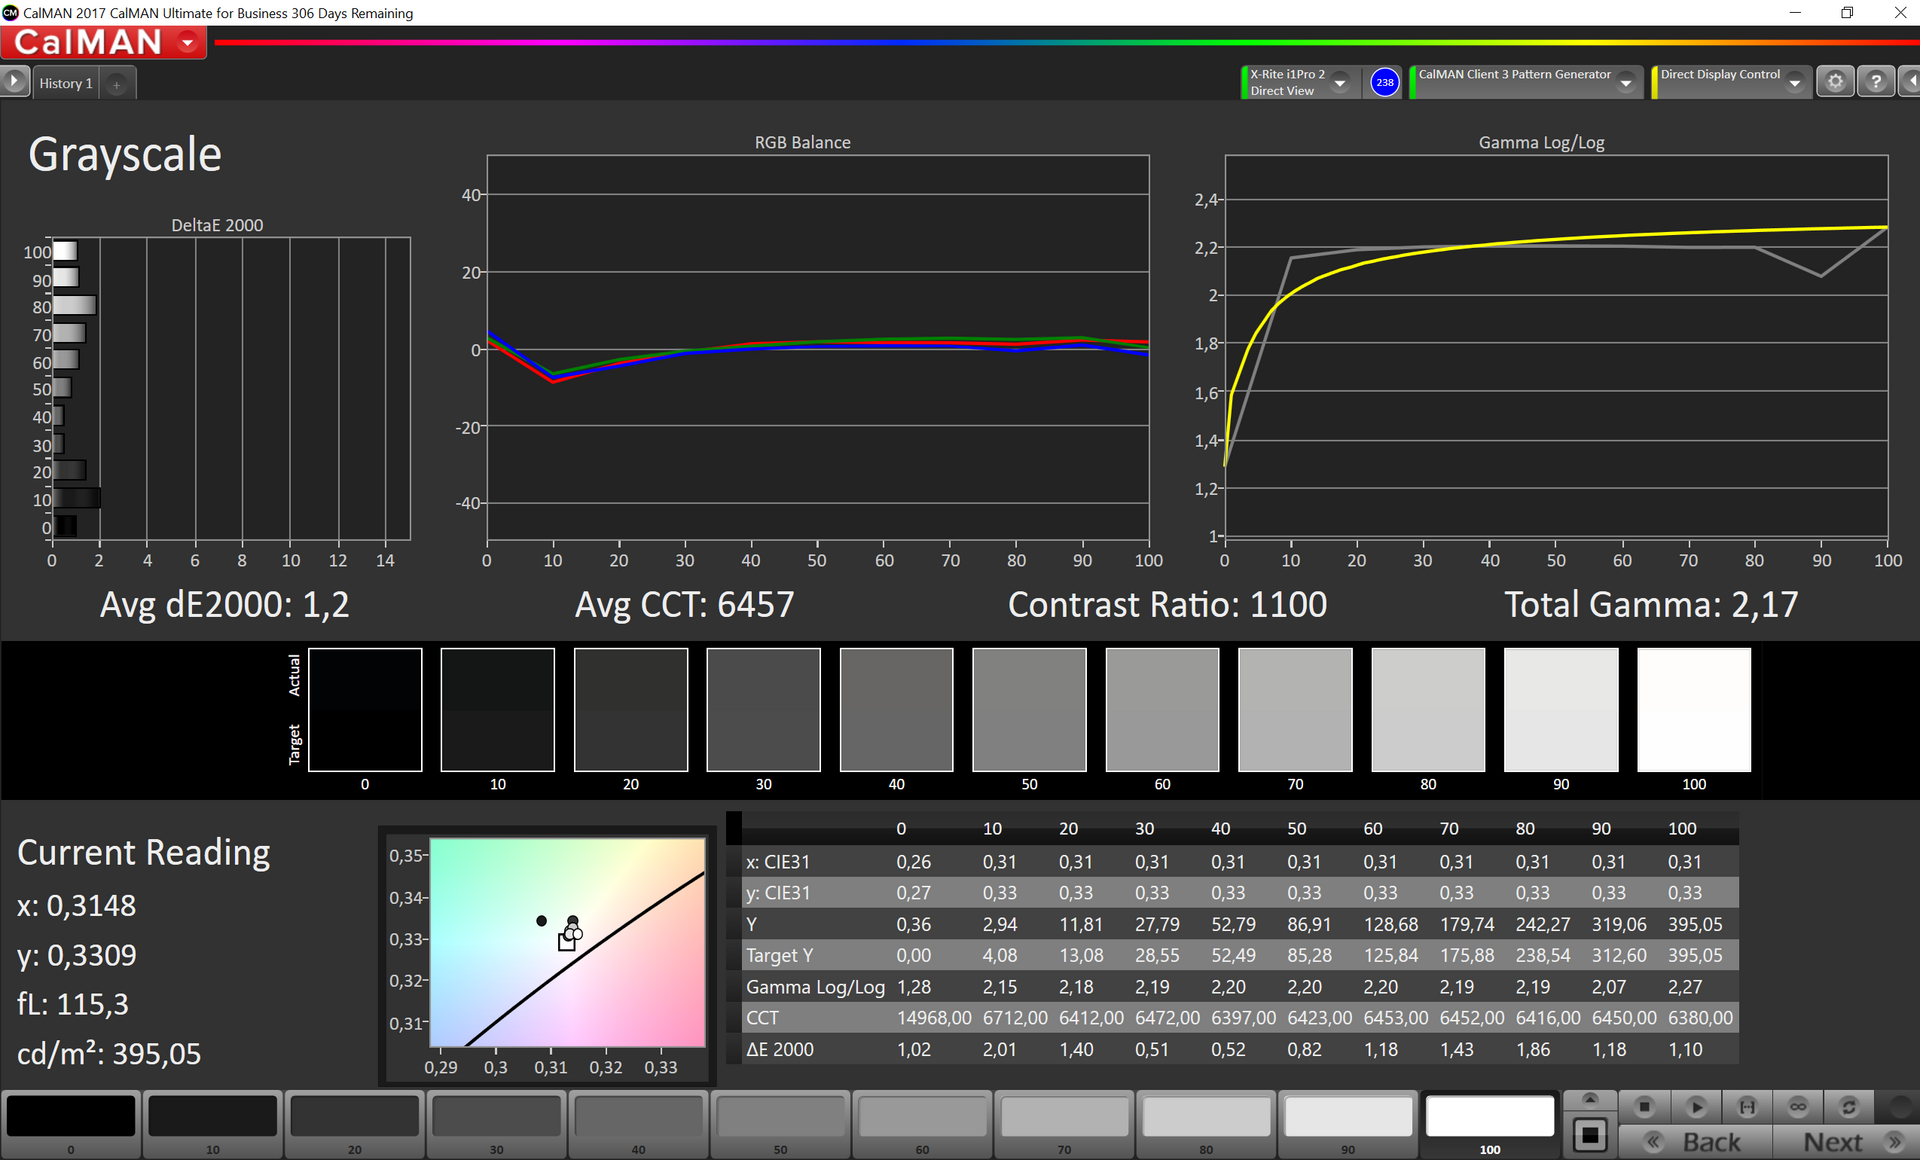
We calibrated the panel with our spectrophotometer X-Rite i1 Pro2 and managed to reduce the deviations significantly. The grayscale performance is on a reference level and the high color deviations are gone as well. Blue is still the most noticeable outlier, but also under the important mark of 3. We would have liked to see a better calibration by default similar to other manufacturers.

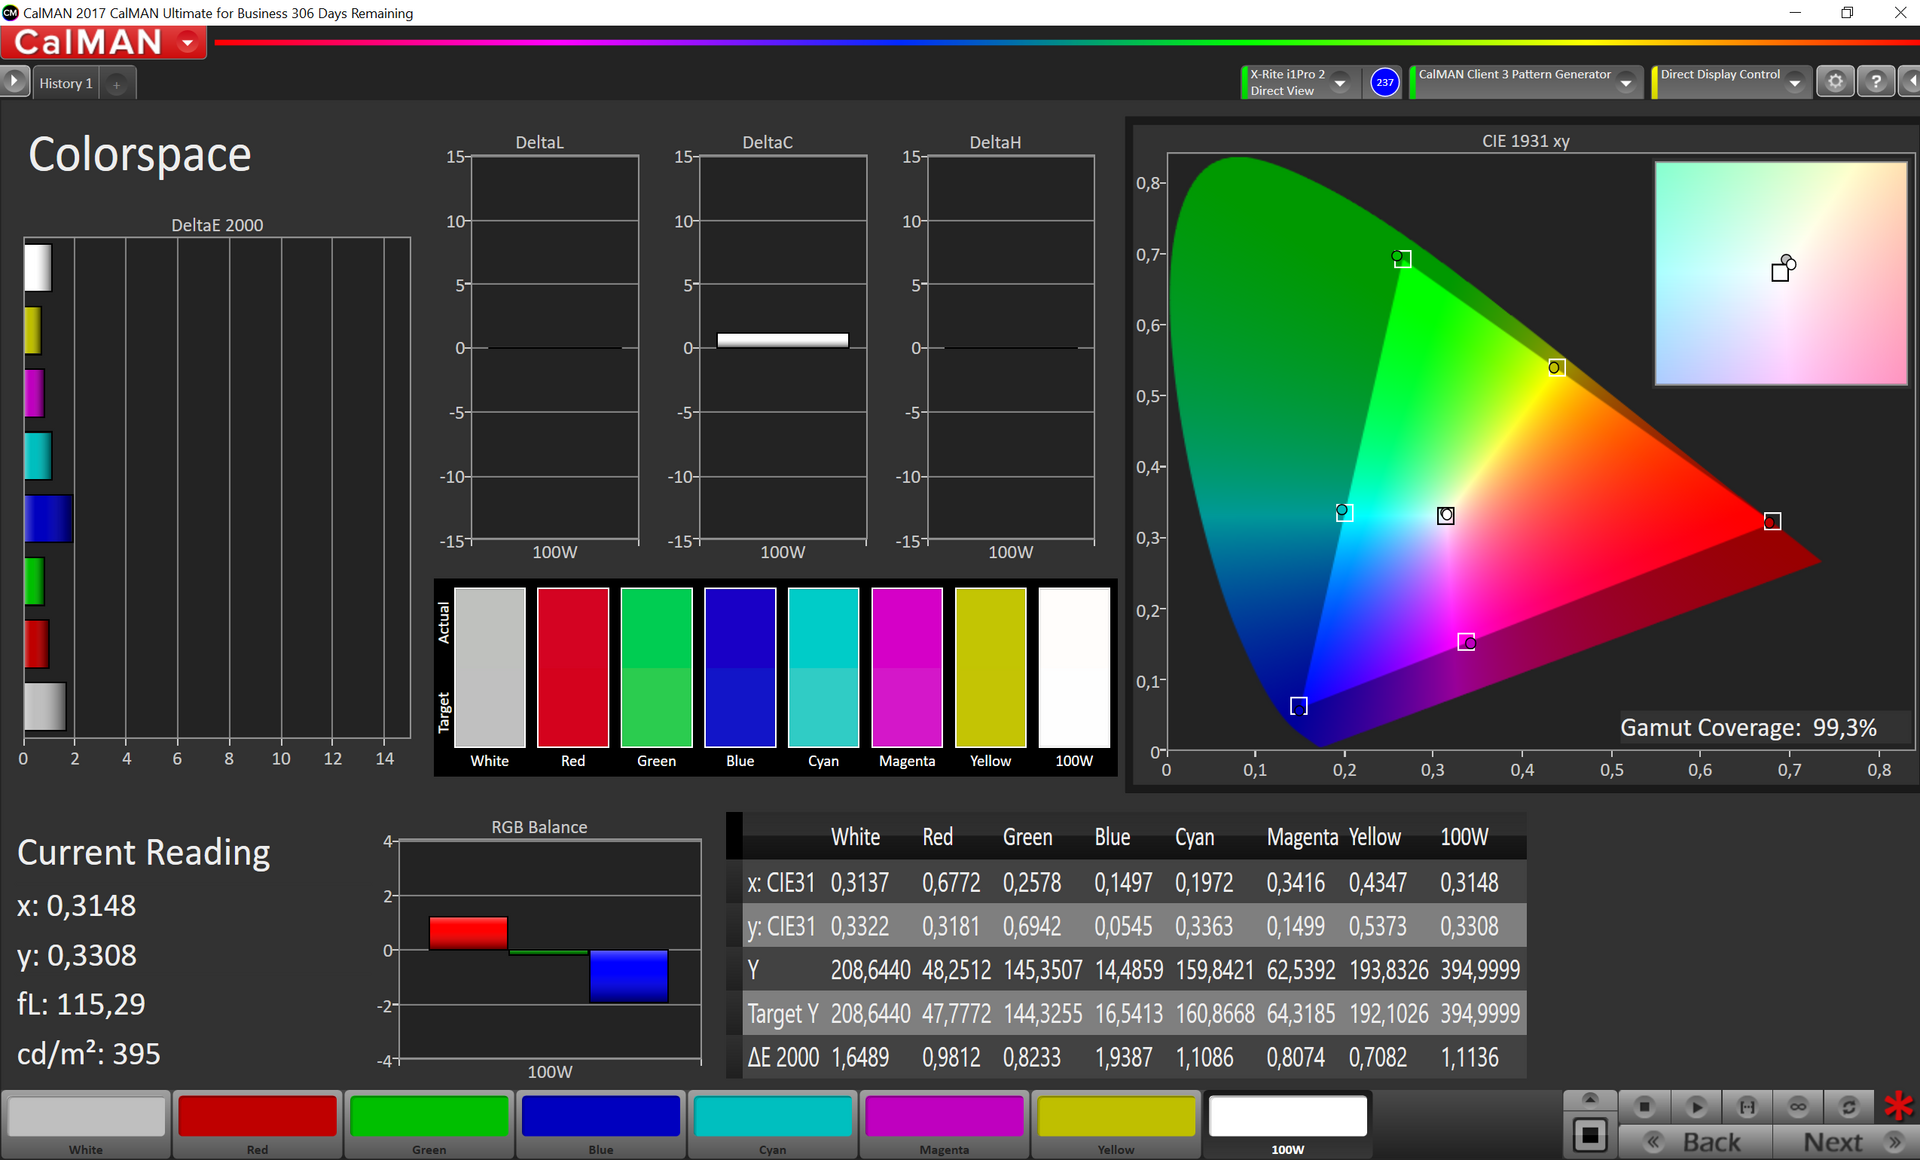
Both the smaller sRGB reference as well as the P3 color space are completely covered by the panel, but you need an external display if you want to work in the AdobeRGB color space (79.4%). All in all, the iMac Pro panel is very similar to the 5K iMac panel that we reviewed back in 2015. Our new model is a bit brighter, but there are no additional changes or improvements by Apple.
Display Response Times
| ↔ Response Time Black to White | ||
|---|---|---|
| 18.8 ms ... rise ↗ and fall ↘ combined | ↗ 11.2 ms rise | 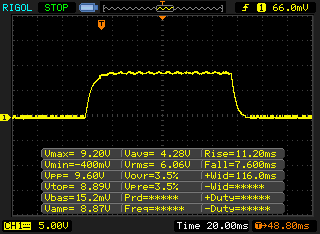 |
| ↘ 7.6 ms fall | ||
| The screen shows good response rates in our tests, but may be too slow for competitive gamers. In comparison, all tested devices range from 0.1 (minimum) to 240 (maximum) ms. » 42 % of all devices are better. This means that the measured response time is similar to the average of all tested devices (19.8 ms). | ||
| ↔ Response Time 50% Grey to 80% Grey | ||
| 30.4 ms ... rise ↗ and fall ↘ combined | ↗ 14 ms rise | 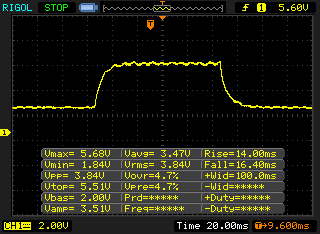 |
| ↘ 16.4 ms fall | ||
| The screen shows slow response rates in our tests and will be unsatisfactory for gamers. In comparison, all tested devices range from 0.165 (minimum) to 636 (maximum) ms. » 41 % of all devices are better. This means that the measured response time is similar to the average of all tested devices (31 ms). | ||
Screen Flickering / PWM (Pulse-Width Modulation)
| Screen flickering / PWM detected | 208.3 Hz | ≤ 50 % brightness setting | 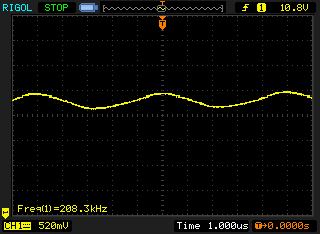 |
The display backlight flickers at 208.3 Hz (worst case, e.g., utilizing PWM) Flickering detected at a brightness setting of 50 % and below. There should be no flickering or PWM above this brightness setting. The frequency of 208.3 Hz is relatively low, so sensitive users will likely notice flickering and experience eyestrain at the stated brightness setting and below. In comparison: 52 % of all tested devices do not use PWM to dim the display. If PWM was detected, an average of 7753 (minimum: 5 - maximum: 343500) Hz was measured. | |||
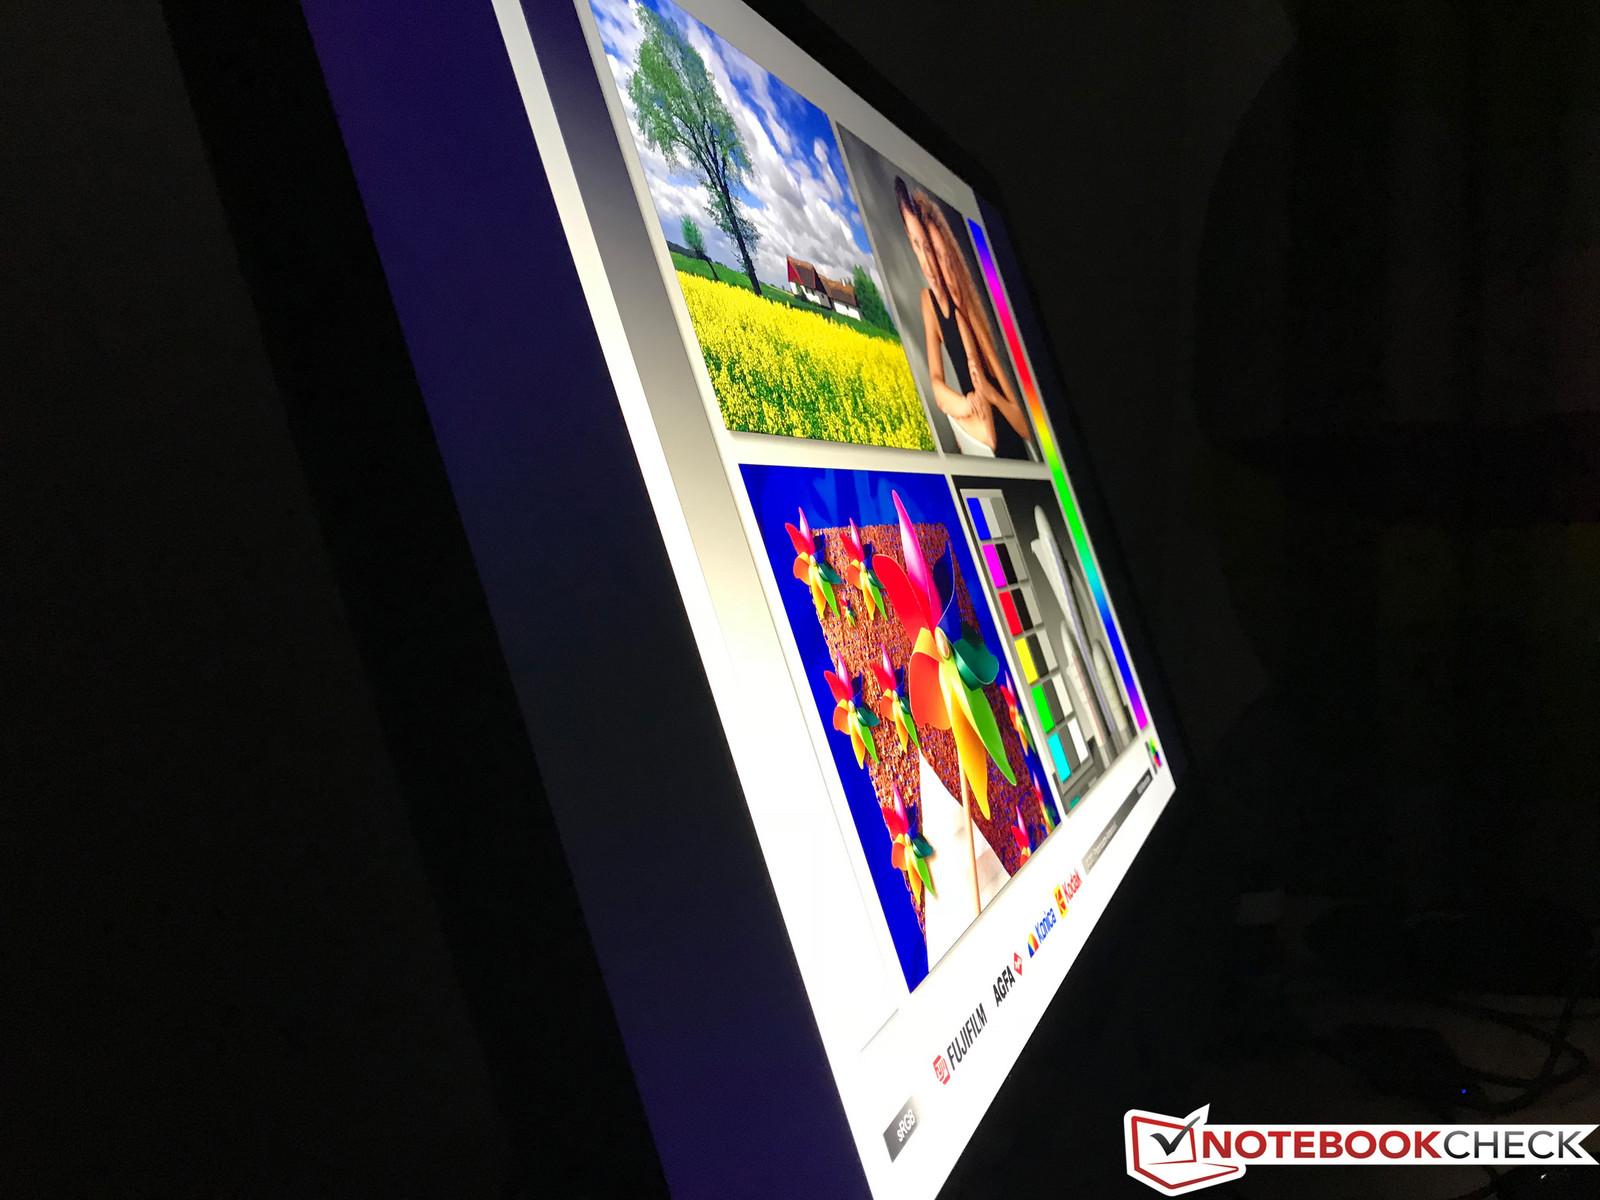
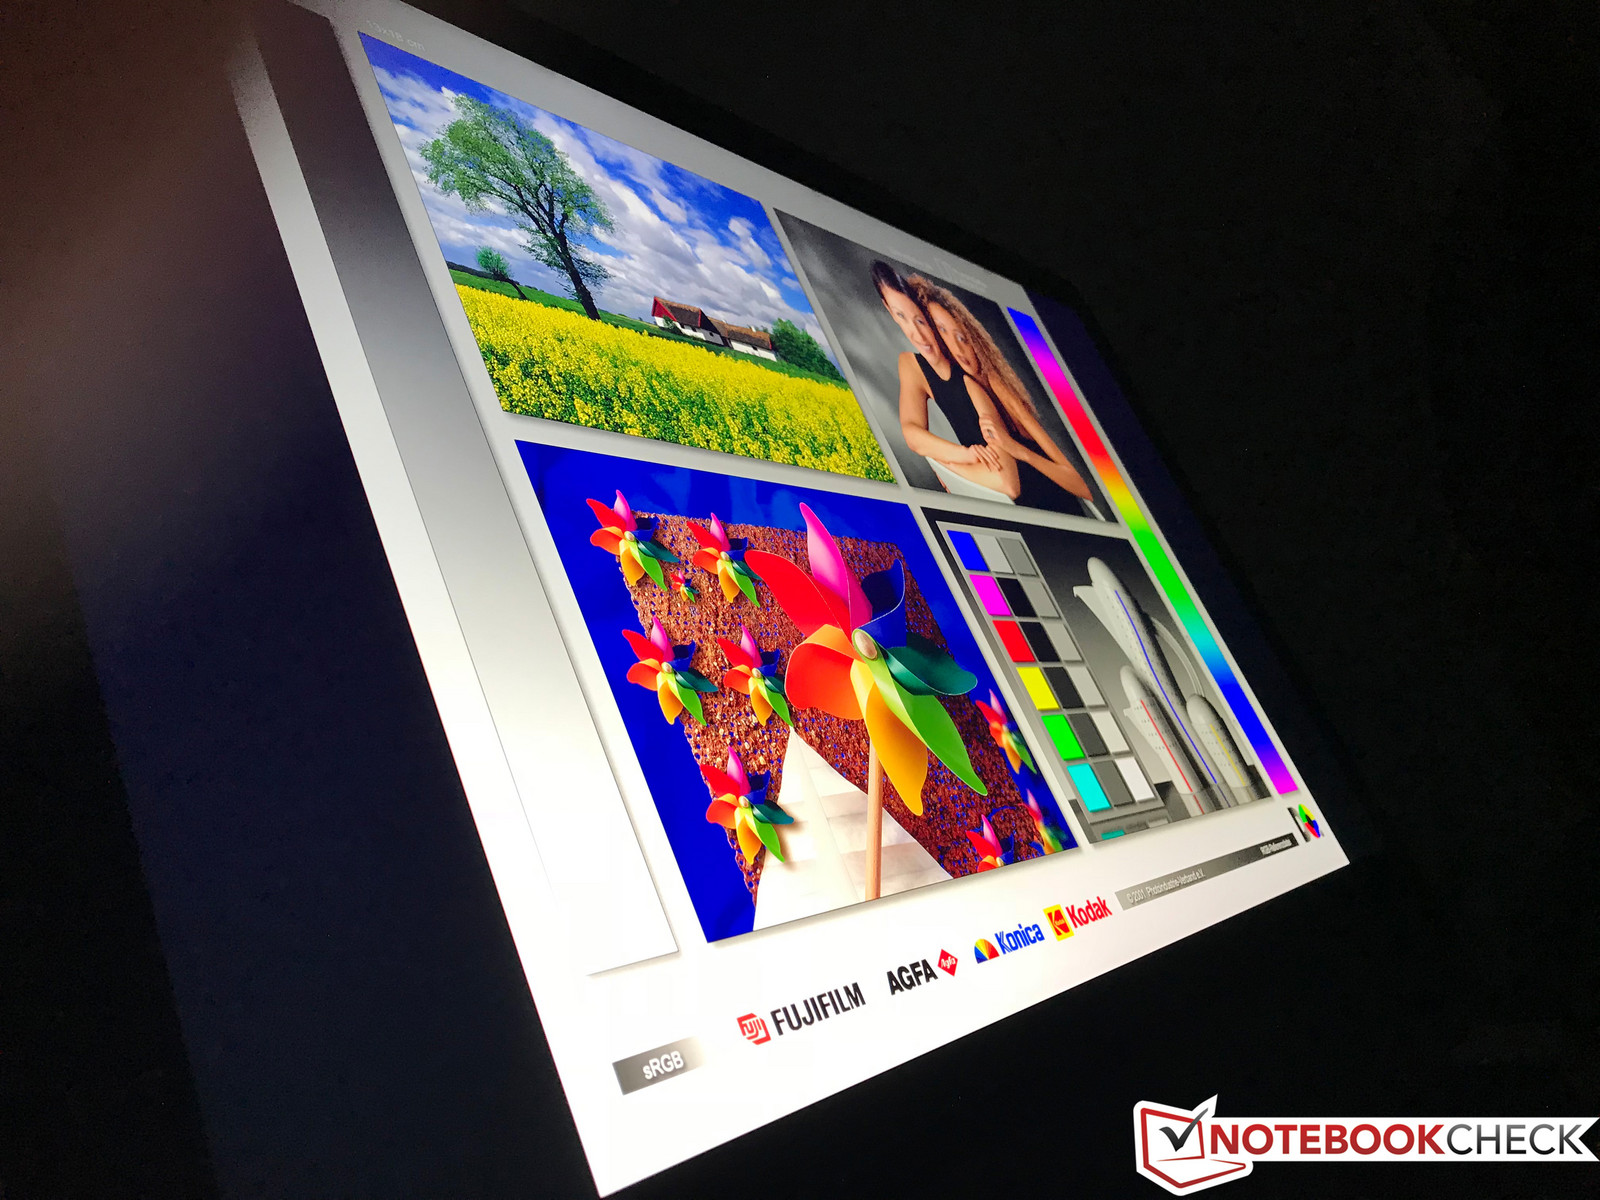
The viewing angle stability of the IPS screen is very good and you can still see a clear image even from very wide angles.
Performance
Apple's iMac Pro is without any doubt a very powerful system, and it is not that easy to classify the performance. There are a lot of professional applications and tasks, so it is almost impossible to cover them all within one review, and all our other mobile workstations are running on Windows. Many benchmarks are not available for macOS, so we test many aspects under Windows to ensure a certain level of comparability with other components.
We used Apple's integrated BootCamp tool for the installation. One thing you have to consider is that the performance, especially the GPU performance, is depending a lot on the drivers and usually a bit better running macOS. We list both scores if the benchmark is available for both operating systems.
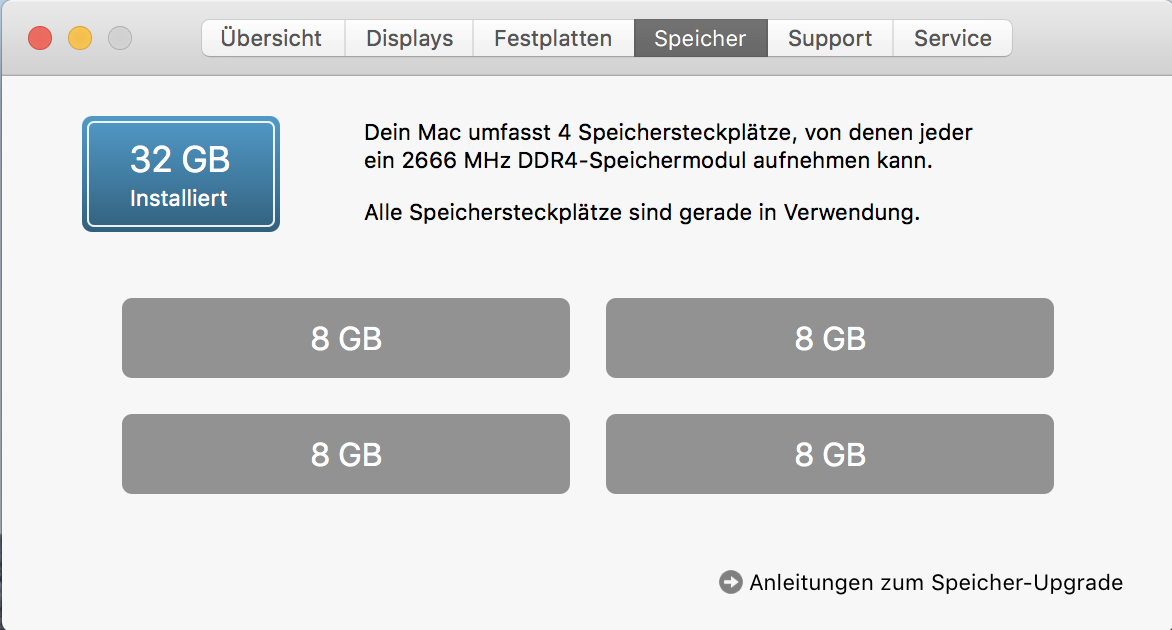
The iMac Pro is exclusively shipped with ECC-RAM. Our test model is equipped with four 8 GB modules; the maximum amount of RAM is 128 GB with four 32 GB modules.
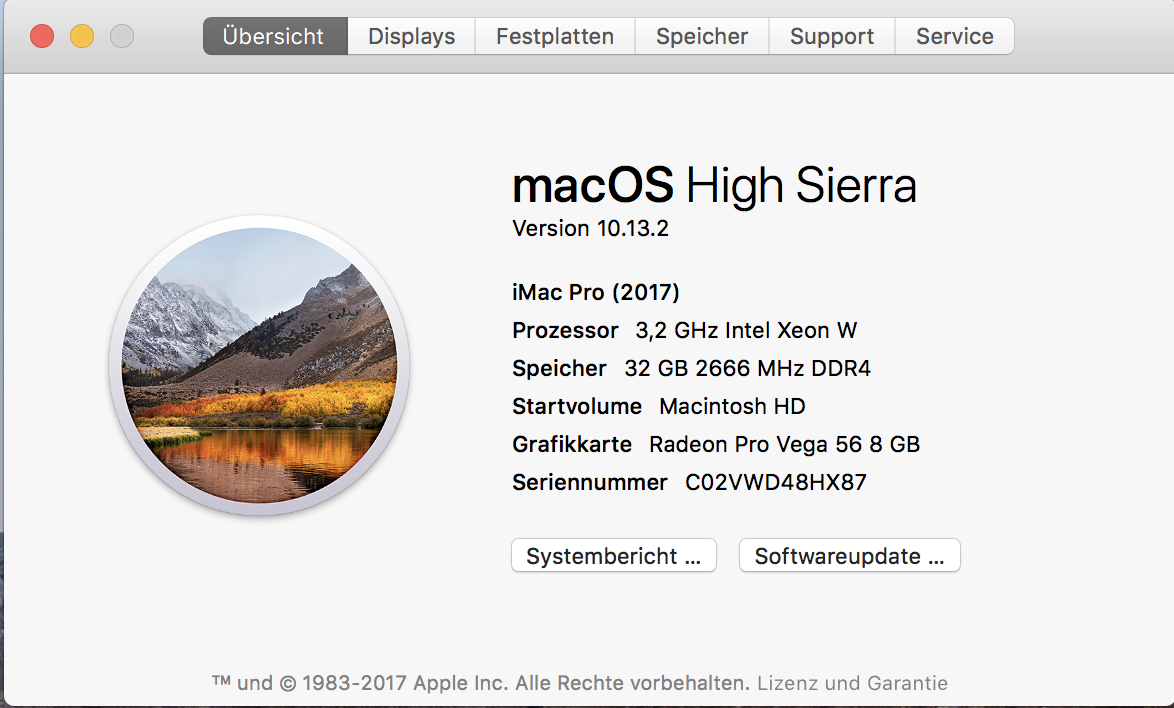
Processor - 8 Core Intel Xeon W
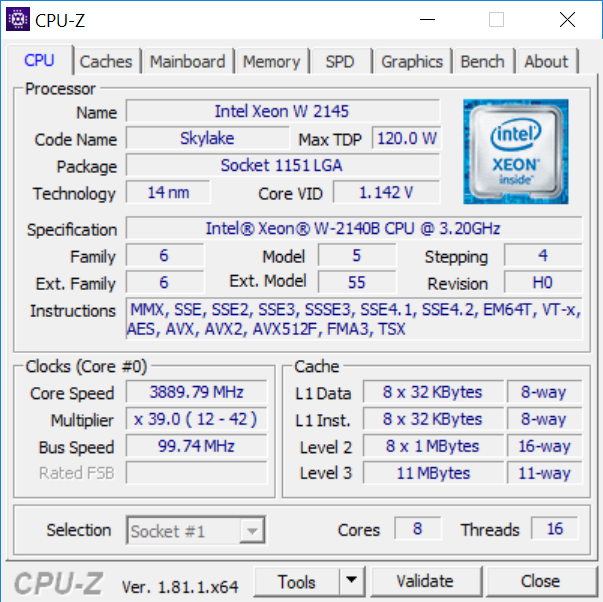
Apple offers four different Xeon processors for the iMac Pro, either with 8, 10, 14, or 18 CPU cores. Our test model is powered by the Intel Xeon W 2145, at least in theory. It should have a base frequency of 3.7 GHz with a Boost of up to 4.5 GHz, but this seems to be a special version for Apple. The exact specification is Xeon W-2140B, a slightly throttled version running at 3.2 and up to 4.2 GHz, respectively.
The processor is based on the 14 nm Skylake-X architecture and has a specified TDP of 140 W. Cinebench is available for both operating systems, so we were able to compare the performance, but there is no noticeable difference. A single core can run at up to 4.2 GHz, which is not a lot nowadays. We included some modern ULV chips and mobile Core i7 models for the comparison and they can easily keep up with the expensive desktop CPU when you only stress one core for a limited time.
The Xeon processor can show its potential when you start to stress more cores (up to 3.9 GHz). The old mobile quad-cores and even the new 6-core CPUs are easily beaten. It also seems Apple has removed all the consumption limitations, which is similar to the MacBook Pros. The chip can consume up to 200 W under sustained workloads and clearly surpasses the original 140-W limit. The benchmark scores only differ slightly in our Cinebench loop (both macOS as well as Win 10). The cooling solution is also very restrained under CPU workloads, so there should be sufficient head room for optional processors with more cores.
More benchmarks are available in our tech section.
System Performance - Responsive, also with BootCamp Windows
It does not matter whether you use macOS or Windows 10; the subjective performance impression is extremely good. All our inputs are executed without delays and even more complex applications are launched without any noteworthy waiting times. The installation of Windows via BootCamp was super easy, because you do not even need a USB stick (Windows image file is sufficient). We did not encounter any hardware or software issues during our review period.
| PCMark 8 Home Score Accelerated v2 | 4327 points | |
| PCMark 8 Creative Score Accelerated v2 | 7689 points | |
| PCMark 8 Work Score Accelerated v2 | 4614 points | |
| PCMark 10 Score | 6050 points | |
Help | ||
Storage Device - SSD-storage only
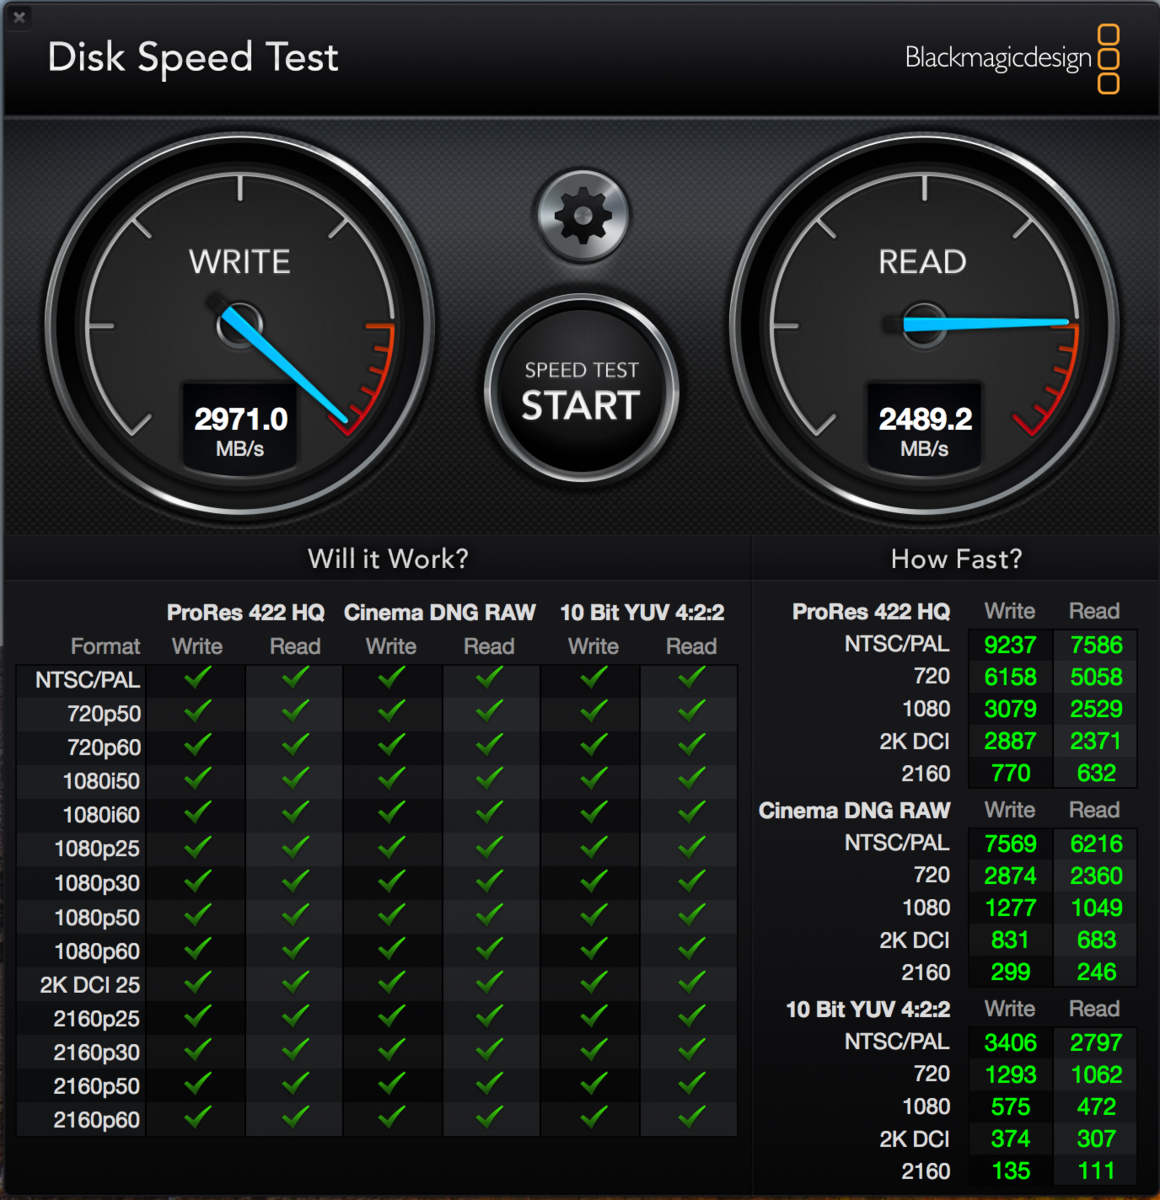
The iMac Pro is only available with fast PCIe-SSD storage and our model is equipped with a 1 TB drive. You can use about 963 GB for your own files and apps after the initial launch. Apple sells the iMac Pro with up to 4 TB SSD storage, but the additional price is extremely high (+3360 Euros/~$3928). As usual, the common Windows performance tools struggle with the SSD in Apple devices, so we use the tool Disk Speed Test in macOS. Interestingly, the write performance of ~3 GB/s is a bit better than the read performance, but the latter is still excellent at about 2.5 GB/s. Drives with a higher storage capacity should perform even a bit better.
We recommend a look at our HDD/SSD ranking for more performance comparisons.

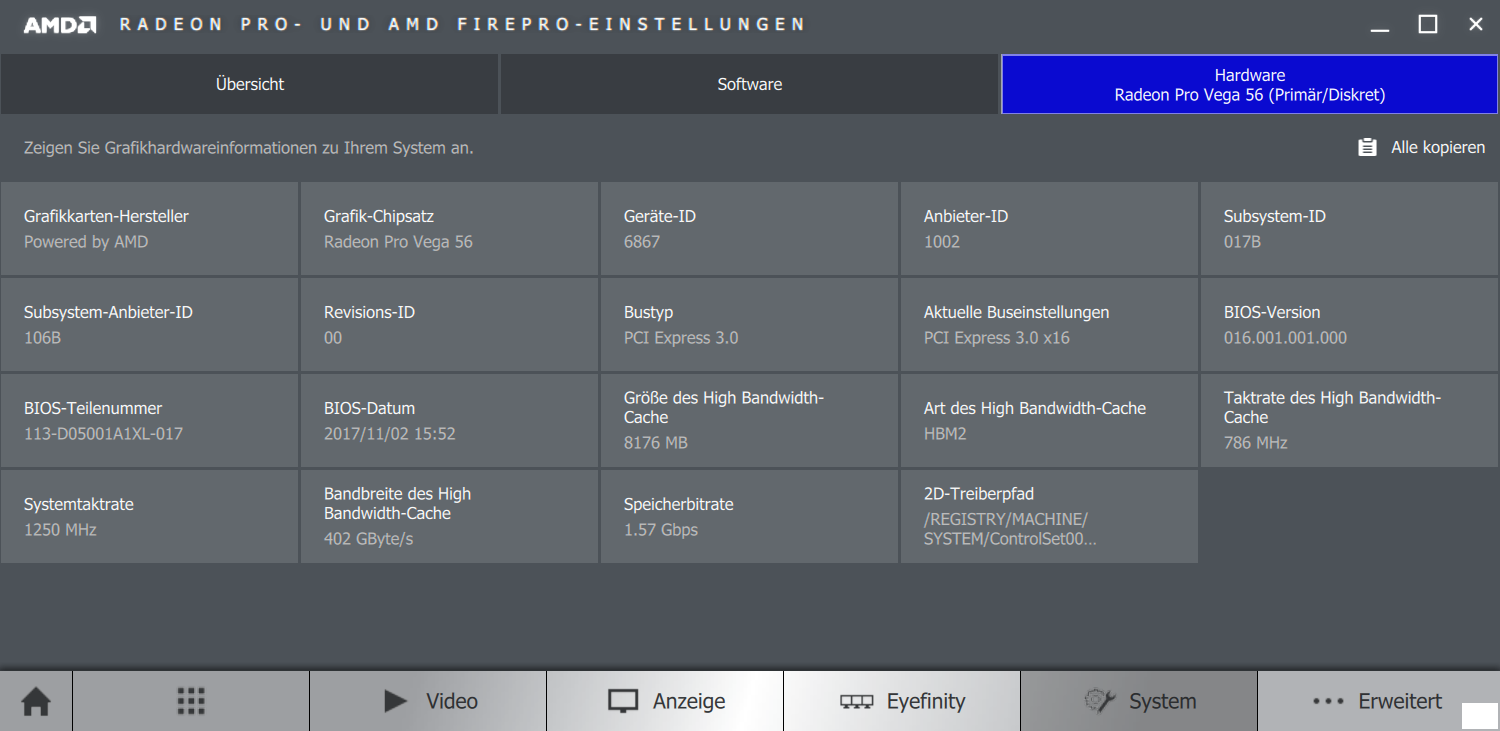
GPU Performance - Radeon Pro Vega with HBM2
The Radeon Pro Vega 56 and the optional Radeon Pro Vega 64 are – just like the regular RX Vega models – based on the Polaris 10 chip (14 nm). AMD deactivates some shader (3584 vs. 4096) and texture mapping units (224 vs. 256) on the Radeon Pro Vega 56 compared to the RX Vega 64. The maximum core clock of the professional GPU is also lower at up to 1250 MHz, while the consumer version reaches up to 1536 MHz. Both GPUs are equipped with 8 GB of HBM2 VRAM, but the clock of the Pro version is once again lower (786 vs. 945 MHz). The optional Radeon Pro Vega 64 (+720 Euros/~$842) has slightly higher clocks, but the biggest advantage is the bigger VRAM at 16 GB. AMD's Radeon Pro Vega also supports VR applications.
| Radeon Pro Vega 56 | Radeon Pro Vega | Radeon RX Vega 64 | |
|---|---|---|---|
| Chip | 14nm Polaris 10 | 14nm Polaris 10 | 14nm Polaris 10 |
| Shader | 3584 | 4096 | 4096 |
| TMUs | 224 | 256 | 256 |
| VRAM | 8 GB HBM2 | 16 GB HBM2 | 8 GB HBM2 |
| Core clock | 1250 MHz | 1350 MHz | 1536 MHz |
| Memory clock | 786 MHz | 786 MHz | 945 MHz |
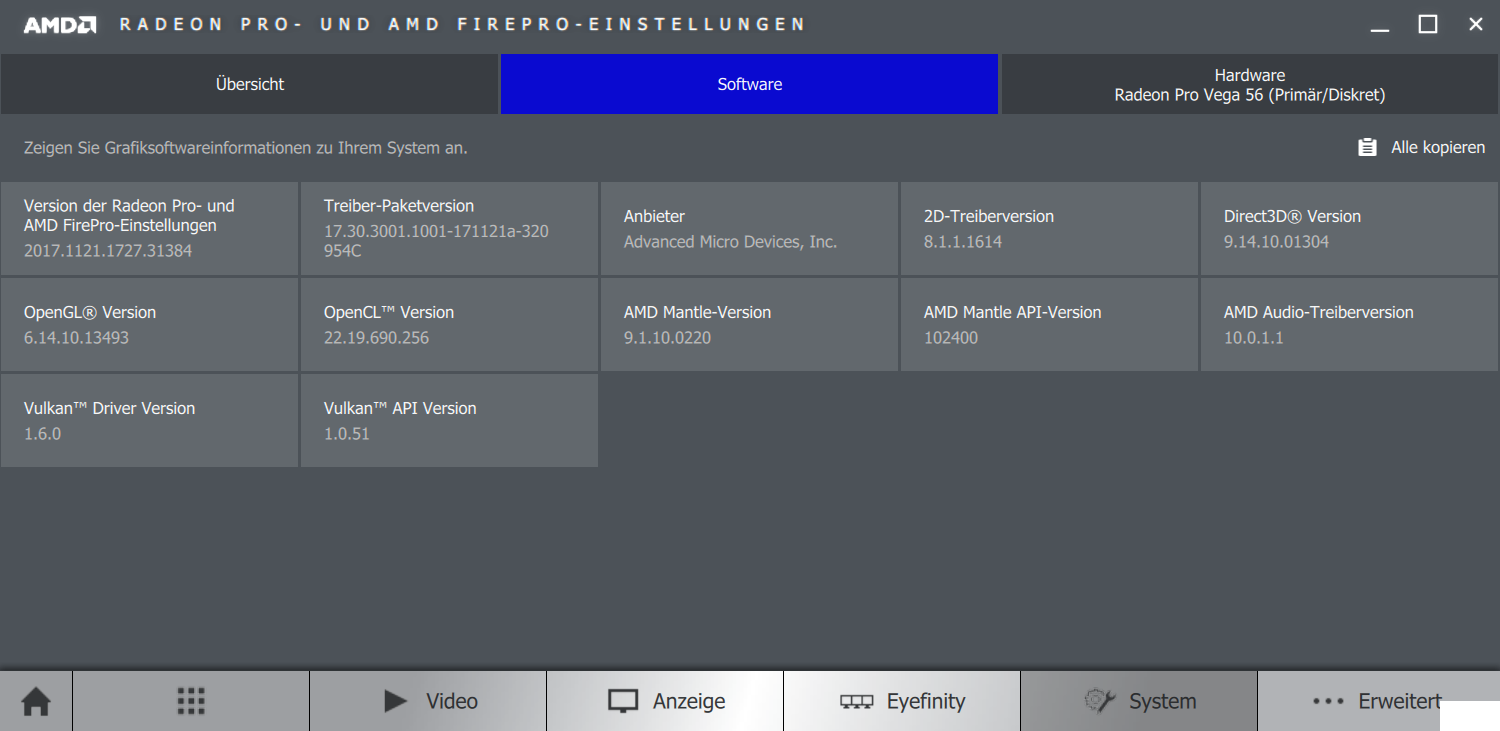
The AMD drivers included in the BootCamp installation worked well with professional applications and benchmarks during our tests, but did not like games (more on that later). The Radeon Pro Vega 56 is often right between the Quadro P4000 and Quadro P5000 in OpenGL and OpenCL benchmarks, but there can be big variations depending on the benchmark with outliers in both directions.
| SiSoft Sandra 2016 | |
| Image Processing | |
| Apple iMac Pro | |
| Dell Precision 7720 | |
| HP ZBook 17 G4-Y3J82AV | |
| Lenovo ThinkPad P71-20HK0004GE | |
| GP Cryptography (Higher Security AES256+SHA2-512) | |
| Apple iMac Pro | |
| HP ZBook 17 G4-Y3J82AV | |
| Dell Precision 7720 | |
| Lenovo ThinkPad P71-20HK0004GE | |
| GP Financial Analysis (FP High/Double Precision) | |
| Dell Precision 7720 | |
| HP ZBook 17 G4-Y3J82AV | |
| Apple iMac Pro | |
| Lenovo ThinkPad P71-20HK0004GE | |
The Radeon Pro 56 also performs well in the regular 3DMarks. Both the GTX 1080 (Laptop/Desktop) as well as the Radeon RX Vega 64 are a bit faster, but the GTX 1070 is falling behind in some tests. Still, the iMac Pro is not a really good system for gaming as you will see in the next section.
| 3DMark 06 Standard Score | 35787 points | |
| 3DMark 11 Performance | 20785 points | |
| 3DMark Fire Strike Score | 15302 points | |
| 3DMark Time Spy Score | 5831 points | |
Help | ||
Gaming Performance
The BootCamp GPU driver caused massive problems during our gaming tests. The GPU was often not recognized correctly or not at all, there were massive scaling issues, we could not change the resolution, or the benchmark results just did not make much sense. We therefore tested the latest drivers from the website bootcampdrivers.com and repeated the tests. However, some titles still caused problems and could not be played, including “Star Wars Battlefront II”, “NFS Payback”, and “Battlefield 1”. All the other titles in the list below ran well, and the GPU performance is usually sufficient for modern titles in the 4K settings, sometimes even in the native 5K resolution.
| 4K High preset | 5K High preset | |
| Witcher 3 | 41.6 fps | 25.9 fps |
| Rainbow 6 Siege | 70.2 fps | 42.5 fps |
| AC: Origins | 33 fps | 22 fps |
| For Honor | 43.6 fps | 32.5 fps |
| GR Wildlands | 34.7 fps | 23 fps |
| Rise of the Tomb Raider | 39.3 fps | 25.6 fps |
| DOTA 2 | 95.8 fps | 67.8 fps |
| low | med. | high | ultra | 4K | |
|---|---|---|---|---|---|
| The Witcher 3 (2015) | 115.7 | 63.9 | 41.6 | ||
| Dota 2 Reborn (2015) | 112 | 107.4 | 102.3 | 95.8 | |
| Rainbow Six Siege (2015) | 198.7 | 135.7 | 70.2 | ||
| Rise of the Tomb Raider (2016) | 94 | 74.8 | 39.3 | ||
| For Honor (2017) | 142.6 | 134.9 | 105.6 | 43.6 | |
| Ghost Recon Wildlands (2017) | 81.7 | 76 | 45.1 | 34.7 | |
| Assassin´s Creed Origins (2017) | 70 | 65 | 57 | 33 |
Emissions
System Noise
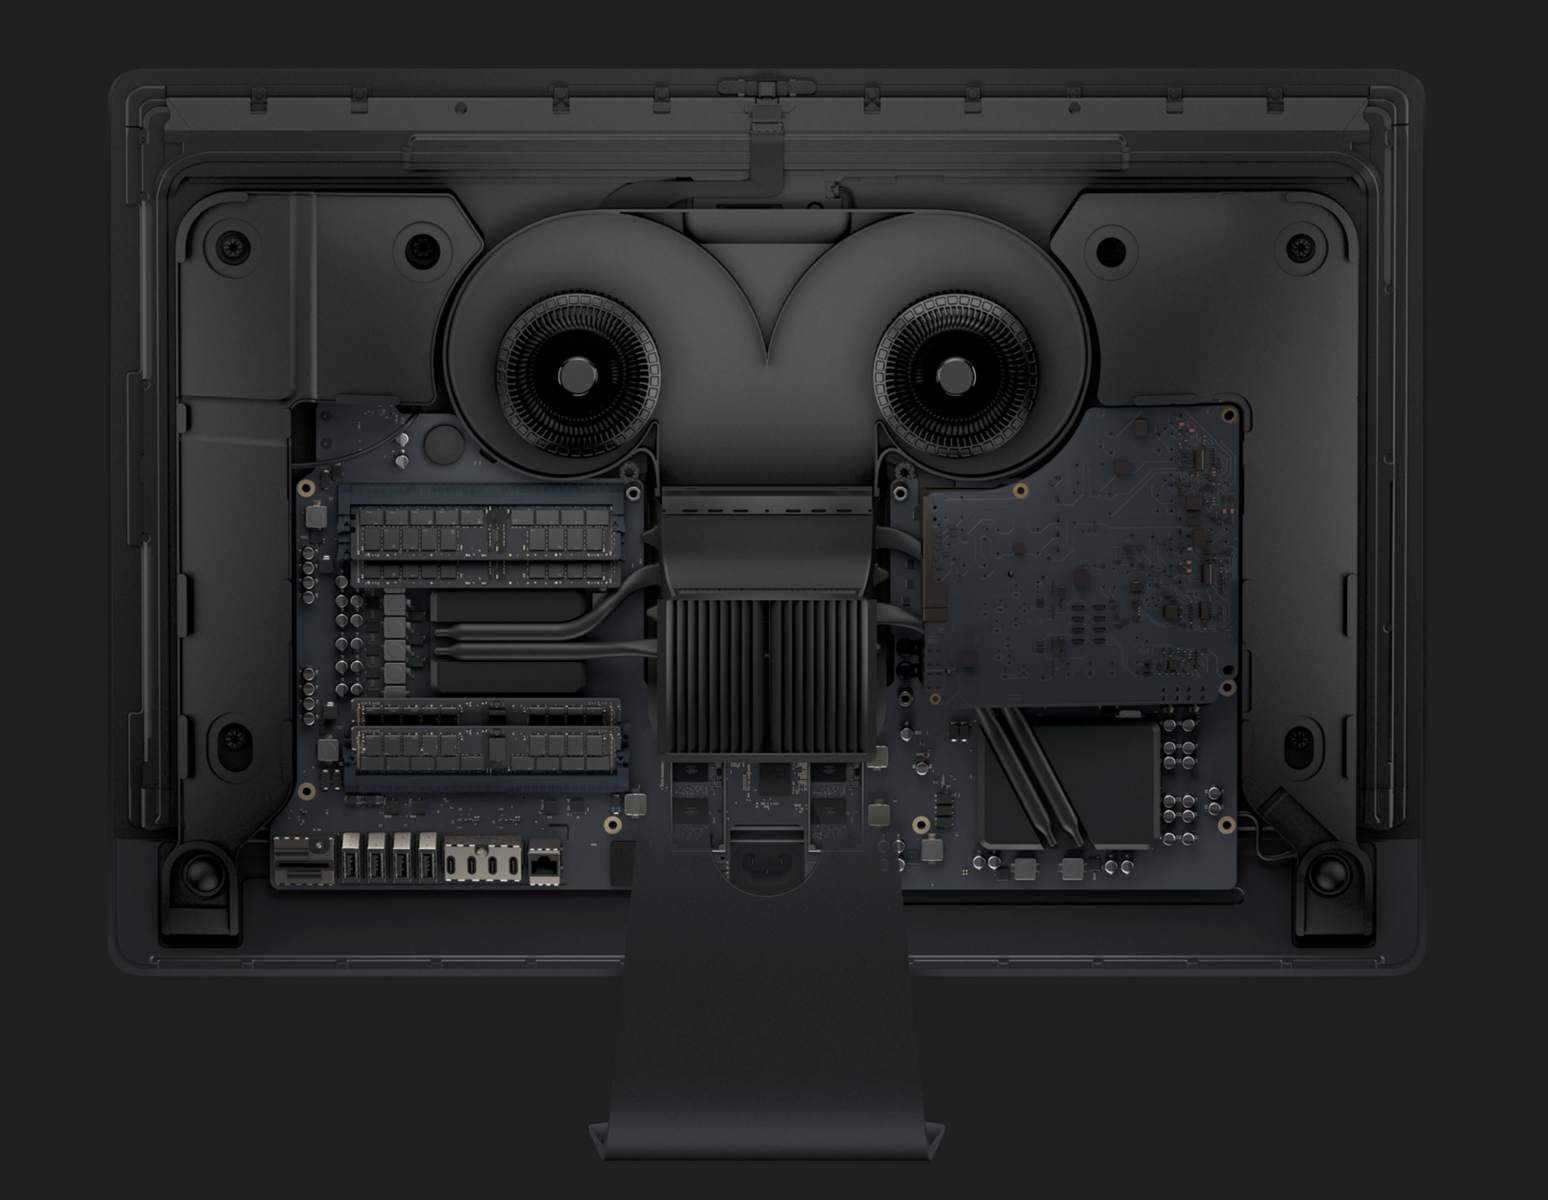
The iMac Pro is equipped with two fans that are running all the time. However, the noise characteristic is very pleasant with a subtle murmur and no high frequencies. You cannot hear the fans at all under light workloads when you are sitting in front of the desk. More load results in a seamless increase of the fan speed, and the GPU definitely has the biggest impact. Running on Windows only results in a noticeable louder system under maximum load, but you will otherwise not notice a difference.
The benchmark Unigine Valley (macOS) did not increase the fan speed, for example, just like the 3DMark Time Spy benchmark (Windows). We performed the macOS stress test with Unigine Valley and the Cinebench R15 Multi, which resulted in pleasant 39.7 dB(A) after a few minutes. The fan speed quickly decreased after the period and we only determined the maximum load of 47.9 dB(A) under extreme load (Windows) and during gaming. However, gaming was noticeably louder in 4K/5K, and much quieter in 1080p so there might still be some driver issues.
Noise level
| Idle |
| 29.8 / 29.8 / 29.8 dB(A) |
| Load |
| 39.7 / 47.9 dB(A) |
 | ||
30 dB silent 40 dB(A) audible 50 dB(A) loud |
||
min: | ||
Temperature
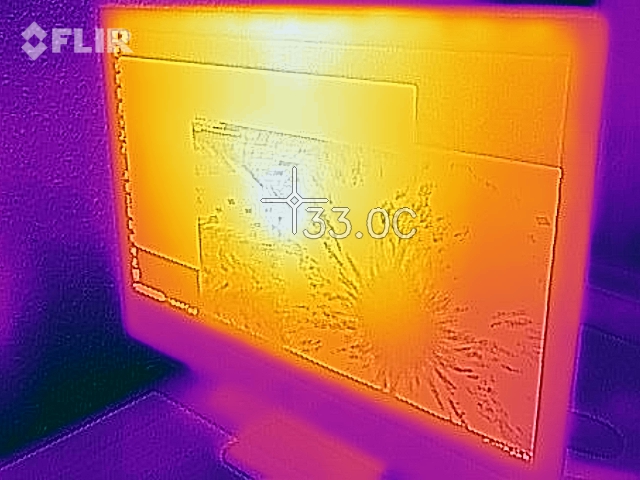
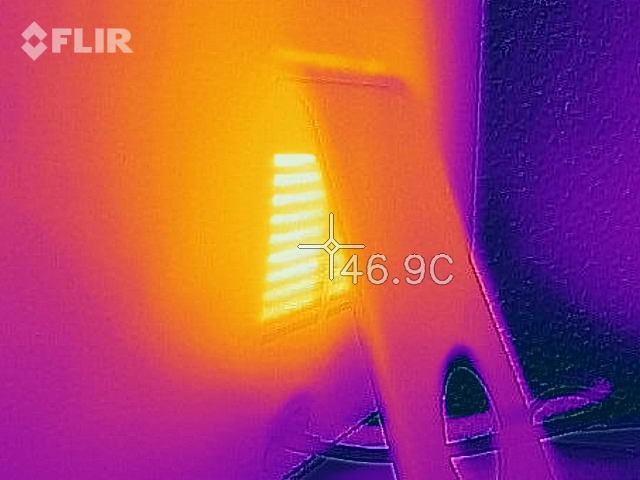
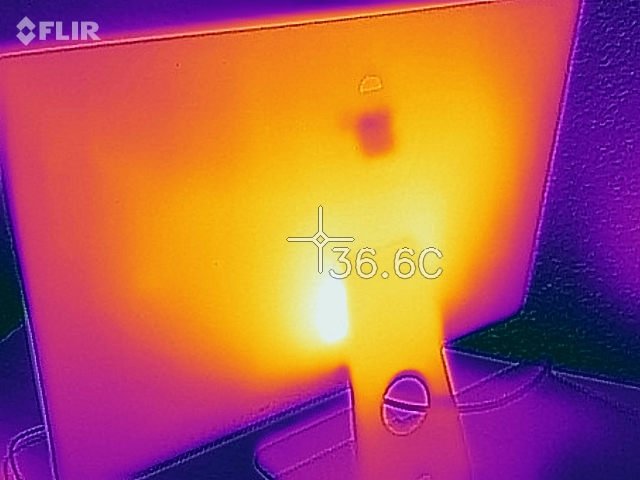
The surface temperatures of a desktop system are obviously not as important as on a mobile device such as a laptop because the device probably sits on the desk anyway. All in all, the cooling solution performs well, and we cannot determine critical temperatures even under load. Only the area around the fan exhaust (directly behind the stand) warms up to more than 45 °C (~113 °F), but this is not critical.
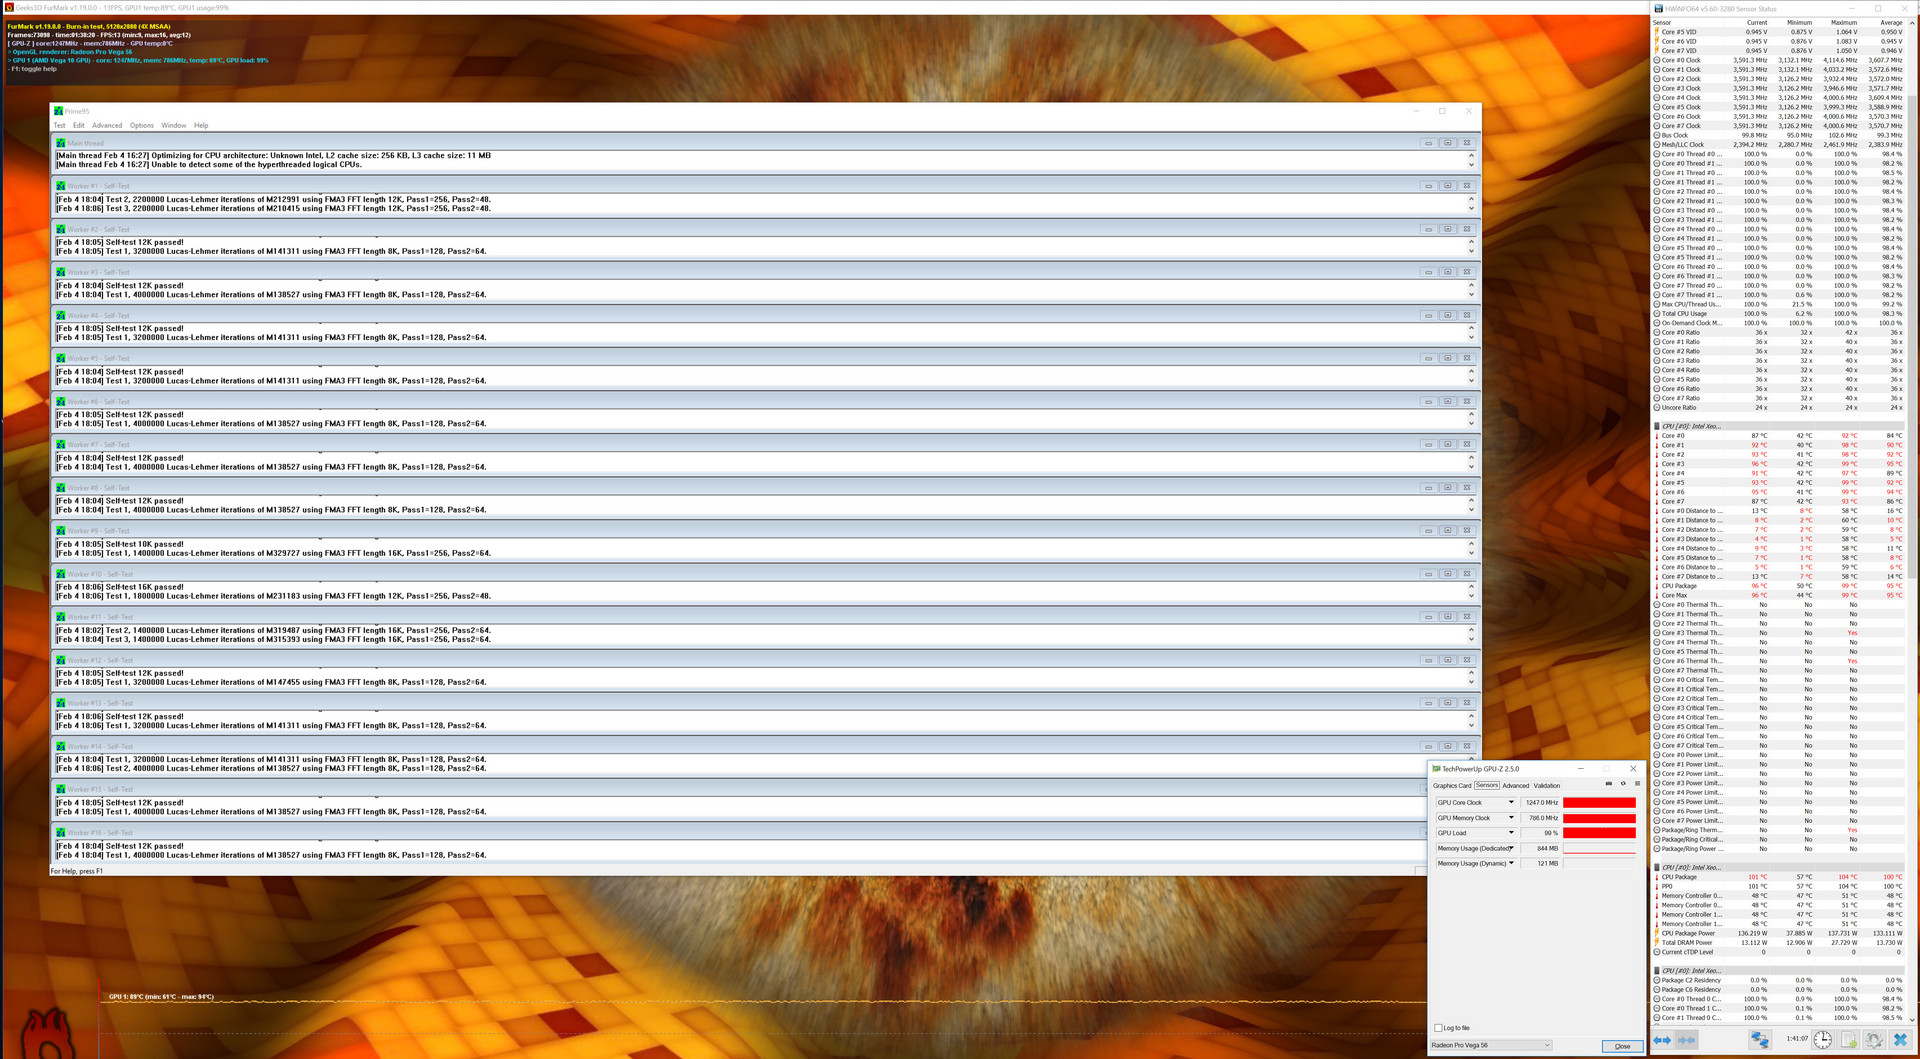
This is "only" the entry-level model of the iMac Pro, but the cooling solution already has a hard time when you stress both the CPU & GPU. The graphics card is favored and maintains its maximum clock during the whole test, but the processor has to reduce its clock a bit. 8x 3.6 GHz (instead of 3.9 GHz) corresponds with a consumption of 136 W, but the CPU temperature is very high at 100 °C (212 °F) on average, which is not uncommon for Apple though. Solid results, but you might not have a performance advantage in this scenario when you get an iMac Pro with more powerful components.
(+) The maximum temperature on the upper side is 31.2 °C / 88 F, compared to the average of 33.9 °C / 93 F, ranging from 25 to 47 °C for the class Desktop.
(-) The bottom heats up to a maximum of 46.1 °C / 115 F, compared to the average of 33.6 °C / 92 F
(+) In idle usage, the average temperature for the upper side is 24.2 °C / 76 F, compared to the device average of 29.5 °C / 85 F.
Speakers
You do not need external speakers unless you plan on watching Hollywood blockbuster movies or listen to a lot of music all the time. The two stereo modules are loud at up to 86 dB(A) and create a very balanced sound. It is even quite powerful thanks to the larger area.
Apple iMac Pro audio analysis
(+) | speakers can play relatively loud (86.1 dB)
Bass 100 - 315 Hz
(+) | good bass - only 3.5% away from median
(±) | linearity of bass is average (7.6% delta to prev. frequency)
Mids 400 - 2000 Hz
(+) | balanced mids - only 1.7% away from median
(+) | mids are linear (4.1% delta to prev. frequency)
Highs 2 - 16 kHz
(±) | reduced highs - on average 8.2% lower than median
(+) | highs are linear (4.8% delta to prev. frequency)
Overall 100 - 16.000 Hz
(+) | overall sound is linear (9.2% difference to median)
Compared to same class
» 33% of all tested devices in this class were better, 11% similar, 56% worse
» The best had a delta of 6%, average was 16%, worst was 46%
Compared to all devices tested
» 3% of all tested devices were better, 1% similar, 96% worse
» The best had a delta of 4%, average was 23%, worst was 134%
Apple MacBook 12 (Early 2016) 1.1 GHz audio analysis
(+) | speakers can play relatively loud (83.6 dB)
Bass 100 - 315 Hz
(±) | reduced bass - on average 11.3% lower than median
(±) | linearity of bass is average (14.2% delta to prev. frequency)
Mids 400 - 2000 Hz
(+) | balanced mids - only 2.4% away from median
(+) | mids are linear (5.5% delta to prev. frequency)
Highs 2 - 16 kHz
(+) | balanced highs - only 2% away from median
(+) | highs are linear (4.5% delta to prev. frequency)
Overall 100 - 16.000 Hz
(+) | overall sound is linear (10.2% difference to median)
Compared to same class
» 7% of all tested devices in this class were better, 2% similar, 91% worse
» The best had a delta of 5%, average was 18%, worst was 53%
Compared to all devices tested
» 5% of all tested devices were better, 1% similar, 94% worse
» The best had a delta of 4%, average was 23%, worst was 134%
Energy Management
Power Consumption
We were quite surprised that the consumption values are pretty similar between macOS and Windows 10, so the BootCamp drivers are pretty well optimized. The idle consumption is between 50 W and 89 W, which sounds like a lot for laptop users. However, you have to consider the desktop components and the large & bright 27-inch panel in particular.
The consumption obviously fluctuates depending on the application. We measure values between 150 W (3DMark 06) and 260 W (Unigine Valley macOS/Witcher 3 Win 10). Our measurement device shows up to 508.5 W under maximum load, so we have already passed the nominal output of the 500 W power adapter, so there is no more headroom for more powerful components in this scenario.
The standby consumption fluctuates between 5 and 6 W depending on the OS, which could be lower.
| Off / Standby | |
| Idle | |
| Load |
|
Key:
min: | |
Verdict
Pros
Cons
Do you really need an iMac Pro or is a regular iMac sufficient? Well, if you have this question you probably do not need the Pro version, because the professional components are for a special user group. The additional cores of the Xeon CPUs have to be utilized, otherwise it is not faster. It is the same situation for the graphics cards. If that is the case, you can just get the regular 5K iMac, which is much more affordable and offers the same screen.
But the iMac Pro is not a really convincing workstation anyway. Yes, the performance is very good, but the cooling solution already has problems with the entry-level components under maximum load. The screen could be better calibrated ex-works and you will need an external screen for graphics work in the AdobeRGB color space. Other drawbacks for a professional system include the limited/complicated as well as the limited service options. If you rely on a system for work, you will most probably purchase additional service such as on-site repair. Other manufacturers like Dell, HP, and Lenovo clearly have an advantage in this respect.
The entry-level price is high, but certainly not completely overpriced considering the components. The Intel Xeon processor alone costs more than $1100 US, but we cannot understand the massive prices for additional RAM and storage. The iMac Pro definitely has a certain appeal and performs well, but it is not the right choice for all professional users.
Apple iMac Pro
- 06/27/2018 v6 (old)
Andreas Osthoff
Price comparison
