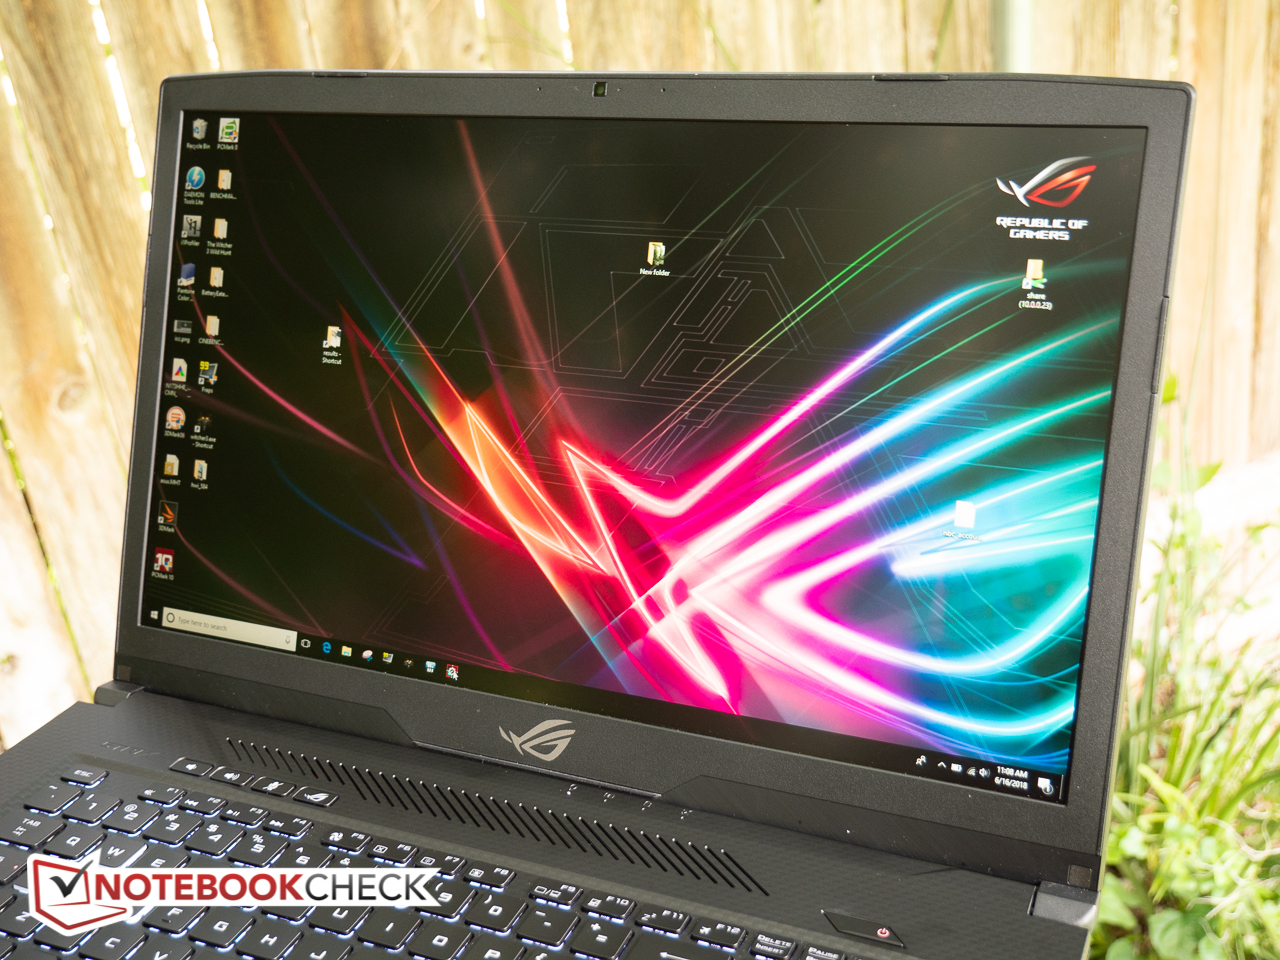
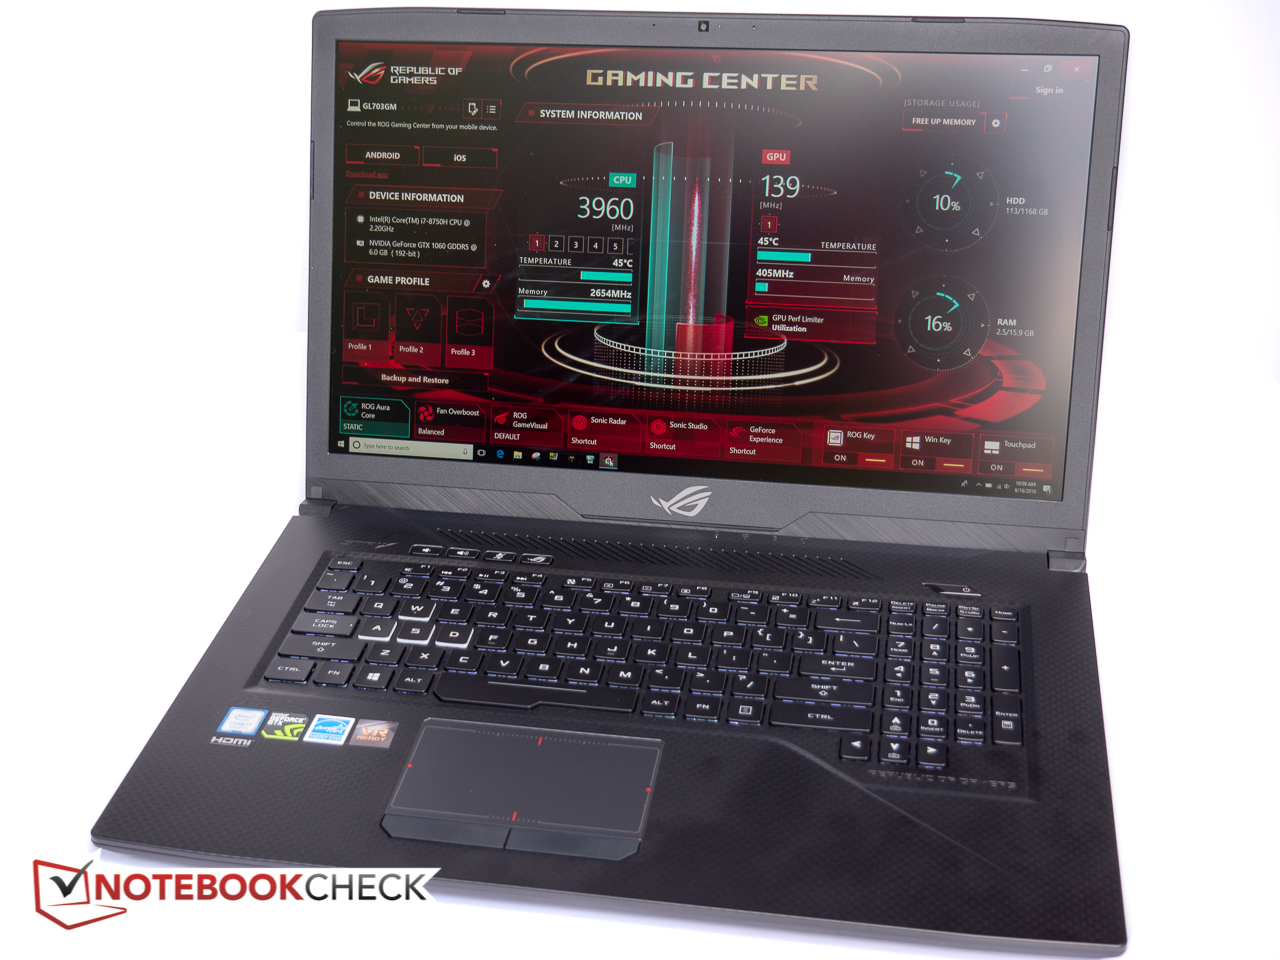
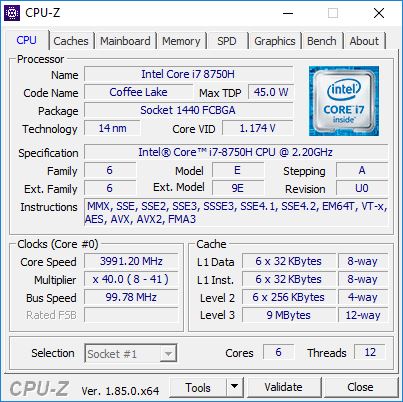
Asus ROG Strix GL703GM Scar Edition (8750H, GTX 1060, FHD 120 Hz) Laptop Review
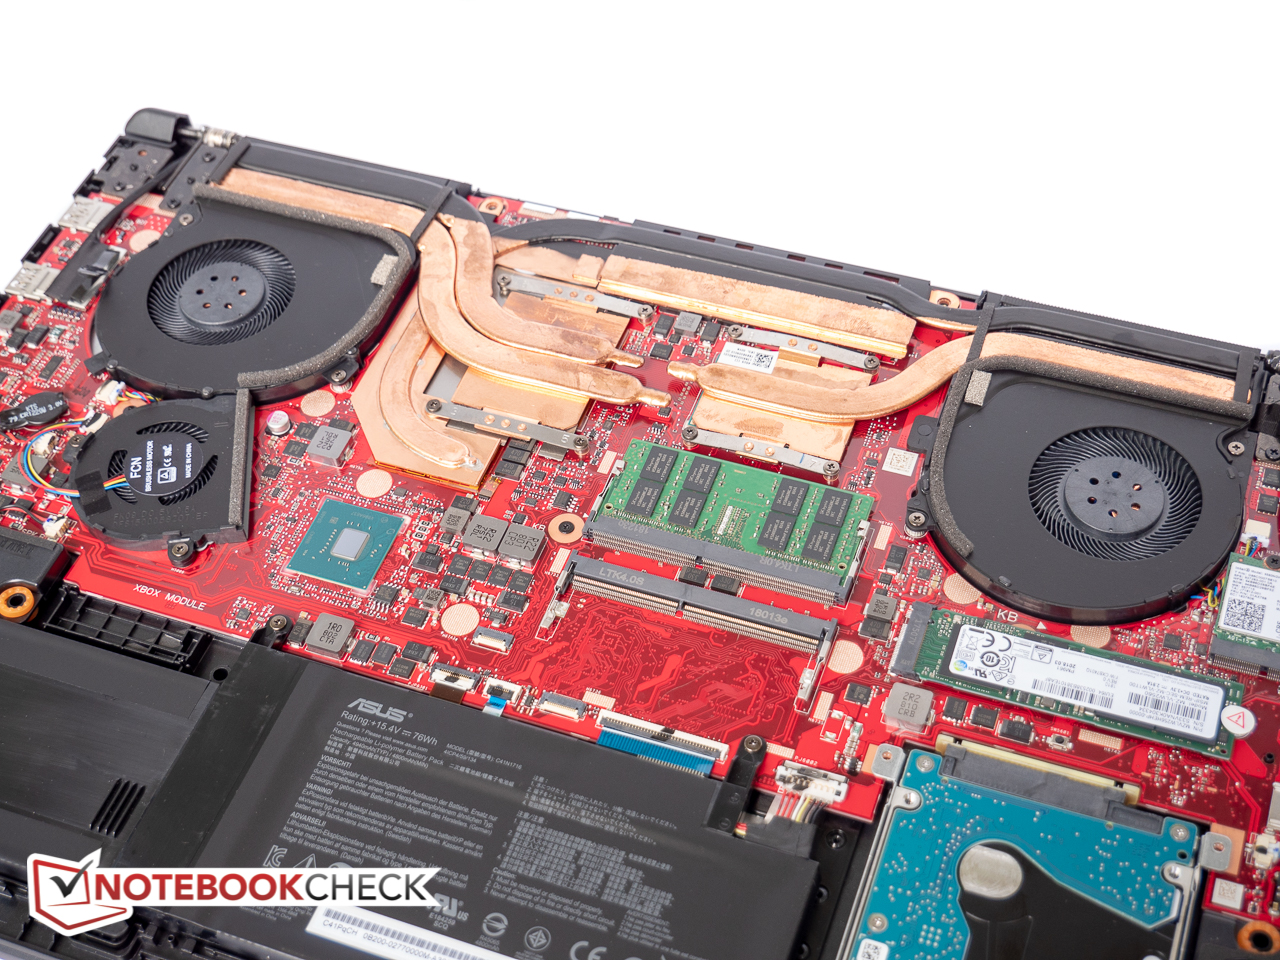
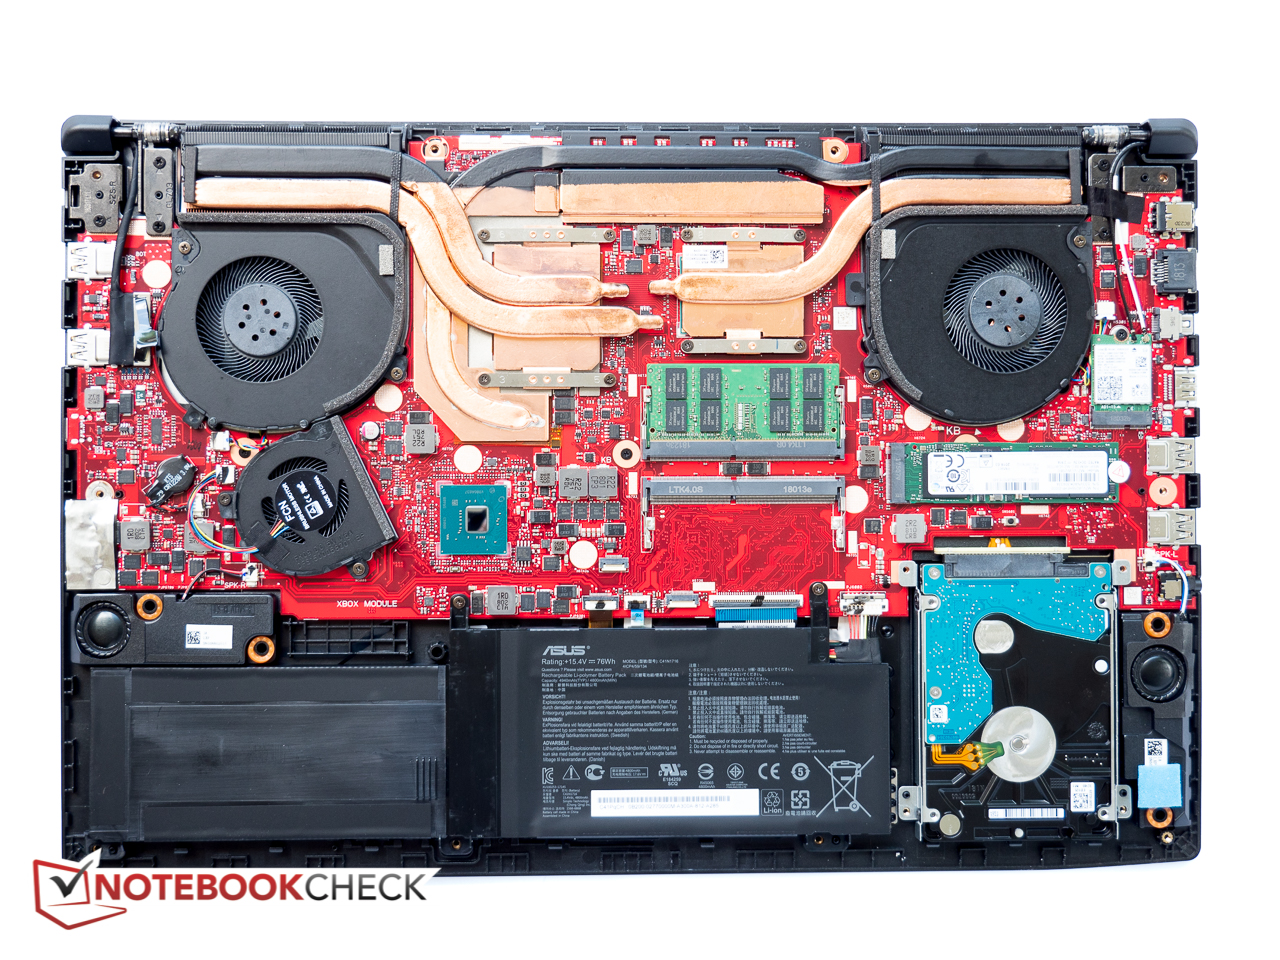
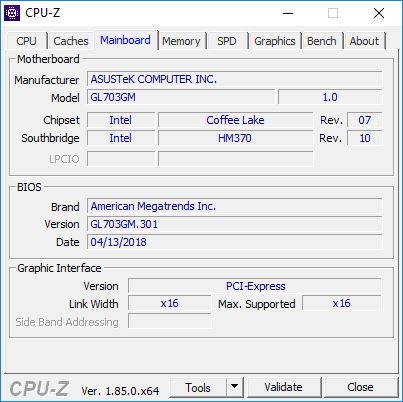
The Asus ROG Strix GL703VM Scar Edition we reviewed earlier this year gets the Coffee Lake-H treatment and now features an i7-8750H hexa-core processor and unchanged Nvidia GTX 1060 graphics. In addition to the obvious CPU upgrade, Asus appears to have revamped the motherboard layout and the cooling system - at least when compared to the "regular" GL703VD we reviewed in 2017. Both previous editions were hot and too noisy under load, so we can only applaud this design change.
The GL703GM might look near-identical to the predecessor, but there are several key differences:
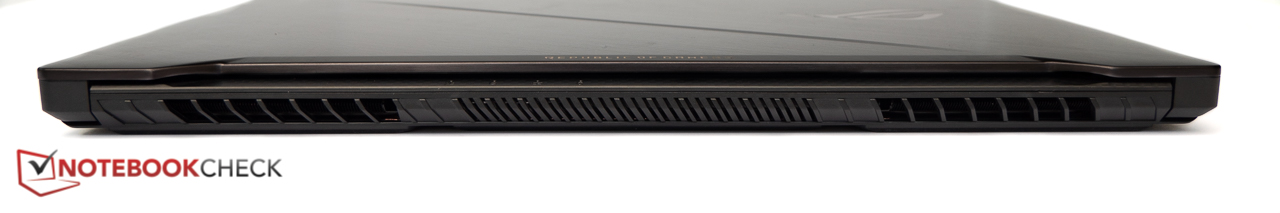
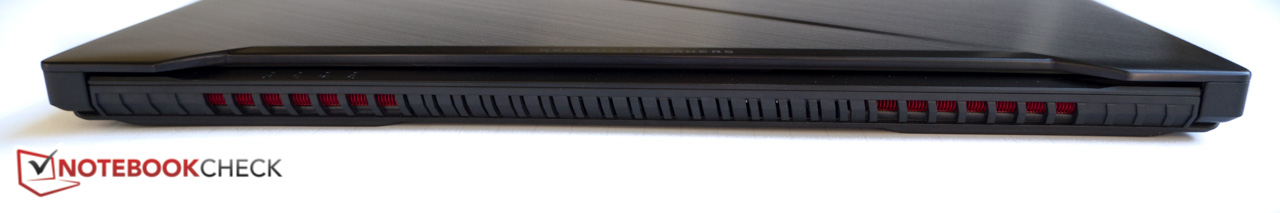
- revamped cooling system / heat pipe design + modified exhausts
- Chi Mei 120 Hz TN panel vs. 120 Hz IPS panel by AU Optronics
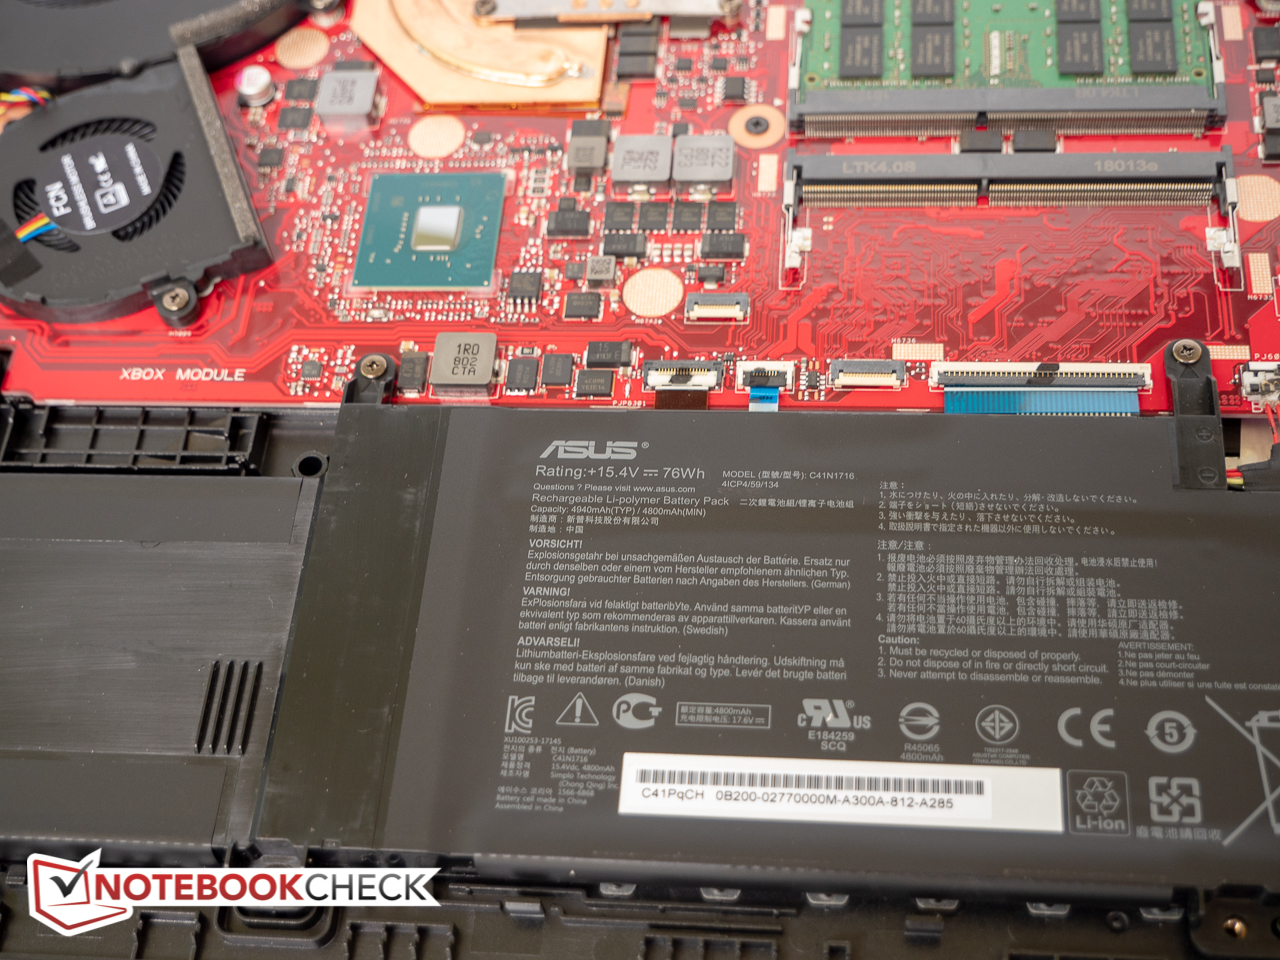
- increased battery capacity
- different speakers
There is no shortage of competitors and we'll compare the GL703VM to other 17.3-inch notebooks like the GTX 1060-equipped Acer Aspire V17 Nitro BE with previous-generation i7 CPU, Asus' own GL703GE with i7-8750H and GTX 1050 Ti, or higher-end notebooks like the MSI GE73 8RF Raider with Coffee Lake-H CPU and higher-end GTX 1070 graphics.
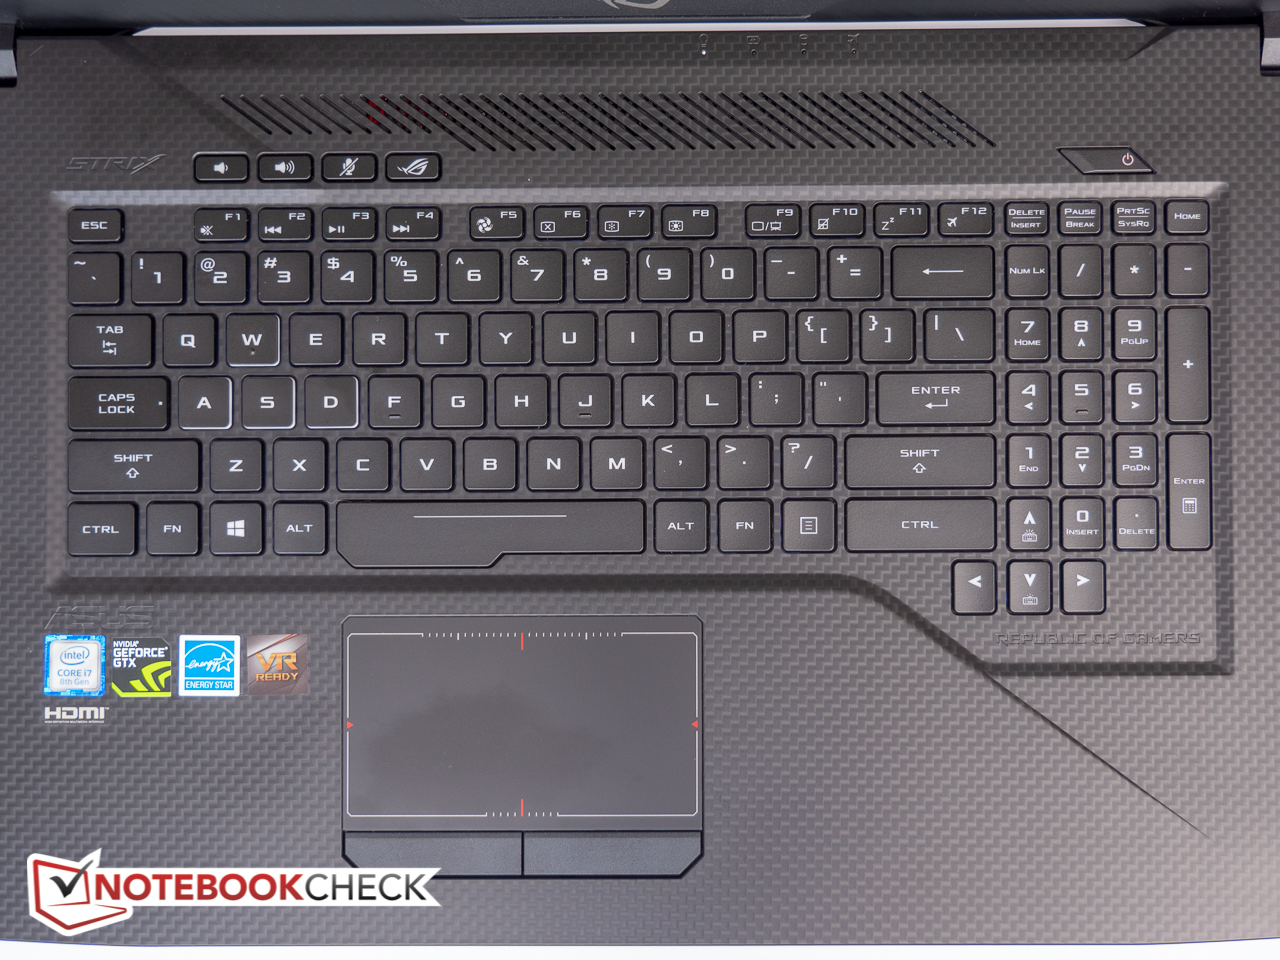
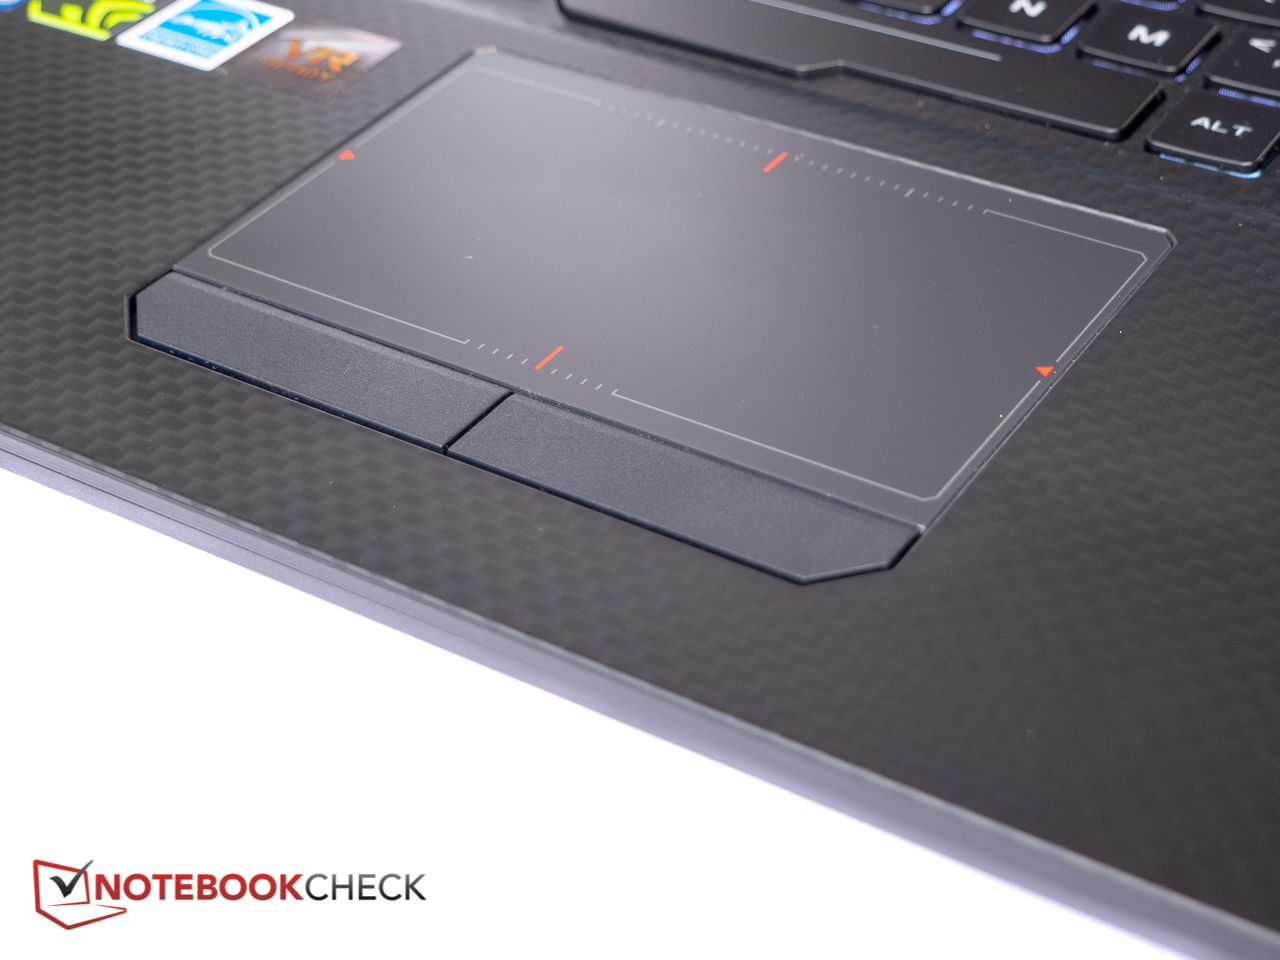
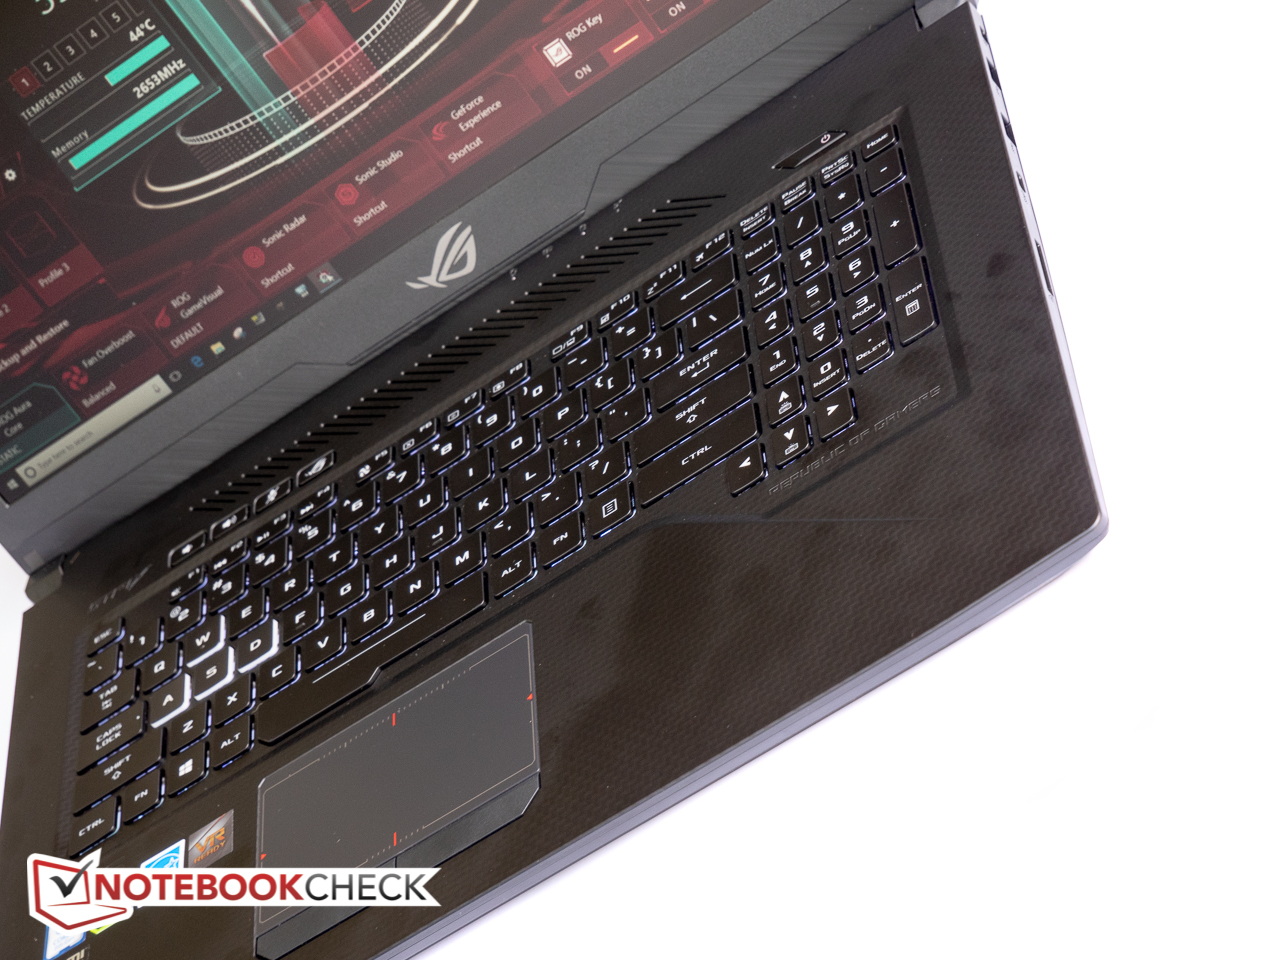
We will drop certain review sections and focus primarily on the performance differences and other merits of the new model. For a more in-depth discussion of the chassis and the input devices, please refer to our reviews of the Asus ROG Strix GL703VM Scar Edition and the Asus ROG Strix GL703VD-DB74.
SD Card Reader
SD Card Reader performance as measured with our Toshiba Exceria Pro SDXC 64 GB UHS-II reference card is slightly better than before at 91 and 85 MB/s for our AS SSD read and JPG Copy tests, respectively. The transfer speeds are still in line with our expectations, but some notebooks like the higher-end Eurocom Q6 offer vastly superior performance.
| SD Card Reader | |
| average JPG Copy Test (av. of 3 runs) | |
| Eurocom Q6 (Toshiba Exceria Pro SDXC 64 GB UHS-II) | |
| Asus Strix GL703GM-DS74 (Toshiba Exceria Pro SDXC 64 GB UHS-II) | |
| HP Omen 17-an014ng (Toshiba Exceria Pro SDXC 64 GB UHS-II) | |
| Razer Blade Pro RZ09-0220 (Toshiba Exceria Pro SDXC 64 GB UHS-II) | |
| MSI GE73 8RF-008 Raider RGB (Toshiba Exceria Pro SDXC 64 GB UHS-II) | |
| Acer Aspire V17 Nitro BE VN7-793-738J (Toshiba Exceria Pro SDXC 64 GB UHS-II) | |
| maximum AS SSD Seq Read Test (1GB) | |
| Eurocom Q6 (Toshiba Exceria Pro SDXC 64 GB UHS-II) | |
| Asus Strix GL703GM-DS74 (Toshiba Exceria Pro SDXC 64 GB UHS-II) | |
| HP Omen 17-an014ng (Toshiba Exceria Pro SDXC 64 GB UHS-II) | |
| Razer Blade Pro RZ09-0220 (Toshiba Exceria Pro SDXC 64 GB UHS-II) | |
| MSI GE73 8RF-008 Raider RGB (Toshiba Exceria Pro SDXC 64 GB UHS-II) | |
| Acer Aspire V17 Nitro BE VN7-793-738J (Toshiba Exceria Pro SDXC 64 GB UHS-II) | |
Communication
Asus replaced the Intel Dual Band Wireless-AC 8265 in the predecessor with the Wireless-AC 9560 (a/b/g/n/ac) module with a theoretical throughput of 1.73 Gbps. Receive rates one meter away from our Linksys EA8500 test router are acceptable at about 650 MBit/s, but at 450 MBit/s, transmit speeds still suffer somewhat. We didn't experience any dropouts or other connectivity issues during the review period. Gamers requiring faster transfer speeds should opt for a hardwired connection via the provided Realtek RTL8168B/8111B PCI-E Gigabit Ethernet module.
Please note that our current wireless test setup is limited to 1 Gbps, so we are unable to test the Wireless-AC 9560 module at its maximum throughput. We're working on improving our setup.
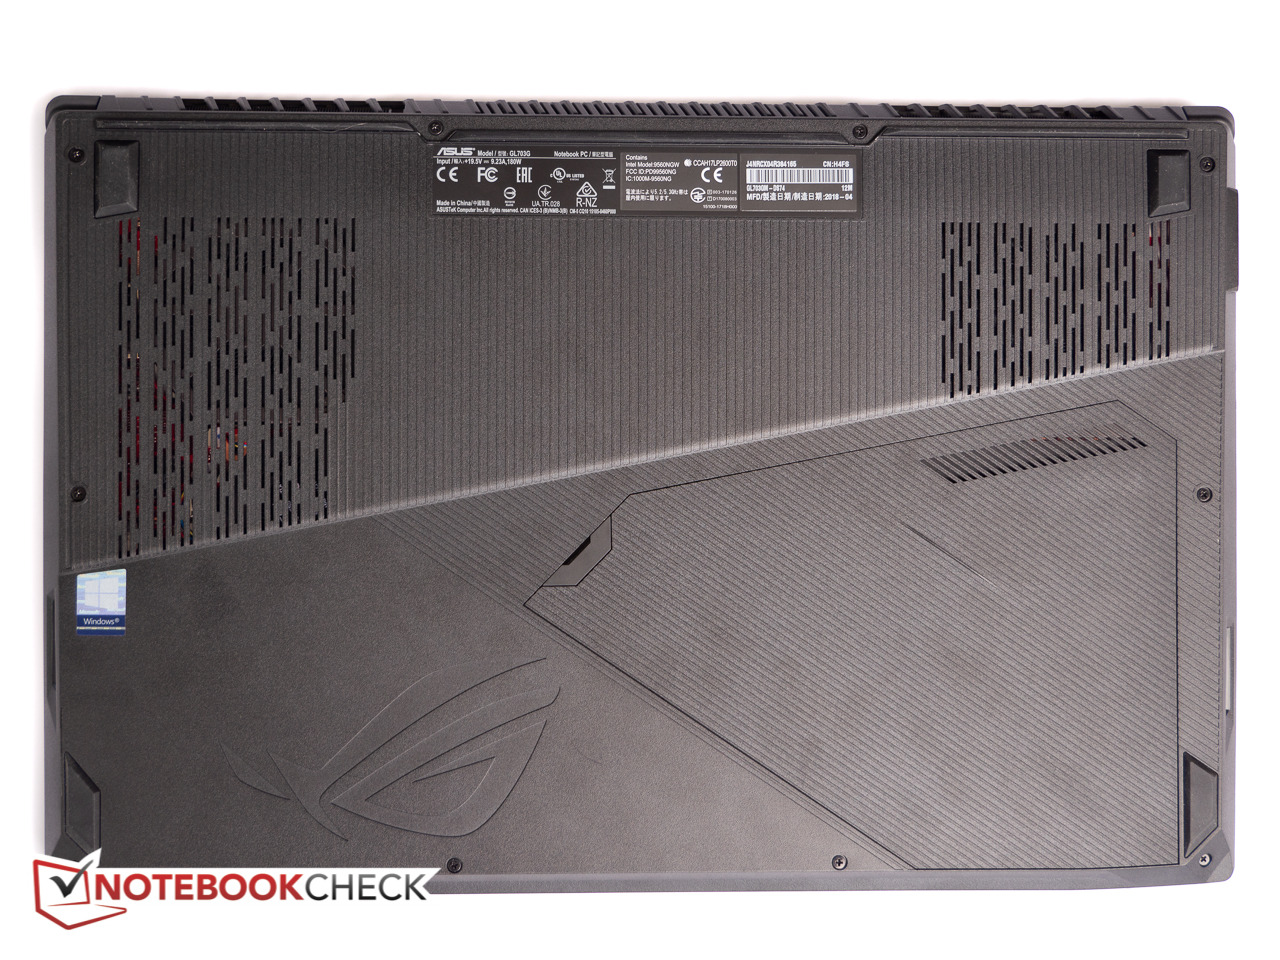
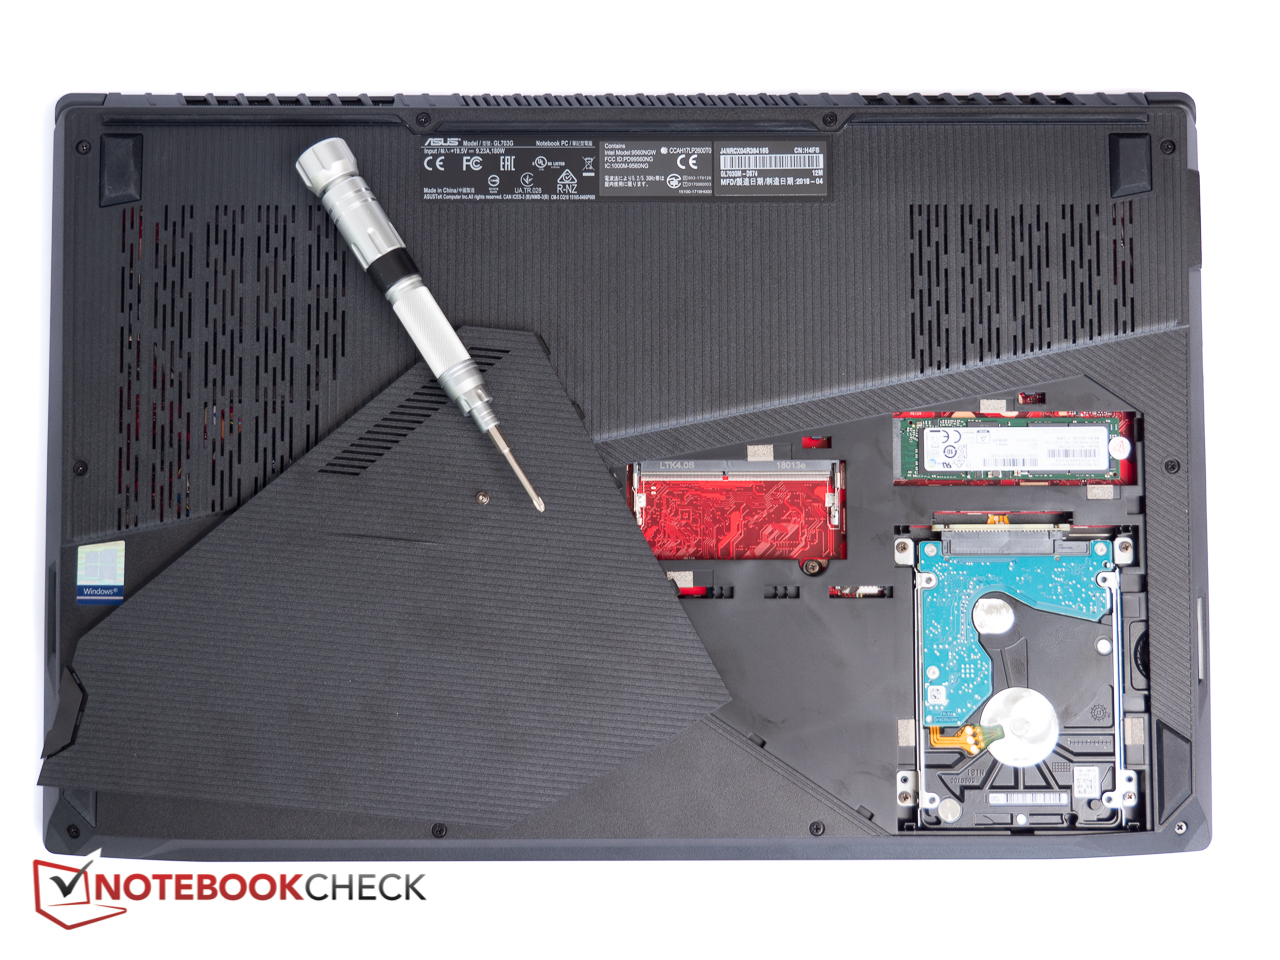
Maintenance
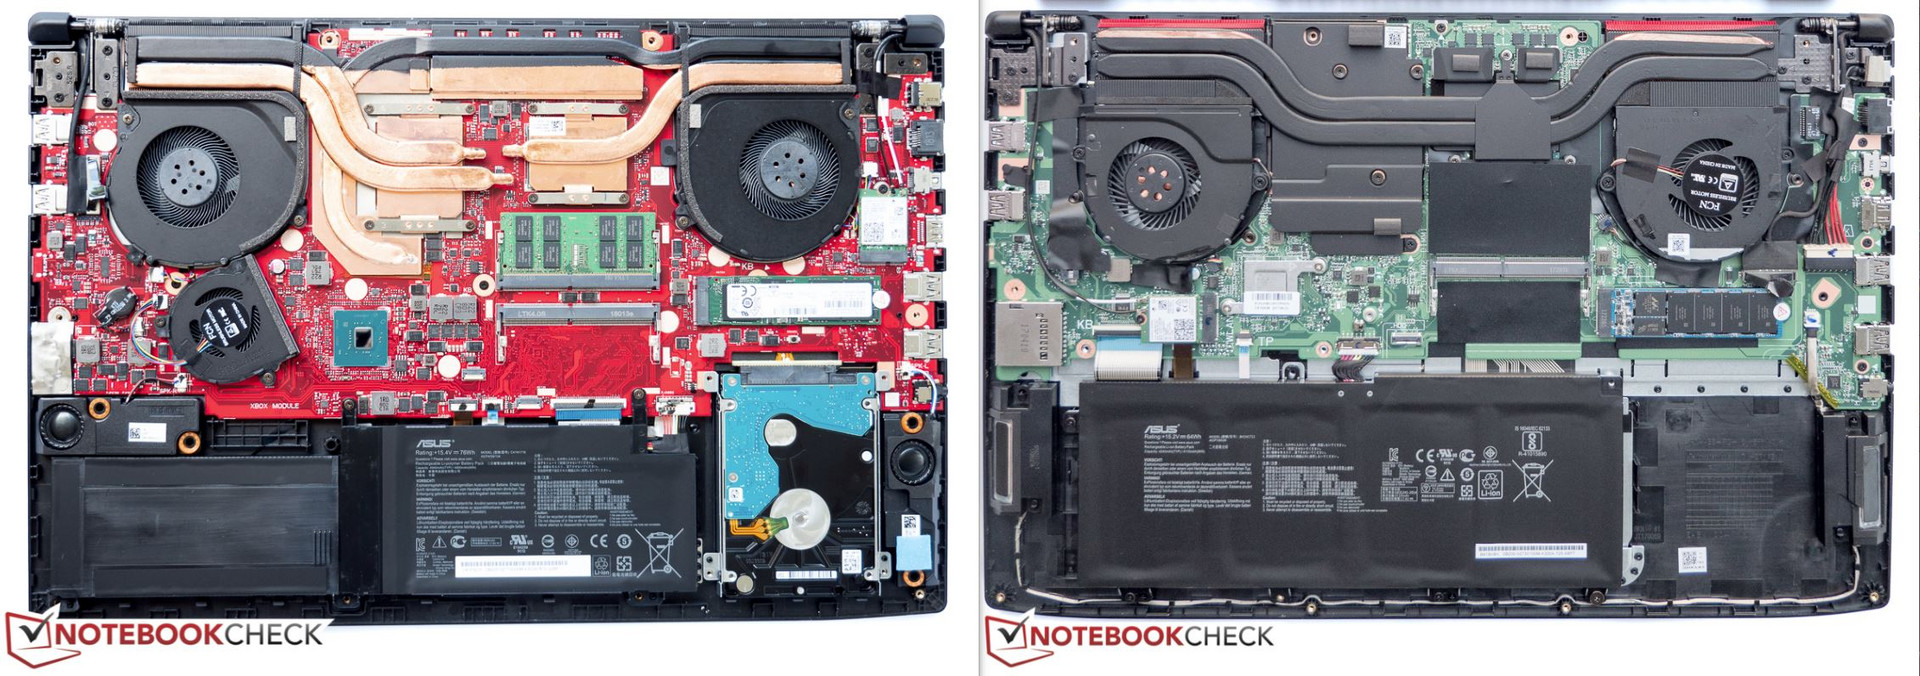
Once again, serviceability is very good and requires the removal of a single screw in order to remove the oddly-shaped maintenance cover. Cleaning the system fans or accessing the primary RAM module and WLAN card requires the removal of the entire bottom plate. Here, the procedure has changed slightly: after removing a total of ten Phillips screws plus the additional one for the maintenance cover, the 2.5-inch hard drive cradle, which is attached with four screws, has to be removed as well. Prying off the bottom panel with a plastic tool or old credit card is easily accomplished and takes just a few minutes.
Display
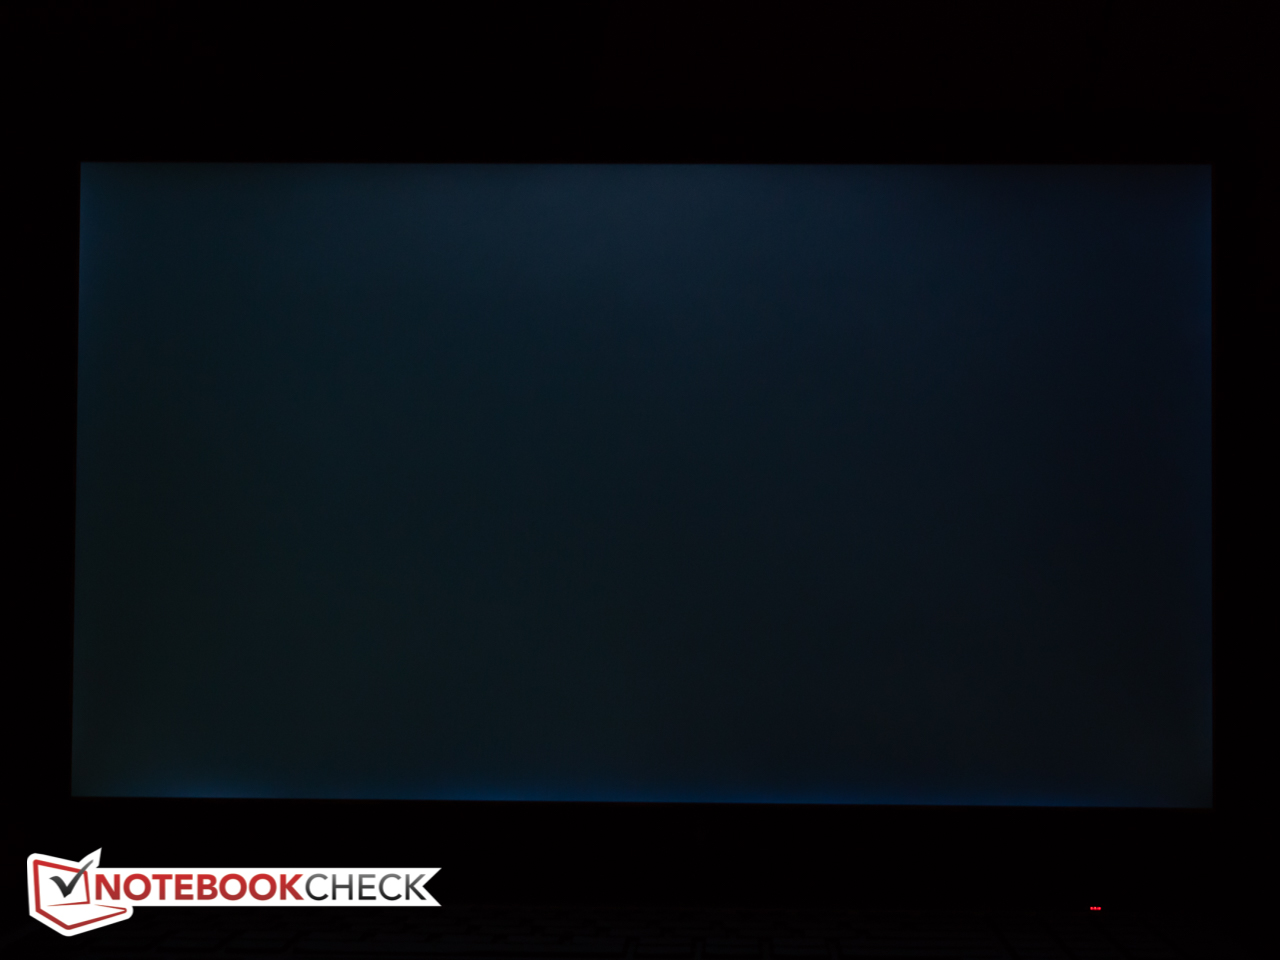
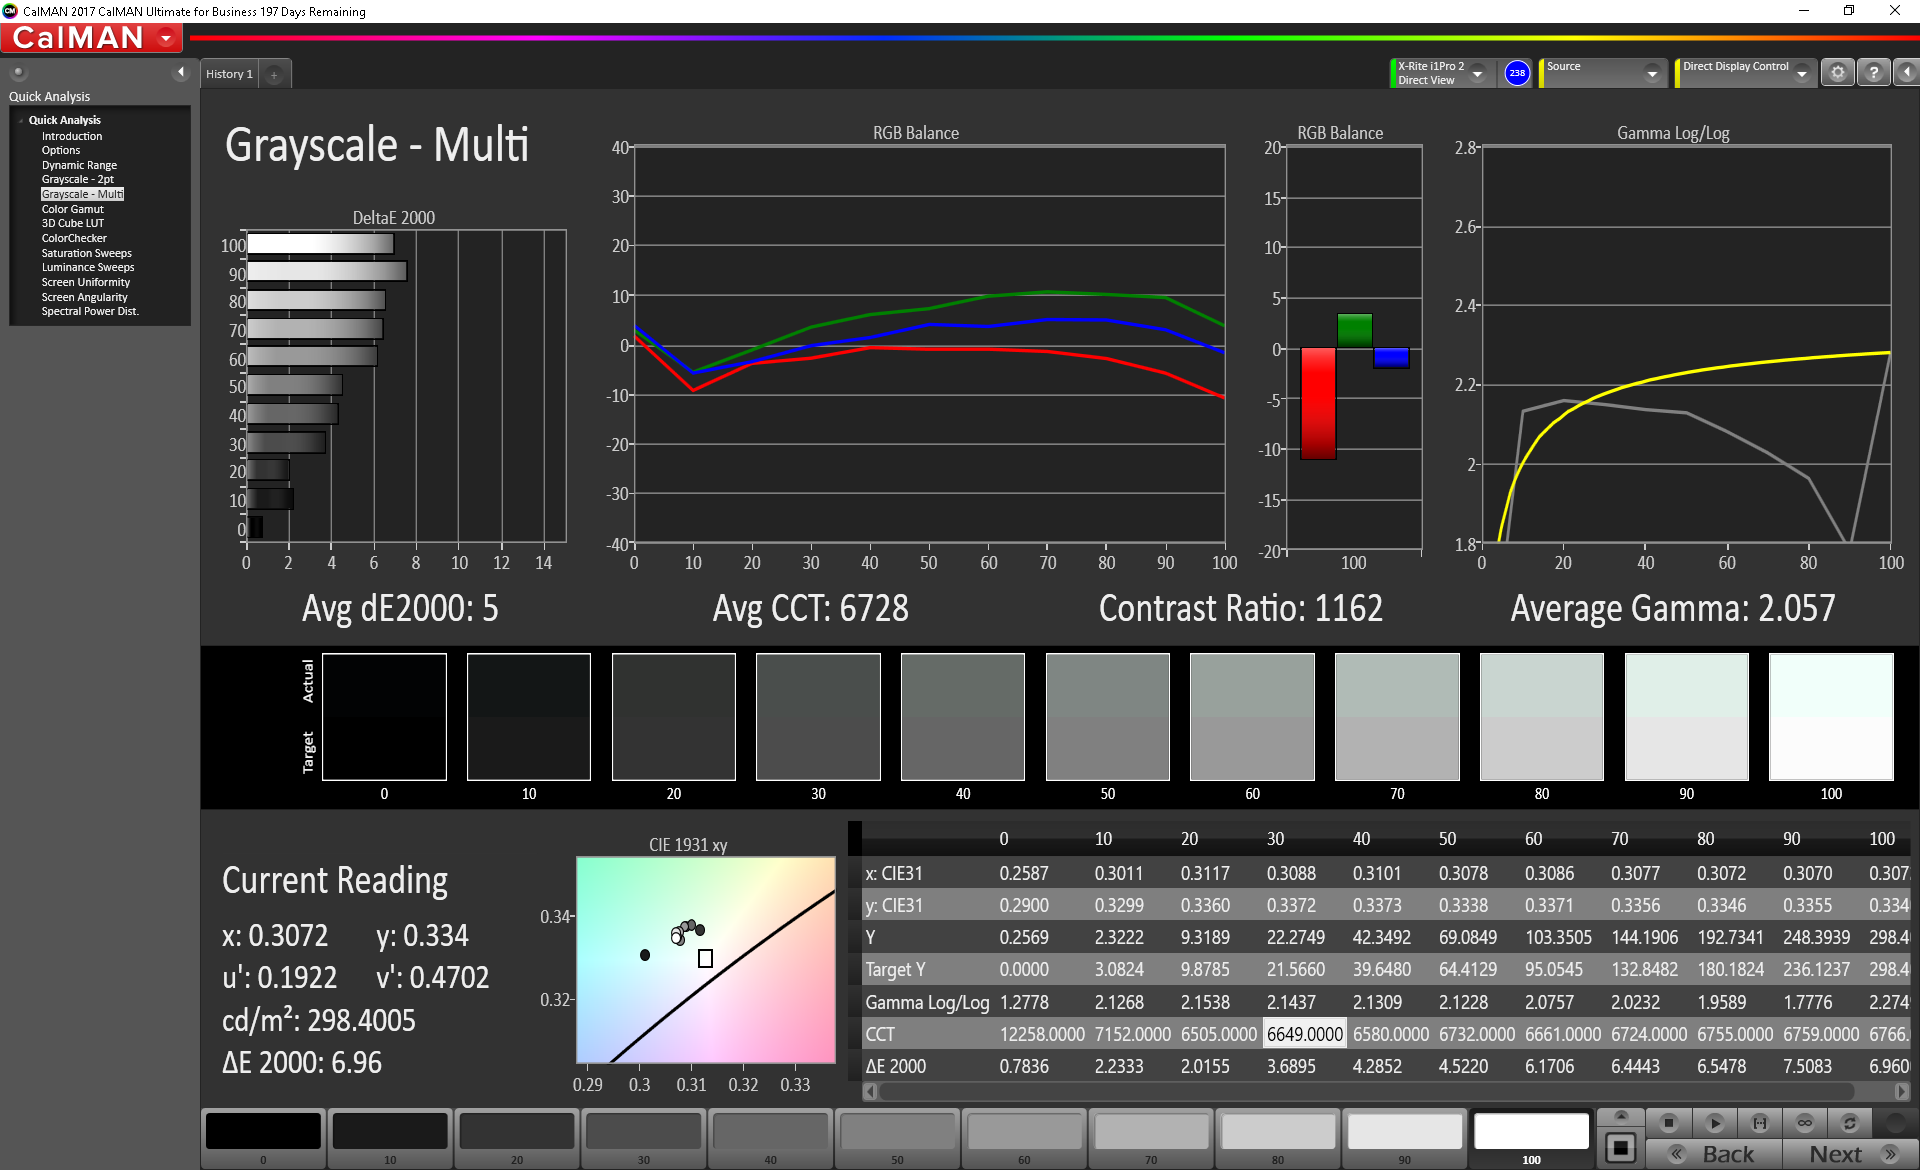
The older Asus ROG Strix GL703VM Scar Edition was equipped with a 120 Hz IPS display from AU Optronics. Asus swapped suppliers as well as the panel technology, as our test unit is equipped with a 120 Hz 1080p TN display supplied by Chi Mei. At an average of 286 cd/m², the TN panel is about as bright as the previous IPS display with an unimpressive contrast ratio and relatively poor brightness distribution, but thanks to the TN technology, the response times have improved significantly.
| |||||||||||||||||||||||||
Brightness Distribution: 84 %
Center on Battery: 297.8 cd/m²
Contrast: 902:1 (Black: 0.33 cd/m²)
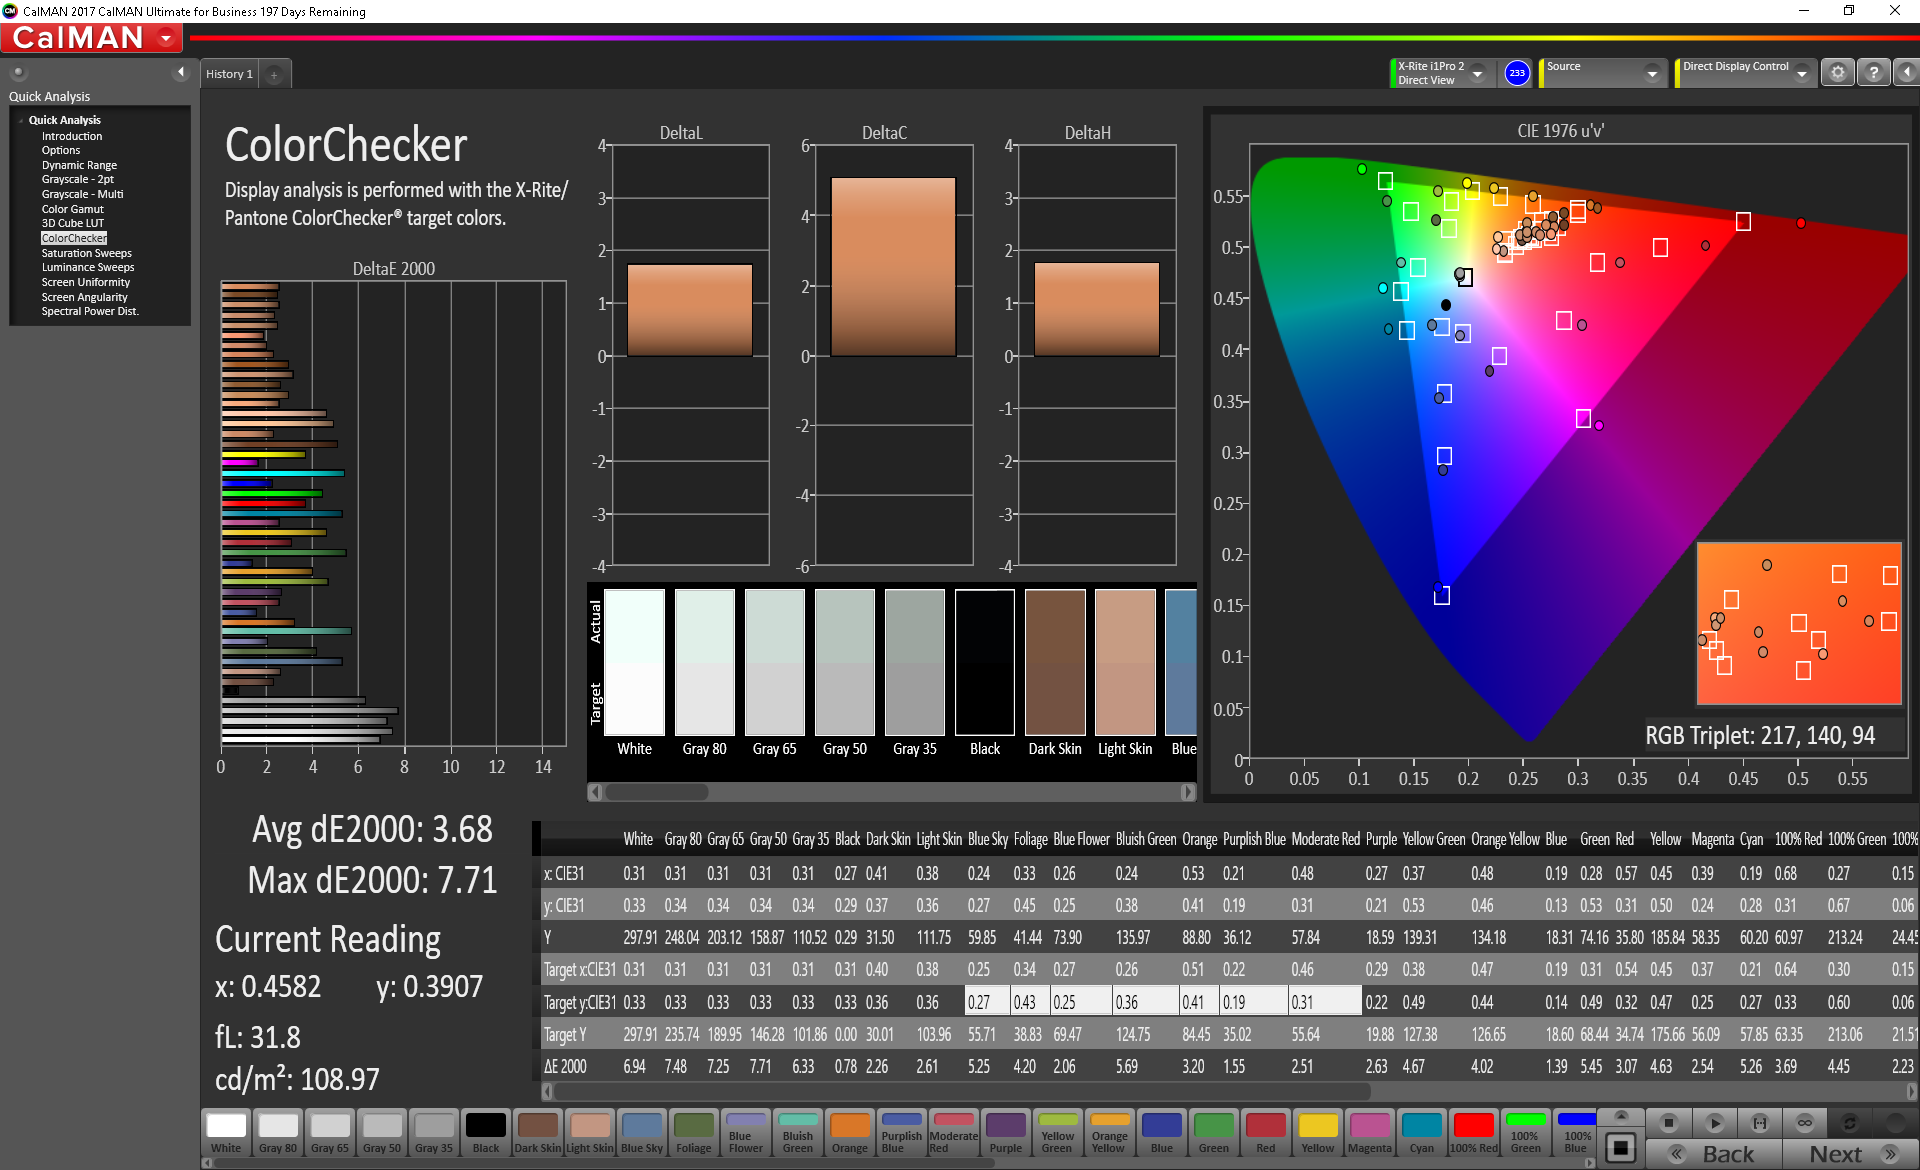
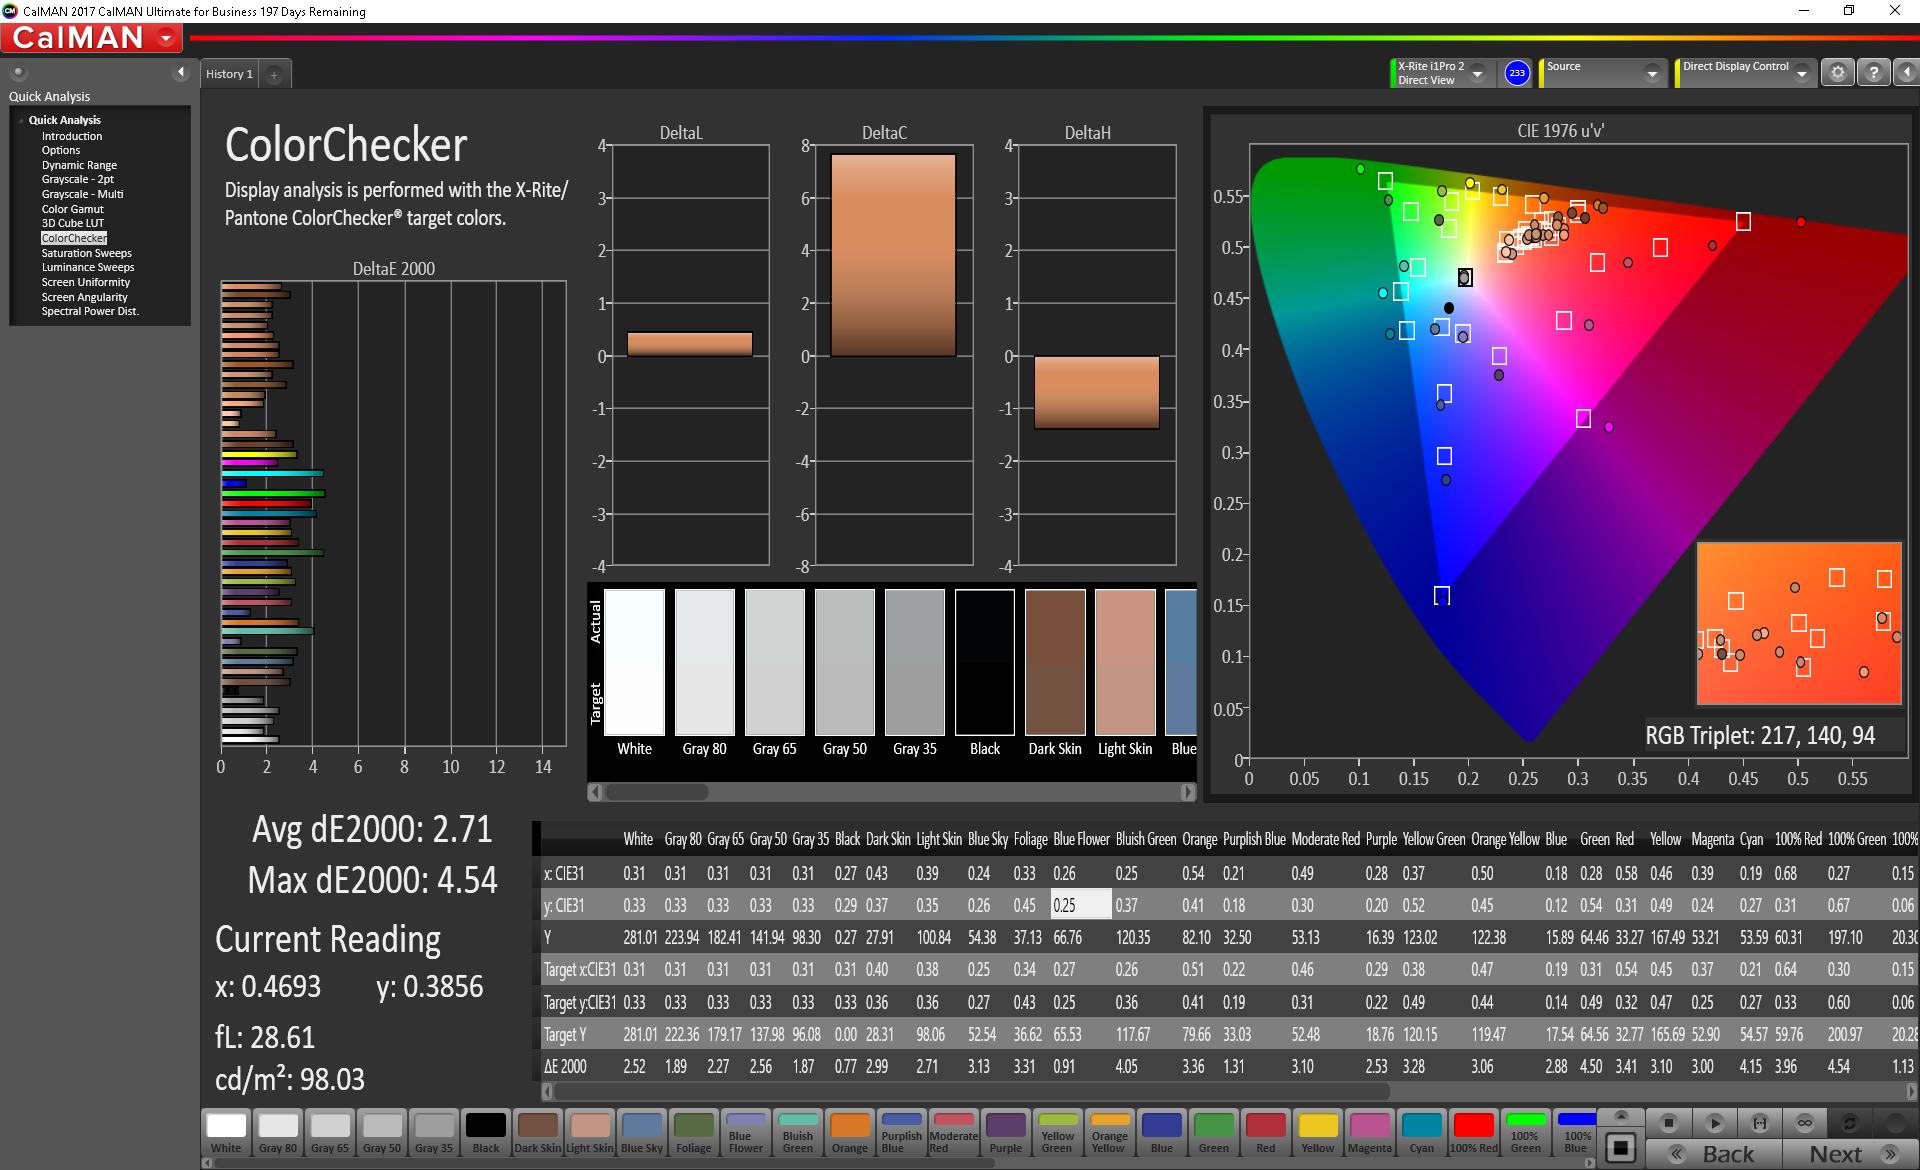
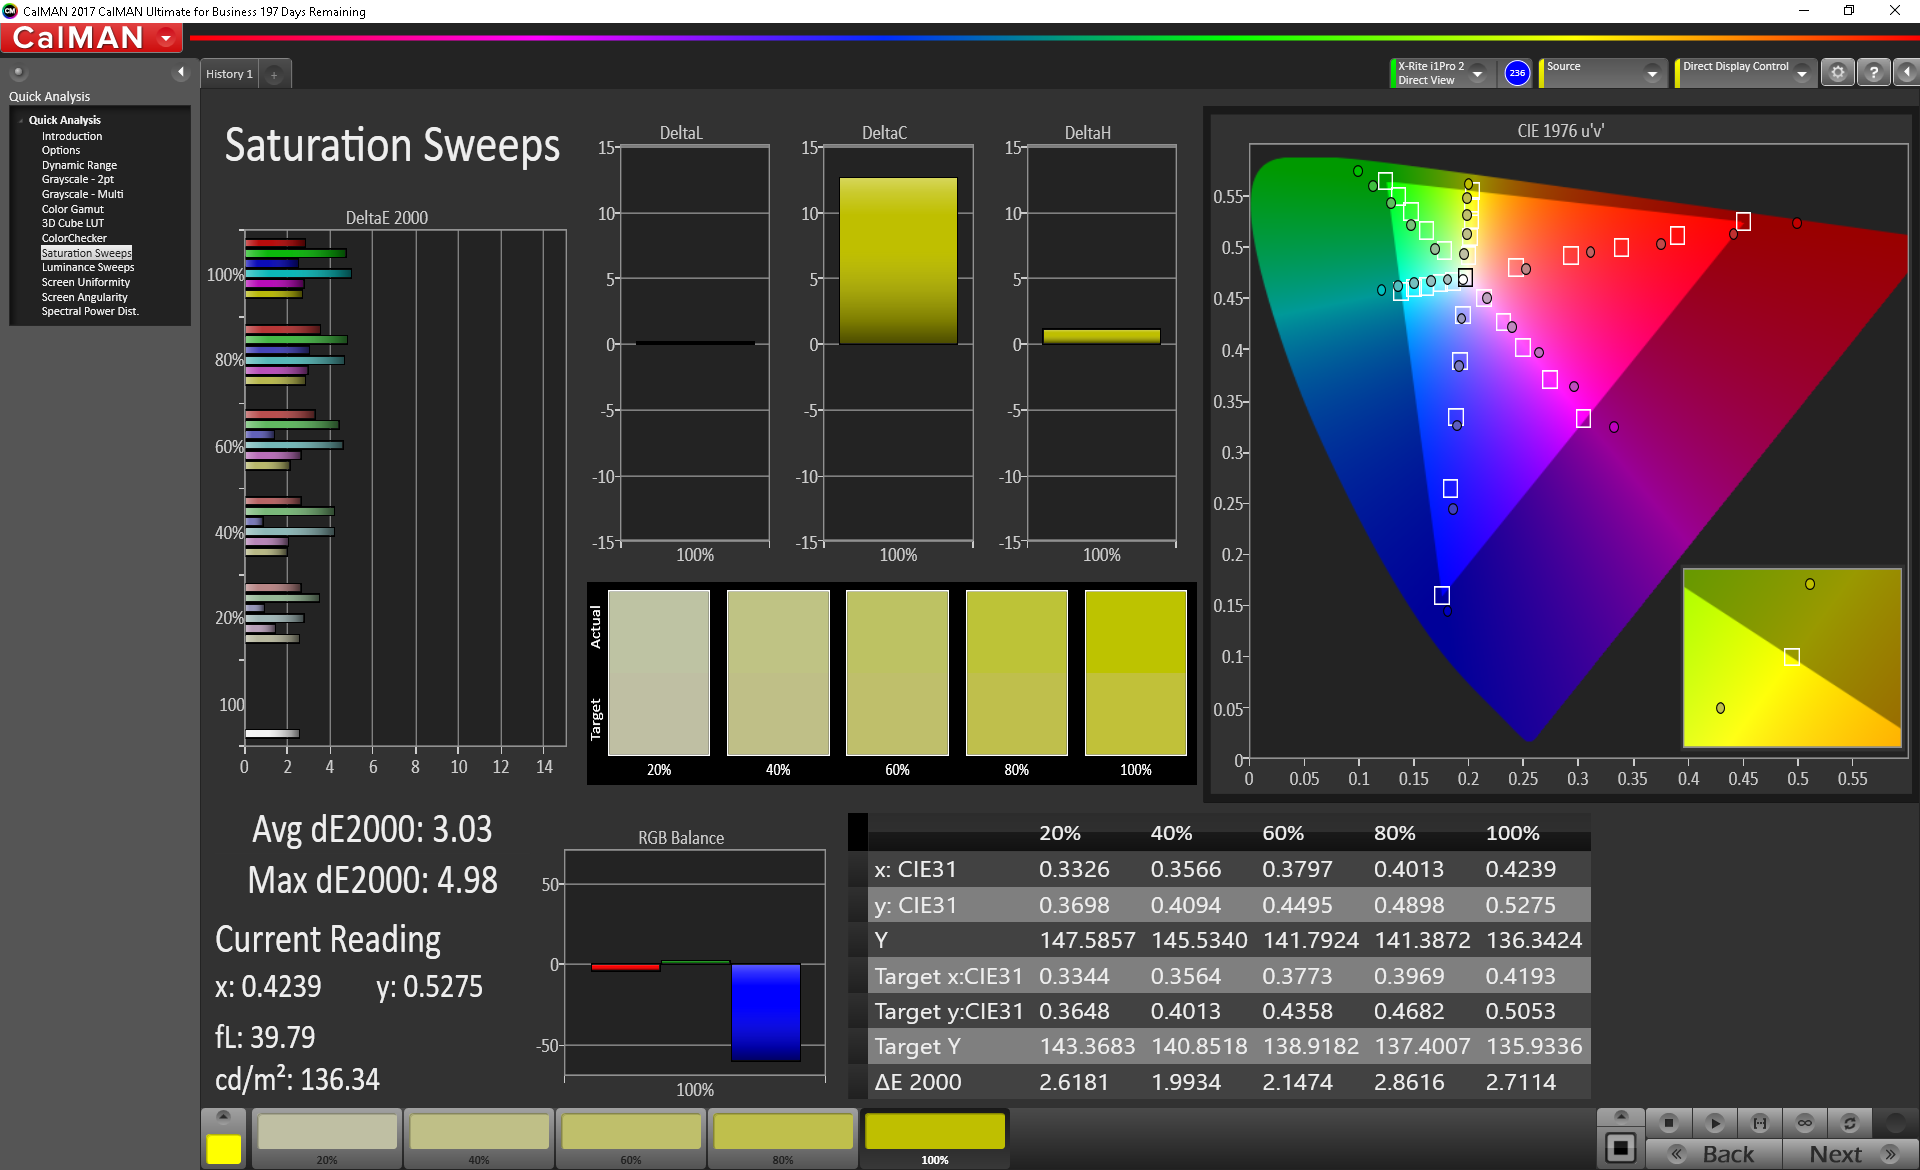
ΔE ColorChecker Calman: 3.68 | ∀{0.5-29.43 Ø4.73}
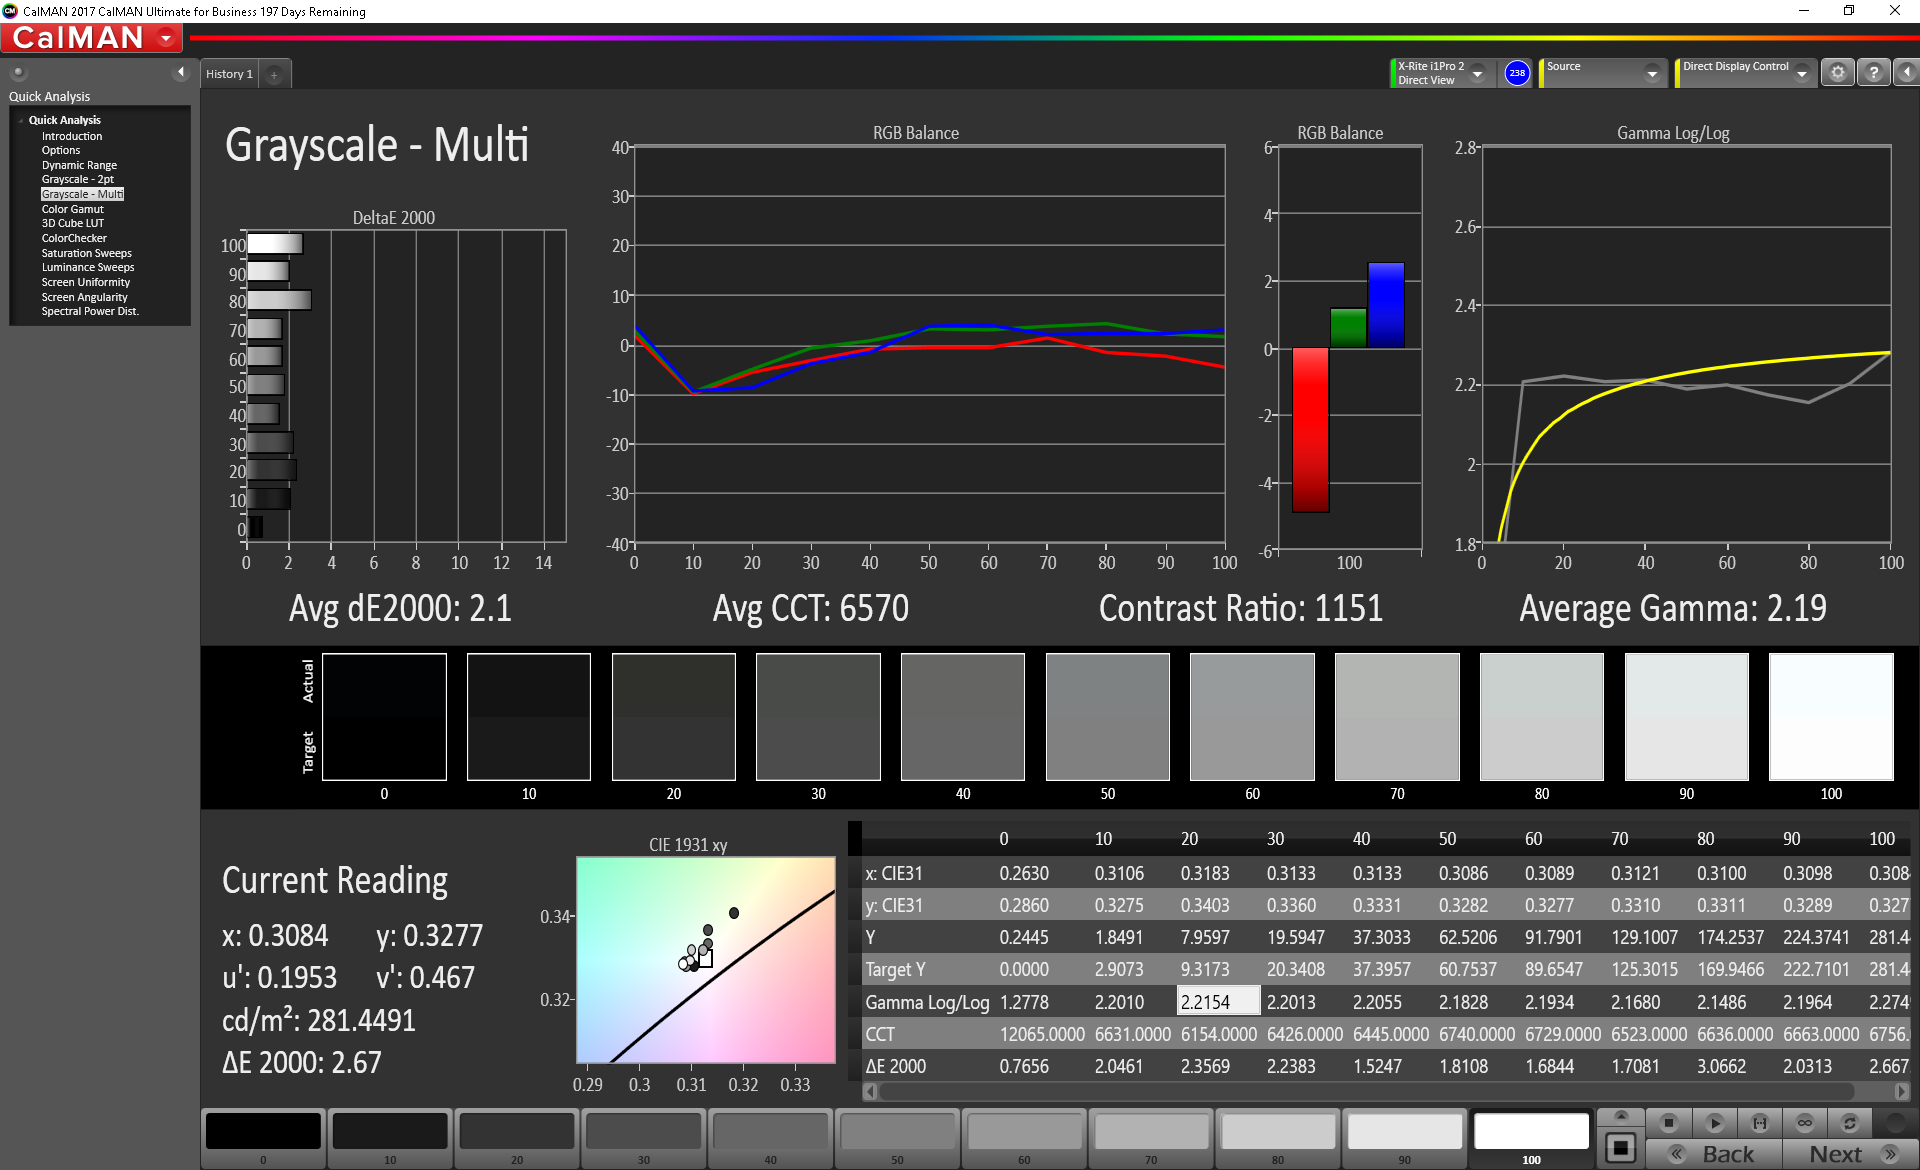
calibrated: 2.71
ΔE Greyscale Calman: 5 | ∀{0.09-98 Ø4.97}
99.97% sRGB (Argyll 1.6.3 3D)
84.77% AdobeRGB 1998 (Argyll 1.6.3 3D)
84.8% AdobeRGB 1998 (Argyll 3D)
100% sRGB (Argyll 3D)
90% Display P3 (Argyll 3D)
Gamma: 2.06
CCT: 6728 K
| Asus Strix GL703GM-DS74 Chi Mei CMN1747 M173JJE-G32, TN LED, 17.3", 1920x1080 | Acer Aspire V17 Nitro BE VN7-793-738J AU Optronics B173ZAN01.0, IPS, 17.3", 3840x2160 | MSI GE73 8RF-008 Raider RGB Chi Mei N173HHE-G32 (CMN1747), TN WLED, 17.3", 1920x1080 | Asus GL703GE-ES73 Chi Mei CMN1747, TN, 17.3", 1920x1080 | HP Omen 17-an014ng AUO149D, IPS, 17.3", 1920x1080 | Asus Strix GL703VM-DB74 AU Optronics B173HAN01.1, IPS, 17.3", 1920x1080 | |
|---|---|---|---|---|---|---|
| Display | 3% | 1% | -1% | -19% | -24% | |
| Display P3 Coverage (%) | 90 | 85.4 -5% | 90.8 1% | 90.1 0% | 64.6 -28% | 61.5 -32% |
| sRGB Coverage (%) | 100 | 100 0% | 99.9 0% | 99.8 0% | 92.9 -7% | 87.2 -13% |
| AdobeRGB 1998 Coverage (%) | 84.8 | 97.8 15% | 85.8 1% | 83.1 -2% | 66.1 -22% | 62.7 -26% |
| Response Times | -248% | -151% | -26% | -363% | -240% | |
| Response Time Grey 50% / Grey 80% * (ms) | 8.8 ? | 29 ? -230% | 28 ? -218% | 11.6 ? -32% | 45.2 ? -414% | 30.8 ? -250% |
| Response Time Black / White * (ms) | 7.4 ? | 27 ? -265% | 13.6 ? -84% | 8.8 ? -19% | 30.4 ? -311% | 24.4 ? -230% |
| PWM Frequency (Hz) | 25510 ? | 25000 ? | 26040 ? | |||
| Screen | 4% | 10% | 8% | 5% | -9% | |
| Brightness middle (cd/m²) | 297.8 | 380 28% | 273 -8% | 331.1 11% | 314 5% | 319.5 7% |
| Brightness (cd/m²) | 285 | 336 18% | 273 -4% | 312 9% | 309 8% | 293 3% |
| Brightness Distribution (%) | 84 | 81 -4% | 90 7% | 86 2% | 88 5% | 67 -20% |
| Black Level * (cd/m²) | 0.33 | 0.32 3% | 0.26 21% | 0.31 6% | 0.34 -3% | 0.65 -97% |
| Contrast (:1) | 902 | 1188 32% | 1050 16% | 1068 18% | 924 2% | 492 -45% |
| Colorchecker dE 2000 * | 3.68 | 5.32 -45% | 3.52 4% | 2.86 22% | 3.19 13% | 3.17 14% |
| Colorchecker dE 2000 max. * | 7.71 | 7.63 1% | 6.34 18% | 6.35 18% | 6.1 21% | 5.32 31% |
| Colorchecker dE 2000 calibrated * | 2.71 | 2.09 23% | 2.66 2% | |||
| Greyscale dE 2000 * | 5 | 4.9 2% | 3.11 38% | 4.3 14% | 3.49 30% | 1.6 68% |
| Gamma | 2.06 107% | 2.61 84% | 2.43 91% | 2.268 97% | 2.34 94% | 2.22 99% |
| CCT | 6728 97% | 6558 99% | 6999 93% | 7034 92% | 7261 90% | 6668 97% |
| Color Space (Percent of AdobeRGB 1998) (%) | 84.77 | 87.2 3% | 76 -10% | 75 -12% | 60 -29% | 56 -34% |
| Color Space (Percent of sRGB) (%) | 99.97 | 100 0% | 100 0% | 100 0% | 93 -7% | 87 -13% |
| Total Average (Program / Settings) | -80% /
-30% | -47% /
-12% | -6% /
2% | -126% /
-49% | -91% /
-42% |
* ... smaller is better
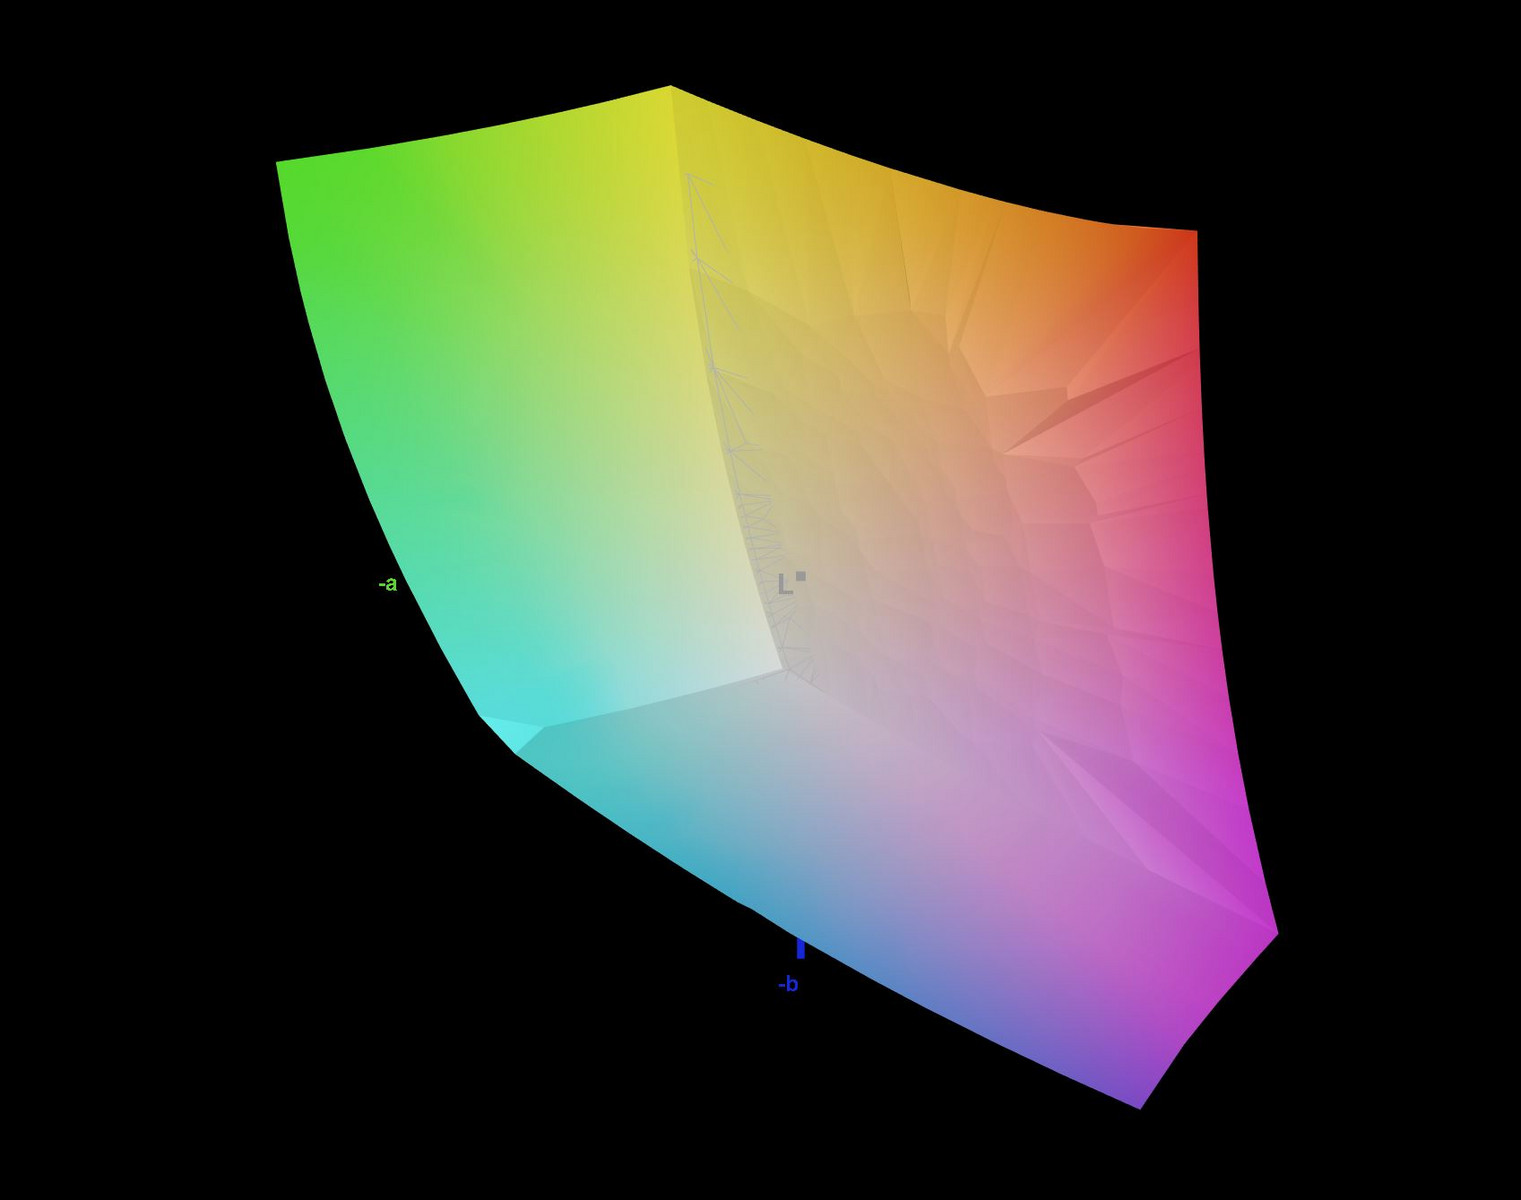
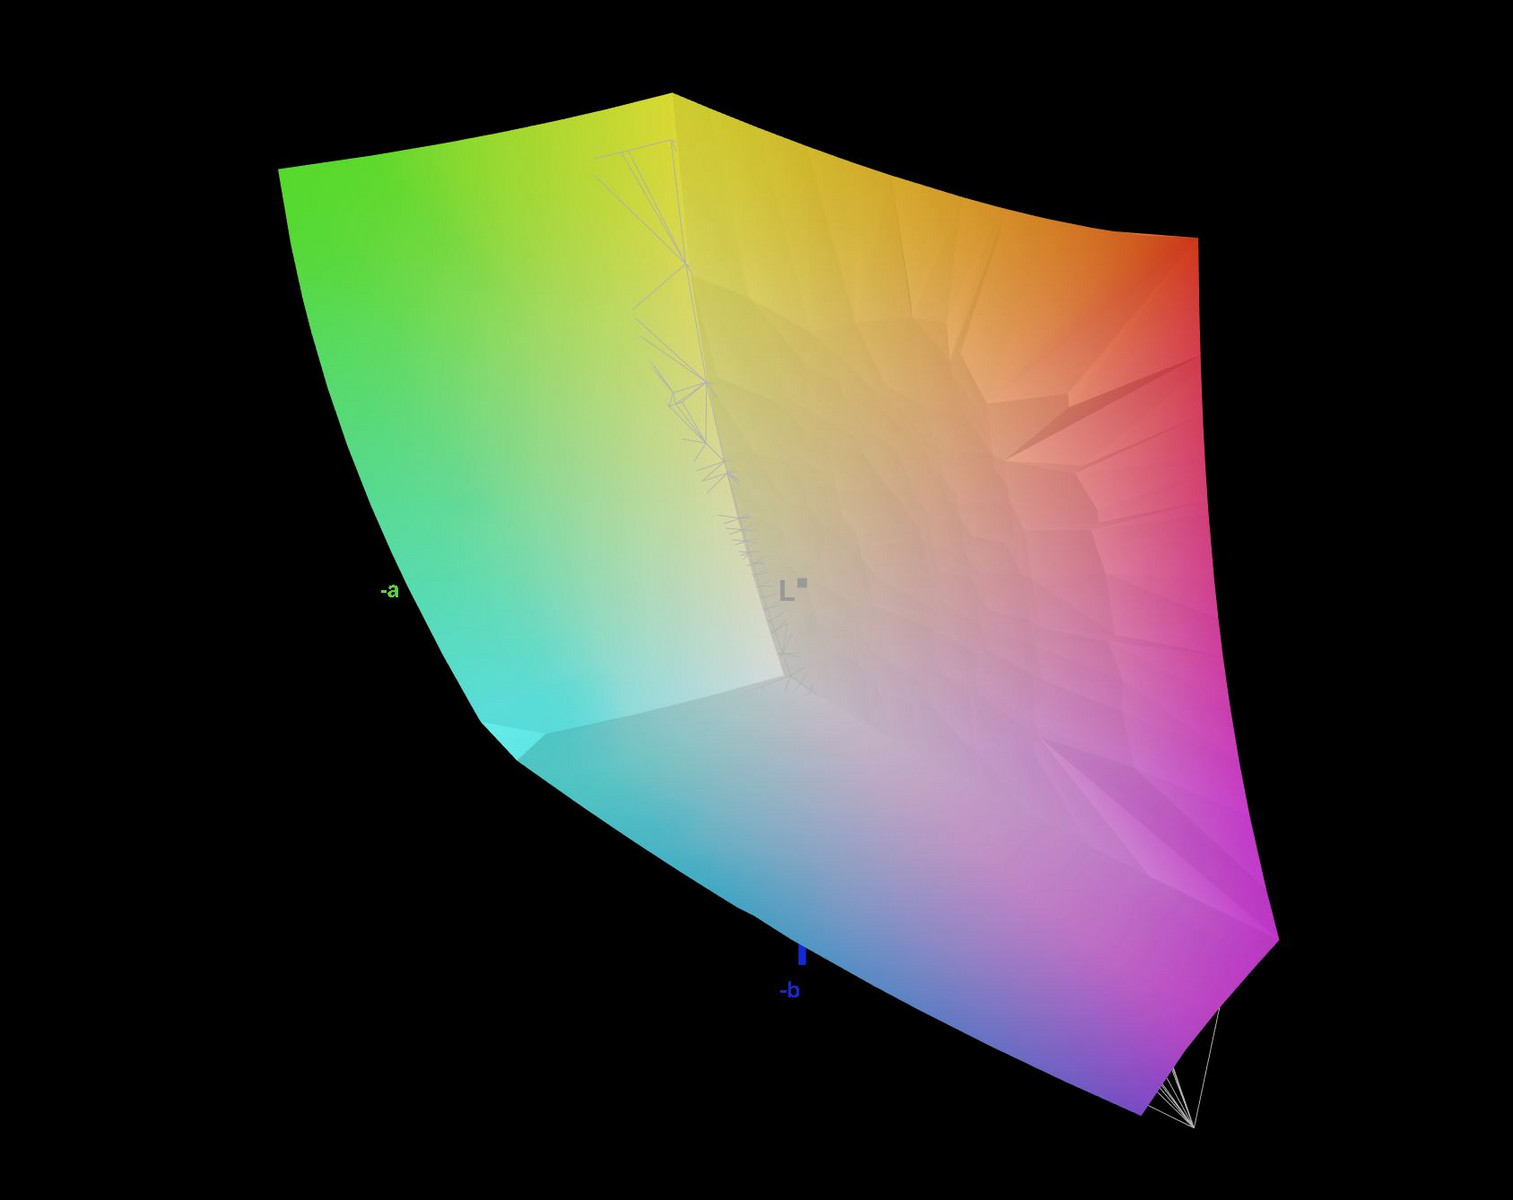
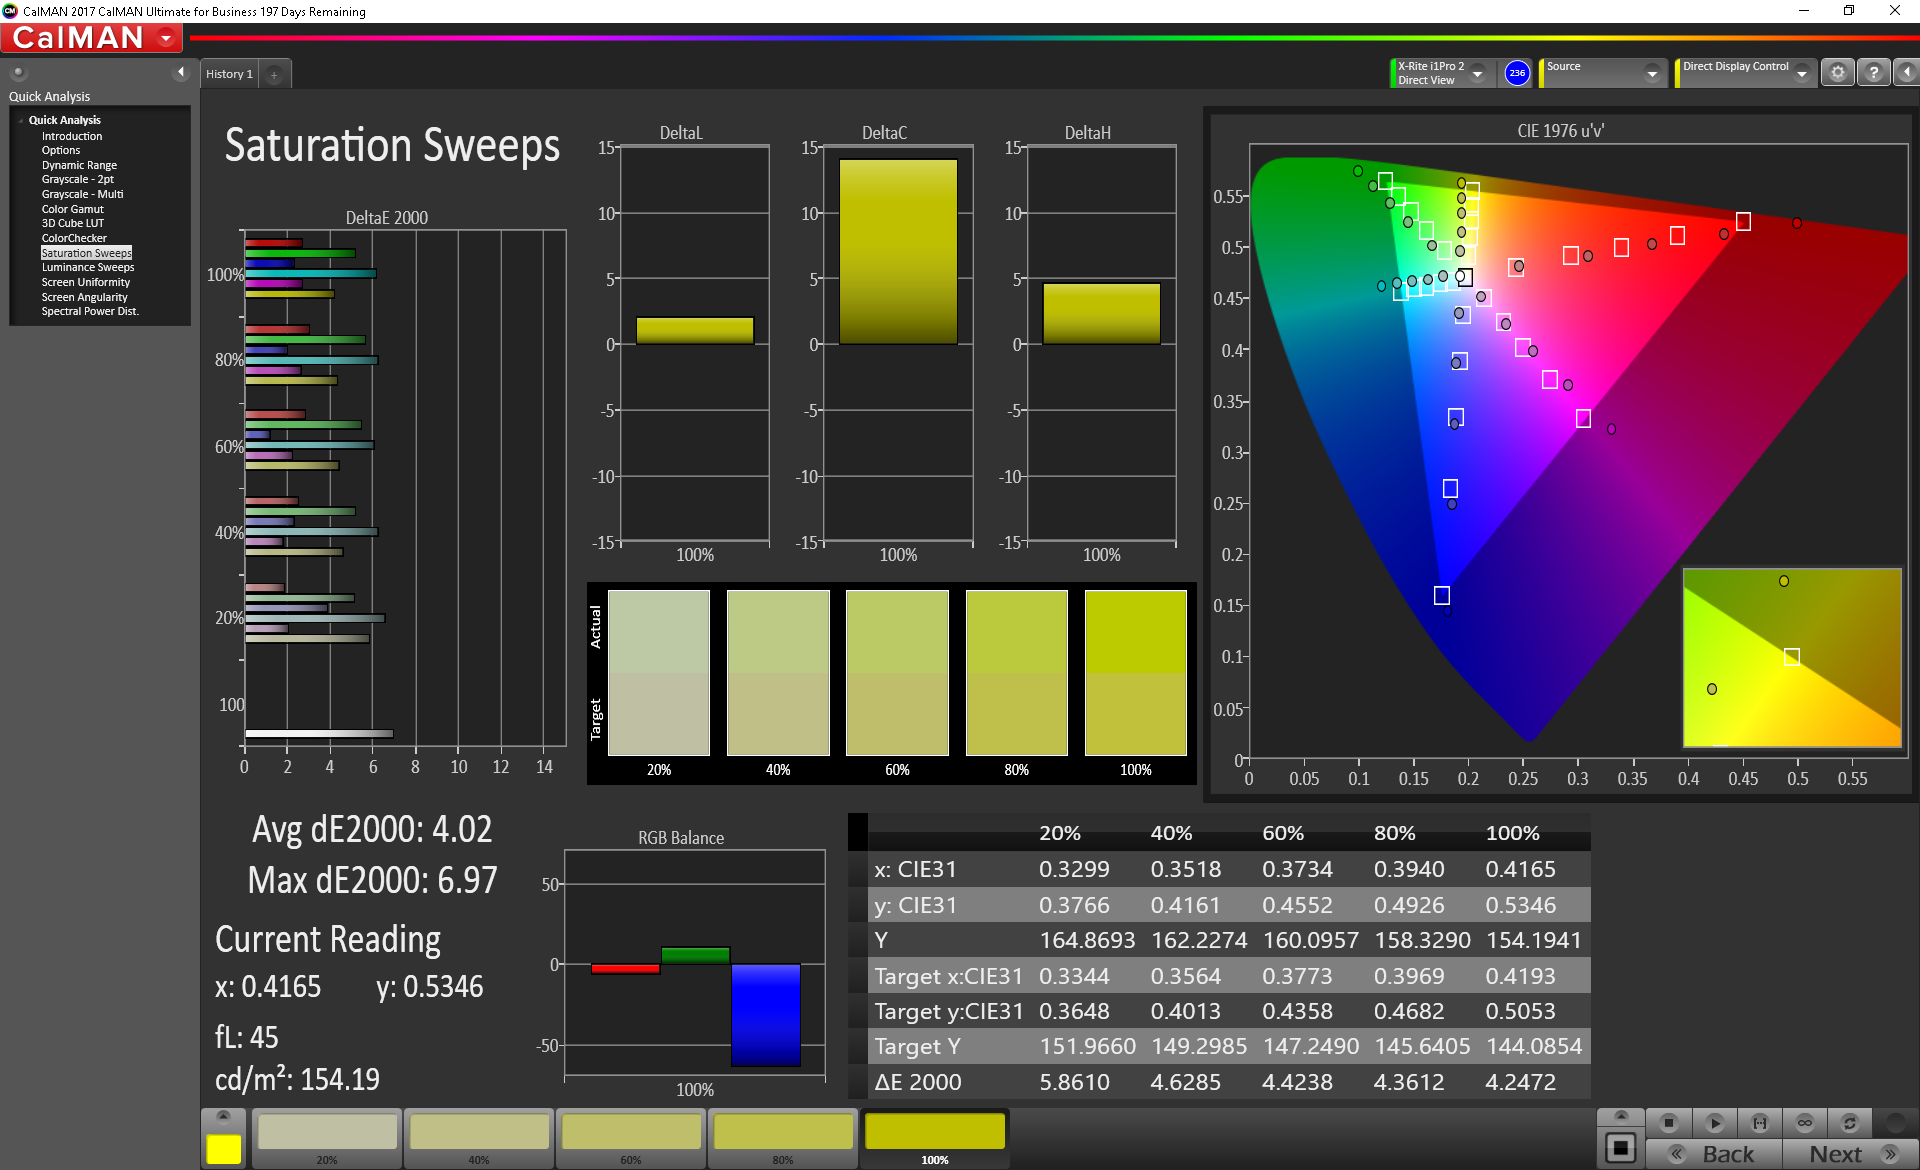
The FHD panel covers the entire sRGB color space and about 85 % of AdobeRGB, thus outperforming the AUO panel Asus used for the GL703VM-DB74. The competing laptops offers similar coverage.
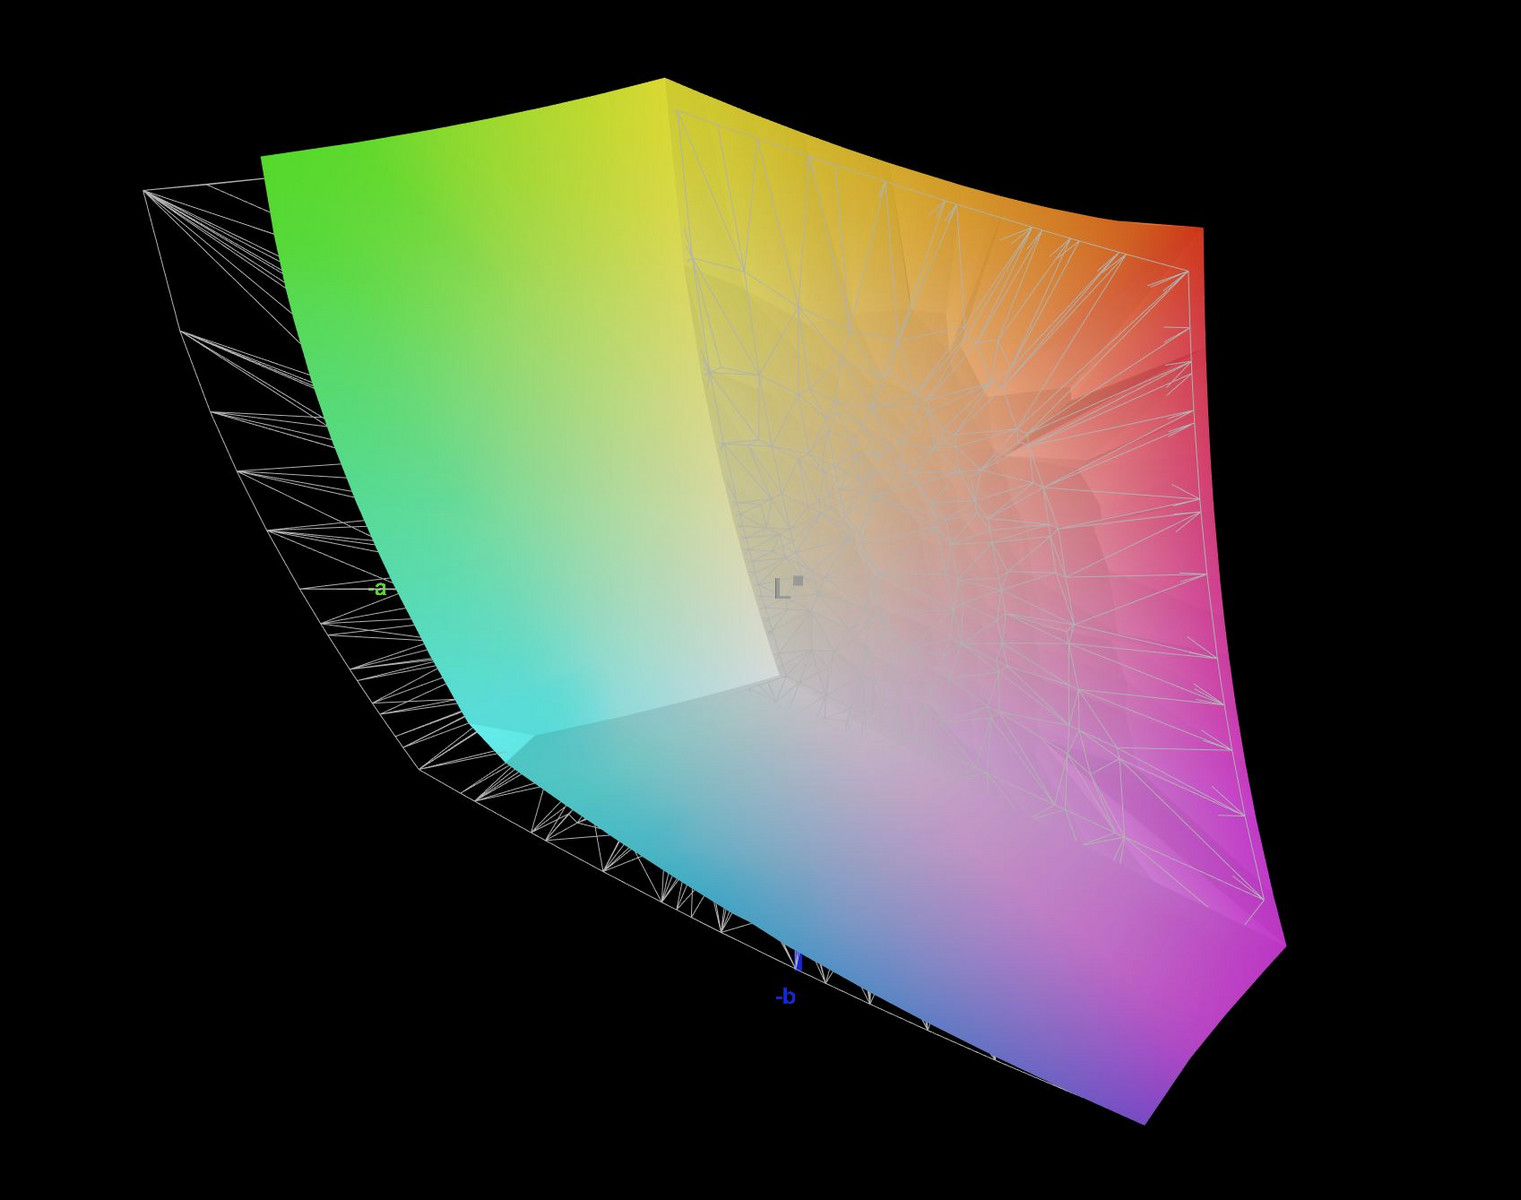
Measurements with our X-Rite spectrophotometer show good color and grayscale out of the box with DeltaE-deviations of 3.7 and 2.7, respectively. A calibration improves the results further with the Delta-E dropping to 2.7 for color and 2.1 for grayscale. For a gaming notebook, the color accuracy is quite acceptable and the GL703GM is certainly usable for occasional photo editing in addition to various other duties.
Display Response Times
| ↔ Response Time Black to White | ||
|---|---|---|
| 7.4 ms ... rise ↗ and fall ↘ combined | ↗ 5.2 ms rise | 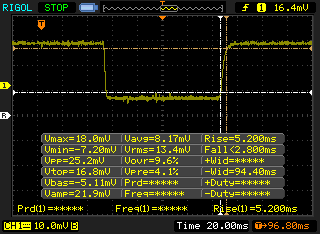 |
| ↘ 2.2 ms fall | ||
| The screen shows very fast response rates in our tests and should be very well suited for fast-paced gaming. In comparison, all tested devices range from 0.1 (minimum) to 240 (maximum) ms. » 22 % of all devices are better. This means that the measured response time is better than the average of all tested devices (19.9 ms). | ||
| ↔ Response Time 50% Grey to 80% Grey | ||
| 8.8 ms ... rise ↗ and fall ↘ combined | ↗ 4.4 ms rise | 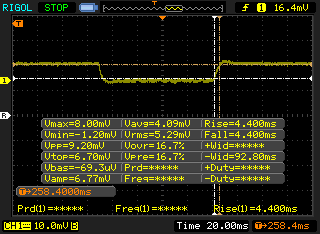 |
| ↘ 4.4 ms fall | ||
| The screen shows fast response rates in our tests and should be suited for gaming. In comparison, all tested devices range from 0.165 (minimum) to 636 (maximum) ms. » 22 % of all devices are better. This means that the measured response time is better than the average of all tested devices (31.1 ms). | ||
Screen Flickering / PWM (Pulse-Width Modulation)
| Screen flickering / PWM detected | 25510 Hz | ≤ 15 % brightness setting | 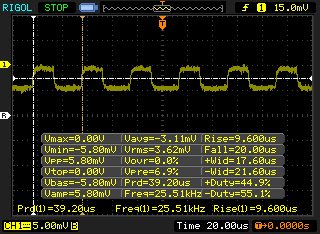 |
The display backlight flickers at 25510 Hz (worst case, e.g., utilizing PWM) Flickering detected at a brightness setting of 15 % and below. There should be no flickering or PWM above this brightness setting. The frequency of 25510 Hz is quite high, so most users sensitive to PWM should not notice any flickering. In comparison: 52 % of all tested devices do not use PWM to dim the display. If PWM was detected, an average of 7794 (minimum: 5 - maximum: 343500) Hz was measured. | |||
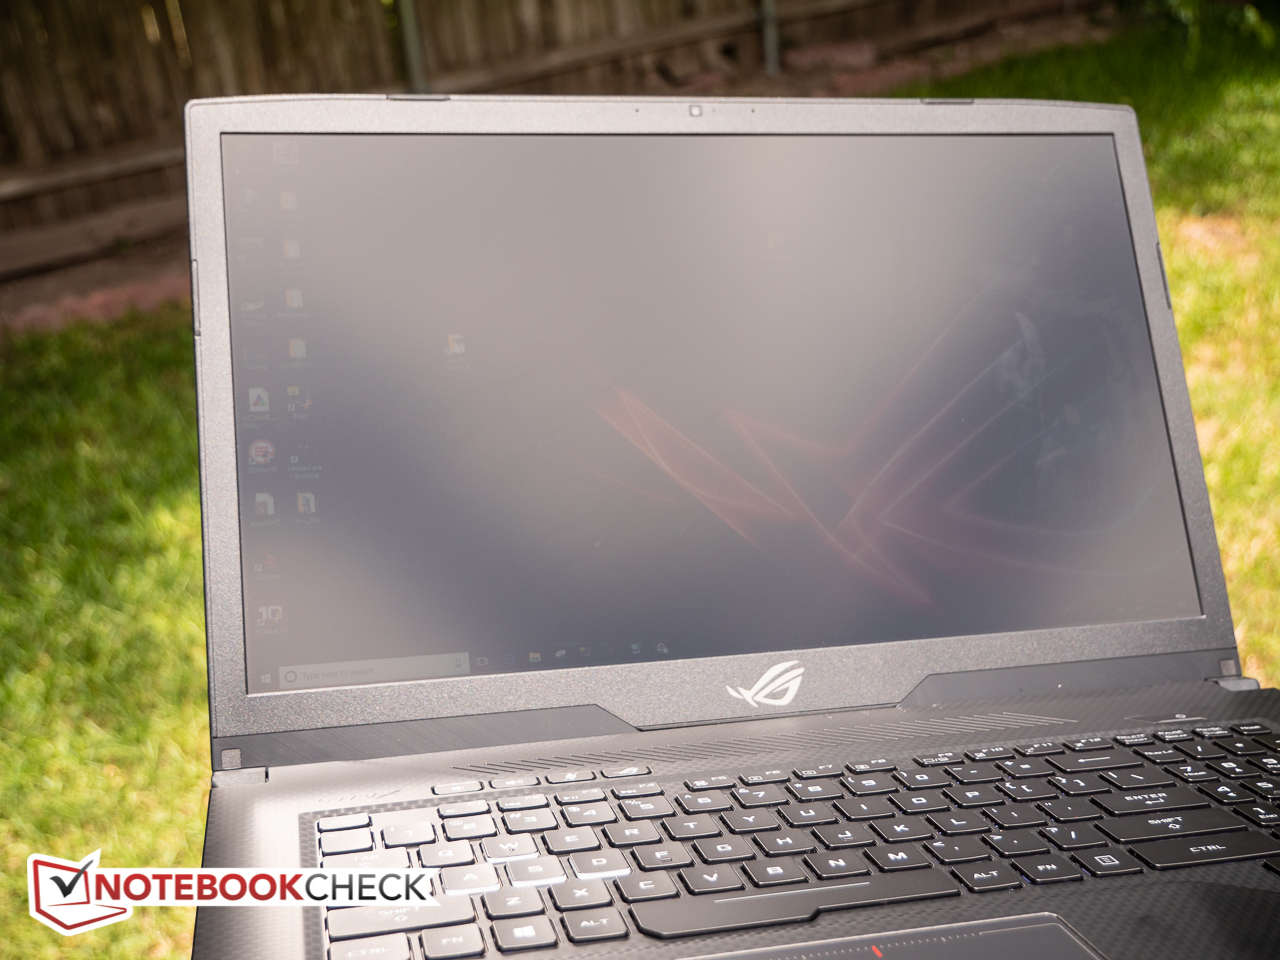
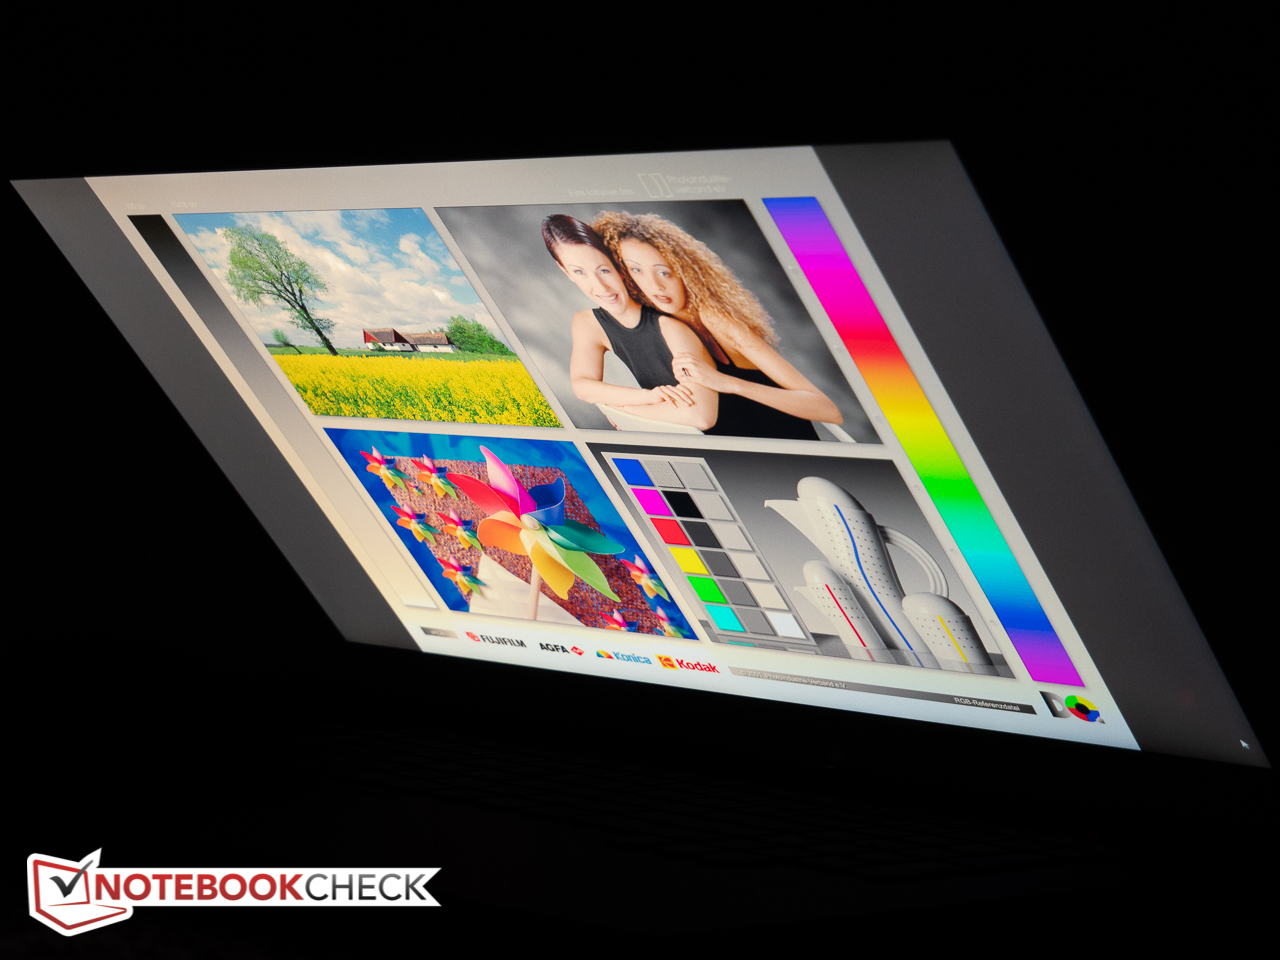
Outdoor visibility is far from stellar given the just average maximum brightness and comparatively low contrast. Direct sunlight washes the screen out completely and is out of the question, but working in the shade is not really a problem. Since this is a TN panel, the viewing angle stability suffers as expected with the colors eventually inverting at more shallow angles.


Performance
At the time of writing, Cukusa offers three different SKUs - all of them with the i7 hexa-core CPU and 16 GB of RAM. The lowest-end model sells for $1250 and comes with a 4 GB GeForce GTX 1050 Ti, the middle model gets the GeForce GTX 1060 with 6GB of RAM and retails for $1600, while the top SKU for $1900 is equipped with the 8 GB GeForce GTX 1070 and a 3 ms FHD G-Sync display running at 144Hz for even smoother gameplay. The latter two models feature a 256 GB NVMe SSD in addition to the 1 TB SSHD; the entry-level model comes with a 128 GB NVMe SSD and the same 1TB SSHD.
Processor
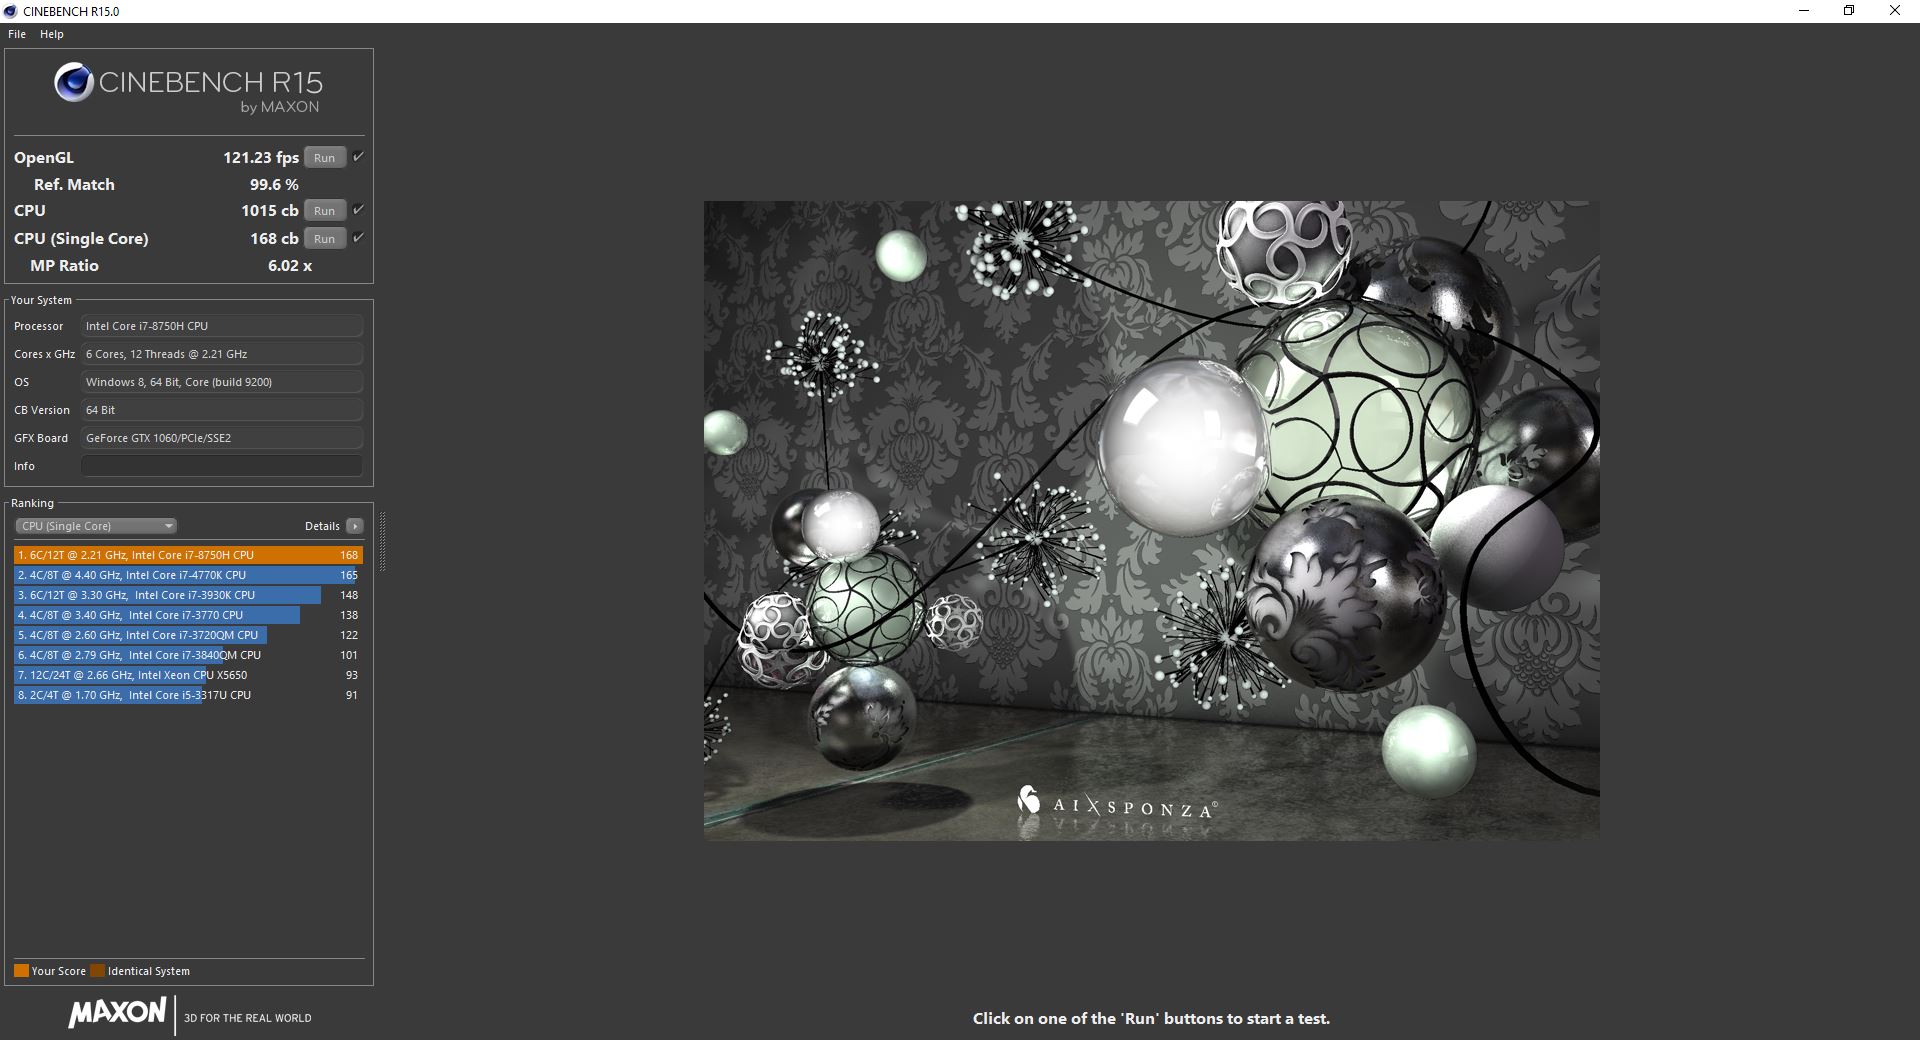
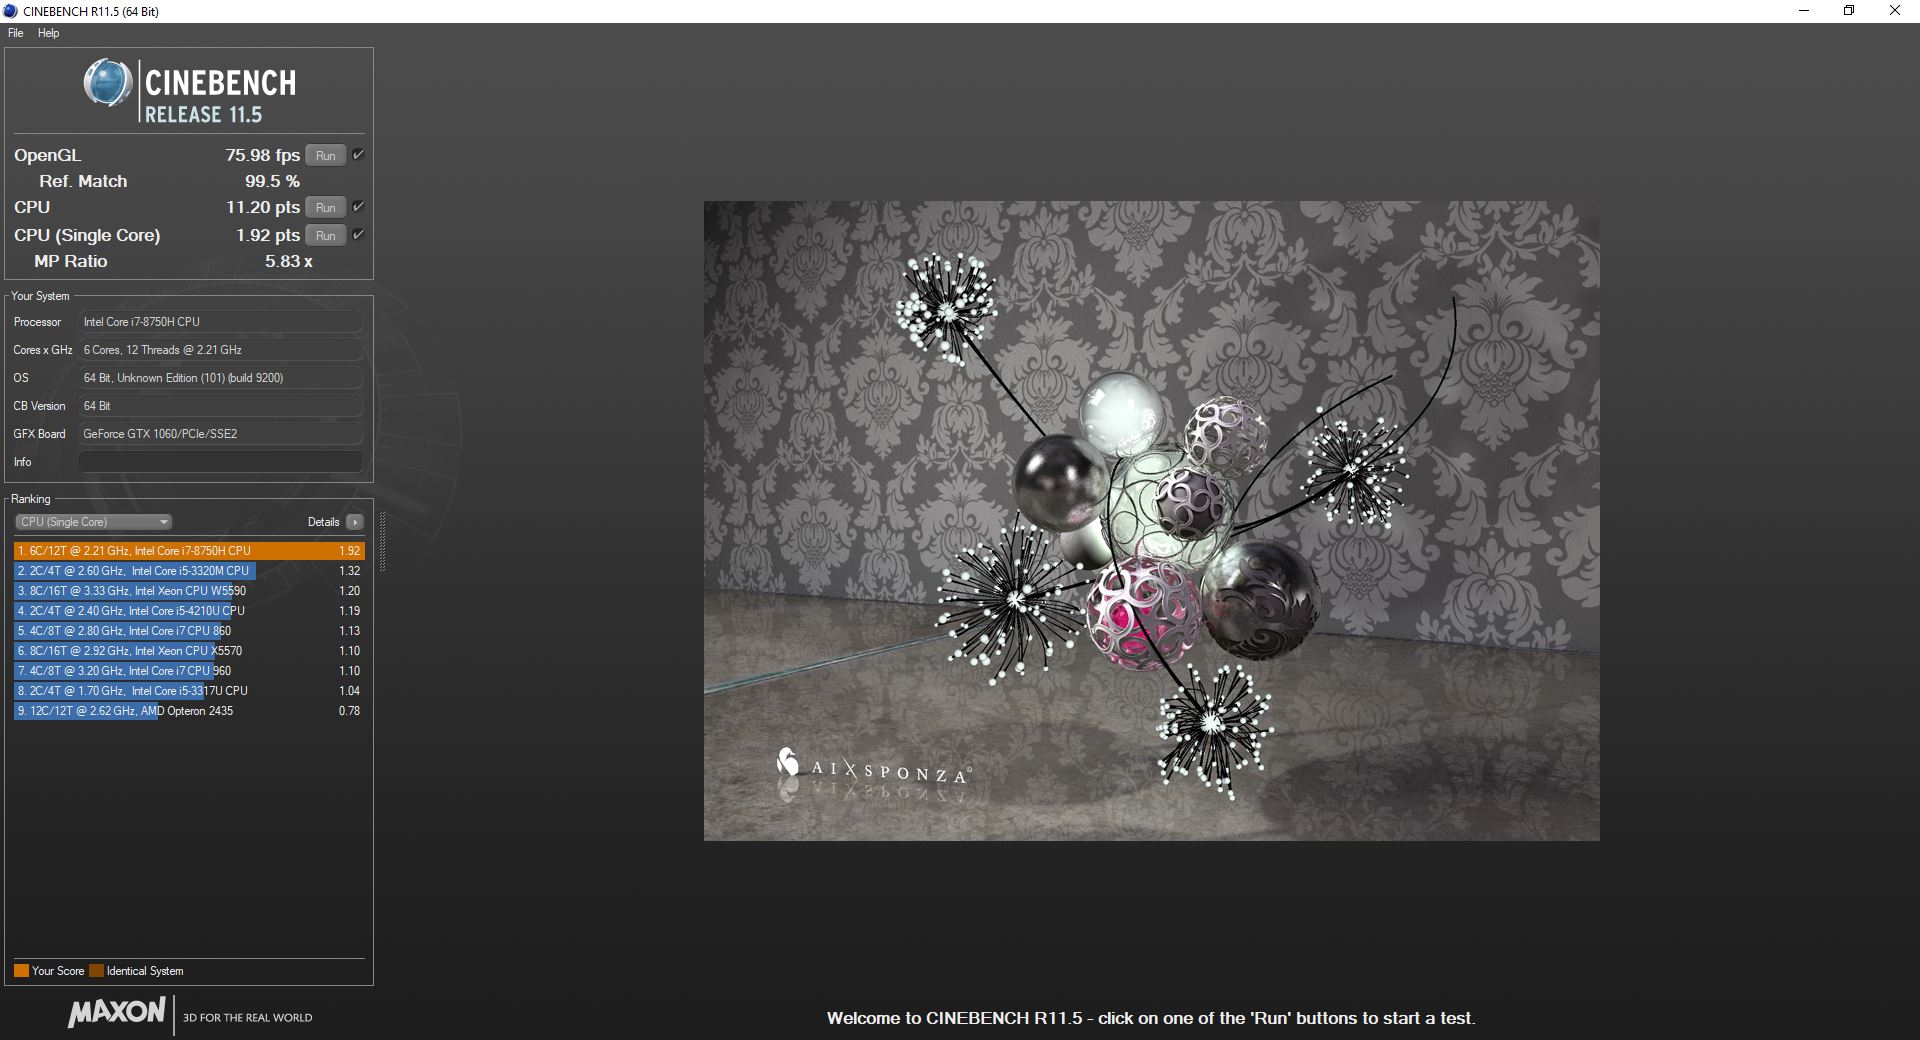
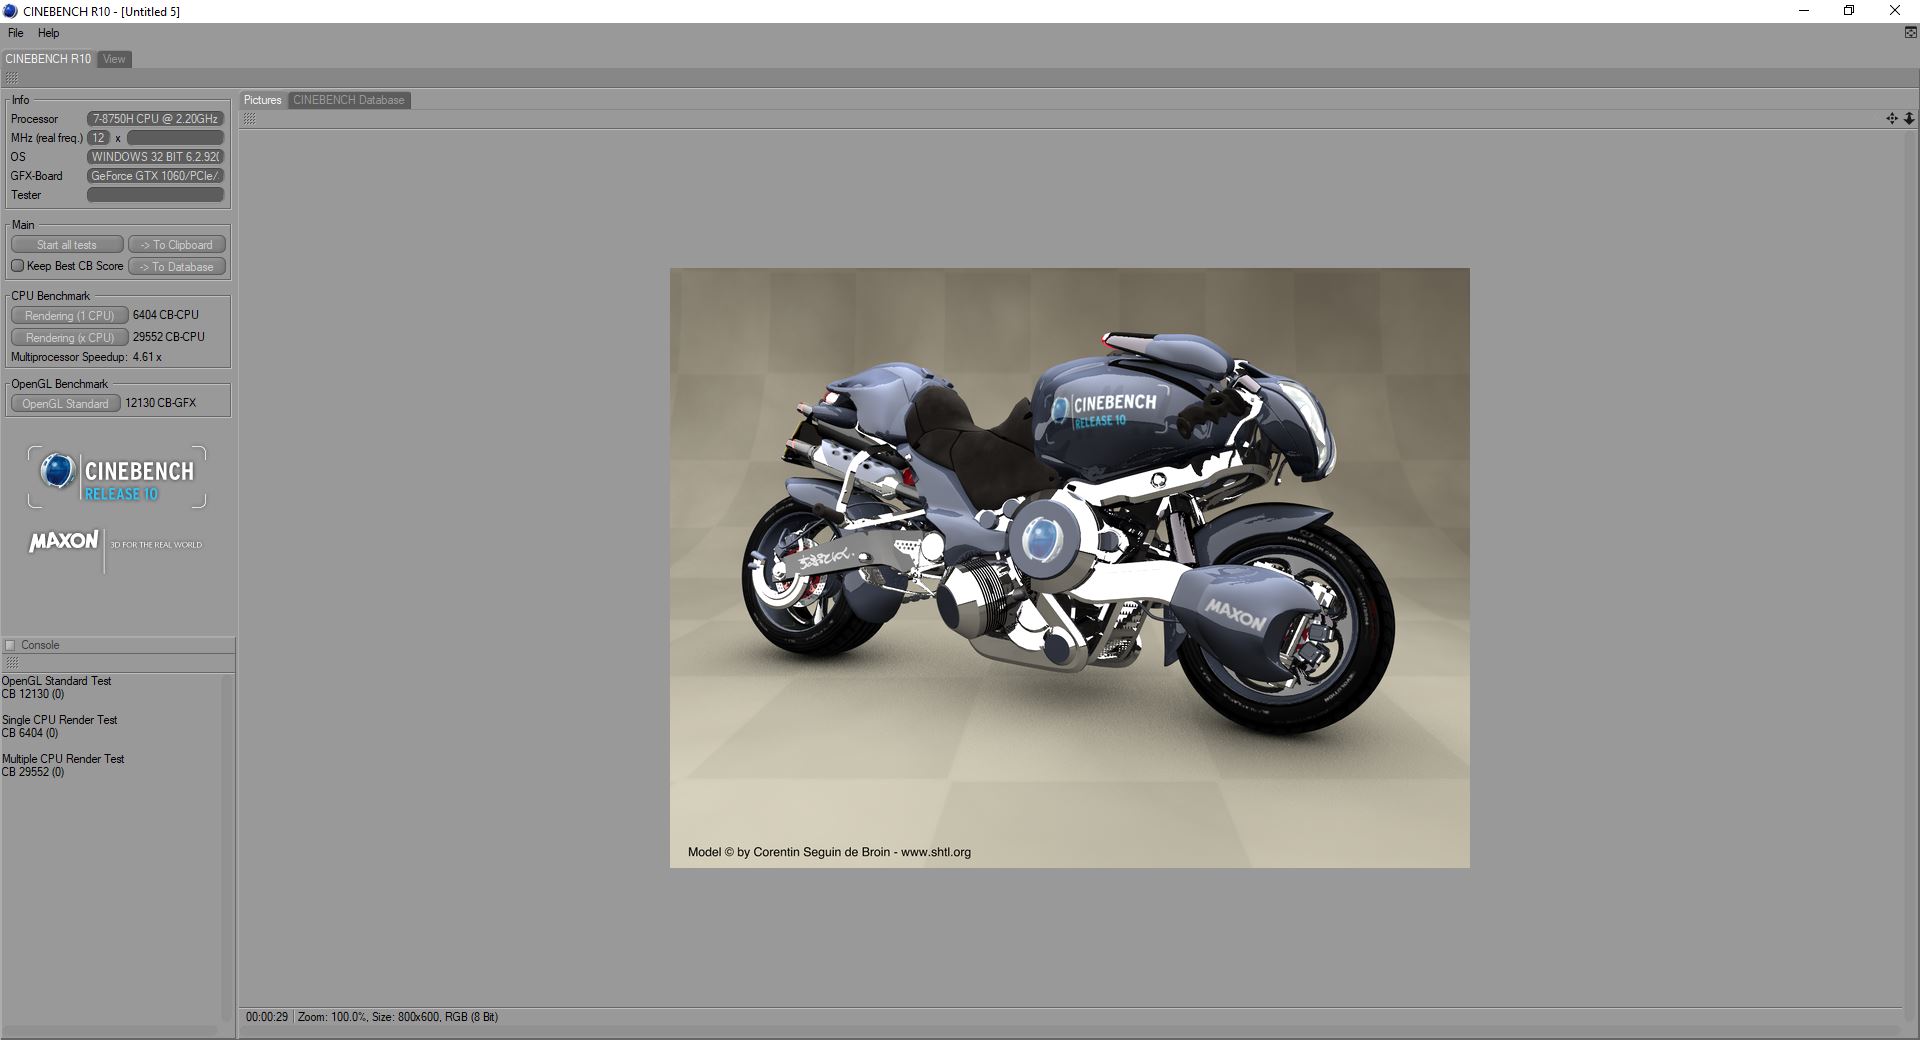
As previous reviews have shown, the new hexa-core i7-8750H offers a significant advantage over the 7th-generation i7-7700HQ, particularly when the application can take advantage of the two additional cores. The CineBench benchmark scores show our GL703GM to be between 18 - 57 percent faster than the GL703VM with the older quad-core i7. Performance lags behind the average for the i7-8750H CPU, but the the difference doesn't exceed the single-digit percentage range.
Sustained multi-core performance is decent, although the initial high score of 1026 does drop to about 935 on average for a reduction of about 9 percent. Subsequent loops of the CineBench R15 Multi-Thread after the initial run show very consistent performance with no major fluctuations. The predecessor-model GL703VM with i7-7700HQ experiences no such initial drop, but also offers a much lower performance across all loops of the CineBench R15 Mutli-Thread test.
See see our dedicated page on the Intel Core i7-8750H for more technical information and benchmark comparisons.
System Performance
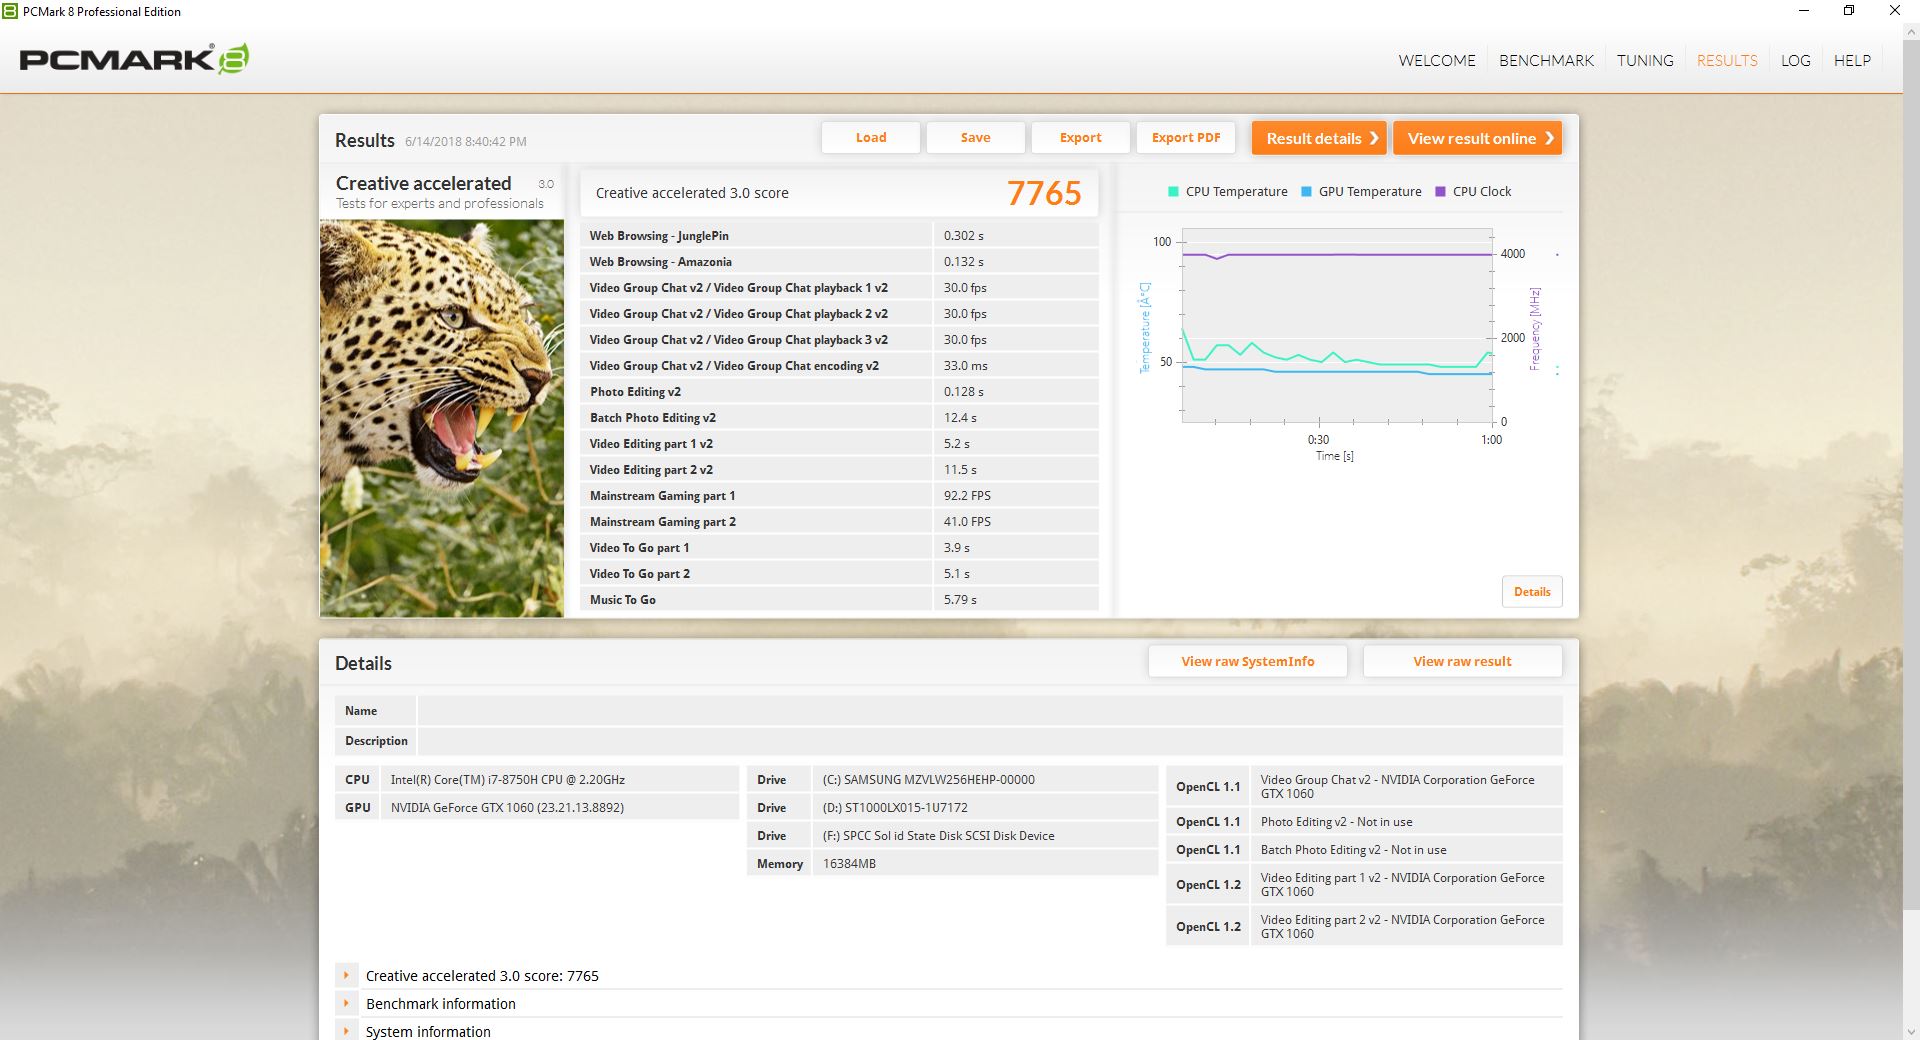
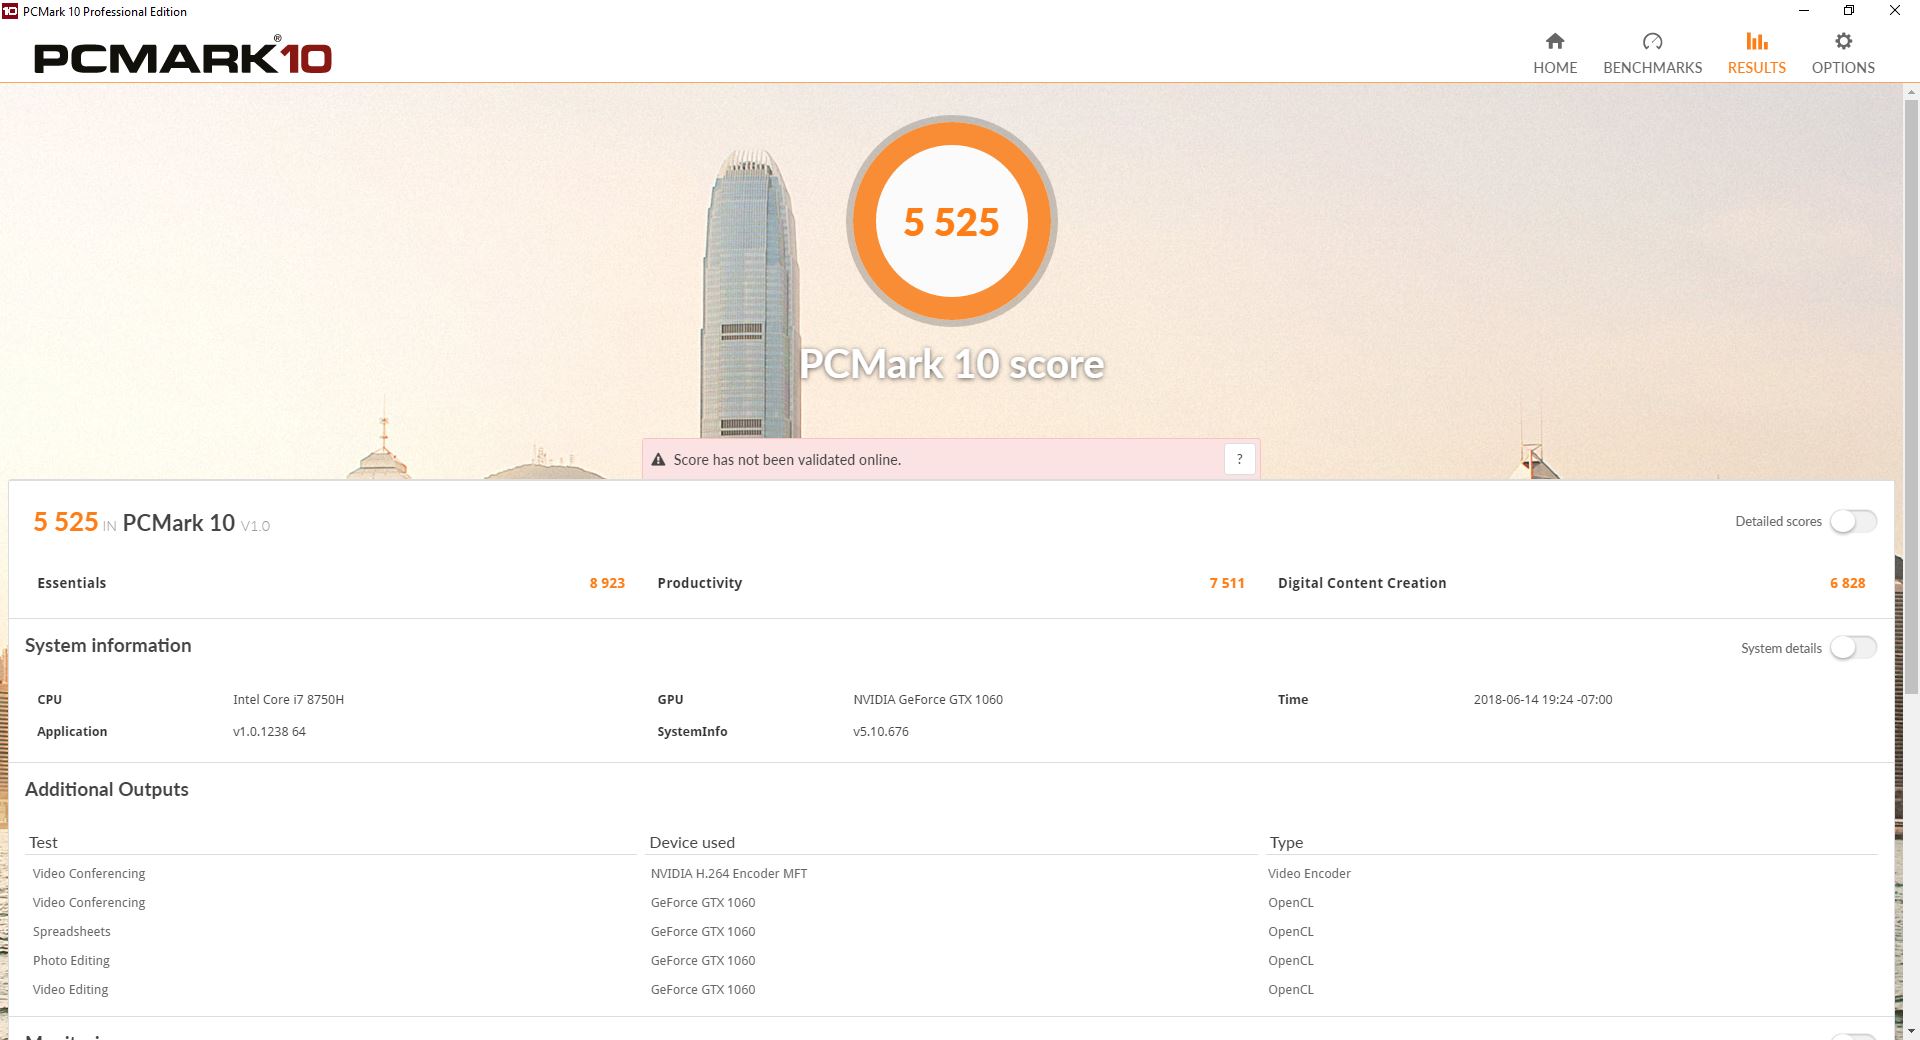
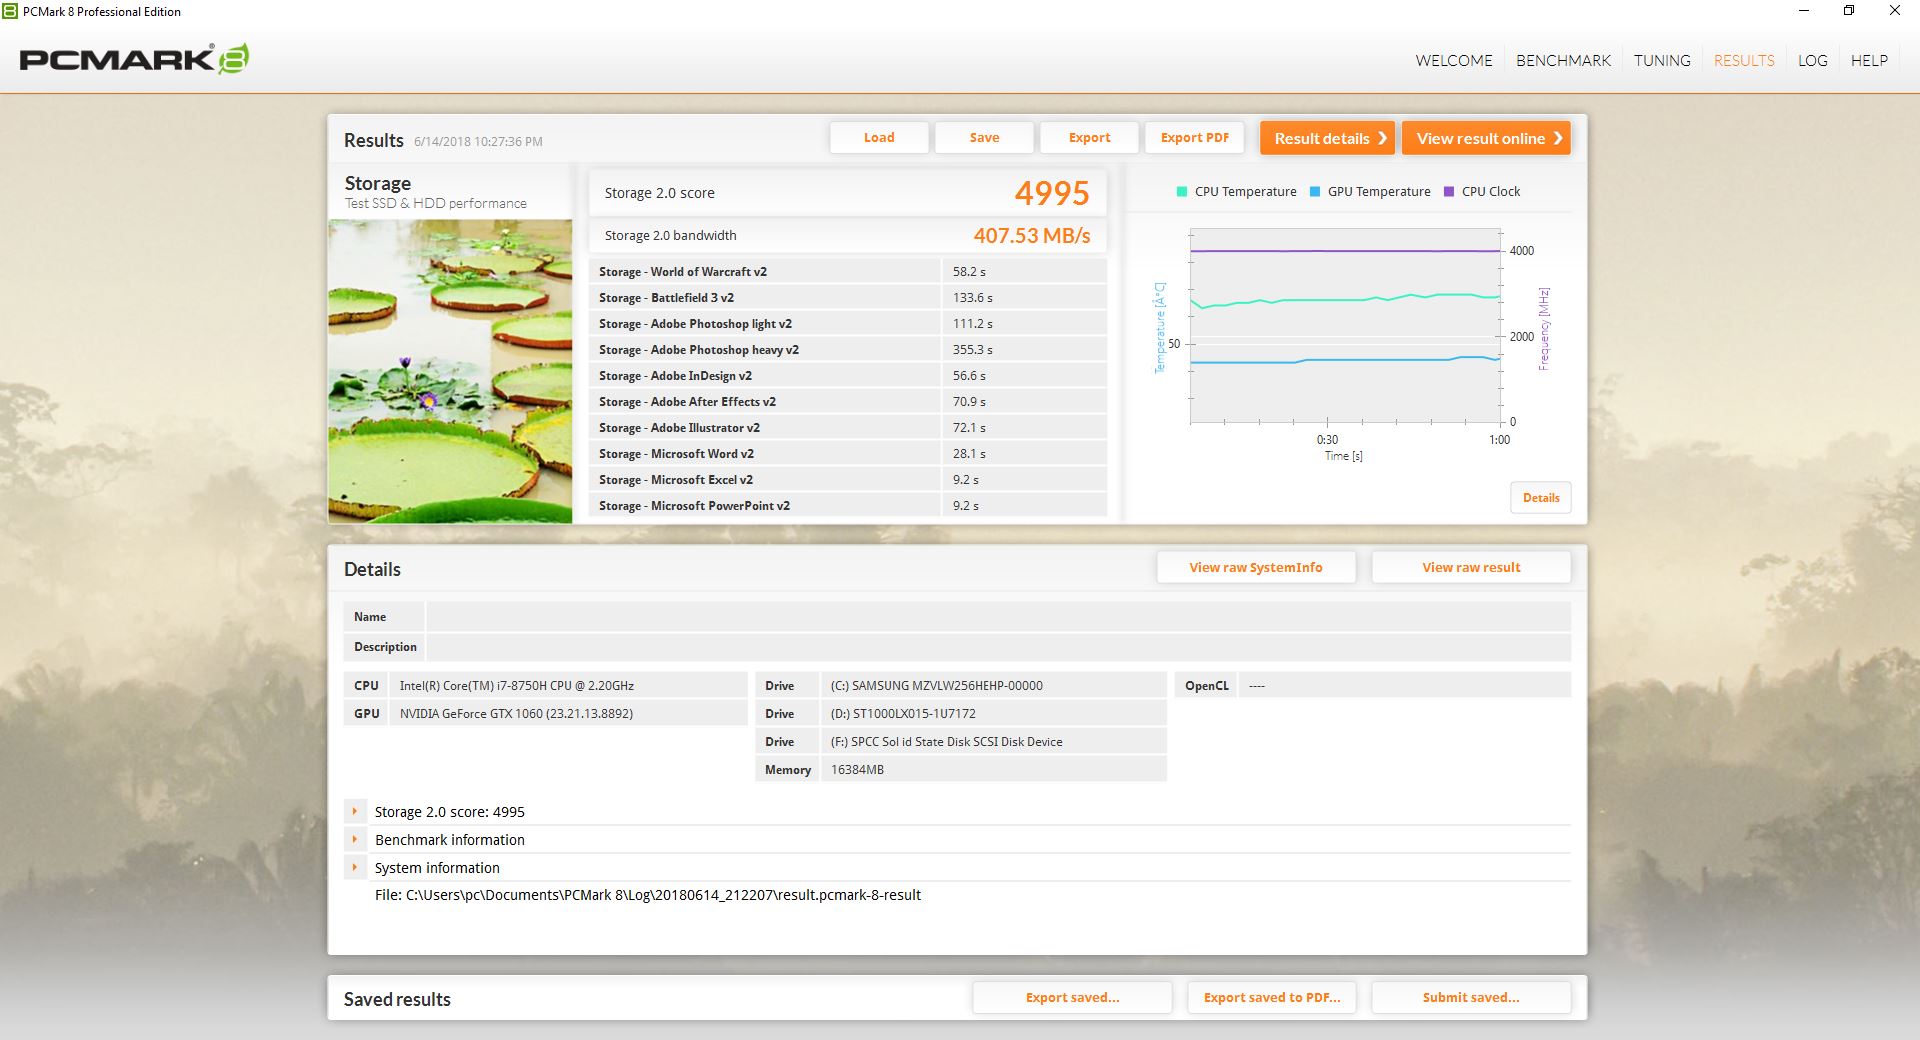
While the GL703GM trails some competitors with the same i7-8750H when it comes to raw processor performance, the overall system performance is top notch according to PCMark with the notebook consistently scoring at or near the top when running the PCMark 8 and PCMark 10 benchmarks. Of course, the synthetic benchmarks benefit hugely from the quick NVMe SSD. Subjectively, the system performance is very snappy with ten-second boot times and next to no lag during heavy multitasking sessions.
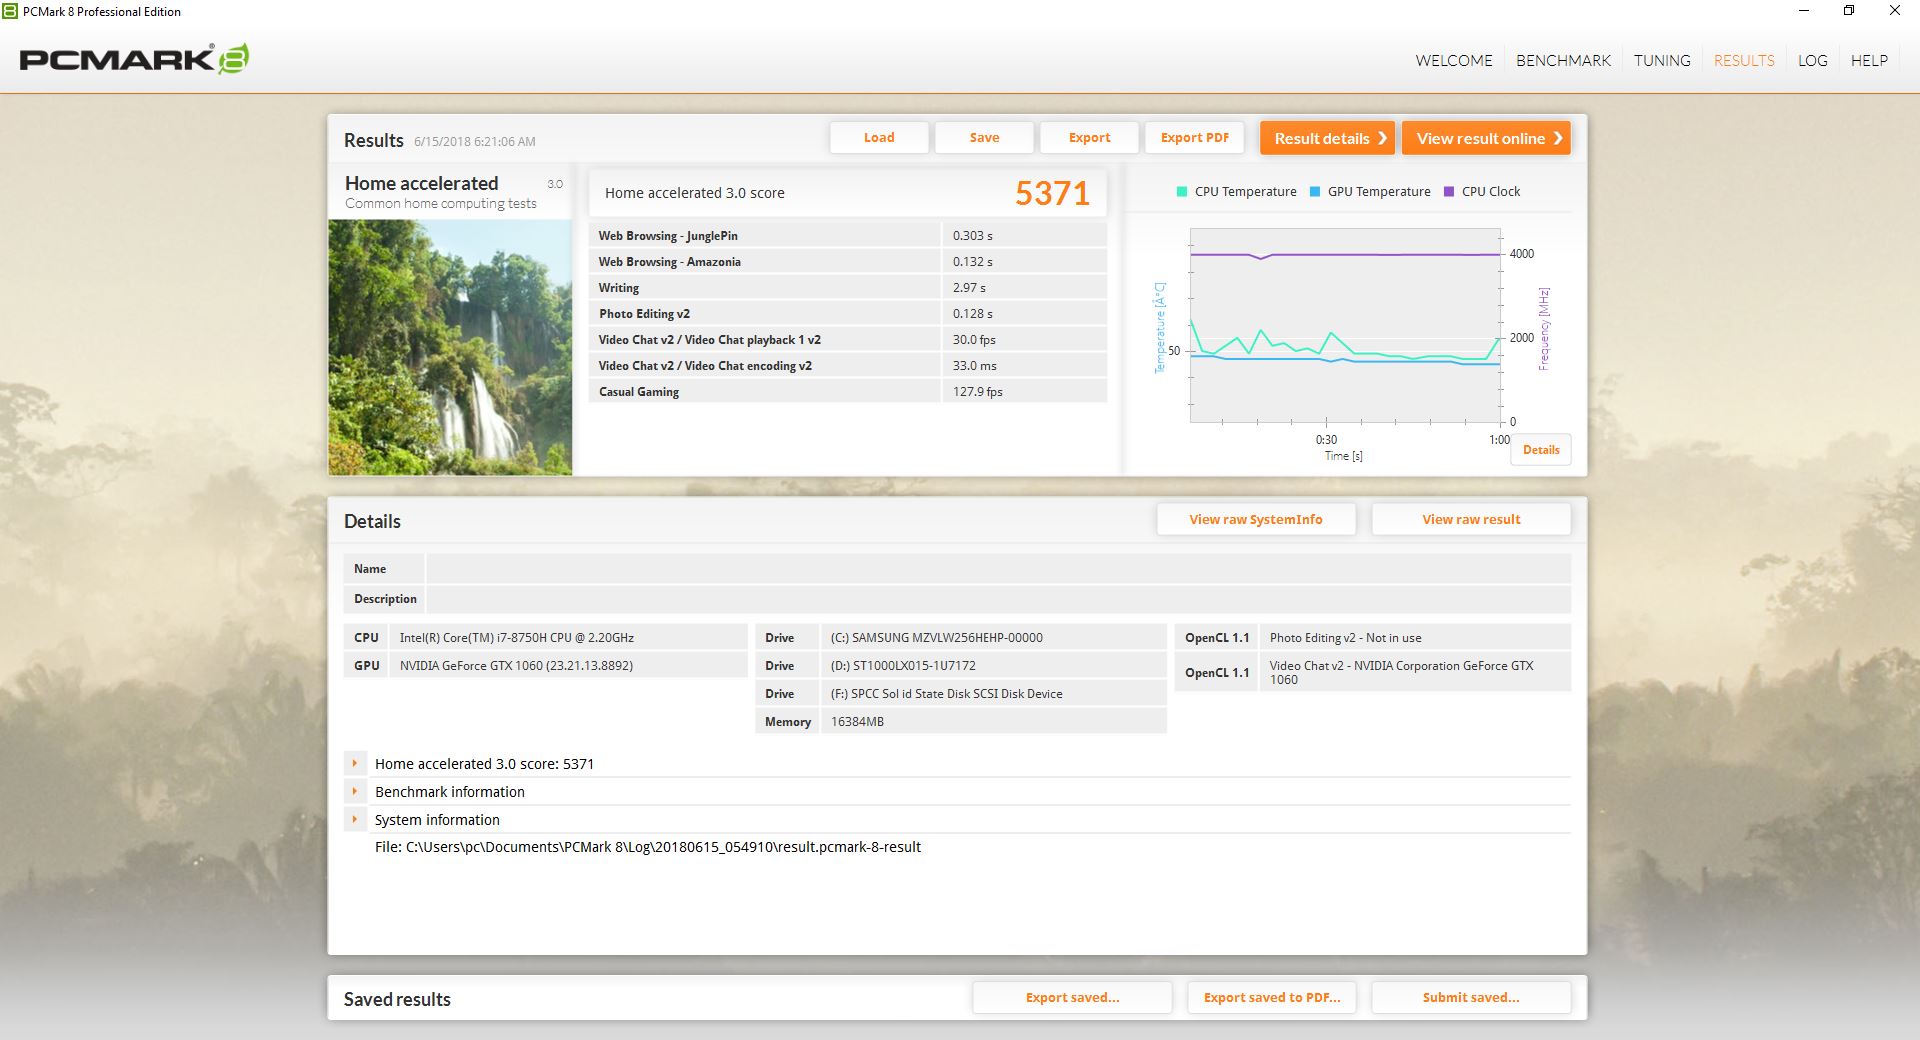
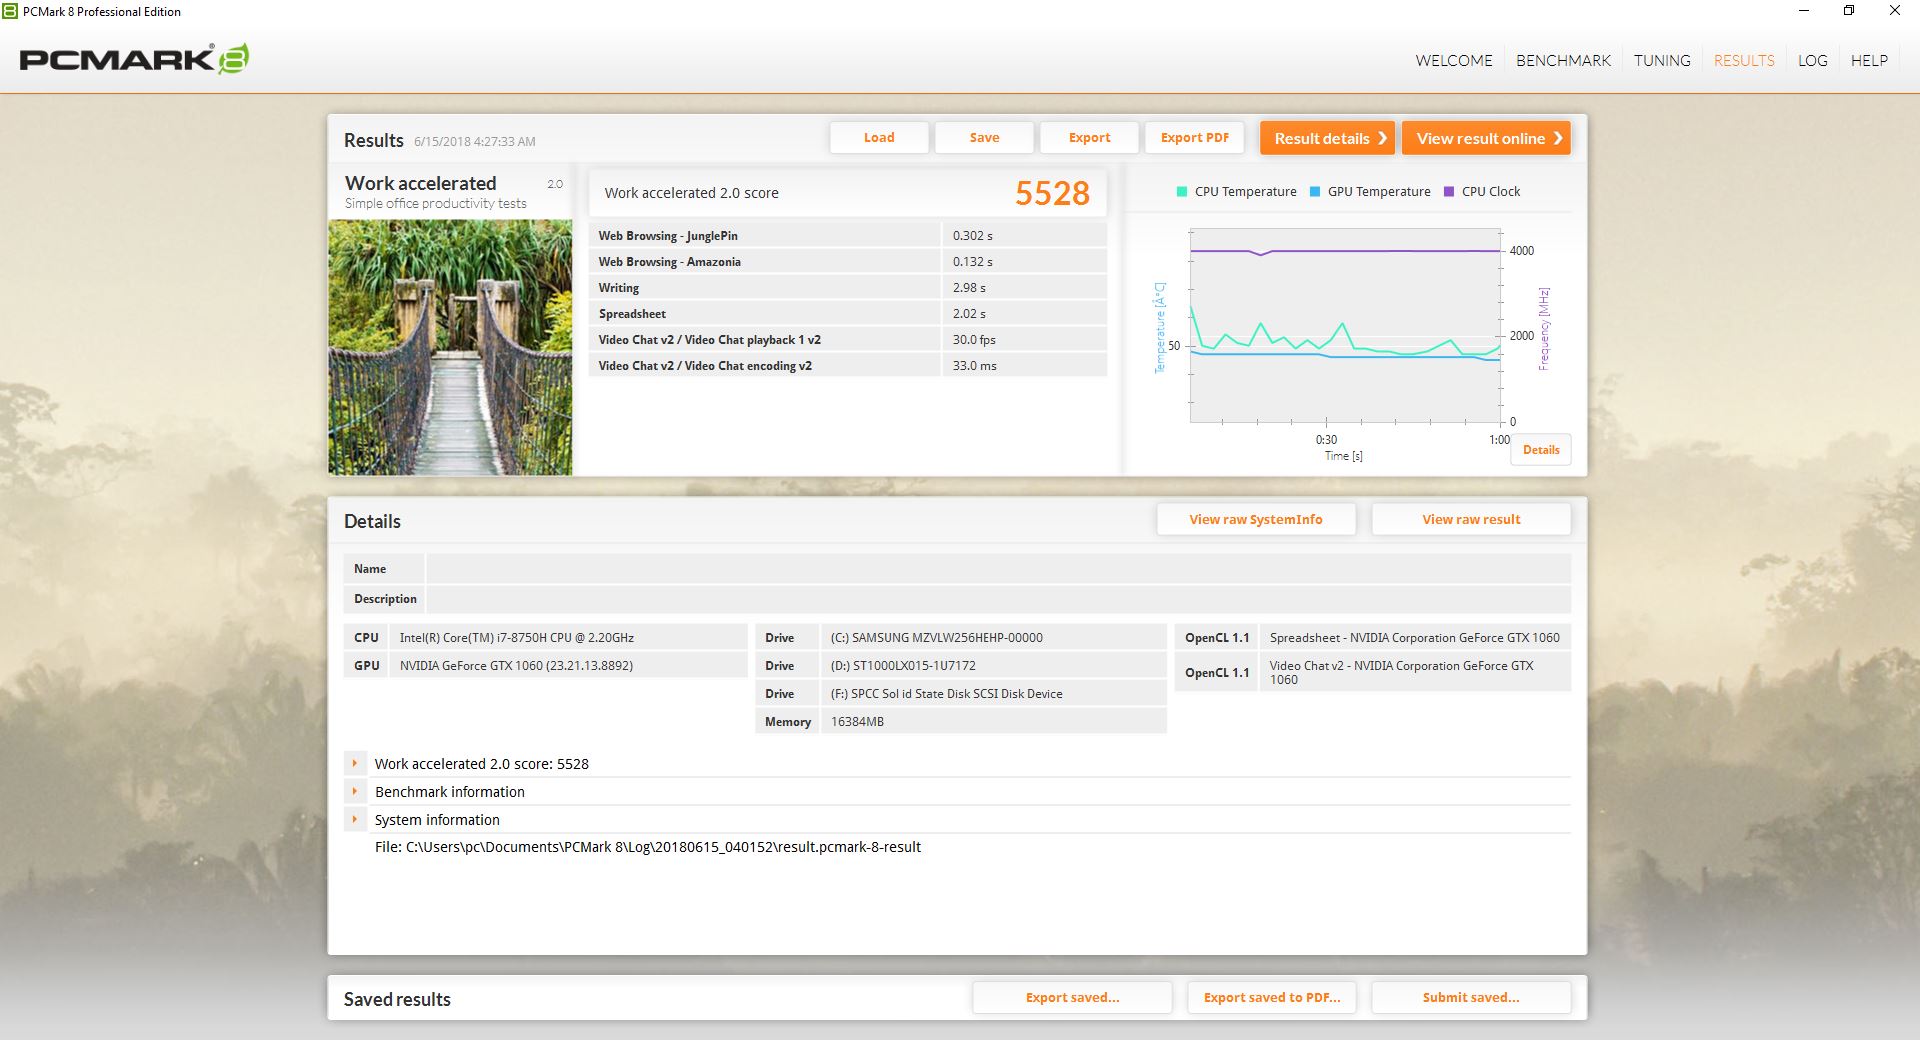
| PCMark 8 Home Score Accelerated v2 | 5371 points | |
| PCMark 8 Creative Score Accelerated v2 | 7765 points | |
| PCMark 8 Work Score Accelerated v2 | 5528 points | |
| PCMark 10 Score | 5525 points | |
Help | ||
Storage Devices
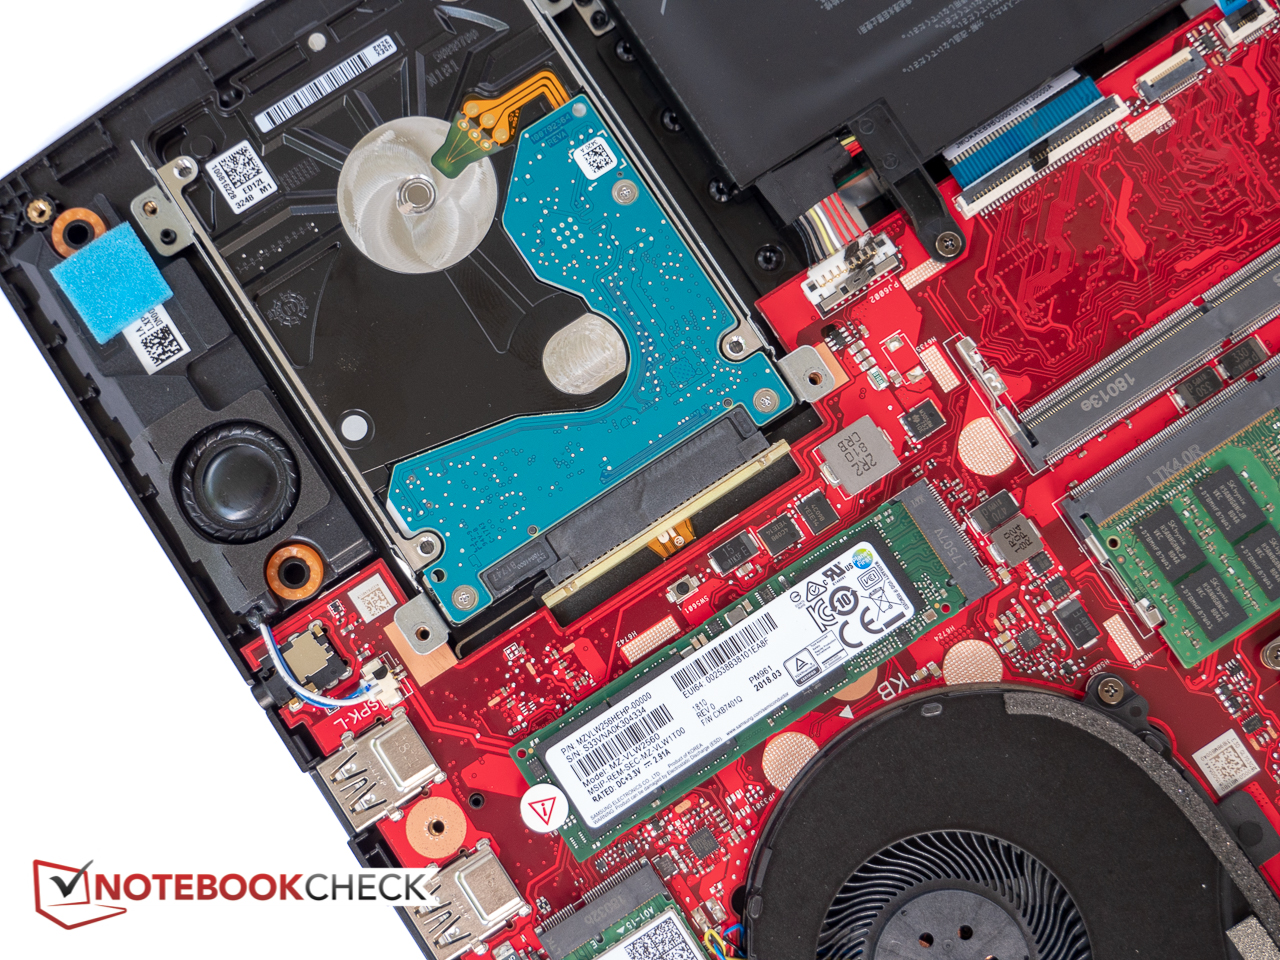
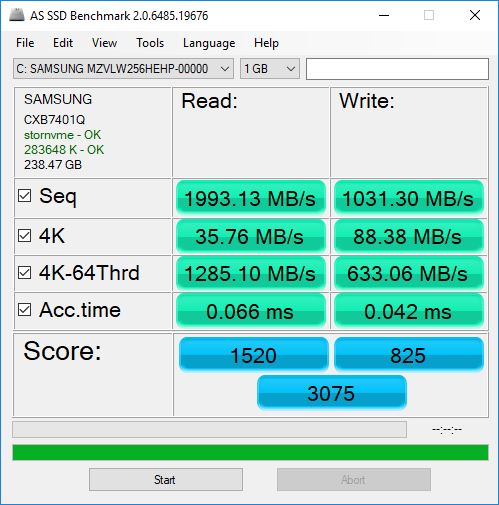
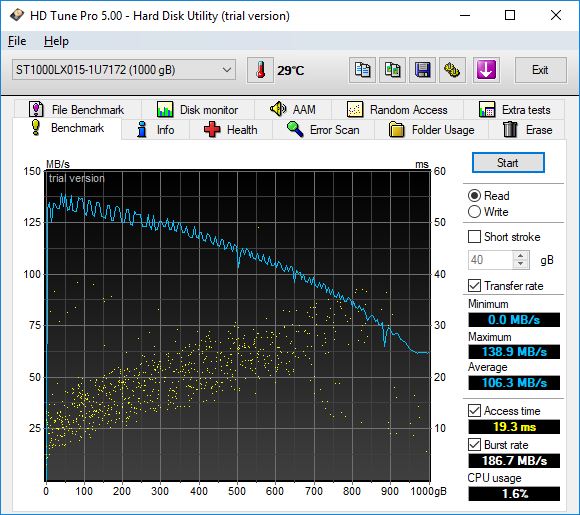
Just like the GL703VD, our particular test unit is equipped with both an M.2 2280 and a 2.5-inch drive. These days, many competing gaming notebooks like the Acer Predator Helios 500 or the MSI GE73 8RF Raider pack two M.2-2880 slots in addition the conventional hard drive bay. Performance of the 256 GB PM961 SSD is very good according to AS SSD, although Samsung's own 512 GB SSD 960 Pro in the Eurocom Q6 is faster - particularly when it comes to the sequential write speeds. Still, the 4K read performance is very similar which helps to explain the very fast boot times and near-instantaneous program launches. Cukusa offers many different options for the hard drive configuration ranging from a 128 GB to 1 TB NVMe SSDs. The secondary Seagate 1 TB ST1000LX015 offers decent performance for a 5400 RPM drive.
Please see our table of HDDs and SSDs for additional benchmark comparisons.
| Asus Strix GL703GM-DS74 Samsung PM961 MZVLW256HEHP | Acer Aspire V17 Nitro BE VN7-793-738J Intel SSD 600p SSDPEKKW512G7 | MSI GE73 8RF-008 Raider RGB Toshiba HG6 THNSNJ256G8NY | HP Omen 17-an014ng Samsung PM961 MZVLW256HEHP | Eurocom Q6 Samsung SSD 960 Pro 512 GB m.2 | |
|---|---|---|---|---|---|
| AS SSD | -17% | -84% | -419% | 31% | |
| Copy Game MB/s (MB/s) | 481 | 816 70% | 295.5 -39% | 633 32% | |
| Copy Program MB/s (MB/s) | 780 | 336 -57% | 192.9 -75% | 363.4 -53% | |
| Copy ISO MB/s (MB/s) | 1043 | 1092 5% | 412.5 -60% | 1768 70% | |
| Score Total (Points) | 3075 | 1678 -45% | 881 -71% | 2205 -28% | 3894 27% |
| Score Write (Points) | 825 | 677 -18% | 254 -69% | 161 -80% | 1693 105% |
| Score Read (Points) | 1520 | 692 -54% | 417 -73% | 1414 -7% | 1477 -3% |
| Access Time Write * (ms) | 0.042 | 0.035 17% | 0.097 -131% | 1.85 -4305% | 0.039 7% |
| Access Time Read * (ms) | 0.066 | 0.075 -14% | 0.235 -256% | 0.058 12% | 0.049 26% |
| 4K-64 Write (MB/s) | 633 | 516 -18% | 172.7 -73% | 122.9 -81% | 1403 122% |
| 4K-64 Read (MB/s) | 1285 | 503 -61% | 351.4 -73% | 1129 -12% | 1195 -7% |
| 4K Write (MB/s) | 88.4 | 104.8 19% | 38.34 -57% | 1.26 -99% | 96.2 9% |
| 4K Read (MB/s) | 35.76 | 29.75 -17% | 14.07 -61% | 47.62 33% | 29.62 -17% |
| Seq Write (MB/s) | 1031 | 566 -45% | 425.7 -59% | 365.5 -65% | 1943 88% |
| Seq Read (MB/s) | 1993 | 1590 -20% | 511 -74% | 2374 19% | 2523 27% |
* ... smaller is better

GPU Performance
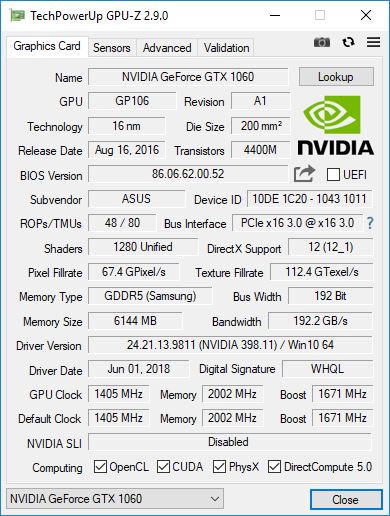
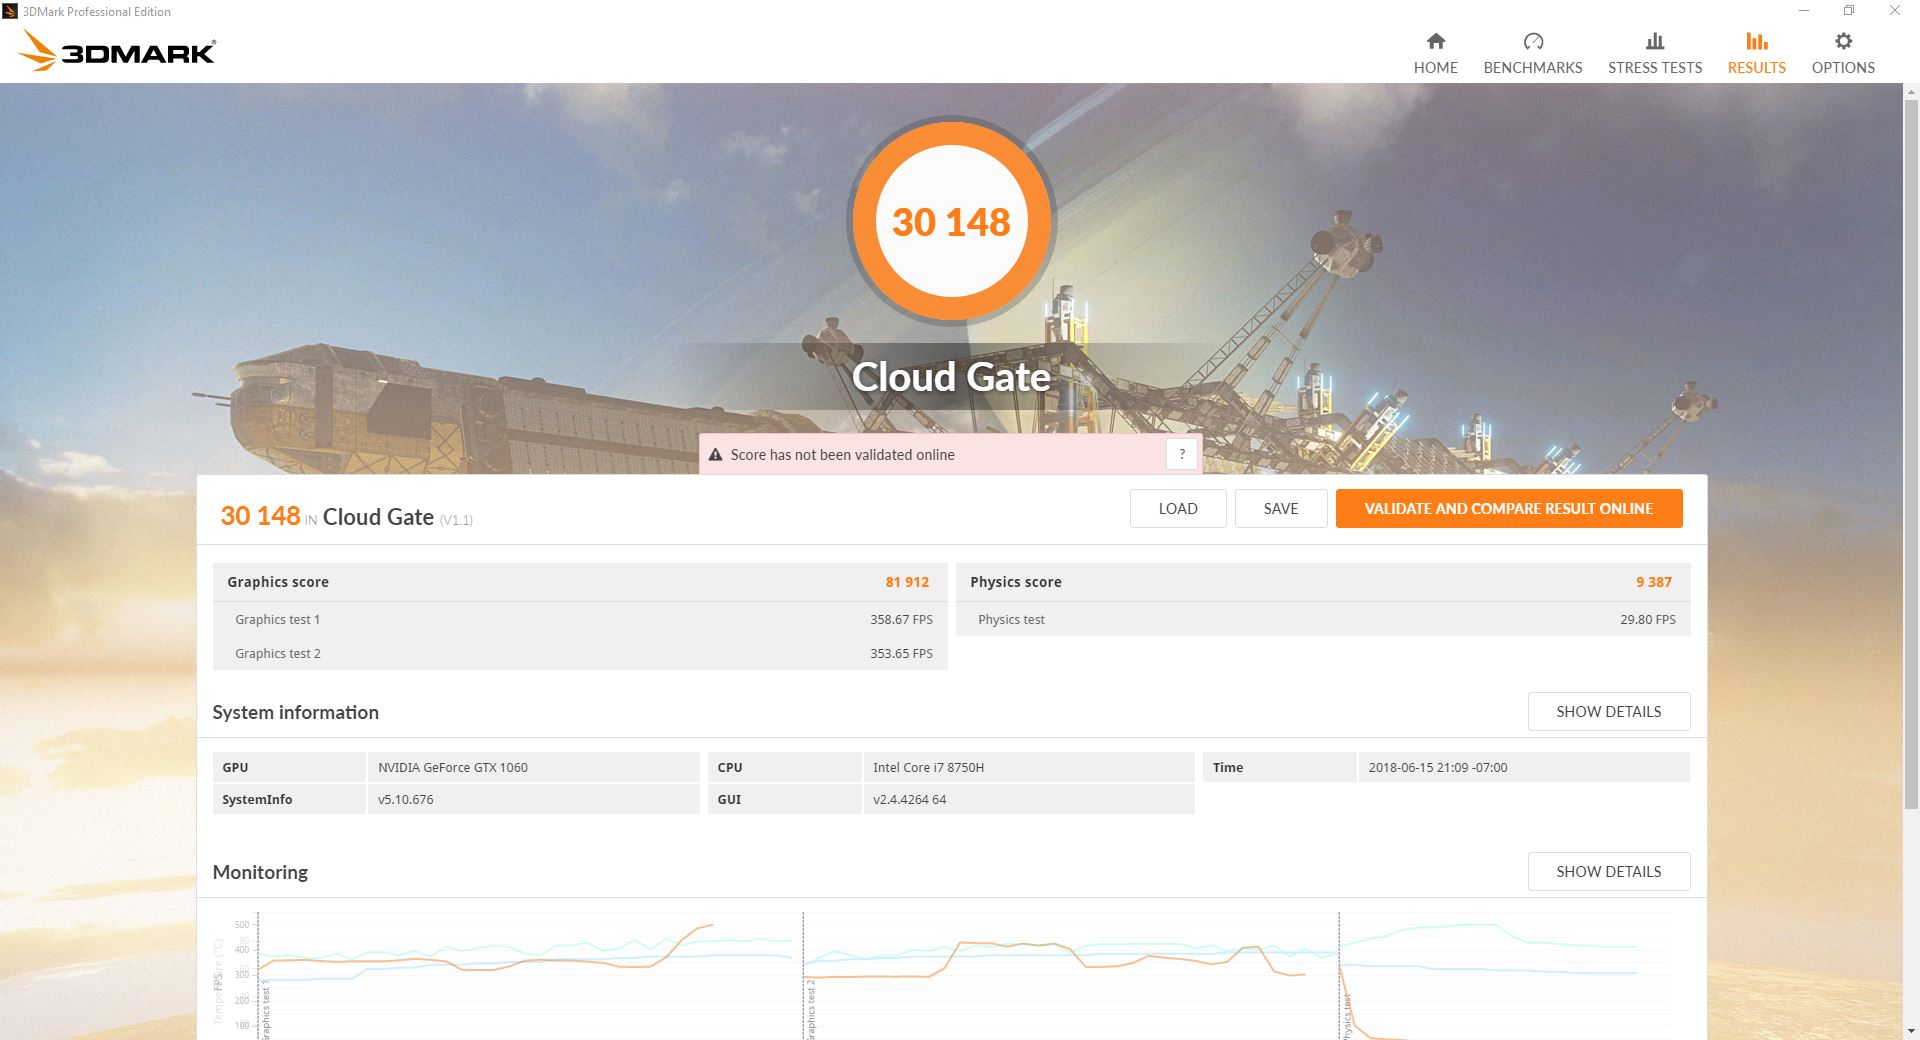
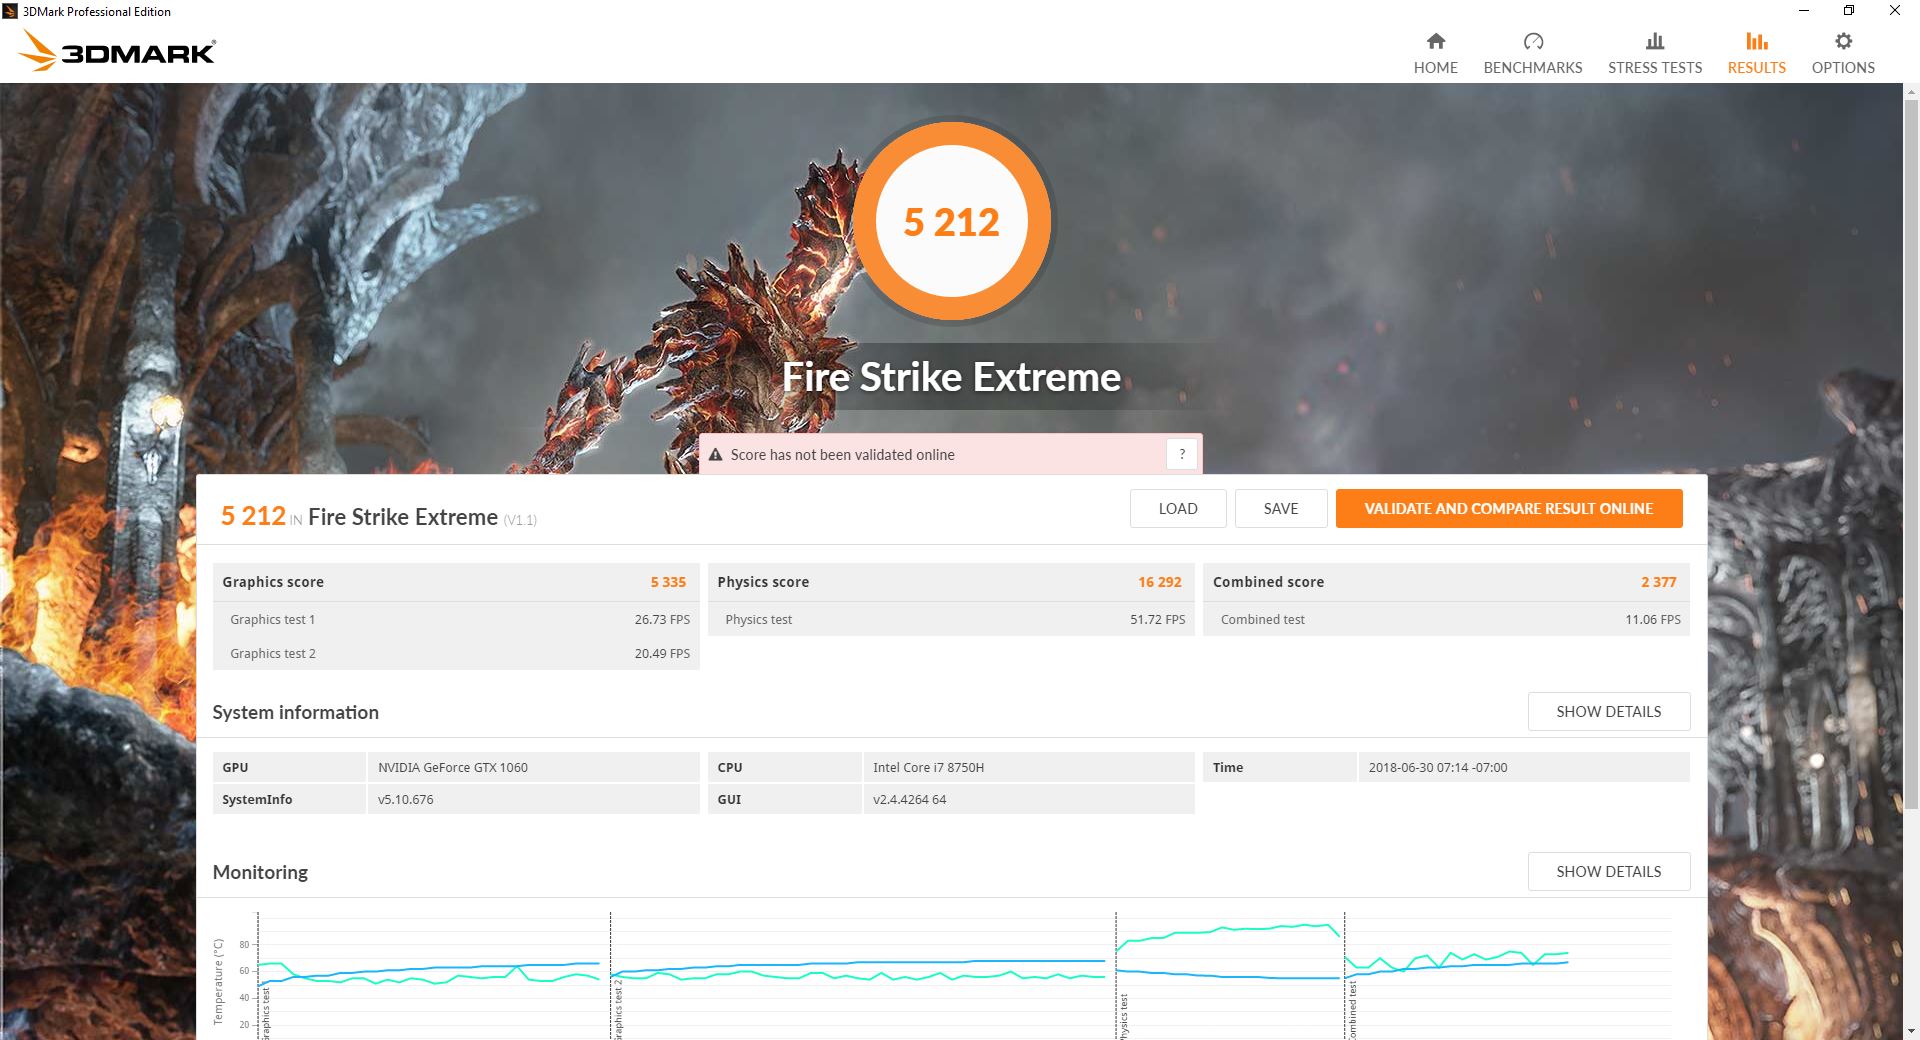
The Nvidia GTX1060 in our test unit comes with 6 GB of GDDR5 RAM and generally performs mid-pack according to the 3DMark 11 and 3DMark 13 benchmark tests. As it is common for gaming notebooks, disconnecting the mains results in a severe performance hit: when we ran 3DMark 11 on battery power, the graphics and physics scores dropped by 53 and 22 percent, respectively.
Gaming performance is good for a GeForce GTX 1060 and allows most titles to be played at FullHD resolution at ultra settings, although some newer games will require reduced settings and/or resolution to keep the frame rates at more appropriate levels for a 120 Hz panel. Systems with the standard GTX 1070 offer at least 30 percent higher frame rates, while notebooks with the GTX 1050 Ti see the frame rate cut in half depending on the game and chosen settings.
For additional technical information and benchmark comparisons, please see our dedicated page on the GeForce GTX 1060.
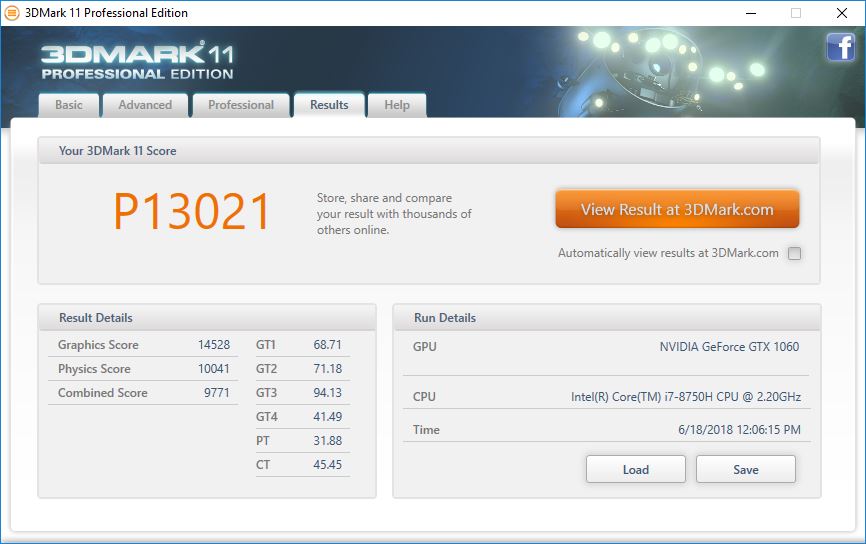
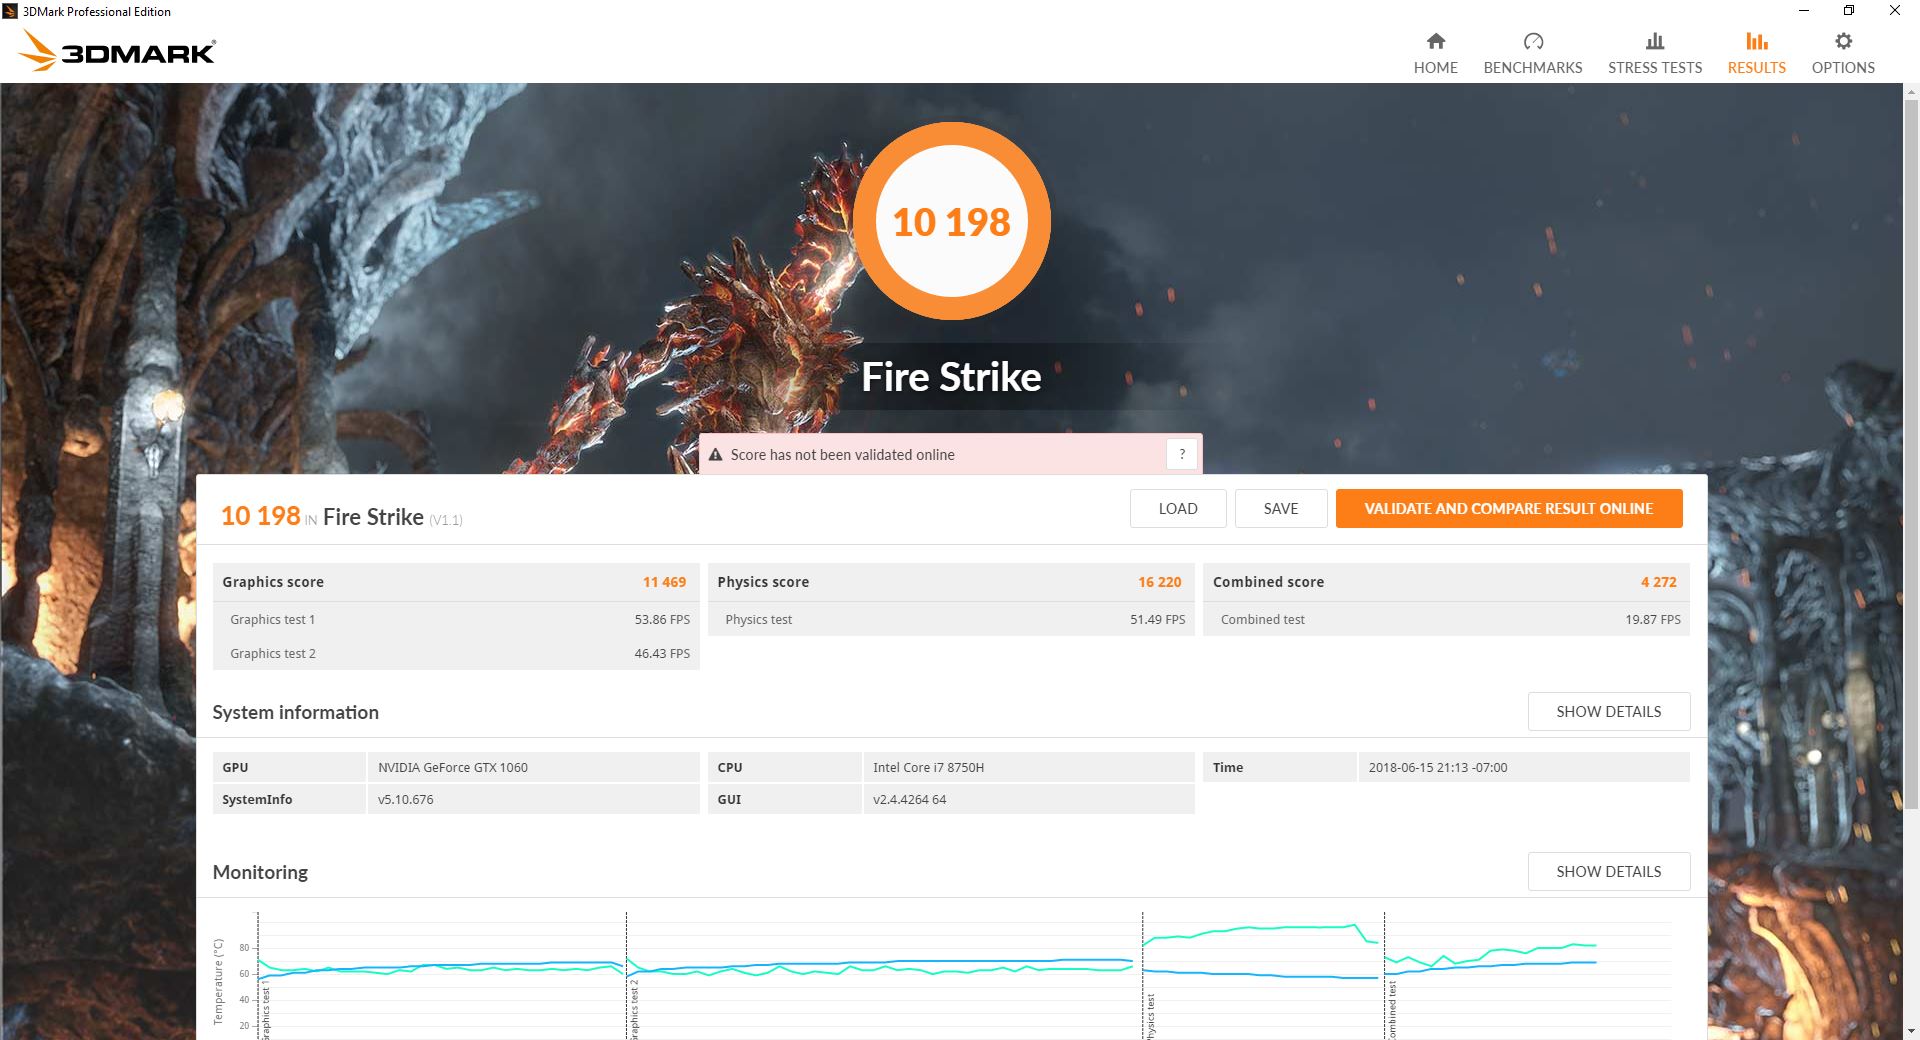
| 3DMark 11 Performance | 13021 points | |
| 3DMark Cloud Gate Standard Score | 30148 points | |
| 3DMark Fire Strike Score | 10198 points | |
| 3DMark Fire Strike Extreme Score | 5212 points | |
Help | ||
| Rise of the Tomb Raider | |
| 1920x1080 Very High Preset AA:FX AF:16x (sort by value) | |
| Asus Strix GL703GM-DS74 | |
| HP Omen 17-an014ng | |
| Razer Blade Pro RZ09-0220 | |
| Eurocom Q6 | |
| Asus Strix GL703VM-DB74 | |
| MSI GP62 7REX-1045US | |
| Average NVIDIA GeForce GTX 1060 Mobile (51 - 68.8, n=37) | |
| 1920x1080 High Preset AA:FX AF:4x (sort by value) | |
| Asus Strix GL703GM-DS74 | |
| HP Omen 17-an014ng | |
| Razer Blade Pro RZ09-0220 | |
| Eurocom Q6 | |
| MSI GP62 7REX-1045US | |
| Average NVIDIA GeForce GTX 1060 Mobile (65.3 - 82, n=24) | |
| 1366x768 Medium Preset AF:2x (sort by value) | |
| Asus Strix GL703GM-DS74 | |
| HP Omen 17-an014ng | |
| Eurocom Q6 | |
| MSI GP62 7REX-1045US | |
| Average NVIDIA GeForce GTX 1060 Mobile (82.2 - 140, n=14) | |
| The Witcher 3 | |
| 1920x1080 Ultra Graphics & Postprocessing (HBAO+) (sort by value) | |
| Asus Strix GL703GM-DS74 | |
| MSI GE73 8RF-008 Raider RGB | |
| Asus GL703GE-ES73 | |
| HP Omen 17-an014ng | |
| Razer Blade Pro RZ09-0220 | |
| Eurocom Q6 | |
| Asus Strix GL703VM-DB74 | |
| Aorus X5 v8 | |
| Average NVIDIA GeForce GTX 1060 Mobile (24 - 42.3, n=60) | |
| 1920x1080 High Graphics & Postprocessing (Nvidia HairWorks Off) (sort by value) | |
| Asus Strix GL703GM-DS74 | |
| MSI GE73 8RF-008 Raider RGB | |
| HP Omen 17-an014ng | |
| Razer Blade Pro RZ09-0220 | |
| Eurocom Q6 | |
| Aorus X5 v8 | |
| Average NVIDIA GeForce GTX 1060 Mobile (52.6 - 80.6, n=49) | |
| 1366x768 Medium Graphics & Postprocessing (sort by value) | |
| Asus Strix GL703GM-DS74 | |
| MSI GE73 8RF-008 Raider RGB | |
| HP Omen 17-an014ng | |
| Eurocom Q6 | |
| Average NVIDIA GeForce GTX 1060 Mobile (91.7 - 138.7, n=16) | |
| low | med. | high | ultra | |
|---|---|---|---|---|
| BioShock Infinite (2013) | 300.4 | 257.8 | 234.2 | 115.2 |
| The Witcher 3 (2015) | 200.7 | 134.3 | 58.8 | 41 |
| Rise of the Tomb Raider (2016) | 183.8 | 140 | 76 | 64 |
Stress Test
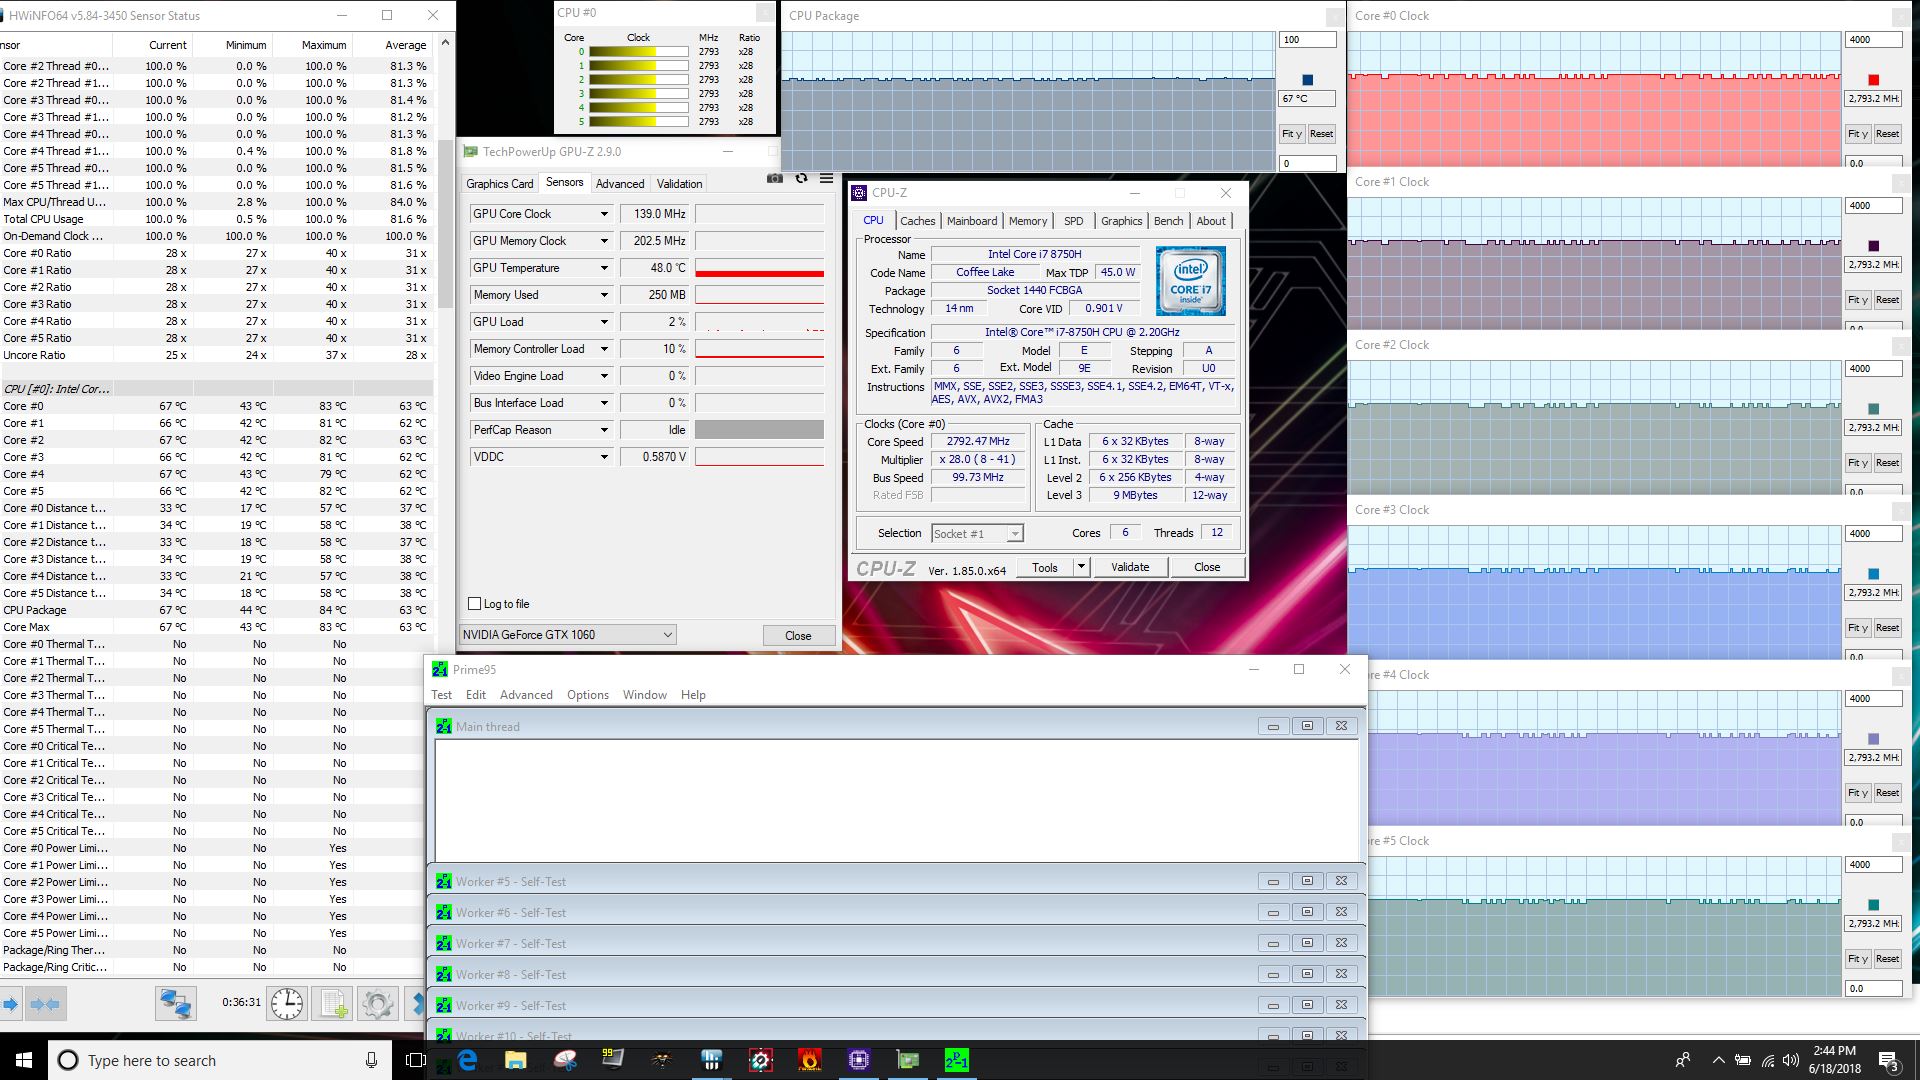
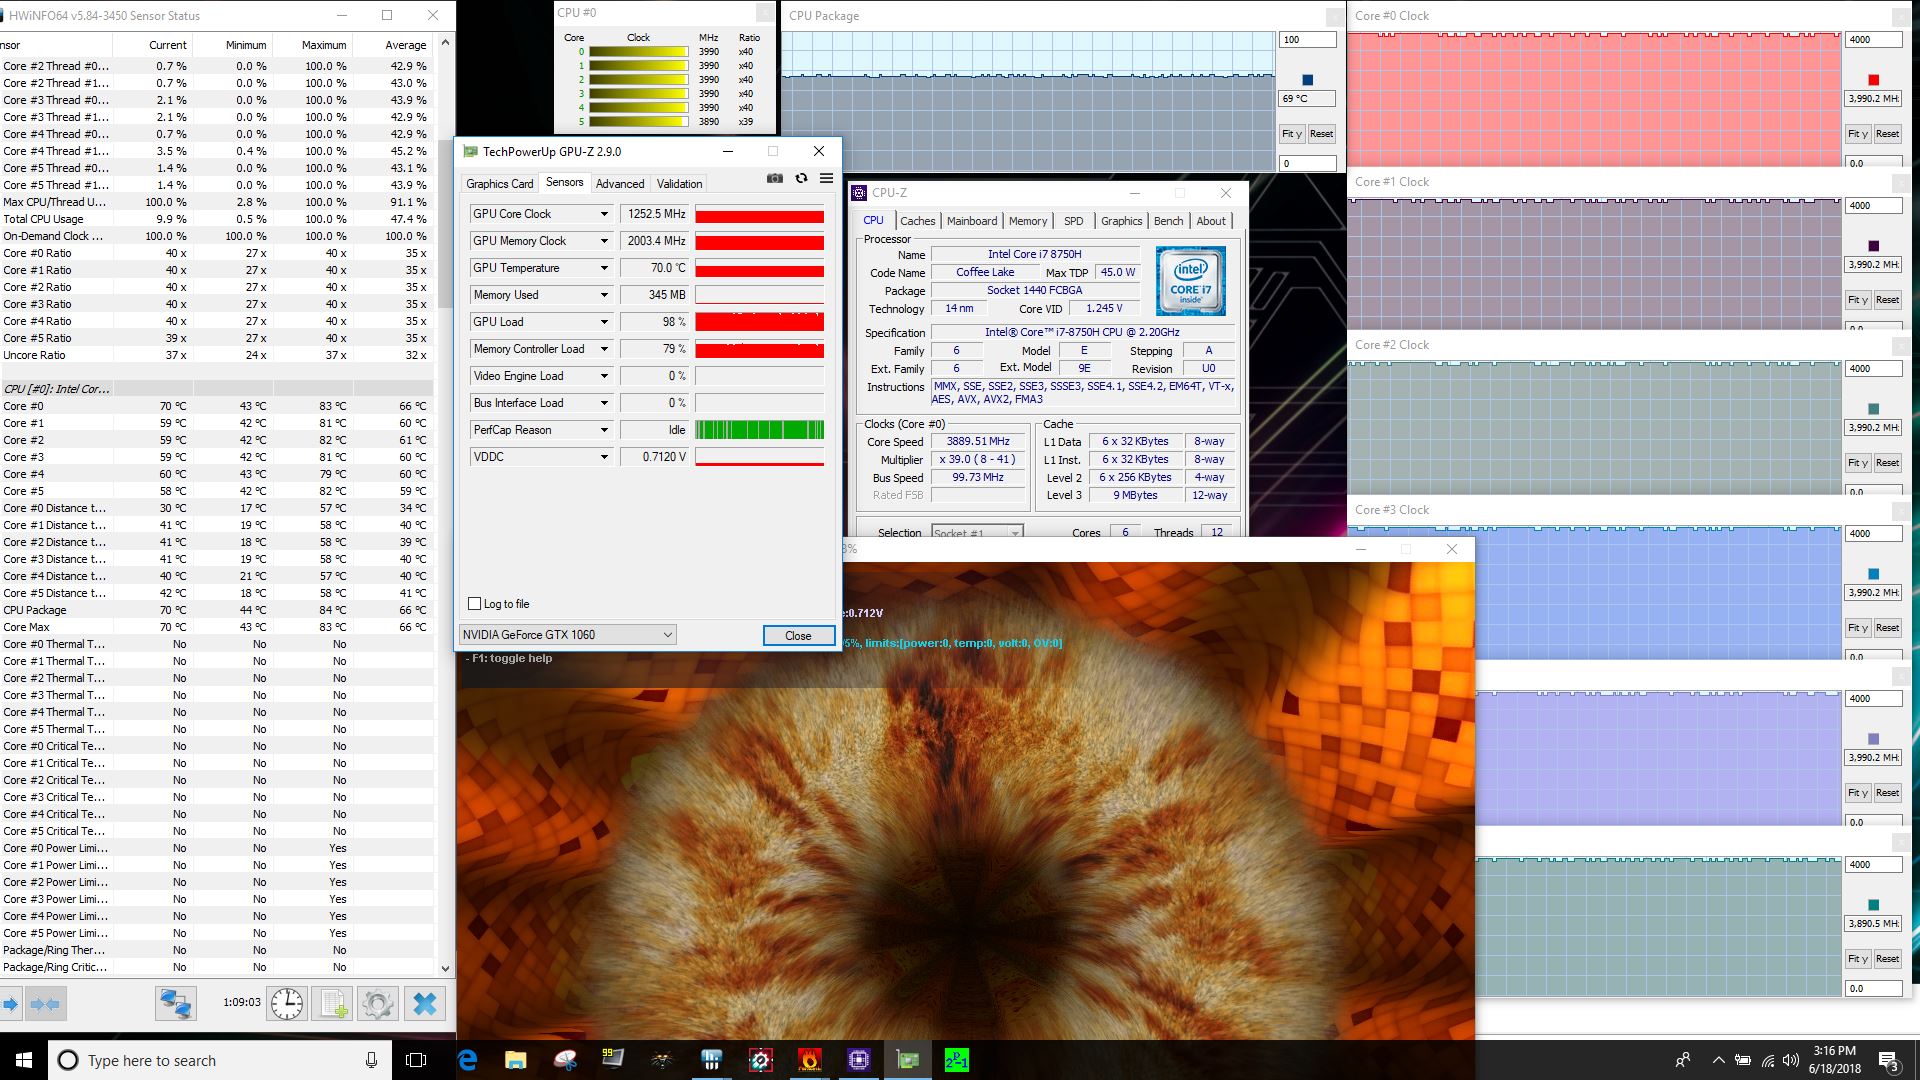
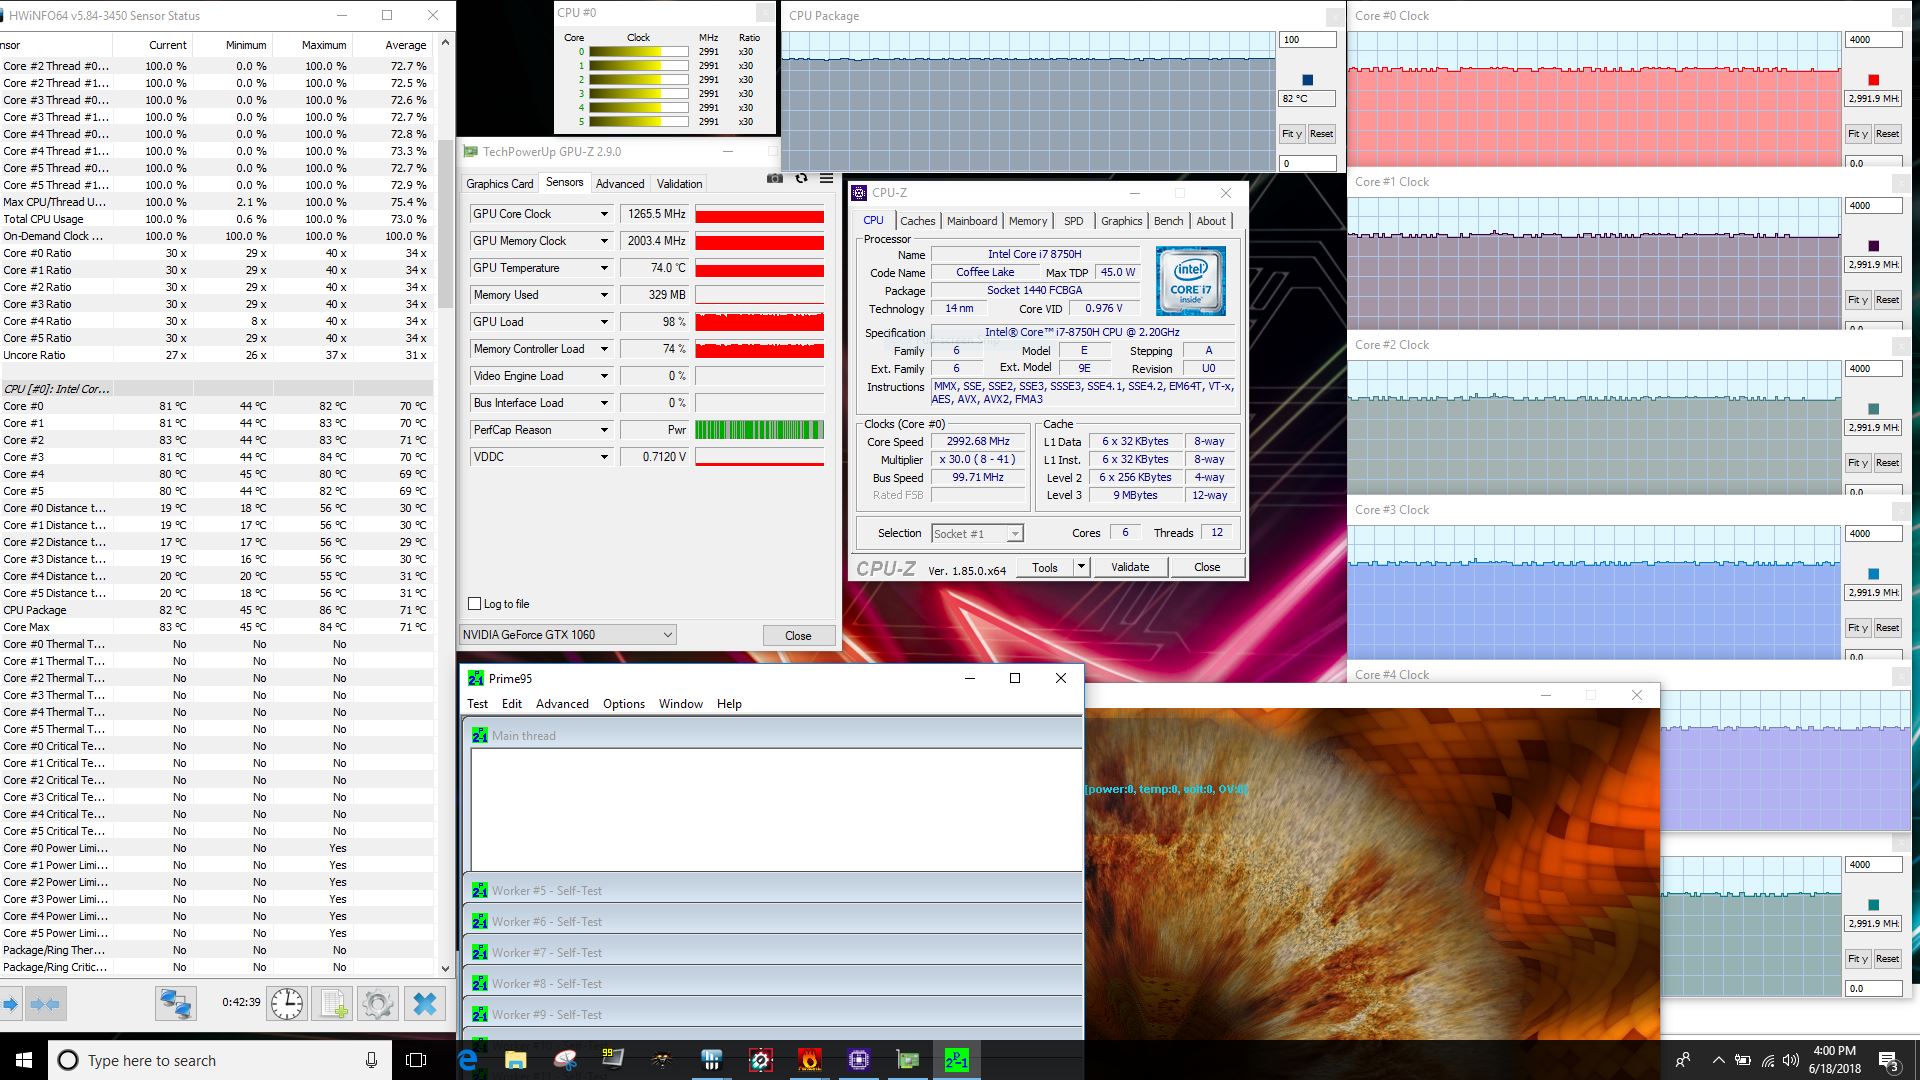
As always, we subject the test unit to unrealistically high loads to identify throttling and stability issues. With Prime95 running, the CPU cores stabilize at between 2.7 - 2.8 GHz at temperatures ranging from 66 to 77 C. Under Furmark stress, the GPU runs at 1250 MHz with the temperature at 70 C. Simultaneous CPU and GPU stress with Prime95 and FurMark running in parallel results in CPU clock rates around 3 GHz at temperatures of 80 - 82 C, while the GPU fluctuates between 1200 and 1300 MHz at 74 C.
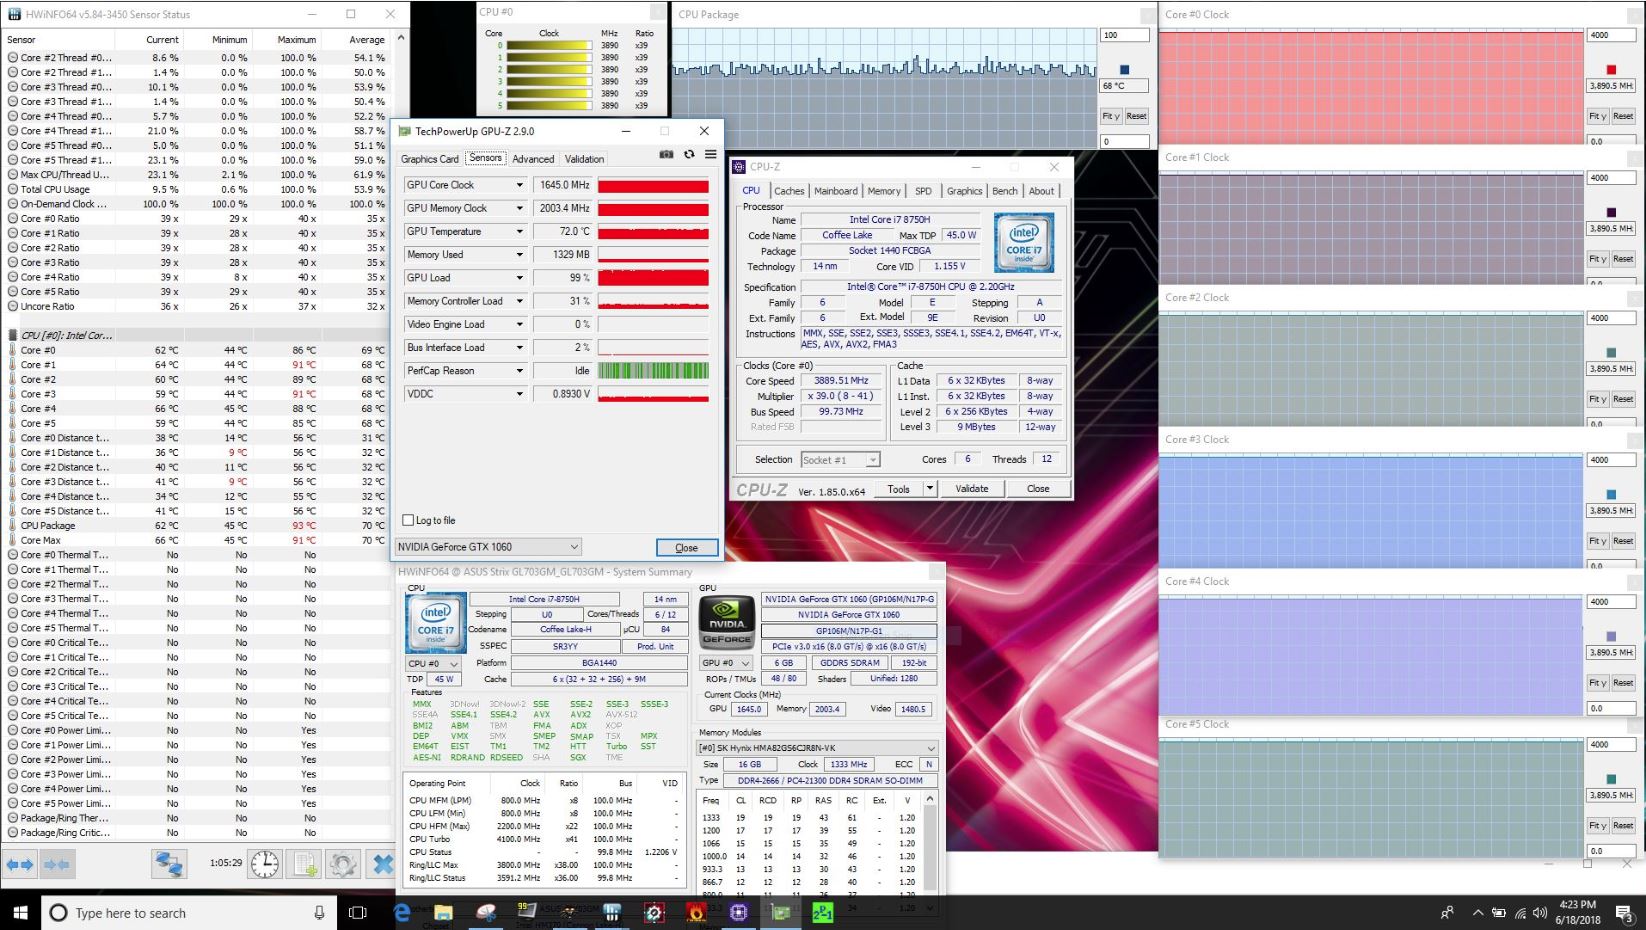
To simulate real-world gaming stress, we run Witcher 3 at the ultra setting. Here, the CPU maintains 3.9 GHz at temperatures of up to 70 C, while the GPU runs at 1600 - 1650 MHz at 71 - 72 C. The fps rate over a couple of hours remain comparatively consistent and follow the day/night cycle, as the graph below shows.
A quick comparison to the predecessors Asus ROG Strix GL703VM Scar Edition as well as the Asus ROG Strix GL703VD-DB74 show that the new cooling system with now 4 heat pipes markedly improves the temperature situation, as our review unit runs at least 10 C cooler on average.
| CPU Clock (GHz) | GPU Clock (MHz) | Average CPU Temperature (°C) | Average GPU Temperature (°C) | |
| Prime95 Stress | 2.7-2.8 | - | 66-67 | - |
| FurMark Stress | - | 1250 | - | 70 |
| Prime95 + FurMark Stress | 3.0 | 1200-1300 | 80-82 | 74 |
| Witcher 3 Stress | 3.9 | 1650 | 70 | 71-72 |
Emissions
System Noise
In addition to the lower temperatures, the system noise level is reduced as well. While the fans are always running even when idling on the desktop, they remain unobtrusive when web browsing, word processing or performing similar tasks. Gaming and maximum load will push the noise level to about 47 - 48 dB. The older GL703VM got quite a bit louder and pegged our meter at up to 55 dB under extreme conditions. From a noise level perspective, the GL703GM performs similarly to competing gaming notebooks, but the fan pitch is fairly bothersome, so we highly recommend headphones for longer gaming sessions.
We did not notice any coil whine or electronic noise on our unit even when running hard drive benchmarks.
Noise level
| Idle |
| 29.4 / 29.4 / 33.7 dB(A) |
| Load |
| 41.2 / 48.3 dB(A) |
 | ||
30 dB silent 40 dB(A) audible 50 dB(A) loud |
||
min: | ||
| Asus Strix GL703GM-DS74 GeForce GTX 1060 Mobile, i7-8750H, Samsung PM961 MZVLW256HEHP | Asus Strix GL703VM-DB74 GeForce GTX 1060 Mobile, i7-7700HQ, Seagate Mobile HDD 1TB ST1000LX015-1U7172 | Acer Aspire V17 Nitro BE VN7-793-738J GeForce GTX 1060 Mobile, i7-7700HQ, Intel SSD 600p SSDPEKKW512G7 | MSI GE73 8RF-008 Raider RGB GeForce GTX 1070 Mobile, i7-8750H, Toshiba HG6 THNSNJ256G8NY | HP Omen 17-an014ng GeForce GTX 1070 Mobile, i7-7700HQ, Samsung PM961 MZVLW256HEHP | |
|---|---|---|---|---|---|
| Noise | -1% | -0% | -6% | -10% | |
| off / environment * (dB) | 28.6 | 28.4 1% | 30.8 -8% | 30 -5% | 30 -5% |
| Idle Minimum * (dB) | 29.4 | 30.2 -3% | 31.4 -7% | 32 -9% | 30 -2% |
| Idle Average * (dB) | 29.4 | 30.2 -3% | 31.4 -7% | 33 -12% | 37 -26% |
| Idle Maximum * (dB) | 33.7 | 30.2 10% | 31.4 7% | 34 -1% | 39 -16% |
| Load Average * (dB) | 41.2 | 38.4 7% | 38.6 6% | 41 -0% | 44 -7% |
| Witcher 3 ultra * (dB) | 47.3 | 49.7 -5% | 50 -6% | 47 1% | |
| Load Maximum * (dB) | 48.3 | 54.5 -13% | 44.3 8% | 54 -12% | 55 -14% |
* ... smaller is better
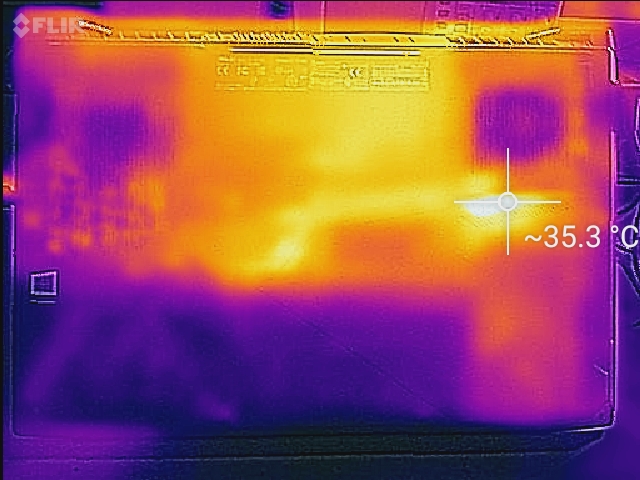
Temperature
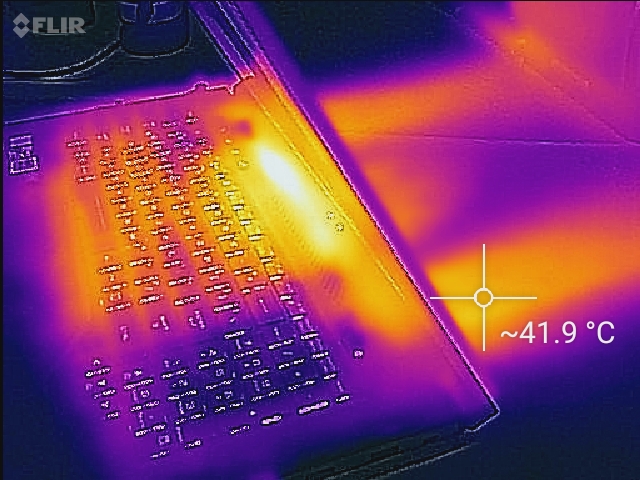
The lower internal temperatures translate to lower surface temperatures all around as well. In comparison to the GL703VM, the palm rests remain significantly cooler at less than 25 C when idling on the desktop and the localized hotspot under maximum stress now tops out at a much more acceptable 55 C vs. 65 C before. The WASD key area reaches a maximum of 37 C under prolonged load, which is comparable to other notebooks in this class.
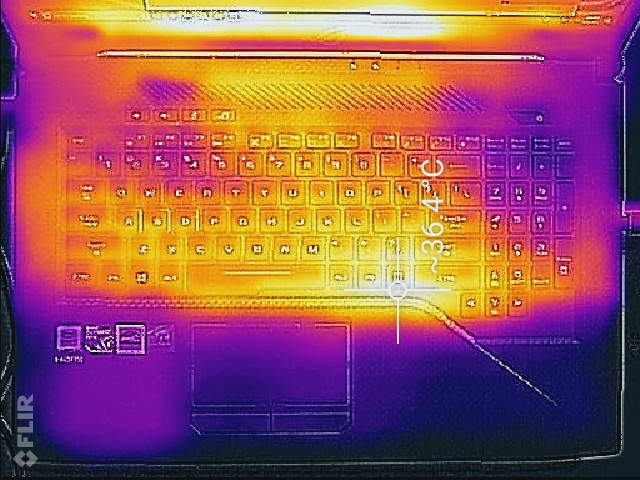
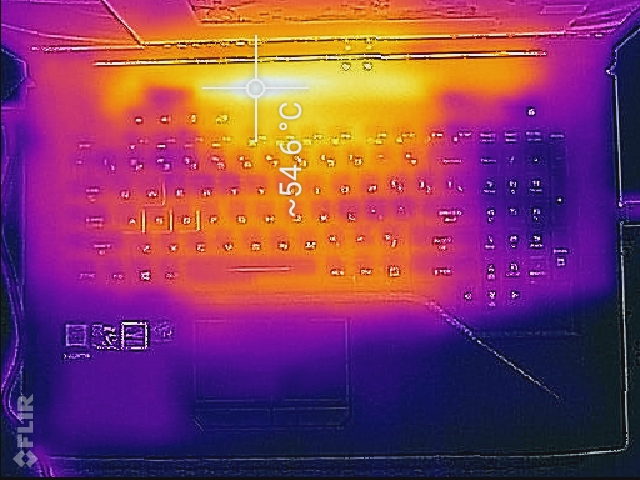
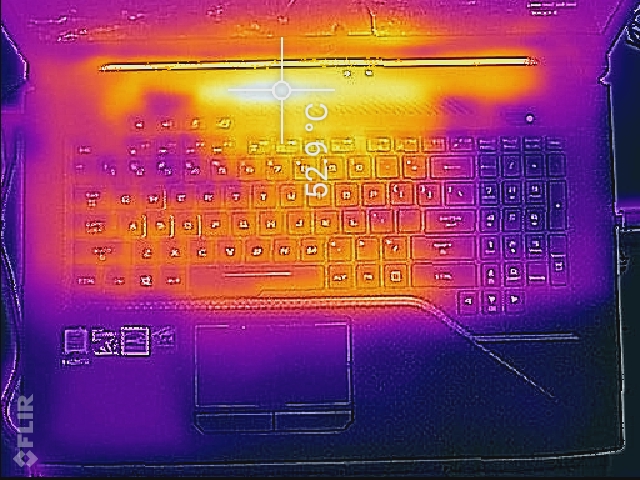
(-) The maximum temperature on the upper side is 54.6 °C / 130 F, compared to the average of 40.4 °C / 105 F, ranging from 21.2 to 68.8 °C for the class Gaming.
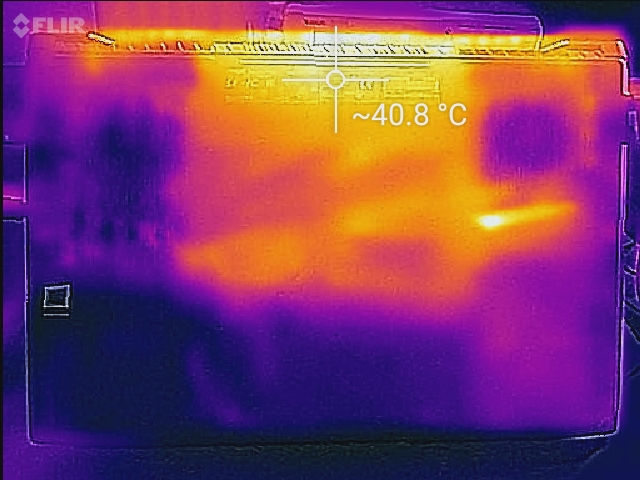
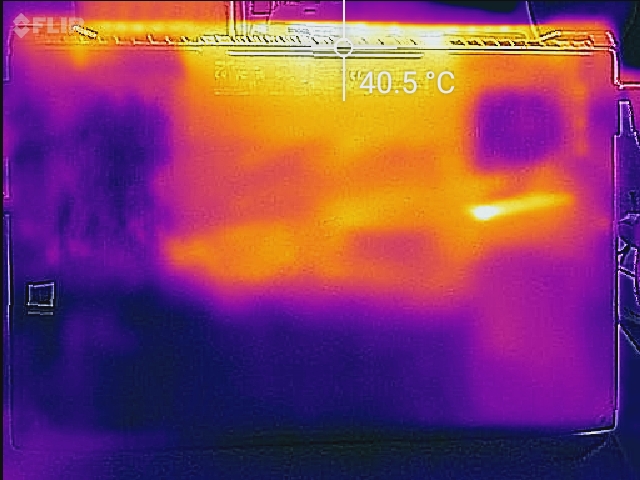
(±) The bottom heats up to a maximum of 41.2 °C / 106 F, compared to the average of 43.2 °C / 110 F
(+) In idle usage, the average temperature for the upper side is 28.1 °C / 83 F, compared to the device average of 33.9 °C / 93 F.
(±) Playing The Witcher 3, the average temperature for the upper side is 35.5 °C / 96 F, compared to the device average of 33.9 °C / 93 F.
(+) The palmrests and touchpad are cooler than skin temperature with a maximum of 28 °C / 82.4 F and are therefore cool to the touch.
(±) The average temperature of the palmrest area of similar devices was 28.8 °C / 83.8 F (+0.8 °C / 1.4 F).
Speakers
Asus has also redesigned the speaker system as is evident in the pictures below. The 2x 1.5 W stereo speakers actually sound quite decent, but the GL703GM can in no way compete with gaming notebooks equipped with dedicated subwoofers. Overall volume is low with balanced mids and highs, but bass is lacking as expected. The included Sonic Studio III offers a custom equalizer mode, but of course the software can't overcome the physical limitations. Vibrations can be felt in the palm rests since the speakers sit right below, but there's no shake or rattle even at maximum volume settings. Since the notebook can get quite noisy while gaming as we mentioned earlier, we recommend headphones for a much improved sound experience.


")
")
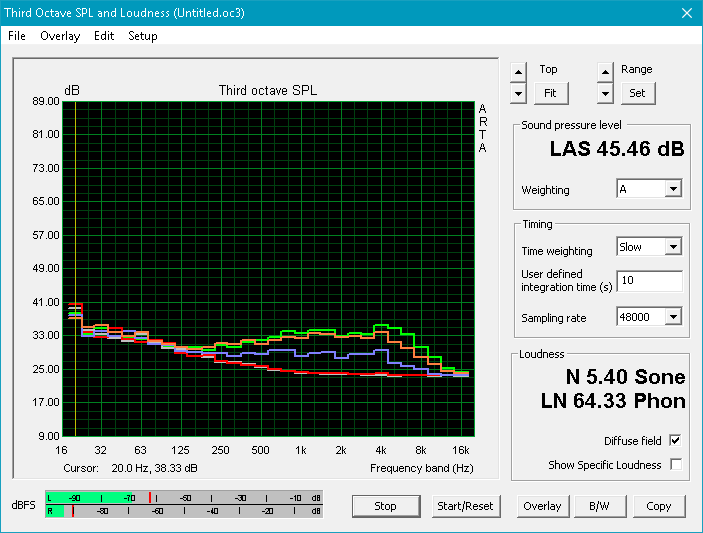
Asus Strix GL703GM-DS74 audio analysis
(-) | not very loud speakers (69.7 dB)
Bass 100 - 315 Hz
(±) | reduced bass - on average 7.3% lower than median
(±) | linearity of bass is average (10.8% delta to prev. frequency)
Mids 400 - 2000 Hz
(+) | balanced mids - only 2.2% away from median
(+) | mids are linear (5.6% delta to prev. frequency)
Highs 2 - 16 kHz
(+) | balanced highs - only 4.2% away from median
(±) | linearity of highs is average (13.1% delta to prev. frequency)
Overall 100 - 16.000 Hz
(±) | linearity of overall sound is average (15.6% difference to median)
Compared to same class
» 36% of all tested devices in this class were better, 6% similar, 58% worse
» The best had a delta of 6%, average was 18%, worst was 132%
Compared to all devices tested
» 23% of all tested devices were better, 5% similar, 72% worse
» The best had a delta of 4%, average was 24%, worst was 134%
Apple MacBook 12 (Early 2016) 1.1 GHz audio analysis
(+) | speakers can play relatively loud (83.6 dB)
Bass 100 - 315 Hz
(±) | reduced bass - on average 11.3% lower than median
(±) | linearity of bass is average (14.2% delta to prev. frequency)
Mids 400 - 2000 Hz
(+) | balanced mids - only 2.4% away from median
(+) | mids are linear (5.5% delta to prev. frequency)
Highs 2 - 16 kHz
(+) | balanced highs - only 2% away from median
(+) | highs are linear (4.5% delta to prev. frequency)
Overall 100 - 16.000 Hz
(+) | overall sound is linear (10.2% difference to median)
Compared to same class
» 7% of all tested devices in this class were better, 2% similar, 91% worse
» The best had a delta of 5%, average was 18%, worst was 53%
Compared to all devices tested
» 5% of all tested devices were better, 1% similar, 94% worse
» The best had a delta of 4%, average was 24%, worst was 134%
Energy Management
Power Consumption
Since the GL703GM with 120 Hz display doesn't support Nvidia's Optimus technology, idling on the desktop will draw between 19 W and 33 W depending on the power profile and chosen brightness, while gaming will demand about 140 W. The older GL703VM required about 125 W under similar load conditions. Notebooks with the GTX 1070 will consume about 15 to 30 percent more power; the MSI GP62 7REX with GeForce GTX 1050 TI draws 25 percent less.
Maximum load pulls 160 W from the power adapter. Since Asus chose to not upgrade the capacity - the medium-sized adapter measures approximately 15.9 x 7.4 x 2.5 cm and supplies 180 W as before - there's not a lot of overhead at maximum load levels.
| Off / Standby | |
| Idle | |
| Load |
|
Key:
min: | |
| Asus Strix GL703GM-DS74 i7-8750H, GeForce GTX 1060 Mobile, Samsung PM961 MZVLW256HEHP, TN LED, 1920x1080, 17.3" | Asus Strix GL703VM-DB74 i7-7700HQ, GeForce GTX 1060 Mobile, Seagate Mobile HDD 1TB ST1000LX015-1U7172, IPS, 1920x1080, 17.3" | MSI GP62 7REX-1045US i7-7700HQ, GeForce GTX 1050 Ti Mobile, Toshiba NVMe THNSN5128GP, TN LED, 1920x1080, 15.6" | MSI GE73 8RF-008 Raider RGB i7-8750H, GeForce GTX 1070 Mobile, Toshiba HG6 THNSNJ256G8NY, TN WLED, 1920x1080, 17.3" | HP Omen 17-an014ng i7-7700HQ, GeForce GTX 1070 Mobile, Samsung PM961 MZVLW256HEHP, IPS, 1920x1080, 17.3" | |
|---|---|---|---|---|---|
| Power Consumption | 15% | 27% | -2% | -11% | |
| Idle Minimum * (Watt) | 18.88 | 17.3 8% | 14.6 23% | 15 21% | 22 -17% |
| Idle Average * (Watt) | 24.36 | 21.8 11% | 17.2 29% | 20 18% | 28 -15% |
| Idle Maximum * (Watt) | 32.27 | 23 29% | 17.3 46% | 26 19% | 35 -8% |
| Load Average * (Watt) | 107.74 | 79.2 26% | 82.7 23% | 97 10% | 93 14% |
| Witcher 3 ultra * (Watt) | 142 | 107 25% | 186 -31% | 157 -11% | |
| Load Maximum * (Watt) | 160.28 | 158.2 1% | 136.7 15% | 239 -49% | 208 -30% |
* ... smaller is better
Battery Life
Despite the increase in battery capacity from 64 Wh to 74 Wh, run times have not increased dramatically. Users can expect about 3.5 hours of real-world web browsing with the balanced profile active and the display set to 150 nits, which isn't all that great compared to some competitors - particularly those equipped with Nvidia's Optimus technology. The much more expensive Razer Blade Pro 2017, for example, lasts almost twice as long on a charge.
| Asus Strix GL703GM-DS74 i7-8750H, GeForce GTX 1060 Mobile, 74 Wh | Acer Aspire V17 Nitro BE VN7-793-738J i7-7700HQ, GeForce GTX 1060 Mobile, 69 Wh | MSI GE73 8RF-008 Raider RGB i7-8750H, GeForce GTX 1070 Mobile, 51 Wh | Asus GL703GE-ES73 i7-8750H, GeForce GTX 1050 Ti Mobile, 64 Wh | HP Omen 17-an014ng i7-7700HQ, GeForce GTX 1070 Mobile, 86 Wh | Razer Blade Pro RZ09-0220 i7-7700HQ, GeForce GTX 1060 Mobile, 70 Wh | Asus Strix GL703VM-DB74 i7-7700HQ, GeForce GTX 1060 Mobile, 64 Wh | MSI GP62 7REX-1045US i7-7700HQ, GeForce GTX 1050 Ti Mobile, 41 Wh | |
|---|---|---|---|---|---|---|---|---|
| Battery runtime | 28% | -23% | 3% | 17% | 73% | -20% | -27% | |
| Reader / Idle (h) | 5.3 | 5.1 -4% | 5.8 9% | 5.8 9% | 12 126% | 4 -25% | 4.3 -19% | |
| WiFi v1.3 (h) | 3.6 | 4.6 28% | 3.1 -14% | 4.8 33% | 4.5 25% | 7 94% | 3.2 -11% | 2.9 -19% |
| Load (h) | 1.2 | 0.6 -50% | 0.8 -33% | 1.4 17% | 1.2 0% | 0.9 -25% | 0.7 -42% |
Pros
Cons
Verdict

Much better thermal management thanks to a redesigned heat pipe and fan system, slightly less noise, and an increase in performance of between 15 - 25 percent: the GL703GM is a definite improvement over the GL703VD with previous-generation i7 processor. The display swap from a 120 Hz IPS panel to one based on TN technology is a double-edged sword, as response times are of course much improved at the cost of reduced viewing angles. Still, most gamers will likely welcome the change. The build quality is decent, the input devices are solid, and the gaming experience leaves nothing to be desired.
The battery life unfortunately remains unimpressive, the system fans still gets loud and sound unpleasant under load and the continued omission of a Thunderbolt 3 port might be frustrating to some.
The GL703GM doesn't generate nearly as much heat as the predecessors and is much easier to live with on a daily basis, but some competitors offer a similar feature set for less money.
Asus' ROG Strix models are generally not offered at bargain prices and at a street price of $1600, the GL703GM is not really an exception. The HP Omen 17 with 8th-generation CPU, 144 Hz G-Sync display and a 128 GB SSD / 1 TB HDD combo sells for about $200 less; users willing to step down to the older quad-core i7 processor can pick up a system like the Acer Predator Helios 300 with higher-end GTX 1070 for about $1500.
Asus Strix GL703GM-DS74
- 07/01/2018 v6 (old)
Bernie Pechlaner
Price comparison