Acer Nitro V 16 ANV16-41 review: An affordable gaming laptop with a hitch
Need for Nitro?
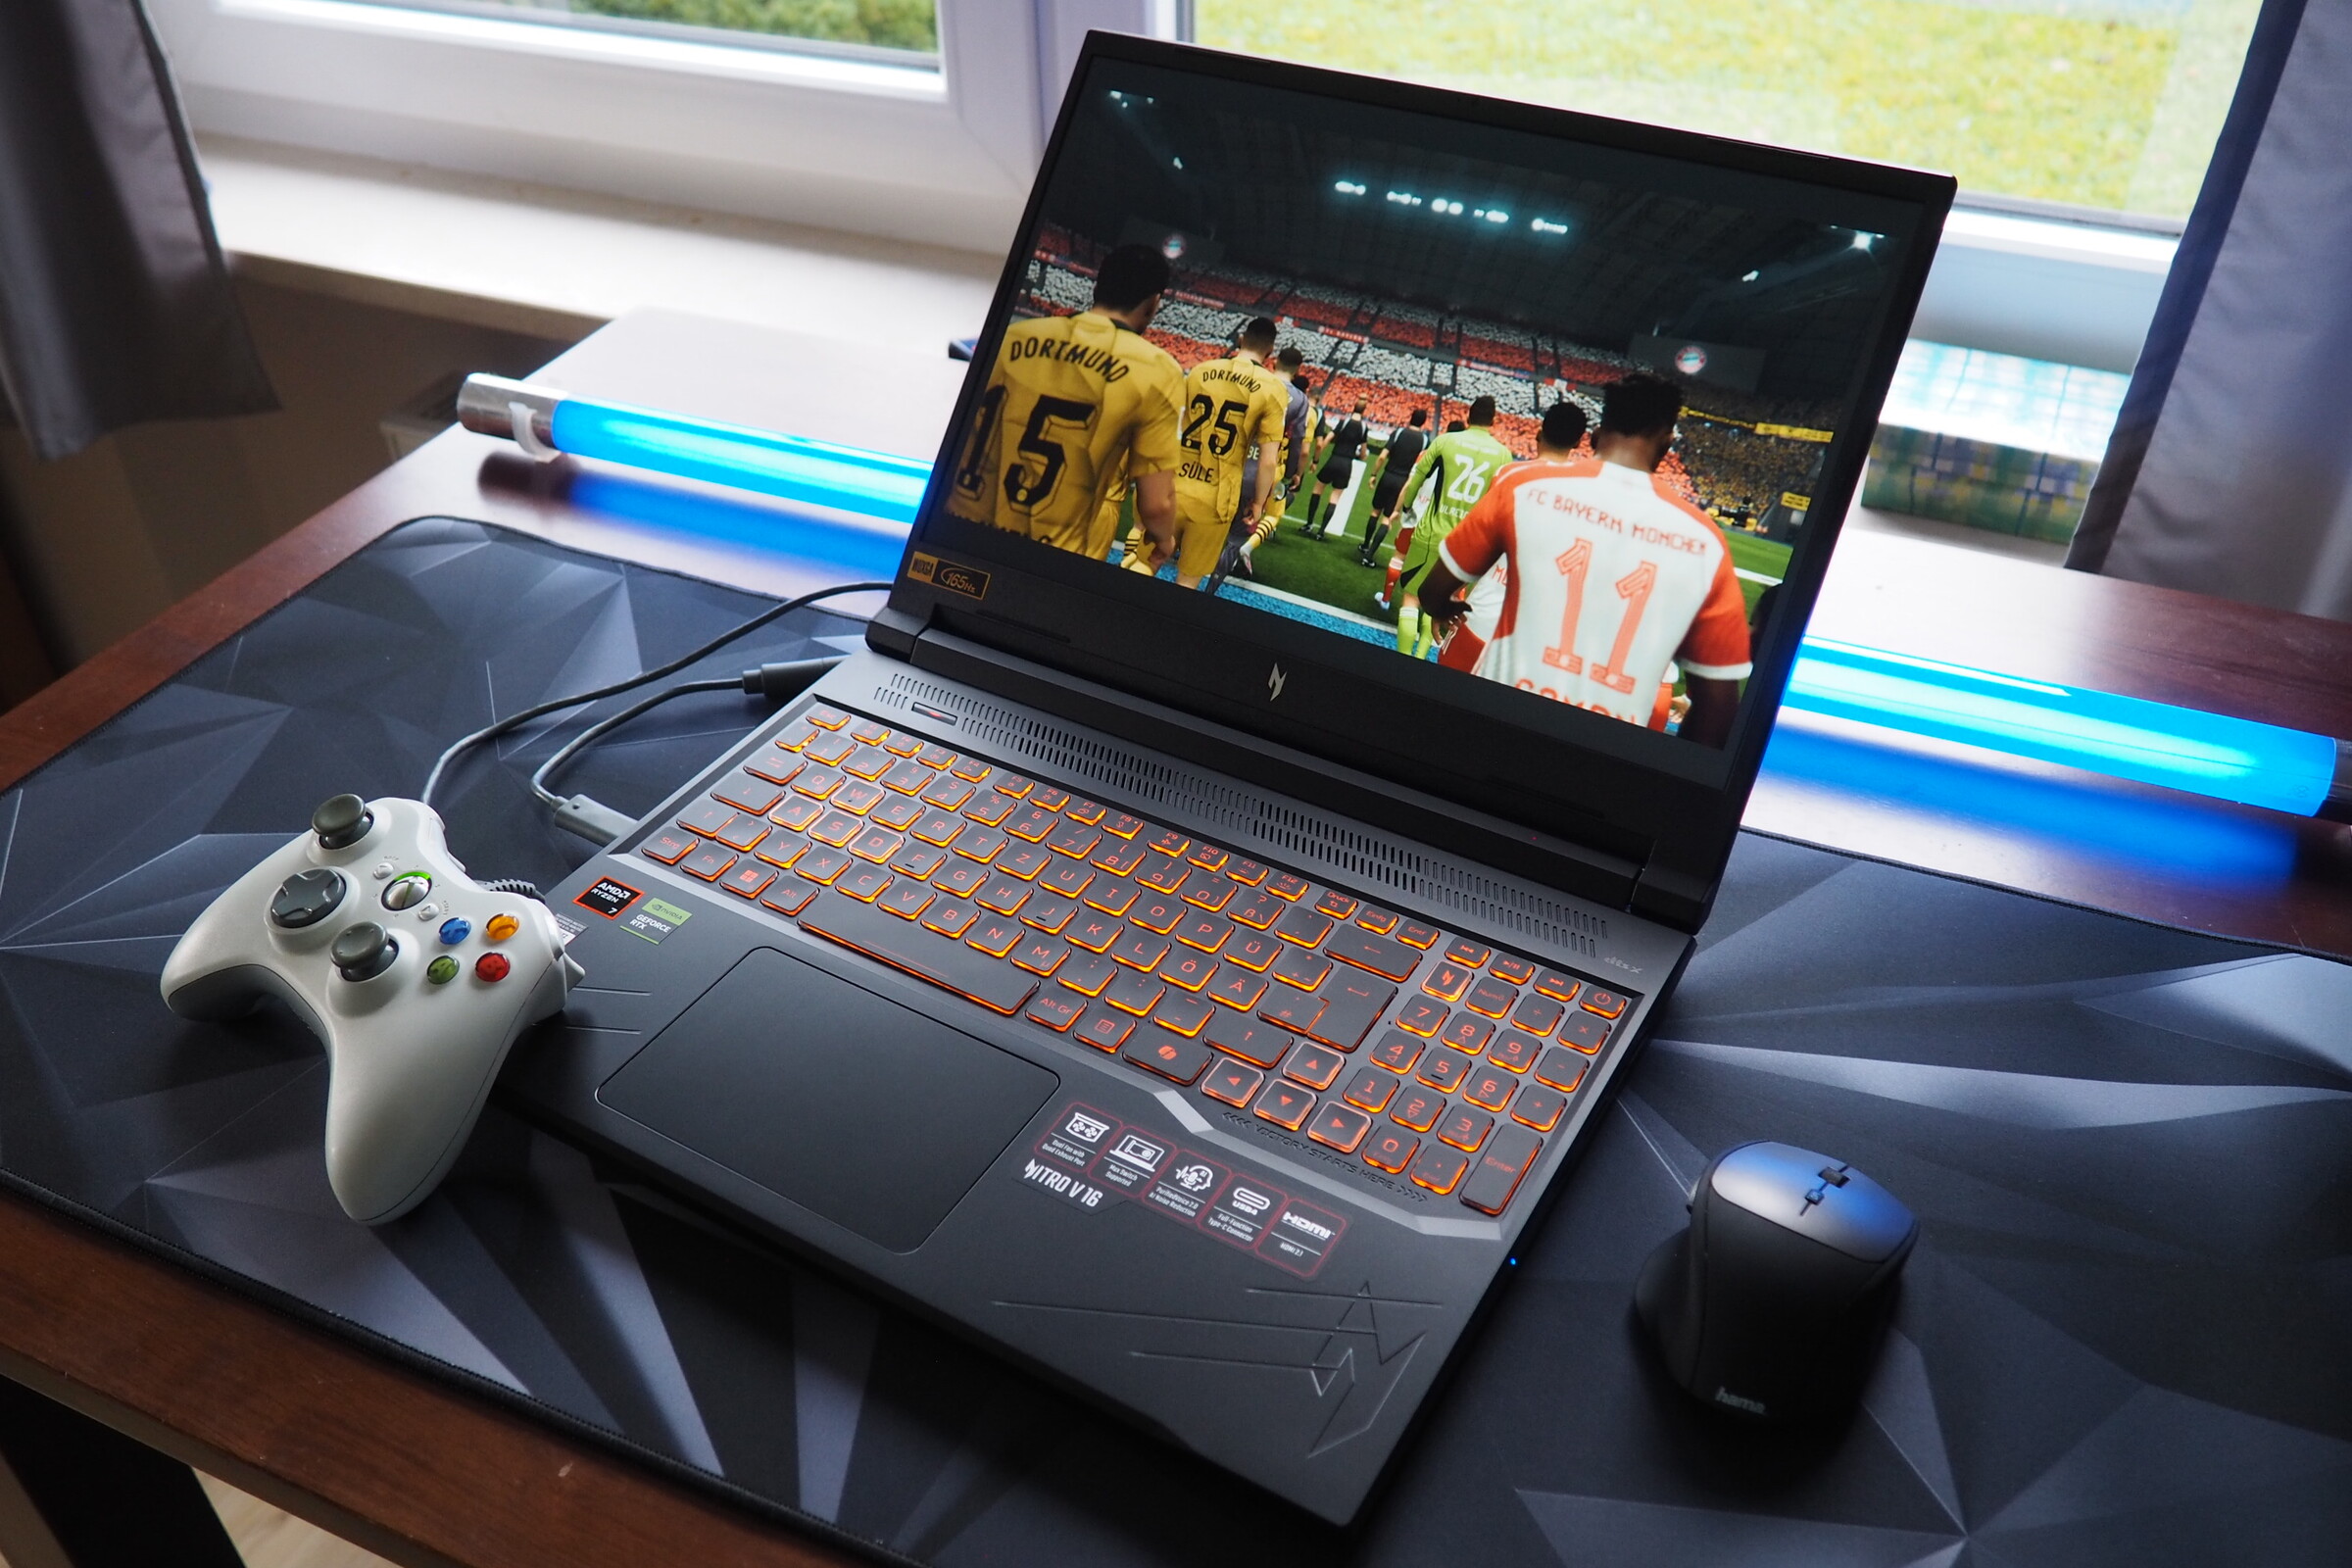
The Nitro V16 is a gaming laptop around the 1,000-dollar mark that offers more than decent performance for its price (Ryzen 8000 & RTX 4060). Find out here whether the 16-inch device did just as well in all the other categories. First things first: Acer has unfortunately failed in one important aspect.Florian Glaser, 👁 Florian Glaser (translated by Daisy Dickson) Published 🇩🇪 🇫🇷 ...
Verdict - Acer has neglected the picture quality
For a laptop to be worthy of our recommendation often depends on a single point. On paper, the Nitro V 16 ANV16-41 made a thoroughly successful impression. AMD's 8000-generation Ryzen processors are known for their good power-to-speed ratio. The situation is similar with the GeForce RTX 4060 from Nvidia, which is installed in our test configuration. 16 GB DDR5 RAM and a 1 TB SSD are also (still) appropriate in the price segment of just over 1,000 dollars.
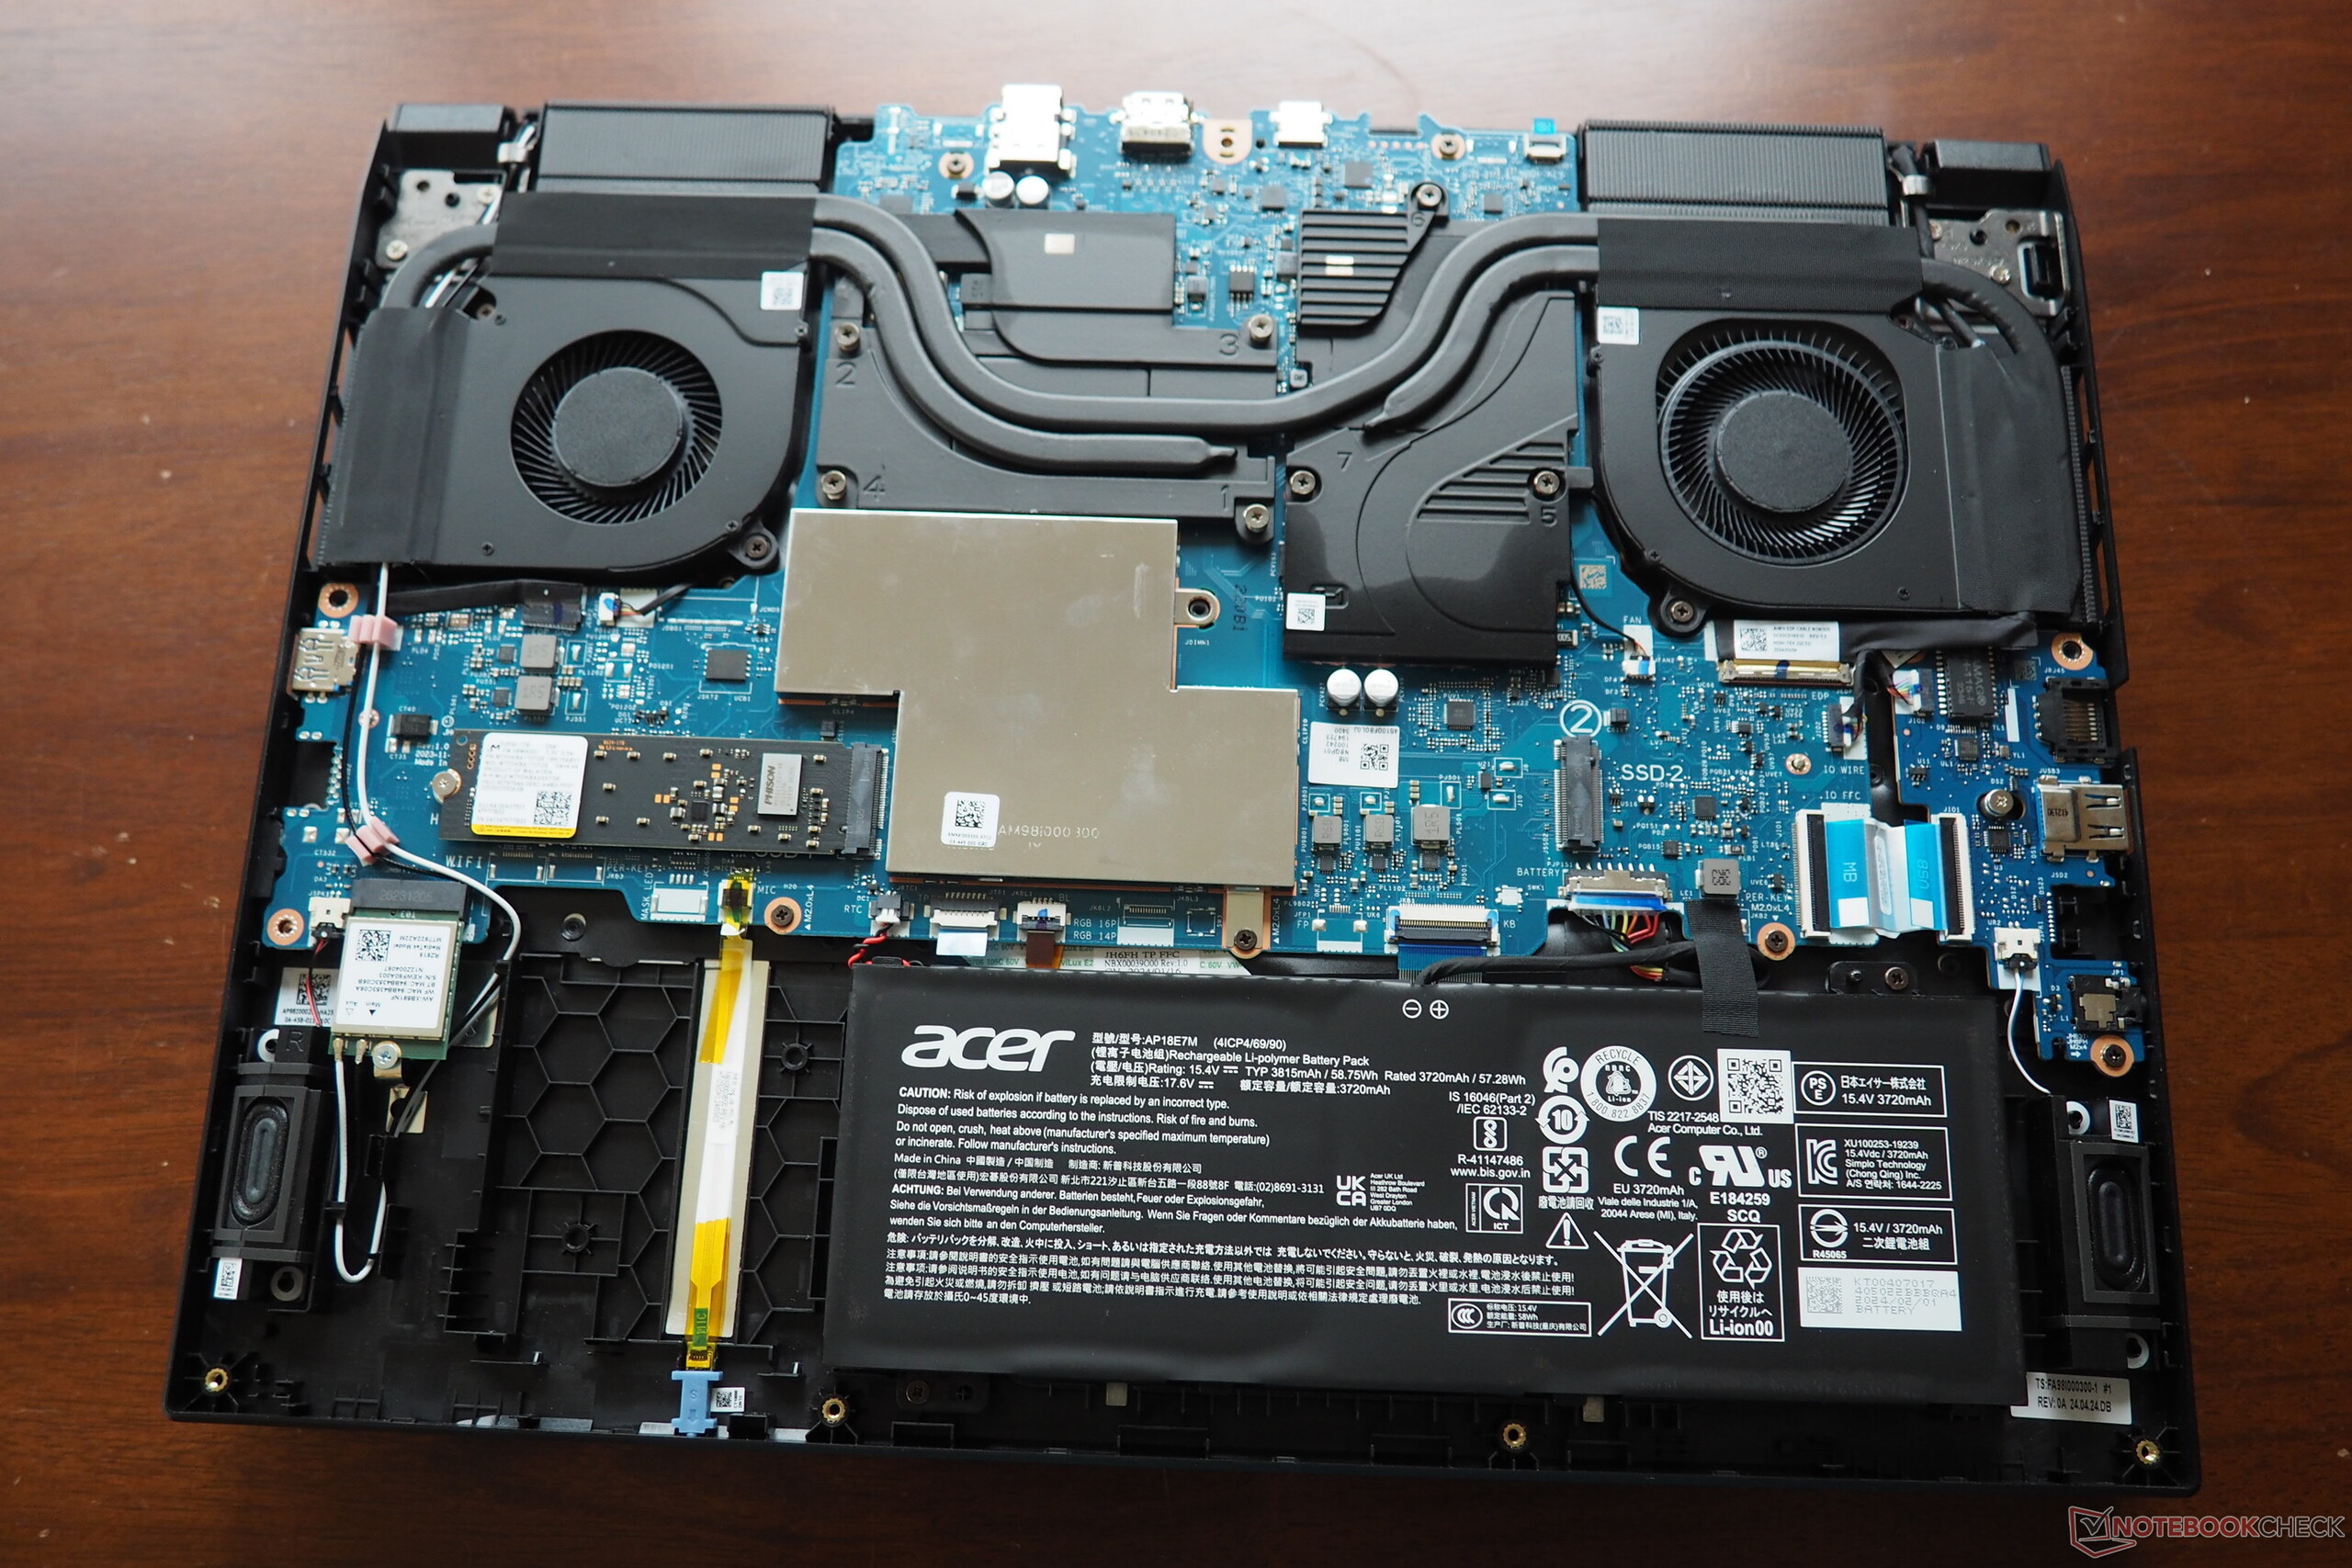
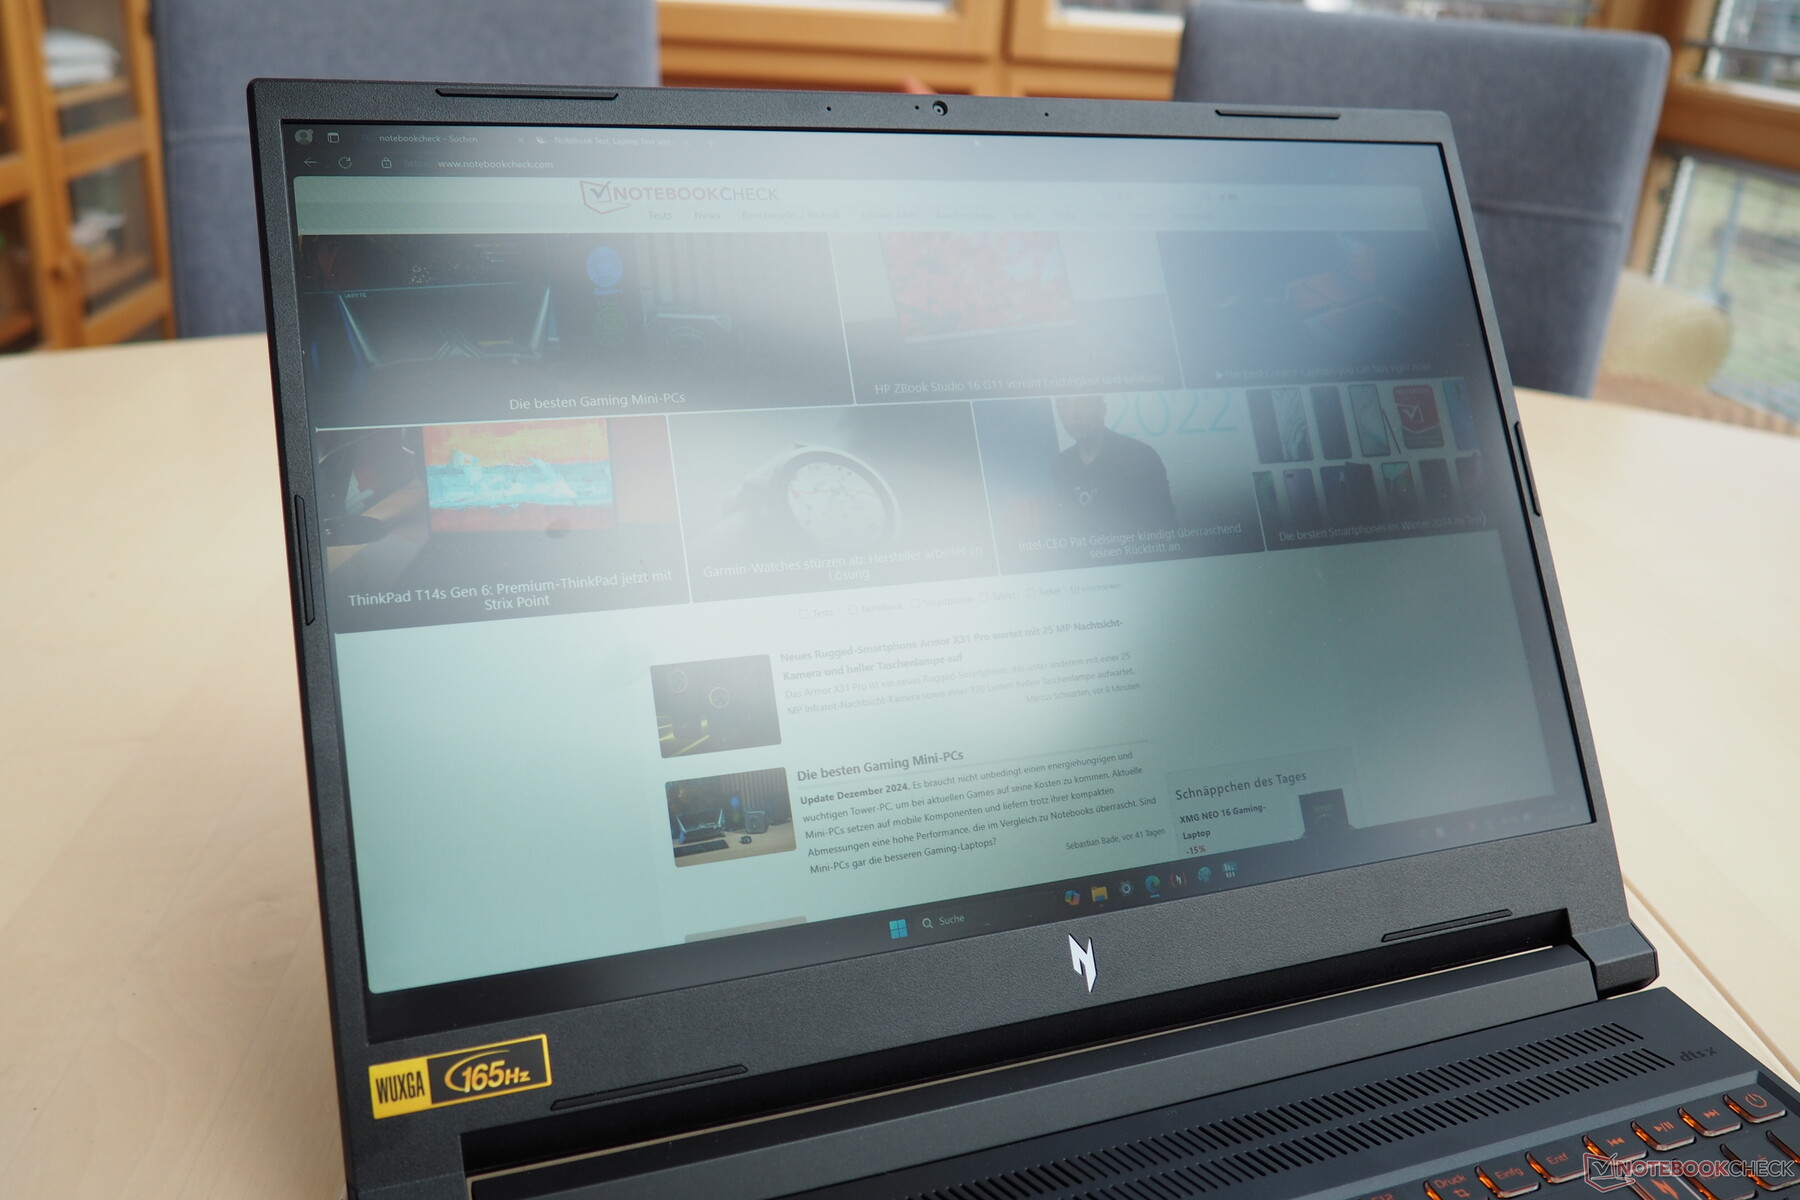
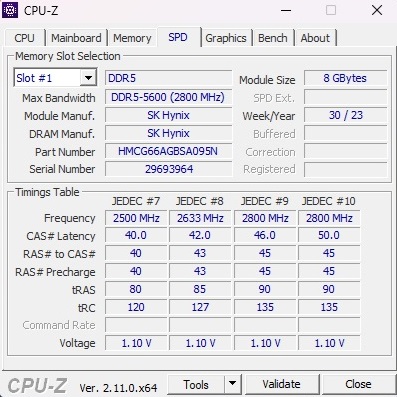
Its IPS screen features the 16:10 aspect ratio which is popular at the moment, and it has a refresh rate of 165 Hz and a resolution of 1,920 x 1,200 pixels. What you don't realize at first glance, however, is that Acer has gone for a rather inferior display, as we will explain in more detail shortly. In summary, its color space coverage in particular is lacking, making content appear rather pale and dull. In other disciplines, it was also only enough to achieve average results—be it its input devices, speakers, webcam or battery capacity. Meanwhile, it scored plus points for its upgrade and maintenance options: Both its RAM (two RAM banks) and mass storage (two M.2 slots) can be easily replaced or expanded if necessary.
Overall, it is still difficult to recommend the Nitro V 16 when glancing at some of its competitors. For a similar or slightly higher price, there are gaming laptops with significantly better displays, such as the Lenovo Legion 5 16IRX G9, which has a Core i7-14650HX and an RTX 4060. We also listed the HP Victus 16, the Nubia RedMagic Titan 16 and the Asus ROG Zephyrus G16—all 16-inch models—as further opponents in our test.
Pros
Cons
Price and availability
At the time of writing, you can purchase the Acer Nitro V 16 ANV16-41-R5AT via online retailers such as Amazon, where it currently costs $959.
Possible alternatives compared
Image | Model / Review | Price | Weight | Height | Display |
|---|---|---|---|---|---|
1. 76.3%  | Acer Nitro V 16 ANV16-41-R5AT AMD Ryzen 7 8845HS ⎘ NVIDIA GeForce RTX 4060 Laptop GPU ⎘ 16 GB Memory, 1024 GB SSD | Amazon: List Price: 1100 EUR | 2.5 kg | 25.5 mm | 16.00" 1920x1200 142 PPI IPS |
2. 89.1% v7 (old)  | Lenovo Legion 5 16IRX G9 Intel Core i7-14650HX ⎘ NVIDIA GeForce RTX 4060 Laptop GPU ⎘ 16 GB Memory, 1024 GB SSD | Amazon: List Price: 1599€ | 2.4 kg | 25.2 mm | 16.00" 2560x1600 189 PPI IPS |
3. 84.3% v7 (old)  | HP Victus 16 (2024) Intel Core i7-14700HX ⎘ NVIDIA GeForce RTX 4060 Laptop GPU ⎘ 16 GB Memory, 512 GB SSD | Amazon: List Price: 1499 Euro | 2.4 kg | 23.9 mm | 16.10" 1920x1080 137 PPI IPS |
4. 81.2%  | Nubia RedMagic Titan 16 Pro Intel Core i9-14900HX ⎘ NVIDIA GeForce RTX 4060 Laptop GPU ⎘ 16 GB Memory, 1024 GB SSD | Amazon: 1. $1,049.00 REDMAGIC 11S Pro 16G+512G Ni... 2. $5.39 Anoowkoa 3 Pack Compatible w... 3. $4.99 Anoowkoa for ZTE Nubia RedMa... List Price: 1759 Euro | 2.4 kg | 23.9 mm | 16.00" 2560x1600 189 PPI IPS |
5. 85.9%  | Asus ROG Zephyrus G16 GA605WV AMD Ryzen AI 9 HX 370 ⎘ NVIDIA GeForce RTX 4060 Laptop GPU ⎘ 32 GB Memory, 1024 GB SSD | Amazon: List Price: 2599€ | 1.8 kg | 17.2 mm | 16.00" 2560x1600 189 PPI OLED |
The Nitro V 16 is available in several variants. Depending on the configuration, it features a Ryzen 5 8645HS or a Ryzen 7 8845HS inside. Its RAM ranges from 16 to 32 GB and its NVMe SSD has a capacity of 1 TB in all cases. Either a GeForce RTX 4050 or RTX 4060 takes care of image processing. The models are priced between $1,000 and $1,400.
Specifications
Case
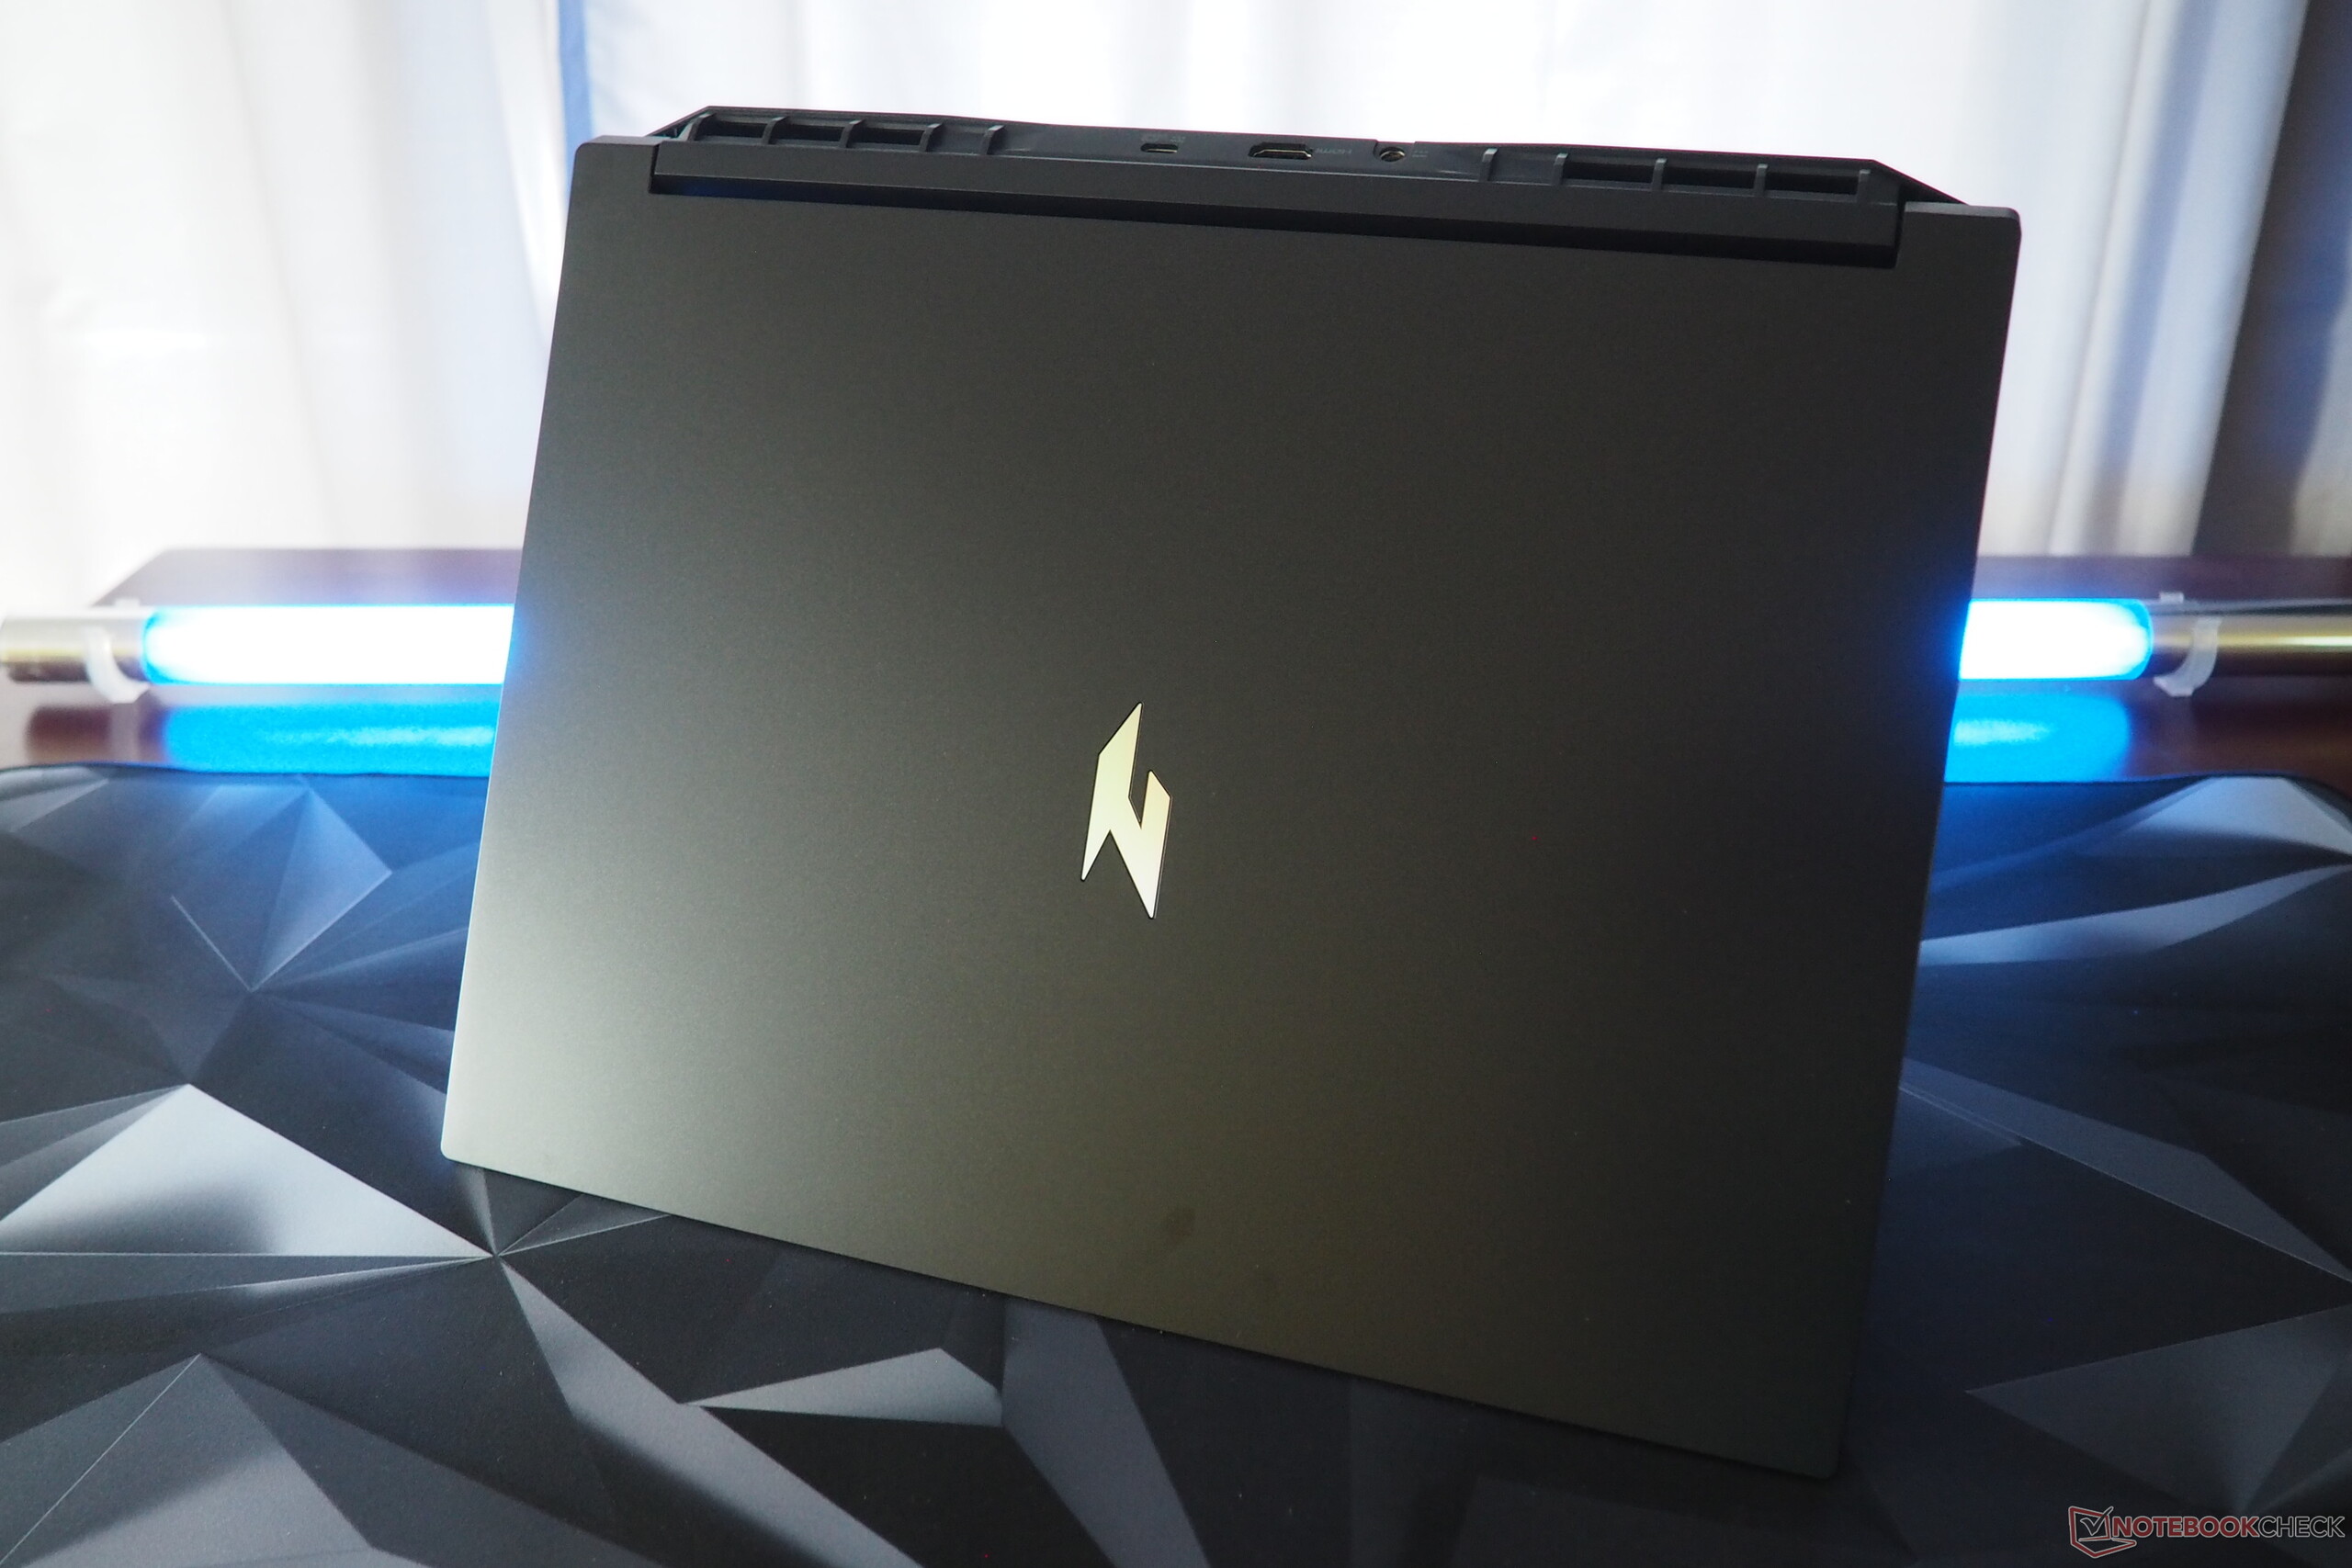
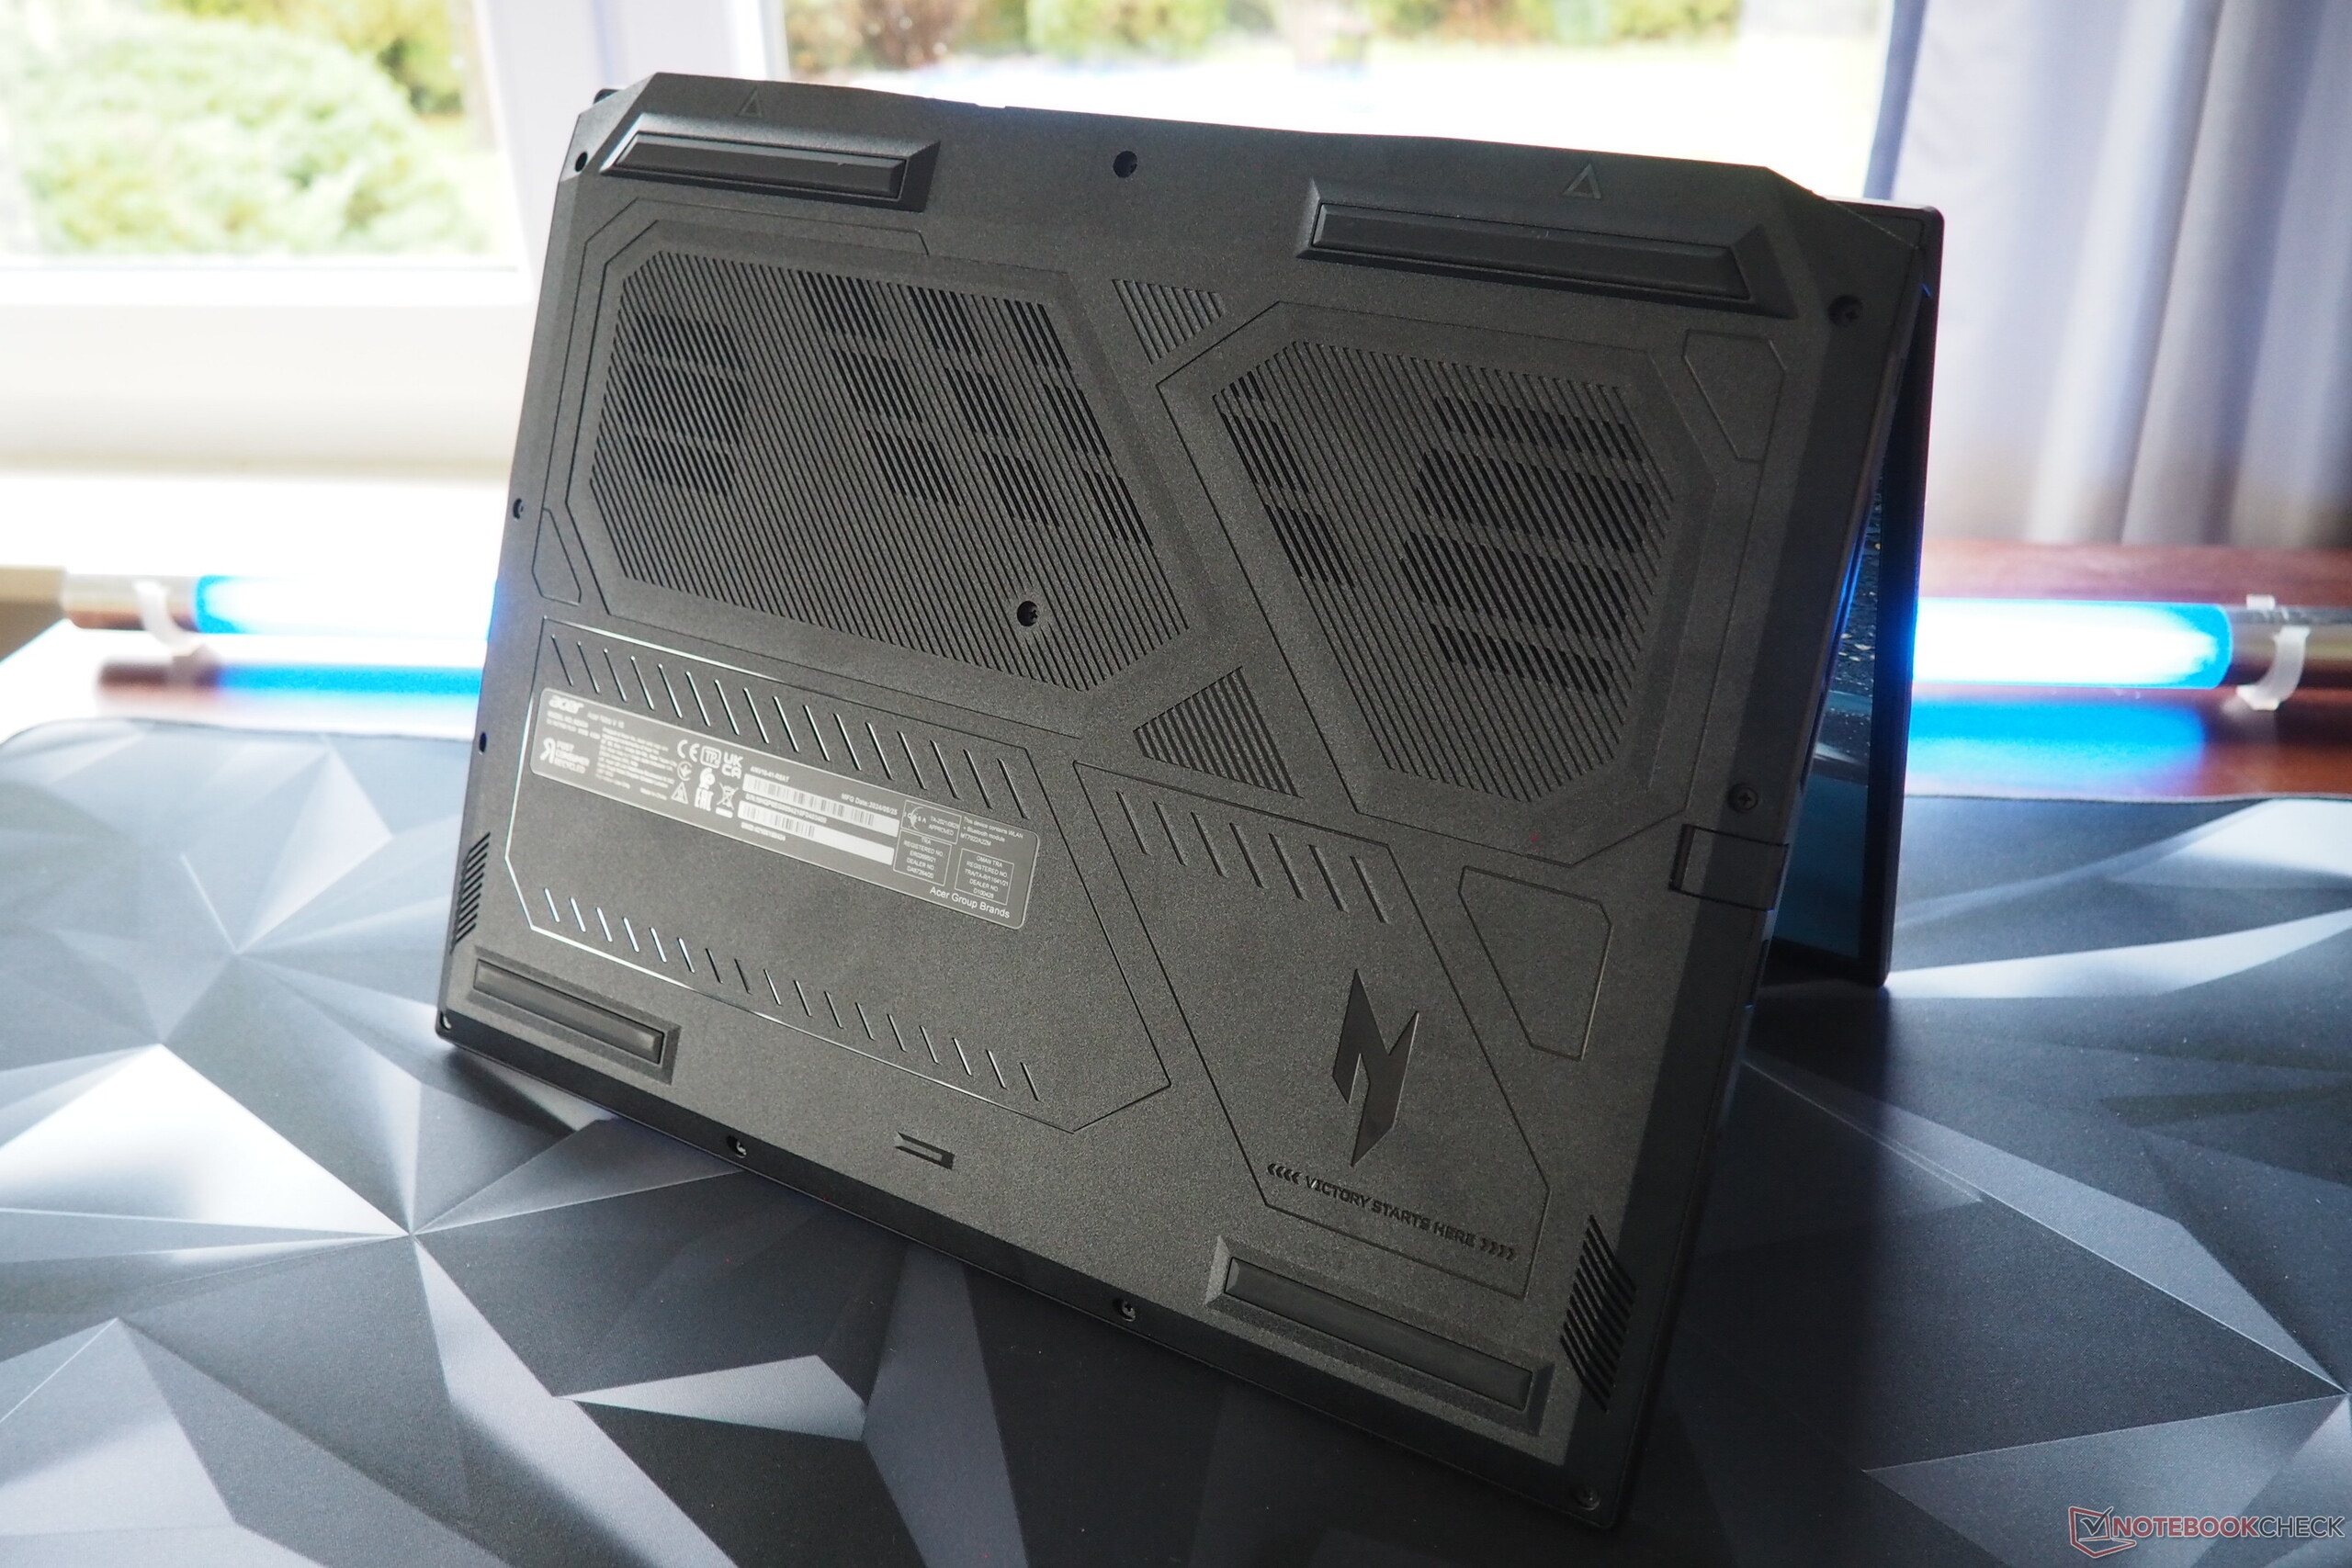
The Acer Nitro V 16's case is made completely out of plastic, which looks neat at first glance, but doesn't feel very high-quality on closer inspection and tends to rattle here and there. However, we have nothing to complain about in terms of its build quality, which is beyond reproach. Its hinges do a passable job and its screen can be easily opened with one hand (maximum angle approx. 145°). Unfortunately, the surfaces of the laptop are prone to collecting visible fingerprints, not least due to its dark color.
With a weight of 2.5 kg, the Nitro V 16 is the heaviest 16-inch model in the comparison field—although most of its competitors are only slightly lighter. Only the Zephyrus G16 stands out with its weight of 1.8 kg. The picture looks almost the same when it comes to build height. At 2.55 cm, the Acer device is again in line with the competition, with only the Asus laptop being below the 2 cm mark.
Connectivity
Ports
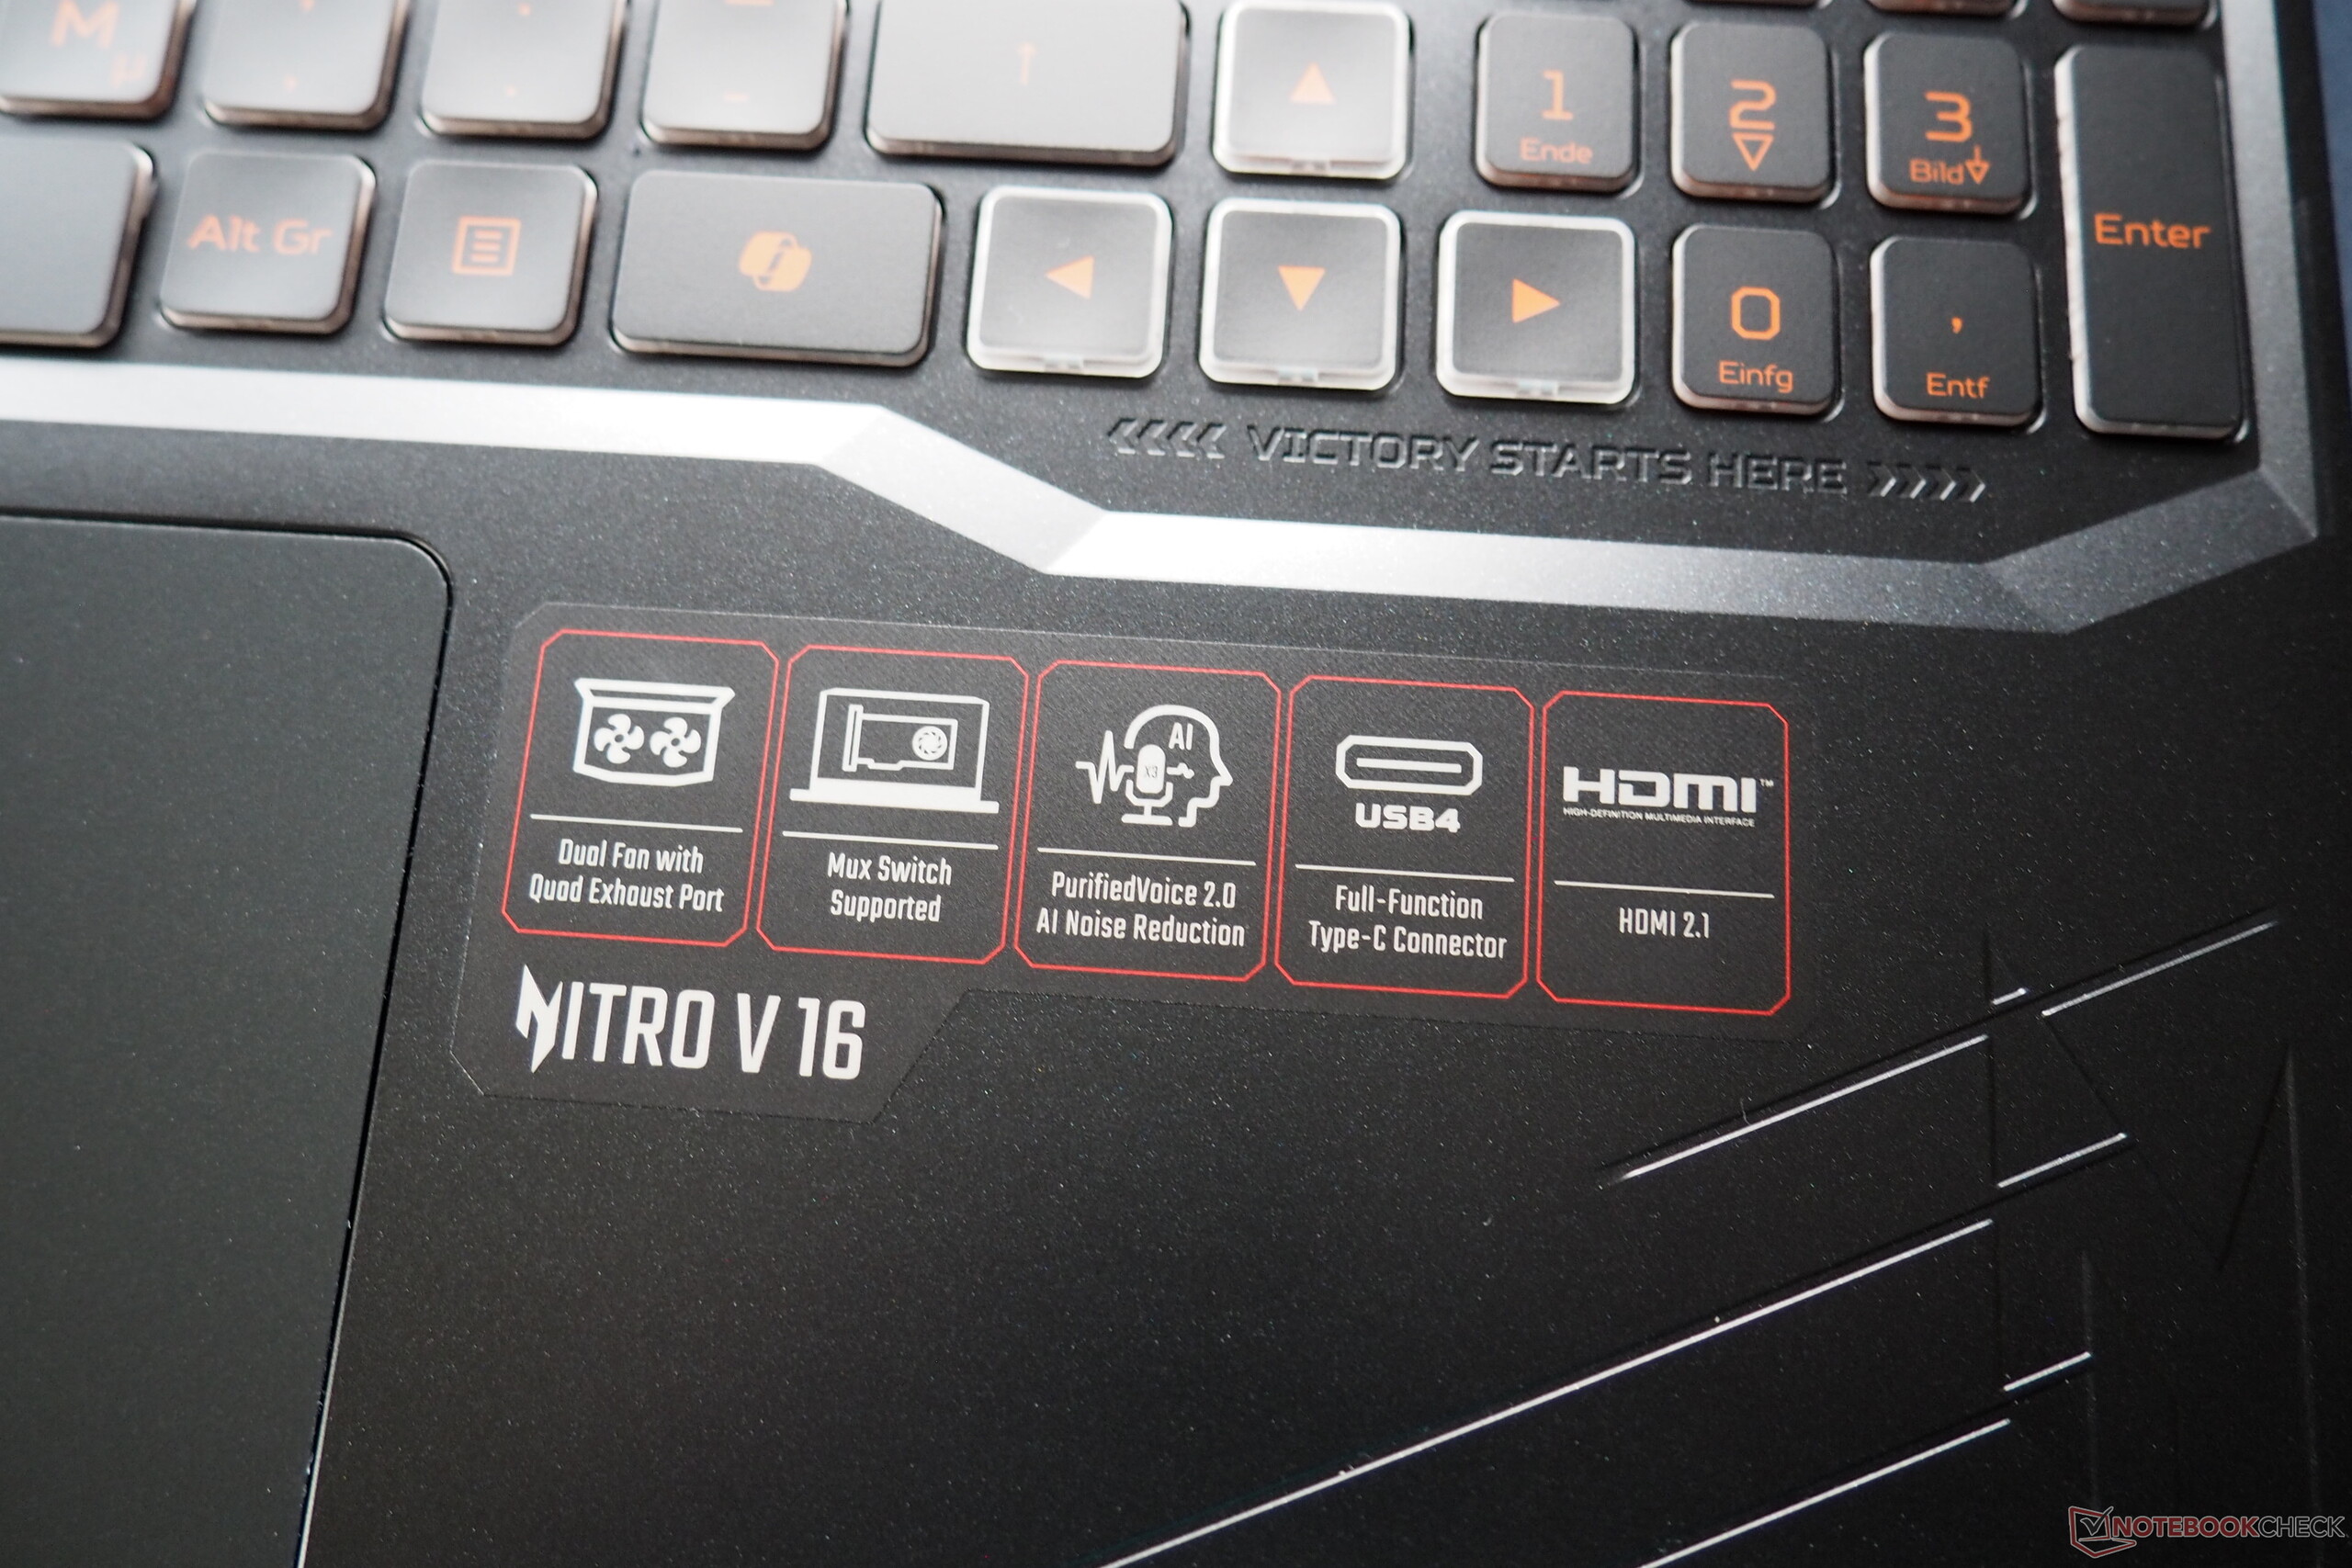
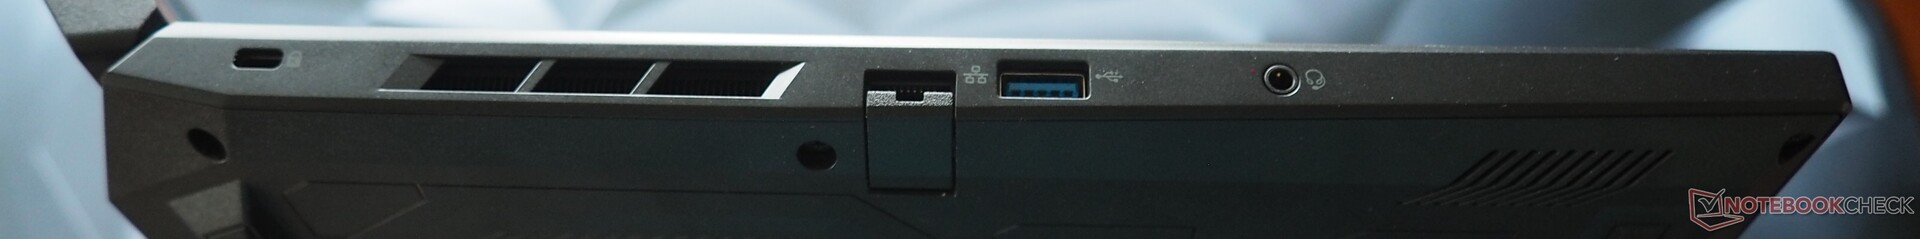
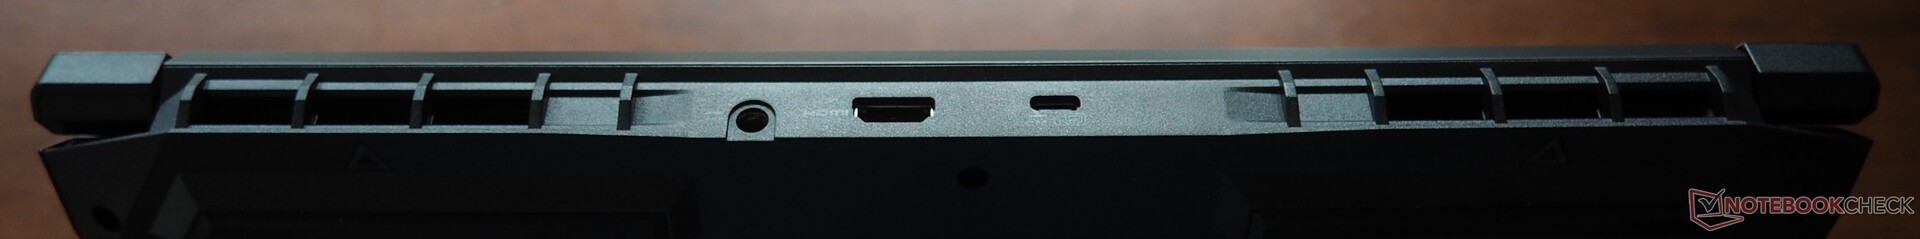
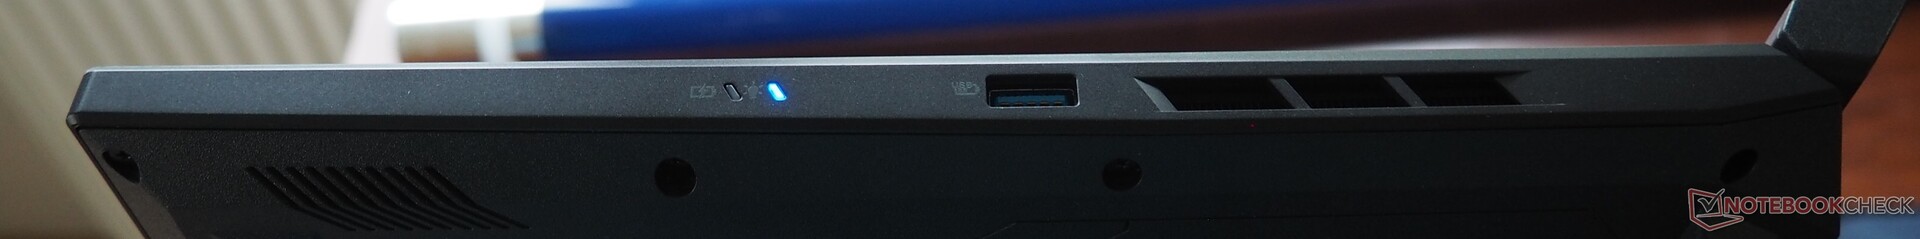
If you exclude the missing card reader, the laptop's selection of ports is quite impressive. Although we would have liked another USB-C port, the existing USB port is a version 4 model (including DisplayPort). The two USB-A ports, on the other hand, use the 3.2 Gen 2 standard. There is also an HDMI 2.1 port, a Gigabit LAN port, an audio jack and an opening for Kensington locks. Acer has placed some of the ports on the back of the device, which is beneficial when using an external mouse (keyword: space).
Communication
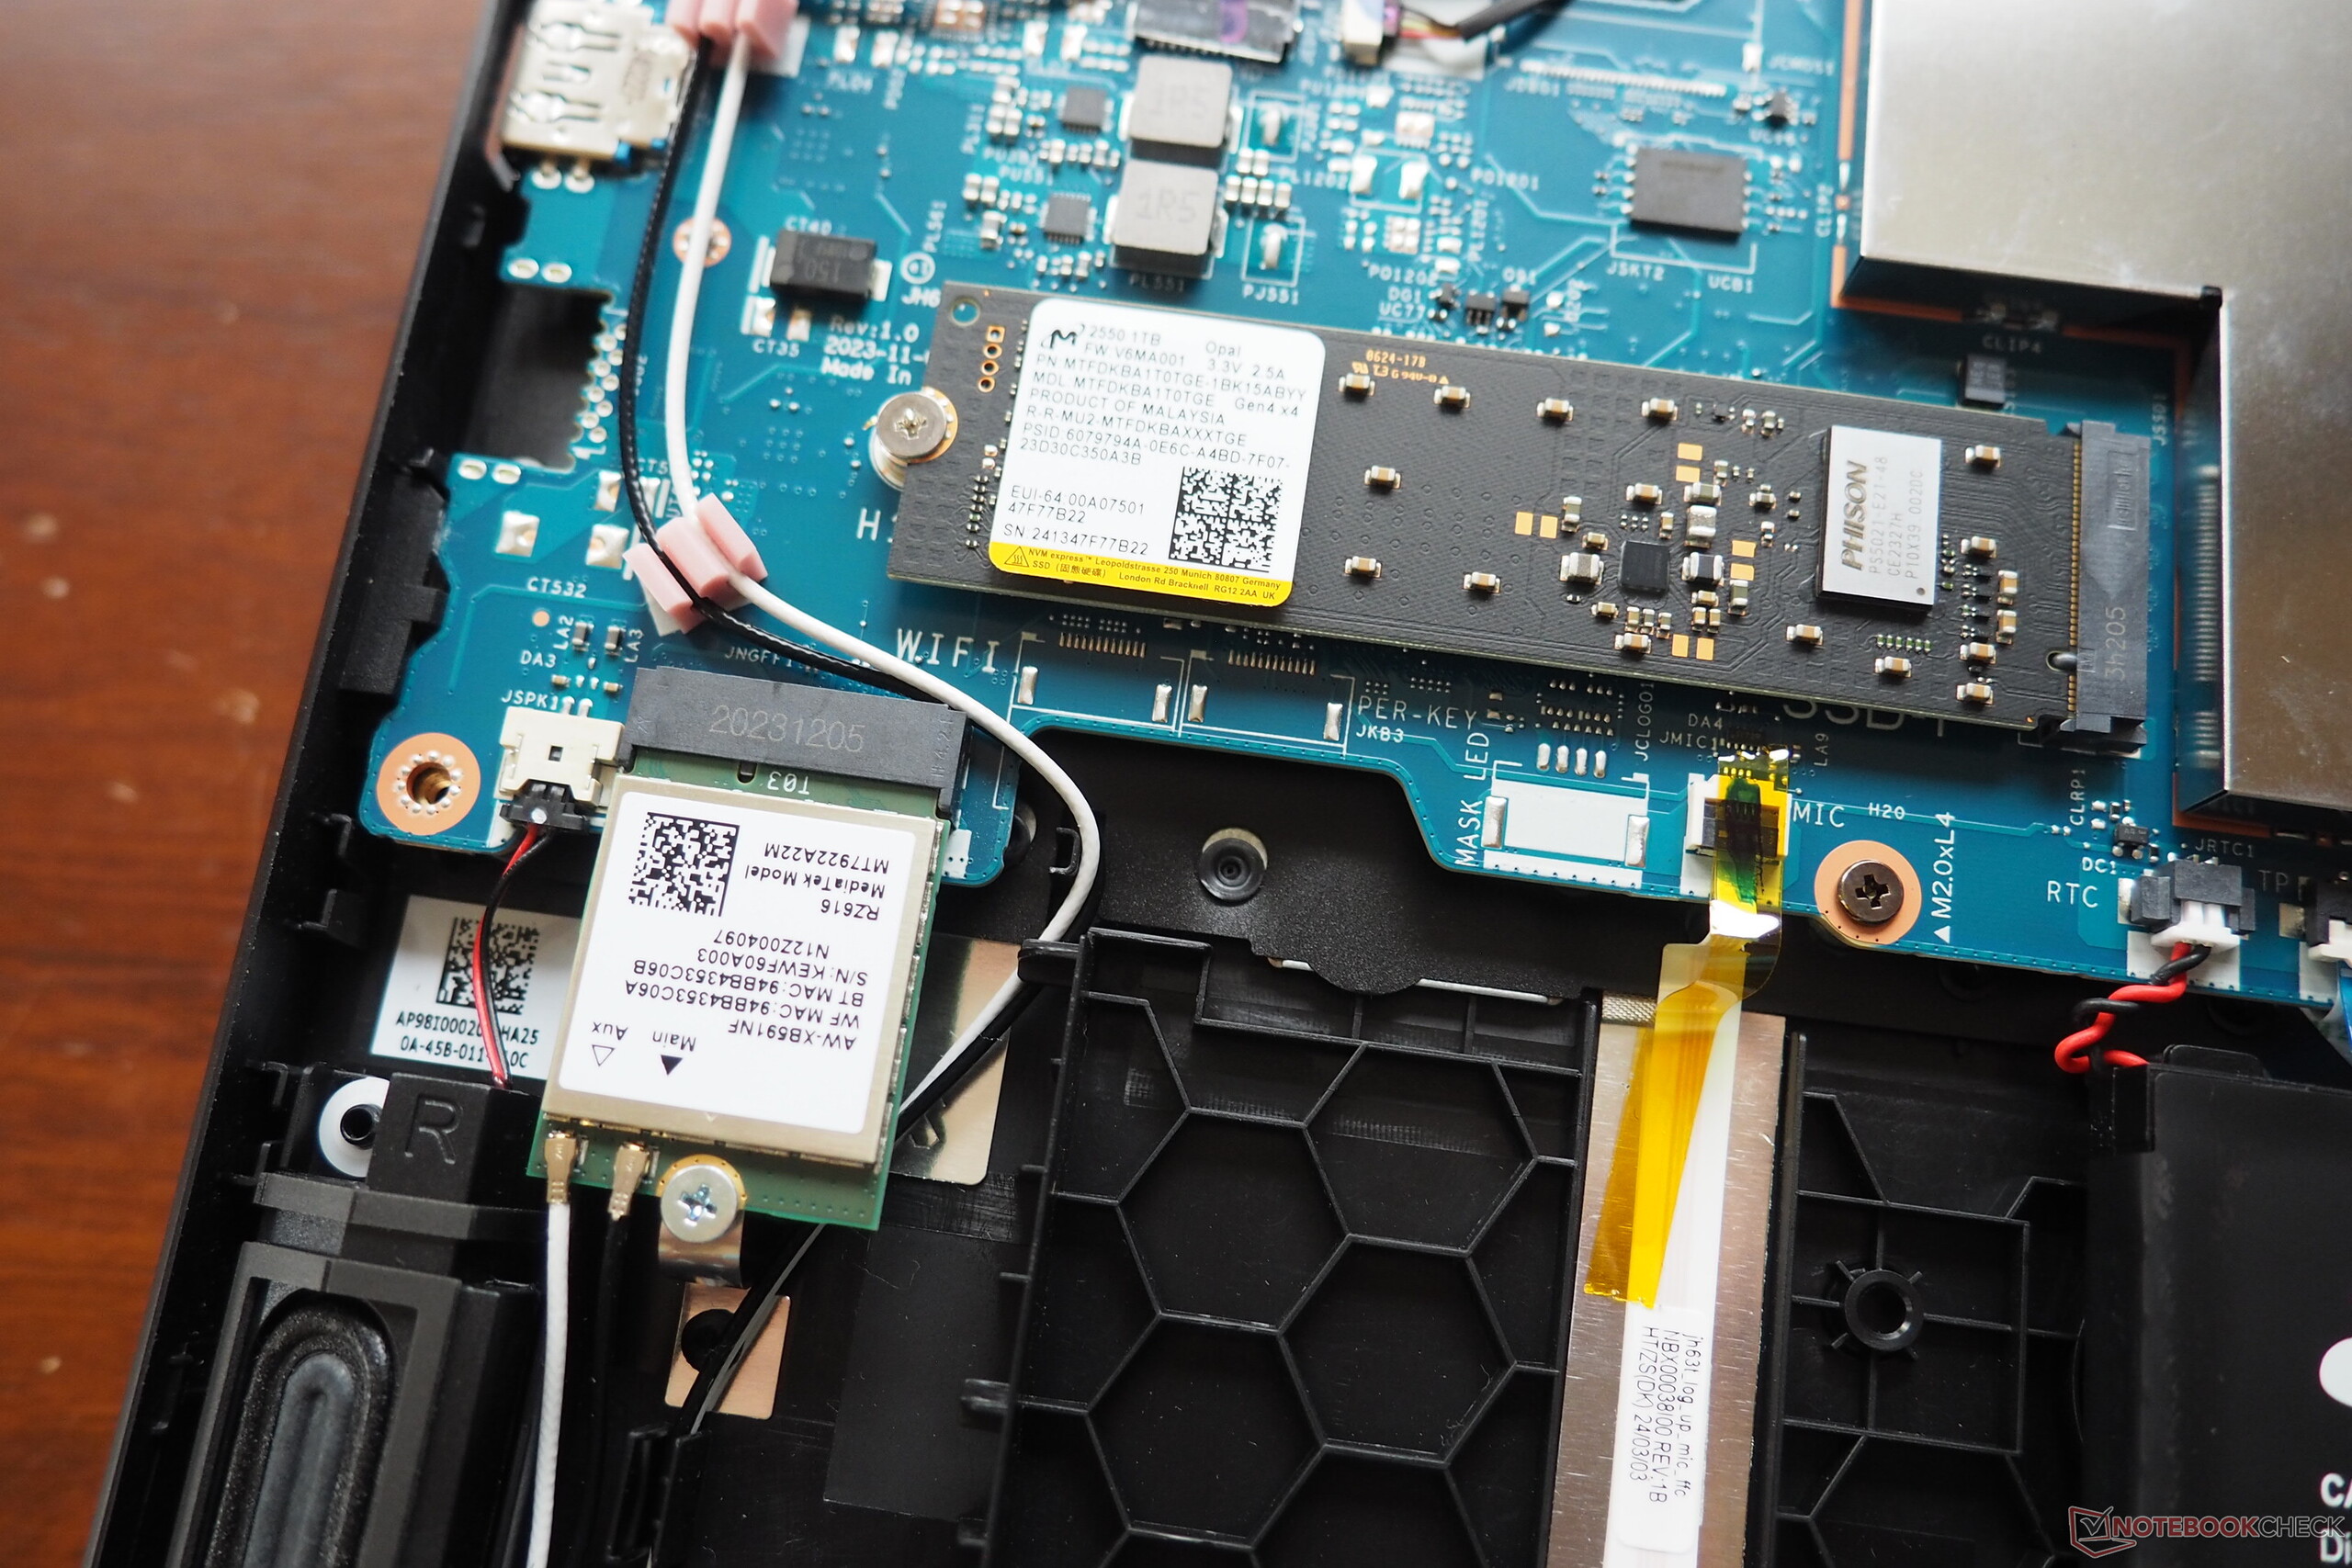
The installed MediaTek chip (RZ616) delivered solid (transmitting) to very good (receiving) performance during our range test from a distance of one meter to the reference router.
Webcam
Buyers can only expect poor-quality standard fare from its webcam. The 0.9 MP model is neither sharp nor particularly true to color (see pictures).


Accessories
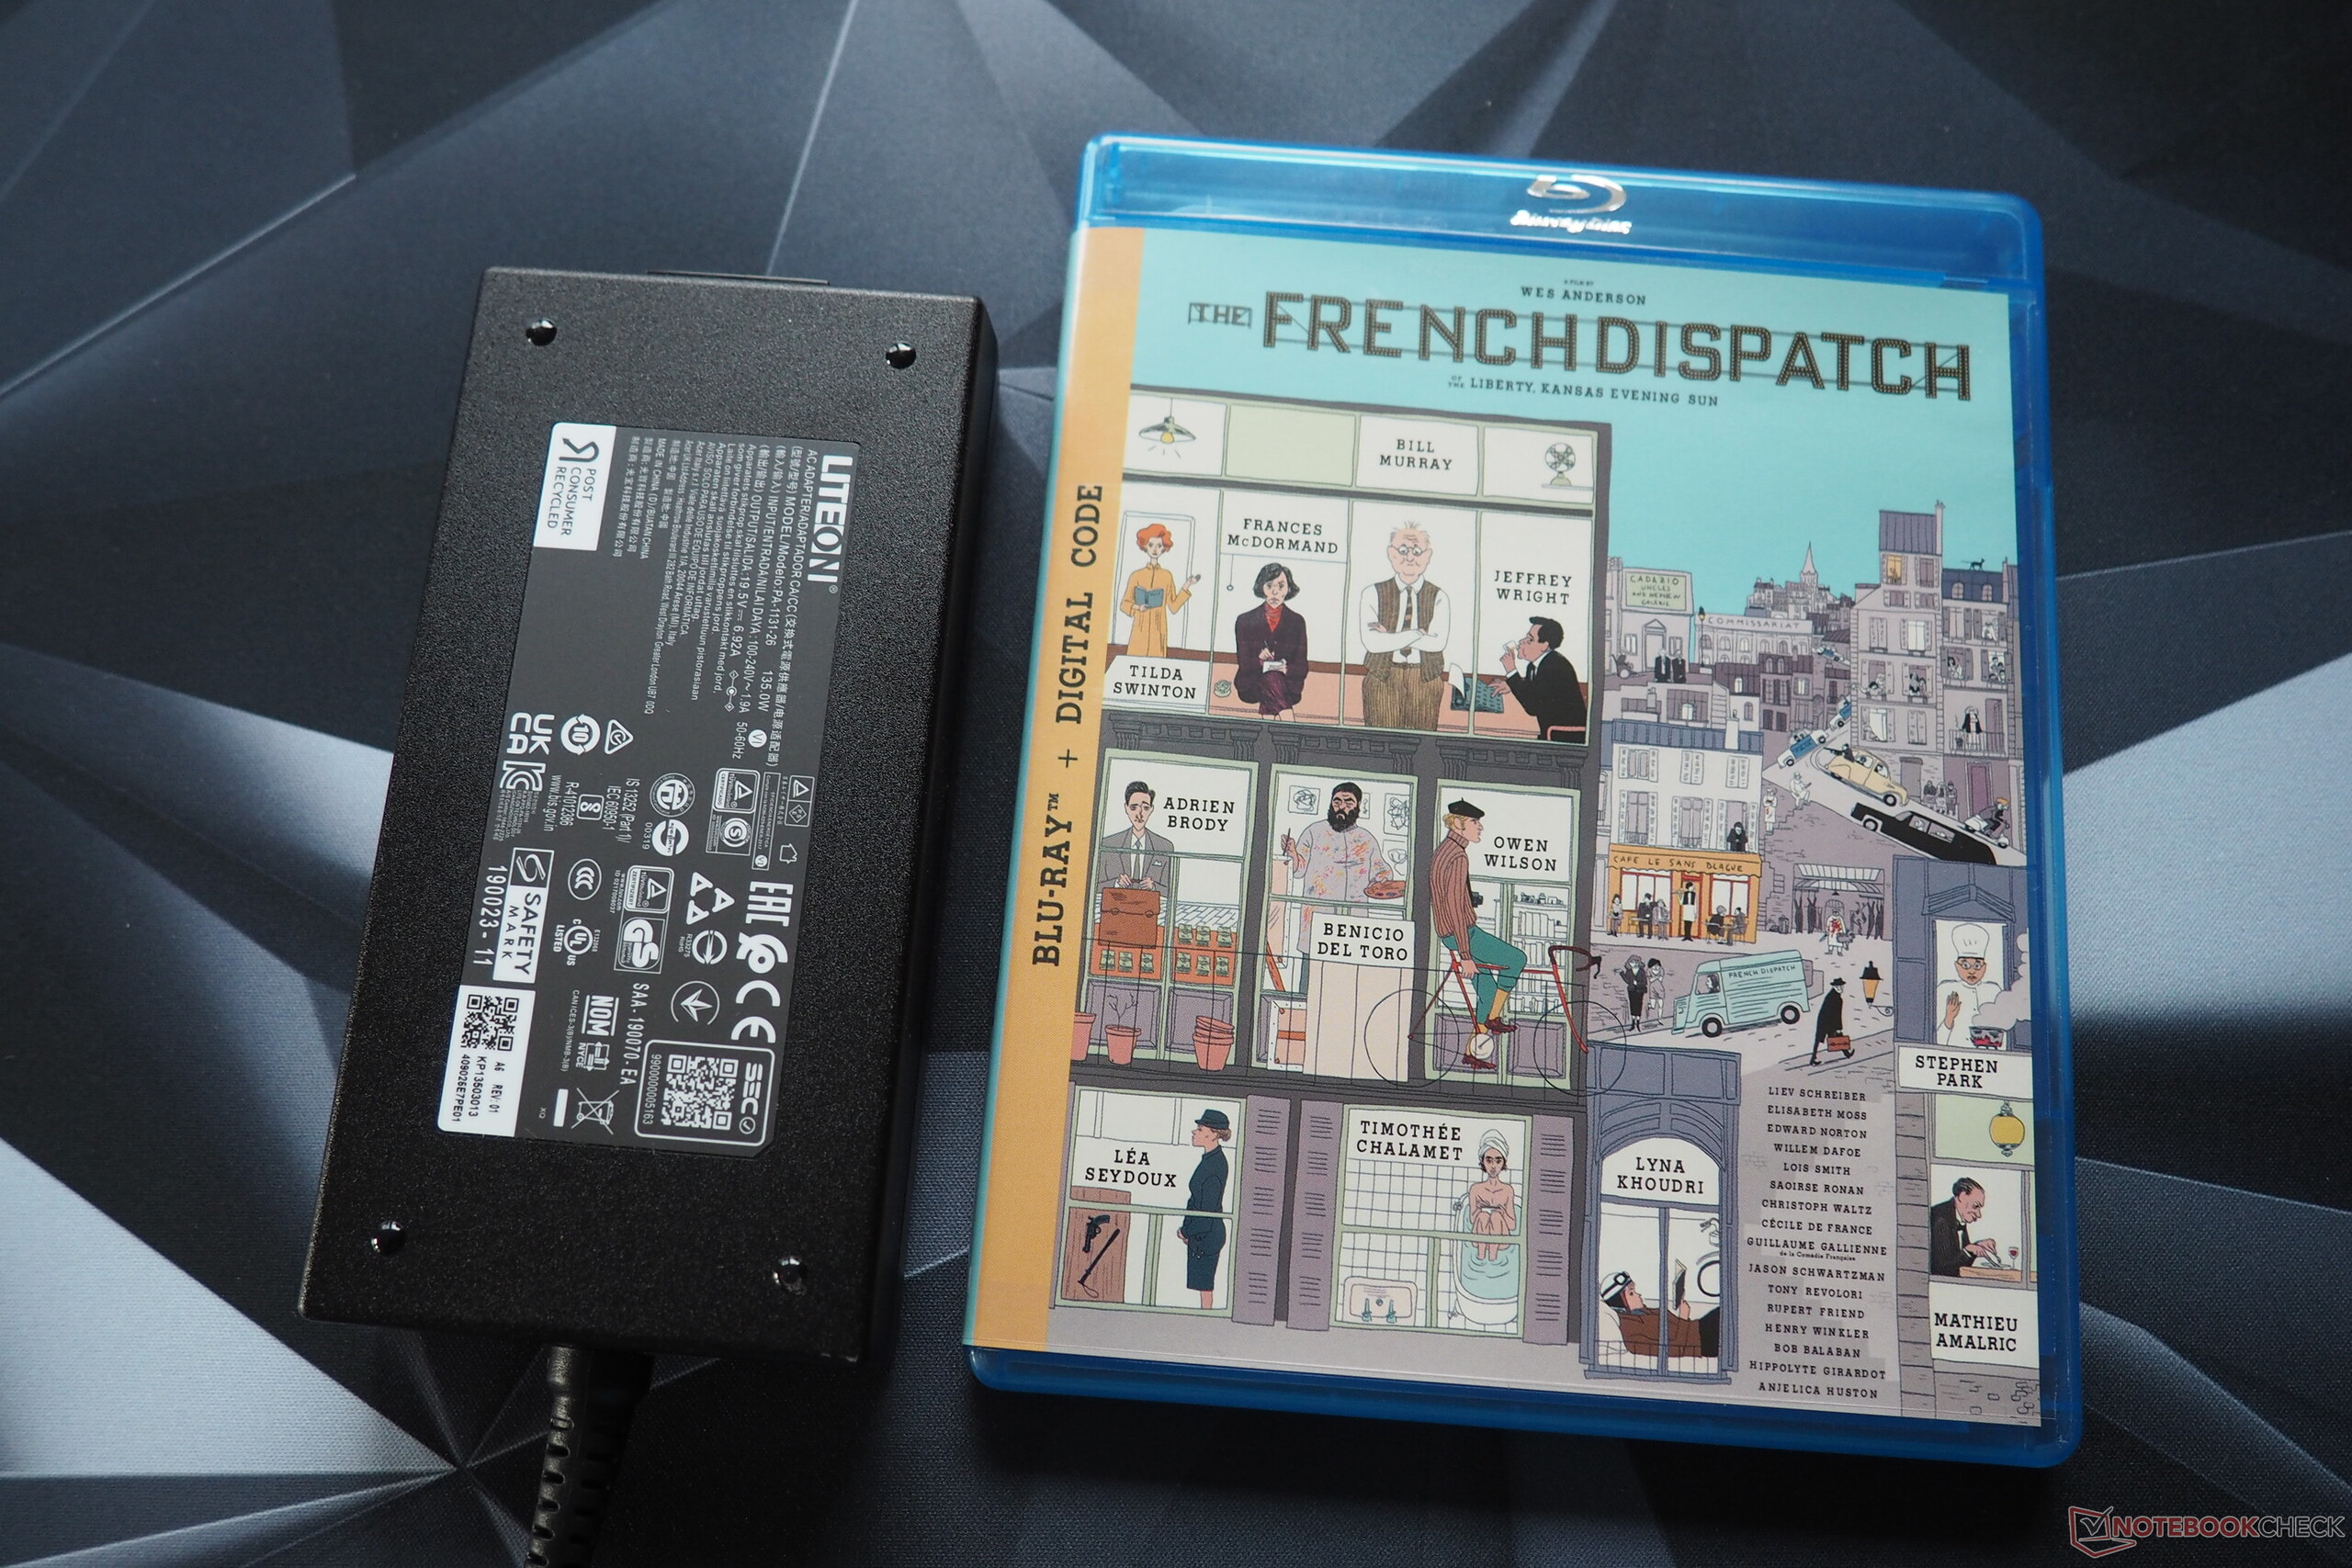
Acer delivers the laptop with a few information leaflets and a semi-compact 135-watt power supply.
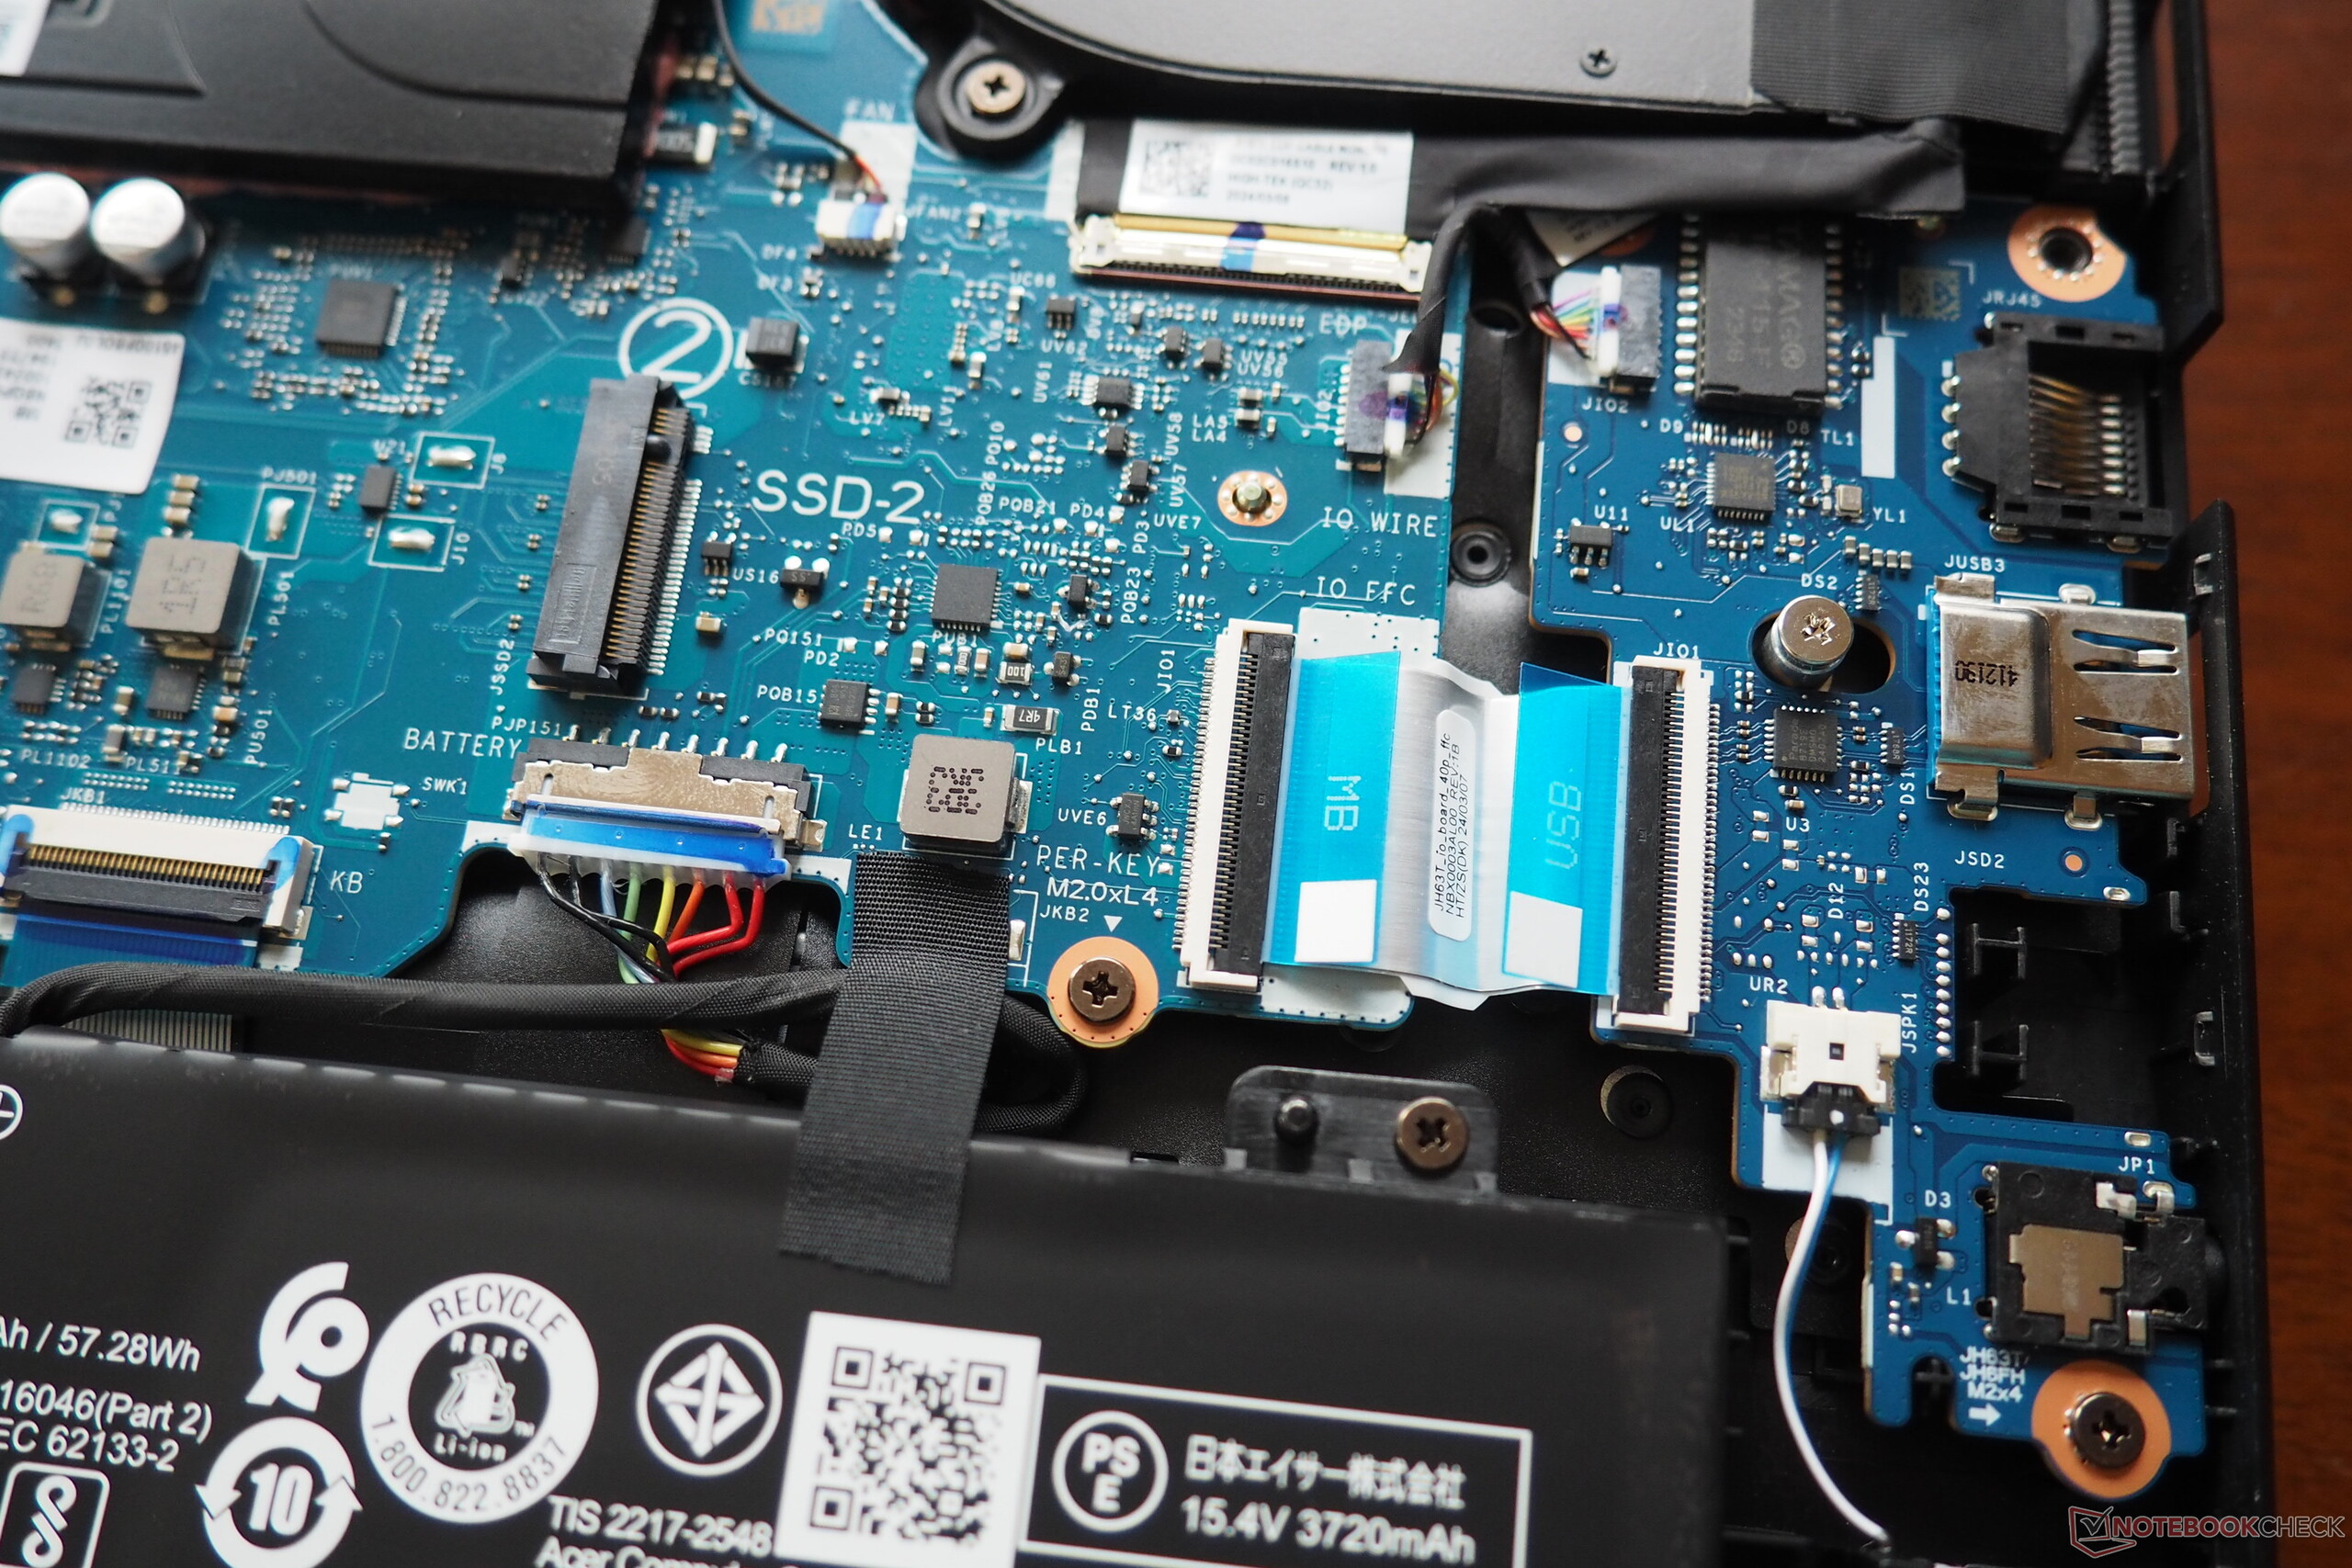
Maintenance
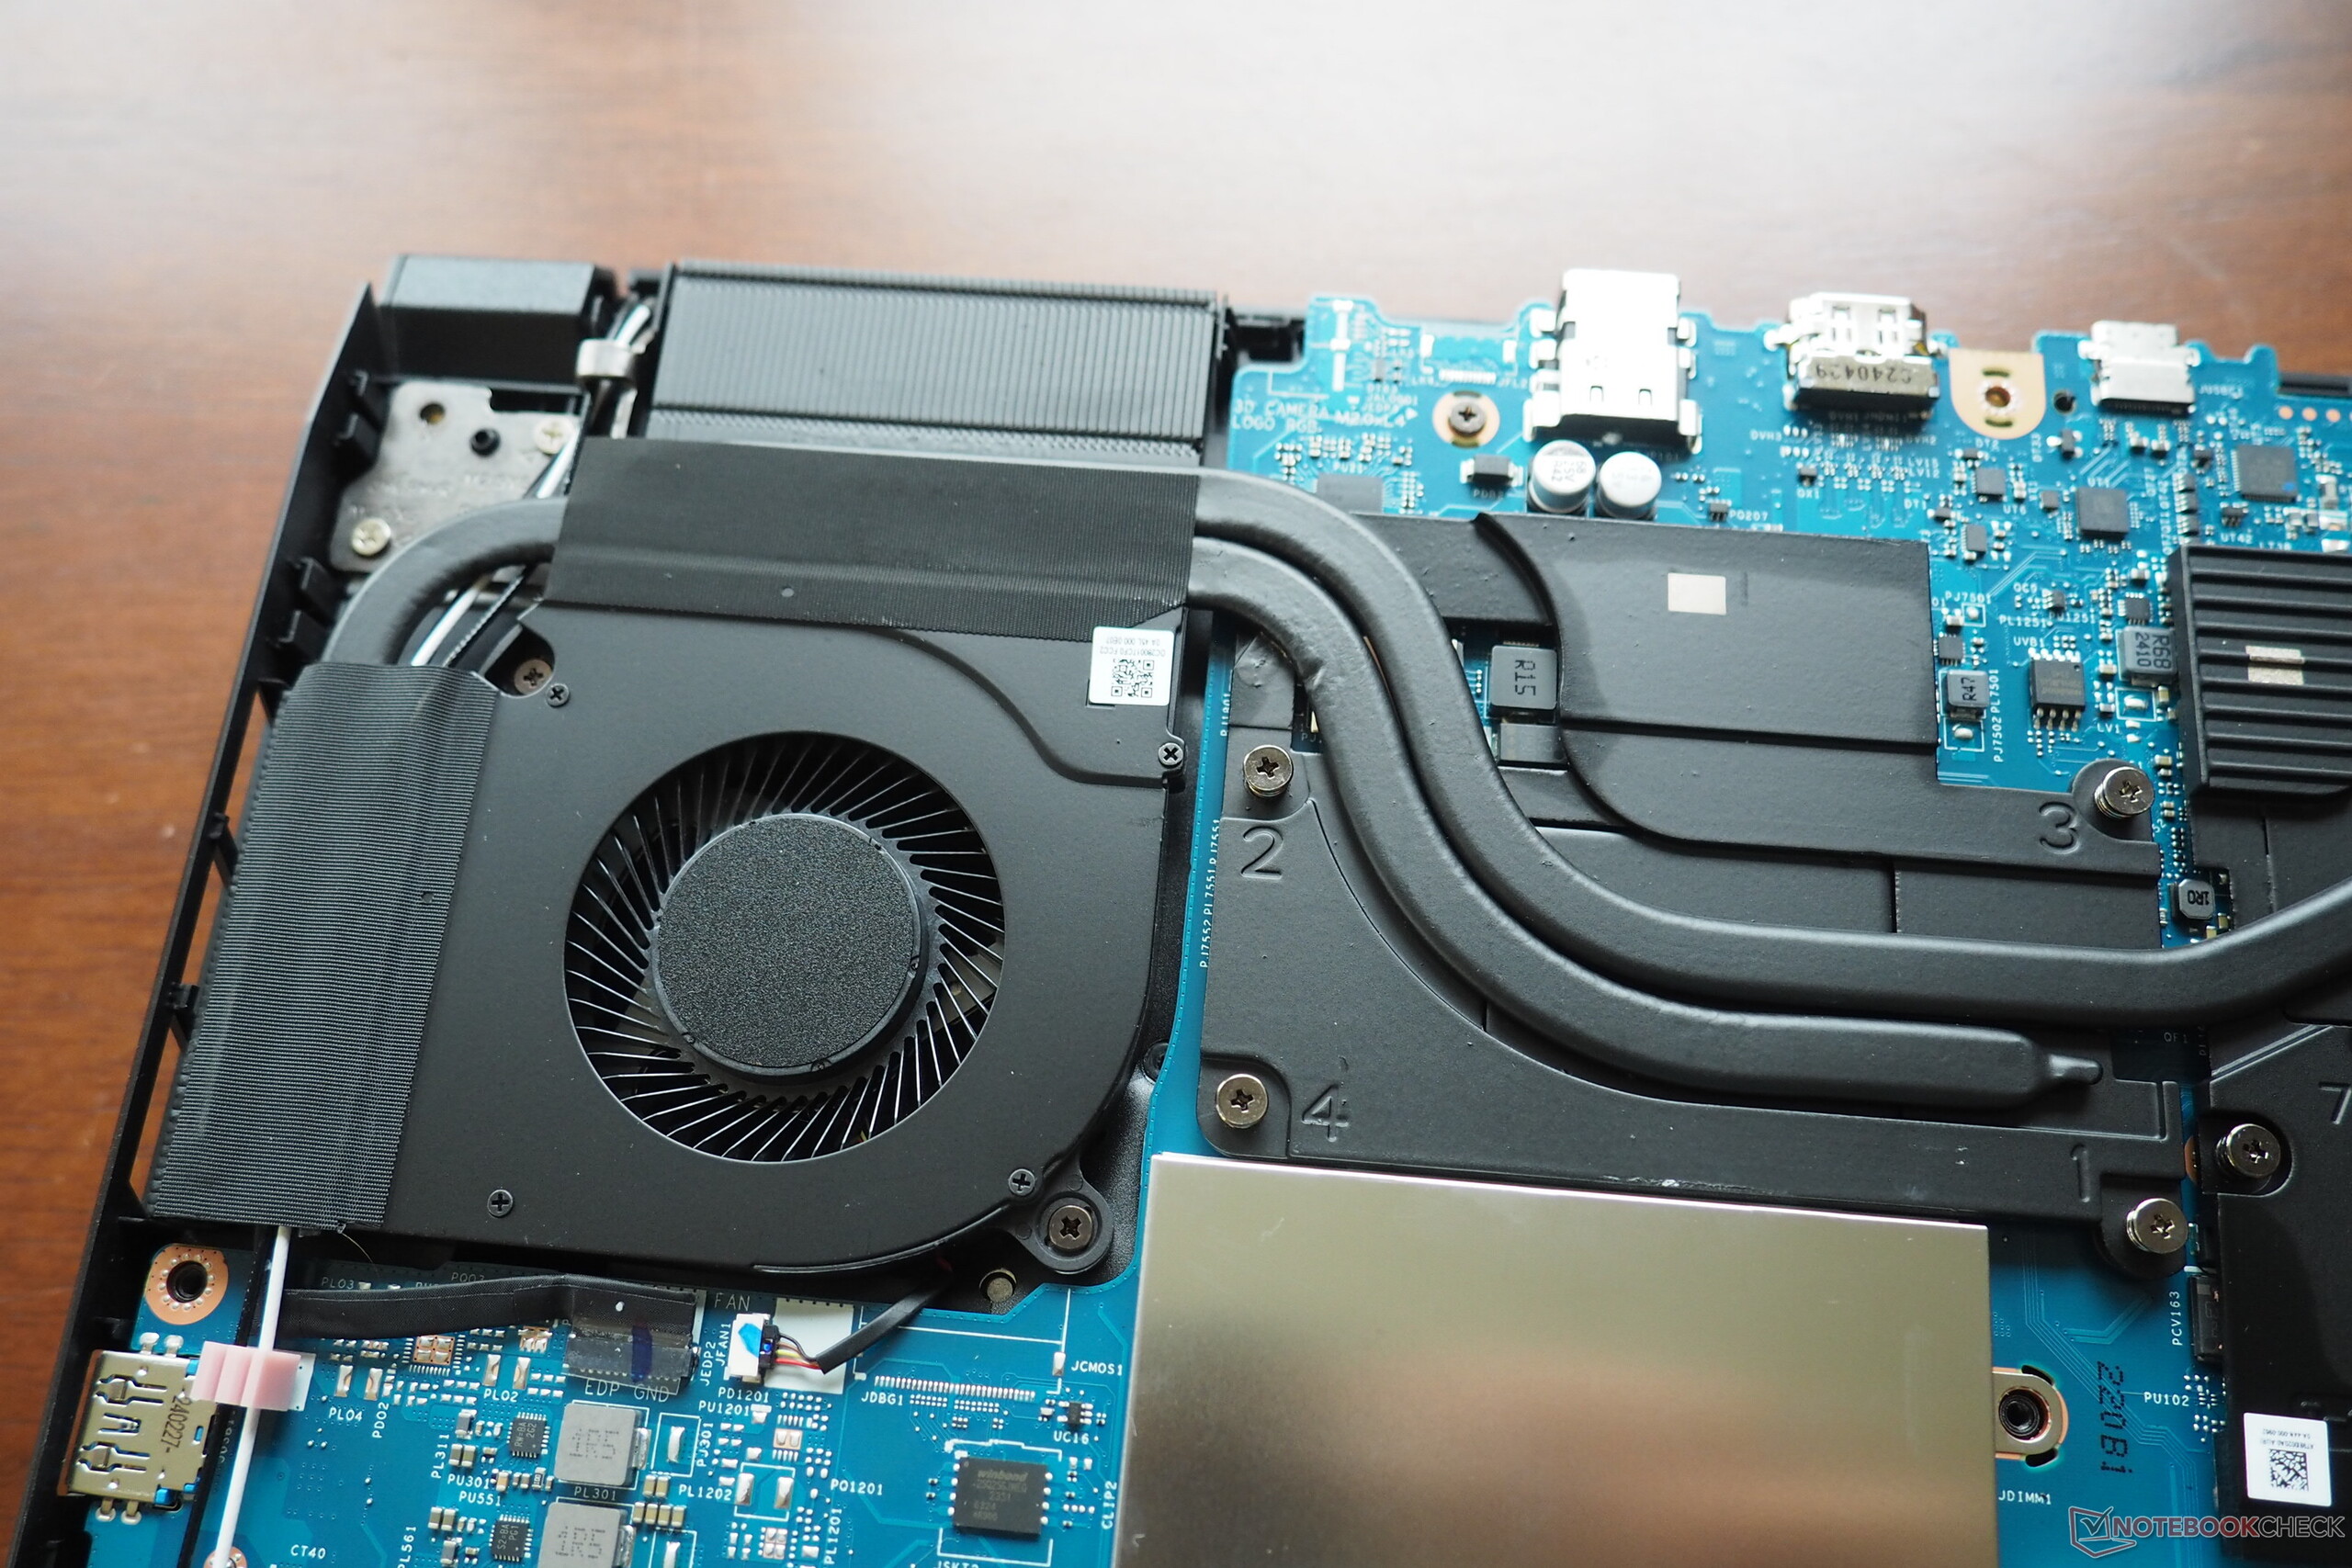
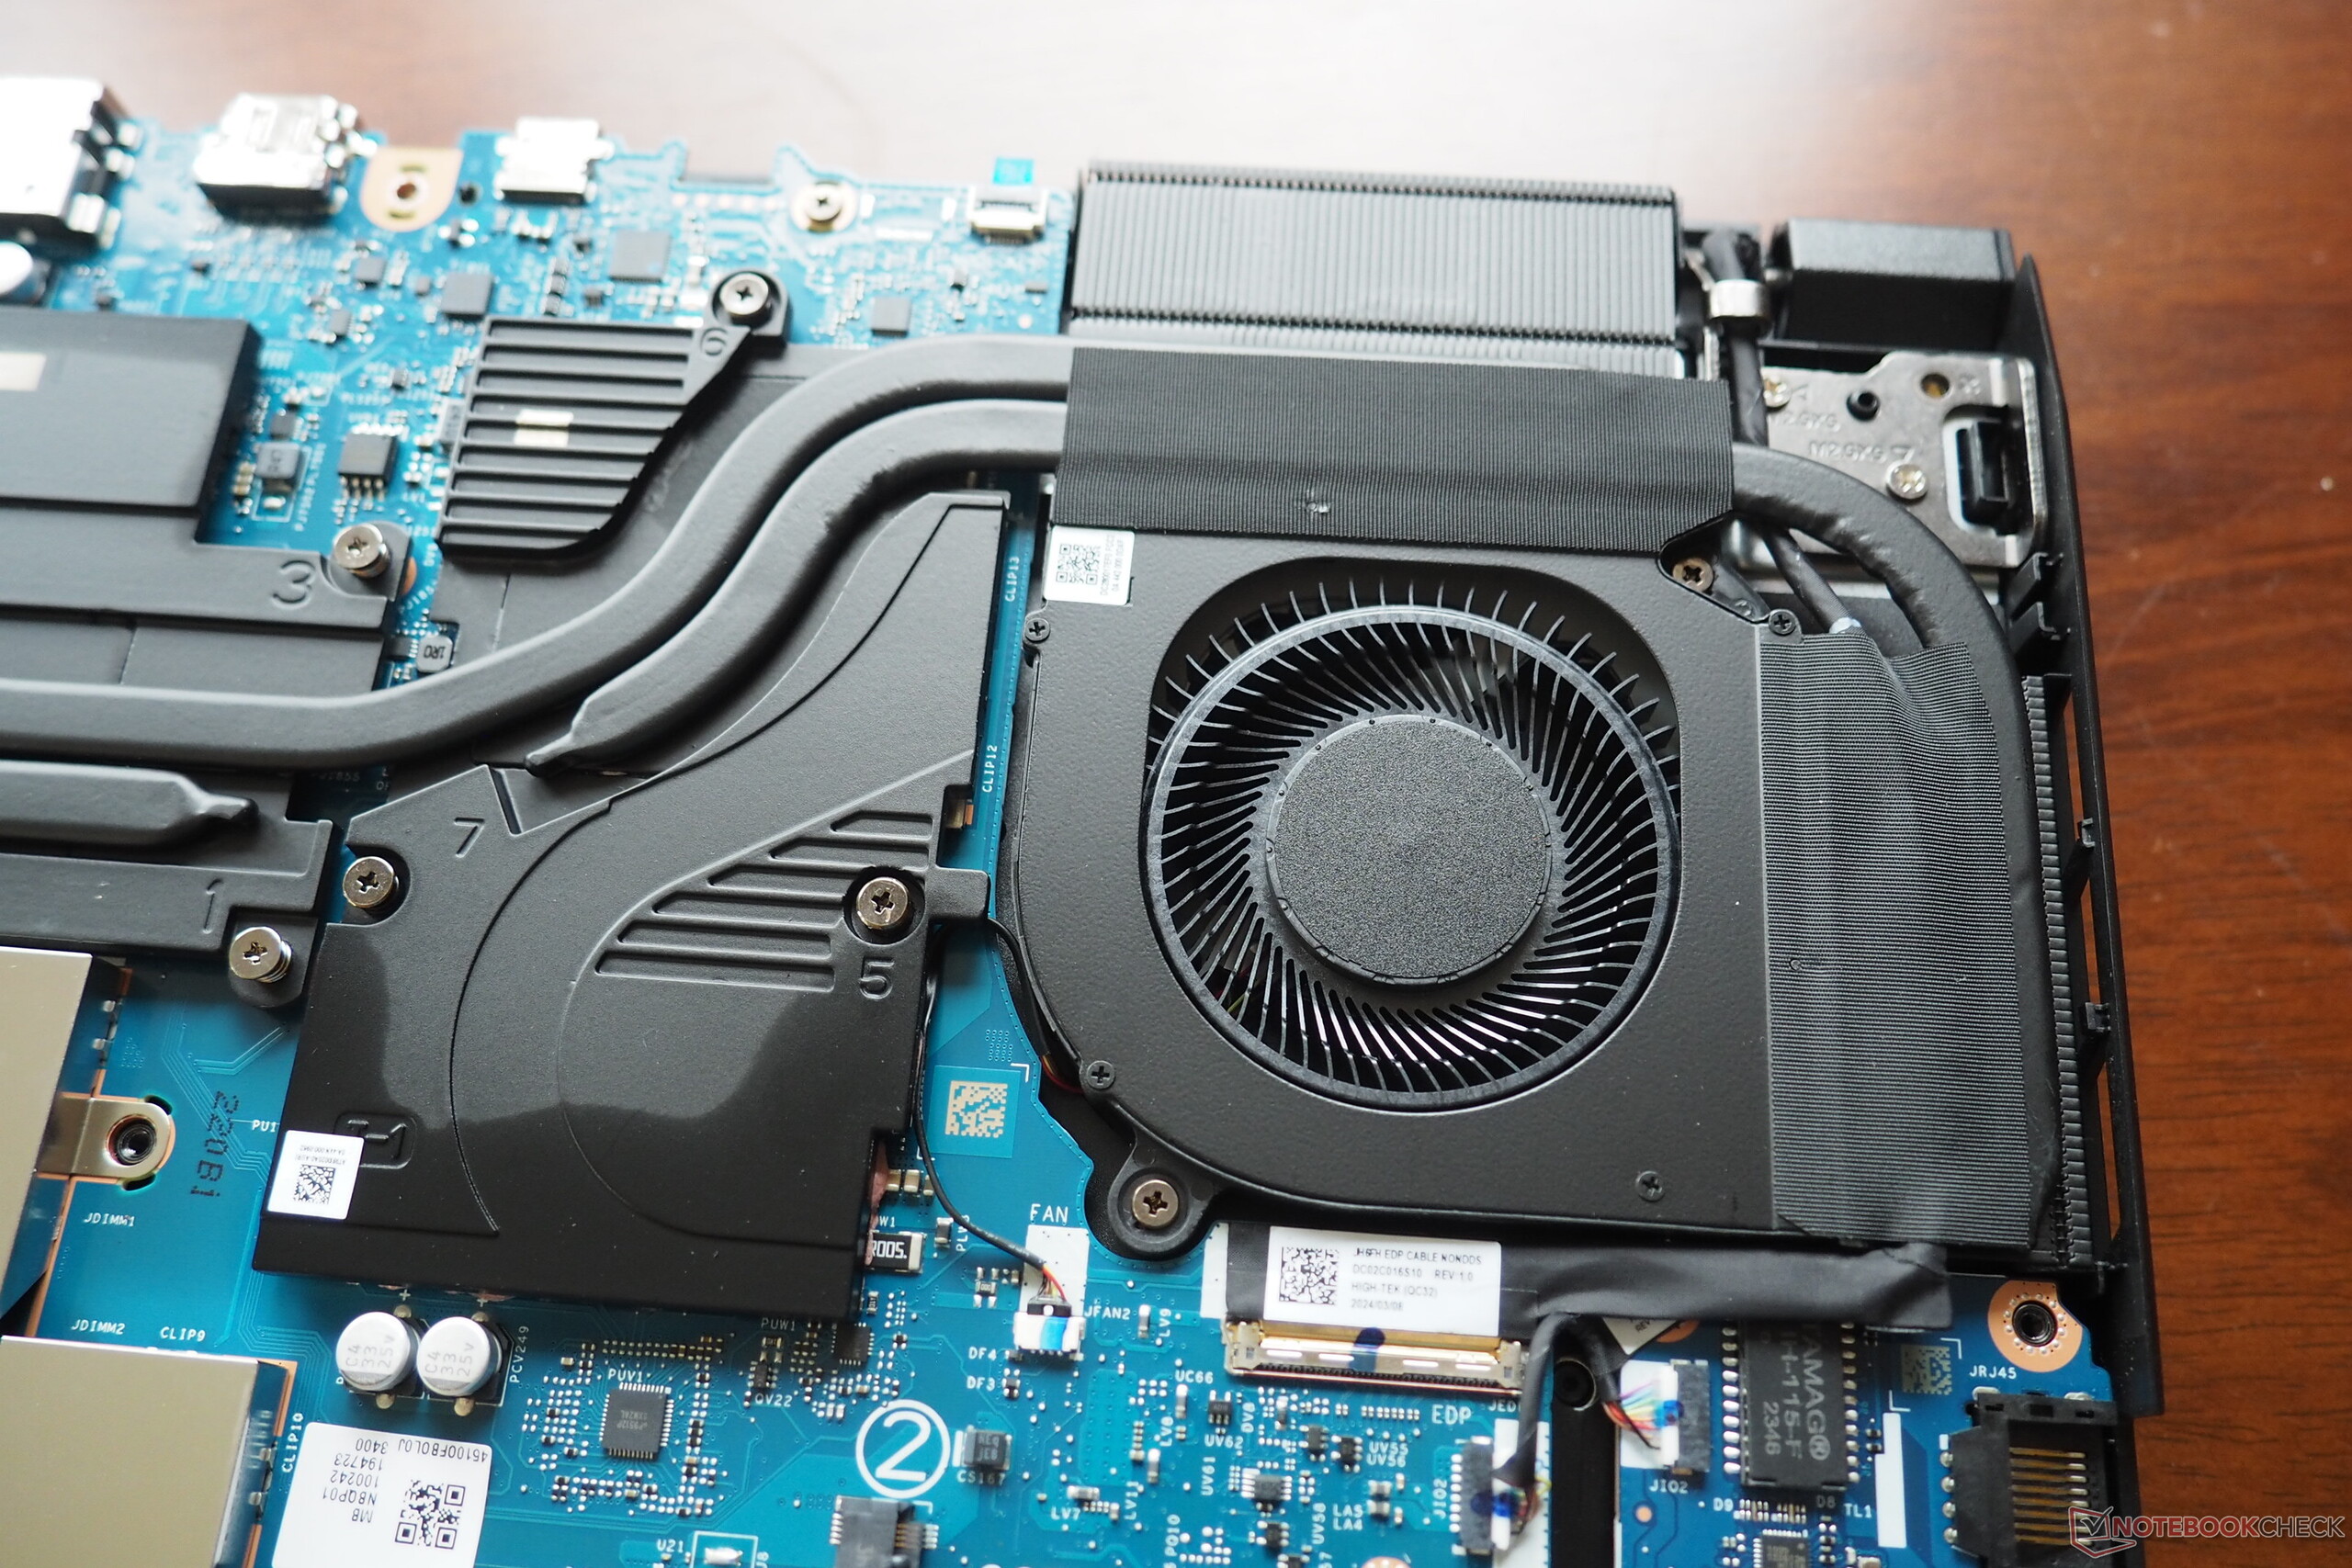
The base plate is secured with a total of 11 Phillips screws. As mentioned at the beginning, there are two M.2 slots (one of which is empty) and two RAM banks under the laptop's hood, although these are concealed behind a cover. The battery, WLAN module and cooling system are also accessible.
Sustainability
The manufacturer mainly uses cardboard for the device's packaging. Only the power supply unit and the laptop itself are wrapped in a plastic film or sleeve.
Warranty
The laptop is covered by a standard 12-month warranty in the United States.
Input devices
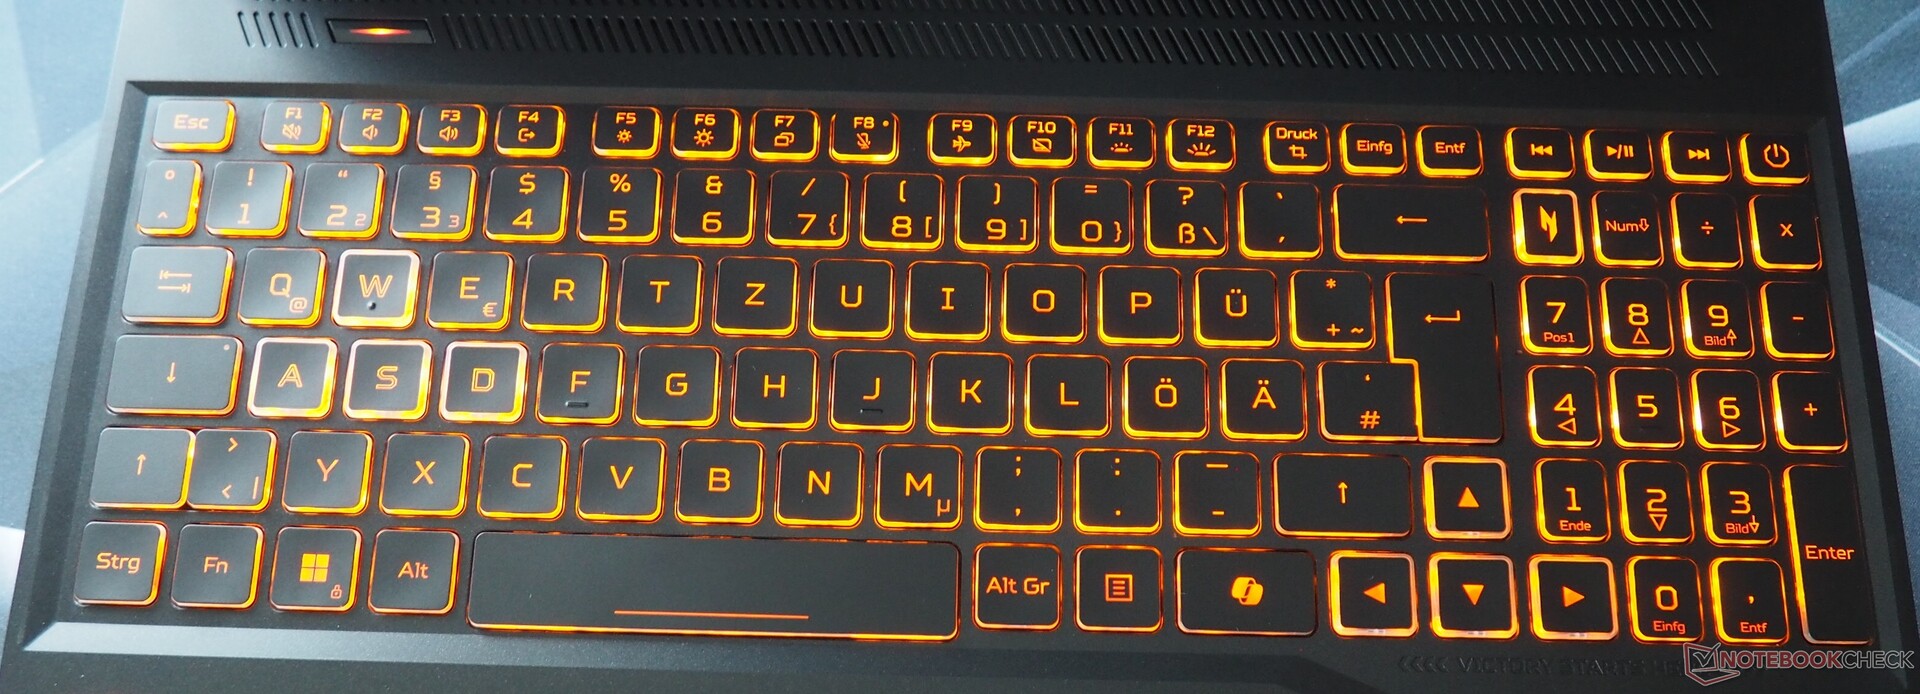
Keyboard
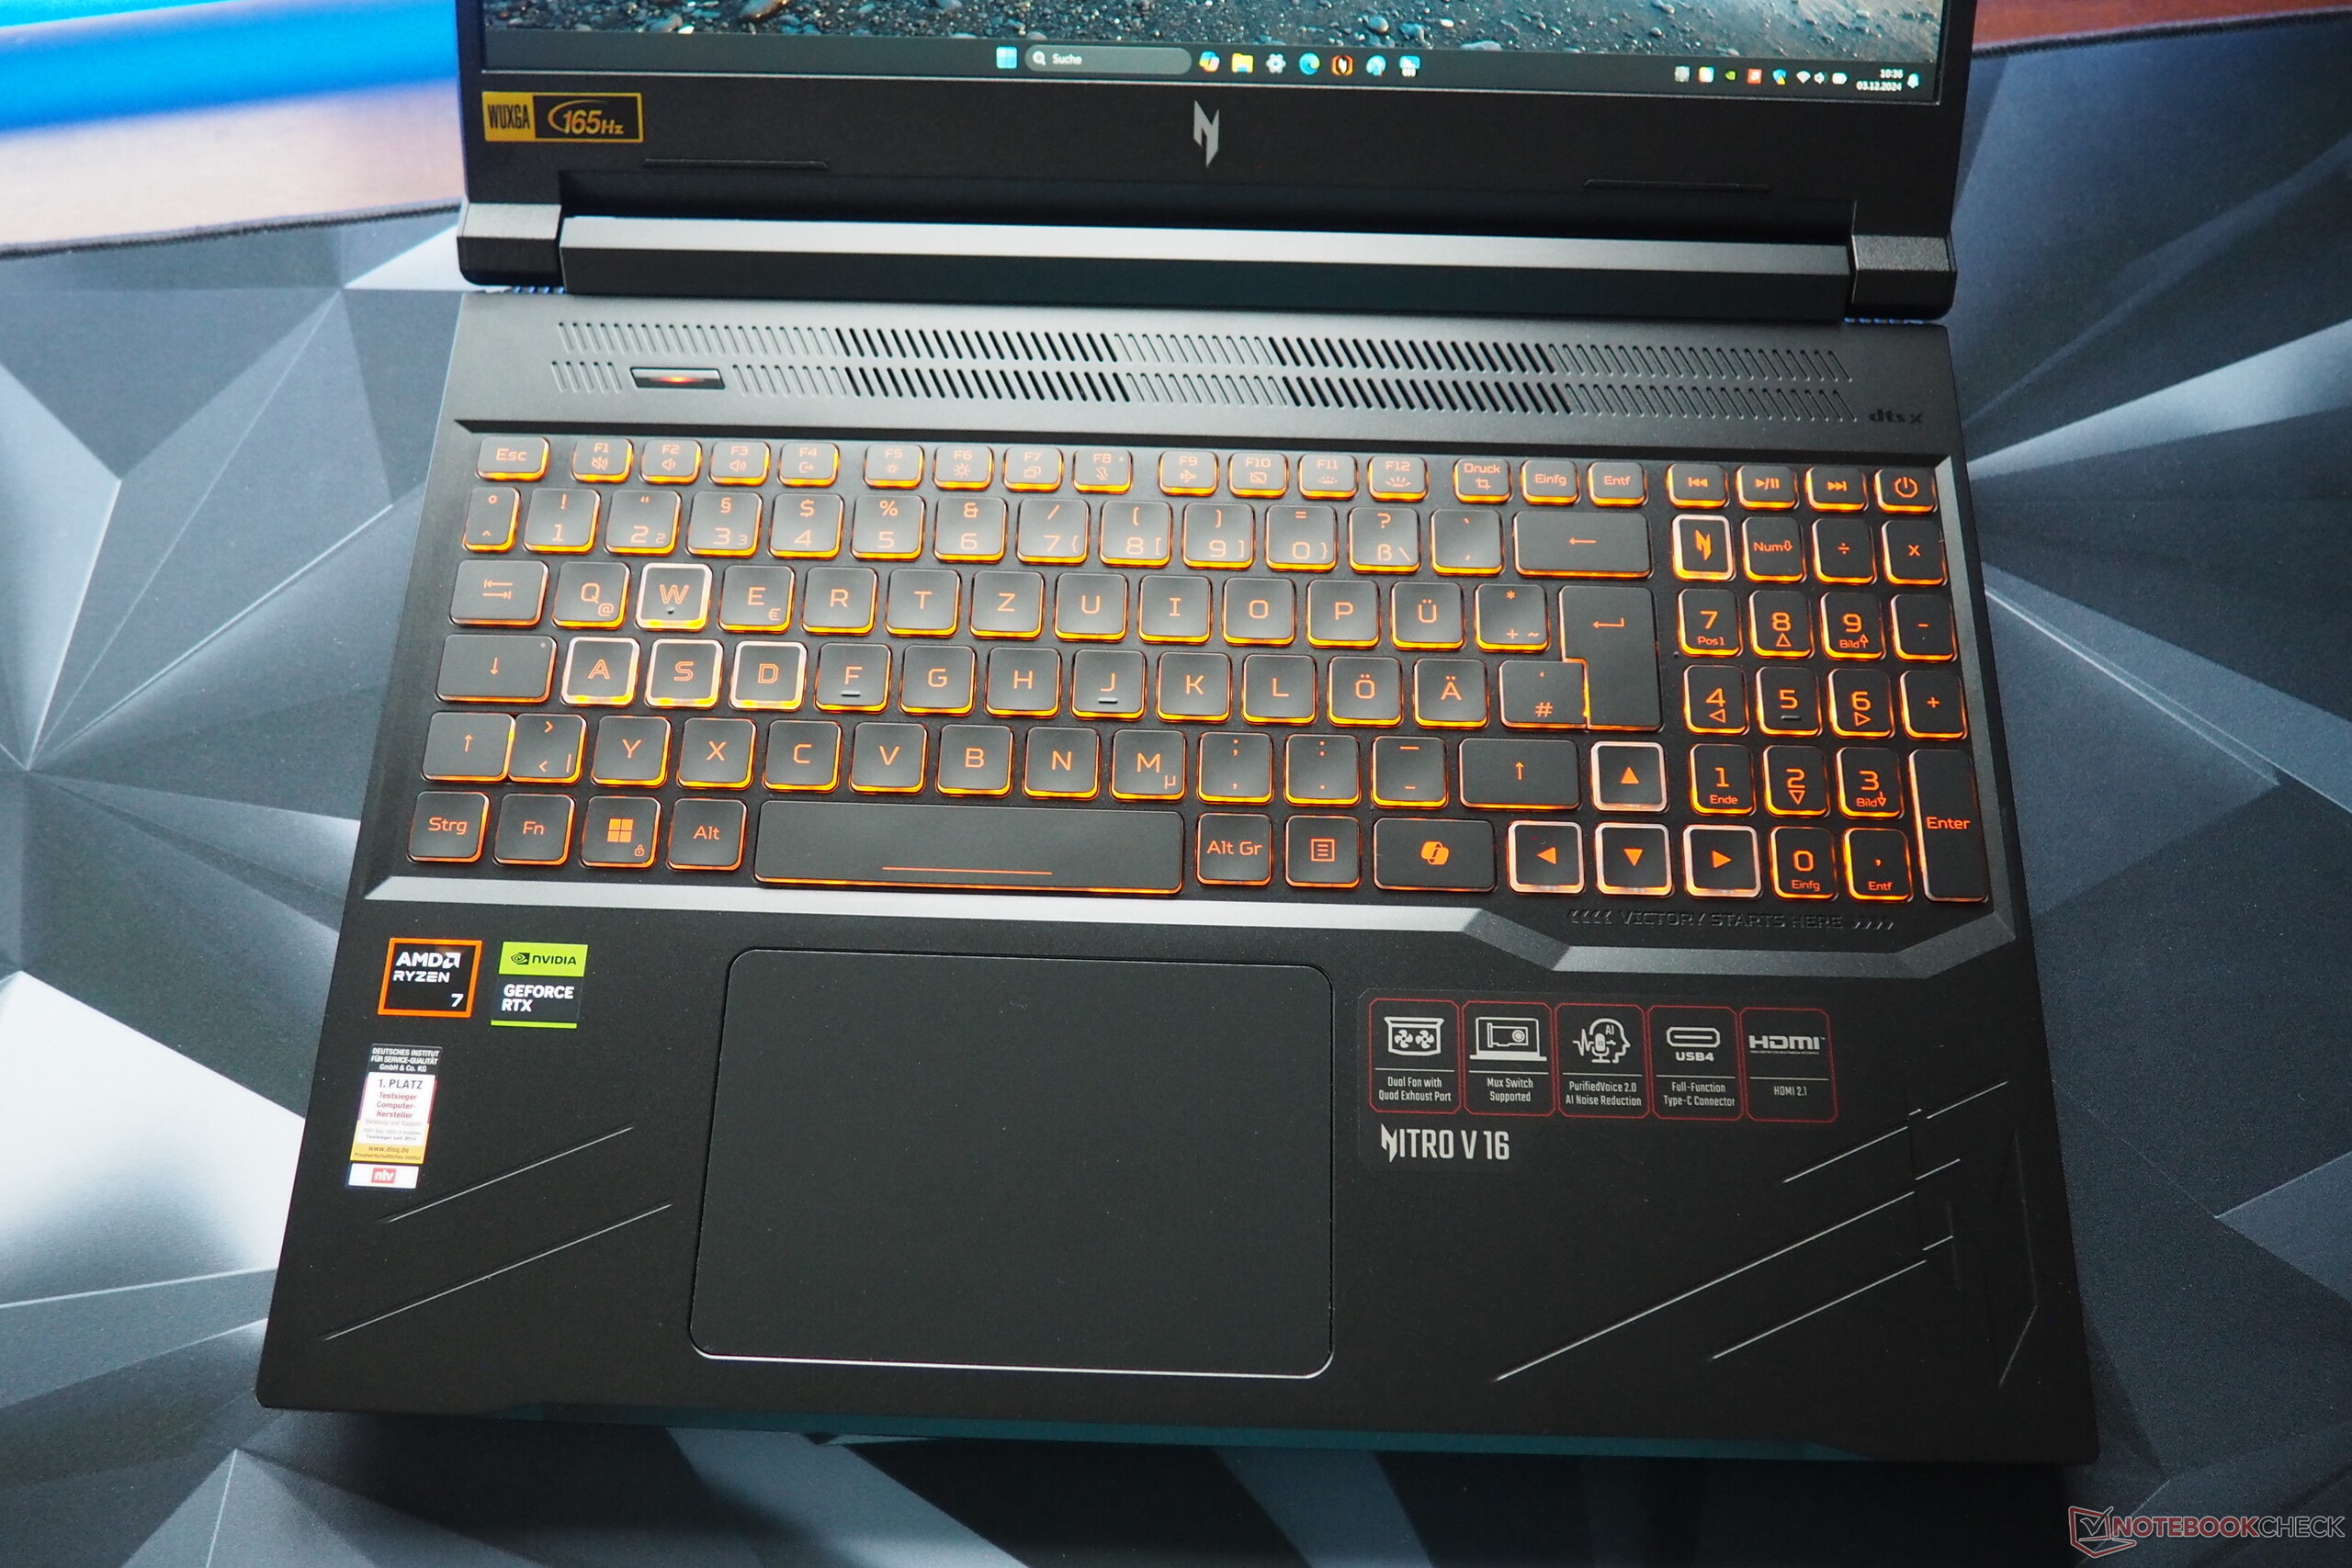
Similar to the Nitro V 15, we would describe this model's keyboard as mediocre. Its somewhat spongy typing feel will likely only satisfy frequent typists to a limited extent. Acer has opted for orange lighting and lettering as a color accent. The latter isn't particularly easy to see from some angles. Its layout has some good aspects as well as some negatives. On the positive side, we have to mention the generously sized directional arrows. We were less pleased with the power button, on the other hand, which isn't separated from the rest of the keys.
Touchpad
The touchpad is roughly on the same level as the keyboard in terms of quality, meaning it is usable but not a real highlight. Acer could work on its precision and gliding properties. The click areas also sound quite rickety, i.e. cheap. However, its size of 12.6 x 8.2 cm gives no cause for criticism.
Display
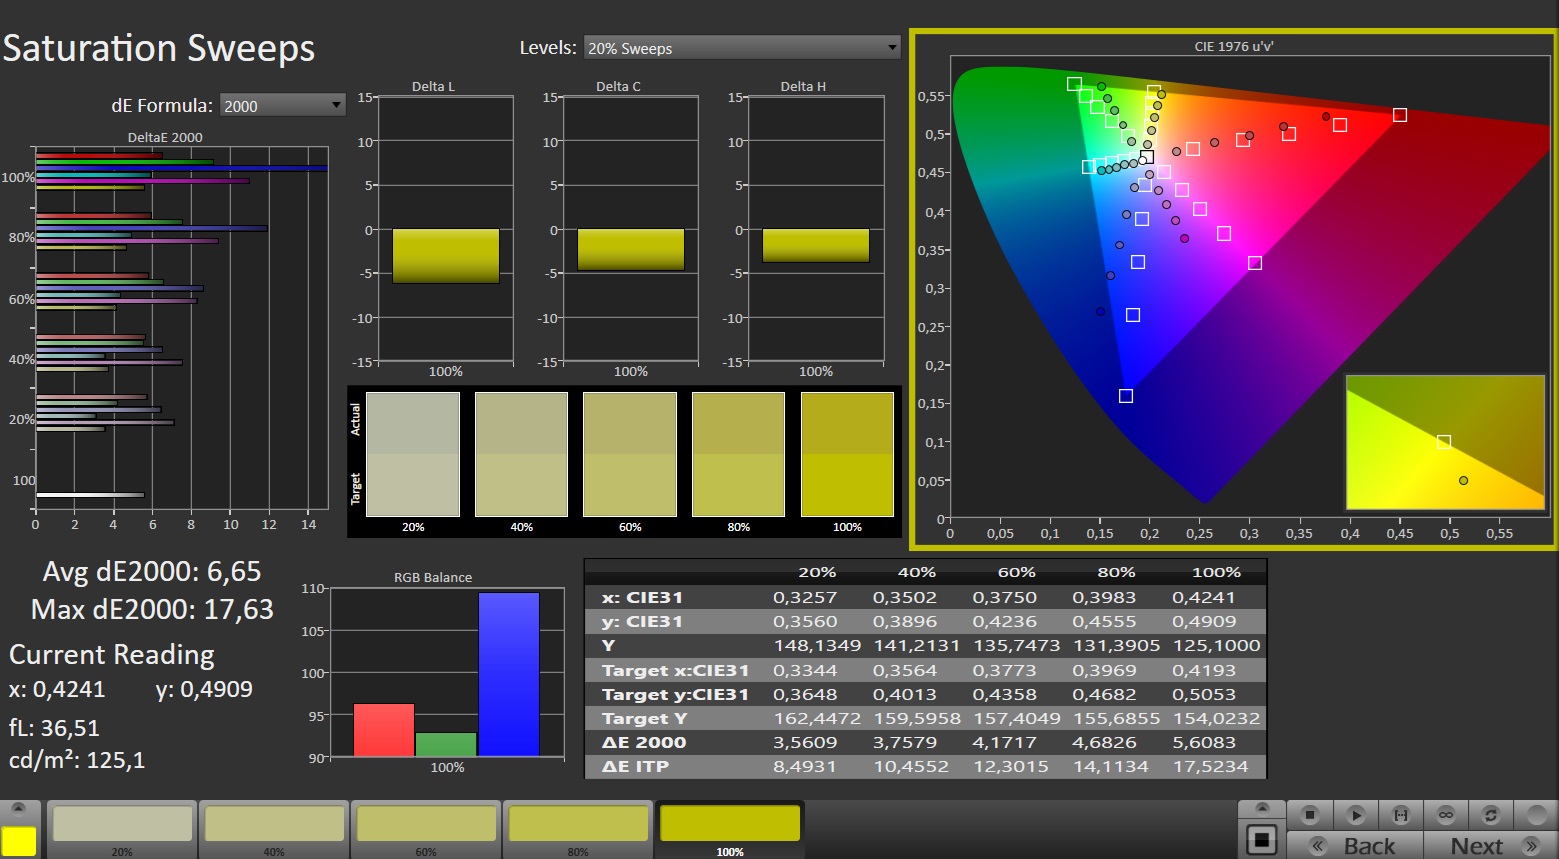
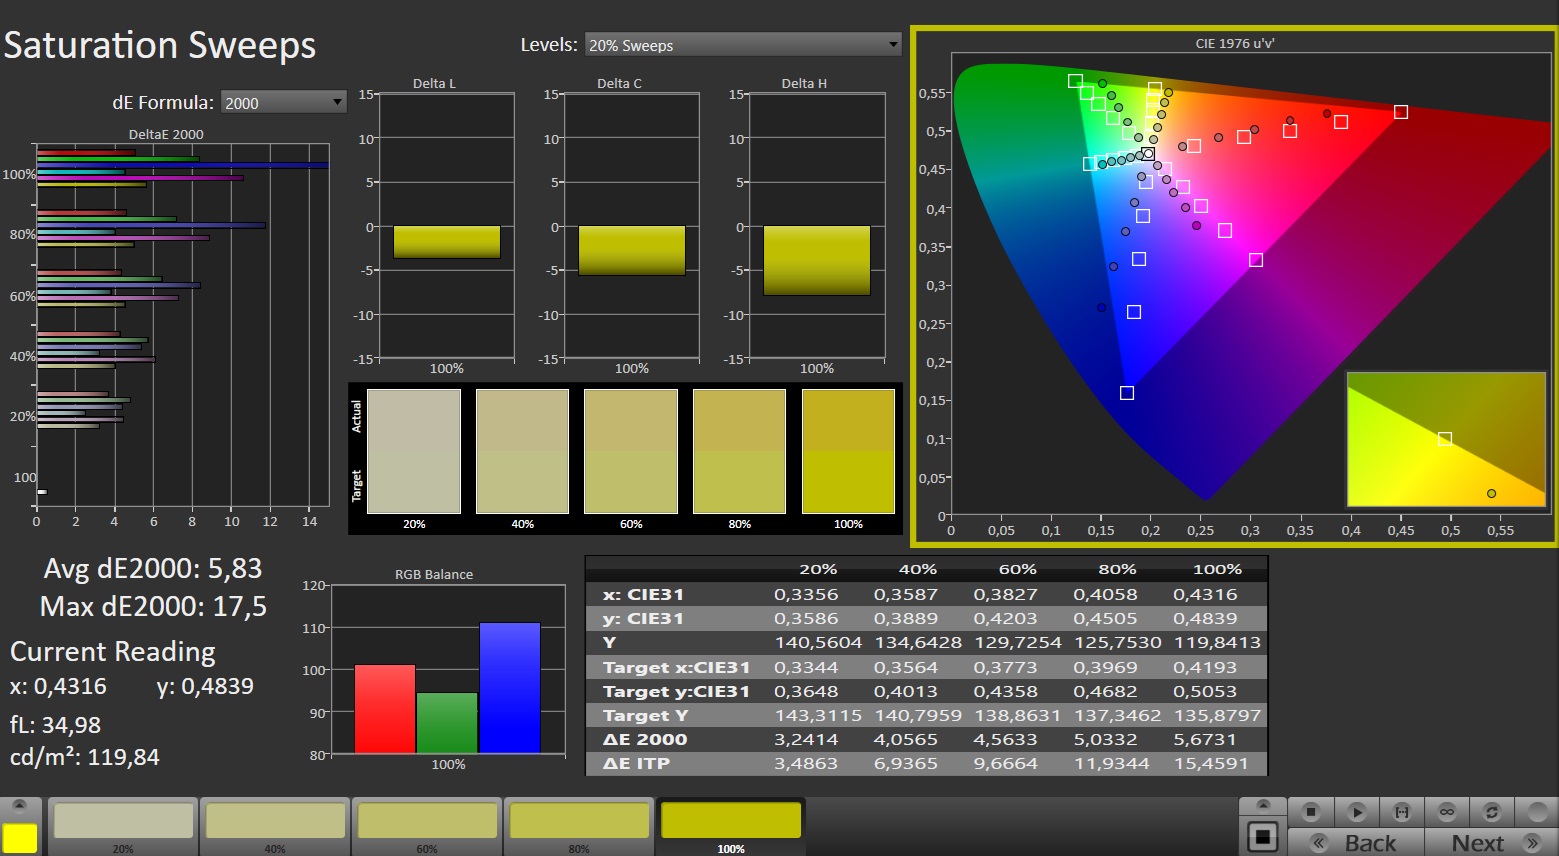
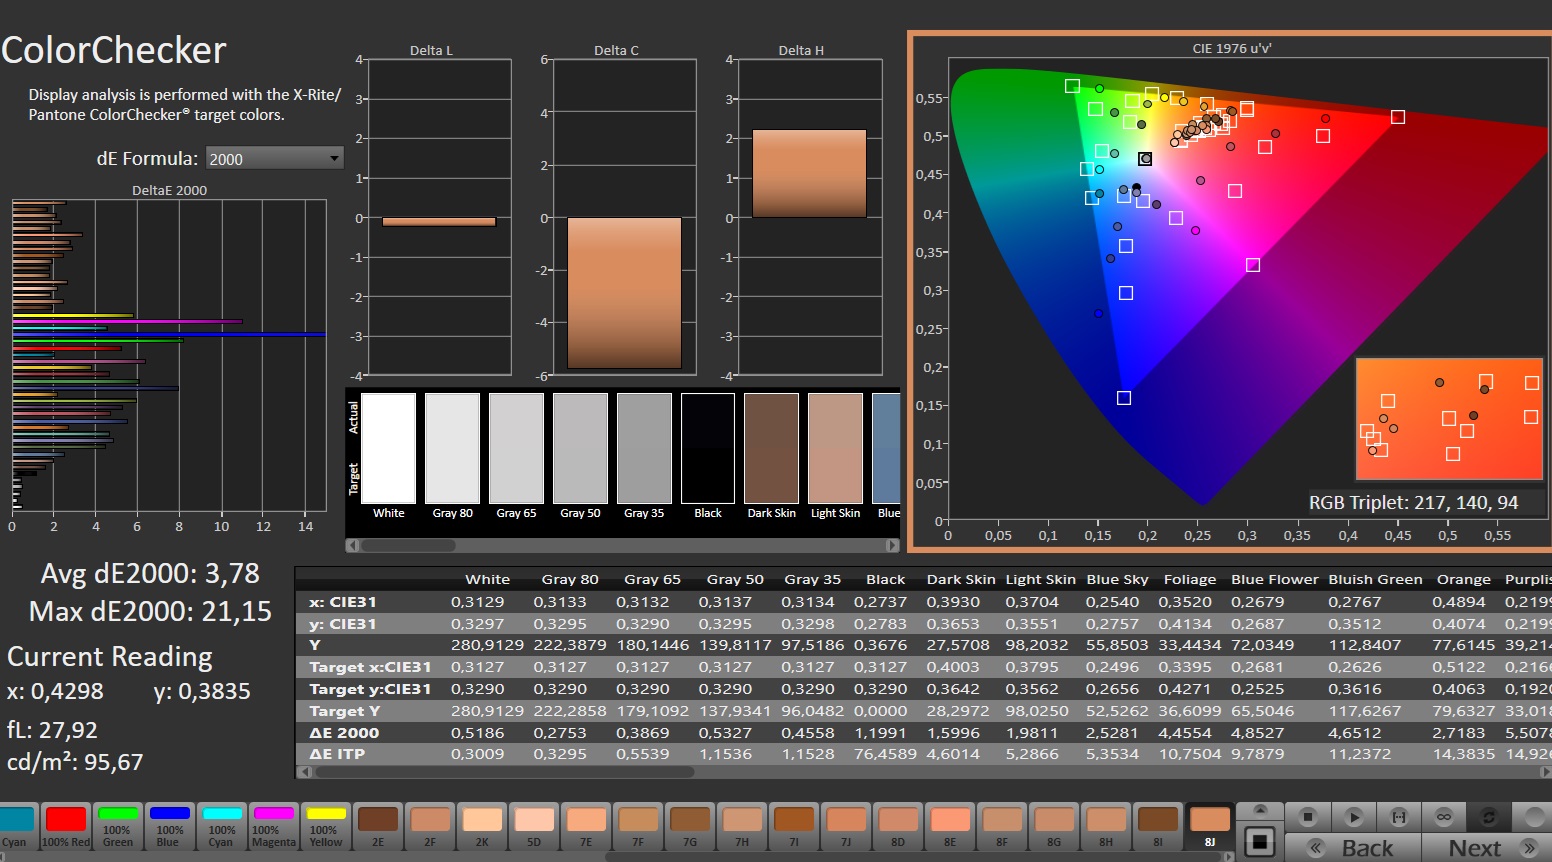
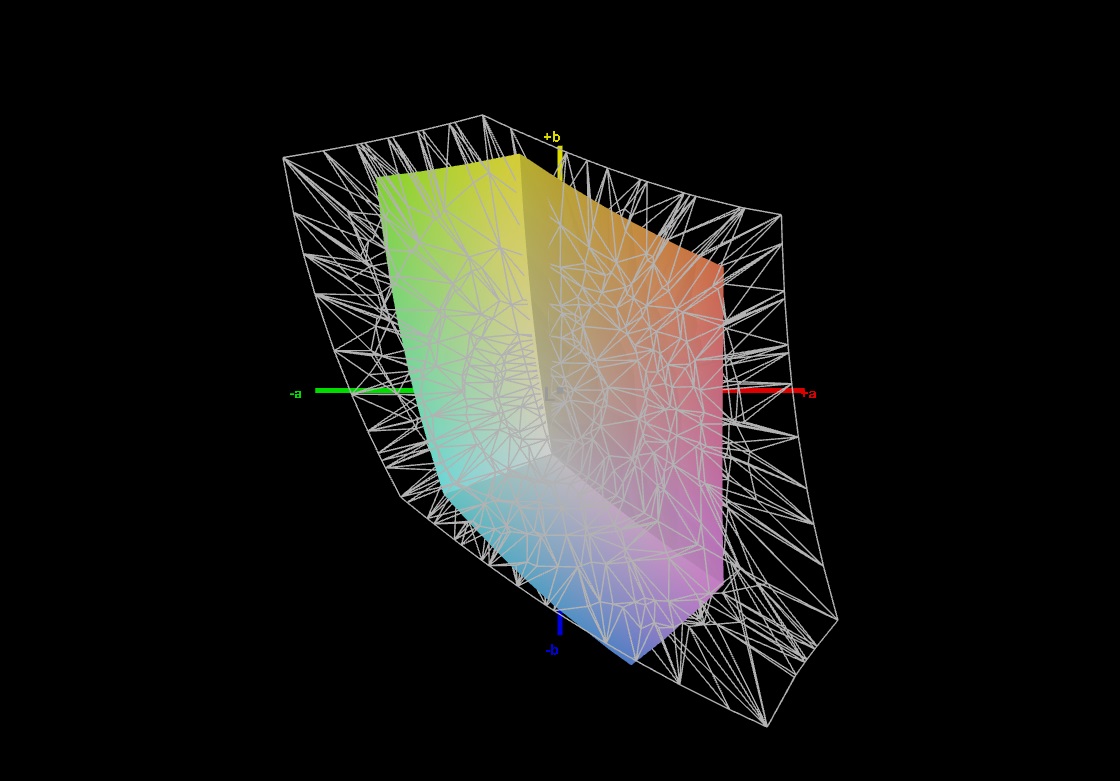
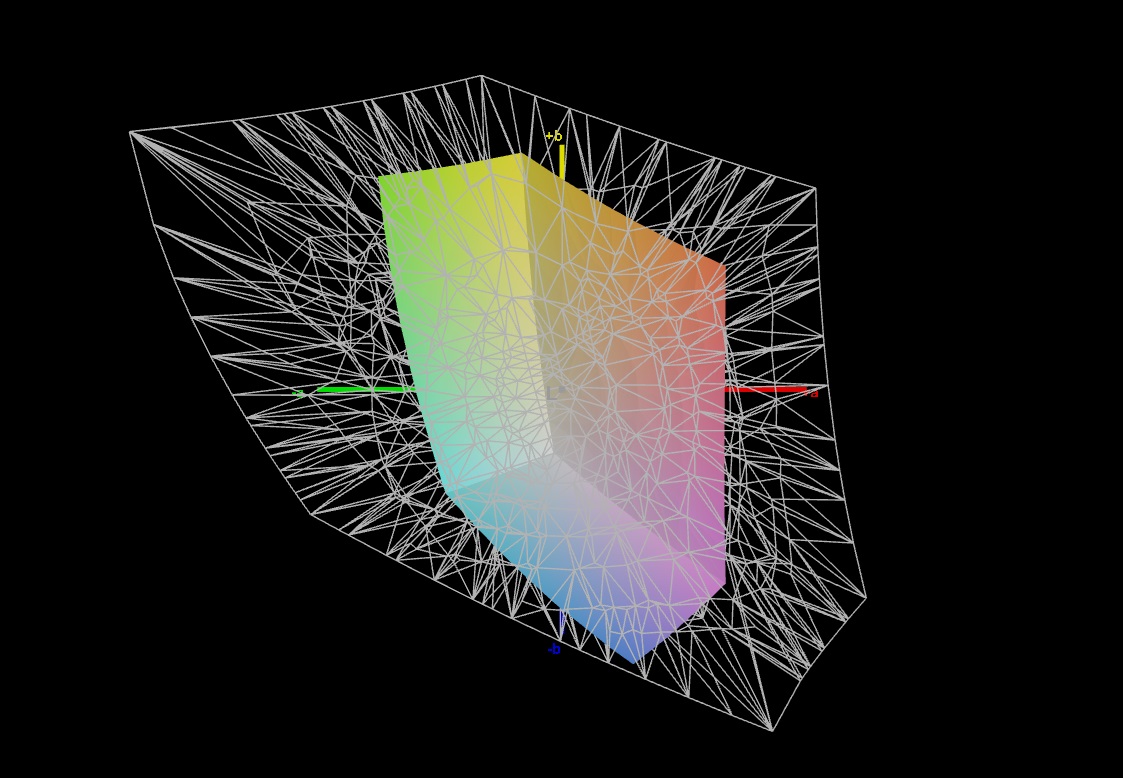
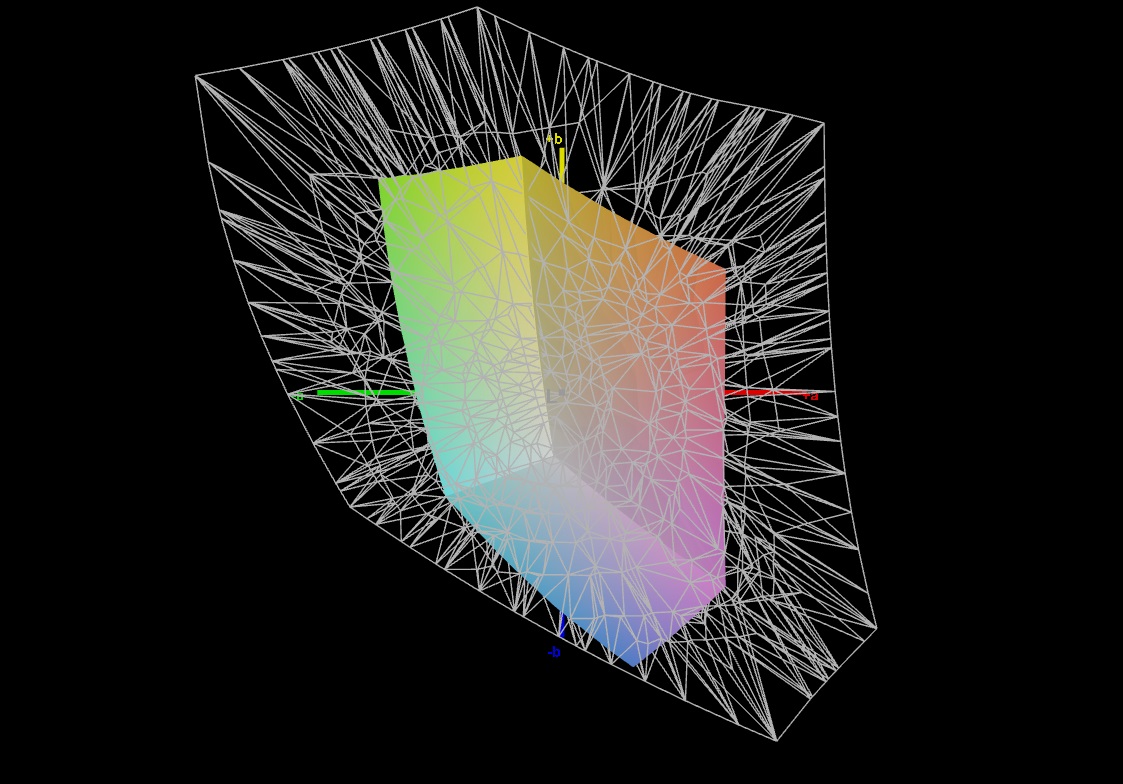
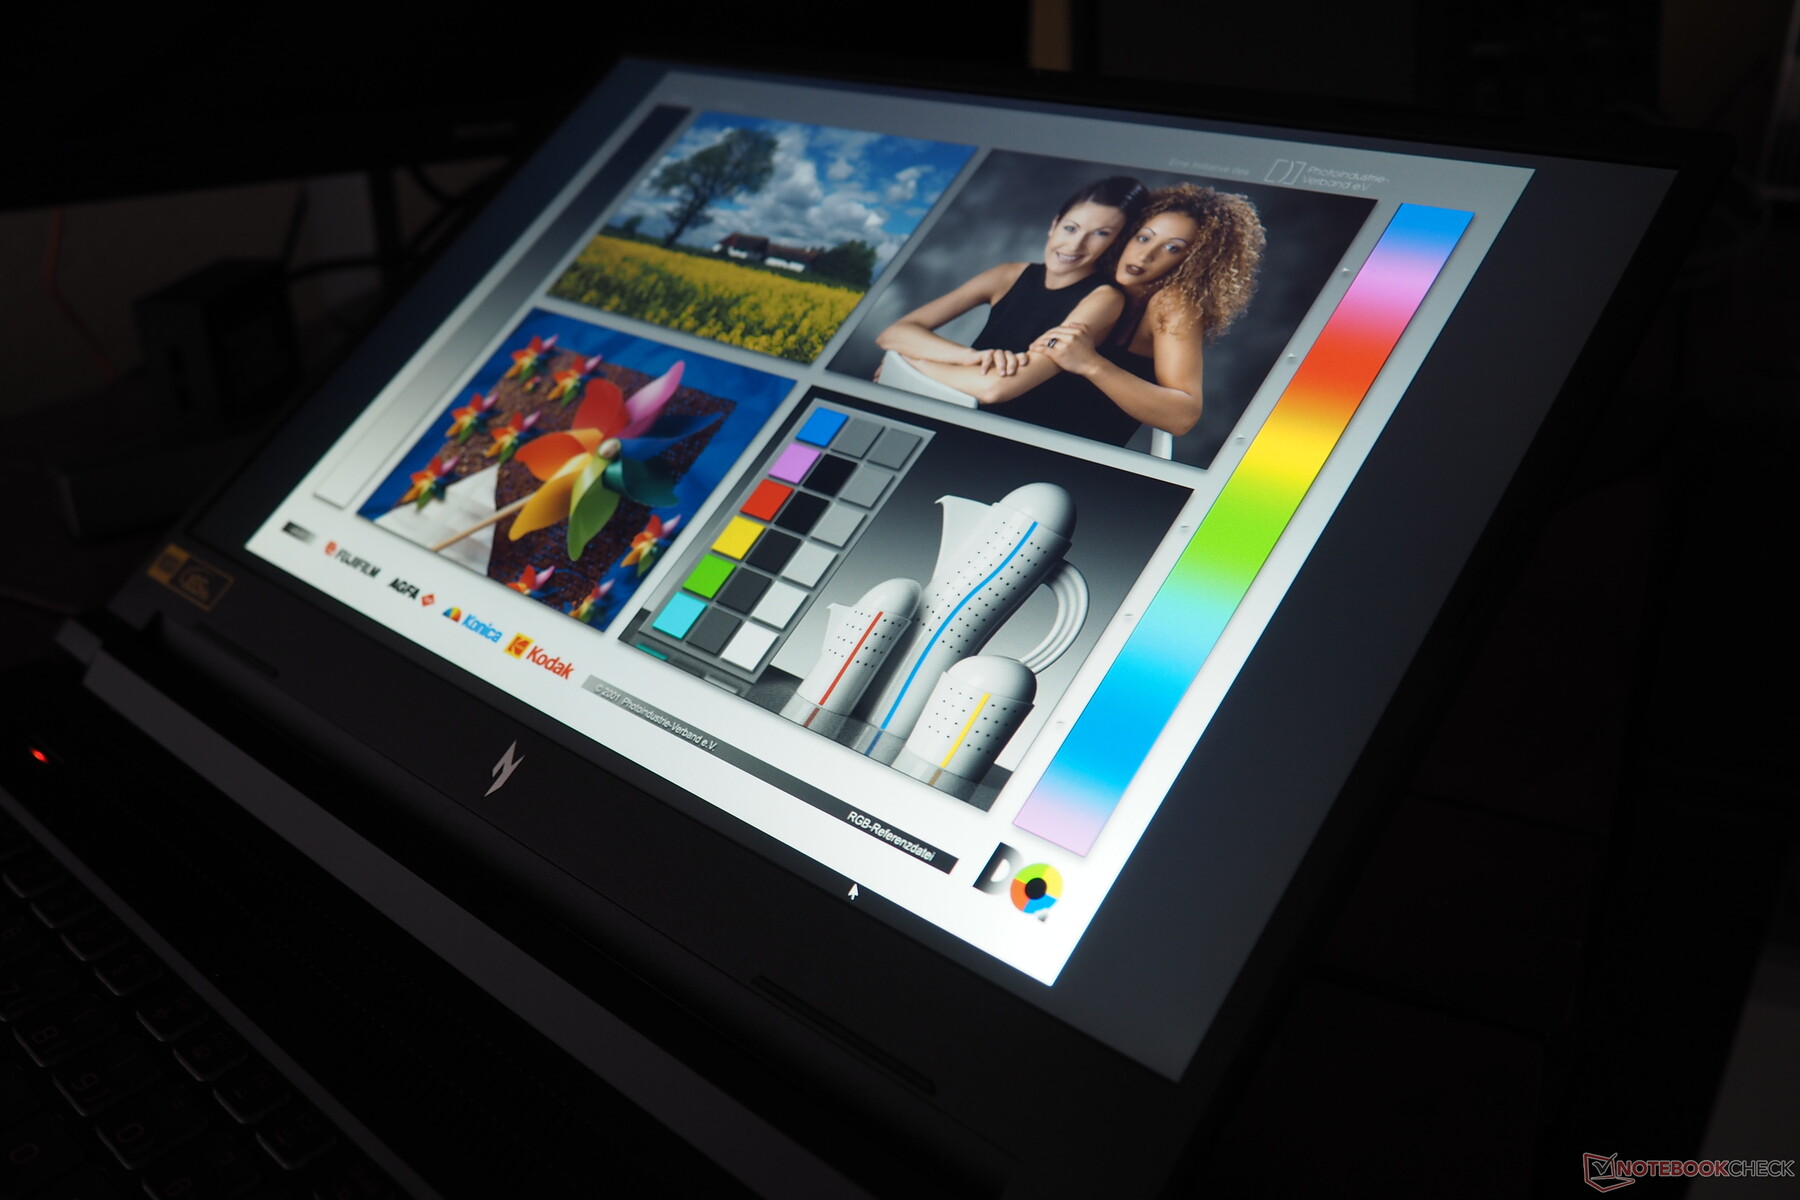
This brings us to the Nitro V 16's biggest weakness, namely its pale display. 57% sRGB coverage, 40% AdobeRGB coverage and 38% DCI-P3 coverage is a pretty poor result and should really be a thing of the past in 2024. Among the comparison devices, such a poor display can only be found in the HP Victus 16.
| |||||||||||||||||||||||||
Brightness Distribution: 93 %
Center on Battery: 303 cd/m²
Contrast: 947:1 (Black: 0.32 cd/m²)
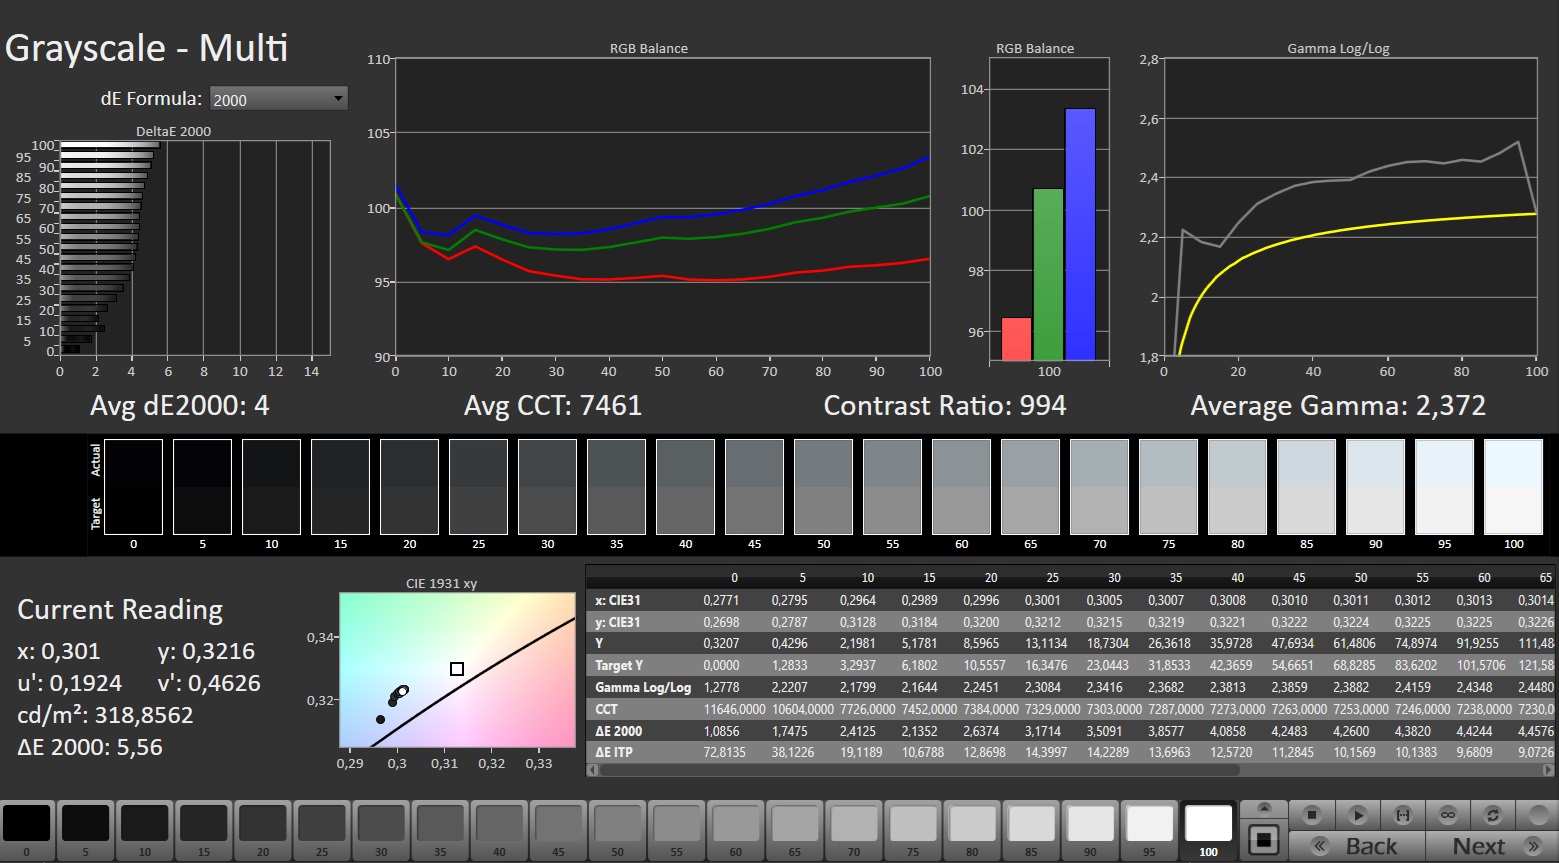
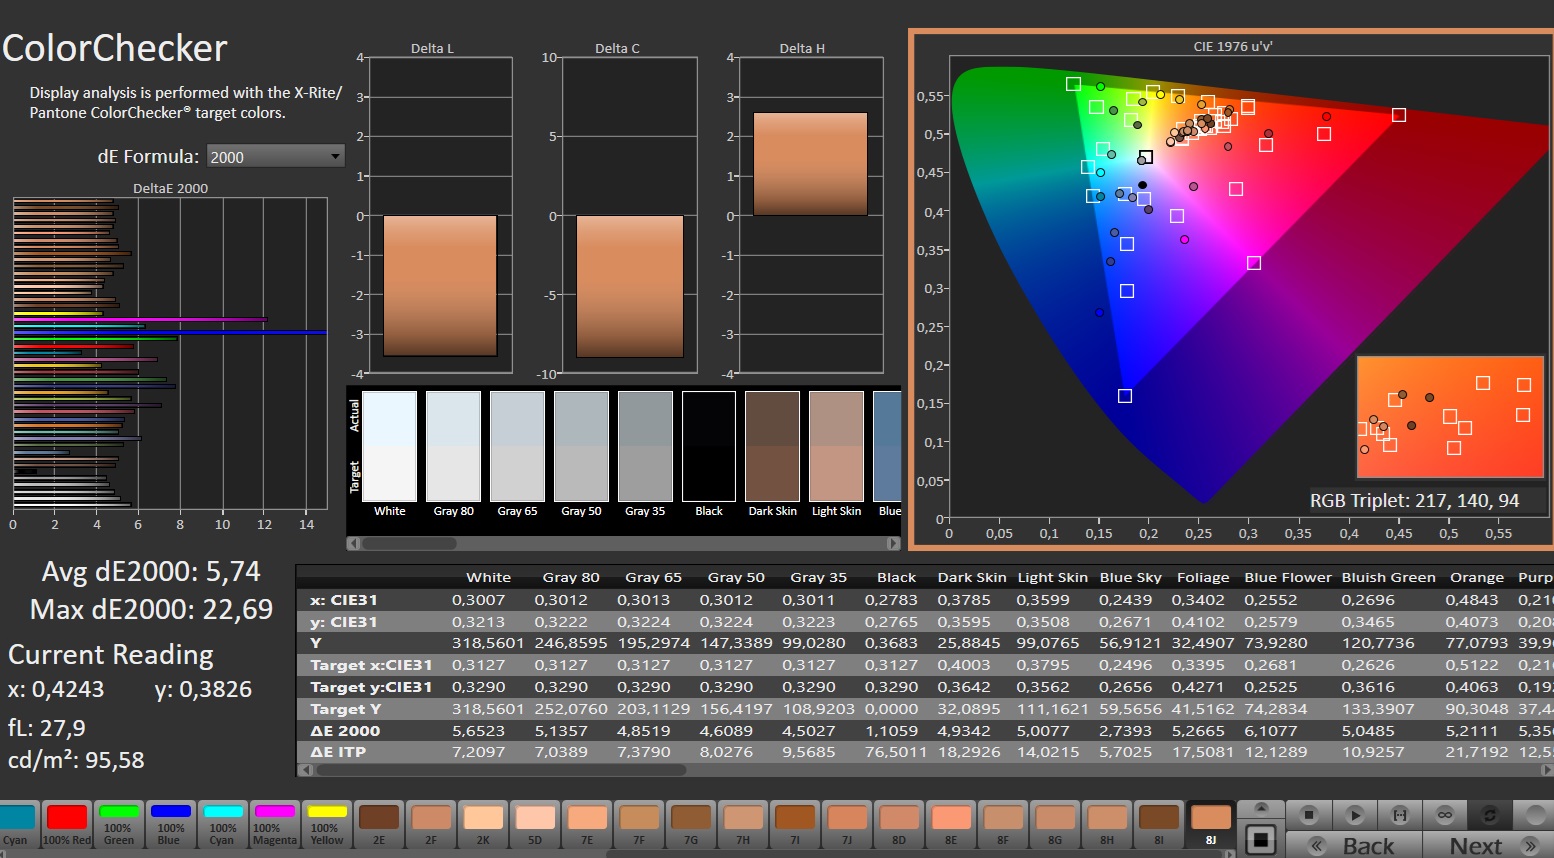
ΔE ColorChecker Calman: 5.74 | ∀{0.5-29.43 Ø4.72}
calibrated: 3.78
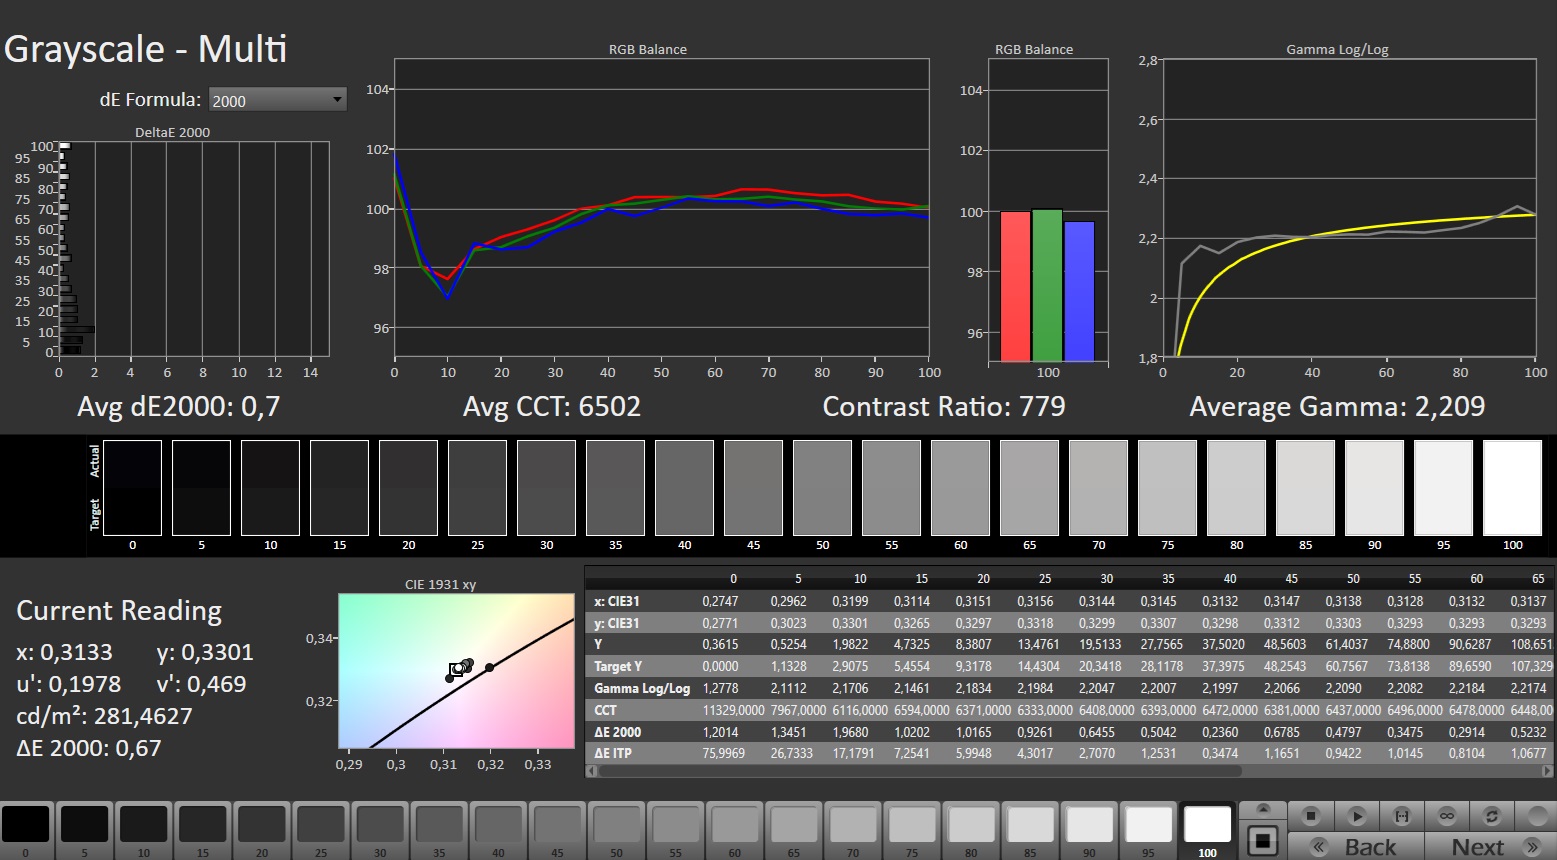
ΔE Greyscale Calman: 4 | ∀{0.09-98 Ø4.97}
39.6% AdobeRGB 1998 (Argyll 3D)
57.4% sRGB (Argyll 3D)
38.3% Display P3 (Argyll 3D)
Gamma: 2.372
CCT: 7461 K
| Acer Nitro V 16 ANV16-41-R5AT AUO B160UAN05.B (AUOD8B1), IPS, 1920x1200, 16", 165 Hz | Lenovo Legion 5 16IRX G9 NE160QDM-NZ3, IPS, 2560x1600, 16", 240 Hz | HP Victus 16 (2024) Chi Mei CMN163E, IPS, 1920x1080, 16.1", 144 Hz | Nubia RedMagic Titan 16 Pro BOE CQ NE160QDM-NZ2, IPS, 2560x1600, 16", 240 Hz | Asus ROG Zephyrus G16 GA605WV ATNA60DL04-0, OLED, 2560x1600, 16", 240 Hz | |
|---|---|---|---|---|---|
| Display | 83% | 8% | 112% | 127% | |
| Display P3 Coverage (%) | 38.3 | 72.4 89% | 41.3 8% | 96.3 151% | 99.9 161% |
| sRGB Coverage (%) | 57.4 | 100 74% | 61.7 7% | 100 74% | 100 74% |
| AdobeRGB 1998 Coverage (%) | 39.6 | 74.1 87% | 42.7 8% | 84.1 112% | 96.9 145% |
| Response Times | 55% | -2% | 80% | 99% | |
| Response Time Grey 50% / Grey 80% * (ms) | 26.5 ? | 12.5 ? 53% | 28.6 ? -8% | 3.9 ? 85% | 0.22 ? 99% |
| Response Time Black / White * (ms) | 19.6 ? | 8.7 ? 56% | 18.7 ? 5% | 5 ? 74% | 0.25 ? 99% |
| PWM Frequency (Hz) | 960 | ||||
| PWM Amplitude * (%) | 55 | ||||
| Screen | 56% | 9% | 31% | 45% | |
| Brightness middle (cd/m²) | 303 | 526 74% | 287 -5% | 543 79% | 416 37% |
| Brightness (cd/m²) | 305 | 500 64% | 288 -6% | 516 69% | 418 37% |
| Brightness Distribution (%) | 93 | 87 -6% | 86 -8% | 86 -8% | 96 3% |
| Black Level * (cd/m²) | 0.32 | 0.33 -3% | 0.19 41% | 0.51 -59% | |
| Contrast (:1) | 947 | 1594 68% | 1511 60% | 1065 12% | |
| Colorchecker dE 2000 * | 5.74 | 1.2 79% | 5.46 5% | 3.19 44% | 1.6 72% |
| Colorchecker dE 2000 max. * | 22.69 | 2.1 91% | 20.36 10% | 7.09 69% | 2.1 91% |
| Colorchecker dE 2000 calibrated * | 3.78 | 1 74% | 3.52 7% | 0.69 82% | |
| Greyscale dE 2000 * | 4 | 1.3 67% | 4.8 -20% | 4.2 -5% | 2.7 32% |
| Gamma | 2.372 93% | 2.23 99% | 2.108 104% | 1.999 110% | 2.16 102% |
| CCT | 7461 87% | 6391 102% | 6442 101% | 7431 87% | 6331 103% |
| Total Average (Program / Settings) | 65% /
62% | 5% /
7% | 74% /
56% | 90% /
77% |
* ... smaller is better
Its response times also only meet multimedia and gaming requirements to a limited extent, with approx. 20 ms for black-to-white and 27 ms for gray-to-grey. Most competitors perform better in this aspect.
Outdoor fans will also hardly get their money's worth. An average of 303 cd/m² tends to be something for indoor use only.
By IPS standards, its black level (0.32 cd/m²) and contrast (947:1) are just about okay, but the Nitro V 16 stands no chance against OLED panels. The screen's viewing-angle stability is similar. On the other hand, the 16-inch panel does without the picture flickering at all brightness levels.
Display Response Times
| ↔ Response Time Black to White | ||
|---|---|---|
| 19.6 ms ... rise ↗ and fall ↘ combined | ↗ 11.6 ms rise | 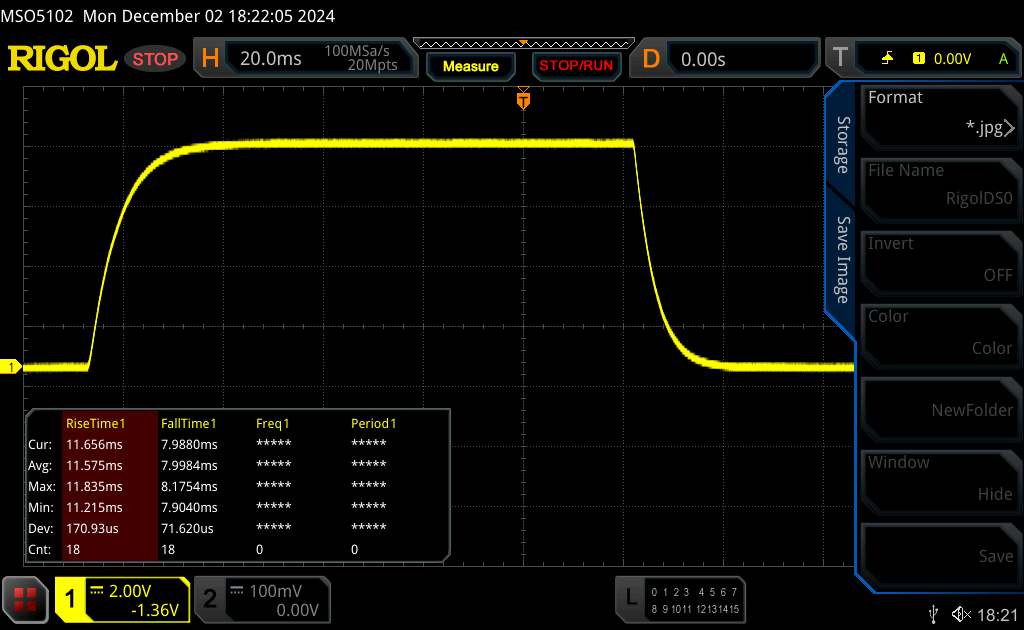 |
| ↘ 8 ms fall | ||
| The screen shows good response rates in our tests, but may be too slow for competitive gamers. In comparison, all tested devices range from 0.1 (minimum) to 240 (maximum) ms. » 43 % of all devices are better. This means that the measured response time is similar to the average of all tested devices (19.8 ms). | ||
| ↔ Response Time 50% Grey to 80% Grey | ||
| 26.5 ms ... rise ↗ and fall ↘ combined | ↗ 13.1 ms rise | 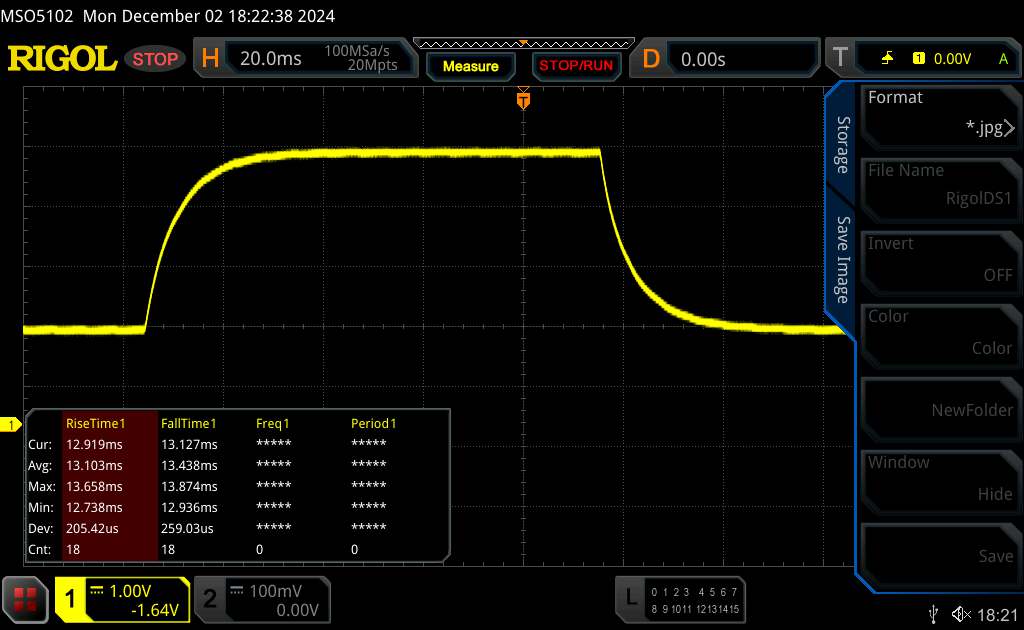 |
| ↘ 13.4 ms fall | ||
| The screen shows relatively slow response rates in our tests and may be too slow for gamers. In comparison, all tested devices range from 0.165 (minimum) to 636 (maximum) ms. » 36 % of all devices are better. This means that the measured response time is better than the average of all tested devices (31 ms). | ||
Screen Flickering / PWM (Pulse-Width Modulation)
| Screen flickering / PWM not detected |  | ||
In comparison: 52 % of all tested devices do not use PWM to dim the display. If PWM was detected, an average of 7750 (minimum: 5 - maximum: 343500) Hz was measured. | |||
Performance
Irrespective of the installed GPU (RTX 4050 or RTX 4060), the Nitro V 16 comes in somewhere in the mid-range of gaming laptops. The Ryzen processor (8645HS or 8845HS) should generally have enough reserves for the coming years.
Testing conditions
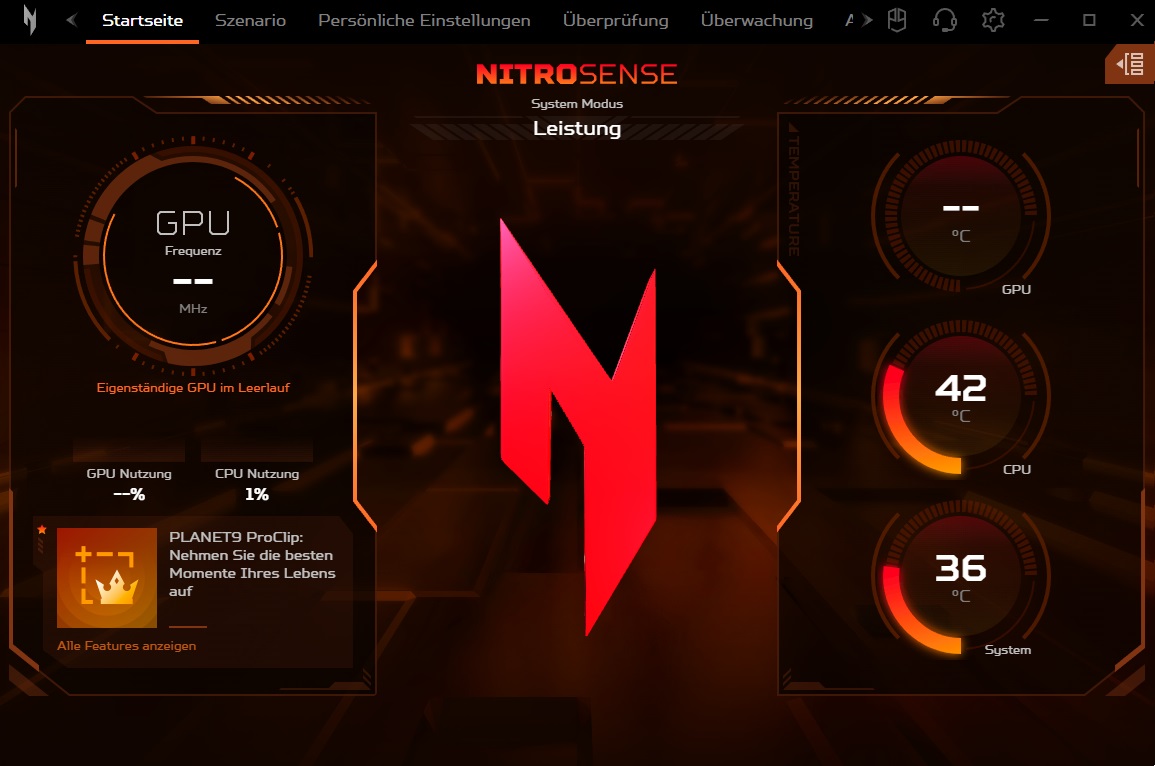
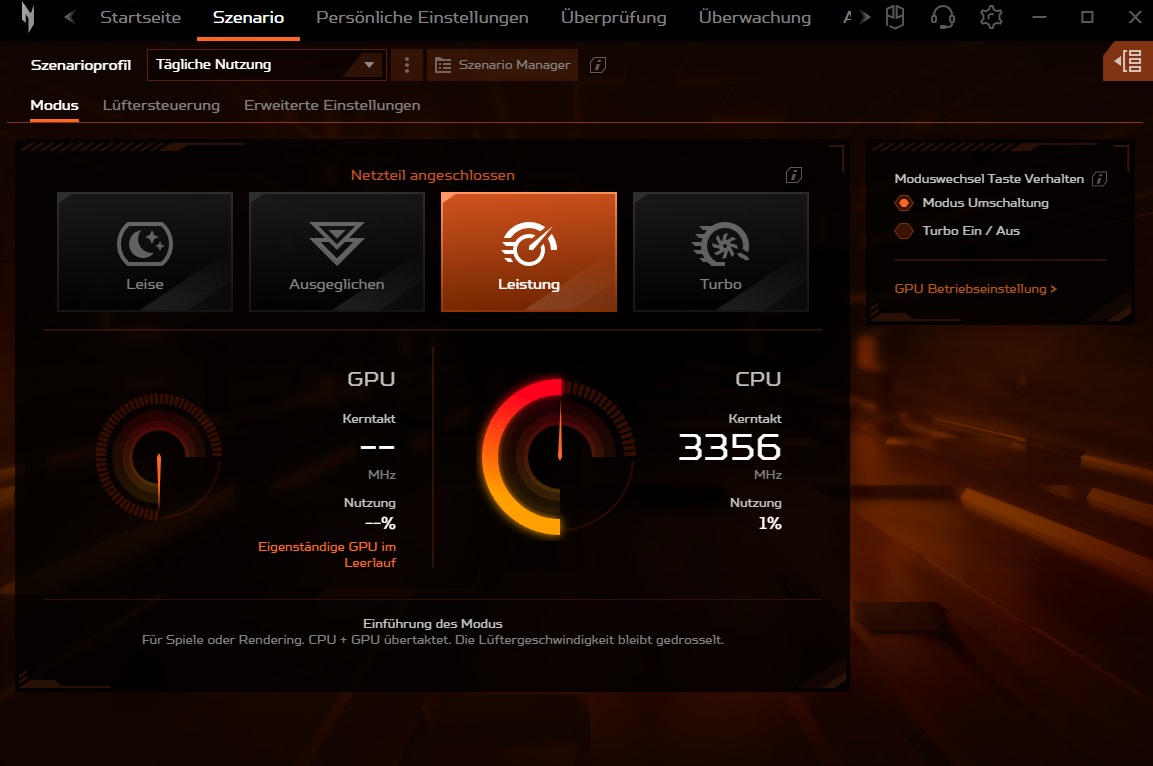
You can switch between different profiles using a special button (or in the NitroSense software). These range from Eco to Turbo, but according to our measurements, they differ very little when it comes to performance and noise emissions. We used Performance mode for our test. Only the laptop's battery life was measured using the Balanced profile.
| Cyberpunk 2077 Loop sequence (FHD/Ultra) | Quiet | Balanced | Performance | Turbo |
| Noise | 52 dB(A) | 53 dB(A) | 54 dB(A) | 55 dB(A) |
| Performance | 59 fps | 63 fps | 64 fps | 68 fps |
| CPU PL1 (HWiNFO) | 45 watts | 45 watts | 54 watts | 54 watts |
| CPU PL2 (HWiNFO) | 65 watts | 65 watts | 65 watts | 65 watts |
Processor
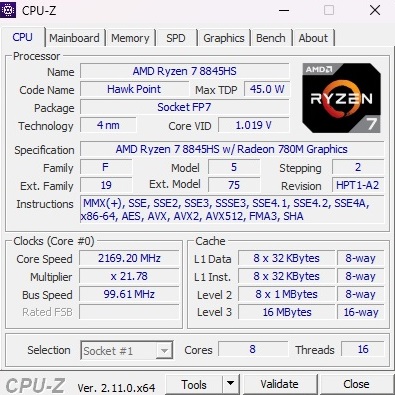
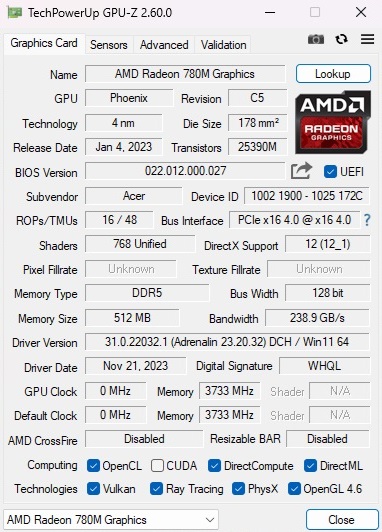
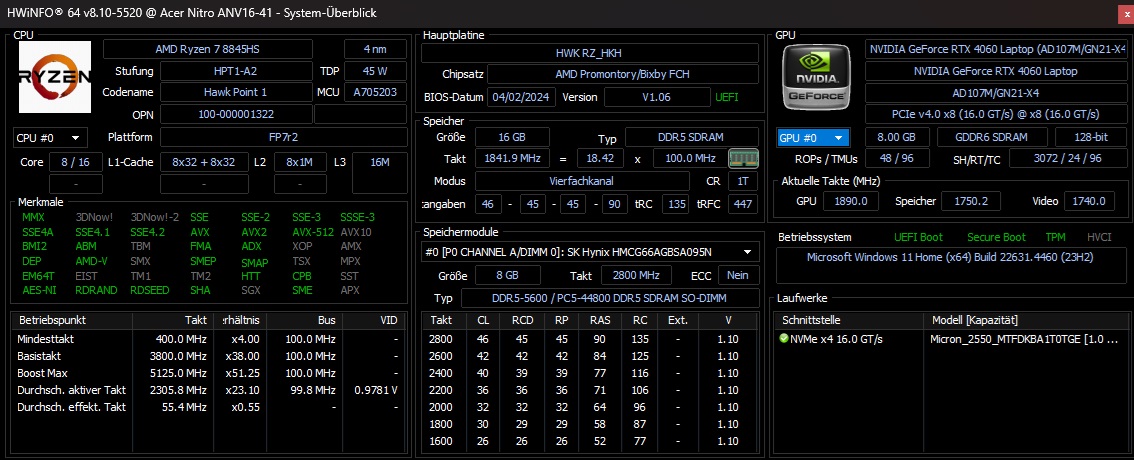
The Ryzen 7 8845HS is an eight-core model from the Zen 4 generation, which can process up to 16 threads in parallel via SMT and houses a fairly fast iGPU in the form of the Radeon 780M. During the benchmarks and the Cinebench loop, the 4 nm chip was roughly on par with the Intel Core i7-14700HX. However, the 8845HS didn't stand a chance against the newer Ryzen AI 9 HX 370.
Cinebench R15 Multi continuous test
* ... smaller is better
System performance
In terms of system performance, the Nitro V 16 landed in the penultimate place, just ahead of the HP Victus 16—although the differences to the other comparison devices weren't all too big. Subjectively, the laptop works and reacts nice and quickly.
CrossMark: Overall | Productivity | Creativity | Responsiveness
WebXPRT 3: Overall
WebXPRT 4: Overall
Mozilla Kraken 1.1: Total
| PCMark 10 / Score | |
| Average of class Gaming (5828 - 11730, n=93, last 2 years) | |
| Average AMD Ryzen 7 8845HS, NVIDIA GeForce RTX 4060 Laptop GPU (7538 - 8822, n=2) | |
| Asus ROG Zephyrus G16 GA605WV | |
| Nubia RedMagic Titan 16 Pro | |
| Lenovo Legion 5 16IRX G9 | |
| Acer Nitro V 16 ANV16-41-R5AT | |
| HP Victus 16 (2024) | |
| PCMark 10 / Essentials | |
| Nubia RedMagic Titan 16 Pro | |
| Lenovo Legion 5 16IRX G9 | |
| HP Victus 16 (2024) | |
| Average of class Gaming (8810 - 11935, n=97, last 2 years) | |
| Asus ROG Zephyrus G16 GA605WV | |
| Average AMD Ryzen 7 8845HS, NVIDIA GeForce RTX 4060 Laptop GPU (9936 - 10061, n=2) | |
| Acer Nitro V 16 ANV16-41-R5AT | |
| PCMark 10 / Productivity | |
| Average AMD Ryzen 7 8845HS, NVIDIA GeForce RTX 4060 Laptop GPU (9789 - 14612, n=2) | |
| Average of class Gaming (6845 - 21327, n=95, last 2 years) | |
| Asus ROG Zephyrus G16 GA605WV | |
| HP Victus 16 (2024) | |
| Acer Nitro V 16 ANV16-41-R5AT | |
| Nubia RedMagic Titan 16 Pro | |
| Lenovo Legion 5 16IRX G9 | |
| PCMark 10 / Digital Content Creation | |
| Average of class Gaming (7602 - 19954, n=95, last 2 years) | |
| Asus ROG Zephyrus G16 GA605WV | |
| Average AMD Ryzen 7 8845HS, NVIDIA GeForce RTX 4060 Laptop GPU (11953 - 12674, n=2) | |
| Lenovo Legion 5 16IRX G9 | |
| Nubia RedMagic Titan 16 Pro | |
| Acer Nitro V 16 ANV16-41-R5AT | |
| HP Victus 16 (2024) | |
| CrossMark / Overall | |
| Nubia RedMagic Titan 16 Pro | |
| Lenovo Legion 5 16IRX G9 | |
| Average of class Gaming (1366 - 2409, n=94, last 2 years) | |
| HP Victus 16 (2024) | |
| Average AMD Ryzen 7 8845HS, NVIDIA GeForce RTX 4060 Laptop GPU (n=1) | |
| Asus ROG Zephyrus G16 GA605WV | |
| CrossMark / Productivity | |
| Nubia RedMagic Titan 16 Pro | |
| Lenovo Legion 5 16IRX G9 | |
| Average of class Gaming (1386 - 2254, n=94, last 2 years) | |
| Average AMD Ryzen 7 8845HS, NVIDIA GeForce RTX 4060 Laptop GPU (n=1) | |
| HP Victus 16 (2024) | |
| Asus ROG Zephyrus G16 GA605WV | |
| CrossMark / Creativity | |
| Lenovo Legion 5 16IRX G9 | |
| Asus ROG Zephyrus G16 GA605WV | |
| Nubia RedMagic Titan 16 Pro | |
| Average of class Gaming (1343 - 2729, n=94, last 2 years) | |
| HP Victus 16 (2024) | |
| Average AMD Ryzen 7 8845HS, NVIDIA GeForce RTX 4060 Laptop GPU (n=1) | |
| CrossMark / Responsiveness | |
| Nubia RedMagic Titan 16 Pro | |
| Lenovo Legion 5 16IRX G9 | |
| HP Victus 16 (2024) | |
| Average of class Gaming (1226 - 2334, n=94, last 2 years) | |
| Average AMD Ryzen 7 8845HS, NVIDIA GeForce RTX 4060 Laptop GPU (n=1) | |
| Asus ROG Zephyrus G16 GA605WV | |
| WebXPRT 3 / Overall | |
| Nubia RedMagic Titan 16 Pro | |
| Average of class Gaming (220 - 532, n=98, last 2 years) | |
| Lenovo Legion 5 16IRX G9 | |
| Acer Nitro V 16 ANV16-41-R5AT | |
| Average AMD Ryzen 7 8845HS, NVIDIA GeForce RTX 4060 Laptop GPU (305 - 305, n=2) | |
| HP Victus 16 (2024) | |
| WebXPRT 4 / Overall | |
| Nubia RedMagic Titan 16 Pro | |
| Average of class Gaming (165 - 354, n=98, last 2 years) | |
| Lenovo Legion 5 16IRX G9 | |
| Asus ROG Zephyrus G16 GA605WV | |
| HP Victus 16 (2024) | |
| Average AMD Ryzen 7 8845HS, NVIDIA GeForce RTX 4060 Laptop GPU (176.4 - 264, n=2) | |
| Acer Nitro V 16 ANV16-41-R5AT | |
| Mozilla Kraken 1.1 / Total | |
| HP Victus 16 (2024) | |
| Acer Nitro V 16 ANV16-41-R5AT | |
| Average AMD Ryzen 7 8845HS, NVIDIA GeForce RTX 4060 Laptop GPU (496 - 523, n=2) | |
| Lenovo Legion 5 16IRX G9 | |
| Average of class Gaming (391 - 590, n=100, last 2 years) | |
| Nubia RedMagic Titan 16 Pro | |
| Asus ROG Zephyrus G16 GA605WV | |
* ... smaller is better
| PCMark 10 Score | 7538 points | |
Help | ||
| AIDA64 / Memory Copy | |
| Asus ROG Zephyrus G16 GA605WV | |
| Average of class Gaming (21750 - 129946, n=104, last 2 years) | |
| Average AMD Ryzen 7 8845HS (61459 - 71873, n=13) | |
| HP Victus 16 (2024) | |
| Acer Nitro V 16 ANV16-41-R5AT | |
| Lenovo Legion 5 16IRX G9 | |
| Nubia RedMagic Titan 16 Pro | |
| AIDA64 / Memory Read | |
| Asus ROG Zephyrus G16 GA605WV | |
| HP Victus 16 (2024) | |
| Average of class Gaming (22956 - 118858, n=104, last 2 years) | |
| Lenovo Legion 5 16IRX G9 | |
| Acer Nitro V 16 ANV16-41-R5AT | |
| Average AMD Ryzen 7 8845HS (49866 - 61976, n=13) | |
| Nubia RedMagic Titan 16 Pro | |
| AIDA64 / Memory Write | |
| Asus ROG Zephyrus G16 GA605WV | |
| Average AMD Ryzen 7 8845HS (68425 - 93239, n=13) | |
| Acer Nitro V 16 ANV16-41-R5AT | |
| Average of class Gaming (22297 - 135096, n=104, last 2 years) | |
| HP Victus 16 (2024) | |
| Lenovo Legion 5 16IRX G9 | |
| Nubia RedMagic Titan 16 Pro | |
| AIDA64 / Memory Latency | |
| Asus ROG Zephyrus G16 GA605WV | |
| Average of class Gaming (75.3 - 259, n=104, last 2 years) | |
| Average AMD Ryzen 7 8845HS (82.5 - 117, n=13) | |
| HP Victus 16 (2024) | |
| Lenovo Legion 5 16IRX G9 | |
| Acer Nitro V 16 ANV16-41-R5AT | |
| Nubia RedMagic Titan 16 Pro | |
* ... smaller is better
DPC latencies
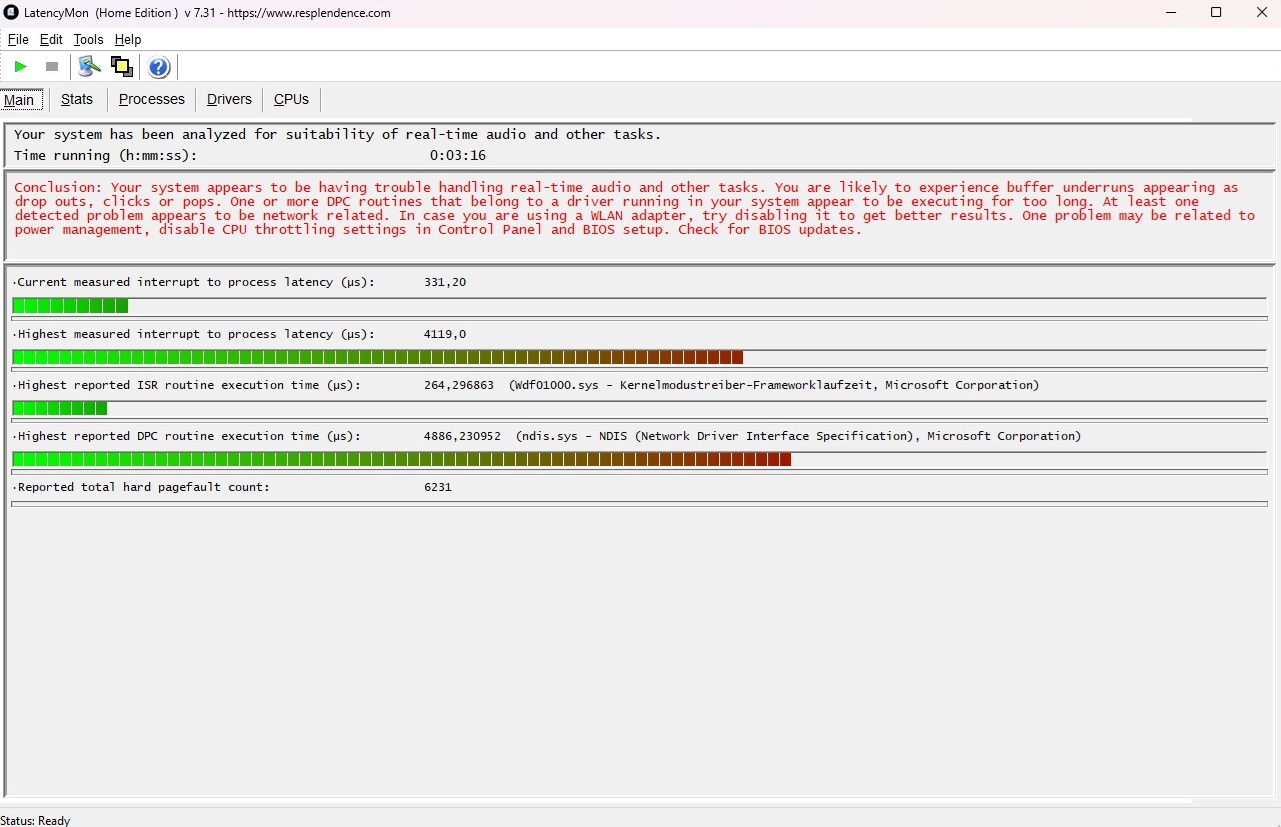
Latency is not a strong point of the 16-inch device. The LatencyMon tool confirmed that the V 16 may have problems with audio processing in real-time and other areas. Only the Zephyrus G16 did well within the comparison field.
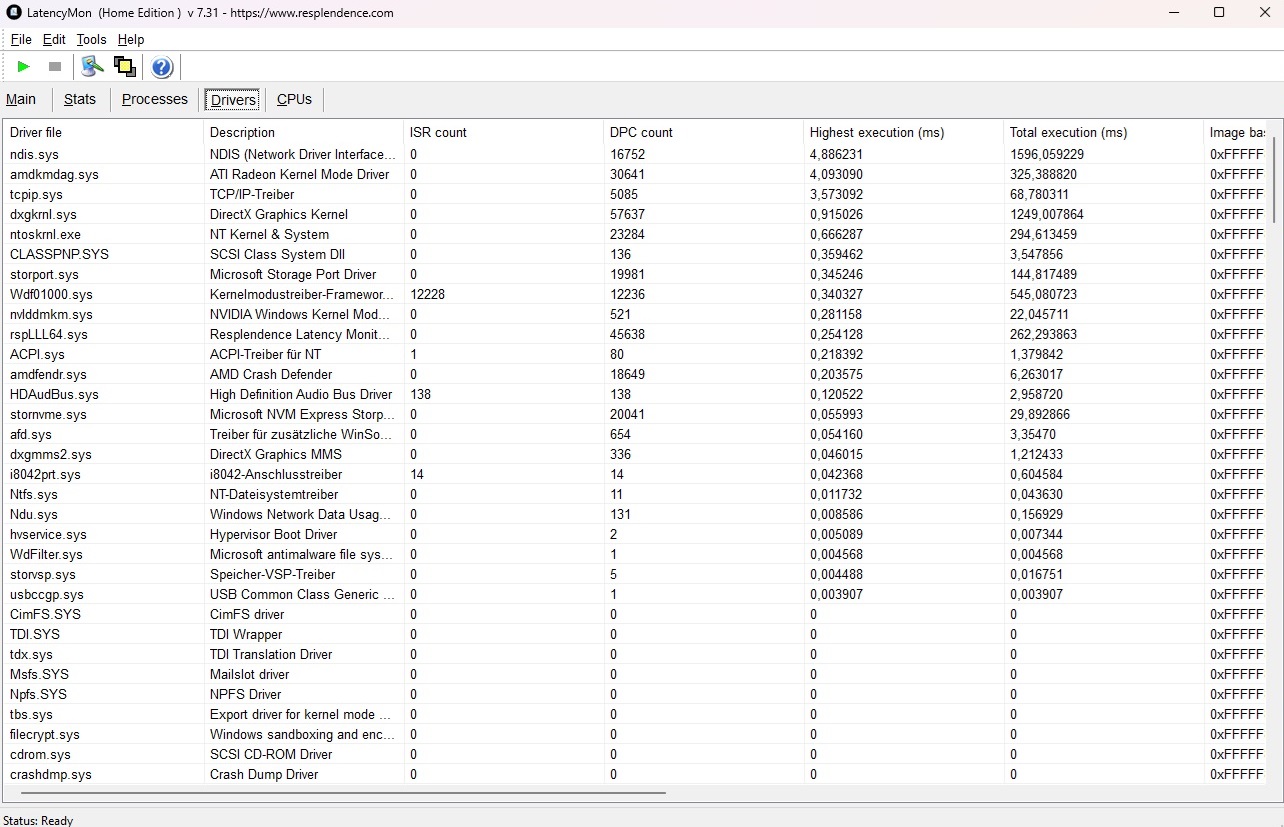
| DPC Latencies / LatencyMon - interrupt to process latency (max), Web, Youtube, Prime95 | |
| Acer Nitro V 16 ANV16-41-R5AT | |
| Nubia RedMagic Titan 16 Pro | |
| Lenovo Legion 5 16IRX G9 | |
| HP Victus 16 (2024) | |
| Asus ROG Zephyrus G16 GA605WV | |
* ... smaller is better
Storage device
Acer has gone for a solid NVMe SSD, namely the Micron 2550. It is neither slow nor particularly fast when reading or writing. In the long-term test using DiskSpd, we noted some minor drops in the long run, but SSD performance fluctuated significantly more or dropped considerably more in other devices (e.g. the Lenovo Legion 5 and the HP Victus 16).

* ... smaller is better
Reading continuous performance: DiskSpd Read Loop, Queue Depth 8
Graphics card
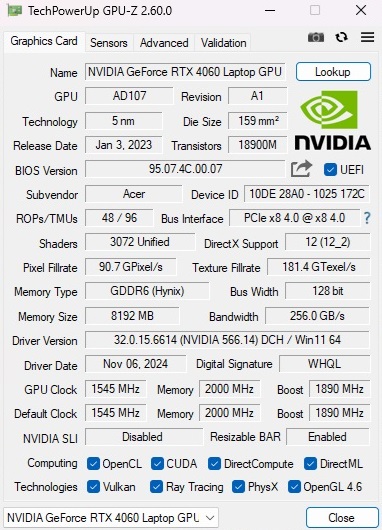
The GeForce RTX 4060 is by far one of the most successful laptop gaming graphics cards of recent years. The mid-range model from Nvidia's Ada Lovelace generation is equipped with 3,072 shader units and 8 GB GDDR6 VRAM. As with the RTX 4070, its VRAM has now reached its limits when running some games, which is why passionate gamers should probably opt for a laptop with an RTX 4080 (12 GB). Despite its moderate TGP of 85 watts inside the Nitro V 16, the 16-inch model performed quite well in the synthetic graphics tests against the competition, some of which run with a TGP of over 100 watts.
| 3DMark 11 Performance | 29566 points | |
| 3DMark Ice Storm Standard Score | 166948 points | |
| 3DMark Cloud Gate Standard Score | 64085 points | |
| 3DMark Fire Strike Score | 23112 points | |
| 3DMark Time Spy Score | 9511 points | |
Help | ||
* ... smaller is better
Gaming performance
During everyday gaming, the Nitro tends to falter—at least compared to the comparison field. We measured other RTX 4060 laptops as sometimes being more than 20% faster. In principle, the RTX 4060 is powerful enough to run almost all modern games smoothly at maximum settings in the screen's native resolution. Only when playing extremely demanding and/or poorly optimized games such as Star Wars Outlaws will you have to make do with reduced details or use DLSS.
| Baldur's Gate 3 - 1920x1080 Ultra Preset AA:T | |
| Average of class Gaming (59.4 - 246, n=102, last 2 years) | |
| Nubia RedMagic Titan 16 Pro | |
| Average NVIDIA GeForce RTX 4060 Laptop GPU (66.5 - 105.5, n=19) | |
| Asus ROG Zephyrus G16 GA605WV | |
| Acer Nitro V 16 ANV16-41-R5AT | |
| low | med. | high | ultra | |
|---|---|---|---|---|
| GTA V (2015) | 175.8 | 167.8 | 104.6 | |
| Dota 2 Reborn (2015) | 161.6 | 156 | 138.3 | 130.5 |
| Final Fantasy XV Benchmark (2018) | 205 | 130.8 | 96.1 | |
| X-Plane 11.11 (2018) | 87.1 | 87.7 | 60.7 | |
| Strange Brigade (2018) | 251 | 200 | 169.7 | |
| Baldur's Gate 3 (2023) | 98.3 | 83.1 | 80.9 | |
| Cyberpunk 2077 (2023) | 90.6 | 77.2 | 66.4 | |
| Prince of Persia The Lost Crown (2024) | 345 | 340 | 337 | |
| Star Wars Outlaws (2024) | 42.6 | 35.6 | 29.1 | |
| Space Marine 2 (2024) | 76.9 | 76 | 67.8 | |
| Final Fantasy XVI (2024) | 64 | 54.8 | 50.4 | |
| God of War Ragnarök (2024) | 102.8 | 88 | 80.2 | |
| Until Dawn (2024) | 80.1 | 56.8 | 43.2 | |
| Call of Duty Black Ops 6 (2024) | 116 | 80 | 76 | |
| Stalker 2 (2024) | 54.1 | 48.1 | 40.2 |
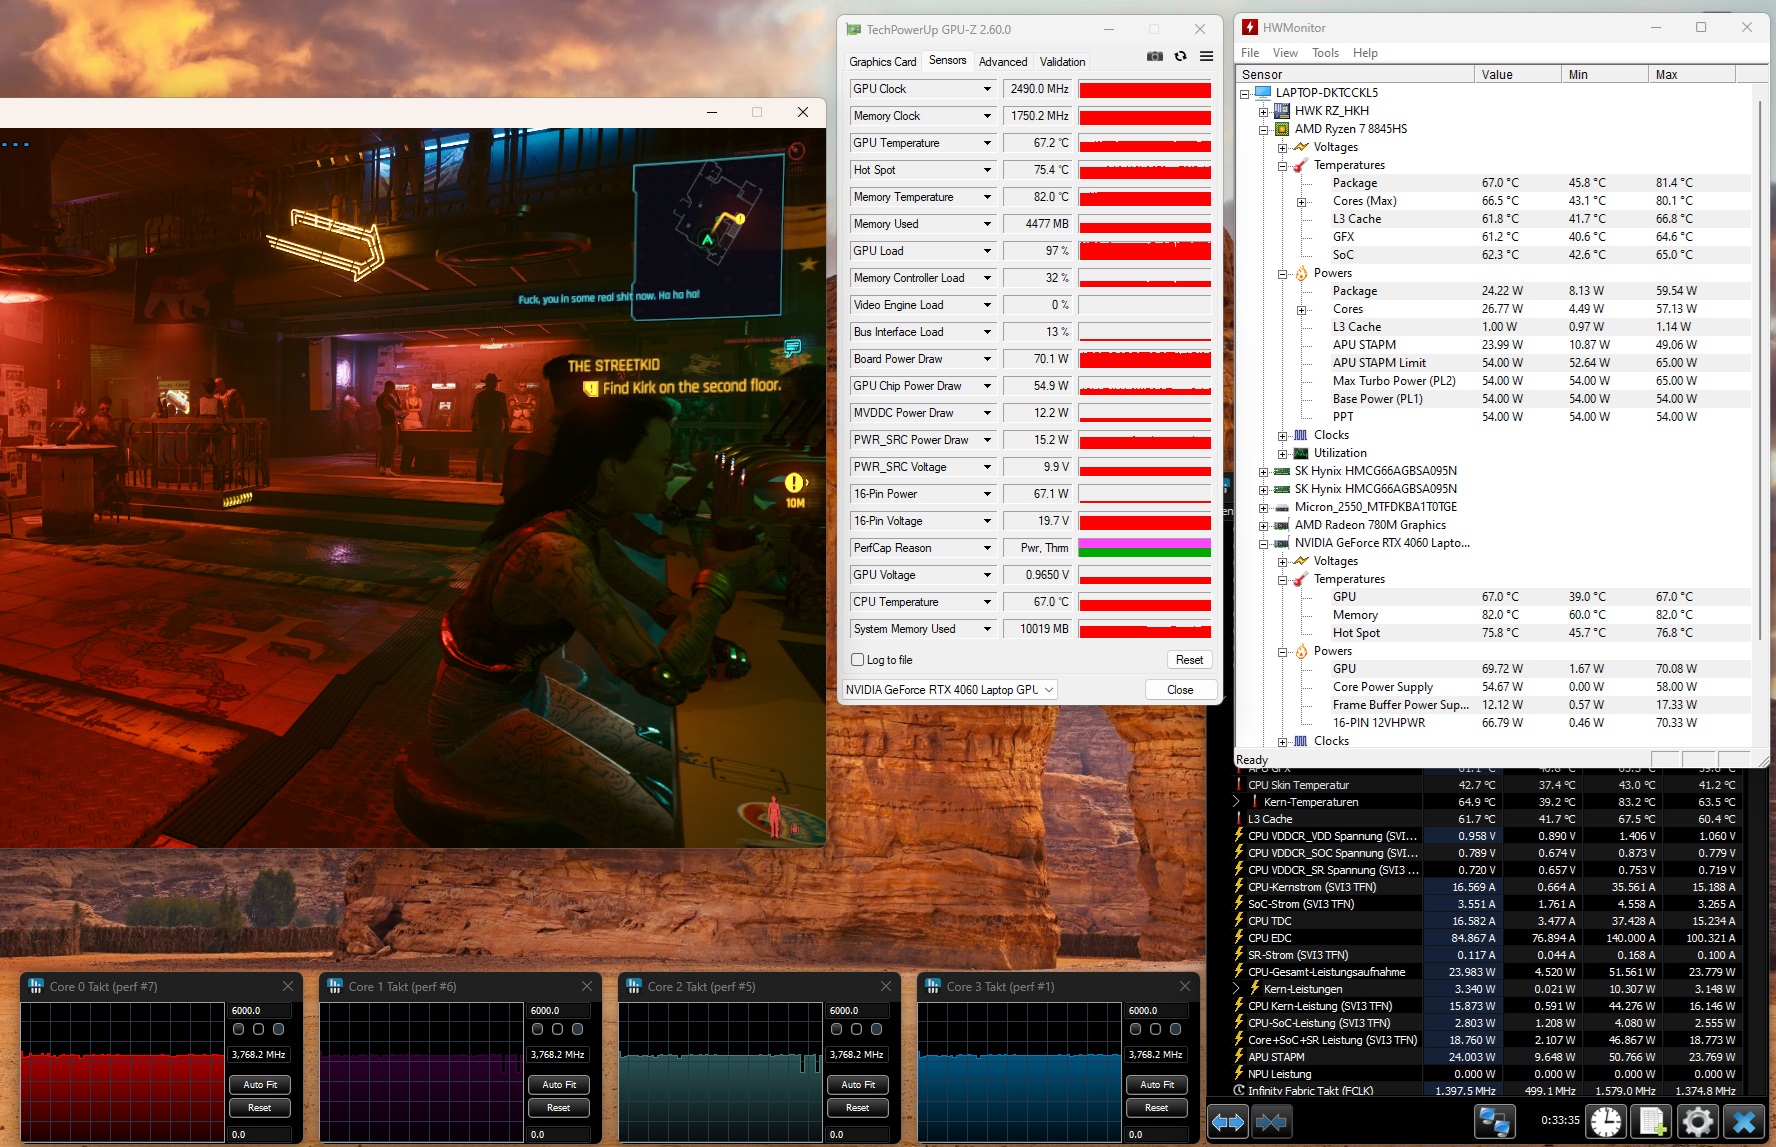
We tested whether the GPU's performance remains constant over longer periods of time using Cyberpunk 2077. We noted no abnormalities in this regard.
Cyberpunk 2077 ultra FPS diagram
Emissions
Noise emissions
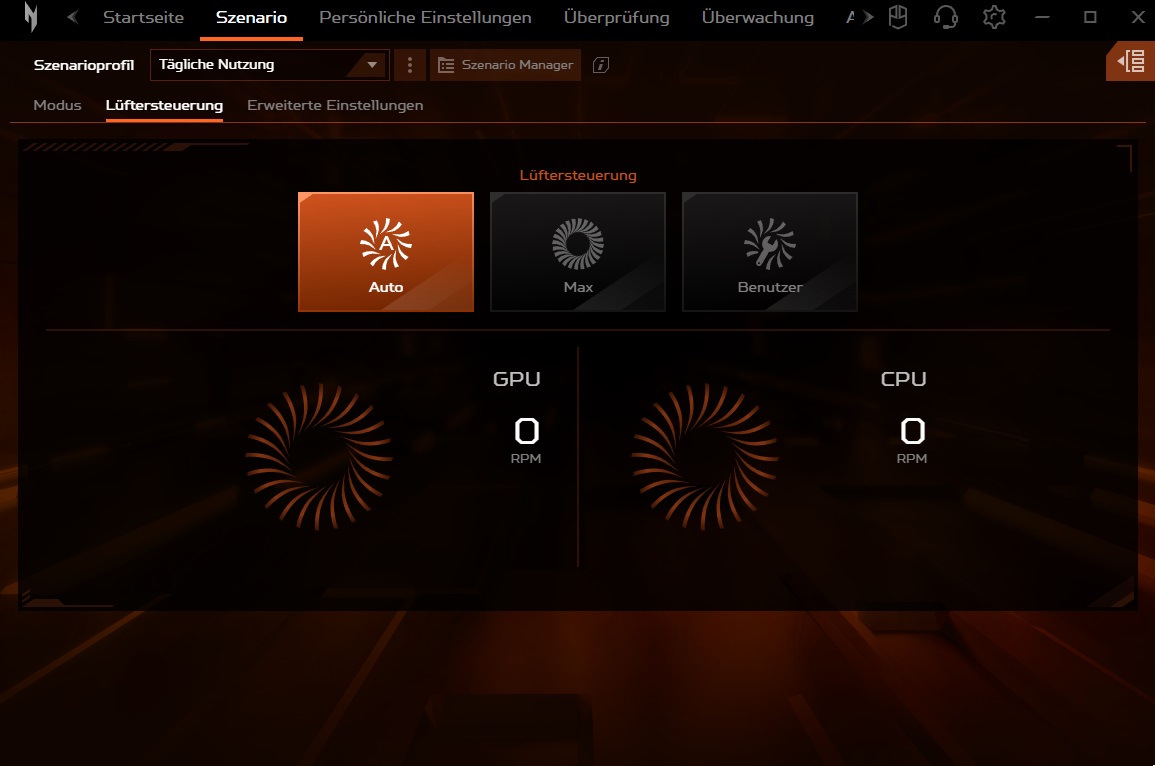
Alongside its display, the Nitro V 16's confused fan control turned out to be one of its biggest weaknesses. Even in Balanced mode, the fans tend to rev up unnecessarily when little things like opening the browser occur. The back-and-forth speed jumps can get pretty annoying in practice, which is why Acer should definitely make improvements in this regard. The 16-inch device is generally quite loud under load. Over 50 dB(A) definitely requires the use of a headset.
Noise level
| Idle |
| 25 / 28 / 37 dB(A) |
| Load |
| 51 / 52 dB(A) |
 | ||
30 dB silent 40 dB(A) audible 50 dB(A) loud |
||
min: | ||
| Acer Nitro V 16 ANV16-41-R5AT R7 8845HS, GeForce RTX 4060 Laptop GPU | Lenovo Legion 5 16IRX G9 i7-14650HX, GeForce RTX 4060 Laptop GPU | HP Victus 16 (2024) i7-14700HX, GeForce RTX 4060 Laptop GPU | Nubia RedMagic Titan 16 Pro i9-14900HX, GeForce RTX 4060 Laptop GPU | Asus ROG Zephyrus G16 GA605WV Ryzen AI 9 HX 370, GeForce RTX 4060 Laptop GPU | |
|---|---|---|---|---|---|
| Noise | 4% | 3% | -10% | 6% | |
| off / environment * (dB) | 25 | 24 4% | 25 -0% | 26 -4% | 24.6 2% |
| Idle Minimum * (dB) | 25 | 24 4% | 28 -12% | 35 -40% | 28.6 -14% |
| Idle Average * (dB) | 28 | 28.8 -3% | 29 -4% | 36 -29% | 28.6 -2% |
| Idle Maximum * (dB) | 37 | 32 14% | 33 11% | 40 -8% | 28.6 23% |
| Load Average * (dB) | 51 | 45.5 11% | 45 12% | 49 4% | 42.8 16% |
| Cyberpunk 2077 ultra * (dB) | 54 | 50 7% | 48.3 11% | ||
| Load Maximum * (dB) | 52 | 55.7 -7% | 48 8% | 52 -0% | 48.3 7% |
| Witcher 3 ultra * (dB) | 53.1 | 43 |
* ... smaller is better
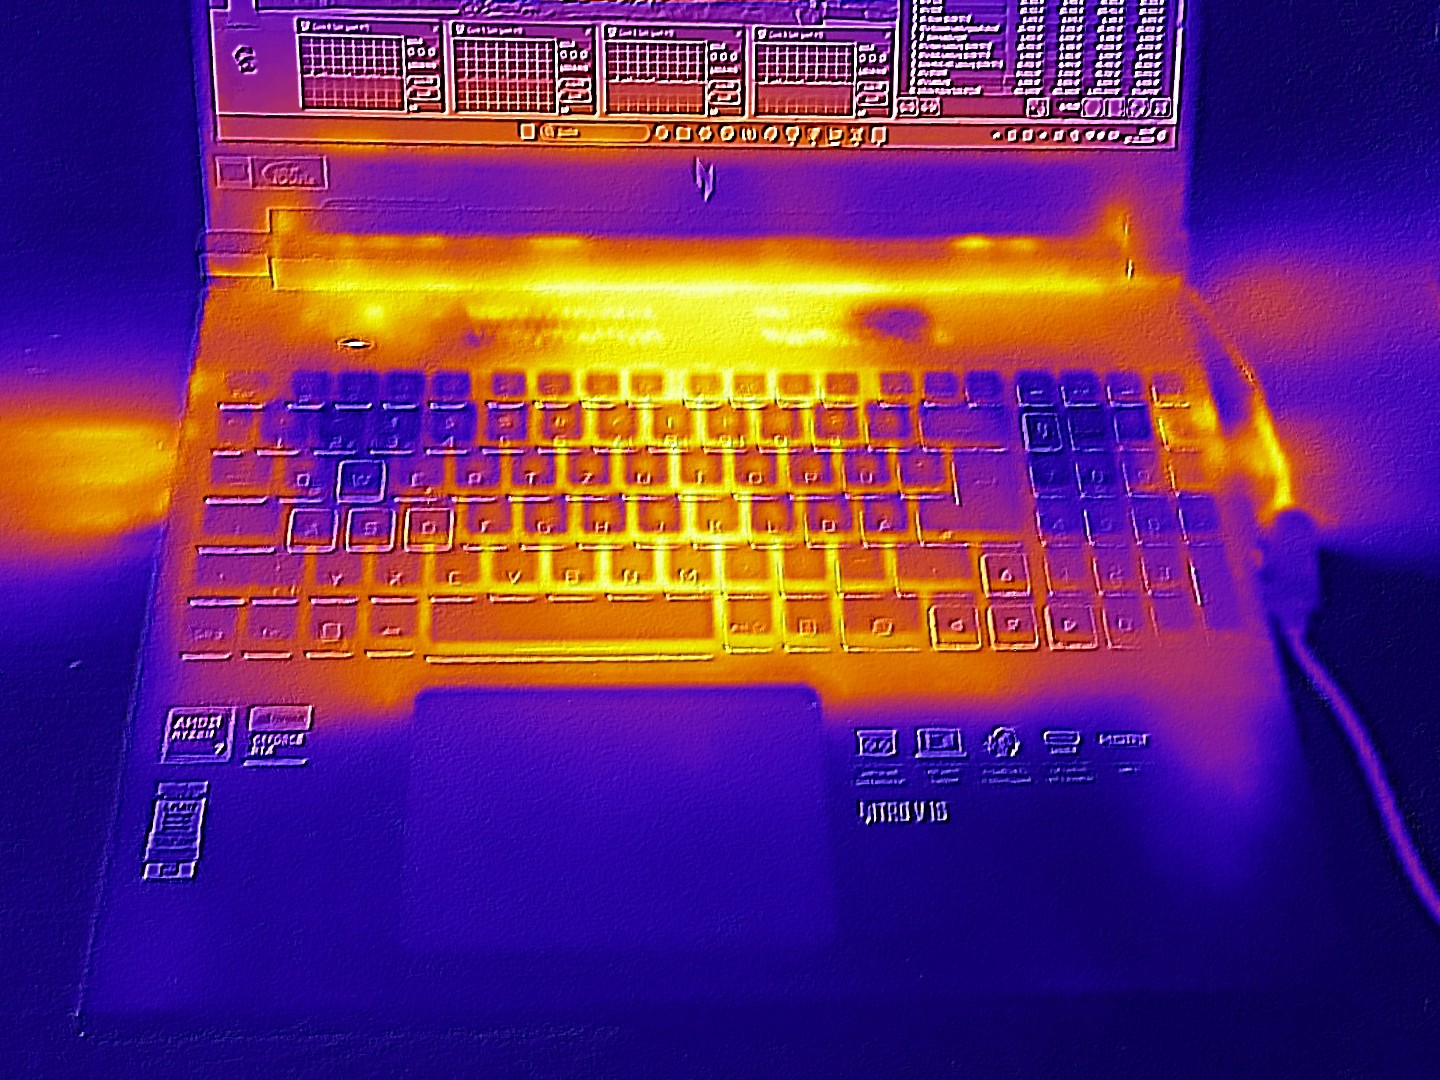
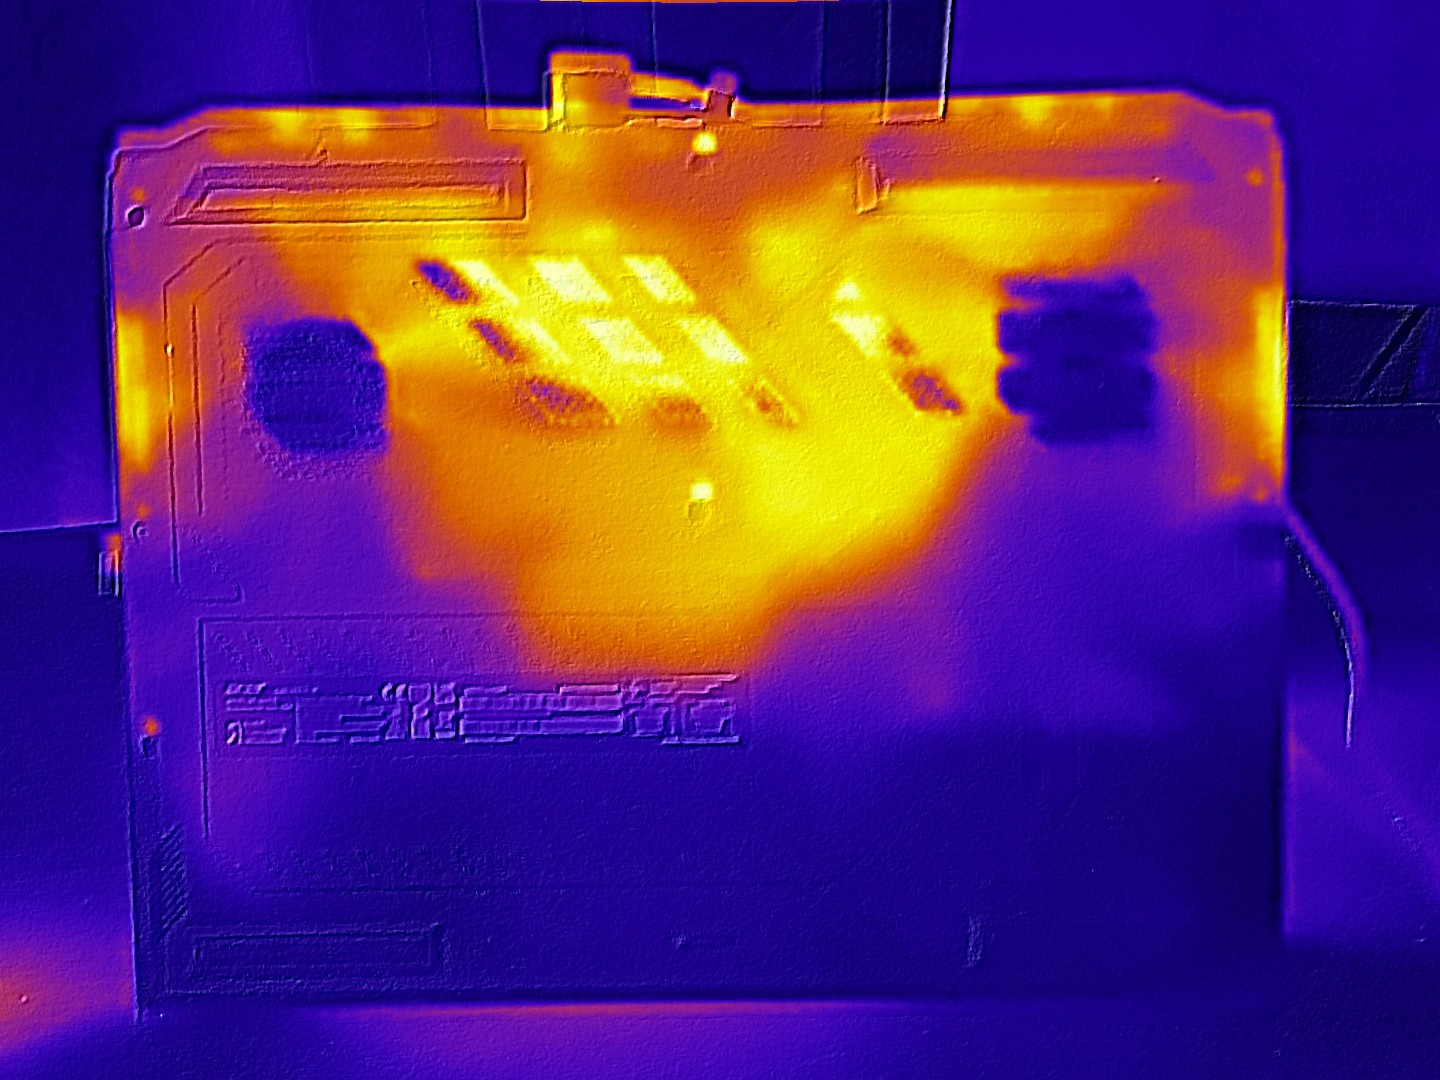
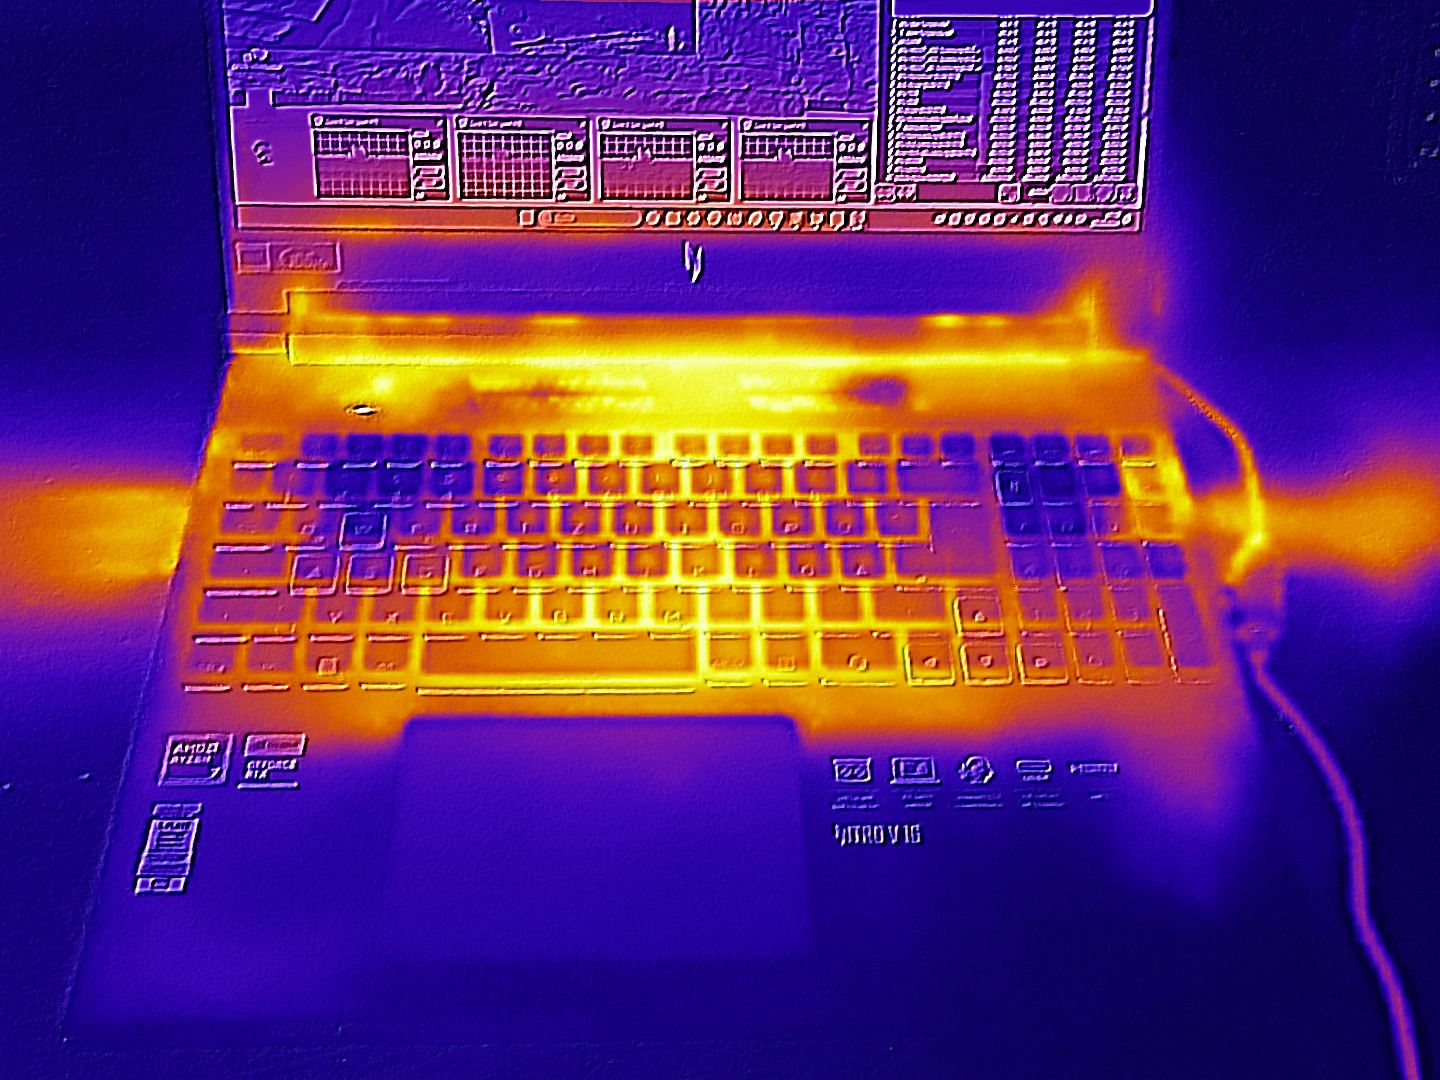
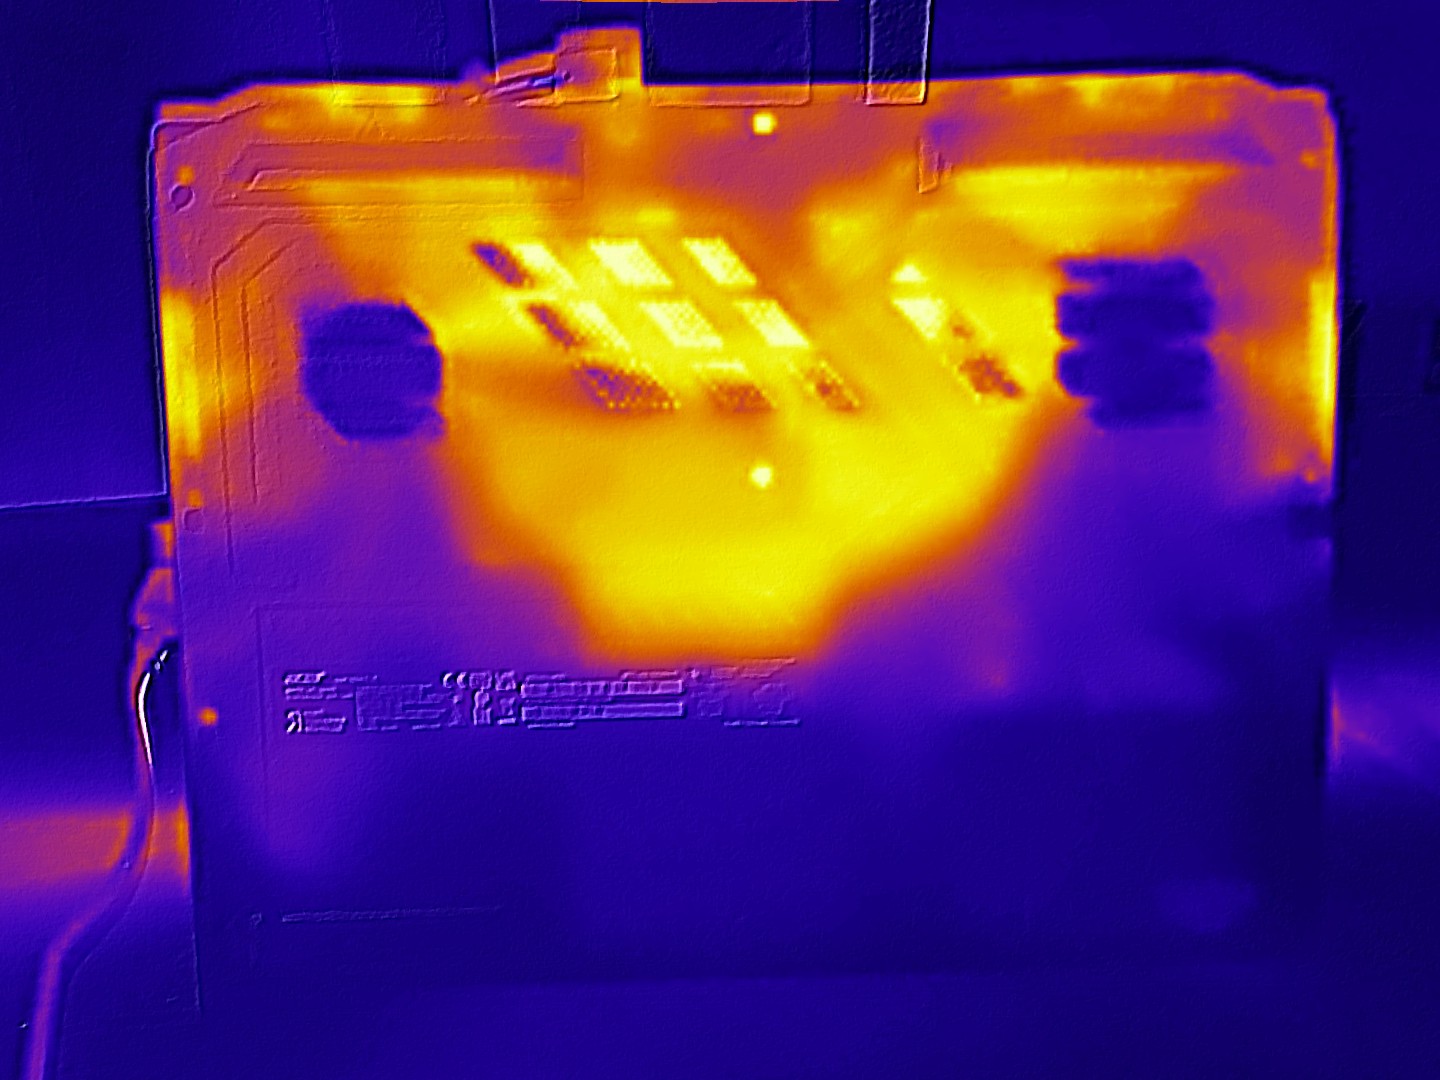
Temperature
Its temperatures, on the other hand, remained within an acceptable range during our test. Although the bottom of the case sometimes heated up to almost 50 °C in places under load, the top didn't get too warm at a maximum of 42 °C. In idle mode, the situation—i.e. the ratio between the top and bottom—looked similar.
(±) The maximum temperature on the upper side is 41 °C / 106 F, compared to the average of 40.4 °C / 105 F, ranging from 21.2 to 68.8 °C for the class Gaming.
(-) The bottom heats up to a maximum of 49 °C / 120 F, compared to the average of 43.2 °C / 110 F
(+) In idle usage, the average temperature for the upper side is 30.1 °C / 86 F, compared to the device average of 33.9 °C / 93 F.
(±) 3: The average temperature for the upper side is 34.9 °C / 95 F, compared to the average of 33.9 °C / 93 F for the class Gaming.
(+) The palmrests and touchpad are cooler than skin temperature with a maximum of 30 °C / 86 F and are therefore cool to the touch.
(±) The average temperature of the palmrest area of similar devices was 28.8 °C / 83.8 F (-1.2 °C / -2.2 F).
| Acer Nitro V 16 ANV16-41-R5AT R7 8845HS, GeForce RTX 4060 Laptop GPU | Lenovo Legion 5 16IRX G9 i7-14650HX, GeForce RTX 4060 Laptop GPU | HP Victus 16 (2024) i7-14700HX, GeForce RTX 4060 Laptop GPU | Nubia RedMagic Titan 16 Pro i9-14900HX, GeForce RTX 4060 Laptop GPU | Asus ROG Zephyrus G16 GA605WV Ryzen AI 9 HX 370, GeForce RTX 4060 Laptop GPU | |
|---|---|---|---|---|---|
| Heat | 6% | 7% | -6% | 3% | |
| Maximum Upper Side * (°C) | 41 | 40.4 1% | 50 -22% | 50 -22% | 48.2 -18% |
| Maximum Bottom * (°C) | 49 | 43.8 11% | 50 -2% | 58 -18% | 51.3 -5% |
| Idle Upper Side * (°C) | 32 | 30.3 5% | 25 22% | 31 3% | 28 12% |
| Idle Bottom * (°C) | 37 | 35.3 5% | 26 30% | 32 14% | 28.8 22% |
* ... smaller is better
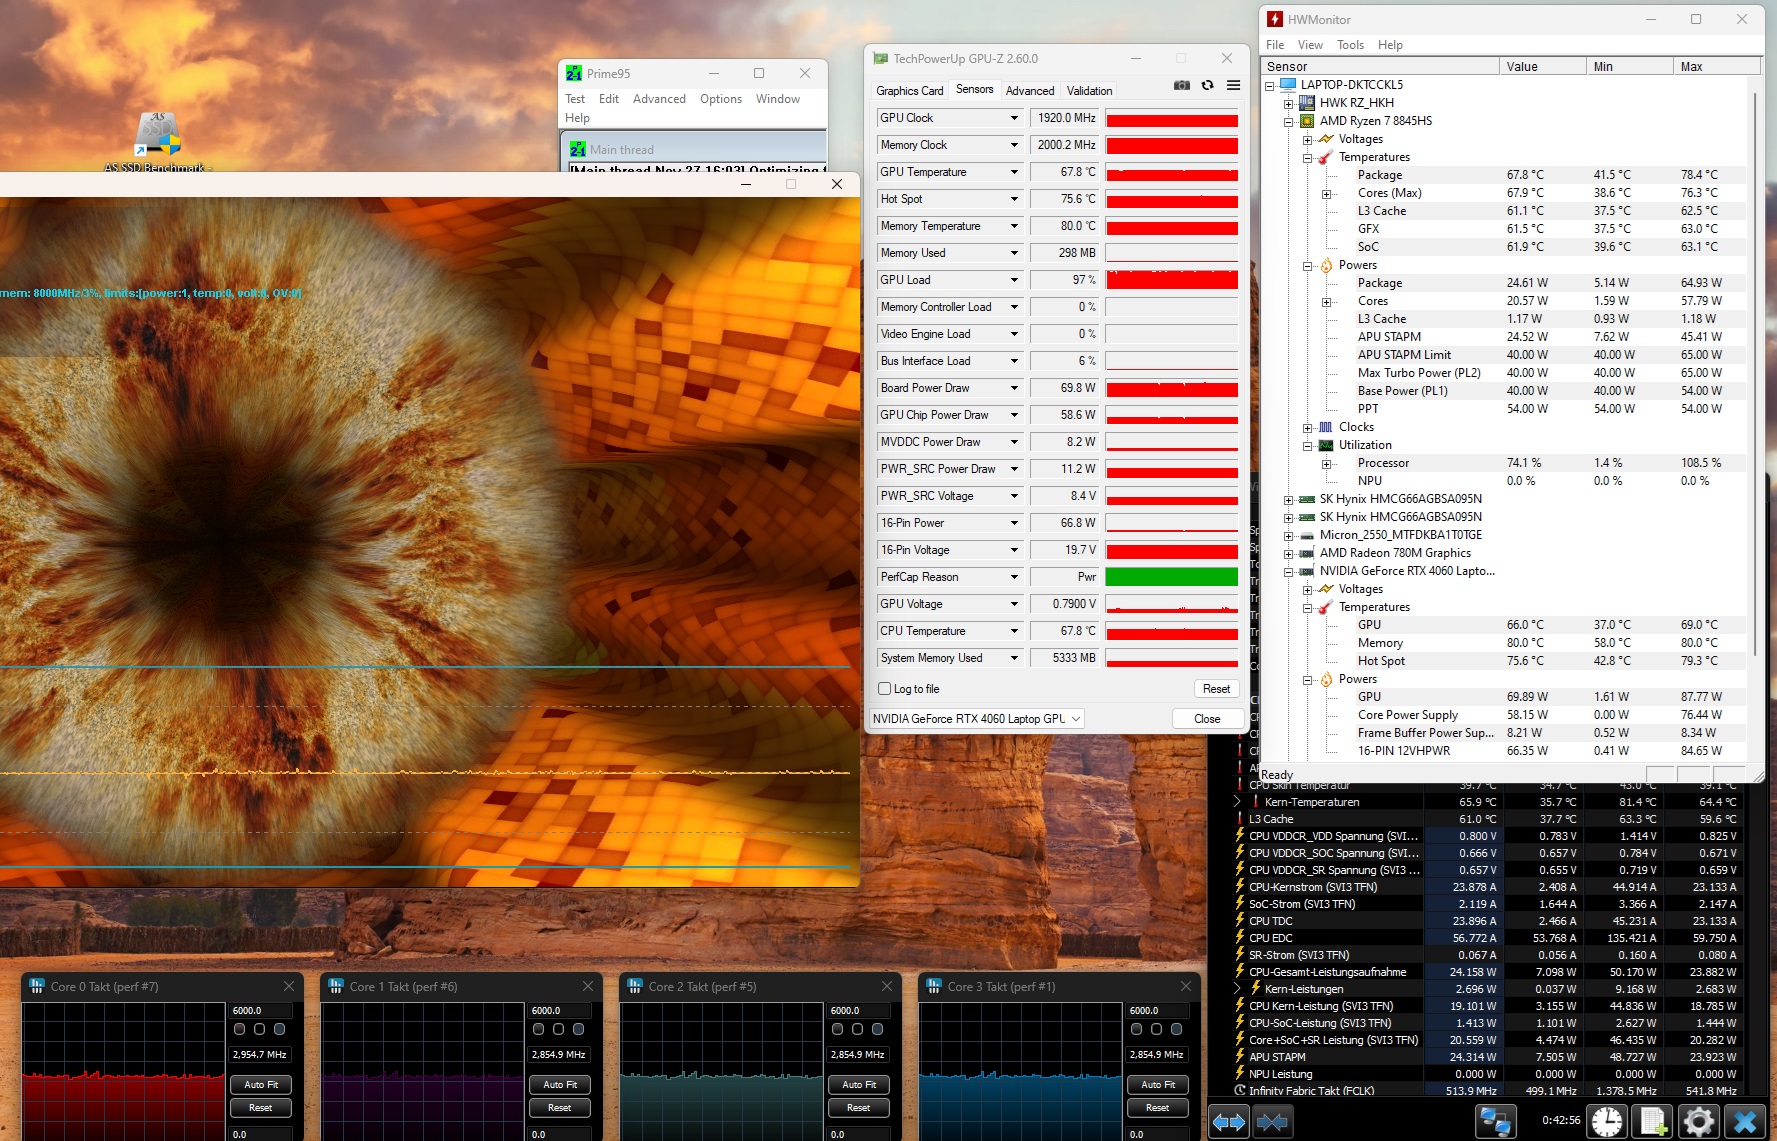
Stress test
There is also no need to worry about the laptop's components. Both when running Cyberpunk 2077 and during the stress test using the Furmark and Prime95 tools, the CPU and GPU stabilized at just under 70 °C, which is completely harmless.
Speakers
The 2.0 system offers a good maximum level of 82 dB(A), but—as we know from most laptops—shows weaknesses when it comes to bass. Its sound quality is sufficient for occasional YouTube videos etc., but for more intensive media enjoyment (movies, music, games, ...) you should connect external speakers or a headset if possible.
Acer Nitro V 16 ANV16-41-R5AT audio analysis
(+) | speakers can play relatively loud (82 dB)
Bass 100 - 315 Hz
(-) | nearly no bass - on average 27.1% lower than median
(±) | linearity of bass is average (14% delta to prev. frequency)
Mids 400 - 2000 Hz
(+) | balanced mids - only 2% away from median
(+) | mids are linear (3.8% delta to prev. frequency)
Highs 2 - 16 kHz
(+) | balanced highs - only 2.1% away from median
(+) | highs are linear (4.2% delta to prev. frequency)
Overall 100 - 16.000 Hz
(±) | linearity of overall sound is average (16% difference to median)
Compared to same class
» 38% of all tested devices in this class were better, 6% similar, 55% worse
» The best had a delta of 6%, average was 18%, worst was 132%
Compared to all devices tested
» 25% of all tested devices were better, 5% similar, 70% worse
» The best had a delta of 4%, average was 23%, worst was 134%
Apple MacBook Pro 16 2021 M1 Pro audio analysis
(+) | speakers can play relatively loud (84.7 dB)
Bass 100 - 315 Hz
(+) | good bass - only 3.8% away from median
(+) | bass is linear (5.2% delta to prev. frequency)
Mids 400 - 2000 Hz
(+) | balanced mids - only 1.3% away from median
(+) | mids are linear (2.1% delta to prev. frequency)
Highs 2 - 16 kHz
(+) | balanced highs - only 1.9% away from median
(+) | highs are linear (2.7% delta to prev. frequency)
Overall 100 - 16.000 Hz
(+) | overall sound is linear (4.6% difference to median)
Compared to same class
» 0% of all tested devices in this class were better, 0% similar, 100% worse
» The best had a delta of 5%, average was 17%, worst was 45%
Compared to all devices tested
» 0% of all tested devices were better, 0% similar, 100% worse
» The best had a delta of 4%, average was 23%, worst was 134%
Power management
Power consumption
Thanks to its Ryzen CPU, the Nitro V 16 is the most frugal representative in our test field. 9 to 13 watts in idle mode and 61 to 134 watts under load were in some cases clearly surpassed by the Intel competition.
| Off / Standby | |
| Idle | |
| Load |
|
Key:
min: | |
| Acer Nitro V 16 ANV16-41-R5AT R7 8845HS, GeForce RTX 4060 Laptop GPU | Lenovo Legion 5 16IRX G9 i7-14650HX, GeForce RTX 4060 Laptop GPU | HP Victus 16 (2024) i7-14700HX, GeForce RTX 4060 Laptop GPU | Nubia RedMagic Titan 16 Pro i9-14900HX, GeForce RTX 4060 Laptop GPU | Asus ROG Zephyrus G16 GA605WV Ryzen AI 9 HX 370, GeForce RTX 4060 Laptop GPU | Average of class Gaming | |
|---|---|---|---|---|---|---|
| Power Consumption | -76% | -62% | -80% | -13% | -78% | |
| Idle Minimum * (Watt) | 9 | 15.4 -71% | 9 -0% | 16 -78% | 6.9 23% | 13 ? -44% |
| Idle Average * (Watt) | 10 | 19.7 -97% | 15 -50% | 19 -90% | 12.6 -26% | 18.7 ? -87% |
| Idle Maximum * (Watt) | 13 | 20.7 -59% | 23 -77% | 27 -108% | 13 -0% | 24.3 ? -87% |
| Load Average * (Watt) | 61 | 102.6 -68% | 123 -102% | 123 -102% | 84.1 -38% | 109.7 ? -80% |
| Cyberpunk 2077 ultra * (Watt) | 118.9 | 184.3 -55% | 127.2 -7% | |||
| Cyberpunk 2077 ultra external monitor * (Watt) | 116.3 | 174.2 -50% | 124.5 -7% | |||
| Load Maximum * (Watt) | 134 | 246.6 -84% | 241 -80% | 240 -79% | 177.6 -33% | 257 ? -92% |
| Witcher 3 ultra * (Watt) | 191.3 | 143.7 |
* ... smaller is better
Power consumption Cyberpunk / stress test
Power consumption with external monitor
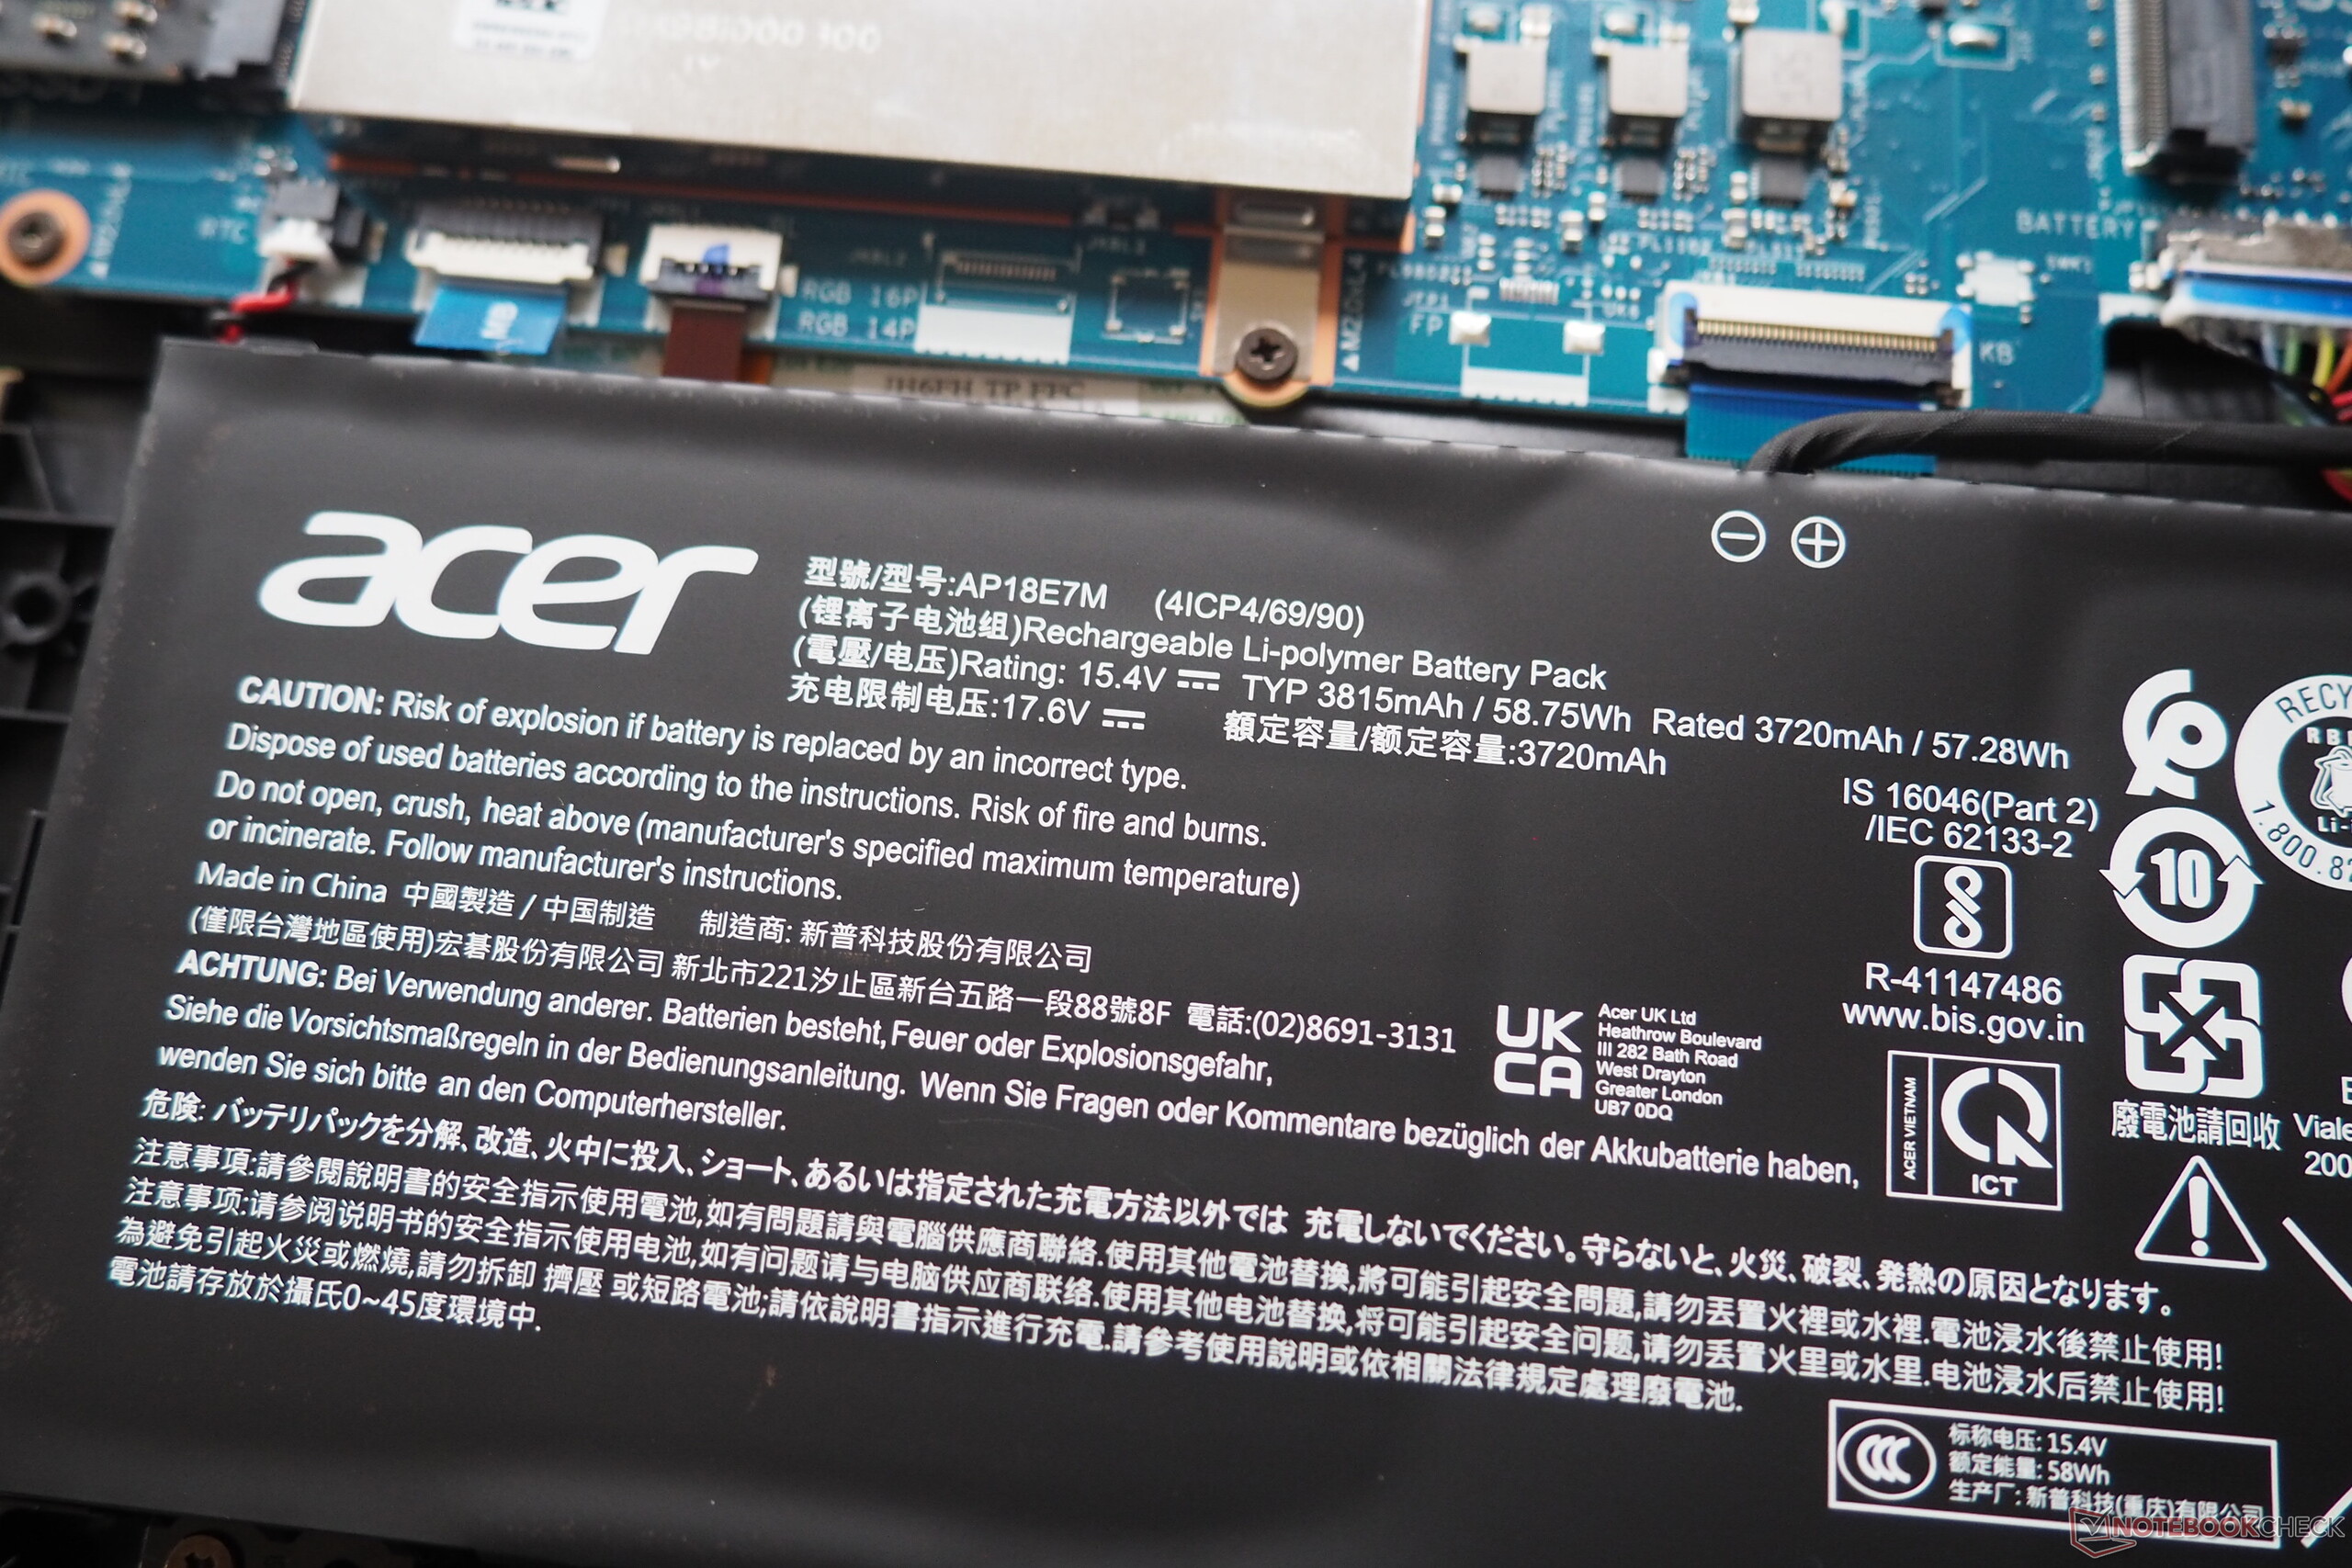
Runtimes
The fact that its battery life isn't totally the best is mainly due to its meager capacity. Although there would have been more space in the laptop's case, Acer has only given the V 16 a capacity of 57 Wh. The competition, on the other hand, can fall back on 80 to 90 Wh. As a result, just under 6 hours in our WLAN test with the brightness reduced to 150 cd/m² is accordingly only mediocre. In other words: There is still a lot of room for improvement here.
| Acer Nitro V 16 ANV16-41-R5AT R7 8845HS, GeForce RTX 4060 Laptop GPU, 57 Wh | Lenovo Legion 5 16IRX G9 i7-14650HX, GeForce RTX 4060 Laptop GPU, 80 Wh | HP Victus 16 (2024) i7-14700HX, GeForce RTX 4060 Laptop GPU, 83 Wh | Nubia RedMagic Titan 16 Pro i9-14900HX, GeForce RTX 4060 Laptop GPU, 80.1 Wh | Asus ROG Zephyrus G16 GA605WV Ryzen AI 9 HX 370, GeForce RTX 4060 Laptop GPU, 90 Wh | Average of class Gaming | |
|---|---|---|---|---|---|---|
| Battery runtime | 25% | 44% | -20% | 36% | 21% | |
| WiFi v1.3 (h) | 5.9 | 7.4 25% | 8.5 44% | 4.7 -20% | 8 36% | 7.11 ? 21% |
| H.264 (h) | 9.6 | 5.3 | 13.7 | 8.64 ? | ||
| Load (h) | 0.8 | 1.3 | 1.7 | 1.502 ? | ||
| Reader / Idle (h) | 8 | 8.71 ? |
Notebookcheck total rating
With a more powerful display and better fan control, the Acer Nitro V 16 could be a thoroughly impressive gaming laptop for the price. In its current form, however, many competitors take the edge.
Acer Nitro V 16 ANV16-41-R5AT
- 12/04/2024 v8
Florian Glaser
 Total Sustainability Score:
 Transparency
The selection of devices to be reviewed is made by our editorial team. The test sample was provided to the author as a loan by the manufacturer or retailer for the purpose of this review. The lender had no influence on this review, nor did the manufacturer receive a copy of this review before publication. There was no obligation to publish this review. As an independent media company, Notebookcheck is not subjected to the authority of manufacturers, retailers or publishers.
This is how Notebookcheck is testing
Every year, Notebookcheck independently reviews hundreds of laptops and smartphones using standardized procedures to ensure that all results are comparable. We have continuously developed our test methods for around 20 years and set industry standards in the process. In our test labs, high-quality measuring equipment is utilized by experienced technicians and editors. These tests involve a multi-stage validation process. Our complex rating system is based on hundreds of well-founded measurements and benchmarks, which maintains objectivity. Further information on our test methods can be found here.

