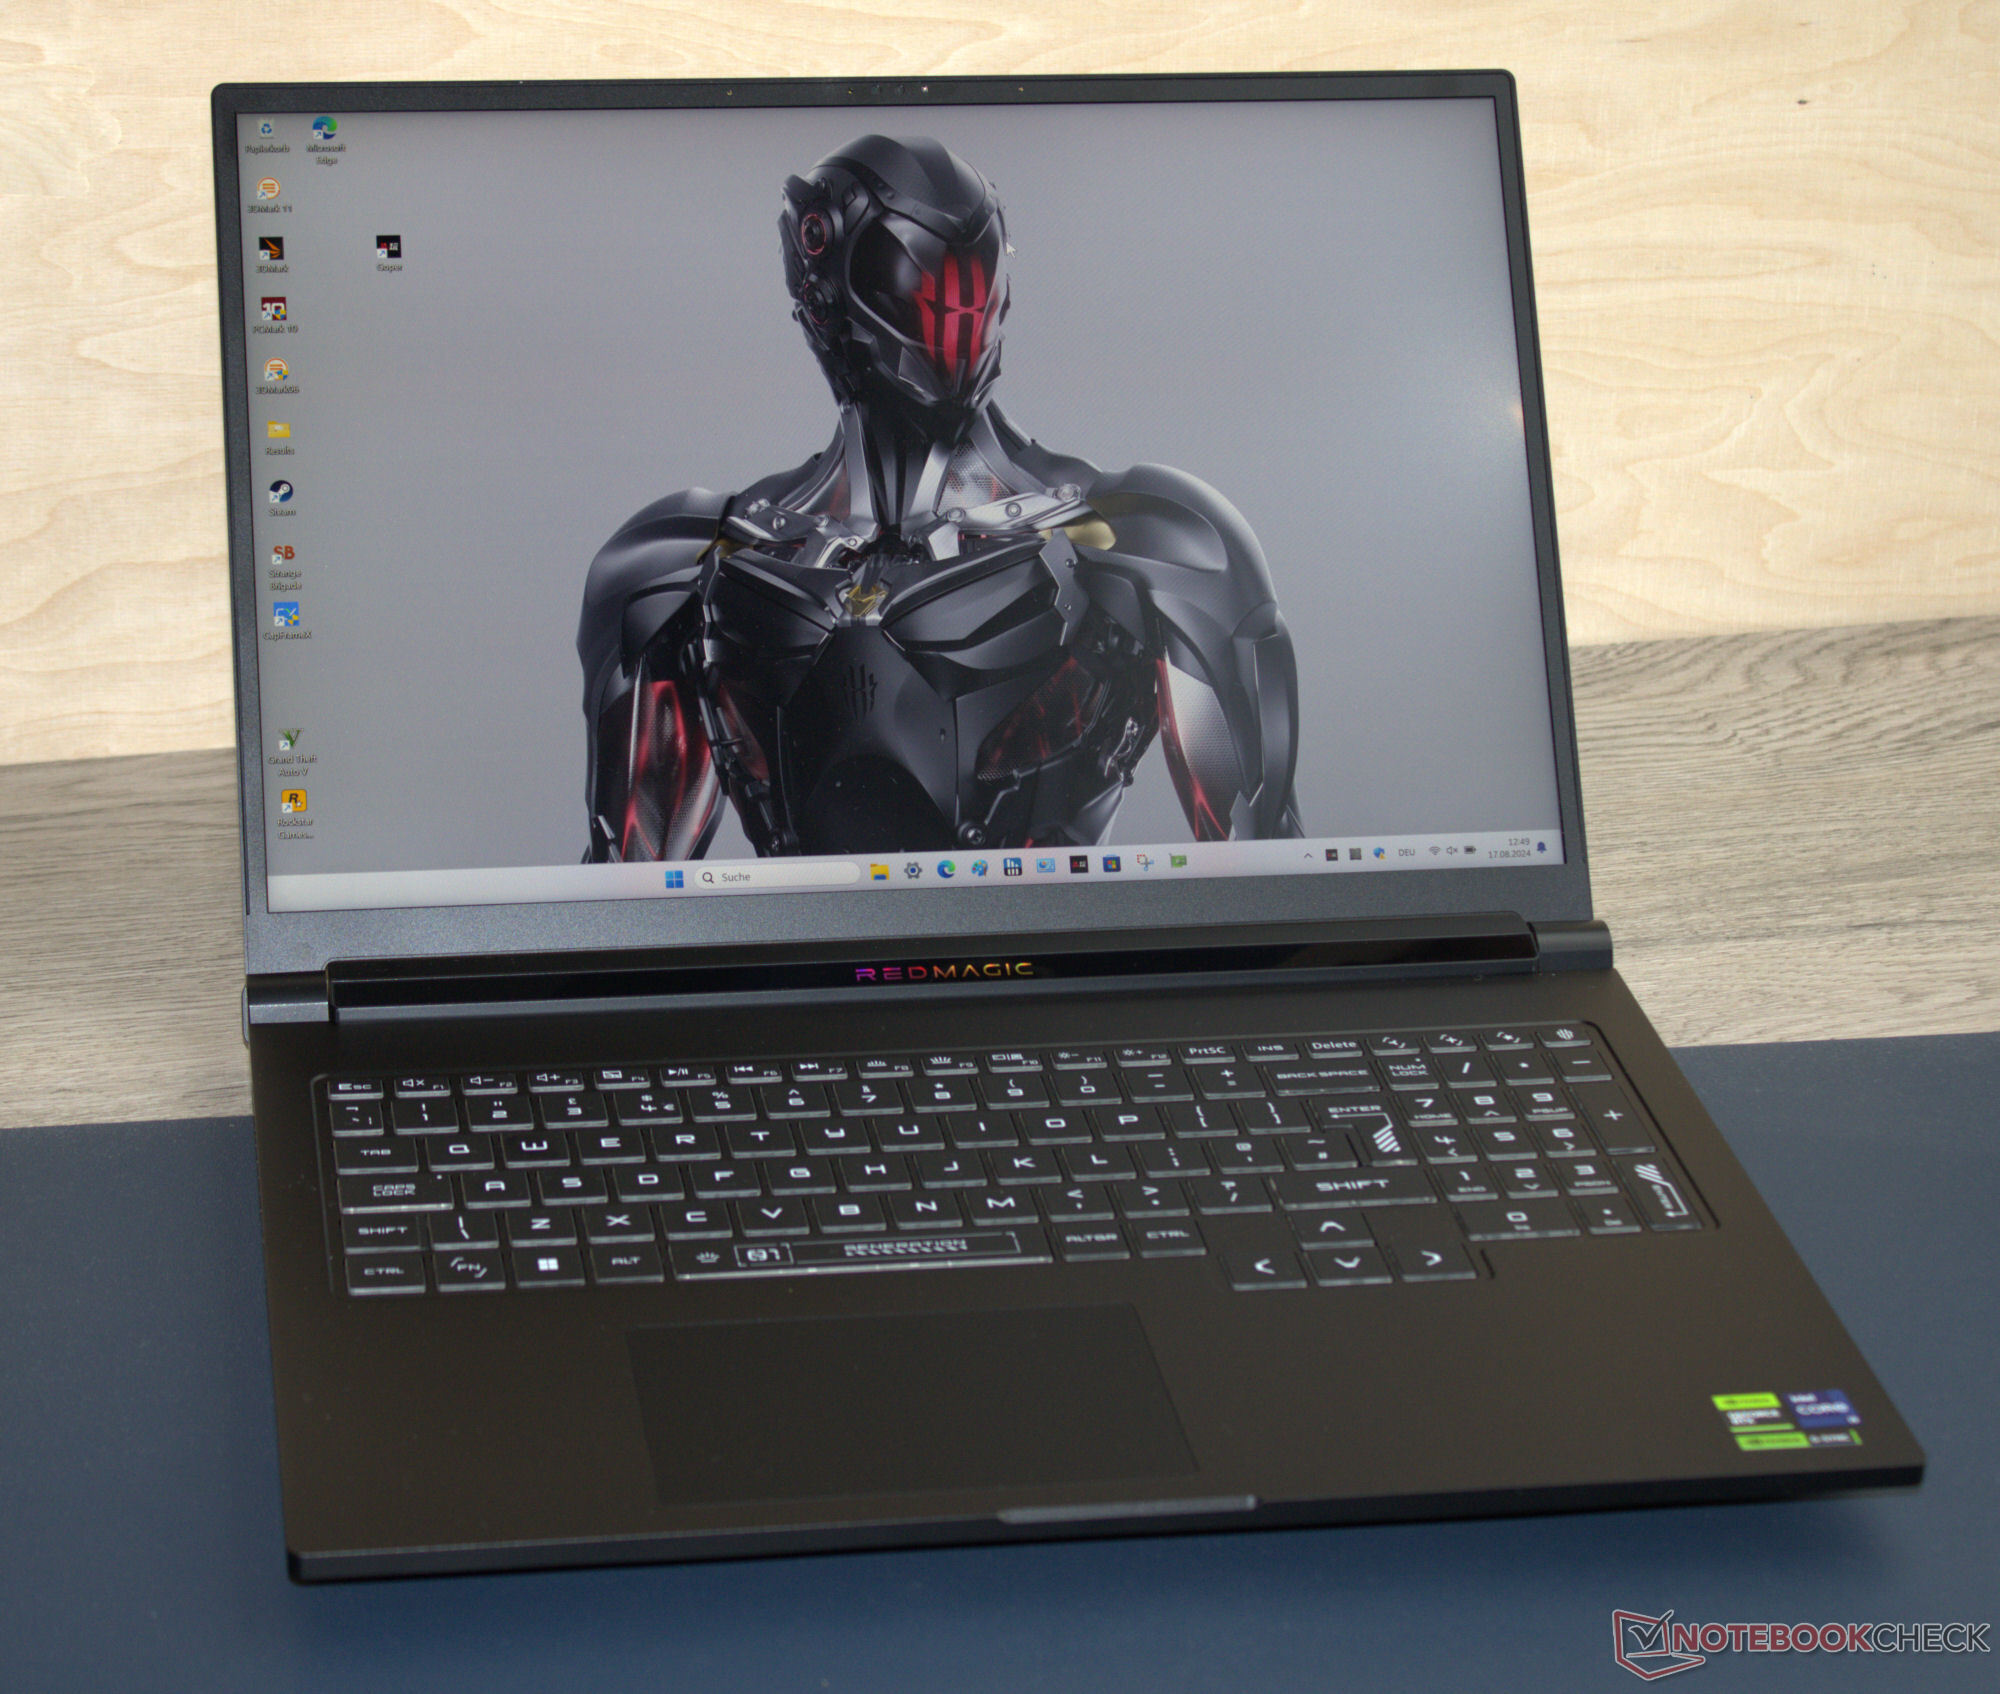
RedMagic Titan 16 Pro review: A gaming laptop made by a smartphone manufacturer

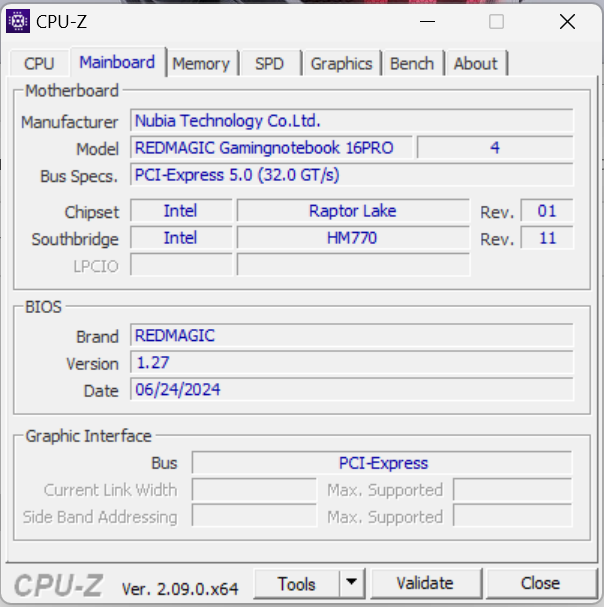
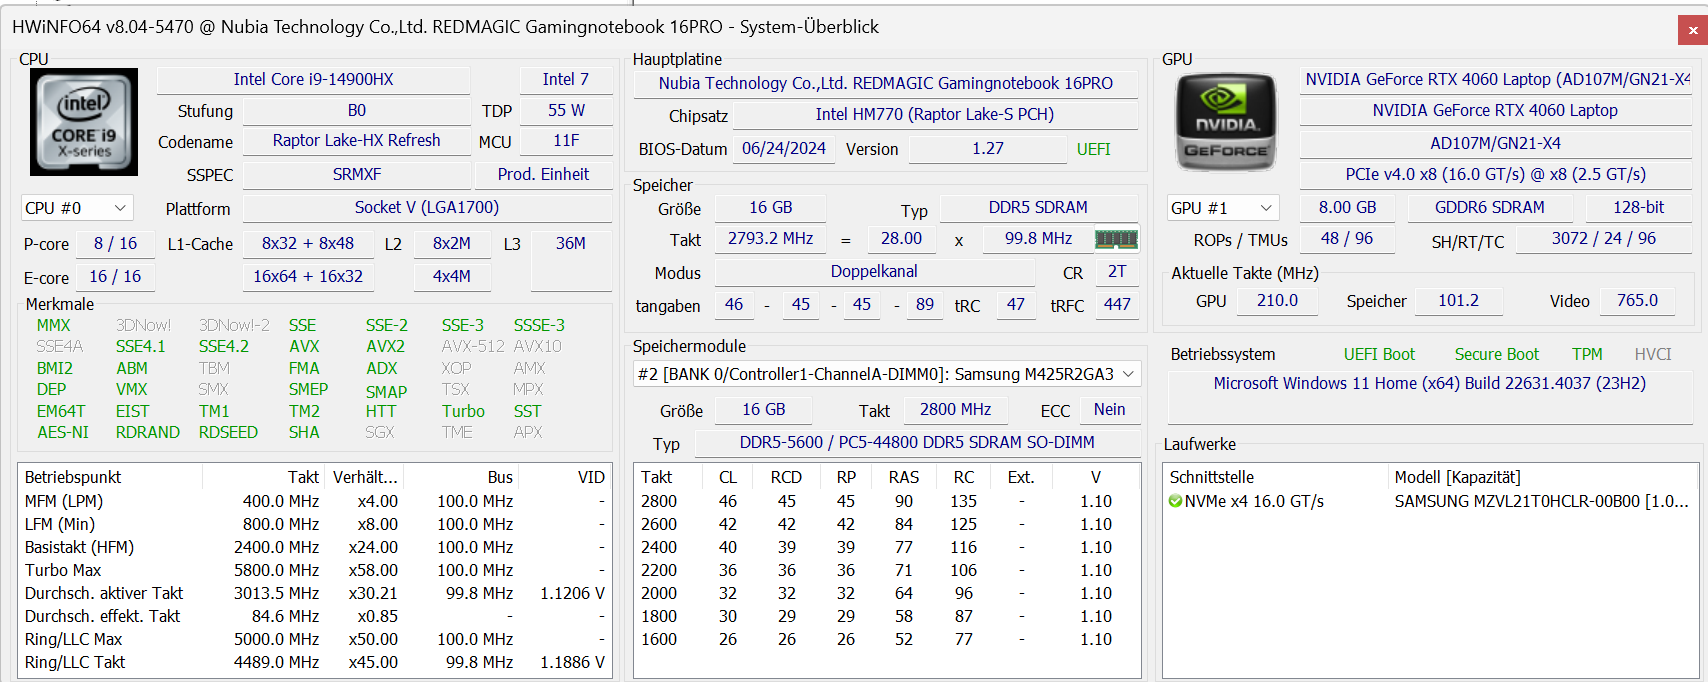
Regular visitors to this website may already be familiar with the "RedMagic" brand from the gaming smartphone segment (for example the Nubia RedMagic 9 Pro). The RedMagic Titan 16 Pro is Nubia's first foray into the gaming laptop world. Its data sheet holds no surprises: A Core i9-14900HX is paired with a GeForce RTX 4060. This is joined by a 16-inch screen with a 16:10 aspect ratio, Thunderbolt 4, DDR5 RAM and 2 SSD slots.
Whether Nubia can stand up to the already well-established competition remains to be seen. The Titan competes against the following devices: The Lenovo Legion Pro 5 16IRX9, HP Victus 16 (2024), Acer Predator Helios Neo 16 (2024), XMG Pro 16 Studio (Mid 24) and the Gigabyte G6X 9KG (2024).
Possible competitors compared
Rating | Version | Date | Model | Weight | Height | Size | Resolution | Price |
|---|---|---|---|---|---|---|---|---|
| 81.2 % | v8 | 08 / 2024 | Nubia RedMagic Titan 16 Pro i9-14900HX, GeForce RTX 4060 Laptop GPU | 2.4 kg | 23.9 mm | 16.00" | 2560x1600 | |
| 82.3 % | v8 | 07 / 2024 | Lenovo Legion Pro 5 16IRX9 G9 i7-14700HX, GeForce RTX 4060 Laptop GPU | 2.5 kg | 26.55 mm | 16.00" | 2560x1600 | |
| 84.3 % v7 (old) | v7 (old) | 05 / 2024 | HP Victus 16 (2024) i7-14700HX, GeForce RTX 4060 Laptop GPU | 2.4 kg | 23.9 mm | 16.10" | 1920x1080 | |
| 86.8 % v7 (old) | v7 (old) | 05 / 2024 | Acer Predator Helios Neo 16 (2024) i7-14700HX, GeForce RTX 4070 Laptop GPU | 2.6 kg | 25.95 mm | 16.00" | 2560x1600 | |
| 81.2 % | v8 | 07 / 2024 | Schenker XMG Pro 16 Studio (Mid 24) i9-14900HX, GeForce RTX 4070 Laptop GPU | 2.3 kg | 19.9 mm | 16.00" | 2560x1600 | |
| 83.2 % v7 (old) | v7 (old) | 03 / 2024 | Gigabyte G6X 9KG (2024) i7-13650HX, GeForce RTX 4060 Laptop GPU | 2.6 kg | 25.1 mm | 16.00" | 1920x1200 |
Please note: We have recently updated our rating system and the results of version 8 are not comparable with the results of version 7. More information is available here.
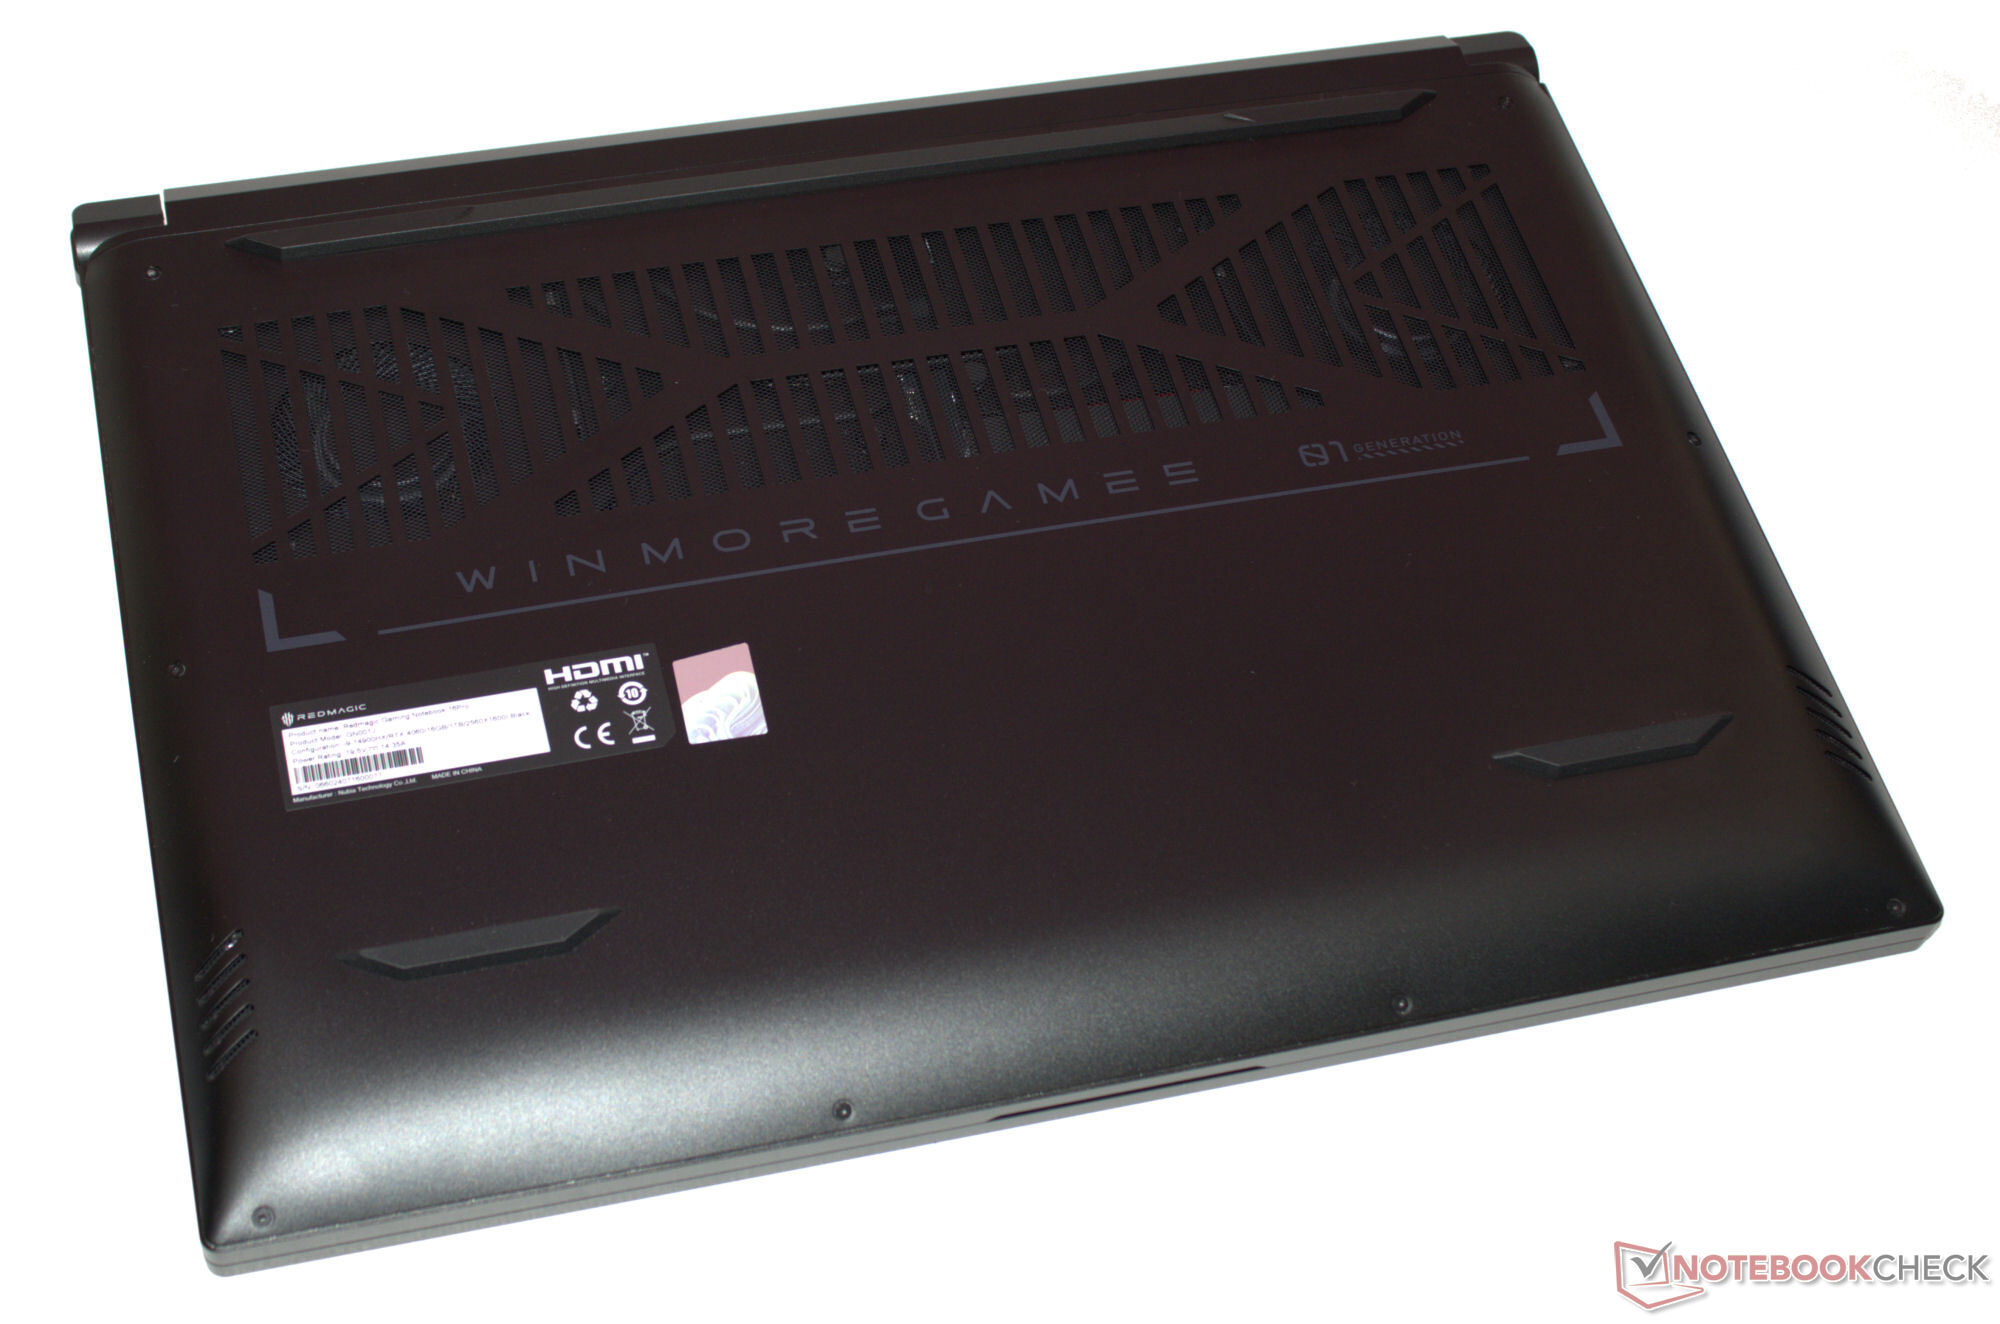
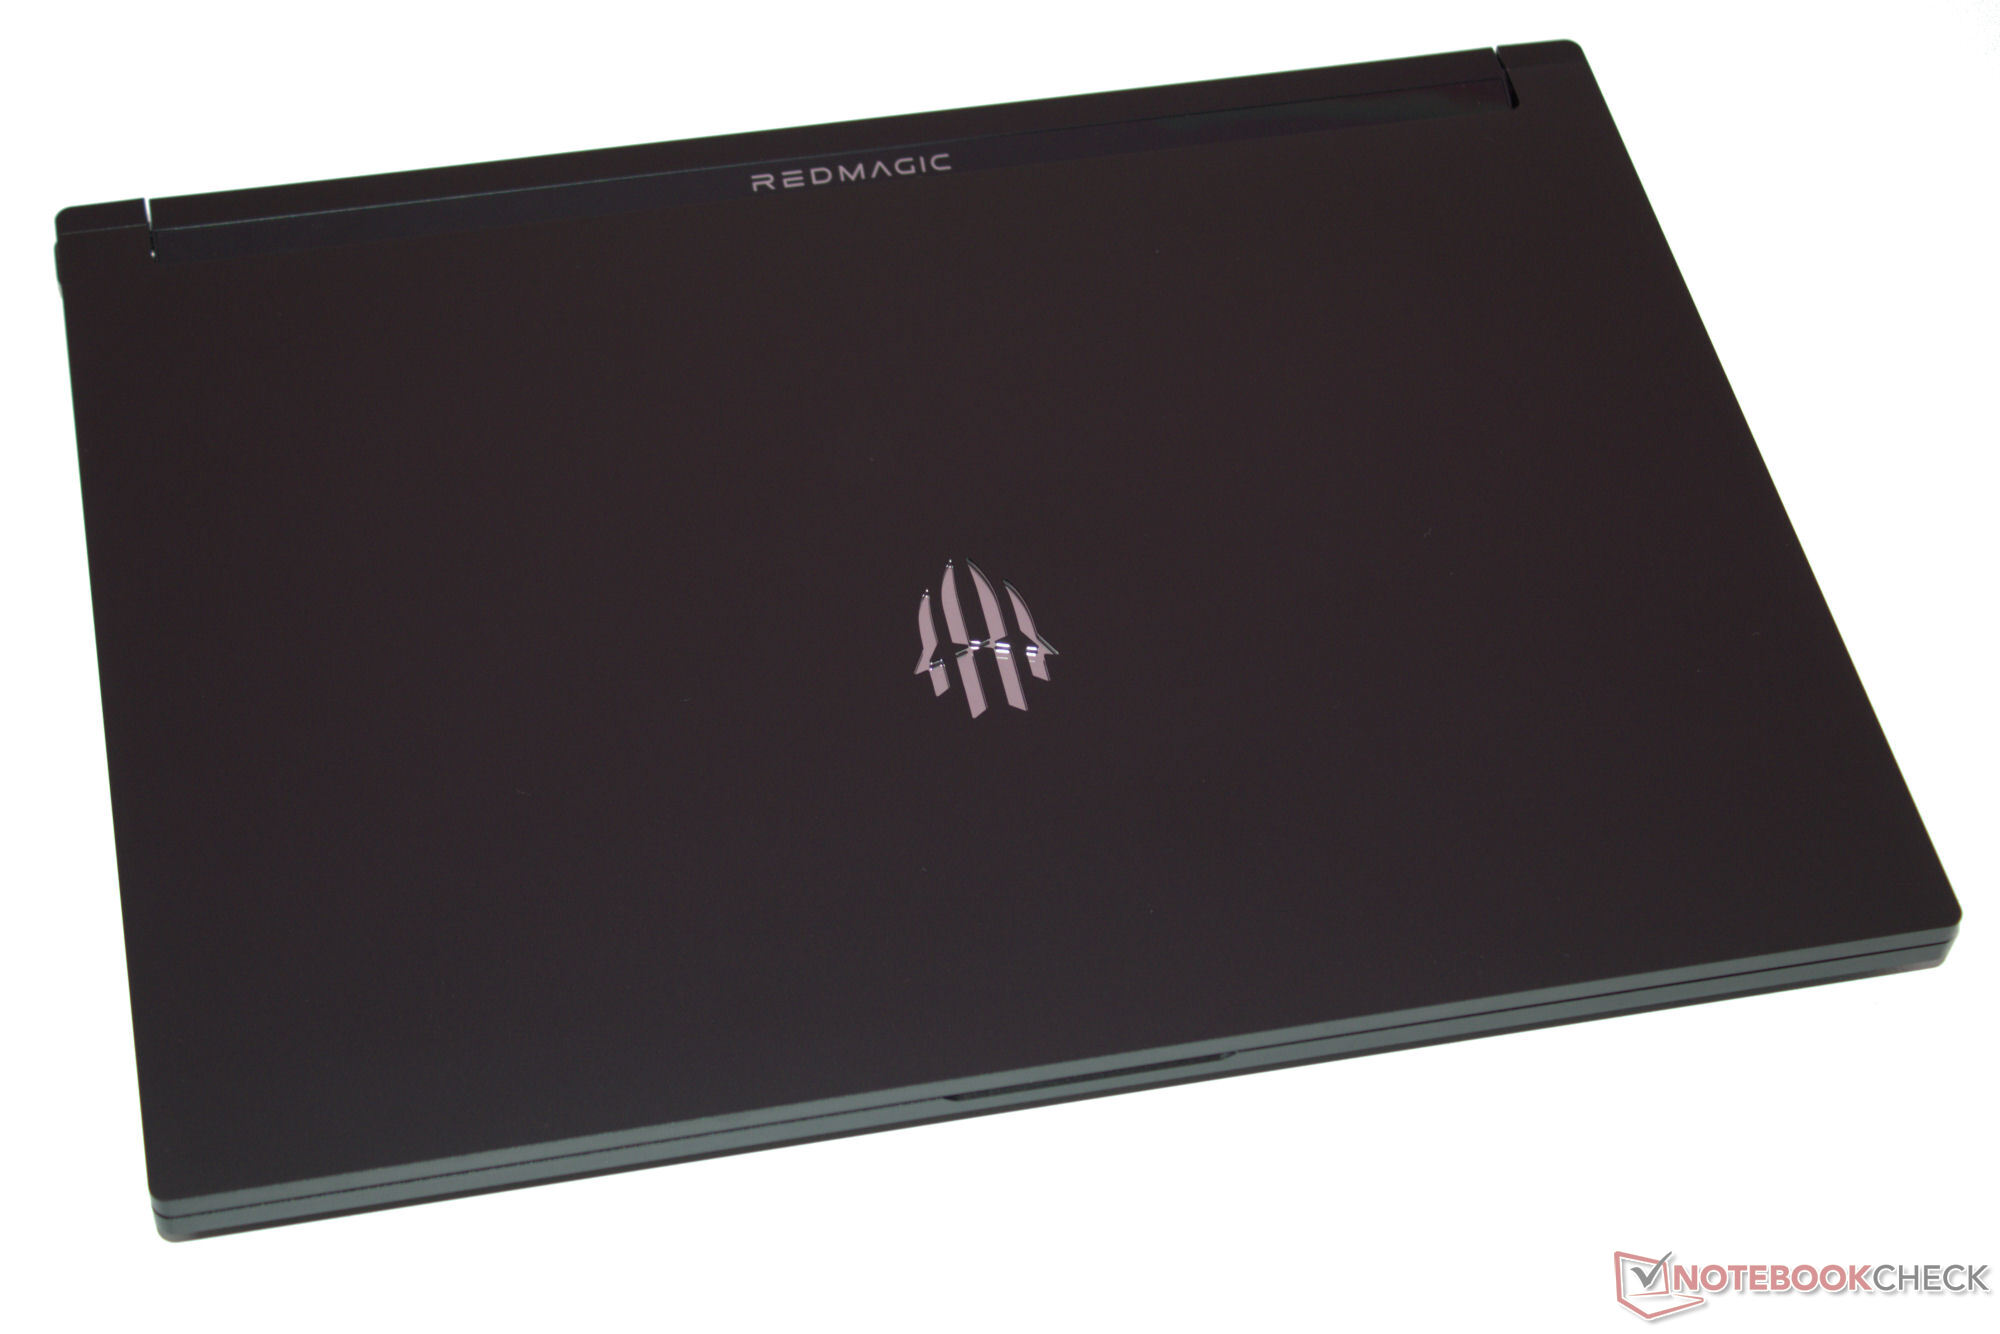
Case - Nubia has gone for an aluminum case
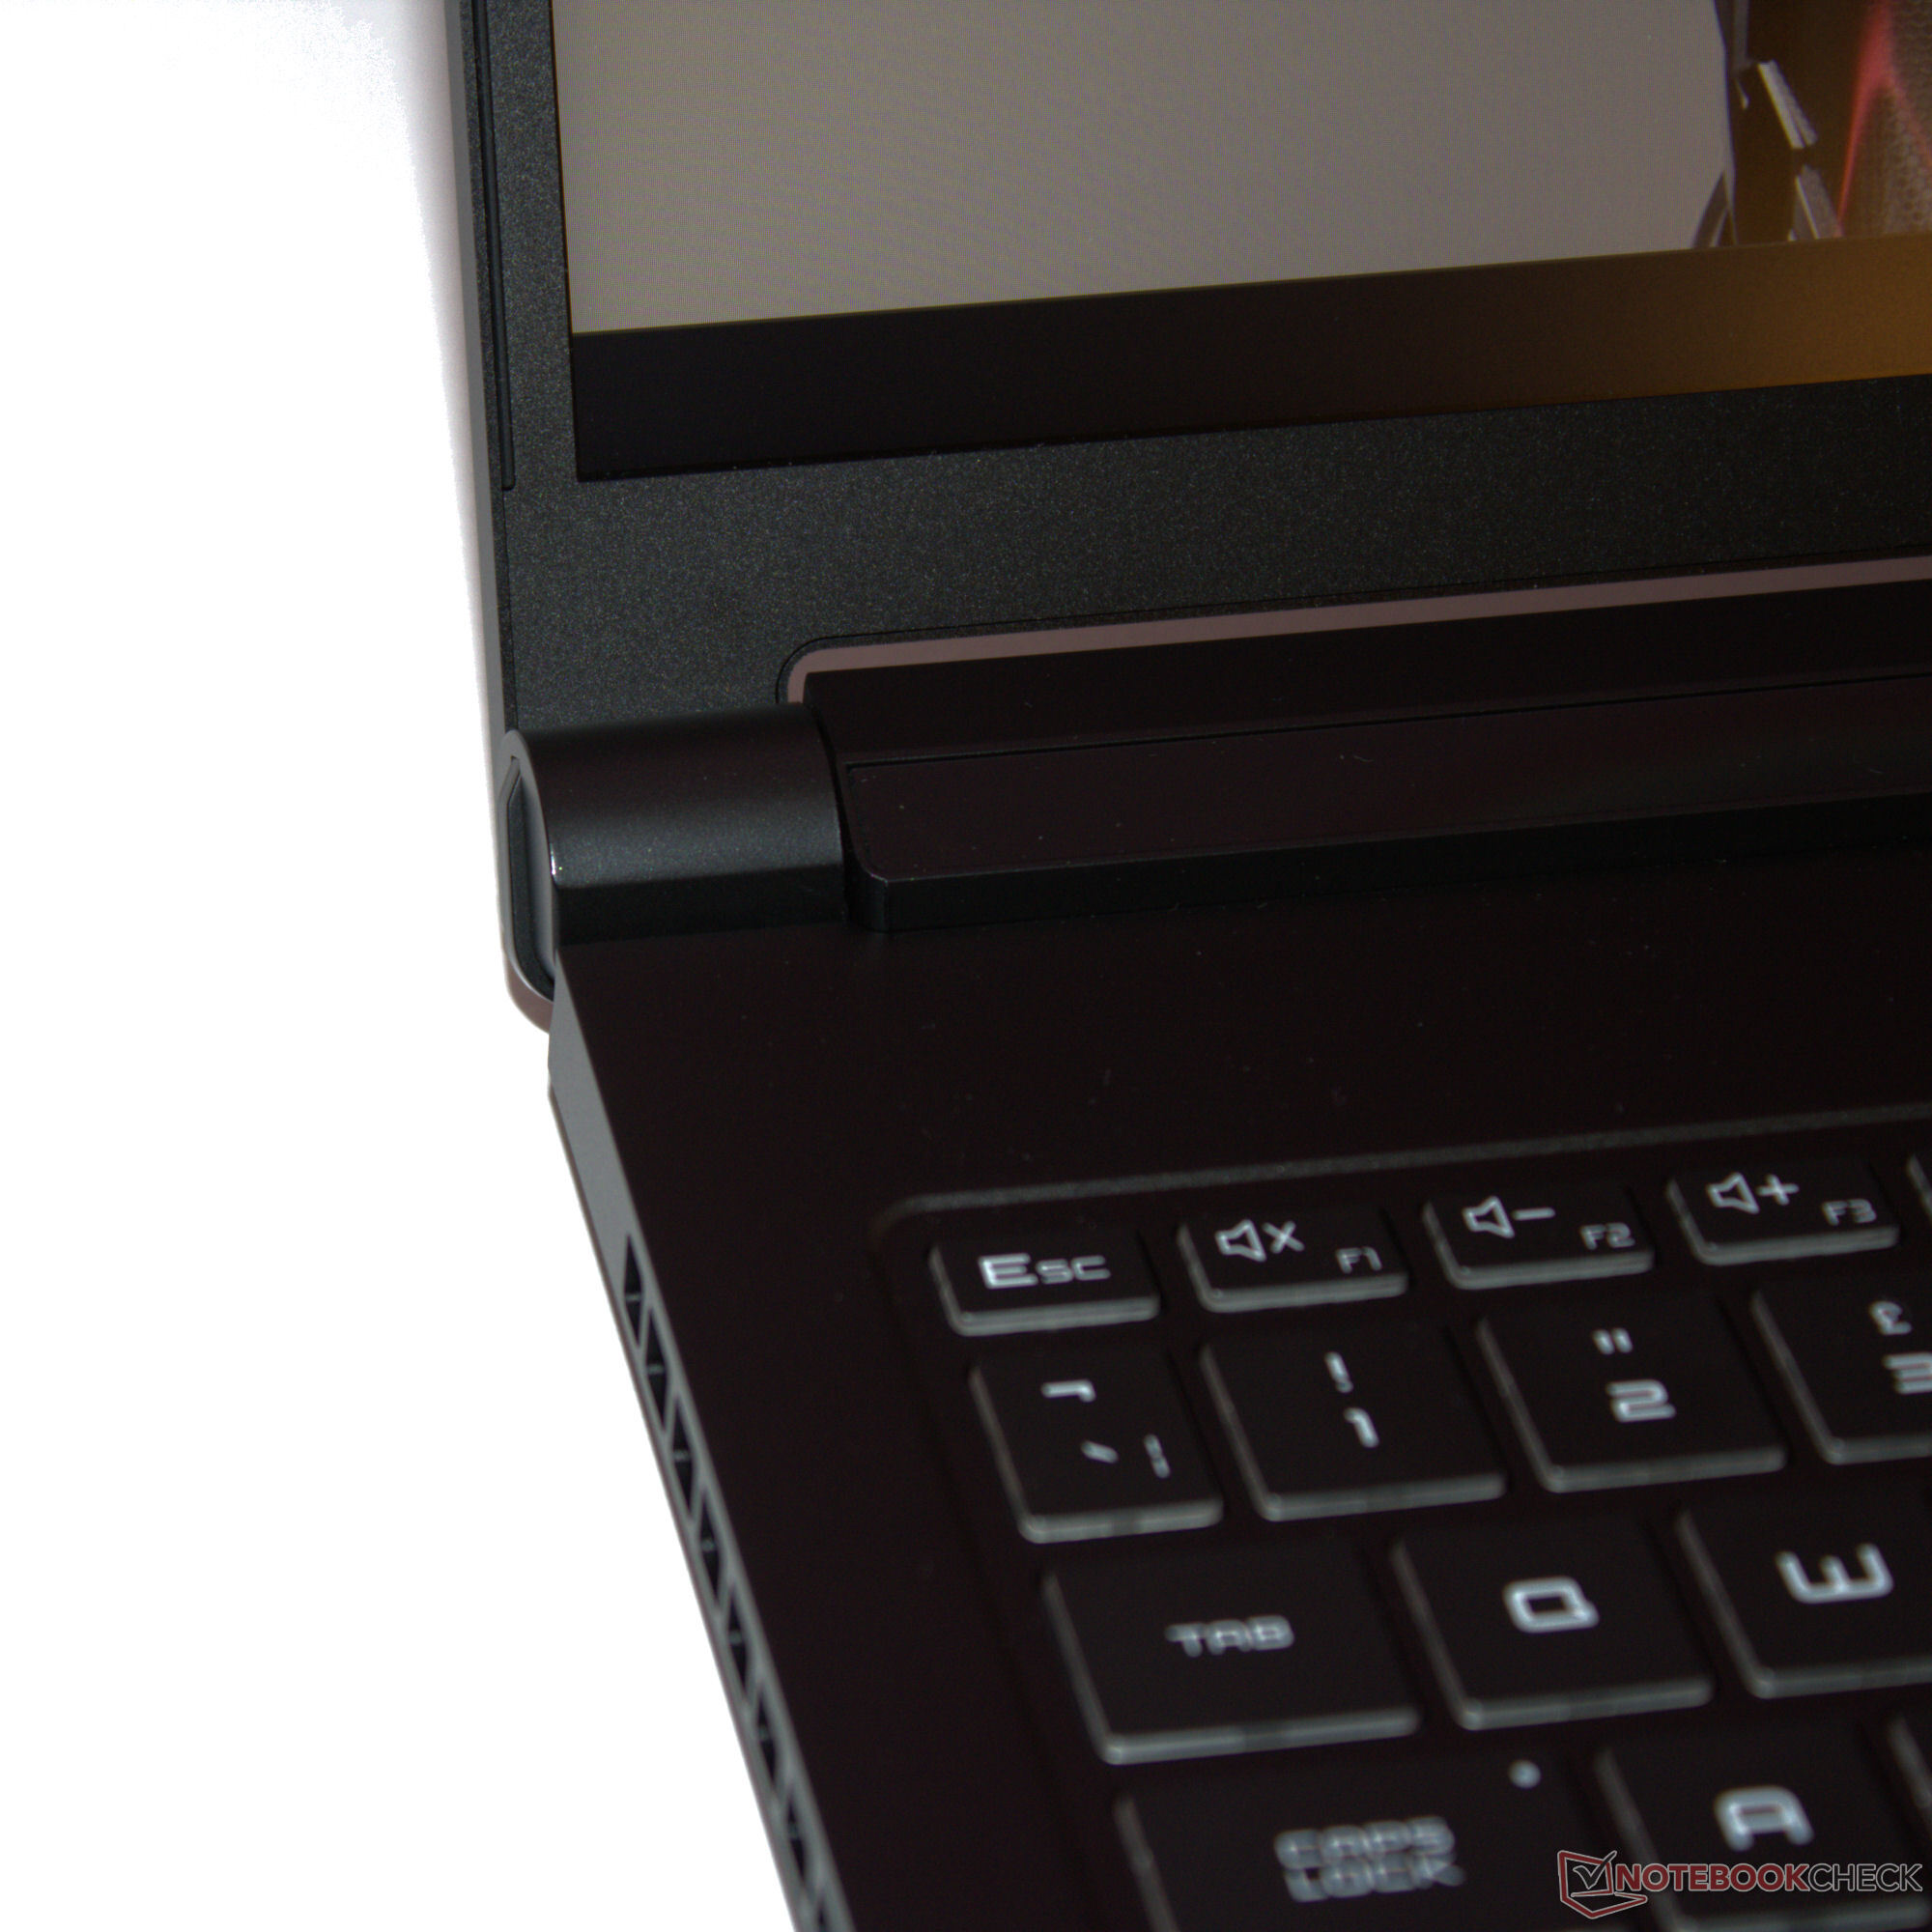
You should always keep a cleaning cloth nearby: The matte-black case's surfaces are super sensitive to collecting fingerprint marks. The aluminum case's base unit and lid can only be twisted a small amount and we didn't encounter any build errors. Applying pressure to the back of the lid doesn't result in any image changes. The very tight hinges hold the lid firmly in position and it only wobbles minimally. Its maximum opening angle is 130 degrees and you can open it with one hand.
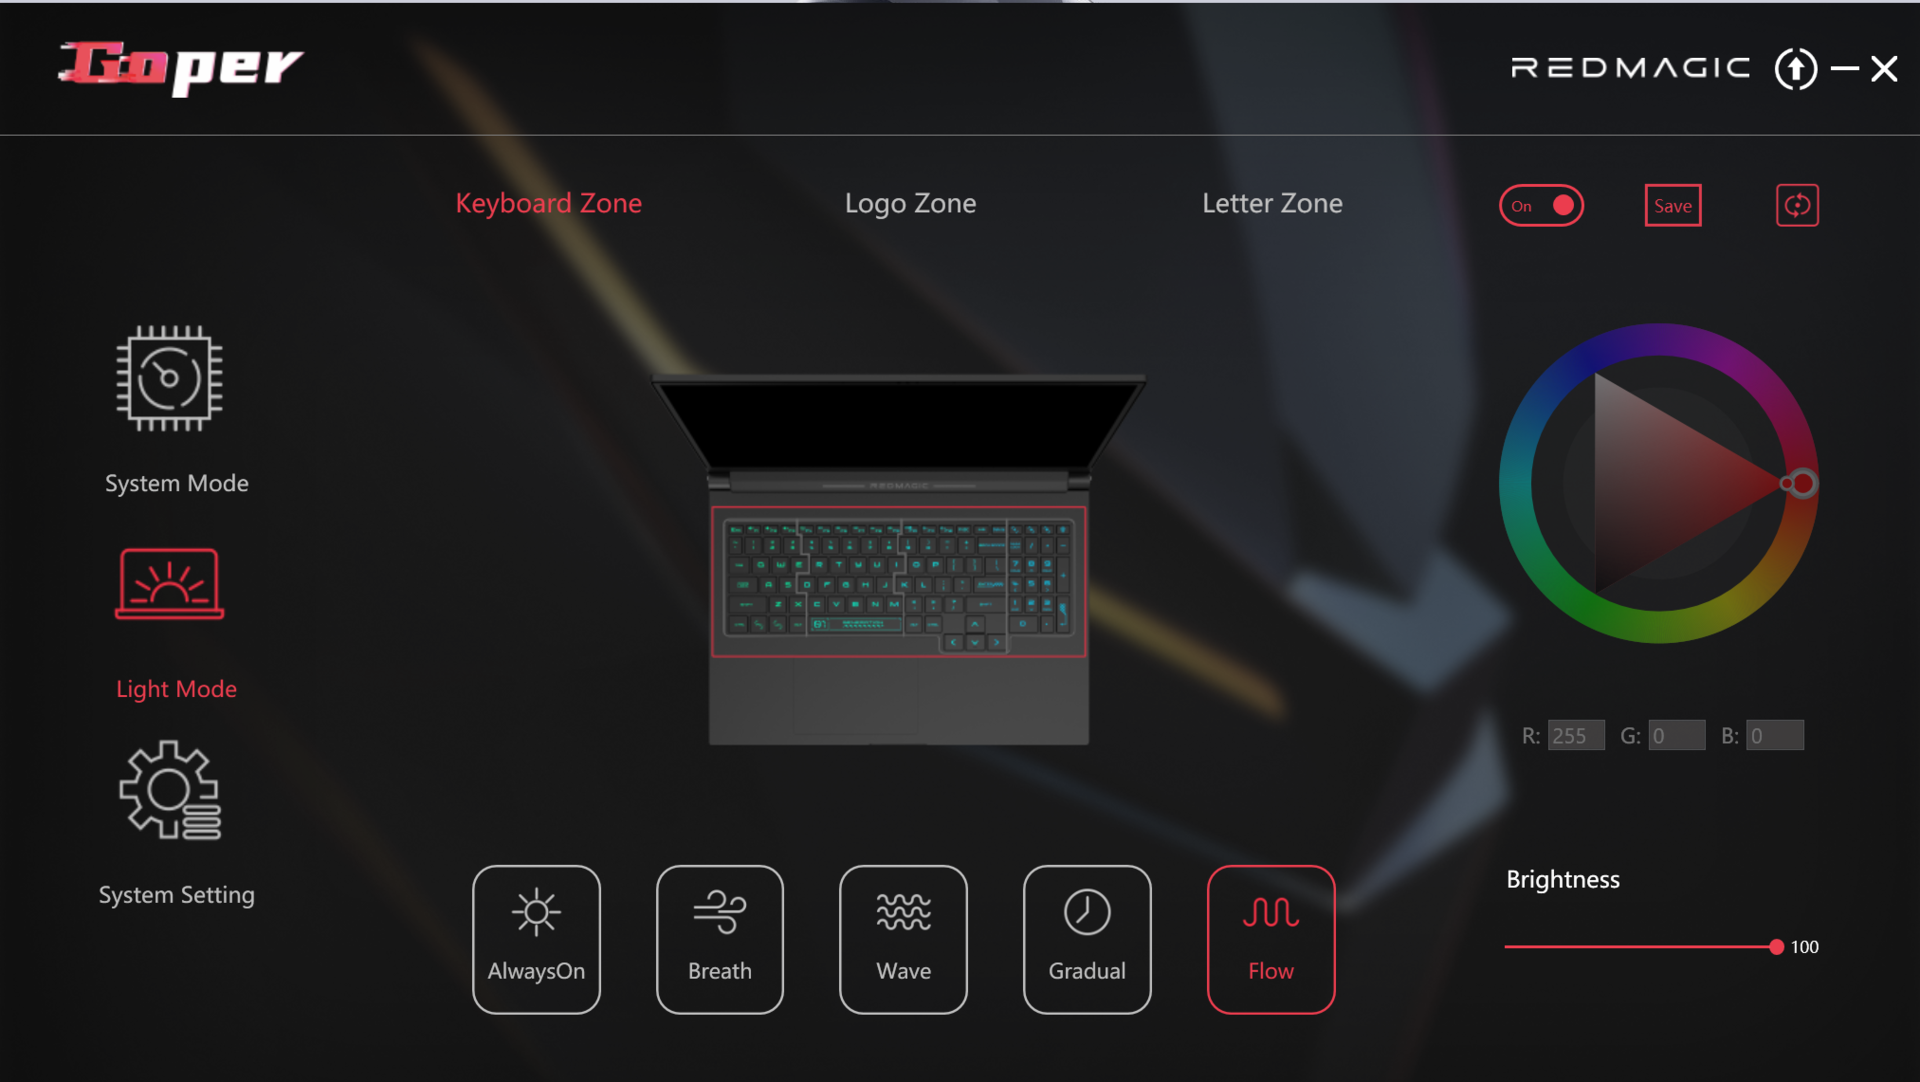
Along with the laptop's backlit keyboard, two LED elements bring some color into the mix: The RedMagic lettering on the hinge cover and the logo on the lid shine in all the colors of the rainbow. All elements can be controlled individually. The lettering also serves as a battery indicator: a red flashing light indicates a low charge level.
Within the comparison field, the Titan proves to be one of the most compact and lightweight devices. Even so, the differences compared to the competition are pretty small.
Connectivity - The Titan features Thunderbolt 4
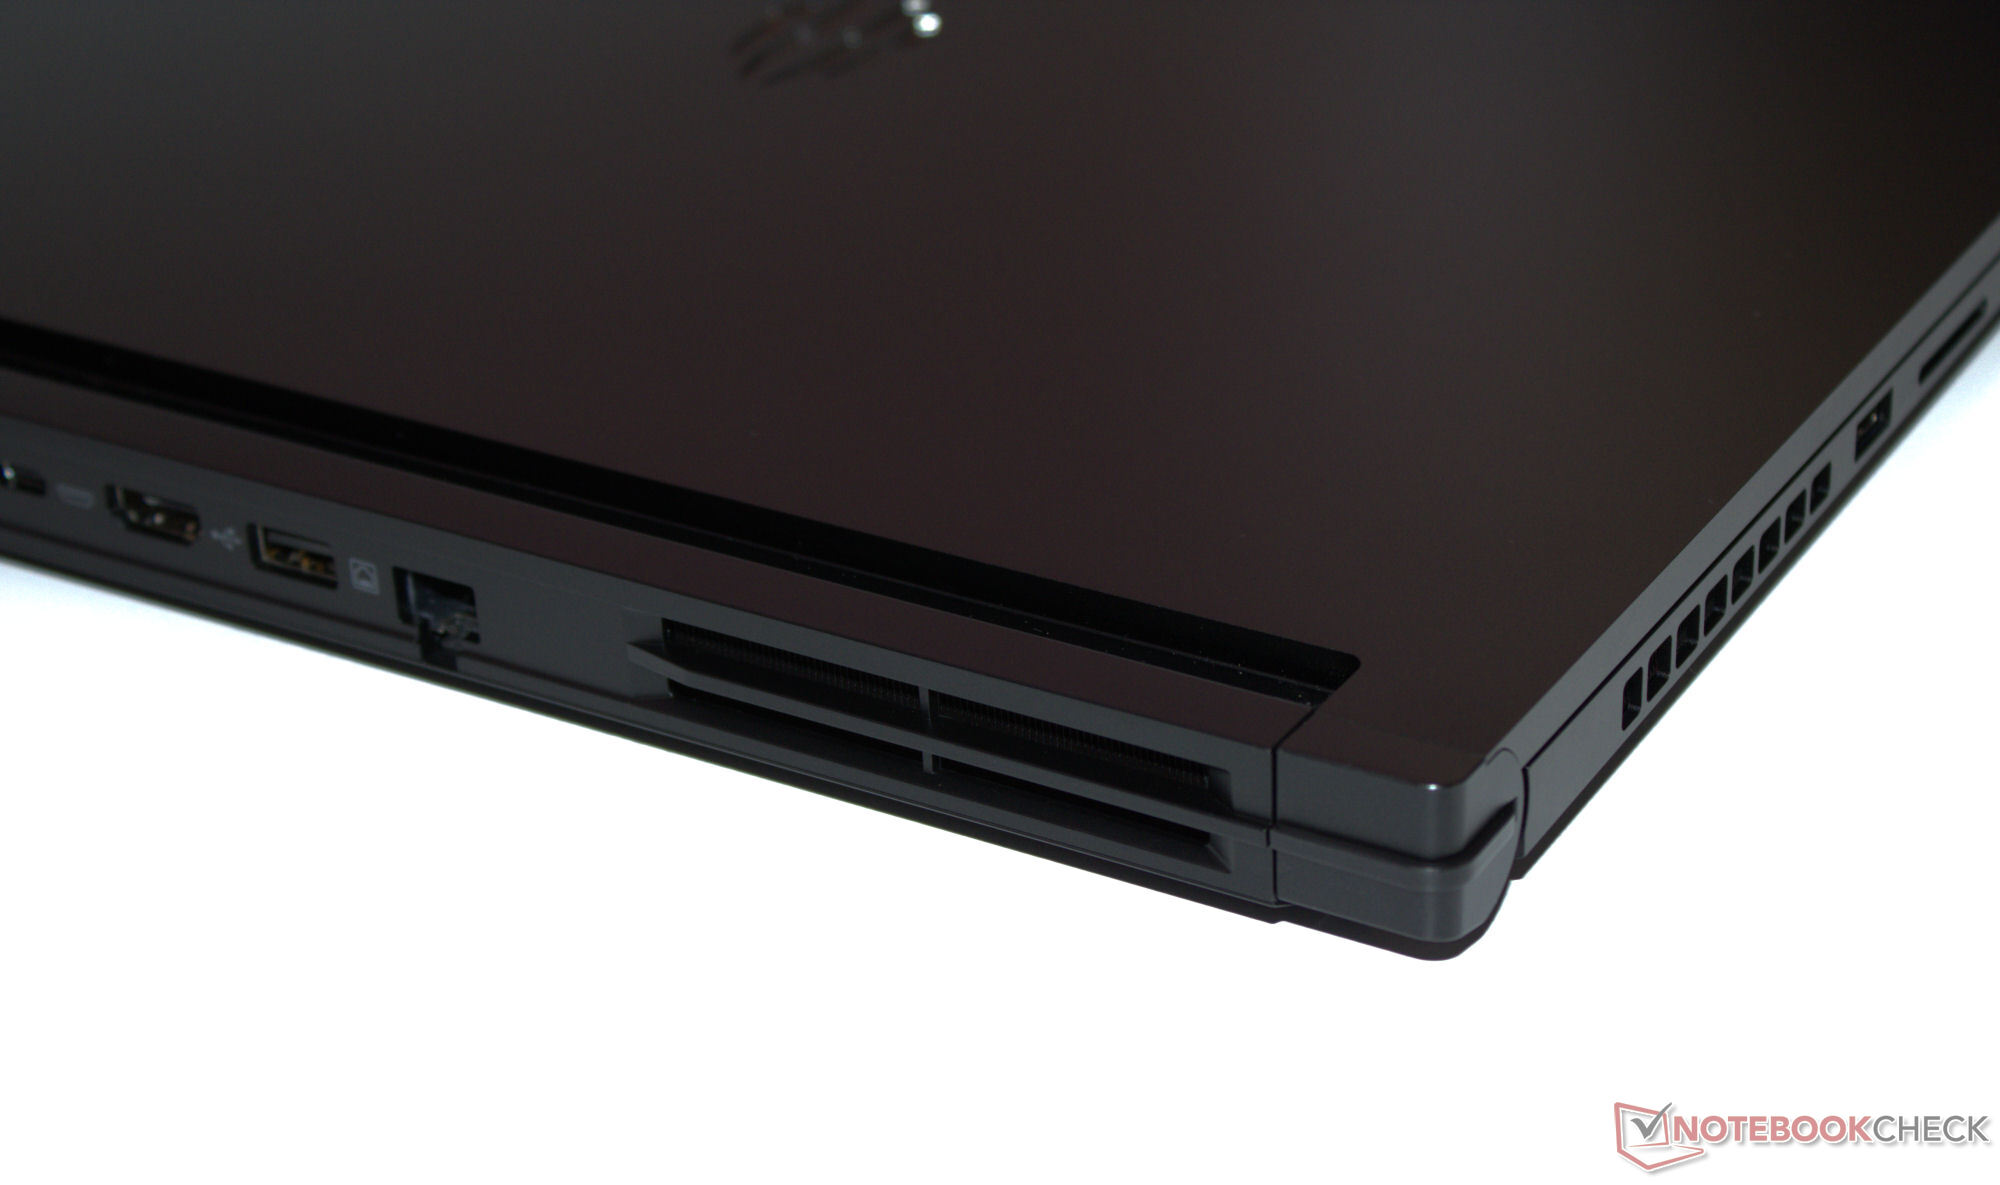
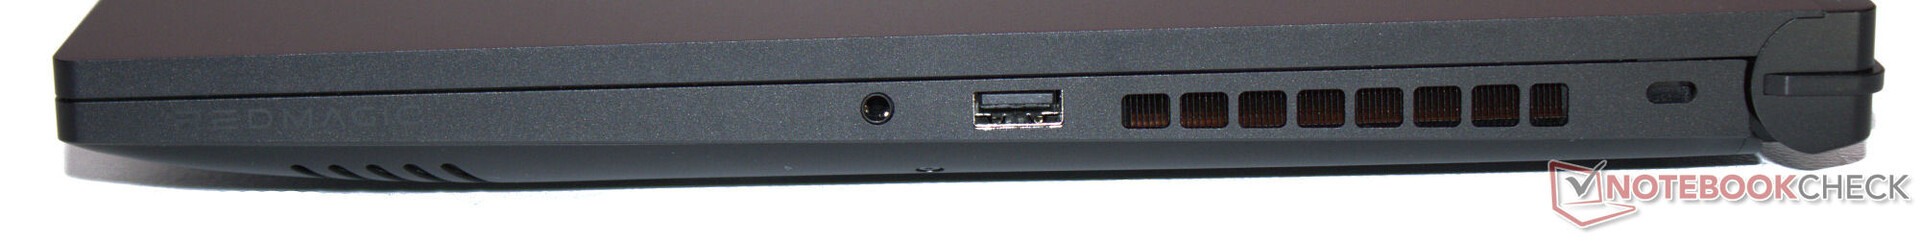
The Titan is equipped with three USB-A ports (2x USB 3.2 Gen 2, 1x USB 3.2 Gen 1) as well as one USB-C port (Thunderbolt 4). The latter supports Power Delivery and DP Alt mode. It has a total of two video outputs (1x HDMI, 1x DP). An audio jack and an ethernet port (1 GBit/s) round out its total package.
The video outputs, network socket and power connection are all situated on the back of the device, so corresponding cables shouldn't get in your way during use. A positive is that there is a USB-A port on the left and right side of the laptop.
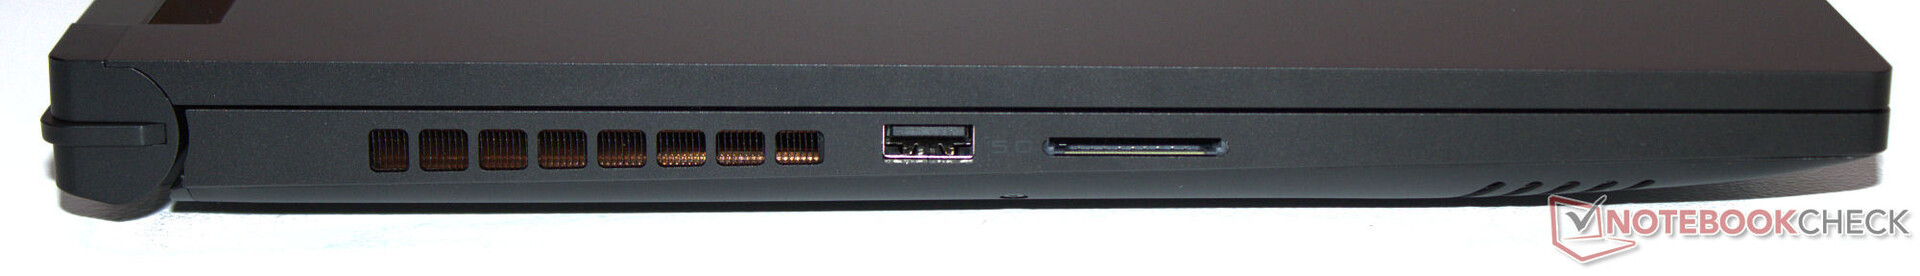
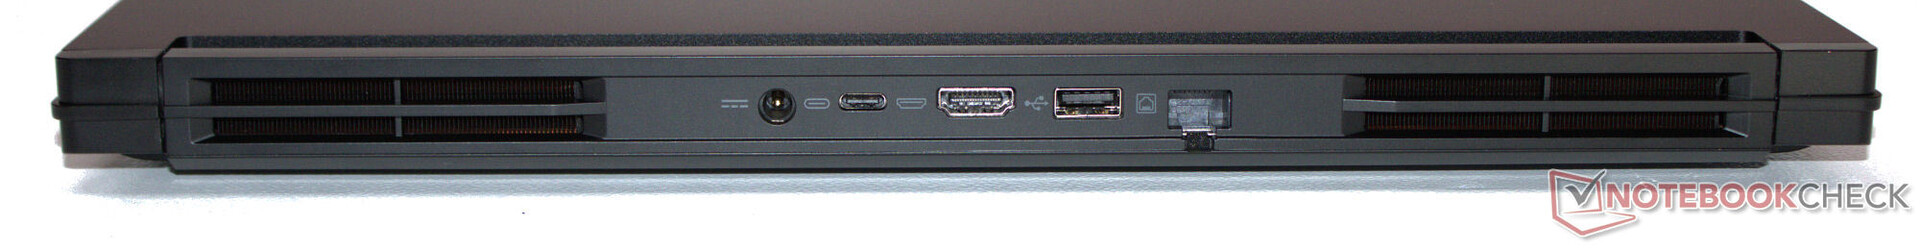
SD card reader
The SD card reader (reference card: AV PRO microSD 128 GB V60) isn't one of the fastest of its kind but it delivers solid data rates in the medium-fast range. Comparing this with the values of the Blade 16 (2024) proves that significantly higher transfer rates could be possible.
| SD Card Reader | |
| average JPG Copy Test (av. of 3 runs) | |
| Razer Blade 16 2024, RTX 4090 | |
| Average of class Gaming (20.9 - 210, n=54, last 2 years) | |
| Schenker XMG Pro 16 Studio (Mid 24) (AV PRO microSD 128 GB V60) | |
| Nubia RedMagic Titan 16 Pro (AV PRO microSD 128 GB V60) | |
| Acer Predator Helios Neo 16 (2024) (AV PRO microSD 128 GB V60) | |
| maximum AS SSD Seq Read Test (1GB) | |
| Razer Blade 16 2024, RTX 4090 | |
| Average of class Gaming (25.5 - 261, n=51, last 2 years) | |
| Schenker XMG Pro 16 Studio (Mid 24) (AV PRO microSD 128 GB V60) | |
| Nubia RedMagic Titan 16 Pro (AV PRO microSD 128 GB V60) | |
| Acer Predator Helios Neo 16 (2024) (AV PRO microSD 128 GB V60) | |
Communication
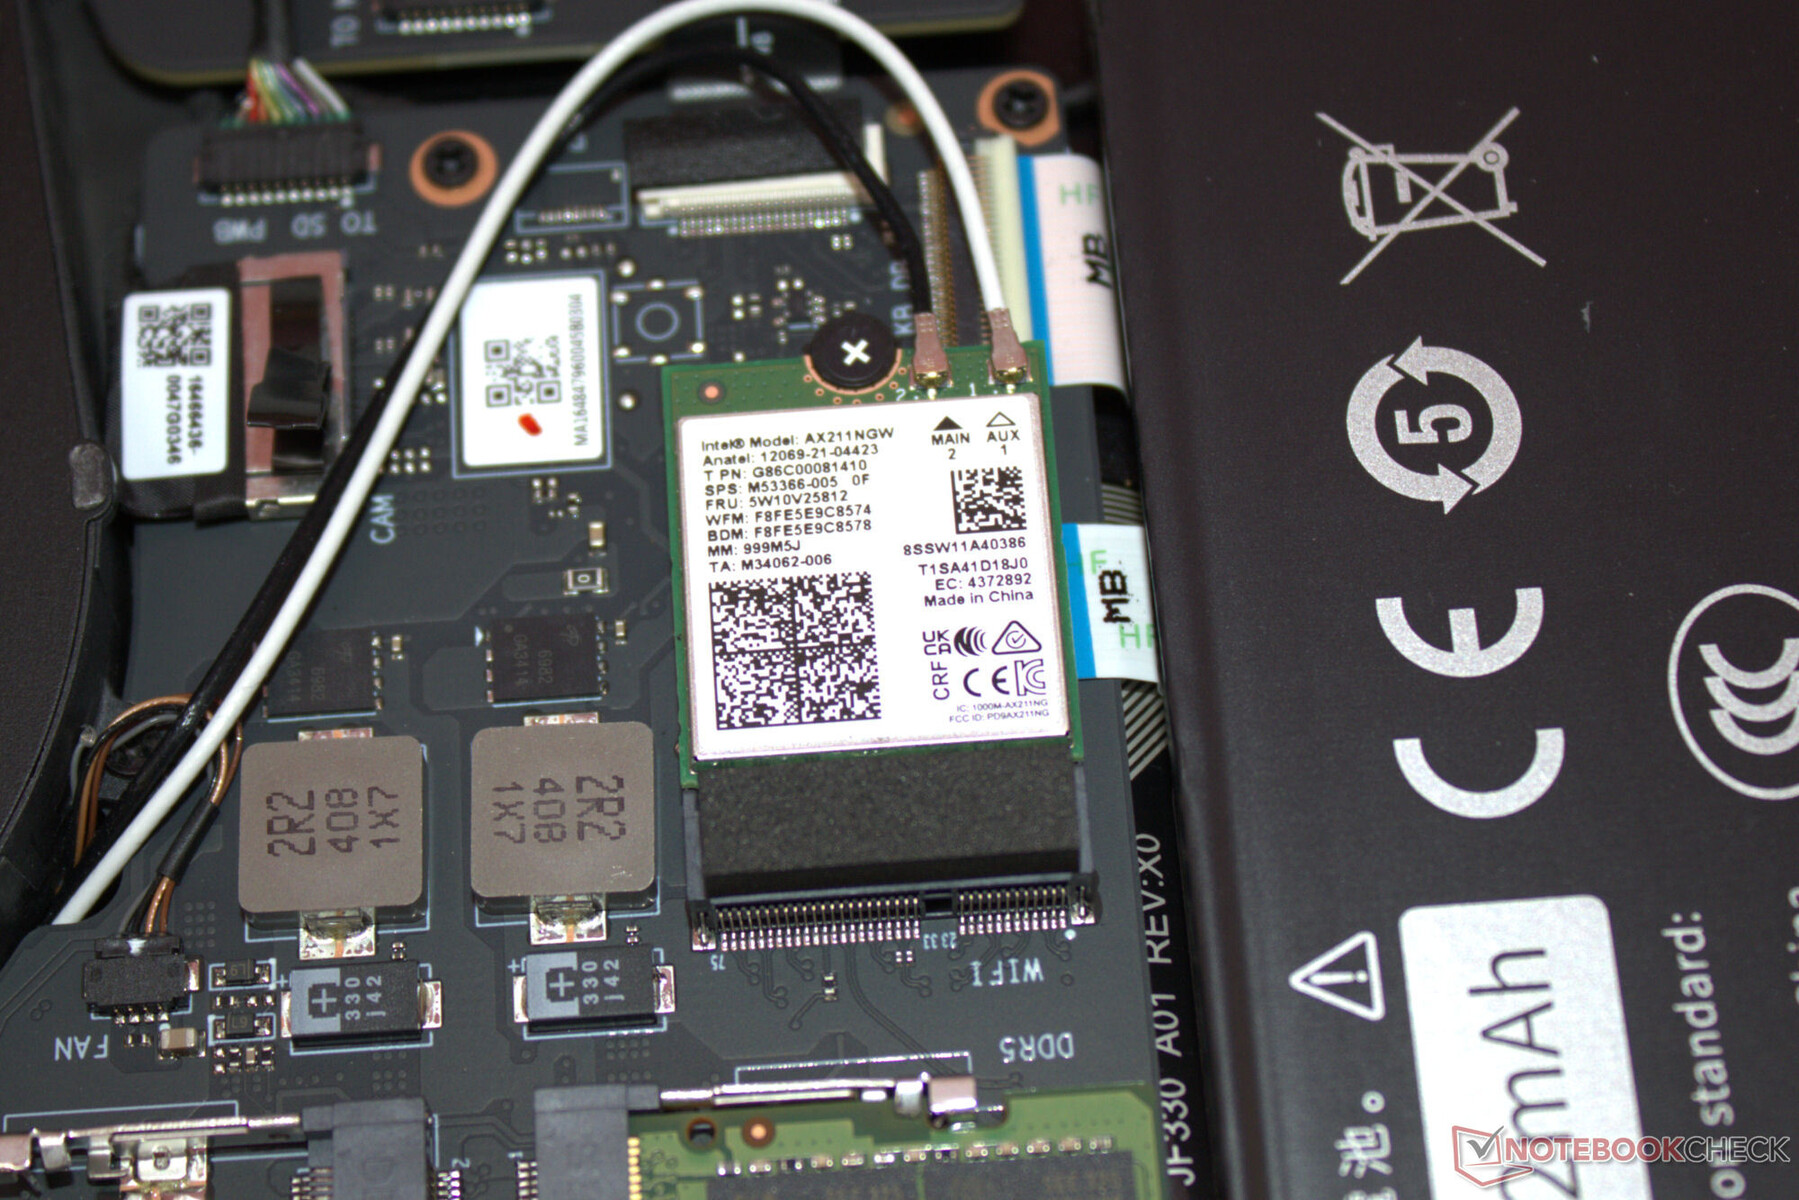
There are no surprises when it comes to its network options: Wired connections are handled by an established Gigabit Ethernet controller (RTL8168/8111, 1 GBit/s) from Realtek. Intel's WiFi 6E chip (AX211) delivers good to very good data rates under optimal conditions (no WiFi devices in the vicinity, short distance between laptop and server).
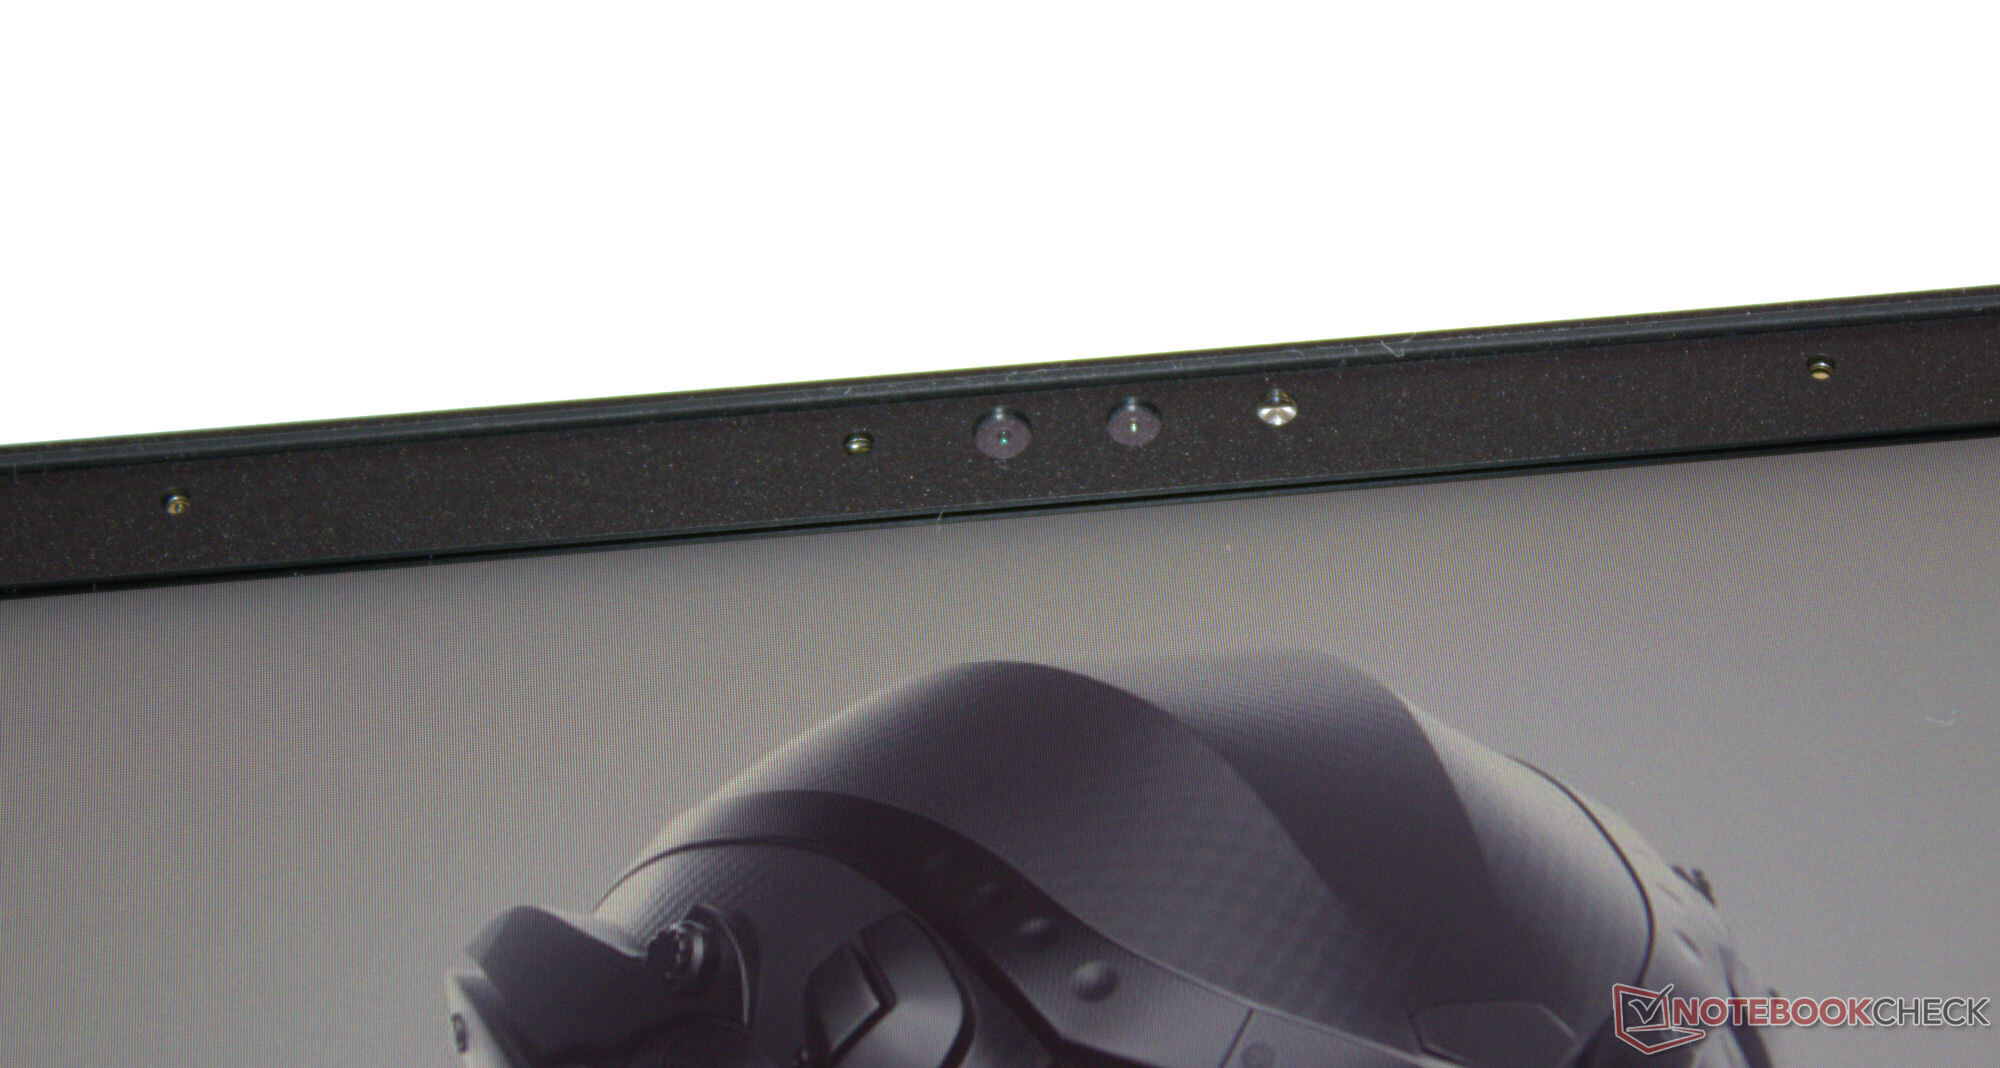
Webcam
The webcam (2.1 MP) is a standard affair, including support for Windows Hello. The camera doesn't have a mechanical cover or a physical on/off switch.


Accessories
Aside from the usual documents (quick-start guide and warranty information), no additional accessories are included with the laptop.
Maintenance
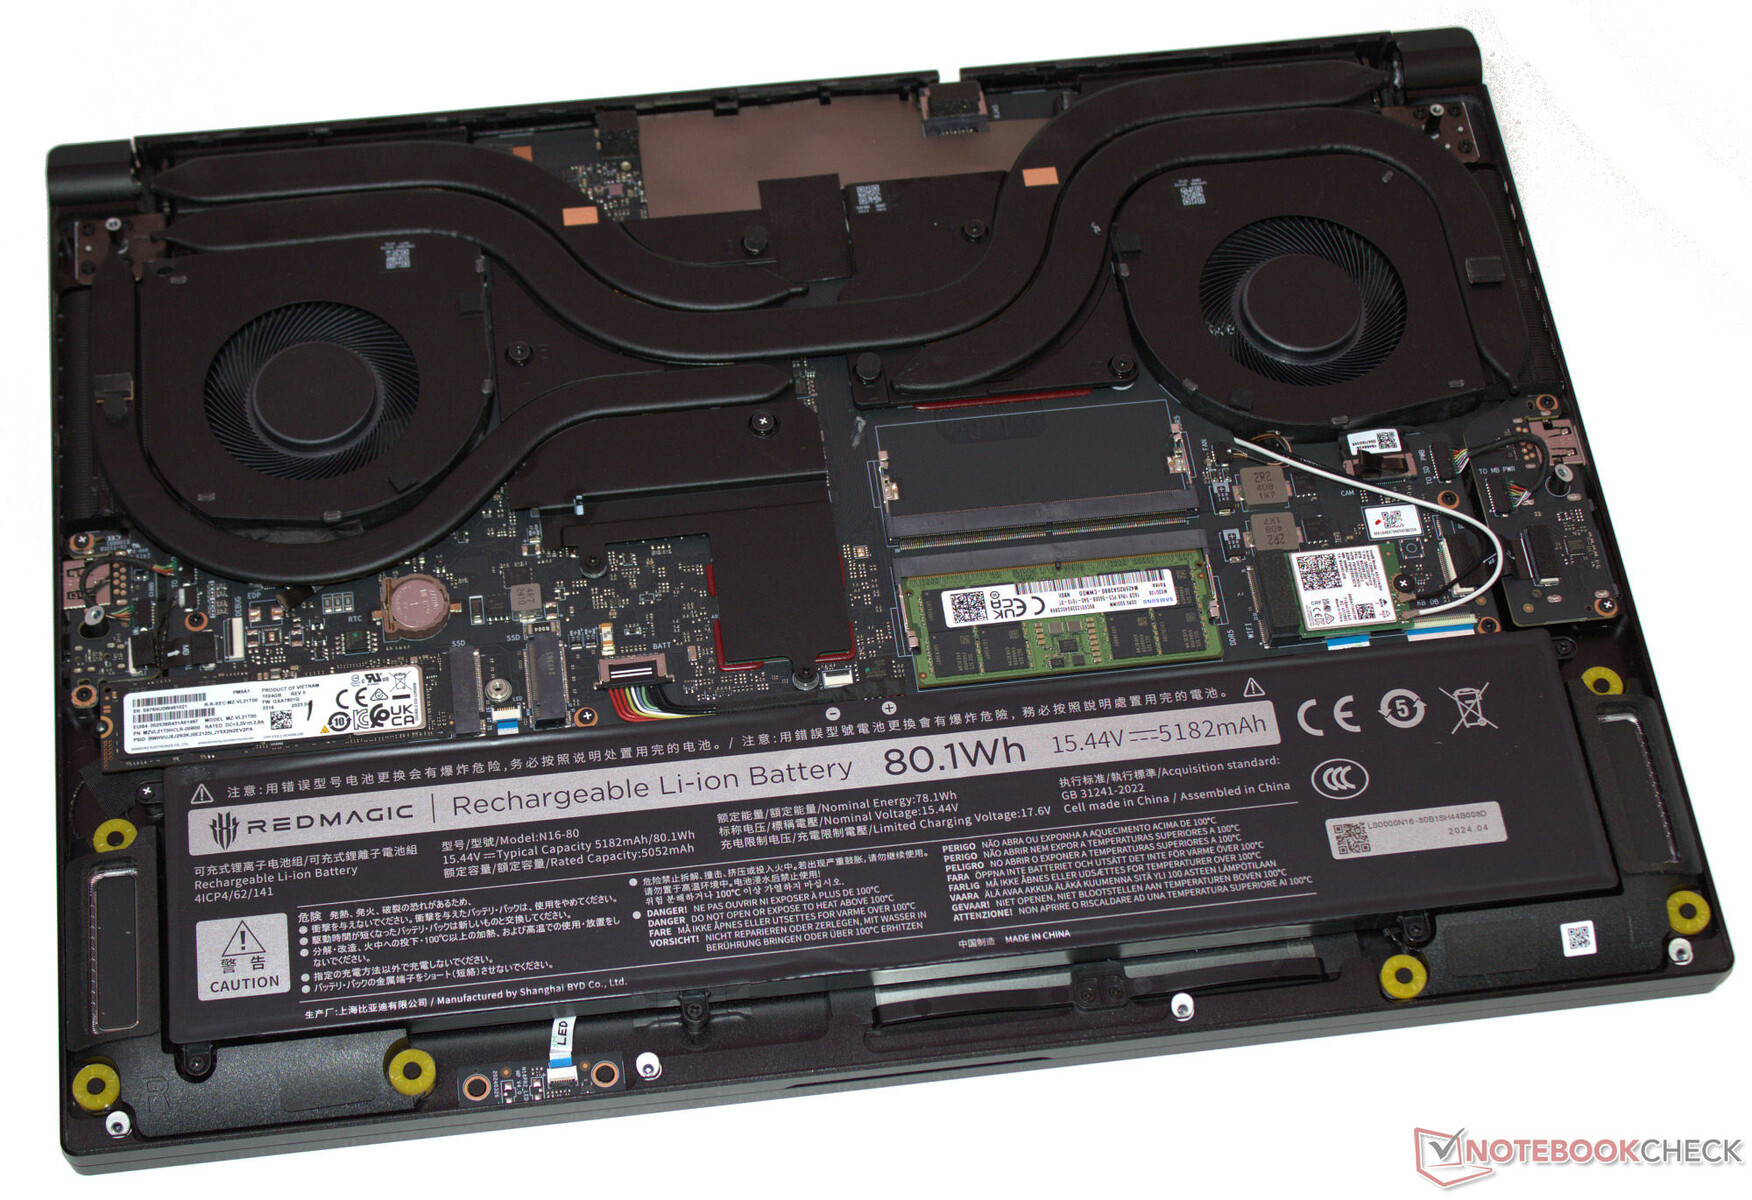
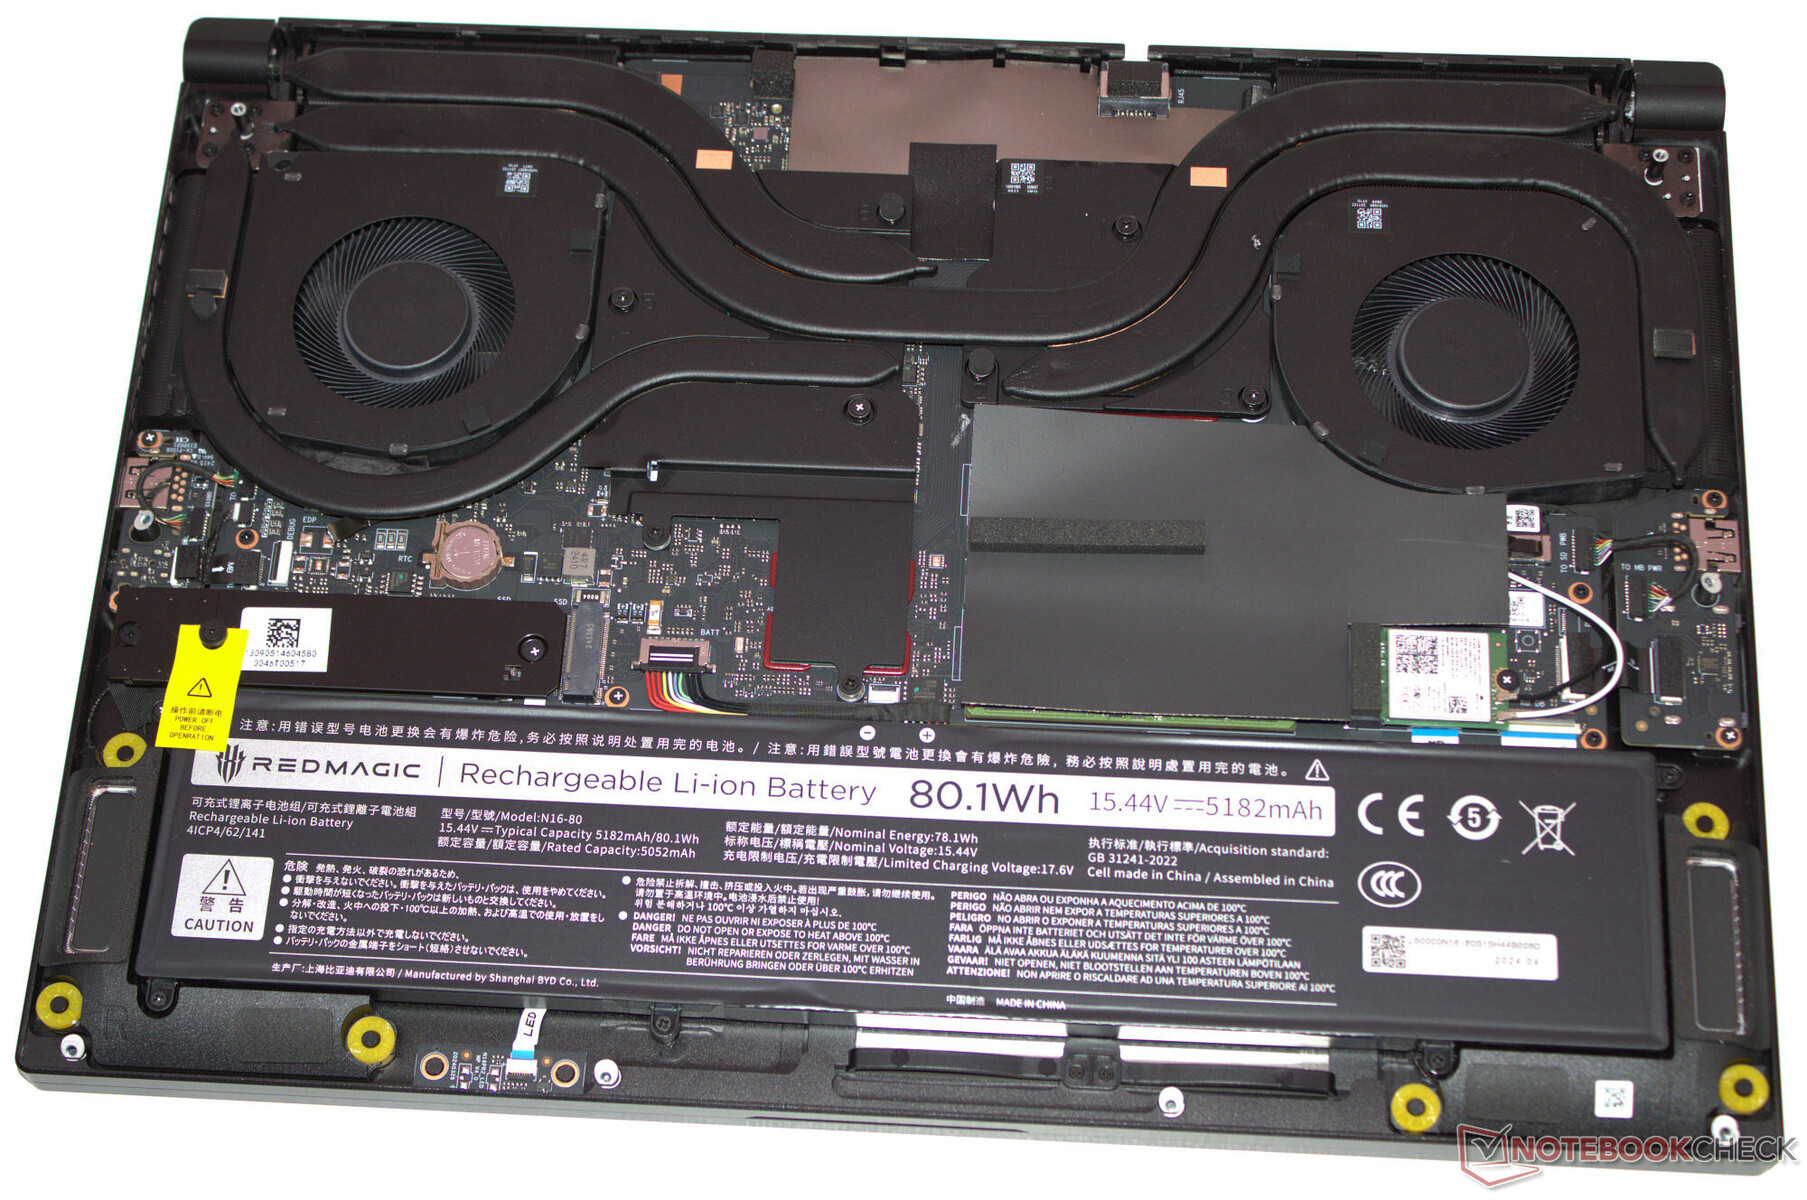
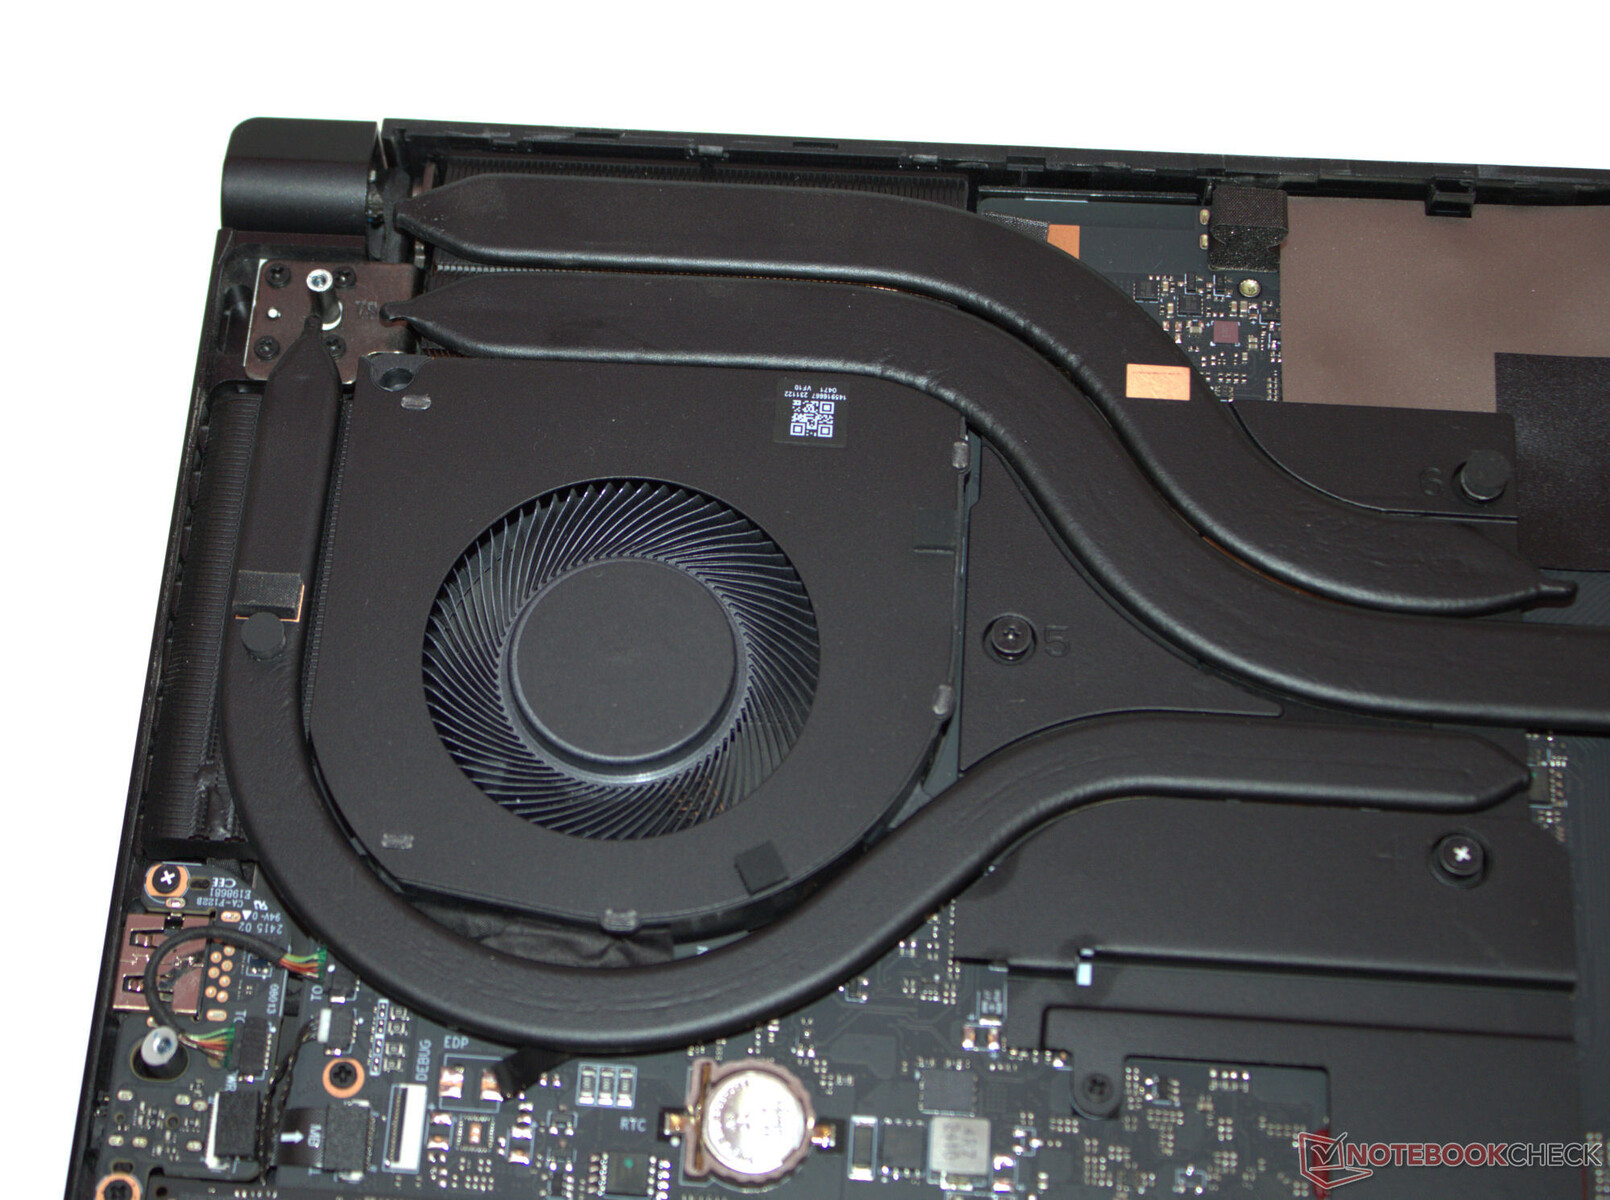
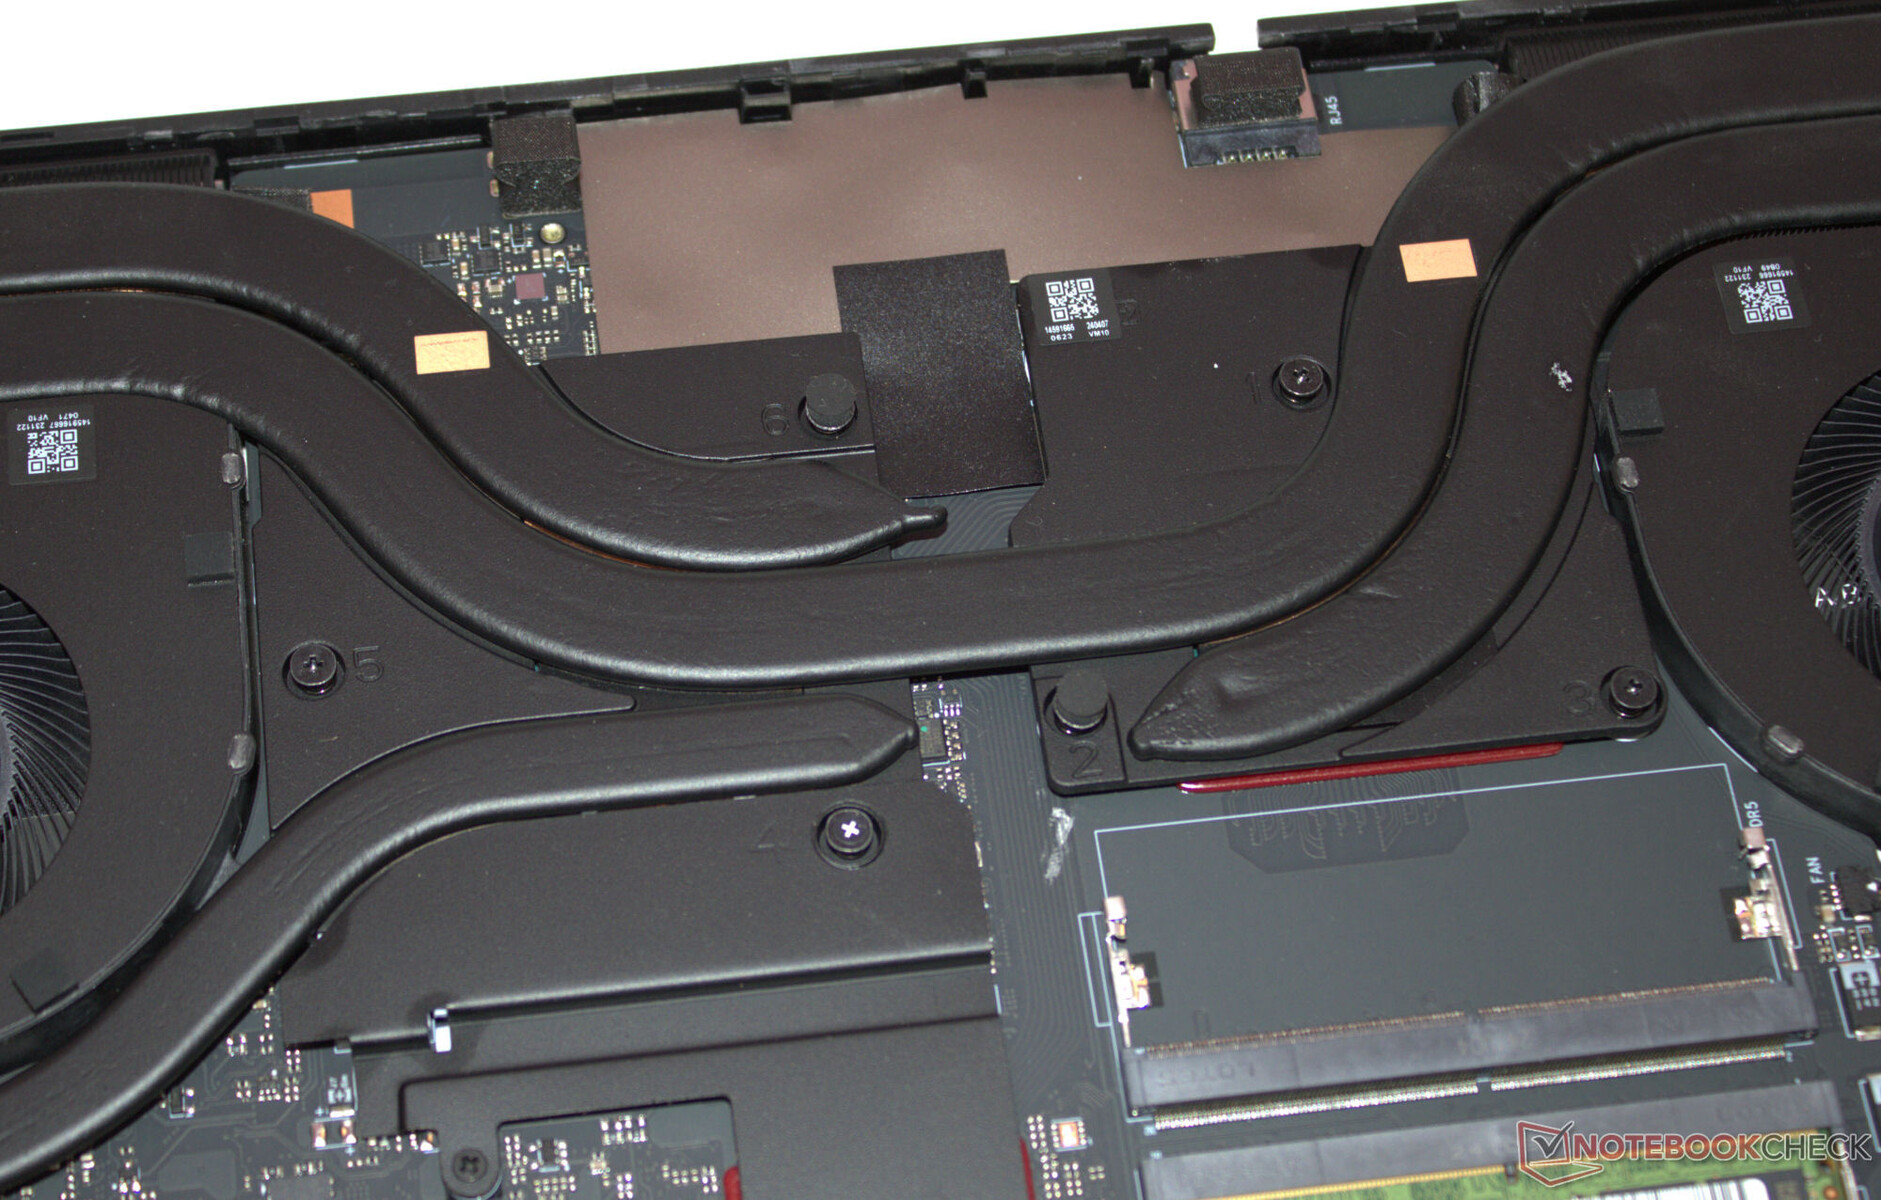
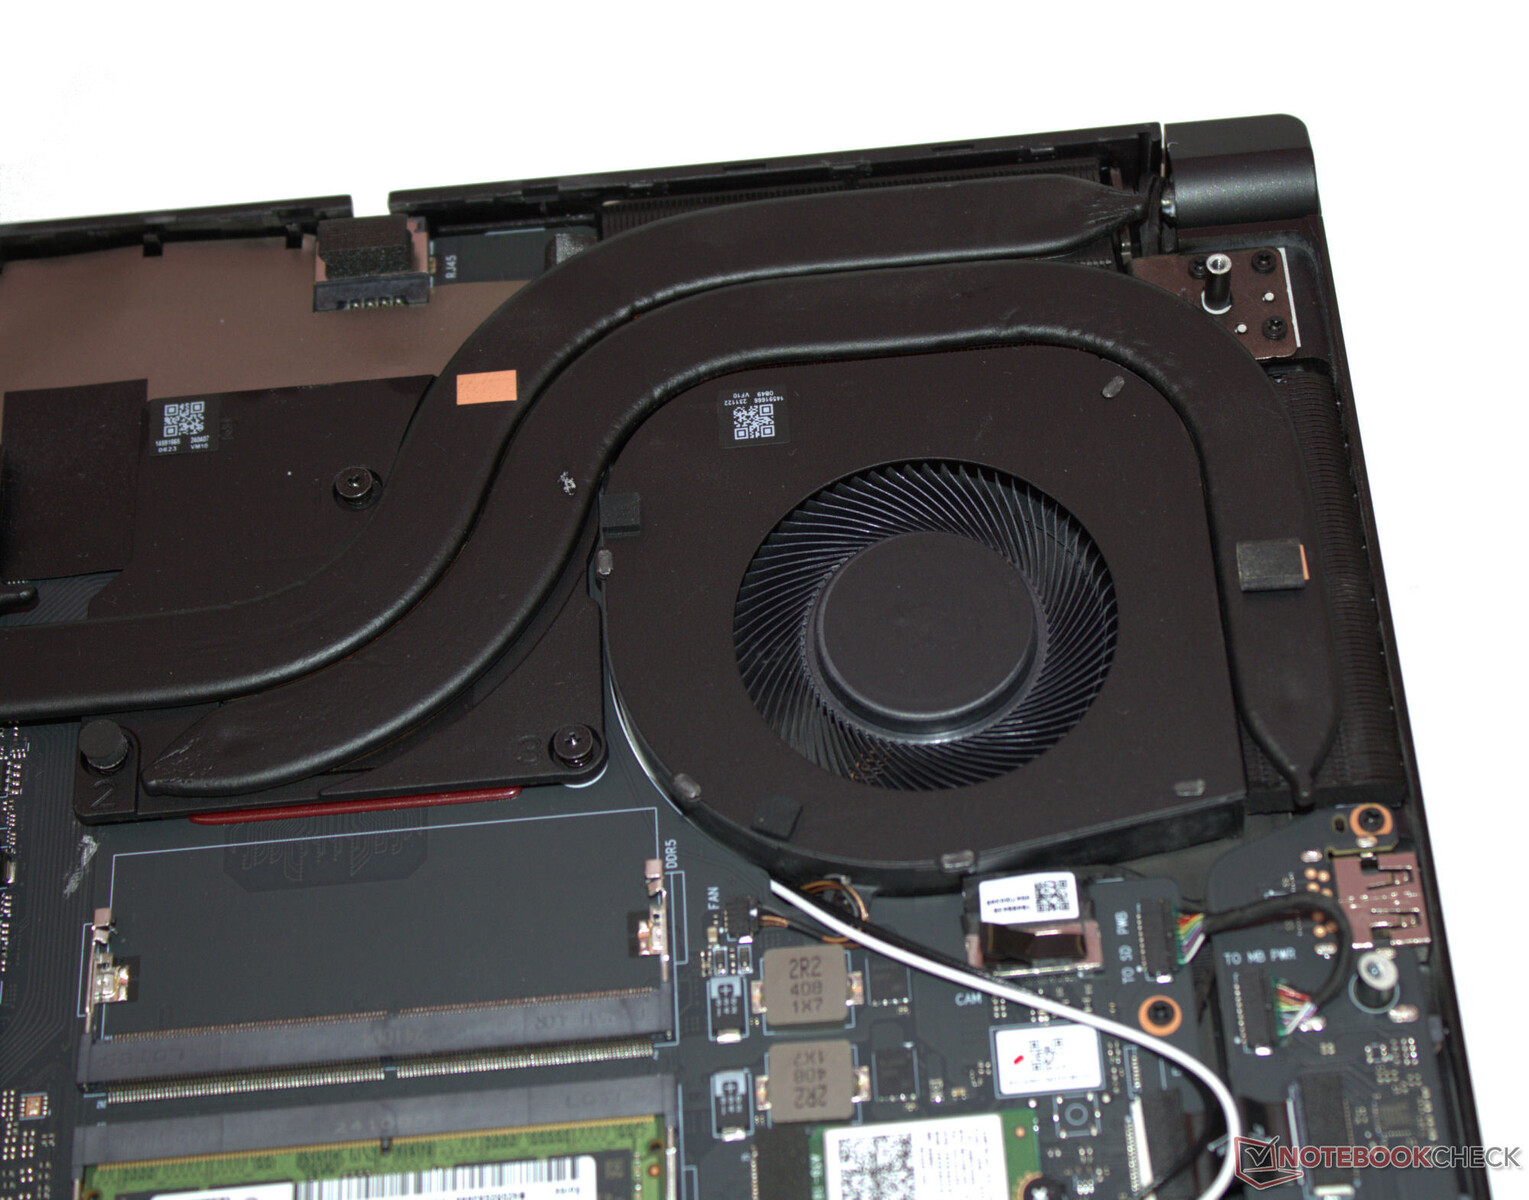
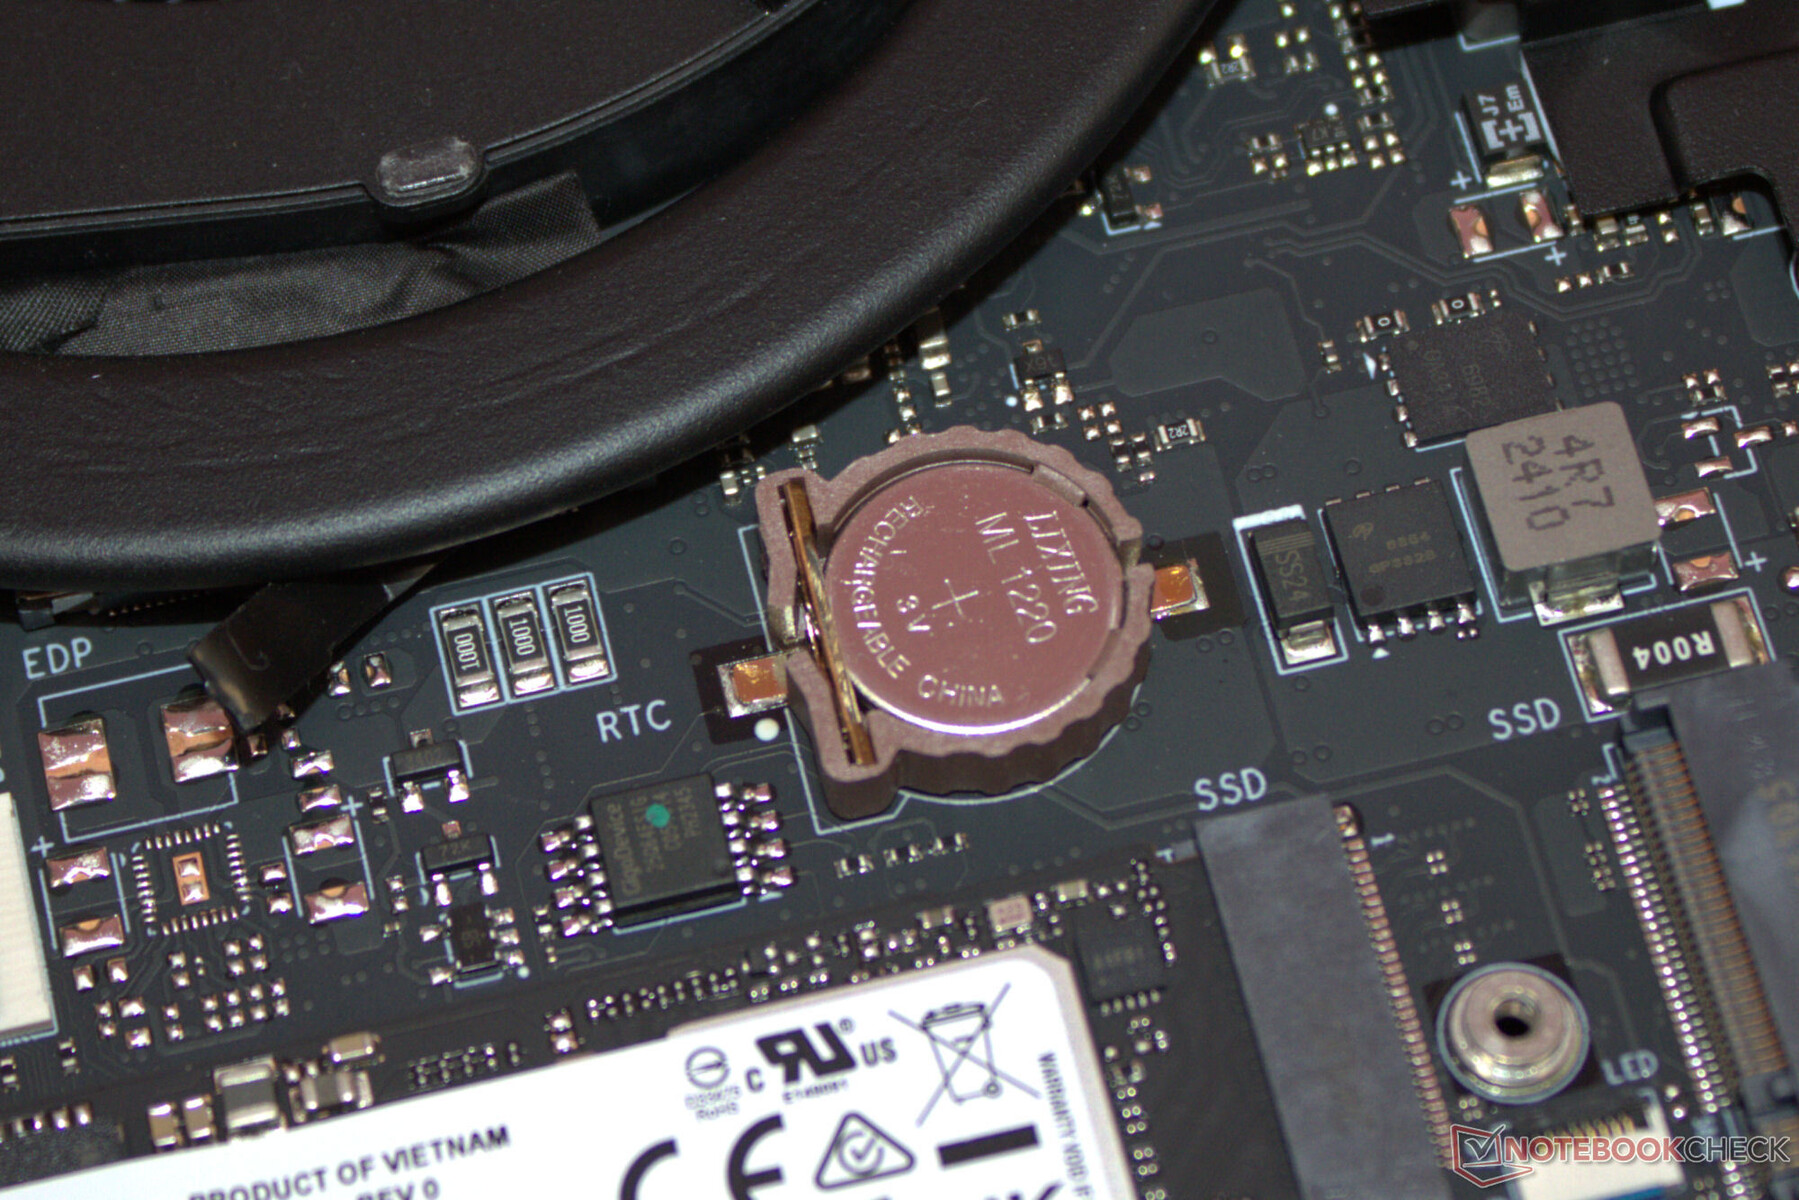
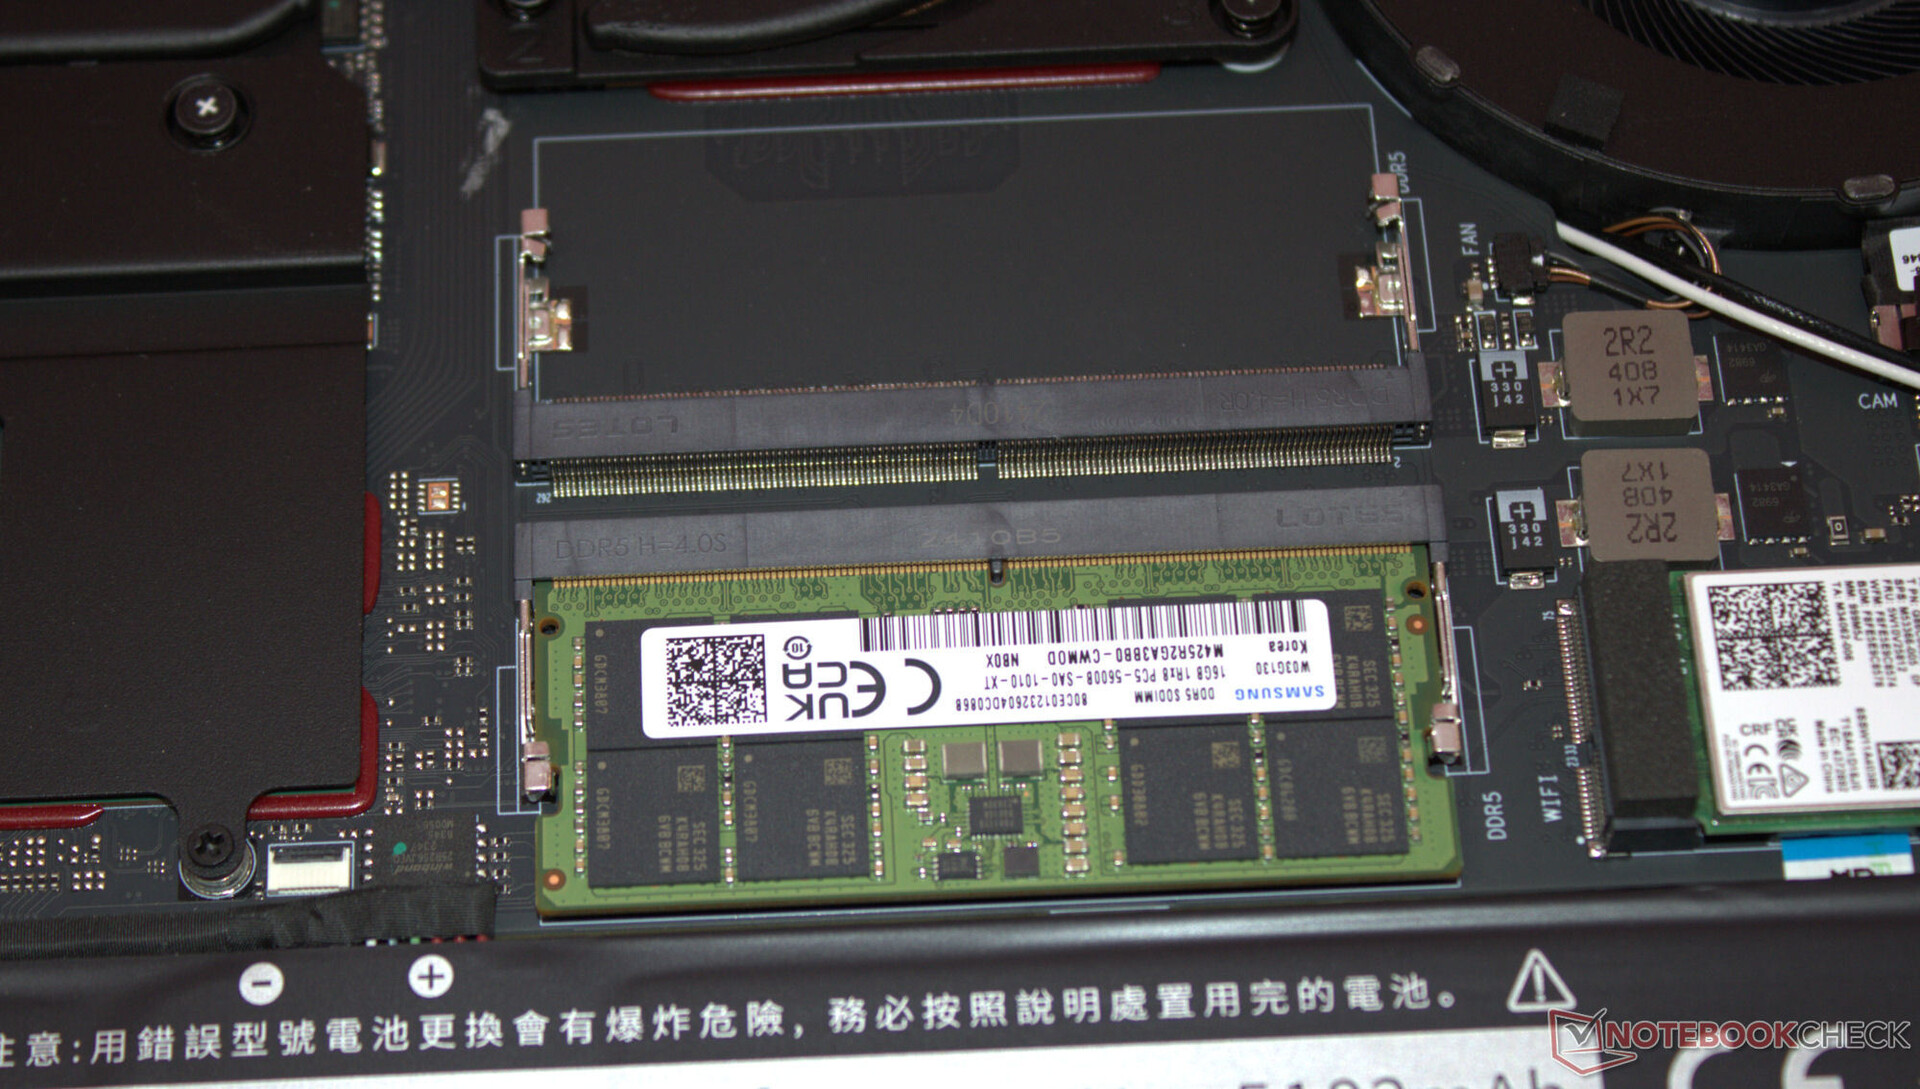
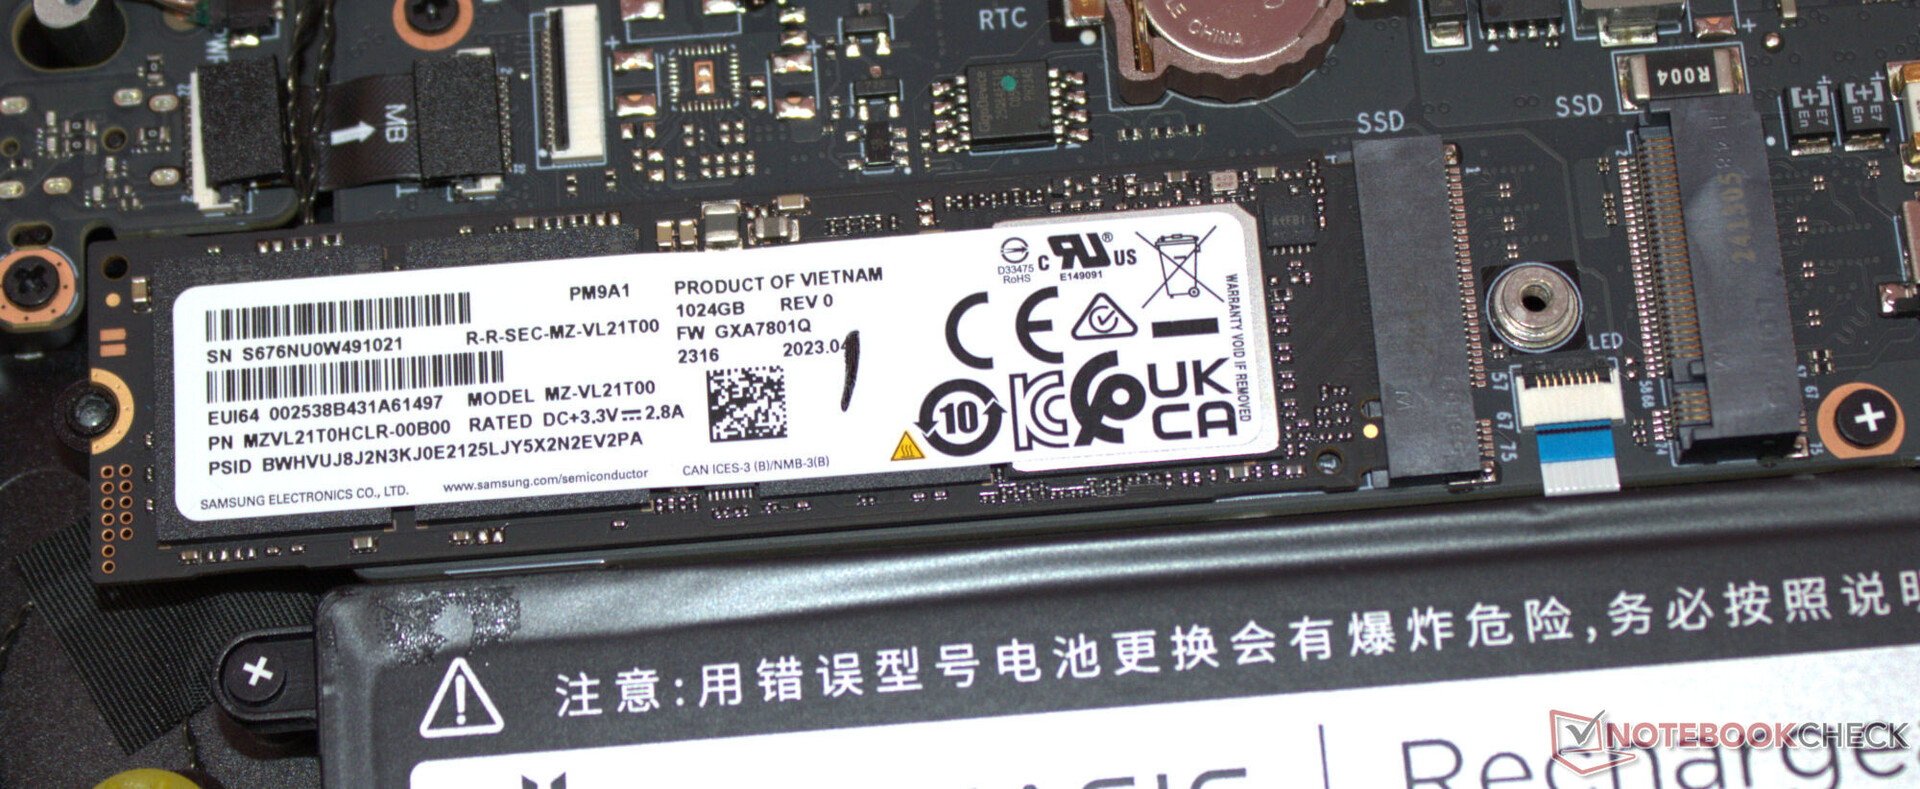
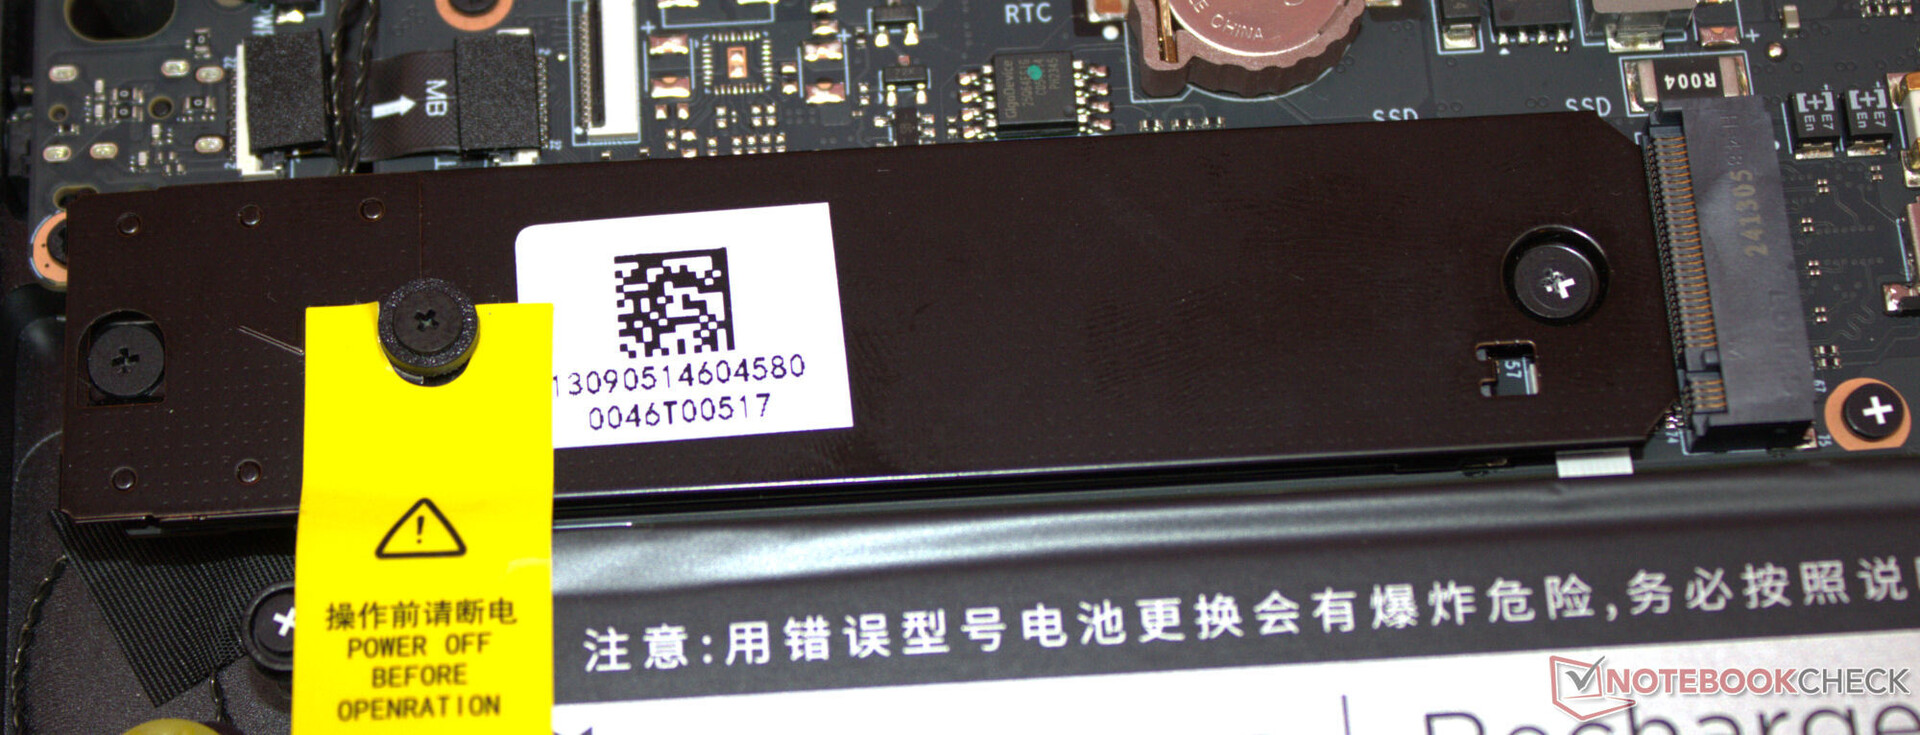
After removing all of the screws on the bottom of the case, the bottom case part can be removed with the help of a plectrum or flat spatula. Then you can access the memory banks (of which one is occupied), SSD (PCIe 4, M.2-2280), second SSD slot (PCIe 4, M.2-2280) WLAN module, BIOS battery, fans and the battery.
Sustainability
Lots of cardboard, little plastic: The laptop is enclosed in a film, while a thin foam mat protects the top of the device. The printed quick-start guide is in a plastic bag. A removable base plate makes repairs to the laptop possible—the entire hardware is accessible. Software updates shouldn't be a problem for the next few years—after all, Windows 11 is used as its operating system.
It remains to be seen how Nubia will handle the supply of spare parts and support for its own software. At the time of testing, there is still no download area for the Titan on the Nubia website.
Warranty
We cannot provide any information regarding the laptop's warranty—it is likely to be for around 12 months, which is standard in the United States. We consider extended warranties to be unlikely.
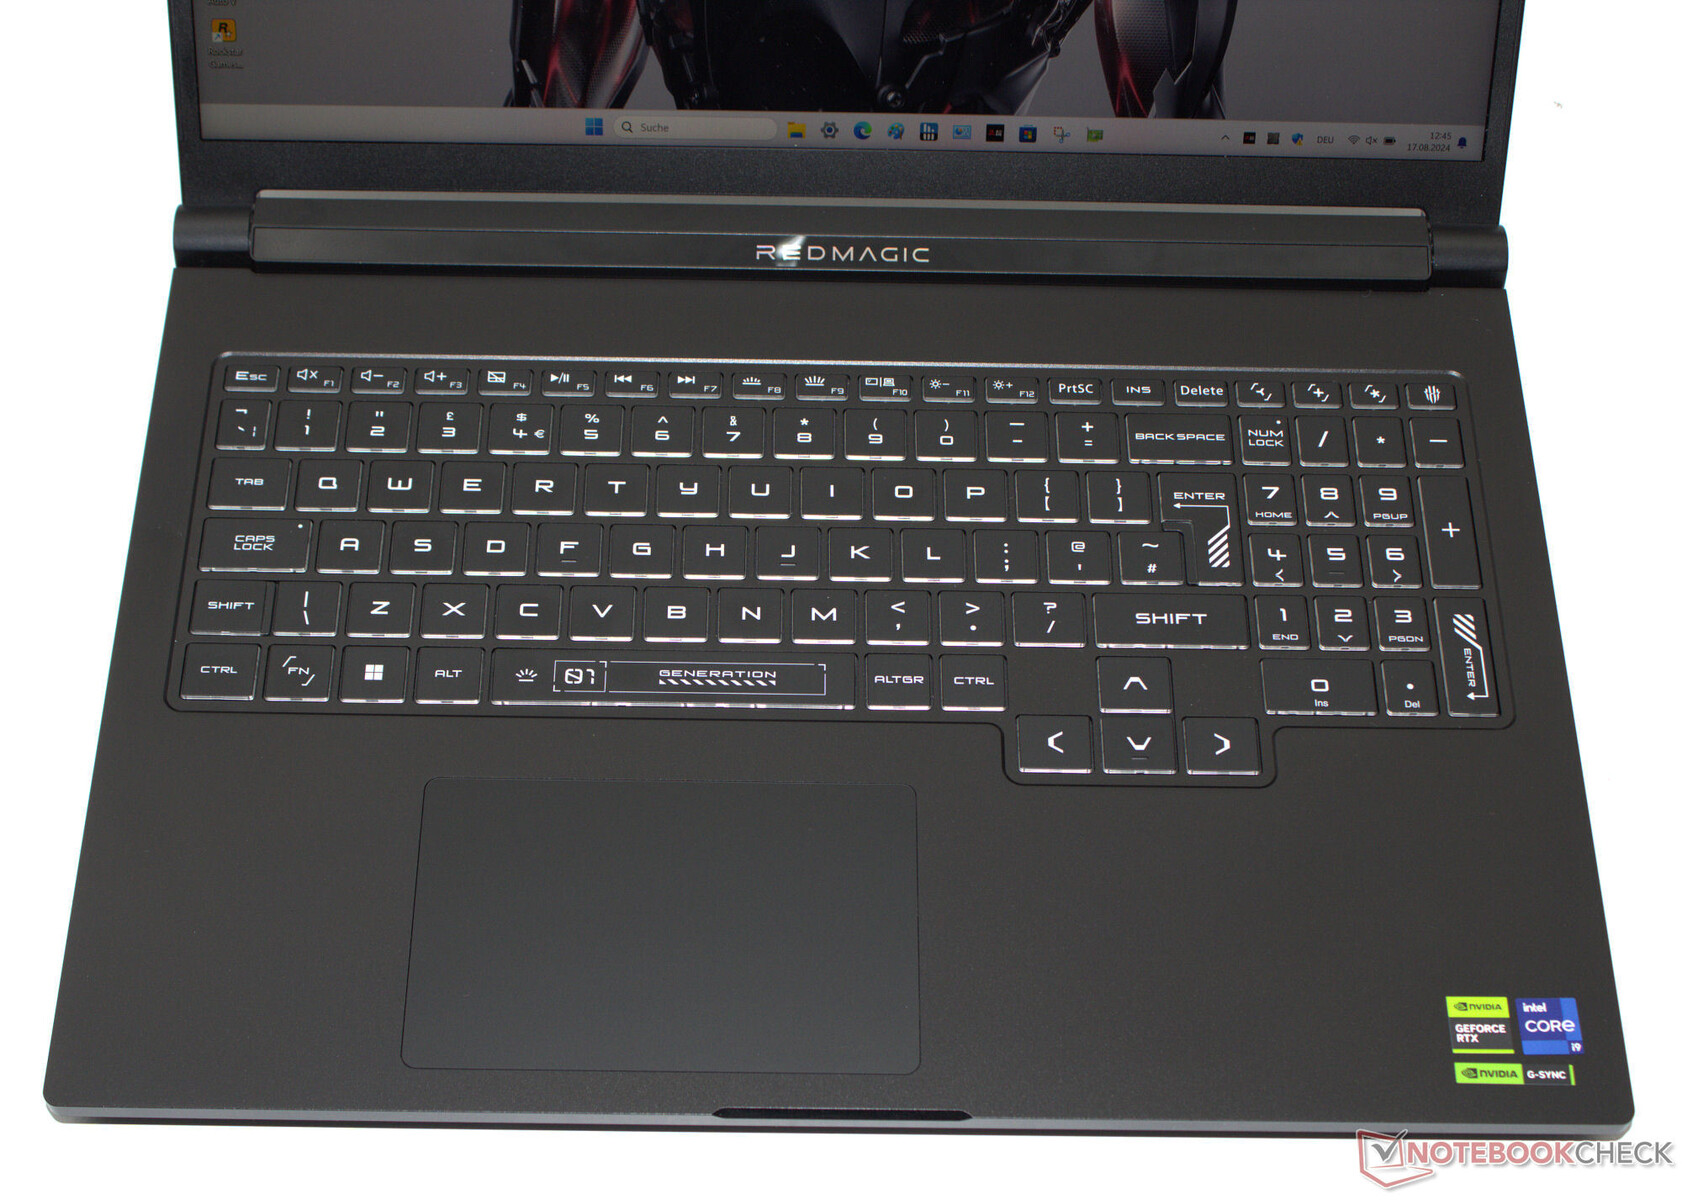
Input devices - The RedMagic laptop with RGB lighting
Keyboard
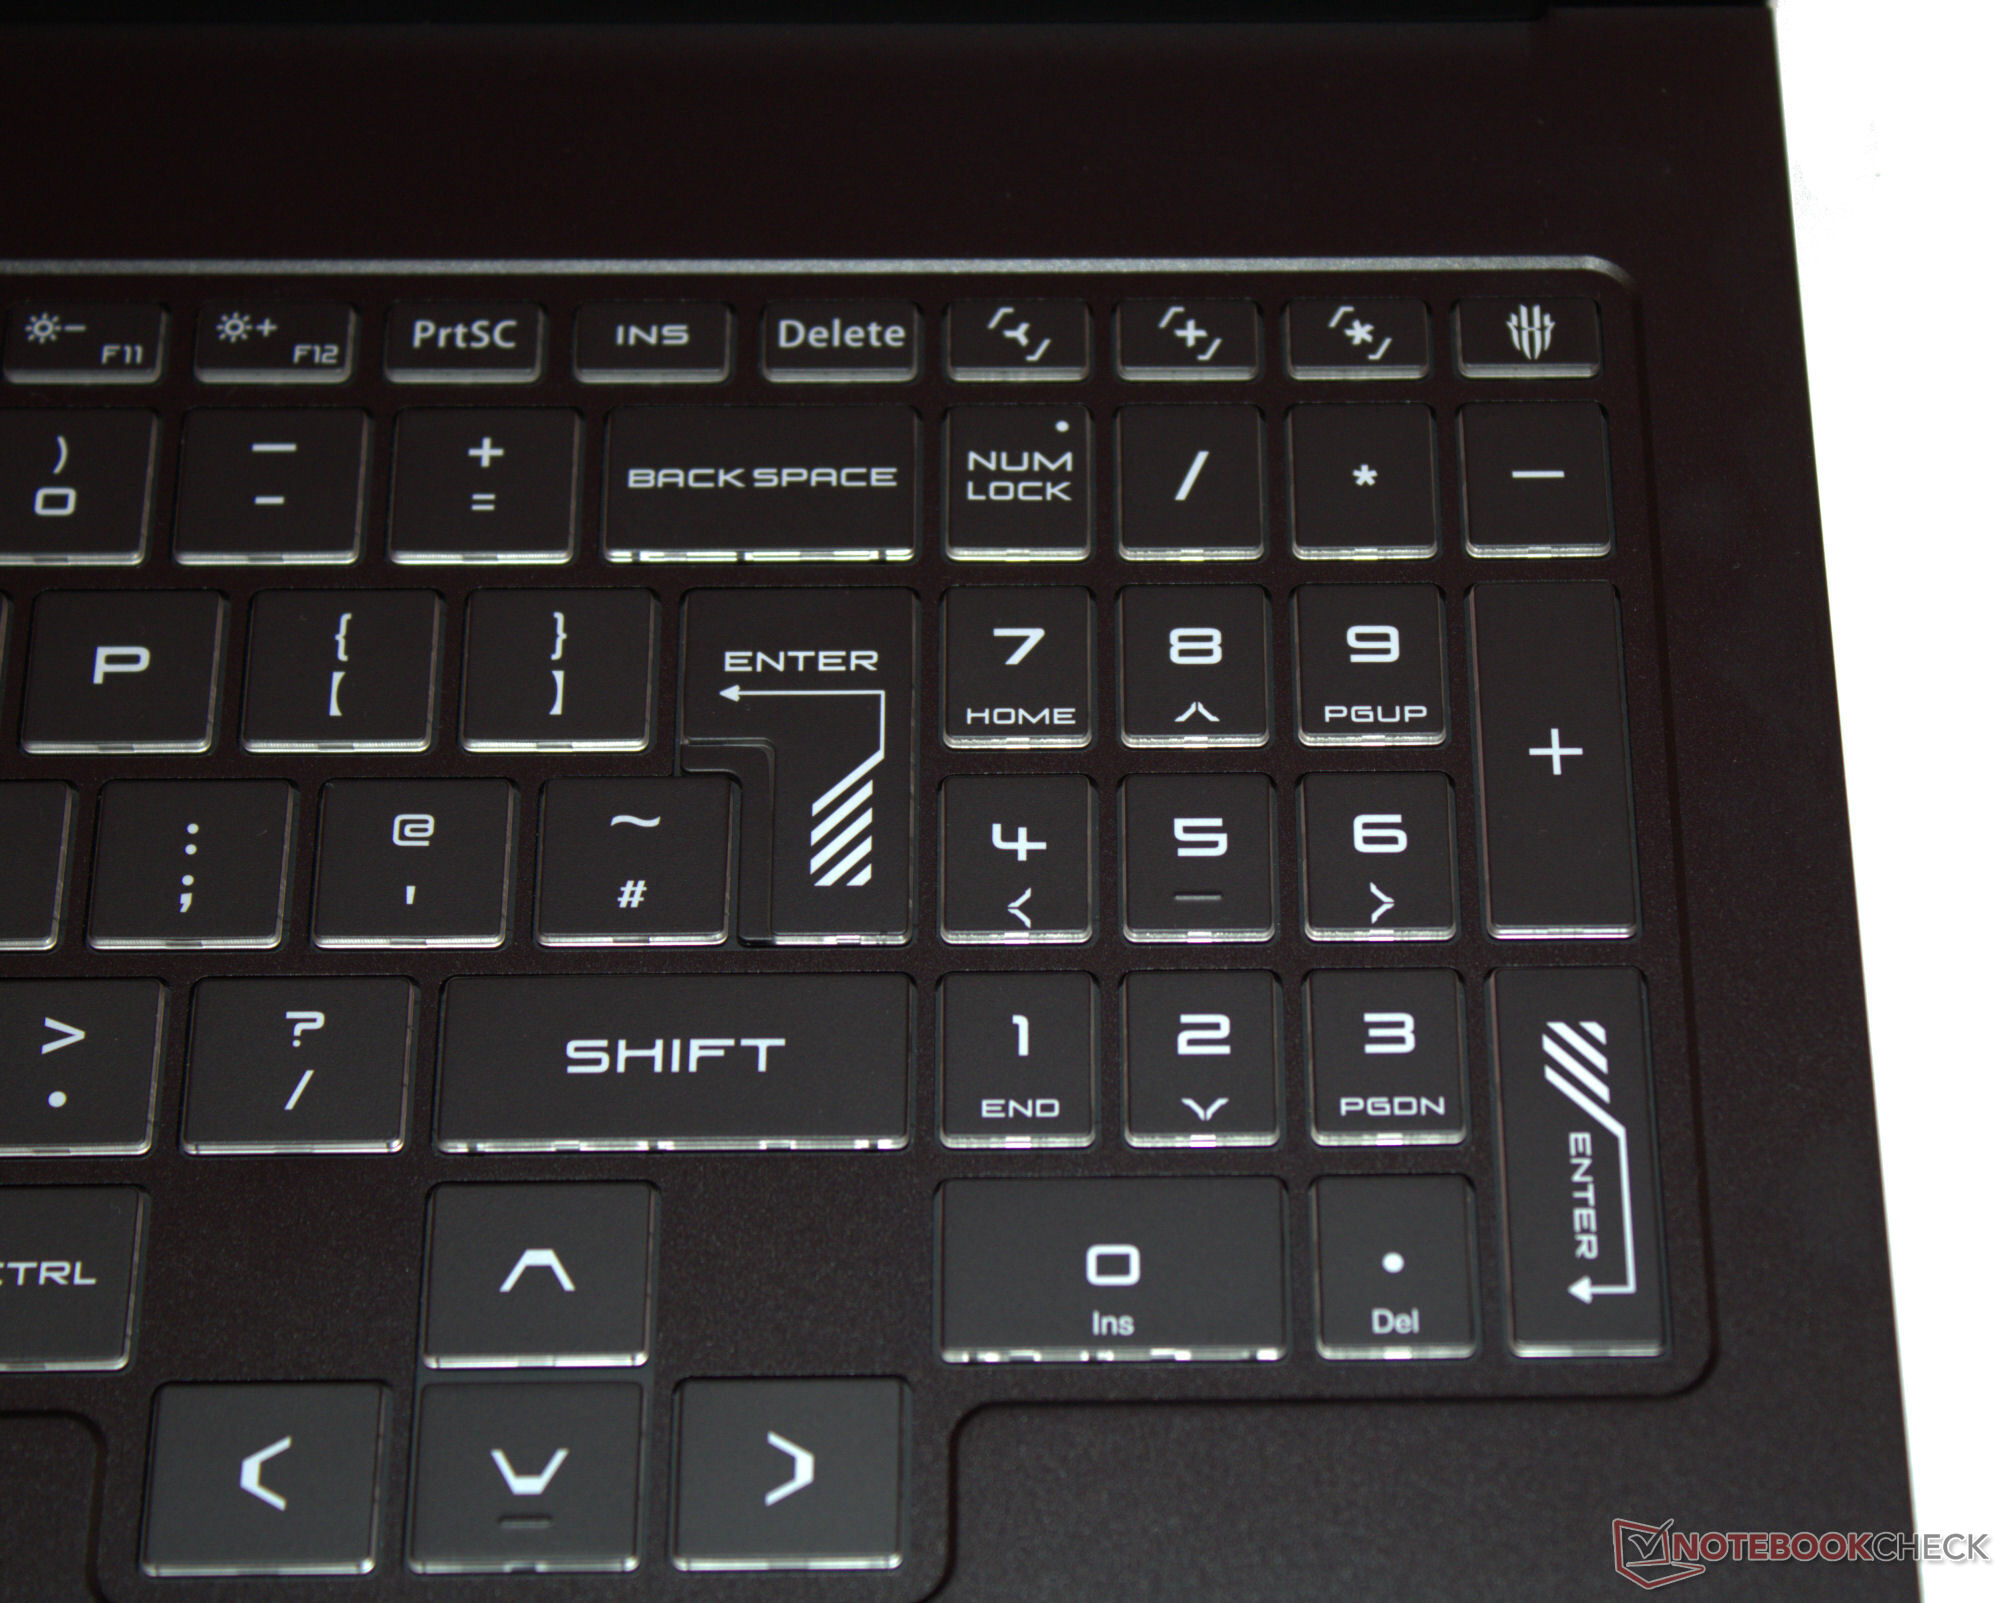
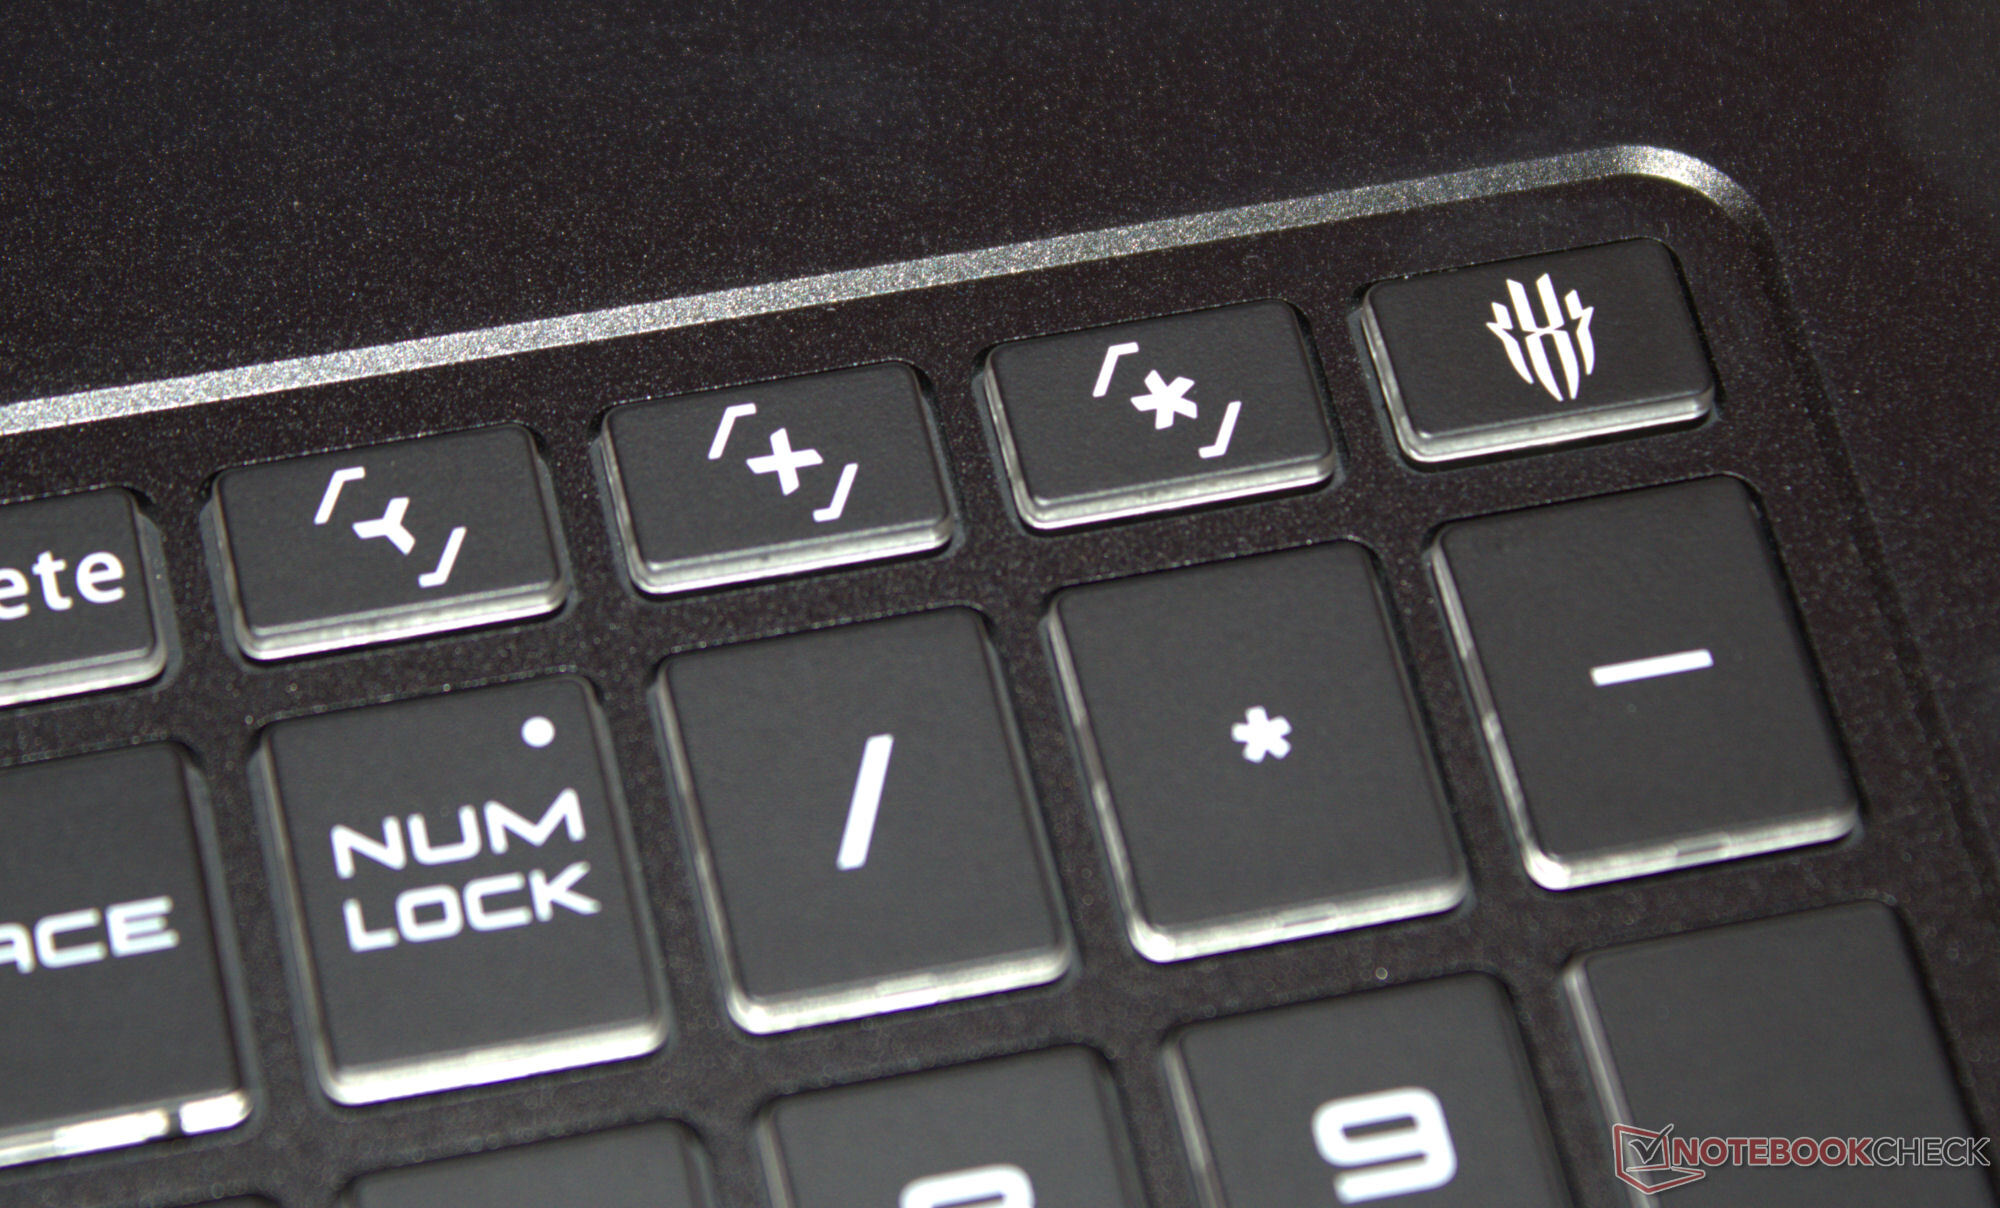
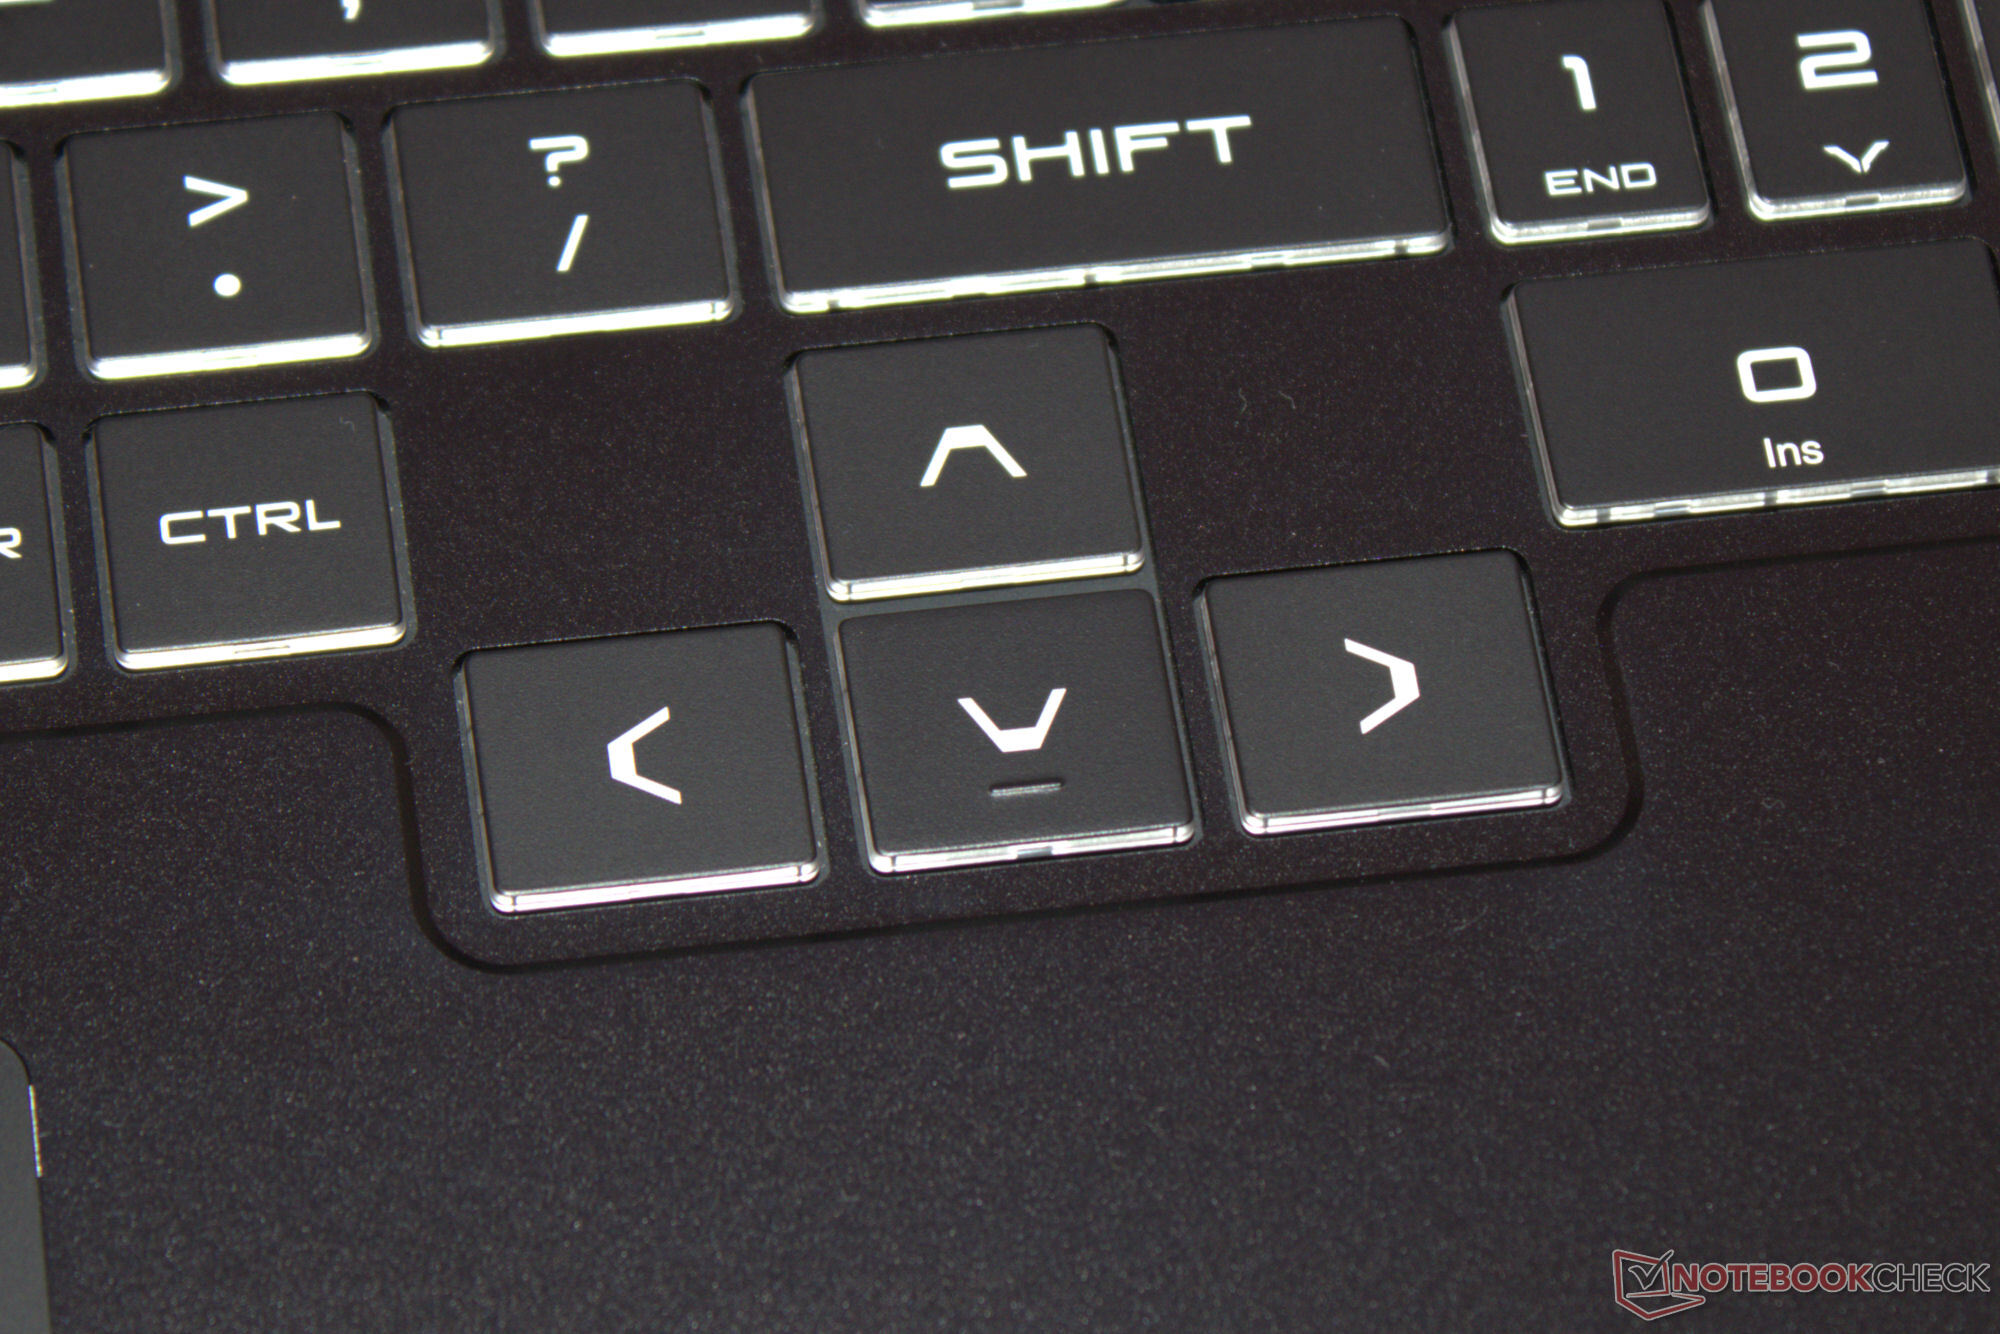
Nubia has gone for a chiclet keyboard including a numerical keypad. The evenly-lit keys feature a short travel and a clear pressure point. The keyboard doesn't yield when typing on it. A positive is that its offset arrow keys are full-sized. Its RGB backlighting is split into four zones, and our test device has a QWERTY keyboard layout. We can't say whether the manufacturer offers localized layouts.
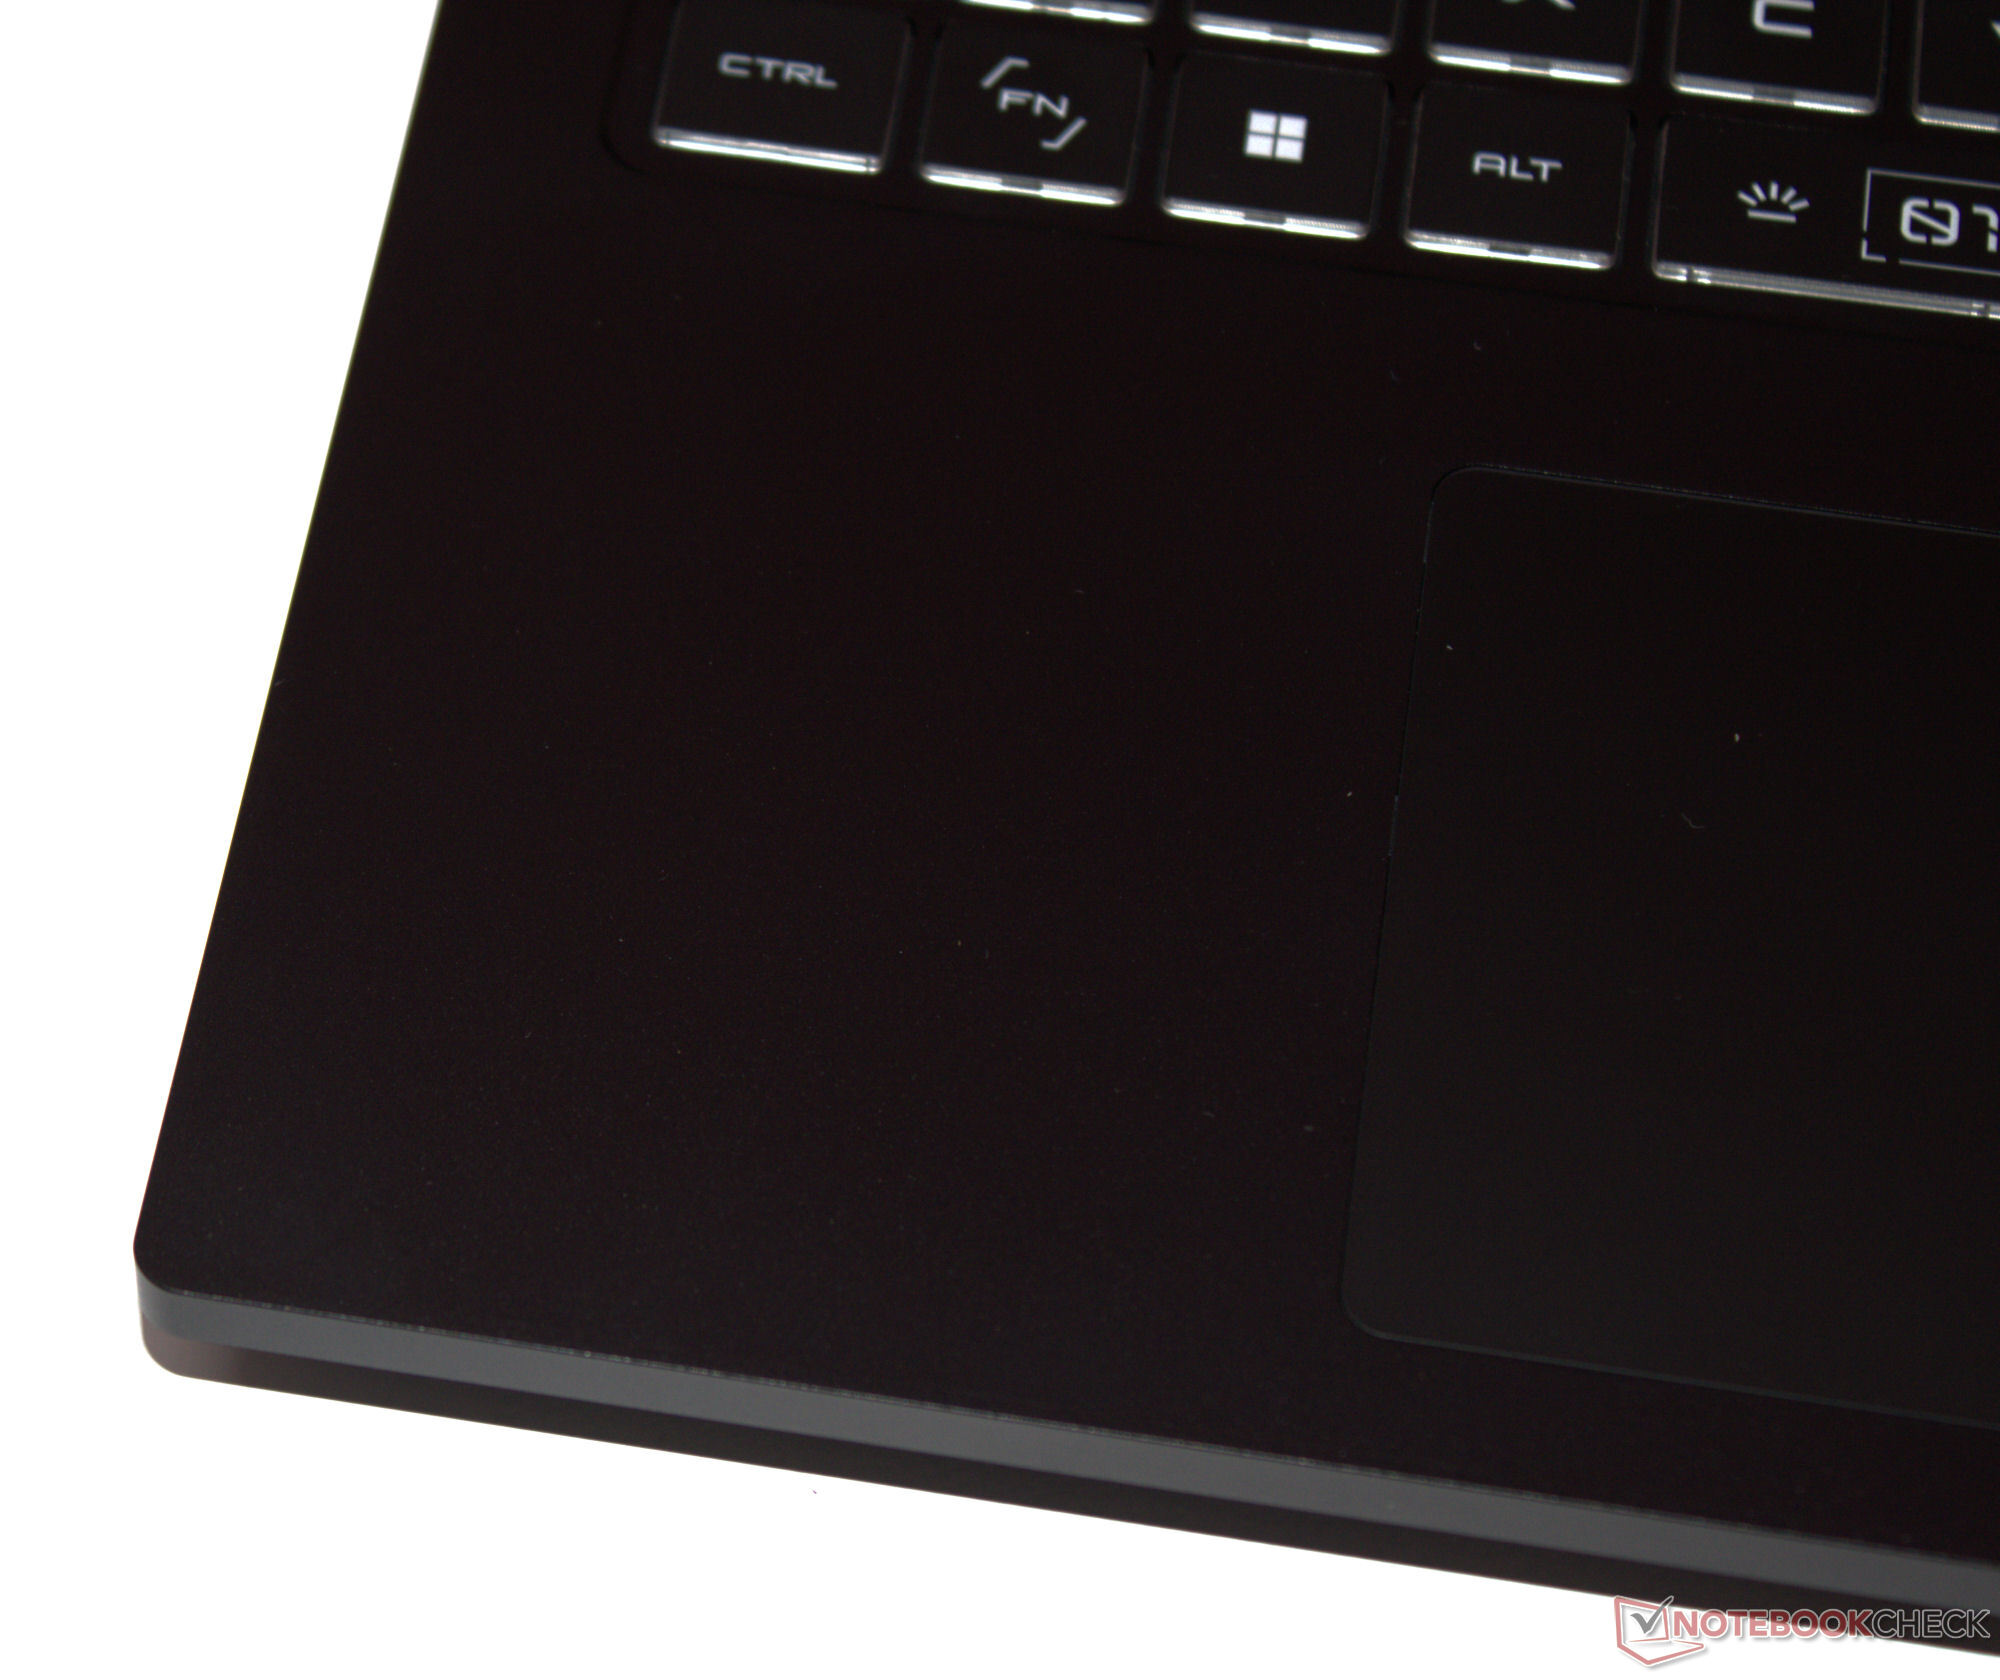
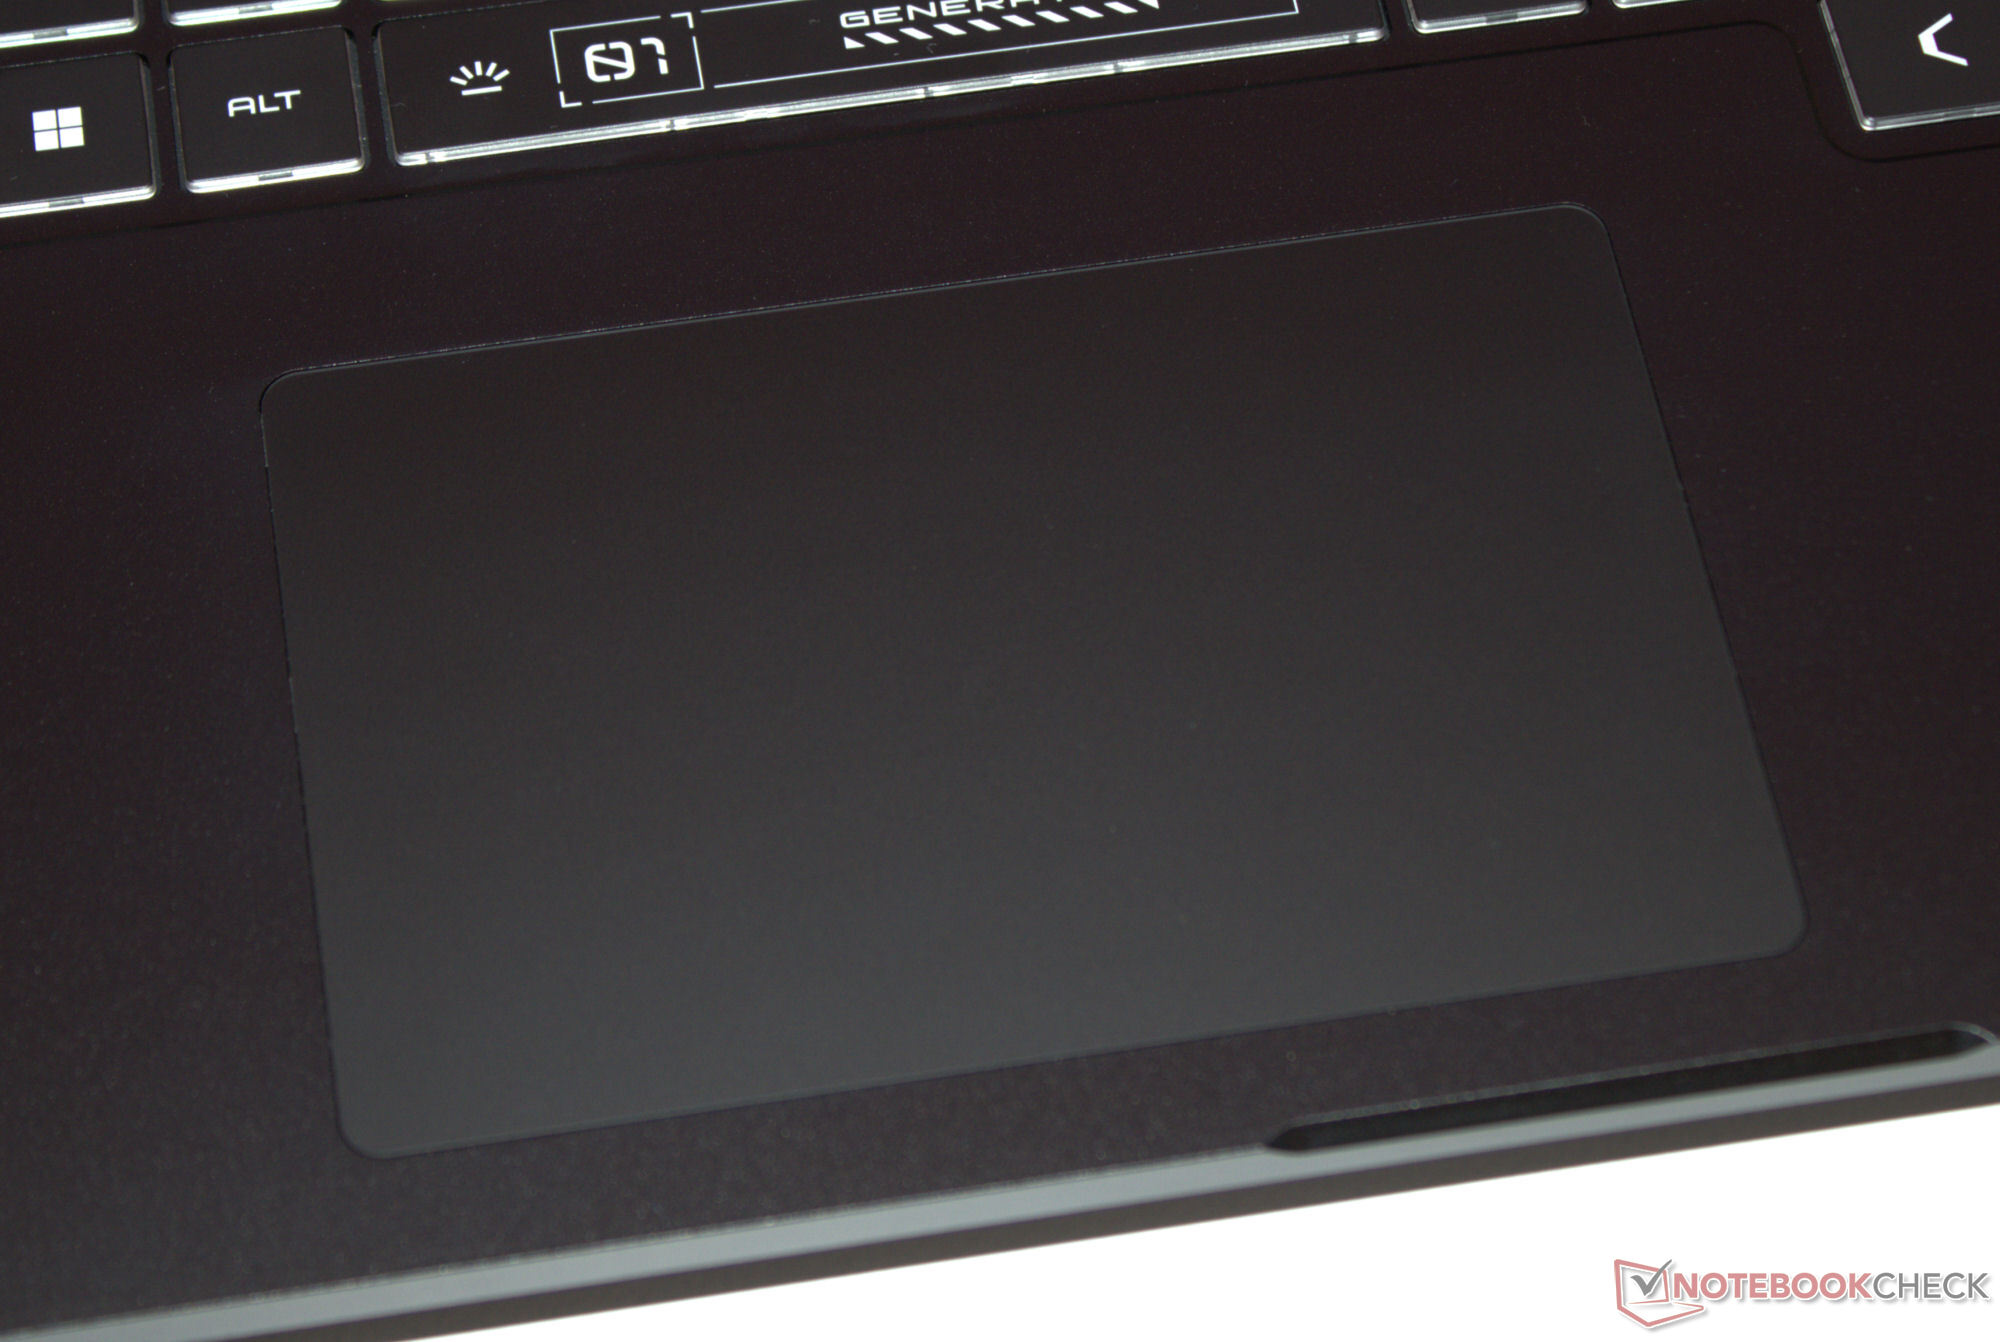
Touchpad
A multi-touch clickpad (approx. 11.7 x 7.5 cm) with a glass surface serves as a mouse replacement. It has a short travel and a clear pressure point. The pad can be deactivated if required.
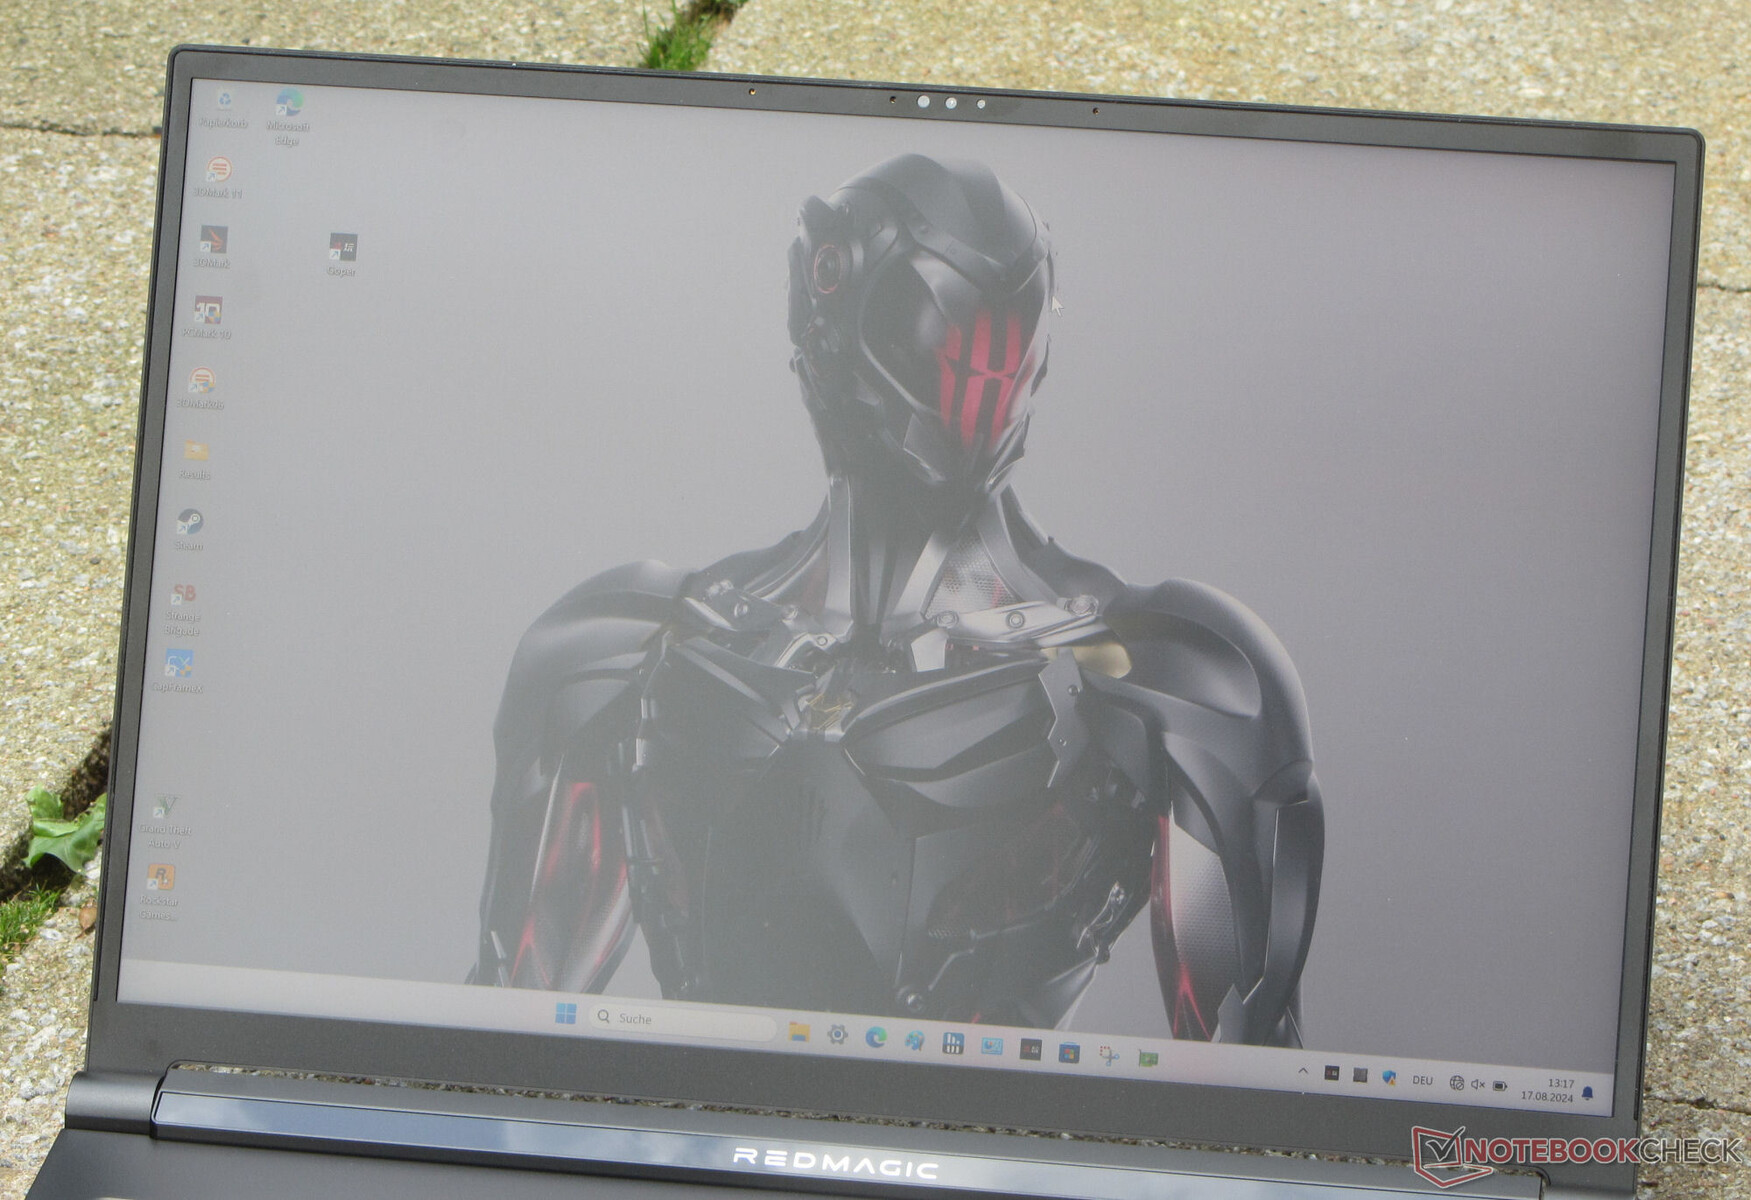
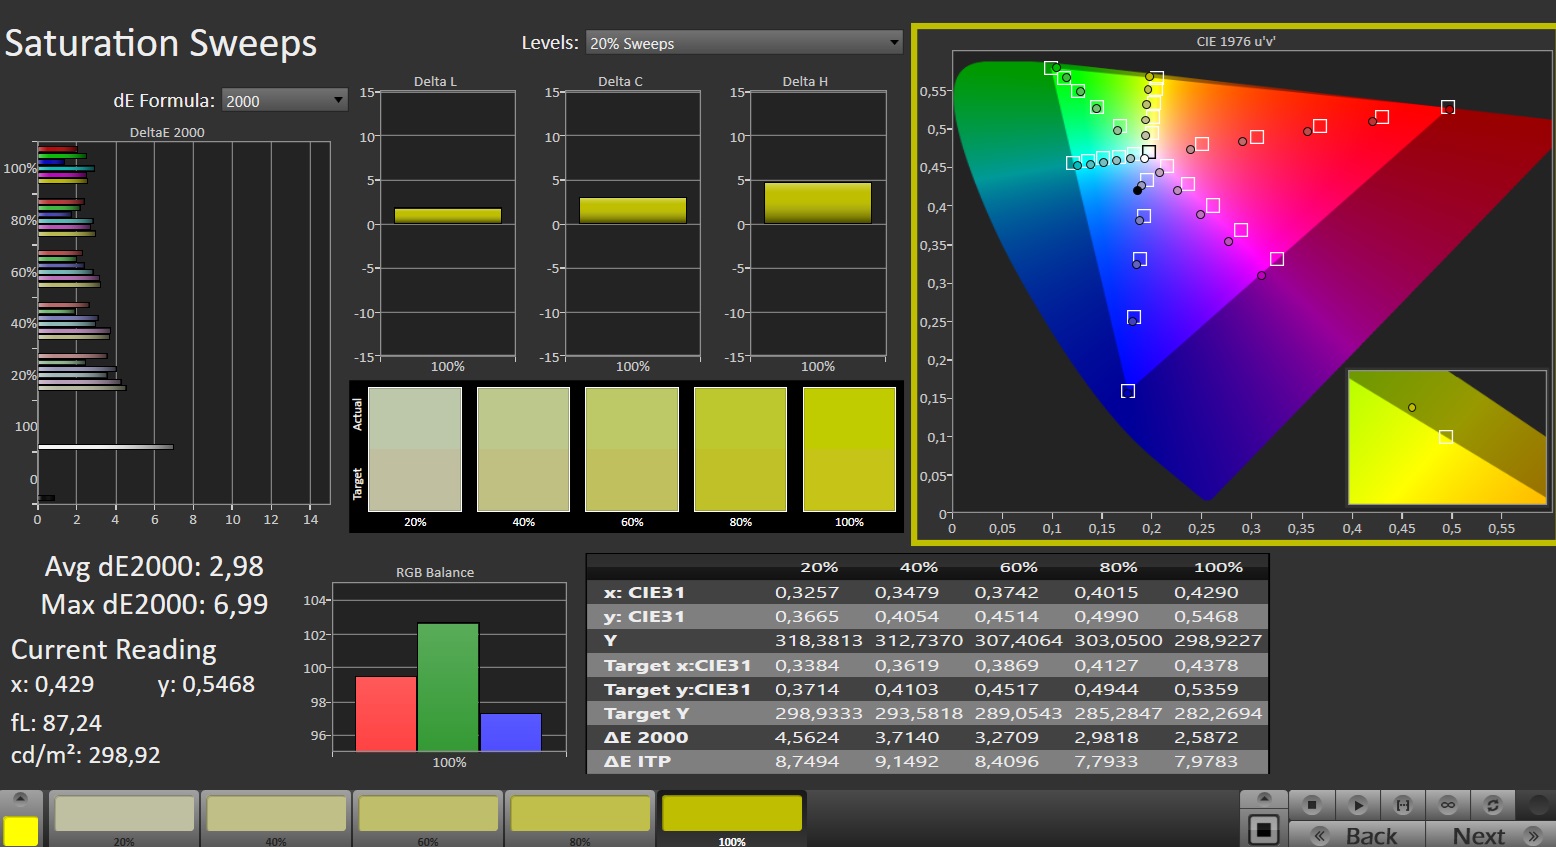
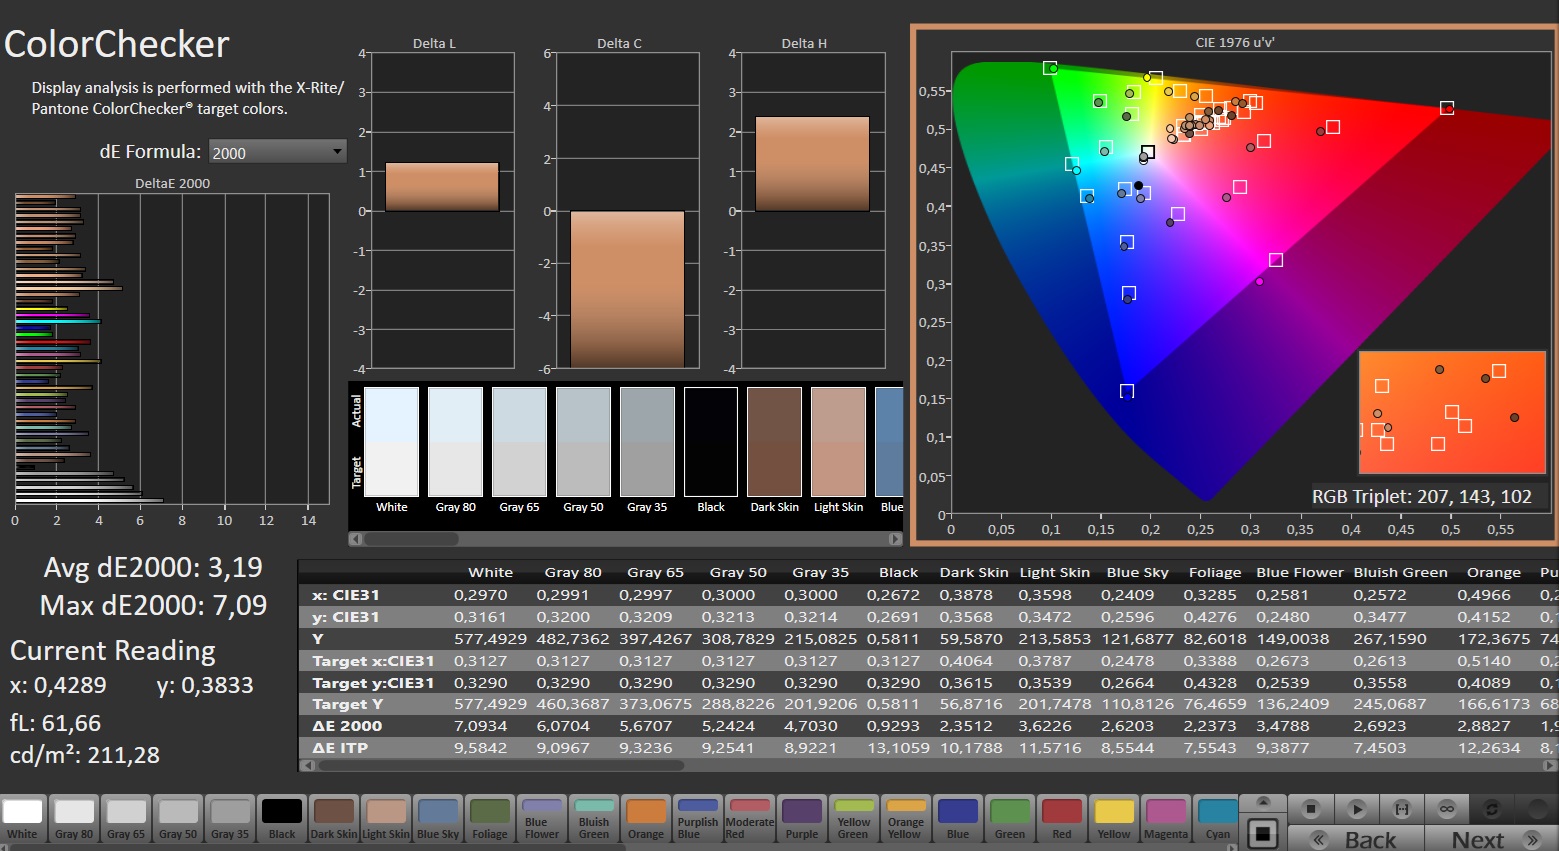
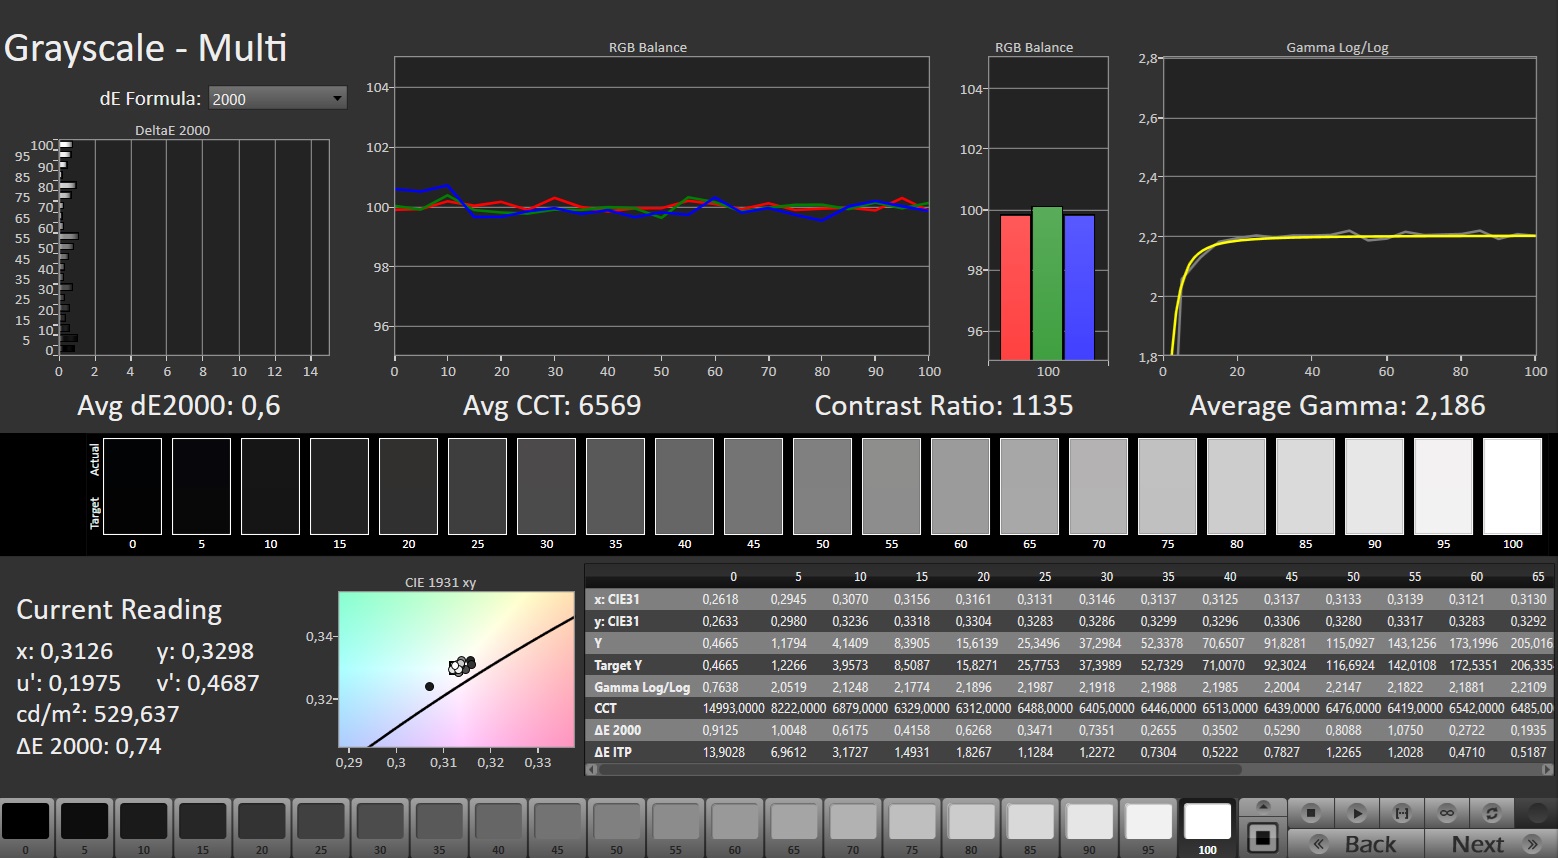
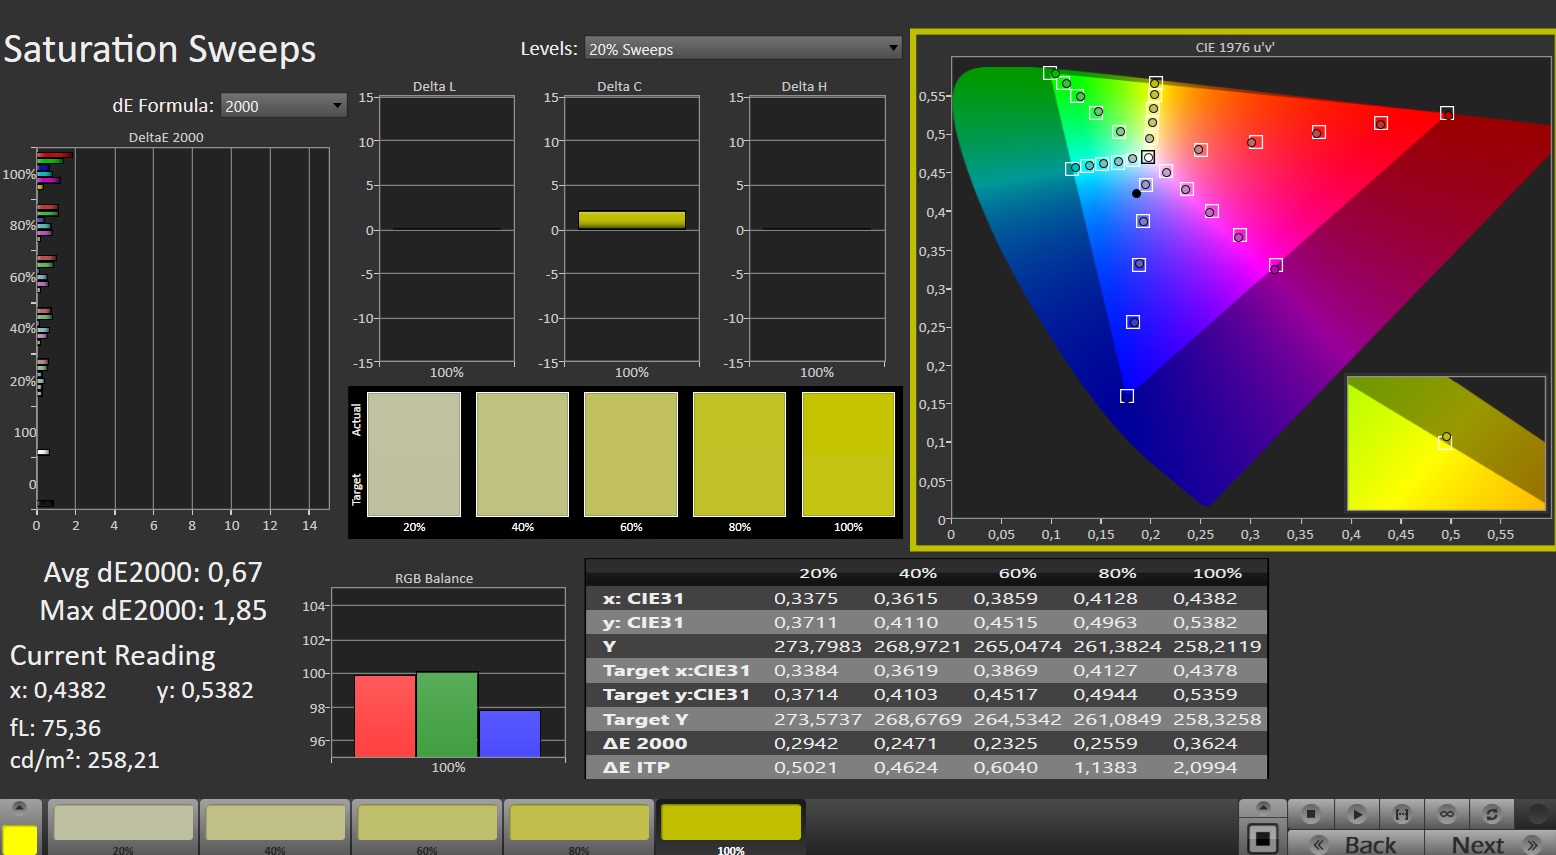
Display - An IPS panel with DCI-P3 coverage
It seems that the work-friendly 16:10 aspect ratio has established itself, as most laptops in the comparison field have screens with this aspect ratio—including the Titan. Nubia has equipped its laptop with a matte, viewing-angle-stable IPS display (2,560 x 1,600 pixels) with a diagonal of 16 inches. The panel is super bright and its contrast meets the target value. It is perfectly possible to read from the screen outdoors. A positive is that the 240-Hz panel shows no signs of PWM flickering and supports G-Sync. Alternative displays are not available.


| |||||||||||||||||||||||||
Brightness Distribution: 86 %
Center on Battery: 543 cd/m²
Contrast: 1065:1 (Black: 0.51 cd/m²)
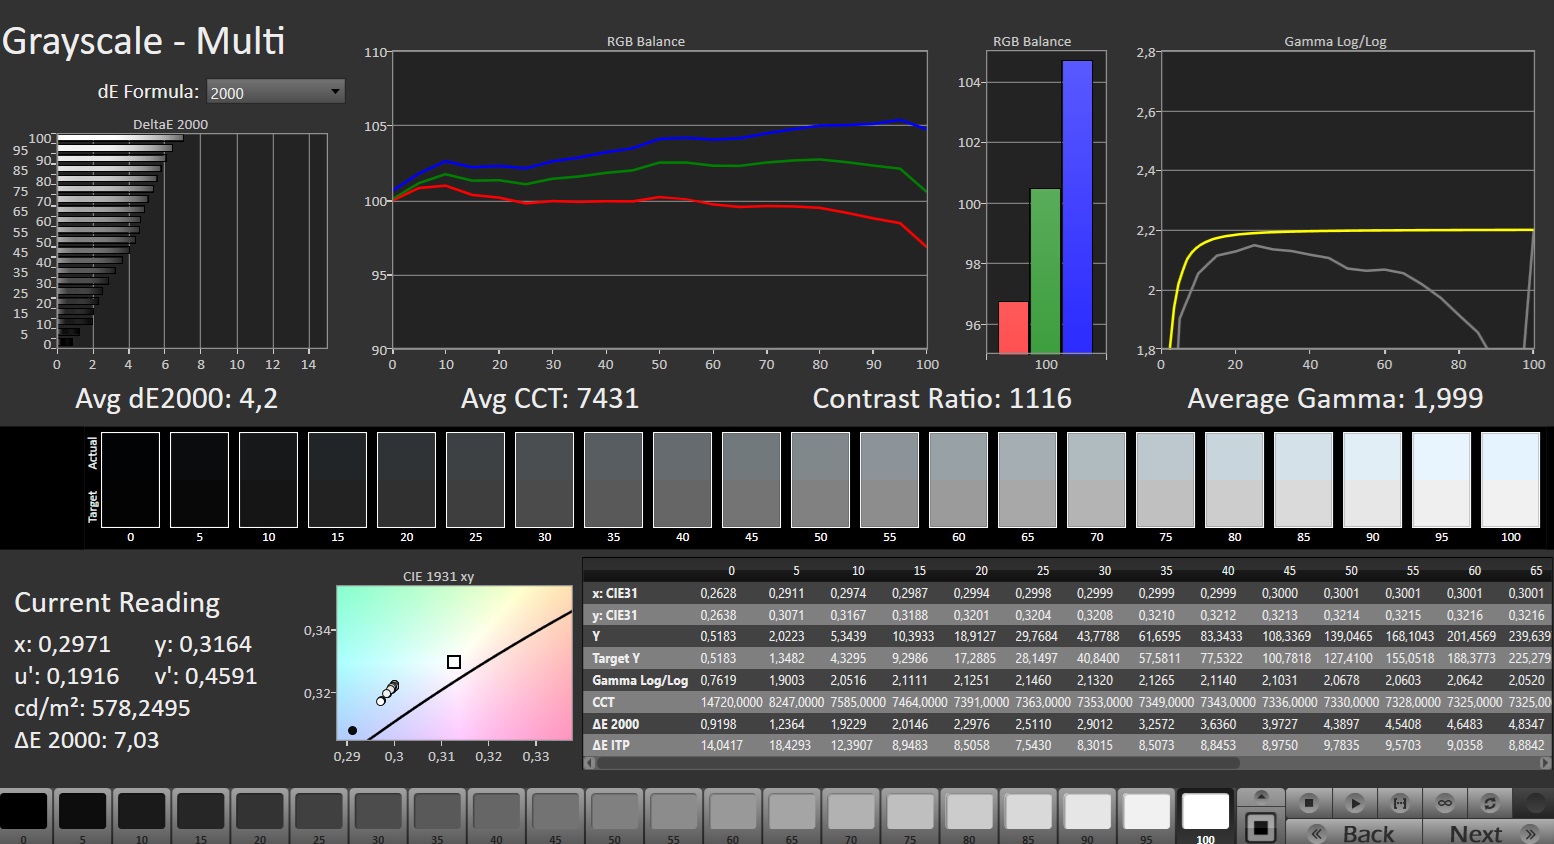
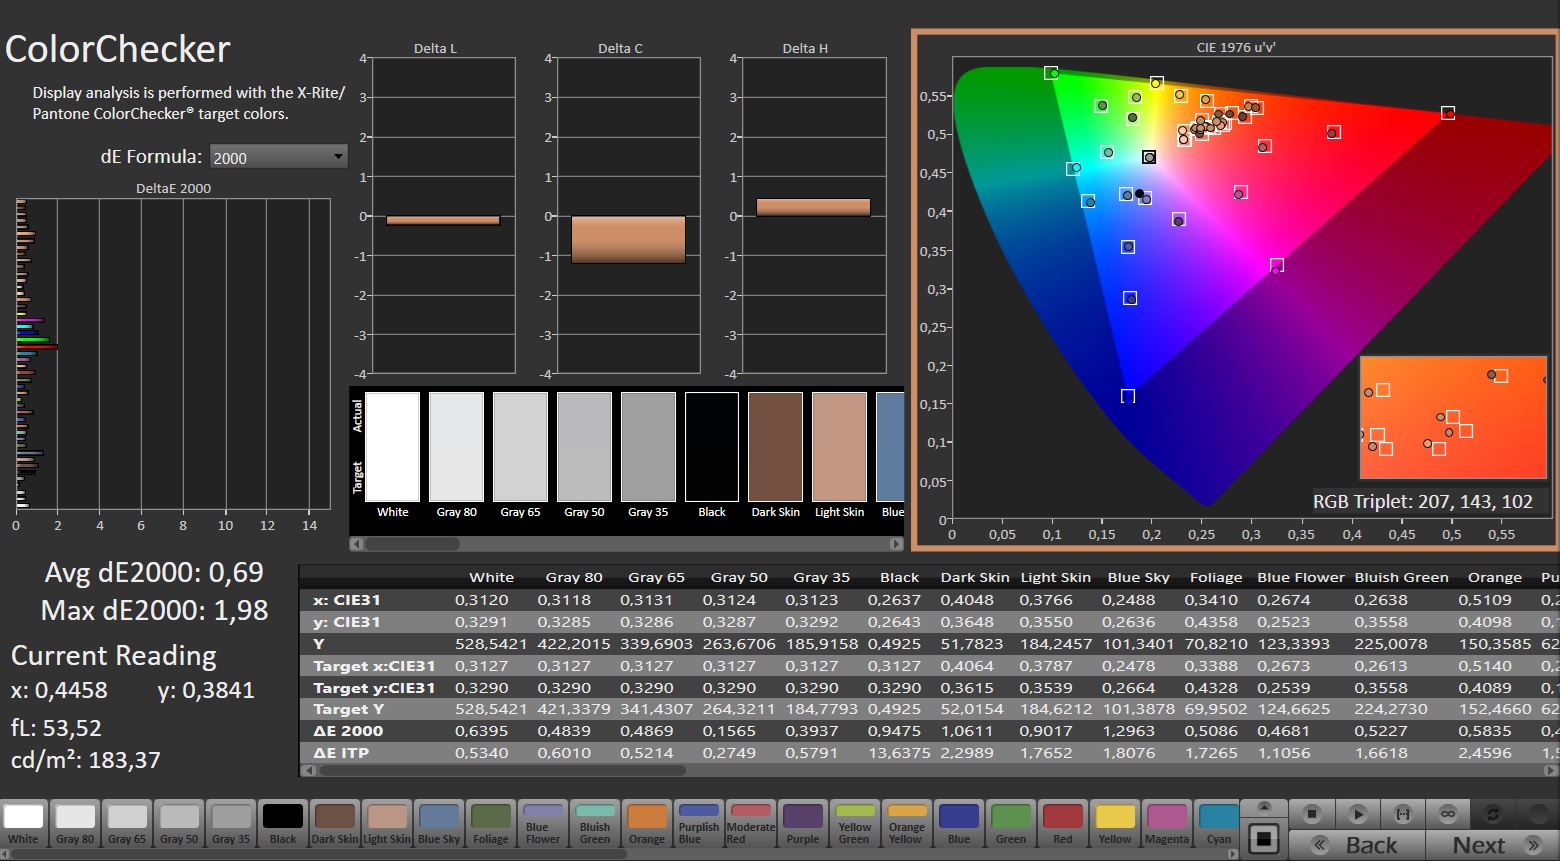
ΔE ColorChecker Calman: 3.19 | ∀{0.5-29.43 Ø4.72}
calibrated: 0.69
ΔE Greyscale Calman: 4.2 | ∀{0.09-98 Ø4.97}
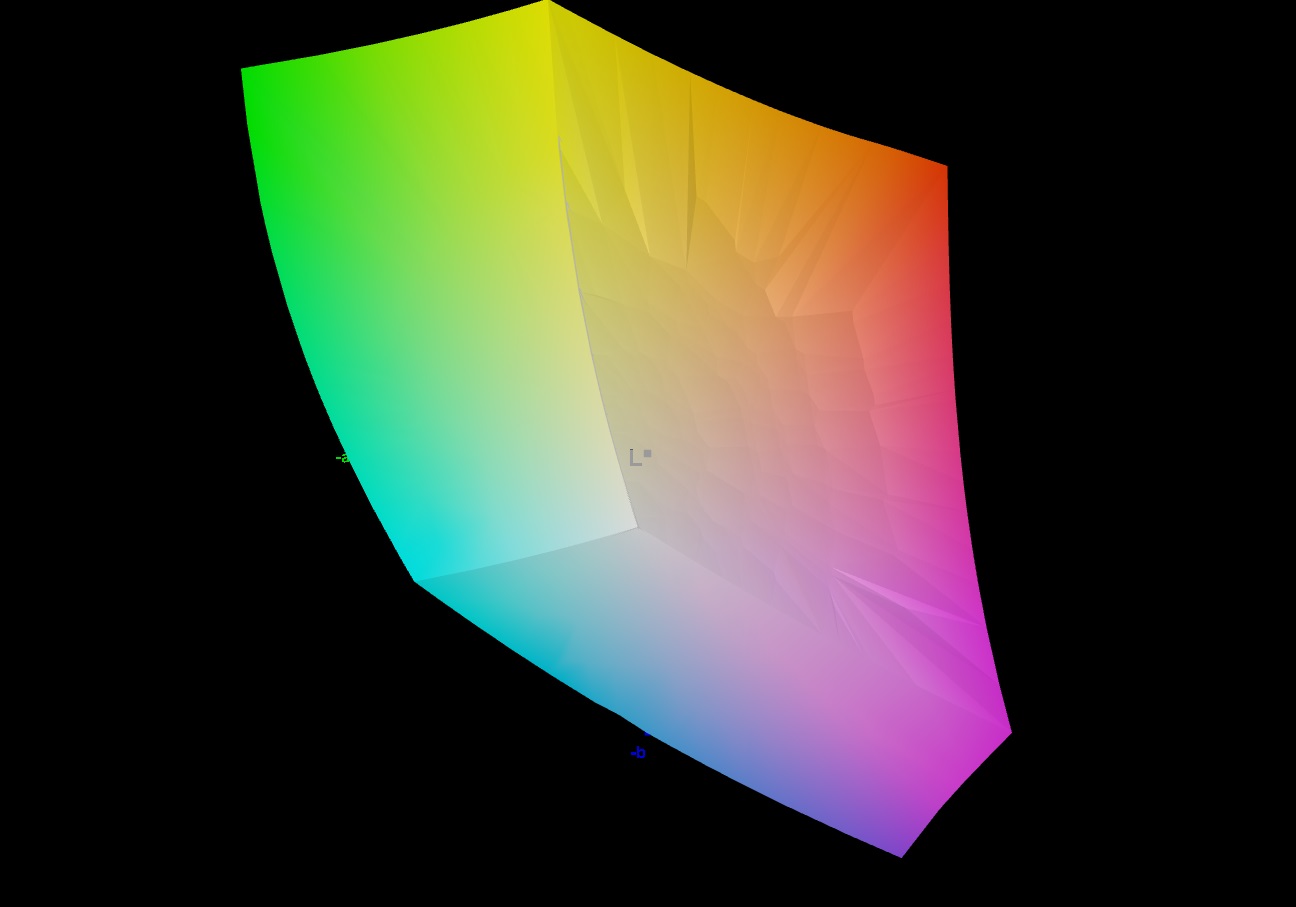
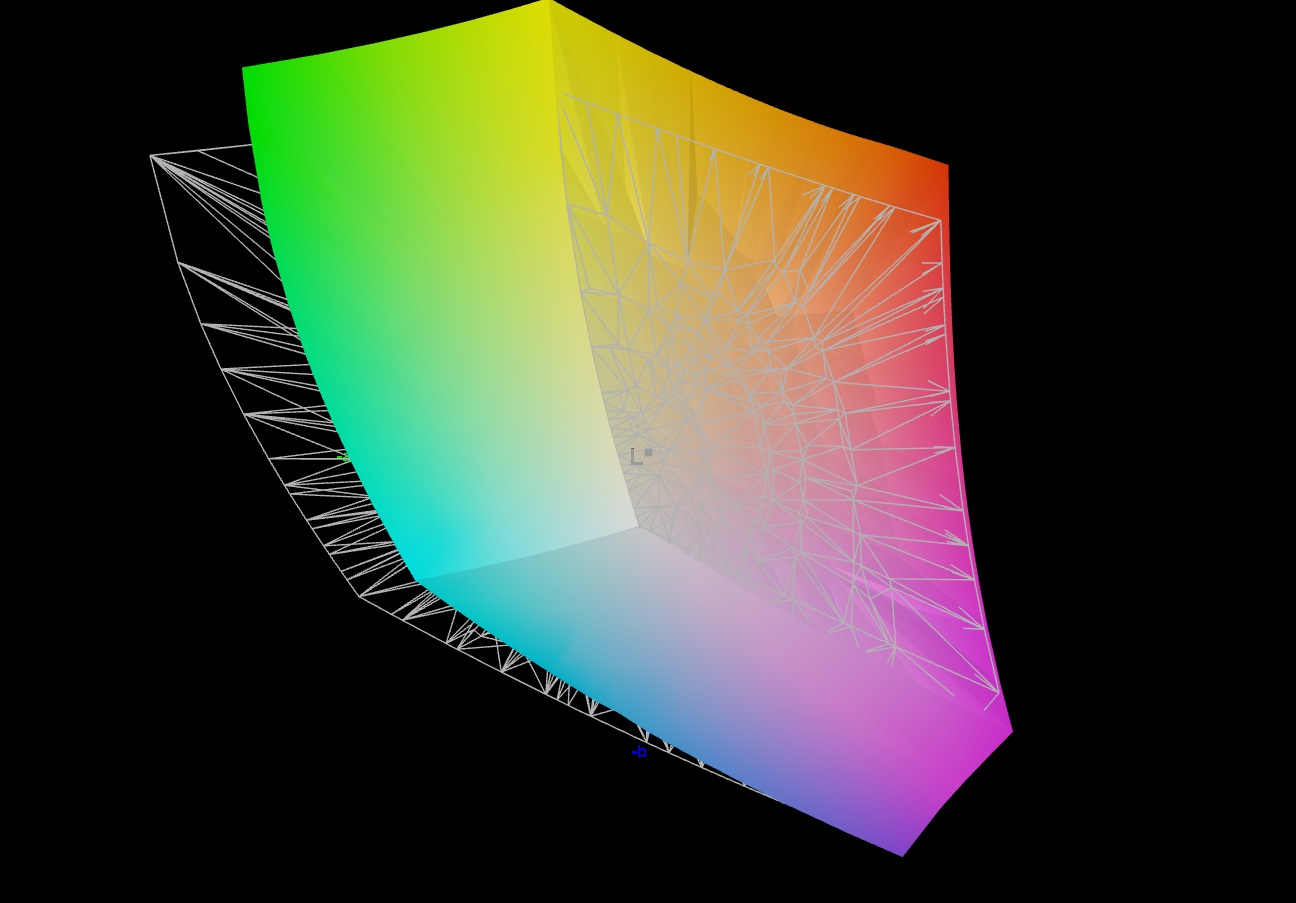
84.1% AdobeRGB 1998 (Argyll 3D)
100% sRGB (Argyll 3D)
96.3% Display P3 (Argyll 3D)
Gamma: 1.999
CCT: 7431 K
| Nubia RedMagic Titan 16 Pro BOE CQ NE160QDM-NZ2, IPS, 2560x1600, 16", 240 Hz | Lenovo Legion Pro 5 16IRX9 G9 BOE NE160QDM-NZB, IPS, 2560x1600, 16", 240 Hz | HP Victus 16 (2024) Chi Mei CMN163E, IPS, 1920x1080, 16.1", 144 Hz | Acer Predator Helios Neo 16 (2024) Chi Mei N160GME-GTB, LED, 2560x1600, 16", 240 Hz | Schenker XMG Pro 16 Studio (Mid 24) BOE CQ NE160QDM-NZ1, IPS, 2560x1600, 16", 240 Hz | Gigabyte G6X 9KG (2024) BOE NE160WUM-NX6, IPS, 1920x1200, 16", 165 Hz | |
|---|---|---|---|---|---|---|
| Display | 2% | -48% | 1% | -15% | -48% | |
| Display P3 Coverage (%) | 96.3 | 99.22 3% | 41.3 -57% | 95.9 0% | 68.8 -29% | 41.8 -57% |
| sRGB Coverage (%) | 100 | 99.93 0% | 61.7 -38% | 99.8 0% | 99.5 0% | 62.4 -38% |
| AdobeRGB 1998 Coverage (%) | 84.1 | 87.81 4% | 42.7 -49% | 86.4 3% | 70.8 -16% | 43.3 -49% |
| Response Times | -54% | -454% | -52% | -126% | -635% | |
| Response Time Grey 50% / Grey 80% * (ms) | 3.9 ? | 4.8 ? -23% | 28.6 ? -633% | 5 ? -28% | 12.7 ? -226% | 40.5 ? -938% |
| Response Time Black / White * (ms) | 5 ? | 9.2 ? -84% | 18.7 ? -274% | 8.8 ? -76% | 6.3 ? -26% | 21.6 ? -332% |
| PWM Frequency (Hz) | ||||||
| Screen | 4% | -74% | 18% | -2% | -68% | |
| Brightness middle (cd/m²) | 543 | 518 -5% | 287 -47% | 521 -4% | 416 -23% | 353 -35% |
| Brightness (cd/m²) | 516 | 491 -5% | 288 -44% | 506 -2% | 392 -24% | 318 -38% |
| Brightness Distribution (%) | 86 | 90 5% | 86 0% | 85 -1% | 86 0% | 81 -6% |
| Black Level * (cd/m²) | 0.51 | 0.36 29% | 0.19 63% | 0.44 14% | 0.38 25% | 0.21 59% |
| Contrast (:1) | 1065 | 1439 35% | 1511 42% | 1184 11% | 1095 3% | 1681 58% |
| Colorchecker dE 2000 * | 3.19 | 4.32 -35% | 5.46 -71% | 1.74 45% | 2.33 27% | 5.21 -63% |
| Colorchecker dE 2000 max. * | 7.09 | 6.37 10% | 20.36 -187% | 3.88 45% | 6.07 14% | 19.95 -181% |
| Colorchecker dE 2000 calibrated * | 0.69 | 0.75 -9% | 3.52 -410% | 0.52 25% | 1.02 -48% | 3.61 -423% |
| Greyscale dE 2000 * | 4.2 | 3.66 13% | 4.8 -14% | 3 29% | 3.7 12% | 3.6 14% |
| Gamma | 1.999 110% | 2.19 100% | 2.108 104% | 2.164 102% | 2.161 102% | 2.367 93% |
| CCT | 7431 87% | 6841 95% | 6442 101% | 6816 95% | 7102 92% | 7138 91% |
| Total Average (Program / Settings) | -16% /
-4% | -192% /
-123% | -11% /
4% | -48% /
-22% | -250% /
-145% |
* ... smaller is better
The panel covers the sRGB and DCI-P3 color spaces completely or nearly completely, but not the AdobeRGB space—this is similar to the screens of most competitors. Its decent color reproduction straight out of the box can be increased into the very good range by performing a calibration: Then, its color deviation drops from 3.19 to 0.69 (target: DeltaE < 3). At the same time, its grayscale depiction looks much more balanced.
Our color profile can be downloaded and used free of charge. A link can be found in the info box of the display.

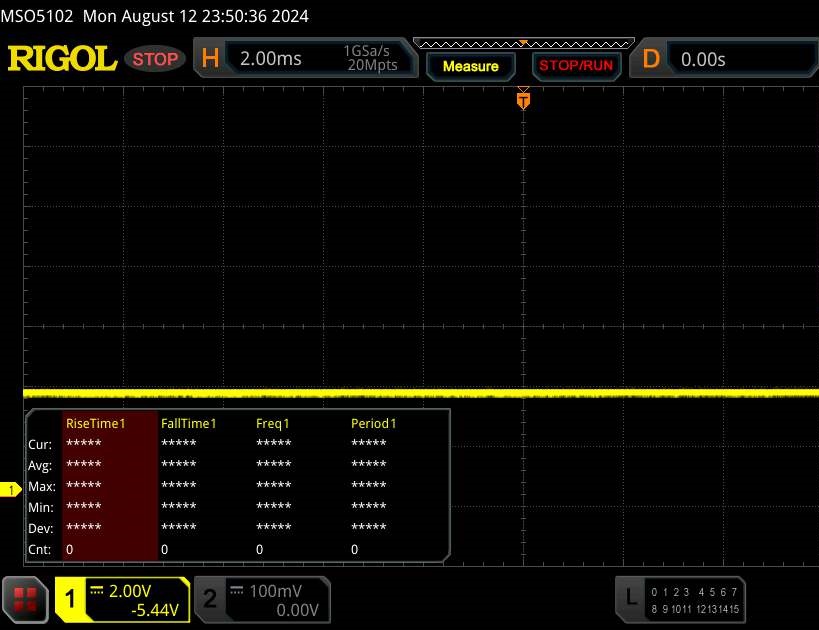
Display Response Times
| ↔ Response Time Black to White | ||
|---|---|---|
| 5 ms ... rise ↗ and fall ↘ combined | ↗ 1.2 ms rise | 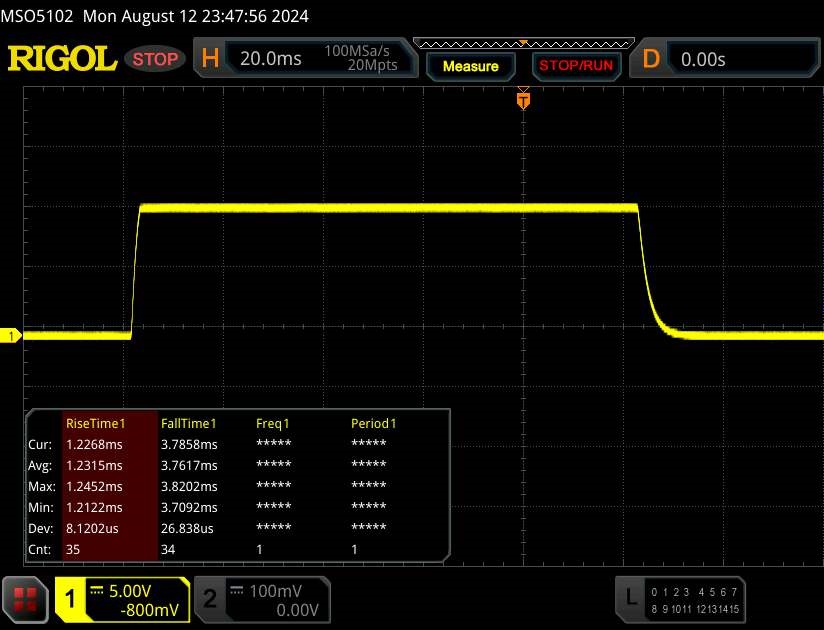 |
| ↘ 3.8 ms fall | ||
| The screen shows very fast response rates in our tests and should be very well suited for fast-paced gaming. In comparison, all tested devices range from 0.1 (minimum) to 240 (maximum) ms. » 17 % of all devices are better. This means that the measured response time is better than the average of all tested devices (19.8 ms). | ||
| ↔ Response Time 50% Grey to 80% Grey | ||
| 3.9 ms ... rise ↗ and fall ↘ combined | ↗ 1.7 ms rise |  |
| ↘ 2.2 ms fall | ||
| The screen shows very fast response rates in our tests and should be very well suited for fast-paced gaming. In comparison, all tested devices range from 0.165 (minimum) to 636 (maximum) ms. » 15 % of all devices are better. This means that the measured response time is better than the average of all tested devices (31 ms). | ||
Screen Flickering / PWM (Pulse-Width Modulation)
| Screen flickering / PWM not detected |  | ||
In comparison: 52 % of all tested devices do not use PWM to dim the display. If PWM was detected, an average of 7763 (minimum: 5 - maximum: 343500) Hz was measured. | |||

Performance - Raptor Lake and Ada Lovelace power the laptop
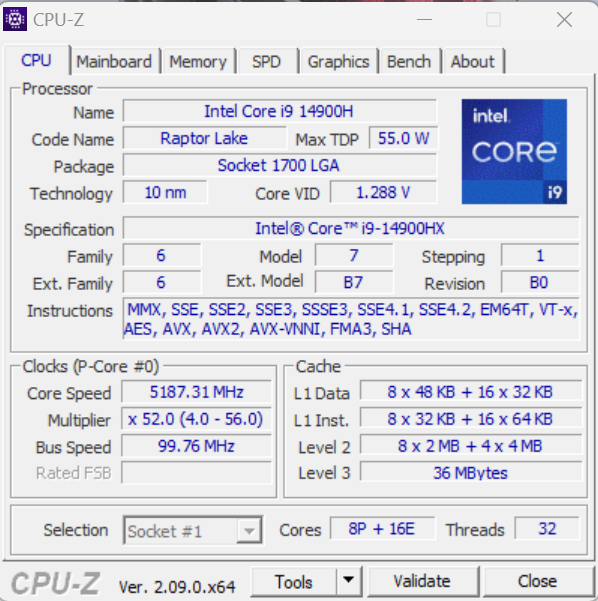
The Titan 16 Pro is aimed at gamers and creators, whereby its focus probably lies on the former. A Core i9-14900HX and a GeForce RTX 4060 power the laptop. Its MRSP is US$1,699. Nubia offers additional variants of this device, but they can't yet be found globally.
Testing conditions
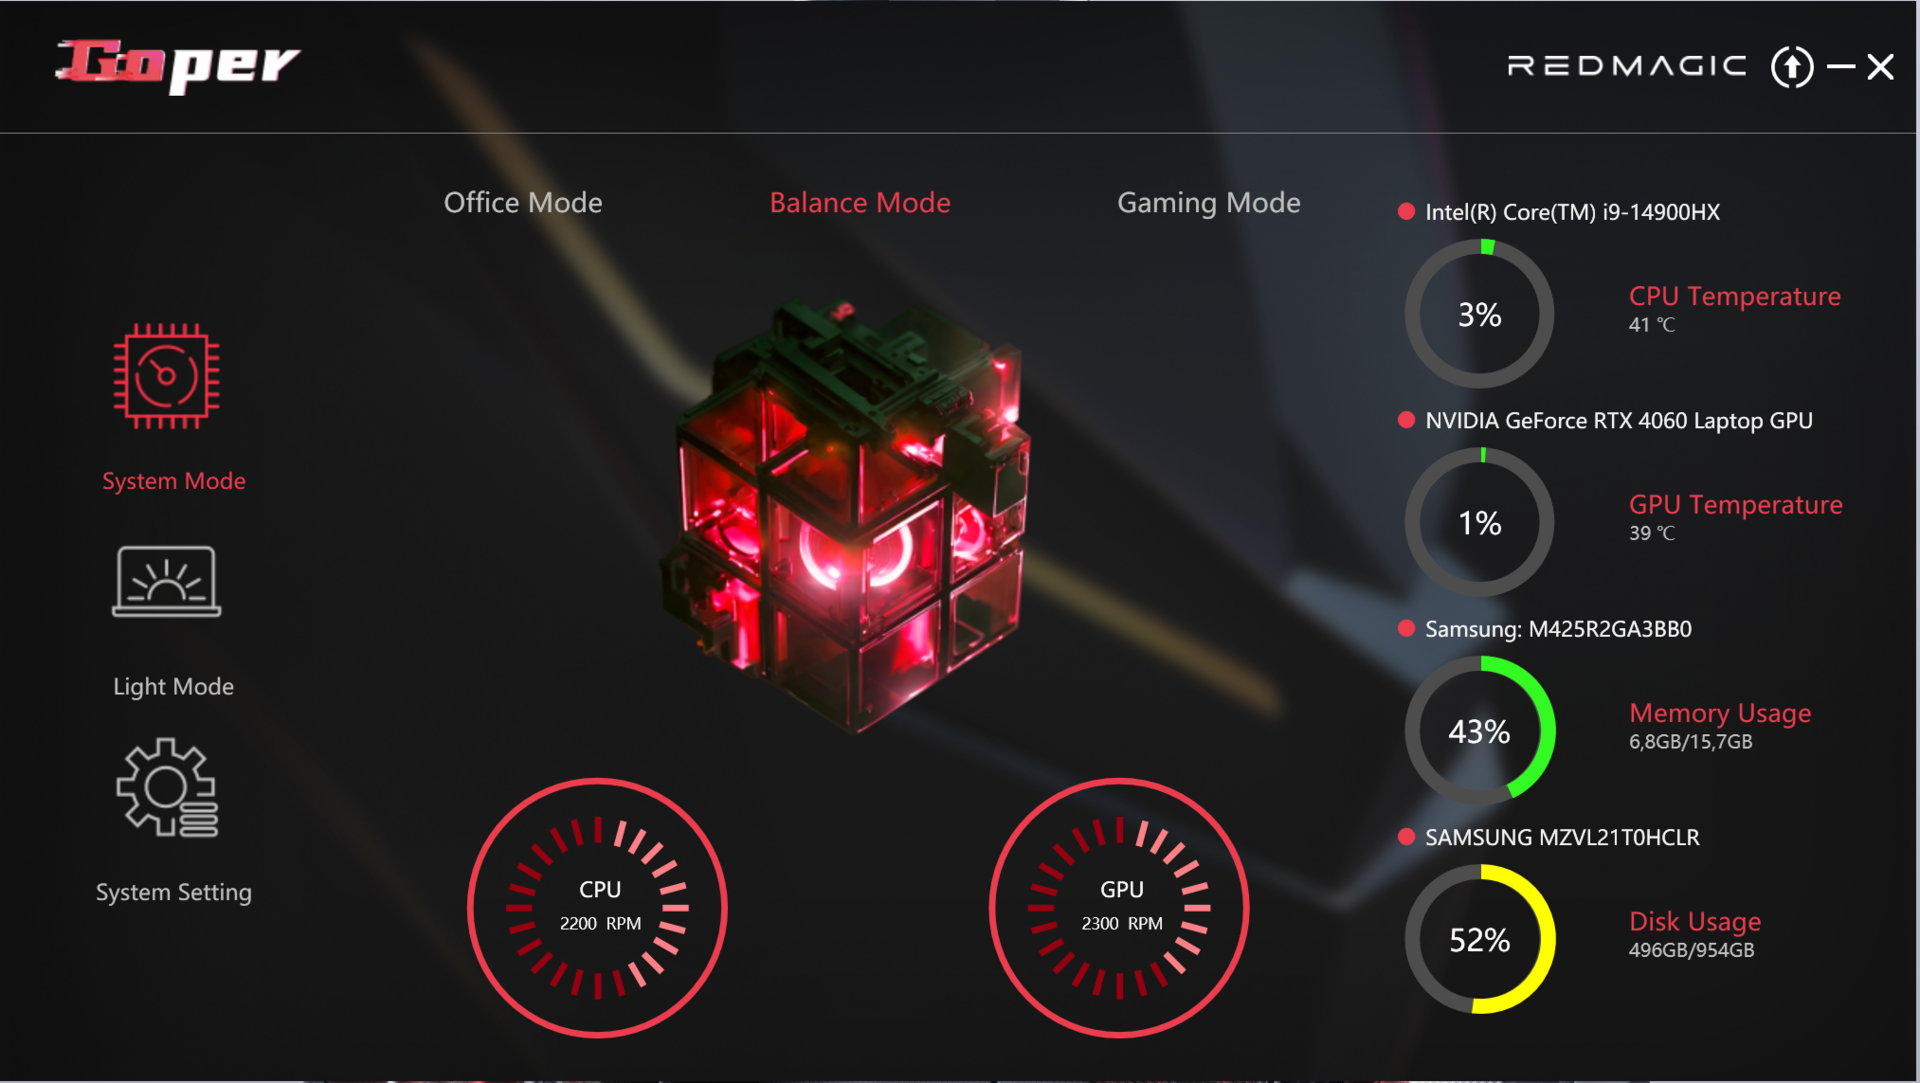
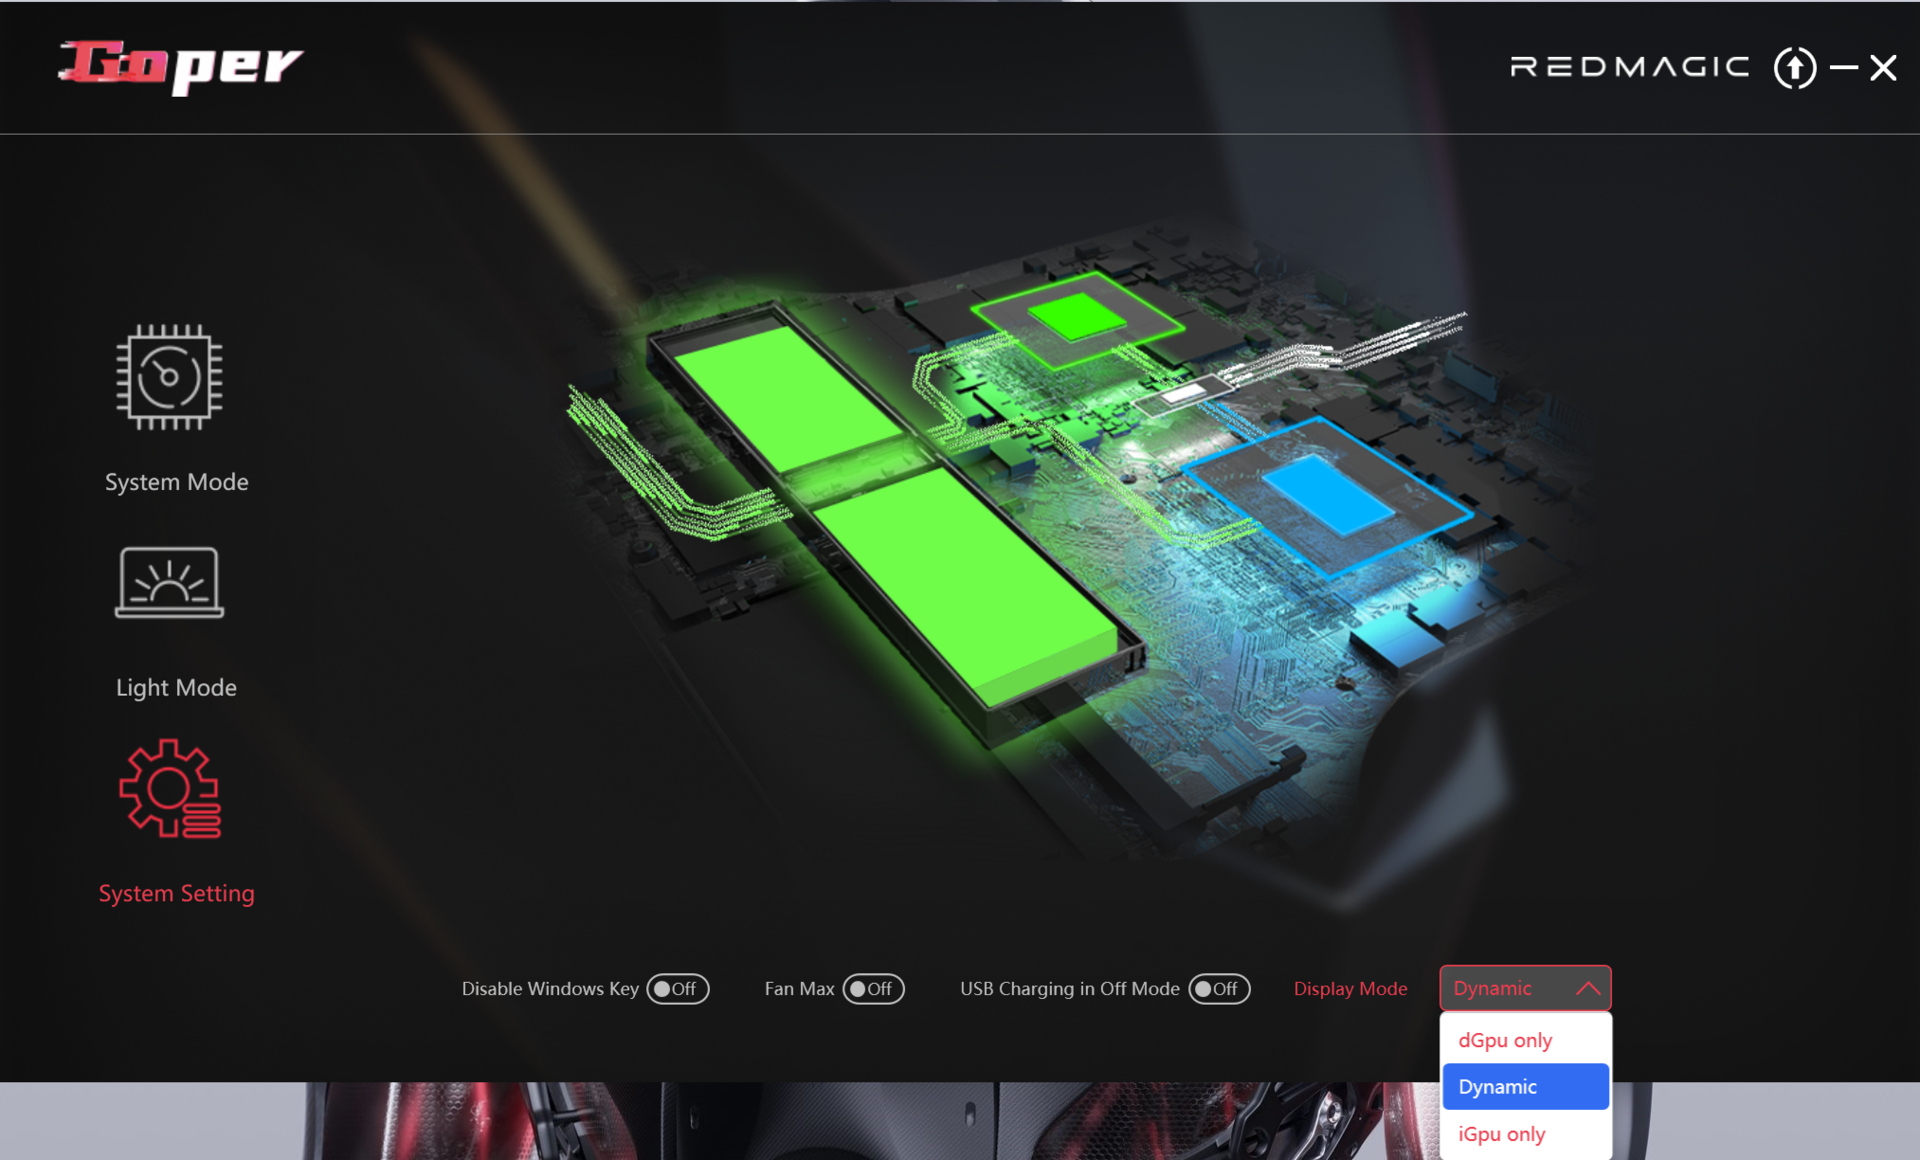
Three manufacturer-specific performance profiles (see table) are available to choose from. Balanced mode (benchmarks) and office mode (battery tests) were used during our test. The GPU mode was set to dynamic (= Optimus). Each profile can be called up directly via a separate key in the top row of the numeric keypad. Alternatively, you can change them via the Goper application (control center of the laptop).

| Balanced mode | Gaming mode | Office mode | |
|---|---|---|---|
| Power Limit 1 (HWInfo) | 45 watts | 100 watts | 35 watts |
| Power Limit 2 (HWInfo) | 140 watts | 140 watts | 140 watts |
| Noise (Cyberpunk 2077) | 50 dB(A) | 53 dB(A) | 47 dB(A) |
| Performance (Cyberpunk 2077) | 66 fps | 66 fps | 60 fps |
Processor
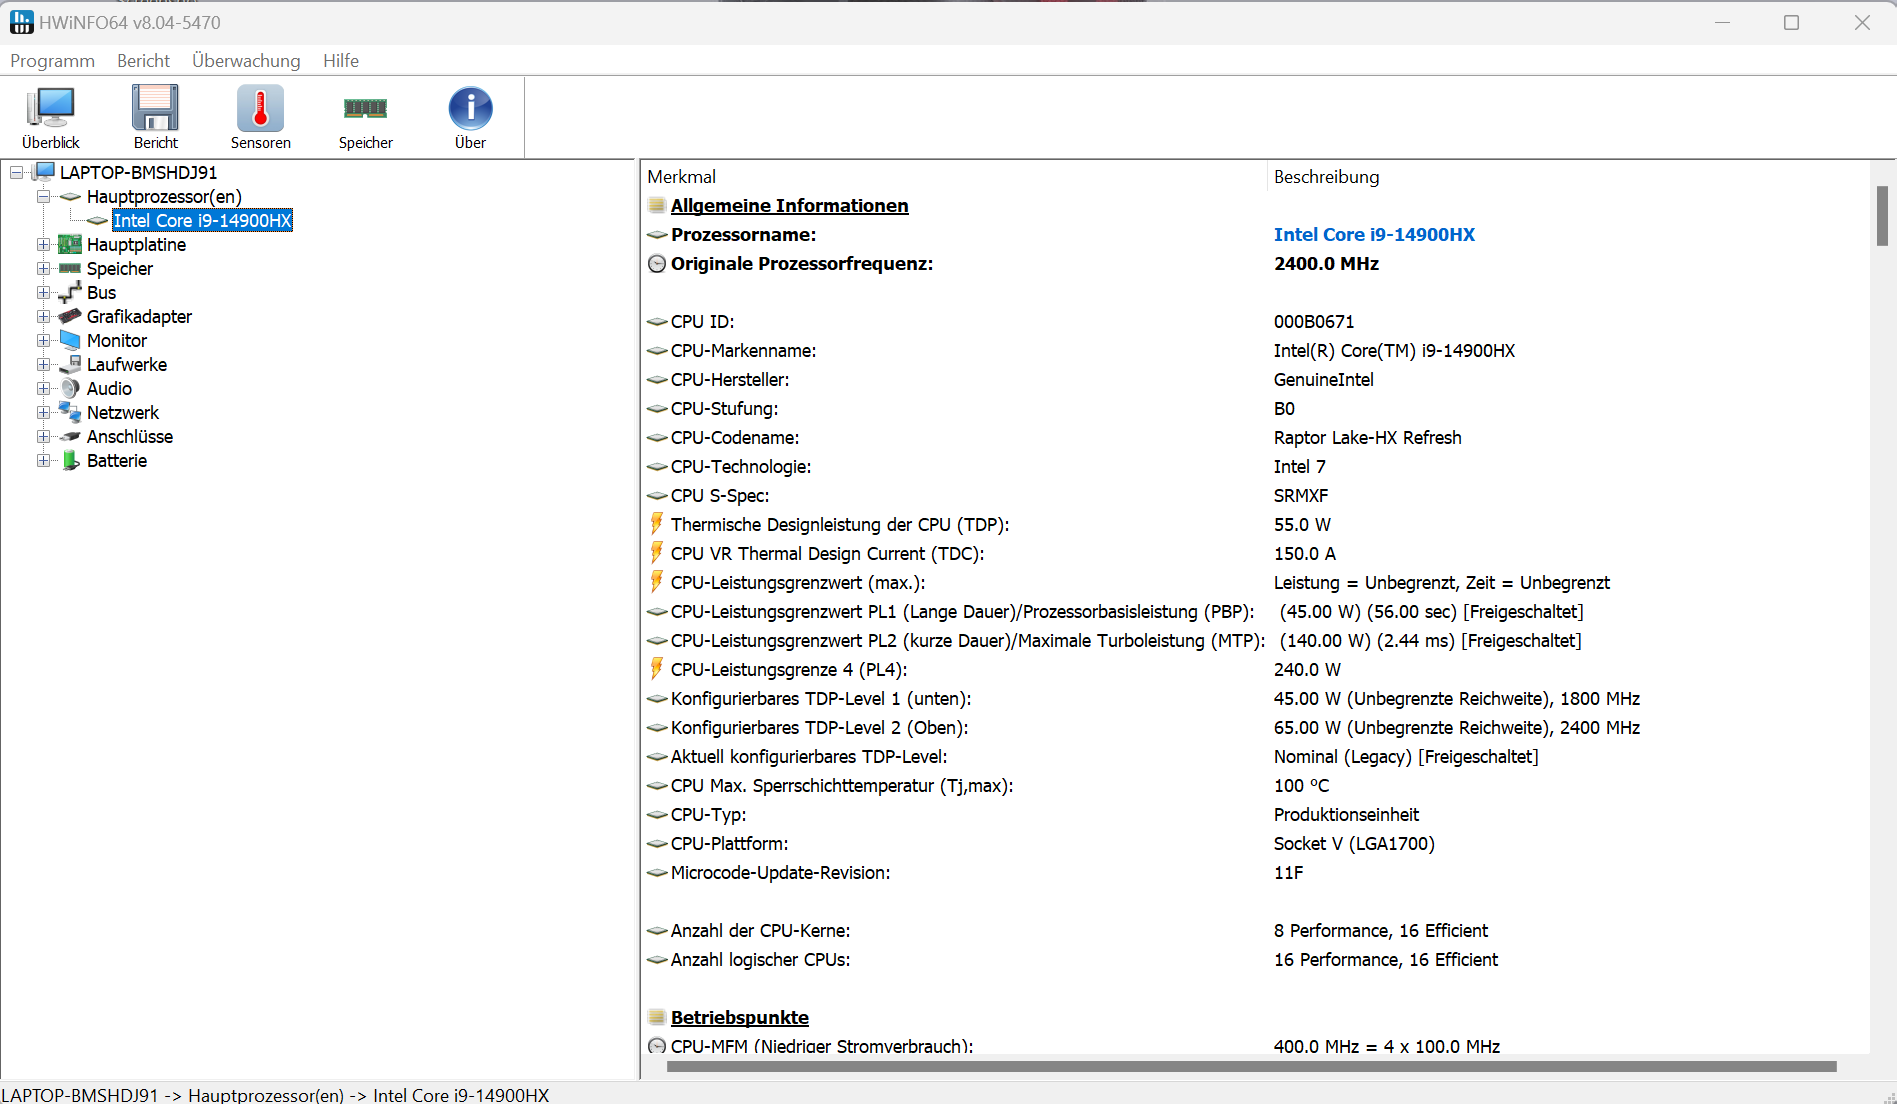
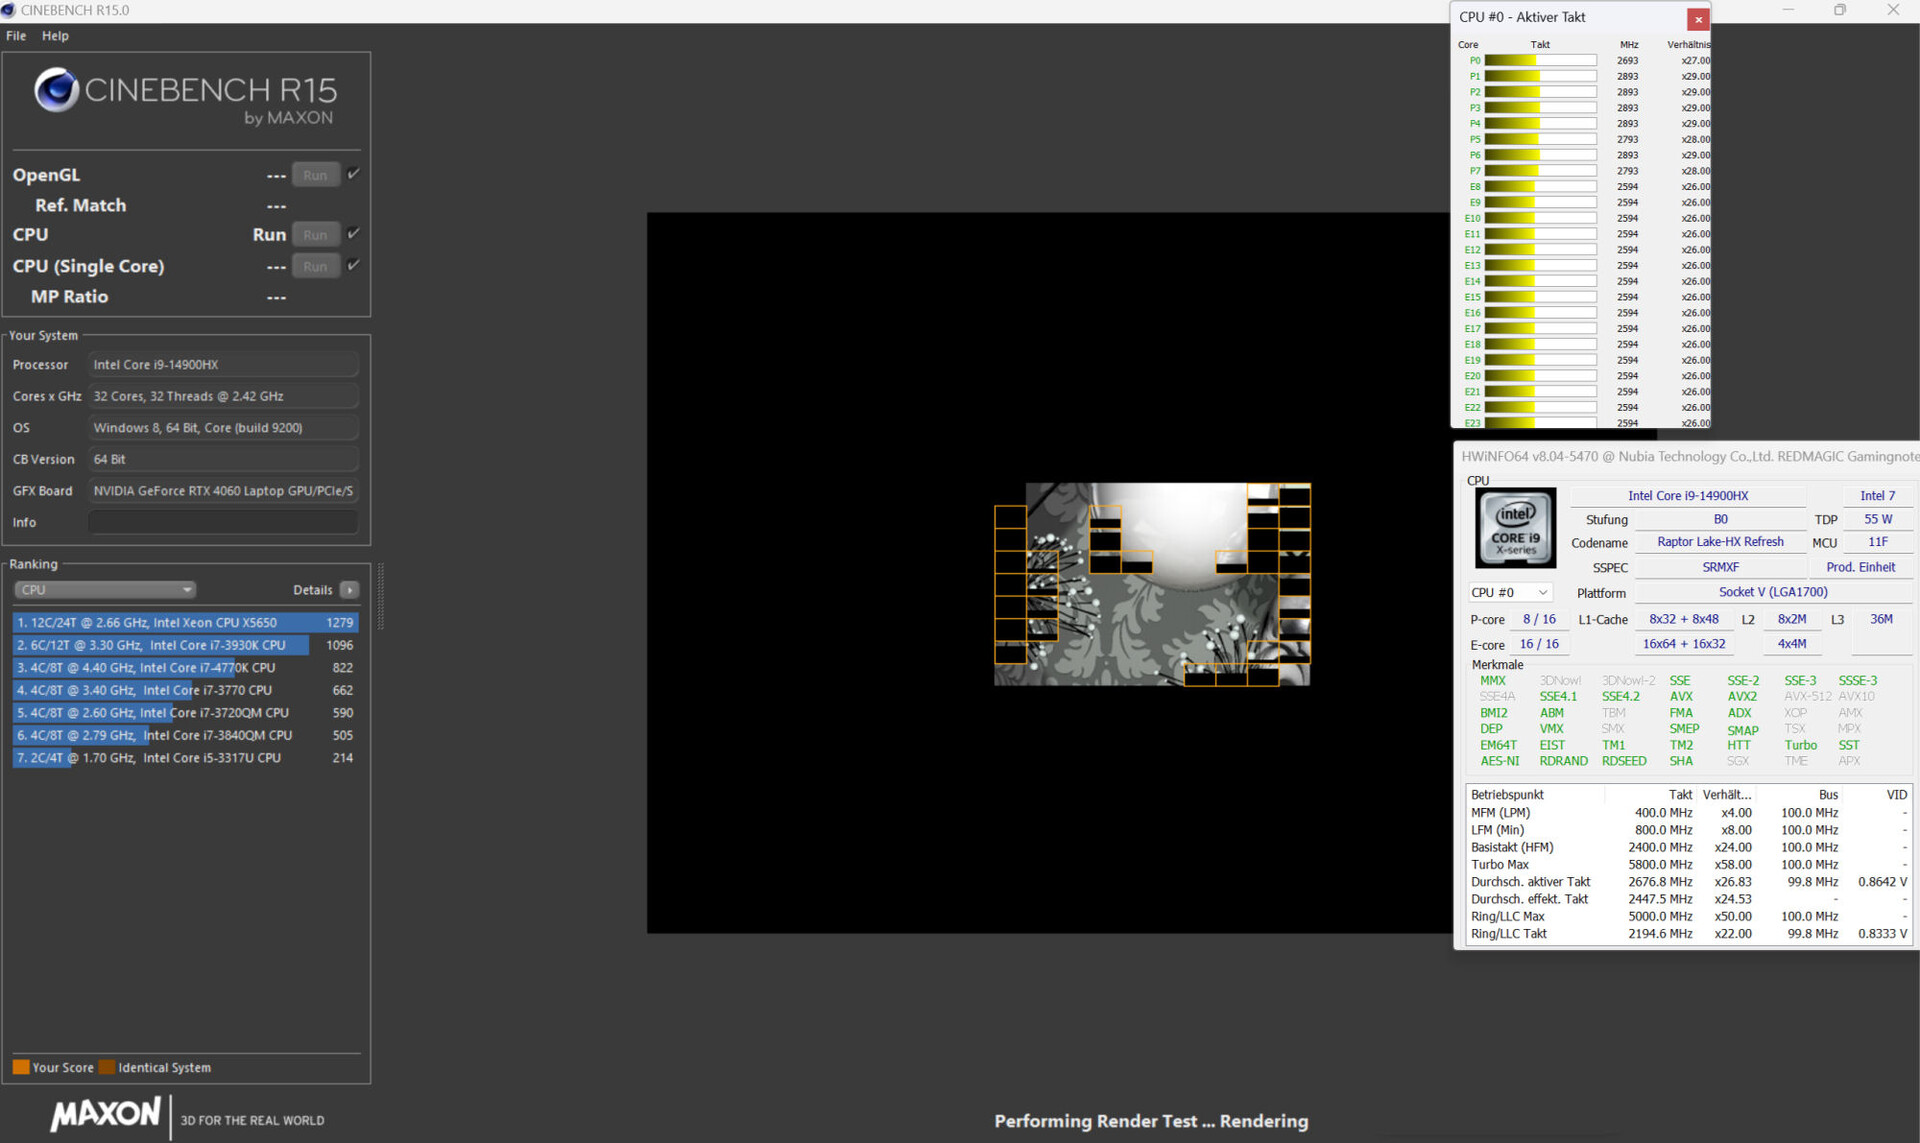
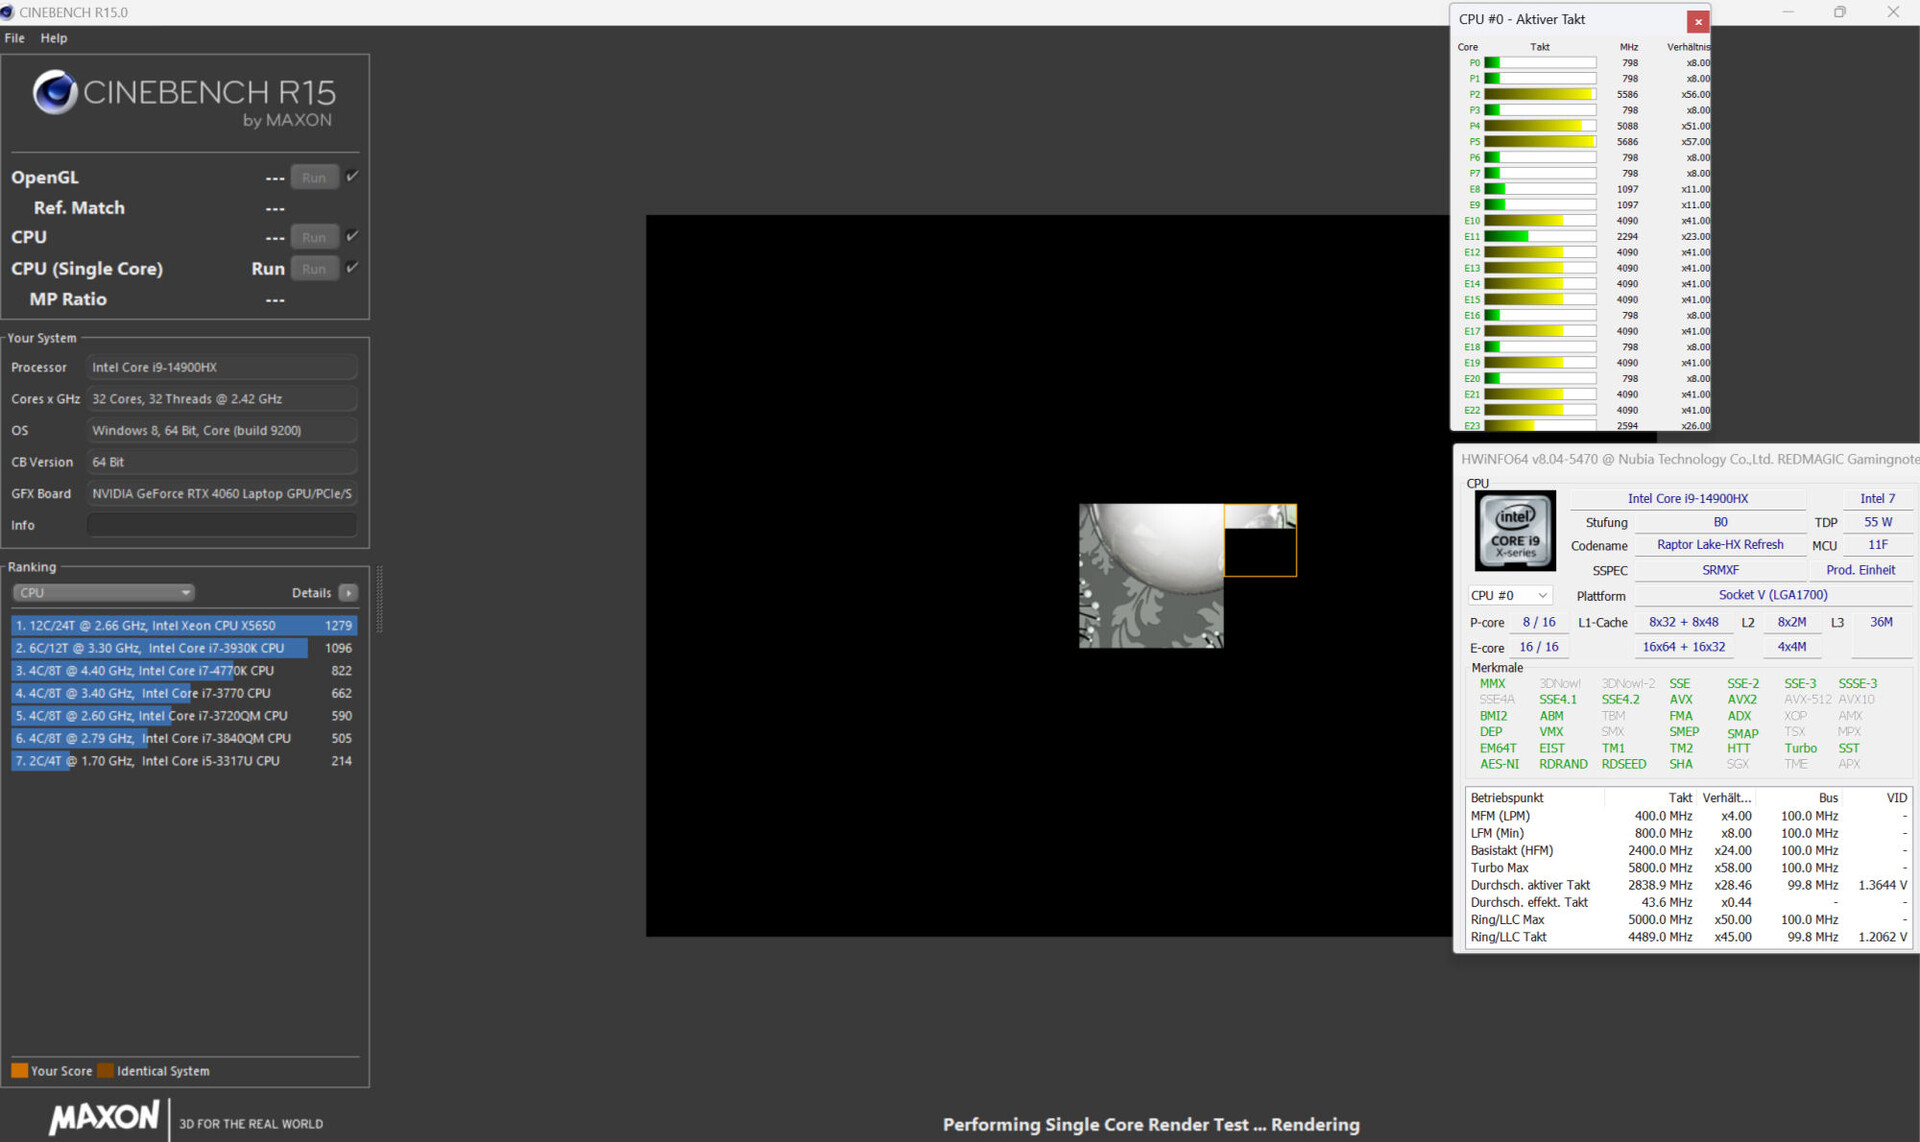
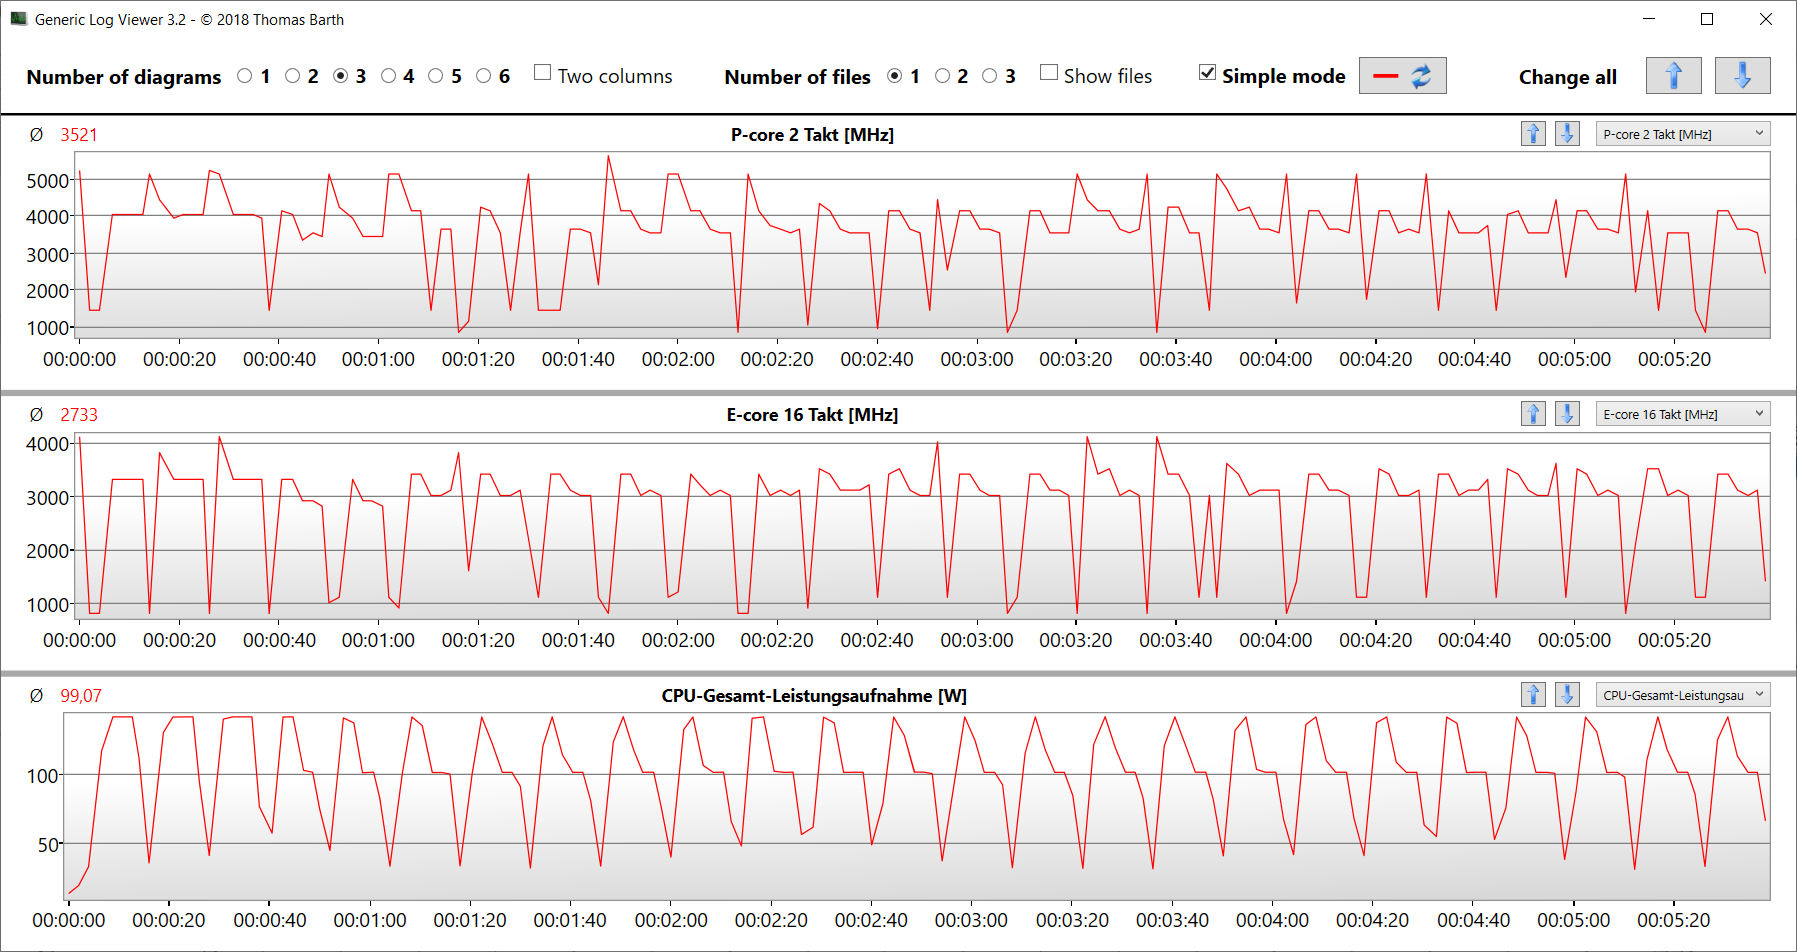
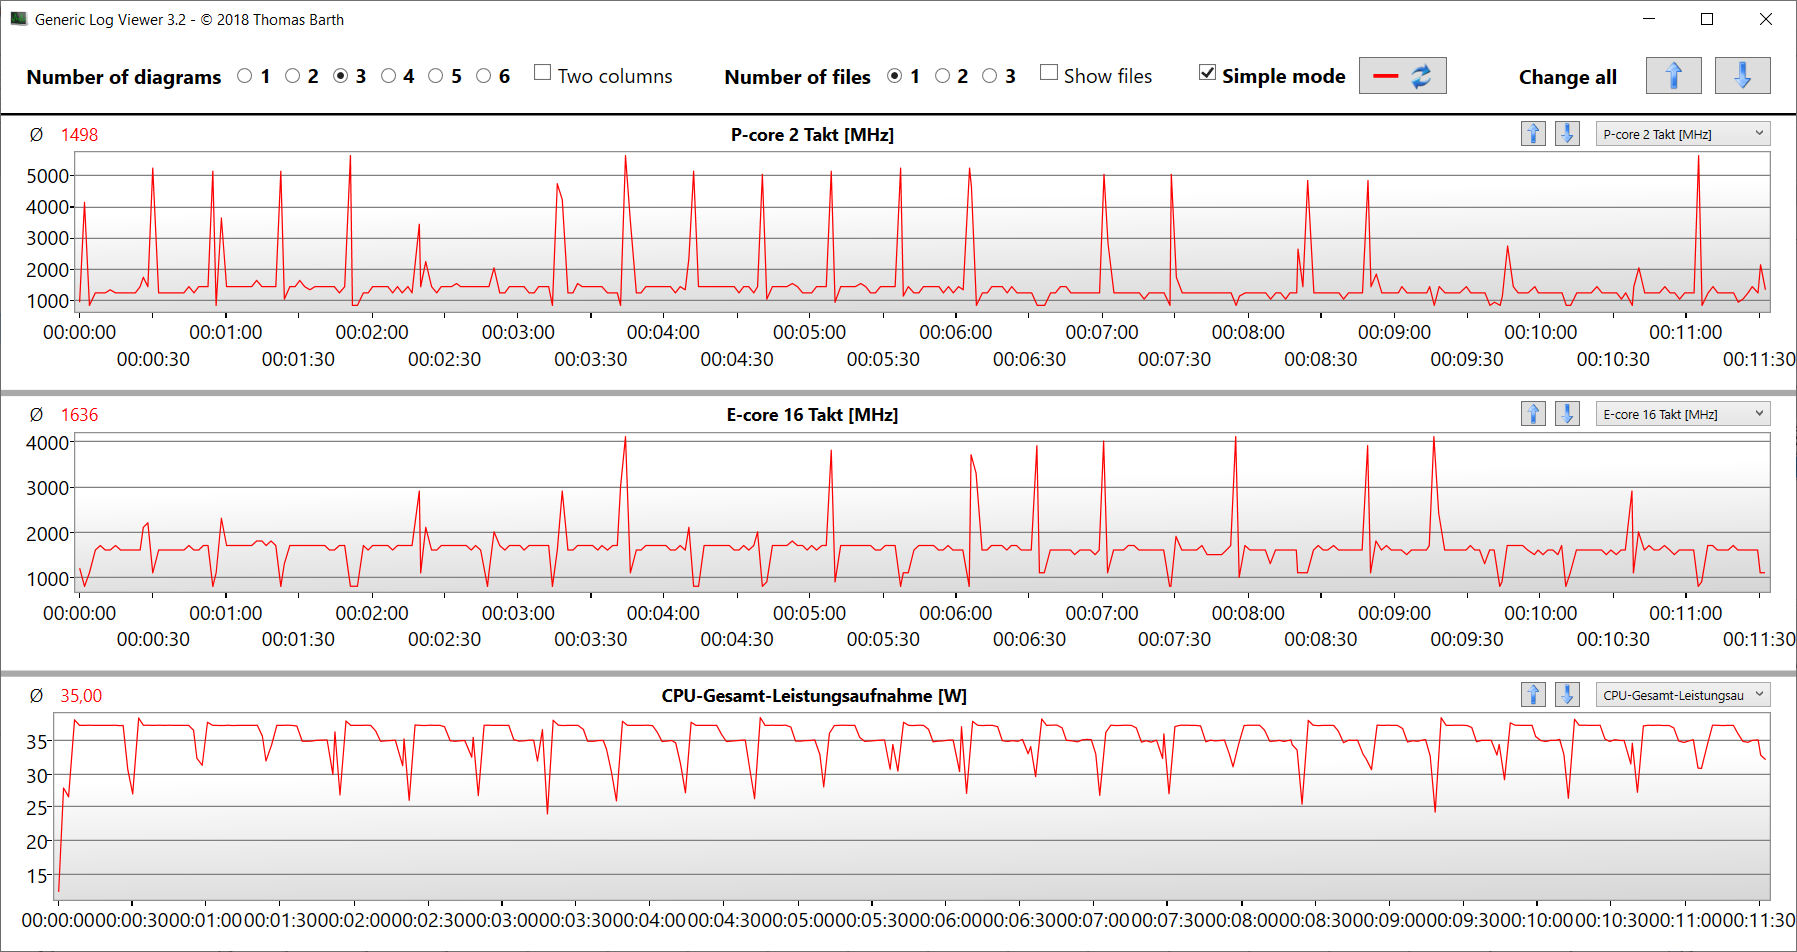
The Titan only has one CPU option available, namely the Core i9-14900HX (Raptor Lake). Its 24 CPU cores (8P + 16E = 32 threads) reach maximum clock rates of 5.8 GHz (P) and 4.1 GHz (E). Continuous multi-thread load (CB15 loop) caused the CPU clock to drop significantly from the first to the third run. After that, a fairly constant level was maintained. The gaming mode profile ensures a significantly higher performance level.
The three power modes deliver very similar single-thread performance at around the same level as the CPU's average. Its multi-thread performance differs to a much greater extent: Only gaming mode resulted in values at the level of the CPU's average during our test, whereas the other two modes were significantly lower.
More information on the Core i9 can be found in our analysis article.
Cinebench R15 Multi continuous test
| CPU Performance rating - Percent | |
| Average Intel Core i9-14900HX | |
| Lenovo Legion Pro 5 16IRX9 G9 | |
| Nubia RedMagic Titan 16 Pro | |
| Schenker XMG Pro 16 Studio (Mid 24) | |
| Acer Predator Helios Neo 16 (2024) | |
| Average of class Gaming | |
| Nubia RedMagic Titan 16 Pro | |
| HP Victus 16 (2024) | |
| Gigabyte G6X 9KG (2024) | |
| Cinebench R20 | |
| CPU (Multi Core) | |
| Nubia RedMagic Titan 16 Pro (Gaming Mode) | |
| Average Intel Core i9-14900HX (6579 - 13832, n=37) | |
| Lenovo Legion Pro 5 16IRX9 G9 | |
| Schenker XMG Pro 16 Studio (Mid 24) | |
| Average of class Gaming (4029 - 16108, n=109, last 2 years) | |
| HP Victus 16 (2024) | |
| Acer Predator Helios Neo 16 (2024) | |
| Gigabyte G6X 9KG (2024) | |
| Nubia RedMagic Titan 16 Pro | |
| CPU (Single Core) | |
| Nubia RedMagic Titan 16 Pro | |
| Average Intel Core i9-14900HX (657 - 859, n=37) | |
| Lenovo Legion Pro 5 16IRX9 G9 | |
| Nubia RedMagic Titan 16 Pro (Gaming Mode) | |
| Acer Predator Helios Neo 16 (2024) | |
| Schenker XMG Pro 16 Studio (Mid 24) | |
| Average of class Gaming (442 - 895, n=109, last 2 years) | |
| Gigabyte G6X 9KG (2024) | |
| HP Victus 16 (2024) | |
| Cinebench R15 | |
| CPU Multi 64Bit | |
| Nubia RedMagic Titan 16 Pro (Gaming Mode) | |
| Average Intel Core i9-14900HX (3263 - 5589, n=38) | |
| Schenker XMG Pro 16 Studio (Mid 24) | |
| Lenovo Legion Pro 5 16IRX9 G9 | |
| Average of class Gaming (1578 - 6271, n=108, last 2 years) | |
| HP Victus 16 (2024) | |
| Acer Predator Helios Neo 16 (2024) | |
| Nubia RedMagic Titan 16 Pro | |
| Gigabyte G6X 9KG (2024) | |
| CPU Single 64Bit | |
| Nubia RedMagic Titan 16 Pro | |
| Nubia RedMagic Titan 16 Pro (Gaming Mode) | |
| Average Intel Core i9-14900HX (247 - 323, n=37) | |
| Lenovo Legion Pro 5 16IRX9 G9 | |
| Average of class Gaming (188.8 - 343, n=109, last 2 years) | |
| Acer Predator Helios Neo 16 (2024) | |
| Schenker XMG Pro 16 Studio (Mid 24) | |
| Gigabyte G6X 9KG (2024) | |
| HP Victus 16 (2024) | |
| Blender - v2.79 BMW27 CPU | |
| Gigabyte G6X 9KG (2024) | |
| Nubia RedMagic Titan 16 Pro | |
| HP Victus 16 (2024) | |
| Average of class Gaming (80 - 330, n=107, last 2 years) | |
| Acer Predator Helios Neo 16 (2024) | |
| Schenker XMG Pro 16 Studio (Mid 24) | |
| Nubia RedMagic Titan 16 Pro (Gaming Mode) | |
| Lenovo Legion Pro 5 16IRX9 G9 | |
| Average Intel Core i9-14900HX (91 - 206, n=37) | |
| Geekbench 6.7 | |
| Multi-Core | |
| Lenovo Legion Pro 5 16IRX9 G9 (6.2.1) | |
| Average Intel Core i9-14900HX (13158 - 19665, n=37) | |
| Acer Predator Helios Neo 16 (2024) (6.2.1) | |
| Schenker XMG Pro 16 Studio (Mid 24) (6.2.1) | |
| Average of class Gaming (6625 - 22104, n=109, last 2 years) | |
| HP Victus 16 (2024) (6.2.1) | |
| Nubia RedMagic Titan 16 Pro (6.2.1, Gaming Mode) | |
| Gigabyte G6X 9KG (2024) (6.2.1) | |
| Nubia RedMagic Titan 16 Pro (6.2.1) | |
| Single-Core | |
| Nubia RedMagic Titan 16 Pro (6.2.1) | |
| Nubia RedMagic Titan 16 Pro (6.2.1, Gaming Mode) | |
| Acer Predator Helios Neo 16 (2024) (6.2.1) | |
| Average Intel Core i9-14900HX (2419 - 3129, n=37) | |
| Lenovo Legion Pro 5 16IRX9 G9 (6.2.1) | |
| Average of class Gaming (1490 - 3259, n=109, last 2 years) | |
| Schenker XMG Pro 16 Studio (Mid 24) (6.2.1) | |
| Gigabyte G6X 9KG (2024) (6.2.1) | |
| HP Victus 16 (2024) (6.2.1) | |
| HWBOT x265 Benchmark v2.2 - 4k Preset | |
| Nubia RedMagic Titan 16 Pro (Gaming Mode) | |
| Average Intel Core i9-14900HX (16.8 - 38.9, n=37) | |
| Average of class Gaming (11.5 - 44.3, n=108, last 2 years) | |
| Lenovo Legion Pro 5 16IRX9 G9 | |
| Schenker XMG Pro 16 Studio (Mid 24) | |
| Acer Predator Helios Neo 16 (2024) | |
| HP Victus 16 (2024) | |
| Gigabyte G6X 9KG (2024) | |
| Nubia RedMagic Titan 16 Pro | |
| LibreOffice - 20 Documents To PDF | |
| HP Victus 16 (2024) (6.3.4.2) | |
| Lenovo Legion Pro 5 16IRX9 G9 (6.3.4.2) | |
| Average of class Gaming (19 - 88.8, n=108, last 2 years) | |
| Schenker XMG Pro 16 Studio (Mid 24) (6.3.4.2) | |
| Average Intel Core i9-14900HX (19 - 85.1, n=37) | |
| Acer Predator Helios Neo 16 (2024) (6.3.4.2) | |
| Nubia RedMagic Titan 16 Pro (6.3.4.2, Gaming Mode) | |
| Gigabyte G6X 9KG (2024) (6.3.4.2) | |
| Nubia RedMagic Titan 16 Pro (6.3.4.2) | |
| R Benchmark 2.5 - Overall mean | |
| HP Victus 16 (2024) | |
| Gigabyte G6X 9KG (2024) | |
| Average of class Gaming (0.3439 - 0.759, n=109, last 2 years) | |
| Schenker XMG Pro 16 Studio (Mid 24) | |
| Lenovo Legion Pro 5 16IRX9 G9 | |
| Average Intel Core i9-14900HX (0.3604 - 0.4859, n=37) | |
| Acer Predator Helios Neo 16 (2024) | |
| Nubia RedMagic Titan 16 Pro | |
| Nubia RedMagic Titan 16 Pro (Gaming Mode) | |
* ... smaller is better
AIDA64: FP32 Ray-Trace | FPU Julia | CPU SHA3 | CPU Queen | FPU SinJulia | FPU Mandel | CPU AES | CPU ZLib | FP64 Ray-Trace | CPU PhotoWorxx
| Performance rating | |
| Average of class Gaming | |
| Average Intel Core i9-14900HX | |
| Nubia RedMagic Titan 16 Pro | |
| Lenovo Legion Pro 5 16IRX9 G9 | |
| Schenker XMG Pro 16 Studio (Mid 24) | |
| Acer Predator Helios Neo 16 (2024) | |
| HP Victus 16 (2024) | |
| Nubia RedMagic Titan 16 Pro | |
| Gigabyte G6X 9KG (2024) | |
| AIDA64 / FP32 Ray-Trace | |
| Average of class Gaming (10227 - 85542, n=107, last 2 years) | |
| Average Intel Core i9-14900HX (13098 - 33474, n=36) | |
| Nubia RedMagic Titan 16 Pro (v6.92.6600, Gaming Mode) | |
| Lenovo Legion Pro 5 16IRX9 G9 (v6.92.6600) | |
| Acer Predator Helios Neo 16 (2024) (v6.92.6600) | |
| Schenker XMG Pro 16 Studio (Mid 24) (v6.92.6600) | |
| HP Victus 16 (2024) (v6.92.6600) | |
| Gigabyte G6X 9KG (2024) (v6.92.6600) | |
| Nubia RedMagic Titan 16 Pro (v6.92.6600) | |
| AIDA64 / FPU Julia | |
| Average of class Gaming (51376 - 238426, n=107, last 2 years) | |
| Average Intel Core i9-14900HX (67573 - 166040, n=36) | |
| Nubia RedMagic Titan 16 Pro (v6.92.6600, Gaming Mode) | |
| Lenovo Legion Pro 5 16IRX9 G9 (v6.92.6600) | |
| Schenker XMG Pro 16 Studio (Mid 24) (v6.92.6600) | |
| Acer Predator Helios Neo 16 (2024) (v6.92.6600) | |
| HP Victus 16 (2024) (v6.92.6600) | |
| Gigabyte G6X 9KG (2024) (v6.92.6600) | |
| Nubia RedMagic Titan 16 Pro (v6.92.6600) | |
| AIDA64 / CPU SHA3 | |
| Average of class Gaming (2180 - 9817, n=107, last 2 years) | |
| Nubia RedMagic Titan 16 Pro (v6.92.6600, Gaming Mode) | |
| Average Intel Core i9-14900HX (3589 - 7979, n=36) | |
| Schenker XMG Pro 16 Studio (Mid 24) (v6.92.6600) | |
| Lenovo Legion Pro 5 16IRX9 G9 (v6.92.6600) | |
| Acer Predator Helios Neo 16 (2024) (v6.92.6600) | |
| HP Victus 16 (2024) (v6.92.6600) | |
| Nubia RedMagic Titan 16 Pro (v6.92.6600) | |
| Gigabyte G6X 9KG (2024) (v6.92.6600) | |
| AIDA64 / CPU Queen | |
| Lenovo Legion Pro 5 16IRX9 G9 (v6.92.6600) | |
| Acer Predator Helios Neo 16 (2024) (v6.92.6600) | |
| Nubia RedMagic Titan 16 Pro (v6.92.6600, Gaming Mode) | |
| Average Intel Core i9-14900HX (118405 - 148966, n=36) | |
| Schenker XMG Pro 16 Studio (Mid 24) (v6.92.6600) | |
| HP Victus 16 (2024) (v6.92.6600) | |
| Nubia RedMagic Titan 16 Pro (v6.92.6600) | |
| Average of class Gaming (49785 - 173351, n=94, last 2 years) | |
| Gigabyte G6X 9KG (2024) (v6.92.6600) | |
| AIDA64 / FPU SinJulia | |
| Nubia RedMagic Titan 16 Pro (v6.92.6600, Gaming Mode) | |
| Average Intel Core i9-14900HX (10475 - 18517, n=36) | |
| Average of class Gaming (4424 - 33636, n=107, last 2 years) | |
| Lenovo Legion Pro 5 16IRX9 G9 (v6.92.6600) | |
| Schenker XMG Pro 16 Studio (Mid 24) (v6.92.6600) | |
| Acer Predator Helios Neo 16 (2024) (v6.92.6600) | |
| HP Victus 16 (2024) (v6.92.6600) | |
| Nubia RedMagic Titan 16 Pro (v6.92.6600) | |
| Gigabyte G6X 9KG (2024) (v6.92.6600) | |
| AIDA64 / FPU Mandel | |
| Average of class Gaming (25115 - 128721, n=107, last 2 years) | |
| Average Intel Core i9-14900HX (32543 - 83662, n=36) | |
| Nubia RedMagic Titan 16 Pro (v6.92.6600, Gaming Mode) | |
| Lenovo Legion Pro 5 16IRX9 G9 (v6.92.6600) | |
| Acer Predator Helios Neo 16 (2024) (v6.92.6600) | |
| Schenker XMG Pro 16 Studio (Mid 24) (v6.92.6600) | |
| HP Victus 16 (2024) (v6.92.6600) | |
| Gigabyte G6X 9KG (2024) (v6.92.6600) | |
| Nubia RedMagic Titan 16 Pro | |
| AIDA64 / CPU AES | |
| Nubia RedMagic Titan 16 Pro (v6.92.6600, Gaming Mode) | |
| Average Intel Core i9-14900HX (86964 - 241777, n=36) | |
| Nubia RedMagic Titan 16 Pro (v6.92.6600) | |
| Lenovo Legion Pro 5 16IRX9 G9 (v6.92.6600) | |
| Schenker XMG Pro 16 Studio (Mid 24) (v6.92.6600) | |
| Average of class Gaming (39258 - 247074, n=107, last 2 years) | |
| Acer Predator Helios Neo 16 (2024) (v6.92.6600) | |
| HP Victus 16 (2024) (v6.92.6600) | |
| Gigabyte G6X 9KG (2024) (v6.92.6600) | |
| AIDA64 / CPU ZLib | |
| Nubia RedMagic Titan 16 Pro (v6.92.6600, Gaming Mode) | |
| Average Intel Core i9-14900HX (1054 - 2292, n=36) | |
| Lenovo Legion Pro 5 16IRX9 G9 (v6.92.6600) | |
| Schenker XMG Pro 16 Studio (Mid 24) (v6.92.6600) | |
| Average of class Gaming (574 - 2531, n=107, last 2 years) | |
| Acer Predator Helios Neo 16 (2024) (v6.92.6600) | |
| HP Victus 16 (2024) (v6.92.6600) | |
| Gigabyte G6X 9KG (2024) (v6.92.6600) | |
| Nubia RedMagic Titan 16 Pro (v6.92.6600) | |
| AIDA64 / FP64 Ray-Trace | |
| Average of class Gaming (5509 - 45446, n=107, last 2 years) | |
| Average Intel Core i9-14900HX (6809 - 18349, n=36) | |
| Lenovo Legion Pro 5 16IRX9 G9 (v6.92.6600) | |
| Nubia RedMagic Titan 16 Pro (v6.92.6600, Gaming Mode) | |
| Schenker XMG Pro 16 Studio (Mid 24) (v6.92.6600) | |
| Acer Predator Helios Neo 16 (2024) (v6.92.6600) | |
| HP Victus 16 (2024) (v6.92.6600) | |
| Gigabyte G6X 9KG (2024) (v6.92.6600) | |
| Nubia RedMagic Titan 16 Pro (v6.92.6600) | |
| AIDA64 / CPU PhotoWorxx | |
| Lenovo Legion Pro 5 16IRX9 G9 (v6.92.6600) | |
| Schenker XMG Pro 16 Studio (Mid 24) (v6.92.6600) | |
| Average Intel Core i9-14900HX (23903 - 54702, n=36) | |
| Acer Predator Helios Neo 16 (2024) (v6.92.6600) | |
| Average of class Gaming (12271 - 89891, n=107, last 2 years) | |
| HP Victus 16 (2024) (v6.92.6600) | |
| Gigabyte G6X 9KG (2024) (v6.92.6600) | |
| Nubia RedMagic Titan 16 Pro (v6.92.6600) | |
| Nubia RedMagic Titan 16 Pro (v6.92.6600, Gaming Mode) | |
System performance
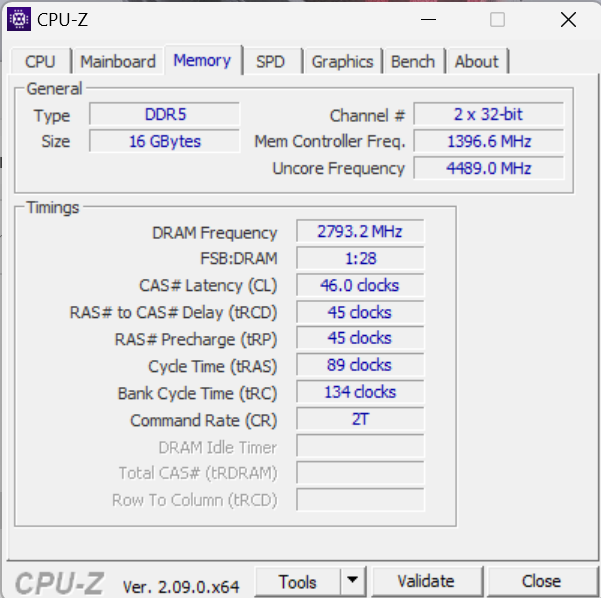
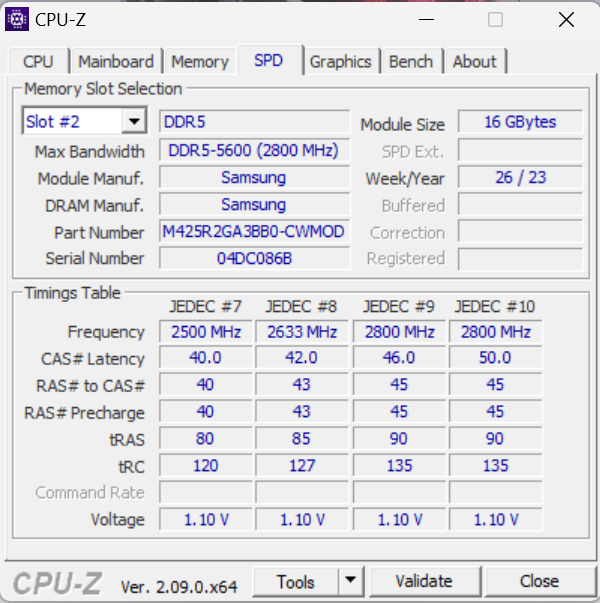
The smooth-running system provides enough power for demanding applications such as gaming, rendering and streaming. However, some of its computing power remains unused as the RAM (16 GB, DDR5-5600) only runs in single-channel mode—the laptop's low memory transfer rates compared to the competition confirmed this. Installing a second memory module (= dual-channel mode active) would provide a remedy to this.
CrossMark: Overall | Productivity | Creativity | Responsiveness
WebXPRT 3: Overall
WebXPRT 4: Overall
Mozilla Kraken 1.1: Total
| PCMark 10 / Score | |
| Average of class Gaming (5828 - 11574, n=95, last 2 years) | |
| Acer Predator Helios Neo 16 (2024) | |
| Lenovo Legion Pro 5 16IRX9 G9 | |
| Schenker XMG Pro 16 Studio (Mid 24) | |
| Average Intel Core i9-14900HX, NVIDIA GeForce RTX 4060 Laptop GPU (7830 - 8322, n=2) | |
| Nubia RedMagic Titan 16 Pro | |
| Gigabyte G6X 9KG (2024) | |
| HP Victus 16 (2024) | |
| PCMark 10 / Essentials | |
| Acer Predator Helios Neo 16 (2024) | |
| Average Intel Core i9-14900HX, NVIDIA GeForce RTX 4060 Laptop GPU (11022 - 11413, n=2) | |
| Lenovo Legion Pro 5 16IRX9 G9 | |
| Nubia RedMagic Titan 16 Pro | |
| HP Victus 16 (2024) | |
| Schenker XMG Pro 16 Studio (Mid 24) | |
| Average of class Gaming (8810 - 12600, n=99, last 2 years) | |
| Gigabyte G6X 9KG (2024) | |
| PCMark 10 / Productivity | |
| Schenker XMG Pro 16 Studio (Mid 24) | |
| Average of class Gaming (6845 - 21327, n=97, last 2 years) | |
| Acer Predator Helios Neo 16 (2024) | |
| Gigabyte G6X 9KG (2024) | |
| Average Intel Core i9-14900HX, NVIDIA GeForce RTX 4060 Laptop GPU (9776 - 10558, n=2) | |
| HP Victus 16 (2024) | |
| Lenovo Legion Pro 5 16IRX9 G9 | |
| Nubia RedMagic Titan 16 Pro | |
| PCMark 10 / Digital Content Creation | |
| Lenovo Legion Pro 5 16IRX9 G9 | |
| Average of class Gaming (7602 - 19657, n=97, last 2 years) | |
| Acer Predator Helios Neo 16 (2024) | |
| Average Intel Core i9-14900HX, NVIDIA GeForce RTX 4060 Laptop GPU (12091 - 12979, n=2) | |
| Schenker XMG Pro 16 Studio (Mid 24) | |
| Nubia RedMagic Titan 16 Pro | |
| Gigabyte G6X 9KG (2024) | |
| HP Victus 16 (2024) | |
| CrossMark / Overall | |
| Acer Predator Helios Neo 16 (2024) | |
| Average Intel Core i9-14900HX, NVIDIA GeForce RTX 4060 Laptop GPU (2103 - 2184, n=2) | |
| Lenovo Legion Pro 5 16IRX9 G9 | |
| Nubia RedMagic Titan 16 Pro | |
| Schenker XMG Pro 16 Studio (Mid 24) | |
| Average of class Gaming (1366 - 2409, n=96, last 2 years) | |
| Gigabyte G6X 9KG (2024) | |
| HP Victus 16 (2024) | |
| CrossMark / Productivity | |
| Acer Predator Helios Neo 16 (2024) | |
| Nubia RedMagic Titan 16 Pro | |
| Average Intel Core i9-14900HX, NVIDIA GeForce RTX 4060 Laptop GPU (2040 - 2042, n=2) | |
| Lenovo Legion Pro 5 16IRX9 G9 | |
| Schenker XMG Pro 16 Studio (Mid 24) | |
| Gigabyte G6X 9KG (2024) | |
| Average of class Gaming (1386 - 2254, n=96, last 2 years) | |
| HP Victus 16 (2024) | |
| CrossMark / Creativity | |
| Acer Predator Helios Neo 16 (2024) | |
| Lenovo Legion Pro 5 16IRX9 G9 | |
| Schenker XMG Pro 16 Studio (Mid 24) | |
| Average Intel Core i9-14900HX, NVIDIA GeForce RTX 4060 Laptop GPU (2240 - 2472, n=2) | |
| Nubia RedMagic Titan 16 Pro | |
| Average of class Gaming (1343 - 2729, n=96, last 2 years) | |
| HP Victus 16 (2024) | |
| Gigabyte G6X 9KG (2024) | |
| CrossMark / Responsiveness | |
| Acer Predator Helios Neo 16 (2024) | |
| Gigabyte G6X 9KG (2024) | |
| Nubia RedMagic Titan 16 Pro | |
| Lenovo Legion Pro 5 16IRX9 G9 | |
| Average Intel Core i9-14900HX, NVIDIA GeForce RTX 4060 Laptop GPU (1849 - 1899, n=2) | |
| HP Victus 16 (2024) | |
| Schenker XMG Pro 16 Studio (Mid 24) | |
| Average of class Gaming (1226 - 2334, n=96, last 2 years) | |
| WebXPRT 3 / Overall | |
| Average Intel Core i9-14900HX, NVIDIA GeForce RTX 4060 Laptop GPU (329 - 339, n=2) | |
| Nubia RedMagic Titan 16 Pro | |
| Acer Predator Helios Neo 16 (2024) | |
| Schenker XMG Pro 16 Studio (Mid 24) | |
| Average of class Gaming (220 - 532, n=100, last 2 years) | |
| Gigabyte G6X 9KG (2024) | |
| Lenovo Legion Pro 5 16IRX9 G9 | |
| HP Victus 16 (2024) | |
| WebXPRT 4 / Overall | |
| Average Intel Core i9-14900HX, NVIDIA GeForce RTX 4060 Laptop GPU (309 - 319, n=2) | |
| Nubia RedMagic Titan 16 Pro | |
| Acer Predator Helios Neo 16 (2024) | |
| Schenker XMG Pro 16 Studio (Mid 24) | |
| Average of class Gaming (165 - 354, n=101, last 2 years) | |
| Lenovo Legion Pro 5 16IRX9 G9 | |
| Gigabyte G6X 9KG (2024) | |
| HP Victus 16 (2024) | |
| Mozilla Kraken 1.1 / Total | |
| HP Victus 16 (2024) | |
| Gigabyte G6X 9KG (2024) | |
| Lenovo Legion Pro 5 16IRX9 G9 | |
| Average of class Gaming (391 - 590, n=104, last 2 years) | |
| Schenker XMG Pro 16 Studio (Mid 24) | |
| Acer Predator Helios Neo 16 (2024) | |
| Nubia RedMagic Titan 16 Pro | |
| Average Intel Core i9-14900HX, NVIDIA GeForce RTX 4060 Laptop GPU (430 - 439, n=2) | |
* ... smaller is better
| PCMark 10 Score | 7830 points | |
Help | ||
| AIDA64 / Memory Copy | |
| Schenker XMG Pro 16 Studio (Mid 24) | |
| Lenovo Legion Pro 5 16IRX9 G9 | |
| Acer Predator Helios Neo 16 (2024) | |
| Average Intel Core i9-14900HX (38028 - 83392, n=36) | |
| Average of class Gaming (21750 - 129946, n=107, last 2 years) | |
| HP Victus 16 (2024) | |
| Gigabyte G6X 9KG (2024) | |
| Nubia RedMagic Titan 16 Pro | |
| AIDA64 / Memory Read | |
| Lenovo Legion Pro 5 16IRX9 G9 | |
| Schenker XMG Pro 16 Studio (Mid 24) | |
| Acer Predator Helios Neo 16 (2024) | |
| Average Intel Core i9-14900HX (43306 - 87568, n=36) | |
| HP Victus 16 (2024) | |
| Average of class Gaming (22956 - 118858, n=107, last 2 years) | |
| Gigabyte G6X 9KG (2024) | |
| Nubia RedMagic Titan 16 Pro | |
| AIDA64 / Memory Write | |
| Lenovo Legion Pro 5 16IRX9 G9 | |
| Average of class Gaming (22297 - 135096, n=107, last 2 years) | |
| Schenker XMG Pro 16 Studio (Mid 24) | |
| Average Intel Core i9-14900HX (37146 - 80589, n=36) | |
| Acer Predator Helios Neo 16 (2024) | |
| HP Victus 16 (2024) | |
| Gigabyte G6X 9KG (2024) | |
| Nubia RedMagic Titan 16 Pro | |
| AIDA64 / Memory Latency | |
| Average of class Gaming (75.3 - 259, n=107, last 2 years) | |
| HP Victus 16 (2024) | |
| Acer Predator Helios Neo 16 (2024) | |
| Gigabyte G6X 9KG (2024) | |
| Average Intel Core i9-14900HX (76.1 - 105, n=36) | |
| Schenker XMG Pro 16 Studio (Mid 24) | |
| Lenovo Legion Pro 5 16IRX9 G9 | |
| Nubia RedMagic Titan 16 Pro | |
* ... smaller is better
DPC latencies
High latencies prevent video and audio editing in real-time. Future software updates could lead to improvements or even deteriorations.

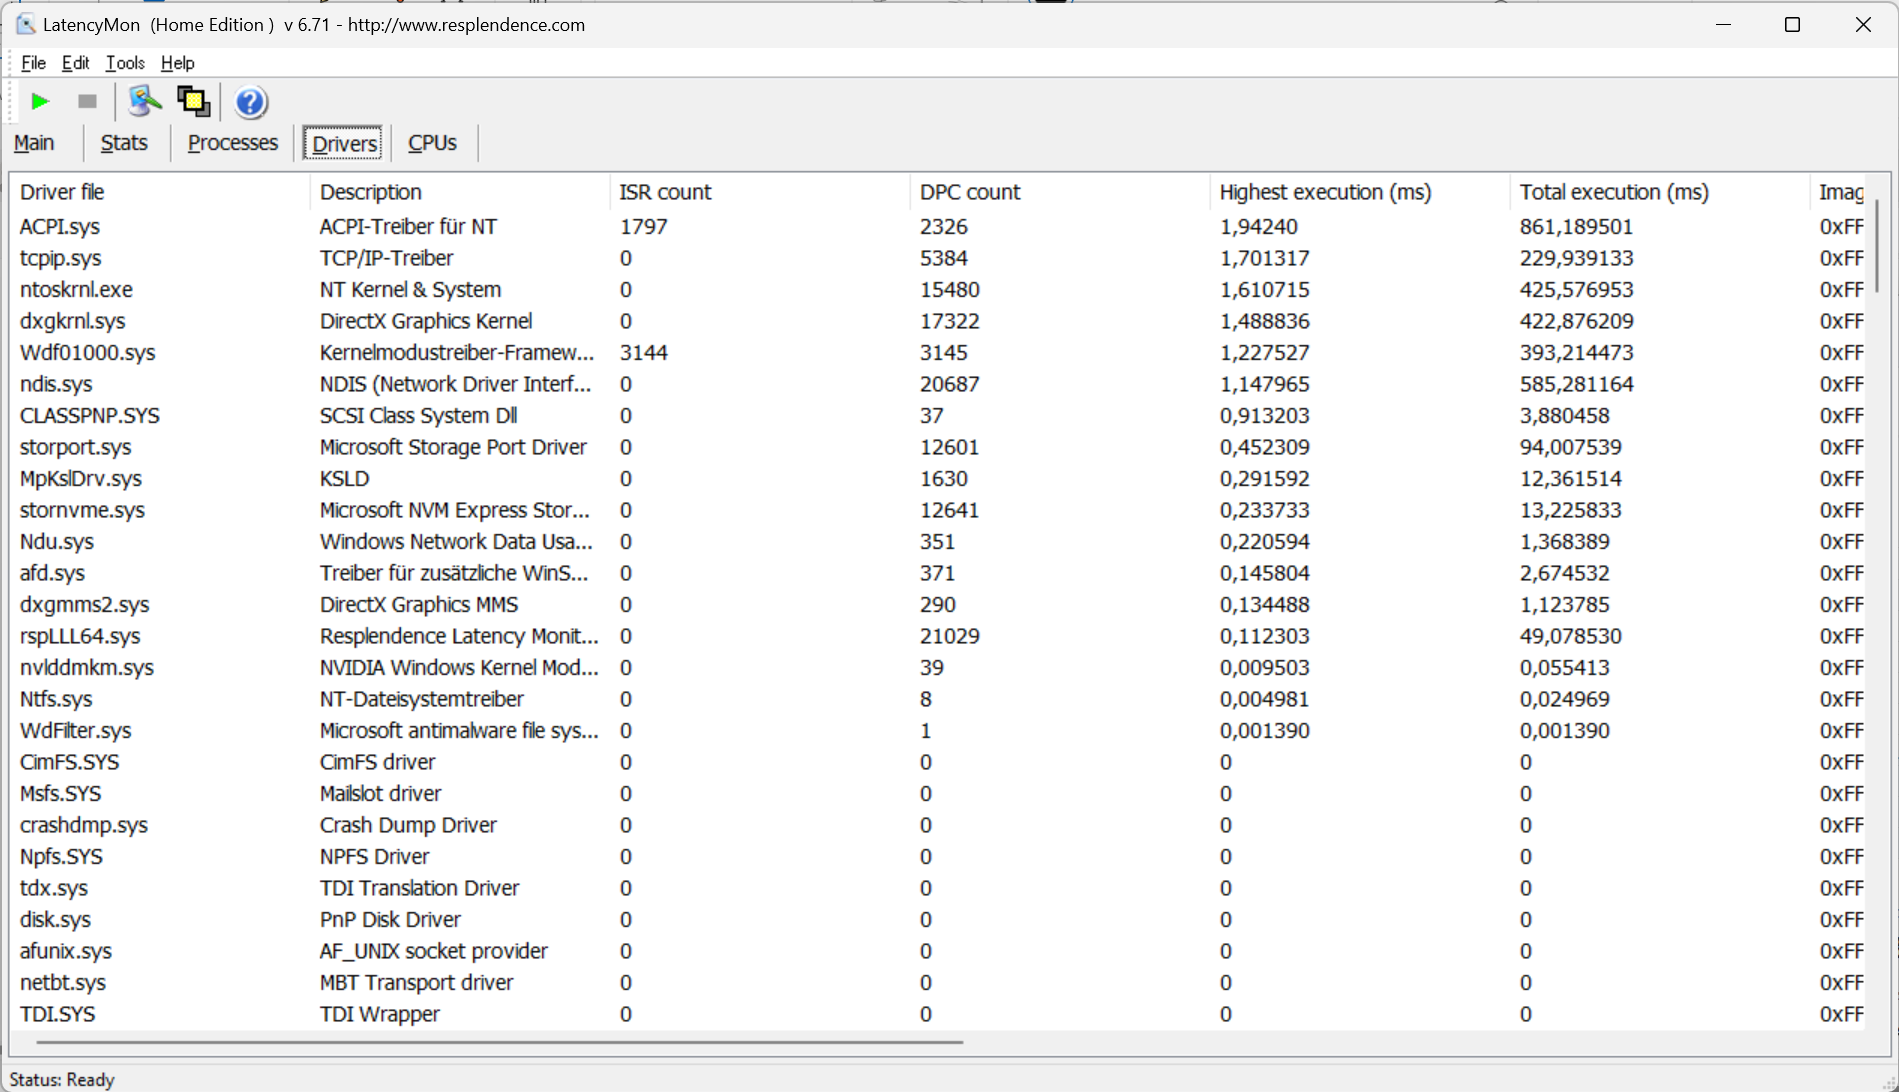
| DPC Latencies / LatencyMon - interrupt to process latency (max), Web, Youtube, Prime95 | |
| Nubia RedMagic Titan 16 Pro | |
| Gigabyte G6X 9KG (2024) | |
| Schenker XMG Pro 16 Studio (Mid 24) | |
| Acer Predator Helios Neo 16 (2024) | |
| Lenovo Legion Pro 5 16IRX9 G9 | |
| HP Victus 16 (2024) | |
* ... smaller is better
Storage devices
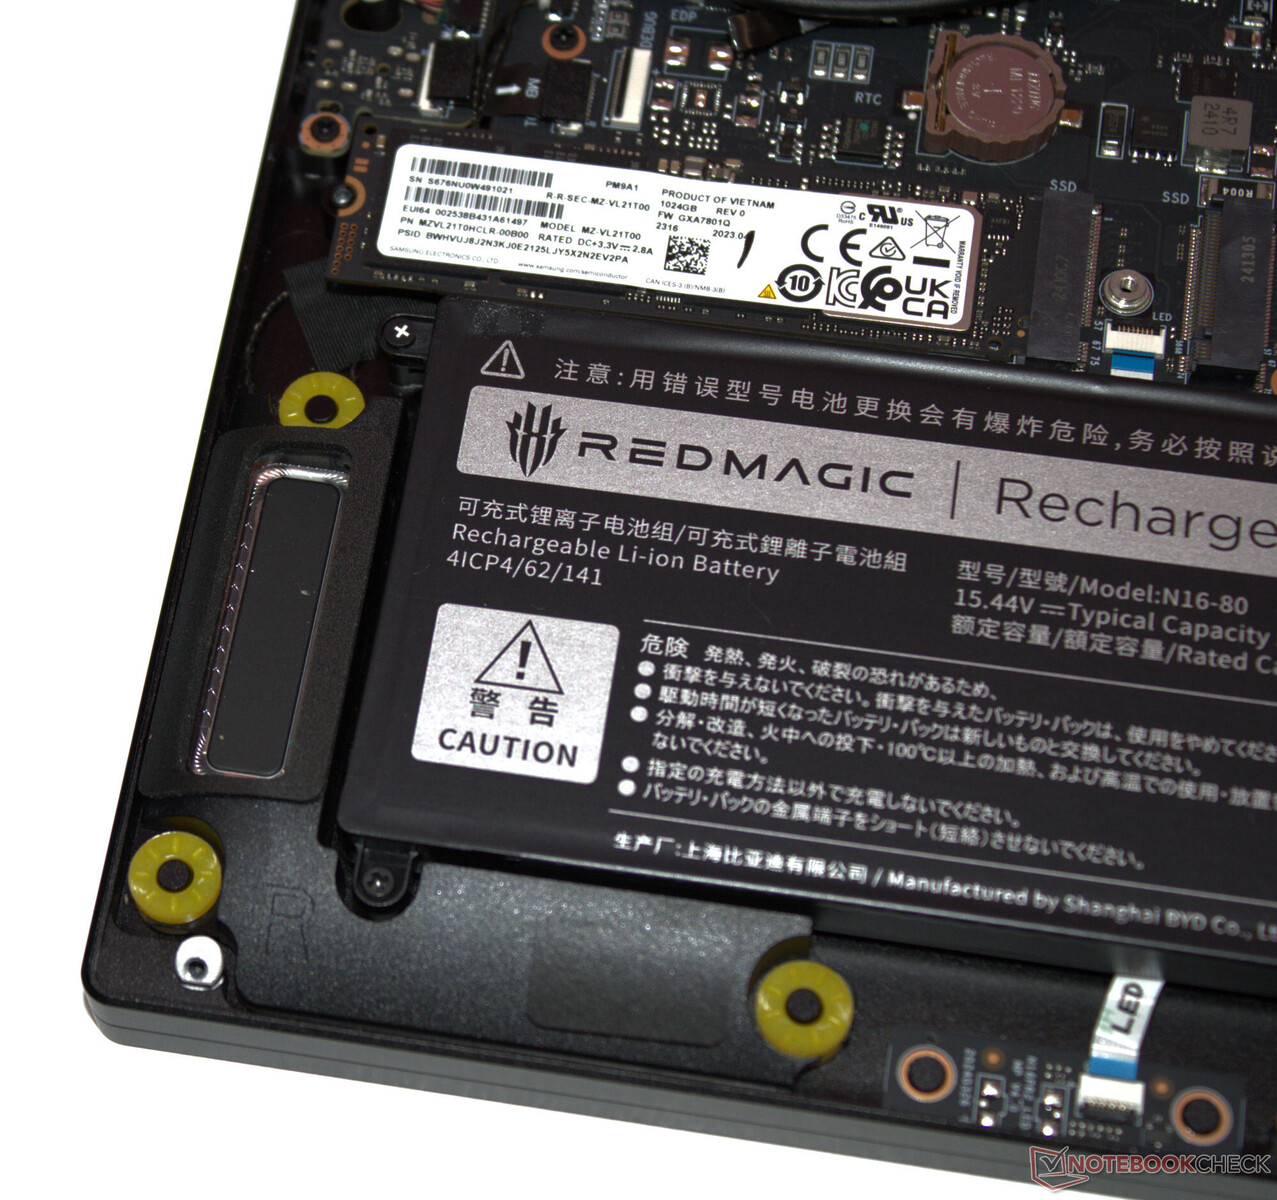
The PCIe 4 SSD (M.2-2280) from Samsung offers a storage capacity of 1 TB and delivers very good data rates. Positive: We observed no thermally induced throttling. The laptop has space for a second PCIe 4 SSD.

* ... smaller is better
Reading continuous performance: DiskSpd Read Loop, Queue Depth 8
Graphics card
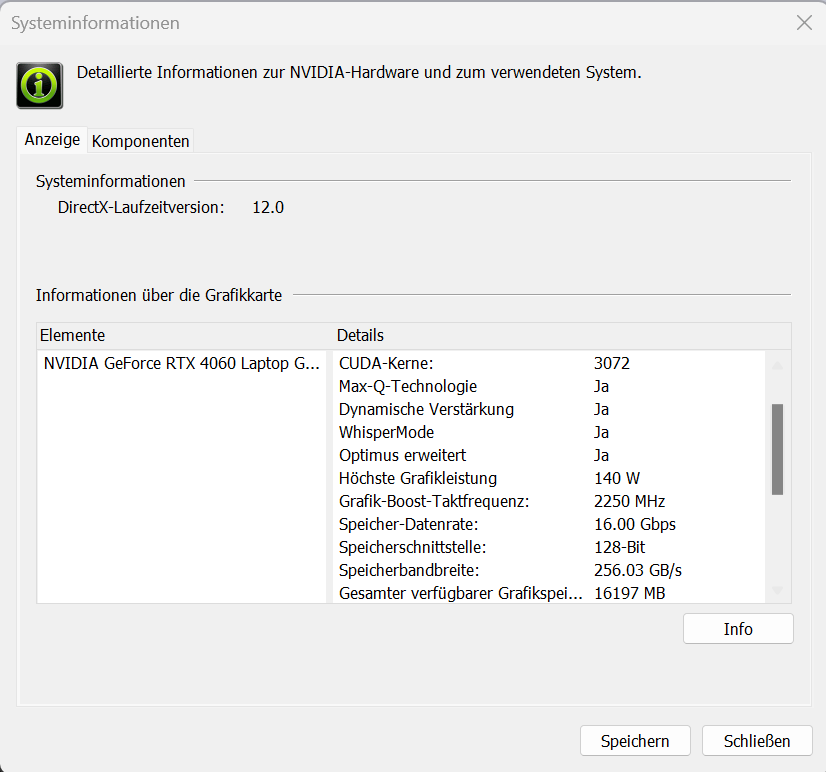
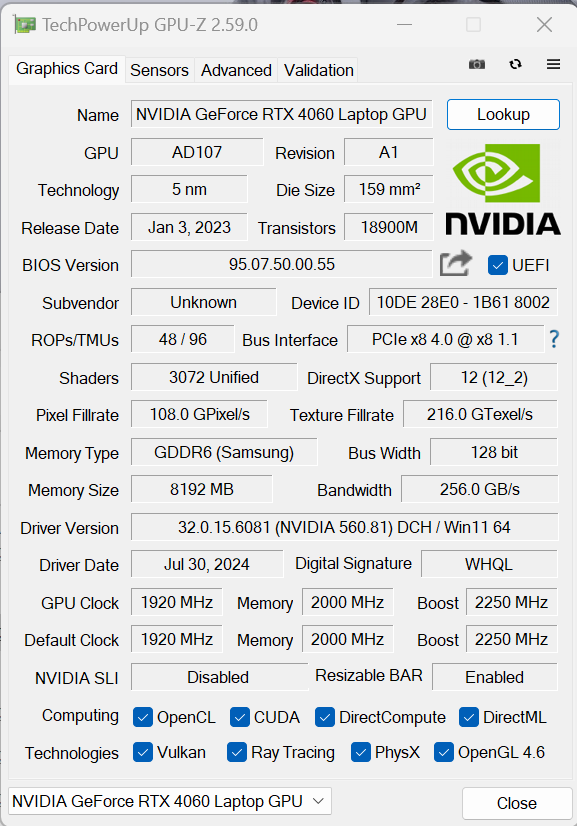
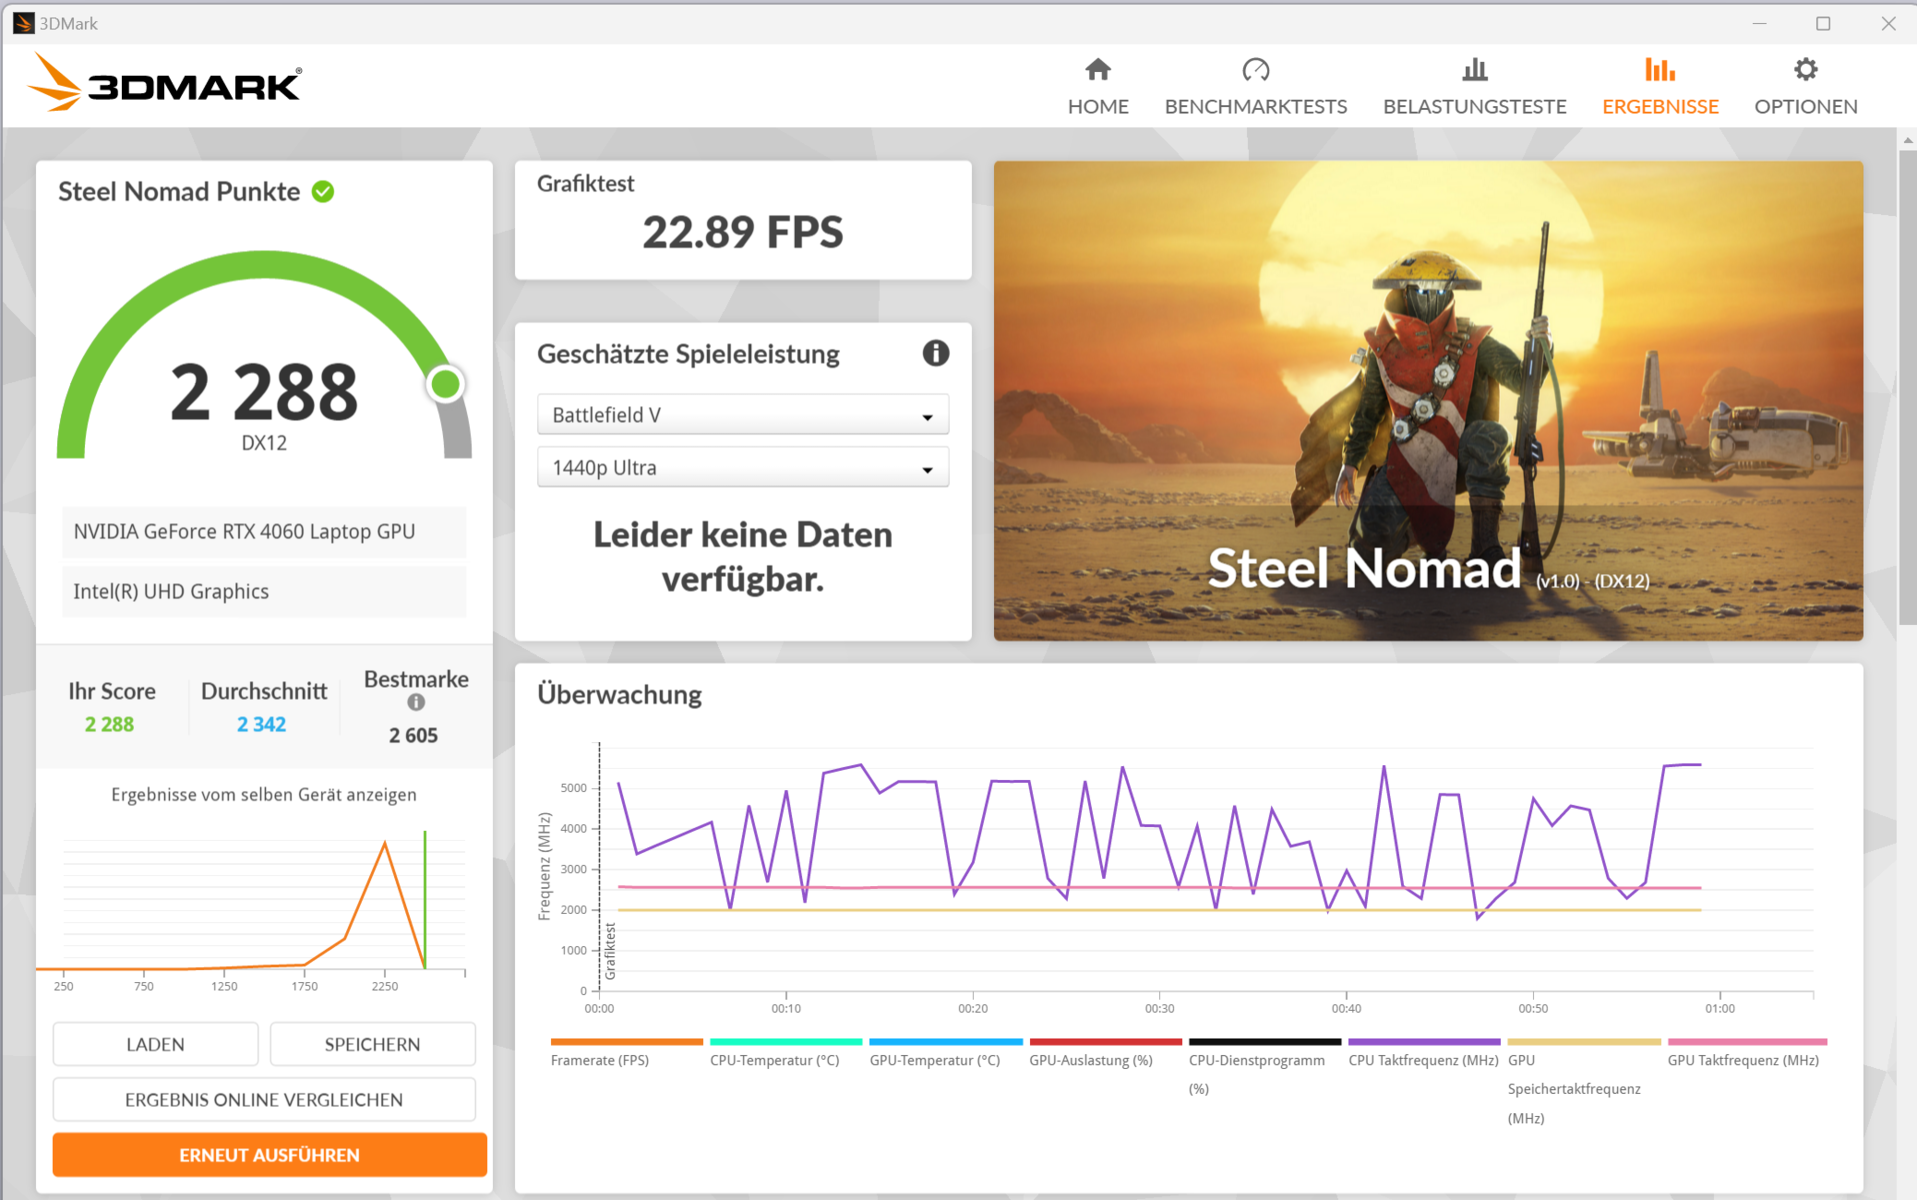
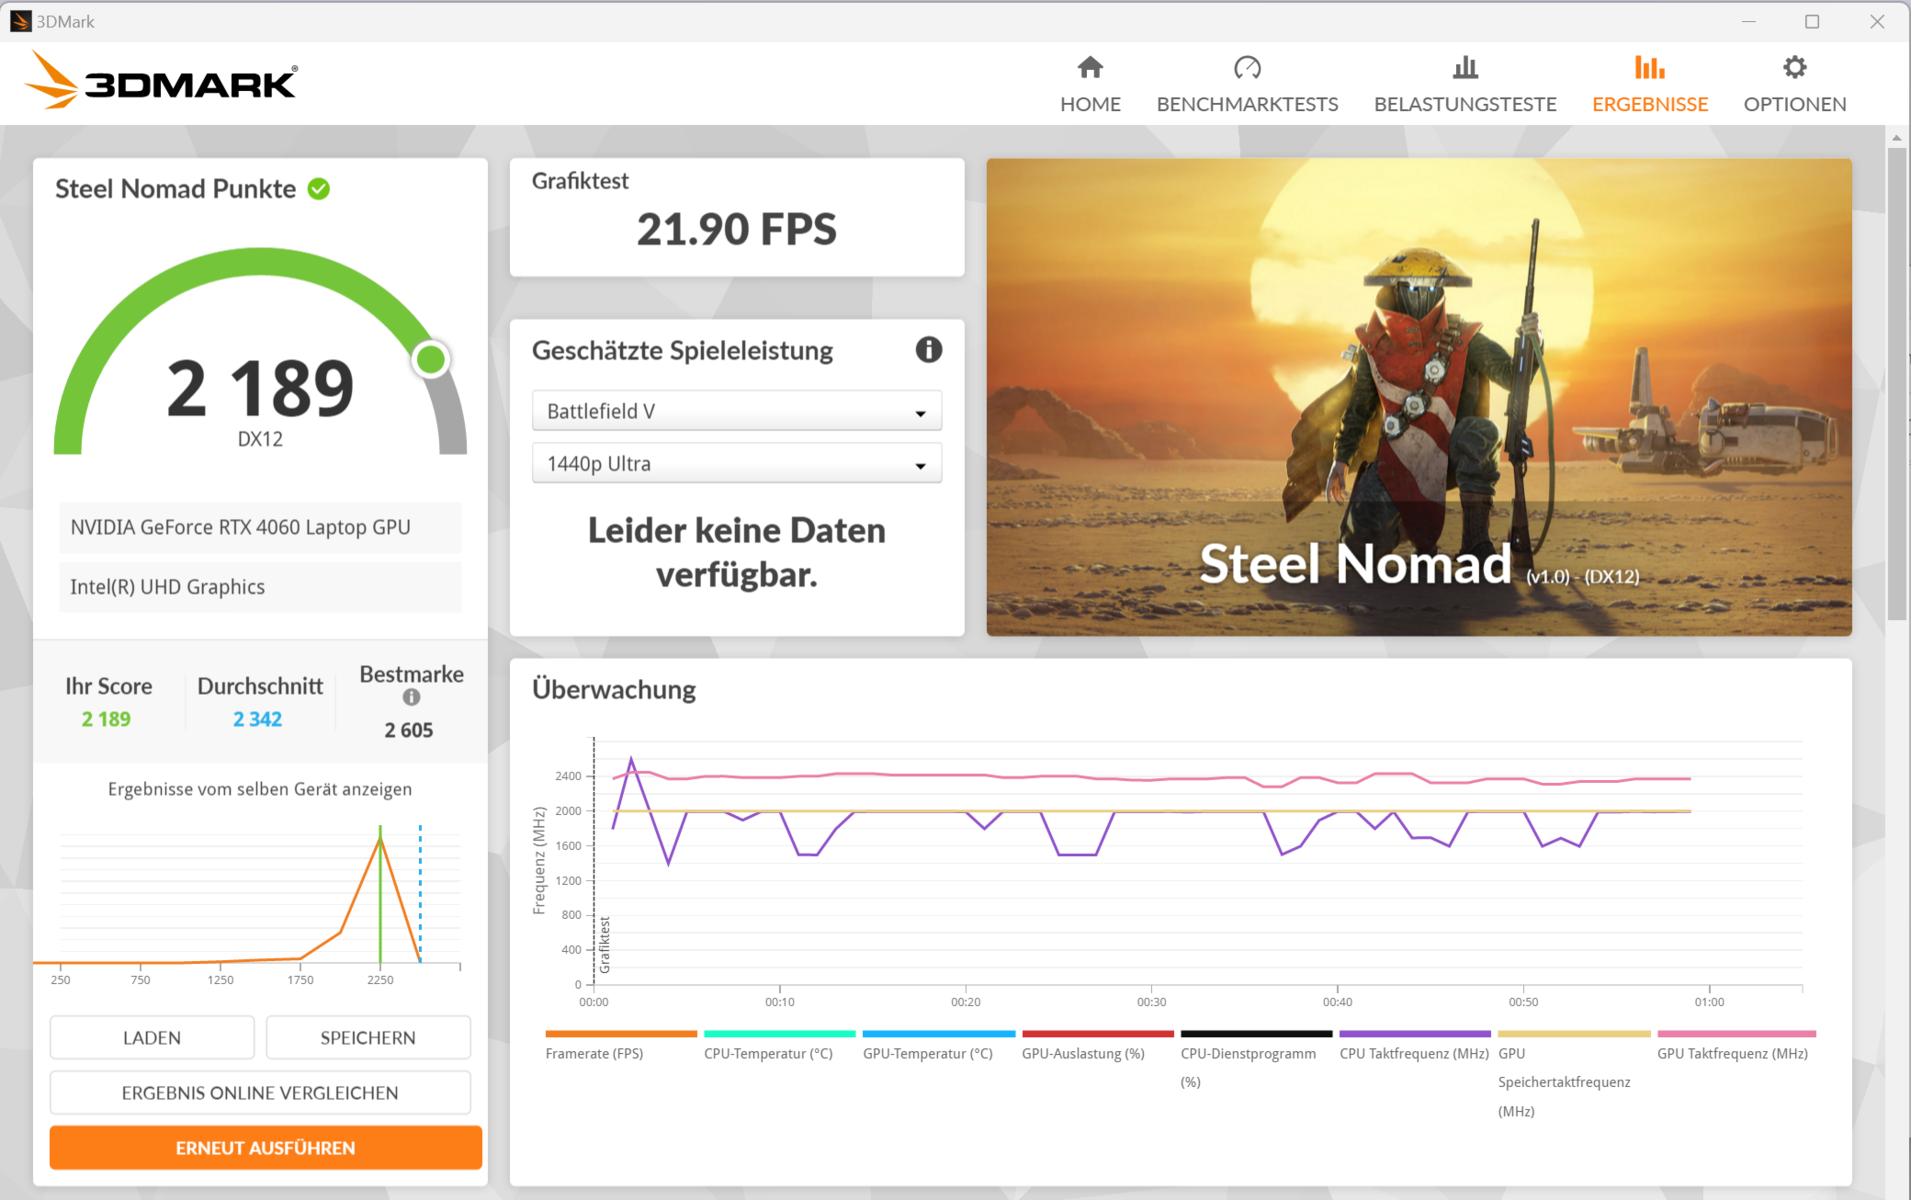
The GeForce RTX 4060 (3,072 shaders, 128-bit bus, 8 GB GDDR6) is currently a (lower) mid-range gaming GPU. Nubia grants it a maximum TGP of 140 watts—more isn't possible. Its benchmark results are slightly above the RTX-4060 average (balanced mode). Gaming mode doesn't result in an increase. Switching between dGPU and Optimus doesn't require a restart—Advanced Optimus is supported.


| 3DMark Performance rating - Percent | |
| Average of class Gaming | |
| Acer Predator Helios Neo 16 (2024) | |
| Schenker XMG Pro 16 Studio (Mid 24) | |
| Lenovo Legion Pro 5 16IRX9 G9 | |
| Nubia RedMagic Titan 16 Pro | |
| Nubia RedMagic Titan 16 Pro | |
| Gigabyte G6X 9KG (2024) | |
| HP Victus 16 (2024) | |
| Average NVIDIA GeForce RTX 4060 Laptop GPU | |
| 3DMark 11 - 1280x720 Performance GPU | |
| Average of class Gaming (21841 - 80022, n=106, last 2 years) | |
| Acer Predator Helios Neo 16 (2024) | |
| Schenker XMG Pro 16 Studio (Mid 24) | |
| Lenovo Legion Pro 5 16IRX9 G9 | |
| Nubia RedMagic Titan 16 Pro (Gaming Mode) | |
| Nubia RedMagic Titan 16 Pro | |
| Gigabyte G6X 9KG (2024) | |
| HP Victus 16 (2024) | |
| Average NVIDIA GeForce RTX 4060 Laptop GPU (28136 - 38912, n=57) | |
| 3DMark | |
| 1920x1080 Fire Strike Graphics | |
| Average of class Gaming (12242 - 62849, n=118, last 2 years) | |
| Acer Predator Helios Neo 16 (2024) | |
| Schenker XMG Pro 16 Studio (Mid 24) | |
| Lenovo Legion Pro 5 16IRX9 G9 | |
| Gigabyte G6X 9KG (2024) | |
| HP Victus 16 (2024) | |
| Nubia RedMagic Titan 16 Pro (Gaming Mode) | |
| Nubia RedMagic Titan 16 Pro | |
| Average NVIDIA GeForce RTX 4060 Laptop GPU (20533 - 29656, n=54) | |
| 2560x1440 Time Spy Graphics | |
| Average of class Gaming (5012 - 26212, n=118, last 2 years) | |
| Acer Predator Helios Neo 16 (2024) | |
| Schenker XMG Pro 16 Studio (Mid 24) | |
| Lenovo Legion Pro 5 16IRX9 G9 | |
| Nubia RedMagic Titan 16 Pro (Gaming Mode) | |
| Nubia RedMagic Titan 16 Pro | |
| Average NVIDIA GeForce RTX 4060 Laptop GPU (7484 - 11451, n=56) | |
| HP Victus 16 (2024) | |
| Gigabyte G6X 9KG (2024) | |
| 3DMark 06 Standard Score | 55770 points | |
| 3DMark 11 Performance | 28427 points | |
| 3DMark Fire Strike Score | 22307 points | |
| 3DMark Time Spy Score | 10789 points | |
| 3DMark Steel Nomad Score | 2288 points | |
Help | ||
| Geekbench 6.7 | |
| GPU OpenCL | |
| Average of class Gaming (67235 - 253130, n=106, last 2 years) | |
| Acer Predator Helios Neo 16 (2024) (6.2.1) | |
| Schenker XMG Pro 16 Studio (Mid 24) (6.2.1) | |
| Nubia RedMagic Titan 16 Pro (6.2.1, Gaming Mode) | |
| Nubia RedMagic Titan 16 Pro (6.2.1) | |
| Gigabyte G6X 9KG (2024) (6.2.1) | |
| HP Victus 16 (2024) (6.2.1) | |
| Average NVIDIA GeForce RTX 4060 Laptop GPU (76525 - 100831, n=39) | |
| Lenovo Legion Pro 5 16IRX9 G9 (6.2.1) | |
| GPU Vulkan | |
| Average of class Gaming (7562 - 231659, n=59, last 2 years) | |
| Schenker XMG Pro 16 Studio (Mid 24) (6.2.1) | |
| Nubia RedMagic Titan 16 Pro (6.2.1, Gaming Mode) | |
| Gigabyte G6X 9KG (2024) (6.2.1) | |
| Acer Predator Helios Neo 16 (2024) (6.2.1) | |
| Average NVIDIA GeForce RTX 4060 Laptop GPU (75631 - 101001, n=24) | |
| HP Victus 16 (2024) (6.2.1) | |
| Nubia RedMagic Titan 16 Pro (6.2.1) | |
| Lenovo Legion Pro 5 16IRX9 G9 (6.2.1) | |
| V-Ray Benchmark Next 4.10 | |
| GPU | |
| Average of class Gaming (427 - 1627, n=103, last 2 years) | |
| Lenovo Legion Pro 5 16IRX9 G9 (v4.10.07 ) | |
| Acer Predator Helios Neo 16 (2024) (v4.10.07 ) | |
| Gigabyte G6X 9KG (2024) (v4.10.07 ) | |
| Nubia RedMagic Titan 16 Pro (v4.10.07 ) | |
| Nubia RedMagic Titan 16 Pro (v4.10.07, Gaming Mode ) | |
| Average NVIDIA GeForce RTX 4060 Laptop GPU (483 - 715, n=46) | |
| HP Victus 16 (2024) (v4.10.07 ) | |
| Schenker XMG Pro 16 Studio (Mid 24) (v4.10.07 ) | |
| CPU | |
| Nubia RedMagic Titan 16 Pro (v4.10.07, Gaming Mode) | |
| Lenovo Legion Pro 5 16IRX9 G9 (v4.10.07 ) | |
| Schenker XMG Pro 16 Studio (Mid 24) (v4.10.07 ) | |
| Average of class Gaming (10048 - 45327, n=101, last 2 years) | |
| Acer Predator Helios Neo 16 (2024) (v4.10.07 ) | |
| HP Victus 16 (2024) (v4.10.07 ) | |
| Average NVIDIA GeForce RTX 4060 Laptop GPU (12680 - 32360, n=46) | |
| Gigabyte G6X 9KG (2024) (v4.10.07 ) | |
| Nubia RedMagic Titan 16 Pro (v4.10.07 ) | |
* ... smaller is better
Gaming performance
The Titan is designed for QHD gaming at high to maximum settings. The installed hardware generates frame rates slightly above the RTX 4060 average (balanced mode). Gaming mode results in a plus when running games that benefit from higher CPU performance—such as Dota 2 Reborn and X-Plane 11. Its graphics performance is otherwise identical.
| Cyberpunk 2077 - 1920x1080 Ultra Preset (FSR off) | |
| Average of class Gaming (17.7 - 169.9, n=118, last 2 years) | |
| Acer Predator Helios Neo 16 (2024) (2.02) | |
| Schenker XMG Pro 16 Studio (Mid 24) (2.12) | |
| Lenovo Legion Pro 5 16IRX9 G9 (2.12) | |
| Nubia RedMagic Titan 16 Pro (2.12, Gaming Mode) | |
| Nubia RedMagic Titan 16 Pro (2.12) | |
| Average NVIDIA GeForce RTX 4060 Laptop GPU (56.4 - 93.1, n=31) | |
| Gigabyte G6X 9KG (2024) (2.02) | |
| HP Victus 16 (2024) (2.02) | |
| Final Fantasy XV Benchmark - 1920x1080 High Quality | |
| Average of class Gaming (41 - 215, n=98, last 2 years) | |
| Acer Predator Helios Neo 16 (2024) (1.3) | |
| Schenker XMG Pro 16 Studio (Mid 24) (1.3) | |
| Lenovo Legion Pro 5 16IRX9 G9 (1.3) | |
| Nubia RedMagic Titan 16 Pro (1.3) | |
| Nubia RedMagic Titan 16 Pro (1.3, Gaming Mode ) | |
| Gigabyte G6X 9KG (2024) (1.3) | |
| HP Victus 16 (2024) (1.3) | |
| Average NVIDIA GeForce RTX 4060 Laptop GPU (75.1 - 109.8, n=51) | |
| Strange Brigade - 1920x1080 ultra AA:ultra AF:16 | |
| Average of class Gaming (76.3 - 456, n=88, last 2 years) | |
| Acer Predator Helios Neo 16 (2024) (1.47.22.14 D3D12) | |
| Schenker XMG Pro 16 Studio (Mid 24) (1.47.22.14 D3D12) | |
| Lenovo Legion Pro 5 16IRX9 G9 (1.47.22.14 D3D12) | |
| Nubia RedMagic Titan 16 Pro (1.47.22.14 D3D12, Gaming Mode ) | |
| Nubia RedMagic Titan 16 Pro (1.47.22.14 D3D12) | |
| Gigabyte G6X 9KG (2024) (1.47.22.14 D3D12) | |
| Average NVIDIA GeForce RTX 4060 Laptop GPU (135.3 - 210, n=50) | |
| HP Victus 16 (2024) (1.47.22.14 D3D12) | |
| Dota 2 Reborn - 1920x1080 ultra (3/3) best looking | |
| Lenovo Legion Pro 5 16IRX9 G9 | |
| Acer Predator Helios Neo 16 (2024) | |
| Nubia RedMagic Titan 16 Pro (Gaming Mode) | |
| Schenker XMG Pro 16 Studio (Mid 24) | |
| Average of class Gaming (84.8 - 248, n=110, last 2 years) | |
| HP Victus 16 (2024) | |
| Nubia RedMagic Titan 16 Pro | |
| Average NVIDIA GeForce RTX 4060 Laptop GPU (115 - 183.8, n=53) | |
| Gigabyte G6X 9KG (2024) | |
| X-Plane 11.11 - 1920x1080 high (fps_test=3) | |
| Nubia RedMagic Titan 16 Pro (Gaming Mode) | |
| Lenovo Legion Pro 5 16IRX9 G9 | |
| Acer Predator Helios Neo 16 (2024) | |
| Schenker XMG Pro 16 Studio (Mid 24) | |
| Nubia RedMagic Titan 16 Pro | |
| Gigabyte G6X 9KG (2024) | |
| Average NVIDIA GeForce RTX 4060 Laptop GPU (60.7 - 141.1, n=54) | |
| HP Victus 16 (2024) | |
| Average of class Gaming (52.1 - 143.5, n=113, last 2 years) | |
| Once Human | |
| 1920x1080 Very High Preset | |
| Nubia RedMagic Titan 16 Pro | |
| Average NVIDIA GeForce RTX 4060 Laptop GPU (88.7 - 94.2, n=2) | |
| Average of class Gaming (14.2 - 94.2, n=2, last 2 years) | |
| 2560x1440 Very High Preset | |
| Nubia RedMagic Titan 16 Pro | |
| Average of class Gaming (n=1last 2 years) | |
| Average NVIDIA GeForce RTX 4060 Laptop GPU (59.1 - 62.3, n=2) | |
| 2560x1440 Very High Preset + Quality FSR | |
| Nubia RedMagic Titan 16 Pro | |
| Average NVIDIA GeForce RTX 4060 Laptop GPU (n=1) | |
| Average of class Gaming (n=1last 2 years) | |
| F1 24 | |
| 1920x1080 Ultra High Preset AA:T AF:16x | |
| Average of class Gaming (46.1 - 157.8, n=57, last 2 years) | |
| Schenker XMG Pro 16 Studio (Mid 24) | |
| Lenovo Legion Pro 5 16IRX9 G9 | |
| Nubia RedMagic Titan 16 Pro | |
| Average NVIDIA GeForce RTX 4060 Laptop GPU (47.5 - 61.6, n=10) | |
| 2560x1440 Ultra High Preset AA:T AF:16x | |
| Average of class Gaming (29.8 - 106.9, n=58, last 2 years) | |
| Schenker XMG Pro 16 Studio (Mid 24) | |
| Nubia RedMagic Titan 16 Pro | |
| Average NVIDIA GeForce RTX 4060 Laptop GPU (24.3 - 38.8, n=6) | |
| 2560x1440 Ultra High Preset + Quality DLSS AF:16x | |
| Average of class Gaming (14.3 - 159.3, n=48, last 2 years) | |
| Schenker XMG Pro 16 Studio (Mid 24) | |
| Nubia RedMagic Titan 16 Pro | |
| Average NVIDIA GeForce RTX 4060 Laptop GPU (48.6 - 61, n=3) | |
| Ghost of Tsushima | |
| 1920x1080 Very High Preset AA:T | |
| Schenker XMG Pro 16 Studio (Mid 24) | |
| Average of class Gaming (28.5 - 108.1, n=15, last 2 years) | |
| Nubia RedMagic Titan 16 Pro | |
| Average NVIDIA GeForce RTX 4060 Laptop GPU (55.6 - 63.4, n=5) | |
| 2560x1440 Very High Preset AA:T | |
| Schenker XMG Pro 16 Studio (Mid 24) | |
| Average of class Gaming (22.7 - 100.3, n=13, last 2 years) | |
| Nubia RedMagic Titan 16 Pro | |
| Average NVIDIA GeForce RTX 4060 Laptop GPU (41.1 - 47.7, n=3) | |
| 2560x1440 Very High Preset + Quality DLSS | |
| Schenker XMG Pro 16 Studio (Mid 24) | |
| Average of class Gaming (55.2 - 105.2, n=10, last 2 years) | |
| Nubia RedMagic Titan 16 Pro | |
| Average NVIDIA GeForce RTX 4060 Laptop GPU (n=1) | |
| The First Descendant | |
| 1920x1080 Ultra Preset | |
| Schenker XMG Pro 16 Studio (Mid 24) | |
| Nubia RedMagic Titan 16 Pro | |
| Average NVIDIA GeForce RTX 4060 Laptop GPU (67.6 - 69.4, n=3) | |
| Average of class Gaming (15.4 - 78.6, n=3, last 2 years) | |
| 2560x1440 Ultra Preset | |
| Schenker XMG Pro 16 Studio (Mid 24) | |
| Average of class Gaming (43.7 - 50.1, n=2, last 2 years) | |
| Nubia RedMagic Titan 16 Pro | |
| Average NVIDIA GeForce RTX 4060 Laptop GPU (43.5 - 43.7, n=2) | |
| 2560x1440 Ultra Preset + Ultra Ray Tracing + DLSS Quality | |
| Schenker XMG Pro 16 Studio (Mid 24) | |
| Nubia RedMagic Titan 16 Pro | |
| Average NVIDIA GeForce RTX 4060 Laptop GPU (n=1) | |
| Average of class Gaming (n=1last 2 years) | |
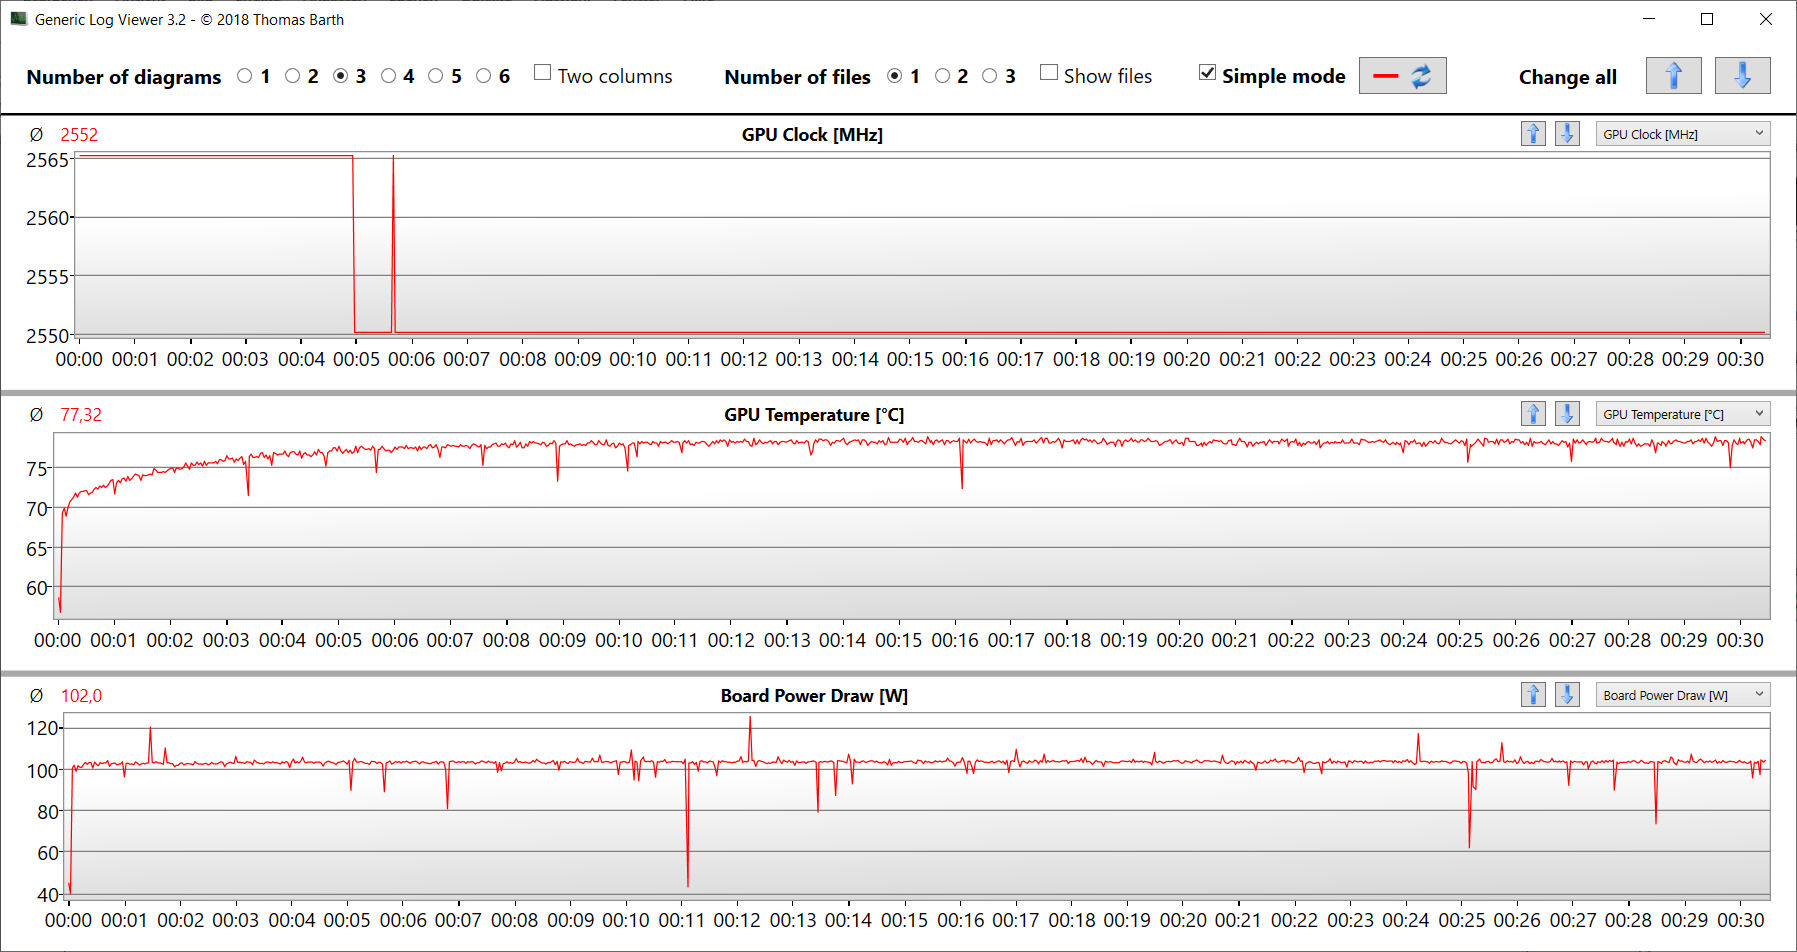
Cyberpunk 2077 Phantom Liberty delivered slightly fluctuating frame rates at a fairly stable level during our 30-minute test (max. settings, FHD). We noted no noticeable drop in performance.
Cyberpunk 2077 ultra FPS diagram
| low | med. | high | ultra | QHD DLSS | QHD FSR | QHD | |
|---|---|---|---|---|---|---|---|
| GTA V (2015) | 186.1 | 184 | 177.7 | 118.4 | 89.3 | ||
| Dota 2 Reborn (2015) | 206 | 170.9 | 160.2 | 146.9 | |||
| Final Fantasy XV Benchmark (2018) | 199.7 | 146 | 105.4 | 76.9 | |||
| X-Plane 11.11 (2018) | 167 | 142.8 | 117.2 | ||||
| Strange Brigade (2018) | 480 | 277 | 219 | 189.2 | 126.9 | ||
| Baldur's Gate 3 (2023) | 140.3 | 110.8 | 97.5 | 96.5 | 65.9 | ||
| Cyberpunk 2077 (2023) | 121.4 | 101.1 | 86.2 | 74.7 | 46.9 | ||
| Dragon's Dogma 2 (2024) | 71.9 | 67.7 | 52.9 | ||||
| Ghost of Tsushima (2024) | 91.3 | 86.8 | 78.2 | 63.4 | 63.6 | 47.7 | |
| F1 24 (2024) | 243 | 225 | 175.8 | 58.8 | 59.2 | 36.7 | |
| The First Descendant (2024) | 159 | 100.9 | 80.6 | 69.4 | 43.7 | ||
| Once Human (2024) | 164.8 | 132.9 | 108.3 | 94.2 | 76.5 | 62.3 |
Emissions - Too loud, too hot
Noise emissions
The Titan is by no means a quietly running laptop. Even in idle mode, the two fans are constantly audible. Cyberpunk caused the level to climb to a loud 50 dB(A) (balanced mode) or an even louder 53 dB(A) (gaming mode). Office mode resulted in an only slightly more moderate value of 47 dB(A). The fans are quieter in battery mode and occasionally stand still.
Noise level
| Idle |
| 35 / 36 / 40 dB(A) |
| Load |
| 49 / 52 dB(A) |
 | ||
30 dB silent 40 dB(A) audible 50 dB(A) loud |
||
min: | ||
| Nubia RedMagic Titan 16 Pro GeForce RTX 4060 Laptop GPU, i9-14900HX, Samsung PM9A1 MZVL21T0HCLR | Lenovo Legion Pro 5 16IRX9 G9 GeForce RTX 4060 Laptop GPU, i7-14700HX, Samsung PM9A1 MZVL21T0HCLR | HP Victus 16 (2024) GeForce RTX 4060 Laptop GPU, i7-14700HX, Kioxia XG8 KXG80ZNV512G | Acer Predator Helios Neo 16 (2024) GeForce RTX 4070 Laptop GPU, i7-14700HX, Samsung PM9A1a MZVL21T0HDLU | Schenker XMG Pro 16 Studio (Mid 24) GeForce RTX 4070 Laptop GPU, i9-14900HX, Samsung 990 Pro 1 TB | Gigabyte G6X 9KG (2024) GeForce RTX 4060 Laptop GPU, i7-13650HX, Gigabyte AG450E1024-SI | |
|---|---|---|---|---|---|---|
| Noise | 17% | 13% | 10% | 5% | 5% | |
| off / environment * (dB) | 26 | 23 12% | 25 4% | 25.2 3% | 25 4% | 26 -0% |
| Idle Minimum * (dB) | 35 | 23 34% | 28 20% | 27.8 21% | 28 20% | 30 14% |
| Idle Average * (dB) | 36 | 23 36% | 29 19% | 32 11% | 31 14% | 32 11% |
| Idle Maximum * (dB) | 40 | 25 37% | 33 17% | 29.6 26% | 35 12% | 35 12% |
| Load Average * (dB) | 49 | 45.18 8% | 45 8% | 45.2 8% | 52 -6% | 51 -4% |
| Cyberpunk 2077 ultra * (dB) | 50 | 52.69 -5% | 53 -6% | |||
| Load Maximum * (dB) | 52 | 53.13 -2% | 48 8% | 55.8 -7% | 52 -0% | 54 -4% |
| Witcher 3 ultra * (dB) | 43 | 51 |
* ... smaller is better
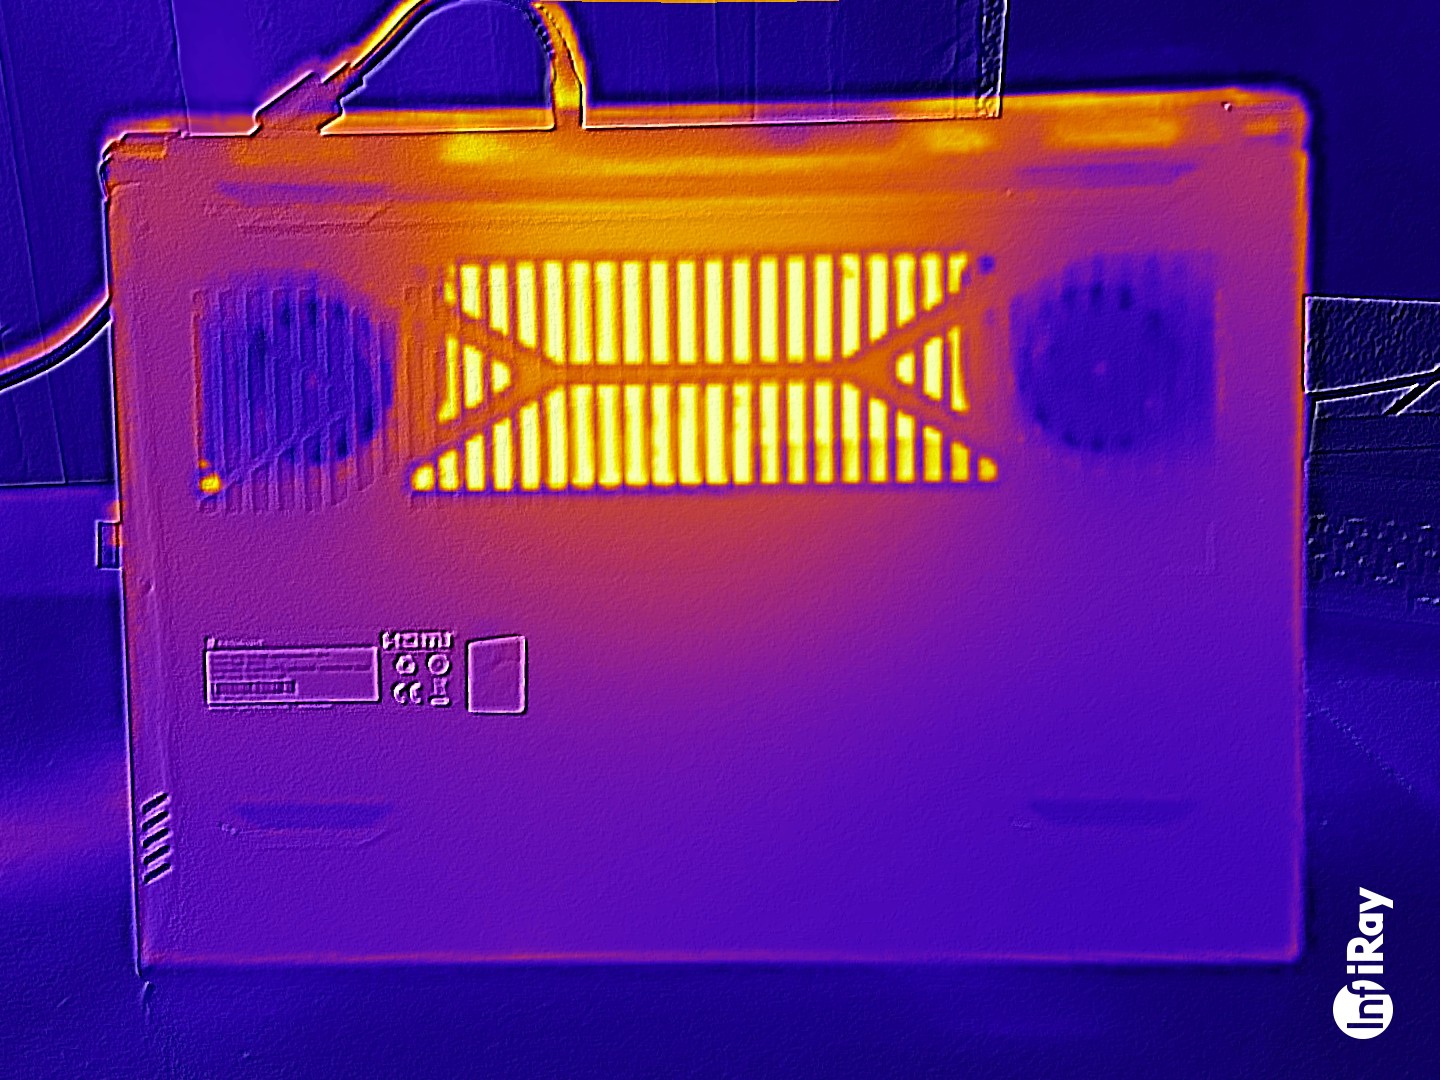
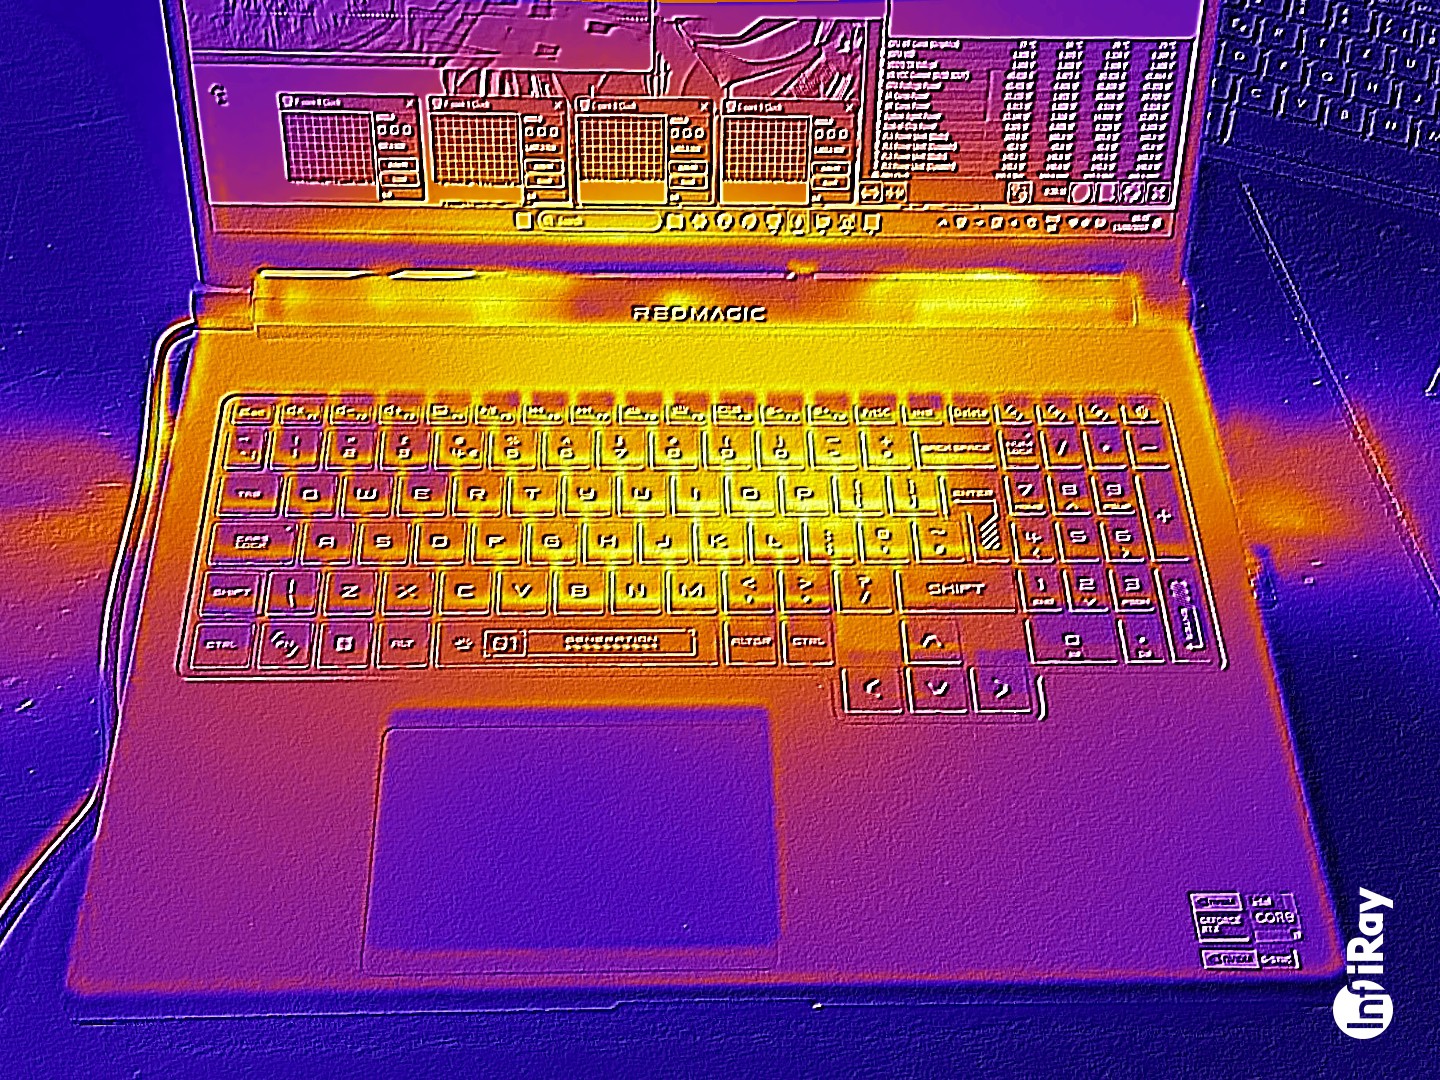
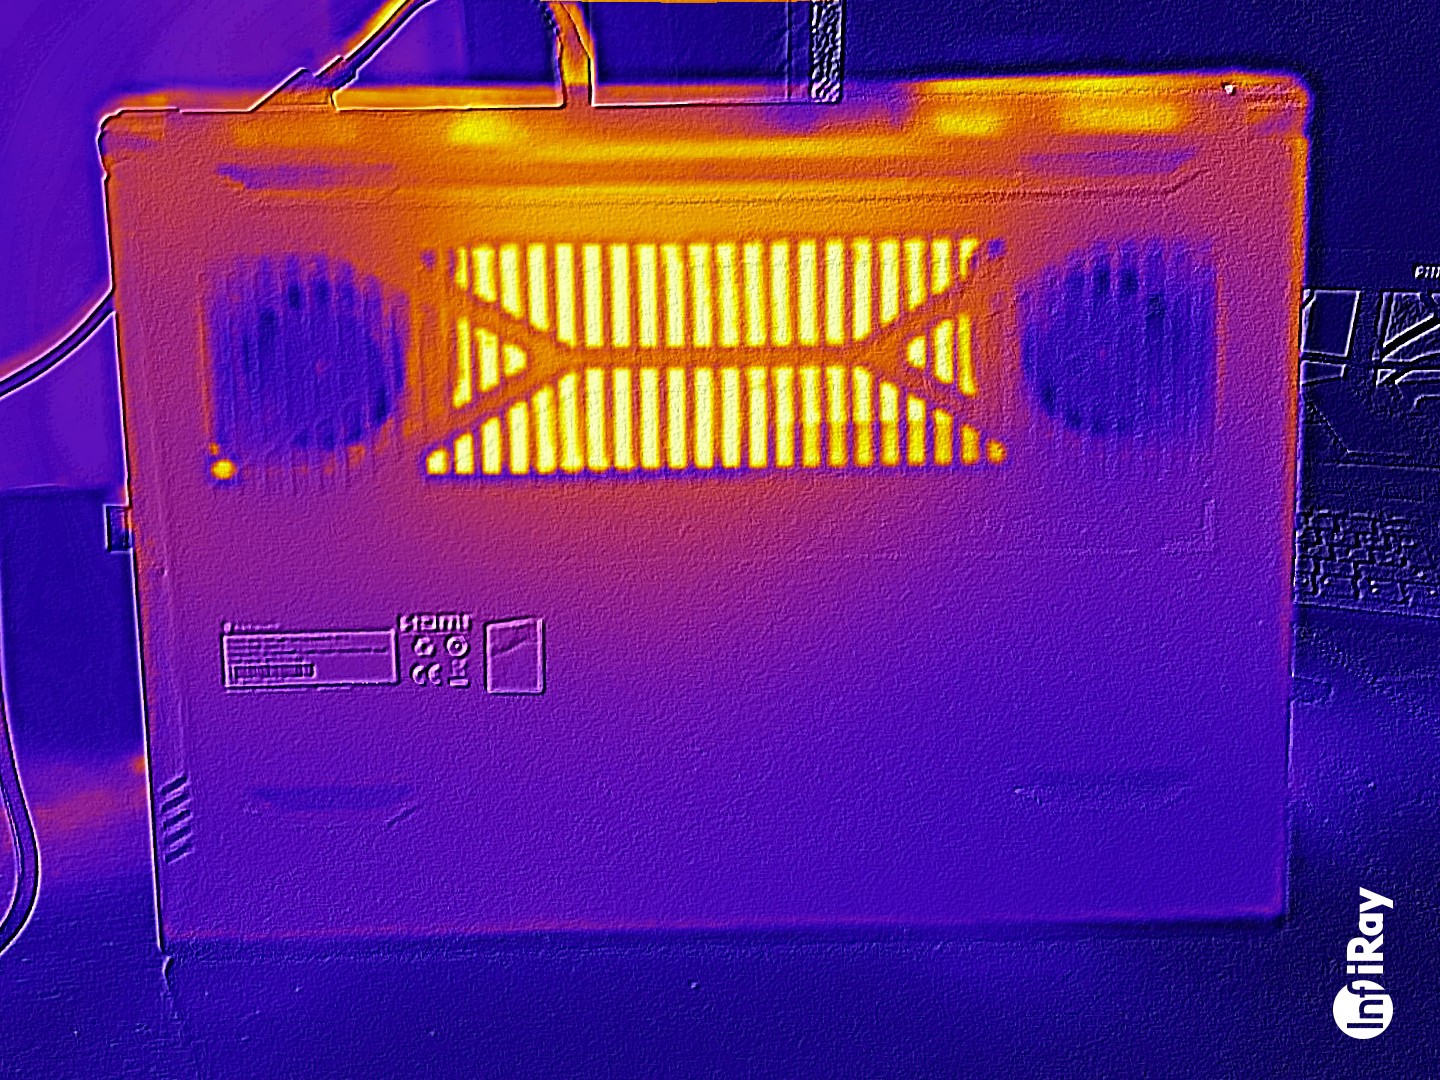
Temperature
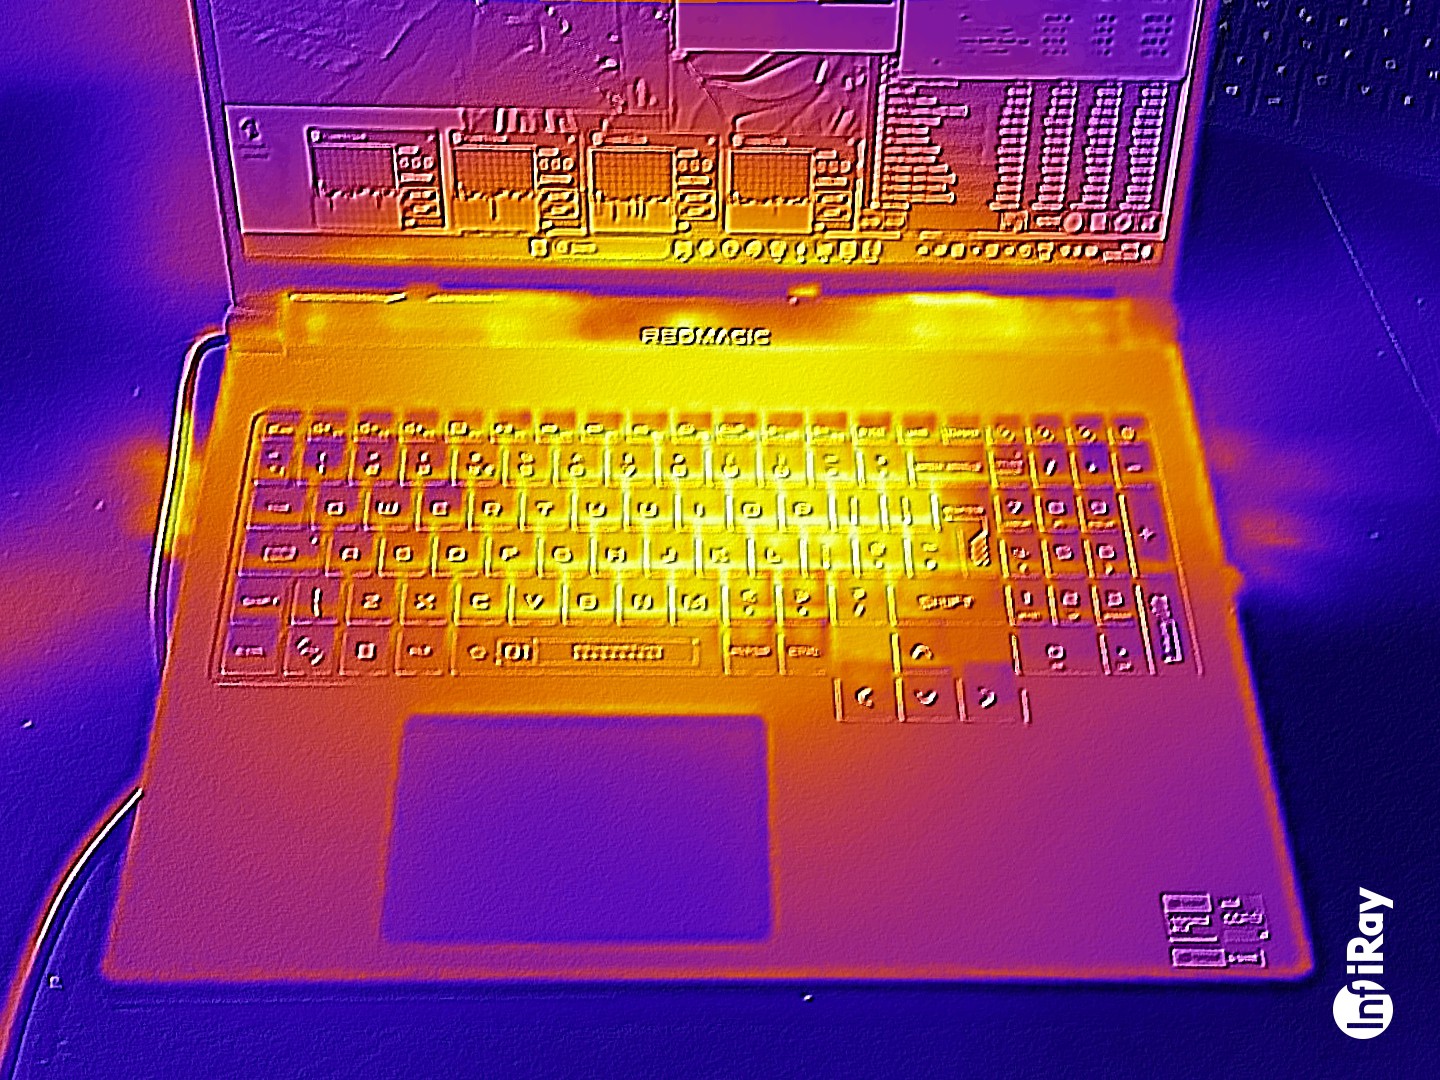
The laptop heats up considerably under load: Cyberpunk 2077 and the stress test caused temperatures above 50 degrees Celsius at certain points. The palm rest's temperatures were sometimes almost too hot. We also noted values above the average in idle mode.
(-) The maximum temperature on the upper side is 50 °C / 122 F, compared to the average of 40.4 °C / 105 F, ranging from 21.2 to 68.8 °C for the class Gaming.
(-) The bottom heats up to a maximum of 58 °C / 136 F, compared to the average of 43.2 °C / 110 F
(+) In idle usage, the average temperature for the upper side is 30.4 °C / 87 F, compared to the device average of 33.9 °C / 93 F.
(-) 3: The average temperature for the upper side is 45.1 °C / 113 F, compared to the average of 33.9 °C / 93 F for the class Gaming.
(-) The palmrests and touchpad can get very hot to the touch with a maximum of 40 °C / 104 F.
(-) The average temperature of the palmrest area of similar devices was 28.8 °C / 83.8 F (-11.2 °C / -20.2 F).
| Nubia RedMagic Titan 16 Pro Intel Core i9-14900HX, NVIDIA GeForce RTX 4060 Laptop GPU | Lenovo Legion Pro 5 16IRX9 G9 Intel Core i7-14700HX, NVIDIA GeForce RTX 4060 Laptop GPU | HP Victus 16 (2024) Intel Core i7-14700HX, NVIDIA GeForce RTX 4060 Laptop GPU | Acer Predator Helios Neo 16 (2024) Intel Core i7-14700HX, NVIDIA GeForce RTX 4070 Laptop GPU | Schenker XMG Pro 16 Studio (Mid 24) Intel Core i9-14900HX, NVIDIA GeForce RTX 4070 Laptop GPU | Gigabyte G6X 9KG (2024) Intel Core i7-13650HX, NVIDIA GeForce RTX 4060 Laptop GPU | |
|---|---|---|---|---|---|---|
| Heat | -9% | 13% | -3% | -13% | 6% | |
| Maximum Upper Side * (°C) | 50 | 50 -0% | 50 -0% | 58 -16% | 51 -2% | 41 18% |
| Maximum Bottom * (°C) | 58 | 57 2% | 50 14% | 45.2 22% | 66 -14% | 43 26% |
| Idle Upper Side * (°C) | 31 | 36 -16% | 25 19% | 31.1 -0% | 35 -13% | 32 -3% |
| Idle Bottom * (°C) | 32 | 39 -22% | 26 19% | 37.2 -16% | 39 -22% | 37 -16% |
* ... smaller is better
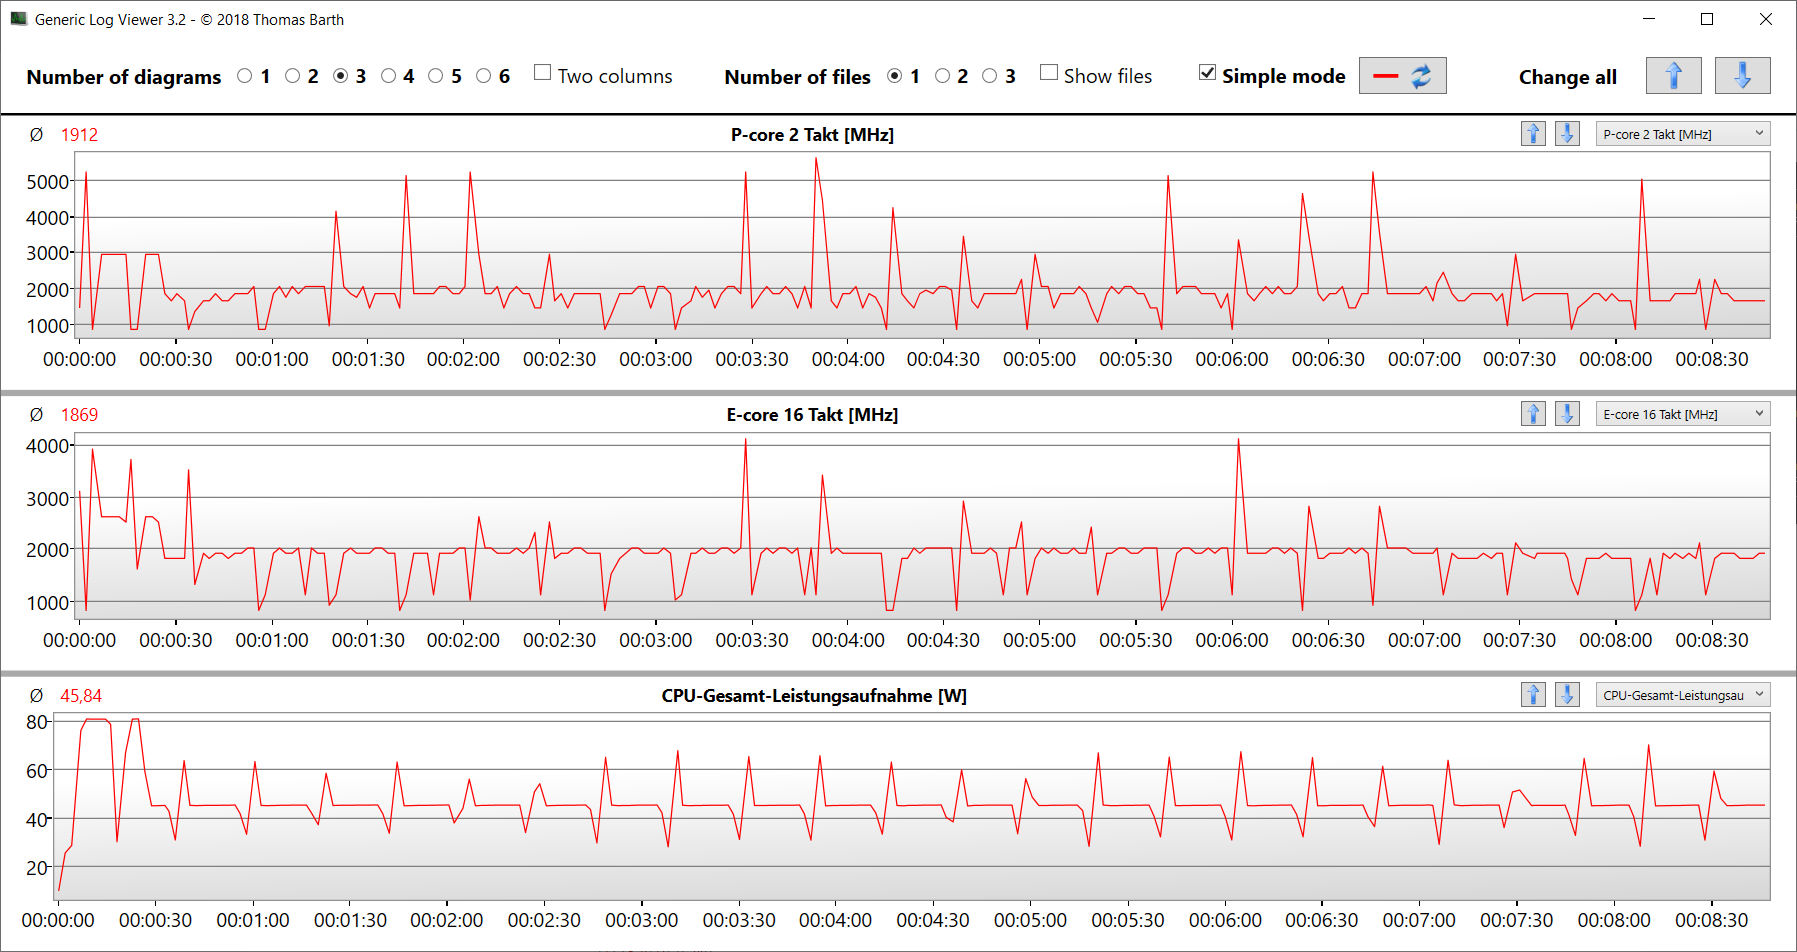
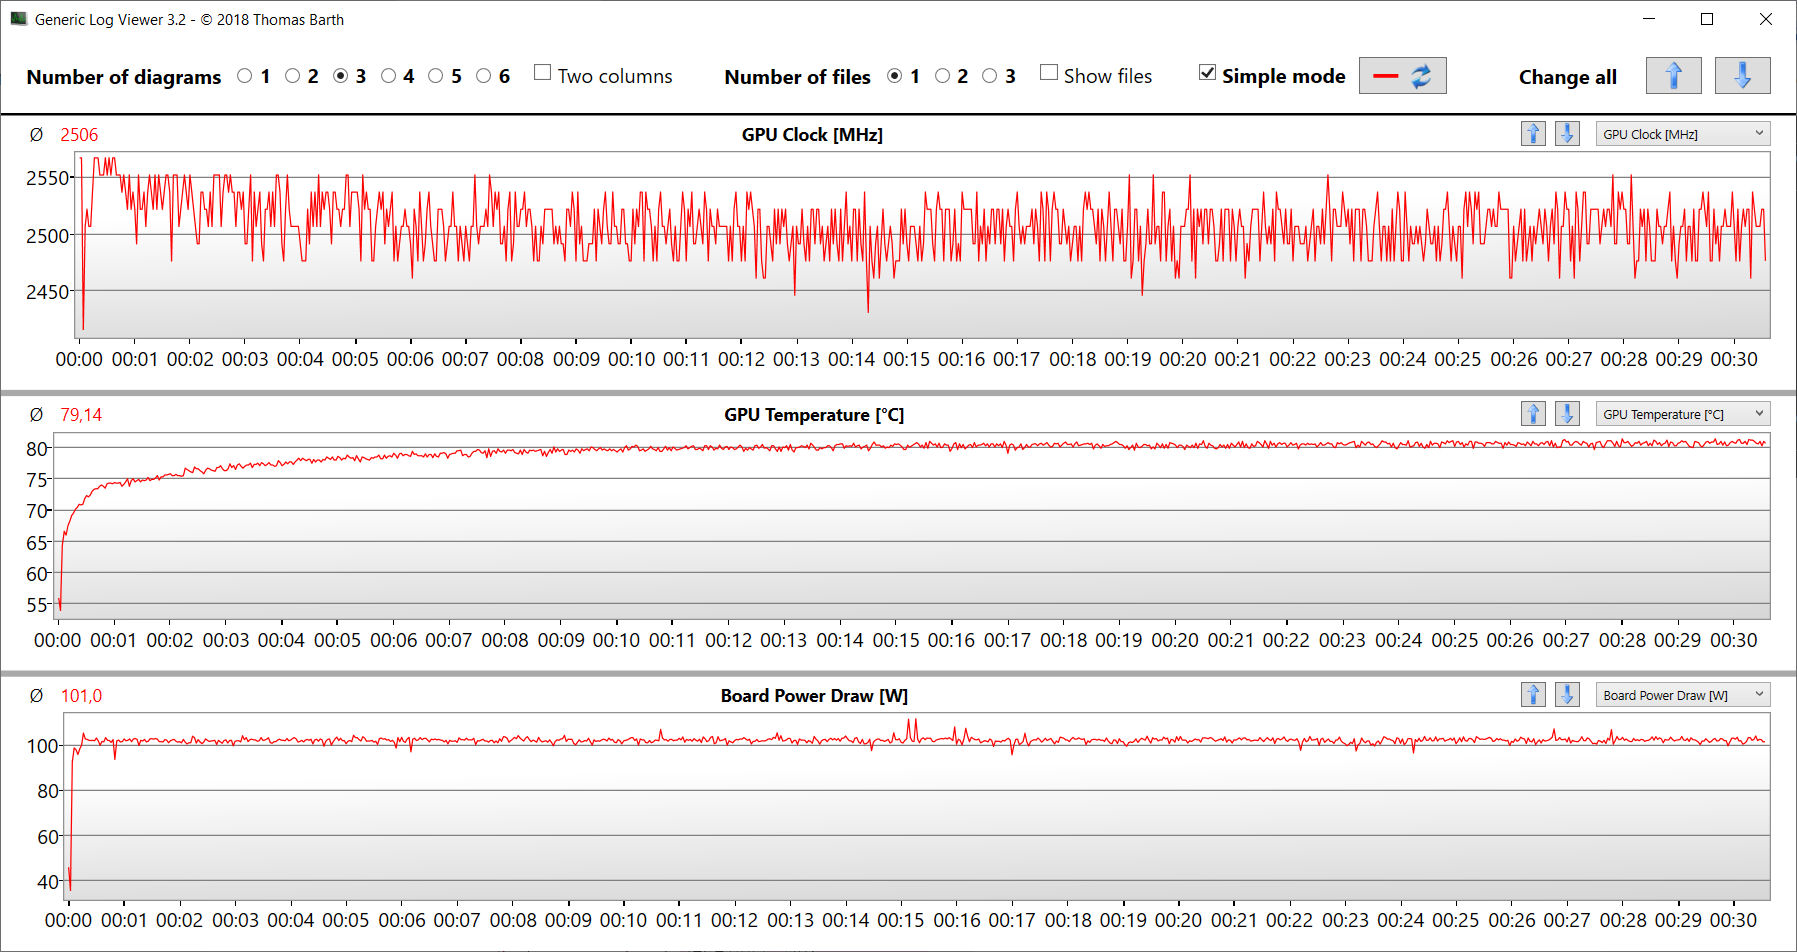
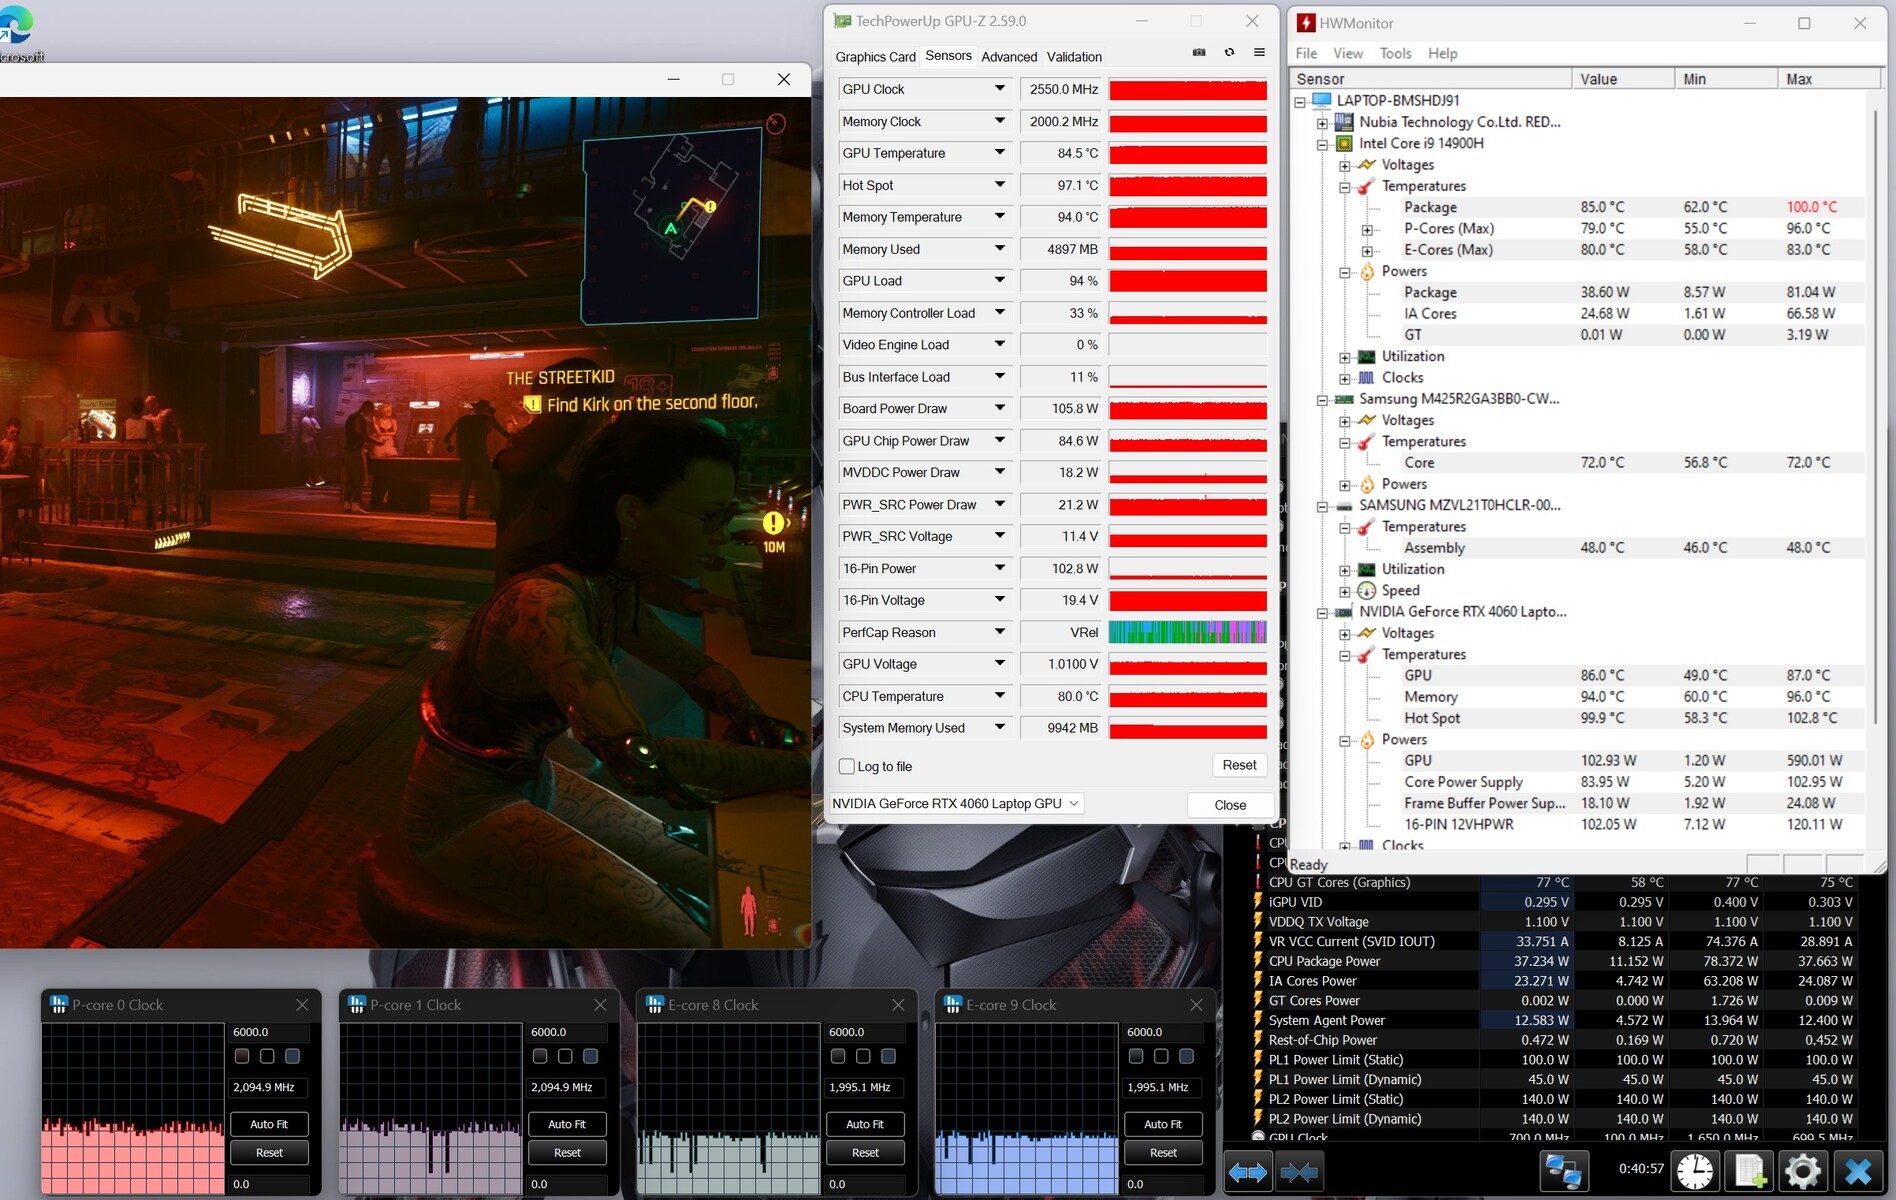
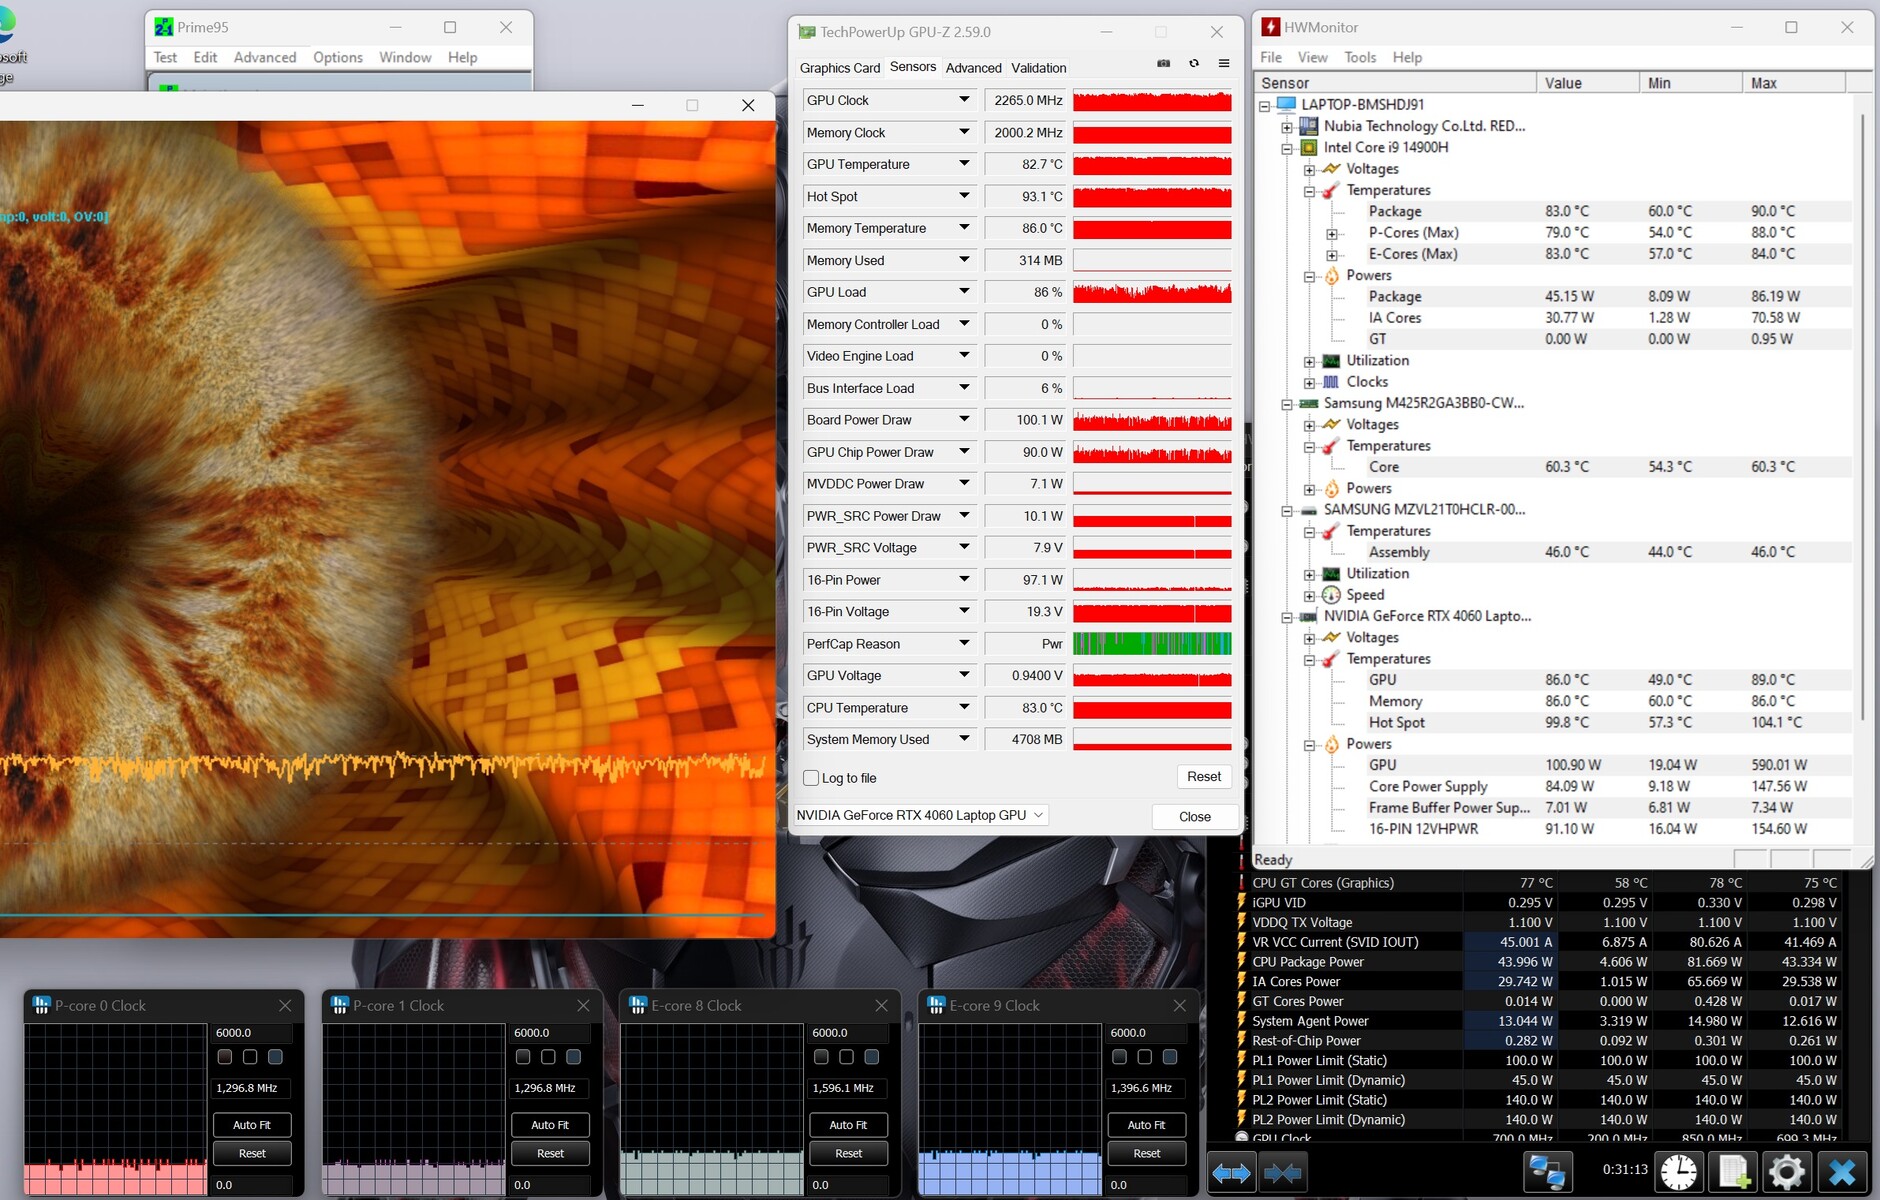
Stress test
The extreme stress test scenario (Prime95 and Furmark in continuous operation) checked the system's stability under full load. The CPU operated at high clock rates at the start of the test, but was then throttled to values below 2 GHz. The GPU worked at full power.
Speakers
The stereo speakers produce a pretty decent sound overall. The bass could do with being a little more pronounced.
Nubia RedMagic Titan 16 Pro audio analysis
(+) | speakers can play relatively loud (84 dB)
Bass 100 - 315 Hz
(±) | reduced bass - on average 14.3% lower than median
(±) | linearity of bass is average (11.3% delta to prev. frequency)
Mids 400 - 2000 Hz
(+) | balanced mids - only 1.8% away from median
(+) | mids are linear (4.9% delta to prev. frequency)
Highs 2 - 16 kHz
(+) | balanced highs - only 2.7% away from median
(+) | highs are linear (5.4% delta to prev. frequency)
Overall 100 - 16.000 Hz
(+) | overall sound is linear (11.5% difference to median)
Compared to same class
» 10% of all tested devices in this class were better, 3% similar, 87% worse
» The best had a delta of 6%, average was 18%, worst was 132%
Compared to all devices tested
» 8% of all tested devices were better, 2% similar, 90% worse
» The best had a delta of 4%, average was 24%, worst was 134%
Lenovo Legion Pro 5 16IRX9 G9 audio analysis
(±) | speaker loudness is average but good (77.13 dB)
Bass 100 - 315 Hz
(-) | nearly no bass - on average 18.3% lower than median
(±) | linearity of bass is average (12% delta to prev. frequency)
Mids 400 - 2000 Hz
(±) | higher mids - on average 6.9% higher than median
(+) | mids are linear (4.9% delta to prev. frequency)
Highs 2 - 16 kHz
(+) | balanced highs - only 4.5% away from median
(±) | linearity of highs is average (9.5% delta to prev. frequency)
Overall 100 - 16.000 Hz
(±) | linearity of overall sound is average (21.6% difference to median)
Compared to same class
» 77% of all tested devices in this class were better, 5% similar, 18% worse
» The best had a delta of 6%, average was 18%, worst was 132%
Compared to all devices tested
» 61% of all tested devices were better, 7% similar, 32% worse
» The best had a delta of 4%, average was 24%, worst was 134%
Power management - The Titan 16 delivers mediocre runtimes
Power consumption
Its power consumption is normal for the hardware installed. Cyberpunk 2077 and the stress test were run with constant power consumption. The power supply (280 watts) is sufficient in size.
| Off / Standby | |
| Idle | |
| Load |
|
Key:
min: | |
| Nubia RedMagic Titan 16 Pro i9-14900HX, GeForce RTX 4060 Laptop GPU | Lenovo Legion Pro 5 16IRX9 G9 i7-14700HX, GeForce RTX 4060 Laptop GPU | HP Victus 16 (2024) i7-14700HX, GeForce RTX 4060 Laptop GPU | Acer Predator Helios Neo 16 (2024) i7-14700HX, GeForce RTX 4070 Laptop GPU | Schenker XMG Pro 16 Studio (Mid 24) i9-14900HX, GeForce RTX 4070 Laptop GPU | Gigabyte G6X 9KG (2024) i7-13650HX, GeForce RTX 4060 Laptop GPU | Average NVIDIA GeForce RTX 4060 Laptop GPU | Average of class Gaming | |
|---|---|---|---|---|---|---|---|---|
| Power Consumption | -4% | 16% | -23% | -35% | 17% | 21% | 7% | |
| Idle Minimum * (Watt) | 16 | 13.7 14% | 9 44% | 26.7 -67% | 31 -94% | 12 25% | 11.5 ? 28% | 13 ? 19% |
| Idle Average * (Watt) | 19 | 17.7 7% | 15 21% | 24.4 -28% | 33 -74% | 13 32% | 16 ? 16% | 18.7 ? 2% |
| Idle Maximum * (Watt) | 27 | 18.5 31% | 23 15% | 32.7 -21% | 41 -52% | 27 -0% | 20.3 ? 25% | 24.3 ? 10% |
| Load Average * (Watt) | 123 | 124 -1% | 123 -0% | 122.1 1% | 114 7% | 105 15% | 92.9 ? 24% | 108.2 ? 12% |
| Cyberpunk 2077 ultra external monitor * (Watt) | 174.2 | 224 -29% | 196.8 -13% | |||||
| Cyberpunk 2077 ultra * (Watt) | 184.3 | 229 -24% | 218 -18% | |||||
| Load Maximum * (Watt) | 240 | 297 -24% | 241 -0% | 241 -0% | 250 -4% | 210 12% | 210 ? 12% | 254 ? -6% |
| Witcher 3 ultra * (Watt) | 143.7 | 190.6 | 167.8 |
* ... smaller is better
Power consumption Cyberpunk / stress test
Power consumption with external monitor
Runtimes
The 16-inch device achieved runtimes of 4:40 h during the WiFi test (accessing websites using a script) and 5:16 h during the video test (short film Big Buck Bunny (H.264 encoding, FHD) in a loop)—not great values. Some of its competitors run for significantly longer.
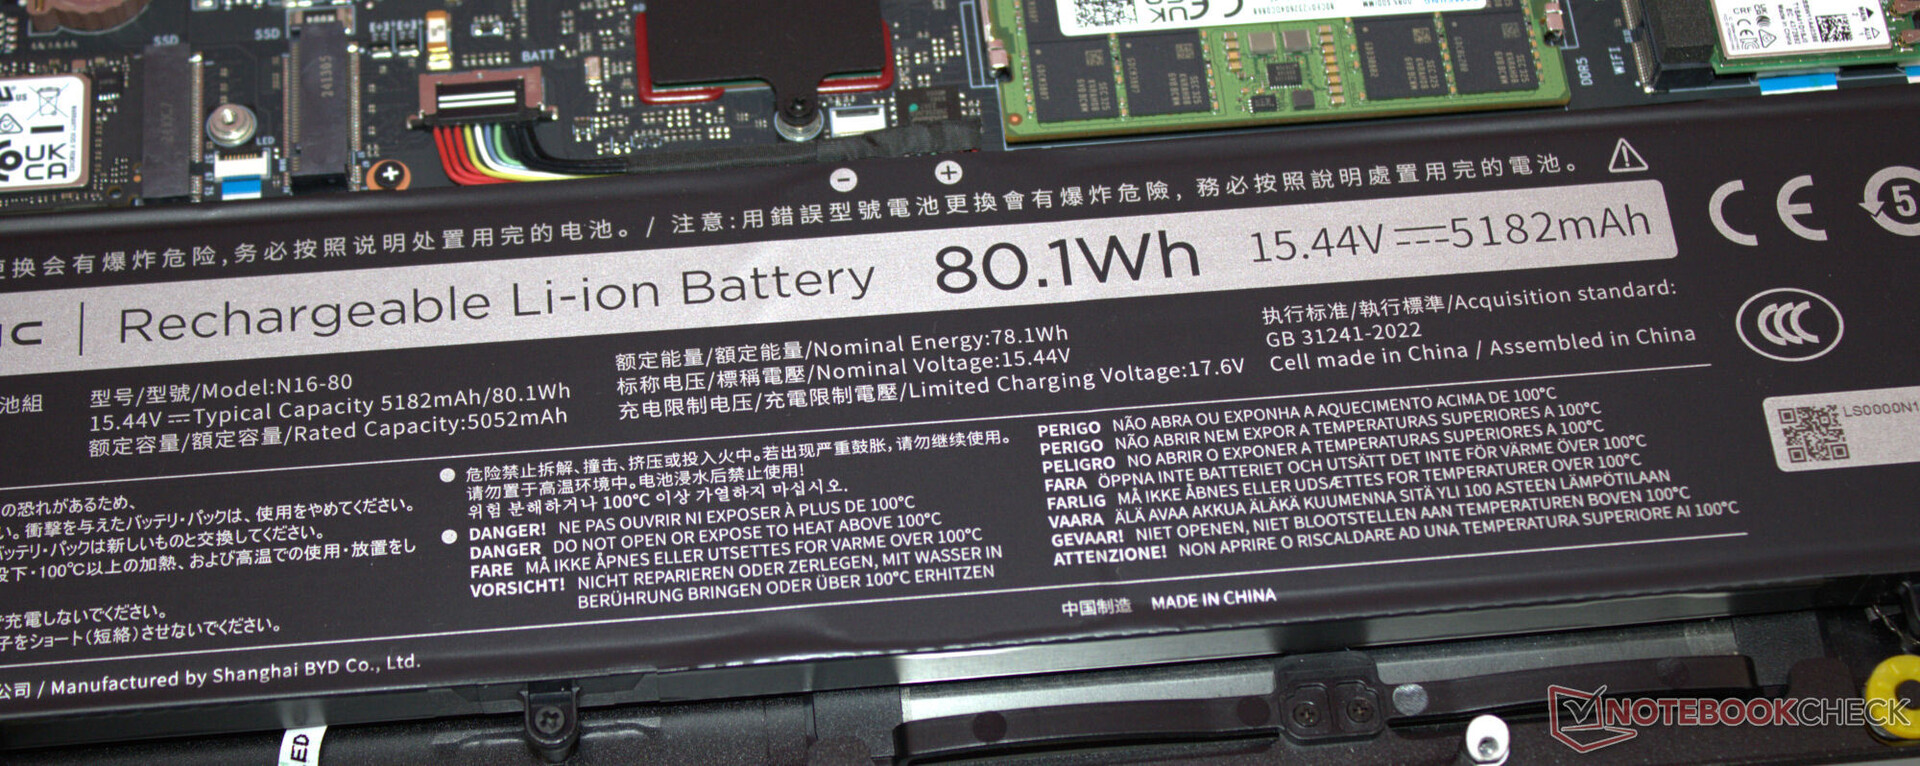
| Nubia RedMagic Titan 16 Pro i9-14900HX, GeForce RTX 4060 Laptop GPU, 80.1 Wh | Lenovo Legion Pro 5 16IRX9 G9 i7-14700HX, GeForce RTX 4060 Laptop GPU, 80 Wh | HP Victus 16 (2024) i7-14700HX, GeForce RTX 4060 Laptop GPU, 83 Wh | Acer Predator Helios Neo 16 (2024) i7-14700HX, GeForce RTX 4070 Laptop GPU, 90.61 Wh | Schenker XMG Pro 16 Studio (Mid 24) i9-14900HX, GeForce RTX 4070 Laptop GPU, 73 Wh | Gigabyte G6X 9KG (2024) i7-13650HX, GeForce RTX 4060 Laptop GPU, 73 Wh | Average of class Gaming | |
|---|---|---|---|---|---|---|---|
| Battery runtime | 15% | 81% | -18% | 19% | 68% | 36% | |
| Reader / Idle (h) | 8 | 5.9 -26% | 8.71 ? 9% | ||||
| H.264 (h) | 5.3 | 5.2 -2% | 4 -25% | 8.9 ? 68% | |||
| WiFi v1.3 (h) | 4.7 | 5.1 9% | 8.5 81% | 3.8 -19% | 5.6 19% | 7.9 68% | 7 ? 49% |
| Load (h) | 1.3 | 1.8 38% | 1.3 0% | 1.51 ? 16% |
Pros
Cons
Verdict - Room for improvement
A Core i9-14900HX and a GeForce RTX 4060 ensure QHD gaming at high to maximum settings. The installed hardware isn't used to its full potential, as the RAM runs in single-channel mode. It's recommended that a second memory module be installed.
Nubia's debut product does what it is designed to do: Bring games onto its screen smoothly. But the competition doesn't exactly need a reason to be afraid.
Its emission values are extremely disappointing: The laptop produces (too) much noise over the entire load range—plus, it heats up a lot. Its bright, true-color IPS screen (16-inch, 2,560 x 1,600 pixels, 240 Hz, G-Sync, DCI-P3) with a work-friendly 16:10 aspect ratio, on the other hand, left a good impression on us.
The laptop's battery life won't knock anyone's socks off. You would expect (slightly) more from a gaming laptop with an 80 Wh battery. At least its installed USB-C port (Thunderbolt 4) supports Power Delivery (and DP Alt mode). This means that you don't necessarily always have to carry the bulky proprietary power supply with you.
One fact that you should consider before purchasing the device: In contrast to established manufacturers such as Acer, Lenovo or HP, Nubia doesn't really have a presence globally. As a result, it isn't possible to estimate what the situation will be regarding spare parts supply, support and repairs.
Its price of US$1,699 certainly doesn't speak in favor of the laptop: For example, a nearly identical configuration of the Acer Predator Helios Neo 16 (with the exception of its RAM which is 32 GB instead of 16 GB) currently only costs US$1,350. Another alternative could be the XMG Pro 16 Studio (Mid 24). The price for a comparable version of this device is about US$2,000 (with Windows 11) or US$1,950 (without Windows as an operating system).
Price and availability
The Nubia RedMagic Titan 16 Pro is available from 08/29/2024 and can be purchased for US$1,699 via the RedMagic store.
Please note: We have recently updated our rating system and the results of version 8 are not comparable with the results of version 7. More information is available here.
Nubia RedMagic Titan 16 Pro
- 08/21/2024 v8
Sascha Mölck
 Total Sustainability Score:
 Transparency
The selection of devices to be reviewed is made by our editorial team. The test sample was provided to the author as a loan by the manufacturer or retailer for the purpose of this review. The lender had no influence on this review, nor did the manufacturer receive a copy of this review before publication. There was no obligation to publish this review. As an independent media company, Notebookcheck is not subjected to the authority of manufacturers, retailers or publishers.
This is how Notebookcheck is testing
Every year, Notebookcheck independently reviews hundreds of laptops and smartphones using standardized procedures to ensure that all results are comparable. We have continuously developed our test methods for around 20 years and set industry standards in the process. In our test labs, high-quality measuring equipment is utilized by experienced technicians and editors. These tests involve a multi-stage validation process. Our complex rating system is based on hundreds of well-founded measurements and benchmarks, which maintains objectivity. Further information on our test methods can be found here.
Price comparison

