
XMG Pro 16 Studio (Mid 24) review: Core i9 and RTX 4070 for gamers and creators
Creator's delight?
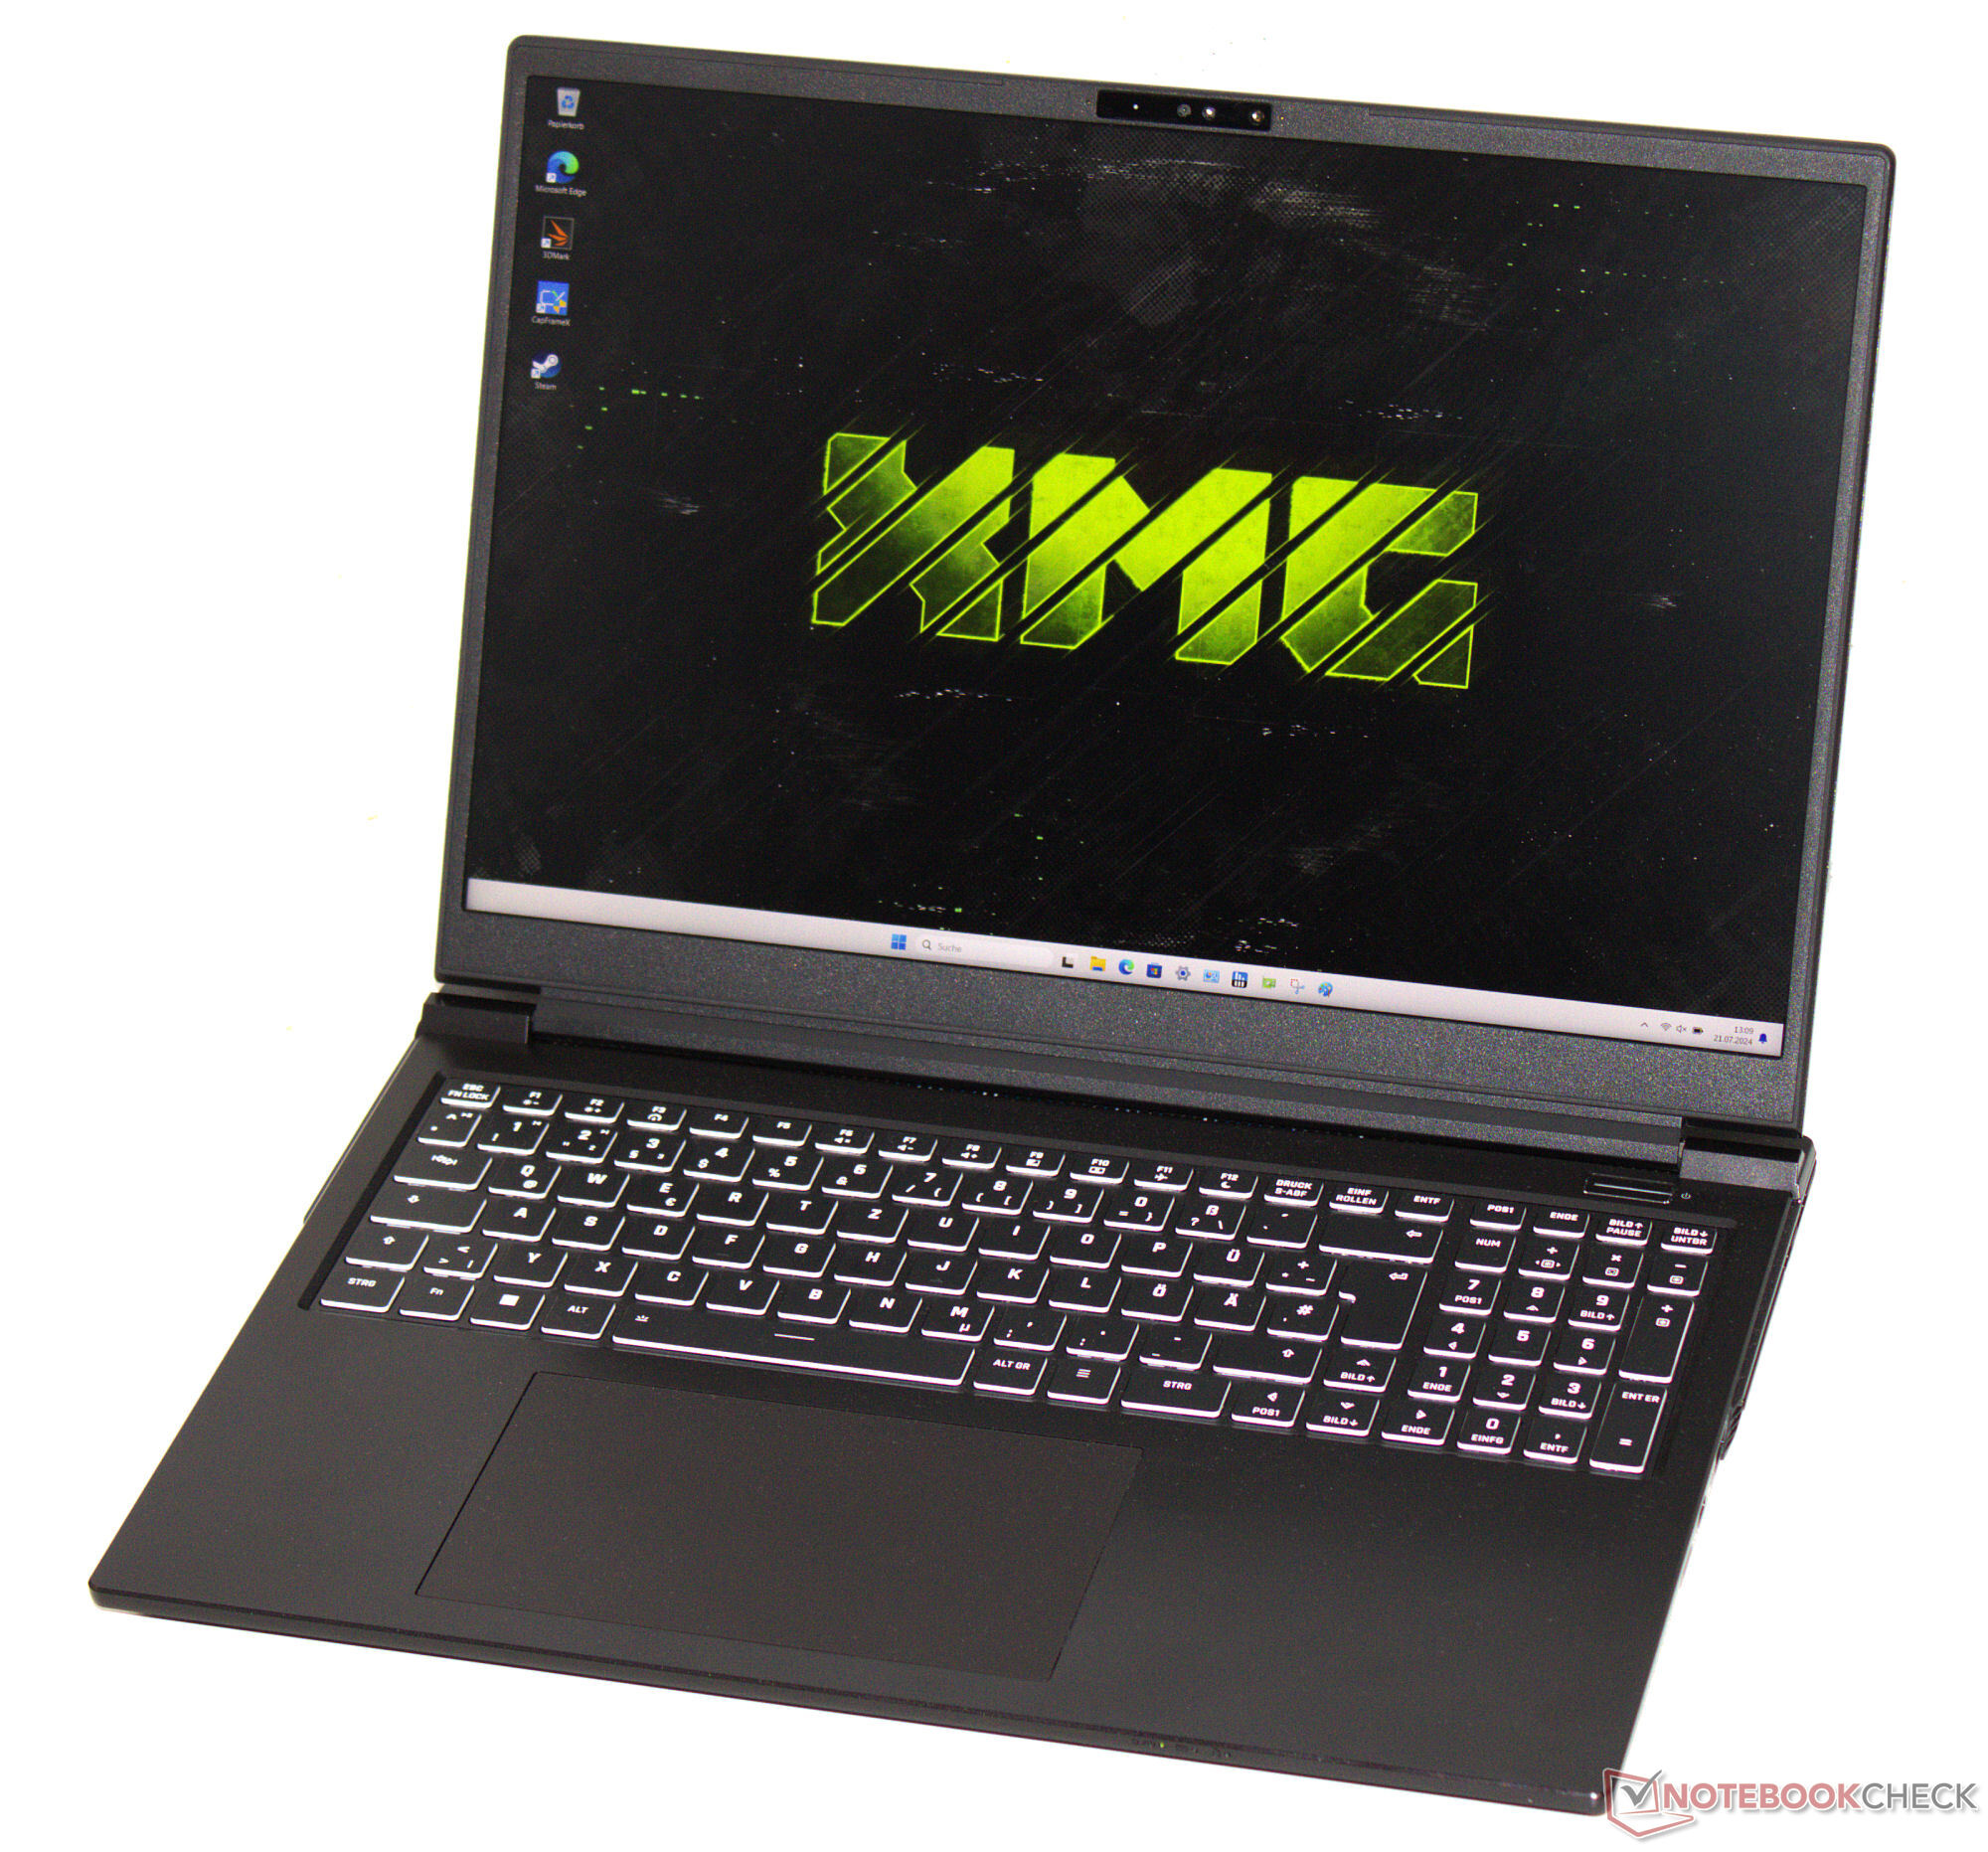
Content creators and gamers make up the target market of the XMG Pro 16 Studio: Schenker has put together an offer consisting of a Core i9 processor, RTX 4070, Thunderbolt 4 port and a 16:10 display (QHD+, 240Hz, sRGB). Good cooling is supposedly ensured through the use of a Vapor Chamber.Sascha Mölck, 👁 Florian Glaser (translated by Daisy Dickson) Published 🇩🇪 🇫🇷 ...
The XMG Pro 16 Studio (Mid 24) is aimed at gamers and creators. The corresponding hardware is on board: A Core i9-14900HX, GeForce RTX 4070 as well as a calibrated (X-Rite) 16-inch display with an aspect ratio of 16:10. A barebone (PE60SNE-S) from the manufacturer Clevo serves as a base for this. This is the successor to the XMG Pro 16 (Mid 23) which—visually—looks the same. Competitors include the Lenovo Legion Pro 5 16IRX9, Acer Predator Helios Neo 16 (2024), Lenovo Legion 7 16 G9 and the Aorus 16X (2024).
Possible competitors compared
Rating | Version | Date | Model | Weight | Height | Size | Resolution | Price |
|---|---|---|---|---|---|---|---|---|
| 81.2 % | v8 | 07 / 2024 | Schenker XMG Pro 16 Studio (Mid 24) i9-14900HX, GeForce RTX 4070 Laptop GPU | 2.3 kg | 19.9 mm | 16.00" | 2560x1600 | |
| 86.8 % v7 (old) | v7 (old) | 05 / 2024 | Acer Predator Helios Neo 16 (2024) i7-14700HX, GeForce RTX 4070 Laptop GPU | 2.6 kg | 25.95 mm | 16.00" | 2560x1600 | |
| 89.3 % v7 (old) | v7 (old) | 03 / 2024 | Lenovo Legion Pro 5 16IRX9 i9-14900HX, GeForce RTX 4070 Laptop GPU | 2.5 kg | 26.95 mm | 16.00" | 2560x1600 | |
| 87.4 % v7 (old) | v7 (old) | 04 / 2024 | Aorus 16X 2024 i9-14900HX, GeForce RTX 4070 Laptop GPU | 2.3 kg | 20 mm | 16.00" | 2560x1600 | |
| 90.8 % v7 (old) | v7 (old) | 04 / 2024 | Lenovo Legion 7 16 IRX G9 i9-14900HX, GeForce RTX 4070 Laptop GPU | 2.3 kg | 19.8 mm | 16.00" | 3200x2000 |
Please note: We have recently updated our rating system and the results of version 8 are not comparable with the results of version 7. More information is available here.
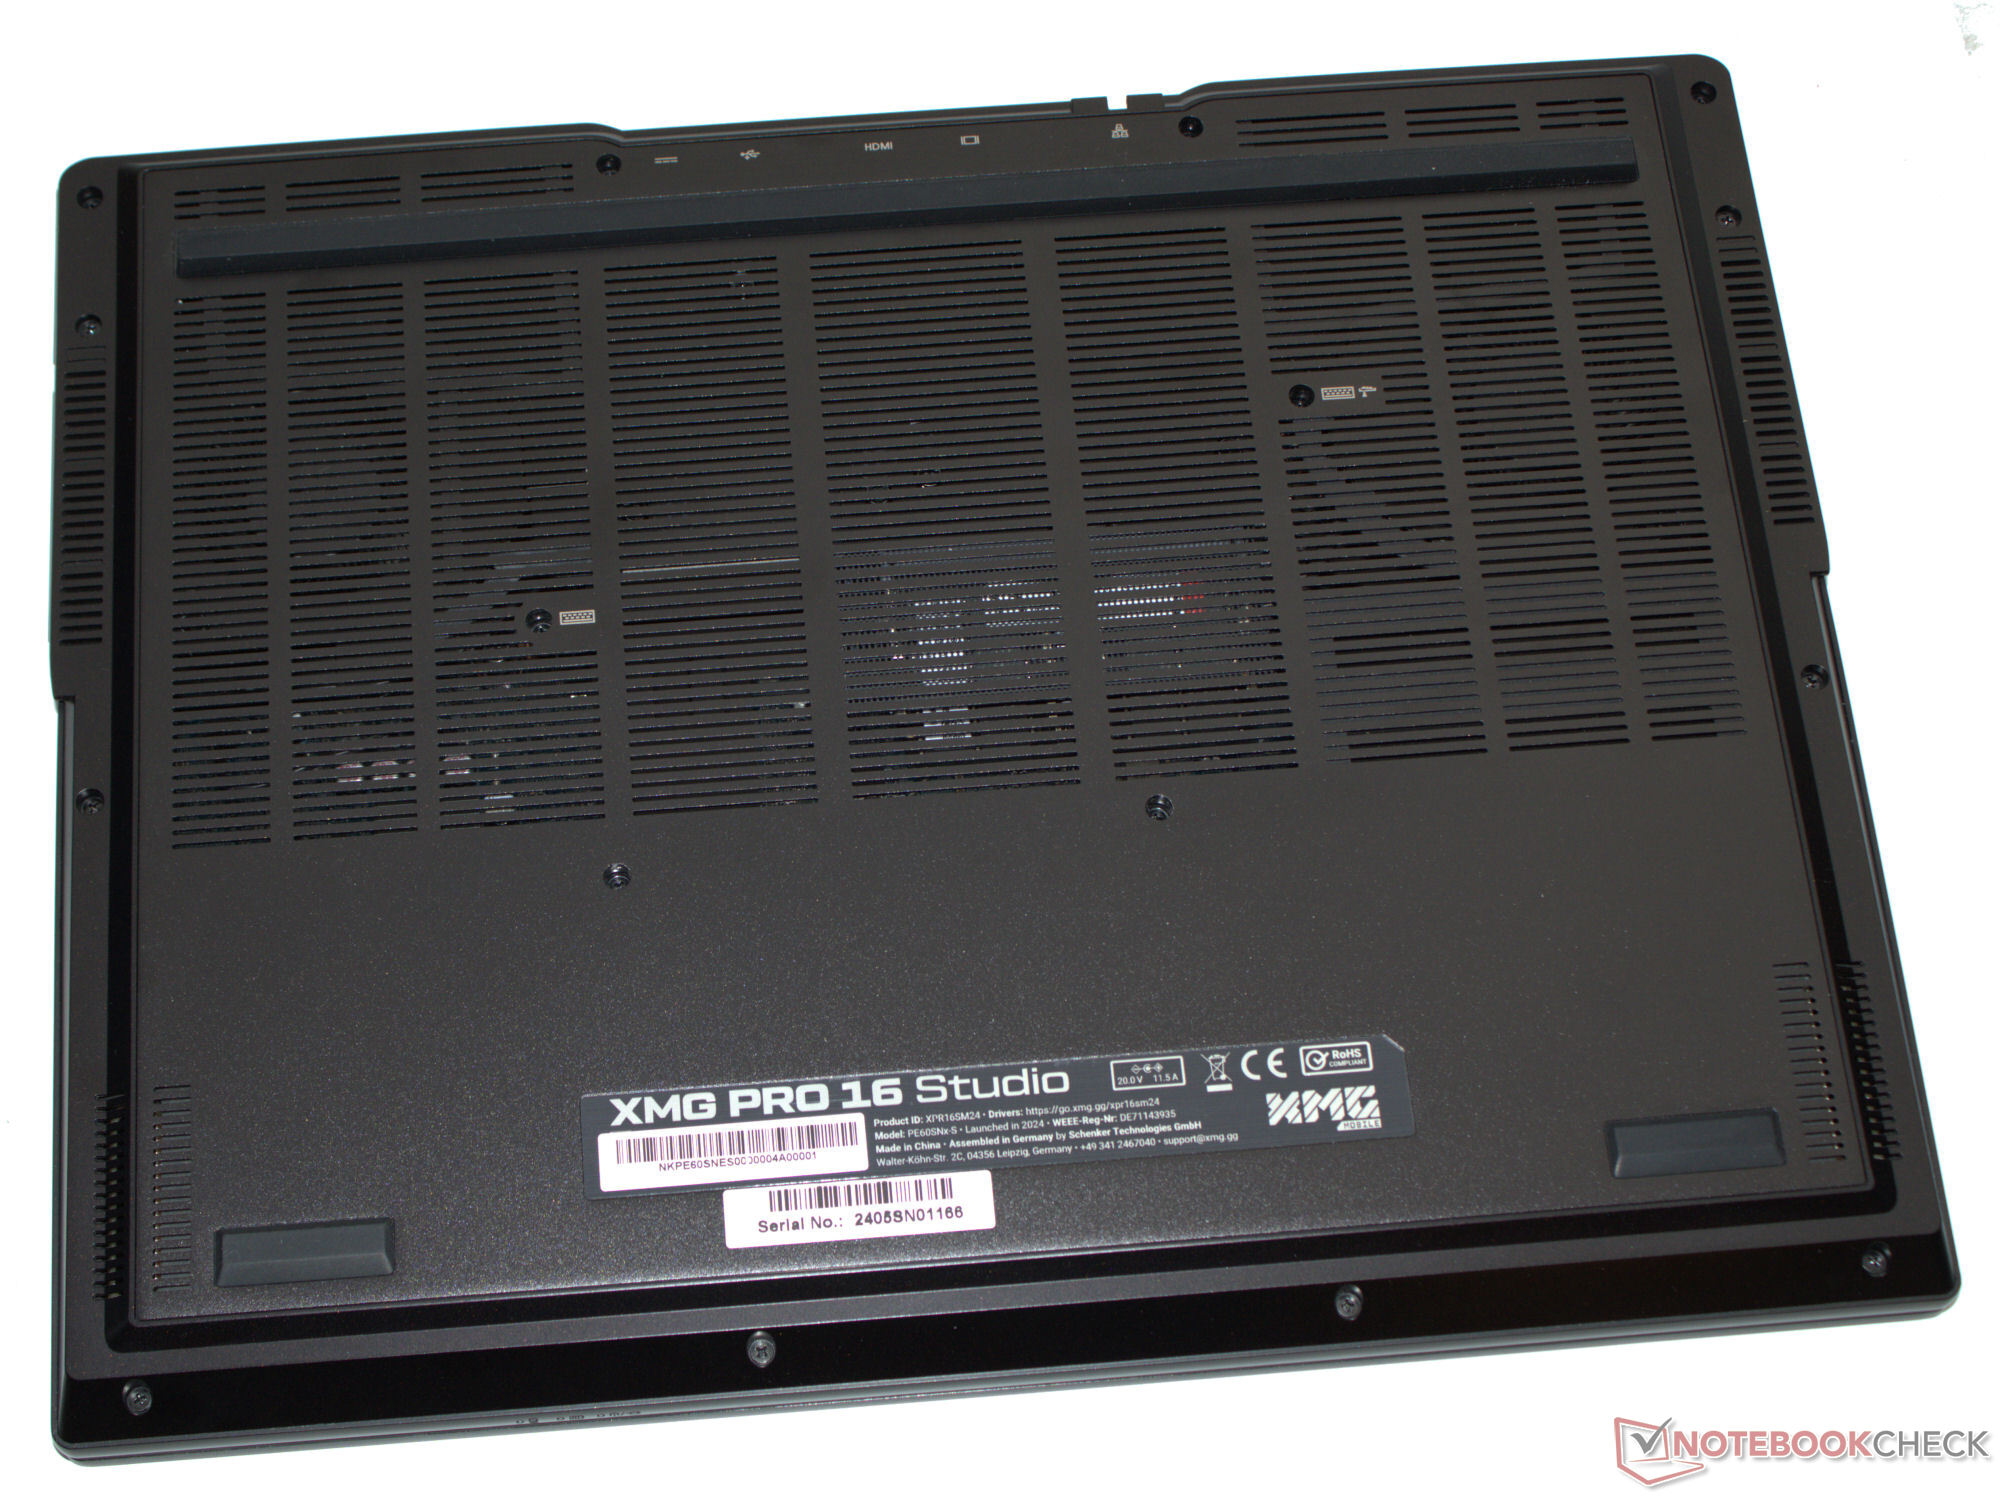
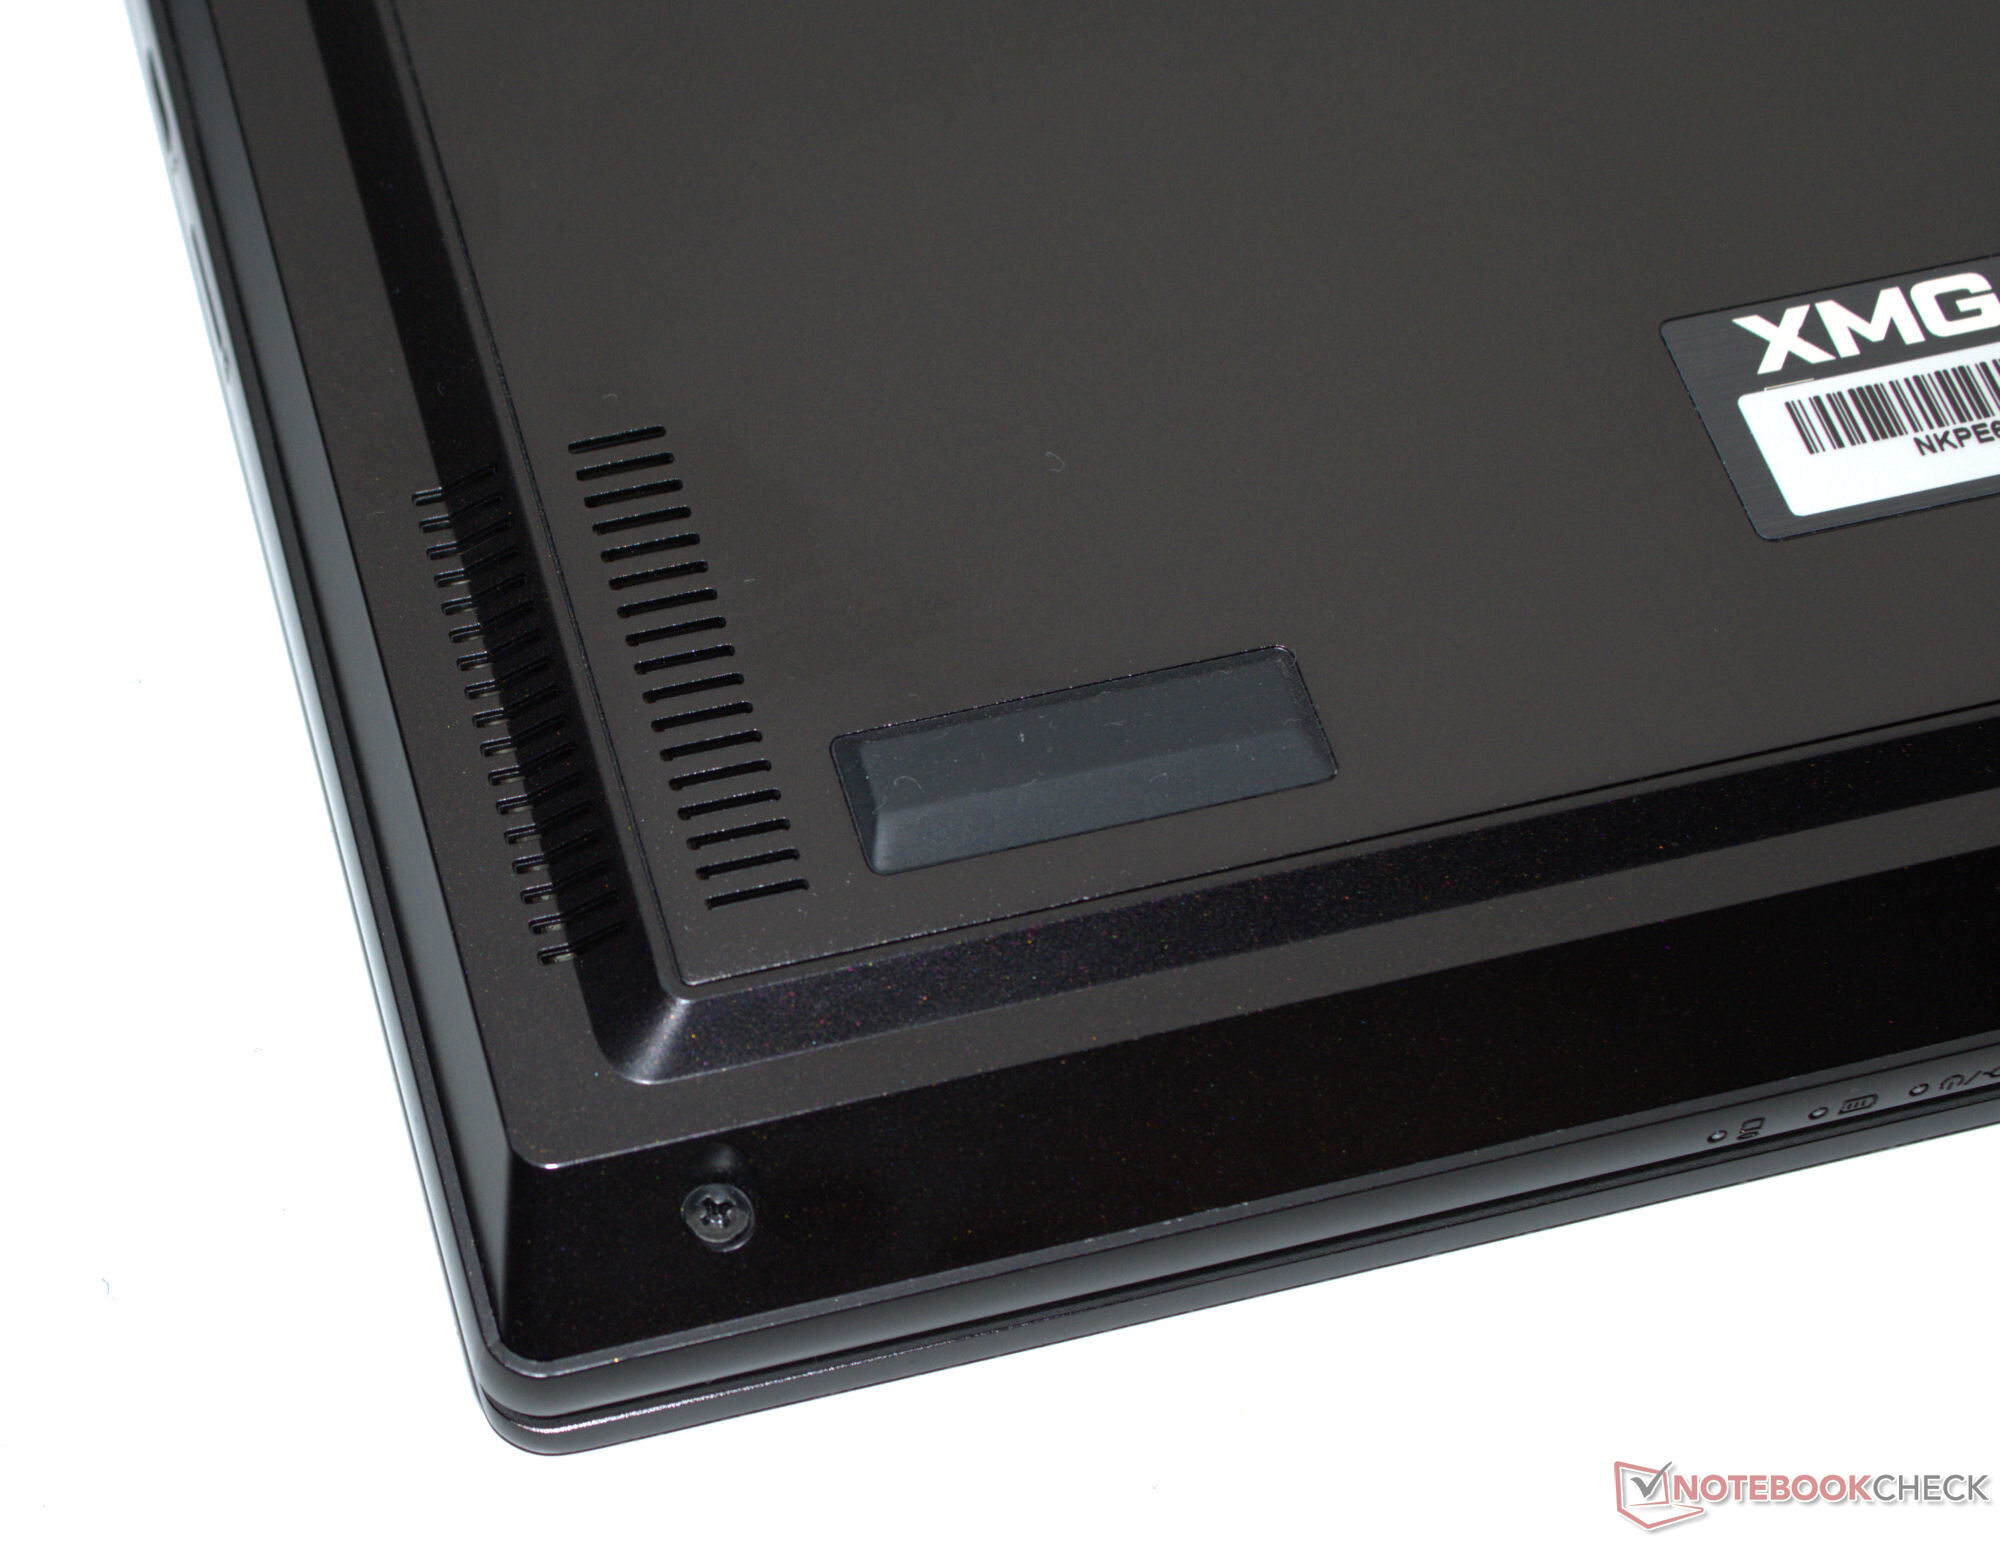
Case & connectivity - Schenker uses a barebone from Clevo
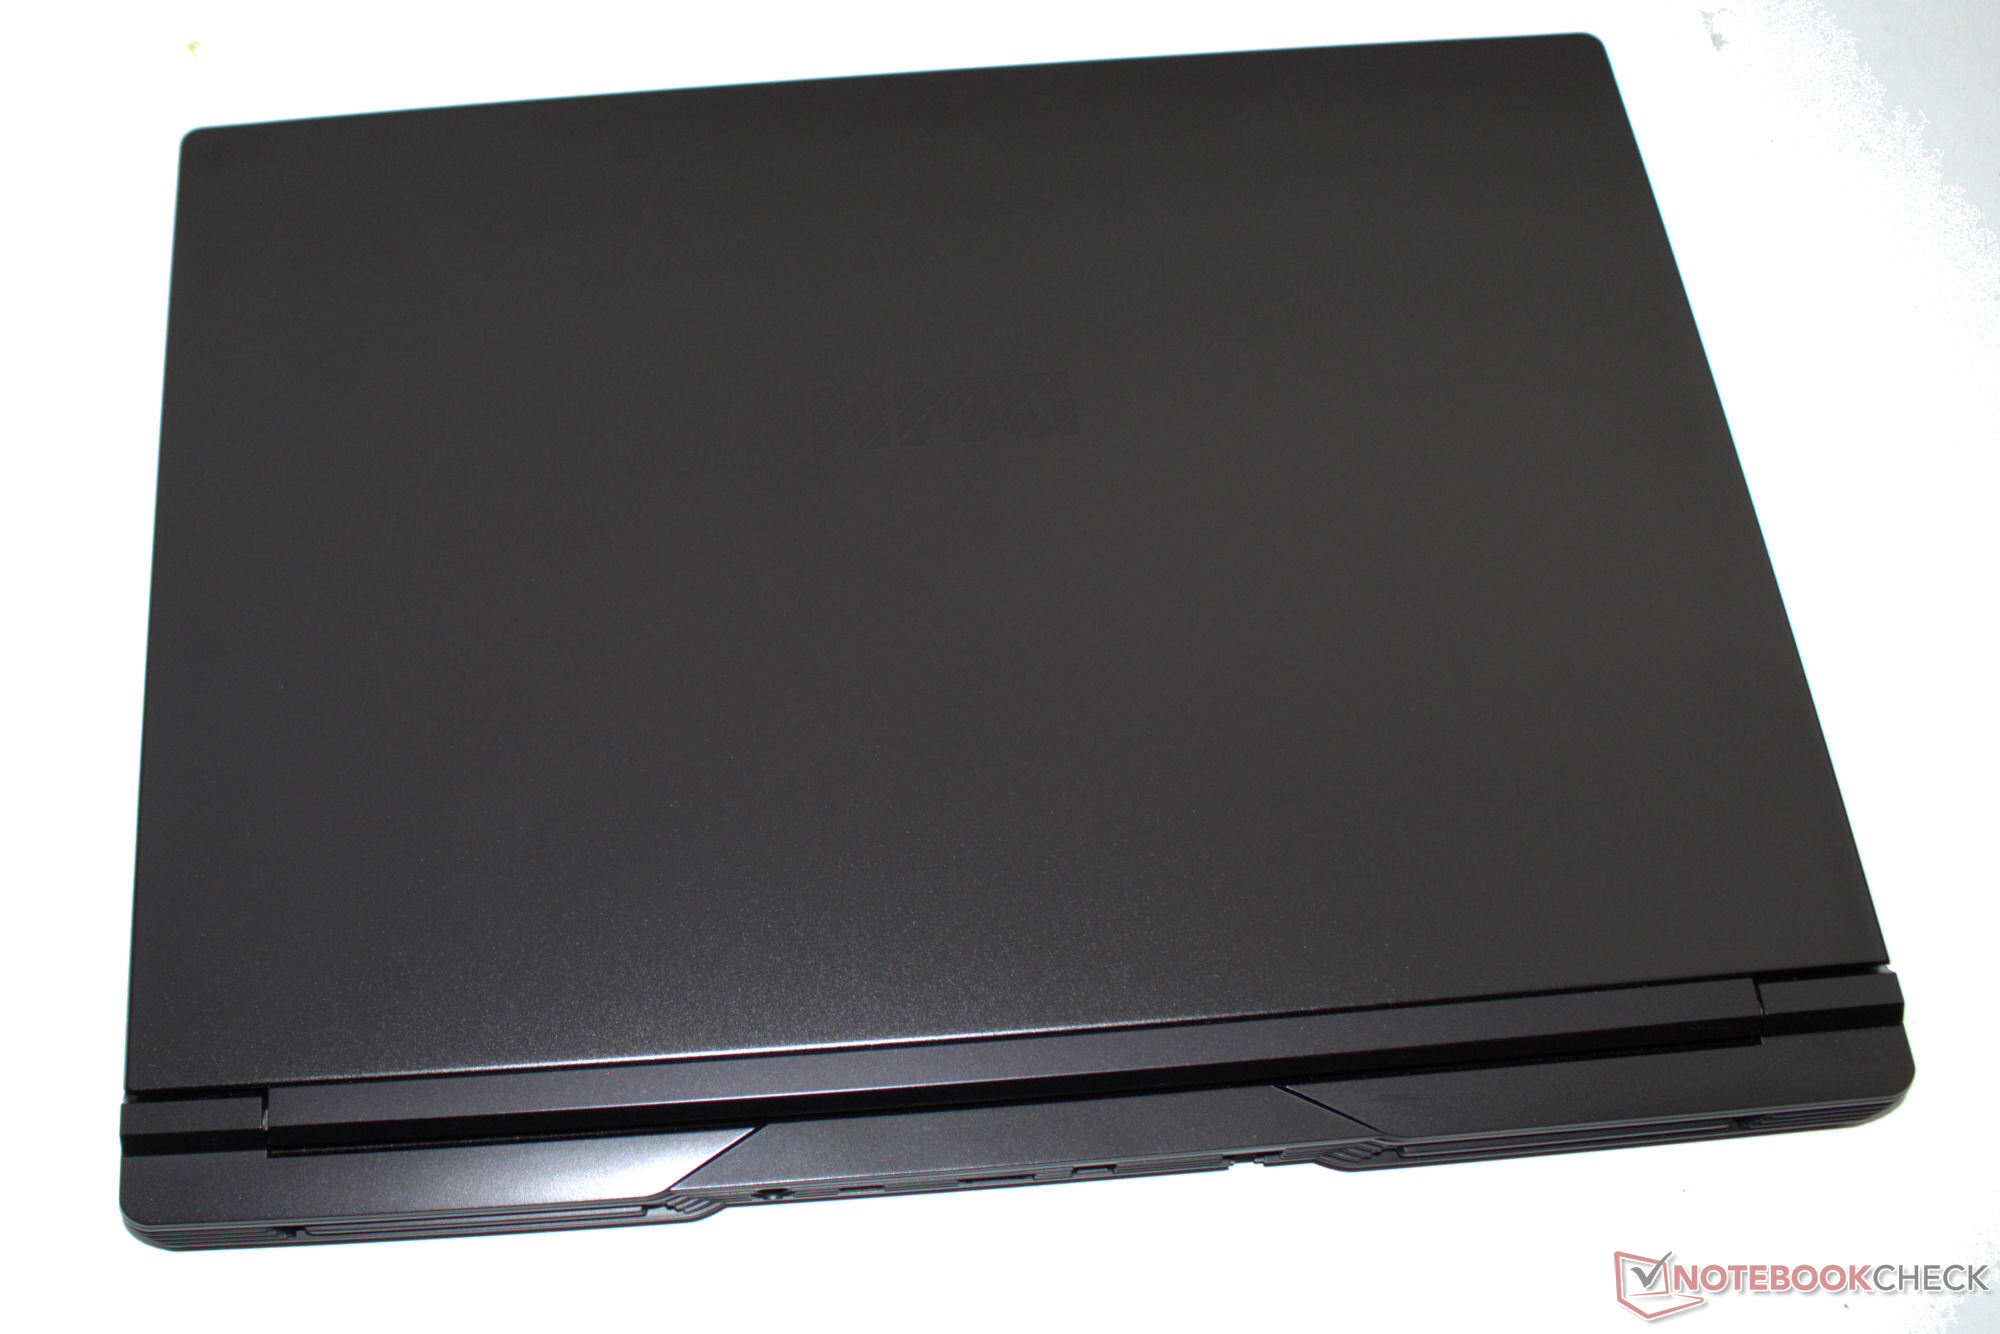
From the outside, nothing has changed: The latest Pro 16 uses the same matte black aluminum case as last year's model—if you just regard its outer case. The base unit and lid can be twisted slightly, but their build quality is good. You will search in vain for LED strips on such a serious-looking case. The lid's maximum opening angle is 130 degrees.
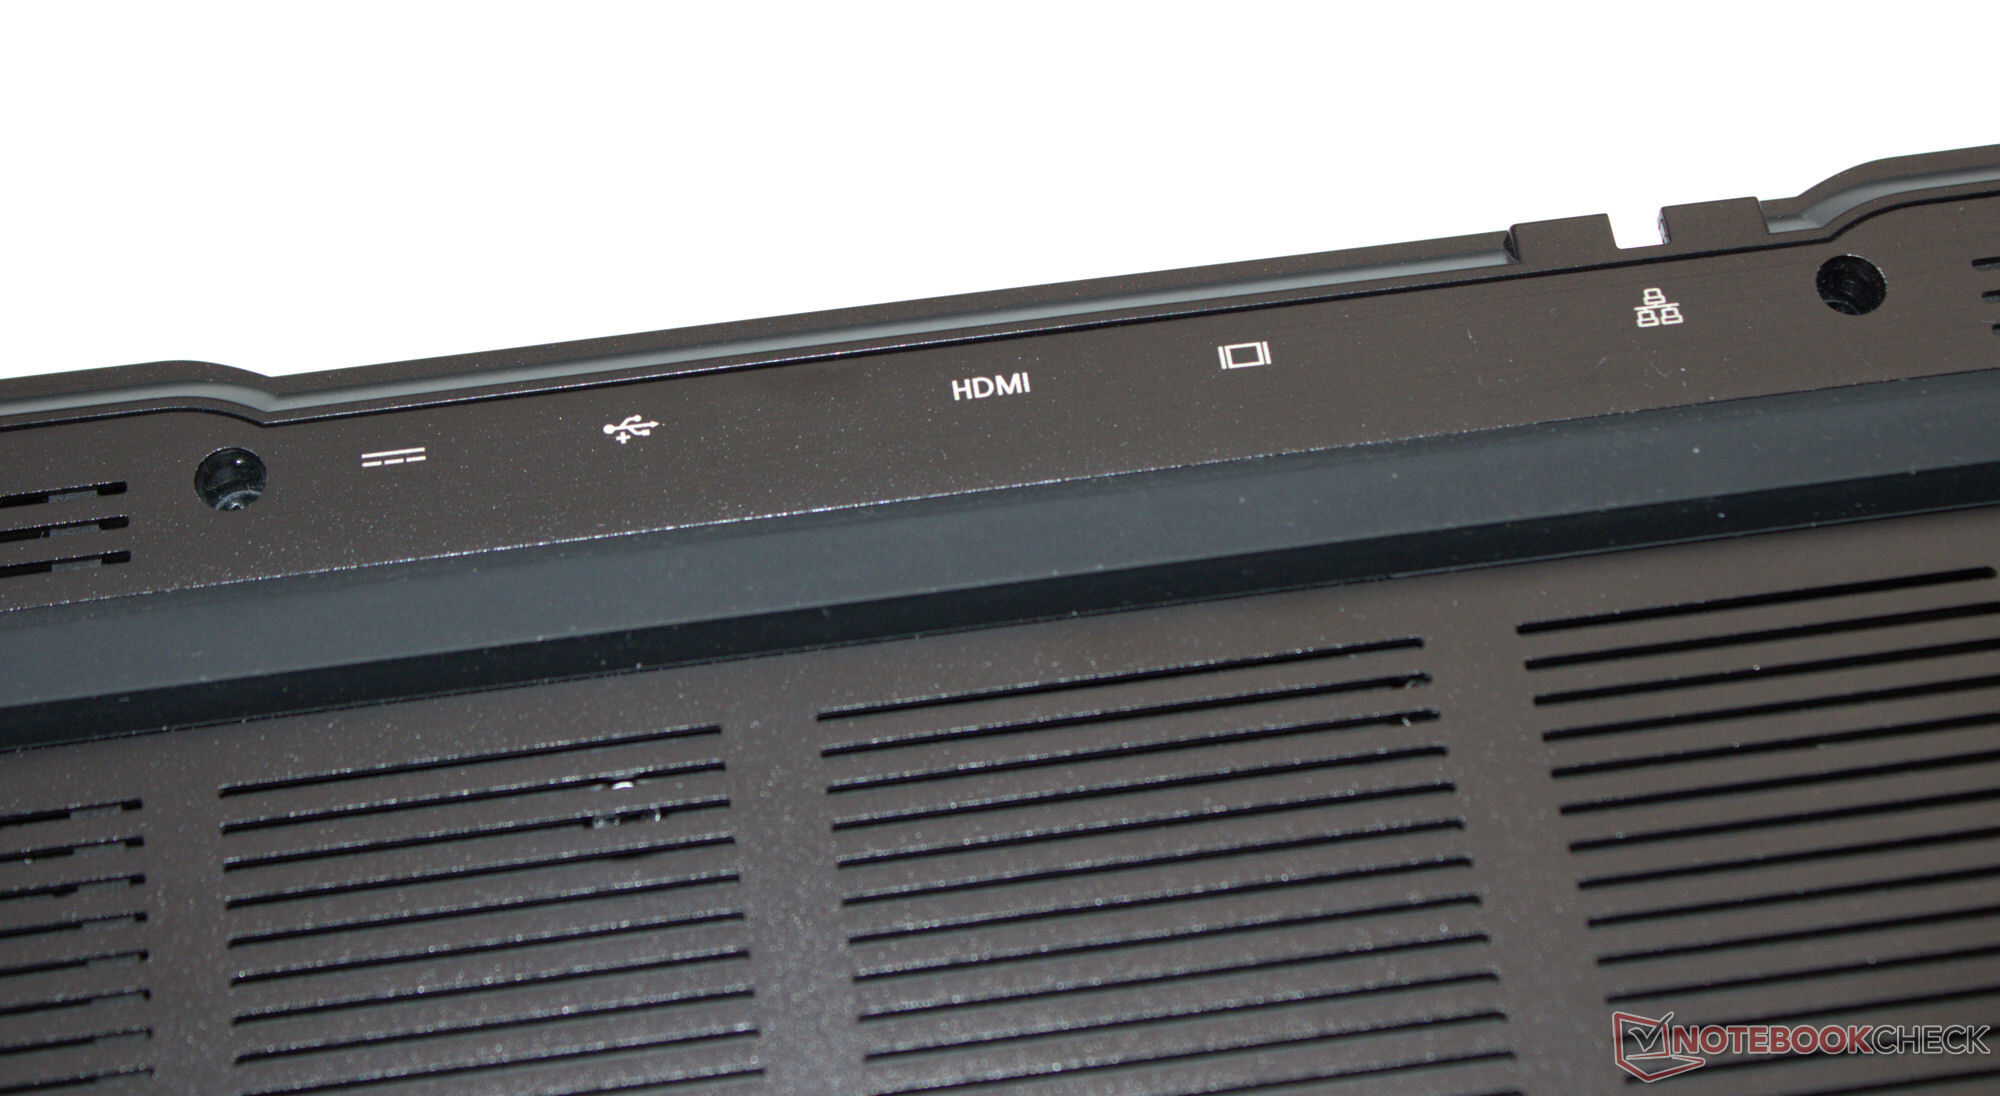
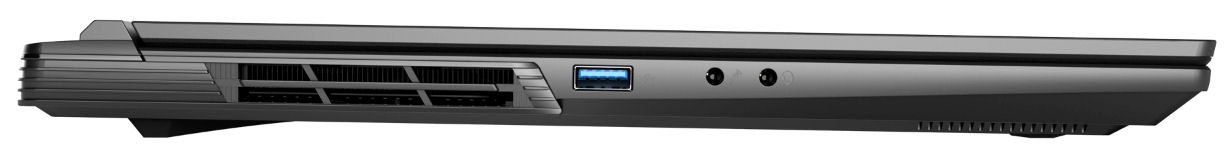
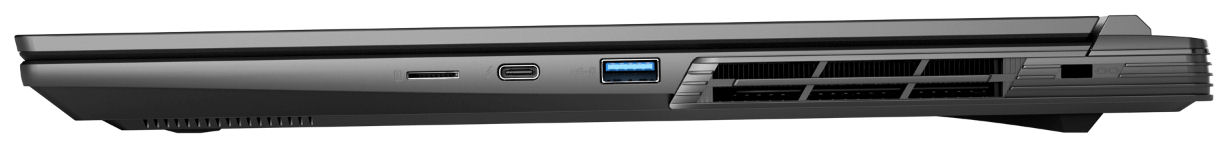
Two USB-A ports (USB 3.2 Gen 1), two USB-C ports (1x USB 3.2 Gen 2, 1x TB 4/USB 4) as well as three video outputs should be sufficient for most users—worst-case scenario, you might have to reach for a docking station. Power Delivery is supported thanks to the TB4 port. The Gigabit Ethernet port allows data rates of up to 2.5 Gbit/s.
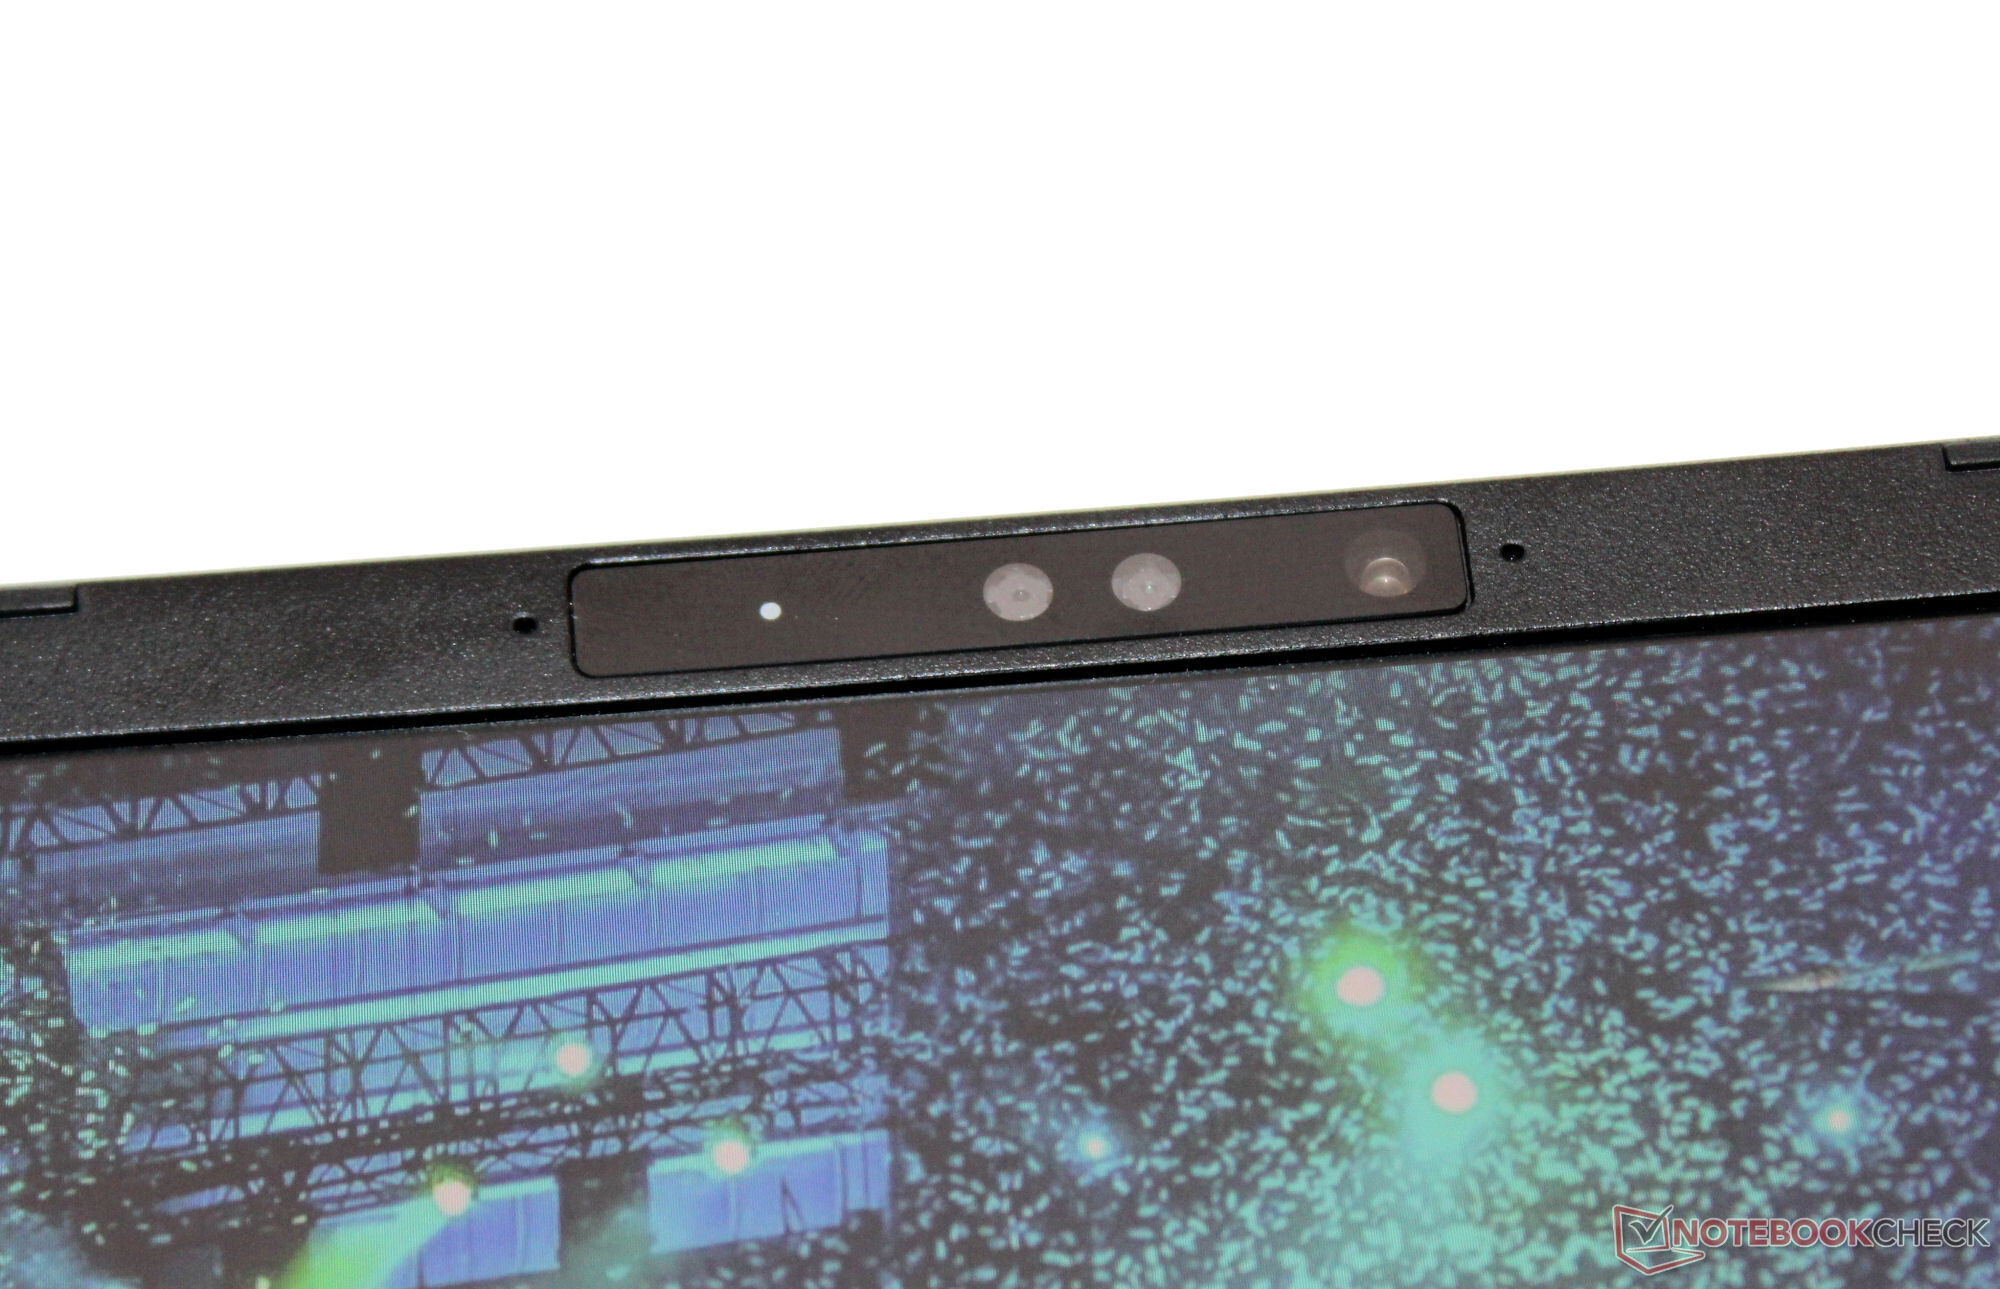
Under optimum conditions (no WiFi devices in close vicinity, short distance between laptop and server PC), Intel's WiFi-6E chip (AX211) produces good to very good data rates. The FHD webcam (2.1 MP, no cover) doesn't take any surprising shots. The MicroSD card reader (reference card: AV PRO microSD 128 GB V60) is of average speed.


| SD Card Reader | |
| average JPG Copy Test (av. of 3 runs) | |
| Aorus 16X 2024 (AV PRO microSD 128 GB V60) | |
| Average of class Gaming (20.9 - 210, n=53, last 2 years) | |
| Schenker XMG Pro 16 Studio (Mid 23) (AV PRO microSD 128 GB V60) | |
| Schenker XMG Pro 16 Studio (Mid 24) (AV PRO microSD 128 GB V60) | |
| Lenovo Legion 7 16 IRX G9 (Angelbird AV Pro V60) | |
| Acer Predator Helios Neo 16 (2024) (AV PRO microSD 128 GB V60) | |
| maximum AS SSD Seq Read Test (1GB) | |
| Aorus 16X 2024 (AV PRO microSD 128 GB V60) | |
| Average of class Gaming (25.5 - 261, n=50, last 2 years) | |
| Schenker XMG Pro 16 Studio (Mid 23) (AV PRO microSD 128 GB V60) | |
| Lenovo Legion 7 16 IRX G9 (Angelbird AV Pro V60) | |
| Schenker XMG Pro 16 Studio (Mid 24) (AV PRO microSD 128 GB V60) | |
| Acer Predator Helios Neo 16 (2024) (AV PRO microSD 128 GB V60) | |

 GeForce RTX 4070 Laptop GPU, i9-14900HX, Samsung 990 Pro 1 TB")
 GeForce RTX 4070 Laptop GPU, i9-14900HX, Samsung 990 Pro 1 TB")
Sustainability
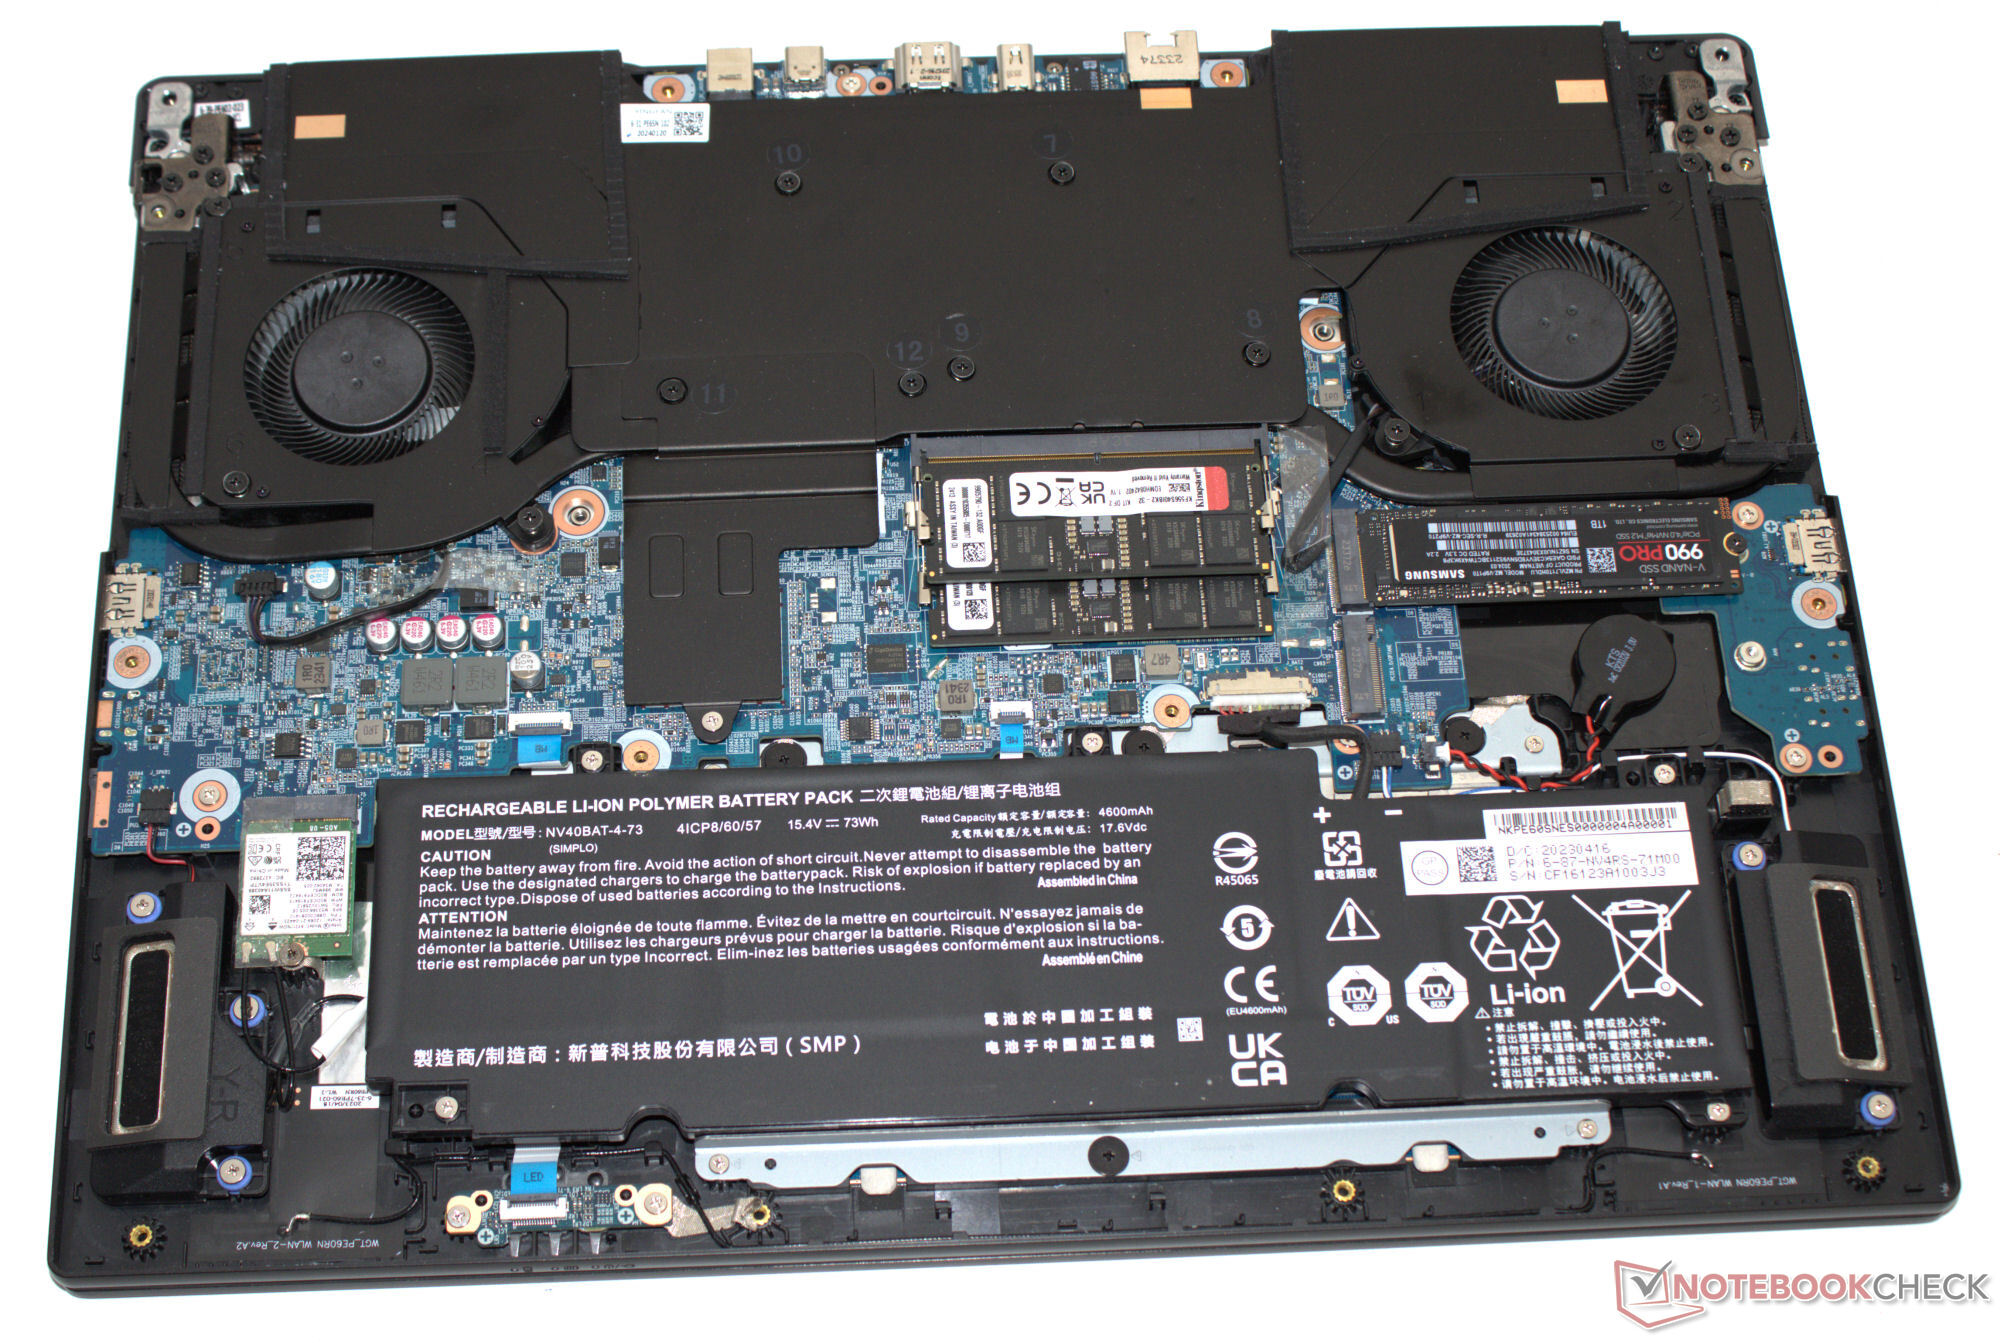
The laptop and accessories are protected by all sorts of plastic sleeves (foam carrier, film, bag). The names of the plastics used are printed on them. Exception: The transparent film cover on the lid lacks the corresponding information. The device's hardware can be accessed after removing the base plate—so you can carry out maintenance and repair work. Software updates should be secured for the next few years.
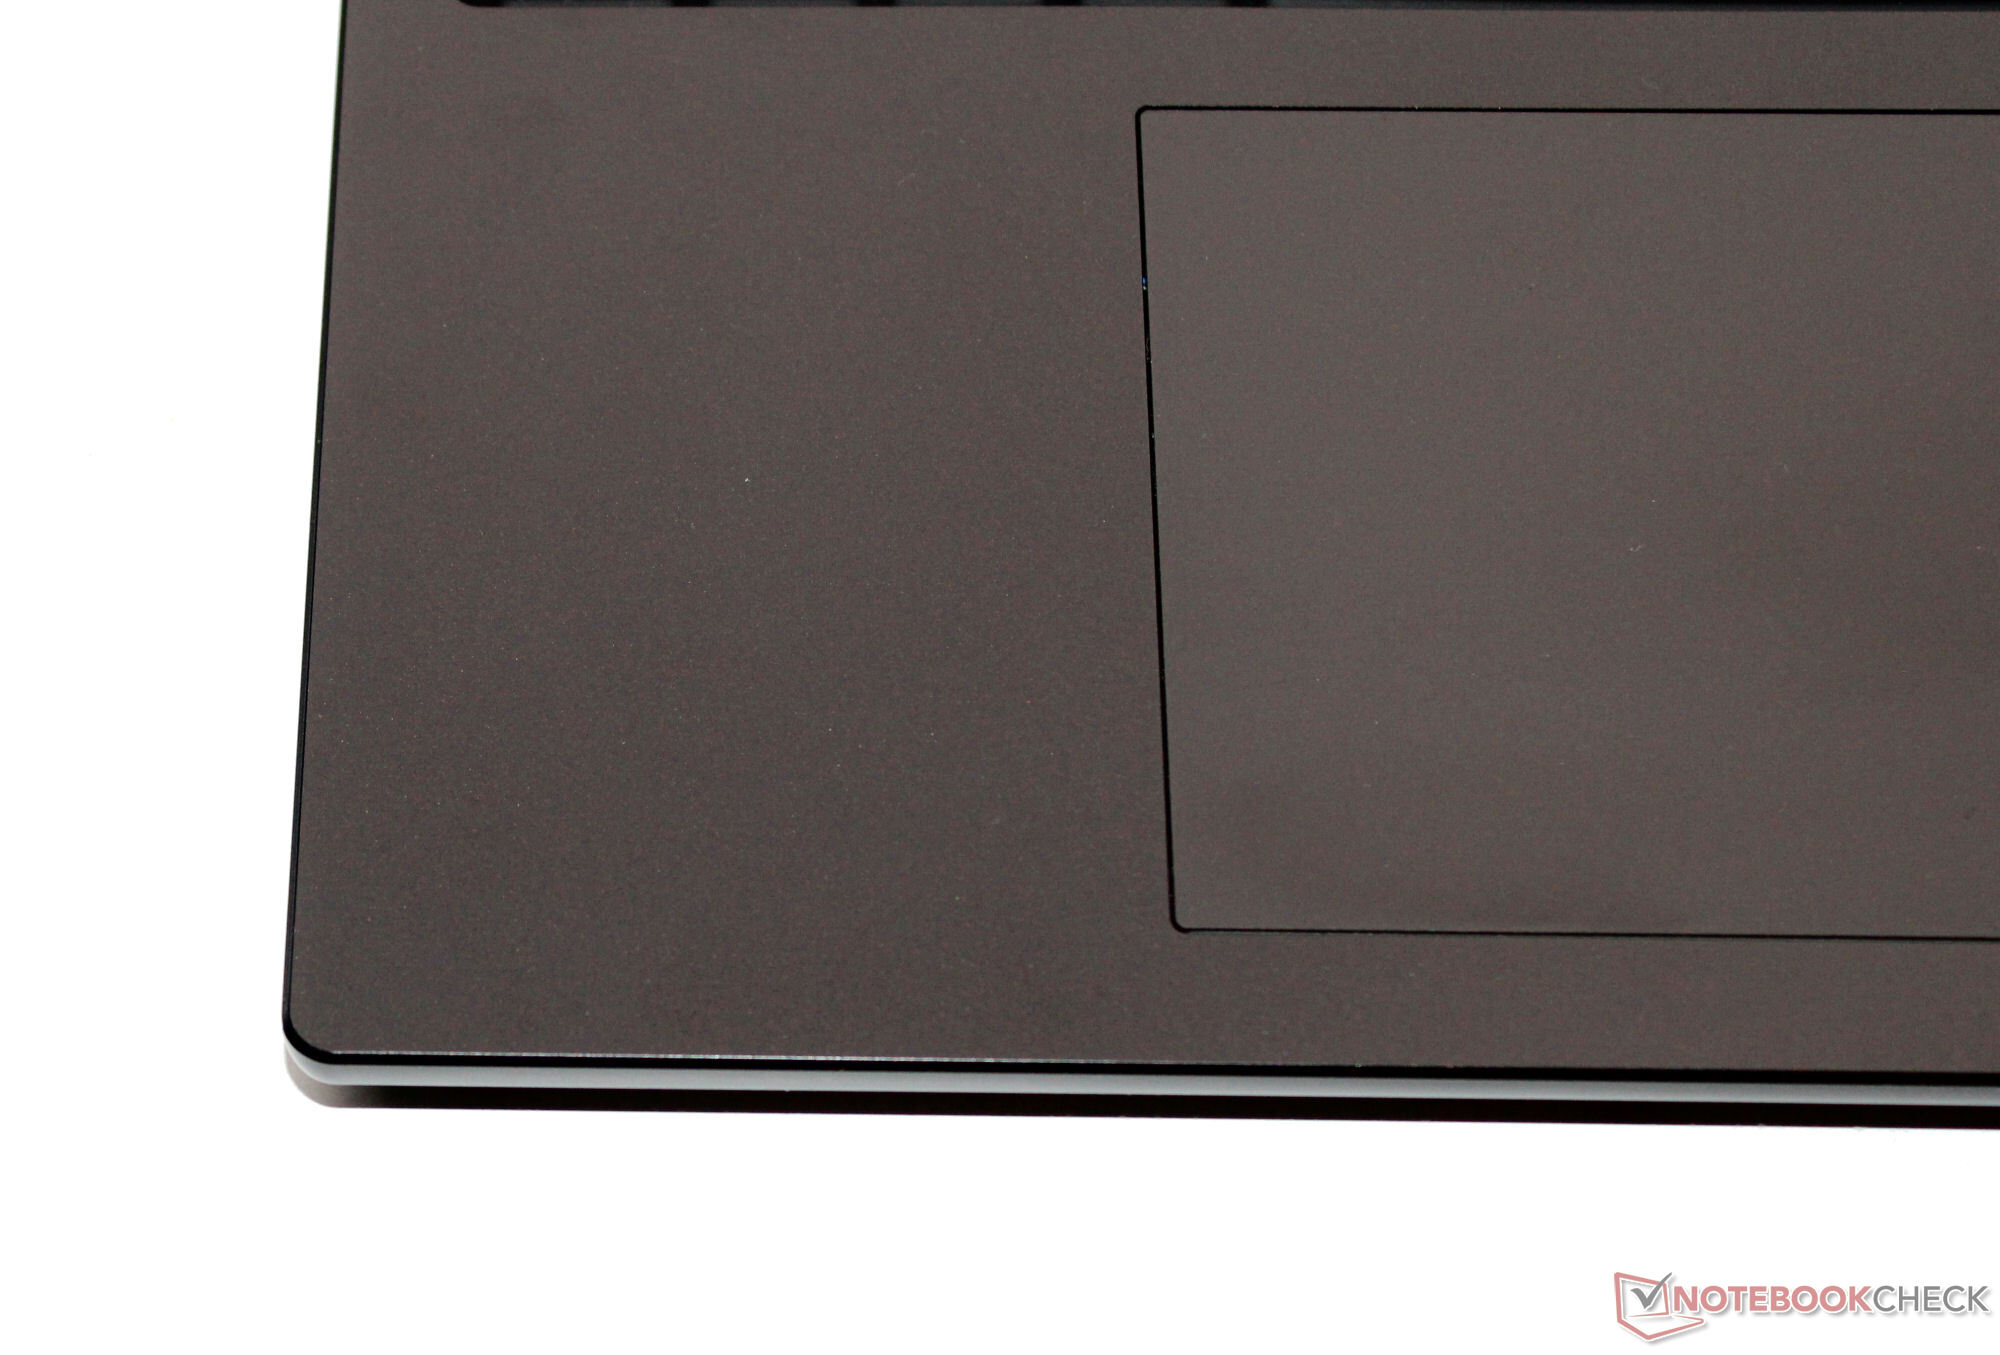
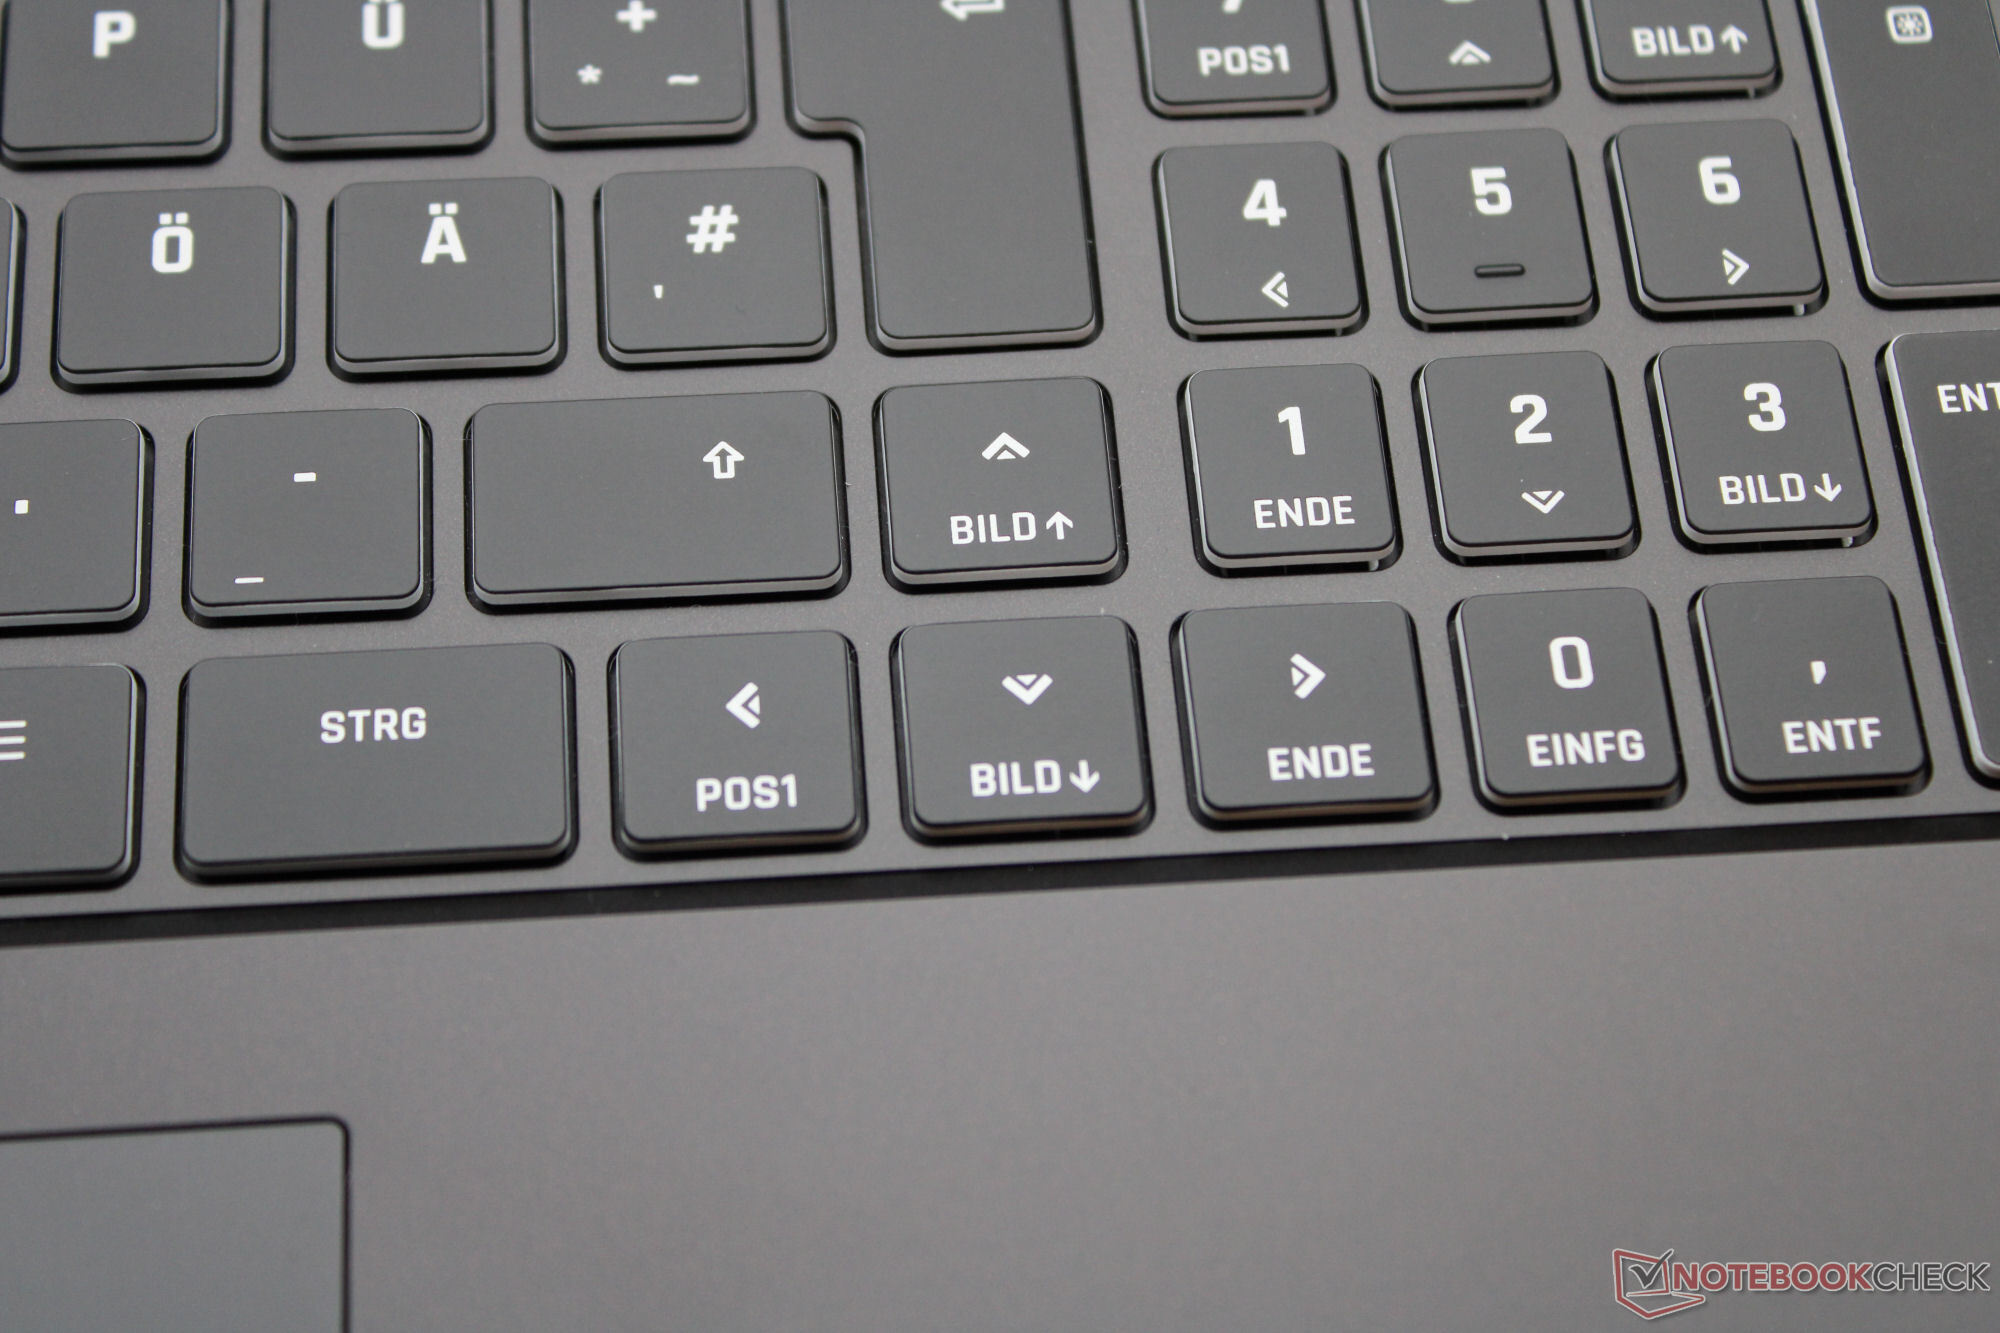
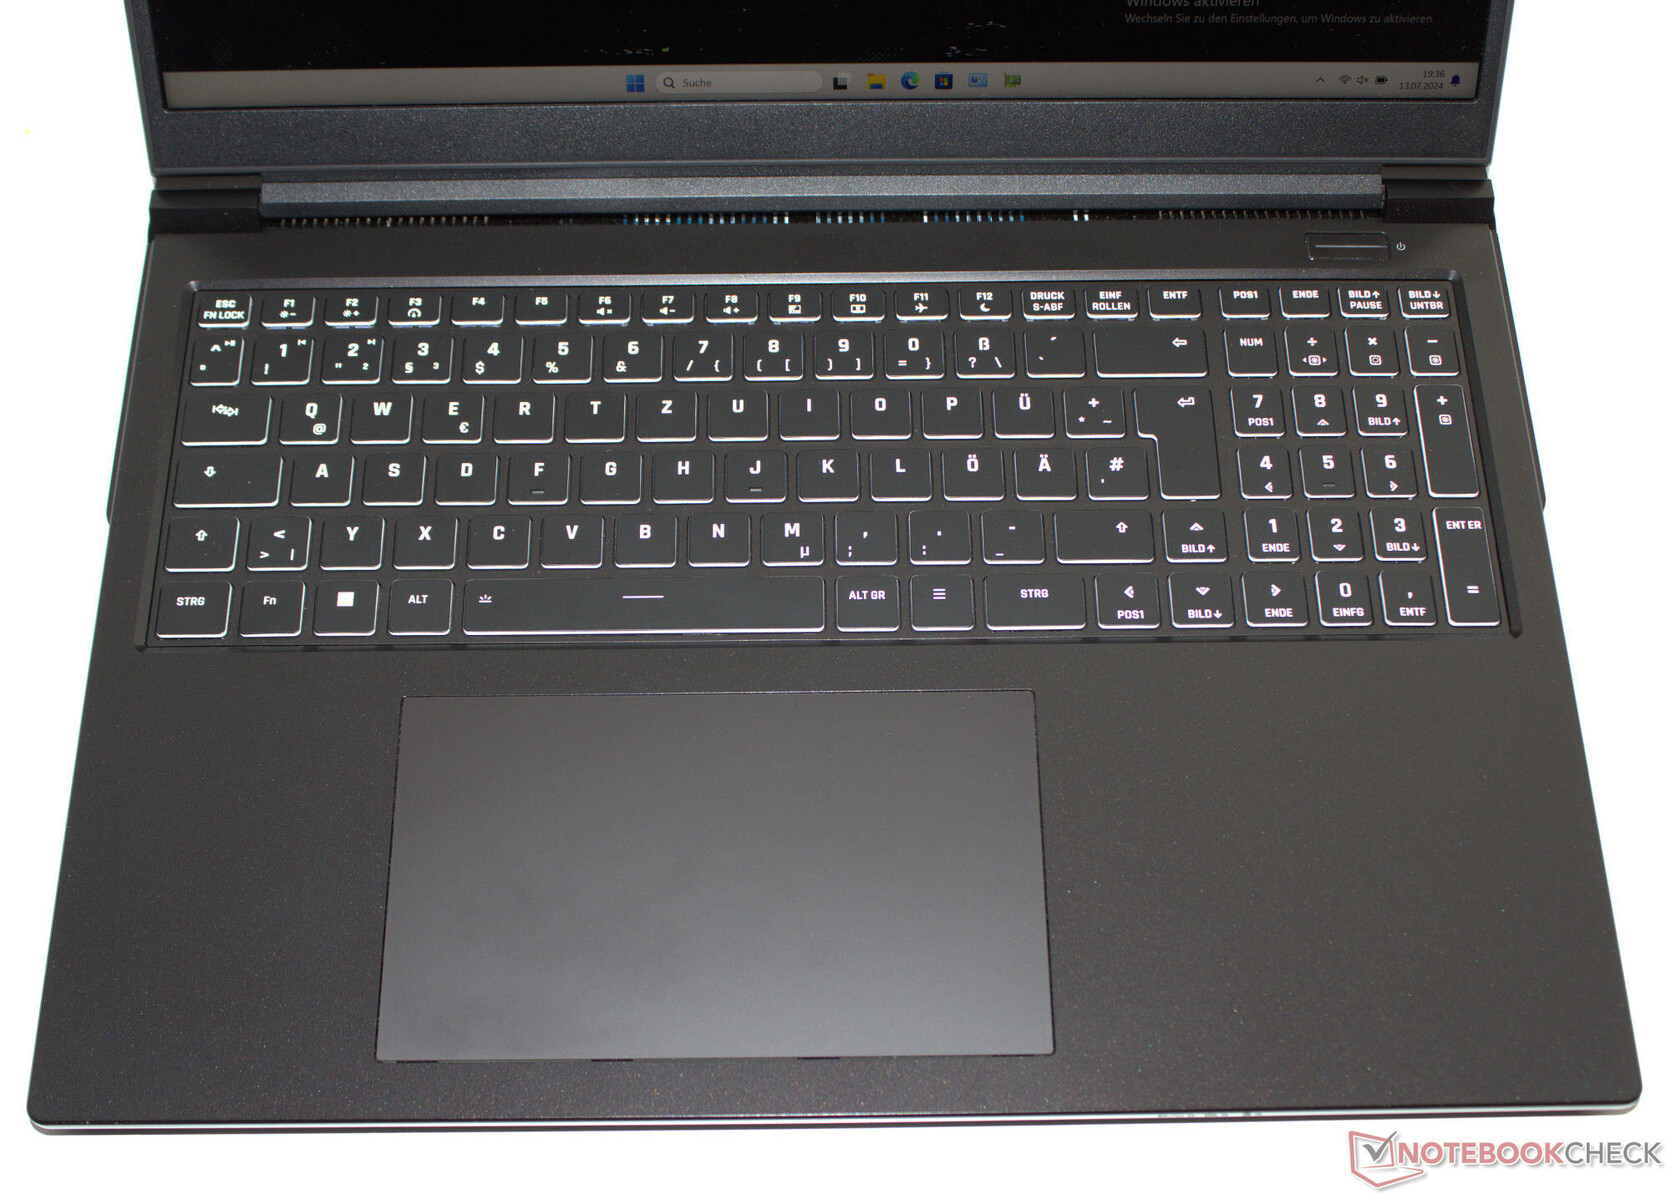
Input devices - The XMG laptop with an exchangeable keyboard
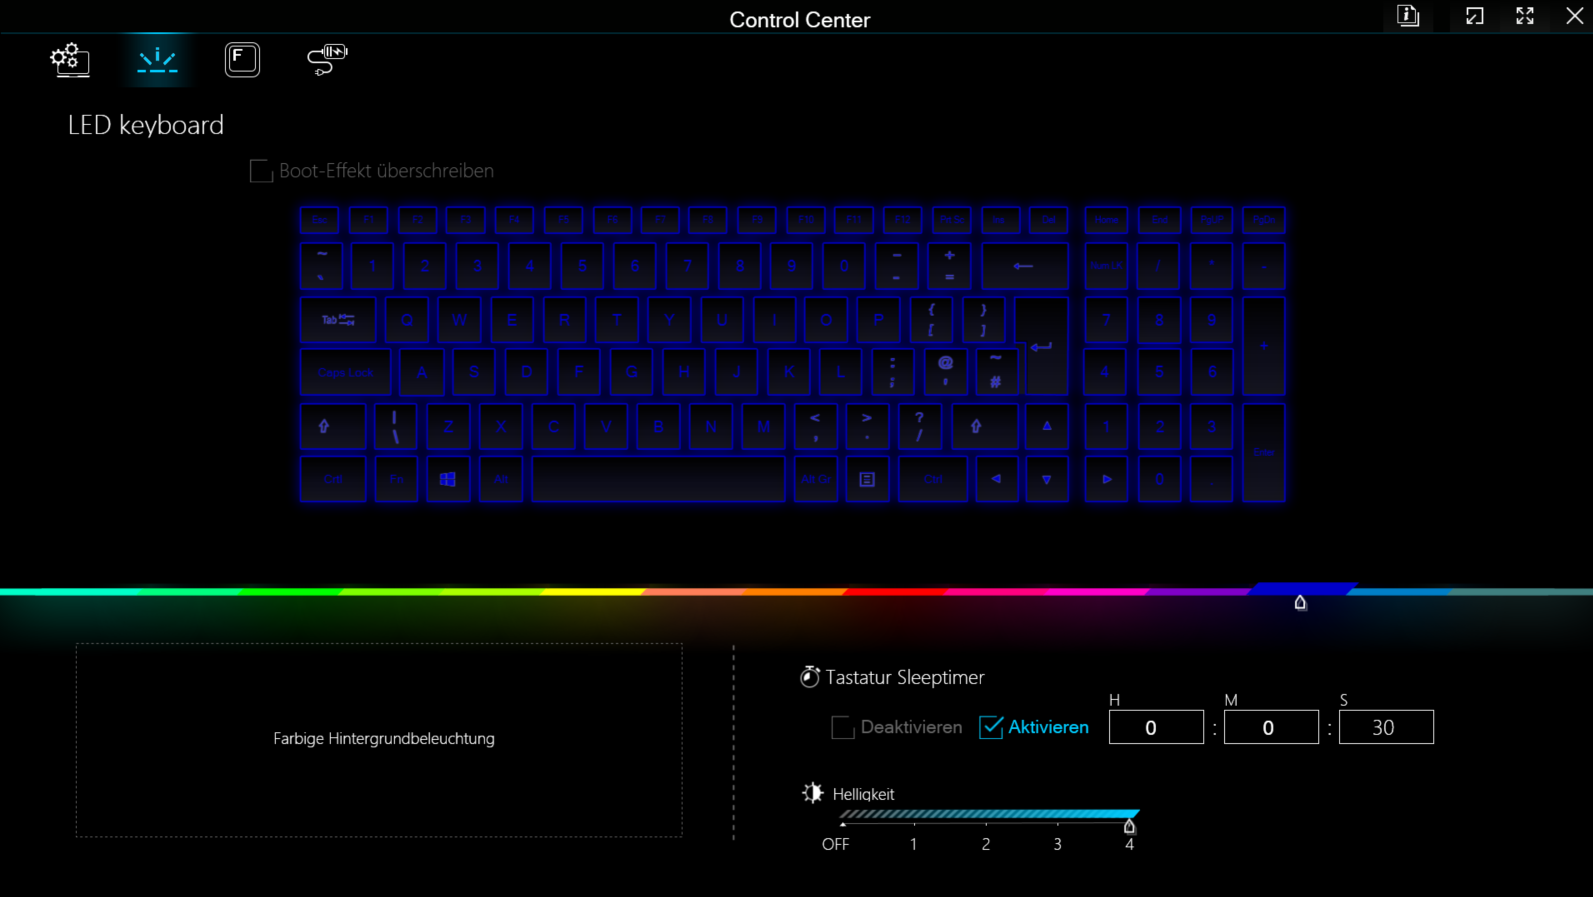
Often the rule with Schenker, and an exception when it comes to other manufacturers: The backlit (RGB, four-level) chiclet keyboard could be easily replaced, as it is only held in place by two screws (and a few clips). Its flat, smooth keys have a medium travel and a clear pressure point. Their resistance could be crisper—but this is a matter of taste. A slight yielding of the keyboard shouldn't get in your way during everyday use. Positive: The four arrow keys are full-sized. A generously sized multi-touch clickpad (15.1 x 9.1 cm) is used to control the mouse pointer.
Display - 16:10, IPS, sRGB
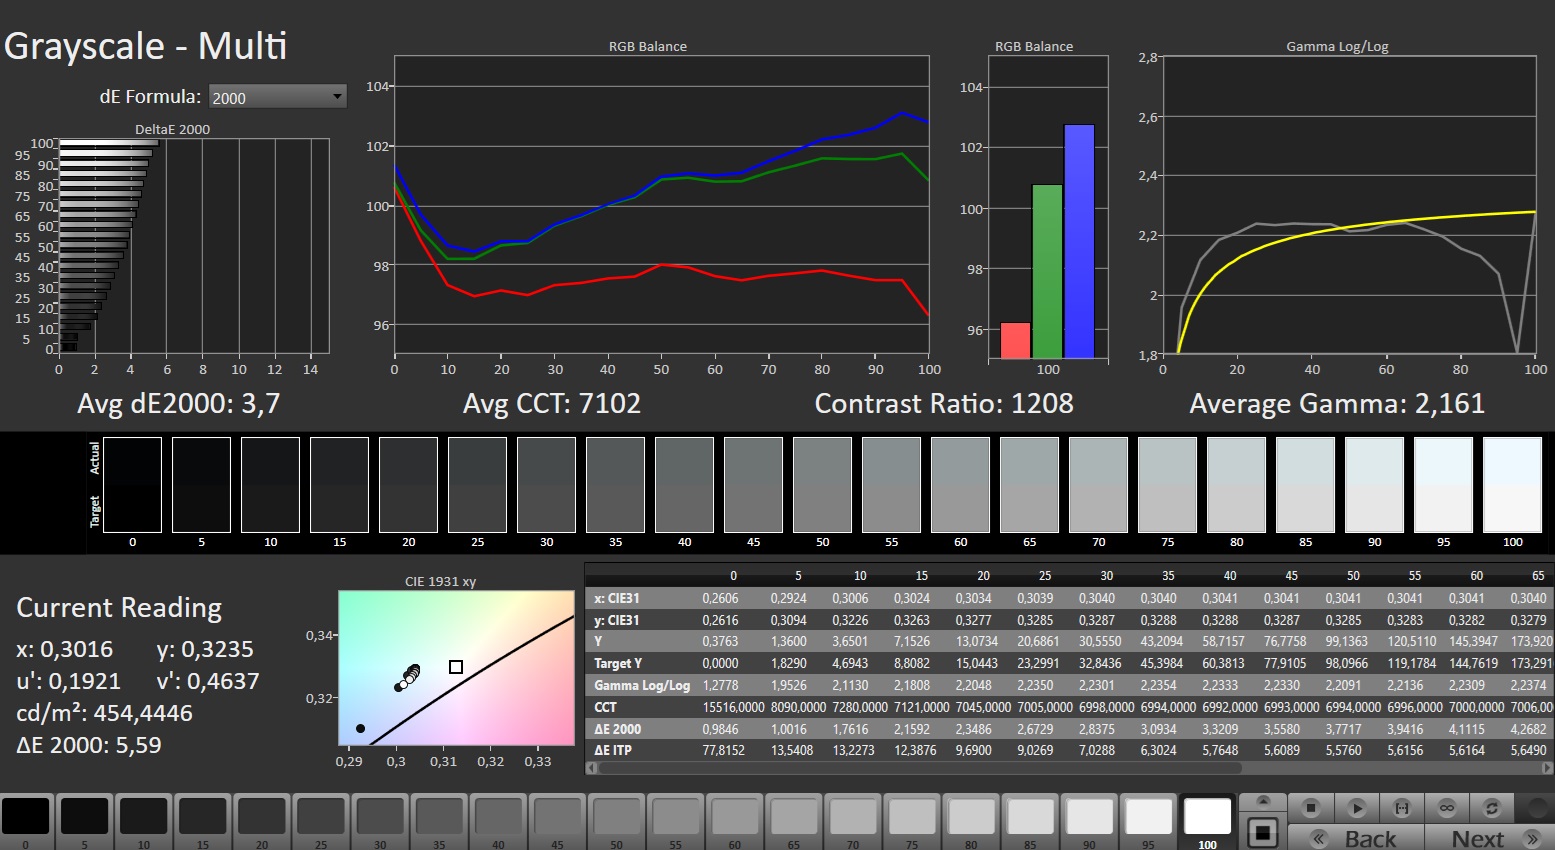
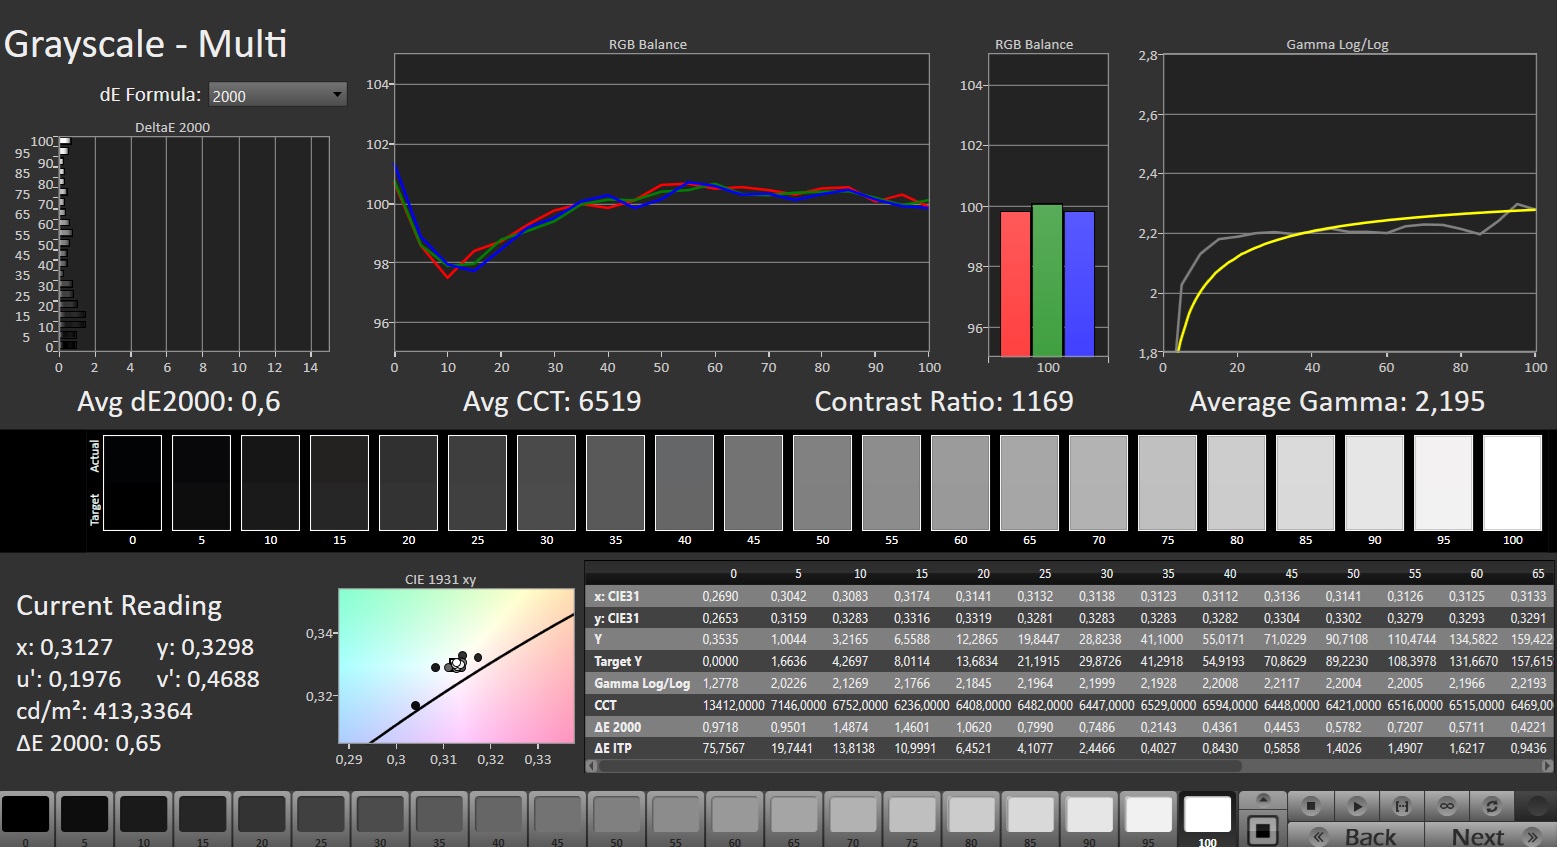
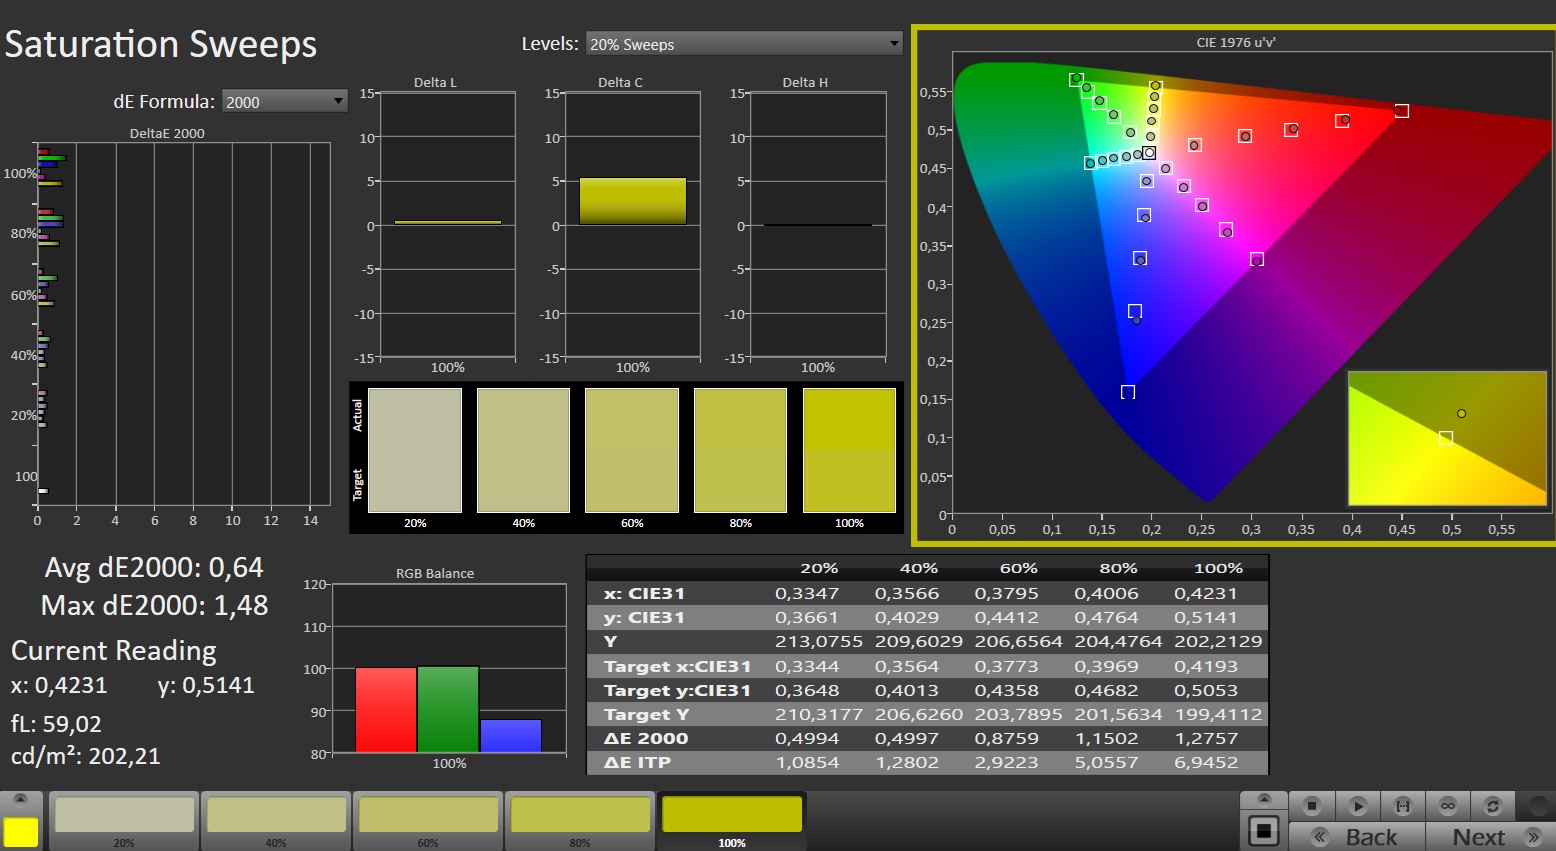
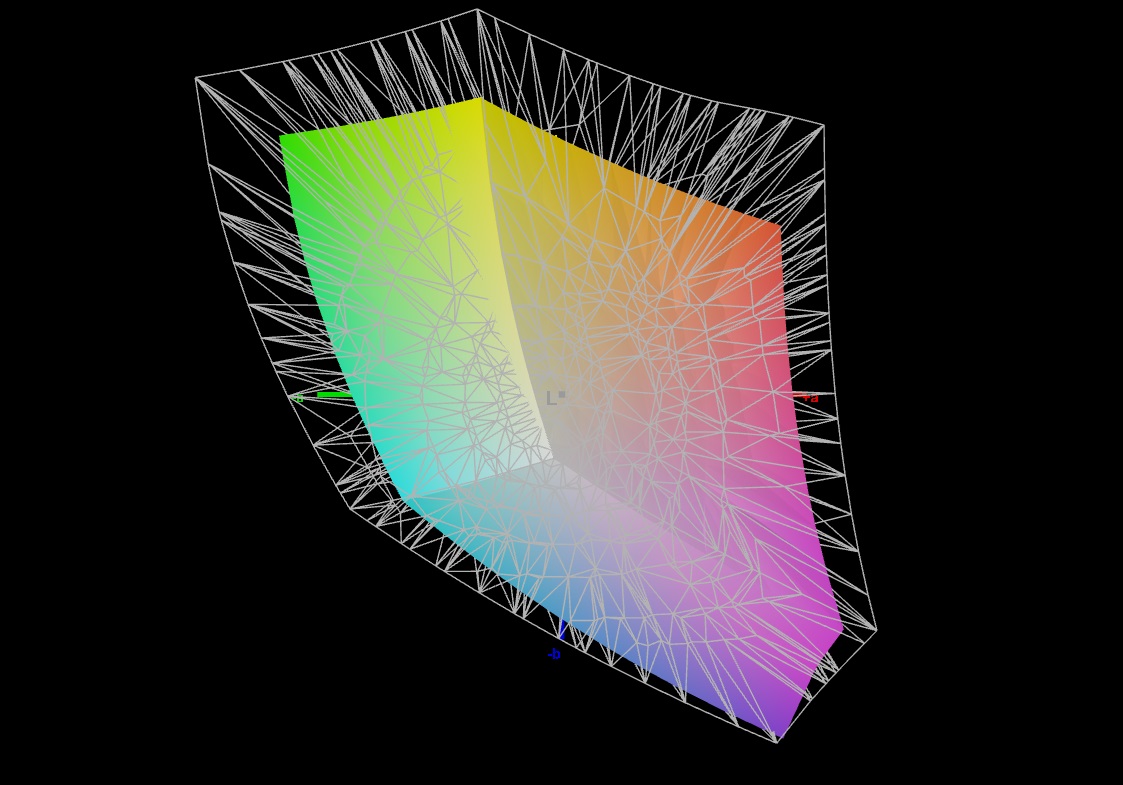
The 16-inch display (2,560 x 1,600 pixels) with a 16:10 aspect ratio is familiar: The laptop makes use of the same IPS panel from BOE that was already used inside the 2023 version of the Pro 16. However, it benefits from a slightly higher maximum brightness. All-in-all, the screen's values which we measured are sufficient for indoor use. Reading outdoors should be possible as long as the sun isn't too bright. Positive: The responsive 240 Hz panel shows no PWM flickering. Alternative display options are not available.


| |||||||||||||||||||||||||
Brightness Distribution: 86 %
Center on Battery: 416 cd/m²
Contrast: 1095:1 (Black: 0.38 cd/m²)
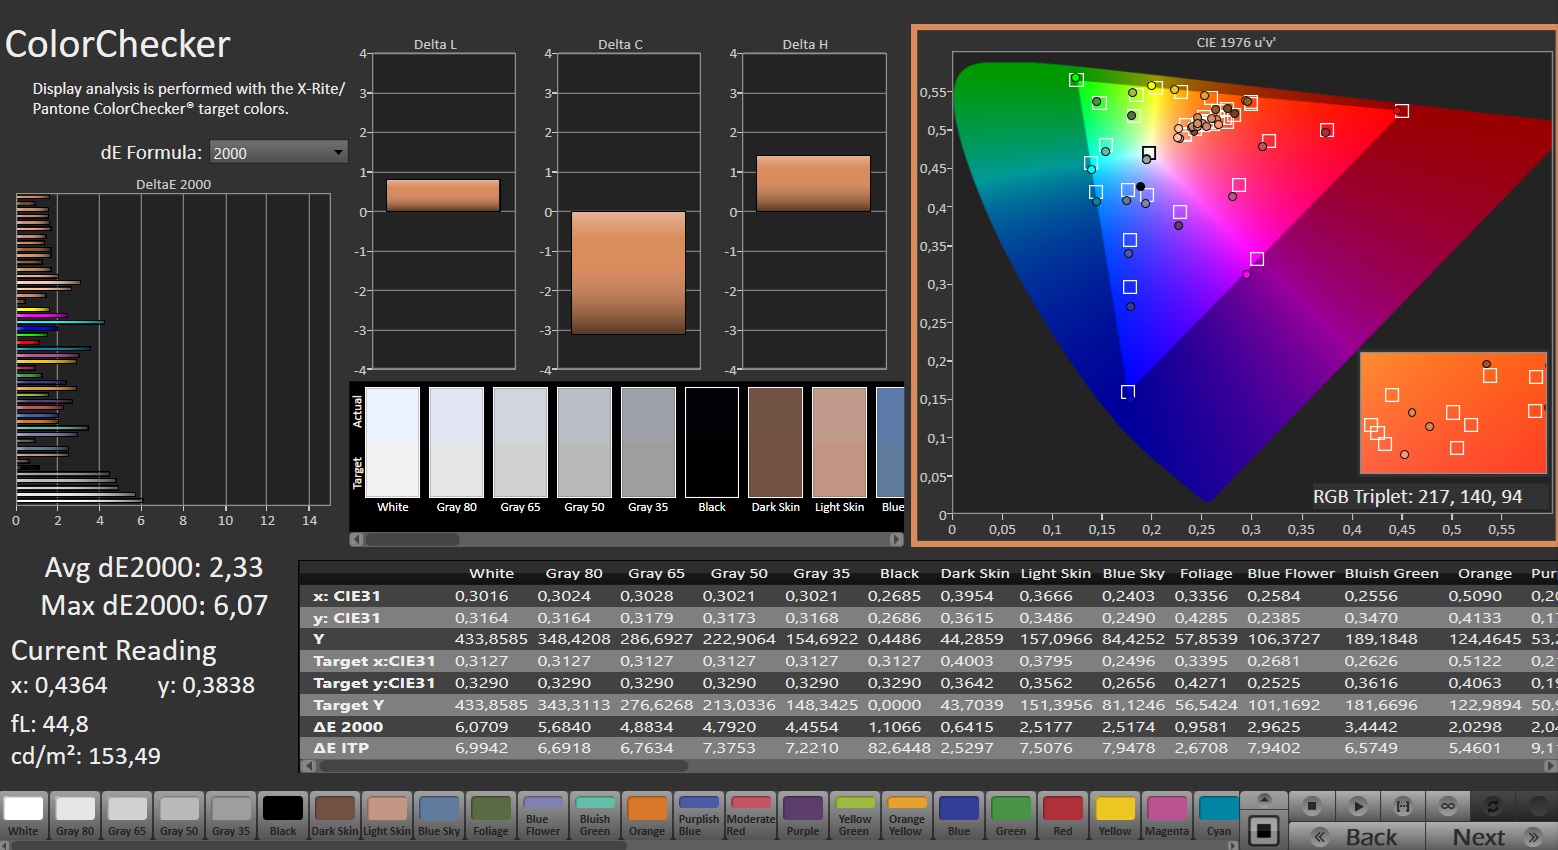
ΔE ColorChecker Calman: 2.33 | ∀{0.5-29.43 Ø4.72}
calibrated: 1.02
ΔE Greyscale Calman: 3.7 | ∀{0.09-98 Ø4.97}
70.8% AdobeRGB 1998 (Argyll 3D)
99.5% sRGB (Argyll 3D)
68.8% Display P3 (Argyll 3D)
Gamma: 2.161
CCT: 7102 K
| Schenker XMG Pro 16 Studio (Mid 24) BOE CQ NE160QDM-NZ1, IPS, 2560x1600, 16" | Acer Predator Helios Neo 16 (2024) Chi Mei N160GME-GTB, LED, 2560x1600, 16" | Lenovo Legion Pro 5 16IRX9 BOE NE160QDM-NYC, IPS, 2560x1600, 16" | Aorus 16X 2024 BOE CQ NE160QDM-NY1, IPS, 2560x1600, 16" | Schenker XMG Pro 16 Studio (Mid 23) BOE CQ NE160QDM-NZ1, IPS, 2560x1600, 16" | Lenovo Legion 7 16 IRX G9 MNG007ZA1-2, IPS, 3200x2000, 16" | |
|---|---|---|---|---|---|---|
| Display | 20% | 0% | -2% | -0% | 21% | |
| Display P3 Coverage (%) | 68.8 | 95.9 39% | 69.3 1% | 67.2 -2% | 69.4 1% | 95 38% |
| sRGB Coverage (%) | 99.5 | 99.8 0% | 99.4 0% | 96.7 -3% | 98.2 -1% | 100 1% |
| AdobeRGB 1998 Coverage (%) | 70.8 | 86.4 22% | 70.1 -1% | 69.3 -2% | 70.1 -1% | 87.2 23% |
| Response Times | 11% | -18% | 28% | -9% | -14% | |
| Response Time Grey 50% / Grey 80% * (ms) | 12.7 ? | 5 ? 61% | 11.9 ? 6% | 7.5 ? 41% | 12.2 ? 4% | 14.4 ? -13% |
| Response Time Black / White * (ms) | 6.3 ? | 8.8 ? -40% | 8.9 ? -41% | 5.4 ? 14% | 7.7 ? -22% | 7.2 ? -14% |
| PWM Frequency (Hz) | ||||||
| Screen | 19% | 20% | 4% | -5% | 23% | |
| Brightness middle (cd/m²) | 416 | 521 25% | 384 -8% | 542 30% | 349 -16% | 412 -1% |
| Brightness (cd/m²) | 392 | 506 29% | 366 -7% | 504 29% | 348 -11% | 396 1% |
| Brightness Distribution (%) | 86 | 85 -1% | 91 6% | 86 0% | 93 8% | 89 3% |
| Black Level * (cd/m²) | 0.38 | 0.44 -16% | 0.35 8% | 0.45 -18% | 0.32 16% | 0.43 -13% |
| Contrast (:1) | 1095 | 1184 8% | 1097 0% | 1204 10% | 1091 0% | 958 -13% |
| Colorchecker dE 2000 * | 2.33 | 1.74 25% | 0.97 58% | 2.73 -17% | 1.98 15% | 0.9 61% |
| Colorchecker dE 2000 max. * | 6.07 | 3.88 36% | 3.57 41% | 5.29 13% | 7.56 -25% | 2 67% |
| Colorchecker dE 2000 calibrated * | 1.02 | 0.52 49% | 0.77 25% | 1.32 -29% | 1.45 -42% | 0.6 41% |
| Greyscale dE 2000 * | 3.7 | 3 19% | 1.5 59% | 2.9 22% | 3.3 11% | 1.4 62% |
| Gamma | 2.161 102% | 2.164 102% | 2.24 98% | 2.192 100% | 2.137 103% | 2.23 99% |
| CCT | 7102 92% | 6816 95% | 6709 97% | 6173 105% | 6672 97% | 6731 97% |
| Total Average (Program / Settings) | 17% /
18% | 1% /
11% | 10% /
6% | -5% /
-5% | 10% /
17% |
* ... smaller is better
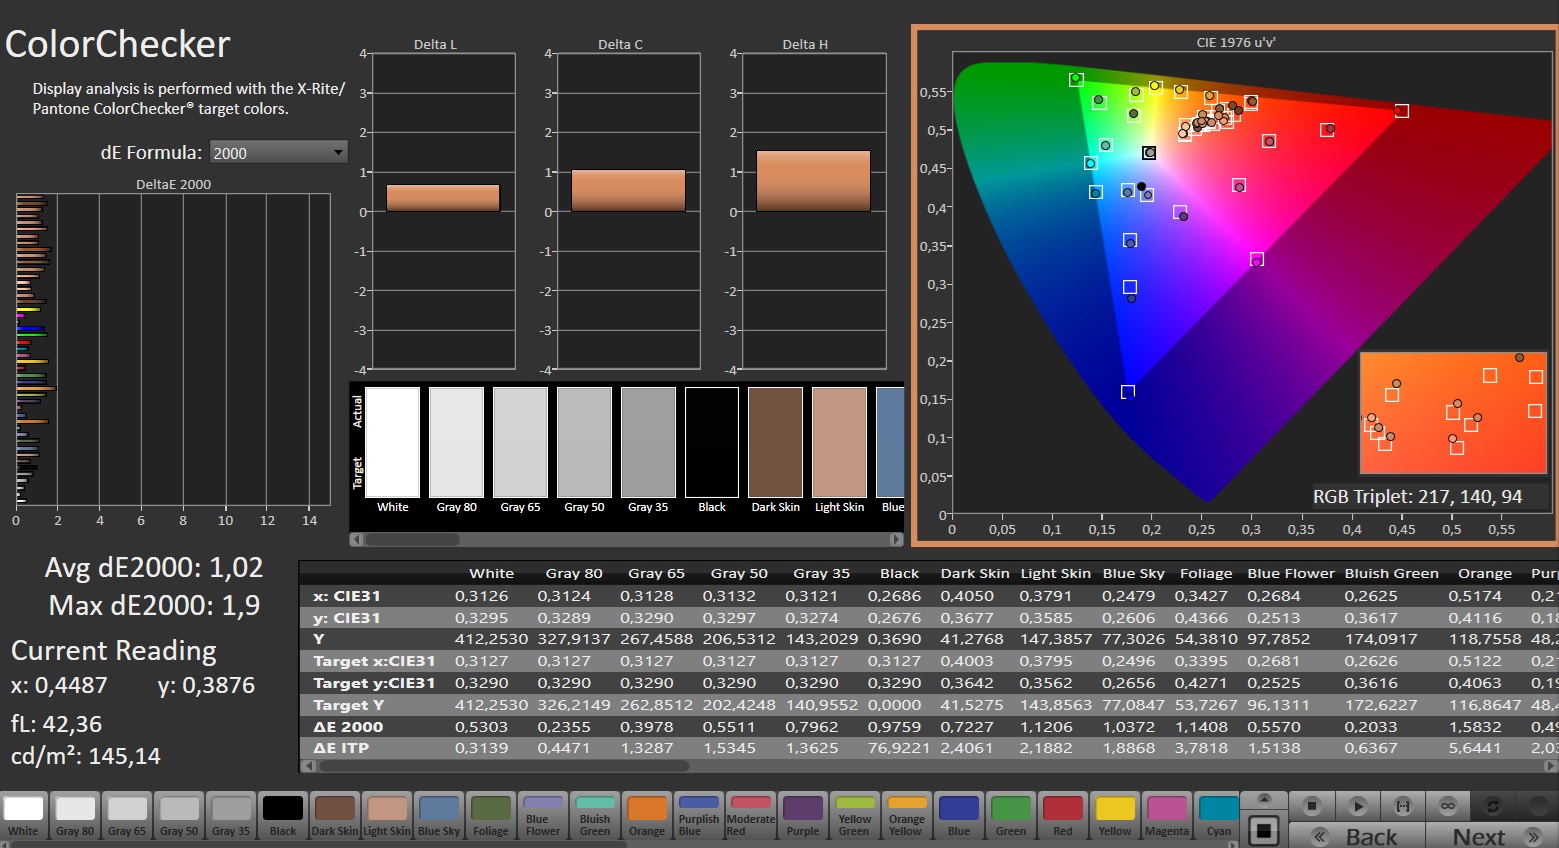
The installed panel's color space coverage is disappointing. Only the sRGB space can be reproduced—not the AdobeRGB and DCI-P3 spaces. However, this is no different from the displays of most competitors. Nevertheless, the screen of a laptop that is marketed as a "professional workstation for content creation" should really offer the full range. Its color reproduction looks better: A slight deviation of 2.26 (target: DeltaE < 3) could be reduced to 1.03 by performing a calibration.

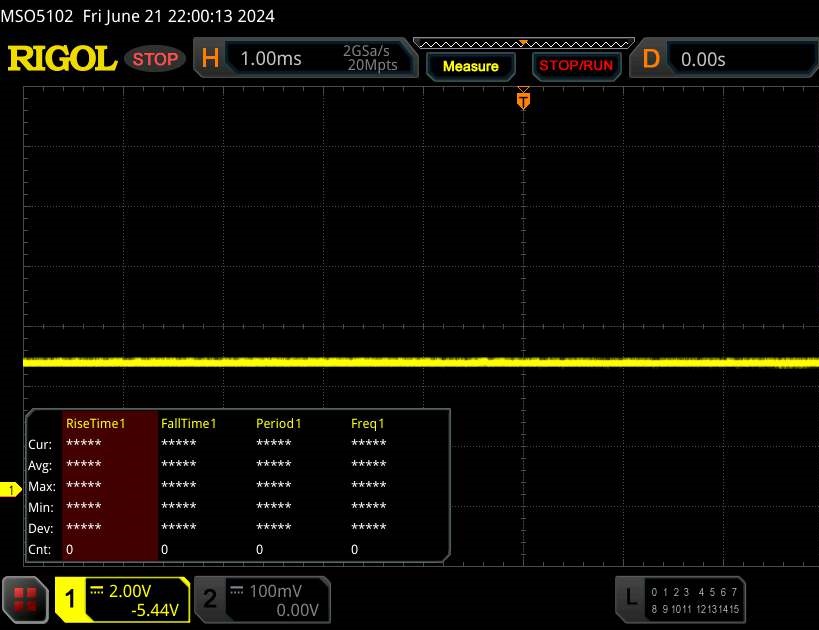
Display Response Times
| ↔ Response Time Black to White | ||
|---|---|---|
| 6.3 ms ... rise ↗ and fall ↘ combined | ↗ 2.5 ms rise | 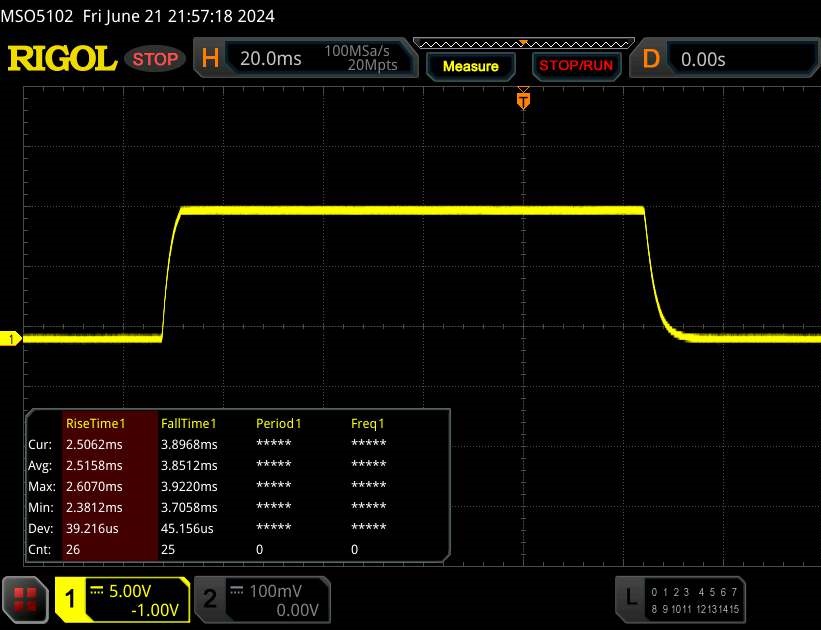 |
| ↘ 3.8 ms fall | ||
| The screen shows very fast response rates in our tests and should be very well suited for fast-paced gaming. In comparison, all tested devices range from 0.1 (minimum) to 240 (maximum) ms. » 20 % of all devices are better. This means that the measured response time is better than the average of all tested devices (19.8 ms). | ||
| ↔ Response Time 50% Grey to 80% Grey | ||
| 12.7 ms ... rise ↗ and fall ↘ combined | ↗ 6 ms rise |  |
| ↘ 6.7 ms fall | ||
| The screen shows good response rates in our tests, but may be too slow for competitive gamers. In comparison, all tested devices range from 0.165 (minimum) to 636 (maximum) ms. » 26 % of all devices are better. This means that the measured response time is better than the average of all tested devices (31 ms). | ||
Screen Flickering / PWM (Pulse-Width Modulation)
| Screen flickering / PWM not detected |  | ||
In comparison: 52 % of all tested devices do not use PWM to dim the display. If PWM was detected, an average of 7763 (minimum: 5 - maximum: 343500) Hz was measured. | |||

Performance - Raptor Lake Refresh replaces Raptor Lake
The XMG Pro 16 Studio (Mid 24), described by Schenker as a "content creation laptop", is aimed at gamers and creators. All models feature a Core i9-14900HX and the available GPU selection includes an RTX 4060 and an RTX 4070—our test device is fitted with an RTX 4070. This variant is available for around US$2,500. Prices start at around US$1,800.

Testing conditions
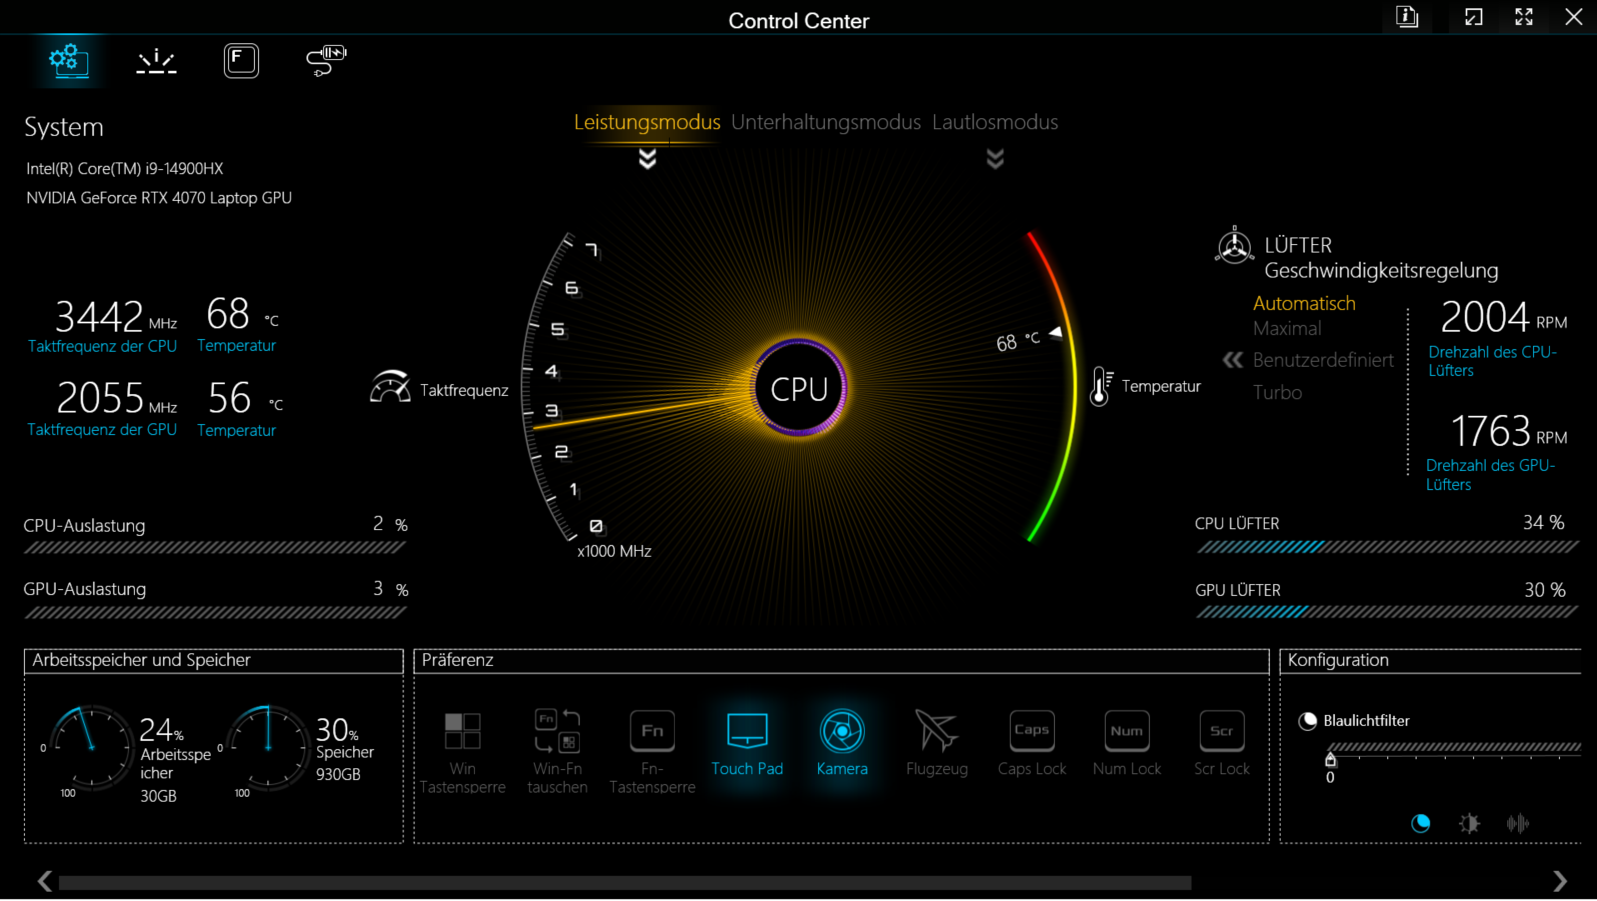
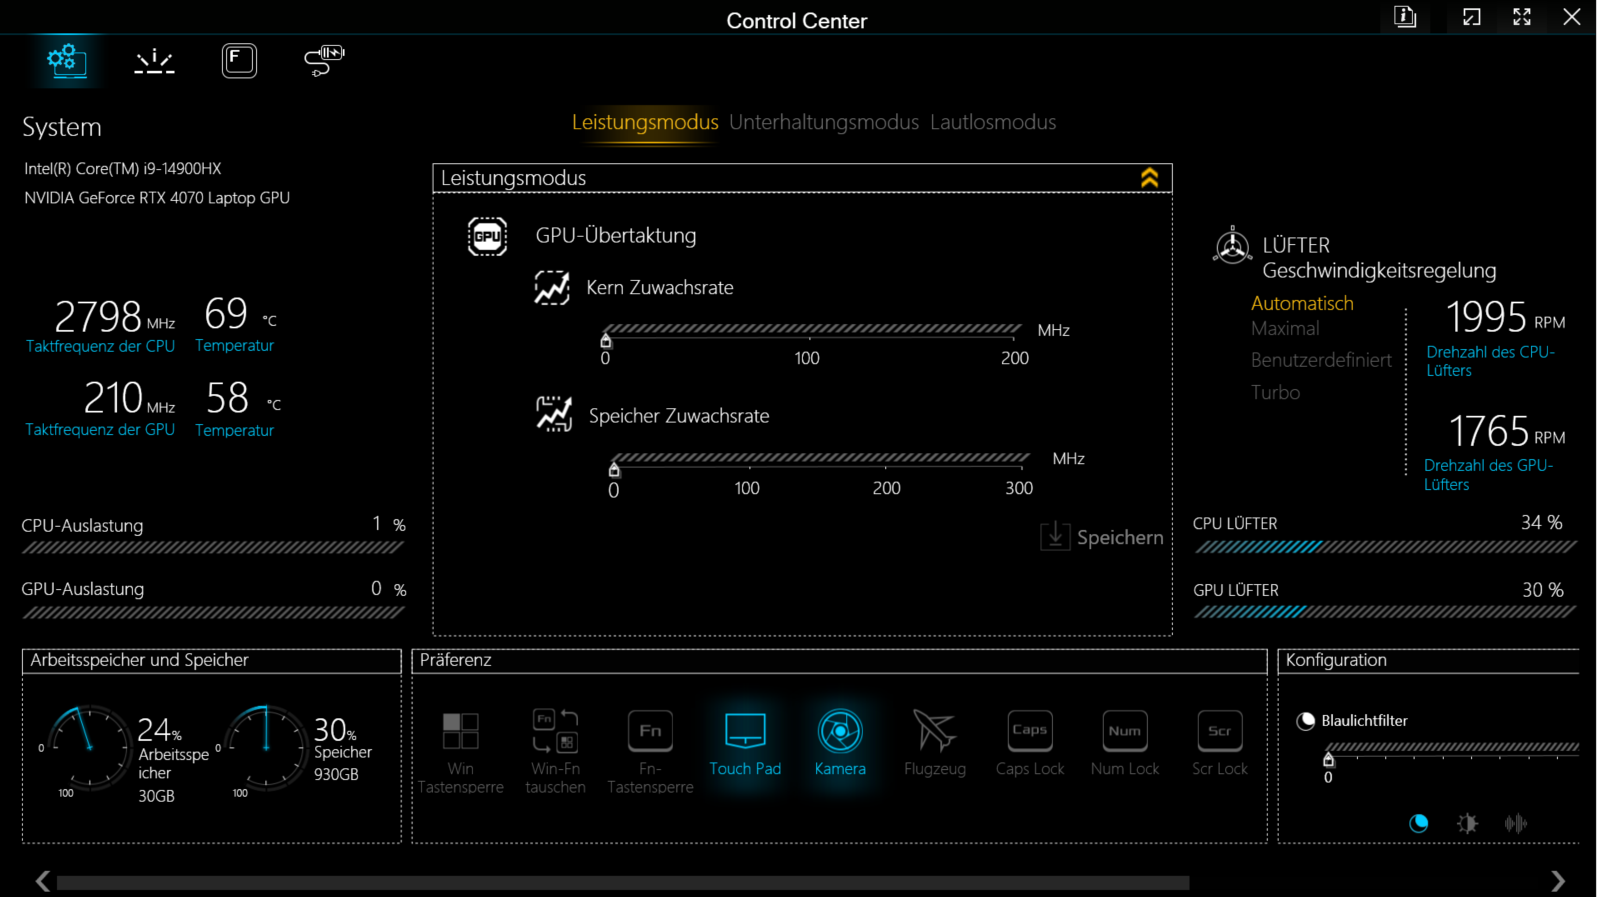
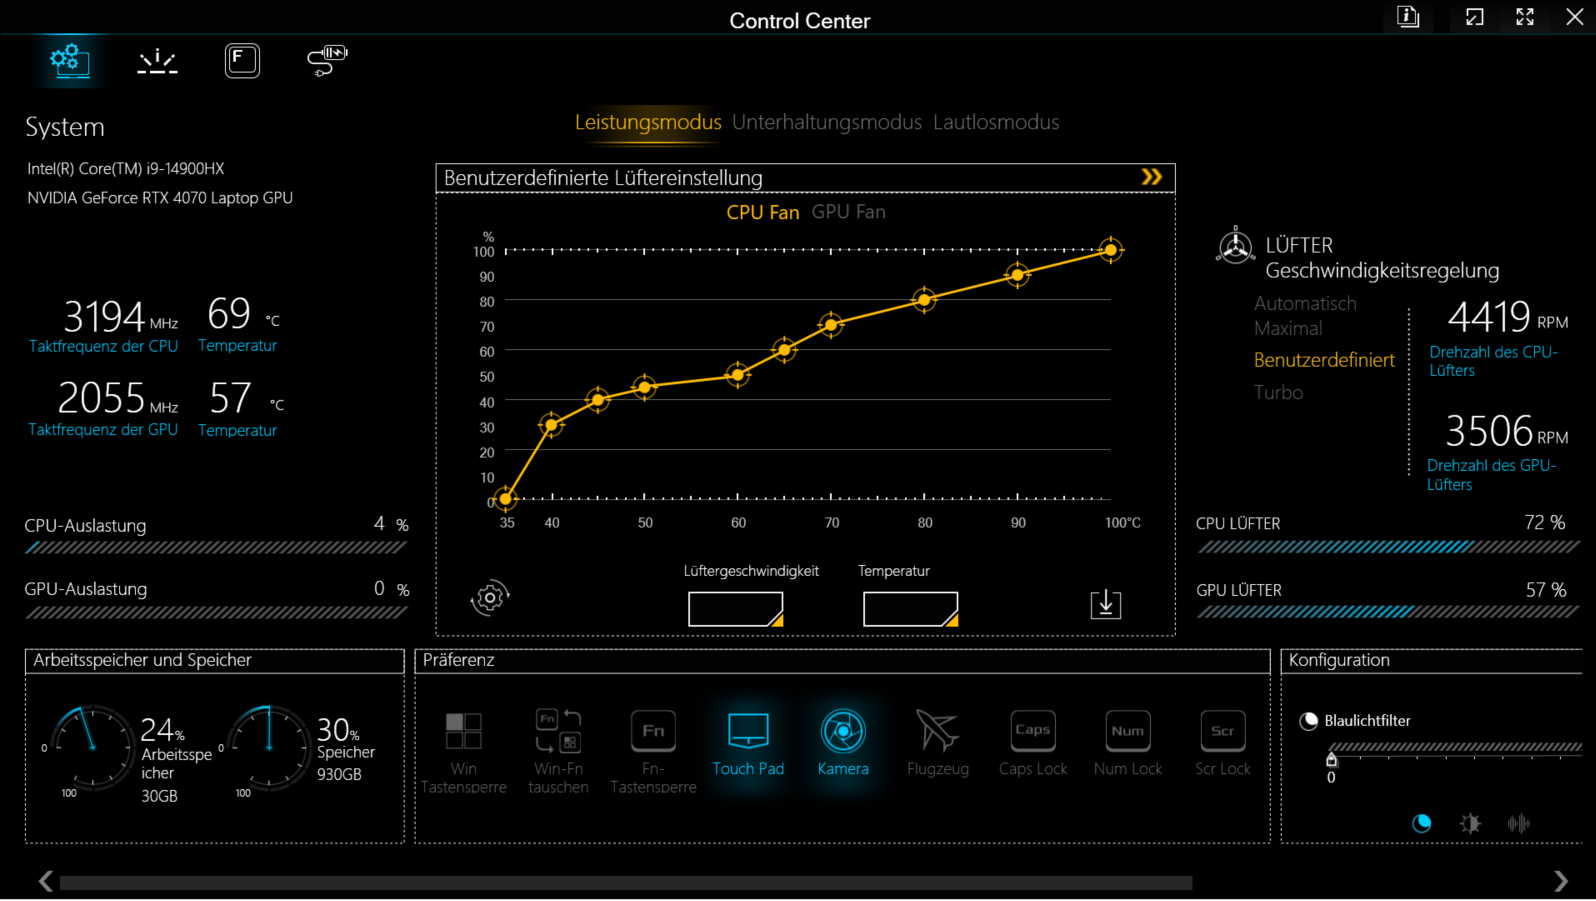
There is a choice of three manufacturer-specific performance modes (see table), which can be switched between using the Control Center software (the laptop's control center). We used the modes performance (benchmarks) and silent (battery tests). Optimus was active.
| Performance mode | Entertainment mode | Silent mode (dGPU off) | |
|---|---|---|---|
| Power Limit 1 (HWInfo) | 135 watts | 55 watts | 25 watts |
| Power Limit 2 (HWInfo) | 150 watts | 135 watts | 35 watts |
| Noise (CP 2077 Phantom) | 53 dB (A) | 49 dB (A) | - |
| Performance (CP 2077 Phantom) | 78 fps | 73 fps | - |
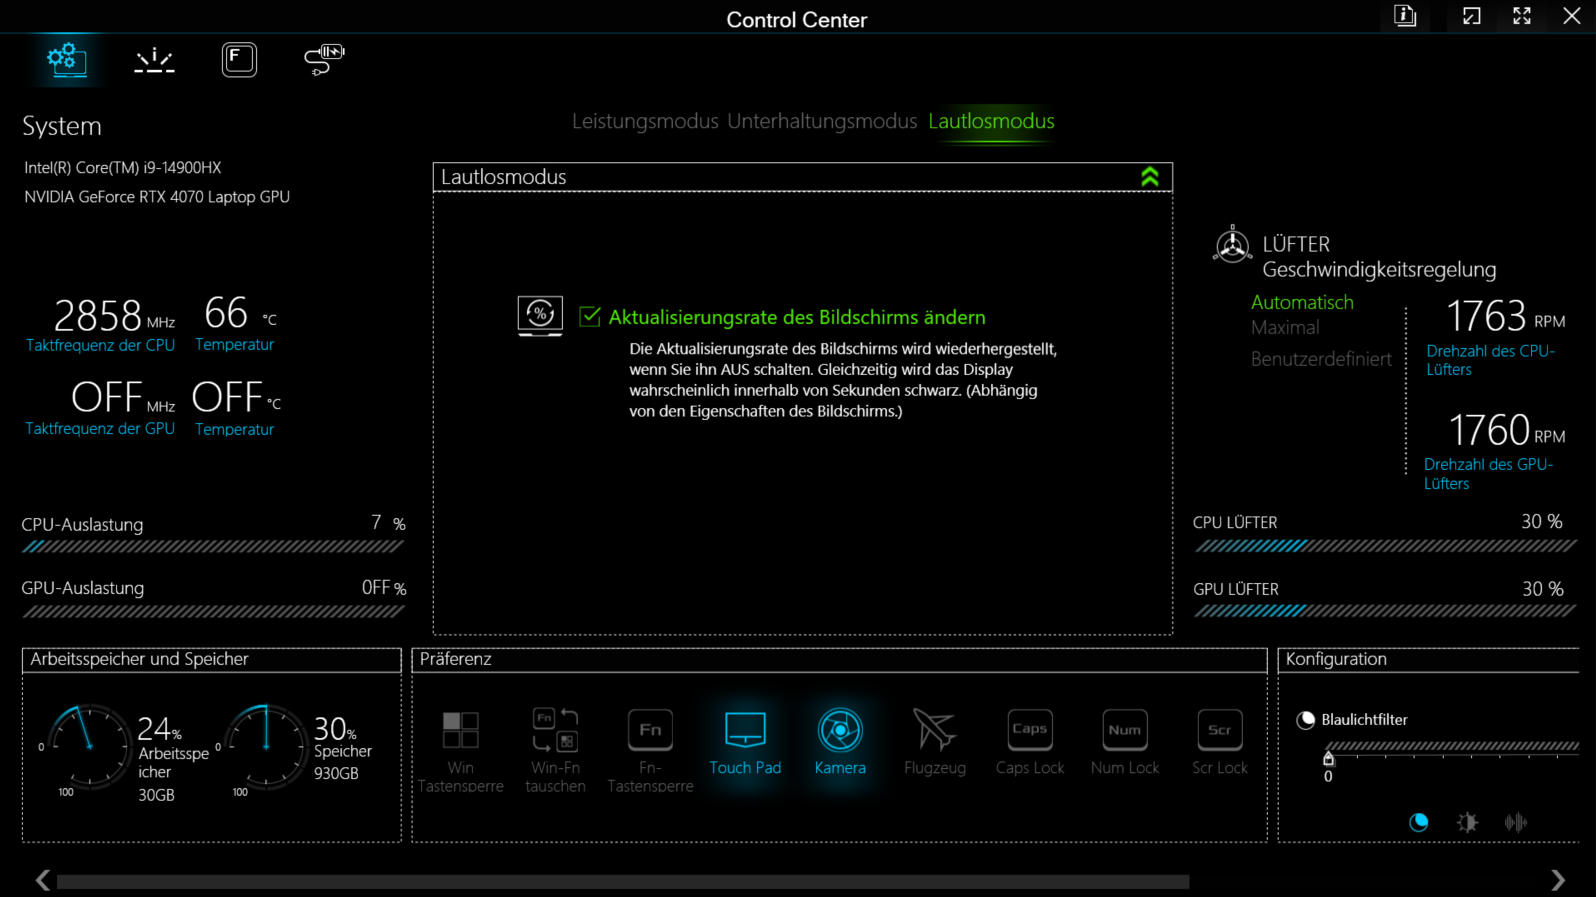
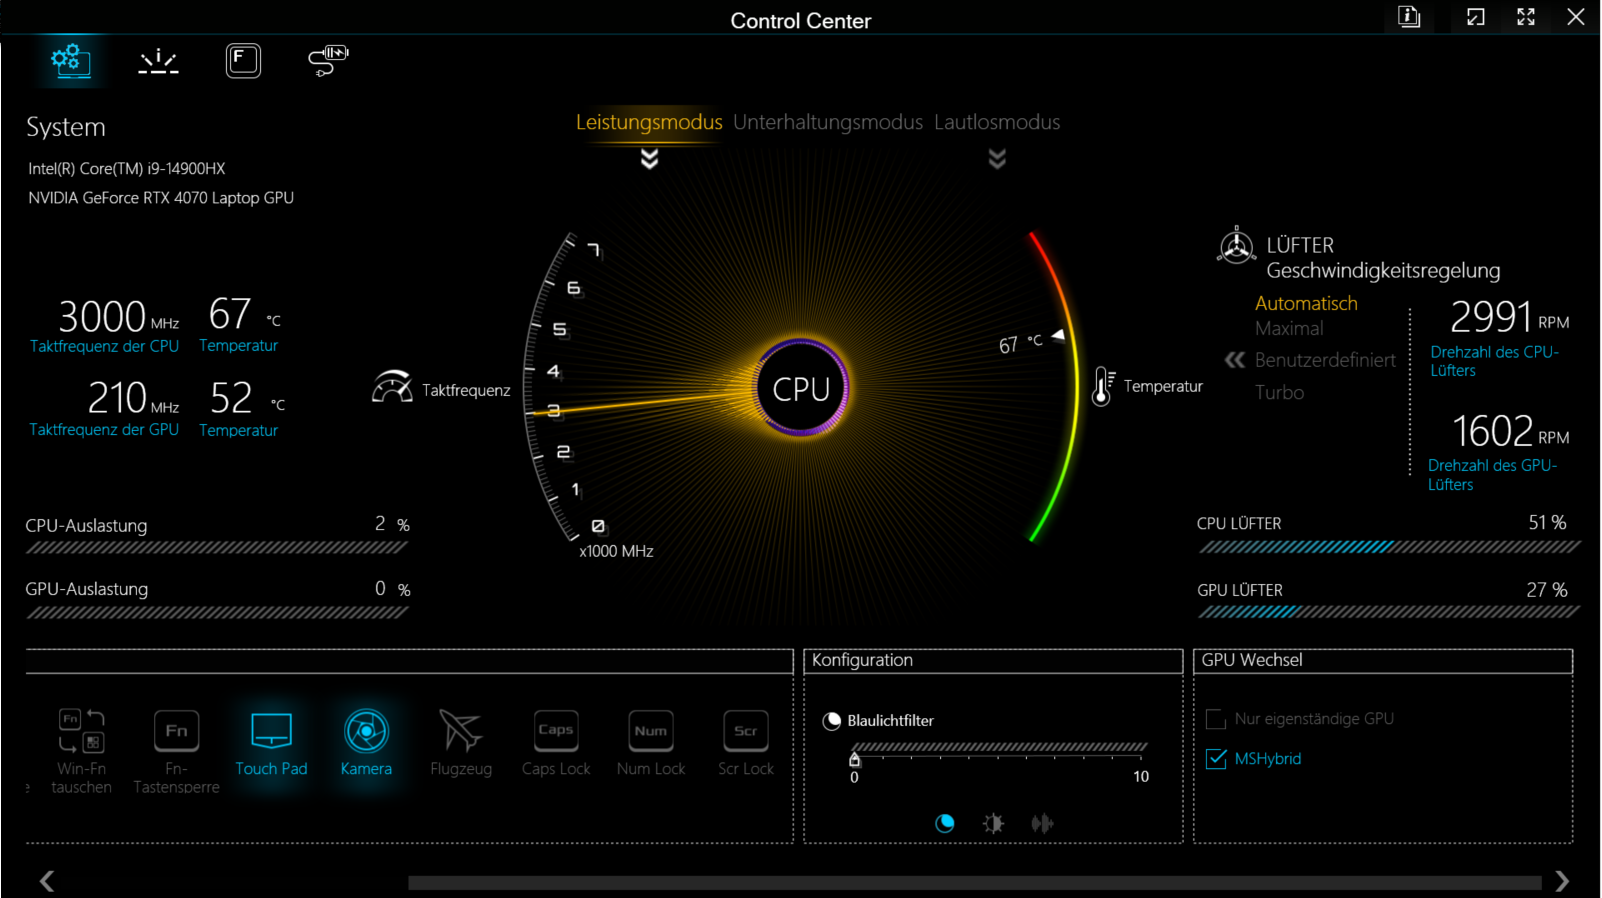
Problems with entertainment mode
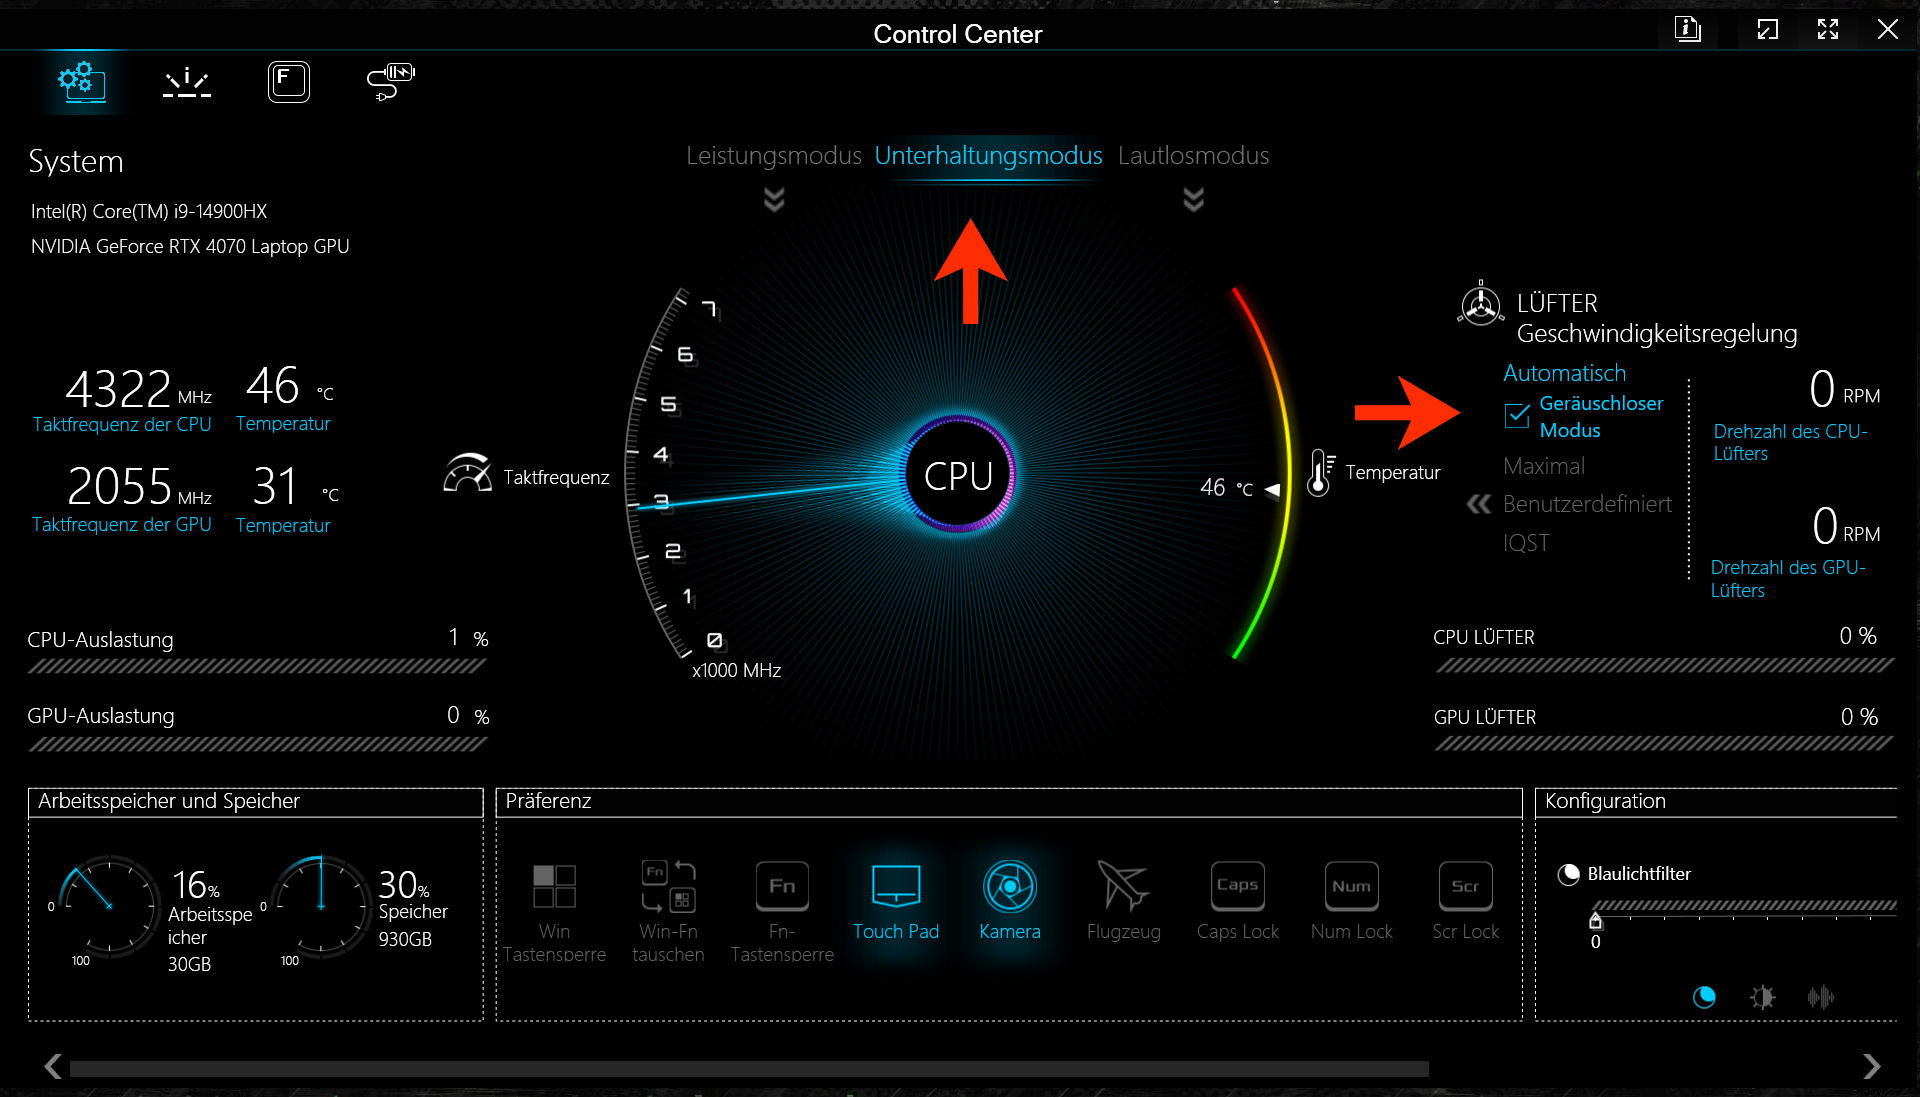
The "entertainment" profile caused significant fluctuations in performance during our test. As a result, we refrained from using it. During the course of the test, Schenker was able to state a way around the problem: Activating the "silent mode" fan option within the Control Center. A future BIOS update should hopefully fix this error.
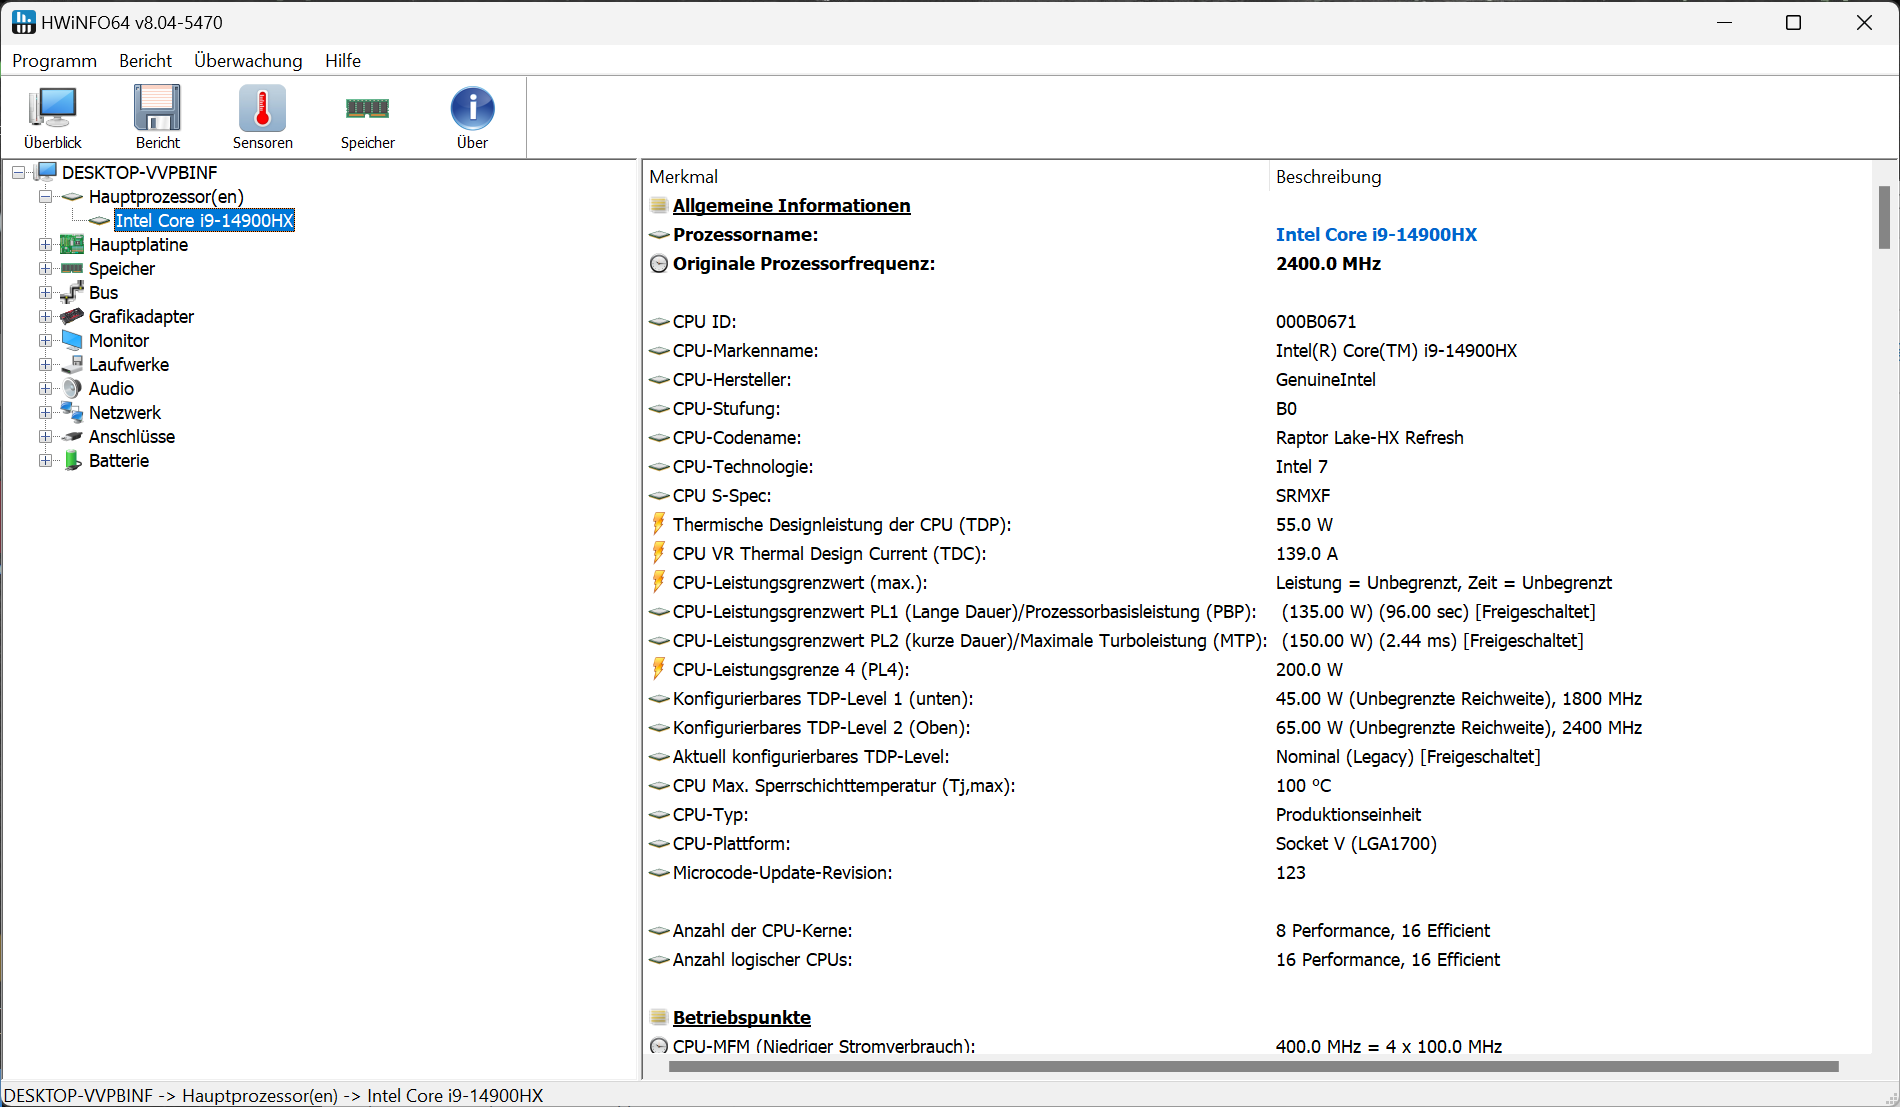
Processor
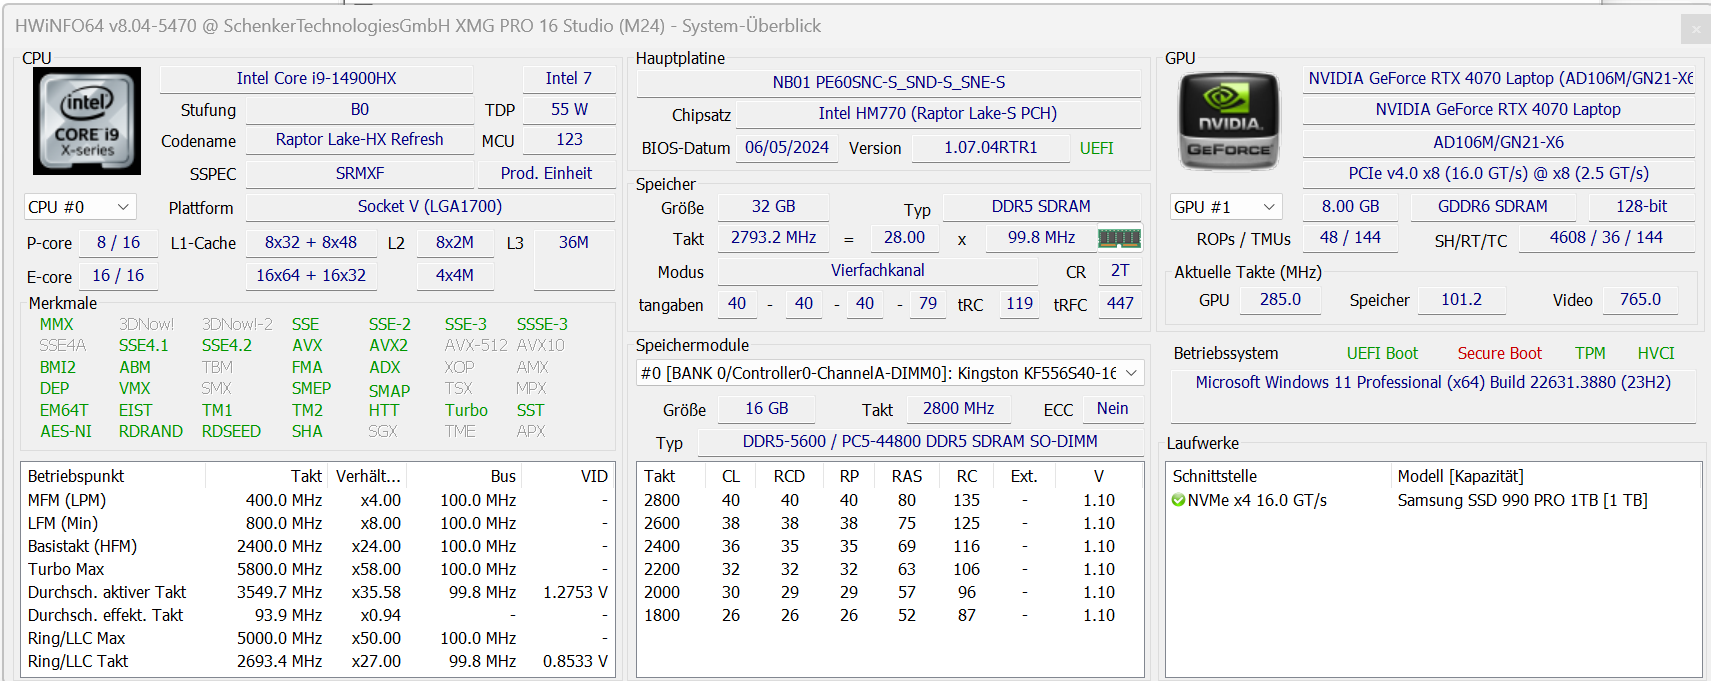
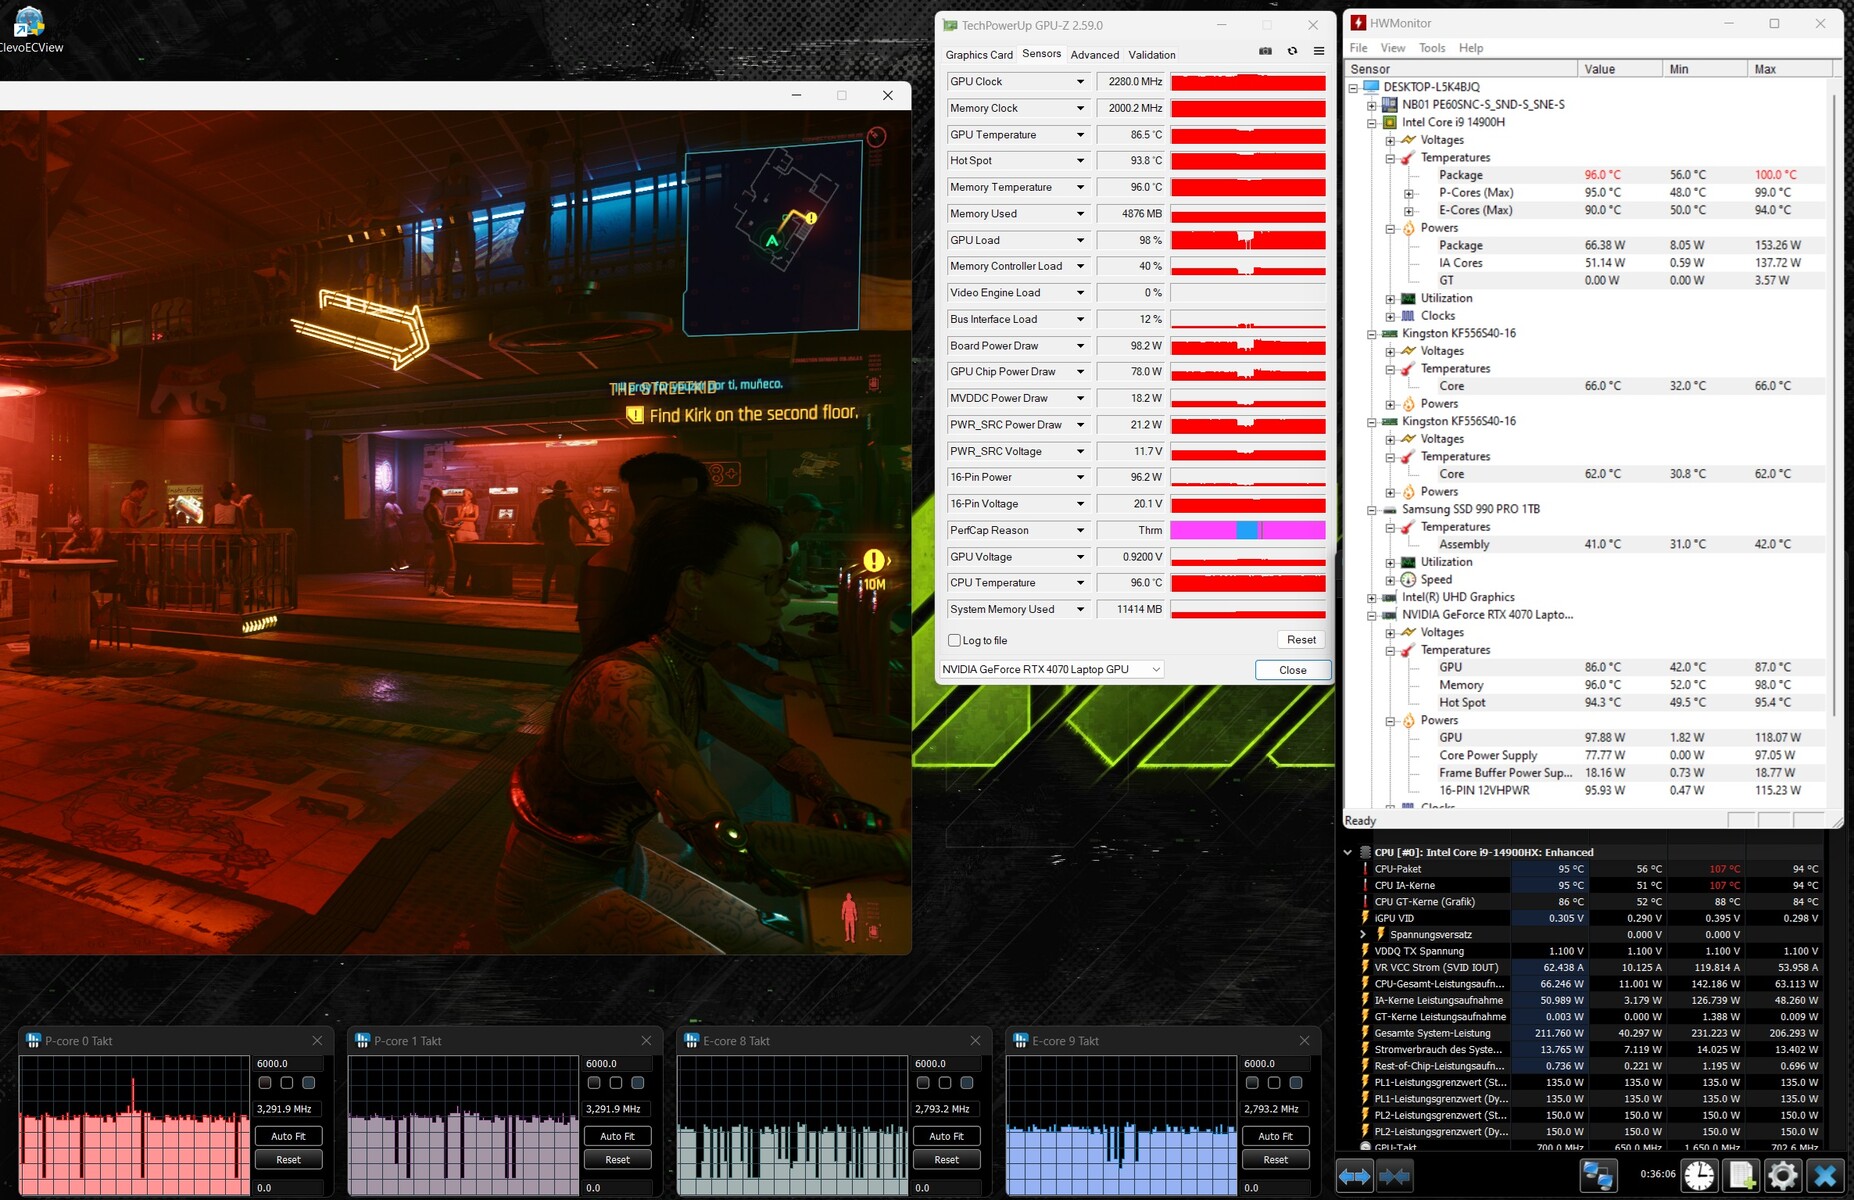
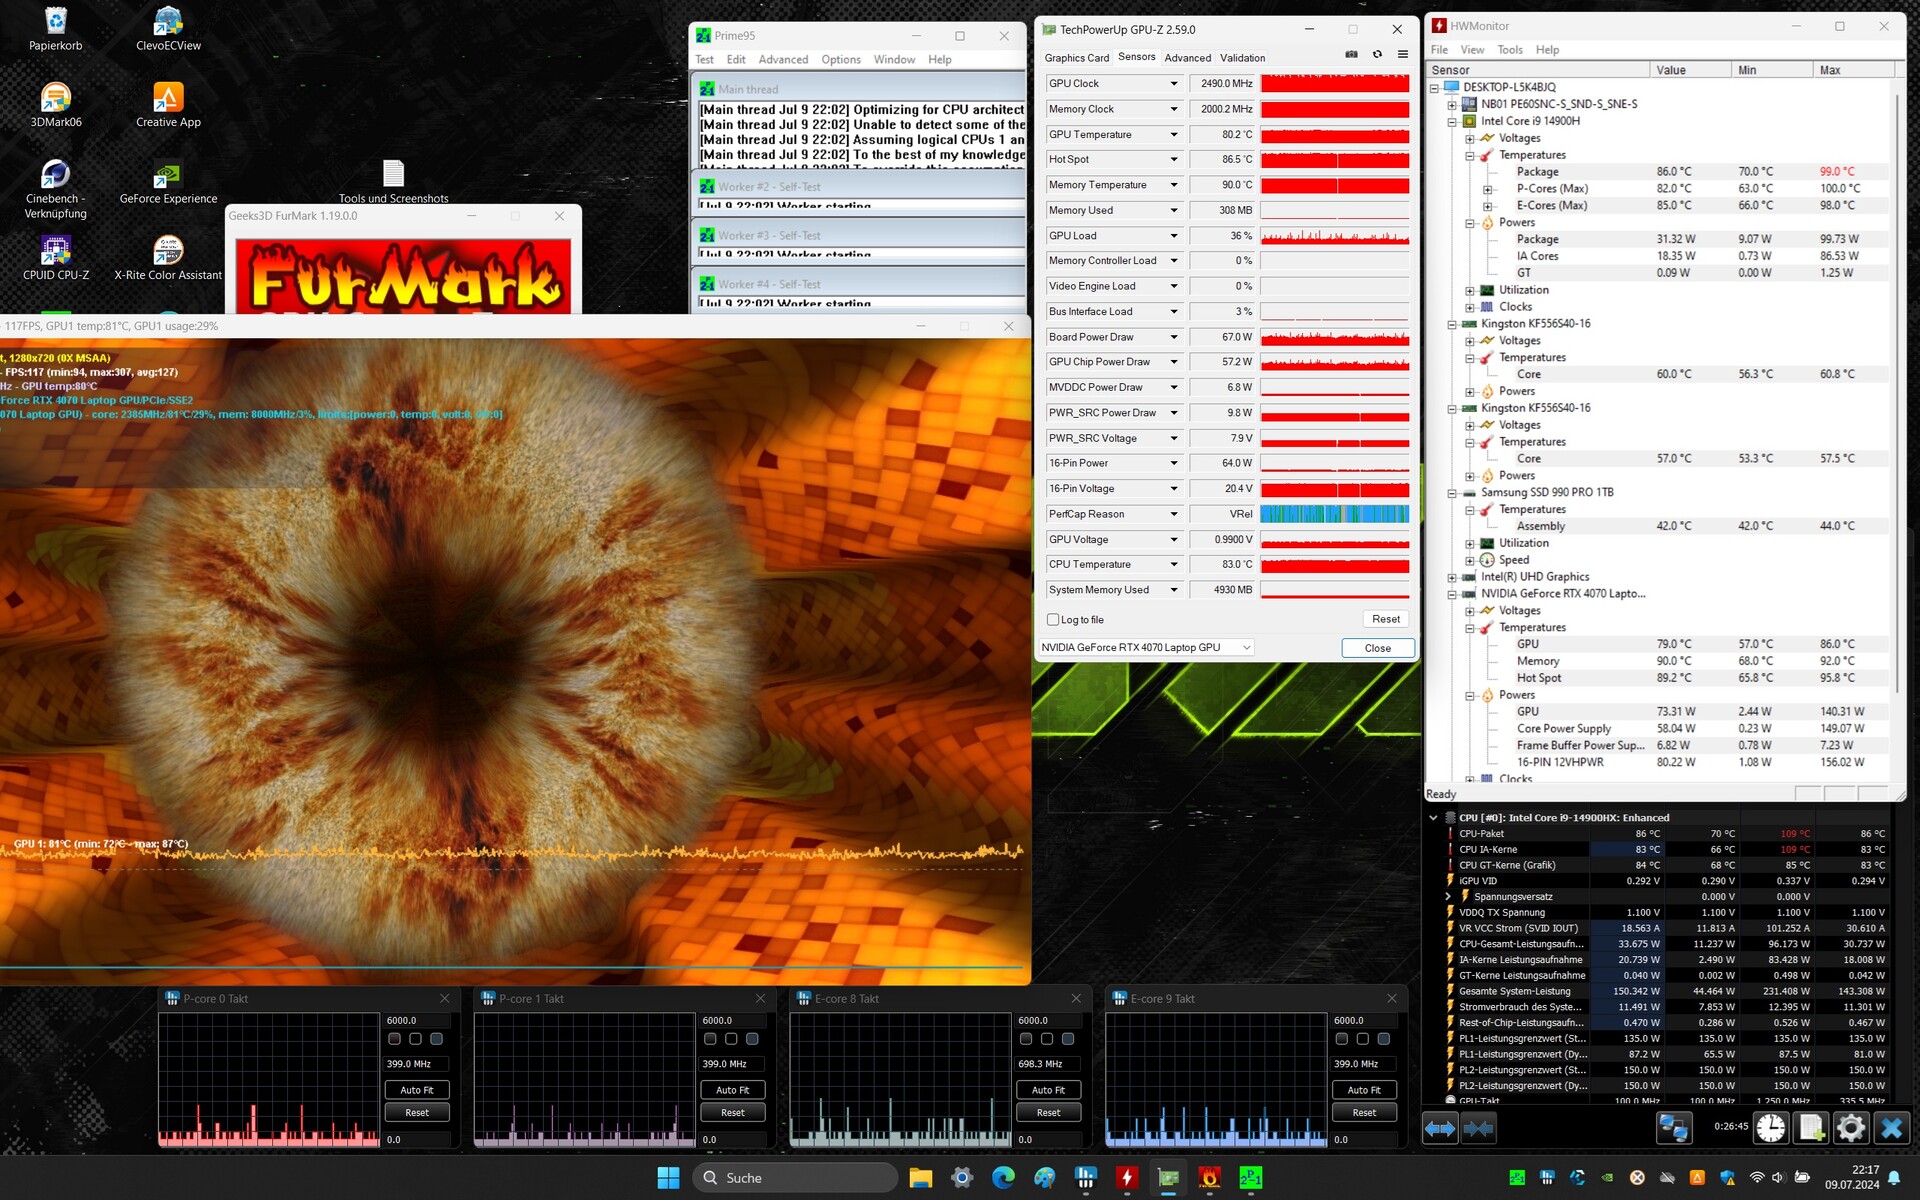
The Core i9-14900HX (Raptor Lake) is used for all Pro 16 configuration variants. Its 24 cores (8P + 16E) can process a total of 32 threads. A surprise: Even when performance mode is active, the processor can't work at full power all the time. Continuous multi-thread load (CB15 Loop) caused the CPU clock to drop significantly from the first to the fifth run. After that, the curve flattened out. Its benchmark results are below the previous CPU average.
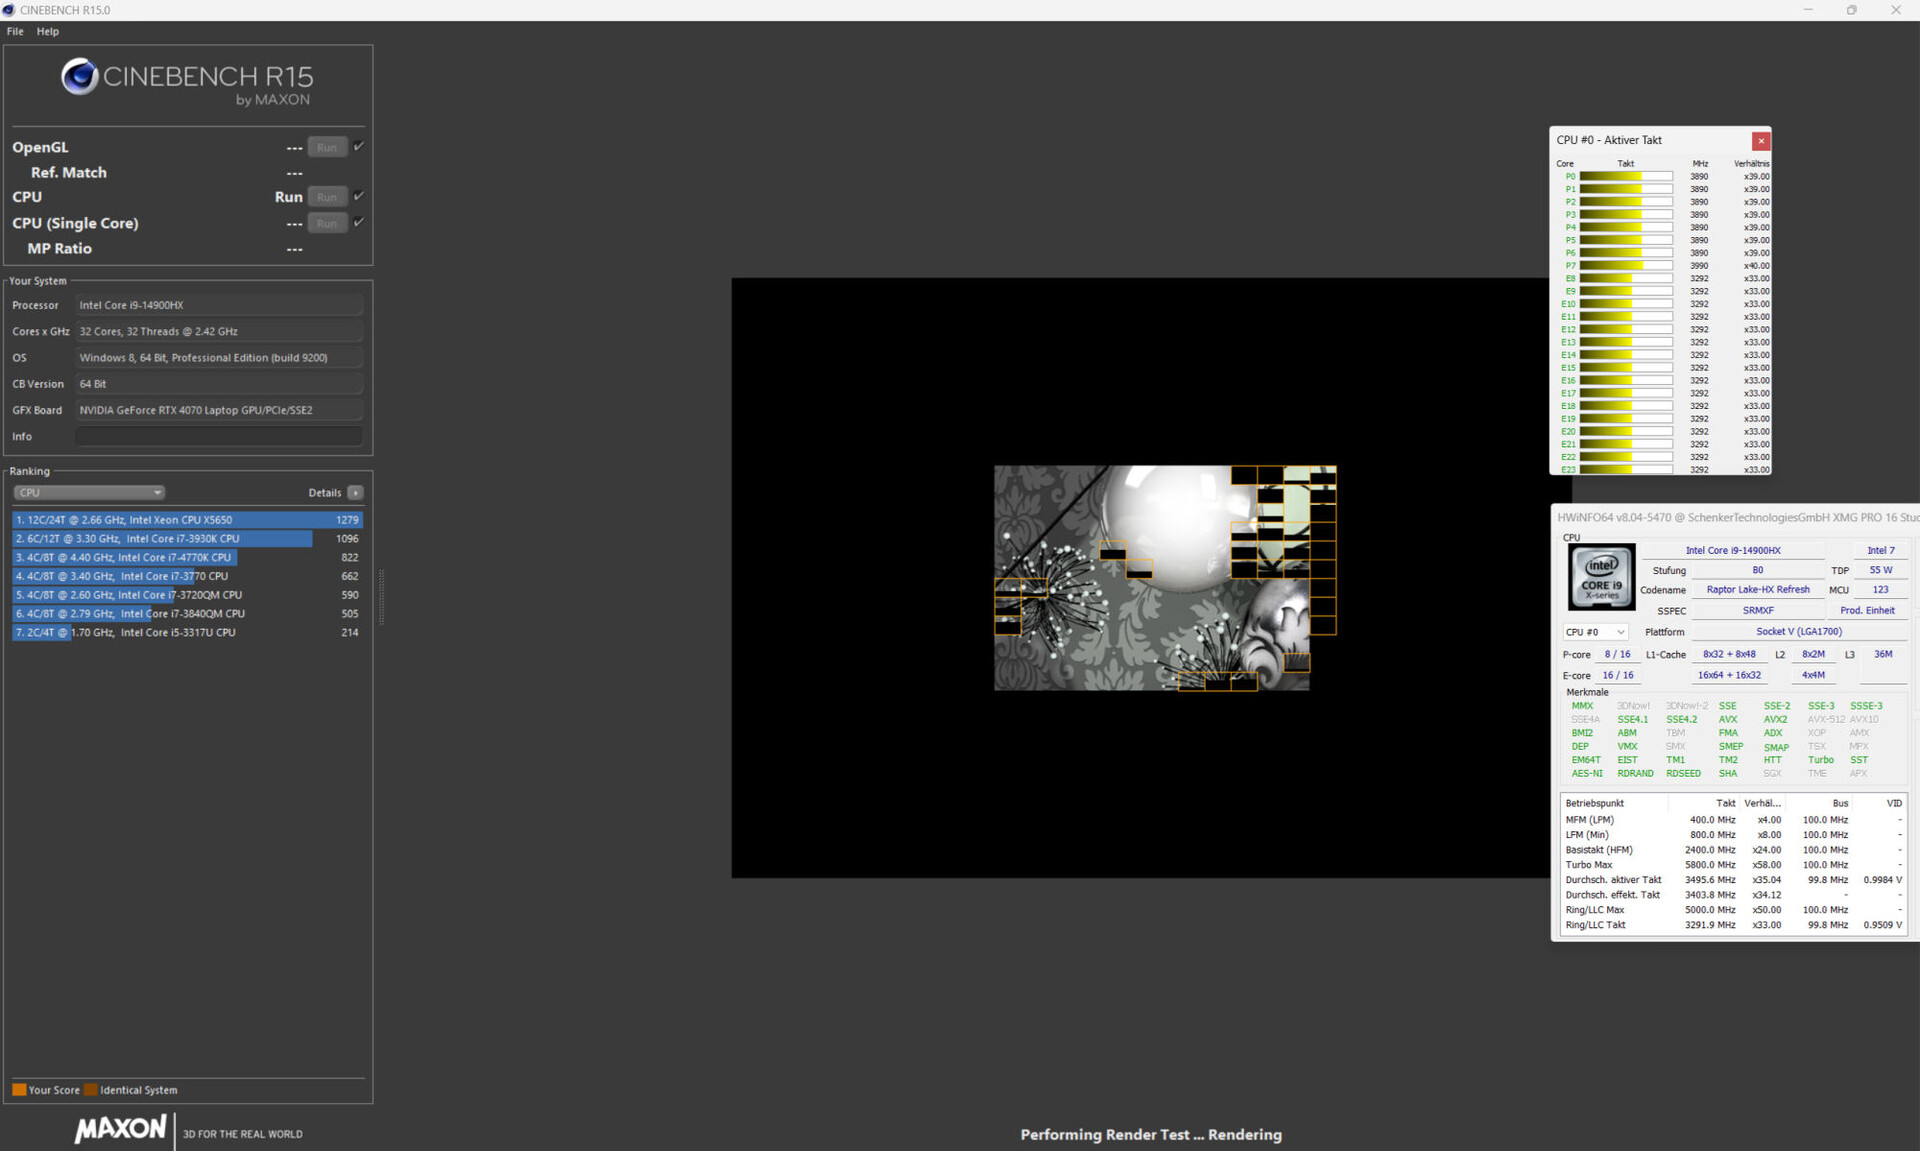
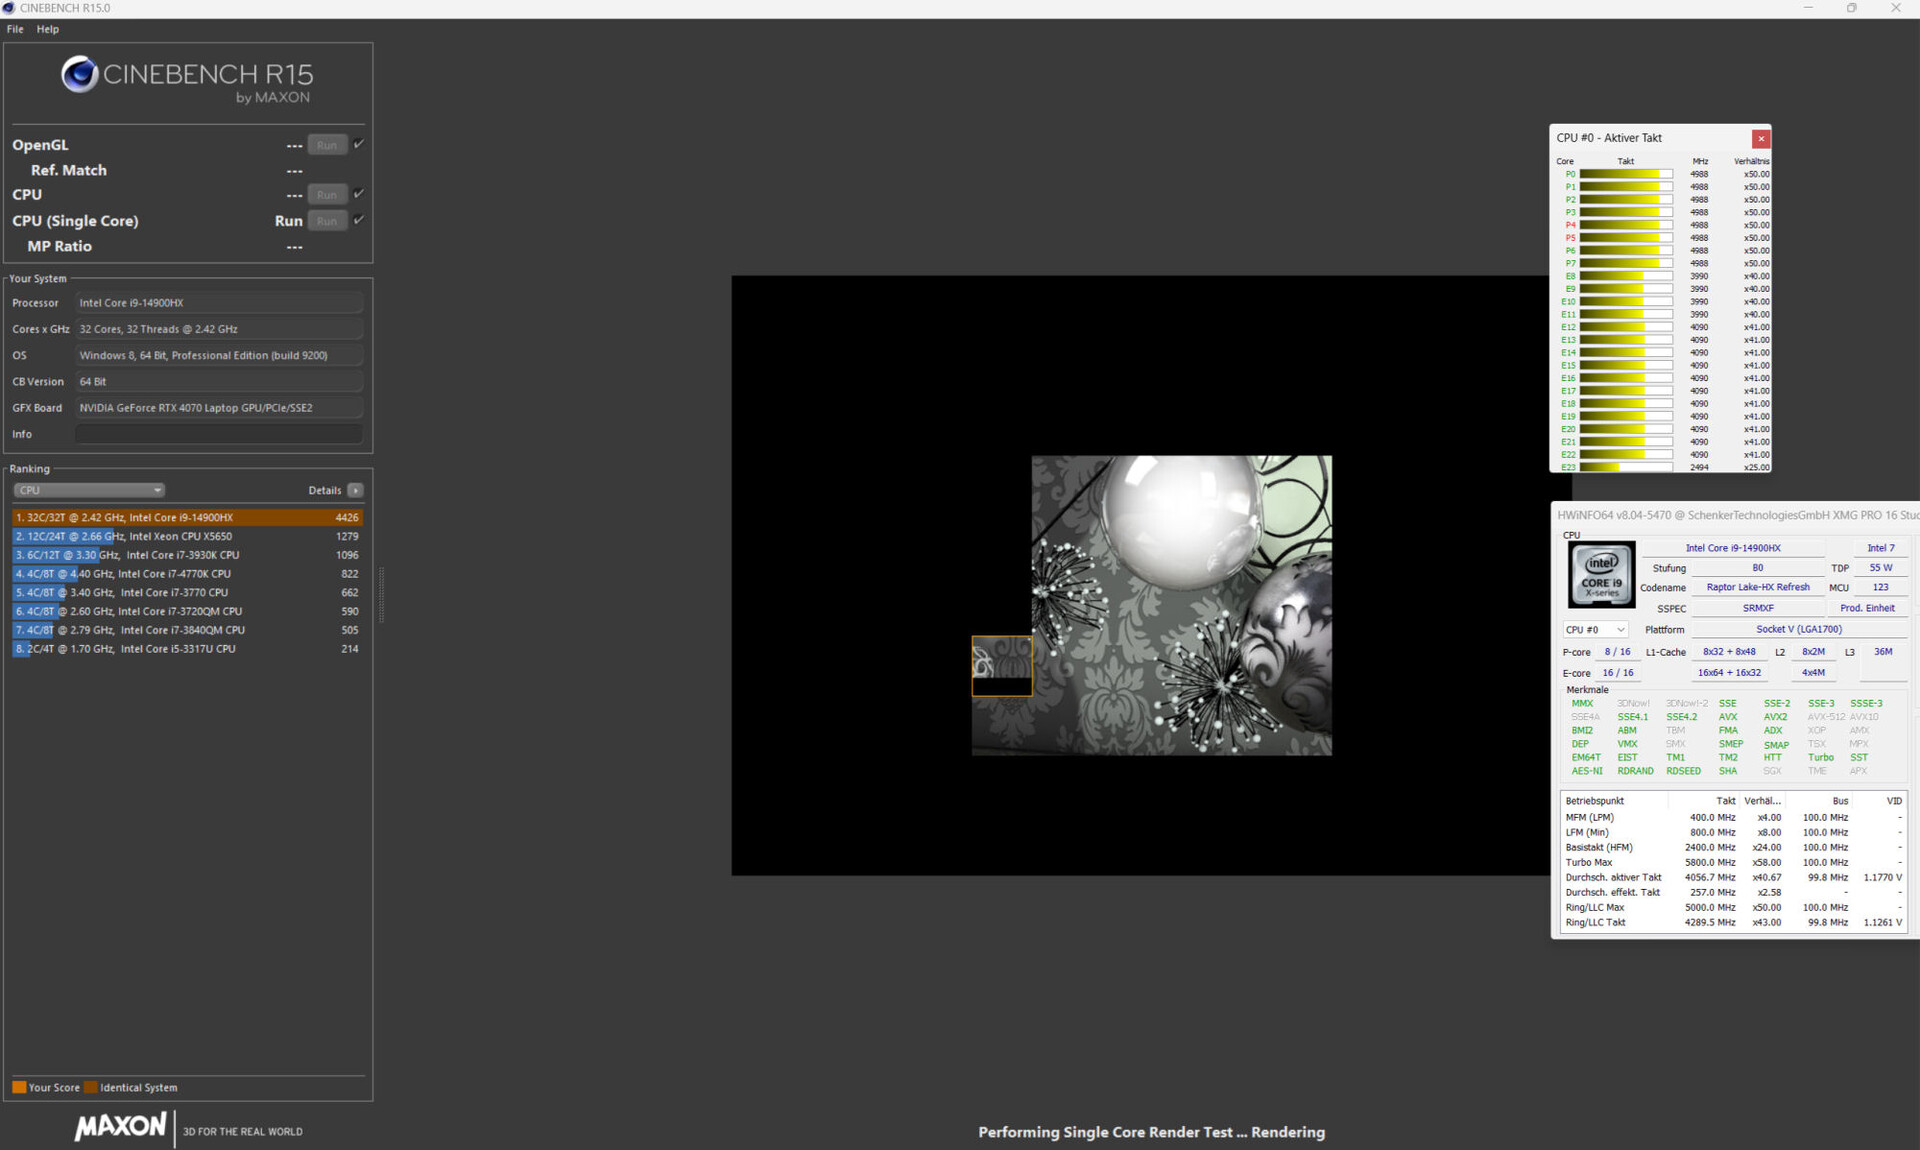
Cinebench R15 Multi continuous test


* ... smaller is better
AIDA64: FP32 Ray-Trace | FPU Julia | CPU SHA3 | CPU Queen | FPU SinJulia | FPU Mandel | CPU AES | CPU ZLib | FP64 Ray-Trace | CPU PhotoWorxx
| Performance rating | |
| Lenovo Legion Pro 5 16IRX9 | |
| Average of class Gaming | |
| Average Intel Core i9-14900HX | |
| Aorus 16X 2024 | |
| Lenovo Legion 7 16 IRX G9 | |
| Schenker XMG Pro 16 Studio (Mid 24) | |
| Acer Predator Helios Neo 16 (2024) | |
| Schenker XMG Pro 16 Studio (Mid 23) | |
| AIDA64 / FP32 Ray-Trace | |
| Average of class Gaming (10227 - 85542, n=106, last 2 years) | |
| Lenovo Legion 7 16 IRX G9 | |
| Lenovo Legion Pro 5 16IRX9 | |
| Average Intel Core i9-14900HX (13098 - 33474, n=36) | |
| Aorus 16X 2024 | |
| Acer Predator Helios Neo 16 (2024) | |
| Schenker XMG Pro 16 Studio (Mid 24) | |
| Schenker XMG Pro 16 Studio (Mid 23) | |
| AIDA64 / FPU Julia | |
| Average of class Gaming (51376 - 238426, n=106, last 2 years) | |
| Lenovo Legion Pro 5 16IRX9 | |
| Average Intel Core i9-14900HX (67573 - 166040, n=36) | |
| Lenovo Legion 7 16 IRX G9 | |
| Aorus 16X 2024 | |
| Schenker XMG Pro 16 Studio (Mid 24) | |
| Acer Predator Helios Neo 16 (2024) | |
| Schenker XMG Pro 16 Studio (Mid 23) | |
| AIDA64 / CPU SHA3 | |
| Lenovo Legion Pro 5 16IRX9 | |
| Average of class Gaming (2180 - 9817, n=106, last 2 years) | |
| Average Intel Core i9-14900HX (3589 - 7979, n=36) | |
| Aorus 16X 2024 | |
| Lenovo Legion 7 16 IRX G9 | |
| Schenker XMG Pro 16 Studio (Mid 24) | |
| Acer Predator Helios Neo 16 (2024) | |
| Schenker XMG Pro 16 Studio (Mid 23) | |
| AIDA64 / CPU Queen | |
| Acer Predator Helios Neo 16 (2024) | |
| Lenovo Legion Pro 5 16IRX9 | |
| Lenovo Legion 7 16 IRX G9 | |
| Aorus 16X 2024 | |
| Average Intel Core i9-14900HX (118405 - 148966, n=36) | |
| Schenker XMG Pro 16 Studio (Mid 24) | |
| Average of class Gaming (49785 - 173351, n=93, last 2 years) | |
| Schenker XMG Pro 16 Studio (Mid 23) | |
| AIDA64 / FPU SinJulia | |
| Lenovo Legion Pro 5 16IRX9 | |
| Average Intel Core i9-14900HX (10475 - 18517, n=36) | |
| Aorus 16X 2024 | |
| Average of class Gaming (4424 - 33636, n=106, last 2 years) | |
| Lenovo Legion 7 16 IRX G9 | |
| Schenker XMG Pro 16 Studio (Mid 24) | |
| Acer Predator Helios Neo 16 (2024) | |
| Schenker XMG Pro 16 Studio (Mid 23) | |
| AIDA64 / FPU Mandel | |
| Average of class Gaming (25115 - 128721, n=106, last 2 years) | |
| Lenovo Legion Pro 5 16IRX9 | |
| Average Intel Core i9-14900HX (32543 - 83662, n=36) | |
| Aorus 16X 2024 | |
| Acer Predator Helios Neo 16 (2024) | |
| Schenker XMG Pro 16 Studio (Mid 24) | |
| Lenovo Legion 7 16 IRX G9 | |
| Schenker XMG Pro 16 Studio (Mid 23) | |
| AIDA64 / CPU AES | |
| Schenker XMG Pro 16 Studio (Mid 23) | |
| Average Intel Core i9-14900HX (86964 - 241777, n=36) | |
| Lenovo Legion Pro 5 16IRX9 | |
| Aorus 16X 2024 | |
| Lenovo Legion 7 16 IRX G9 | |
| Schenker XMG Pro 16 Studio (Mid 24) | |
| Average of class Gaming (39258 - 247074, n=106, last 2 years) | |
| Acer Predator Helios Neo 16 (2024) | |
| AIDA64 / CPU ZLib | |
| Lenovo Legion Pro 5 16IRX9 | |
| Average Intel Core i9-14900HX (1054 - 2292, n=36) | |
| Aorus 16X 2024 | |
| Schenker XMG Pro 16 Studio (Mid 24) | |
| Lenovo Legion 7 16 IRX G9 | |
| Average of class Gaming (574 - 2531, n=106, last 2 years) | |
| Acer Predator Helios Neo 16 (2024) | |
| Schenker XMG Pro 16 Studio (Mid 23) | |
| AIDA64 / FP64 Ray-Trace | |
| Average of class Gaming (5509 - 45446, n=106, last 2 years) | |
| Lenovo Legion Pro 5 16IRX9 | |
| Average Intel Core i9-14900HX (6809 - 18349, n=36) | |
| Lenovo Legion 7 16 IRX G9 | |
| Aorus 16X 2024 | |
| Schenker XMG Pro 16 Studio (Mid 24) | |
| Acer Predator Helios Neo 16 (2024) | |
| Schenker XMG Pro 16 Studio (Mid 23) | |
| AIDA64 / CPU PhotoWorxx | |
| Lenovo Legion Pro 5 16IRX9 | |
| Aorus 16X 2024 | |
| Schenker XMG Pro 16 Studio (Mid 24) | |
| Lenovo Legion 7 16 IRX G9 | |
| Schenker XMG Pro 16 Studio (Mid 23) | |
| Average Intel Core i9-14900HX (23903 - 54702, n=36) | |
| Acer Predator Helios Neo 16 (2024) | |
| Average of class Gaming (12271 - 89891, n=106, last 2 years) | |
System performance
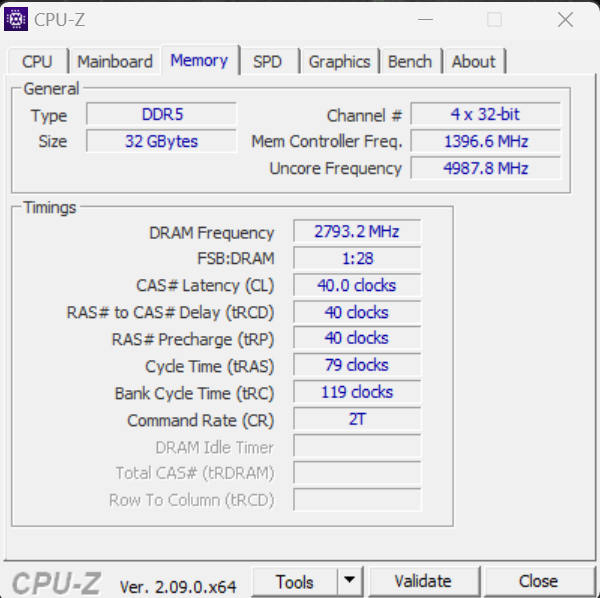
The smooth-running system provides enough performance for gaming, rendering and streaming, but the installed hardware isn't able to set any new records. The RAM's transfer rates are on a normal level for DDR5-5600 RAM.
CrossMark: Overall | Productivity | Creativity | Responsiveness
WebXPRT 3: Overall
WebXPRT 4: Overall
Mozilla Kraken 1.1: Total
| PCMark 10 / Score | |
| Lenovo Legion Pro 5 16IRX9 | |
| Aorus 16X 2024 | |
| Average of class Gaming (5828 - 11574, n=94, last 2 years) | |
| Acer Predator Helios Neo 16 (2024) | |
| Average Intel Core i9-14900HX, NVIDIA GeForce RTX 4070 Laptop GPU (7768 - 8550, n=8) | |
| Schenker XMG Pro 16 Studio (Mid 24) | |
| Lenovo Legion 7 16 IRX G9 | |
| Schenker XMG Pro 16 Studio (Mid 23) | |
| PCMark 10 / Essentials | |
| Schenker XMG Pro 16 Studio (Mid 23) | |
| Acer Predator Helios Neo 16 (2024) | |
| Lenovo Legion Pro 5 16IRX9 | |
| Aorus 16X 2024 | |
| Lenovo Legion 7 16 IRX G9 | |
| Average Intel Core i9-14900HX, NVIDIA GeForce RTX 4070 Laptop GPU (10104 - 11815, n=8) | |
| Schenker XMG Pro 16 Studio (Mid 24) | |
| Average of class Gaming (8810 - 11935, n=98, last 2 years) | |
| PCMark 10 / Productivity | |
| Aorus 16X 2024 | |
| Schenker XMG Pro 16 Studio (Mid 24) | |
| Average of class Gaming (6845 - 21327, n=96, last 2 years) | |
| Average Intel Core i9-14900HX, NVIDIA GeForce RTX 4070 Laptop GPU (9577 - 11103, n=8) | |
| Schenker XMG Pro 16 Studio (Mid 23) | |
| Acer Predator Helios Neo 16 (2024) | |
| Lenovo Legion Pro 5 16IRX9 | |
| Lenovo Legion 7 16 IRX G9 | |
| PCMark 10 / Digital Content Creation | |
| Lenovo Legion Pro 5 16IRX9 | |
| Average of class Gaming (7602 - 19657, n=96, last 2 years) | |
| Lenovo Legion 7 16 IRX G9 | |
| Average Intel Core i9-14900HX, NVIDIA GeForce RTX 4070 Laptop GPU (12114 - 14827, n=8) | |
| Aorus 16X 2024 | |
| Acer Predator Helios Neo 16 (2024) | |
| Schenker XMG Pro 16 Studio (Mid 24) | |
| Schenker XMG Pro 16 Studio (Mid 23) | |
| CrossMark / Overall | |
| Aorus 16X 2024 | |
| Lenovo Legion 7 16 IRX G9 | |
| Acer Predator Helios Neo 16 (2024) | |
| Average Intel Core i9-14900HX, NVIDIA GeForce RTX 4070 Laptop GPU (2002 - 2312, n=7) | |
| Schenker XMG Pro 16 Studio (Mid 24) | |
| Lenovo Legion Pro 5 16IRX9 | |
| Average of class Gaming (1366 - 2409, n=95, last 2 years) | |
| Schenker XMG Pro 16 Studio (Mid 23) | |
| CrossMark / Productivity | |
| Aorus 16X 2024 | |
| Lenovo Legion 7 16 IRX G9 | |
| Acer Predator Helios Neo 16 (2024) | |
| Average Intel Core i9-14900HX, NVIDIA GeForce RTX 4070 Laptop GPU (1827 - 2191, n=7) | |
| Schenker XMG Pro 16 Studio (Mid 24) | |
| Schenker XMG Pro 16 Studio (Mid 23) | |
| Average of class Gaming (1386 - 2254, n=95, last 2 years) | |
| Lenovo Legion Pro 5 16IRX9 | |
| CrossMark / Creativity | |
| Aorus 16X 2024 | |
| Acer Predator Helios Neo 16 (2024) | |
| Lenovo Legion 7 16 IRX G9 | |
| Schenker XMG Pro 16 Studio (Mid 24) | |
| Average Intel Core i9-14900HX, NVIDIA GeForce RTX 4070 Laptop GPU (2258 - 2458, n=7) | |
| Lenovo Legion Pro 5 16IRX9 | |
| Average of class Gaming (1343 - 2729, n=95, last 2 years) | |
| Schenker XMG Pro 16 Studio (Mid 23) | |
| CrossMark / Responsiveness | |
| Lenovo Legion 7 16 IRX G9 | |
| Aorus 16X 2024 | |
| Average Intel Core i9-14900HX, NVIDIA GeForce RTX 4070 Laptop GPU (1734 - 2330, n=7) | |
| Acer Predator Helios Neo 16 (2024) | |
| Schenker XMG Pro 16 Studio (Mid 23) | |
| Lenovo Legion Pro 5 16IRX9 | |
| Schenker XMG Pro 16 Studio (Mid 24) | |
| Average of class Gaming (1226 - 2334, n=95, last 2 years) | |
| WebXPRT 3 / Overall | |
| Lenovo Legion 7 16 IRX G9 | |
| Aorus 16X 2024 | |
| Acer Predator Helios Neo 16 (2024) | |
| Lenovo Legion Pro 5 16IRX9 | |
| Average Intel Core i9-14900HX, NVIDIA GeForce RTX 4070 Laptop GPU (269 - 342, n=8) | |
| Schenker XMG Pro 16 Studio (Mid 23) | |
| Schenker XMG Pro 16 Studio (Mid 24) | |
| Average of class Gaming (220 - 532, n=99, last 2 years) | |
| WebXPRT 4 / Overall | |
| Acer Predator Helios Neo 16 (2024) | |
| Schenker XMG Pro 16 Studio (Mid 24) | |
| Average Intel Core i9-14900HX, NVIDIA GeForce RTX 4070 Laptop GPU (291 - 304, n=6) | |
| Lenovo Legion 7 16 IRX G9 | |
| Lenovo Legion Pro 5 16IRX9 | |
| Average of class Gaming (165 - 354, n=100, last 2 years) | |
| Mozilla Kraken 1.1 / Total | |
| Schenker XMG Pro 16 Studio (Mid 23) | |
| Average of class Gaming (391 - 590, n=103, last 2 years) | |
| Schenker XMG Pro 16 Studio (Mid 24) | |
| Lenovo Legion Pro 5 16IRX9 | |
| Average Intel Core i9-14900HX, NVIDIA GeForce RTX 4070 Laptop GPU (431 - 469, n=8) | |
| Acer Predator Helios Neo 16 (2024) | |
| Lenovo Legion 7 16 IRX G9 | |
| Aorus 16X 2024 | |
* ... smaller is better
| PCMark 10 Score | 8166 points | |
Help | ||
| AIDA64 / Memory Copy | |
| Lenovo Legion Pro 5 16IRX9 | |
| Lenovo Legion 7 16 IRX G9 | |
| Aorus 16X 2024 | |
| Schenker XMG Pro 16 Studio (Mid 24) | |
| Acer Predator Helios Neo 16 (2024) | |
| Average Intel Core i9-14900HX (38028 - 83392, n=36) | |
| Average of class Gaming (21750 - 129946, n=106, last 2 years) | |
| Schenker XMG Pro 16 Studio (Mid 23) | |
| AIDA64 / Memory Read | |
| Aorus 16X 2024 | |
| Lenovo Legion Pro 5 16IRX9 | |
| Lenovo Legion 7 16 IRX G9 | |
| Schenker XMG Pro 16 Studio (Mid 24) | |
| Acer Predator Helios Neo 16 (2024) | |
| Average Intel Core i9-14900HX (43306 - 87568, n=36) | |
| Schenker XMG Pro 16 Studio (Mid 23) | |
| Average of class Gaming (22956 - 118858, n=106, last 2 years) | |
| AIDA64 / Memory Write | |
| Aorus 16X 2024 | |
| Lenovo Legion Pro 5 16IRX9 | |
| Average of class Gaming (22297 - 135096, n=106, last 2 years) | |
| Lenovo Legion 7 16 IRX G9 | |
| Schenker XMG Pro 16 Studio (Mid 24) | |
| Average Intel Core i9-14900HX (37146 - 80589, n=36) | |
| Schenker XMG Pro 16 Studio (Mid 23) | |
| Acer Predator Helios Neo 16 (2024) | |
| AIDA64 / Memory Latency | |
| Average of class Gaming (75.3 - 259, n=106, last 2 years) | |
| Acer Predator Helios Neo 16 (2024) | |
| Schenker XMG Pro 16 Studio (Mid 23) | |
| Average Intel Core i9-14900HX (76.1 - 105, n=36) | |
| Schenker XMG Pro 16 Studio (Mid 24) | |
| Lenovo Legion 7 16 IRX G9 | |
| Lenovo Legion Pro 5 16IRX9 | |
| Aorus 16X 2024 | |
* ... smaller is better
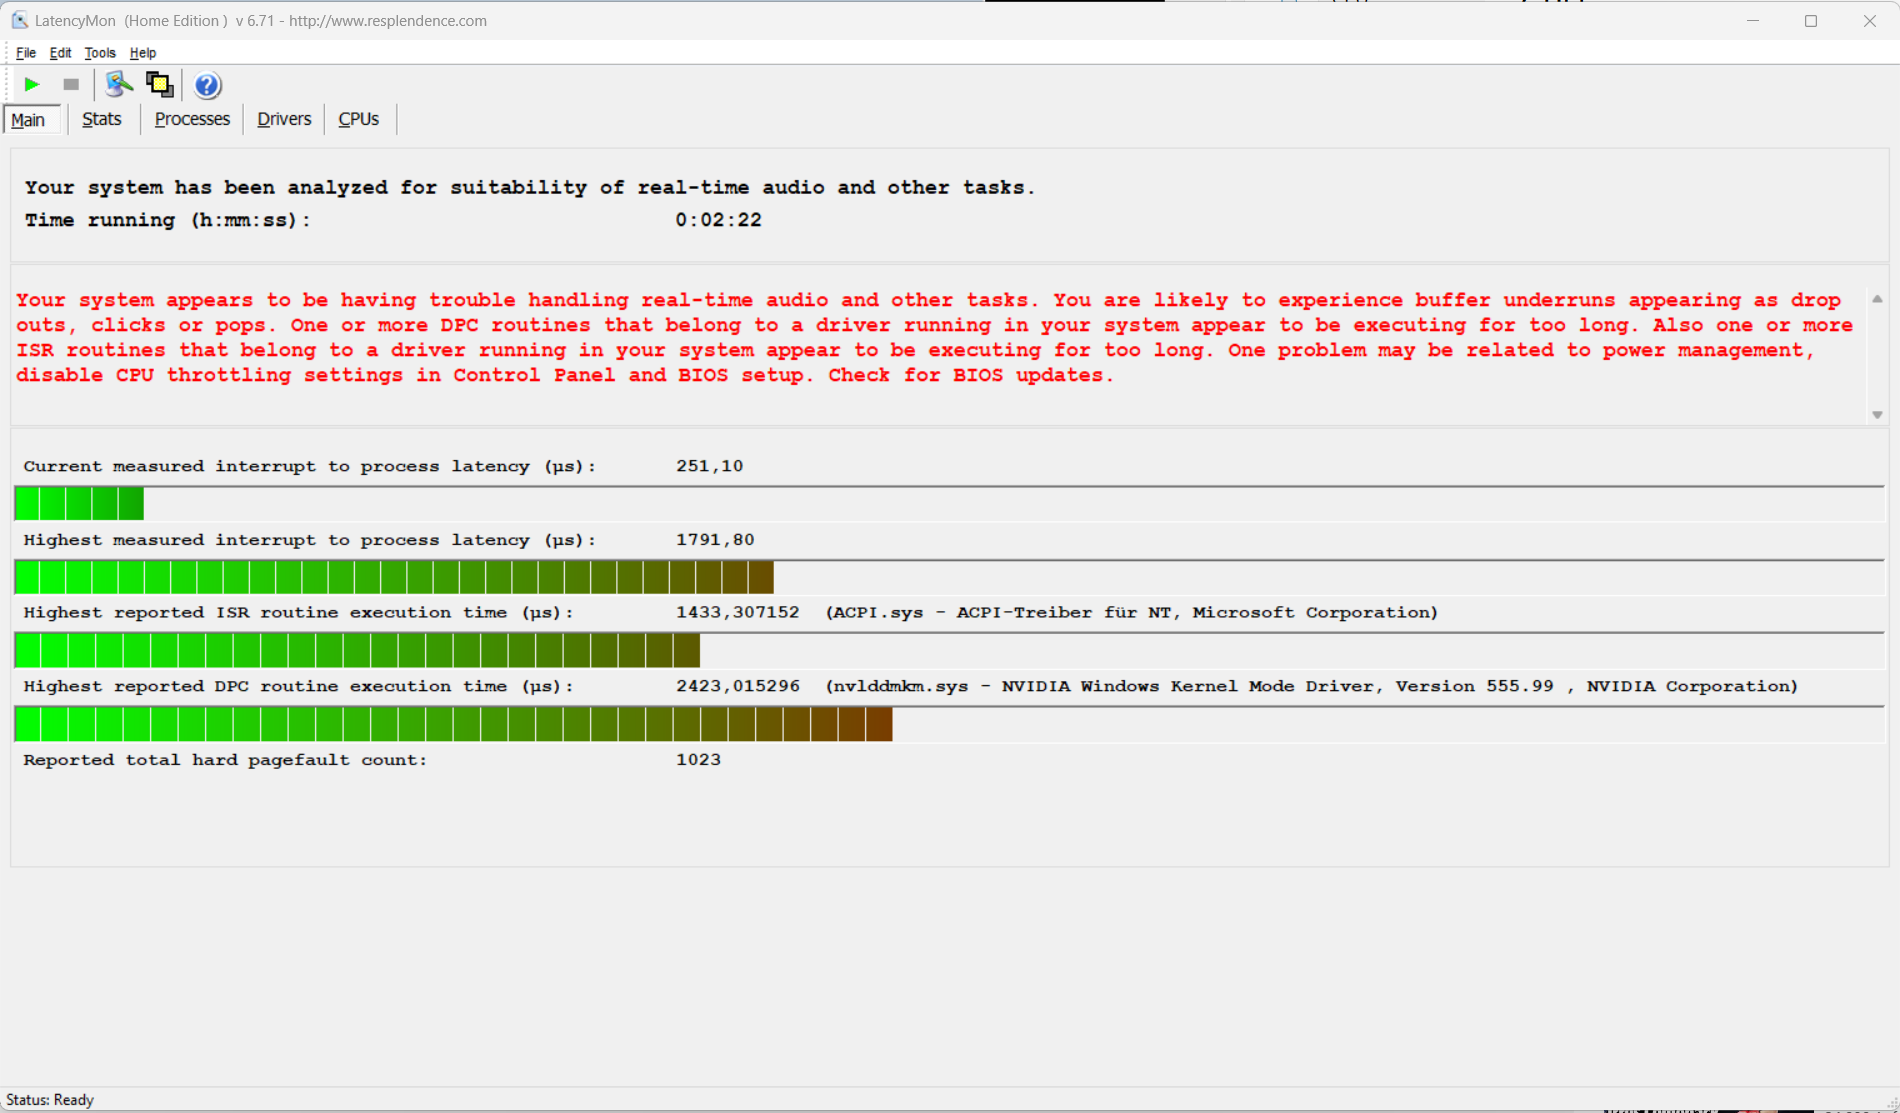
DPC latencies
Due to the laptop's relatively high latencies, real-time video and audio editing is not intended. However, future software updates could lead to changes in this respect.

| DPC Latencies / LatencyMon - interrupt to process latency (max), Web, Youtube, Prime95 | |
| Schenker XMG Pro 16 Studio (Mid 23) | |
| Schenker XMG Pro 16 Studio (Mid 24) | |
| Lenovo Legion 7 16 IRX G9 | |
| Acer Predator Helios Neo 16 (2024) | |
| Aorus 16X 2024 | |
| Lenovo Legion Pro 5 16IRX9 | |
* ... smaller is better
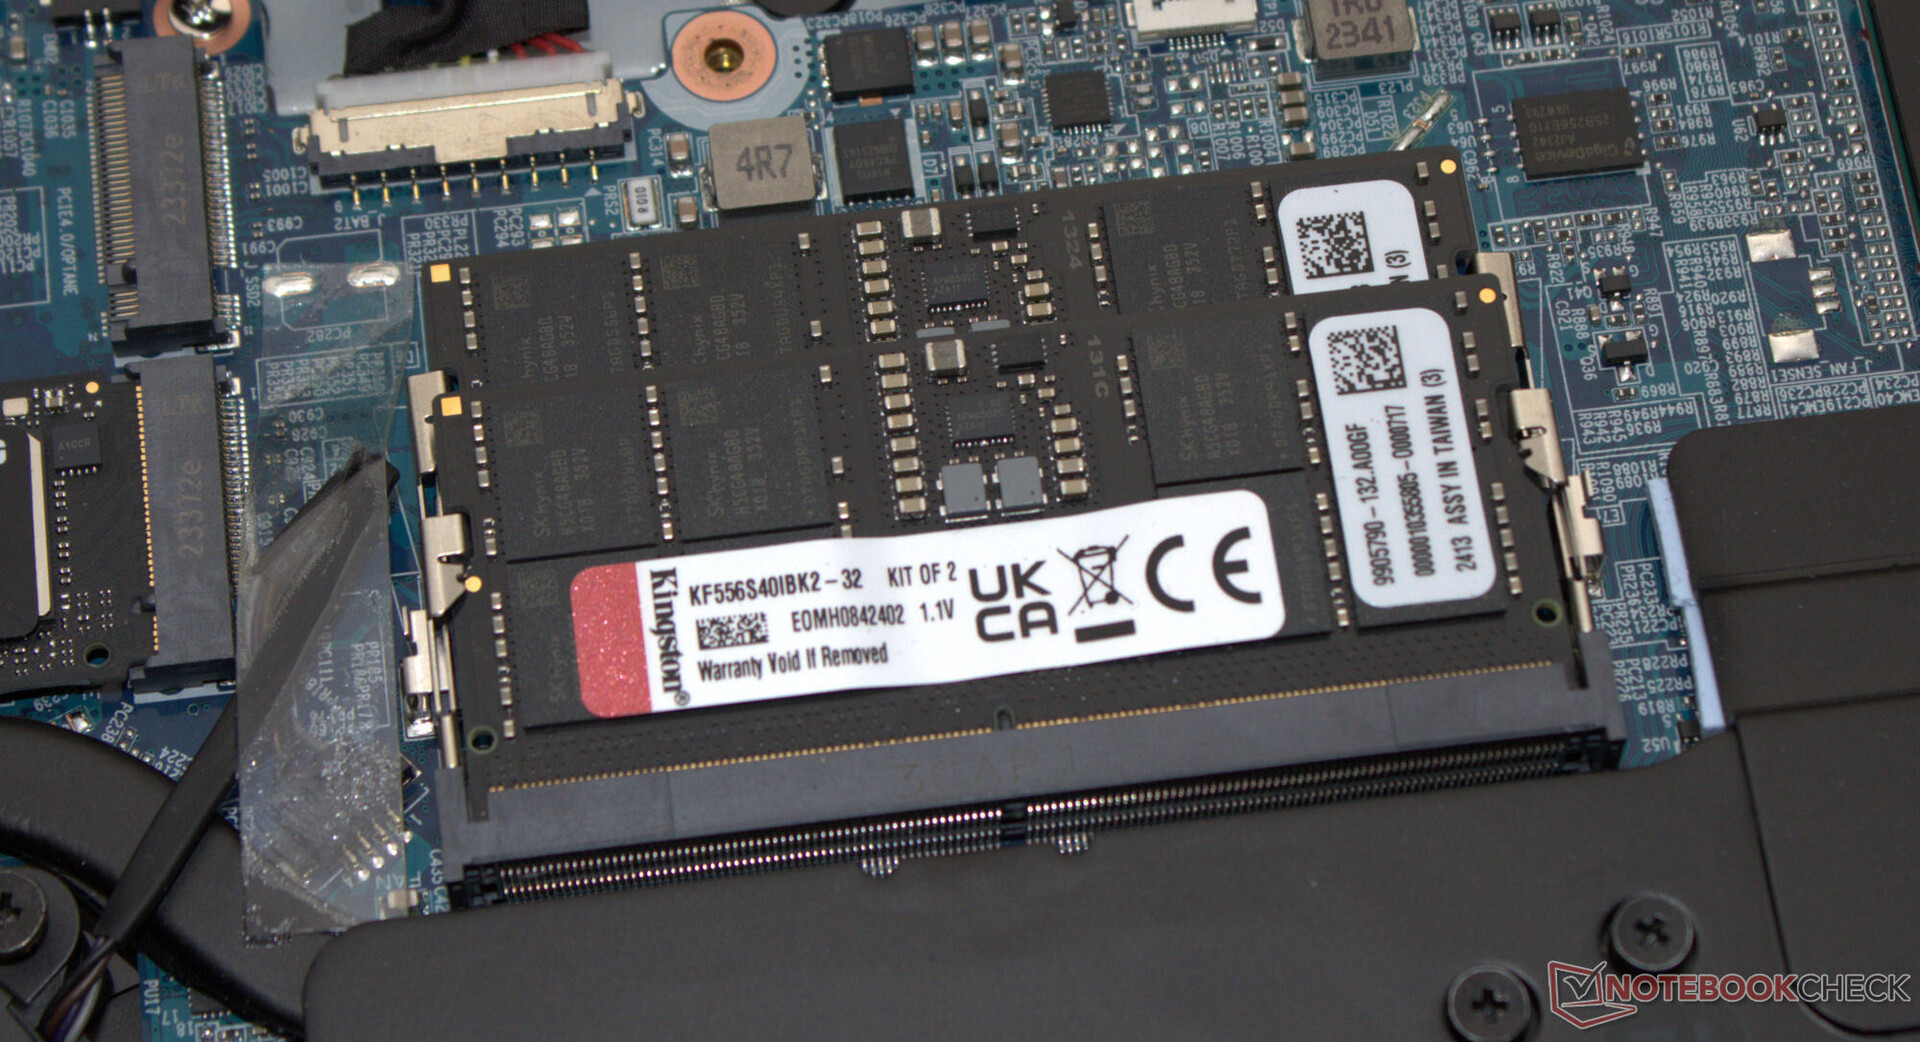
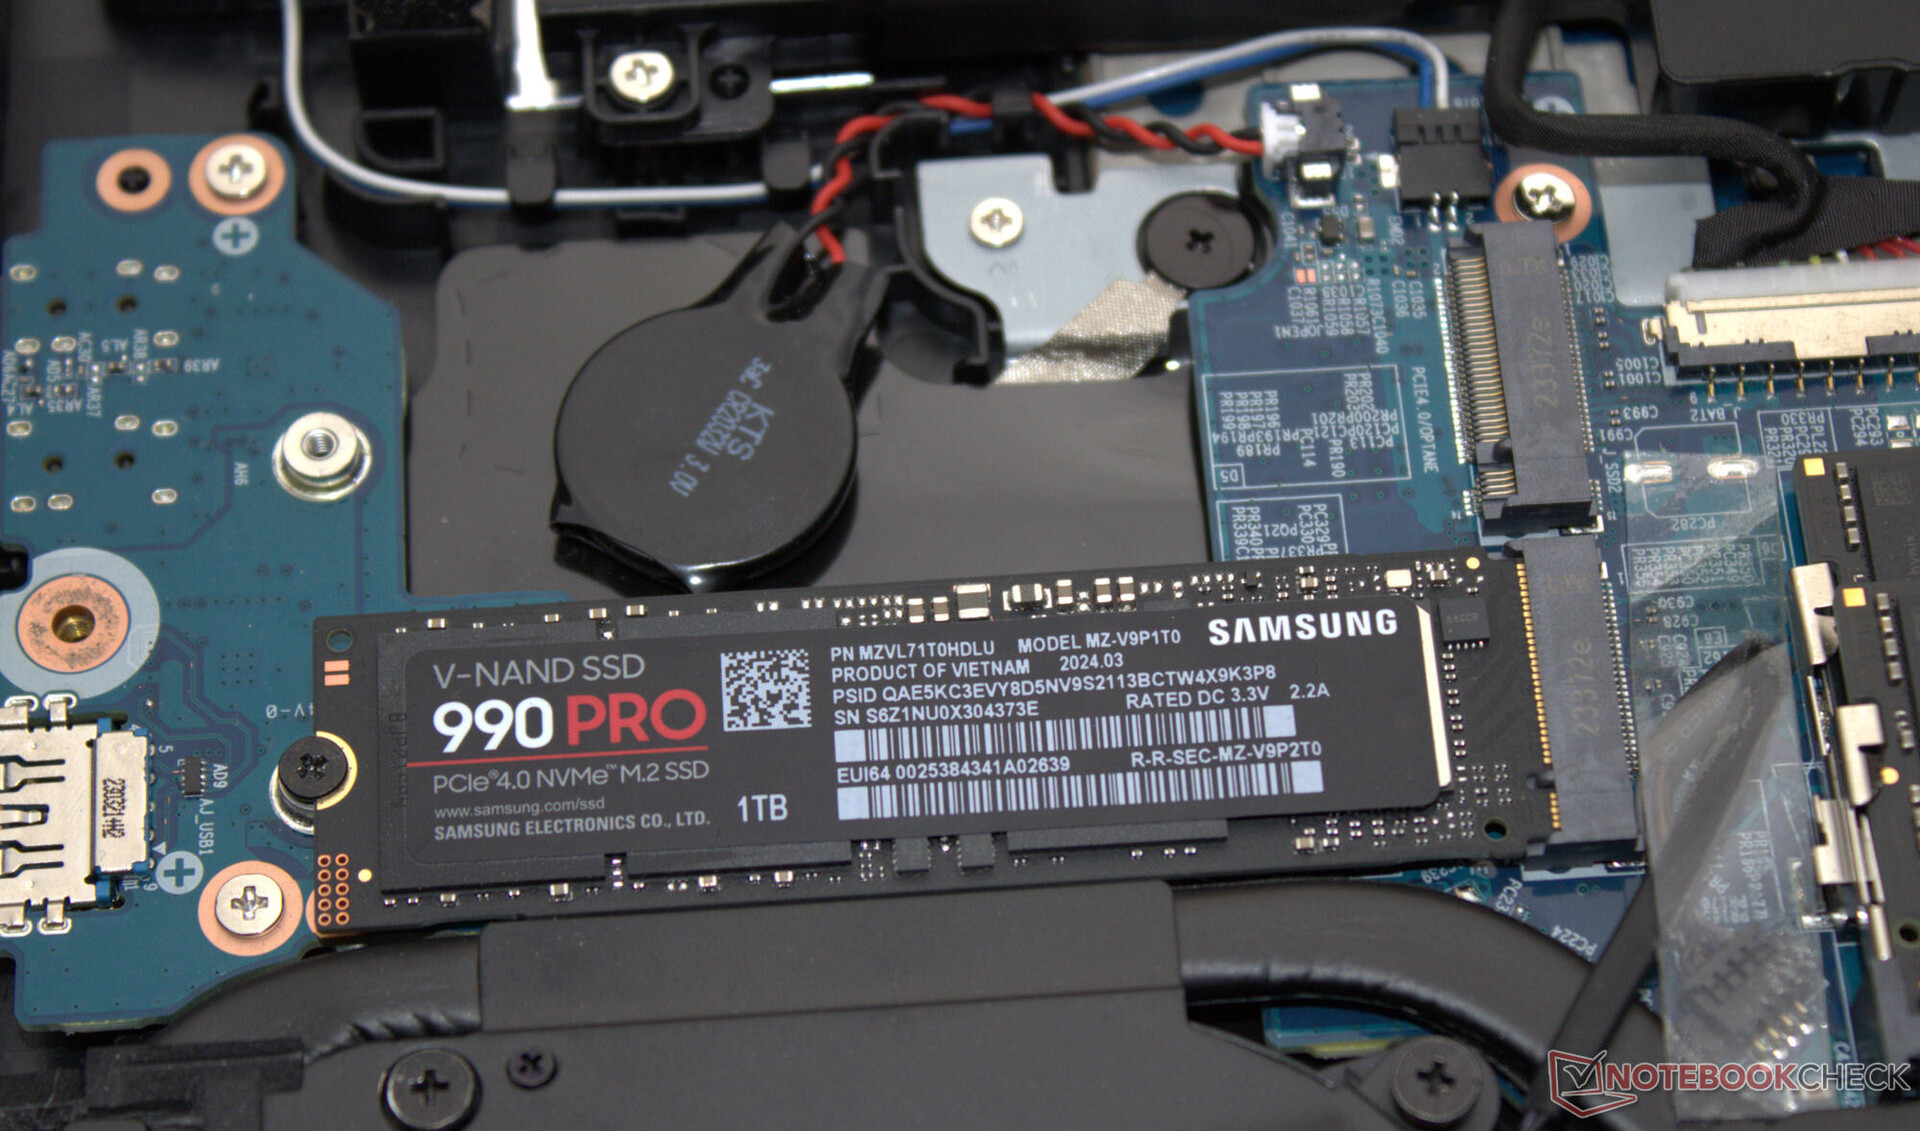
Storage devices
The Schenker online store has a variety of SSDs to choose from—our test device features a lightning-fast model (1 TB, PCIe 4, M.2-2280) from Samsung. Positive: Thermally induced throttling didn't occur. The laptop can accommodate up to two PCIe 4 SSDs (M.2-2280). RAID-0/1 is supported.

* ... smaller is better
Reading continuous performance: DiskSpd Read Loop, Queue Depth 8
Graphics card
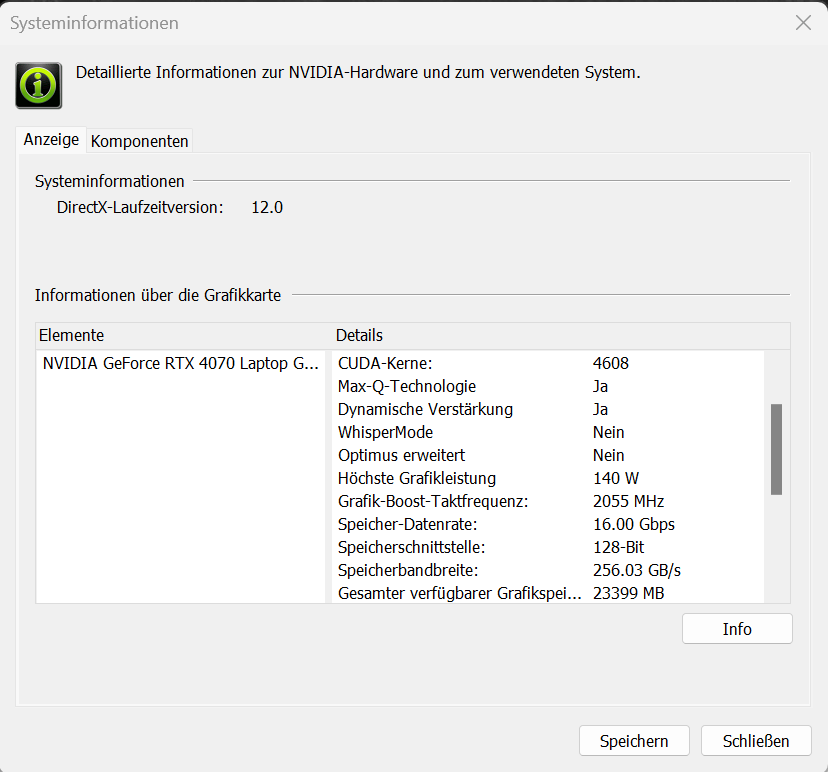
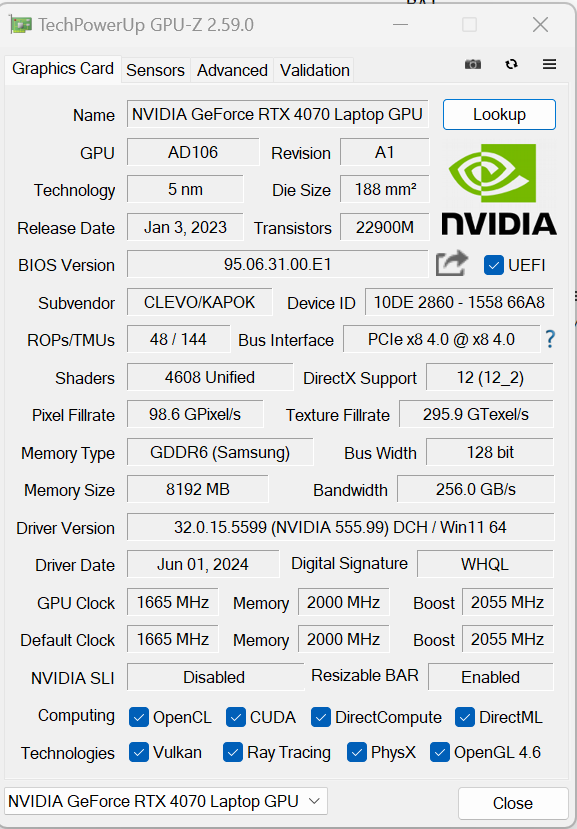
QHD gaming at high to maximum settings is no problem for the installed GeForce RTX 4070 (TGP: 140 watts): It delivers frame rates (and benchmark results) slightly above the GPU average. A little tight for today's requirements: The GPU only has 8 GB of VRAM (GDDR6) at its disposal. Switching between dGPU and Optimus requires a restart.

| 3DMark 11 Performance | 34173 points | |
| 3DMark Fire Strike Score | 23584 points | |
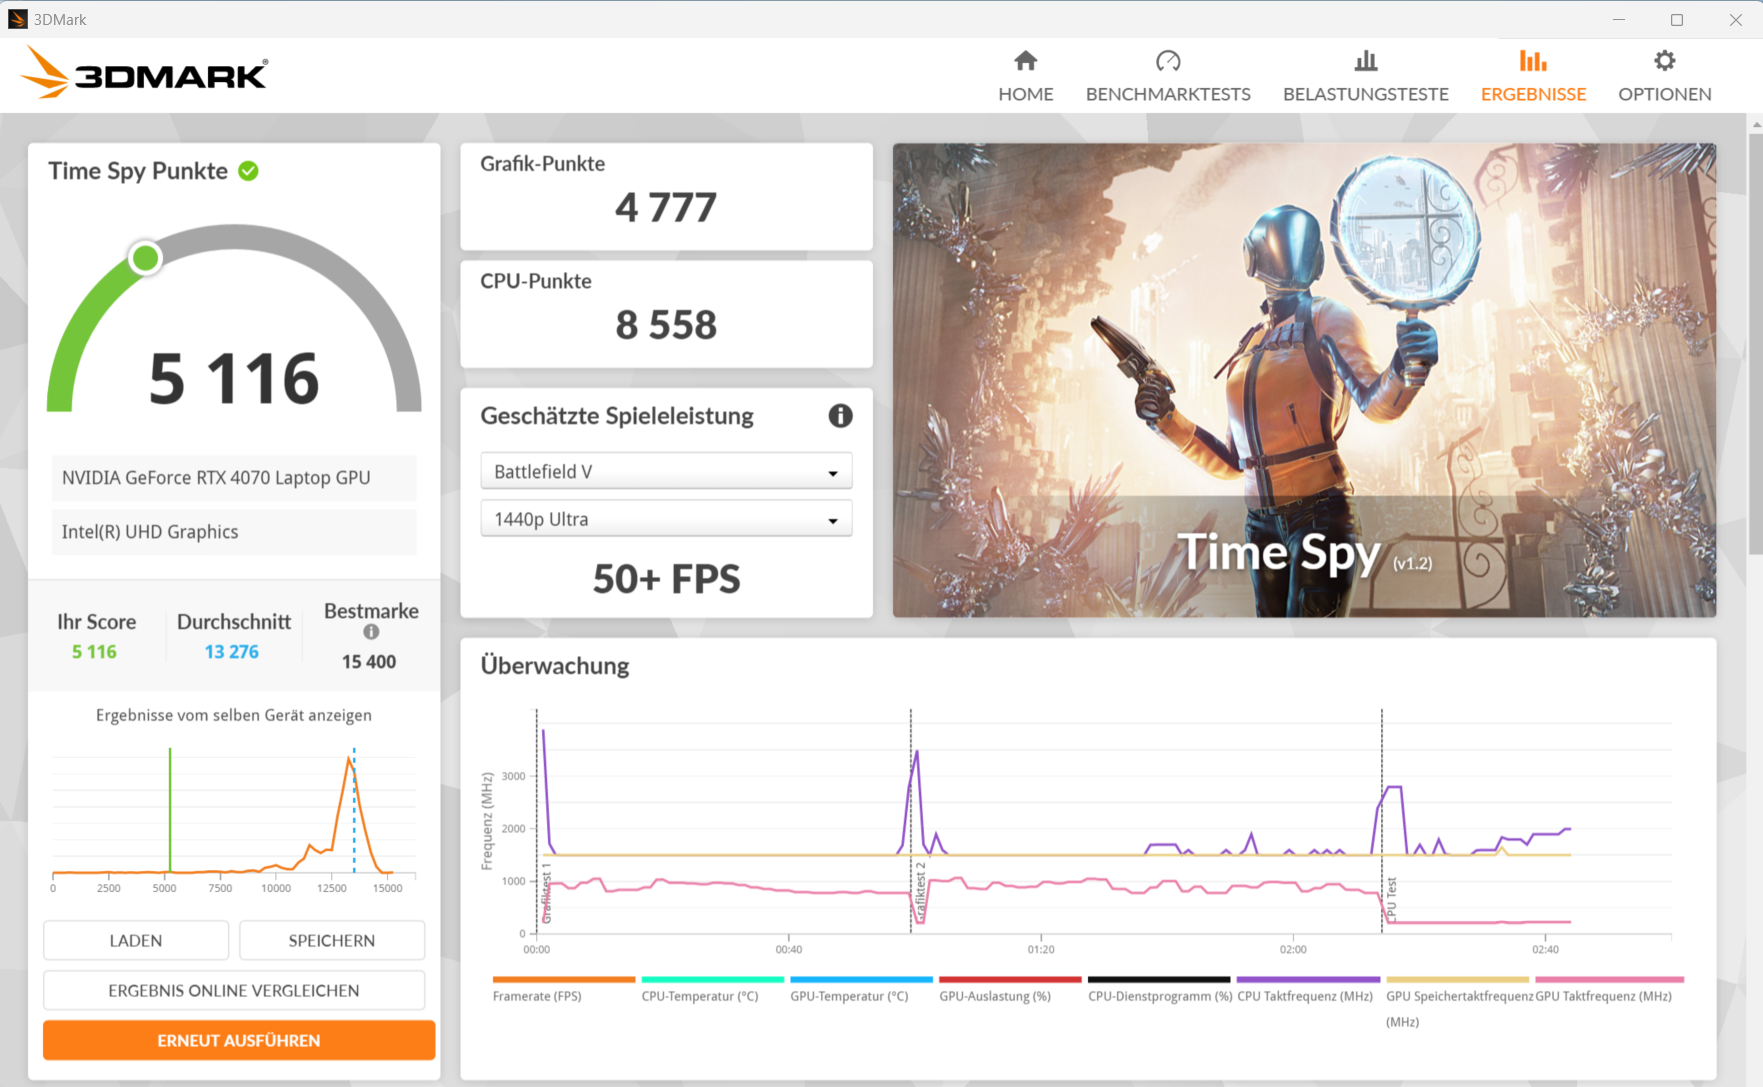
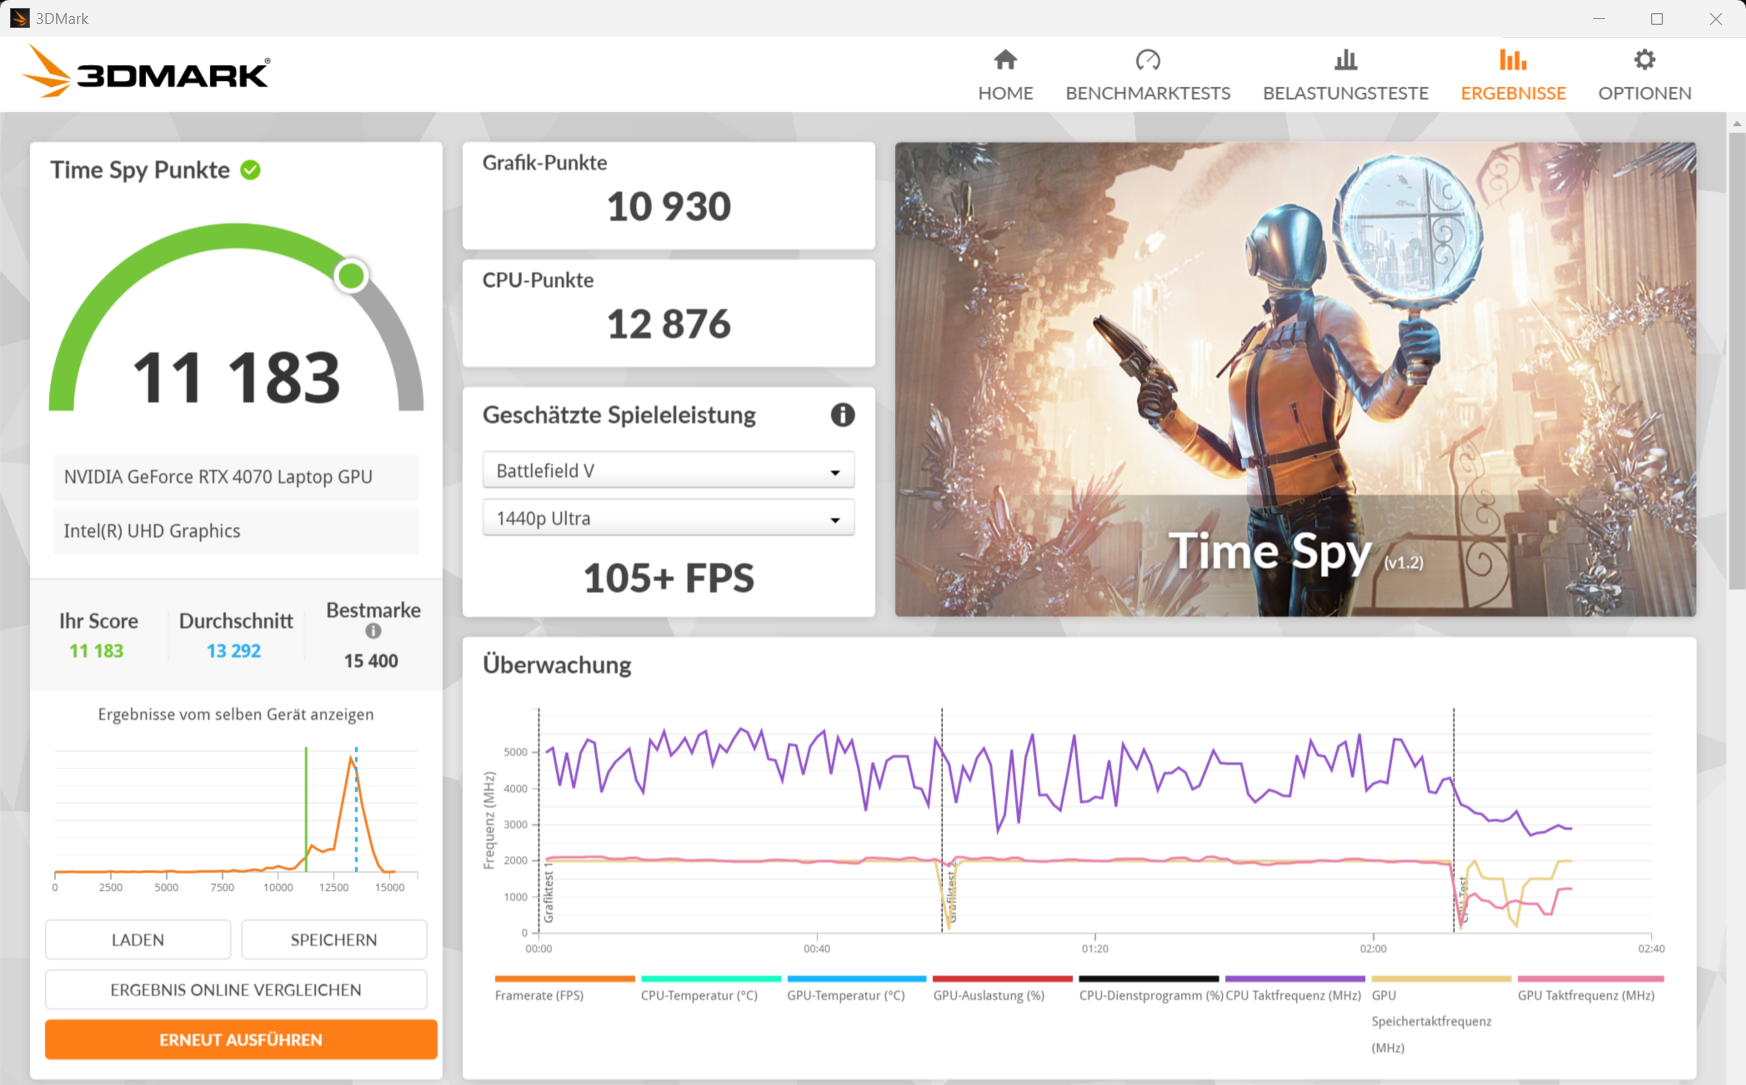
| 3DMark Time Spy Score | 12286 points | |
| 3DMark Steel Nomad Score | 2598 points | |
Help | ||
* ... smaller is better
| Senua's Saga Hellblade 2 | |
| 1920x1080 High Preset | |
| Average of class Gaming (33.9 - 86.1, n=12, last 2 years) | |
| Schenker XMG Pro 16 Studio (Mid 24) | |
| Average NVIDIA GeForce RTX 4070 Laptop GPU (34.3 - 51.2, n=4) | |
| 2560x1440 High Preset | |
| Average of class Gaming (24.2 - 63.1, n=10, last 2 years) | |
| Schenker XMG Pro 16 Studio (Mid 24) | |
| Average NVIDIA GeForce RTX 4070 Laptop GPU (23.7 - 33.3, n=4) | |
| 2560x1440 High Preset + Quality DLSS | |
| Average of class Gaming (39.6 - 81.9, n=9, last 2 years) | |
| Schenker XMG Pro 16 Studio (Mid 24) | |
| Average NVIDIA GeForce RTX 4070 Laptop GPU (42.2 - 47.8, n=2) | |
| Ghost of Tsushima | |
| 1920x1080 Very High Preset AA:T | |
| Schenker XMG Pro 16 Studio (Mid 24) | |
| Average of class Gaming (28.5 - 108.1, n=15, last 2 years) | |
| Average NVIDIA GeForce RTX 4070 Laptop GPU (55.3 - 73.7, n=5) | |
| 2560x1440 Very High Preset AA:T | |
| Schenker XMG Pro 16 Studio (Mid 24) | |
| Average of class Gaming (22.7 - 100.3, n=13, last 2 years) | |
| Average NVIDIA GeForce RTX 4070 Laptop GPU (43.6 - 56.1, n=5) | |
| 2560x1440 Very High Preset + Quality DLSS | |
| Schenker XMG Pro 16 Studio (Mid 24) | |
| Average of class Gaming (55.2 - 105.2, n=10, last 2 years) | |
| Average NVIDIA GeForce RTX 4070 Laptop GPU (57 - 74.2, n=3) | |
| The First Descendant | |
| 1920x1080 Ultra Preset | |
| Schenker XMG Pro 16 Studio (Mid 24) | |
| Average NVIDIA GeForce RTX 4070 Laptop GPU (73.7 - 83.6, n=5) | |
| Average of class Gaming (15.4 - 78.6, n=3, last 2 years) | |
| 2560x1440 Ultra Preset | |
| Schenker XMG Pro 16 Studio (Mid 24) | |
| Average NVIDIA GeForce RTX 4070 Laptop GPU (48.2 - 52.5, n=5) | |
| Average of class Gaming (43.7 - 50.1, n=2, last 2 years) | |
| 2560x1440 Ultra Preset + Ultra Ray Tracing + DLSS Quality | |
| Schenker XMG Pro 16 Studio (Mid 24) | |
| Average NVIDIA GeForce RTX 4070 Laptop GPU (48.6 - 51.8, n=2) | |
| Average of class Gaming (n=1last 2 years) | |
| F1 24 | |
| 1920x1080 Ultra High Preset AA:T AF:16x | |
| Average of class Gaming (46.1 - 157.8, n=57, last 2 years) | |
| Average NVIDIA GeForce RTX 4070 Laptop GPU (58.4 - 81.2, n=10) | |
| Schenker XMG Pro 16 Studio (Mid 24) | |
| 2560x1440 Ultra High Preset AA:T AF:16x | |
| Average of class Gaming (29.8 - 106.9, n=57, last 2 years) | |
| Average NVIDIA GeForce RTX 4070 Laptop GPU (36.8 - 51.3, n=10) | |
| Schenker XMG Pro 16 Studio (Mid 24) | |
| 2560x1440 Ultra High Preset + Quality DLSS AF:16x | |
| Average of class Gaming (14.3 - 159.3, n=48, last 2 years) | |
| Average NVIDIA GeForce RTX 4070 Laptop GPU (57 - 86.3, n=8) | |
| Schenker XMG Pro 16 Studio (Mid 24) | |
Cyberpunk 2077 ultra FPS diagram

| low | med. | high | ultra | QHD DLSS | QHD | |
|---|---|---|---|---|---|---|
| GTA V (2015) | 186.7 | 184.9 | 180.9 | 126 | 95.9 | |
| Dota 2 Reborn (2015) | 231 | 196.2 | 181.6 | 160.8 | ||
| Final Fantasy XV Benchmark (2018) | 214 | 163.6 | 119.7 | 86.8 | ||
| X-Plane 11.11 (2018) | 178 | 147.3 | 119.5 | |||
| Strange Brigade (2018) | 457 | 297 | 236 | 206 | 135.9 | |
| Baldur's Gate 3 (2023) | 171.8 | 132 | 115.3 | 111.8 | 77.2 | |
| Cyberpunk 2077 (2023) | 126.3 | 112.1 | 95.5 | 82.5 | 48.6 | |
| Dragon's Dogma 2 (2024) | 81 | 70.4 | 58.5 | |||
| Ghost of Tsushima (2024) | 114.9 | 102.8 | 93 | 73.7 | 74.2 | 56.1 |
| Senua's Saga Hellblade 2 (2024) | 78.3 | 64.9 | 51.2 | 47.8 | 33.3 | |
| F1 24 (2024) | 239 | 238 | 203 | 70.4 | 71.8 | 45.1 |
| The First Descendant (2024) | 171 | 110.9 | 91.3 | 80 | 51.2 |
Emissions & power - The XMG Pro with a high power consumption
Noise emissions
Cyberpunk 2077 increases the laptop's noise emissions to up to 53 dB(A) (performance mode), while the entertainment profile produces slightly more moderate values. Silent mode isn't suitable for gaming, as the dGPU is switched off. The device's noise level is lower when idling and during everyday use (office, internet): The fans don't rev up excessively and occasionally, they stand still. Sometimes, an electronic crackling can be heard from inside the laptop.
Noise level
| Idle |
| 28 / 31 / 35 dB(A) |
| Load |
| 52 / 52 dB(A) |
 | ||
30 dB silent 40 dB(A) audible 50 dB(A) loud |
||
min: | ||
| Schenker XMG Pro 16 Studio (Mid 24) GeForce RTX 4070 Laptop GPU, i9-14900HX, Samsung 990 Pro 1 TB | Acer Predator Helios Neo 16 (2024) GeForce RTX 4070 Laptop GPU, i7-14700HX, Samsung PM9A1a MZVL21T0HDLU | Lenovo Legion Pro 5 16IRX9 GeForce RTX 4070 Laptop GPU, i9-14900HX, Samsung PM9A1 MZVL21T0HCLR | Aorus 16X 2024 GeForce RTX 4070 Laptop GPU, i9-14900HX, Gigabyte AG450E1024-SI | Schenker XMG Pro 16 Studio (Mid 23) GeForce RTX 4070 Laptop GPU, i9-13900H, Samsung 990 Pro 1 TB | Lenovo Legion 7 16 IRX G9 GeForce RTX 4070 Laptop GPU, i9-14900HX, SK Hynix HFS001TEJ9X115N | |
|---|---|---|---|---|---|---|
| Noise | 3% | 10% | -3% | 7% | 16% | |
| off / environment * (dB) | 25 | 25.2 -1% | 23.9 4% | 26 -4% | 25 -0% | 24.5 2% |
| Idle Minimum * (dB) | 28 | 27.8 1% | 24.3 13% | 26 7% | 26 7% | 24.5 12% |
| Idle Average * (dB) | 31 | 32 -3% | 24.3 22% | 32 -3% | 29 6% | 24.5 21% |
| Idle Maximum * (dB) | 35 | 29.6 15% | 28.9 17% | 38 -9% | 34 3% | 24.5 30% |
| Load Average * (dB) | 52 | 45.2 13% | 45.8 12% | 54 -4% | 43 17% | 34.8 33% |
| Cyberpunk 2077 ultra * (dB) | 53 | |||||
| Load Maximum * (dB) | 52 | 55.8 -7% | 56.6 -9% | 55 -6% | 48 8% | 54.1 -4% |
| Witcher 3 ultra * (dB) | 51 | 50 | 48 | 54.1 |
* ... smaller is better
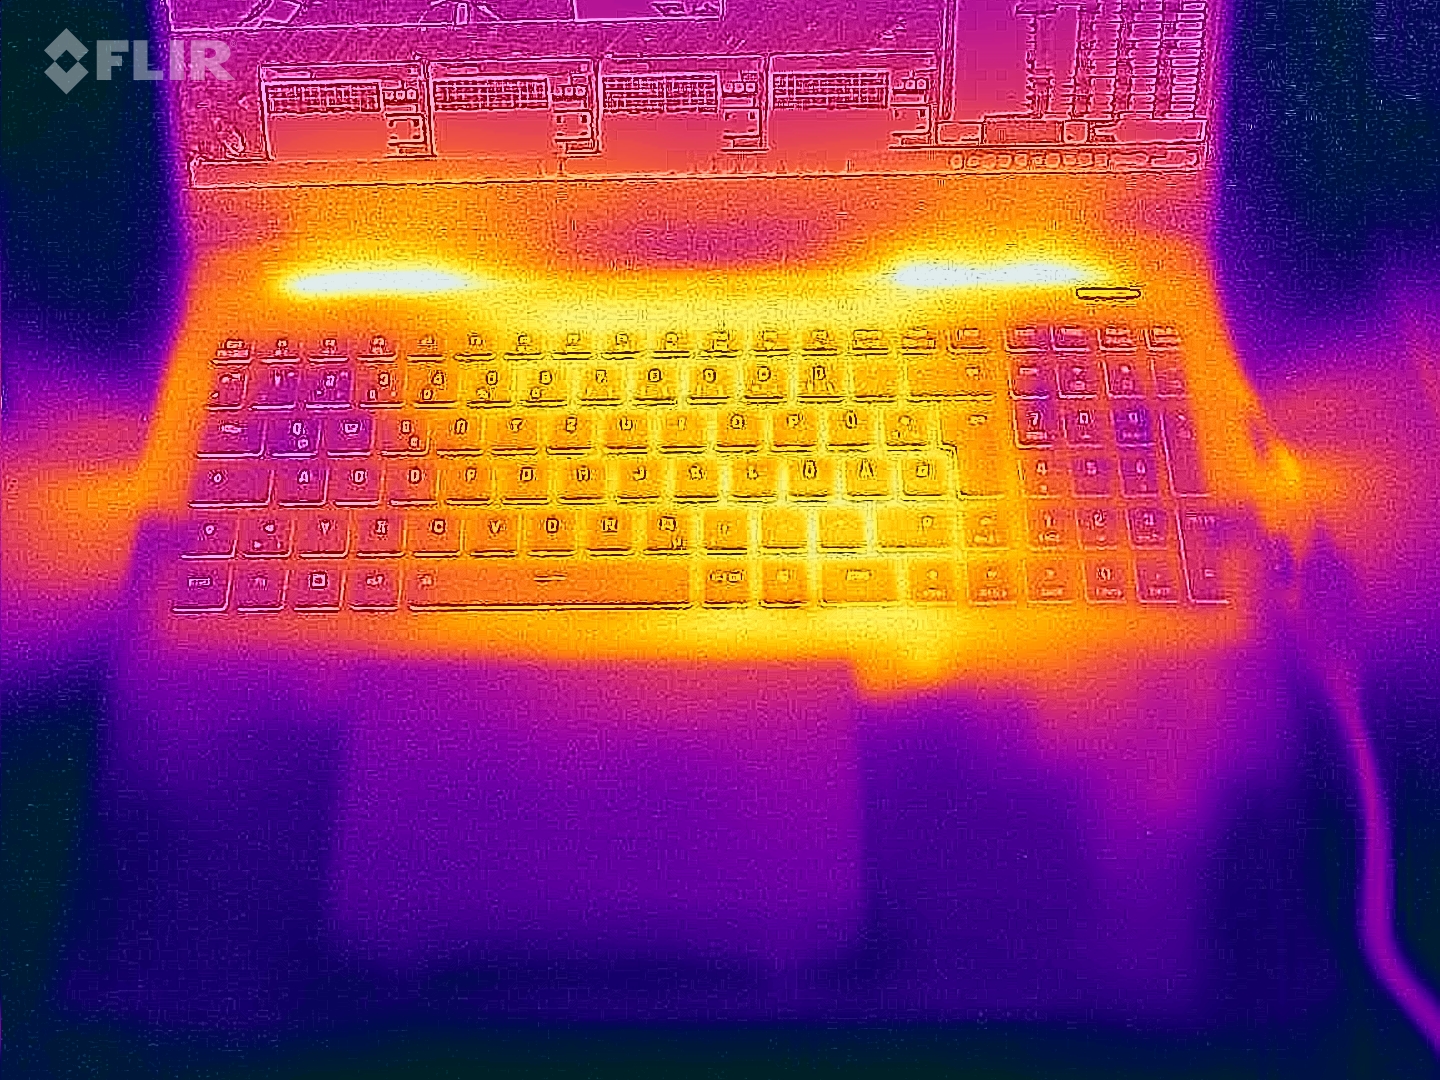
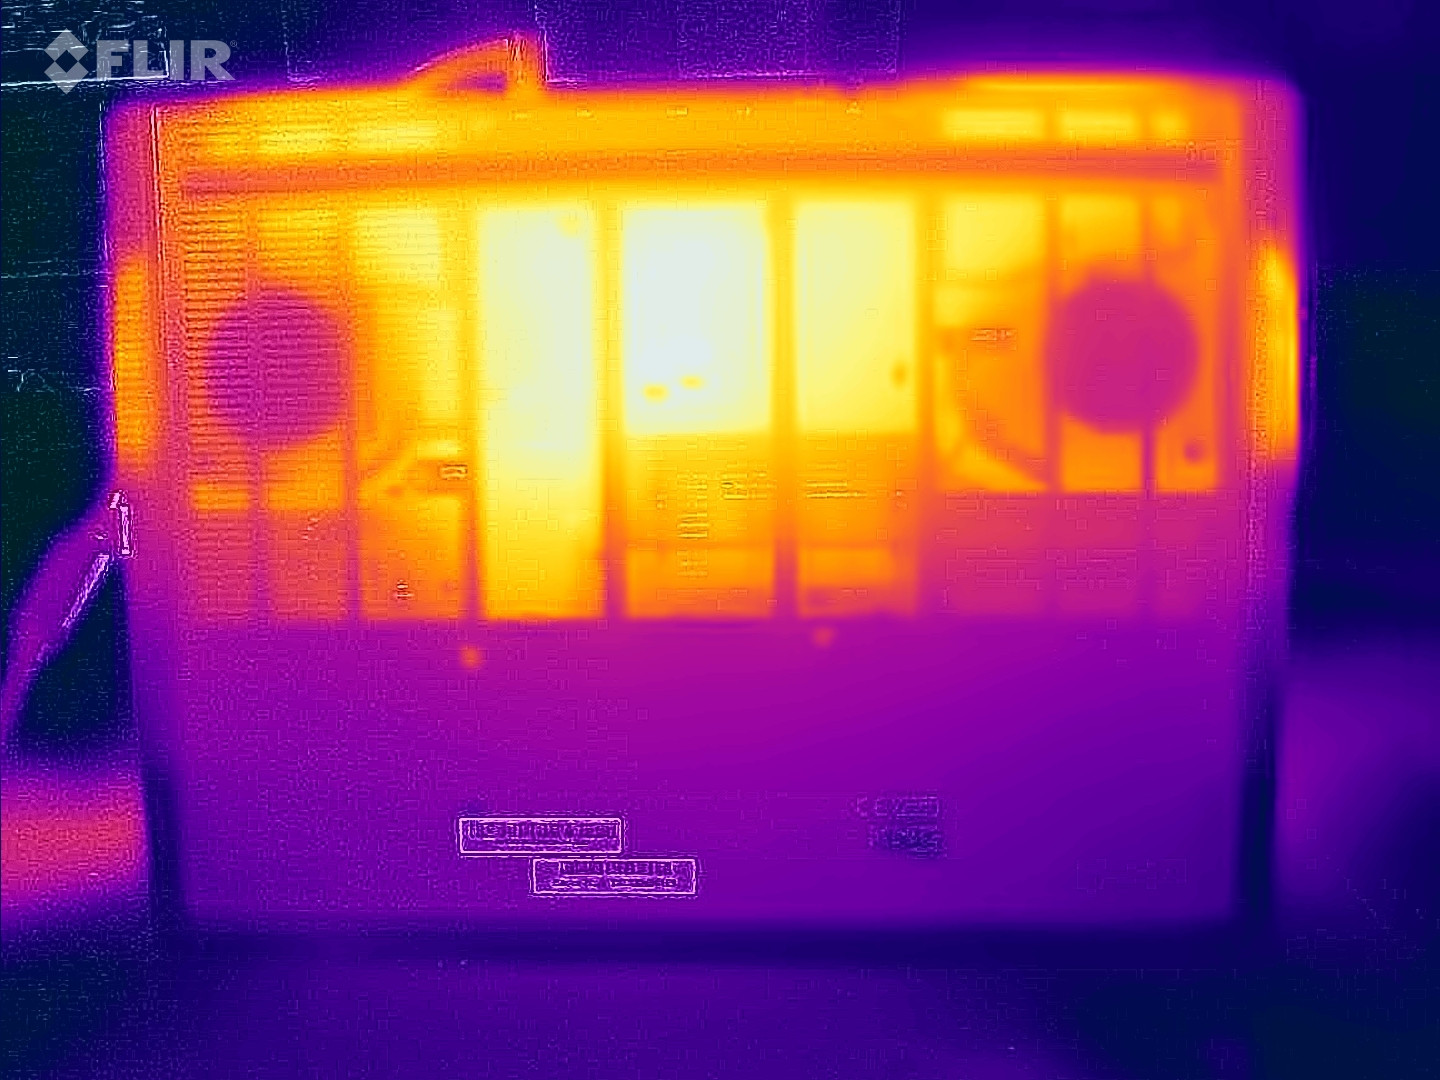
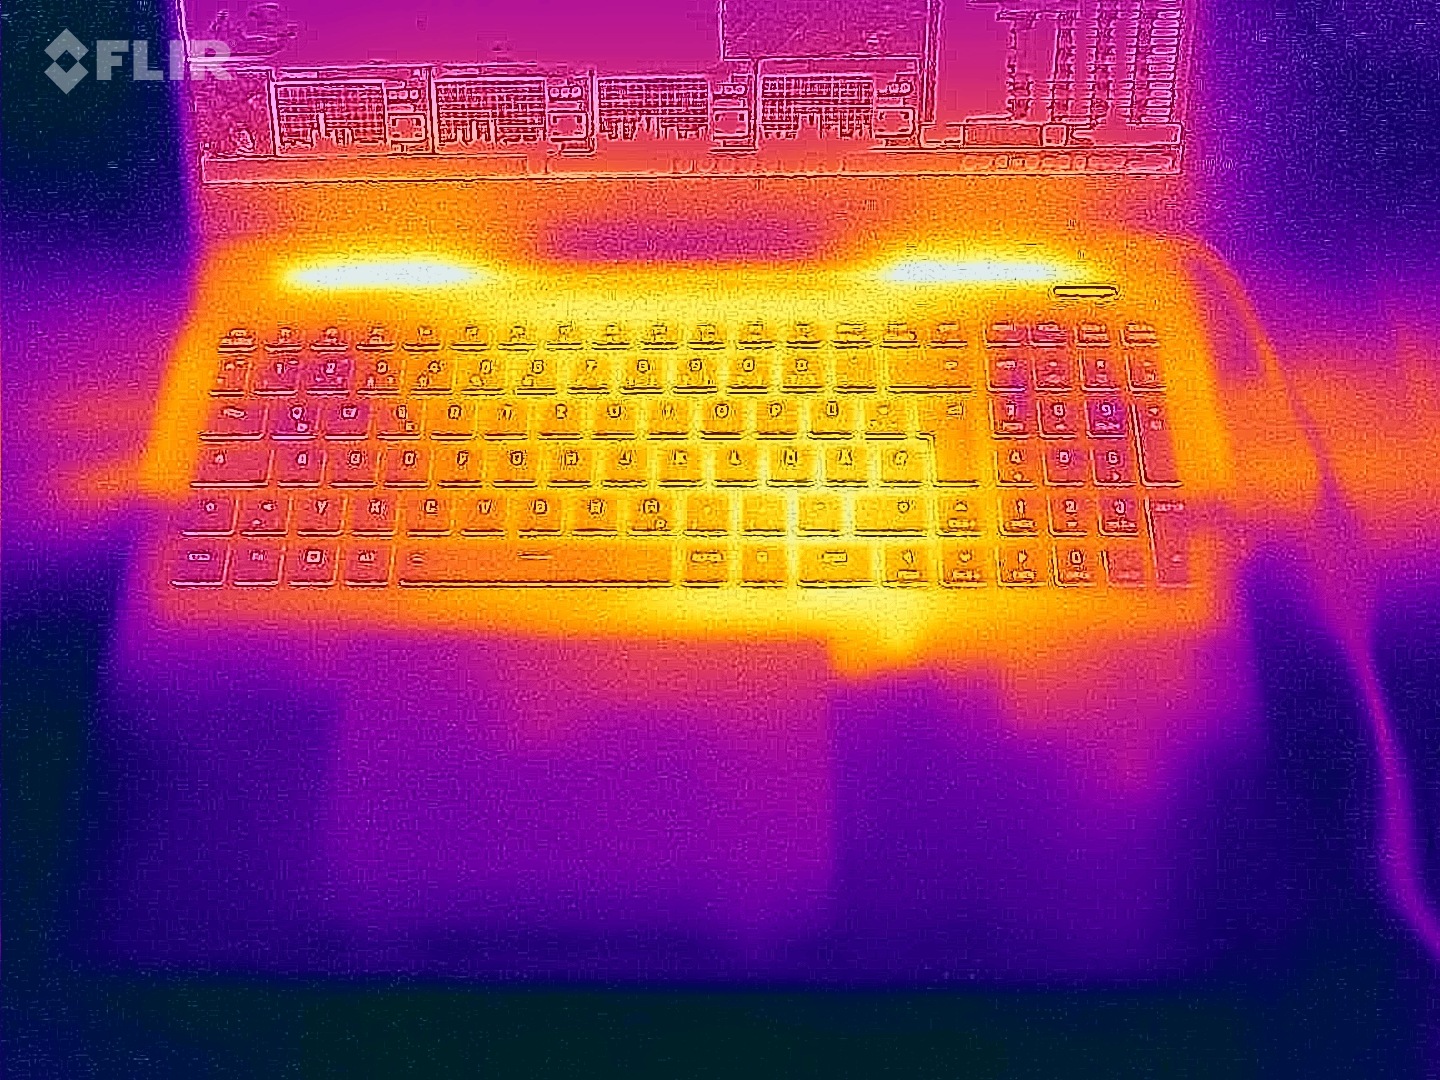
Temperature
The laptop heats up noticeably: Cyberpunk and the stress tests resulted in temperatures above 60 degrees Celsius at certain points. Values above the average can also be reached during everyday use (office, internet). The temperatures of the palm rest aren't as bad.
The extreme stress test scenario (Prime95 and Furmark in continuous operation) checks the system's stability under full load. The device's priorities are clearly distributed: While the GPU worked at full power, the CPU clock (400 MHz to 2 GHz) was below the base clock.
(-) The maximum temperature on the upper side is 51 °C / 124 F, compared to the average of 40.4 °C / 105 F, ranging from 21.2 to 68.8 °C for the class Gaming.
(-) The bottom heats up to a maximum of 66 °C / 151 F, compared to the average of 43.2 °C / 110 F
(±) In idle usage, the average temperature for the upper side is 32.3 °C / 90 F, compared to the device average of 33.9 °C / 93 F.
(-) 3: The average temperature for the upper side is 42.2 °C / 108 F, compared to the average of 33.9 °C / 93 F for the class Gaming.
(+) The palmrests and touchpad are cooler than skin temperature with a maximum of 31 °C / 87.8 F and are therefore cool to the touch.
(-) The average temperature of the palmrest area of similar devices was 28.8 °C / 83.8 F (-2.2 °C / -4 F).

| Schenker XMG Pro 16 Studio (Mid 24) Intel Core i9-14900HX, NVIDIA GeForce RTX 4070 Laptop GPU | Acer Predator Helios Neo 16 (2024) Intel Core i7-14700HX, NVIDIA GeForce RTX 4070 Laptop GPU | Lenovo Legion Pro 5 16IRX9 Intel Core i9-14900HX, NVIDIA GeForce RTX 4070 Laptop GPU | Aorus 16X 2024 Intel Core i9-14900HX, NVIDIA GeForce RTX 4070 Laptop GPU | Schenker XMG Pro 16 Studio (Mid 23) Intel Core i9-13900H, NVIDIA GeForce RTX 4070 Laptop GPU | Lenovo Legion 7 16 IRX G9 Intel Core i9-14900HX, NVIDIA GeForce RTX 4070 Laptop GPU | |
|---|---|---|---|---|---|---|
| Heat | 9% | 11% | 14% | 2% | 22% | |
| Maximum Upper Side * (°C) | 51 | 58 -14% | 43.8 14% | 41 20% | 55 -8% | 43.7 14% |
| Maximum Bottom * (°C) | 66 | 45.2 32% | 55.4 16% | 41 38% | 66 -0% | 42.9 35% |
| Idle Upper Side * (°C) | 35 | 31.1 11% | 32.8 6% | 37 -6% | 33 6% | 29.1 17% |
| Idle Bottom * (°C) | 39 | 37.2 5% | 36 8% | 38 3% | 35 10% | 30.6 22% |
* ... smaller is better
Speakers
There is a clear lack of bass. Otherwise, the stereo speakers produce an acceptable sound. Their maximum level could be slightly higher.
Schenker XMG Pro 16 Studio (Mid 24) audio analysis
(±) | speaker loudness is average but good (79 dB)
Bass 100 - 315 Hz
(-) | nearly no bass - on average 15.1% lower than median
(±) | linearity of bass is average (13.6% delta to prev. frequency)
Mids 400 - 2000 Hz
(±) | higher mids - on average 5.3% higher than median
(+) | mids are linear (4.4% delta to prev. frequency)
Highs 2 - 16 kHz
(+) | balanced highs - only 4.4% away from median
(+) | highs are linear (4.9% delta to prev. frequency)
Overall 100 - 16.000 Hz
(±) | linearity of overall sound is average (17.7% difference to median)
Compared to same class
» 52% of all tested devices in this class were better, 10% similar, 38% worse
» The best had a delta of 6%, average was 18%, worst was 132%
Compared to all devices tested
» 35% of all tested devices were better, 8% similar, 57% worse
» The best had a delta of 4%, average was 23%, worst was 134%
Lenovo Legion Pro 5 16IRX9 audio analysis
(±) | speaker loudness is average but good (80.7 dB)
Bass 100 - 315 Hz
(-) | nearly no bass - on average 19% lower than median
(±) | linearity of bass is average (10.1% delta to prev. frequency)
Mids 400 - 2000 Hz
(+) | balanced mids - only 4.7% away from median
(+) | mids are linear (5.7% delta to prev. frequency)
Highs 2 - 16 kHz
(+) | balanced highs - only 3.3% away from median
(+) | highs are linear (5.6% delta to prev. frequency)
Overall 100 - 16.000 Hz
(±) | linearity of overall sound is average (17.2% difference to median)
Compared to same class
» 46% of all tested devices in this class were better, 11% similar, 42% worse
» The best had a delta of 6%, average was 18%, worst was 132%
Compared to all devices tested
» 32% of all tested devices were better, 8% similar, 60% worse
» The best had a delta of 4%, average was 23%, worst was 134%
Power consumption
In idle mode, the laptop's power consumption is far too high—significantly higher than the similarly equipped predecessor model. Cyberpunk and the stress tests were run with slightly decreasing, constantly fluctuating power consumption. The 230-watt power supply unit is still sufficiently sized. Short-term load peaks, such as at the start of the stress test, are not a problem for it.
| Off / Standby | |
| Idle | |
| Load |
|
Key:
min: | |
| Schenker XMG Pro 16 Studio (Mid 24) GeForce RTX 4070 Laptop GPU, i9-14900HX, Samsung 990 Pro 1 TB | Acer Predator Helios Neo 16 (2024) GeForce RTX 4070 Laptop GPU, i7-14700HX, Samsung PM9A1a MZVL21T0HDLU | Lenovo Legion Pro 5 16IRX9 GeForce RTX 4070 Laptop GPU, i9-14900HX, Samsung PM9A1 MZVL21T0HCLR | Aorus 16X 2024 GeForce RTX 4070 Laptop GPU, i9-14900HX, Gigabyte AG450E1024-SI | Schenker XMG Pro 16 Studio (Mid 23) GeForce RTX 4070 Laptop GPU, i9-13900H, Samsung 990 Pro 1 TB | |
|---|---|---|---|---|---|
| Power Consumption | 11% | 23% | 22% | 43% | |
| Idle Minimum * (Watt) | 31 | 26.7 14% | 12.5 60% | 13 58% | 8 74% |
| Idle Average * (Watt) | 33 | 24.4 26% | 24.6 25% | 18 45% | 12 64% |
| Idle Maximum * (Watt) | 41 | 32.7 20% | 24.8 40% | 35 15% | 23 44% |
| Load Average * (Watt) | 114 | 122.1 -7% | 109.6 4% | 138 -21% | 94 18% |
| Cyberpunk 2077 ultra * (Watt) | 218 | ||||
| Cyberpunk 2077 ultra external monitor * (Watt) | 196.8 | ||||
| Load Maximum * (Watt) | 250 | 241 4% | 284.9 -14% | 222 11% | 215 14% |
| Witcher 3 ultra * (Watt) | 190.6 | 218 | 172.6 | 181.5 |
* ... smaller is better
Power consumption Cyberpunk / stress test
Power consumption with external monitor
Runtimes
The Pro 16 also requires more power than its predecessor under low load in battery mode. As a result, it achieved a runtime of 5:37 hours during the WiFi test (mapping the load when accessing websites using a script). This leaves it a good hour behind its predecessor—which had the same battery capacity of 73 Wh.
Pros
Cons
Verdict - A powerhouse with problems
The Pro 16's focus lies on permanently high GPU power with performance values slightly above the GPU's average. The CPU already has to take it easy after a short while—the CB15 Loop revealed this.
The XMG Pro 16 Studio (Mid 24) can be assigned to the model maintenance department. Apart from a switch from Raptor Lake to Raptor Lake Refresh, the laptop boasts no significant new features.
The device's noise and heat development as well as its power consumption in idle mode are all (too) high. With regard to how power-hungry the laptop is, we can't rule out that our test sample has a defect. Its runtimes are decent.
Its installed 16:10 panel (16 inches, 2,560 x 1,600 pixels, sRGB, IPS, 240 Hz) is fine, but it lacks the DCI-P3 color space that is a prerequisite for a creator laptop. The device can still accommodate two PCIe 4 SSDs and RAID 0/1 is supported. A TB-4 port provides expansion options (external GPU, docking) and supports Power Delivery.
An alternative could be the Aorus 16X (2024). It can get a little more computing power out of the same CPU, features a much brighter screen (including Dolby Vision)—plus, it boasts better runtimes.
Price and availability
The new XMG Pro 16 Studio (Mid 24) can be configured and ordered via bestware.com, with the present test device costing around US$2,500.
Please note: We have recently updated our rating system and the results of version 8 are not comparable with the results of version 7. More information is available here.
Schenker XMG Pro 16 Studio (Mid 24)
- 07/23/2024 v8
Sascha Mölck
 Total Sustainability Score:
 Transparency
The selection of devices to be reviewed is made by our editorial team. The test sample was provided to the author as a loan by the manufacturer or retailer for the purpose of this review. The lender had no influence on this review, nor did the manufacturer receive a copy of this review before publication. There was no obligation to publish this review. As an independent media company, Notebookcheck is not subjected to the authority of manufacturers, retailers or publishers.
This is how Notebookcheck is testing
Every year, Notebookcheck independently reviews hundreds of laptops and smartphones using standardized procedures to ensure that all results are comparable. We have continuously developed our test methods for around 20 years and set industry standards in the process. In our test labs, high-quality measuring equipment is utilized by experienced technicians and editors. These tests involve a multi-stage validation process. Our complex rating system is based on hundreds of well-founded measurements and benchmarks, which maintains objectivity. Further information on our test methods can be found here.
Price comparison

