XMG Pro 16 Studio (Mid 23) review: The RTX 4070 laptop for gamers and creators

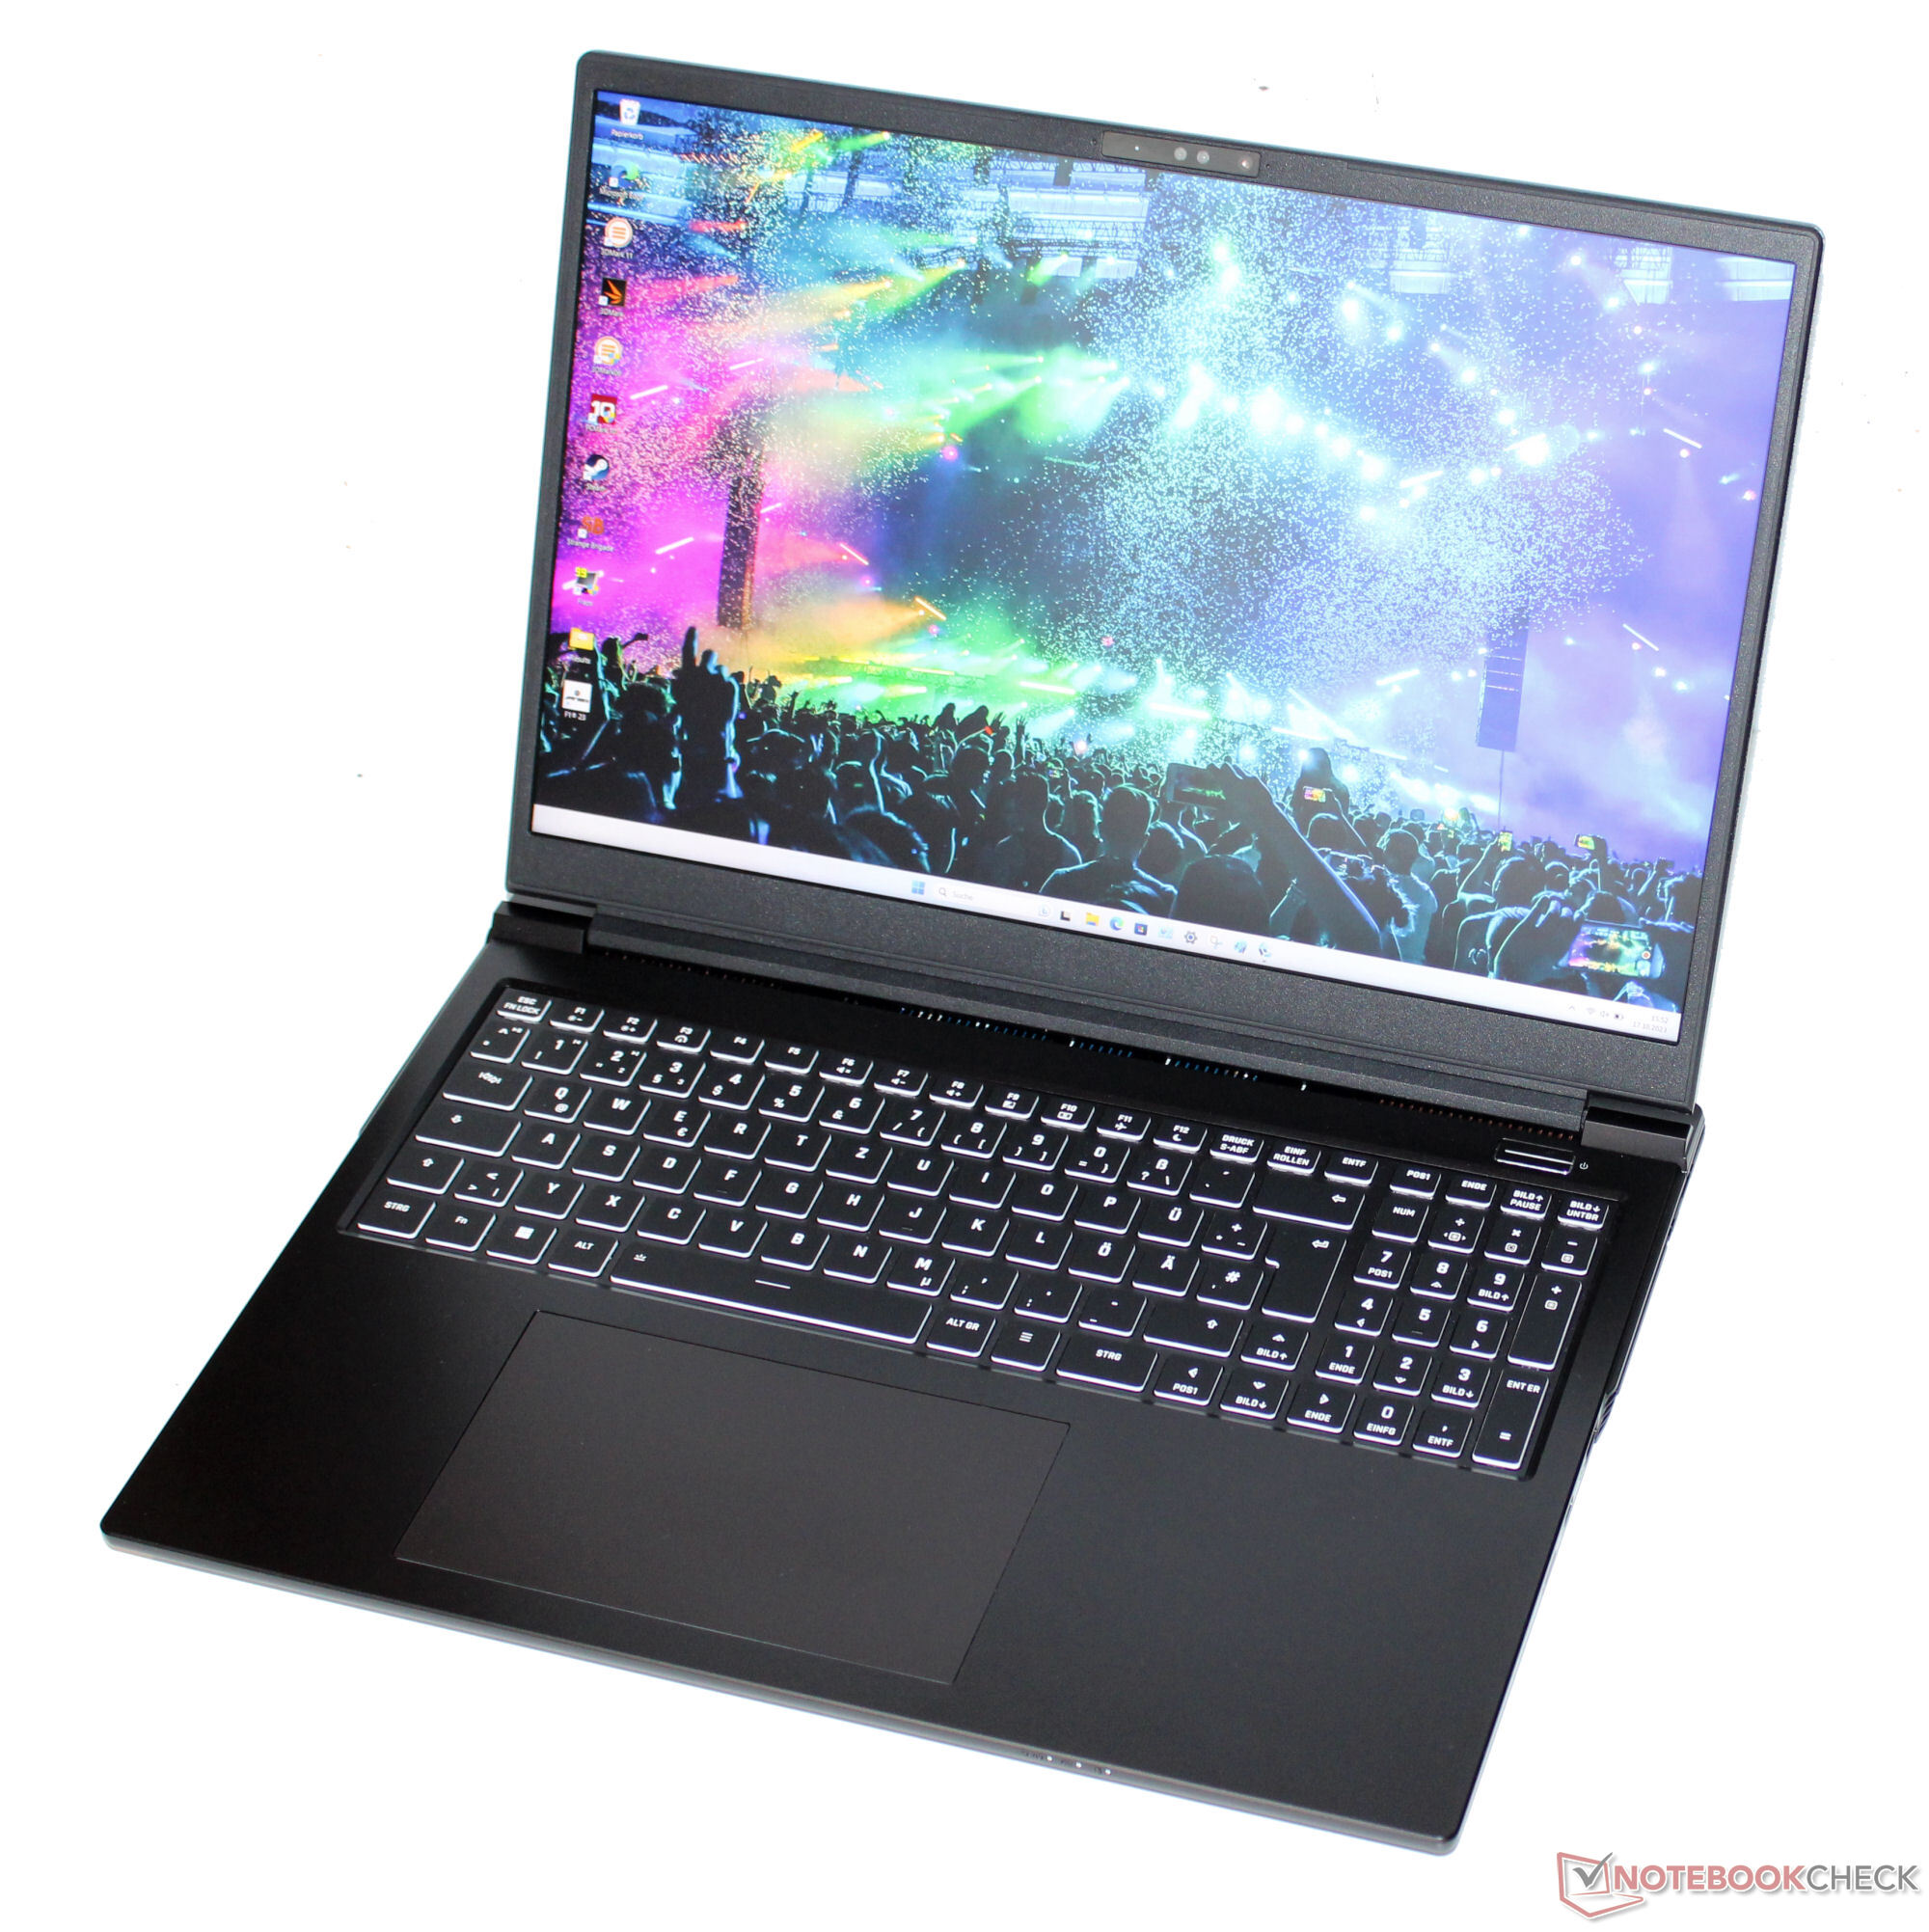
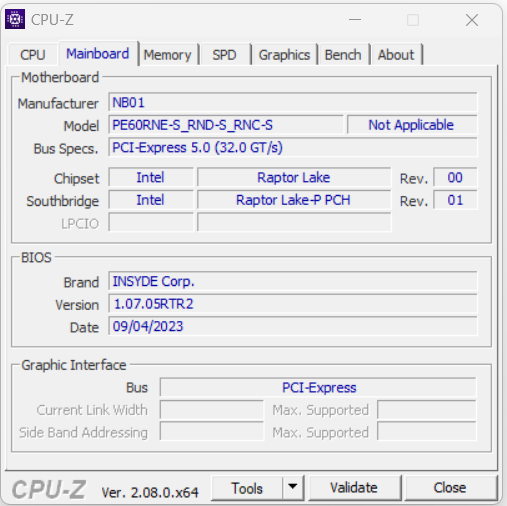
The XMG Pro 16 Studio (Mid 23) - a 16-inch laptop for gamers and creators - is based on a barebone (PE60RNE-S) made by Clevo and the present variant can currently be found for around US$2,400. Competitors include the Lenovo Legion Slim 7i 16 Gen 8, HP Omen Transcend 16, Asus Vivobook Pro 16X and the MSI Stealth 16 Studio A13VG.
Possible competitors compared
Rating | Date | Model | Weight | Height | Size | Resolution | Price |
|---|---|---|---|---|---|---|---|
| 87.9 % v7 (old) | 10 / 2023 | Schenker XMG Pro 16 Studio (Mid 23) i9-13900H, GeForce RTX 4070 Laptop GPU | 2.6 kg | 19.9 mm | 16.00" | 2560x1600 | |
| 86.2 % v7 (old) | 07 / 2023 | Asus Vivobook Pro 16X K6604JV-MX016W i9-13980HX, GeForce RTX 4060 Laptop GPU | 2.1 kg | 22.8 mm | 16.00" | 3200x2000 | |
| 90 % v7 (old) | 07 / 2023 | Lenovo Legion Slim 7i 16 Gen 8 i9-13900H, GeForce RTX 4070 Laptop GPU | 2.1 kg | 19.9 mm | 16.00" | 2560x1600 | |
| 87.9 % v7 (old) | 08 / 2023 | HP Omen Transcend 16 i9-13900HX, GeForce RTX 4070 Laptop GPU | 2.3 kg | 19.8 mm | 16.00" | 2560x1600 | |
| 88.8 % v7 (old) | 07 / 2023 | MSI Stealth 16 Studio A13VG i7-13700H, GeForce RTX 4070 Laptop GPU | 2 kg | 19.95 mm | 16.00" | 2560x1600 |
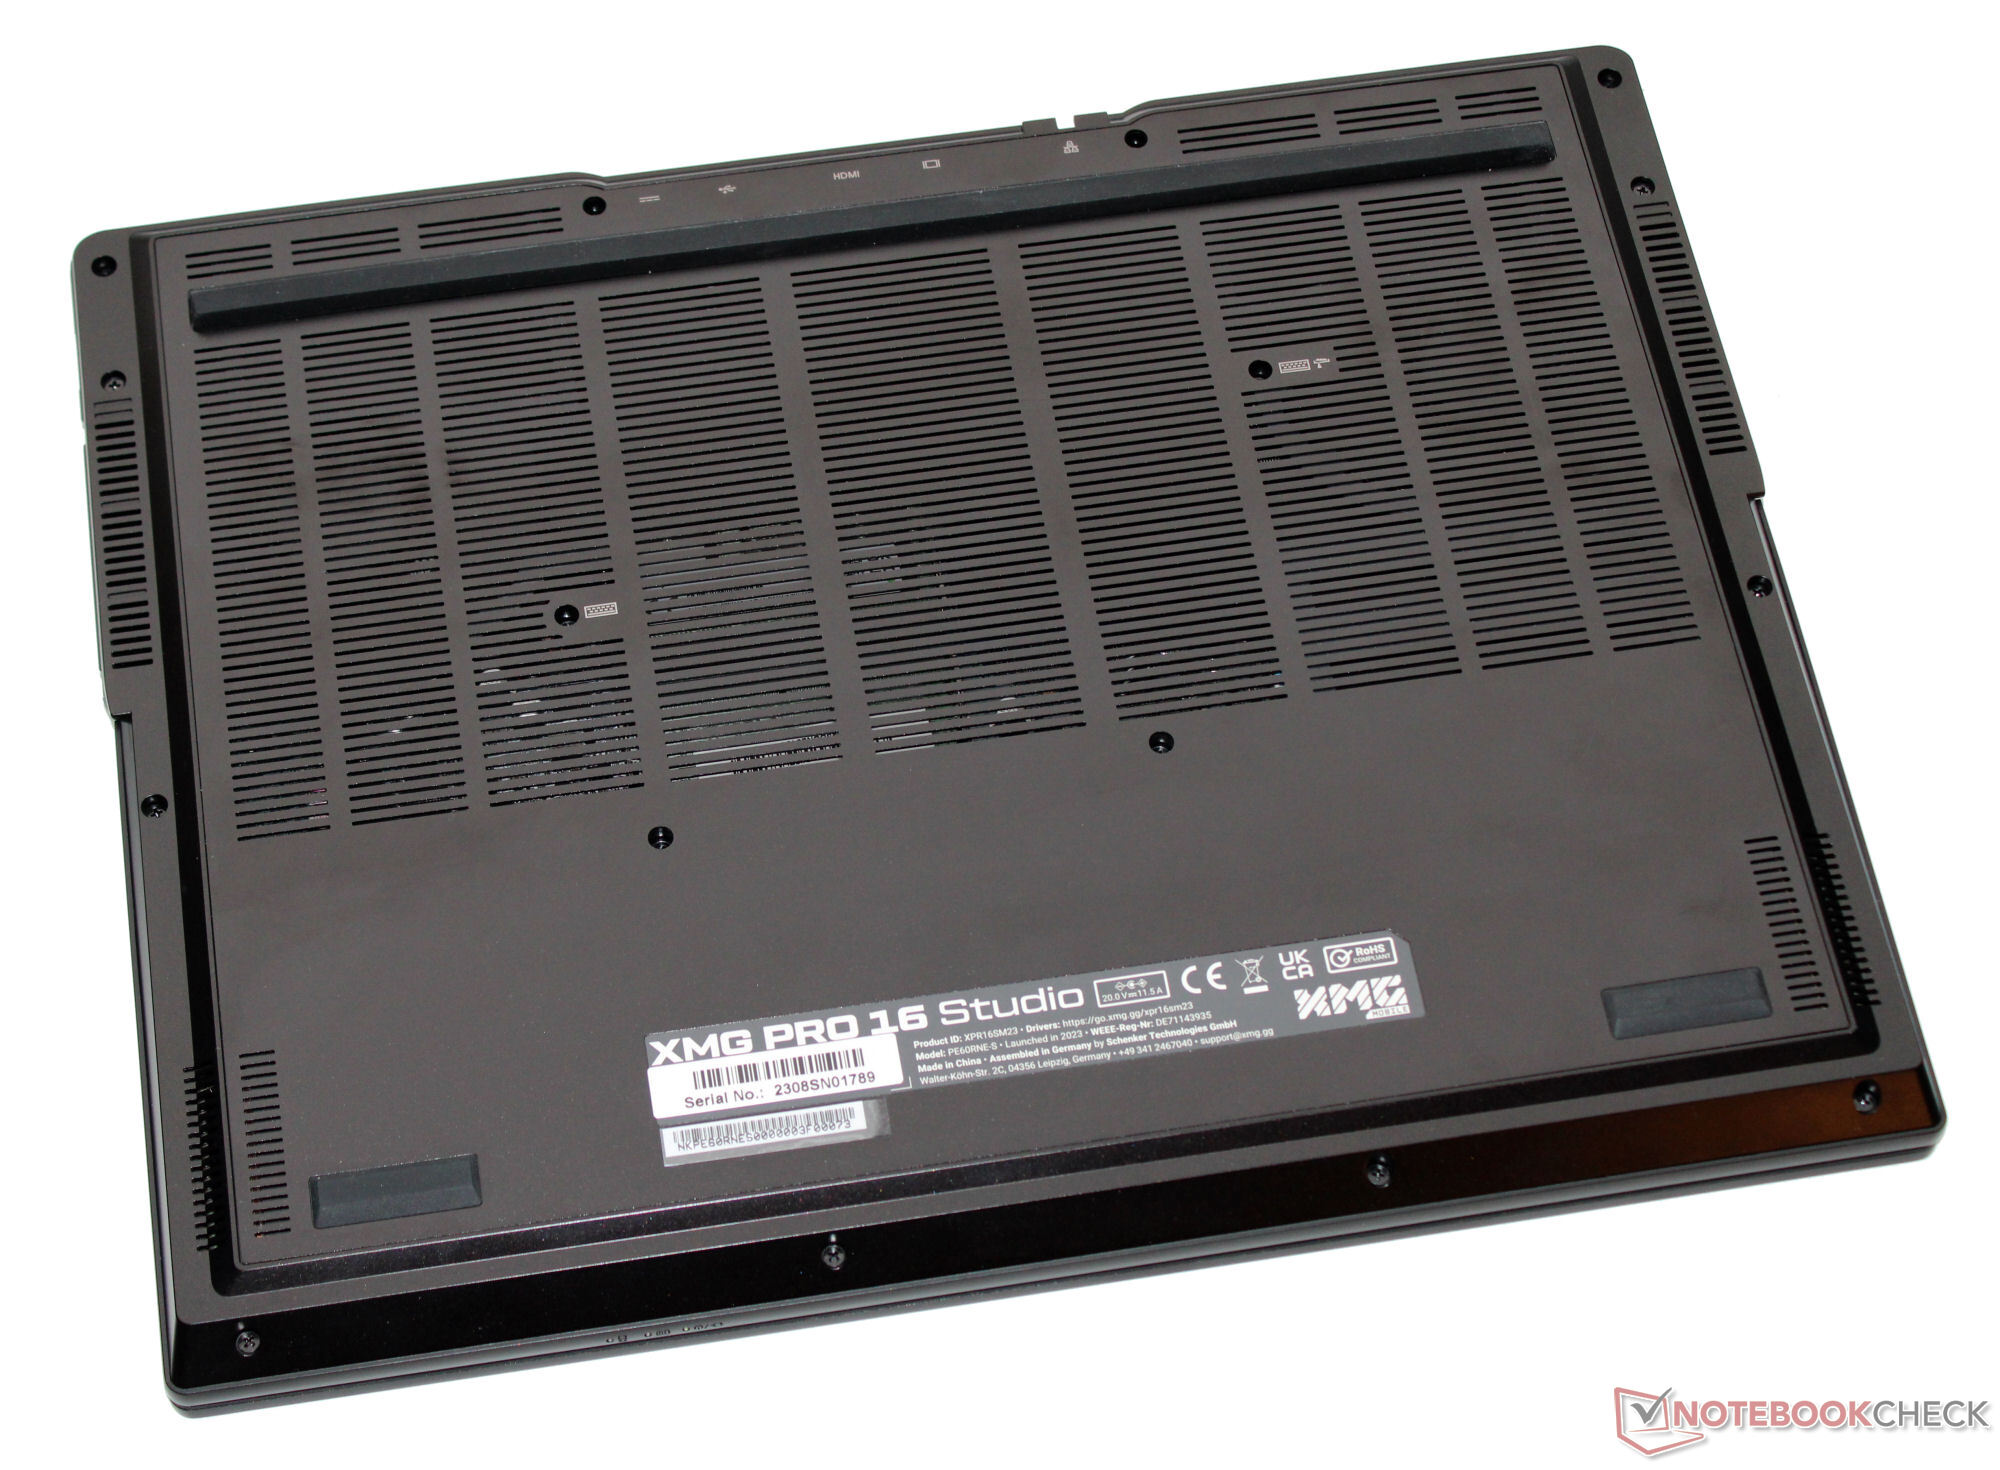
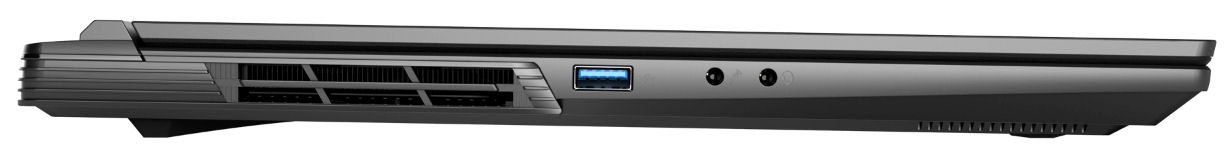
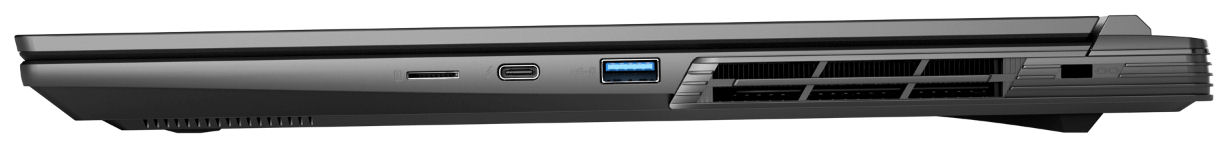
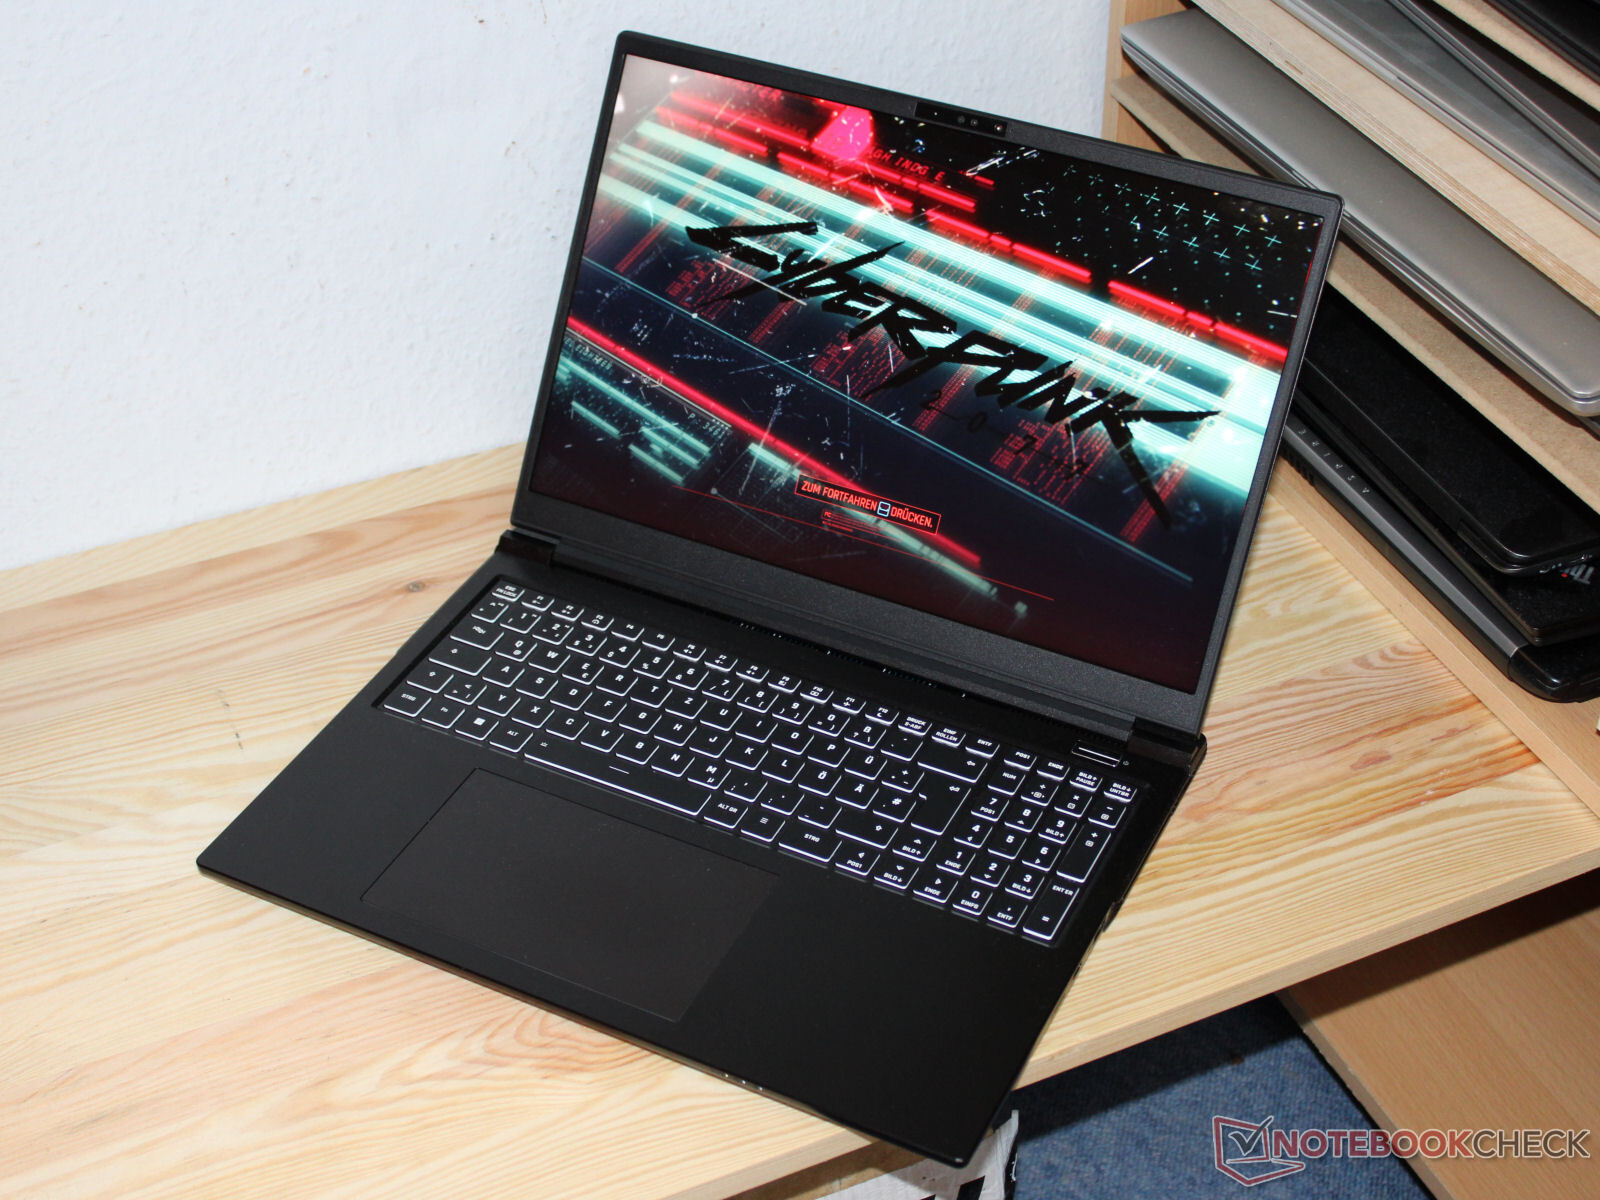
Case & connectivity - Clevo barebone with Thunderbolt 4
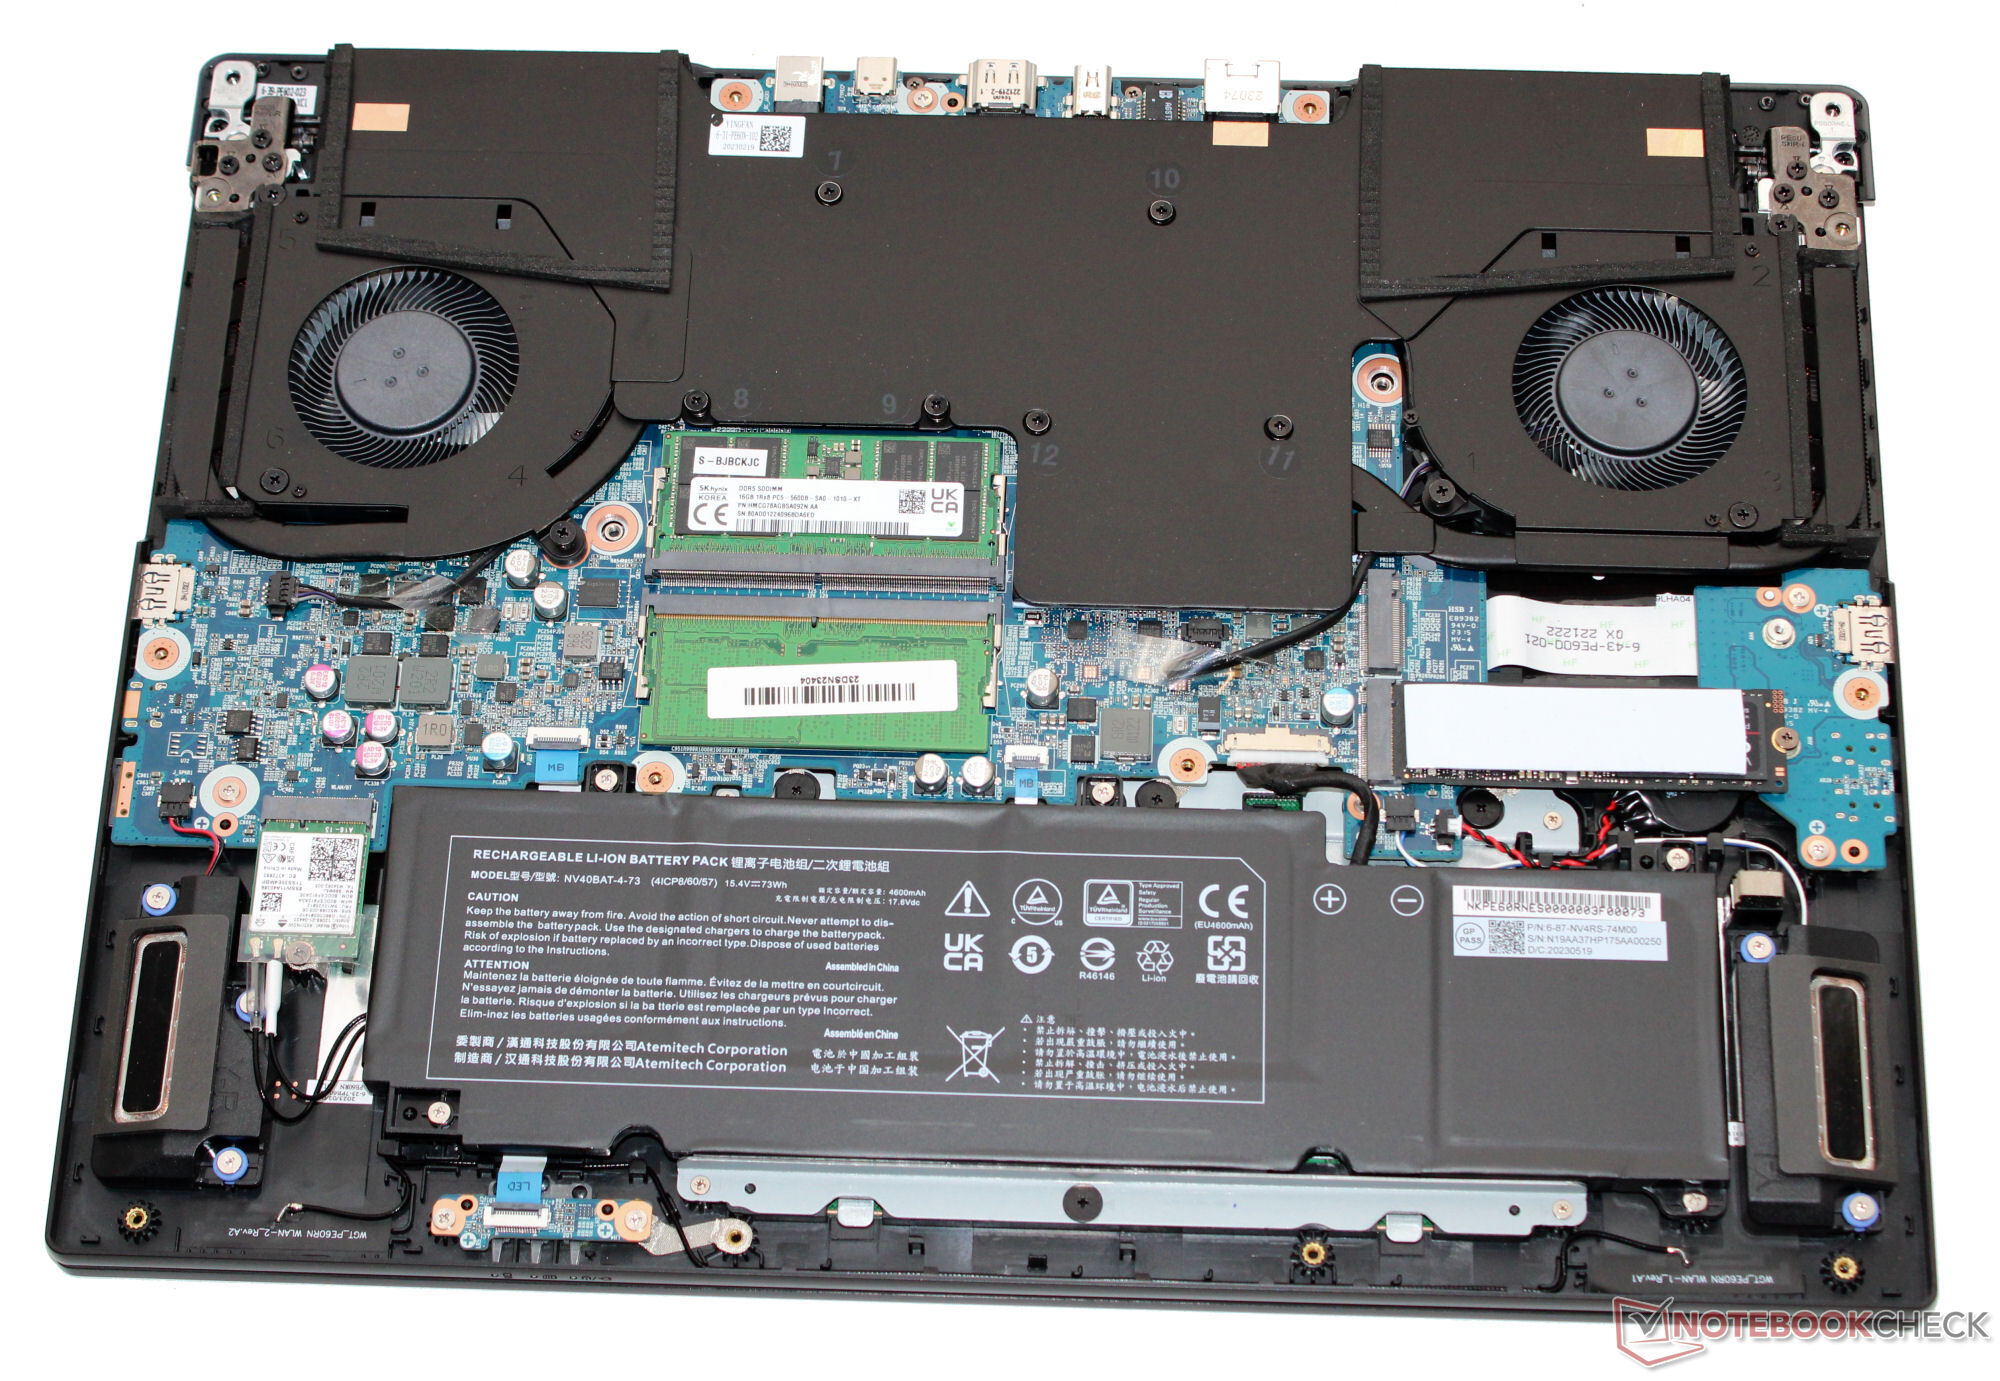
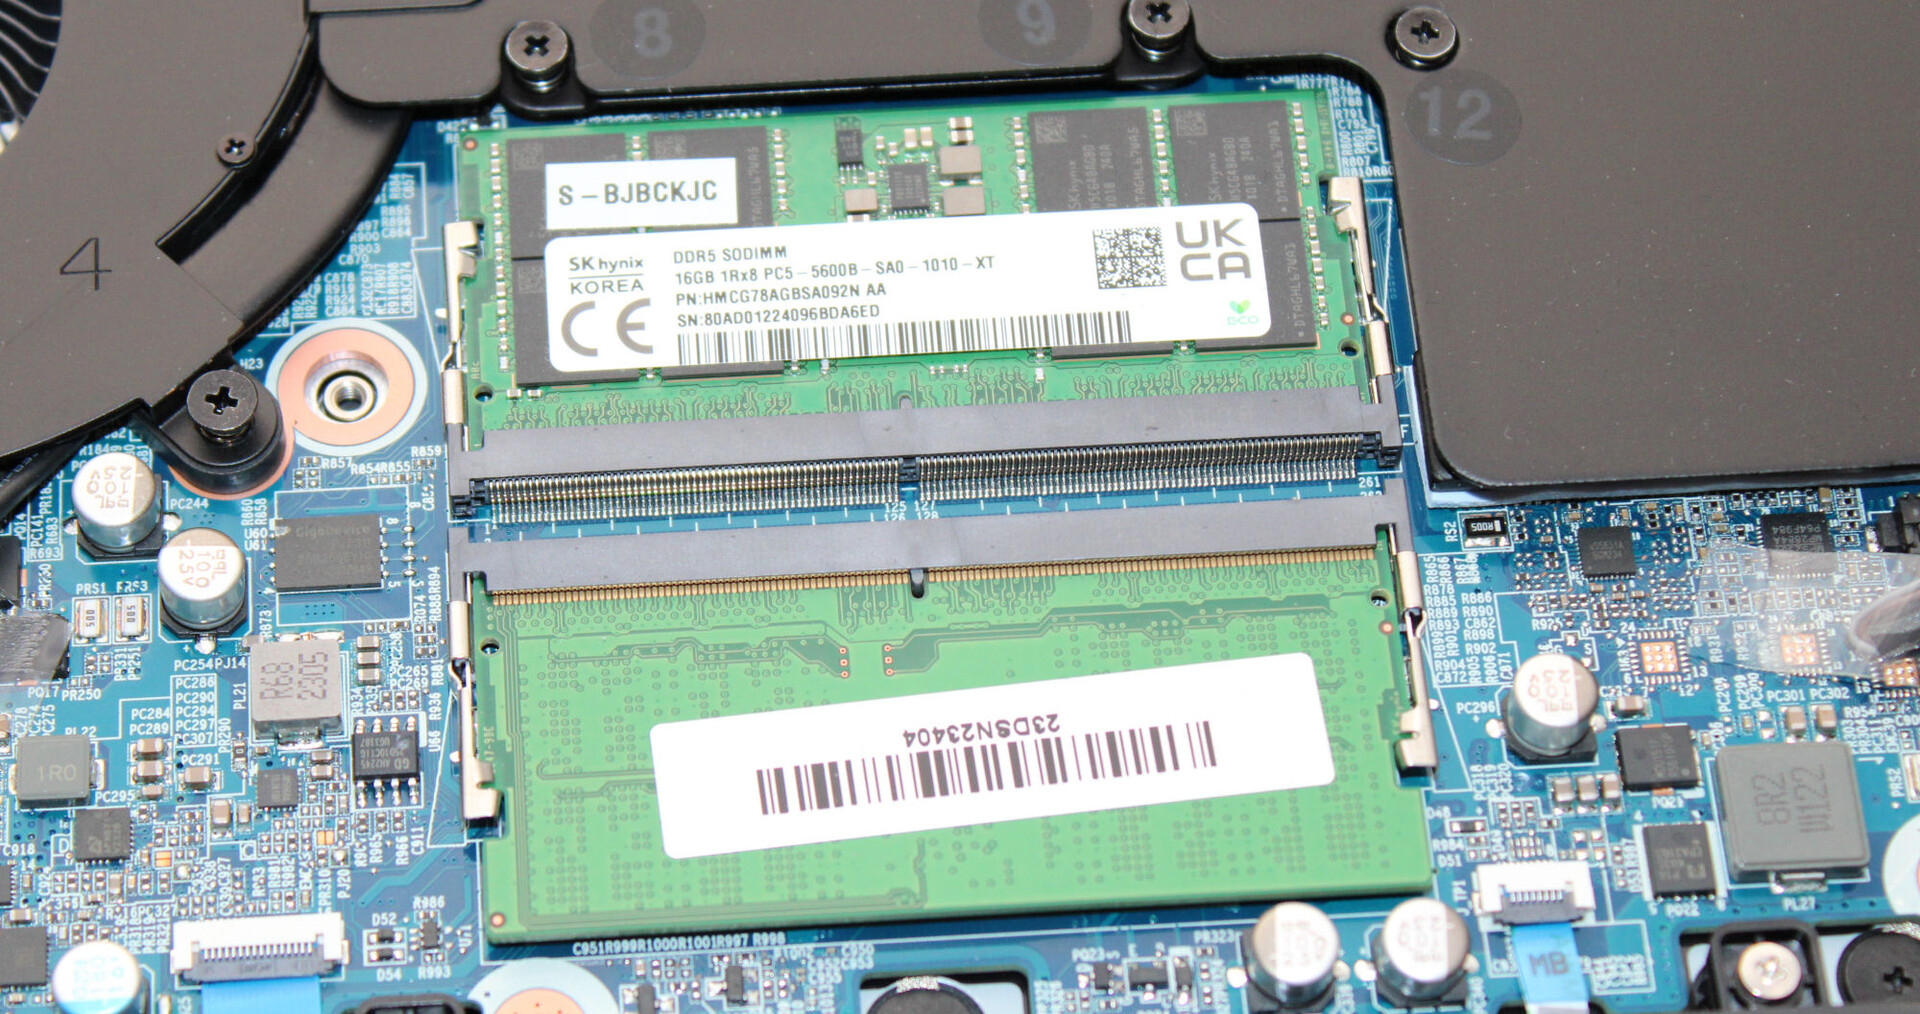
The matte-black case's lid and bottom are made from aluminum and the rest is made from plastic. The subtly designed case is built well. The base unit and lid can be twisted ever so slightly, but this is nothing to worry about. The battery (screwed on, not glued on) as well as the rest of the laptop's innards can be accessed once you remove the bottom plate.
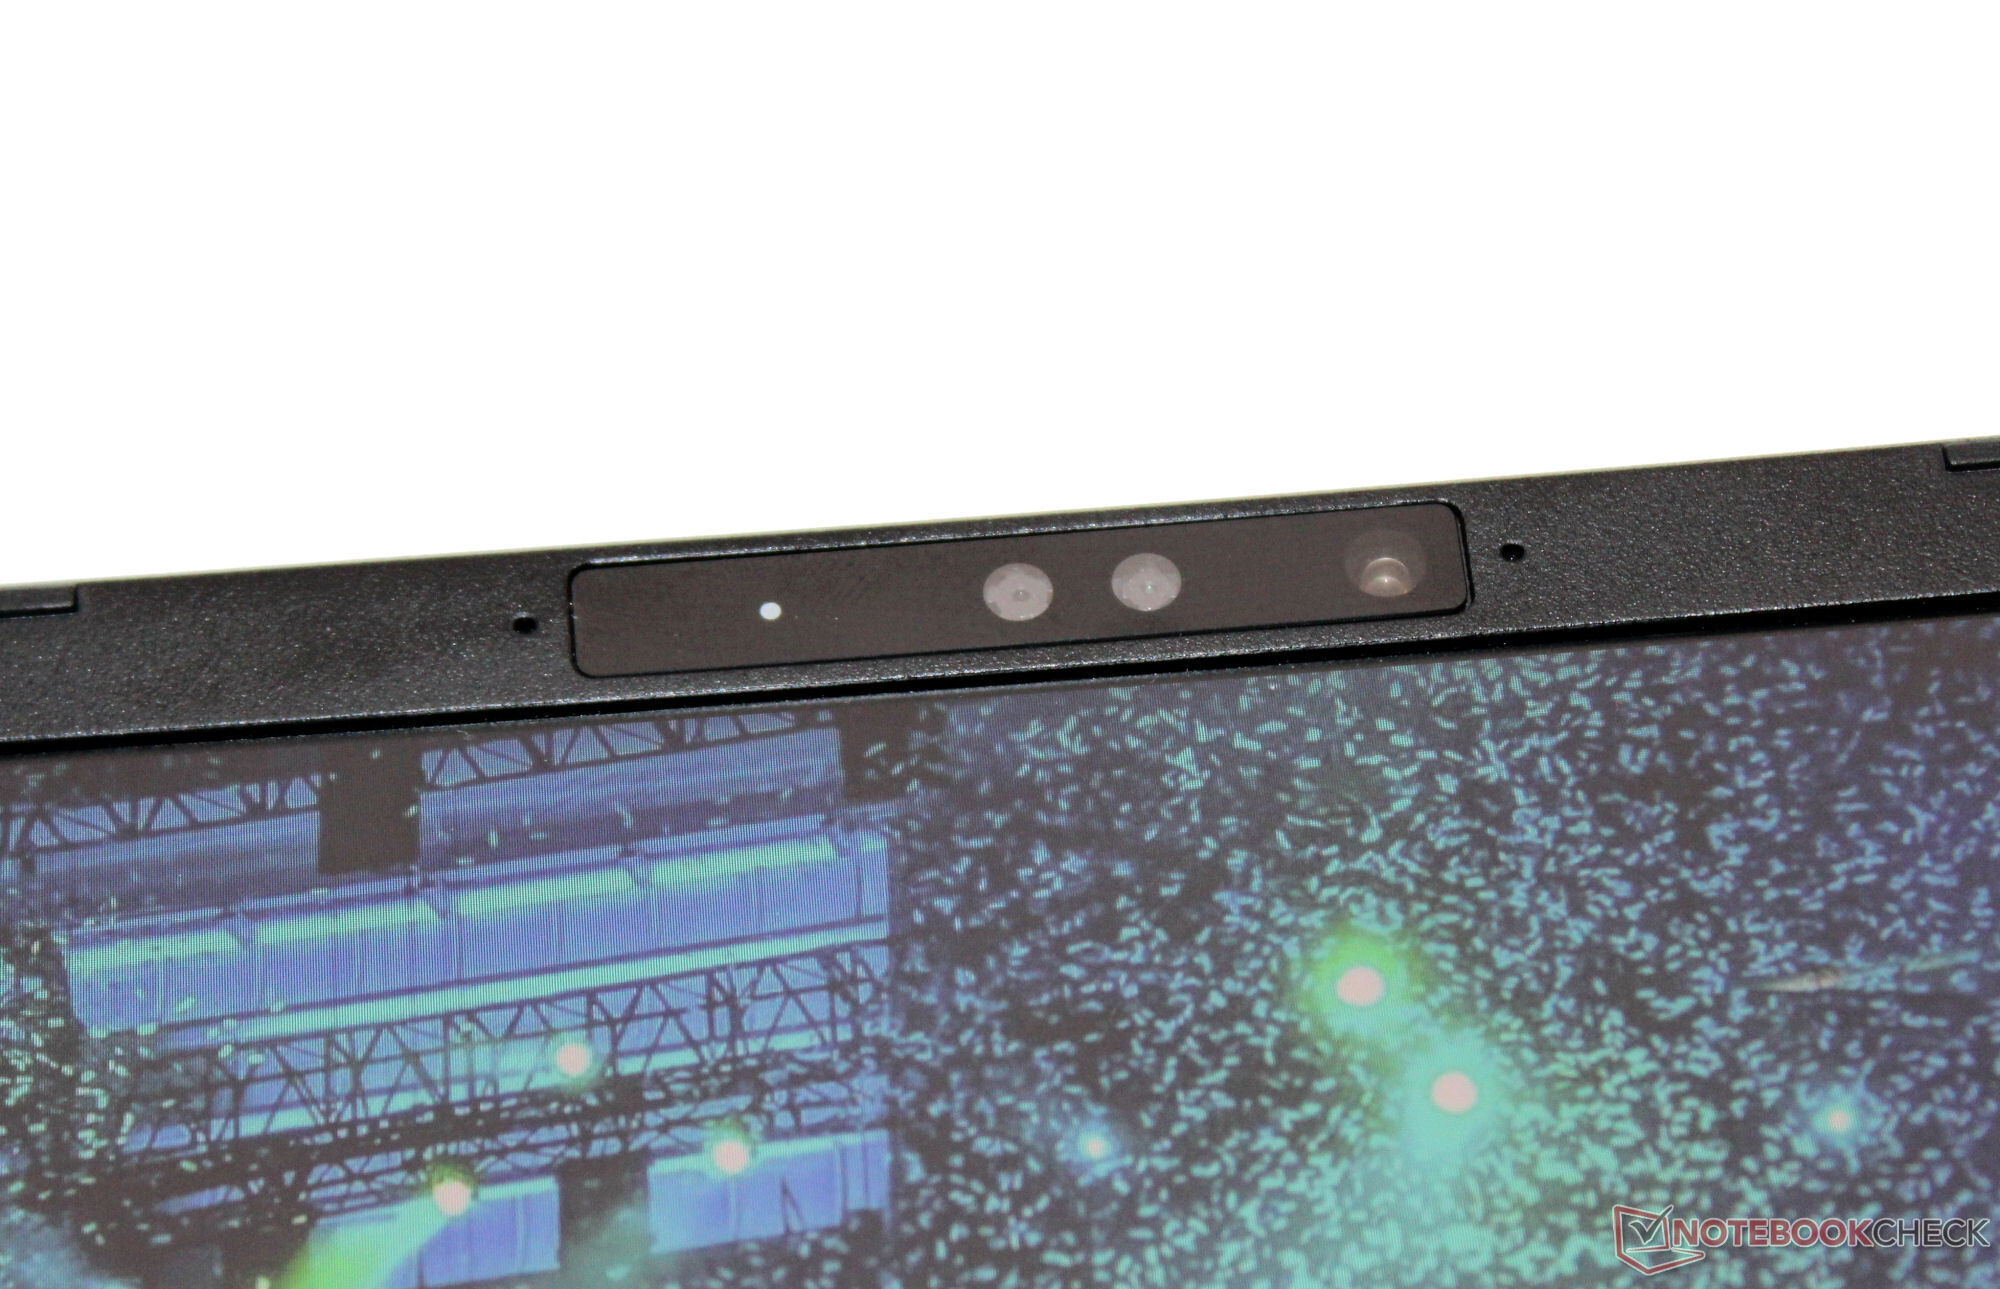
The Pro features two USB-A ports (USB 3.2 Gen 1) and two USB-C ports (1x USB 3.2 Gen 2, 1x Thunderbolt 4). The TB-4 port supports Power Delivery and can output a DisplayPort signal. In total, the laptop has three video outputs (1x HDMI, 2x DP). Its MicroSD card reader (reference card: AV PRO microSD 128 GB V60) can be classed as one of average speed. Its webcam (2.1 MP, max. 1,920 x 1,080 pixels, no cover) is pretty standard.
In optimum conditions (no WiFi devices in close vicinity, short distance between laptop and server PC), it achieves excellent WiFi data rates. The laptop uses a WiFi 6E chip (Intel AX211), and wired connections are taken care of by a Realtek RTL8125 controller (2.5 GBit/s).


| SD Card Reader | |
| average JPG Copy Test (av. of 3 runs) | |
| MSI Stealth 16 Studio A13VG | |
| Average of class Gaming (20.9 - 210, n=54, last 2 years) | |
| Asus Vivobook Pro 16X K6604JV-MX016W | |
| Schenker XMG Pro 16 Studio (Mid 23) (AV PRO microSD 128 GB V60) | |
| Lenovo Legion Slim 7i 16 Gen 8 (Toshiba Exceria Pro SDXC 64 GB UHS-II) | |
| maximum AS SSD Seq Read Test (1GB) | |
| MSI Stealth 16 Studio A13VG | |
| Average of class Gaming (25.5 - 261, n=51, last 2 years) | |
| Asus Vivobook Pro 16X K6604JV-MX016W | |
| Schenker XMG Pro 16 Studio (Mid 23) (AV PRO microSD 128 GB V60) | |
| Lenovo Legion Slim 7i 16 Gen 8 (Toshiba Exceria Pro SDXC 64 GB UHS-II) | |

 GeForce RTX 4070 Laptop GPU, i9-13900H, Samsung 990 Pro 1 TB")
 GeForce RTX 4070 Laptop GPU, i9-13900H, Samsung 990 Pro 1 TB")
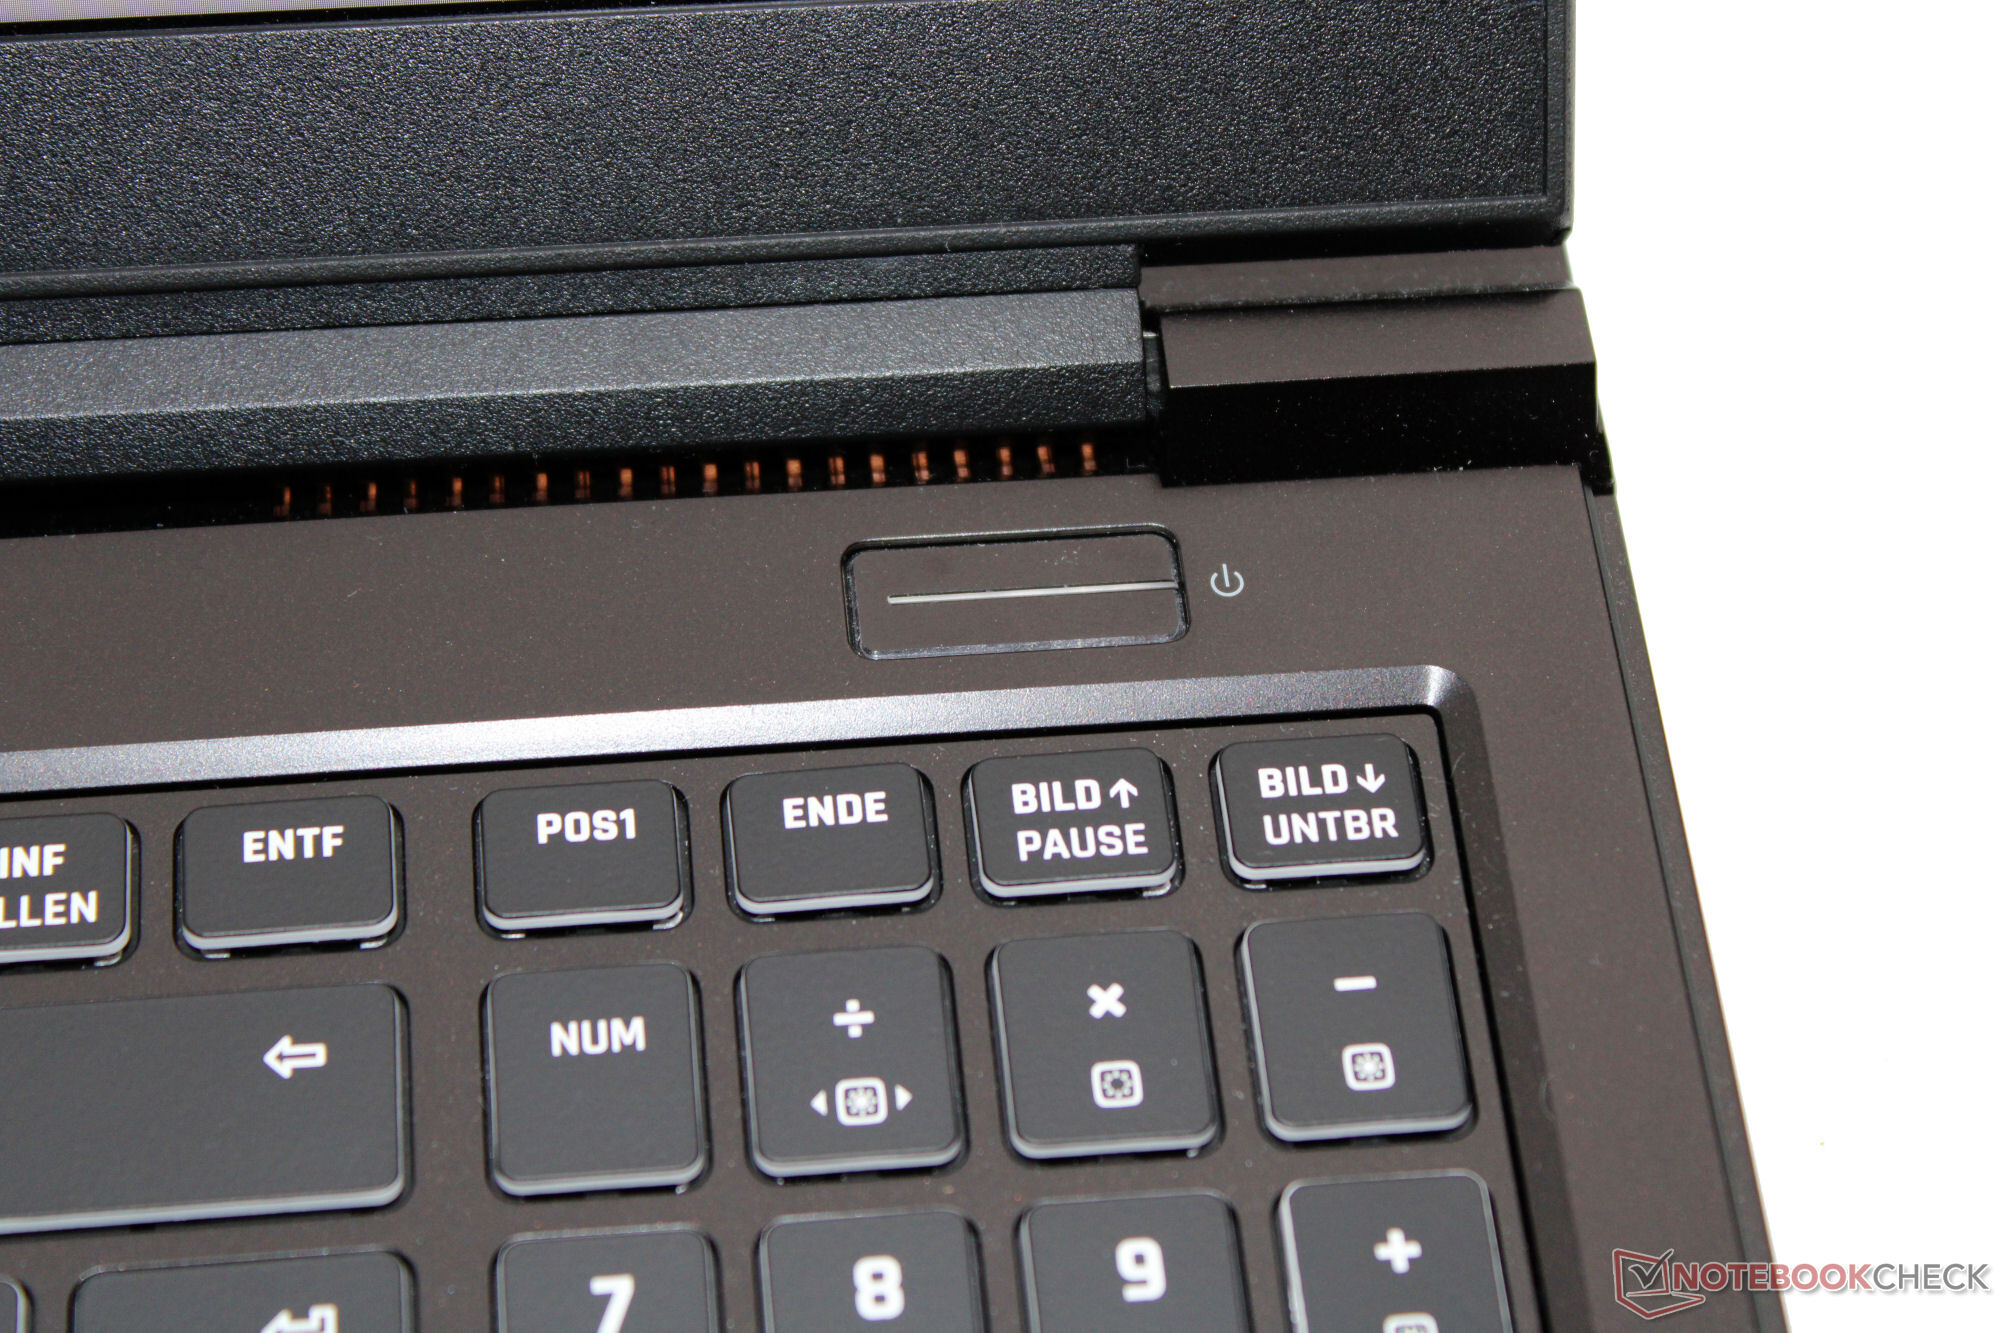
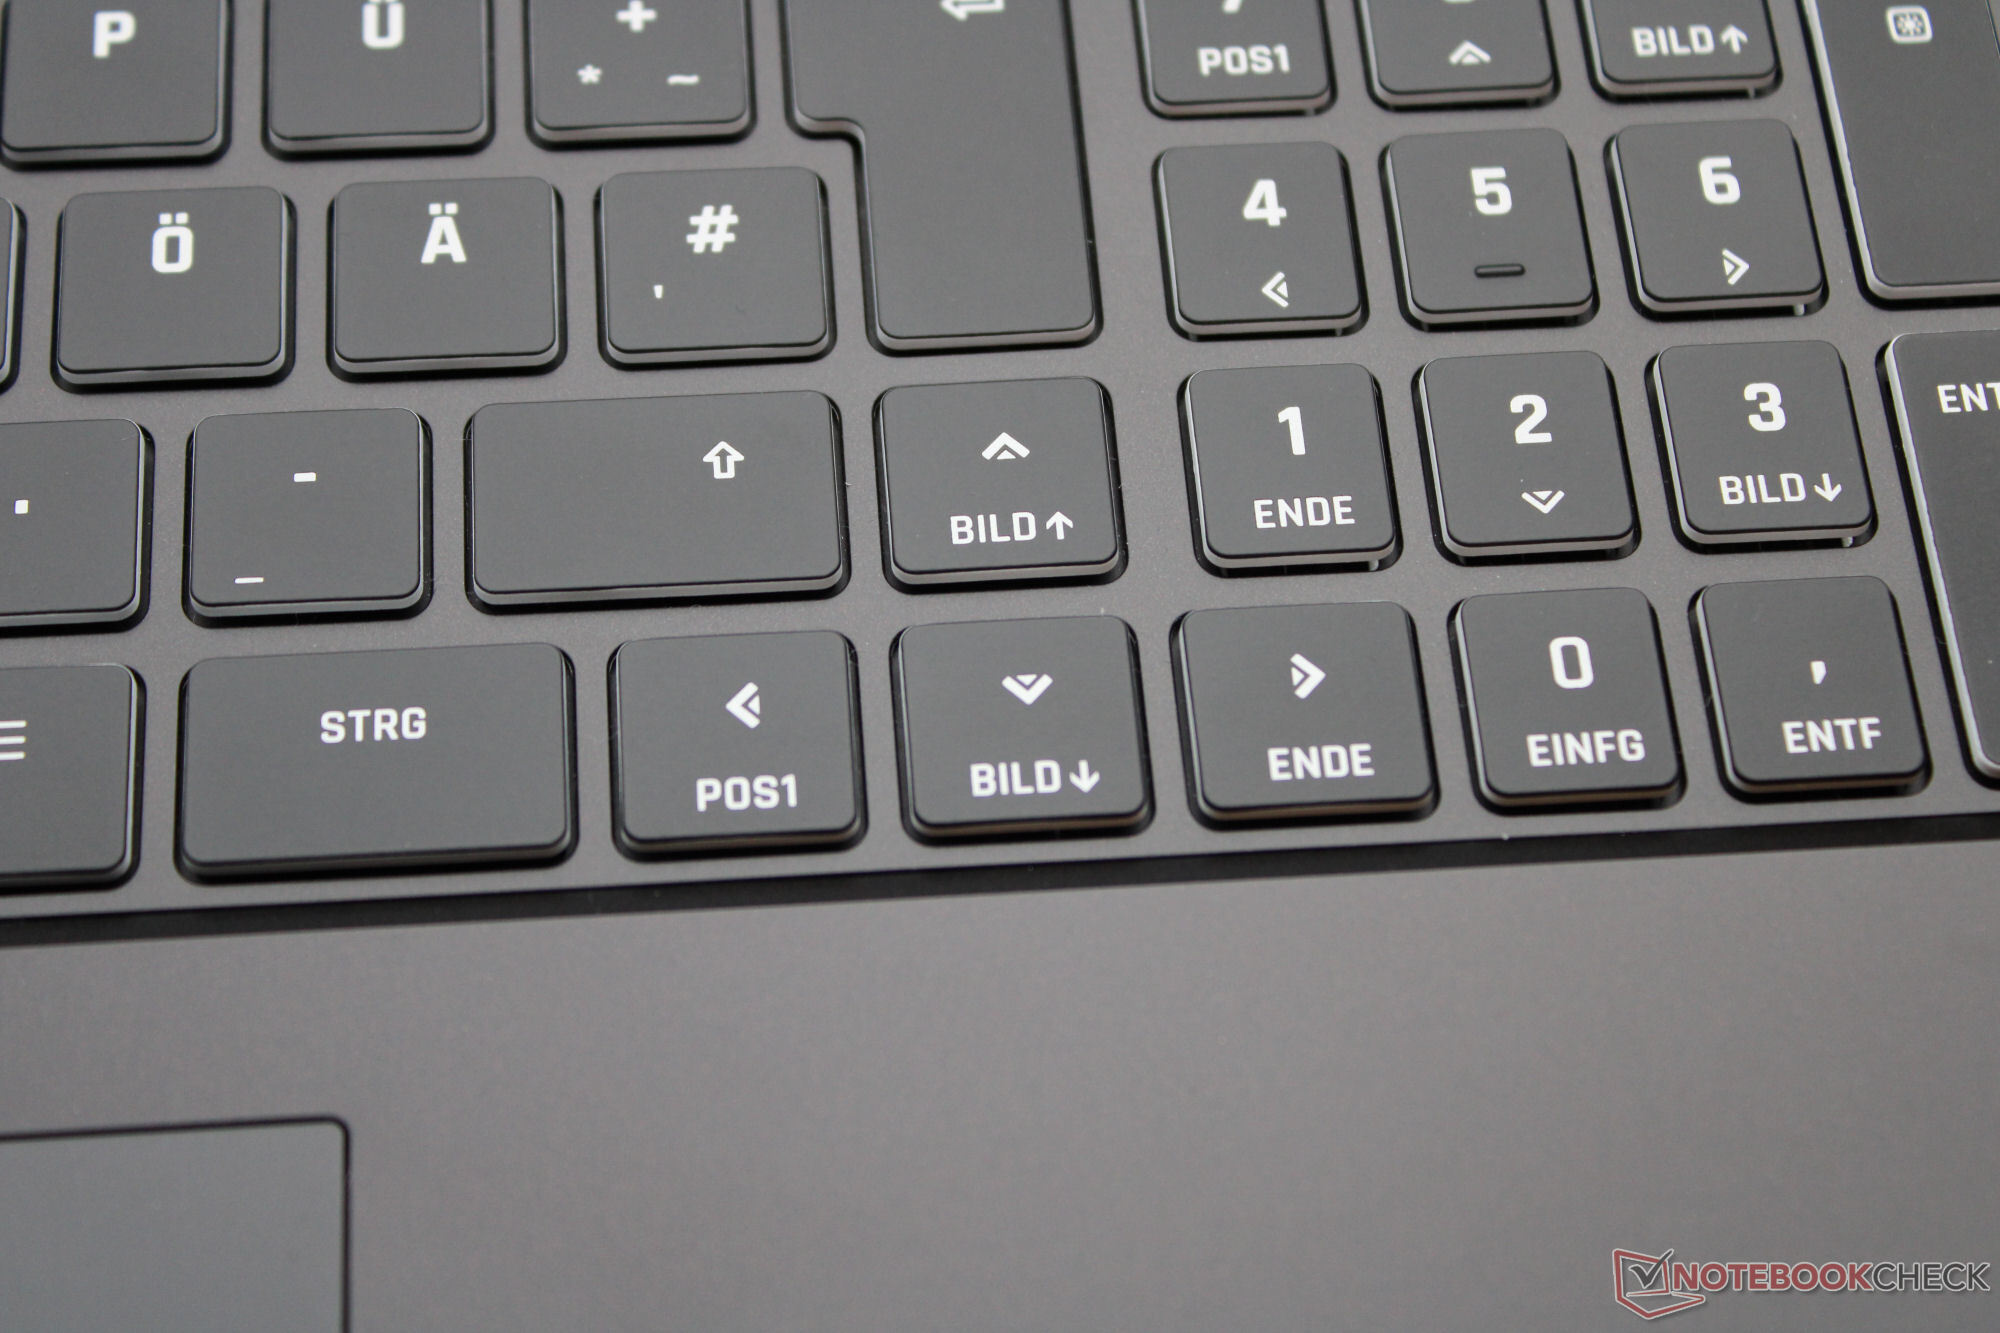
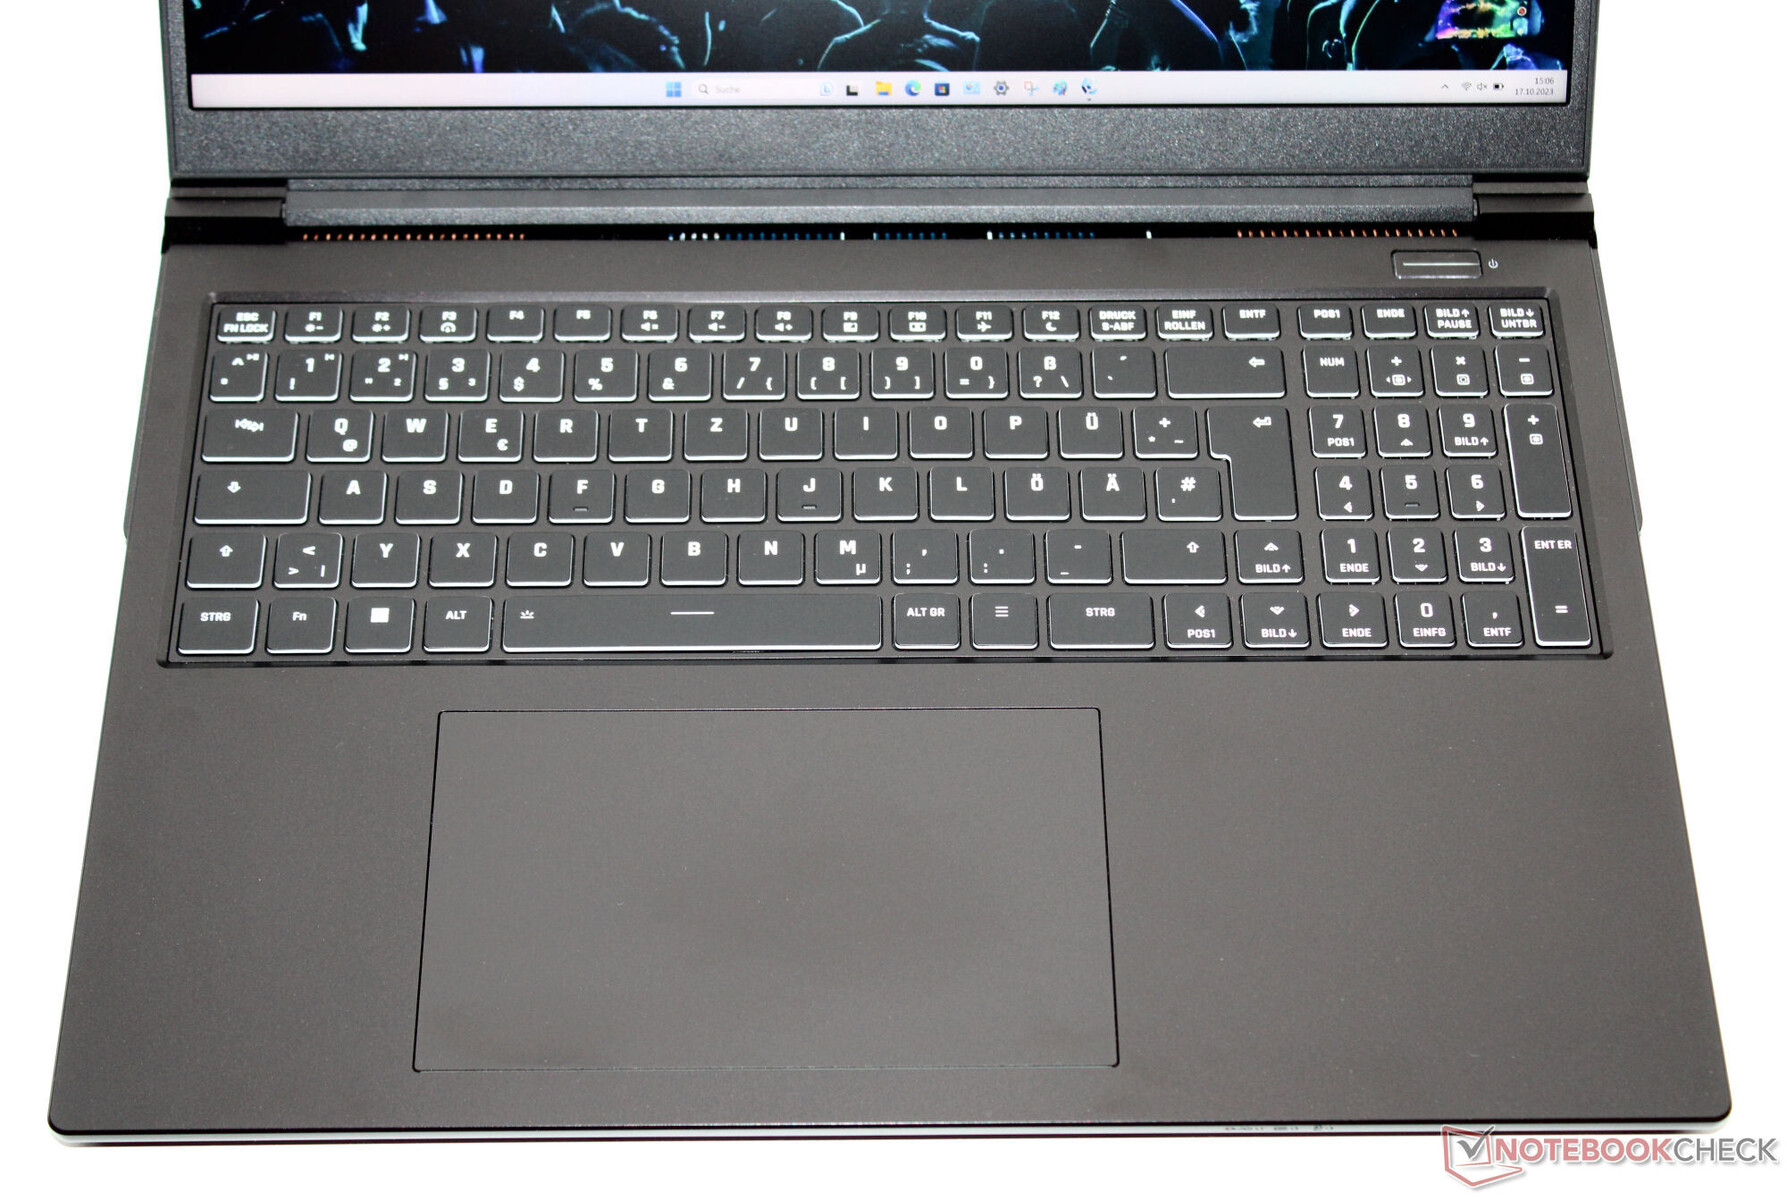
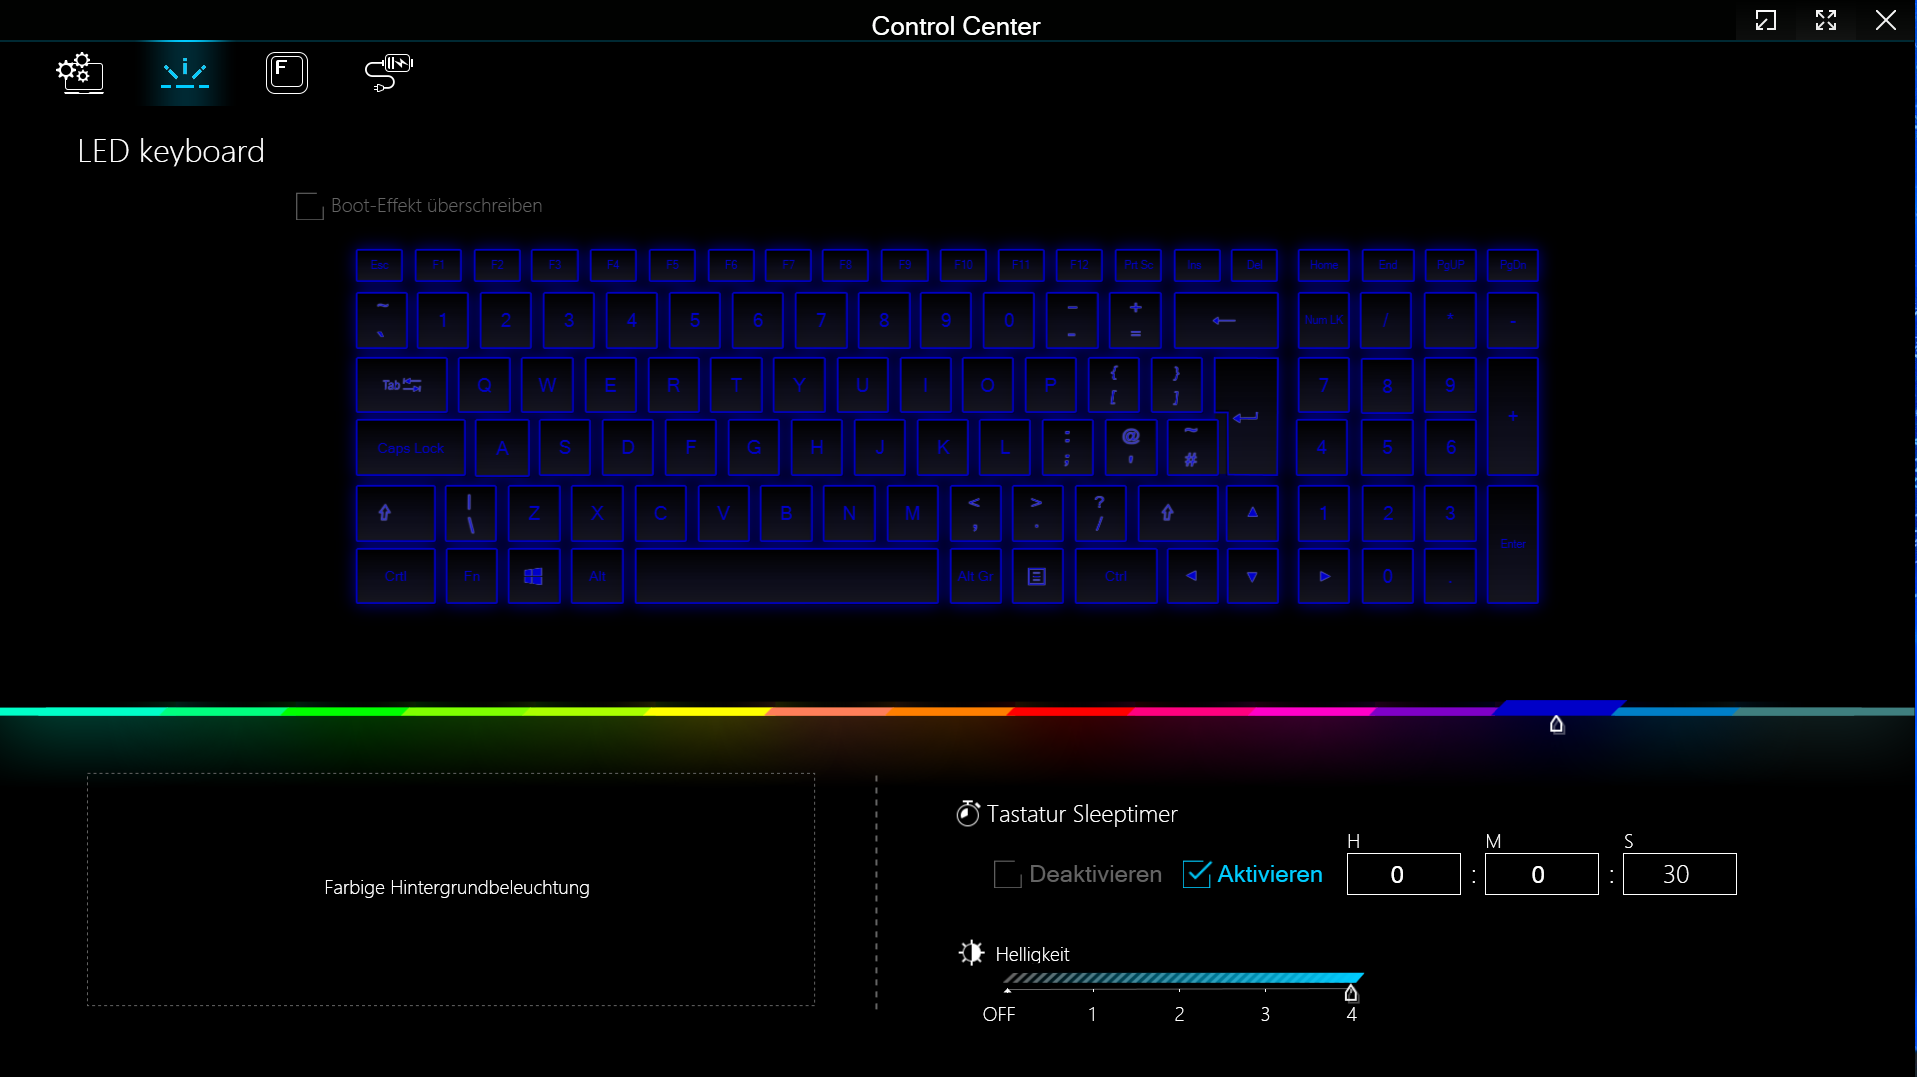
Input devices - The XMG laptop features illuminated keys
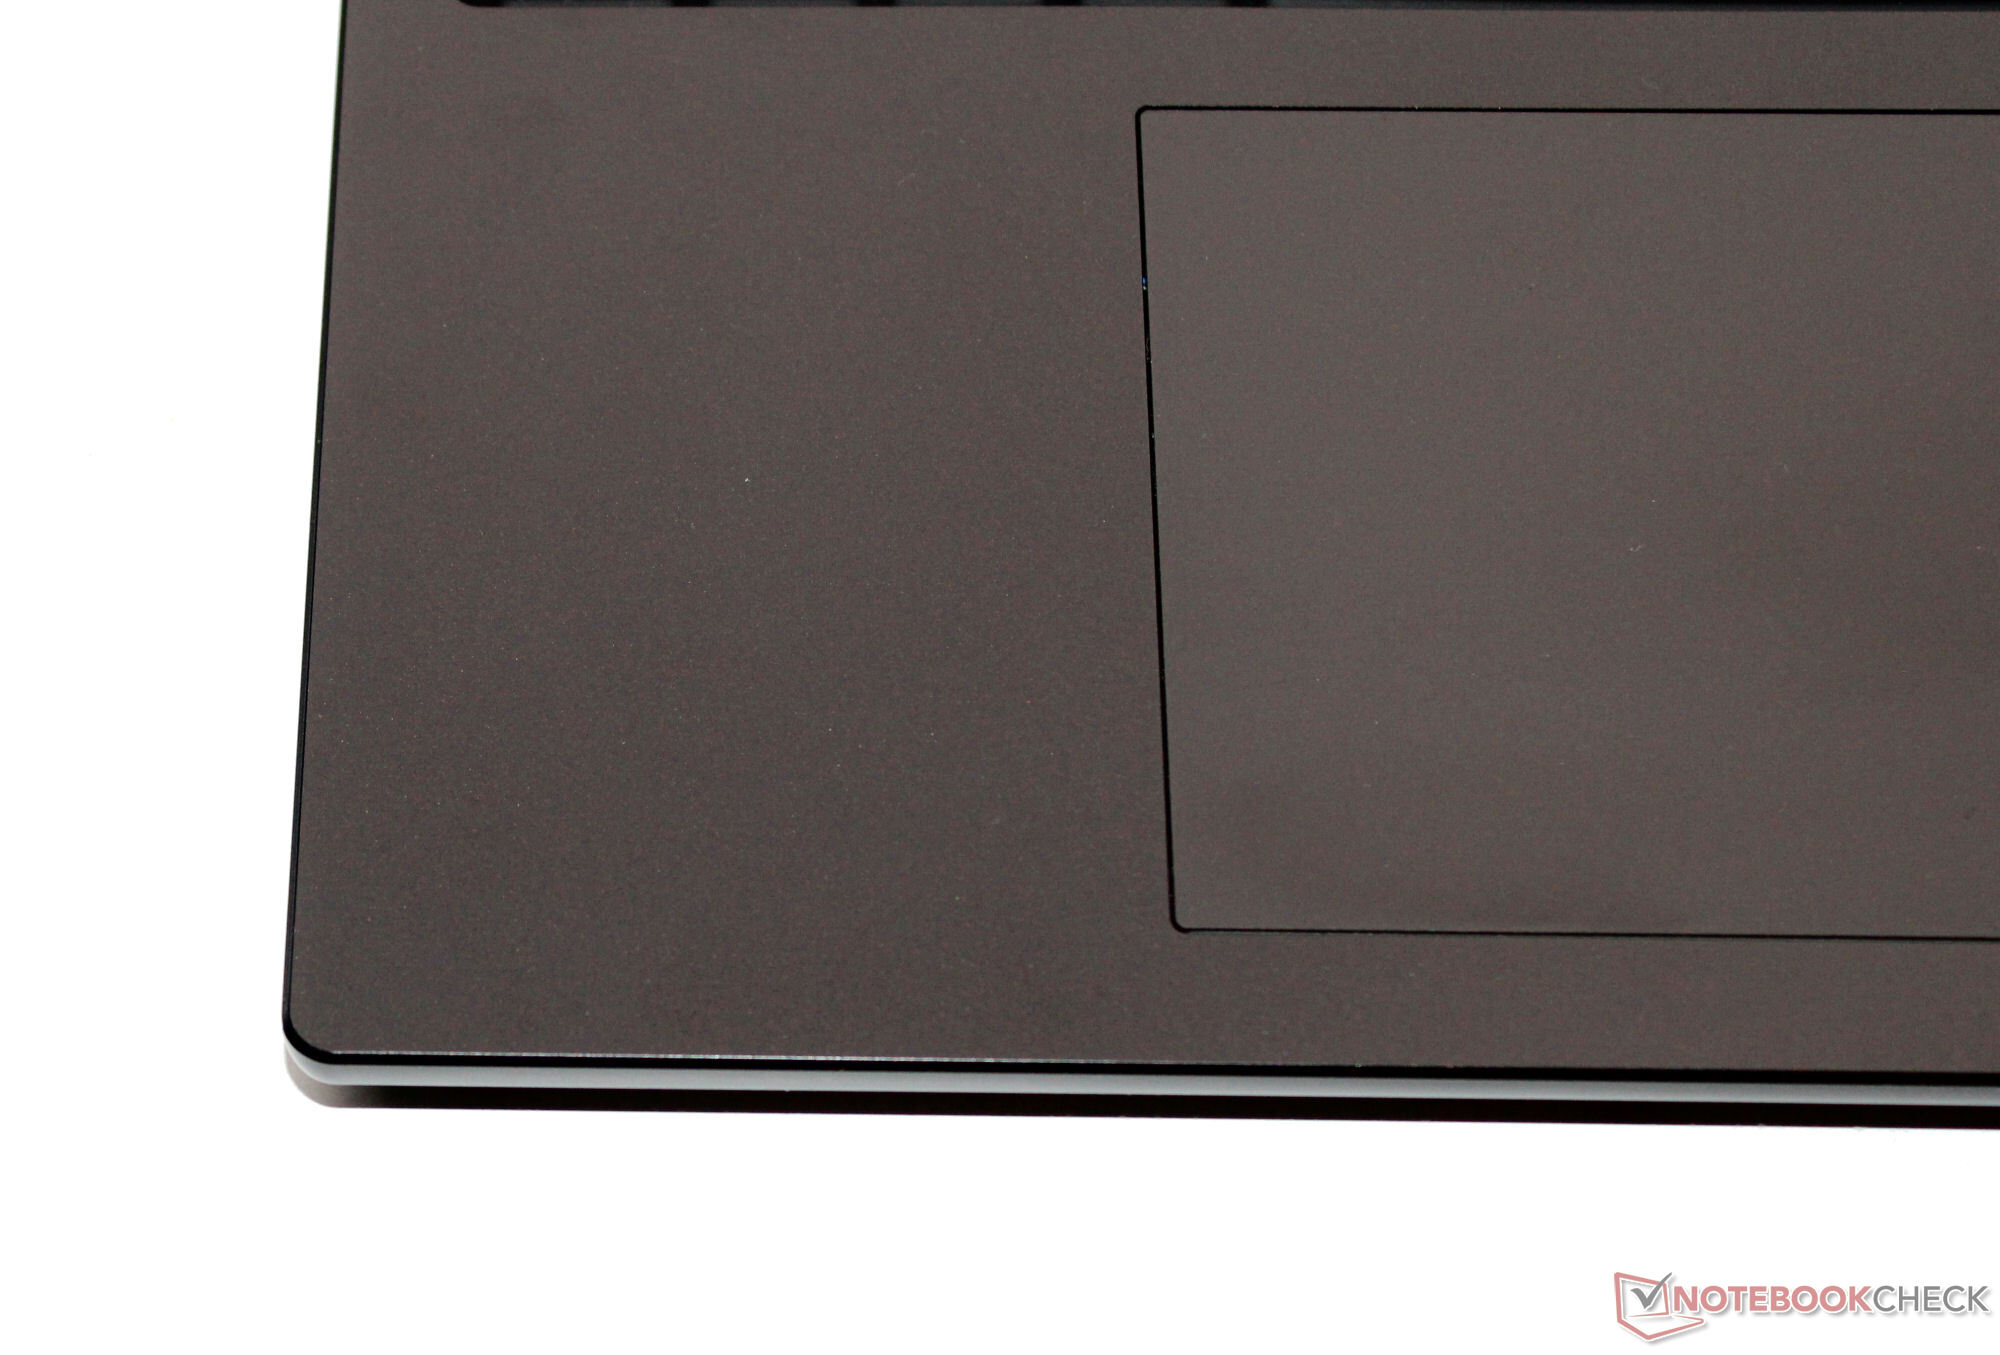
The chiclet keyboard's (RGB illumination) even, smooth keys feature a medium lift and a clear pressure point. The key resistance could do with being a bit more crisp. In total, Schenker has delivered a keyboard fit for everyday use. A clickpad acts as a replacement for a mouse (about 15.1 x 9.1 cm), which features a short lift and a clear pressure point.
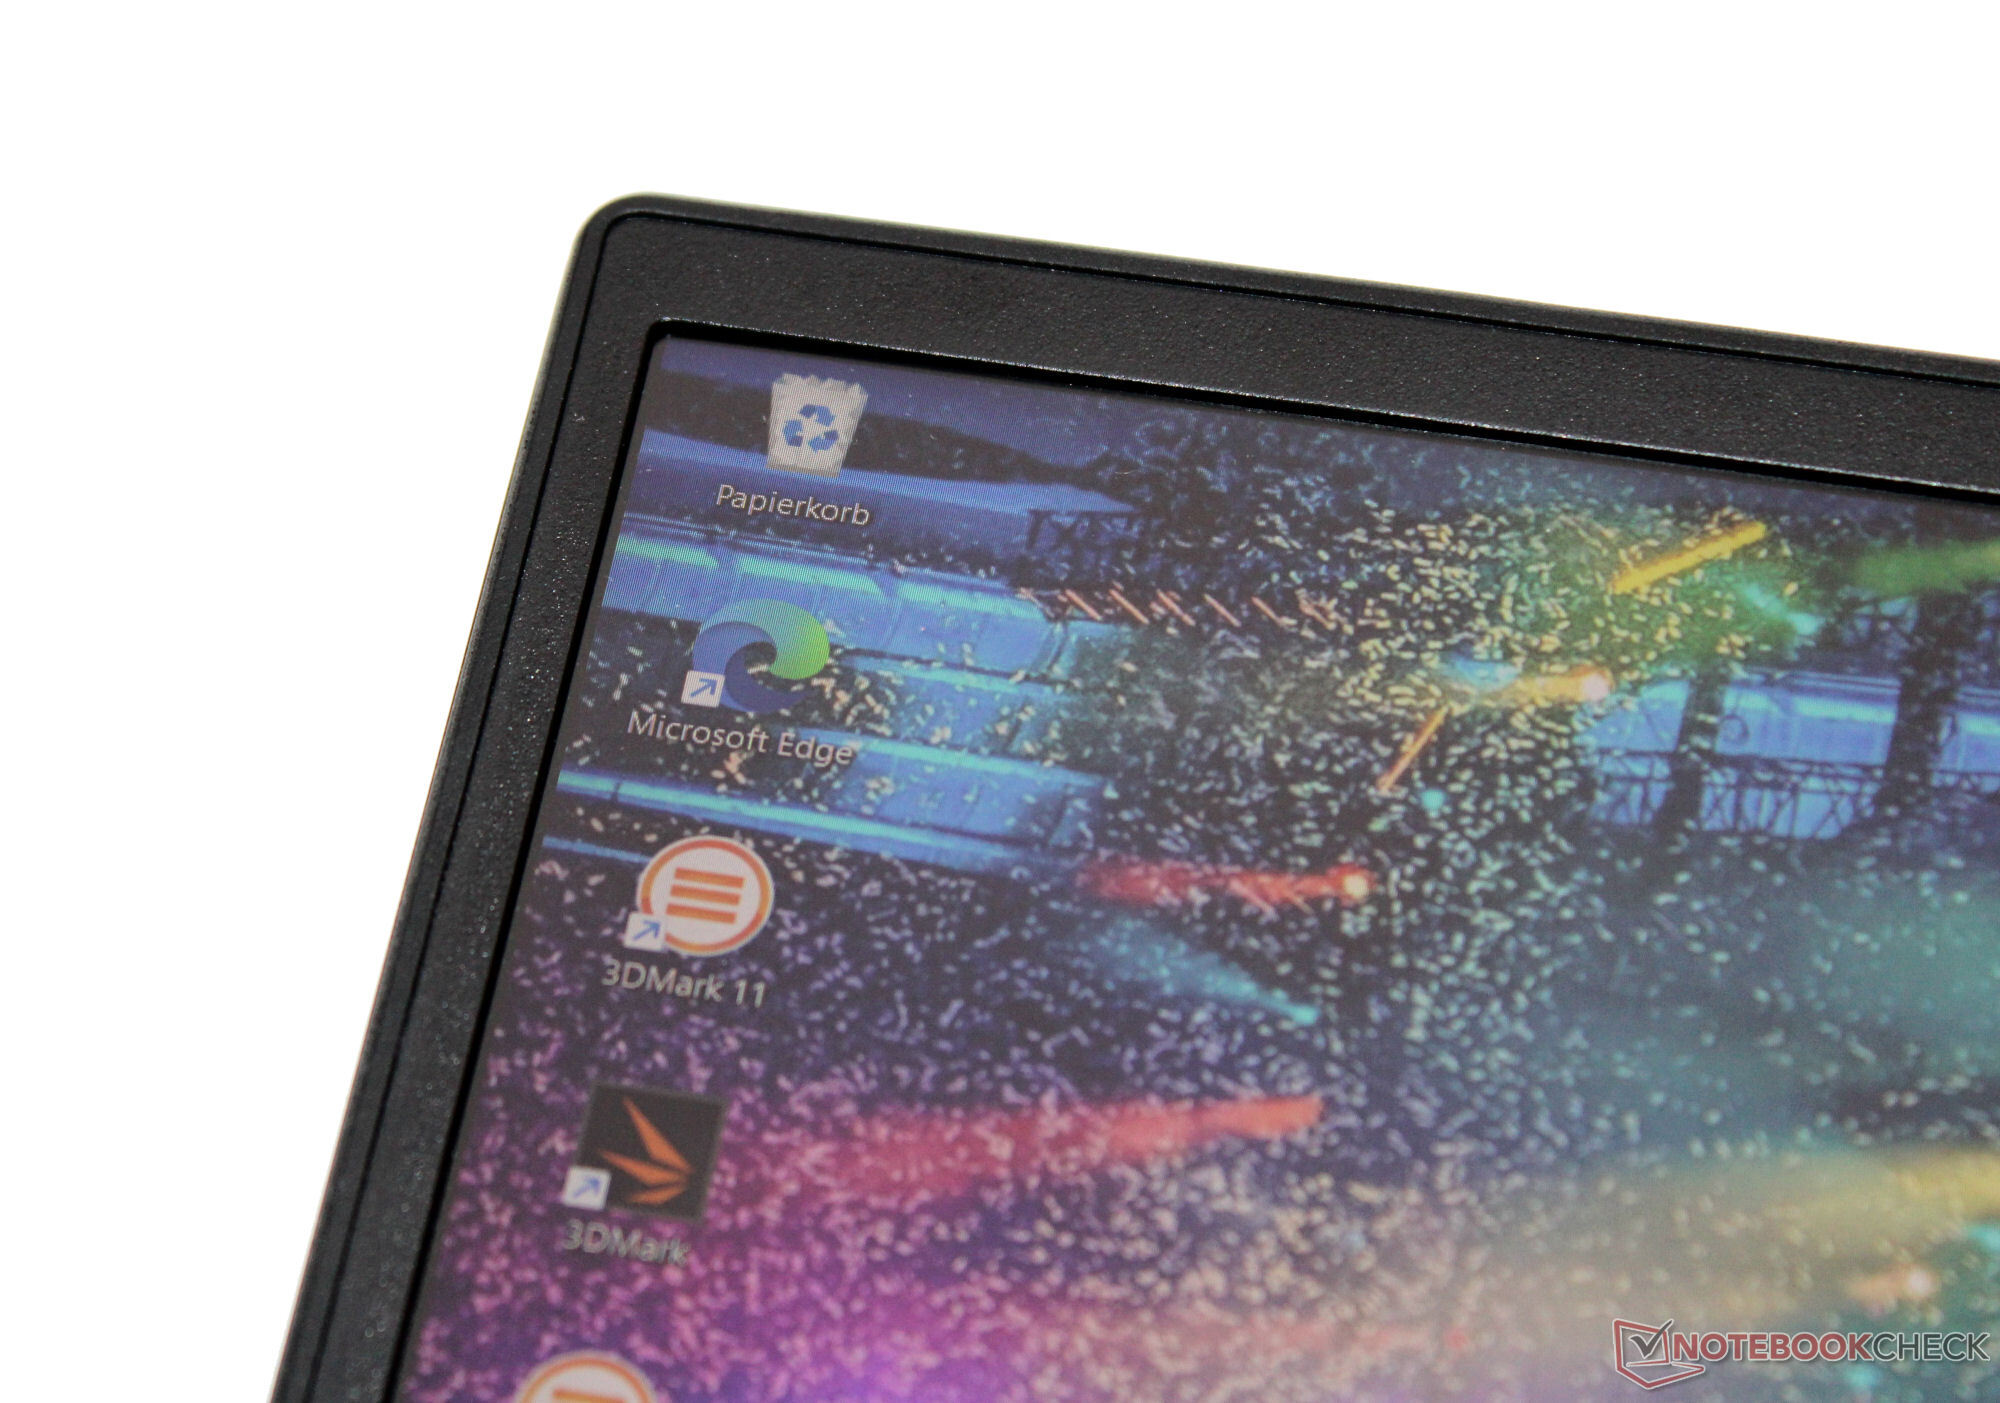
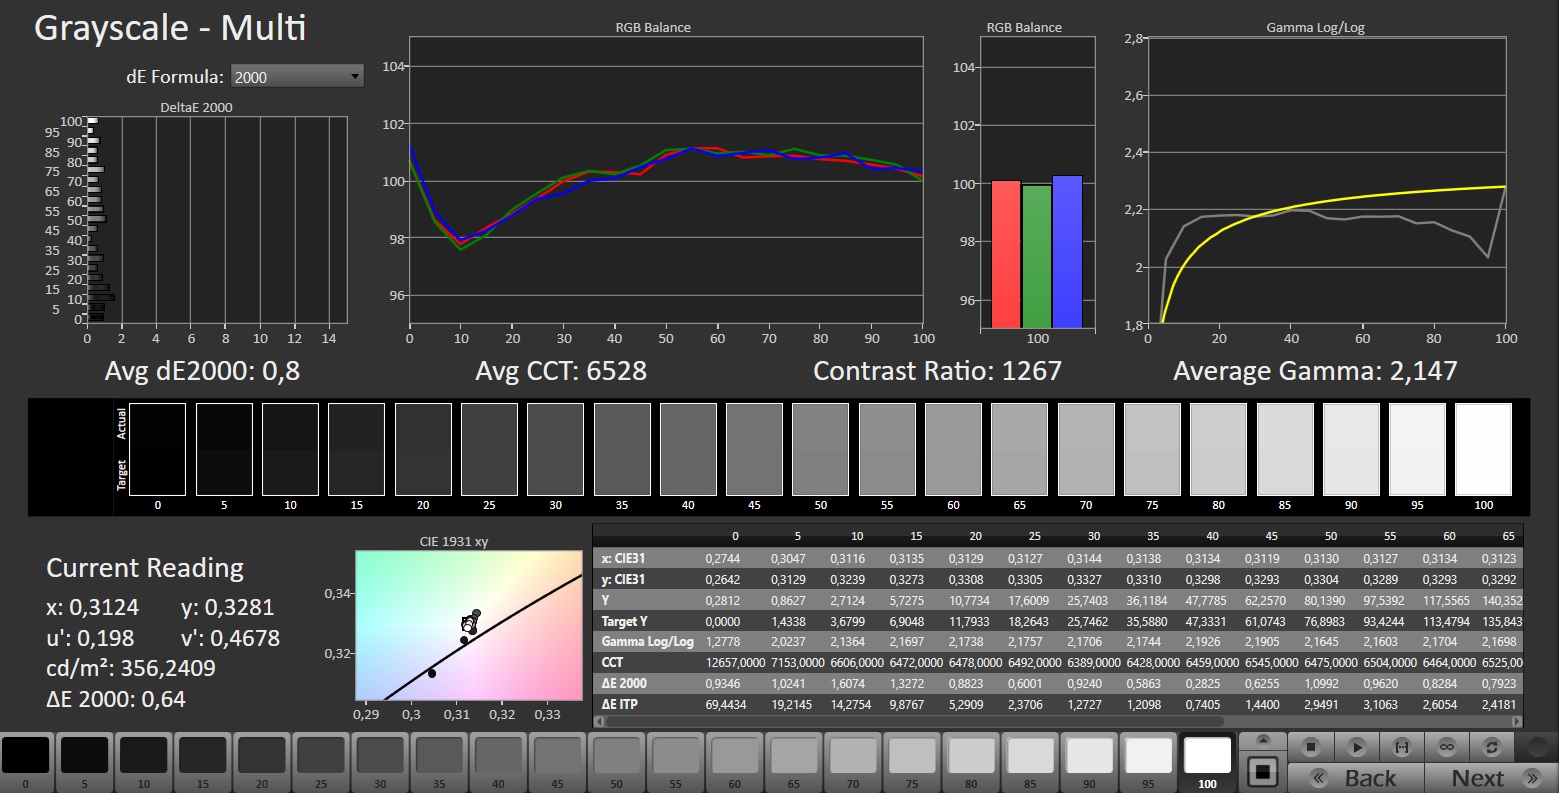
Display - A 16:10 panel with sRGB coverage
The device's fast-reacting 240-Hz panel with an aspect ratio of 16:10 shows no signs of PWM flickering at any brightness level. The matte 16-inch display's (2,560 x 1,600 pixels) brightness and contrast both hit their respective targets (> 300 cd/m² and 1,000:1). Alternative displays are not available.
| |||||||||||||||||||||||||
Brightness Distribution: 93 %
Center on Battery: 349 cd/m²
Contrast: 1091:1 (Black: 0.32 cd/m²)
ΔE ColorChecker Calman: 1.98 | ∀{0.5-29.43 Ø4.73}
calibrated: 1.45
ΔE Greyscale Calman: 3.3 | ∀{0.09-98 Ø4.97}
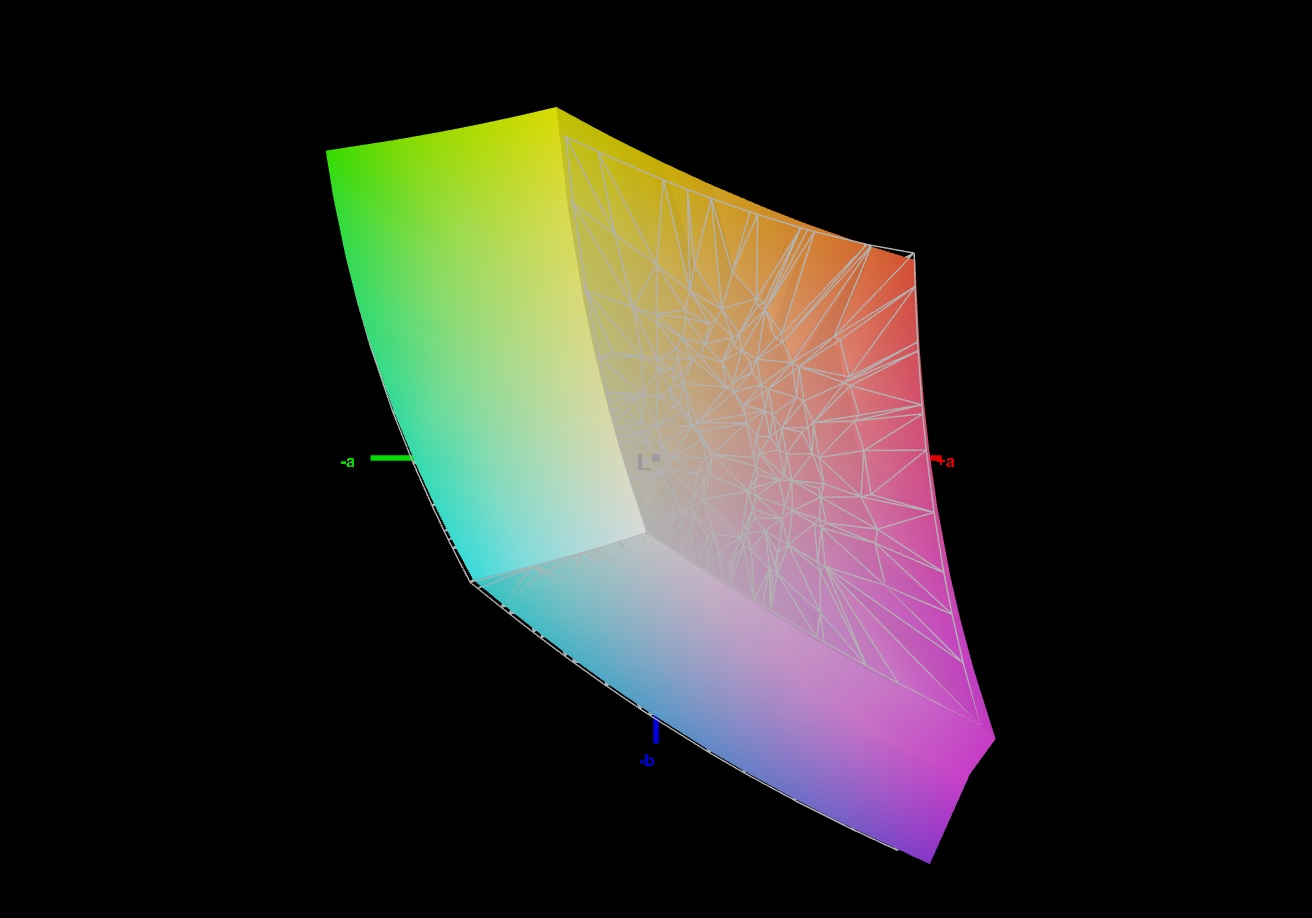
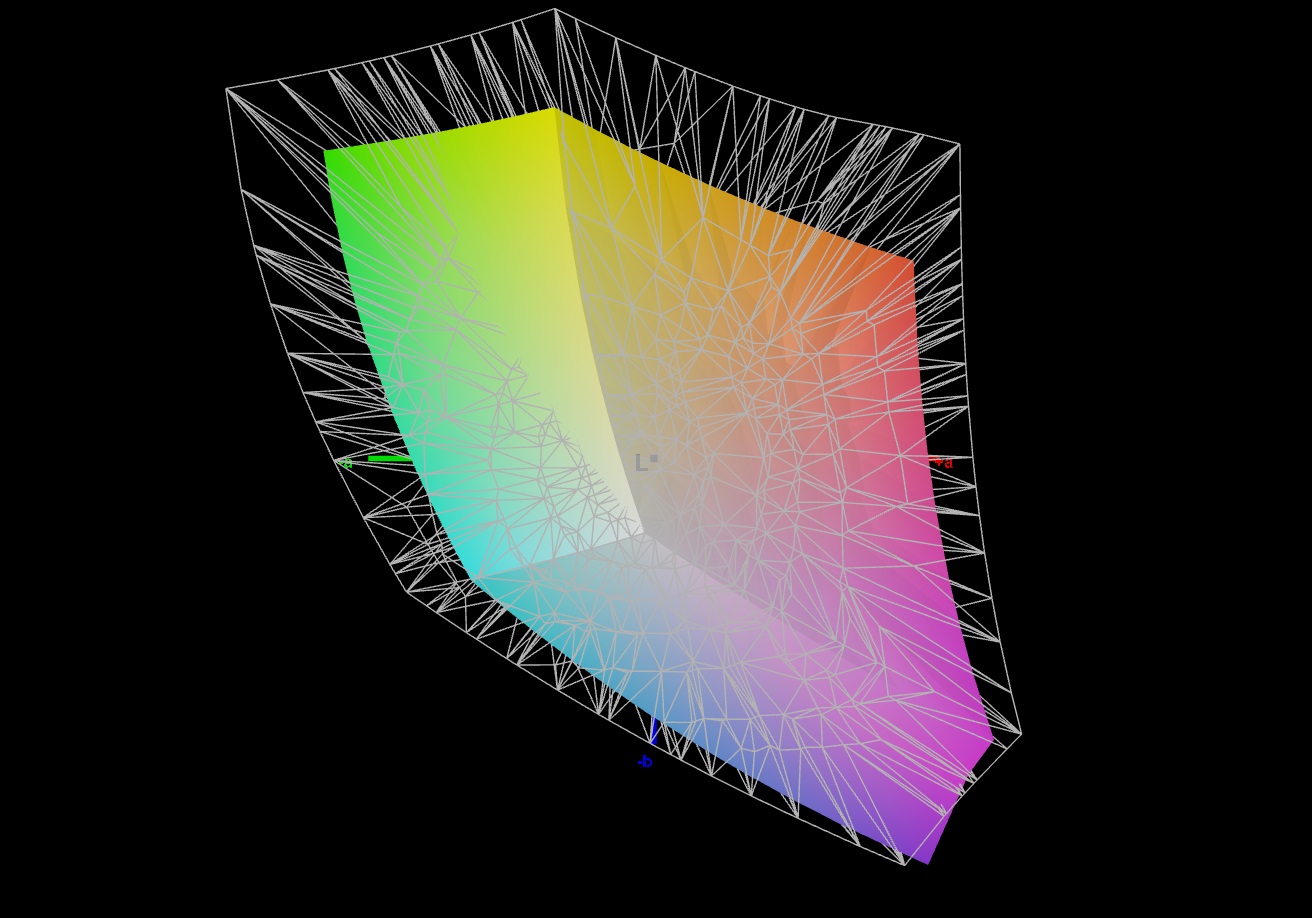
70.1% AdobeRGB 1998 (Argyll 3D)
98.2% sRGB (Argyll 3D)
69.4% Display P3 (Argyll 3D)
Gamma: 2.137
CCT: 6672 K
| Schenker XMG Pro 16 Studio (Mid 23) BOE CQ NE160QDM-NZ1, IPS, 2560x1600, 16" | Asus Vivobook Pro 16X K6604JV-MX016W Samsung SDC4178 ATNA60BX01-1, OLED, 3200x2000, 16" | Lenovo Legion Slim 7i 16 Gen 8 CSOT T3 MNG007DA2-3, IPS, 2560x1600, 16" | HP Omen Transcend 16 AUOA3A6, Mini-LED, 2560x1600, 16" | MSI Stealth 16 Studio A13VG AUO26A9, IPS, 2560x1600, 16" | |
|---|---|---|---|---|---|
| Display | 27% | 2% | 23% | 21% | |
| Display P3 Coverage (%) | 69.4 | 98.4 42% | 70.4 1% | 99.2 43% | 96.4 39% |
| sRGB Coverage (%) | 98.2 | 99.7 2% | 99.4 1% | 100 2% | 99.7 2% |
| AdobeRGB 1998 Coverage (%) | 70.1 | 95.8 37% | 72.5 3% | 87.6 25% | 84.8 21% |
| Response Times | 85% | -7% | -191% | 46% | |
| Response Time Grey 50% / Grey 80% * (ms) | 12.2 ? | 1.6 ? 87% | 12 ? 2% | 26.4 ? -116% | 4.4 ? 64% |
| Response Time Black / White * (ms) | 7.7 ? | 1.4 ? 82% | 8.9 ? -16% | 28.2 ? -266% | 5.6 ? 27% |
| PWM Frequency (Hz) | 120 ? | 3506 ? | |||
| Screen | 66% | 17% | 204% | -19% | |
| Brightness middle (cd/m²) | 349 | 347 -1% | 474.6 36% | 791.1 127% | 424 21% |
| Brightness (cd/m²) | 348 | 346 -1% | 445 28% | 800 130% | 411 18% |
| Brightness Distribution (%) | 93 | 97 4% | 86 -8% | 95 2% | 88 -5% |
| Black Level * (cd/m²) | 0.32 | 0.06 81% | 0.39 -22% | 0.04 87% | 0.37 -16% |
| Contrast (:1) | 1091 | 5783 430% | 1217 12% | 19778 1713% | 1146 5% |
| Colorchecker dE 2000 * | 1.98 | 1.89 5% | 2.12 -7% | 4.37 -121% | 3.04 -54% |
| Colorchecker dE 2000 max. * | 7.56 | 3.26 57% | 4.73 37% | 10.39 -37% | 7.5 1% |
| Colorchecker dE 2000 calibrated * | 1.45 | 1.97 -36% | 0.57 61% | 1.04 28% | 3.04 -110% |
| Greyscale dE 2000 * | 3.3 | 1.55 53% | 2.8 15% | 6.5 -97% | 4.34 -32% |
| Gamma | 2.137 103% | 2.39 92% | 2.22 99% | 2.28 96% | 2.32 95% |
| CCT | 6672 97% | 6458 101% | 6542 99% | 6000 108% | 6952 93% |
| Total Average (Program / Settings) | 59% /
60% | 4% /
10% | 12% /
109% | 16% /
-1% |
* ... smaller is better
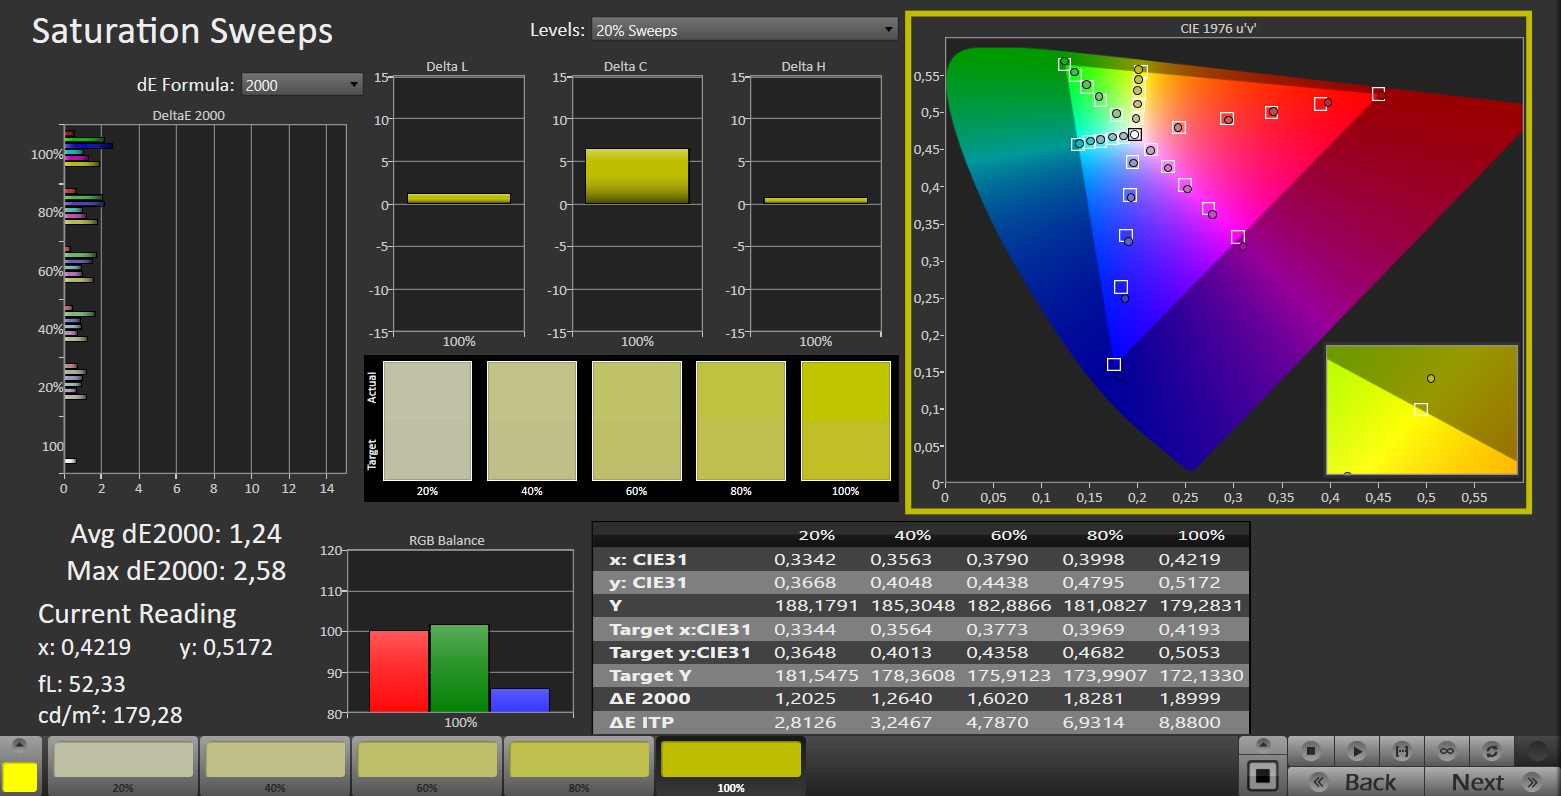
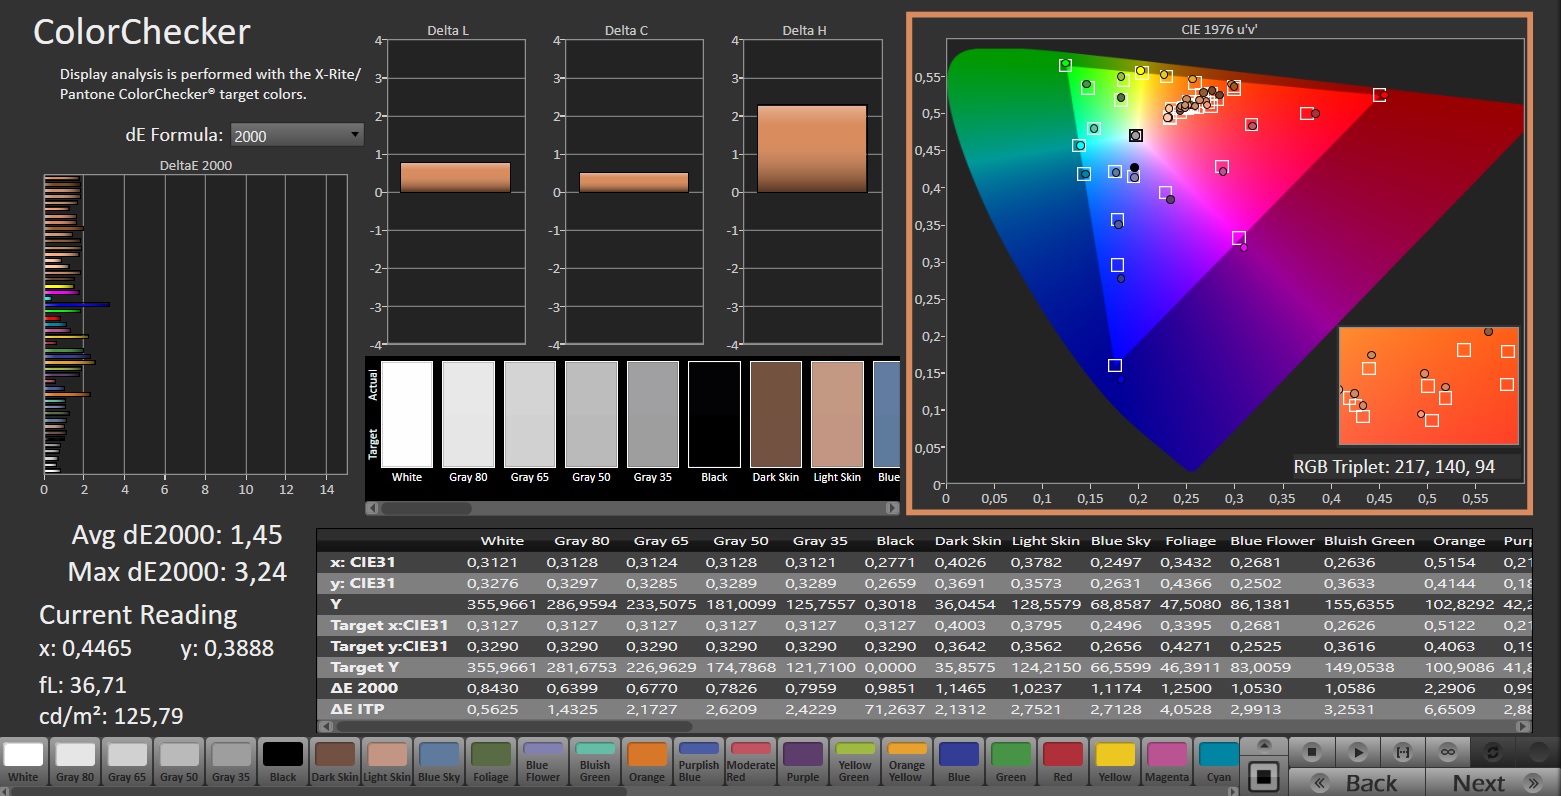
Straight out of the box, the screen shows pretty good color depiction: With a deviation of about 2, its target (DeltaE < 3) is hit. Calibrating the display leads to a smaller deviation of 1.45 and more balanced gray tones. The panel can almost entirely depict the sRGB color space — but not AdobeRGB or DCI P3. Here, the competition has more to offer at times.


Display Response Times
| ↔ Response Time Black to White | ||
|---|---|---|
| 7.7 ms ... rise ↗ and fall ↘ combined | ↗ 4 ms rise | 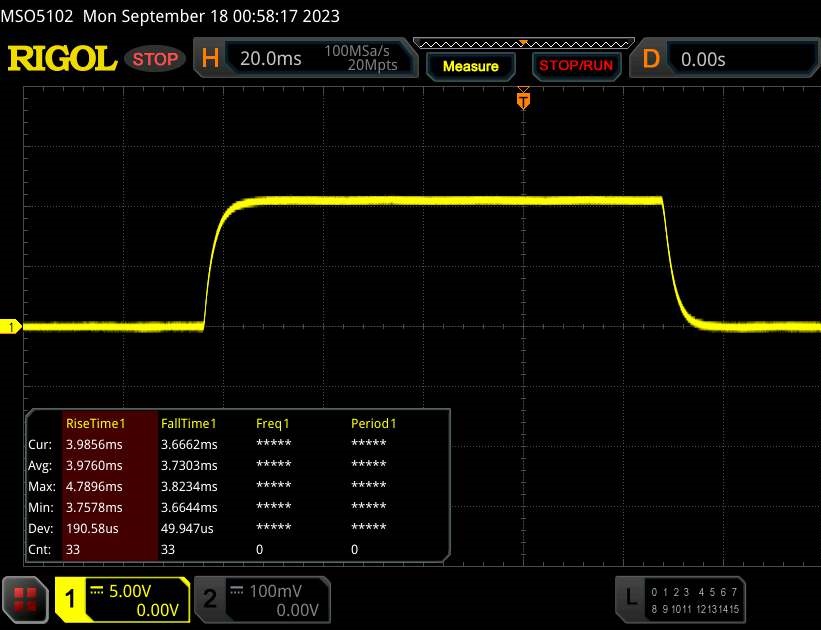 |
| ↘ 3.7 ms fall | ||
| The screen shows very fast response rates in our tests and should be very well suited for fast-paced gaming. In comparison, all tested devices range from 0.1 (minimum) to 240 (maximum) ms. » 22 % of all devices are better. This means that the measured response time is better than the average of all tested devices (19.9 ms). | ||
| ↔ Response Time 50% Grey to 80% Grey | ||
| 12.2 ms ... rise ↗ and fall ↘ combined | ↗ 5.9 ms rise | 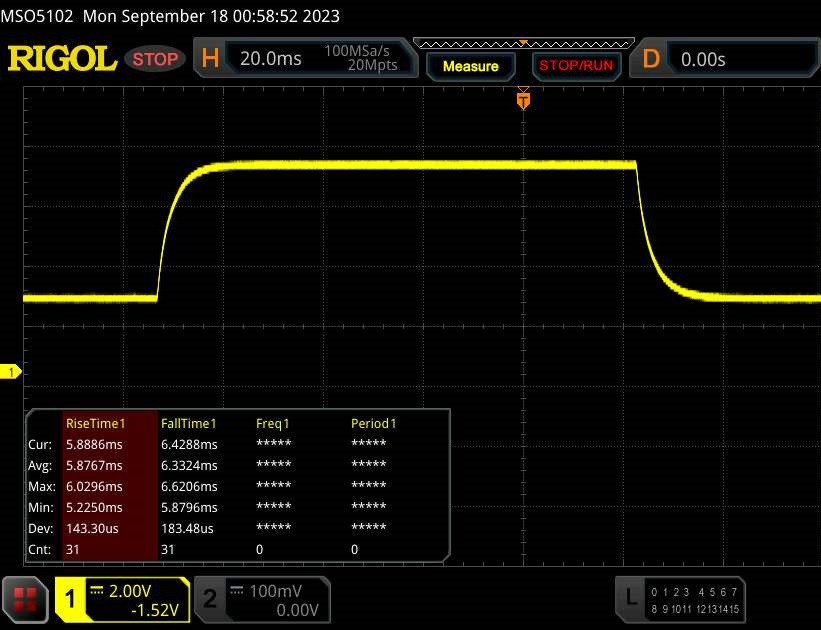 |
| ↘ 6.3 ms fall | ||
| The screen shows good response rates in our tests, but may be too slow for competitive gamers. In comparison, all tested devices range from 0.165 (minimum) to 636 (maximum) ms. » 26 % of all devices are better. This means that the measured response time is better than the average of all tested devices (31.1 ms). | ||
Screen Flickering / PWM (Pulse-Width Modulation)
| Screen flickering / PWM not detected | 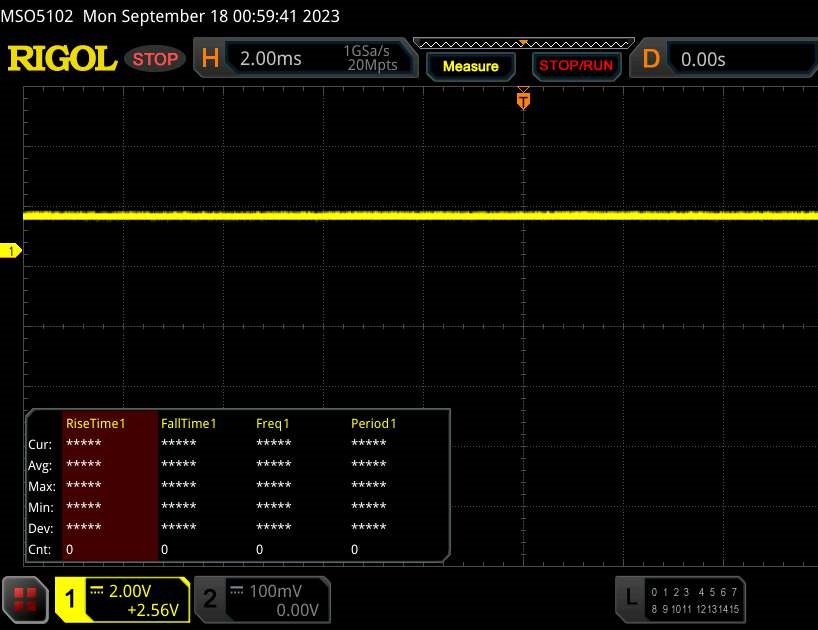 | ||
In comparison: 52 % of all tested devices do not use PWM to dim the display. If PWM was detected, an average of 7794 (minimum: 5 - maximum: 343500) Hz was measured. | |||
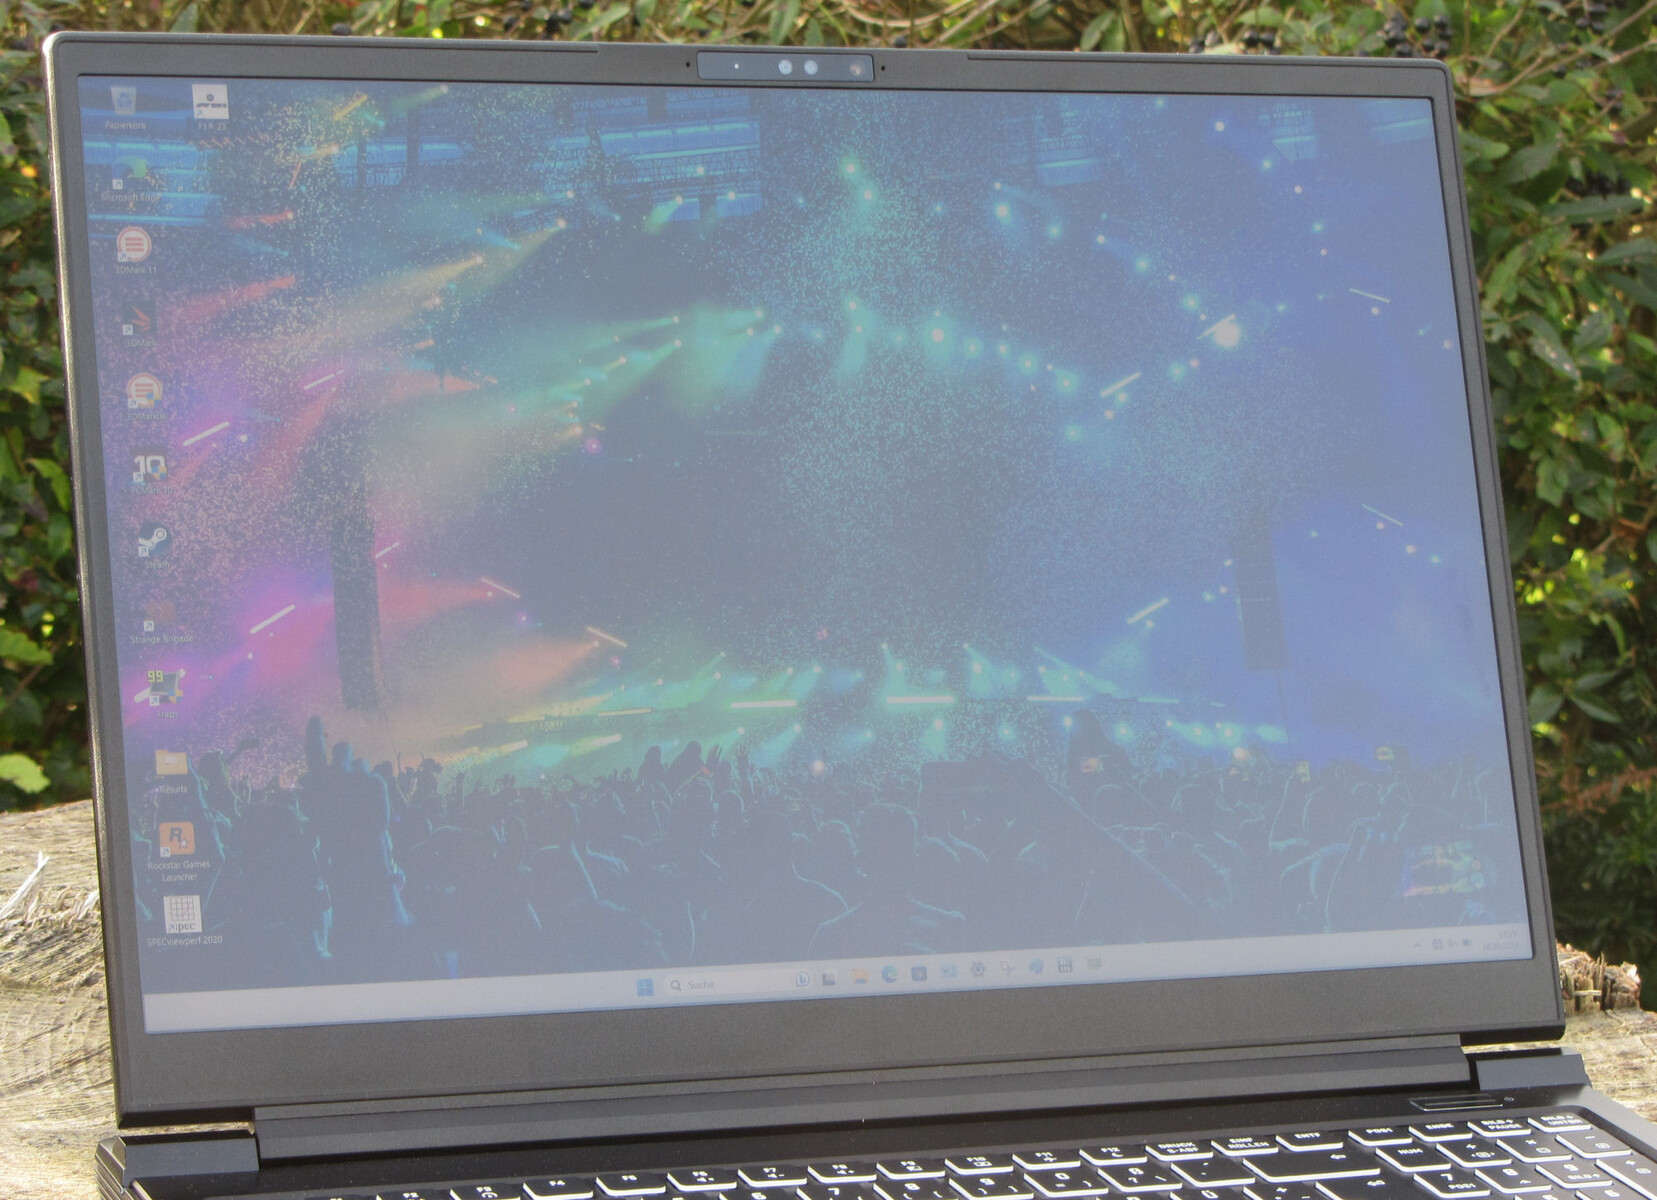
The laptop's viewing-angle stable IPS panel remains legible from every angle. Outside, you can read from the display as long as the sun isn't shining all too brightly.
Performance - The Schenker laptop relies on Raptor Lake and Ada Lovelace
The gamer and creator oriented XMG Pro 16 Studio relies on Raptor Lake and Ada Lovelace. A GeForce RTX Studio certification is supposed to guarantee high performance, custom drivers, good software support and a fitting display color space coverage. The laptop can be individually configured via Schenker's online shop. The present variant can be had for around US$2,400 and cheaper models start from about US$1,900.


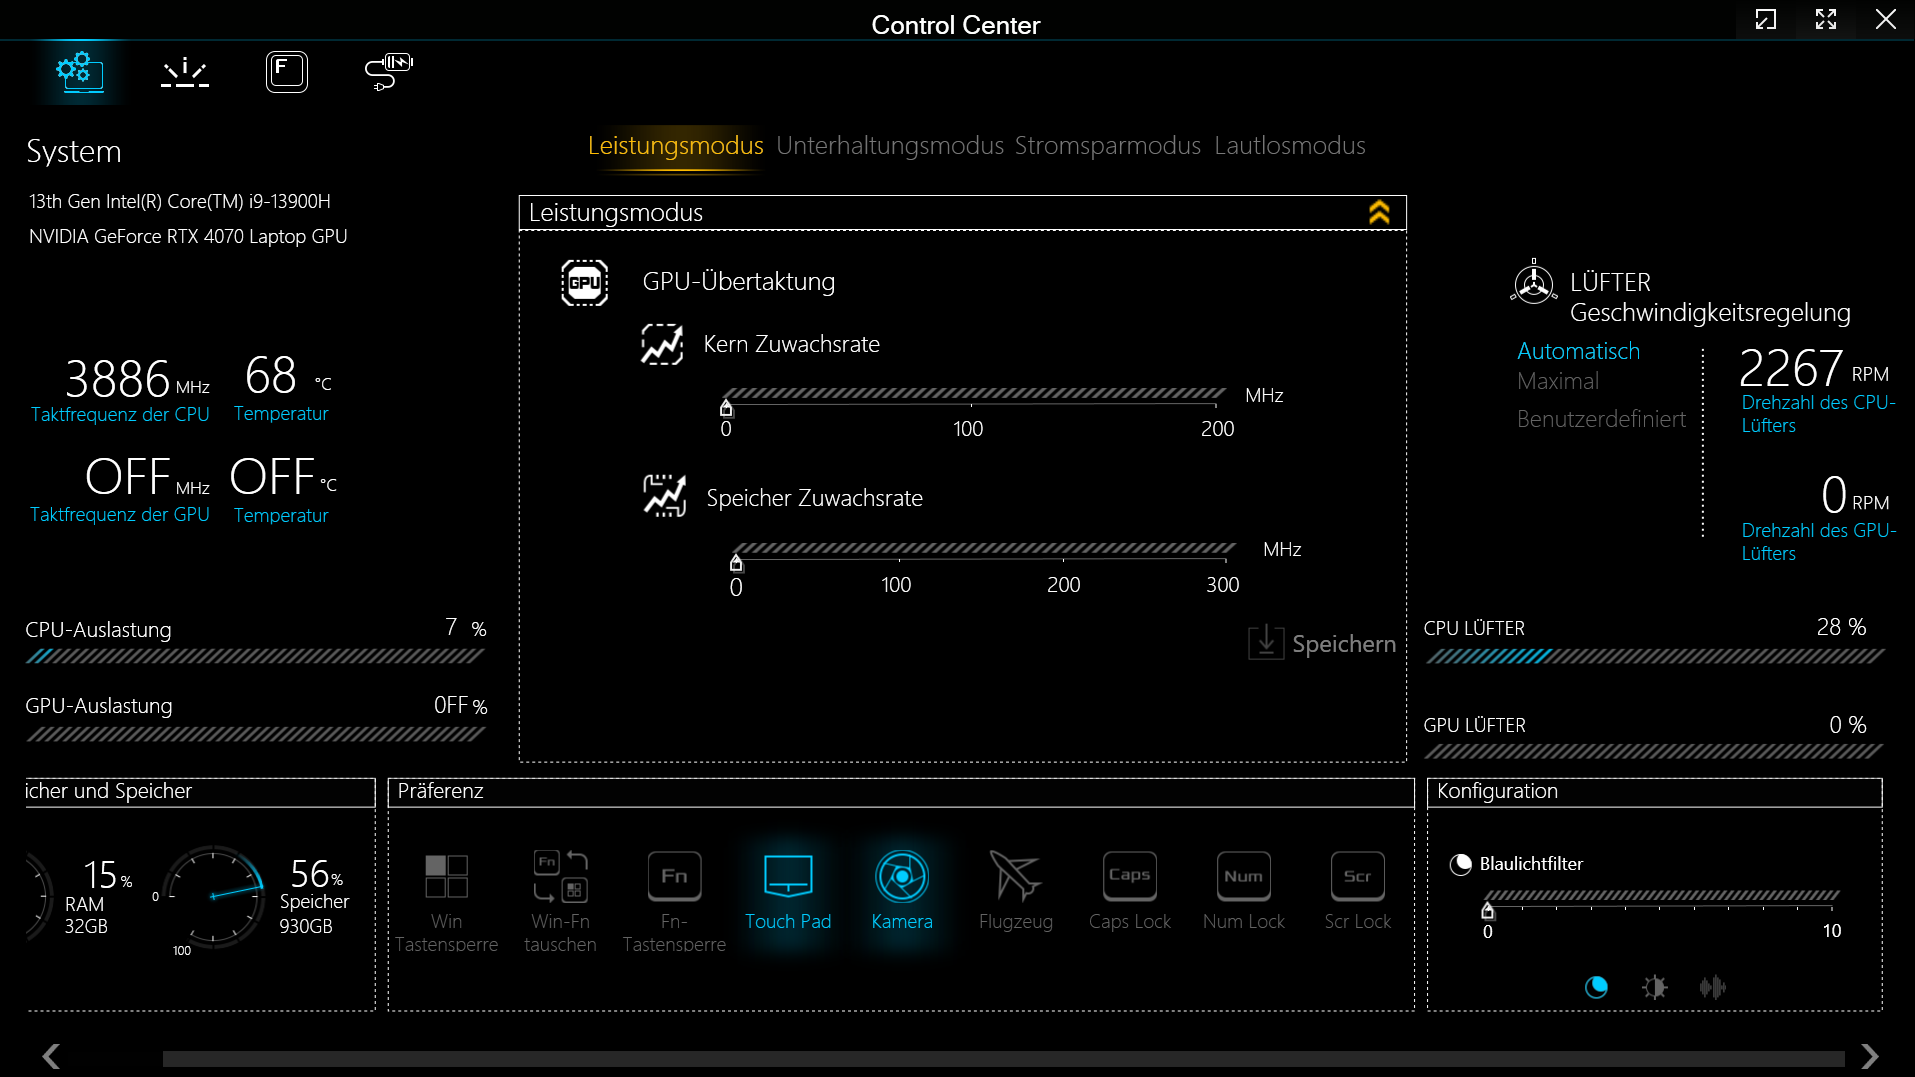
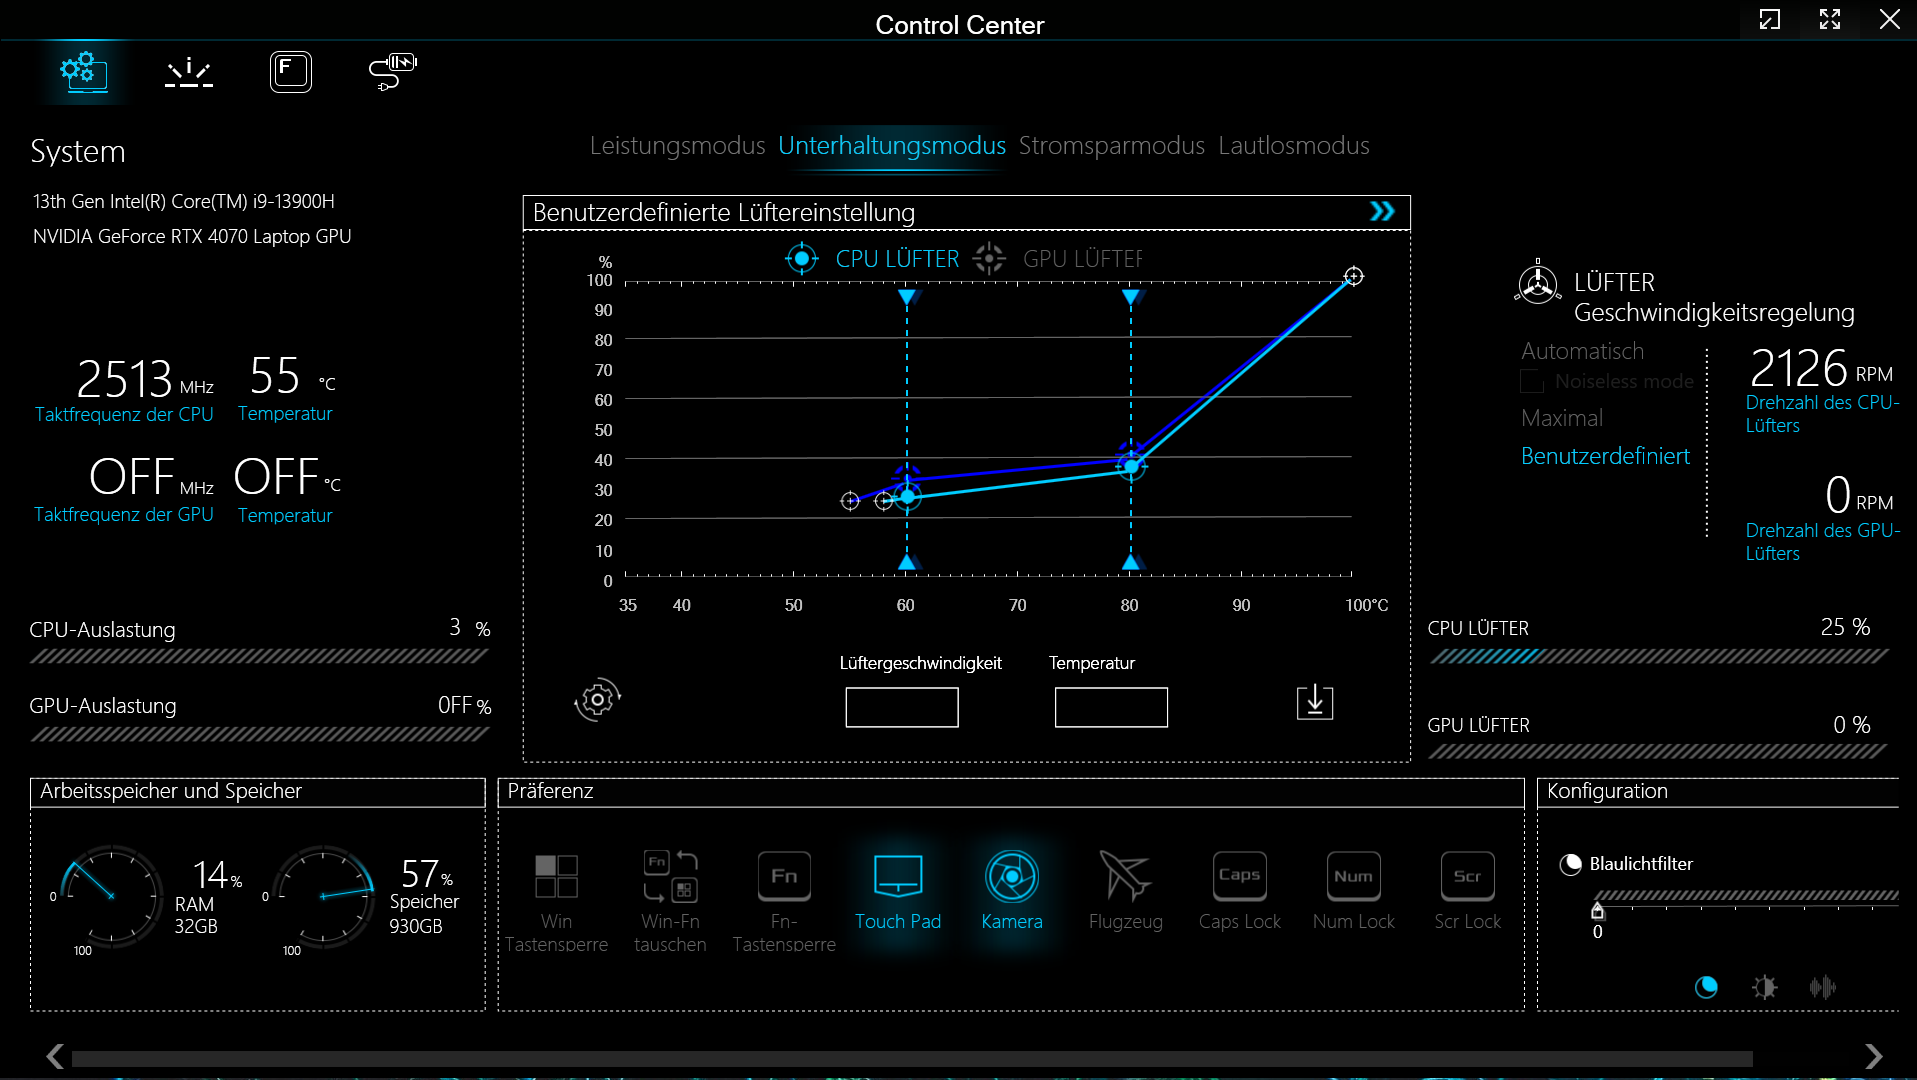
Testing conditions
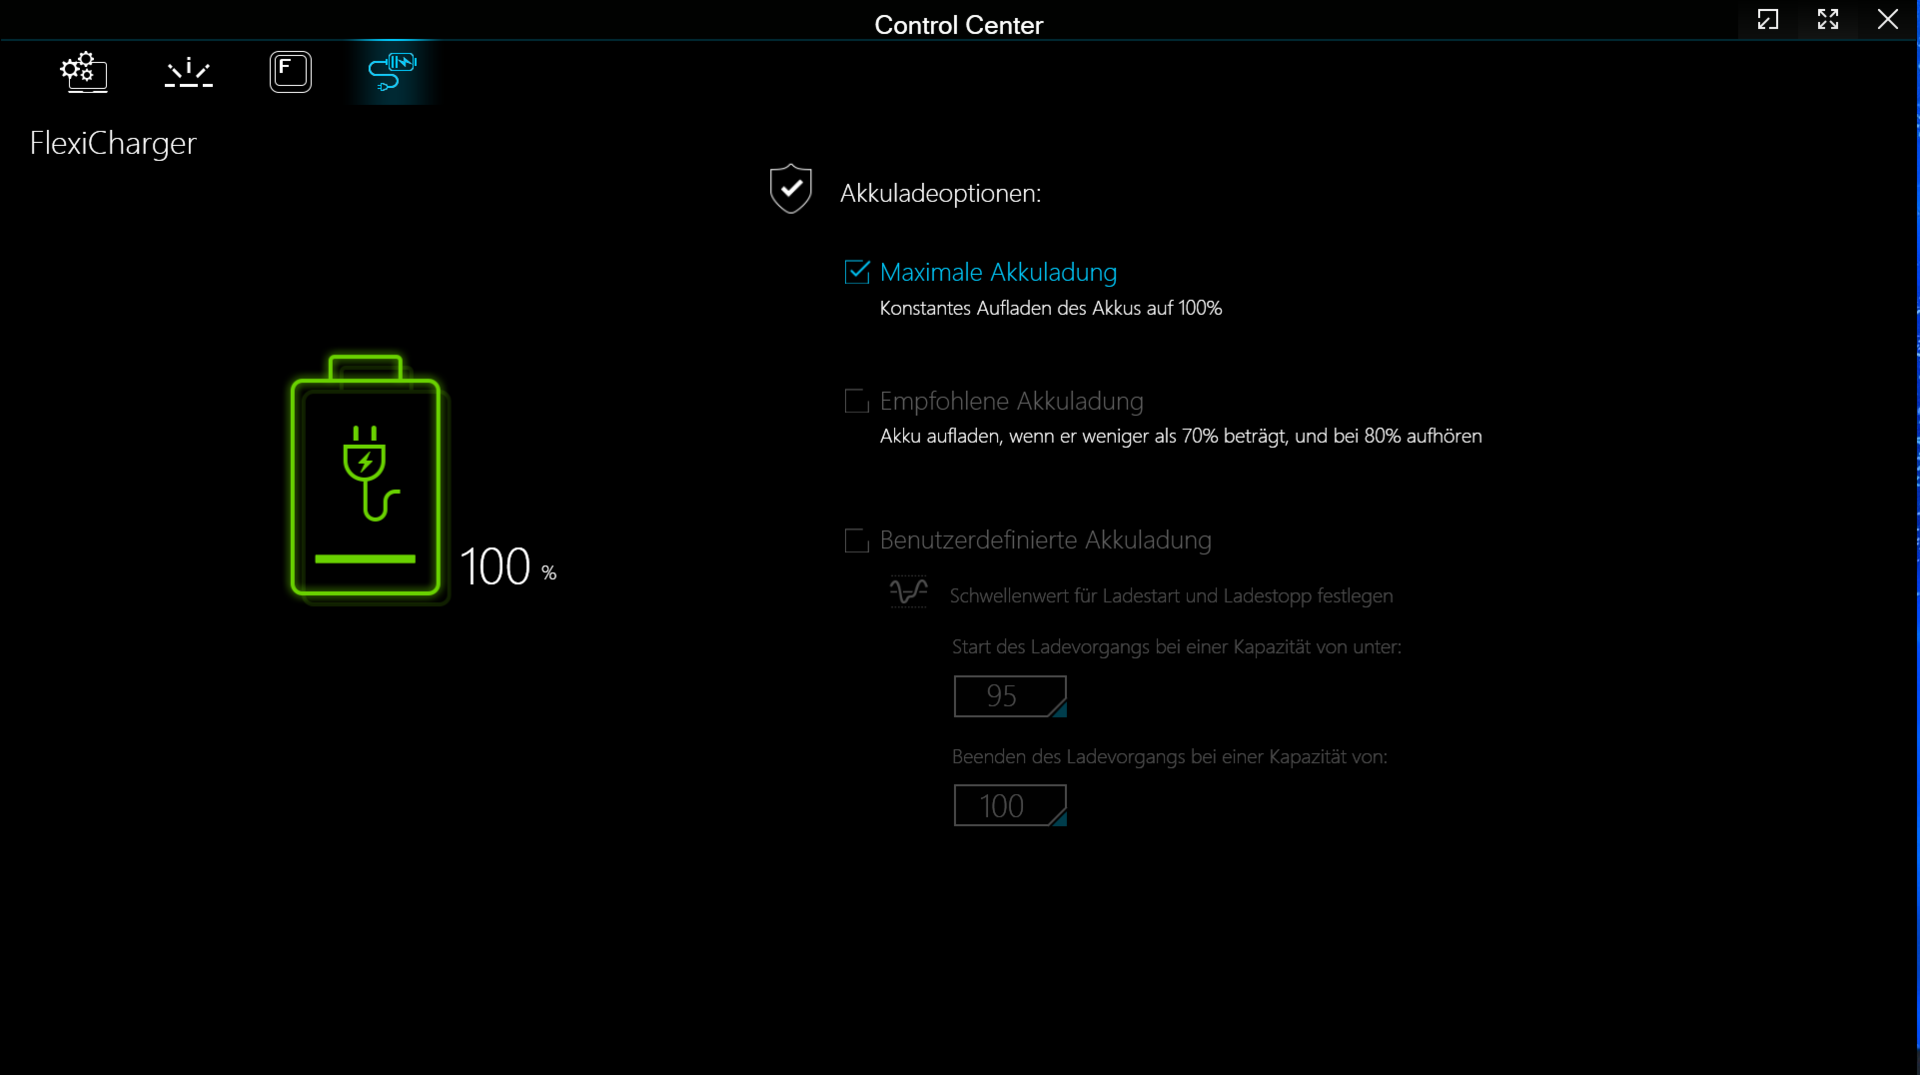
The Pro offers four manufacturer-specific performance modes (see table) that can be switched between via the Control Center software (the laptop's control center). "Entertainment Mode" (benchmarks) and "Power Saving Mode" (battery tests) were used. Optimus was active.
| Entertainment Mode | Performance Mode | Power Saving Mode | Silent Mode | |
|---|---|---|---|---|
| Power Limit 1 (HWInfo) | 70 watts | 100 watts | 15 watts | 15 watts |
| Power Limit 2 (HWInfo) | 90 watts | 120 watts | 30 watts | 30 watts |
| Noise (Witcher 3) | 48 dB(A) | 55 dB (A) | - | 42 dB (A) |
| Performance (Witcher 3) | ~114 fps | ~118 fps | - | ~100-114 fps |


Processor
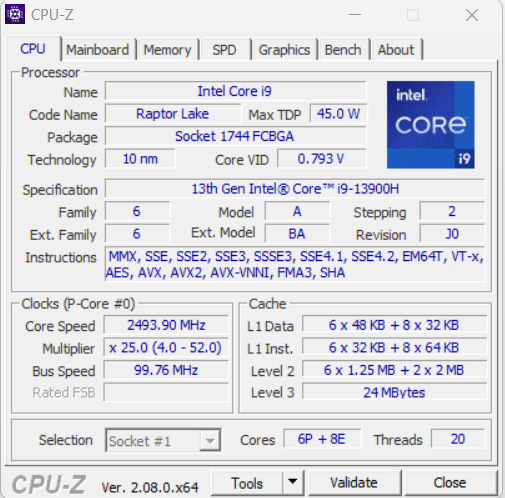
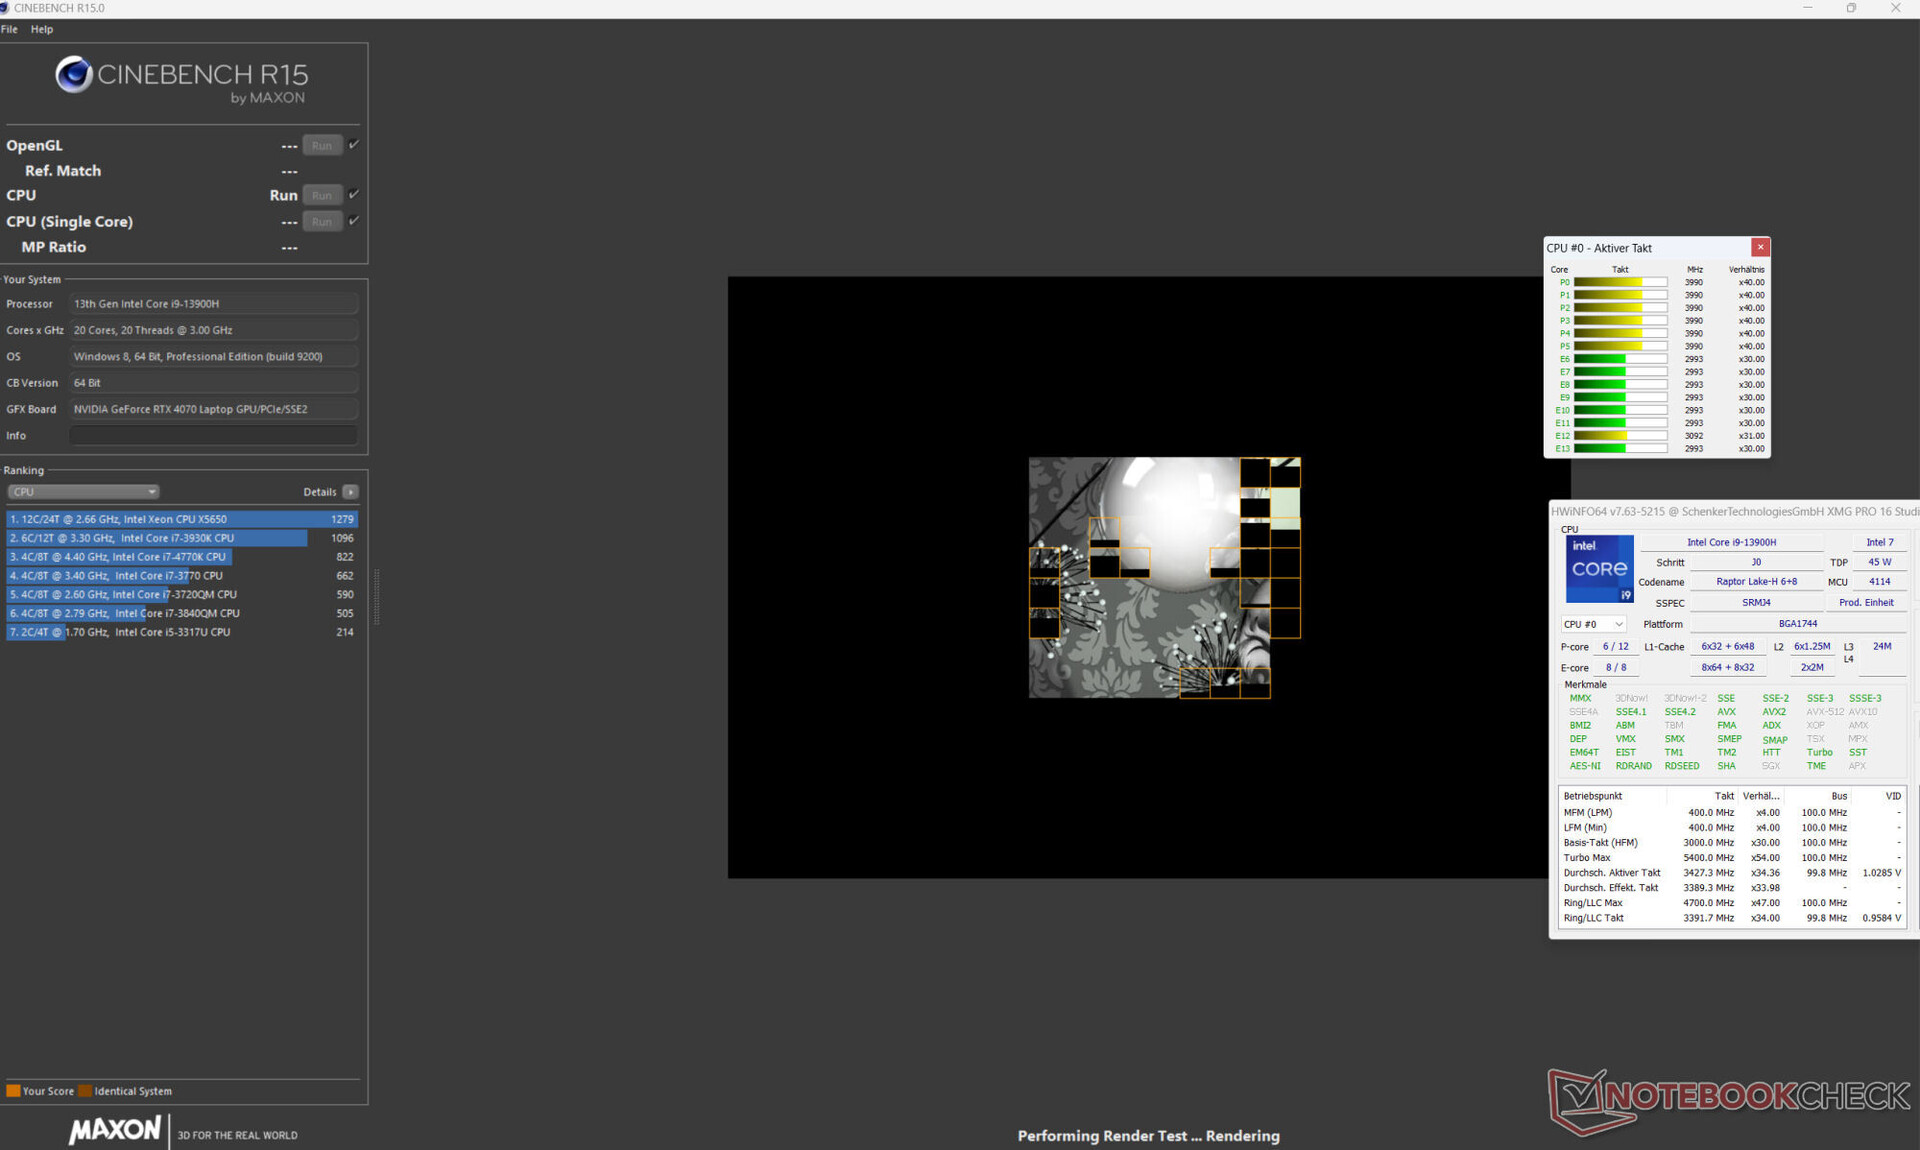
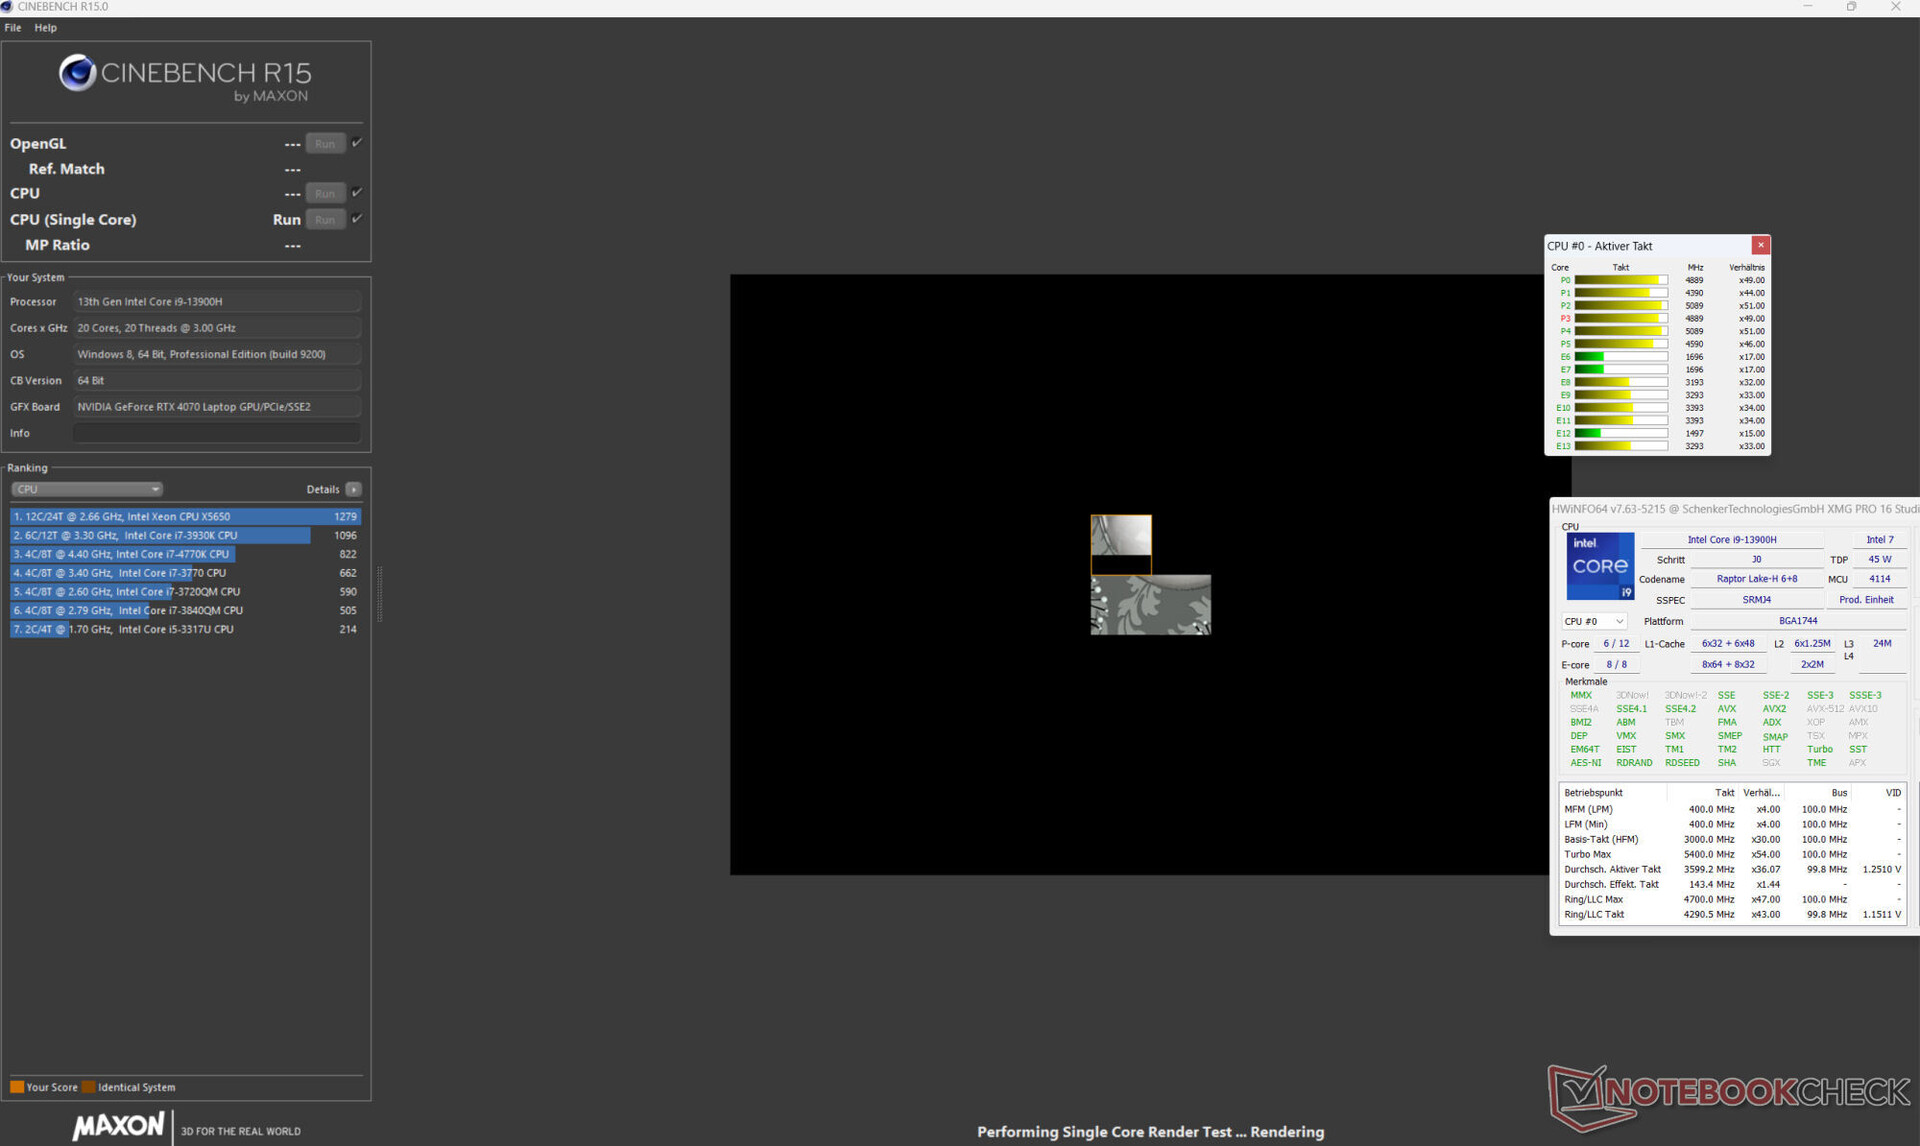
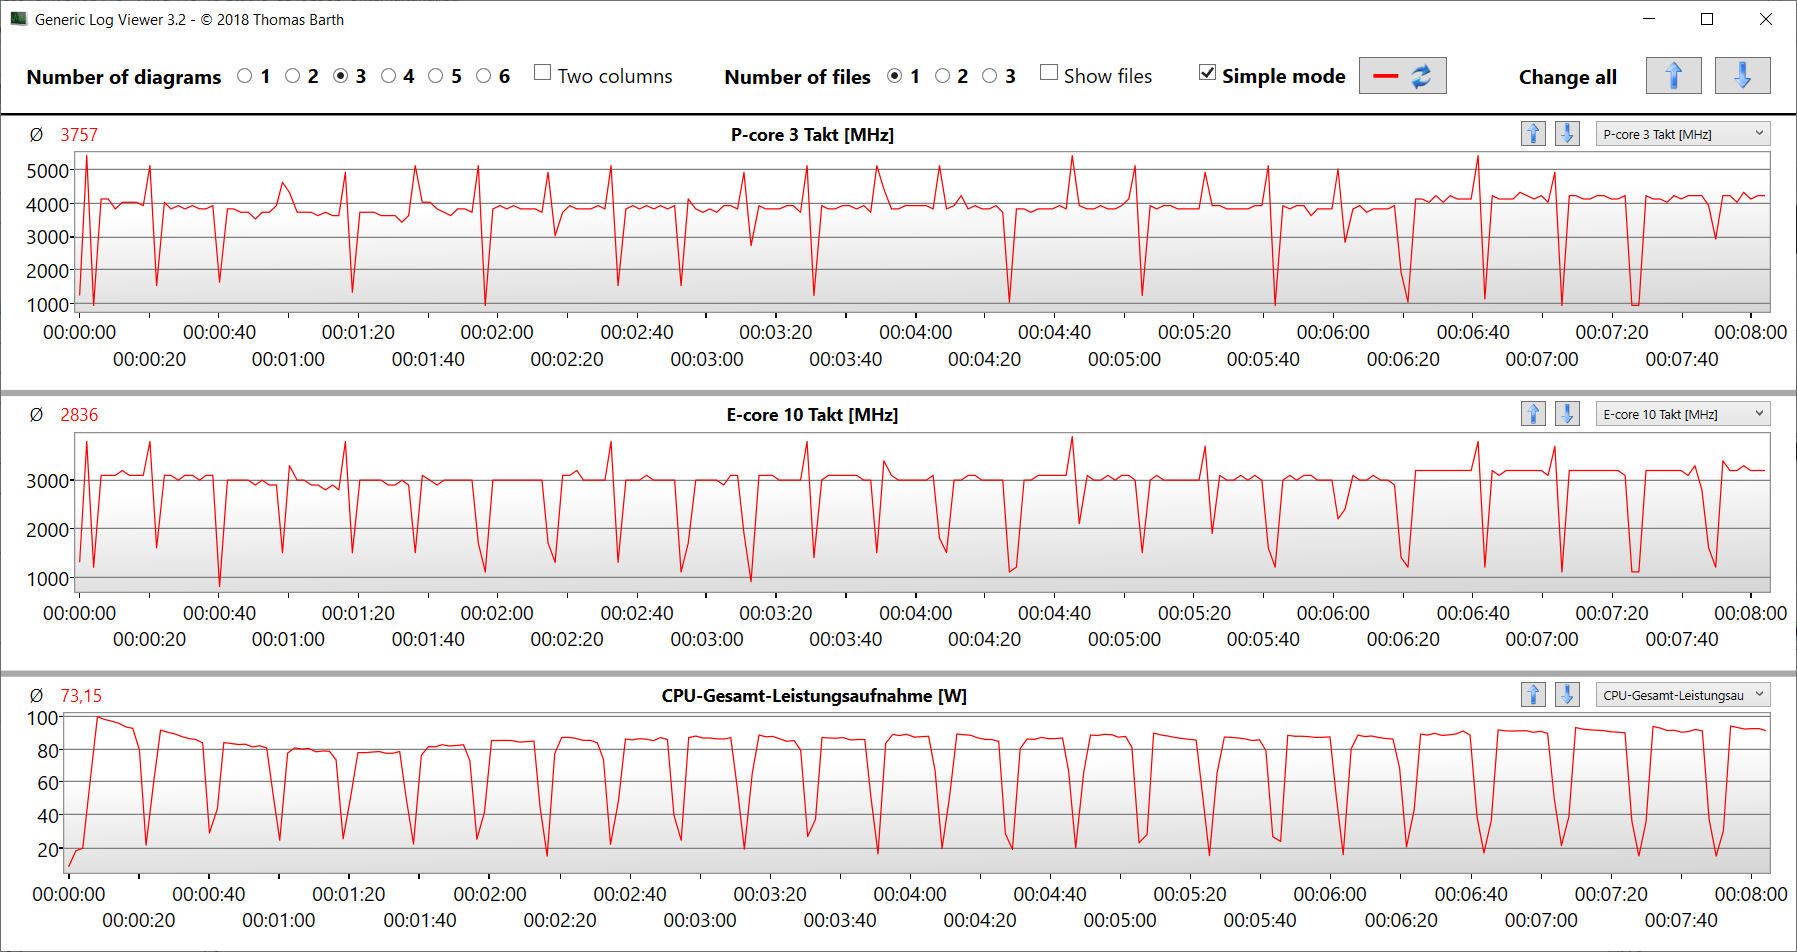
The Core i9-13900H's (6P, 8E) 14 CPU cores achieve maximum clock rates of 5.4 GHz (P) and 4.1 GHz (E). Permanent multi-thread load (CB15 Loop) led the clock rate to sink slightly from the first to the fourth run. After this, the values remained constant.
We measured benchmark results slightly above the previously determined CPU average (connected to mains). In battery mode, the more relevant single-thread performance (158 points; CB15) sank to a bigger extent than the multi-thread performance (1,696 points; CB15).
Cinebench R15 Multi continuous test

* ... smaller is better
AIDA64: FP32 Ray-Trace | FPU Julia | CPU SHA3 | CPU Queen | FPU SinJulia | FPU Mandel | CPU AES | CPU ZLib | FP64 Ray-Trace | CPU PhotoWorxx
| Performance rating | |
| Average of class Gaming | |
| HP Omen Transcend 16 | |
| Asus Vivobook Pro 16X K6604JV-MX016W | |
| Schenker XMG Pro 16 Studio (Mid 23) | |
| MSI Stealth 16 Studio A13VG | |
| Lenovo Legion Slim 7i 16 Gen 8 | |
| Average Intel Core i9-13900H | |
| AIDA64 / FP32 Ray-Trace | |
| Average of class Gaming (10227 - 85542, n=109, last 2 years) | |
| HP Omen Transcend 16 | |
| Asus Vivobook Pro 16X K6604JV-MX016W | |
| MSI Stealth 16 Studio A13VG | |
| Lenovo Legion Slim 7i 16 Gen 8 | |
| Schenker XMG Pro 16 Studio (Mid 23) | |
| Average Intel Core i9-13900H (6788 - 19557, n=25) | |
| AIDA64 / FPU Julia | |
| Average of class Gaming (51376 - 238426, n=109, last 2 years) | |
| HP Omen Transcend 16 | |
| Asus Vivobook Pro 16X K6604JV-MX016W | |
| Lenovo Legion Slim 7i 16 Gen 8 | |
| Schenker XMG Pro 16 Studio (Mid 23) | |
| MSI Stealth 16 Studio A13VG | |
| Average Intel Core i9-13900H (22551 - 95579, n=25) | |
| AIDA64 / CPU SHA3 | |
| Average of class Gaming (2180 - 9817, n=109, last 2 years) | |
| HP Omen Transcend 16 | |
| Asus Vivobook Pro 16X K6604JV-MX016W | |
| MSI Stealth 16 Studio A13VG | |
| Lenovo Legion Slim 7i 16 Gen 8 | |
| Schenker XMG Pro 16 Studio (Mid 23) | |
| Average Intel Core i9-13900H (2491 - 4270, n=25) | |
| AIDA64 / CPU Queen | |
| Asus Vivobook Pro 16X K6604JV-MX016W | |
| HP Omen Transcend 16 | |
| Lenovo Legion Slim 7i 16 Gen 8 | |
| Average of class Gaming (49785 - 173351, n=100, last 2 years) | |
| MSI Stealth 16 Studio A13VG | |
| Average Intel Core i9-13900H (65121 - 120936, n=25) | |
| Schenker XMG Pro 16 Studio (Mid 23) | |
| AIDA64 / FPU SinJulia | |
| Average of class Gaming (4424 - 33636, n=109, last 2 years) | |
| Asus Vivobook Pro 16X K6604JV-MX016W | |
| HP Omen Transcend 16 | |
| Lenovo Legion Slim 7i 16 Gen 8 | |
| MSI Stealth 16 Studio A13VG | |
| Schenker XMG Pro 16 Studio (Mid 23) | |
| Average Intel Core i9-13900H (6108 - 11631, n=25) | |
| AIDA64 / FPU Mandel | |
| Average of class Gaming (25115 - 128721, n=109, last 2 years) | |
| HP Omen Transcend 16 | |
| Asus Vivobook Pro 16X K6604JV-MX016W | |
| Lenovo Legion Slim 7i 16 Gen 8 | |
| MSI Stealth 16 Studio A13VG | |
| Schenker XMG Pro 16 Studio (Mid 23) | |
| Average Intel Core i9-13900H (11283 - 48474, n=25) | |
| AIDA64 / CPU AES | |
| Schenker XMG Pro 16 Studio (Mid 23) | |
| HP Omen Transcend 16 | |
| Asus Vivobook Pro 16X K6604JV-MX016W | |
| Average of class Gaming (39258 - 247074, n=109, last 2 years) | |
| Average Intel Core i9-13900H (3691 - 149377, n=25) | |
| MSI Stealth 16 Studio A13VG | |
| Lenovo Legion Slim 7i 16 Gen 8 | |
| AIDA64 / CPU ZLib | |
| HP Omen Transcend 16 | |
| Average of class Gaming (574 - 2531, n=109, last 2 years) | |
| Asus Vivobook Pro 16X K6604JV-MX016W | |
| Lenovo Legion Slim 7i 16 Gen 8 | |
| Schenker XMG Pro 16 Studio (Mid 23) | |
| Average Intel Core i9-13900H (789 - 1254, n=25) | |
| MSI Stealth 16 Studio A13VG | |
| AIDA64 / FP64 Ray-Trace | |
| Average of class Gaming (5509 - 45446, n=109, last 2 years) | |
| HP Omen Transcend 16 | |
| Asus Vivobook Pro 16X K6604JV-MX016W | |
| MSI Stealth 16 Studio A13VG | |
| Lenovo Legion Slim 7i 16 Gen 8 | |
| Schenker XMG Pro 16 Studio (Mid 23) | |
| Average Intel Core i9-13900H (3655 - 10716, n=25) | |
| AIDA64 / CPU PhotoWorxx | |
| HP Omen Transcend 16 | |
| Schenker XMG Pro 16 Studio (Mid 23) | |
| MSI Stealth 16 Studio A13VG | |
| Average of class Gaming (12271 - 89891, n=109, last 2 years) | |
| Asus Vivobook Pro 16X K6604JV-MX016W | |
| Average Intel Core i9-13900H (10871 - 50488, n=25) | |
| Lenovo Legion Slim 7i 16 Gen 8 | |
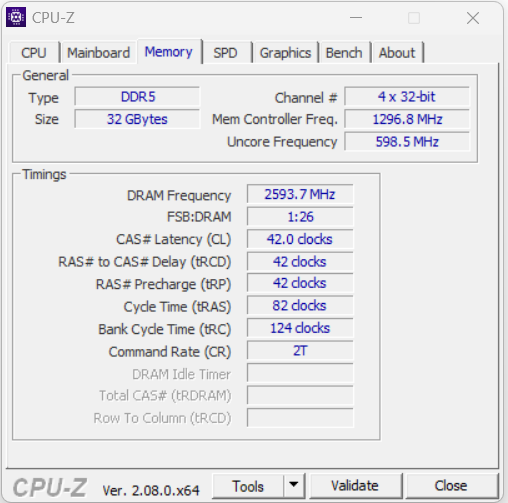
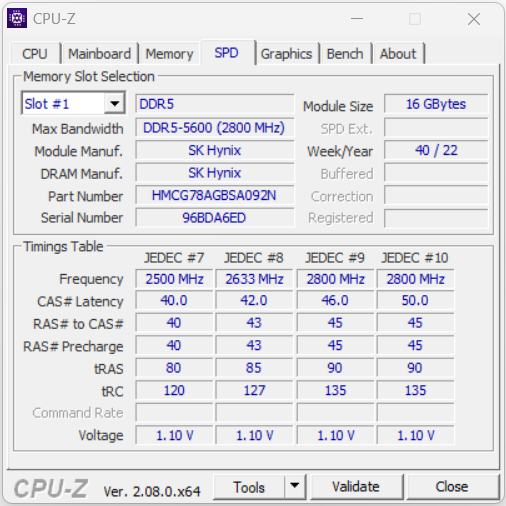
System performance
The smoothly running system isn't lacking in computing power. Gaming, rendering, and video editing are among the computer's core competencies. The RAM's transfer rates are on a normal level for DDR5-5600 RAM.
CrossMark: Overall | Productivity | Creativity | Responsiveness
| PCMark 10 / Score | |
| Lenovo Legion Slim 7i 16 Gen 8 | |
| Average of class Gaming (5828 - 11574, n=95, last 2 years) | |
| HP Omen Transcend 16 | |
| Schenker XMG Pro 16 Studio (Mid 23) | |
| Average Intel Core i9-13900H, NVIDIA GeForce RTX 4070 Laptop GPU (5855 - 8538, n=8) | |
| MSI Stealth 16 Studio A13VG | |
| Asus Vivobook Pro 16X K6604JV-MX016W | |
| PCMark 10 / Essentials | |
| Schenker XMG Pro 16 Studio (Mid 23) | |
| Lenovo Legion Slim 7i 16 Gen 8 | |
| HP Omen Transcend 16 | |
| Average Intel Core i9-13900H, NVIDIA GeForce RTX 4070 Laptop GPU (8835 - 11940, n=8) | |
| Average of class Gaming (8810 - 12600, n=99, last 2 years) | |
| Asus Vivobook Pro 16X K6604JV-MX016W | |
| MSI Stealth 16 Studio A13VG | |
| PCMark 10 / Productivity | |
| Lenovo Legion Slim 7i 16 Gen 8 | |
| Average of class Gaming (6845 - 18766, n=97, last 2 years) | |
| Schenker XMG Pro 16 Studio (Mid 23) | |
| Average Intel Core i9-13900H, NVIDIA GeForce RTX 4070 Laptop GPU (7967 - 10991, n=8) | |
| HP Omen Transcend 16 | |
| MSI Stealth 16 Studio A13VG | |
| Asus Vivobook Pro 16X K6604JV-MX016W | |
| PCMark 10 / Digital Content Creation | |
| Average of class Gaming (7602 - 19657, n=97, last 2 years) | |
| Lenovo Legion Slim 7i 16 Gen 8 | |
| HP Omen Transcend 16 | |
| Average Intel Core i9-13900H, NVIDIA GeForce RTX 4070 Laptop GPU (7738 - 13575, n=8) | |
| Schenker XMG Pro 16 Studio (Mid 23) | |
| MSI Stealth 16 Studio A13VG | |
| Asus Vivobook Pro 16X K6604JV-MX016W | |
| CrossMark / Overall | |
| Asus Vivobook Pro 16X K6604JV-MX016W | |
| Average of class Gaming (1366 - 2409, n=97, last 2 years) | |
| Lenovo Legion Slim 7i 16 Gen 8 | |
| HP Omen Transcend 16 | |
| Schenker XMG Pro 16 Studio (Mid 23) | |
| Average Intel Core i9-13900H, NVIDIA GeForce RTX 4070 Laptop GPU (1104 - 1974, n=7) | |
| MSI Stealth 16 Studio A13VG | |
| CrossMark / Productivity | |
| Asus Vivobook Pro 16X K6604JV-MX016W | |
| Lenovo Legion Slim 7i 16 Gen 8 | |
| Schenker XMG Pro 16 Studio (Mid 23) | |
| Average of class Gaming (1386 - 2254, n=97, last 2 years) | |
| HP Omen Transcend 16 | |
| Average Intel Core i9-13900H, NVIDIA GeForce RTX 4070 Laptop GPU (1058 - 1914, n=7) | |
| MSI Stealth 16 Studio A13VG | |
| CrossMark / Creativity | |
| Asus Vivobook Pro 16X K6604JV-MX016W | |
| HP Omen Transcend 16 | |
| Average of class Gaming (1343 - 2729, n=97, last 2 years) | |
| Lenovo Legion Slim 7i 16 Gen 8 | |
| Schenker XMG Pro 16 Studio (Mid 23) | |
| Average Intel Core i9-13900H, NVIDIA GeForce RTX 4070 Laptop GPU (1178 - 2254, n=7) | |
| MSI Stealth 16 Studio A13VG | |
| CrossMark / Responsiveness | |
| Schenker XMG Pro 16 Studio (Mid 23) | |
| Lenovo Legion Slim 7i 16 Gen 8 | |
| Average of class Gaming (1226 - 2334, n=97, last 2 years) | |
| Asus Vivobook Pro 16X K6604JV-MX016W | |
| Average Intel Core i9-13900H, NVIDIA GeForce RTX 4070 Laptop GPU (1037 - 1952, n=7) | |
| MSI Stealth 16 Studio A13VG | |
| HP Omen Transcend 16 | |
| PCMark 10 Score | 8010 points | |
Help | ||
| AIDA64 / Memory Copy | |
| HP Omen Transcend 16 | |
| Average of class Gaming (21750 - 129946, n=109, last 2 years) | |
| Schenker XMG Pro 16 Studio (Mid 23) | |
| MSI Stealth 16 Studio A13VG | |
| Asus Vivobook Pro 16X K6604JV-MX016W | |
| Average Intel Core i9-13900H (37448 - 74486, n=25) | |
| Lenovo Legion Slim 7i 16 Gen 8 | |
| AIDA64 / Memory Read | |
| HP Omen Transcend 16 | |
| Asus Vivobook Pro 16X K6604JV-MX016W | |
| Schenker XMG Pro 16 Studio (Mid 23) | |
| MSI Stealth 16 Studio A13VG | |
| Average of class Gaming (22956 - 118858, n=109, last 2 years) | |
| Average Intel Core i9-13900H (41599 - 75433, n=25) | |
| Lenovo Legion Slim 7i 16 Gen 8 | |
| AIDA64 / Memory Write | |
| HP Omen Transcend 16 | |
| Average of class Gaming (22297 - 135096, n=109, last 2 years) | |
| Schenker XMG Pro 16 Studio (Mid 23) | |
| MSI Stealth 16 Studio A13VG | |
| Asus Vivobook Pro 16X K6604JV-MX016W | |
| Average Intel Core i9-13900H (36152 - 88505, n=25) | |
| Lenovo Legion Slim 7i 16 Gen 8 | |
| AIDA64 / Memory Latency | |
| Average of class Gaming (75.3 - 259, n=109, last 2 years) | |
| Asus Vivobook Pro 16X K6604JV-MX016W | |
| Average Intel Core i9-13900H (75.8 - 102.3, n=25) | |
| HP Omen Transcend 16 | |
| MSI Stealth 16 Studio A13VG | |
| Schenker XMG Pro 16 Studio (Mid 23) | |
| Lenovo Legion Slim 7i 16 Gen 8 | |
* ... smaller is better
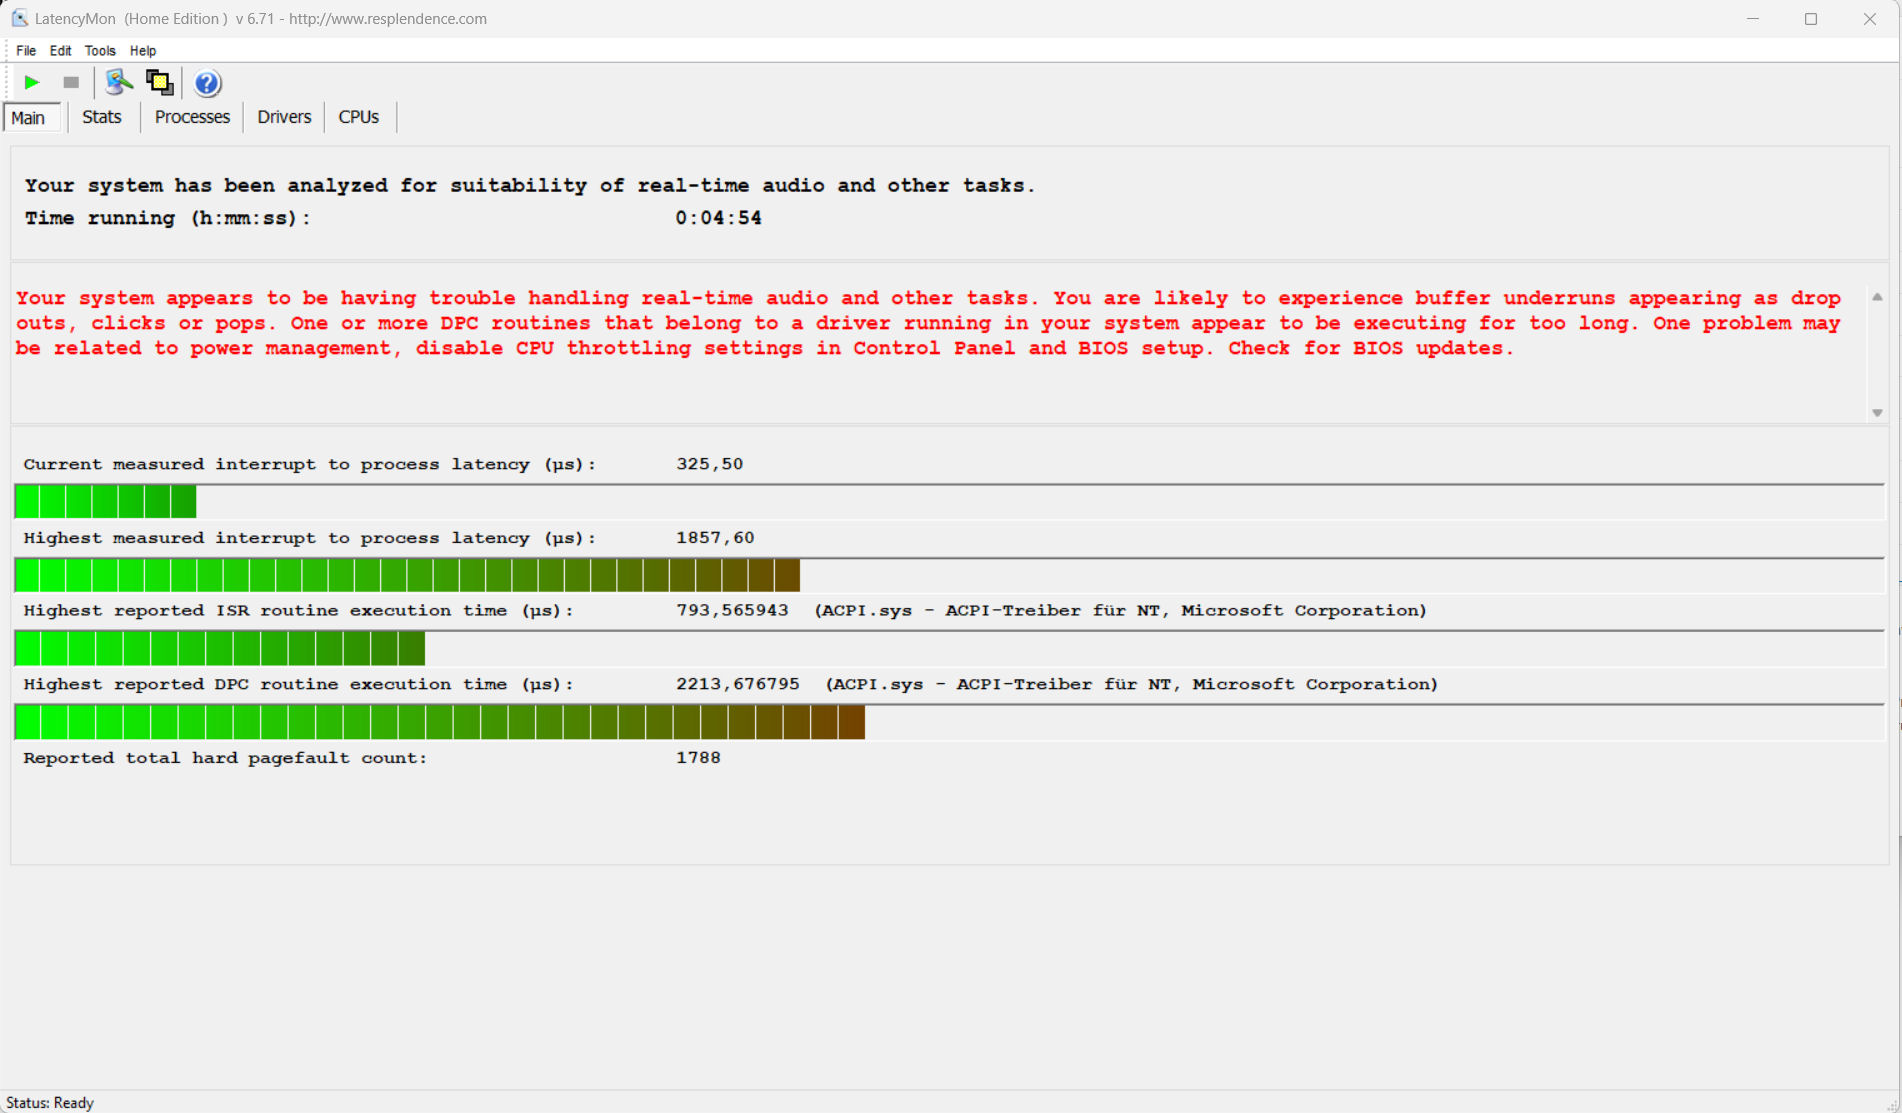
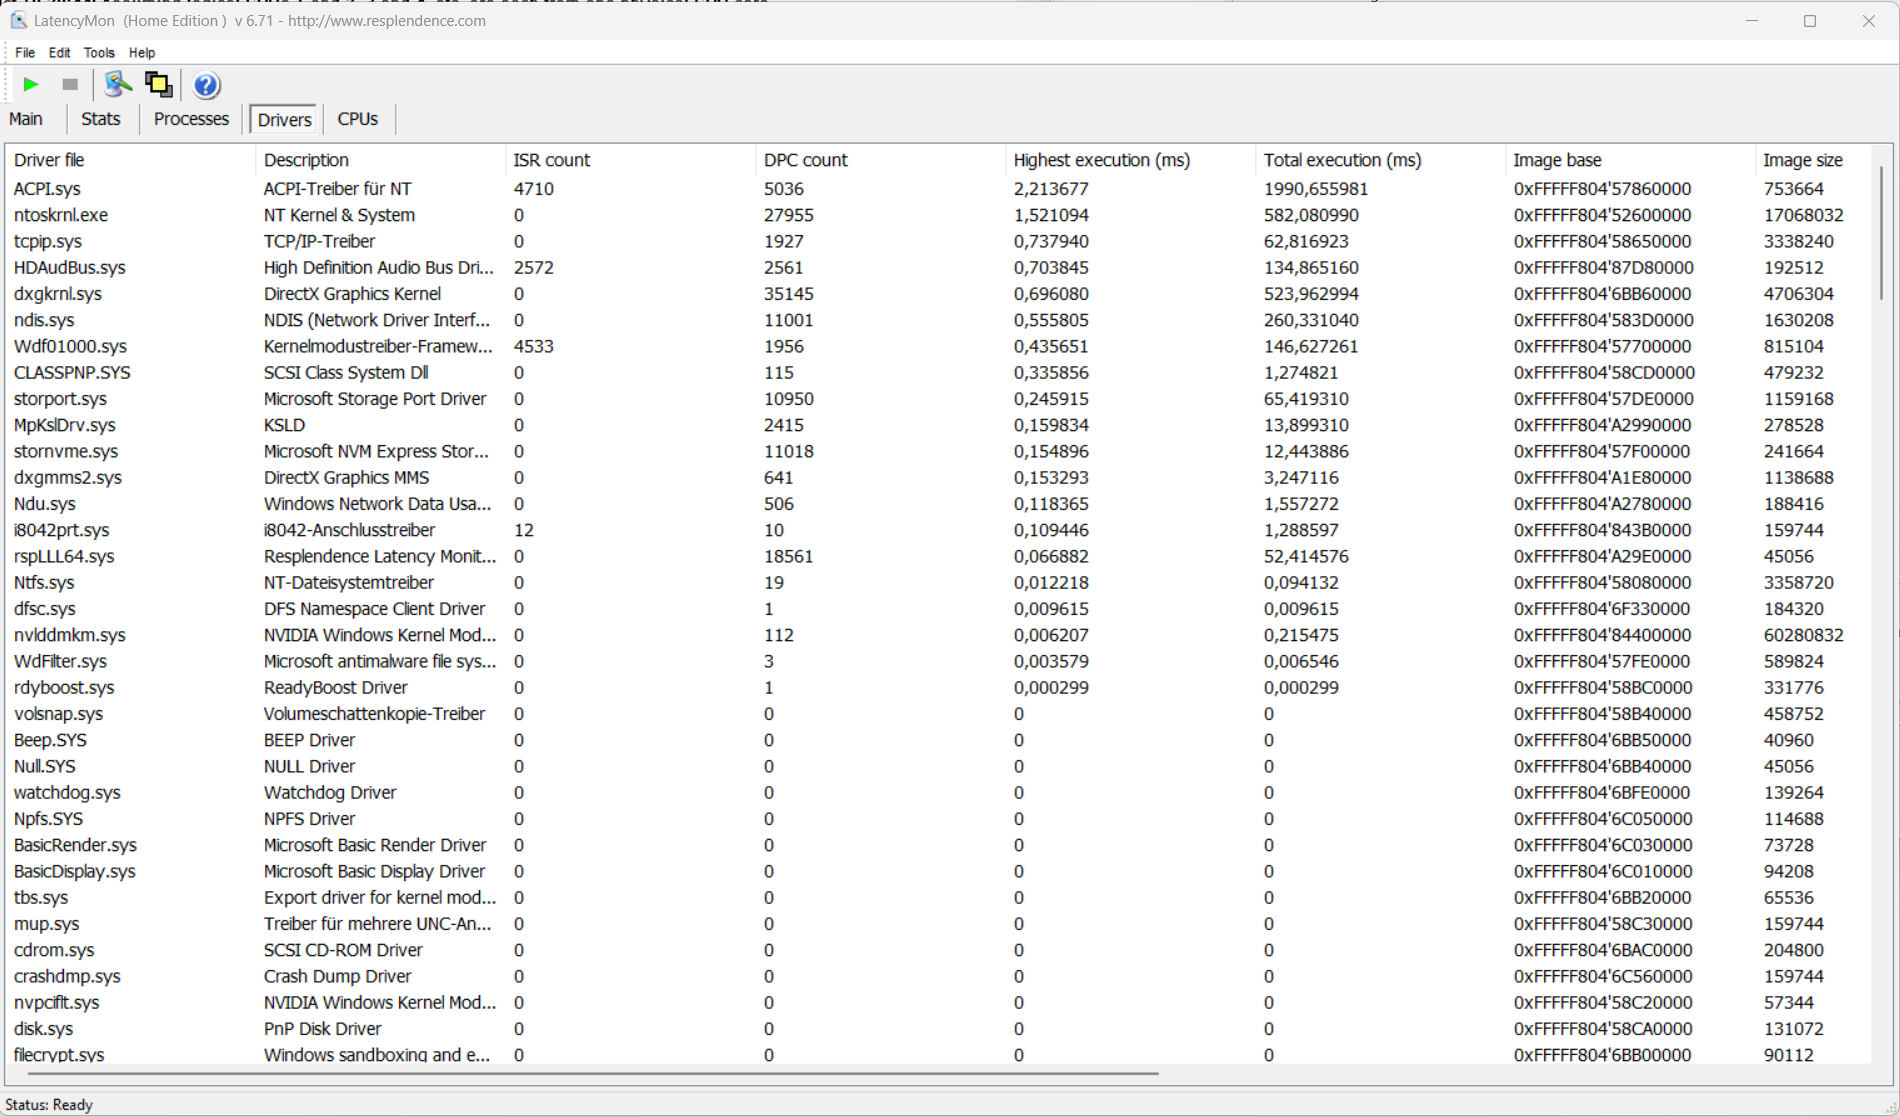
DPC latency
The standardized latency monitor test (web surfing, 4k video playback, Prime95 high-load) revealed some anomalies. The system doesn't seem to be suitable for real-time video and audio editing. Future software updates could lead to improvements or even degradations.
| DPC Latencies / LatencyMon - interrupt to process latency (max), Web, Youtube, Prime95 | |
| MSI Stealth 16 Studio A13VG | |
| Lenovo Legion Slim 7i 16 Gen 8 | |
| Asus Vivobook Pro 16X K6604JV-MX016W | |
| Schenker XMG Pro 16 Studio (Mid 23) | |
| HP Omen Transcend 16 | |
* ... smaller is better
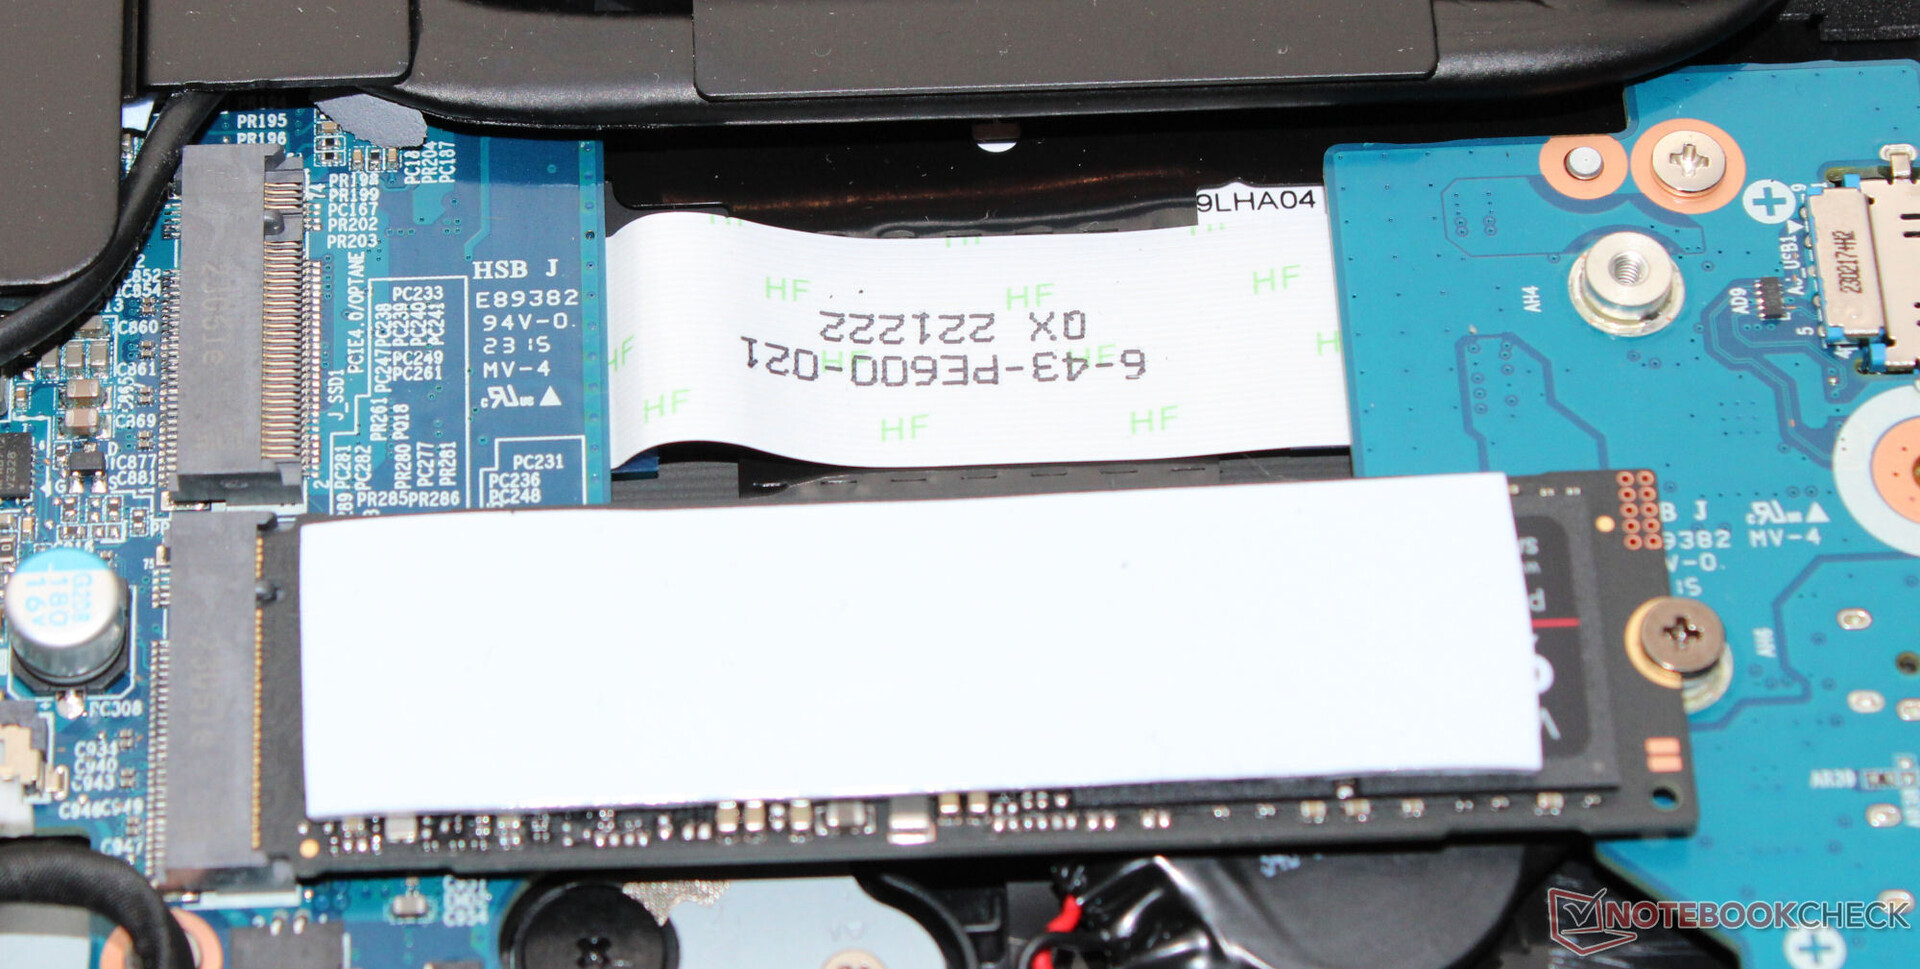
Storage devices
The Pro 16 can accommodate a total of two PCIe 4 SSDs with the format M.2-2280. RAID-0/1 is supported. The Samsung SSD (1 TB, PCIe 4, M.2-2280) in our test device delivered excellent transfer rates. Positive: Thermal throttling did not occur.

* ... smaller is better
Reading continuous performance: DiskSpd Read Loop, Queue Depth 8
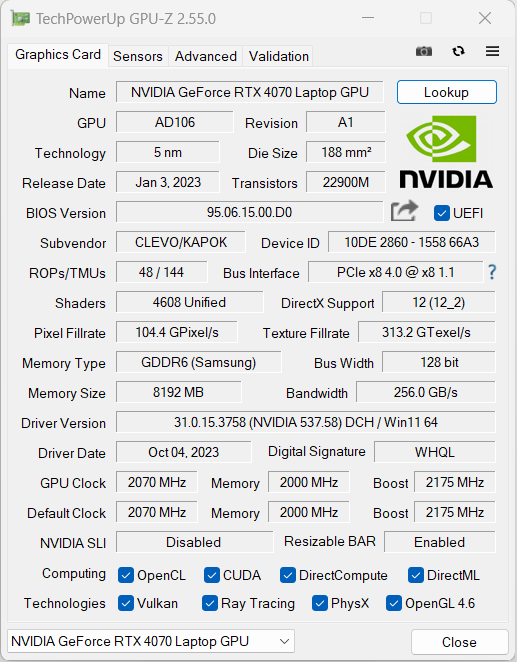
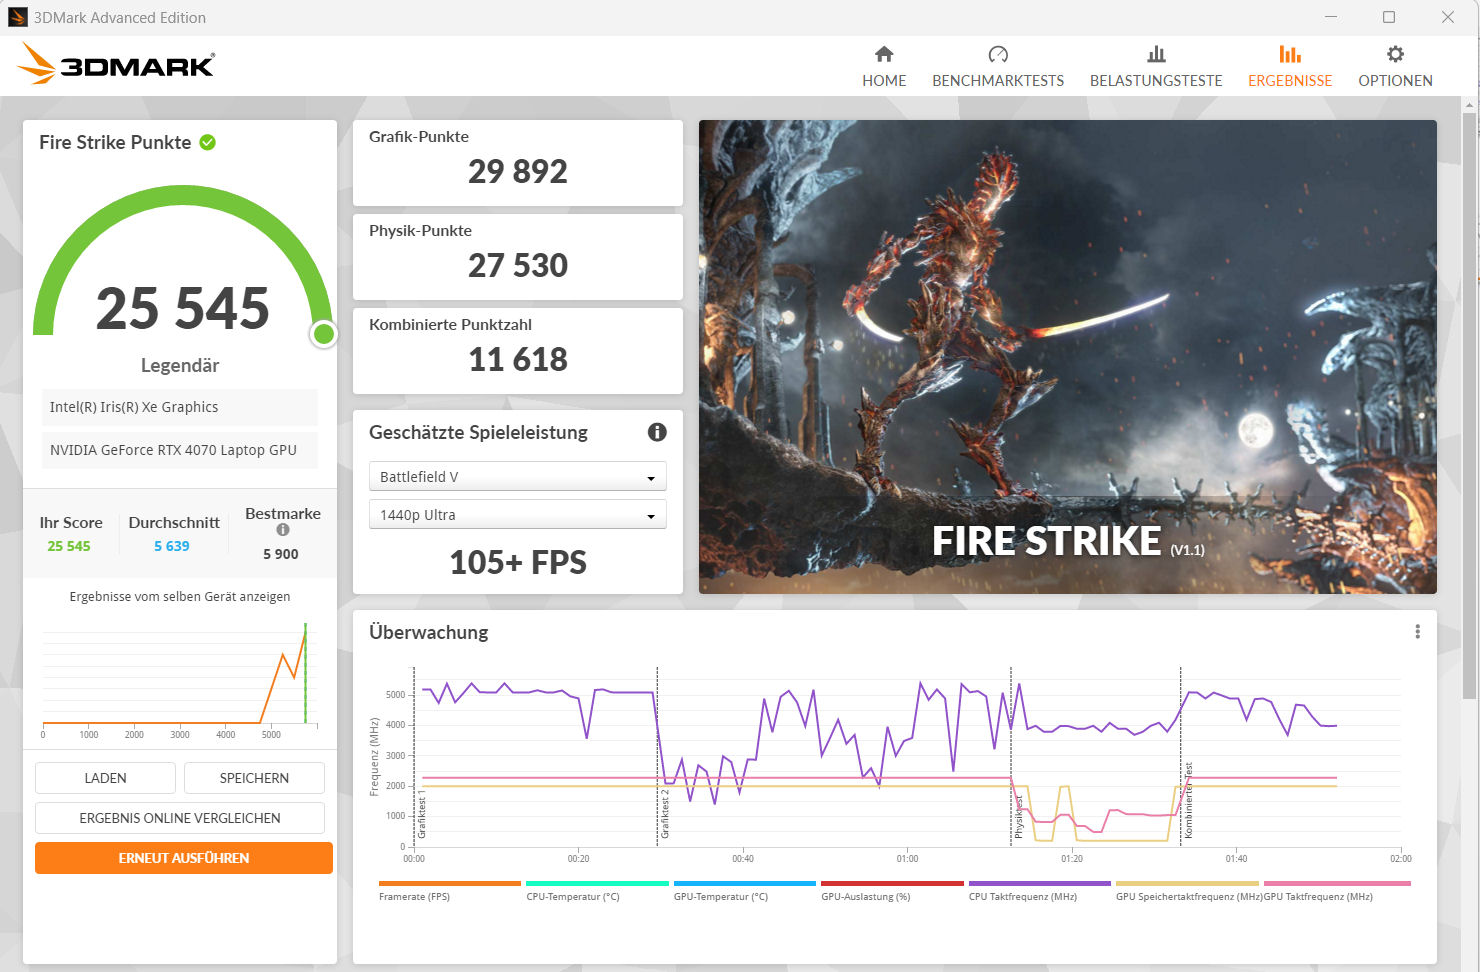
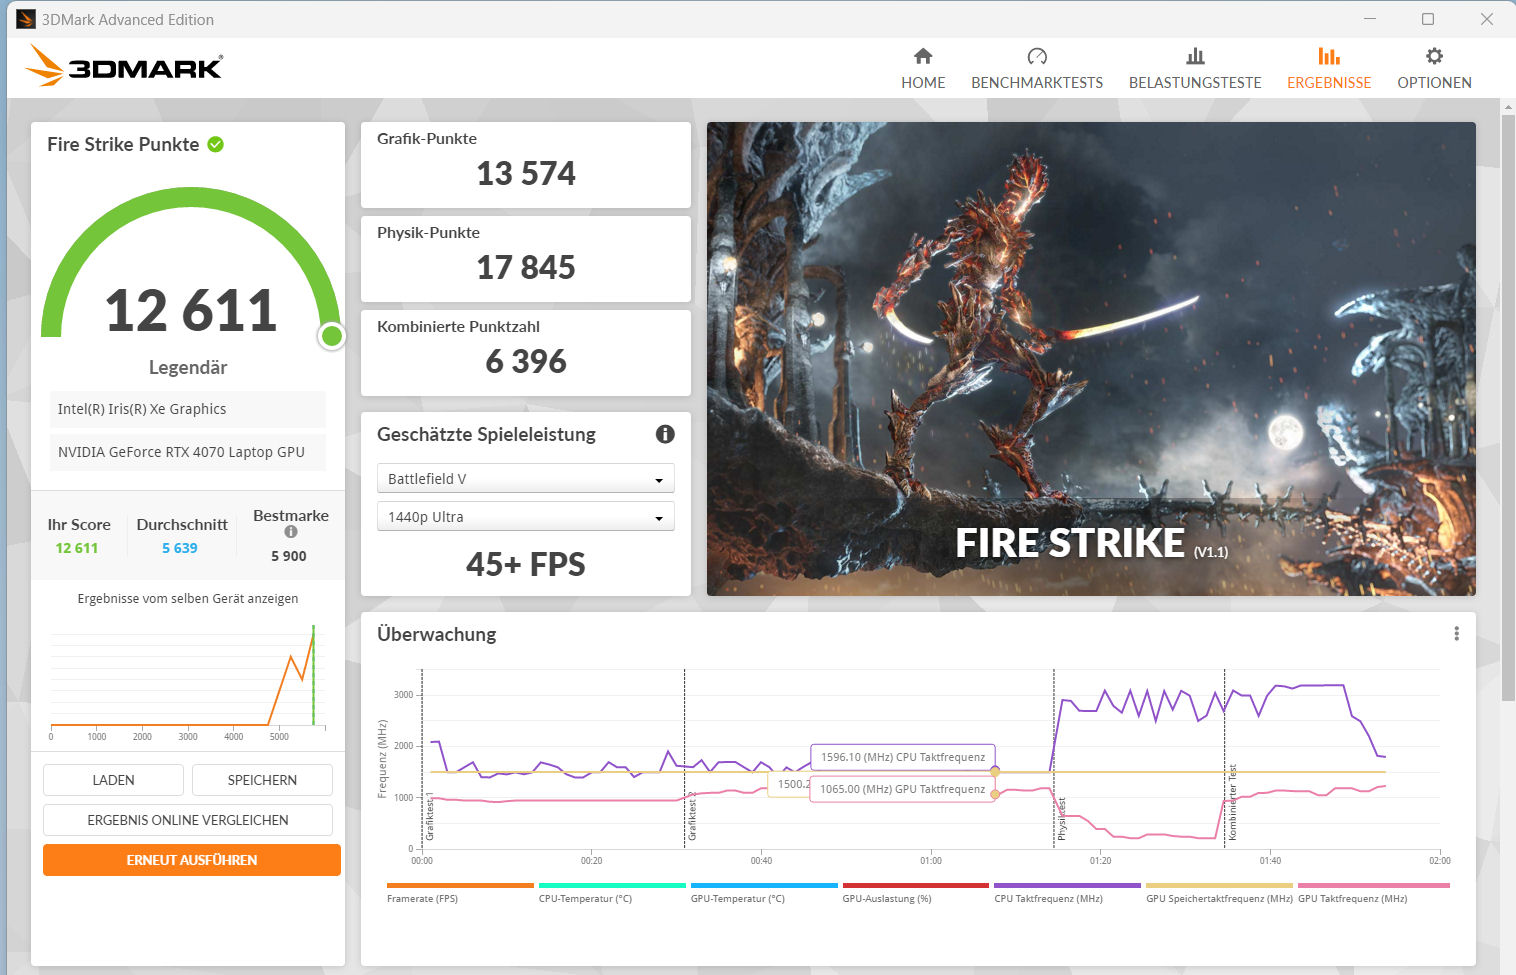
Graphics card
The GeForce RTX 4070 offers 4,608 shaders, a 128 bit wide bus and fast GDDR6 RAM (8,192 MB). Schenker has set its maximum TGP at 140 watts (115 watts + 25 watts Dynamic Boost) — more is not possible.
The graphics core allows for QHD gaming at high to maximum settings. In doing so, it achieves frame rates above the previously determined RTX 4070 average. Using dGPU mode (activated via the BIOS) leads to a slight boost in performance. The graphics core and memory can be overclocked via the Control Center (Performance Mode -> click the downwards pointing arrows). Advanced Optimus is not supported.


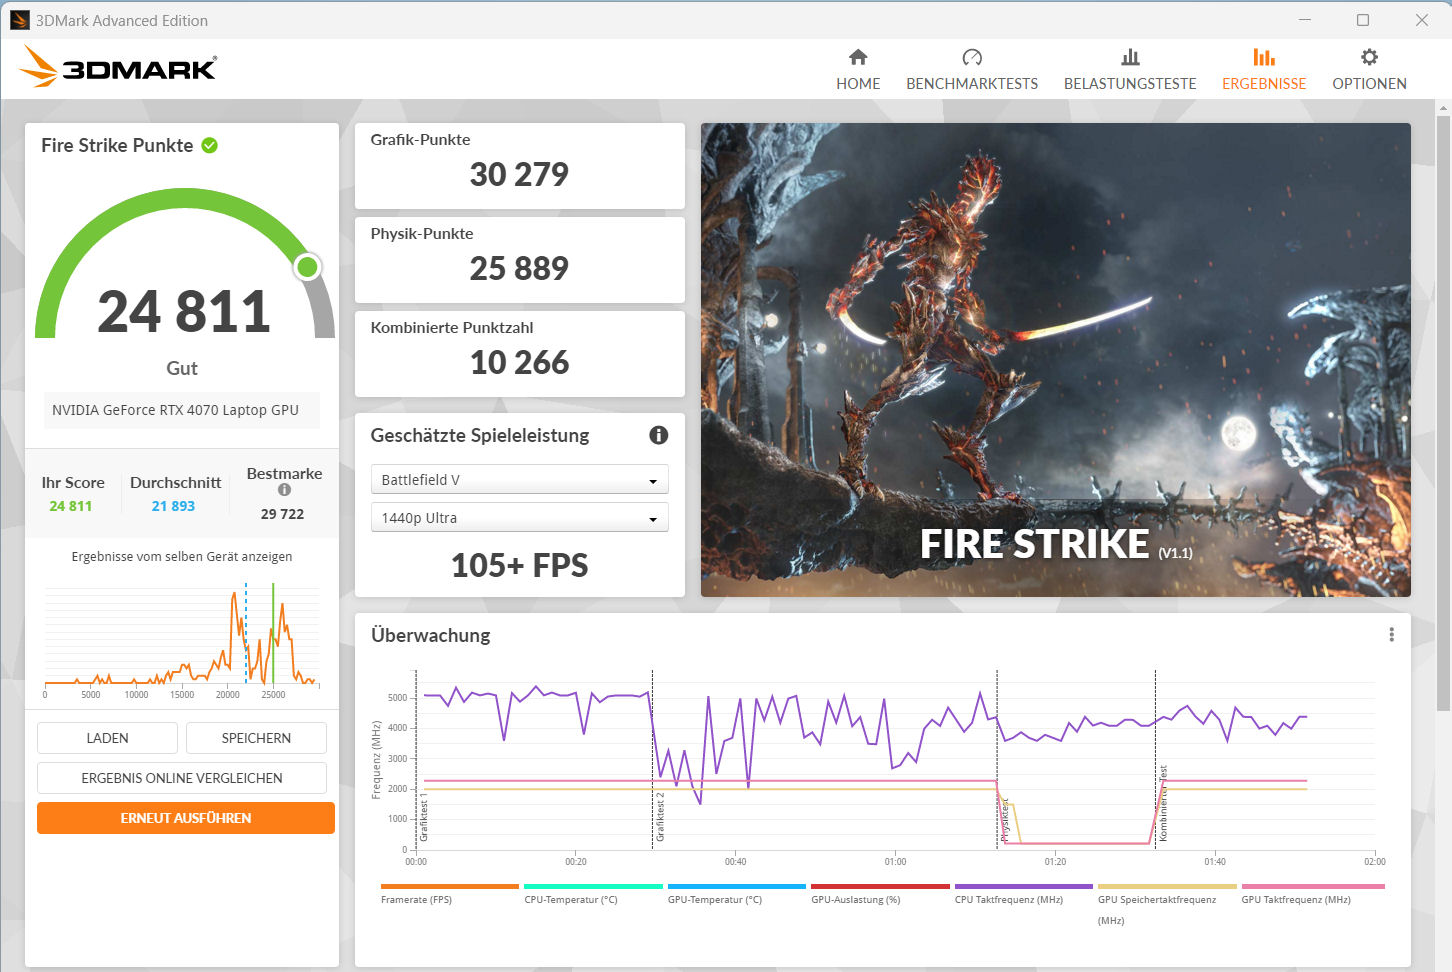
| 3DMark 06 Standard Score | 54913 points | |
| 3DMark 11 Performance | 34302 points | |
| 3DMark Cloud Gate Standard Score | 62061 points | |
| 3DMark Fire Strike Score | 25545 points | |
| 3DMark Time Spy Score | 12134 points | |
Help | ||
* ... smaller is better
| The Witcher 3 - 1920x1080 Ultra Graphics & Postprocessing (HBAO+) | |
| Average of class Gaming (95 - 240, n=8, last 2 years) | |
| MSI Stealth 16 Studio A13VG | |
| Schenker XMG Pro 16 Studio (Mid 23) | |
| Lenovo Legion Slim 7i 16 Gen 8 | |
| Average NVIDIA GeForce RTX 4070 Laptop GPU (69.8 - 133.7, n=57) | |
| HP Omen Transcend 16 | |
| Asus Vivobook Pro 16X K6604JV-MX016W | |
| Lies of P | |
| 1920x1080 Best Preset | |
| Average NVIDIA GeForce RTX 4070 Laptop GPU (137.4 - 148.1, n=4) | |
| Schenker XMG Pro 16 Studio (Mid 23) | |
| 2560x1440 Best Preset | |
| Average NVIDIA GeForce RTX 4070 Laptop GPU (97.2 - 98.8, n=4) | |
| Schenker XMG Pro 16 Studio (Mid 23) | |
| Assassin's Creed Mirage | |
| 1920x1080 Ultra High Preset (Adaptive Quality Off) | |
| Schenker XMG Pro 16 Studio (Mid 23) | |
| Average NVIDIA GeForce RTX 4070 Laptop GPU (91 - 99, n=6) | |
| 2560x1440 Ultra High Preset (Adaptive Quality Off) | |
| Average NVIDIA GeForce RTX 4070 Laptop GPU (73 - 80, n=6) | |
| Schenker XMG Pro 16 Studio (Mid 23) | |
| Lords of the Fallen | |
| 1920x1080 Ultra Preset | |
| Average NVIDIA GeForce RTX 4070 Laptop GPU (44.3 - 67.7, n=4) | |
| Schenker XMG Pro 16 Studio (Mid 23) | |
| 2560x1440 Ultra Preset | |
| Average NVIDIA GeForce RTX 4070 Laptop GPU (29.1 - 47.1, n=4) | |
| Schenker XMG Pro 16 Studio (Mid 23) | |
| Total War Pharaoh | |
| 1920x1080 Ultra Preset | |
| Average NVIDIA GeForce RTX 4070 Laptop GPU (110 - 136.2, n=5) | |
| Schenker XMG Pro 16 Studio (Mid 23) | |
| Average of class Gaming (42.9 - 161.4, n=2, last 2 years) | |
| 2560x1440 Ultra Preset | |
| Average NVIDIA GeForce RTX 4070 Laptop GPU (87.2 - 96.6, n=5) | |
| Schenker XMG Pro 16 Studio (Mid 23) | |
| Average of class Gaming (24.1 - 127.4, n=2, last 2 years) | |
Witcher 3 FPS diagram


| low | med. | high | ultra | QHD | |
|---|---|---|---|---|---|
| GTA V (2015) | 186.8 | 185.9 | 181.3 | 125.4 | 93.2 |
| The Witcher 3 (2015) | 474.9 | 365.4 | 231.4 | 118.4 | 86.9 |
| Dota 2 Reborn (2015) | 210 | 187.5 | 176.5 | 162.8 | |
| Final Fantasy XV Benchmark (2018) | 219 | 159.8 | 115.5 | 84.1 | |
| X-Plane 11.11 (2018) | 166.7 | 146.4 | 119.5 | ||
| Strange Brigade (2018) | 544 | 280 | 232 | 202 | 132.8 |
| Cyberpunk 2077 1.6 (2022) | 147 | 115 | 95.3 | 86.7 | 55.4 |
| Returnal (2023) | 115 | 112 | 101 | 85 | 63 |
| F1 23 (2023) | 279 | 261 | 198.2 | 67.6 | 45.6 |
| Lies of P (2023) | 206 | 182 | 159.8 | 140.1 | 97.3 |
| Cyberpunk 2077 (2023) | 131.7 | 113.2 | 98.3 | 87.9 | 57.1 |
| Assassin's Creed Mirage (2023) | 143 | 132 | 125 | 99 | 75 |
| Total War Pharaoh (2023) | 385.9 | 239.5 | 146.2 | 113.3 | 87.2 |
| Lords of the Fallen (2023) | 96.9 | 84.1 | 63.4 | 45.9 | 29.1 |
Emissions & power - The Pro 16 delivers good runtimes
Noise emissions
While gaming, noise emissions can rise up to 55 dB(A) (Performance Mode). "Entertainment Mode", which we used, delivers moderate noise emissions of 48 dB(A). It could be quieter: In Silent Mode, you can achieve emissions of 42 dB(A), at the expense of some gaming performance. In idle mode and in everyday use (office, internet), one of the two fans is often in use and sometimes, they both remain off.
Noise level
| Idle |
| 26 / 29 / 34 dB(A) |
| Load |
| 43 / 48 dB(A) |
 | ||
30 dB silent 40 dB(A) audible 50 dB(A) loud |
||
min: | ||
| Schenker XMG Pro 16 Studio (Mid 23) i9-13900H, GeForce RTX 4070 Laptop GPU | Asus Vivobook Pro 16X K6604JV-MX016W i9-13980HX, GeForce RTX 4060 Laptop GPU | Lenovo Legion Slim 7i 16 Gen 8 i9-13900H, GeForce RTX 4070 Laptop GPU | HP Omen Transcend 16 i9-13900HX, GeForce RTX 4070 Laptop GPU | MSI Stealth 16 Studio A13VG i7-13700H, GeForce RTX 4070 Laptop GPU | |
|---|---|---|---|---|---|
| Noise | -4% | 10% | -3% | 11% | |
| off / environment * (dB) | 25 | 25.2 -1% | 22.8 9% | 22.9 8% | 24 4% |
| Idle Minimum * (dB) | 26 | 26.6 -2% | 23.6 9% | 29.1 -12% | 24 8% |
| Idle Average * (dB) | 29 | 26.6 8% | 23.6 19% | 29.1 -0% | 24 17% |
| Idle Maximum * (dB) | 34 | 29.2 14% | 25.7 24% | 29.1 14% | 24 29% |
| Load Average * (dB) | 43 | 53.4 -24% | 27.6 36% | 45.7 -6% | 34.81 19% |
| Witcher 3 ultra * (dB) | 48 | 54.4 -13% | 54.3 -13% | 44.05 8% | |
| Load Maximum * (dB) | 48 | 56.9 -19% | 54.4 -13% | 54.3 -13% | 51.57 -7% |
* ... smaller is better
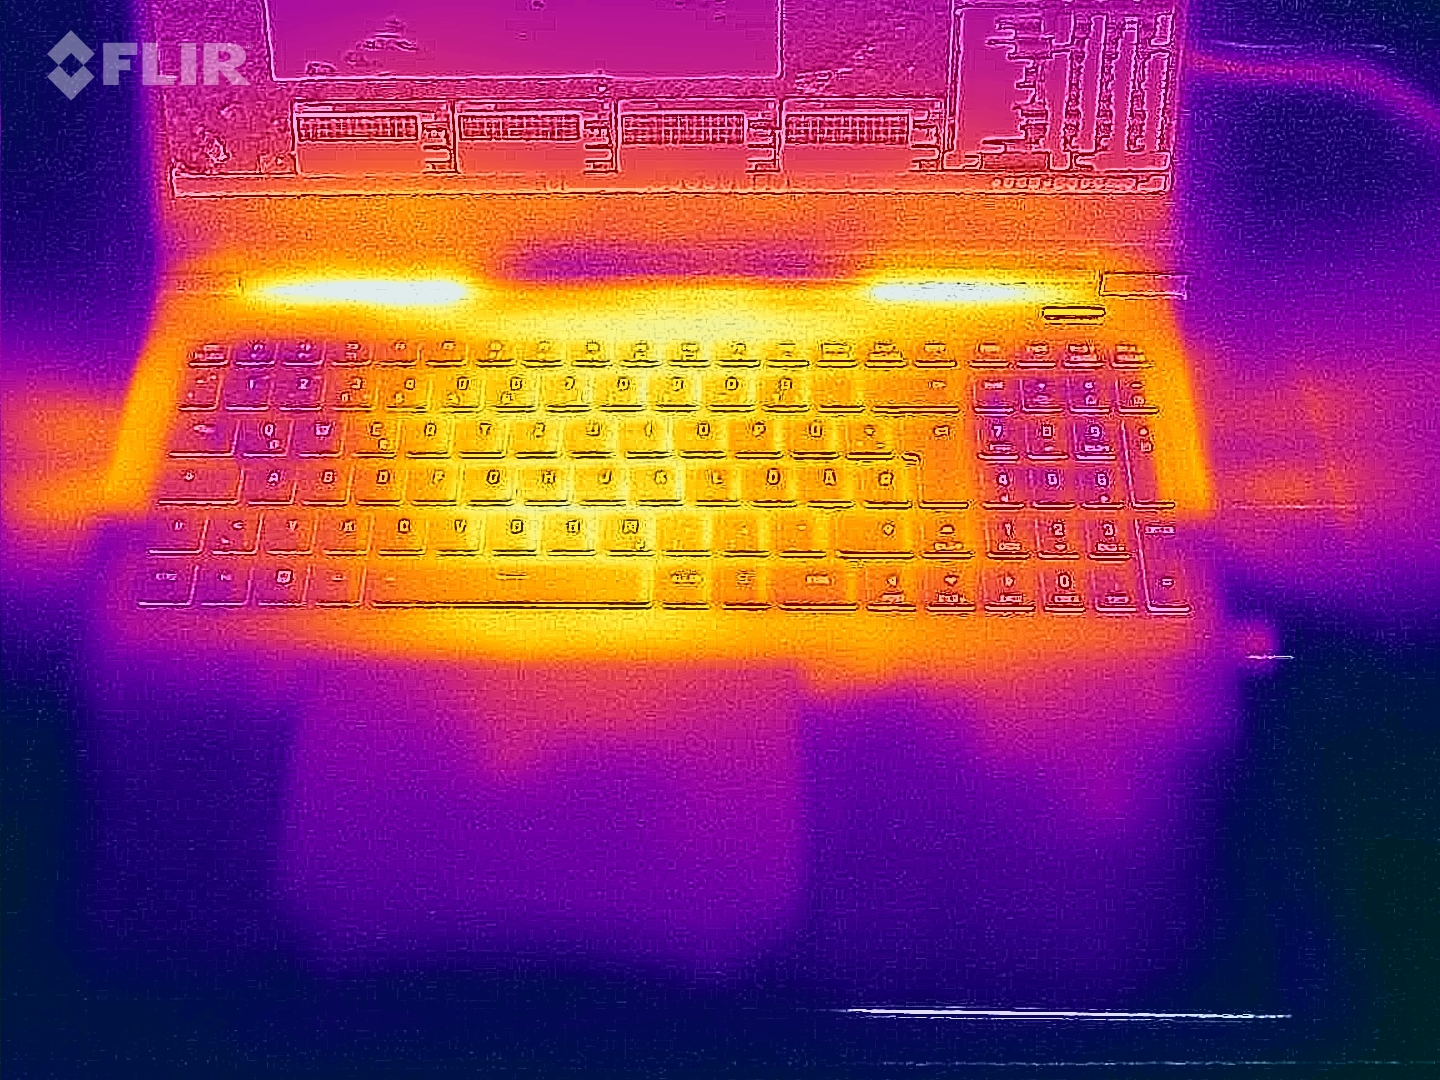
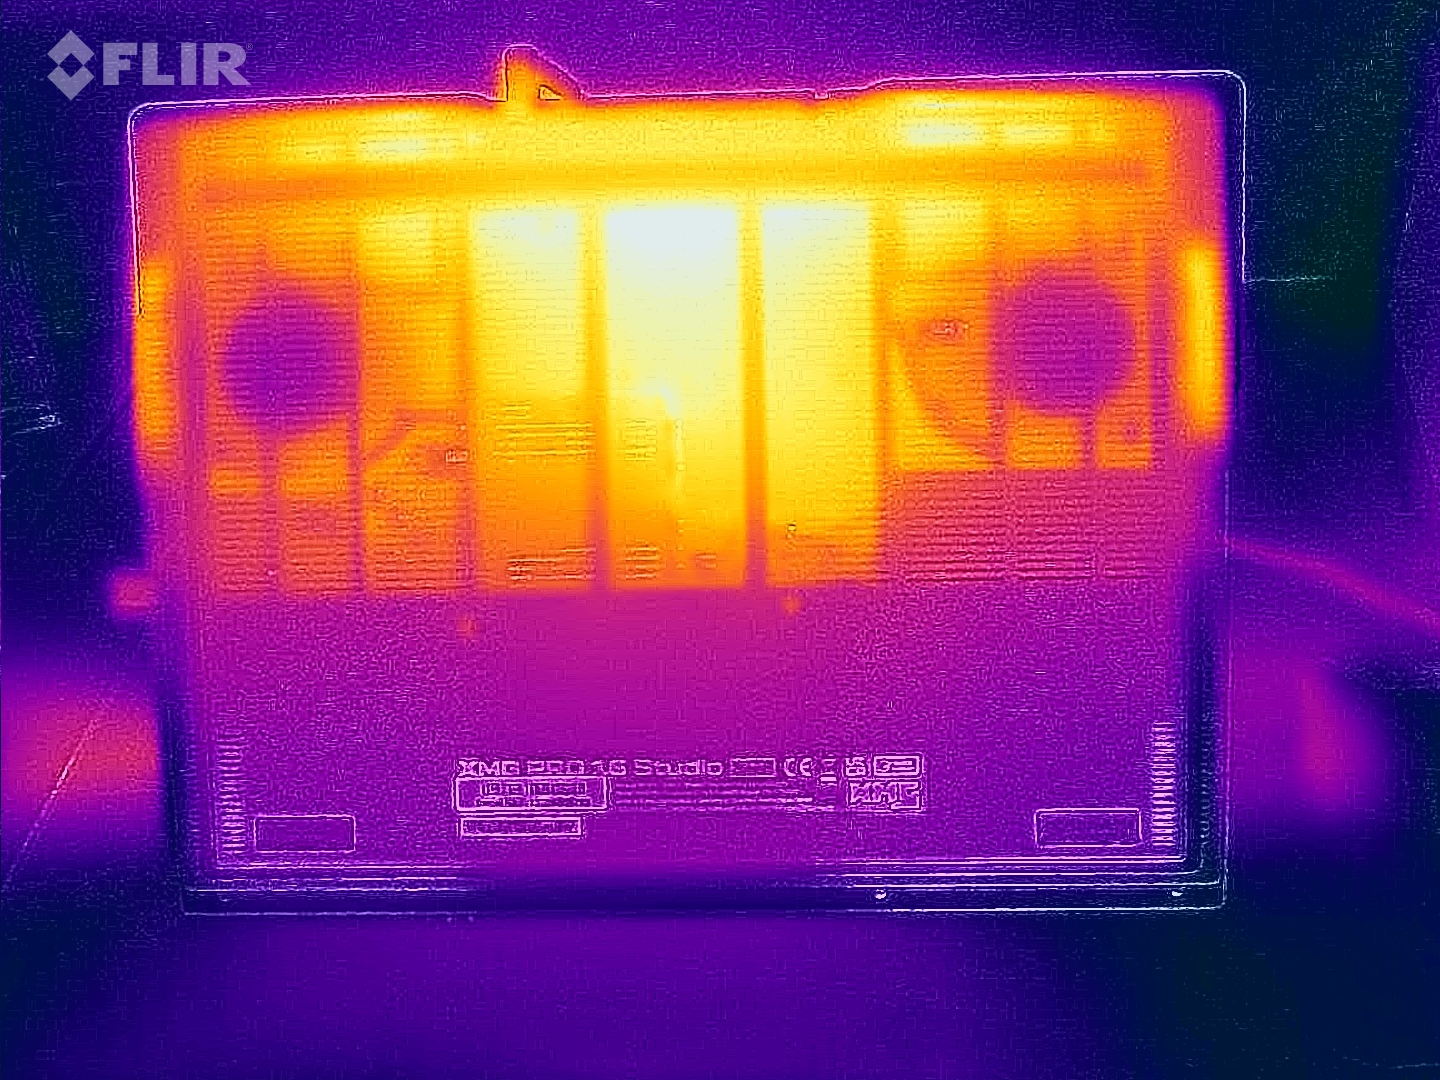
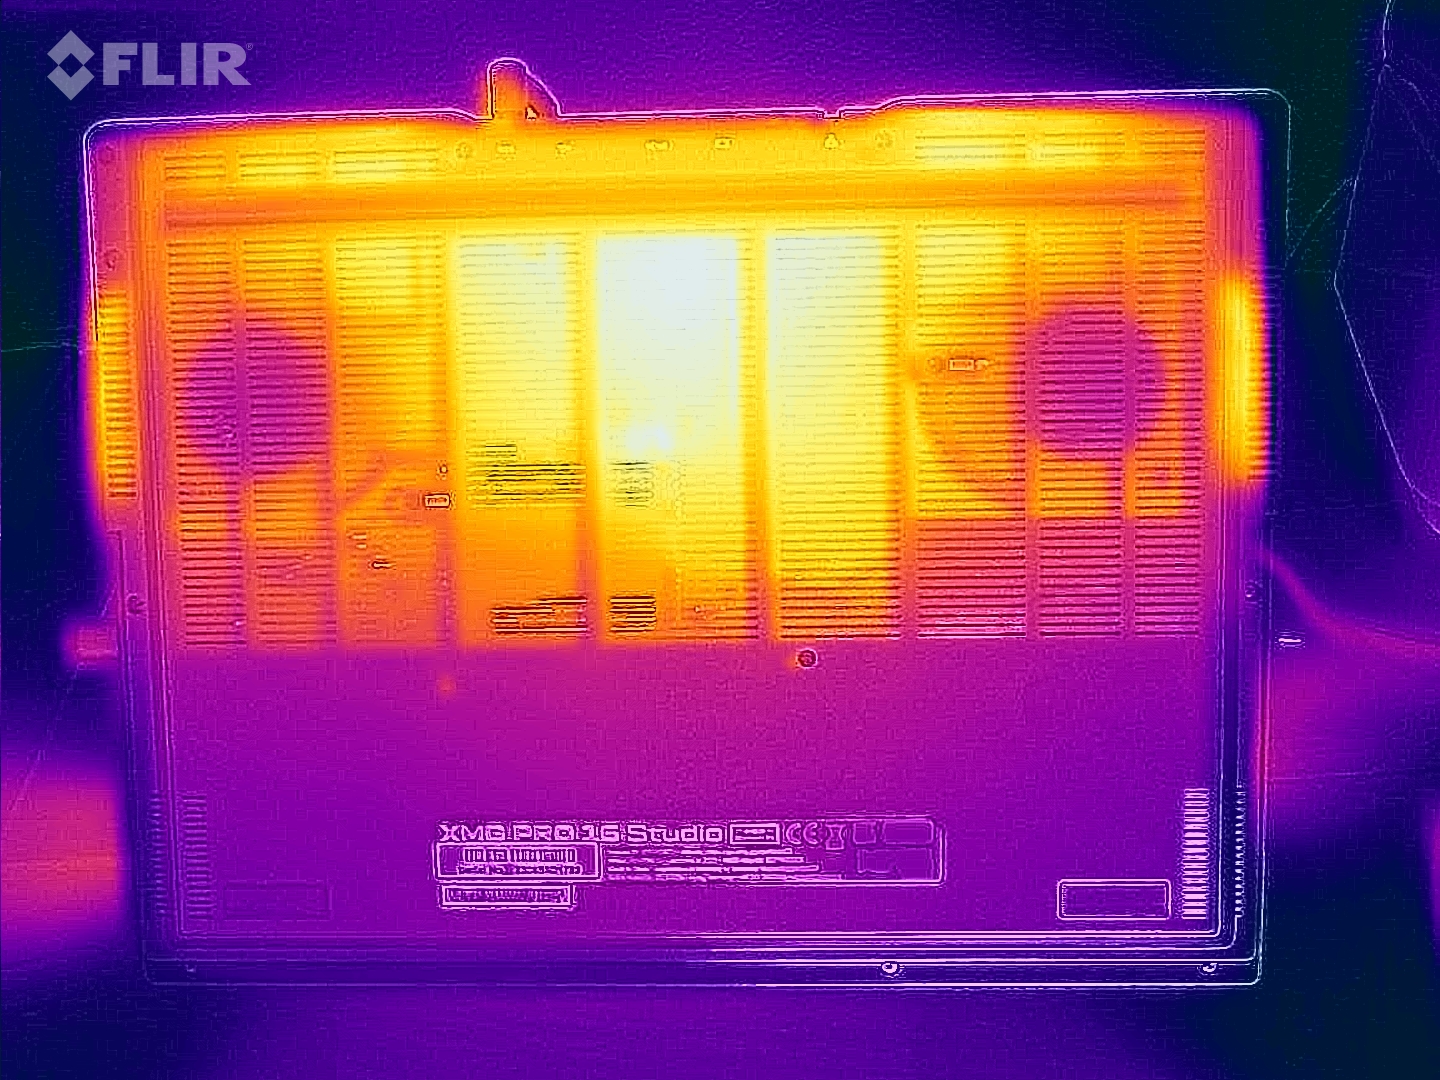
Temperature
The stress test and Witcher 3 test led to the laptop's temperatures rising significantly. In certain areas, we measured temperatures above 60 degrees Celsius. In everyday use (office, internet), these values generally remain within the green zone — but on a higher level than competitors such as the Lenovo Legion Slim 7i 16 Gen 8.
(-) The maximum temperature on the upper side is 55 °C / 131 F, compared to the average of 40.4 °C / 105 F, ranging from 21.2 to 68.8 °C for the class Gaming.
(-) The bottom heats up to a maximum of 66 °C / 151 F, compared to the average of 43.2 °C / 110 F
(+) In idle usage, the average temperature for the upper side is 30.1 °C / 86 F, compared to the device average of 33.9 °C / 93 F.
(-) Playing The Witcher 3, the average temperature for the upper side is 43.9 °C / 111 F, compared to the device average of 33.9 °C / 93 F.
(+) The palmrests and touchpad are reaching skin temperature as a maximum (33 °C / 91.4 F) and are therefore not hot.
(-) The average temperature of the palmrest area of similar devices was 28.8 °C / 83.8 F (-4.2 °C / -7.6 F).
| Schenker XMG Pro 16 Studio (Mid 23) Intel Core i9-13900H, NVIDIA GeForce RTX 4070 Laptop GPU | Asus Vivobook Pro 16X K6604JV-MX016W Intel Core i9-13980HX, NVIDIA GeForce RTX 4060 Laptop GPU | Lenovo Legion Slim 7i 16 Gen 8 Intel Core i9-13900H, NVIDIA GeForce RTX 4070 Laptop GPU | HP Omen Transcend 16 Intel Core i9-13900HX, NVIDIA GeForce RTX 4070 Laptop GPU | MSI Stealth 16 Studio A13VG Intel Core i7-13700H, NVIDIA GeForce RTX 4070 Laptop GPU | |
|---|---|---|---|---|---|
| Heat | 11% | 15% | 16% | -6% | |
| Maximum Upper Side * (°C) | 55 | 39.7 28% | 49.8 9% | 47.4 14% | 60 -9% |
| Maximum Bottom * (°C) | 66 | 60 9% | 48.8 26% | 54.4 18% | 61 8% |
| Idle Upper Side * (°C) | 33 | 30.9 6% | 29.4 11% | 28.4 14% | 38.2 -16% |
| Idle Bottom * (°C) | 35 | 34.7 1% | 30 14% | 29.2 17% | 37.7 -8% |
* ... smaller is better
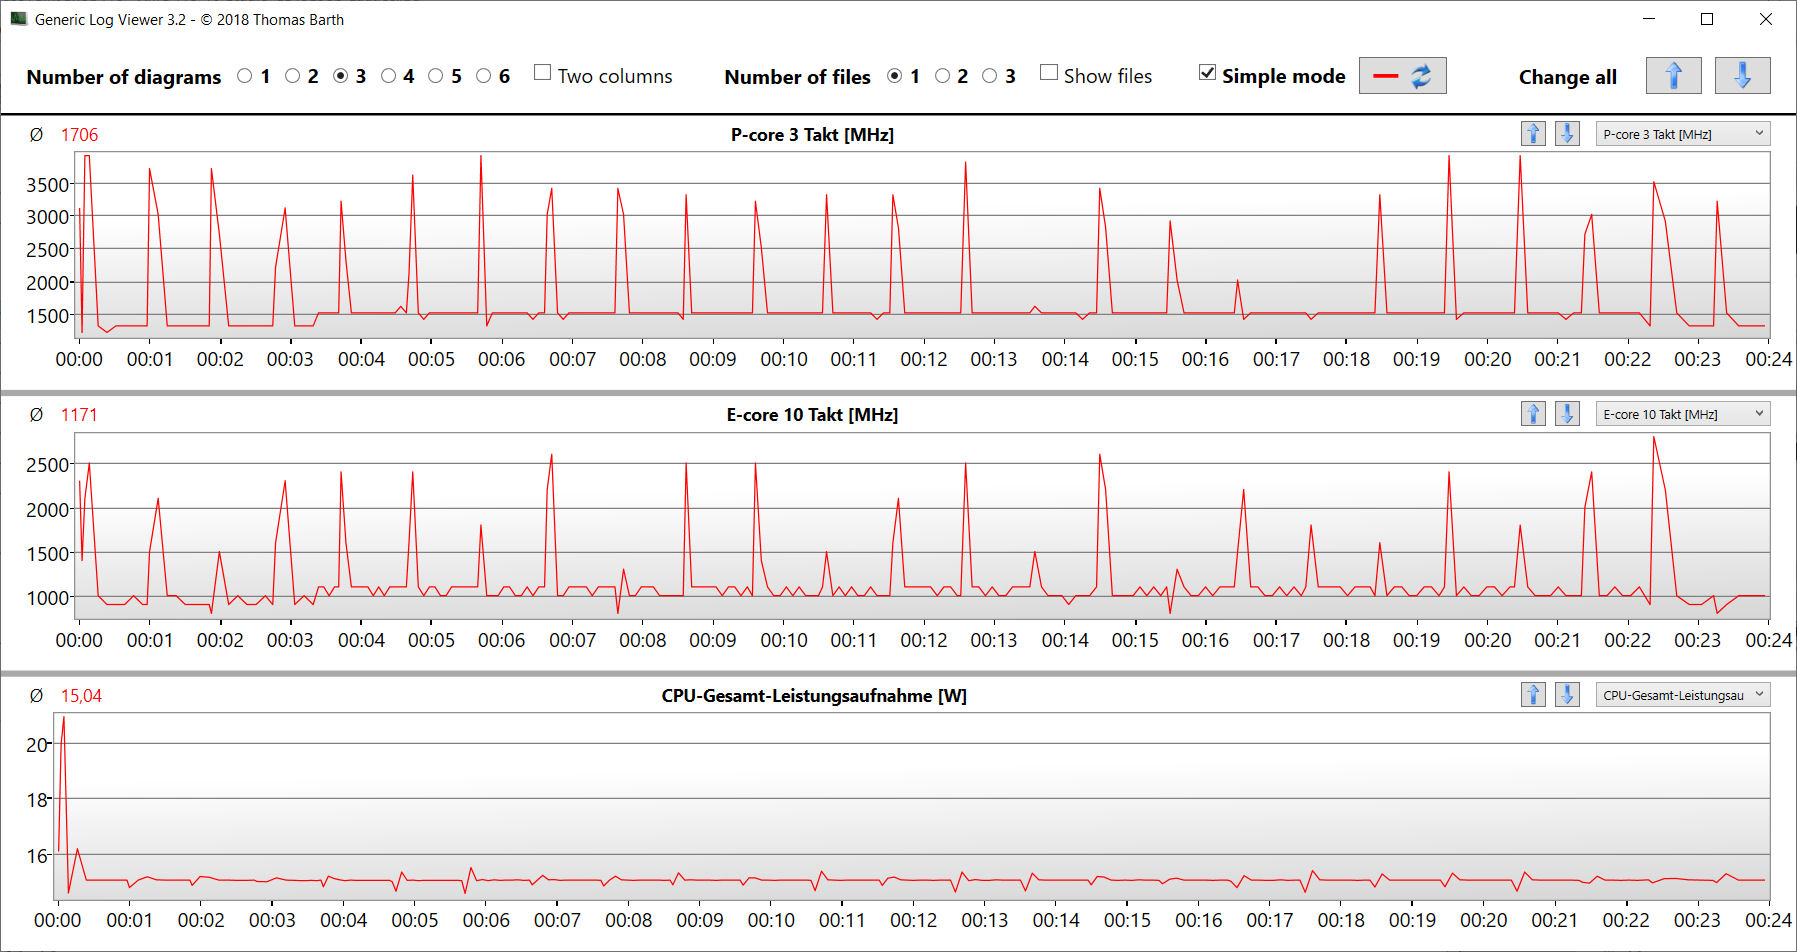
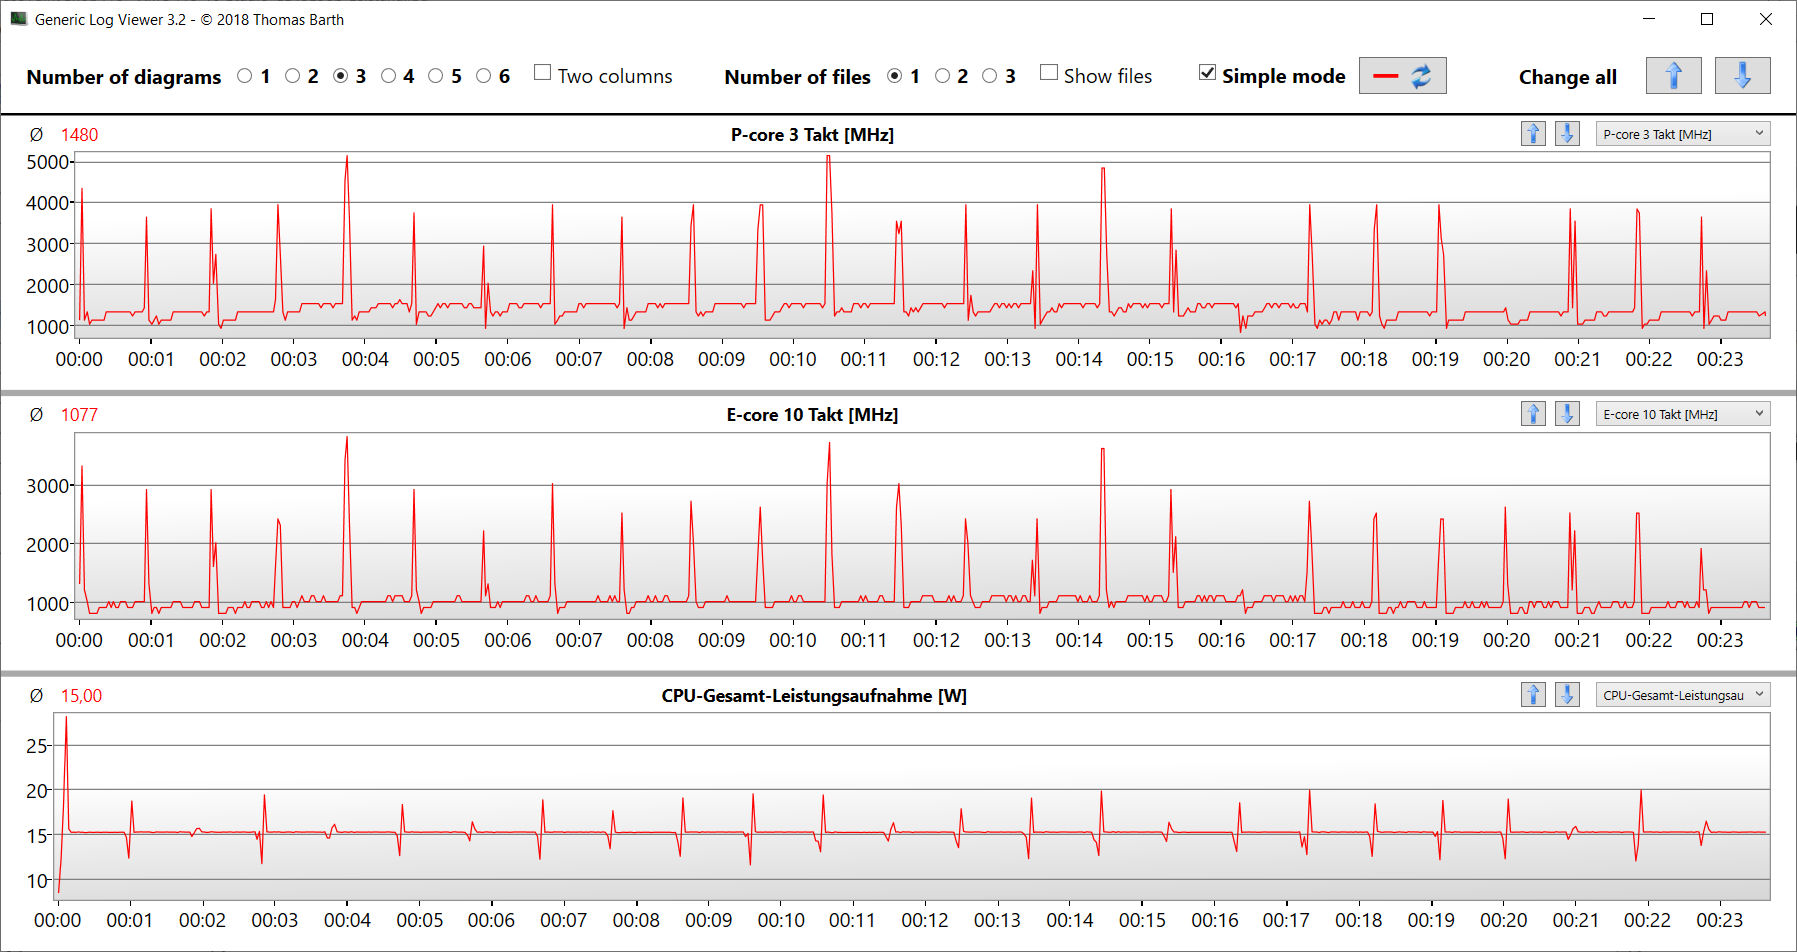
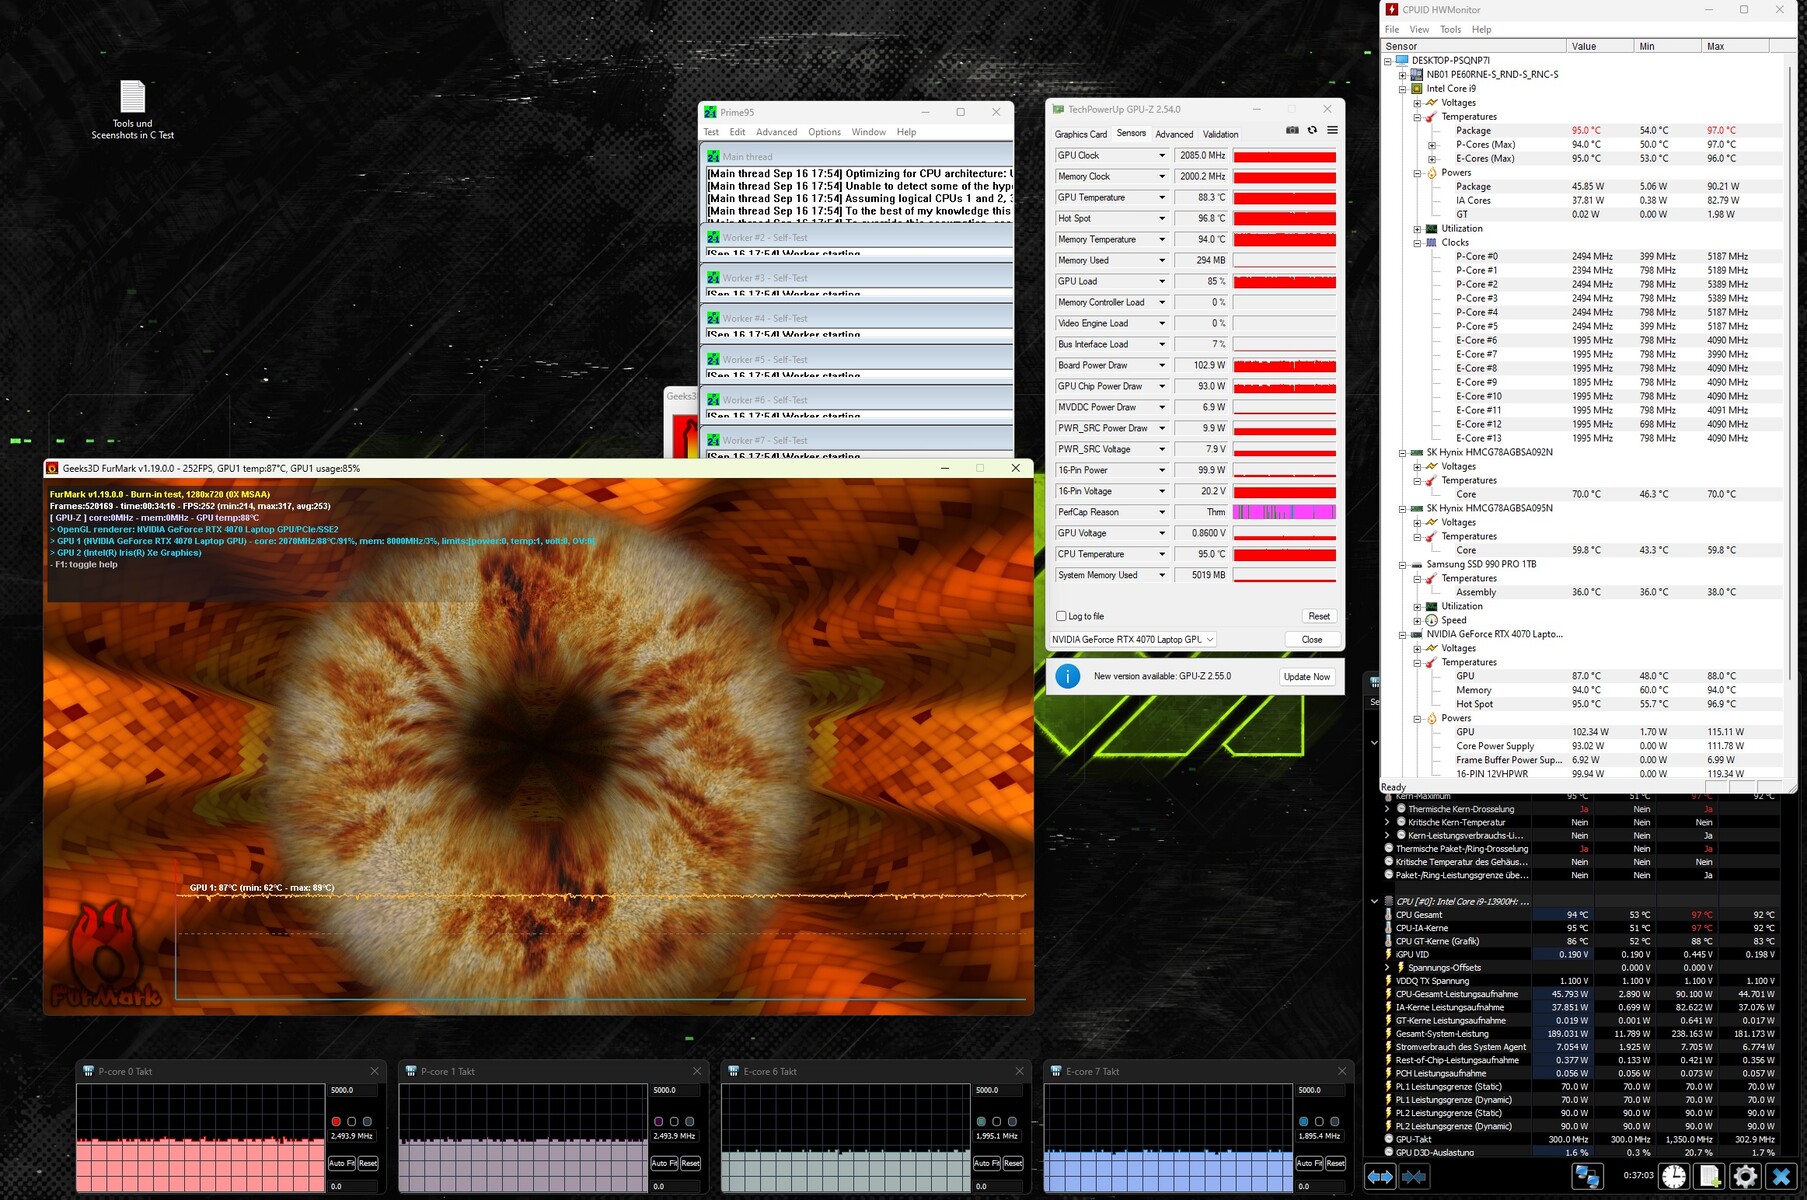
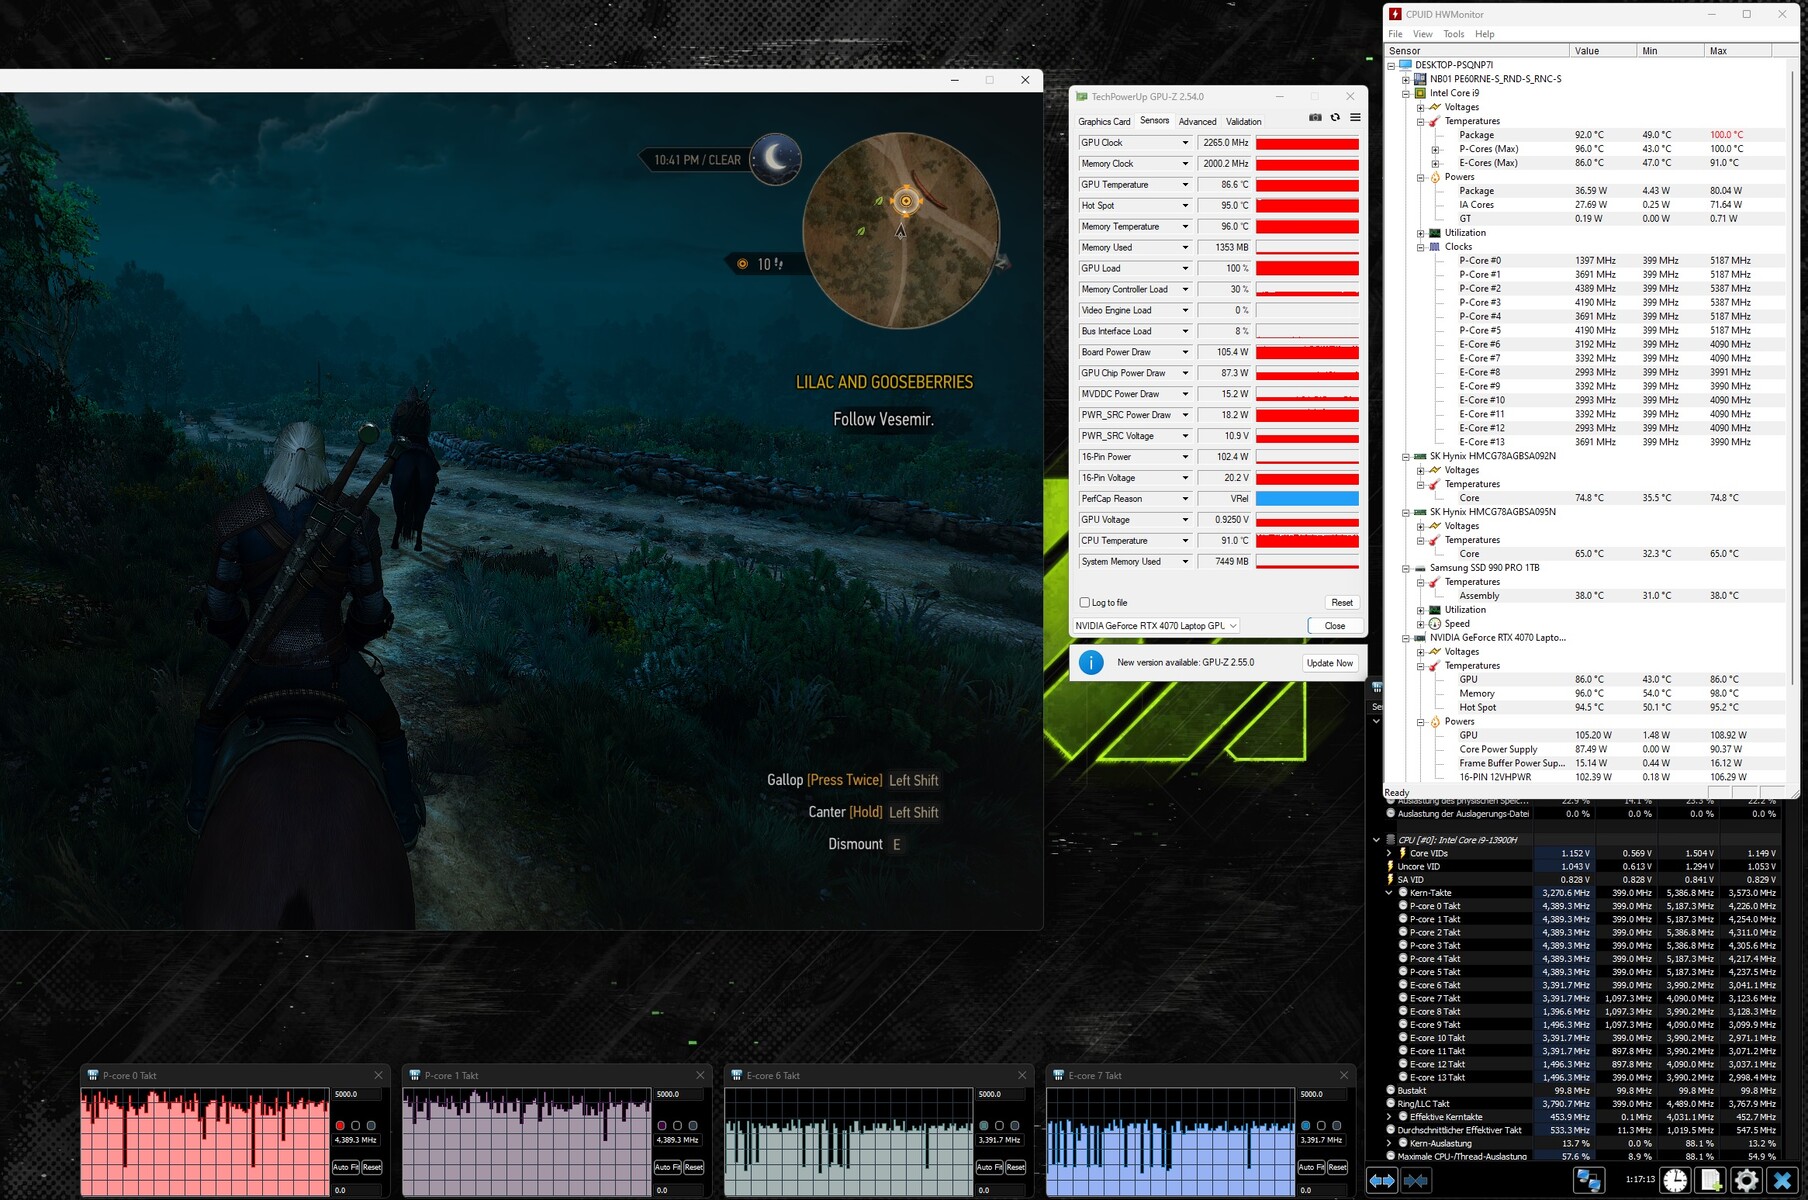
Stress test
The stress test (Prime95 and Furmark in continuous use) simulates an extreme scenario to test how stable the system remains under full load. The CPU (P: 3.8 to 3.9 GHz, E: 2.7 GHz) began the test with high clock rates. In the further course, these values sank down to around the base clock level. The GPU ran at nearly full power.

Speakers
The stereo speakers produce a very decent sound overall. The bass could do with being more powerful.
Schenker XMG Pro 16 Studio (Mid 23) audio analysis
(±) | speaker loudness is average but good (80 dB)
Bass 100 - 315 Hz
(±) | reduced bass - on average 12.7% lower than median
(+) | bass is linear (6.1% delta to prev. frequency)
Mids 400 - 2000 Hz
(+) | balanced mids - only 2.3% away from median
(+) | mids are linear (4.8% delta to prev. frequency)
Highs 2 - 16 kHz
(+) | balanced highs - only 2.6% away from median
(+) | highs are linear (6% delta to prev. frequency)
Overall 100 - 16.000 Hz
(+) | overall sound is linear (10.9% difference to median)
Compared to same class
» 7% of all tested devices in this class were better, 3% similar, 90% worse
» The best had a delta of 6%, average was 18%, worst was 132%
Compared to all devices tested
» 6% of all tested devices were better, 2% similar, 92% worse
» The best had a delta of 4%, average was 24%, worst was 134%
Lenovo Legion Slim 7i 16 Gen 8 audio analysis
(+) | speakers can play relatively loud (84.8 dB)
Bass 100 - 315 Hz
(±) | reduced bass - on average 12.1% lower than median
(±) | linearity of bass is average (9% delta to prev. frequency)
Mids 400 - 2000 Hz
(+) | balanced mids - only 1.4% away from median
(+) | mids are linear (3.3% delta to prev. frequency)
Highs 2 - 16 kHz
(+) | balanced highs - only 4.4% away from median
(+) | highs are linear (5.6% delta to prev. frequency)
Overall 100 - 16.000 Hz
(+) | overall sound is linear (10.5% difference to median)
Compared to same class
» 6% of all tested devices in this class were better, 2% similar, 92% worse
» The best had a delta of 6%, average was 18%, worst was 132%
Compared to all devices tested
» 5% of all tested devices were better, 1% similar, 93% worse
» The best had a delta of 4%, average was 24%, worst was 134%
Power consumption
The Pro 16 didn't show any conspicuous power consumption values. The rates are on a normal level for the installed hardware. The Witcher 3 test and stress test were run with slightly decreasing power consumption. The power supply (230 watts) is sufficiently sized. Praiseworthy: Within the comparison field, the XMG laptop has the lowest overall energy consumption.
| Off / Standby | |
| Idle | |
| Load |
|
Key:
min: | |
| Schenker XMG Pro 16 Studio (Mid 23) i9-13900H, GeForce RTX 4070 Laptop GPU | Asus Vivobook Pro 16X K6604JV-MX016W i9-13980HX, GeForce RTX 4060 Laptop GPU | Lenovo Legion Slim 7i 16 Gen 8 i9-13900H, GeForce RTX 4070 Laptop GPU | HP Omen Transcend 16 i9-13900HX, GeForce RTX 4070 Laptop GPU | MSI Stealth 16 Studio A13VG i7-13700H, GeForce RTX 4070 Laptop GPU | Average of class Gaming | |
|---|---|---|---|---|---|---|
| Power Consumption | -23% | -65% | -76% | -8% | -32% | |
| Idle Minimum * (Watt) | 8 | 13.8 -73% | 22 -175% | 19.2 -140% | 11 -38% | 13.2 ? -65% |
| Idle Average * (Watt) | 12 | 16 -33% | 29 -142% | 22.7 -89% | 18 -50% | 18.9 ? -58% |
| Idle Maximum * (Watt) | 23 | 19 17% | 39.5 -72% | 55.4 -141% | 19 17% | 24.3 ? -6% |
| Load Average * (Watt) | 94 | 147 -56% | 98.7 -5% | 128.4 -37% | 91 3% | 108 ? -15% |
| Witcher 3 ultra * (Watt) | 181.5 | 147.8 19% | 171.8 5% | 206 -13% | 130 28% | |
| Load Maximum * (Watt) | 215 | 244 -13% | 213.2 1% | 292 -36% | 228 -6% | 254 ? -18% |
* ... smaller is better
Power consumption Witcher 3 / stress test
Power consumption with external monitor
Runtimes
In our realistic WLAN test (depicting load while calling up websites using a script), the 16-inch laptop achieved runtimes of 6:45 h — a generally good result. Within the comparison field, the Pro 16 features the smallest battery capacity (73 Wh) but it offers the best per-Wh runtimes.
Pros
Cons
Verdict - A harmonious powerhouse
Video and image editing, streaming, rendering and gaming are all part of the laptop's expertise. The required power is delivered by a Core i9-13900H and a GeForce RTX 4070 on a consistently high level. It is possible to find a good compromise between performance and noise emissions.
Schenker's XMG Pro 16 Studio (Mid 23) proves to be a powerful tool for gamers and creators.
Its QHD+ display (16 inches, 2,560 x 1,600 pixels, sRGB, IPS, 240 Hz) with a work-friendly 16:10 aspect ratio generally left a good impression on us. Even so: A creator laptop's screen should be able to depict the DCI P3 color space. Two SSD slots (PCIe 4) including RAID-0/1 support ensure lots of storage and short loading times.
Its USB-C ports (1x USB 3.2 Gen 2, 1x Thunderbolt 4) make the laptop easy to integrate into existing workspace setups and open up further expansion options (external GPU, docking). Its TB-4 port can output a DisplayPort signal and it supports Power Delivery. Adding to this are relatively good runtimes.
An alternative could be the Lenovo Legion Slim 7i 16 Gen 8: It features the same CPU and GPU but can deliver slightly more computing power. The laptop's weaknesses: Higher power consumption, soldered-on RAM, SSD throttling.
Price and availability
The XMG Pro 16 Studio can be individually configured and ordered via the Schenker online store. Our test device can be had for around US$2,400.
Schenker XMG Pro 16 Studio (Mid 23)
- 10/22/2023 v7 (old)
Sascha Mölck
Transparency
The selection of devices to be reviewed is made by our editorial team. The test sample was provided to the author as a loan by the manufacturer or retailer for the purpose of this review. The lender had no influence on this review, nor did the manufacturer receive a copy of this review before publication. There was no obligation to publish this review. As an independent media company, Notebookcheck is not subjected to the authority of manufacturers, retailers or publishers.
This is how Notebookcheck is testing
Every year, Notebookcheck independently reviews hundreds of laptops and smartphones using standardized procedures to ensure that all results are comparable. We have continuously developed our test methods for around 20 years and set industry standards in the process. In our test labs, high-quality measuring equipment is utilized by experienced technicians and editors. These tests involve a multi-stage validation process. Our complex rating system is based on hundreds of well-founded measurements and benchmarks, which maintains objectivity. Further information on our test methods can be found here.
Price comparison

