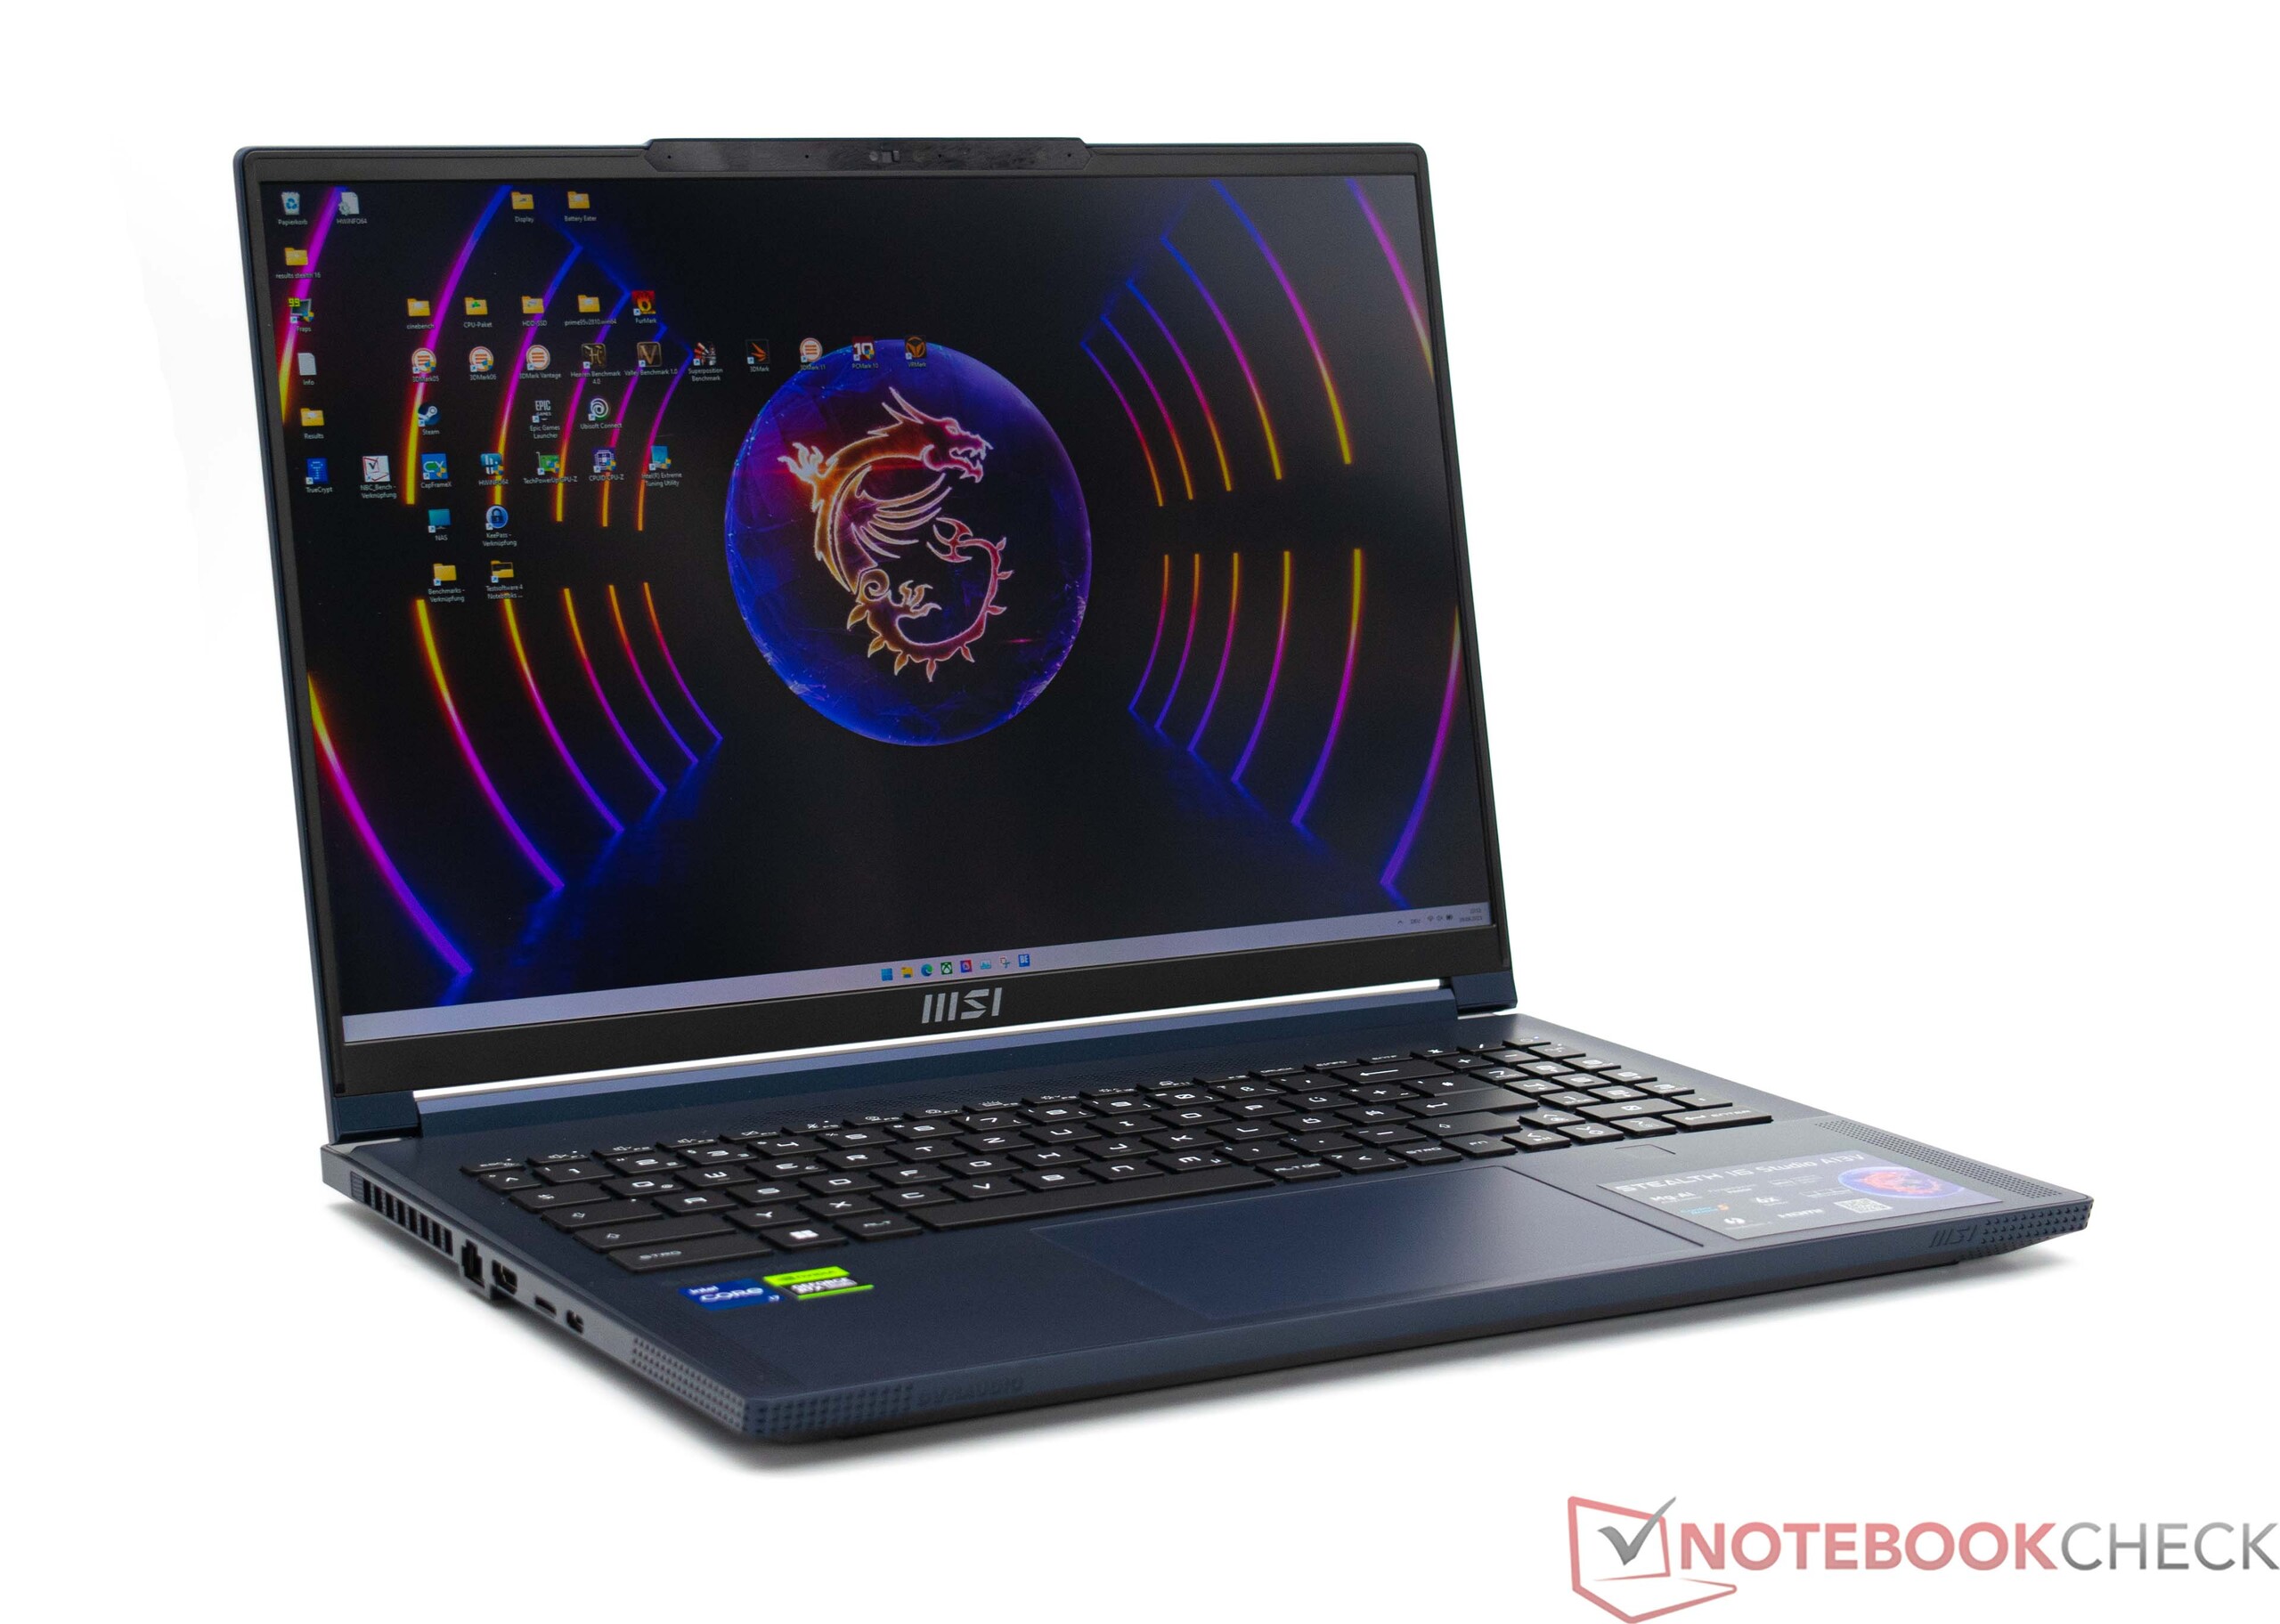
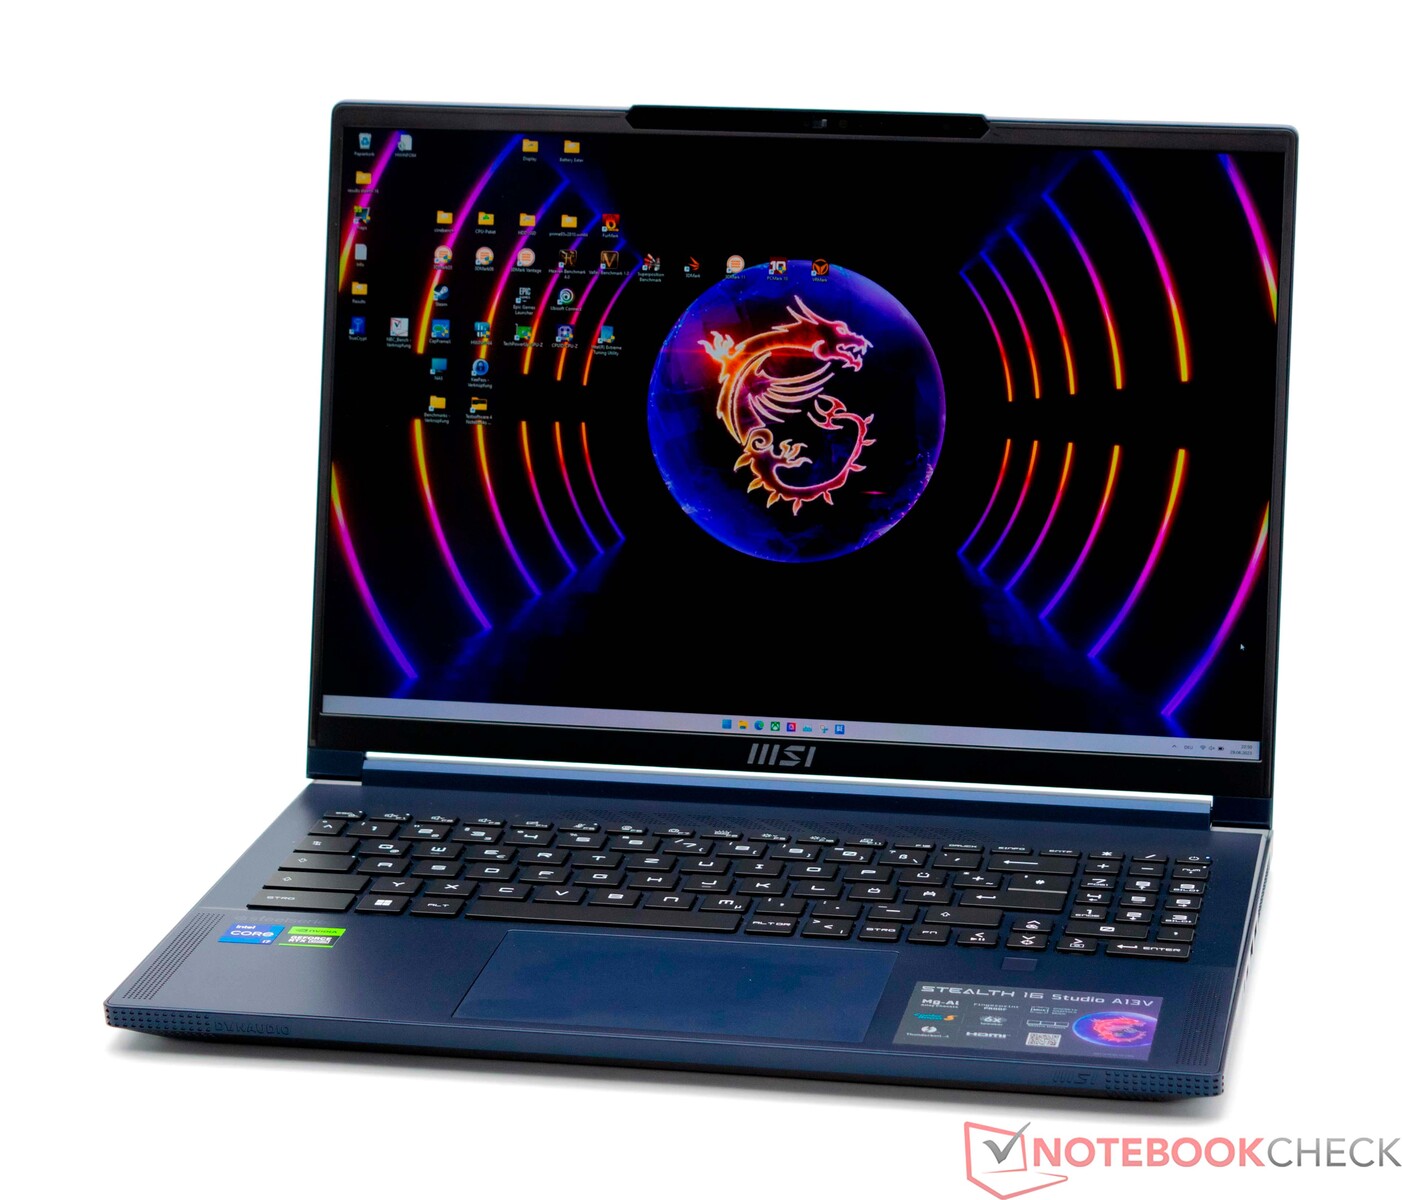
MSI Stealth 16 Studio laptop review: An extremely light, 16-inch, Core i7, RTX 4070 device for gamers and creators
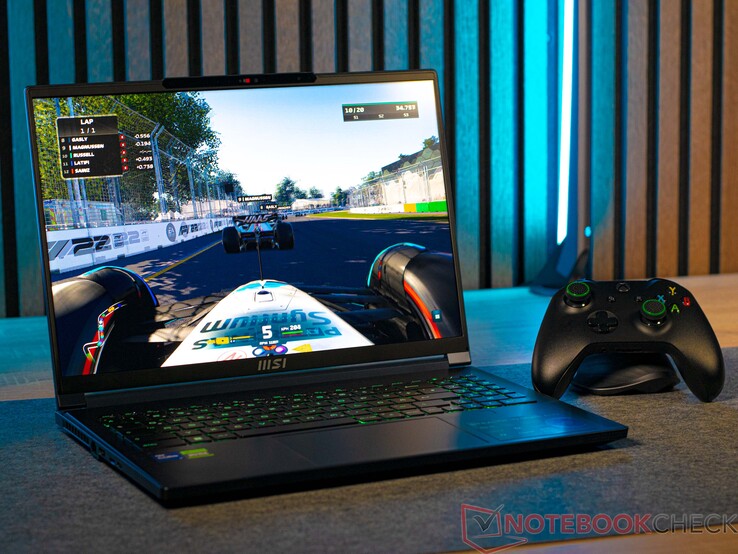
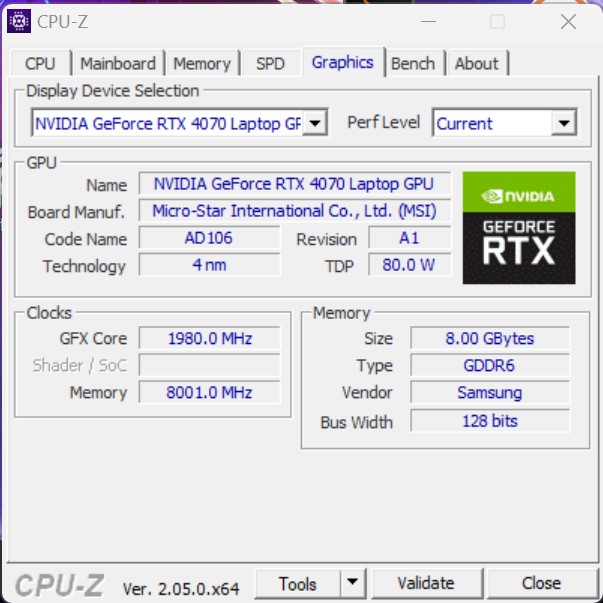
The new MSI Stealth 16 Studio A13VG is based on an Intel Raptor Lake H processor and a current Nvidia mobile GPU. In terms of the details, our review device has an Intel Core i7-13700H paired with an Nvidia GeForce RTX 4070 laptop GPU. However, visually speaking, the MSI Stealth 16 Studio A13VG is very understated and manages to tread the line between a powerful business laptop and a gaming laptop. Basically, we also see this device as forming an excellent basis for creators who could see themselves taking advantage of the MSI Stealth 16 Studio A13VG's strengths because of its powerful components and good portability.
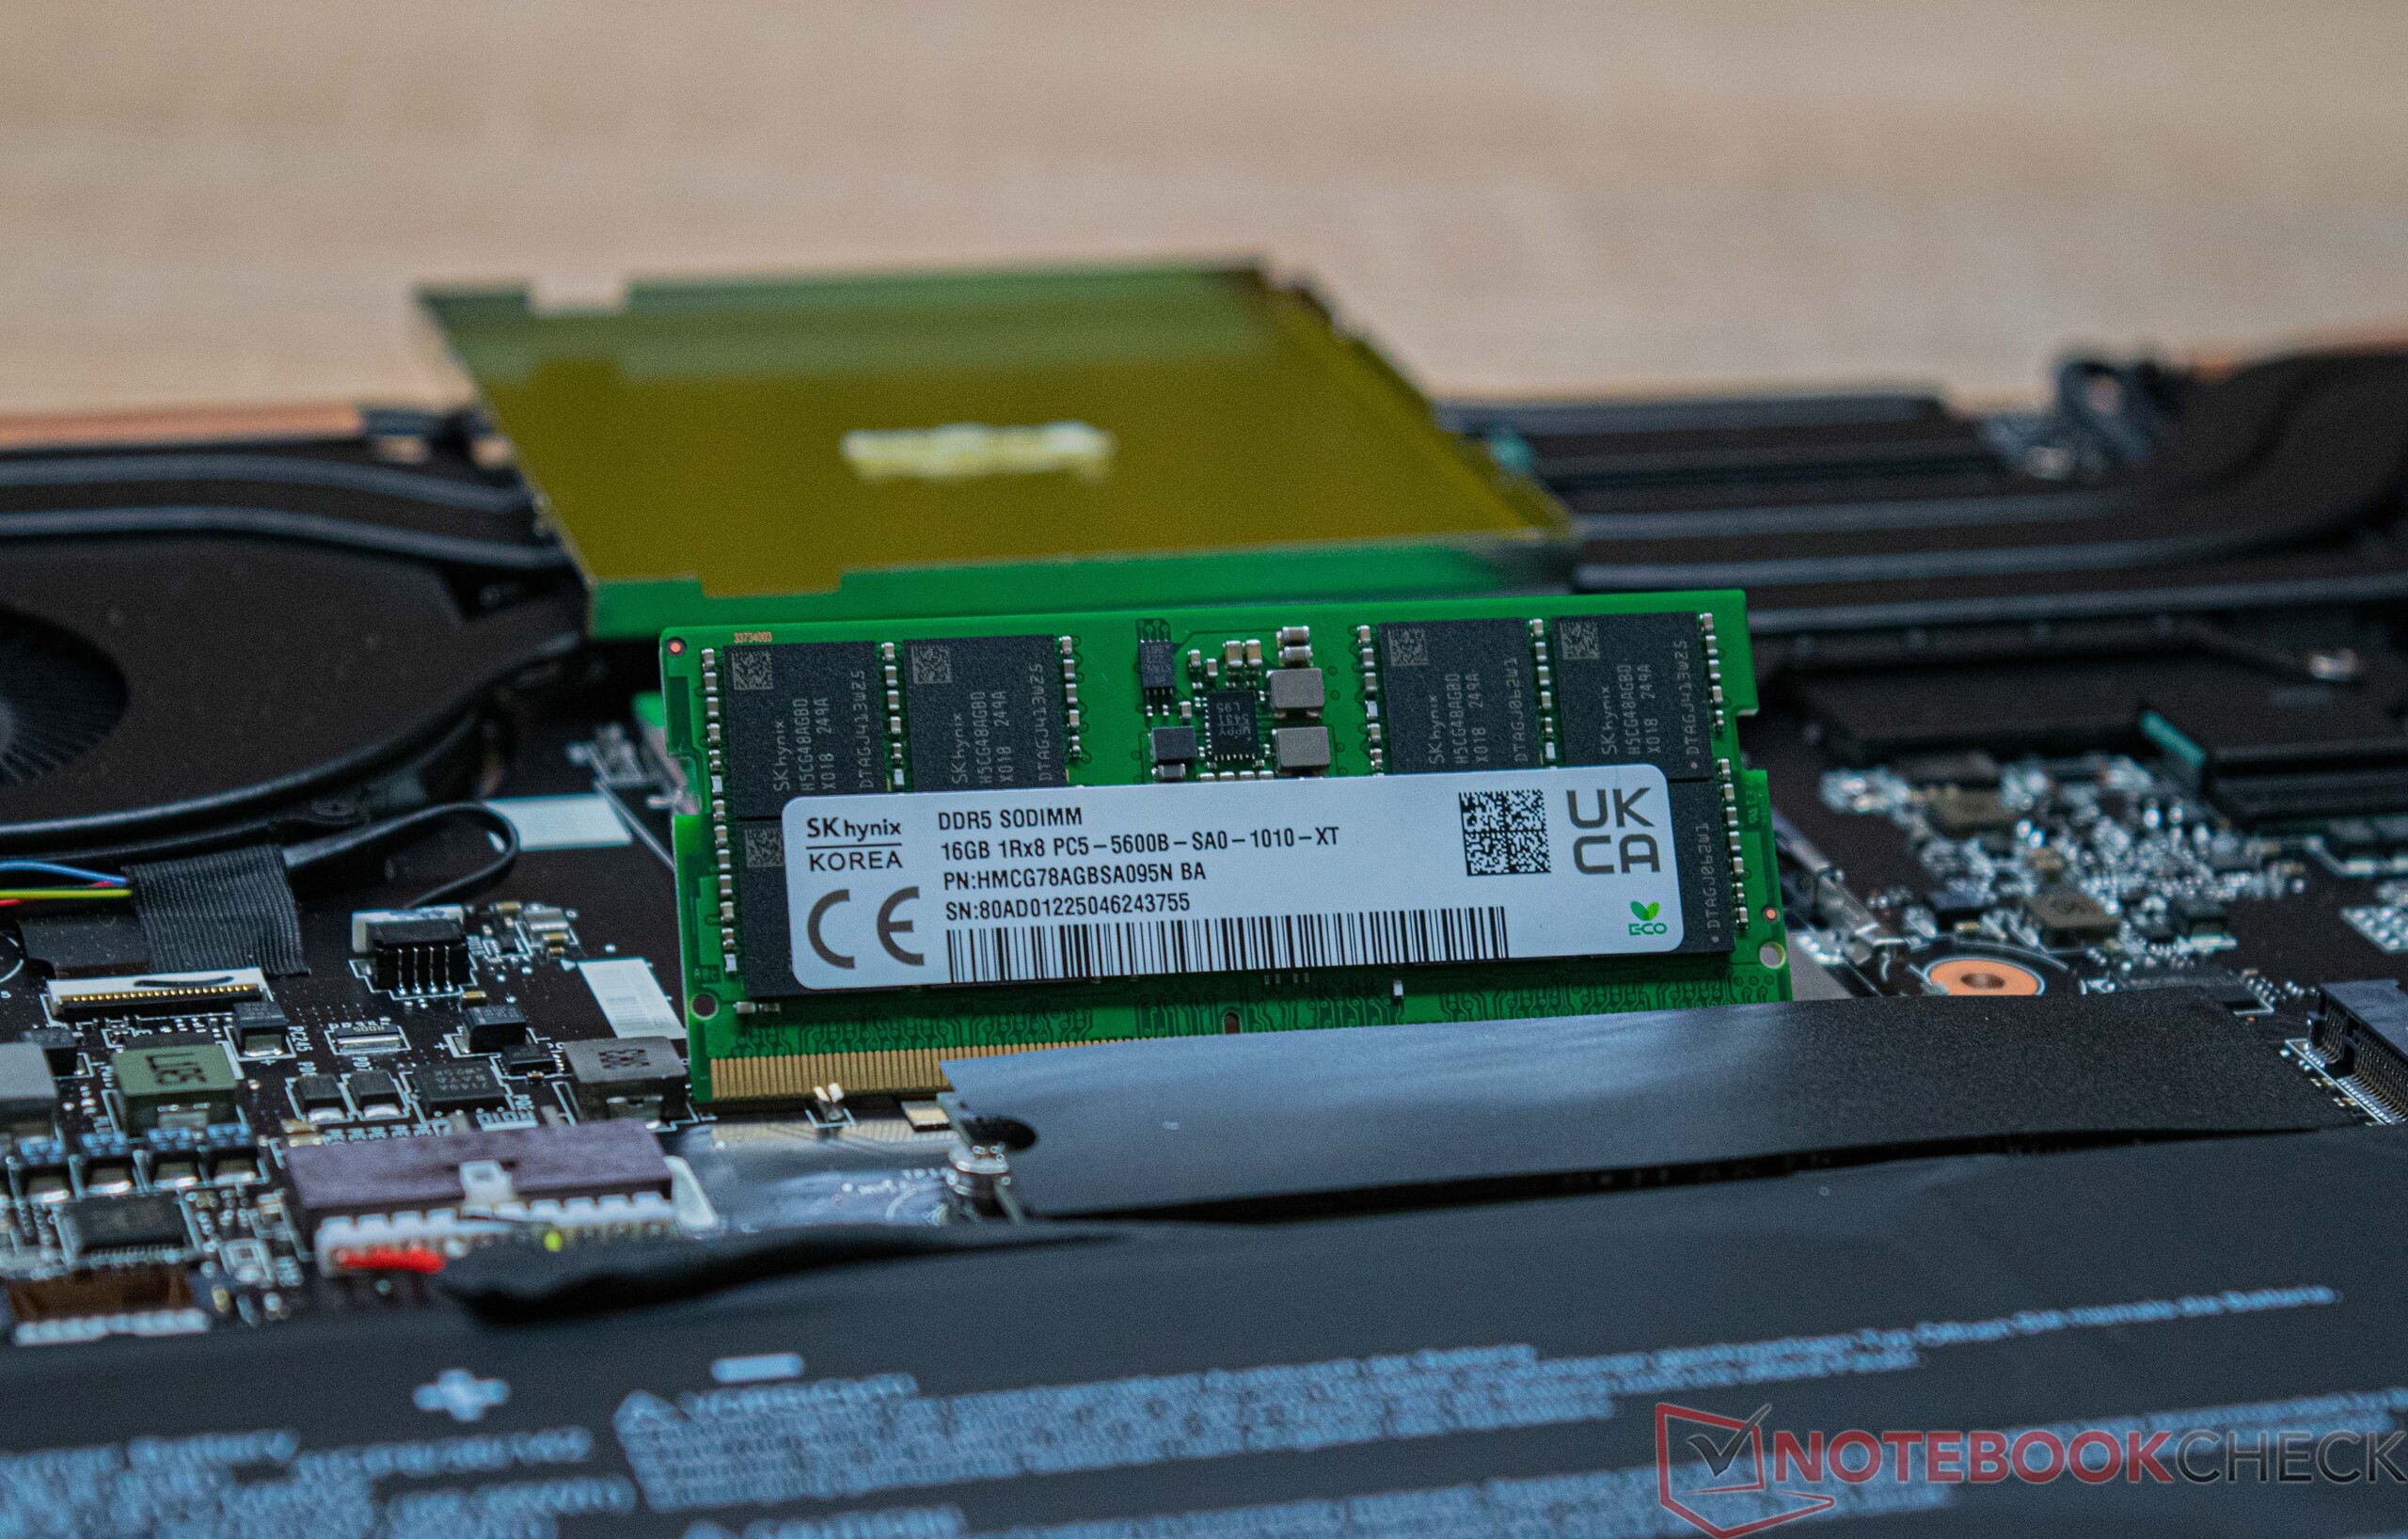
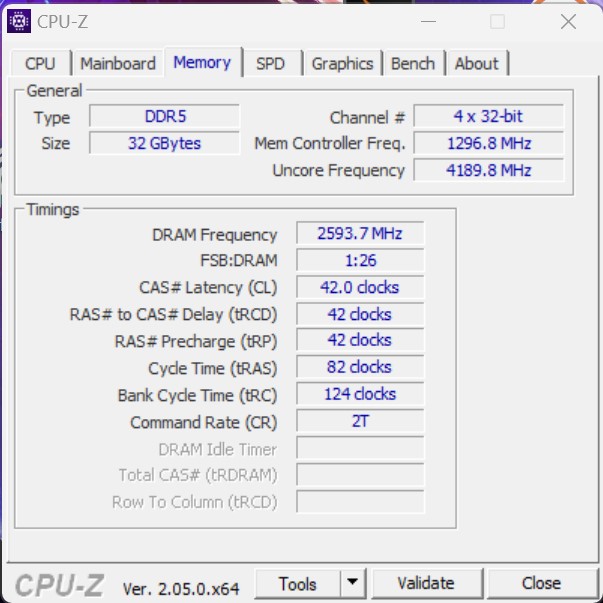
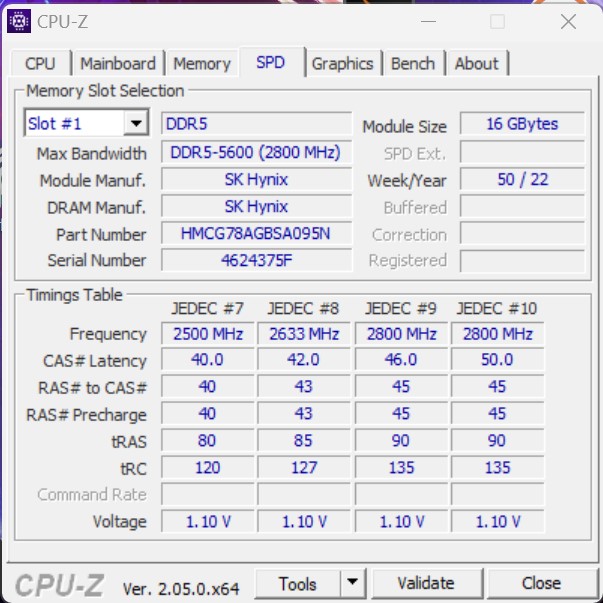
However, price-wise, the MSI Stealth 16 Studio A13VG finds itself in the high-end segment. But, in addition to the already mentioned components, there is 32 GB of DDR5 RAM and an SSD with a whole 2 TB of storage. Likewise, we shouldn't forget the 16-inch, QHD+- display. With its 240 Hz refresh rate, it's aimed squarely at the gaming community.
In this review, the MSI Stealth 16 Studio A13VG will have to prove itself against current 16-inch laptops. See the table below for more details.
Possible competitors compared
Rating | Date | Model | Weight | Height | Size | Resolution | Price |
|---|---|---|---|---|---|---|---|
| 88.8 % v7 (old) | 07 / 2023 | MSI Stealth 16 Studio A13VG i7-13700H, GeForce RTX 4070 Laptop GPU | 2 kg | 19.95 mm | 16.00" | 2560x1600 | |
| 89.7 % v7 (old) | 06 / 2023 | Asus ROG Flow X16 GV601V i9-13900H, GeForce RTX 4060 Laptop GPU | 2.1 kg | 19.4 mm | 16.00" | 2560x1600 | |
| 89 % v7 (old) | 04 / 2023 | Medion Erazer Major X20 i9-13900HX, GeForce RTX 4070 Laptop GPU | 2.4 kg | 29 mm | 16.00" | 2560x1600 | |
| 88.1 % v7 (old) | 06 / 2023 | Acer Nitro 16 AN16-41 R7 7735HS, GeForce RTX 4070 Laptop GPU | 2.7 kg | 27.9 mm | 16.00" | 2560x1600 | |
| 86.6 % v7 (old) | 12 / 2022 | Corsair Voyager a1600 R9 6900HS, Radeon RX 6800M | 2.4 kg | 19.9 mm | 16.00" | 2560x1600 | |
| 86.2 % v7 (old) | 03 / 2023 | Gigabyte AERO 16 OLED BSF i9-13900H, GeForce RTX 4070 Laptop GPU | 2.1 kg | 18 mm | 16.00" | 3840x2400 |
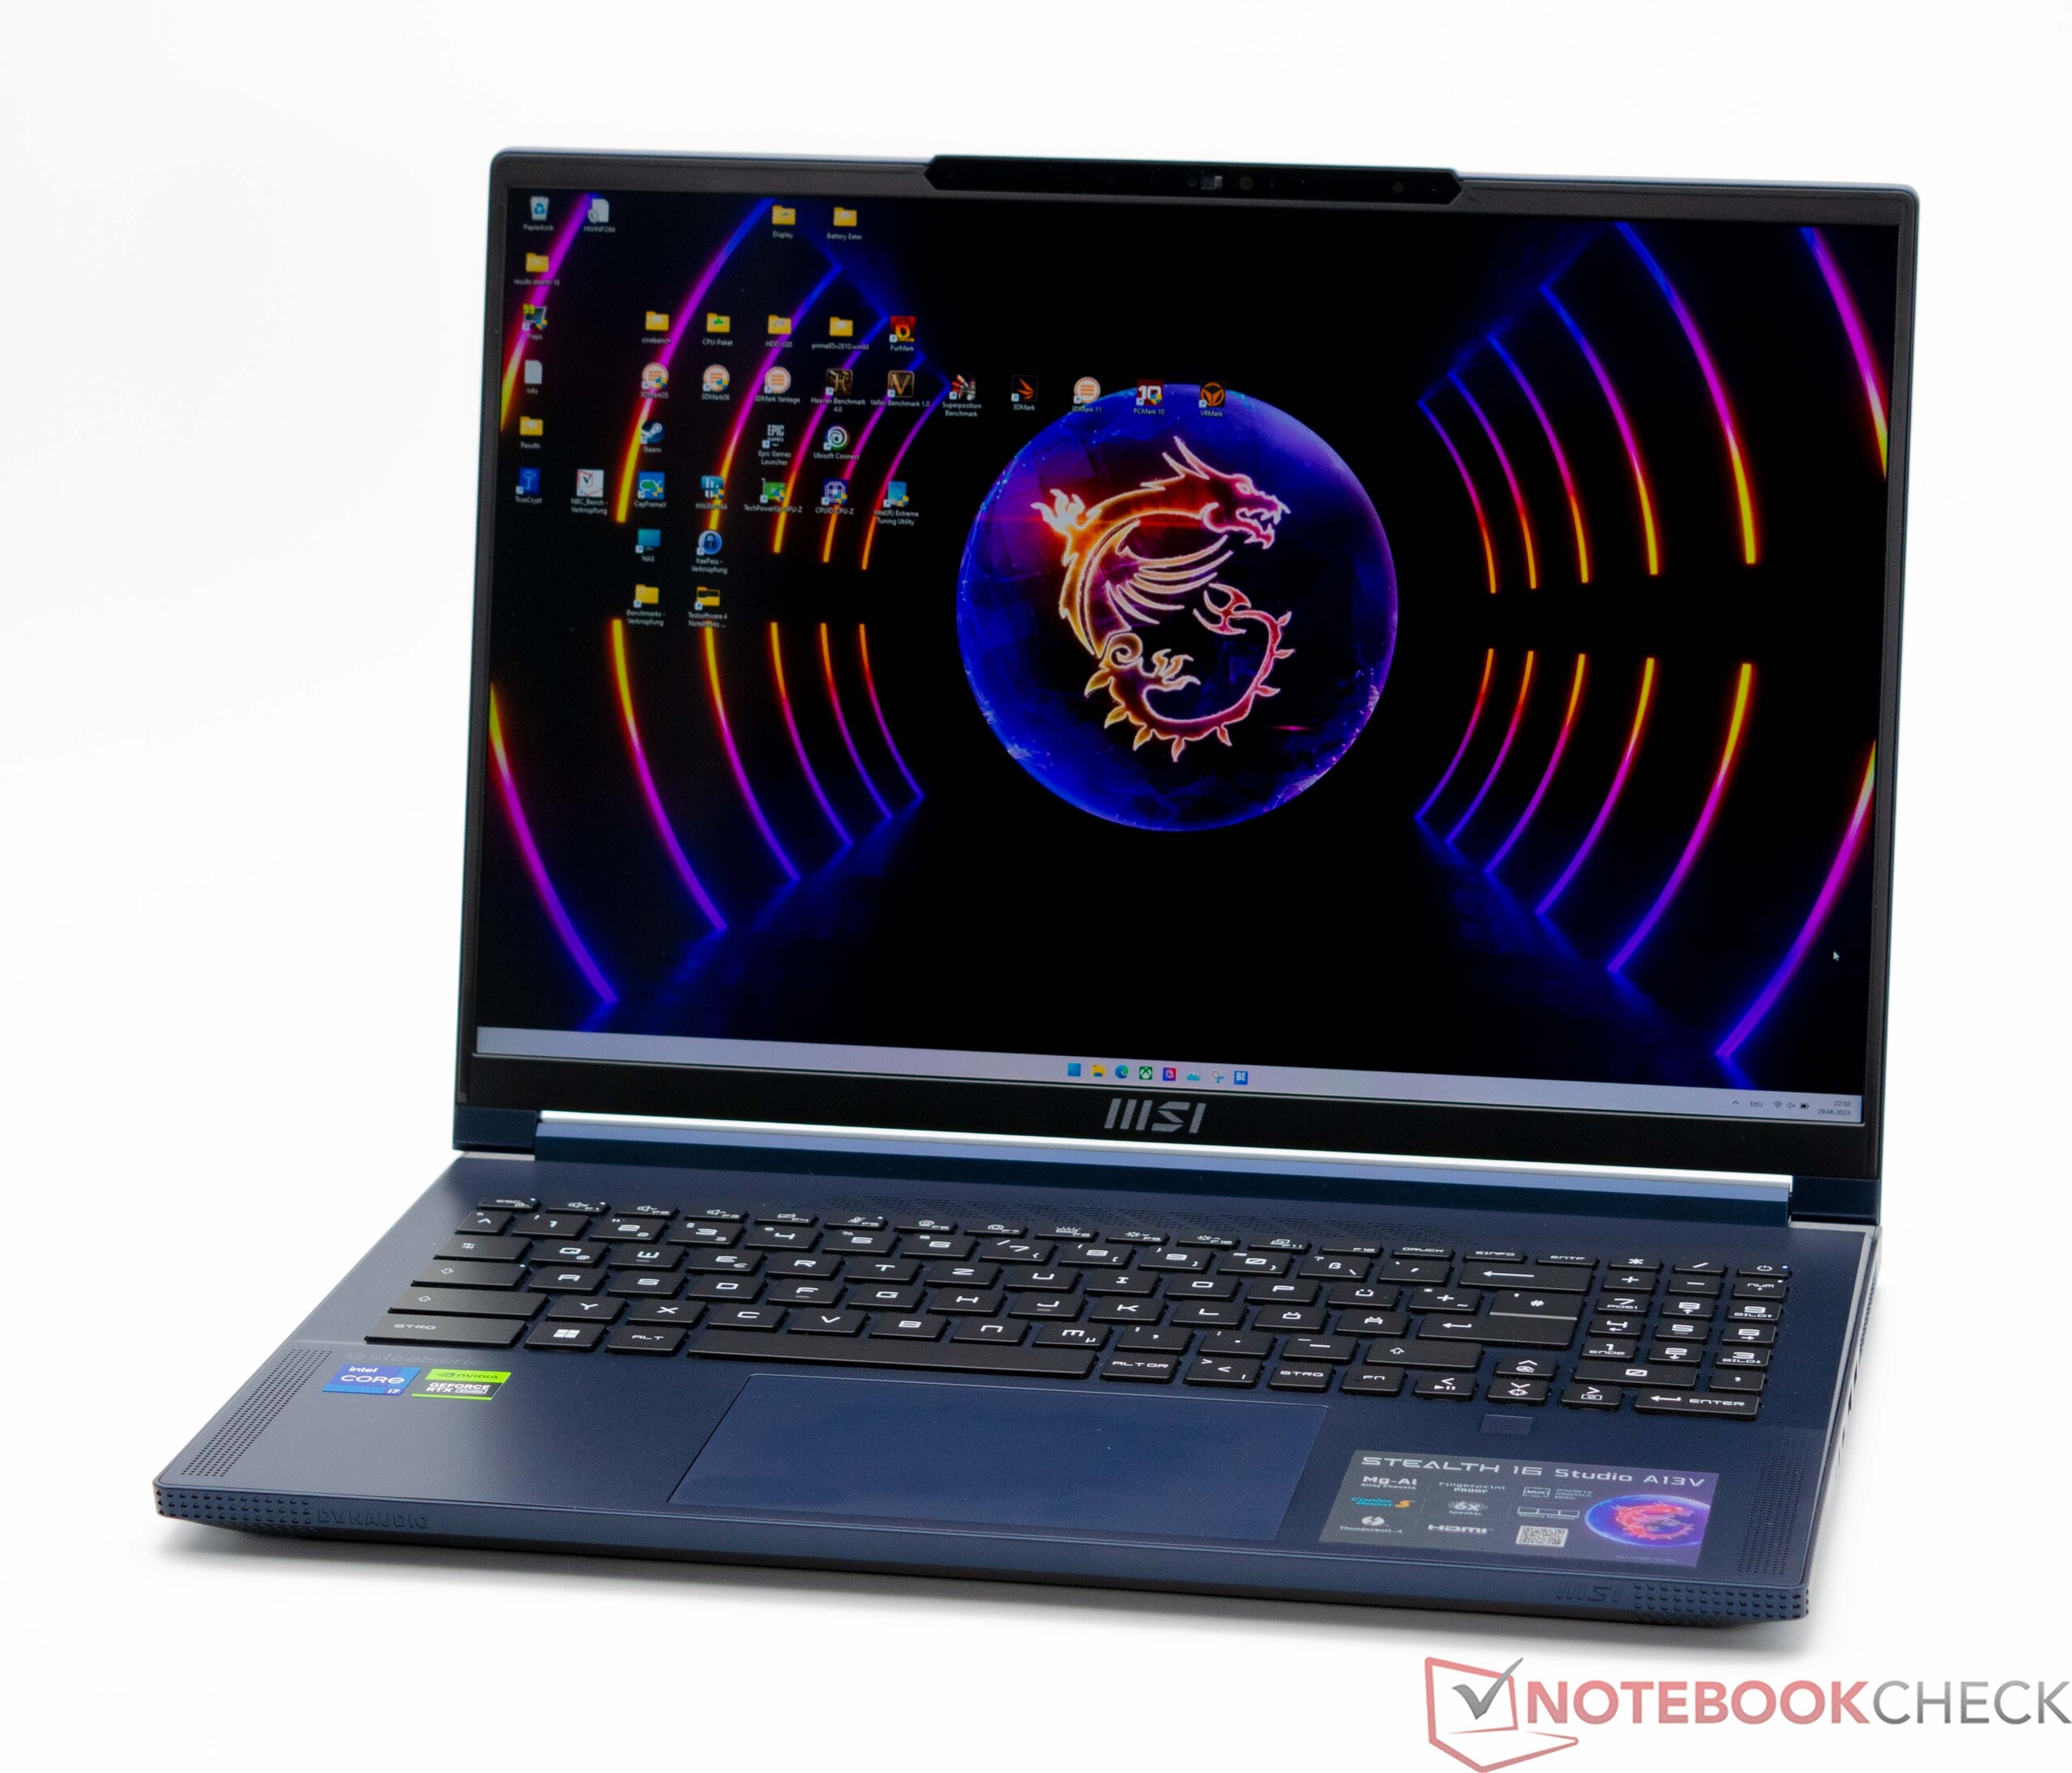
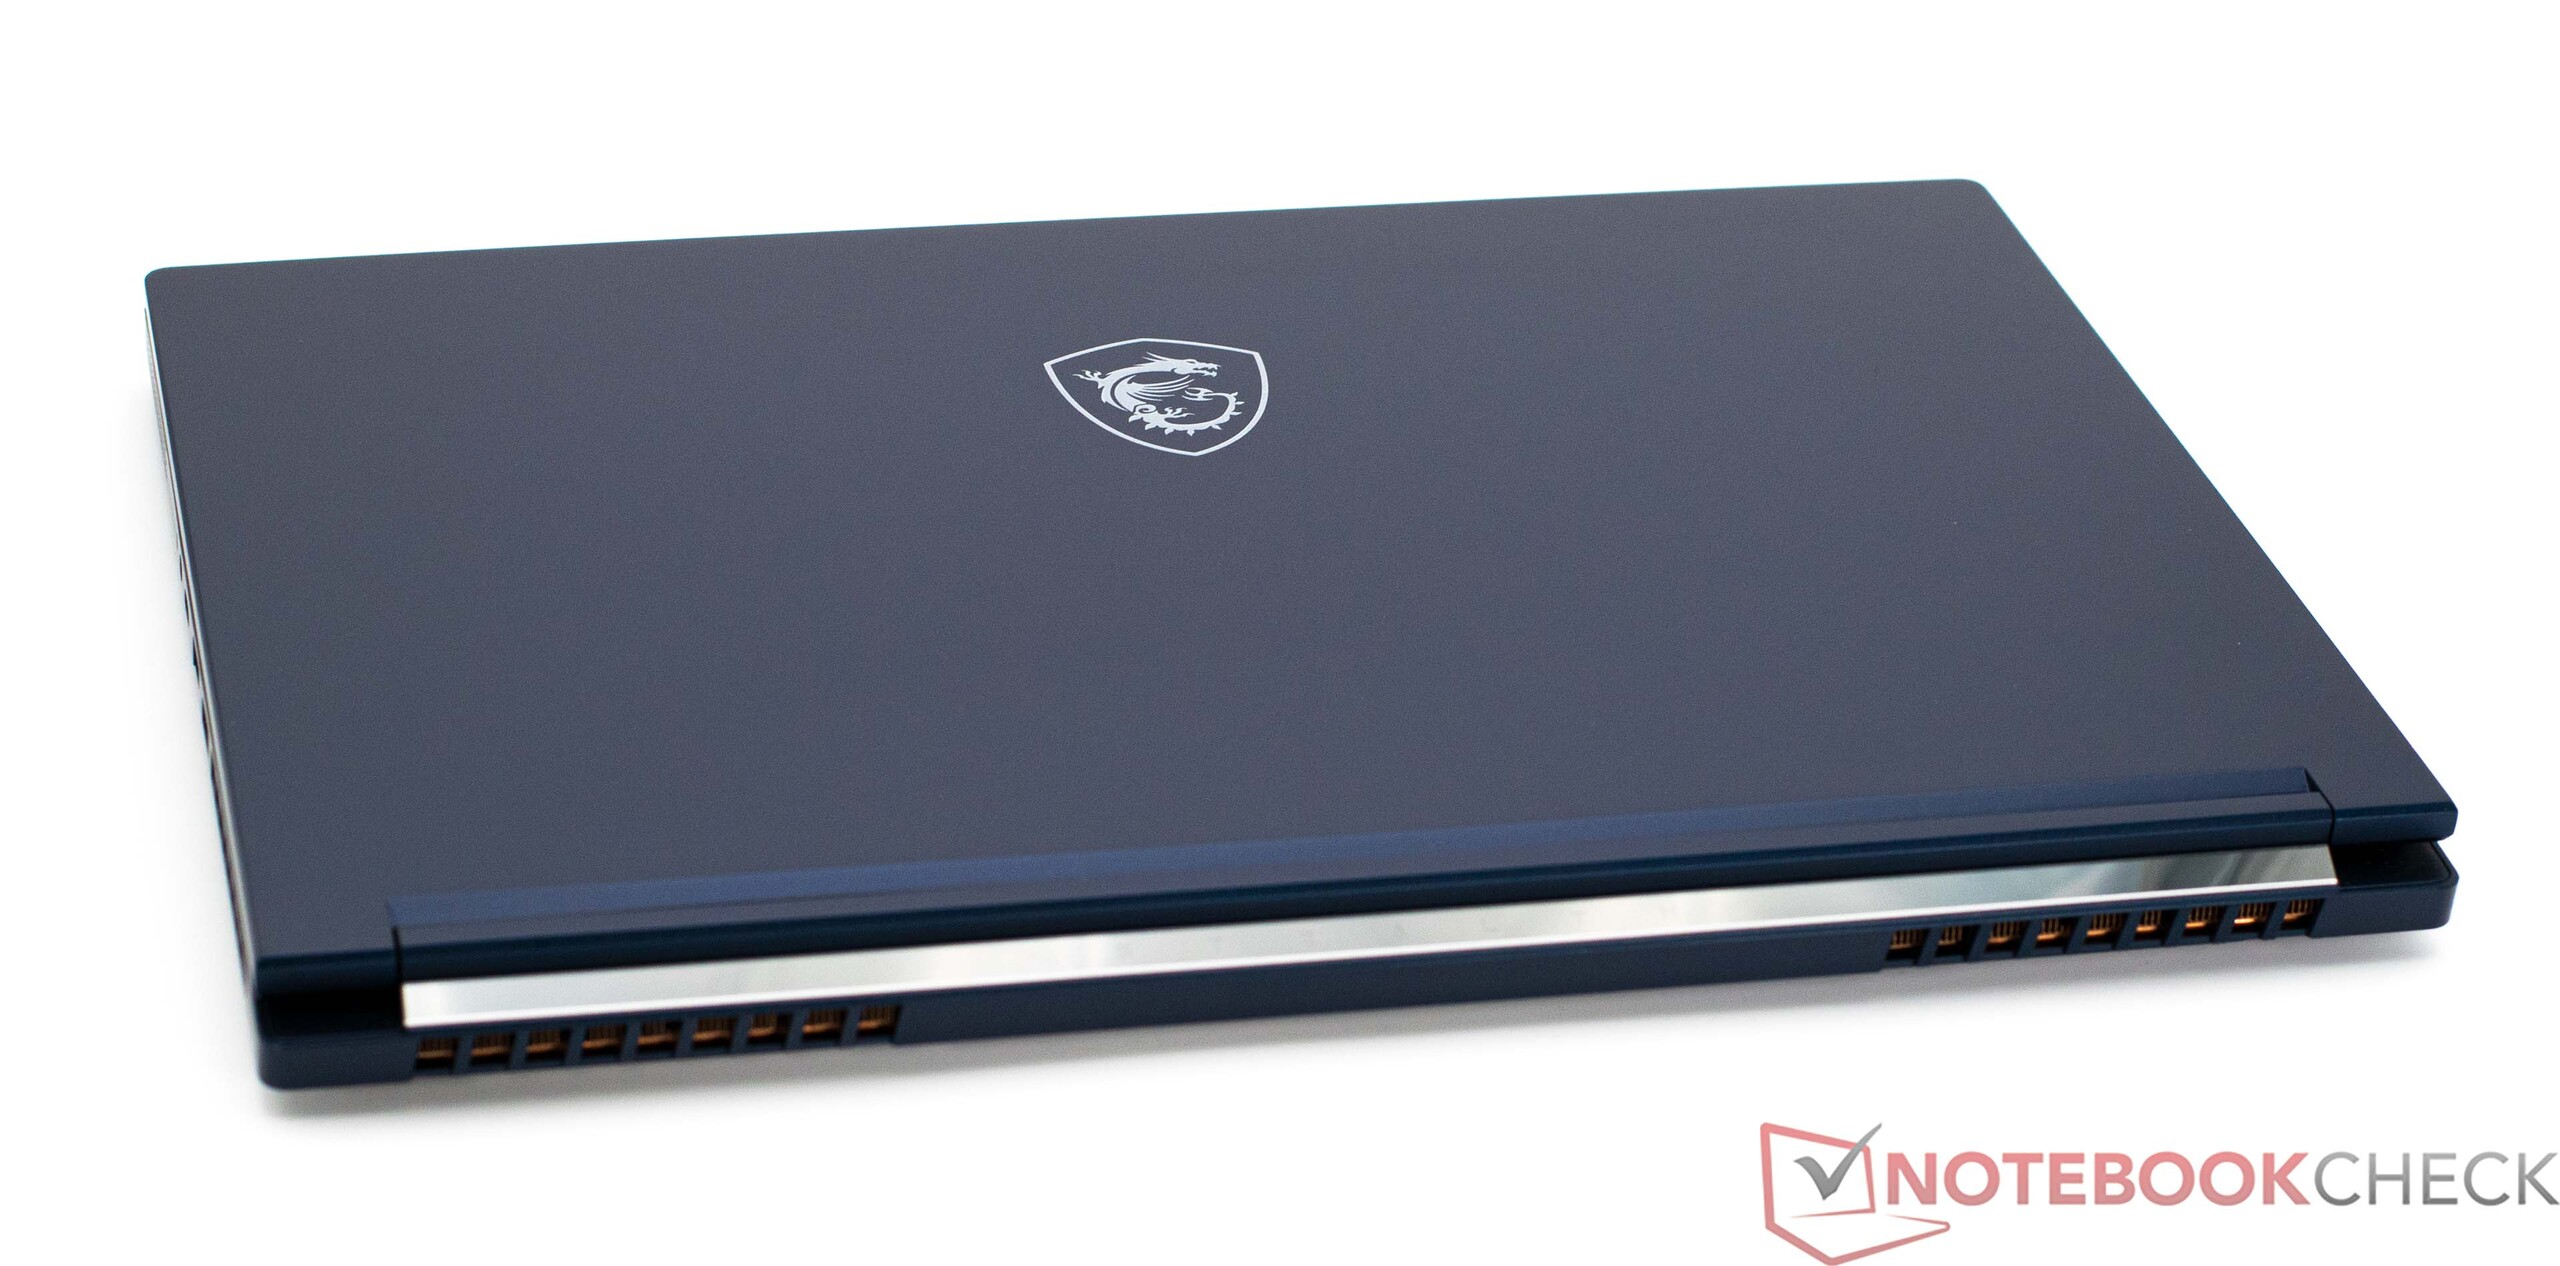
Case - Aluminum and magnesium provide sturdiness
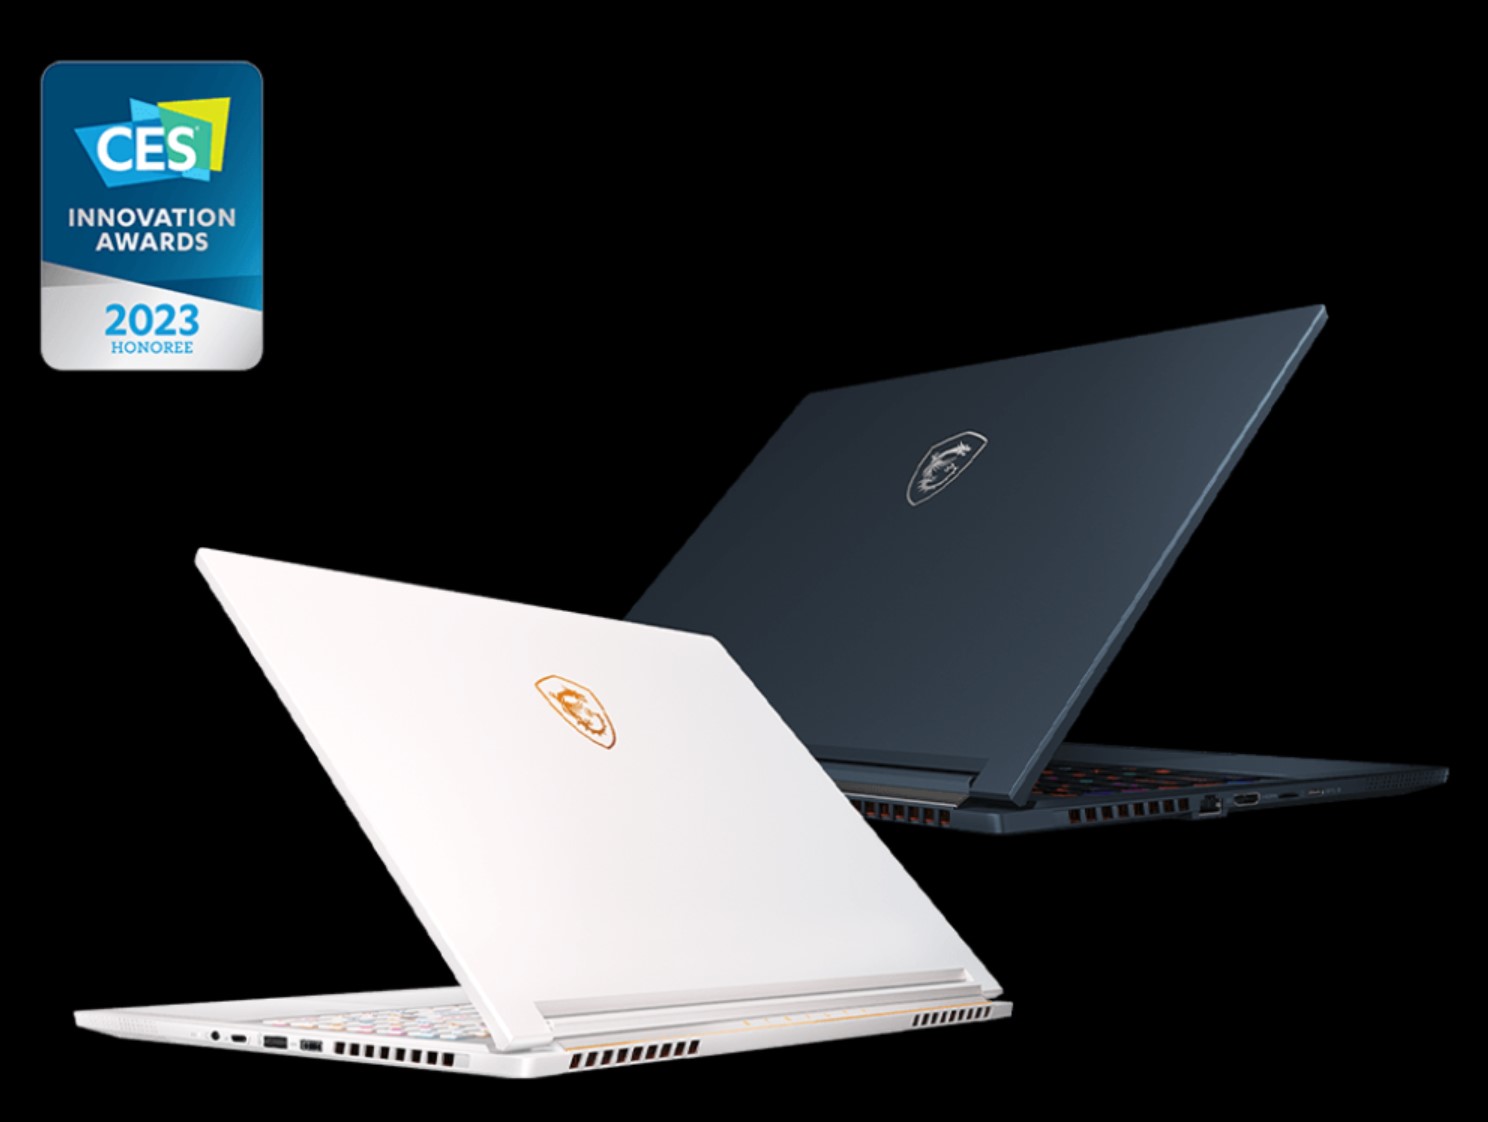
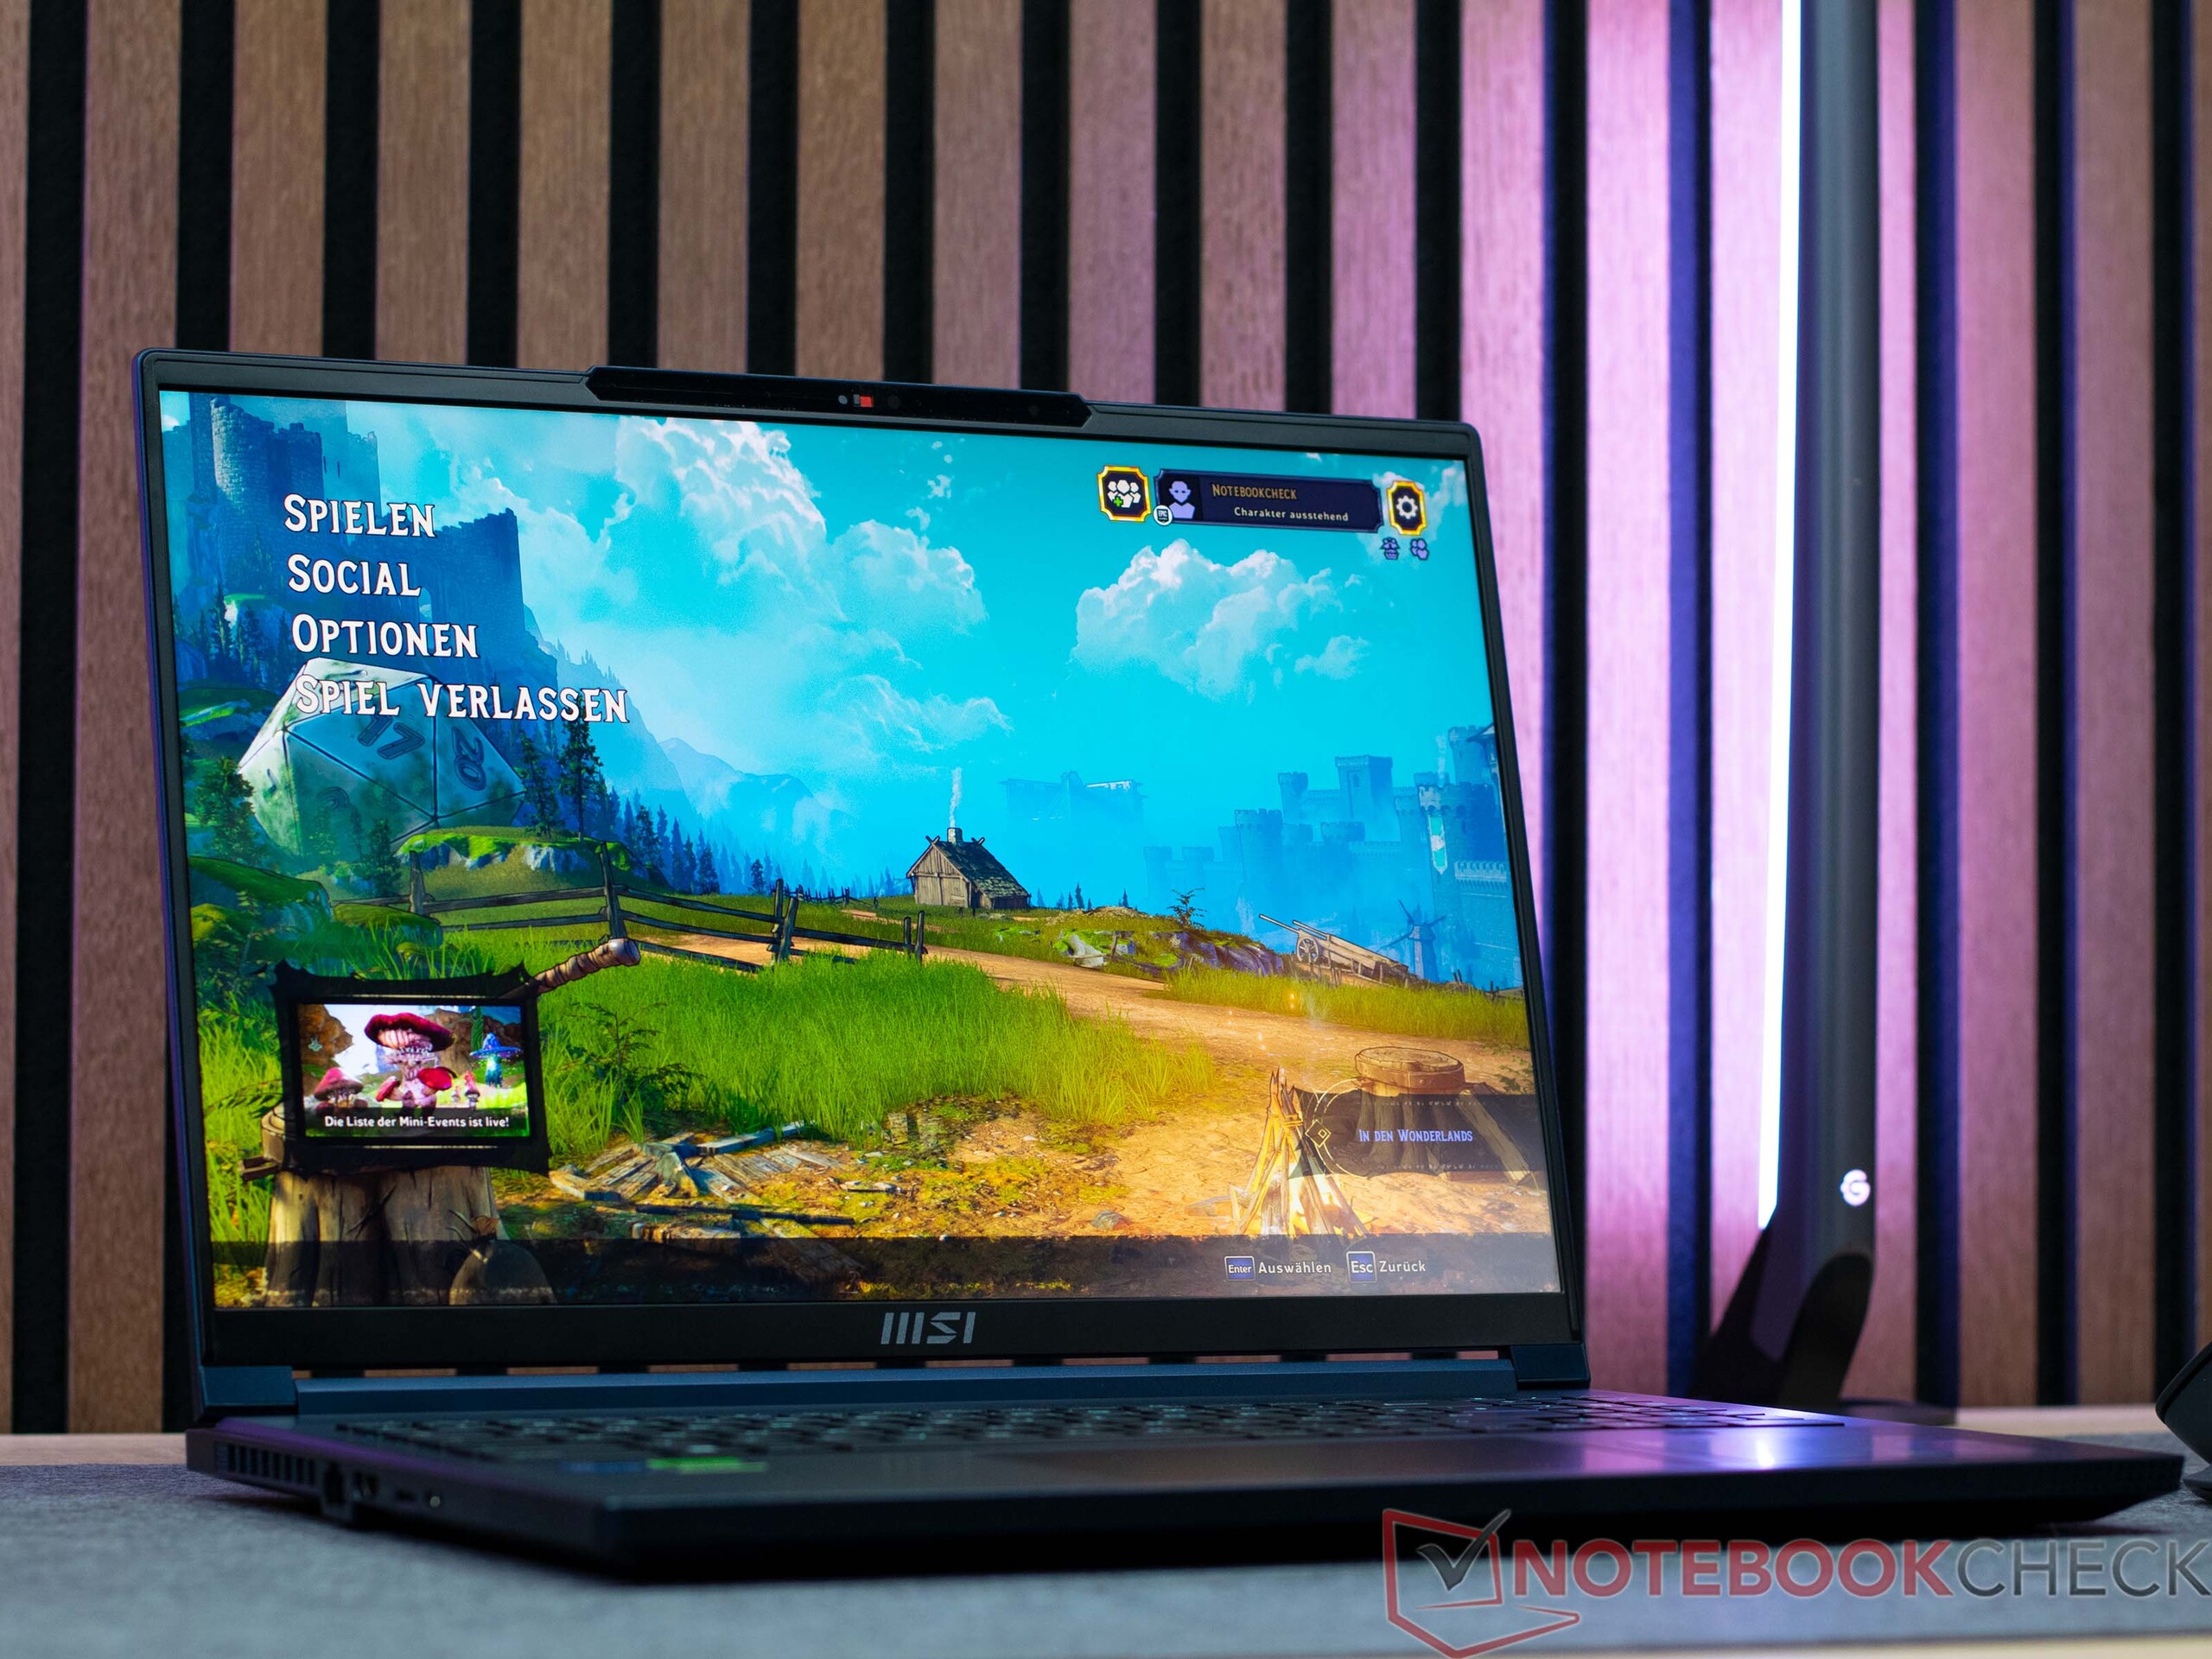
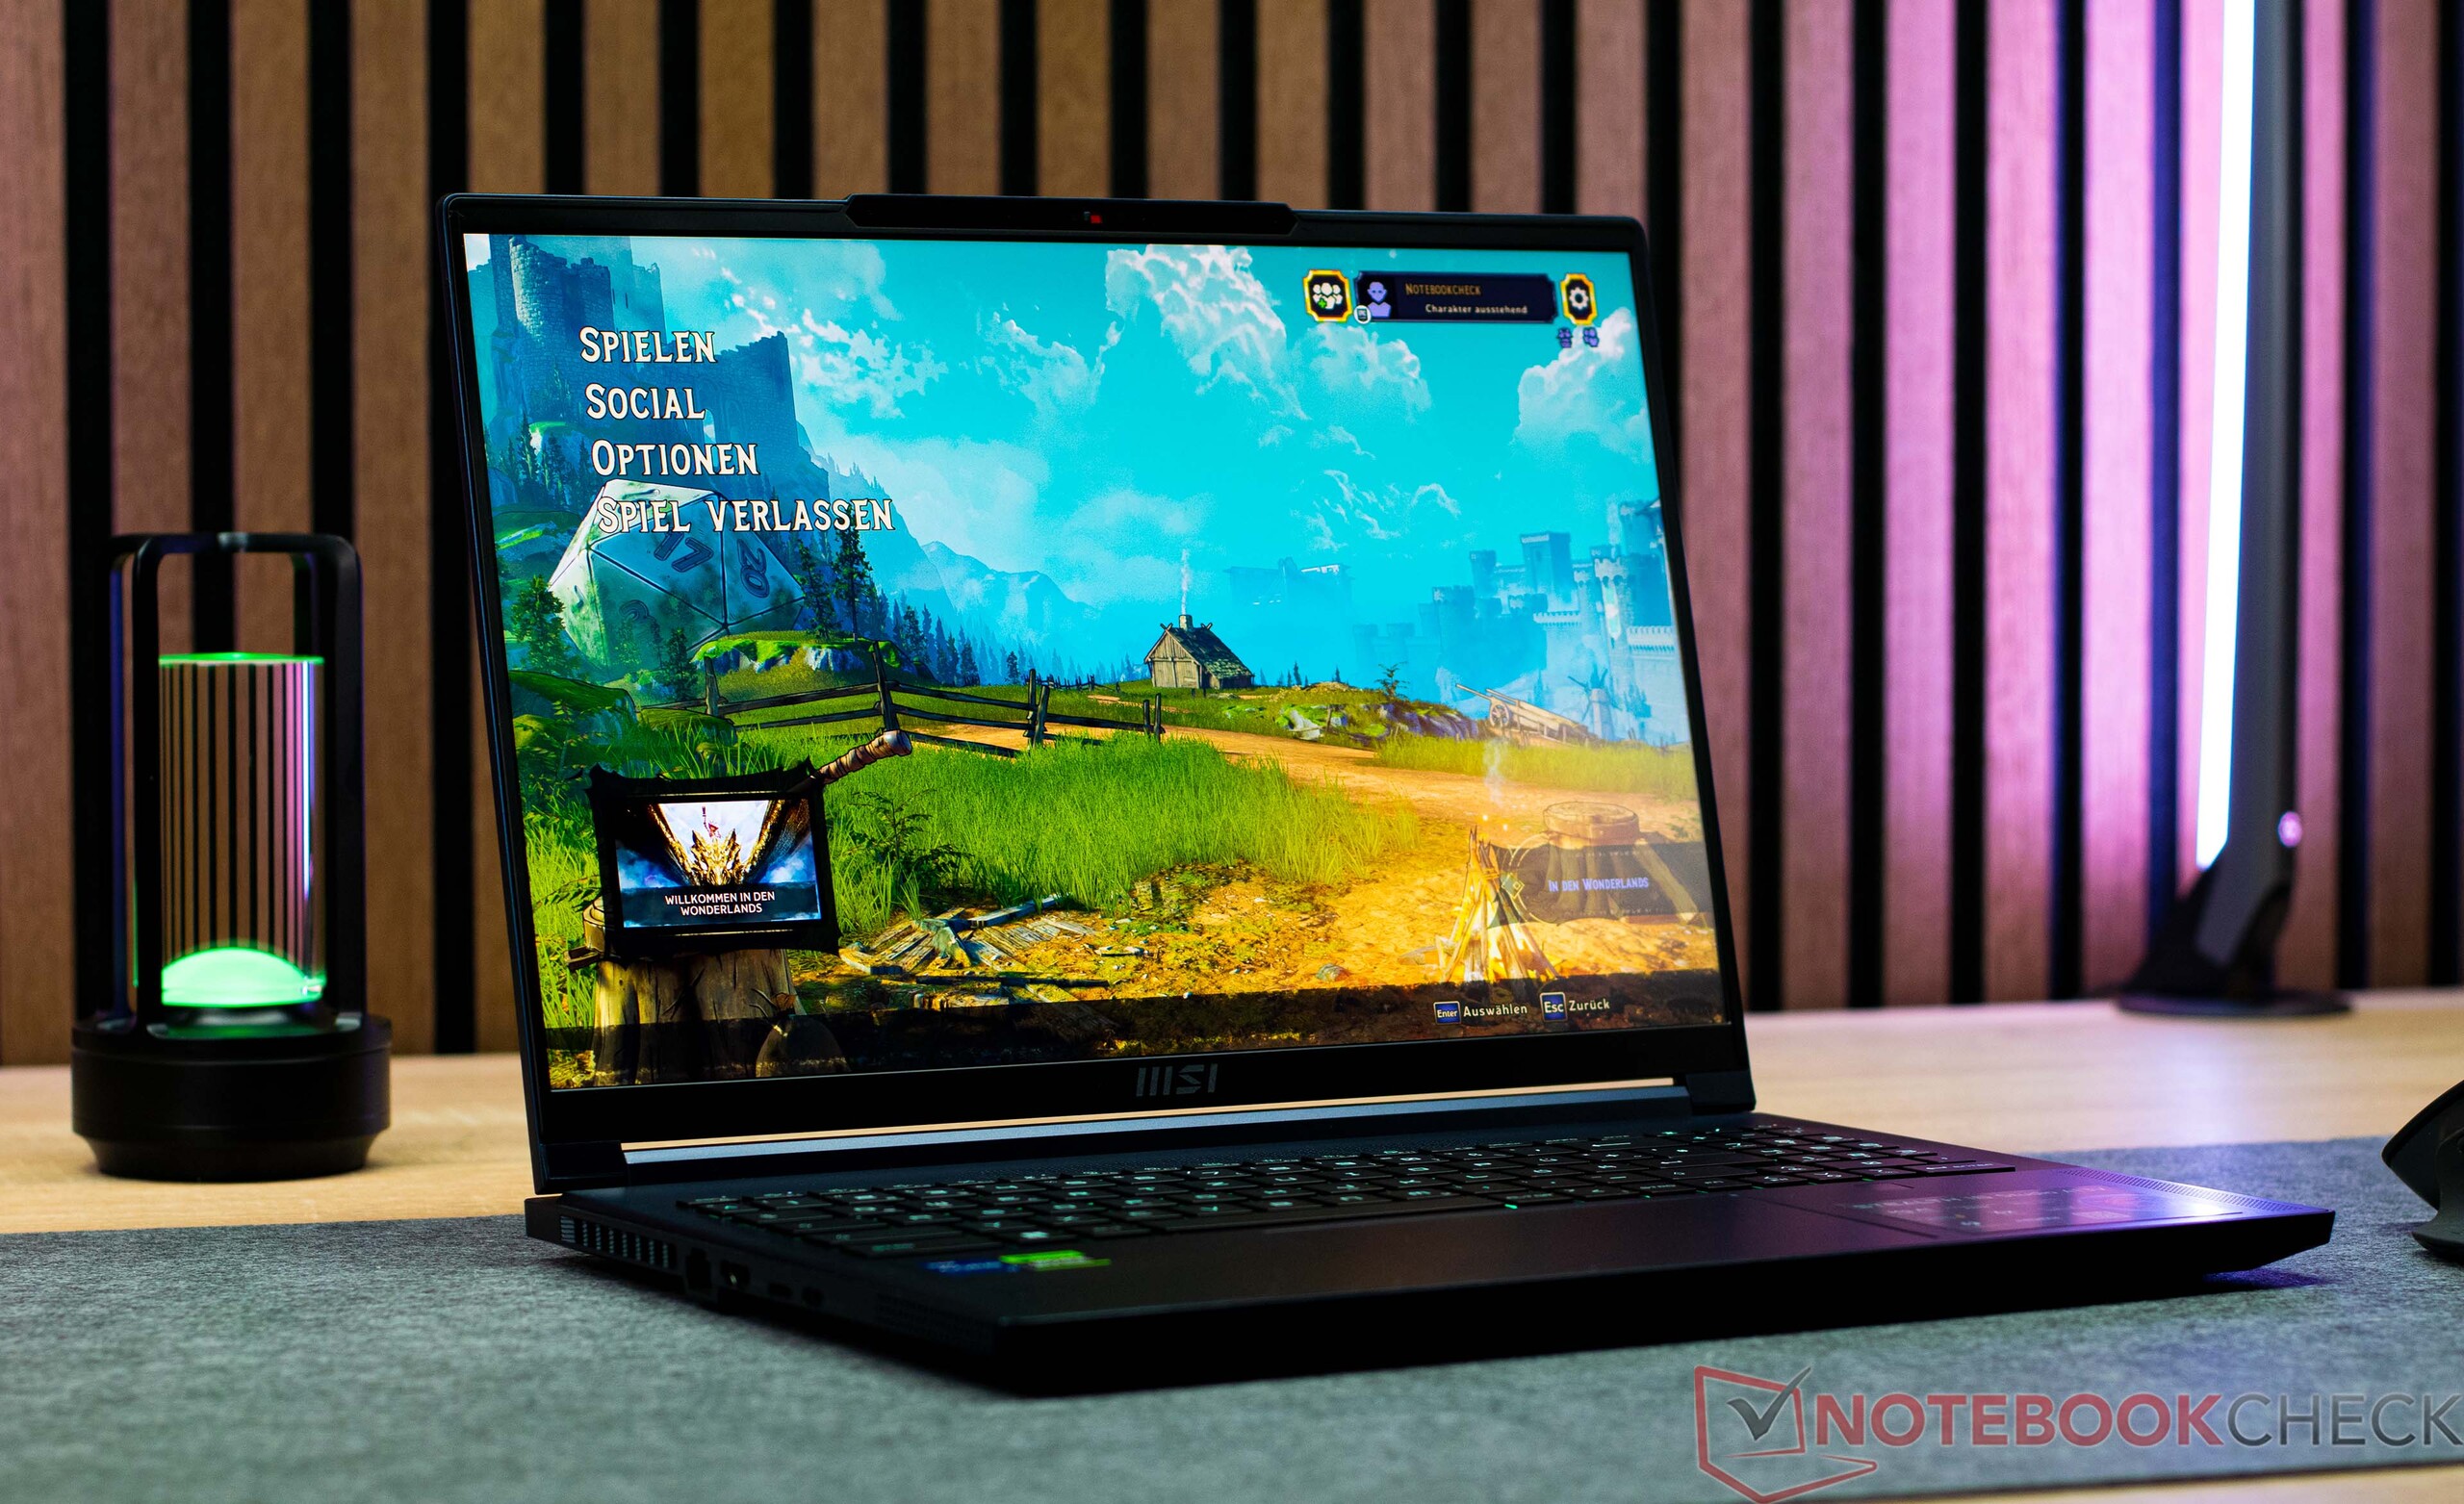
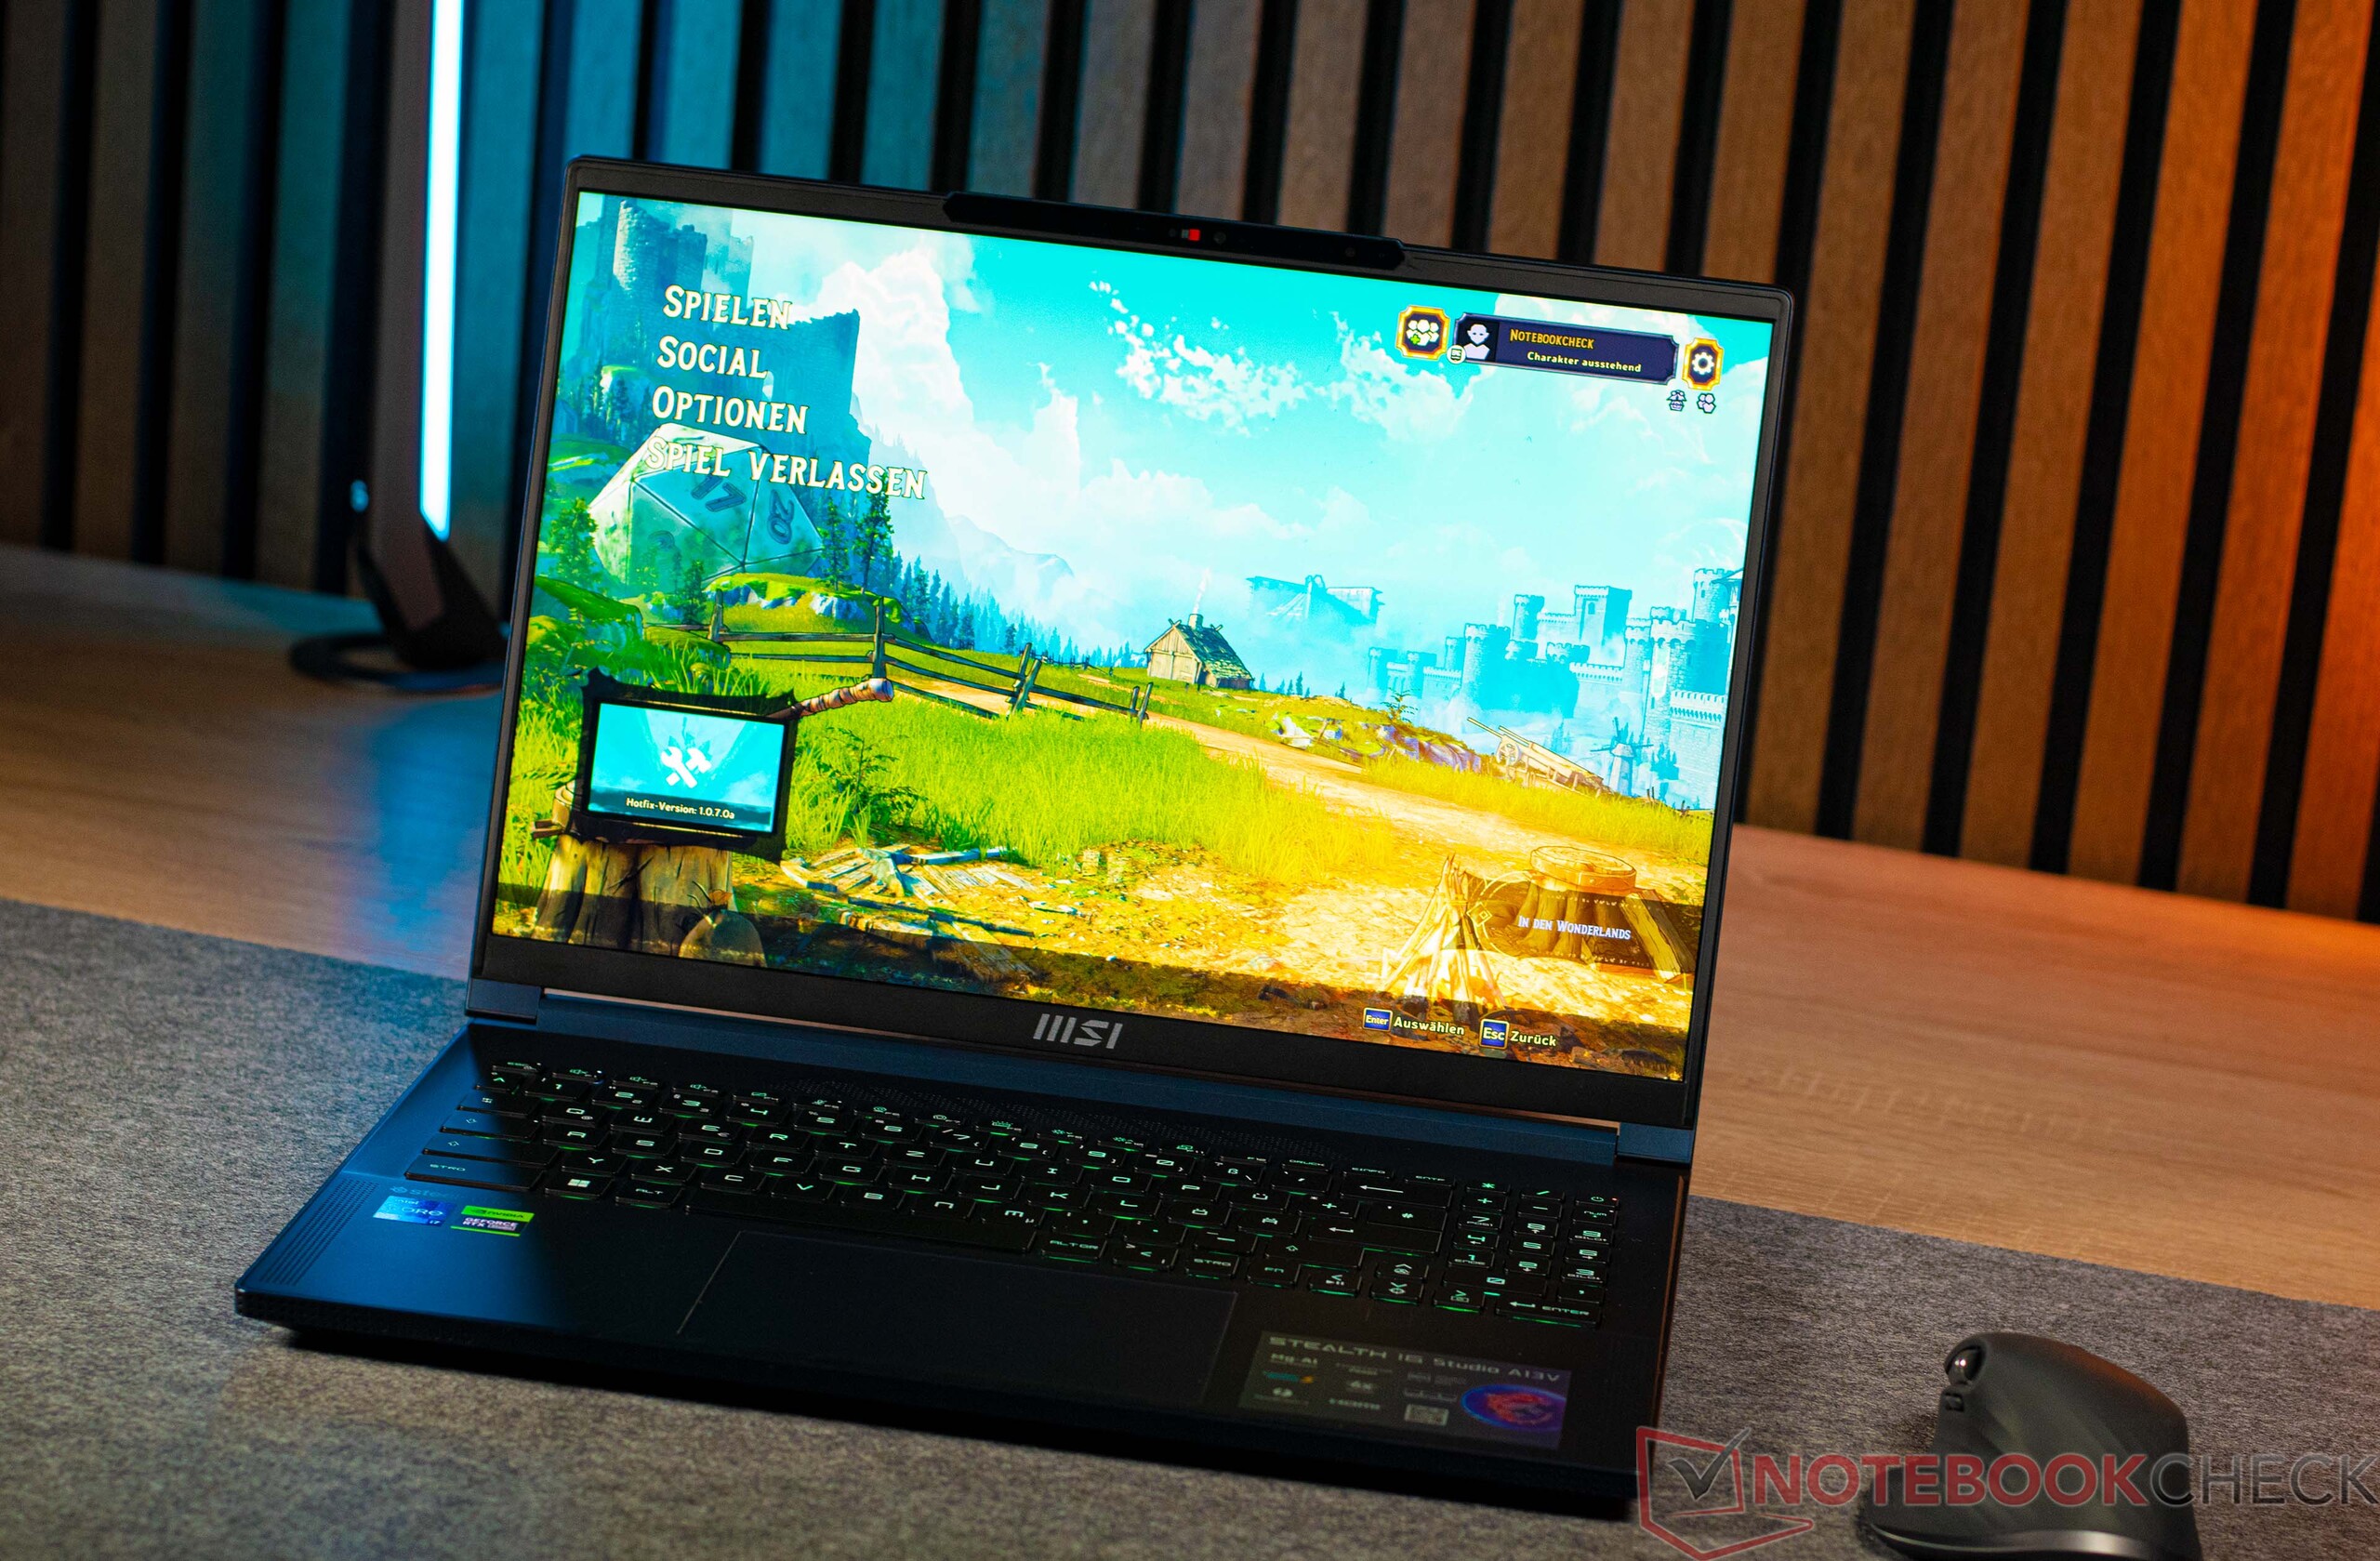
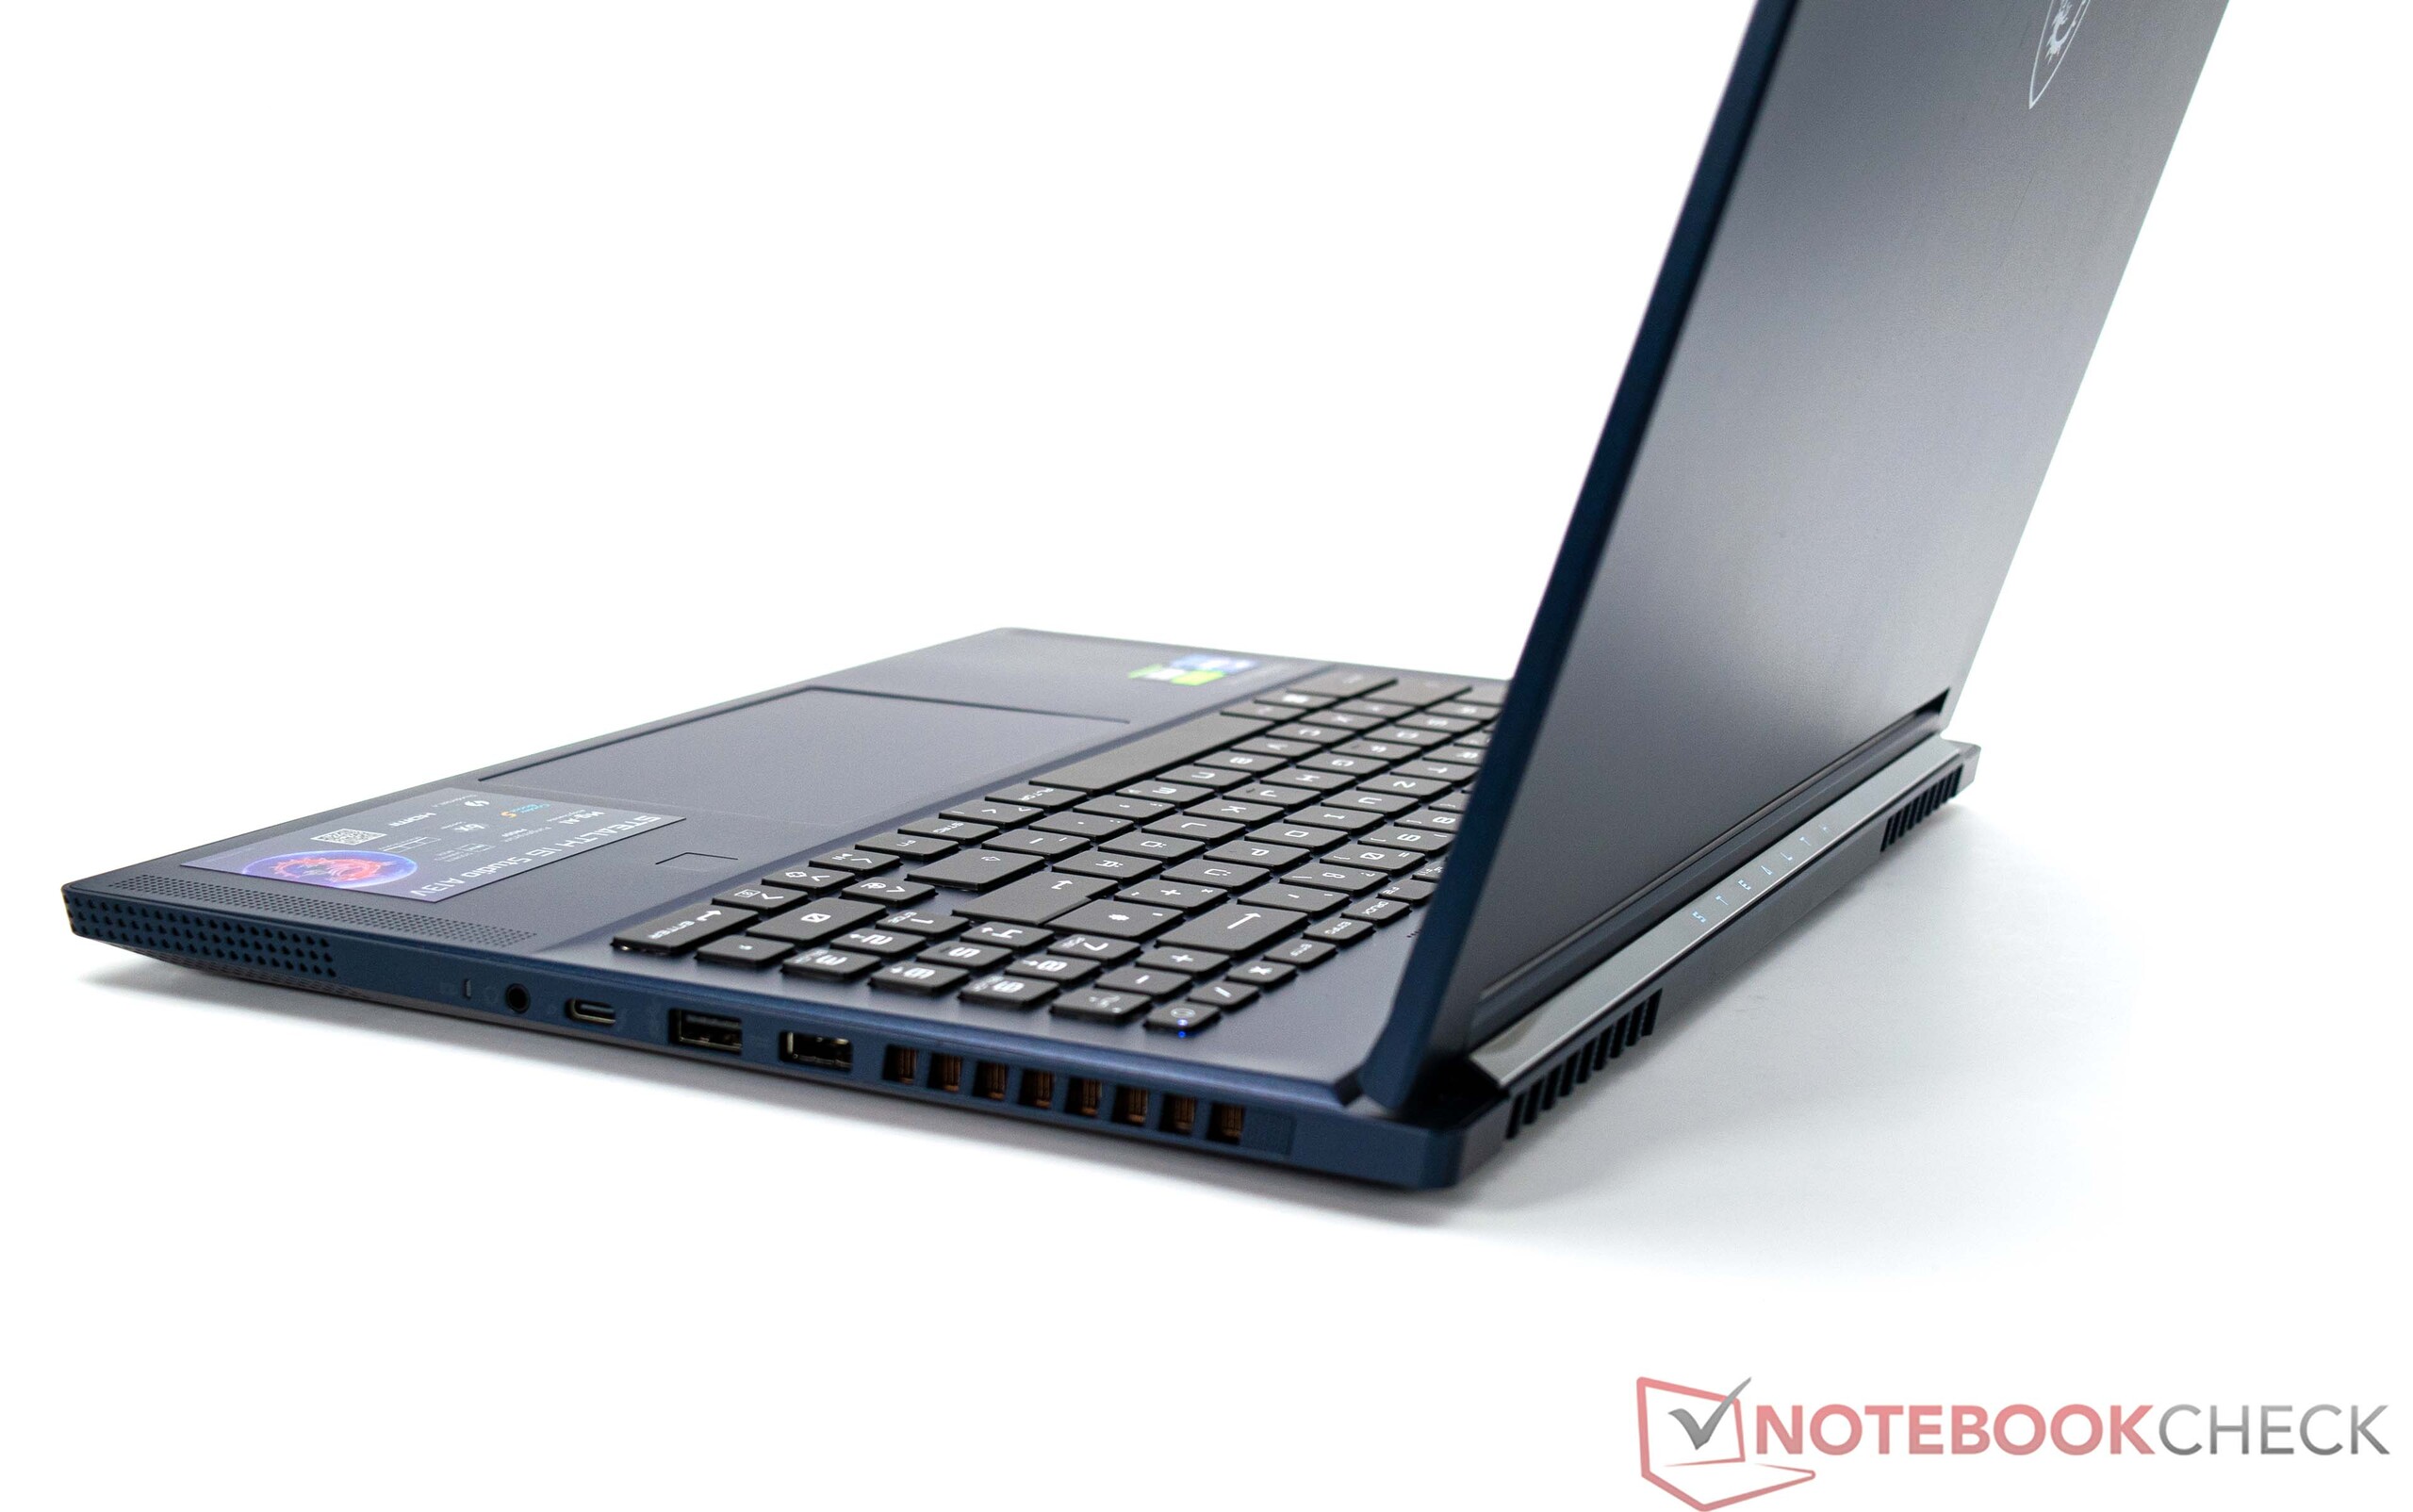
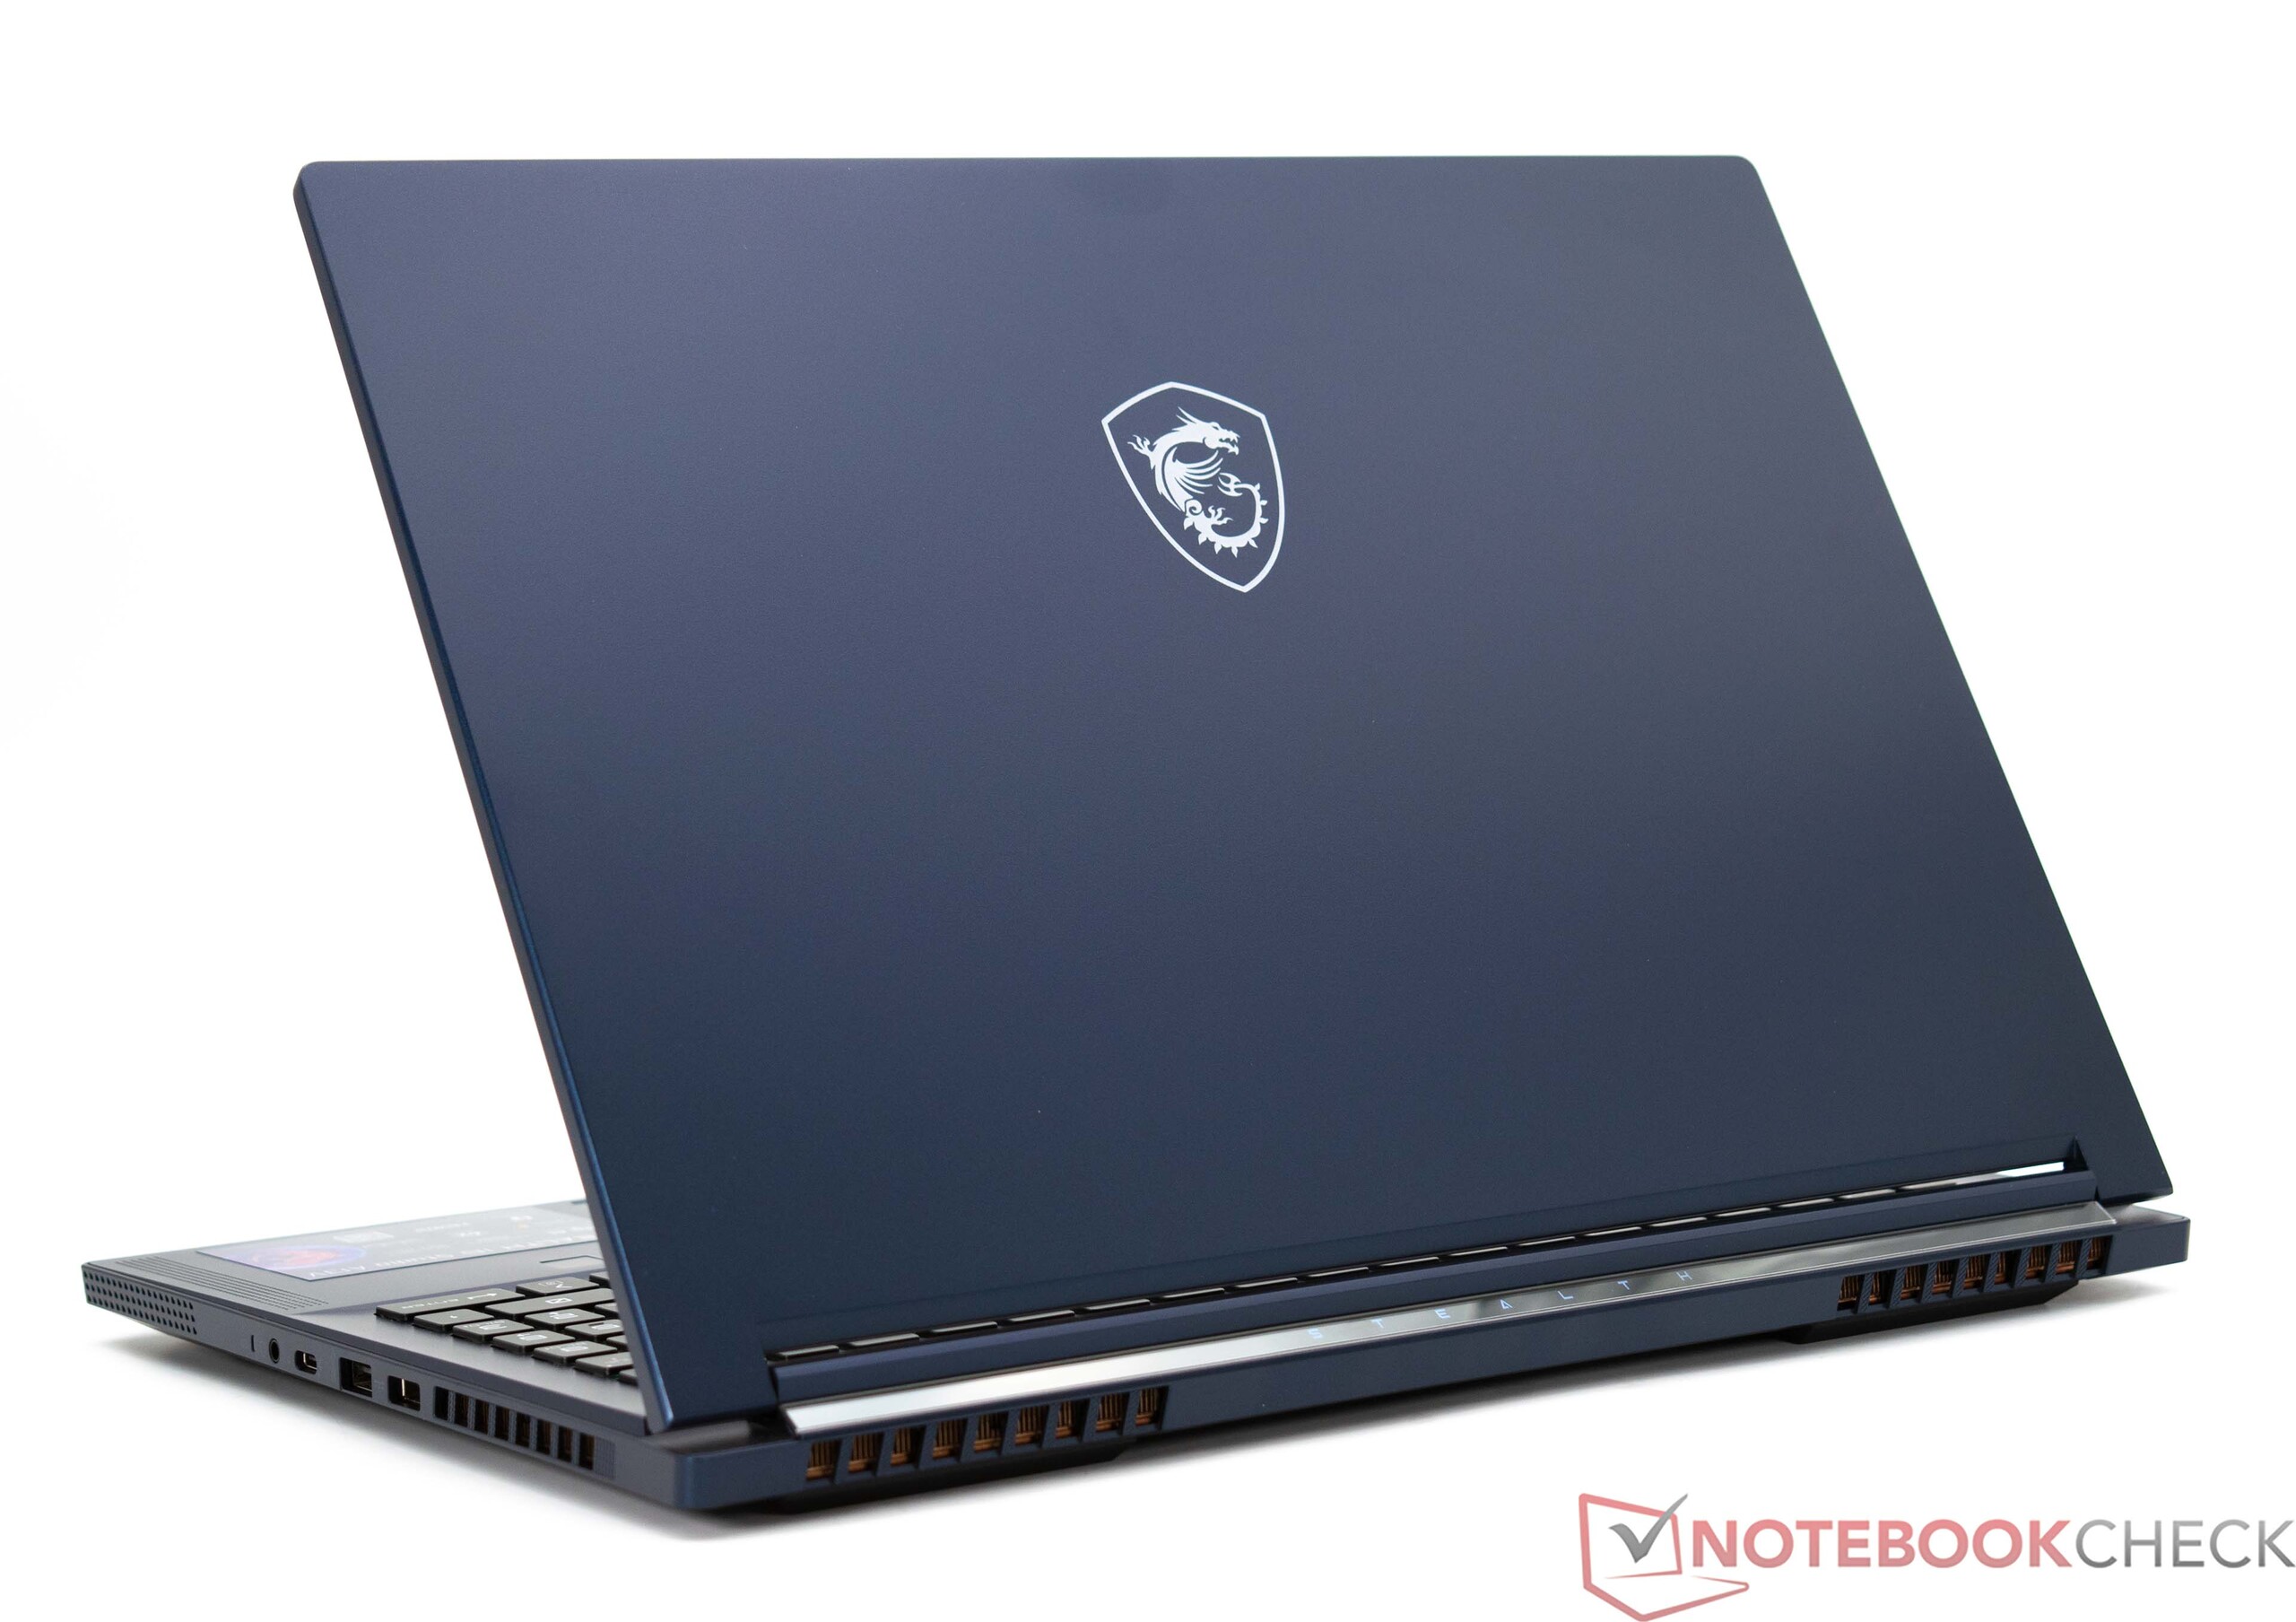
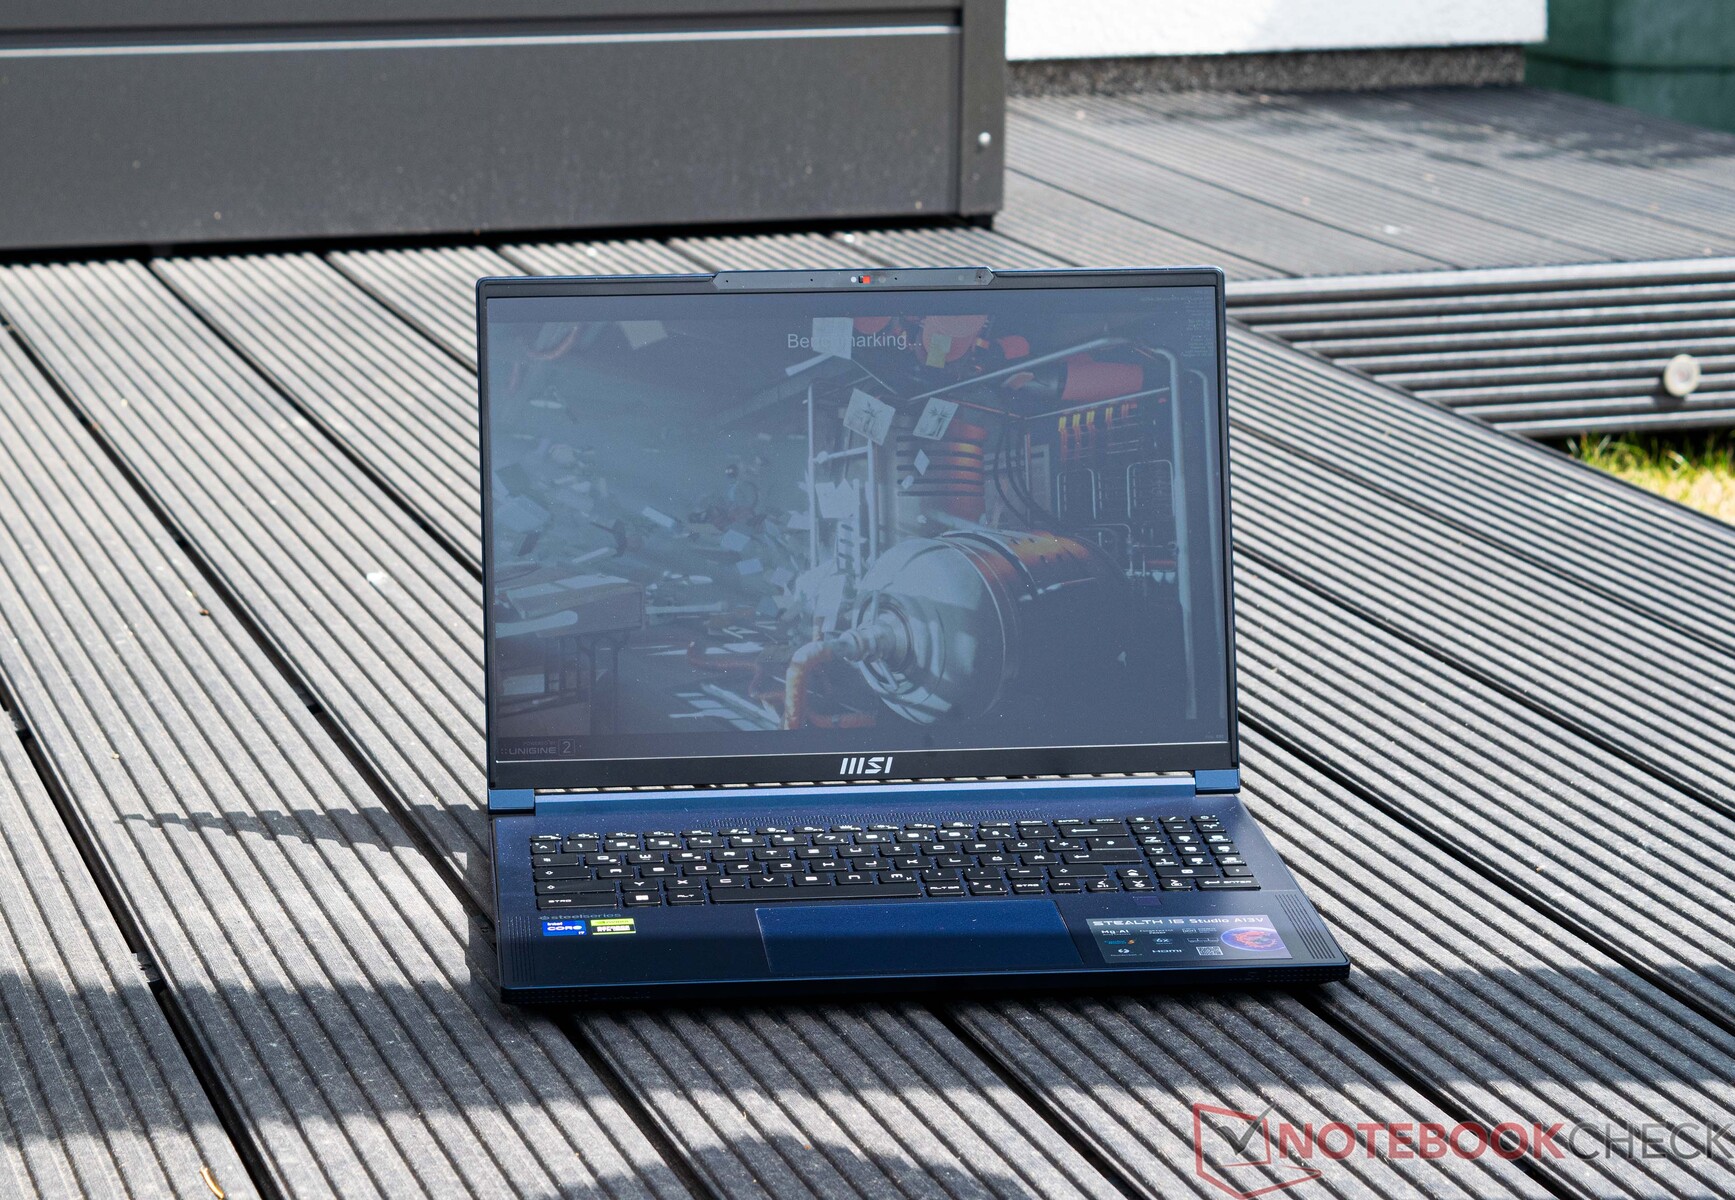
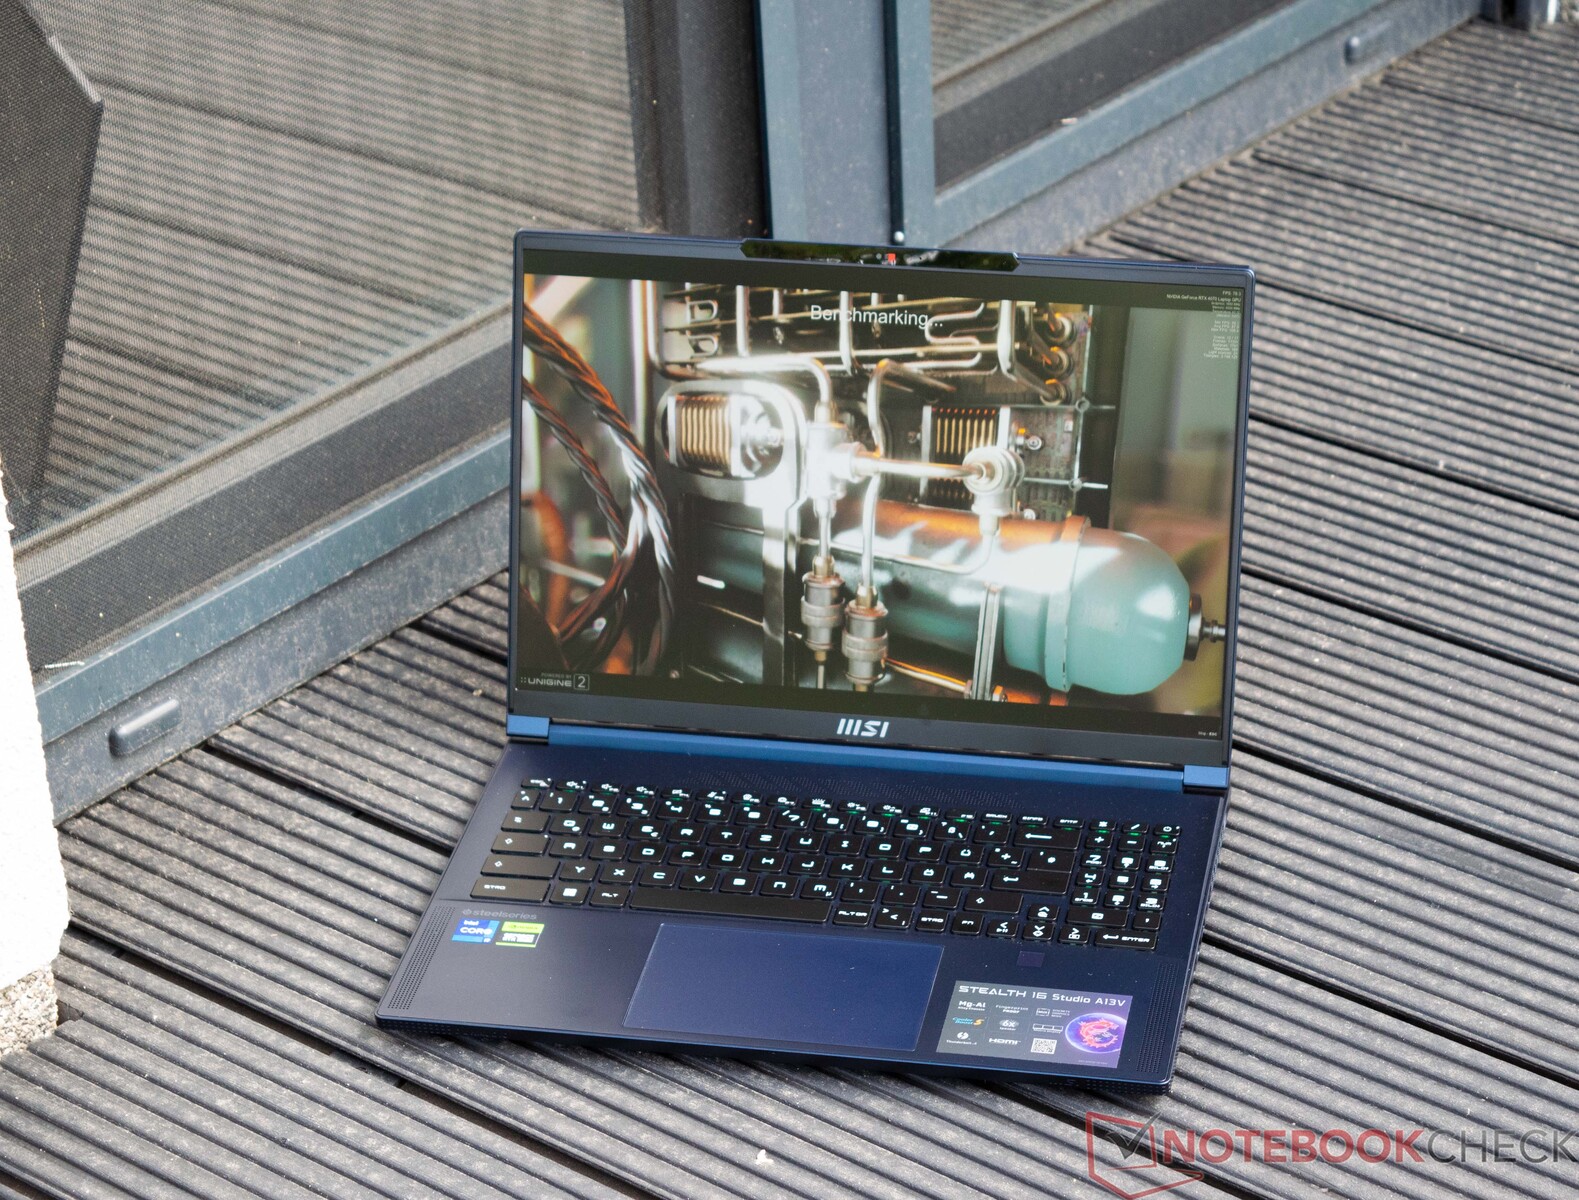
Mainly high-quality materials are used in the MSI Stealth 16 Studio A13VG. The mix of aluminum and magnesium lends the device not only an air of finesse and good stability but simultaneously reduces its weight. The application of selective pressure only results in minimal flexing of the base but only if modest pressure is applied. On the other hand, the case lid can be twisted slightly, although this doesn't appear to be an extremely negative aspect in the MSI Stealth 16 Studio A13VG. The hinges do a good job and help to prevent the lid from teetering back and forth. Nevertheless, the device can be opened with one hand. From a design perspective, the laptop is understated and does without a lot of RGB lighting. On the rear side, only the "Stealth" lettering is subtly illuminated. Our review device is blue but, alternatively, the MSI Stealth 16 Studio also comes completely in white.
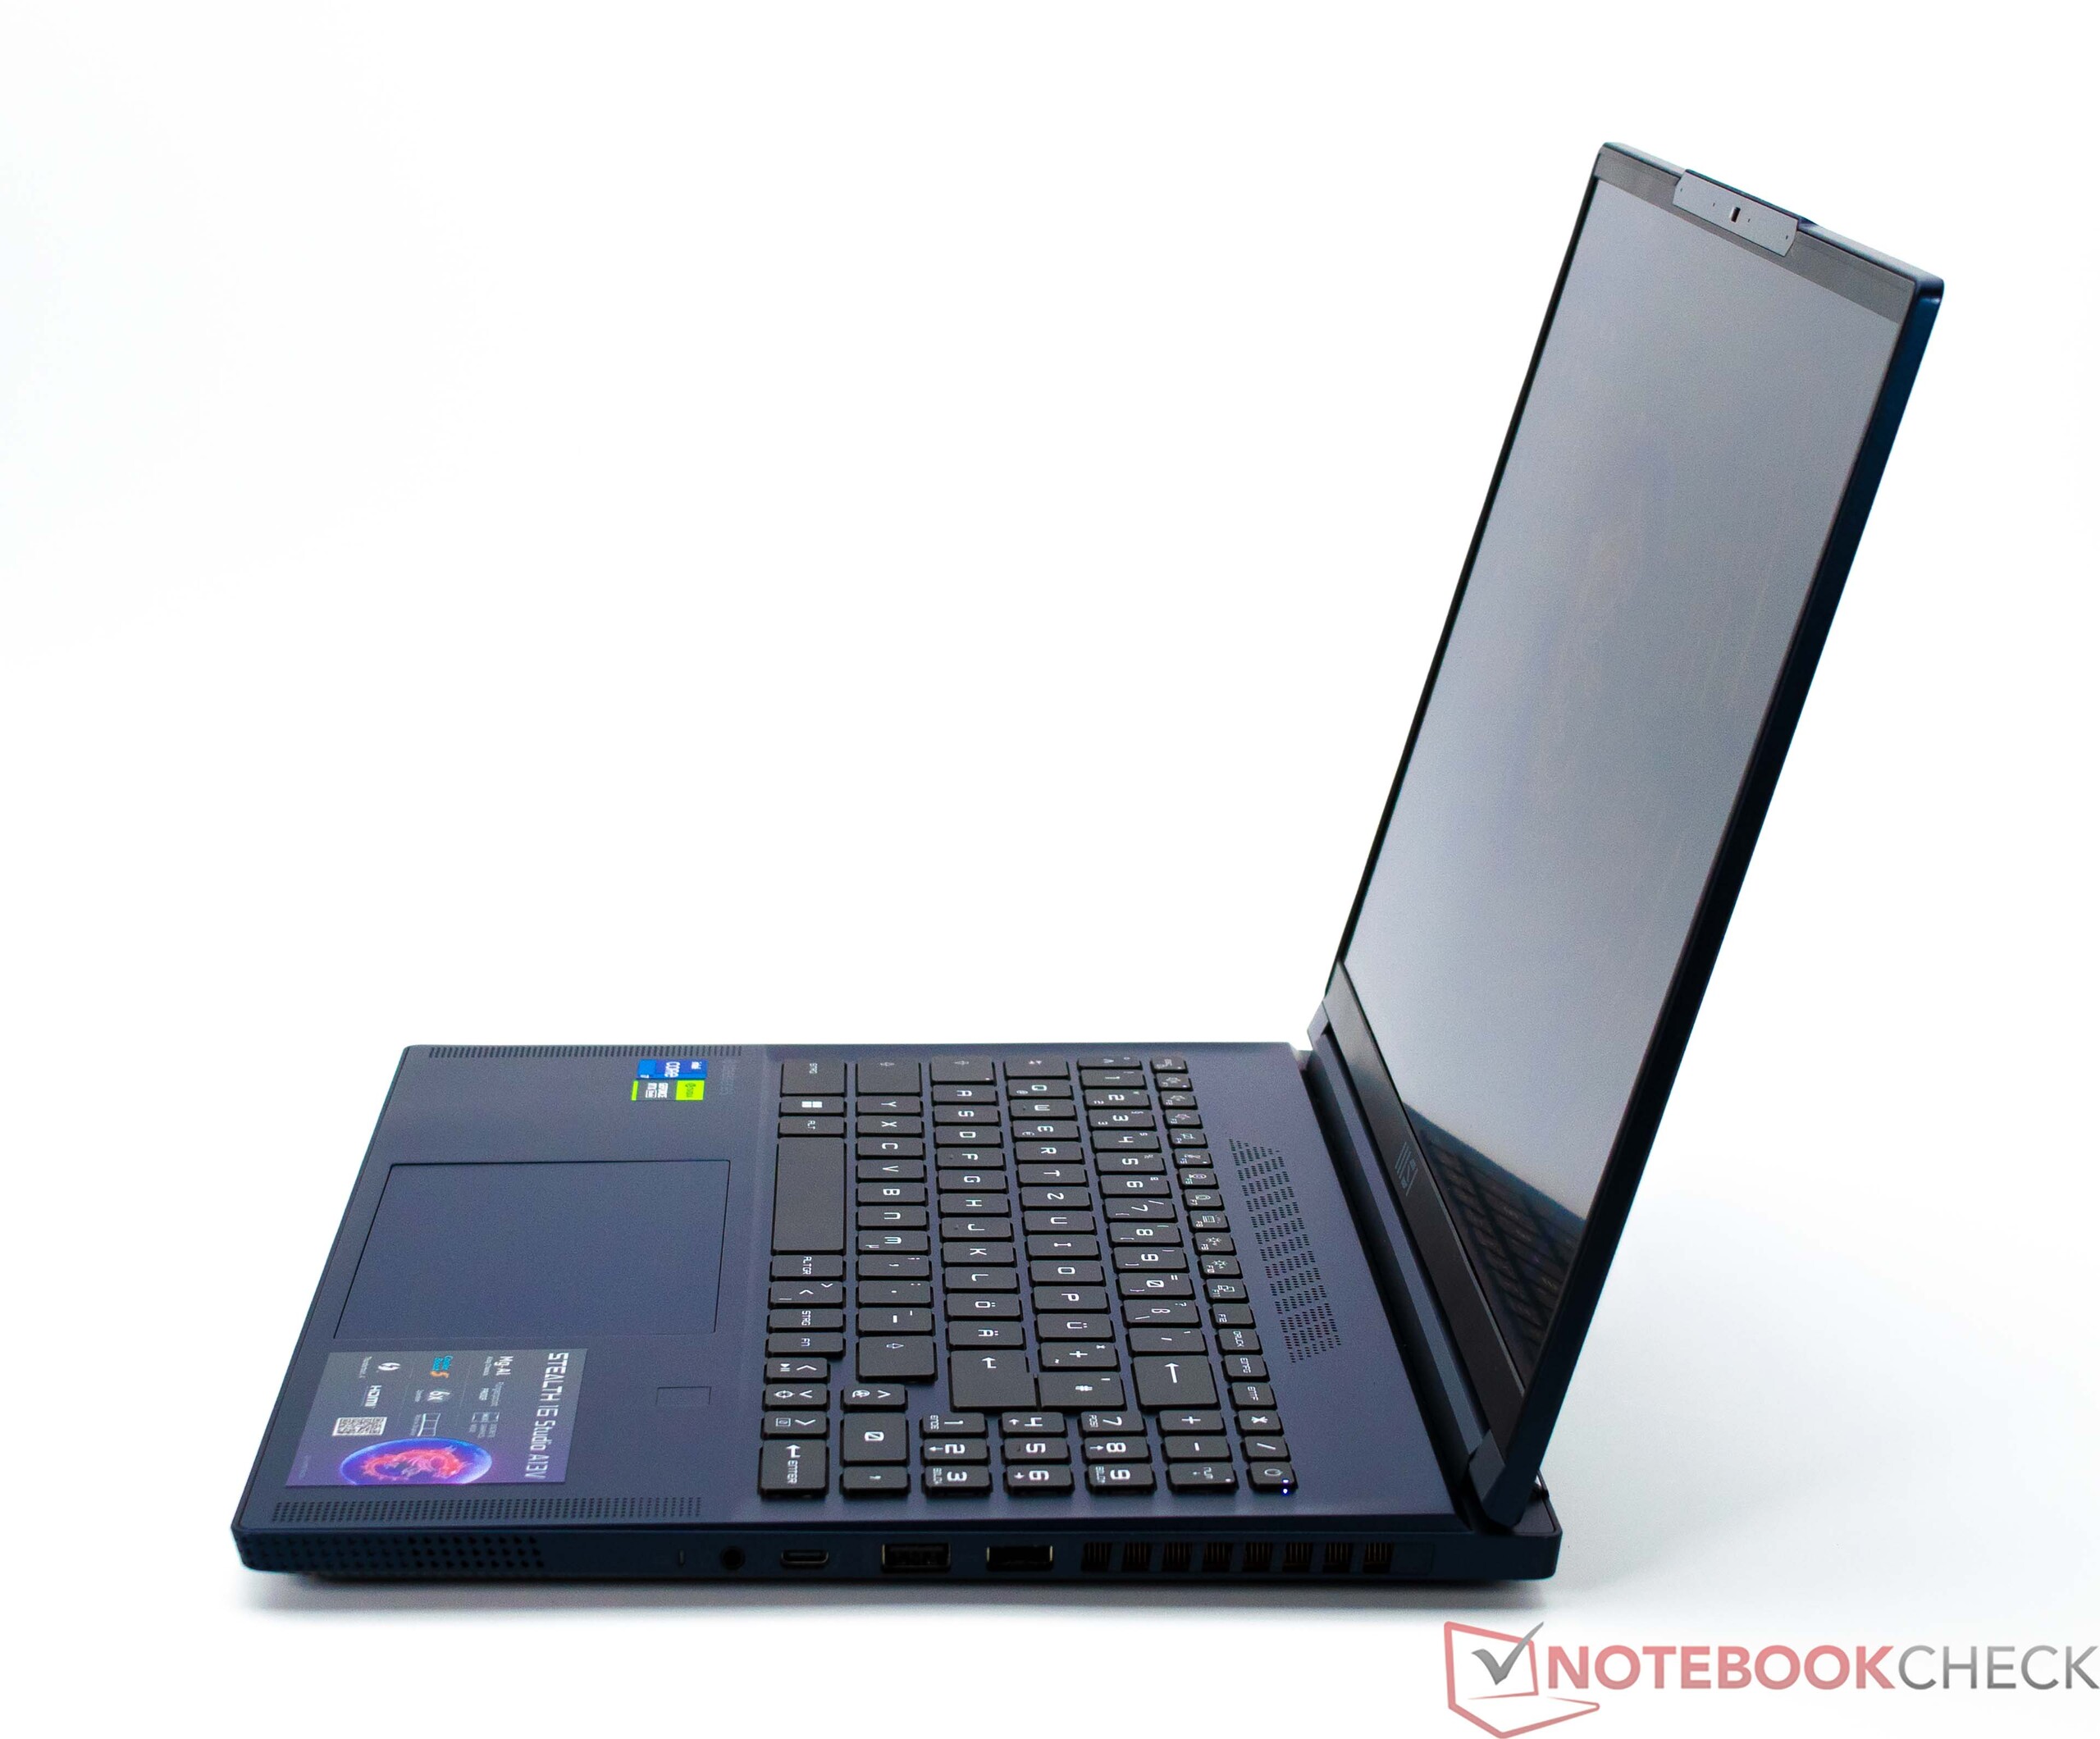
When it comes to the laptop's desktop footprint, all the devices here take up more or less the same amount of space. By contrast, in terms of weight, the MSI Stealth 16 Studio A13VG belongs to the lightest candidates in our comparison with the device tipping the scales at just over 2 kilograms. The PSU comes in at 576 grams.
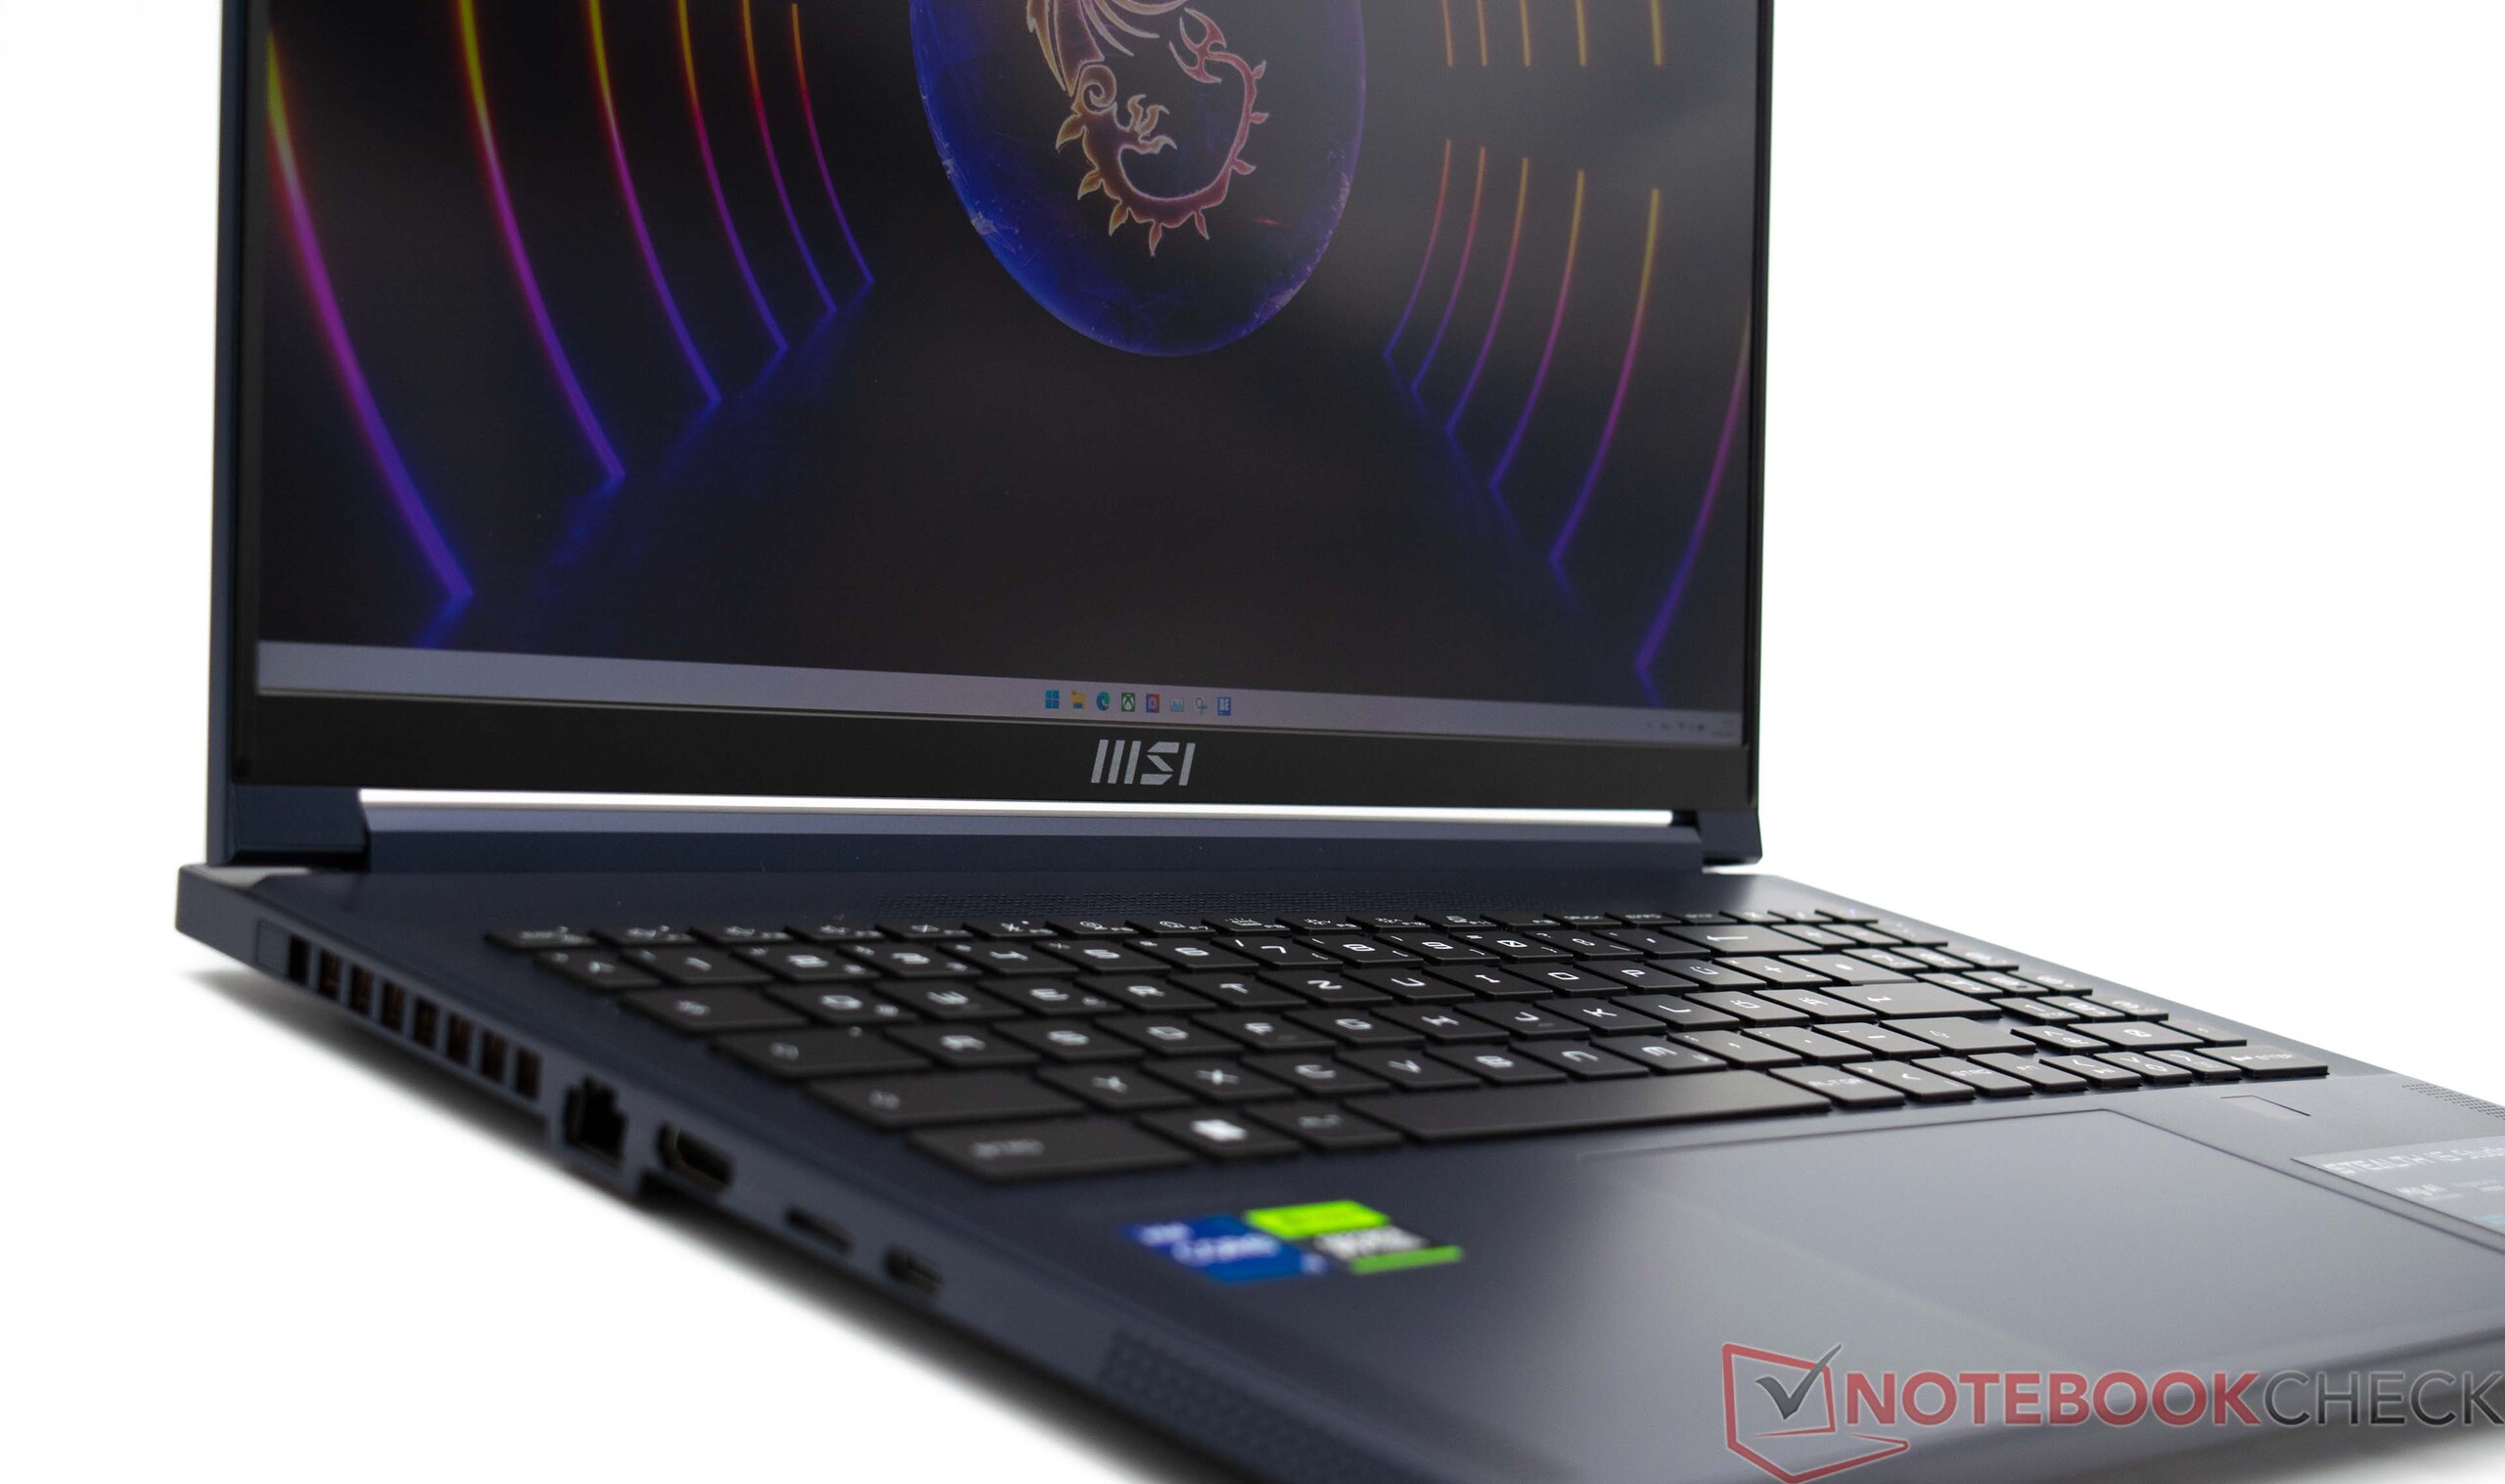
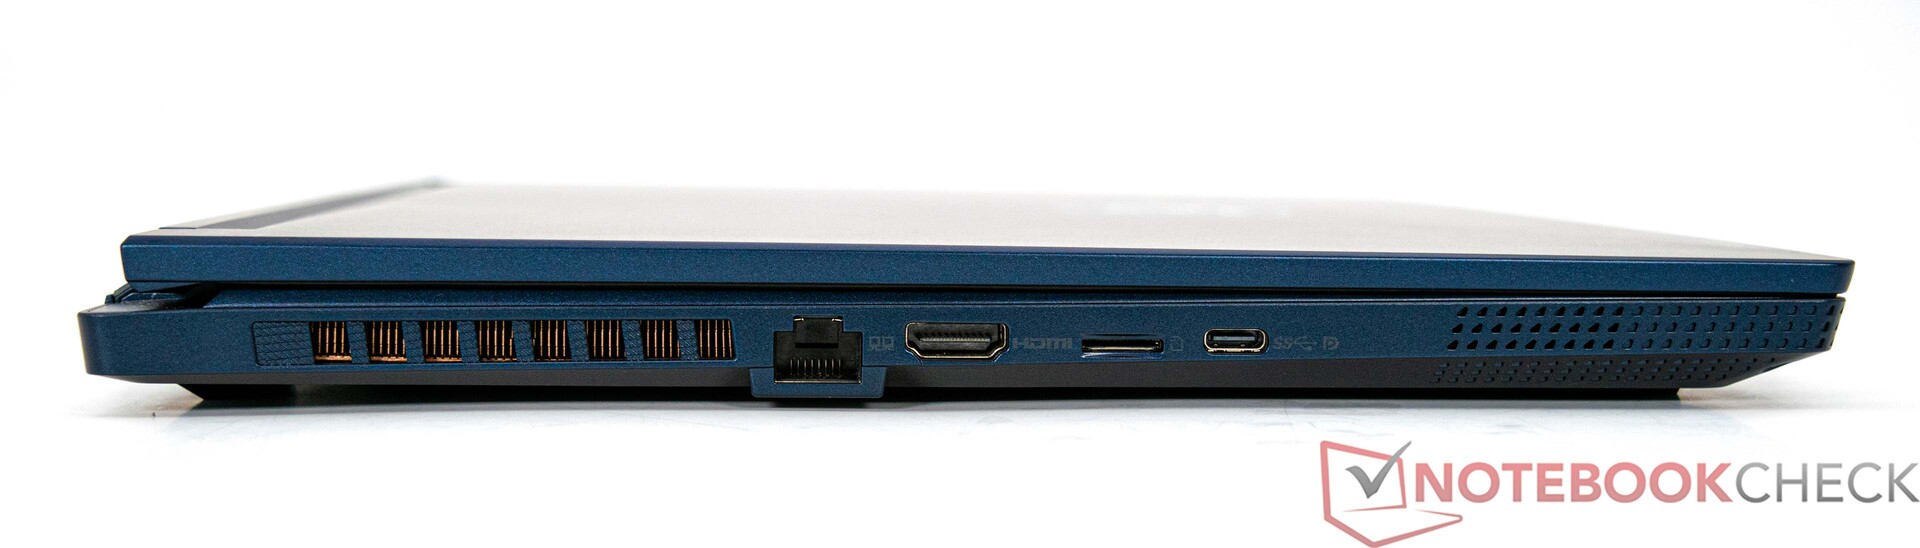
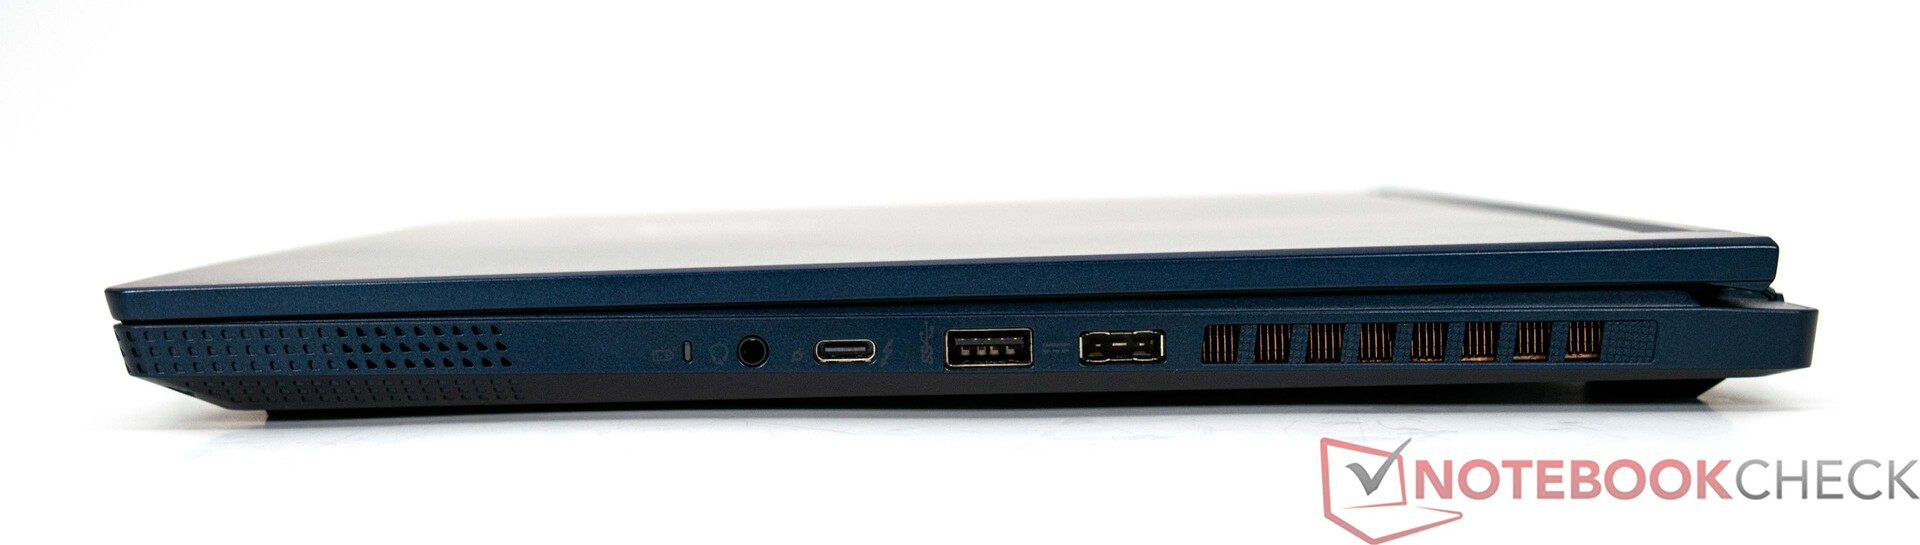
Features - uncluttered and with Thunderbolt 4
Unfortunately, the MSI Stealth 16 Studio A13VG doesn't come with a particularly generous amount of ports. However, the interfaces provided should be sufficient for most users in everyday situations. At least a modern Thunderbolt 4 port with Power Delivery (PD) is included. But, users are limited to only one USB-A port. External monitors can be connected to the laptop either via HDMI or USB-C meaning a total of three displays can be used simultaneously.
SD card reader

The MSI Stealth 16 Studio A13VG is equipped with a card reader which can take microSD memory cards. The card reader supports the fast UHS-II standard. In our tests, we recorded excellent results using our reference card, the AV PRO microSD 128 GB V60. However, the competition from Asus and Gigabyte are also impressive and score even better in the area of sequential data.
| SD Card Reader | |
| average JPG Copy Test (av. of 3 runs) | |
| Gigabyte AERO 16 OLED BSF | |
| MSI Stealth 16 Studio A13VG | |
| Average of class Gaming (20.9 - 210, n=54, last 2 years) | |
| Asus ROG Flow X16 GV601V | |
| Corsair Voyager a1600 (AV Pro SD microSD 128 GB V60) | |
| Acer Nitro 16 AN16-41 (AV Pro SD microSD 128 GB V60) | |
| Medion Erazer Major X20 (AV PRO microSD 128 GB V60) | |
| maximum AS SSD Seq Read Test (1GB) | |
| Asus ROG Flow X16 GV601V | |
| Gigabyte AERO 16 OLED BSF | |
| MSI Stealth 16 Studio A13VG | |
| Average of class Gaming (25.5 - 261, n=51, last 2 years) | |
| Corsair Voyager a1600 (AV Pro SD microSD 128 GB V60) | |
| Medion Erazer Major X20 (AV PRO microSD 128 GB V60) | |
| Acer Nitro 16 AN16-41 (AV Pro SD microSD 128 GB V60) | |
Communication
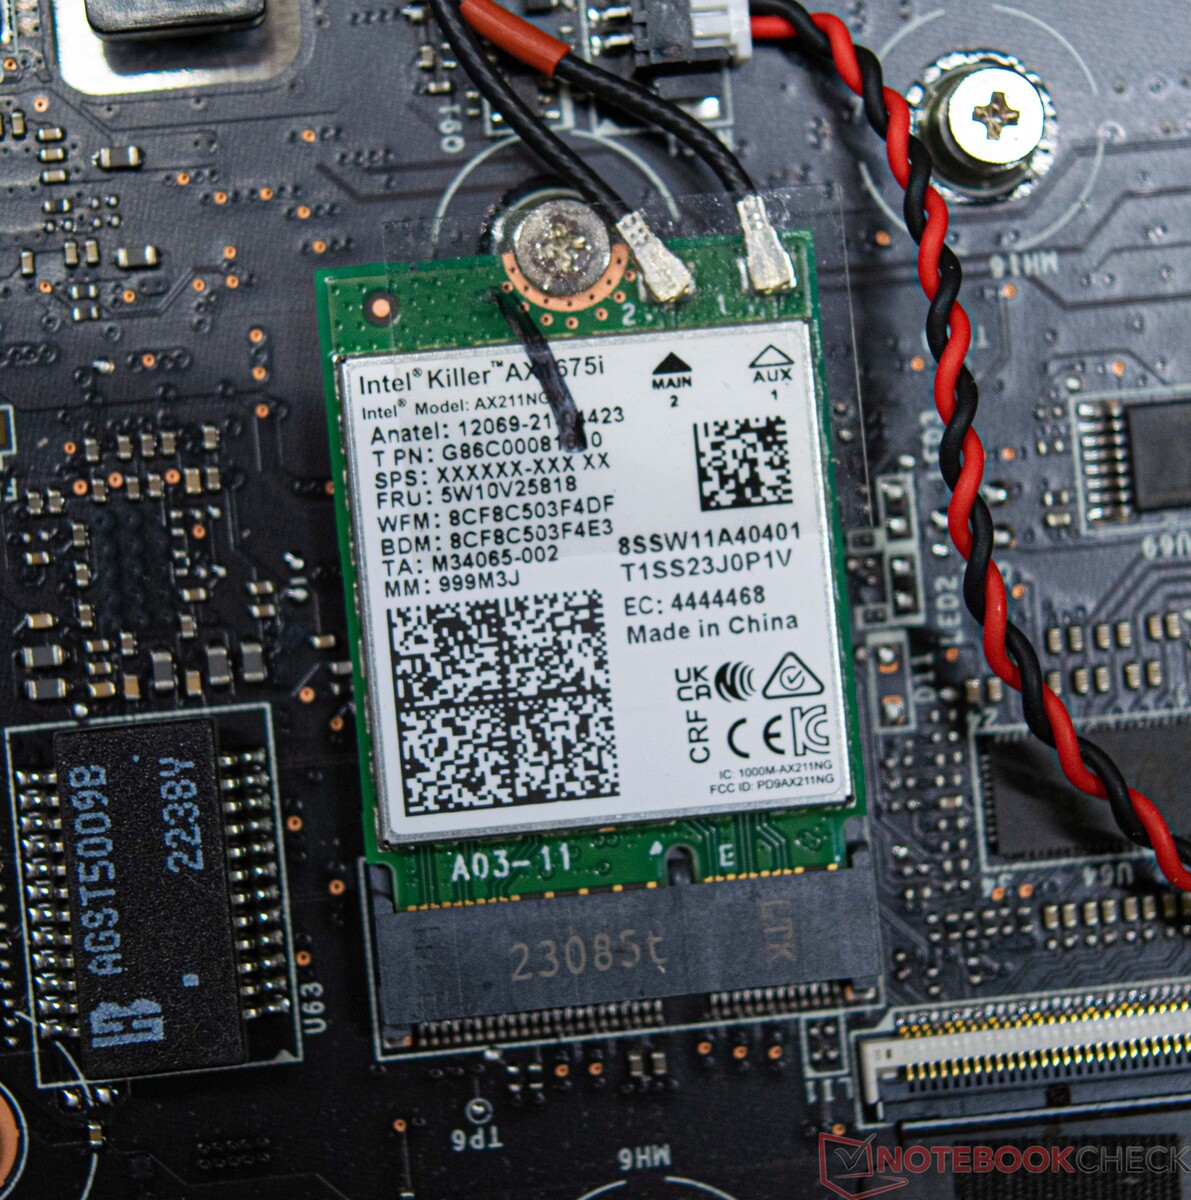
Essentially, the installed Wi-Fi module performs decently. Compared to its competitors, the MSI Stealth 16 Studio A13VG can't quite assert itself, although our review device has nothing to hide in terms of the performance it demonstrated here. For this, we used our Asus ROG Rapture GT-AXE11000 test router. Alternatively, the MSI Stealth 16 Studio A13VG also offers an ethernet port. Transfer speeds of up to 2.5 GBit/s are possible.
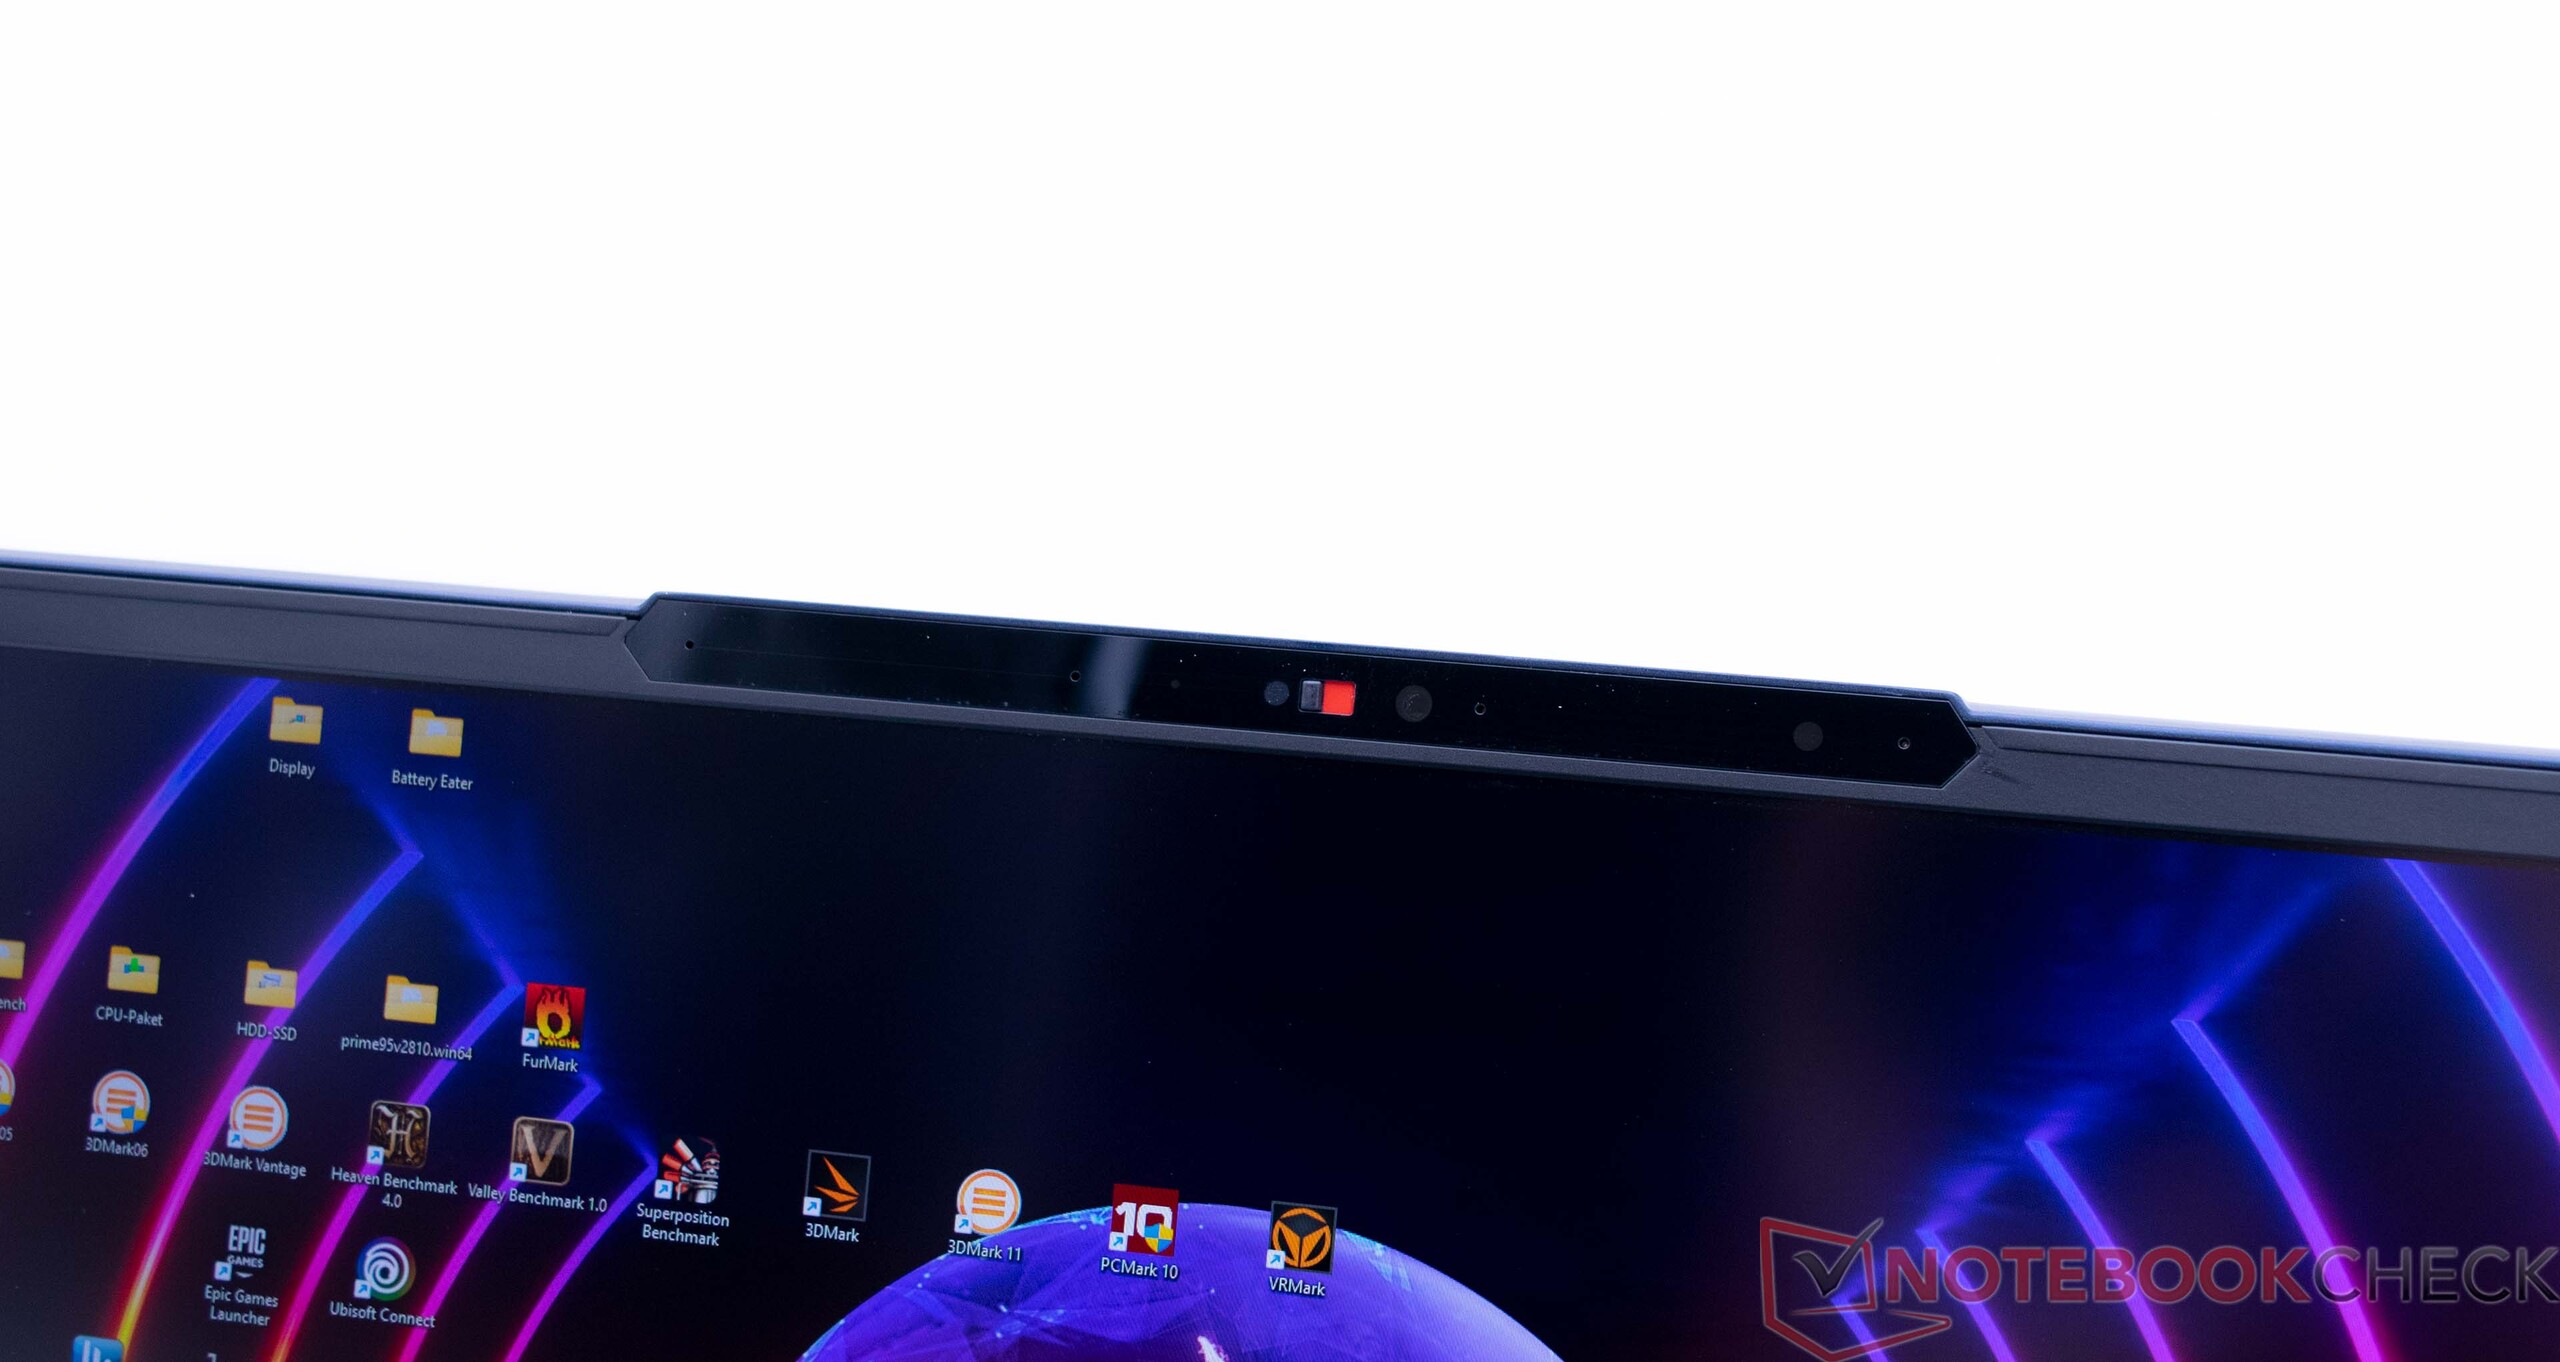
Webcam
The MSI Stealth 16 Studio A13VG comes with an FHD webcam which is suitable for straightforward video calls. A few points are deducted due to the low color accuracy.


Security
The MSI Stealth 16 Studio A13VG's integrated fingerprint sensor does a good job and ensures uncomplicated system authentication.
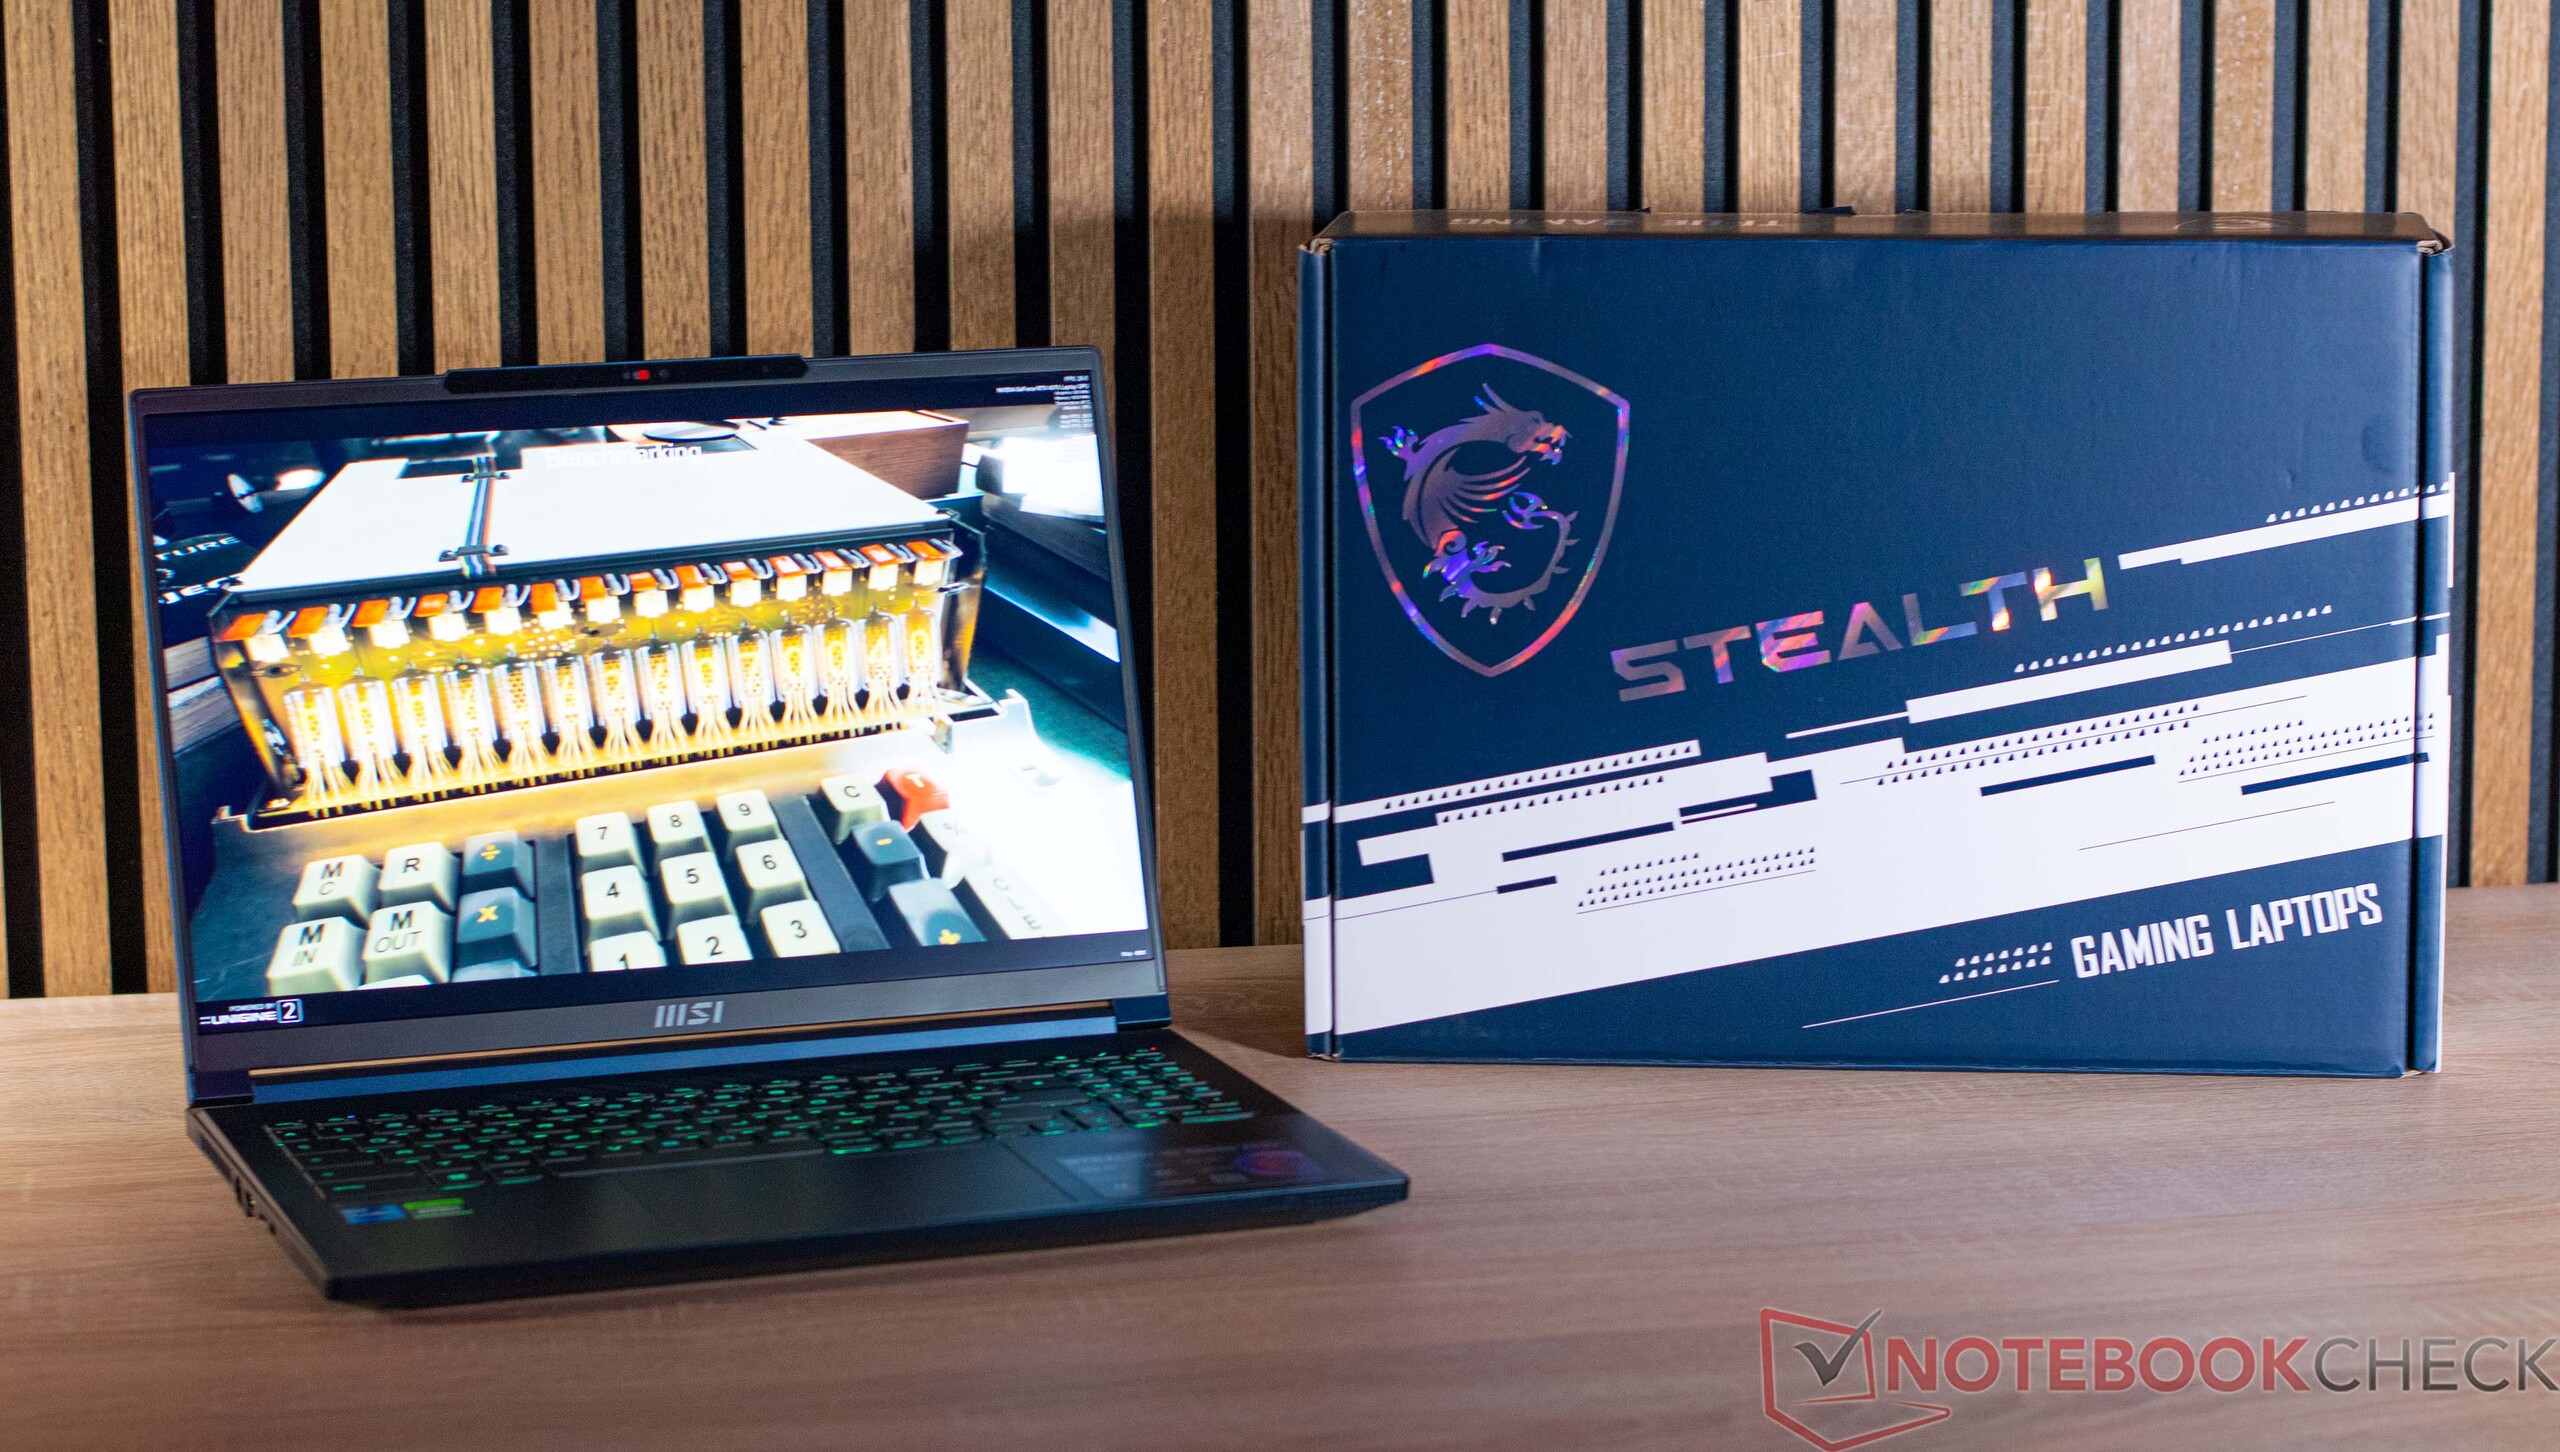
Accessories
Included in the box and in addition to the device itself, there is also a 240-watt PSU as well as the obligatory paperwork.
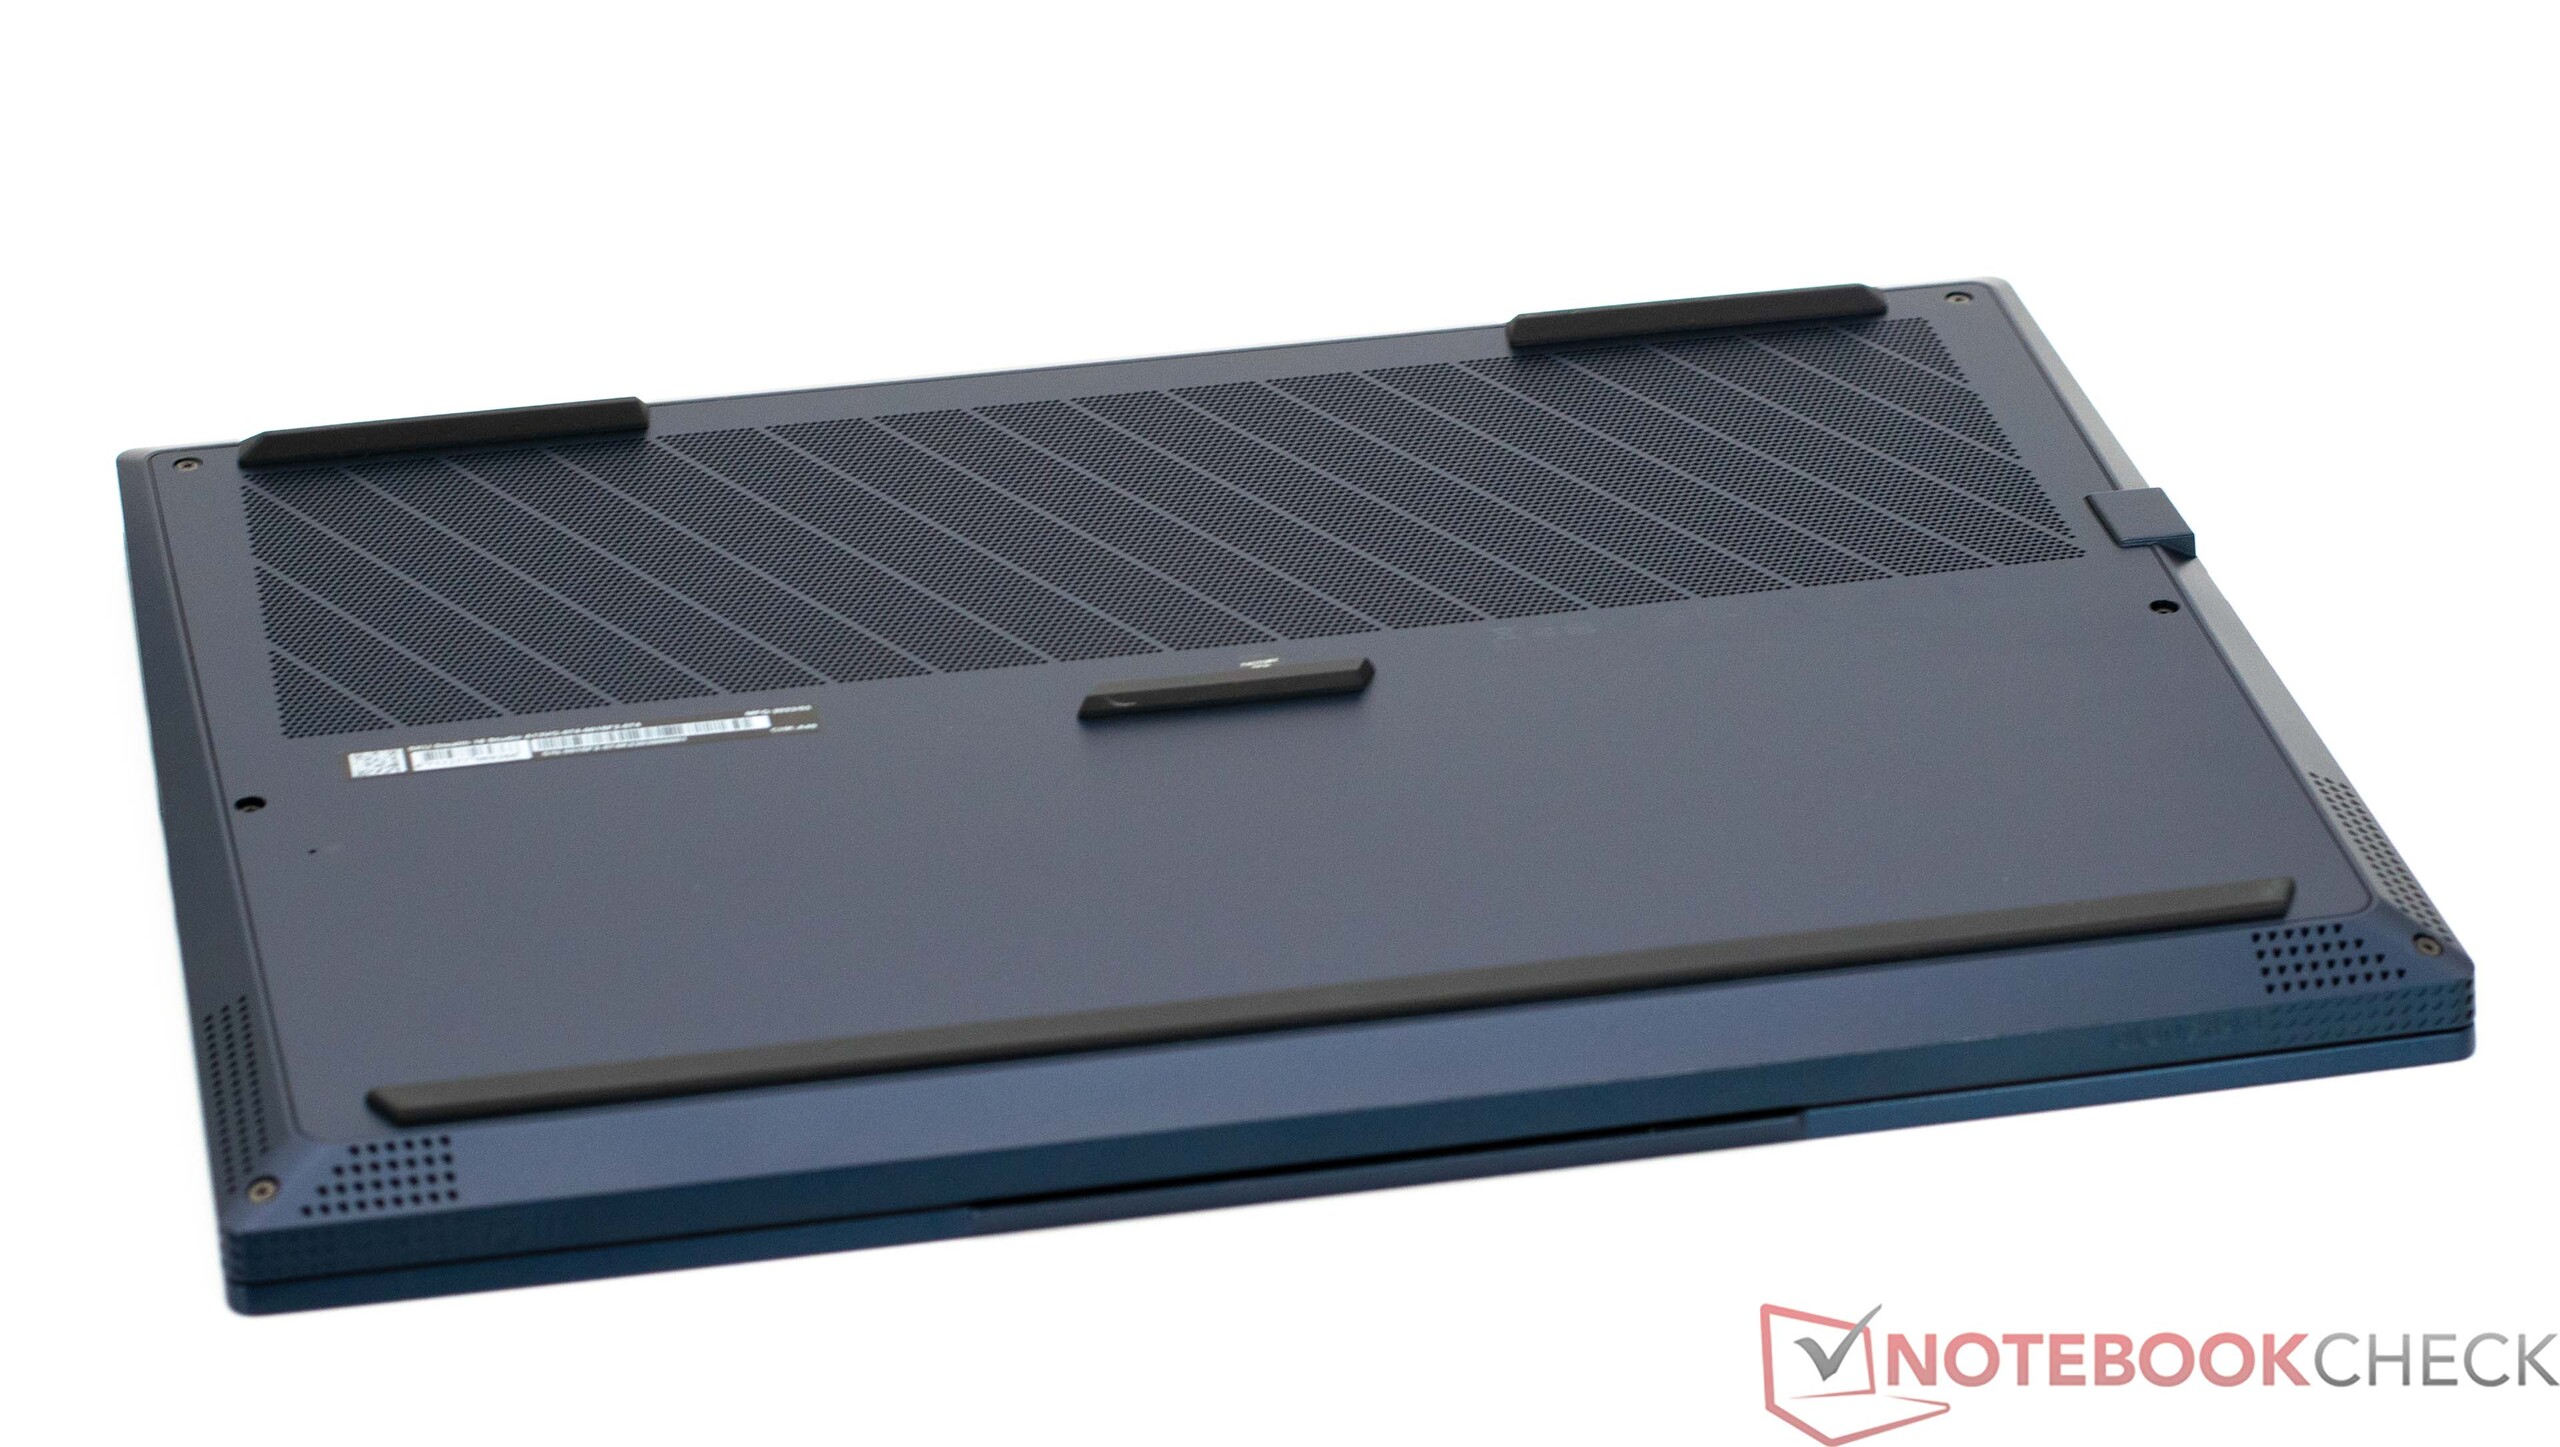
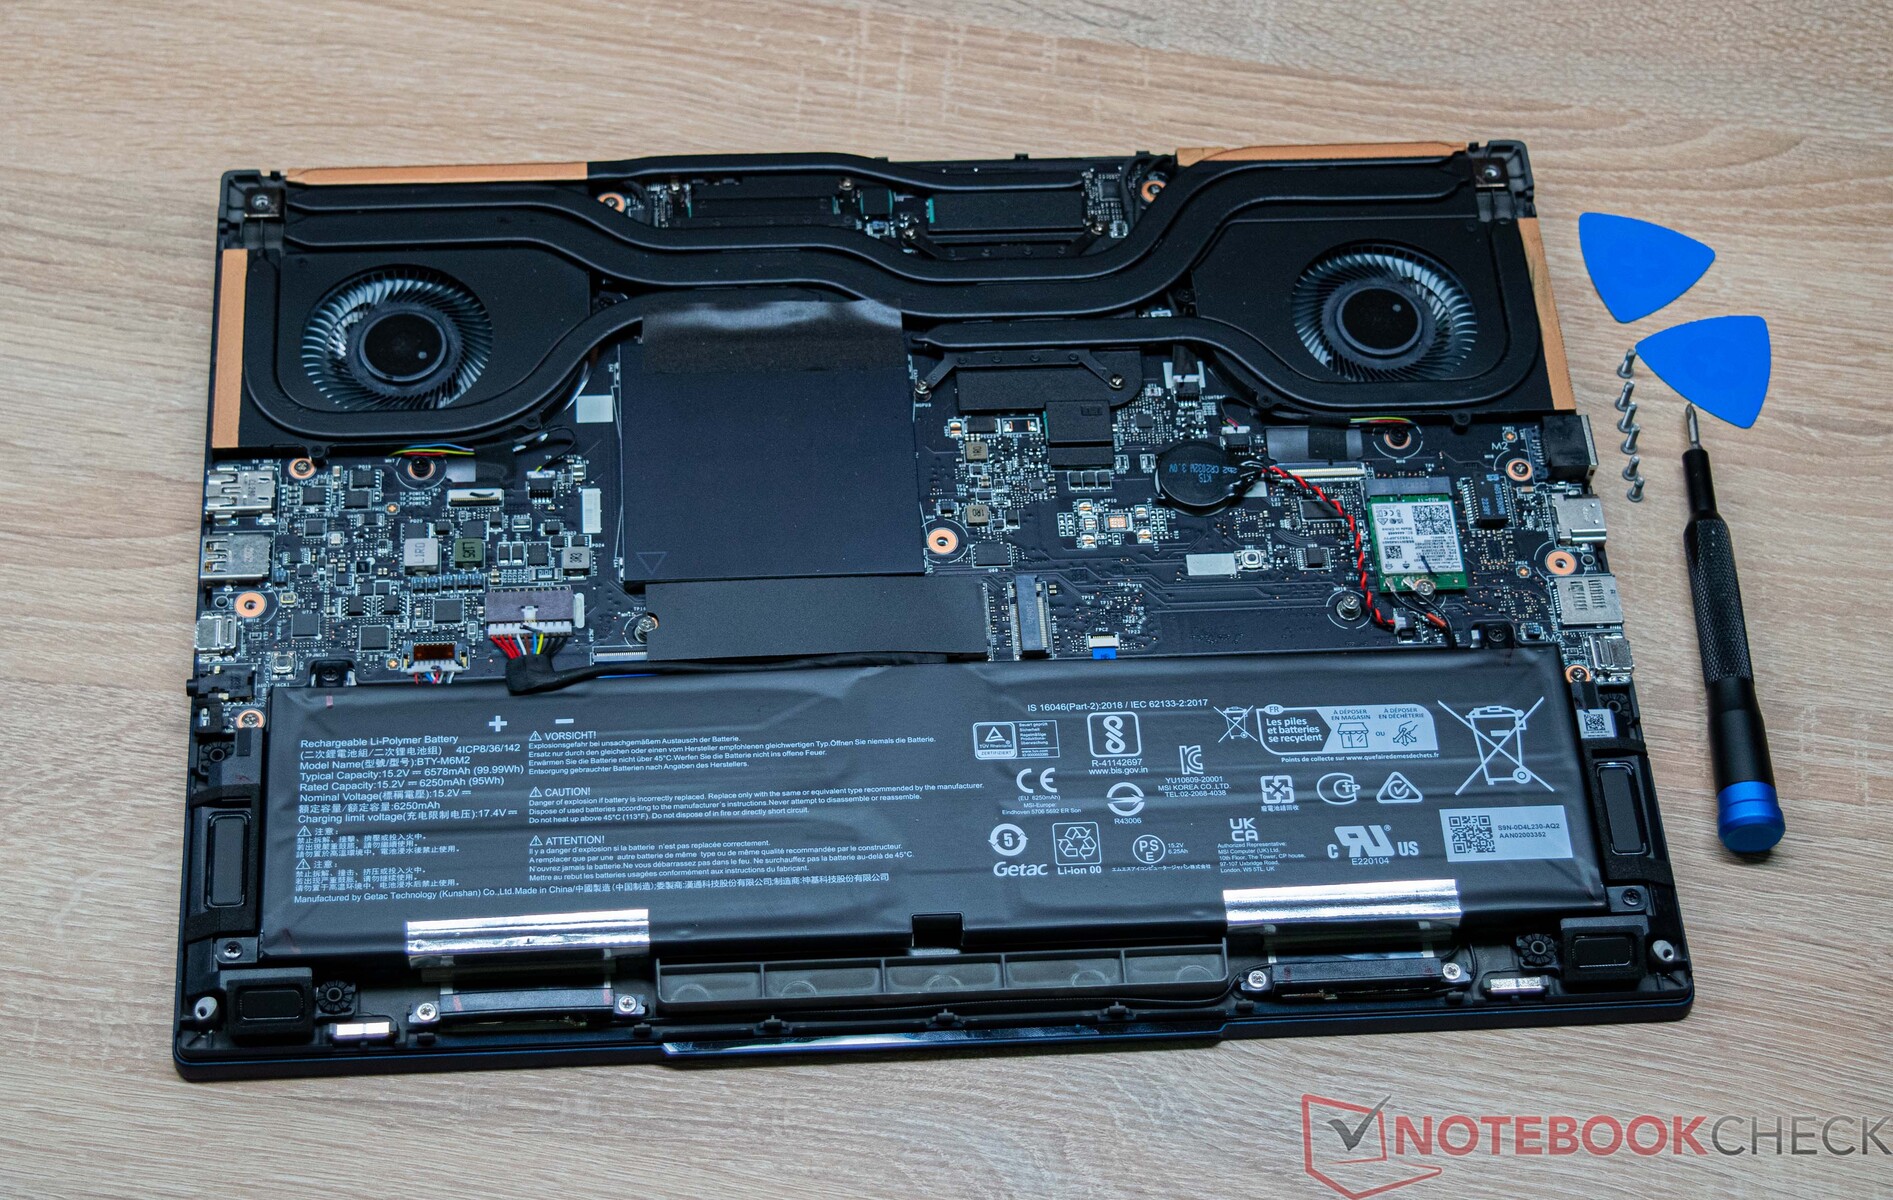
Maintenance
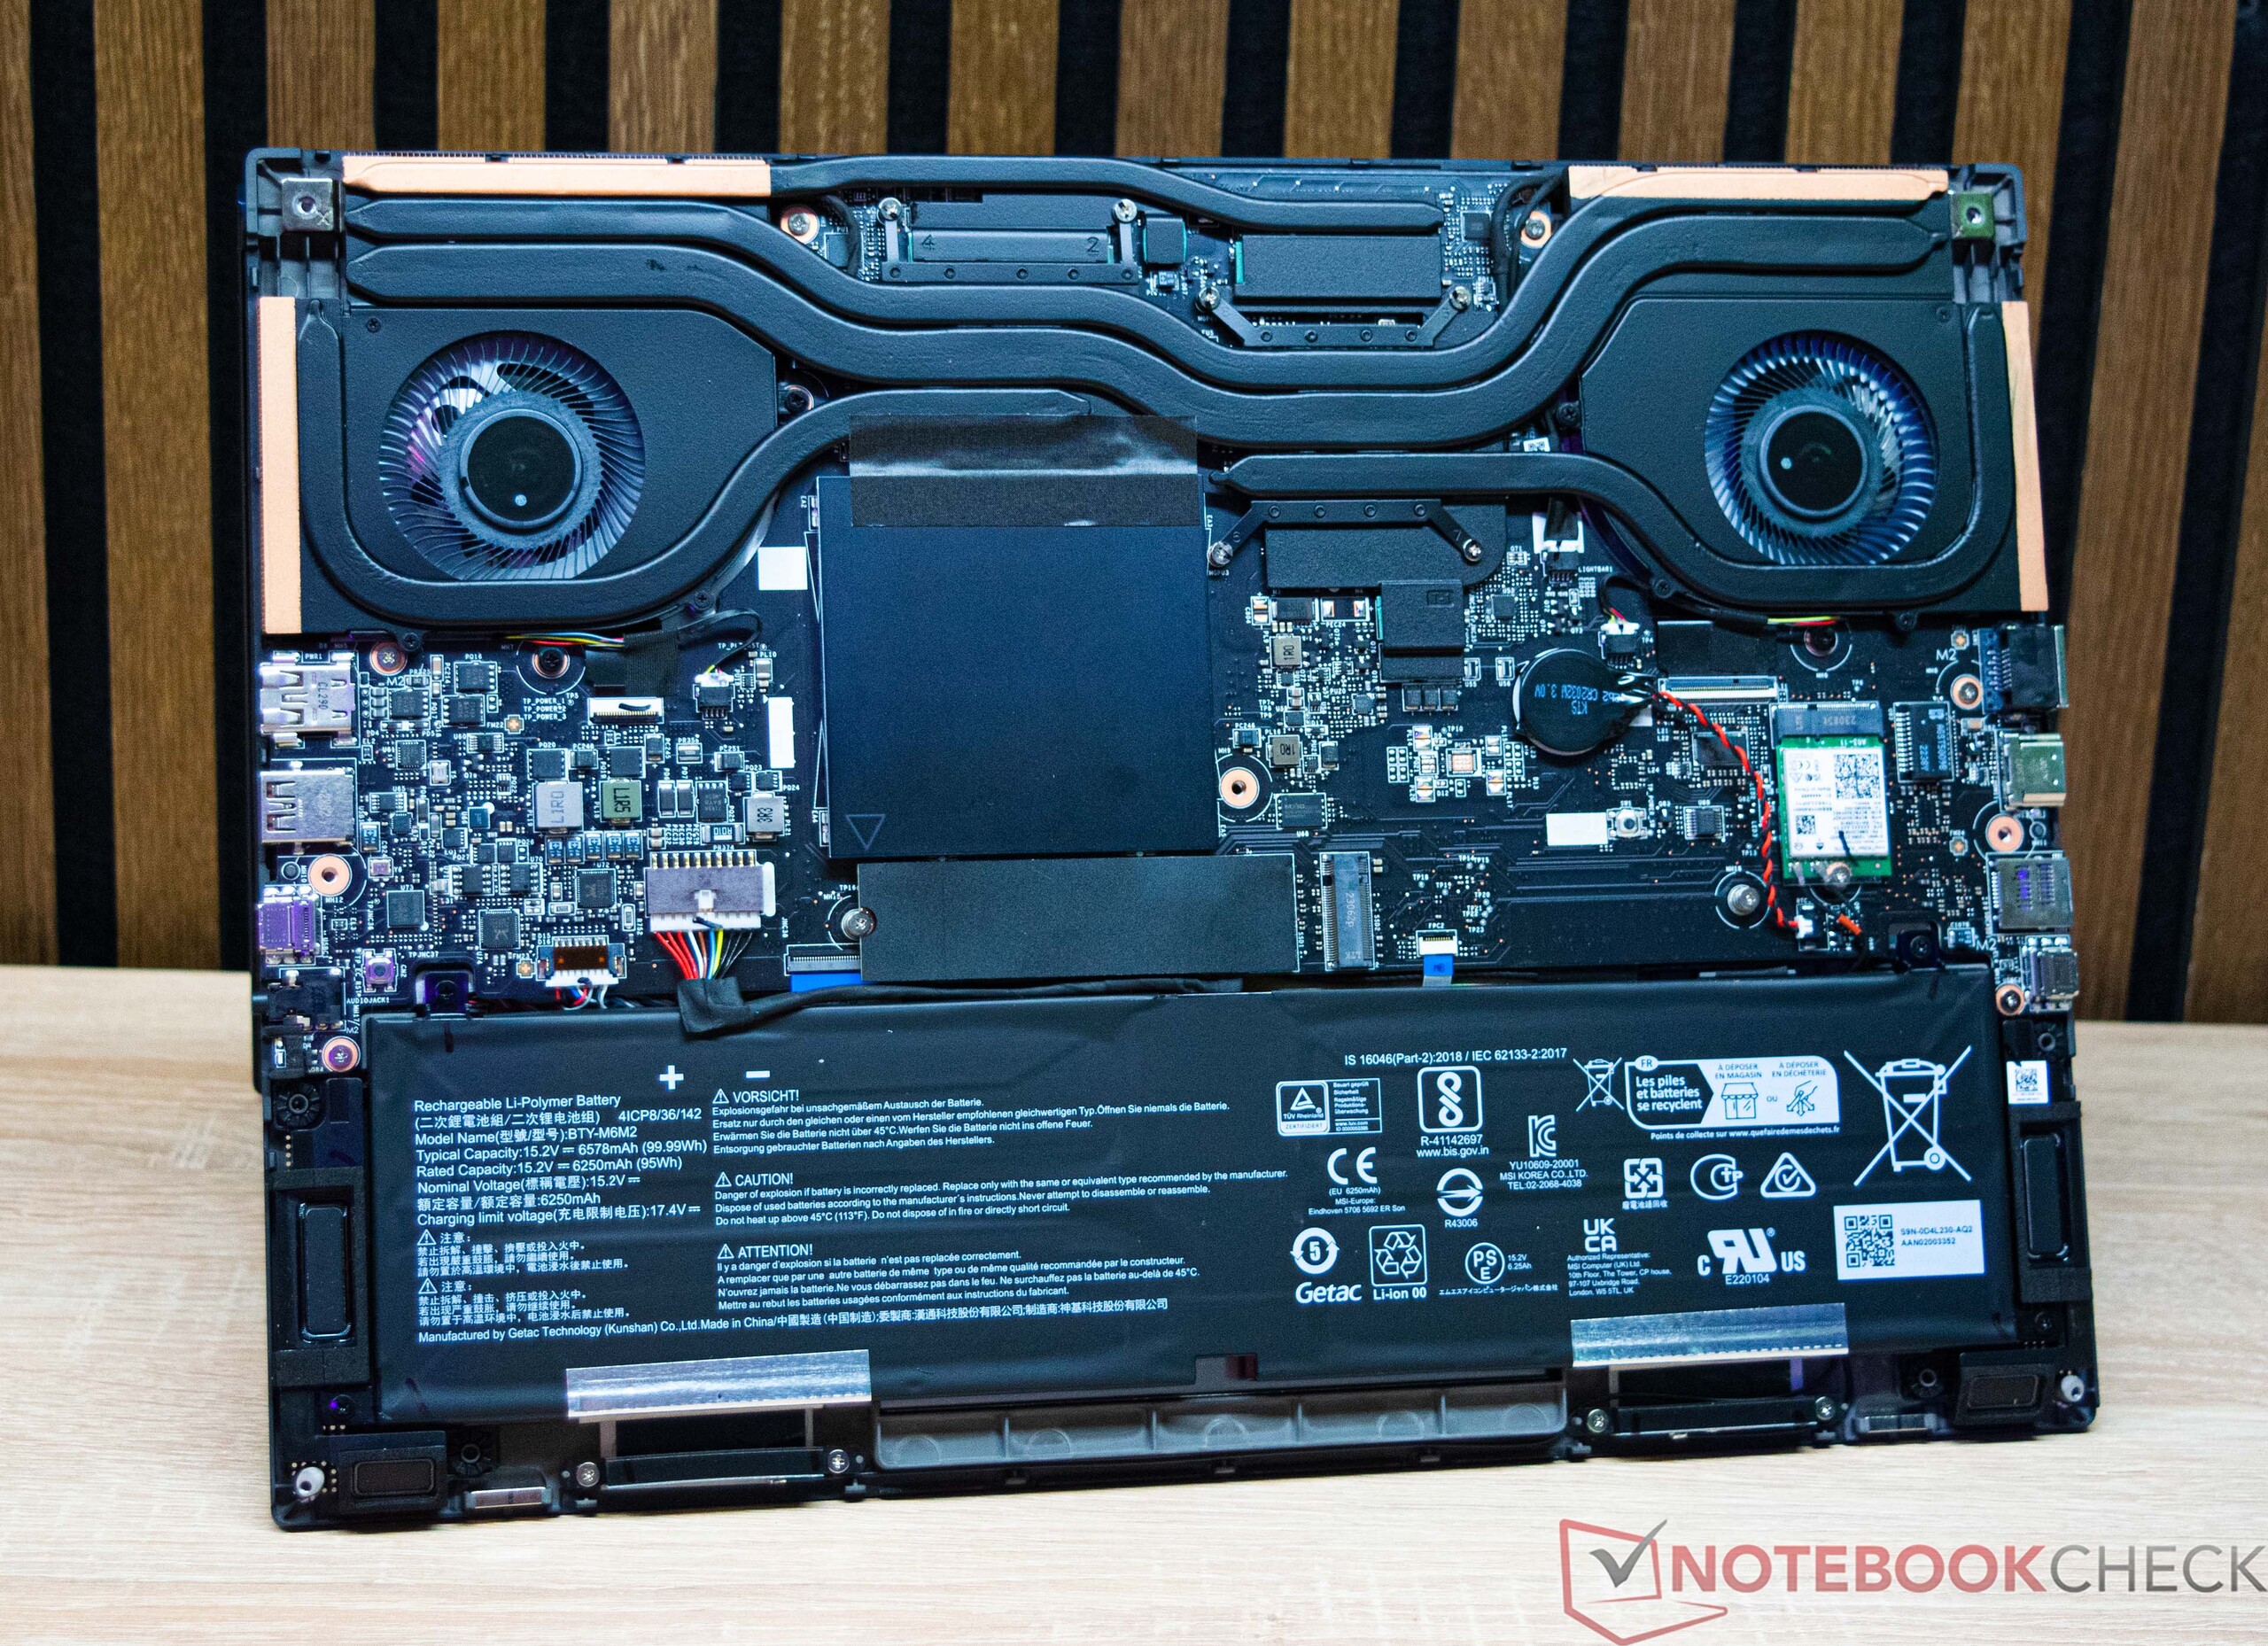
It is possible to undertake maintenance work on the MSI Stealth 16 Studio A13VG. However, in order to do this, the base plate, which is secured by a number of screws, has to be disassembled. After removing the screws, the base plate remains securely attached to the base. However, with the proper tools, we were able to remove the base plate. Nevertheless, caution is advised in order to avoid damage. In principle, components such as the RAM or mass storage device can be swapped or expanded as an additional M.2 2280 slot is available. Likewise, the Wi-Fi is not fixed and can also be swapped or replaced.
Warranty
The MSI Stealth 16 Studio A13VG comes with a 24-month warranty which includes Pickup & Return service.
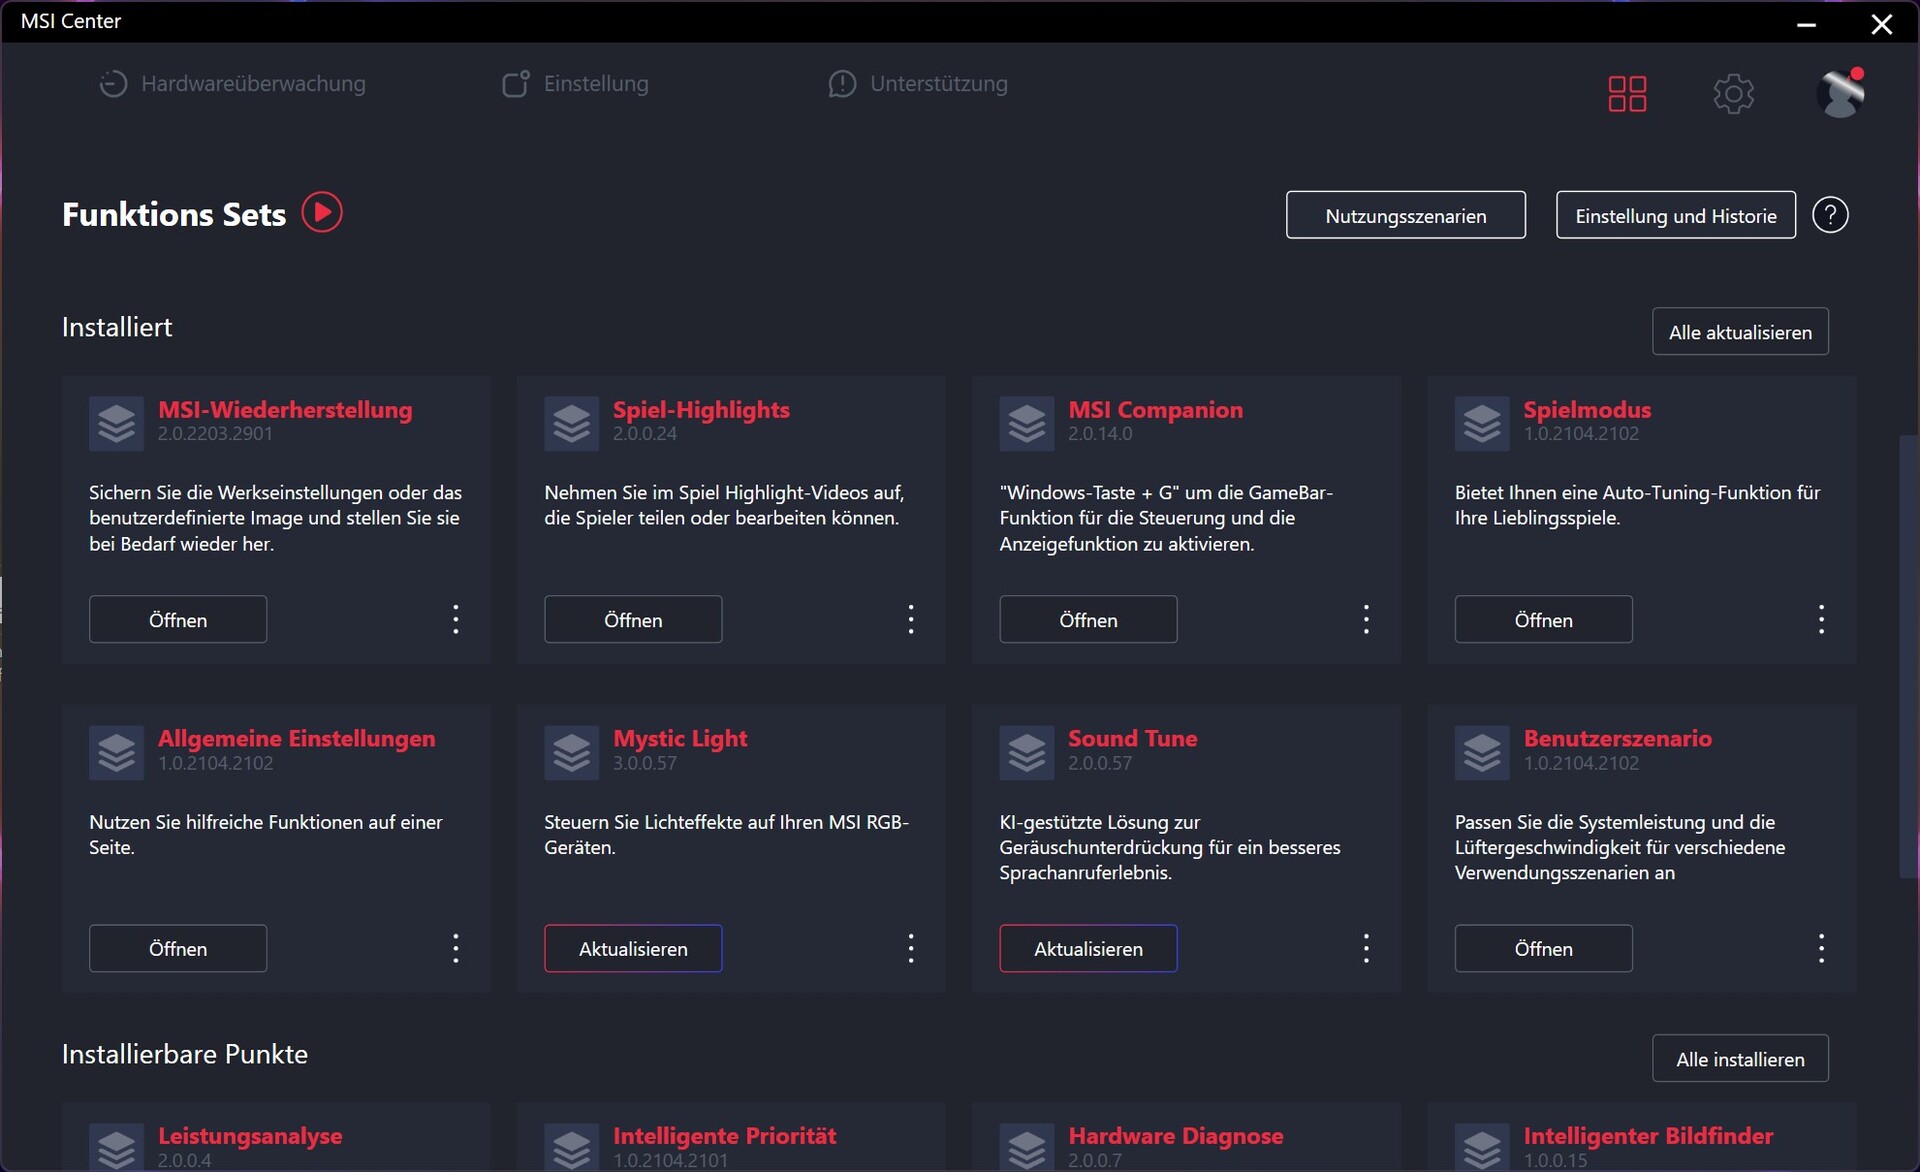
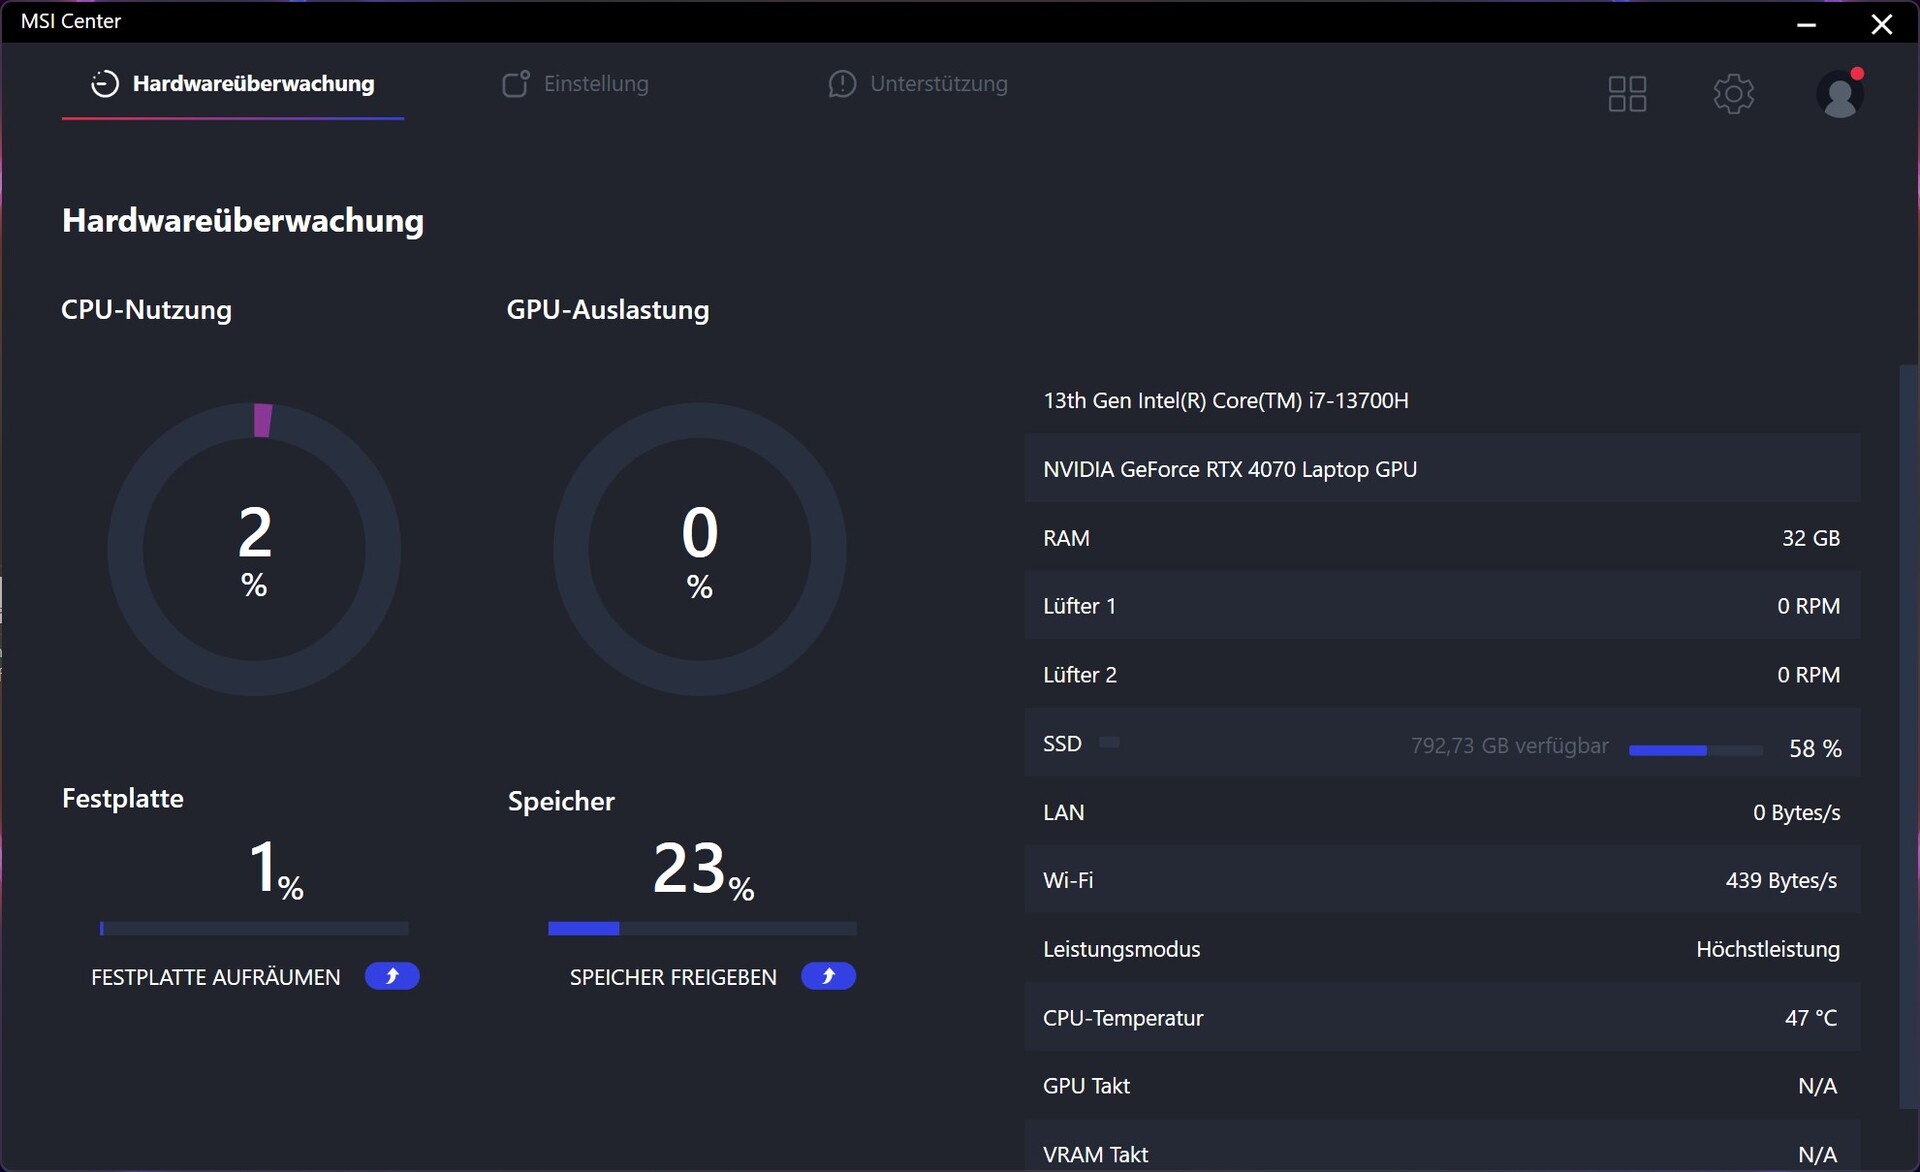
Software - MSI Center is your main office
With MSI Center, the manufacturer has a suitable tool for controlling and monitoring the MSI Stealth 16 Studio A13VG. In tests, we encountered no problems using MSI Center. Using this allows the user to regulate the laptop's performance which, amongst other things, greatly influences the amount of background noise. There are also clear differences, also from a performance point of view, due to the varying power limits in the assorted modes.
Input devices - familiar design and pleasant in everyday use
Keyboard
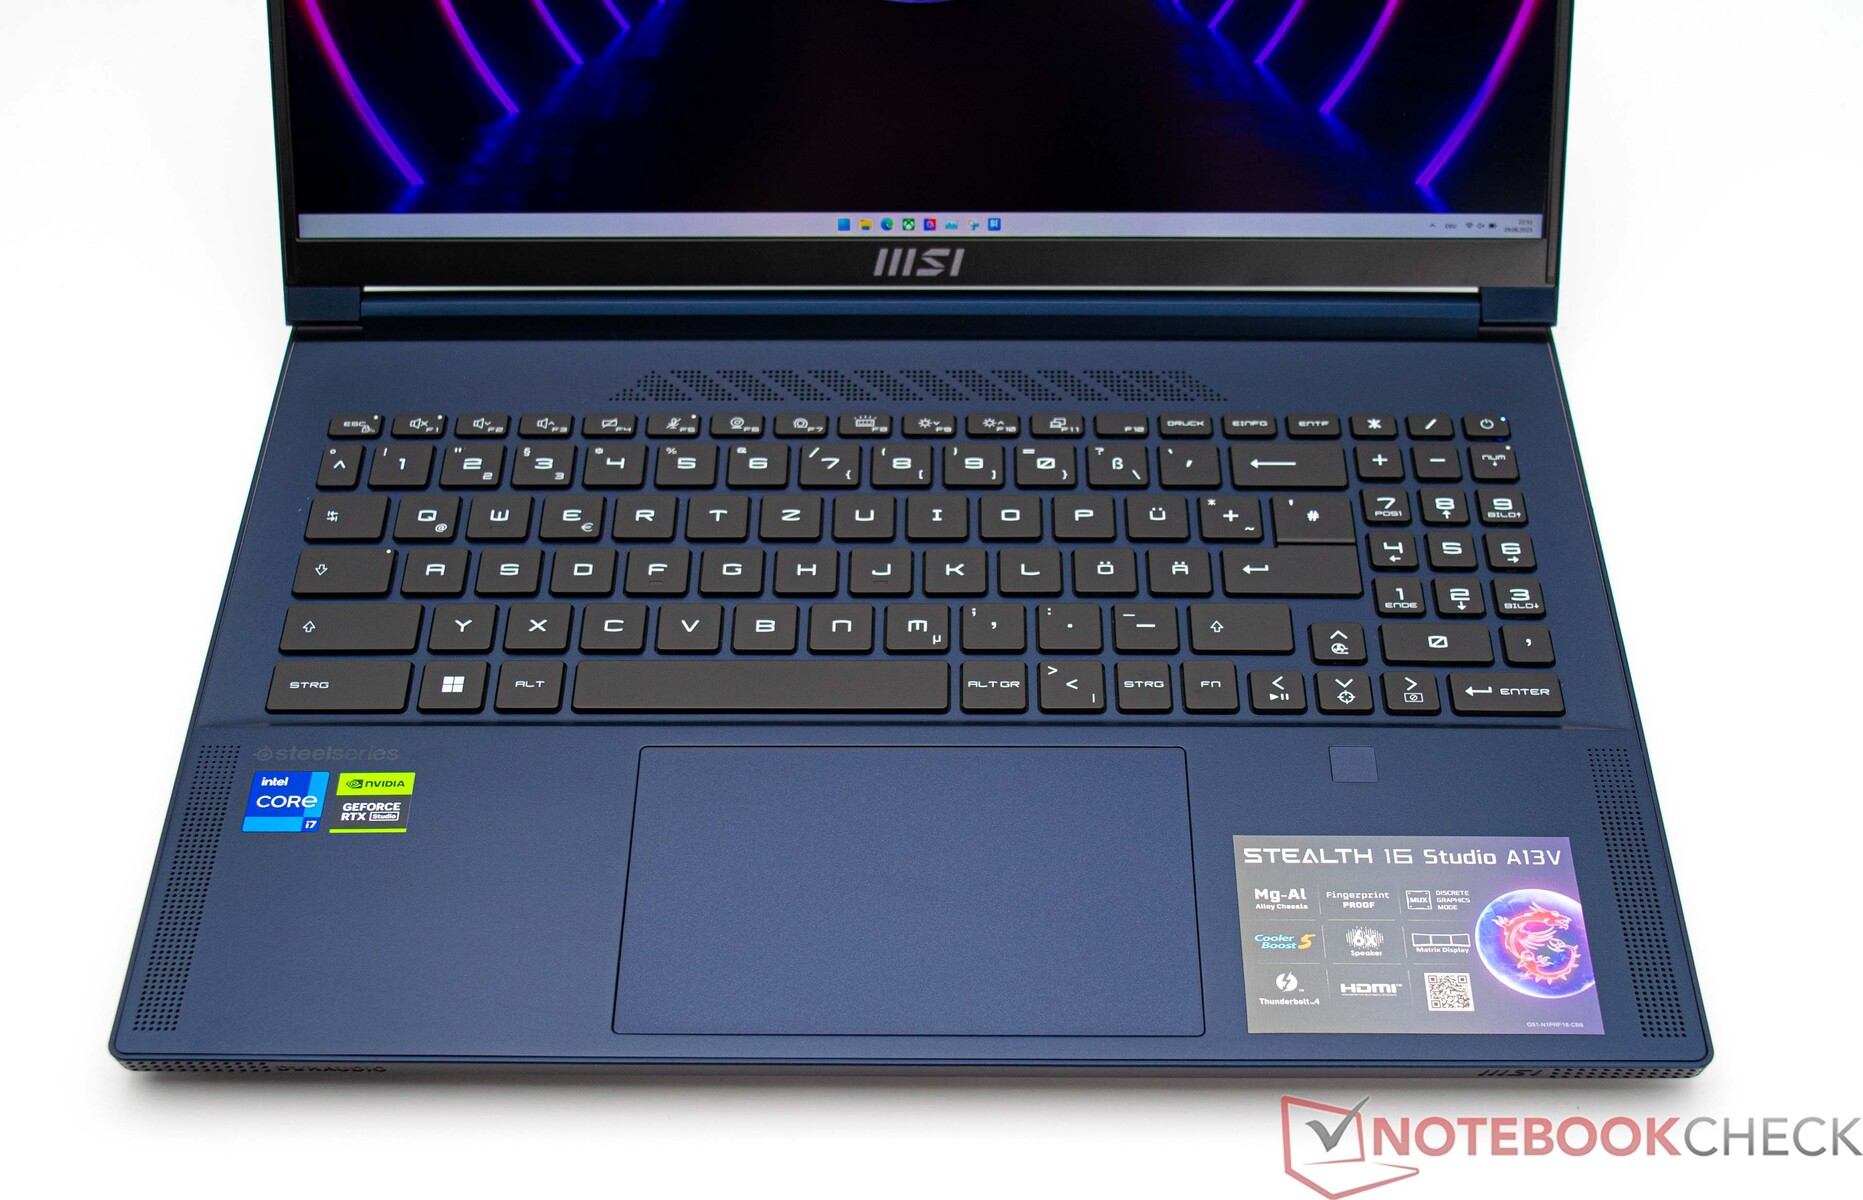
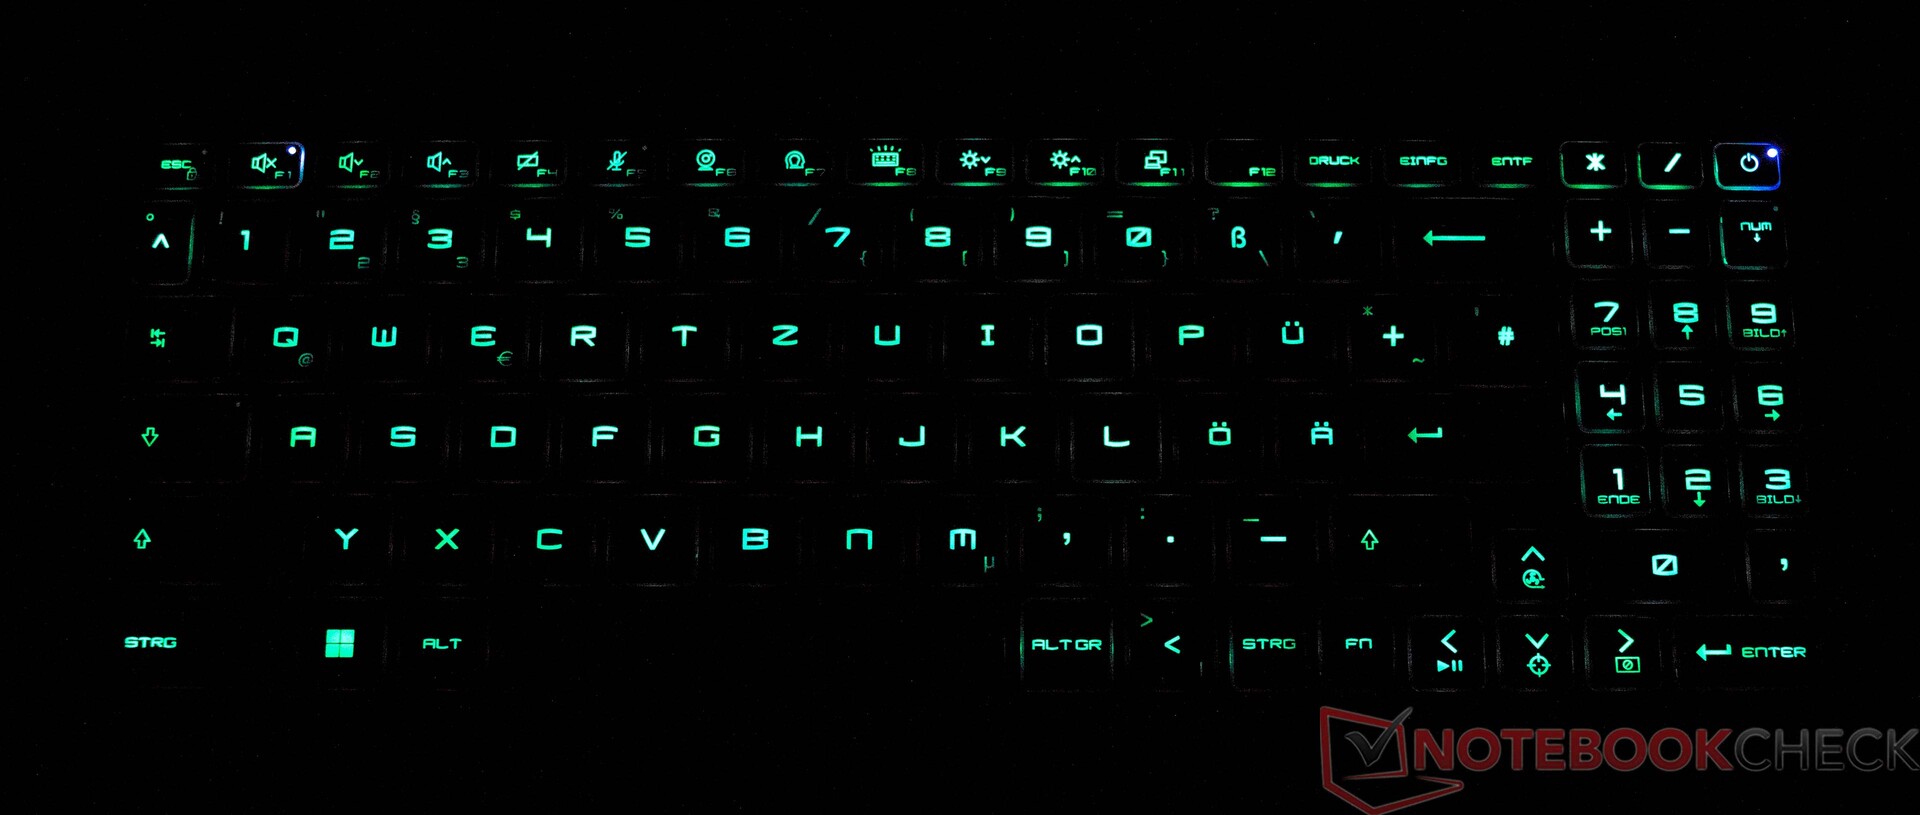
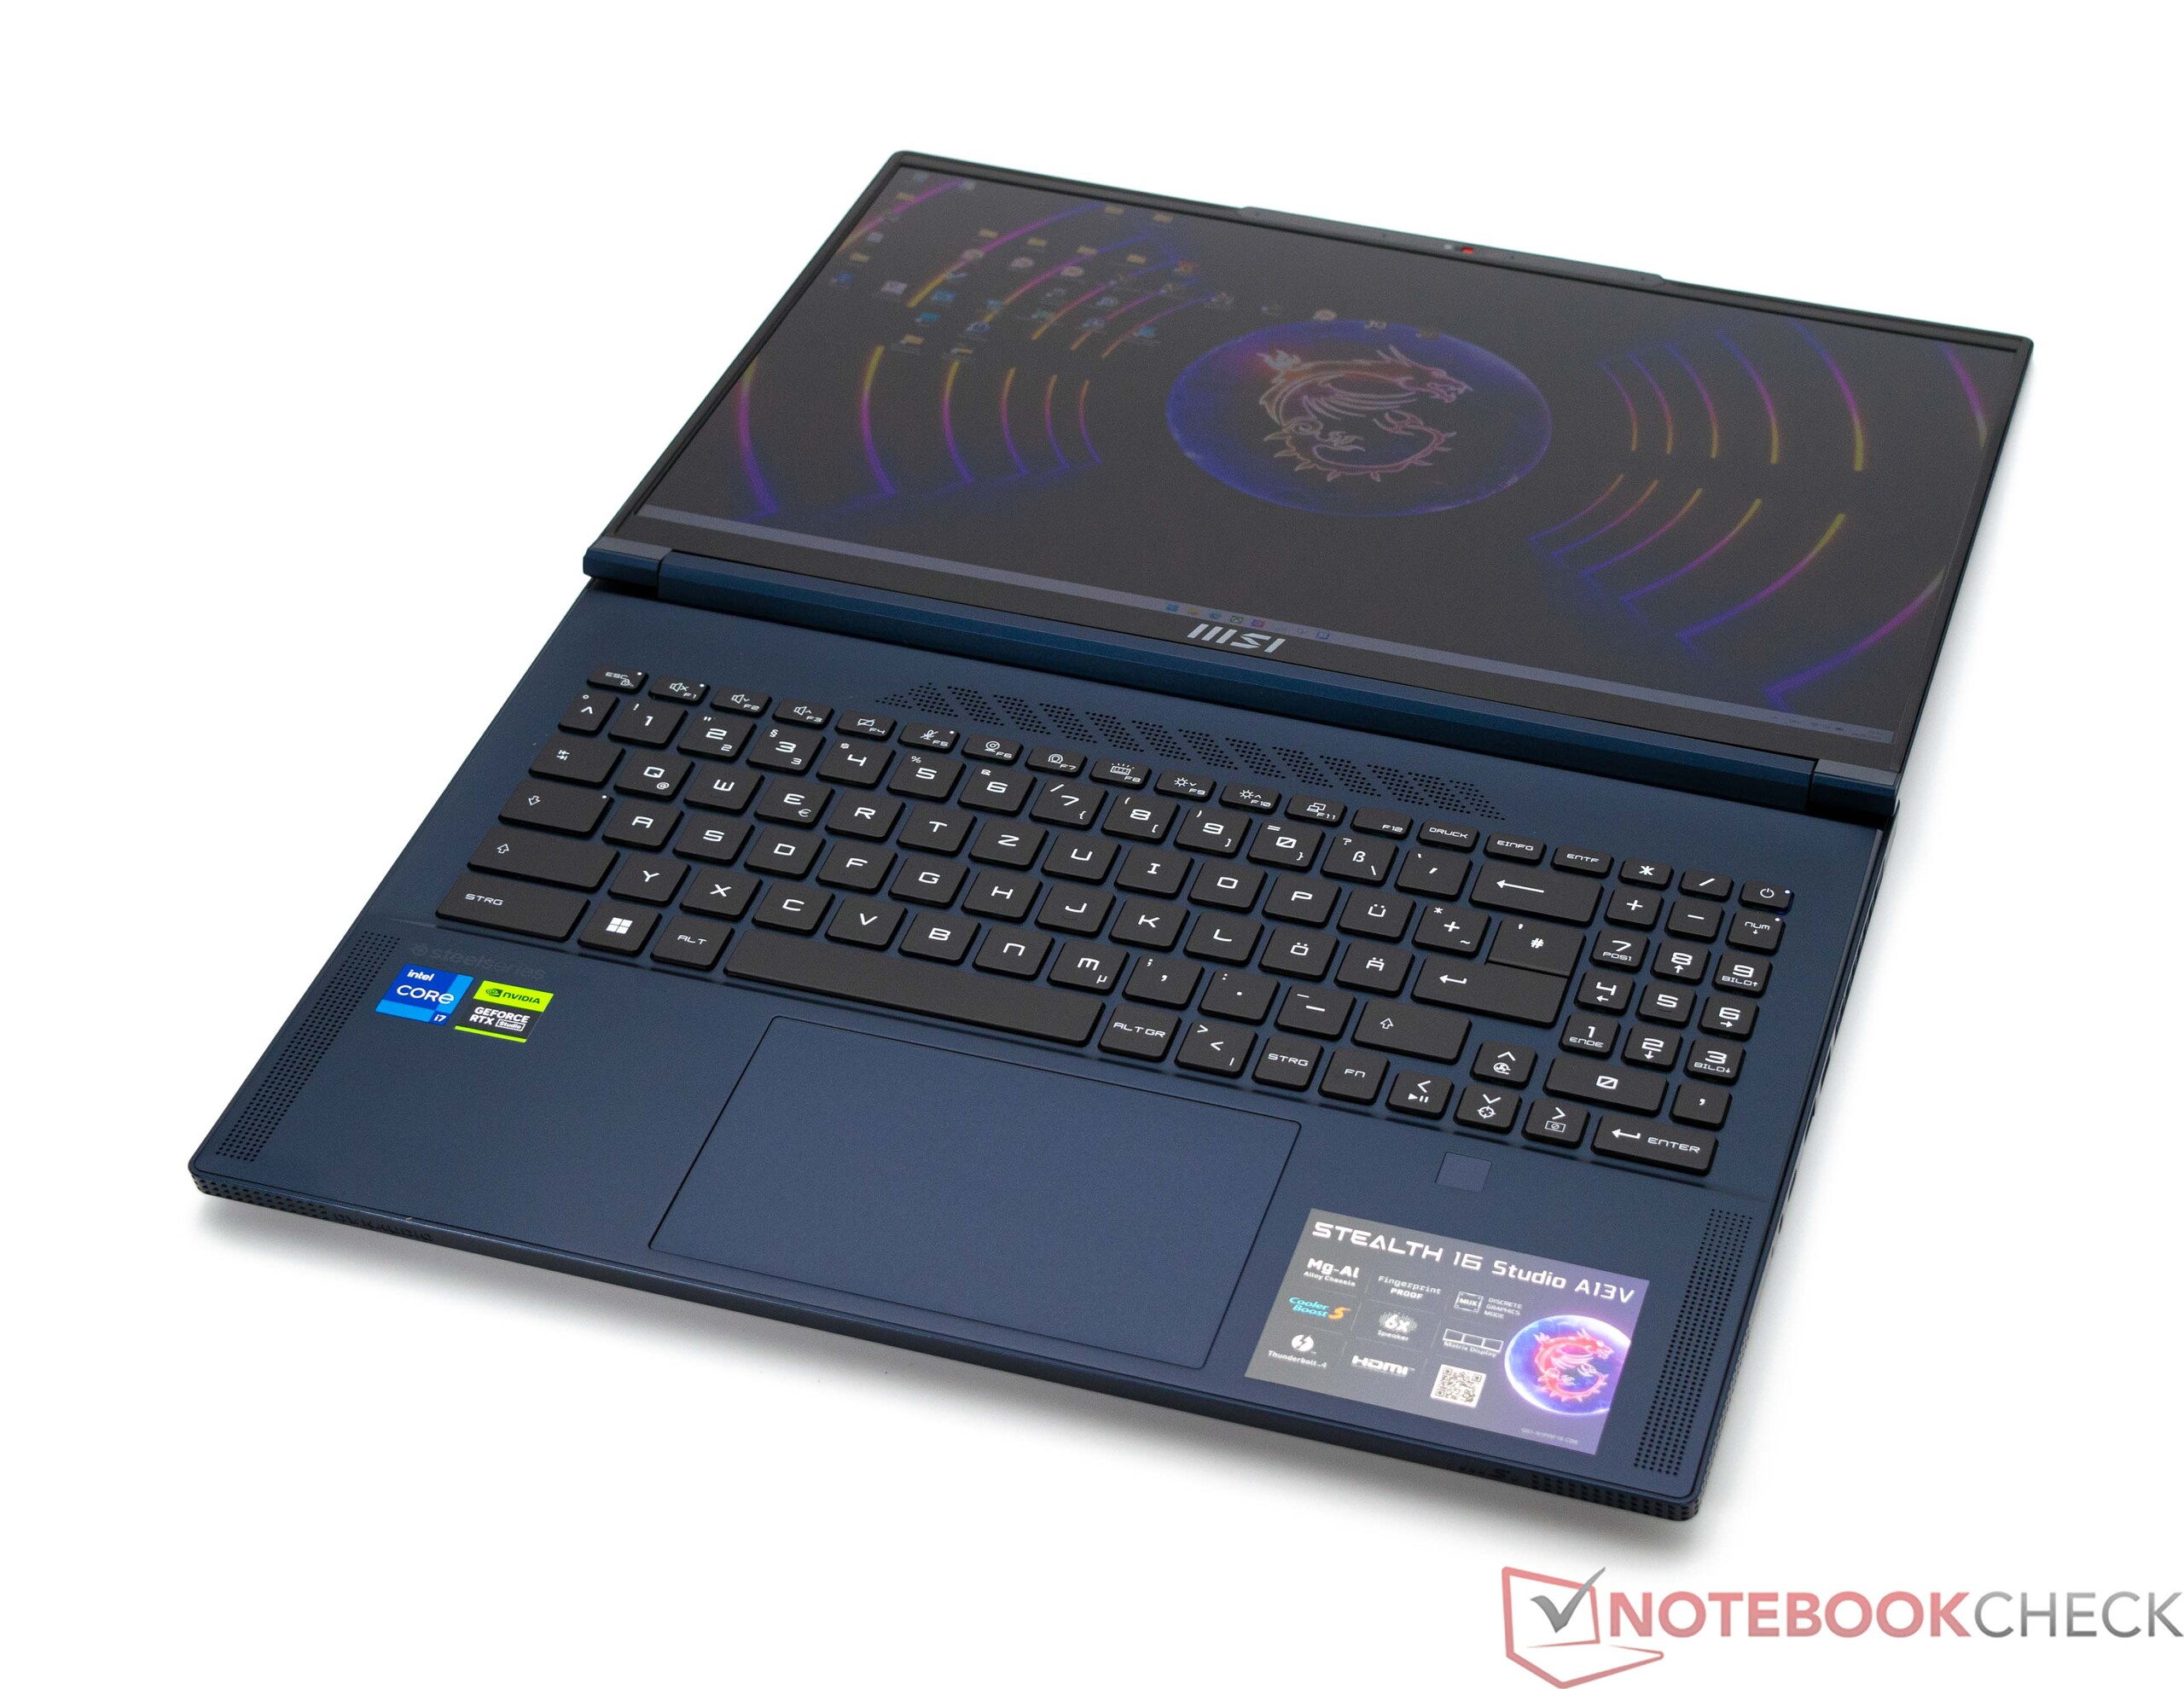
In cooperation with SteelSeries, the MSI Stealth 16 Studio A13VG has been fitted with a 6-line chiclet keyboard including a numerical keypad. The lettering is typical for MSI although the smooth keys provide a significantly muted strike. The key travel is very short and the pressure point is clearly defined. Therefore, you shouldn't expect to receive angry looks when typing quickly in the office since the background noise is very subdued. The backlighting can be changed to one of three different brightness levels by employing a key combination. What is noticeable is that MSI has decided against putting the Fn key on the left-hand side. However, using MSI Center, a workaround is possible by swapping the assignment of the Windows key with the Fn key on the right-hand side. Doing this allows the user to choose their own optimum setting.
Touchpad
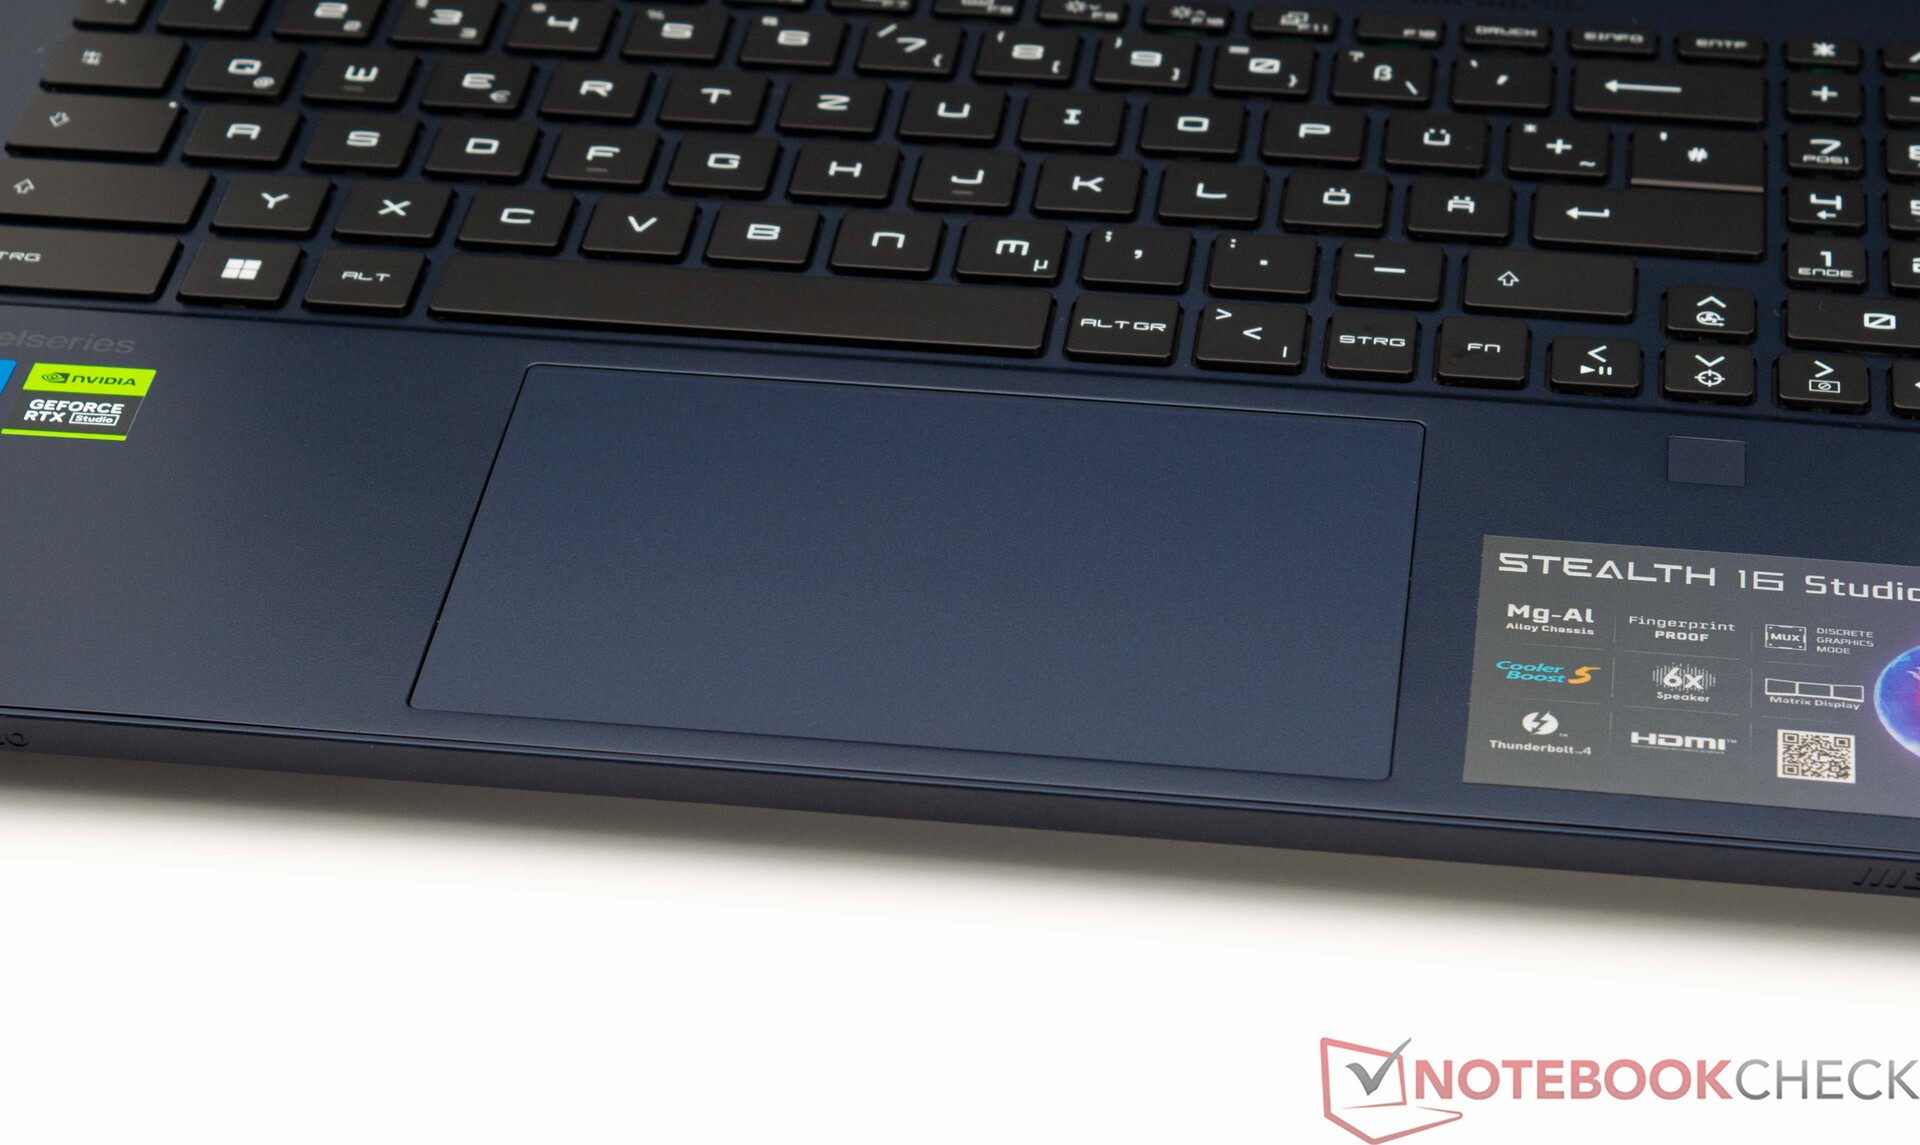
A mouse alternative can be found in the form of a multi-touch capable touchpad. At 13.1 x 8.2 cm, it is a wonderful size. Design-wise, the touchpad matches the base's top surface perfectly. This surface has a noticeably smoother feel than the palm rest. This results in optimum gliding properties. The touchpad is responsive and very precise, even toward the edges. The pad offers short travel for inputs and helps provide the user with a clear pressure point and crisp feedback.
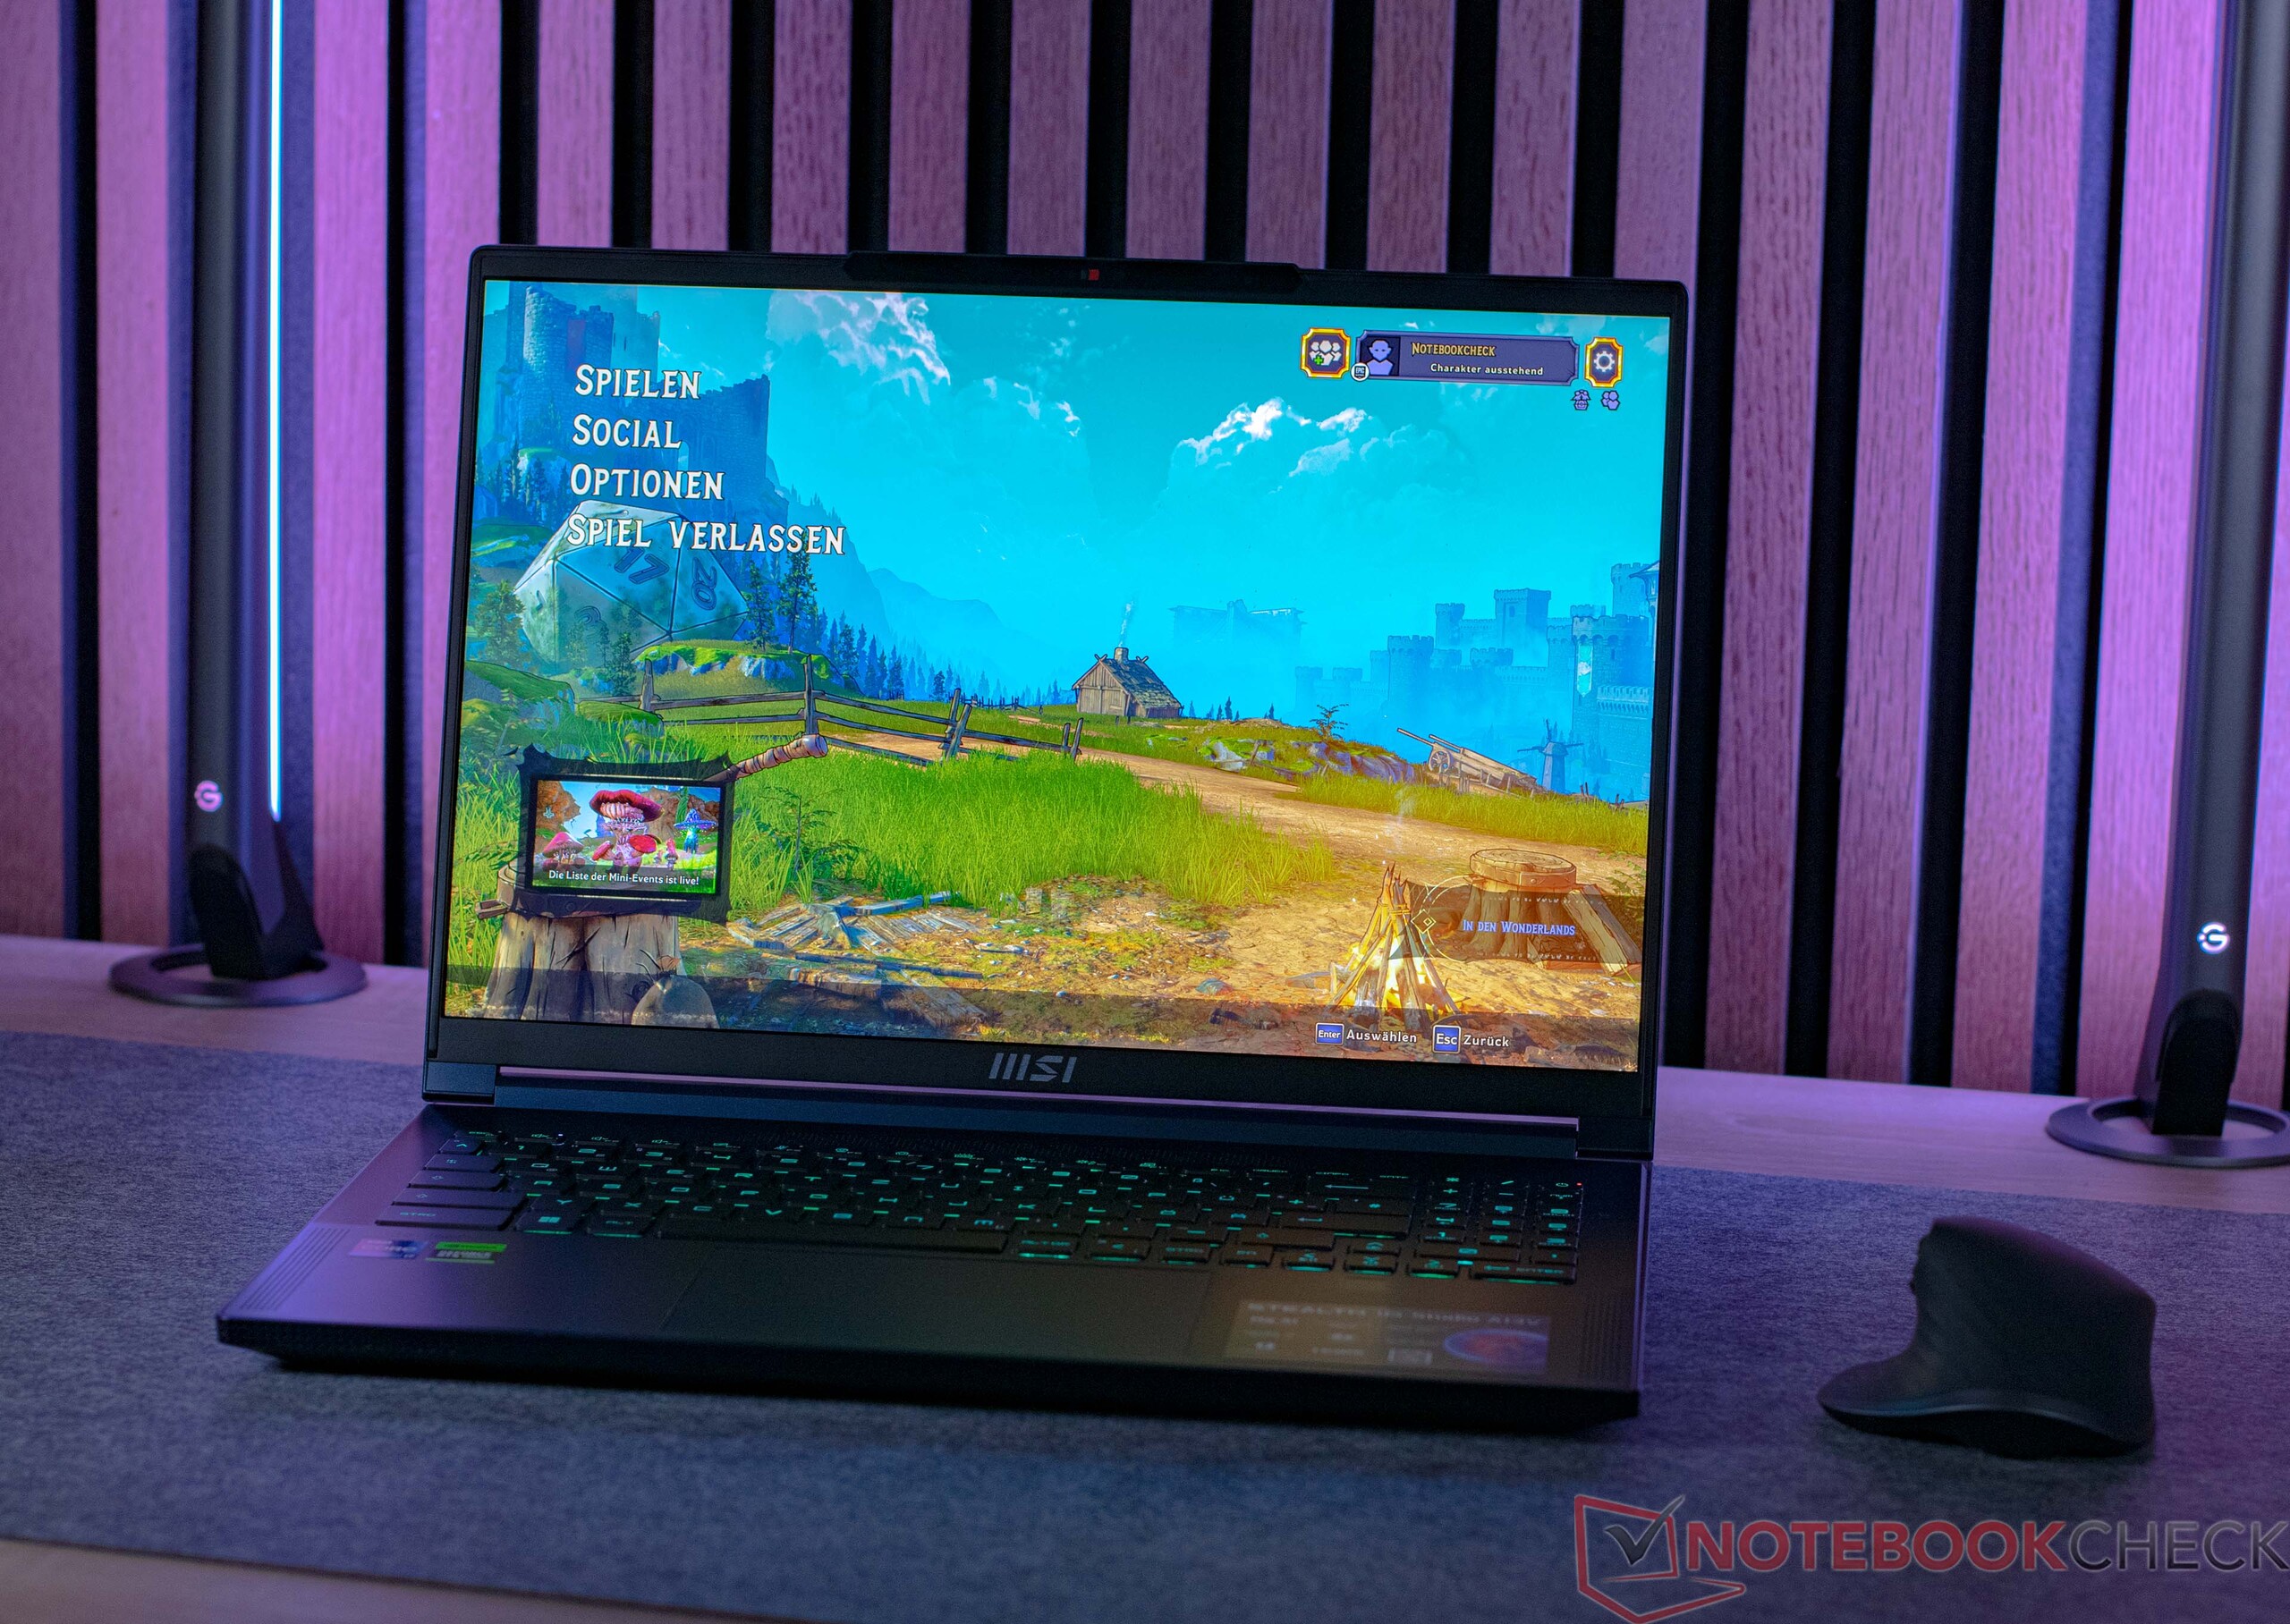
Display - 240 Hz in a user-friendly, 16:10 aspect ratio

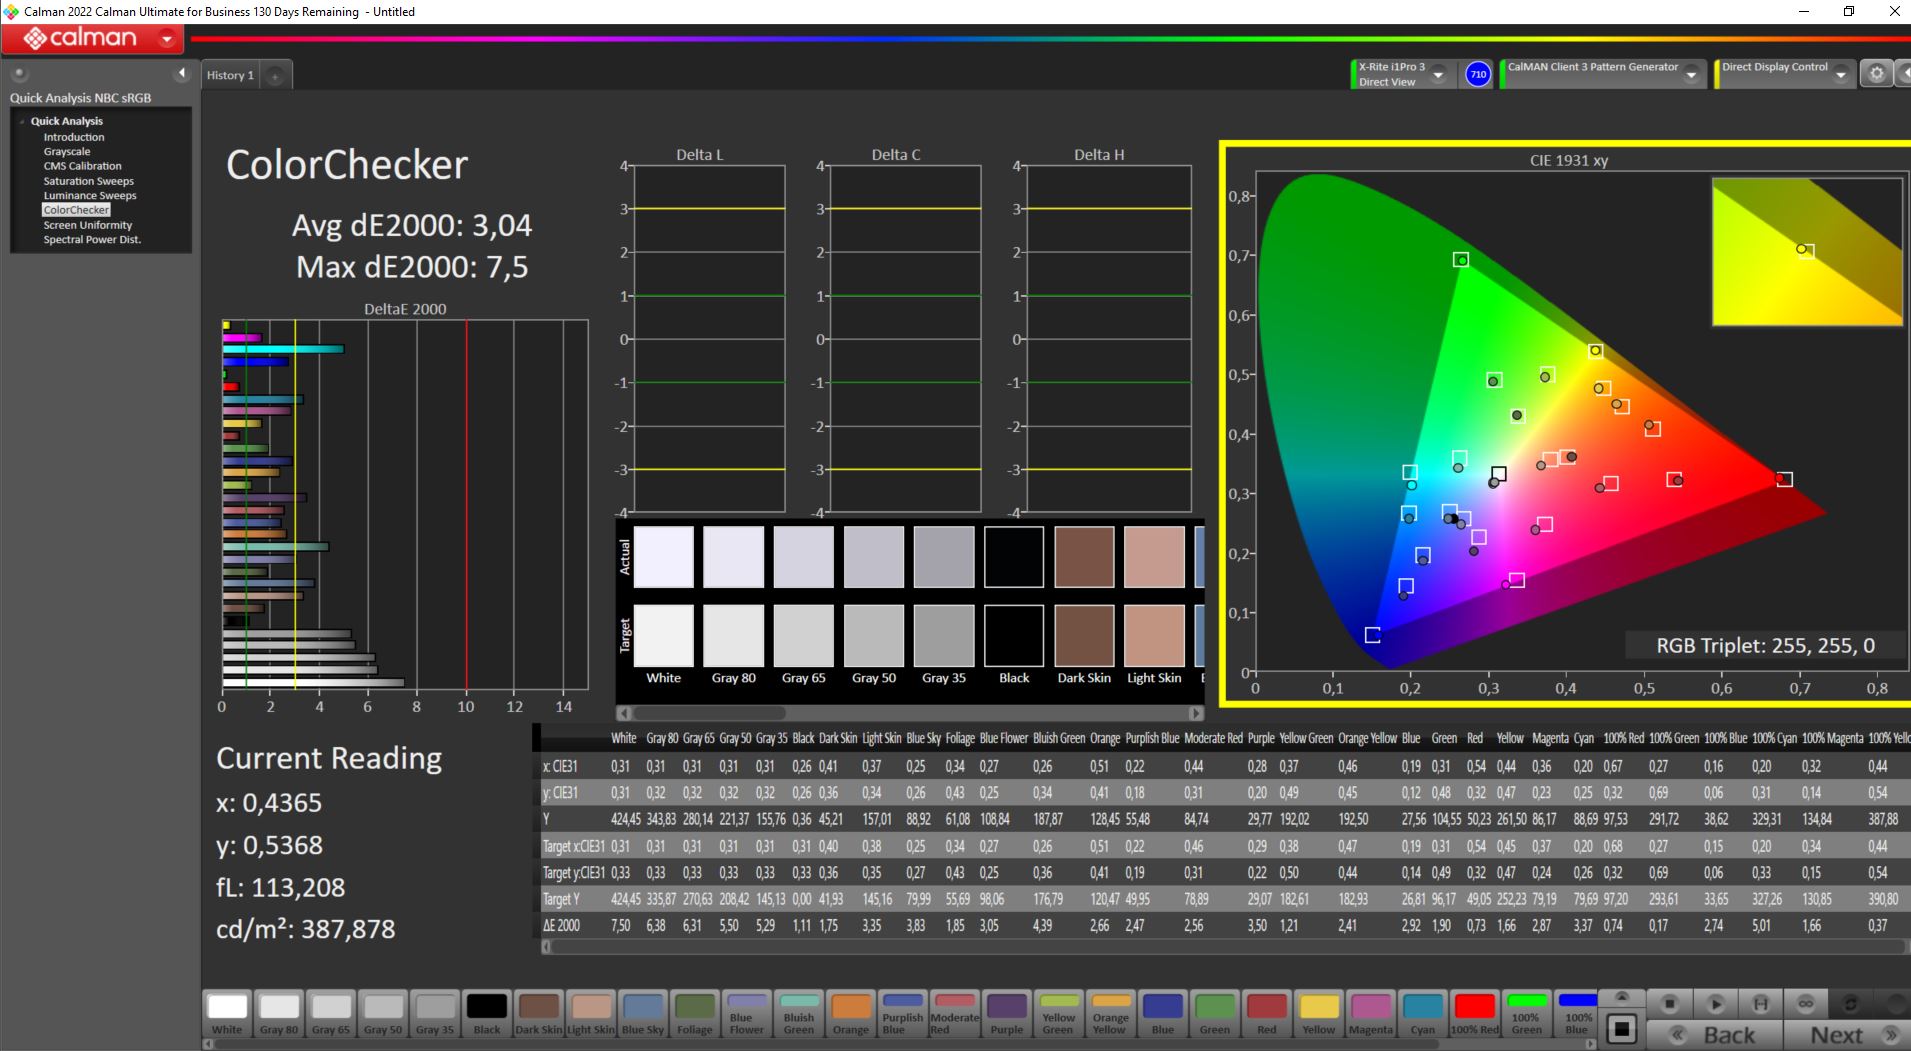
The MSI Stealth 16 Studio A13VG comes with a good 16-inch QHD+ panel and its 240 Hz refresh rate ought to fulfil most gamer's wishes. We measured an average display brightness of 424 cd/m². This means the display is relatively bright and it even manages to be better than much of the competition. Only the Acer Nitro 16 and the Asus ROG Flow X16 offer brighter displays. Our review device had to battle with slight screen bleeding and this is something we had to take into consideration when awarding our display score. By contrast, no PWM was detected which can prevent signs of fatigue during longer use.
Alternative display options such as a 4K panel are not earmarked for the MSI Stealth 16 Studio A13VG.
| |||||||||||||||||||||||||
Brightness Distribution: 88 %
Center on Battery: 428 cd/m²
Contrast: 1146:1 (Black: 0.37 cd/m²)
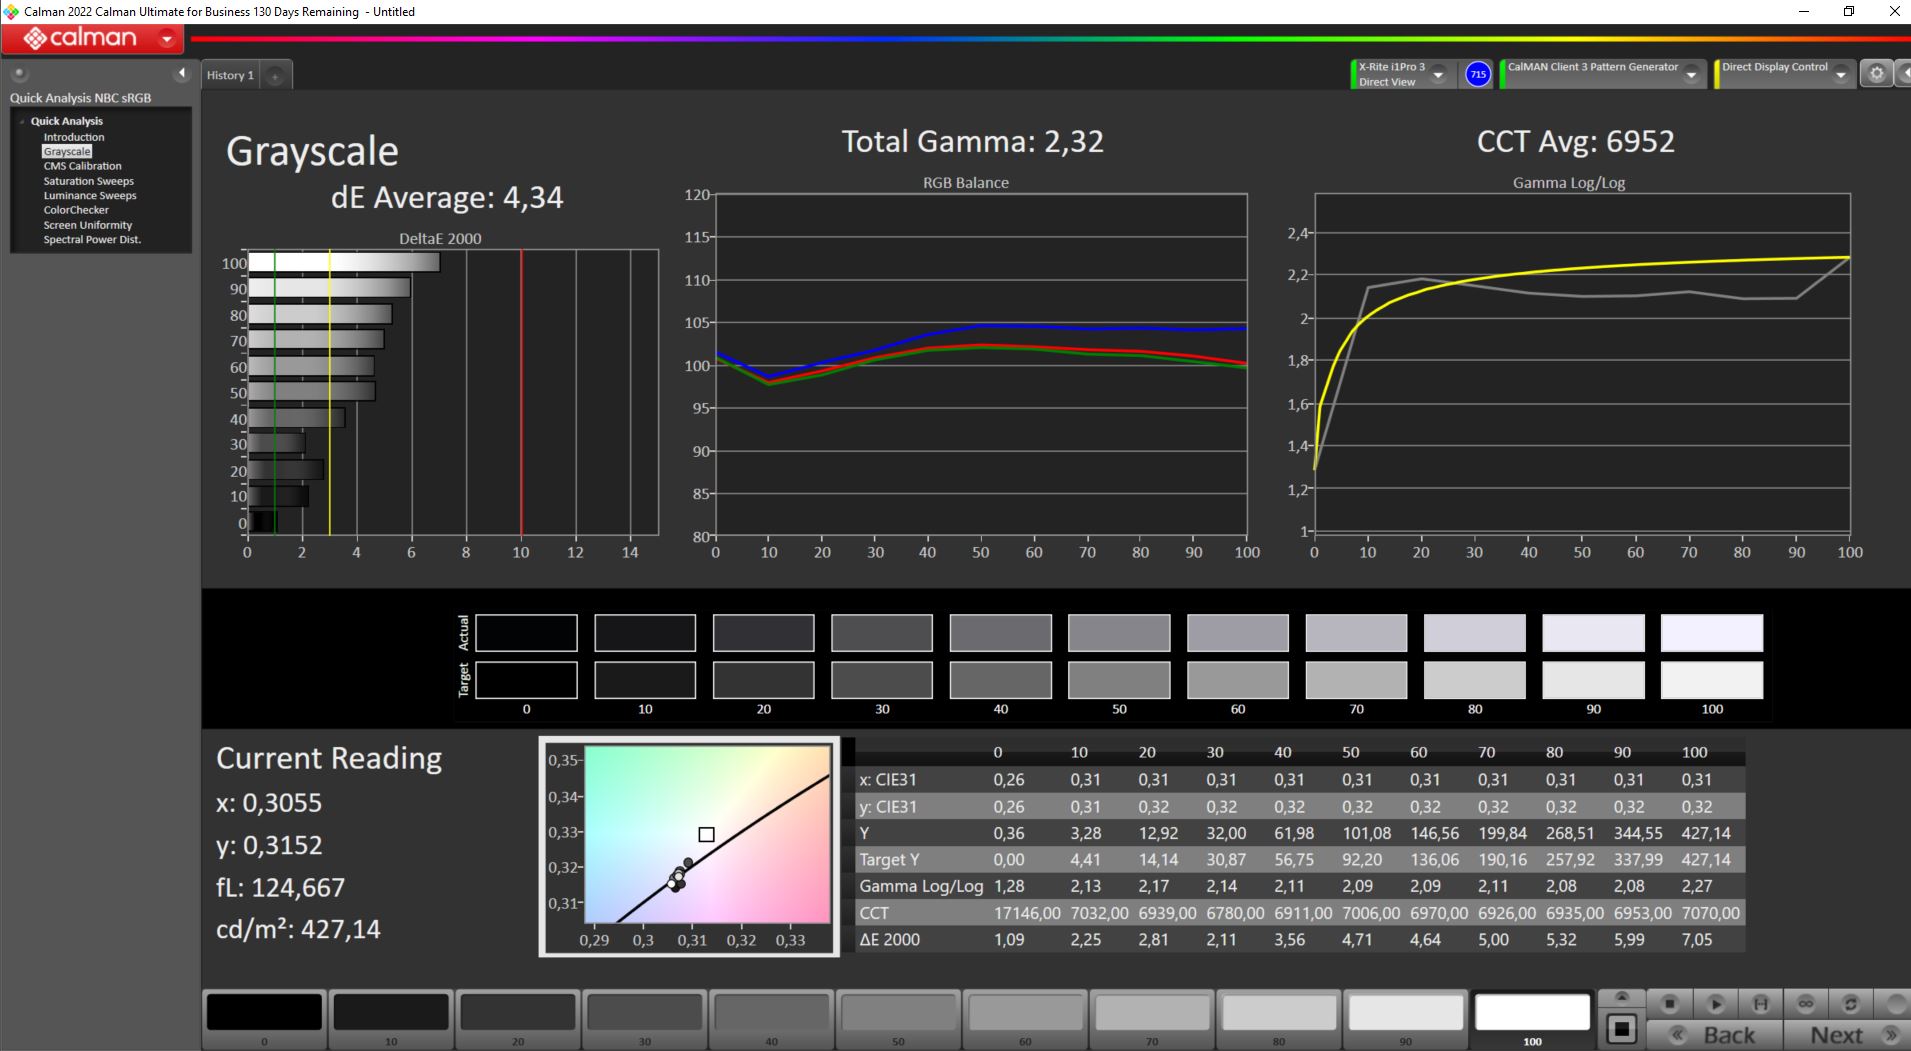
ΔE ColorChecker Calman: 3.04 | ∀{0.5-29.43 Ø4.71}
calibrated: 3.04
ΔE Greyscale Calman: 4.34 | ∀{0.09-98 Ø4.96}
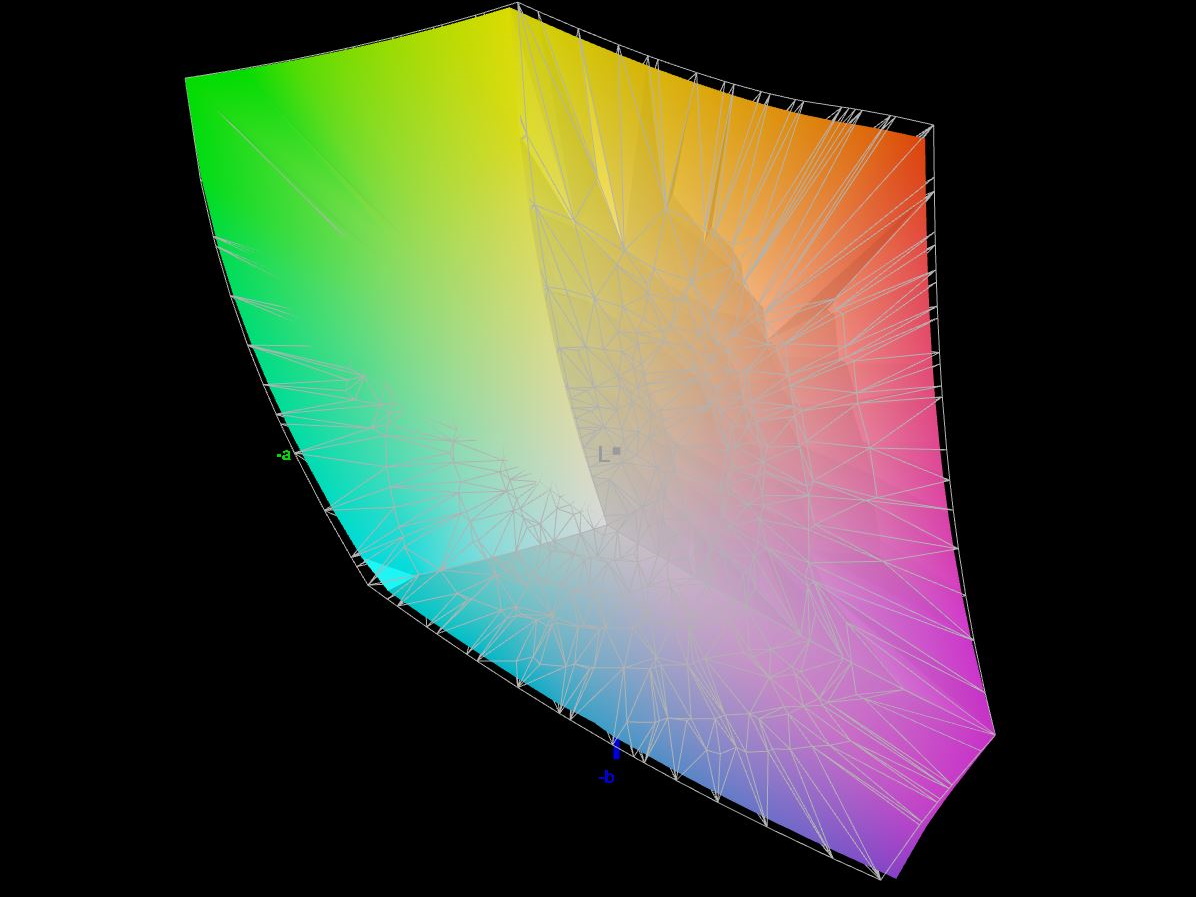
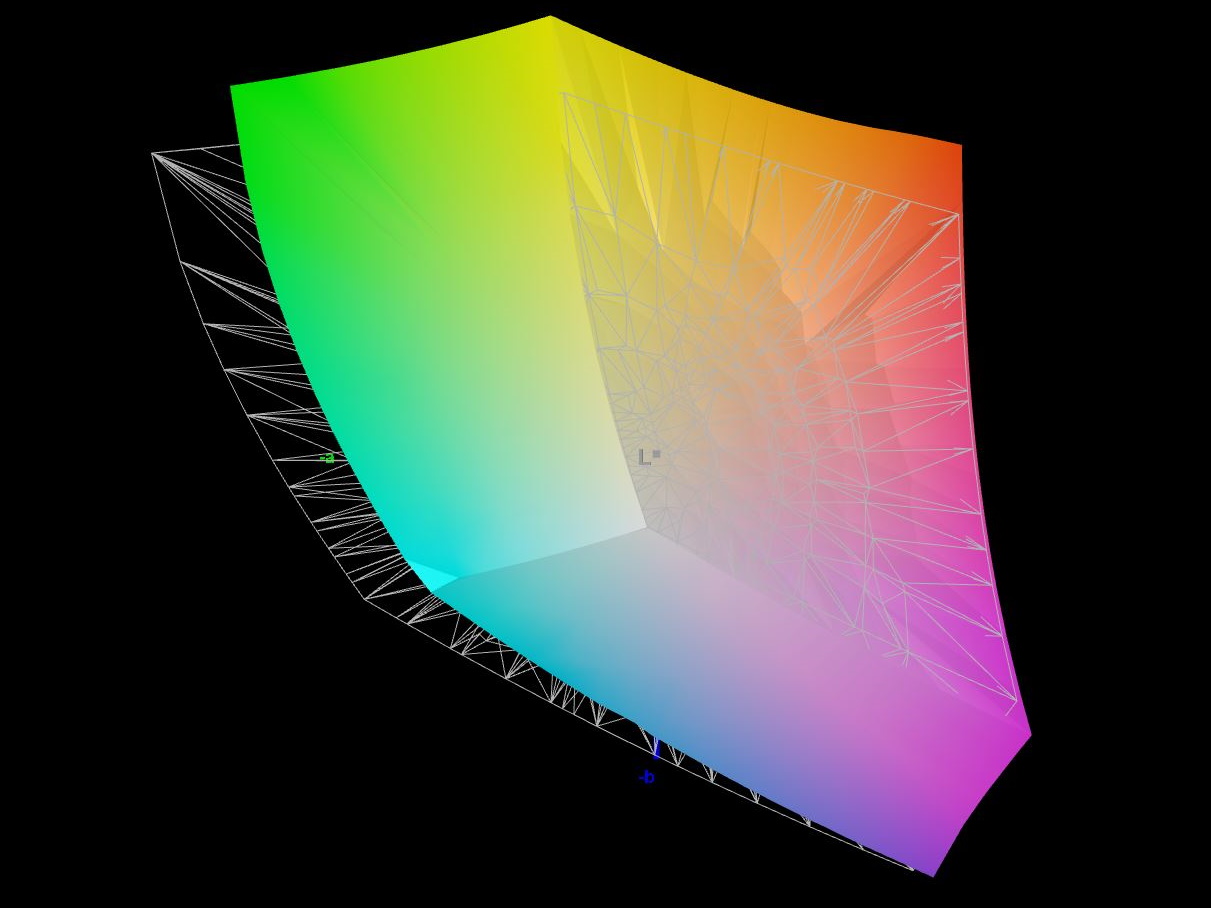
84.8% AdobeRGB 1998 (Argyll 3D)
99.7% sRGB (Argyll 3D)
96.4% Display P3 (Argyll 3D)
Gamma: 2.32
CCT: 6952 K
| MSI Stealth 16 Studio A13VG AUO26A9, IPS, 2560x1600, 16" | Asus ROG Flow X16 GV601V TMX1603 (TL160ADMP03-0), IPS, 2560x1600, 16" | Medion Erazer Major X20 BOE CQ NE160QDM-NZ1, IPS, 2560x1600, 16" | Acer Nitro 16 AN16-41 BOE CQ NE16QDM-NY1, IPS, 2560x1600, 16" | Corsair Voyager a1600 BOE0A3B, IPS, 2560x1600, 16" | Gigabyte AERO 16 OLED BSF Samsung SDC4191 (ATNA60YV09-0, OLED, 3840x2400, 16" | |
|---|---|---|---|---|---|---|
| Display | 0% | -15% | -16% | -16% | 6% | |
| Display P3 Coverage (%) | 96.4 | 96.61 0% | 69.4 -28% | 67.9 -30% | 68.7 -29% | 99.9 4% |
| sRGB Coverage (%) | 99.7 | 99.92 0% | 98 -2% | 99.1 -1% | 98.2 -2% | 100 0% |
| AdobeRGB 1998 Coverage (%) | 84.8 | 84.63 0% | 70.9 -16% | 69.9 -18% | 70.1 -17% | 96.4 14% |
| Response Times | -11% | -114% | -70% | -137% | 60% | |
| Response Time Grey 50% / Grey 80% * (ms) | 4.4 ? | 3.8 ? 14% | 13.1 ? -198% | 11 ? -150% | 13 ? -195% | 2 ? 55% |
| Response Time Black / White * (ms) | 5.6 ? | 7.6 ? -36% | 7.3 ? -30% | 5 ? 11% | 10 ? -79% | 1.98 ? 65% |
| PWM Frequency (Hz) | 60 | |||||
| Screen | 21% | 16% | 25% | 6% | 144% | |
| Brightness middle (cd/m²) | 424 | 486 15% | 374 -12% | 520 23% | 355 -16% | 389.97 -8% |
| Brightness (cd/m²) | 411 | 469 14% | 357 -13% | 494 20% | 340 -17% | 395 -4% |
| Brightness Distribution (%) | 88 | 91 3% | 92 5% | 91 3% | 91 3% | 97 10% |
| Black Level * (cd/m²) | 0.37 | 0.39 -5% | 0.33 11% | 0.39 -5% | 0.53 -43% | 0.03 92% |
| Contrast (:1) | 1146 | 1246 9% | 1133 -1% | 1333 16% | 670 -42% | 12999 1034% |
| Colorchecker dE 2000 * | 3.04 | 2.27 25% | 2.43 20% | 1.94 36% | 2.43 20% | 2 34% |
| Colorchecker dE 2000 max. * | 7.5 | 5.73 24% | 3.97 47% | 5.62 25% | 4.31 43% | 4.1 45% |
| Colorchecker dE 2000 calibrated * | 3.04 | 0.6 80% | 1.4 54% | 0.74 76% | 1.14 63% | 1.68 45% |
| Greyscale dE 2000 * | 4.34 | 3.36 23% | 3.1 29% | 2.94 32% | 2.62 40% | 2.23 49% |
| Gamma | 2.32 95% | 2.46 89% | 2.191 100% | 2.37 93% | 2.28 96% | 2.41 91% |
| CCT | 6952 93% | 6625 98% | 6194 105% | 6443 101% | 6909 94% | 6323 103% |
| Total Average (Program / Settings) | 3% /
12% | -38% /
-10% | -20% /
3% | -49% /
-19% | 70% /
103% |
* ... smaller is better
Our measurements revealed good color space coverage in the sRGB color space which is covered to almost 100 percent. Also, in terms of the P3 color space, we saw a wonderful result of over 96 percent although the extended AdobeRGB color space can only be reproduced to 84.8 percent. With these figures, the IPS scores well and only loses out to the Gigabyte AERO 16's OLED panel. Nevertheless, it's a given that this laptop can be used for semi-professional image or video editing.
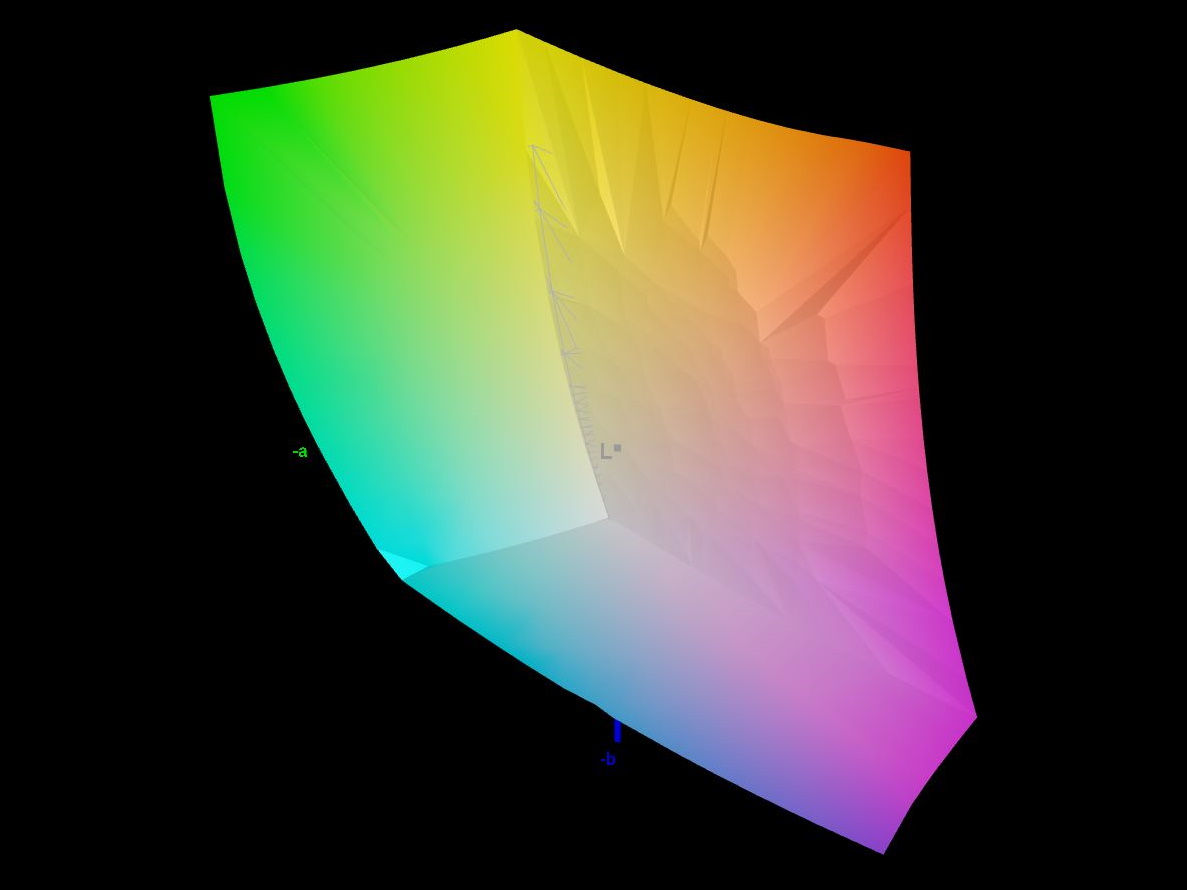
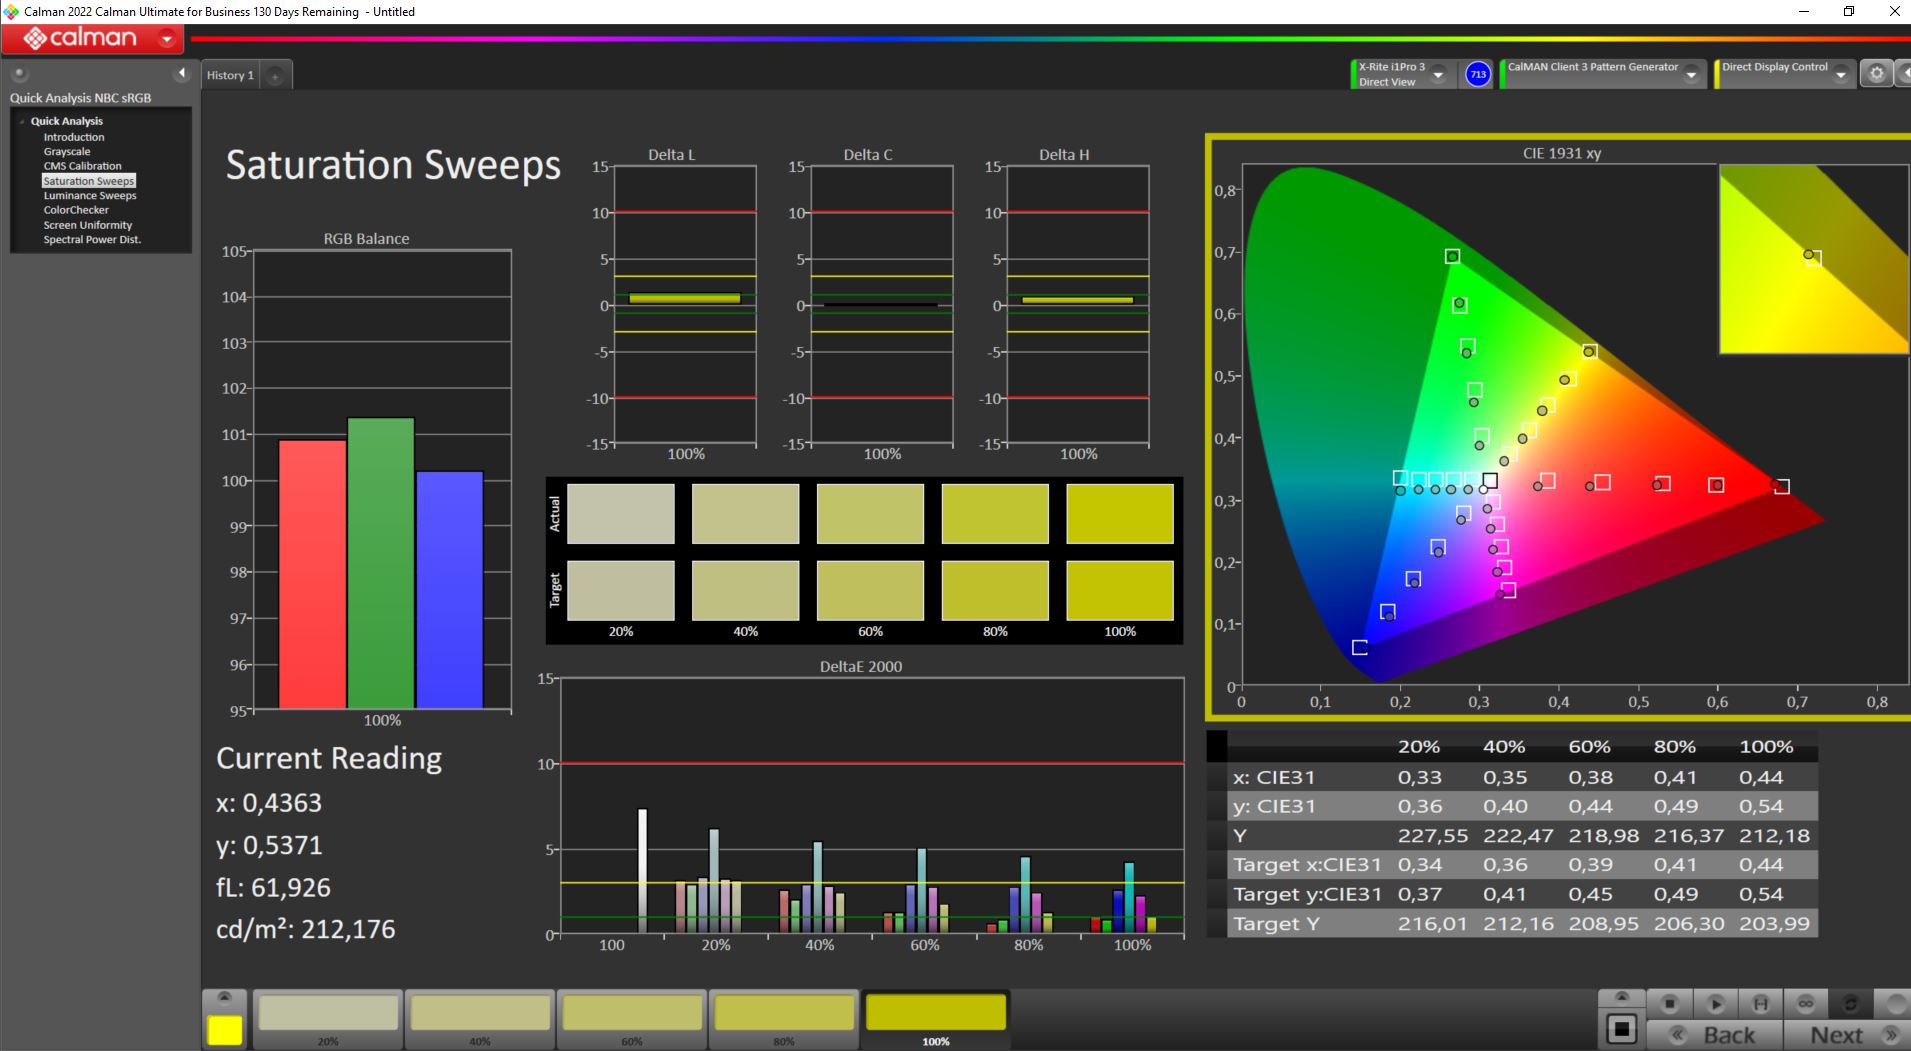
Subjectively, the image quality of the built-in display is excellent. The matte surface prevents reflections and visible graining is also absent. In summary, out of the box, the measured DeltaE-2000 color values are relatively close to the target value of <3. However, the competition proves that better is possible. Typical for IPS, we observed a slight but not very pronounced blue tint in the MSI Stealth 16 Studio A13VG.
Our manual calibration didn't lead to any improvements. We also intend to provide the ICC profile for this display.
Display Response Times
| ↔ Response Time Black to White | ||
|---|---|---|
| 5.6 ms ... rise ↗ and fall ↘ combined | ↗ 2.2 ms rise | 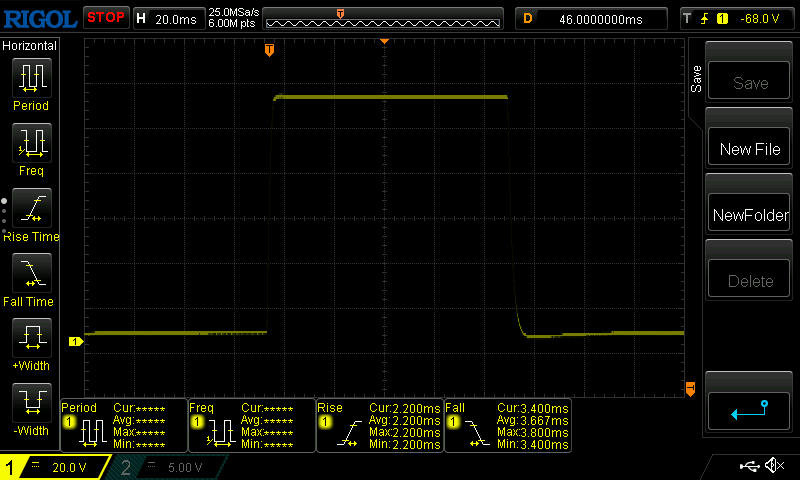 |
| ↘ 3.4 ms fall | ||
| The screen shows very fast response rates in our tests and should be very well suited for fast-paced gaming. In comparison, all tested devices range from 0.1 (minimum) to 240 (maximum) ms. » 18 % of all devices are better. This means that the measured response time is better than the average of all tested devices (19.8 ms). | ||
| ↔ Response Time 50% Grey to 80% Grey | ||
| 4.4 ms ... rise ↗ and fall ↘ combined | ↗ 2.2 ms rise | 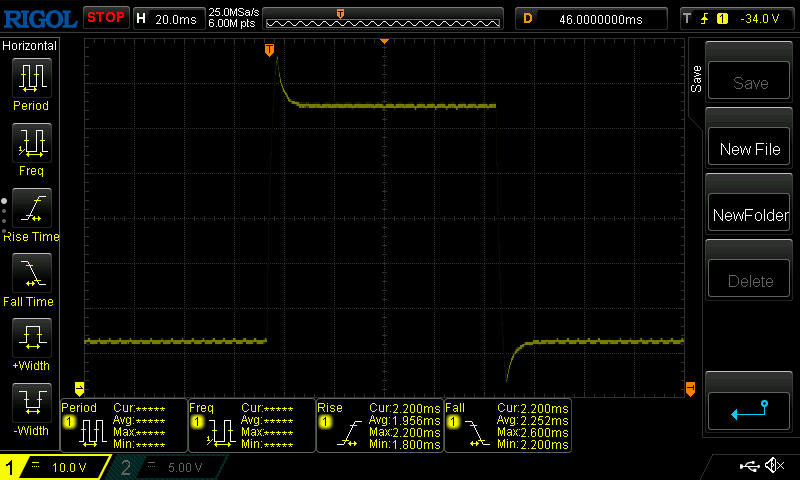 |
| ↘ 2.2 ms fall | ||
| The screen shows very fast response rates in our tests and should be very well suited for fast-paced gaming. In comparison, all tested devices range from 0.165 (minimum) to 636 (maximum) ms. » 16 % of all devices are better. This means that the measured response time is better than the average of all tested devices (30.9 ms). | ||
Screen Flickering / PWM (Pulse-Width Modulation)
| Screen flickering / PWM not detected | 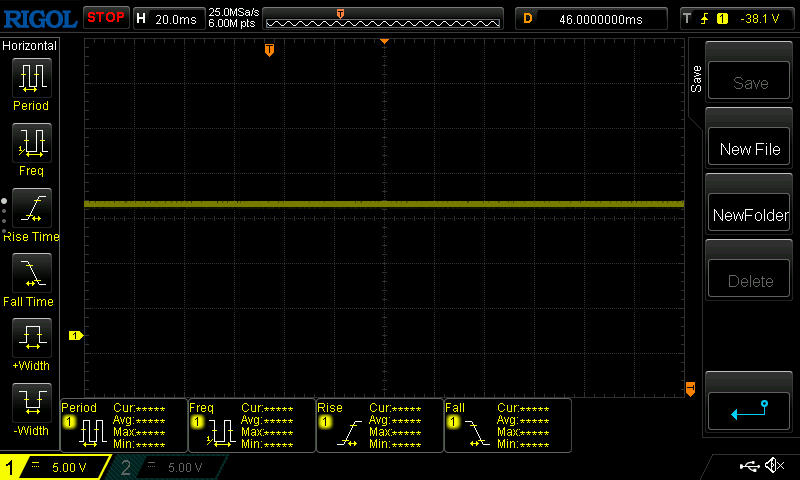 | ||
In comparison: 52 % of all tested devices do not use PWM to dim the display. If PWM was detected, an average of 7744 (minimum: 5 - maximum: 343500) Hz was measured. | |||
The comparatively good display brightness is sufficient for outdoor use. However, users should have a preference for a place in the shade. There is an absence of annoying reflections thanks to the display's matte surface.
Under normal use, the built-in IPS panel is a wonderful display. As seen in the four corner images, changes in color are only visible when viewed from both a wide and steep angle.

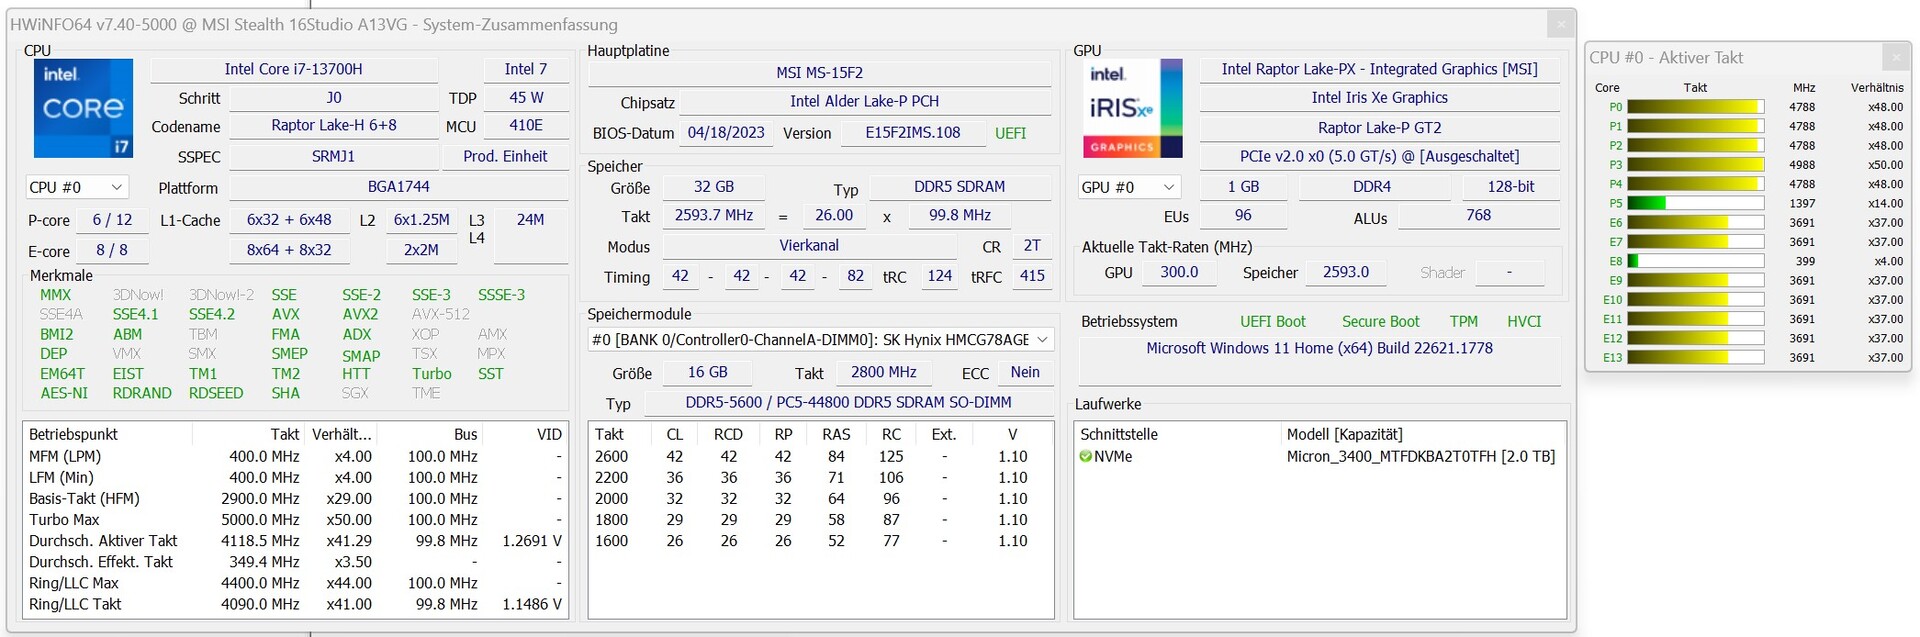
Performance - the power of 14 cores - Intel Core i7-13700H
The MSI Stealth 16 Studio A13VG, which is based on the Intel Core i7-13700H and the Nvidia GeForce RTX 4070 laptop GPU, offers a level of power meaning it scores well as a powerful gaming laptop. However, gaming is not the device's only main ability since the wonderful display and its elegant looks also make it an inviting prospect for creators. An alternative to our review model can be found in the form of the MSI Stealth 16 Studio A13V which also comes with an Nvidia GeForce RTX 4060 laptop GPU.
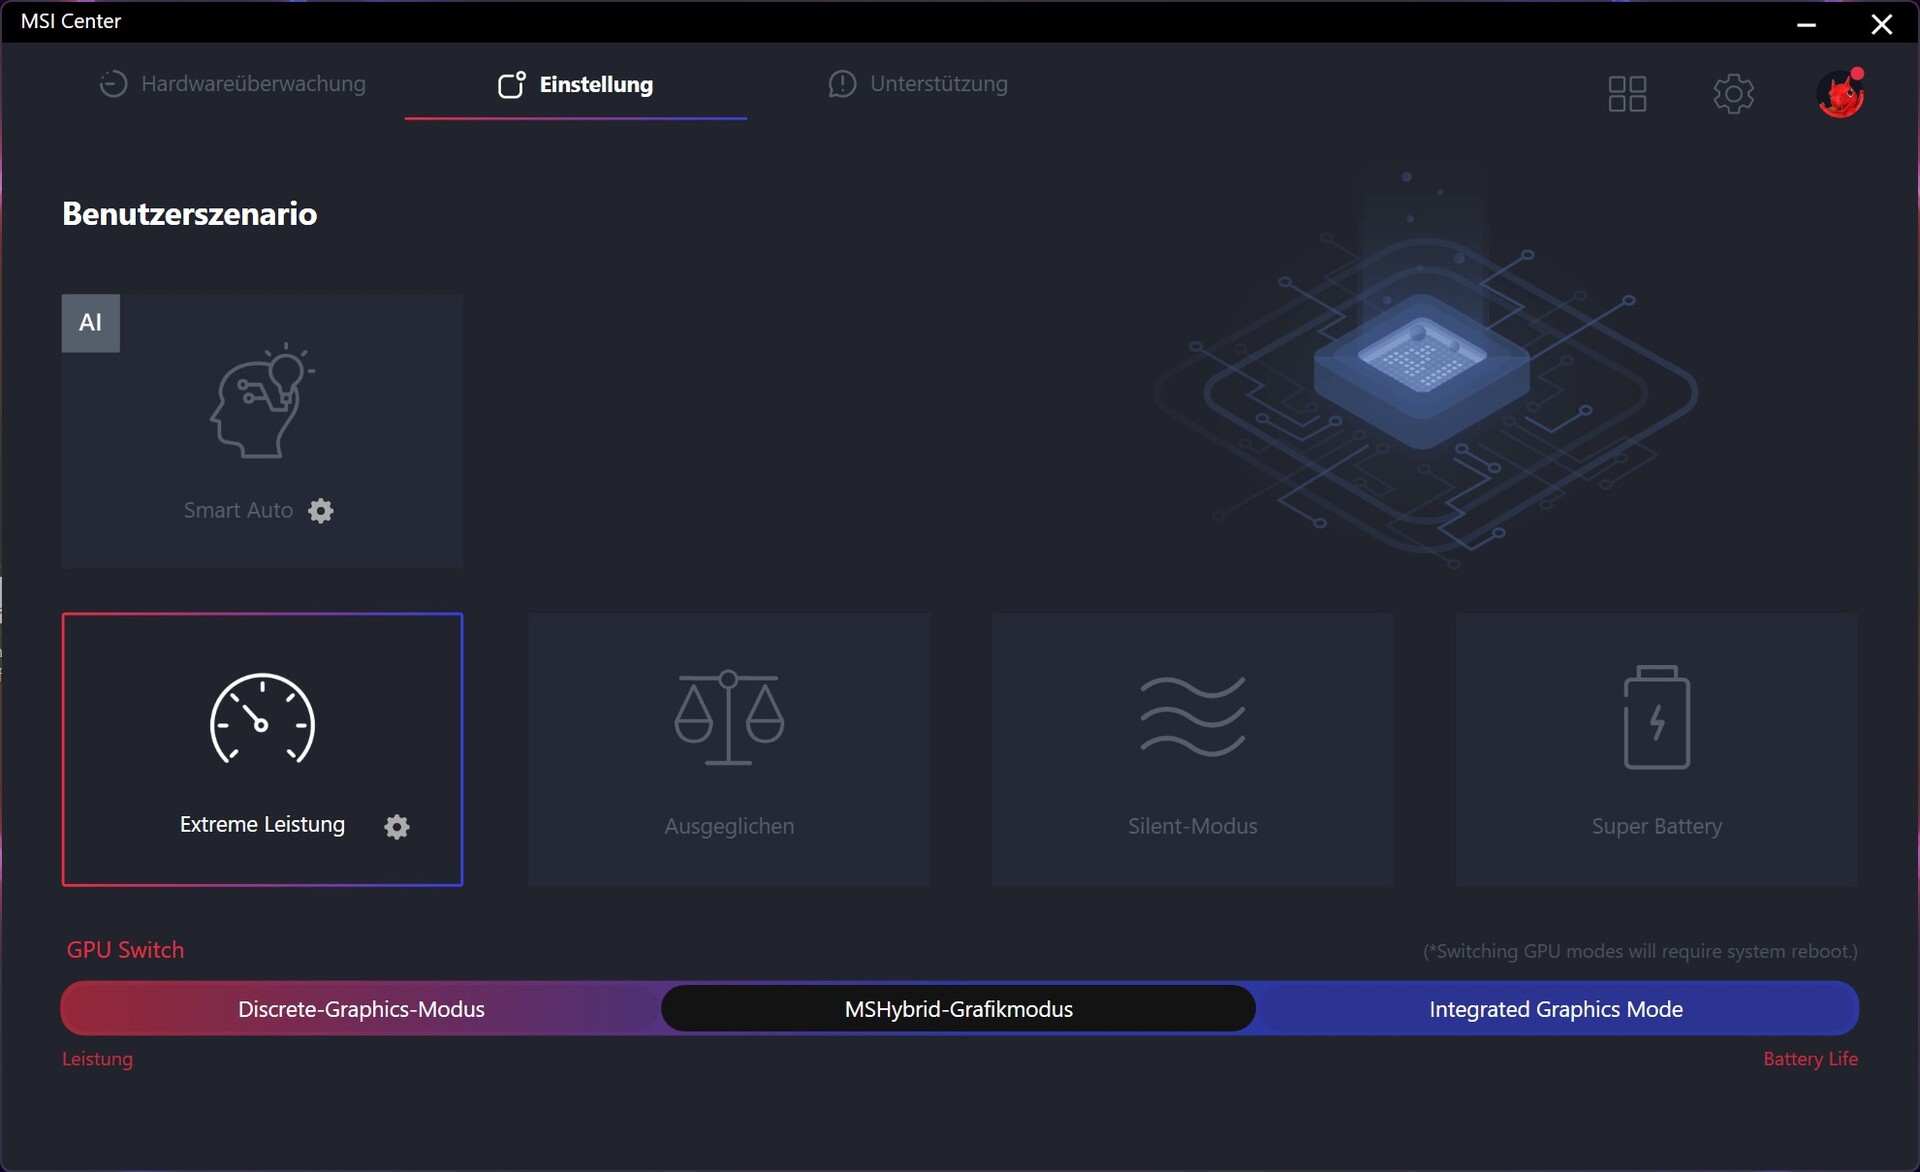
Test conditions
Various performance profiles which affect the CPU and GPU can be selected by using the MSI Center. Unless otherwise stated, the performance tests were carried out using the Extreme Performance
profile. In addition, we made the energy and volume measurement deviations in accordance with our test criteria.
| Mode | CPU Power PL1 | CPU Power PL2 | GPU Power |
|---|---|---|---|
| Super battery | 15 W | 15 W | 80 W |
| Silent mode | 25 W | 45 W | 80 W |
| Balanced | 45 W | 45 W | 80 W |
| Extreme Performance | 115 W | 160 W | 105 W |
Processor
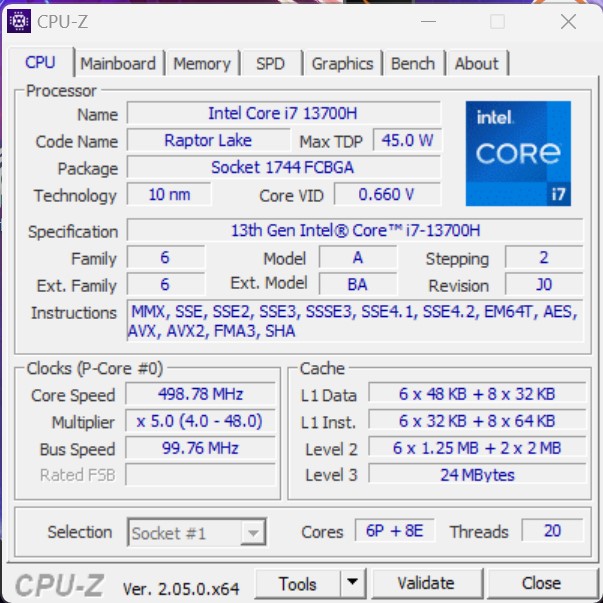
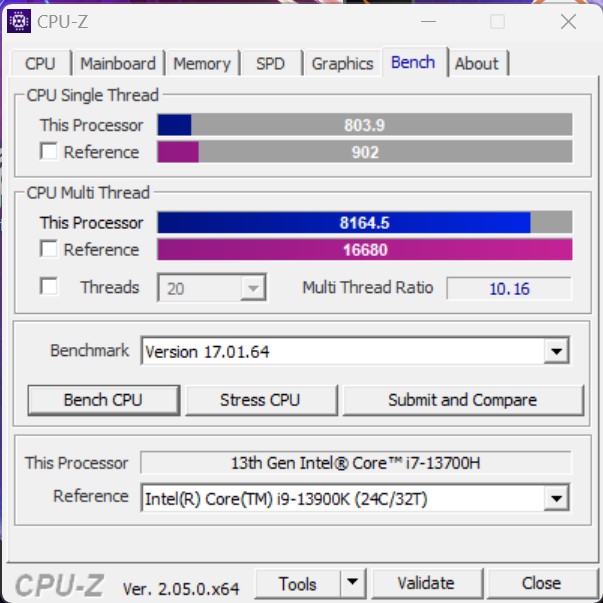
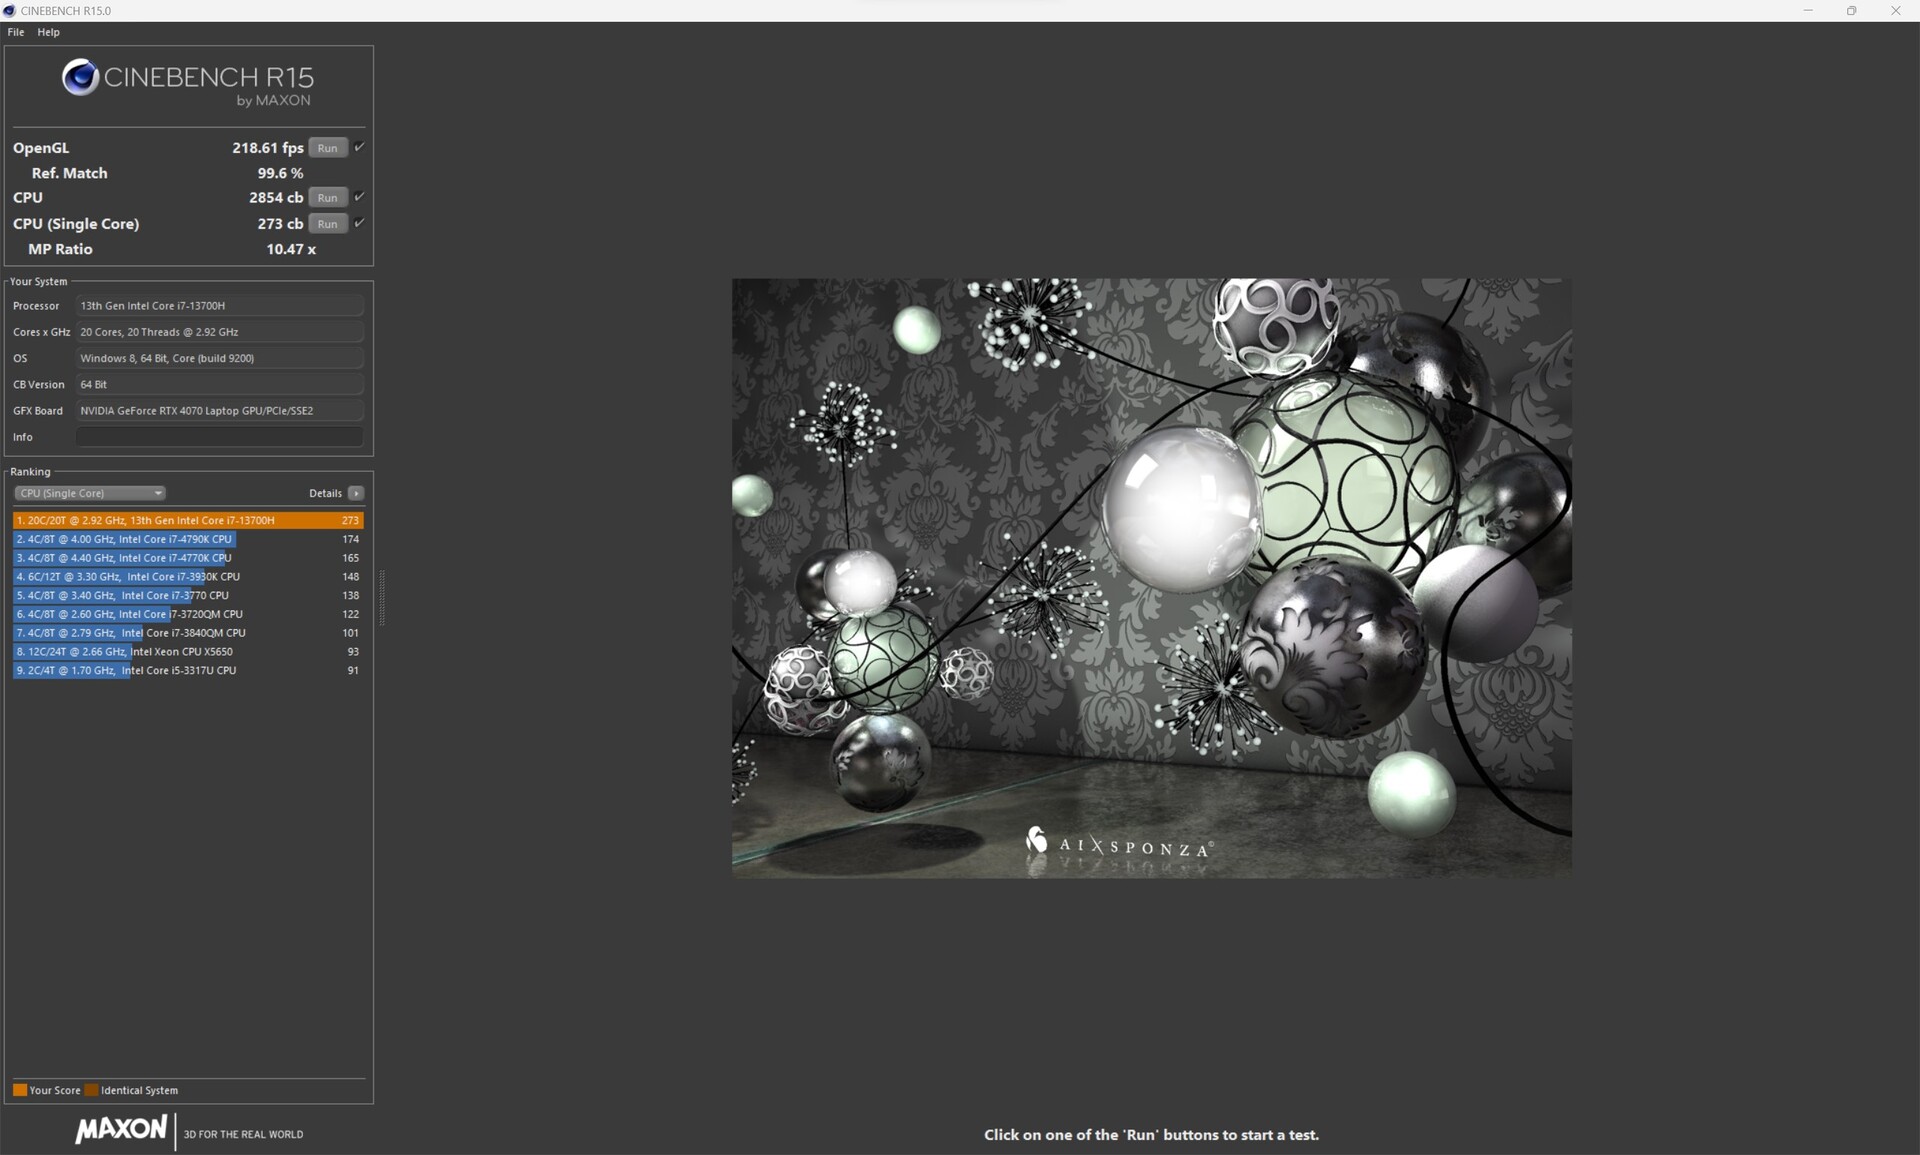
The Intel Core-i7-13700H processor (Raptor Lake) consists of eight efficiency cores (no hyper-threading, 1.8 to 3.7 GHz) and six performance cores (hyper-threading, 2.4 to 5.0 GHz). In total, this results in 20 logical CPU cores. Based on the Core i7-13700H, the MSI Stealth 16 Studio A13VG achieves good performance which is ahead of our previously documented performance with the Intel Core i7-13700H. Even the Gigabyte AERO 16, which is equipped with an Intel Core i9-13900H, has to make way for our review sample. The Medion Erazer Major X20 is the undisputed leader of the pack. But, compared to Intel Core i9-13900HX, the MSI Stealth 16 Studio A13VG is around 30 percent less performant.
The Cinebench R15 loop test shows that in the beginning, the CPU boost was relatively well maintained, but, after the 11th run, the SoC is unable to deliver its full power. We recorded a loss in performance of around 15 percent compared to the first run.
Cinebench R15 Multi Continuous Test
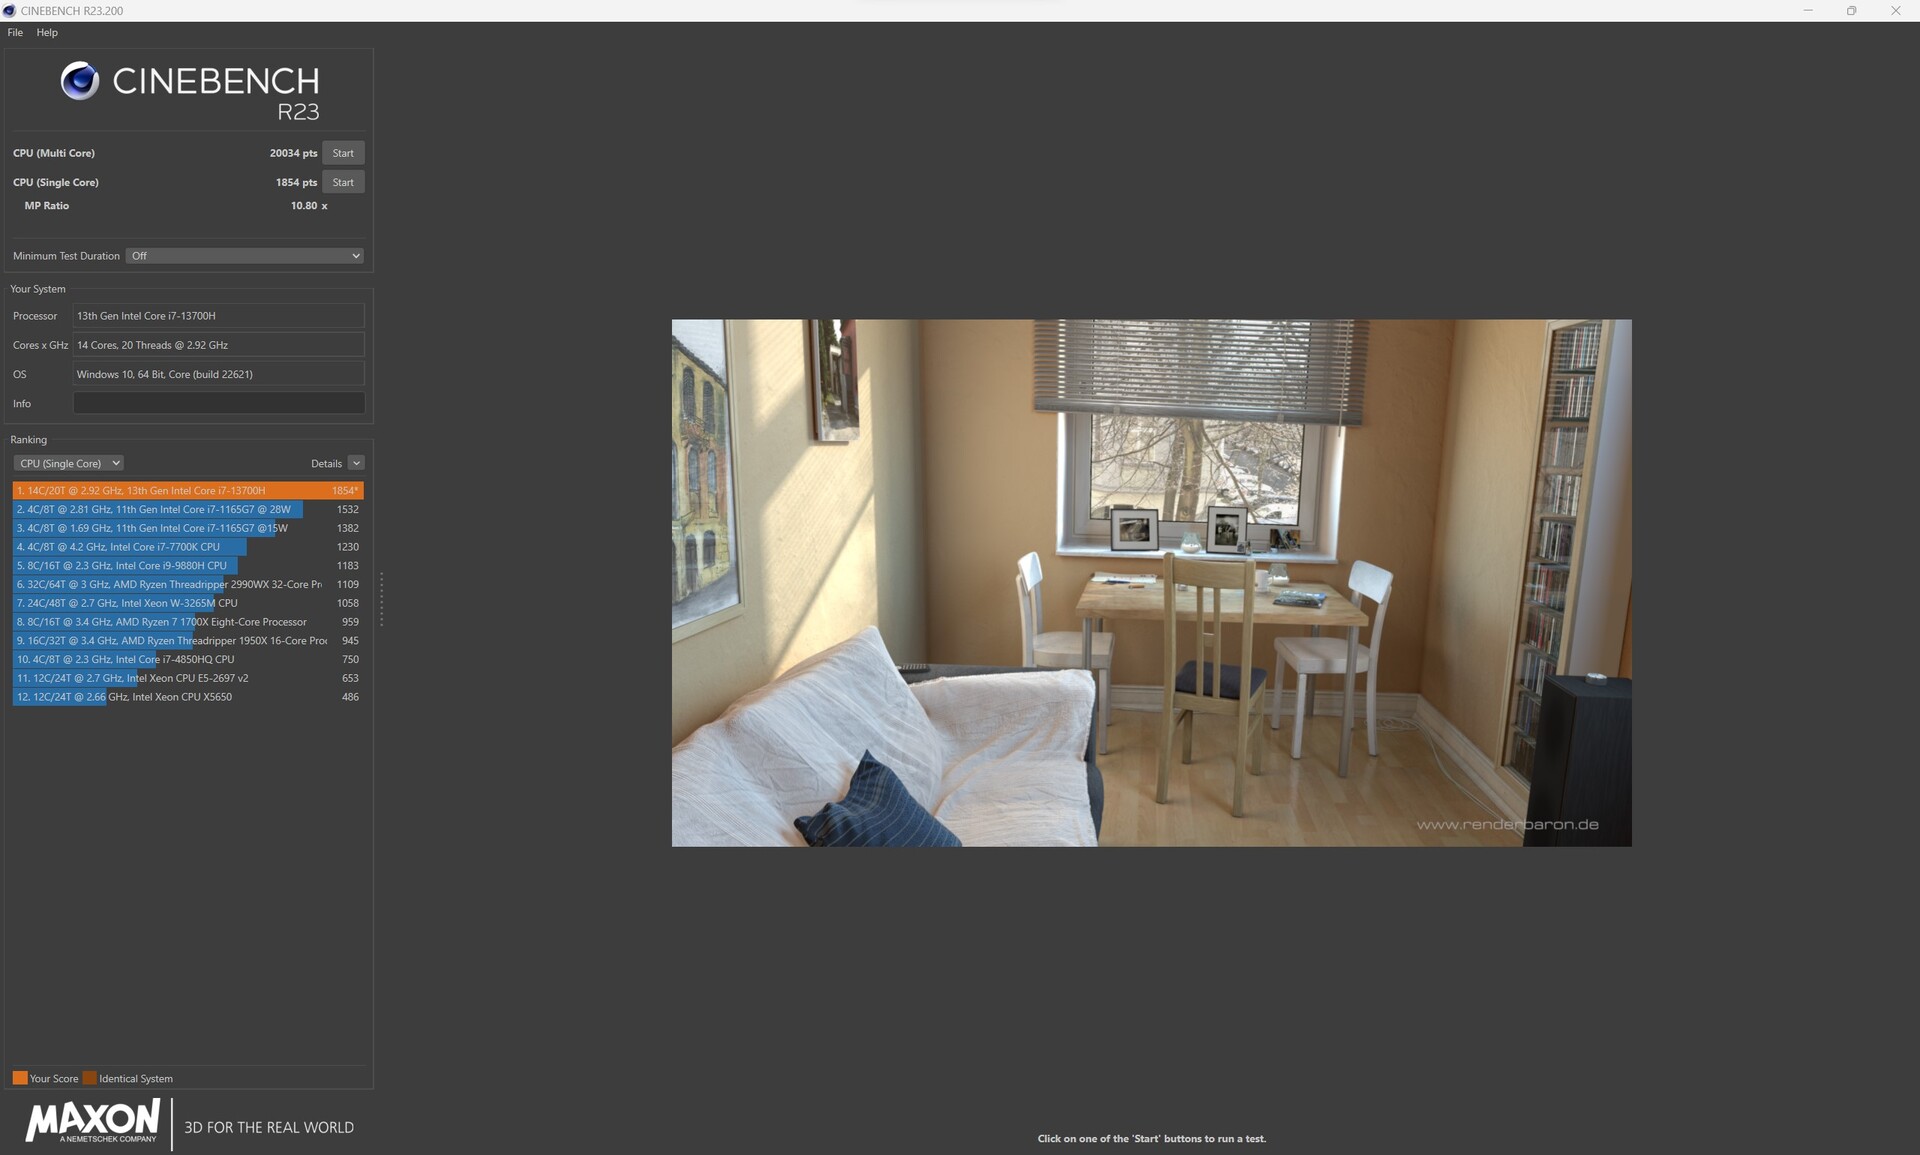
Cinebench R23: Multi Core | Single Core
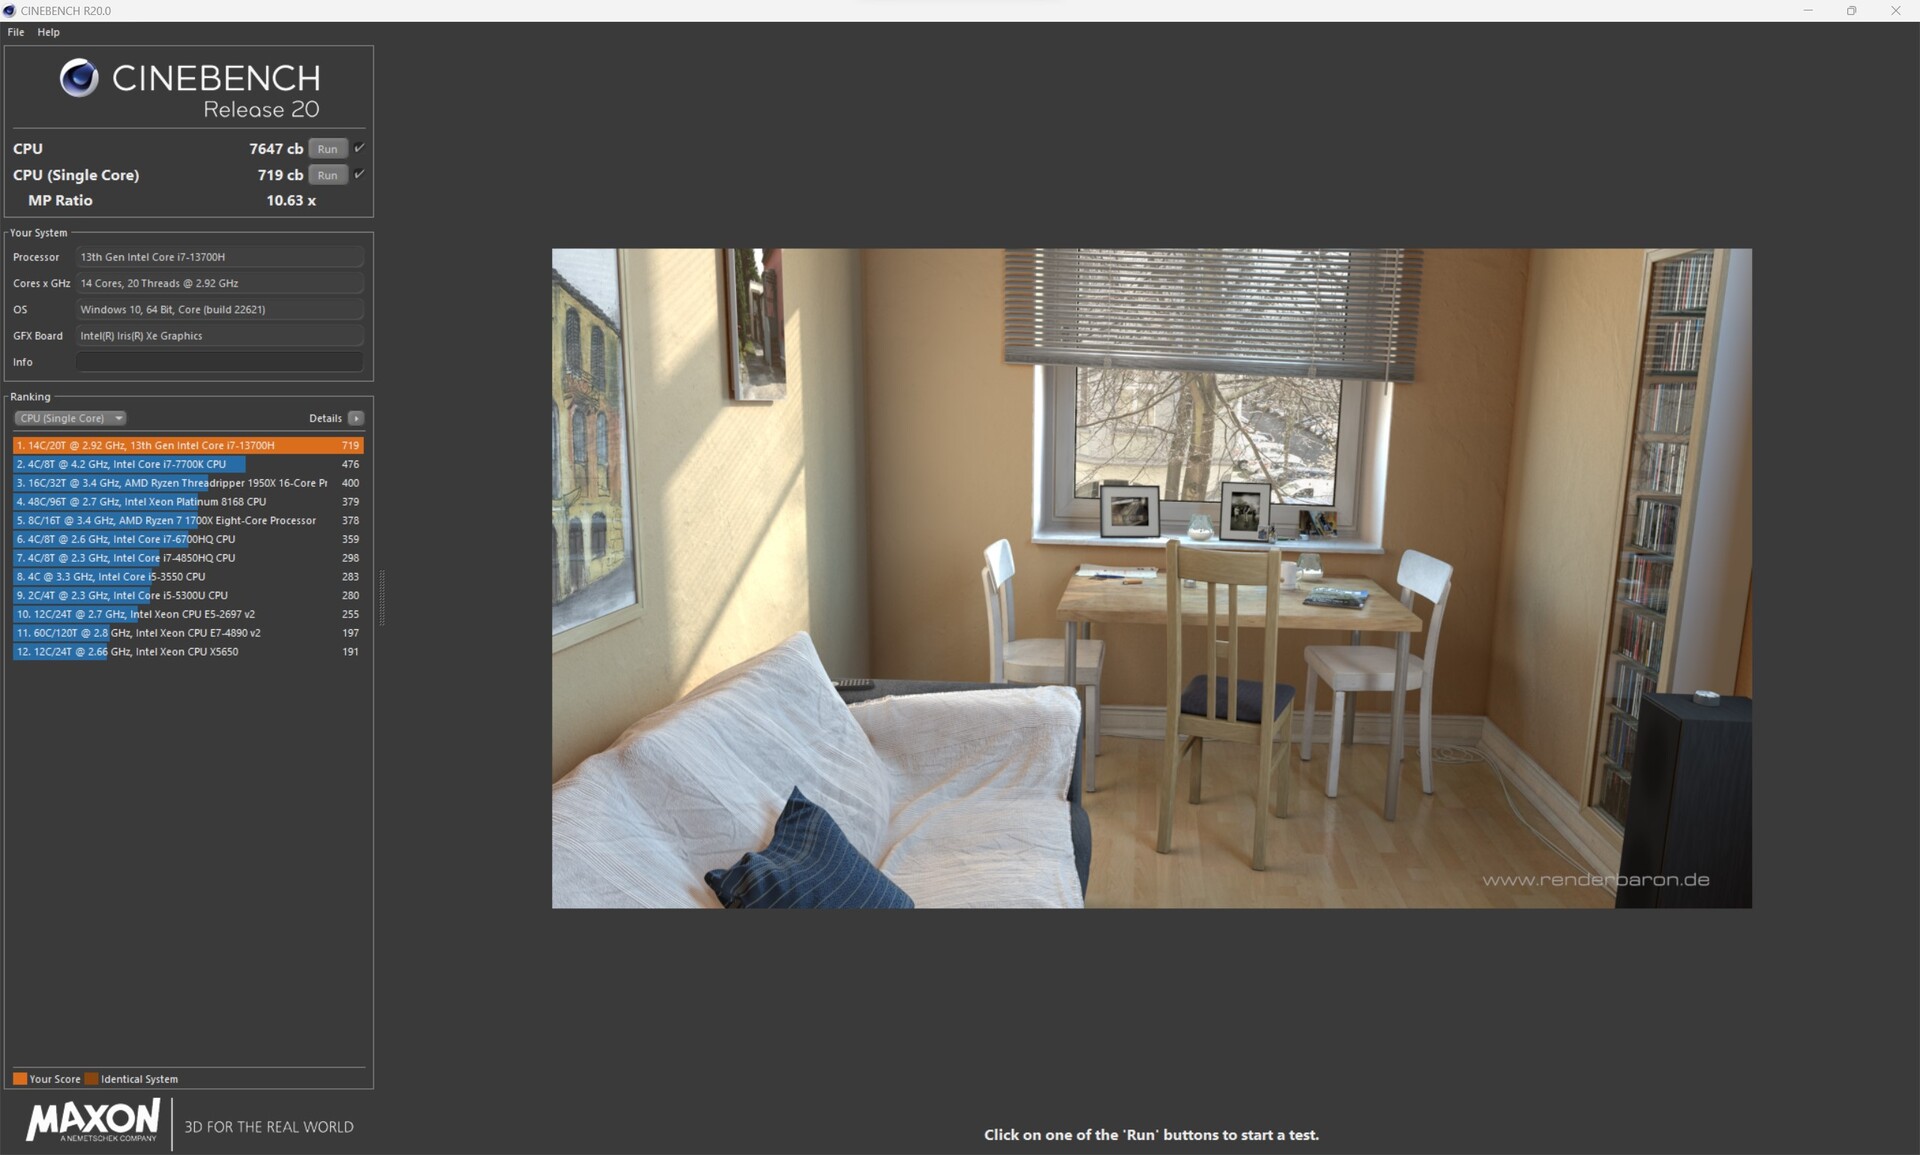
Cinebench R20: CPU (Multi Core) | CPU (Single Core)
Cinebench R15: CPU Multi 64Bit | CPU Single 64Bit
Blender: v2.79 BMW27 CPU
7-Zip 18.03: 7z b 4 | 7z b 4 -mmt1
Geekbench 5.5: Multi-Core | Single-Core
HWBOT x265 Benchmark v2.2: 4k Preset
LibreOffice : 20 Documents To PDF
R Benchmark 2.5: Overall mean
| CPU Performance rating | |
| Medion Erazer Major X20 | |
| Average of class Gaming | |
| Asus ROG Flow X16 GV601V | |
| MSI Stealth 16 Studio A13VG | |
| Gigabyte AERO 16 OLED BSF | |
| Average Intel Core i7-13700H | |
| Acer Nitro 16 AN16-41 | |
| Corsair Voyager a1600 | |
| Cinebench R23 / Multi Core | |
| Medion Erazer Major X20 | |
| Average of class Gaming (10488 - 42661, n=104, last 2 years) | |
| MSI Stealth 16 Studio A13VG | |
| Asus ROG Flow X16 GV601V | |
| Gigabyte AERO 16 OLED BSF | |
| Average Intel Core i7-13700H (5890 - 20034, n=29) | |
| Acer Nitro 16 AN16-41 | |
| Corsair Voyager a1600 | |
| Cinebench R23 / Single Core | |
| Medion Erazer Major X20 | |
| Average of class Gaming (1601 - 2415, n=104, last 2 years) | |
| Asus ROG Flow X16 GV601V | |
| MSI Stealth 16 Studio A13VG | |
| Average Intel Core i7-13700H (1323 - 1914, n=29) | |
| Gigabyte AERO 16 OLED BSF | |
| Corsair Voyager a1600 | |
| Acer Nitro 16 AN16-41 | |
| Cinebench R20 / CPU (Multi Core) | |
| Medion Erazer Major X20 | |
| Average of class Gaming (4029 - 16433, n=103, last 2 years) | |
| MSI Stealth 16 Studio A13VG | |
| Asus ROG Flow X16 GV601V | |
| Gigabyte AERO 16 OLED BSF | |
| Average Intel Core i7-13700H (2322 - 7674, n=29) | |
| Acer Nitro 16 AN16-41 | |
| Corsair Voyager a1600 | |
| Cinebench R20 / CPU (Single Core) | |
| Average of class Gaming (622 - 913, n=103, last 2 years) | |
| Medion Erazer Major X20 | |
| Asus ROG Flow X16 GV601V | |
| MSI Stealth 16 Studio A13VG | |
| Average Intel Core i7-13700H (508 - 741, n=29) | |
| Gigabyte AERO 16 OLED BSF | |
| Acer Nitro 16 AN16-41 | |
| Corsair Voyager a1600 | |
| Cinebench R15 / CPU Multi 64Bit | |
| Medion Erazer Major X20 | |
| Average of class Gaming (1578 - 6330, n=102, last 2 years) | |
| Asus ROG Flow X16 GV601V | |
| Gigabyte AERO 16 OLED BSF | |
| MSI Stealth 16 Studio A13VG | |
| Average Intel Core i7-13700H (905 - 2982, n=29) | |
| Acer Nitro 16 AN16-41 | |
| Corsair Voyager a1600 | |
| Cinebench R15 / CPU Single 64Bit | |
| Average of class Gaming (188.8 - 350, n=103, last 2 years) | |
| Medion Erazer Major X20 | |
| Asus ROG Flow X16 GV601V | |
| MSI Stealth 16 Studio A13VG | |
| Average Intel Core i7-13700H (213 - 278, n=29) | |
| Acer Nitro 16 AN16-41 | |
| Corsair Voyager a1600 | |
| Gigabyte AERO 16 OLED BSF | |
| Blender / v2.79 BMW27 CPU | |
| Average Intel Core i7-13700H (169 - 555, n=29) | |
| Corsair Voyager a1600 | |
| Acer Nitro 16 AN16-41 | |
| Asus ROG Flow X16 GV601V | |
| Gigabyte AERO 16 OLED BSF | |
| MSI Stealth 16 Studio A13VG | |
| Average of class Gaming (79 - 330, n=101, last 2 years) | |
| Medion Erazer Major X20 | |
| 7-Zip 18.03 / 7z b 4 | |
| Medion Erazer Major X20 | |
| Average of class Gaming (33491 - 148086, n=102, last 2 years) | |
| MSI Stealth 16 Studio A13VG | |
| Gigabyte AERO 16 OLED BSF | |
| Asus ROG Flow X16 GV601V | |
| Corsair Voyager a1600 | |
| Acer Nitro 16 AN16-41 | |
| Average Intel Core i7-13700H (27322 - 76344, n=29) | |
| 7-Zip 18.03 / 7z b 4 -mmt1 | |
| Medion Erazer Major X20 | |
| Average of class Gaming (4824 - 7436, n=102, last 2 years) | |
| Asus ROG Flow X16 GV601V | |
| MSI Stealth 16 Studio A13VG | |
| Average Intel Core i7-13700H (4825 - 6238, n=29) | |
| Corsair Voyager a1600 | |
| Acer Nitro 16 AN16-41 | |
| Gigabyte AERO 16 OLED BSF | |
| Geekbench 5.5 / Multi-Core | |
| Medion Erazer Major X20 | |
| Average of class Gaming (6460 - 28263, n=102, last 2 years) | |
| Asus ROG Flow X16 GV601V | |
| Gigabyte AERO 16 OLED BSF | |
| MSI Stealth 16 Studio A13VG | |
| Average Intel Core i7-13700H (6165 - 14215, n=29) | |
| Corsair Voyager a1600 | |
| Acer Nitro 16 AN16-41 | |
| Geekbench 5.5 / Single-Core | |
| Average of class Gaming (1403 - 2474, n=102, last 2 years) | |
| Medion Erazer Major X20 | |
| Asus ROG Flow X16 GV601V | |
| MSI Stealth 16 Studio A13VG | |
| Average Intel Core i7-13700H (1362 - 1919, n=29) | |
| Gigabyte AERO 16 OLED BSF | |
| Acer Nitro 16 AN16-41 | |
| Corsair Voyager a1600 | |
| HWBOT x265 Benchmark v2.2 / 4k Preset | |
| Average of class Gaming (11.5 - 44.4, n=102, last 2 years) | |
| Medion Erazer Major X20 | |
| Asus ROG Flow X16 GV601V | |
| Gigabyte AERO 16 OLED BSF | |
| MSI Stealth 16 Studio A13VG | |
| Acer Nitro 16 AN16-41 | |
| Corsair Voyager a1600 | |
| Average Intel Core i7-13700H (6.72 - 21.2, n=29) | |
| LibreOffice / 20 Documents To PDF | |
| Gigabyte AERO 16 OLED BSF | |
| Corsair Voyager a1600 | |
| MSI Stealth 16 Studio A13VG | |
| Acer Nitro 16 AN16-41 | |
| Average of class Gaming (33.2 - 88.8, n=102, last 2 years) | |
| Average Intel Core i7-13700H (31.3 - 62.4, n=29) | |
| Medion Erazer Major X20 | |
| Asus ROG Flow X16 GV601V | |
| R Benchmark 2.5 / Overall mean | |
| Acer Nitro 16 AN16-41 | |
| Gigabyte AERO 16 OLED BSF | |
| Corsair Voyager a1600 | |
| Average Intel Core i7-13700H (0.4308 - 0.607, n=29) | |
| MSI Stealth 16 Studio A13VG | |
| Average of class Gaming (0.3439 - 0.59, n=102, last 2 years) | |
| Asus ROG Flow X16 GV601V | |
| Medion Erazer Major X20 | |
* ... smaller is better
AIDA64: FP32 Ray-Trace | FPU Julia | CPU SHA3 | CPU Queen | FPU SinJulia | FPU Mandel | CPU AES | CPU ZLib | FP64 Ray-Trace | CPU PhotoWorxx
| Performance rating | |
| Average of class Gaming | |
| Medion Erazer Major X20 | |
| Gigabyte AERO 16 OLED BSF | |
| Corsair Voyager a1600 | |
| MSI Stealth 16 Studio A13VG | |
| Asus ROG Flow X16 GV601V | |
| Acer Nitro 16 AN16-41 | |
| Average Intel Core i7-13700H | |
| AIDA64 / FP32 Ray-Trace | |
| Average of class Gaming (10227 - 85542, n=102, last 2 years) | |
| Medion Erazer Major X20 | |
| Gigabyte AERO 16 OLED BSF | |
| MSI Stealth 16 Studio A13VG | |
| Acer Nitro 16 AN16-41 | |
| Corsair Voyager a1600 | |
| Average Intel Core i7-13700H (4986 - 18908, n=29) | |
| Asus ROG Flow X16 GV601V | |
| AIDA64 / FPU Julia | |
| Average of class Gaming (51376 - 372155, n=102, last 2 years) | |
| Medion Erazer Major X20 | |
| Acer Nitro 16 AN16-41 | |
| Corsair Voyager a1600 | |
| Gigabyte AERO 16 OLED BSF | |
| Asus ROG Flow X16 GV601V | |
| MSI Stealth 16 Studio A13VG | |
| Average Intel Core i7-13700H (25360 - 92359, n=29) | |
| AIDA64 / CPU SHA3 | |
| Average of class Gaming (2180 - 10115, n=102, last 2 years) | |
| Medion Erazer Major X20 | |
| Asus ROG Flow X16 GV601V | |
| Gigabyte AERO 16 OLED BSF | |
| MSI Stealth 16 Studio A13VG | |
| Acer Nitro 16 AN16-41 | |
| Corsair Voyager a1600 | |
| Average Intel Core i7-13700H (1339 - 4224, n=29) | |
| AIDA64 / CPU Queen | |
| Medion Erazer Major X20 | |
| Average of class Gaming (49785 - 173351, n=86, last 2 years) | |
| Asus ROG Flow X16 GV601V | |
| Acer Nitro 16 AN16-41 | |
| MSI Stealth 16 Studio A13VG | |
| Corsair Voyager a1600 | |
| Average Intel Core i7-13700H (59324 - 107159, n=29) | |
| Gigabyte AERO 16 OLED BSF | |
| AIDA64 / FPU SinJulia | |
| Medion Erazer Major X20 | |
| Average of class Gaming (4424 - 33636, n=102, last 2 years) | |
| Acer Nitro 16 AN16-41 | |
| Corsair Voyager a1600 | |
| Asus ROG Flow X16 GV601V | |
| MSI Stealth 16 Studio A13VG | |
| Gigabyte AERO 16 OLED BSF | |
| Average Intel Core i7-13700H (4800 - 11050, n=29) | |
| AIDA64 / FPU Mandel | |
| Average of class Gaming (25115 - 196829, n=102, last 2 years) | |
| Medion Erazer Major X20 | |
| Acer Nitro 16 AN16-41 | |
| Corsair Voyager a1600 | |
| Gigabyte AERO 16 OLED BSF | |
| MSI Stealth 16 Studio A13VG | |
| Asus ROG Flow X16 GV601V | |
| Average Intel Core i7-13700H (12321 - 45118, n=29) | |
| AIDA64 / CPU AES | |
| Gigabyte AERO 16 OLED BSF | |
| Corsair Voyager a1600 | |
| Medion Erazer Major X20 | |
| Average of class Gaming (39258 - 247074, n=102, last 2 years) | |
| Asus ROG Flow X16 GV601V | |
| MSI Stealth 16 Studio A13VG | |
| Average Intel Core i7-13700H (28769 - 151254, n=29) | |
| Acer Nitro 16 AN16-41 | |
| AIDA64 / CPU ZLib | |
| Medion Erazer Major X20 | |
| Average of class Gaming (574 - 2531, n=102, last 2 years) | |
| Asus ROG Flow X16 GV601V | |
| Gigabyte AERO 16 OLED BSF | |
| MSI Stealth 16 Studio A13VG | |
| Average Intel Core i7-13700H (389 - 1215, n=29) | |
| Acer Nitro 16 AN16-41 | |
| Corsair Voyager a1600 | |
| AIDA64 / FP64 Ray-Trace | |
| Average of class Gaming (5509 - 45446, n=102, last 2 years) | |
| Medion Erazer Major X20 | |
| Gigabyte AERO 16 OLED BSF | |
| Asus ROG Flow X16 GV601V | |
| MSI Stealth 16 Studio A13VG | |
| Acer Nitro 16 AN16-41 | |
| Corsair Voyager a1600 | |
| Average Intel Core i7-13700H (2540 - 10135, n=29) | |
| AIDA64 / CPU PhotoWorxx | |
| MSI Stealth 16 Studio A13VG | |
| Gigabyte AERO 16 OLED BSF | |
| Average of class Gaming (12271 - 89891, n=102, last 2 years) | |
| Medion Erazer Major X20 | |
| Average Intel Core i7-13700H (12872 - 52727, n=29) | |
| Asus ROG Flow X16 GV601V | |
| Corsair Voyager a1600 | |
| Acer Nitro 16 AN16-41 | |
System performance
In terms of system performance, the MSI Stealth 16 Studio A13VG secured a mid-table placing in our benchmark tests. At six and nine percent, respectively, the gap to first place is relatively small. However, the system performance is excellent and is above average for the gaming laptops released in the last two years. When it comes to the AIDA64 benchmarks, the MSI Stealth 16 Studio A13VG delivers consistently flawless results due to its fast DDR5 RAM with our review device even managing to secure the top spot.
CrossMark: Overall | Productivity | Creativity | Responsiveness
| PCMark 10 / Score | |
| Average of class Gaming (5828 - 12414, n=93, last 2 years) | |
| Gigabyte AERO 16 OLED BSF | |
| Asus ROG Flow X16 GV601V | |
| Medion Erazer Major X20 | |
| Average Intel Core i7-13700H, NVIDIA GeForce RTX 4070 Laptop GPU (7158 - 7956, n=8) | |
| MSI Stealth 16 Studio A13VG | |
| Acer Nitro 16 AN16-41 | |
| Corsair Voyager a1600 | |
| PCMark 10 / Essentials | |
| Medion Erazer Major X20 | |
| Asus ROG Flow X16 GV601V | |
| Gigabyte AERO 16 OLED BSF | |
| Average Intel Core i7-13700H, NVIDIA GeForce RTX 4070 Laptop GPU (10252 - 11449, n=8) | |
| Average of class Gaming (8810 - 11935, n=97, last 2 years) | |
| Acer Nitro 16 AN16-41 | |
| MSI Stealth 16 Studio A13VG | |
| Corsair Voyager a1600 | |
| PCMark 10 / Productivity | |
| Average of class Gaming (6845 - 25323, n=95, last 2 years) | |
| Asus ROG Flow X16 GV601V | |
| Medion Erazer Major X20 | |
| Average Intel Core i7-13700H, NVIDIA GeForce RTX 4070 Laptop GPU (8501 - 10769, n=8) | |
| MSI Stealth 16 Studio A13VG | |
| Gigabyte AERO 16 OLED BSF | |
| Acer Nitro 16 AN16-41 | |
| Corsair Voyager a1600 | |
| PCMark 10 / Digital Content Creation | |
| Average of class Gaming (7602 - 19954, n=95, last 2 years) | |
| Gigabyte AERO 16 OLED BSF | |
| Corsair Voyager a1600 | |
| Asus ROG Flow X16 GV601V | |
| Average Intel Core i7-13700H, NVIDIA GeForce RTX 4070 Laptop GPU (10358 - 12908, n=8) | |
| MSI Stealth 16 Studio A13VG | |
| Acer Nitro 16 AN16-41 | |
| Medion Erazer Major X20 | |
| CrossMark / Overall | |
| Average of class Gaming (1366 - 2409, n=94, last 2 years) | |
| Asus ROG Flow X16 GV601V | |
| Average Intel Core i7-13700H, NVIDIA GeForce RTX 4070 Laptop GPU (1768 - 2073, n=6) | |
| Gigabyte AERO 16 OLED BSF | |
| Medion Erazer Major X20 | |
| MSI Stealth 16 Studio A13VG | |
| Acer Nitro 16 AN16-41 | |
| Corsair Voyager a1600 | |
| CrossMark / Productivity | |
| Asus ROG Flow X16 GV601V | |
| Average of class Gaming (1386 - 2254, n=94, last 2 years) | |
| Average Intel Core i7-13700H, NVIDIA GeForce RTX 4070 Laptop GPU (1645 - 2006, n=6) | |
| Gigabyte AERO 16 OLED BSF | |
| MSI Stealth 16 Studio A13VG | |
| Medion Erazer Major X20 | |
| Acer Nitro 16 AN16-41 | |
| Corsair Voyager a1600 | |
| CrossMark / Creativity | |
| Average of class Gaming (1343 - 2786, n=94, last 2 years) | |
| Asus ROG Flow X16 GV601V | |
| Medion Erazer Major X20 | |
| Average Intel Core i7-13700H, NVIDIA GeForce RTX 4070 Laptop GPU (1936 - 2137, n=6) | |
| Gigabyte AERO 16 OLED BSF | |
| MSI Stealth 16 Studio A13VG | |
| Acer Nitro 16 AN16-41 | |
| Corsair Voyager a1600 | |
| CrossMark / Responsiveness | |
| Gigabyte AERO 16 OLED BSF | |
| Average Intel Core i7-13700H, NVIDIA GeForce RTX 4070 Laptop GPU (1451 - 2202, n=6) | |
| Average of class Gaming (1226 - 2334, n=94, last 2 years) | |
| Asus ROG Flow X16 GV601V | |
| MSI Stealth 16 Studio A13VG | |
| Medion Erazer Major X20 | |
| Acer Nitro 16 AN16-41 | |
| Corsair Voyager a1600 | |
| PCMark 10 Score | 7329 points | |
Help | ||
| AIDA64 / Memory Copy | |
| Average of class Gaming (21750 - 129946, n=102, last 2 years) | |
| MSI Stealth 16 Studio A13VG | |
| Medion Erazer Major X20 | |
| Gigabyte AERO 16 OLED BSF | |
| Average Intel Core i7-13700H (24334 - 78081, n=29) | |
| Asus ROG Flow X16 GV601V | |
| Corsair Voyager a1600 | |
| Acer Nitro 16 AN16-41 | |
| AIDA64 / Memory Read | |
| Average of class Gaming (22956 - 118858, n=102, last 2 years) | |
| Medion Erazer Major X20 | |
| MSI Stealth 16 Studio A13VG | |
| Gigabyte AERO 16 OLED BSF | |
| Asus ROG Flow X16 GV601V | |
| Average Intel Core i7-13700H (23681 - 79656, n=29) | |
| Corsair Voyager a1600 | |
| Acer Nitro 16 AN16-41 | |
| AIDA64 / Memory Write | |
| Average of class Gaming (22297 - 135096, n=102, last 2 years) | |
| MSI Stealth 16 Studio A13VG | |
| Gigabyte AERO 16 OLED BSF | |
| Average Intel Core i7-13700H (22986 - 99898, n=29) | |
| Medion Erazer Major X20 | |
| Asus ROG Flow X16 GV601V | |
| Corsair Voyager a1600 | |
| Acer Nitro 16 AN16-41 | |
| AIDA64 / Memory Latency | |
| Average of class Gaming (75.3 - 165.4, n=102, last 2 years) | |
| Corsair Voyager a1600 | |
| Gigabyte AERO 16 OLED BSF | |
| Average Intel Core i7-13700H (82.4 - 136.8, n=29) | |
| Acer Nitro 16 AN16-41 | |
| Asus ROG Flow X16 GV601V | |
| Medion Erazer Major X20 | |
| MSI Stealth 16 Studio A13VG | |
* ... smaller is better
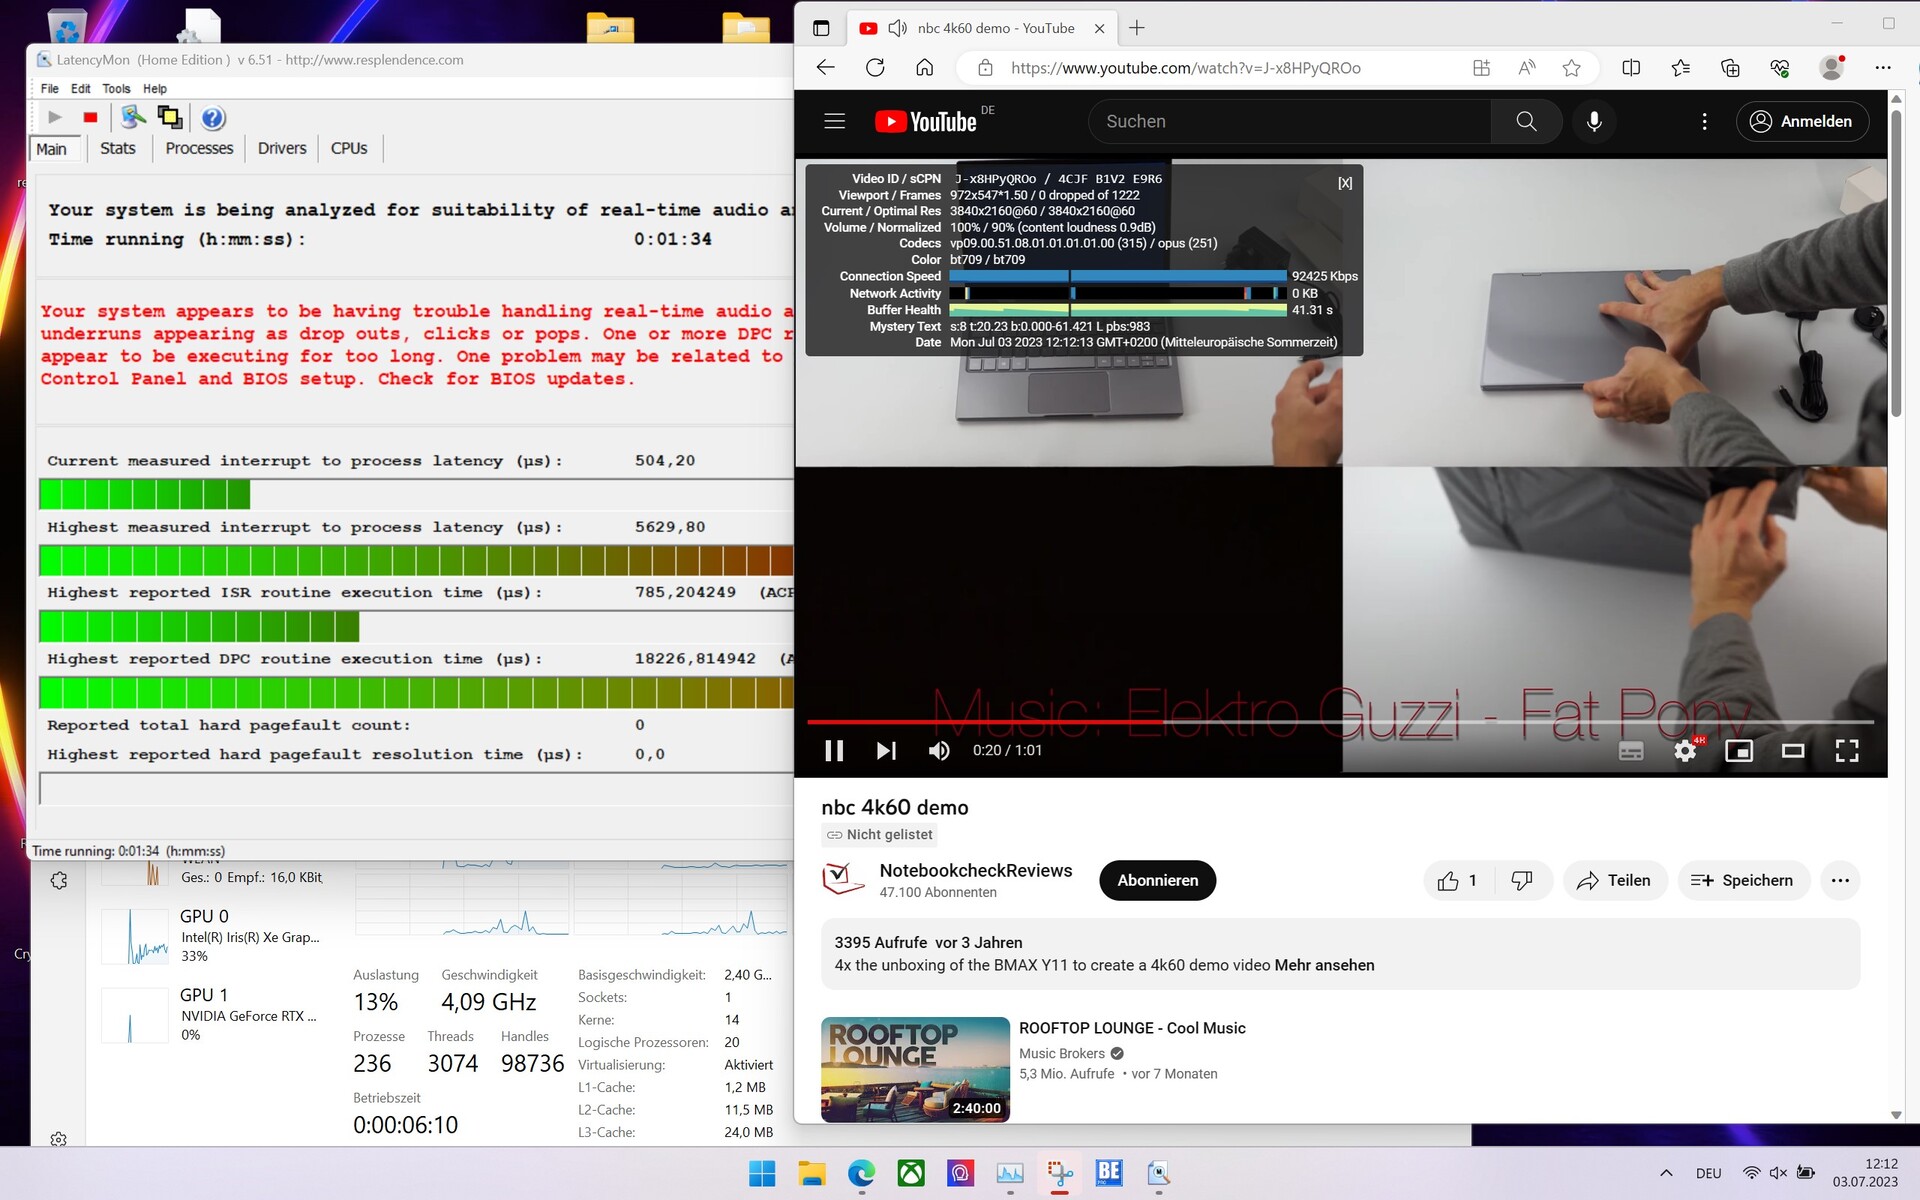
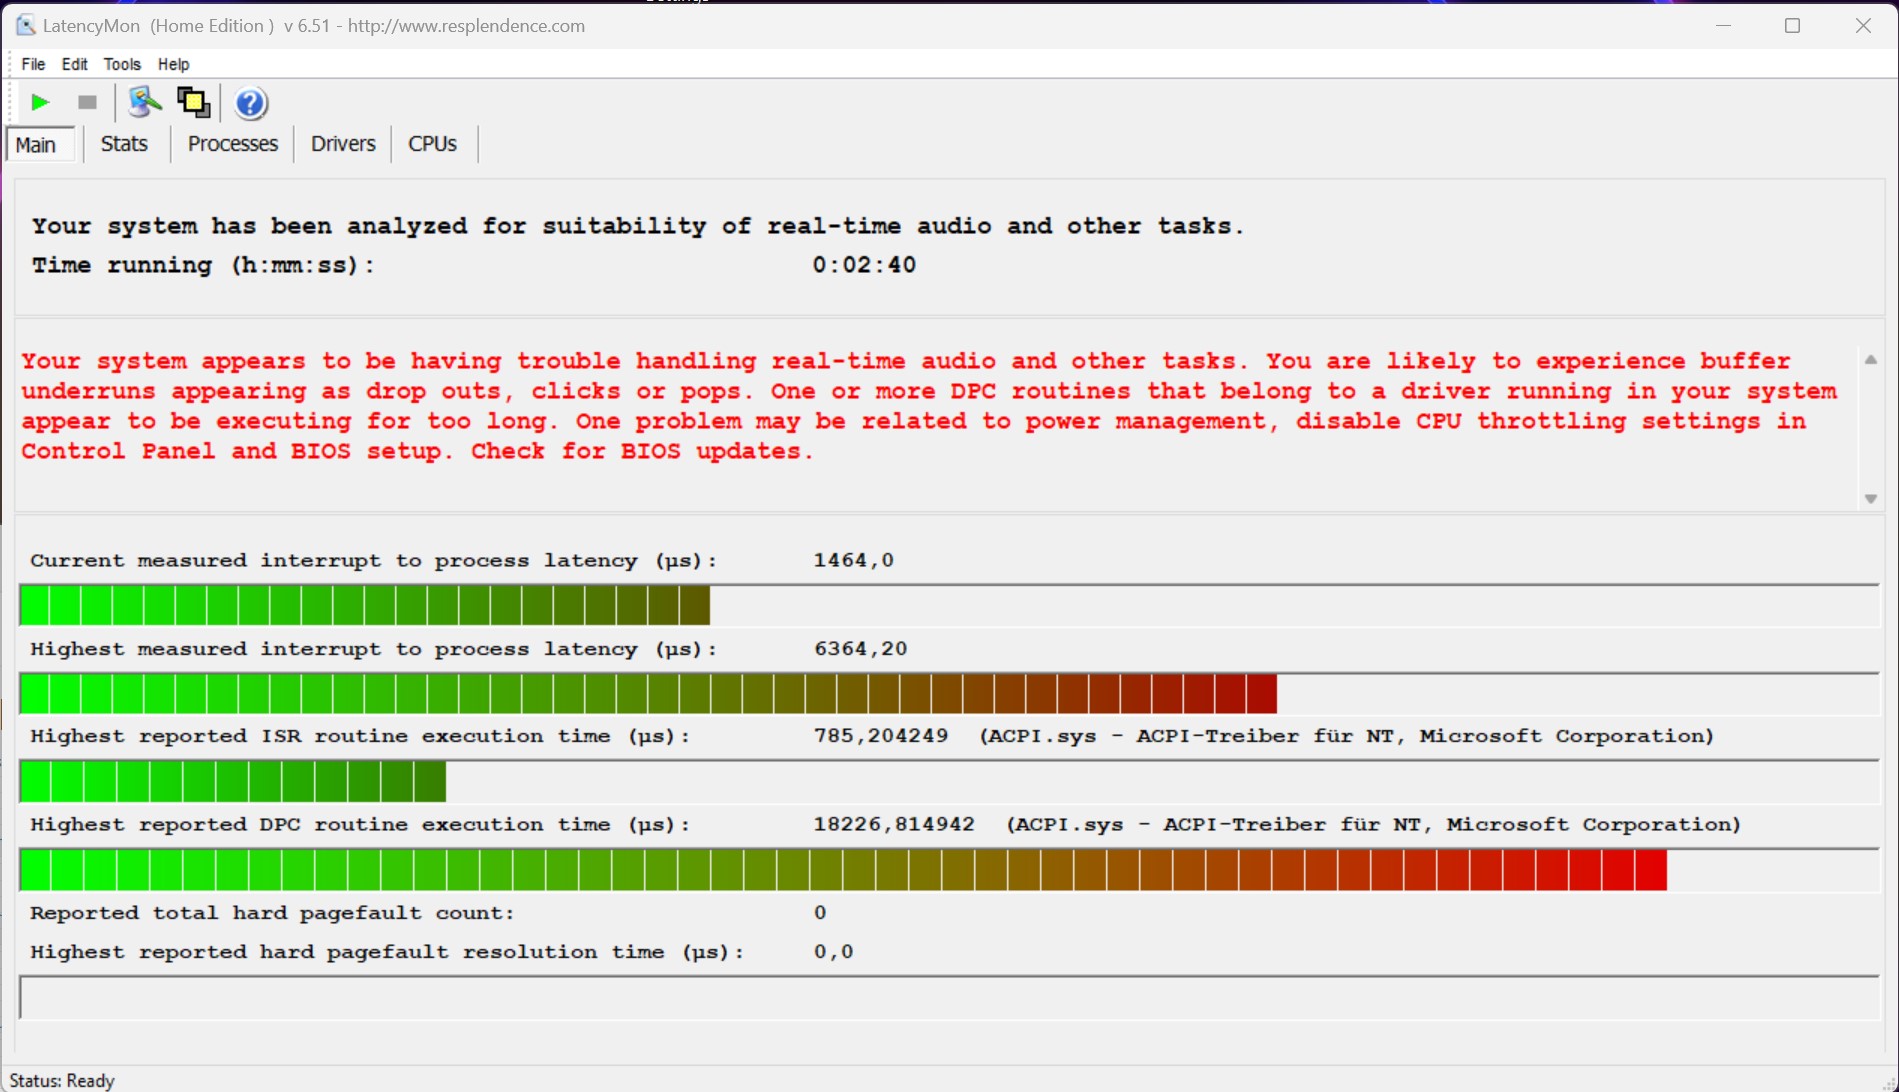
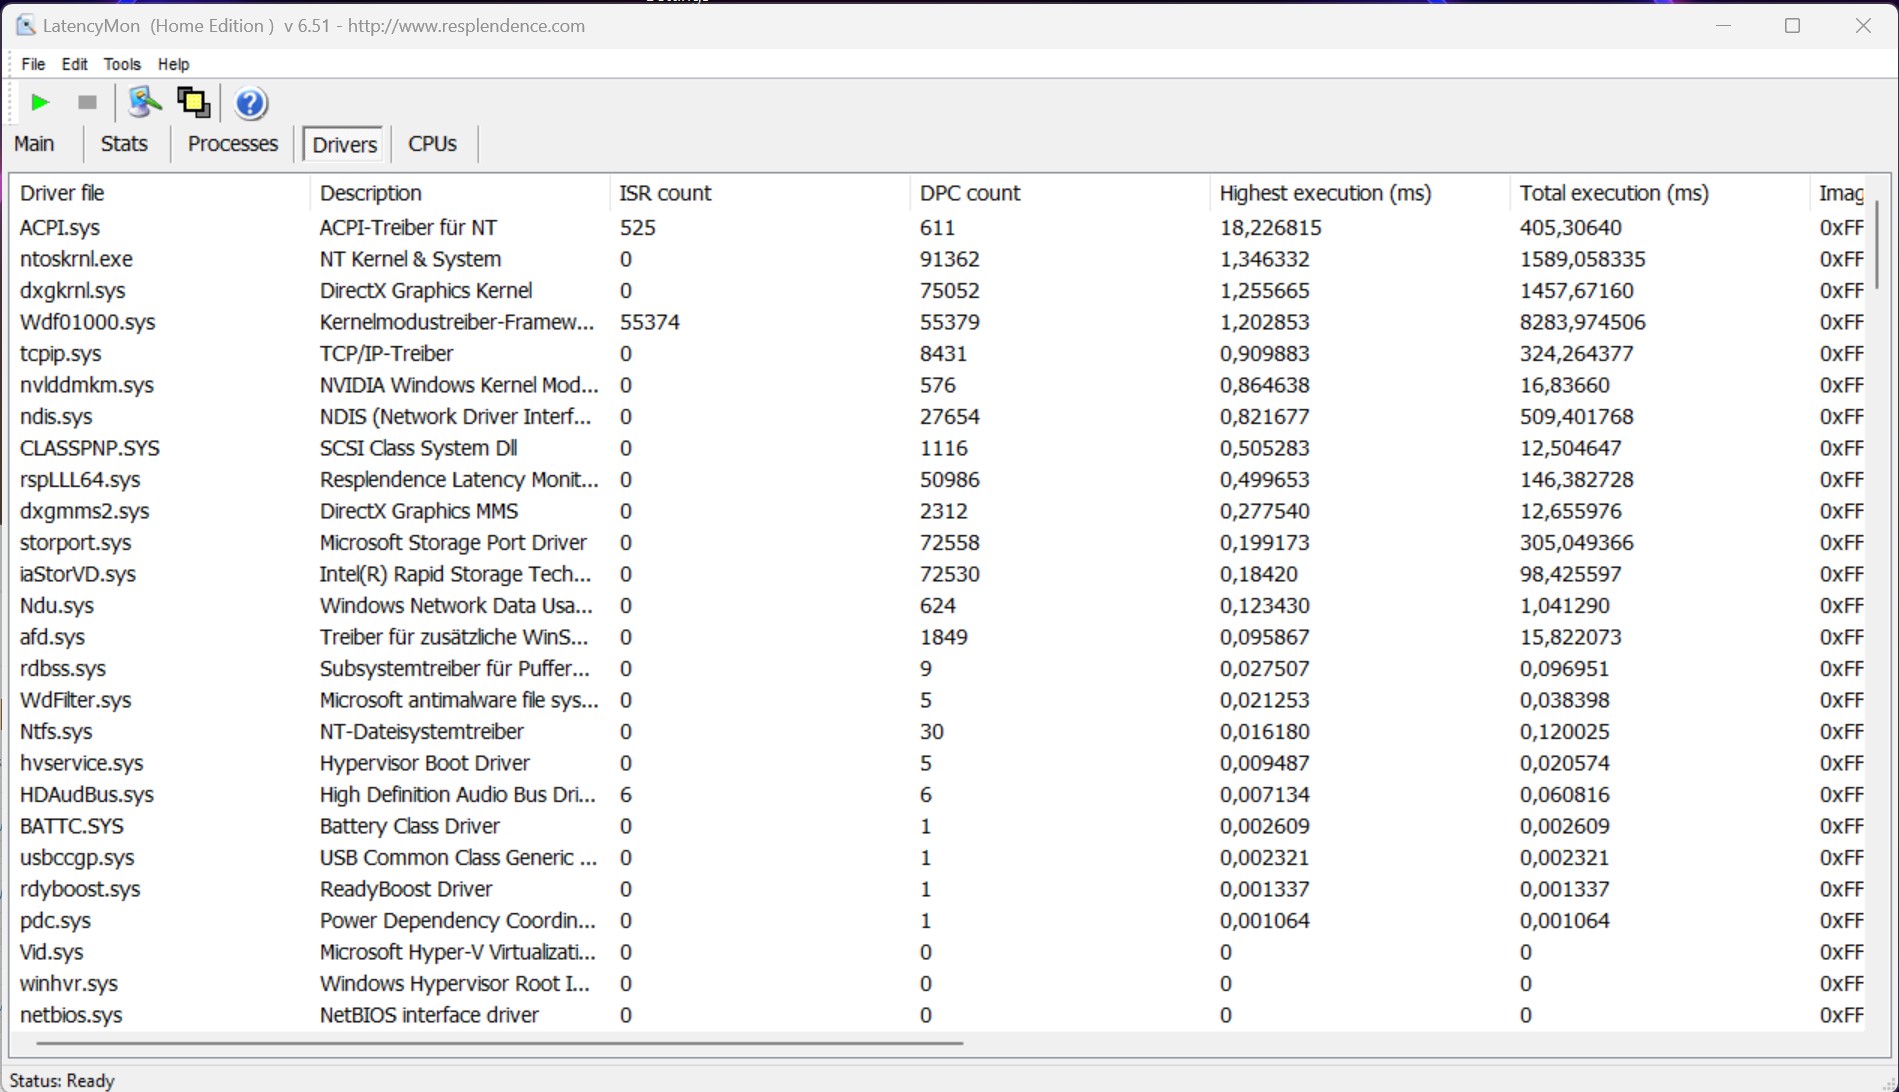
DPC latencies
The MSI Stealth 16 Studio A13VG's standardized Latency Monitor test (surfing the internet, 4K video playback, Prime95 high load) returned extreme values. Future software updates should hopefully ensure improvements so that the system can be considered completely suitable for real-time video and audio processing. However, it's worth mentioning that no skipped frames were detected during the 4K video playback.
| DPC Latencies / LatencyMon - interrupt to process latency (max), Web, Youtube, Prime95 | |
| MSI Stealth 16 Studio A13VG | |
| Medion Erazer Major X20 | |
| Acer Nitro 16 AN16-41 | |
| Asus ROG Flow X16 GV601V | |
| Gigabyte AERO 16 OLED BSF | |
| Corsair Voyager a1600 | |
* ... smaller is better
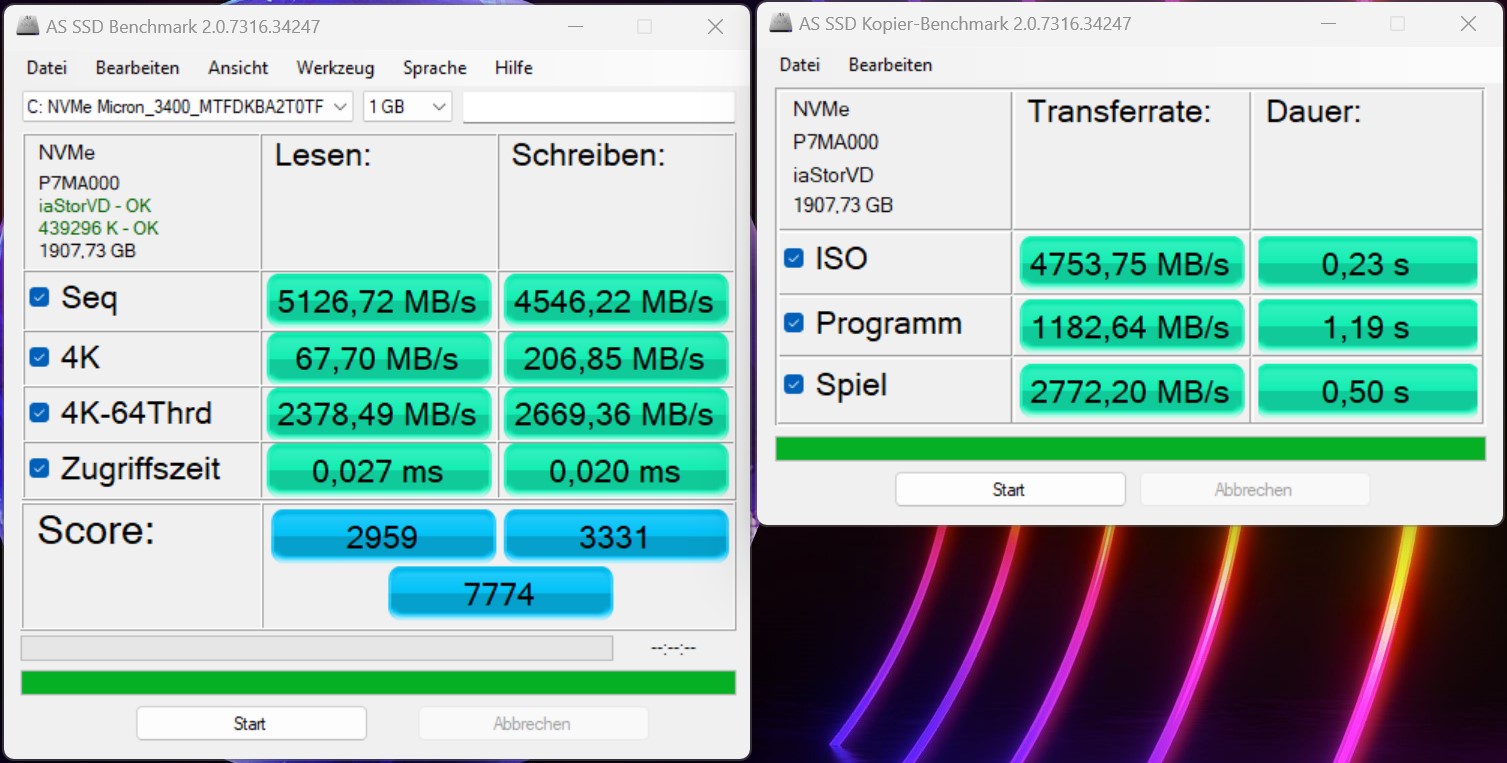
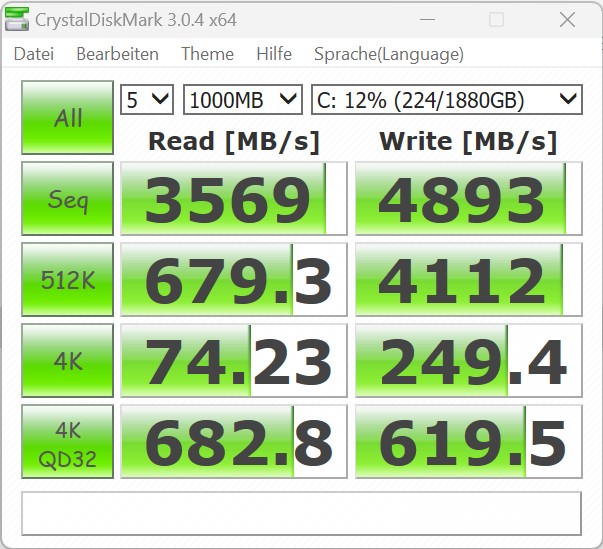
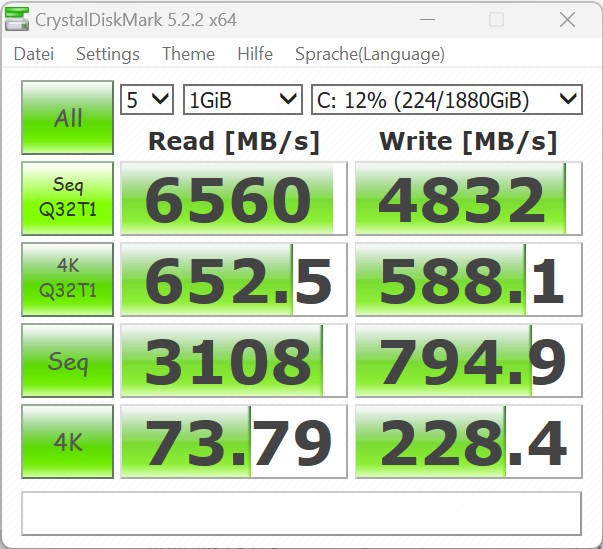
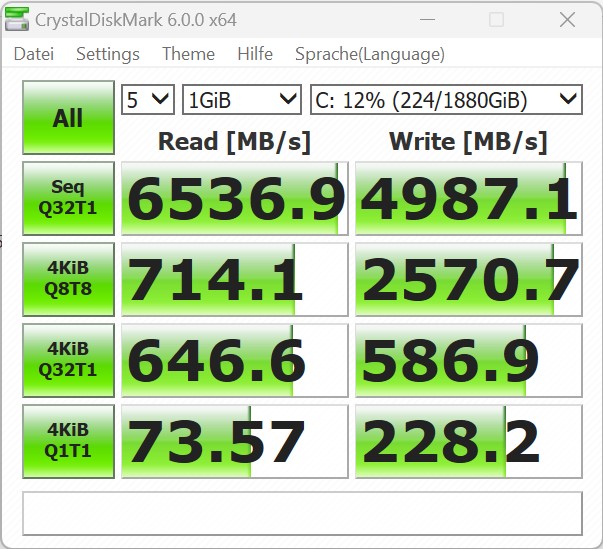
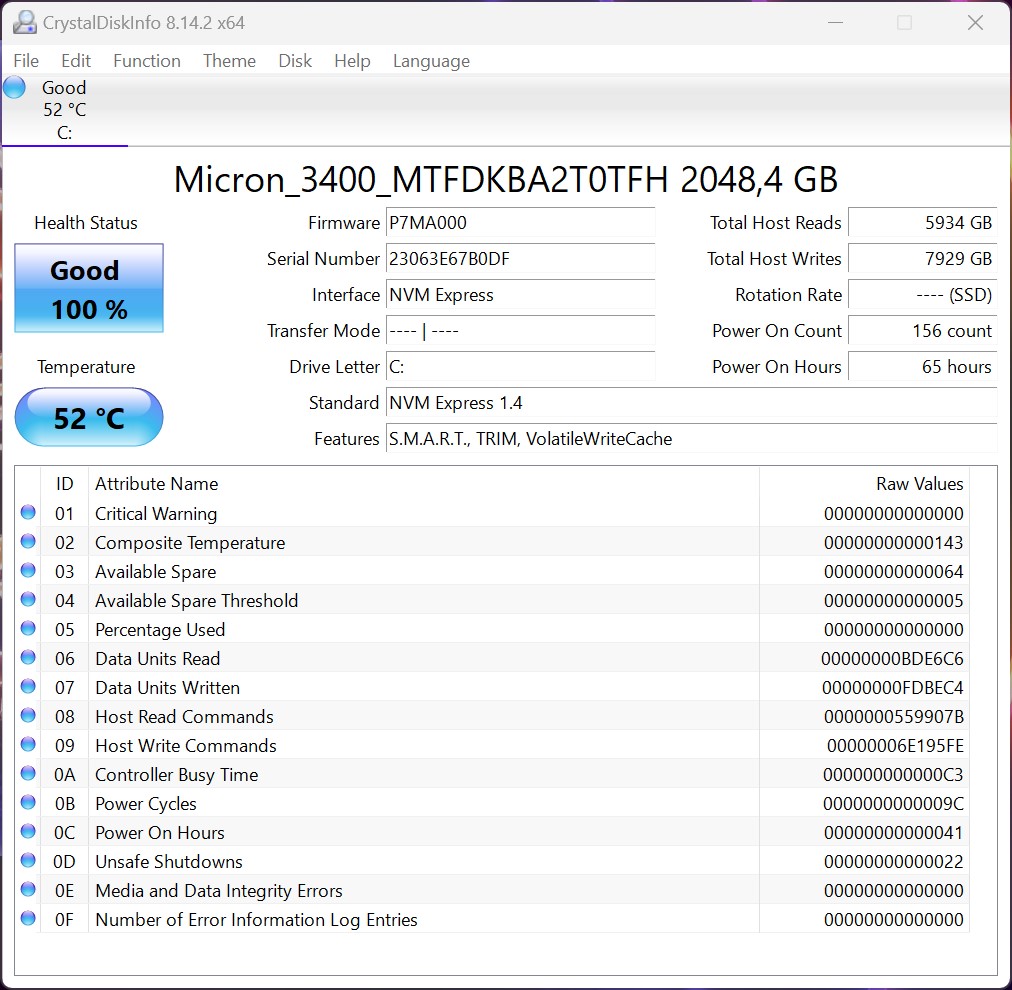
Mass storage
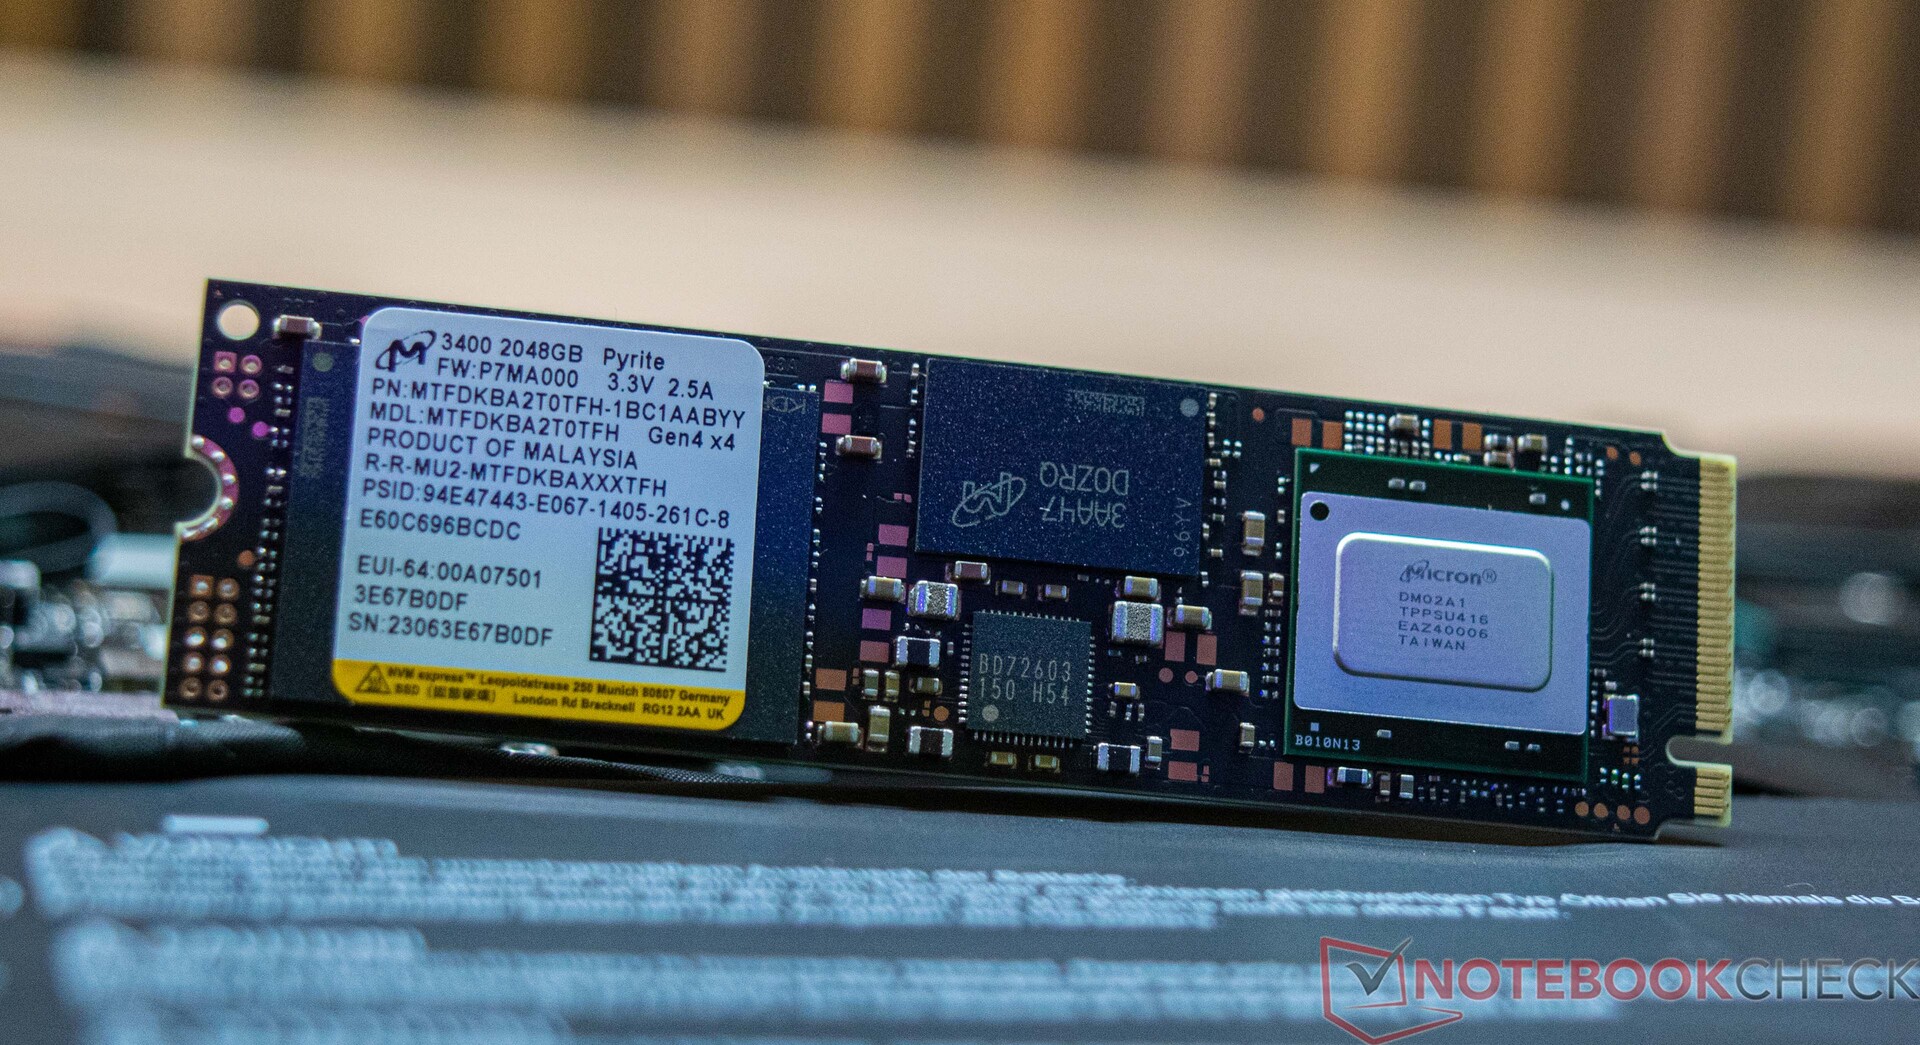
The MSI Stealth 16 Studio A13VG's mass storage comes in the form of an SSD from Micron. At 2 TB, the installed model offers plenty of storage space, thereby underpinning its intended use. In tests, the SSD delivered excellent values thanks to its PCIe connection. Once again, this helped our review device secure first place. However, the MSI Stealth 16 Studio A13VG had permanent problems reading and writing to and from the SSD with the read performance dropping significantly after only a short period of continuous load. The Acer Nitro 16 was the only other device where we saw a similarly large drop in performance. The MSI Stealth 16 Studio A13VG can house a total of two SSDs.
For more comparisons and benchmarks, take a look at our comparison table.

* ... smaller is better
Continuous Performance Read: DiskSpd Read Loop, Queue Depth 8
Graphics card
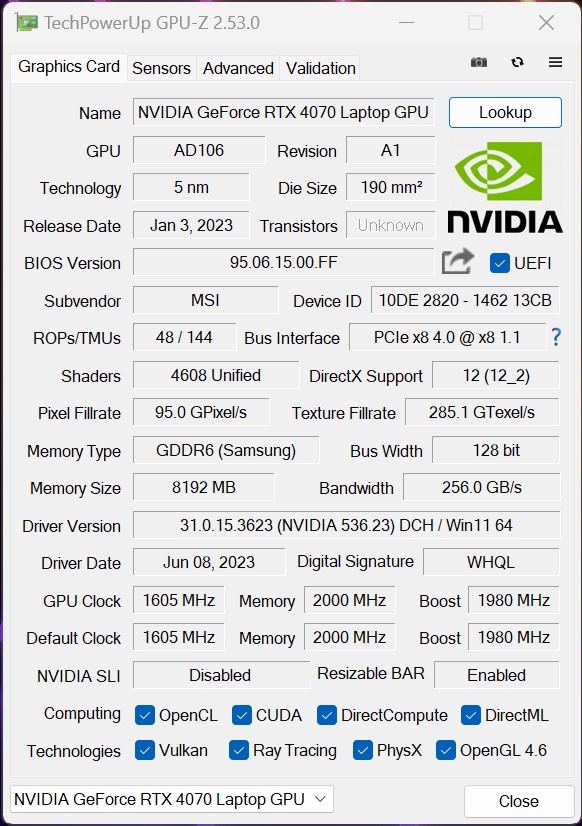
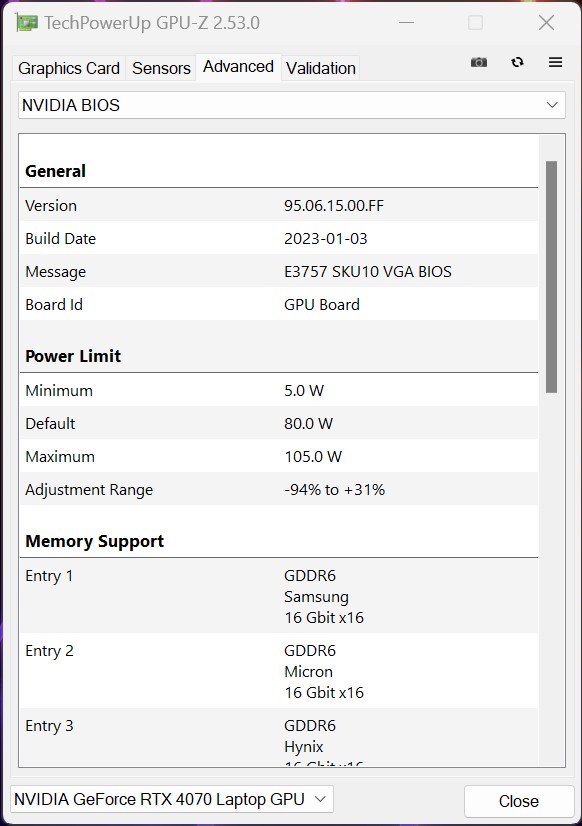
Das MSI Stealth 16 Studio A13VG relies on an Nvidia GeForce RTX 4070 laptop GPU which has an available TGP of up to 105 watts. This means that the graphics card is not granted the maximum possible TGP of up to 115 watts. However, in our comparison, we saw our review sample deliver good 3D performance in synthetic tests and its 3DMark performance rating was almost enough to secure first place.
Additional Nvidia GeForce RTX 4070 laptop GPU benchmarks can be found here.
| 3DMark 05 Standard | 53254 points | |
| 3DMark 06 Standard Score | 63808 points | |
| 3DMark Vantage P Result | 94245 points | |
| 3DMark 11 Performance | 34960 points | |
| 3DMark Ice Storm Standard Score | 94921 points | |
| 3DMark Cloud Gate Standard Score | 63781 points | |
| 3DMark Fire Strike Score | 26244 points | |
| 3DMark Fire Strike Extreme Score | 13736 points | |
| 3DMark Time Spy Score | 11980 points | |
Help | ||
* ... smaller is better
Gaming performance
The Nvidia GeForce RTX 4070 laptop GPU employed here is fast enough to be able to play numerous games smoothly and display them at native revolution. Our tests show that the Medion Erazer Major X20 delivers better graphics performance with the same graphics adapter. Compared to the Gigabyte AERO 16, the MSI Stealth 16 Studio A13VG displayed an almost identical level of performance. On top of that, we also noticed that Acer's Nitro 16, which is also equipped with an Nvidia GeForce RTX 4070 laptop GPU, is clearly inferior. However, we wouldn't want to be deprived of the benefits of the Ada Lovelace architecture which is also in the mobile GPUs. This means you can use features such as DLSS 3 and Frame Generation, as long as the games themselves support this technology. This can sometimes lead to a significant increase in the frame rate.
| Performance rating - Percent | |
| Average of class Gaming | |
| Medion Erazer Major X20 | |
| Gigabyte AERO 16 OLED BSF | |
| MSI Stealth 16 Studio A13VG | |
| Asus ROG Flow X16 GV601V | |
| Acer Nitro 16 AN16-41 | |
| Corsair Voyager a1600 | |
| The Witcher 3 - 1920x1080 Ultra Graphics & Postprocessing (HBAO+) | |
| Average of class Gaming (104.7 - 240, n=7, last 2 years) | |
| Medion Erazer Major X20 | |
| MSI Stealth 16 Studio A13VG | |
| Gigabyte AERO 16 OLED BSF | |
| Acer Nitro 16 AN16-41 | |
| Corsair Voyager a1600 | |
| Asus ROG Flow X16 GV601V | |
| GTA V - 1920x1080 Highest AA:4xMSAA + FX AF:16x | |
| Average of class Gaming (67.1 - 186.9, n=90, last 2 years) | |
| Medion Erazer Major X20 | |
| Gigabyte AERO 16 OLED BSF | |
| MSI Stealth 16 Studio A13VG | |
| Asus ROG Flow X16 GV601V | |
| Acer Nitro 16 AN16-41 | |
| Corsair Voyager a1600 | |
| Final Fantasy XV Benchmark - 1920x1080 High Quality | |
| Average of class Gaming (64.2 - 215, n=91, last 2 years) | |
| Medion Erazer Major X20 | |
| Gigabyte AERO 16 OLED BSF | |
| MSI Stealth 16 Studio A13VG | |
| Acer Nitro 16 AN16-41 | |
| Asus ROG Flow X16 GV601V | |
| Corsair Voyager a1600 | |
| Strange Brigade - 1920x1080 ultra AA:ultra AF:16 | |
| Average of class Gaming (113.6 - 458, n=83, last 2 years) | |
| Medion Erazer Major X20 | |
| Corsair Voyager a1600 | |
| Gigabyte AERO 16 OLED BSF | |
| MSI Stealth 16 Studio A13VG | |
| Acer Nitro 16 AN16-41 | |
| Asus ROG Flow X16 GV601V | |
| Dota 2 Reborn - 1920x1080 ultra (3/3) best looking | |
| Medion Erazer Major X20 | |
| Average of class Gaming (84.8 - 252, n=104, last 2 years) | |
| MSI Stealth 16 Studio A13VG | |
| Asus ROG Flow X16 GV601V | |
| Gigabyte AERO 16 OLED BSF | |
| Corsair Voyager a1600 | |
| Acer Nitro 16 AN16-41 | |
In order to check how stable the frame rates are over longer periods of time, we ran the game The Witcher 3 for around 60 minutes at Full HD resolution and maximum presets. In the process, the game character was not moved. The diagram shows relatively consistent frame rate performance.
Witcher 3 FPS diagram
| low | med. | high | ultra | QHD | |
|---|---|---|---|---|---|
| GTA V (2015) | 187 | 184.7 | 180.3 | 119.7 | 92.8 |
| The Witcher 3 (2015) | 452.3 | 390.5 | 226.7 | 119 | |
| Dota 2 Reborn (2015) | 189.6 | 169 | 160.5 | 154.7 | |
| Final Fantasy XV Benchmark (2018) | 202 | 154.2 | 115 | 83.8 | |
| X-Plane 11.11 (2018) | 158.5 | 142.4 | 110.2 | ||
| Far Cry 5 (2018) | 190 | 157 | 150 | 143 | 113 |
| Strange Brigade (2018) | 470 | 286 | 230 | 200 | 132 |
| Shadow of the Tomb Raider (2018) | 206 | 163.4 | 158.1 | 145.9 | 104 |
| Far Cry New Dawn (2019) | 165 | 140 | 135 | 120 | 105 |
| Metro Exodus (2019) | 221 | 141.3 | 109.8 | 87.2 | 69.1 |
| Borderlands 3 (2019) | 175.9 | 145.9 | 119.7 | 98.6 | 71.5 |
| F1 2020 (2020) | 331 | 276 | 235 | 183 | 142.6 |
| F1 2021 (2021) | 378 | 300 | 238 | 139.5 | 108.5 |
| Far Cry 6 (2021) | 168.8 | 143 | 126.5 | 114.5 | 86.7 |
| God of War (2022) | 143.1 | 119.5 | 95.6 | 68.8 | 58.5 |
| GRID Legends (2022) | 182.9 | 164.1 | 150.1 | 131.7 | 112.1 |
| Tiny Tina's Wonderlands (2022) | 230 | 190.1 | 130.3 | 101.7 | 70.5 |
| F1 22 (2022) | 256 | 246 | 183.4 | 76.7 | 49.7 |
| Uncharted Legacy of Thieves Collection (2022) | 94 | 92.4 | 86.2 | 82.7 | 61.2 |
| High On Life (2023) | 220 | 178.7 | 134.1 | 110.6 | 66.9 |
| Dead Space Remake (2023) | 102.8 | 98.2 | 86.7 | 86.5 | 56.5 |
| Returnal (2023) | 115 | 111 | 102 | 88 | 63 |
| Company of Heroes 3 (2023) | 211.8 | 191.4 | 156.5 | 153.9 | 114.8 |
| Resident Evil 4 Remake (2023) | 160.1 | 123.4 | 113.1 | 82.4 | 61.3 |
| The Last of Us (2023) | 114.4 | 96.5 | 85.5 | 75 | 43.9 |
| Star Wars Jedi Survivor (2023) | 92.1 | 80.6 | 75.6 | 71.1 | 47 |
| Diablo 4 (2023) | 255 | 233 | 208 | 177.8 | 105.4 |
| F1 23 (2023) | 230 | 232 | 189 | 71 | 45 |
Emissions - Good battery life but high temperatures
Noise emissions
When idling and in everyday office use working with Office and performing internet-based tasks, the MSI Stealth 16 Studio A13VG is silent. We only measured just short of 35 dB(A) under average load where a quiet but audible whirring noise could be heard. Under load, it can get very noisy with stress test maximum values of 51.5 dB(A). At 62 dB(A), the Acer Nitro 16 AN16-41 demonstrates that it is possible to get significantly louder.
Basically, the MSI Stealth 16 Studio A13VG also allows for almost silent operation. To achieve this you must select either the "Silent" or "Super Battery" mode energy profiles, both of which be selected in the MSI Center.
You can also take control of the fan via the MSI Center. In addition to the predefined profiles, you can create your own fan curves.
Noise level
| Idle |
| 24 / 24 / 24 dB(A) |
| Load |
| 34.81 / 51.57 dB(A) |
 | ||
30 dB silent 40 dB(A) audible 50 dB(A) loud |
||
min: | ||
| MSI Stealth 16 Studio A13VG GeForce RTX 4070 Laptop GPU, i7-13700H, Micron 3400 2TB MTFDKBA2T0TFH | Asus ROG Flow X16 GV601V GeForce RTX 4060 Laptop GPU, i9-13900H, WD PC SN560 SDDPNQE-1T00 | Medion Erazer Major X20 GeForce RTX 4070 Laptop GPU, i9-13900HX, Phison E18-1TB-PHISON-SSD-B47R | Acer Nitro 16 AN16-41 GeForce RTX 4070 Laptop GPU, R7 7735HS, Samsung PM9A1 MZVL21T0HCLR | Corsair Voyager a1600 Radeon RX 6800M, R9 6900HS, Samsung PM9A1 MZVL22T0HBLB | Gigabyte AERO 16 OLED BSF GeForce RTX 4070 Laptop GPU, i9-13900H, Gigabyte AG470S1TB-SI B10 | |
|---|---|---|---|---|---|---|
| Noise | -3% | -18% | -8% | -23% | -15% | |
| off / environment * (dB) | 24 | 24 -0% | 24 -0% | 25.7 -7% | 29.9 -25% | 23 4% |
| Idle Minimum * (dB) | 24 | 24 -0% | 25 -4% | 25.7 -7% | 30.5 -27% | 23 4% |
| Idle Average * (dB) | 24 | 24 -0% | 29 -21% | 25.7 -7% | 30.6 -28% | 23 4% |
| Idle Maximum * (dB) | 24 | 24 -0% | 31 -29% | 26.3 -10% | 30.7 -28% | 33.64 -40% |
| Load Average * (dB) | 34.81 | 36.71 -5% | 50 -44% | 33.9 3% | 44.5 -28% | 51.49 -48% |
| Witcher 3 ultra * (dB) | 44.05 | 50.92 -16% | 53 -20% | 55.27 -25% | ||
| Load Maximum * (dB) | 51.57 | 50.92 1% | 57 -11% | 62 -20% | 51.1 1% | 55.24 -7% |
* ... smaller is better
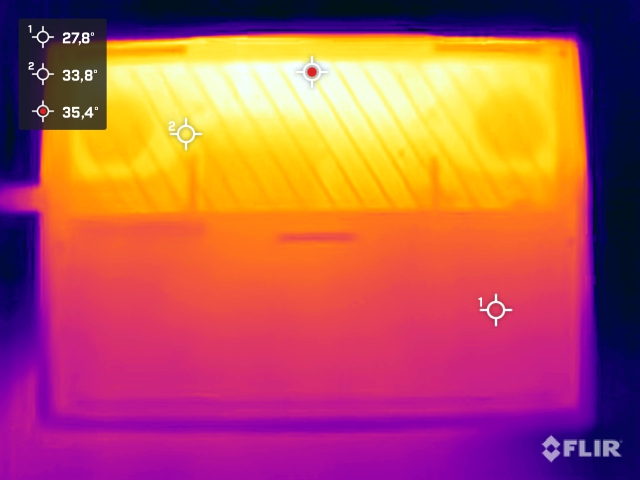
Temperature
In the stress test, we recorded high case temperatures under load and also when gaming. At over 60 °C, the temperatures are higher on both the laptop's top and bottom sides than its peers. As a result, it can get uncomfortable when using the device on your lap under load.
(-) The maximum temperature on the upper side is 60 °C / 140 F, compared to the average of 40.4 °C / 105 F, ranging from 21.2 to 68.8 °C for the class Gaming.
(-) The bottom heats up to a maximum of 61 °C / 142 F, compared to the average of 43.2 °C / 110 F
(±) In idle usage, the average temperature for the upper side is 33.2 °C / 92 F, compared to the device average of 33.9 °C / 93 F.
(-) Playing The Witcher 3, the average temperature for the upper side is 44.7 °C / 112 F, compared to the device average of 33.9 °C / 93 F.
(±) The palmrests and touchpad can get very hot to the touch with a maximum of 36 °C / 96.8 F.
(-) The average temperature of the palmrest area of similar devices was 28.8 °C / 83.8 F (-7.2 °C / -13 F).


| MSI Stealth 16 Studio A13VG Intel Core i7-13700H, NVIDIA GeForce RTX 4070 Laptop GPU | Asus ROG Flow X16 GV601V Intel Core i9-13900H, NVIDIA GeForce RTX 4060 Laptop GPU | Medion Erazer Major X20 Intel Core i9-13900HX, NVIDIA GeForce RTX 4070 Laptop GPU | Acer Nitro 16 AN16-41 AMD Ryzen 7 7735HS, NVIDIA GeForce RTX 4070 Laptop GPU | Corsair Voyager a1600 AMD Ryzen 9 6900HS, AMD Radeon RX 6800M | Gigabyte AERO 16 OLED BSF Intel Core i9-13900H, NVIDIA GeForce RTX 4070 Laptop GPU | |
|---|---|---|---|---|---|---|
| Heat | 19% | 11% | 18% | 11% | 34% | |
| Maximum Upper Side * (°C) | 60 | 46 23% | 46 23% | 41.5 31% | 50.7 15% | 41 32% |
| Maximum Bottom * (°C) | 61 | 41 33% | 49 20% | 51.8 15% | 54.2 11% | 47 23% |
| Idle Upper Side * (°C) | 38.2 | 36 6% | 37 3% | 31.6 17% | 35.8 6% | 23 40% |
| Idle Bottom * (°C) | 37.7 | 33 12% | 38 -1% | 34.5 8% | 33 12% | 23 39% |
* ... smaller is better
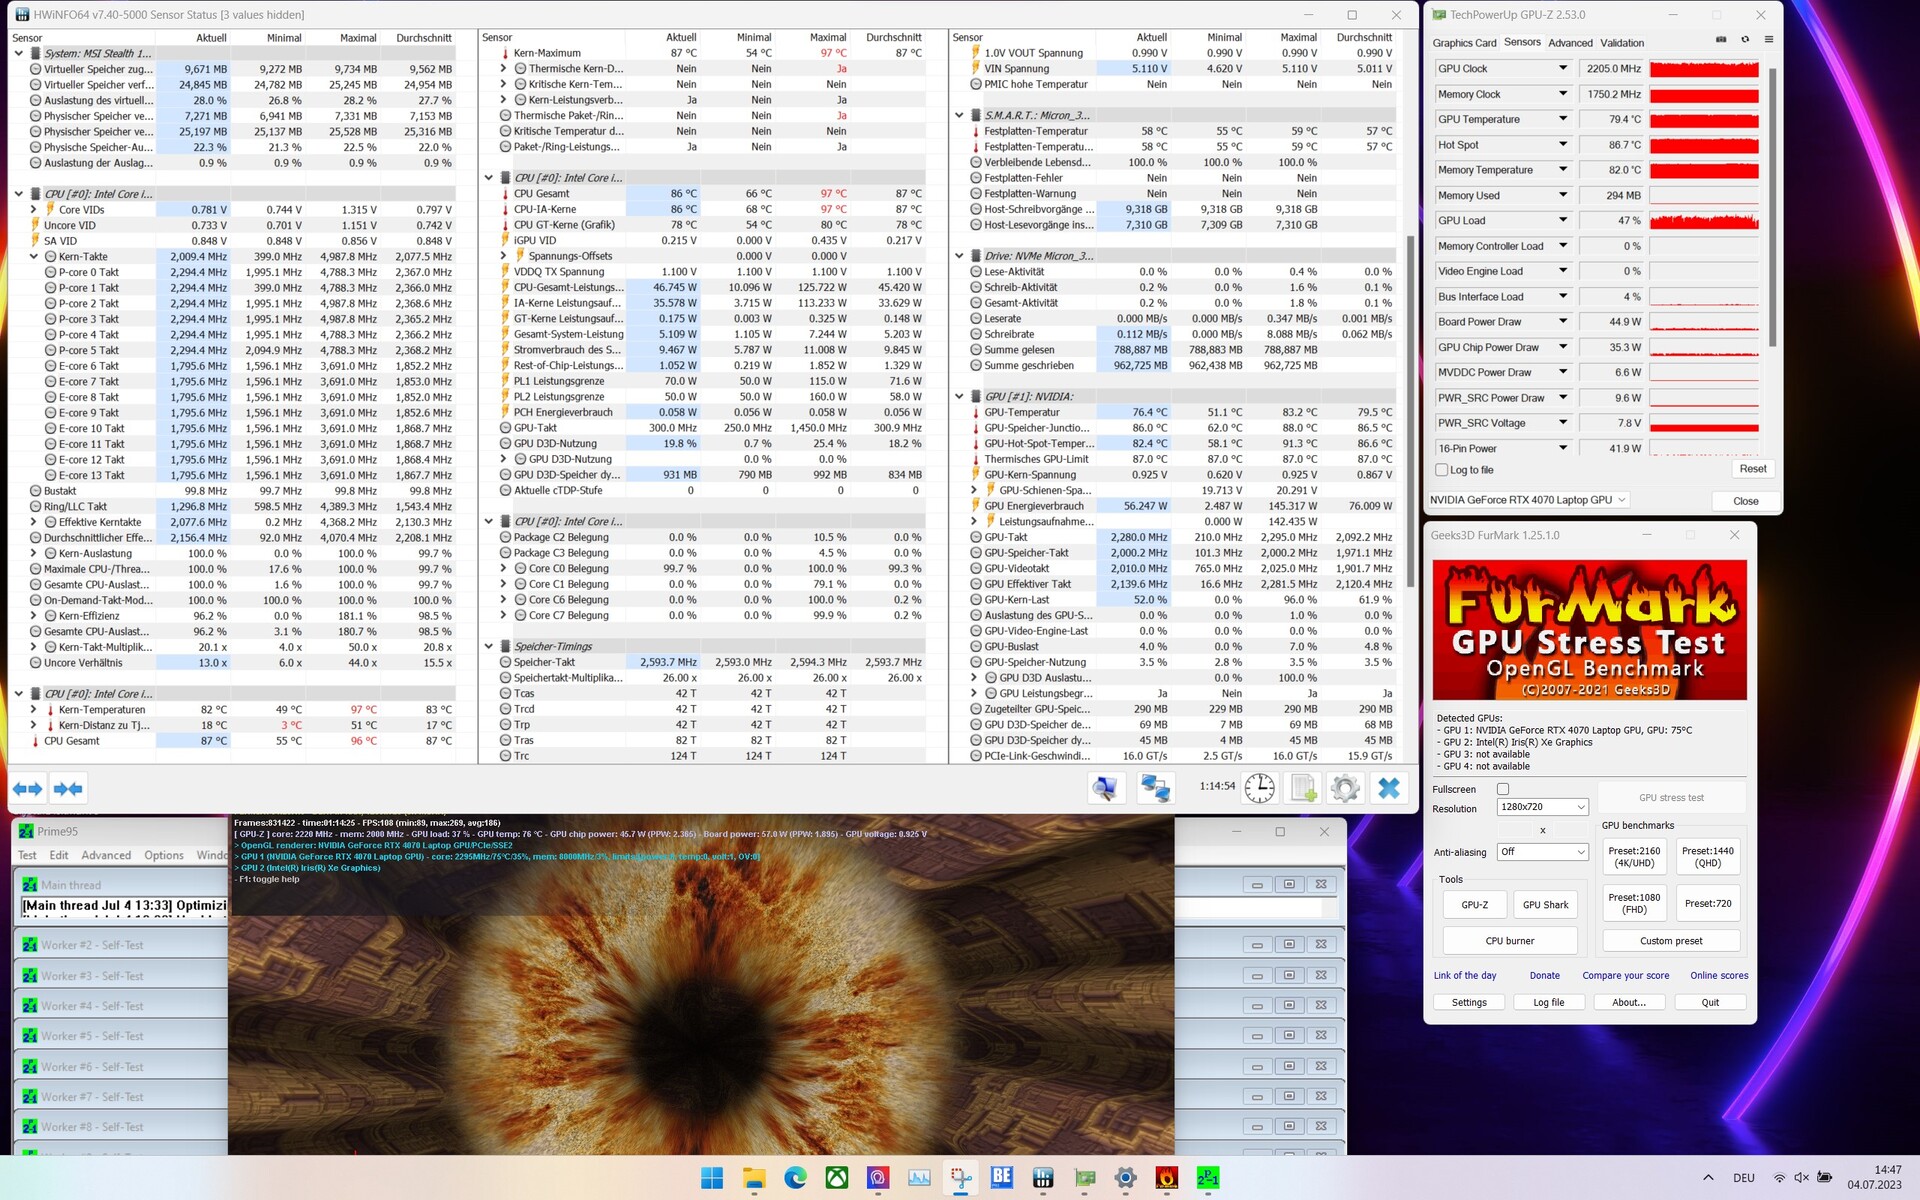
Stress test
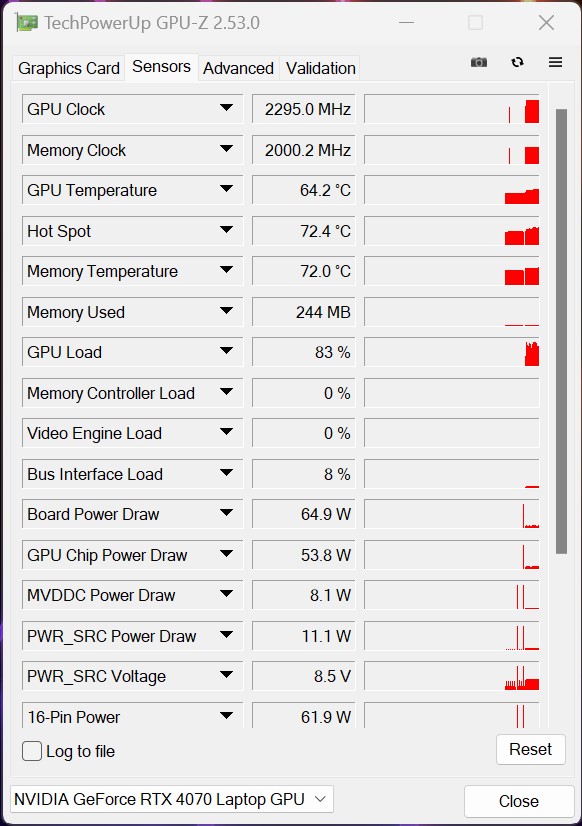
We used Prime95 and FurMark in continuous operation to simulate the stress test. It represents an extreme scenario and serves to check the system stability under full load. In terms of the processor, the highest value we observed was 97 °C which was reached at the very beginning. Over a longer period of time, the CPU temperature settled to around 87 °C. When it came to the graphics adapter, we recorded a maximum hot spot value high of 91 °C. At an average of around 80 °C, we saw considerably lower temperatures under load. This means the graphics card's thermal limit of (87 °C) was not reached.


Speakers
The MSI Stealth 16 Studio A13VG's sound system is based on six speakers which produce a good audio experience. Playback up to maximum volume is clear and free of interference but can't replace an external system.

MSI Stealth 16 Studio A13VG audio analysis
(+) | speakers can play relatively loud (85.48 dB)
Bass 100 - 315 Hz
(±) | reduced bass - on average 9% lower than median
(±) | linearity of bass is average (8.7% delta to prev. frequency)
Mids 400 - 2000 Hz
(+) | balanced mids - only 4.6% away from median
(+) | mids are linear (5.4% delta to prev. frequency)
Highs 2 - 16 kHz
(+) | balanced highs - only 2.7% away from median
(+) | highs are linear (5.1% delta to prev. frequency)
Overall 100 - 16.000 Hz
(+) | overall sound is linear (9.3% difference to median)
Compared to same class
» 3% of all tested devices in this class were better, 2% similar, 95% worse
» The best had a delta of 6%, average was 18%, worst was 132%
Compared to all devices tested
» 3% of all tested devices were better, 1% similar, 96% worse
» The best had a delta of 4%, average was 23%, worst was 134%
Asus ROG Flow X16 GV601V audio analysis
(±) | speaker loudness is average but good (77.38 dB)
Bass 100 - 315 Hz
(±) | reduced bass - on average 9.6% lower than median
(±) | linearity of bass is average (9.2% delta to prev. frequency)
Mids 400 - 2000 Hz
(+) | balanced mids - only 4.7% away from median
(±) | linearity of mids is average (7.5% delta to prev. frequency)
Highs 2 - 16 kHz
(+) | balanced highs - only 2.2% away from median
(+) | highs are linear (6.1% delta to prev. frequency)
Overall 100 - 16.000 Hz
(+) | overall sound is linear (12% difference to median)
Compared to same class
» 12% of all tested devices in this class were better, 4% similar, 84% worse
» The best had a delta of 6%, average was 18%, worst was 132%
Compared to all devices tested
» 9% of all tested devices were better, 2% similar, 88% worse
» The best had a delta of 4%, average was 23%, worst was 134%
Energy management - a bigger battery and moderate energy requirements
Power consumption
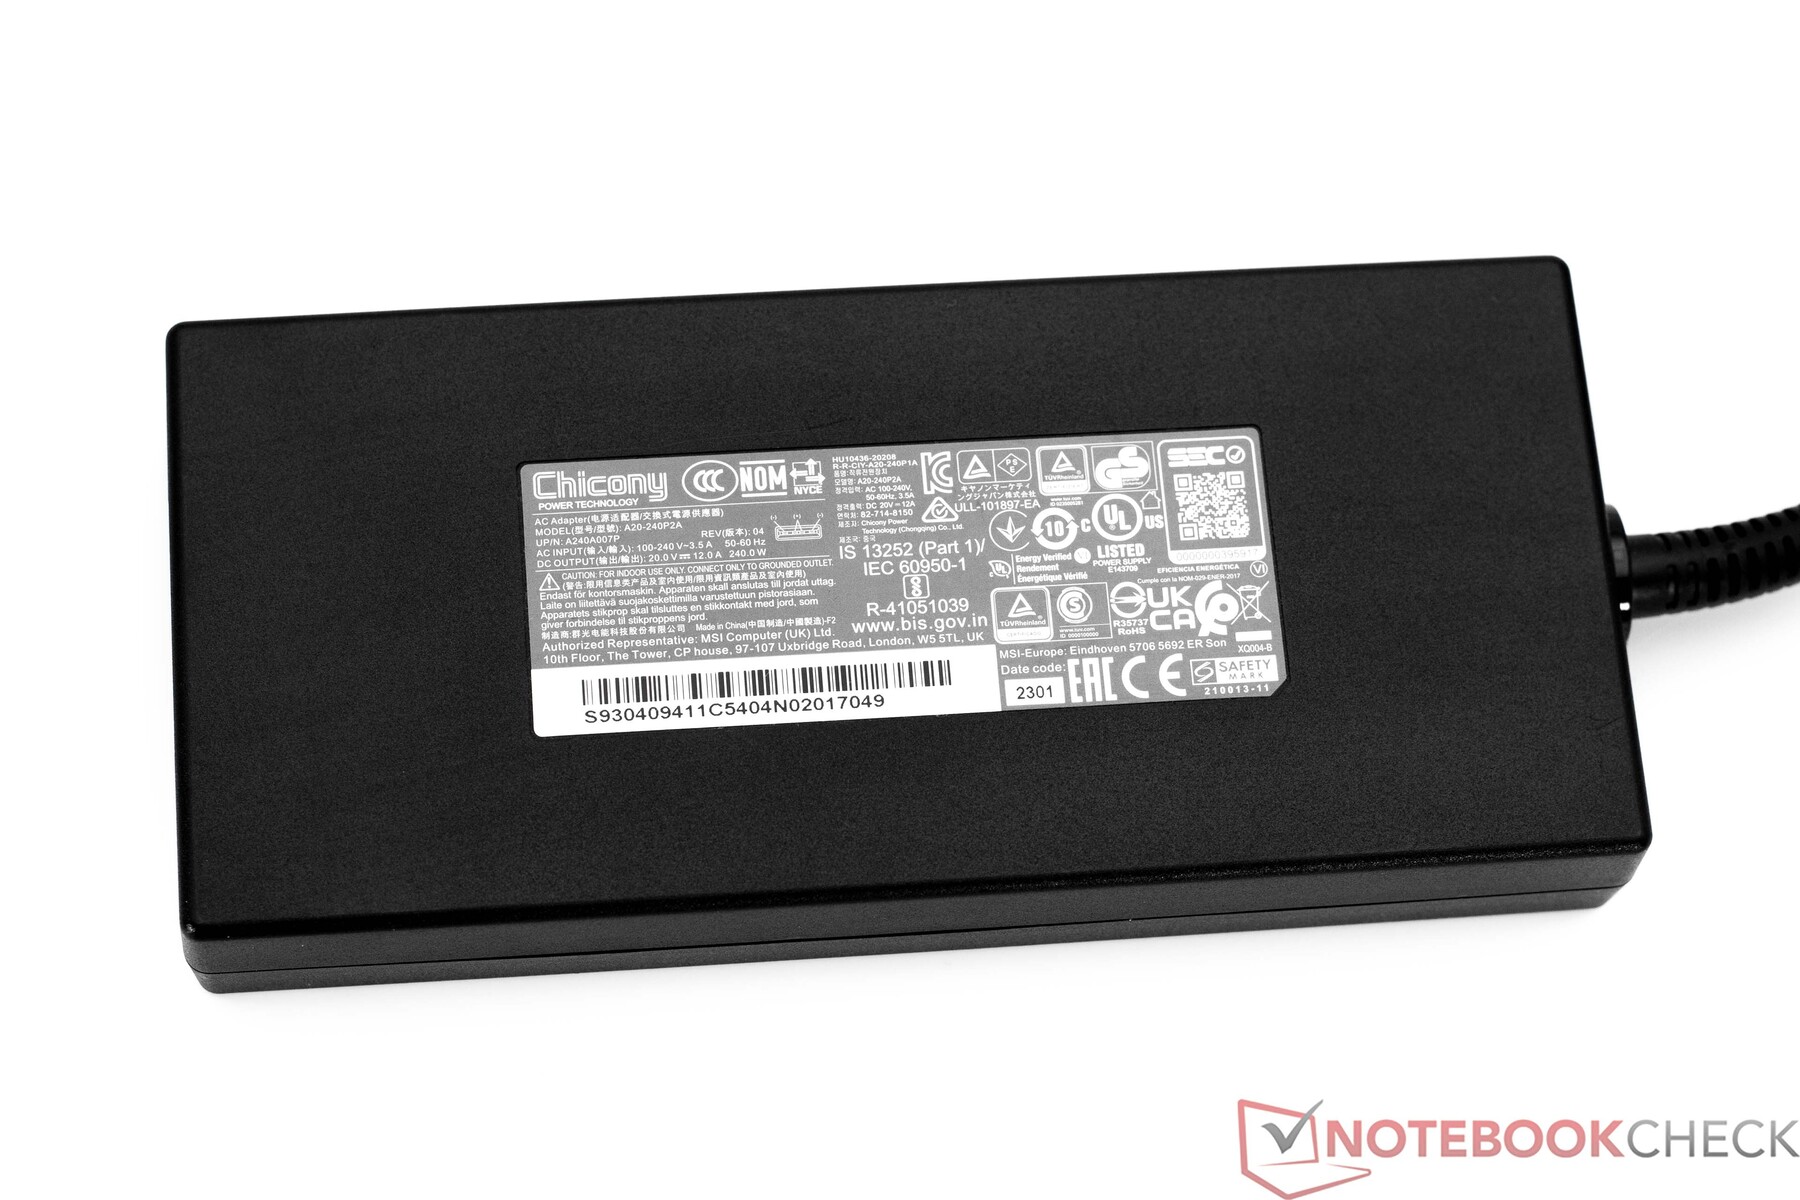
The MSI Stealth 16 Studio A13VG didn't display any abnormalities in terms of power consumption. The recorded values in idle use are actually very good although the competition sometimes manages to deliver better results. However, the minimally higher power consumption is very low. Under load, we observed normal values you would associate with this basic hardware. At 240 watts, the PSU is well-sized and isn't overwhelmed with a maximum of 228 watts.
| Off / Standby | |
| Idle | |
| Load |
|
Key:
min: | |
| MSI Stealth 16 Studio A13VG i7-13700H, GeForce RTX 4070 Laptop GPU, Micron 3400 2TB MTFDKBA2T0TFH, IPS, 2560x1600, 16" | Asus ROG Flow X16 GV601V i9-13900H, GeForce RTX 4060 Laptop GPU, WD PC SN560 SDDPNQE-1T00, IPS, 2560x1600, 16" | Medion Erazer Major X20 i9-13900HX, GeForce RTX 4070 Laptop GPU, Phison E18-1TB-PHISON-SSD-B47R, IPS, 2560x1600, 16" | Acer Nitro 16 AN16-41 R7 7735HS, GeForce RTX 4070 Laptop GPU, Samsung PM9A1 MZVL21T0HCLR, IPS, 2560x1600, 16" | Corsair Voyager a1600 R9 6900HS, Radeon RX 6800M, Samsung PM9A1 MZVL22T0HBLB, IPS, 2560x1600, 16" | Gigabyte AERO 16 OLED BSF i9-13900H, GeForce RTX 4070 Laptop GPU, Gigabyte AG470S1TB-SI B10, OLED, 3840x2400, 16" | Average NVIDIA GeForce RTX 4070 Laptop GPU | Average of class Gaming | |
|---|---|---|---|---|---|---|---|---|
| Power Consumption | 3% | -25% | -10% | -38% | -0% | -11% | -18% | |
| Idle Minimum * (Watt) | 11 | 9.6 13% | 12 -9% | 11.6 -5% | 16.9 -54% | 11.8 -7% | 13.2 ? -20% | 13.1 ? -19% |
| Idle Average * (Watt) | 18 | 16 11% | 16 11% | 15.6 13% | 20.3 -13% | 16.1 11% | 18.2 ? -1% | 19 ? -6% |
| Idle Maximum * (Watt) | 19 | 16.9 11% | 26 -37% | 16.5 13% | 22.2 -17% | 17 11% | 24.6 ? -29% | 24.6 ? -29% |
| Load Average * (Watt) | 91 | 104 -14% | 115 -26% | 155 -70% | 133.4 -47% | 100.6 -11% | 97 ? -7% | 111.3 ? -22% |
| Witcher 3 ultra * (Watt) | 130 | 142 -9% | 191.6 -47% | 154.8 -19% | 206 -58% | 158 -22% | ||
| Load Maximum * (Watt) | 228 | 214 6% | 319 -40% | 205 10% | 192 16% | 221 ? 3% | 260 ? -14% |
* ... smaller is better
Power consumption Witcher 3 / stress test
Power consumption with an external monitor
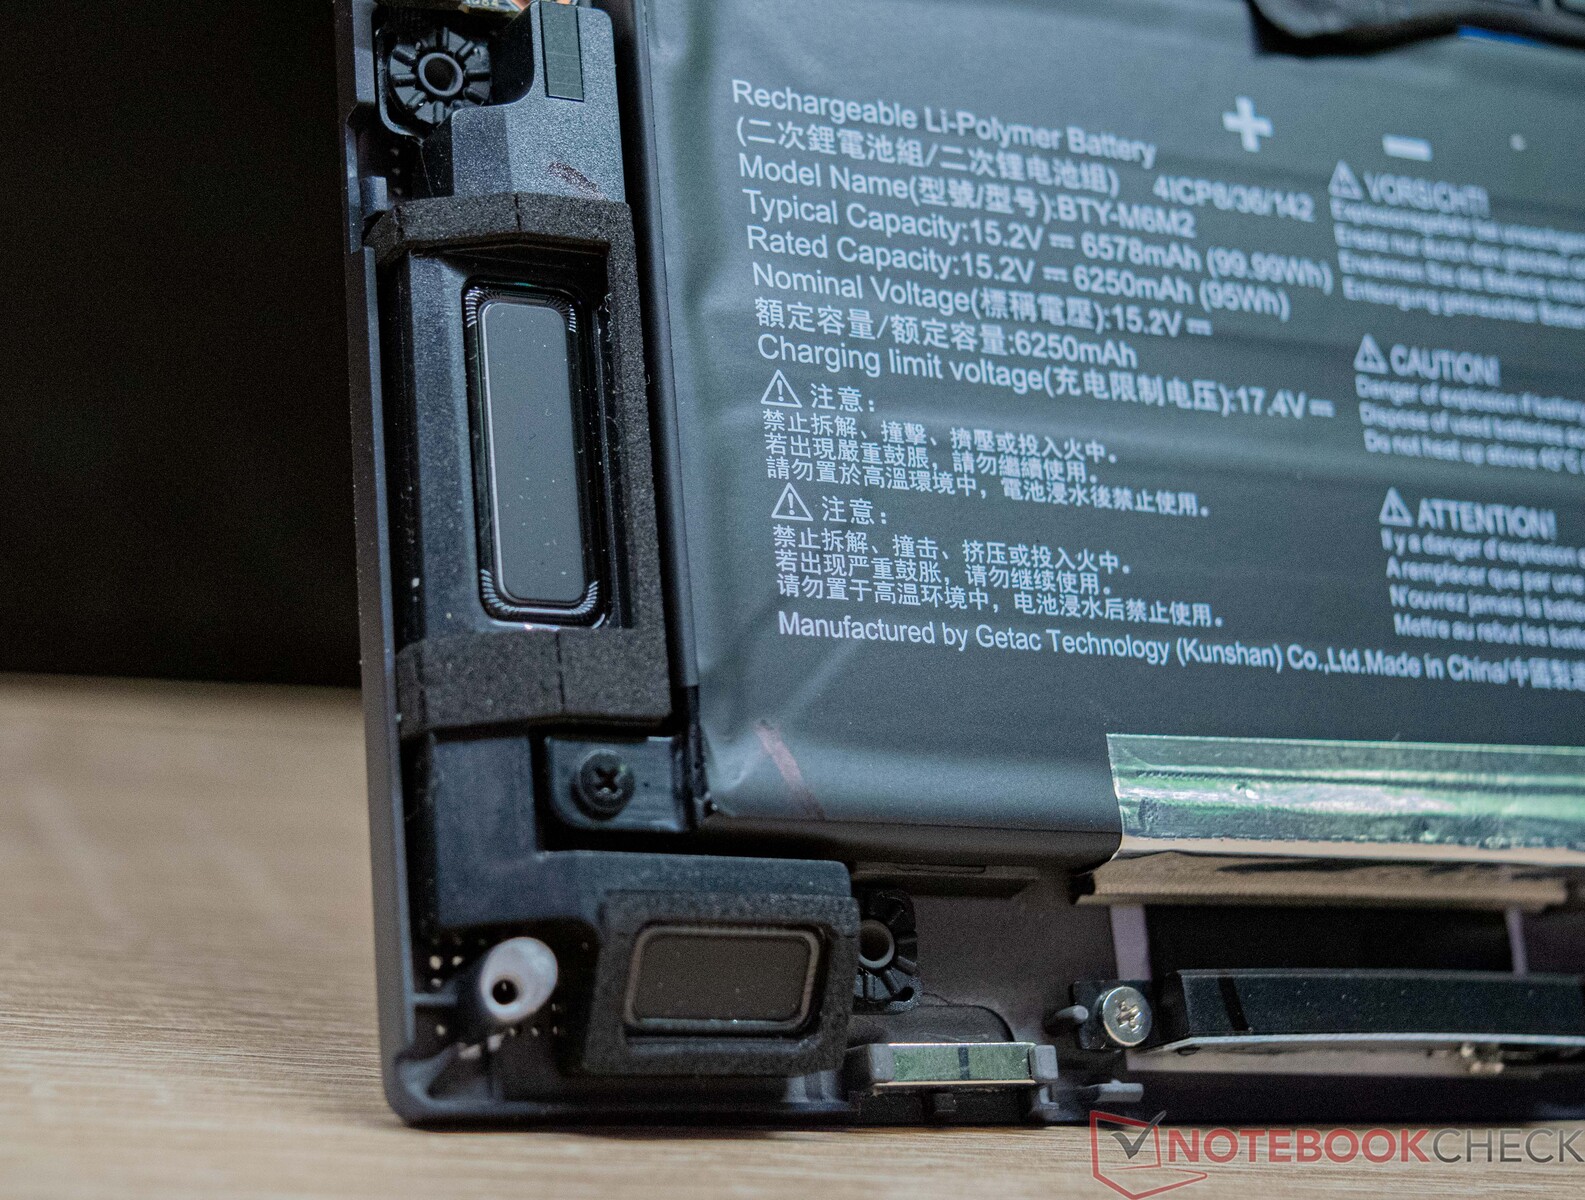
Battery life
Das MSI Stealth 16 Studio A13VG has a 99 Wh battery which is the maximum size a laptop can take. Due to its capacity, our review sample managed 7 hours 46 minutes and 7 hours 42 minutes, respectively, in our Wi-Fi test loop (using a script to load a website) and video test Big Buck Bunny short film (H.264 coding, FHD). That means the MSI Stealth 16 Studio A13VG manages excellent battery life for a gaming laptop. During both tests, the display brightness was set to 150 cd/m². In our case, this meant reducing the brightness to 37 percent.
A full charge takes pretty much exactly three hours. However, after roughly half that time, the battery is charged to 70 percent.


| MSI Stealth 16 Studio A13VG i7-13700H, GeForce RTX 4070 Laptop GPU, 99.9 Wh | Asus ROG Flow X16 GV601V i9-13900H, GeForce RTX 4060 Laptop GPU, 90 Wh | Medion Erazer Major X20 i9-13900HX, GeForce RTX 4070 Laptop GPU, 62.3 Wh | Acer Nitro 16 AN16-41 R7 7735HS, GeForce RTX 4070 Laptop GPU, 90 Wh | Corsair Voyager a1600 R9 6900HS, Radeon RX 6800M, 99 Wh | Gigabyte AERO 16 OLED BSF i9-13900H, GeForce RTX 4070 Laptop GPU, 88 Wh | Average of class Gaming | |
|---|---|---|---|---|---|---|---|
| Battery runtime | -7% | -44% | 8% | -24% | -7% | -17% | |
| Reader / Idle (h) | 11 | 5.8 -47% | 12.2 11% | 7 -36% | 7.84 ? -29% | ||
| H.264 (h) | 7.7 | 8.9 16% | 4.2 -45% | 10.2 32% | 6 -22% | 7.4 -4% | 8.27 ? 7% |
| WiFi v1.3 (h) | 7.8 | 7.9 1% | 3.9 -50% | 9 15% | 5.8 -26% | 7.5 -4% | 7.08 ? -9% |
| Load (h) | 2.4 | 1.5 -37% | 1.6 -33% | 1.8 -25% | 2.1 -12% | 2.1 -12% | 1.496 ? -38% |
Pros
Cons
Verdict - a premium laptop for creators
In terms of its built-in CPU and GPU, the MSI Stealth 16 Studio A13VG is a gaming laptop through and through. Purely from a visual point of view, the MSI Stealth 16 Studio A13VG presents itself as a tasteful business laptop with gaming ambitions. In doing so, the device covers a wide range of needs, in order to appeal to many users. The laptop is aimed at creators who rely on high-level system performance. The performance of the Intel Core i7-13700H combined with the Nvidia-GeForce RTX 4070 laptop GPU is consistently good. The display also has to meet the necessary requirements and this is something it manages with its high color space coverage.
We were also impressed with the rest of the specs - 32 GB of DDR5 RAM and a total of 2 TB of SSD storage is an excellent basis which ensures the laptop won't need upgrading anytime soon. The 16-inch display offers QHD+ resolution, a 16:10 aspect ratio and a 240 Hz refresh rate proves its gaming credentials.
The MSI Stealth 16 Studio A13VG is simultaneously a very powerful and very light laptop for content creators and gamers.
On the other hand, sound limitations come in the form of the volume which, however, is typical for a gaming laptop. We also view the port selection quite critically as only one USB-A port is simply not enough for this class of device. Nevertheless, there is a modern Thunderbolt 4 port which allows the laptop to be usefully expanded. The card reader implementation is good and performance-wise it has no reason to hide.
When it comes to mobility, the MSI Stealth 16 Studio A13VG cuts a good figure as both the low weight and good battery life are above average. Many settings can be undertaken via the MSI Center, and with the right ones the device even runs almost silently.
However, in terms of pricing, the MSI Stealth 16 Studio A13VG has a difficult time with a current asking price of around $2549. For a cheaper alternative, it would be worthwhile to take a look at the Medion Erazer Major X20, which is equipped with an Nvidia GeForce RTX 4070 laptop GPU and also delivers excellent performance.
Price and availability
The MSI Stealth 16 Studio A13VG with a 1 TB SSD and 64 GB of RAM is currently available at BestBuy for $2,549.99.
MSI Stealth 16 Studio A13VG
- 11/28/2023 v7 (old)
Sebastian Bade
Transparency
The selection of devices to be reviewed is made by our editorial team. The test sample was provided to the author as a loan by the manufacturer or retailer for the purpose of this review. The lender had no influence on this review, nor did the manufacturer receive a copy of this review before publication. There was no obligation to publish this review. As an independent media company, Notebookcheck is not subjected to the authority of manufacturers, retailers or publishers.
This is how Notebookcheck is testing
Every year, Notebookcheck independently reviews hundreds of laptops and smartphones using standardized procedures to ensure that all results are comparable. We have continuously developed our test methods for around 20 years and set industry standards in the process. In our test labs, high-quality measuring equipment is utilized by experienced technicians and editors. These tests involve a multi-stage validation process. Our complex rating system is based on hundreds of well-founded measurements and benchmarks, which maintains objectivity. Further information on our test methods can be found here.
Price comparison

