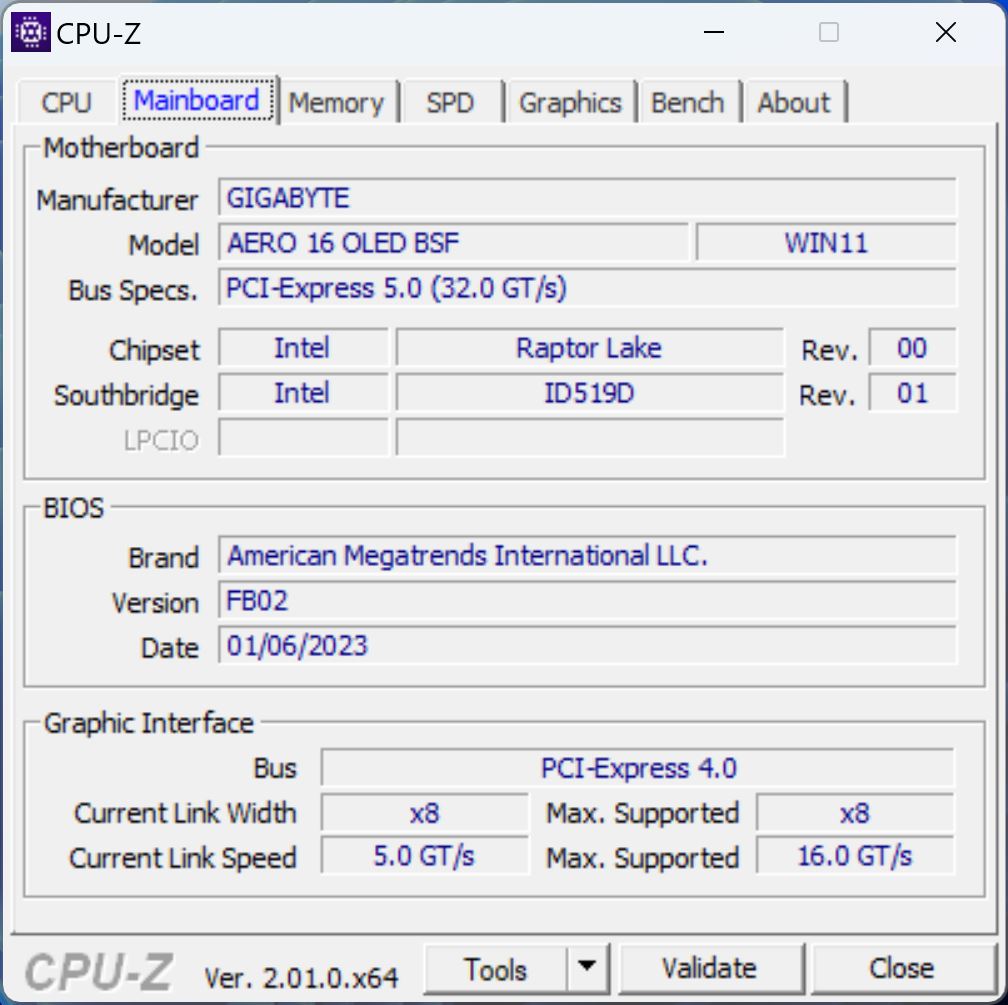
Slim Gigabyte AERO 16 OLED laptop review: Efficient RTX 4070 for gamers and creatives
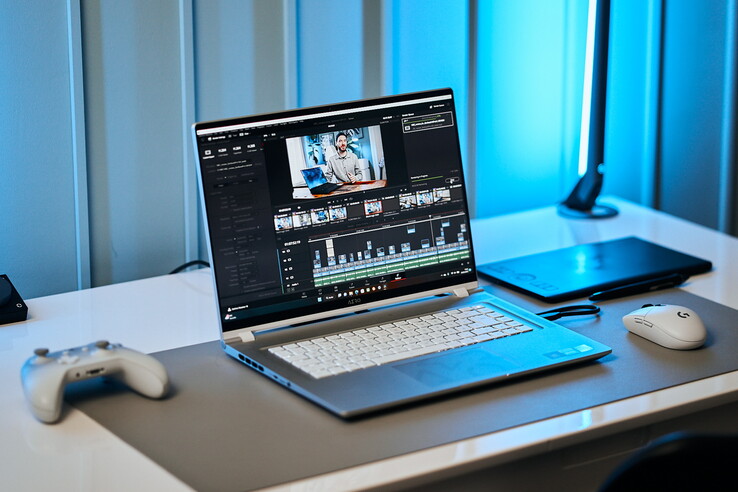
Gigabyte's Aero 16 OLED is an interesting mix of gaming laptop and workstation for creatives. In addition to the switch from Alder to Raptor Lake CPU and from Nvidia RTX 30x to RTX 40x, other changes have also been made, such as to the case and the ports.
We've previously reviewed the predecessor with the RTX 3080 Ti and our current configuration has an RTX 4070. So far we've only reviewed the new Razer Blade 18 with the same GPU, so the 18-incher will have to serve as comparison in the 3D benchmarks. Otherwise we compare previous generation 16-inch competitors, including the Asus Zenbook Pro 16X OLED, the Asus TUF Gaming A16 and the MSI CreatorPro Z16P with its Nvidia A300.
Possible Competitors in Comparison
Rating | Date | Model | Weight | Height | Size | Resolution | Price |
|---|---|---|---|---|---|---|---|
| 86.2 % v7 (old) | 03 / 2023 | Gigabyte AERO 16 OLED BSF i9-13900H, GeForce RTX 4070 Laptop GPU | 2.1 kg | 18 mm | 16.00" | 3840x2400 | |
| 84.7 % v7 (old) | 03 / 2022 | Gigabyte Aero 16 YE5 i9-12900HK, GeForce RTX 3080 Ti Laptop GPU | 2.3 kg | 22.4 mm | 16.00" | 3840x2400 | |
| 91.4 % v7 (old) | 02 / 2023 | Razer Blade 18 RTX 4070 i9-13950HX, GeForce RTX 4070 Laptop GPU | 3 kg | 21.9 mm | 18.00" | 2560x1600 | |
| 88.4 % v7 (old) | 12 / 2022 | Asus ZenBook Pro 16X OLED UX7602ZM-ME115W i9-12900H, GeForce RTX 3060 Laptop GPU | 2.4 kg | 19.5 mm | 16.00" | 3840x2400 | |
| 86.2 % v7 (old) | 02 / 2023 | Asus TUF Gaming A16 FA617 R7 7735HS, Radeon RX 7600S | 2.2 kg | 27 mm | 16.00" | 1920x1200 | |
| 84.3 % v7 (old) | 11 / 2022 | MSI CreatorPro Z16P B12UKST i7-12700H, RTX A3000 Laptop GPU | 2.4 kg | 19 mm | 16.00" | 2560x1600 |
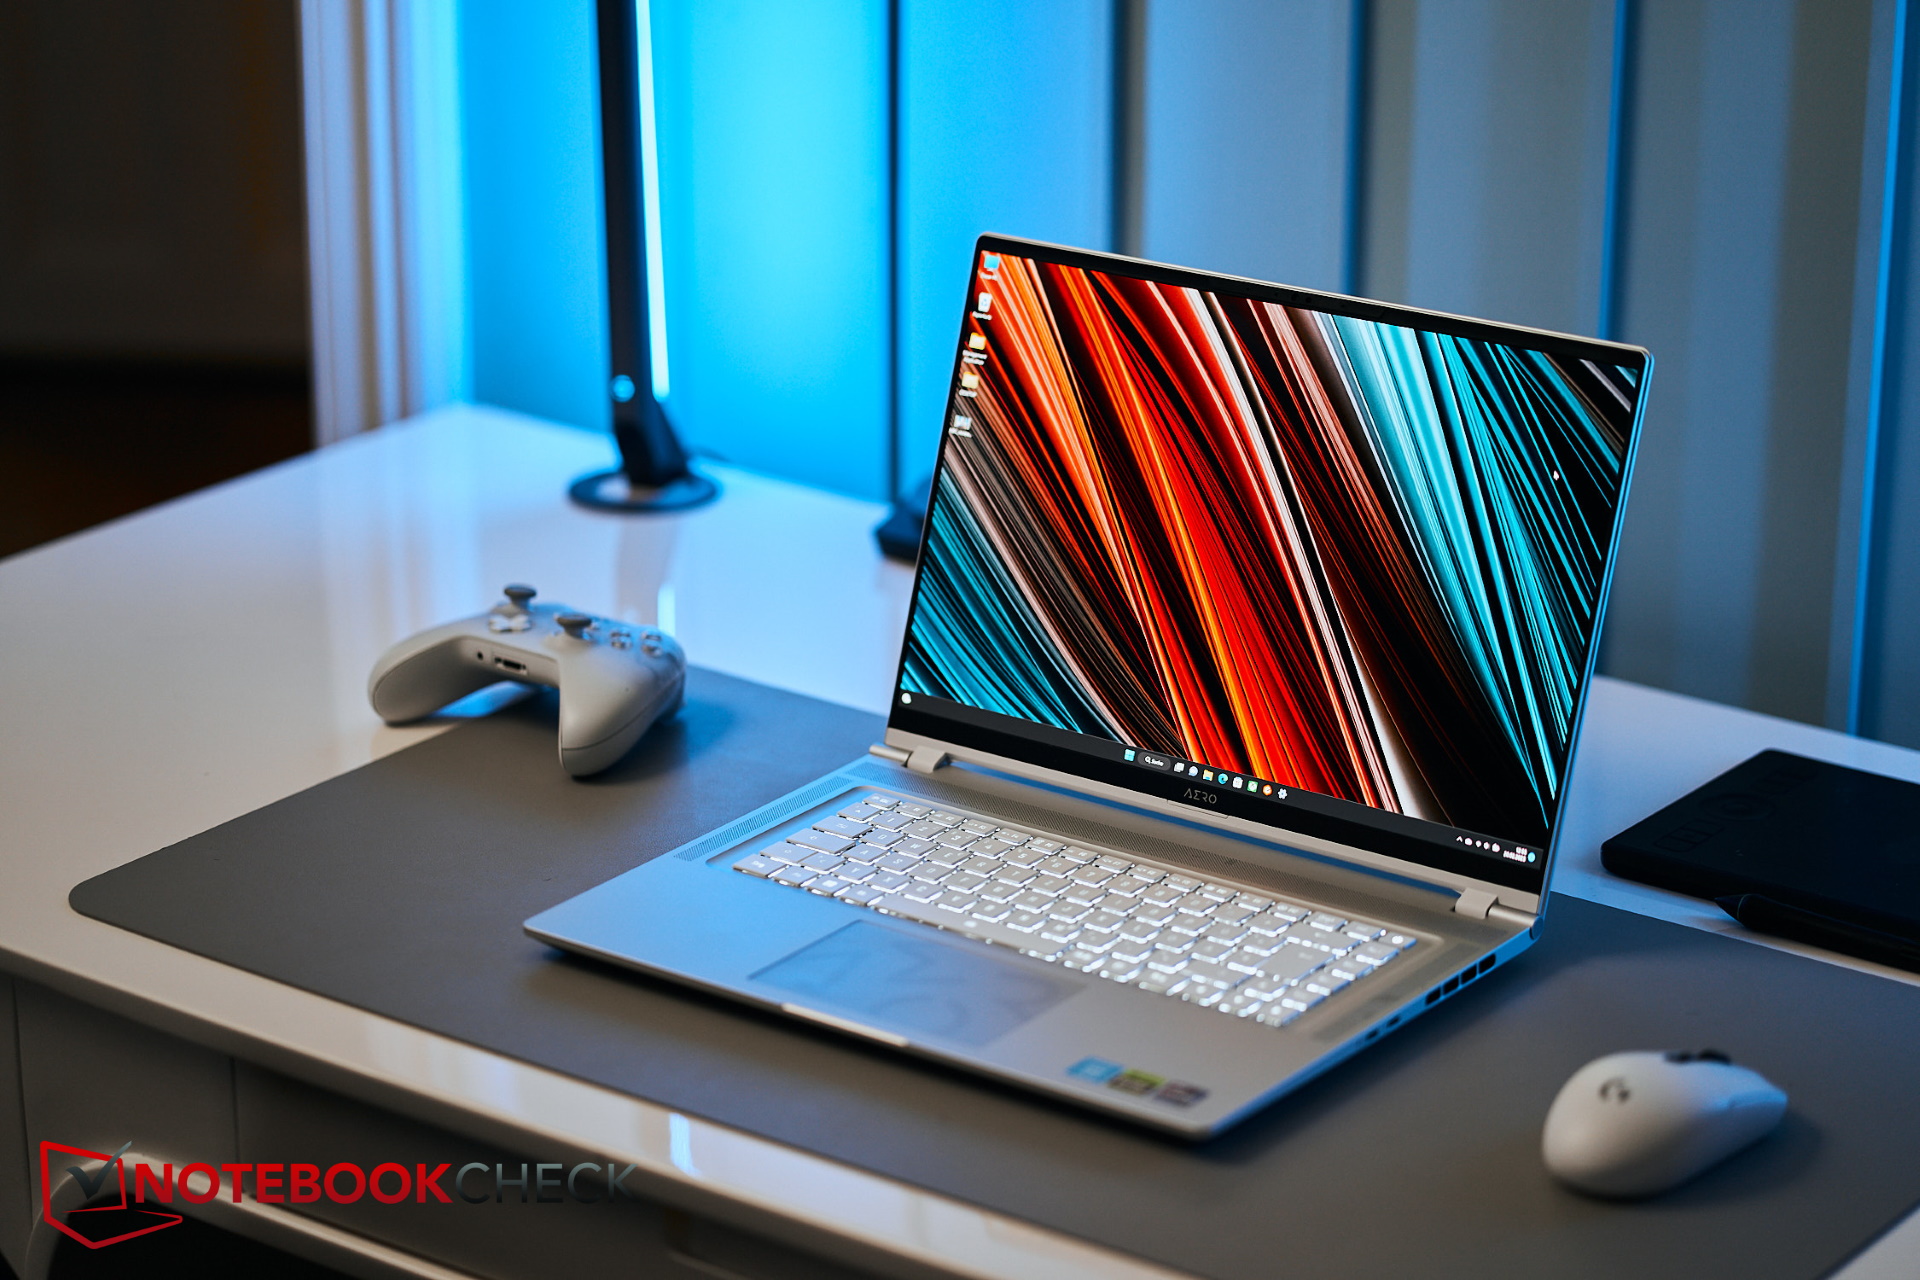
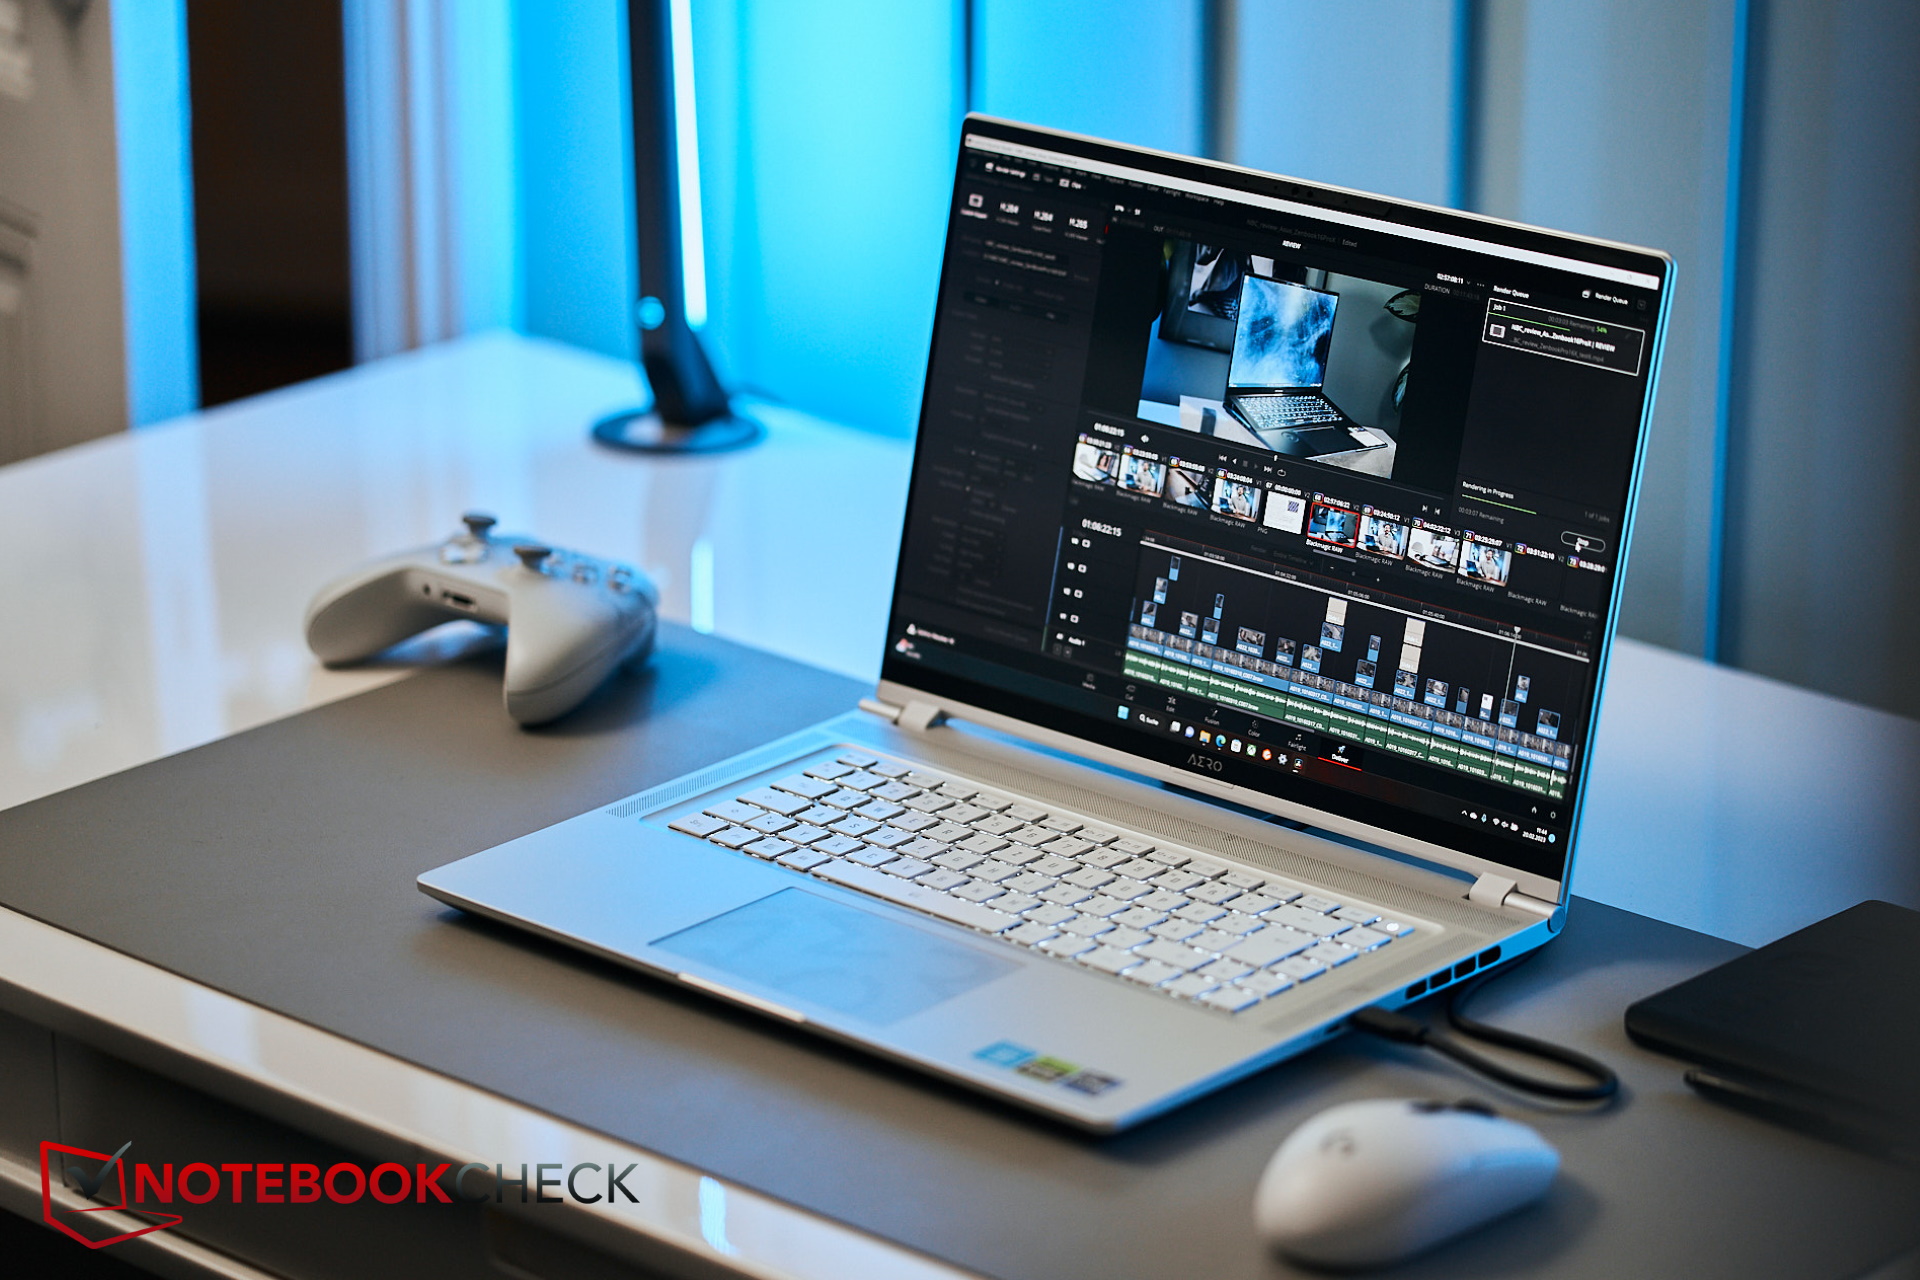
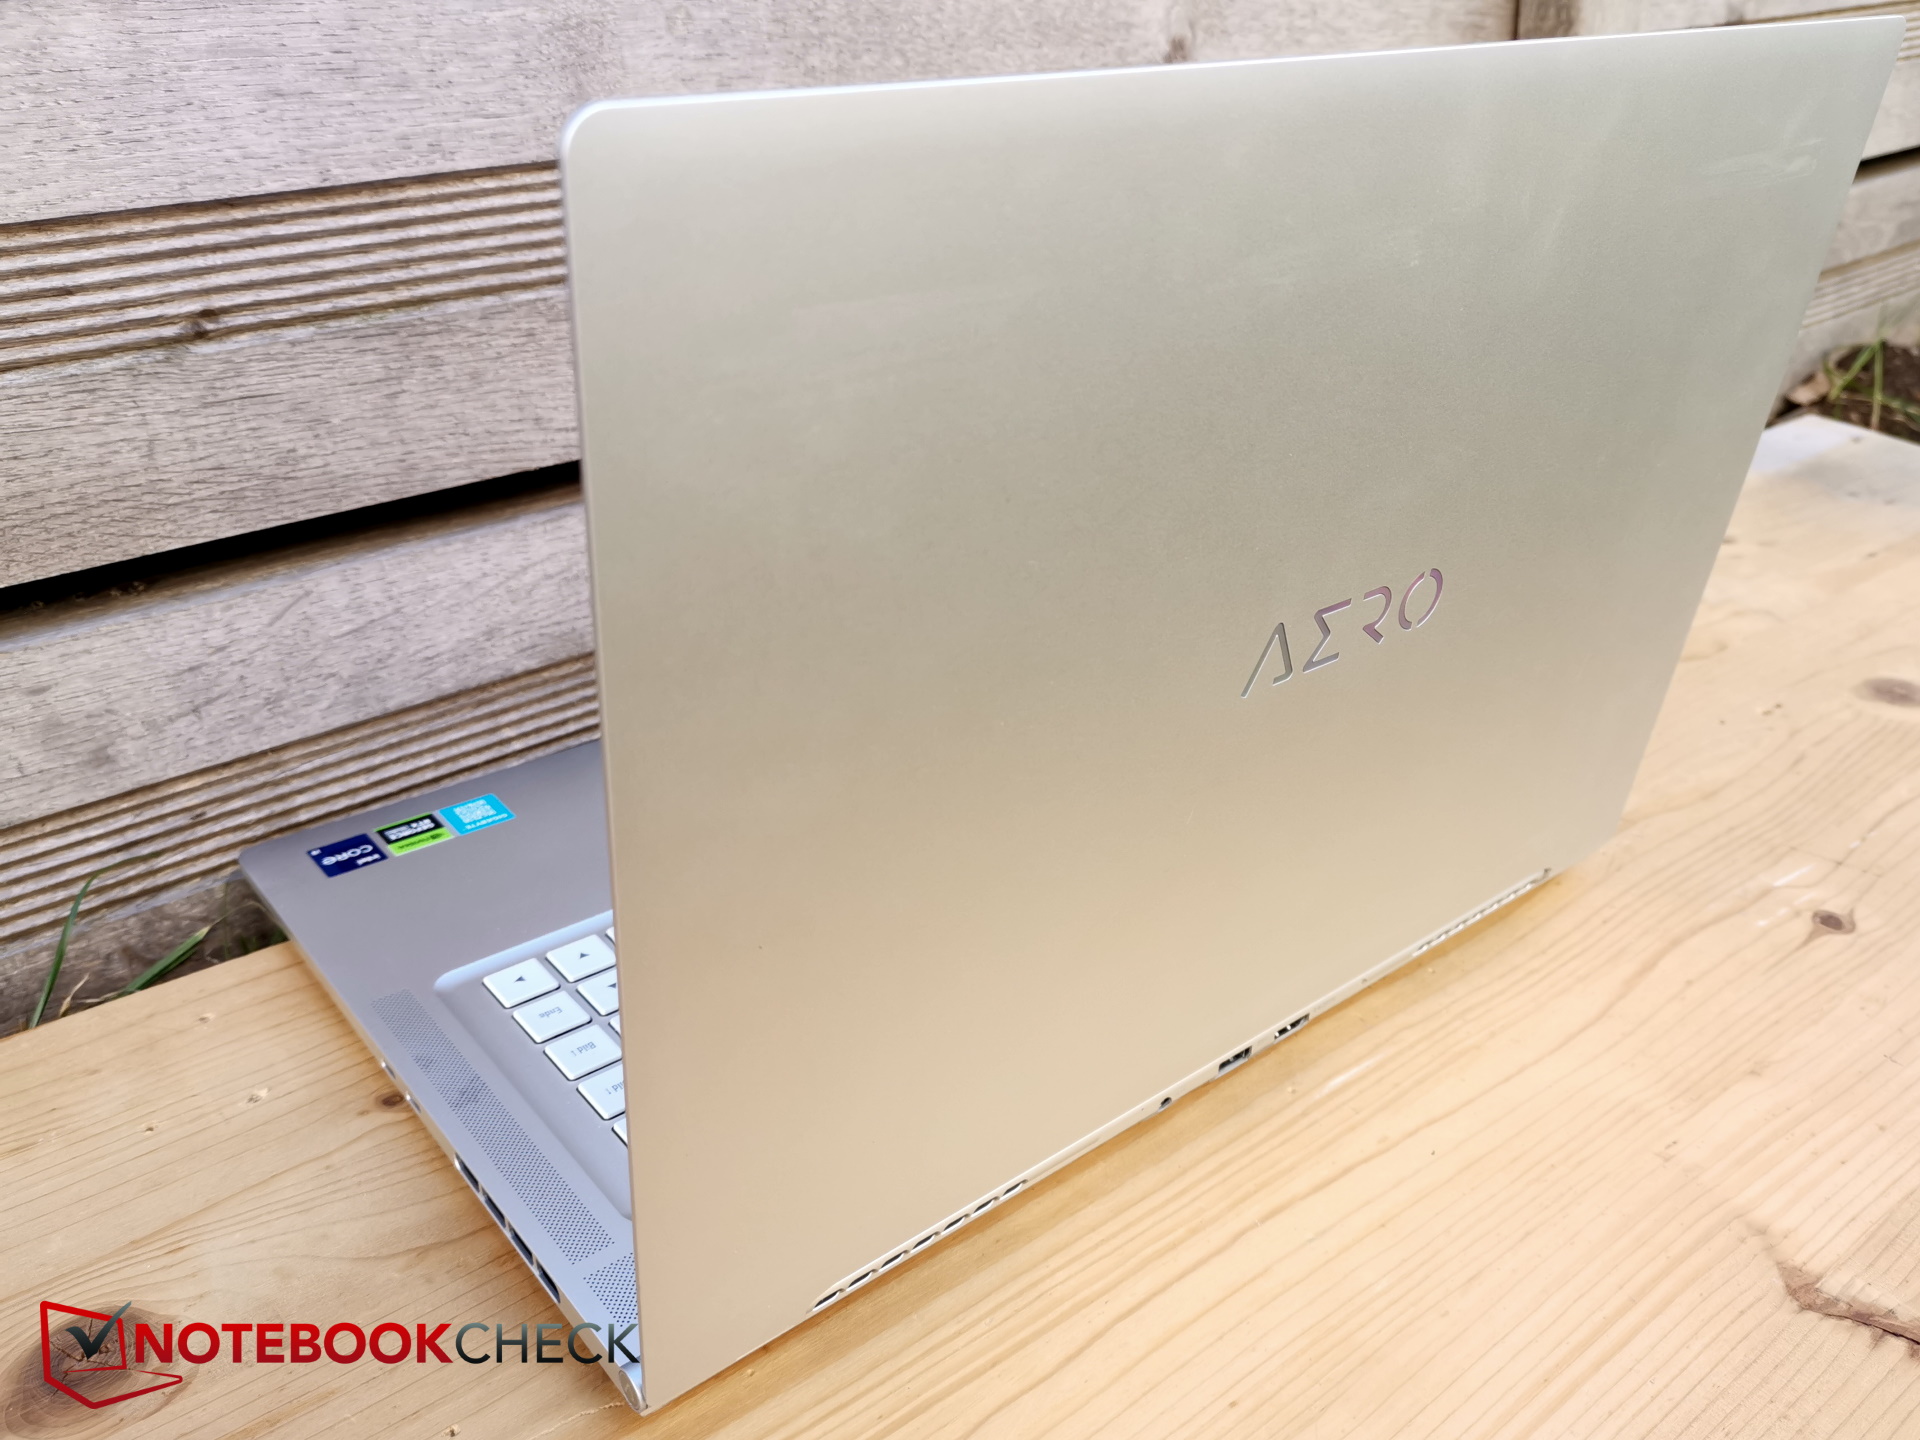
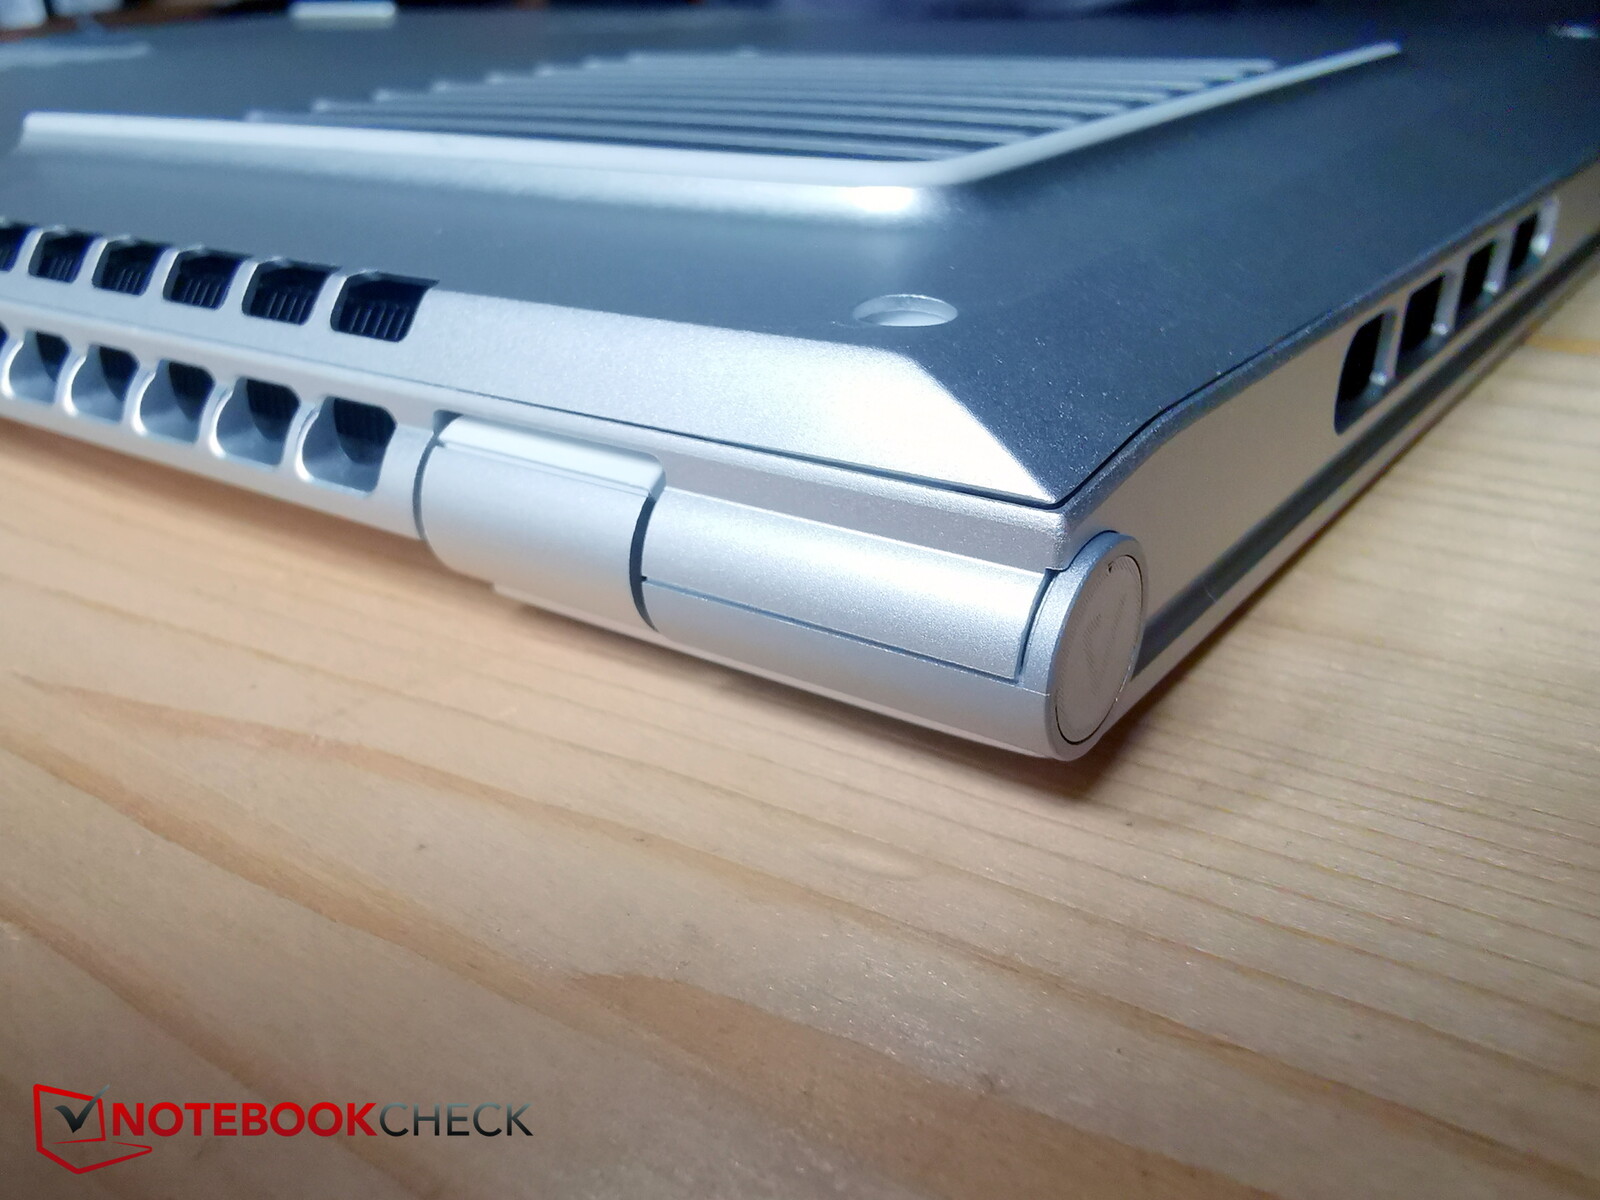
Case - Sturdy metal chassis in silver color
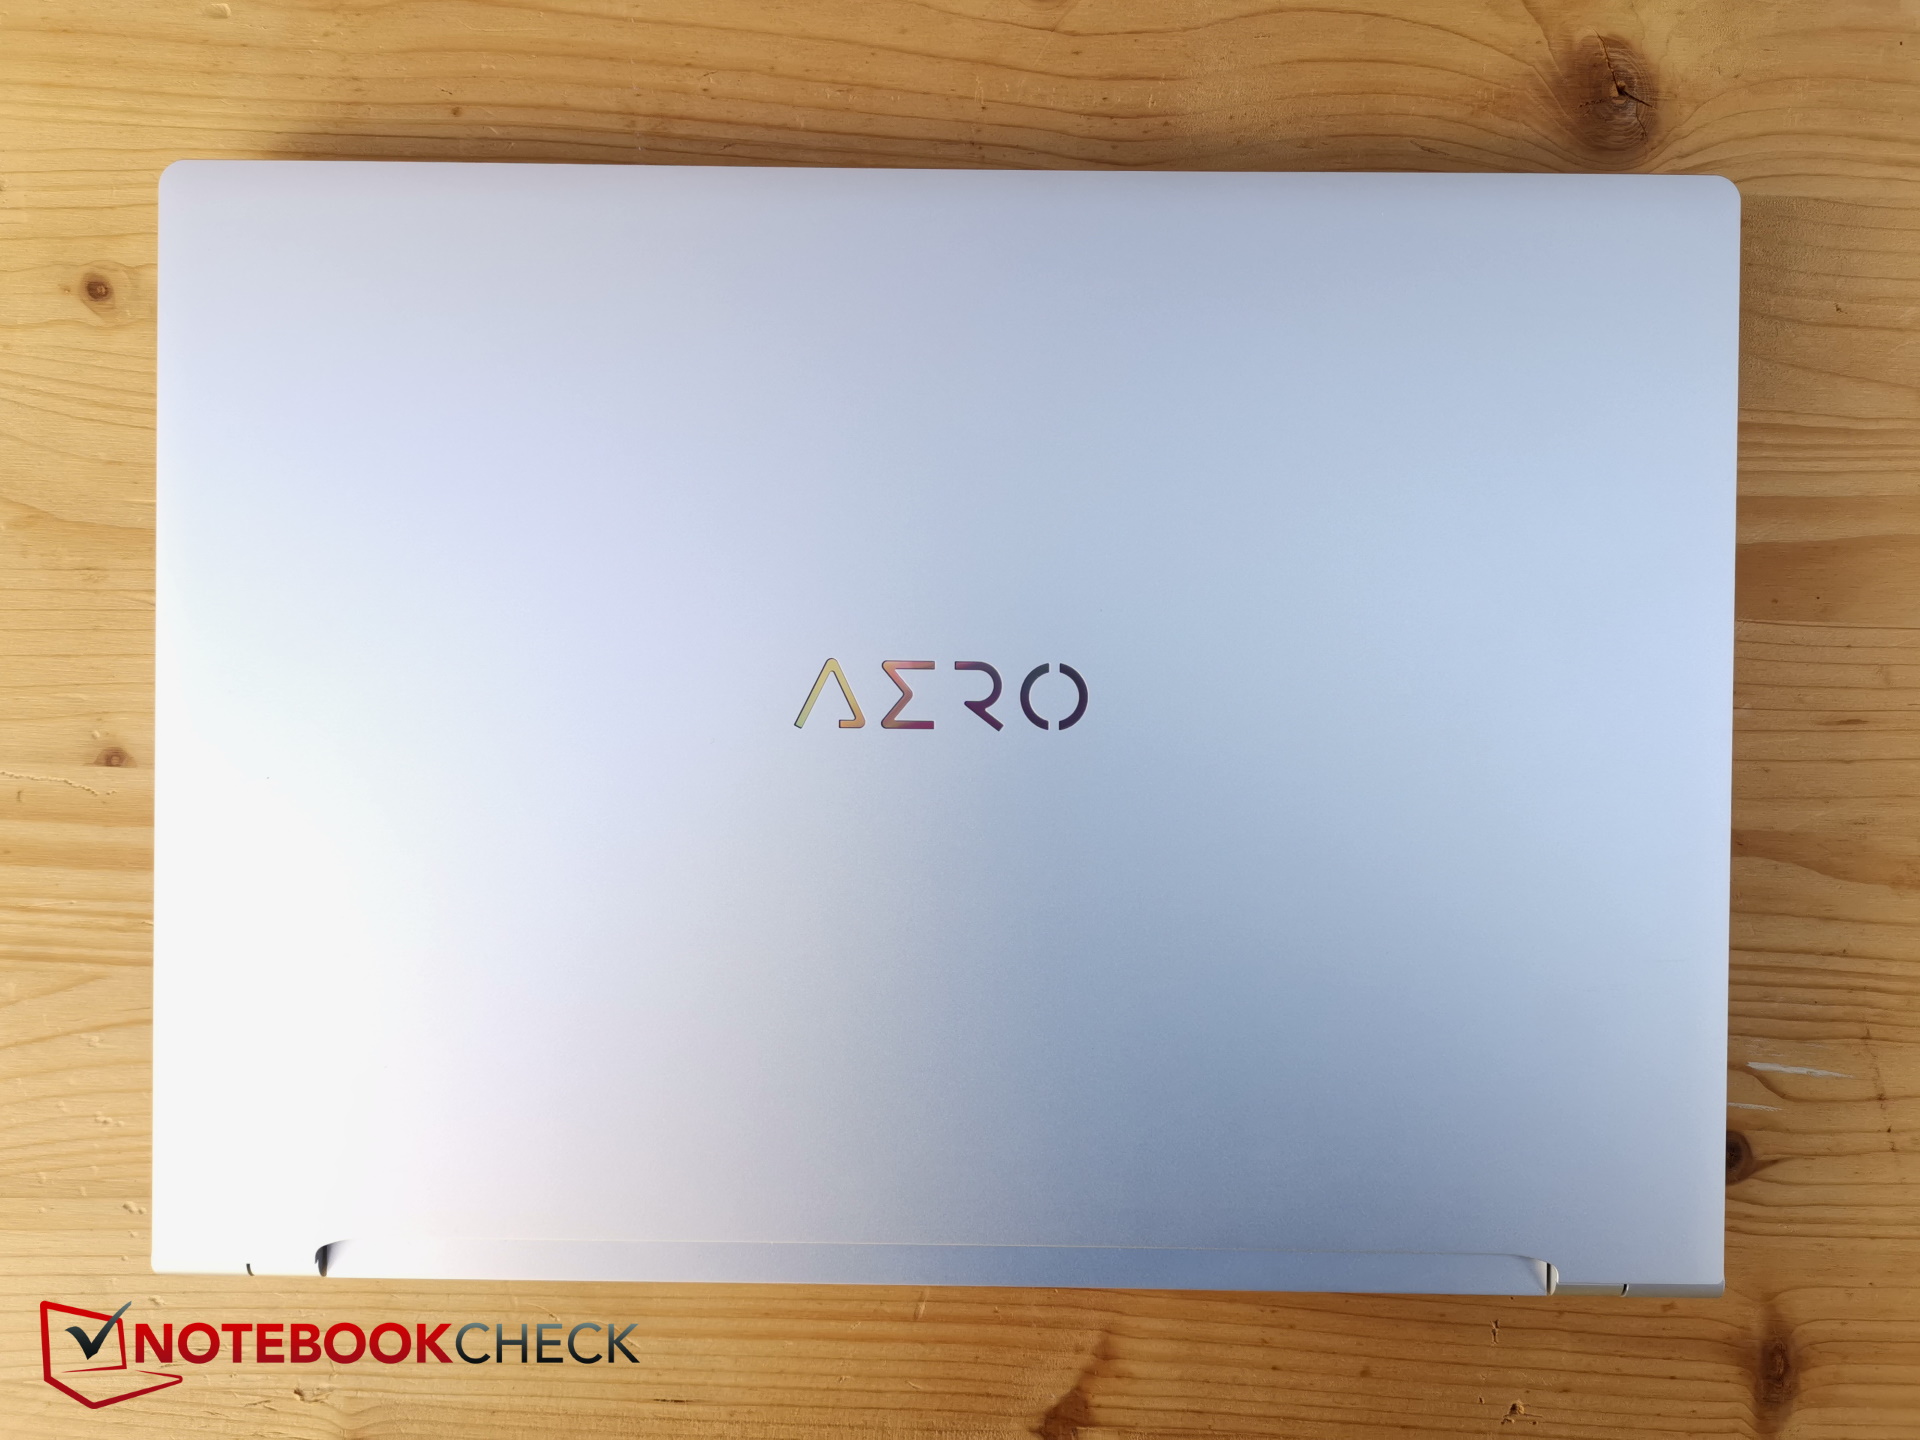
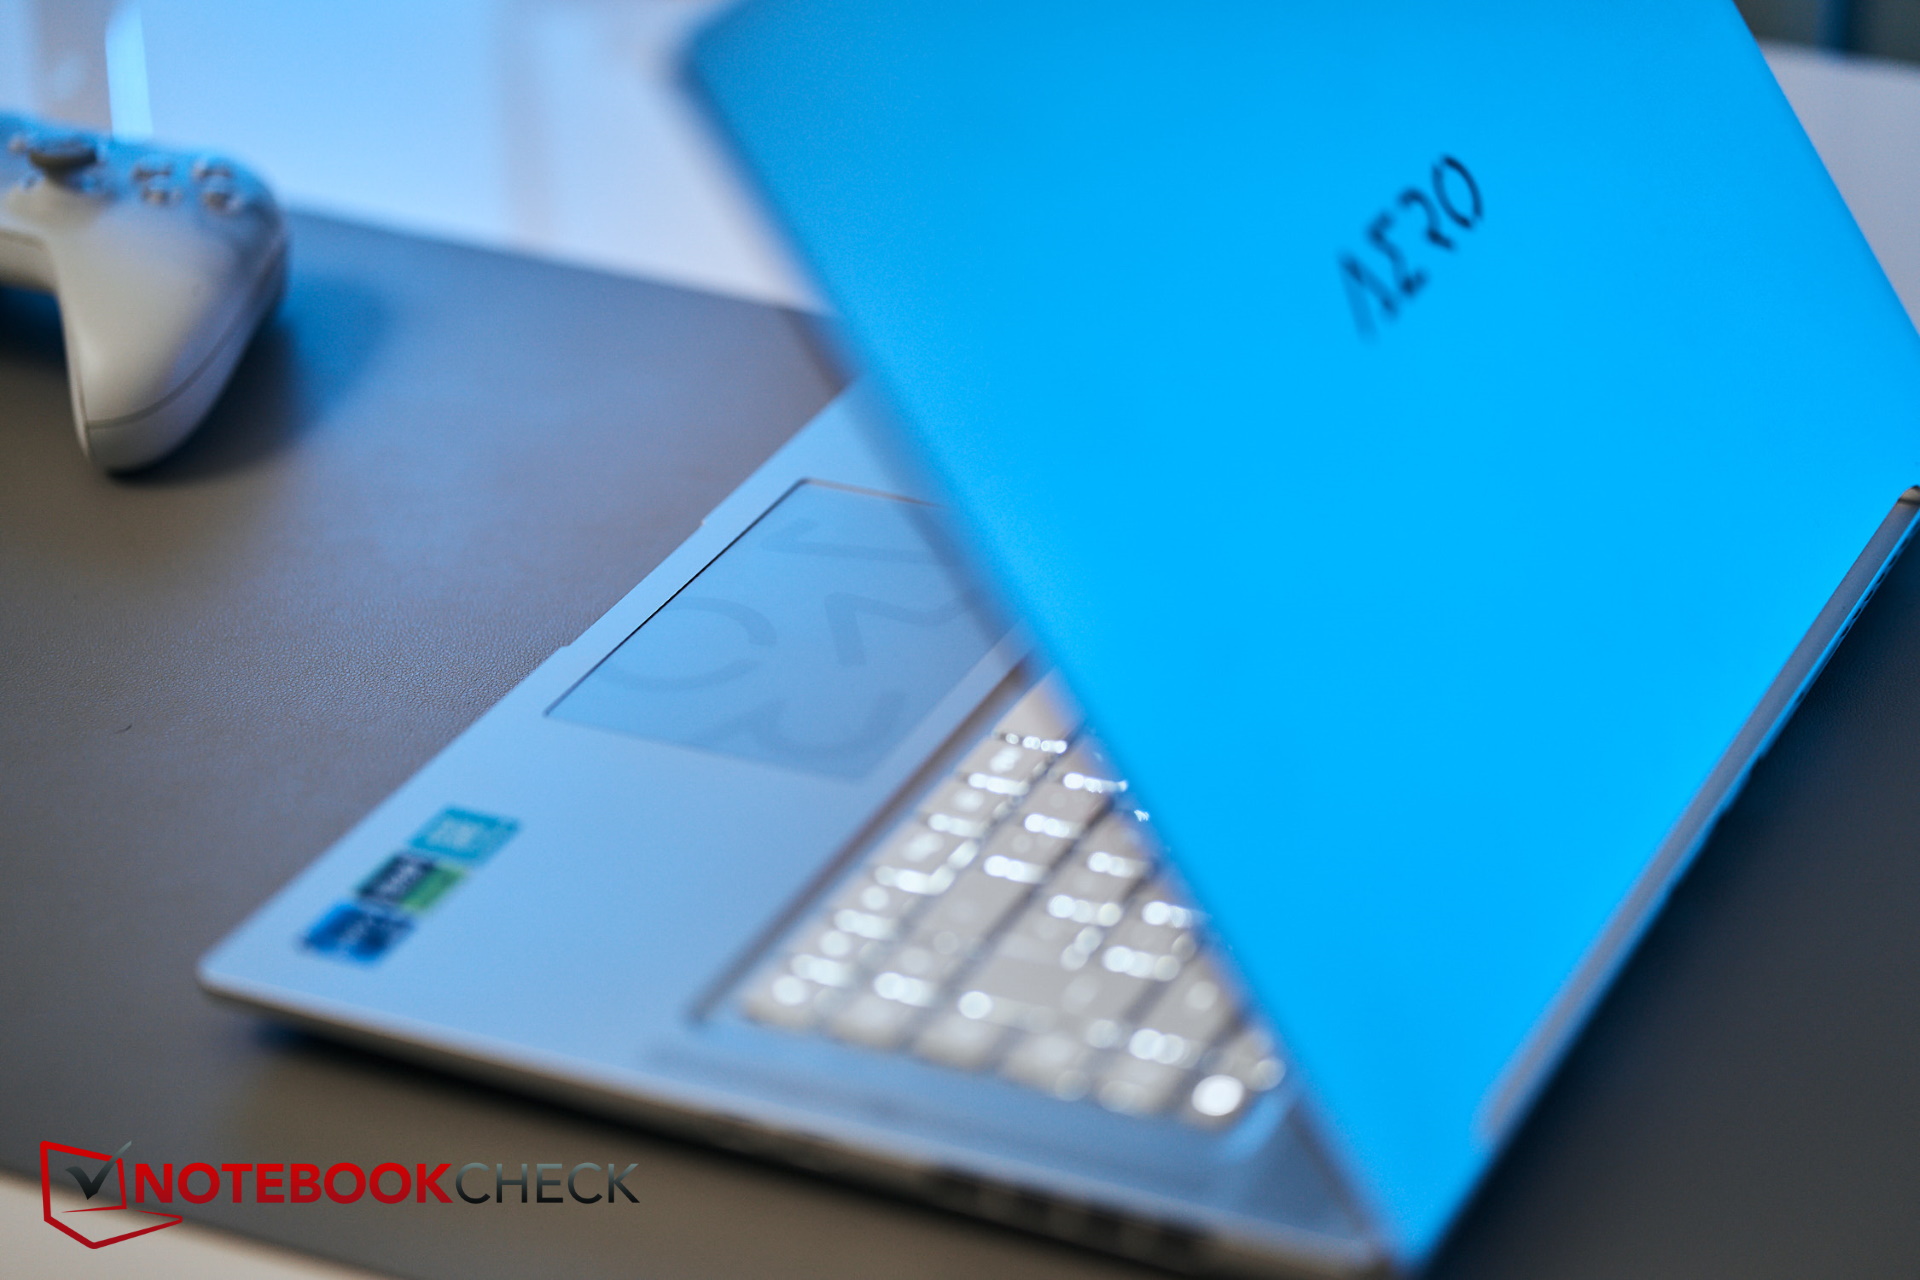
At first glance, the design appears to be unchanged, but if you take a closer look, you can see that the narrow, silver metal chassis has changed quite a bit. For example, it has become even thinner and Gigabyte has finally shifted some of the ports to the back. Overall, the manufacturer's design is more in the direction of a business and office laptop than a gaming laptop, which will certainly please the target group. So the hidden gamer looks quite inconspicuous in an office setting, even alongside a MacBook.
The smooth metal unibody is still stable, especially at the base, which can hardly be twisted. The keyboard has been lowered slightly.
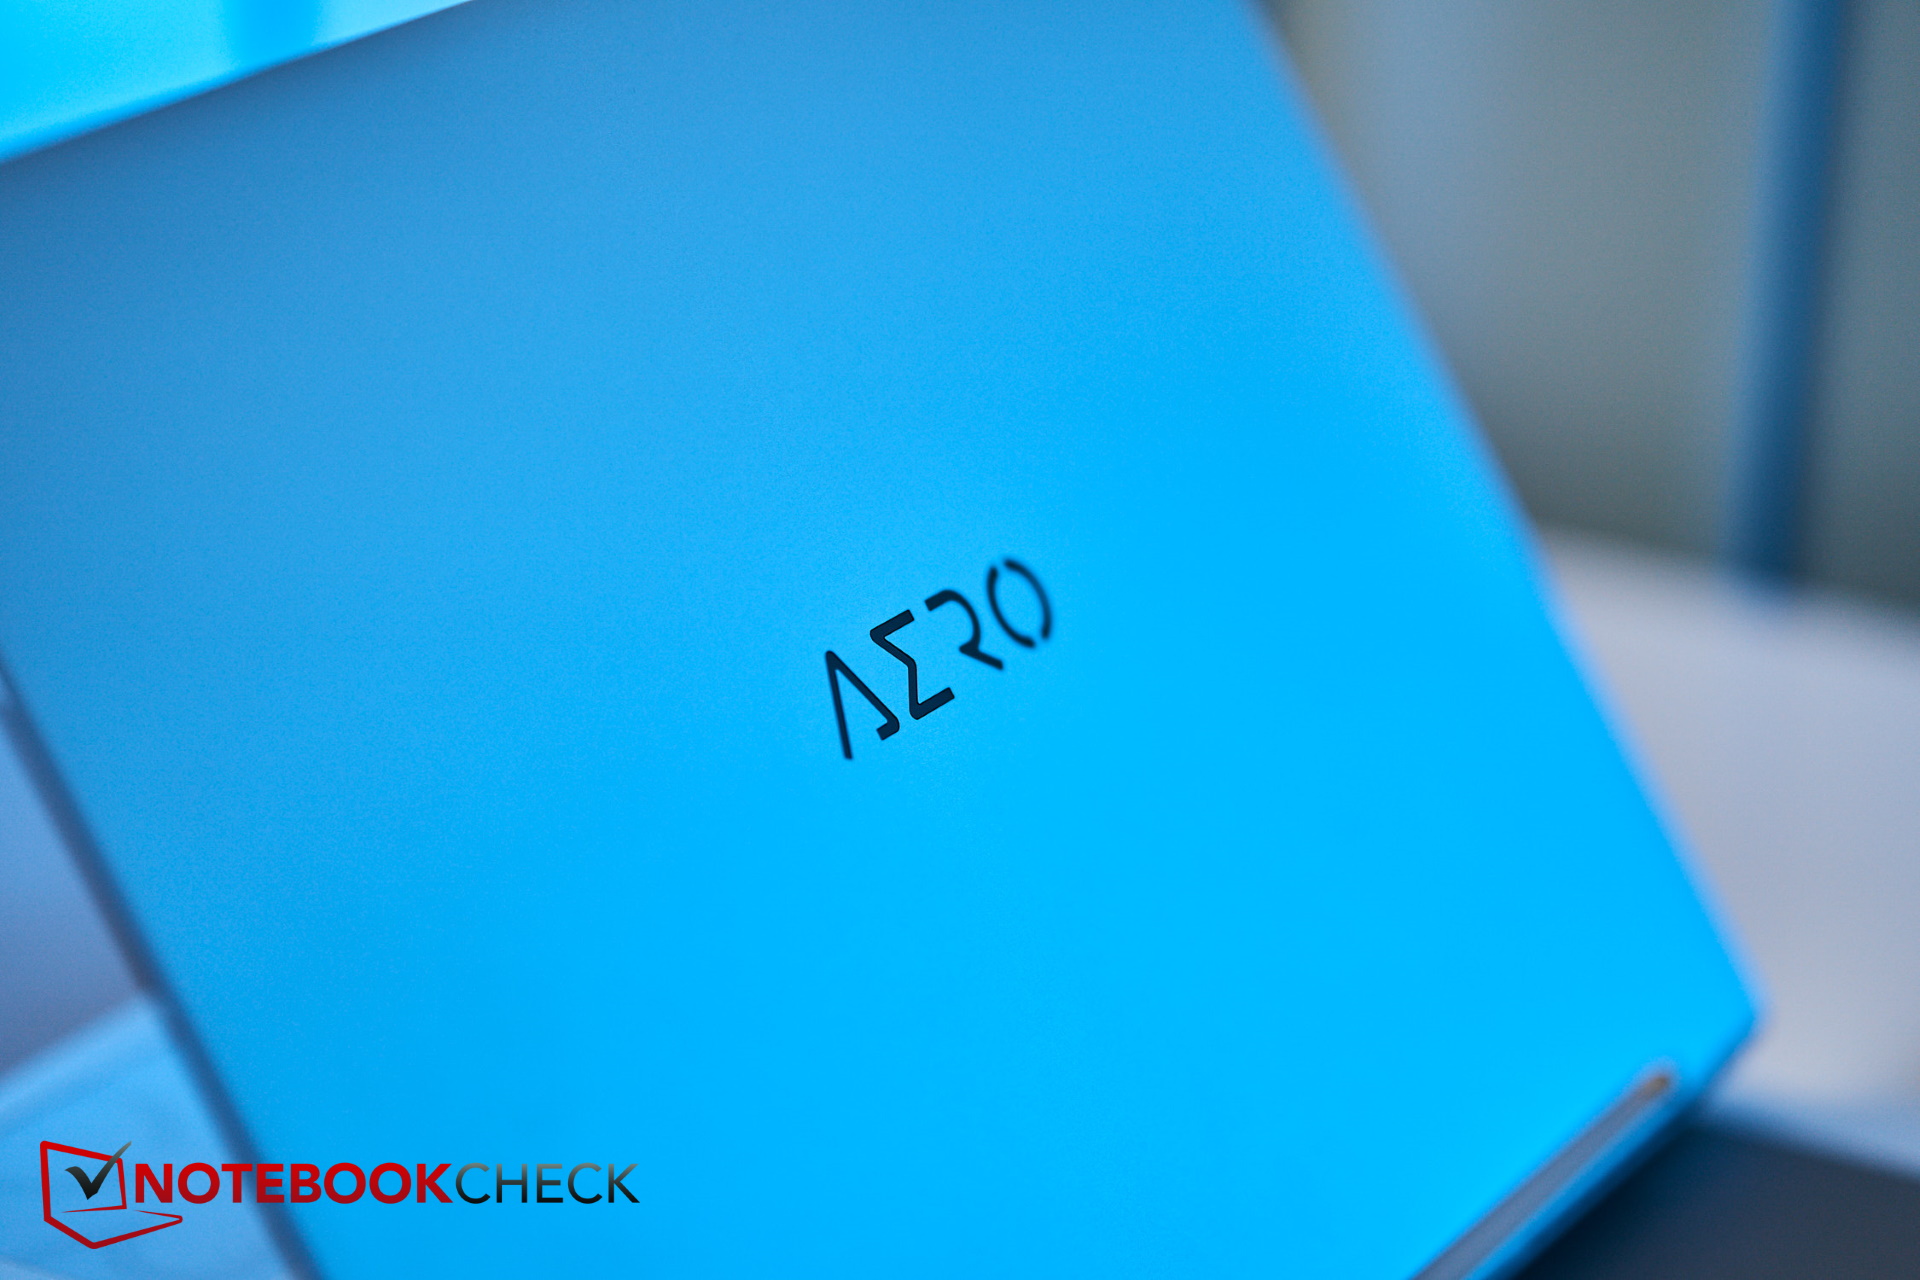
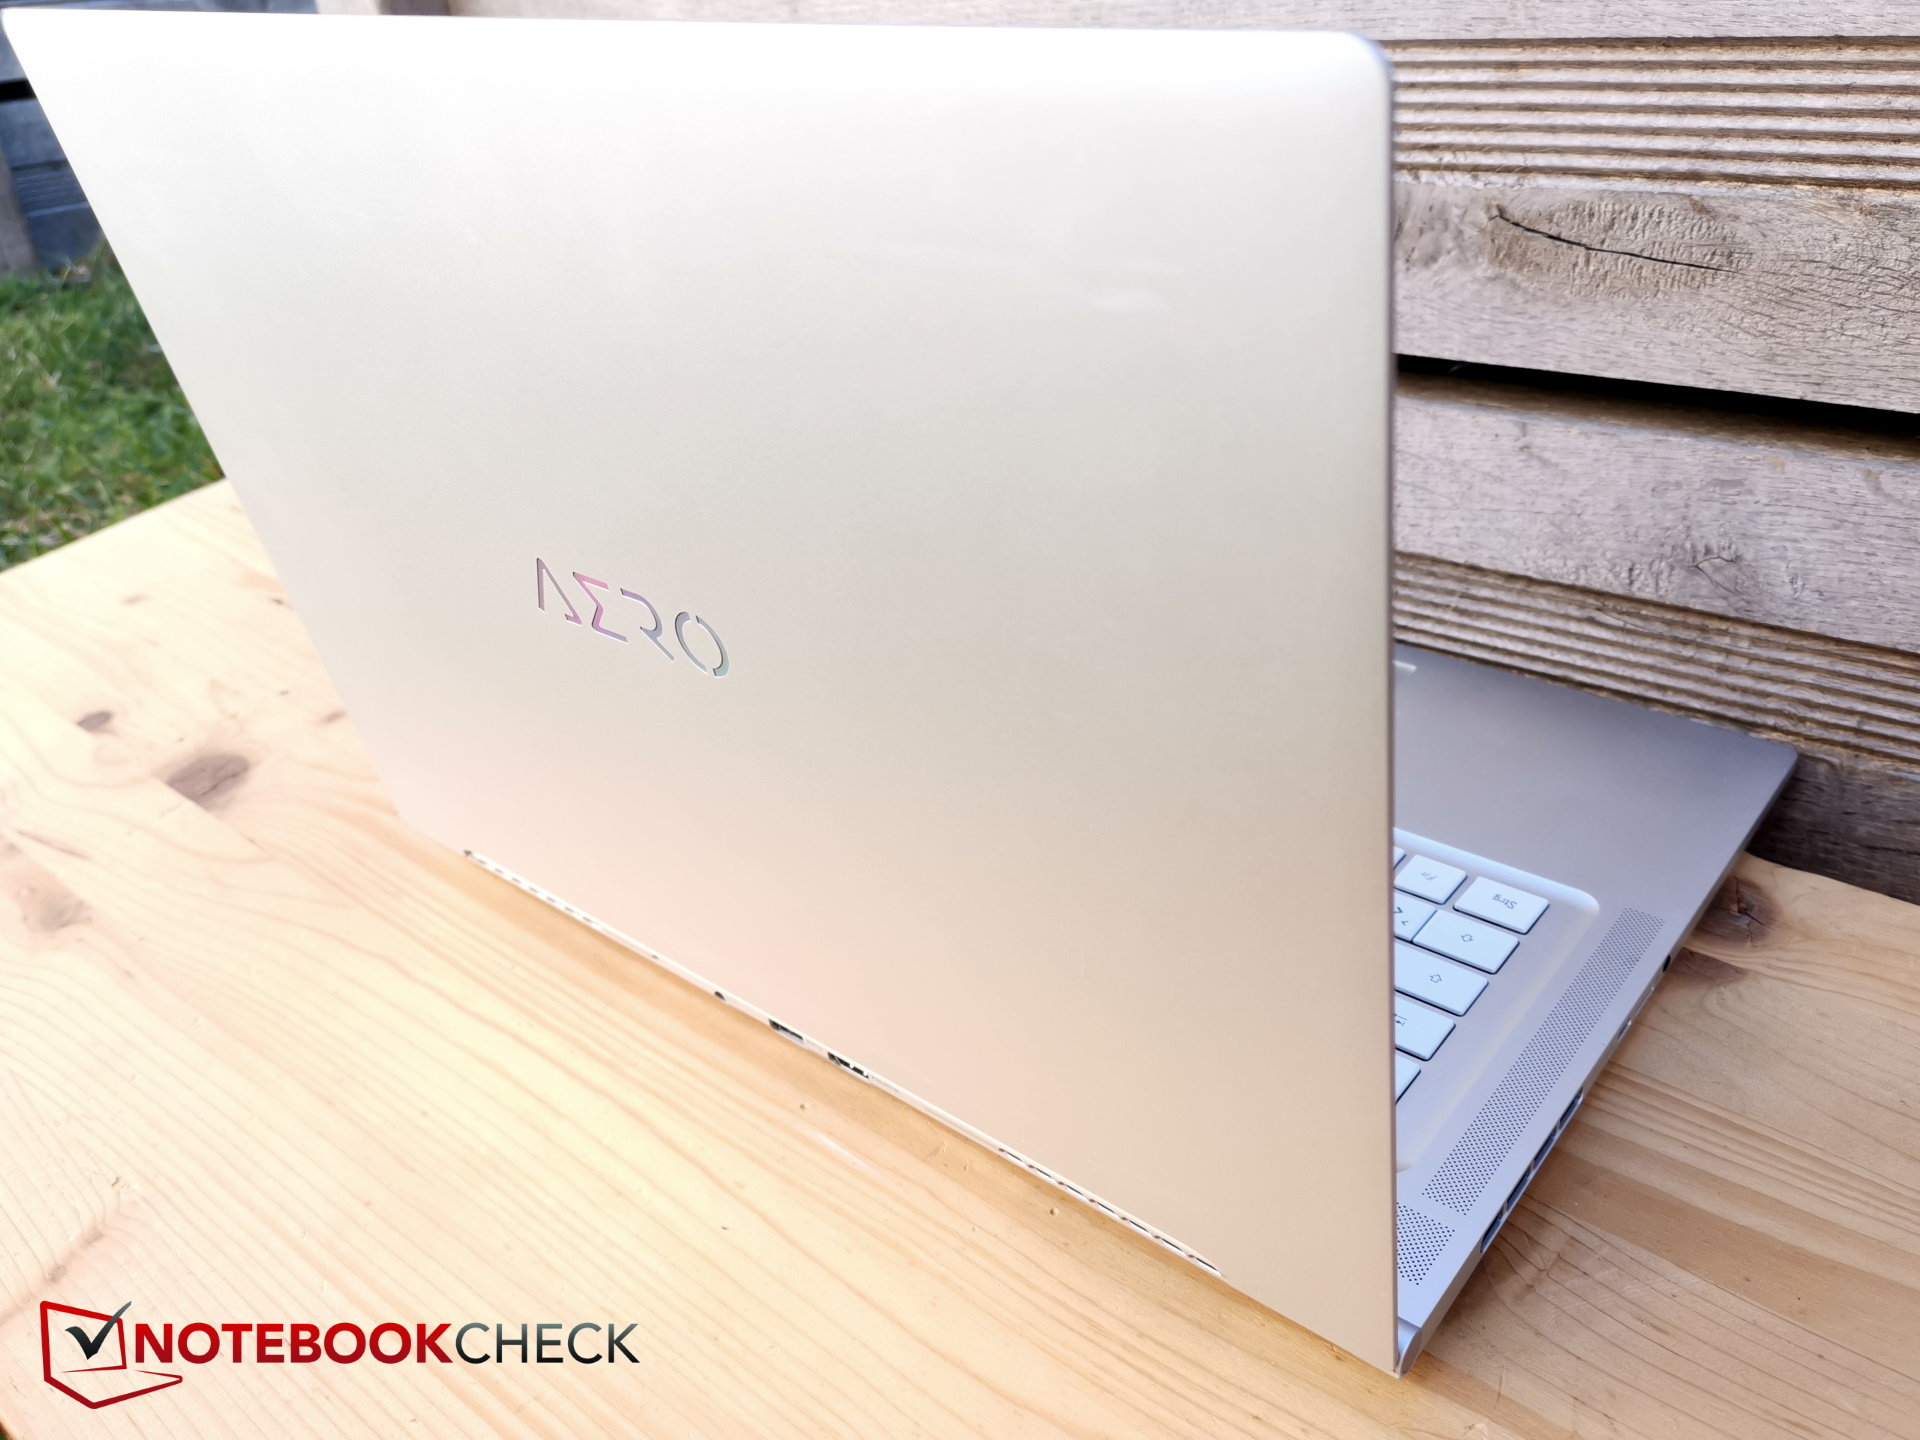
The display lid, on which the illuminated "Aero" logo is emblazoned, is somewhat less rigid. Only the display frame is made of plastic.
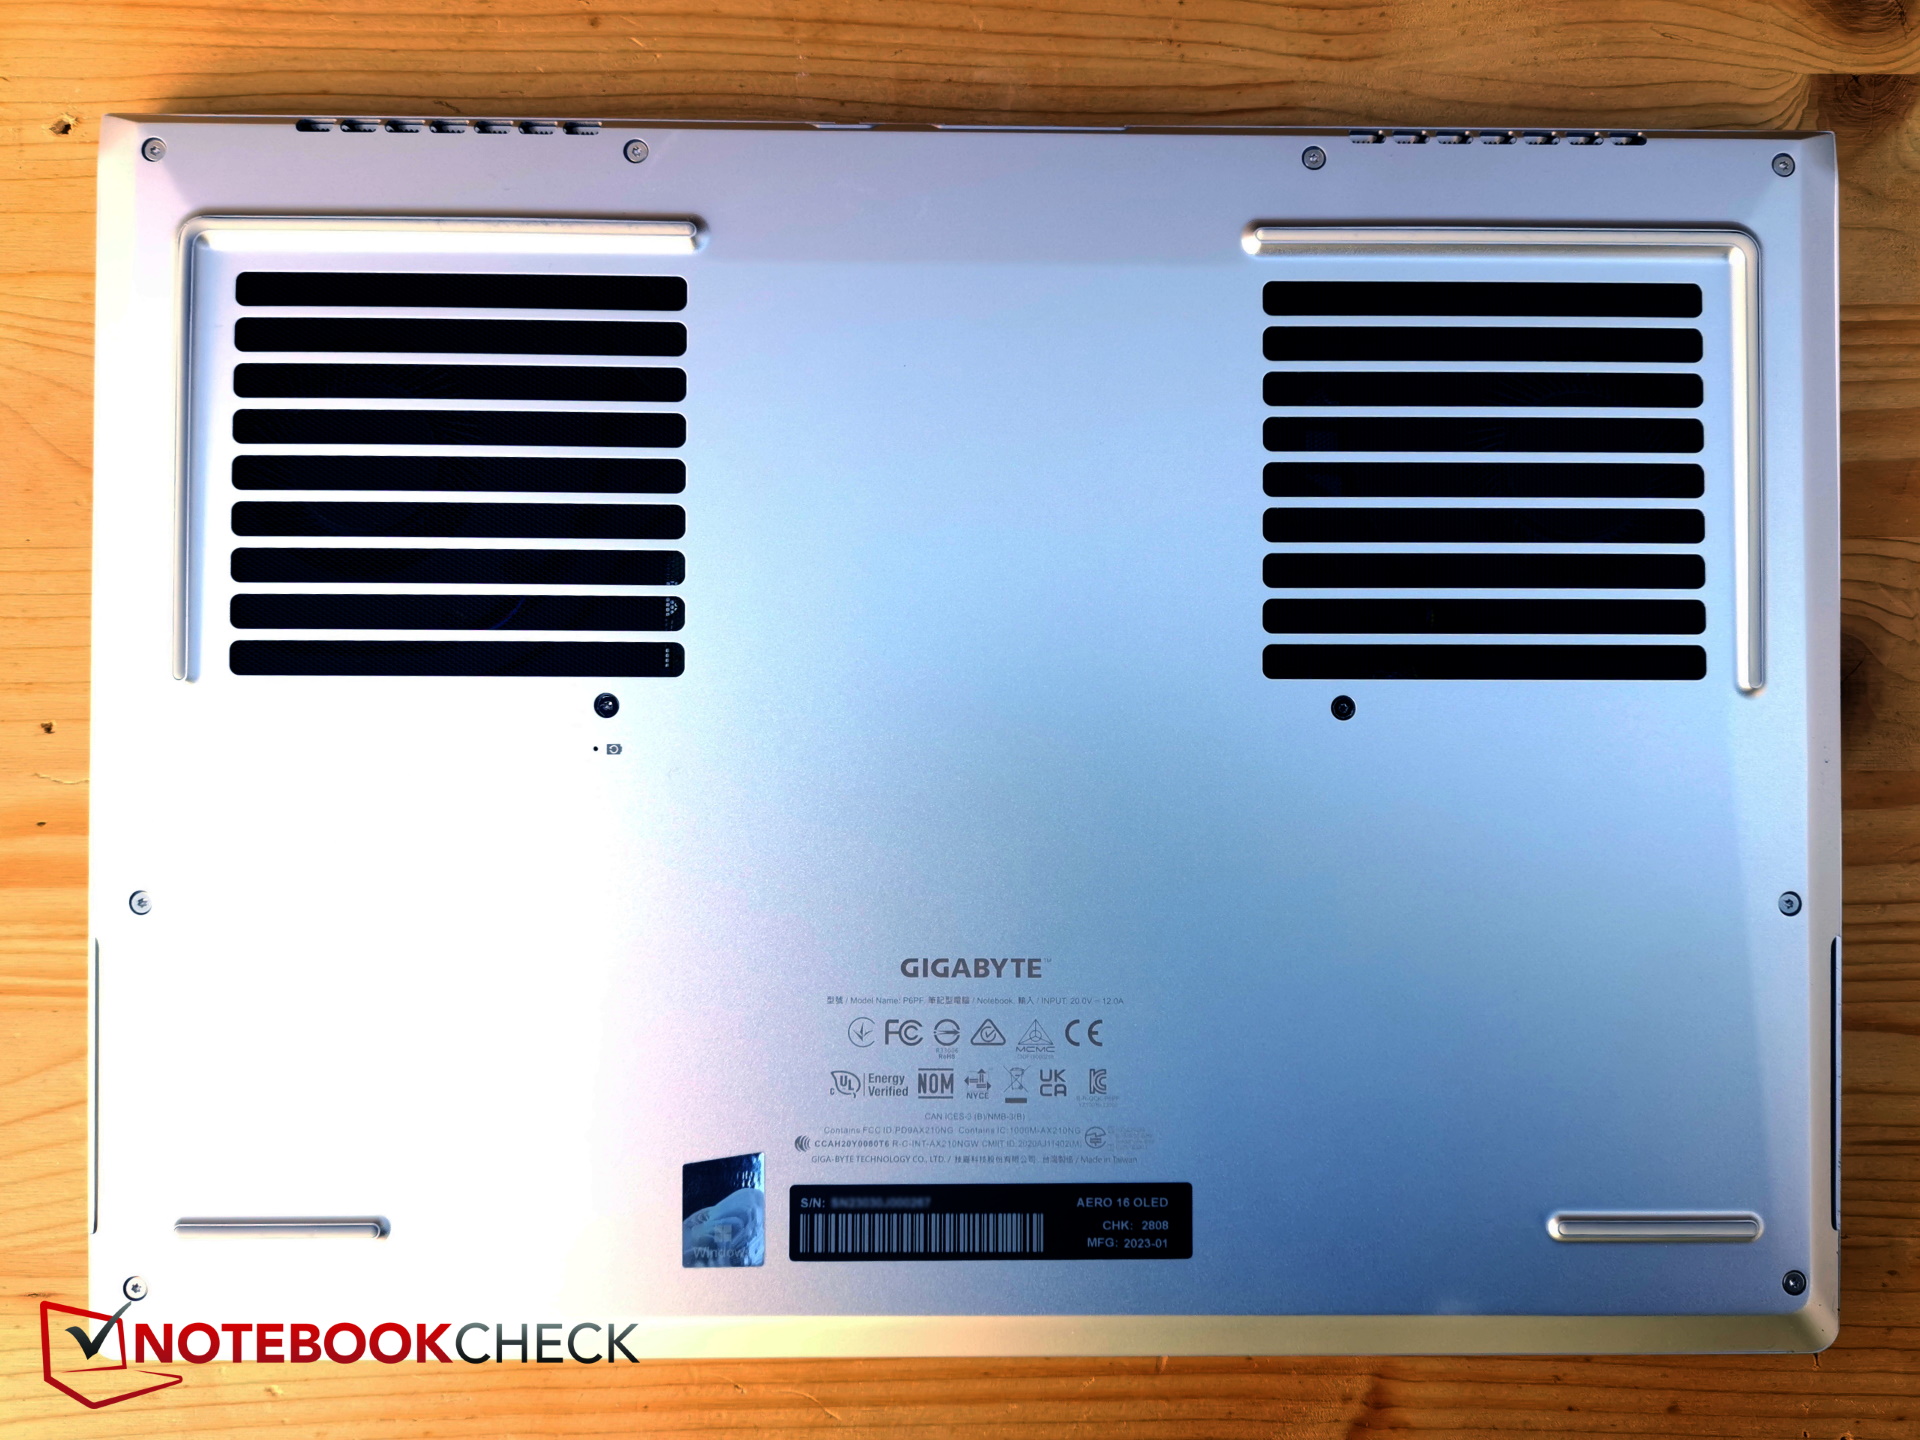
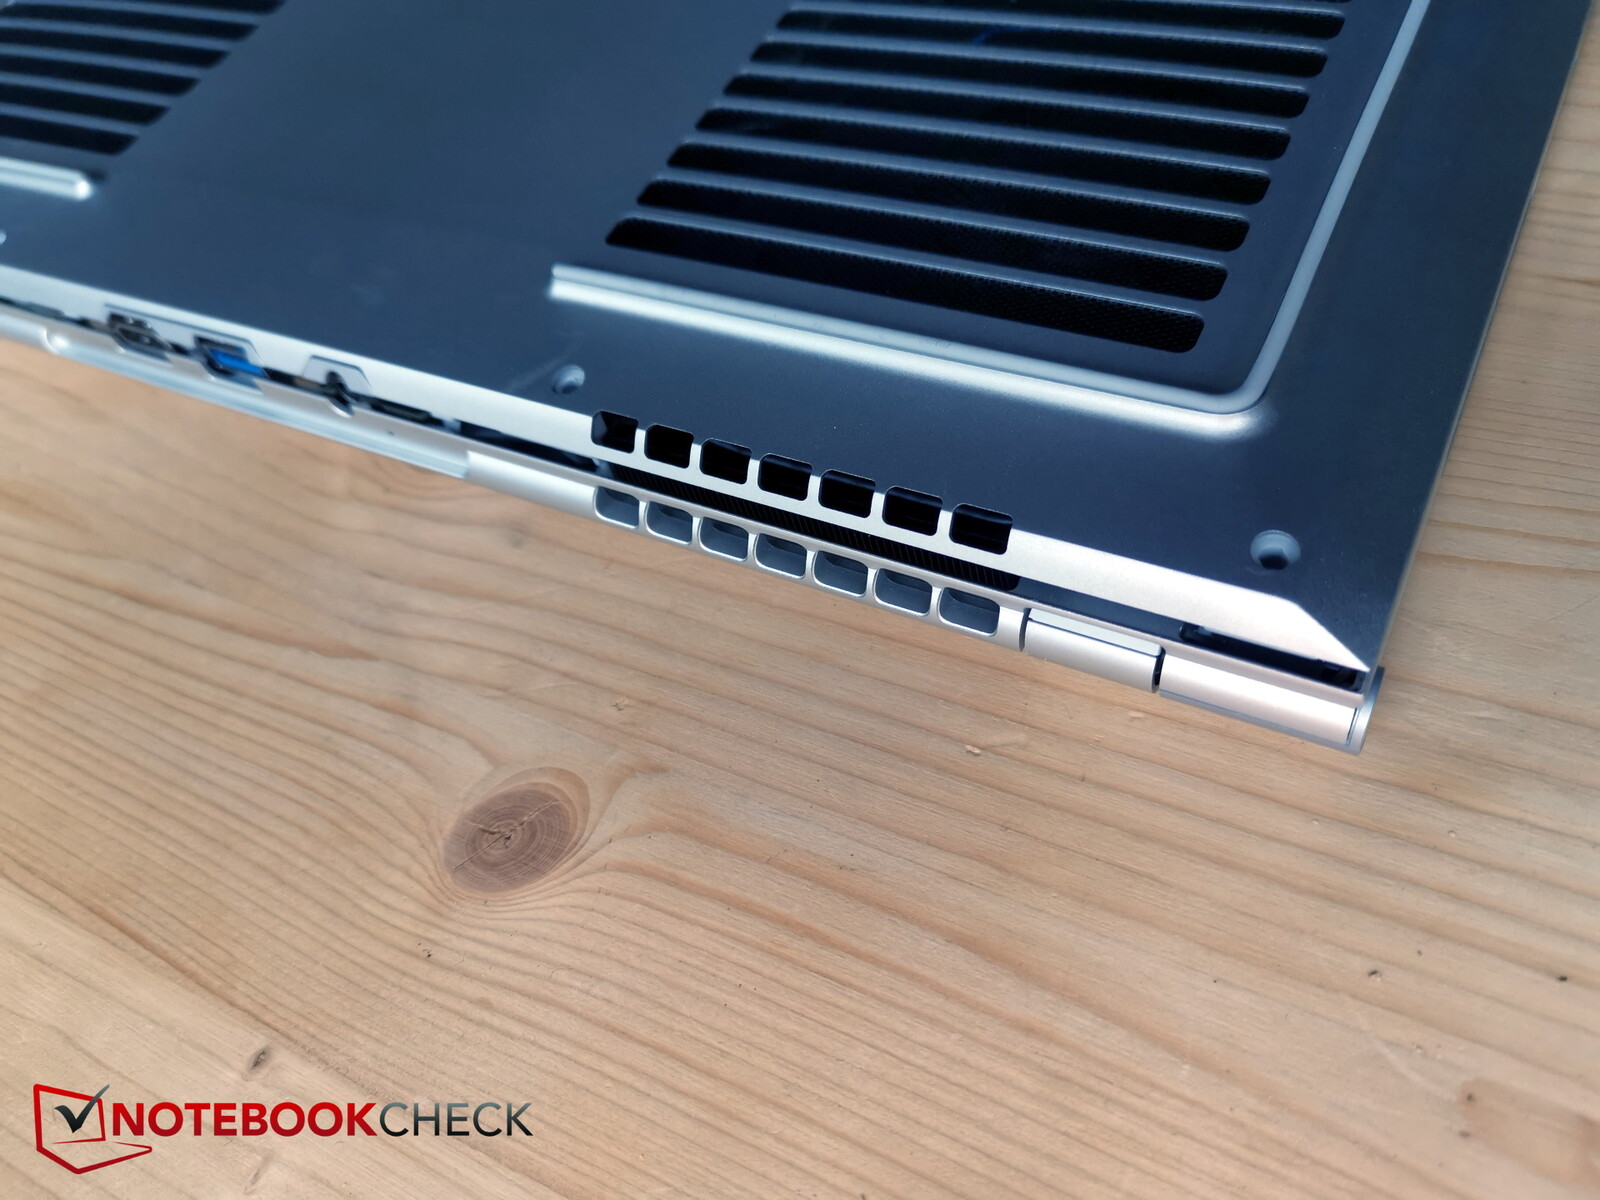
Ventilation grilles are practically everywhere, namely at the back, on the sides, below and above. The build quality seems to be on a good level and no gaps were found.


At just 18 mm, the Aero 16 is slightly thinner than the ZenBook Pro 16X or the MSI CreatorPro Z16P. It is also lighter, with the predecessor having weighed 200 g more.
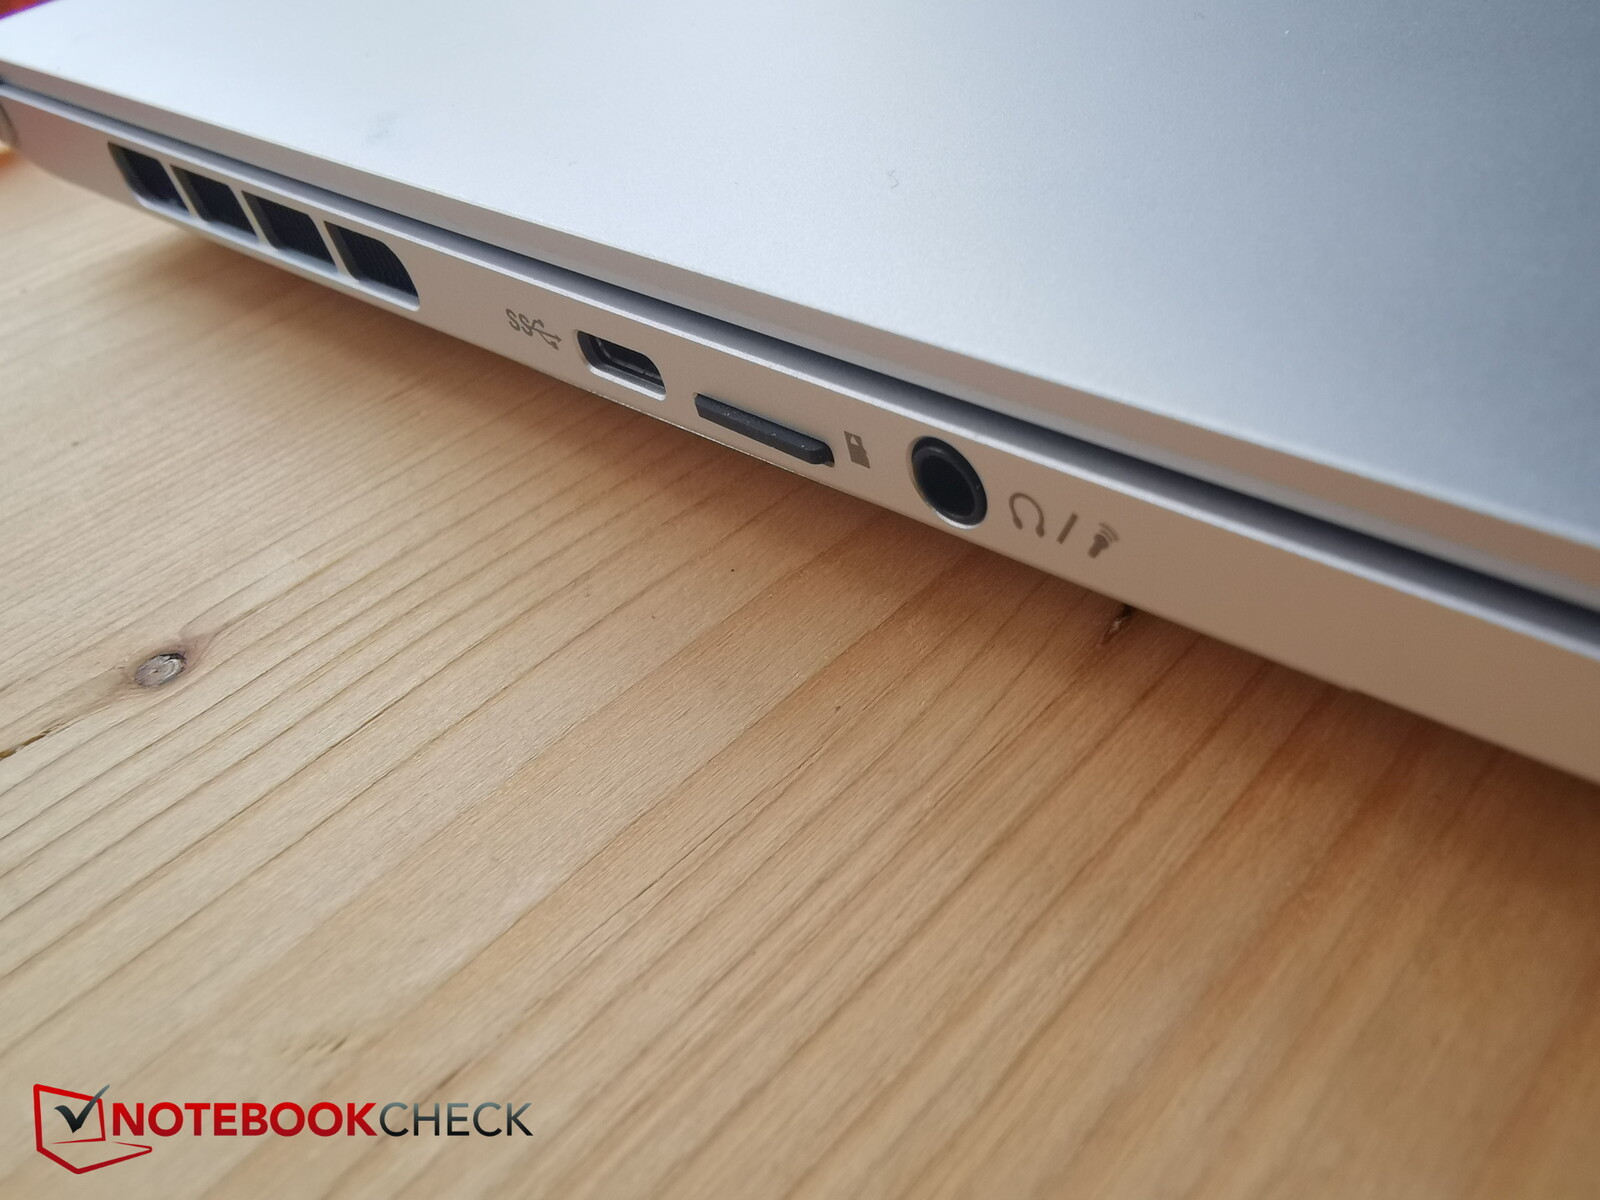
Equipment - Aero 16 with ports at last!
A lot has changed in the ports, fortunately, because the meager three USB-C ports of the predecessor had to be expanded with an Aero Hub to include HDMI, USB-A, etc.
This year, the new Aero houses almost all the necessary ports. To do this, it utilizes the space at the back where the mains connection is, for example. We would have preferred a USB-A instead of one of the three USB-C ports on the side, and a LAN port is still missing, but at least there is now an HDMI port and a (microSD) reader. The port distribution is good, except for USB-A at the back instead of on the side.


SD Card Reader
MicroSD cards click into place and protrude only minimally (1 - 2 mm).
The transfer rates are good; we copied 1 GB of image material from our AV PRO microSD 128 GB V60 to the desktop in about 7 seconds.
If competitors have a reader at all, it is slower.
| SD Card Reader | |
| average JPG Copy Test (av. of 3 runs) | |
| Razer Blade 18 RTX 4070 (Angelibird AV Pro V60) | |
| Gigabyte AERO 16 OLED BSF | |
| Average of class Gaming (20.9 - 210, n=54, last 2 years) | |
| MSI CreatorPro Z16P B12UKST (AV Pro V60) | |
| Asus ZenBook Pro 16X OLED UX7602ZM-ME115W (AV Pro SD microSD 128 GB V60) | |
| maximum AS SSD Seq Read Test (1GB) | |
| Razer Blade 18 RTX 4070 (Angelibird AV Pro V60) | |
| Gigabyte AERO 16 OLED BSF | |
| Average of class Gaming (25.5 - 261, n=51, last 2 years) | |
| MSI CreatorPro Z16P B12UKST (AV Pro V60) | |
| Asus ZenBook Pro 16X OLED UX7602ZM-ME115W (AV Pro SD microSD 128 GB V60) | |
Communication
The Intel AX210 chip was also installed in last year's model and again ensures good transfer rates, though the MSI CreatorPro is even faster.
The module supports Wifi 6E and thus the 6 GHz range.
Webcam
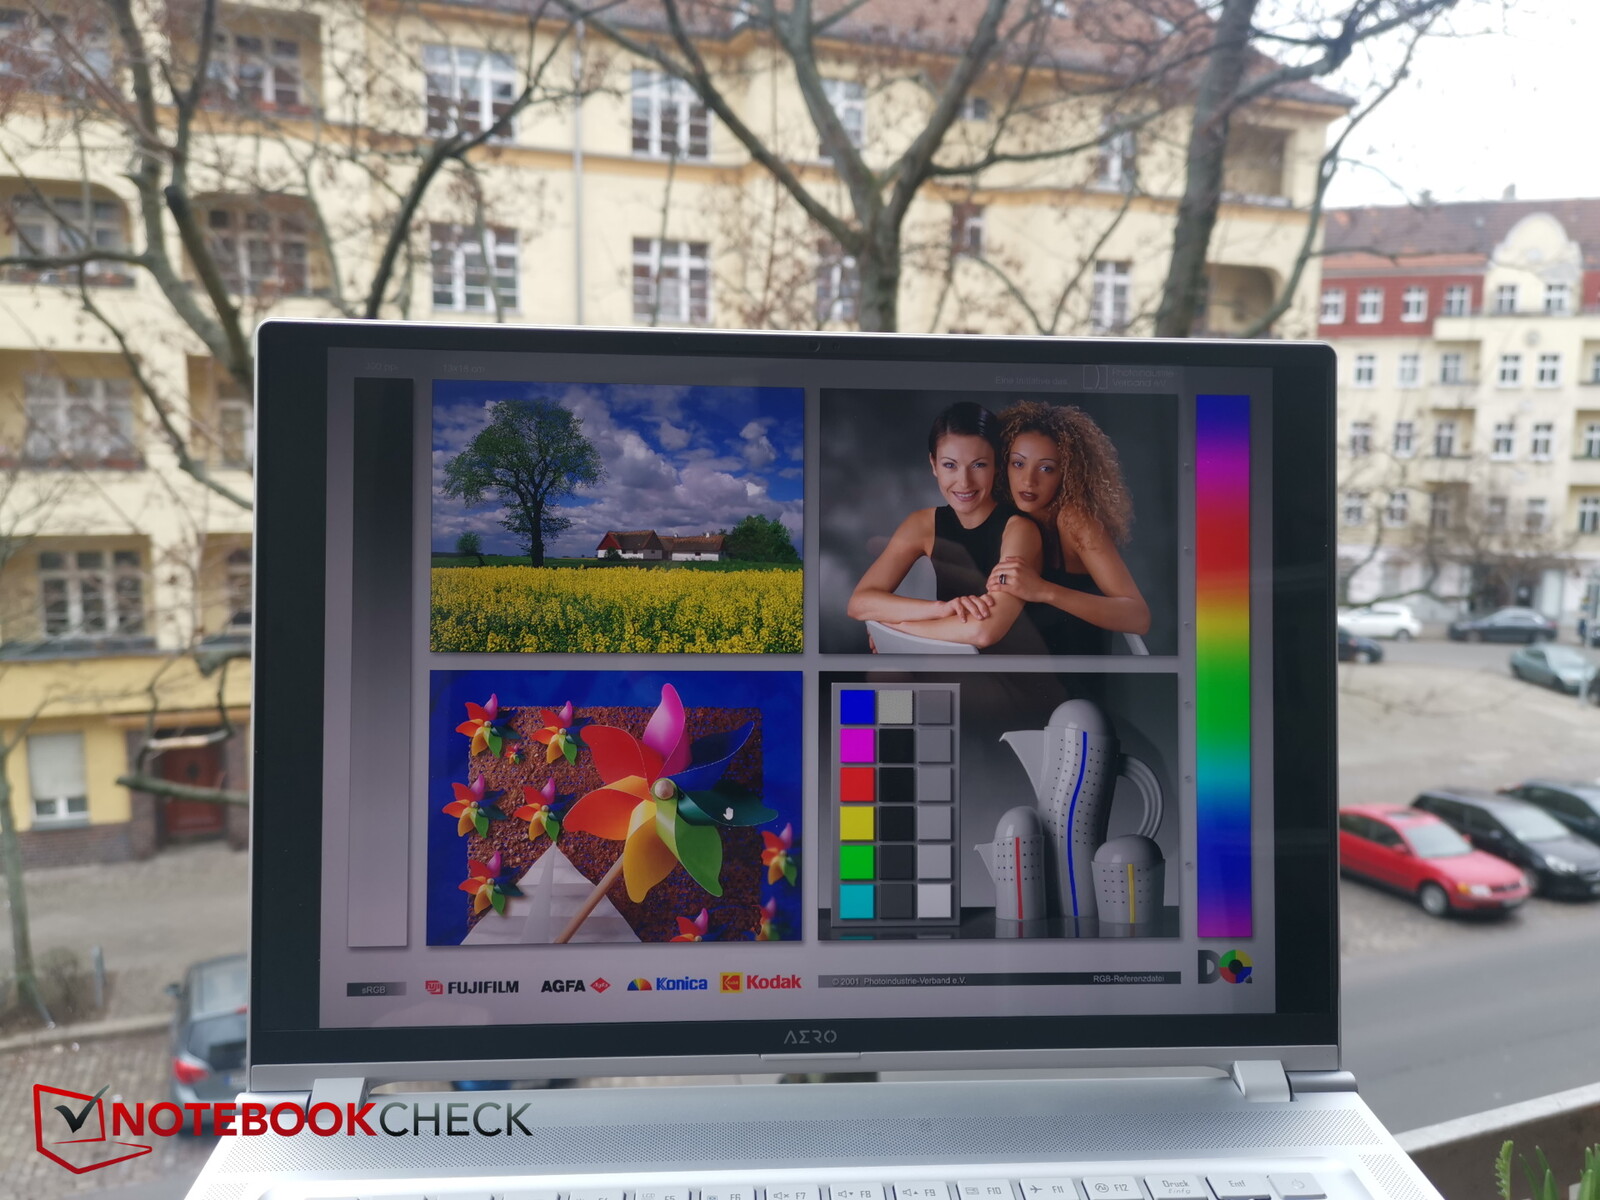
Gigabyte has finally installed a Full HD camera into the creative laptop, with the resulting image being quite usable, even in suboptimal lighting conditions. A look at the ColorChecker, however, unfortunately shows that the colors deviate greatly. The predecessor had a 720p camera.


Security
The Aero is not really for security fanatics. TPM is on board, but there is no fingerprint sensor or Kensington connection.
Accessories and Warranty
No accessories are included together with the laptop upon purchase.
In Germany, the manufacturer provides a 24-month warranty. This may differ in other regions, so interested buyers should double-check before purchase.
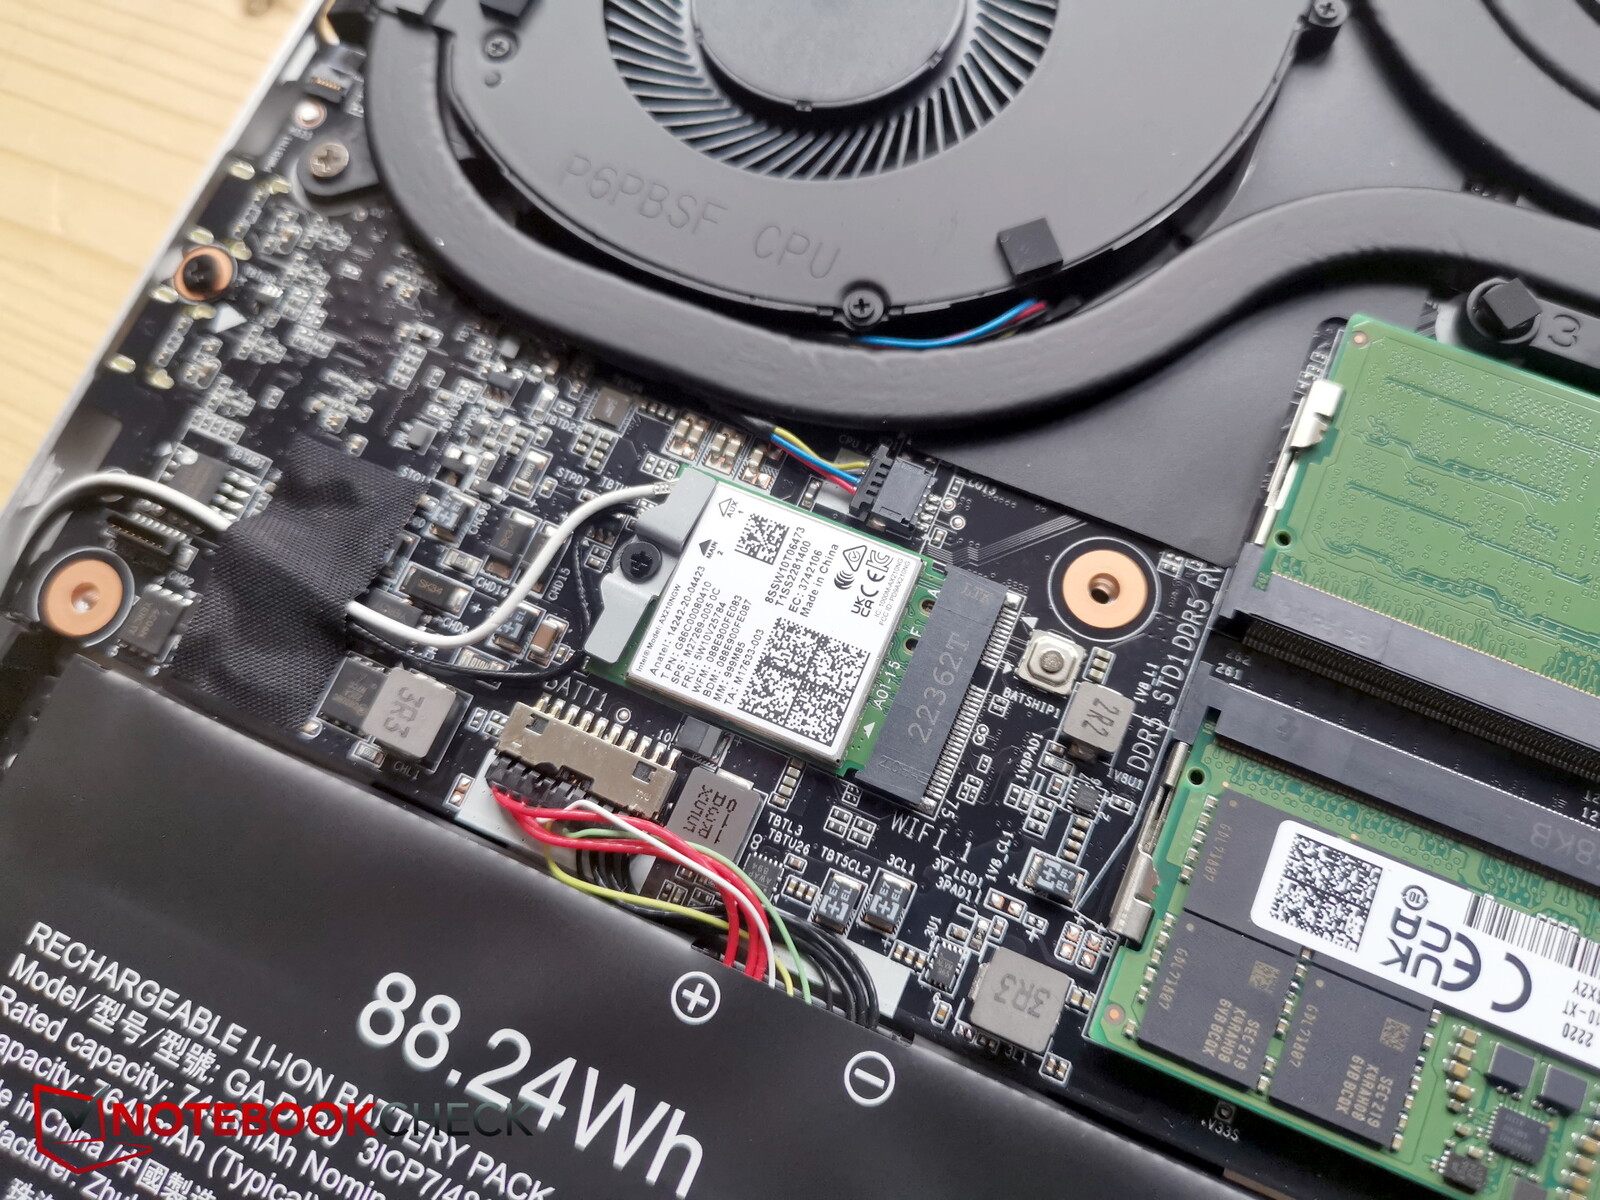
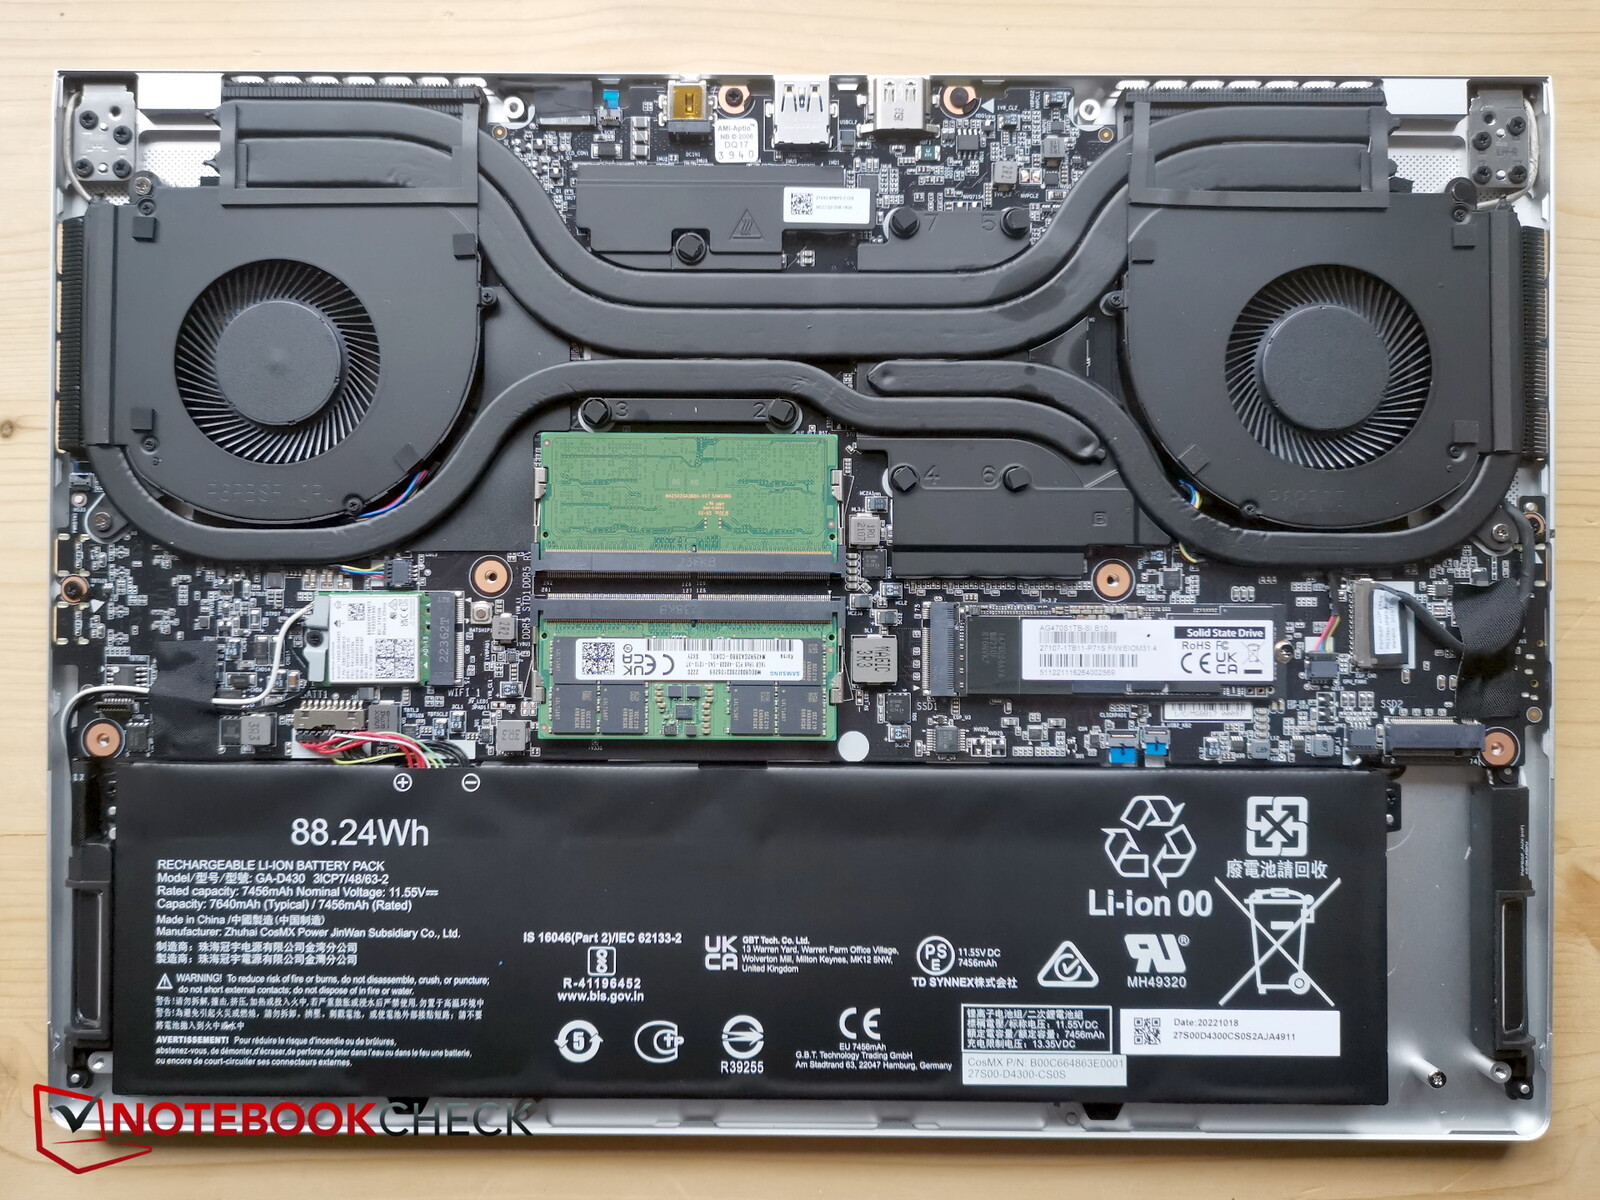
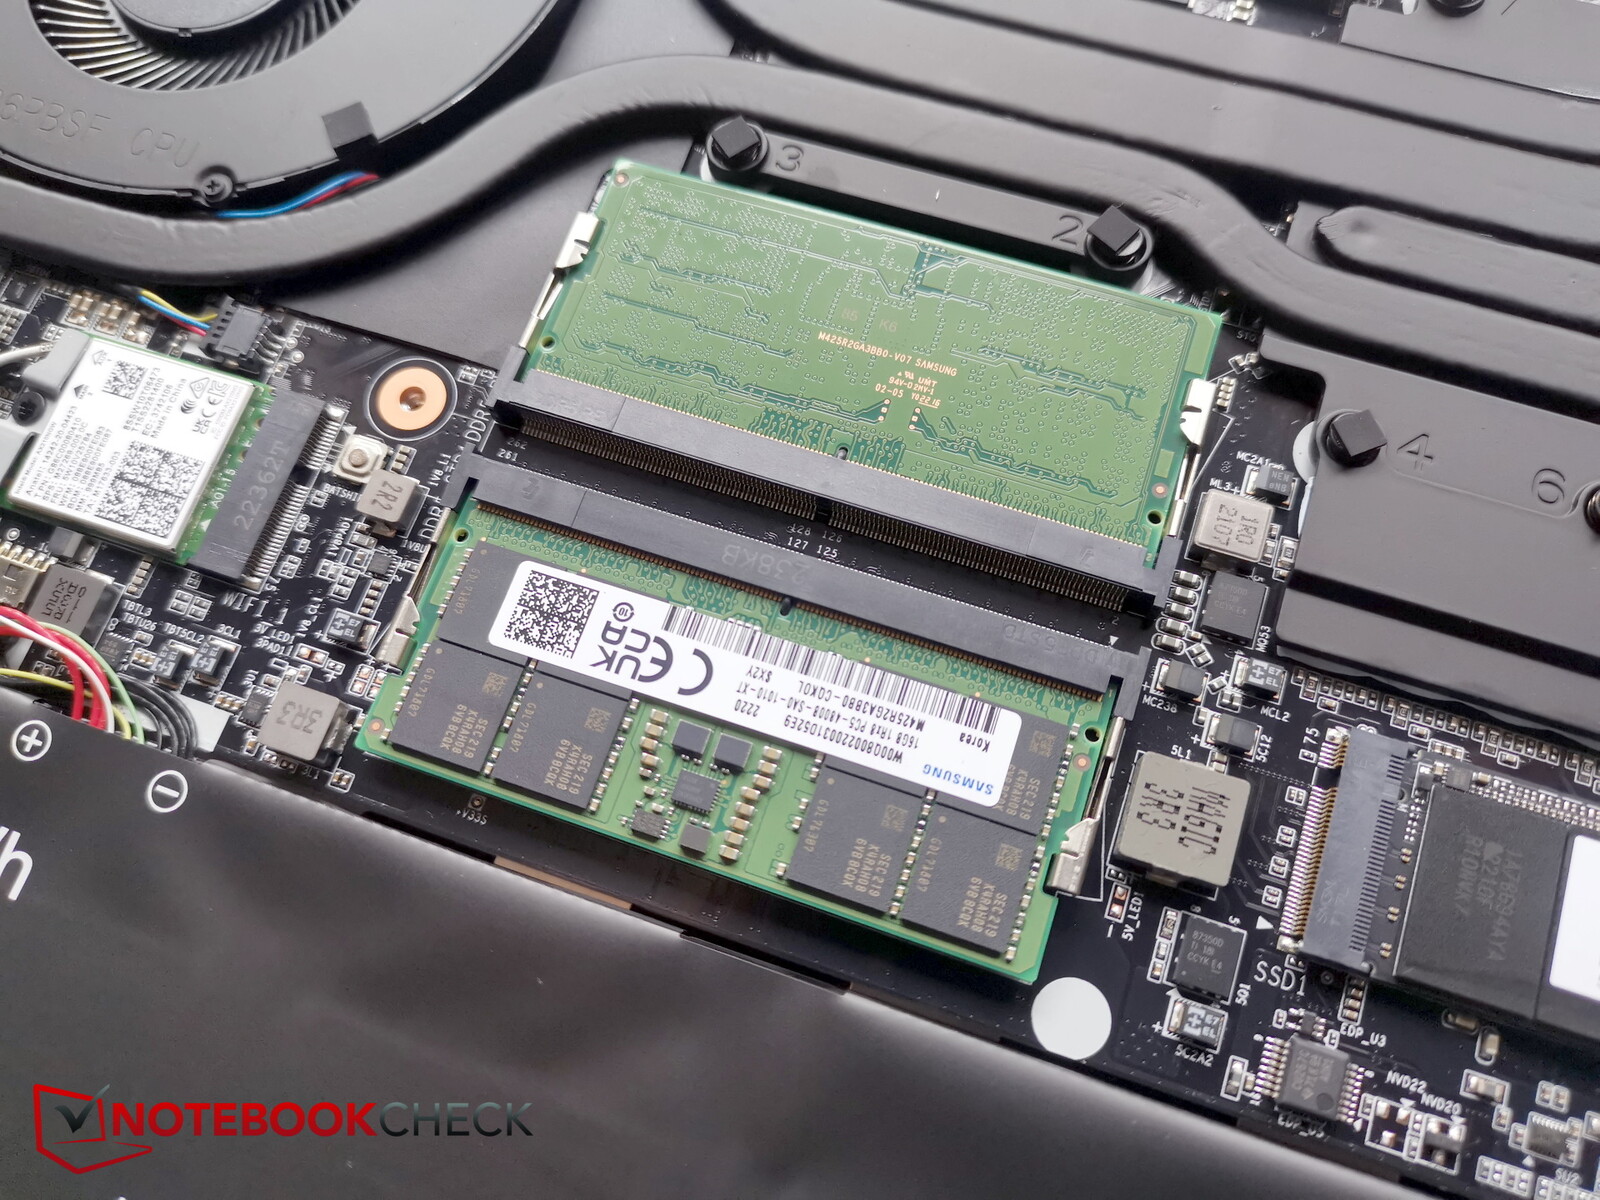
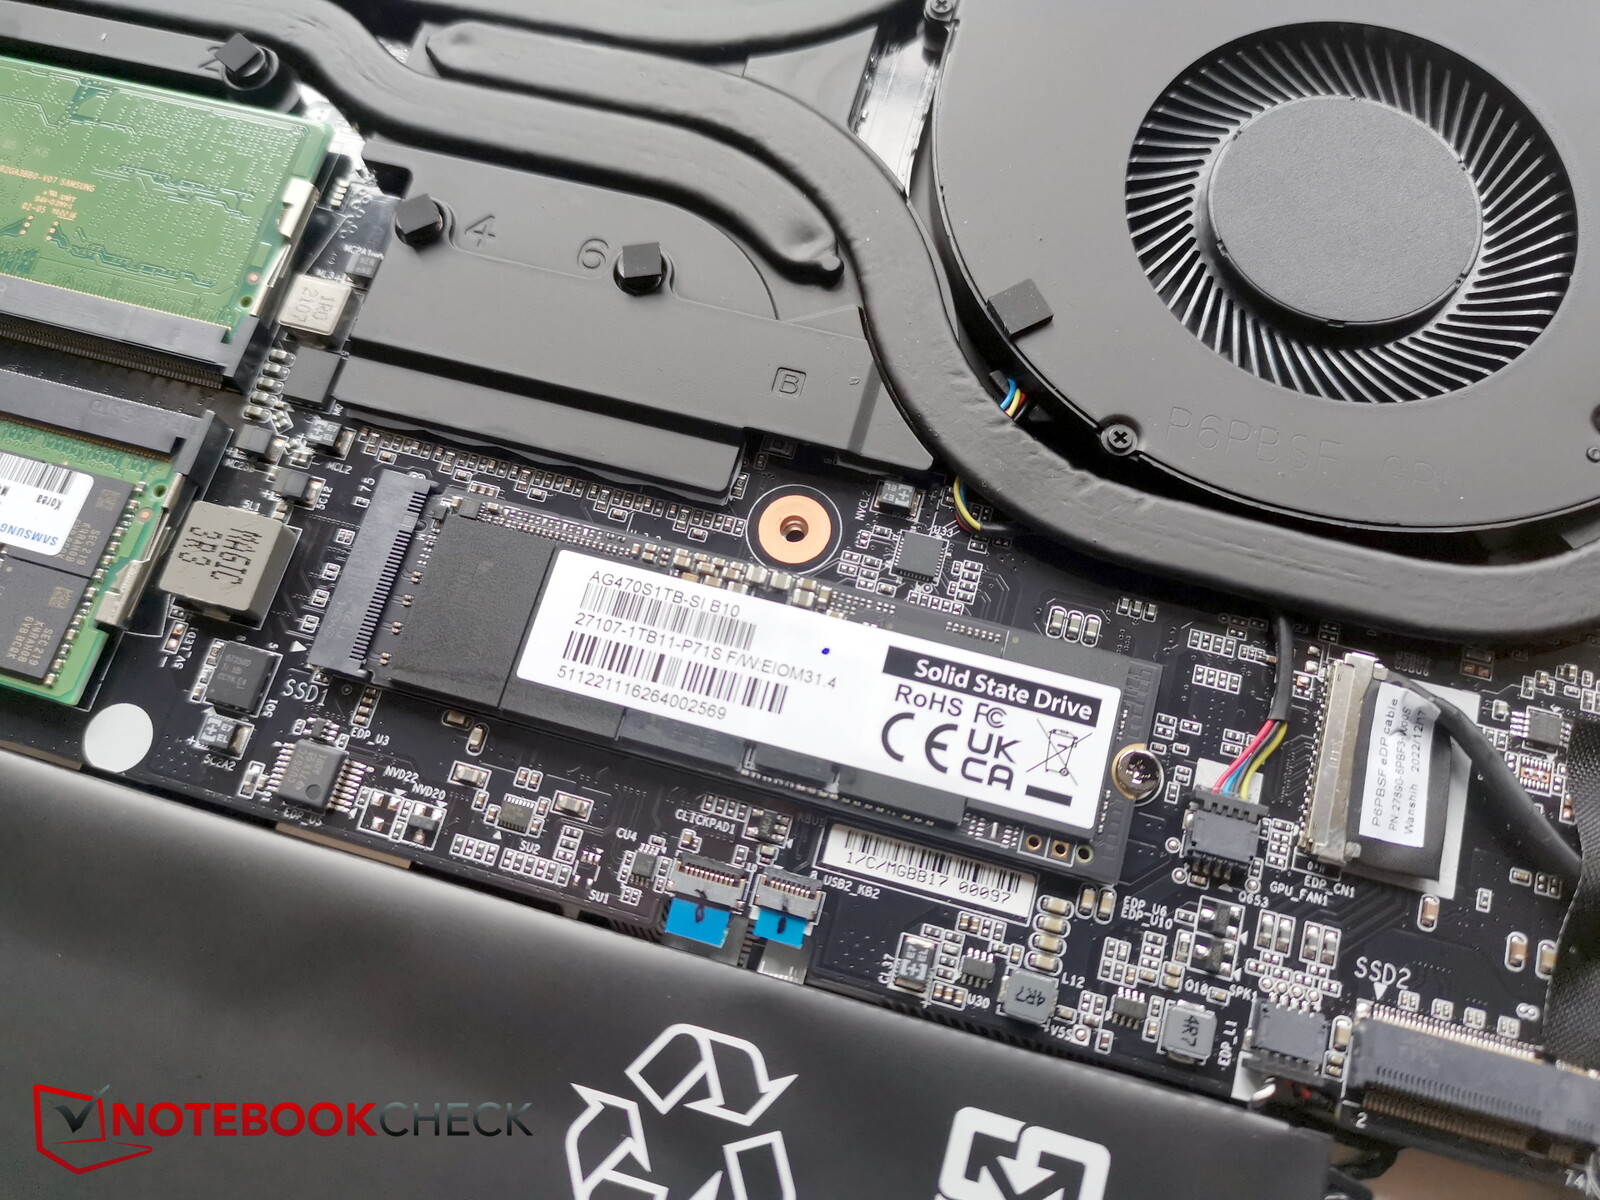
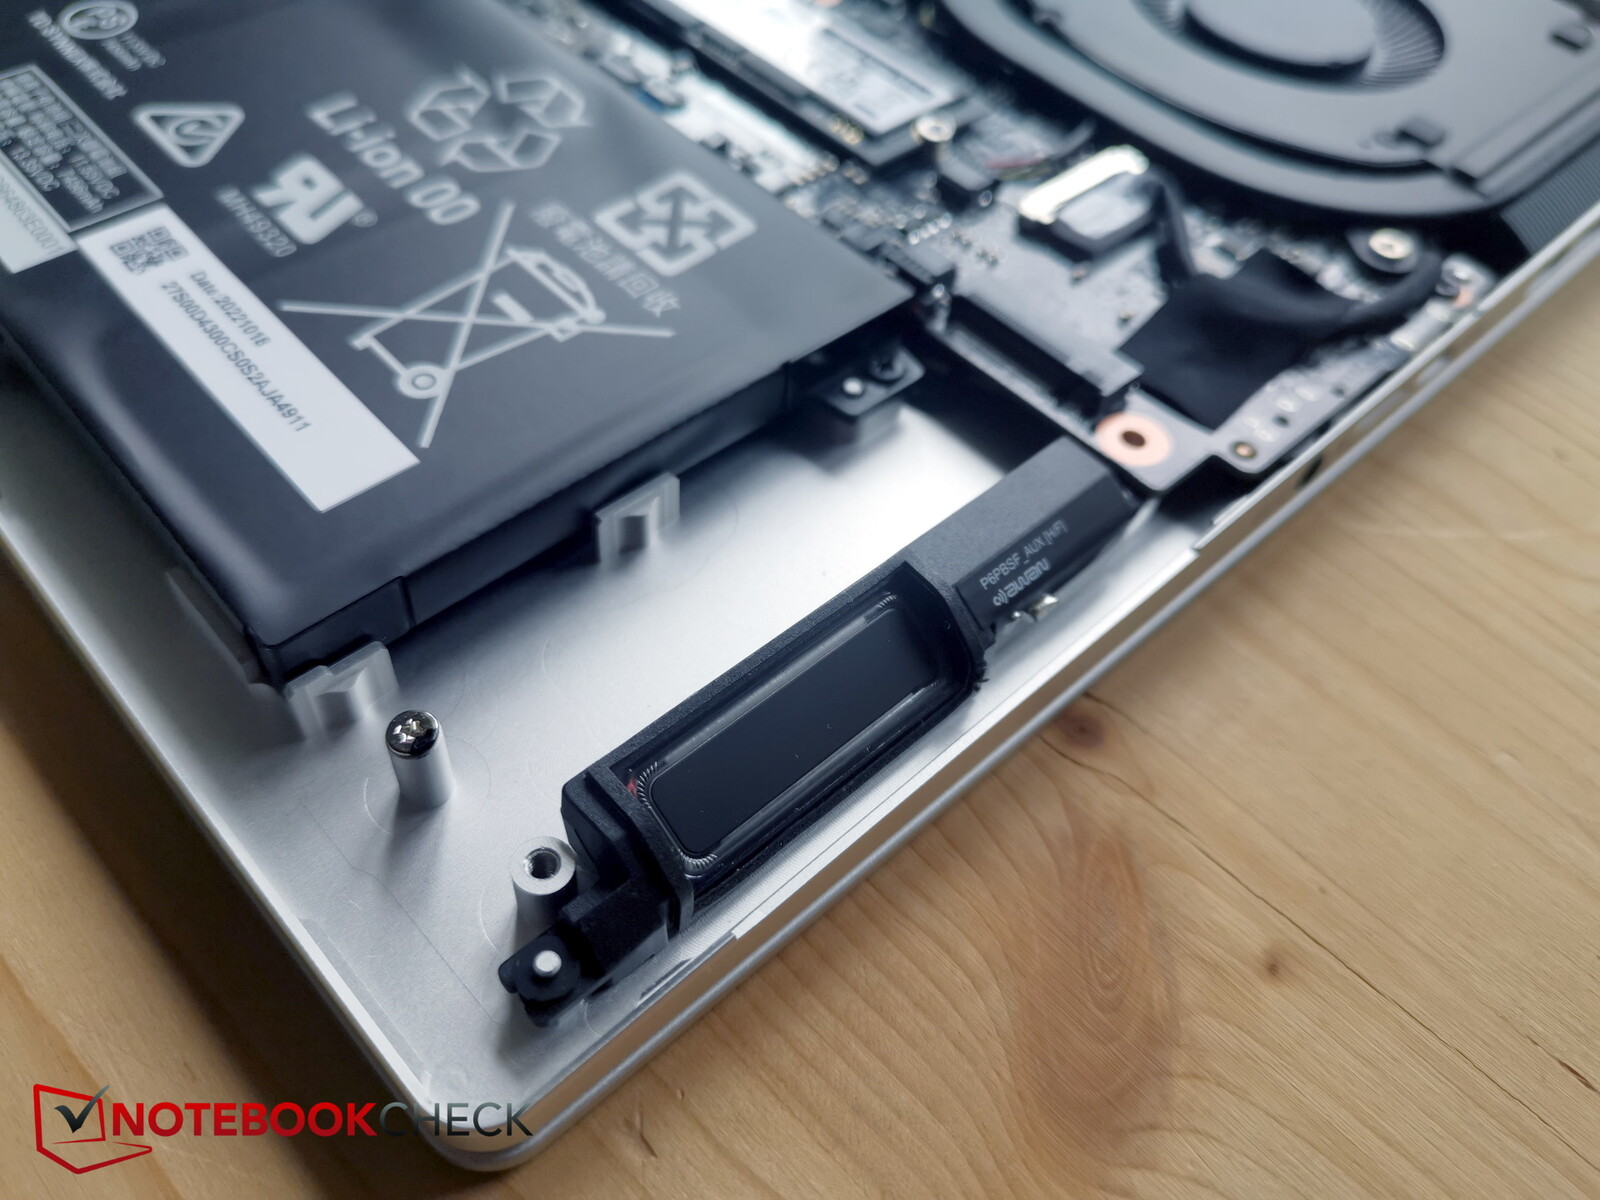
Maintenance
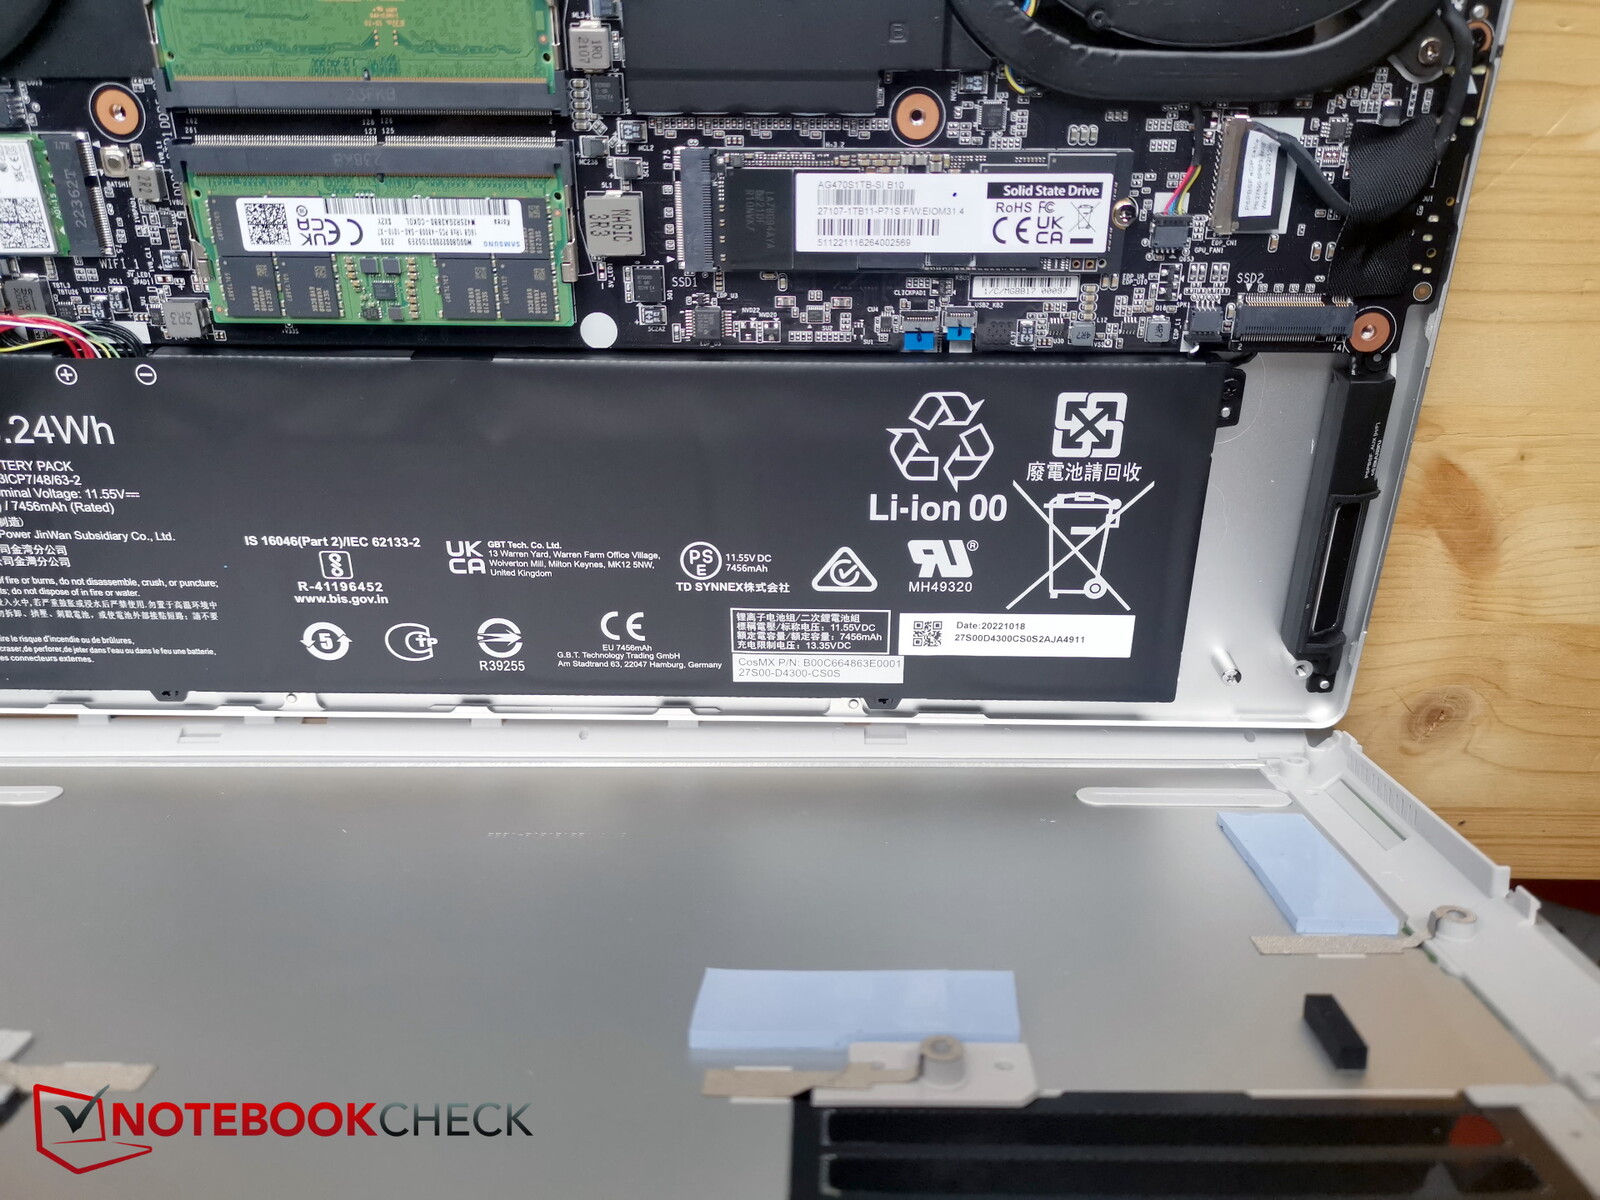
First, 10 torx screws need to be removed. Afterwards, finding a gap in the tight chassis for inserting level tools is not so easy. The best way to do this is towards the back. Once the first step has been made, it becomes much easier and the baseplate can be detached quite effortlessly.
Inside, you have access to the fans, the battery, the replaceable WLAN module, the two RAM slots and the two M.2 SSD slots, one of which is occupied. There are cooling pads on the base plate for the two SSD slots.
Input Devices - Usable inputs
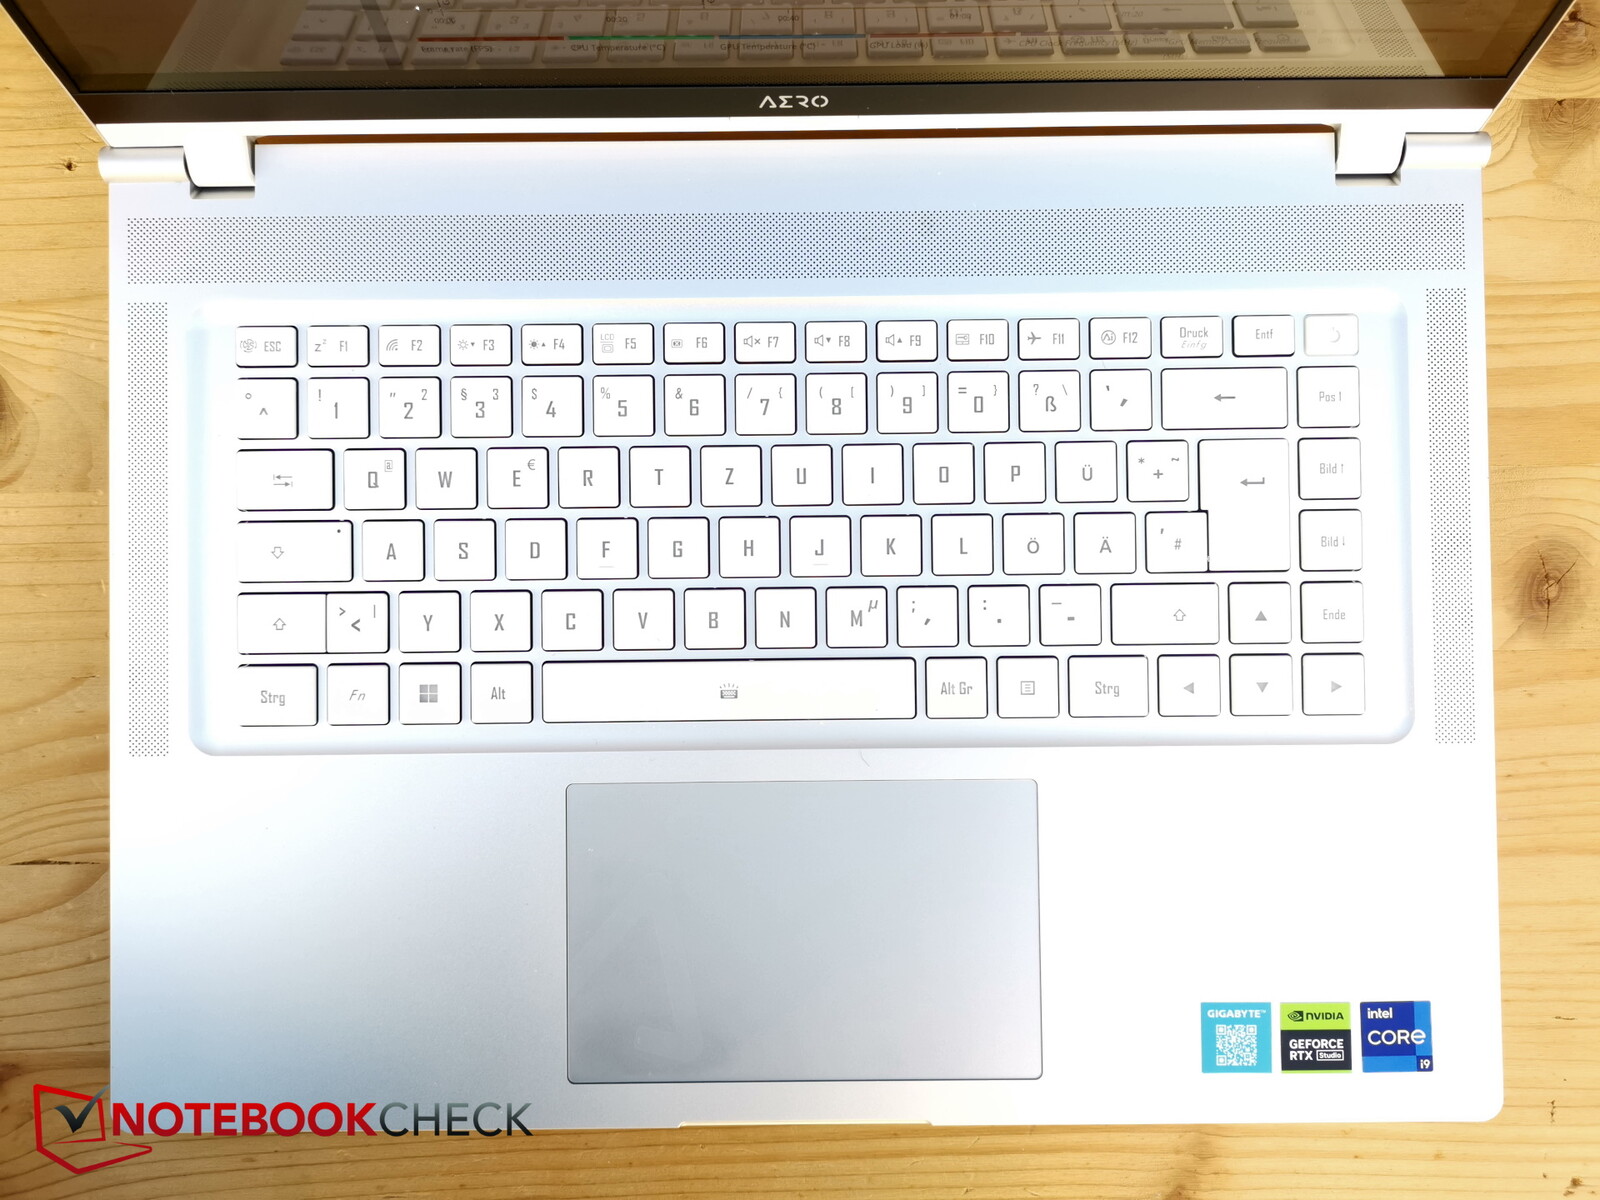
Keyboard
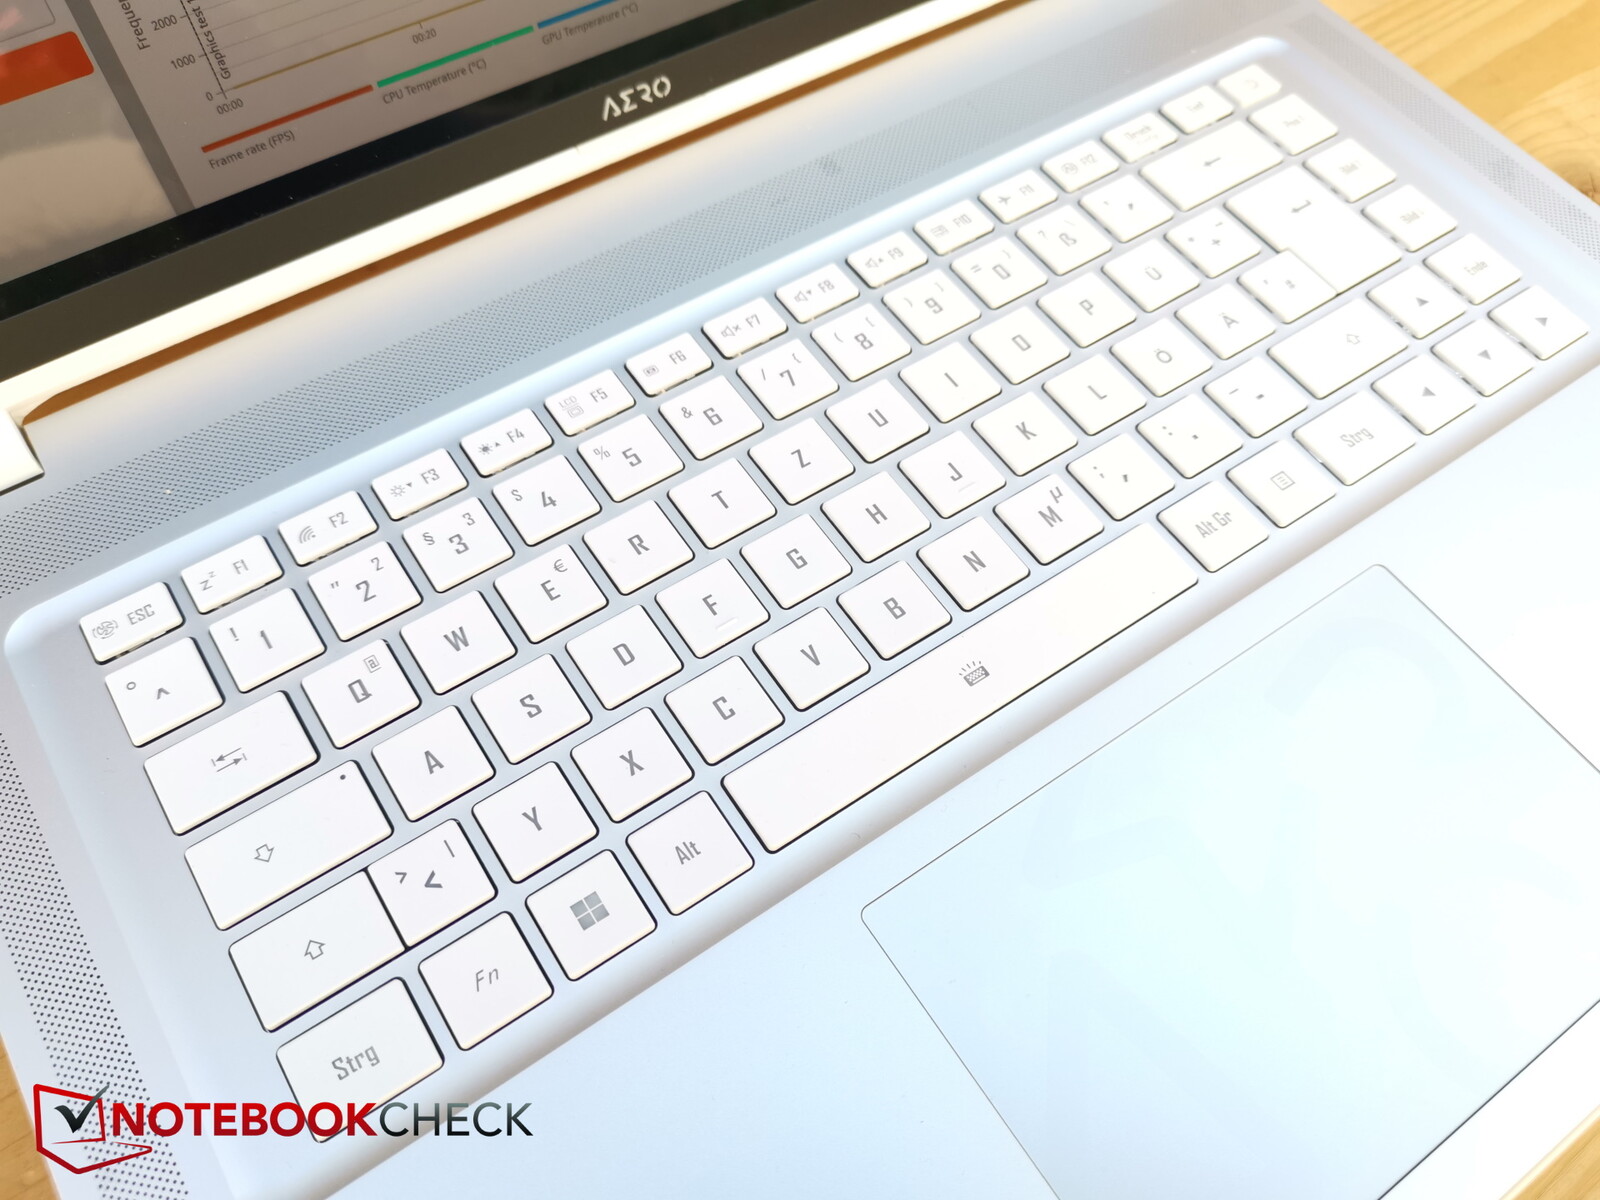
The keyboard now has white instead of black keys. This looks more elegant, but you should refrain from activating the white keyboard backlight in bright lighting, otherwise you'll no longer be able to discern the lettering - but who does?
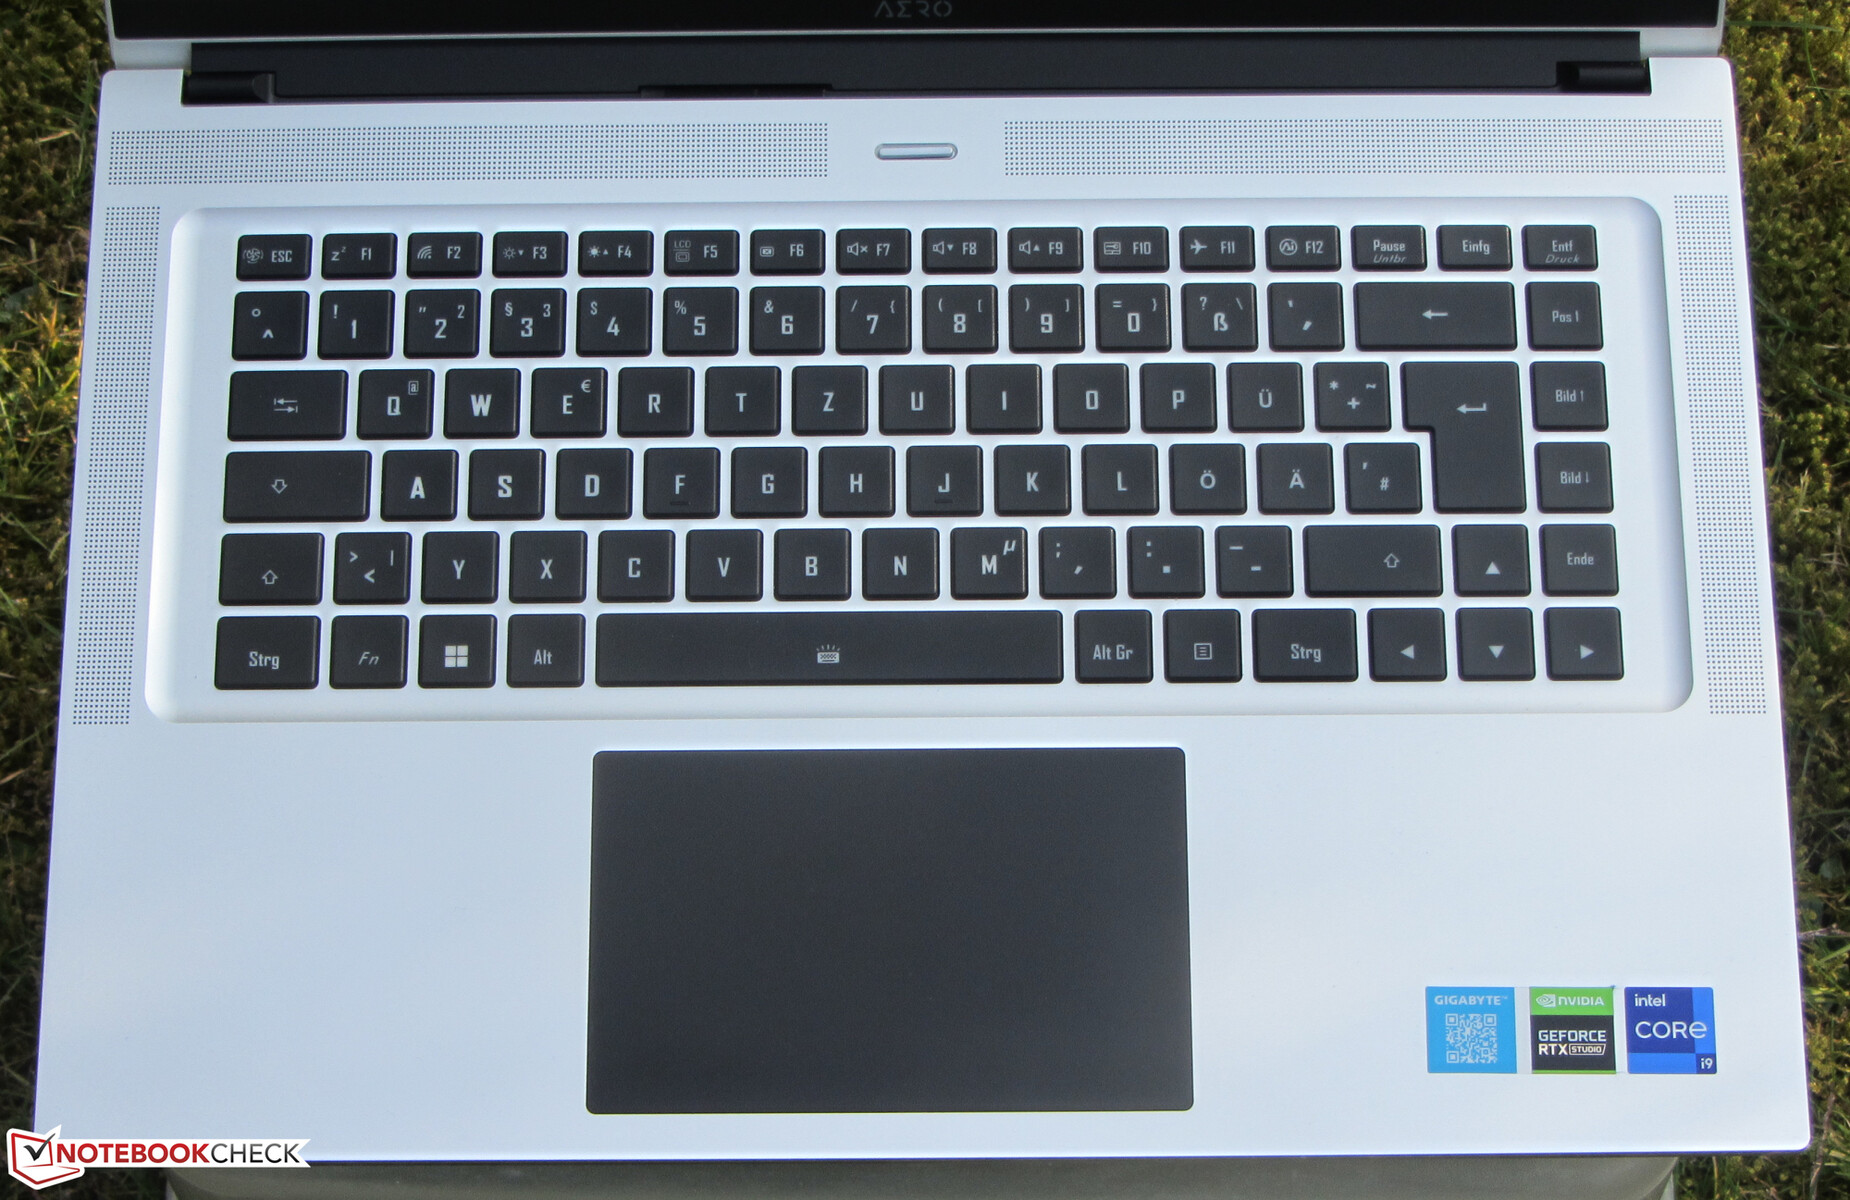
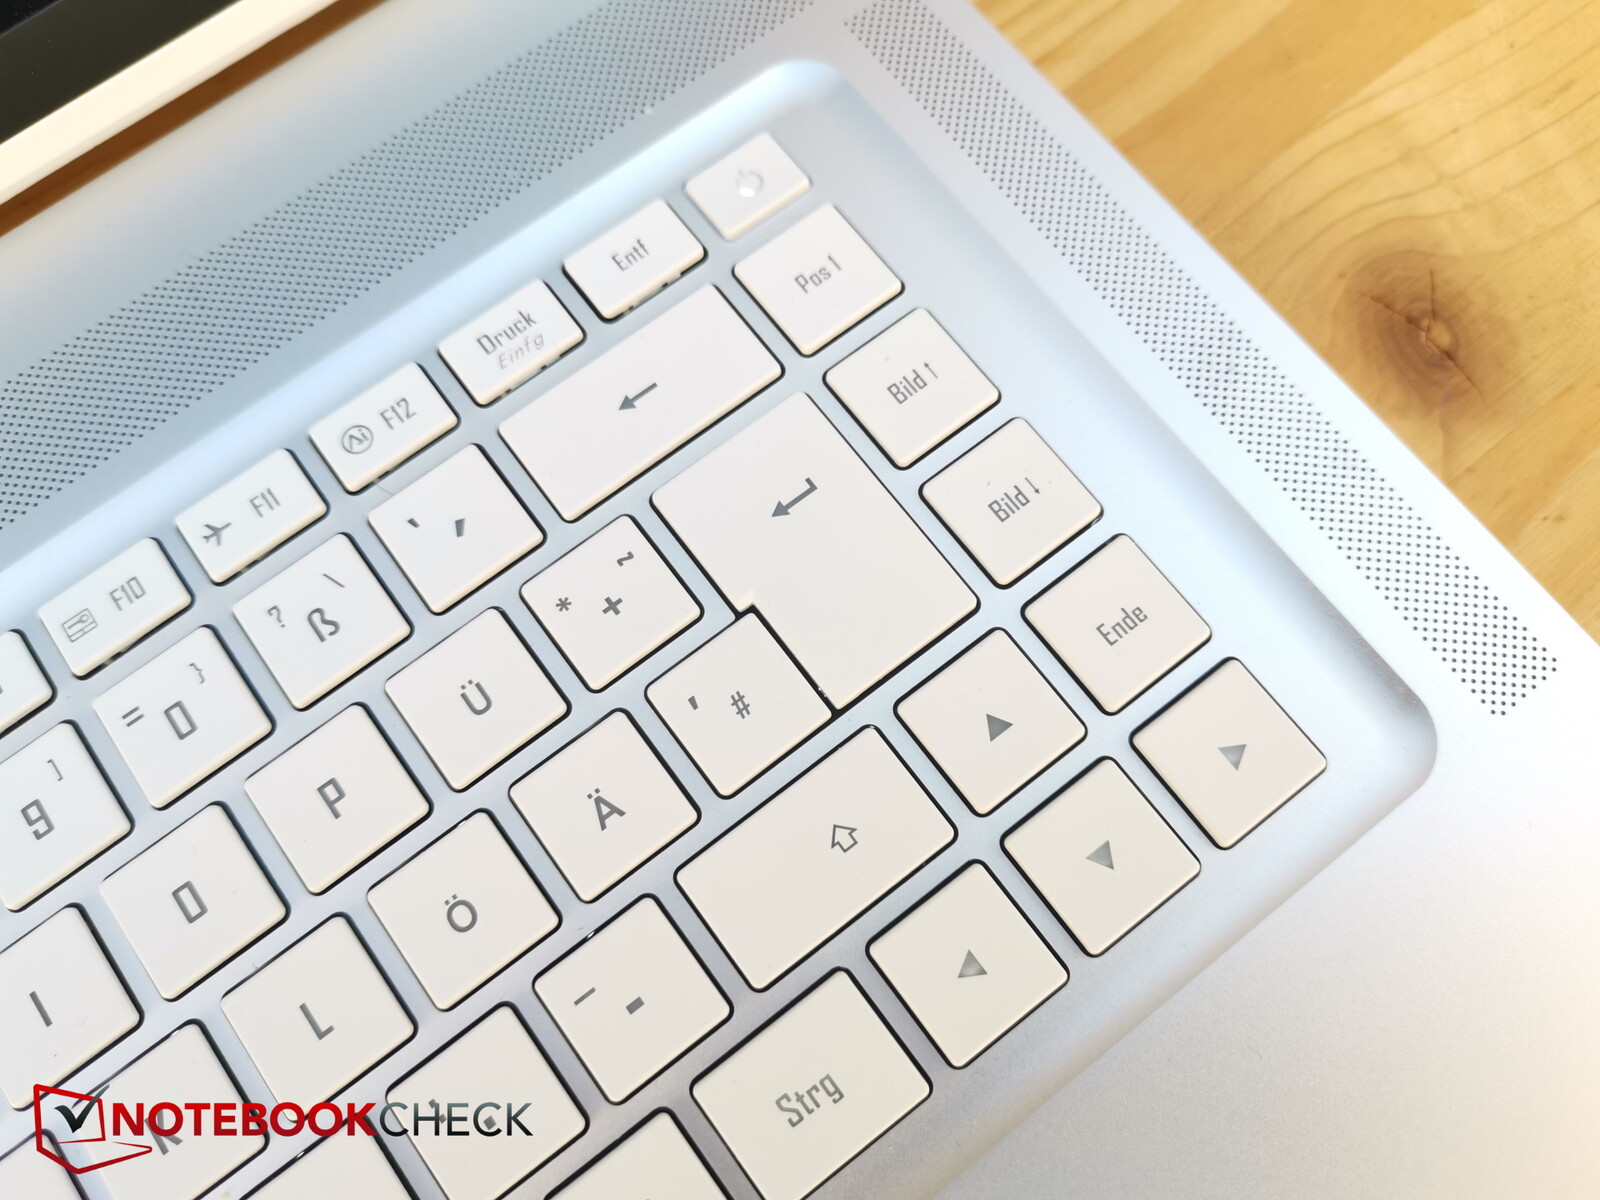
The layout looks very tidy. None of the keys appear out of place, and even the arrow keys are of normal size - very good. Keys are of medium size and are all well spaced apart.
Key travel is around 1.7 mm and the feedback just barely perceptible. Typing is quick and the noise moderate, but the space bar is a little louder.
Although the on/off switch is integrated into the top right of the keyboard, it has a much firmer pressure point and is a little smaller so that it is not so easy to press accidentally. In Gigabyte laptops, the special keys for brightness (further left here) and volume (further right here) are usually swapped, which takes some getting used to.
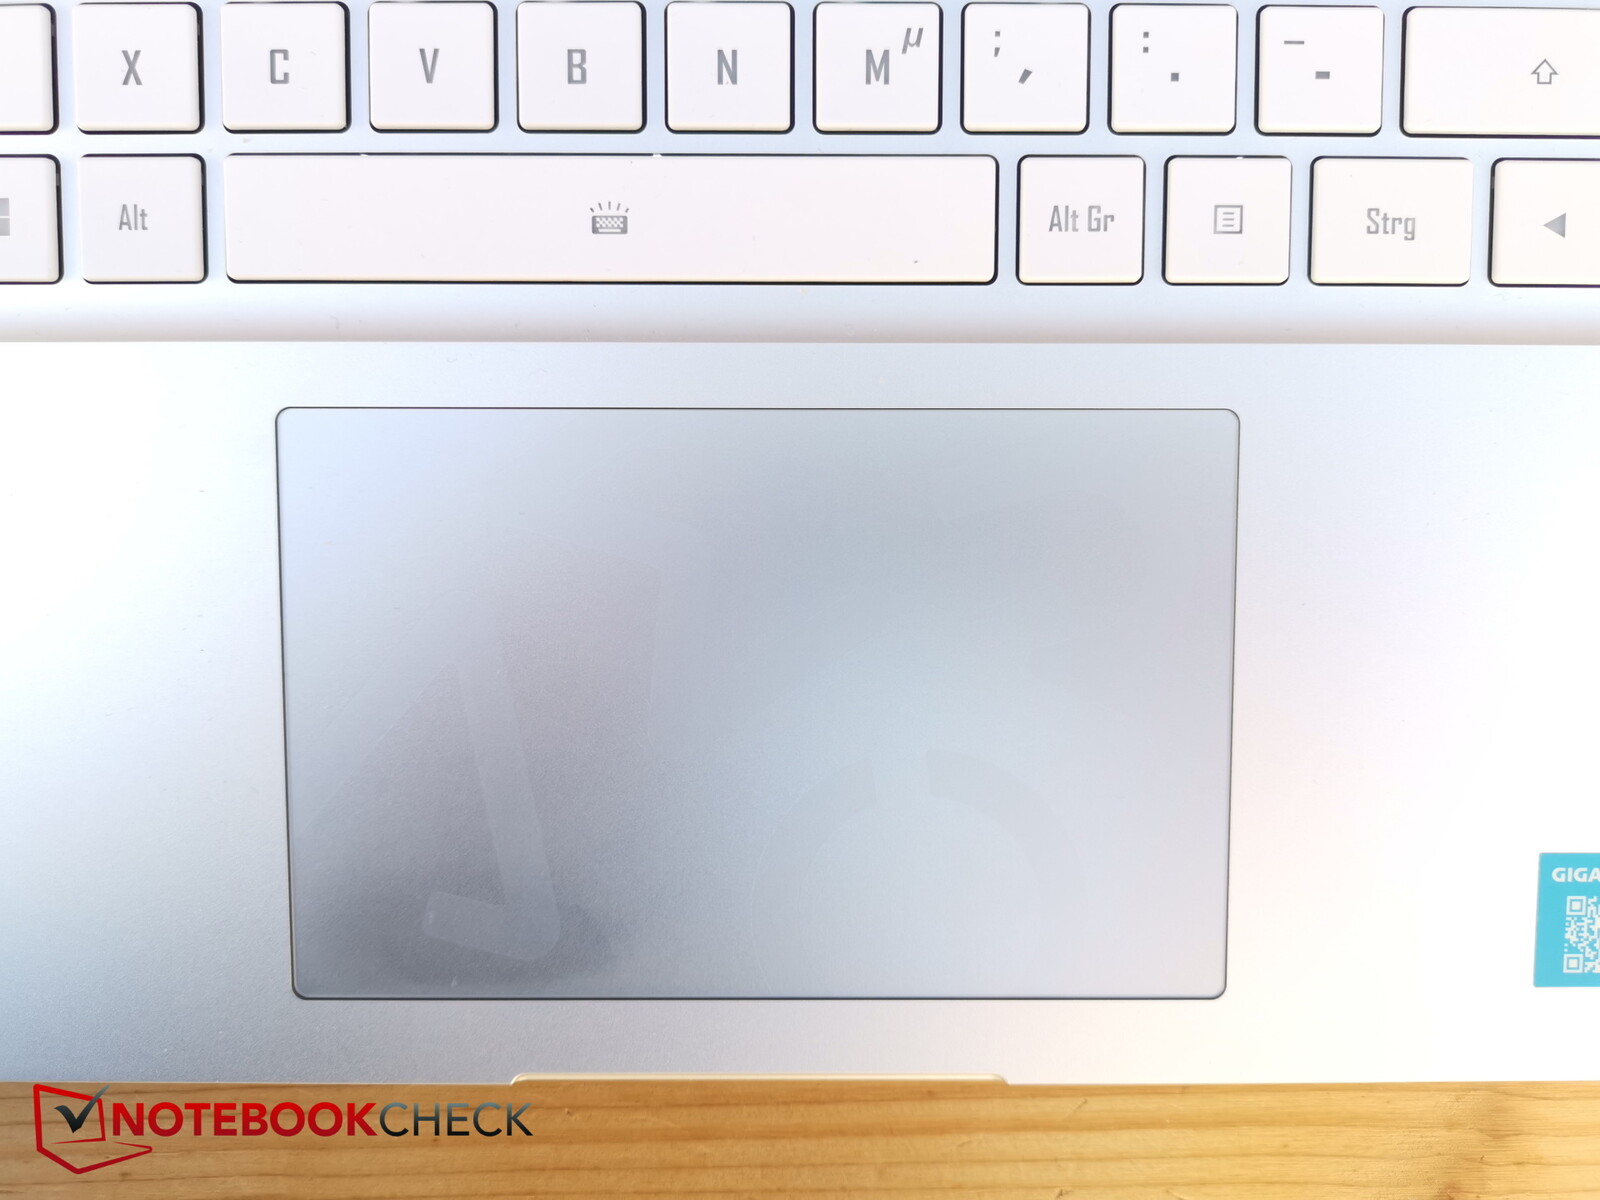
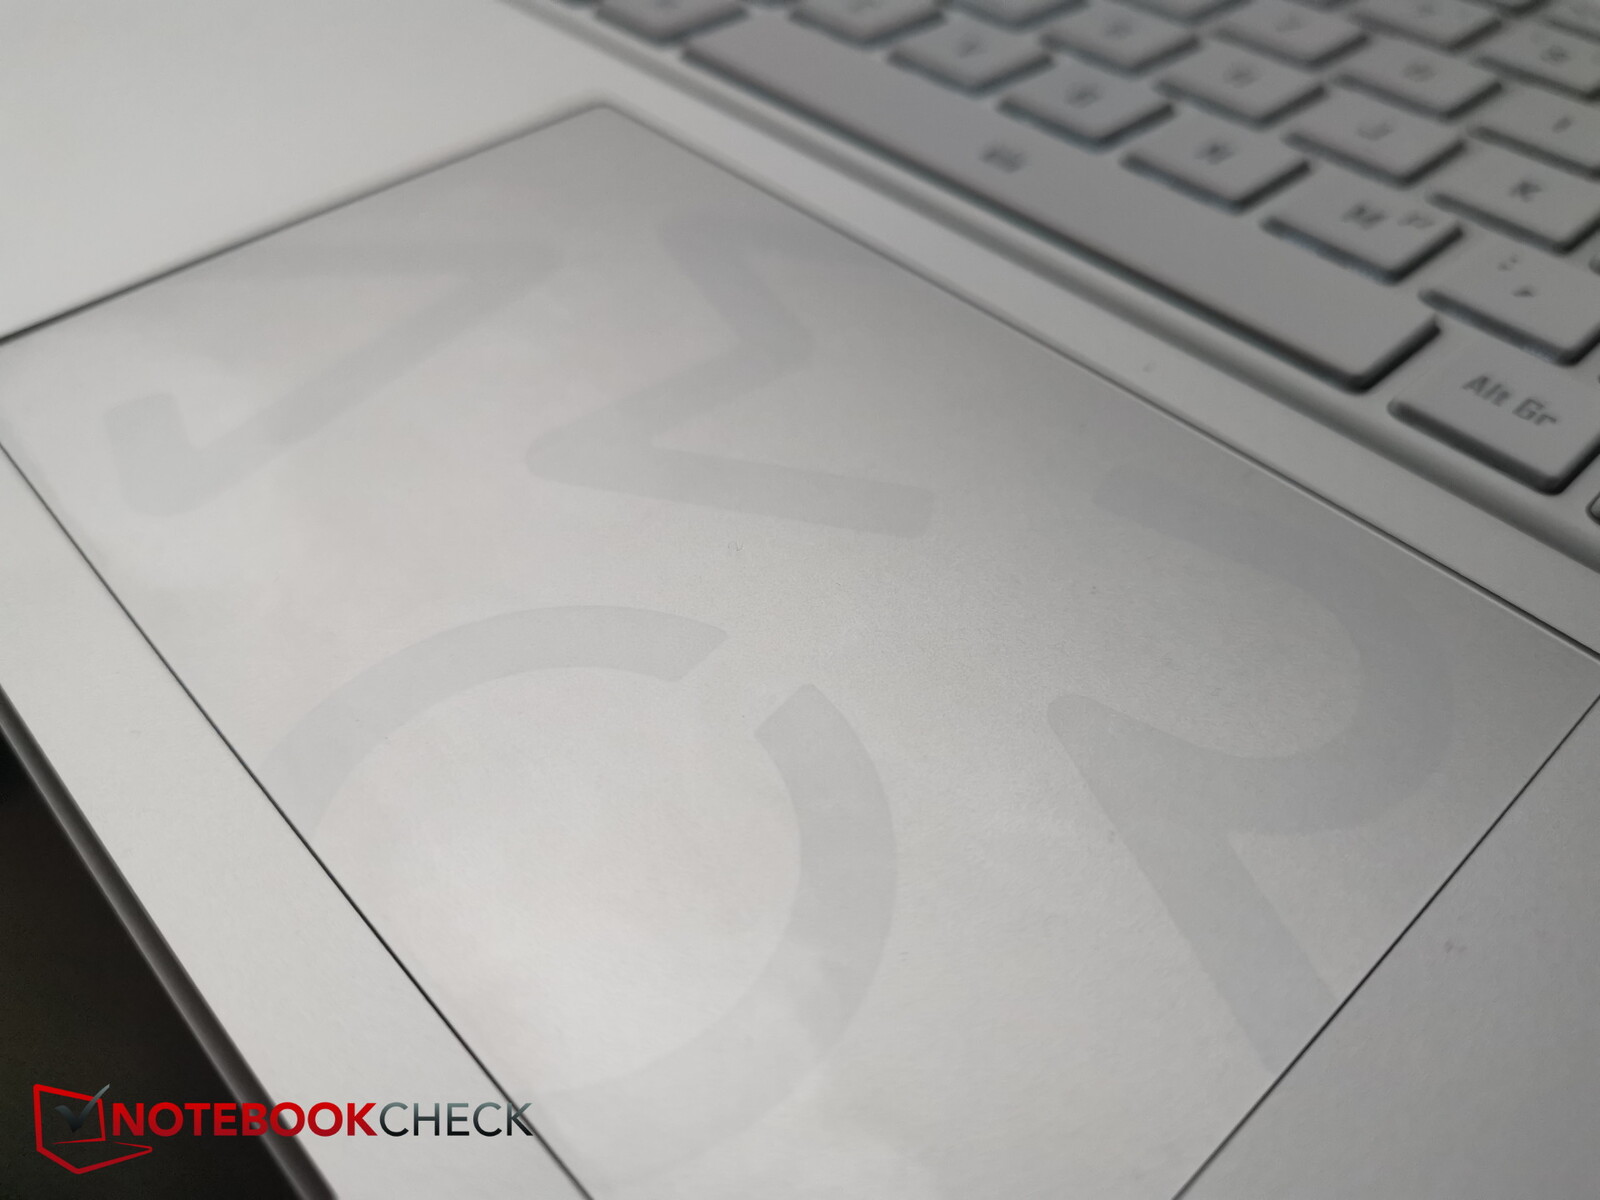
Touchpad
The touchpad remains the same size as its predecessor (approx. 12.1 x 7.6 cm), but is now silver instead of black and offers good gliding properties, even with very slow movements.
The integrated keys provide clear feedback and are thus slightly louder than the keyboard keys, but still moderate.
Display - 16 inch OLED, the highlight
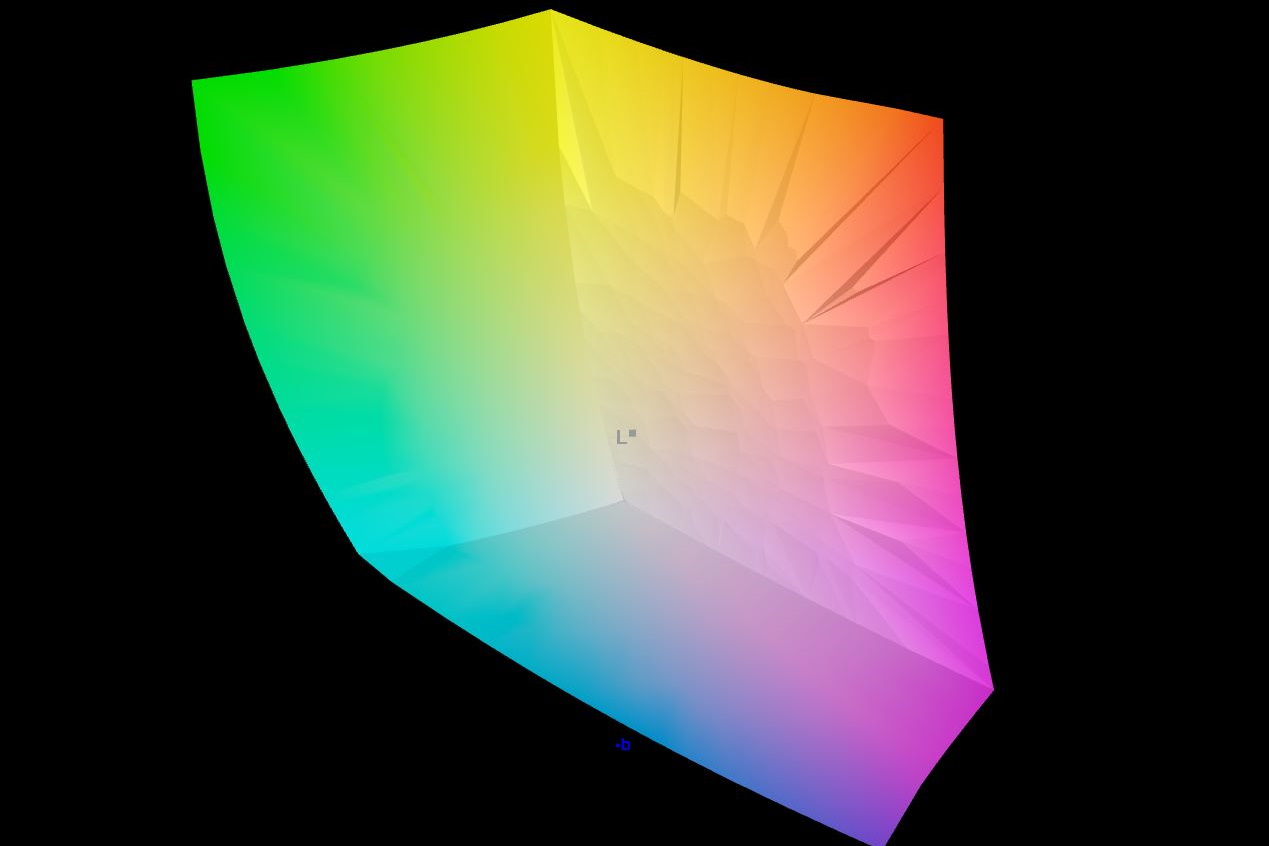
Gigabyte again installs a 16-inch OLED panel from Samsung with a 16:10 aspect ratio and a 4K resolution of 3,840 x 2,400. The panel has a new version number, but still only offers 60 Hz - a downside for gamers. Otherwise the OLED panel boasts a rich contrast, a great black level and very good illumination. The IPS competition can no longer keep up here.
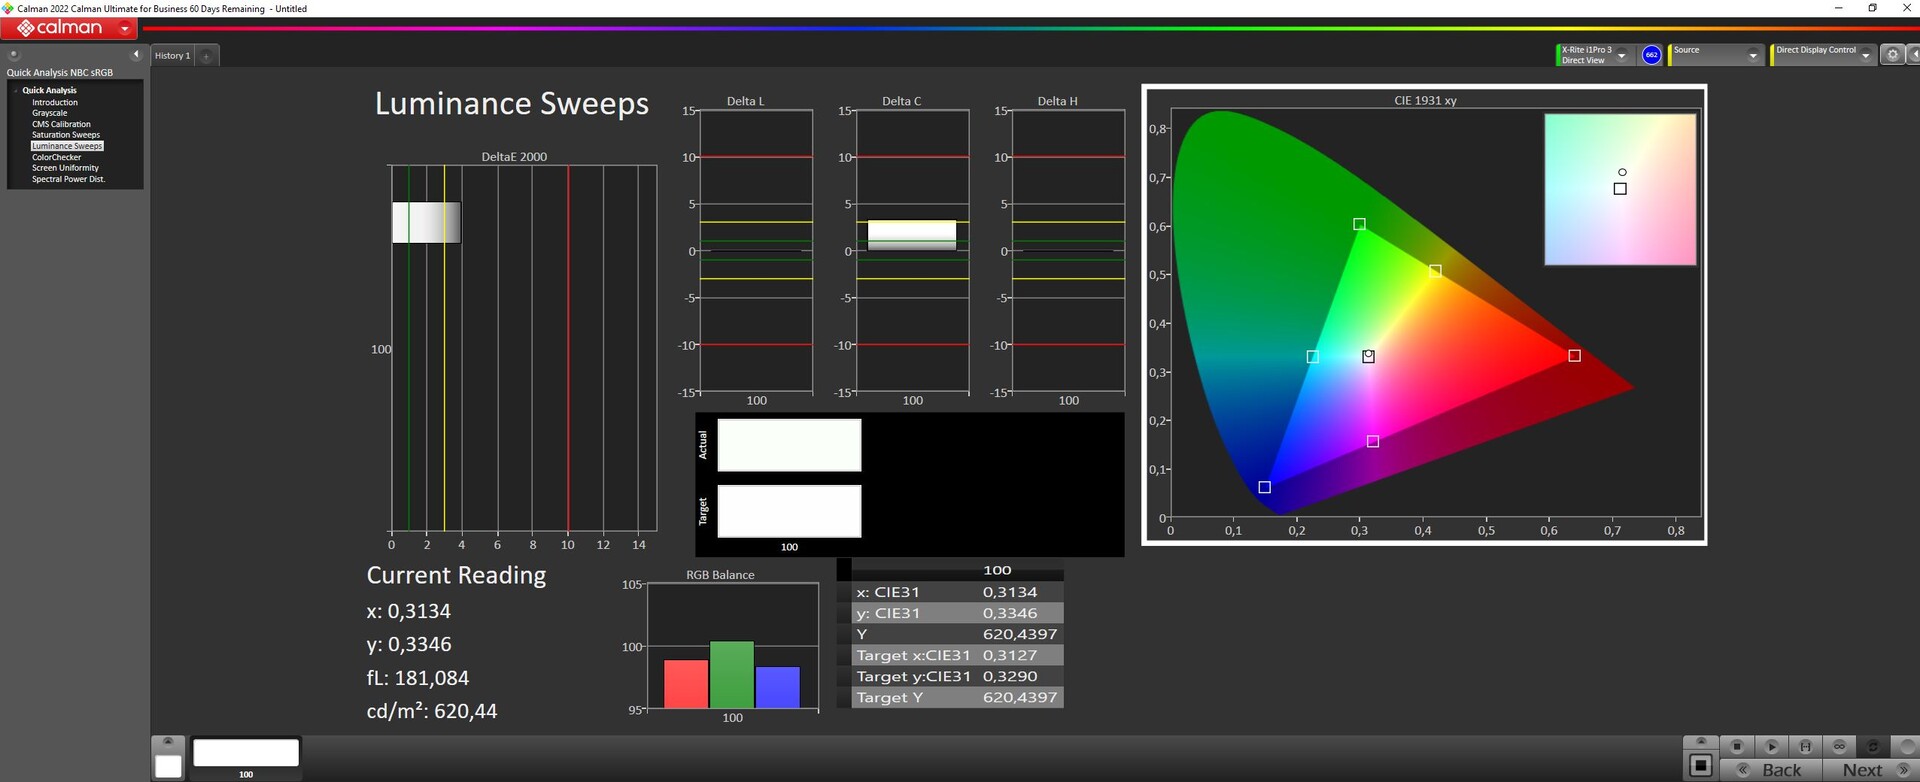
We measured a brightness of just under 400 nits in SDR display mode. But the panel also meets the HDR600 standard. So we measured in HDR mode and arrived at a peak brightness of 620 nits. This is only possible with a small measuring field, since OLEDs quickly darken on large, bright areas.
Screen bleeding is not an issue with OLEDs. Response times are also excellent.
| |||||||||||||||||||||||||
Brightness Distribution: 97 %
Center on Battery: 387.56 cd/m²
Contrast: 12999:1 (Black: 0.03 cd/m²)
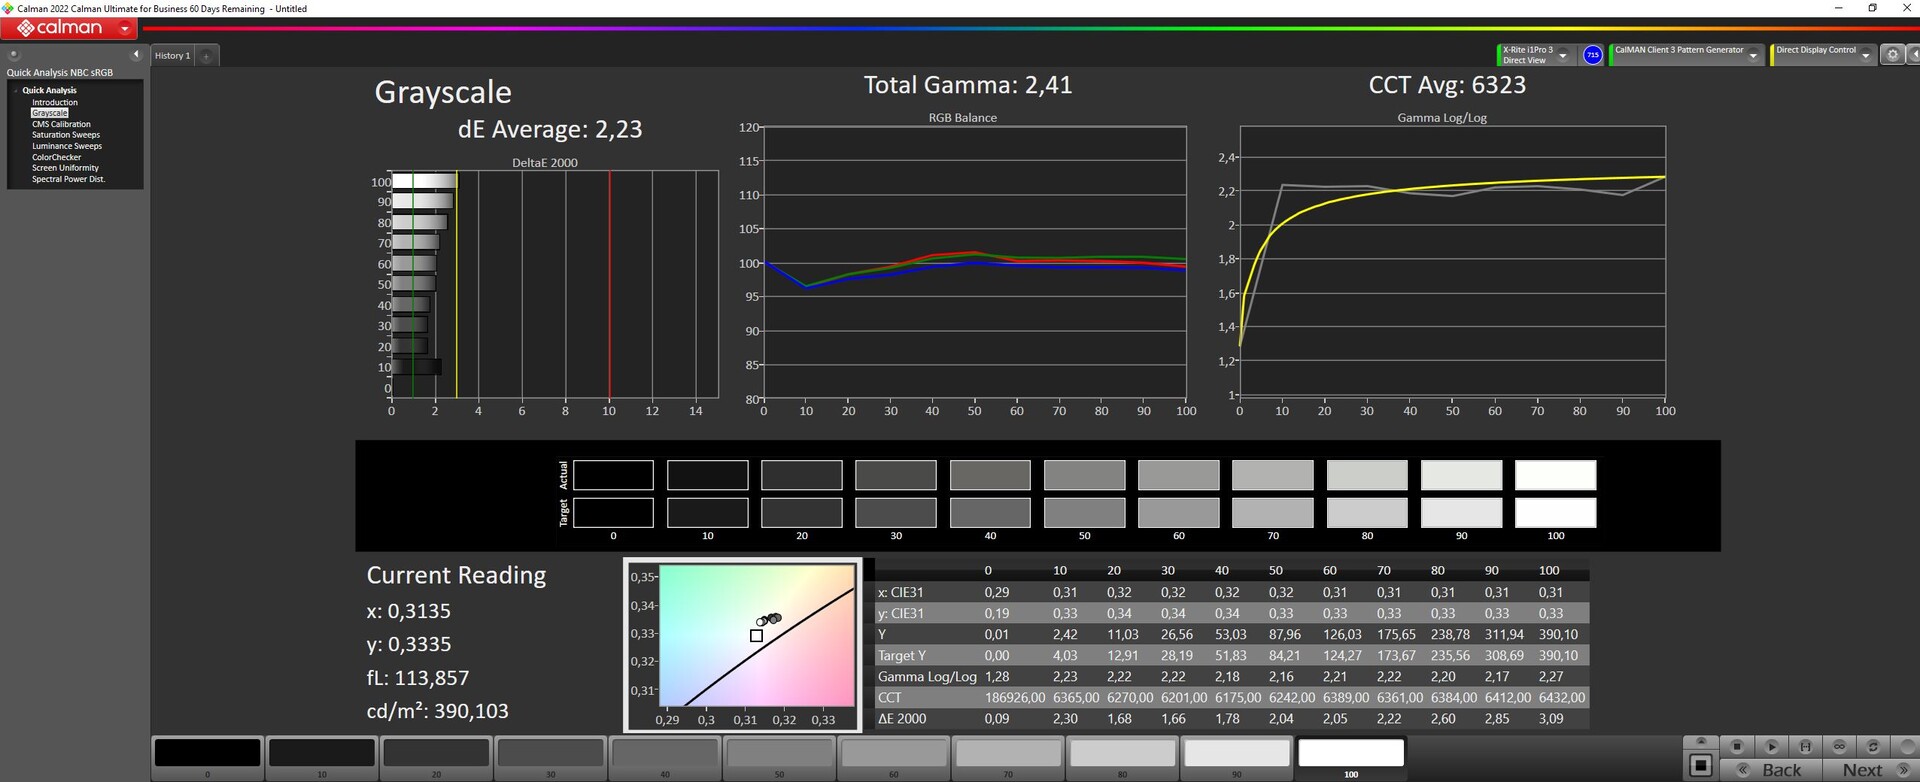
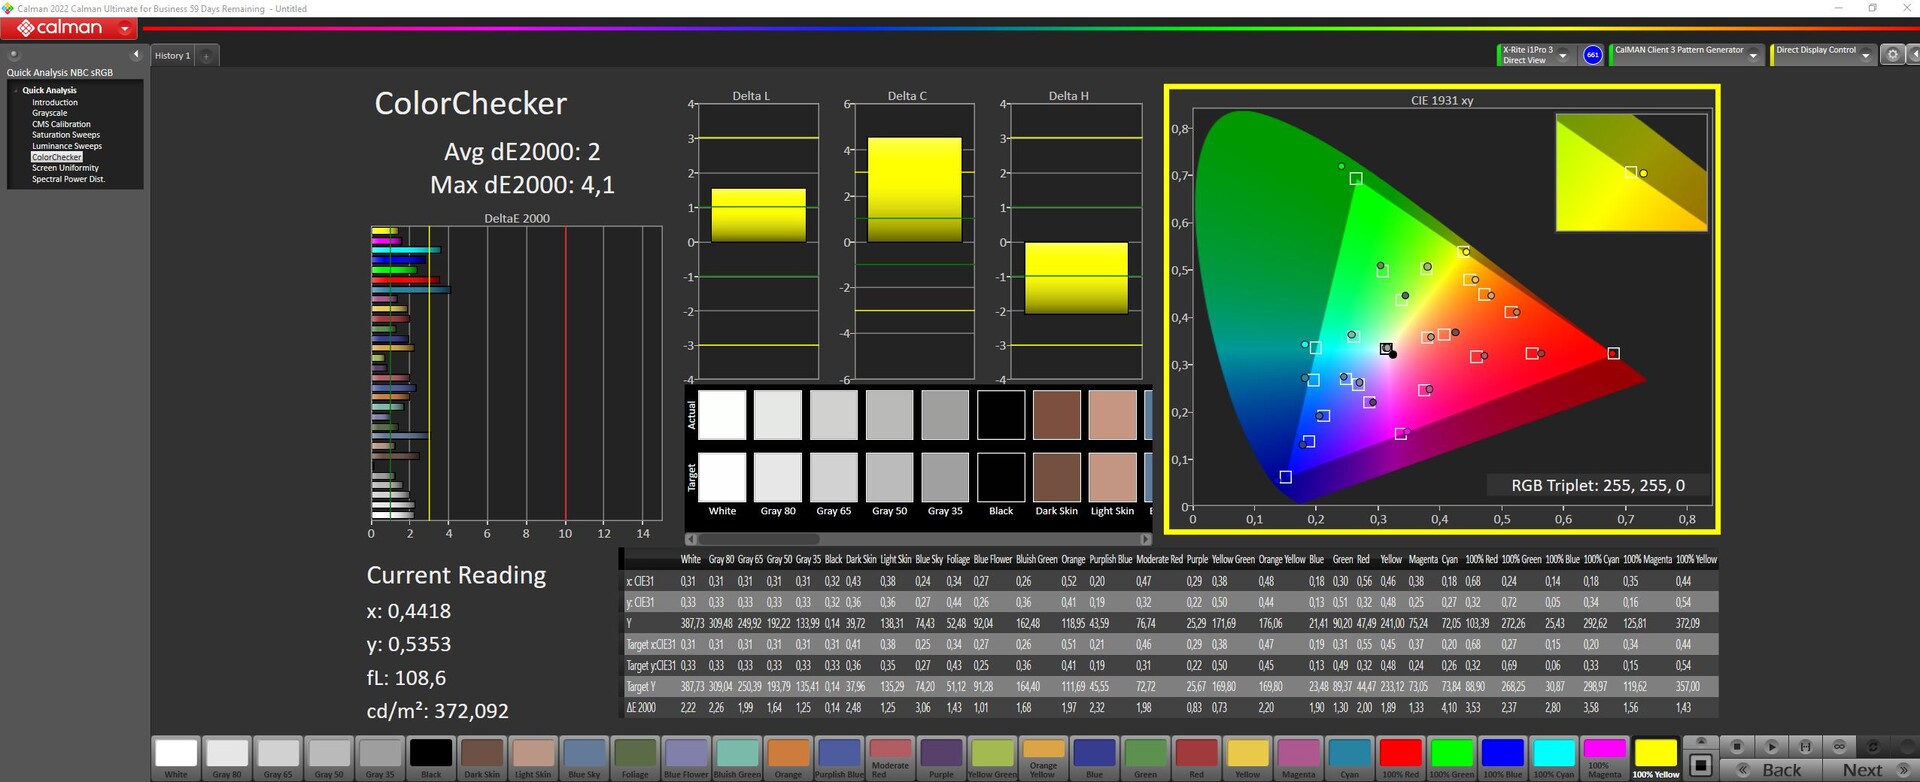
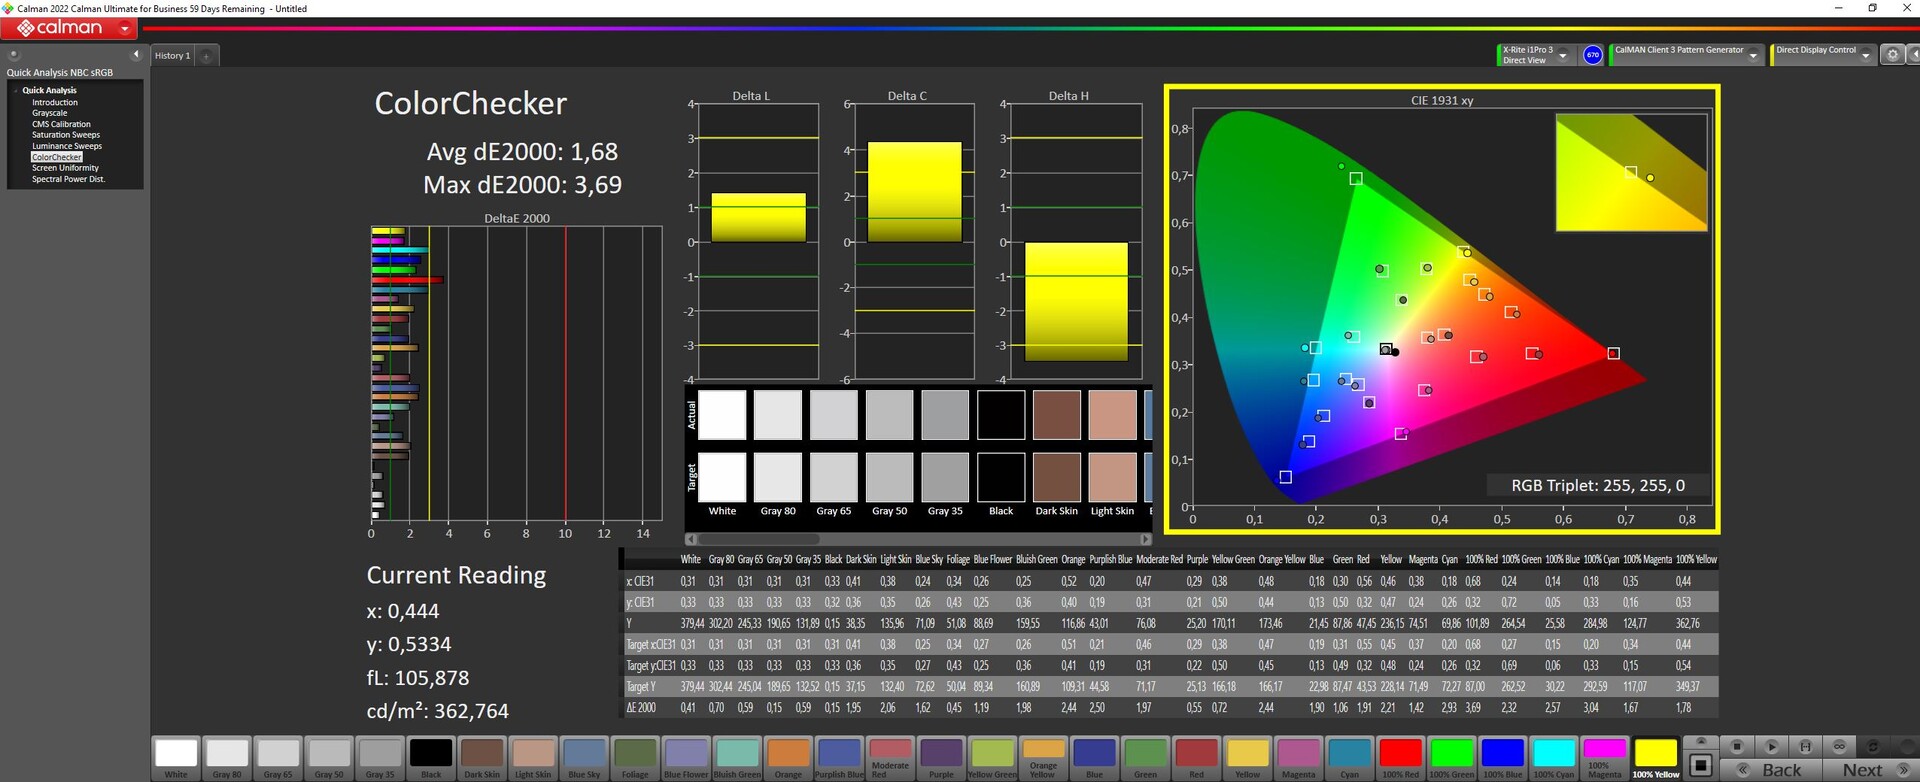
ΔE ColorChecker Calman: 2 | ∀{0.5-29.43 Ø4.72}
calibrated: 1.68
ΔE Greyscale Calman: 2.23 | ∀{0.09-98 Ø4.97}
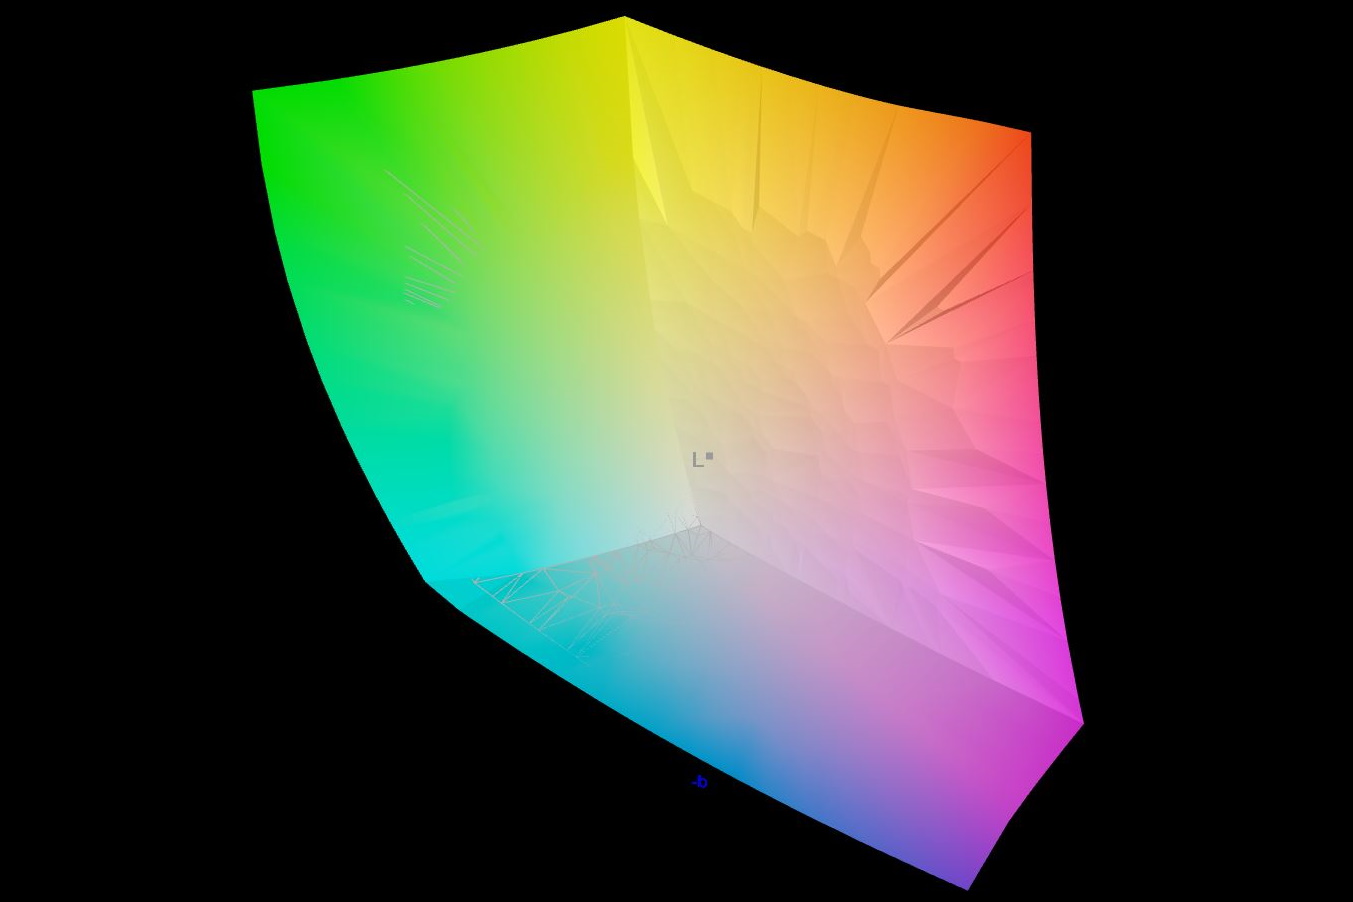
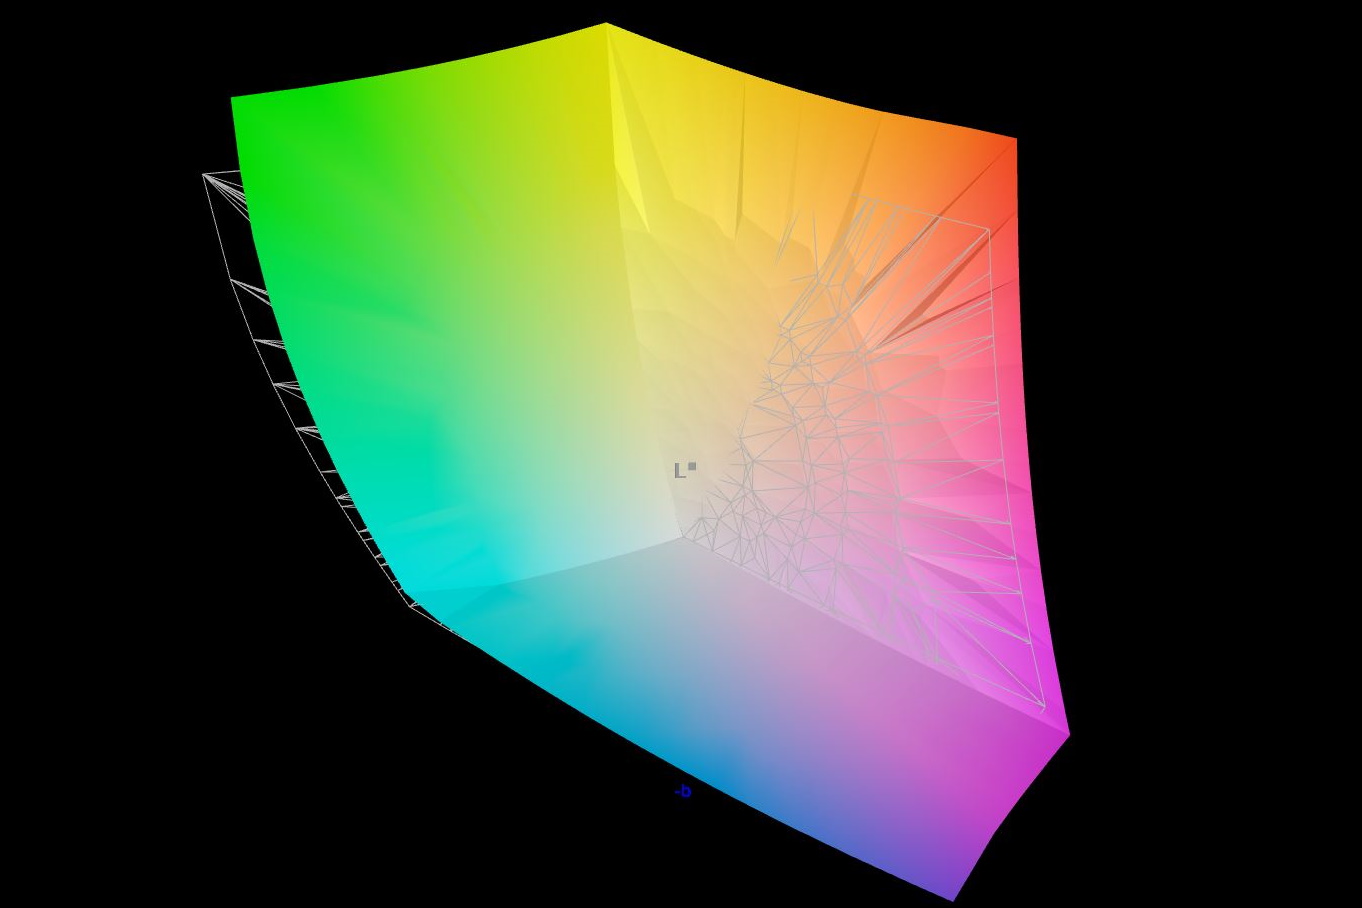
96.4% AdobeRGB 1998 (Argyll 3D)
100% sRGB (Argyll 3D)
99.9% Display P3 (Argyll 3D)
Gamma: 2.41
CCT: 6323 K
| Gigabyte AERO 16 OLED BSF Samsung SDC4191 (ATNA60YV09-0, OLED, 3840x2400, 16" | Gigabyte Aero 16 YE5 Samsung SDC416B, AMOLED, 3840x2400, 16" | Razer Blade 18 RTX 4070 AU Optronics B180QAN01.0, IPS, 2560x1600, 18" | Asus ZenBook Pro 16X OLED UX7602ZM-ME115W Samsung SDC415D, OLED, 3840x2400, 16" | Asus TUF Gaming A16 FA617 NE160WUM-NX2 (BOE0B33), IPS-Level, 1920x1200, 16" | MSI CreatorPro Z16P B12UKST B160QAN02.N, IPS, 2560x1600, 16" | |
|---|---|---|---|---|---|---|
| Display | -5% | -3% | -20% | -4% | ||
| Display P3 Coverage (%) | 99.9 | 96.9 -3% | 99.84 0% | 69.4 -31% | 97.6 -2% | |
| sRGB Coverage (%) | 100 | 99.8 0% | 99.99 0% | 97.8 -2% | 99.9 0% | |
| AdobeRGB 1998 Coverage (%) | 96.4 | 85.3 -12% | 88.9 -8% | 70.9 -26% | 87.4 -9% | |
| Response Times | -11% | -207% | -1% | -580% | -407% | |
| Response Time Grey 50% / Grey 80% * (ms) | 2 ? | 2.4 ? -20% | 4.2 ? -110% | 2 ? -0% | 17 ? -750% | 12.8 ? -540% |
| Response Time Black / White * (ms) | 1.98 ? | 2 ? -1% | 8 ? -304% | 2 ? -1% | 10.1 ? -410% | 7.4 ? -274% |
| PWM Frequency (Hz) | 60 | 60 ? | 59 ? | |||
| Screen | 34% | -208% | -8% | -80% | -118% | |
| Brightness middle (cd/m²) | 389.97 | 368 -6% | 549.6 41% | 346 -11% | 308 -21% | 407 4% |
| Brightness (cd/m²) | 395 | 368 -7% | 524 33% | 354 -10% | 293 -26% | 388 -2% |
| Brightness Distribution (%) | 97 | 93 -4% | 89 -8% | 96 -1% | 90 -7% | 88 -9% |
| Black Level * (cd/m²) | 0.03 | 0.01 67% | 0.53 -1667% | 0.23 -667% | 0.36 -1100% | |
| Contrast (:1) | 12999 | 36800 183% | 1037 -92% | 1339 -90% | 1131 -91% | |
| Colorchecker dE 2000 * | 2 | 2.33 -17% | 3.32 -66% | 2.28 -14% | 1.47 26% | 1.3 35% |
| Colorchecker dE 2000 max. * | 4.1 | 4.34 -6% | 6.63 -62% | 4.94 -20% | 2.98 27% | 2.5 39% |
| Colorchecker dE 2000 calibrated * | 1.68 | 2.7 -61% | 2.16 -29% | 1.02 39% | 0.7 58% | |
| Greyscale dE 2000 * | 2.23 | 0.8 64% | 2 10% | 1.64 26% | 2.2 1% | 2.1 6% |
| Gamma | 2.41 91% | 2.119 104% | 2.29 96% | 2.37 93% | 2.228 99% | 2.26 97% |
| CCT | 6323 103% | 6569 99% | 6319 103% | 6384 102% | 6228 104% | 6437 101% |
| Total Average (Program / Settings) | 12% /
25% | -140% /
-164% | -4% /
-6% | -227% /
-138% | -176% /
-135% |
* ... smaller is better
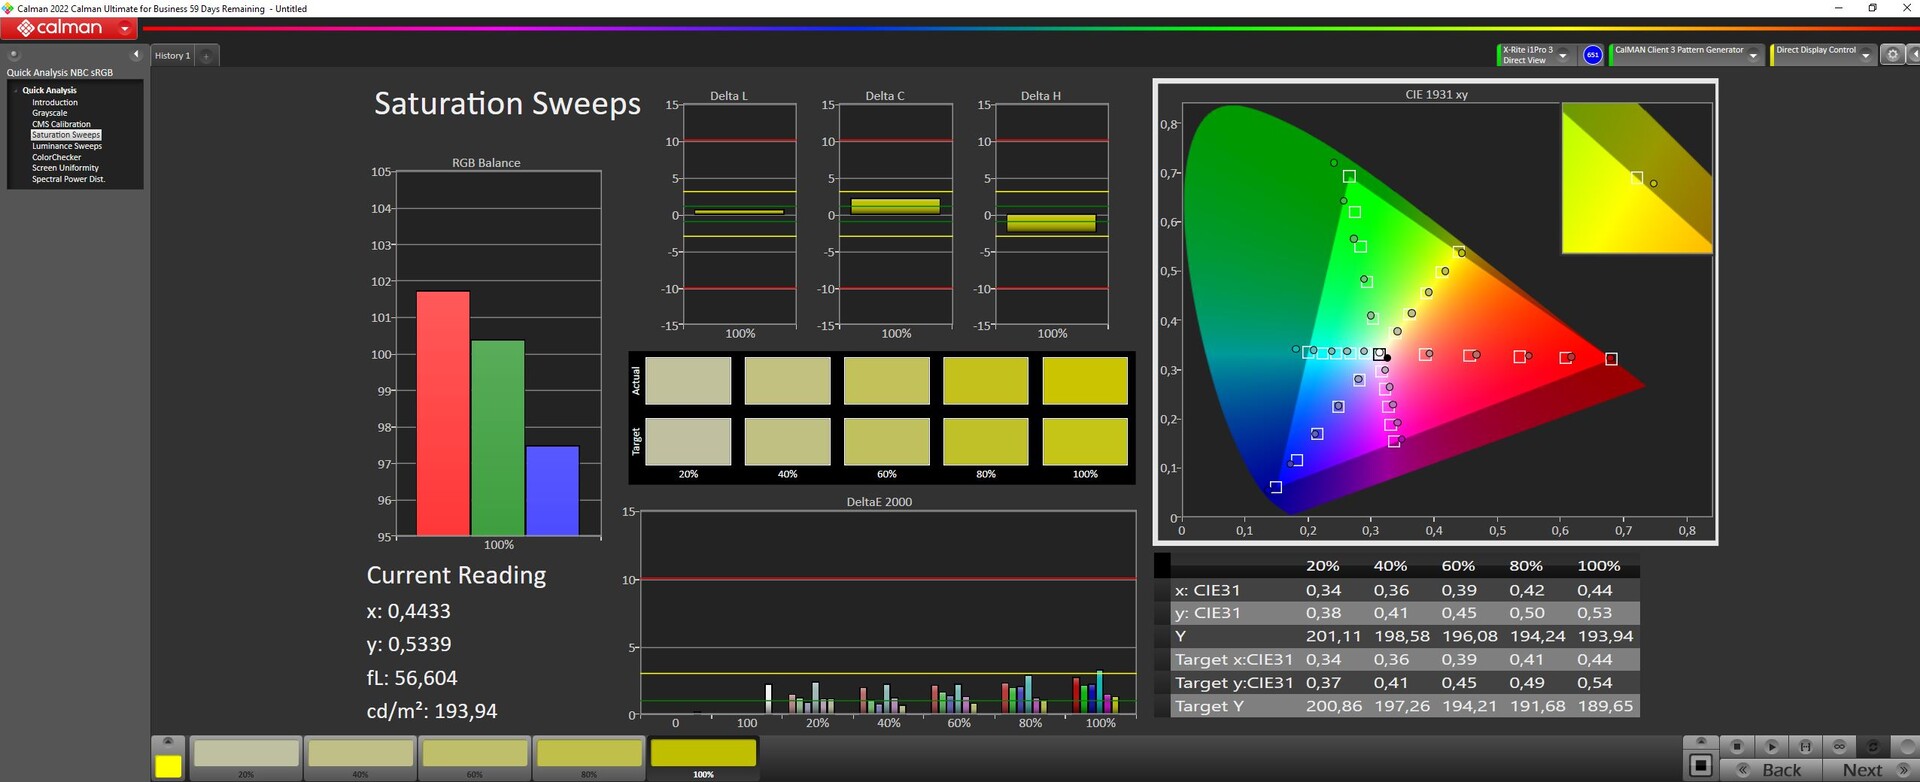
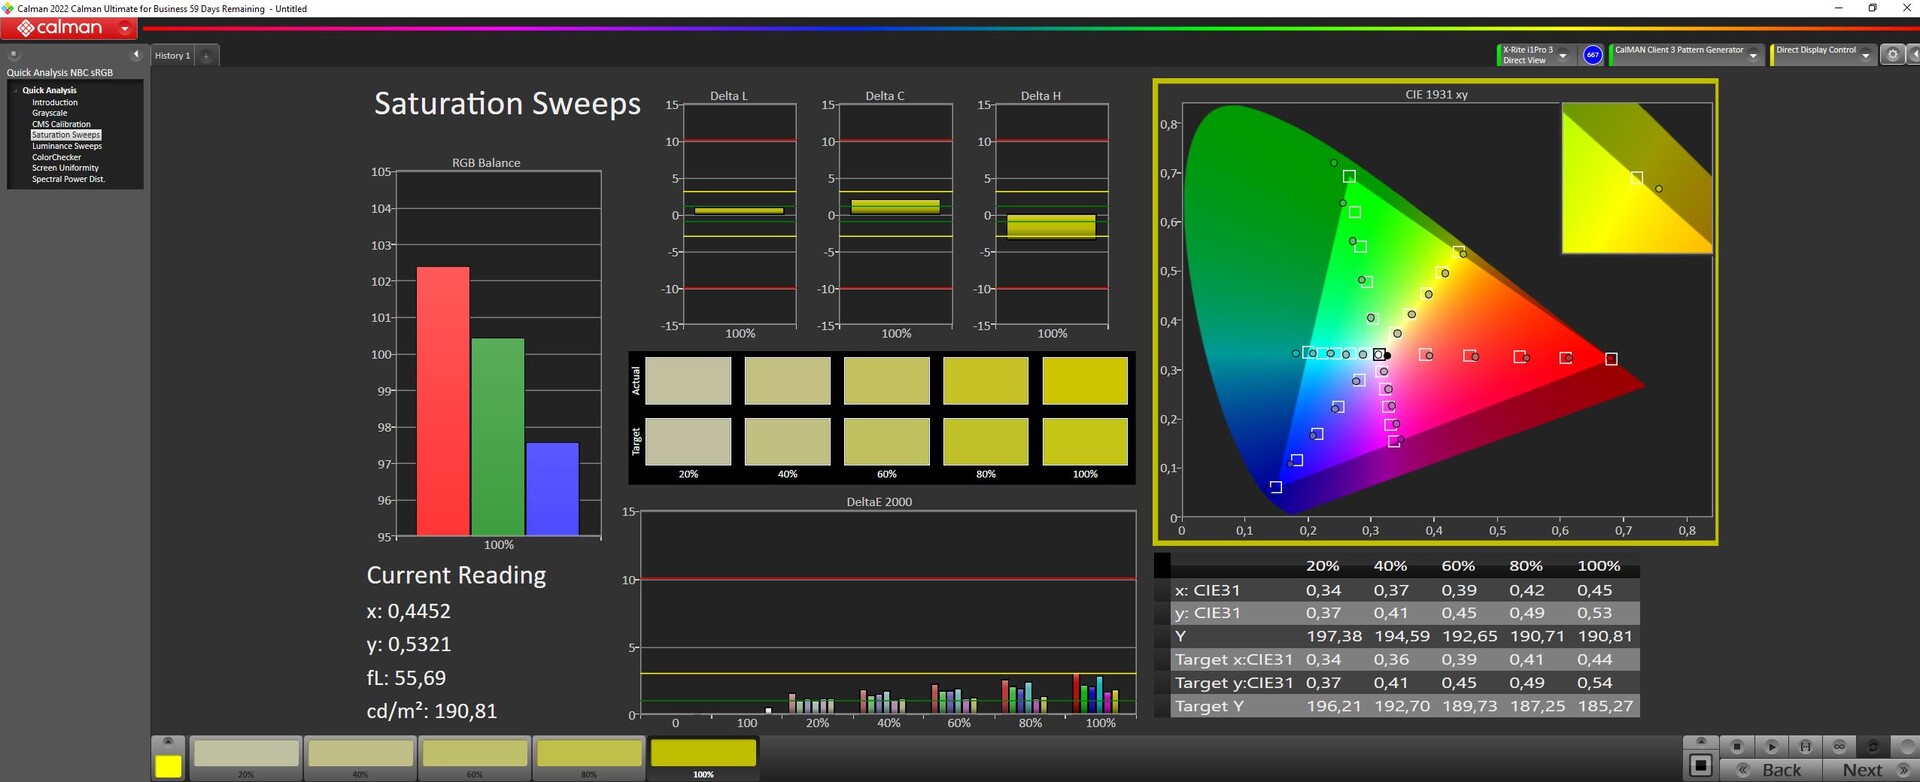
Gigabyte advertises the Aero 16 as providing 100 percent DCI-P3 coverage and our measurements confirm this claim. Even AdobeRGB is covered at 96.4 percent. The OLED display is thus very suitable for editing photos and videos.
The display is already well calibrated ex works; our calibration via Portrait Displays Calman Color Calibration pushes the DeltaE values down slightly even more. So the display has only very slight color and grayscale deviations. Our ICC profile can be downloaded above.

Display Response Times
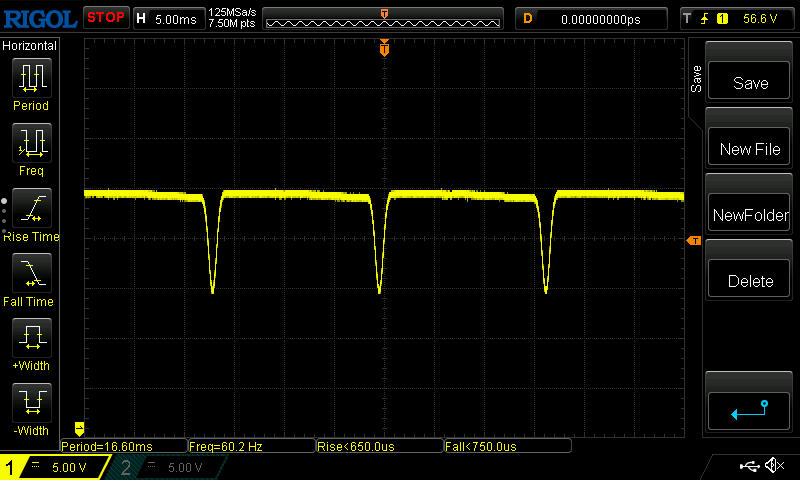
| ↔ Response Time Black to White | ||
|---|---|---|
| 1.98 ms ... rise ↗ and fall ↘ combined | ↗ 0.5 ms rise | 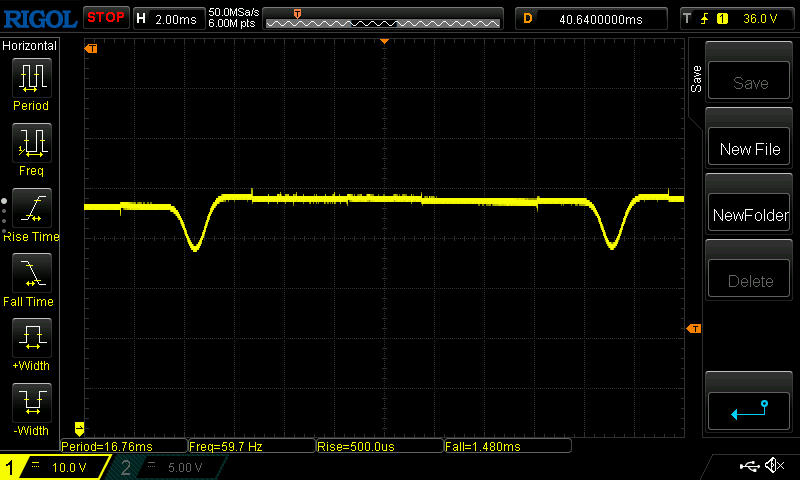 |
| ↘ 1.48 ms fall | ||
| The screen shows very fast response rates in our tests and should be very well suited for fast-paced gaming. In comparison, all tested devices range from 0.1 (minimum) to 240 (maximum) ms. » 11 % of all devices are better. This means that the measured response time is better than the average of all tested devices (19.8 ms). | ||
| ↔ Response Time 50% Grey to 80% Grey | ||
| 2 ms ... rise ↗ and fall ↘ combined | ↗ 1 ms rise | 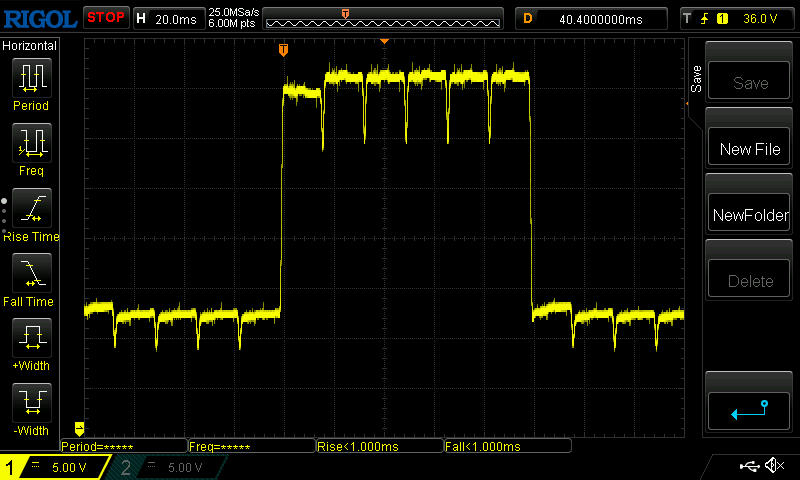 |
| ↘ 1 ms fall | ||
| The screen shows very fast response rates in our tests and should be very well suited for fast-paced gaming. In comparison, all tested devices range from 0.165 (minimum) to 636 (maximum) ms. » 10 % of all devices are better. This means that the measured response time is better than the average of all tested devices (31 ms). | ||
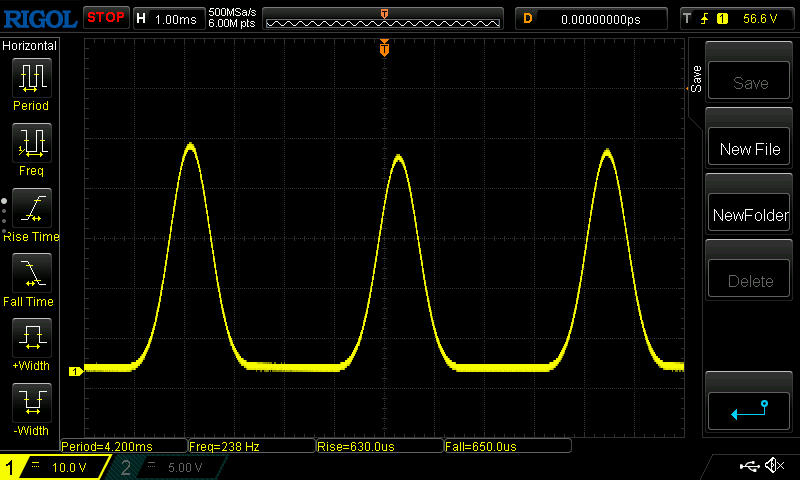
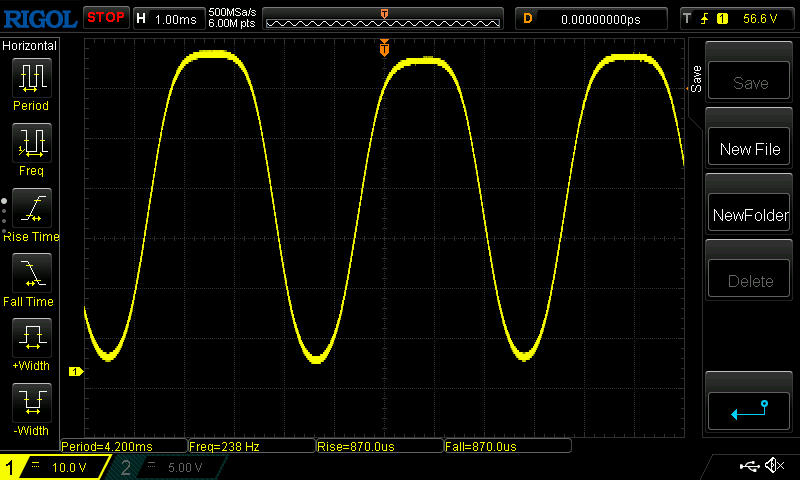
Screen Flickering / PWM (Pulse-Width Modulation)
| Screen flickering / PWM detected | 60 Hz |  | |
The display backlight flickers at 60 Hz (worst case, e.g., utilizing PWM) . The frequency of 60 Hz is very low, so the flickering may cause eyestrain and headaches after extended use. In comparison: 52 % of all tested devices do not use PWM to dim the display. If PWM was detected, an average of 7747 (minimum: 5 - maximum: 343500) Hz was measured. | |||
As is typical for OLEDs, the display flickers at 60 Hz at full brightness. At around 50 percent brightness and below, the frequency changes, and 238 Hz may prove annoying for sensitive people.
Outdoors, of course, the reflective surface is distracting. The rather average SDR brightness and the good contrasts can only balance out this disadvantage to a limited extent. A shady spot and a direct viewing angle are recommended.

A loss in brightness only becomes noticeable when looking at the display from extreme angles.

Performance - Good 3D performance despite 105 W
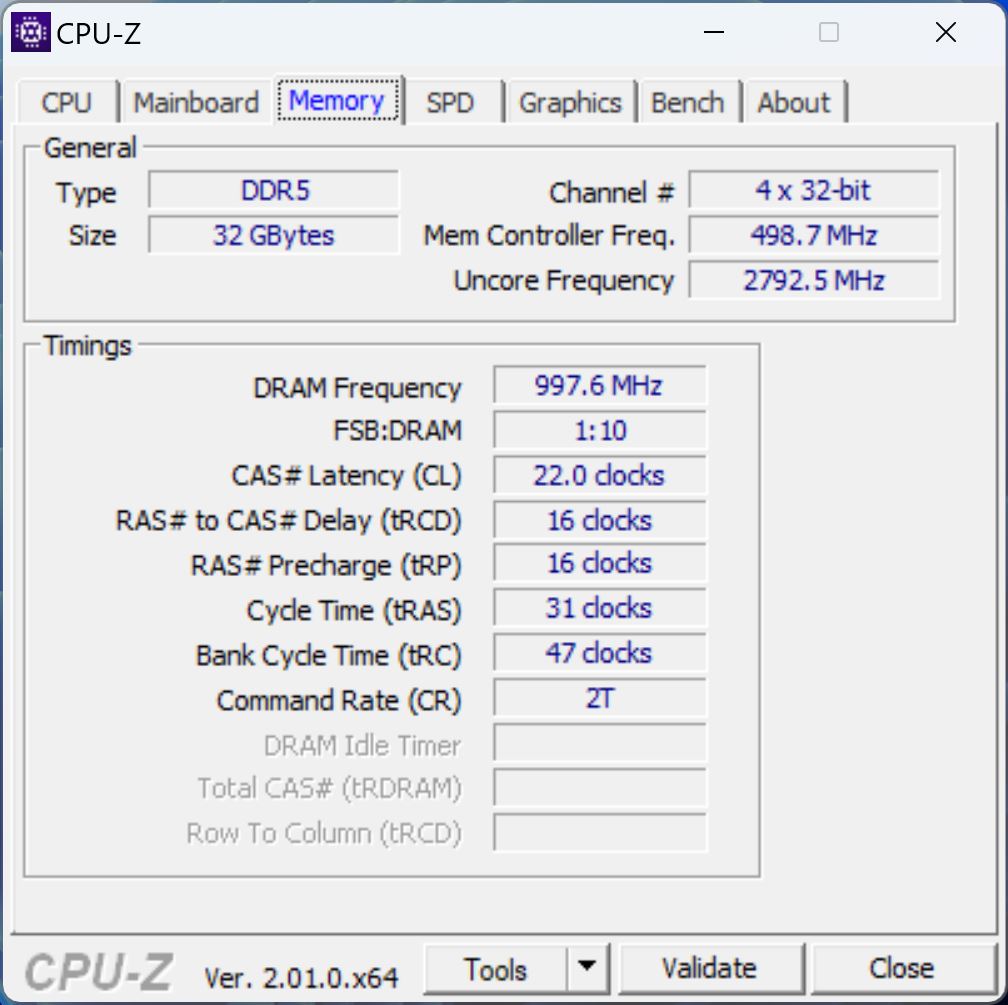
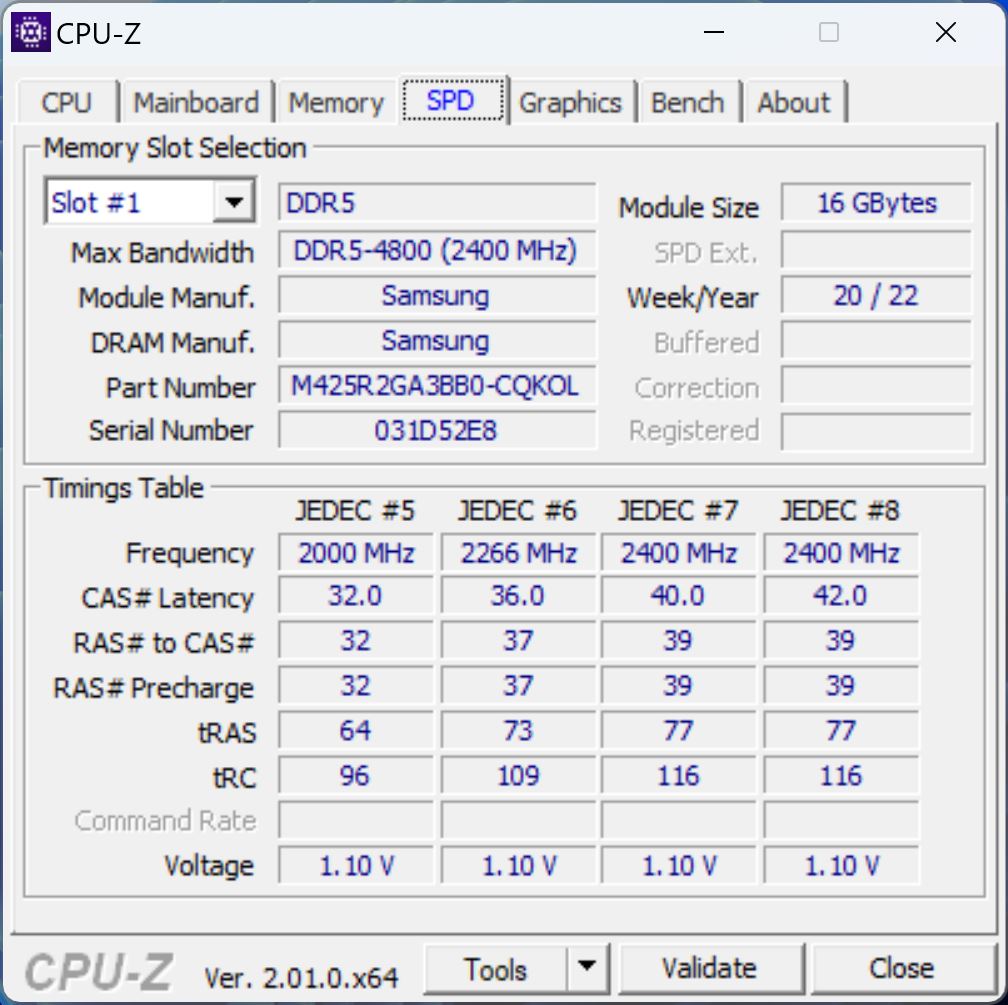
The Aero houses brand-new hardware. The combination of i9-13900H, RTX 4070 and 32 GB DDR5-4800 should not pose any problems for users, whether gaming or using creative applications.
However, all this hardware is packed into a slim case, so it does not run at full power, as will be shown below. After all, a creative laptop is not supposed to be a super-hot roaring laptop, so hardcore gamers will have to suffer a little here.
Testing Conditions
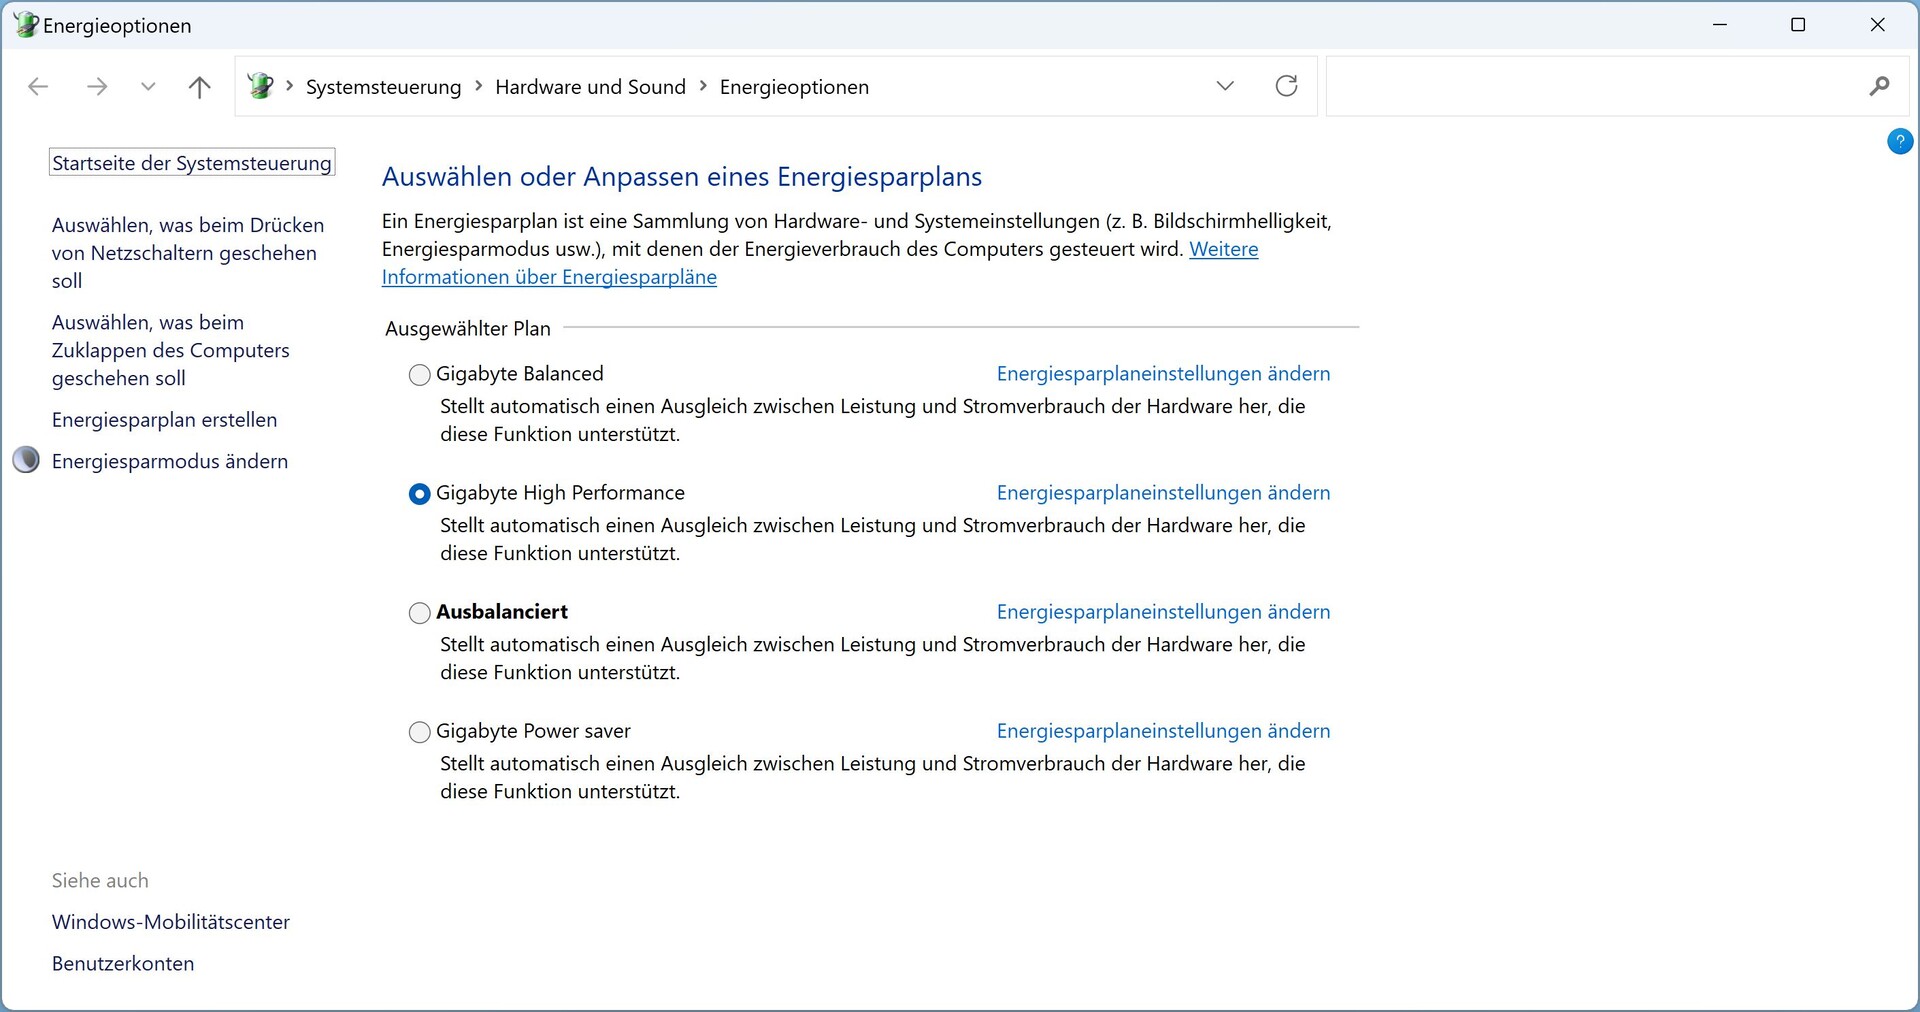
Our test device didn't have a Control Center preinstalled, so there were no performance modes to begin with. The power modes preinstalled in Windows by Gigabyte had virtually no influence on CPU performance in Cinebench R15.
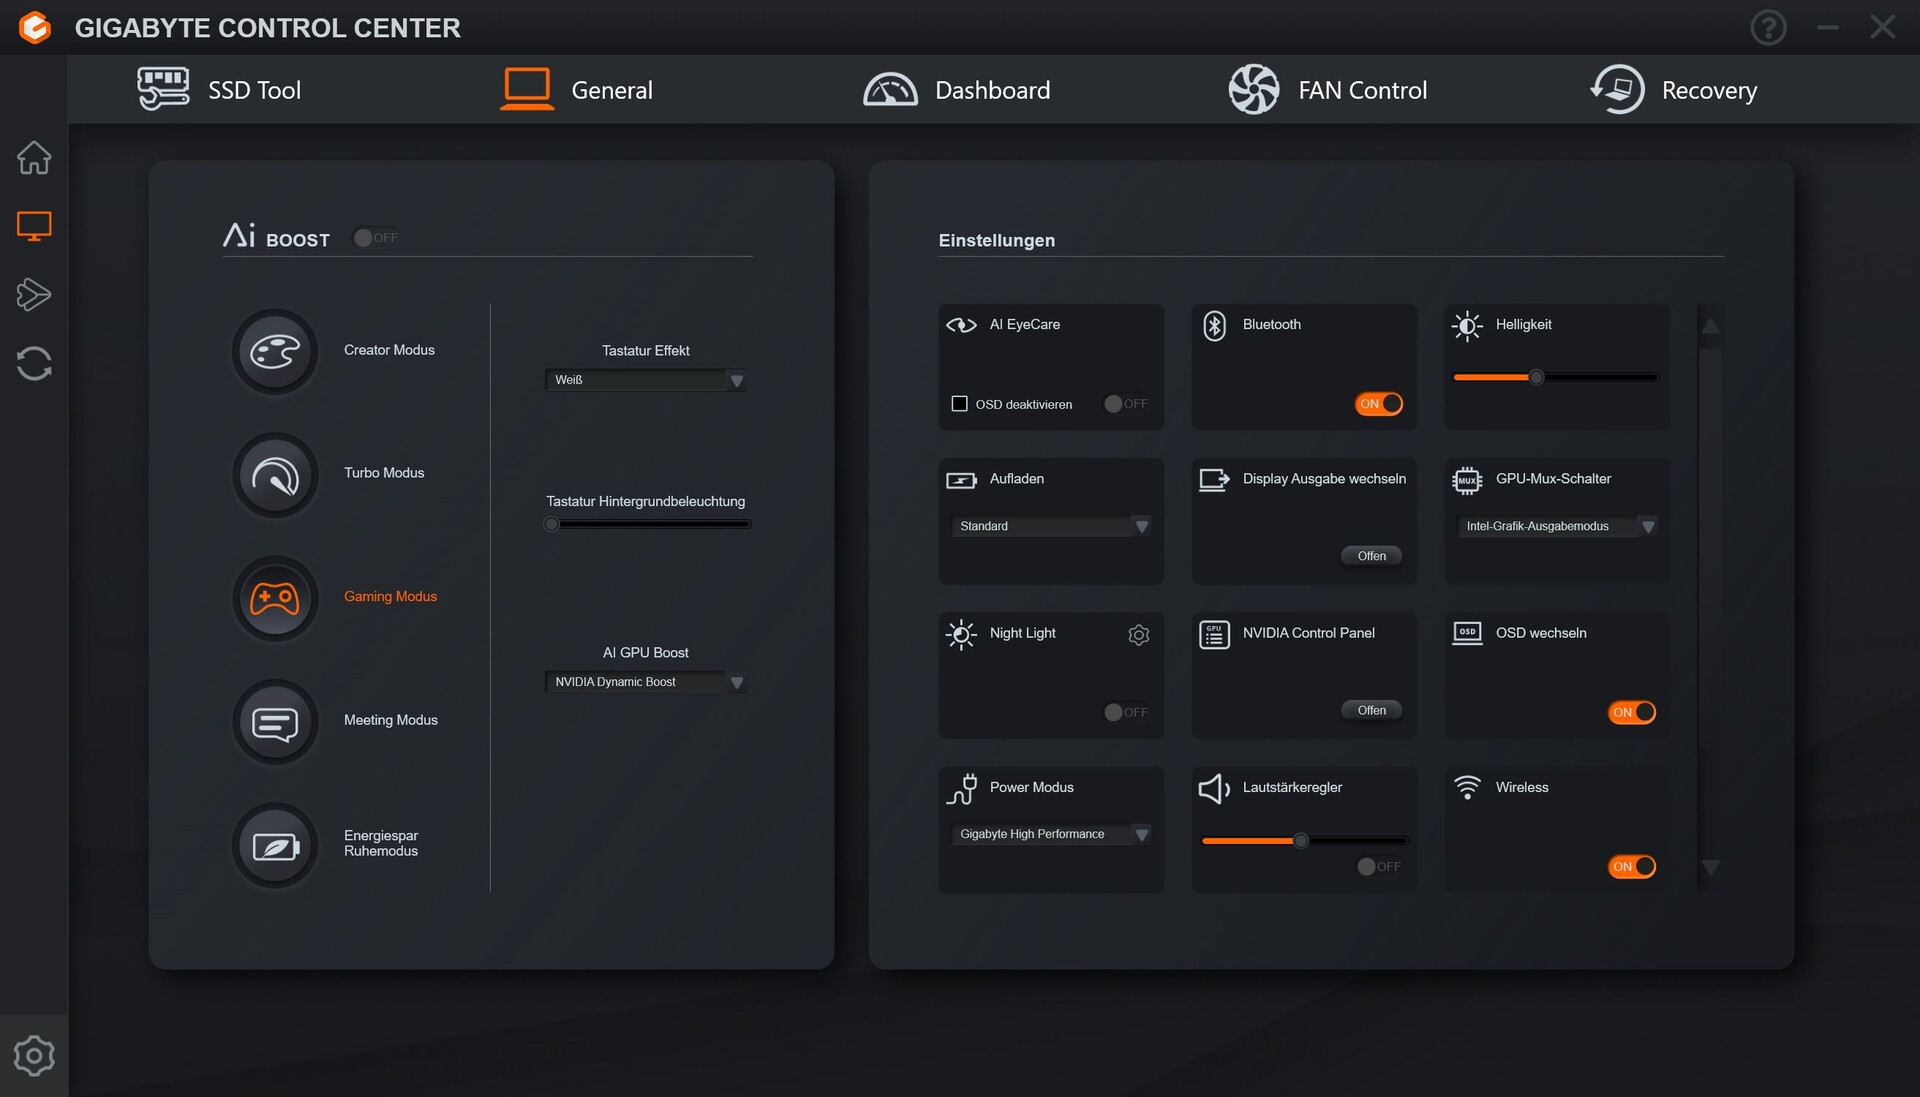
Therefore, and because the fans never stood still at first, we installed the Gigabyte Control Center afterwards. Here we were faced with the difficult choice of the performance mode: there are a total of five here, and we had a hard time choosing between Content Creator and Gaming. So we had to decide between good performance but louder fans, or quieter operation with weaker performance.
In the end, we performed the CPU benchmarks without the Control Center, i.e. in the delivery state. The GPU benchmarks then run in gaming mode.
The software isn't always entirely free of errors. For example, it just displayed a black window during some starts. Also confusing is that, in addition to the modes, there is another selection window "Power Mode" with further options for power control. These likely represent the energy modes, because if you set this to Custom, the Windows power modes can be selected.
There is also an "AI" switch on the left of the main modes. The "AI" independently selects the best mode depending on the situation, for example, the energy-saving mode when we disconnect the power plug.

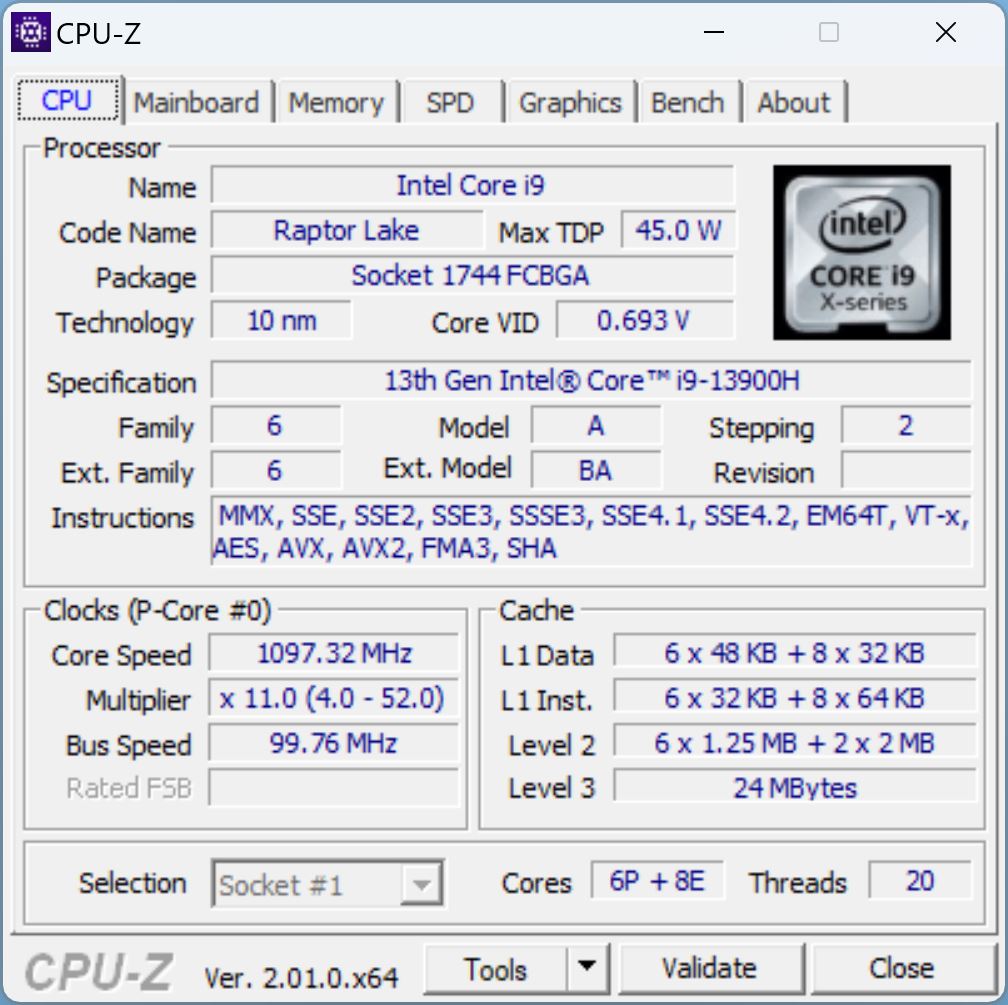
Processor
At the heart of the Aero is an Intel Core i9-13900H, one of the flagships of Intel's brand new Raptor Lake series. This provides 6 performance and 8 efficiency cores, with the former clocking at up to 5.4 GHz in turbo! Alternatively, the device is also available with an i7-13700H.
In our Cinebench R15 loop, the Aero comes out on top, but the advantage over the i9-12900H from the Alder Lake series is marginal and the predecessor is hardly slower across all CPU tests.
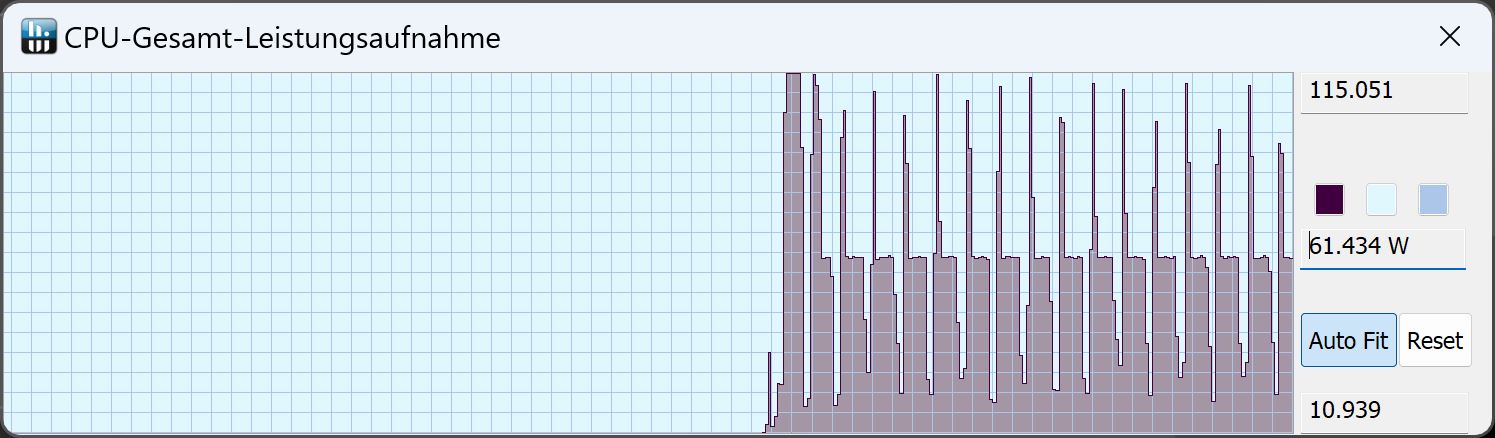
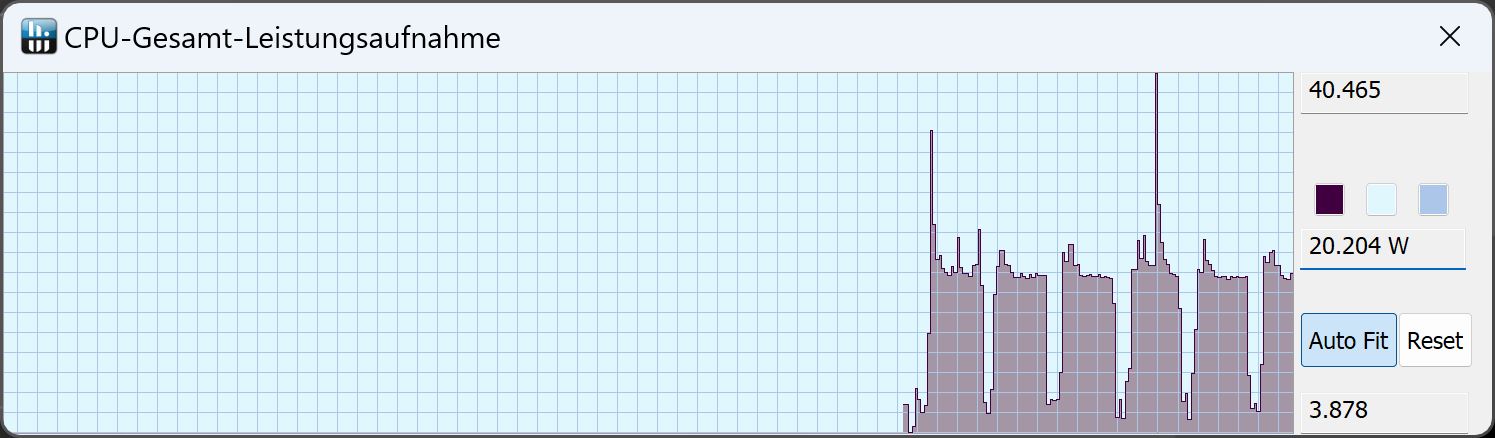
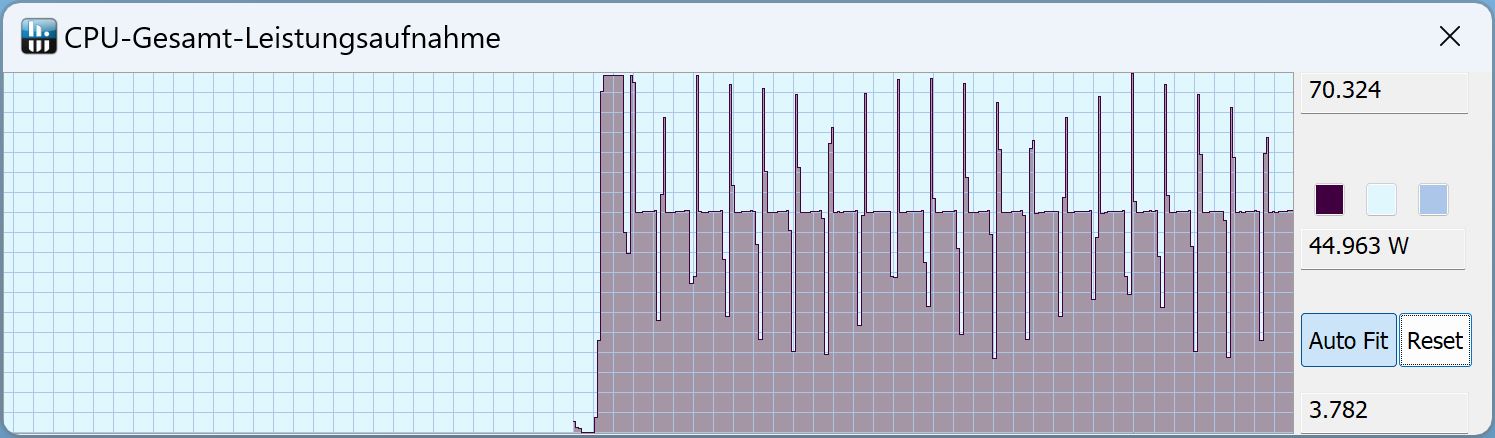
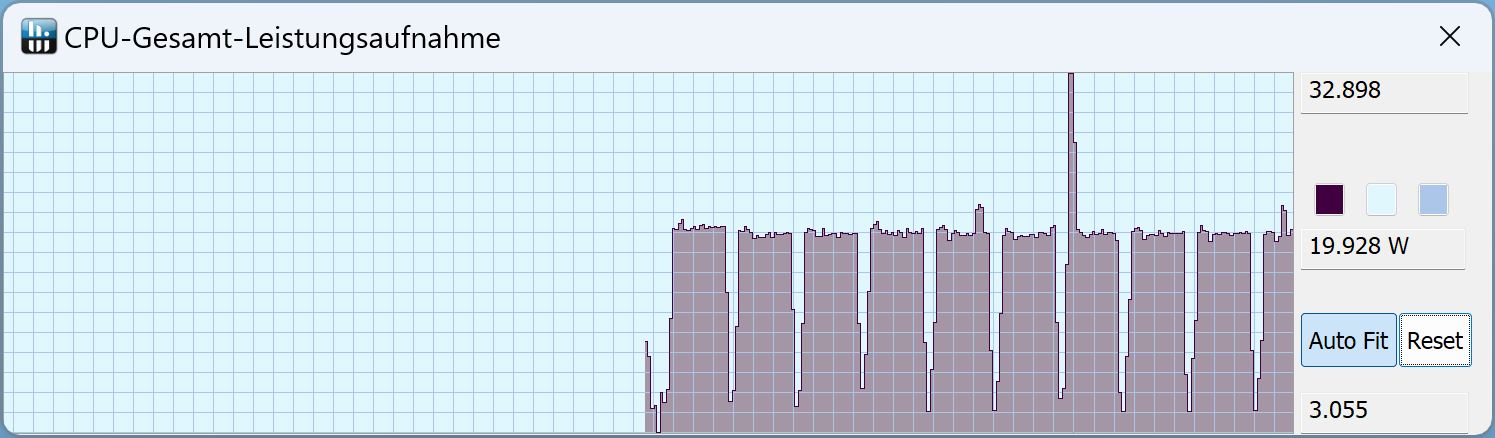
A look at the power consumption shows that you should definitely install the Control Center. Because in delivery state, the CPU only treats itself to 70 W for a short time before falling to 45 W. On the other hand, if you switch to Gaming Mode in the Control Center, the short-term TDP increases to 115 W, and then hangs at around 60 W for the rest of a Cinebench run. So it very much depends on the power settings.
Without Gaming mode, the new Aero 16 is no faster than its predecessor across all CPU benchmarks.
The CPU can only draw on around 20 W in battery mode and the Cinebench score is correspondingly lower.
Cinebench R15 Multi Sustained Load
Cinebench R23: Multi Core | Single Core
Cinebench R20: CPU (Multi Core) | CPU (Single Core)
Cinebench R15: CPU Multi 64Bit | CPU Single 64Bit
Blender: v2.79 BMW27 CPU
7-Zip 18.03: 7z b 4 | 7z b 4 -mmt1
Geekbench 5.5: Multi-Core | Single-Core
HWBOT x265 Benchmark v2.2: 4k Preset
LibreOffice : 20 Documents To PDF
R Benchmark 2.5: Overall mean
| CPU Performance rating | |
| Razer Blade 18 RTX 4070 | |
| Average of class Gaming | |
| Gigabyte Aero 16 YE5 | |
| Asus ZenBook Pro 16X OLED UX7602ZM-ME115W | |
| Average Intel Core i9-13900H | |
| Gigabyte AERO 16 OLED BSF | |
| MSI CreatorPro Z16P B12UKST | |
| Asus TUF Gaming A16 FA617 | |
| Cinebench R23 / Multi Core | |
| Razer Blade 18 RTX 4070 | |
| Average of class Gaming (10488 - 40970, n=106, last 2 years) | |
| Gigabyte AERO 16 OLED BSF | |
| Gigabyte Aero 16 YE5 | |
| MSI CreatorPro Z16P B12UKST | |
| Average Intel Core i9-13900H (11997 - 20385, n=28) | |
| Asus ZenBook Pro 16X OLED UX7602ZM-ME115W | |
| Asus TUF Gaming A16 FA617 | |
| Cinebench R23 / Single Core | |
| Razer Blade 18 RTX 4070 | |
| Average of class Gaming (1166 - 2387, n=106, last 2 years) | |
| Gigabyte Aero 16 YE5 | |
| Average Intel Core i9-13900H (1297 - 2054, n=26) | |
| MSI CreatorPro Z16P B12UKST | |
| Asus ZenBook Pro 16X OLED UX7602ZM-ME115W | |
| Gigabyte AERO 16 OLED BSF | |
| Asus TUF Gaming A16 FA617 | |
| Cinebench R20 / CPU (Multi Core) | |
| Razer Blade 18 RTX 4070 | |
| Average of class Gaming (4029 - 16108, n=105, last 2 years) | |
| Gigabyte AERO 16 OLED BSF | |
| Gigabyte Aero 16 YE5 | |
| MSI CreatorPro Z16P B12UKST | |
| Average Intel Core i9-13900H (4935 - 7716, n=25) | |
| Asus ZenBook Pro 16X OLED UX7602ZM-ME115W | |
| Asus TUF Gaming A16 FA617 | |
| Cinebench R20 / CPU (Single Core) | |
| Razer Blade 18 RTX 4070 | |
| Average of class Gaming (442 - 904, n=105, last 2 years) | |
| Average Intel Core i9-13900H (428 - 792, n=25) | |
| Gigabyte Aero 16 YE5 | |
| Asus ZenBook Pro 16X OLED UX7602ZM-ME115W | |
| MSI CreatorPro Z16P B12UKST | |
| Gigabyte AERO 16 OLED BSF | |
| Asus TUF Gaming A16 FA617 | |
| Cinebench R15 / CPU Multi 64Bit | |
| Razer Blade 18 RTX 4070 | |
| Average of class Gaming (1578 - 6271, n=104, last 2 years) | |
| Gigabyte AERO 16 OLED BSF | |
| Gigabyte Aero 16 YE5 | |
| Average Intel Core i9-13900H (2061 - 3100, n=26) | |
| Asus ZenBook Pro 16X OLED UX7602ZM-ME115W | |
| Asus TUF Gaming A16 FA617 | |
| MSI CreatorPro Z16P B12UKST | |
| Cinebench R15 / CPU Single 64Bit | |
| Razer Blade 18 RTX 4070 | |
| Average of class Gaming (188.8 - 344, n=105, last 2 years) | |
| Gigabyte Aero 16 YE5 | |
| Average Intel Core i9-13900H (211 - 297, n=26) | |
| Asus ZenBook Pro 16X OLED UX7602ZM-ME115W | |
| Asus ZenBook Pro 16X OLED UX7602ZM-ME115W | |
| Asus TUF Gaming A16 FA617 | |
| Gigabyte AERO 16 OLED BSF | |
| MSI CreatorPro Z16P B12UKST | |
| Blender / v2.79 BMW27 CPU | |
| Asus TUF Gaming A16 FA617 | |
| Average Intel Core i9-13900H (166 - 268, n=24) | |
| MSI CreatorPro Z16P B12UKST | |
| Gigabyte Aero 16 YE5 | |
| Asus ZenBook Pro 16X OLED UX7602ZM-ME115W | |
| Gigabyte AERO 16 OLED BSF | |
| Average of class Gaming (80 - 330, n=103, last 2 years) | |
| Razer Blade 18 RTX 4070 | |
| 7-Zip 18.03 / 7z b 4 | |
| Razer Blade 18 RTX 4070 | |
| Average of class Gaming (33491 - 148086, n=104, last 2 years) | |
| Gigabyte AERO 16 OLED BSF | |
| Asus ZenBook Pro 16X OLED UX7602ZM-ME115W | |
| Gigabyte Aero 16 YE5 | |
| MSI CreatorPro Z16P B12UKST | |
| Average Intel Core i9-13900H (45045 - 79032, n=25) | |
| Asus TUF Gaming A16 FA617 | |
| 7-Zip 18.03 / 7z b 4 -mmt1 | |
| Razer Blade 18 RTX 4070 | |
| Average of class Gaming (4199 - 7436, n=104, last 2 years) | |
| Gigabyte Aero 16 YE5 | |
| Average Intel Core i9-13900H (3665 - 6600, n=25) | |
| Asus ZenBook Pro 16X OLED UX7602ZM-ME115W | |
| Asus TUF Gaming A16 FA617 | |
| MSI CreatorPro Z16P B12UKST | |
| Gigabyte AERO 16 OLED BSF | |
| Geekbench 5.5 / Multi-Core | |
| Razer Blade 18 RTX 4070 | |
| Average of class Gaming (6460 - 27010, n=104, last 2 years) | |
| Gigabyte Aero 16 YE5 | |
| Gigabyte AERO 16 OLED BSF | |
| Asus ZenBook Pro 16X OLED UX7602ZM-ME115W | |
| Average Intel Core i9-13900H (9094 - 15410, n=26) | |
| MSI CreatorPro Z16P B12UKST | |
| Asus TUF Gaming A16 FA617 | |
| Geekbench 5.5 / Single-Core | |
| Average of class Gaming (986 - 2474, n=104, last 2 years) | |
| Razer Blade 18 RTX 4070 | |
| Average Intel Core i9-13900H (1140 - 2043, n=26) | |
| Gigabyte Aero 16 YE5 | |
| Asus ZenBook Pro 16X OLED UX7602ZM-ME115W | |
| MSI CreatorPro Z16P B12UKST | |
| Gigabyte AERO 16 OLED BSF | |
| Asus TUF Gaming A16 FA617 | |
| HWBOT x265 Benchmark v2.2 / 4k Preset | |
| Razer Blade 18 RTX 4070 | |
| Average of class Gaming (11.5 - 44.3, n=104, last 2 years) | |
| Gigabyte AERO 16 OLED BSF | |
| MSI CreatorPro Z16P B12UKST | |
| Asus ZenBook Pro 16X OLED UX7602ZM-ME115W | |
| Average Intel Core i9-13900H (14.1 - 22.3, n=25) | |
| Gigabyte Aero 16 YE5 | |
| Asus TUF Gaming A16 FA617 | |
| LibreOffice / 20 Documents To PDF | |
| Asus TUF Gaming A16 FA617 | |
| Gigabyte AERO 16 OLED BSF | |
| Average of class Gaming (33.2 - 88.8, n=104, last 2 years) | |
| Average Intel Core i9-13900H (34.4 - 82.8, n=25) | |
| Razer Blade 18 RTX 4070 | |
| Asus ZenBook Pro 16X OLED UX7602ZM-ME115W | |
| Gigabyte Aero 16 YE5 | |
| MSI CreatorPro Z16P B12UKST | |
| R Benchmark 2.5 / Overall mean | |
| Asus TUF Gaming A16 FA617 | |
| Gigabyte AERO 16 OLED BSF | |
| MSI CreatorPro Z16P B12UKST | |
| Average Intel Core i9-13900H (0.4052 - 0.723, n=25) | |
| Asus ZenBook Pro 16X OLED UX7602ZM-ME115W | |
| Average of class Gaming (0.3439 - 0.759, n=105, last 2 years) | |
| Gigabyte Aero 16 YE5 | |
| Razer Blade 18 RTX 4070 | |
* ... smaller is better
AIDA64: FP32 Ray-Trace | FPU Julia | CPU SHA3 | CPU Queen | FPU SinJulia | FPU Mandel | CPU AES | CPU ZLib | FP64 Ray-Trace | CPU PhotoWorxx
| Performance rating | |
| Razer Blade 18 RTX 4070 | |
| Average of class Gaming | |
| Gigabyte AERO 16 OLED BSF | |
| MSI CreatorPro Z16P B12UKST | |
| Asus TUF Gaming A16 FA617 | |
| Asus ZenBook Pro 16X OLED UX7602ZM-ME115W | |
| Average Intel Core i9-13900H | |
| Gigabyte Aero 16 YE5 | |
| AIDA64 / FP32 Ray-Trace | |
| Average of class Gaming (10227 - 85542, n=103, last 2 years) | |
| Razer Blade 18 RTX 4070 | |
| Gigabyte AERO 16 OLED BSF | |
| Asus TUF Gaming A16 FA617 | |
| Average Intel Core i9-13900H (6788 - 19557, n=25) | |
| MSI CreatorPro Z16P B12UKST | |
| Asus ZenBook Pro 16X OLED UX7602ZM-ME115W | |
| Gigabyte Aero 16 YE5 | |
| AIDA64 / FPU Julia | |
| Average of class Gaming (51376 - 238426, n=103, last 2 years) | |
| Razer Blade 18 RTX 4070 | |
| Asus TUF Gaming A16 FA617 | |
| Gigabyte AERO 16 OLED BSF | |
| Average Intel Core i9-13900H (22551 - 95579, n=25) | |
| Asus ZenBook Pro 16X OLED UX7602ZM-ME115W | |
| MSI CreatorPro Z16P B12UKST | |
| Gigabyte Aero 16 YE5 | |
| AIDA64 / CPU SHA3 | |
| Razer Blade 18 RTX 4070 | |
| Average of class Gaming (2180 - 9817, n=103, last 2 years) | |
| Gigabyte AERO 16 OLED BSF | |
| Asus ZenBook Pro 16X OLED UX7602ZM-ME115W | |
| MSI CreatorPro Z16P B12UKST | |
| Average Intel Core i9-13900H (2491 - 4270, n=25) | |
| Asus TUF Gaming A16 FA617 | |
| Gigabyte Aero 16 YE5 | |
| AIDA64 / CPU Queen | |
| Razer Blade 18 RTX 4070 | |
| Average of class Gaming (49785 - 173351, n=89, last 2 years) | |
| Asus ZenBook Pro 16X OLED UX7602ZM-ME115W | |
| Gigabyte Aero 16 YE5 | |
| Average Intel Core i9-13900H (65121 - 120936, n=25) | |
| Asus TUF Gaming A16 FA617 | |
| MSI CreatorPro Z16P B12UKST | |
| Gigabyte AERO 16 OLED BSF | |
| AIDA64 / FPU SinJulia | |
| Razer Blade 18 RTX 4070 | |
| Average of class Gaming (4424 - 33636, n=103, last 2 years) | |
| Asus TUF Gaming A16 FA617 | |
| Gigabyte AERO 16 OLED BSF | |
| Asus ZenBook Pro 16X OLED UX7602ZM-ME115W | |
| Average Intel Core i9-13900H (6108 - 11631, n=25) | |
| Gigabyte Aero 16 YE5 | |
| MSI CreatorPro Z16P B12UKST | |
| AIDA64 / FPU Mandel | |
| Average of class Gaming (25115 - 128721, n=103, last 2 years) | |
| Razer Blade 18 RTX 4070 | |
| Asus TUF Gaming A16 FA617 | |
| Gigabyte AERO 16 OLED BSF | |
| Average Intel Core i9-13900H (11283 - 48474, n=25) | |
| Asus ZenBook Pro 16X OLED UX7602ZM-ME115W | |
| MSI CreatorPro Z16P B12UKST | |
| Gigabyte Aero 16 YE5 | |
| AIDA64 / CPU AES | |
| Gigabyte AERO 16 OLED BSF | |
| MSI CreatorPro Z16P B12UKST | |
| Razer Blade 18 RTX 4070 | |
| Average of class Gaming (39258 - 247074, n=103, last 2 years) | |
| Gigabyte Aero 16 YE5 | |
| Average Intel Core i9-13900H (3691 - 149377, n=25) | |
| Asus ZenBook Pro 16X OLED UX7602ZM-ME115W | |
| Asus TUF Gaming A16 FA617 | |
| AIDA64 / CPU ZLib | |
| Razer Blade 18 RTX 4070 | |
| Average of class Gaming (574 - 2531, n=103, last 2 years) | |
| Gigabyte AERO 16 OLED BSF | |
| Average Intel Core i9-13900H (789 - 1254, n=25) | |
| Asus ZenBook Pro 16X OLED UX7602ZM-ME115W | |
| MSI CreatorPro Z16P B12UKST | |
| Gigabyte Aero 16 YE5 | |
| Asus TUF Gaming A16 FA617 | |
| AIDA64 / FP64 Ray-Trace | |
| Average of class Gaming (5509 - 45446, n=103, last 2 years) | |
| Razer Blade 18 RTX 4070 | |
| Gigabyte AERO 16 OLED BSF | |
| Asus TUF Gaming A16 FA617 | |
| Average Intel Core i9-13900H (3655 - 10716, n=25) | |
| Asus ZenBook Pro 16X OLED UX7602ZM-ME115W | |
| MSI CreatorPro Z16P B12UKST | |
| Gigabyte Aero 16 YE5 | |
| AIDA64 / CPU PhotoWorxx | |
| Razer Blade 18 RTX 4070 | |
| Asus ZenBook Pro 16X OLED UX7602ZM-ME115W | |
| Gigabyte AERO 16 OLED BSF | |
| Average of class Gaming (12271 - 89891, n=103, last 2 years) | |
| MSI CreatorPro Z16P B12UKST | |
| Average Intel Core i9-13900H (10871 - 50488, n=25) | |
| Gigabyte Aero 16 YE5 | |
| Asus TUF Gaming A16 FA617 | |
System Performance
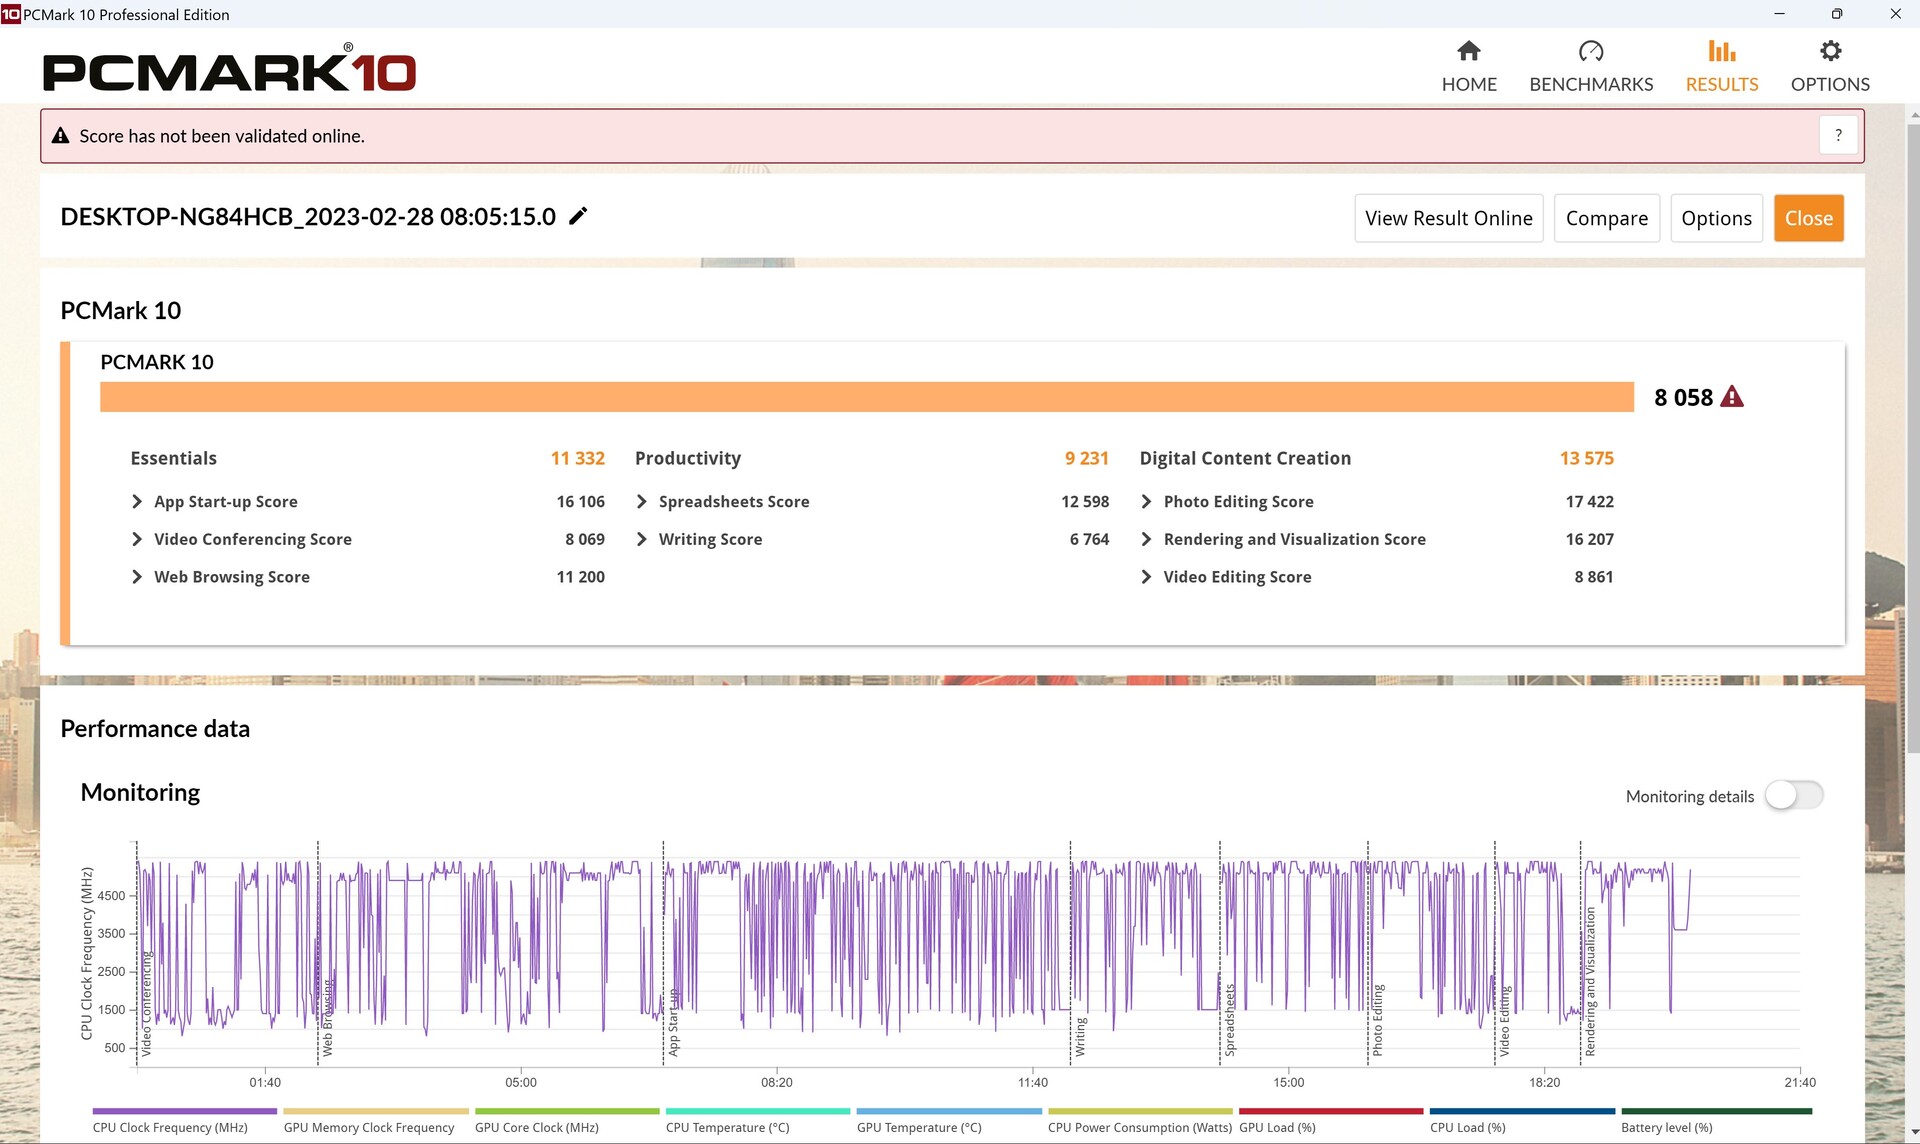
In PCMark 10, our Aero exchanges blows with last year's MSI CreatorPro Z16P. Unfortunately, the Aero has a weak productivity score, but it does very well in the other sub-tests.
CrossMark: Overall | Productivity | Creativity | Responsiveness
| PCMark 10 / Score | |
| Average of class Gaming (5828 - 11730, n=92, last 2 years) | |
| Gigabyte AERO 16 OLED BSF | |
| Gigabyte Aero 16 YE5 | |
| Average Intel Core i9-13900H, NVIDIA GeForce RTX 4070 Laptop GPU (5855 - 8538, n=8) | |
| Razer Blade 18 RTX 4070 | |
| Asus ZenBook Pro 16X OLED UX7602ZM-ME115W | |
| Asus TUF Gaming A16 FA617 | |
| MSI CreatorPro Z16P B12UKST | |
| PCMark 10 / Essentials | |
| Razer Blade 18 RTX 4070 | |
| Gigabyte AERO 16 OLED BSF | |
| Asus ZenBook Pro 16X OLED UX7602ZM-ME115W | |
| Gigabyte Aero 16 YE5 | |
| Average Intel Core i9-13900H, NVIDIA GeForce RTX 4070 Laptop GPU (8835 - 11940, n=8) | |
| Average of class Gaming (8810 - 11935, n=96, last 2 years) | |
| Asus TUF Gaming A16 FA617 | |
| MSI CreatorPro Z16P B12UKST | |
| PCMark 10 / Productivity | |
| Average of class Gaming (6845 - 21327, n=94, last 2 years) | |
| Asus ZenBook Pro 16X OLED UX7602ZM-ME115W | |
| Gigabyte Aero 16 YE5 | |
| Average Intel Core i9-13900H, NVIDIA GeForce RTX 4070 Laptop GPU (7967 - 10991, n=8) | |
| Razer Blade 18 RTX 4070 | |
| MSI CreatorPro Z16P B12UKST | |
| Asus TUF Gaming A16 FA617 | |
| Gigabyte AERO 16 OLED BSF | |
| PCMark 10 / Digital Content Creation | |
| Average of class Gaming (7602 - 19954, n=94, last 2 years) | |
| Gigabyte AERO 16 OLED BSF | |
| Gigabyte Aero 16 YE5 | |
| Average Intel Core i9-13900H, NVIDIA GeForce RTX 4070 Laptop GPU (7738 - 13575, n=8) | |
| Asus TUF Gaming A16 FA617 | |
| Razer Blade 18 RTX 4070 | |
| Asus ZenBook Pro 16X OLED UX7602ZM-ME115W | |
| MSI CreatorPro Z16P B12UKST | |
| CrossMark / Overall | |
| Razer Blade 18 RTX 4070 | |
| Gigabyte Aero 16 YE5 | |
| Average of class Gaming (1366 - 2409, n=93, last 2 years) | |
| MSI CreatorPro Z16P B12UKST | |
| Gigabyte AERO 16 OLED BSF | |
| Average Intel Core i9-13900H, NVIDIA GeForce RTX 4070 Laptop GPU (1104 - 1974, n=7) | |
| Asus ZenBook Pro 16X OLED UX7602ZM-ME115W | |
| CrossMark / Productivity | |
| Gigabyte Aero 16 YE5 | |
| Razer Blade 18 RTX 4070 | |
| Average of class Gaming (1386 - 2254, n=93, last 2 years) | |
| MSI CreatorPro Z16P B12UKST | |
| Gigabyte AERO 16 OLED BSF | |
| Average Intel Core i9-13900H, NVIDIA GeForce RTX 4070 Laptop GPU (1058 - 1914, n=7) | |
| Asus ZenBook Pro 16X OLED UX7602ZM-ME115W | |
| CrossMark / Creativity | |
| Razer Blade 18 RTX 4070 | |
| Average of class Gaming (1343 - 2729, n=93, last 2 years) | |
| Gigabyte Aero 16 YE5 | |
| MSI CreatorPro Z16P B12UKST | |
| Asus ZenBook Pro 16X OLED UX7602ZM-ME115W | |
| Average Intel Core i9-13900H, NVIDIA GeForce RTX 4070 Laptop GPU (1178 - 2254, n=7) | |
| Gigabyte AERO 16 OLED BSF | |
| CrossMark / Responsiveness | |
| Gigabyte Aero 16 YE5 | |
| Gigabyte AERO 16 OLED BSF | |
| Razer Blade 18 RTX 4070 | |
| MSI CreatorPro Z16P B12UKST | |
| Average of class Gaming (1226 - 2334, n=93, last 2 years) | |
| Average Intel Core i9-13900H, NVIDIA GeForce RTX 4070 Laptop GPU (1037 - 1952, n=7) | |
| Asus ZenBook Pro 16X OLED UX7602ZM-ME115W | |
| PCMark 10 Score | 8058 points | |
Help | ||
| AIDA64 / Memory Copy | |
| Average of class Gaming (21750 - 129946, n=103, last 2 years) | |
| Asus ZenBook Pro 16X OLED UX7602ZM-ME115W | |
| Gigabyte AERO 16 OLED BSF | |
| MSI CreatorPro Z16P B12UKST | |
| Gigabyte Aero 16 YE5 | |
| Average Intel Core i9-13900H (37448 - 74486, n=25) | |
| MSI Katana 17 B13VFK | |
| Asus TUF Gaming A16 FA617 | |
| AIDA64 / Memory Read | |
| Average of class Gaming (22956 - 118858, n=103, last 2 years) | |
| Asus ZenBook Pro 16X OLED UX7602ZM-ME115W | |
| Gigabyte AERO 16 OLED BSF | |
| Gigabyte Aero 16 YE5 | |
| MSI CreatorPro Z16P B12UKST | |
| Average Intel Core i9-13900H (41599 - 75433, n=25) | |
| MSI Katana 17 B13VFK | |
| Asus TUF Gaming A16 FA617 | |
| AIDA64 / Memory Write | |
| Average of class Gaming (22297 - 135096, n=103, last 2 years) | |
| Gigabyte AERO 16 OLED BSF | |
| MSI CreatorPro Z16P B12UKST | |
| Average Intel Core i9-13900H (36152 - 88505, n=25) | |
| Asus ZenBook Pro 16X OLED UX7602ZM-ME115W | |
| Gigabyte Aero 16 YE5 | |
| Asus TUF Gaming A16 FA617 | |
| MSI Katana 17 B13VFK | |
| AIDA64 / Memory Latency | |
| Asus ZenBook Pro 16X OLED UX7602ZM-ME115W | |
| Average of class Gaming (75.3 - 259, n=103, last 2 years) | |
| MSI Katana 17 B13VFK | |
| MSI CreatorPro Z16P B12UKST | |
| Gigabyte AERO 16 OLED BSF | |
| Gigabyte Aero 16 YE5 | |
| Average Intel Core i9-13900H (75.8 - 102.3, n=25) | |
| Asus TUF Gaming A16 FA617 | |
* ... smaller is better
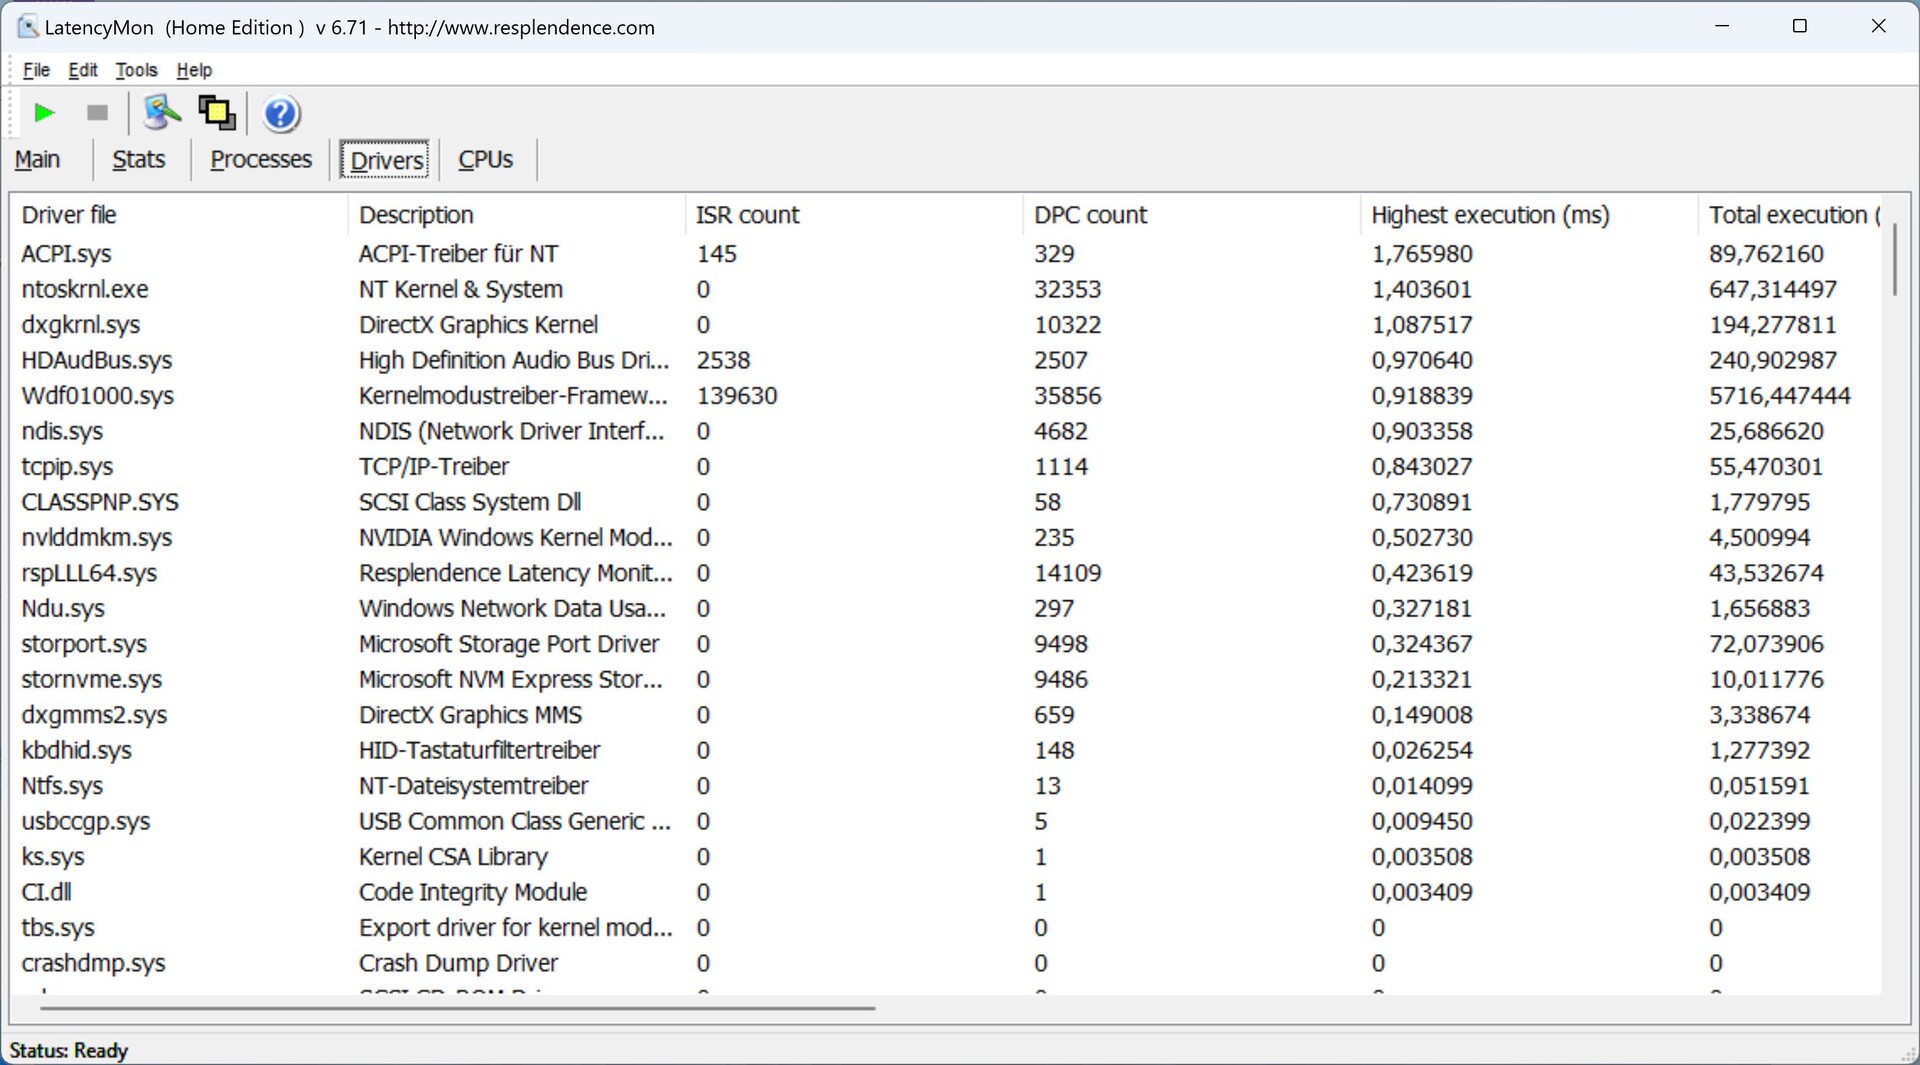
DPC Latency
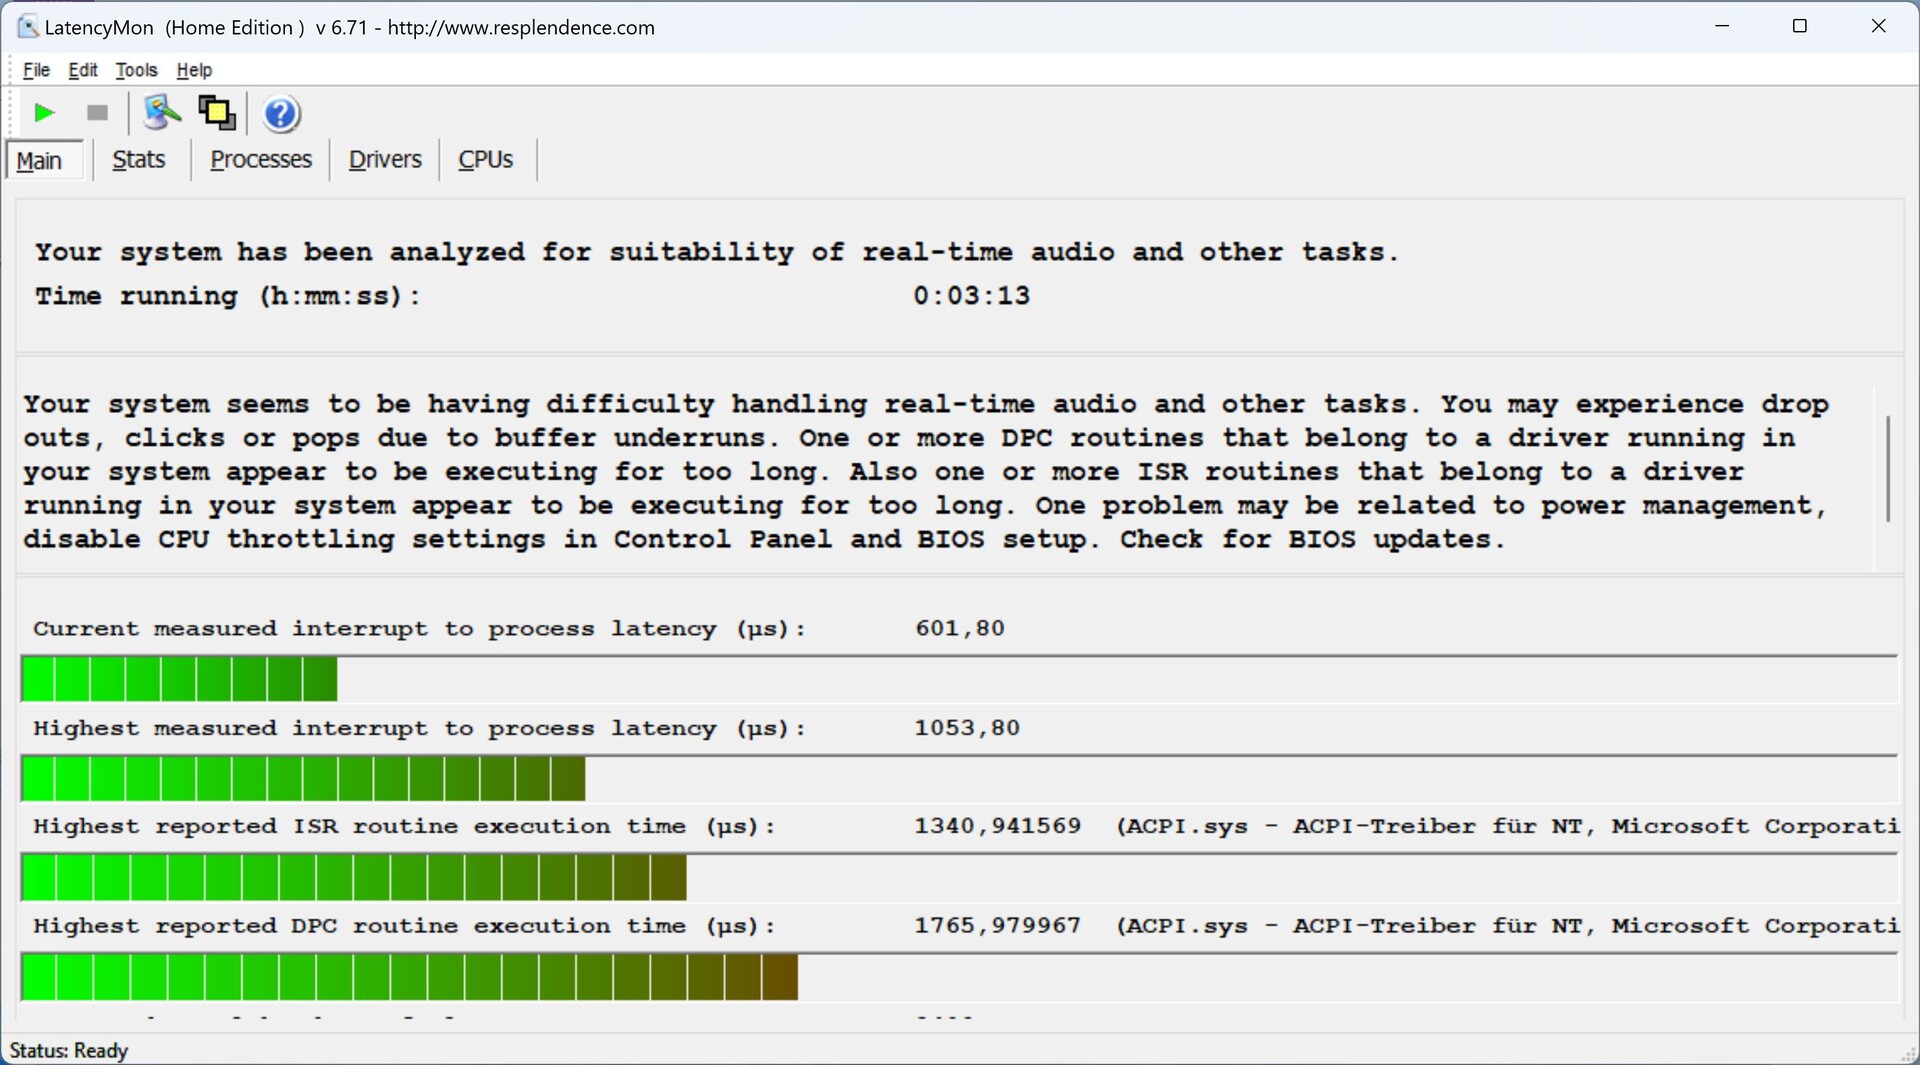
Shortly after starting LatencyMon, the software detects the first DPC latencies. These increase further when launching the browser and opening multiple tabs. Our 4K/60 fps YouTube video, on the other hand, is rendered smoothly and without skipped frames.
The Razer Blade 18 has even worse latency values than our Aero.

| DPC Latencies / LatencyMon - interrupt to process latency (max), Web, Youtube, Prime95 | |
| Razer Blade 18 RTX 4070 | |
| Gigabyte AERO 16 OLED BSF | |
| Gigabyte Aero 16 YE5 | |
| MSI CreatorPro Z16P B12UKST | |
| Asus ZenBook Pro 16X OLED UX7602ZM-ME115W | |
| Asus TUF Gaming A16 FA617 | |
* ... smaller is better
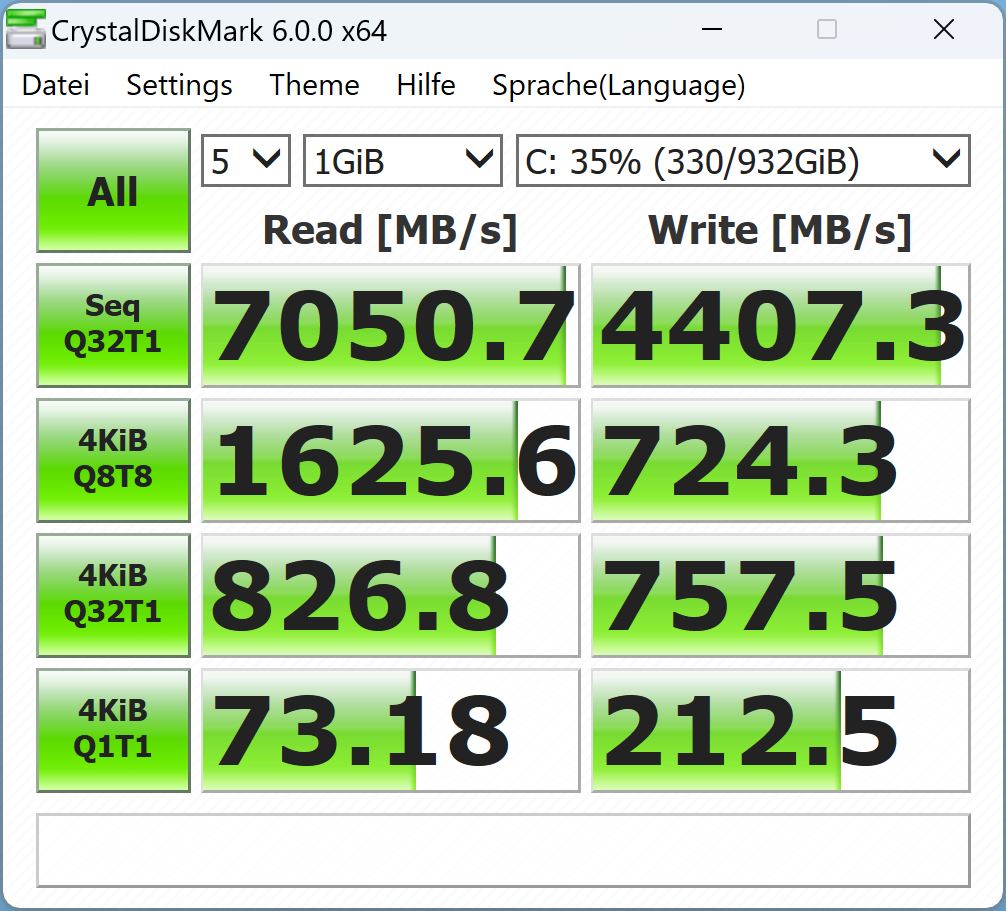
Storage Device
The manufacturer uses a very fast PCIe Gen4 NVMe SSD from its own company. It is currently ranked second in our best list.
The model here doesn't quite reach its best performance, especially since the Phison memory in the predecessor (rank 1) is a tad faster.
At least performance is relatively constant, and it's good that a cooling pad is attached to the base plate.


* ... smaller is better
Sustained Read Performance: DiskSpd Read Loop, Queue Depth 8
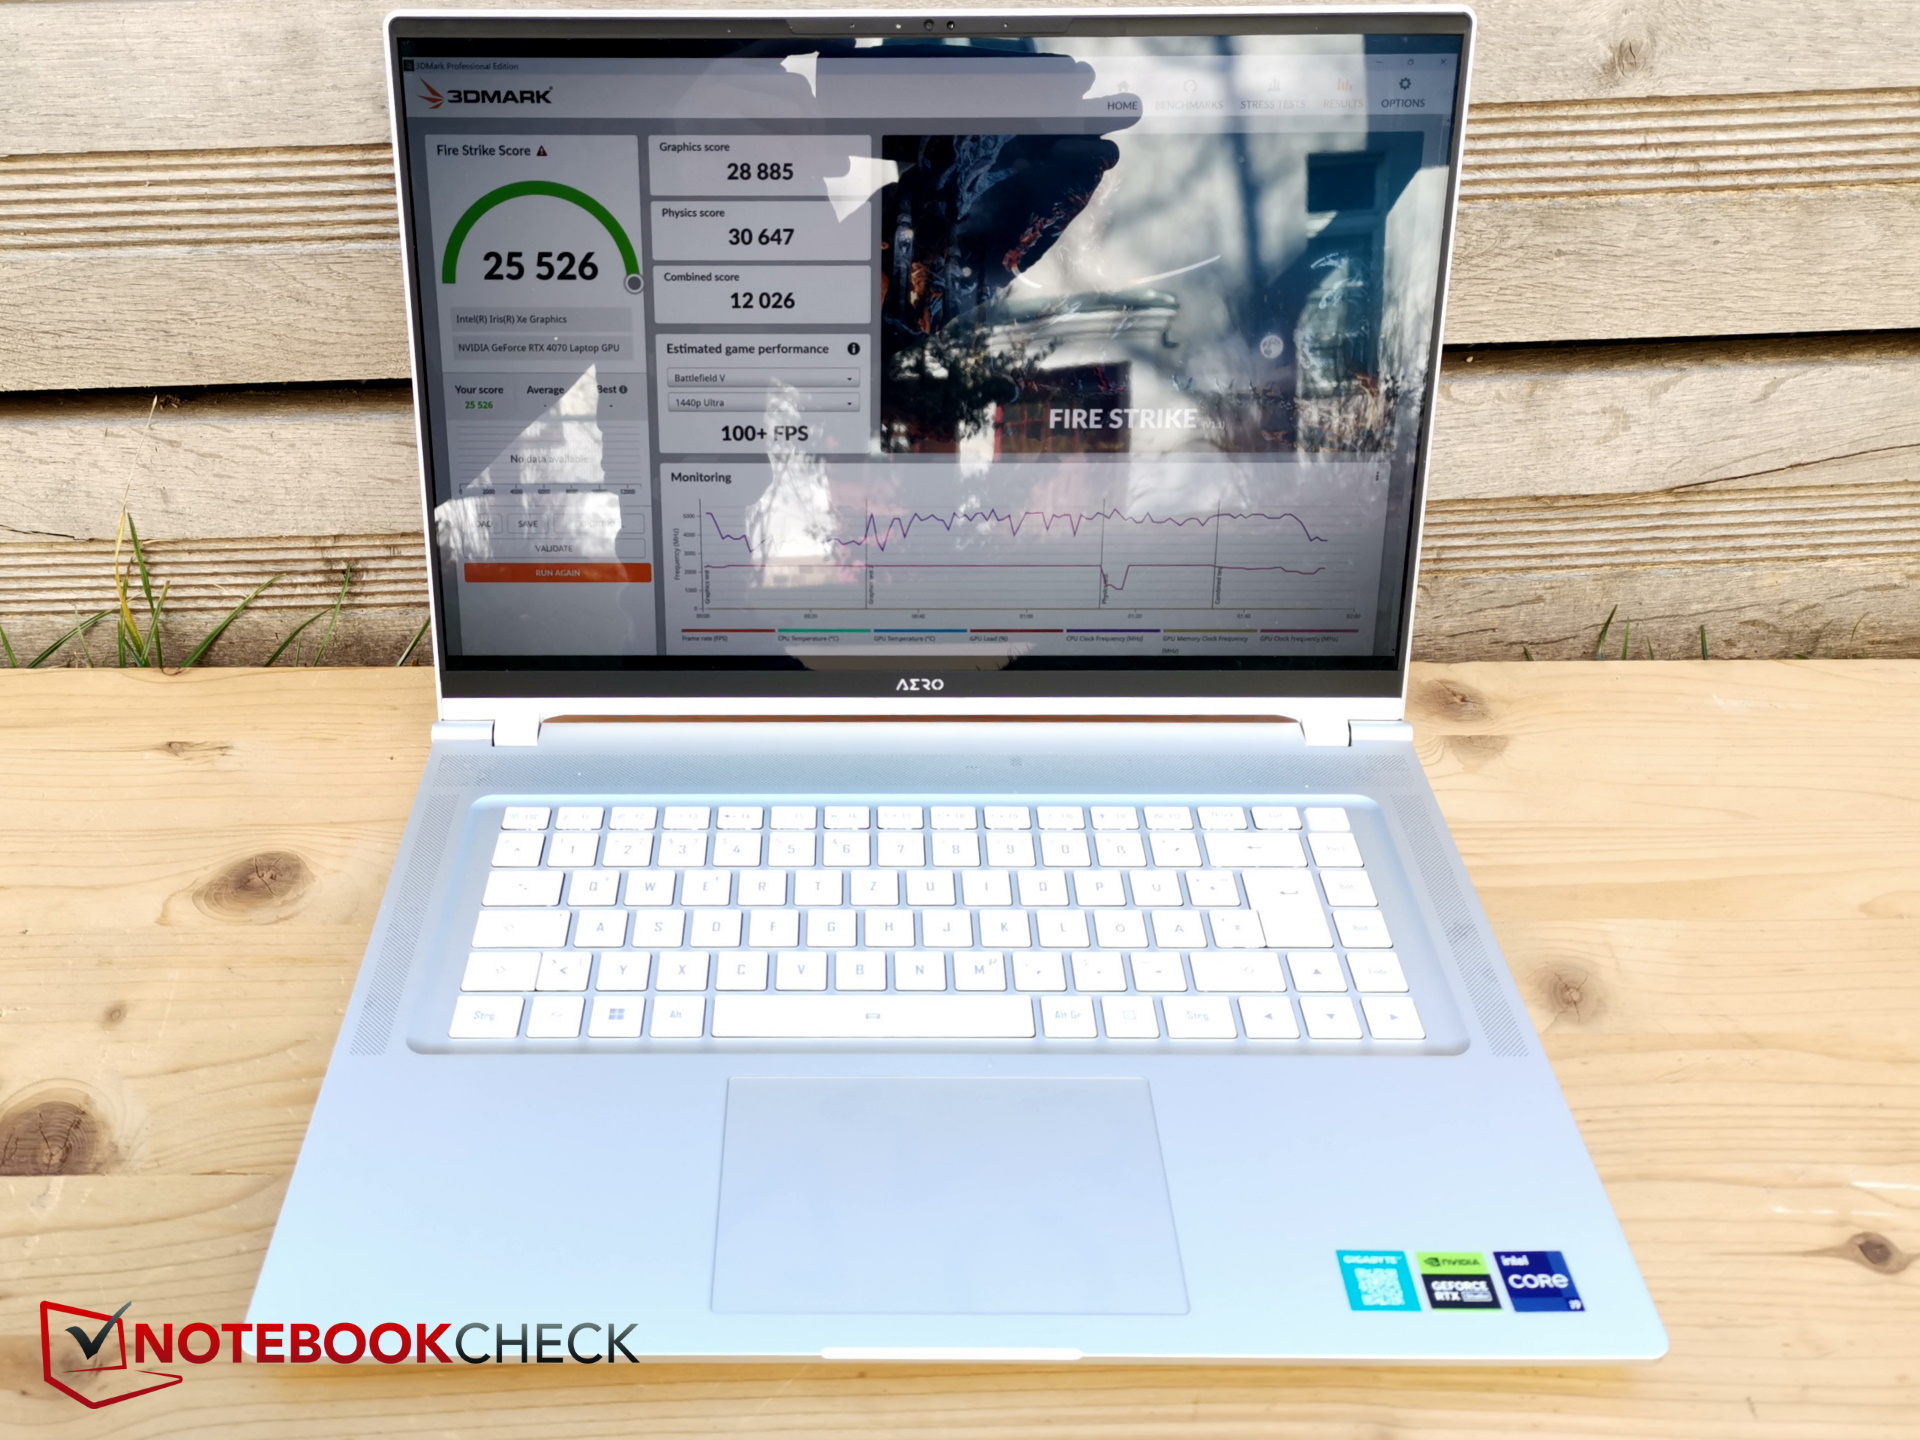
Graphics Card
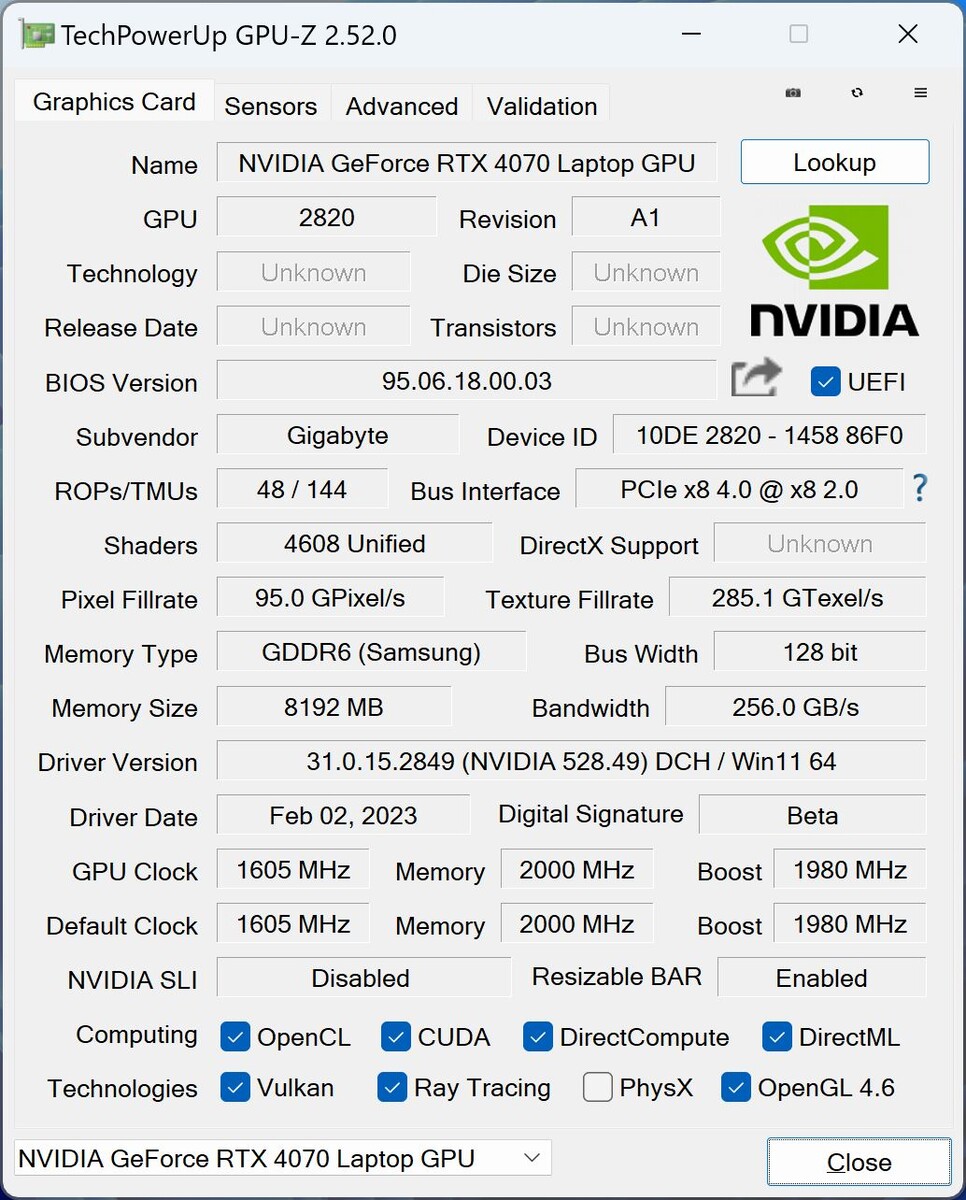
When it comes to the GPU, you have the choice between the RTX 4060 and RTX 4070; the more powerful variant is installed in our test unit. In the thin Aero, it normally consumes around 105 W. The maximum is 115 plus 25 W Dynamic Boost, but our colleague Andreas recently pointed out in his review of the card that hardly any performance increases occur above 100 W for the RTX 4070.
In the synthetic 3DMarks, the card is on the expected level, although we don't have too many other measurements in our database. After all, it is occasionally ahead of competing devices with an RTX 3080 Ti, while the predecessor with its RTX 3080 Ti is also beaten by almost 20 percent, the CreatorPro by 30 percent. Even the Blade 18 with the same GPU and nominally faster CPU is slightly behind. The Alienware x15 R2 with its RTX 3080 Ti, on the other hand, is slightly ahead.
A lot of 3D performance is lost in Battery Mode, with the score in Fire Strike dropping by almost 70 percent!
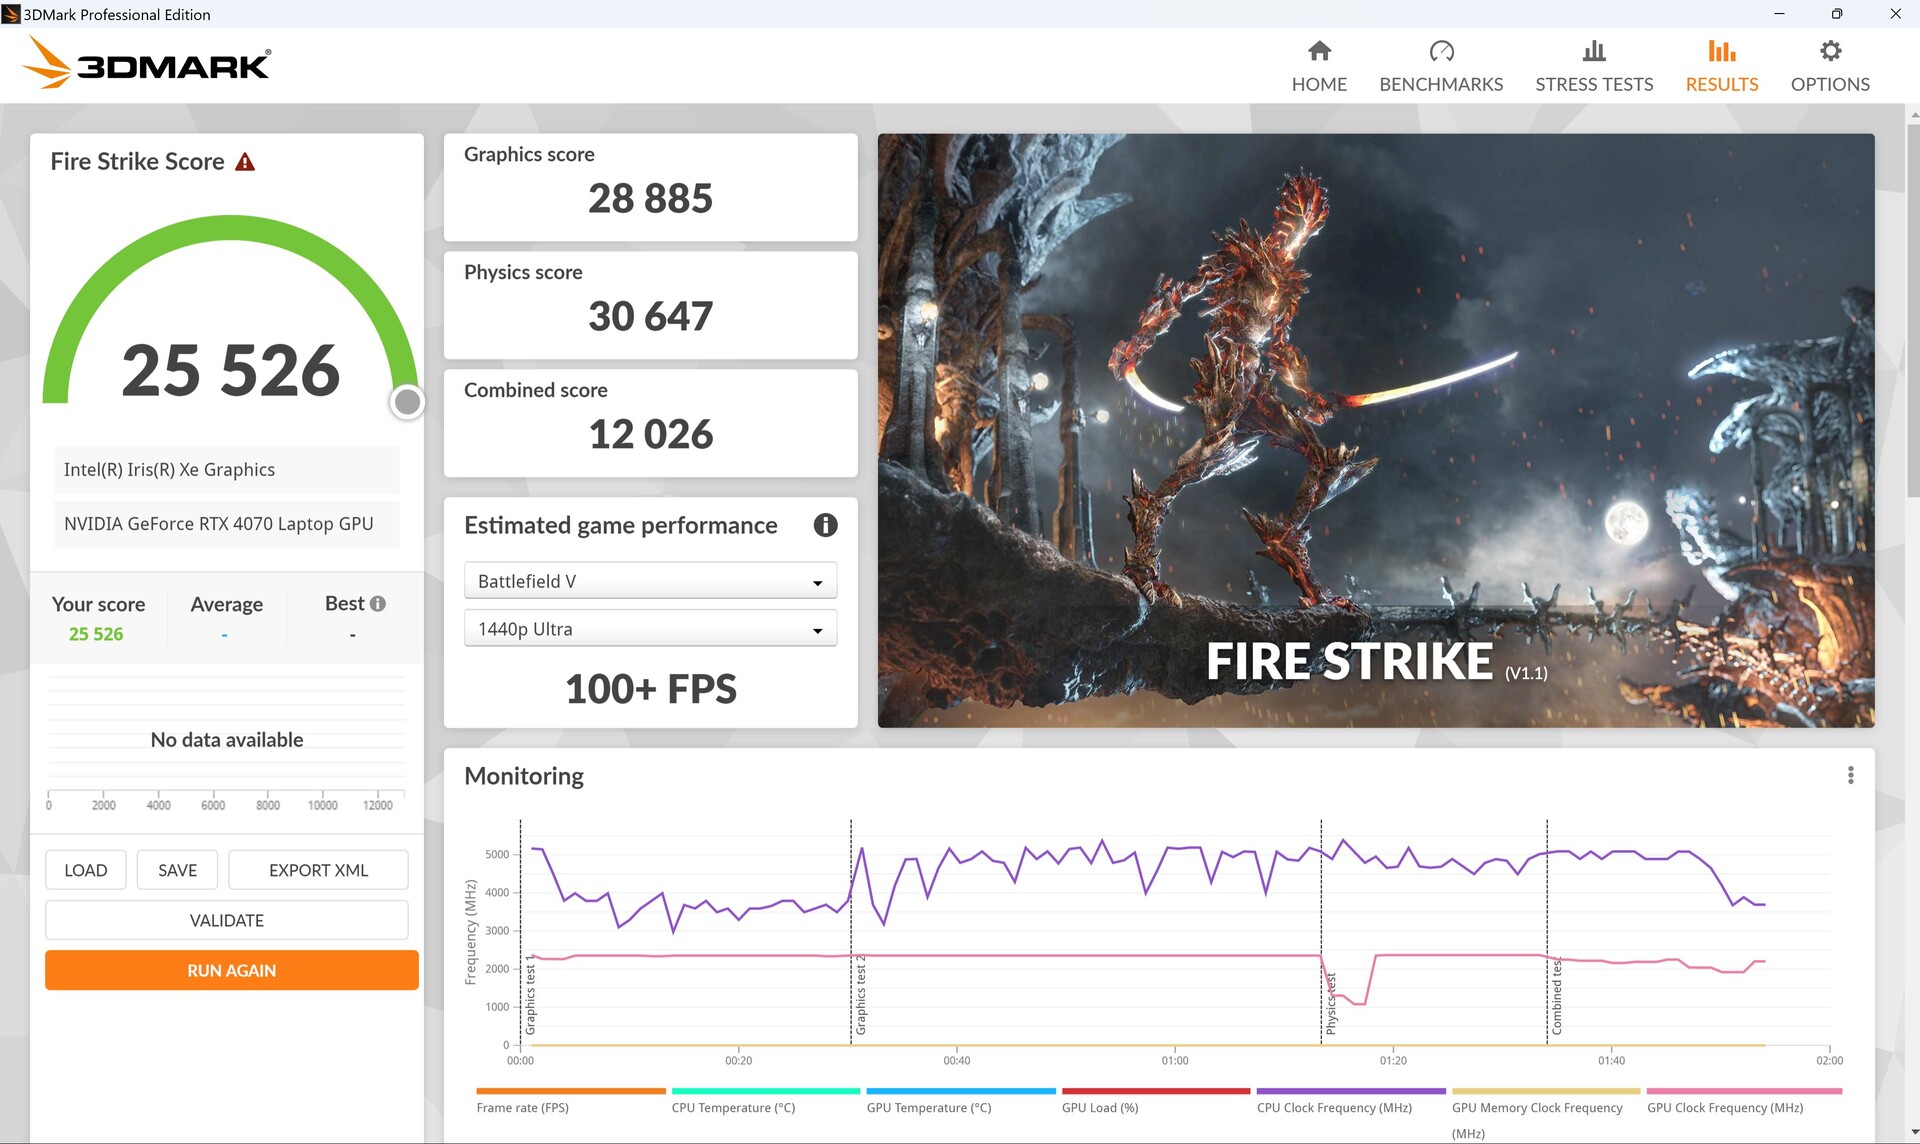

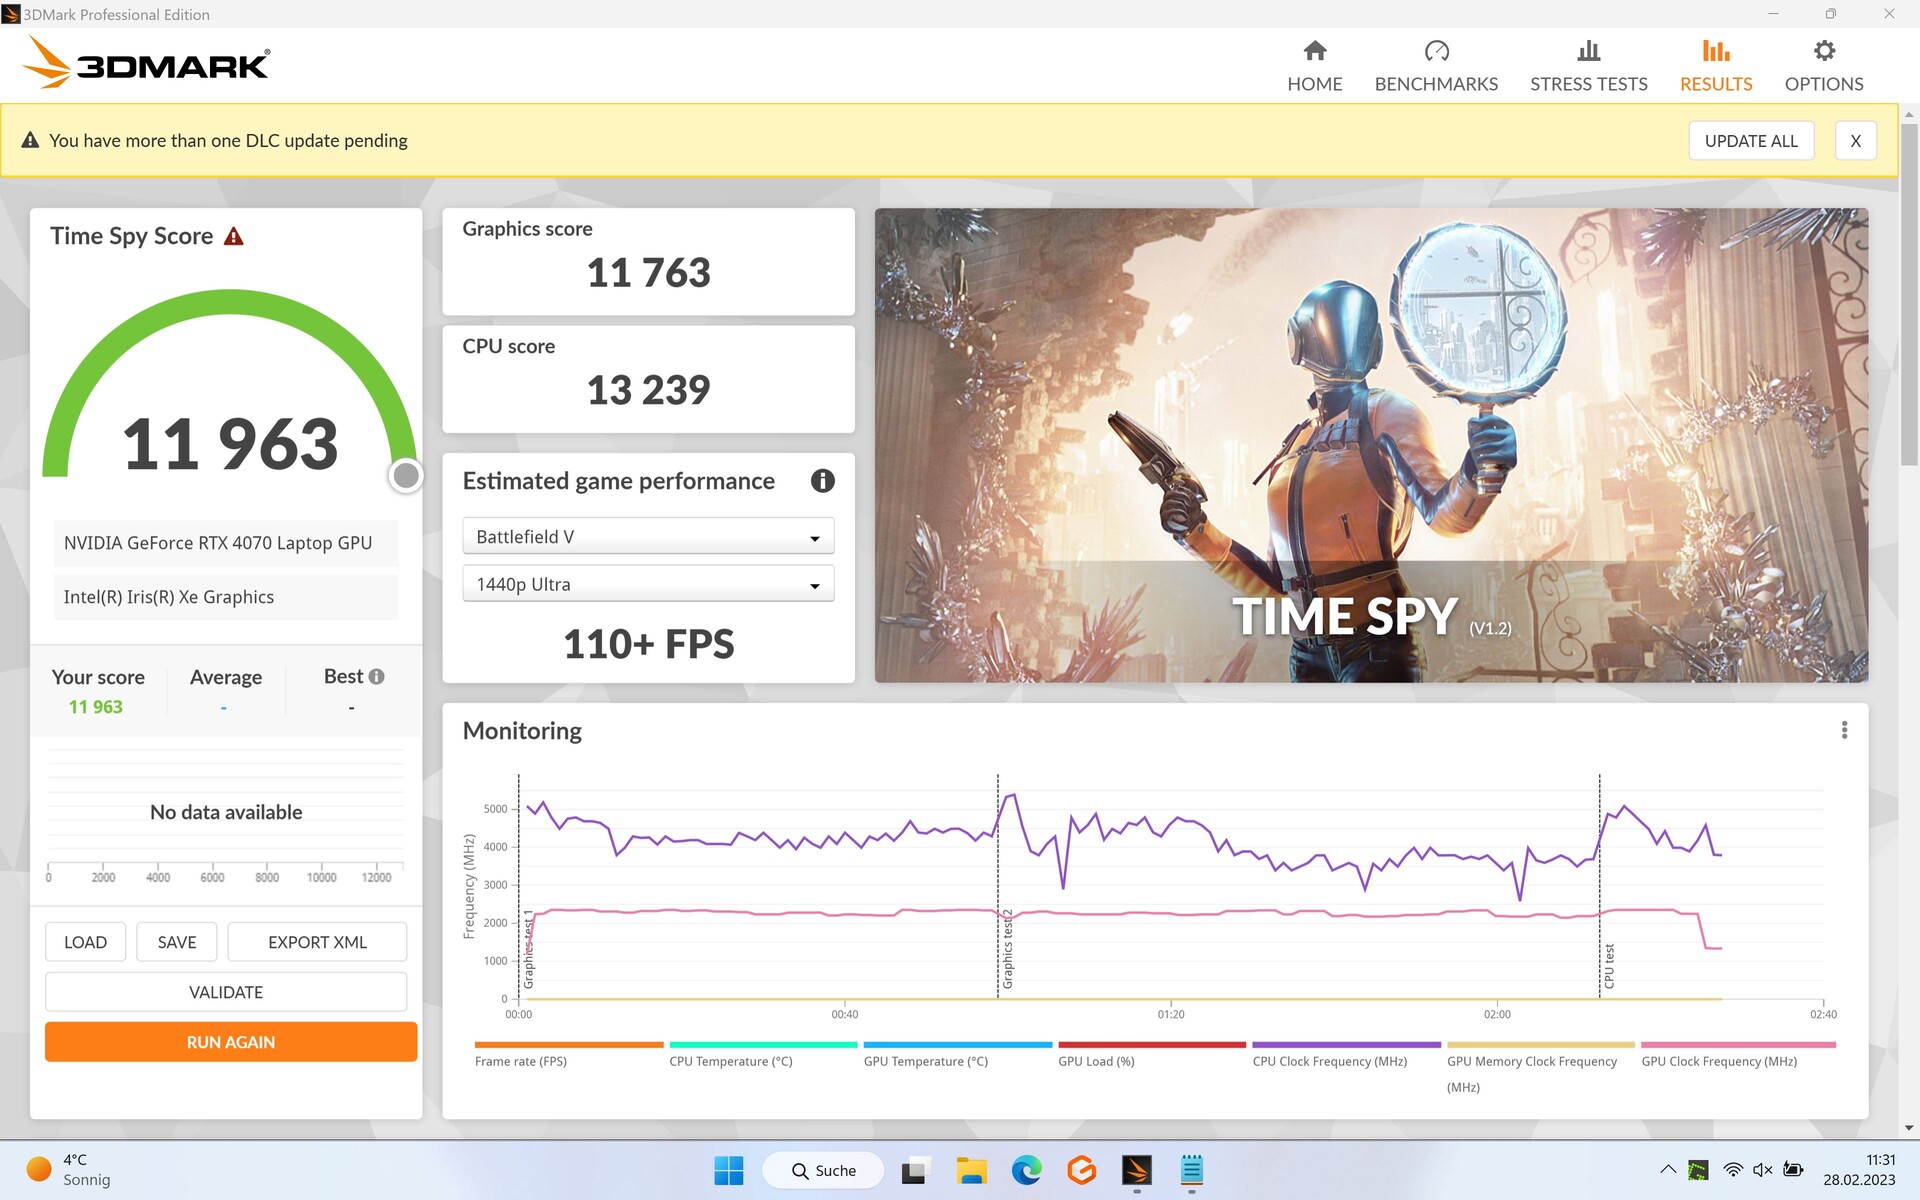
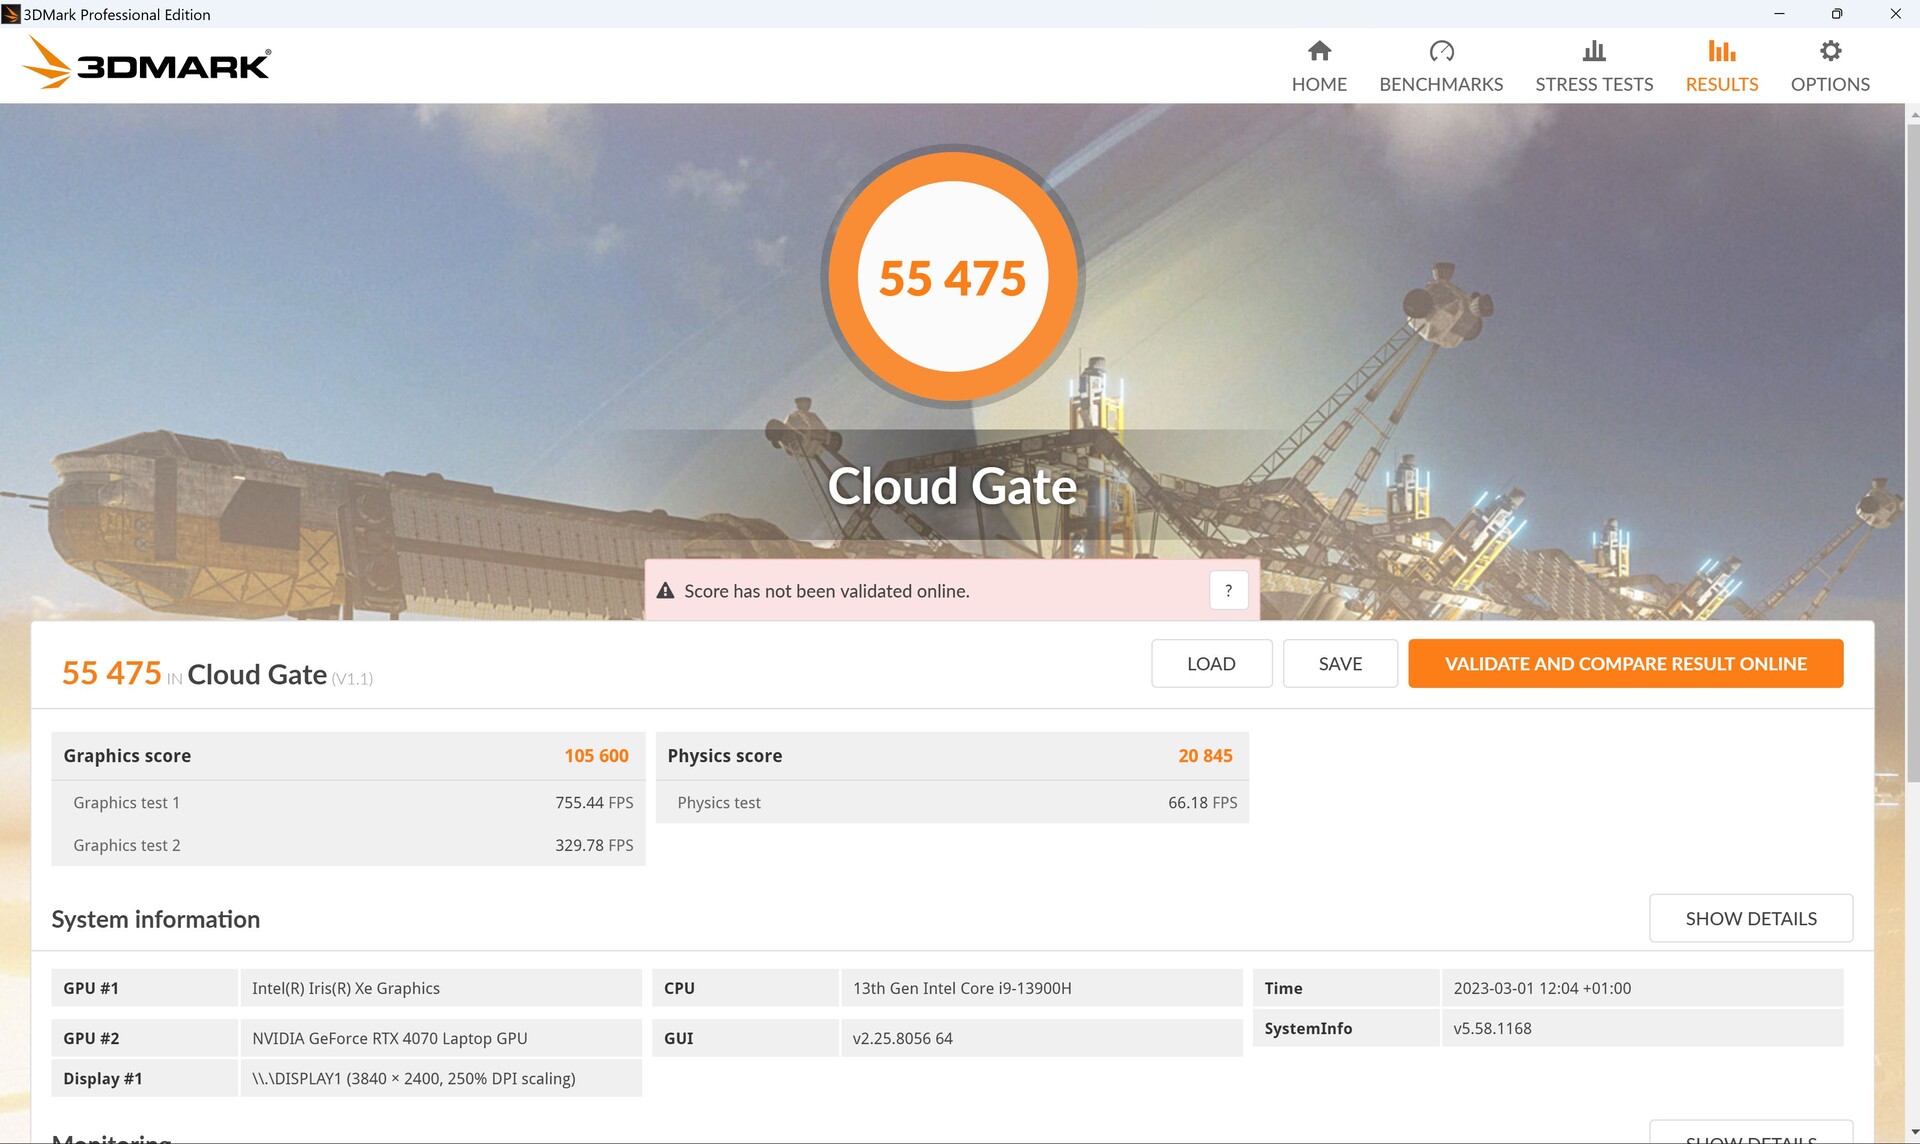
| 3DMark 11 Performance | 33703 points | |
| 3DMark Cloud Gate Standard Score | 55475 points | |
| 3DMark Fire Strike Score | 25526 points | |
| 3DMark Fire Strike Extreme Score | 13175 points | |
| 3DMark Time Spy Score | 12029 points | |
Help | ||
* ... smaller is better
Gaming Performance
In gaming, the Aero 16 is just overtaken by the Blade 18 overall, and only because of the weak results in DOTA 2 Reborn and X-Plane 11.11. The Aero even has the edge in GPU-heavy games. This is interesting because the RTX 4070 is allowed 140 W in the Blade, but only 105 W in the Aero, which confirms that it makes little sense to run the card above 100 W at the moment.
Overall, it can handle all games up to 2K and sometimes even above, although the card sometimes runs out of steam in very demanding games at 4K.
Ray tracing performance, on the other hand, is very good. In Cyberpunkt, it only drops from around 85 to 65 fps with activated ray tracing at 1080p.
| The Witcher 3 - 1920x1080 Ultra Graphics & Postprocessing (HBAO+) | |
| Average of class Gaming (104.7 - 240, n=6, last 2 years) | |
| Gigabyte AERO 16 OLED BSF | |
| Razer Blade 18 RTX 4070 | |
| Gigabyte Aero 16 YE5 | |
| Asus TUF Gaming A16 FA617 | |
| Asus ZenBook Pro 16X OLED UX7602ZM-ME115W | |
| MSI CreatorPro Z16P B12UKST | |
| Final Fantasy XV Benchmark - 1920x1080 High Quality | |
| Average of class Gaming (41 - 215, n=94, last 2 years) | |
| Gigabyte AERO 16 OLED BSF | |
| Razer Blade 18 RTX 4070 | |
| Gigabyte Aero 16 YE5 | |
| Asus ZenBook Pro 16X OLED UX7602ZM-ME115W | |
| Asus TUF Gaming A16 FA617 | |
| MSI CreatorPro Z16P B12UKST | |
| Dota 2 Reborn - 1920x1080 ultra (3/3) best looking | |
| Razer Blade 18 RTX 4070 | |
| Gigabyte Aero 16 YE5 | |
| Average of class Gaming (84.8 - 248, n=106, last 2 years) | |
| MSI CreatorPro Z16P B12UKST | |
| Gigabyte AERO 16 OLED BSF | |
| Asus ZenBook Pro 16X OLED UX7602ZM-ME115W | |
| Asus TUF Gaming A16 FA617 | |
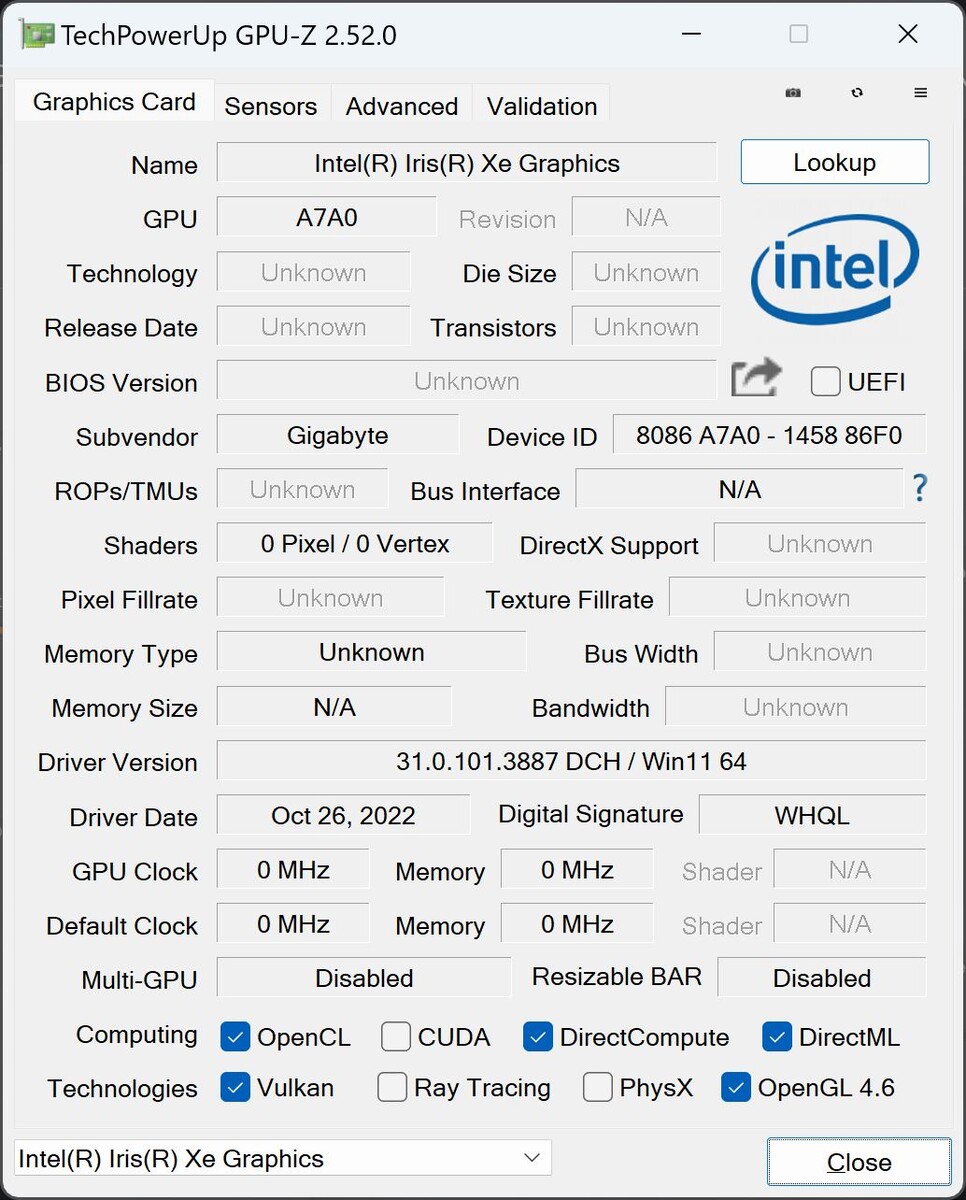
The Aero 16 does not offer Advanced Optimus, and the same applies to Nvidia's Whisper Mode. However, a MUX switch is available so that you can manually switch between iGPU and dGPU.
In gaming mode, the frame rate in Witcher 3 is quite constant for over an hour and is above that of a Razer Blade 18.
The GPU's power consumption is almost constant at around 105 W, which means that both the core clock (2,350 MHz) and memory clock (2,000 MHz) are also very constant. The card heats up to about 80 °C.
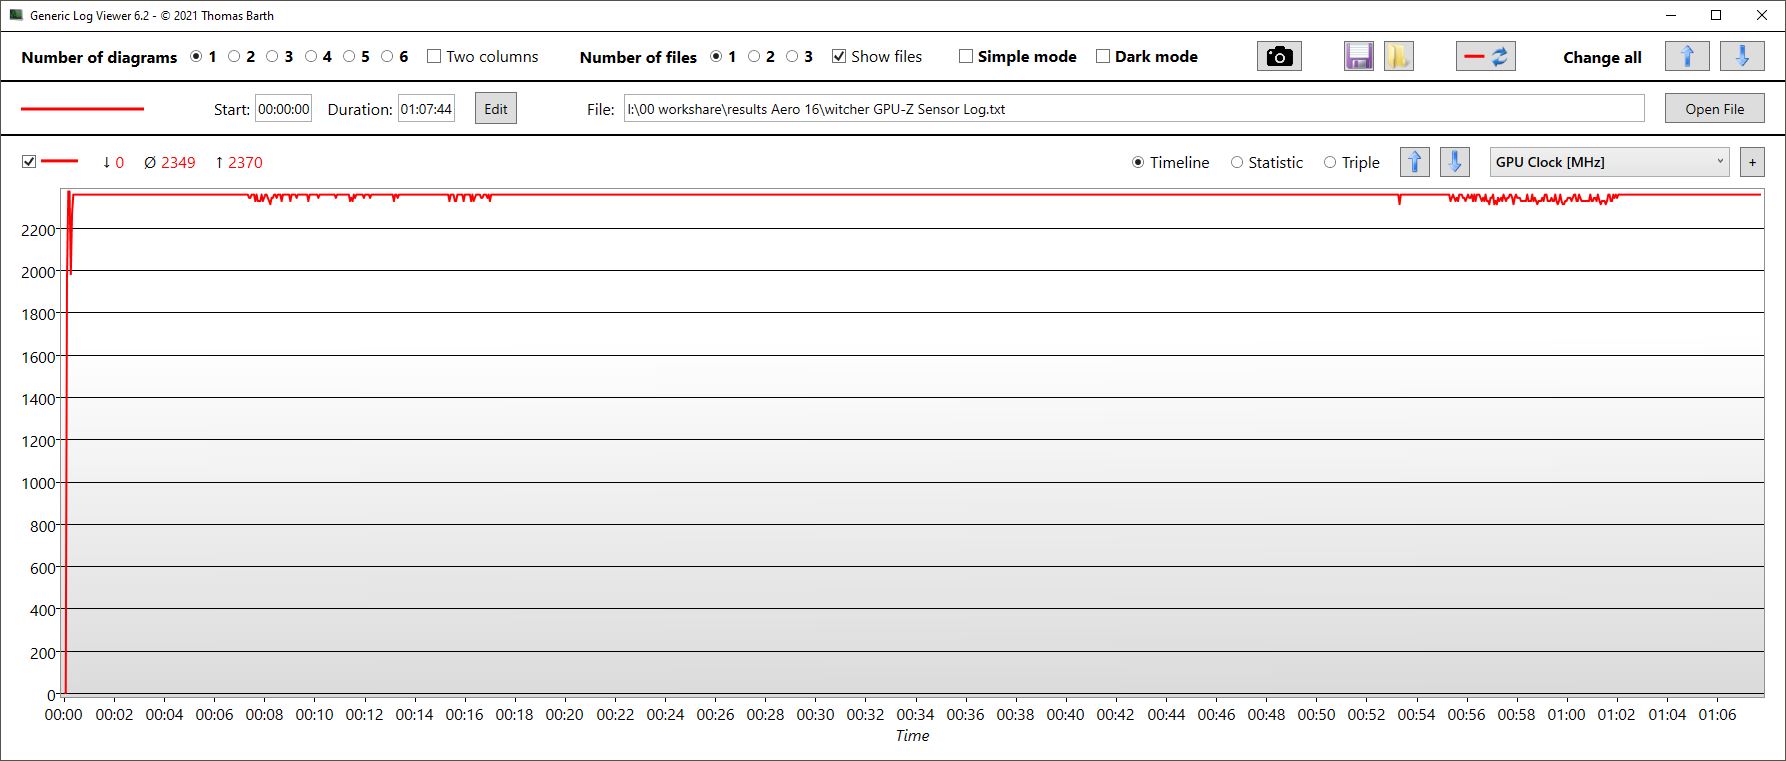
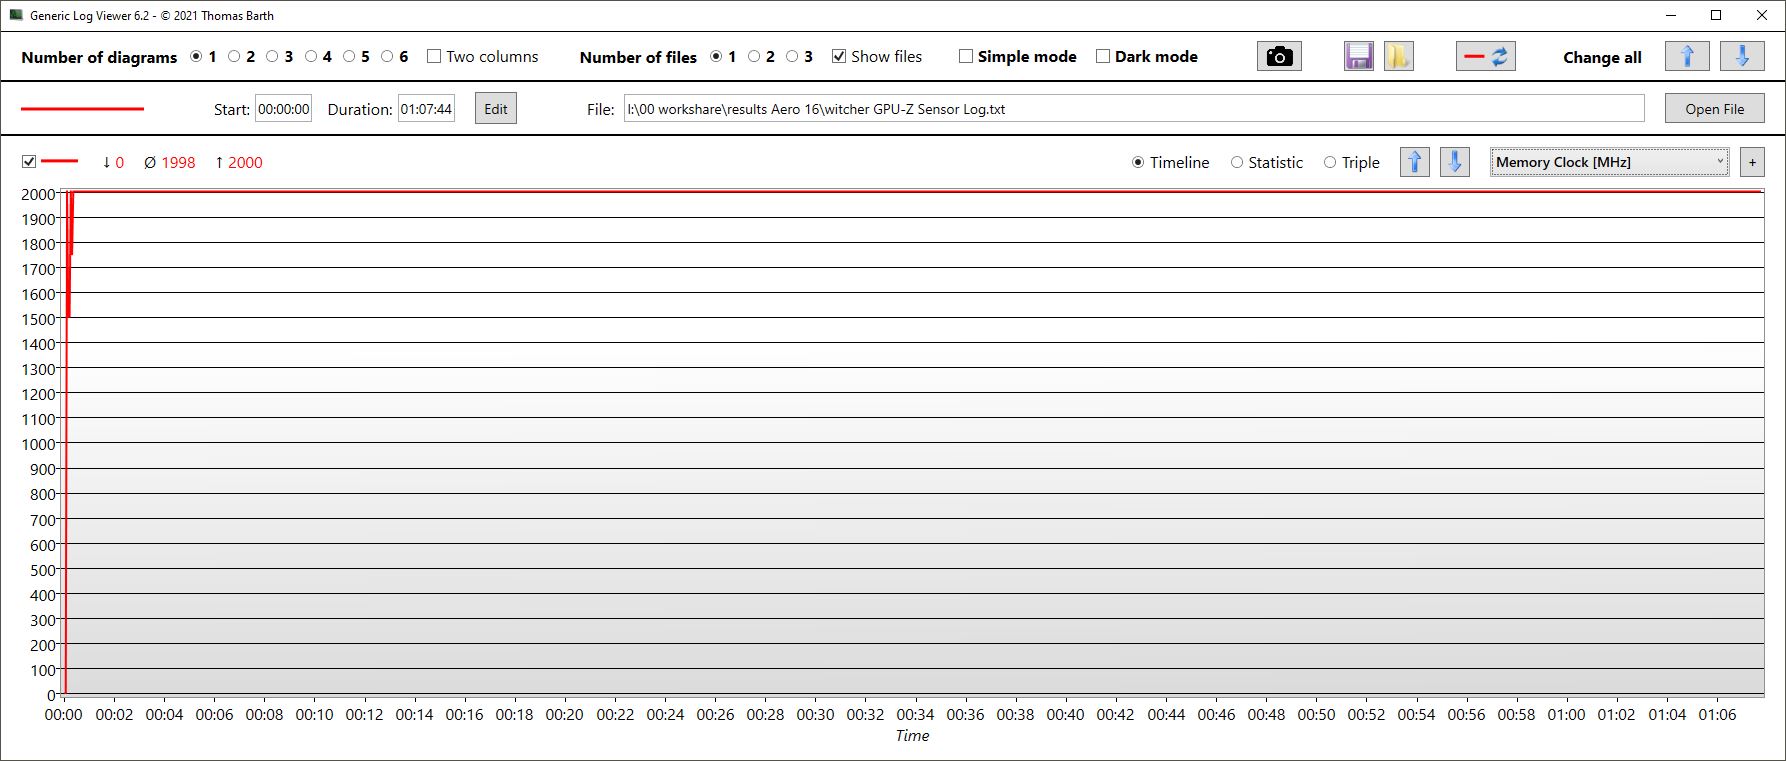
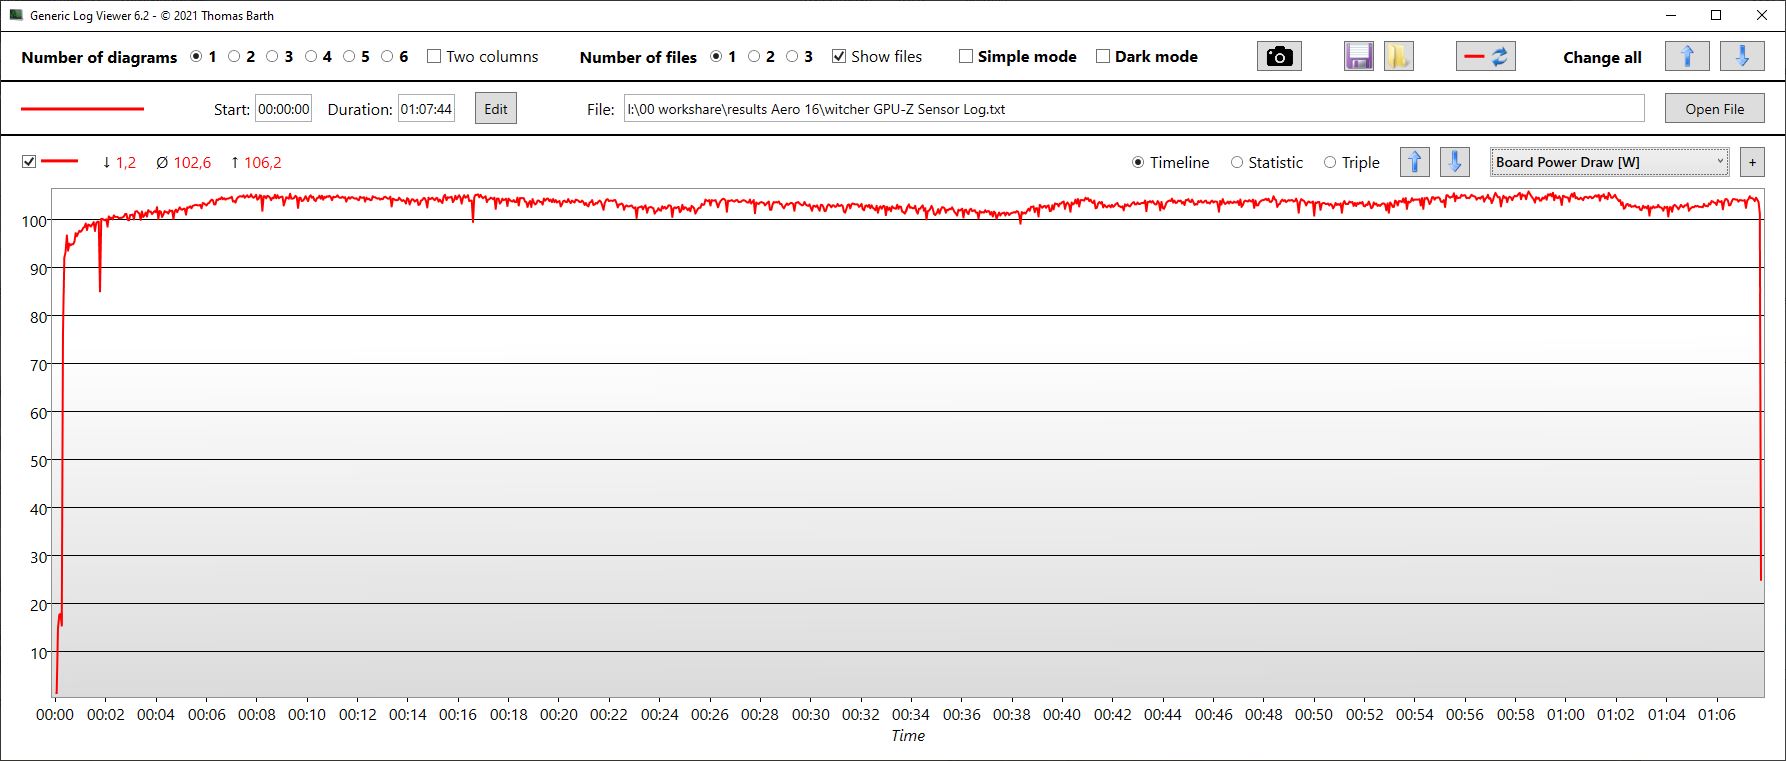
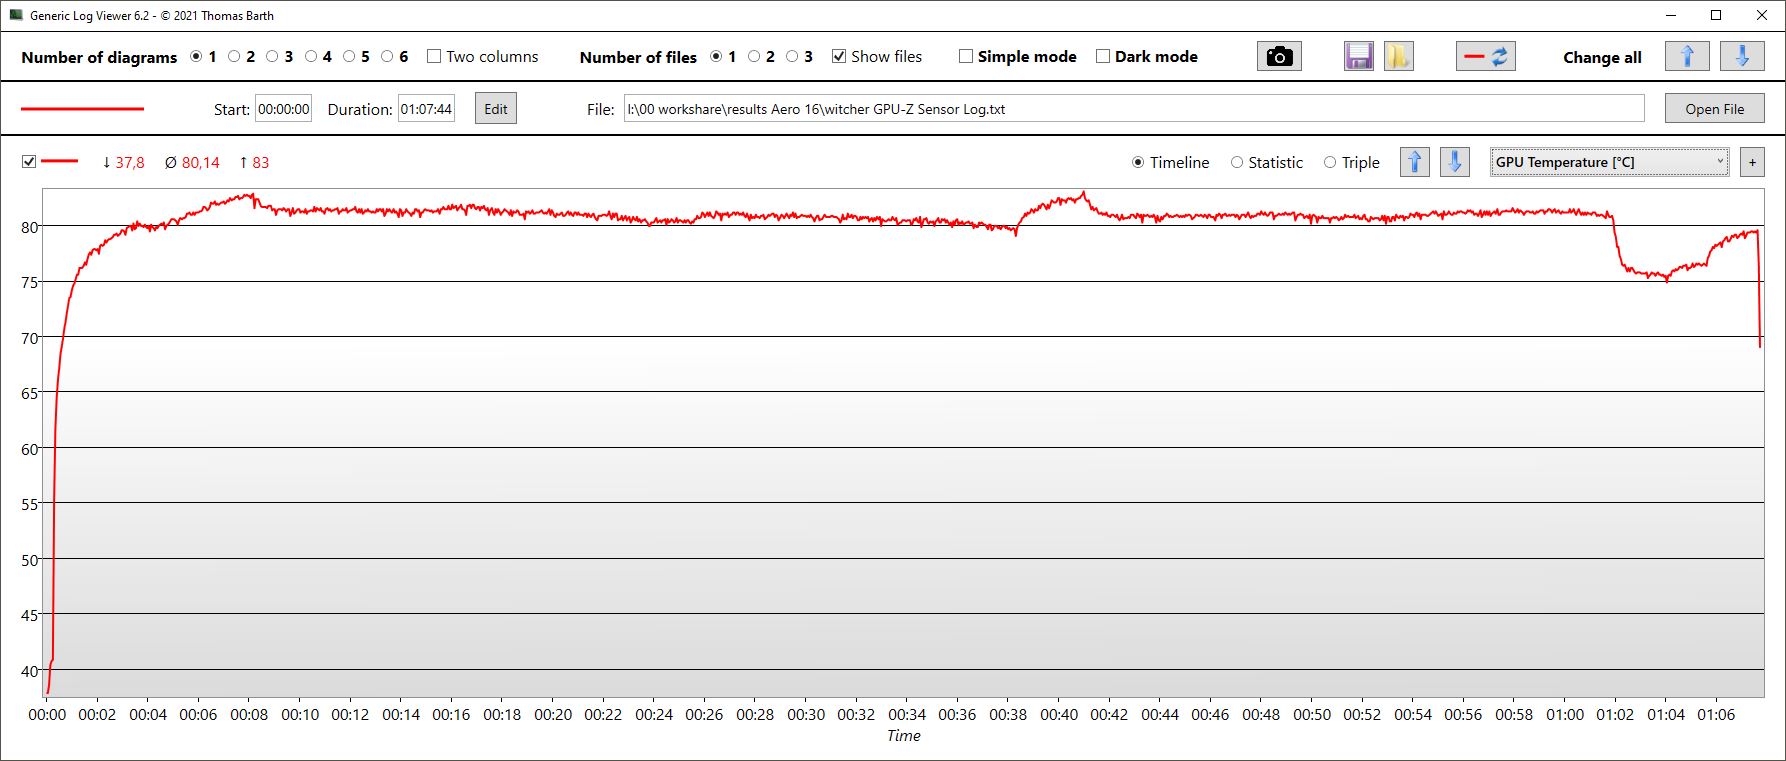
Witcher 3 FPS Chart
| low | med. | high | ultra | QHD | 4K | |
|---|---|---|---|---|---|---|
| GTA V (2015) | 185.3 | 186.4 | 183.1 | 123.2 | 90.6 | 75 |
| The Witcher 3 (2015) | 236 | 116 | ||||
| Dota 2 Reborn (2015) | 164.7 | 157 | 150.9 | 144.5 | 128.3 | |
| Final Fantasy XV Benchmark (2018) | 132.3 | 116.2 | 84.7 | 46.1 | ||
| X-Plane 11.11 (2018) | 169.3 | 148 | 115.3 | 98.5 | ||
| Far Cry 5 (2018) | 202 | 168 | 159 | 149 | 115 | 55 |
| Strange Brigade (2018) | 481 | 300 | 237 | 204 | 138.8 | 67.6 |
| Shadow of the Tomb Raider (2018) | 158 | 129 | 70 | |||
| Assassin´s Creed Valhalla (2020) | 106 | 78 | 41 | |||
| Cyberpunk 2077 1.6 (2022) | 84.75 | 53.28 | 19.59 | |||
| F1 22 (2022) | 220 | 214 | 173.8 | 66.6 | 44.3 | 21.5 |
| Call of Duty Modern Warfare 2 2022 (2022) | 101 | 72 | 39 | |||
| Spider-Man Miles Morales (2022) | 90.5 | 68.9 | 40.5 | |||
| The Callisto Protocol (2022) | 78.86 | 59.07 | 32.96 |
Emissions - Aero 16 remains quite cool, but not quiet
Noise
The slim Aero 16 gets quite loud in Gaming Mode under heavy stress. Gaming or our stress test causes the fans to spin up to 55 dB, which is louder than the competition, but not surprising given the thin form factor.
In Creator Mode, the volume drops from the 55 dB of Gaming Mode to around 50 dB in stress testing. This brings the Aero closer to the competition, which has a similar noise level. Only Meeting Mode tries to keep the device really quiet.
Noise level
| Idle |
| 23 / 23 / 33.64 dB(A) |
| Load |
| 51.49 / 55.24 dB(A) |
 | ||
30 dB silent 40 dB(A) audible 50 dB(A) loud |
||
min: | ||
| Gigabyte AERO 16 OLED BSF GeForce RTX 4070 Laptop GPU, i9-13900H, Gigabyte AG470S1TB-SI B10 | Gigabyte Aero 16 YE5 GeForce RTX 3080 Ti Laptop GPU, i9-12900HK, Phison ESR01TBMFCT | Razer Blade 18 RTX 4070 GeForce RTX 4070 Laptop GPU, i9-13950HX, SSSTC CA6-8D1024 | Asus ZenBook Pro 16X OLED UX7602ZM-ME115W GeForce RTX 3060 Laptop GPU, i9-12900H, Samsung PM9A1 MZVL21T0HCLR | Asus TUF Gaming A16 FA617 Radeon RX 7600S, R7 7735HS, Micron 2400 MTFDKBA1T0QFM | MSI CreatorPro Z16P B12UKST RTX A3000 Laptop GPU, i7-12700H, Samsung PM9A1 MZVL21T0HCLR | |
|---|---|---|---|---|---|---|
| Noise | -7% | 8% | -1% | 5% | 4% | |
| off / environment * (dB) | 23 | 25 -9% | 23.5 -2% | 26 -13% | 24 -4% | 24.1 -5% |
| Idle Minimum * (dB) | 23 | 30 -30% | 23.8 -3% | 26 -13% | 24 -4% | 27.1 -18% |
| Idle Average * (dB) | 23 | 32 -39% | 23.8 -3% | 26 -13% | 25 -9% | 27.1 -18% |
| Idle Maximum * (dB) | 33.64 | 33 2% | 26.8 20% | 26 23% | 28 17% | 27.1 19% |
| Load Average * (dB) | 51.49 | 45 13% | 37.3 28% | 48 7% | 42 18% | 42.9 17% |
| Witcher 3 ultra * (dB) | 55.27 | 50 10% | 48 13% | 50 10% | 44 20% | |
| Load Maximum * (dB) | 55.24 | 52 6% | 53.5 3% | 54.6 1% | 50 9% | 47 15% |
* ... smaller is better
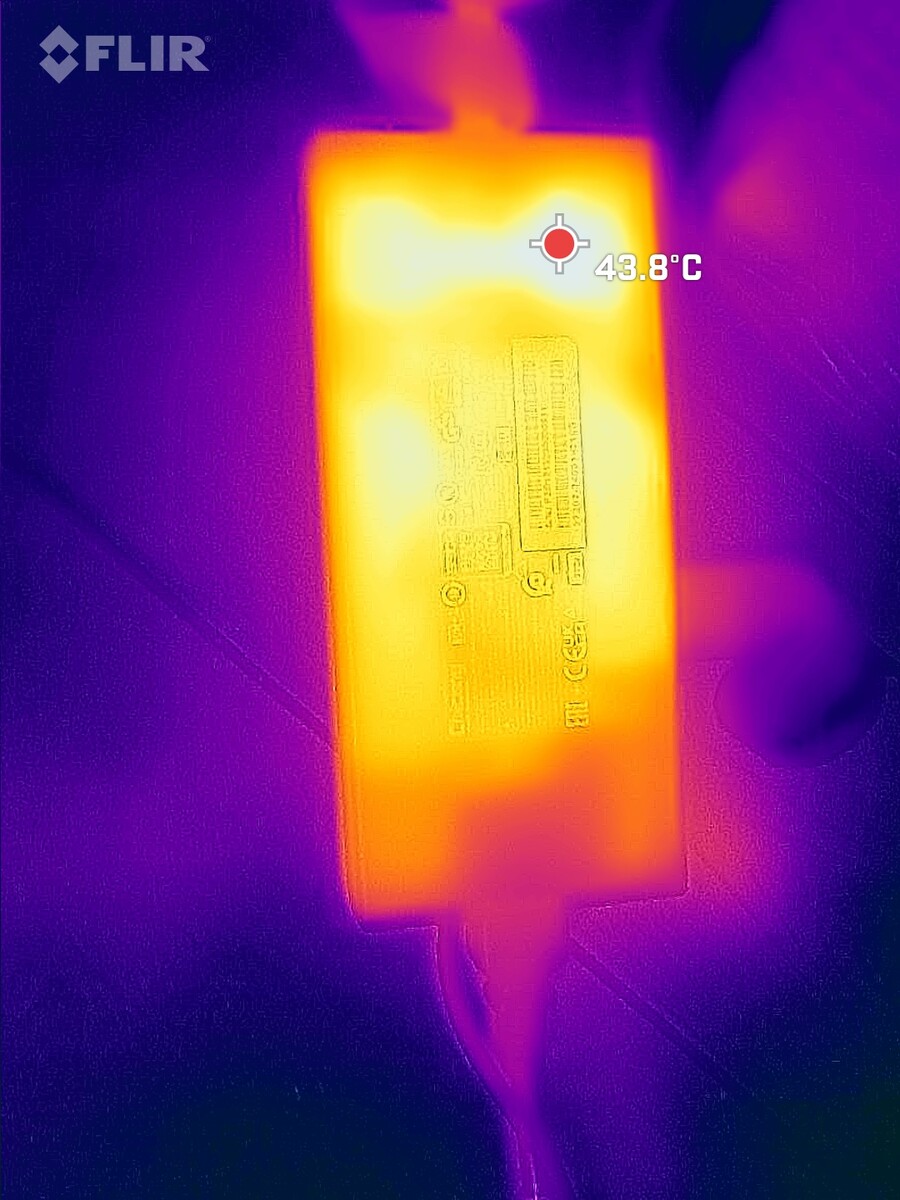
Temperature
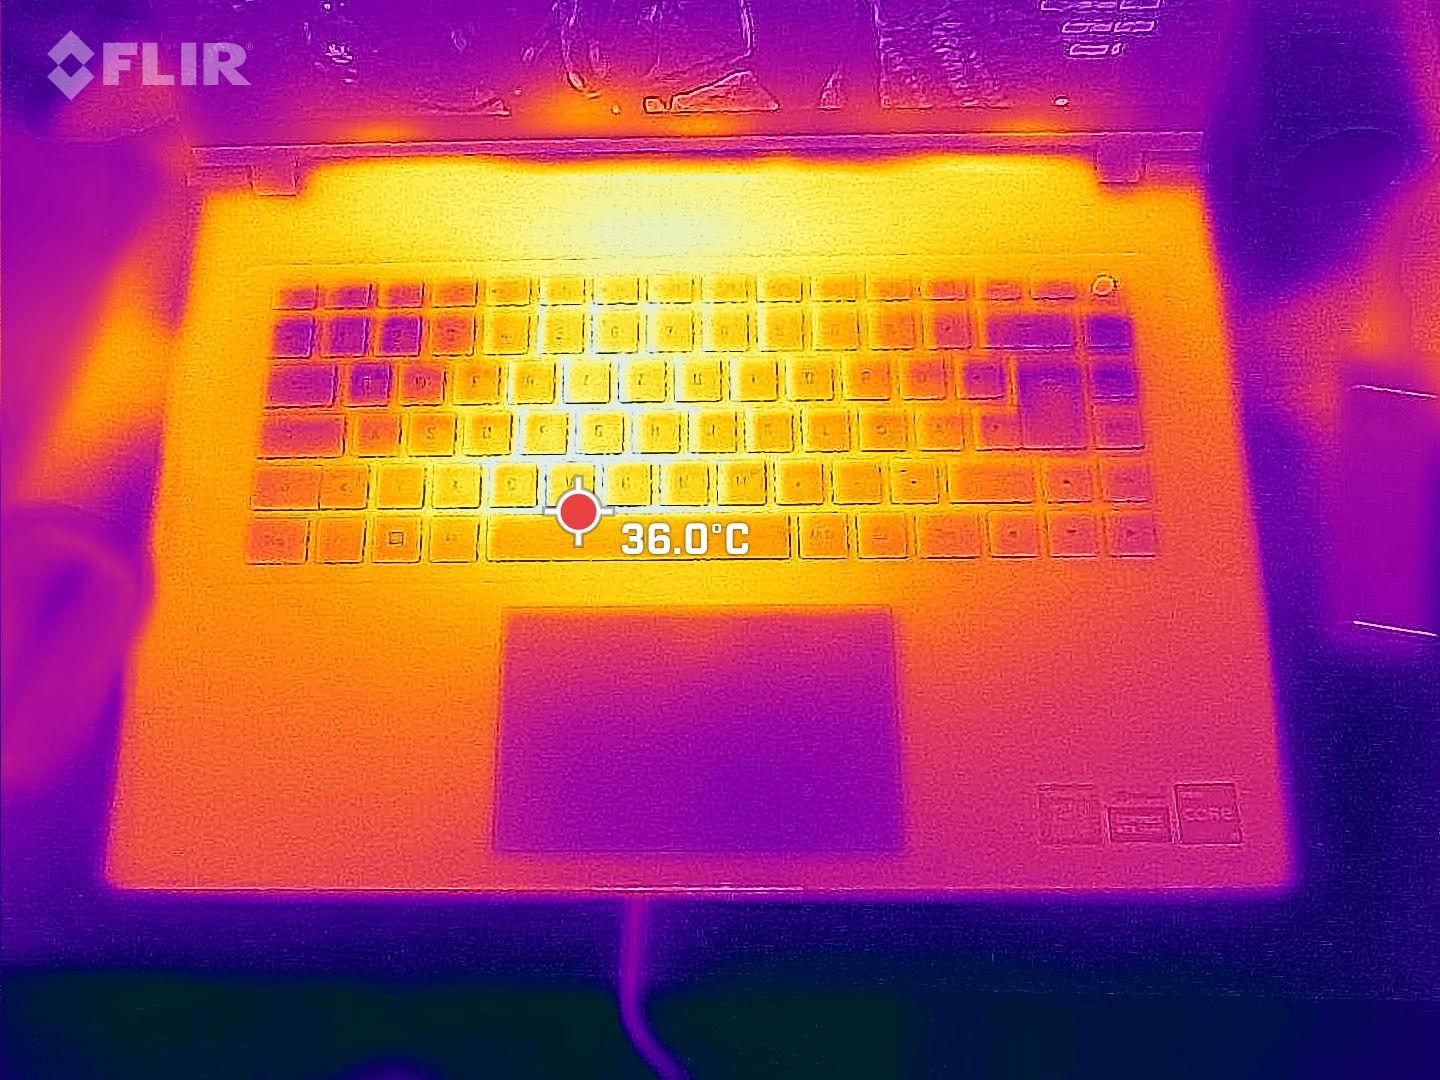
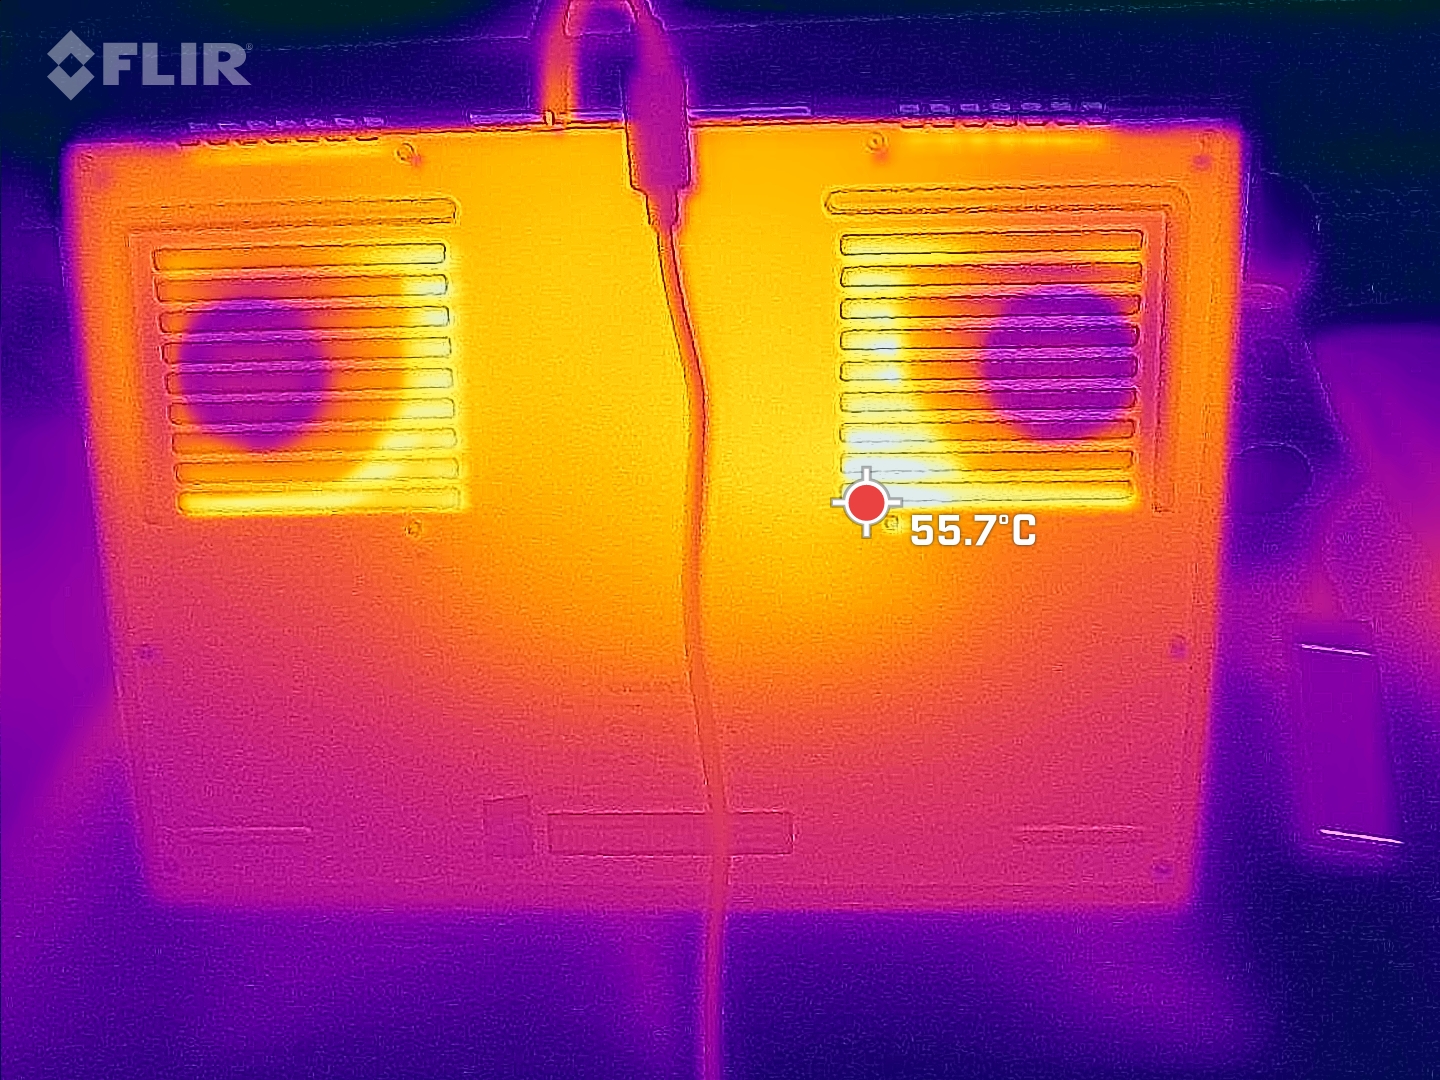
Despite its slim case, the Aero performs well in this field. The comparatively loud fans and the metal case dissipate the heat well, so that the hot spots on the back remain well below 50 °C. The predecessor and several competitors fare worse here. The palm rests are always within a comfortable range.
(±) The maximum temperature on the upper side is 41 °C / 106 F, compared to the average of 40.4 °C / 105 F, ranging from 21.2 to 68.8 °C for the class Gaming.
(-) The bottom heats up to a maximum of 47 °C / 117 F, compared to the average of 43.2 °C / 110 F
(+) In idle usage, the average temperature for the upper side is 21.8 °C / 71 F, compared to the device average of 33.9 °C / 93 F.
(±) Playing The Witcher 3, the average temperature for the upper side is 36.8 °C / 98 F, compared to the device average of 33.9 °C / 93 F.
(+) The palmrests and touchpad are reaching skin temperature as a maximum (33 °C / 91.4 F) and are therefore not hot.
(-) The average temperature of the palmrest area of similar devices was 28.8 °C / 83.8 F (-4.2 °C / -7.6 F).
| Gigabyte AERO 16 OLED BSF Intel Core i9-13900H, NVIDIA GeForce RTX 4070 Laptop GPU | Gigabyte Aero 16 YE5 Intel Core i9-12900HK, NVIDIA GeForce RTX 3080 Ti Laptop GPU | Razer Blade 18 RTX 4070 Intel Core i9-13950HX, NVIDIA GeForce RTX 4070 Laptop GPU | Asus ZenBook Pro 16X OLED UX7602ZM-ME115W Intel Core i9-12900H, NVIDIA GeForce RTX 3060 Laptop GPU | Asus TUF Gaming A16 FA617 AMD Ryzen 7 7735HS, AMD Radeon RX 7600S | MSI CreatorPro Z16P B12UKST Intel Core i7-12700H, NVIDIA RTX A3000 Laptop GPU | |
|---|---|---|---|---|---|---|
| Heat | -31% | -14% | -17% | -45% | -26% | |
| Maximum Upper Side * (°C) | 41 | 49 -20% | 39.2 4% | 32 22% | 54 -32% | 56.3 -37% |
| Maximum Bottom * (°C) | 47 | 55 -17% | 35.6 24% | 41.6 11% | 47 -0% | 68.3 -45% |
| Idle Upper Side * (°C) | 23 | 33 -43% | 31.8 -38% | 32.6 -42% | 40 -74% | 25.2 -10% |
| Idle Bottom * (°C) | 23 | 33 -43% | 33.2 -44% | 36 -57% | 40 -74% | 25.9 -13% |
* ... smaller is better
Stress Testing
In stress testing, the CPU is able to consume 105 W in short bursts before falling to a constant 62 W after a few seconds. At the same time, the clock starts briefly at 4.1 GHz before dropping to around 2.9 GHz. However, this does not remain constant but fluctuates with temperature. When the core temperatures reach 90 °C, the clock is throttled slightly, after which the temperatures drop again. At just over 80 °C, the clock rate then rises slightly again, etc.
The GPU clock also fluctuates continuously between 1.7 and 2.4 GHz. In contrast, the memory clock rises and falls from 2 GHz to 1.75 GHz. The same waveform is evident in the GPU temperature, which fluctuates roughly between 70 and 80 °C. The power consumption never reaches its maximum in the stress test, but hovers only around 67 W.
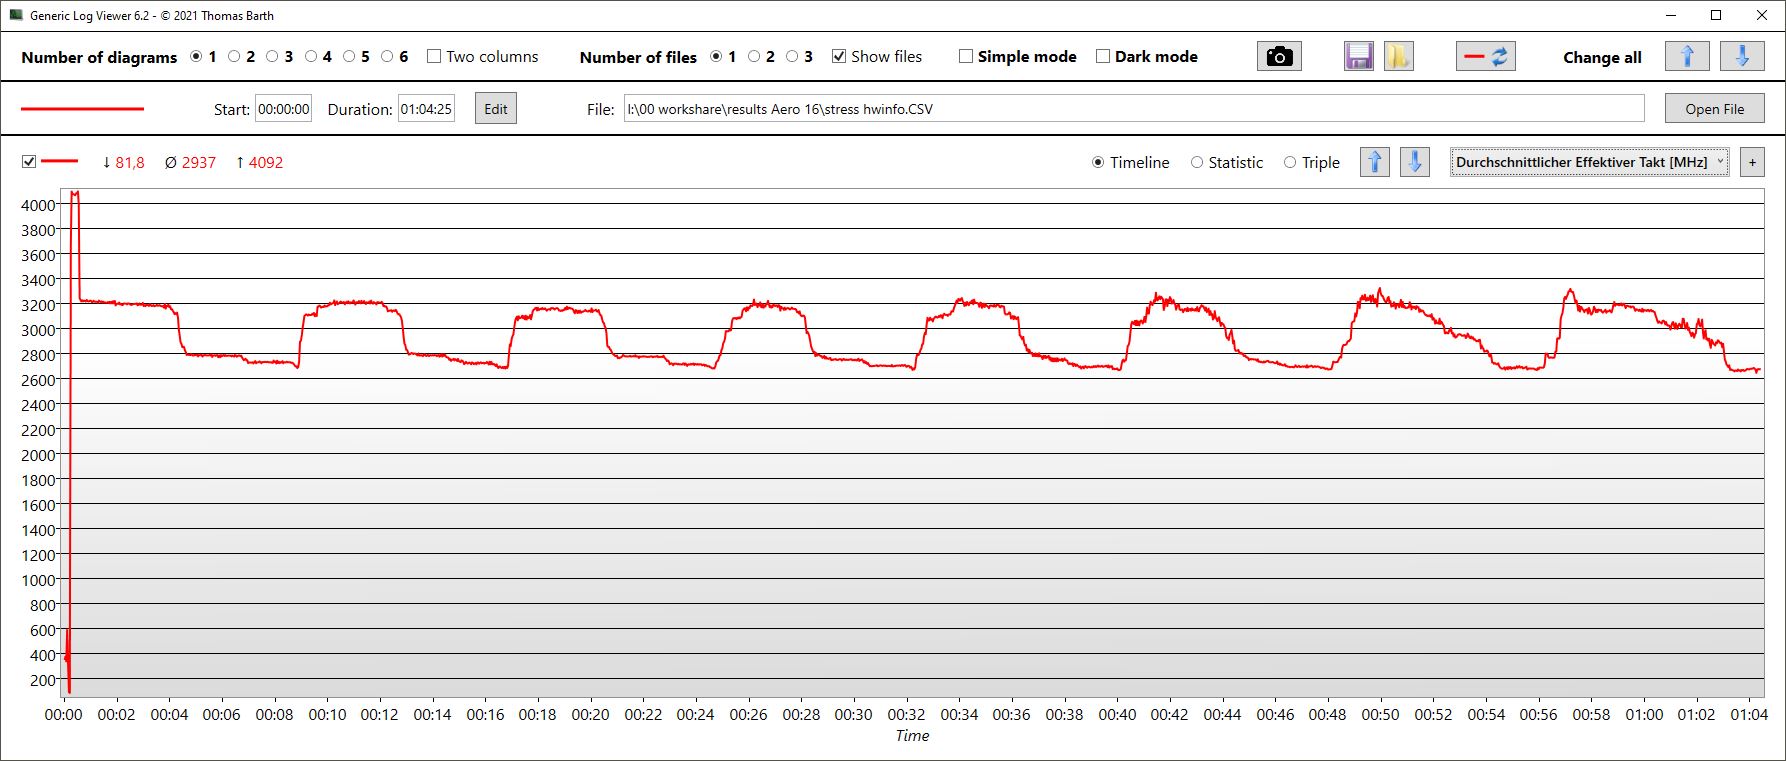
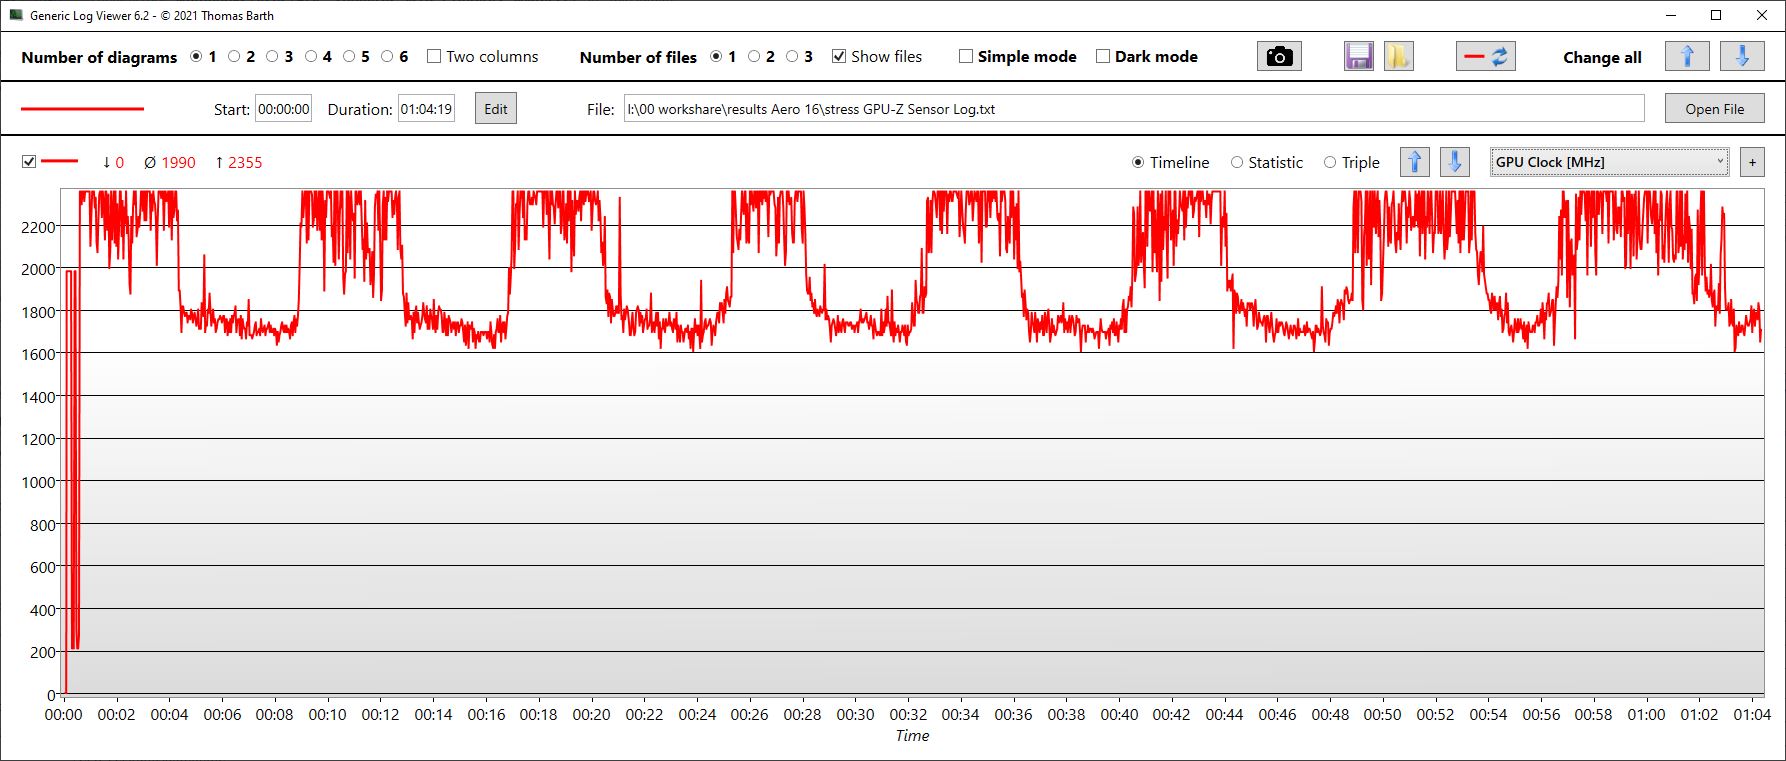
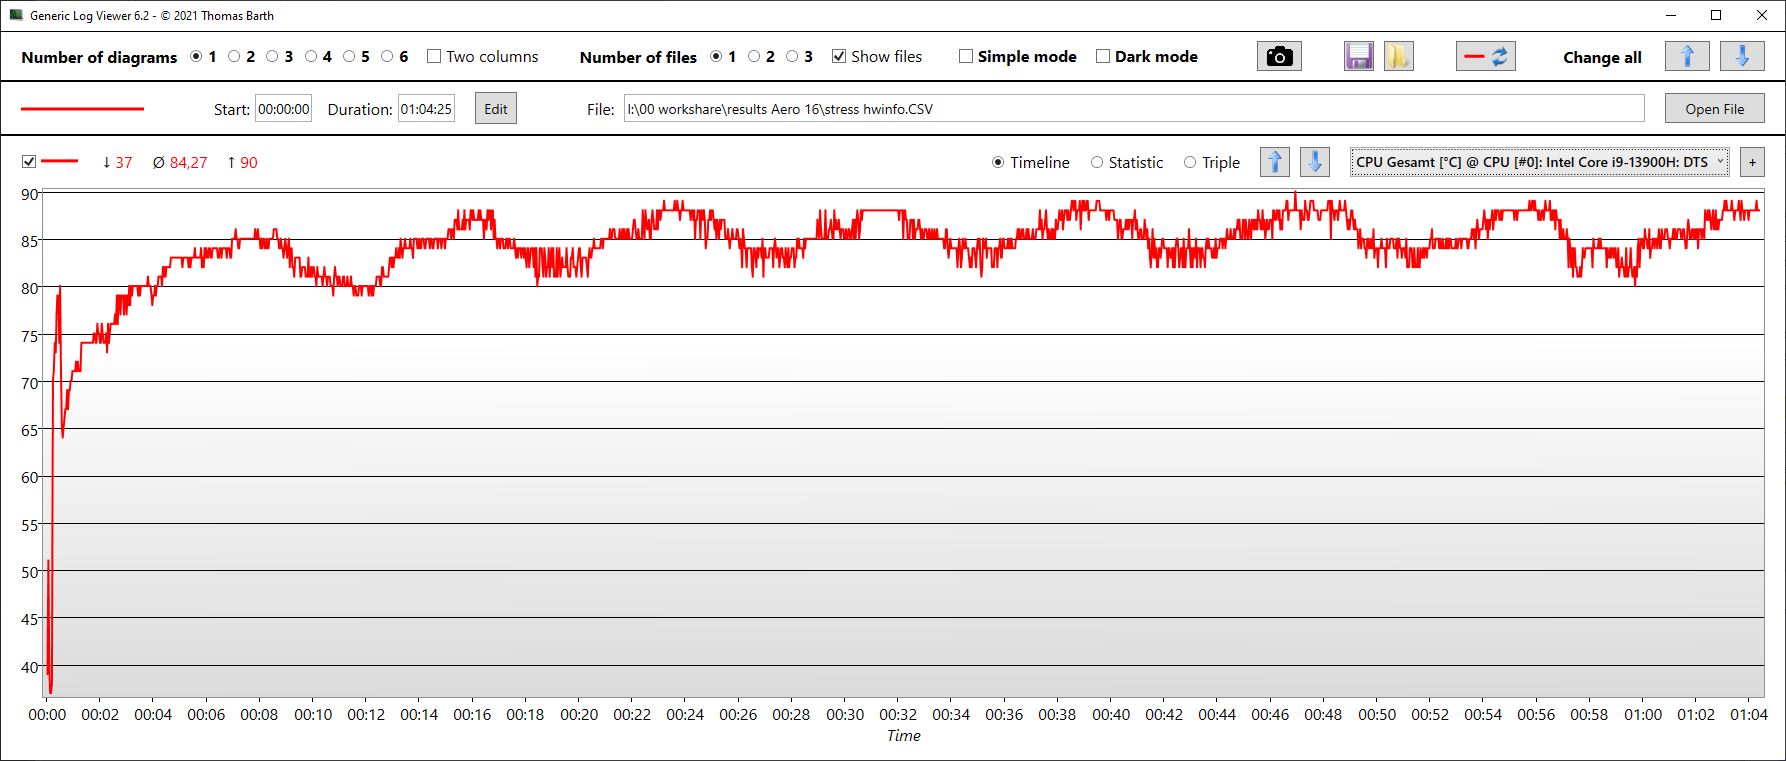
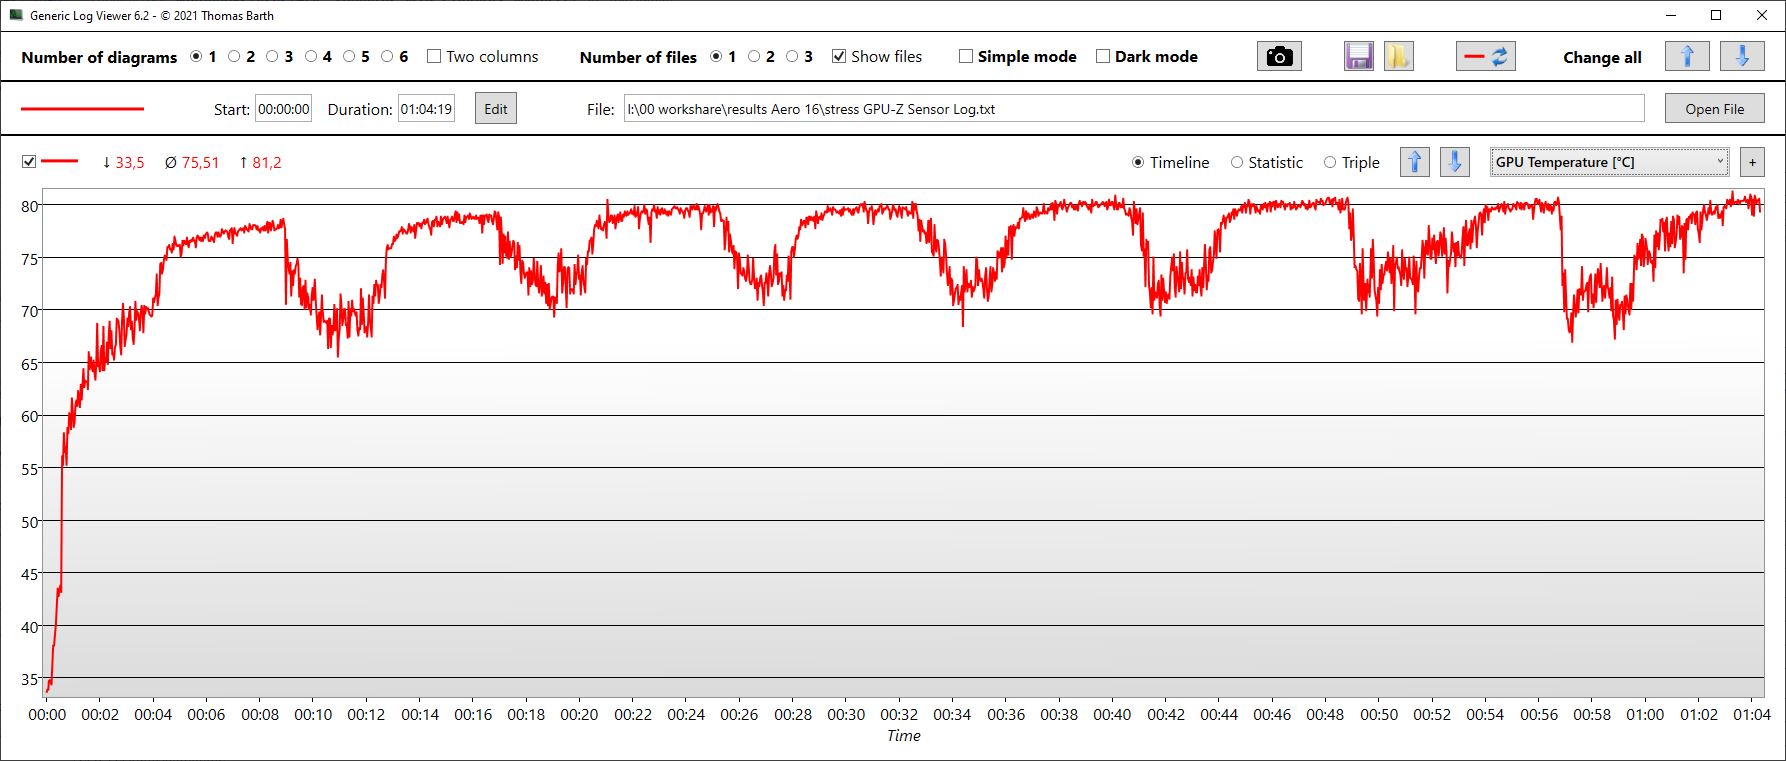
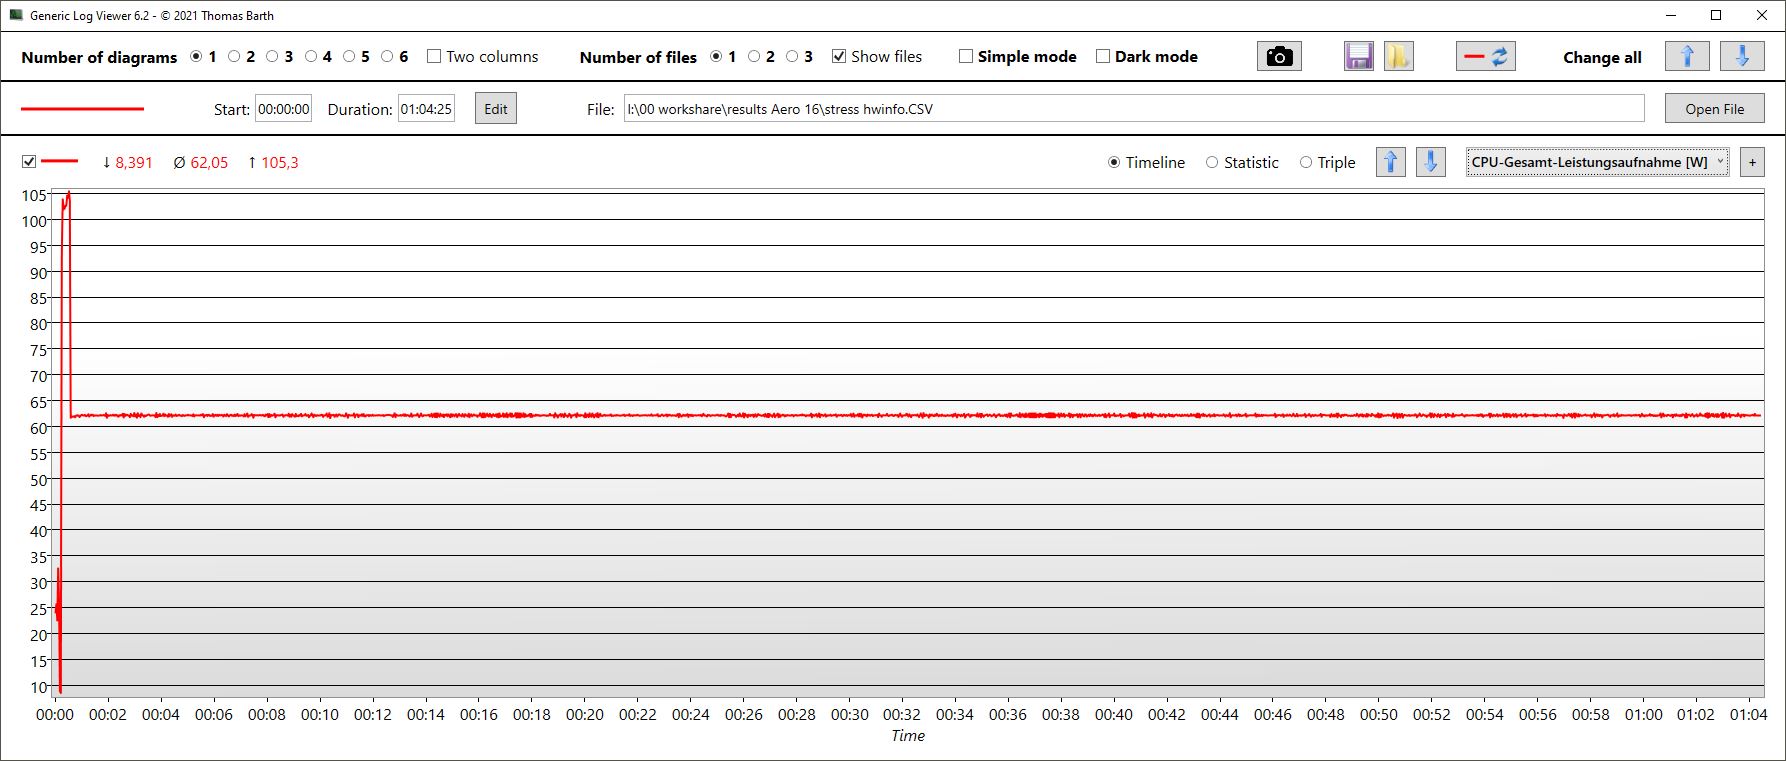
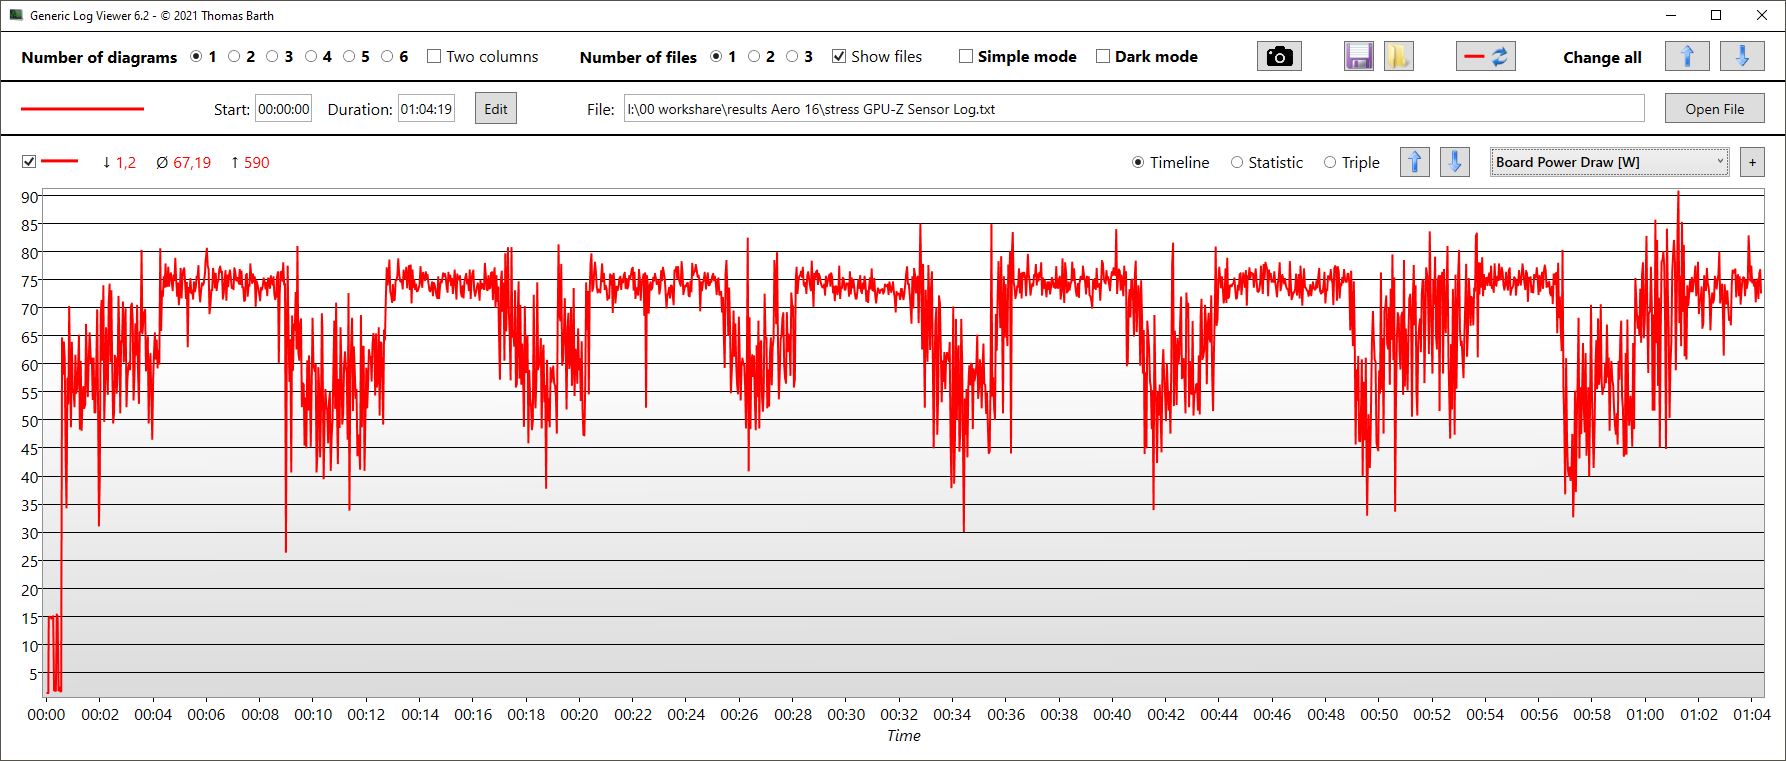
| CPU Clock (GHz) | GPU Clock (MHz) | Average CPU Temperature (°C) | Average GPU Temperature (°C) | |
| Prime95 + FurMark Stress | 2,9 | 1.990 | 84 | 76 |
| Witcher 3 Stress | 1,8 | 2.350 | 69 | 80 |
Speakers
Gigabyte has installed two stereo speakers with 2 W each, which is generally standard. Unfortunately, the speakers aren't really convincing in any discipline: they're reasonably loud, but are unable to deliver well-balanced mids or highs.
In addition to the digital outputs, the 3.5 mm headset slot can be used for external devices.
Gigabyte AERO 16 OLED BSF audio analysis
(±) | speaker loudness is average but good (81.68 dB)
Bass 100 - 315 Hz
(-) | nearly no bass - on average 15.6% lower than median
(±) | linearity of bass is average (14.3% delta to prev. frequency)
Mids 400 - 2000 Hz
(±) | higher mids - on average 12.8% higher than median
(-) | mids are not linear (16.8% delta to prev. frequency)
Highs 2 - 16 kHz
(±) | higher highs - on average 11% higher than median
(-) | highs are not linear (16.3% delta to prev. frequency)
Overall 100 - 16.000 Hz
(-) | overall sound is not linear (48.4% difference to median)
Compared to same class
» 100% of all tested devices in this class were better, 0% similar, 0% worse
» The best had a delta of 6%, average was 18%, worst was 132%
Compared to all devices tested
» 96% of all tested devices were better, 0% similar, 4% worse
» The best had a delta of 4%, average was 23%, worst was 134%
Asus ZenBook Pro 16X OLED UX7602ZM-ME115W audio analysis
(+) | speakers can play relatively loud (94.7 dB)
Bass 100 - 315 Hz
(-) | nearly no bass - on average 16% lower than median
(±) | linearity of bass is average (7.9% delta to prev. frequency)
Mids 400 - 2000 Hz
(+) | balanced mids - only 1.8% away from median
(+) | mids are linear (3.8% delta to prev. frequency)
Highs 2 - 16 kHz
(±) | higher highs - on average 6.2% higher than median
(+) | highs are linear (2.8% delta to prev. frequency)
Overall 100 - 16.000 Hz
(+) | overall sound is linear (13.3% difference to median)
Compared to same class
» 28% of all tested devices in this class were better, 4% similar, 68% worse
» The best had a delta of 5%, average was 17%, worst was 45%
Compared to all devices tested
» 14% of all tested devices were better, 3% similar, 83% worse
» The best had a delta of 4%, average was 23%, worst was 134%
Power Management - Efficient RTX 4070 in Aero 16
Power Consumption
Energy consumption is very good, especially compared to the previous generation. In the predecessor, the power-hungry RTX 3080 Ti was also throttled at 105 W. In the gaming benchmarks, you can see that the old card performs noticeably worse while consuming significantly more. The new RTX 40x generation is clearly much more efficient. More information on the efficiency of the new RTX 40x generation can be found here.
When gaming with Witcher 3, the average consumption is around 158 W. The medium-sized standard power supply from Chicony is rated at 240 W and copes well with load peaks of up to 192 W in stress testing.
| Off / Standby | |
| Idle | |
| Load |
|
Key:
min: | |
| Gigabyte AERO 16 OLED BSF i9-13900H, GeForce RTX 4070 Laptop GPU, Gigabyte AG470S1TB-SI B10, OLED, 3840x2400, 16" | Gigabyte Aero 16 YE5 i9-12900HK, GeForce RTX 3080 Ti Laptop GPU, Phison ESR01TBMFCT, AMOLED, 3840x2400, 16" | Razer Blade 18 RTX 4070 i9-13950HX, GeForce RTX 4070 Laptop GPU, SSSTC CA6-8D1024, IPS, 2560x1600, 18" | Asus ZenBook Pro 16X OLED UX7602ZM-ME115W i9-12900H, GeForce RTX 3060 Laptop GPU, Samsung PM9A1 MZVL21T0HCLR, OLED, 3840x2400, 16" | Asus TUF Gaming A16 FA617 R7 7735HS, Radeon RX 7600S, Micron 2400 MTFDKBA1T0QFM, IPS-Level, 1920x1200, 16" | MSI CreatorPro Z16P B12UKST i7-12700H, RTX A3000 Laptop GPU, Samsung PM9A1 MZVL21T0HCLR, IPS, 2560x1600, 16" | Average NVIDIA GeForce RTX 4070 Laptop GPU | Average of class Gaming | |
|---|---|---|---|---|---|---|---|---|
| Power Consumption | -64% | -84% | 4% | 14% | 2% | -16% | -23% | |
| Idle Minimum * (Watt) | 11.8 | 26 -120% | 24.5 -108% | 11.1 6% | 8 32% | 10.8 8% | 13.2 ? -12% | 13 ? -10% |
| Idle Average * (Watt) | 16.1 | 30 -86% | 34.1 -112% | 11.4 29% | 11 32% | 16.3 -1% | 18.2 ? -13% | 18.7 ? -16% |
| Idle Maximum * (Watt) | 17 | 37 -118% | 47.7 -181% | 14.4 15% | 16 6% | 16.9 1% | 24.6 ? -45% | 24.3 ? -43% |
| Load Average * (Watt) | 100.6 | 127 -26% | 140 -39% | 137.4 -37% | 97 4% | 111.7 -11% | 97 ? 4% | 110.2 ? -10% |
| Witcher 3 ultra * (Watt) | 158 | 176 -11% | 202 -28% | 136 14% | 161.5 -2% | 152.1 4% | ||
| Load Maximum * (Watt) | 192 | 236 -23% | 261 -36% | 197 -3% | 168 12% | 177.4 8% | 221 ? -15% | 258 ? -34% |
* ... smaller is better
Power Consumption Witcher 3 / Stress Test
Power Consumption with an External Monitor
Battery Life
Battery runtimes depend heavily on the selected mode, and the bright OLED screen also drains quite a bit of juice. The laptop still has an 88 Wh battery. Due to the overall lower consumption, longer runtimes can be achieved with a well-chosen energy saving mode.
When watching a film or surfing the web at reduced brightness, we get just under 7.5 hours each, a good value. Gigabyte has automatically activated the energy-saving mode here. At maximum brightness, the runtime falls to 5.5 hours.
| Gigabyte AERO 16 OLED BSF i9-13900H, GeForce RTX 4070 Laptop GPU, 88 Wh | Alienware x15 R2 P111F i9-12900H, GeForce RTX 3080 Ti Laptop GPU, 87 Wh | MSI Creator Z16P B12UHST i9-12900H, GeForce RTX 3080 Ti Laptop GPU, 90 Wh | Asus ROG Zephyrus Duo 16 GX650RX R9 6900HX, GeForce RTX 3080 Ti Laptop GPU, 90 Wh | Acer Predator Triton 500 SE PT516-52s-70KX i7-12700H, GeForce RTX 3080 Ti Laptop GPU, 99.98 Wh | Gigabyte Aero 16 YE5 i9-12900HK, GeForce RTX 3080 Ti Laptop GPU, 99 Wh | Average of class Gaming | |
|---|---|---|---|---|---|---|---|
| Battery runtime | -20% | -35% | -7% | -3% | -13% | -5% | |
| H.264 (h) | 7.4 | 5.8 -22% | 9.3 26% | 8.2 11% | 7.5 1% | 8.64 ? 17% | |
| WiFi v1.3 (h) | 7.5 | 6 -20% | 5.2 -31% | 7.8 4% | 5.7 -24% | 6.4 -15% | 7.15 ? -5% |
| Load (h) | 2.1 | 1 -52% | 1 -52% | 2.2 5% | 1.6 -24% | 1.502 ? -28% | |
| Reader / Idle (h) | 12.5 | 8.9 | 8.71 ? |
Pros
Cons
Verdict - One step closer to the goal

Until now, high-performance laptops have often been big, loud and hot, making them suitable for either gamers or creatives, depending on the design. In the future, we would ideally like silent, cool and, if need be, small, mobile laptops. The Aero is a good step in this direction, even if the current technology is far from ideal.
The Aero performs better than its thicker predecessor with the RTX 3080 Ti (also only 105 W), but its efficient RTX 4070 consumes noticeably less and stays cooler, though not quieter. If you're looking for discreet, you'll benefit from the many power modes and manual setting options in the Control Center. This allows you to adapt the performance and emissions of the Aero to the respective situation or environment. Because the present Aero scores better in the "Gaming" rating category (88%) than in the "Multimedia" category (86%), we are rating it as a gaming notebook.
Gamers might be bothered by the fact that the otherwise great OLED display can only operate at 60 Hz. Otherwise all other points of criticism, such as the unbalanced speakers, are relatively mild.
The Aero 16 OLED not only has a great screen, but is also particularly thin and, thanks to the efficient RTX 4070, also powerful and yet comparatively economical and cool.
The competition never sleeps and is also exploring the possibilities of the new RTX 40x generation. We have only reviewed a few so far, so alternatives are still rare.
Price and Availability
Interested buyers can check directly via Gigabyte's official product page here, where you click on Buy and select your corresponding region and country from the drop down list. You will then be forward to a list of online stores that may list the laptop in your country.
In the US, for example, Amazon lists the two configurations of the Gigabyte Aero 16 OLED, namely one with an i9-13900H and 32 GB RAM and the other with an i7-13700H and 16 GB RAM. Both are US$2.299,00 and US$2.099,00, respectively. Of course, this is not representative of global availability, which is likely to fluctuate depending on regional and shipping factors.
Prices are as of 12.03.2023 and subject to change.
Gigabyte AERO 16 OLED BSF
- 03/13/2023 v7 (old)
Christian Hintze
Transparency
The selection of devices to be reviewed is made by our editorial team. The test sample was provided to the author as a loan by the manufacturer or retailer for the purpose of this review. The lender had no influence on this review, nor did the manufacturer receive a copy of this review before publication. There was no obligation to publish this review. As an independent media company, Notebookcheck is not subjected to the authority of manufacturers, retailers or publishers.
This is how Notebookcheck is testing
Every year, Notebookcheck independently reviews hundreds of laptops and smartphones using standardized procedures to ensure that all results are comparable. We have continuously developed our test methods for around 20 years and set industry standards in the process. In our test labs, high-quality measuring equipment is utilized by experienced technicians and editors. These tests involve a multi-stage validation process. Our complex rating system is based on hundreds of well-founded measurements and benchmarks, which maintains objectivity. Further information on our test methods can be found here.
Price comparison

