Verdict: The Aero X16 is a good overall package, but the RTX 5070 Laptop disappoints
With the Aero X16, Gigabyte is launching one of the first gaming laptops on the market that is equipped with the new RTX 5070 Laptop. Together with the AMD Ryzen processor, this results in an efficient package and many games can also be played smoothly in QHD resolution.
The problem, however, is that the speed advantage over the last gen RTX 4070 Laptop GPU is very small and the unchanged 8 GB video memory becomes increasingly problematic with demanding titles. Gigabyte can't be faulted with this, of course, as all upcoming laptops with the RTX 5070 Laptop will have this problem.
The matte IPS display with a 165 Hz refresh rate cannot match up to the brilliance of OLEDs, but the overall picture quality is subjectively good with decent measured values. The display is also suitable for image editing in the sRGB color space without any problems.
The plastic chassis makes a good impression overall and the keyboard in particular is very comfortable. However, some of the equipment has been cut back, as there is neither PCIe Gen5 support nor Wi-Fi 7. This is certainly passable for most users, but how does one still install a lame USB 2.0 port in a laptop that costs a good €1,800 is a mystery to us.
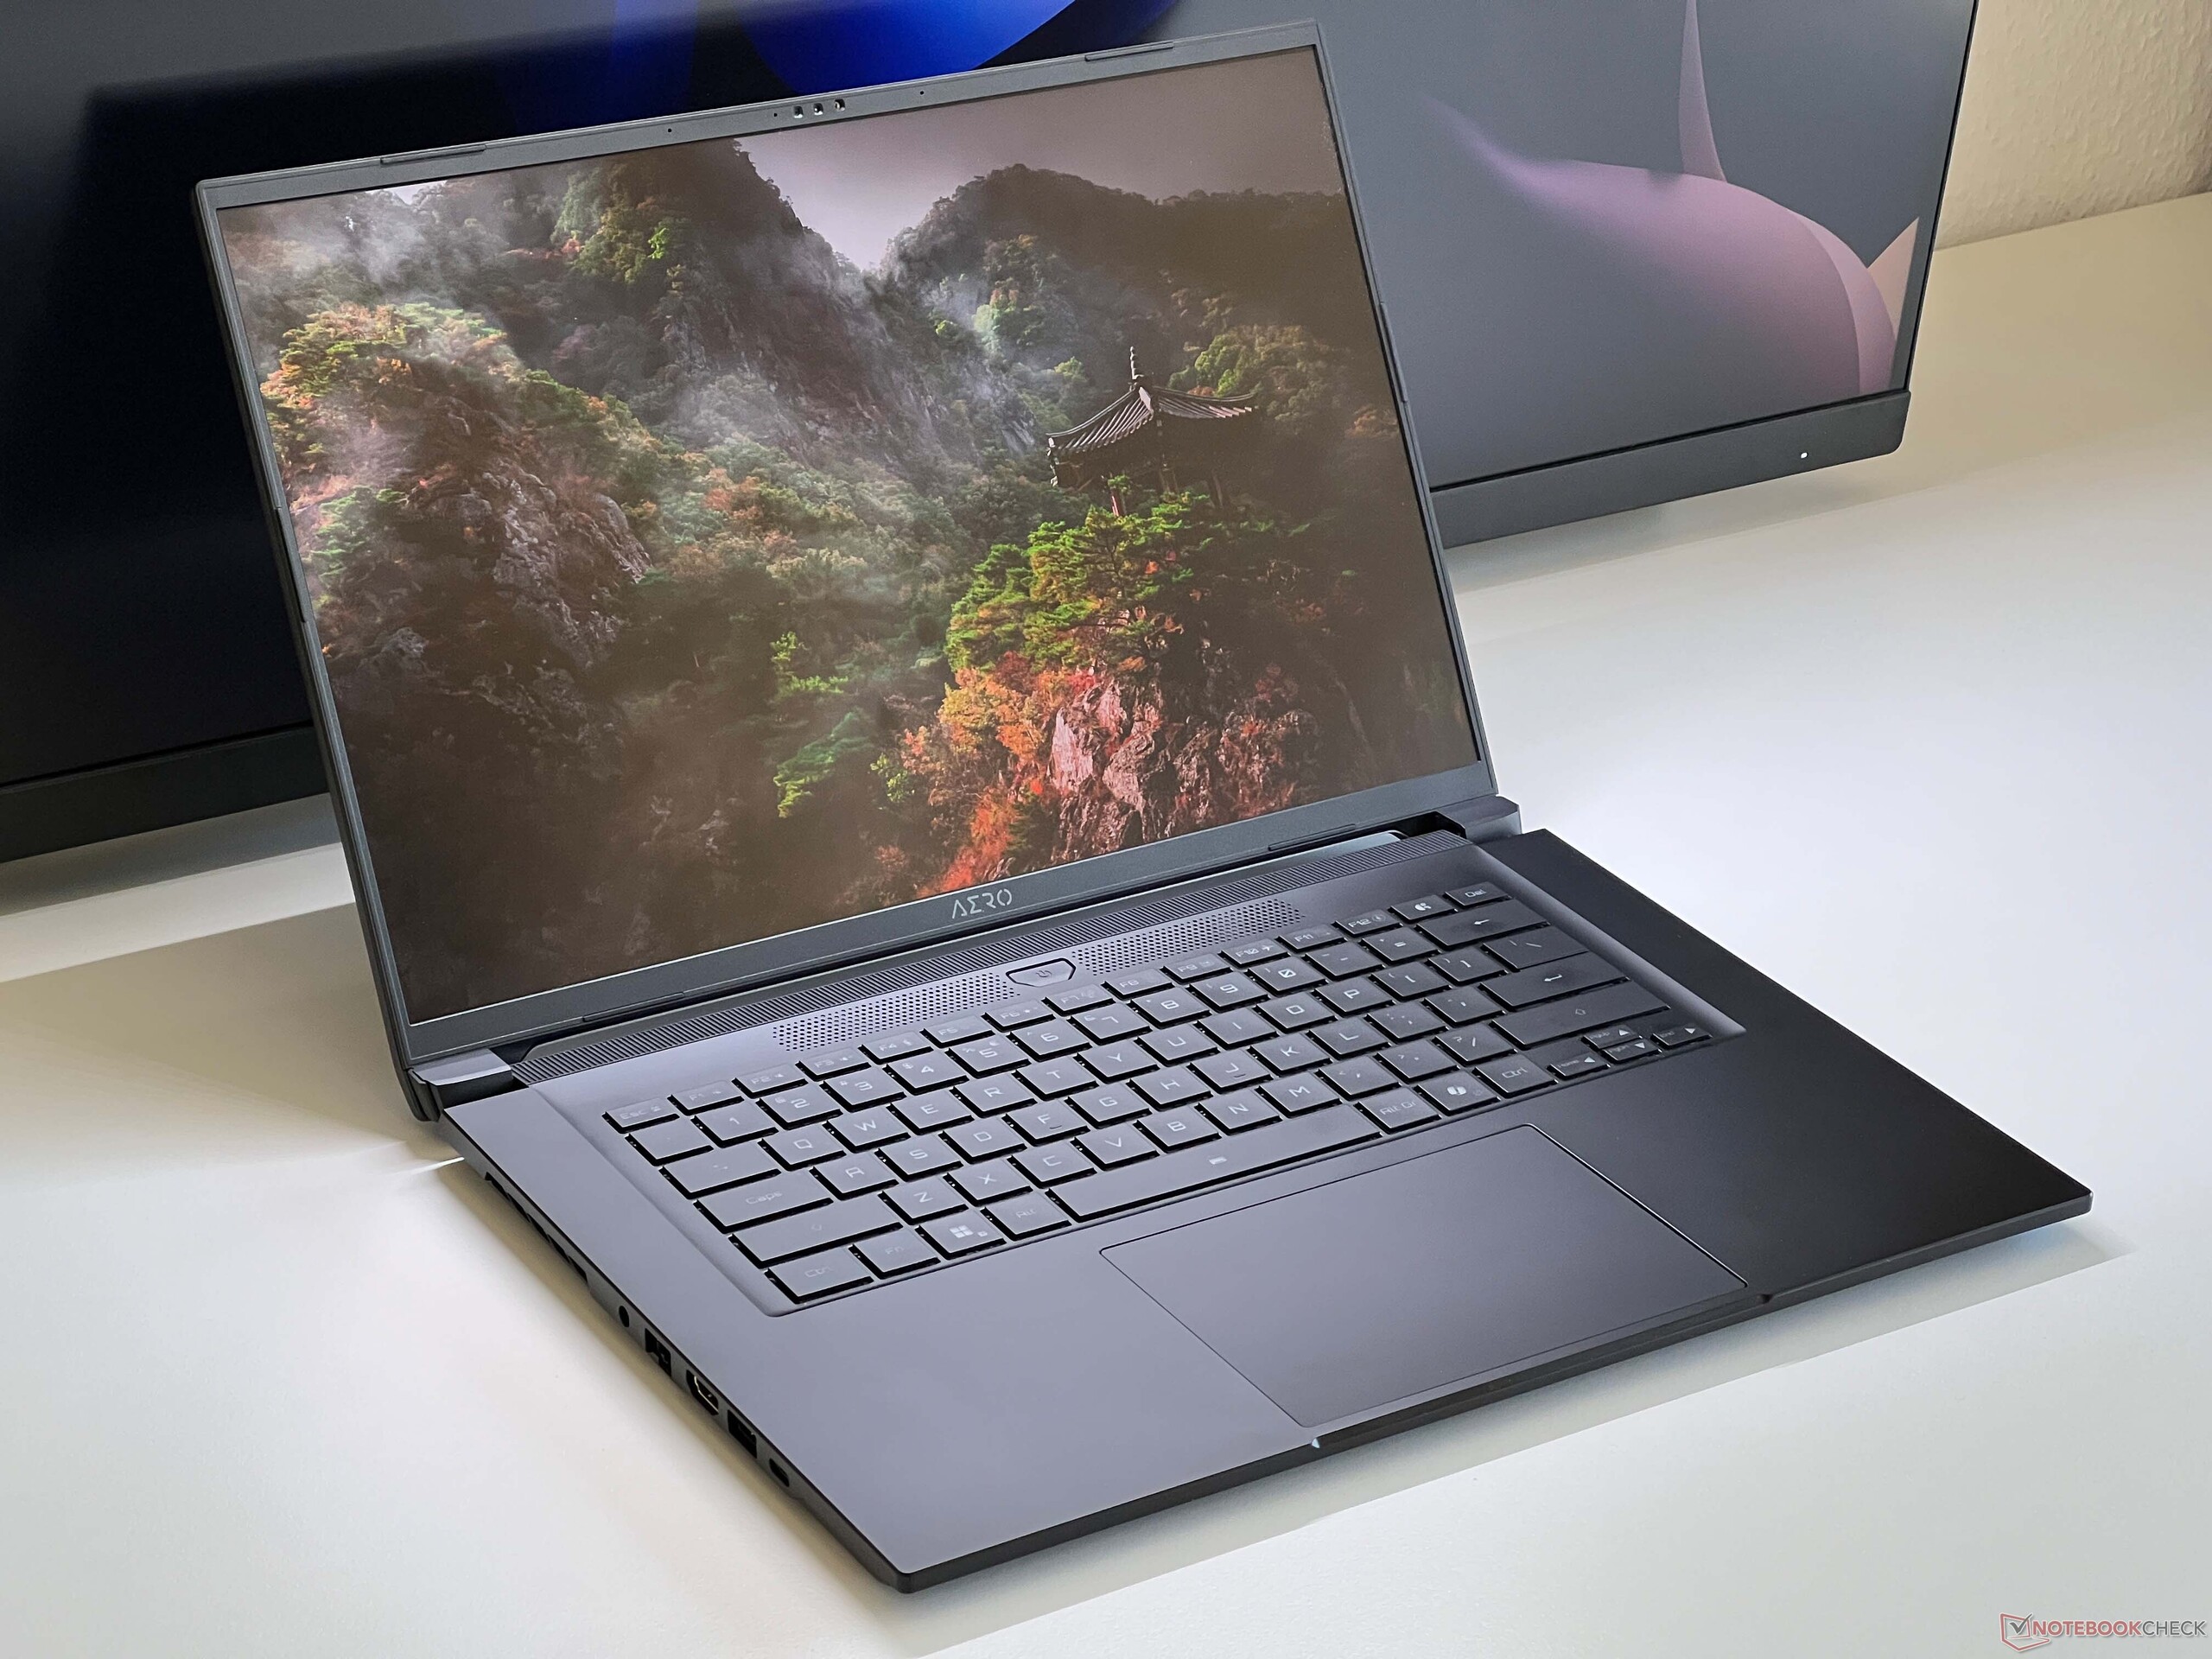
The distribution of connections on the two front side areas is not very ideal. Upgrade options, on the other hand, are very good with expandable RAM and two SSD slots.
That being said, the disappointing performance of the RTX 5070 Laptop remains. It makes much more sense to buy a laptop with the older RTX 4070 Laptop GPU, as you then get nearly the same gaming performance for a lower price.
Pros
Cons
Price and availability
Currently, only the more expensive version of the Aero X16 is available for €1,999 from Amazon and Notebooksbilliger.
- $1,560.00GIGABYTE AERO X16, Copilot+ PC - 165Hz 2560x1600 WQXGA - Manufactured by NVIDIA GeForce RTX 5070 - AMD Ryzen AI 9 HX 370-1TB SSD with 32GB DDR5 RAM - Windows 11 Home - Lunar White - 2WHA3USC64DH
- $1,193.00GIGABYTE AERO X16; Copilot+ PC - 165Hz 2560x1600 WQXGA - NVIDIA GeForce RTX 5060 - AMD Ryzen AI 7 350-1TB SSD with 16GB DDR5 RAM - Windows 11 Home - Space Gray
- $1,699.00GIGABYTE AERO X16, Copilot+ PC - 165Hz 2560x1600 WQXGA - Manufactured by NVIDIA GeForce RTX 5070 - AMD Ryzen AI 9 HX 370-1TB SSD with 32GB DDR5 RAM - Windows 11 Home - Space Gray - 2WHA3USC64AH
Table of Contents
- Verdict: The Aero X16 is a good overall package, but the RTX 5070 Laptop disappoints
- Specifications
- Case & features: Sturdy, fingerprint-prone plastic housing
- Input devices: Comfortable keyboard
- Display: Matte 165 Hz IPS with no PWM
- Performance: AMD Zen 5 with expandable RAM
- Emissions and Energy: Tolerable heat and noise output when not stressed
- Notebookcheck overall rating
- Potential competitors in comparison
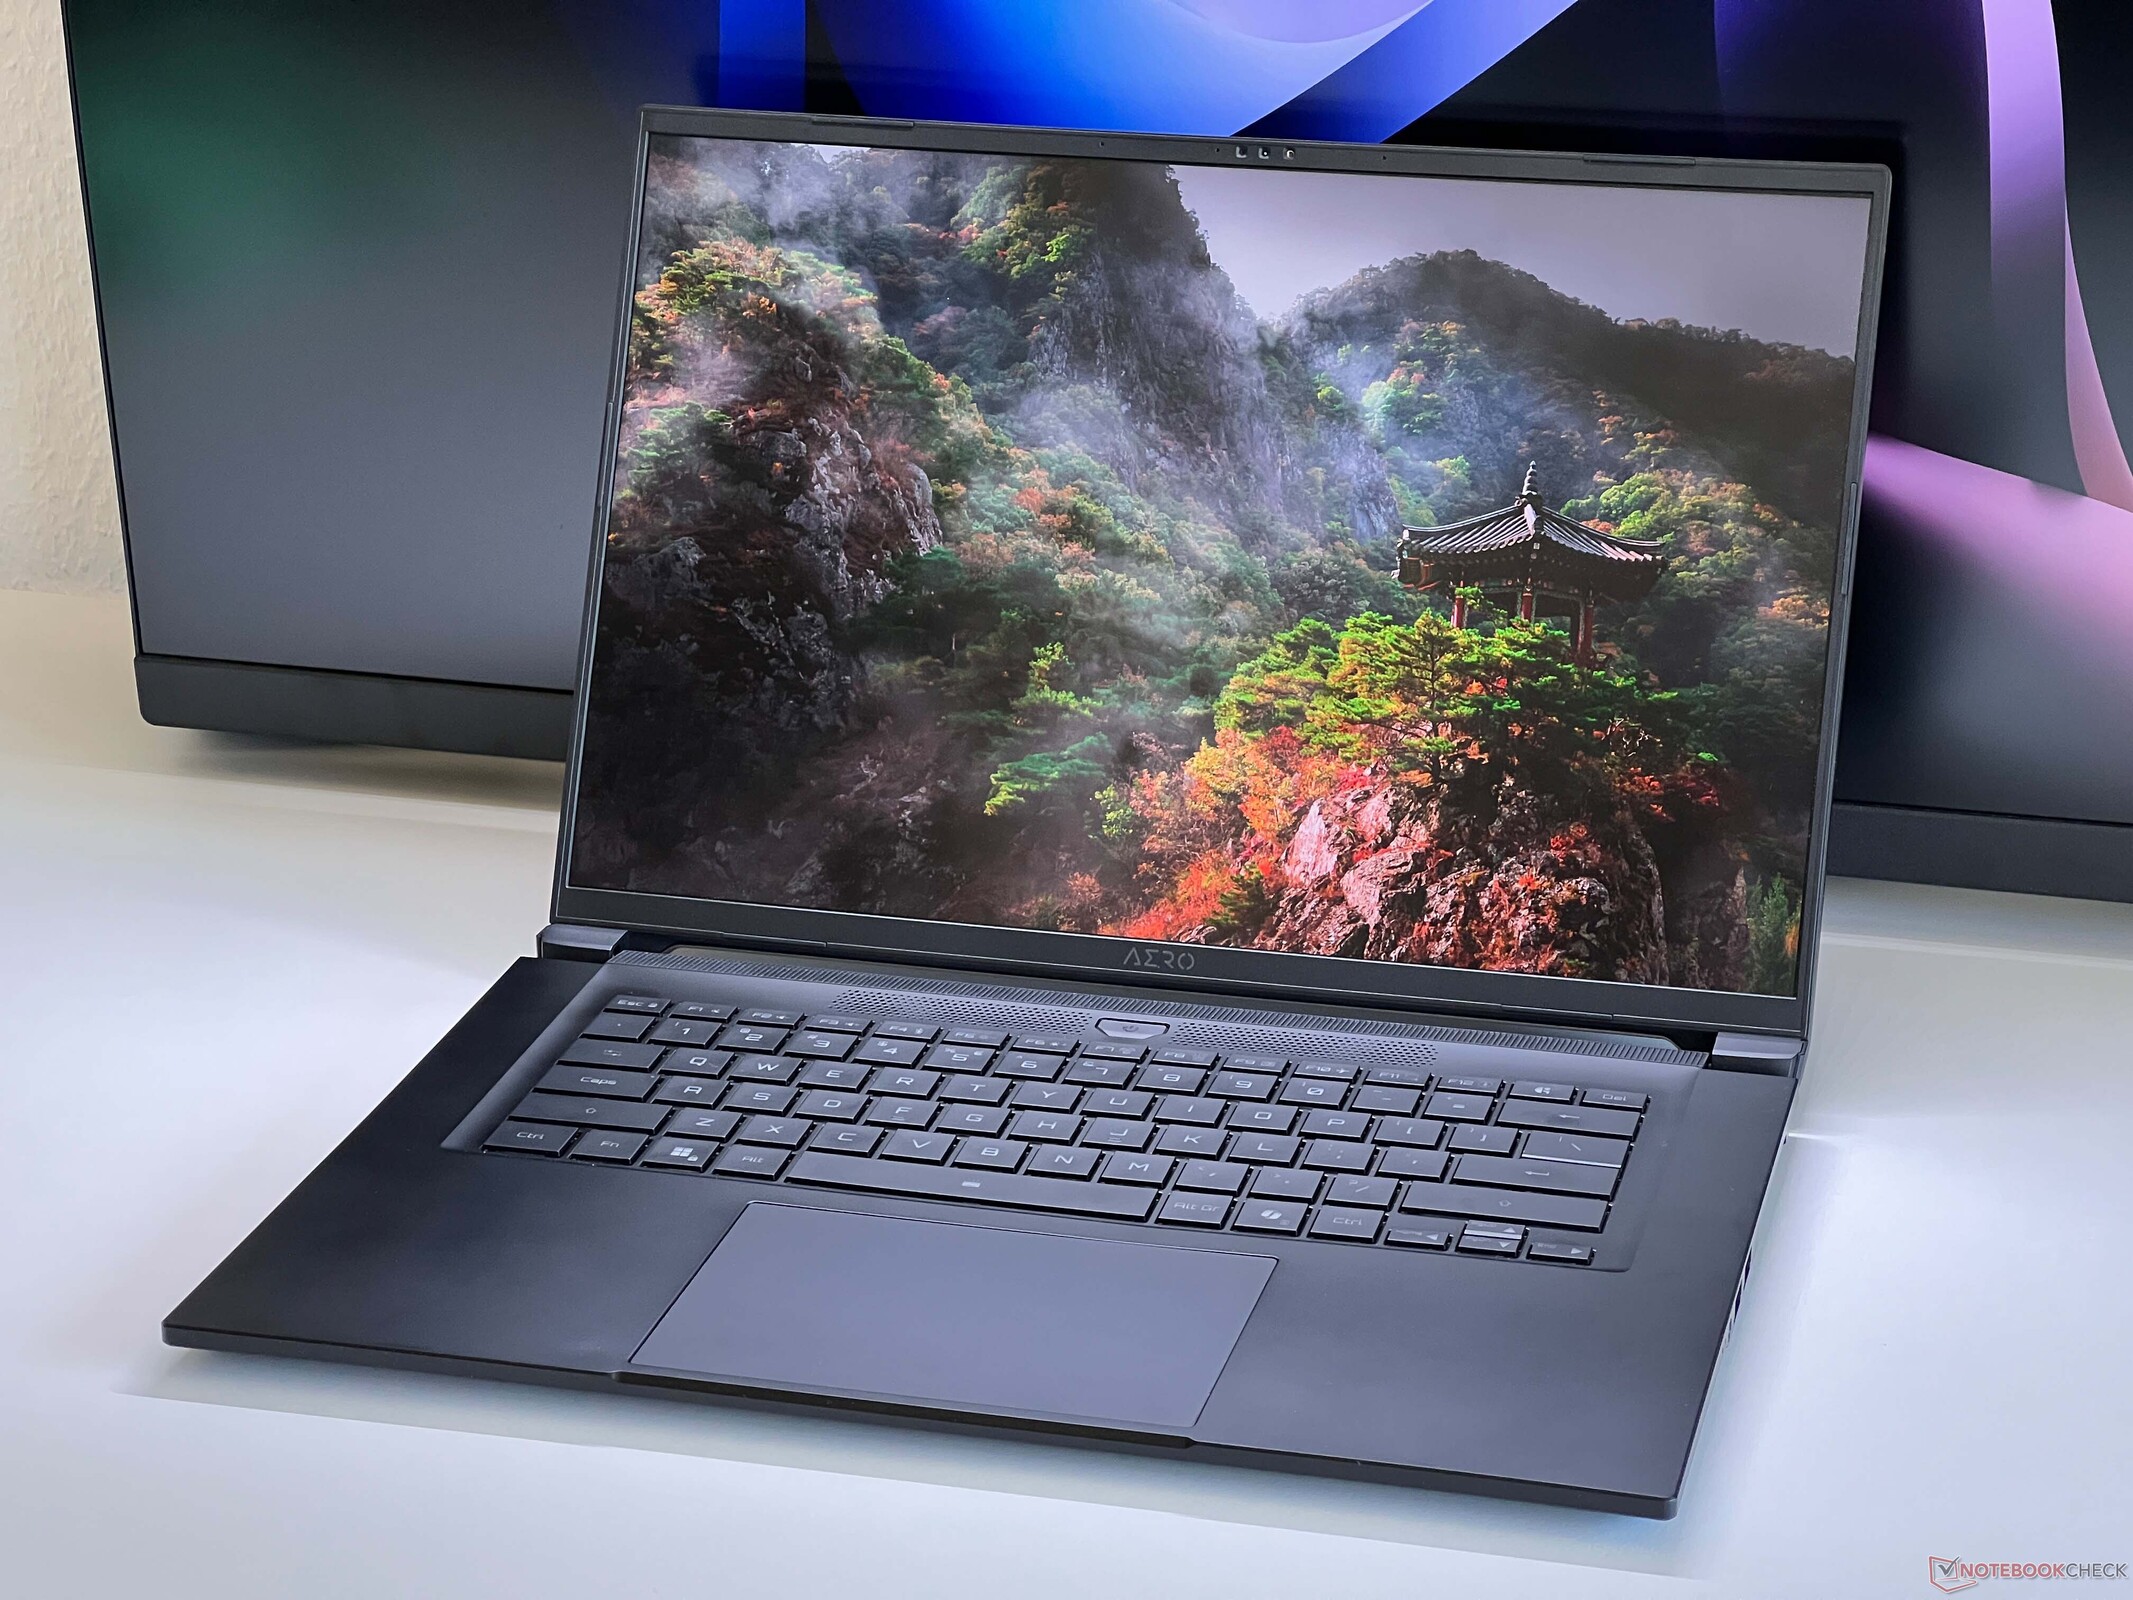
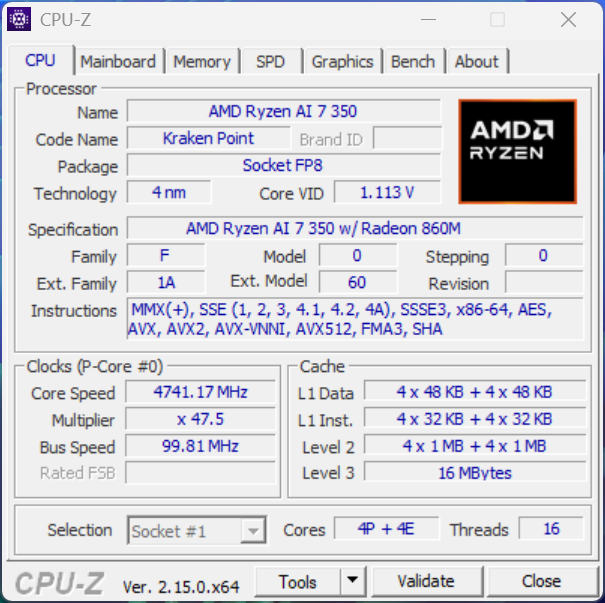
With the Aero X16, Gigabyte is introducing a slim 16-inch gaming/multimedia laptop that combines the latest AMD Ryzen AI mobile processors with the new Nvidia GeForce RTX 5070 Laptop that works at a maximum TGP of 85 W.
We are testing the entry-level version of the Aero X16 featuring the Ryzen AI 7 350, RTX 5070 Laptop, 32 GB RAM, a 1 TB SSD, and a matte IPS display (2,560x1,600) with a 165 Hz refresh rate.
This configuration is available for an RRP of €1,799. There is also a variant with the Ryzen AI 9 HX 370 and a 2 TB SSD for €1,999.
Specifications
Case & features: Sturdy, fingerprint-prone plastic housing
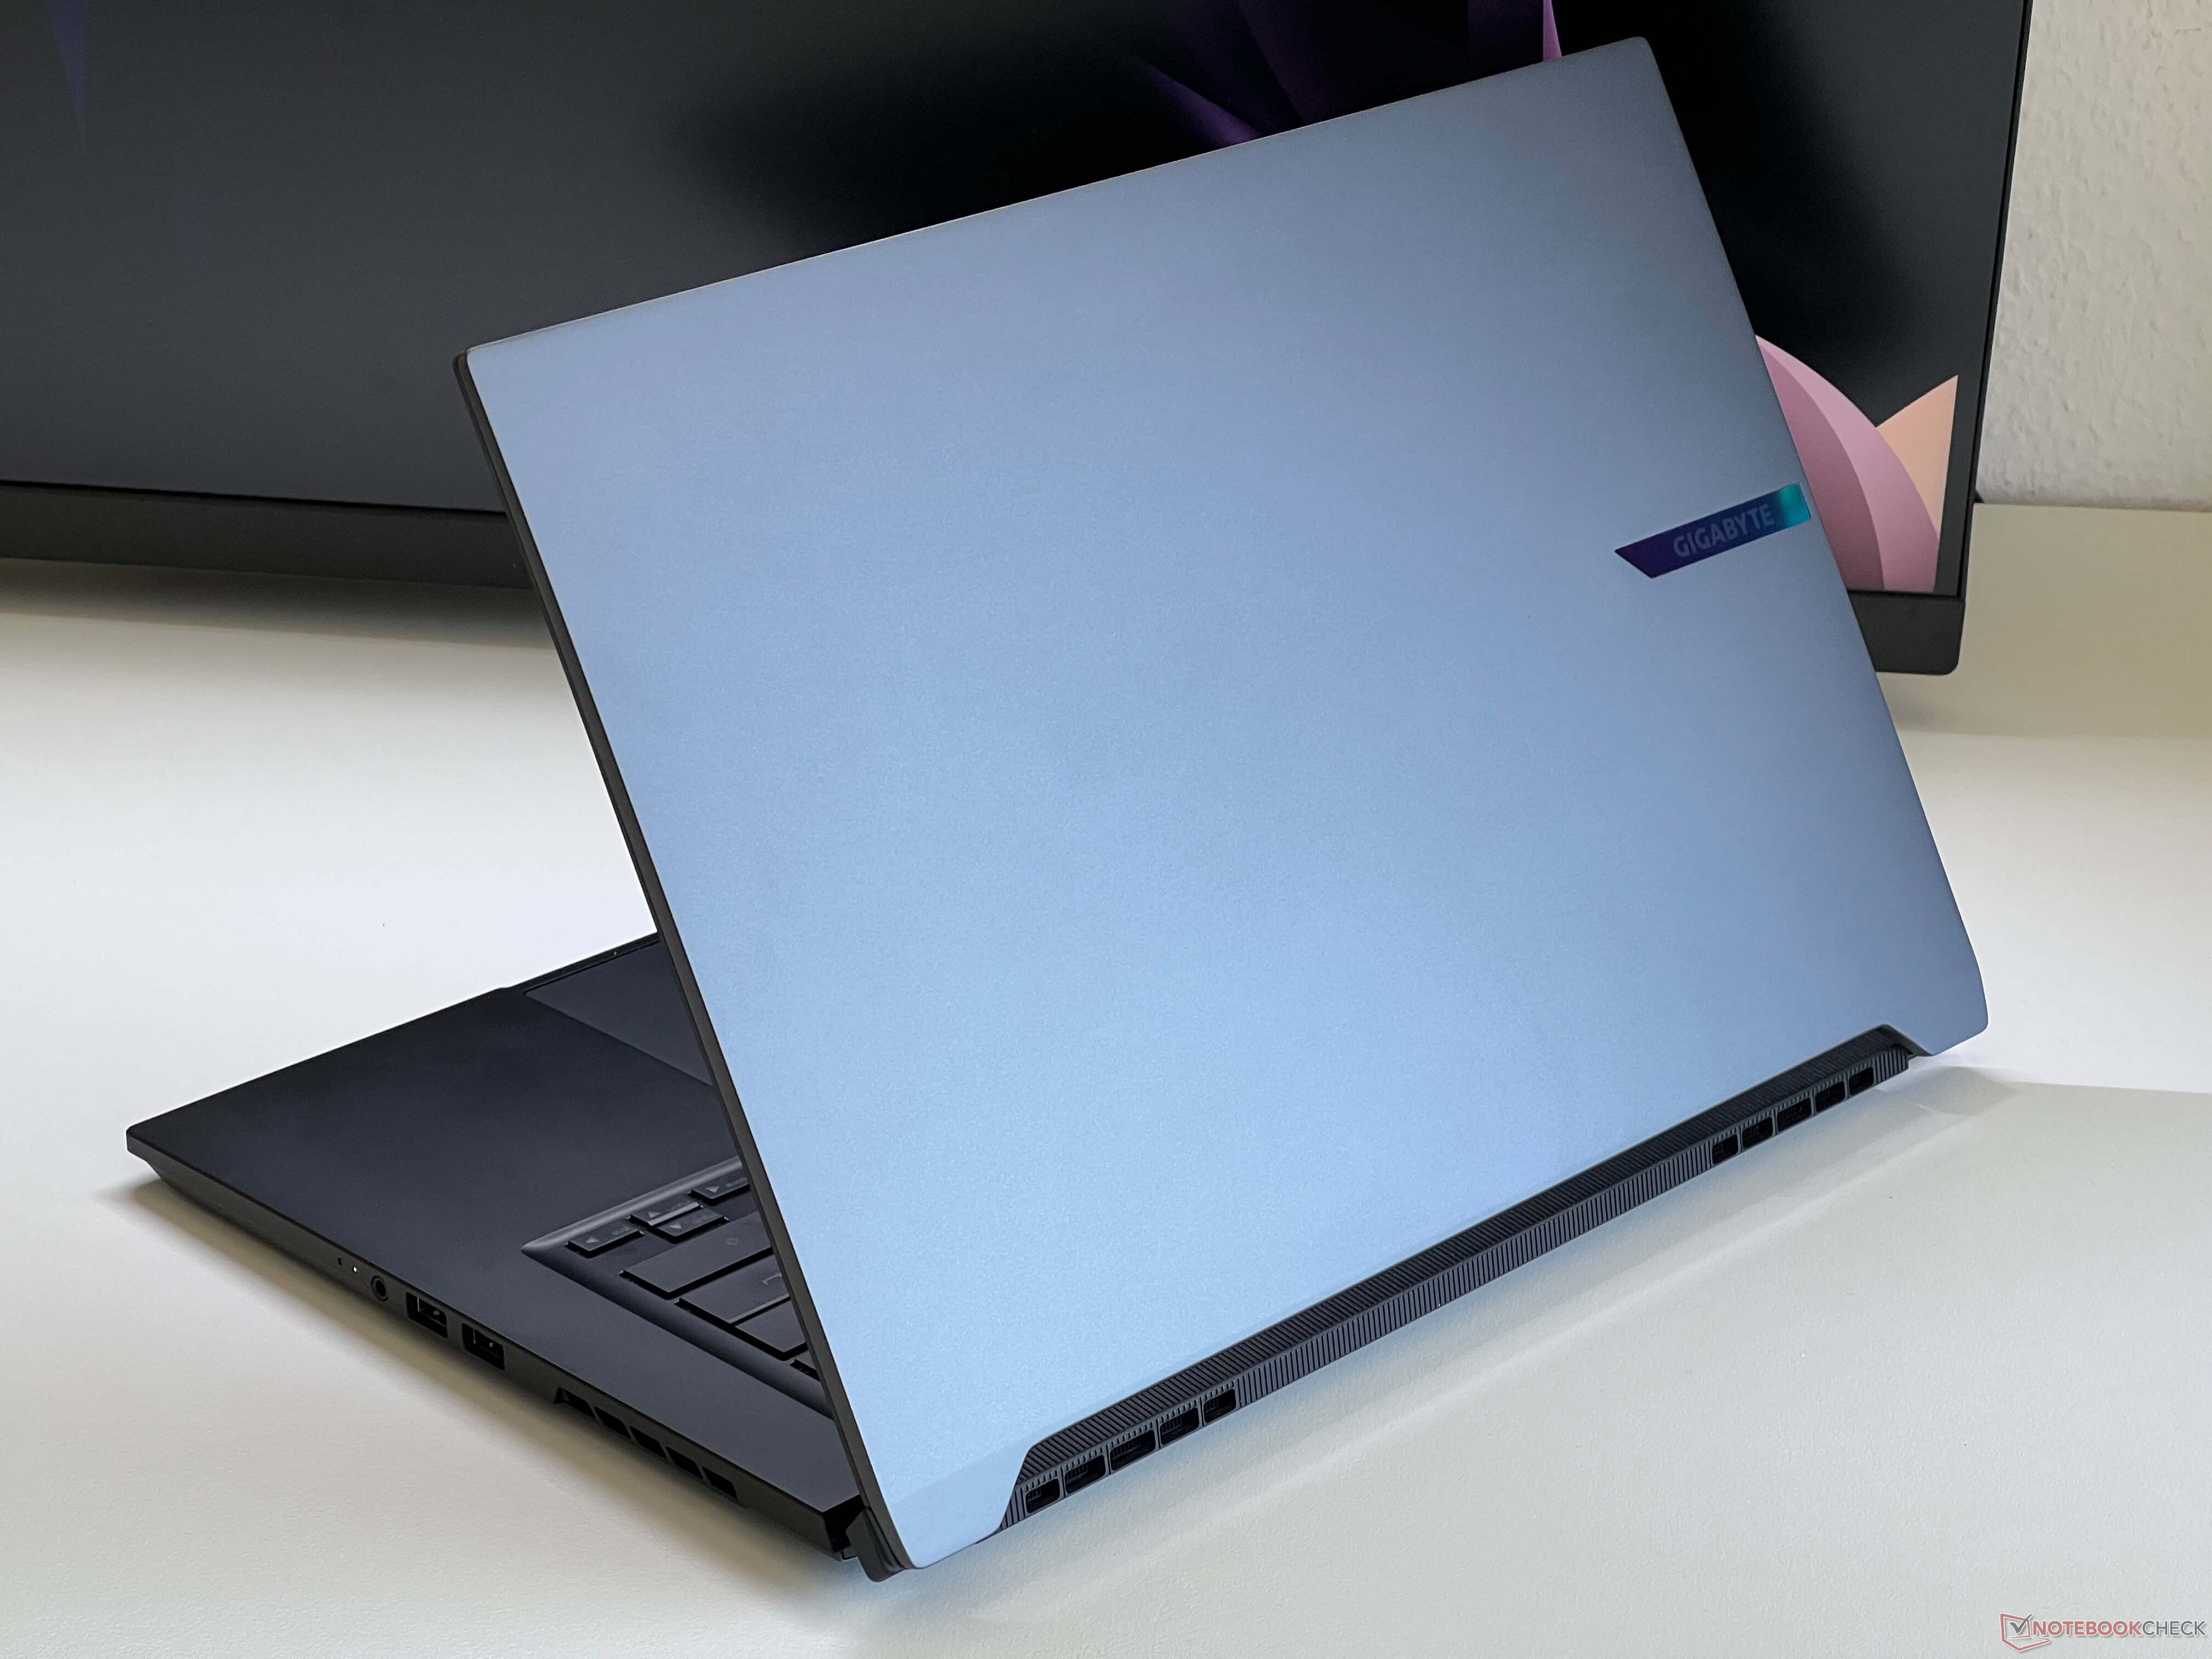
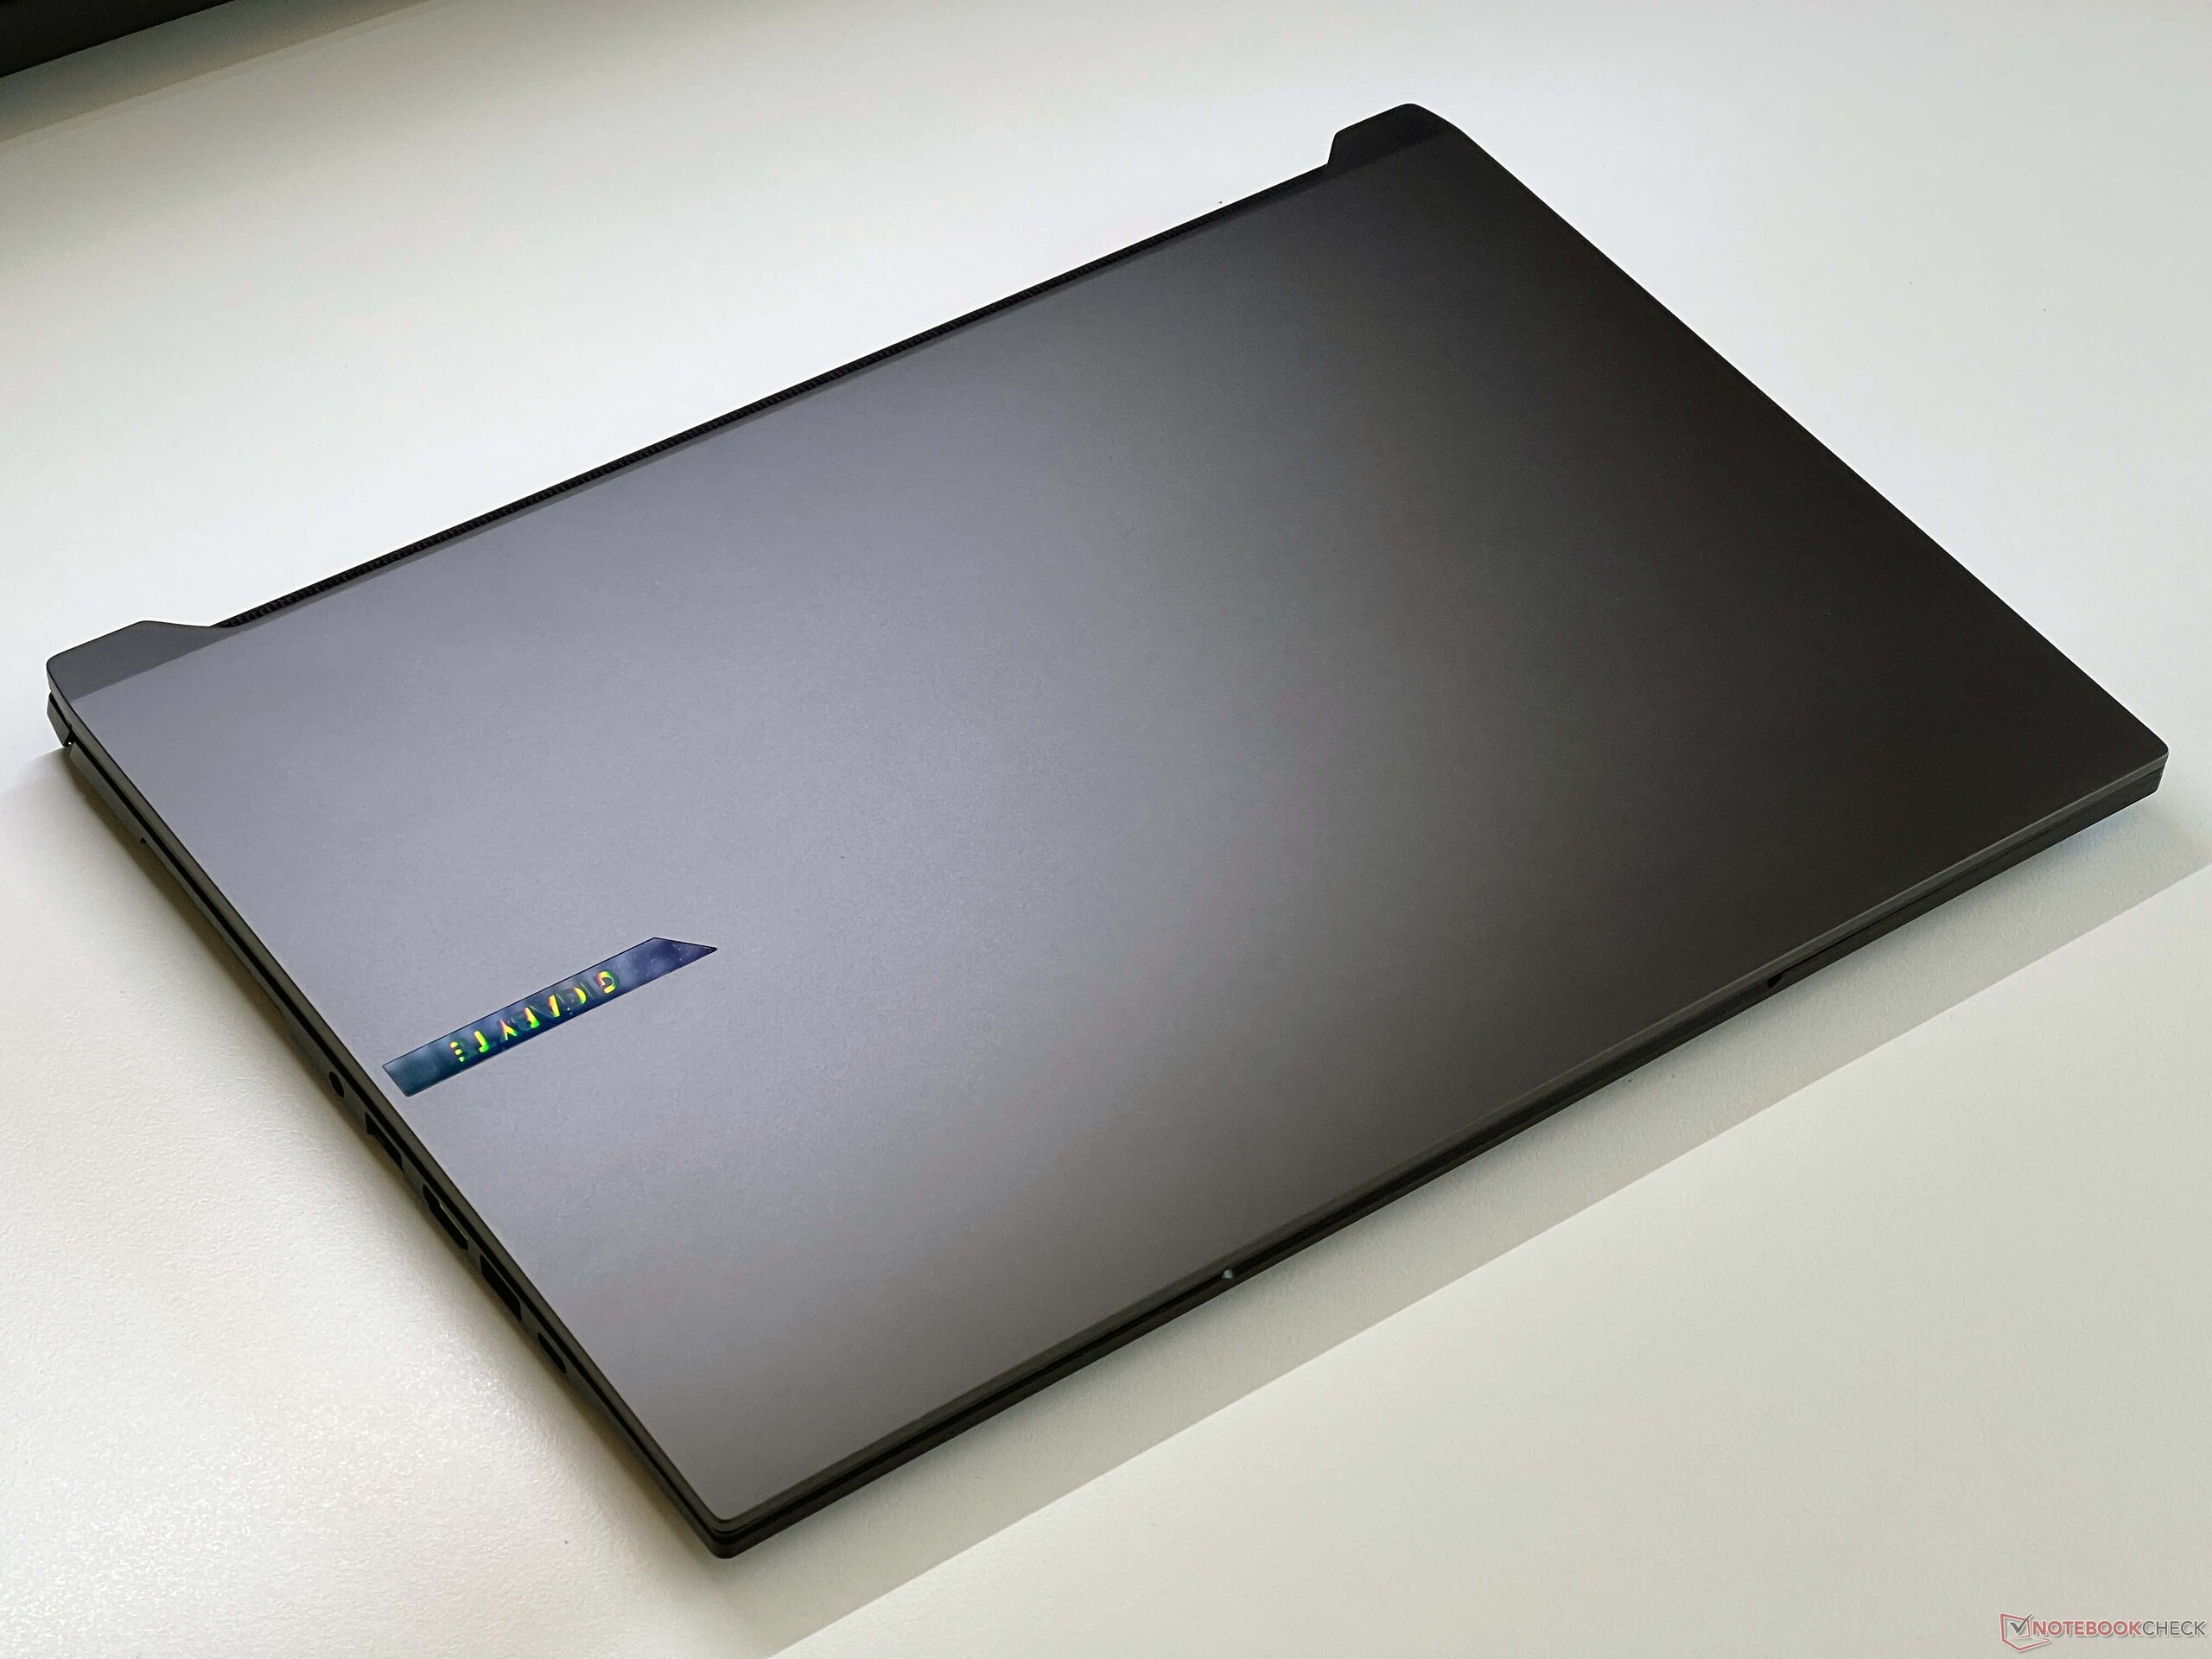
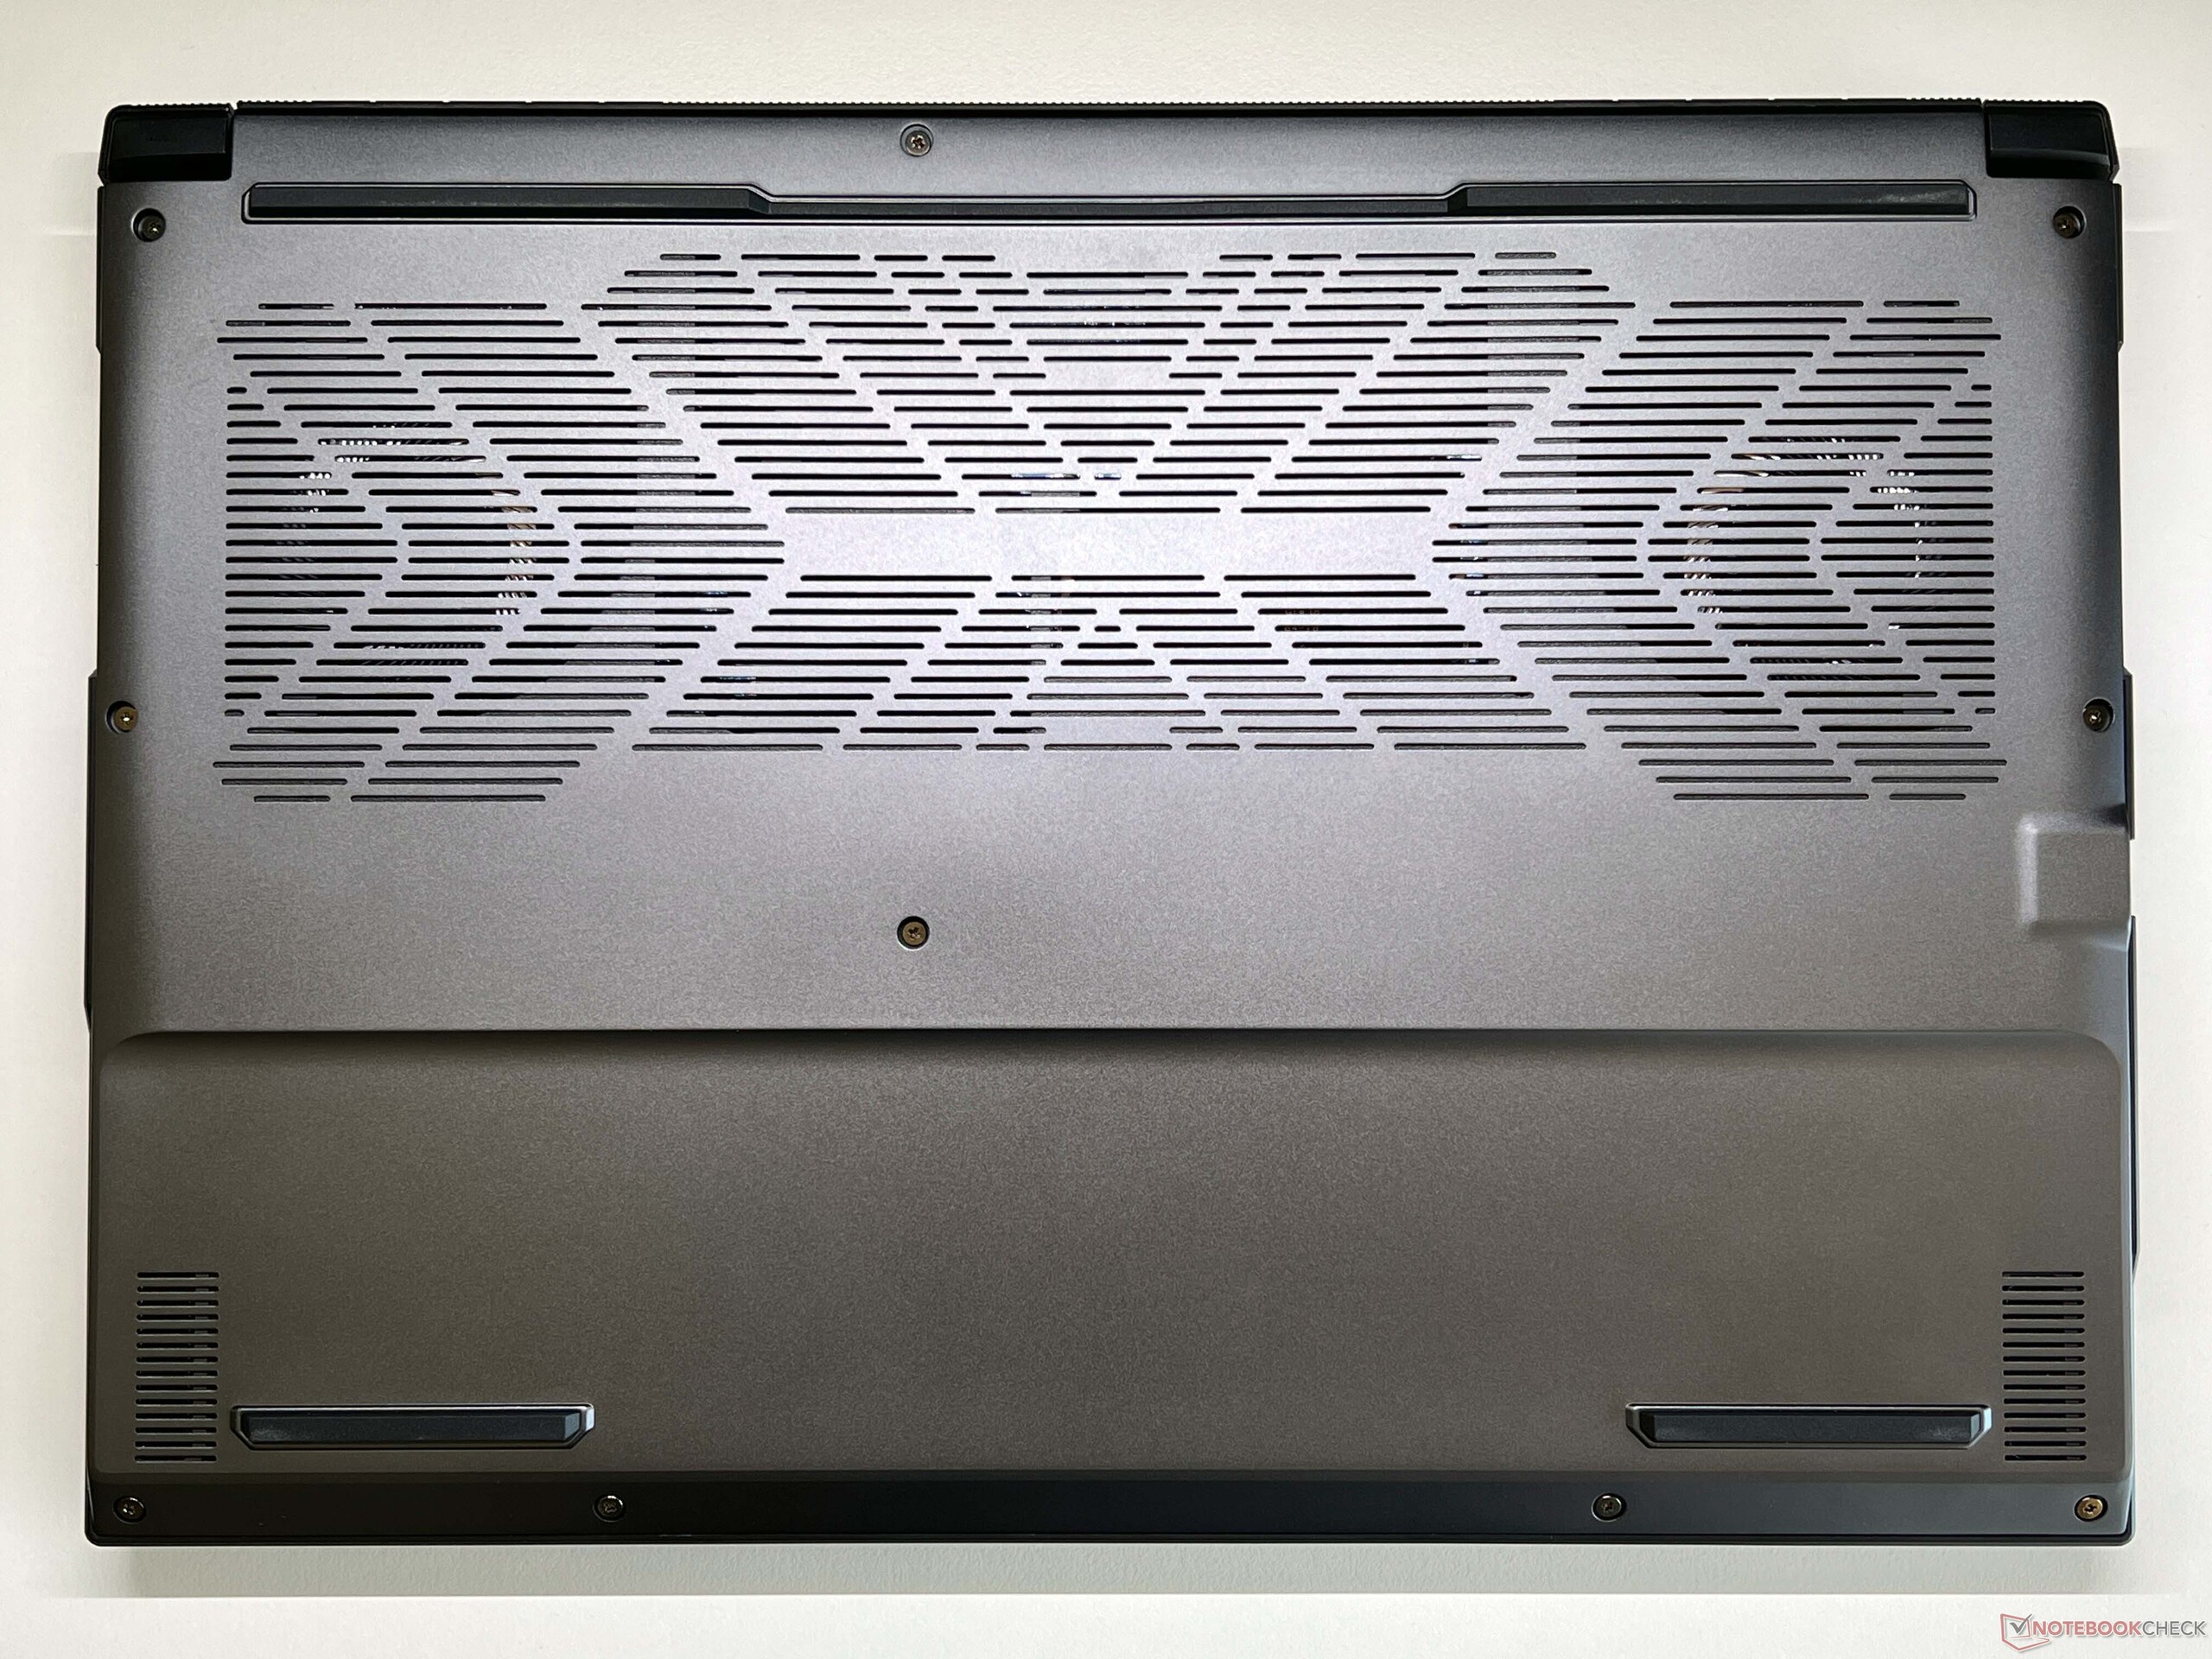
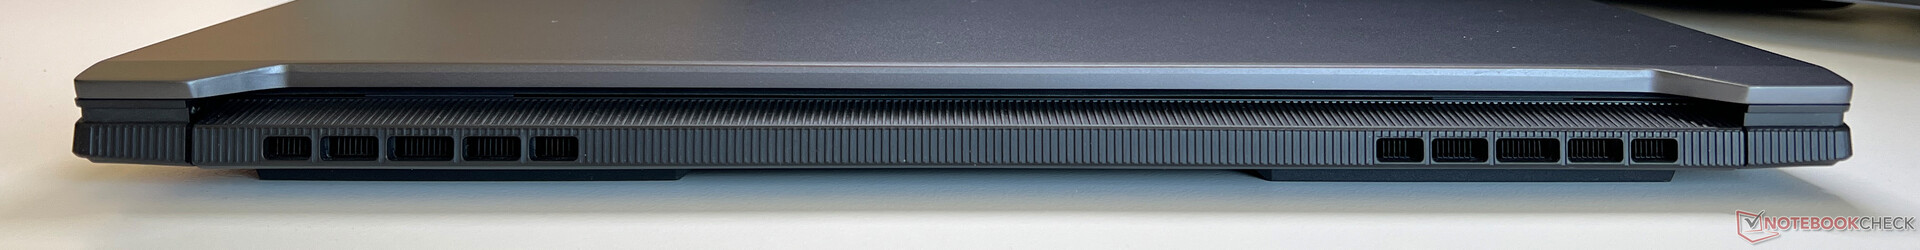
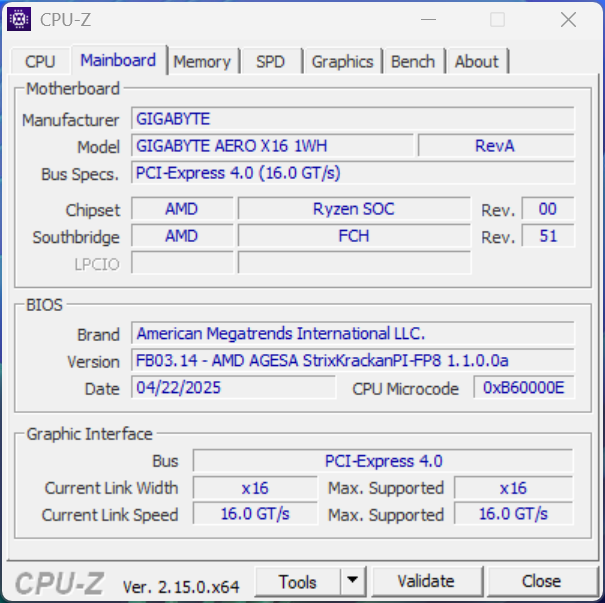
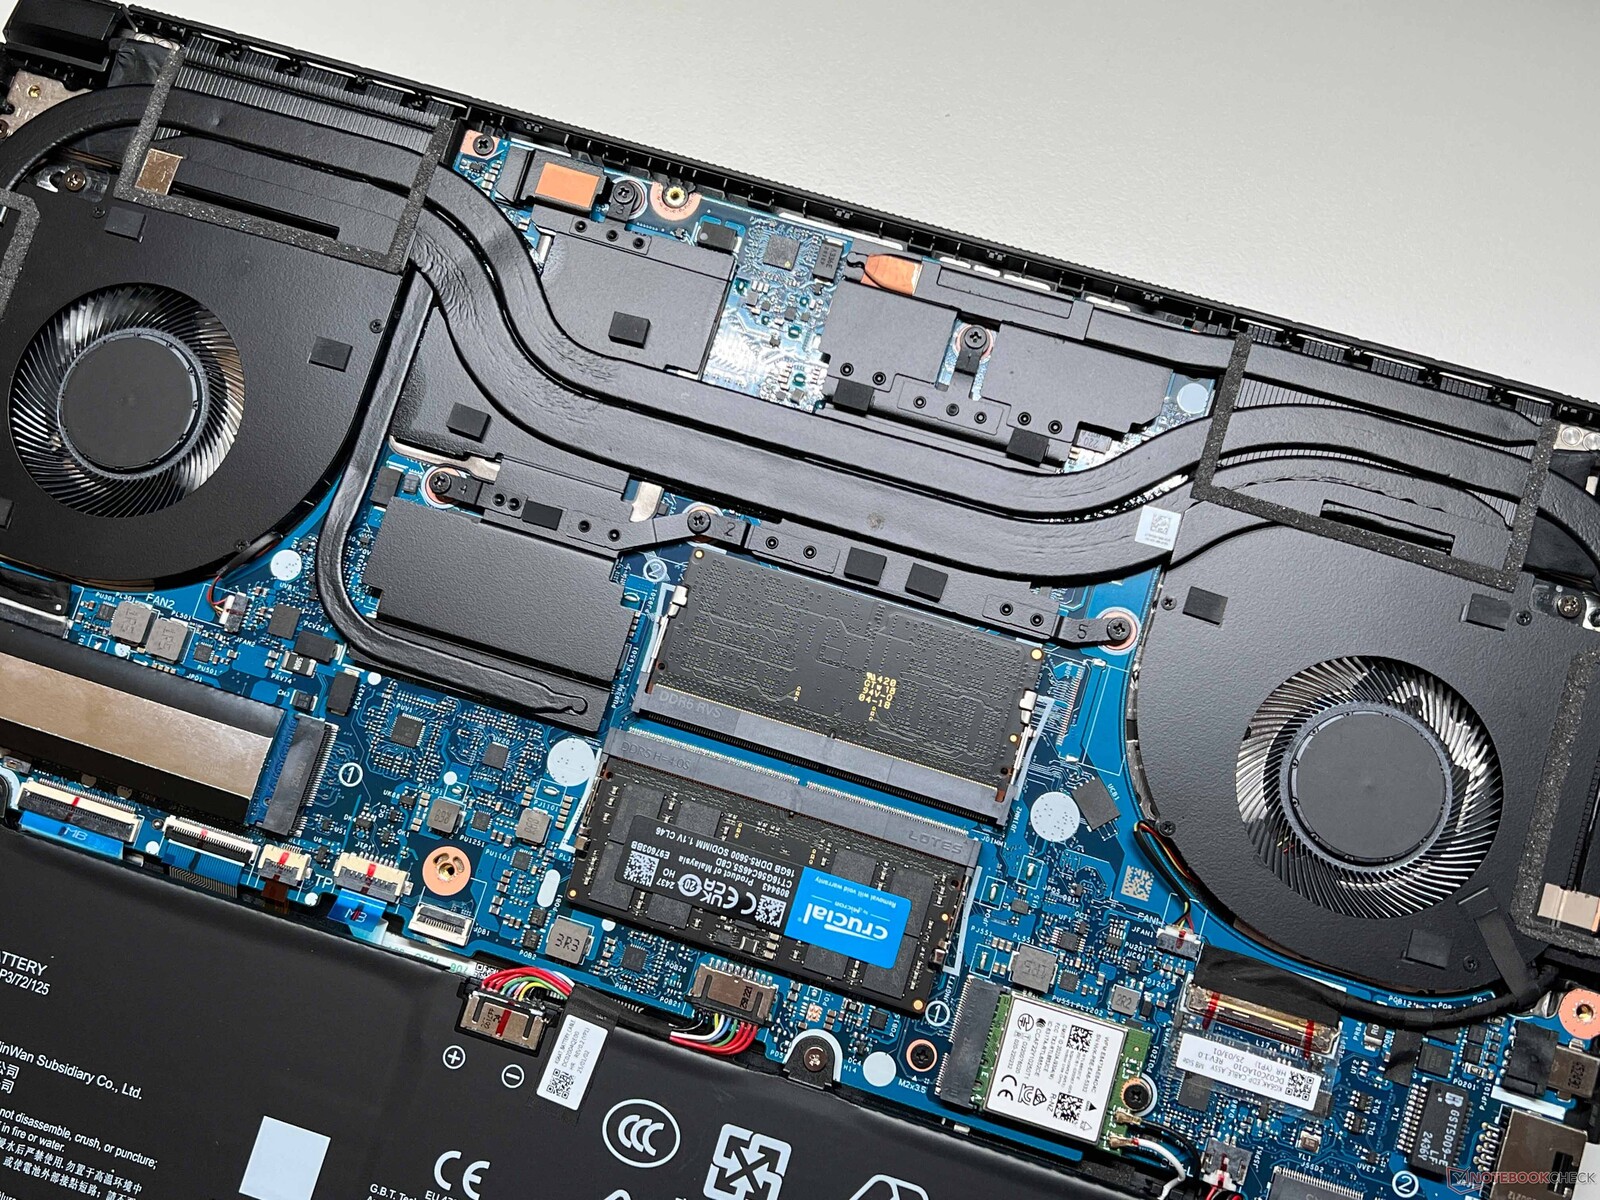
Gigabyte uses a plastic construction for the new Aero X16. The chassis is quite compact for a 16-inch device with a height of 16.7-19.9 mm and a weight of 1.97 kg. In addition to our dark gray version — which is very susceptible to fingerprints — a white version is also available. Both the stability and the workmanship are very good overall.
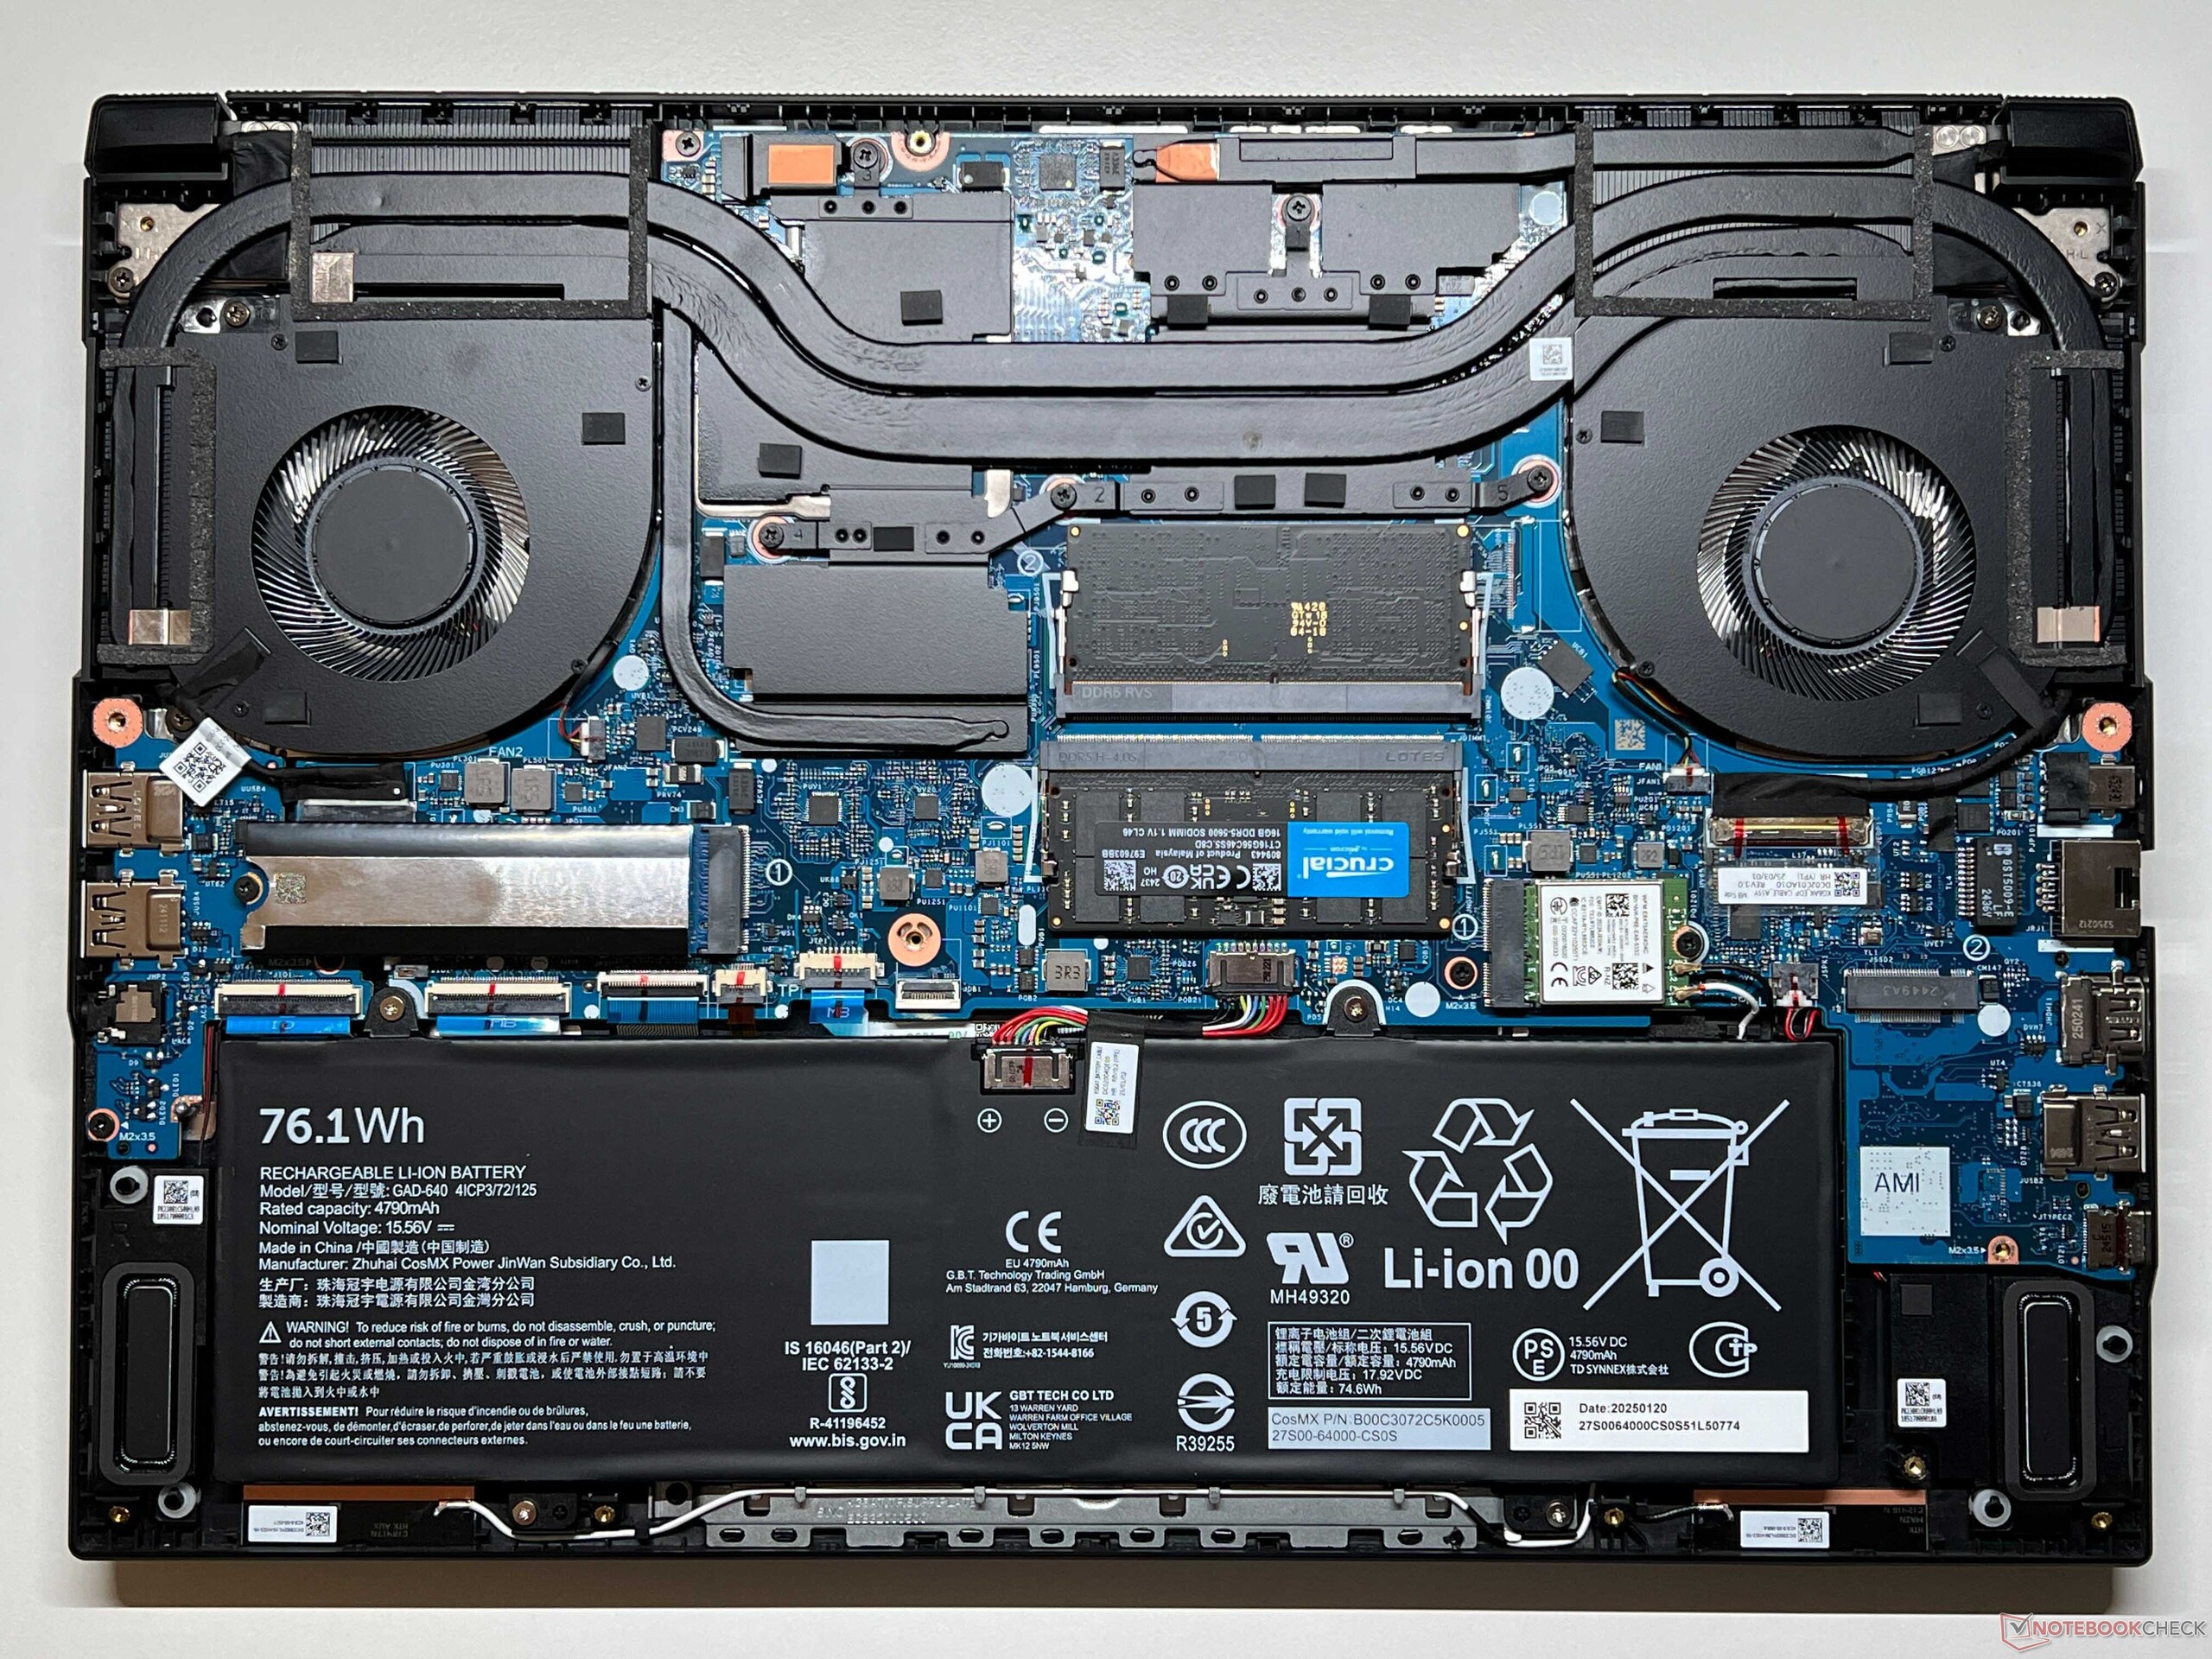
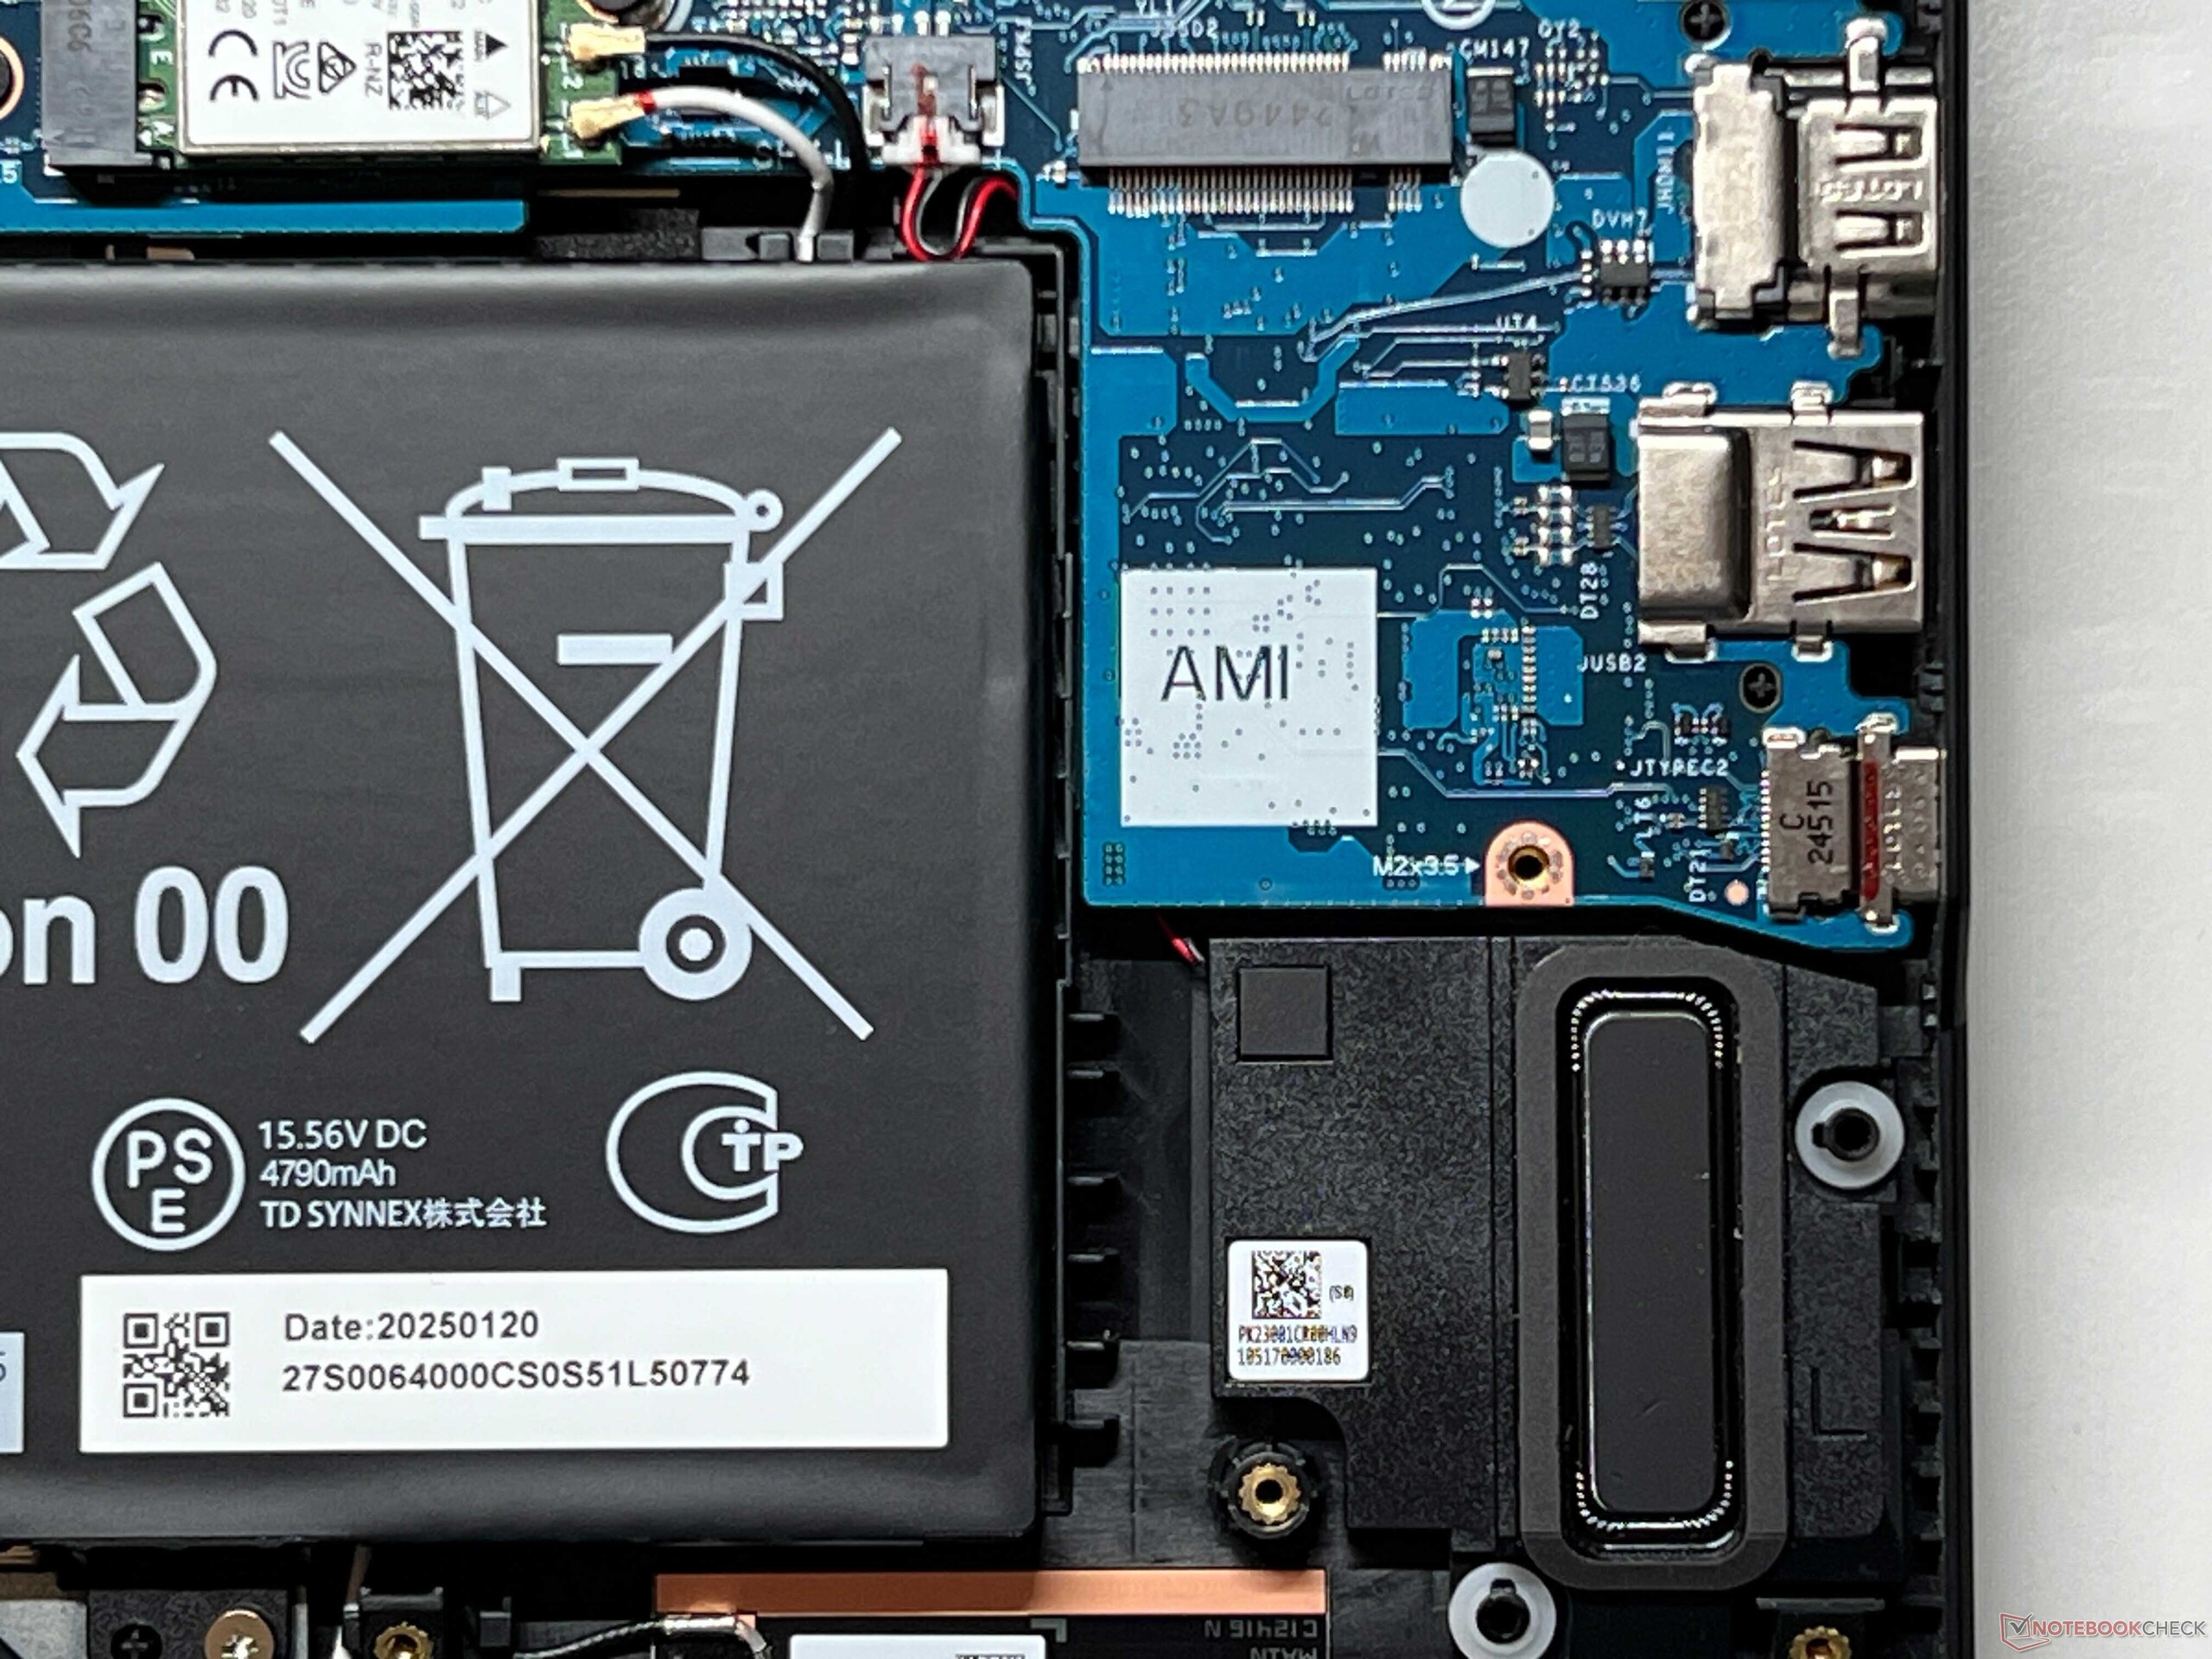
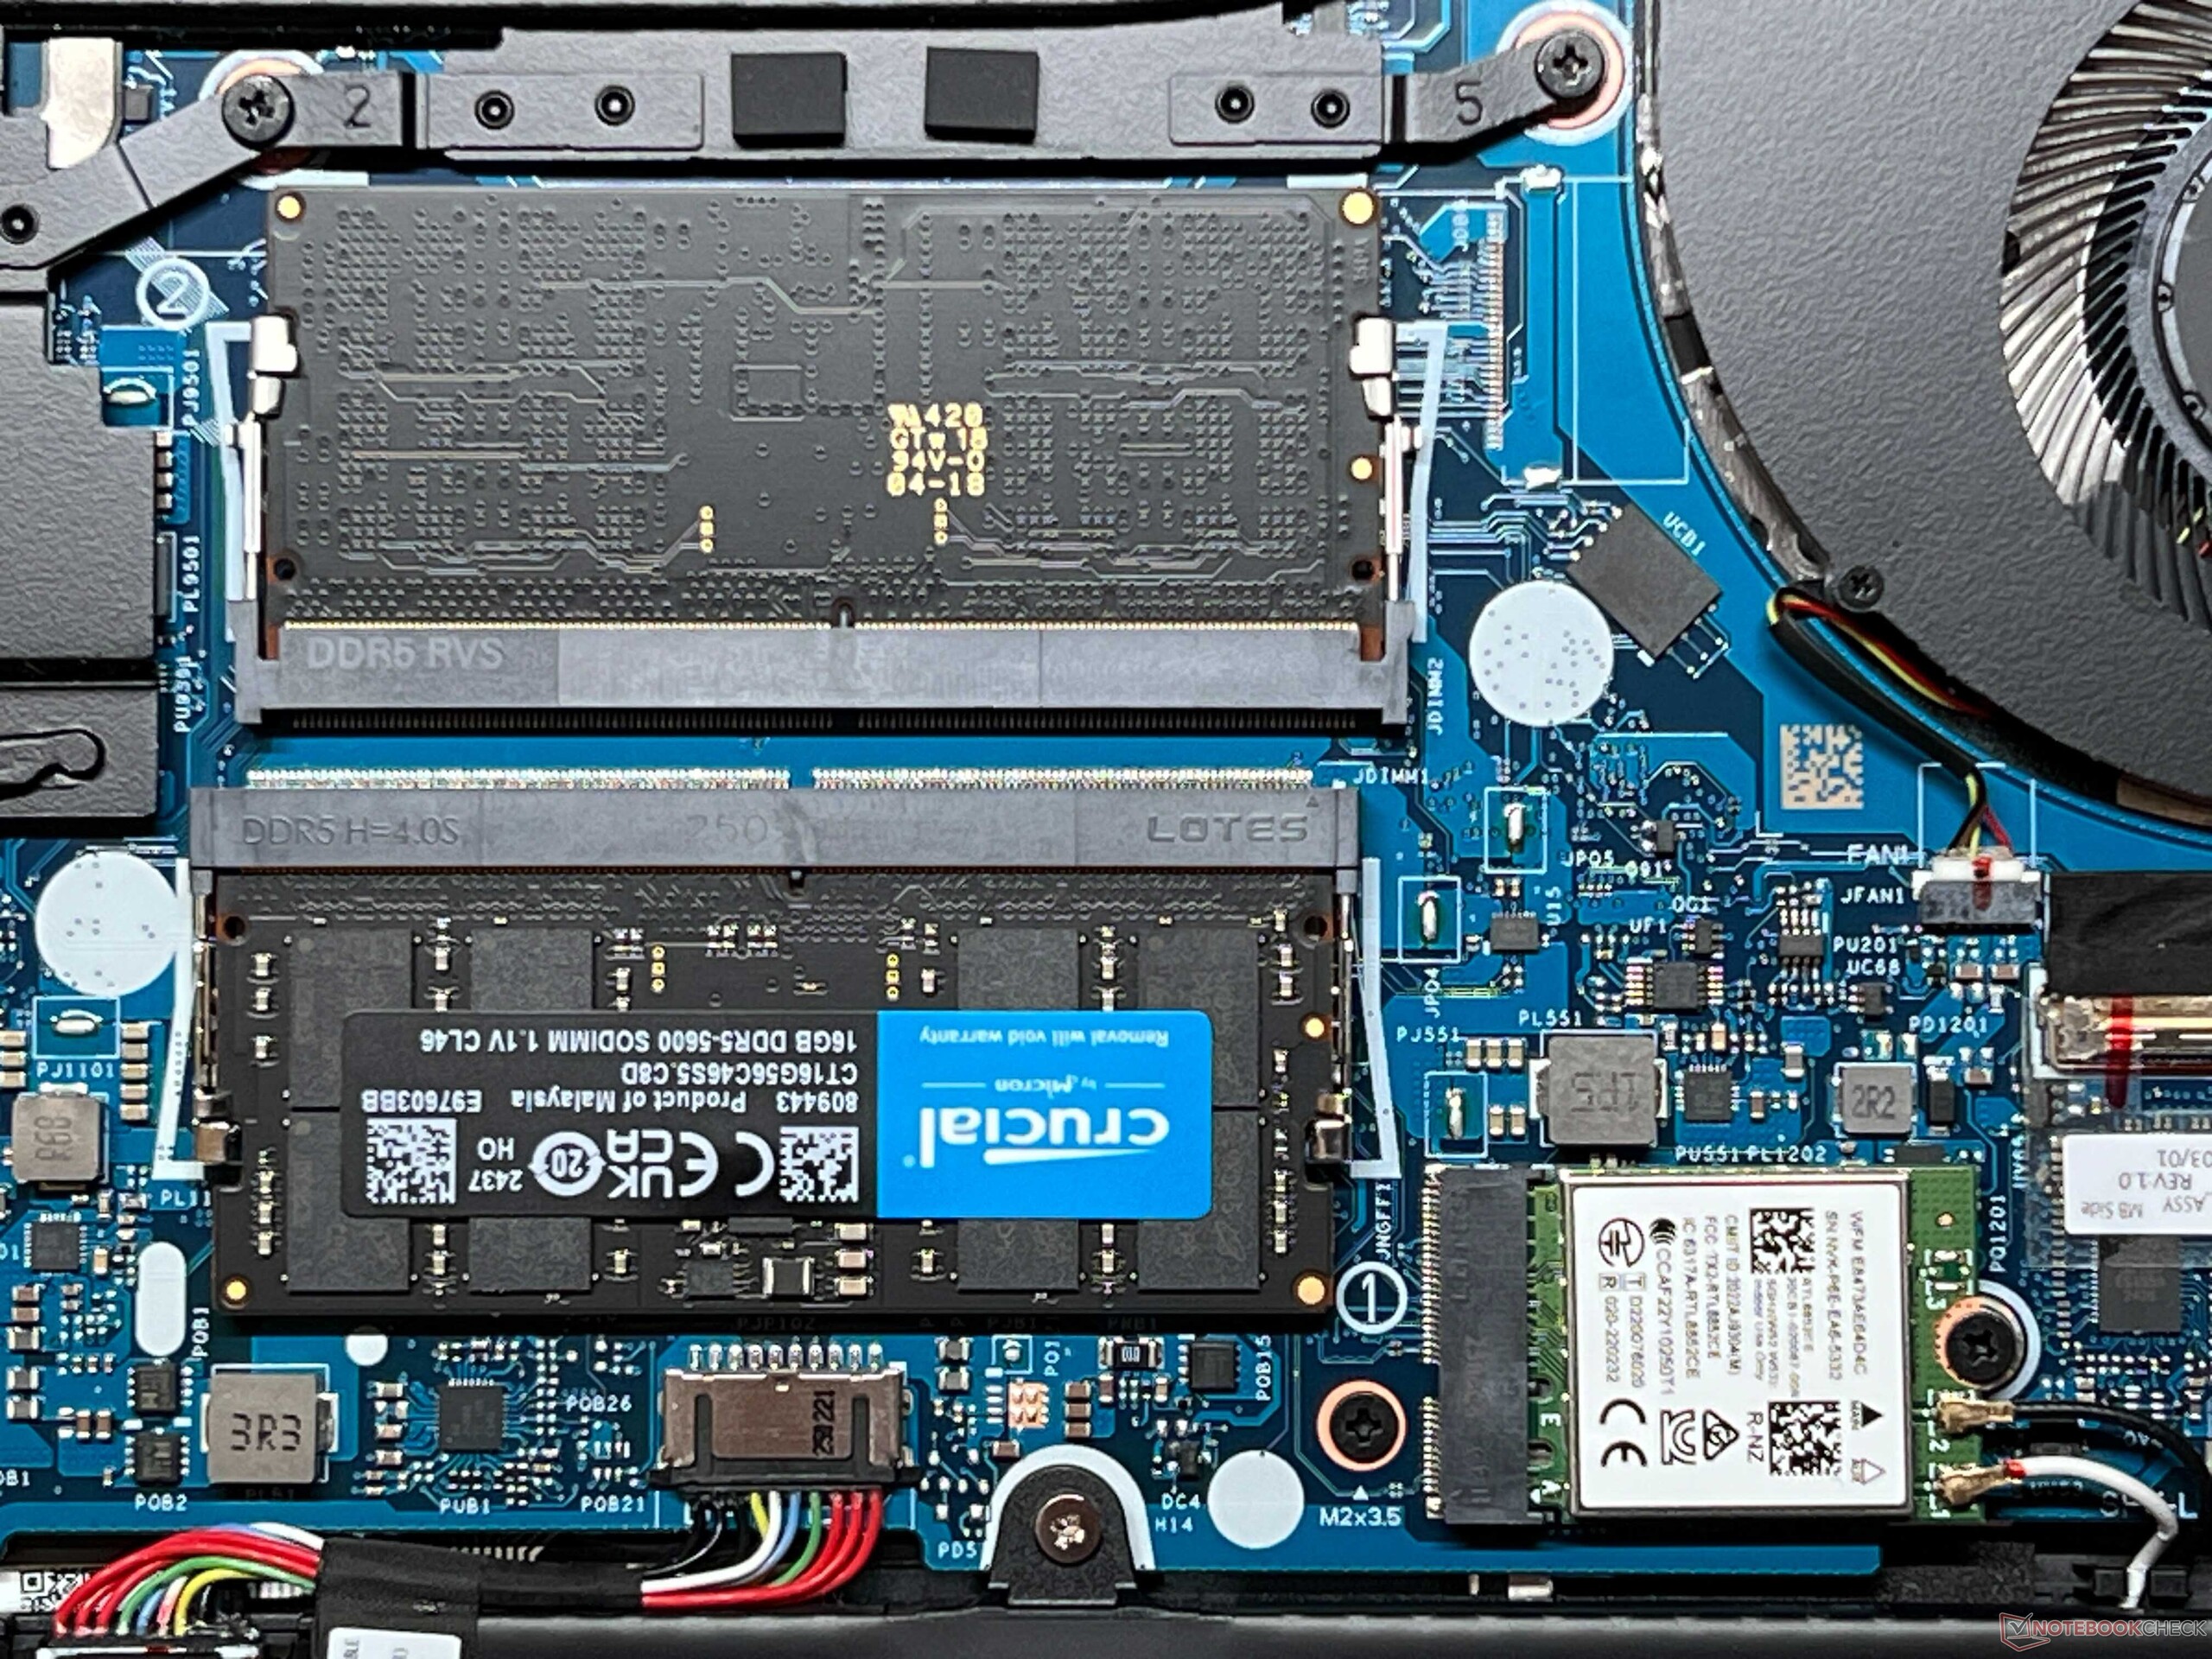
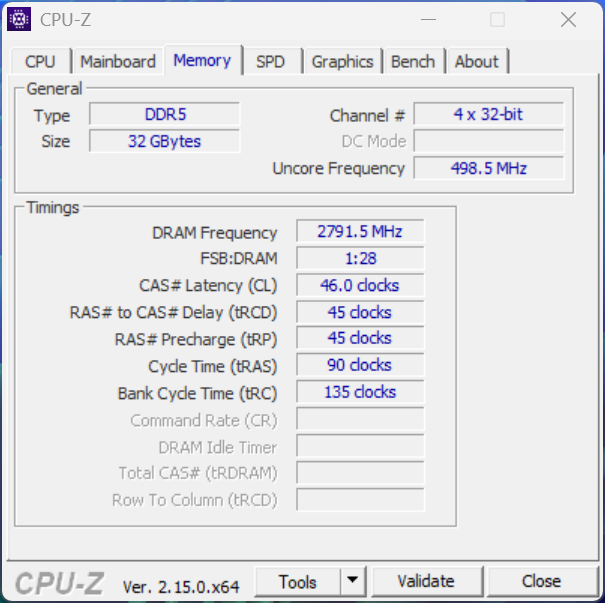
The two hinges are sturdy-enough (maximum opening angle 135°) and only allow minimal rocking. Upgrade options are very good, as the Aero X16 is one of the first devices to combine a Zen 5 processor with expandable RAM. Two M.2-2280 slots for SSDs are available as well.
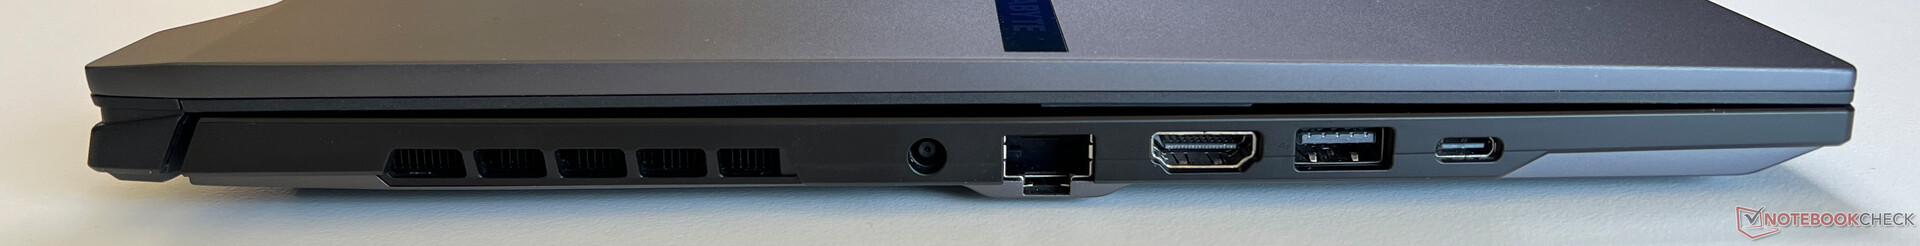
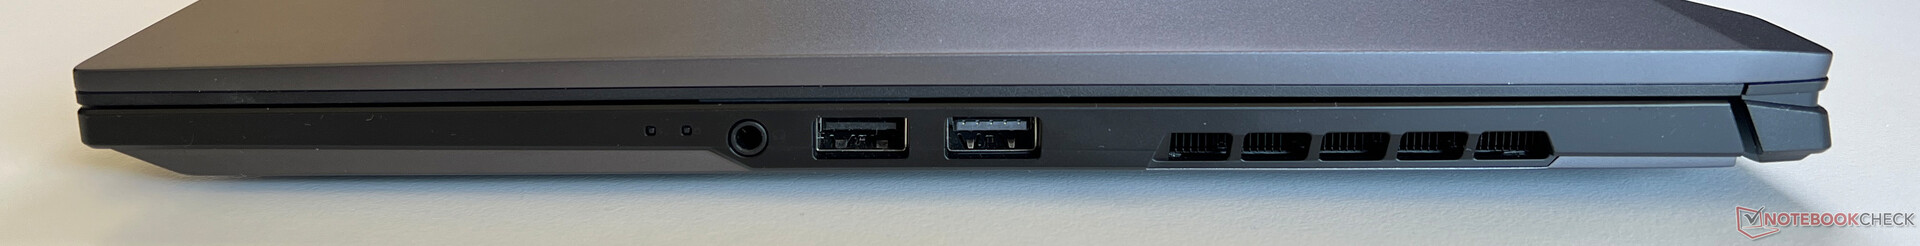
However, there are a few feature compromises you need to contend with. For starters, there is only a Wi-Fi 6E module and a slow USB 2.0 port, which is inexplicable for a high-end laptop in 2025.
The ports are located very near to the front on both sides. Thanks to the AMD processor, the Gigabyte Aero X16 is a Copilot+ laptop with advanced AI functions including live subtitles and studio effects for the webcam.
The webcam takes pictures in 1080p and fulfills its purpose, but the picture quality is not particularly good. An IR module for face recognition is available.
| Networking | |
| Gigabyte Aero X16 1WH | |
| iperf3 transmit AXE11000 | |
| iperf3 receive AXE11000 | |
| Asus TUF Gaming A16 FA608WV | |
| iperf3 transmit AXE11000 | |
| iperf3 receive AXE11000 | |
| iperf3 transmit AXE11000 6GHz | |
| iperf3 receive AXE11000 6GHz | |
| Lenovo Yoga Pro 9 16IMH9 | |
| iperf3 transmit AXE11000 | |
| iperf3 receive AXE11000 | |
| Dell XPS 16 9640 | |
| iperf3 transmit AXE11000 | |
| iperf3 receive AXE11000 | |
| Asus ROG Zephyrus G16 2024 GU605M | |
| iperf3 transmit AXE11000 | |
| iperf3 receive AXE11000 | |
| Schenker XMG CORE 16 (L23) | |
| iperf3 transmit AXE11000 | |
| iperf3 receive AXE11000 | |


Sustainability
Gigabyte does not provide any information on environmental standards, the CO2 footprint or the use of recycled materials. The packaging consists almost entirely of cardboard.
Input devices: Comfortable keyboard
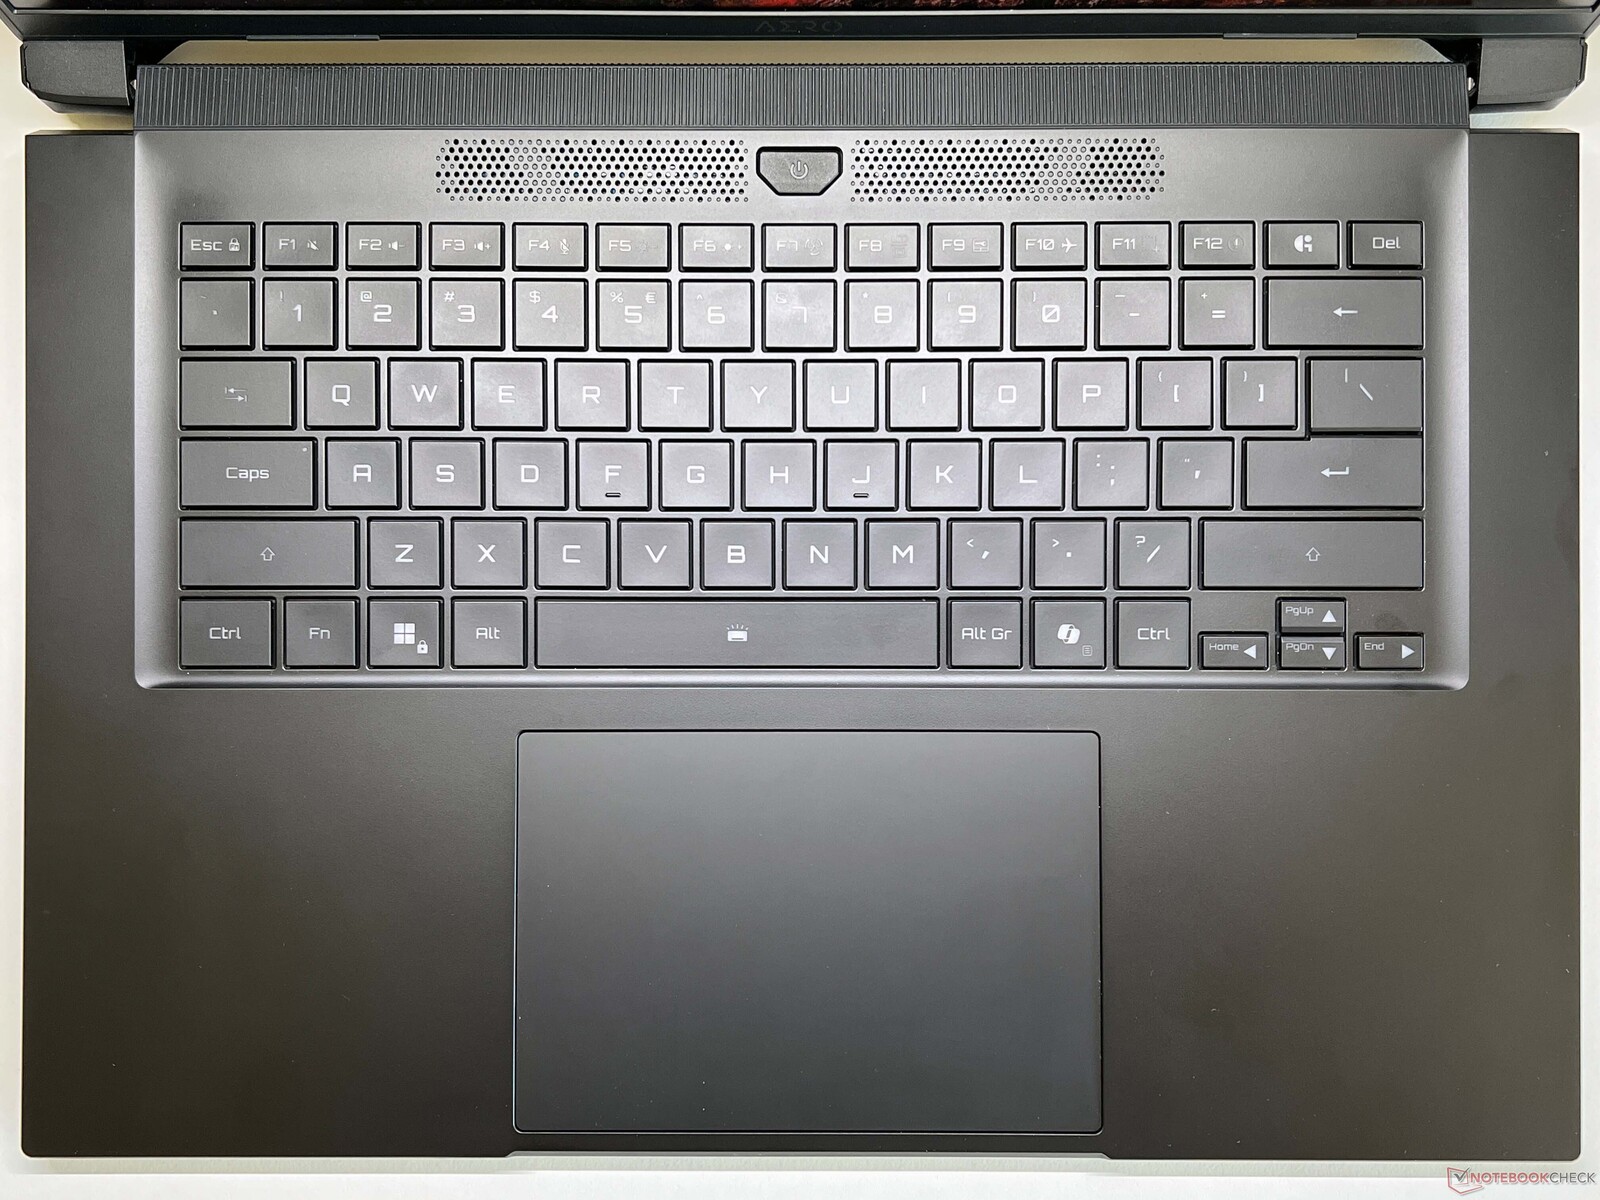
The Aero X16 does not have a number pad, but it offers a very comfortable keyboard with a long 1.7 mm keystroke and a precise pressure point. In terms of layout, only the small arrow keys are really annoying. There is a 1-zone RGB backlight with three intensity levels.
The touchpad is sufficiently large (13.3 x 9 cm) and offers very good gliding properties, but the mechanical clicks are a little loud.

Display: Matte 165 Hz IPS with no PWM
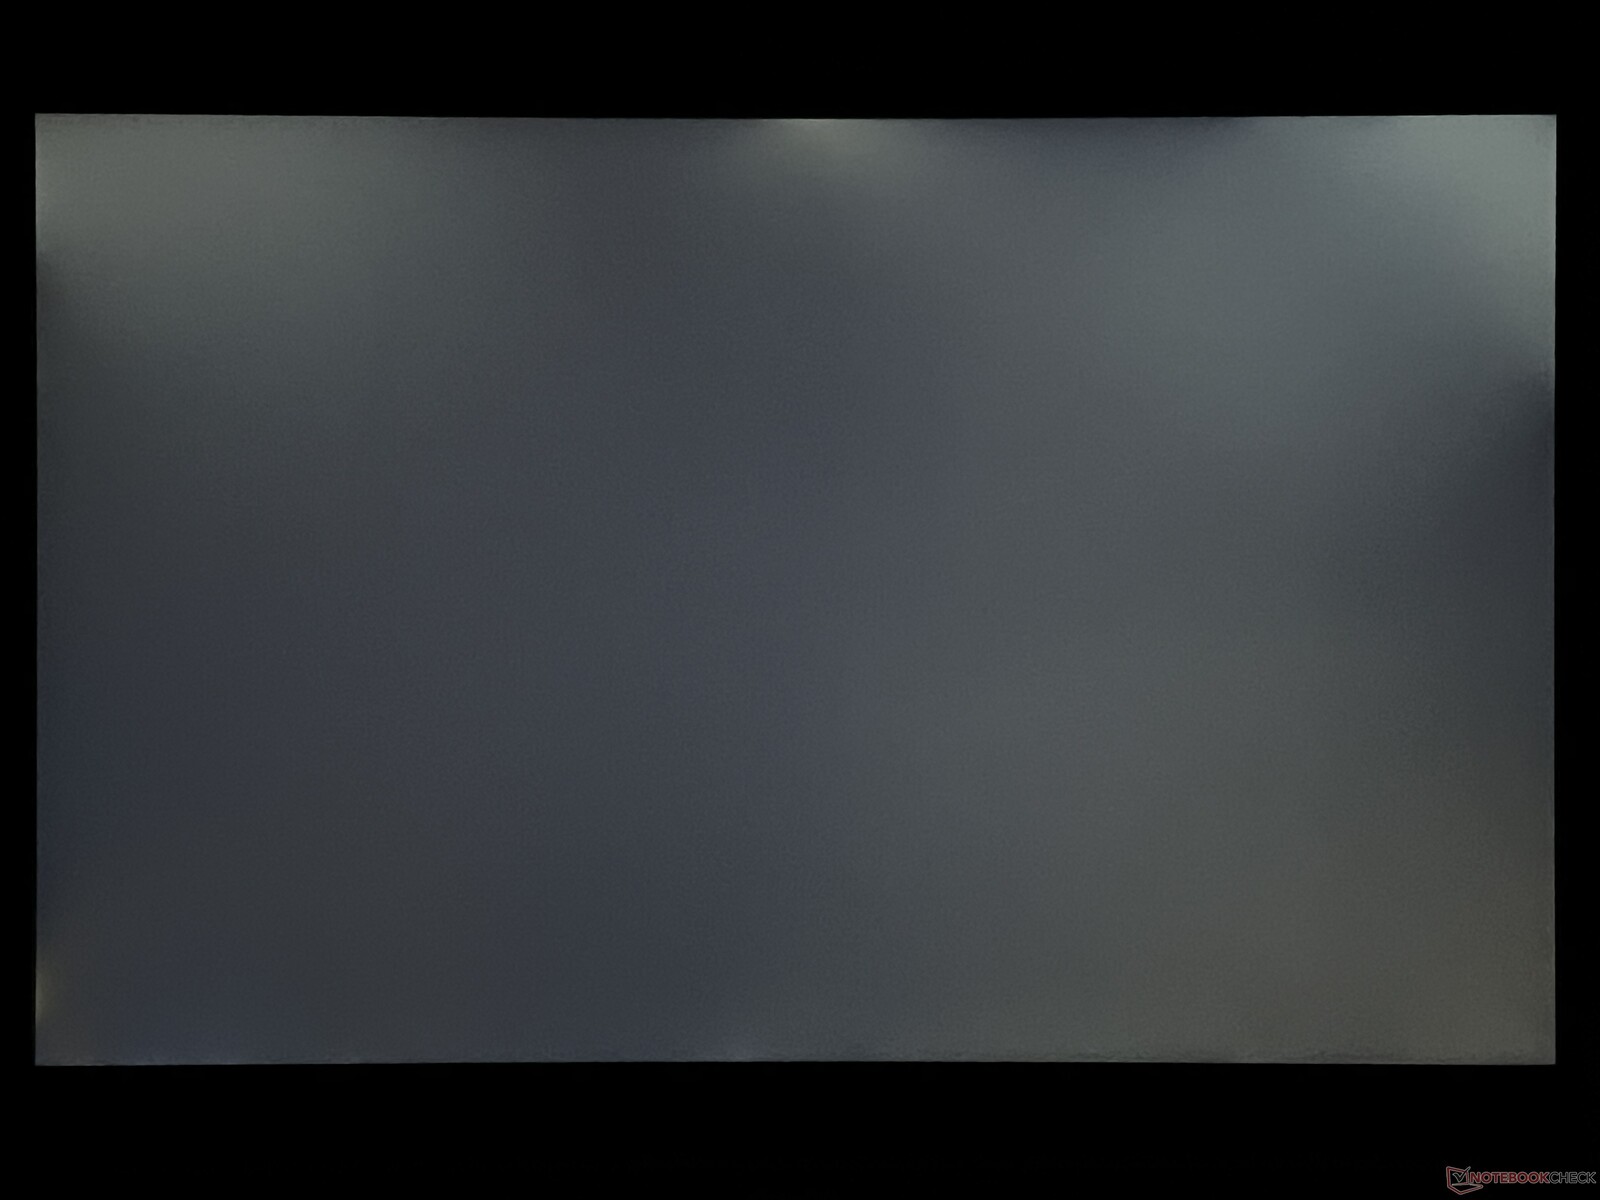
The Aero X16 uses a matte IPS screen with a 2,560x1,600 resolution and a 165 Hz refresh rate. The picture quality is subjectively good with sharp content and rich colors, and even bright content only appears slightly grainy on closer inspection.
However, the IPS panel cannot keep up with OLED panels or mini-LEDs. That being said, there is no PWM flickering and the response times are fast.
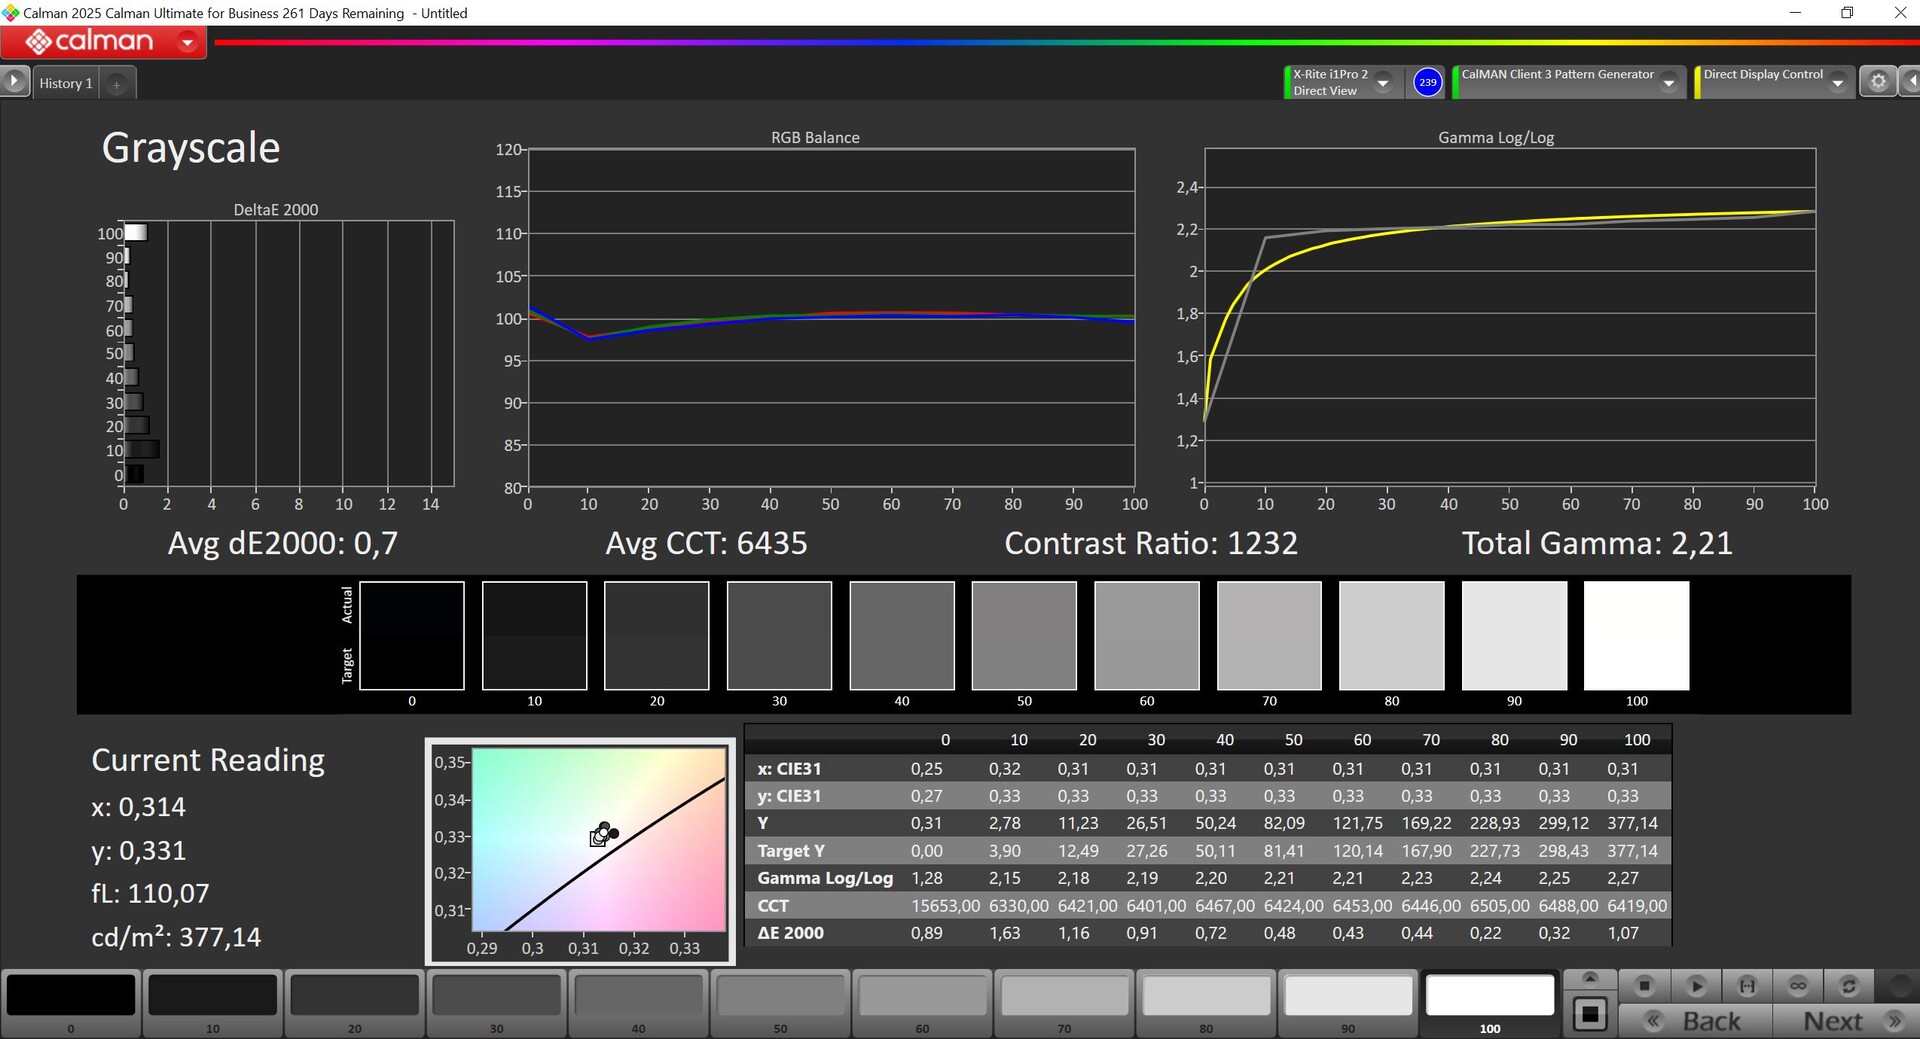
We measured a 403 cd/m² peak brightness, which, together with the slightly higher black level of 0.32 cd/m², only results in a 1,234:1 measured contrast ratio.
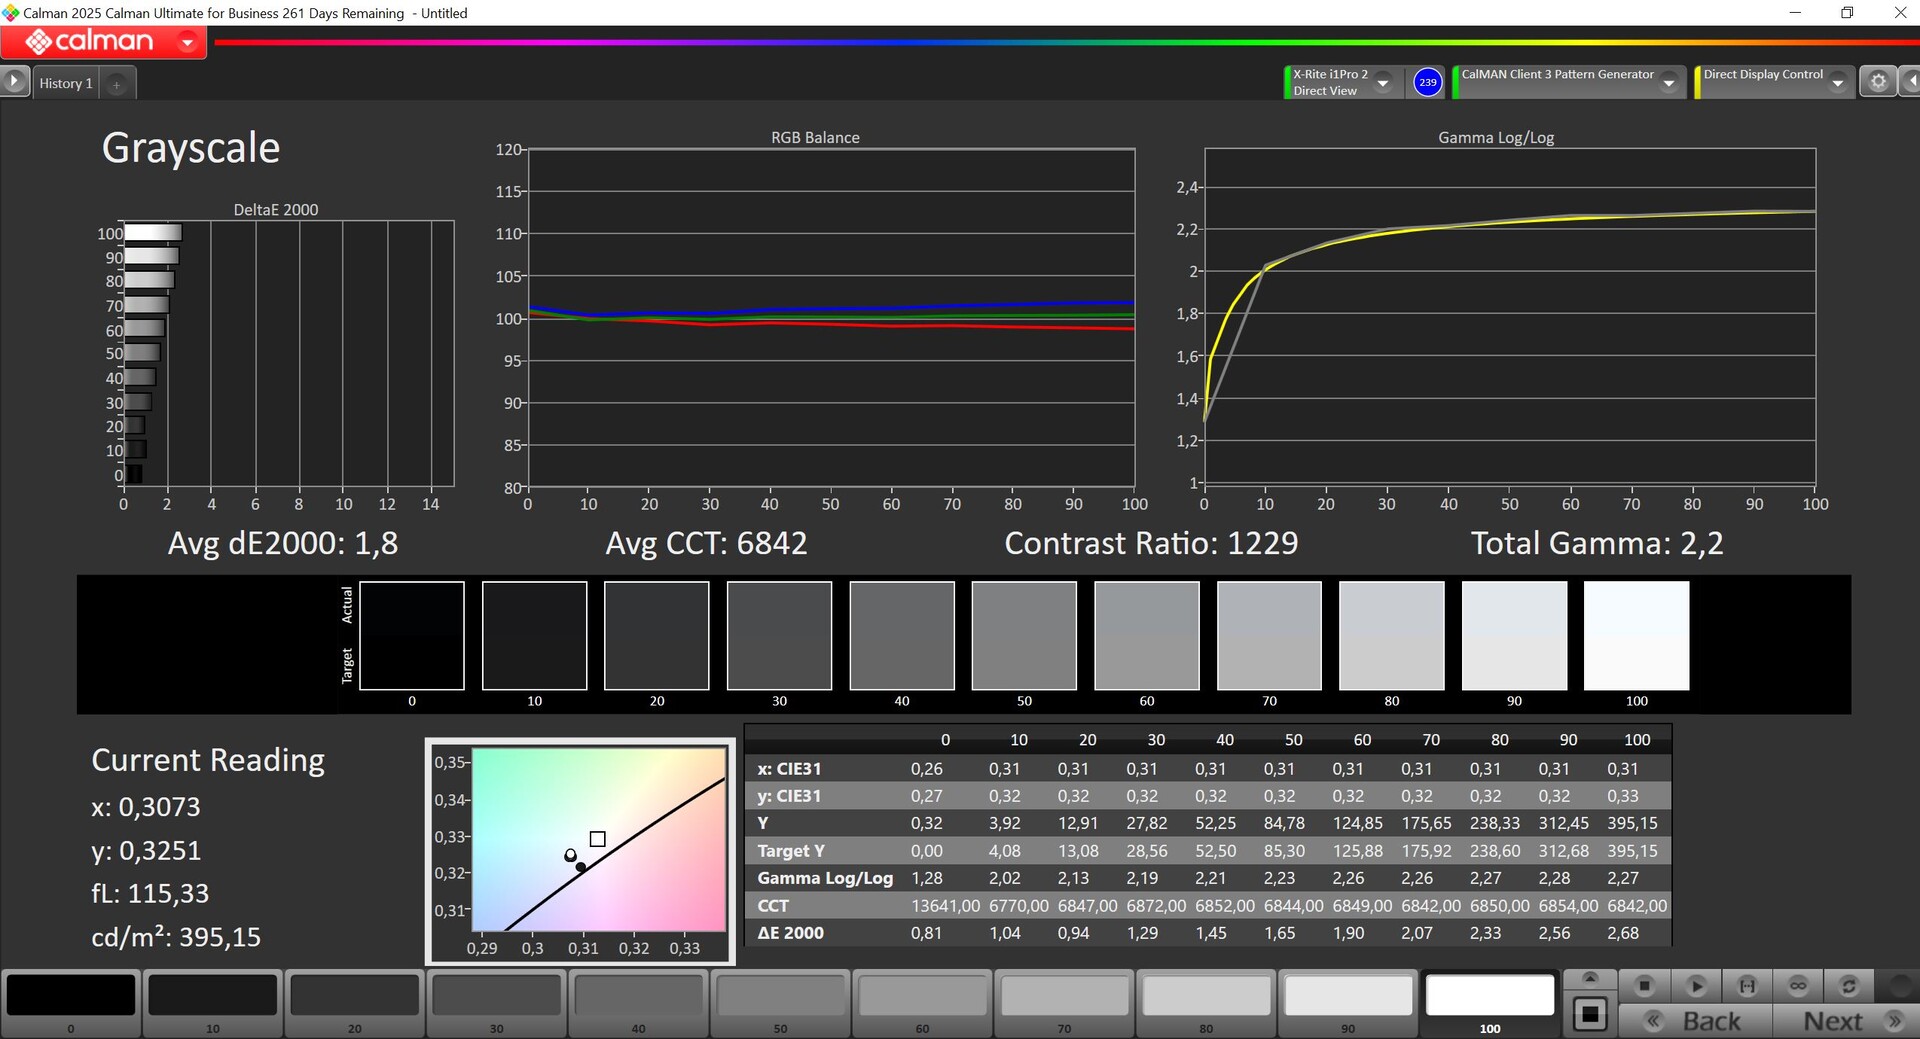
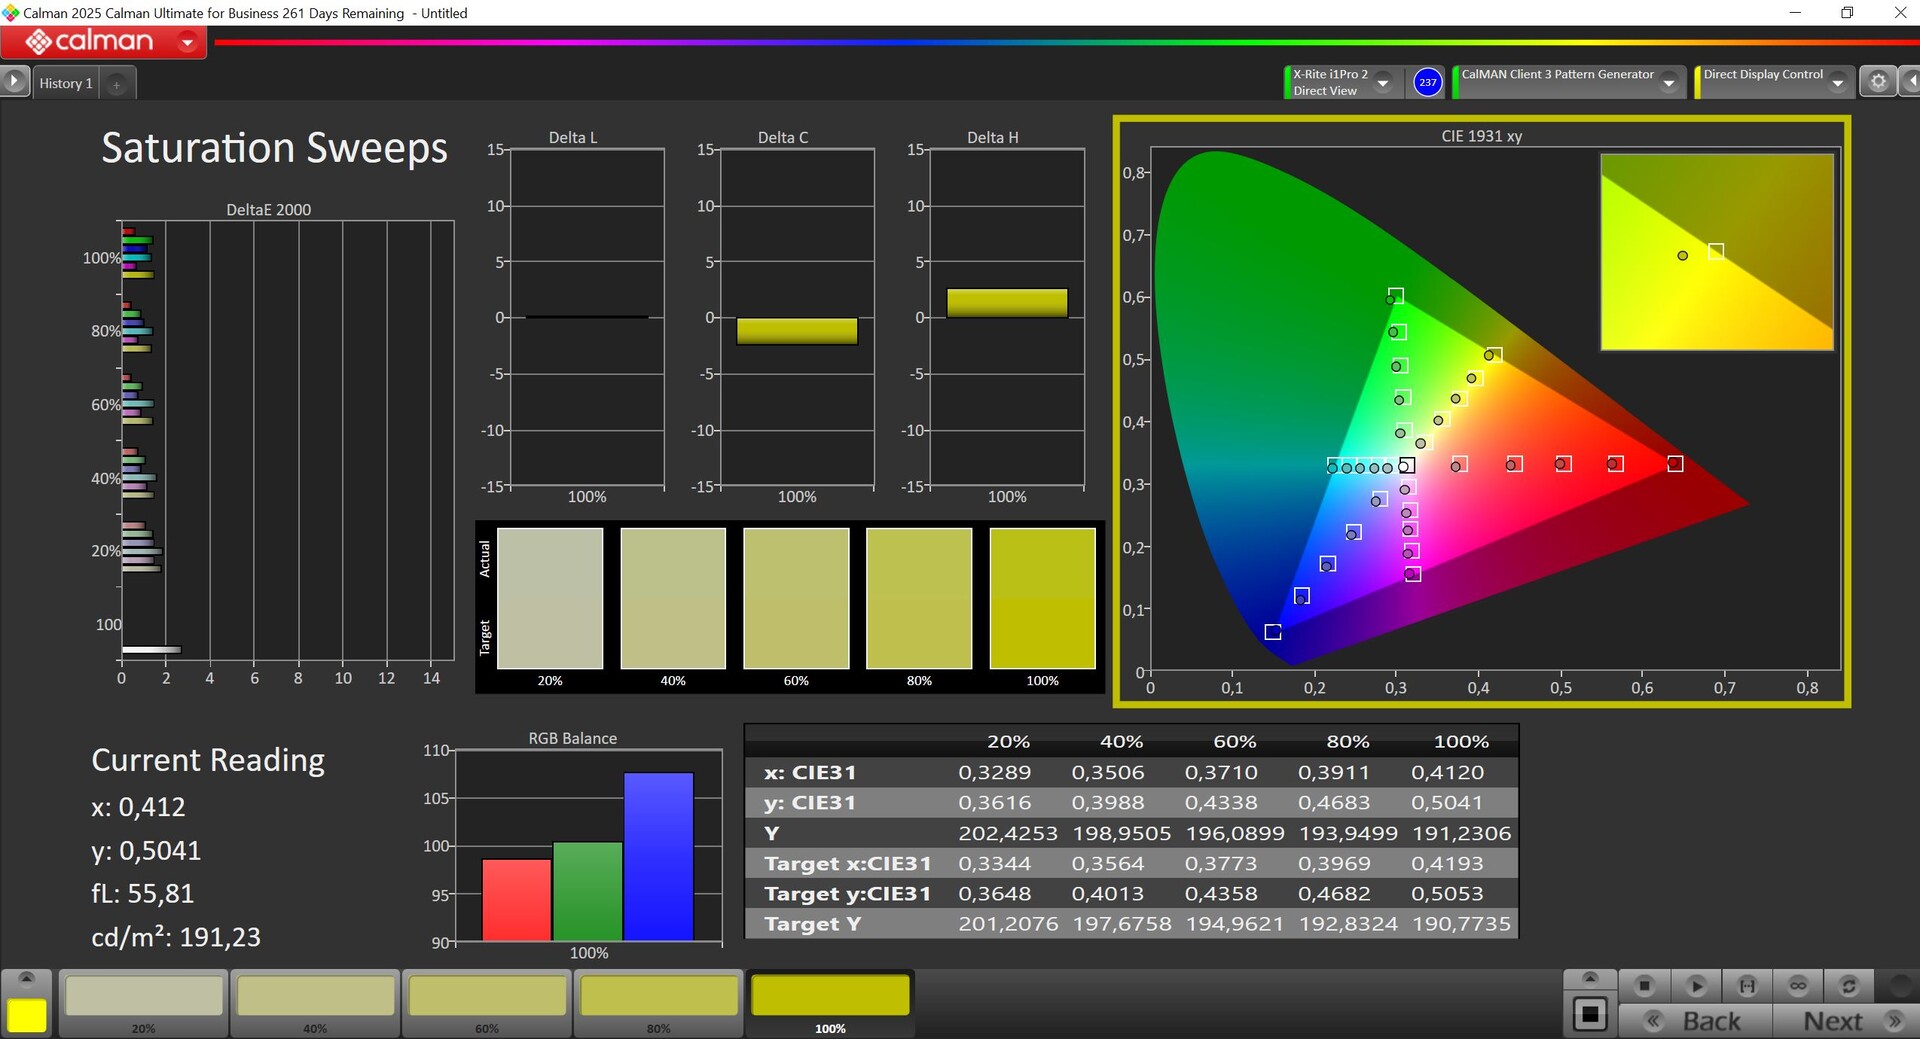
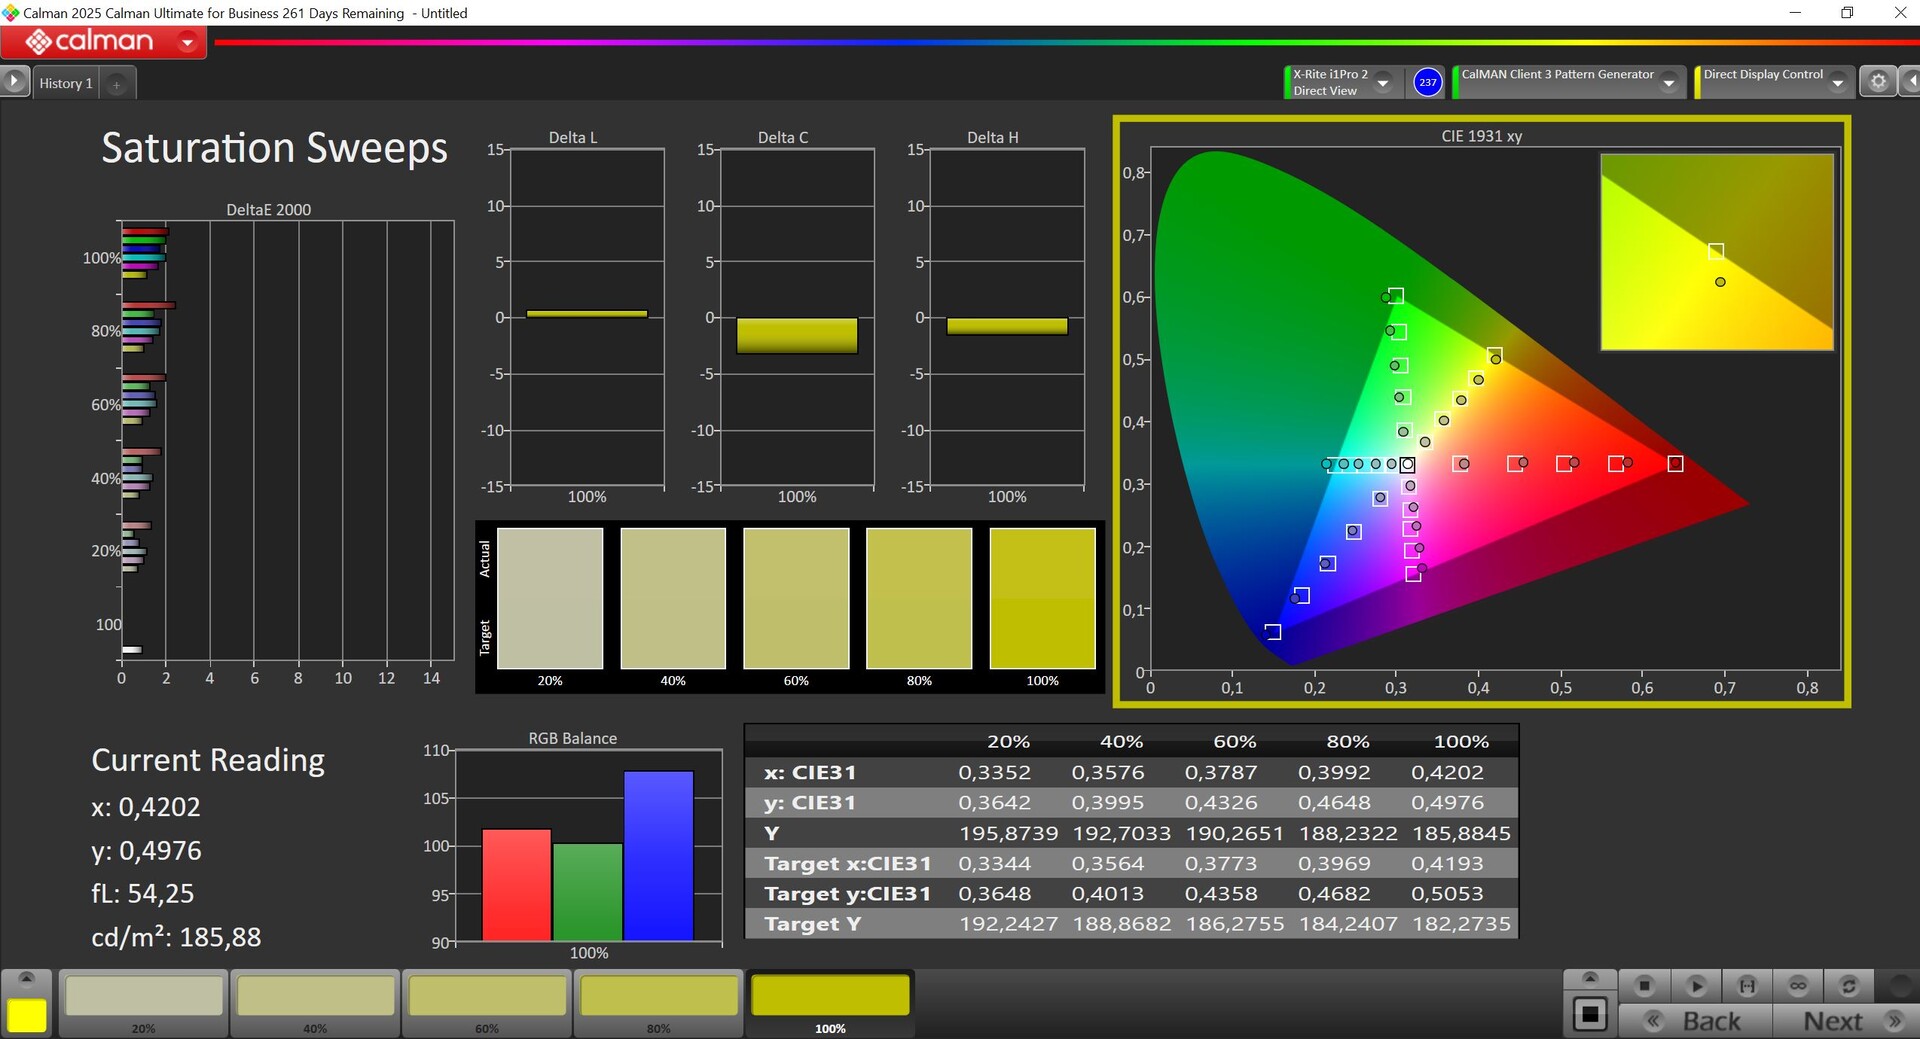
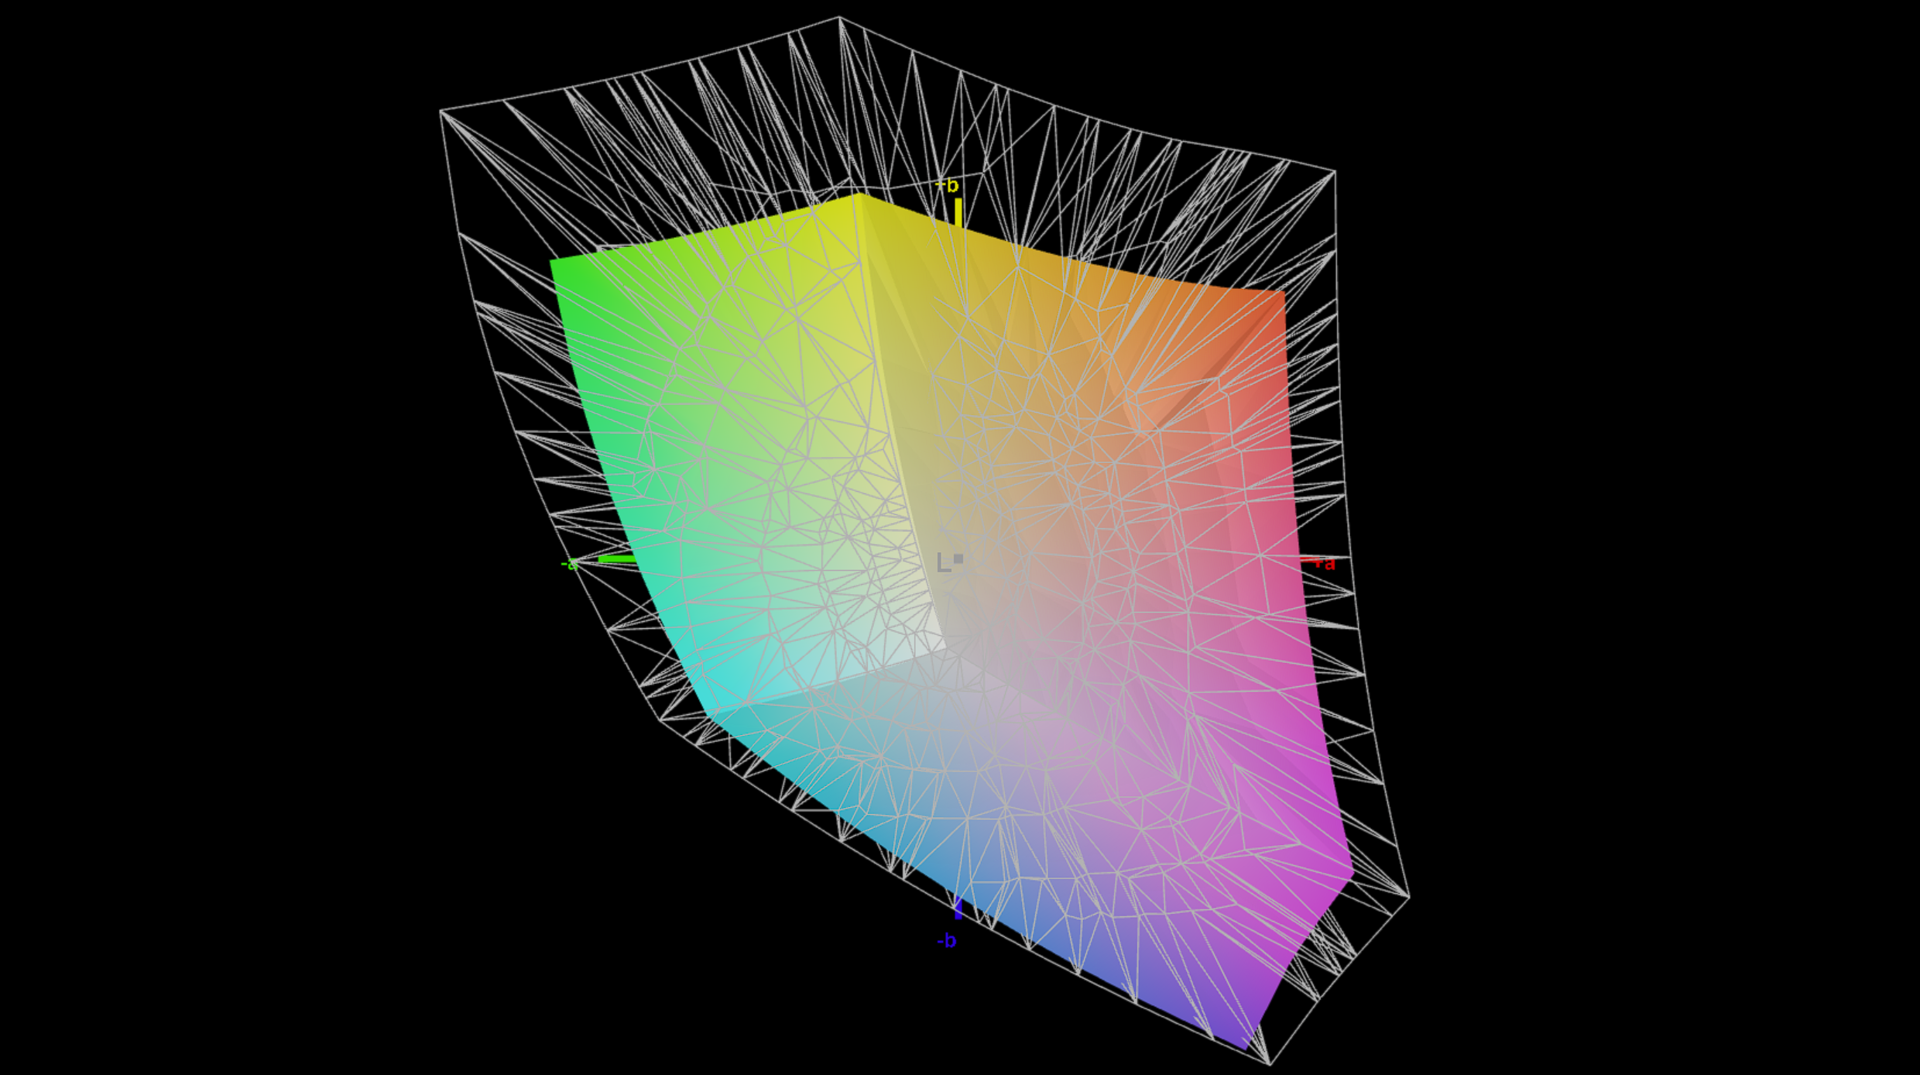
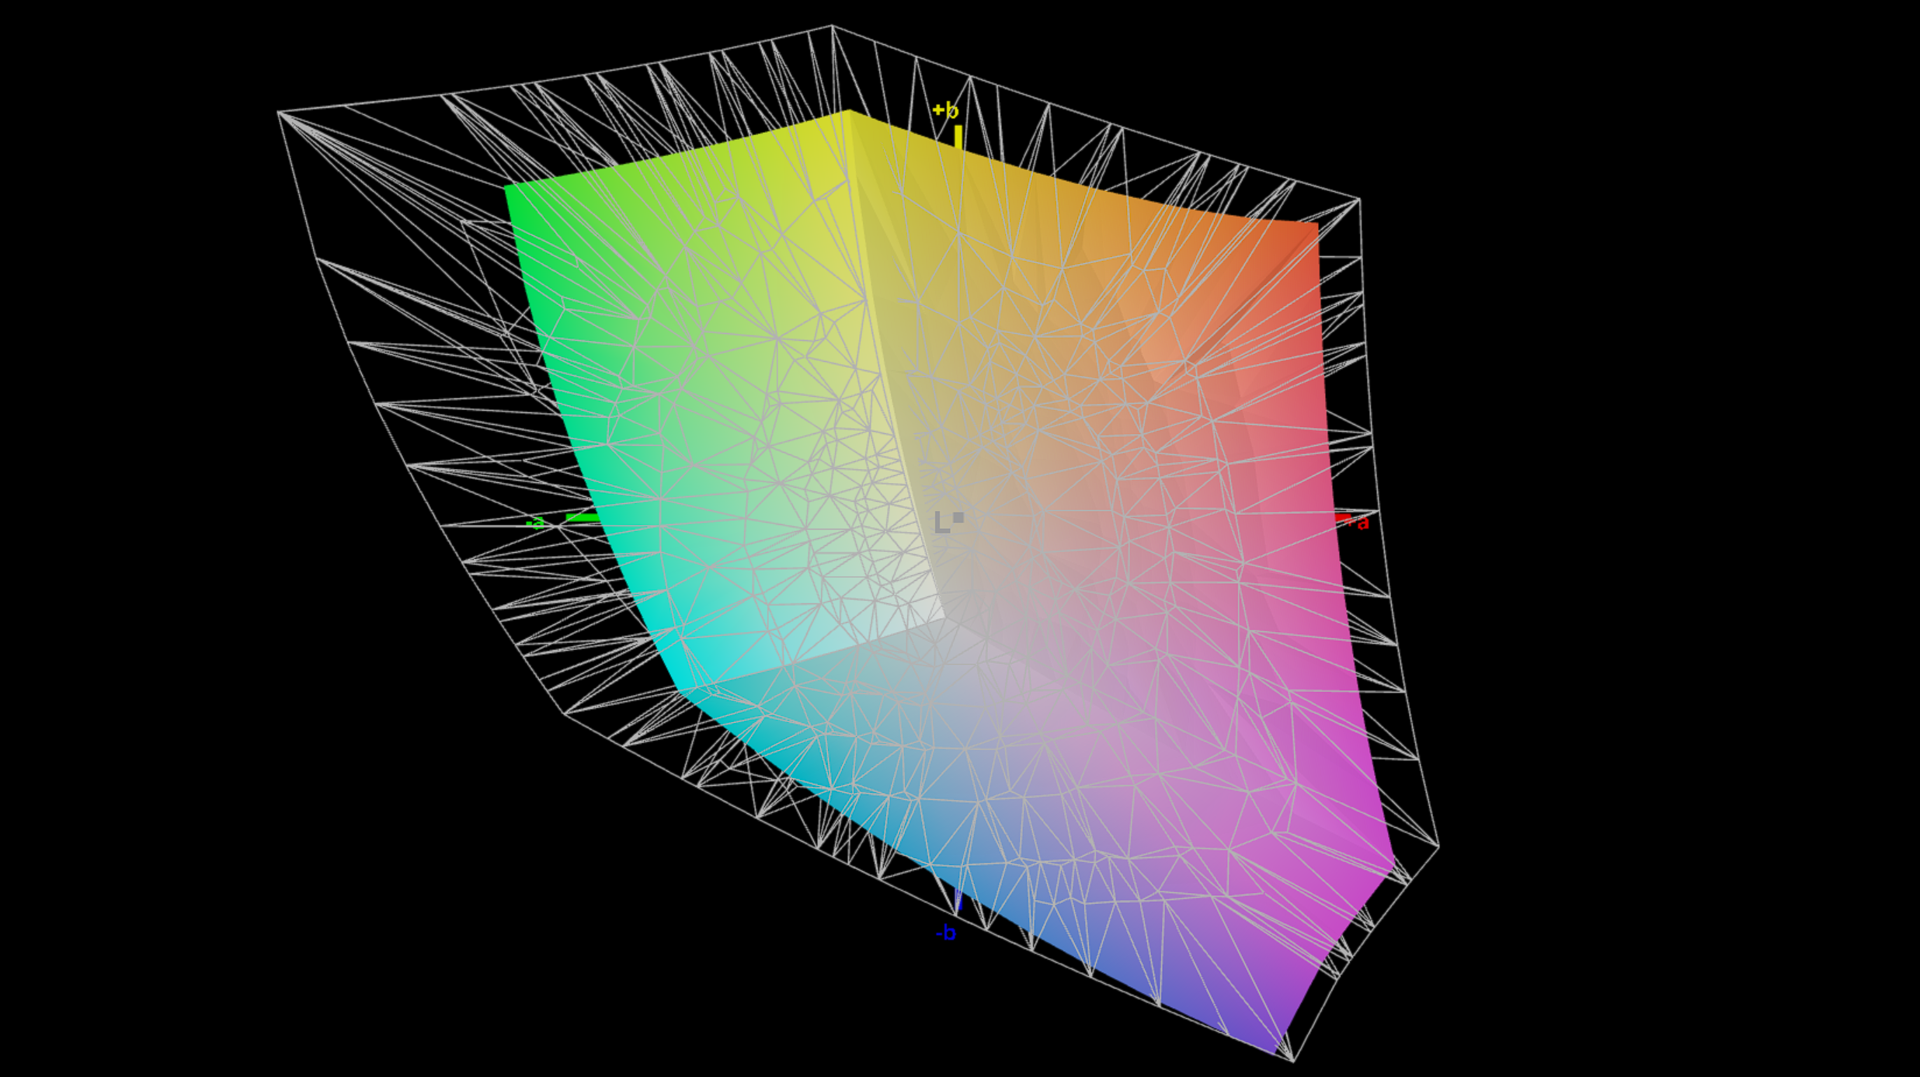
Analysis with the professional Calman Ultimate software from Portrait Displays already shows very accurate colors ex-works, but there is a minimal blue cast and a slightly cooler color temperature.
We can correct this with our own calibration, but the maximum brightness drops by around 25 cd/m². The sRGB color space is fully covered, so the Aero X16 is also suitable for editing images and videos.
| |||||||||||||||||||||||||
Brightness Distribution: 97 %
Center on Battery: 395 cd/m²
Contrast: 1234:1 (Black: 0.32 cd/m²)
ΔE ColorChecker Calman: 1.3 | ∀{0.5-29.43 Ø4.72}
calibrated: 1.4
ΔE Greyscale Calman: 1.8 | ∀{0.09-98 Ø4.97}
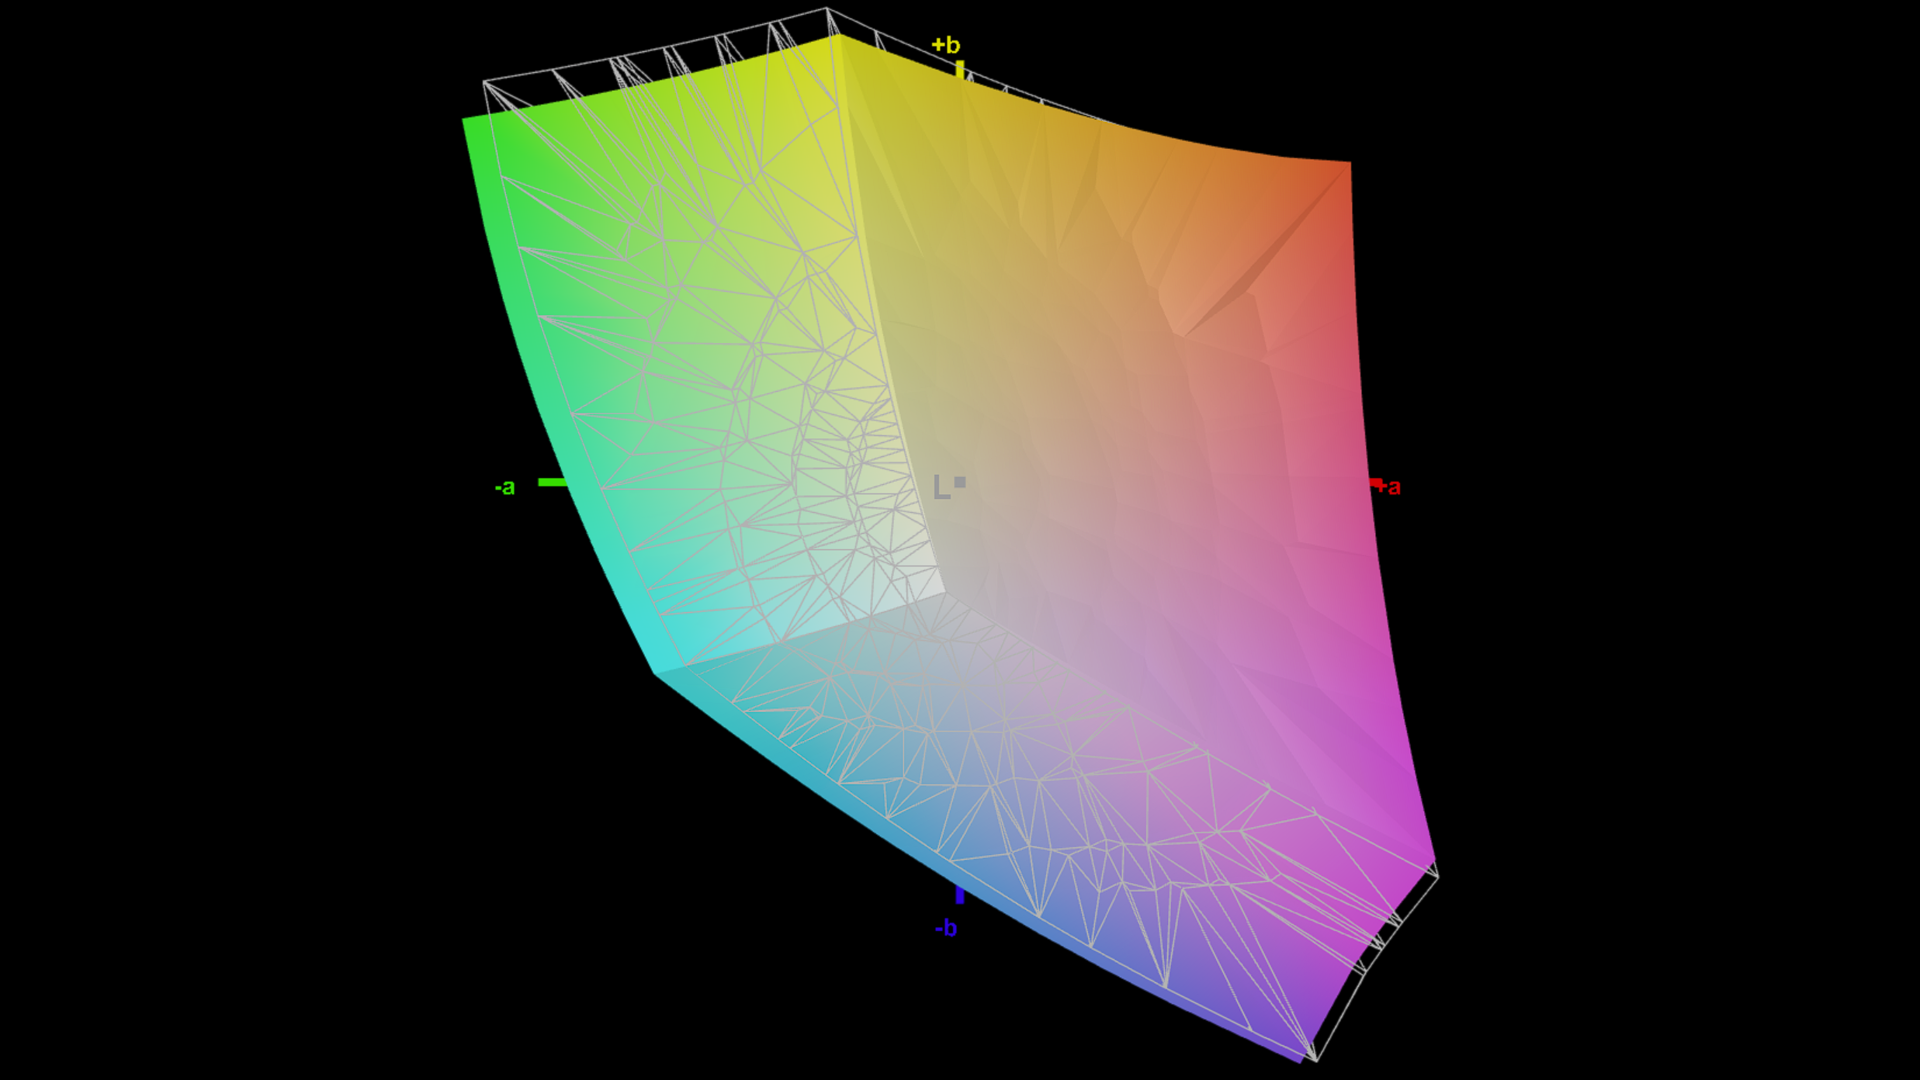
71.2% AdobeRGB 1998 (Argyll 3D)
96.1% sRGB (Argyll 3D)
68.7% Display P3 (Argyll 3D)
Gamma: 2.2
CCT: 6842 K
| Gigabyte Aero X16 1WH MNG007DA5-1, IPS, 2560x1600, 16", 165 Hz | Asus TUF Gaming A16 FA608WV B160UAN08.1 (AUO9BB0), IPS, 1920x1200, 16", 144 Hz | Lenovo Yoga Pro 9 16IMH9 LEN160-3.2K, Mini-LED, 3200x2000, 16", 165 Hz | Dell XPS 16 9640 SDC4196, OLED, 3840x2400, 16.3", 90 Hz | Asus ROG Zephyrus G16 2024 GU605M ATNA60DL01-0, OLED, 2560x1600, 16", 240 Hz | Schenker XMG CORE 16 (L23) BOE0AF0 (), IPS, 2560x1600, 16", 240 Hz | |
|---|---|---|---|---|---|---|
| Display | -41% | 22% | 23% | 28% | 0% | |
| Display P3 Coverage (%) | 68.7 | 39.8 -42% | 97 41% | 98.3 43% | 99.9 45% | 68.3 -1% |
| sRGB Coverage (%) | 96.1 | 59.7 -38% | 99.9 4% | 100 4% | 100 4% | 98.6 3% |
| AdobeRGB 1998 Coverage (%) | 71.2 | 41.1 -42% | 86.6 22% | 87.8 23% | 96.9 36% | 69.6 -2% |
| Response Times | -32% | -145% | 89% | 97% | -14% | |
| Response Time Grey 50% / Grey 80% * (ms) | 12 ? | 13.6 ? -13% | 22.2 ? -85% | 0.82 ? 93% | 0.22 ? 98% | 13.2 ? -10% |
| Response Time Black / White * (ms) | 5.6 ? | 8.4 ? -50% | 17 ? -204% | 0.85 ? 85% | 0.25 ? 96% | 6.6 ? -18% |
| PWM Frequency (Hz) | 4840 ? | 360 ? | 960 ? | |||
| Screen | -147% | 22% | -5% | -7% | -39% | |
| Brightness middle (cd/m²) | 395 | 347 -12% | 651 65% | 366 -7% | 416 5% | 376 -5% |
| Brightness (cd/m²) | 398 | 321 -19% | 673 69% | 367 -8% | 418 5% | 358 -10% |
| Brightness Distribution (%) | 97 | 88 -9% | 93 -4% | 96 -1% | 96 -1% | 88 -9% |
| Black Level * (cd/m²) | 0.32 | 0.3 6% | 0.22 31% | 0.33 -3% | ||
| Contrast (:1) | 1234 | 1157 -6% | 2959 140% | 1139 -8% | ||
| Colorchecker dE 2000 * | 1.3 | 5.89 -353% | 1.9 -46% | 1.3 -0% | 1.6 -23% | 2.74 -111% |
| Colorchecker dE 2000 max. * | 2.8 | 19.26 -588% | 4.2 -50% | 3.6 -29% | 2.1 25% | 6.78 -142% |
| Colorchecker dE 2000 calibrated * | 1.4 | 4.3 -207% | 0.6 57% | 1 29% | 0.88 37% | |
| Greyscale dE 2000 * | 1.8 | 4.27 -137% | 3 -67% | 2.2 -22% | 2.7 -50% | 3.57 -98% |
| Gamma | 2.2 100% | 2.47 89% | 2.18 101% | 2.14 103% | 2.16 102% | 2.4 92% |
| CCT | 6842 95% | 7158 91% | 6738 96% | 6680 97% | 6331 103% | 7246 90% |
| Total Average (Program / Settings) | -73% /
-108% | -34% /
-2% | 36% /
18% | 39% /
22% | -18% /
-27% |
* ... smaller is better


Display Response Times
| ↔ Response Time Black to White | ||
|---|---|---|
| 5.6 ms ... rise ↗ and fall ↘ combined | ↗ 2.1 ms rise | 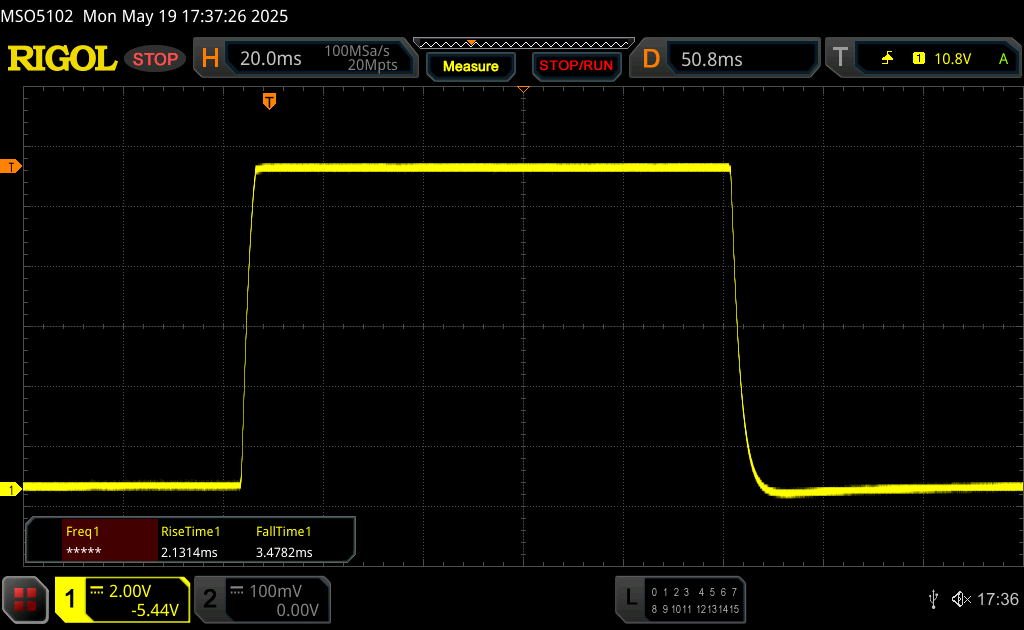 |
| ↘ 3.5 ms fall | ||
| The screen shows very fast response rates in our tests and should be very well suited for fast-paced gaming. In comparison, all tested devices range from 0.1 (minimum) to 240 (maximum) ms. » 18 % of all devices are better. This means that the measured response time is better than the average of all tested devices (19.8 ms). | ||
| ↔ Response Time 50% Grey to 80% Grey | ||
| 12 ms ... rise ↗ and fall ↘ combined | ↗ 5.7 ms rise | 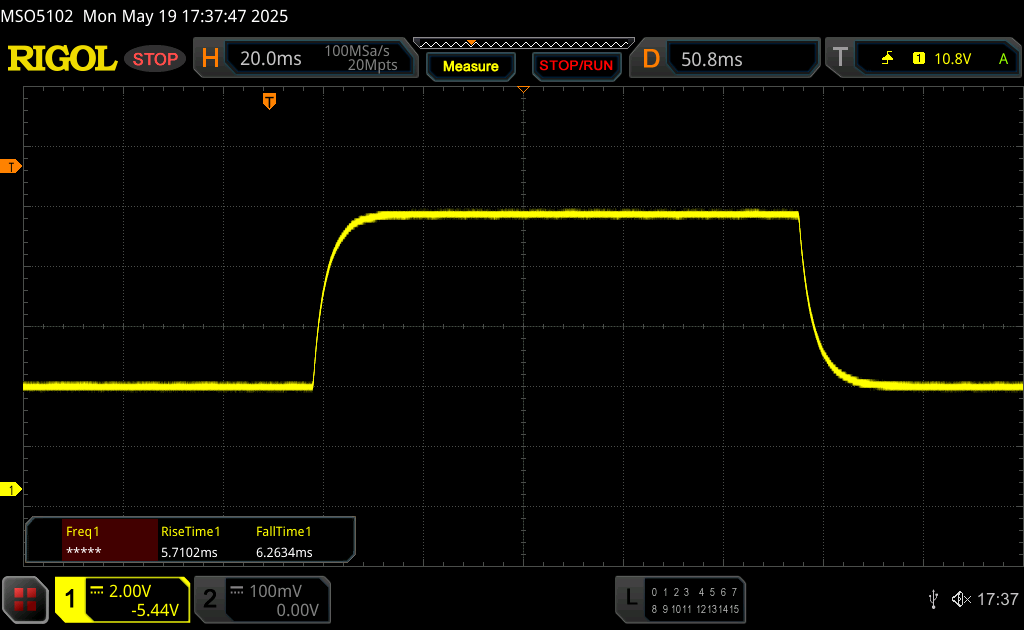 |
| ↘ 6.3 ms fall | ||
| The screen shows good response rates in our tests, but may be too slow for competitive gamers. In comparison, all tested devices range from 0.165 (minimum) to 636 (maximum) ms. » 25 % of all devices are better. This means that the measured response time is better than the average of all tested devices (31 ms). | ||
Screen Flickering / PWM (Pulse-Width Modulation)
| Screen flickering / PWM not detected |  | ||
In comparison: 52 % of all tested devices do not use PWM to dim the display. If PWM was detected, an average of 7763 (minimum: 5 - maximum: 343500) Hz was measured. | |||


Performance: AMD Zen 5 with expandable RAM
Test conditions
Gigabyte offers various energy profiles and extensive setting options with its own GiMATE software. We carried out all benchmarks and measurements in Performance (gaming) mode.
Processor
The AMD Ryzen AI 7 350 (Krackan Point) with eight Zen 5 cores (4x Zen 5 + 4x Zen 5c) is found mainly in cheaper laptops and offers decent performance. The optional Ryzen AI 9 HX 370 would certainly benefit more from the higher 70 W power limit.
Sustained multi-core performance remains completely stable under load. In battery mode (max. 45 W), the multi-core performance drops by only 6%.
Cinebench R15 Multi-core loop
Cinebench 2024: CPU Multi Core | CPU Single Core
Cinebench R23: Multi Core | Single Core
Cinebench R20: CPU (Multi Core) | CPU (Single Core)
Cinebench R15: CPU Multi 64Bit | CPU Single 64Bit
Blender: v2.79 BMW27 CPU
7-Zip 18.03: 7z b 4 | 7z b 4 -mmt1
Geekbench 6.7: Multi-Core | Single-Core
Geekbench 5.5: Multi-Core | Single-Core
HWBOT x265 Benchmark v2.2: 4k Preset
LibreOffice : 20 Documents To PDF
R Benchmark 2.5: Overall mean
| CPU Performance rating | |
| Average of class Gaming | |
| Asus TUF Gaming A16 FA608WV -2! | |
| Lenovo Yoga Pro 9 16IMH9 -2! | |
| Gigabyte Aero X16 1WH | |
| Dell XPS 16 9640 | |
| Schenker XMG CORE 16 (L23) -2! | |
| Average AMD Ryzen AI 7 350 | |
| Asus ROG Zephyrus G16 2024 GU605M | |
| Cinebench 2024 / CPU Multi Core | |
| Average of class Gaming (486 - 2298, n=91, last 2 years) | |
| Dell XPS 16 9640 | |
| Gigabyte Aero X16 1WH | |
| Average AMD Ryzen AI 7 350 (720 - 1011, n=15) | |
| Asus ROG Zephyrus G16 2024 GU605M | |
| Cinebench 2024 / CPU Single Core | |
| Average of class Gaming (95 - 138.2, n=91, last 2 years) | |
| Gigabyte Aero X16 1WH | |
| Average AMD Ryzen AI 7 350 (113.5 - 119, n=15) | |
| Dell XPS 16 9640 | |
| Asus ROG Zephyrus G16 2024 GU605M | |
| Cinebench R23 / Multi Core | |
| Average of class Gaming (10488 - 40970, n=110, last 2 years) | |
| Asus TUF Gaming A16 FA608WV | |
| Lenovo Yoga Pro 9 16IMH9 | |
| Dell XPS 16 9640 | |
| Gigabyte Aero X16 1WH | |
| Asus ROG Zephyrus G16 2024 GU605M | |
| Schenker XMG CORE 16 (L23) | |
| Average AMD Ryzen AI 7 350 (12647 - 18243, n=18) | |
| Cinebench R23 / Single Core | |
| Asus TUF Gaming A16 FA608WV | |
| Average of class Gaming (1166 - 2356, n=110, last 2 years) | |
| Gigabyte Aero X16 1WH | |
| Average AMD Ryzen AI 7 350 (1916 - 2006, n=18) | |
| Lenovo Yoga Pro 9 16IMH9 | |
| Dell XPS 16 9640 | |
| Schenker XMG CORE 16 (L23) | |
| Asus ROG Zephyrus G16 2024 GU605M | |
| Cinebench R20 / CPU (Multi Core) | |
| Average of class Gaming (4029 - 16108, n=109, last 2 years) | |
| Asus TUF Gaming A16 FA608WV | |
| Lenovo Yoga Pro 9 16IMH9 | |
| Dell XPS 16 9640 | |
| Gigabyte Aero X16 1WH | |
| Asus ROG Zephyrus G16 2024 GU605M | |
| Schenker XMG CORE 16 (L23) | |
| Average AMD Ryzen AI 7 350 (4897 - 7067, n=16) | |
| Cinebench R20 / CPU (Single Core) | |
| Asus TUF Gaming A16 FA608WV | |
| Average of class Gaming (442 - 895, n=109, last 2 years) | |
| Gigabyte Aero X16 1WH | |
| Average AMD Ryzen AI 7 350 (751 - 784, n=16) | |
| Lenovo Yoga Pro 9 16IMH9 | |
| Asus ROG Zephyrus G16 2024 GU605M | |
| Schenker XMG CORE 16 (L23) | |
| Dell XPS 16 9640 | |
| Cinebench R15 / CPU Multi 64Bit | |
| Average of class Gaming (1578 - 6271, n=108, last 2 years) | |
| Asus TUF Gaming A16 FA608WV | |
| Lenovo Yoga Pro 9 16IMH9 | |
| Dell XPS 16 9640 | |
| Schenker XMG CORE 16 (L23) | |
| Asus ROG Zephyrus G16 2024 GU605M | |
| Average AMD Ryzen AI 7 350 (1932 - 2734, n=17) | |
| Gigabyte Aero X16 1WH | |
| Cinebench R15 / CPU Single 64Bit | |
| Asus TUF Gaming A16 FA608WV | |
| Average of class Gaming (188.8 - 343, n=109, last 2 years) | |
| Lenovo Yoga Pro 9 16IMH9 | |
| Average AMD Ryzen AI 7 350 (203 - 305, n=17) | |
| Schenker XMG CORE 16 (L23) | |
| Asus ROG Zephyrus G16 2024 GU605M | |
| Dell XPS 16 9640 | |
| Gigabyte Aero X16 1WH | |
| Blender / v2.79 BMW27 CPU | |
| Average AMD Ryzen AI 7 350 (181 - 386, n=17) | |
| Asus ROG Zephyrus G16 2024 GU605M | |
| Schenker XMG CORE 16 (L23) | |
| Gigabyte Aero X16 1WH | |
| Dell XPS 16 9640 | |
| Lenovo Yoga Pro 9 16IMH9 | |
| Average of class Gaming (80 - 330, n=107, last 2 years) | |
| Asus TUF Gaming A16 FA608WV | |
| 7-Zip 18.03 / 7z b 4 | |
| Average of class Gaming (33491 - 148086, n=108, last 2 years) | |
| Asus TUF Gaming A16 FA608WV | |
| Lenovo Yoga Pro 9 16IMH9 | |
| Schenker XMG CORE 16 (L23) | |
| Dell XPS 16 9640 | |
| Asus ROG Zephyrus G16 2024 GU605M | |
| Gigabyte Aero X16 1WH | |
| Average AMD Ryzen AI 7 350 (48124 - 64653, n=16) | |
| 7-Zip 18.03 / 7z b 4 -mmt1 | |
| Schenker XMG CORE 16 (L23) | |
| Average of class Gaming (4199 - 7436, n=108, last 2 years) | |
| Asus TUF Gaming A16 FA608WV | |
| Gigabyte Aero X16 1WH | |
| Average AMD Ryzen AI 7 350 (4609 - 6371, n=16) | |
| Lenovo Yoga Pro 9 16IMH9 | |
| Dell XPS 16 9640 | |
| Asus ROG Zephyrus G16 2024 GU605M | |
| Geekbench 6.7 / Multi-Core | |
| Average of class Gaming (6625 - 22104, n=109, last 2 years) | |
| Lenovo Yoga Pro 9 16IMH9 | |
| Gigabyte Aero X16 1WH | |
| Asus TUF Gaming A16 FA608WV | |
| Dell XPS 16 9640 | |
| Asus ROG Zephyrus G16 2024 GU605M | |
| Schenker XMG CORE 16 (L23) | |
| Average AMD Ryzen AI 7 350 (10774 - 14194, n=17) | |
| Geekbench 6.7 / Single-Core | |
| Asus TUF Gaming A16 FA608WV | |
| Gigabyte Aero X16 1WH | |
| Average of class Gaming (1490 - 3259, n=109, last 2 years) | |
| Average AMD Ryzen AI 7 350 (1874 - 2942, n=17) | |
| Schenker XMG CORE 16 (L23) | |
| Lenovo Yoga Pro 9 16IMH9 | |
| Dell XPS 16 9640 | |
| Asus ROG Zephyrus G16 2024 GU605M | |
| Geekbench 5.5 / Multi-Core | |
| Average of class Gaming (6460 - 27010, n=108, last 2 years) | |
| Asus TUF Gaming A16 FA608WV | |
| Lenovo Yoga Pro 9 16IMH9 | |
| Dell XPS 16 9640 | |
| Asus ROG Zephyrus G16 2024 GU605M | |
| Gigabyte Aero X16 1WH | |
| Schenker XMG CORE 16 (L23) | |
| Average AMD Ryzen AI 7 350 (6705 - 12968, n=18) | |
| Geekbench 5.5 / Single-Core | |
| Asus TUF Gaming A16 FA608WV | |
| Gigabyte Aero X16 1WH | |
| Average of class Gaming (986 - 2474, n=108, last 2 years) | |
| Schenker XMG CORE 16 (L23) | |
| Lenovo Yoga Pro 9 16IMH9 | |
| Average AMD Ryzen AI 7 350 (805 - 2155, n=18) | |
| Dell XPS 16 9640 | |
| Asus ROG Zephyrus G16 2024 GU605M | |
| HWBOT x265 Benchmark v2.2 / 4k Preset | |
| Average of class Gaming (11.5 - 44.3, n=108, last 2 years) | |
| Asus TUF Gaming A16 FA608WV | |
| Lenovo Yoga Pro 9 16IMH9 | |
| Gigabyte Aero X16 1WH | |
| Schenker XMG CORE 16 (L23) | |
| Dell XPS 16 9640 | |
| Asus ROG Zephyrus G16 2024 GU605M | |
| Average AMD Ryzen AI 7 350 (14 - 22.9, n=16) | |
| LibreOffice / 20 Documents To PDF | |
| Schenker XMG CORE 16 (L23) | |
| Average AMD Ryzen AI 7 350 (43.3 - 88.8, n=16) | |
| Gigabyte Aero X16 1WH | |
| Asus ROG Zephyrus G16 2024 GU605M | |
| Average of class Gaming (19 - 88.8, n=108, last 2 years) | |
| Asus TUF Gaming A16 FA608WV | |
| Dell XPS 16 9640 | |
| Lenovo Yoga Pro 9 16IMH9 | |
| R Benchmark 2.5 / Overall mean | |
| Dell XPS 16 9640 | |
| Asus ROG Zephyrus G16 2024 GU605M | |
| Lenovo Yoga Pro 9 16IMH9 | |
| Schenker XMG CORE 16 (L23) | |
| Average AMD Ryzen AI 7 350 (0.403 - 0.565, n=16) | |
| Average of class Gaming (0.3439 - 0.759, n=109, last 2 years) | |
| Asus TUF Gaming A16 FA608WV | |
| Gigabyte Aero X16 1WH | |
* ... smaller is better
AIDA64: FP32 Ray-Trace | FPU Julia | CPU SHA3 | CPU Queen | FPU SinJulia | FPU Mandel | CPU AES | CPU ZLib | FP64 Ray-Trace | CPU PhotoWorxx
| Performance rating | |
| Asus TUF Gaming A16 FA608WV | |
| Average of class Gaming | |
| Schenker XMG CORE 16 (L23) | |
| Gigabyte Aero X16 1WH | |
| Lenovo Yoga Pro 9 16IMH9 | |
| Average AMD Ryzen AI 7 350 | |
| Dell XPS 16 9640 | |
| Asus ROG Zephyrus G16 2024 GU605M | |
| AIDA64 / FP32 Ray-Trace | |
| Asus TUF Gaming A16 FA608WV | |
| Average of class Gaming (10227 - 85542, n=107, last 2 years) | |
| Schenker XMG CORE 16 (L23) | |
| Gigabyte Aero X16 1WH | |
| Average AMD Ryzen AI 7 350 (20203 - 28112, n=16) | |
| Lenovo Yoga Pro 9 16IMH9 | |
| Dell XPS 16 9640 | |
| Asus ROG Zephyrus G16 2024 GU605M | |
| AIDA64 / FPU Julia | |
| Asus TUF Gaming A16 FA608WV | |
| Average of class Gaming (51376 - 238426, n=107, last 2 years) | |
| Schenker XMG CORE 16 (L23) | |
| Gigabyte Aero X16 1WH | |
| Average AMD Ryzen AI 7 350 (75098 - 110301, n=16) | |
| Lenovo Yoga Pro 9 16IMH9 | |
| Dell XPS 16 9640 | |
| Asus ROG Zephyrus G16 2024 GU605M | |
| AIDA64 / CPU SHA3 | |
| Average of class Gaming (2180 - 9817, n=107, last 2 years) | |
| Asus TUF Gaming A16 FA608WV | |
| Schenker XMG CORE 16 (L23) | |
| Gigabyte Aero X16 1WH | |
| Lenovo Yoga Pro 9 16IMH9 | |
| Dell XPS 16 9640 | |
| Average AMD Ryzen AI 7 350 (3395 - 4399, n=16) | |
| Asus ROG Zephyrus G16 2024 GU605M | |
| AIDA64 / CPU Queen | |
| Average of class Gaming (49785 - 173351, n=94, last 2 years) | |
| Schenker XMG CORE 16 (L23) | |
| Asus TUF Gaming A16 FA608WV | |
| Lenovo Yoga Pro 9 16IMH9 | |
| Asus ROG Zephyrus G16 2024 GU605M | |
| Dell XPS 16 9640 | |
| Gigabyte Aero X16 1WH | |
| Average AMD Ryzen AI 7 350 (67317 - 77400, n=16) | |
| AIDA64 / FPU SinJulia | |
| Asus TUF Gaming A16 FA608WV | |
| Schenker XMG CORE 16 (L23) | |
| Average of class Gaming (4424 - 33636, n=107, last 2 years) | |
| Gigabyte Aero X16 1WH | |
| Average AMD Ryzen AI 7 350 (11916 - 13856, n=16) | |
| Lenovo Yoga Pro 9 16IMH9 | |
| Asus ROG Zephyrus G16 2024 GU605M | |
| Dell XPS 16 9640 | |
| AIDA64 / FPU Mandel | |
| Asus TUF Gaming A16 FA608WV | |
| Average of class Gaming (25115 - 128721, n=107, last 2 years) | |
| Schenker XMG CORE 16 (L23) | |
| Gigabyte Aero X16 1WH | |
| Average AMD Ryzen AI 7 350 (39456 - 59540, n=15) | |
| Lenovo Yoga Pro 9 16IMH9 | |
| Dell XPS 16 9640 | |
| Asus ROG Zephyrus G16 2024 GU605M | |
| AIDA64 / CPU AES | |
| Average of class Gaming (39258 - 247074, n=107, last 2 years) | |
| Lenovo Yoga Pro 9 16IMH9 | |
| Schenker XMG CORE 16 (L23) | |
| Gigabyte Aero X16 1WH | |
| Dell XPS 16 9640 | |
| Asus TUF Gaming A16 FA608WV | |
| Asus ROG Zephyrus G16 2024 GU605M | |
| Average AMD Ryzen AI 7 350 (56915 - 87670, n=16) | |
| AIDA64 / CPU ZLib | |
| Average of class Gaming (574 - 2531, n=107, last 2 years) | |
| Asus TUF Gaming A16 FA608WV | |
| Lenovo Yoga Pro 9 16IMH9 | |
| Dell XPS 16 9640 | |
| Gigabyte Aero X16 1WH | |
| Asus ROG Zephyrus G16 2024 GU605M | |
| Schenker XMG CORE 16 (L23) | |
| Average AMD Ryzen AI 7 350 (663 - 1140, n=16) | |
| AIDA64 / FP64 Ray-Trace | |
| Asus TUF Gaming A16 FA608WV | |
| Average of class Gaming (5509 - 45446, n=107, last 2 years) | |
| Gigabyte Aero X16 1WH | |
| Schenker XMG CORE 16 (L23) | |
| Average AMD Ryzen AI 7 350 (10707 - 15222, n=15) | |
| Lenovo Yoga Pro 9 16IMH9 | |
| Dell XPS 16 9640 | |
| Asus ROG Zephyrus G16 2024 GU605M | |
| AIDA64 / CPU PhotoWorxx | |
| Lenovo Yoga Pro 9 16IMH9 | |
| Dell XPS 16 9640 | |
| Asus ROG Zephyrus G16 2024 GU605M | |
| Average of class Gaming (12271 - 89891, n=107, last 2 years) | |
| Gigabyte Aero X16 1WH | |
| Schenker XMG CORE 16 (L23) | |
| Average AMD Ryzen AI 7 350 (25170 - 47405, n=16) | |
| Asus TUF Gaming A16 FA608WV | |
System performance
The Aero X16 performs well in the system benchmarks and there were no problems in everyday use either, as all apps worked without delay.
PCMark 10: Score | Essentials | Productivity | Digital Content Creation
CrossMark: Overall | Productivity | Creativity | Responsiveness
WebXPRT 3: Overall
WebXPRT 4: Overall
Mozilla Kraken 1.1: Total
| Performance rating | |
| Average of class Gaming | |
| Dell XPS 16 9640 -1! | |
| Average AMD Ryzen AI 7 350, NVIDIA GeForce RTX 5070 Laptop | |
| Gigabyte Aero X16 1WH | |
| Asus TUF Gaming A16 FA608WV | |
| Schenker XMG CORE 16 (L23) -1! | |
| Lenovo Yoga Pro 9 16IMH9 | |
| Asus ROG Zephyrus G16 2024 GU605M | |
| PCMark 10 / Score | |
| Average of class Gaming (5828 - 11574, n=95, last 2 years) | |
| Average AMD Ryzen AI 7 350, NVIDIA GeForce RTX 5070 Laptop (7717 - 8986, n=3) | |
| Schenker XMG CORE 16 (L23) | |
| Gigabyte Aero X16 1WH | |
| Asus TUF Gaming A16 FA608WV | |
| Lenovo Yoga Pro 9 16IMH9 | |
| Asus ROG Zephyrus G16 2024 GU605M | |
| Dell XPS 16 9640 | |
| PCMark 10 / Essentials | |
| Lenovo Yoga Pro 9 16IMH9 | |
| Schenker XMG CORE 16 (L23) | |
| Average AMD Ryzen AI 7 350, NVIDIA GeForce RTX 5070 Laptop (10496 - 11793, n=3) | |
| Average of class Gaming (8810 - 12600, n=99, last 2 years) | |
| Asus TUF Gaming A16 FA608WV | |
| Gigabyte Aero X16 1WH | |
| Dell XPS 16 9640 | |
| Asus ROG Zephyrus G16 2024 GU605M | |
| PCMark 10 / Productivity | |
| Average AMD Ryzen AI 7 350, NVIDIA GeForce RTX 5070 Laptop (10416 - 15127, n=3) | |
| Average of class Gaming (6845 - 21327, n=97, last 2 years) | |
| Schenker XMG CORE 16 (L23) | |
| Gigabyte Aero X16 1WH | |
| Asus TUF Gaming A16 FA608WV | |
| Asus ROG Zephyrus G16 2024 GU605M | |
| Dell XPS 16 9640 | |
| Lenovo Yoga Pro 9 16IMH9 | |
| PCMark 10 / Digital Content Creation | |
| Average of class Gaming (7602 - 19657, n=97, last 2 years) | |
| Schenker XMG CORE 16 (L23) | |
| Asus TUF Gaming A16 FA608WV | |
| Gigabyte Aero X16 1WH | |
| Lenovo Yoga Pro 9 16IMH9 | |
| Average AMD Ryzen AI 7 350, NVIDIA GeForce RTX 5070 Laptop (9858 - 12404, n=3) | |
| Asus ROG Zephyrus G16 2024 GU605M | |
| Dell XPS 16 9640 | |
| CrossMark / Overall | |
| Average of class Gaming (1366 - 2409, n=96, last 2 years) | |
| Dell XPS 16 9640 | |
| Average AMD Ryzen AI 7 350, NVIDIA GeForce RTX 5070 Laptop (1719 - 1858, n=3) | |
| Asus TUF Gaming A16 FA608WV | |
| Gigabyte Aero X16 1WH | |
| Asus ROG Zephyrus G16 2024 GU605M | |
| Lenovo Yoga Pro 9 16IMH9 | |
| Schenker XMG CORE 16 (L23) | |
| CrossMark / Productivity | |
| Average of class Gaming (1386 - 2254, n=96, last 2 years) | |
| Dell XPS 16 9640 | |
| Average AMD Ryzen AI 7 350, NVIDIA GeForce RTX 5070 Laptop (1635 - 1732, n=3) | |
| Gigabyte Aero X16 1WH | |
| Schenker XMG CORE 16 (L23) | |
| Asus ROG Zephyrus G16 2024 GU605M | |
| Lenovo Yoga Pro 9 16IMH9 | |
| Asus TUF Gaming A16 FA608WV | |
| CrossMark / Creativity | |
| Average of class Gaming (1343 - 2729, n=96, last 2 years) | |
| Asus TUF Gaming A16 FA608WV | |
| Dell XPS 16 9640 | |
| Average AMD Ryzen AI 7 350, NVIDIA GeForce RTX 5070 Laptop (1956 - 2077, n=3) | |
| Lenovo Yoga Pro 9 16IMH9 | |
| Gigabyte Aero X16 1WH | |
| Asus ROG Zephyrus G16 2024 GU605M | |
| Schenker XMG CORE 16 (L23) | |
| CrossMark / Responsiveness | |
| Average of class Gaming (1226 - 2334, n=96, last 2 years) | |
| Dell XPS 16 9640 | |
| Average AMD Ryzen AI 7 350, NVIDIA GeForce RTX 5070 Laptop (1357 - 1642, n=3) | |
| Gigabyte Aero X16 1WH | |
| Schenker XMG CORE 16 (L23) | |
| Asus ROG Zephyrus G16 2024 GU605M | |
| Asus TUF Gaming A16 FA608WV | |
| Lenovo Yoga Pro 9 16IMH9 | |
| WebXPRT 3 / Overall | |
| Gigabyte Aero X16 1WH | |
| Average of class Gaming (220 - 532, n=100, last 2 years) | |
| Average AMD Ryzen AI 7 350, NVIDIA GeForce RTX 5070 Laptop (288 - 336, n=3) | |
| Lenovo Yoga Pro 9 16IMH9 | |
| Schenker XMG CORE 16 (L23) | |
| Asus ROG Zephyrus G16 2024 GU605M | |
| Dell XPS 16 9640 | |
| Asus TUF Gaming A16 FA608WV | |
| WebXPRT 4 / Overall | |
| Average of class Gaming (165 - 354, n=101, last 2 years) | |
| Gigabyte Aero X16 1WH | |
| Asus TUF Gaming A16 FA608WV | |
| Lenovo Yoga Pro 9 16IMH9 | |
| Average AMD Ryzen AI 7 350, NVIDIA GeForce RTX 5070 Laptop (246 - 277, n=3) | |
| Asus ROG Zephyrus G16 2024 GU605M | |
| Dell XPS 16 9640 | |
| Mozilla Kraken 1.1 / Total | |
| Asus ROG Zephyrus G16 2024 GU605M | |
| Schenker XMG CORE 16 (L23) | |
| Lenovo Yoga Pro 9 16IMH9 | |
| Average of class Gaming (391 - 590, n=104, last 2 years) | |
| Average AMD Ryzen AI 7 350, NVIDIA GeForce RTX 5070 Laptop (431 - 470, n=2) | |
| Gigabyte Aero X16 1WH | |
| Asus TUF Gaming A16 FA608WV | |
* ... smaller is better
| PCMark 10 Score | 7925 points | |
Help | ||
| AIDA64 / Memory Copy | |
| Lenovo Yoga Pro 9 16IMH9 | |
| Dell XPS 16 9640 | |
| Asus TUF Gaming A16 FA608WV | |
| Asus ROG Zephyrus G16 2024 GU605M | |
| Average AMD Ryzen AI 7 350 (37823 - 106997, n=16) | |
| Gigabyte Aero X16 1WH | |
| Average of class Gaming (21750 - 129946, n=107, last 2 years) | |
| Schenker XMG CORE 16 (L23) | |
| AIDA64 / Memory Read | |
| Asus TUF Gaming A16 FA608WV | |
| Lenovo Yoga Pro 9 16IMH9 | |
| Asus ROG Zephyrus G16 2024 GU605M | |
| Dell XPS 16 9640 | |
| Average of class Gaming (22956 - 118858, n=107, last 2 years) | |
| Gigabyte Aero X16 1WH | |
| Schenker XMG CORE 16 (L23) | |
| Average AMD Ryzen AI 7 350 (43921 - 63650, n=16) | |
| AIDA64 / Memory Write | |
| Asus TUF Gaming A16 FA608WV | |
| Average AMD Ryzen AI 7 350 (42576 - 110817, n=16) | |
| Gigabyte Aero X16 1WH | |
| Schenker XMG CORE 16 (L23) | |
| Average of class Gaming (22297 - 135096, n=107, last 2 years) | |
| Lenovo Yoga Pro 9 16IMH9 | |
| Dell XPS 16 9640 | |
| Asus ROG Zephyrus G16 2024 GU605M | |
| AIDA64 / Memory Latency | |
| Asus ROG Zephyrus G16 2024 GU605M | |
| Dell XPS 16 9640 | |
| Lenovo Yoga Pro 9 16IMH9 | |
| Asus TUF Gaming A16 FA608WV | |
| Average of class Gaming (75.3 - 259, n=107, last 2 years) | |
| Average AMD Ryzen AI 7 350 (87.7 - 109.8, n=16) | |
| Gigabyte Aero X16 1WH | |
| Schenker XMG CORE 16 (L23) | |
* ... smaller is better
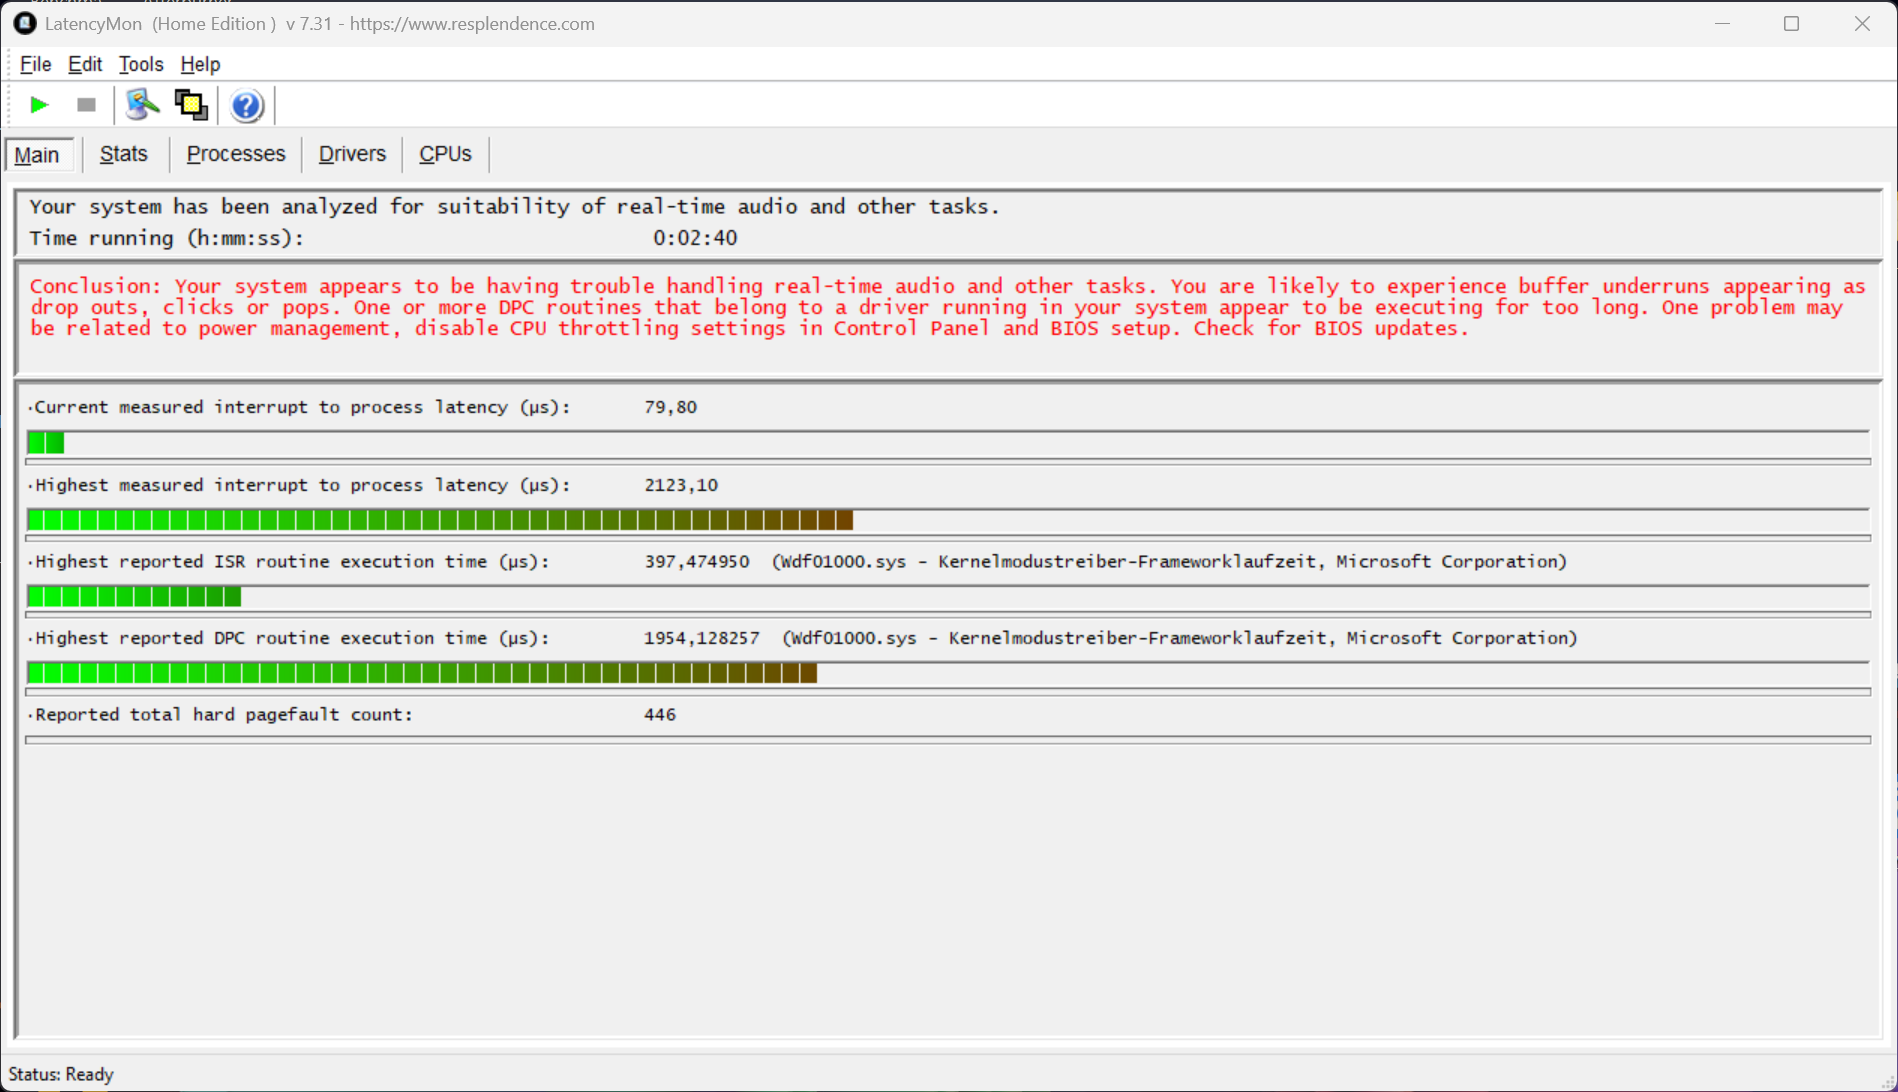
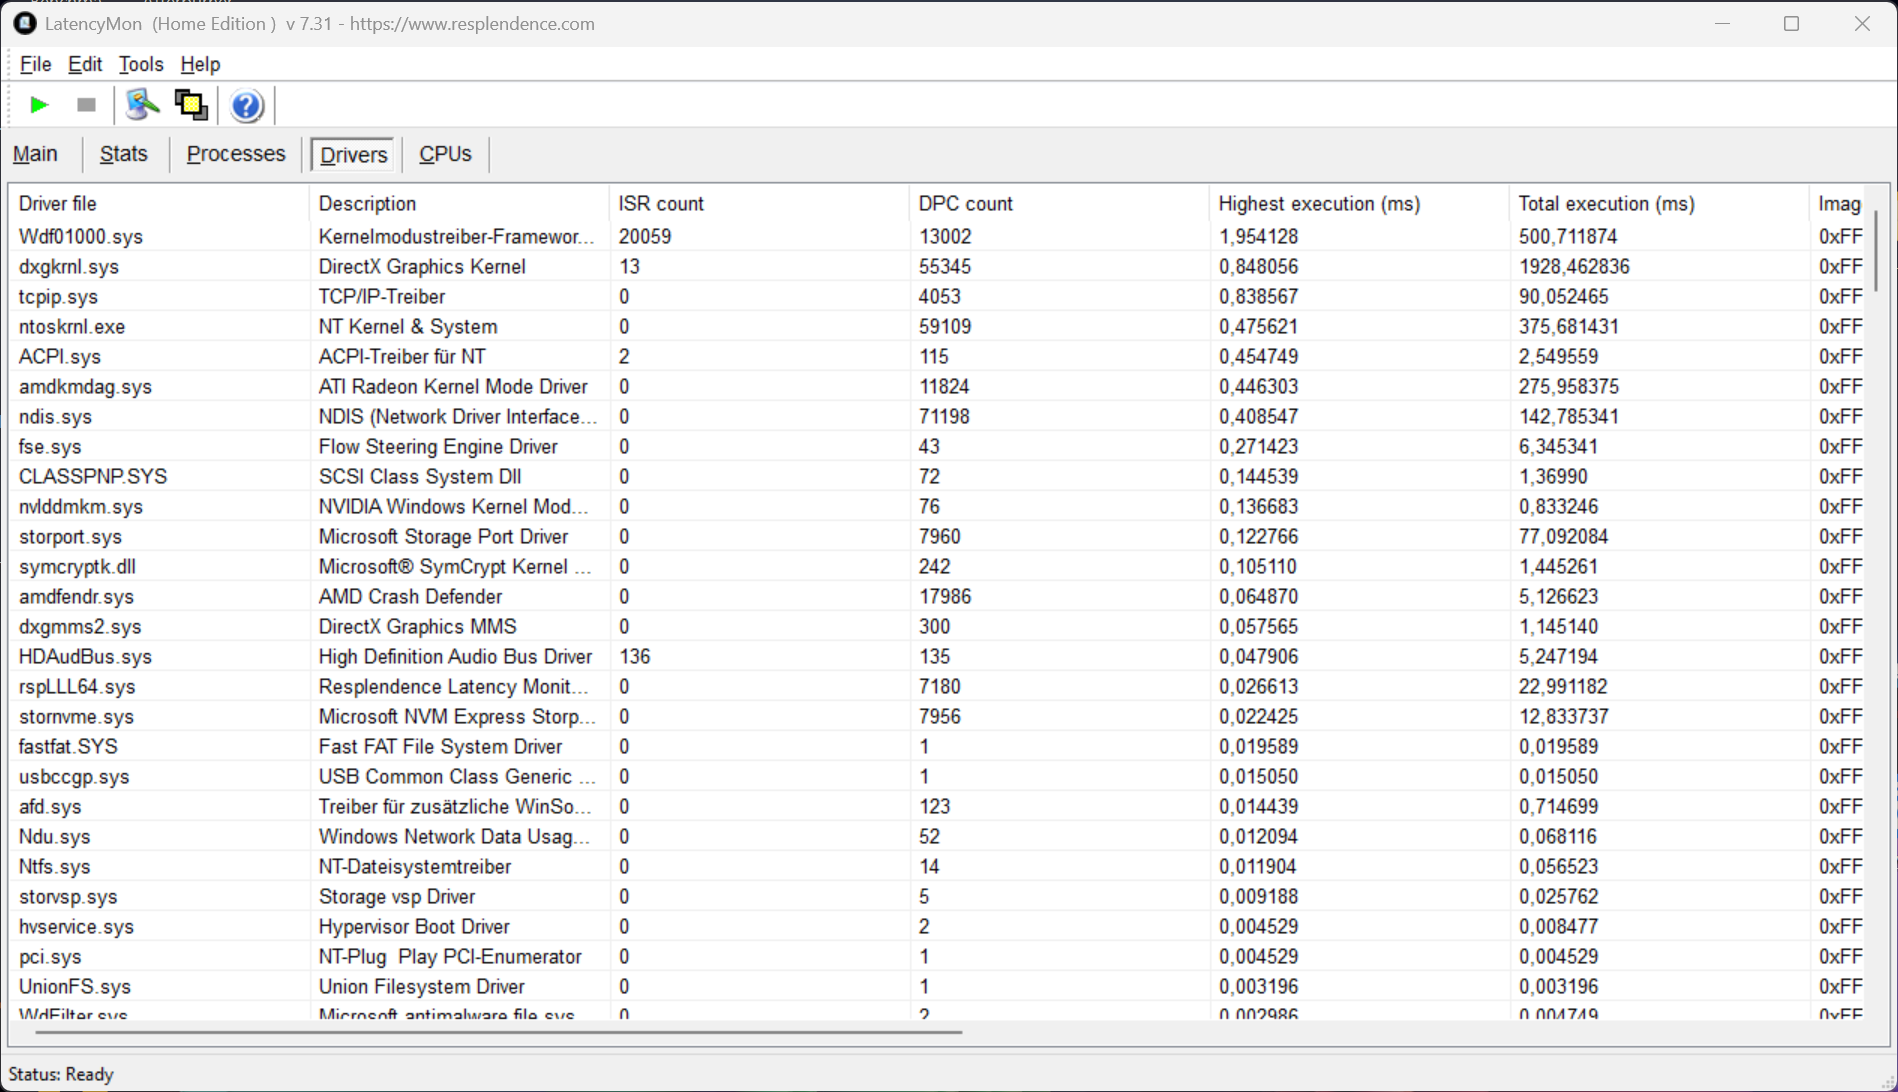
DPC latency
In our standardized latency test (surfing the Internet, 4K YouTube playback, CPU load), the Aero X16 with the current BIOS version shows limitations when using real-time audio applications.
| DPC Latencies / LatencyMon - interrupt to process latency (max), Web, Youtube, Prime95 | |
| Asus ROG Zephyrus G16 2024 GU605M | |
| Gigabyte Aero X16 1WH | |
| Asus TUF Gaming A16 FA608WV | |
| Dell XPS 16 9640 | |
| Schenker XMG CORE 16 (L23) | |
| Lenovo Yoga Pro 9 16IMH9 | |
* ... smaller is better
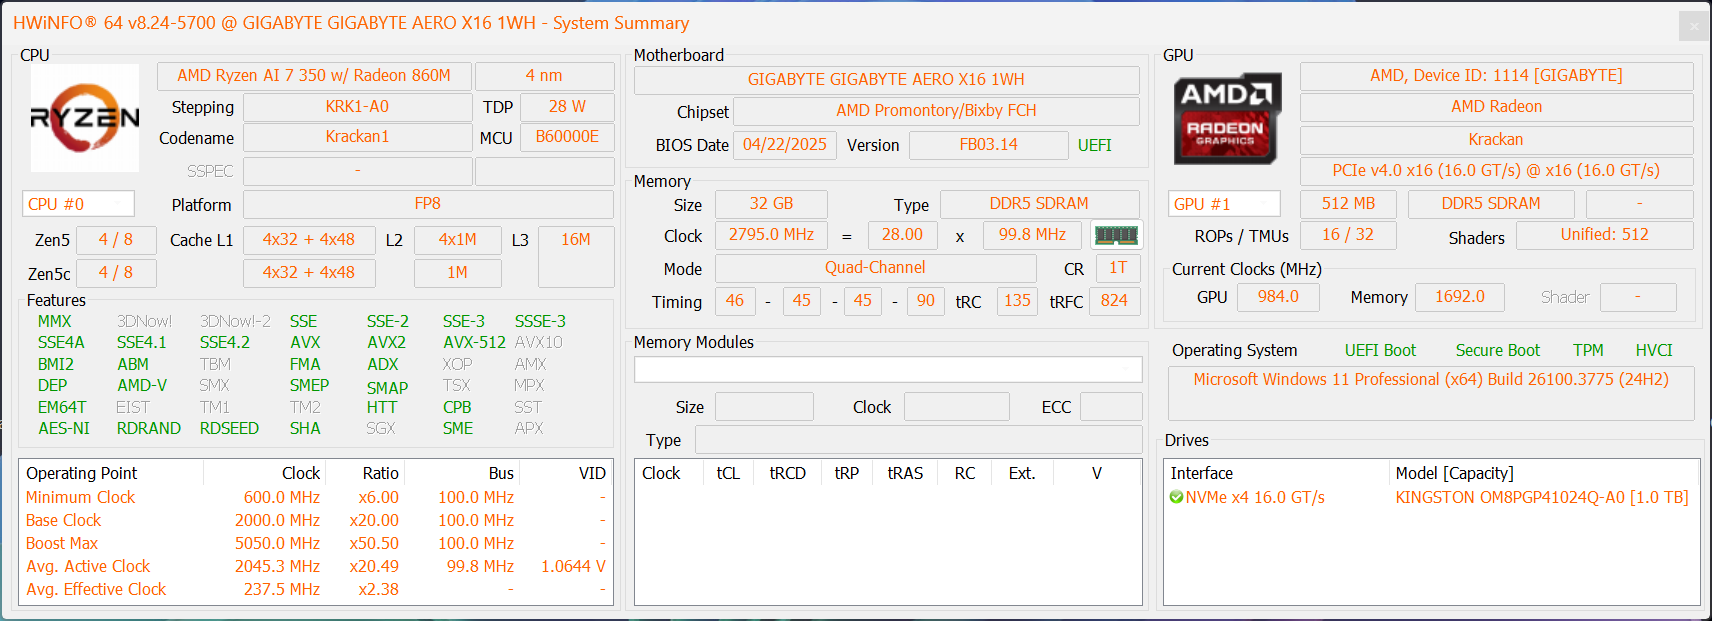
Storage devices
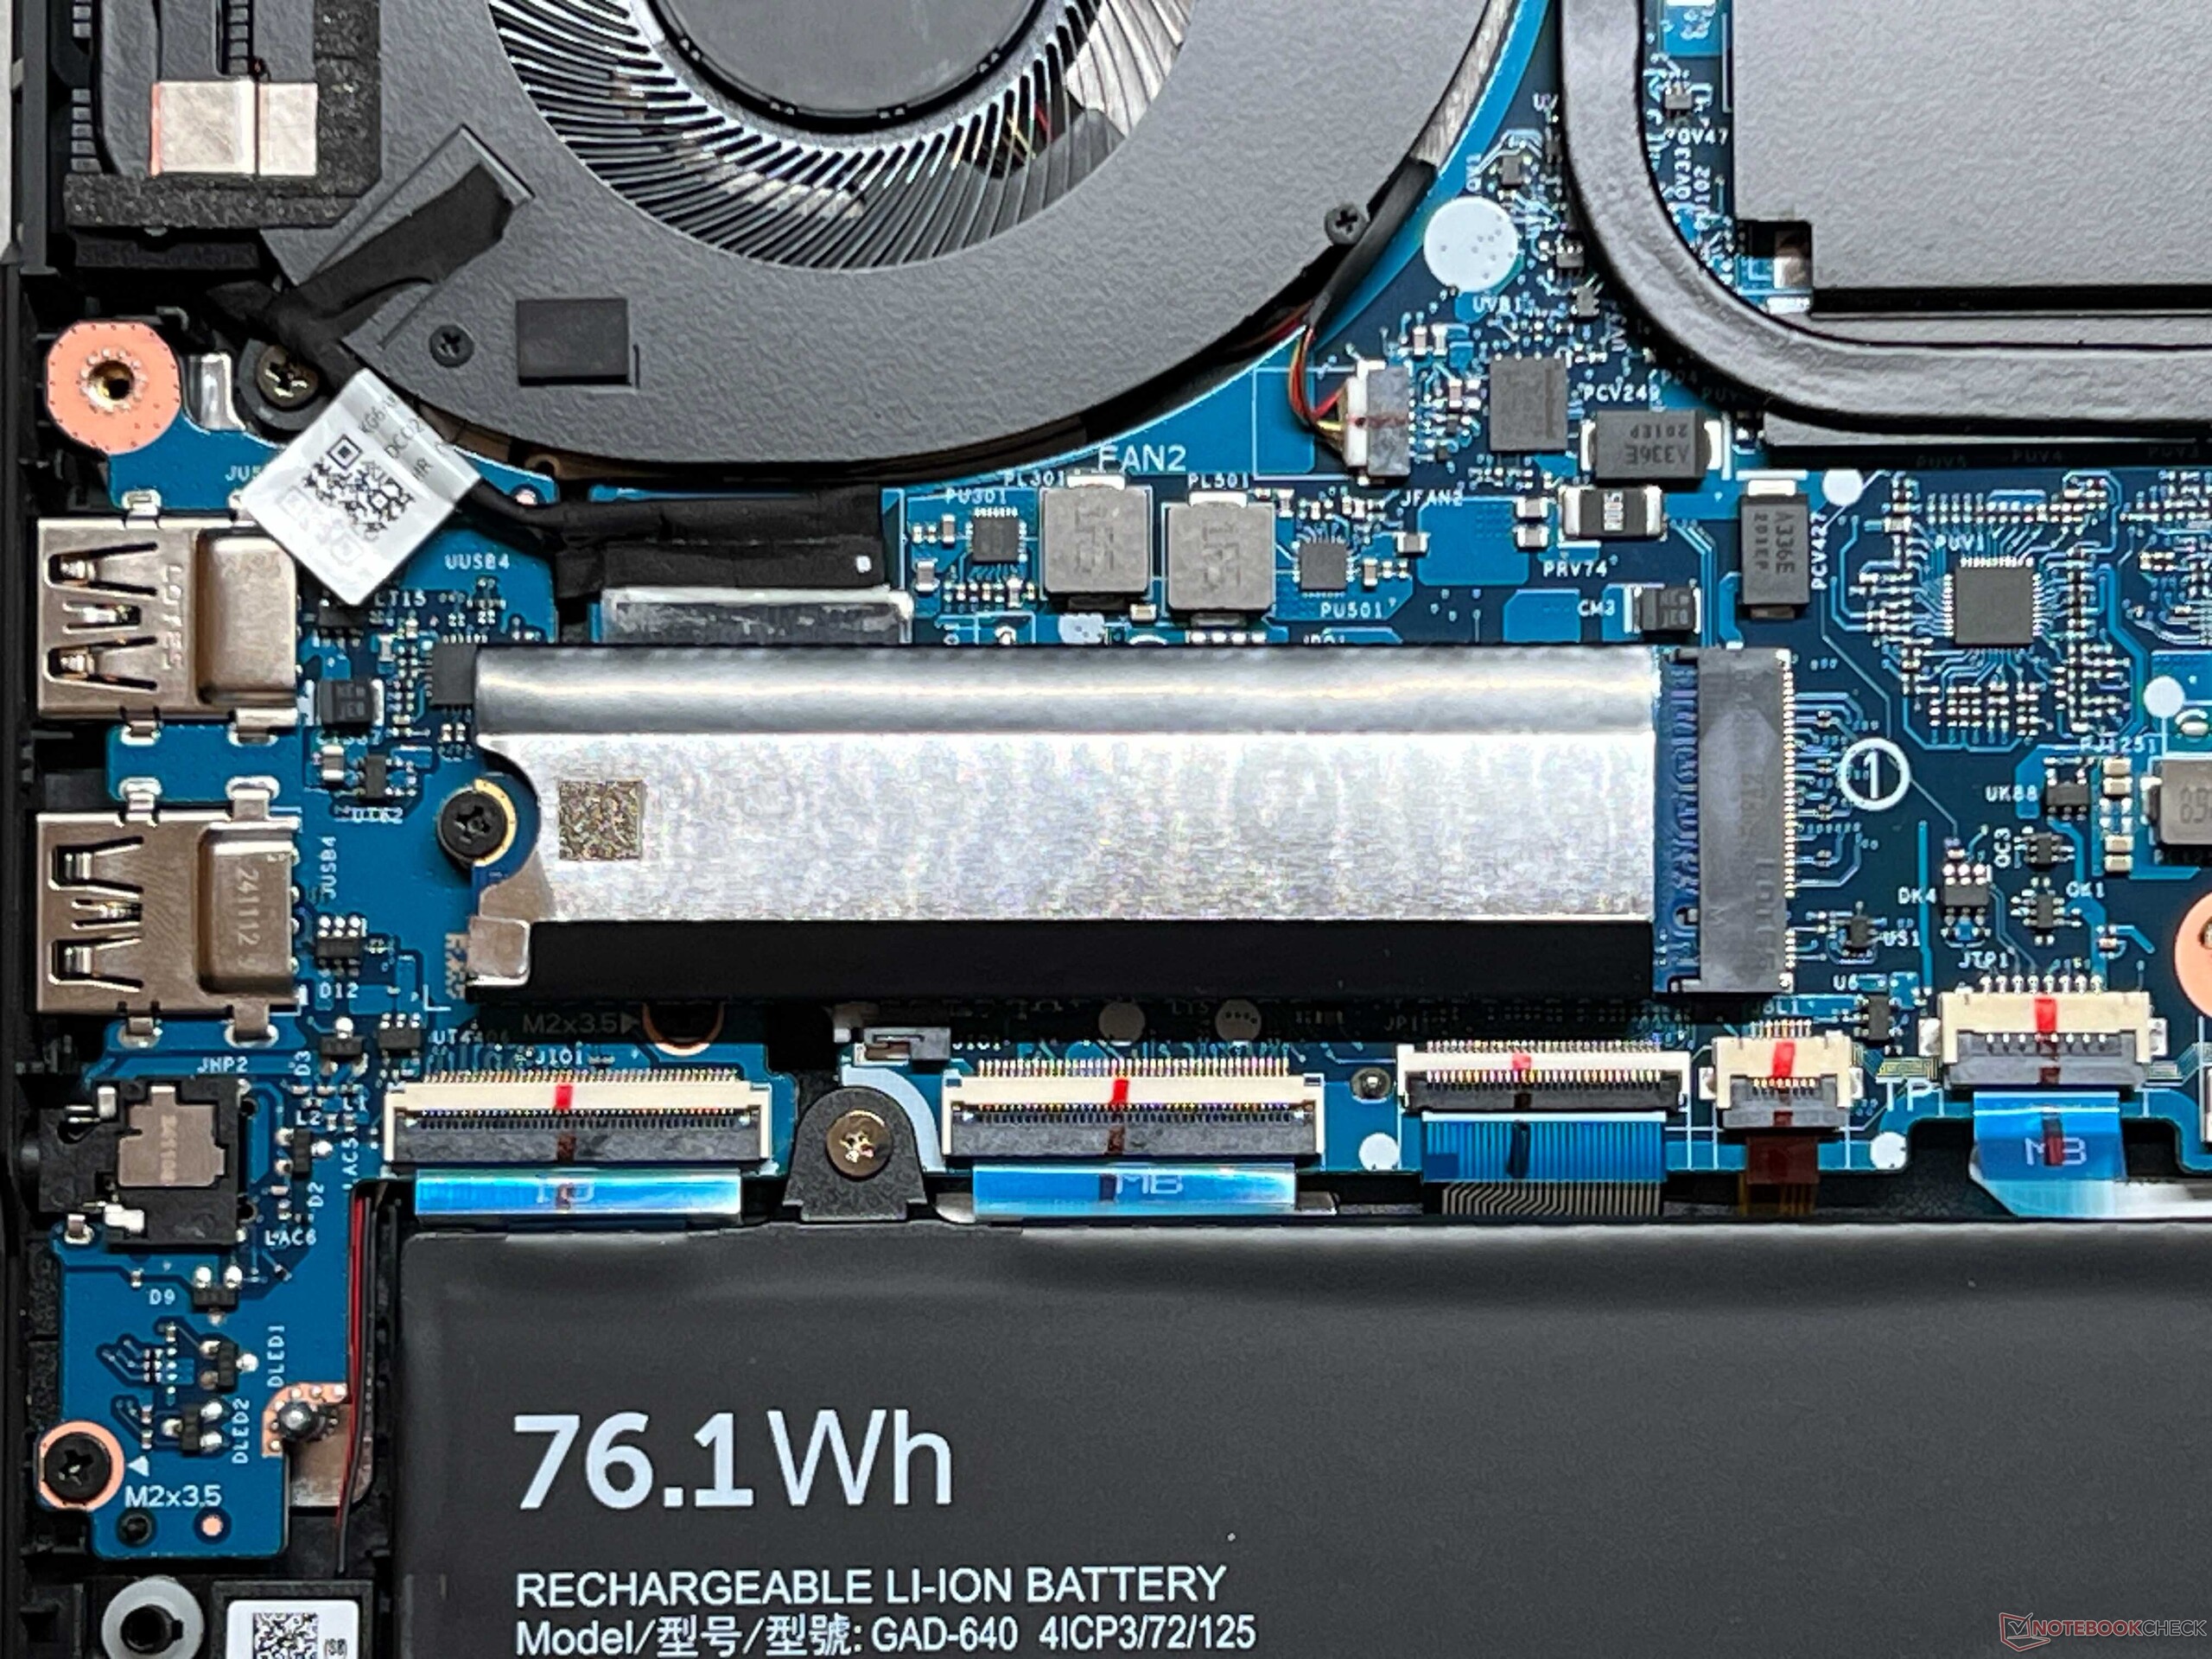
A 1 TB SSD from Kingston is installed came installed in our Aero X16 sample. The transfer rates of the PCIe 4.0 x4 SSD are good overall and remain stable even under constant load.
However, the second SSD slot is only connected via PCIe 4.0 x2, so the transfer rates here are limited to a maximum of around 3.5 GB/s.

* ... smaller is better
Disk throttling: DiskSpd Read Loop, Queue Depth 8
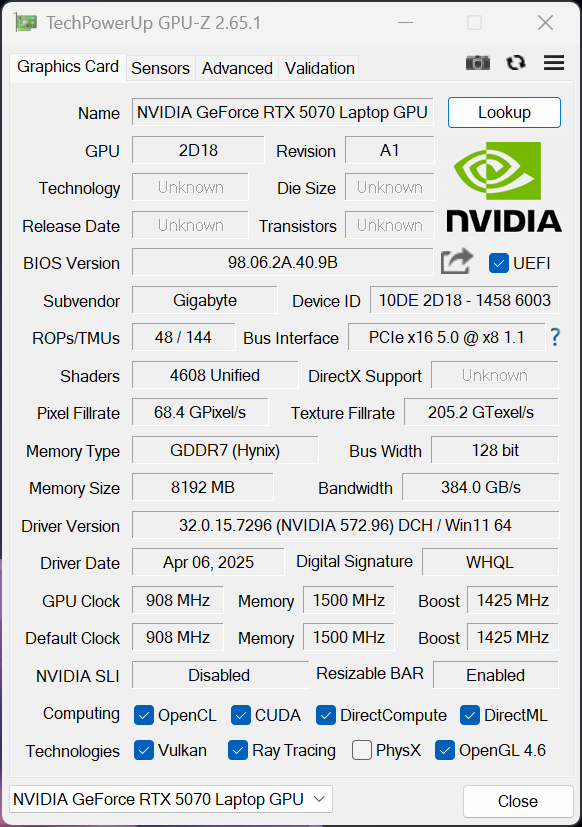
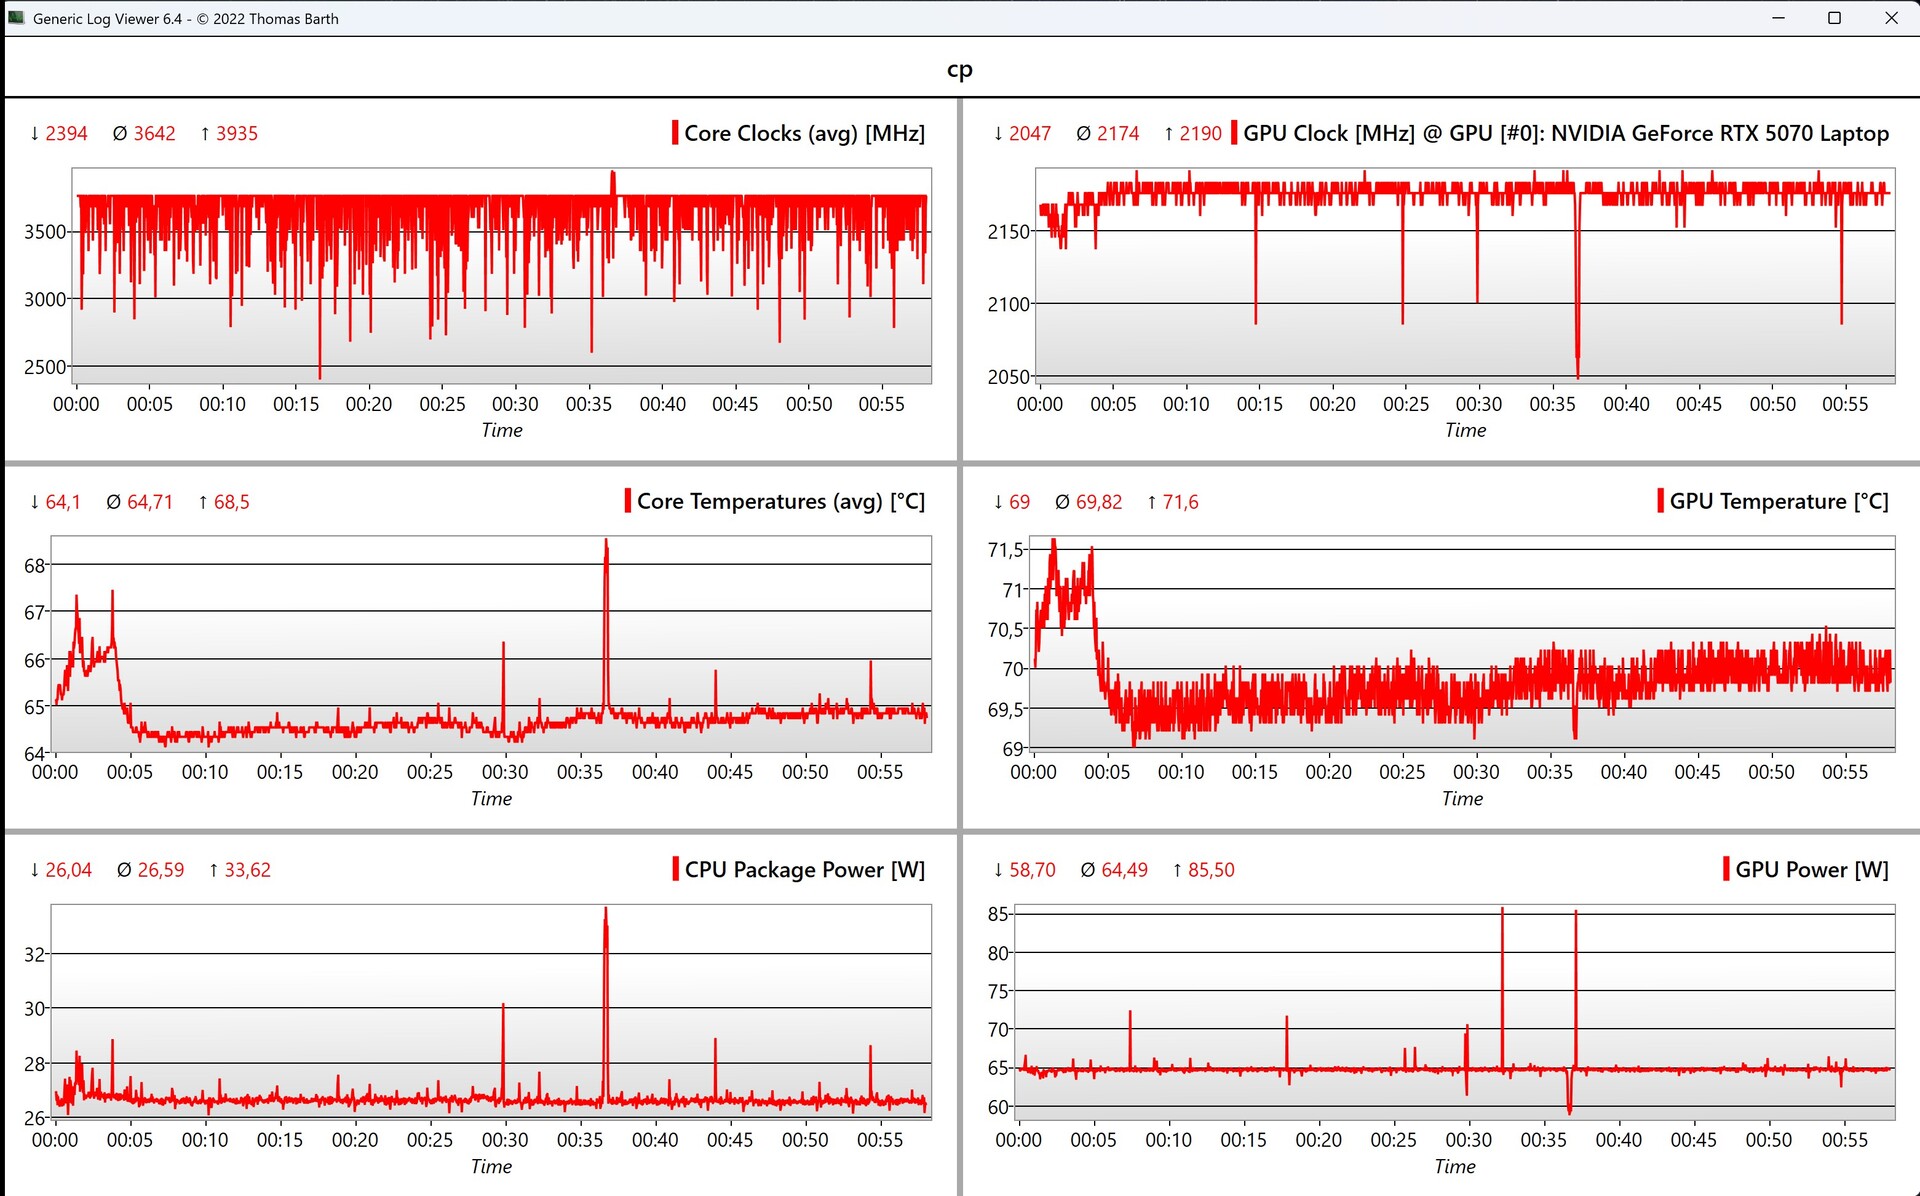
GPU performance
The Gigabyte Aero X16 is based on the new GeForce RTX 5070 Laptop with an 85 W TGP and the regular Optimus GPU switching. As we showed in our analysis the new 5070 Laptop is not much faster than the previous RTX 4070 Laptop. The 8 GB of VRAM isn't particularly futureproof either.
In both the synthetic and gaming benchmarks, the RTX 5070 Laptop is on par with variants of the RTX 4070 Laptop with slightly higher TGP values of up to 100 W, while scoring a few percentage points ahead of 80 W RTX 4070 Laptop variants.
The offered gaming performance is sufficient for the QHD resolution in current titles in principle, although the VRAM can pose a limitation with some quality settings.
GPU performance remains stable under constant load, but power consumption is reduced to 35 W (-53%) on battery.
| 3DMark 11 Performance | 32789 points | |
| 3DMark Fire Strike Score | 27569 points | |
| 3DMark Time Spy Score | 11868 points | |
| 3DMark Steel Nomad Score | 2587 points | |
| 3DMark Steel Nomad Light Score | 11847 points | |
| 3DMark Steel Nomad Light Unlimited Score | 12062 points | |
Help | ||
| Blender / v3.3 Classroom OPTIX/RTX | |
| Asus ROG Zephyrus G16 2024 GU605M | |
| Dell XPS 16 9640 | |
| Asus TUF Gaming A16 FA608WV | |
| Gigabyte Aero X16 1WH | |
| Schenker XMG CORE 16 (L23) | |
| Average NVIDIA GeForce RTX 5070 Laptop (17 - 24, n=28) | |
| Lenovo Yoga Pro 9 16IMH9 | |
| Average of class Gaming (9 - 32, n=109, last 2 years) | |
| Blender / v3.3 Classroom CUDA | |
| Asus TUF Gaming A16 FA608WV | |
| Average NVIDIA GeForce RTX 5070 Laptop (29 - 228, n=29) | |
| Dell XPS 16 9640 | |
| Gigabyte Aero X16 1WH | |
| Average of class Gaming (15 - 233, n=110, last 2 years) | |
| Asus ROG Zephyrus G16 2024 GU605M | |
| Schenker XMG CORE 16 (L23) | |
| Lenovo Yoga Pro 9 16IMH9 | |
| Blender / v3.3 Classroom CPU | |
| Asus ROG Zephyrus G16 2024 GU605M | |
| Gigabyte Aero X16 1WH | |
| Dell XPS 16 9640 | |
| Schenker XMG CORE 16 (L23) | |
| Lenovo Yoga Pro 9 16IMH9 | |
| Average NVIDIA GeForce RTX 5070 Laptop (137 - 507, n=26) | |
| Average of class Gaming (122 - 565, n=105, last 2 years) | |
| Asus TUF Gaming A16 FA608WV | |
* ... smaller is better
| Cyberpunk 2077 - 1920x1080 Ultra Preset (FSR off) | |
| Average of class Gaming (17.7 - 169.9, n=118, last 2 years) | |
| Gigabyte Aero X16 1WH | |
| Lenovo Yoga Pro 9 16IMH9 | |
| Asus TUF Gaming A16 FA608WV | |
| Asus ROG Zephyrus G16 2024 GU605M | |
| Dell XPS 16 9640 | |
| Baldur's Gate 3 - 1920x1080 Ultra Preset AA:T | |
| Average of class Gaming (59.4 - 246, n=105, last 2 years) | |
| Lenovo Yoga Pro 9 16IMH9 | |
| Gigabyte Aero X16 1WH | |
| Asus TUF Gaming A16 FA608WV | |
| Dell XPS 16 9640 | |
| GTA V - 1920x1080 Highest AA:4xMSAA + FX AF:16x | |
| Average of class Gaming (48.3 - 186.9, n=97, last 2 years) | |
| Schenker XMG CORE 16 (L23) | |
| Asus TUF Gaming A16 FA608WV | |
| Gigabyte Aero X16 1WH | |
| Lenovo Yoga Pro 9 16IMH9 | |
| Dell XPS 16 9640 | |
| Asus ROG Zephyrus G16 2024 GU605M | |
| Final Fantasy XV Benchmark - 1920x1080 High Quality | |
| Average of class Gaming (41 - 215, n=98, last 2 years) | |
| Schenker XMG CORE 16 (L23) | |
| Gigabyte Aero X16 1WH | |
| Lenovo Yoga Pro 9 16IMH9 | |
| Asus TUF Gaming A16 FA608WV | |
| Asus ROG Zephyrus G16 2024 GU605M | |
| Dell XPS 16 9640 | |
| Strange Brigade - 1920x1080 ultra AA:ultra AF:16 | |
| Average of class Gaming (76.3 - 456, n=88, last 2 years) | |
| Gigabyte Aero X16 1WH | |
| Schenker XMG CORE 16 (L23) | |
| Lenovo Yoga Pro 9 16IMH9 | |
| Asus TUF Gaming A16 FA608WV | |
| Dell XPS 16 9640 | |
| Asus ROG Zephyrus G16 2024 GU605M | |
| Dota 2 Reborn - 1920x1080 ultra (3/3) best looking | |
| Average of class Gaming (84.8 - 248, n=110, last 2 years) | |
| Lenovo Yoga Pro 9 16IMH9 | |
| Asus TUF Gaming A16 FA608WV | |
| Schenker XMG CORE 16 (L23) | |
| Gigabyte Aero X16 1WH | |
| Asus ROG Zephyrus G16 2024 GU605M | |
| Dell XPS 16 9640 | |
Cyberpunk 2077 1080p Ultra FPS chart
| low | med. | high | ultra | QHD DLSS | QHD | 4K DLSS | 4K | |
|---|---|---|---|---|---|---|---|---|
| GTA V (2015) | 111.8 | 105.7 | ||||||
| The Witcher 3 (2015) | 104.7 | |||||||
| Dota 2 Reborn (2015) | 158 | 129.5 | 141.6 | 131.9 | ||||
| Final Fantasy XV Benchmark (2018) | 210 | 149.9 | 119.5 | 85.8 | 49.1 | |||
| X-Plane 11.11 (2018) | 104.3 | 100.7 | 83.7 | |||||
| Strange Brigade (2018) | 511 | 331 | 270 | 234 | 164.2 | 90.3 | ||
| Baldur's Gate 3 (2023) | 109.4 | 75.8 | 65.1 | 41.1 | ||||
| Cyberpunk 2077 (2023) | 90.1 | 58.3 | 26.4 | |||||
| Alan Wake 2 (2023) | 64.6 | 41.5 | 18.6 | |||||
| F1 24 (2024) | 77.7 | 76.1 | 48.7 | 18.9 | 15.5 | |||
| Call of Duty Black Ops 6 (2024) | 95 | 73 | 68 | 39 | 38 | |||
| Assassin's Creed Shadows (2025) | 40 | 39 | 30 | 24 | 18 |
Emissions and Energy: Tolerable heat and noise output when not stressed
Noise emissions
The dual fans of the Aero X16 usually remain deactivated in everyday use and only really turn up when gaming or under very high load.
However, they get very loud at around 50 dB(A) sound pressure level (SPL) in the Performance mode.
We recorded a maximum SPL of 46.8 dB(A) in Balanced and 35.4 dB(A) in Eco modes. There were no other electronic noises from the test device.
Noise level
| Idle |
| 23.9 / 23.9 / 23.9 dB(A) |
| Load |
| 33.2 / 50.2 dB(A) |
 | ||
30 dB silent 40 dB(A) audible 50 dB(A) loud |
||
min: | ||
| Gigabyte Aero X16 1WH GeForce RTX 5070 Laptop, Ryzen AI 7 350, Kingston OM8PGP41024Q-A0 | Asus TUF Gaming A16 FA608WV GeForce RTX 4060 Laptop GPU, Ryzen AI 9 HX 370, Micron 2400 MTFDKBA1T0QFM | Lenovo Yoga Pro 9 16IMH9 GeForce RTX 4070 Laptop GPU, Ultra 9 185H, SK Hynix HFS001TEJ9X115N | Dell XPS 16 9640 GeForce RTX 4070 Laptop GPU, Ultra 7 155H, Kioxia XG8 KXG80ZNV1T02 | Asus ROG Zephyrus G16 2024 GU605M GeForce RTX 4070 Laptop GPU, Ultra 7 155H, WD PC SN560 SDDPNQE-1T00 | Schenker XMG CORE 16 (L23) GeForce RTX 4070 Laptop GPU, R7 7840HS, Samsung 990 Pro 1 TB | |
|---|---|---|---|---|---|---|
| Noise | 7% | -11% | -7% | -6% | -5% | |
| off / environment * (dB) | 23.9 | 23 4% | 24.3 -2% | 24.5 -3% | 23.9 -0% | 23 4% |
| Idle Minimum * (dB) | 23.9 | 23 4% | 24.3 -2% | 24.5 -3% | 23.9 -0% | 23 4% |
| Idle Average * (dB) | 23.9 | 23 4% | 24.3 -2% | 24.5 -3% | 27.8 -16% | 28.48 -19% |
| Idle Maximum * (dB) | 23.9 | 29.11 -22% | 25.8 -8% | 27.5 -15% | 30.1 -26% | 28.48 -19% |
| Load Average * (dB) | 33.2 | 31 7% | 48.1 -45% | 39.6 -19% | 34.2 -3% | 30 10% |
| Cyberpunk 2077 ultra * (dB) | 50.2 | 36.23 28% | ||||
| Load Maximum * (dB) | 50.2 | 39.44 21% | 53.9 -7% | 49.7 1% | 46.4 8% | 54.12 -8% |
| Witcher 3 ultra * (dB) | 49.7 | 49.7 | 46.4 | 54.12 |
* ... smaller is better
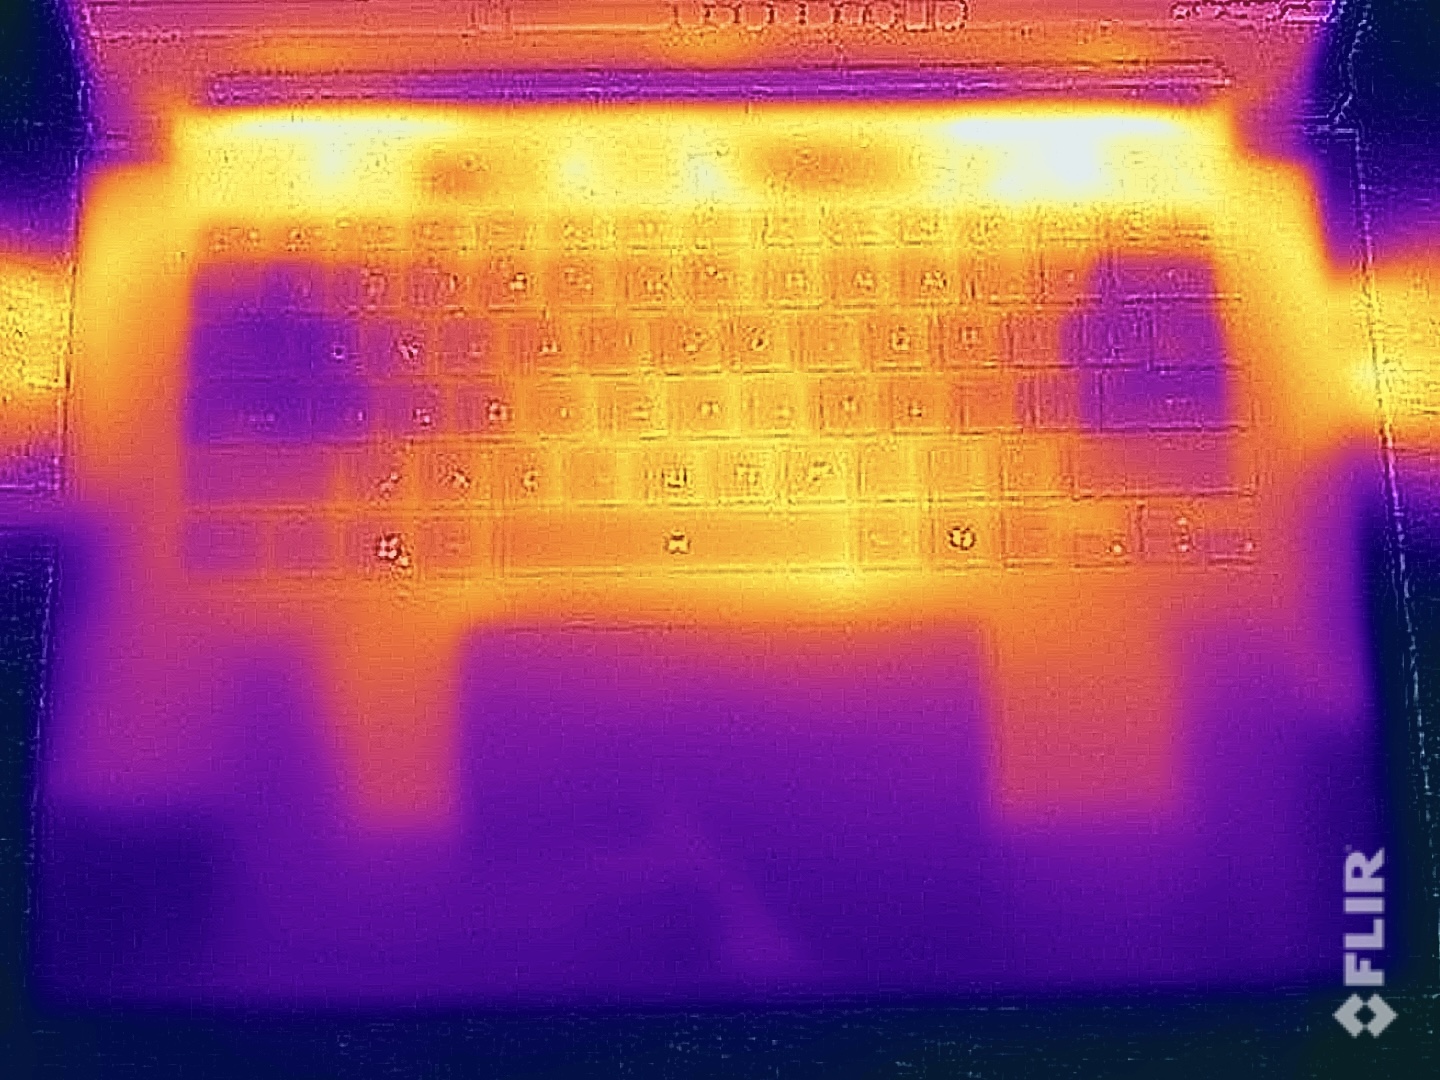
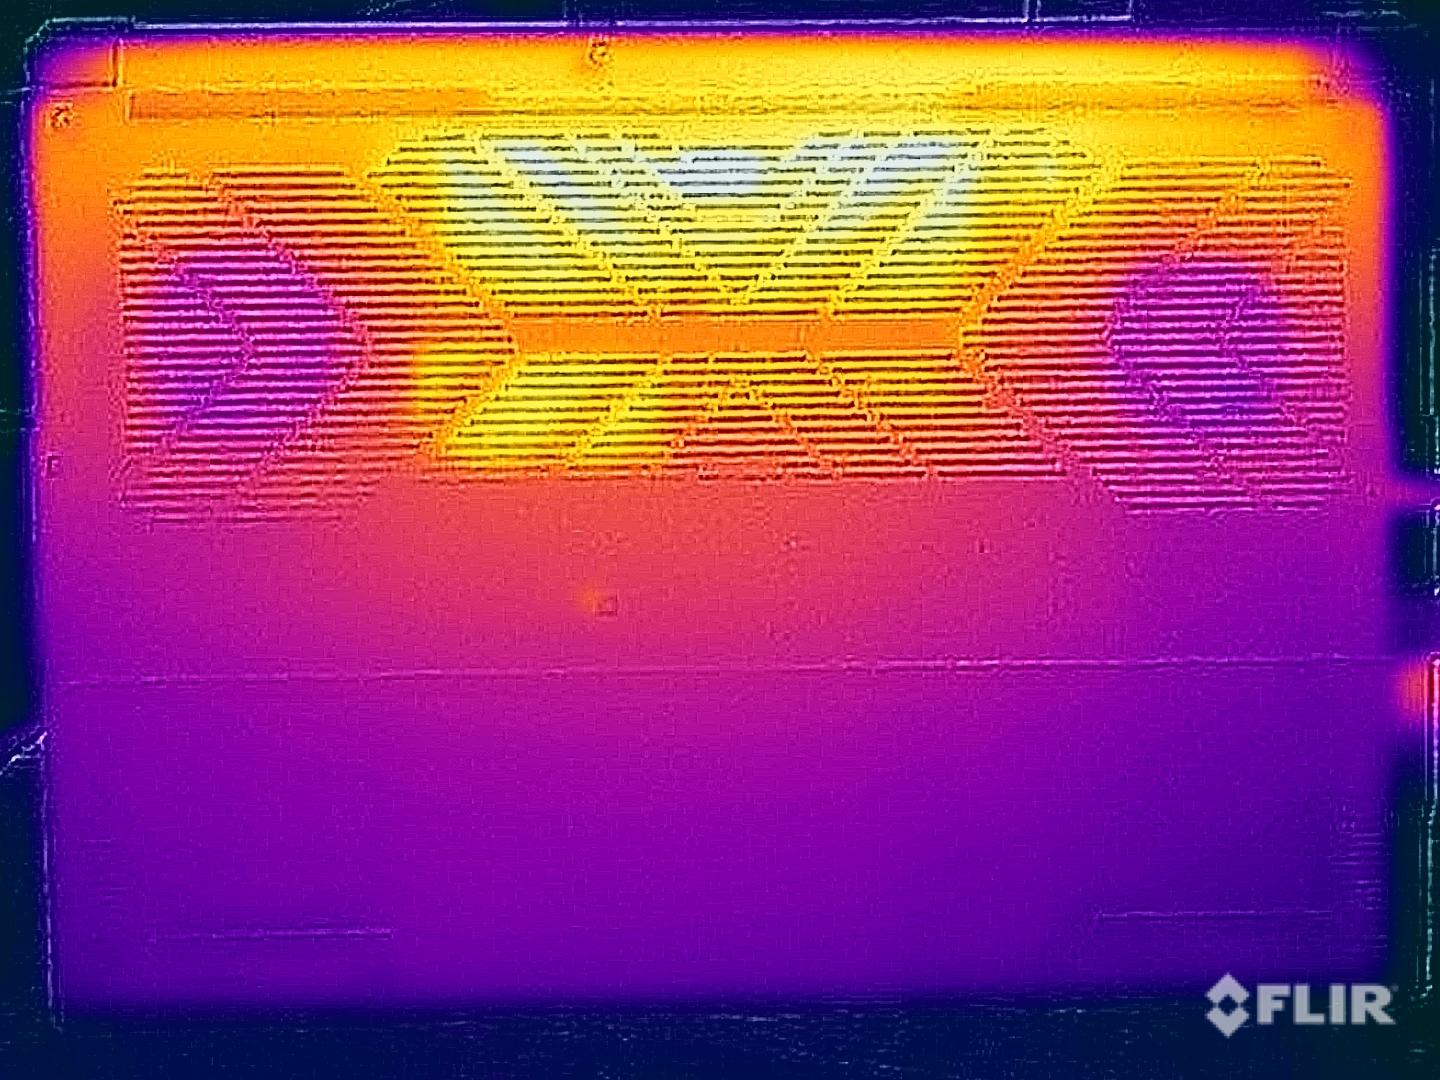
Temperature
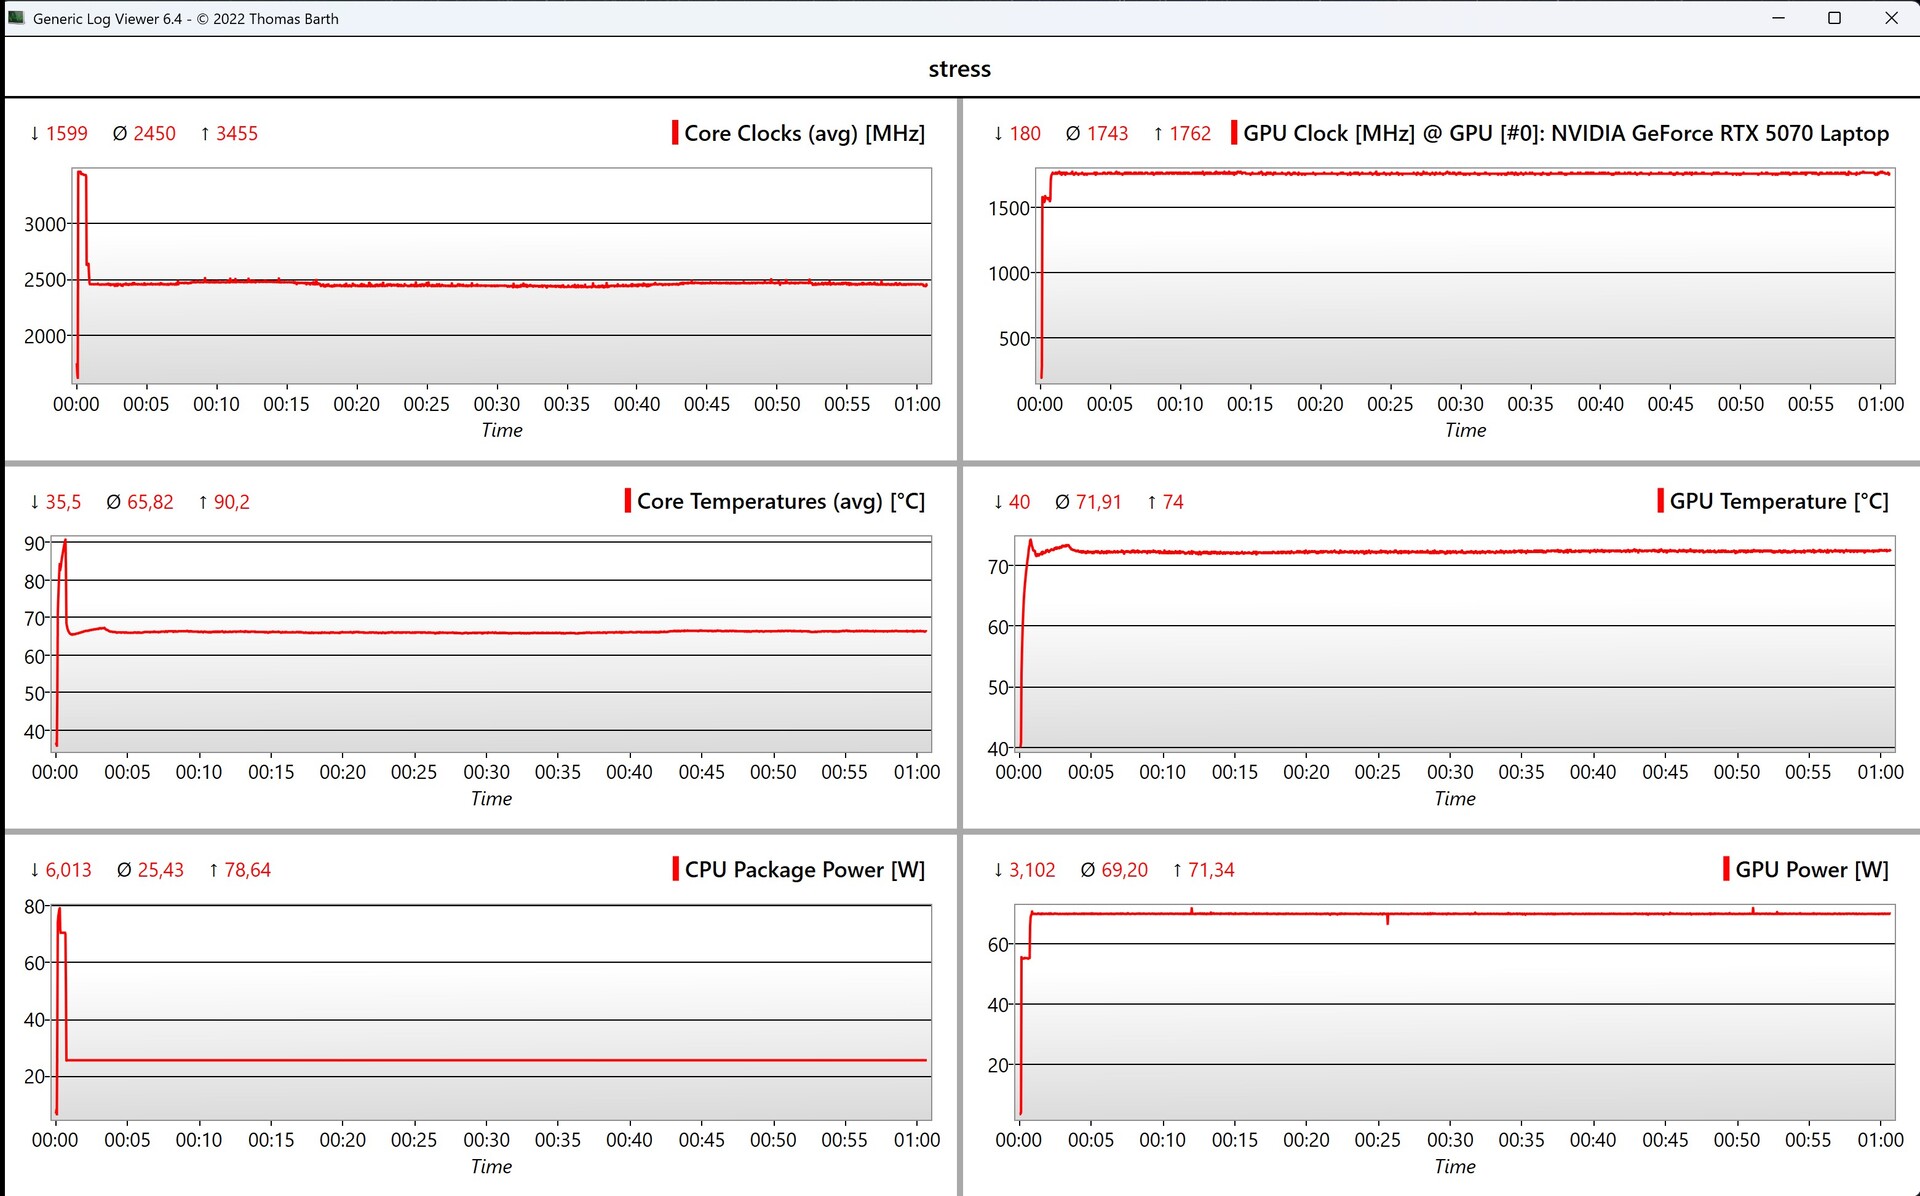
The chassis remains cool while performing basic tasks, but we measured almost 50 °C in the rear area of the underside under stress. Therefore, you should not place the Aero X16 on your thighs under high load.
However, the top of the base unit remains relatively cooler and there are no restrictions when typing while running heavy loads. In the stress test with combined CPU/GPU load, the RTX 5070 Laptop card operates at 70 W while the Ryzen AI 7 350 is limited to 25 W.
(±) The maximum temperature on the upper side is 43.3 °C / 110 F, compared to the average of 40.4 °C / 105 F, ranging from 21.2 to 68.8 °C for the class Gaming.
(-) The bottom heats up to a maximum of 50.3 °C / 123 F, compared to the average of 43.2 °C / 110 F
(+) In idle usage, the average temperature for the upper side is 26.6 °C / 80 F, compared to the device average of 33.9 °C / 93 F.
(±) 3: The average temperature for the upper side is 36.5 °C / 98 F, compared to the average of 33.9 °C / 93 F for the class Gaming.
(+) The palmrests and touchpad are reaching skin temperature as a maximum (32.5 °C / 90.5 F) and are therefore not hot.
(-) The average temperature of the palmrest area of similar devices was 28.8 °C / 83.8 F (-3.7 °C / -6.7 F).
| Gigabyte Aero X16 1WH AMD Ryzen AI 7 350, NVIDIA GeForce RTX 5070 Laptop | Asus TUF Gaming A16 FA608WV AMD Ryzen AI 9 HX 370, NVIDIA GeForce RTX 4060 Laptop GPU | Lenovo Yoga Pro 9 16IMH9 Intel Core Ultra 9 185H, NVIDIA GeForce RTX 4070 Laptop GPU | Dell XPS 16 9640 Intel Core Ultra 7 155H, NVIDIA GeForce RTX 4070 Laptop GPU | Asus ROG Zephyrus G16 2024 GU605M Intel Core Ultra 7 155H, NVIDIA GeForce RTX 4070 Laptop GPU | Schenker XMG CORE 16 (L23) AMD Ryzen 7 7840HS, NVIDIA GeForce RTX 4070 Laptop GPU | |
|---|---|---|---|---|---|---|
| Heat | 7% | 5% | 9% | -6% | -7% | |
| Maximum Upper Side * (°C) | 43.3 | 38 12% | 41.7 4% | 39.4 9% | 50.3 -16% | 46 -6% |
| Maximum Bottom * (°C) | 50.3 | 37 26% | 46.3 8% | 36.9 27% | 48 5% | 44 13% |
| Idle Upper Side * (°C) | 27 | 28 -4% | 26.2 3% | 28.2 -4% | 28.8 -7% | 32 -19% |
| Idle Bottom * (°C) | 28.3 | 30 -6% | 27.2 4% | 27.4 3% | 29.8 -5% | 33 -17% |
* ... smaller is better
Speakers
The two stereo speakers (2x 2 watts) impress with clear voice reproduction, but are not very powerful overall.
Gigabyte Aero X16 1WH audio analysis
(±) | speaker loudness is average but good (76 dB)
Bass 100 - 315 Hz
(-) | nearly no bass - on average 15.4% lower than median
(±) | linearity of bass is average (13.1% delta to prev. frequency)
Mids 400 - 2000 Hz
(+) | balanced mids - only 3.3% away from median
(+) | mids are linear (5.5% delta to prev. frequency)
Highs 2 - 16 kHz
(+) | balanced highs - only 2.8% away from median
(+) | highs are linear (5.7% delta to prev. frequency)
Overall 100 - 16.000 Hz
(±) | linearity of overall sound is average (15.5% difference to median)
Compared to same class
» 35% of all tested devices in this class were better, 7% similar, 58% worse
» The best had a delta of 6%, average was 18%, worst was 132%
Compared to all devices tested
» 23% of all tested devices were better, 4% similar, 73% worse
» The best had a delta of 4%, average was 23%, worst was 134%
Asus TUF Gaming A16 FA608WV audio analysis
(±) | speaker loudness is average but good (79.84 dB)
Bass 100 - 315 Hz
(-) | nearly no bass - on average 18.3% lower than median
(+) | bass is linear (6.8% delta to prev. frequency)
Mids 400 - 2000 Hz
(±) | higher mids - on average 5.6% higher than median
(+) | mids are linear (5.5% delta to prev. frequency)
Highs 2 - 16 kHz
(+) | balanced highs - only 4.4% away from median
(+) | highs are linear (5.4% delta to prev. frequency)
Overall 100 - 16.000 Hz
(±) | linearity of overall sound is average (18.8% difference to median)
Compared to same class
» 62% of all tested devices in this class were better, 8% similar, 30% worse
» The best had a delta of 6%, average was 18%, worst was 132%
Compared to all devices tested
» 43% of all tested devices were better, 8% similar, 49% worse
» The best had a delta of 4%, average was 23%, worst was 134%
Lenovo Yoga Pro 9 16IMH9 audio analysis
(+) | speakers can play relatively loud (84.5 dB)
Bass 100 - 315 Hz
(±) | reduced bass - on average 7% lower than median
(±) | linearity of bass is average (7.2% delta to prev. frequency)
Mids 400 - 2000 Hz
(+) | balanced mids - only 3.9% away from median
(+) | mids are linear (4.5% delta to prev. frequency)
Highs 2 - 16 kHz
(+) | balanced highs - only 2.8% away from median
(+) | highs are linear (3.2% delta to prev. frequency)
Overall 100 - 16.000 Hz
(+) | overall sound is linear (8.8% difference to median)
Compared to same class
» 11% of all tested devices in this class were better, 2% similar, 87% worse
» The best had a delta of 5%, average was 17%, worst was 45%
Compared to all devices tested
» 3% of all tested devices were better, 1% similar, 97% worse
» The best had a delta of 4%, average was 23%, worst was 134%
Dell XPS 16 9640 audio analysis
(+) | speakers can play relatively loud (83.4 dB)
Bass 100 - 315 Hz
(±) | reduced bass - on average 11.2% lower than median
(±) | linearity of bass is average (8.9% delta to prev. frequency)
Mids 400 - 2000 Hz
(+) | balanced mids - only 4.5% away from median
(+) | mids are linear (3% delta to prev. frequency)
Highs 2 - 16 kHz
(+) | balanced highs - only 1.4% away from median
(+) | highs are linear (2% delta to prev. frequency)
Overall 100 - 16.000 Hz
(+) | overall sound is linear (10% difference to median)
Compared to same class
» 13% of all tested devices in this class were better, 2% similar, 84% worse
» The best had a delta of 5%, average was 17%, worst was 45%
Compared to all devices tested
» 4% of all tested devices were better, 1% similar, 94% worse
» The best had a delta of 4%, average was 23%, worst was 134%
Asus ROG Zephyrus G16 2024 GU605M audio analysis
(+) | speakers can play relatively loud (83.3 dB)
Bass 100 - 315 Hz
(+) | good bass - only 3.8% away from median
(±) | linearity of bass is average (8.1% delta to prev. frequency)
Mids 400 - 2000 Hz
(+) | balanced mids - only 3.5% away from median
(+) | mids are linear (2.4% delta to prev. frequency)
Highs 2 - 16 kHz
(+) | balanced highs - only 2.2% away from median
(+) | highs are linear (3.7% delta to prev. frequency)
Overall 100 - 16.000 Hz
(+) | overall sound is linear (7.3% difference to median)
Compared to same class
» 1% of all tested devices in this class were better, 0% similar, 99% worse
» The best had a delta of 6%, average was 18%, worst was 132%
Compared to all devices tested
» 1% of all tested devices were better, 0% similar, 99% worse
» The best had a delta of 4%, average was 23%, worst was 134%
Schenker XMG CORE 16 (L23) audio analysis
(±) | speaker loudness is average but good (79.4 dB)
Bass 100 - 315 Hz
(-) | nearly no bass - on average 21.6% lower than median
(±) | linearity of bass is average (11.4% delta to prev. frequency)
Mids 400 - 2000 Hz
(±) | higher mids - on average 5.4% higher than median
(+) | mids are linear (6.7% delta to prev. frequency)
Highs 2 - 16 kHz
(+) | balanced highs - only 2.3% away from median
(+) | highs are linear (6.6% delta to prev. frequency)
Overall 100 - 16.000 Hz
(±) | linearity of overall sound is average (17.1% difference to median)
Compared to same class
» 46% of all tested devices in this class were better, 12% similar, 43% worse
» The best had a delta of 6%, average was 18%, worst was 132%
Compared to all devices tested
» 31% of all tested devices were better, 8% similar, 61% worse
» The best had a delta of 4%, average was 23%, worst was 134%
Energy consumption
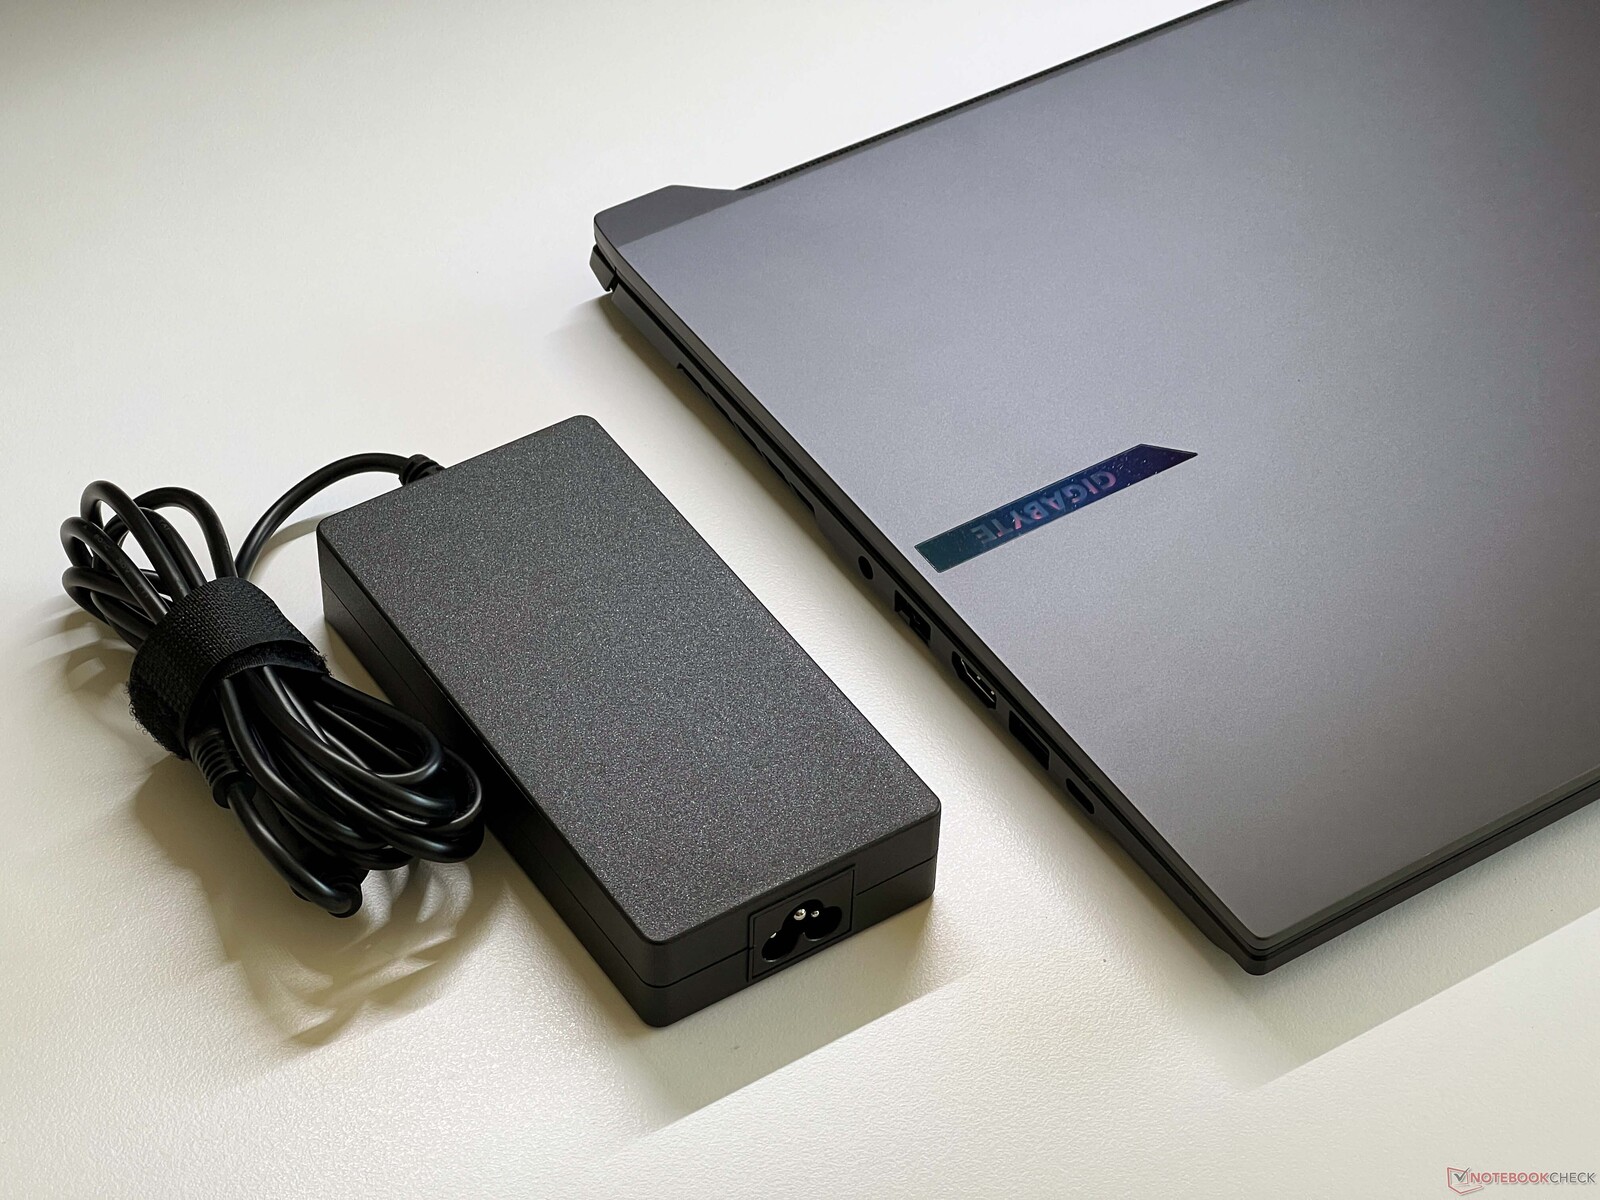
The Aero X16 is a comparatively economical device with 11 W consumption in idle mode. Our measurements show a maximum power draw of 155 W during the stress test, which then quickly levels off at 127 W.
You can expect the laptop to draw about 120 W when gaming, so the supplied compact 150 W power supply unit can keep the laptop sufficiently fed.
| Off / Standby | |
| Idle | |
| Load |
|
Key:
min: | |
| Gigabyte Aero X16 1WH Ryzen AI 7 350, GeForce RTX 5070 Laptop, Kingston OM8PGP41024Q-A0, IPS, 2560x1600, 16" | Asus TUF Gaming A16 FA608WV Ryzen AI 9 HX 370, GeForce RTX 4060 Laptop GPU, Micron 2400 MTFDKBA1T0QFM, IPS, 1920x1200, 16" | Lenovo Yoga Pro 9 16IMH9 Ultra 9 185H, GeForce RTX 4070 Laptop GPU, SK Hynix HFS001TEJ9X115N, Mini-LED, 3200x2000, 16" | Dell XPS 16 9640 Ultra 7 155H, GeForce RTX 4070 Laptop GPU, Kioxia XG8 KXG80ZNV1T02, OLED, 3840x2400, 16.3" | Asus ROG Zephyrus G16 2024 GU605M Ultra 7 155H, GeForce RTX 4070 Laptop GPU, WD PC SN560 SDDPNQE-1T00, OLED, 2560x1600, 16" | Schenker XMG CORE 16 (L23) R7 7840HS, GeForce RTX 4070 Laptop GPU, Samsung 990 Pro 1 TB, IPS, 2560x1600, 16" | |
|---|---|---|---|---|---|---|
| Power Consumption | -18% | -59% | 1% | -12% | -44% | |
| Idle Minimum * (Watt) | 5.8 | 6.8 -17% | 10.3 -78% | 7.7 -33% | 8.3 -43% | 11 -90% |
| Idle Average * (Watt) | 10.9 | 12.7 -17% | 21.9 -101% | 10.3 6% | 12.5 -15% | 15.2 -39% |
| Idle Maximum * (Watt) | 11.2 | 15.2 -36% | 22.4 -100% | 10.6 5% | 12.8 -14% | 16 -43% |
| Load Average * (Watt) | 91.3 | 85 7% | 96.9 -6% | 76.5 16% | 71.3 22% | 64 30% |
| Cyberpunk 2077 ultra external monitor * (Watt) | 117.9 | 143 -21% | ||||
| Cyberpunk 2077 ultra * (Watt) | 123.8 | 145 -17% | ||||
| Load Maximum * (Watt) | 155.3 | 199 -28% | 173.8 -12% | 138.5 11% | 169.1 -9% | 280 -80% |
| Witcher 3 ultra * (Watt) | 159.6 | 126.4 | 127.5 | 179 |
* ... smaller is better
Power consumption: Cyberpunk 2077 / Stress test
Power consumption: External monitor
Battery life
The 76 Whr battery is relatively small for a 16-inch device, and the ensuing battery life is only average. Our standardized WLAN test runs for 8.5 hours at a brightness of 150 cd/m² and just under 6.5 hours at full brightness.
A full charge with the device switched on takes 94 minutes, with 80% charge reached after 45 minutes.

Notebookcheck overall rating
The Gigabyte Aero X16 comes across as a well-rounded midrange gaming laptop with decent specs, but the RTX 5070 Laptop GPU with its 8 GB VRAM can quickly prove to be a limitation in modern AAA games at QHD max settings.
Gigabyte Aero X16 1WH
- 05/21/2025 v8
Andreas Osthoff
 Total Sustainability Score:
 Potential competitors in comparison
Image | Model / Review | Price | Weight | Height | Display |
|---|---|---|---|---|---|
1. 83.7%  | Gigabyte Aero X16 1WH AMD Ryzen AI 7 350 ⎘ NVIDIA GeForce RTX 5070 Laptop ⎘ 32 GB Memory, 1024 GB SSD | Amazon: List Price: 1799€ | 2 kg | 19.9 mm | 16.00" 2560x1600 189 PPI IPS |
2. 83%  | Asus TUF Gaming A16 FA608WV AMD Ryzen AI 9 HX 370 ⎘ NVIDIA GeForce RTX 4060 Laptop GPU ⎘ 16 GB Memory, 1024 GB SSD | Amazon: List Price: 1399 Euro | 2.2 kg | 25.7 mm | 16.00" 1920x1200 142 PPI IPS |
3. 88.7% v7 (old)  | Lenovo Yoga Pro 9 16IMH9 Intel Core Ultra 9 185H ⎘ NVIDIA GeForce RTX 4070 Laptop GPU ⎘ 32 GB Memory, 1024 GB SSD | Amazon: List Price: 2700€ | 2.1 kg | 18.3 mm | 16.00" 3200x2000 236 PPI Mini-LED |
4. 88.6% v7 (old)  | Dell XPS 16 9640 Intel Core Ultra 7 155H ⎘ NVIDIA GeForce RTX 4070 Laptop GPU ⎘ 32 GB Memory, 1024 GB SSD | Amazon: 1. $2,799.99 Dell XPS 16 9640 Laptop | In... 2. $2,199.00 New XPS 16 9640 Business Lap... 3. $2,499.00 Dell XPS 16 9640 16.3" Touch... | 2.3 kg | 18.7 mm | 16.30" 3840x2400 139 PPI OLED |
5. 92.3% v7 (old)  | Asus ROG Zephyrus G16 2024 GU605M Intel Core Ultra 7 155H ⎘ NVIDIA GeForce RTX 4070 Laptop GPU ⎘ 16 GB Memory, 1024 GB SSD | Amazon: List Price: 3000€ | 1.8 kg | 16.4 mm | 16.00" 2560x1600 189 PPI OLED |
6. 89.2% v7 (old)  | Schenker XMG CORE 16 (L23) AMD Ryzen 7 7840HS ⎘ NVIDIA GeForce RTX 4070 Laptop GPU ⎘ 32 GB Memory, 1024 GB SSD | Amazon: 1. $26.00 Laptop GPU Cooling Fan for S... 2. $26.00 Laptop CPU Cooling Fan for S... List Price: 2230 Euro | 2.4 kg | 26.1 mm | 16.00" 2560x1600 189 PPI IPS |
Transparency
The selection of devices to be reviewed is made by our editorial team. The test sample was provided to the author as a loan by the manufacturer or retailer for the purpose of this review. The lender had no influence on this review, nor did the manufacturer receive a copy of this review before publication. There was no obligation to publish this review. As an independent media company, Notebookcheck is not subjected to the authority of manufacturers, retailers or publishers.
This is how Notebookcheck is testing
Every year, Notebookcheck independently reviews hundreds of laptops and smartphones using standardized procedures to ensure that all results are comparable. We have continuously developed our test methods for around 20 years and set industry standards in the process. In our test labs, high-quality measuring equipment is utilized by experienced technicians and editors. These tests involve a multi-stage validation process. Our complex rating system is based on hundreds of well-founded measurements and benchmarks, which maintains objectivity. Further information on our test methods can be found here.

