Asus ROG Zephyrus G16 2024 review - The gaming laptop now with G-Sync OLED and Intel Meteor Lake
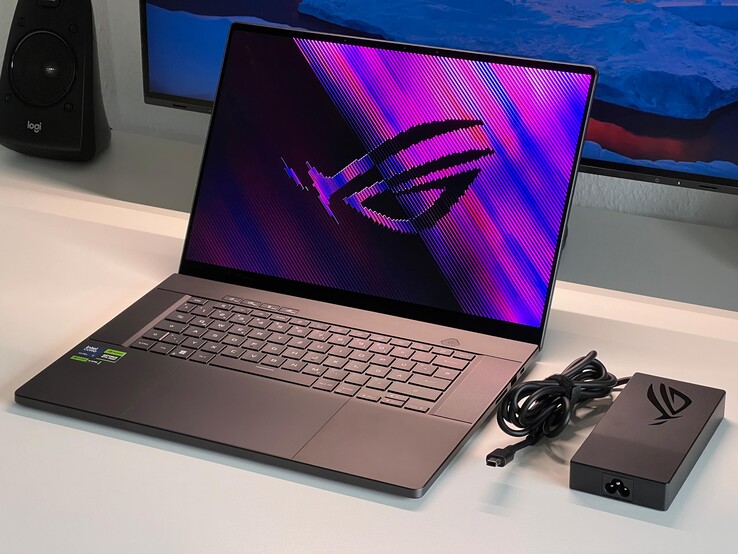
Republic of Gamers—this stands for gaming laptops at Asus. When it comes to the new ROG Zephyrus G16 (and also the smaller G14), however, the manufacturer has altered its approach slightly, aiming to speak to further types of customers. To do so, it uses a flatter and more elegant case design, but this limits what components can be installed. The result is a high-end gaming/multimedia hybrid laptop which could also be interesting for content creators or, in general, users who are on the hunt for a stylish and powerful device. In fact, the new Zephyrus G16 is also the only 2024 gaming laptop from Asus to date that uses a new Meteor Lake processor from Intel. The smaller ROG Zephyrus G14 (review will be published soon), on the other hand, uses the new Ryzen 8000 processors from AMD.
Our test version of the ROG Zephyrus G16 GU605M isn't the high-end variant, as aside from its new Core Ultra 7 155H, it is equipped with the GeForce RTX 4070 Laptop. In addition, it now features an OLED display from Samsung which has a 240-Hz refresh rate and supports G-Sync for the first time. Furthermore, the laptop has 16 GB RAM and a 1-TB SSD installed. The new G16 is available to purchase from February 15th with prices starting from US$2,899.99; we can't yet name an MRSP for our test configuration.
February 5, 2024 update: Battery life tests with the OLED panel's refresh rate set to 240 Hz added. Please scroll down to the Runtimes section for details.
Possible competitors compared
Rating | Date | Model | Weight | Height | Size | Resolution | Price |
|---|---|---|---|---|---|---|---|
| 92.3 % v7 (old) | 02 / 2024 | Asus ROG Zephyrus G16 2024 GU605M Ultra 7 155H, GeForce RTX 4070 Laptop GPU | 1.8 kg | 16.4 mm | 16.00" | 2560x1600 | |
| 88.4 % v7 (old) | 08 / 2023 | Lenovo Yoga Pro 9 16-IRP G8 i7-13705H, GeForce RTX 4060 Laptop GPU | 2.2 kg | 18.2 mm | 16.00" | 3200x2000 | |
| 91.2 % v7 (old) | 02 / 2023 | Razer Blade 16 Early 2023 i9-13950HX, GeForce RTX 4080 Laptop GPU | 2.4 kg | 21.99 mm | 16.00" | 2560x1600 | |
| 86.2 % v7 (old) | 03 / 2023 | Gigabyte AERO 16 OLED BSF i9-13900H, GeForce RTX 4070 Laptop GPU | 2.1 kg | 18 mm | 16.00" | 3840x2400 | |
| 88.6 % v7 (old) | 07 / 2023 | Schenker VISION 16 Pro (M23) i7-13700H, GeForce RTX 4070 Laptop GPU | 1.6 kg | 17.1 mm | 16.00" | 2560x1600 | |
| 88.8 % v7 (old) | 07 / 2023 | MSI Stealth 16 Studio A13VG i7-13700H, GeForce RTX 4070 Laptop GPU | 2 kg | 19.95 mm | 16.00" | 2560x1600 | |
| 93.2 % v7 (old) | 11 / 2023 | Apple MacBook Pro 16 2023 M3 Max Apple M3 Max 16-Core, M3 Max 40-Core GPU | 2.1 kg | 16.9 mm | 16.00" | 3456x2234 |
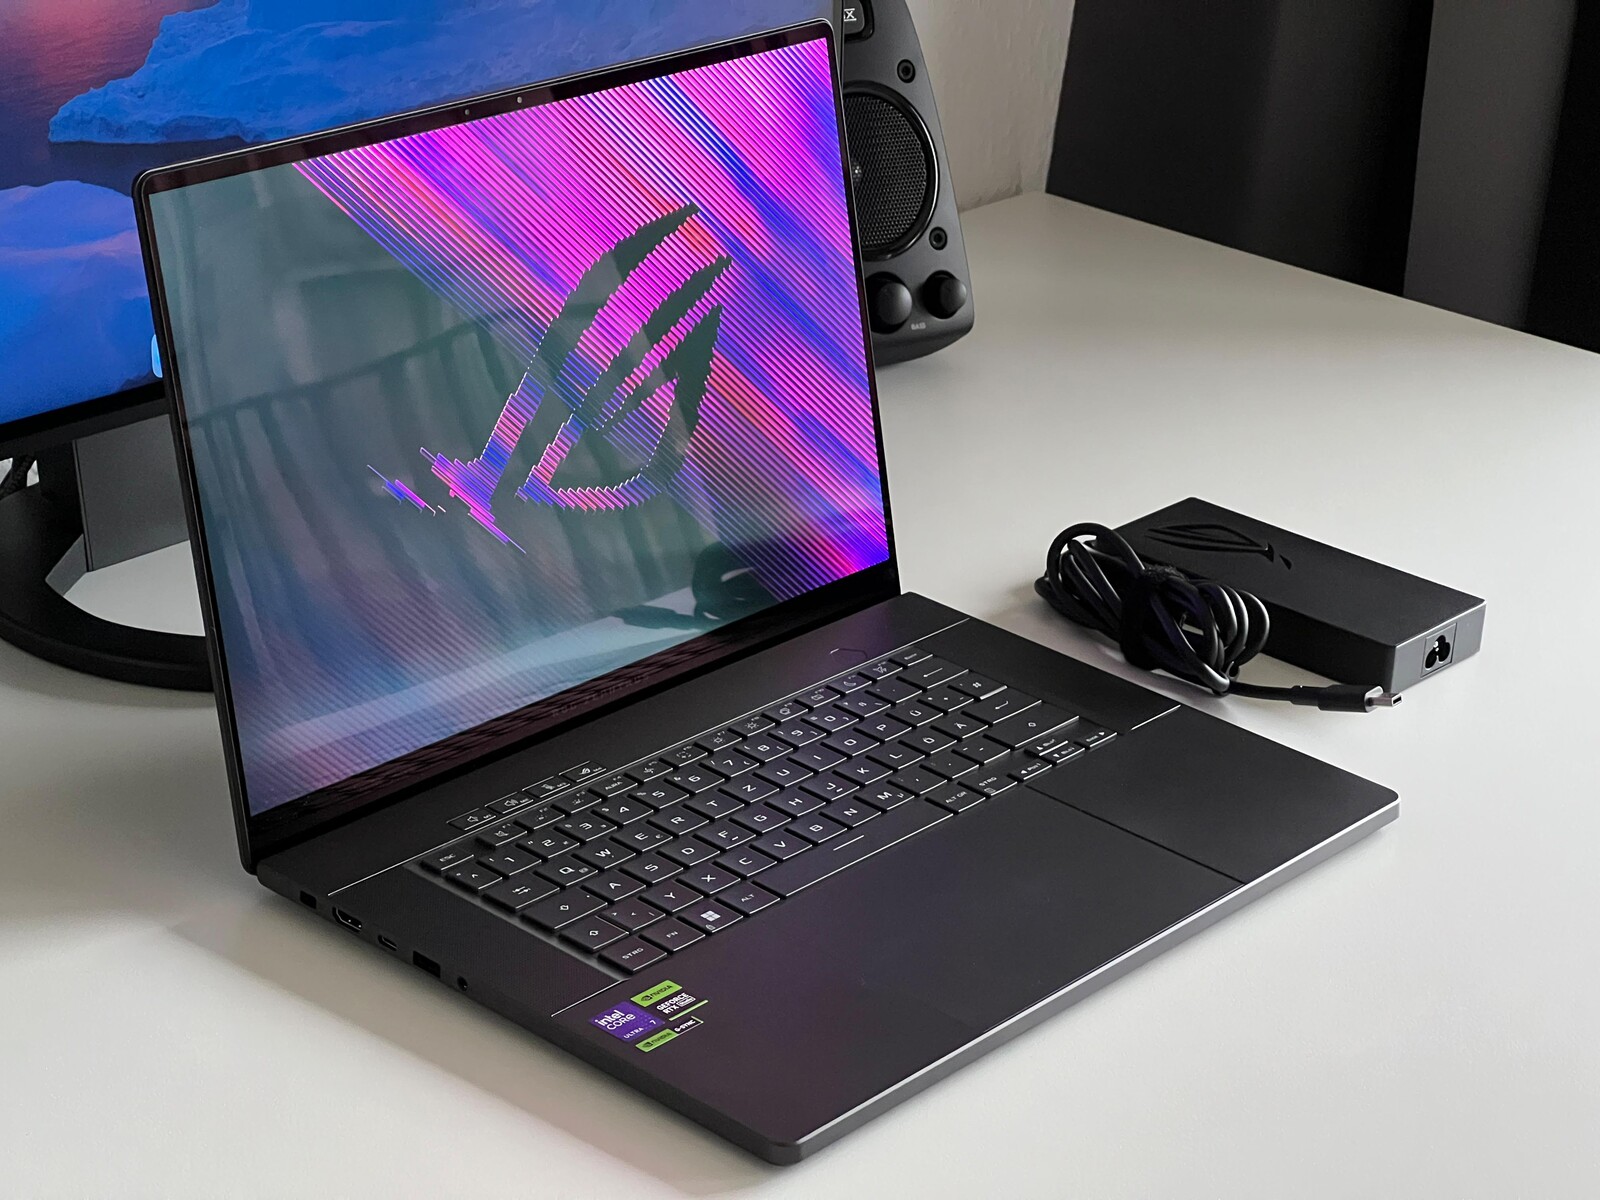
Case - The Zephyrus now made from aluminum
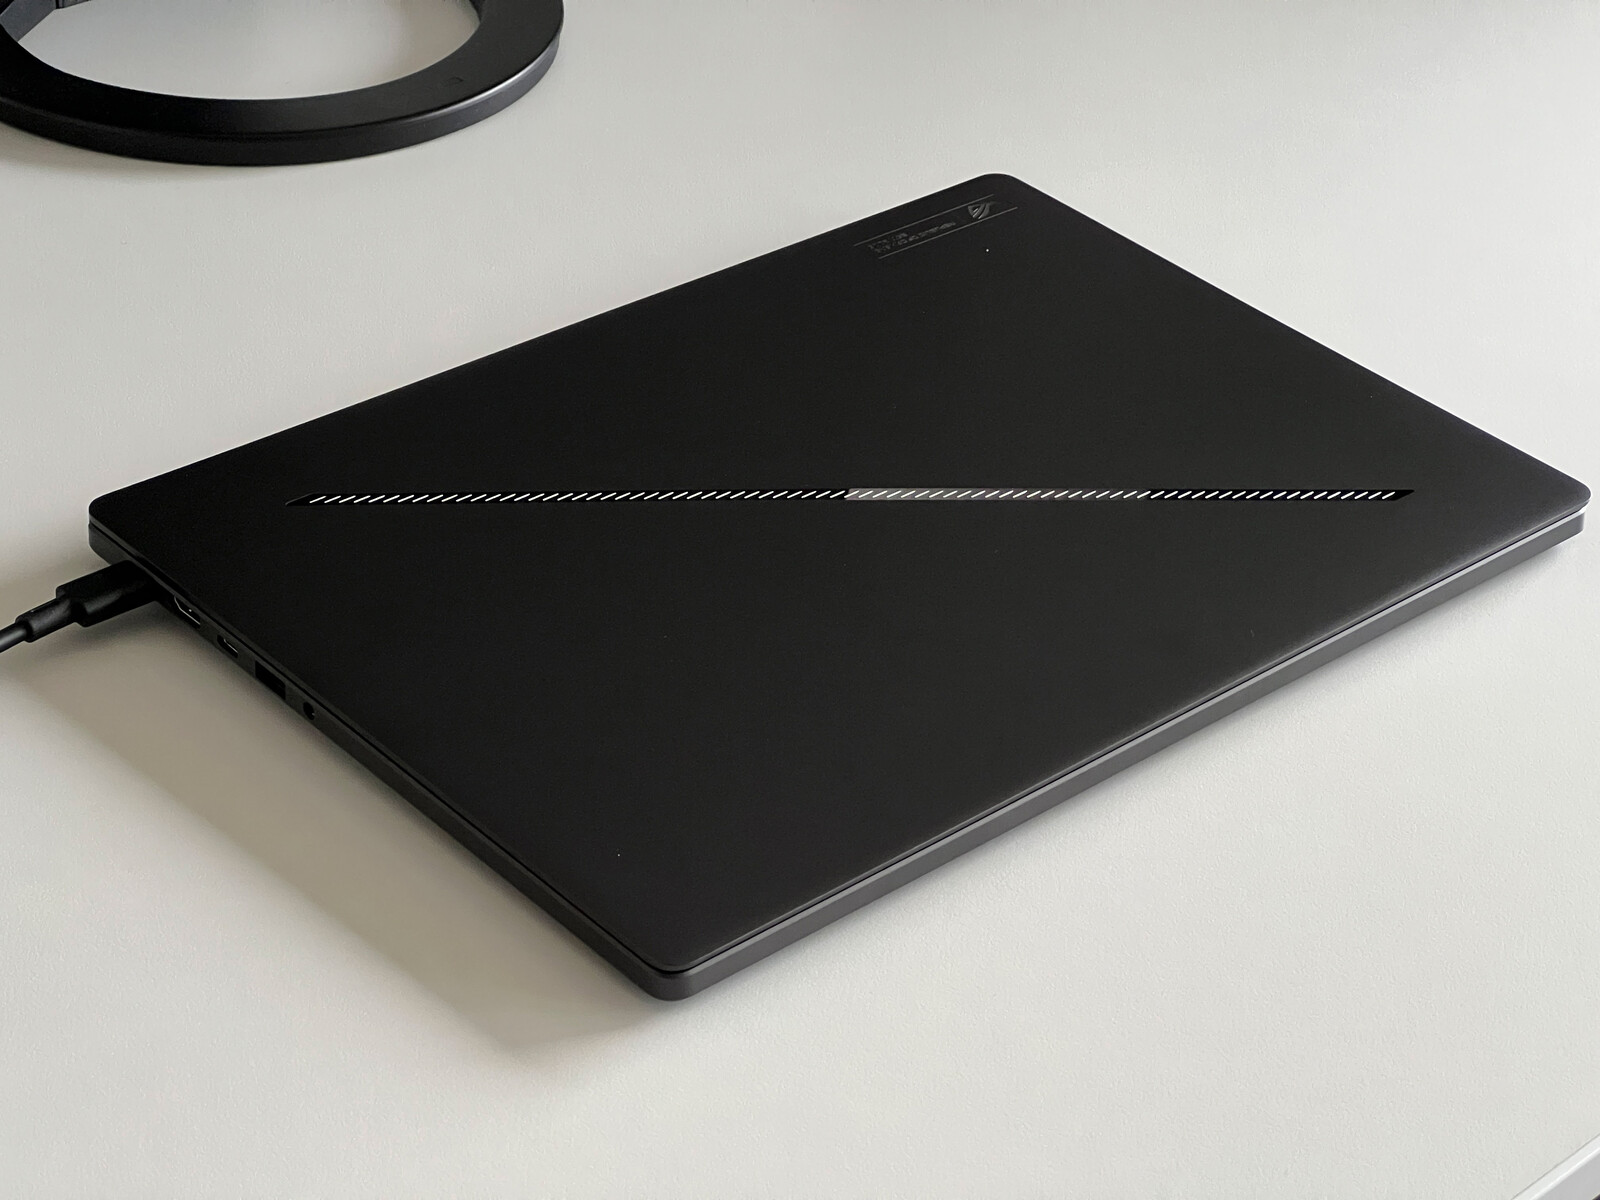
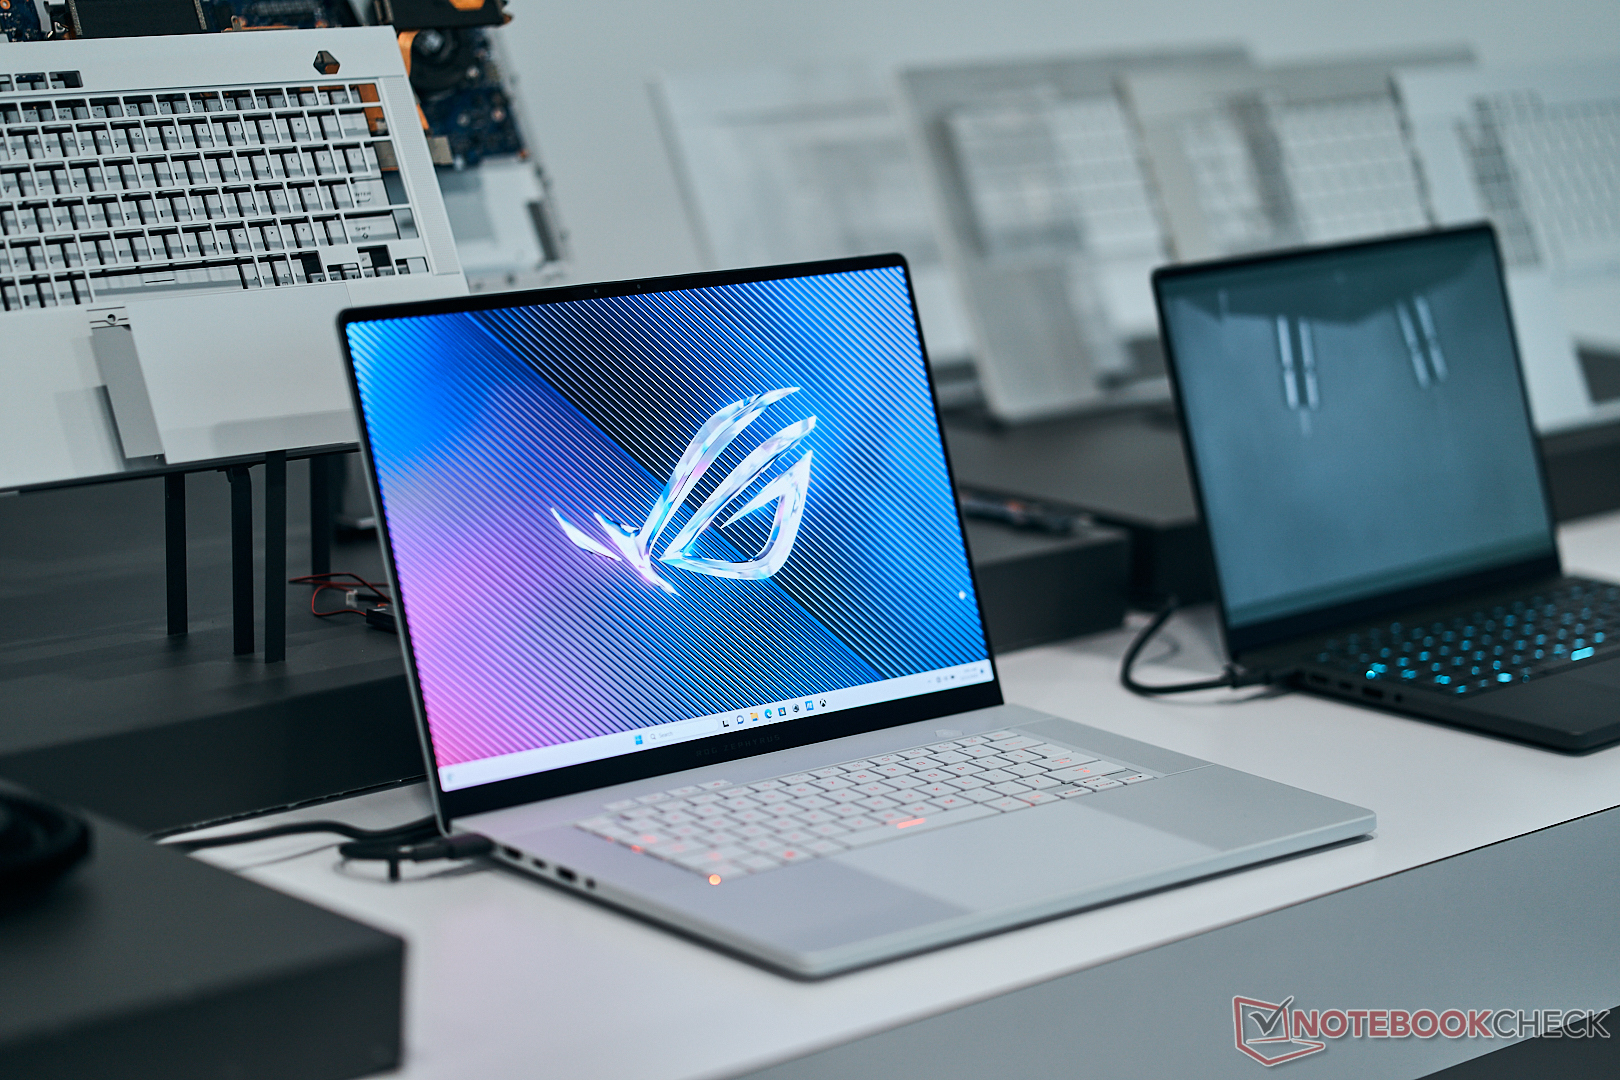
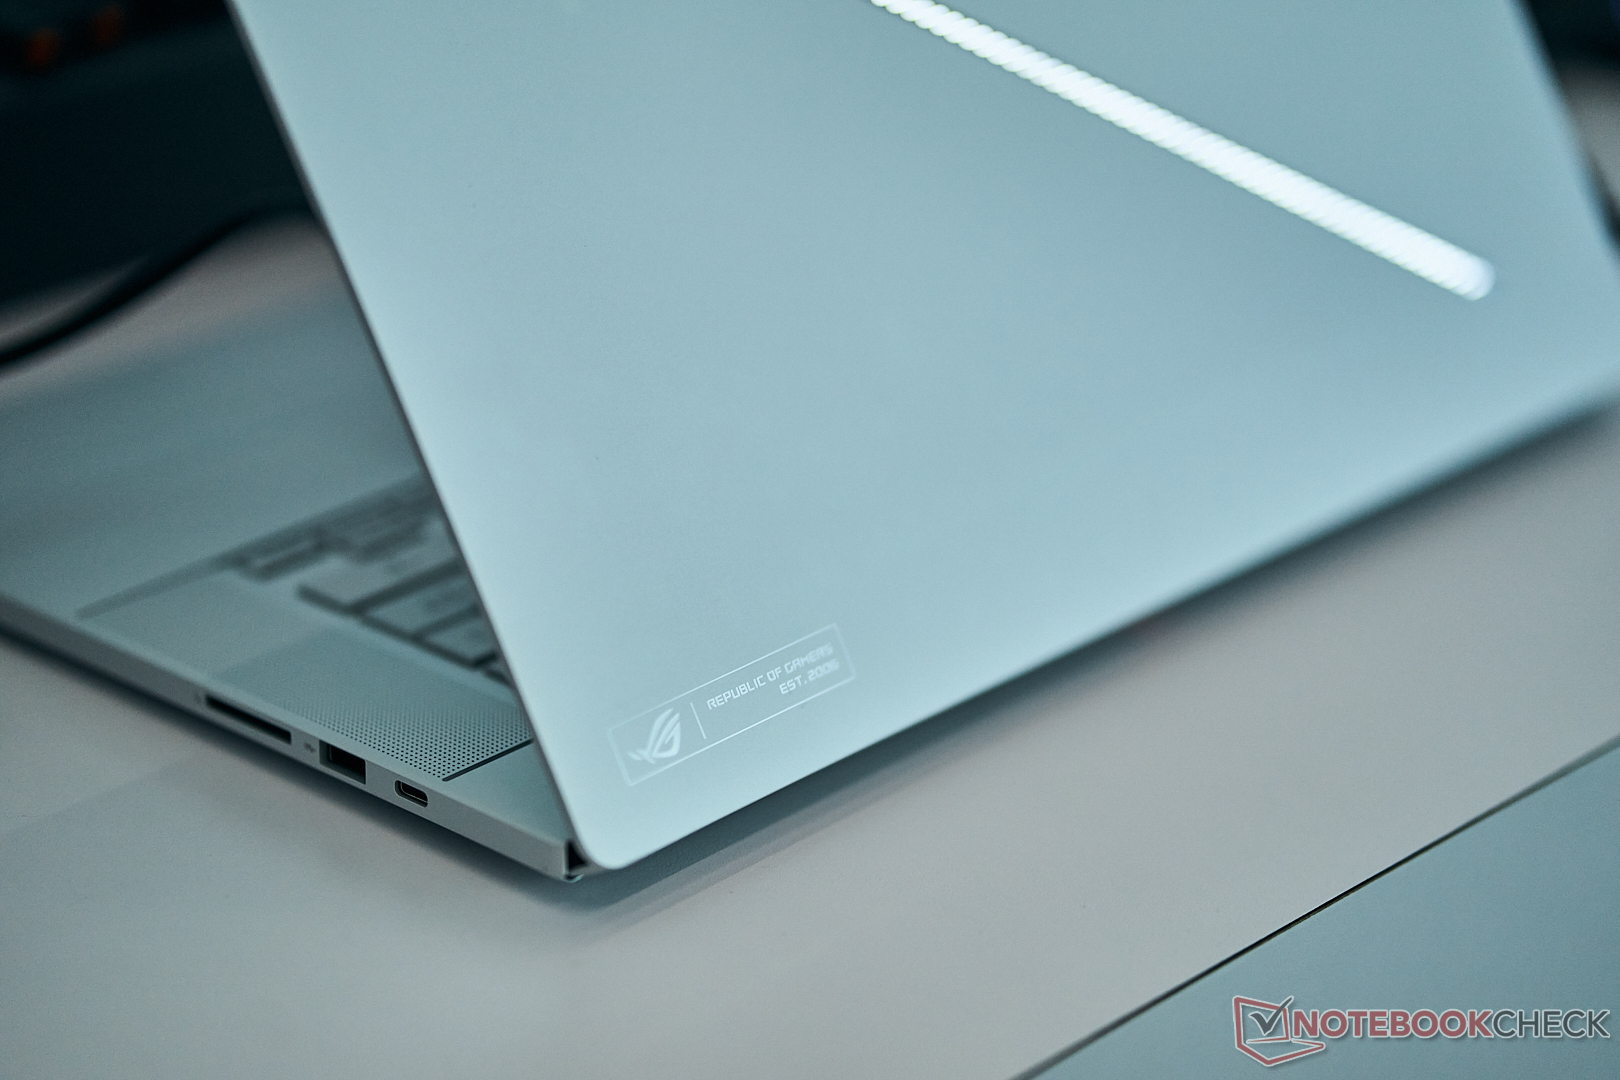
Asus' new Zephyrus G16 features an elegant aluminium unibody case and at first glance, you are immediately reminded of devices like the Razer Blade 16 or the Apple MacBook Pro 16. When handling the laptop, there is no doubt that this is a true premium device. Our test device is the dark-gray version (Eclipse Gray) and during the preview event at the end of last year, we also had a chance to take a look at the white variant (Platinum White). The white model is a little less of a fingerprint magnet but in turn, the dark-gray model is a little more inconspicuous. We also included a few pictures of the white variant in our photo gallery.

Asus has forgone the extensive dot-matrix display on the lid of the new model and in turn, it features a thin diagonal white light strip (Slash Lighting) consisting of 28 mini LEDs and 7 different zones. It can be programmed (for example, as a notification light) or alternatively, it can be completely deactivated if you don't to draw too much attention to the device. Aside from the keyboard, there are no further illuminated elements.
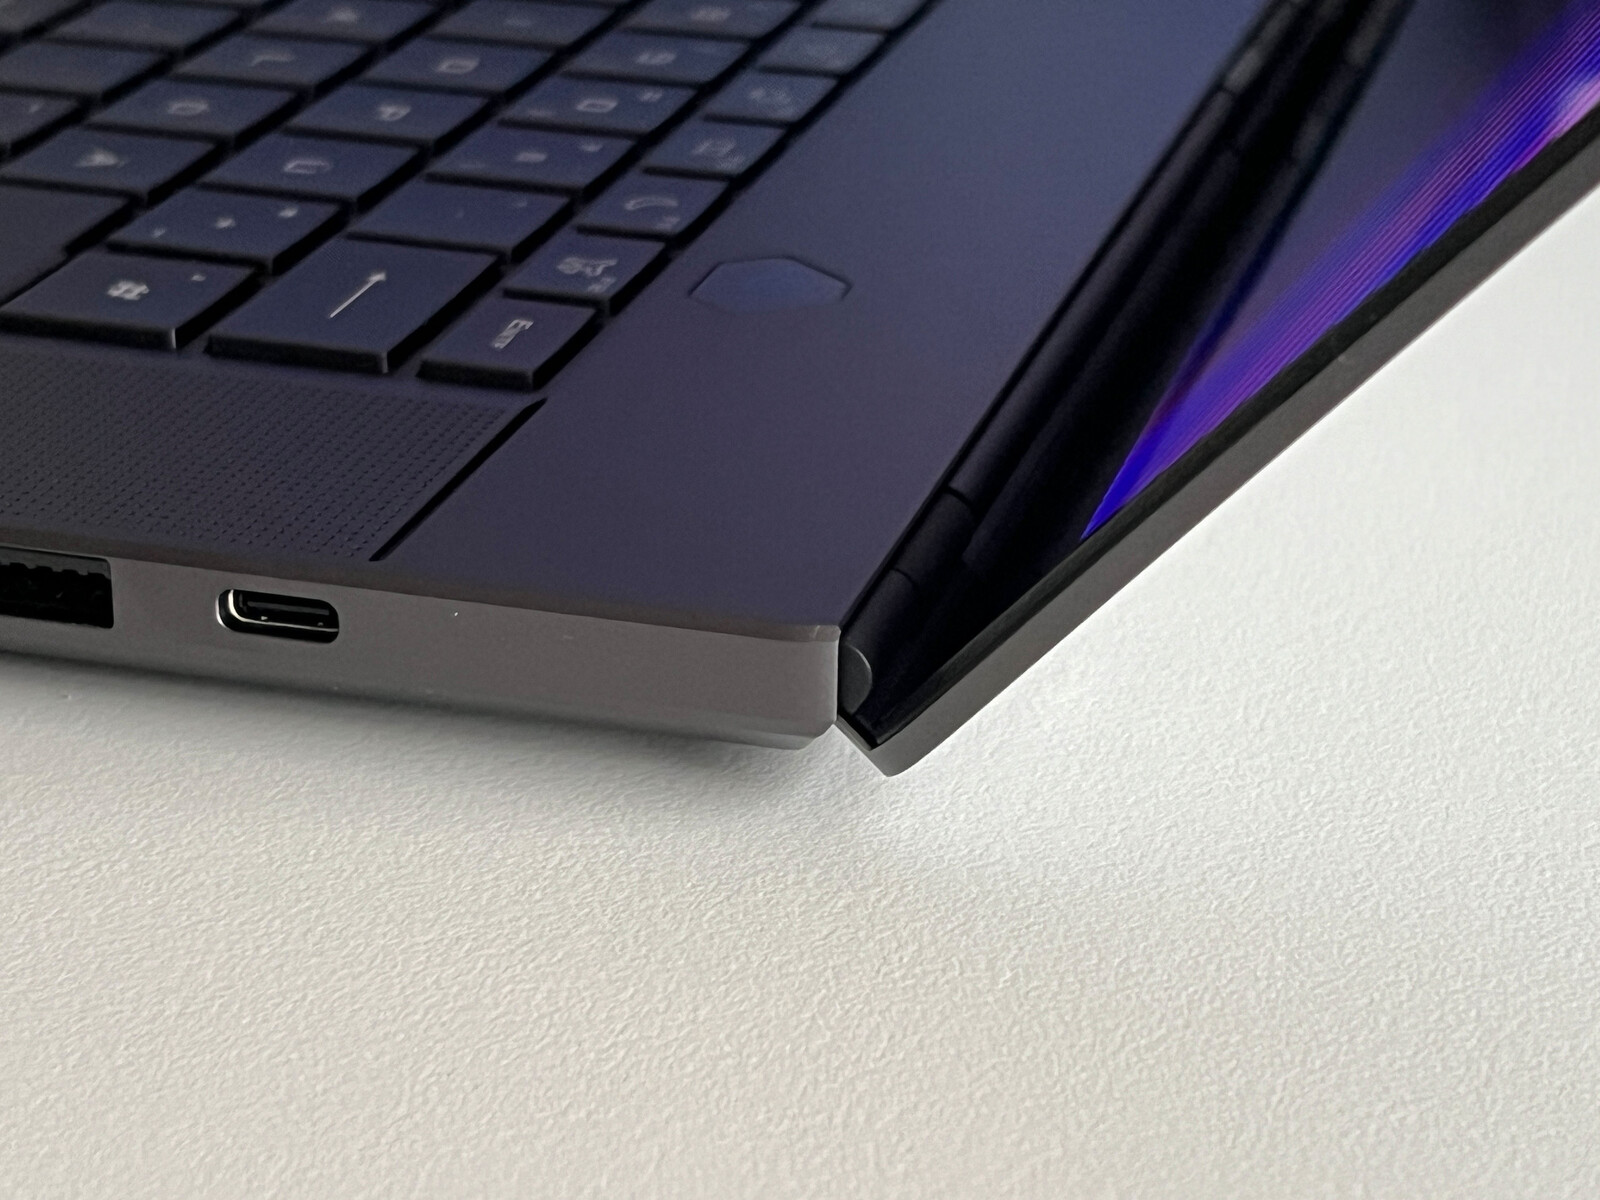
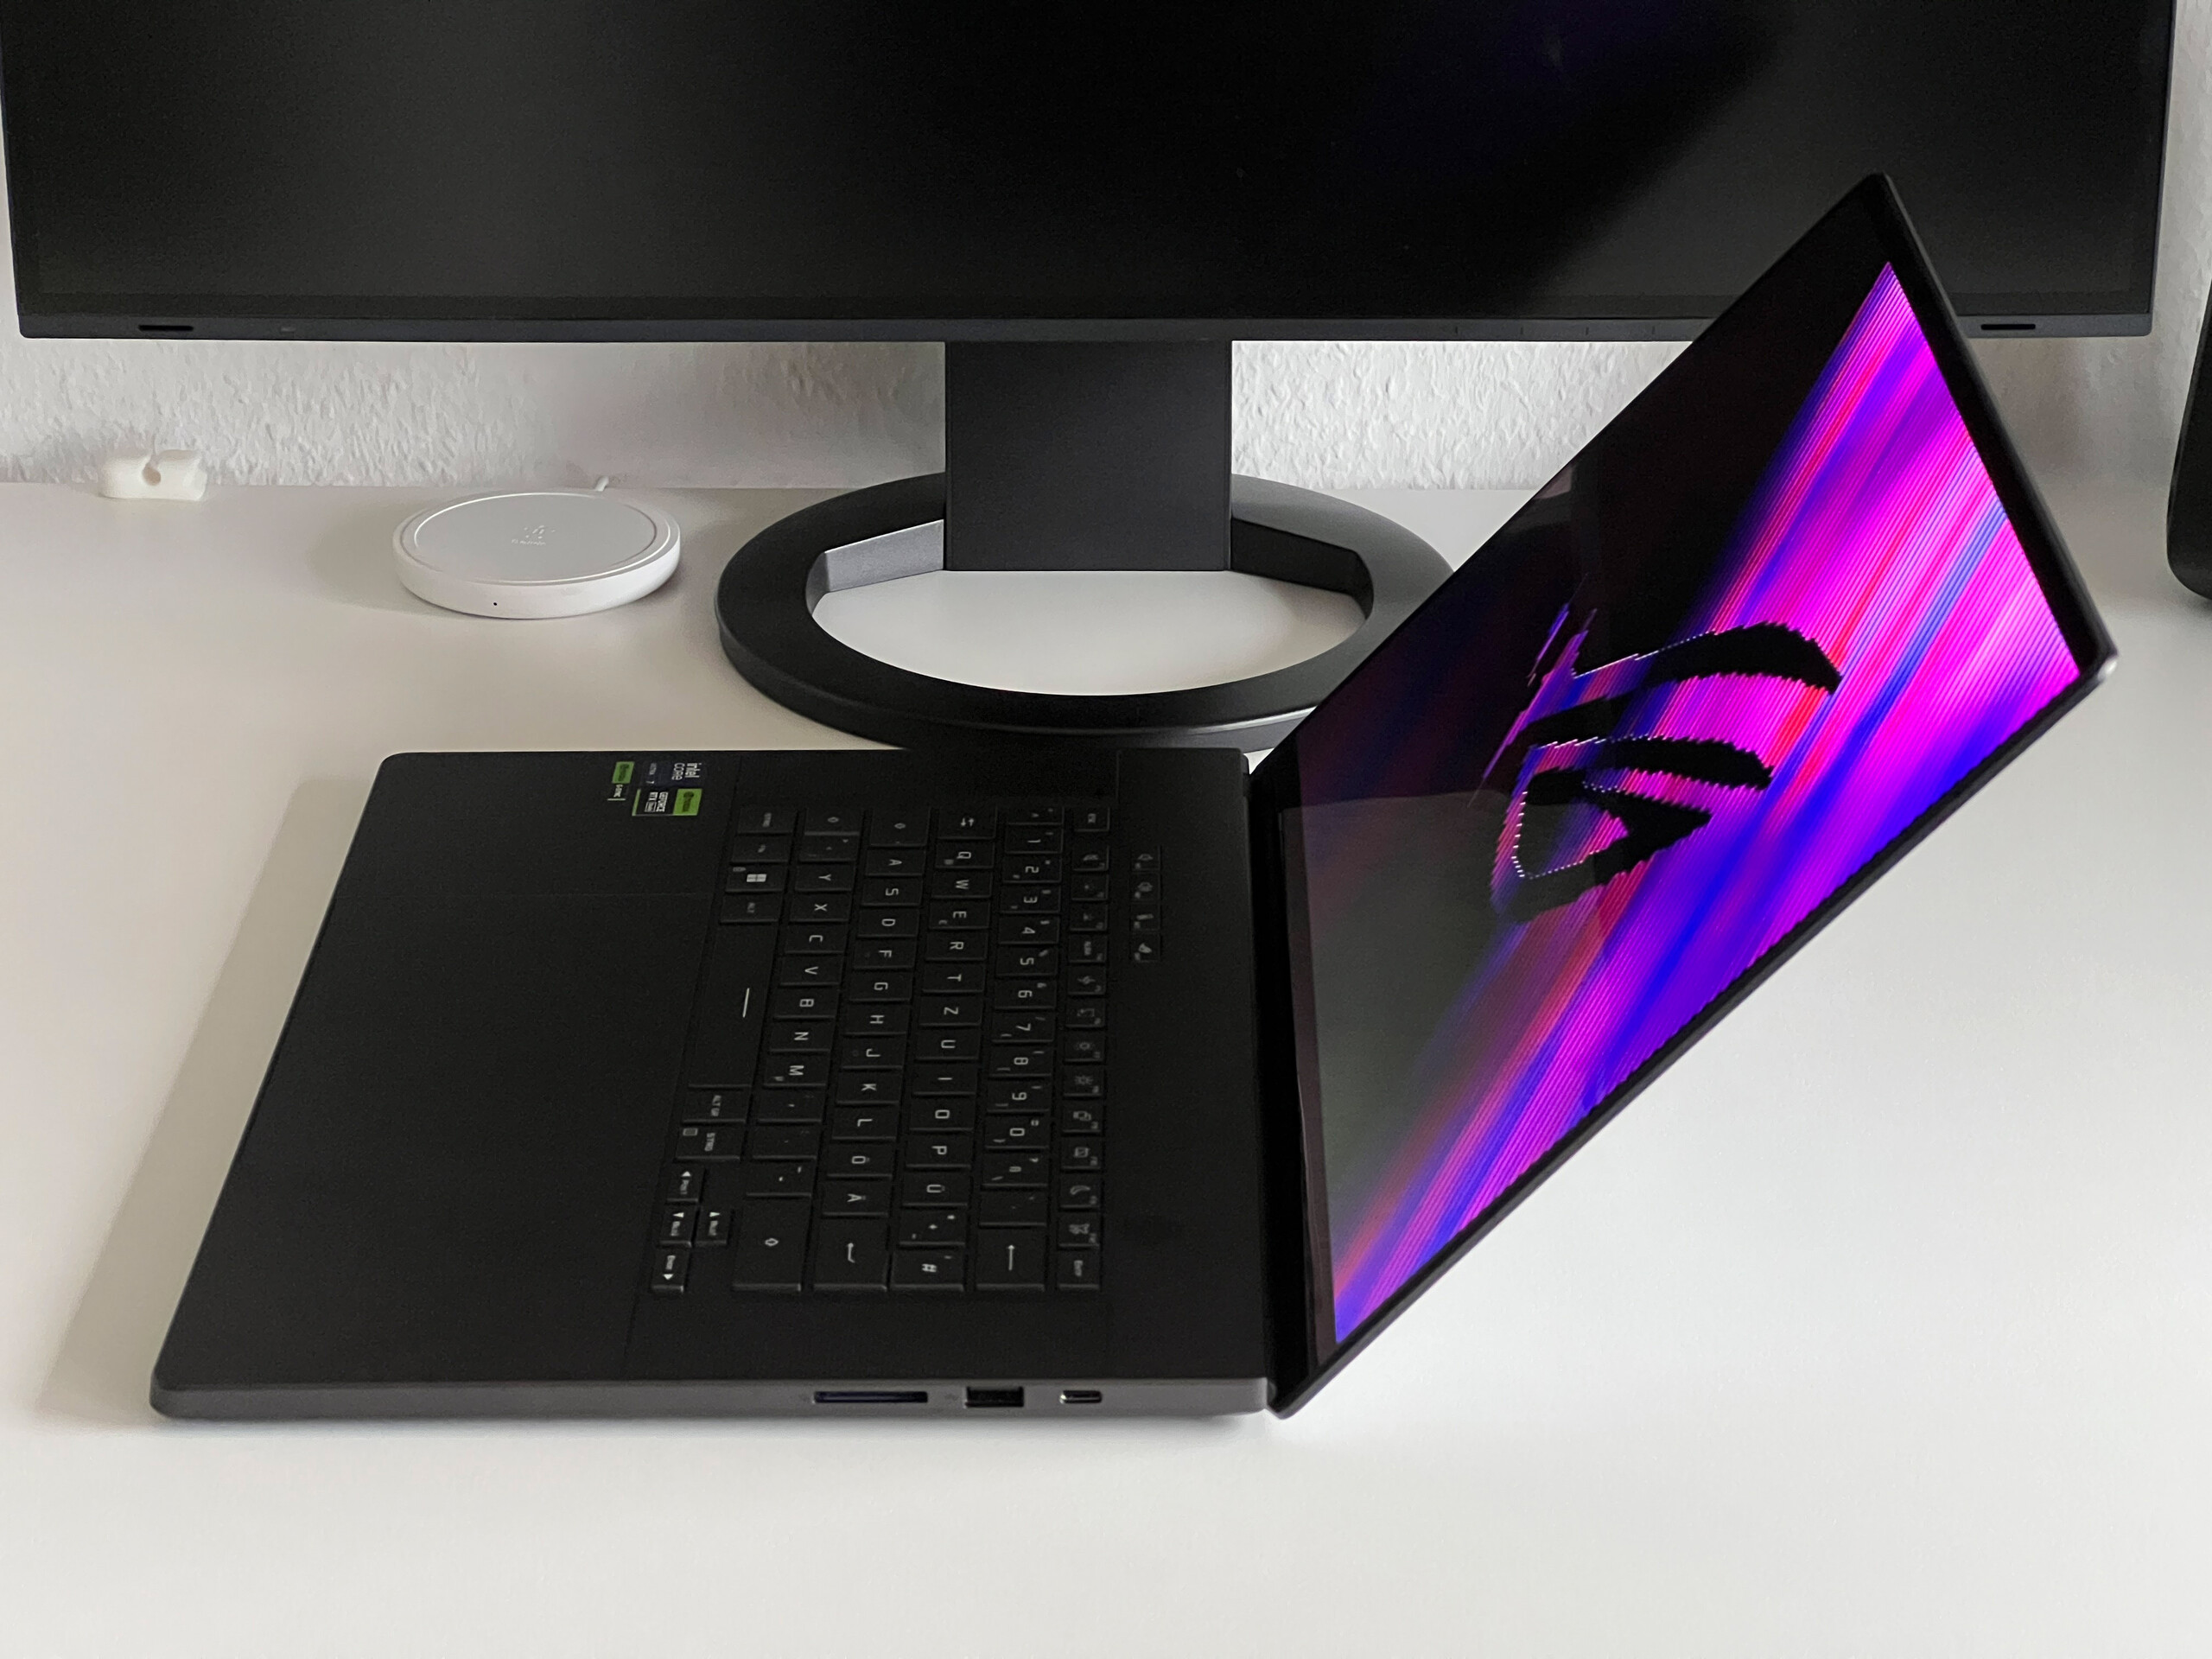
The device's build and stability are astounding and the keyboard practically can't be pressed in at all—even using lots of pressure. Creaking noises are also foreign to the Zephyrus. The thin display lid is a little more flexible but we noted no issues here, either. However, the new hinge design limits the laptop's maximum opening angle to 135 degrees. The lid can easily be opened with one hand but for our taste, the hinge could do with being set a little more tightly, as it wobbles quite a bit when you adjust the angle.
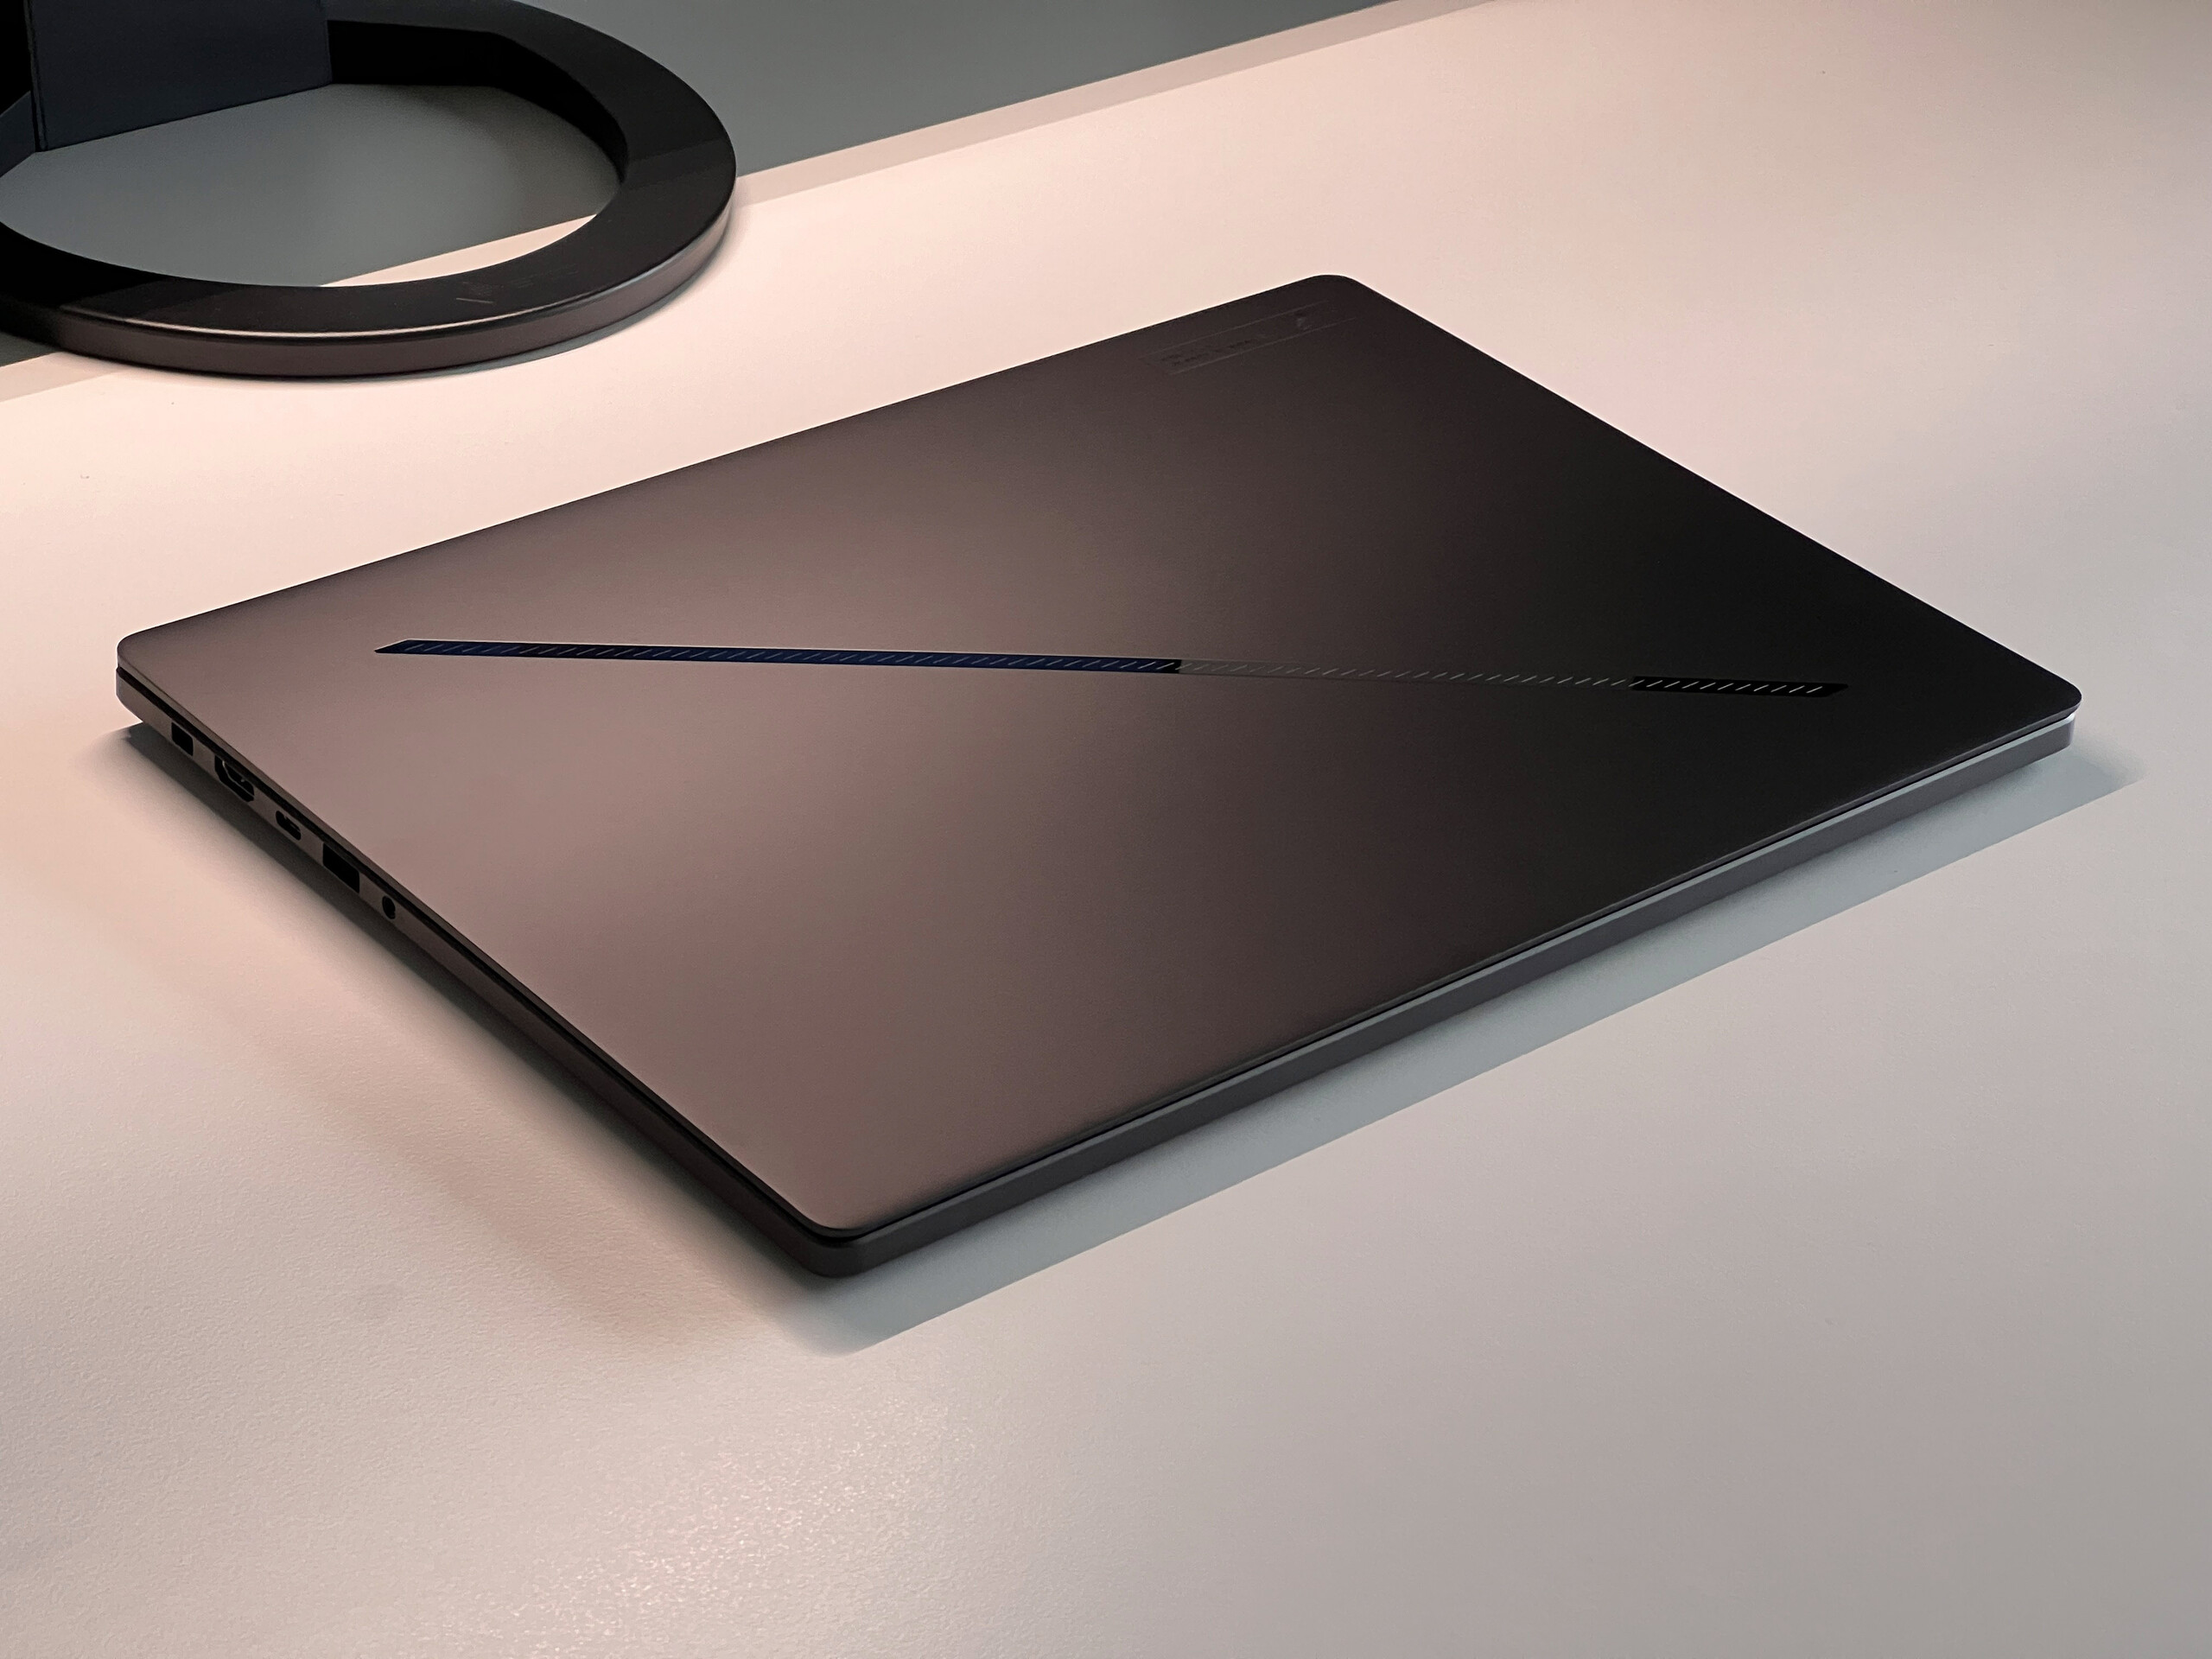
The new ROG Zephyrus G16 is one of the most compact models in our comparison field and together with the Vision 16 Pro and the MacBook Pro, its 16.4 mm make it one of the thinnest models, too. However, it should also be noted that our test device is the thinnest version of the range, as the TFT models and Vapor-Chamber models are a little thicker. It is lightweight as well, weighing 1.8 kg; the 200-watt power supply adds an additional 583 grams onto the scales.
Connectivity - Thunderbolt and speedy WLAN
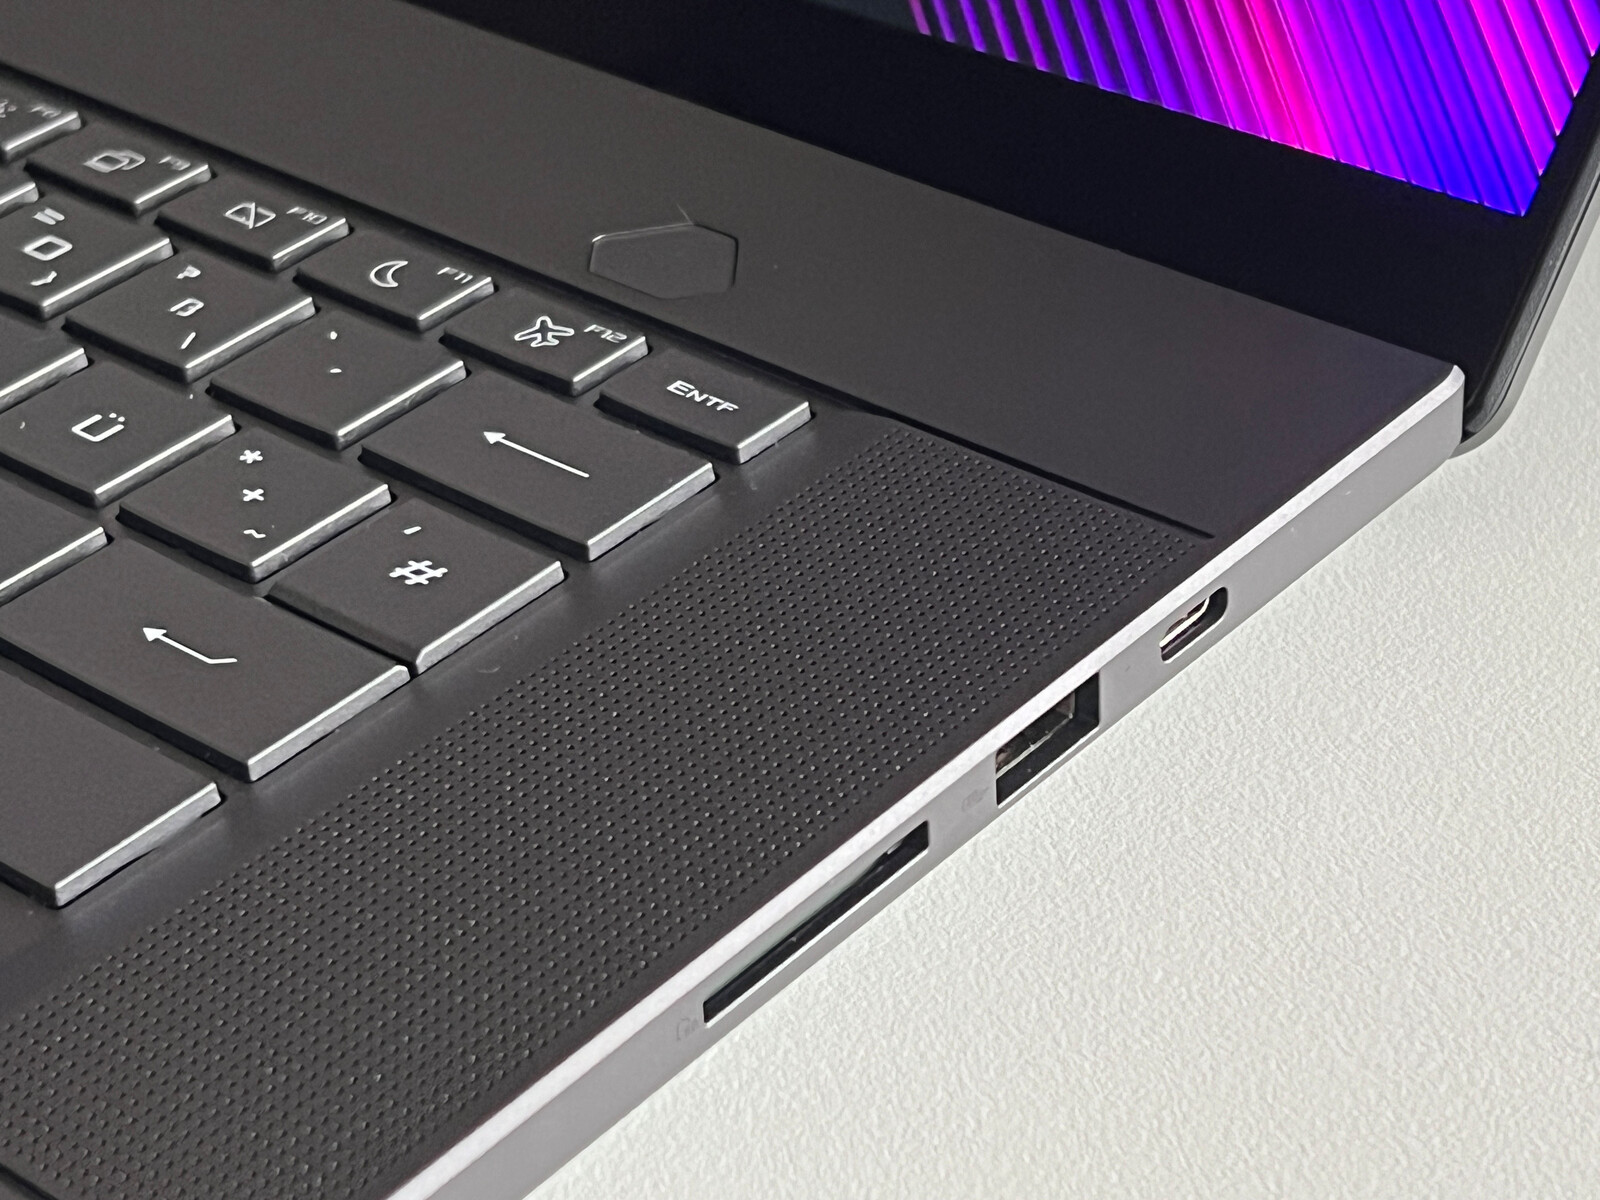
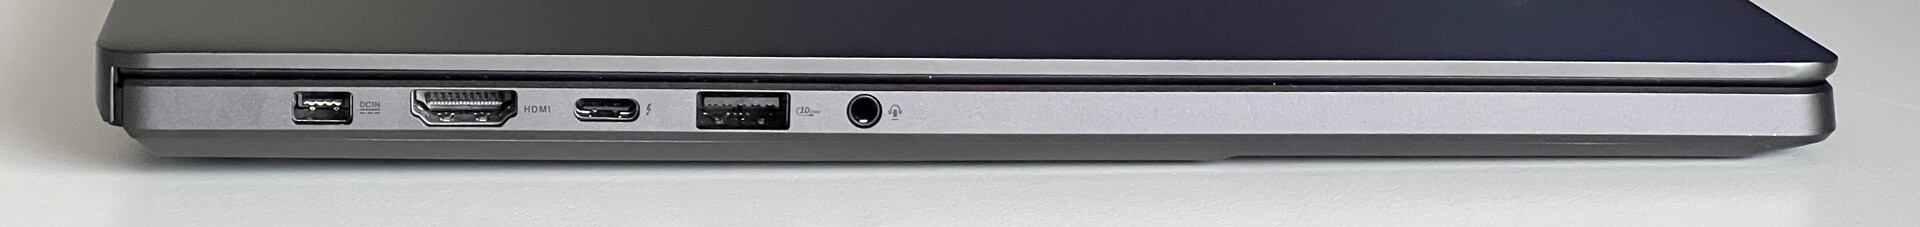
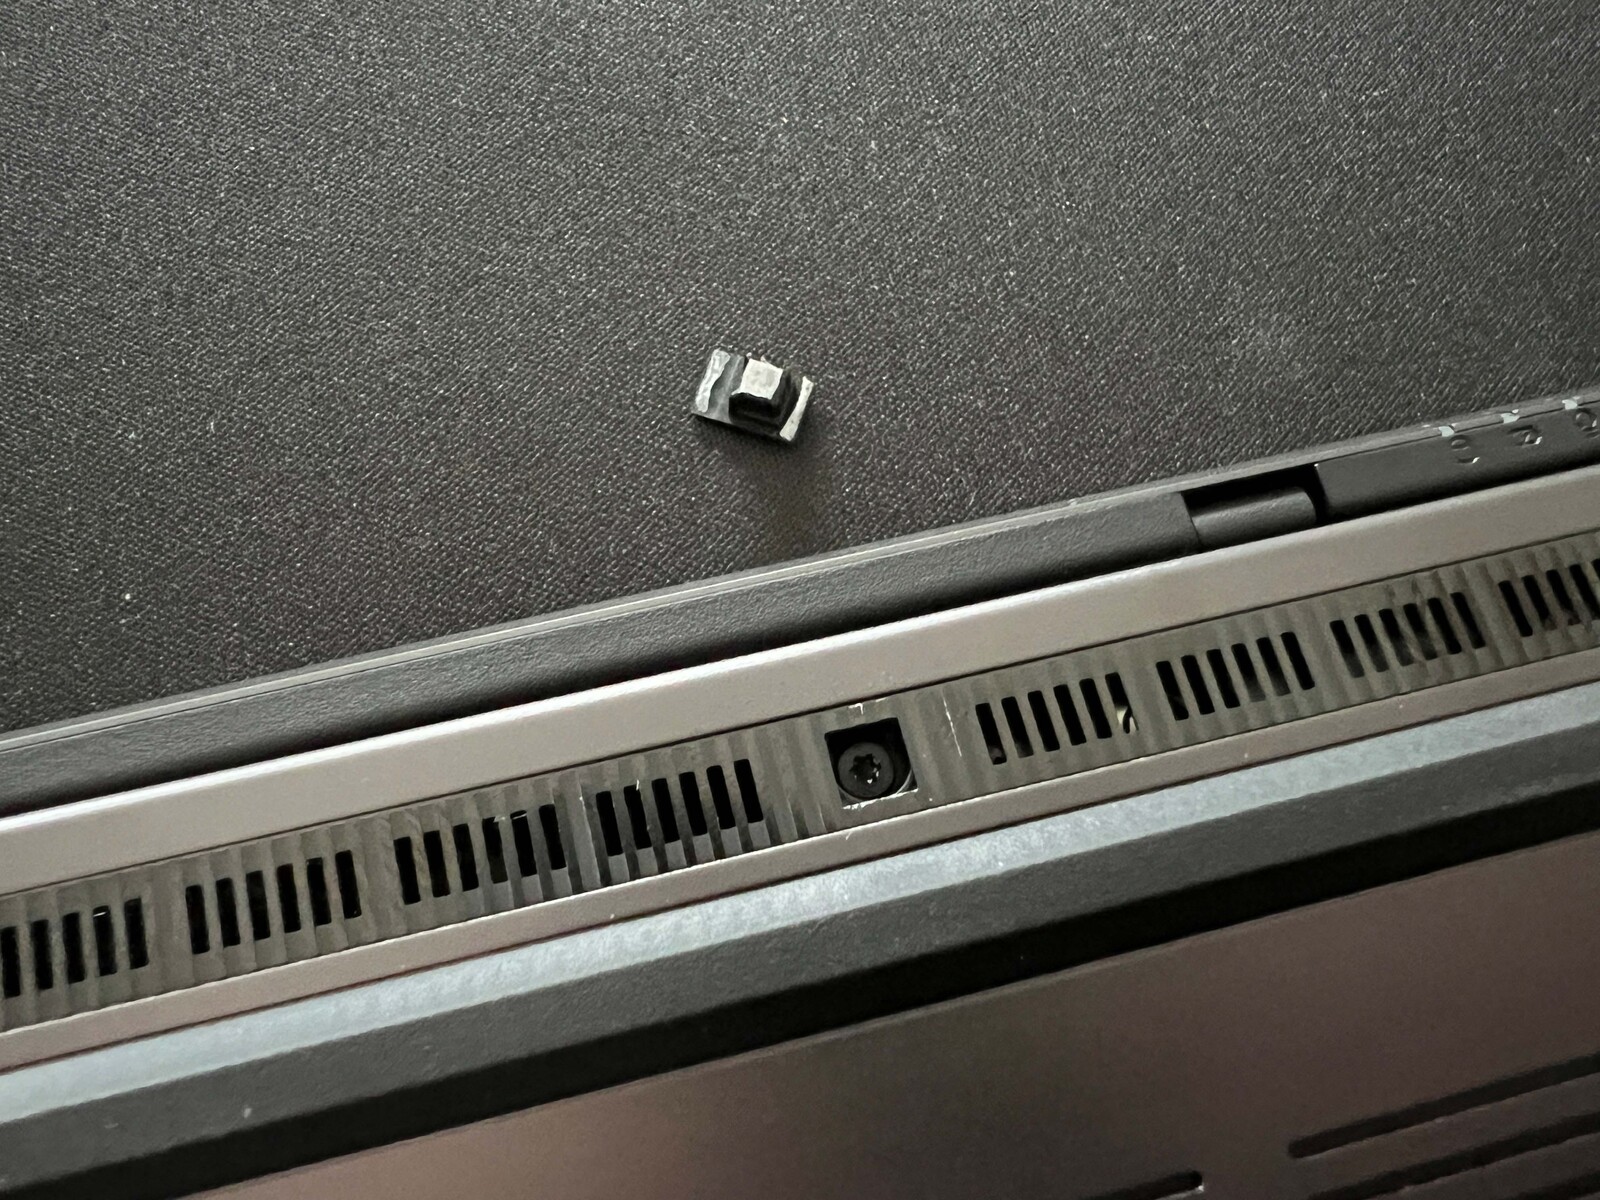
The back is completely taken up by the cooling, which is why the ports are spread out between both sides of the laptop. Asus now uses a new rectangular power supply connector which has been placed on the back left of the case. The device features all the important connections, as aside from USB-C, it also has USB-A, a full HDMI output and a card reader. Both USB-C ports support Power Delivery at up to 100 watts and the one on the left supports Thunderbolt 4. It just doesn't have an Ethernet connection—if required, you will have to use a USB adapter.
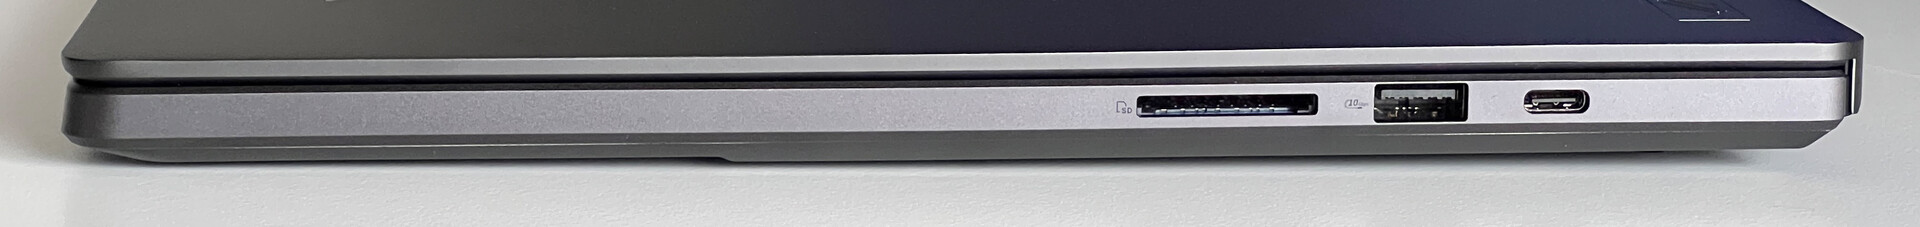
SD card reader
The G16 has a full-featured card reader on the right side, whereby inserted cards jut out by about 1.2 cm. In combination with our reference card (Angelbird AV Pro V60), it achieved transfer rates of around 80-90 MB/s, meaning the test device came out near the bottom.
| SD Card Reader | |
| average JPG Copy Test (av. of 3 runs) | |
| Gigabyte AERO 16 OLED BSF | |
| Apple MacBook Pro 16 2023 M3 Max (Angelbird AV Pro V60) | |
| MSI Stealth 16 Studio A13VG | |
| Average of class Gaming (20.9 - 210, n=55, last 2 years) | |
| Razer Blade 16 Early 2023 (AV PRO microSD 128 GB V60) | |
| Asus ROG Zephyrus G16 2024 GU605M | |
| Lenovo Yoga Pro 9 16-IRP G8 (Angelibird AV Pro V60) | |
| Schenker VISION 16 Pro (M23) (Angelbird AV Pro V60) | |
| maximum AS SSD Seq Read Test (1GB) | |
| Apple MacBook Pro 16 2023 M3 Max (Angelbird AV Pro V60) | |
| Razer Blade 16 Early 2023 (AV PRO microSD 128 GB V60) | |
| Gigabyte AERO 16 OLED BSF | |
| MSI Stealth 16 Studio A13VG | |
| Average of class Gaming (25.5 - 261, n=52, last 2 years) | |
| Asus ROG Zephyrus G16 2024 GU605M | |
| Lenovo Yoga Pro 9 16-IRP G8 (Angelibird AV Pro V60) | |
| Schenker VISION 16 Pro (M23) (Angelbird AV Pro V60) | |
Communication
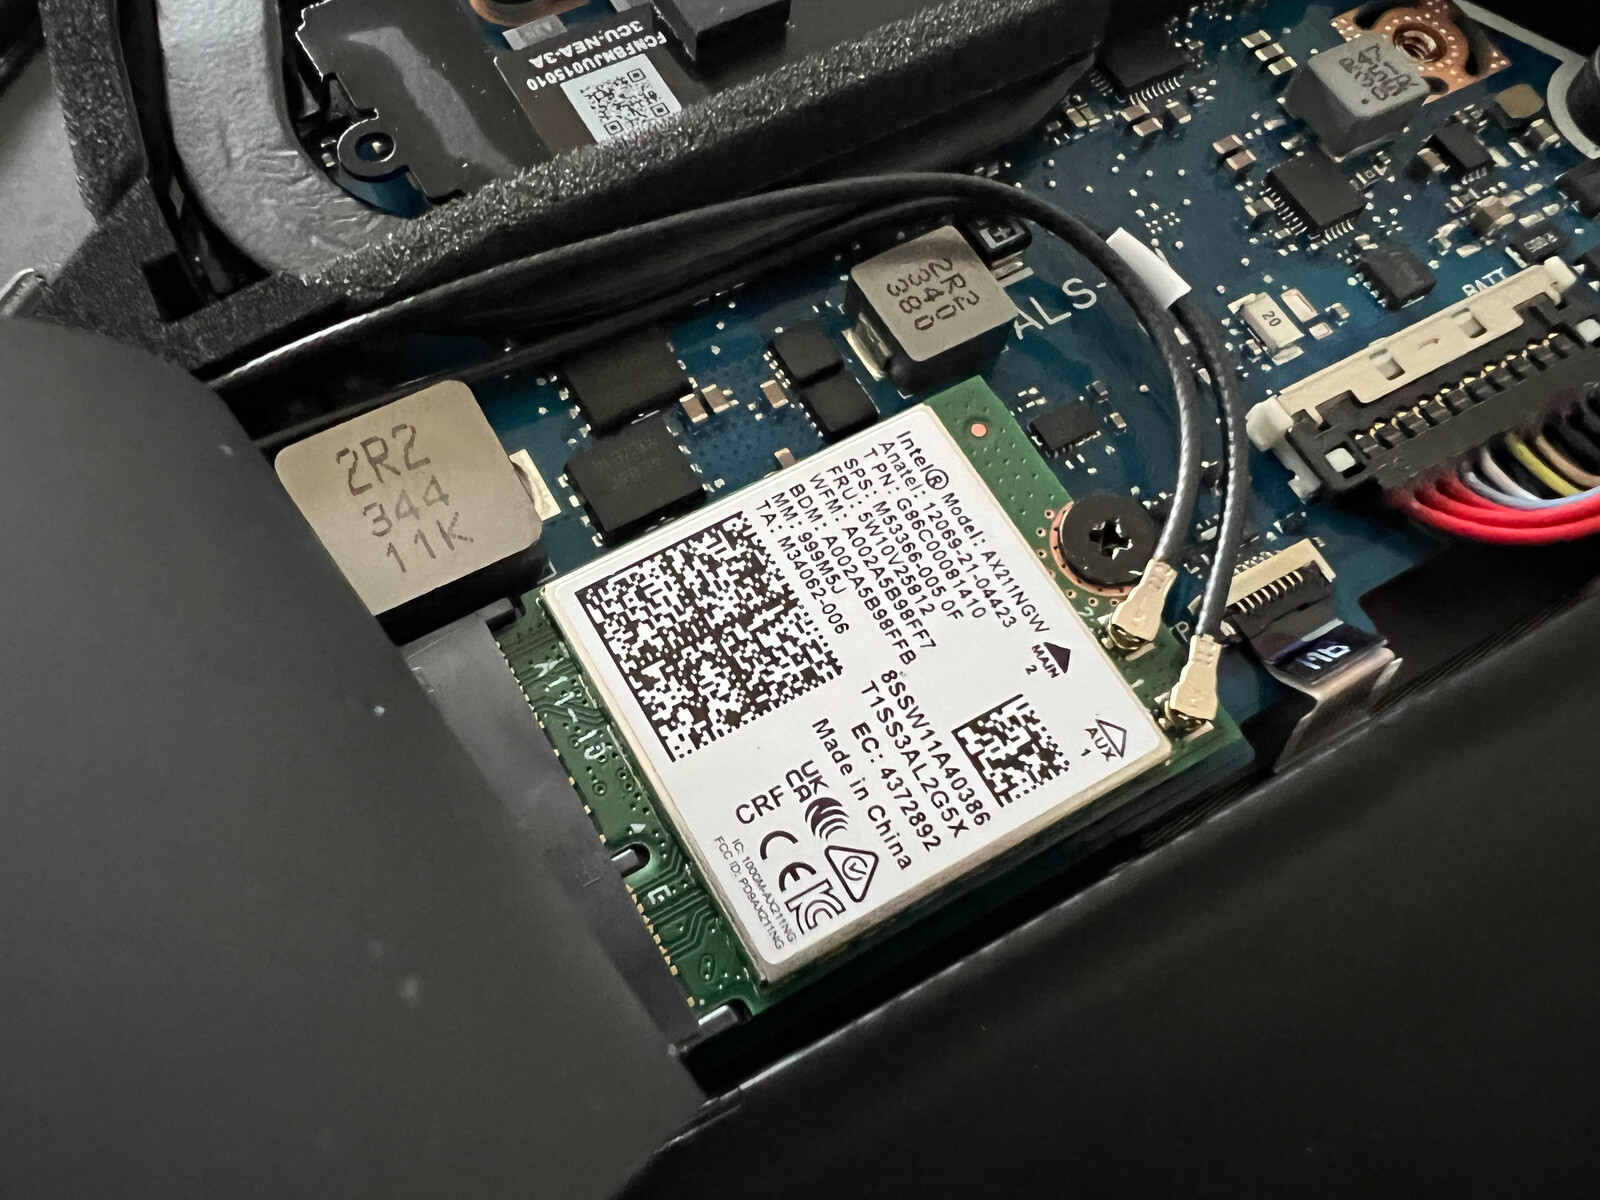
Asus has forgone Wi-Fi 7 but even so, the AX211 module from Intel is still an up-to-date WLAN adapter that supports Bluetooth 5.3 as well as Wi-Fi 6E. Together with our reference router from Asus, its transfer rates were very good and stable and during our test period, we had no issues surrounding signal quality.
| Networking | |
| Asus ROG Zephyrus G16 2024 GU605M | |
| iperf3 transmit AXE11000 | |
| iperf3 receive AXE11000 | |
| Lenovo Yoga Pro 9 16-IRP G8 | |
| iperf3 transmit AXE11000 | |
| iperf3 receive AXE11000 | |
| Razer Blade 16 Early 2023 | |
| iperf3 transmit AXE11000 | |
| iperf3 receive AXE11000 | |
| iperf3 transmit AXE11000 6GHz | |
| iperf3 receive AXE11000 6GHz | |
| Gigabyte AERO 16 OLED BSF | |
| iperf3 transmit AXE11000 6GHz | |
| iperf3 receive AXE11000 6GHz | |
| Schenker VISION 16 Pro (M23) | |
| iperf3 transmit AXE11000 | |
| iperf3 receive AXE11000 | |
| MSI Stealth 16 Studio A13VG | |
| iperf3 transmit AXE11000 | |
| iperf3 receive AXE11000 | |
| iperf3 transmit AXE11000 6GHz | |
| iperf3 receive AXE11000 6GHz | |
| Apple MacBook Pro 16 2023 M3 Max | |
| iperf3 transmit AXE11000 | |
| iperf3 receive AXE11000 | |
Webcam
The 1080p webcam installed into the upper display frame takes decent photos in good lighting conditions and it also supports functions like facial tracking and soft focus. It features an additional IR camera for facial recognition via Windows Hello.


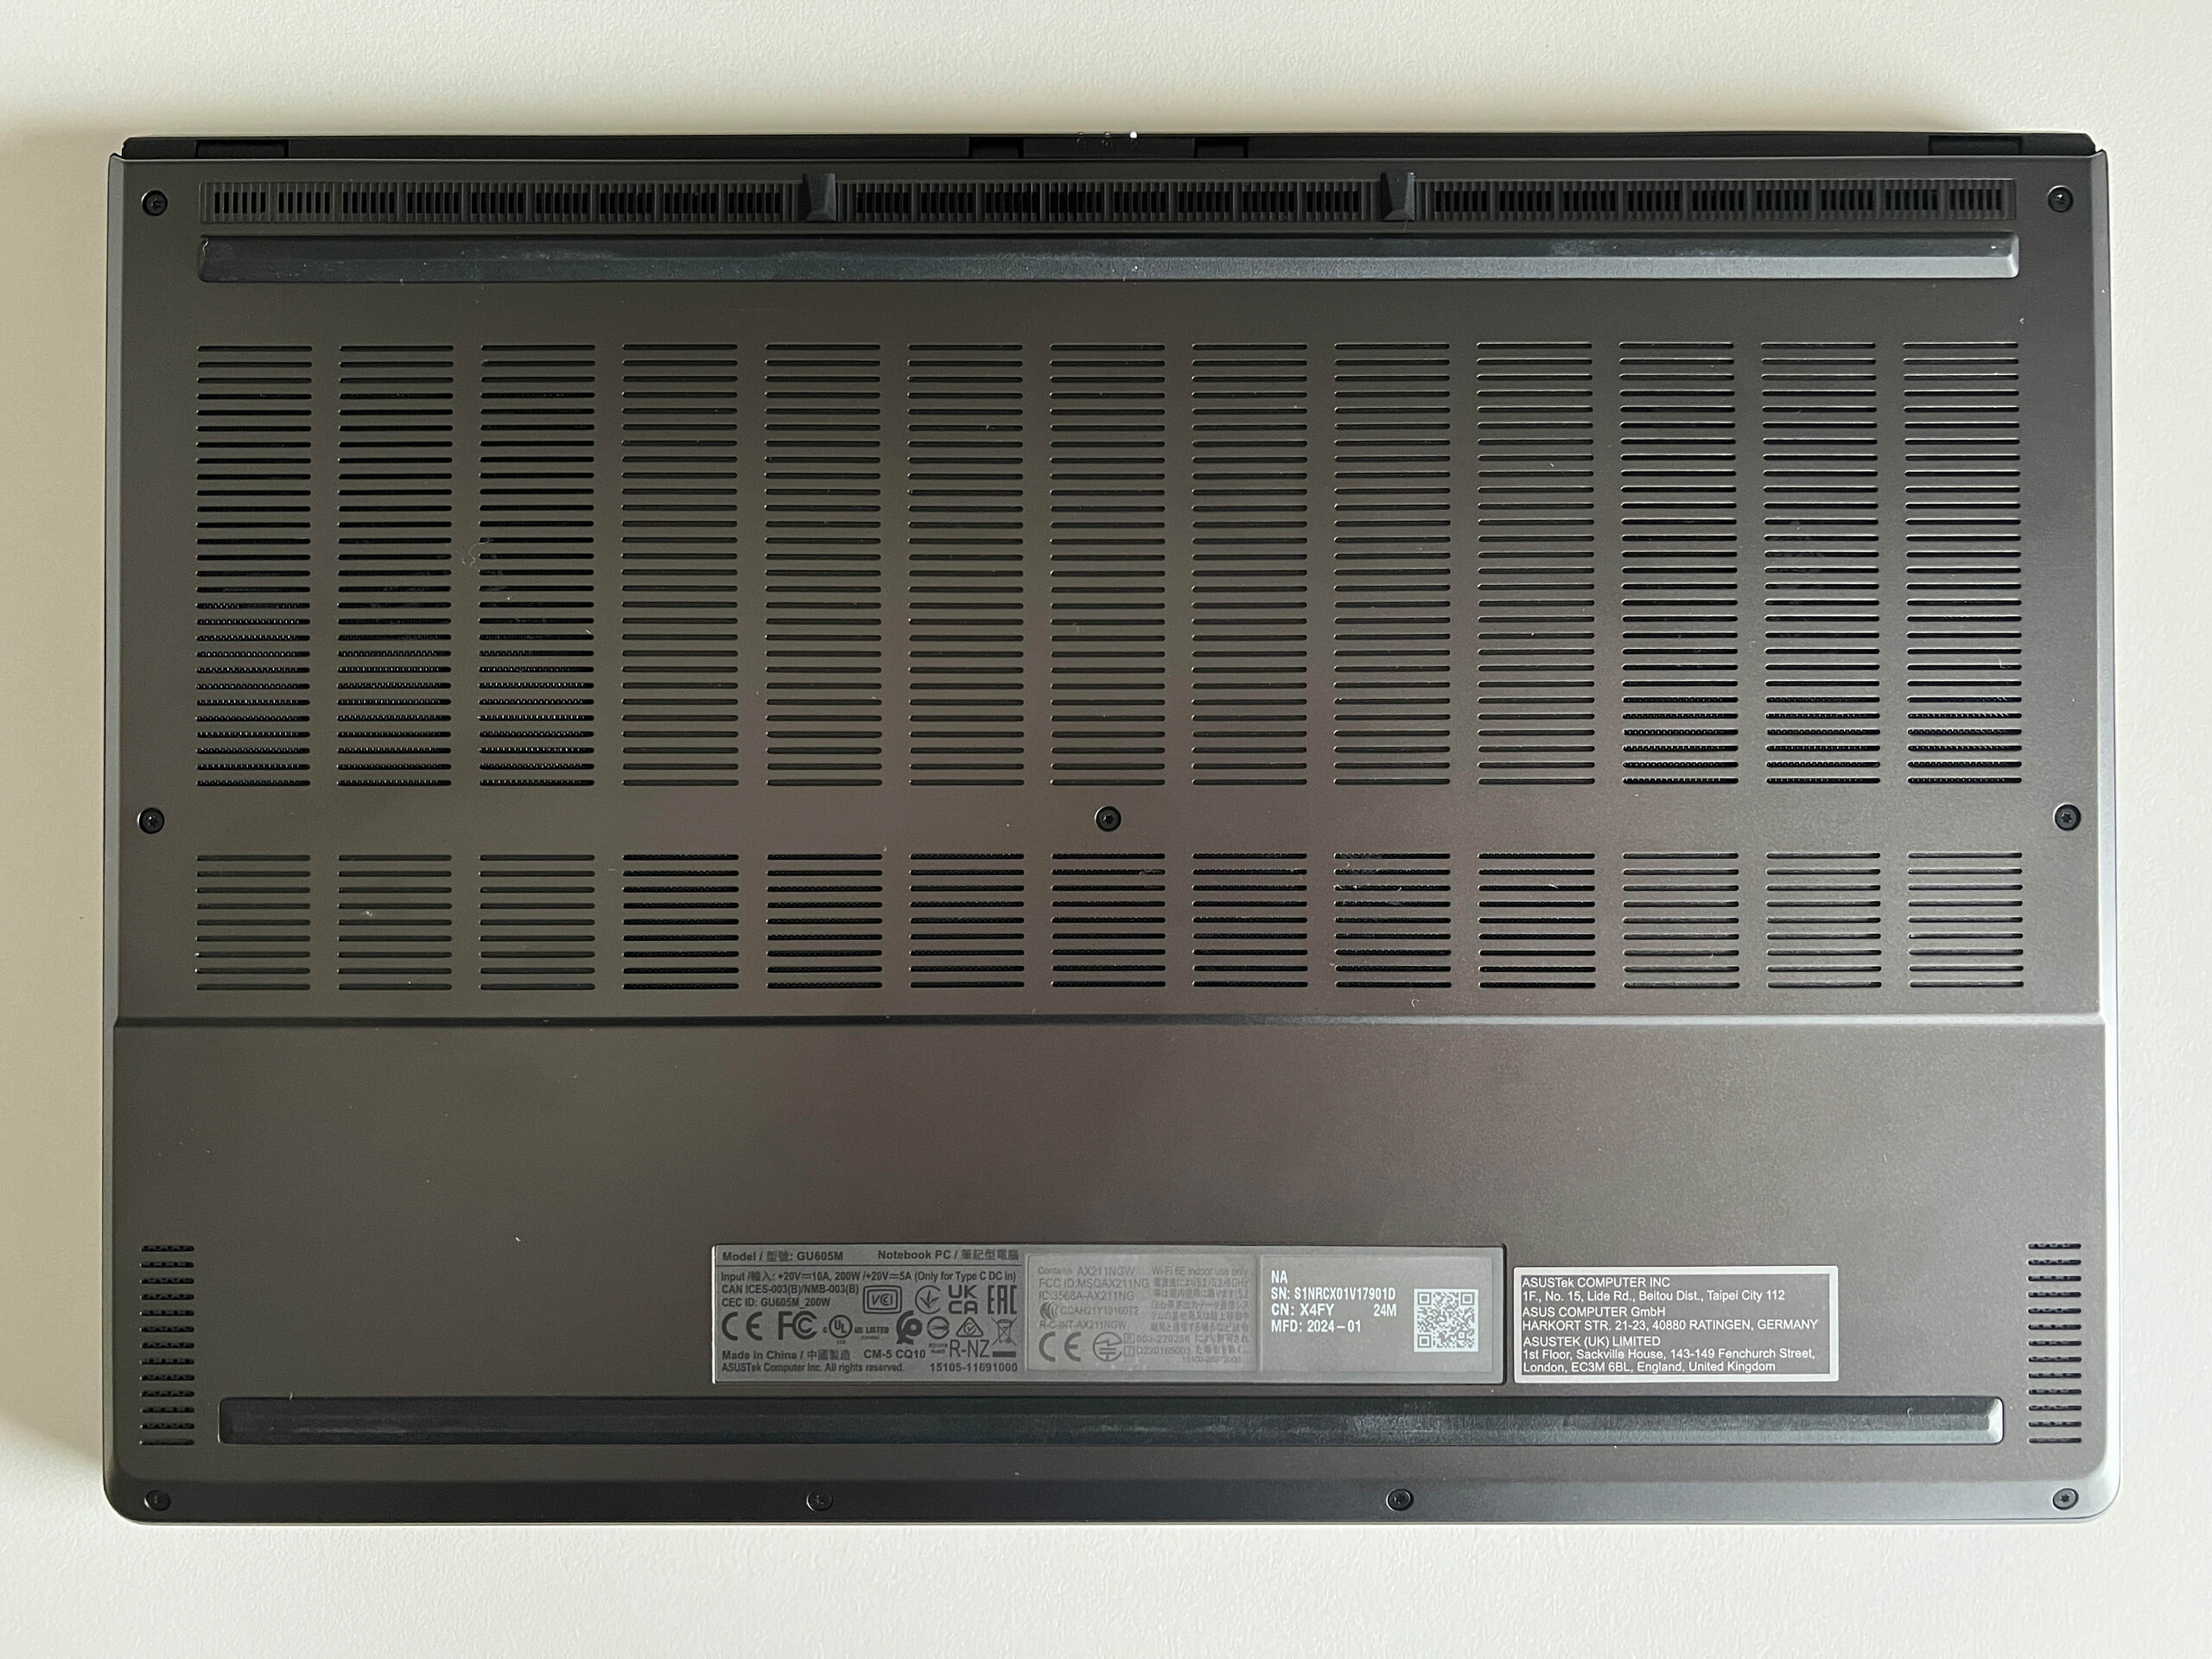
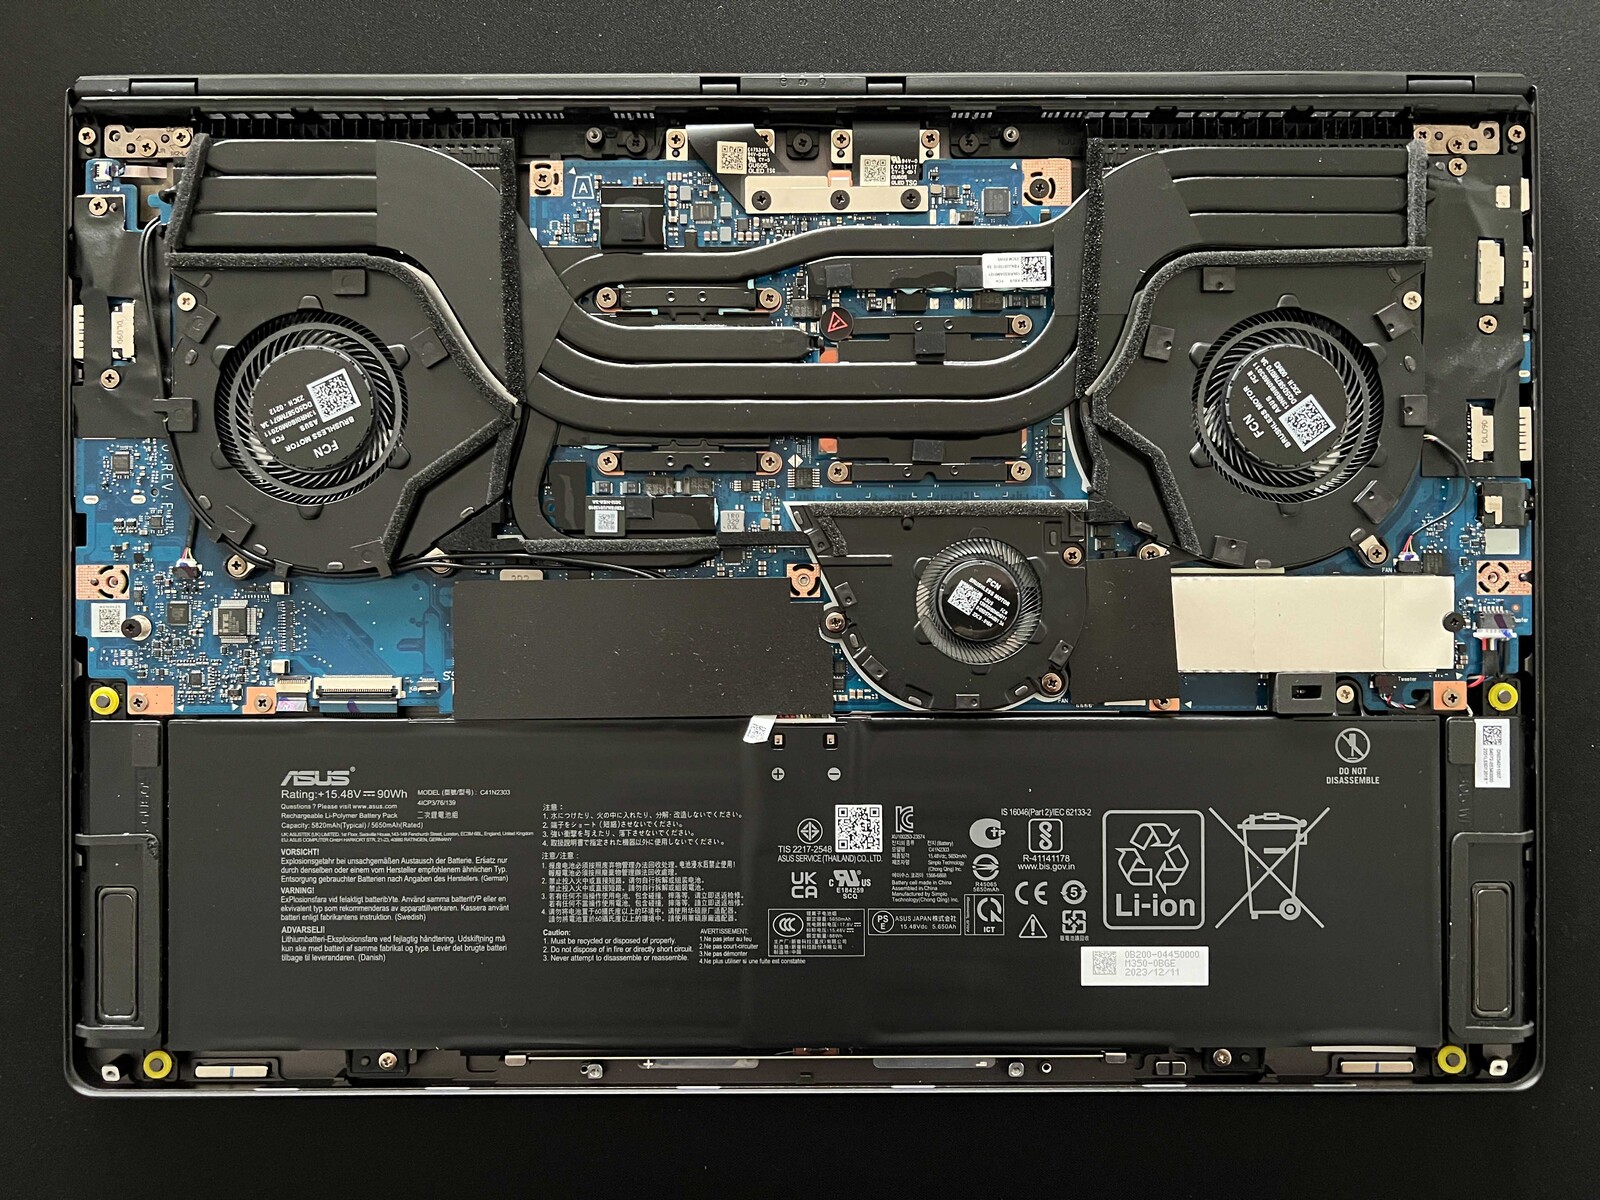
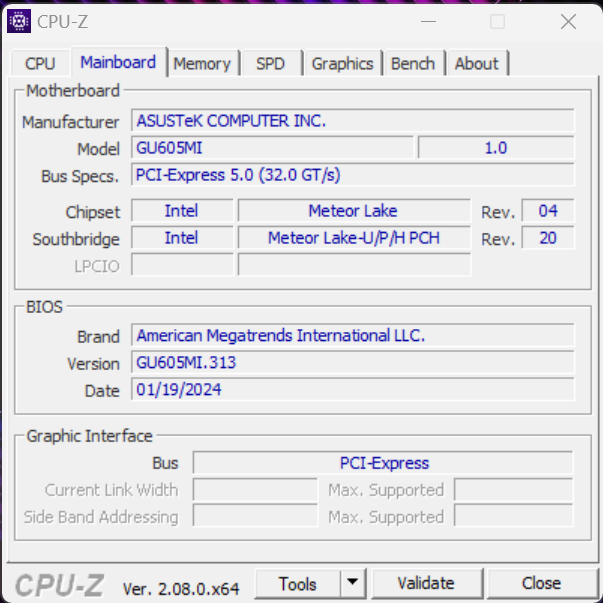
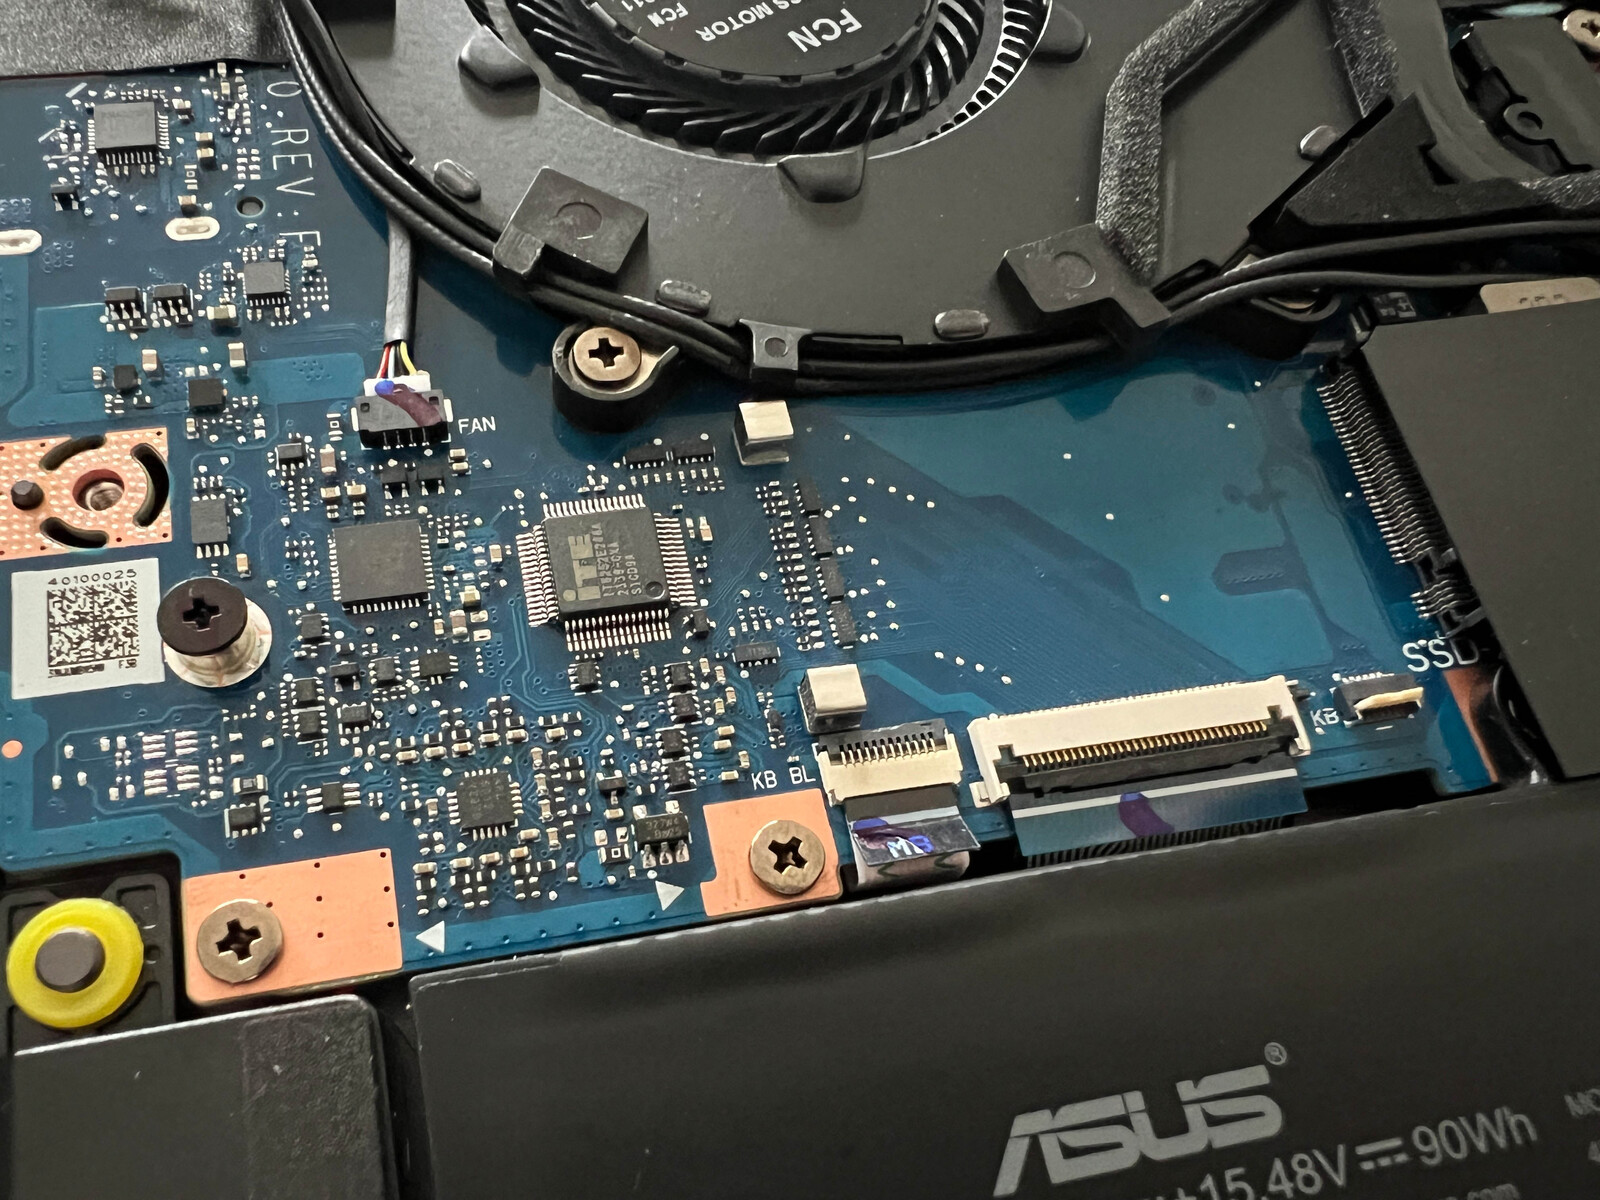
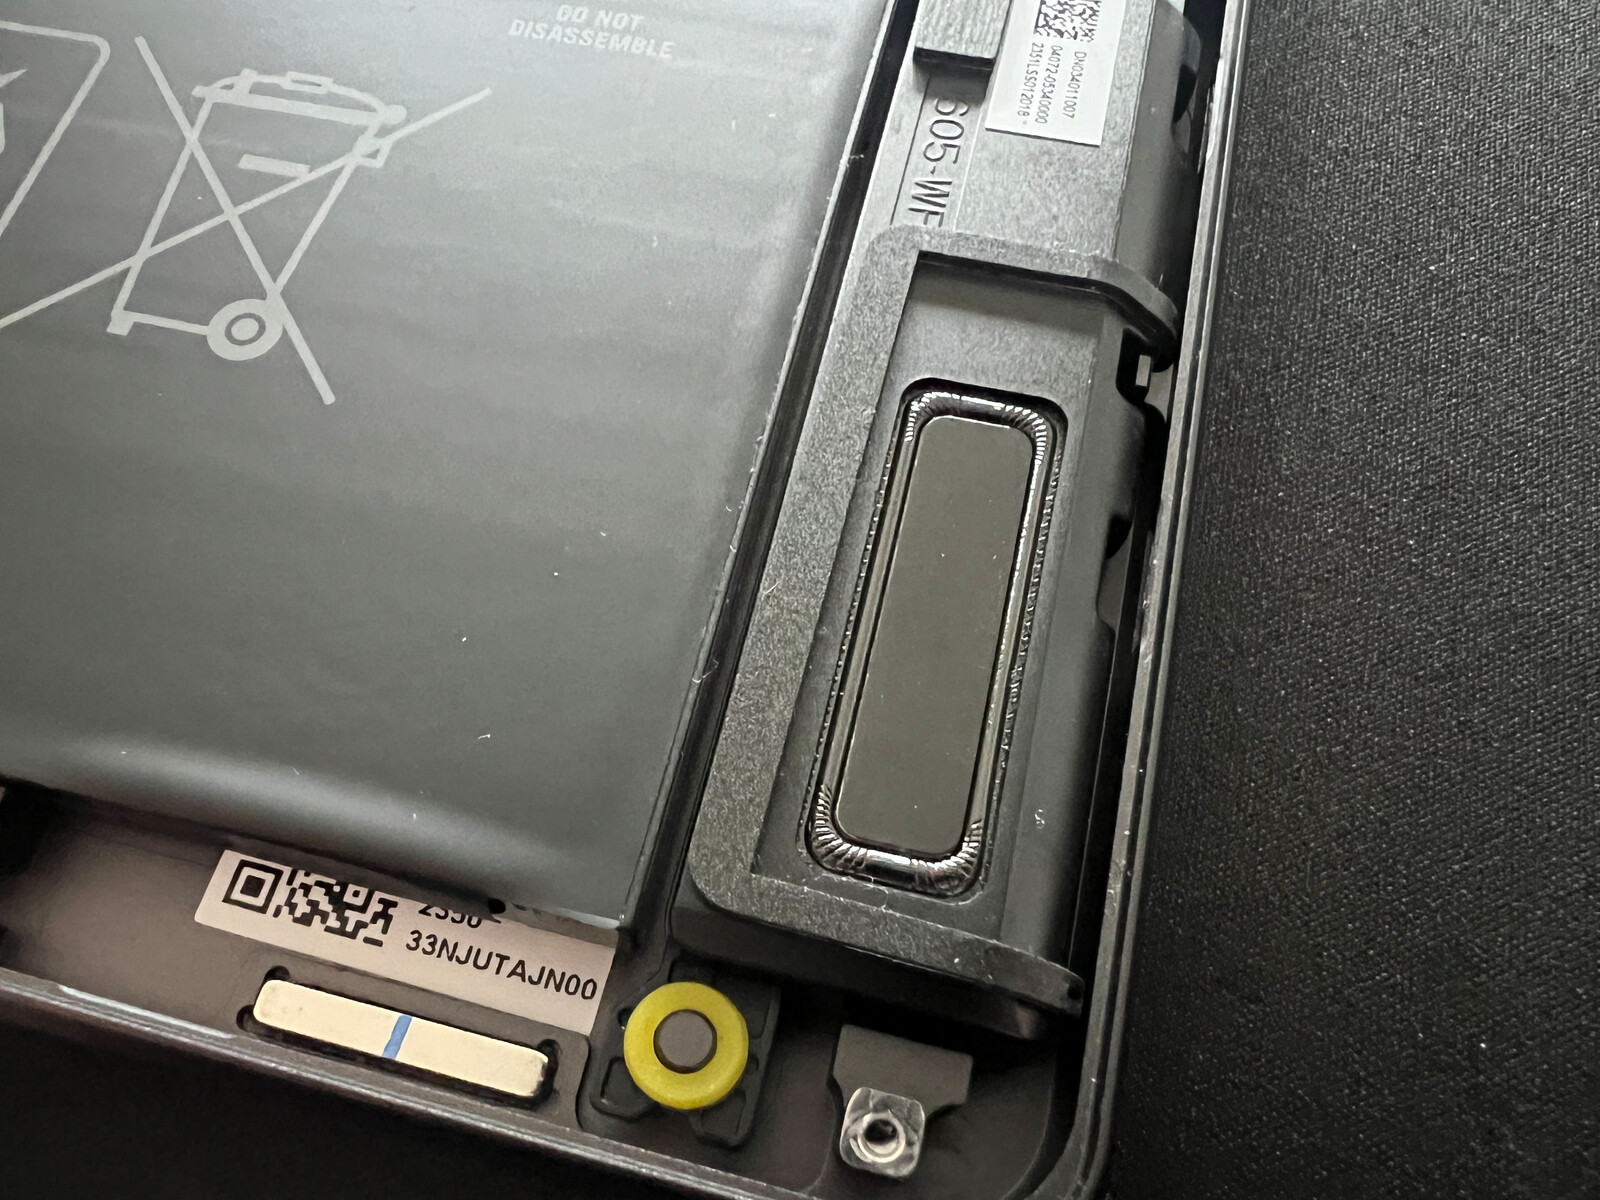
Maintenance
Aside from the visible screws, two further ones are hidden beneath glued-on rubber covers. This makes accessing the components unnecessarily difficult. However, you can't really get up to much on the inside anyway, as the RAM is now soldered on. On the flip side, there are two slots for SSDs and if desired, the WLAN module and battery can be swapped out. You can also access the fans to clean them.
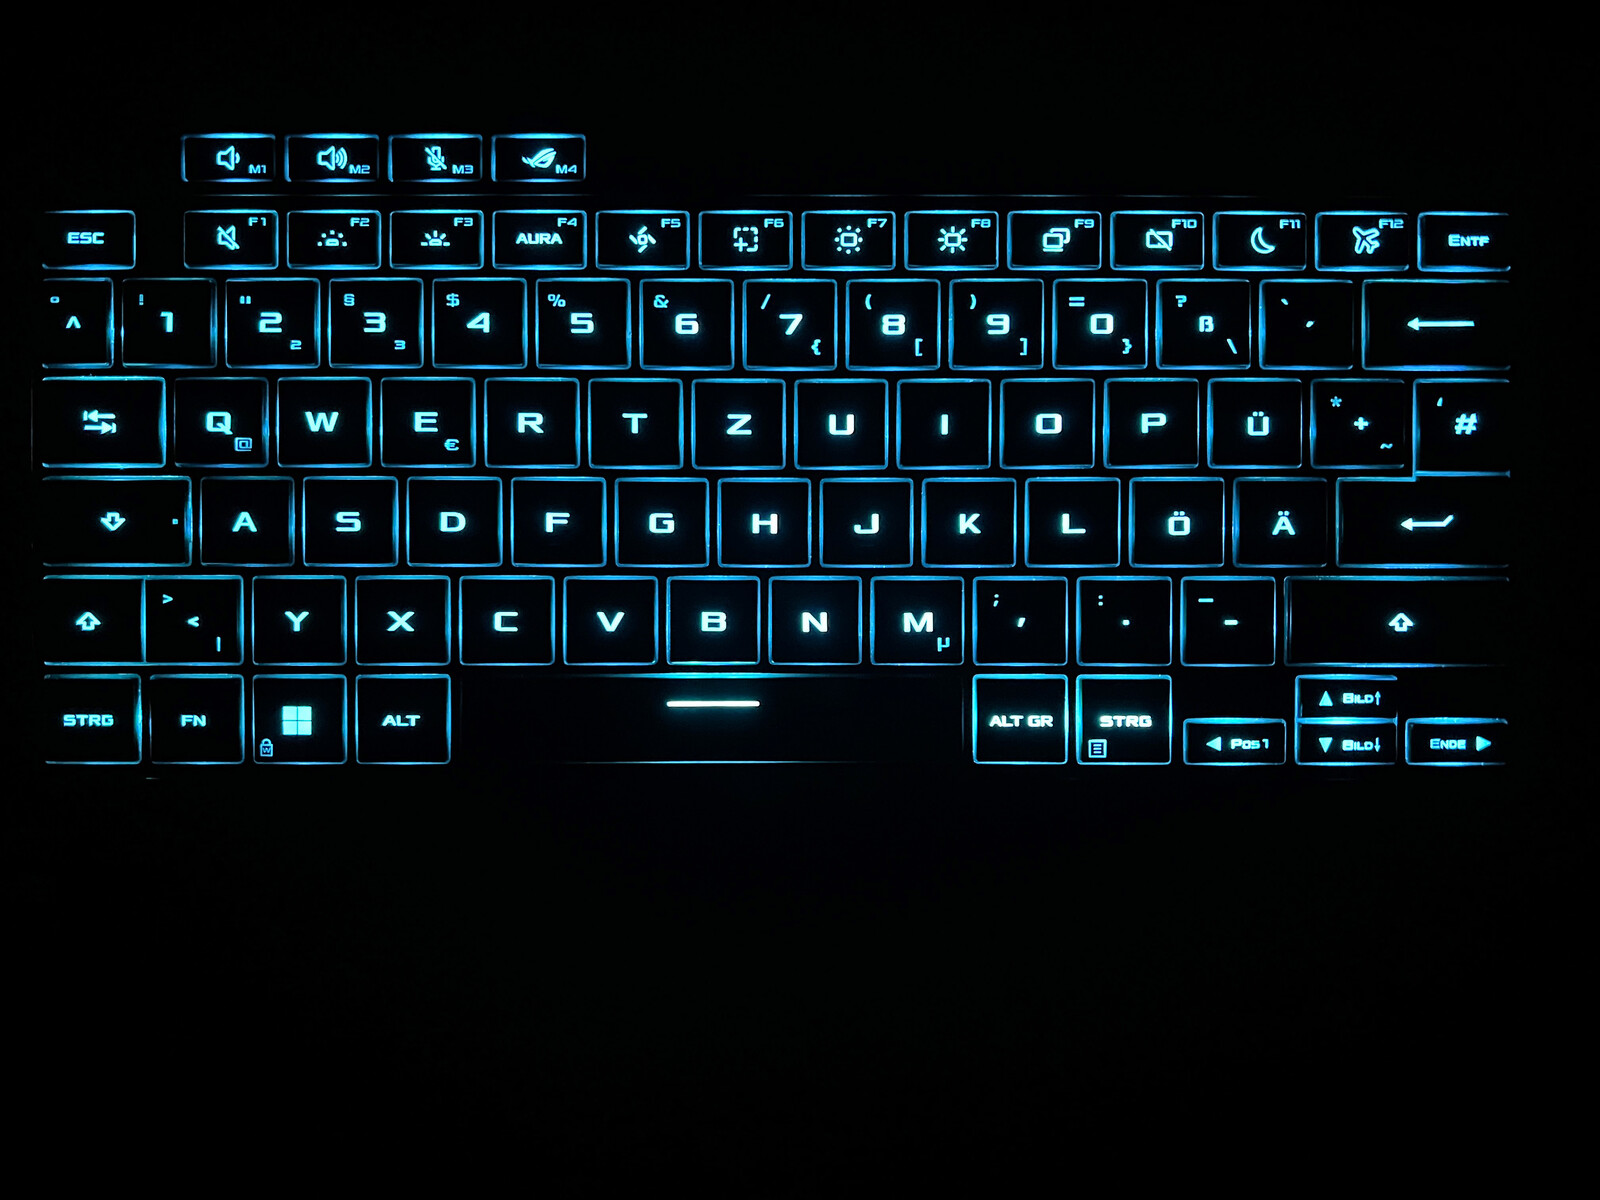
Input devices - Comfortable keyboard and huge touchpad
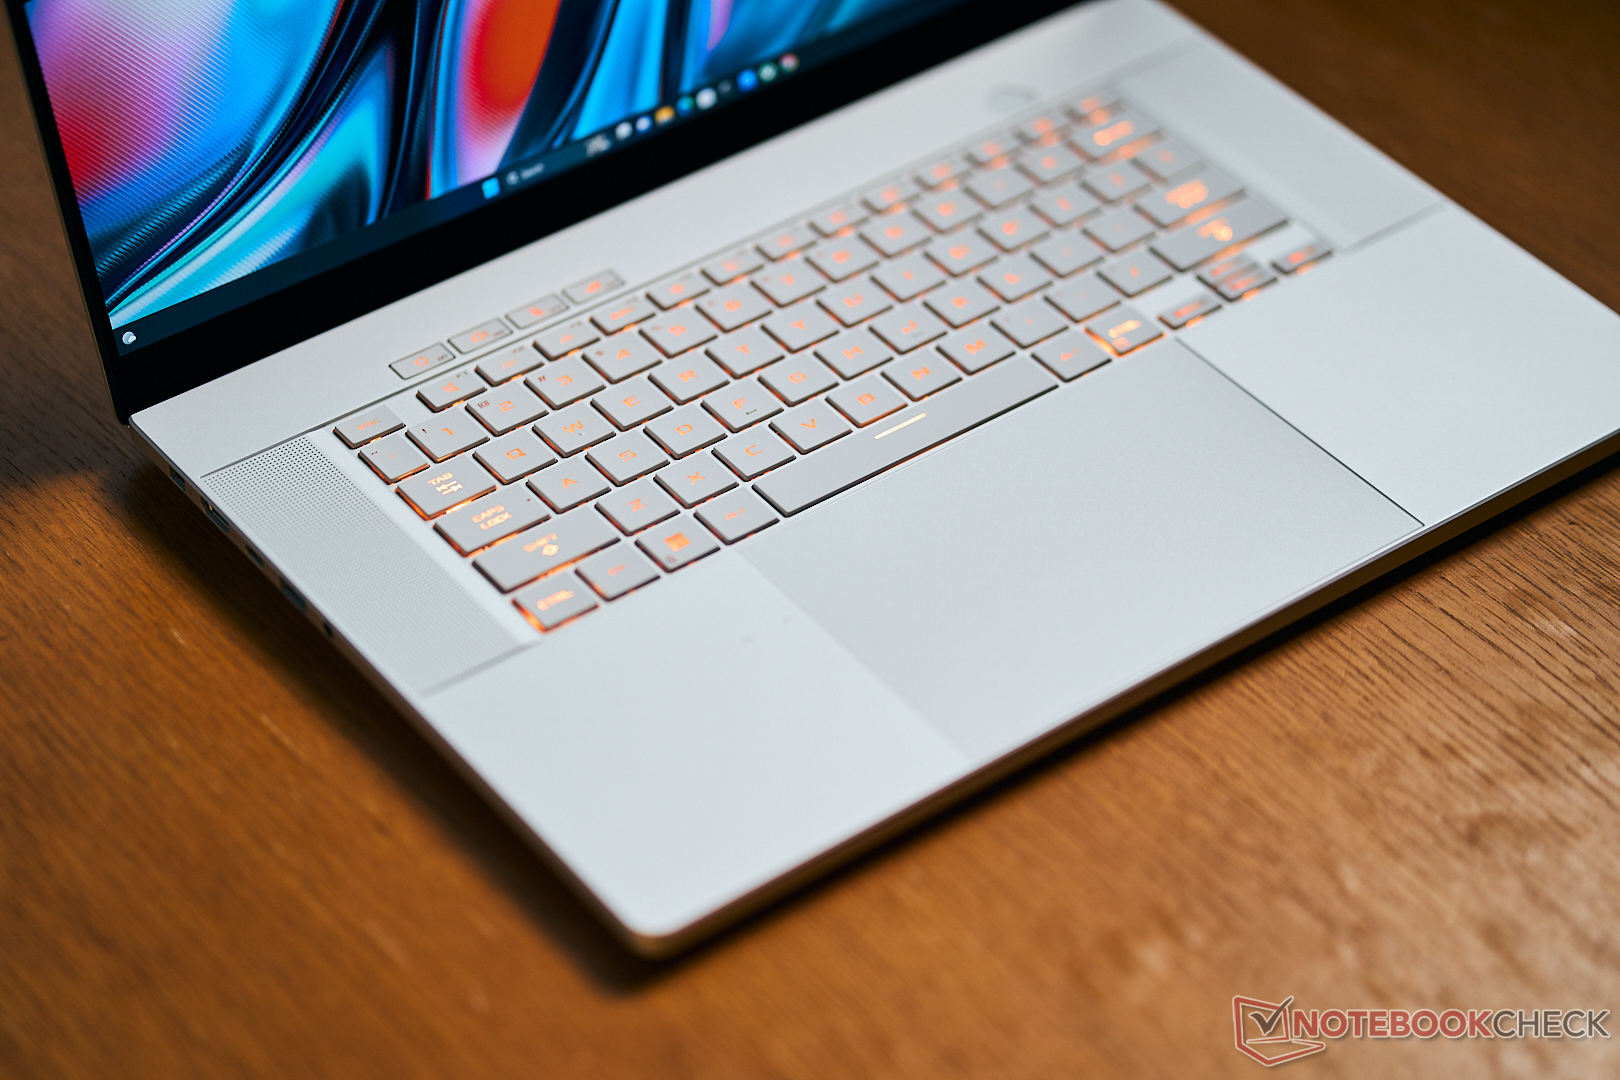
The G16 features a backlit keyboard (one RGB zone, 3 intensity levels) with no dedicated number pad. The layout isn't anything out of the ordinary but you do have to get used to the single-line Enter key as well as the small arrow keys—this isn't ideal for a gaming laptop. The keyboard itself is, however, extremely comfortable and its keys have a generous lift of 1.7 mm. It is quite quiet in everyday use and you can easily use it to write longer texts.
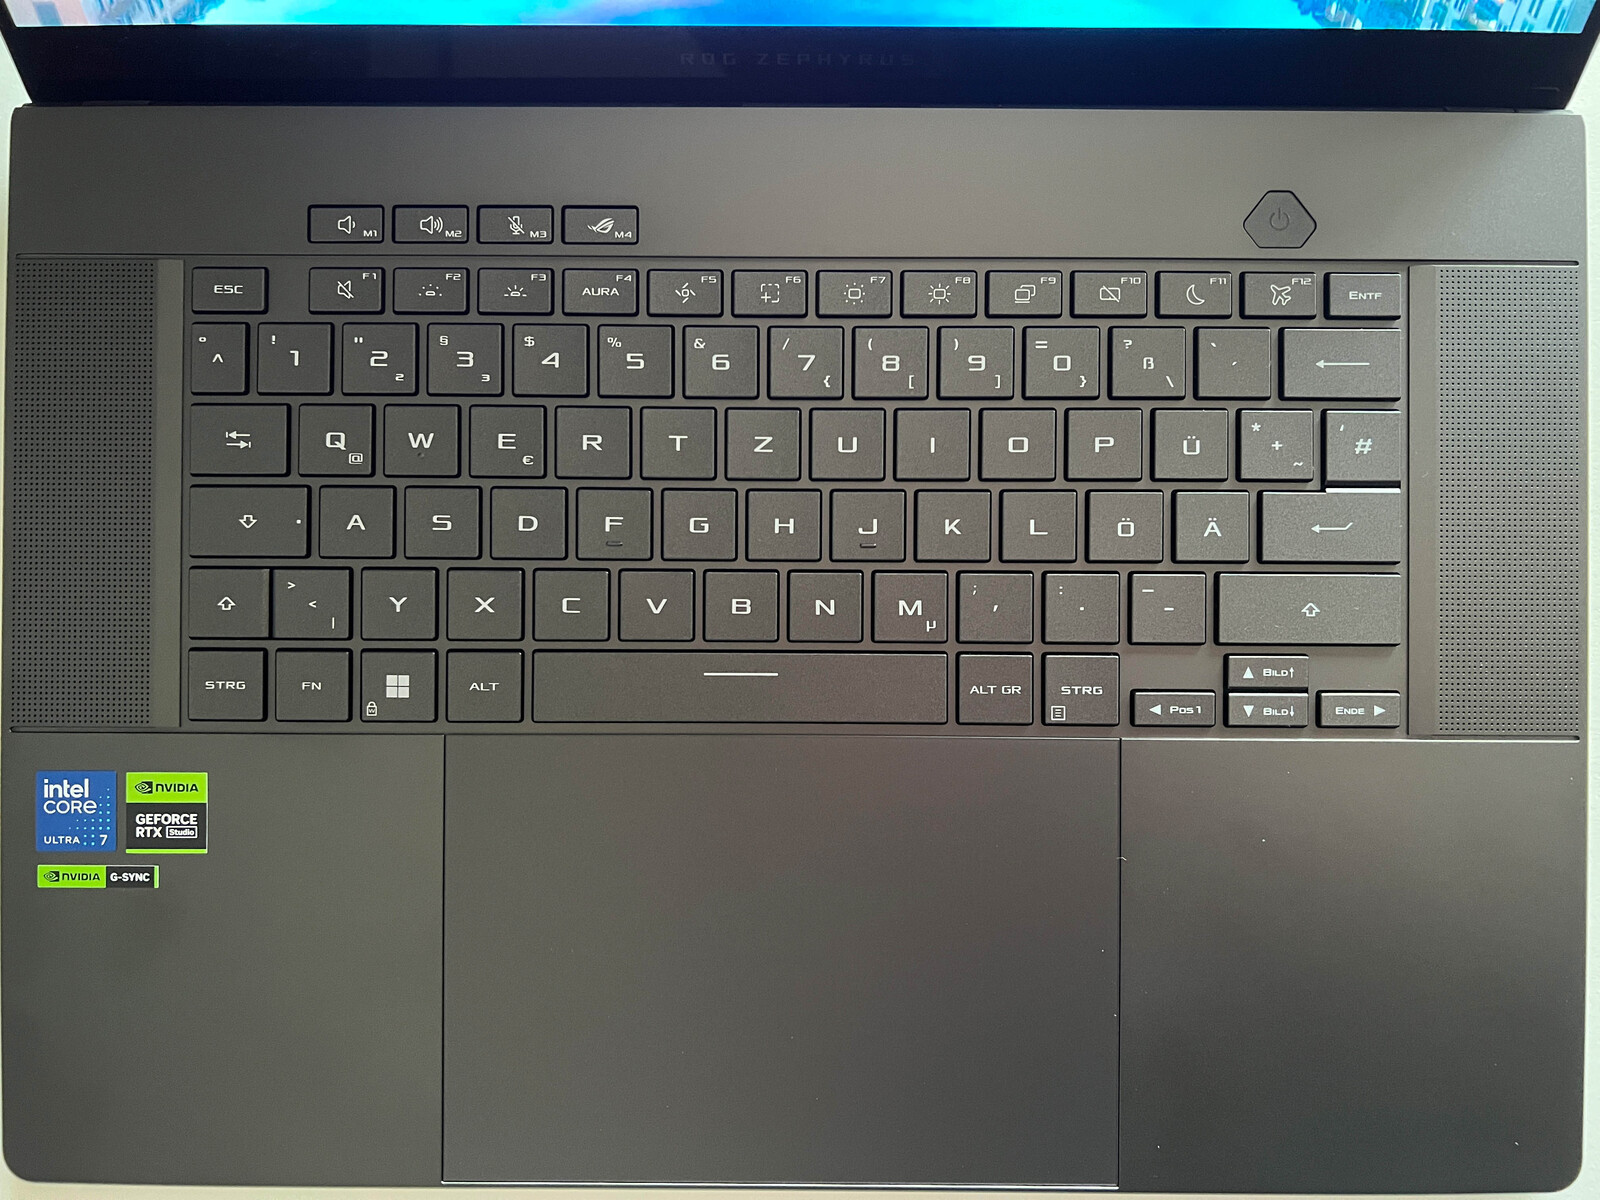
The laptop's new touchpad is extremely large, measuring 15 x 9.9 cm (37 % bigger than before) with a 16:10 ratio. It feels great to operate thanks to its smooth surface, and its clicking noise is nice and muffled, giving it a high-quality feel.
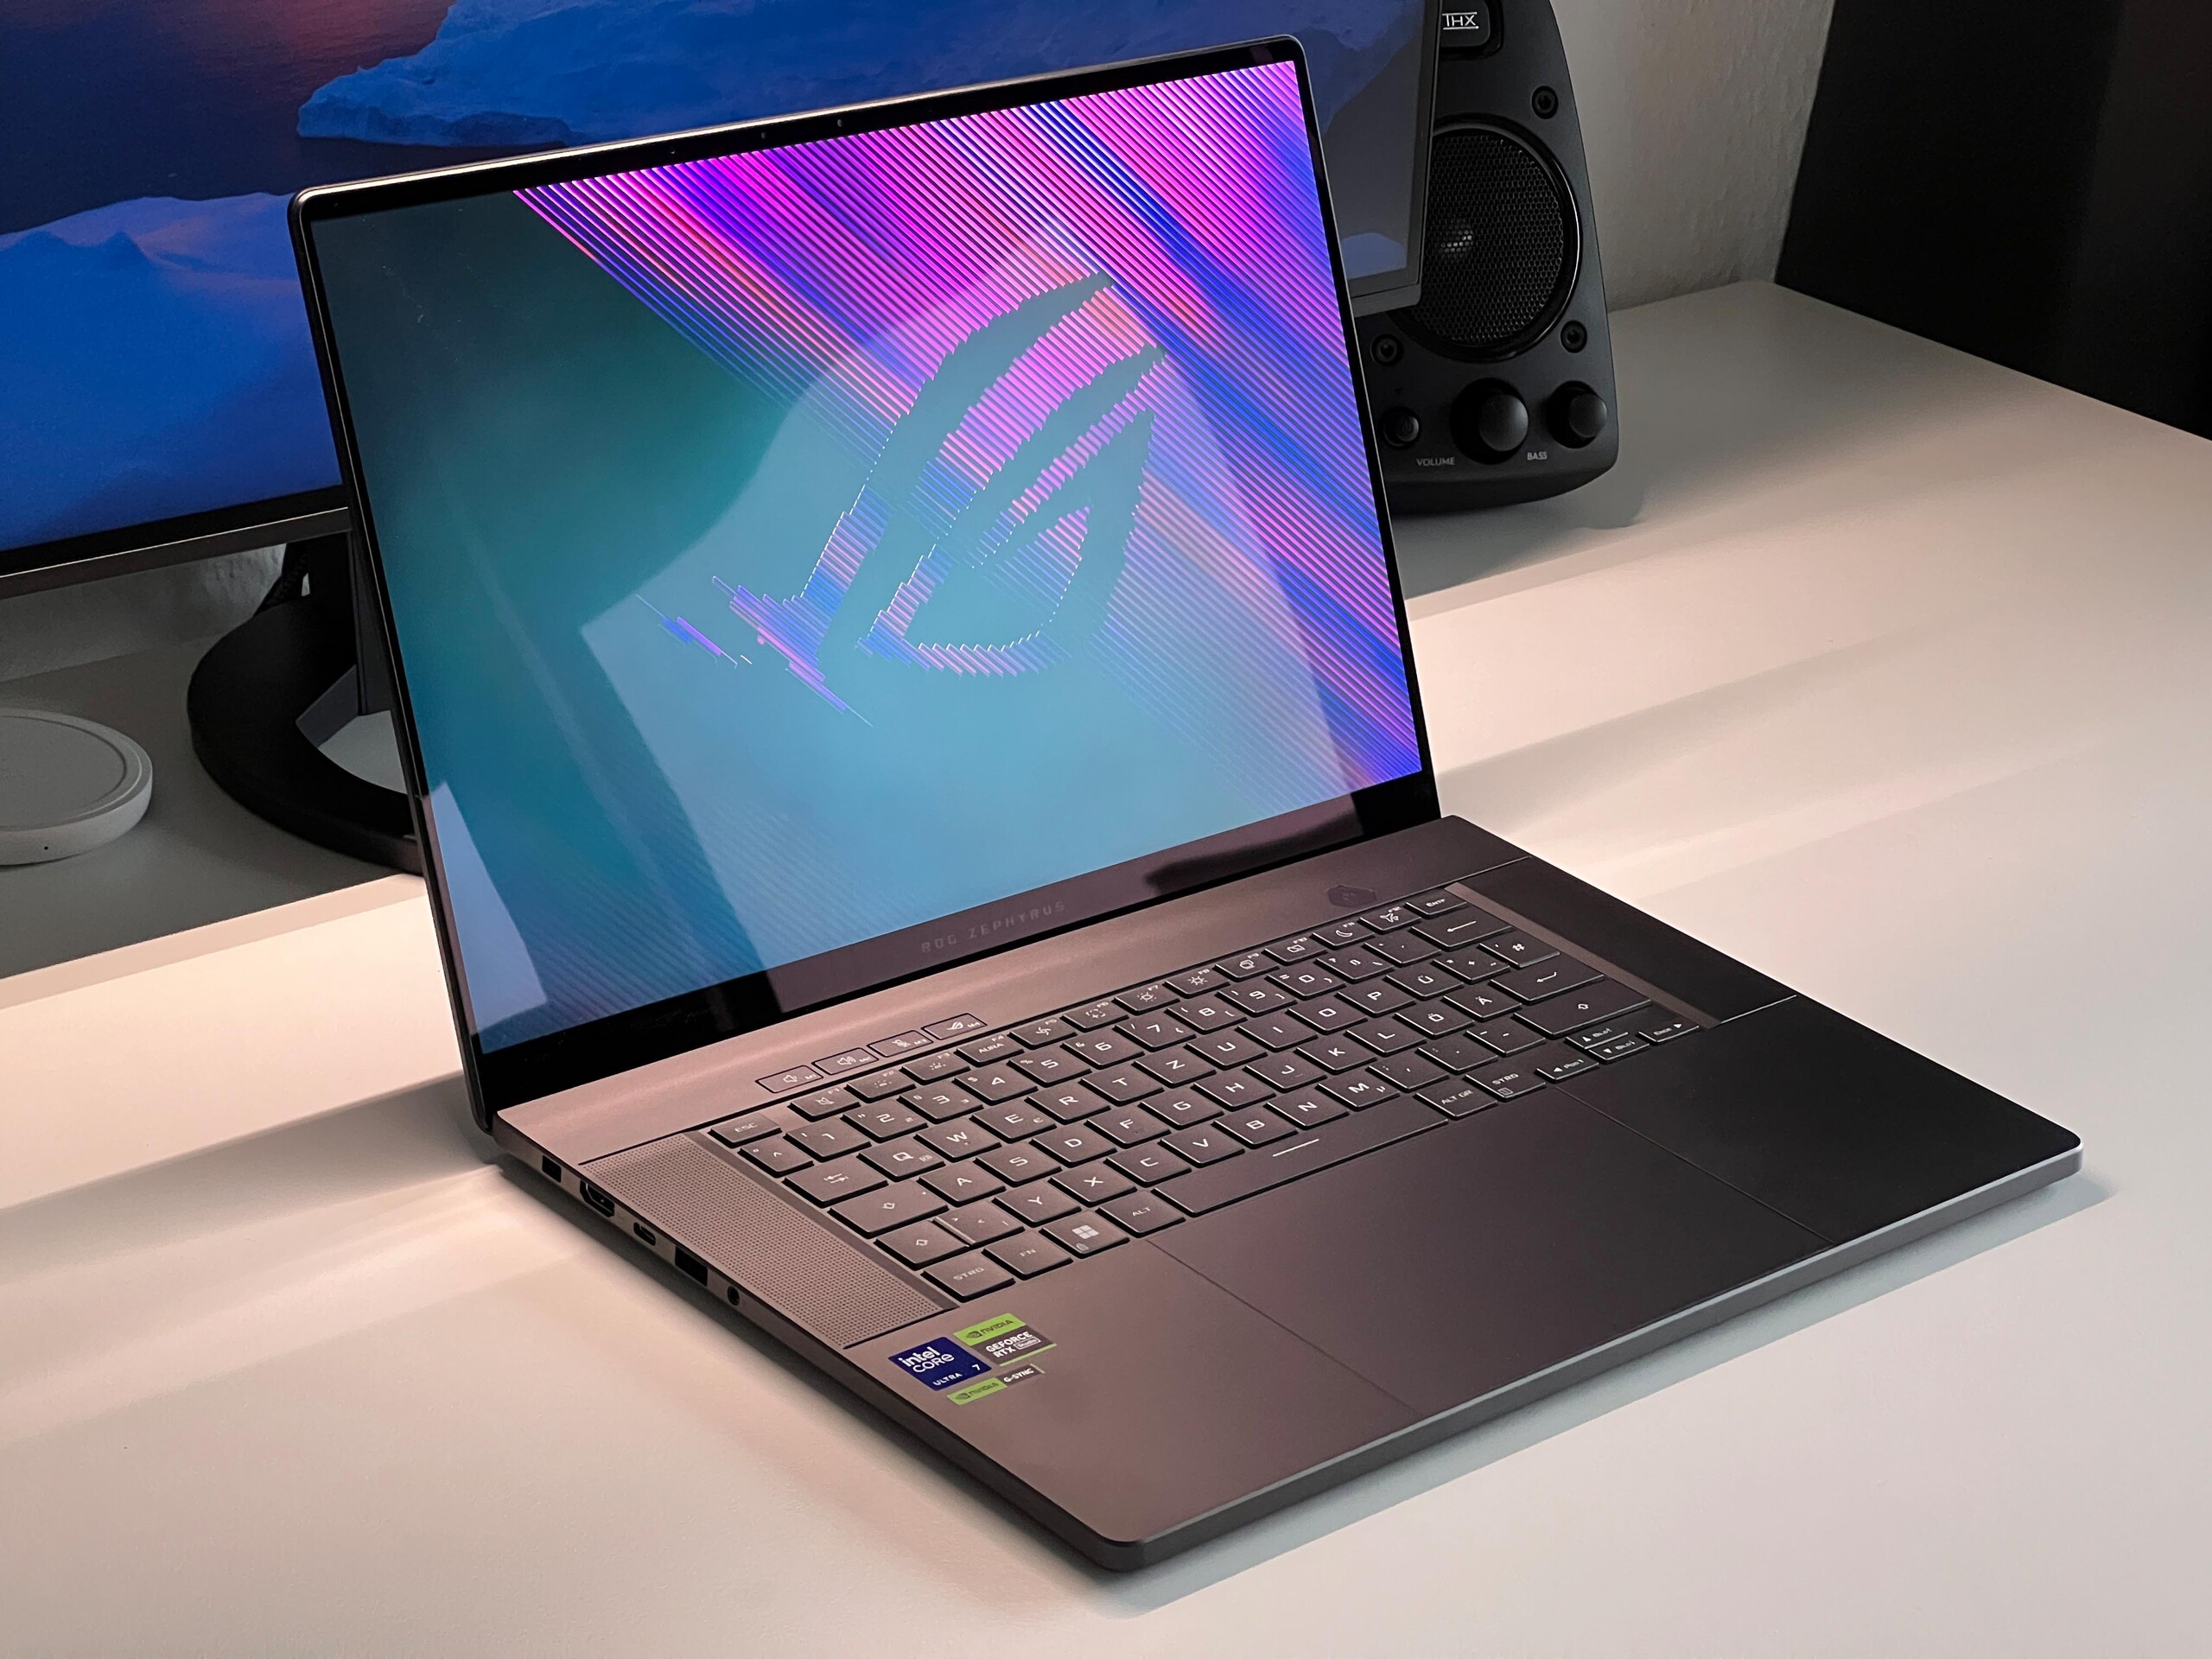
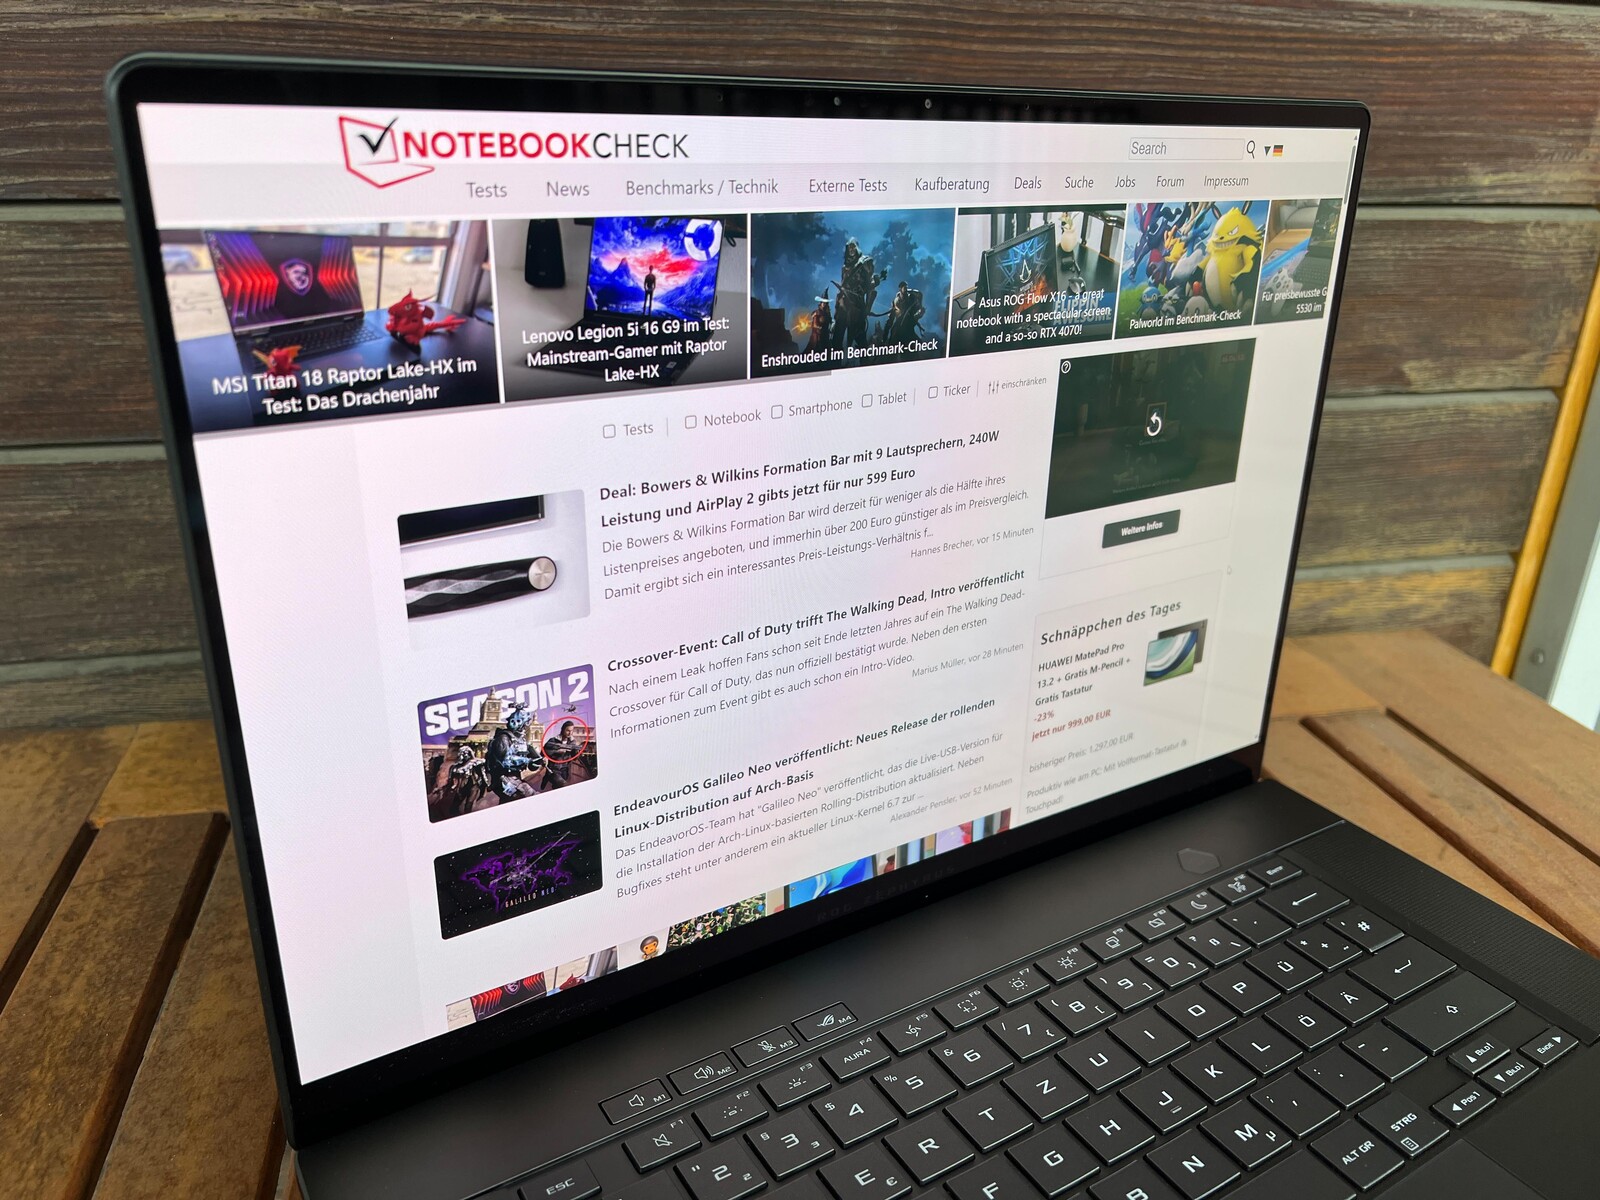
Display - Asus' first 240-Hz OLED with G-Sync

The new ROG Zephyrus G16 is the first laptop to have a 16-inch OLED panel that supports G-Sync. Furthermore, its refresh rate is 240 Hz and subjectively, the reflective Samsung panel's picture quality is just astounding: Content is razor-sharp and colors look super vivid. Thanks to its fast response times, the OLED is also perfect for gaming. Asus hasn't installed a brightness sensor.
In SDR mode, it has an average brightness of 420 cd/m², which is a good result. As is typical for OLED, it has a black value of 0, leading to an extremely high contrast ratio. Asus has stated a maximum HDR brightness of 500 cd/m², whereas we measured a peak of 455 cd/m². In this aspect, the Samsung panel can't quite keep up with other OLED monitors and especially the mini LED panel installed into Apple's MacBook Pro 16 (max. 1,600 cd/m²). Moreover, we have to continue to critique Windows' HDR implementation, as it has to be activated manually and subsequently, the color profiles don't work right anymore. This currently affects all Windows devices. Due to the OLED panel's build, it doesn't suffer from any halo effects.
| |||||||||||||||||||||||||
Brightness Distribution: 96 %
Center on Battery: 416 cd/m²
Contrast: ∞:1 (Black: 0 cd/m²)
ΔE ColorChecker Calman: 1.6 | ∀{0.5-29.43 Ø4.73}
ΔE Greyscale Calman: 2.7 | ∀{0.09-98 Ø4.97}
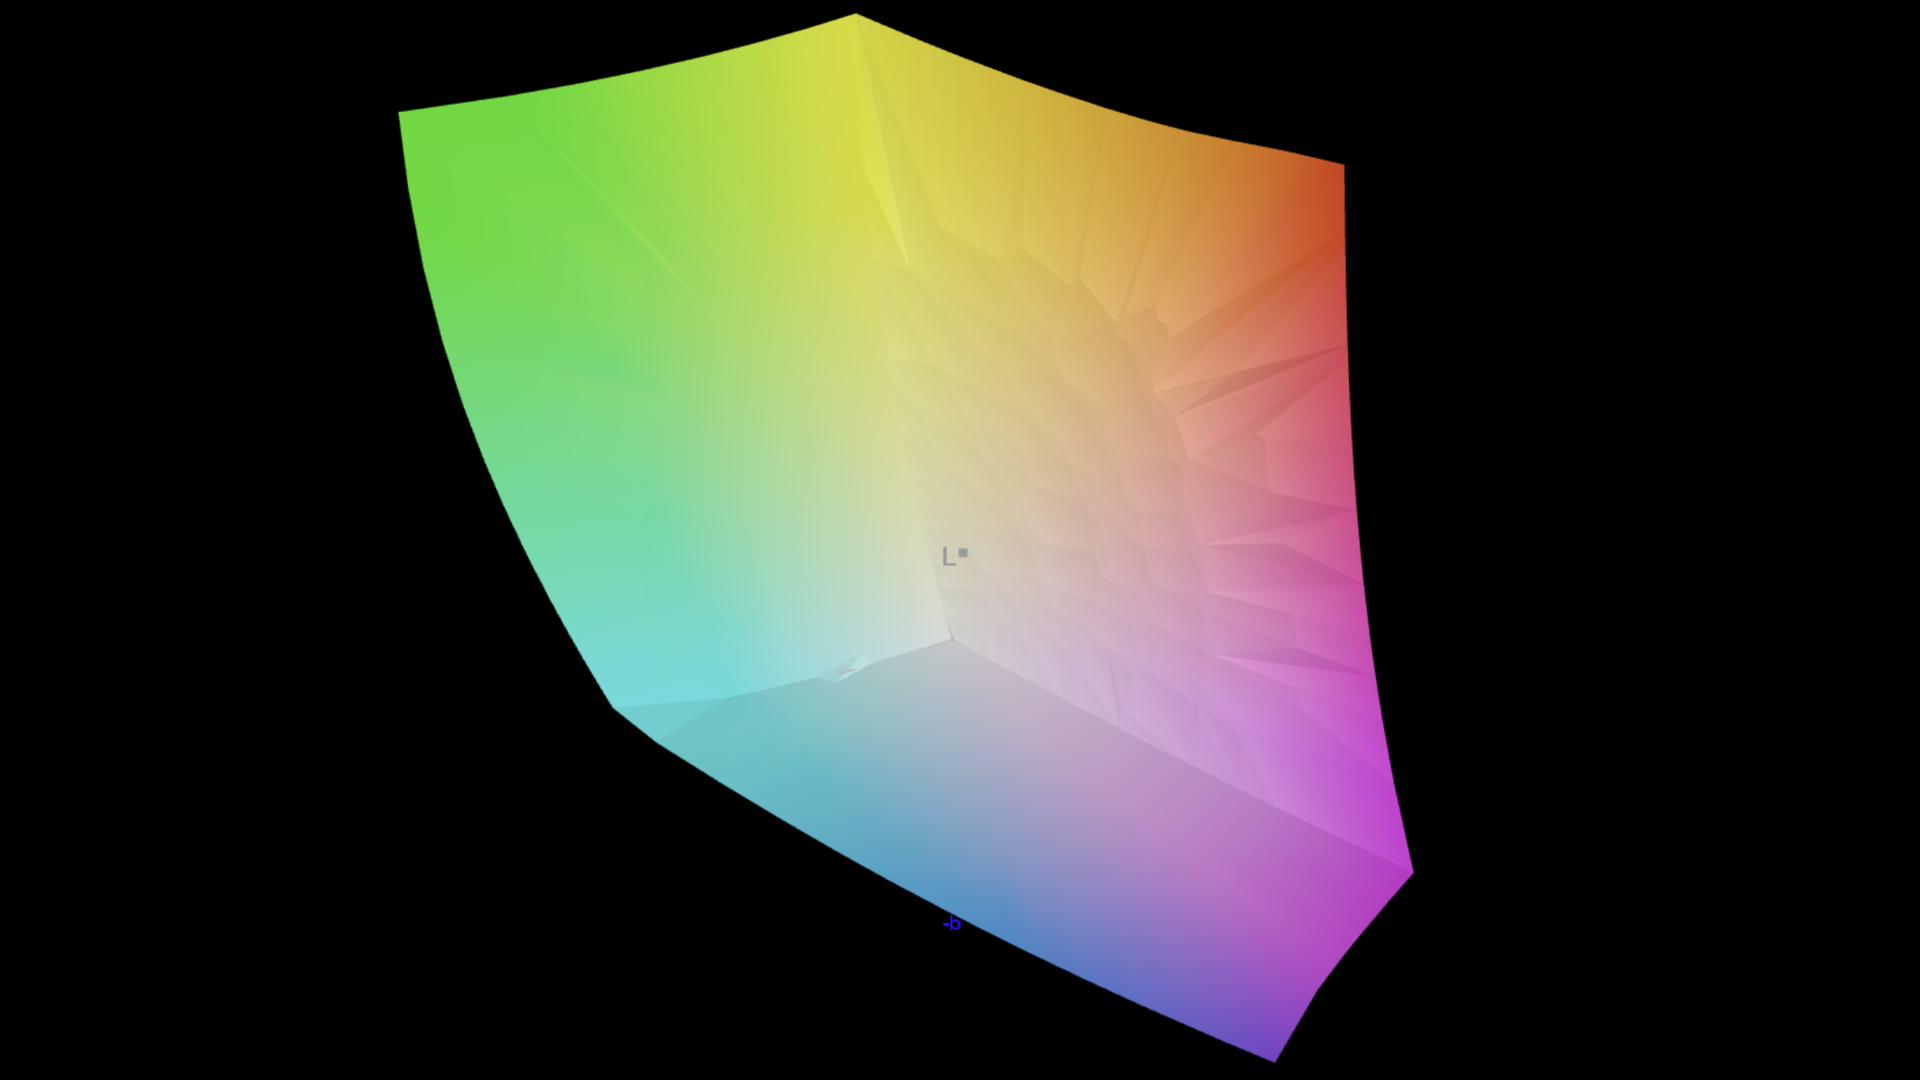
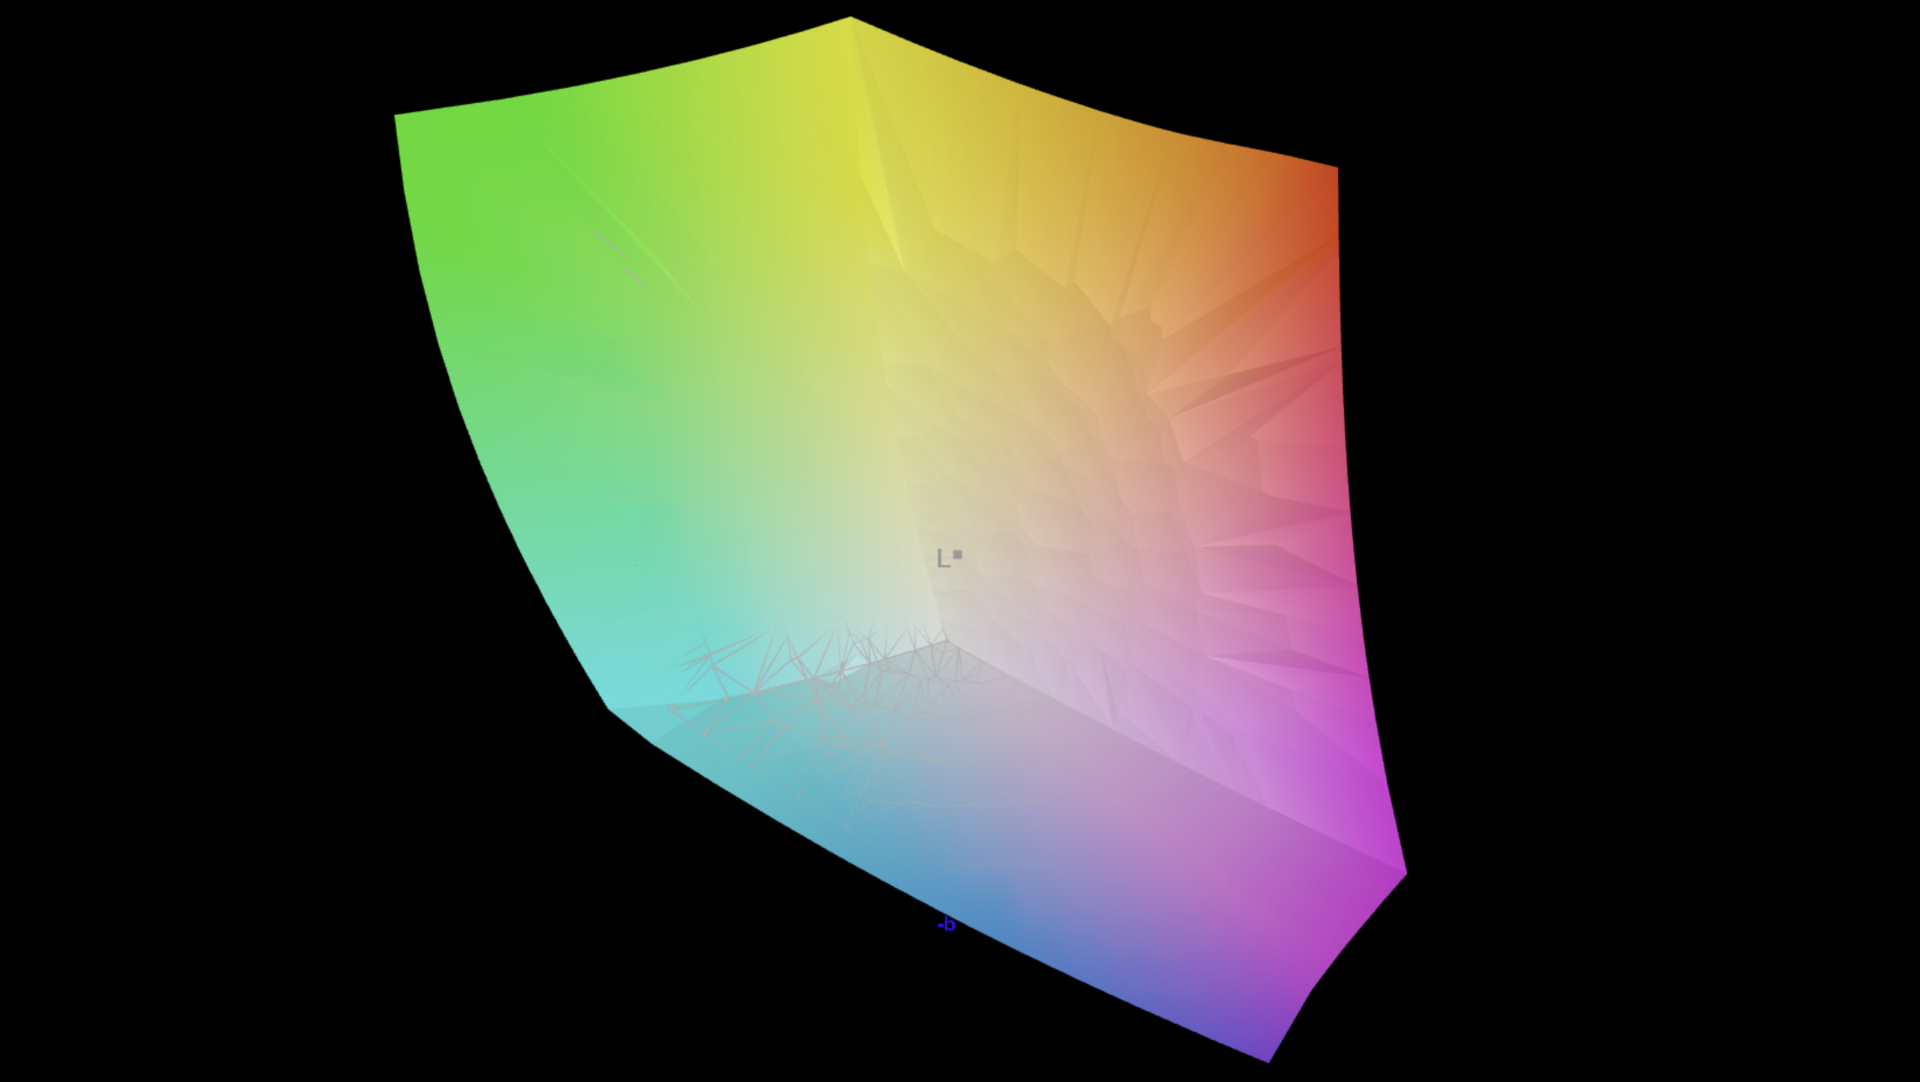
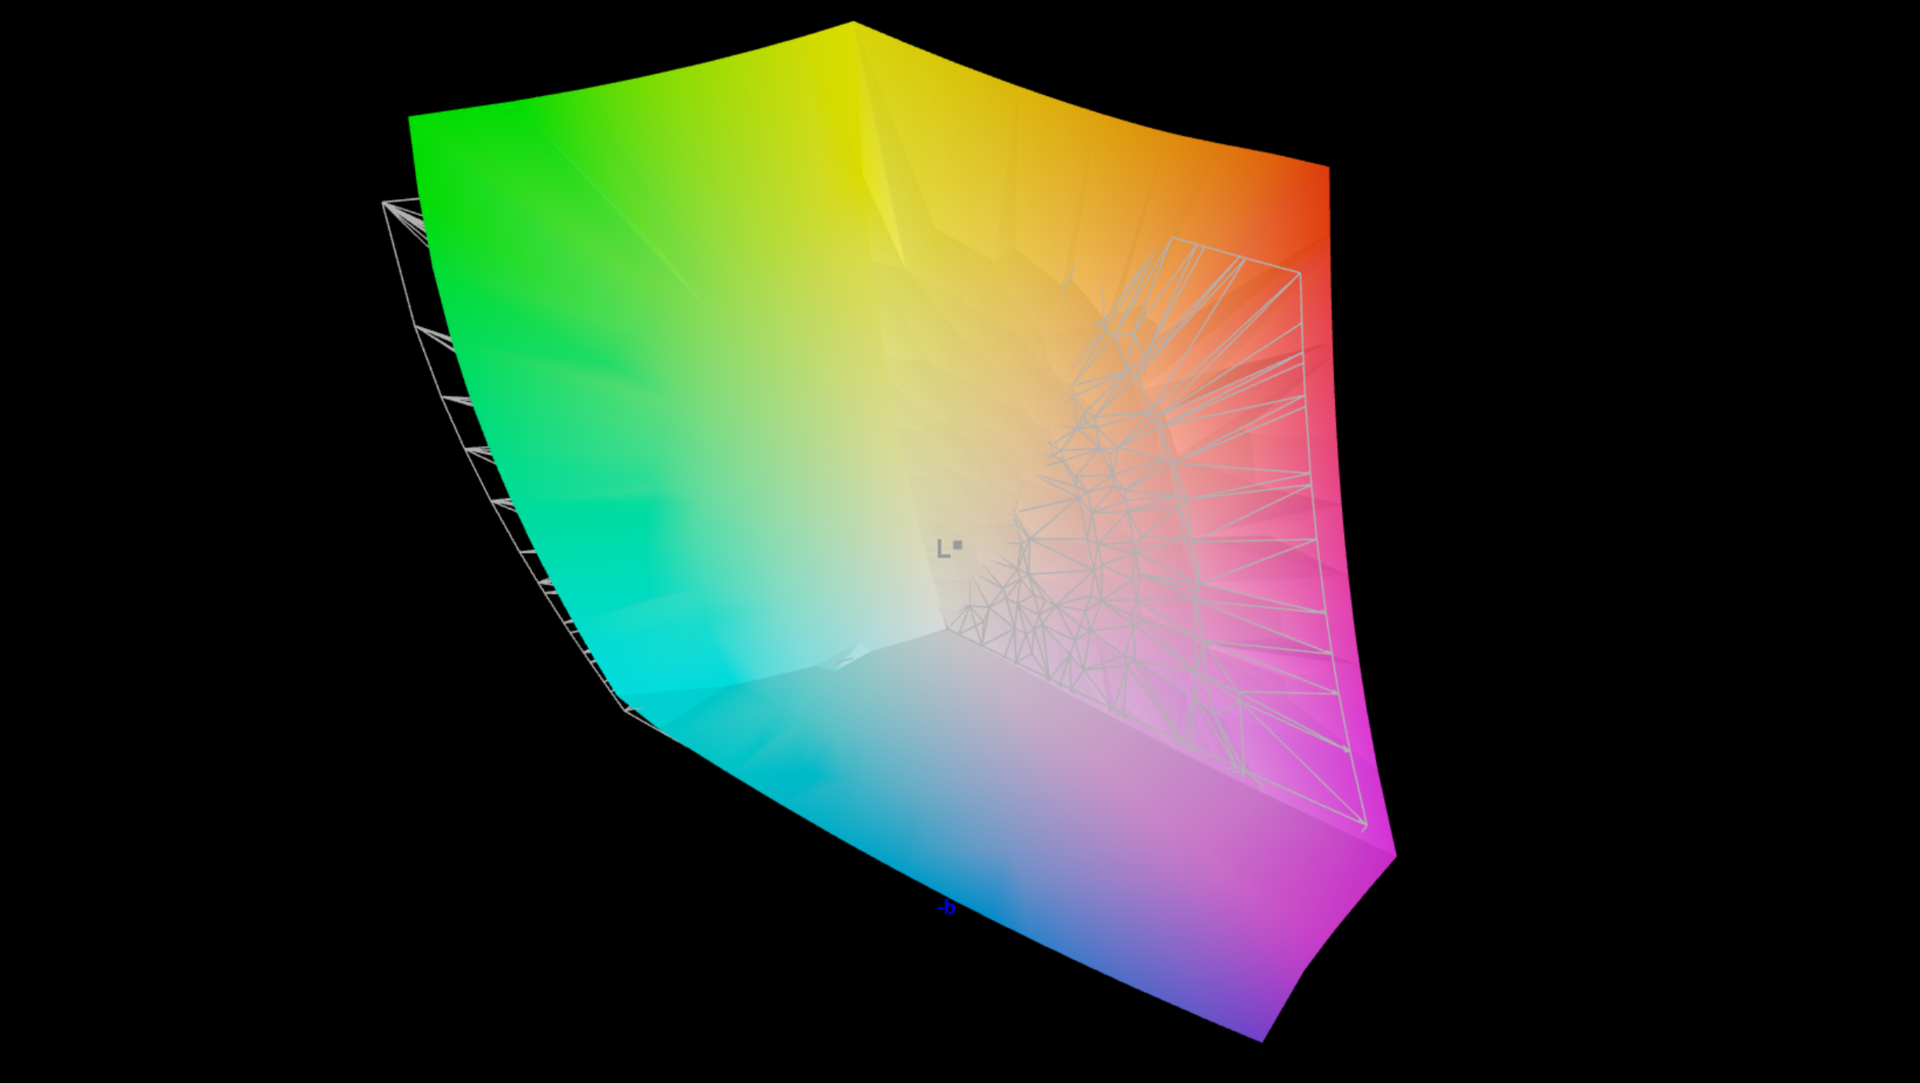
96.9% AdobeRGB 1998 (Argyll 3D)
100% sRGB (Argyll 3D)
99.9% Display P3 (Argyll 3D)
Gamma: 2.16
CCT: 6331 K
| Asus ROG Zephyrus G16 2024 GU605M ATNA60DL01-0, OLED, 2560x1600, 16" | Lenovo Yoga Pro 9 16-IRP G8 LEN160-3.2K, Mini-LED, 3200x2000, 16" | Razer Blade 16 Early 2023 CSOT T3 MNG007DA4-1, IPS, 2560x1600, 16" | Gigabyte AERO 16 OLED BSF Samsung SDC4191 (ATNA60YV09-0, OLED, 3840x2400, 16" | Schenker VISION 16 Pro (M23) NE160QDM-NZ1, IPS, 2560x1600, 16" | MSI Stealth 16 Studio A13VG AUO26A9, IPS, 2560x1600, 16" | Apple MacBook Pro 16 2023 M3 Max Mini-LED, 3456x2234, 16" | |
|---|---|---|---|---|---|---|---|
| Display | -2% | -3% | -0% | -20% | -5% | -1% | |
| Display P3 Coverage (%) | 99.9 | 97 -3% | 98.5 -1% | 99.9 0% | 68.8 -31% | 96.4 -4% | 99.2 -1% |
| sRGB Coverage (%) | 100 | 99.8 0% | 100 0% | 100 0% | 98.8 -1% | 99.7 0% | |
| AdobeRGB 1998 Coverage (%) | 96.9 | 95.1 -2% | 89.7 -7% | 96.4 -1% | 70 -28% | 84.8 -12% | |
| Response Times | -4922% | -3800% | -751% | -4634% | -2020% | -23825% | |
| Response Time Grey 50% / Grey 80% * (ms) | 0.22 ? | 14 ? -6264% | 6.6 ? -2900% | 2 ? -809% | 13.7 ? -6127% | 4.4 ? -1900% | 66.9 ? -30309% |
| Response Time Black / White * (ms) | 0.25 ? | 9.2 ? -3580% | 12 ? -4700% | 1.98 ? -692% | 8.1 ? -3140% | 5.6 ? -2140% | 43.6 ? -17340% |
| PWM Frequency (Hz) | 960 ? | 5800 ? | 60 | 14877 | |||
| Screen | 16% | -55% | -19% | -84% | -69% | 19% | |
| Brightness middle (cd/m²) | 416 | 539 30% | 456.8 10% | 389.97 -6% | 384 -8% | 424 2% | 630 51% |
| Brightness (cd/m²) | 418 | 546 31% | 437 5% | 395 -6% | 371 -11% | 411 -2% | 604 44% |
| Brightness Distribution (%) | 96 | 96 0% | 83 -14% | 97 1% | 88 -8% | 88 -8% | 94 -2% |
| Black Level * (cd/m²) | 0.18 | 0.35 | 0.03 | 0.3 | 0.37 | ||
| Colorchecker dE 2000 * | 1.6 | 1.4 13% | 3.7 -131% | 2 -25% | 3.4 -113% | 3.04 -90% | 1.2 25% |
| Colorchecker dE 2000 max. * | 2.1 | 2.1 -0% | 6.42 -206% | 4.1 -95% | 9.2 -338% | 7.5 -257% | 2.8 -33% |
| Greyscale dE 2000 * | 2.7 | 2.2 19% | 2.6 4% | 2.23 17% | 3.4 -26% | 4.34 -61% | 1.9 30% |
| Gamma | 2.16 102% | 2.19 100% | 2.3 96% | 2.41 91% | 2.16 102% | 2.32 95% | 2.29 96% |
| CCT | 6331 103% | 6479 100% | 6108 106% | 6323 103% | 7462 87% | 6952 93% | 6812 95% |
| Contrast (:1) | 2994 | 1305 | 12999 | 1280 | 1146 | ||
| Colorchecker dE 2000 calibrated * | 0.66 | 1.68 | 1.3 | 3.04 | |||
| Total Average (Program / Settings) | -1636% /
-887% | -1286% /
-722% | -257% /
-147% | -1579% /
-894% | -698% /
-407% | -7936% /
-5282% |
* ... smaller is better
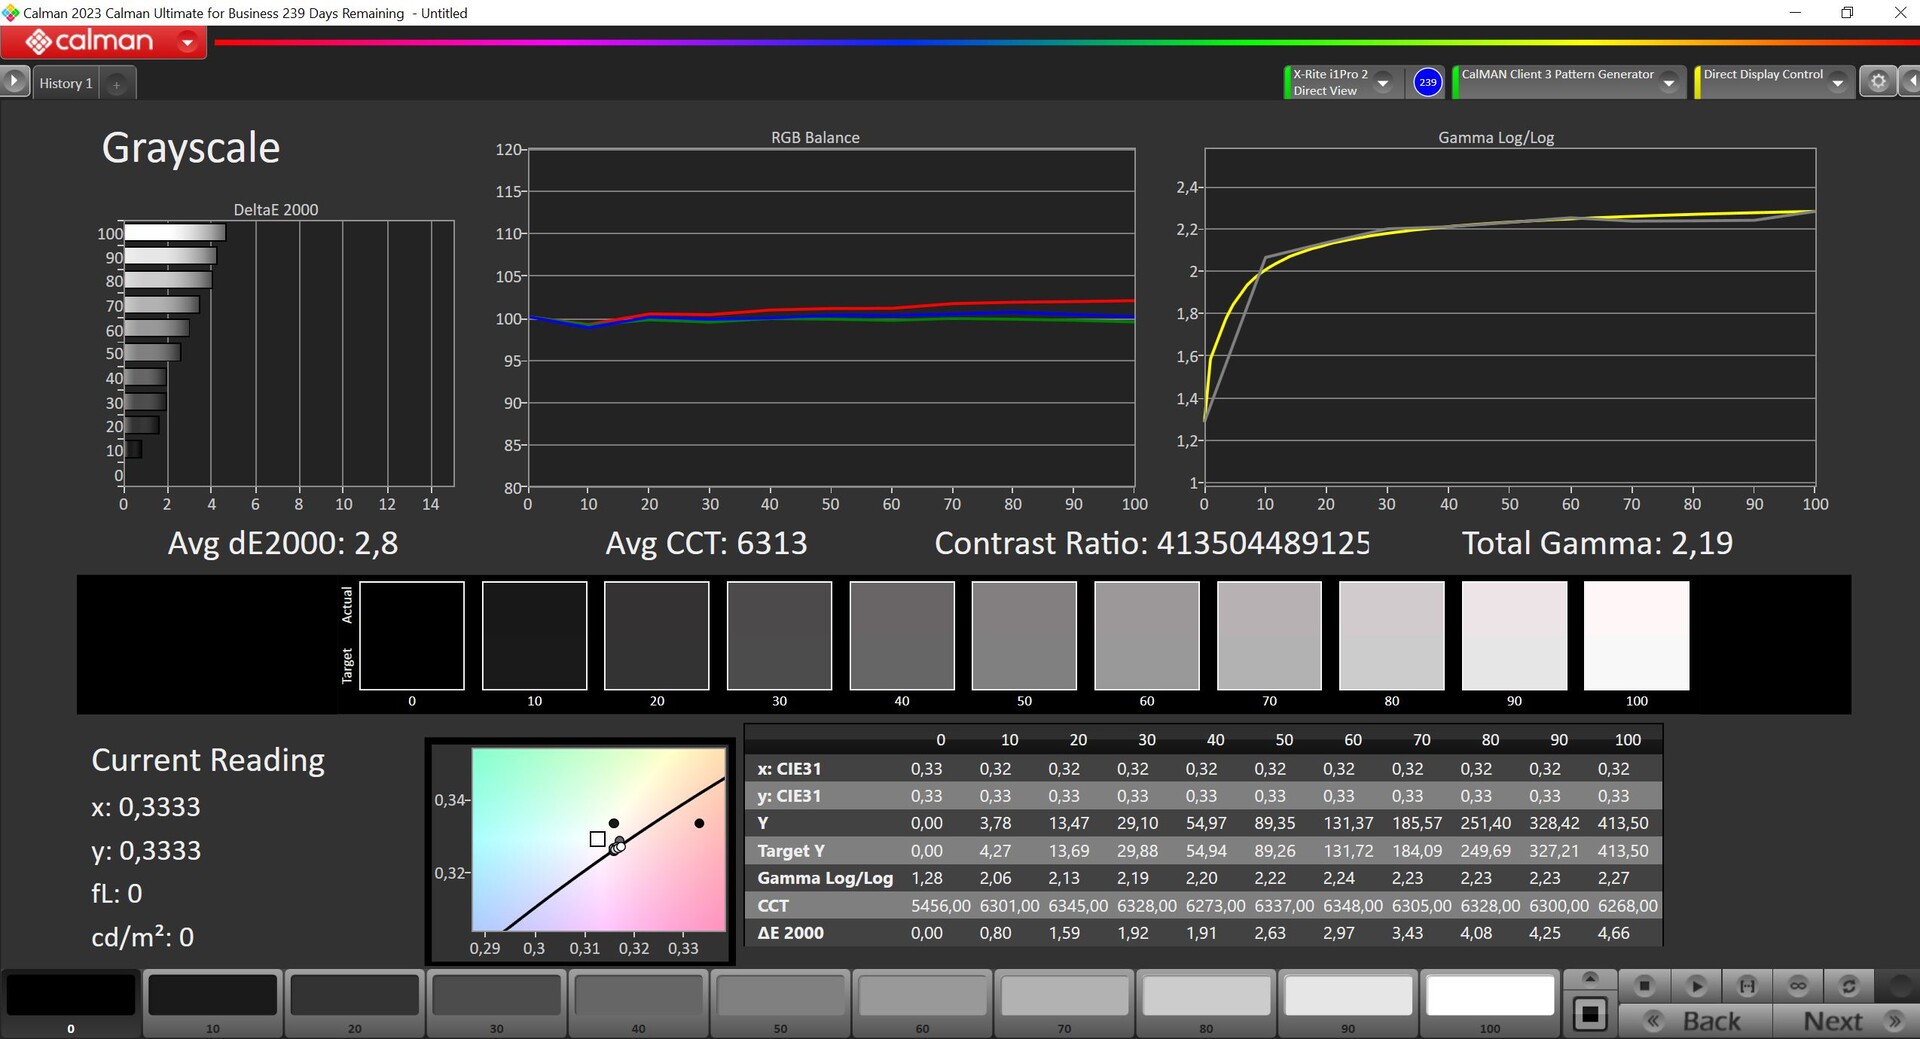
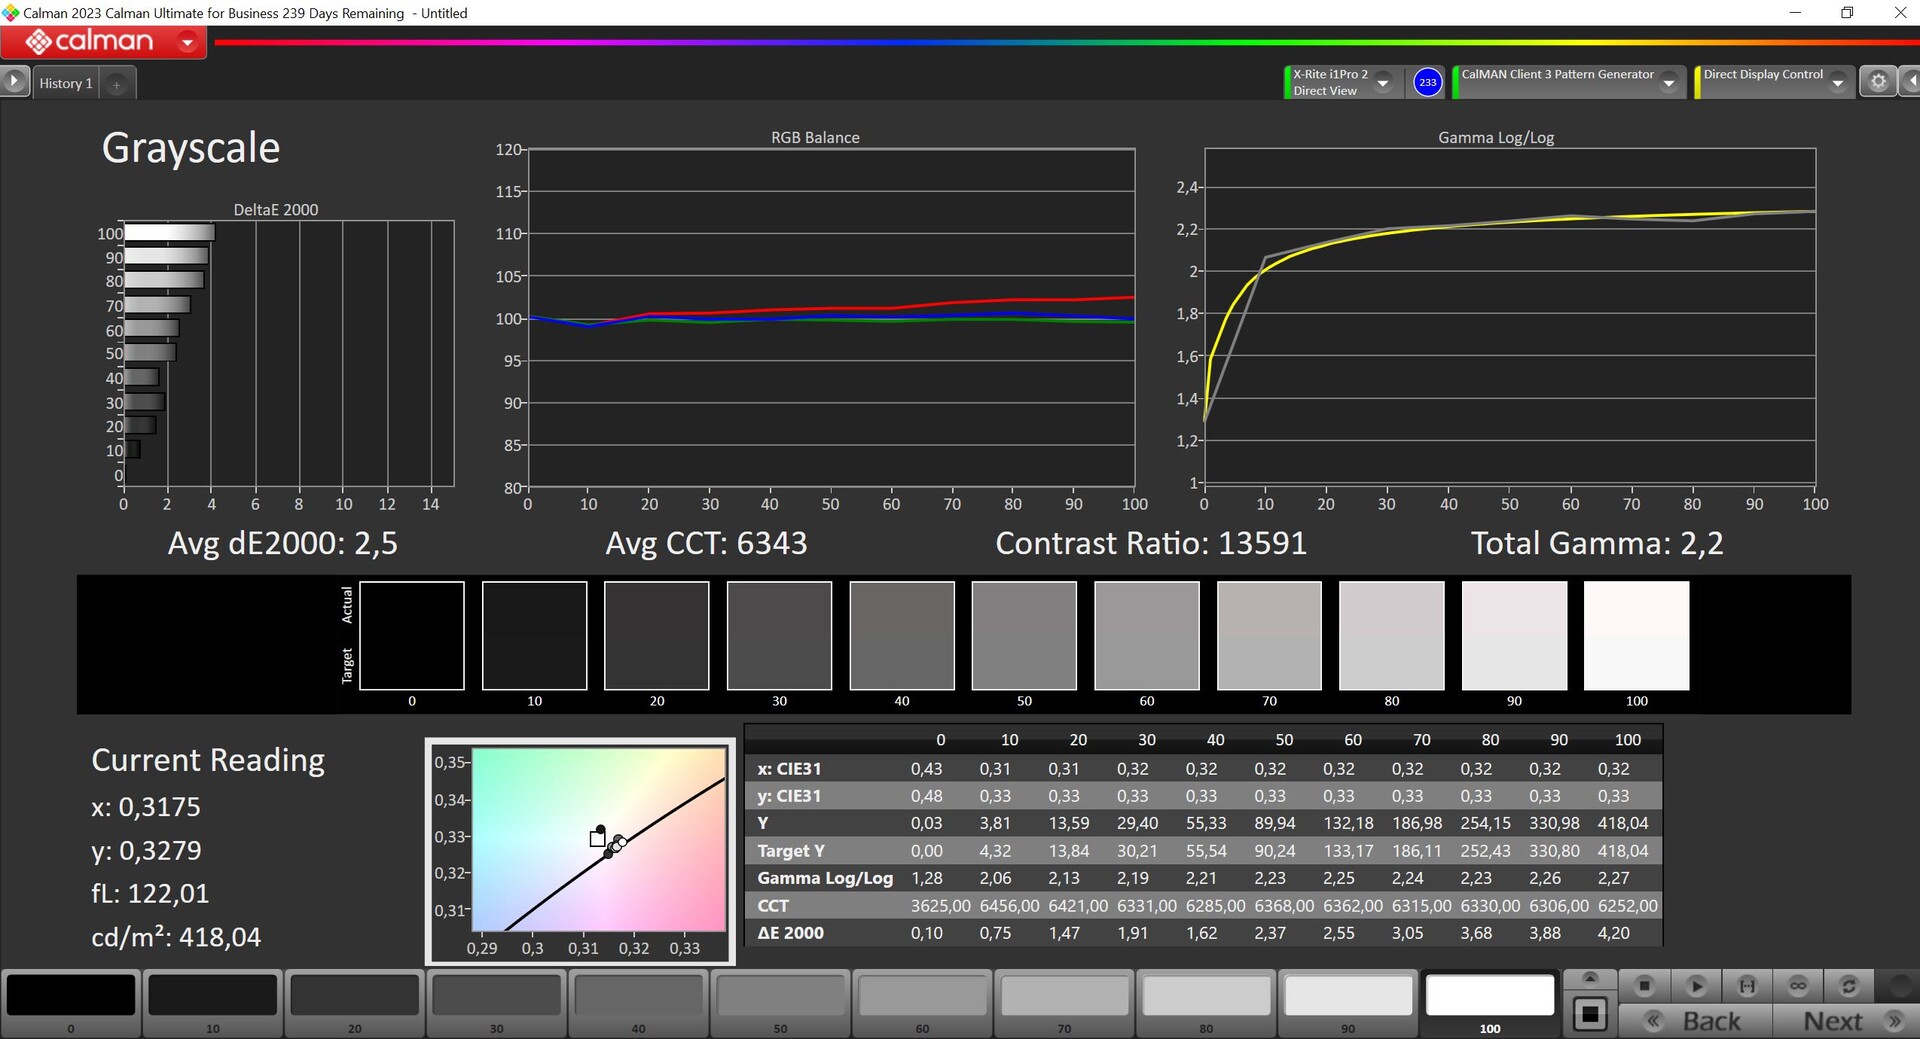
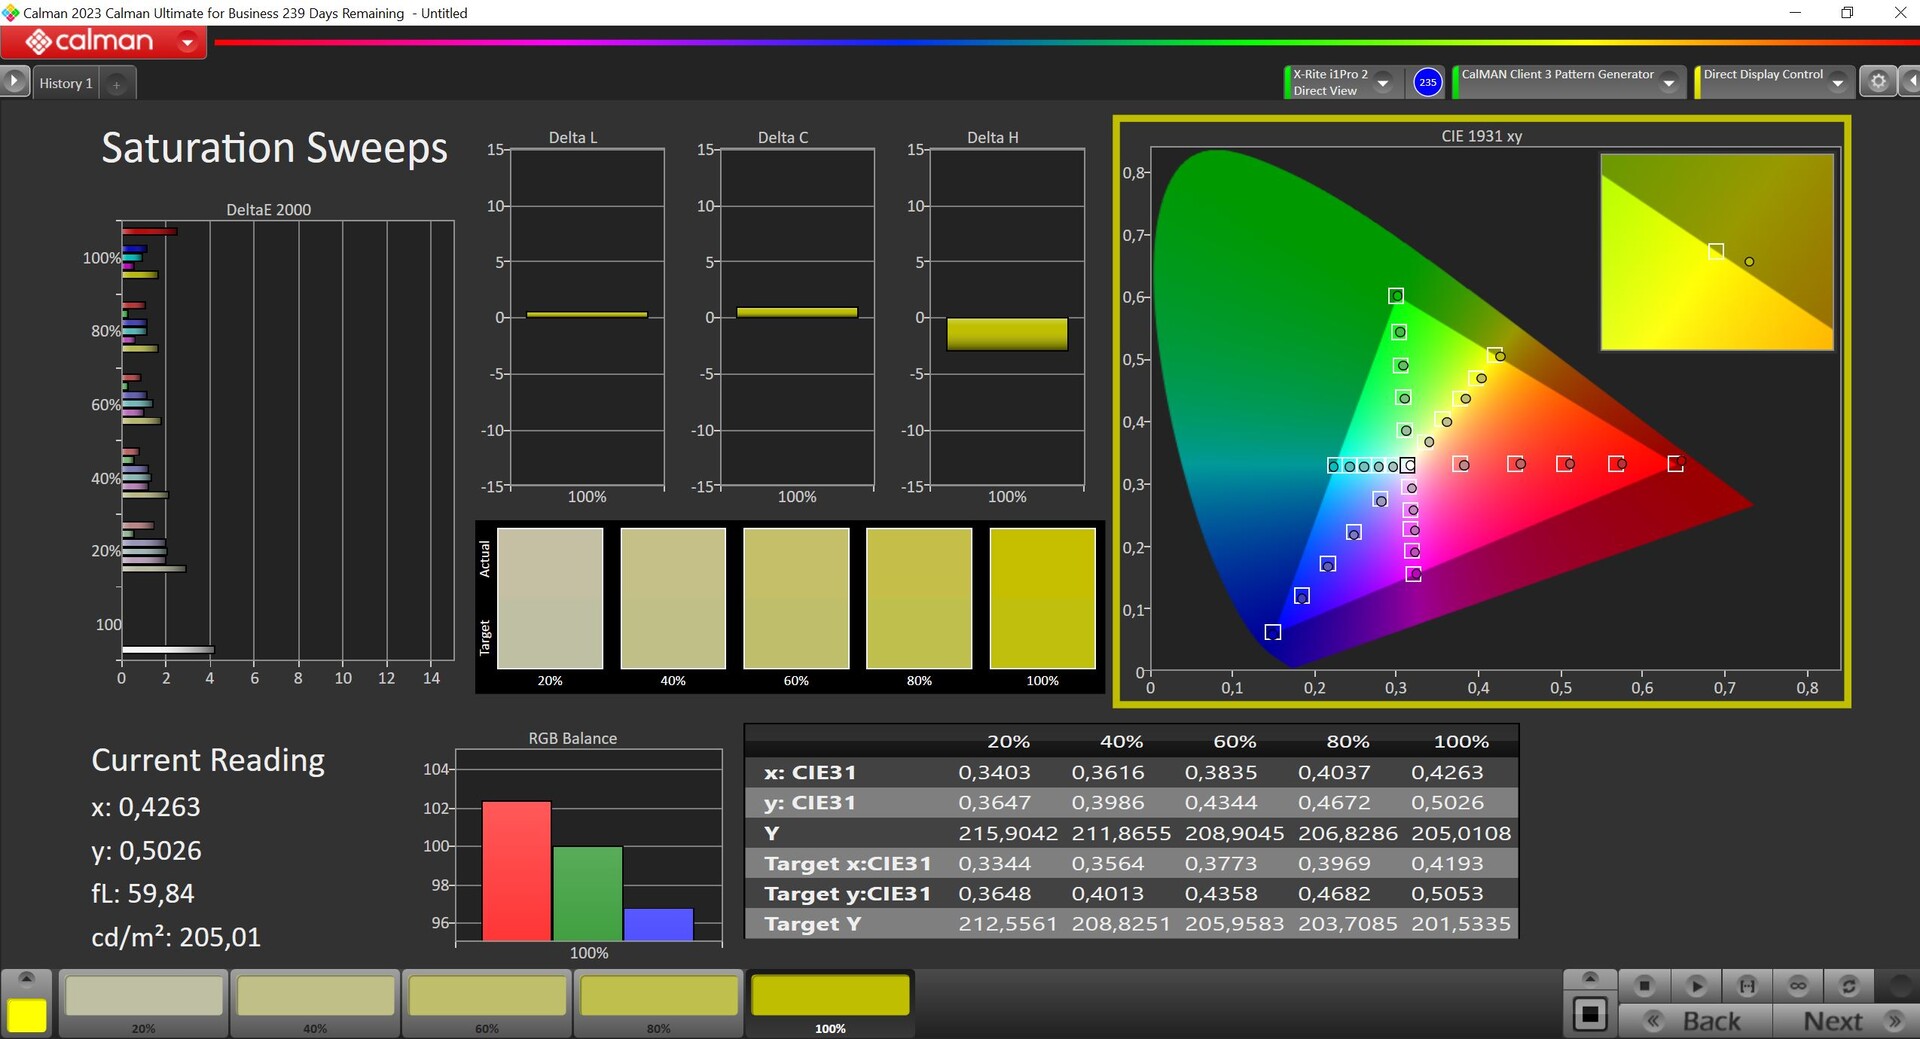
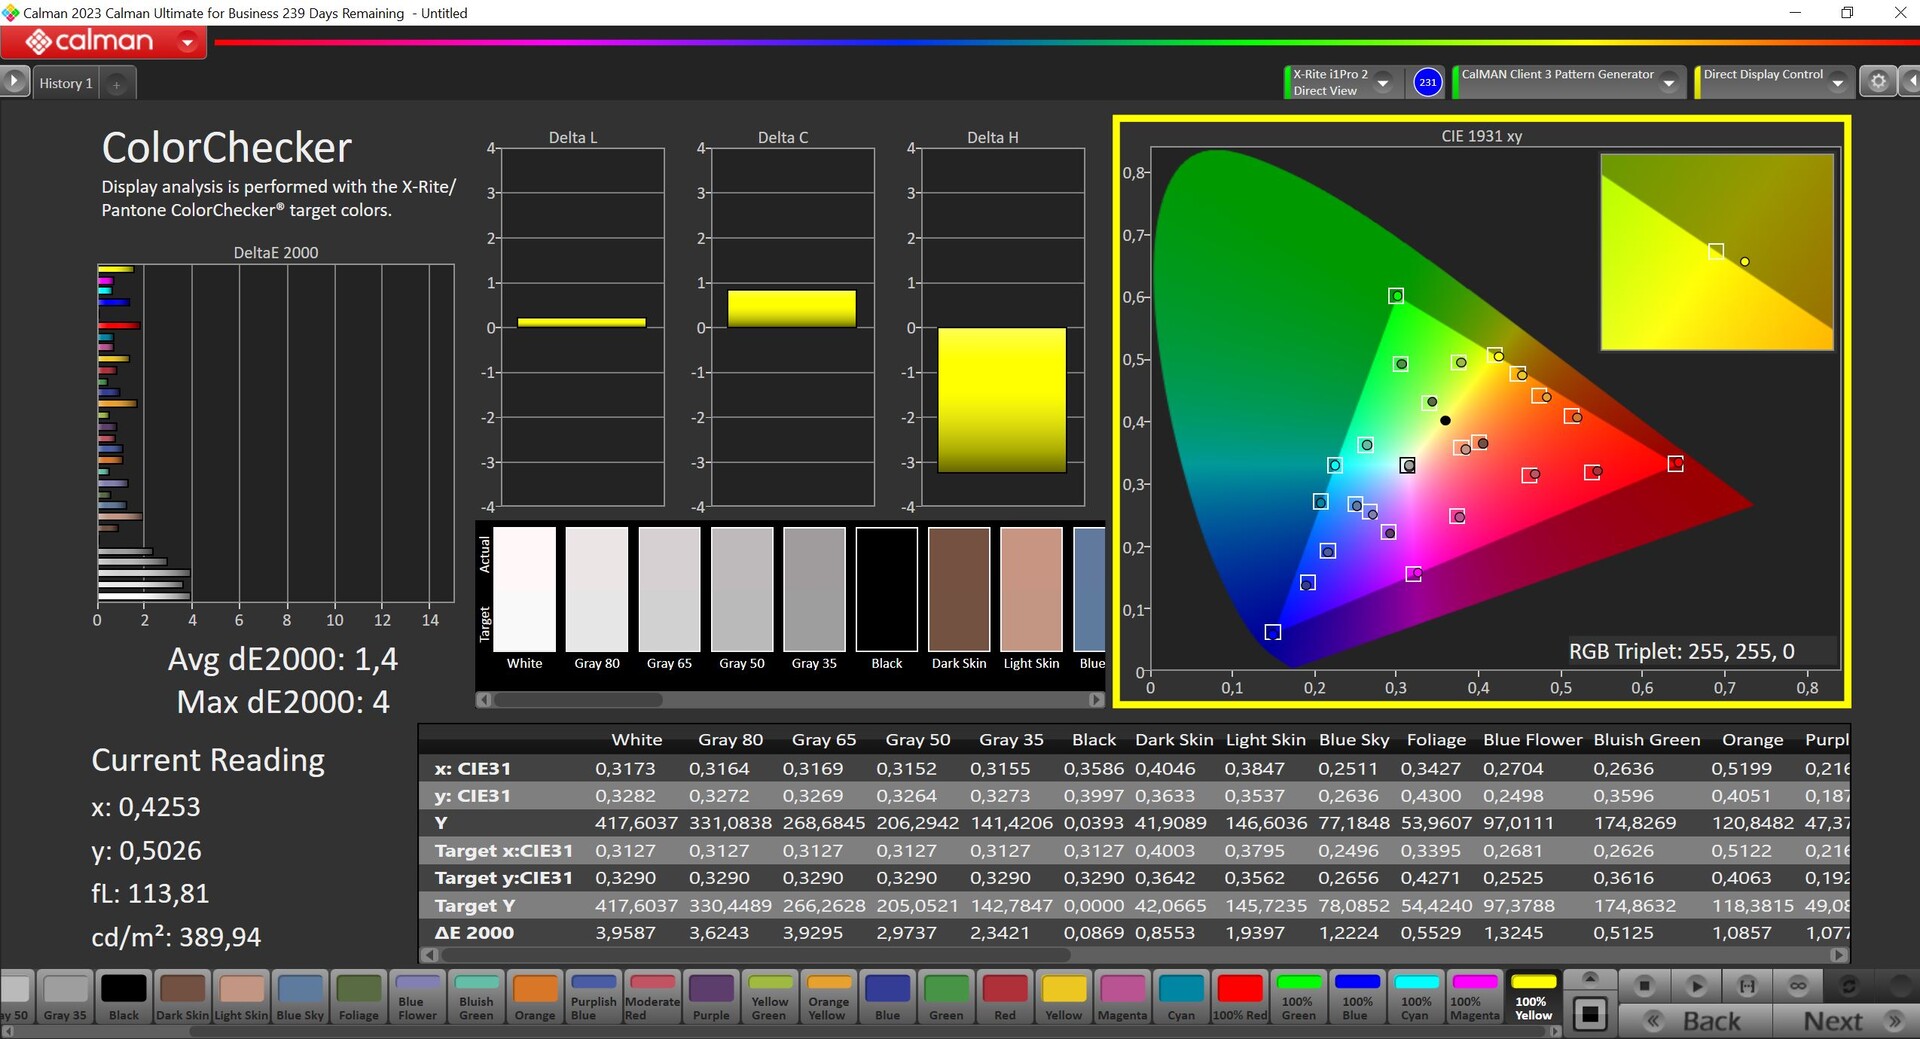
The Armoury-Crate software gives you different color profiles to select from, which we analyzed using the professional CalMAN software (X-Rite i1 Pro2). The pre-selected profile Native is great for everyday use, but the colors are a little too oversaturated. To ensure the best color accuracy, you should go for the profile Display P3. Gray tones may still show some deviations (but without a color tint), however, its color accuracy compared to the P3 reference is already excellent and all colors show deviations below the important value of 3.
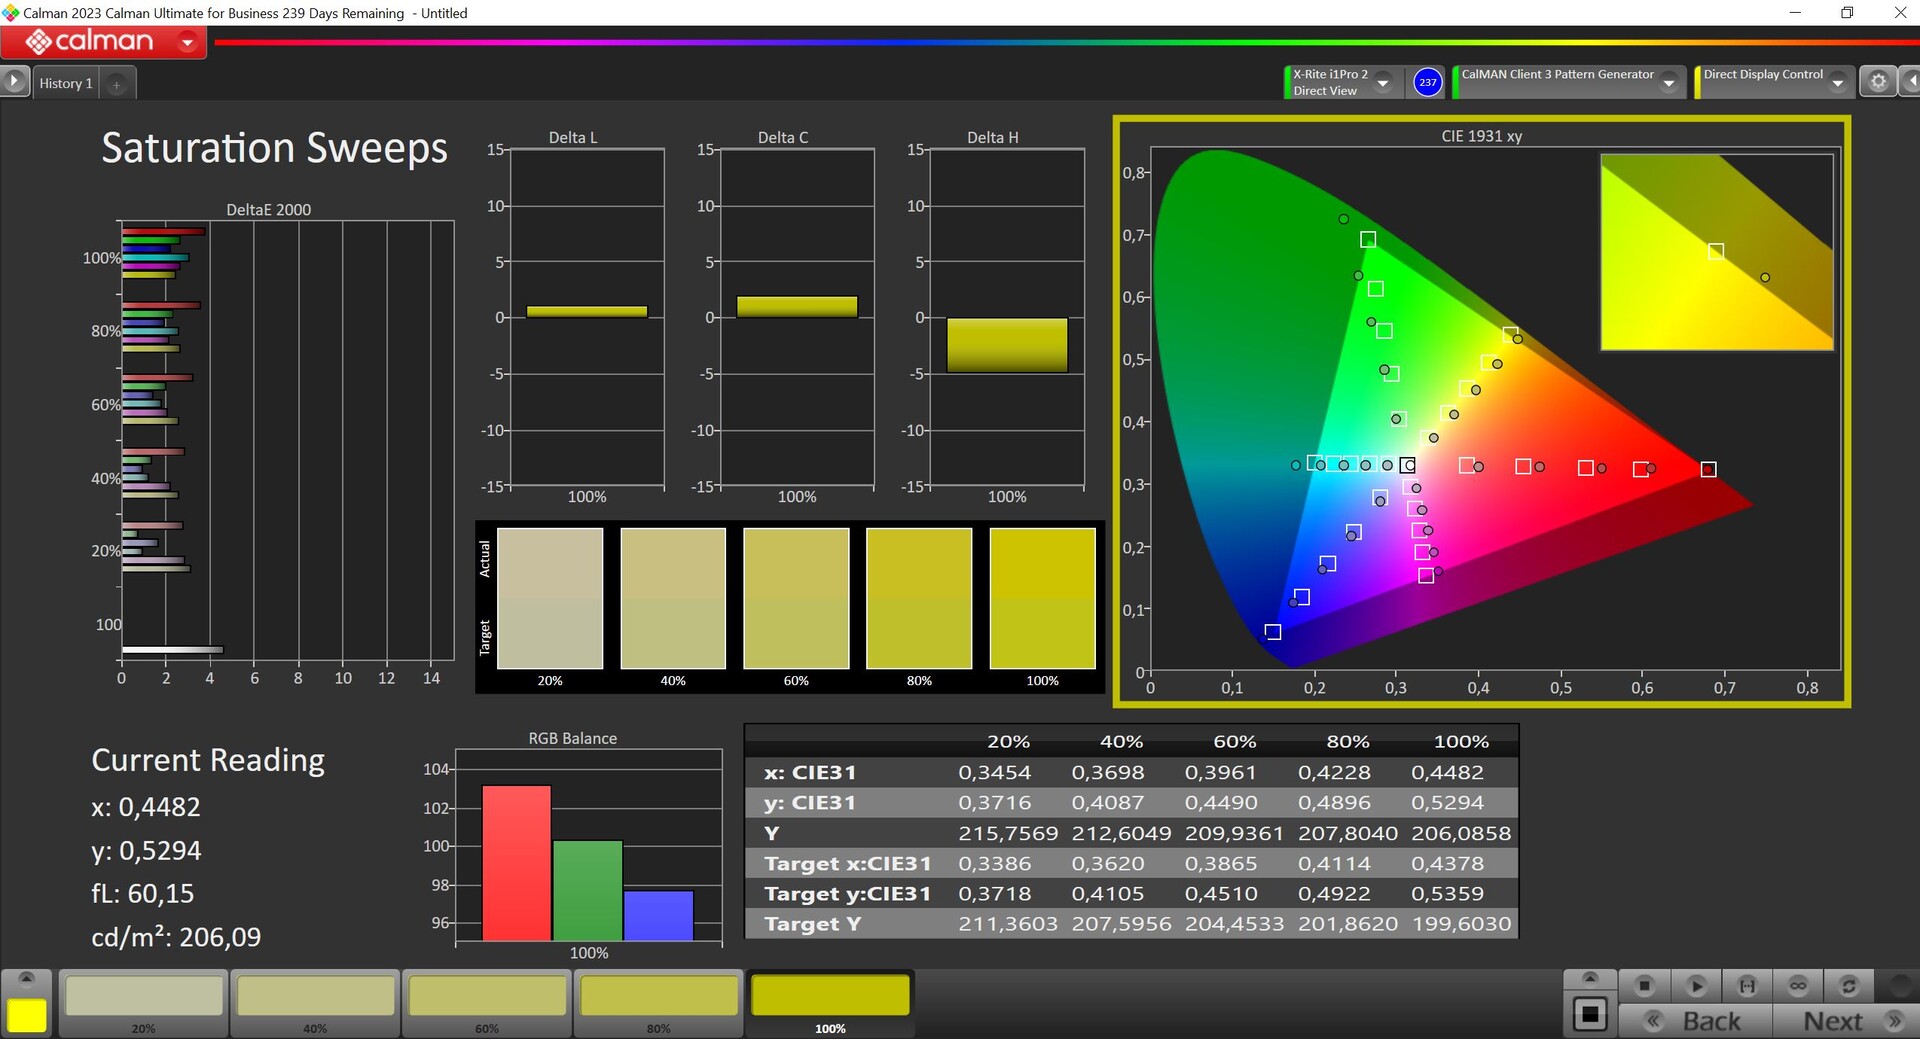
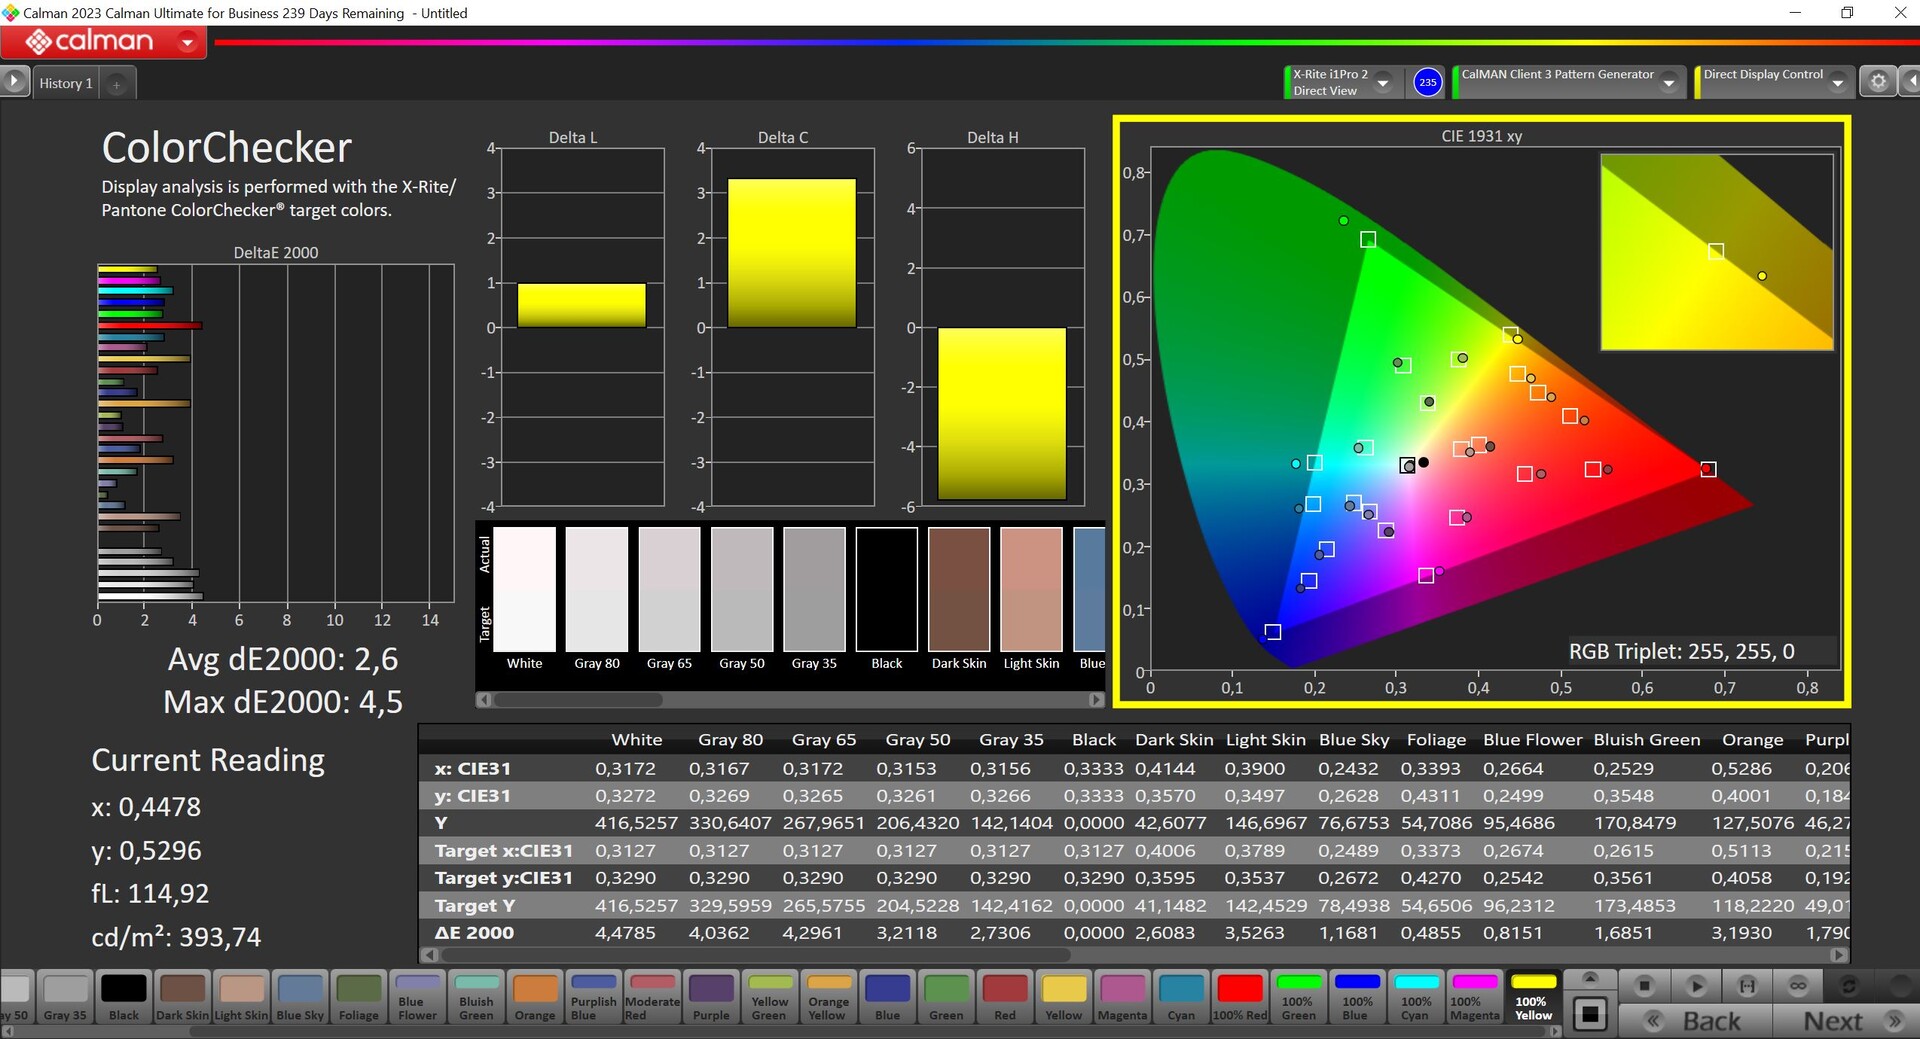


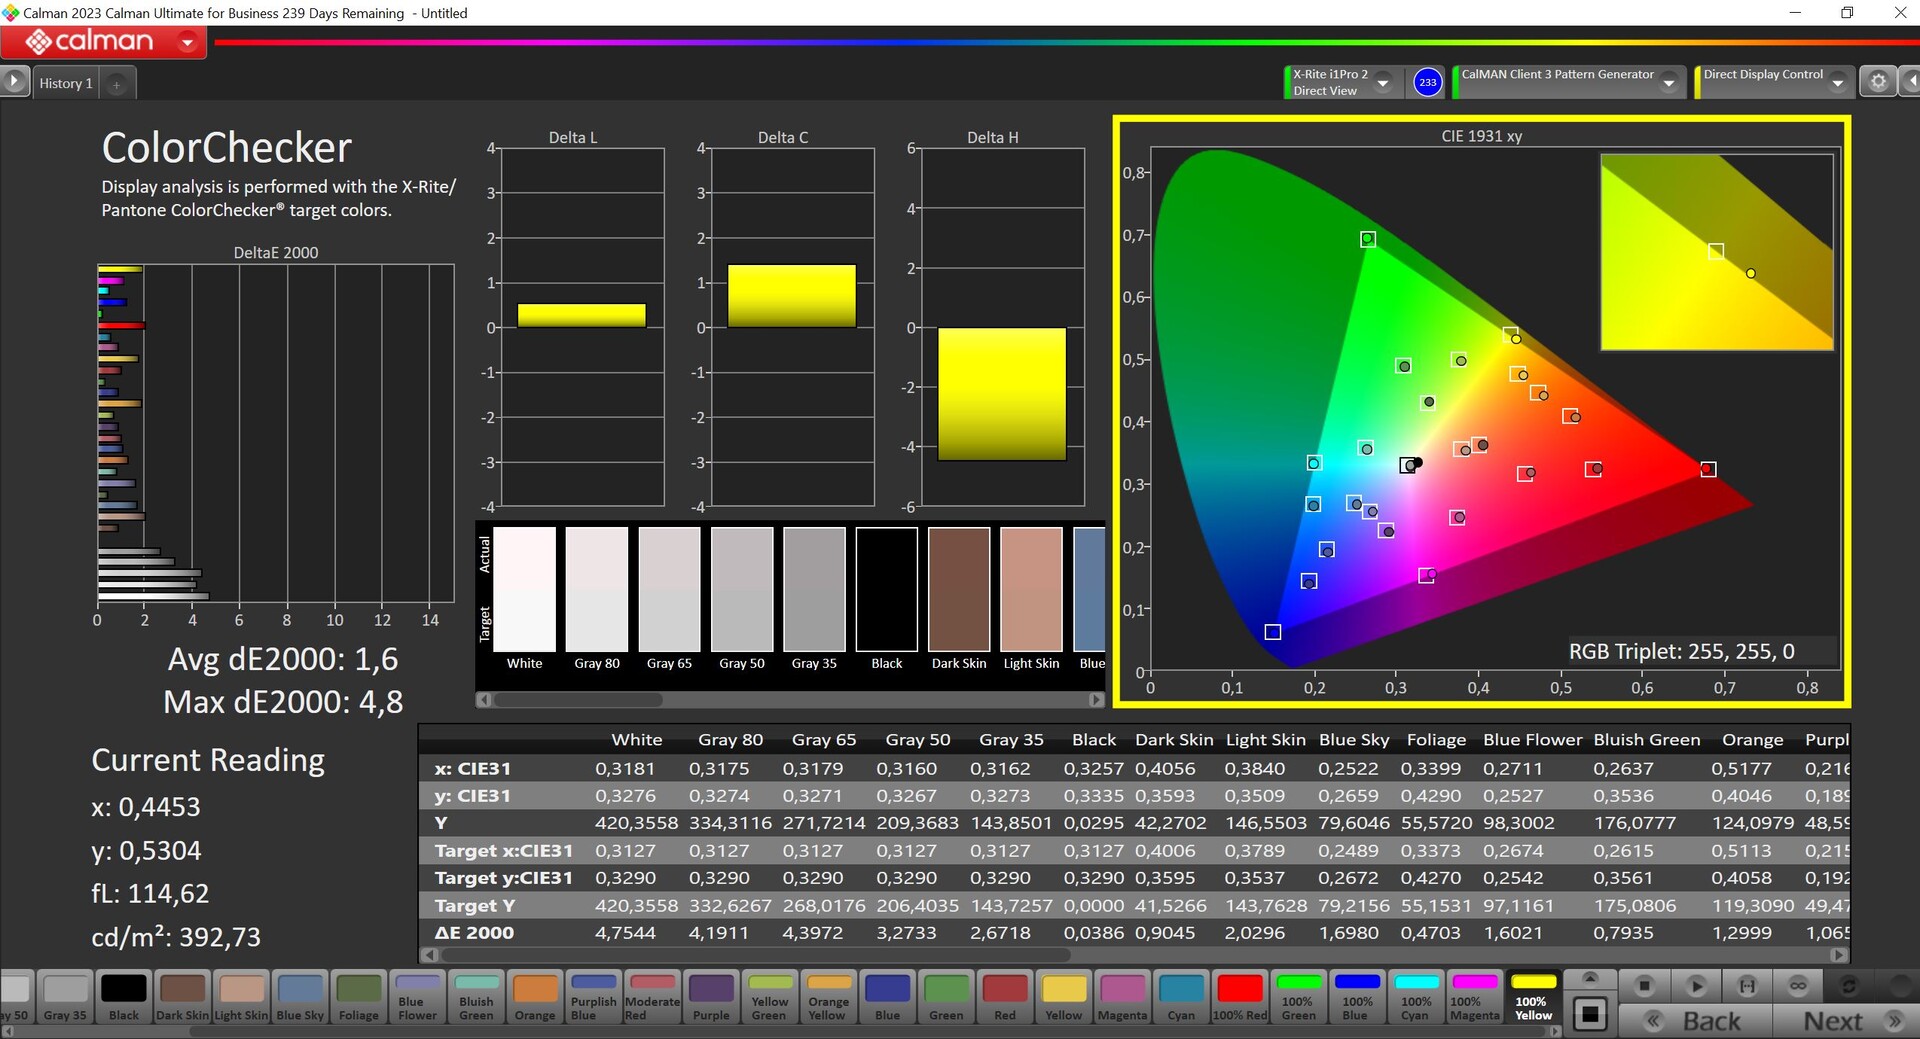
We additionally calibrated the display ourselves—with mixed results. Although we were able to improve grayscale deviations ever so slightly, this resulted in larger color deviations and all-in-all, it didn't really improve the situation. This is why we aren't making the corresponding profile available for download. The display covers the P3 color space in its entirety, but it also features a very accurate sRGB mode, in case you would like to edit photos or videos in the smaller color space.
Display Response Times
| ↔ Response Time Black to White | ||
|---|---|---|
| 0.25 ms ... rise ↗ and fall ↘ combined | ↗ 0.13 ms rise | 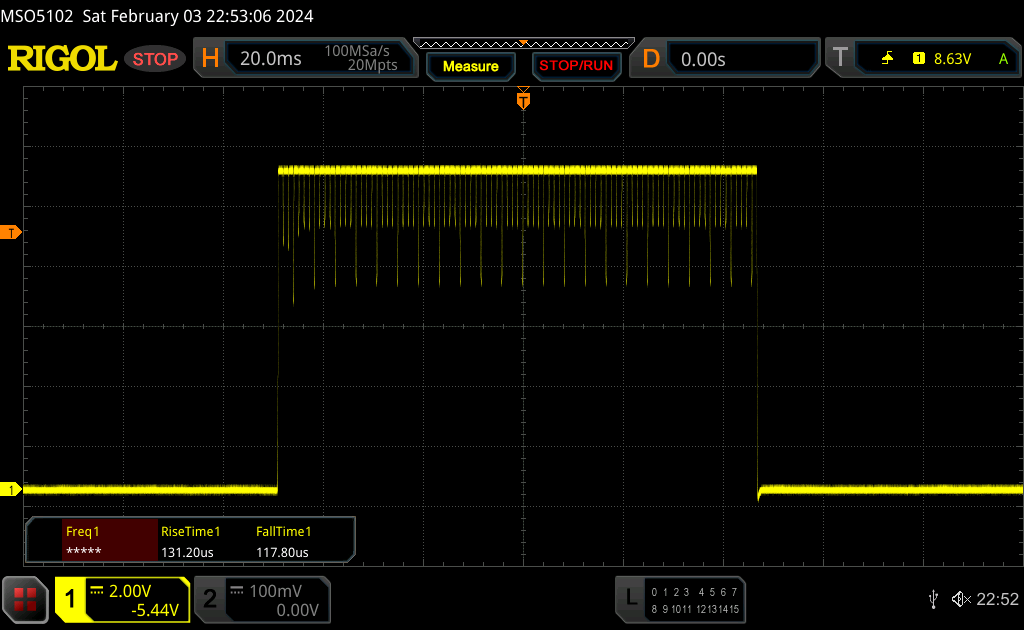 |
| ↘ 0.12 ms fall | ||
| The screen shows very fast response rates in our tests and should be very well suited for fast-paced gaming. In comparison, all tested devices range from 0.1 (minimum) to 240 (maximum) ms. » 0 % of all devices are better. This means that the measured response time is better than the average of all tested devices (19.9 ms). | ||
| ↔ Response Time 50% Grey to 80% Grey | ||
| 0.22 ms ... rise ↗ and fall ↘ combined | ↗ 0.11 ms rise | 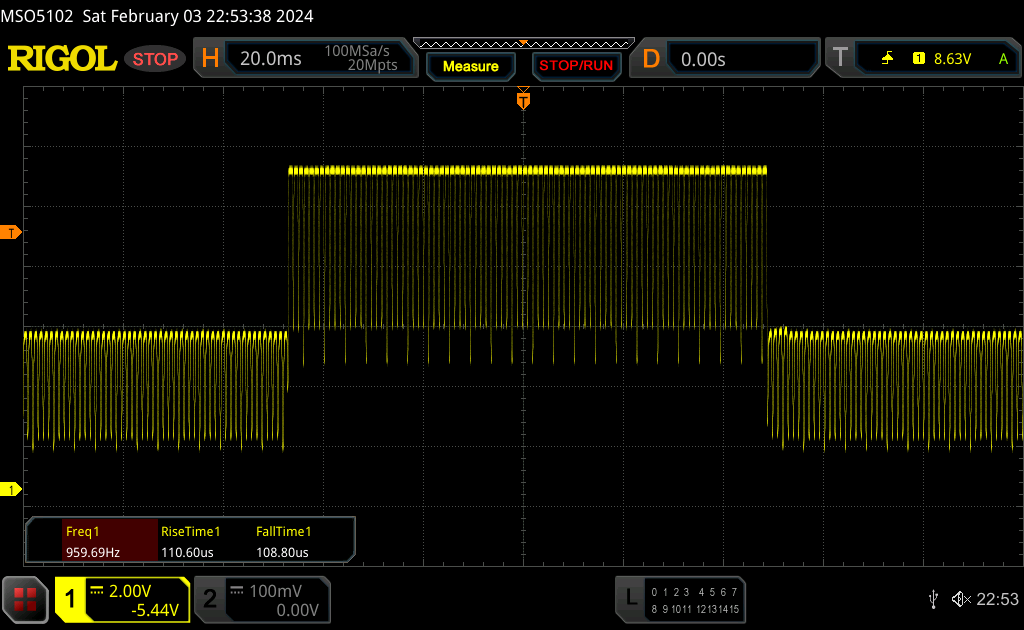 |
| ↘ 0.11 ms fall | ||
| The screen shows very fast response rates in our tests and should be very well suited for fast-paced gaming. In comparison, all tested devices range from 0.165 (minimum) to 636 (maximum) ms. » 0 % of all devices are better. This means that the measured response time is better than the average of all tested devices (31.1 ms). | ||
Screen Flickering / PWM (Pulse-Width Modulation)
| Screen flickering / PWM detected | 960 Hz | ≤ 60 % brightness setting | 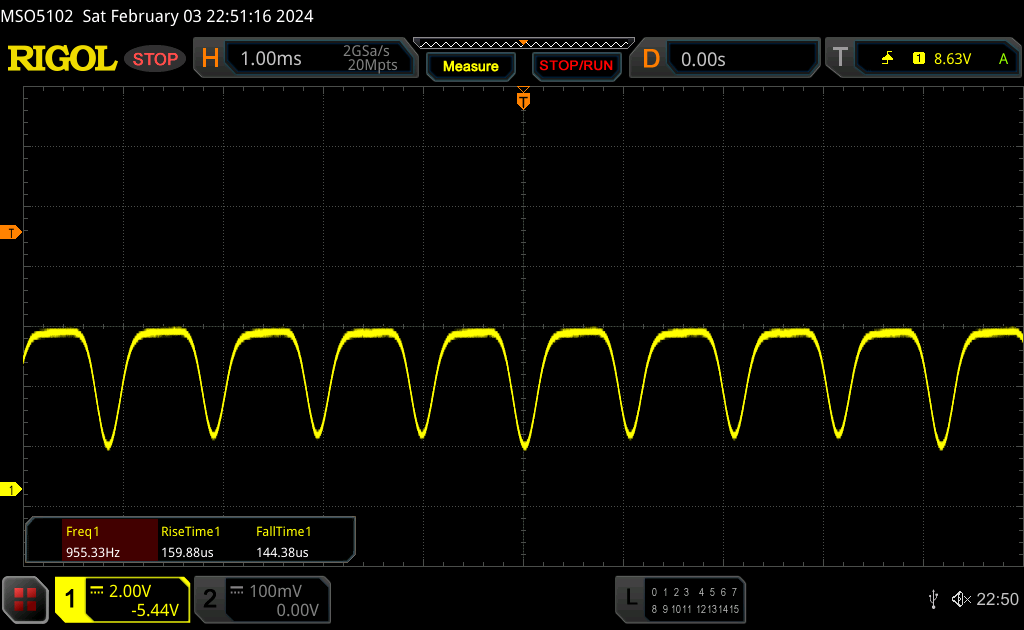 |
The display backlight flickers at 960 Hz (worst case, e.g., utilizing PWM) Flickering detected at a brightness setting of 60 % and below. There should be no flickering or PWM above this brightness setting. The frequency of 960 Hz is quite high, so most users sensitive to PWM should not notice any flickering. In comparison: 52 % of all tested devices do not use PWM to dim the display. If PWM was detected, an average of 7798 (minimum: 5 - maximum: 343500) Hz was measured. | |||
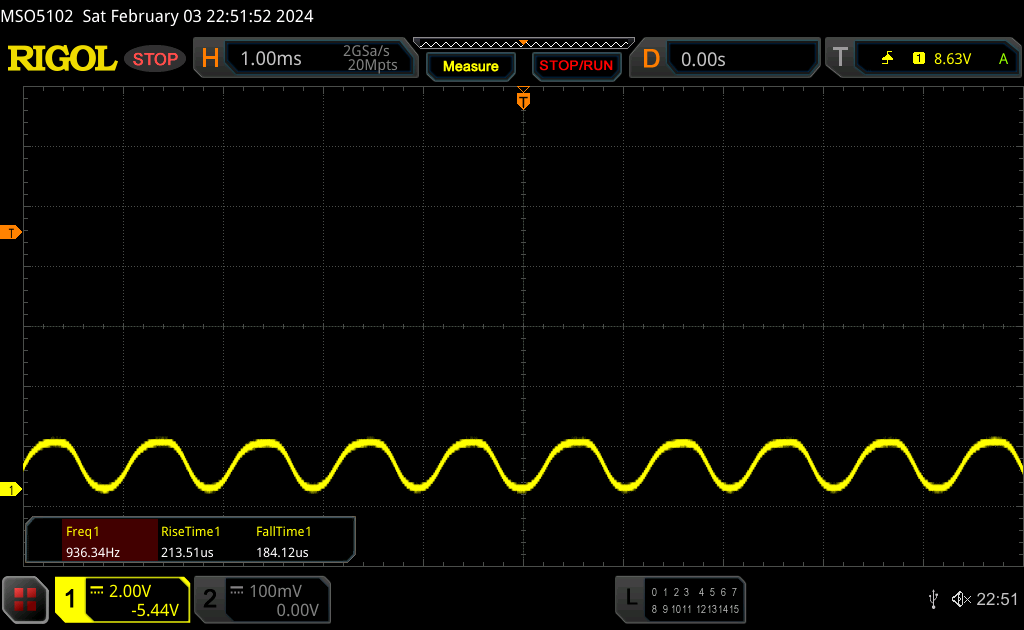
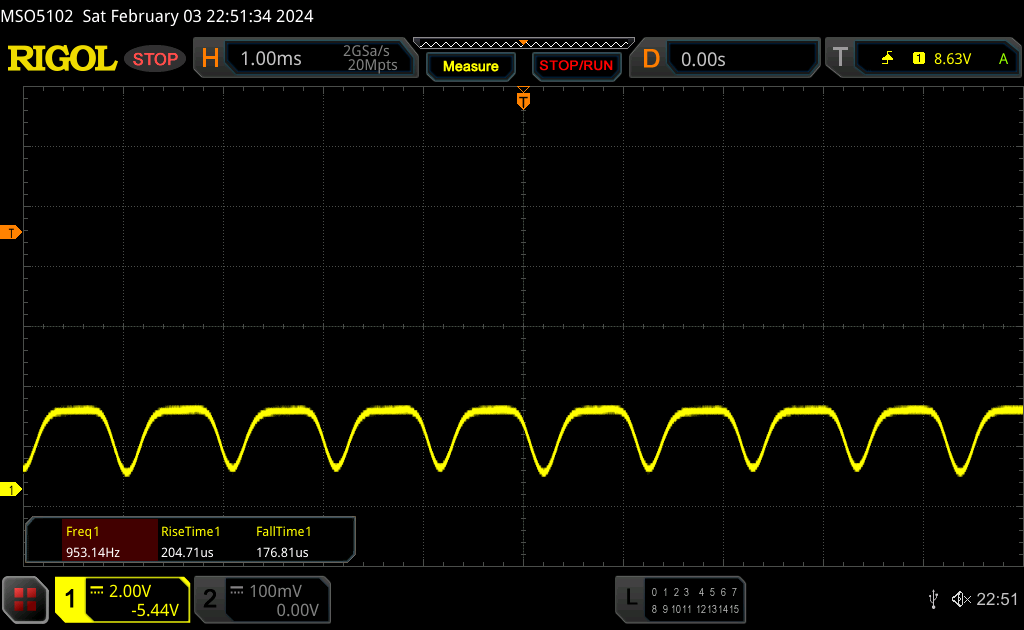
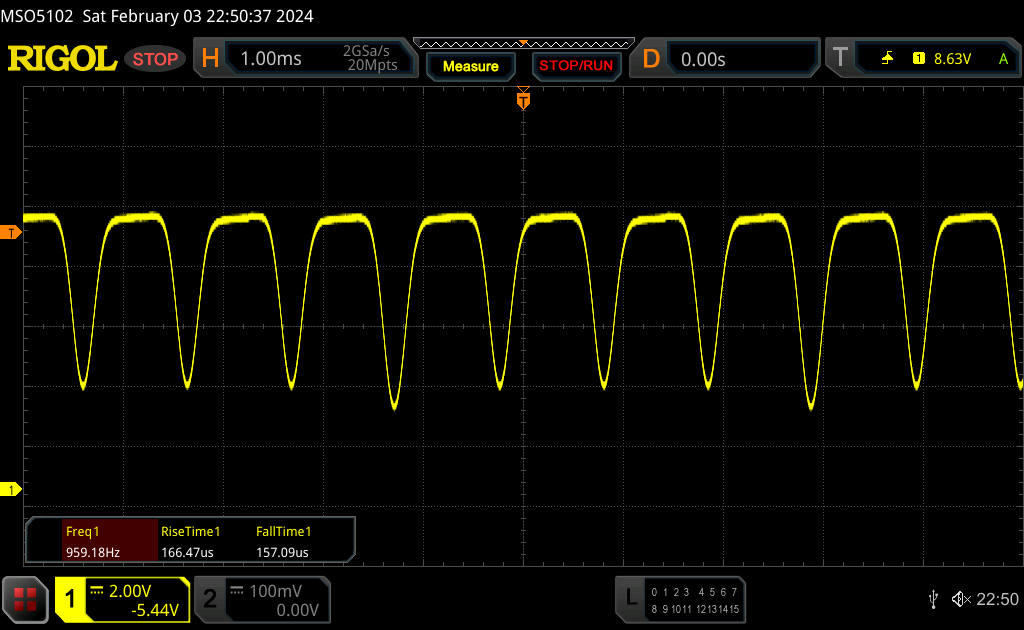
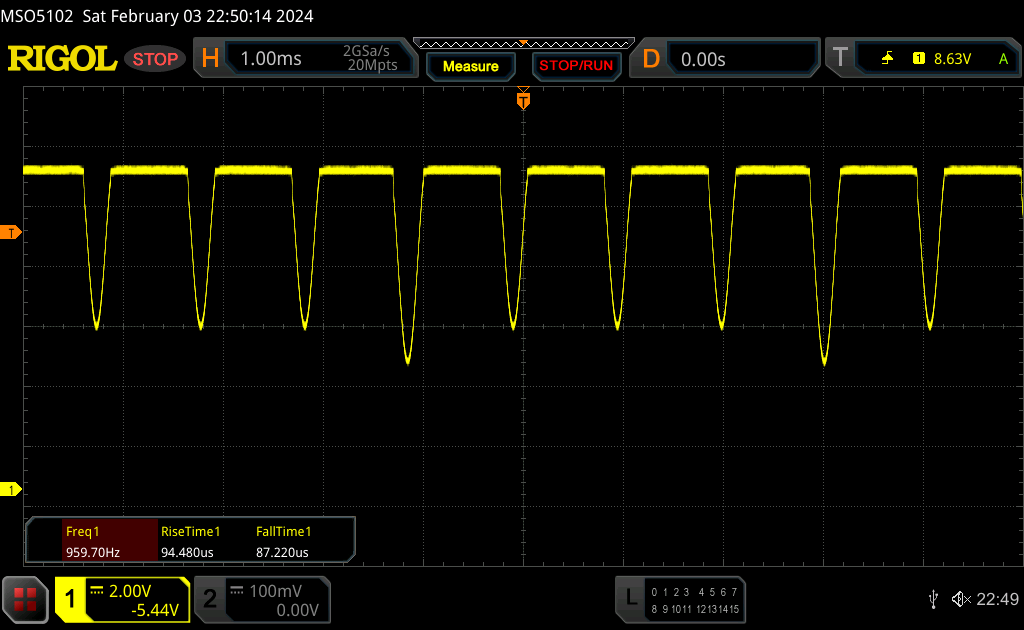
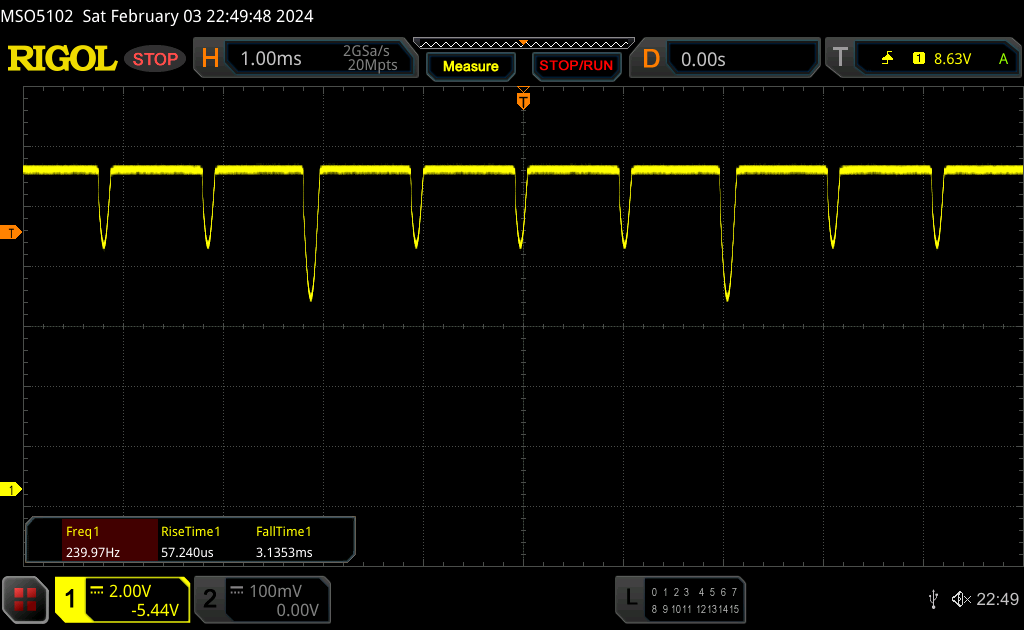
In general, the new OLED panel runs using PWM at a frequency of 960 Hz but at brightness levels over 60 %, it makes use of less-harmful DC dimming (at 240 Hz). As soon as the brightness falls beneath this level, a warning pops up stating that DC dimming is no longer available. As was already the case on other OLED laptops from Asus, you get the chance to dim the display using software which lets you continue to use DC dimming. We would just wish to see this control being combined with the regular brightness control in order to maximize comfort.


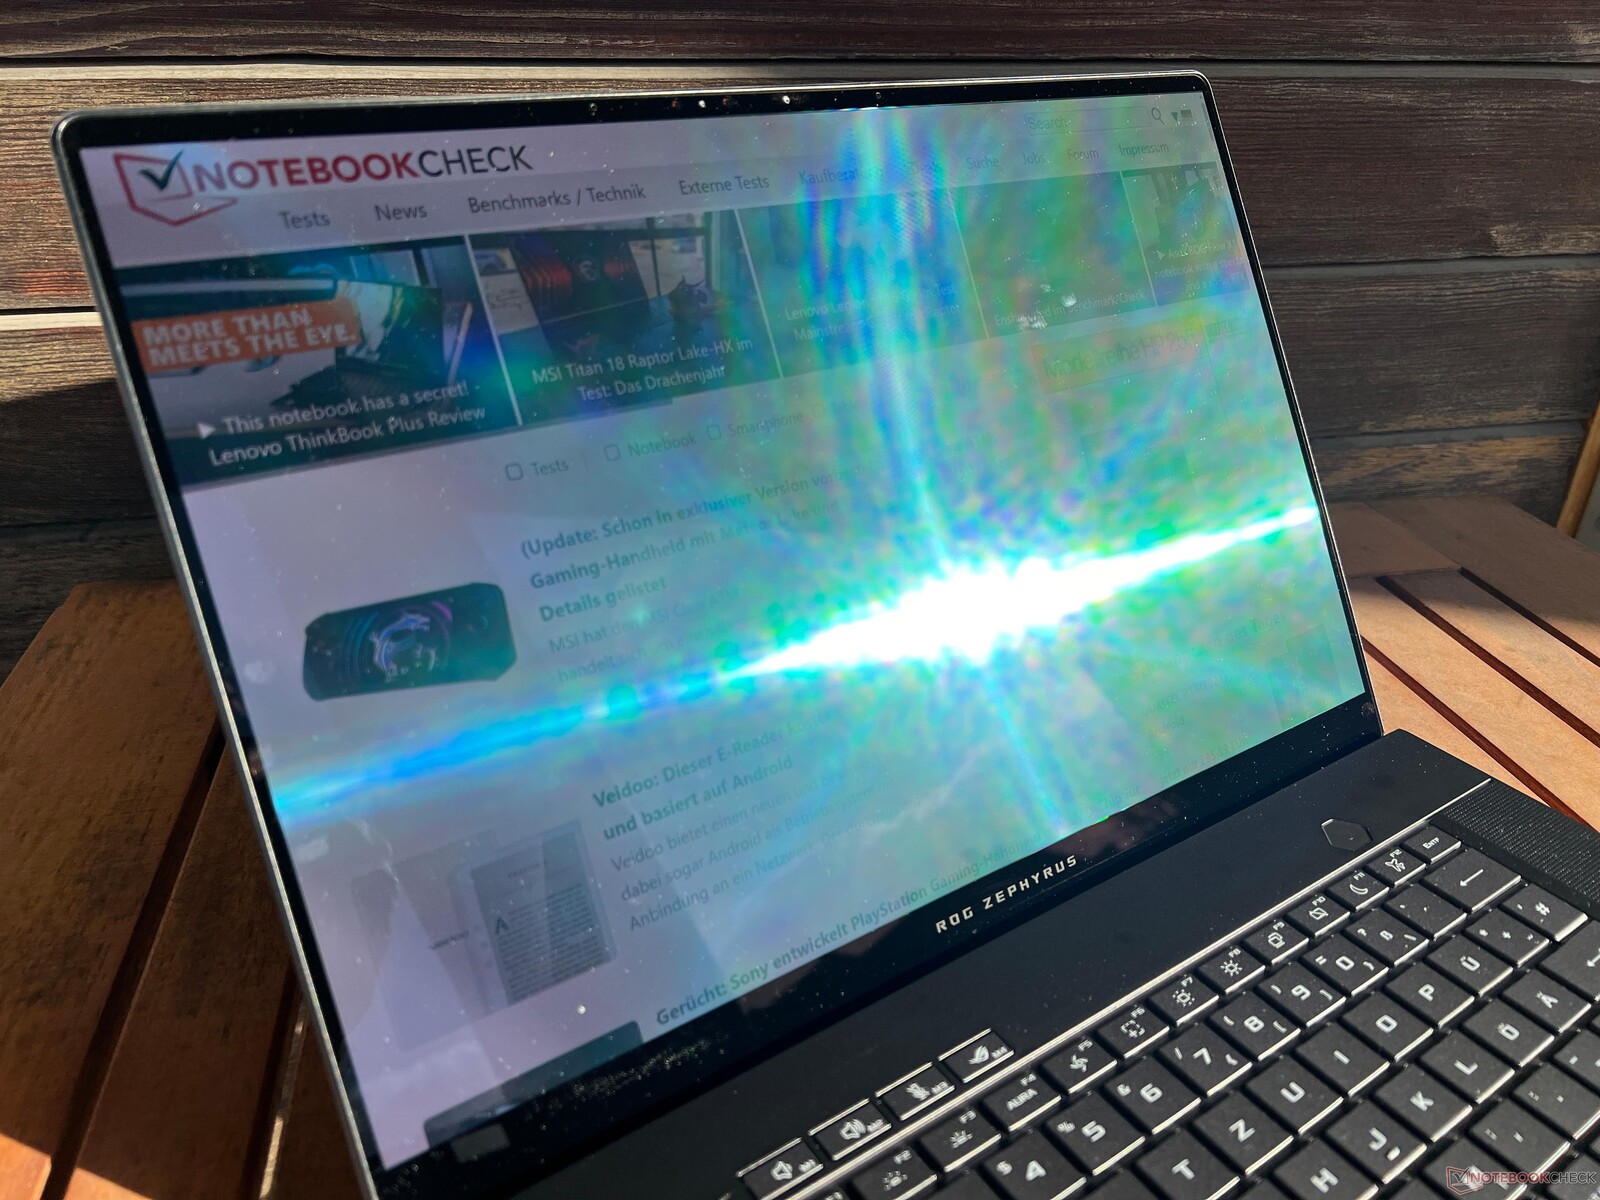

The Zephyrus G16 does really well outside and even on sunny days, you can use it well—as long as you stay out of direct sunlight. Its viewing-angle stability is great and only large deviations from the center lead to a slight blue shimmer being noticeable, but this is typical for OLED panels.

Performance - The Zephyrus now with Meteor Lake
Testing conditions
Within its Armoury-Crate software, Asus offers a variety of energy profiles as well as a manual mode that lets you individually set the GPU/CPU performance. We put together the energy profiles' values in the following table. It should be noted, however, that these values only count for the configurations featuring the 4070/4060/4050 Laptop which are fitted with conventional heat pipes and three fans. The more powerful models with the RTX 4080/4090 Laptop, on the other hand, have a Vapor-Chamber cooling system with two fans, which is why the processor and GPU consume more power (in all profiles).
| Energy profile | CPU load | CB R23 Multi | GPU load | Time Spy graphics | Cyberpunk 2077 QHD Ultra | max. fan emissions |
|---|---|---|---|---|---|---|
| Quiet | 60->45 watts | 15,869 points | 65 watts | 9,042 points | 32.6 fps | 41.5 dB(A) |
| Performance | 70->50 watts | 17,133 points | 80 watts | 10,989 points | 43.7 fps | 46.4 dB(A) |
| Turbo | 95->70 watts | 18,372 points | 105 watts | 12,312 points | 48.7 fps | 52.4 dB(A) |
After several tests, we decided to run the following benchmarks and measurements using performance mode. Although you might not get the maximum performance, the fans remain bearable when playing games, as noise emissions from about 48 dB(A) are hard to tolerate. Thanks to its great speakers, you can even get away with playing without headphones with performance mode selected. Even so, if you require the maximum performance possible, then you can easily switch modes with the push of a button (however, turbo is only available when connected to the mains). During simple tasks, you should select quiet mode, as otherwise, the fans can almost always be heard.
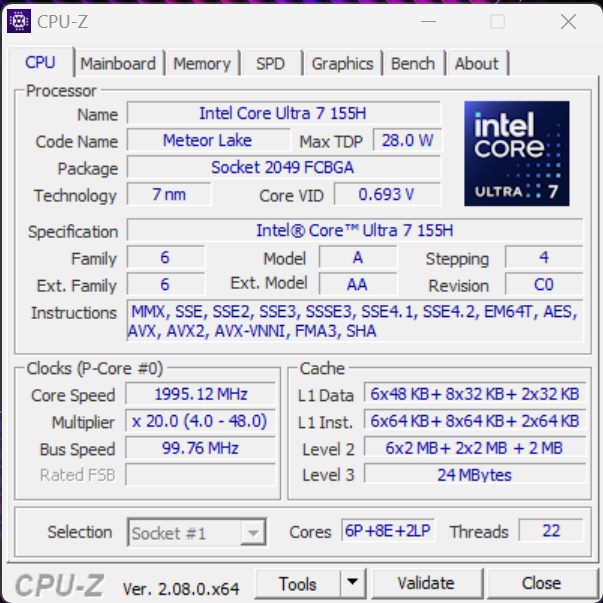
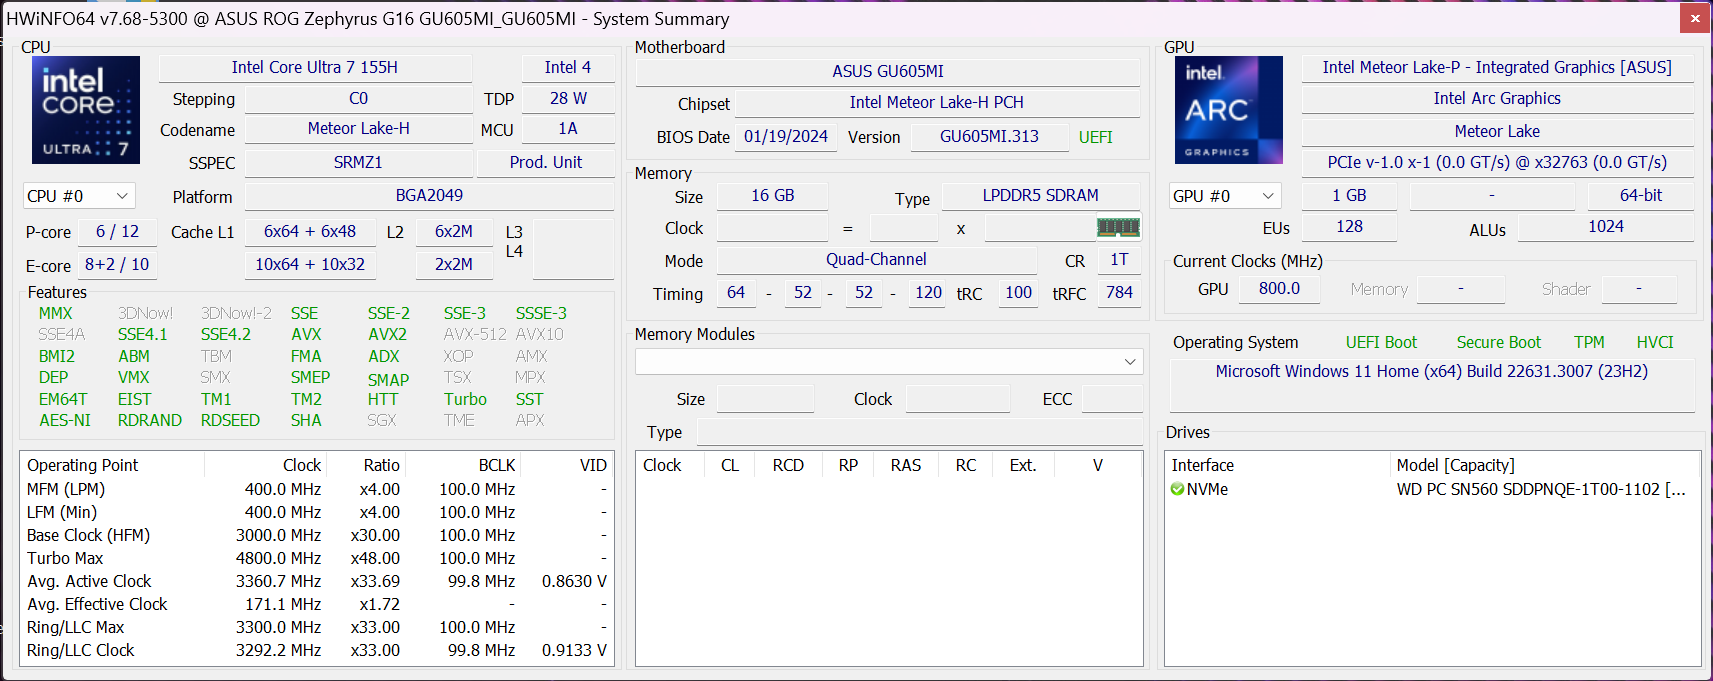
Processor - Core Ultra 7 155H
We already took a look at the new Meteor-Lake-gen Core Ultra 7 155H in our analysis article. With power limits of 70/50 watts, the processor does well—but there is no real difference to the old Raptor-Lake chips such as the Core i7-13700H and this also doesn't change when you select turbo mode. Its single-core performance is slightly weaker, however, and we are already looking forward to seeing how Meteor Lake fares against the new Ryzen-8000 CPUs. All-in-all, its multi-core performance remains very constant in total. In battery use, the CPU performance remains constant. Further CPU benchmarks can be found here.
Cinebench R15 Multi continuous test
Cinebench R20: CPU (Multi Core) | CPU (Single Core)
Cinebench R15: CPU Multi 64Bit | CPU Single 64Bit
Blender: v2.79 BMW27 CPU
7-Zip 18.03: 7z b 4 | 7z b 4 -mmt1
Geekbench 6.7: Multi-Core | Single-Core
Geekbench 5.5: Multi-Core | Single-Core
HWBOT x265 Benchmark v2.2: 4k Preset
LibreOffice : 20 Documents To PDF
R Benchmark 2.5: Overall mean
| Cinebench R20 / CPU (Multi Core) | |
| Average of class Gaming (4029 - 16108, n=112, last 2 years) | |
| Razer Blade 16 Early 2023 | |
| MSI Stealth 16 Studio A13VG | |
| Lenovo Yoga Pro 9 16-IRP G8 | |
| Gigabyte AERO 16 OLED BSF | |
| Asus ROG Zephyrus G16 2024 GU605M | |
| Apple MacBook Pro 16 2023 M3 Max | |
| Schenker VISION 16 Pro (M23) | |
| Cinebench R20 / CPU (Single Core) | |
| Average of class Gaming (442 - 895, n=112, last 2 years) | |
| Razer Blade 16 Early 2023 | |
| Lenovo Yoga Pro 9 16-IRP G8 | |
| Schenker VISION 16 Pro (M23) | |
| MSI Stealth 16 Studio A13VG | |
| Asus ROG Zephyrus G16 2024 GU605M | |
| Gigabyte AERO 16 OLED BSF | |
| Apple MacBook Pro 16 2023 M3 Max | |
| Cinebench R15 / CPU Multi 64Bit | |
| Razer Blade 16 Early 2023 | |
| Average of class Gaming (1578 - 6271, n=113, last 2 years) | |
| Apple MacBook Pro 16 2023 M3 Max | |
| Lenovo Yoga Pro 9 16-IRP G8 | |
| Gigabyte AERO 16 OLED BSF | |
| MSI Stealth 16 Studio A13VG | |
| Asus ROG Zephyrus G16 2024 GU605M | |
| Schenker VISION 16 Pro (M23) | |
| Cinebench R15 / CPU Single 64Bit | |
| Average of class Gaming (188.8 - 343, n=112, last 2 years) | |
| Schenker VISION 16 Pro (M23) | |
| Razer Blade 16 Early 2023 | |
| Lenovo Yoga Pro 9 16-IRP G8 | |
| MSI Stealth 16 Studio A13VG | |
| Apple MacBook Pro 16 2023 M3 Max | |
| Asus ROG Zephyrus G16 2024 GU605M | |
| Gigabyte AERO 16 OLED BSF | |
| 7-Zip 18.03 / 7z b 4 -mmt1 | |
| Razer Blade 16 Early 2023 | |
| Average of class Gaming (4199 - 7436, n=111, last 2 years) | |
| Schenker VISION 16 Pro (M23) | |
| MSI Stealth 16 Studio A13VG | |
| Lenovo Yoga Pro 9 16-IRP G8 | |
| Gigabyte AERO 16 OLED BSF | |
| Asus ROG Zephyrus G16 2024 GU605M | |
| Geekbench 6.7 / Multi-Core | |
| Apple MacBook Pro 16 2023 M3 Max | |
| Razer Blade 16 Early 2023 | |
| Razer Blade 16 Early 2023 | |
| Razer Blade 16 Early 2023 | |
| Average of class Gaming (6625 - 22104, n=112, last 2 years) | |
| Lenovo Yoga Pro 9 16-IRP G8 | |
| Asus ROG Zephyrus G16 2024 GU605M | |
| Geekbench 6.7 / Single-Core | |
| Apple MacBook Pro 16 2023 M3 Max | |
| Razer Blade 16 Early 2023 | |
| Razer Blade 16 Early 2023 | |
| Razer Blade 16 Early 2023 | |
| Average of class Gaming (1490 - 3259, n=112, last 2 years) | |
| Lenovo Yoga Pro 9 16-IRP G8 | |
| Asus ROG Zephyrus G16 2024 GU605M | |
| HWBOT x265 Benchmark v2.2 / 4k Preset | |
| Razer Blade 16 Early 2023 | |
| Average of class Gaming (11.5 - 44.3, n=111, last 2 years) | |
| Lenovo Yoga Pro 9 16-IRP G8 | |
| Gigabyte AERO 16 OLED BSF | |
| Asus ROG Zephyrus G16 2024 GU605M | |
| MSI Stealth 16 Studio A13VG | |
| Schenker VISION 16 Pro (M23) | |
| LibreOffice / 20 Documents To PDF | |
| Gigabyte AERO 16 OLED BSF | |
| MSI Stealth 16 Studio A13VG | |
| Asus ROG Zephyrus G16 2024 GU605M | |
| Average of class Gaming (19 - 88.8, n=111, last 2 years) | |
| Lenovo Yoga Pro 9 16-IRP G8 | |
| Schenker VISION 16 Pro (M23) | |
| Razer Blade 16 Early 2023 | |
| R Benchmark 2.5 / Overall mean | |
| Gigabyte AERO 16 OLED BSF | |
| Asus ROG Zephyrus G16 2024 GU605M | |
| Lenovo Yoga Pro 9 16-IRP G8 | |
| MSI Stealth 16 Studio A13VG | |
| Schenker VISION 16 Pro (M23) | |
| Average of class Gaming (0.3439 - 0.759, n=112, last 2 years) | |
| Razer Blade 16 Early 2023 | |
* ... smaller is better
AIDA64: FP32 Ray-Trace | FPU Julia | CPU SHA3 | CPU Queen | FPU SinJulia | FPU Mandel | CPU AES | CPU ZLib | FP64 Ray-Trace | CPU PhotoWorxx
| Performance rating | |
| Average of class Gaming | |
| Razer Blade 16 Early 2023 | |
| Gigabyte AERO 16 OLED BSF | |
| Lenovo Yoga Pro 9 16-IRP G8 | |
| MSI Stealth 16 Studio A13VG | |
| Asus ROG Zephyrus G16 2024 GU605M | |
| Schenker VISION 16 Pro (M23) | |
| Average Intel Core Ultra 7 155H | |
| AIDA64 / FP32 Ray-Trace | |
| Average of class Gaming (10227 - 85542, n=110, last 2 years) | |
| Razer Blade 16 Early 2023 | |
| Razer Blade 16 Early 2023 | |
| Razer Blade 16 Early 2023 | |
| Gigabyte AERO 16 OLED BSF | |
| MSI Stealth 16 Studio A13VG | |
| Lenovo Yoga Pro 9 16-IRP G8 | |
| Asus ROG Zephyrus G16 2024 GU605M | |
| Schenker VISION 16 Pro (M23) | |
| Average Intel Core Ultra 7 155H (6670 - 18470, n=50) | |
| AIDA64 / FPU Julia | |
| Average of class Gaming (51376 - 238426, n=110, last 2 years) | |
| Razer Blade 16 Early 2023 | |
| Razer Blade 16 Early 2023 | |
| Razer Blade 16 Early 2023 | |
| Lenovo Yoga Pro 9 16-IRP G8 | |
| Gigabyte AERO 16 OLED BSF | |
| Asus ROG Zephyrus G16 2024 GU605M | |
| MSI Stealth 16 Studio A13VG | |
| Schenker VISION 16 Pro (M23) | |
| Average Intel Core Ultra 7 155H (40905 - 93181, n=50) | |
| AIDA64 / CPU SHA3 | |
| Razer Blade 16 Early 2023 | |
| Razer Blade 16 Early 2023 | |
| Razer Blade 16 Early 2023 | |
| Average of class Gaming (2180 - 9817, n=110, last 2 years) | |
| Lenovo Yoga Pro 9 16-IRP G8 | |
| Gigabyte AERO 16 OLED BSF | |
| MSI Stealth 16 Studio A13VG | |
| Asus ROG Zephyrus G16 2024 GU605M | |
| Average Intel Core Ultra 7 155H (1940 - 4436, n=50) | |
| Schenker VISION 16 Pro (M23) | |
| AIDA64 / CPU Queen | |
| Razer Blade 16 Early 2023 | |
| Razer Blade 16 Early 2023 | |
| Average of class Gaming (49785 - 173351, n=101, last 2 years) | |
| Lenovo Yoga Pro 9 16-IRP G8 | |
| MSI Stealth 16 Studio A13VG | |
| Schenker VISION 16 Pro (M23) | |
| Gigabyte AERO 16 OLED BSF | |
| Asus ROG Zephyrus G16 2024 GU605M | |
| Average Intel Core Ultra 7 155H (64698 - 94181, n=50) | |
| AIDA64 / FPU SinJulia | |
| Razer Blade 16 Early 2023 | |
| Razer Blade 16 Early 2023 | |
| Razer Blade 16 Early 2023 | |
| Average of class Gaming (4424 - 33636, n=110, last 2 years) | |
| Lenovo Yoga Pro 9 16-IRP G8 | |
| MSI Stealth 16 Studio A13VG | |
| Asus ROG Zephyrus G16 2024 GU605M | |
| Gigabyte AERO 16 OLED BSF | |
| Average Intel Core Ultra 7 155H (5639 - 10647, n=50) | |
| Schenker VISION 16 Pro (M23) | |
| AIDA64 / FPU Mandel | |
| Average of class Gaming (25115 - 128721, n=110, last 2 years) | |
| Razer Blade 16 Early 2023 | |
| Razer Blade 16 Early 2023 | |
| Razer Blade 16 Early 2023 | |
| Gigabyte AERO 16 OLED BSF | |
| MSI Stealth 16 Studio A13VG | |
| Lenovo Yoga Pro 9 16-IRP G8 | |
| Asus ROG Zephyrus G16 2024 GU605M | |
| Average Intel Core Ultra 7 155H (18236 - 47685, n=50) | |
| Schenker VISION 16 Pro (M23) | |
| AIDA64 / CPU AES | |
| Razer Blade 16 Early 2023 | |
| Razer Blade 16 Early 2023 | |
| Razer Blade 16 Early 2023 | |
| Gigabyte AERO 16 OLED BSF | |
| Average of class Gaming (39258 - 247074, n=110, last 2 years) | |
| Lenovo Yoga Pro 9 16-IRP G8 | |
| MSI Stealth 16 Studio A13VG | |
| Asus ROG Zephyrus G16 2024 GU605M | |
| Average Intel Core Ultra 7 155H (45713 - 152179, n=50) | |
| Schenker VISION 16 Pro (M23) | |
| AIDA64 / CPU ZLib | |
| Razer Blade 16 Early 2023 | |
| Razer Blade 16 Early 2023 | |
| Razer Blade 16 Early 2023 | |
| Average of class Gaming (574 - 2531, n=110, last 2 years) | |
| Lenovo Yoga Pro 9 16-IRP G8 | |
| Gigabyte AERO 16 OLED BSF | |
| Asus ROG Zephyrus G16 2024 GU605M | |
| MSI Stealth 16 Studio A13VG | |
| Average Intel Core Ultra 7 155H (557 - 1250, n=50) | |
| Schenker VISION 16 Pro (M23) | |
| AIDA64 / FP64 Ray-Trace | |
| Average of class Gaming (5509 - 45446, n=110, last 2 years) | |
| Razer Blade 16 Early 2023 | |
| Razer Blade 16 Early 2023 | |
| Razer Blade 16 Early 2023 | |
| Gigabyte AERO 16 OLED BSF | |
| MSI Stealth 16 Studio A13VG | |
| Lenovo Yoga Pro 9 16-IRP G8 | |
| Asus ROG Zephyrus G16 2024 GU605M | |
| Schenker VISION 16 Pro (M23) | |
| Average Intel Core Ultra 7 155H (3569 - 9802, n=50) | |
| AIDA64 / CPU PhotoWorxx | |
| Lenovo Yoga Pro 9 16-IRP G8 | |
| Razer Blade 16 Early 2023 | |
| Razer Blade 16 Early 2023 | |
| Razer Blade 16 Early 2023 | |
| Asus ROG Zephyrus G16 2024 GU605M | |
| Average Intel Core Ultra 7 155H (32719 - 54223, n=50) | |
| MSI Stealth 16 Studio A13VG | |
| Gigabyte AERO 16 OLED BSF | |
| Schenker VISION 16 Pro (M23) | |
| Average of class Gaming (12271 - 89891, n=110, last 2 years) | |
System performance
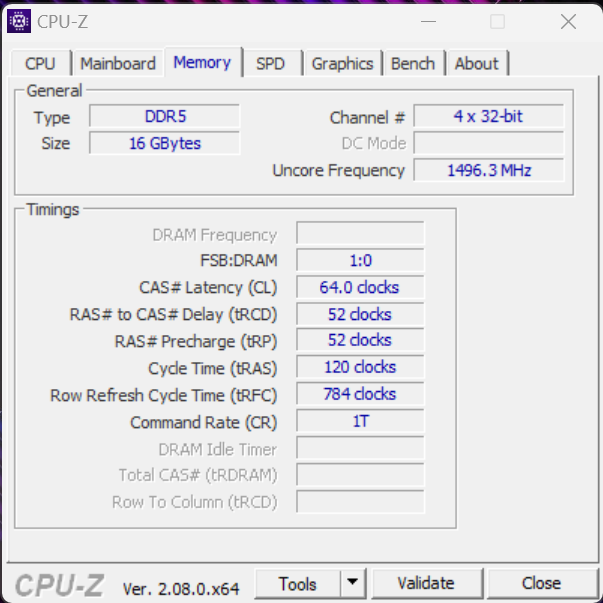
Subjectively, the laptop performs well—only during graphics switching (e.g. booting up games) does it hang slightly during the MUX switch, but this is completely normal. The competition achieved more points in the synthetic tests, however, you won't likely notice the difference in everyday use. Its memory benchmark results were excellent, but its RAM can't be expanded and 16 GB on a high-end device is simply not enough. All models should have 32 GB as standard.
CrossMark: Overall | Productivity | Creativity | Responsiveness
WebXPRT 3: Overall
WebXPRT 4: Overall
Mozilla Kraken 1.1: Total
| PCMark 10 / Score | |
| Average of class Gaming (5828 - 11574, n=96, last 2 years) | |
| Gigabyte AERO 16 OLED BSF | |
| Razer Blade 16 Early 2023 | |
| Average Intel Core Ultra 7 155H, NVIDIA GeForce RTX 4070 Laptop GPU (7084 - 7761, n=4) | |
| Schenker VISION 16 Pro (M23) | |
| MSI Stealth 16 Studio A13VG | |
| Lenovo Yoga Pro 9 16-IRP G8 | |
| Asus ROG Zephyrus G16 2024 GU605M | |
| PCMark 10 / Essentials | |
| Gigabyte AERO 16 OLED BSF | |
| Razer Blade 16 Early 2023 | |
| Lenovo Yoga Pro 9 16-IRP G8 | |
| Schenker VISION 16 Pro (M23) | |
| Average of class Gaming (8810 - 12600, n=100, last 2 years) | |
| MSI Stealth 16 Studio A13VG | |
| Average Intel Core Ultra 7 155H, NVIDIA GeForce RTX 4070 Laptop GPU (10038 - 10393, n=4) | |
| Asus ROG Zephyrus G16 2024 GU605M | |
| PCMark 10 / Productivity | |
| Average of class Gaming (6845 - 18766, n=98, last 2 years) | |
| Schenker VISION 16 Pro (M23) | |
| MSI Stealth 16 Studio A13VG | |
| Average Intel Core Ultra 7 155H, NVIDIA GeForce RTX 4070 Laptop GPU (9192 - 9518, n=4) | |
| Gigabyte AERO 16 OLED BSF | |
| Asus ROG Zephyrus G16 2024 GU605M | |
| Lenovo Yoga Pro 9 16-IRP G8 | |
| Razer Blade 16 Early 2023 | |
| PCMark 10 / Digital Content Creation | |
| Razer Blade 16 Early 2023 | |
| Average of class Gaming (7602 - 19657, n=98, last 2 years) | |
| Gigabyte AERO 16 OLED BSF | |
| Average Intel Core Ultra 7 155H, NVIDIA GeForce RTX 4070 Laptop GPU (10100 - 13035, n=4) | |
| MSI Stealth 16 Studio A13VG | |
| Lenovo Yoga Pro 9 16-IRP G8 | |
| Schenker VISION 16 Pro (M23) | |
| Asus ROG Zephyrus G16 2024 GU605M | |
| CrossMark / Overall | |
| Apple MacBook Pro 16 2023 M3 Max | |
| Average of class Gaming (1366 - 2409, n=98, last 2 years) | |
| Schenker VISION 16 Pro (M23) | |
| Gigabyte AERO 16 OLED BSF | |
| Lenovo Yoga Pro 9 16-IRP G8 | |
| MSI Stealth 16 Studio A13VG | |
| Average Intel Core Ultra 7 155H, NVIDIA GeForce RTX 4070 Laptop GPU (1687 - 1848, n=4) | |
| Asus ROG Zephyrus G16 2024 GU605M | |
| Razer Blade 16 Early 2023 | |
| CrossMark / Productivity | |
| Average of class Gaming (1386 - 2254, n=98, last 2 years) | |
| Apple MacBook Pro 16 2023 M3 Max | |
| Schenker VISION 16 Pro (M23) | |
| Gigabyte AERO 16 OLED BSF | |
| MSI Stealth 16 Studio A13VG | |
| Lenovo Yoga Pro 9 16-IRP G8 | |
| Average Intel Core Ultra 7 155H, NVIDIA GeForce RTX 4070 Laptop GPU (1589 - 1750, n=4) | |
| Asus ROG Zephyrus G16 2024 GU605M | |
| Razer Blade 16 Early 2023 | |
| CrossMark / Creativity | |
| Apple MacBook Pro 16 2023 M3 Max | |
| Average of class Gaming (1343 - 2729, n=98, last 2 years) | |
| Lenovo Yoga Pro 9 16-IRP G8 | |
| Schenker VISION 16 Pro (M23) | |
| Gigabyte AERO 16 OLED BSF | |
| Asus ROG Zephyrus G16 2024 GU605M | |
| MSI Stealth 16 Studio A13VG | |
| Average Intel Core Ultra 7 155H, NVIDIA GeForce RTX 4070 Laptop GPU (1860 - 2014, n=4) | |
| Razer Blade 16 Early 2023 | |
| CrossMark / Responsiveness | |
| Gigabyte AERO 16 OLED BSF | |
| Schenker VISION 16 Pro (M23) | |
| Average of class Gaming (1226 - 2334, n=98, last 2 years) | |
| MSI Stealth 16 Studio A13VG | |
| Average Intel Core Ultra 7 155H, NVIDIA GeForce RTX 4070 Laptop GPU (1424 - 1683, n=4) | |
| Lenovo Yoga Pro 9 16-IRP G8 | |
| Apple MacBook Pro 16 2023 M3 Max | |
| Asus ROG Zephyrus G16 2024 GU605M | |
| Razer Blade 16 Early 2023 | |
| WebXPRT 3 / Overall | |
| Apple MacBook Pro 16 2023 M3 Max | |
| Average of class Gaming (242 - 532, n=101, last 2 years) | |
| Schenker VISION 16 Pro (M23) | |
| Lenovo Yoga Pro 9 16-IRP G8 | |
| MSI Stealth 16 Studio A13VG | |
| Asus ROG Zephyrus G16 2024 GU605M | |
| Average Intel Core Ultra 7 155H, NVIDIA GeForce RTX 4070 Laptop GPU (264 - 294, n=4) | |
| Razer Blade 16 Early 2023 | |
| Gigabyte AERO 16 OLED BSF | |
| WebXPRT 4 / Overall | |
| Average of class Gaming (176.4 - 354, n=101, last 2 years) | |
| Razer Blade 16 Early 2023 | |
| Schenker VISION 16 Pro (M23) | |
| MSI Stealth 16 Studio A13VG | |
| Lenovo Yoga Pro 9 16-IRP G8 | |
| Asus ROG Zephyrus G16 2024 GU605M | |
| Average Intel Core Ultra 7 155H, NVIDIA GeForce RTX 4070 Laptop GPU (247 - 257, n=4) | |
| Gigabyte AERO 16 OLED BSF | |
| Mozilla Kraken 1.1 / Total | |
| Gigabyte AERO 16 OLED BSF | |
| Average Intel Core Ultra 7 155H, NVIDIA GeForce RTX 4070 Laptop GPU (546 - 568, n=3) | |
| Asus ROG Zephyrus G16 2024 GU605M | |
| MSI Stealth 16 Studio A13VG | |
| Lenovo Yoga Pro 9 16-IRP G8 | |
| Schenker VISION 16 Pro (M23) | |
| Razer Blade 16 Early 2023 | |
| Average of class Gaming (391 - 590, n=106, last 2 years) | |
| Apple MacBook Pro 16 2023 M3 Max | |
* ... smaller is better
| PCMark 10 Score | 7123 points | |
Help | ||
| AIDA64 / Memory Copy | |
| Asus ROG Zephyrus G16 2024 GU605M | |
| Average Intel Core Ultra 7 155H (62397 - 96791, n=50) | |
| Razer Blade 16 Early 2023 | |
| Razer Blade 16 Early 2023 | |
| Razer Blade 16 Early 2023 | |
| Lenovo Yoga Pro 9 16-IRP G8 | |
| Average of class Gaming (21750 - 129946, n=110, last 2 years) | |
| MSI Stealth 16 Studio A13VG | |
| Gigabyte AERO 16 OLED BSF | |
| Schenker VISION 16 Pro (M23) | |
| AIDA64 / Memory Read | |
| Razer Blade 16 Early 2023 | |
| Razer Blade 16 Early 2023 | |
| Razer Blade 16 Early 2023 | |
| Asus ROG Zephyrus G16 2024 GU605M | |
| Average Intel Core Ultra 7 155H (60544 - 90647, n=50) | |
| Lenovo Yoga Pro 9 16-IRP G8 | |
| Average of class Gaming (22956 - 118858, n=110, last 2 years) | |
| MSI Stealth 16 Studio A13VG | |
| Schenker VISION 16 Pro (M23) | |
| Gigabyte AERO 16 OLED BSF | |
| AIDA64 / Memory Write | |
| Lenovo Yoga Pro 9 16-IRP G8 | |
| Razer Blade 16 Early 2023 | |
| Razer Blade 16 Early 2023 | |
| Razer Blade 16 Early 2023 | |
| Average of class Gaming (22297 - 135096, n=110, last 2 years) | |
| Asus ROG Zephyrus G16 2024 GU605M | |
| Average Intel Core Ultra 7 155H (58692 - 93451, n=50) | |
| MSI Stealth 16 Studio A13VG | |
| Gigabyte AERO 16 OLED BSF | |
| Schenker VISION 16 Pro (M23) | |
| AIDA64 / Memory Latency | |
| Average Intel Core Ultra 7 155H (116.2 - 233, n=50) | |
| Asus ROG Zephyrus G16 2024 GU605M | |
| Lenovo Yoga Pro 9 16-IRP G8 | |
| Average of class Gaming (75.3 - 259, n=110, last 2 years) | |
| Razer Blade 16 Early 2023 | |
| Razer Blade 16 Early 2023 | |
| Razer Blade 16 Early 2023 | |
| Gigabyte AERO 16 OLED BSF | |
| MSI Stealth 16 Studio A13VG | |
| Schenker VISION 16 Pro (M23) | |
* ... smaller is better
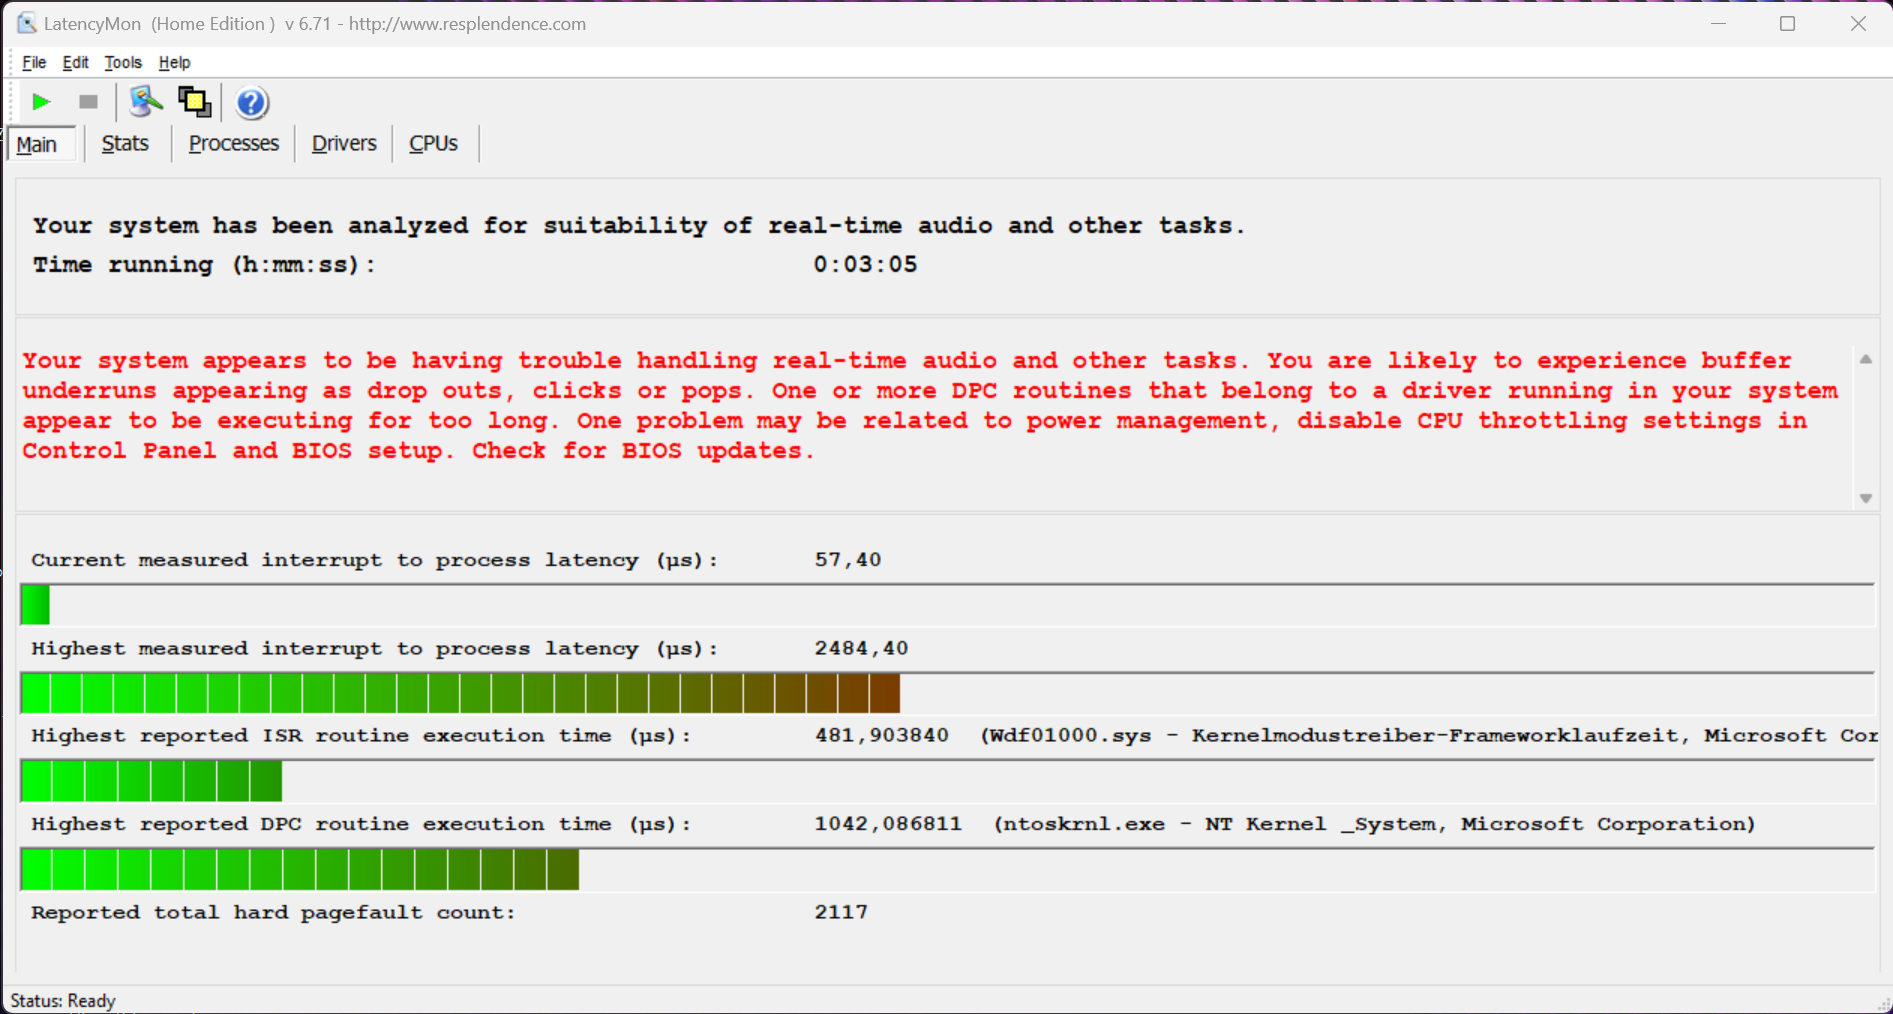
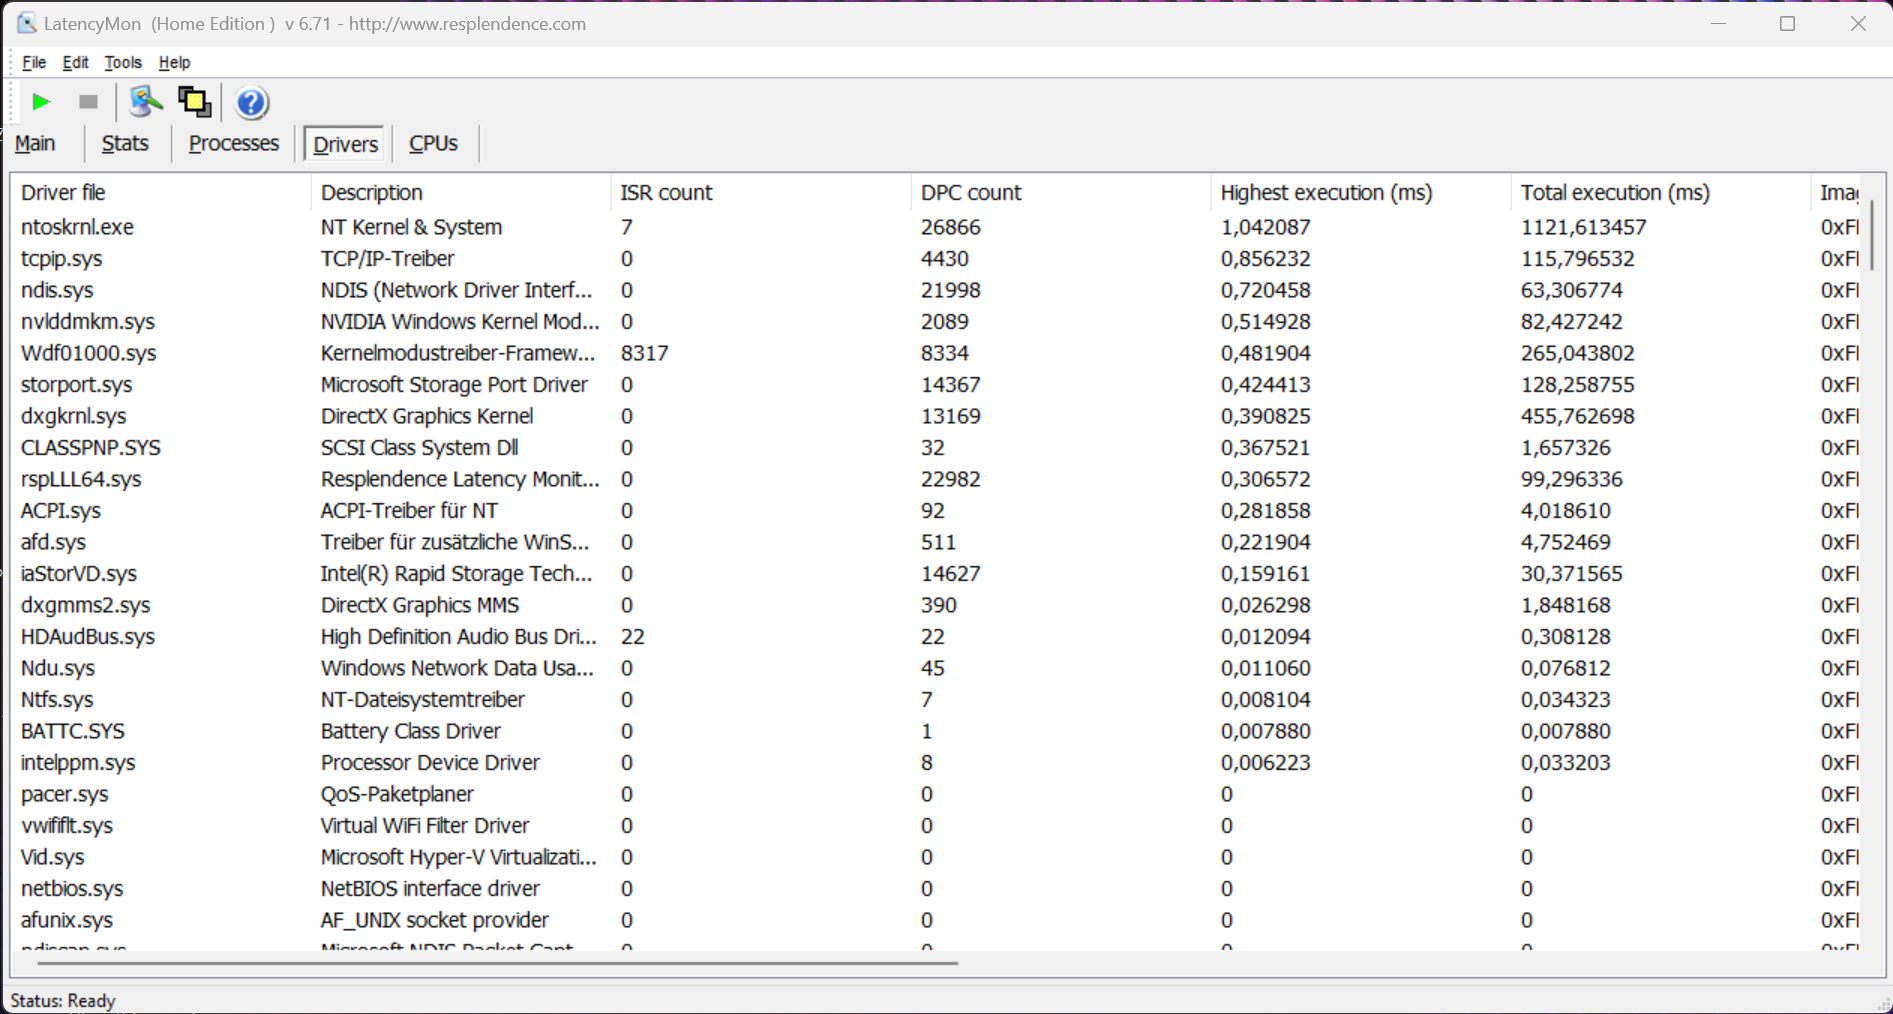
DPC latency
In our standardized latency test (surfing the web, 4K YouTube playback, CPU load), the test device with the current BIOS version showed slight limitations when using real-time audio applications.
| DPC Latencies / LatencyMon - interrupt to process latency (max), Web, Youtube, Prime95 | |
| MSI Stealth 16 Studio A13VG | |
| Lenovo Yoga Pro 9 16-IRP G8 | |
| Asus ROG Zephyrus G16 2024 GU605M | |
| Razer Blade 16 Early 2023 | |
| Gigabyte AERO 16 OLED BSF | |
| Schenker VISION 16 Pro (M23) | |
* ... smaller is better
Storage devices
The new G16 has two M.2-2280 slots which are connected via PCIe 4.0. The 1-TB version of the Western Digital SN560 is installed into our test device and although it delivered good transfer rates of up to 5 GB/s, it isn't one of the fastest drives on the market. At least its performance remains constant even under permanent load. Ex-works, users have 855 GB free to use. Further SSD benchmarks can be found here.

* ... smaller is better
Reading continuous performance: DiskSpd Read Loop, Queue Depth 8
Graphics card
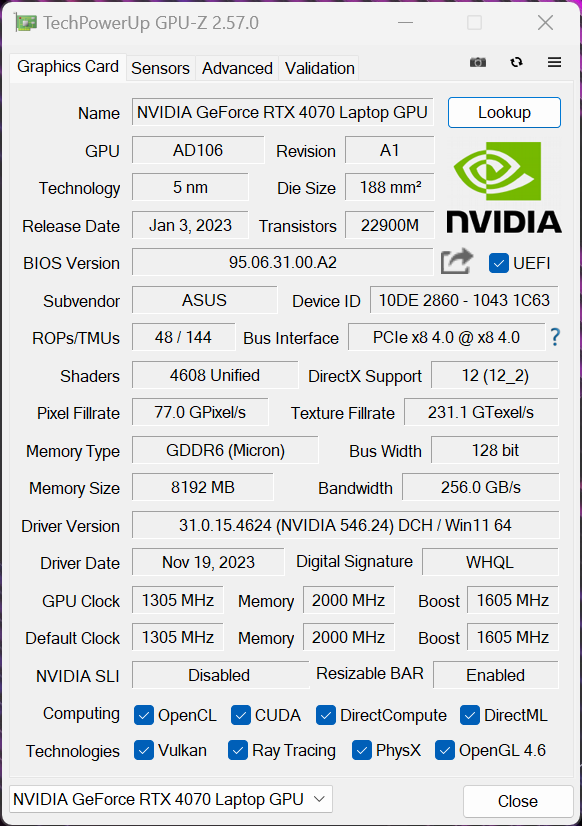
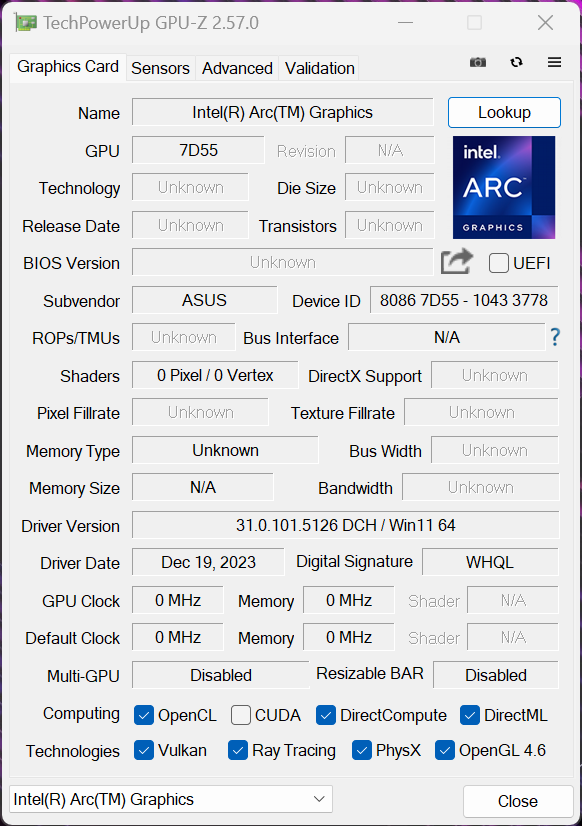
The GeForce RTX 4070 Laptop has 8 GB RAM and in performance mode, it runs at a maximum of 80 watts. In order to access its full performance of up to 105 watts, you have to select turbo mode. The Zephyrus G16 features a MUX switch with Advanced Optimus, so switching to the dGPU doesn't require you to restart the system. The new Meteor-Lake processors' Arc iGPU shows considerably improved performance compared to the old Iris Xe Graphics G7, but since the G16 has a dedicated Nvidia GPU, this isn't all too important.
Its benchmark results were okay and you could achieve a bit better performance using turbo mode (this would also close the gap to the comparison devices). Under permanent load, the GPU is only allowed to consume 42 watts, which is why the GPU performance ends up being 27 % lower. Further GPU benchmarks can be found here.
| 3DMark 11 Performance | 31273 points | |
| 3DMark Fire Strike Score | 23302 points | |
| 3DMark Time Spy Score | 10850 points | |
Help | ||
| Blender / v3.3 Classroom OPTIX/RTX | |
| Lenovo Yoga Pro 9 16-IRP G8 | |
| MSI Stealth 16 Studio A13VG | |
| Schenker VISION 16 Pro (M23) | |
| Asus ROG Zephyrus G16 2024 GU605M | |
| Average NVIDIA GeForce RTX 4070 Laptop GPU (18 - 30, n=68) | |
| Gigabyte AERO 16 OLED BSF | |
| Average of class Gaming (9 - 32, n=112, last 2 years) | |
| Razer Blade 16 Early 2023 | |
| Blender / v3.3 Classroom CUDA | |
| Lenovo Yoga Pro 9 16-IRP G8 | |
| MSI Stealth 16 Studio A13VG | |
| Schenker VISION 16 Pro (M23) | |
| Average NVIDIA GeForce RTX 4070 Laptop GPU (32 - 50, n=67) | |
| Gigabyte AERO 16 OLED BSF | |
| Asus ROG Zephyrus G16 2024 GU605M | |
| Average of class Gaming (15 - 228, n=112, last 2 years) | |
| Razer Blade 16 Early 2023 | |
| Blender / v3.3 Classroom CPU | |
| Schenker VISION 16 Pro (M23) | |
| Asus ROG Zephyrus G16 2024 GU605M | |
| Lenovo Yoga Pro 9 16-IRP G8 | |
| Gigabyte AERO 16 OLED BSF | |
| MSI Stealth 16 Studio A13VG | |
| Average NVIDIA GeForce RTX 4070 Laptop GPU (158 - 440, n=67) | |
| Average of class Gaming (122 - 565, n=108, last 2 years) | |
| Razer Blade 16 Early 2023 | |
| Apple MacBook Pro 16 2023 M3 Max | |
| Blender / v3.3 Classroom METAL | |
| Apple MacBook Pro 16 2023 M3 Max | |
* ... smaller is better
Gaming performance
Even though the new ROG Zephyrus G16 is no longer a hardcore gaming laptop, its gaming performance naturally remains a very important aspect—and the new model certainly didn't disappoint. The RTX 4070 Laptop's performance, together with that of the Meteor-Lake processor, is more than enough to run current games smoothly. In combination with the great OLED panel, this laptop offers an extraordinary gaming experience. Only extremely demanding games or ray tracing might require the use of upscaling technologies, if these are supported by the game. In addition, its gaming performance remains completely stable even during longer sessions.
| The Witcher 3 - 1920x1080 Ultra Graphics & Postprocessing (HBAO+) | |
| Razer Blade 16 Early 2023 | |
| Average of class Gaming (95 - 240, n=8, last 2 years) | |
| MSI Stealth 16 Studio A13VG | |
| Gigabyte AERO 16 OLED BSF | |
| Schenker VISION 16 Pro (M23) | |
| Asus ROG Zephyrus G16 2024 GU605M | |
| Lenovo Yoga Pro 9 16-IRP G8 | |
| Final Fantasy XV Benchmark - 1920x1080 High Quality | |
| Razer Blade 16 Early 2023 | |
| Average of class Gaming (41 - 215, n=104, last 2 years) | |
| Gigabyte AERO 16 OLED BSF | |
| MSI Stealth 16 Studio A13VG | |
| Schenker VISION 16 Pro (M23) | |
| Asus ROG Zephyrus G16 2024 GU605M | |
| Lenovo Yoga Pro 9 16-IRP G8 | |
| Call of Duty Modern Warfare 3 2023 | |
| 1920x1080 Extreme Preset | |
| Average NVIDIA GeForce RTX 4070 Laptop GPU (92 - 120, n=7) | |
| Asus ROG Zephyrus G16 2024 GU605M | |
| Average of class Gaming (27 - 95, n=3, last 2 years) | |
| 2560x1440 Extreme Preset | |
| Average NVIDIA GeForce RTX 4070 Laptop GPU (64 - 83, n=6) | |
| Asus ROG Zephyrus G16 2024 GU605M | |
| Average of class Gaming (54 - 66, n=2, last 2 years) | |
| Avatar Frontiers of Pandora | |
| 1920x1080 Ultra Preset AA:T | |
| Average of class Gaming (n=1last 2 years) | |
| Average NVIDIA GeForce RTX 4070 Laptop GPU (49 - 62, n=9) | |
| Asus ROG Zephyrus G16 2024 GU605M | |
| 2560x1440 Ultra Preset AA:T | |
| Average of class Gaming (n=1last 2 years) | |
| Average NVIDIA GeForce RTX 4070 Laptop GPU (32 - 42, n=9) | |
| Asus ROG Zephyrus G16 2024 GU605M | |
We also noted the impact the different energy modes have on several games with QHD resolution and maximum details. As you can see, there are some differences, but they are by no means huge. Even in quiet mode, you can usually still run them quite well (especially if you lower the resolution slightly or use DLSS)—in practice, you should just try out lots of different settings.
| Energy profile | Far Cry 5 | Witcher 3 | Cyberpunk 2077 | Modern Warfare 3 | Avatar | Star Wars Jedi Survivor |
|---|---|---|---|---|---|---|
| Quiet | 87 fps | 68.5 fps | 32.6 fps | 49 fps | 23 fps | 29.8 fps |
| Performance | 94 fps | 82.4 fps | 43.7 fps | 64 fps | 32 fps | 39.5 fps |
| Turbo | 105 fps | 83.9 fps | 48.7 fps | 66 fps | 34 fps | 42.5 fps |
Witcher 3 FPS diagram
| low | med. | high | ultra | QHD | |
|---|---|---|---|---|---|
| GTA V (2015) | 166.5 | 98.8 | 79.6 | ||
| The Witcher 3 (2015) | 221 | 98.6 | 82.4 | ||
| Dota 2 Reborn (2015) | 162.3 | 146.8 | 140.7 | 131.6 | |
| Final Fantasy XV Benchmark (2018) | 131.8 | 100.8 | 76.3 | ||
| X-Plane 11.11 (2018) | 119.9 | 106.3 | 81.2 | ||
| Far Cry 5 (2018) | 147 | 126 | 121 | 112 | 94 |
| Strange Brigade (2018) | 211 | 129.3 | 123.4 | ||
| F1 2021 (2021) | 294 | 270 | 220 | 123.1 | 95.2 |
| F1 22 (2022) | 192.9 | 199.7 | 168.1 | 65.6 | 44.3 |
| Star Wars Jedi Survivor (2023) | 78.7 | 69.9 | 65.1 | 61.5 | 39.5 |
| F1 23 (2023) | 195.2 | 193.8 | 165.4 | 55.8 | 36 |
| Cyberpunk 2077 (2023) | 96.4 | 90 | 77 | 69 | 43.7 |
| Call of Duty Modern Warfare 3 2023 (2023) | 143 | 130 | 101 | 94 | 64 |
| Avatar Frontiers of Pandora (2023) | 81 | 75 | 66 | 49 | 32 |
Emissions - The ROG G16 with a third fan
Noise emissions
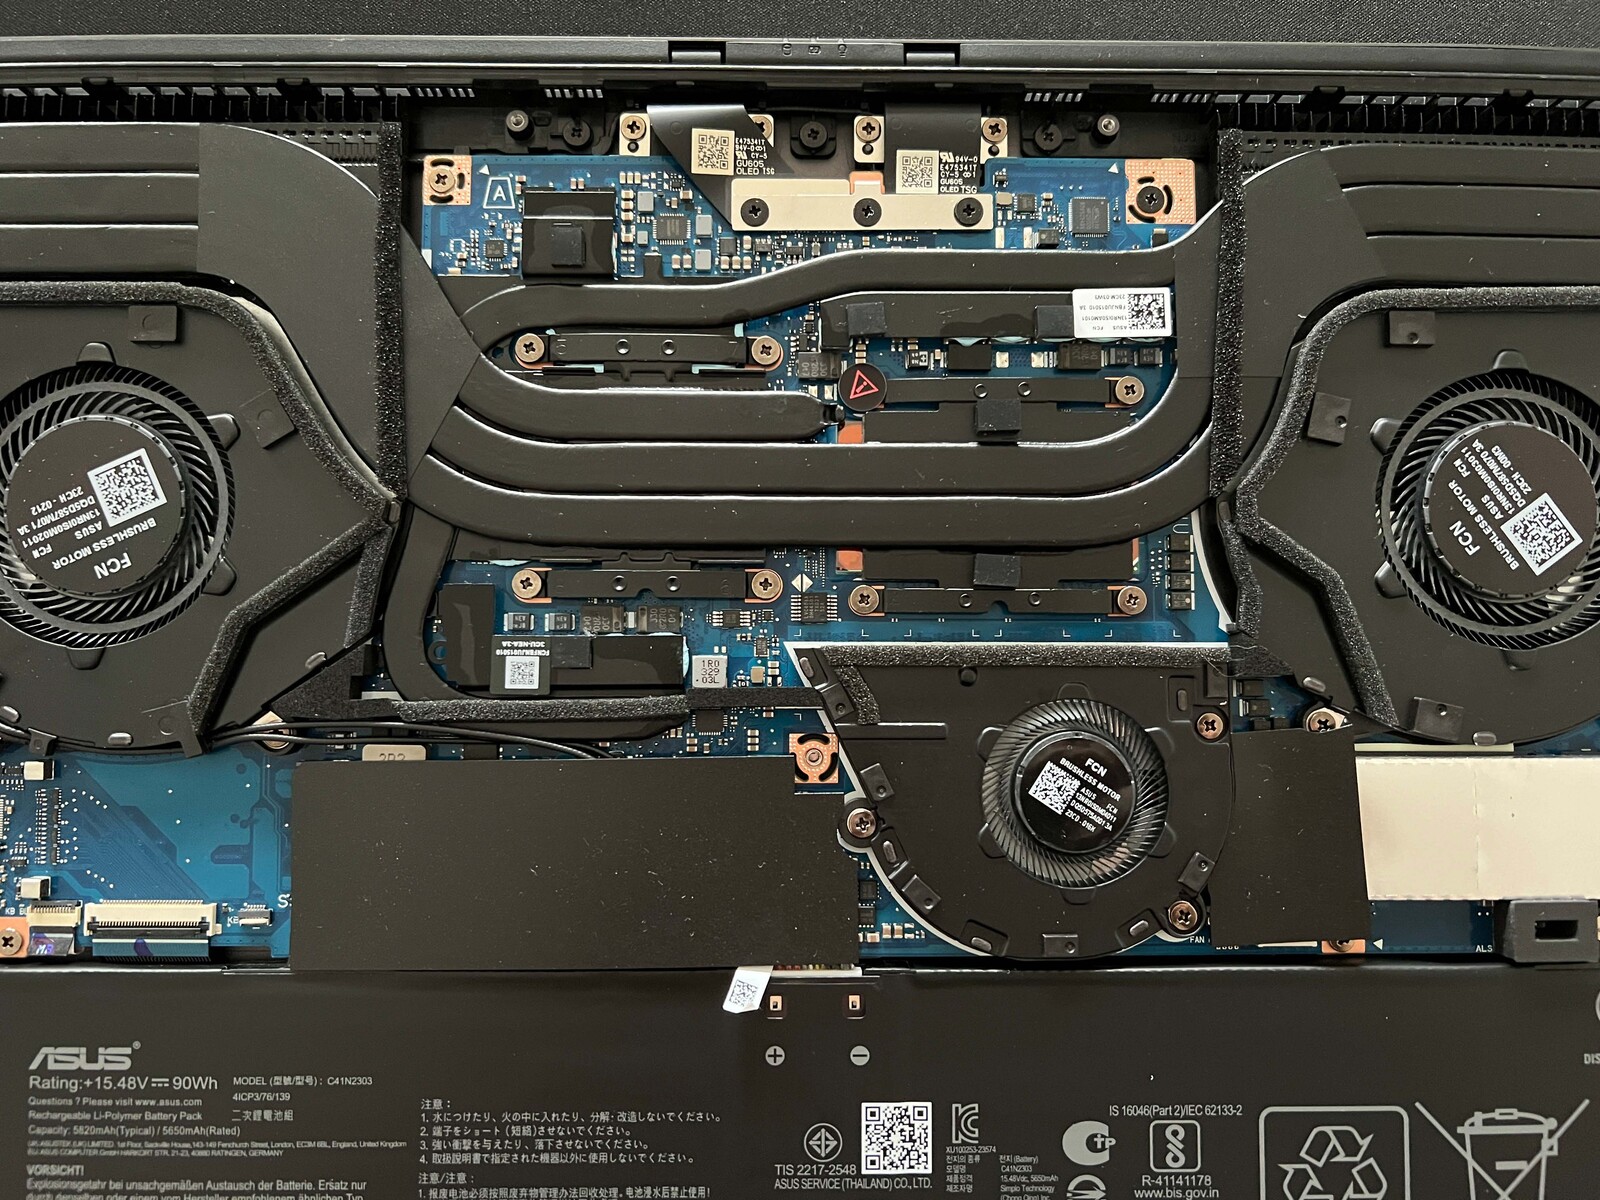
As previously mentioned, the models with the RTX 4050/4060/4070 Laptop use a conventional heat pipe cooling unit with a third case fan. This fan sucks in fresh air via the bottom and directs it toward the GPU. The problem is, however, that this small fan runs very fast with a high rotation speed, which leads to it being pretty noticeable. In general, the new Zephyrus G16 is by no means a silent laptop—even during everyday tasks—as the fans spring into action very quickly. This is even the case when using quiet mode. Under load, it very quickly hits about 46 dB(A) with performance mode in use, which is clearly audible but still tolerable. In turn, from around 48 dB(A), the fans' noise emissions get quite uncomfortable as there is an additional humming noise present, resulting in us not being able to recommend using turbo mode (max. 52.4 dB(A)). The following table shows a summary of the noise emissions using the different energy profiles. We didn't note any additional electronic noises coming from our test device. These test results are not representative of the models with the RTX 4080/4090 Laptop which use two fans including a Vapor Chamber. We will try to test one of these models as soon as possible.
| Energy profile | 3DMark 06 | Witcher 3 | Cyberpunk 2077 Phantom Liberty | Stress test |
|---|---|---|---|---|
| Quiet | 30.4 dB(A) | 38 dB(A) | 41.5 dB(A) | 41.5 dB(A) |
| Performance | 34.2 dB(A) | 46.4 dB(A) | 46.4 dB(A) | 46.4 dB(A) |
| Turbo | 41.5 dB(A) | 52.4 dB(A) | 52.4 dB(A) | 52.4 dB(A) |
Noise level
| Idle |
| 23.9 / 27.8 / 30.1 dB(A) |
| Load |
| 34.2 / 46.4 dB(A) |
 | ||
30 dB silent 40 dB(A) audible 50 dB(A) loud |
||
min: | ||
| Asus ROG Zephyrus G16 2024 GU605M GeForce RTX 4070 Laptop GPU, Ultra 7 155H, WD PC SN560 SDDPNQE-1T00 | Lenovo Yoga Pro 9 16-IRP G8 GeForce RTX 4060 Laptop GPU, i7-13705H, Samsung PM9A1 MZVL21T0HCLR | Razer Blade 16 Early 2023 GeForce RTX 4080 Laptop GPU, i9-13950HX, SSSTC CA6-8D1024 | Gigabyte AERO 16 OLED BSF GeForce RTX 4070 Laptop GPU, i9-13900H, Gigabyte AG470S1TB-SI B10 | Schenker VISION 16 Pro (M23) GeForce RTX 4070 Laptop GPU, i7-13700H, Samsung 990 Pro 1 TB | MSI Stealth 16 Studio A13VG GeForce RTX 4070 Laptop GPU, i7-13700H, Micron 3400 2TB MTFDKBA2T0TFH | Apple MacBook Pro 16 2023 M3 Max M3 Max 40-Core GPU, Apple M3 Max 16-Core, Apple SSD AP8192Z | |
|---|---|---|---|---|---|---|---|
| Noise | -5% | 2% | -11% | -12% | 4% | 5% | |
| off / environment * (dB) | 23.9 | 24.7 -3% | 23 4% | 23 4% | 25.9 -8% | 24 -0% | 23.7 1% |
| Idle Minimum * (dB) | 23.9 | 24.7 -3% | 23 4% | 23 4% | 25.9 -8% | 24 -0% | 23.7 1% |
| Idle Average * (dB) | 27.8 | 26.2 6% | 23 17% | 23 17% | 25.9 7% | 24 14% | 23.7 15% |
| Idle Maximum * (dB) | 30.1 | 26.2 13% | 23.6 22% | 33.64 -12% | 32 -6% | 24 20% | 23.7 21% |
| Load Average * (dB) | 34.2 | 39.7 -16% | 39 -14% | 51.49 -51% | 47.2 -38% | 34.81 -2% | 40.8 -19% |
| Witcher 3 ultra * (dB) | 46.4 | 53.2 -15% | 51.6 -11% | 55.27 -19% | 53.1 -14% | 44.05 5% | 42.8 8% |
| Load Maximum * (dB) | 46.4 | 53.2 -15% | 51.3 -11% | 55.24 -19% | 53.1 -14% | 51.57 -11% | 42.8 8% |
* ... smaller is better
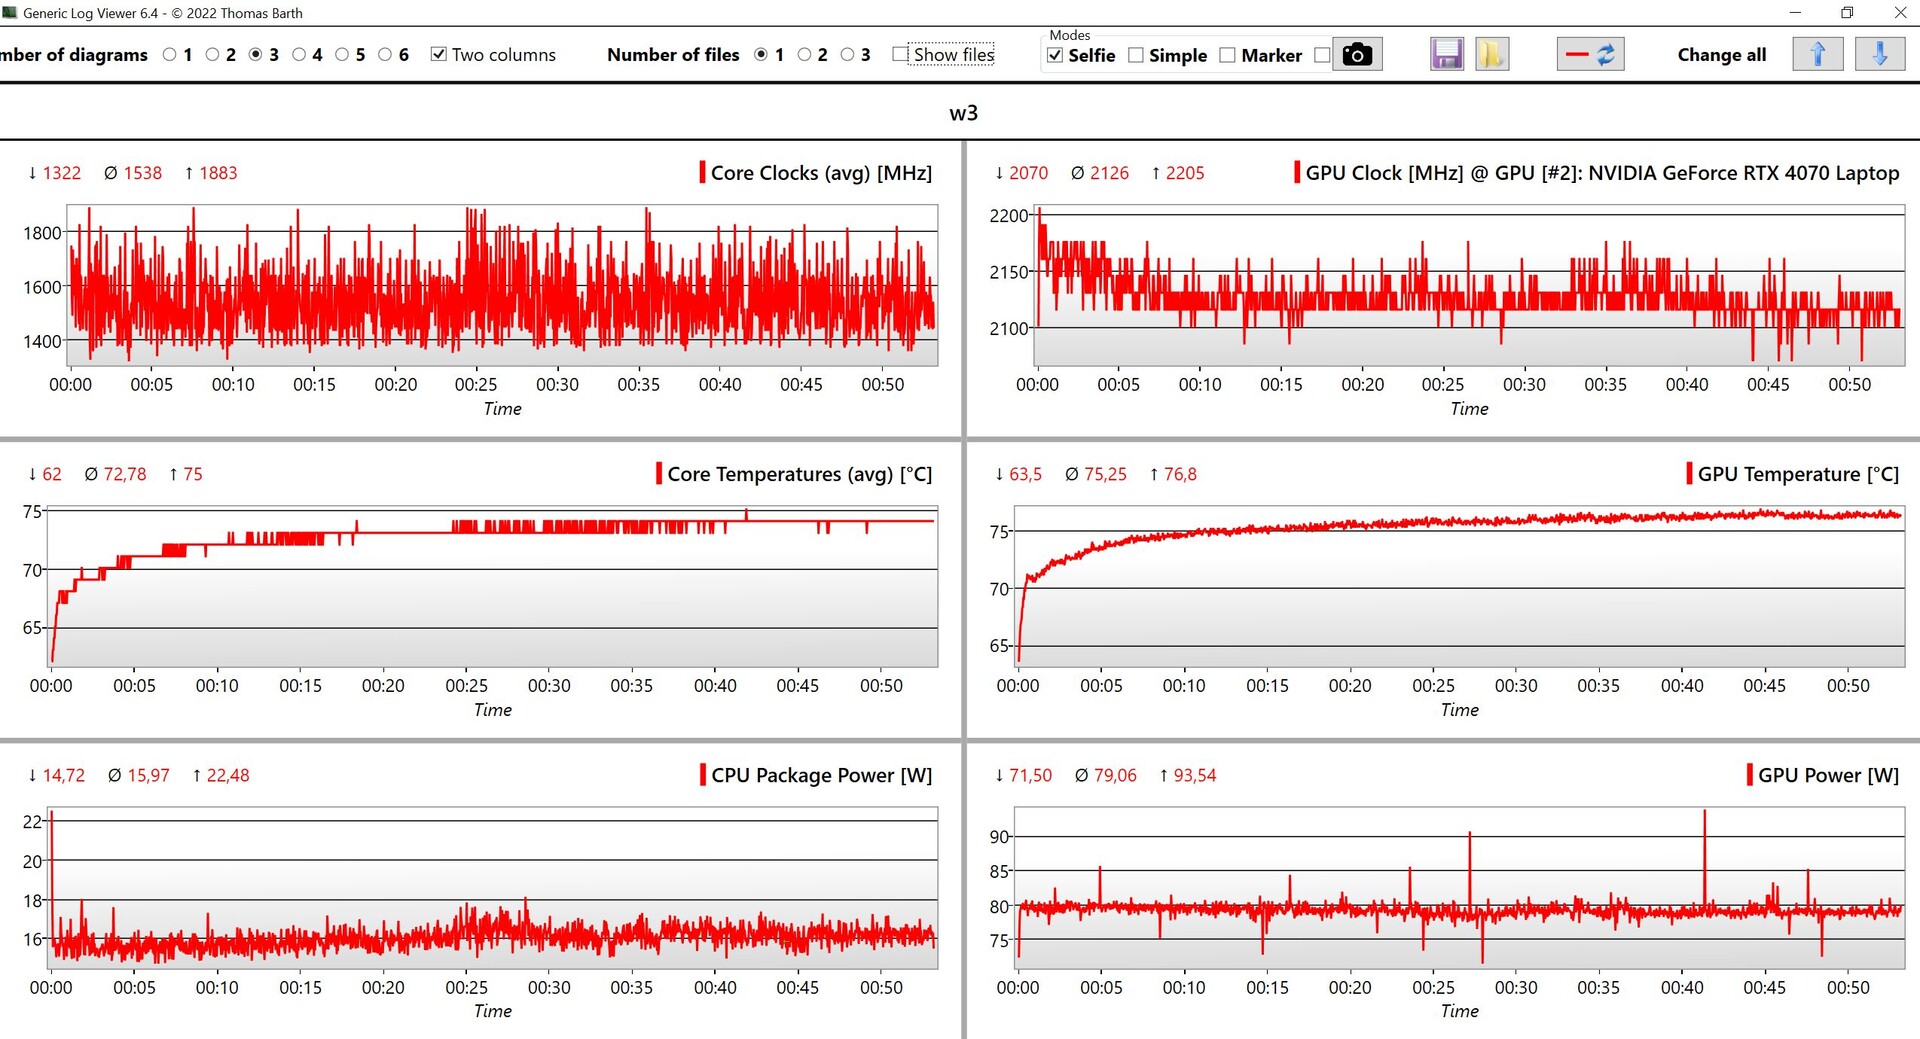
Temperature
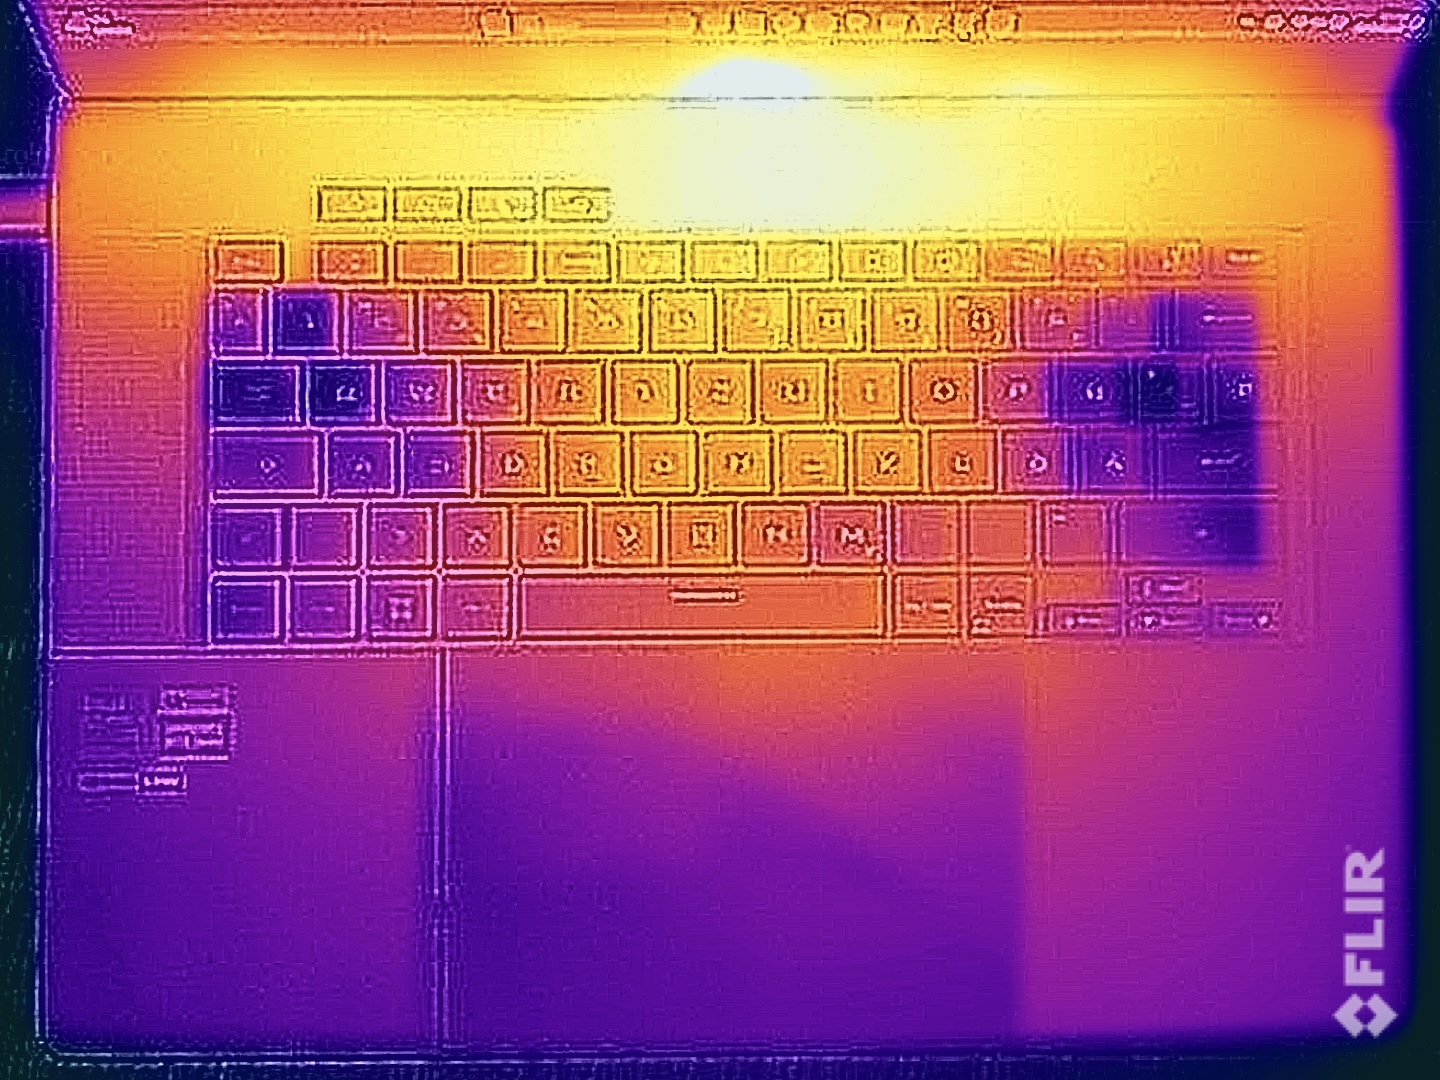
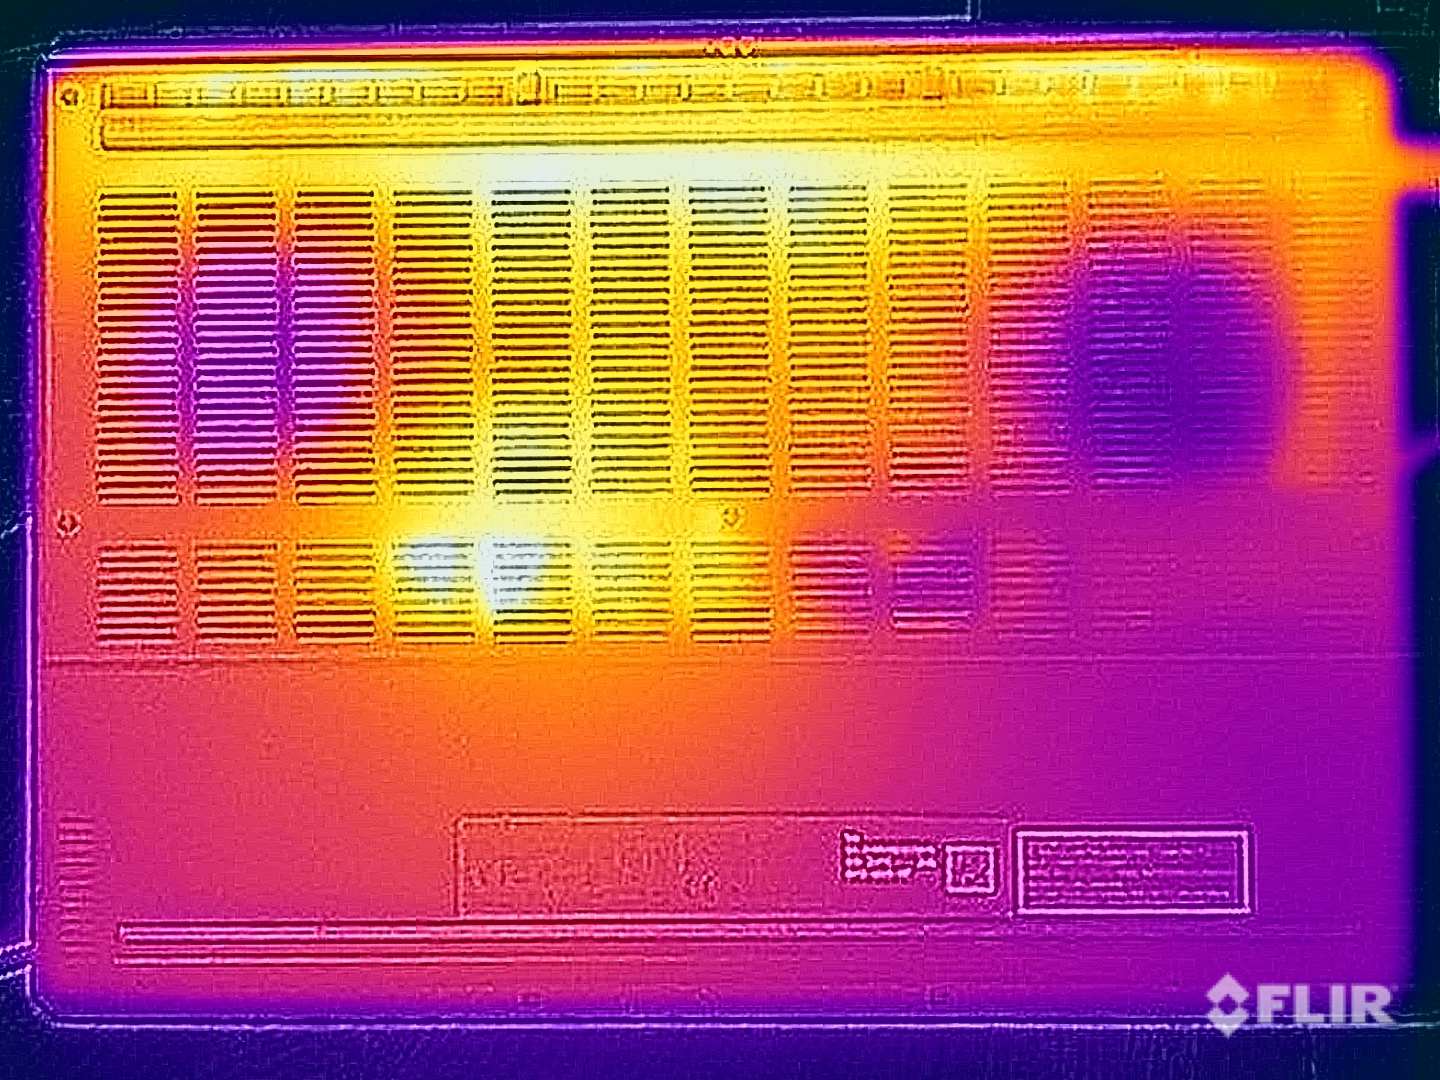
Despite its thin case, the Zephyrus G16's temperature results are good. During simple tasks, the device barely gets warm. Under load, we measured up to 50 °C on the top of the base unit, but only in the area above the keyboard. The keyboard itself remains a lot cooler and poses no limitations when operating the laptop. On the bottom, we measured temperatures between ~45-48 °C, so you shouldn't place it onto your thighs in this case.
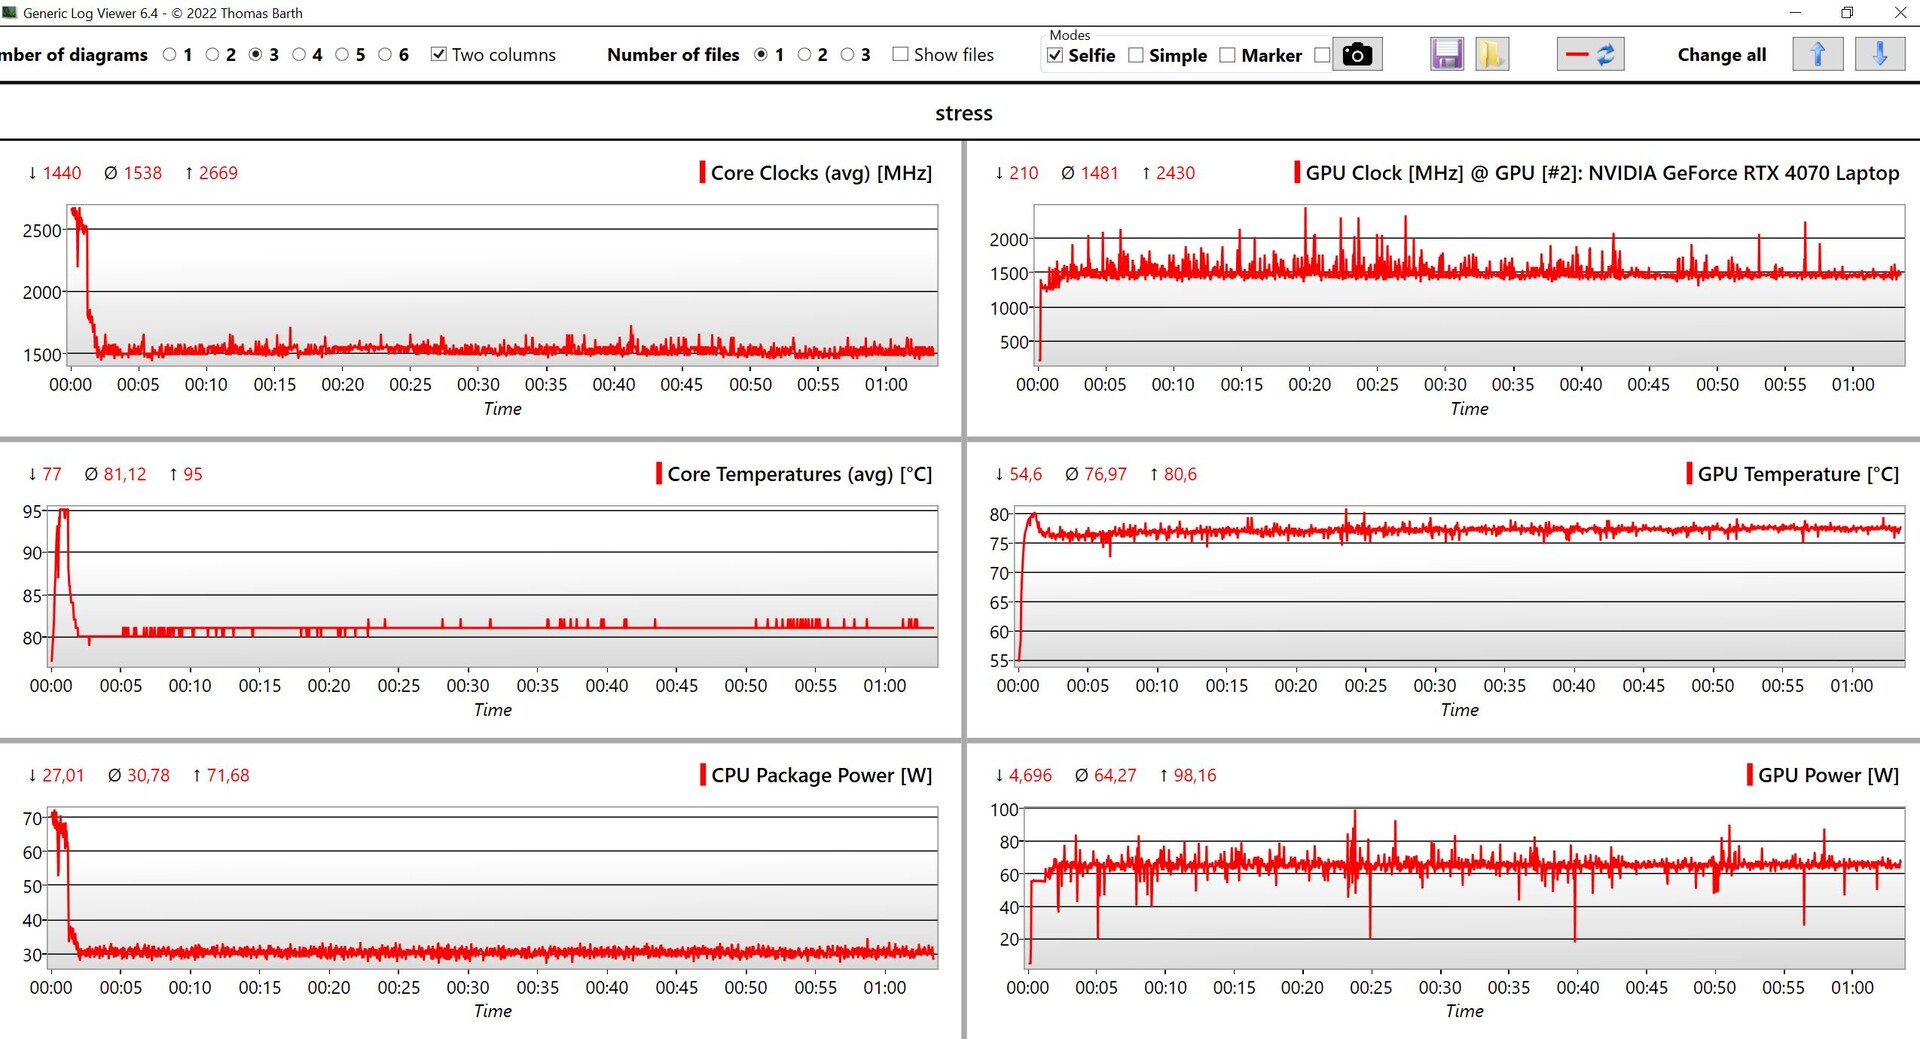
During the stress test, the CPU balanced out at 30 watts and the GPU at 65 watts, which is exactly what is stated by Asus when it comes to the profile performance. In quiet mode, we noted 30/45 watts and in turbo mode, we measured 35+85 watts.
(-) The maximum temperature on the upper side is 50.3 °C / 123 F, compared to the average of 40.4 °C / 105 F, ranging from 21.2 to 68.8 °C for the class Gaming.
(-) The bottom heats up to a maximum of 48 °C / 118 F, compared to the average of 43.2 °C / 110 F
(+) In idle usage, the average temperature for the upper side is 26.6 °C / 80 F, compared to the device average of 33.9 °C / 93 F.
(±) Playing The Witcher 3, the average temperature for the upper side is 38 °C / 100 F, compared to the device average of 33.9 °C / 93 F.
(+) The palmrests and touchpad are reaching skin temperature as a maximum (32.4 °C / 90.3 F) and are therefore not hot.
(-) The average temperature of the palmrest area of similar devices was 28.8 °C / 83.8 F (-3.6 °C / -6.5 F).
| Asus ROG Zephyrus G16 2024 GU605M Intel Core Ultra 7 155H, NVIDIA GeForce RTX 4070 Laptop GPU | Lenovo Yoga Pro 9 16-IRP G8 Intel Core i7-13705H, NVIDIA GeForce RTX 4060 Laptop GPU | Razer Blade 16 Early 2023 Intel Core i9-13950HX, NVIDIA GeForce RTX 4080 Laptop GPU | Gigabyte AERO 16 OLED BSF Intel Core i9-13900H, NVIDIA GeForce RTX 4070 Laptop GPU | Schenker VISION 16 Pro (M23) Intel Core i7-13700H, NVIDIA GeForce RTX 4070 Laptop GPU | MSI Stealth 16 Studio A13VG Intel Core i7-13700H, NVIDIA GeForce RTX 4070 Laptop GPU | Apple MacBook Pro 16 2023 M3 Max Apple M3 Max 16-Core, Apple M3 Max 40-Core GPU | |
|---|---|---|---|---|---|---|---|
| Heat | 7% | 6% | 16% | 3% | -27% | 18% | |
| Maximum Upper Side * (°C) | 50.3 | 41.6 17% | 40 20% | 41 18% | 46.7 7% | 60 -19% | 42.3 16% |
| Maximum Bottom * (°C) | 48 | 50 -4% | 37.6 22% | 47 2% | 54.1 -13% | 61 -27% | 42 12% |
| Idle Upper Side * (°C) | 28.8 | 26.8 7% | 32.4 -13% | 23 20% | 26.5 8% | 38.2 -33% | 22.5 22% |
| Idle Bottom * (°C) | 29.8 | 27.9 6% | 31.4 -5% | 23 23% | 26.8 10% | 37.7 -27% | 22.9 23% |
* ... smaller is better
Speakers
Asus has installed a sound system with 6 modules (4x woofers at 2 watts each + 2x tweeters at 2 watts each) into the ROG Zephyrus G16. The results are great and about on the same level as the MacBook Pro 16 which is currently still the one to beat. Multimedia competitors such as the excellent Lenovo Yoga Pro 9 16 can also be beaten by Asus when it comes to this. The sound is very powerful and spatial, and the modules can get very loud without distorting too much. This means that even using performance mode, you can easily still play sound through the speakers. All-in-all, an outstanding performance.
Asus ROG Zephyrus G16 2024 GU605M audio analysis
(+) | speakers can play relatively loud (83.3 dB)
Bass 100 - 315 Hz
(+) | good bass - only 3.8% away from median
(±) | linearity of bass is average (8.1% delta to prev. frequency)
Mids 400 - 2000 Hz
(+) | balanced mids - only 3.5% away from median
(+) | mids are linear (2.4% delta to prev. frequency)
Highs 2 - 16 kHz
(+) | balanced highs - only 2.2% away from median
(+) | highs are linear (3.7% delta to prev. frequency)
Overall 100 - 16.000 Hz
(+) | overall sound is linear (7.3% difference to median)
Compared to same class
» 1% of all tested devices in this class were better, 0% similar, 99% worse
» The best had a delta of 6%, average was 18%, worst was 132%
Compared to all devices tested
» 1% of all tested devices were better, 0% similar, 99% worse
» The best had a delta of 4%, average was 24%, worst was 134%
Lenovo Yoga Pro 9 16-IRP G8 audio analysis
(±) | speaker loudness is average but good (80.5 dB)
Bass 100 - 315 Hz
(+) | good bass - only 4.9% away from median
(±) | linearity of bass is average (9.1% delta to prev. frequency)
Mids 400 - 2000 Hz
(+) | balanced mids - only 3.2% away from median
(+) | mids are linear (6.5% delta to prev. frequency)
Highs 2 - 16 kHz
(+) | balanced highs - only 2.9% away from median
(+) | highs are linear (3% delta to prev. frequency)
Overall 100 - 16.000 Hz
(+) | overall sound is linear (8.4% difference to median)
Compared to same class
» 9% of all tested devices in this class were better, 2% similar, 89% worse
» The best had a delta of 5%, average was 17%, worst was 45%
Compared to all devices tested
» 2% of all tested devices were better, 1% similar, 97% worse
» The best had a delta of 4%, average was 24%, worst was 134%
Apple MacBook Pro 16 2023 M3 Max audio analysis
(+) | speakers can play relatively loud (84.3 dB)
Bass 100 - 315 Hz
(±) | reduced bass - on average 5% lower than median
(+) | bass is linear (5.6% delta to prev. frequency)
Mids 400 - 2000 Hz
(+) | balanced mids - only 1.2% away from median
(+) | mids are linear (3.1% delta to prev. frequency)
Highs 2 - 16 kHz
(+) | balanced highs - only 2.4% away from median
(+) | highs are linear (2.4% delta to prev. frequency)
Overall 100 - 16.000 Hz
(+) | overall sound is linear (5.3% difference to median)
Compared to same class
» 1% of all tested devices in this class were better, 1% similar, 98% worse
» The best had a delta of 5%, average was 17%, worst was 45%
Compared to all devices tested
» 0% of all tested devices were better, 0% similar, 100% worse
» The best had a delta of 4%, average was 24%, worst was 134%
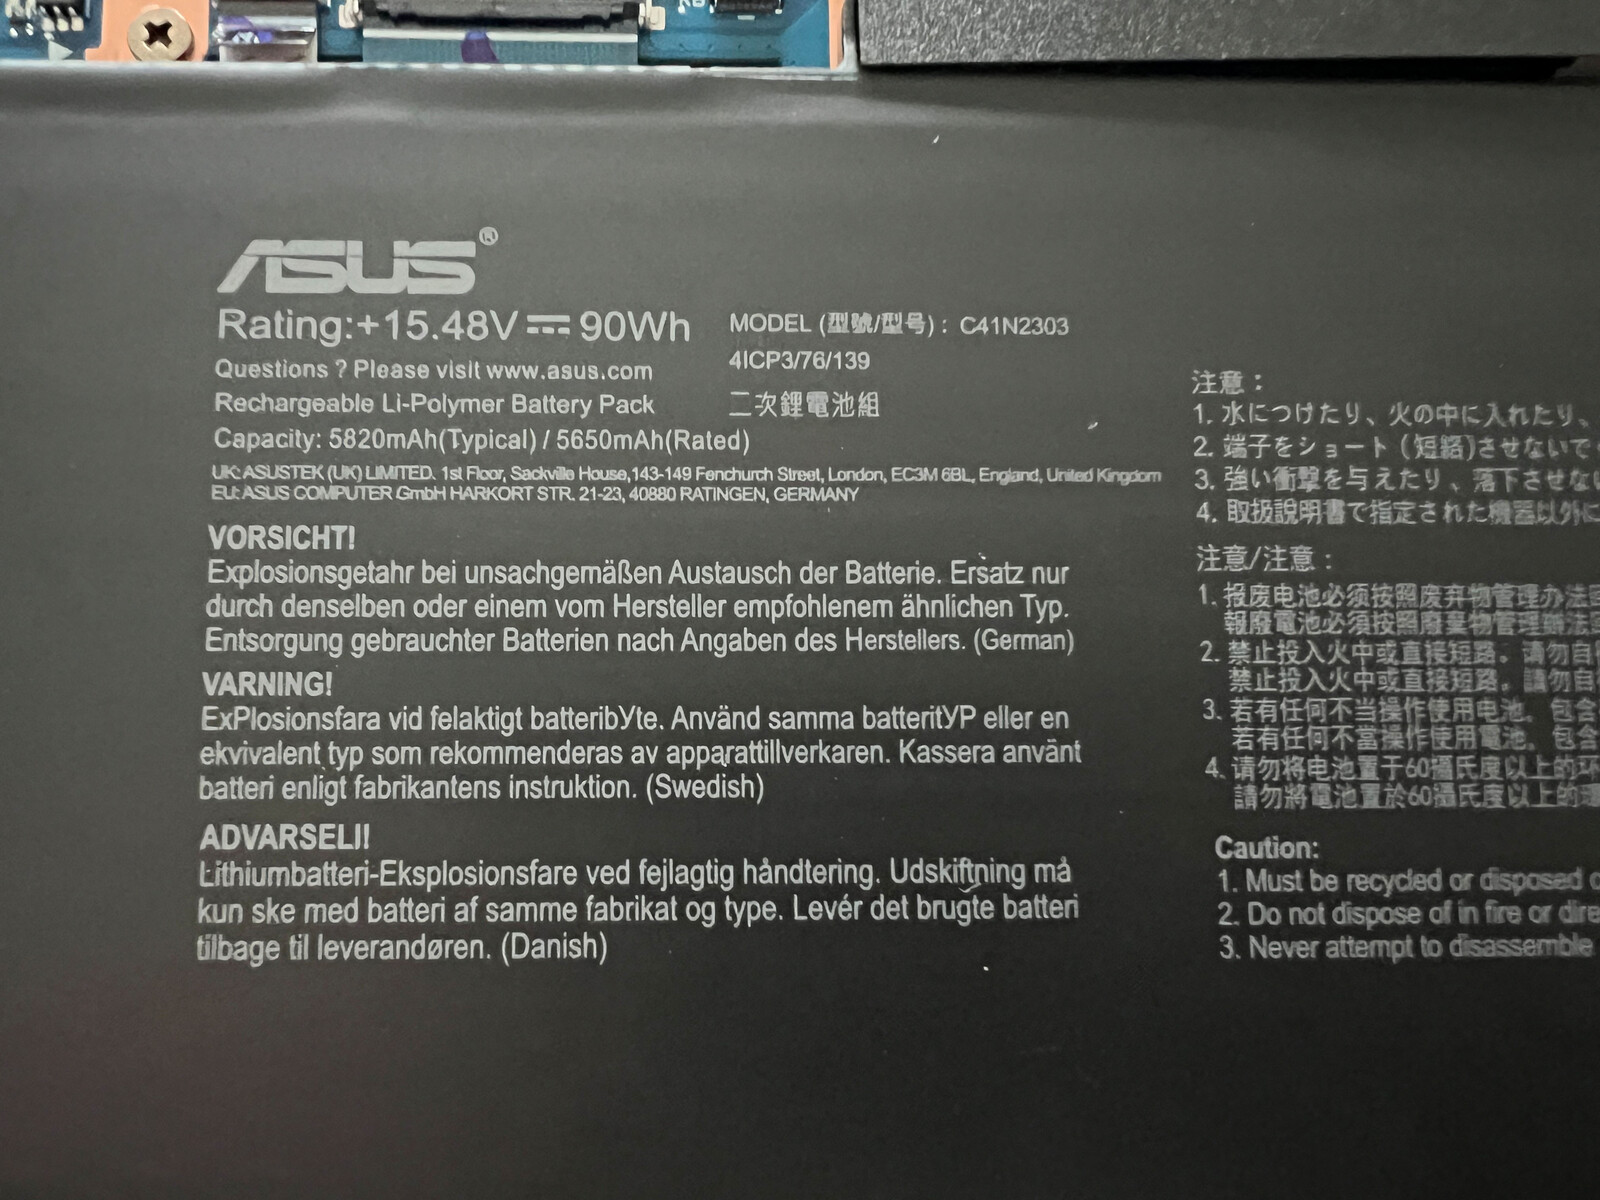
Power management - A 90-Wh battery leads to decent runtimes
Power consumption
The laptop's power consumption measurements are less of a surprise, although the test device benefitted massively from its dark standard wallpaper during the idle measurements in particular. As is typical for OLED displays, consumption varies depending on which content is depicted, with light images using up more power. While gaming, we noted 120 watts and during the stress test, it hit 170 watts for a short period of time—this then balanced out quickly at 165 watts. As a result, we can safely say that the 200-watt power supply is more than powerful enough; configurations with the RTX 4080/4090 Laptop come delivered with a more powerful 240-watt power supply.
| Off / Standby | |
| Idle | |
| Load |
|
Key:
min: | |
| Asus ROG Zephyrus G16 2024 GU605M Ultra 7 155H, GeForce RTX 4070 Laptop GPU, WD PC SN560 SDDPNQE-1T00, OLED, 2560x1600, 16" | Lenovo Yoga Pro 9 16-IRP G8 i7-13705H, GeForce RTX 4060 Laptop GPU, Samsung PM9A1 MZVL21T0HCLR, Mini-LED, 3200x2000, 16" | Razer Blade 16 Early 2023 i9-13950HX, GeForce RTX 4080 Laptop GPU, SSSTC CA6-8D1024, IPS, 2560x1600, 16" | Gigabyte AERO 16 OLED BSF i9-13900H, GeForce RTX 4070 Laptop GPU, Gigabyte AG470S1TB-SI B10, OLED, 3840x2400, 16" | Schenker VISION 16 Pro (M23) i7-13700H, GeForce RTX 4070 Laptop GPU, Samsung 990 Pro 1 TB, IPS, 2560x1600, 16" | MSI Stealth 16 Studio A13VG i7-13700H, GeForce RTX 4070 Laptop GPU, Micron 3400 2TB MTFDKBA2T0TFH, IPS, 2560x1600, 16" | Apple MacBook Pro 16 2023 M3 Max Apple M3 Max 16-Core, M3 Max 40-Core GPU, Apple SSD AP8192Z, Mini-LED, 3456x2234, 16" | Average NVIDIA GeForce RTX 4070 Laptop GPU | Average of class Gaming | |
|---|---|---|---|---|---|---|---|---|---|
| Power Consumption | -41% | -113% | -31% | -5% | -32% | -5% | -53% | -61% | |
| Idle Minimum * (Watt) | 8.3 | 10.9 -31% | 15.2 -83% | 11.8 -42% | 8.6 -4% | 11 -33% | 5.2 37% | 13.2 ? -59% | 13.3 ? -60% |
| Idle Average * (Watt) | 12.5 | 22.6 -81% | 22.8 -82% | 16.1 -29% | 12 4% | 18 -44% | 16.9 -35% | 18.2 ? -46% | 19 ? -52% |
| Idle Maximum * (Watt) | 12.8 | 23.5 -84% | 49.8 -289% | 17 -33% | 12.4 3% | 19 -48% | 17.2 -34% | 24.6 ? -92% | 24.5 ? -91% |
| Load Average * (Watt) | 71.3 | 84.6 -19% | 121.2 -70% | 100.6 -41% | 80 -12% | 91 -28% | 90.5 -27% | 97 ? -36% | 108.1 ? -52% |
| Witcher 3 ultra * (Watt) | 127.5 | 159.5 -25% | 242 -90% | 158 -24% | 147.7 -16% | 130 -2% | 109 15% | ||
| Load Maximum * (Watt) | 169.1 | 177.3 -5% | 273.7 -62% | 192 -14% | 173.1 -2% | 228 -35% | 145.2 14% | 221 ? -31% | 254 ? -50% |
* ... smaller is better
Power consumption Witcher 3 / stress test
Power consumption with external monitor
Runtimes
The Asus laptop is equipped with a large 90-Wh battery and its runtimes are excellent in total compared to the Windows comparison devices—only the MacBook Pro 16 came far ahead. Within the Armoury Crate software, it is set that the refresh rate is reduced to 60 Hz in battery mode, which is why we are using these values for the comparison (we will add the values at 240 Hz shortly). During the WLAN test—which often isn't optimal for OLED panels due to lots of bright websites—we noted runtimes of 07:15 hours at 150 cd/m² (57 % of its maximum brightness) and 05:45 hours at full brightness. During the video test at 150 cd/m², its results of just over 11 hours were a lot better. It seems that the new Arc iGPU (or its video decoder) runs very efficiently in this aspect, as the other Meteor-Lake test devices' good runtimes also thoroughly stand out in the video test (for example the Zenbook 14 OLED or the Spectre x360 14—reviews coming soon). If you play an HDR video at maximum brightness, its runtimes are about 7.5 hours, but this is naturally also to do with its limited HDR brightness. One full charge takes 112 minutes with the device switched on, whereby 60 % of its capacity is available after about 35 minutes and 80 % is available after 50 minutes.
February 5, 2024 update: Enabling the 240 Hz mode leads to battery life figures shrinking noticeably. Surfing the Web at a brightness level of around 150 cd/m² drained the battery in 6 hours and 21 minutes. This is about an hour less than the result obtained at 60 Hz. At full brightness, 5 hours and 45 minutes are no longer obtainable. One will have to be content with 5 hours instead.
| Asus ROG Zephyrus G16 2024 GU605M Ultra 7 155H, GeForce RTX 4070 Laptop GPU, 90 Wh | Lenovo Yoga Pro 9 16-IRP G8 i7-13705H, GeForce RTX 4060 Laptop GPU, 75 Wh | Razer Blade 16 Early 2023 i9-13950HX, GeForce RTX 4080 Laptop GPU, 95.2 Wh | Gigabyte AERO 16 OLED BSF i9-13900H, GeForce RTX 4070 Laptop GPU, 88 Wh | Schenker VISION 16 Pro (M23) i7-13700H, GeForce RTX 4070 Laptop GPU, 80 Wh | MSI Stealth 16 Studio A13VG i7-13700H, GeForce RTX 4070 Laptop GPU, 99.9 Wh | Apple MacBook Pro 16 2023 M3 Max Apple M3 Max 16-Core, M3 Max 40-Core GPU, 99.6 Wh | Average of class Gaming | |
|---|---|---|---|---|---|---|---|---|
| Battery runtime | -29% | 1% | 15% | -5% | 25% | 70% | -2% | |
| H.264 (h) | 11.2 | 7.5 -33% | 7.4 -34% | 7.8 -30% | 7.7 -31% | 20.4 82% | 8.26 ? -26% | |
| WiFi v1.3 (h) | 7.3 | 6.4 -12% | 6.1 -16% | 7.5 3% | 7.8 7% | 7.8 7% | 16.7 129% | 7.01 ? -4% |
| Load (h) | 1.2 | 0.7 -42% | 1.4 17% | 2.1 75% | 1.3 8% | 2.4 100% | 1.2 0% | 1.47 ? 23% |
Pros
Cons
Verdict - The new ROG Zephyrus G16 is an outstanding gaming/multimedia hybrid
Asus has tweaked its concept surrounding the new ROG Zephyrus G16, now aiming to attract a wider audience. In our eyes, this has been a success on the manufacturer's side, as its new 2024 model is an extremely high-quality, compact and lightweight 16-inch laptop with an aluminum case, impressive speakers, great input devices and a wonderful OLED panel. The latter can't quite live up to the competition when it comes to its HDR capabilities, as its maximum brightness is limited. Even so, films and games look great on the 240-Hz OLED screen and gamers will be pleased with its quick response times and G-Sync support. Furthermore, Asus remains one of the only manufacturers to offer a software solution that dims the display without reaching potentially harmful PWM areas.
Its components' performance is good, too, although the new Meteor-Lake processor doesn't really offer any increased performance compared to its old Raptor-Lake counterpart—plus, its single-core performance is actually even worse. The new mobile processors' actual strength—the new Arc iGPU—doesn't bring much to the table in this case, as a dedicated Nvidia GPU is installed into the device.
A high-quality and lightweight aluminum case, great OLED display and excellent speakers: Thanks to its powerful hardware, the new ROG Zephyrus G16 can of course still depict current games, but Asus' 2024 model edges more in the direction of high-end multimedia. So, even if you have no gaming ambitions whatsoever, it's still worth taking a look at the new Zephyrus G16.
Our biggest issue lies in the laptop's cooling, as the G16 only remains truly silent in the rarest of cases, plus, its additional system fan unfortunately has a very high rotation speed. It is also a shame that only the two versions with the RTX 4080/4090 Laptop benefit from more powerful Vapor-Chamber cooling, which leads to a completely different fan behavior and the CPU being able to profit from higher power limits. The device's soldered-on RAM is another disadvantage—especially when you consider that our test sample only has 16 GB installed. For a starting price of almost US$3,000, Asus should really install 32 GB RAM as standard.
The new ROG Zephyrus G16's biggest competitor is surely the Razer Blade 16 and our review of the new 2024 variant (which also features a Samsung OLED) will be published soon. When it comes to multimedia devices, the Lenovo Yoga Pro 9i 16 or the Apple MacBook Pro 16 are its biggest rivals, although, these devices only offer limited gaming capabilities.
Price and availability
The new ROG Zephyrus G16 is available from 02/15/2024 and individual configurations are already listed. Prices start from US$2,899.99.
Asus ROG Zephyrus G16 2024 GU605M
- 02/04/2024 v7 (old)
Andreas Osthoff
Transparency
The selection of devices to be reviewed is made by our editorial team. The test sample was provided to the author as a loan by the manufacturer or retailer for the purpose of this review. The lender had no influence on this review, nor did the manufacturer receive a copy of this review before publication. There was no obligation to publish this review. As an independent media company, Notebookcheck is not subjected to the authority of manufacturers, retailers or publishers.
This is how Notebookcheck is testing
Every year, Notebookcheck independently reviews hundreds of laptops and smartphones using standardized procedures to ensure that all results are comparable. We have continuously developed our test methods for around 20 years and set industry standards in the process. In our test labs, high-quality measuring equipment is utilized by experienced technicians and editors. These tests involve a multi-stage validation process. Our complex rating system is based on hundreds of well-founded measurements and benchmarks, which maintains objectivity. Further information on our test methods can be found here.
Price comparison

