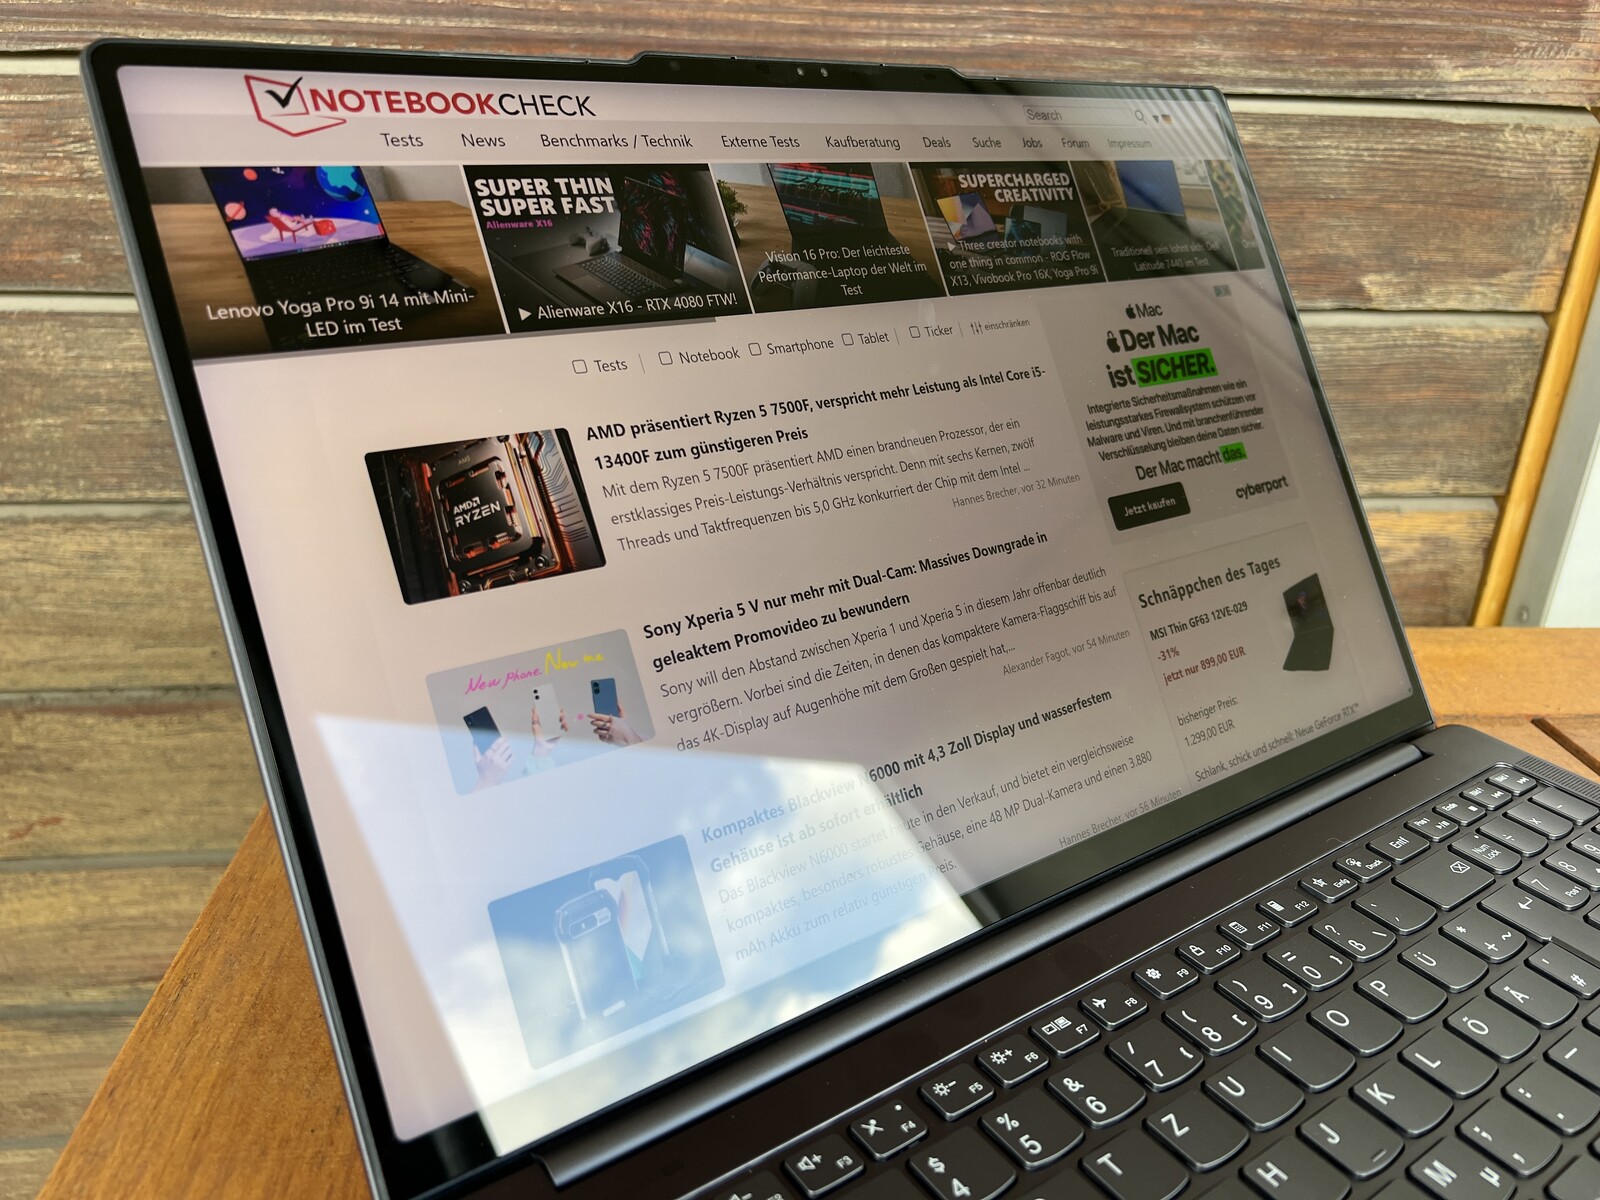
Lenovo Yoga Pro 9i 16 laptop review: Great mini-LED panel, but unnecessary cost-saving measures
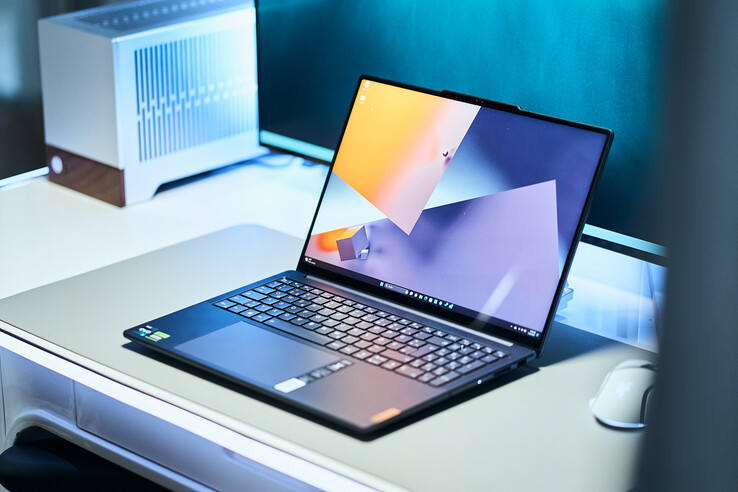
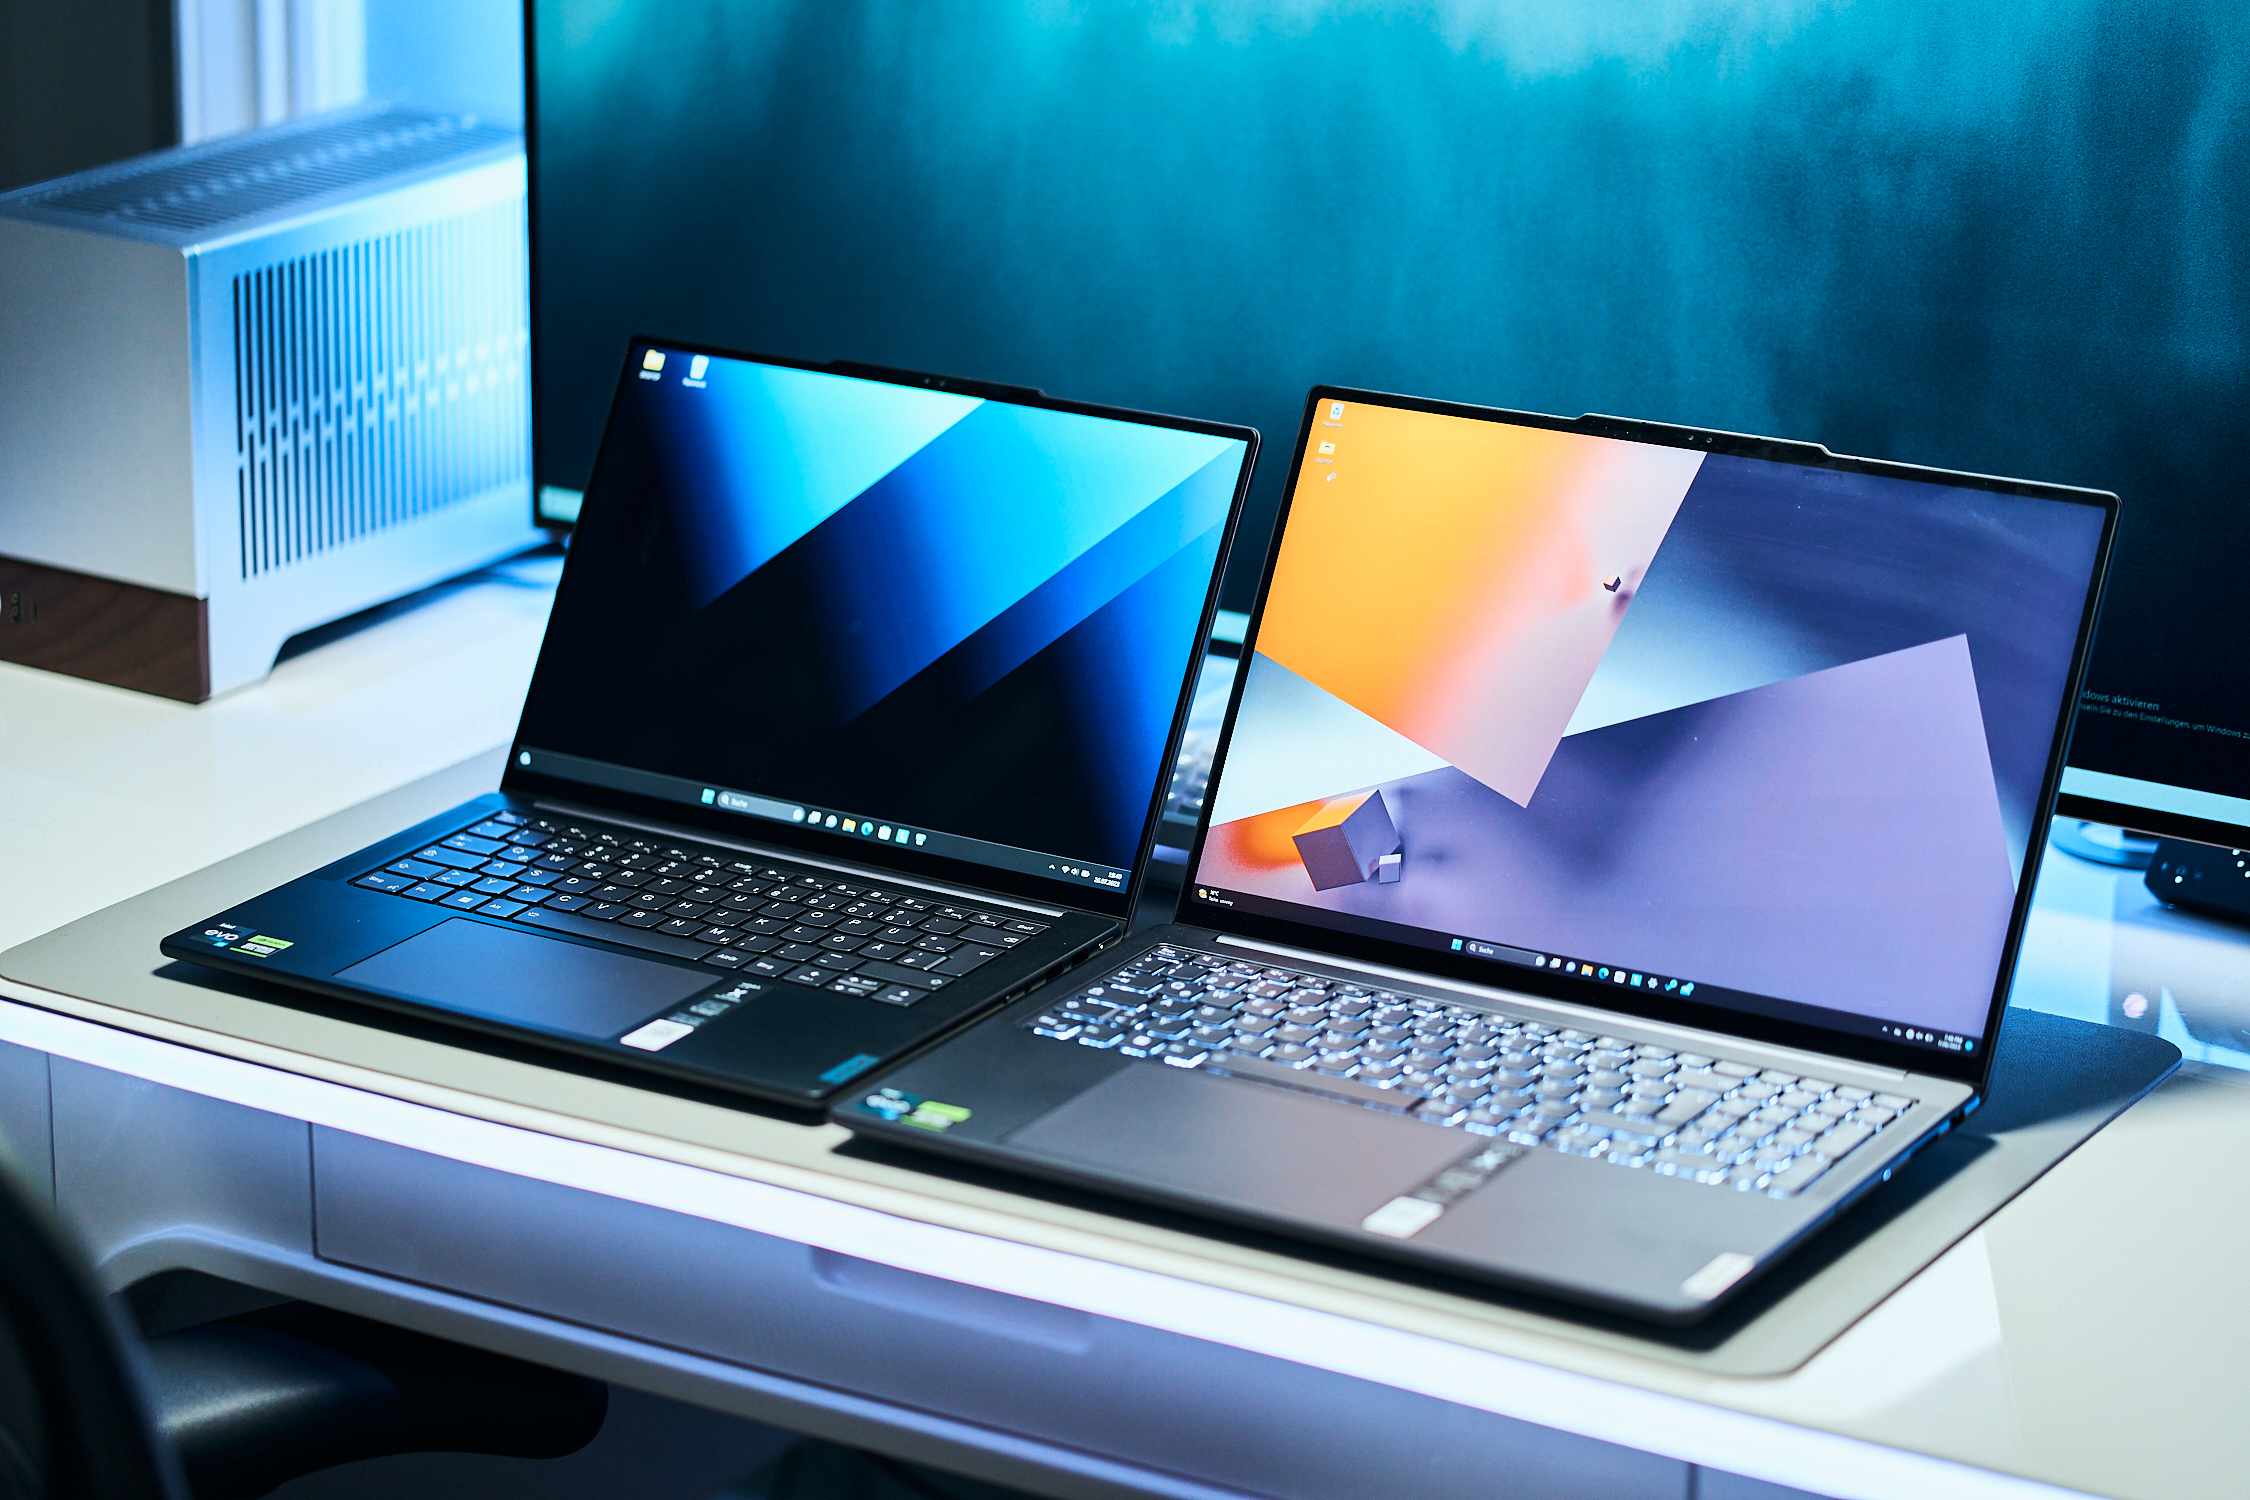
Having looked closely at the 14-inch version of the new Lenovo Yoga Pro 9i, we now take a look at the 16-inch version. The tech specs (apart from the size) are fundamentally identical, as a 3.2K mini-LED touchscreen with 165 Hz and AdobeRGB coverage is also used here. Under the hood are the latest Raptor Lake H CPUs from Intel and Nvidia GPUs ranging from the RTX 4050 to the RTX 4070. In detail, however, there are some differences which we also take a look at.
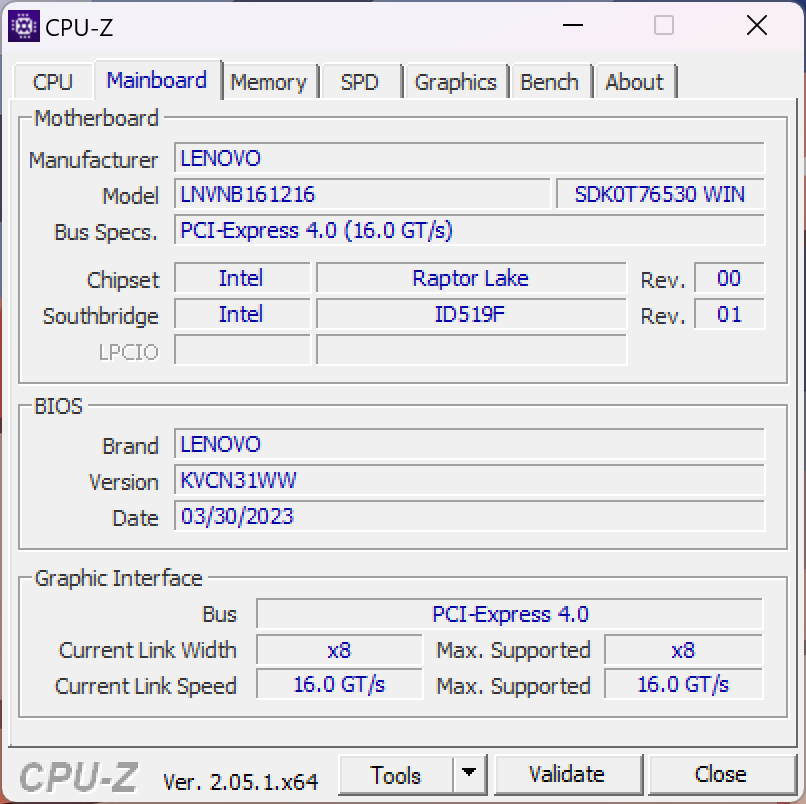
Our test device is the 83BY0016GE model and is priced at EUR 2,399 (Translator's note: models in the US are considerably cheaper - see "Price and Availability" at the end of this review) with a 3.2K mini LED panel (165 Hz), a Core i7 processor, a GeForce RTX 4060, 16 GB LPDDR5X 6400 RAM and a 1 TB PCIe 4.0 SSD. We were also able to run some benchmarks on a more powerful configuration (Core i9, RTX 4070 laptop, 64 GB RAM).
Possible competitors in comparison
Rating | Date | Model | Weight | Height | Size | Resolution | Price |
|---|---|---|---|---|---|---|---|
| 88.4 % v7 (old) | 08 / 2023 | Lenovo Yoga Pro 9 16-IRP G8 i7-13705H, GeForce RTX 4060 Laptop GPU | 2.2 kg | 18.2 mm | 16.00" | 3200x2000 | |
| 88.6 % v7 (old) | 07 / 2023 | Schenker VISION 16 Pro (M23) i7-13700H, GeForce RTX 4070 Laptop GPU | 1.6 kg | 17.1 mm | 16.00" | 2560x1600 | |
| 86.2 % v7 (old) | 07 / 2023 | Asus Vivobook Pro 16X K6604JV-MX016W i9-13980HX, GeForce RTX 4060 Laptop GPU | 2.1 kg | 22.8 mm | 16.00" | 3200x2000 | |
| 86.1 % v7 (old) | 06 / 2023 | Asus ProArt Studiobook 16 OLED H7604 i9-13980HX, GeForce RTX 4070 Laptop GPU | 2.4 kg | 23.9 mm | 16.00" | 3200x2000 | |
| 88.8 % v7 (old) | 07 / 2023 | MSI Stealth 16 Studio A13VG i7-13700H, GeForce RTX 4070 Laptop GPU | 2 kg | 19.95 mm | 16.00" | 2560x1600 | |
| 93.7 % v7 (old) | 03 / 2023 | Apple MacBook Pro 16 2023 M2 Max M2 Max, M2 Max 38-Core GPU | 2.2 kg | 16.8 mm | 16.20" | 3456x2234 |
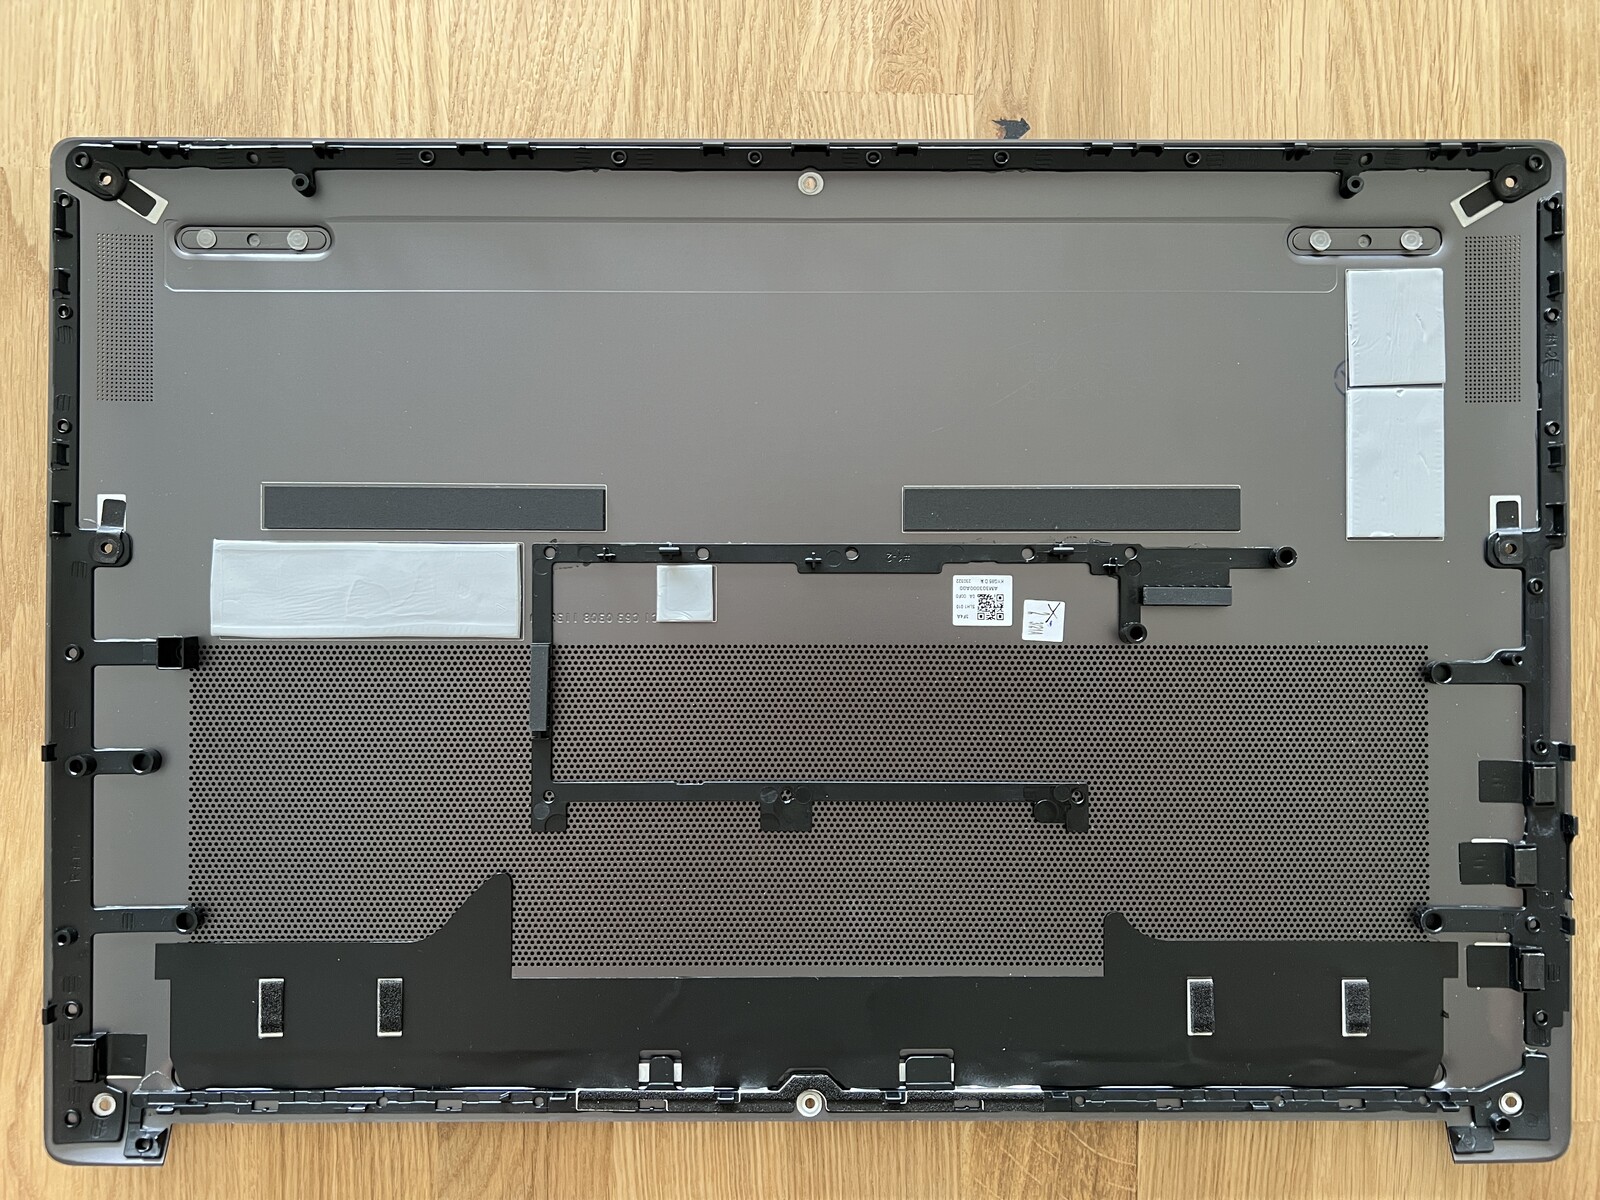
Case - Aluminum casing with a creaky base plate
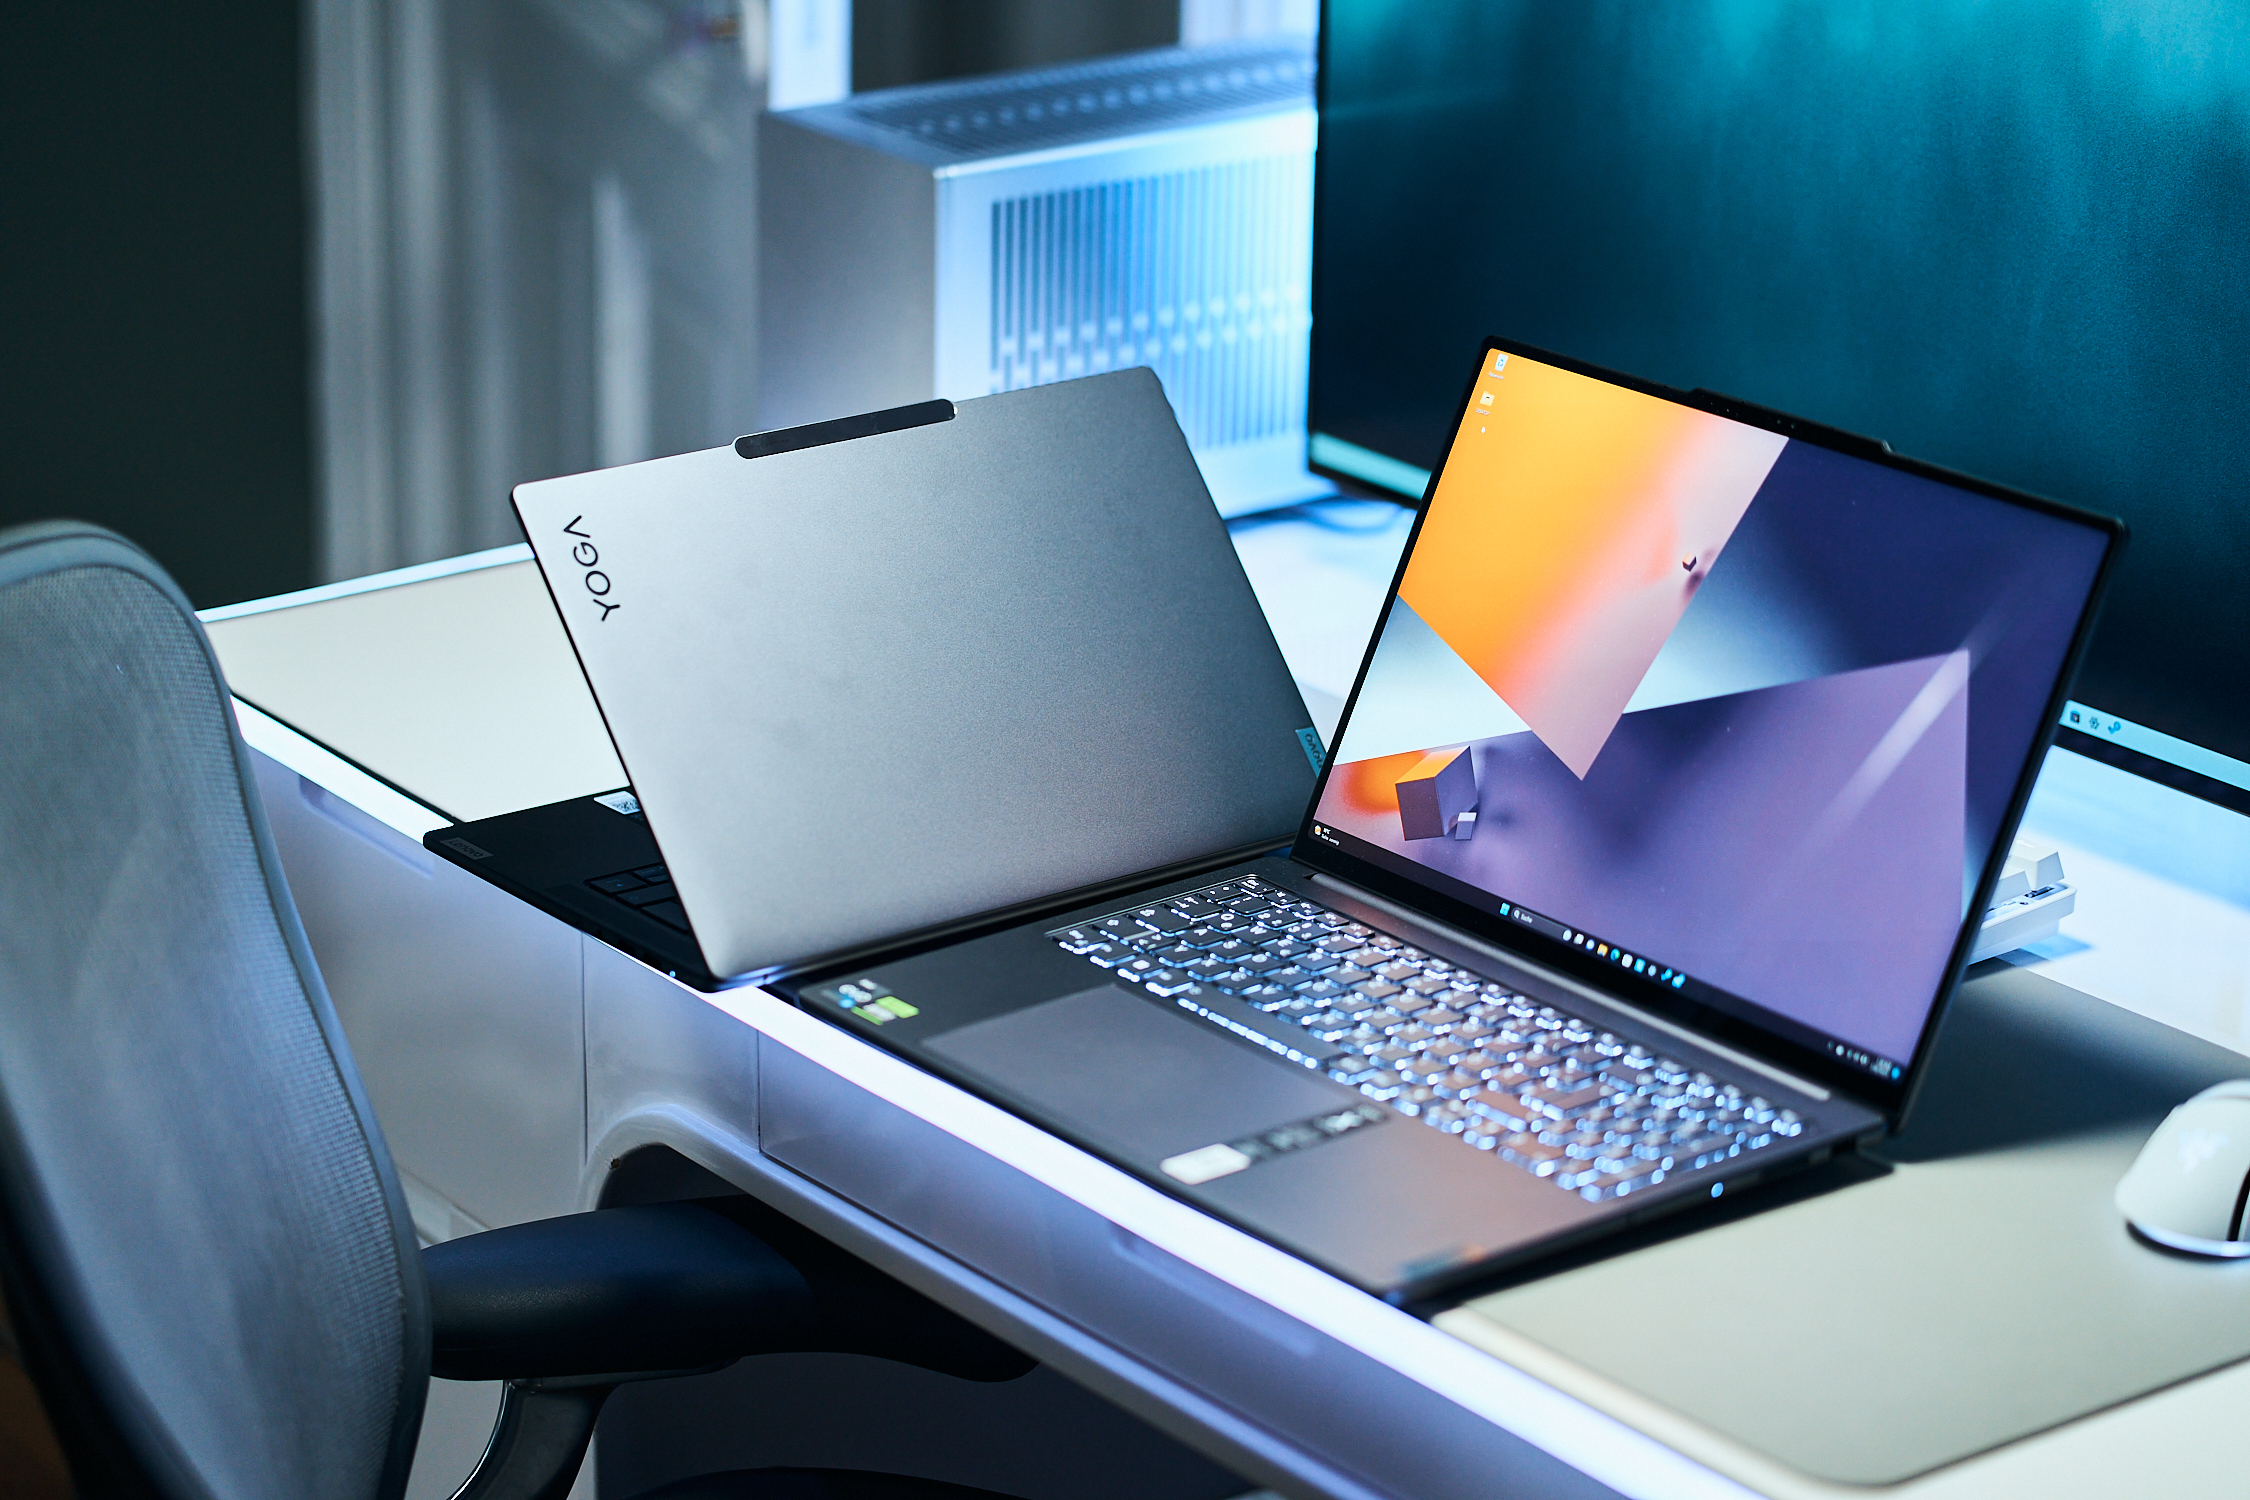
The case design is the same as the smaller Yoga Pro 9i 14, i.e. an aluminum construction is used. However, the 16-inch model has a weak point: the base plate is very thin and emits unpleasant creaking noises when handled, which is not at all fitting for a premium device. The problem was also present (albeit less pronounced) in the second test device, so this may be a general problem. This is a pity because there are no defects otherwise in terms of workmanship or stability. The base unit can only be pressed in minimally in the central area, but practically cannot be twisted at all. The lid is a little more flexible than the smaller 14-inch model, but no issues pop up here either. The two hinges are well adjusted (only minimal teetering) and hold the screen securely in place, even at small opening angles. At the same time, one-handed opening of the display is possible and the maximum opening angle is 180 degrees.
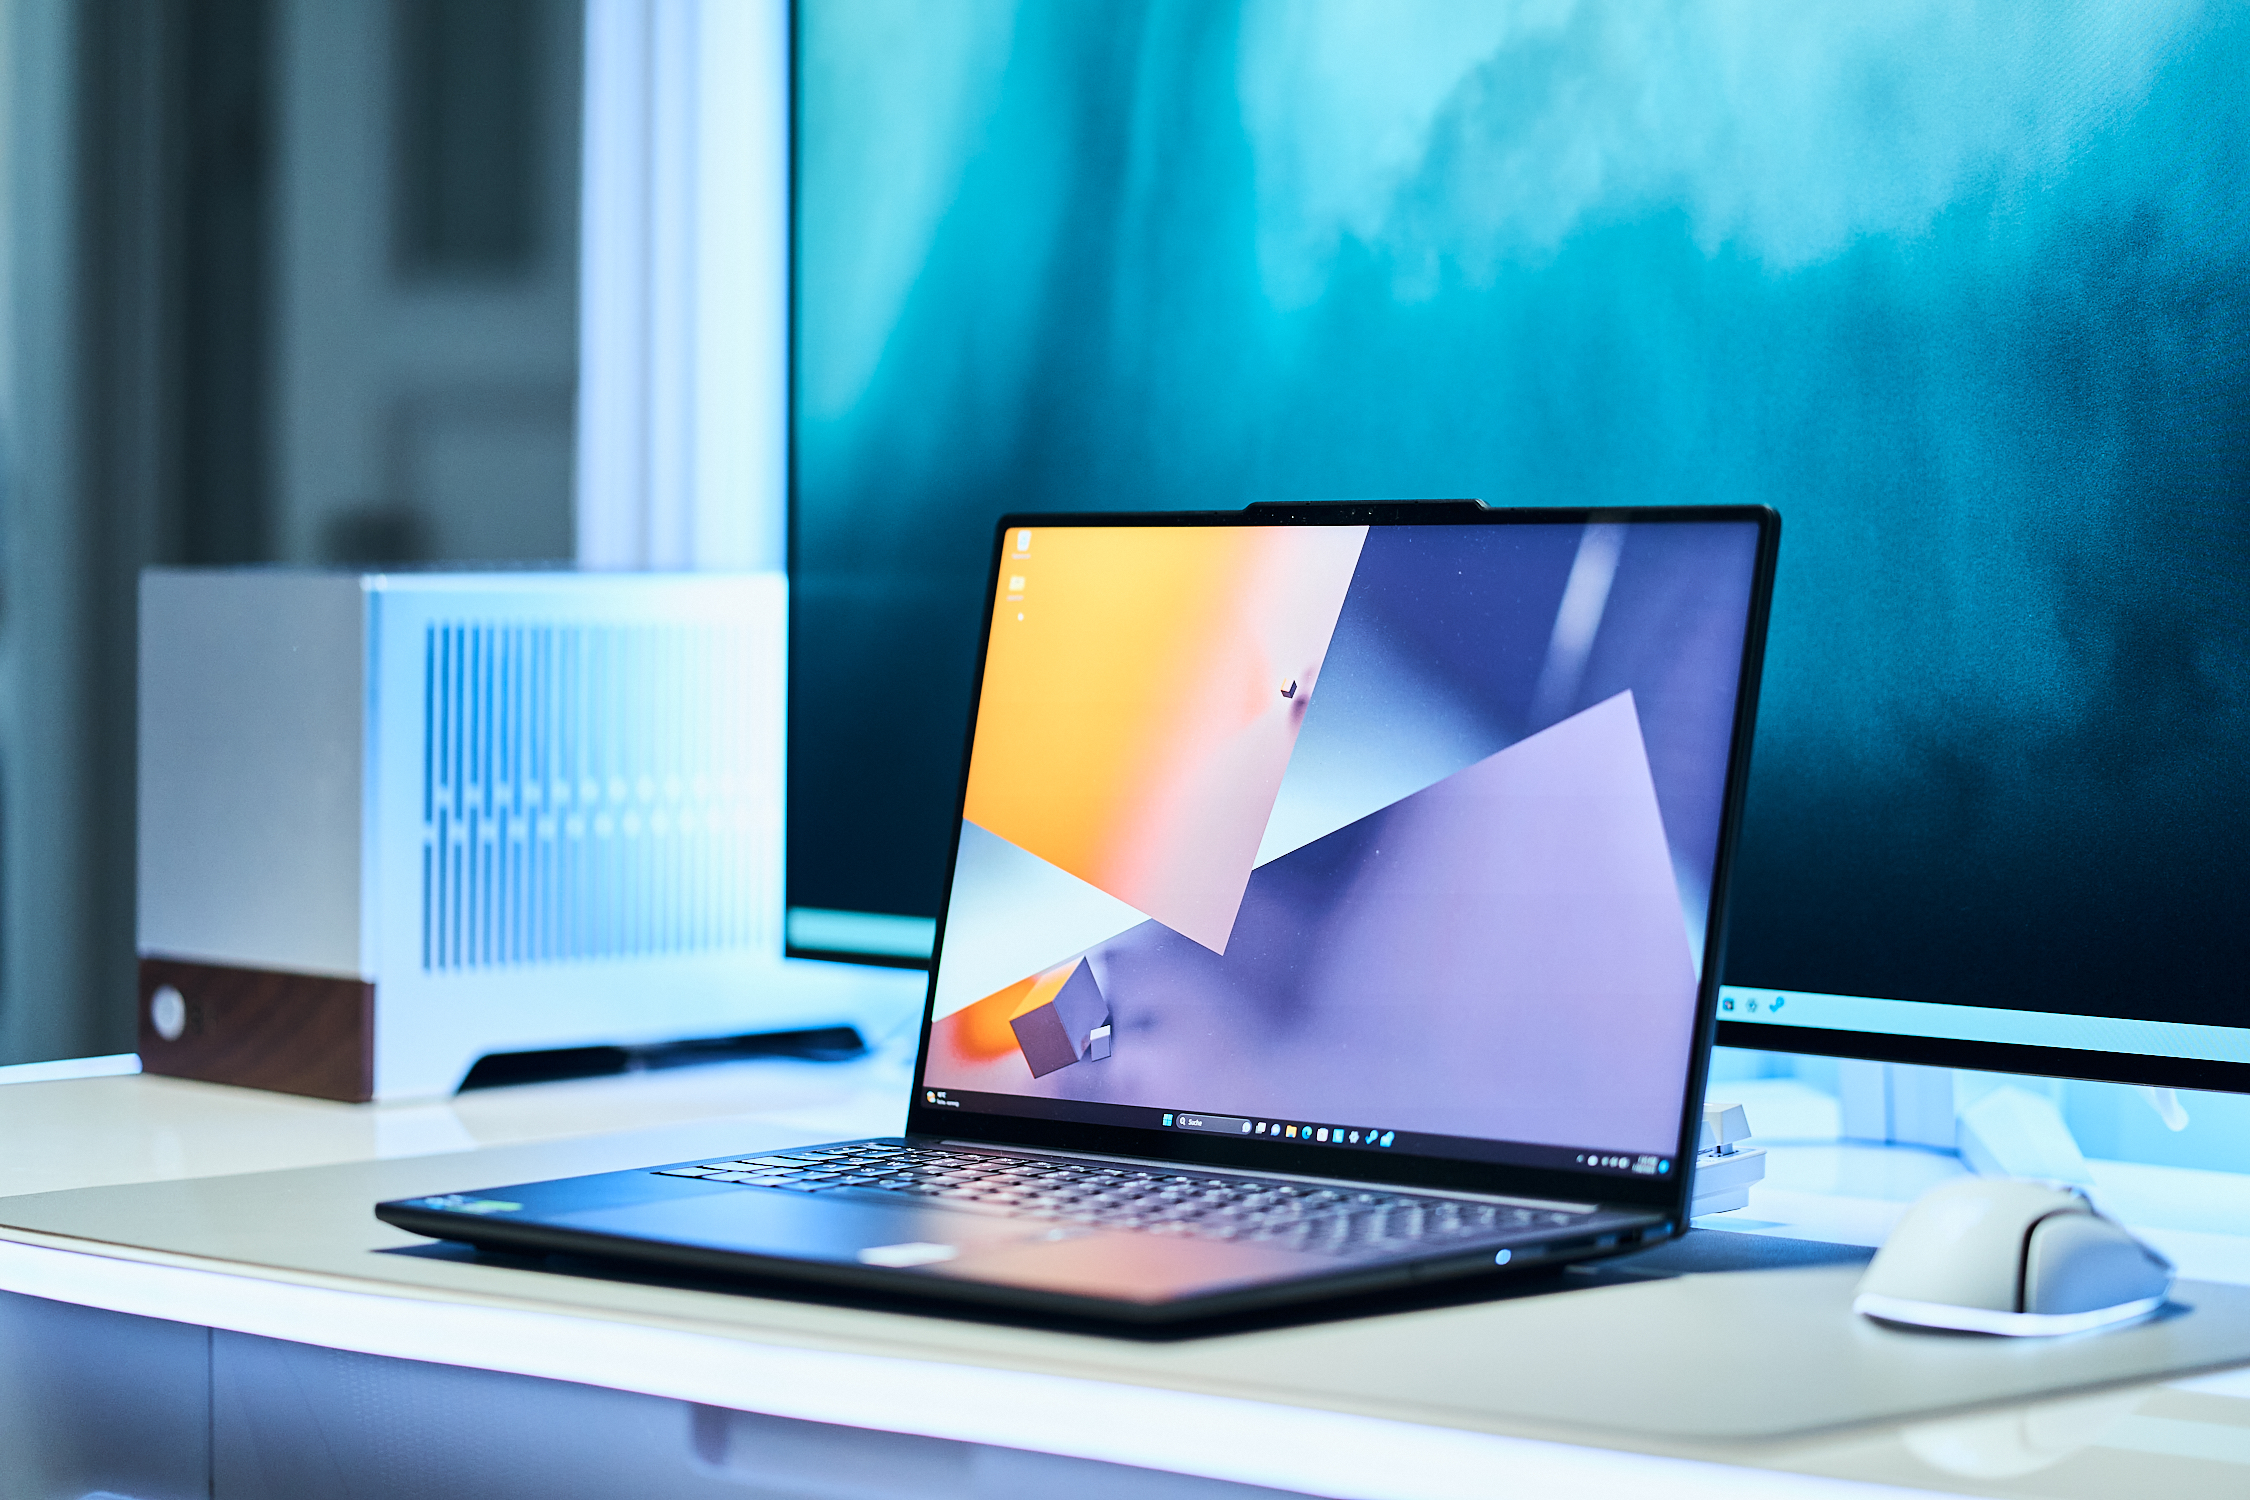
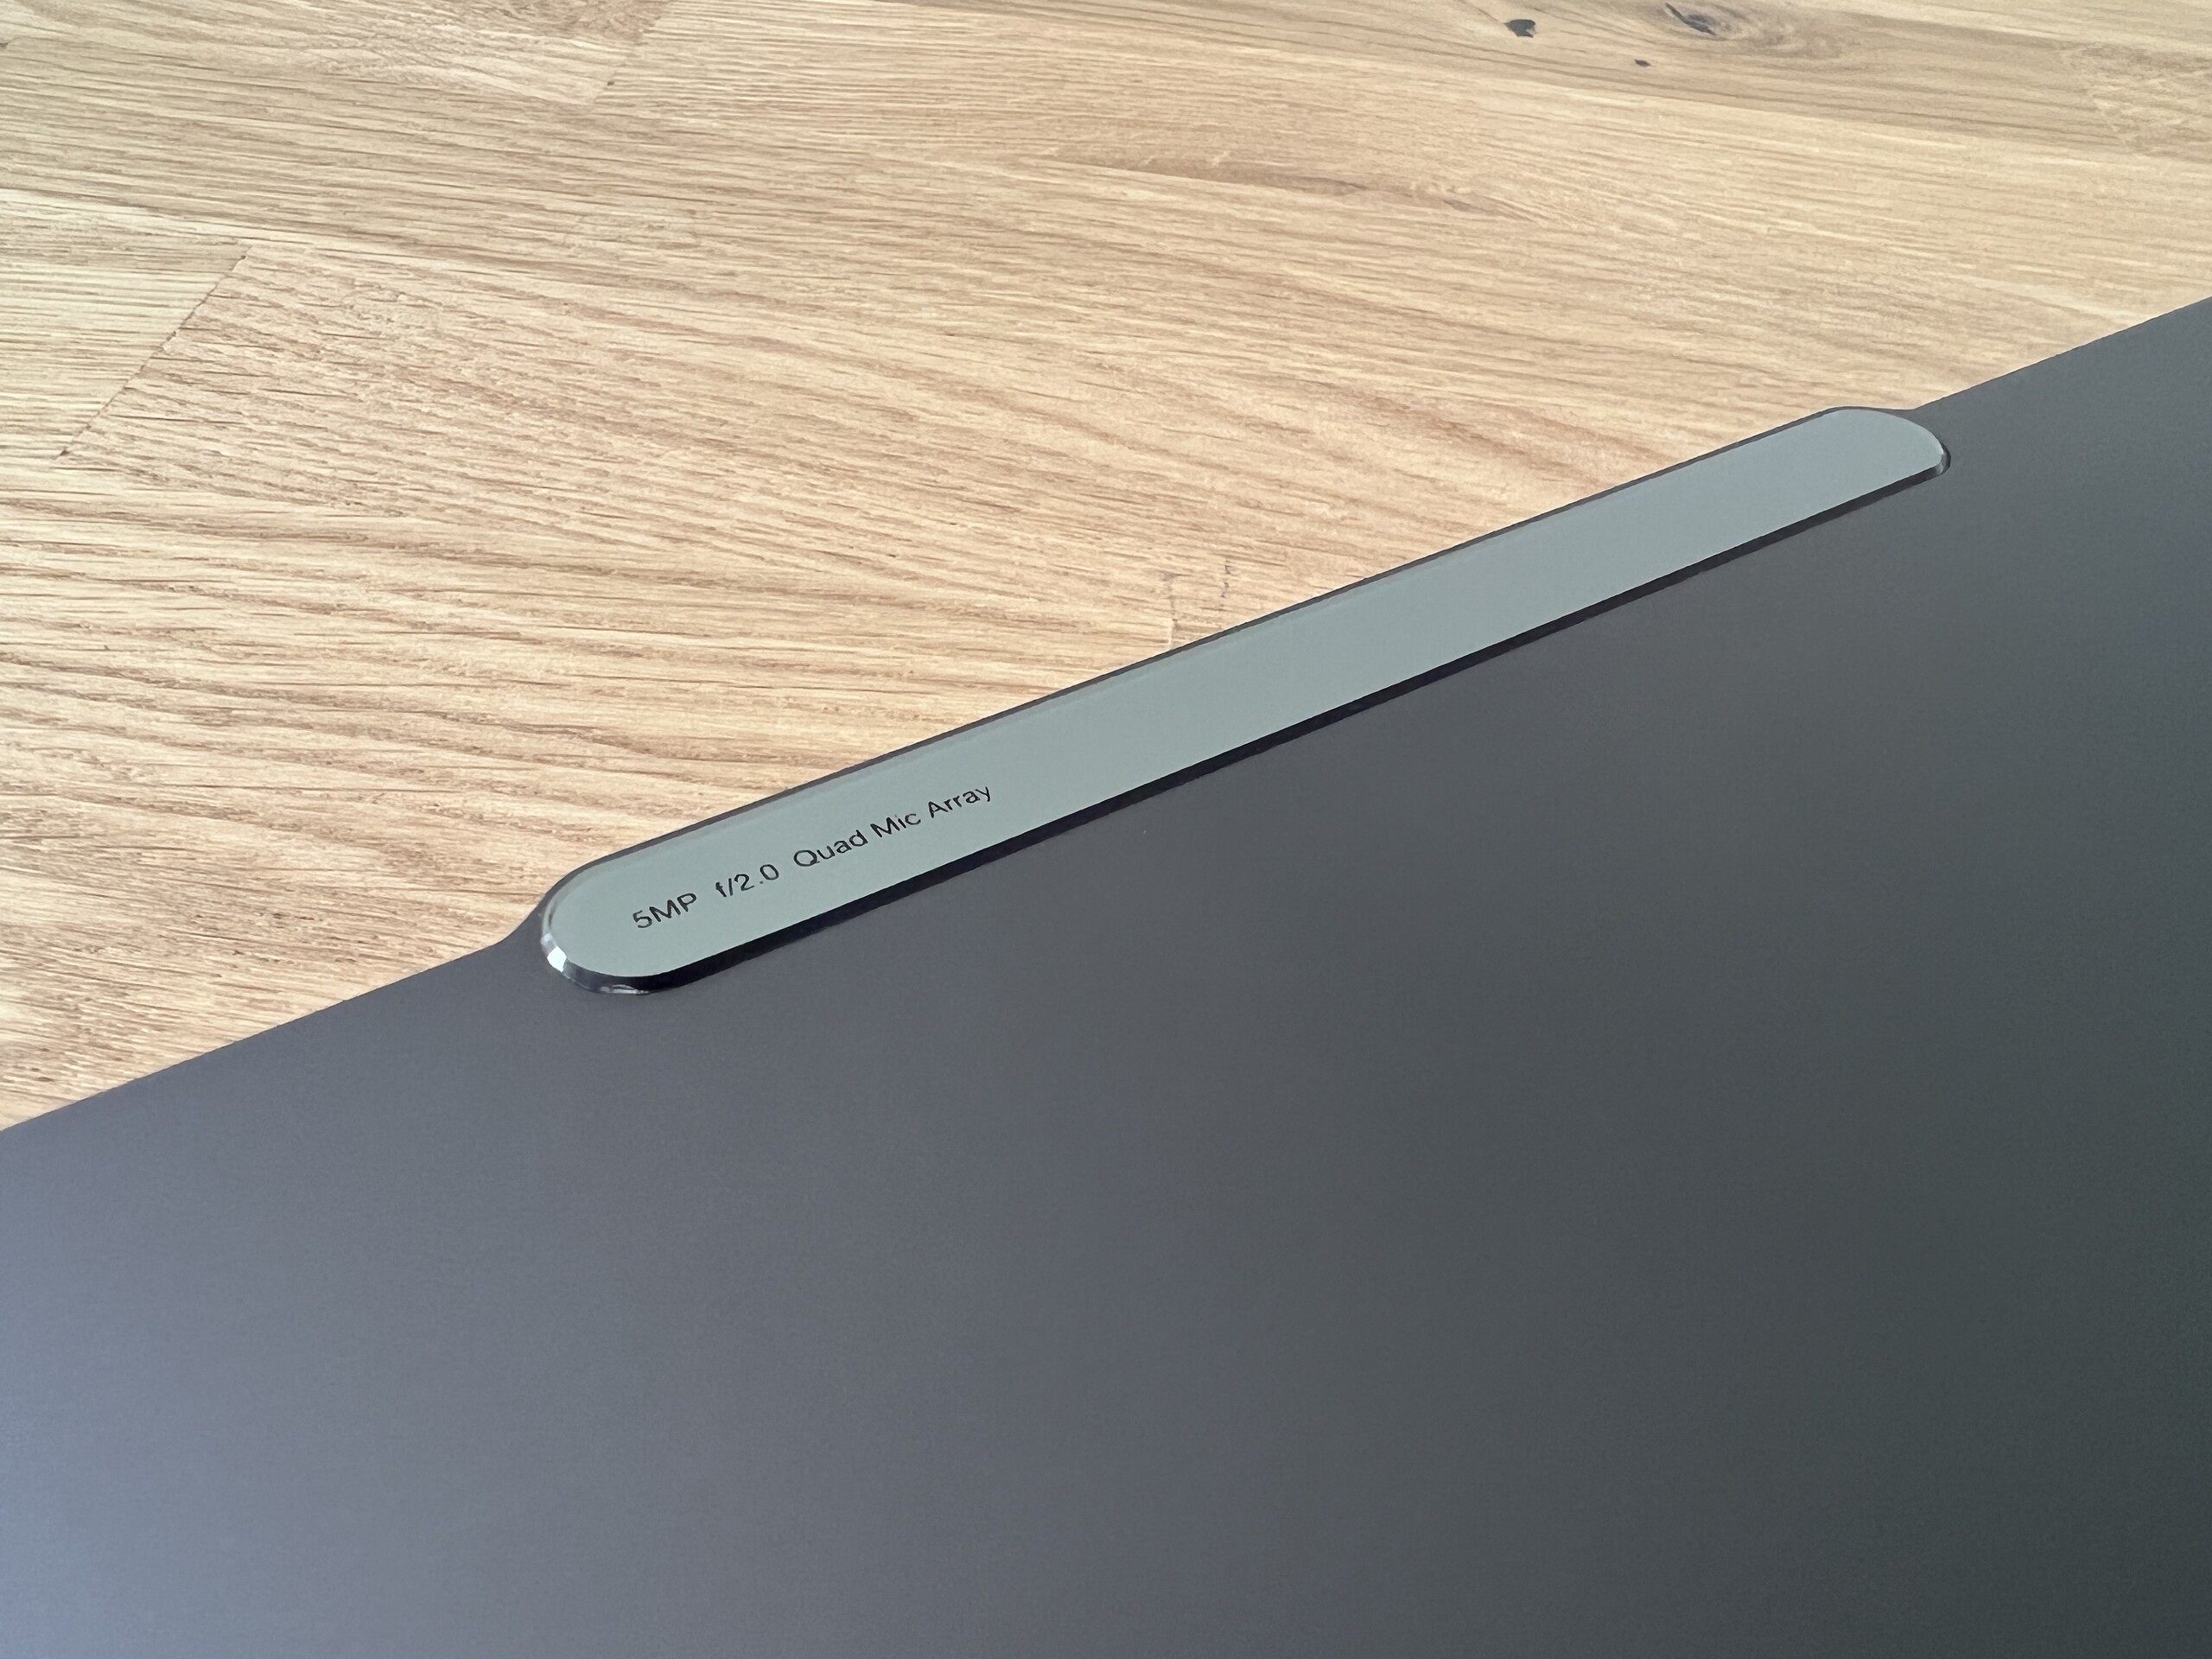
Our test unit is the Strom Grey variant, which is very inconspicuous and fits right into the office without attracting attention. Those who like it more colourful can opt for the Tidal Teal (turquoise green) color variant. Overall, the design looks very modern and the screen's edges are quite narrow, but the camera hump is somewhat annoying because it sits a little deeper than the rest of the screen lid.
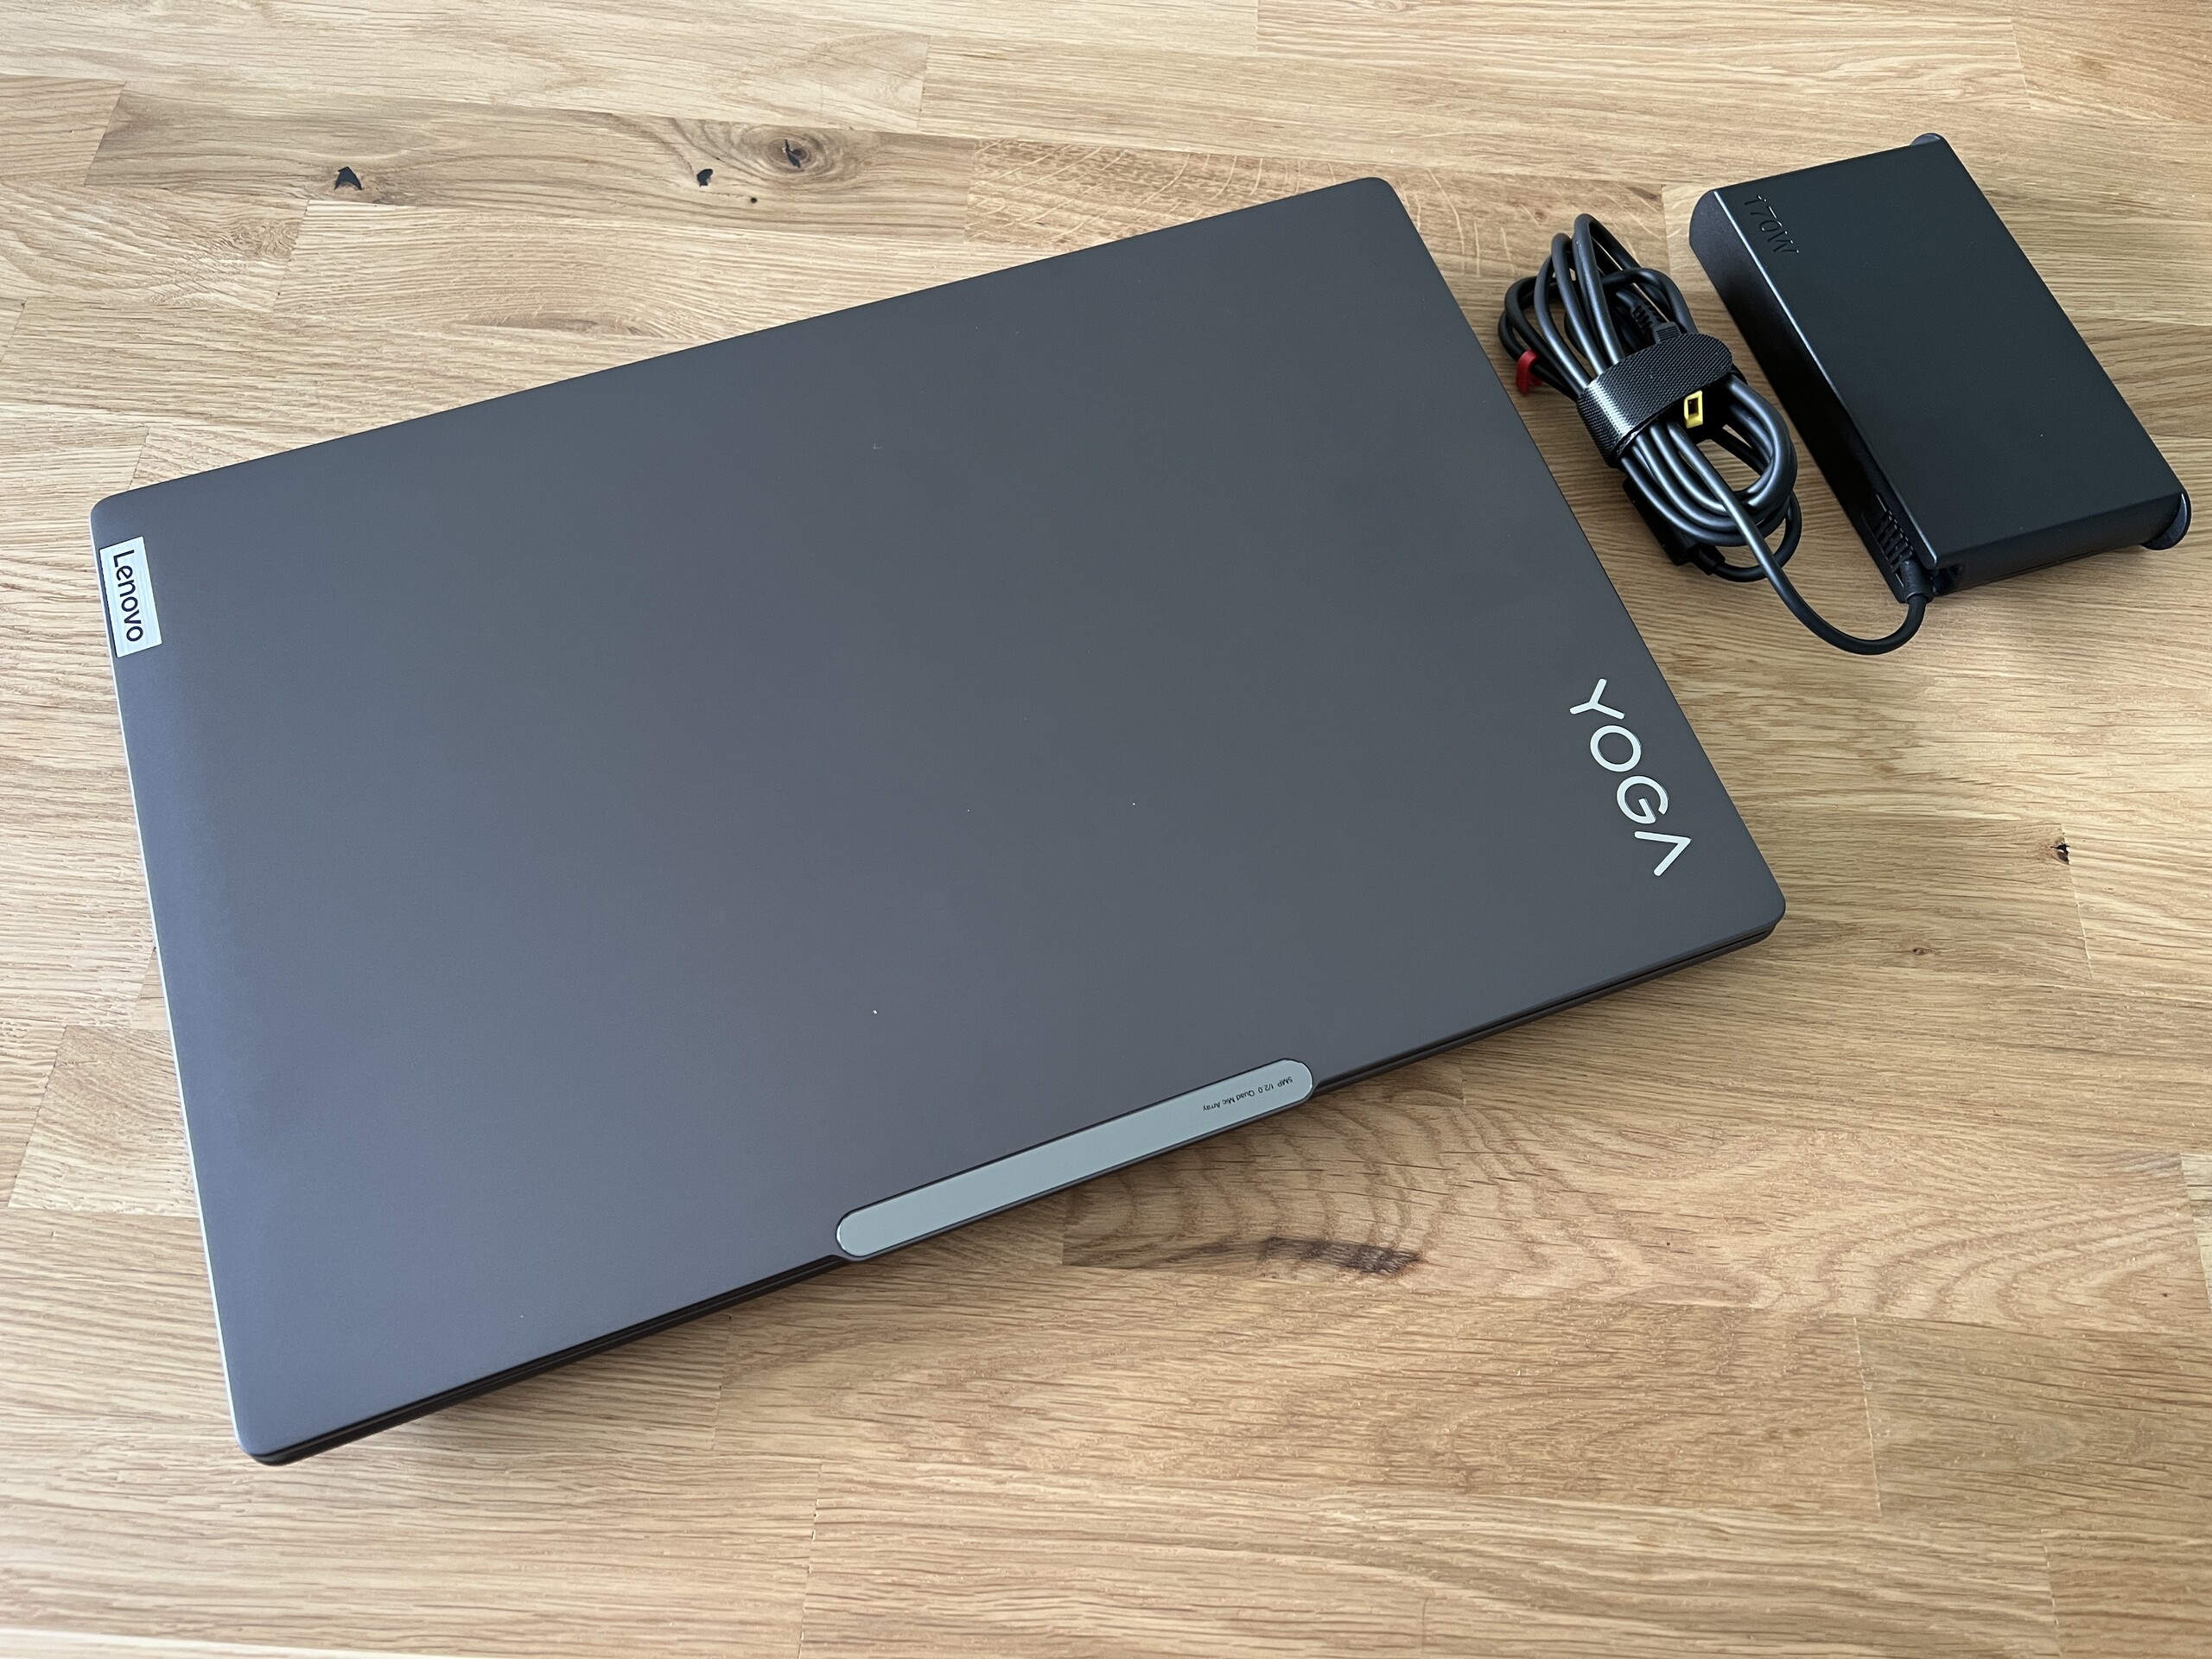
Together with the Schenker Vision 16 Pro and the Apple MacBook Pro 16, the Yoga Pro 9i 16 has the smallest footprint in the comparison field, but is also one of the heavier models at just over 2.2 kg, although the differences here are not huge. The only exception is the Vision 16 Pro at just 1.6 kg. The included 170 watt power adapter weighs around 570 grams.
Equipment - 16-inch Yoga Pro with HDMI 1.4b only
Differences to the smaller model are to be found in the ports. Only one USB-C port is installed here, which at least also supports Thunderbolt 4 and can be used for charging if necessary (this worked without issue with a 65-watt power supply). Since there is a dedicated power supply (SlimTip) here, the lack of a second USB port can be overlooked, but we don't understand why the HMDI output of the 16-inch version supports just the 1.4b standard, which is why 4K can only be output at 30 Hz.


SD Card Reader
The card reader on the right takes regular SD cards, which protrude about 2 cm from the device. The transfer rates in conjunction with our Angelbird AV Pro V60 reference card are around 80 MB/s. This is an average value that is clearly surpassed by some competitors.
| SD Card Reader | |
| average JPG Copy Test (av. of 3 runs) | |
| Apple MacBook Pro 16 2023 M2 Max (Angelbird AV Pro V60) | |
| MSI Stealth 16 Studio A13VG | |
| Average of class Multimedia (23 - 531, n=43, last 2 years) | |
| Asus Vivobook Pro 16X K6604JV-MX016W | |
| Lenovo Yoga Pro 9 16-IRP G8 (Angelibird AV Pro V60) | |
| Asus ProArt Studiobook 16 OLED H7604 (Angelibird AV Pro V60) | |
| Schenker VISION 16 Pro (M23) (Angelbird AV Pro V60) | |
| maximum AS SSD Seq Read Test (1GB) | |
| Apple MacBook Pro 16 2023 M2 Max (Angelbird AV Pro V60) | |
| Average of class Multimedia (27.9 - 1455, n=42, last 2 years) | |
| MSI Stealth 16 Studio A13VG | |
| Asus Vivobook Pro 16X K6604JV-MX016W | |
| Asus ProArt Studiobook 16 OLED H7604 (Angelibird AV Pro V60) | |
| Lenovo Yoga Pro 9 16-IRP G8 (Angelibird AV Pro V60) | |
| Schenker VISION 16 Pro (M23) (Angelbird AV Pro V60) | |
Communication
A port for wired network connections is not available, but this can be implemented via an optional USB adapter. Intel's AX211 module, which also supports the current Wi-Fi 6E standard, is responsible for wireless connections. We measured high and stable transfer rates with our Asus reference router. No issues arose in practice either, neither in large data transfers nor downloads.
| Networking | |
| Lenovo Yoga Pro 9 16-IRP G8 | |
| iperf3 transmit AXE11000 | |
| iperf3 receive AXE11000 | |
| Schenker VISION 16 Pro (M23) | |
| iperf3 transmit AXE11000 | |
| iperf3 receive AXE11000 | |
| Asus Vivobook Pro 16X K6604JV-MX016W | |
| iperf3 transmit AXE11000 | |
| iperf3 receive AXE11000 | |
| iperf3 transmit AXE11000 6GHz | |
| iperf3 receive AXE11000 6GHz | |
| Asus ProArt Studiobook 16 OLED H7604 | |
| iperf3 transmit AXE11000 | |
| iperf3 receive AXE11000 | |
| MSI Stealth 16 Studio A13VG | |
| iperf3 transmit AXE11000 | |
| iperf3 receive AXE11000 | |
| iperf3 transmit AXE11000 6GHz | |
| iperf3 receive AXE11000 6GHz | |
| Apple MacBook Pro 16 2023 M2 Max | |
| iperf3 transmit AXE11000 6GHz | |
| iperf3 receive AXE11000 6GHz | |
Webcam
The slightly thicker camera hump houses a 5 MP camera that delivers good image quality, both for pictures and videos. This removes the need for an external webcam, especially for video conferences. An IR sensor is also installed, which enables facial recognition via Windows Hello. The camera can be deactivated via a small slider on the right side of the case (e-shutter).


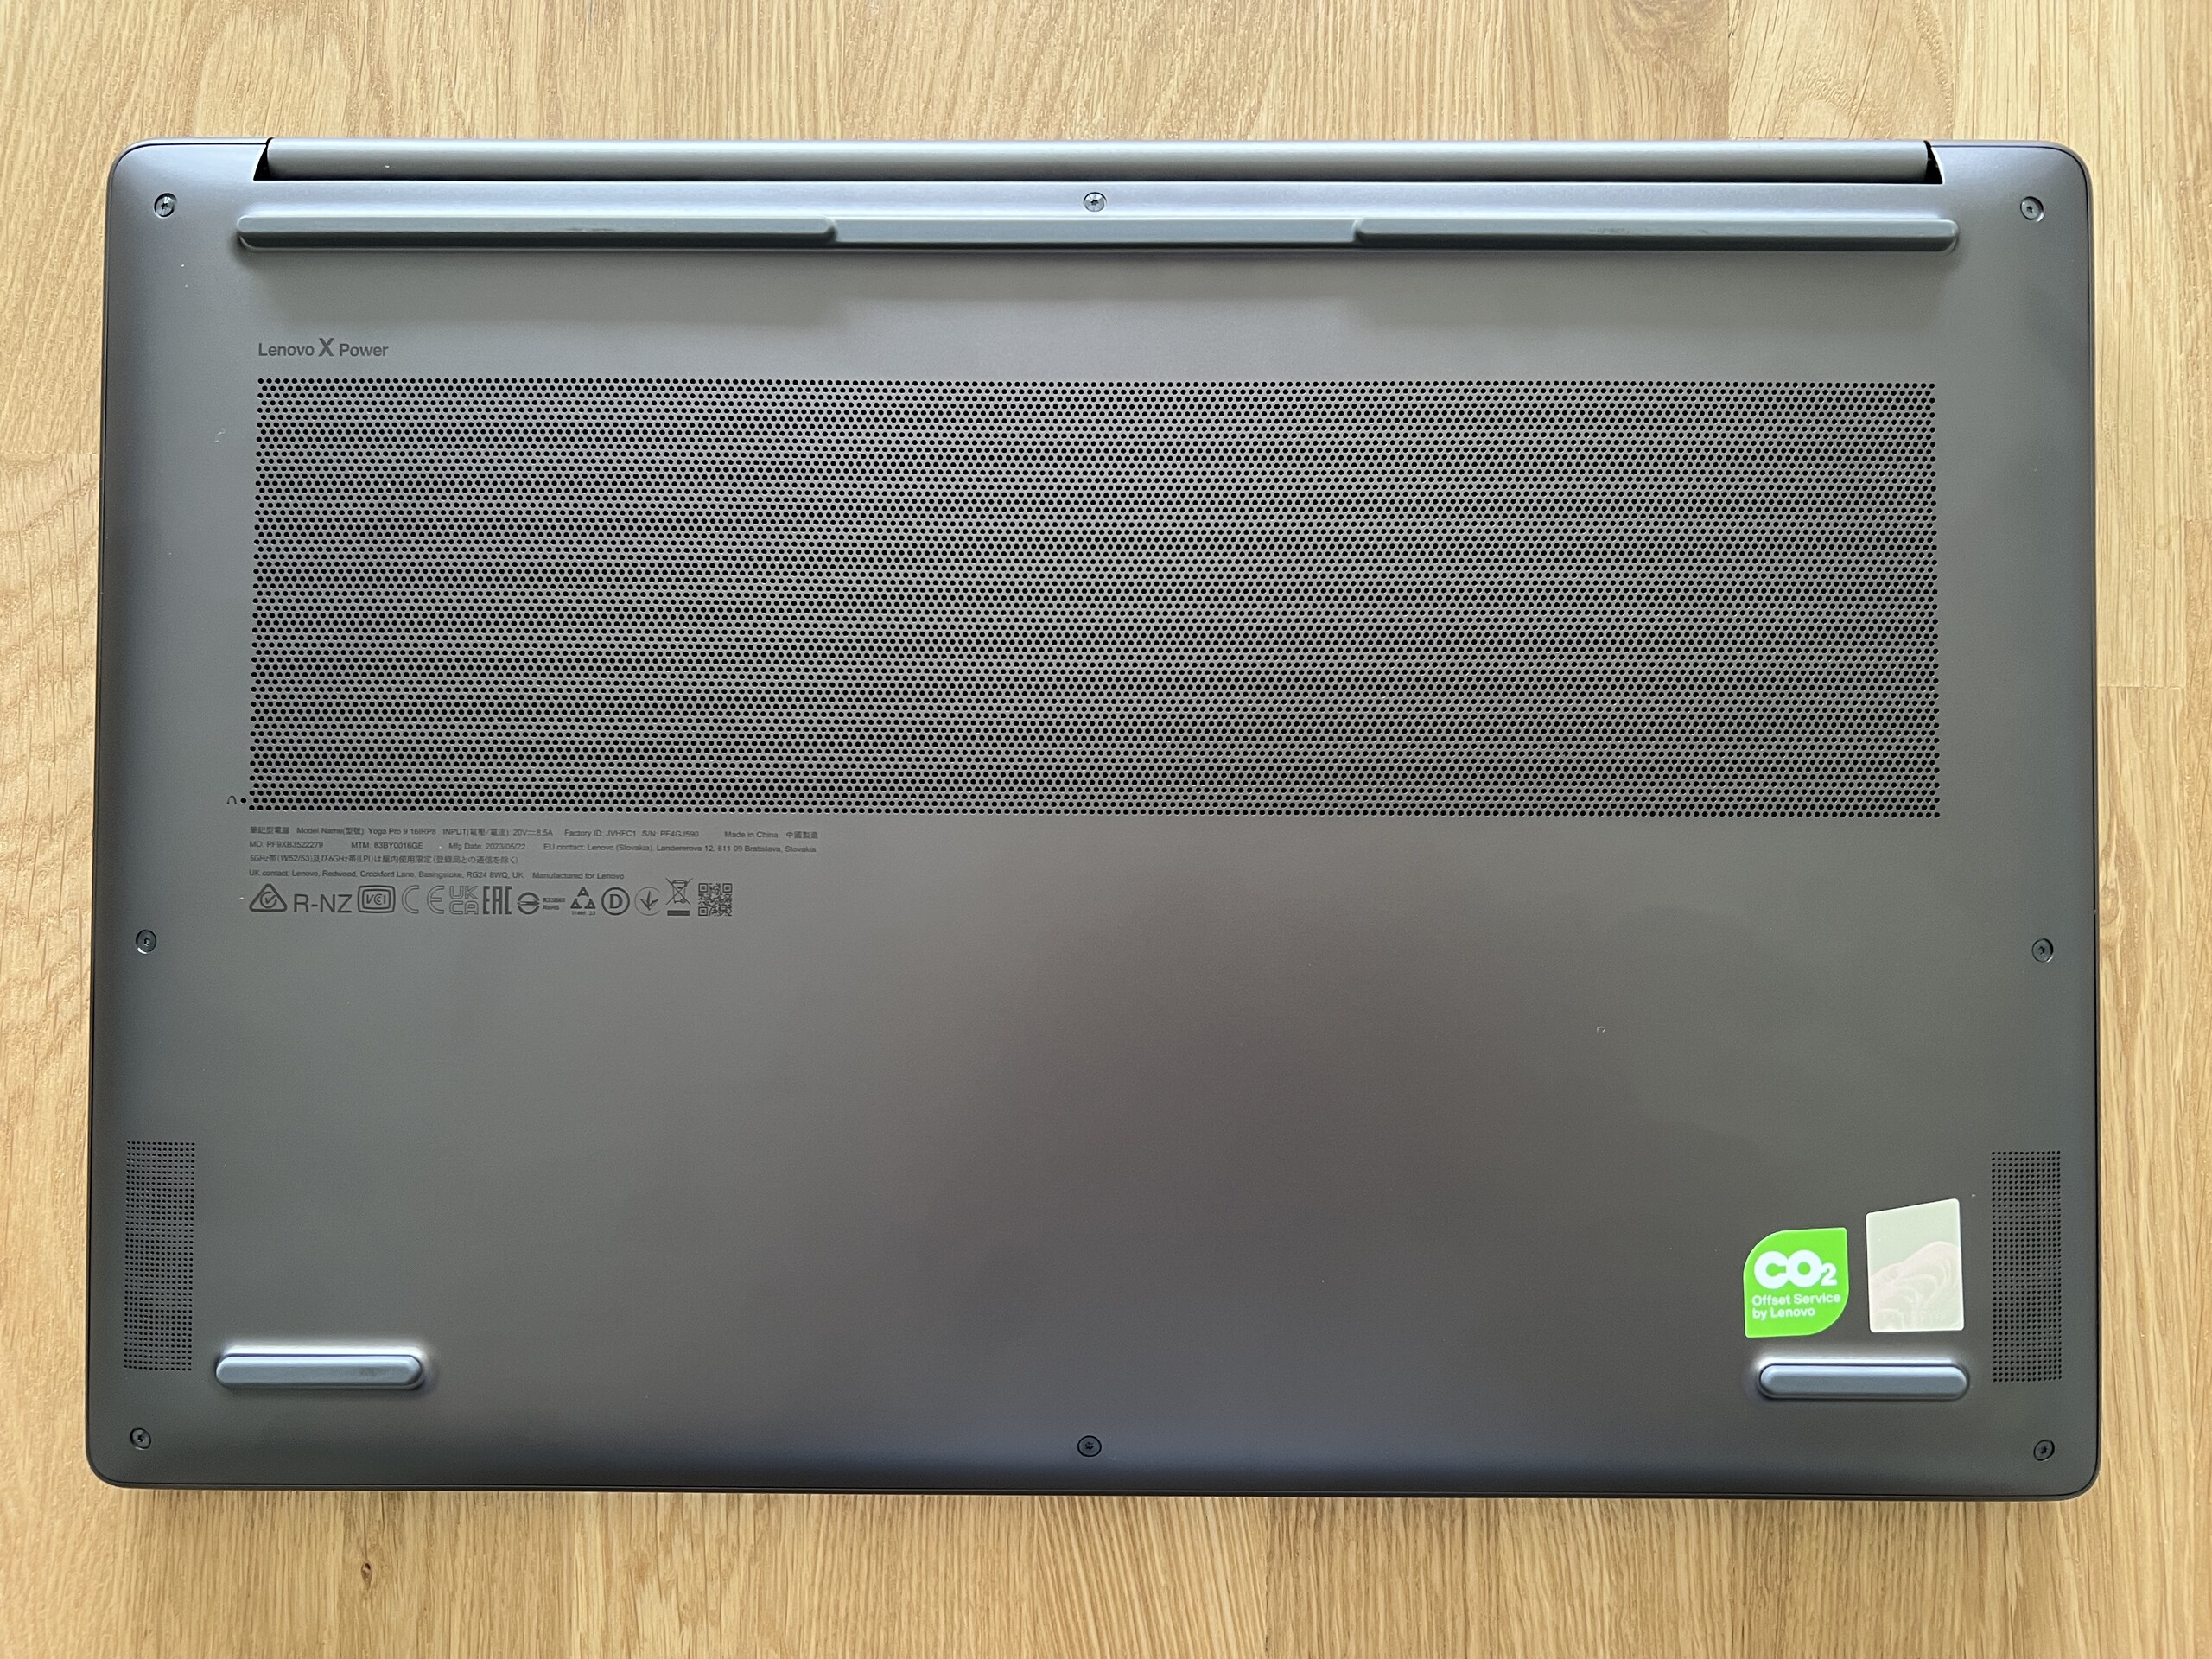
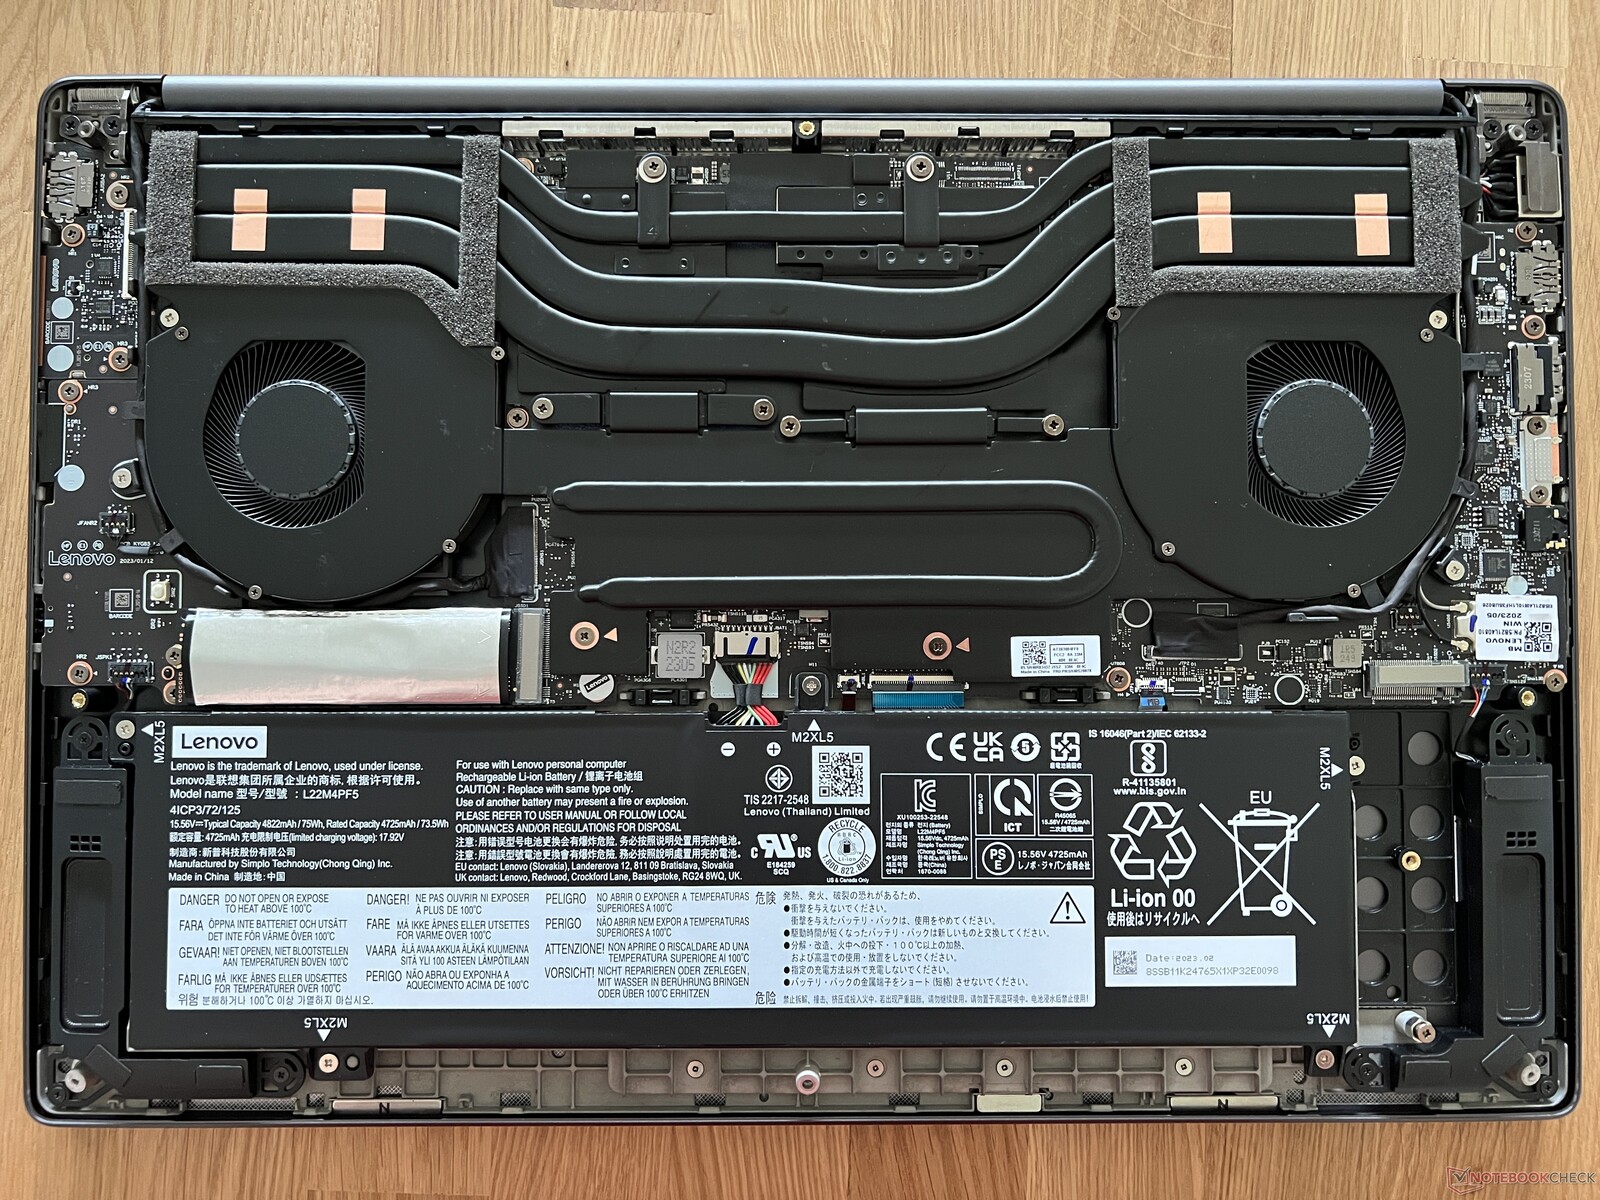
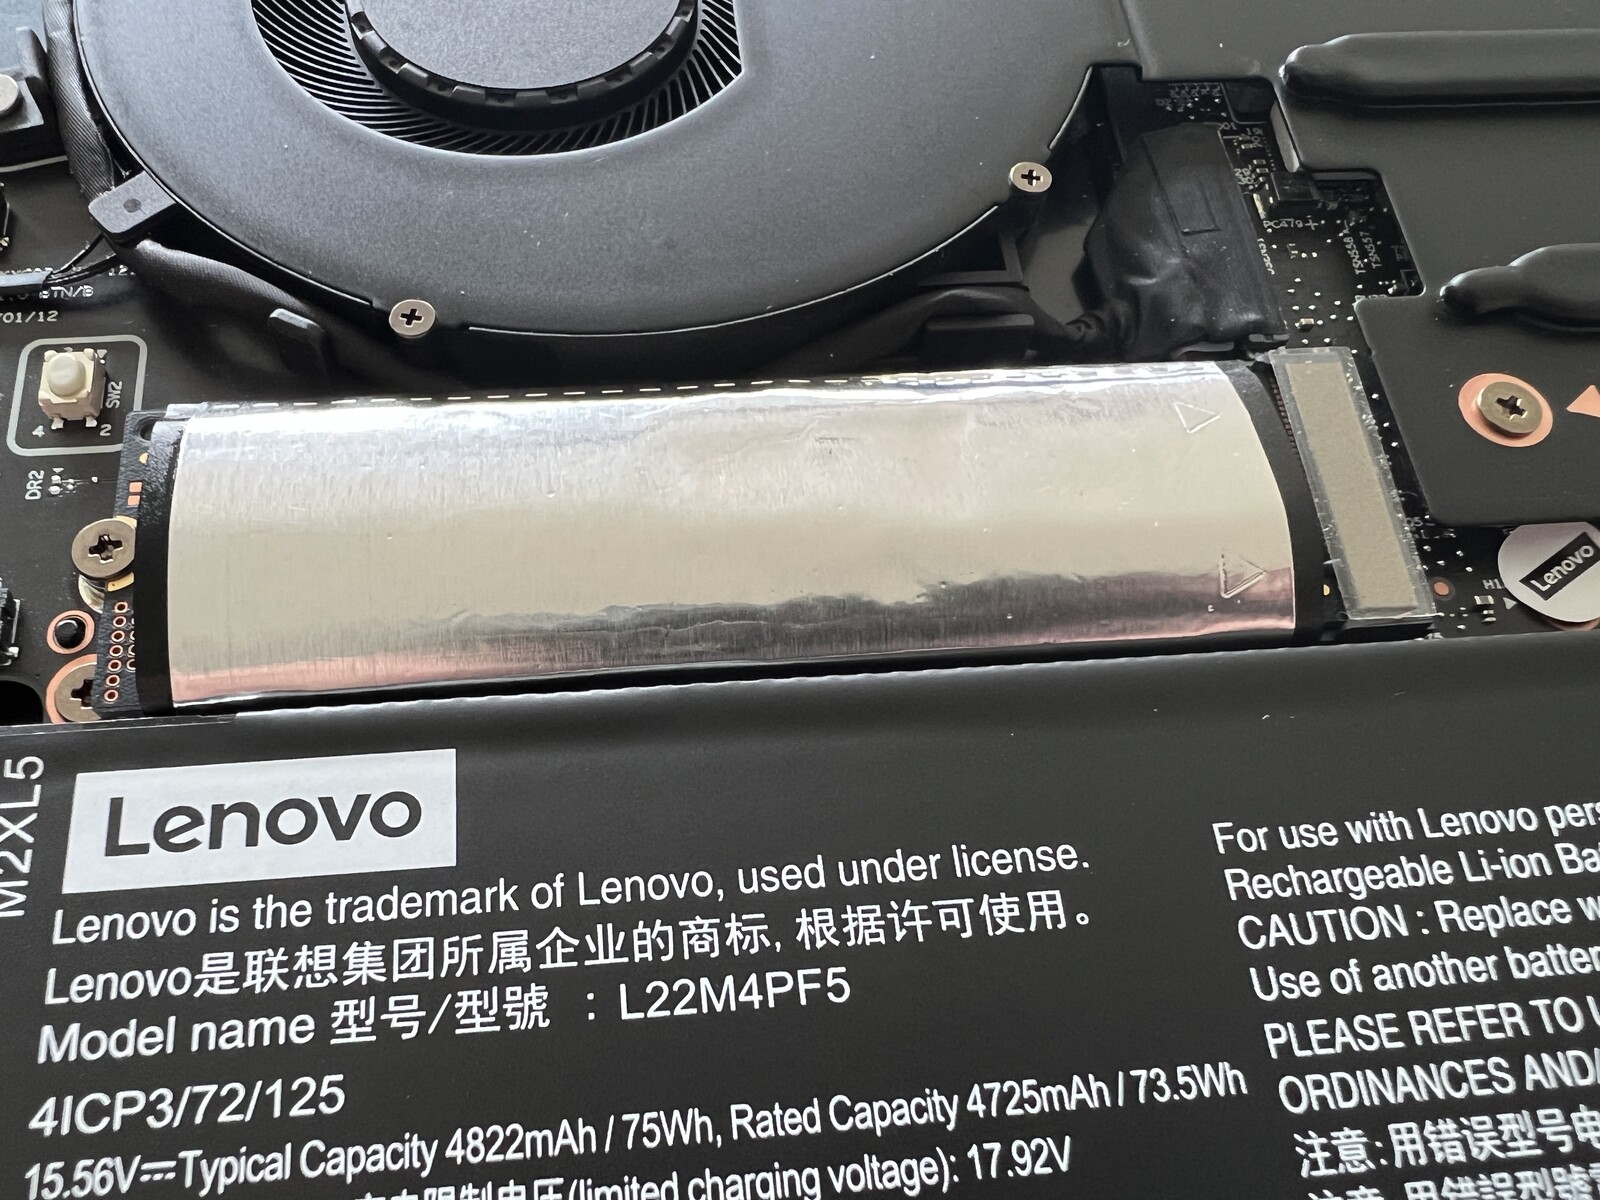
Maintenance
The base plate is secured with a few Torx screws (T5) and comes off easily. You then have access to the two fans, the battery and the two slots for the M.2-2280 SSDs. However, the RAM and the WLAN module are soldered.
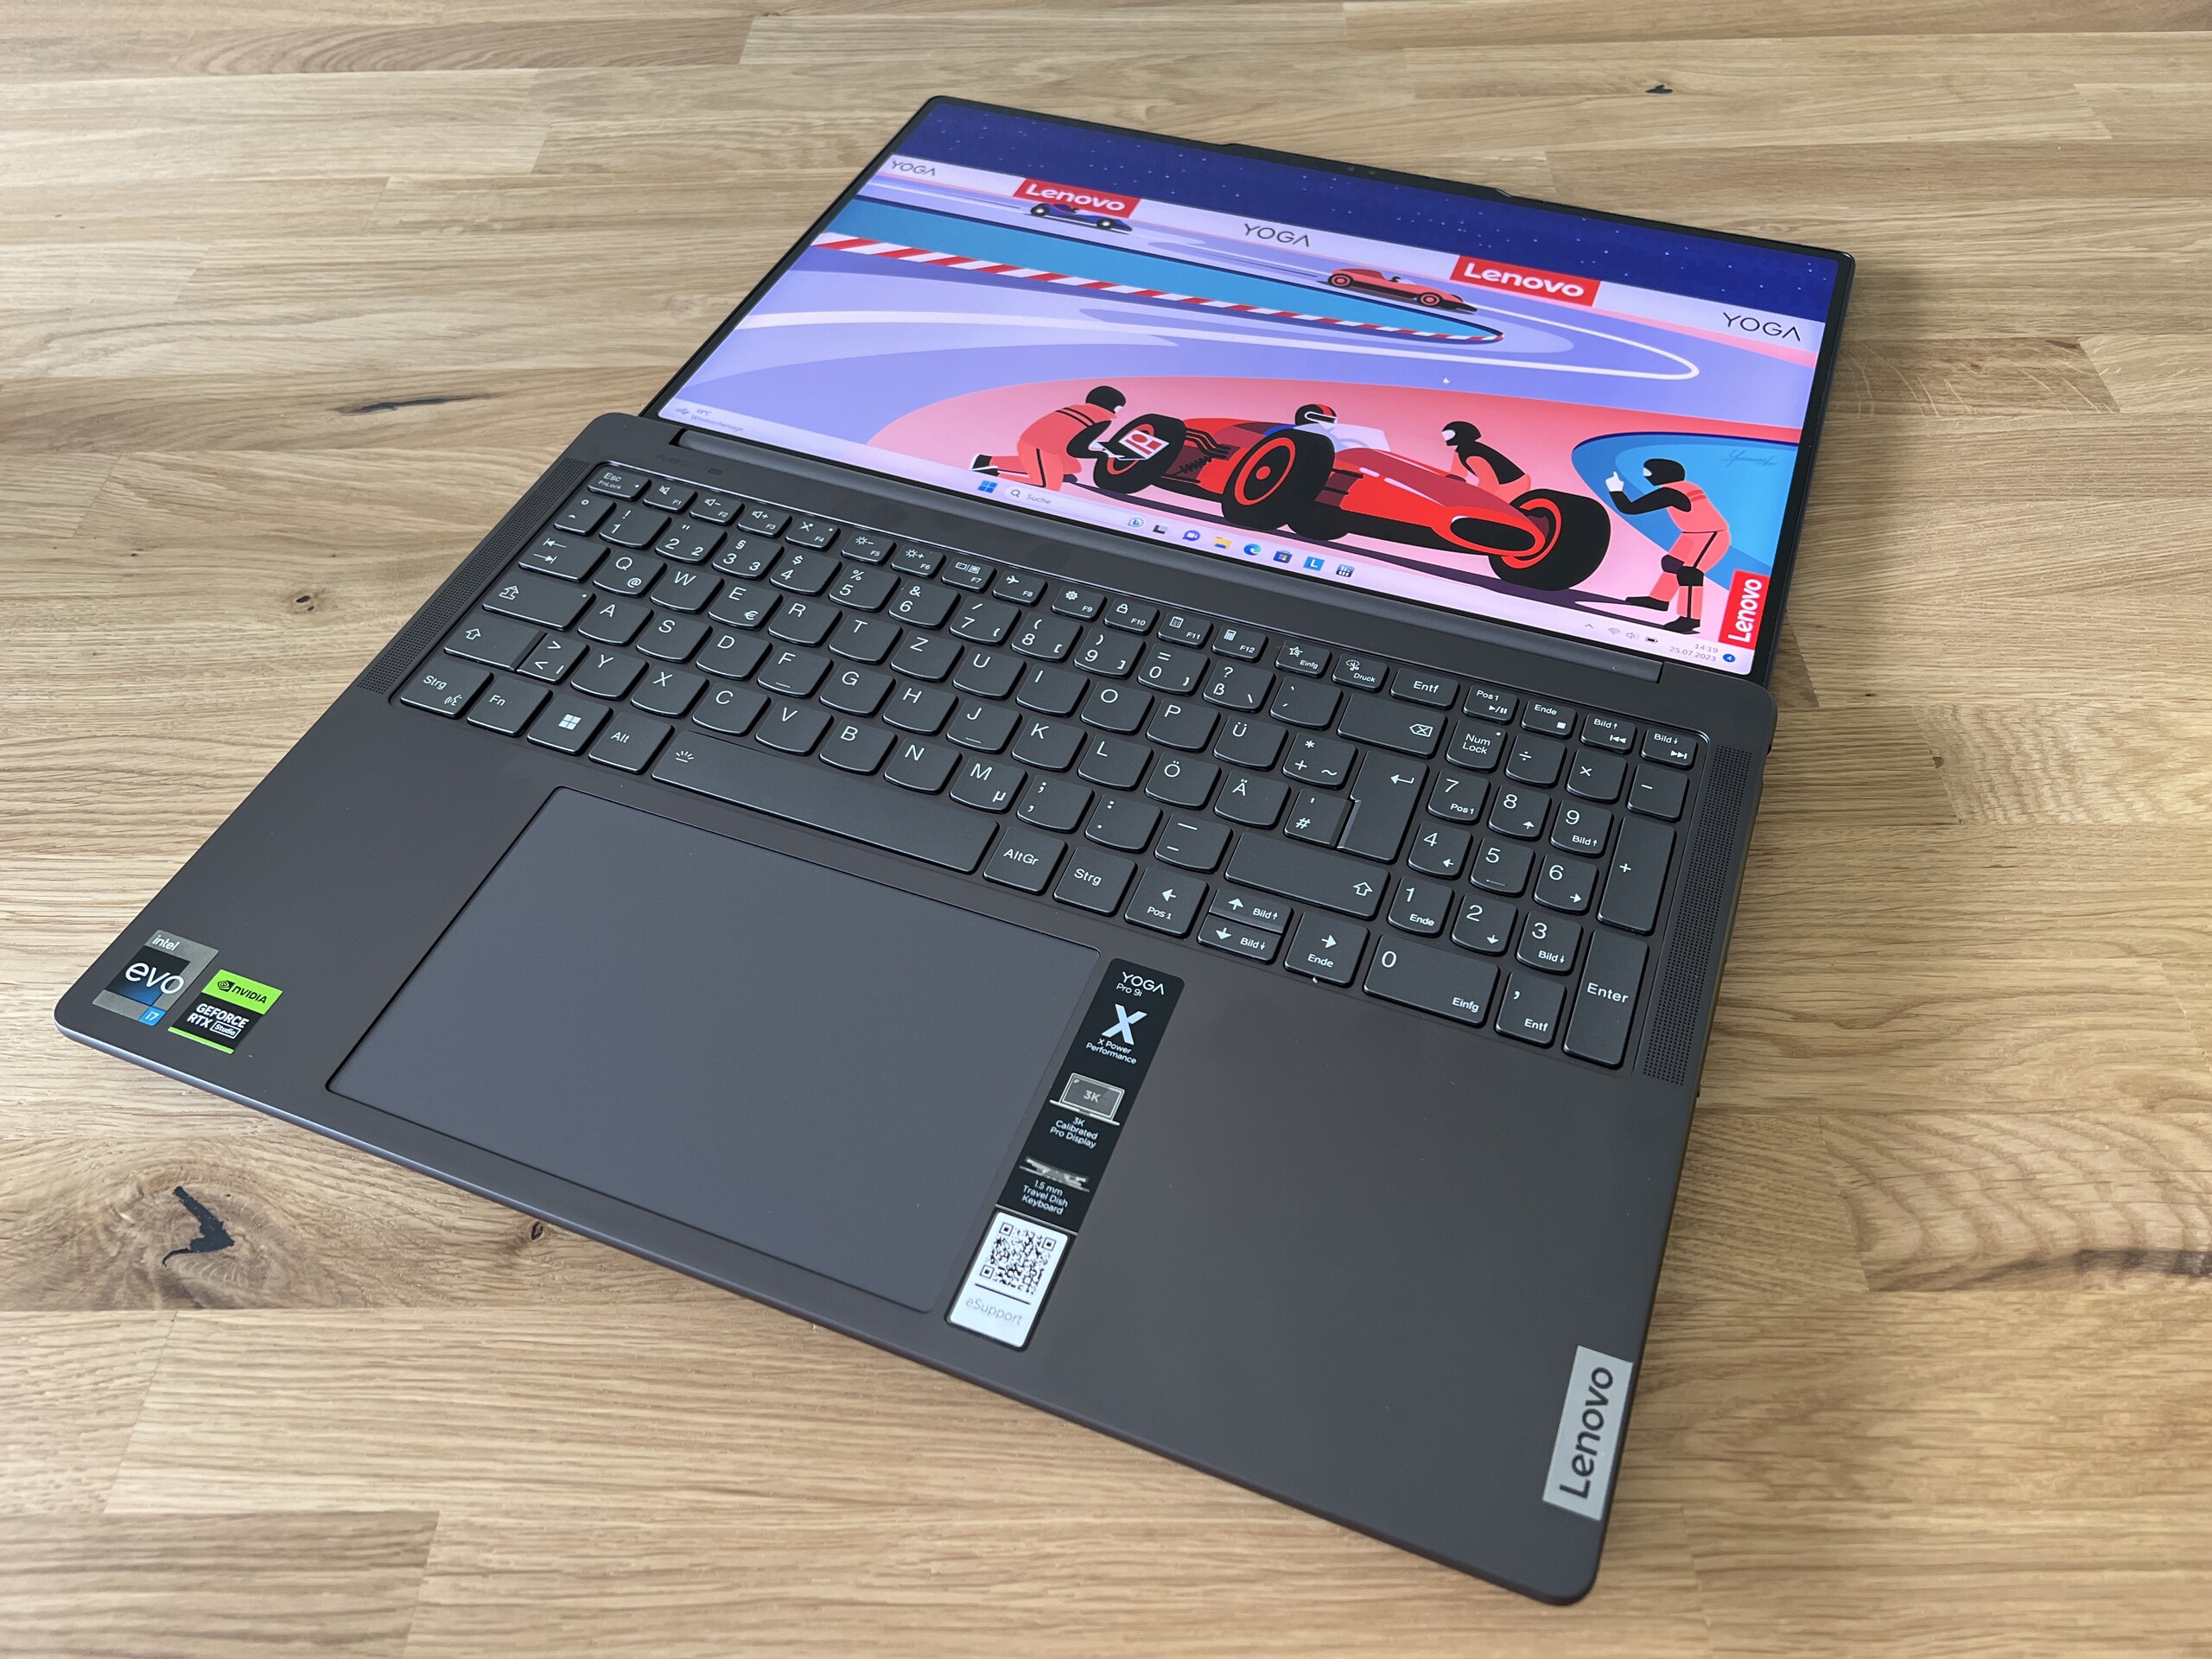
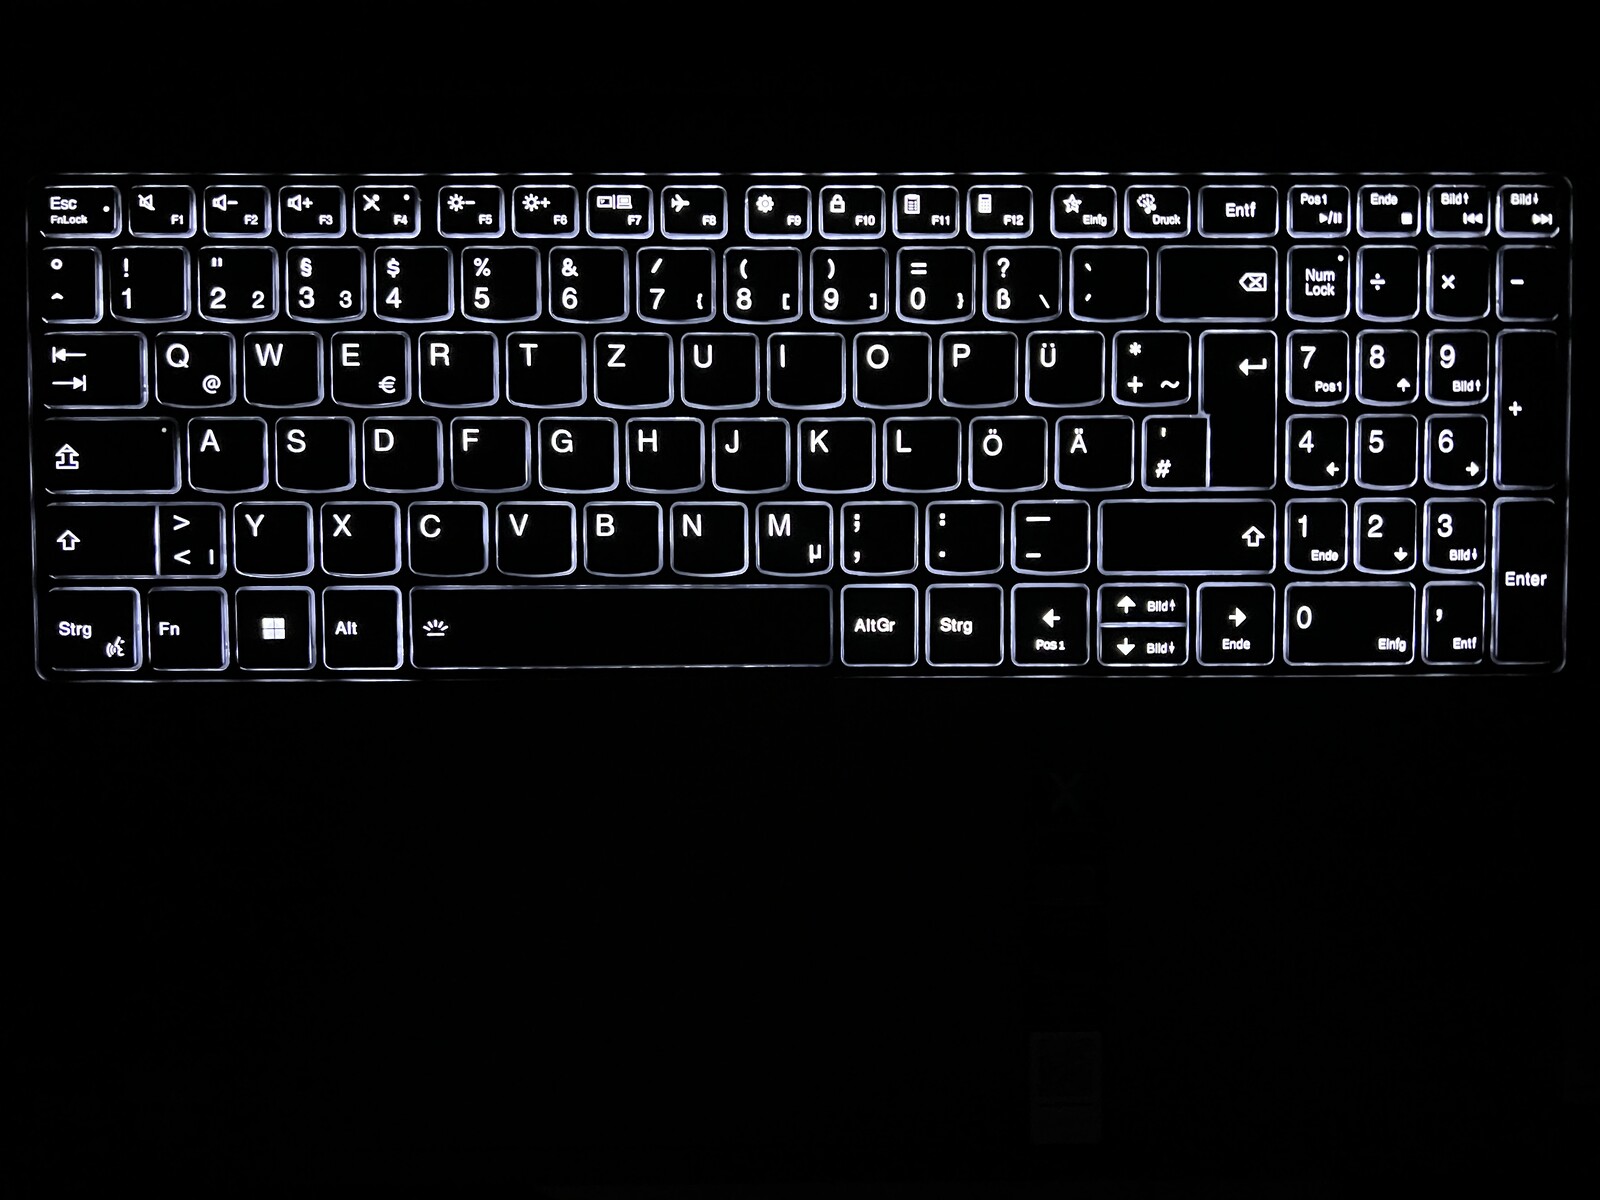
Input Devices - Lenovo installs a good keyboard with numpad
Lenovo doesn't leave the extra case width unused and adds a dedicated number pad to the keyboard. Like in the smaller Yoga Pro 9i 14, the manufacturer installs a comfortable and precise keyboard that also offers sufficient key travel of 1.5 mm. Longer texts can also be typed up without strain. A two-stage white backlight that can be activated automatically via sensor helps in dark environments.
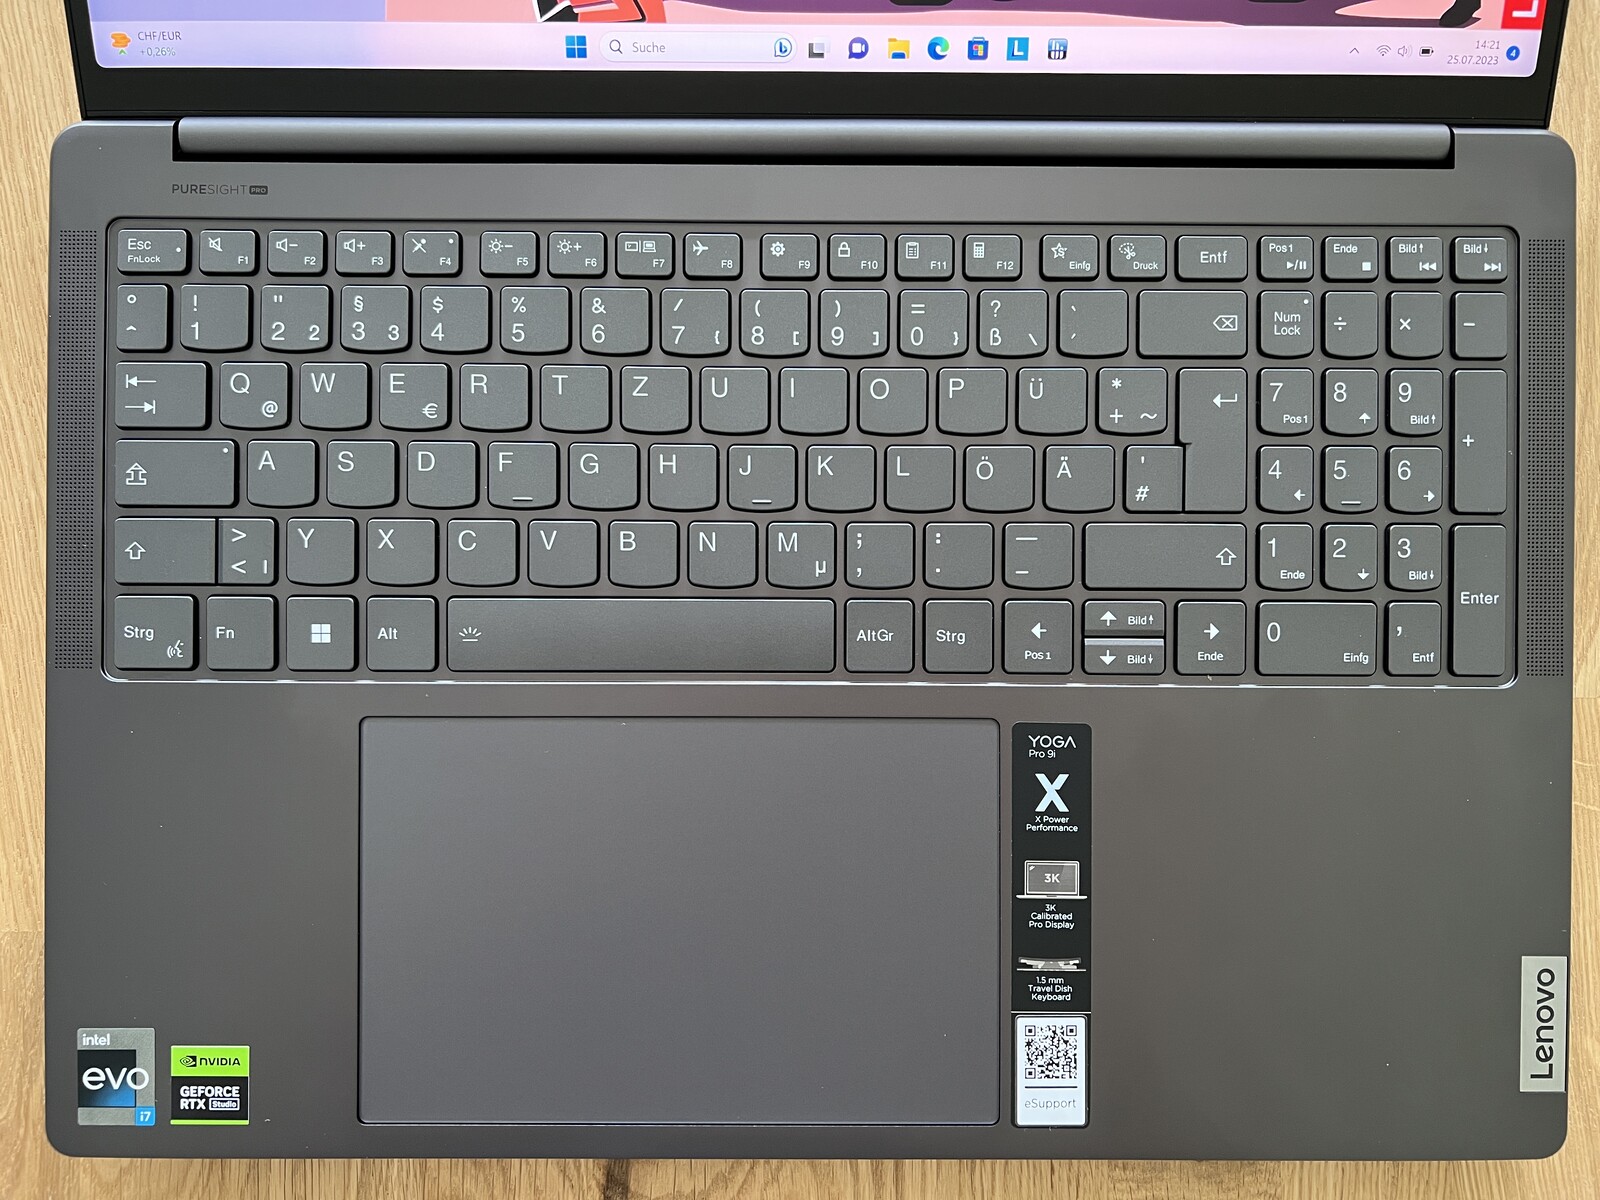
The touchpad of the 16-inch Yoga is even larger and, at 15 x 9.5 cm, offers a lot of space for pointer control and gestures of up to four fingers, which also work very well and reliably thanks to good gliding properties. The lower half can also be pressed down, which is characterized by a very loud and cheap-sound clicking noise. We recommend just tapping the pad for input here. In contrast to the smaller 14-inch model, the touchpad is not in the middle of the case, but is offset slightly to the left.
Display - Mini LED at 165 Hz
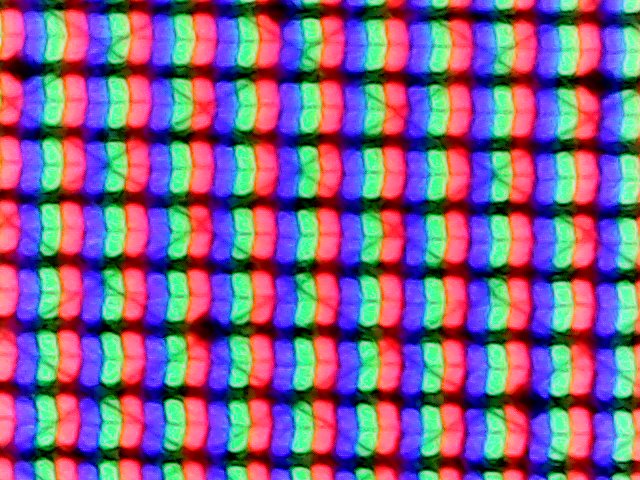
The specs of the display only differ from its smaller sibling in the screen diagonal, as the Yoga Pro 9i 16 also uses a mini LED screen with a resolution of 3,200 x 2,000 (16:10) and a frequency of 165 Hz. The glossy panel also supports touch input. The subjective picture impression is excellent, especially with HDR content. In addition to the mini-LED screen, Lenovo also offers a regular IPS panel (3200x2000 pixels, 165 Hz, sRGB).
There is again a big difference between the SDR and HDR modes: in normal SDR mode the mini-LED backlight is not active and the panel behaves like a normal IPS model. Black content is therefore not completely black and slight halos are also visible. Unlike the 14-inch model, however, the PWM control is different, which is why we were unable to determine response times exactly. Flickering at 5.8 kHz occurs at all brightness levels, but should not be a problem for the vast majority of users.
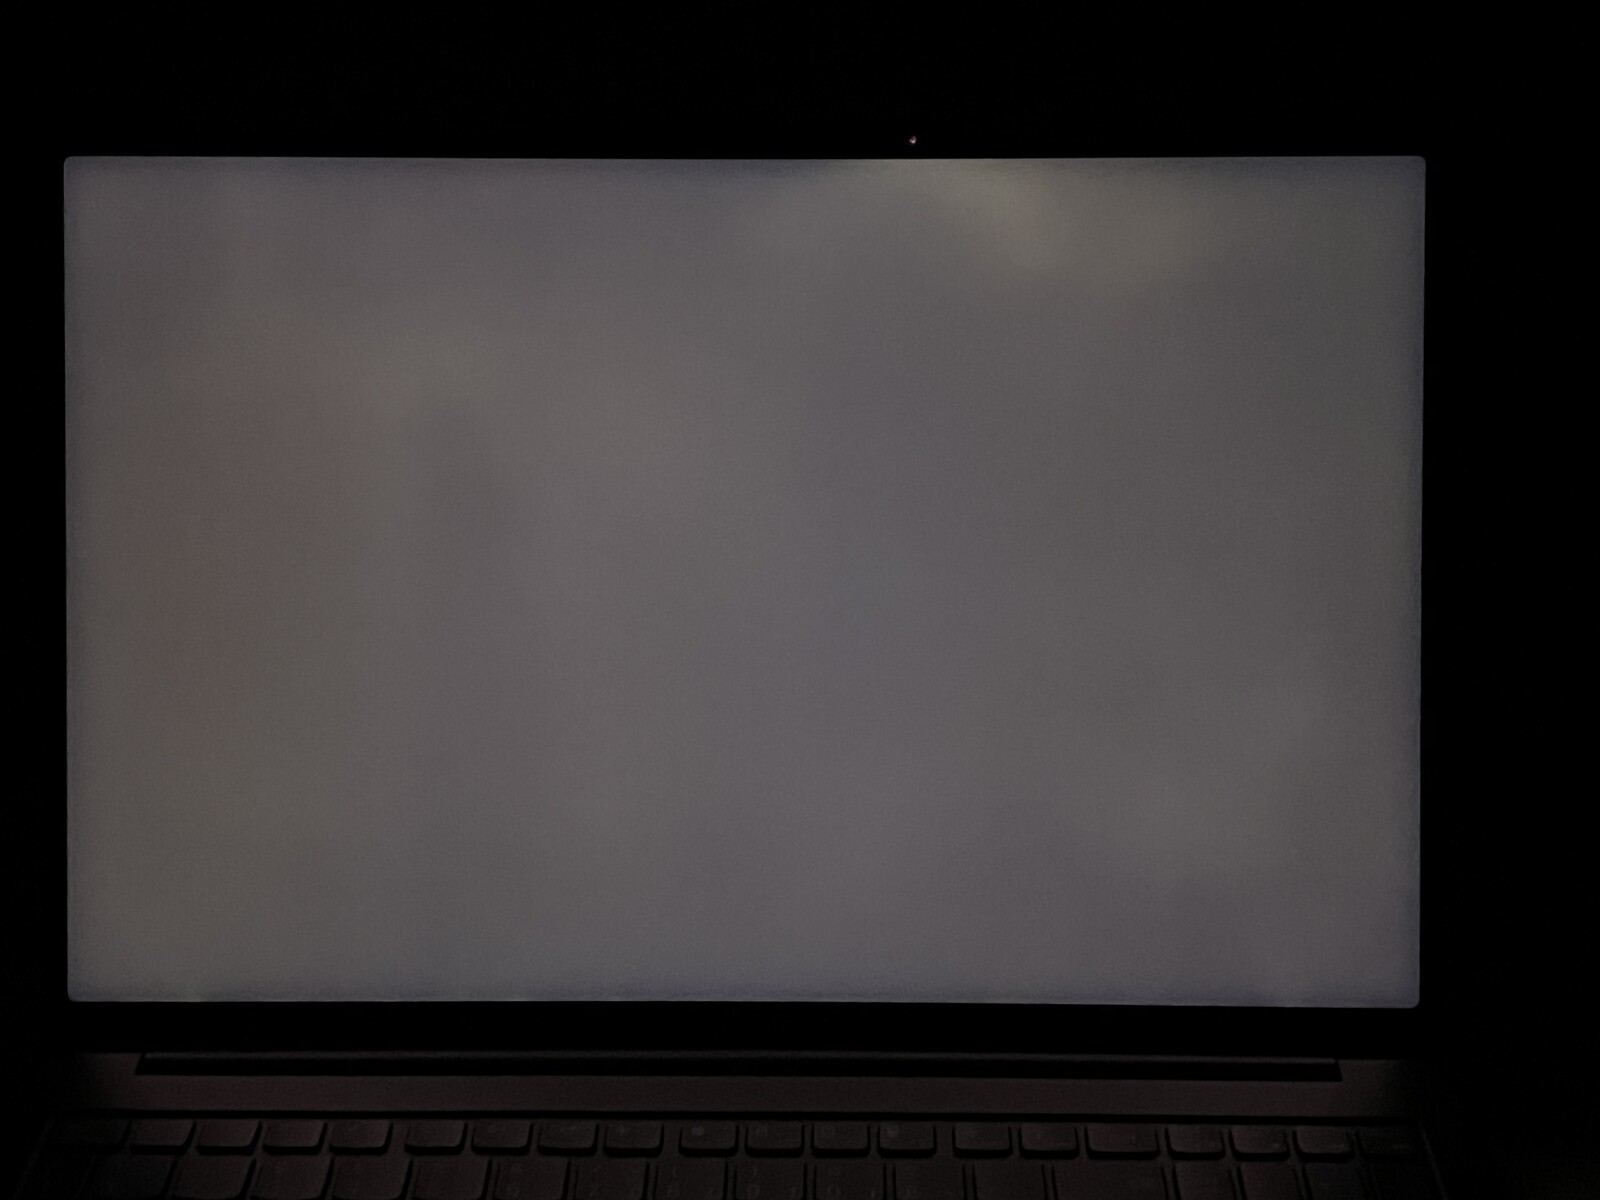
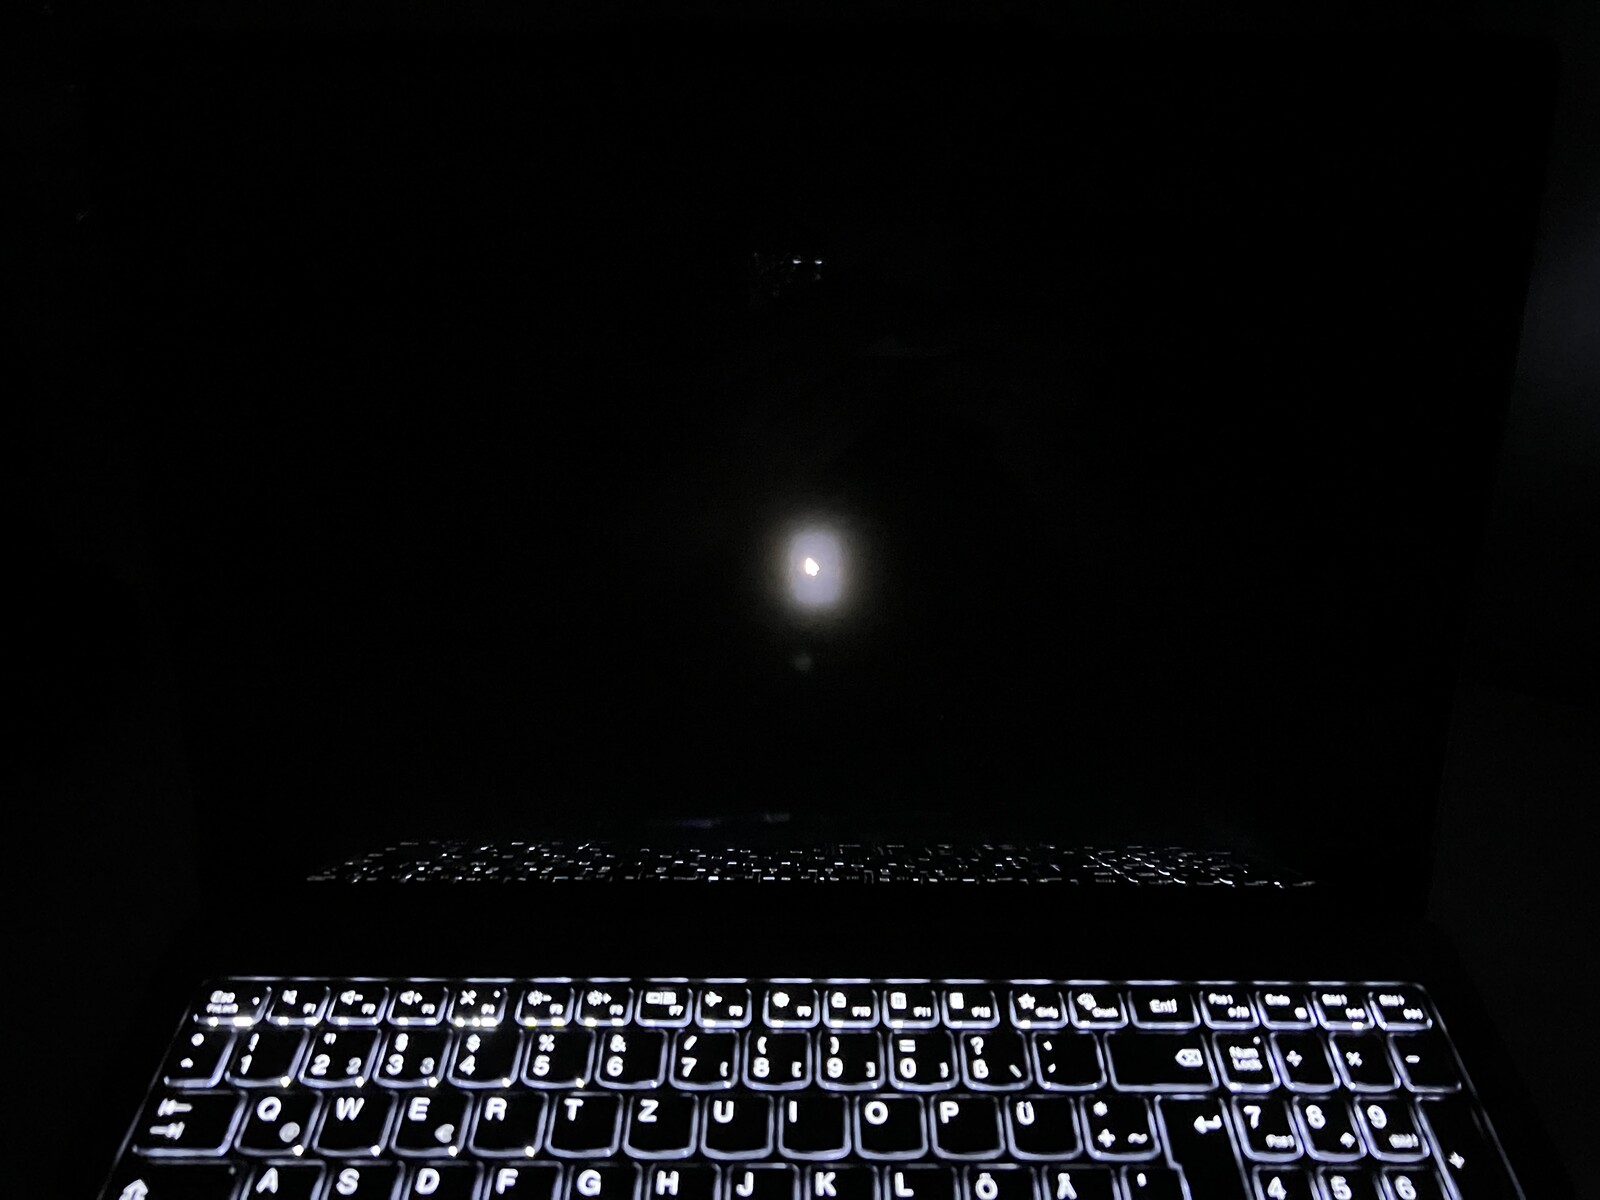
In SDR mode, the 16-inch mini-LED screen reaches a lower brightness of just around 550 cd/m² (~700 cd/m² for the 14-inch panel), which is roughly on par with the MacBook Pro 16. The black value is 0.18 cd/m² in SDR mode, which is why the contrast ratio is "only" ~3,000:1. This is low compared to other mini-LED or OLED panels, but still very good compared to normal IPS screens.


The black value is just 0 in HDR mode, which is why the contrast ratio is also extremely high. Black content is really black here and you can see the difference very clearly in the two comparison images above. With HDR content, the maximum brightness is then just under 1,100 cd/m², which is significantly lower than that of the 14-inch Yoga and also lower than the manufacturer's specification of 1,200 cd/m². HDR mode also results in visible blooming due to the mini-LED zones, although the effect is not particularly pronounced here.
Unfortunately, Windows' HDR implementation still leaves a lot to be desired because the HDR mode has to be activated manually first. This in turn means that Windows no longer offers any color profiles and HDR mode is effectively limited to the sRGB color space.
| |||||||||||||||||||||||||
Brightness Distribution: 96 %
Center on Battery: 545 cd/m²
Contrast: 2994:1 (Black: 0.18 cd/m²)
ΔE ColorChecker Calman: 1.4 | ∀{0.5-29.43 Ø4.73}
ΔE Greyscale Calman: 2.2 | ∀{0.09-98 Ø4.97}
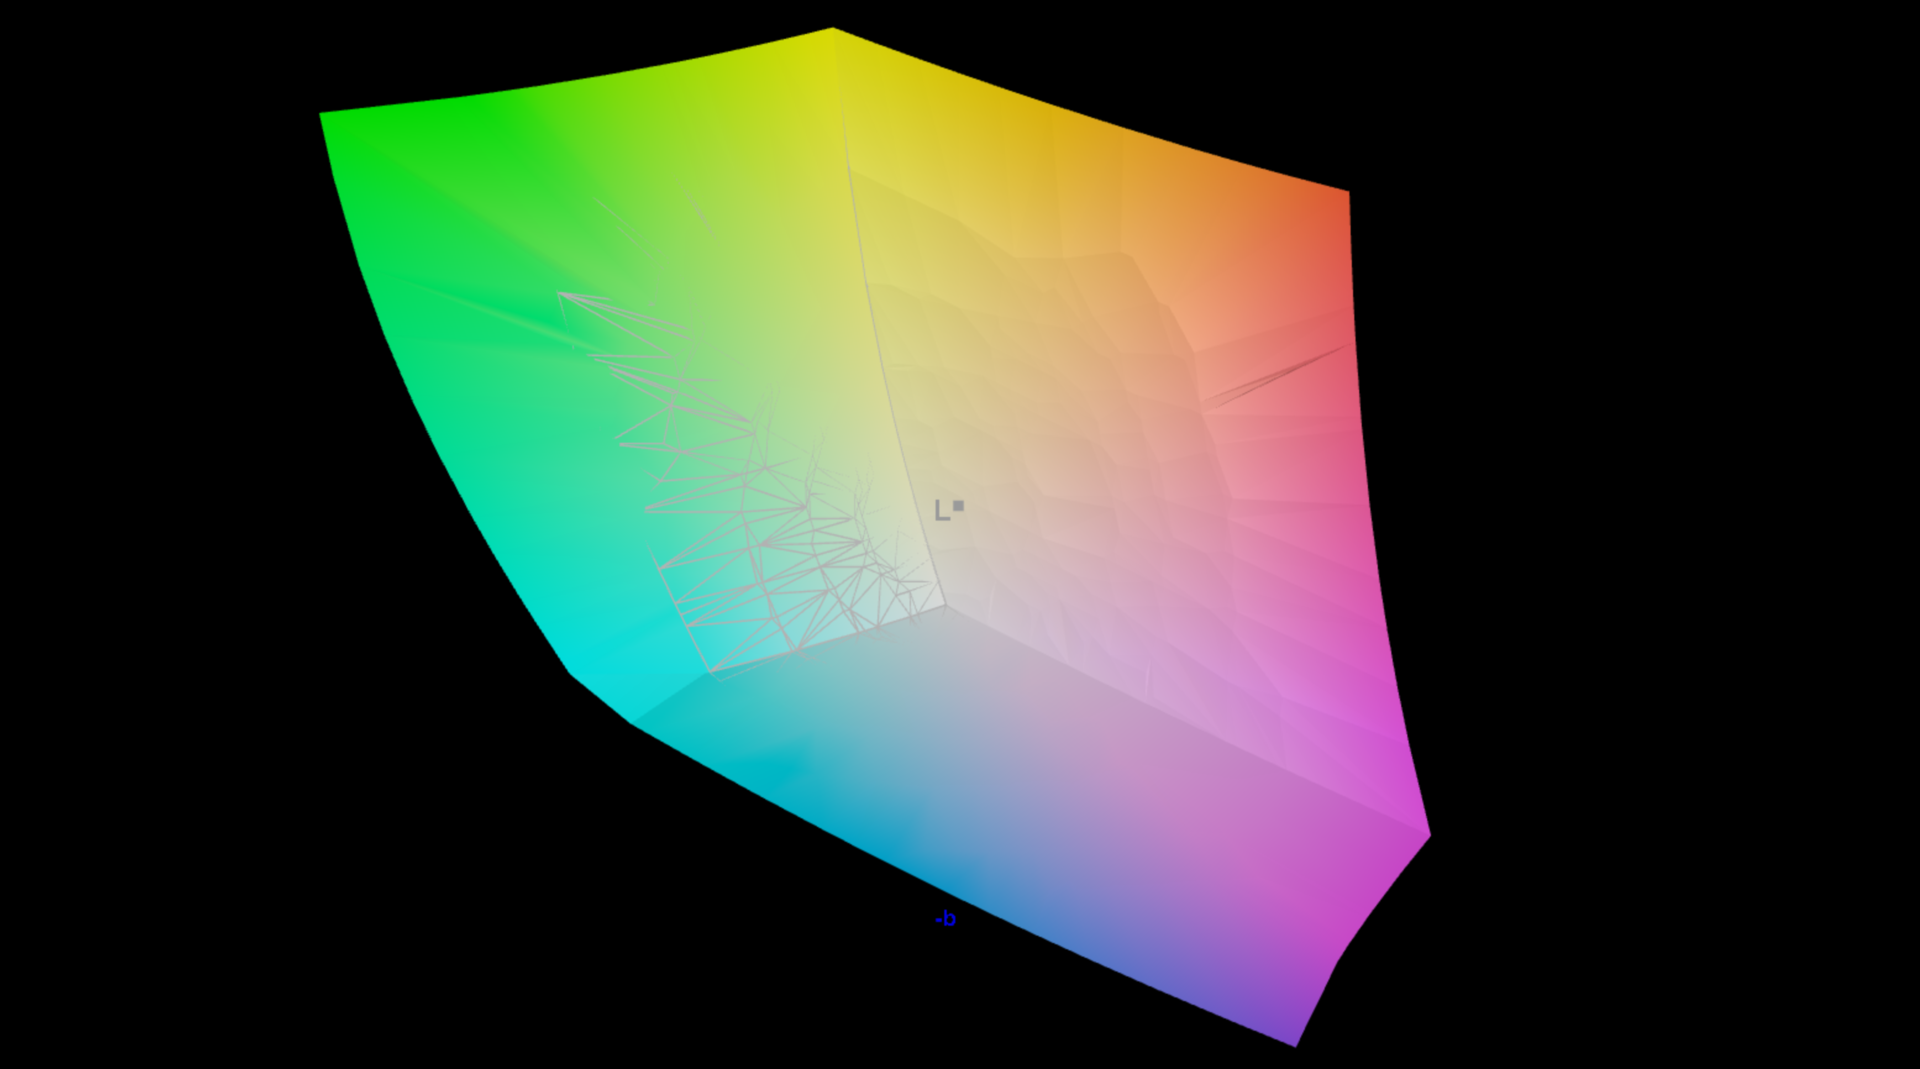
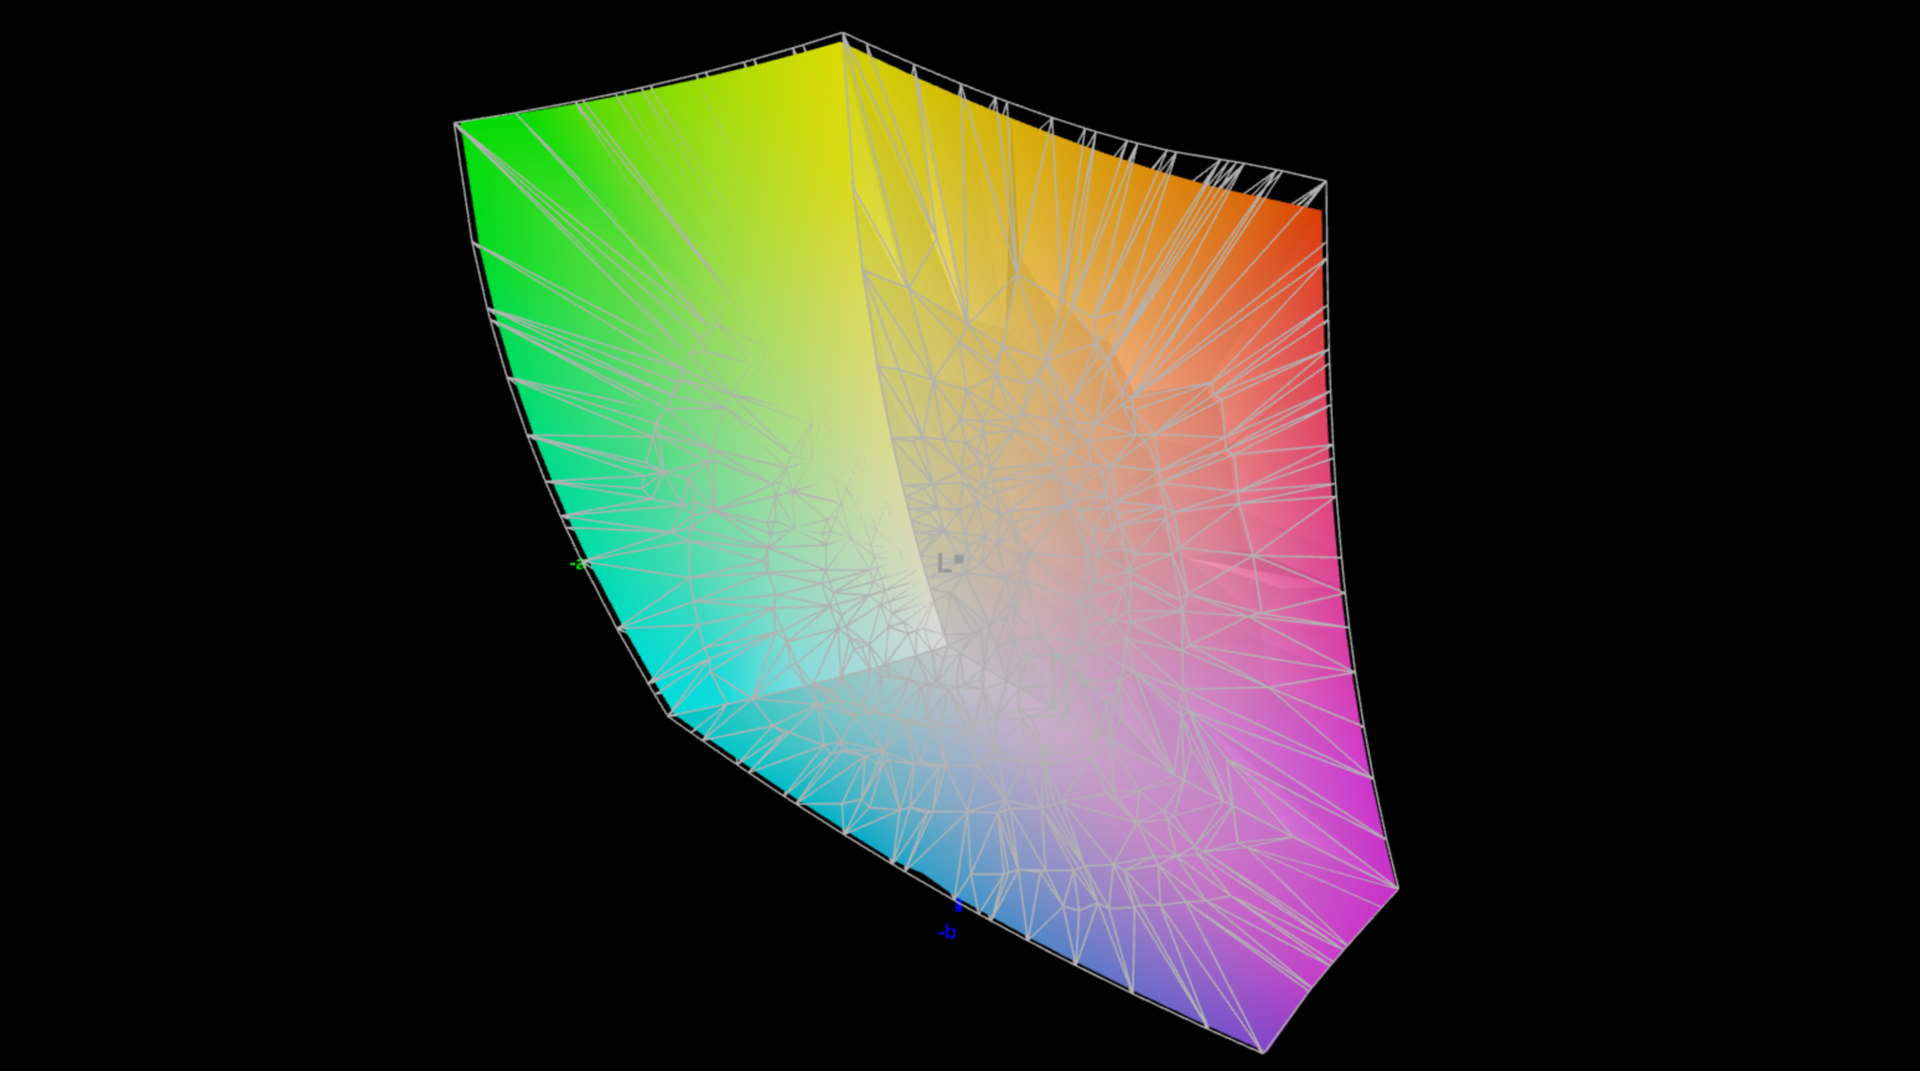
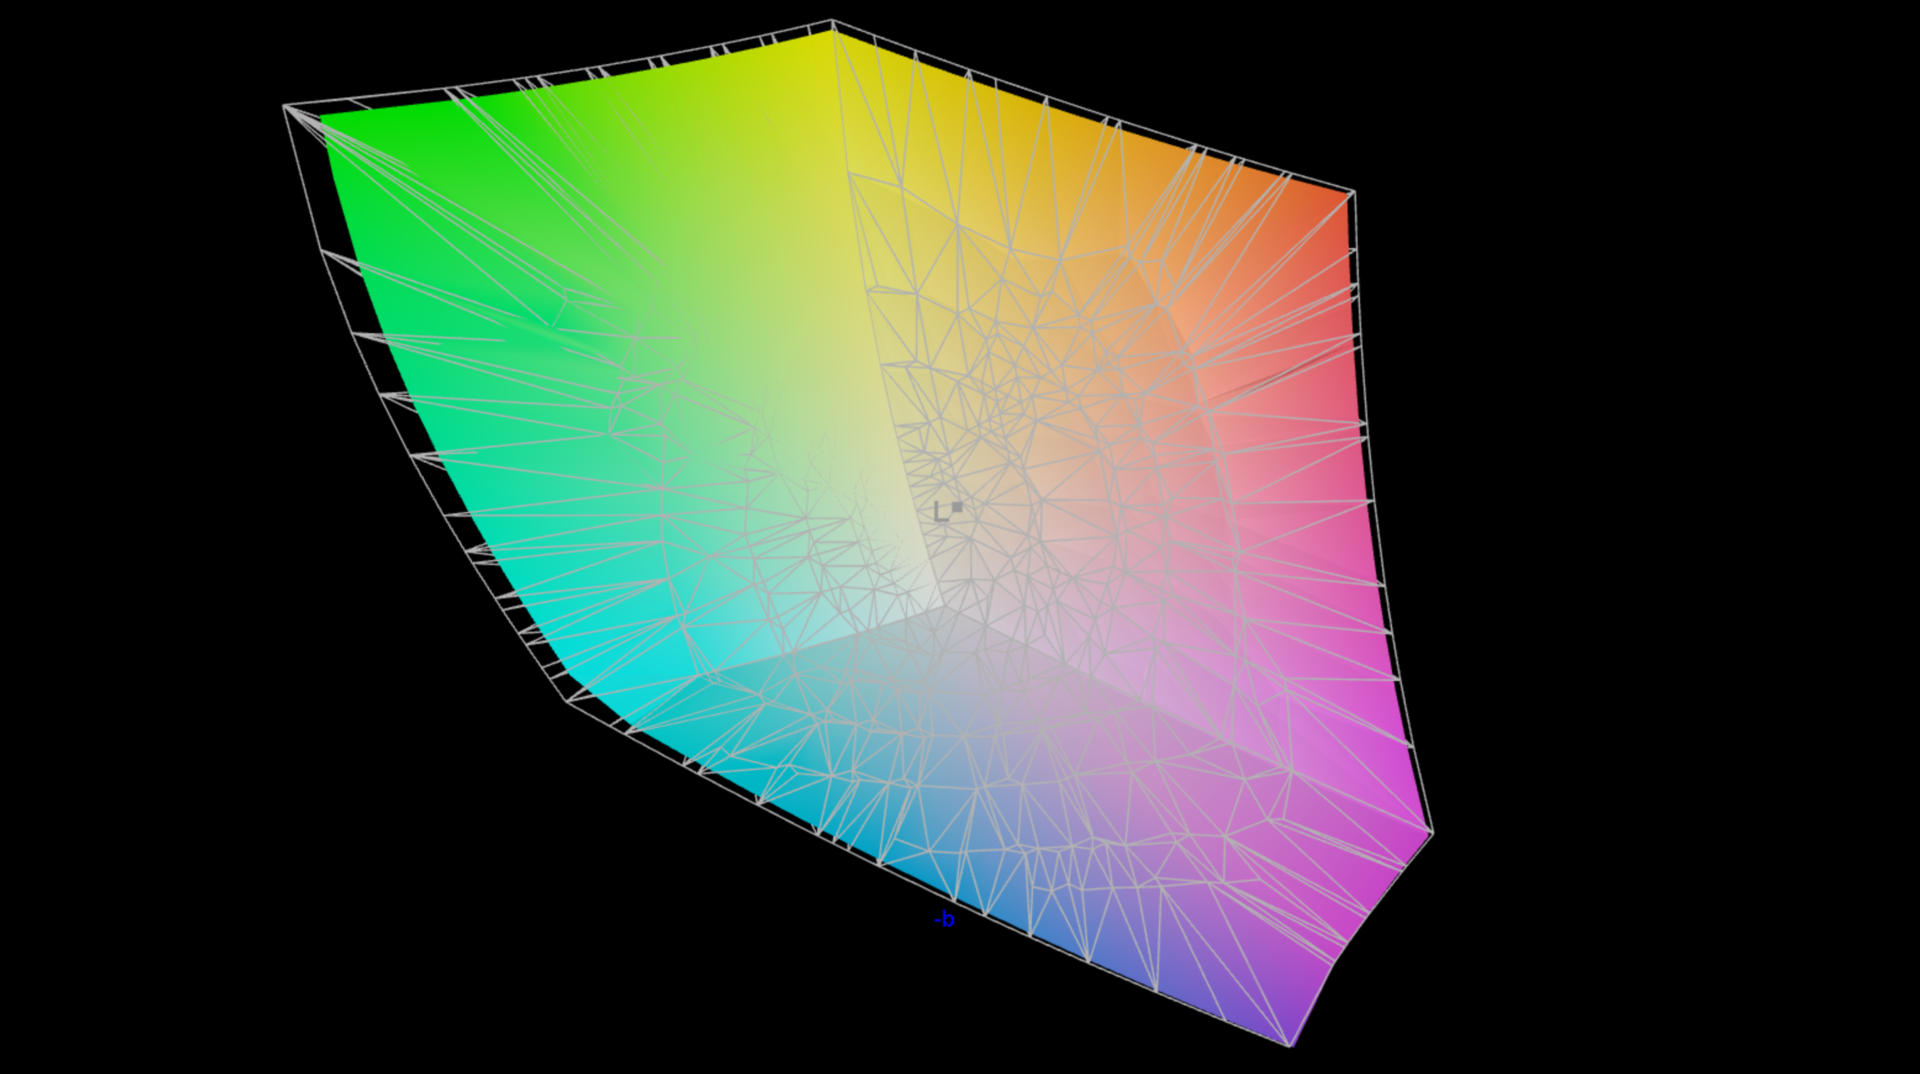
95.1% AdobeRGB 1998 (Argyll 3D)
99.8% sRGB (Argyll 3D)
97% Display P3 (Argyll 3D)
Gamma: 2.19
CCT: 6479 K
| Lenovo Yoga Pro 9 16-IRP G8 LEN160-3.2K, Mini-LED, 3200x2000, 16" | Schenker VISION 16 Pro (M23) NE160QDM-NZ1, IPS, 2560x1600, 16" | Asus Vivobook Pro 16X K6604JV-MX016W Samsung SDC4178 ATNA60BX01-1, OLED, 3200x2000, 16" | Asus ProArt Studiobook 16 OLED H7604 ATNA60BX01-1, OLED, 3200x2000, 16" | MSI Stealth 16 Studio A13VG AUO26A9, IPS, 2560x1600, 16" | Apple MacBook Pro 16 2023 M2 Max Mini-LED, 3456x2234, 16.2" | |
|---|---|---|---|---|---|---|
| Display | -19% | 1% | -1% | -4% | -2% | |
| Display P3 Coverage (%) | 97 | 68.8 -29% | 98.4 1% | 99.6 3% | 96.4 -1% | 99 2% |
| sRGB Coverage (%) | 99.8 | 98.8 -1% | 99.7 0% | 100 0% | 99.7 0% | 100 0% |
| AdobeRGB 1998 Coverage (%) | 95.1 | 70 -26% | 95.8 1% | 89.4 -6% | 84.8 -11% | 88.5 -7% |
| Response Times | 7% | 87% | 94% | 54% | -444% | |
| Response Time Grey 50% / Grey 80% * (ms) | 14 ? | 13.7 ? 2% | 1.6 ? 89% | 0.59 ? 96% | 4.4 ? 69% | 80.5 ? -475% |
| Response Time Black / White * (ms) | 9.2 ? | 8.1 ? 12% | 1.4 ? 85% | 0.79 ? 91% | 5.6 ? 39% | 47.2 ? -413% |
| PWM Frequency (Hz) | 5800 ? | 120 ? | 240 ? | 14880 ? | ||
| Screen | -91% | 4% | 42% | -87% | 2094% | |
| Brightness middle (cd/m²) | 539 | 384 -29% | 347 -36% | 349 -35% | 424 -21% | 504 -6% |
| Brightness (cd/m²) | 546 | 371 -32% | 346 -37% | 350 -36% | 411 -25% | 487 -11% |
| Brightness Distribution (%) | 96 | 88 -8% | 97 1% | 95 -1% | 88 -8% | 94 -2% |
| Black Level * (cd/m²) | 0.18 | 0.3 -67% | 0.06 67% | 0.02 89% | 0.37 -106% | 0.001 99% |
| Contrast (:1) | 2994 | 1280 -57% | 5783 93% | 17450 483% | 1146 -62% | 504000 16734% |
| Colorchecker dE 2000 * | 1.4 | 3.4 -143% | 1.89 -35% | 2.1 -50% | 3.04 -117% | 1.5 -7% |
| Colorchecker dE 2000 max. * | 2.1 | 9.2 -338% | 3.26 -55% | 5.5 -162% | 7.5 -257% | 3.3 -57% |
| Greyscale dE 2000 * | 2.2 | 3.4 -55% | 1.55 30% | 1.2 45% | 4.34 -97% | 2.1 5% |
| Gamma | 2.19 100% | 2.16 102% | 2.39 92% | 2.19 100% | 2.32 95% | 2.25 98% |
| CCT | 6479 100% | 7462 87% | 6458 101% | 6545 99% | 6952 93% | 6882 94% |
| Colorchecker dE 2000 calibrated * | 1.3 | 1.97 | 2.1 | 3.04 | ||
| Total Average (Program / Settings) | -34% /
-59% | 31% /
16% | 45% /
40% | -12% /
-46% | 549% /
1220% |
* ... smaller is better
We measured the panel using professional CalMAN software. In the preinstalled Lenovo Vantage software, you can choose between the sRGB, Display P3 and AdobeRGB color profiles. Since Lenovo advertises full AdobeRGB coverage, we also used this profile for our measurements.

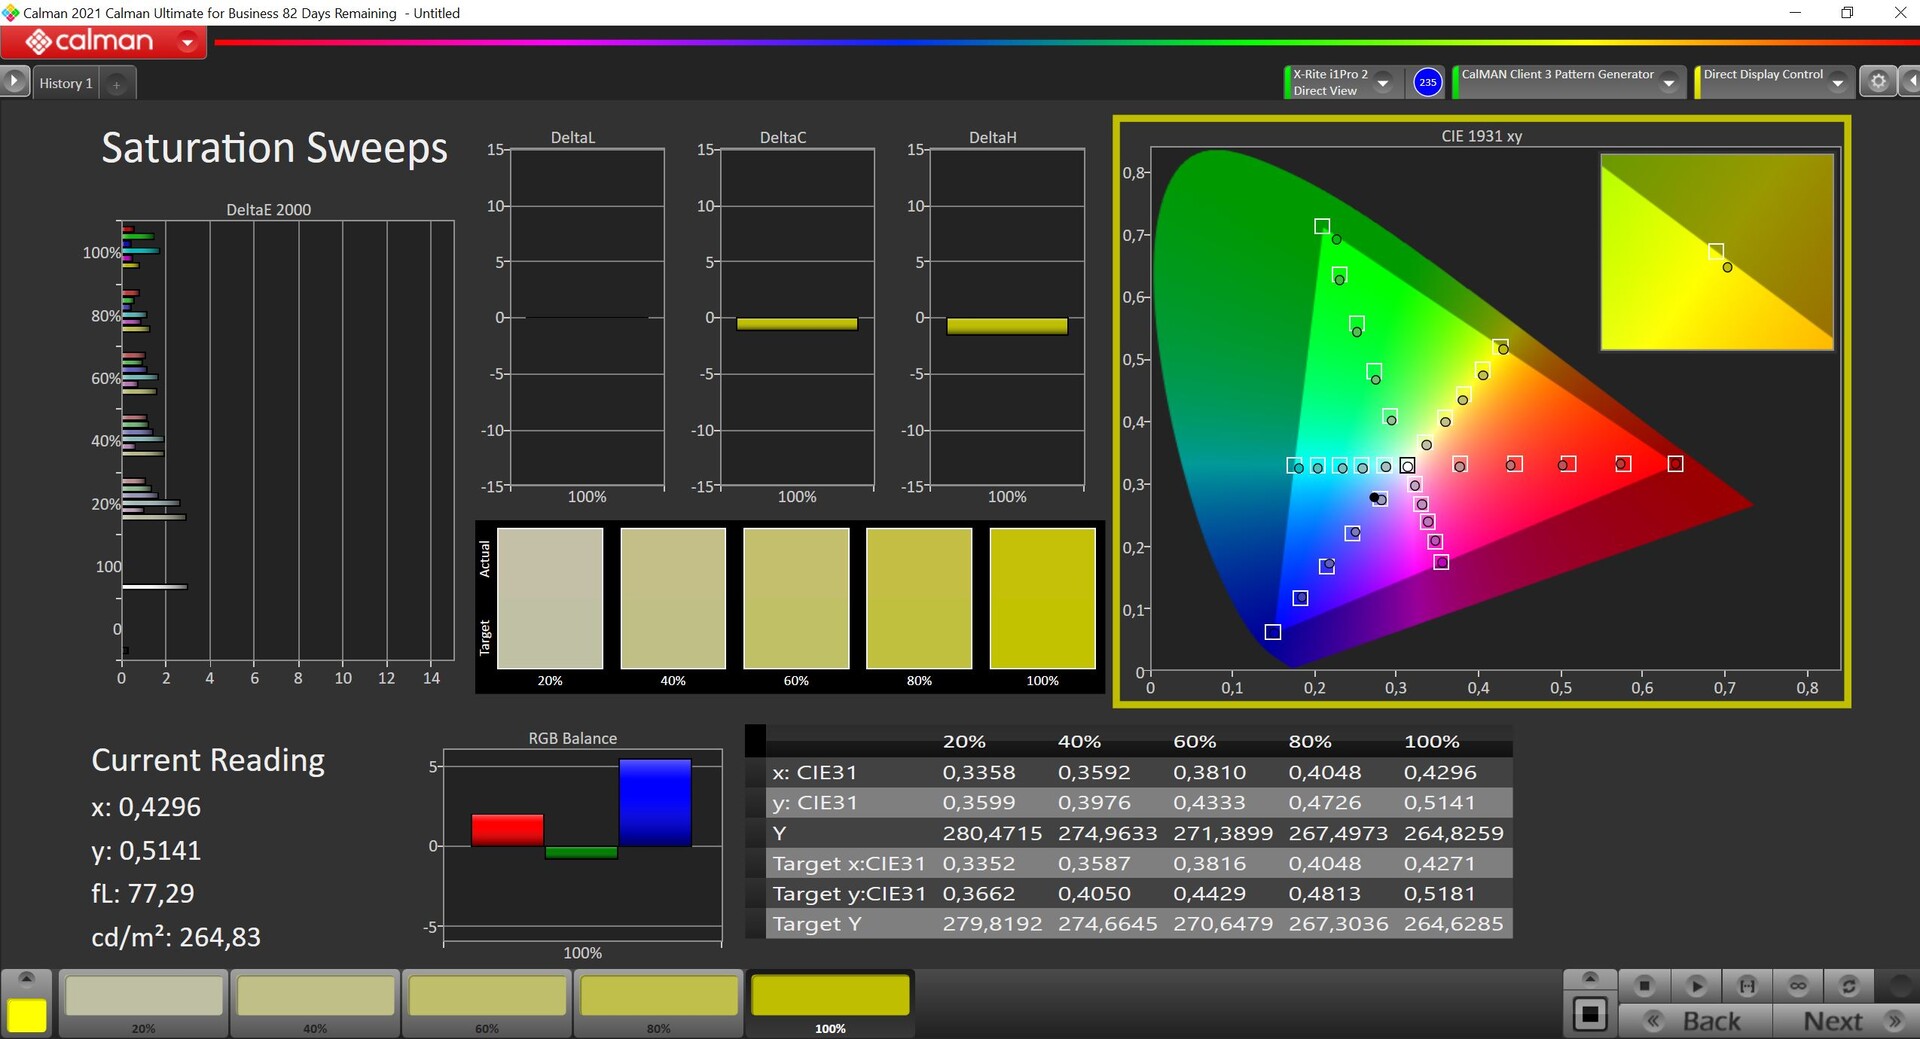
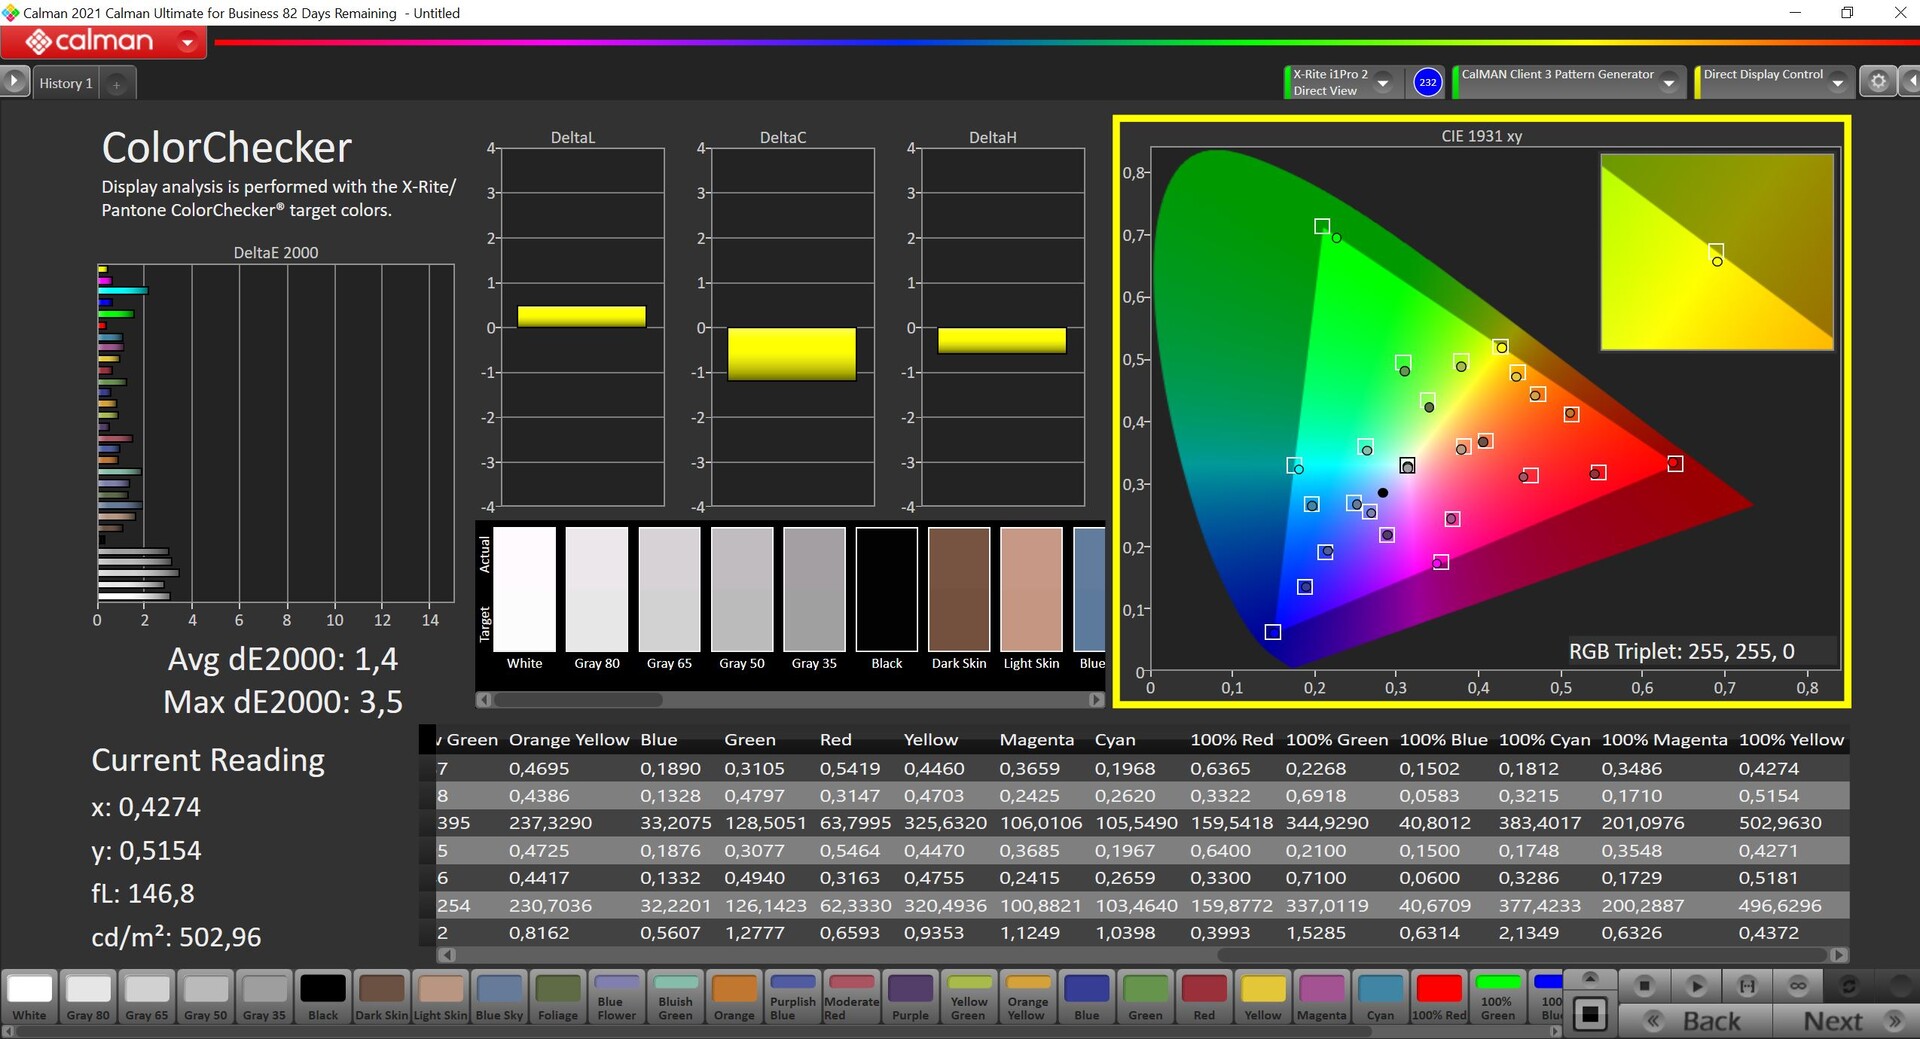
The panel's standard calibration turns out much better than the 14-inch model and the average DeltaE-2000 deviation is already below 3, both for grayscale and colors (no outliers here either). We were unable to confirm the advertised DeltaE value of <1, but a subsequent calibration isn't really necessary here and we unable to improve the display with our own calibration, which is why we do not offer a color profile for download at this point. The panel almost completely covers both the P3 and the AdobeRGB color spaces.
Display Response Times
| ↔ Response Time Black to White | ||
|---|---|---|
| 9.2 ms ... rise ↗ and fall ↘ combined | ↗ 2.2 ms rise | 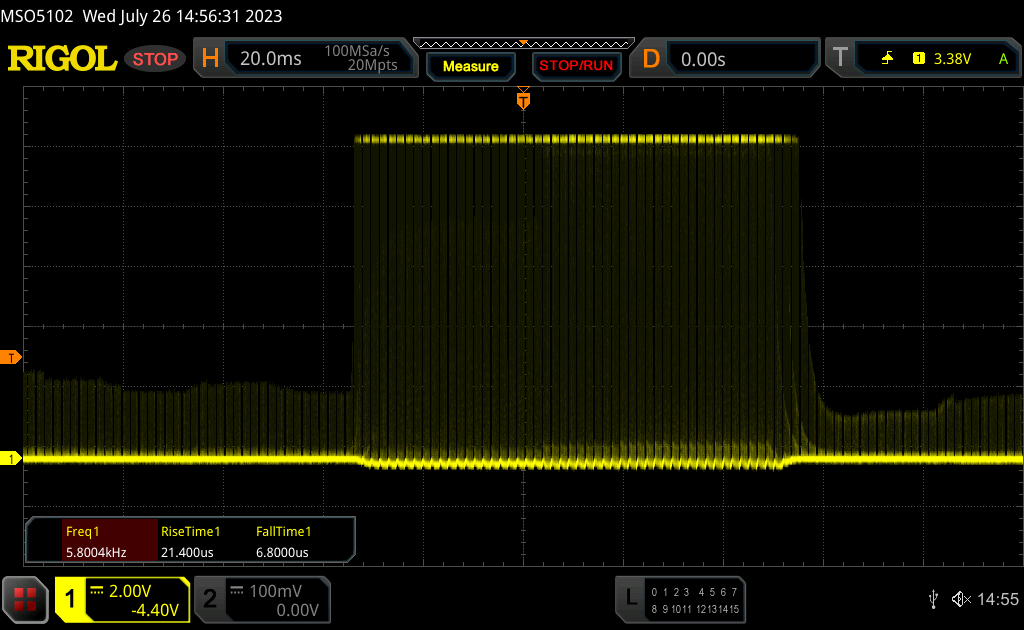 |
| ↘ 7 ms fall | ||
| The screen shows fast response rates in our tests and should be suited for gaming. In comparison, all tested devices range from 0.1 (minimum) to 240 (maximum) ms. » 25 % of all devices are better. This means that the measured response time is better than the average of all tested devices (19.9 ms). | ||
| ↔ Response Time 50% Grey to 80% Grey | ||
| 14 ms ... rise ↗ and fall ↘ combined | ↗ 7.5 ms rise | 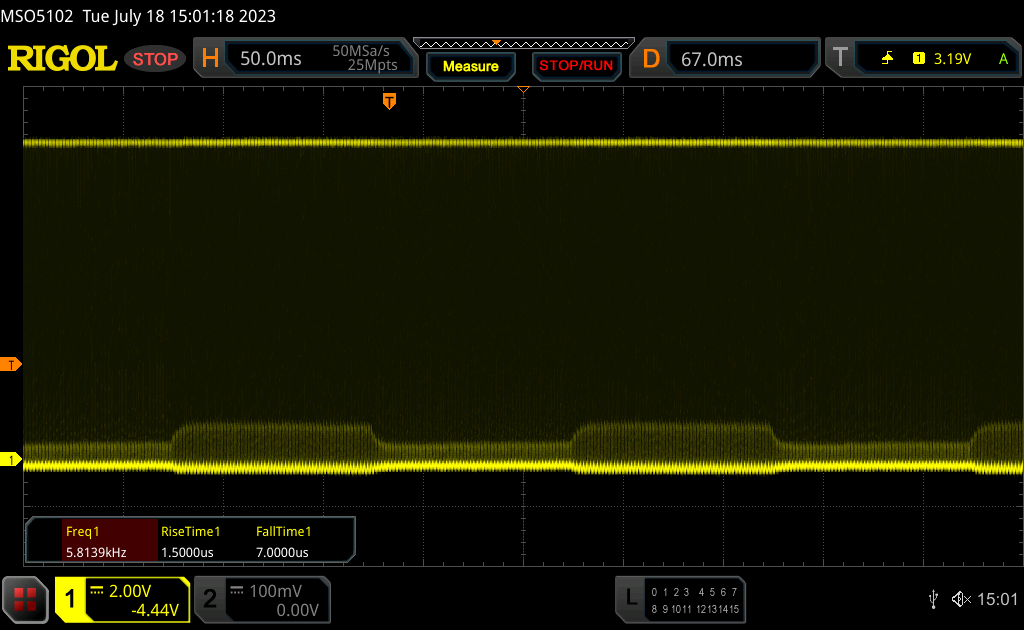 |
| ↘ 6.5 ms fall | ||
| The screen shows good response rates in our tests, but may be too slow for competitive gamers. In comparison, all tested devices range from 0.165 (minimum) to 636 (maximum) ms. » 28 % of all devices are better. This means that the measured response time is better than the average of all tested devices (31.1 ms). | ||
Screen Flickering / PWM (Pulse-Width Modulation)
| Screen flickering / PWM detected | 5800 Hz | ≤ 100 % brightness setting | 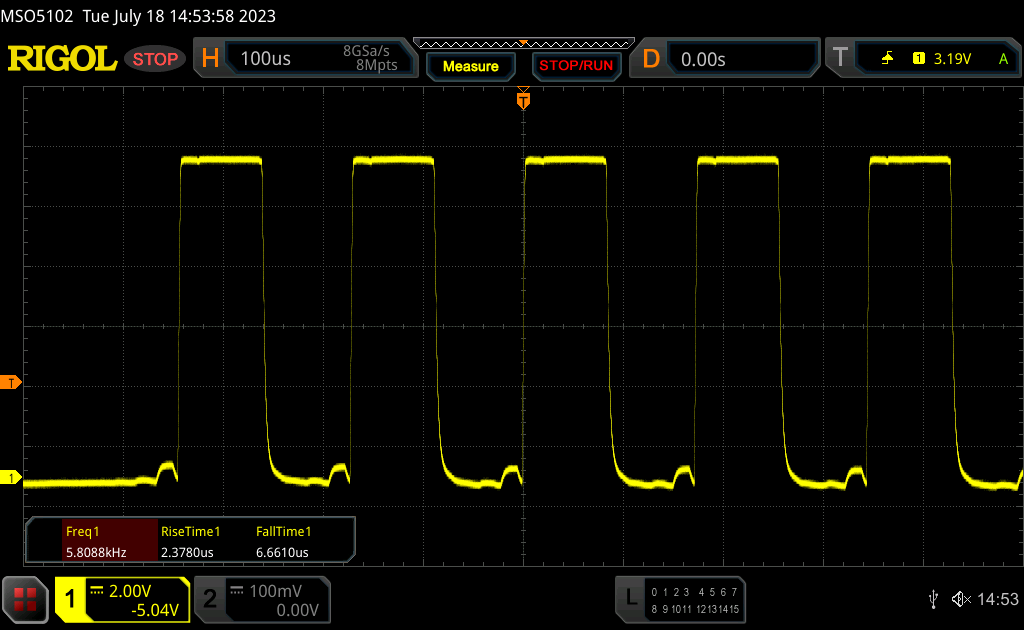 |
The display backlight flickers at 5800 Hz (worst case, e.g., utilizing PWM) Flickering detected at a brightness setting of 100 % and below. There should be no flickering or PWM above this brightness setting. The frequency of 5800 Hz is quite high, so most users sensitive to PWM should not notice any flickering. In comparison: 52 % of all tested devices do not use PWM to dim the display. If PWM was detected, an average of 7798 (minimum: 5 - maximum: 343500) Hz was measured. | |||

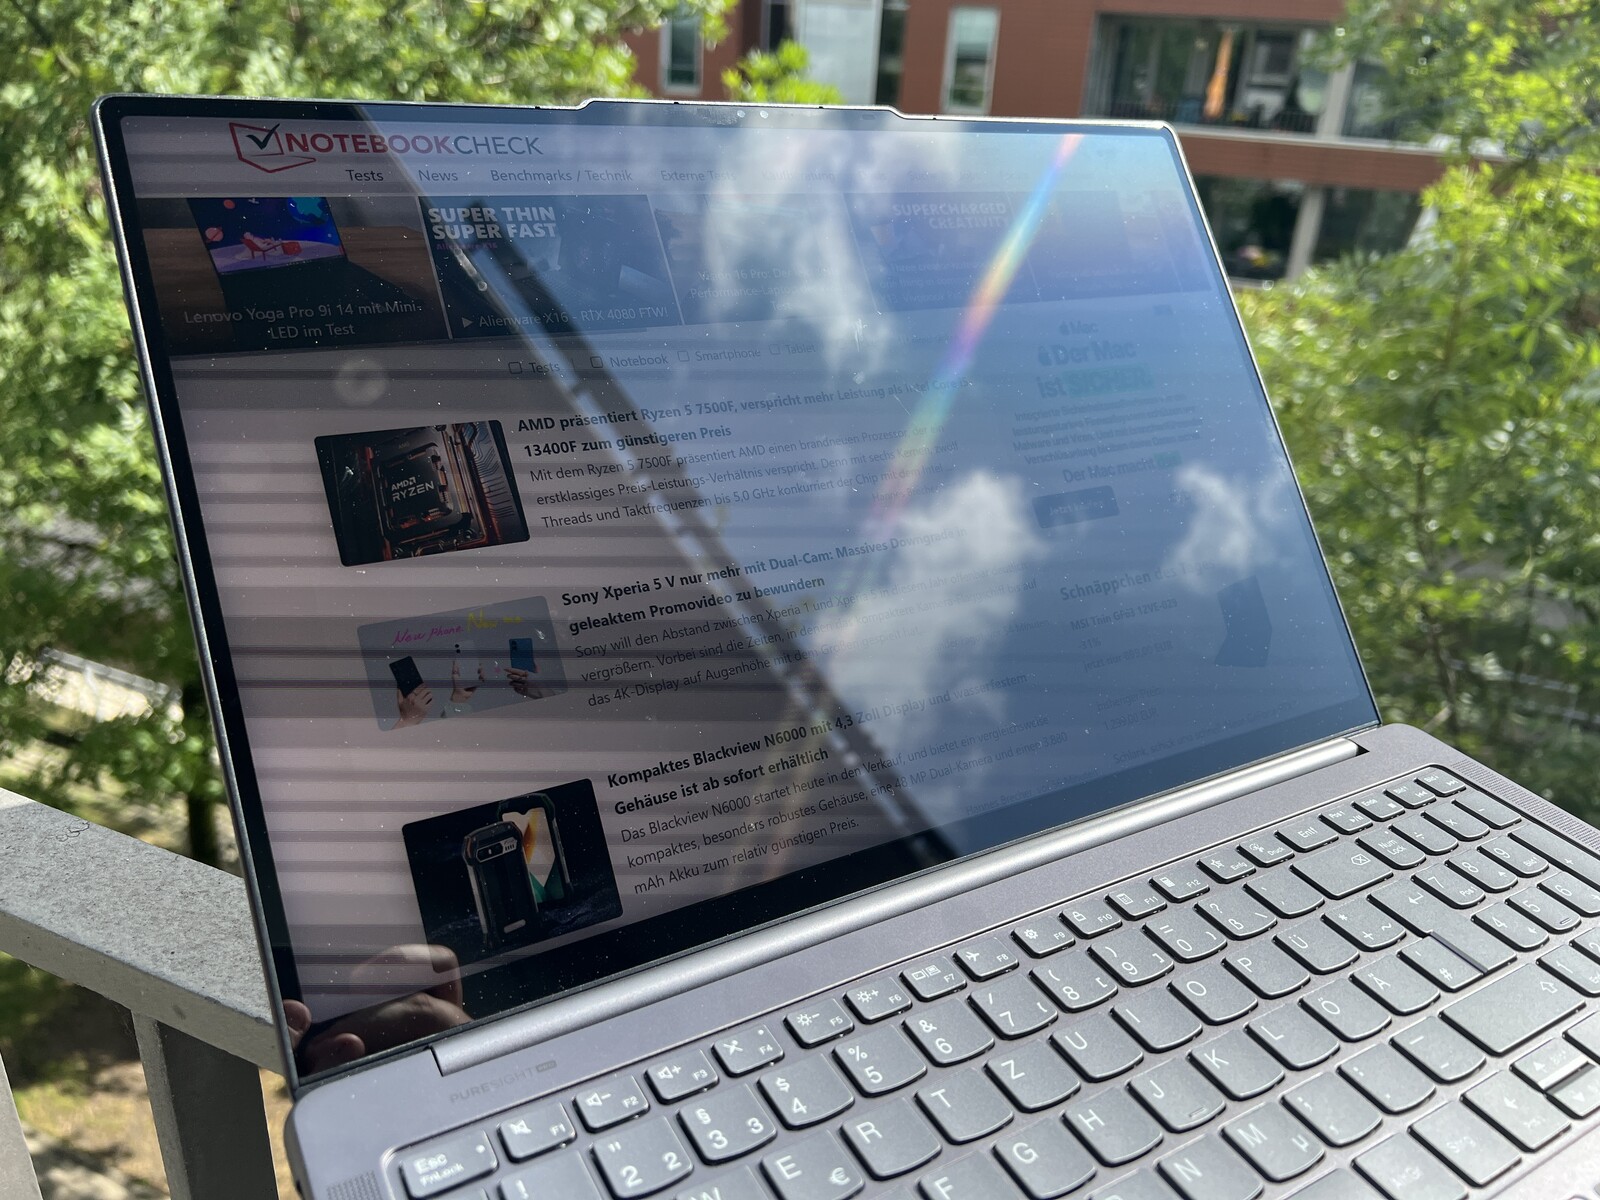
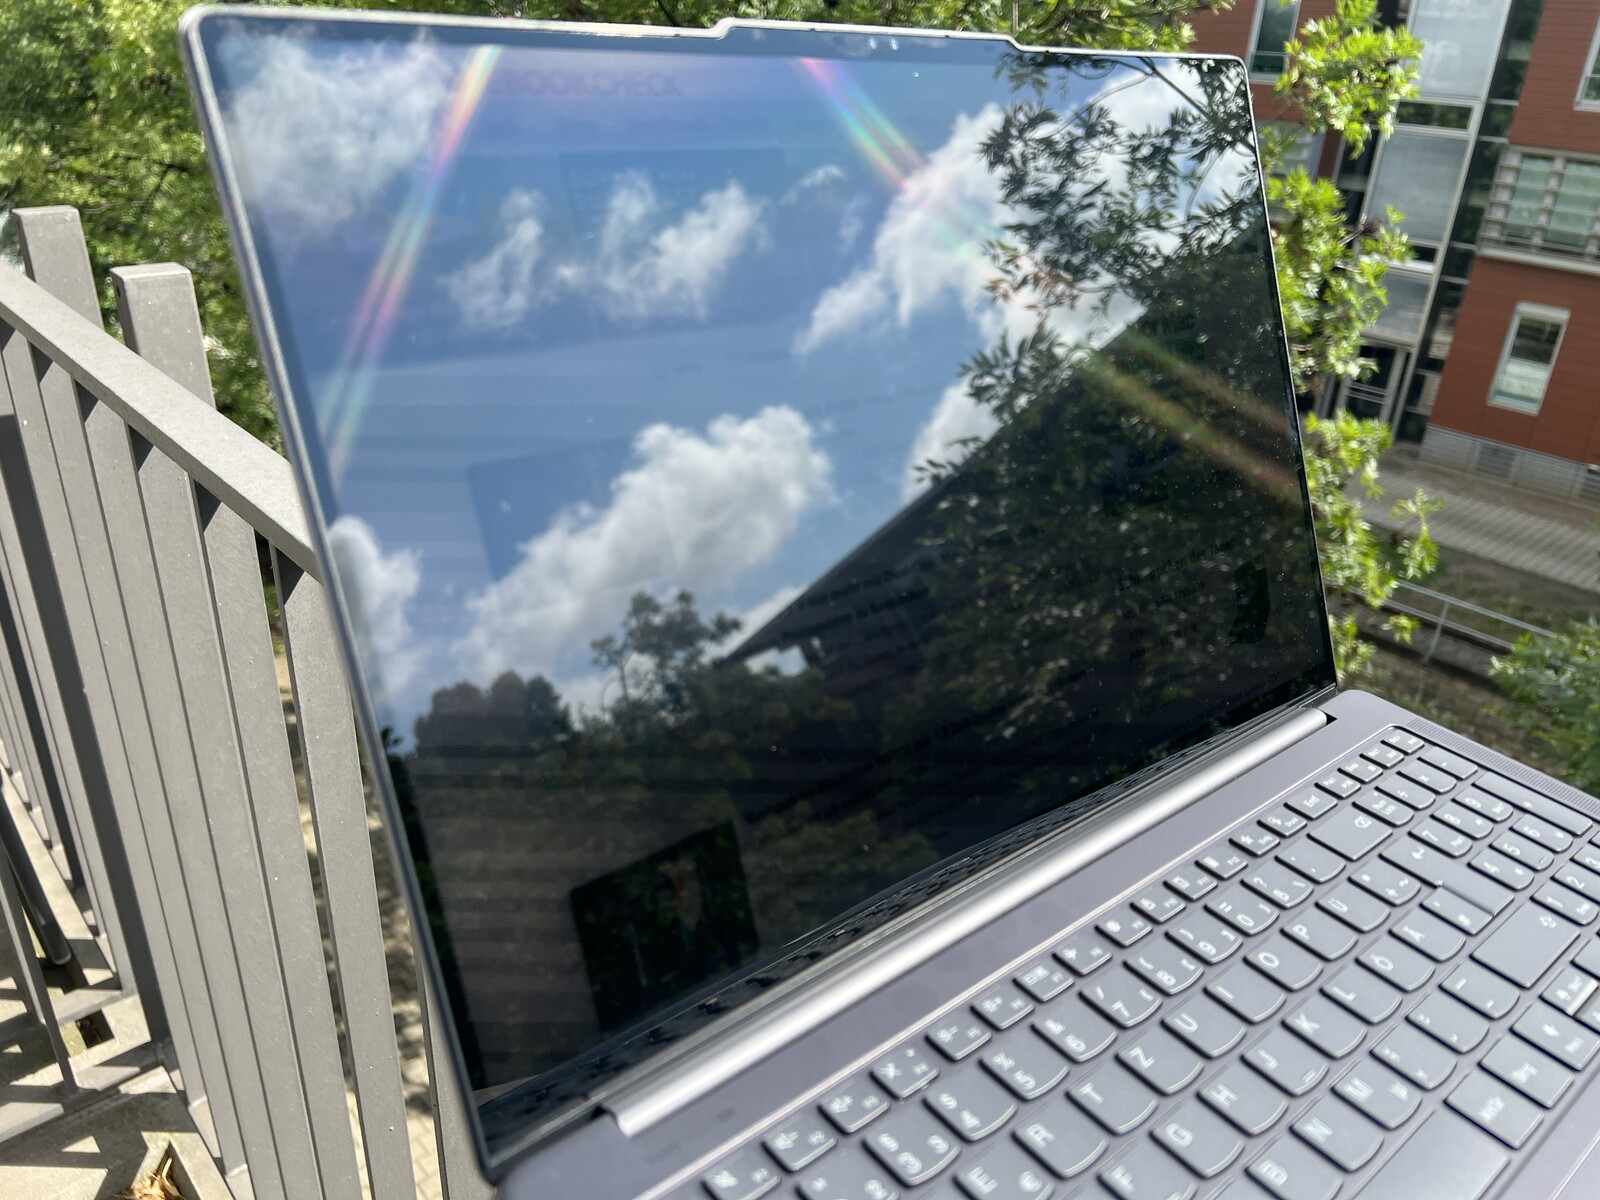
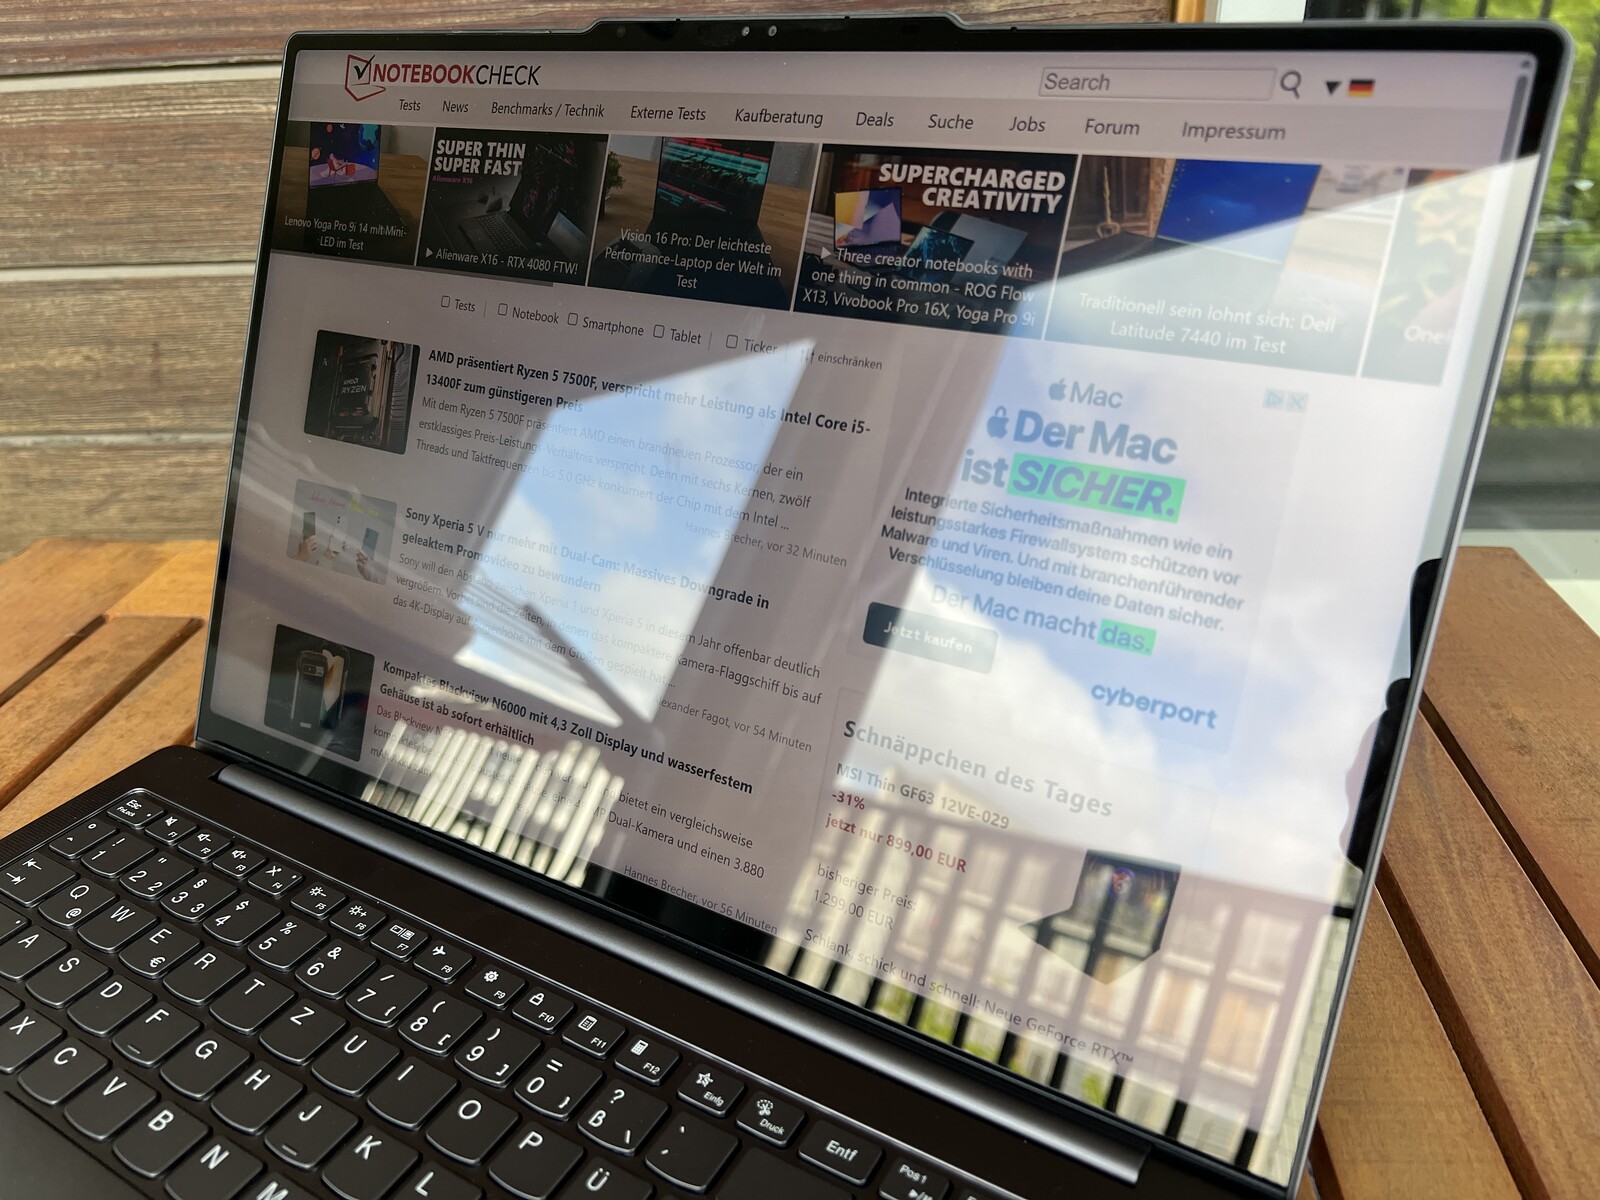
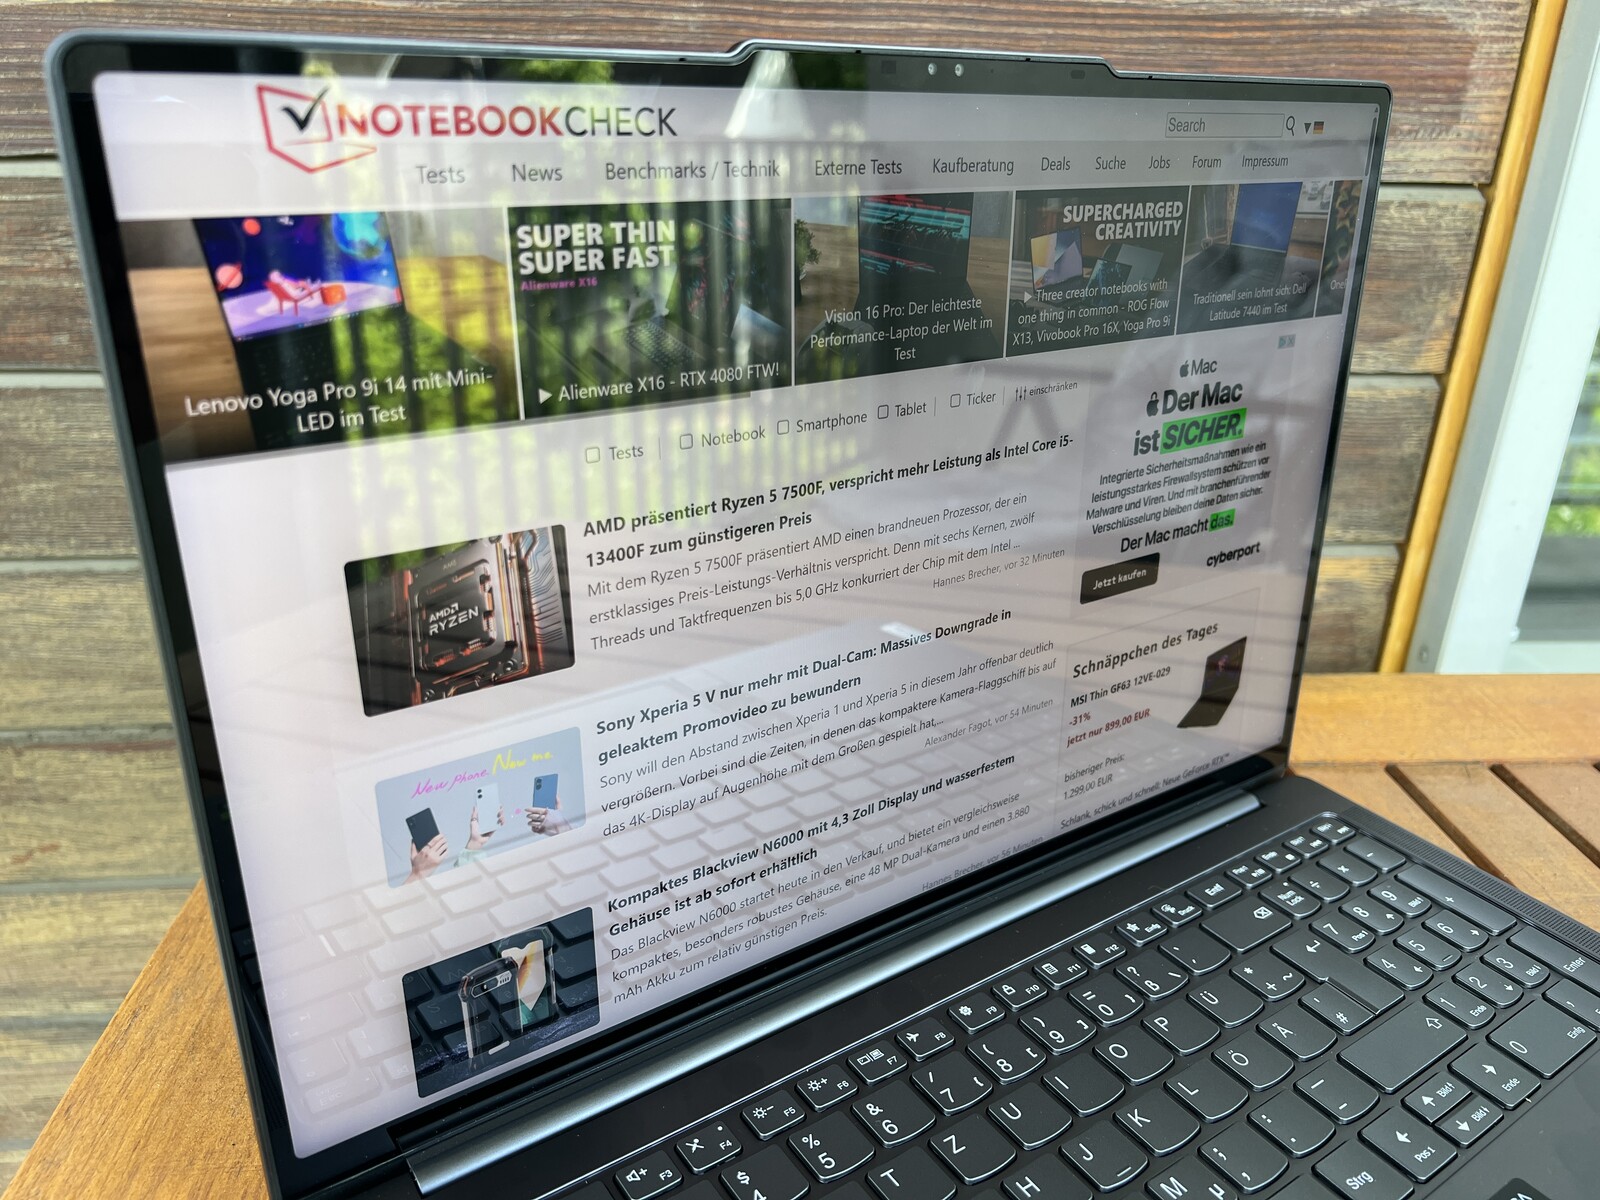
The touchscreen is very reflective and annoying reflections occur even indoors. On sunny days, finding a suitable position in order to be able to properly recognize screen content is not easy. The viewing angle stability is very good.

Performance - RTX 4060 with 100 watts
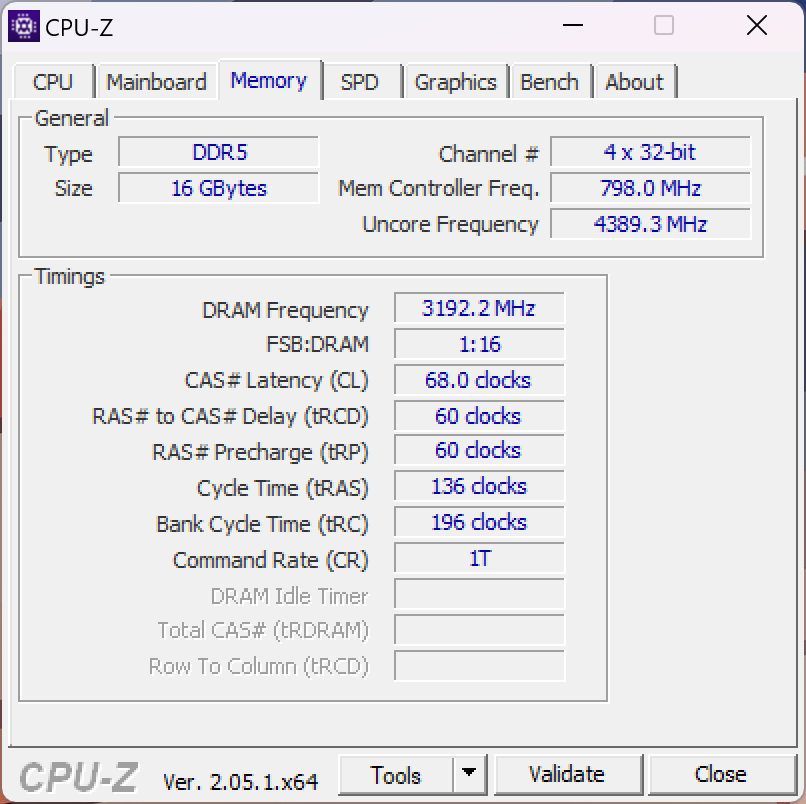
As previously mentioned, the Yoga Pro 9i 16 comes with either a Core i7 or Core i9 processor as well as the GeForce RTX 4050, RTX 4060 or RTX 4070 graphics cards (100 watts TGP in each case). The working memory consists of faster LPDDR5X-6400 RAM, but this is soldered and cannot be expanded.

Testing Conditions
The preinstalled Lenovo Vantage app offers three different performance profiles that can be conveniently switched via the Fn+Q key combination at any time. We have listed the respective TDP/TGP values in the table below. We used High Performance mode by default for our benchmarks and measurements.
| Mode | CPU load | GPU load | Stress test | Max. fan volume |
|---|---|---|---|---|
| Battery | 40 -> 25 watts | 22 watts | CPU: 25 watts GPU: 22 watts |
31.4 dB(A) |
| Smart Cooling | 75 -> 65 watts | 55 watts | CPU: 30 watts GPU: 45 watts |
44.5 dB(A) |
| High Performance | 125 -> 80 watts | 100 watts | CPU: 30 watts GPU: 100 watts |
53.2 dB(A) |
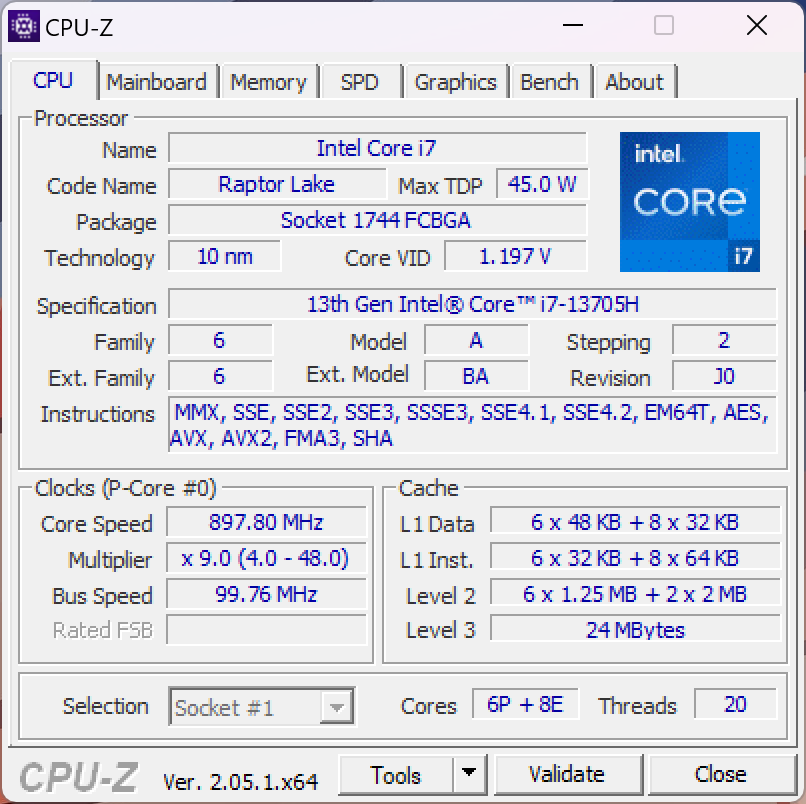
Processor
The 16-inch model of the Yoga Pro 9i also uses the Core i7-13705H, which is the same as the regular Core i7-13700H apart from the vPro capabilities. In High Performance mode, the processor is able to consume up to 125 watts for short periods of time and 80 watts permanently, which brings about very good results. Interestingly, the optional Core i9-13905H performs slightly worse, so the upgrade isn't worth it. Within our comparison group, the Yoga only has to admit defeat to competitors with significantly faster HX processors.
The processor is able to consume a maximum of 85 watts in battery mode, which leads to a performance reduction of around 20% in the multi-core tests. More CPU benchmarks are available in our tech section.
Cinebench R15 Multi Sustained Load

Cinebench R23: Multi Core | Single Core
Cinebench R20: CPU (Multi Core) | CPU (Single Core)
Cinebench R15: CPU Multi 64Bit | CPU Single 64Bit
Blender: v2.79 BMW27 CPU
7-Zip 18.03: 7z b 4 | 7z b 4 -mmt1
Geekbench 5.5: Multi-Core | Single-Core
HWBOT x265 Benchmark v2.2: 4k Preset
LibreOffice : 20 Documents To PDF
R Benchmark 2.5: Overall mean
| CPU Performance rating | |
| Asus ProArt Studiobook 16 OLED H7604 | |
| Asus Vivobook Pro 16X K6604JV-MX016W | |
| Apple MacBook Pro 16 2023 M2 Max -6! | |
| Lenovo Yoga Pro 9 16-IRP G8 | |
| Average Intel Core i7-13705H | |
| MSI Stealth 16 Studio A13VG | |
| Average of class Multimedia | |
| Schenker VISION 16 Pro (M23) | |
| Cinebench R23 / Multi Core | |
| Asus ProArt Studiobook 16 OLED H7604 | |
| Asus Vivobook Pro 16X K6604JV-MX016W | |
| MSI Stealth 16 Studio A13VG | |
| Lenovo Yoga Pro 9 16-IRP G8 | |
| Average Intel Core i7-13705H (17855 - 19675, n=2) | |
| Average of class Multimedia (4861 - 33362, n=81, last 2 years) | |
| Apple MacBook Pro 16 2023 M2 Max | |
| Schenker VISION 16 Pro (M23) | |
| Cinebench R23 / Single Core | |
| Asus ProArt Studiobook 16 OLED H7604 | |
| Average of class Multimedia (1128 - 2459, n=73, last 2 years) | |
| Schenker VISION 16 Pro (M23) | |
| Lenovo Yoga Pro 9 16-IRP G8 | |
| Average Intel Core i7-13705H (1869 - 1879, n=2) | |
| MSI Stealth 16 Studio A13VG | |
| Asus Vivobook Pro 16X K6604JV-MX016W | |
| Apple MacBook Pro 16 2023 M2 Max | |
| Cinebench R20 / CPU (Multi Core) | |
| Asus ProArt Studiobook 16 OLED H7604 | |
| Asus Vivobook Pro 16X K6604JV-MX016W | |
| MSI Stealth 16 Studio A13VG | |
| Lenovo Yoga Pro 9 16-IRP G8 | |
| Average Intel Core i7-13705H (6868 - 7529, n=2) | |
| Average of class Multimedia (1887 - 12912, n=64, last 2 years) | |
| Schenker VISION 16 Pro (M23) | |
| Apple MacBook Pro 16 2023 M2 Max | |
| Cinebench R20 / CPU (Single Core) | |
| Asus ProArt Studiobook 16 OLED H7604 | |
| Lenovo Yoga Pro 9 16-IRP G8 | |
| Schenker VISION 16 Pro (M23) | |
| Average Intel Core i7-13705H (723 - 732, n=2) | |
| Average of class Multimedia (425 - 853, n=64, last 2 years) | |
| MSI Stealth 16 Studio A13VG | |
| Asus Vivobook Pro 16X K6604JV-MX016W | |
| Apple MacBook Pro 16 2023 M2 Max | |
| Cinebench R15 / CPU Multi 64Bit | |
| Asus Vivobook Pro 16X K6604JV-MX016W | |
| Asus ProArt Studiobook 16 OLED H7604 | |
| Lenovo Yoga Pro 9 16-IRP G8 | |
| Average Intel Core i7-13705H (2750 - 2987, n=2) | |
| MSI Stealth 16 Studio A13VG | |
| Average of class Multimedia (856 - 5224, n=68, last 2 years) | |
| Schenker VISION 16 Pro (M23) | |
| Apple MacBook Pro 16 2023 M2 Max | |
| Cinebench R15 / CPU Single 64Bit | |
| Asus ProArt Studiobook 16 OLED H7604 | |
| Asus Vivobook Pro 16X K6604JV-MX016W | |
| Average of class Multimedia (184.8 - 326, n=66, last 2 years) | |
| Schenker VISION 16 Pro (M23) | |
| Lenovo Yoga Pro 9 16-IRP G8 | |
| Average Intel Core i7-13705H (273 - 274, n=2) | |
| MSI Stealth 16 Studio A13VG | |
| Apple MacBook Pro 16 2023 M2 Max | |
| Blender / v2.79 BMW27 CPU | |
| Average of class Multimedia (100 - 557, n=65, last 2 years) | |
| Schenker VISION 16 Pro (M23) | |
| Average Intel Core i7-13705H (172 - 190, n=2) | |
| Lenovo Yoga Pro 9 16-IRP G8 | |
| MSI Stealth 16 Studio A13VG | |
| Asus Vivobook Pro 16X K6604JV-MX016W | |
| Asus ProArt Studiobook 16 OLED H7604 | |
| 7-Zip 18.03 / 7z b 4 | |
| Asus ProArt Studiobook 16 OLED H7604 | |
| Asus Vivobook Pro 16X K6604JV-MX016W | |
| Lenovo Yoga Pro 9 16-IRP G8 | |
| MSI Stealth 16 Studio A13VG | |
| Average Intel Core i7-13705H (71884 - 78446, n=2) | |
| Schenker VISION 16 Pro (M23) | |
| Average of class Multimedia (29095 - 130368, n=62, last 2 years) | |
| 7-Zip 18.03 / 7z b 4 -mmt1 | |
| Asus ProArt Studiobook 16 OLED H7604 | |
| Asus Vivobook Pro 16X K6604JV-MX016W | |
| Schenker VISION 16 Pro (M23) | |
| MSI Stealth 16 Studio A13VG | |
| Average Intel Core i7-13705H (5924 - 6075, n=2) | |
| Lenovo Yoga Pro 9 16-IRP G8 | |
| Average of class Multimedia (3666 - 7545, n=63, last 2 years) | |
| Geekbench 5.5 / Multi-Core | |
| Asus ProArt Studiobook 16 OLED H7604 | |
| Asus Vivobook Pro 16X K6604JV-MX016W | |
| Apple MacBook Pro 16 2023 M2 Max | |
| Lenovo Yoga Pro 9 16-IRP G8 | |
| Average Intel Core i7-13705H (14124 - 14521, n=2) | |
| MSI Stealth 16 Studio A13VG | |
| Average of class Multimedia (4652 - 20422, n=62, last 2 years) | |
| Schenker VISION 16 Pro (M23) | |
| Geekbench 5.5 / Single-Core | |
| Asus ProArt Studiobook 16 OLED H7604 | |
| Asus Vivobook Pro 16X K6604JV-MX016W | |
| Apple MacBook Pro 16 2023 M2 Max | |
| Average of class Multimedia (805 - 2974, n=62, last 2 years) | |
| Schenker VISION 16 Pro (M23) | |
| Average Intel Core i7-13705H (1791 - 1891, n=2) | |
| MSI Stealth 16 Studio A13VG | |
| Lenovo Yoga Pro 9 16-IRP G8 | |
| HWBOT x265 Benchmark v2.2 / 4k Preset | |
| Asus ProArt Studiobook 16 OLED H7604 | |
| Asus Vivobook Pro 16X K6604JV-MX016W | |
| Lenovo Yoga Pro 9 16-IRP G8 | |
| Average Intel Core i7-13705H (18.9 - 21.3, n=2) | |
| MSI Stealth 16 Studio A13VG | |
| Average of class Multimedia (5.26 - 36.1, n=63, last 2 years) | |
| Schenker VISION 16 Pro (M23) | |
| LibreOffice / 20 Documents To PDF | |
| MSI Stealth 16 Studio A13VG | |
| Asus Vivobook Pro 16X K6604JV-MX016W | |
| Average of class Multimedia (23.9 - 146.7, n=64, last 2 years) | |
| Lenovo Yoga Pro 9 16-IRP G8 | |
| Schenker VISION 16 Pro (M23) | |
| Average Intel Core i7-13705H (47.4 - 47.7, n=2) | |
| Asus ProArt Studiobook 16 OLED H7604 | |
| R Benchmark 2.5 / Overall mean | |
| Average of class Multimedia (0.3604 - 0.947, n=63, last 2 years) | |
| Lenovo Yoga Pro 9 16-IRP G8 | |
| MSI Stealth 16 Studio A13VG | |
| Average Intel Core i7-13705H (0.4305 - 0.4571, n=2) | |
| Schenker VISION 16 Pro (M23) | |
| Asus Vivobook Pro 16X K6604JV-MX016W | |
| Asus ProArt Studiobook 16 OLED H7604 | |
* ... smaller is better
AIDA64: FP32 Ray-Trace | FPU Julia | CPU SHA3 | CPU Queen | FPU SinJulia | FPU Mandel | CPU AES | CPU ZLib | FP64 Ray-Trace | CPU PhotoWorxx
| Performance rating | |
| Asus ProArt Studiobook 16 OLED H7604 | |
| Asus Vivobook Pro 16X K6604JV-MX016W | |
| Lenovo Yoga Pro 9 16-IRP G8 | |
| Average Intel Core i7-13705H | |
| MSI Stealth 16 Studio A13VG | |
| Average of class Multimedia | |
| Schenker VISION 16 Pro (M23) | |
| AIDA64 / FP32 Ray-Trace | |
| Asus ProArt Studiobook 16 OLED H7604 | |
| Asus Vivobook Pro 16X K6604JV-MX016W | |
| MSI Stealth 16 Studio A13VG | |
| Average of class Multimedia (2214 - 50388, n=60, last 2 years) | |
| Lenovo Yoga Pro 9 16-IRP G8 | |
| Average Intel Core i7-13705H (16297 - 17568, n=2) | |
| Schenker VISION 16 Pro (M23) | |
| AIDA64 / FPU Julia | |
| Asus ProArt Studiobook 16 OLED H7604 | |
| Asus Vivobook Pro 16X K6604JV-MX016W | |
| Lenovo Yoga Pro 9 16-IRP G8 | |
| Average Intel Core i7-13705H (80950 - 92250, n=2) | |
| Average of class Multimedia (12867 - 201874, n=61, last 2 years) | |
| MSI Stealth 16 Studio A13VG | |
| Schenker VISION 16 Pro (M23) | |
| AIDA64 / CPU SHA3 | |
| Asus ProArt Studiobook 16 OLED H7604 | |
| Asus Vivobook Pro 16X K6604JV-MX016W | |
| Lenovo Yoga Pro 9 16-IRP G8 | |
| MSI Stealth 16 Studio A13VG | |
| Average Intel Core i7-13705H (3673 - 4189, n=2) | |
| Average of class Multimedia (653 - 8623, n=61, last 2 years) | |
| Schenker VISION 16 Pro (M23) | |
| AIDA64 / CPU Queen | |
| Asus ProArt Studiobook 16 OLED H7604 | |
| Asus Vivobook Pro 16X K6604JV-MX016W | |
| Lenovo Yoga Pro 9 16-IRP G8 | |
| Average Intel Core i7-13705H (106151 - 106736, n=2) | |
| MSI Stealth 16 Studio A13VG | |
| Schenker VISION 16 Pro (M23) | |
| Average of class Multimedia (13483 - 181505, n=49, last 2 years) | |
| AIDA64 / FPU SinJulia | |
| Asus ProArt Studiobook 16 OLED H7604 | |
| Asus Vivobook Pro 16X K6604JV-MX016W | |
| Lenovo Yoga Pro 9 16-IRP G8 | |
| MSI Stealth 16 Studio A13VG | |
| Average Intel Core i7-13705H (10635 - 11077, n=2) | |
| Average of class Multimedia (1240 - 28794, n=61, last 2 years) | |
| Schenker VISION 16 Pro (M23) | |
| AIDA64 / FPU Mandel | |
| Asus ProArt Studiobook 16 OLED H7604 | |
| Asus Vivobook Pro 16X K6604JV-MX016W | |
| MSI Stealth 16 Studio A13VG | |
| Average of class Multimedia (6395 - 105740, n=60, last 2 years) | |
| Lenovo Yoga Pro 9 16-IRP G8 | |
| Average Intel Core i7-13705H (40508 - 42686, n=2) | |
| Schenker VISION 16 Pro (M23) | |
| AIDA64 / CPU AES | |
| Asus ProArt Studiobook 16 OLED H7604 | |
| Asus Vivobook Pro 16X K6604JV-MX016W | |
| Lenovo Yoga Pro 9 16-IRP G8 | |
| MSI Stealth 16 Studio A13VG | |
| Average Intel Core i7-13705H (75651 - 85118, n=2) | |
| Average of class Multimedia (13243 - 126790, n=61, last 2 years) | |
| Schenker VISION 16 Pro (M23) | |
| AIDA64 / CPU ZLib | |
| Asus ProArt Studiobook 16 OLED H7604 | |
| Asus Vivobook Pro 16X K6604JV-MX016W | |
| Lenovo Yoga Pro 9 16-IRP G8 | |
| Average Intel Core i7-13705H (1126 - 1226, n=2) | |
| MSI Stealth 16 Studio A13VG | |
| Average of class Multimedia (167.2 - 2022, n=61, last 2 years) | |
| Schenker VISION 16 Pro (M23) | |
| AIDA64 / FP64 Ray-Trace | |
| Asus ProArt Studiobook 16 OLED H7604 | |
| Asus Vivobook Pro 16X K6604JV-MX016W | |
| MSI Stealth 16 Studio A13VG | |
| Average of class Multimedia (1014 - 26875, n=61, last 2 years) | |
| Lenovo Yoga Pro 9 16-IRP G8 | |
| Average Intel Core i7-13705H (8846 - 9166, n=2) | |
| Schenker VISION 16 Pro (M23) | |
| AIDA64 / CPU PhotoWorxx | |
| Lenovo Yoga Pro 9 16-IRP G8 | |
| Average Intel Core i7-13705H (51796 - 52257, n=2) | |
| Average of class Multimedia (12860 - 88154, n=61, last 2 years) | |
| Asus ProArt Studiobook 16 OLED H7604 | |
| MSI Stealth 16 Studio A13VG | |
| Schenker VISION 16 Pro (M23) | |
| Asus Vivobook Pro 16X K6604JV-MX016W | |
System Performance
Performance values in the synthetic benchmarks are very good, although competing notebooks are also on a very similar level overall. In everyday use, the laptop is always smooth and responsive. No issues arose during testing either.
CrossMark: Overall | Productivity | Creativity | Responsiveness
| PCMark 10 / Score | |
| Average of class Multimedia (4325 - 10386, n=58, last 2 years) | |
| Asus ProArt Studiobook 16 OLED H7604 | |
| Schenker VISION 16 Pro (M23) | |
| MSI Stealth 16 Studio A13VG | |
| Lenovo Yoga Pro 9 16-IRP G8 | |
| Average Intel Core i7-13705H, NVIDIA GeForce RTX 4060 Laptop GPU (n=1) | |
| Asus Vivobook Pro 16X K6604JV-MX016W | |
| PCMark 10 / Essentials | |
| Lenovo Yoga Pro 9 16-IRP G8 | |
| Average Intel Core i7-13705H, NVIDIA GeForce RTX 4060 Laptop GPU (n=1) | |
| Asus ProArt Studiobook 16 OLED H7604 | |
| Schenker VISION 16 Pro (M23) | |
| Asus Vivobook Pro 16X K6604JV-MX016W | |
| Average of class Multimedia (8025 - 11664, n=57, last 2 years) | |
| MSI Stealth 16 Studio A13VG | |
| PCMark 10 / Productivity | |
| Average of class Multimedia (7323 - 18233, n=57, last 2 years) | |
| Asus ProArt Studiobook 16 OLED H7604 | |
| Schenker VISION 16 Pro (M23) | |
| MSI Stealth 16 Studio A13VG | |
| Asus Vivobook Pro 16X K6604JV-MX016W | |
| Lenovo Yoga Pro 9 16-IRP G8 | |
| Average Intel Core i7-13705H, NVIDIA GeForce RTX 4060 Laptop GPU (n=1) | |
| PCMark 10 / Digital Content Creation | |
| MSI Stealth 16 Studio A13VG | |
| Lenovo Yoga Pro 9 16-IRP G8 | |
| Average Intel Core i7-13705H, NVIDIA GeForce RTX 4060 Laptop GPU (n=1) | |
| Schenker VISION 16 Pro (M23) | |
| Asus ProArt Studiobook 16 OLED H7604 | |
| Average of class Multimedia (3651 - 16240, n=57, last 2 years) | |
| Asus Vivobook Pro 16X K6604JV-MX016W | |
| CrossMark / Overall | |
| Asus ProArt Studiobook 16 OLED H7604 | |
| Asus Vivobook Pro 16X K6604JV-MX016W | |
| Apple MacBook Pro 16 2023 M2 Max | |
| Schenker VISION 16 Pro (M23) | |
| Average of class Multimedia (866 - 2728, n=67, last 2 years) | |
| Lenovo Yoga Pro 9 16-IRP G8 | |
| Average Intel Core i7-13705H, NVIDIA GeForce RTX 4060 Laptop GPU (n=1) | |
| MSI Stealth 16 Studio A13VG | |
| CrossMark / Productivity | |
| Asus ProArt Studiobook 16 OLED H7604 | |
| Asus Vivobook Pro 16X K6604JV-MX016W | |
| Schenker VISION 16 Pro (M23) | |
| Average of class Multimedia (931 - 2489, n=67, last 2 years) | |
| MSI Stealth 16 Studio A13VG | |
| Lenovo Yoga Pro 9 16-IRP G8 | |
| Average Intel Core i7-13705H, NVIDIA GeForce RTX 4060 Laptop GPU (n=1) | |
| Apple MacBook Pro 16 2023 M2 Max | |
| CrossMark / Creativity | |
| Apple MacBook Pro 16 2023 M2 Max | |
| Asus ProArt Studiobook 16 OLED H7604 | |
| Asus Vivobook Pro 16X K6604JV-MX016W | |
| Average of class Multimedia (907 - 3465, n=67, last 2 years) | |
| Lenovo Yoga Pro 9 16-IRP G8 | |
| Average Intel Core i7-13705H, NVIDIA GeForce RTX 4060 Laptop GPU (n=1) | |
| Schenker VISION 16 Pro (M23) | |
| MSI Stealth 16 Studio A13VG | |
| CrossMark / Responsiveness | |
| Asus ProArt Studiobook 16 OLED H7604 | |
| Schenker VISION 16 Pro (M23) | |
| Asus Vivobook Pro 16X K6604JV-MX016W | |
| MSI Stealth 16 Studio A13VG | |
| Lenovo Yoga Pro 9 16-IRP G8 | |
| Average Intel Core i7-13705H, NVIDIA GeForce RTX 4060 Laptop GPU (n=1) | |
| Average of class Multimedia (605 - 2024, n=67, last 2 years) | |
| Apple MacBook Pro 16 2023 M2 Max | |
| PCMark 10 Score | 7301 points | |
Help | ||
| AIDA64 / Memory Copy | |
| Average of class Multimedia (21158 - 132135, n=61, last 2 years) | |
| Average Intel Core i7-13705H (78047 - 79495, n=2) | |
| Lenovo Yoga Pro 9 16-IRP G8 | |
| Asus ProArt Studiobook 16 OLED H7604 | |
| MSI Stealth 16 Studio A13VG | |
| Asus Vivobook Pro 16X K6604JV-MX016W | |
| Schenker VISION 16 Pro (M23) | |
| AIDA64 / Memory Read | |
| Average of class Multimedia (19699 - 174586, n=61, last 2 years) | |
| Lenovo Yoga Pro 9 16-IRP G8 | |
| Asus ProArt Studiobook 16 OLED H7604 | |
| Asus Vivobook Pro 16X K6604JV-MX016W | |
| Average Intel Core i7-13705H (72741 - 77976, n=2) | |
| MSI Stealth 16 Studio A13VG | |
| Schenker VISION 16 Pro (M23) | |
| AIDA64 / Memory Write | |
| Lenovo Yoga Pro 9 16-IRP G8 | |
| Average Intel Core i7-13705H (90999 - 95196, n=2) | |
| Average of class Multimedia (17733 - 134998, n=61, last 2 years) | |
| Asus ProArt Studiobook 16 OLED H7604 | |
| MSI Stealth 16 Studio A13VG | |
| Asus Vivobook Pro 16X K6604JV-MX016W | |
| Schenker VISION 16 Pro (M23) | |
| AIDA64 / Memory Latency | |
| Average of class Multimedia (7 - 535, n=60, last 2 years) | |
| Lenovo Yoga Pro 9 16-IRP G8 | |
| Average Intel Core i7-13705H (93.9 - 115, n=2) | |
| Asus Vivobook Pro 16X K6604JV-MX016W | |
| MSI Stealth 16 Studio A13VG | |
| Asus ProArt Studiobook 16 OLED H7604 | |
| Schenker VISION 16 Pro (M23) | |
* ... smaller is better
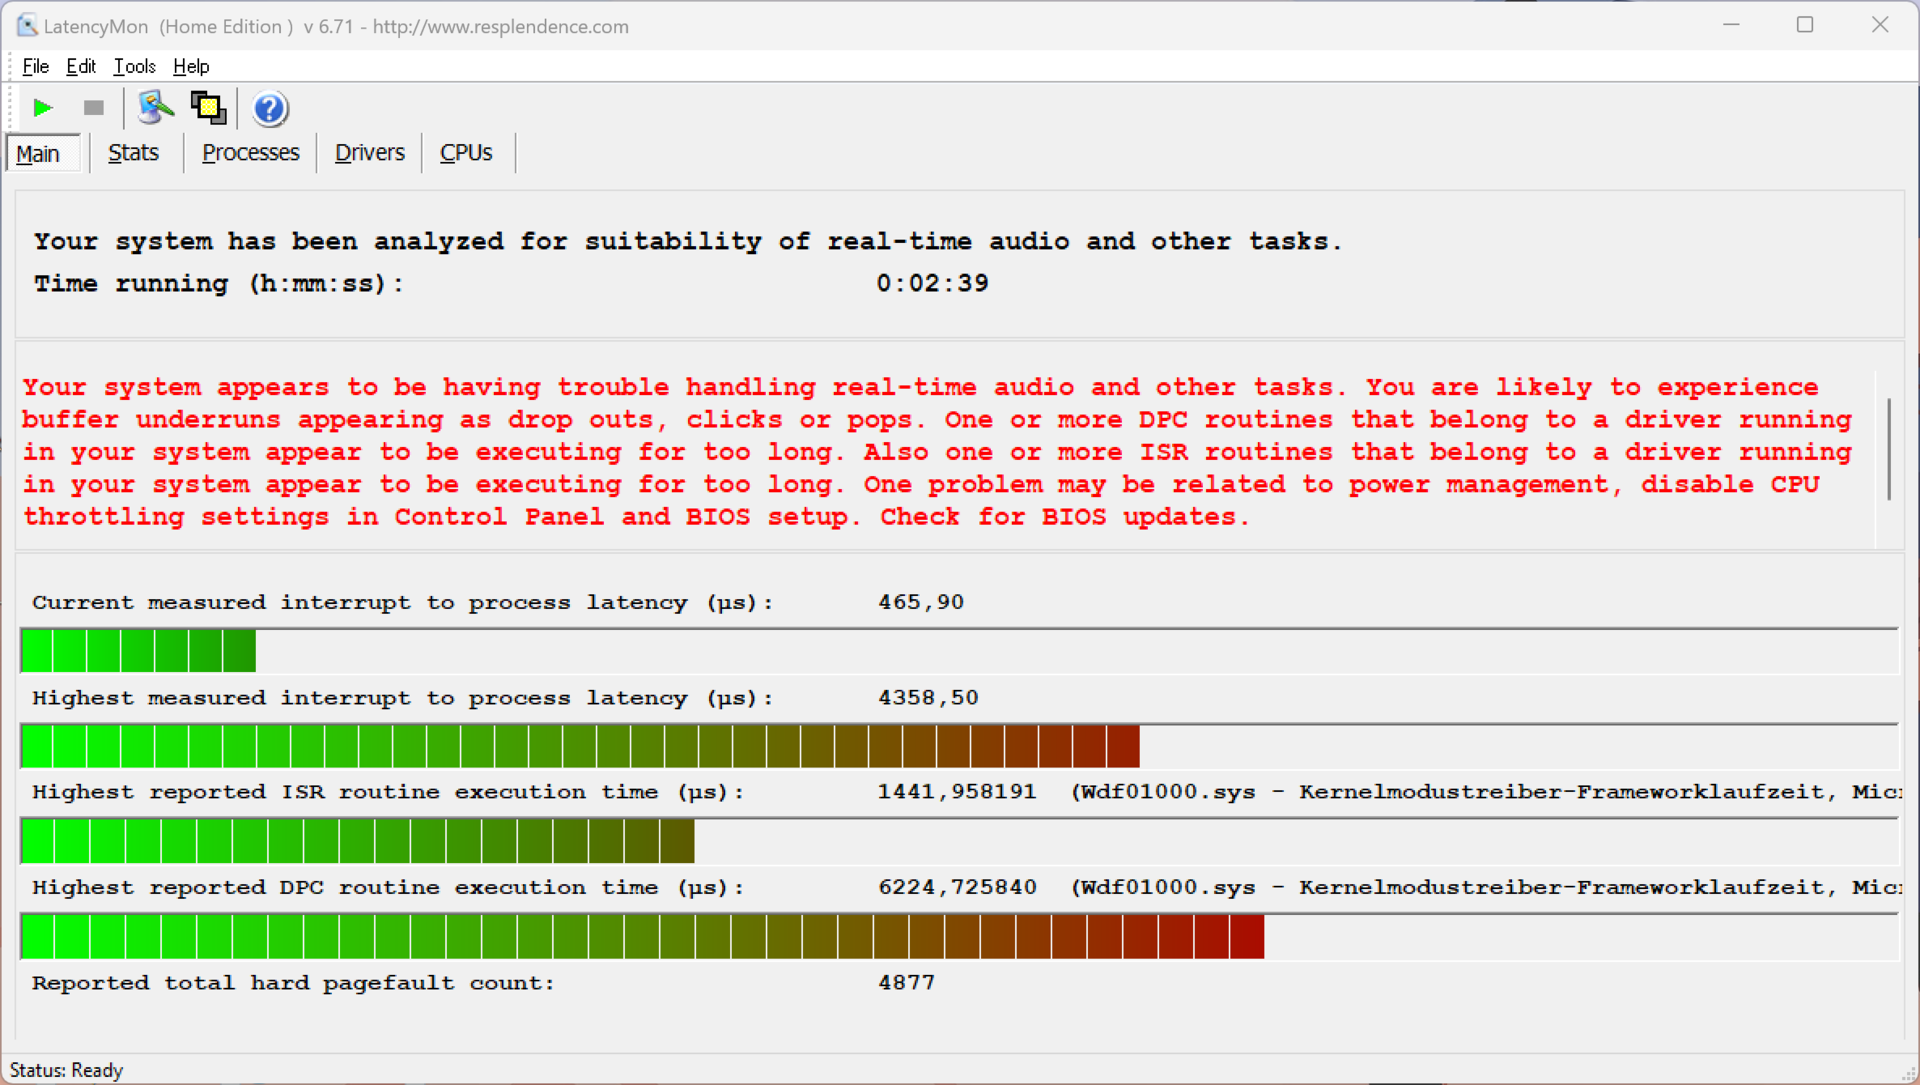
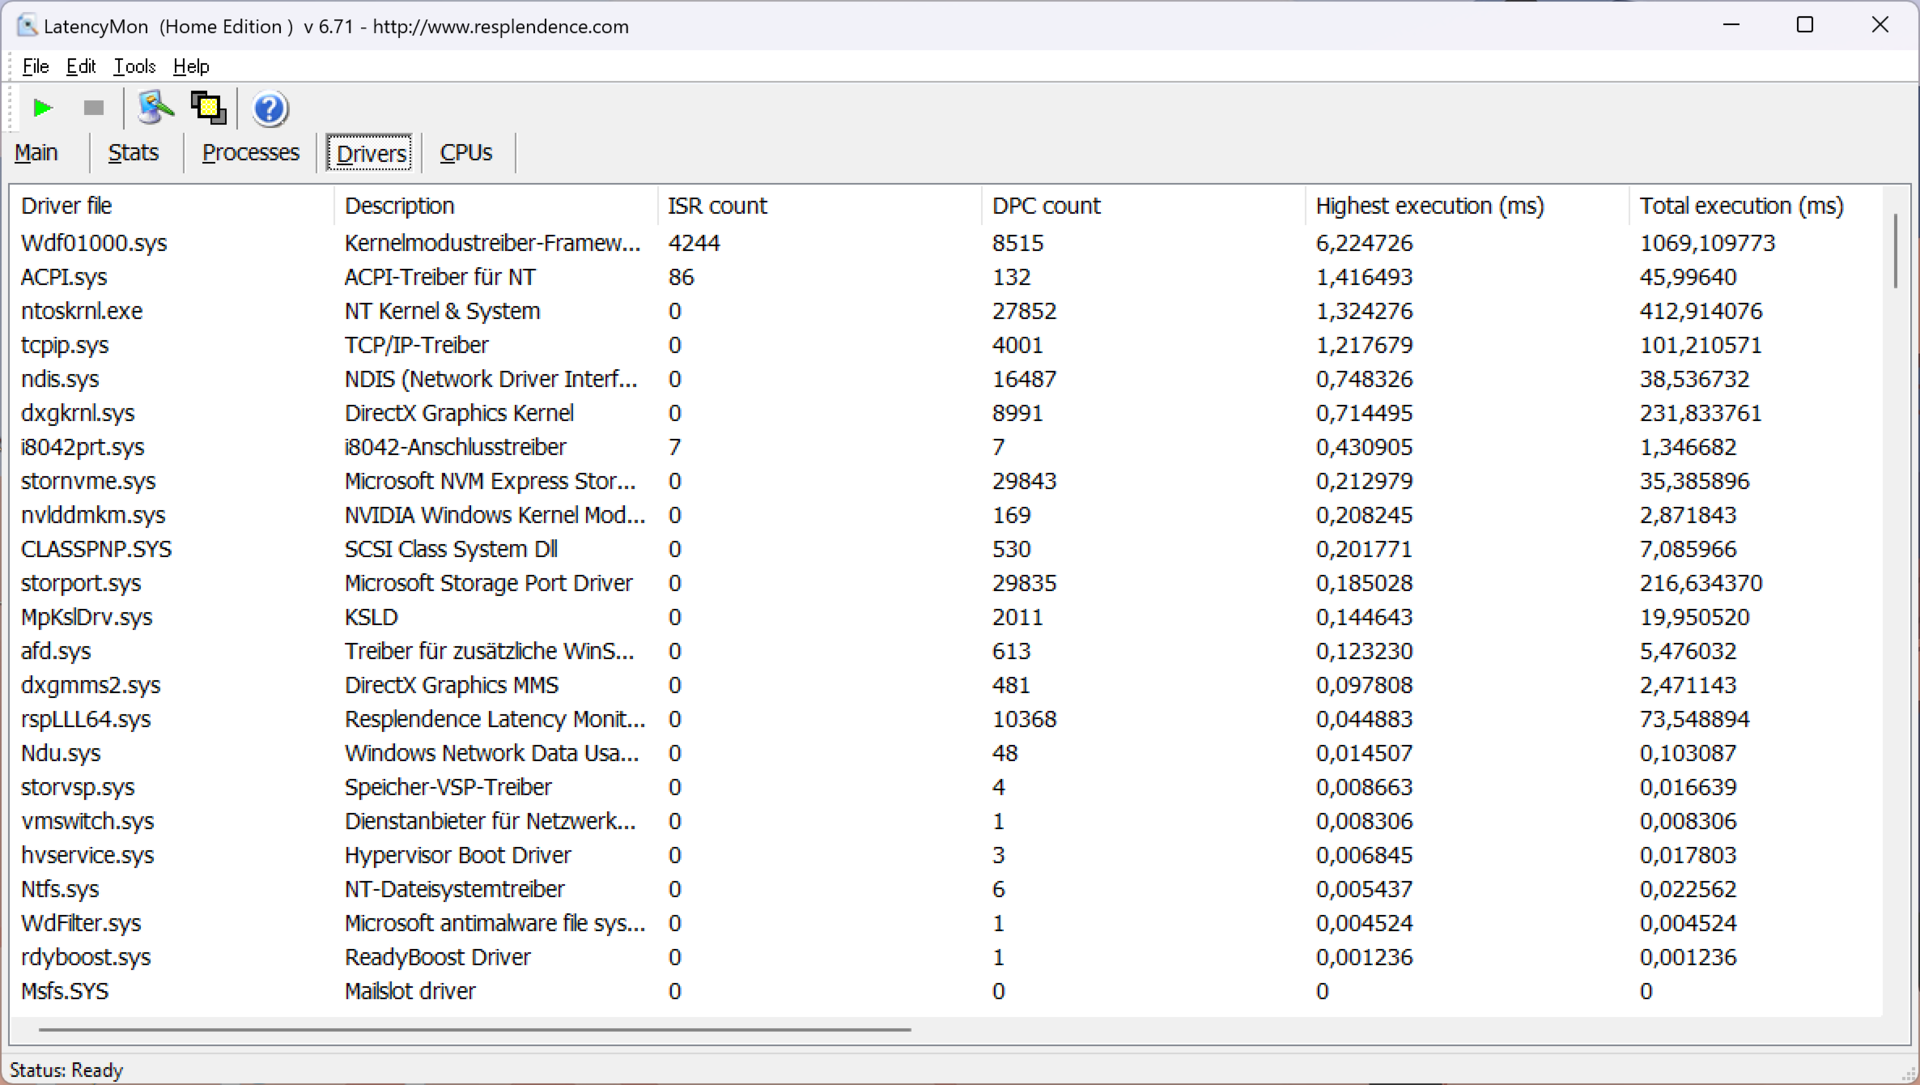
DPC Latency
Our test unit revealed significant restrictions in our standardized latency test (web browsing, 4K YouTube playback, CPU load) with the present BIOS version and is therefore unsuitable for real-time audio applications.
| DPC Latencies / LatencyMon - interrupt to process latency (max), Web, Youtube, Prime95 | |
| MSI Stealth 16 Studio A13VG | |
| Lenovo Yoga Pro 9 16-IRP G8 | |
| Asus Vivobook Pro 16X K6604JV-MX016W | |
| Asus ProArt Studiobook 16 OLED H7604 | |
| Schenker VISION 16 Pro (M23) | |
* ... smaller is better
Storage Devices

Lenovo uses the extra space of the 16-inch chassis for a second M.2 slot, which however only supports PCIe 3.0 x4. The primary slot is connected via PCIe-4.0, and the 1 TB version of the Samsung PM9A1 (OEM version of the 980 Pro) is installed in our test device. After the first start-up, the user has 891 GB available. Transfer rates are very good overall and performance remains stable under prolonged load, which is not always guaranteed with modern drives. However, the 990 Pro successor (see Schenker Vision 16 Pro) once again offers significant advantages in random accesses. More SSD benchmarks are available here.

* ... smaller is better
Sustained Read Performance: DiskSpd Read Loop, Queue Depth 8
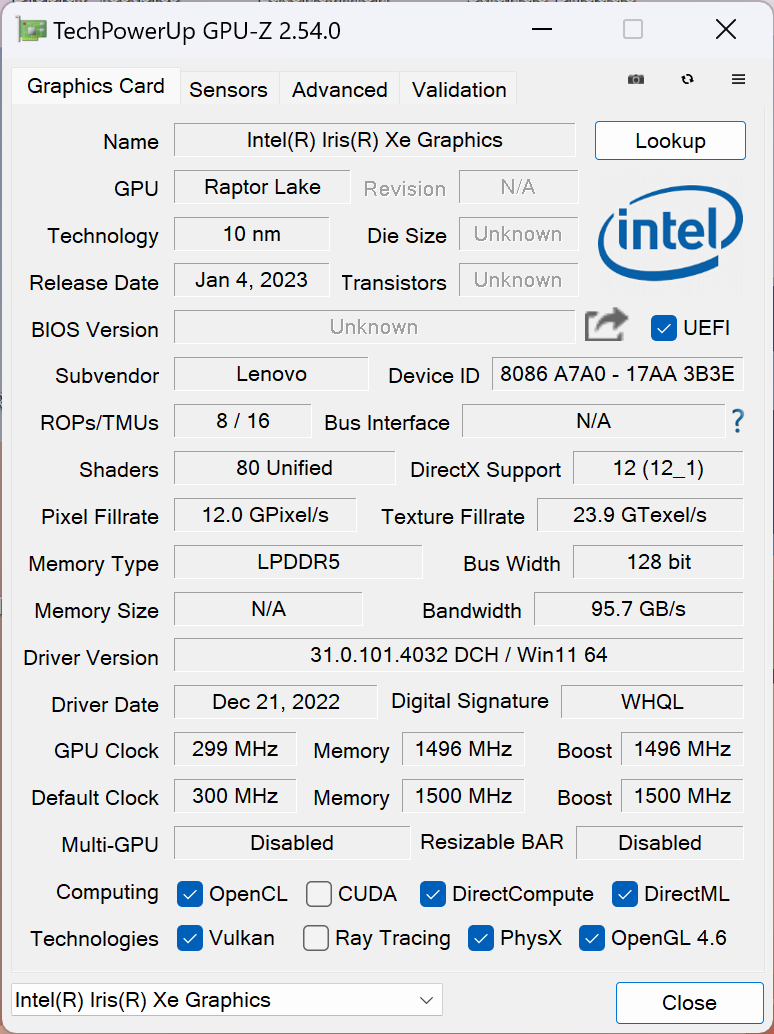
Graphics Card

The processor's integrated Iris Xe Graphics G7 handles graphics processing for simple tasks, and the dedicated GeForce GPU only takes over in more demanding tasks (e.g. games). In contrast to the Yoga Pro 9i 14, Lenovo does without Advanced Optimus here and there is no MUX switch to bypass the iGPU completely. This isn't unusual for a multimedia laptop, but we are surprised at the difference compared to its smaller sibling, which is better equipped in this respect.
Our test unit is equipped with the GeForce RTX 4060, which is the 100-watt version. Theoretically, there are much faster models, but you have to be careful here because according to our test, the 4060 only consumes a maximum of ~105 watts during gaming anyway. Only in synthetic tests like Furmark is the consumption higher. Hence, an RTX 4060 with a 140-watt TGP does not really bring any advantages over the 100-watt version in the Yoga Pro 9i when gaming, for example, nor does the optional RTX 4070.
Overall the results are very good and the Yoga is also just ahead of the average results of the RTX 4060 in our database. The GPU can even be overclocked in the Vantage app. Those who opt for the Yoga with the RTX 4070 can expect a performance boost of about 15-20%. Under sustained load, GPU performance remains stable. When unplugged (max. 68-watt TGP), performance is around 18% lower. More GPU benchmarks are listed here.
| Geekbench 6.7 - GPU OpenCL | |
| Average NVIDIA GeForce RTX 4060 Laptop GPU (76525 - 100831, n=39) | |
| Lenovo Yoga Pro 9 16-IRP G8 | |
| Average of class Multimedia (9994 - 187922, n=74, last 2 years) | |
| 3DMark 11 Performance | 30821 points | |
| 3DMark Fire Strike Score | 23225 points | |
| 3DMark Time Spy Score | 10393 points | |
Help | ||
| Blender / v3.3 Classroom OPTIX/RTX | |
| Average of class Multimedia (12 - 105, n=24, last 2 years) | |
| Asus Vivobook Pro 16X K6604JV-MX016W | |
| Lenovo Yoga Pro 9 16-IRP G8 | |
| MSI Stealth 16 Studio A13VG | |
| Schenker VISION 16 Pro (M23) | |
| Average NVIDIA GeForce RTX 4060 Laptop GPU (19 - 28, n=53) | |
| Asus ProArt Studiobook 16 OLED H7604 | |
| Lenovo Yoga Pro 9i RTX4070 | |
| Blender / v3.3 Classroom CUDA | |
| Average of class Multimedia (20 - 186, n=24, last 2 years) | |
| Asus Vivobook Pro 16X K6604JV-MX016W | |
| Lenovo Yoga Pro 9 16-IRP G8 | |
| Average NVIDIA GeForce RTX 4060 Laptop GPU (39 - 53, n=53) | |
| MSI Stealth 16 Studio A13VG | |
| Asus ProArt Studiobook 16 OLED H7604 | |
| Schenker VISION 16 Pro (M23) | |
| Blender / v3.3 Classroom METAL | |
| Apple MacBook Pro 16 2023 M2 Max | |
| Average of class Multimedia (17.8 - 68, n=5, last 2 years) | |
| Blender / v3.3 Classroom CPU | |
| Average of class Multimedia (134.5 - 1042, n=68, last 2 years) | |
| Schenker VISION 16 Pro (M23) | |
| Apple MacBook Pro 16 2023 M2 Max | |
| Average NVIDIA GeForce RTX 4060 Laptop GPU (189 - 452, n=53) | |
| Lenovo Yoga Pro 9 16-IRP G8 | |
| Lenovo Yoga Pro 9i RTX4070 | |
| MSI Stealth 16 Studio A13VG | |
| Asus Vivobook Pro 16X K6604JV-MX016W | |
| Asus ProArt Studiobook 16 OLED H7604 | |
* ... smaller is better
Gaming Performance
The gaming performance is pretty much in line with our expectations, so the Yoga Pro 9i 16 is able to run modern titles very well and you can usually select the QHD resolution at maximum details. Only very demanding titles such as Star Wars Jedi Survivor or F1 2023 (where ray tracing is already active) cause the notebook to struggle. Here you either have to reduce the details or use upsampling (e.g. DLSS) to increase the frame rate. Performance remains completely stable during long gaming sessions.
| The Witcher 3 - 1920x1080 Ultra Graphics & Postprocessing (HBAO+) | |
| Lenovo Yoga Pro 9i RTX4070 | |
| MSI Stealth 16 Studio A13VG | |
| Asus ProArt Studiobook 16 OLED H7604 | |
| Schenker VISION 16 Pro (M23) | |
| Asus Vivobook Pro 16X K6604JV-MX016W | |
| Lenovo Yoga Pro 9 16-IRP G8 | |
| Average of class Multimedia (11 - 121, n=13, last 2 years) | |
Witcher 3 FPS chart

| low | med. | high | ultra | QHD | |
|---|---|---|---|---|---|
| GTA V (2015) | 175.9 | 169.4 | 107.4 | 84.1 | |
| The Witcher 3 (2015) | 203 | 90.8 | |||
| Dota 2 Reborn (2015) | 170.8 | 156.4 | 148.5 | 142.3 | |
| Final Fantasy XV Benchmark (2018) | 186 | 134.6 | 95.7 | 70.6 | |
| X-Plane 11.11 (2018) | 145.9 | 127.4 | 98.3 | ||
| Far Cry 5 (2018) | 166 | 146 | 136 | 127 | 97 |
| Strange Brigade (2018) | 265 | 214 | 184.1 | 123.7 | |
| F1 2021 (2021) | 274 | 221 | 123.2 | 92.4 | |
| Cyberpunk 2077 1.6 (2022) | 114 | 94 | 82 | 75 | 54 |
| F1 22 (2022) | 220 | 218 | 160 | 62.7 | 40 |
| Star Wars Jedi Survivor (2023) | 75 | 68 | 62 | 60 | 38 |
| F1 23 (2023) | 227 | 225 | 172.7 | 54.1 | 34.2 |
Emissions - Excellent speakers in the Yoga Pro 9i 16
Noise

The volume of the two fans depends largely on the chosen performance mode. We always recommend using battery-saving mode for everyday tasks, since the fans are usually disabled here. The fans start up very quickly, especially in High Performance mode, which can be annoying in everyday use. It also quickly gets loud under load and we measured between 44.5 dB(A) (Smart Cooling) and 53.2 dB(A) (High Performance) during gaming, which is very clearly audible. In both modes are headphones certainly the preferable option, although other Windows competitors fare no better here either. At least the fans don't pulsate unnecessarily and no other electronic noises were detected.
| Scenario | Battery | Smart Cooling | High Performance |
|---|---|---|---|
| 3DMark 06 | 31.4dB(A) | 35.4dB(A) | 39.7dB(A) |
| Witcher 3 | 31.4dB(A) | 44.5dB(A) | 53.2dB(A) |
| Stress test | 31.4 dB(A) | 35.4 dB(A) | 53.2 dB(A) |
Noise level
| Idle |
| 24.7 / 26.2 / 26.2 dB(A) |
| Load |
| 39.7 / 53.2 dB(A) |
 | ||
30 dB silent 40 dB(A) audible 50 dB(A) loud |
||
min: | ||
| Lenovo Yoga Pro 9 16-IRP G8 GeForce RTX 4060 Laptop GPU, i7-13705H, Samsung PM9A1 MZVL21T0HCLR | Schenker VISION 16 Pro (M23) GeForce RTX 4070 Laptop GPU, i7-13700H, Samsung 990 Pro 1 TB | Asus Vivobook Pro 16X K6604JV-MX016W GeForce RTX 4060 Laptop GPU, i9-13980HX, Solidigm P41 Plus SSDPFKNU010TZ | Asus ProArt Studiobook 16 OLED H7604 GeForce RTX 4070 Laptop GPU, i9-13980HX, Phison EM2804TBMTCB47 | MSI Stealth 16 Studio A13VG GeForce RTX 4070 Laptop GPU, i7-13700H, Micron 3400 2TB MTFDKBA2T0TFH | Apple MacBook Pro 16 2023 M2 Max M2 Max 38-Core GPU, M2 Max, Apple SSD AP2048Z | |
|---|---|---|---|---|---|---|
| Noise | -7% | -11% | -3% | 8% | 12% | |
| off / environment * (dB) | 24.7 | 25.9 -5% | 25.2 -2% | 24.5 1% | 24 3% | 23.9 3% |
| Idle Minimum * (dB) | 24.7 | 25.9 -5% | 26.6 -8% | 24.5 1% | 24 3% | 23.9 3% |
| Idle Average * (dB) | 26.2 | 25.9 1% | 26.6 -2% | 24.5 6% | 24 8% | 23.9 9% |
| Idle Maximum * (dB) | 26.2 | 32 -22% | 29.2 -11% | 24.5 6% | 24 8% | 23.9 9% |
| Load Average * (dB) | 39.7 | 47.2 -19% | 53.4 -35% | 47.6 -20% | 34.81 12% | 36.6 8% |
| Witcher 3 ultra * (dB) | 53.2 | 53.1 -0% | 55.9 -5% | 44.05 17% | 35.1 34% | |
| Load Maximum * (dB) | 53.2 | 53.1 -0% | 56.9 -7% | 56.7 -7% | 51.57 3% | 43.2 19% |
* ... smaller is better
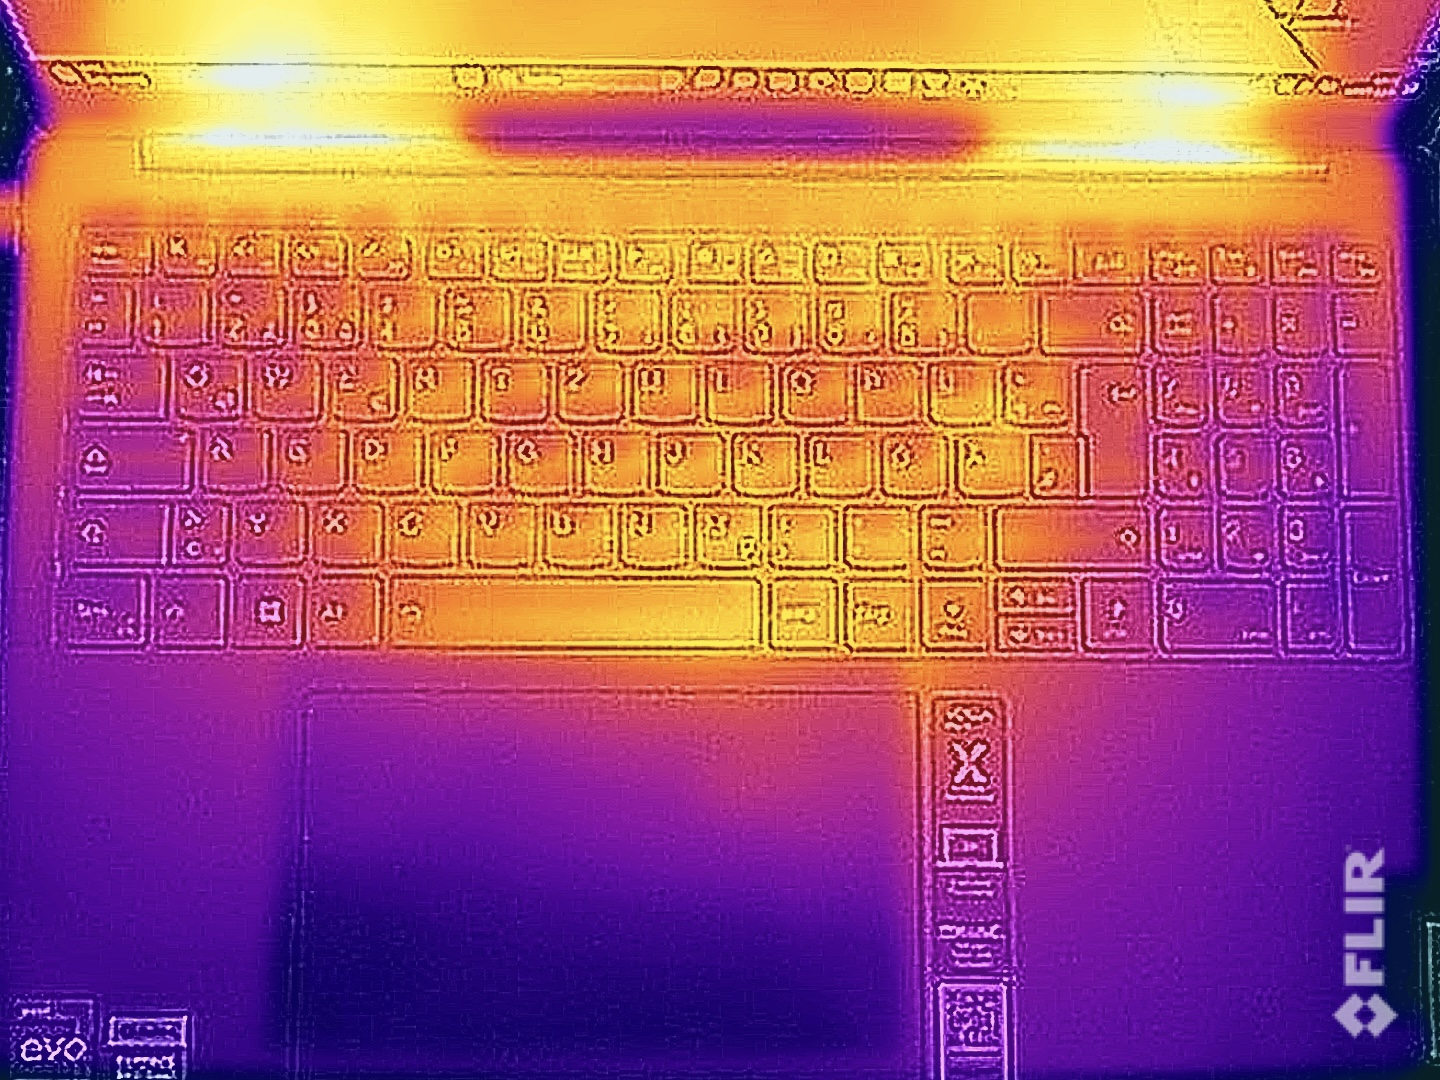
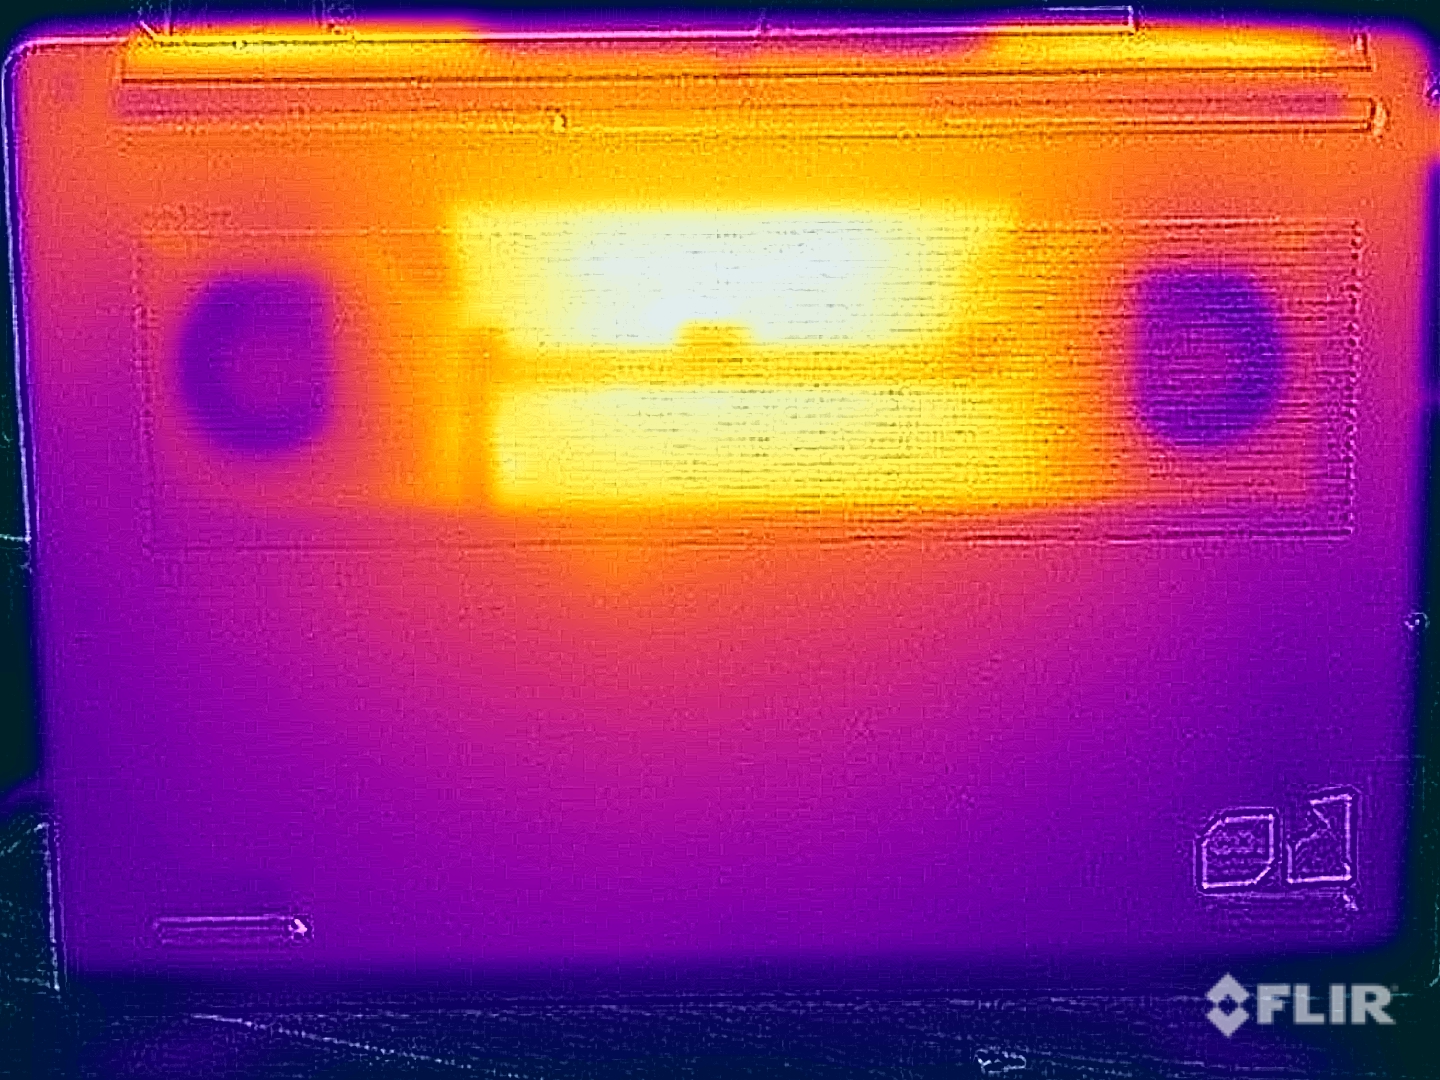
Temperature
There are no problems at all with surface temperatures in everyday use, but you shouldn't place the device on your lap under load or while playing games. We measured up to 50 °C on the underside, which can be unpleasant if it comes into contact with the skin. However, the results are by no means critical and overall the 16-inch model performs better here than the smaller Yoga Pro 9i 14 and most Windows competitors. The keyboard even stays significantly cooler at 35-40 °C, so there are no restrictions on use here.
In the stress test, the GPU is clearly prioritized by the system and consistently runs at the full 100 watts while the processor quickly levels off at 30 watts.

(±) The maximum temperature on the upper side is 41.6 °C / 107 F, compared to the average of 36.8 °C / 98 F, ranging from 21 to 71 °C for the class Multimedia.
(-) The bottom heats up to a maximum of 50 °C / 122 F, compared to the average of 39.1 °C / 102 F
(+) In idle usage, the average temperature for the upper side is 26.4 °C / 80 F, compared to the device average of 31.3 °C / 88 F.
(±) Playing The Witcher 3, the average temperature for the upper side is 35.6 °C / 96 F, compared to the device average of 31.3 °C / 88 F.
(+) The palmrests and touchpad are reaching skin temperature as a maximum (34.9 °C / 94.8 F) and are therefore not hot.
(-) The average temperature of the palmrest area of similar devices was 28.7 °C / 83.7 F (-6.2 °C / -11.1 F).
| Lenovo Yoga Pro 9 16-IRP G8 Intel Core i7-13705H, NVIDIA GeForce RTX 4060 Laptop GPU | Schenker VISION 16 Pro (M23) Intel Core i7-13700H, NVIDIA GeForce RTX 4070 Laptop GPU | Asus Vivobook Pro 16X K6604JV-MX016W Intel Core i9-13980HX, NVIDIA GeForce RTX 4060 Laptop GPU | Asus ProArt Studiobook 16 OLED H7604 Intel Core i9-13980HX, NVIDIA GeForce RTX 4070 Laptop GPU | MSI Stealth 16 Studio A13VG Intel Core i7-13700H, NVIDIA GeForce RTX 4070 Laptop GPU | Apple MacBook Pro 16 2023 M2 Max Apple M2 Max, Apple M2 Max 38-Core GPU | |
|---|---|---|---|---|---|---|
| Heat | -4% | -14% | -12% | -36% | 11% | |
| Maximum Upper Side * (°C) | 41.6 | 46.7 -12% | 39.7 5% | 44.1 -6% | 60 -44% | 44.2 -6% |
| Maximum Bottom * (°C) | 50 | 54.1 -8% | 60 -20% | 48 4% | 61 -22% | 42.9 14% |
| Idle Upper Side * (°C) | 26.8 | 26.5 1% | 30.9 -15% | 32.7 -22% | 38.2 -43% | 22.4 16% |
| Idle Bottom * (°C) | 27.9 | 26.8 4% | 34.7 -24% | 34.9 -25% | 37.7 -35% | 22.3 20% |
* ... smaller is better
Speakers
The 16-inch variant of the Yoga Pro 9i is equipped with six speakers (4 woofers + 2 tweeters, 6 watts each) and is able to improve upon the already-solid performance of the 14-inch model, even if the maximum volume is a little lower. The sound is overall very good and the gap to the Apple MacBook Pro 16 (also 6 speakers) is not large either. All in all, the speakers do their job very well.
Lenovo Yoga Pro 9 16-IRP G8 audio analysis
(±) | speaker loudness is average but good (80.5 dB)
Bass 100 - 315 Hz
(+) | good bass - only 4.9% away from median
(±) | linearity of bass is average (9.1% delta to prev. frequency)
Mids 400 - 2000 Hz
(+) | balanced mids - only 3.2% away from median
(+) | mids are linear (6.5% delta to prev. frequency)
Highs 2 - 16 kHz
(+) | balanced highs - only 2.9% away from median
(+) | highs are linear (3% delta to prev. frequency)
Overall 100 - 16.000 Hz
(+) | overall sound is linear (8.4% difference to median)
Compared to same class
» 9% of all tested devices in this class were better, 2% similar, 89% worse
» The best had a delta of 5%, average was 17%, worst was 45%
Compared to all devices tested
» 2% of all tested devices were better, 1% similar, 97% worse
» The best had a delta of 4%, average was 24%, worst was 134%
Apple MacBook Pro 16 2023 M2 Max audio analysis
(+) | speakers can play relatively loud (86.1 dB)
Bass 100 - 315 Hz
(+) | good bass - only 3.9% away from median
(+) | bass is linear (5.7% delta to prev. frequency)
Mids 400 - 2000 Hz
(+) | balanced mids - only 1.2% away from median
(+) | mids are linear (1.5% delta to prev. frequency)
Highs 2 - 16 kHz
(+) | balanced highs - only 2.5% away from median
(+) | highs are linear (1.7% delta to prev. frequency)
Overall 100 - 16.000 Hz
(+) | overall sound is linear (4.9% difference to median)
Compared to same class
» 0% of all tested devices in this class were better, 0% similar, 99% worse
» The best had a delta of 5%, average was 17%, worst was 45%
Compared to all devices tested
» 0% of all tested devices were better, 0% similar, 100% worse
» The best had a delta of 4%, average was 24%, worst was 134%
Energy Management - Short battery life
Power Consumption
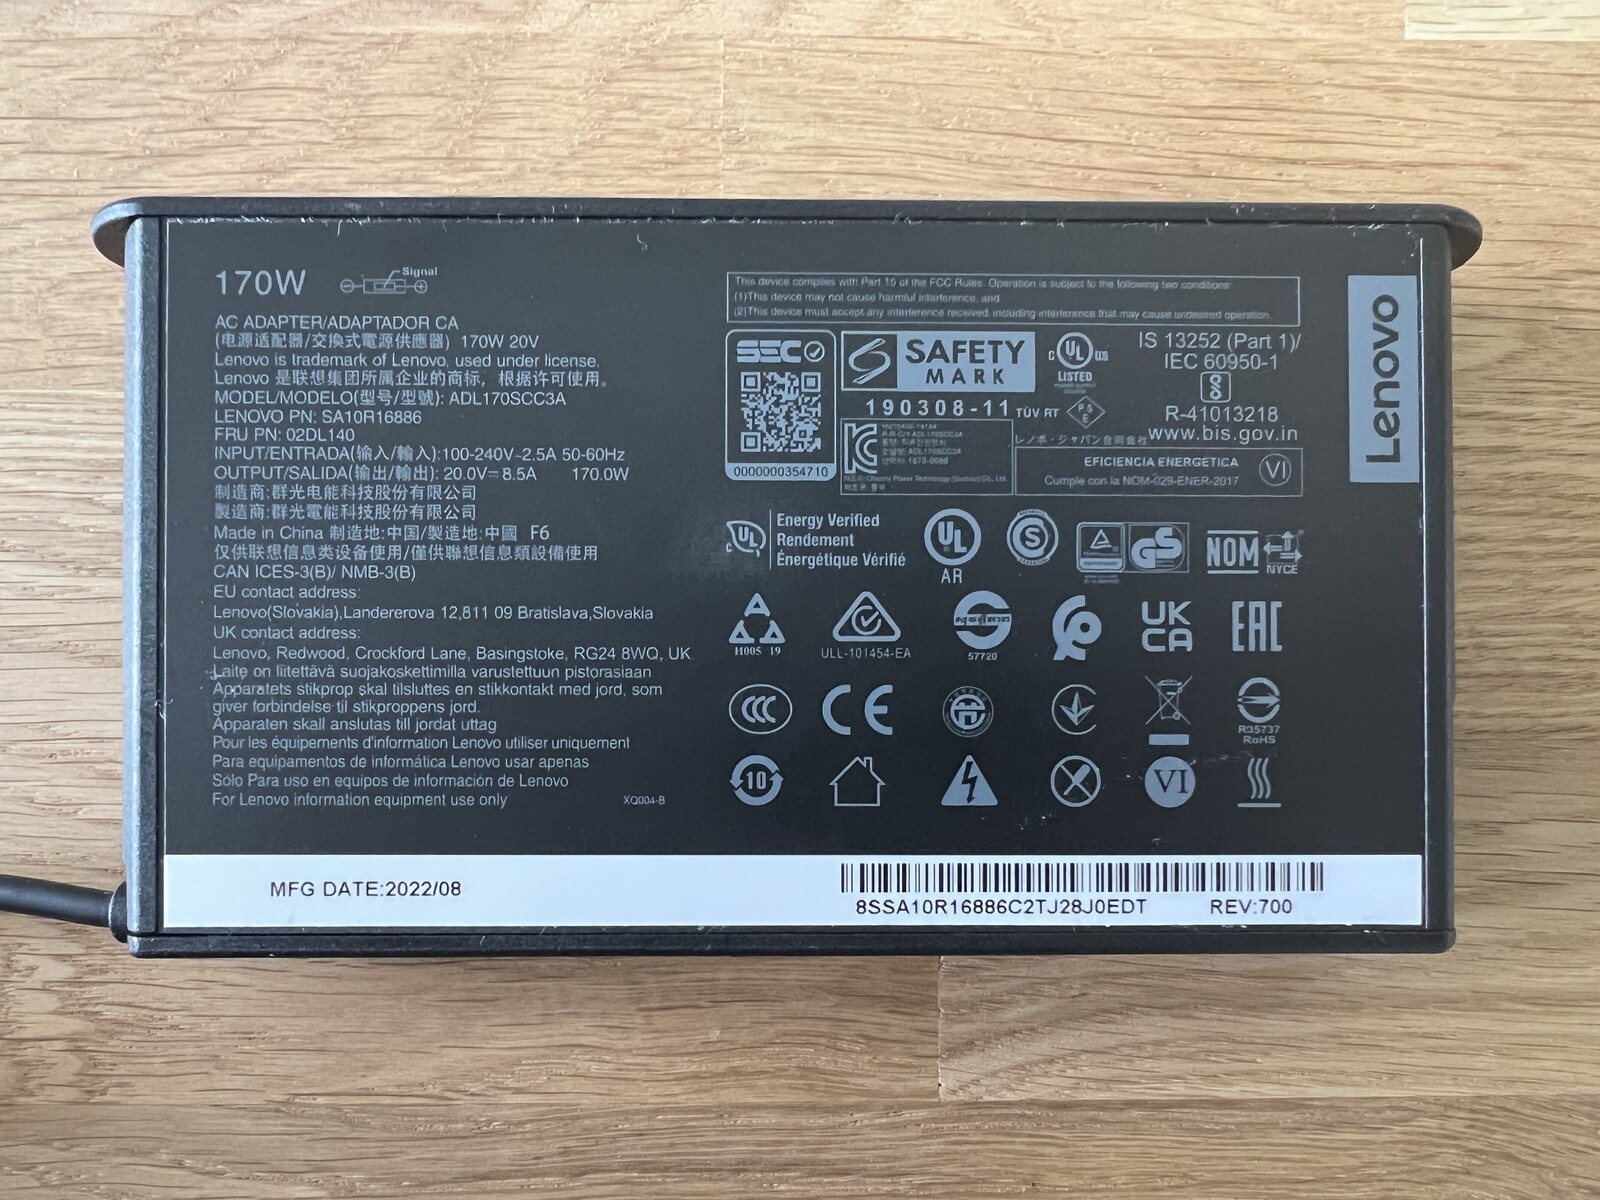
The large 16-inch display is largely responsible for the power consumption in everyday use and we measured up to 24 watts in idle at maximum SDR brightness. By comparison, the smaller 14-inch model consumes 20 watts despite higher brightness. In HDR mode, up to 40 watts is possible. Under load, we briefly see around 177 watts, but this quickly settles at around 170 watts (~160-170 watts during gaming). So the 170 watt power adapter is just sufficient, but there is no room to charge the battery in such situations. A model with 200 or 230 watts would have been the better choice here.
| Off / Standby | |
| Idle | |
| Load |
|
Key:
min: | |
| Lenovo Yoga Pro 9 16-IRP G8 i7-13705H, GeForce RTX 4060 Laptop GPU, Samsung PM9A1 MZVL21T0HCLR, Mini-LED, 3200x2000, 16" | Schenker VISION 16 Pro (M23) i7-13700H, GeForce RTX 4070 Laptop GPU, Samsung 990 Pro 1 TB, IPS, 2560x1600, 16" | Asus Vivobook Pro 16X K6604JV-MX016W i9-13980HX, GeForce RTX 4060 Laptop GPU, Solidigm P41 Plus SSDPFKNU010TZ, OLED, 3200x2000, 16" | Asus ProArt Studiobook 16 OLED H7604 i9-13980HX, GeForce RTX 4070 Laptop GPU, Phison EM2804TBMTCB47, OLED, 3200x2000, 16" | MSI Stealth 16 Studio A13VG i7-13700H, GeForce RTX 4070 Laptop GPU, Micron 3400 2TB MTFDKBA2T0TFH, IPS, 2560x1600, 16" | Apple MacBook Pro 16 2023 M2 Max M2 Max, M2 Max 38-Core GPU, Apple SSD AP2048Z, Mini-LED, 3456x2234, 16.2" | Average NVIDIA GeForce RTX 4060 Laptop GPU | Average of class Multimedia | |
|---|---|---|---|---|---|---|---|---|
| Power Consumption | 22% | -14% | -18% | 3% | 22% | 2% | 42% | |
| Idle Minimum * (Watt) | 10.9 | 8.6 21% | 13.8 -27% | 12.8 -17% | 11 -1% | 5.2 52% | 11.5 ? -6% | 5.71 ? 48% |
| Idle Average * (Watt) | 22.6 | 12 47% | 16 29% | 19.9 12% | 18 20% | 16.5 27% | 16 ? 29% | 10.1 ? 55% |
| Idle Maximum * (Watt) | 23.5 | 12.4 47% | 19 19% | 20.3 14% | 19 19% | 16.8 29% | 20.3 ? 14% | 12.4 ? 47% |
| Load Average * (Watt) | 84.6 | 80 5% | 147 -74% | 131.4 -55% | 91 -8% | 113 -34% | 92.9 ? -10% | 65 ? 23% |
| Witcher 3 ultra * (Watt) | 159.5 | 147.7 7% | 147.8 7% | 196.5 -23% | 130 18% | 92 42% | ||
| Load Maximum * (Watt) | 177.3 | 173.1 2% | 244 -38% | 246.8 -39% | 228 -29% | 145 18% | 210 ? -18% | 112.2 ? 37% |
* ... smaller is better
Power consumption Witcher 3 / Stress test
Power consumption with an external monitor
Battery Life
Lenovo also equips the Yoga Pro 9i 16 with a 75 Wh battery. In view of the higher consumption rates, one can be forgiven for already assuming that the battery life is bound to be even worse than in the 14-inch model. At 150 cd/m² (corresponding to 50% of the maximum SDR brightness) and 60 Hz, the results are still okay with 6.5 hours in the WLAN test (165 Hz: ~5.5 hours) and 7.5 hours in the video test. But as soon as you use high brightness and/or the higher frequency of 165 Hz, it becomes problematic. At full SDR brightness, our Wi-Fi test only lasts a little over 3.5 hours at 60 Hz and 15 minutes less at 165 Hz. An HDR video with full brightness drains the battery completely in just 133 minutes.
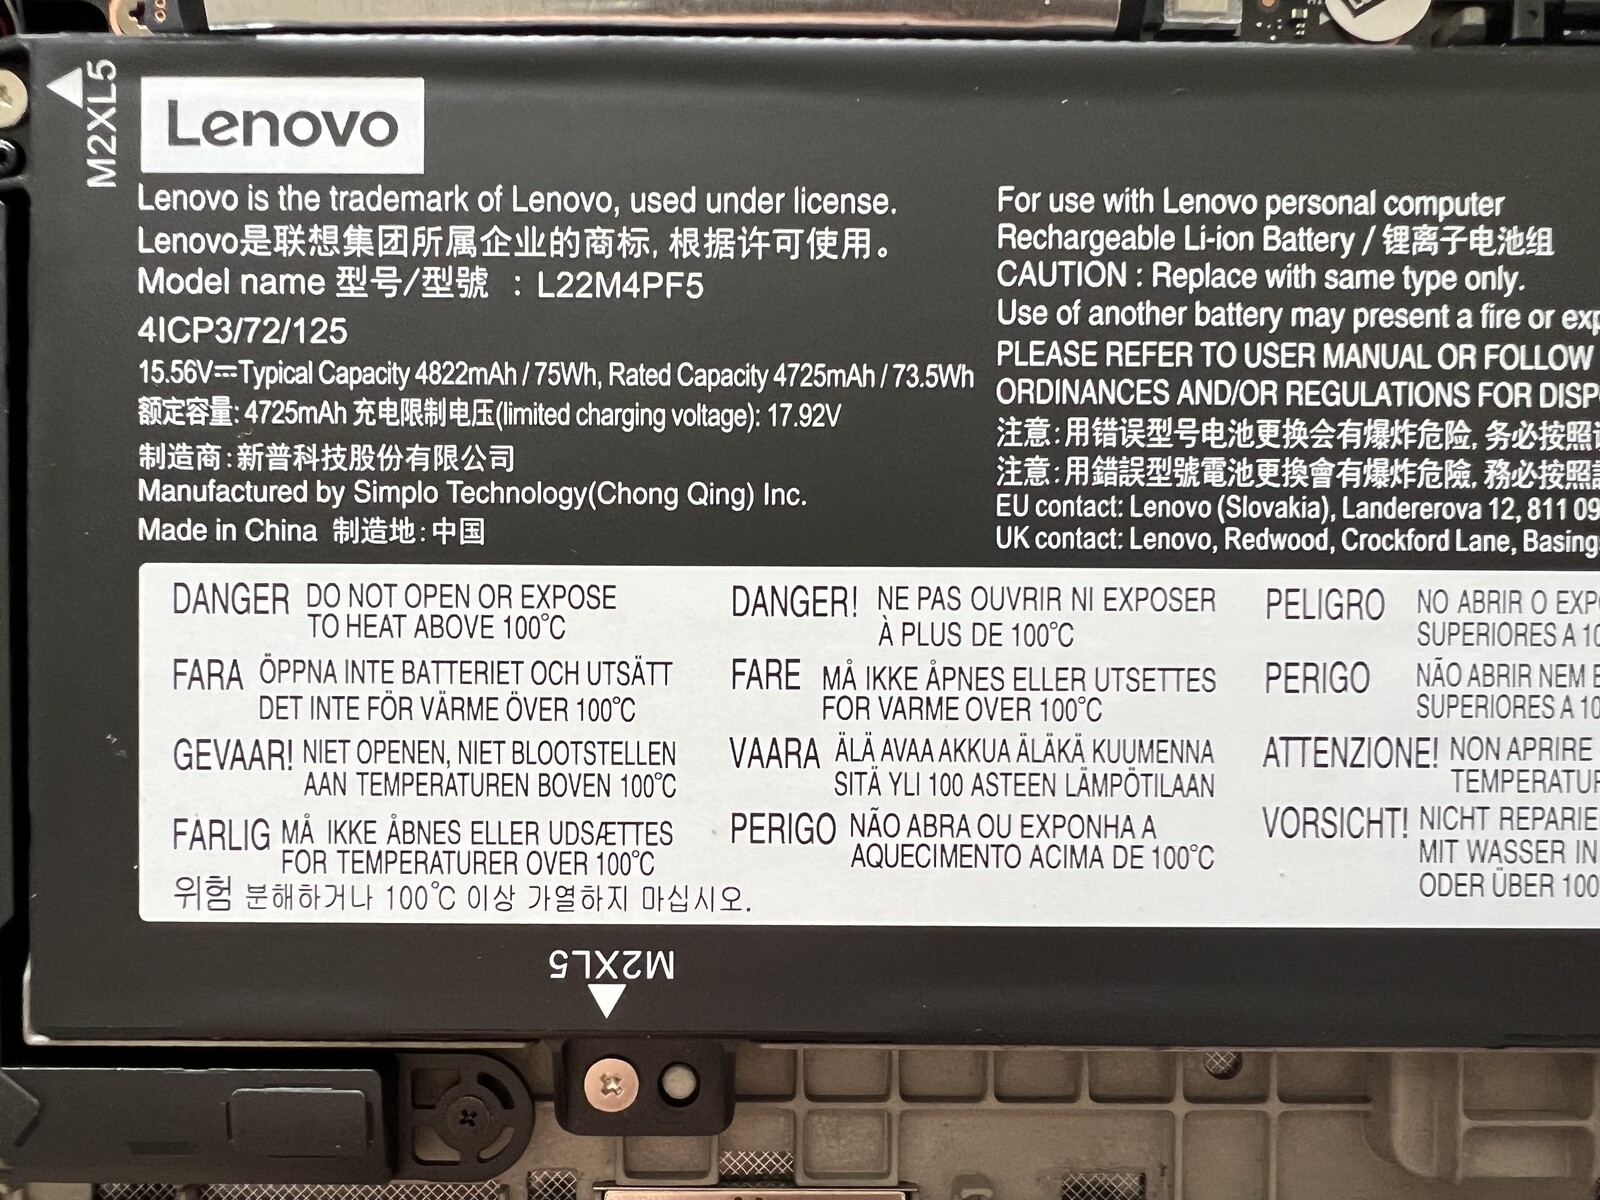
In view of these results, Lenovo should have installed a bigger battery instead of the second M.2 slot or at least given the customer the choice. The charging process is very linear up to 80% and takes 48 minutes to get there. The complete charging process takes 87 minutes when the device is switched on.
| Lenovo Yoga Pro 9 16-IRP G8 i7-13705H, GeForce RTX 4060 Laptop GPU, 75 Wh | Schenker VISION 16 Pro (M23) i7-13700H, GeForce RTX 4070 Laptop GPU, 80 Wh | Asus Vivobook Pro 16X K6604JV-MX016W i9-13980HX, GeForce RTX 4060 Laptop GPU, 90 Wh | Asus ProArt Studiobook 16 OLED H7604 i9-13980HX, GeForce RTX 4070 Laptop GPU, 90 Wh | MSI Stealth 16 Studio A13VG i7-13700H, GeForce RTX 4070 Laptop GPU, 99.9 Wh | Apple MacBook Pro 16 2023 M2 Max M2 Max, M2 Max 38-Core GPU, 99.6 Wh | Average of class Multimedia | |
|---|---|---|---|---|---|---|---|
| Battery runtime | 37% | 29% | 8% | 89% | 112% | 115% | |
| H.264 (h) | 7.5 | 7.8 4% | 5.3 -29% | 6 -20% | 7.7 3% | 18.7 149% | 16.4 ? 119% |
| WiFi v1.3 (h) | 6.4 | 7.8 22% | 6.5 2% | 5.6 -13% | 7.8 22% | 14.8 131% | 12 ? 88% |
| Load (h) | 0.7 | 1.3 86% | 1.5 114% | 1.1 57% | 2.4 243% | 1.1 57% | 1.675 ? 139% |
Pros
Cons
Verdict - The Yoga Pro 9i mainly struggles with battery life

The Yoga Pro 9i 16 is supposed to be Lenovo's most powerful and best multimedia notebook. Compared to the smaller Yoga Pro 9i 14, however, one has the impression that the manufacturer has made cuts in several areas on the 16-inch model. But first of all, the performance is overall very good and both the main components, namely the CPU and GPU, are faster than in the 14-inch model. So we wonder why the Yoga Pro 9i 16 does not offer Advanced Optimus and why the HDMI port only supports the 1.4b standard. Consequently, 4K displays can only run at 30 Hz, which does not conform to the current level of technology and does not match the high price. Also problematic is the decision to make the RAM soldered. On the topic of the case, another thing that bothers us is the creaking base plate.
The glossy mini-LED panel looks fantastic, especially with HDR content, and also offers accurate color reproduction in addition to complete AdobeRGB coverage. Unfortunately, the measurements are worse here than in the 14-inch model; the manufacturer appears to have put in less work here, since the large 16-inch model flickers at all brightness levels. The large display also has high energy consumption rates, so we cannot understand why Lenovo has not installed a larger battery.
The Lenovo Yoga Pro 9i 16, on its own terms, is a very good multimedia notebook with a great mini-LED panel, high performance, good keyboard and fantastic speakers. However, Lenovo has cut back in several areas and there are certain drawbacks compared to the smaller 14-inch model, which is incomprehensible.
Of course, there are lots of positive aspects. We've already mentioned the solid performance values along with the good keyboard, numpad and excellent speakers. Excluding the creaking base panel, the case is very good and the build quality very stable. Lastly, the 16-inch model also offers a second SSD slot.
The battery life is very poor overall and definitely a weakness. The Apple MacBook Pro 16 thus has a massive advantage here despite its excellent and bright mini-LED panel. Windows-equipped rivals with OLED displays such as the Asus Vivobook Pro 16X or Asus Studiobook 16 OLED fare no better here and are clearly behind in regard to screen brightness. IPS rivals Schenker Vision 16 Pro and the MSI Stealth 16 Studio have advantages such as matte displays and no PWN flickering, but do not support HDR.
Price and Availability
In Lenovo's US store, a variant with the Core i9-13905H, RTX 4060 and 32 GB RAM is currently available for $2,199.99.
Prices are as of 02.08.2023 and are subject to change.
Lenovo Yoga Pro 9 16-IRP G8
- 07/31/2023 v7 (old)
Andreas Osthoff
Transparency
The selection of devices to be reviewed is made by our editorial team. The test sample was provided to the author as a loan by the manufacturer or retailer for the purpose of this review. The lender had no influence on this review, nor did the manufacturer receive a copy of this review before publication. There was no obligation to publish this review. As an independent media company, Notebookcheck is not subjected to the authority of manufacturers, retailers or publishers.
This is how Notebookcheck is testing
Every year, Notebookcheck independently reviews hundreds of laptops and smartphones using standardized procedures to ensure that all results are comparable. We have continuously developed our test methods for around 20 years and set industry standards in the process. In our test labs, high-quality measuring equipment is utilized by experienced technicians and editors. These tests involve a multi-stage validation process. Our complex rating system is based on hundreds of well-founded measurements and benchmarks, which maintains objectivity. Further information on our test methods can be found here.
Price comparison

