Asus ProArt Studiobook 16 OLED review: Multimedia laptop with extreme CPU performance
Asus is primarily targeting creative users with the ProArt Studiobook 16 and offers an additional input feature in the DialPad. The current Studiobook 16 OLED 2023 uses Intel's fastest mobile processor, the Core i9-13980HX, in combination with the new GeForce RTX 4070 Laptop. The display has also changed, as the 4K OLED has been swapped for a 3K touchscreen model with 120 Hz. Our test device is the high-end model with 64 GB RAM and a 4 TB PCIe SSD for EUR 3999 (US$4380). Alternatively, there is also a variant with the RTX 4070 Laptop, 32 GB RAM and a 2 TB SSD for EUR 3499 (US$3800) or an RTX 4060 Laptop with 32 GB RAM and a 1 TB SSD for EUR 2,999 (US$3300).
Possible competitors in comparison
Rating | Date | Model | Weight | Height | Size | Resolution | Price |
|---|---|---|---|---|---|---|---|
| 86.1 % v7 (old) | 06 / 2023 | Asus ProArt Studiobook 16 OLED H7604 i9-13980HX, GeForce RTX 4070 Laptop GPU | 2.4 kg | 23.9 mm | 16.00" | 3200x2000 | |
| 86.2 % v7 (old) | 03 / 2023 | Gigabyte AERO 16 OLED BSF i9-13900H, GeForce RTX 4070 Laptop GPU | 2.1 kg | 18 mm | 16.00" | 3840x2400 | |
| 89.4 % v7 (old) | 04 / 2023 | Samsung Galaxy Book3 Ultra 16 i7-13700H, GeForce RTX 4050 Laptop GPU | 1.8 kg | 16.5 mm | 16.00" | 2880x1800 | |
| 89.2 % v7 (old) | 04 / 2023 | MSI Stealth 17 Studio A13VH-014 i9-13900H, GeForce RTX 4080 Laptop GPU | 3 kg | 21.3 mm | 17.30" | 3840x2160 | |
| 93.7 % v7 (old) | 03 / 2023 | Apple MacBook Pro 16 2023 M2 Max M2 Max, M2 Max 38-Core GPU | 2.2 kg | 16.8 mm | 16.20" | 3456x2234 | |
| 88 % v7 (old) | 04 / 2023 | Asus Zephyrus Duo 16 GX650PY-NM006W R9 7945HX, GeForce RTX 4090 Laptop GPU | 2.7 kg | 29.7 mm | 16.00" | 2560x1600 |
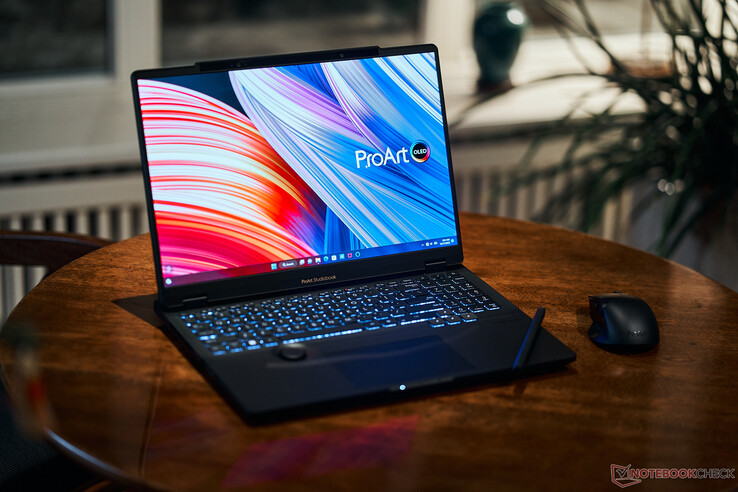
Case - ProArt is restrained
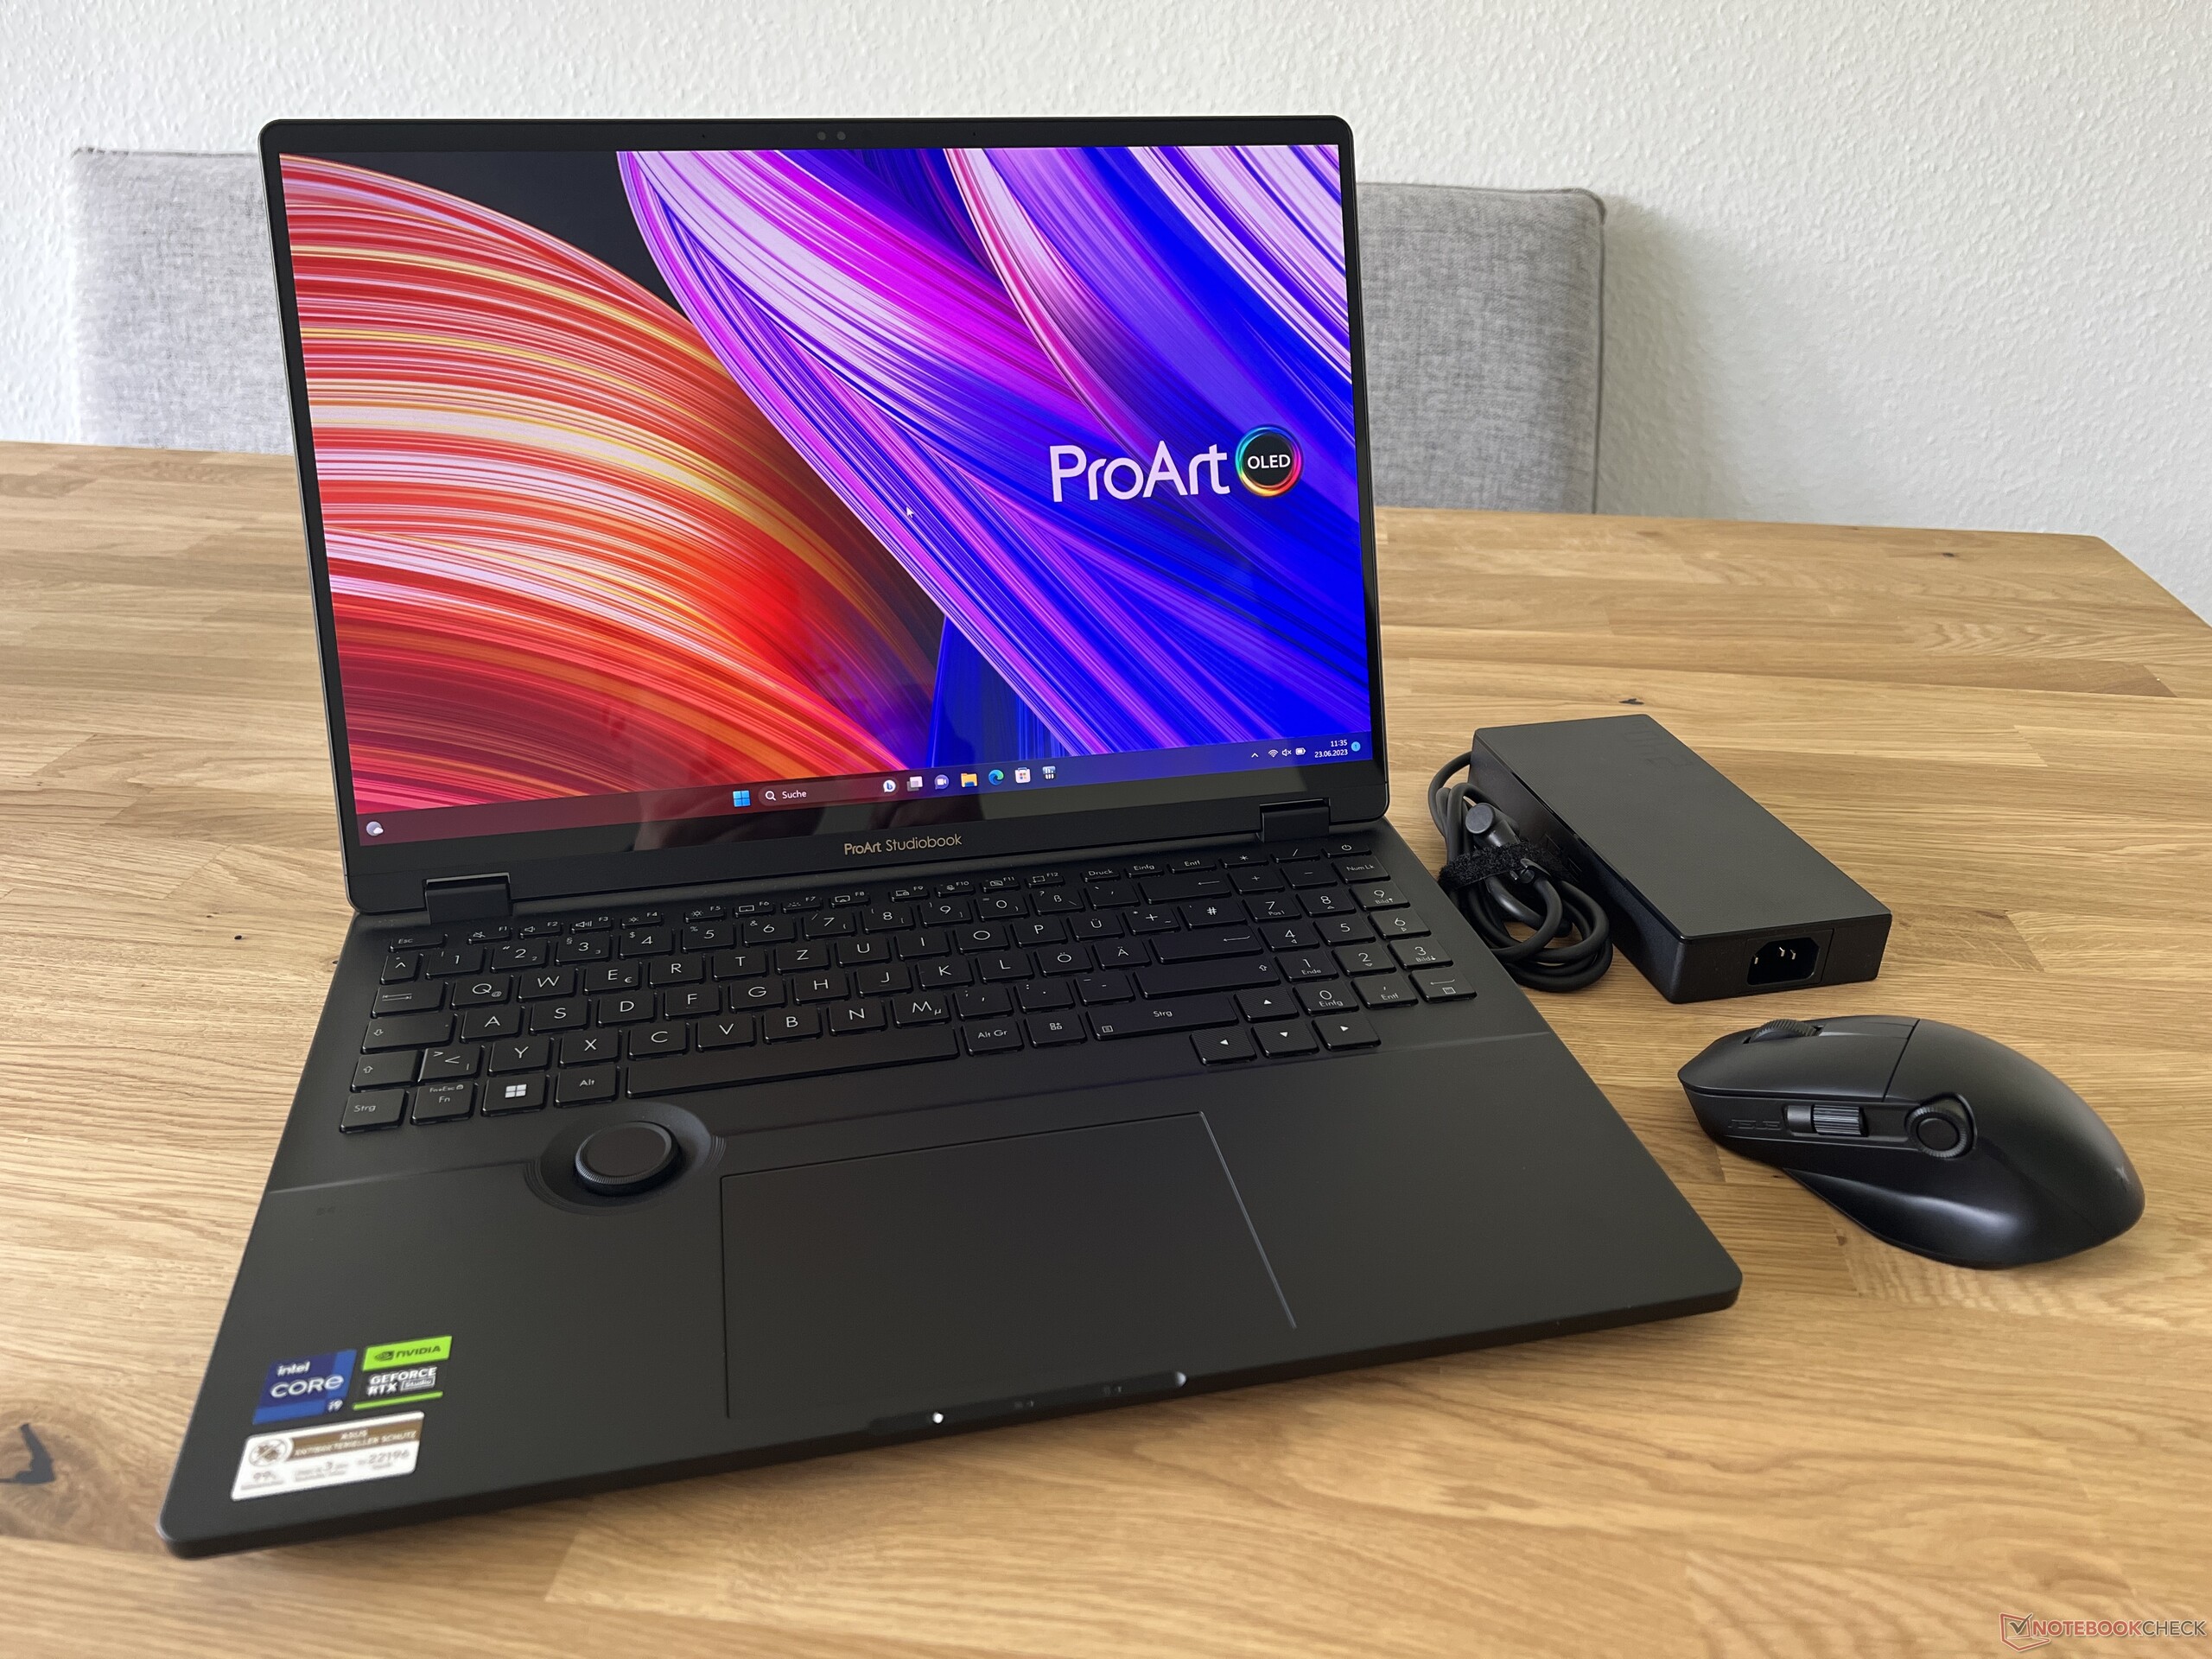
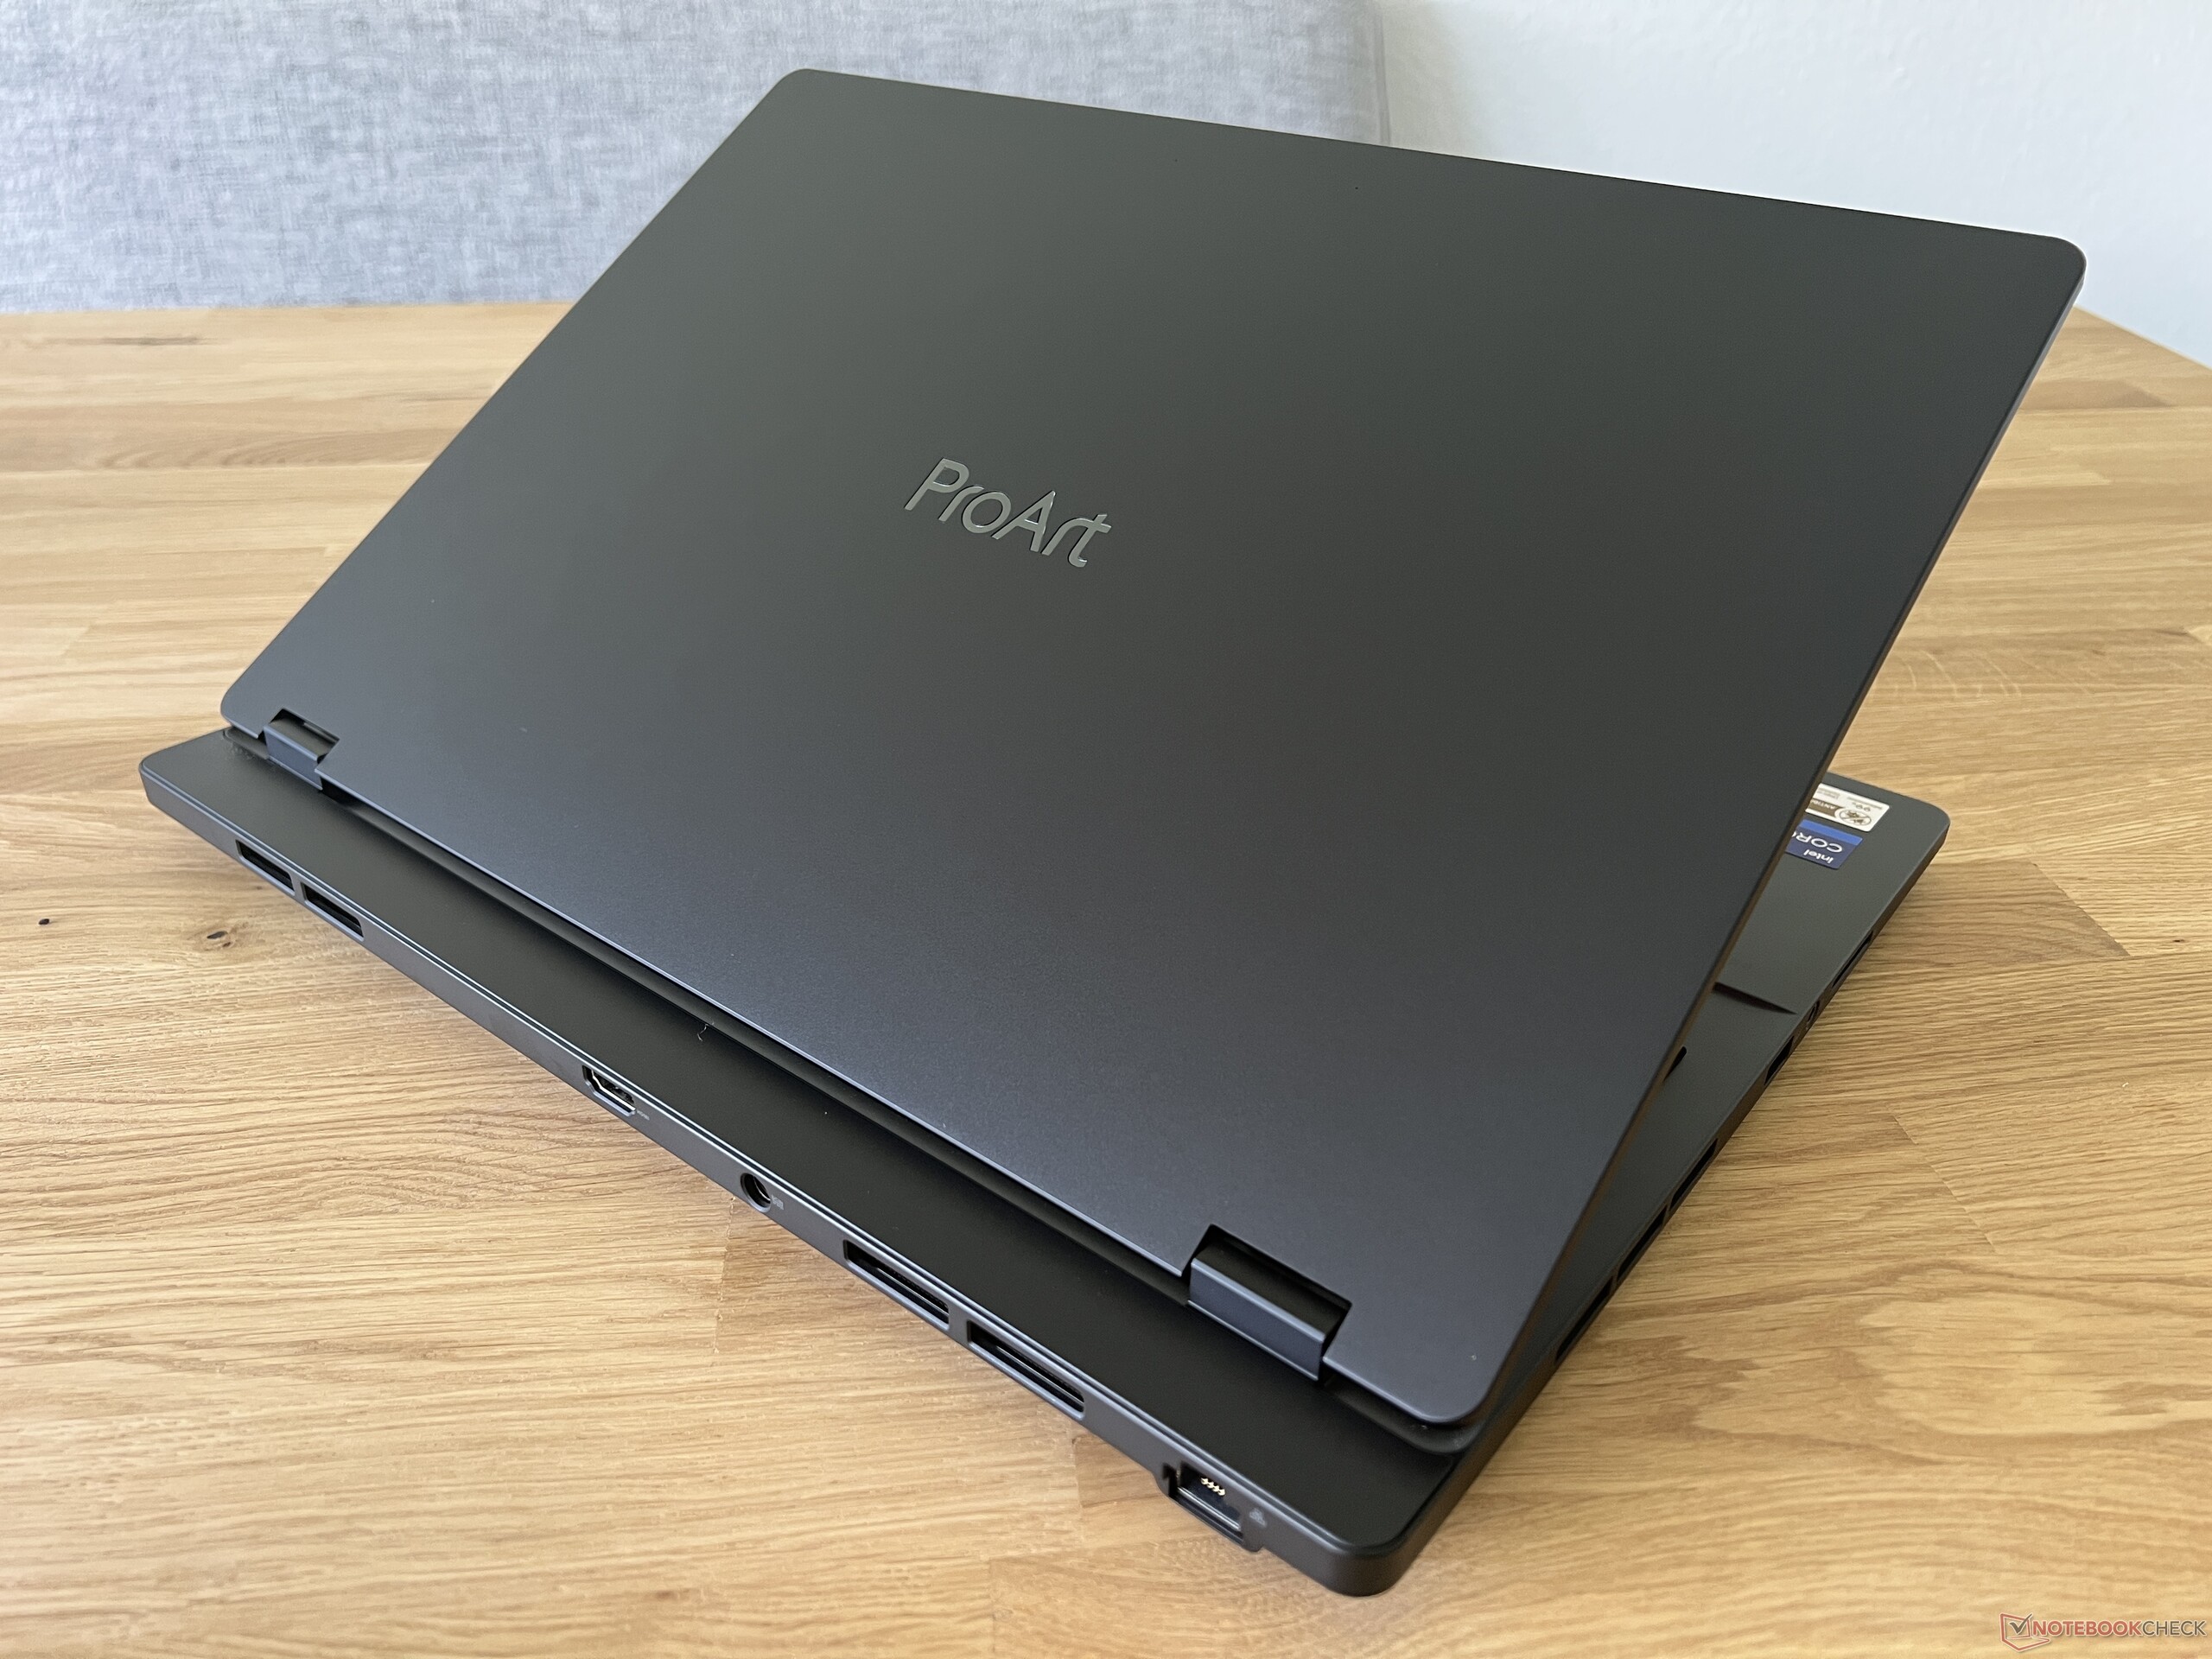
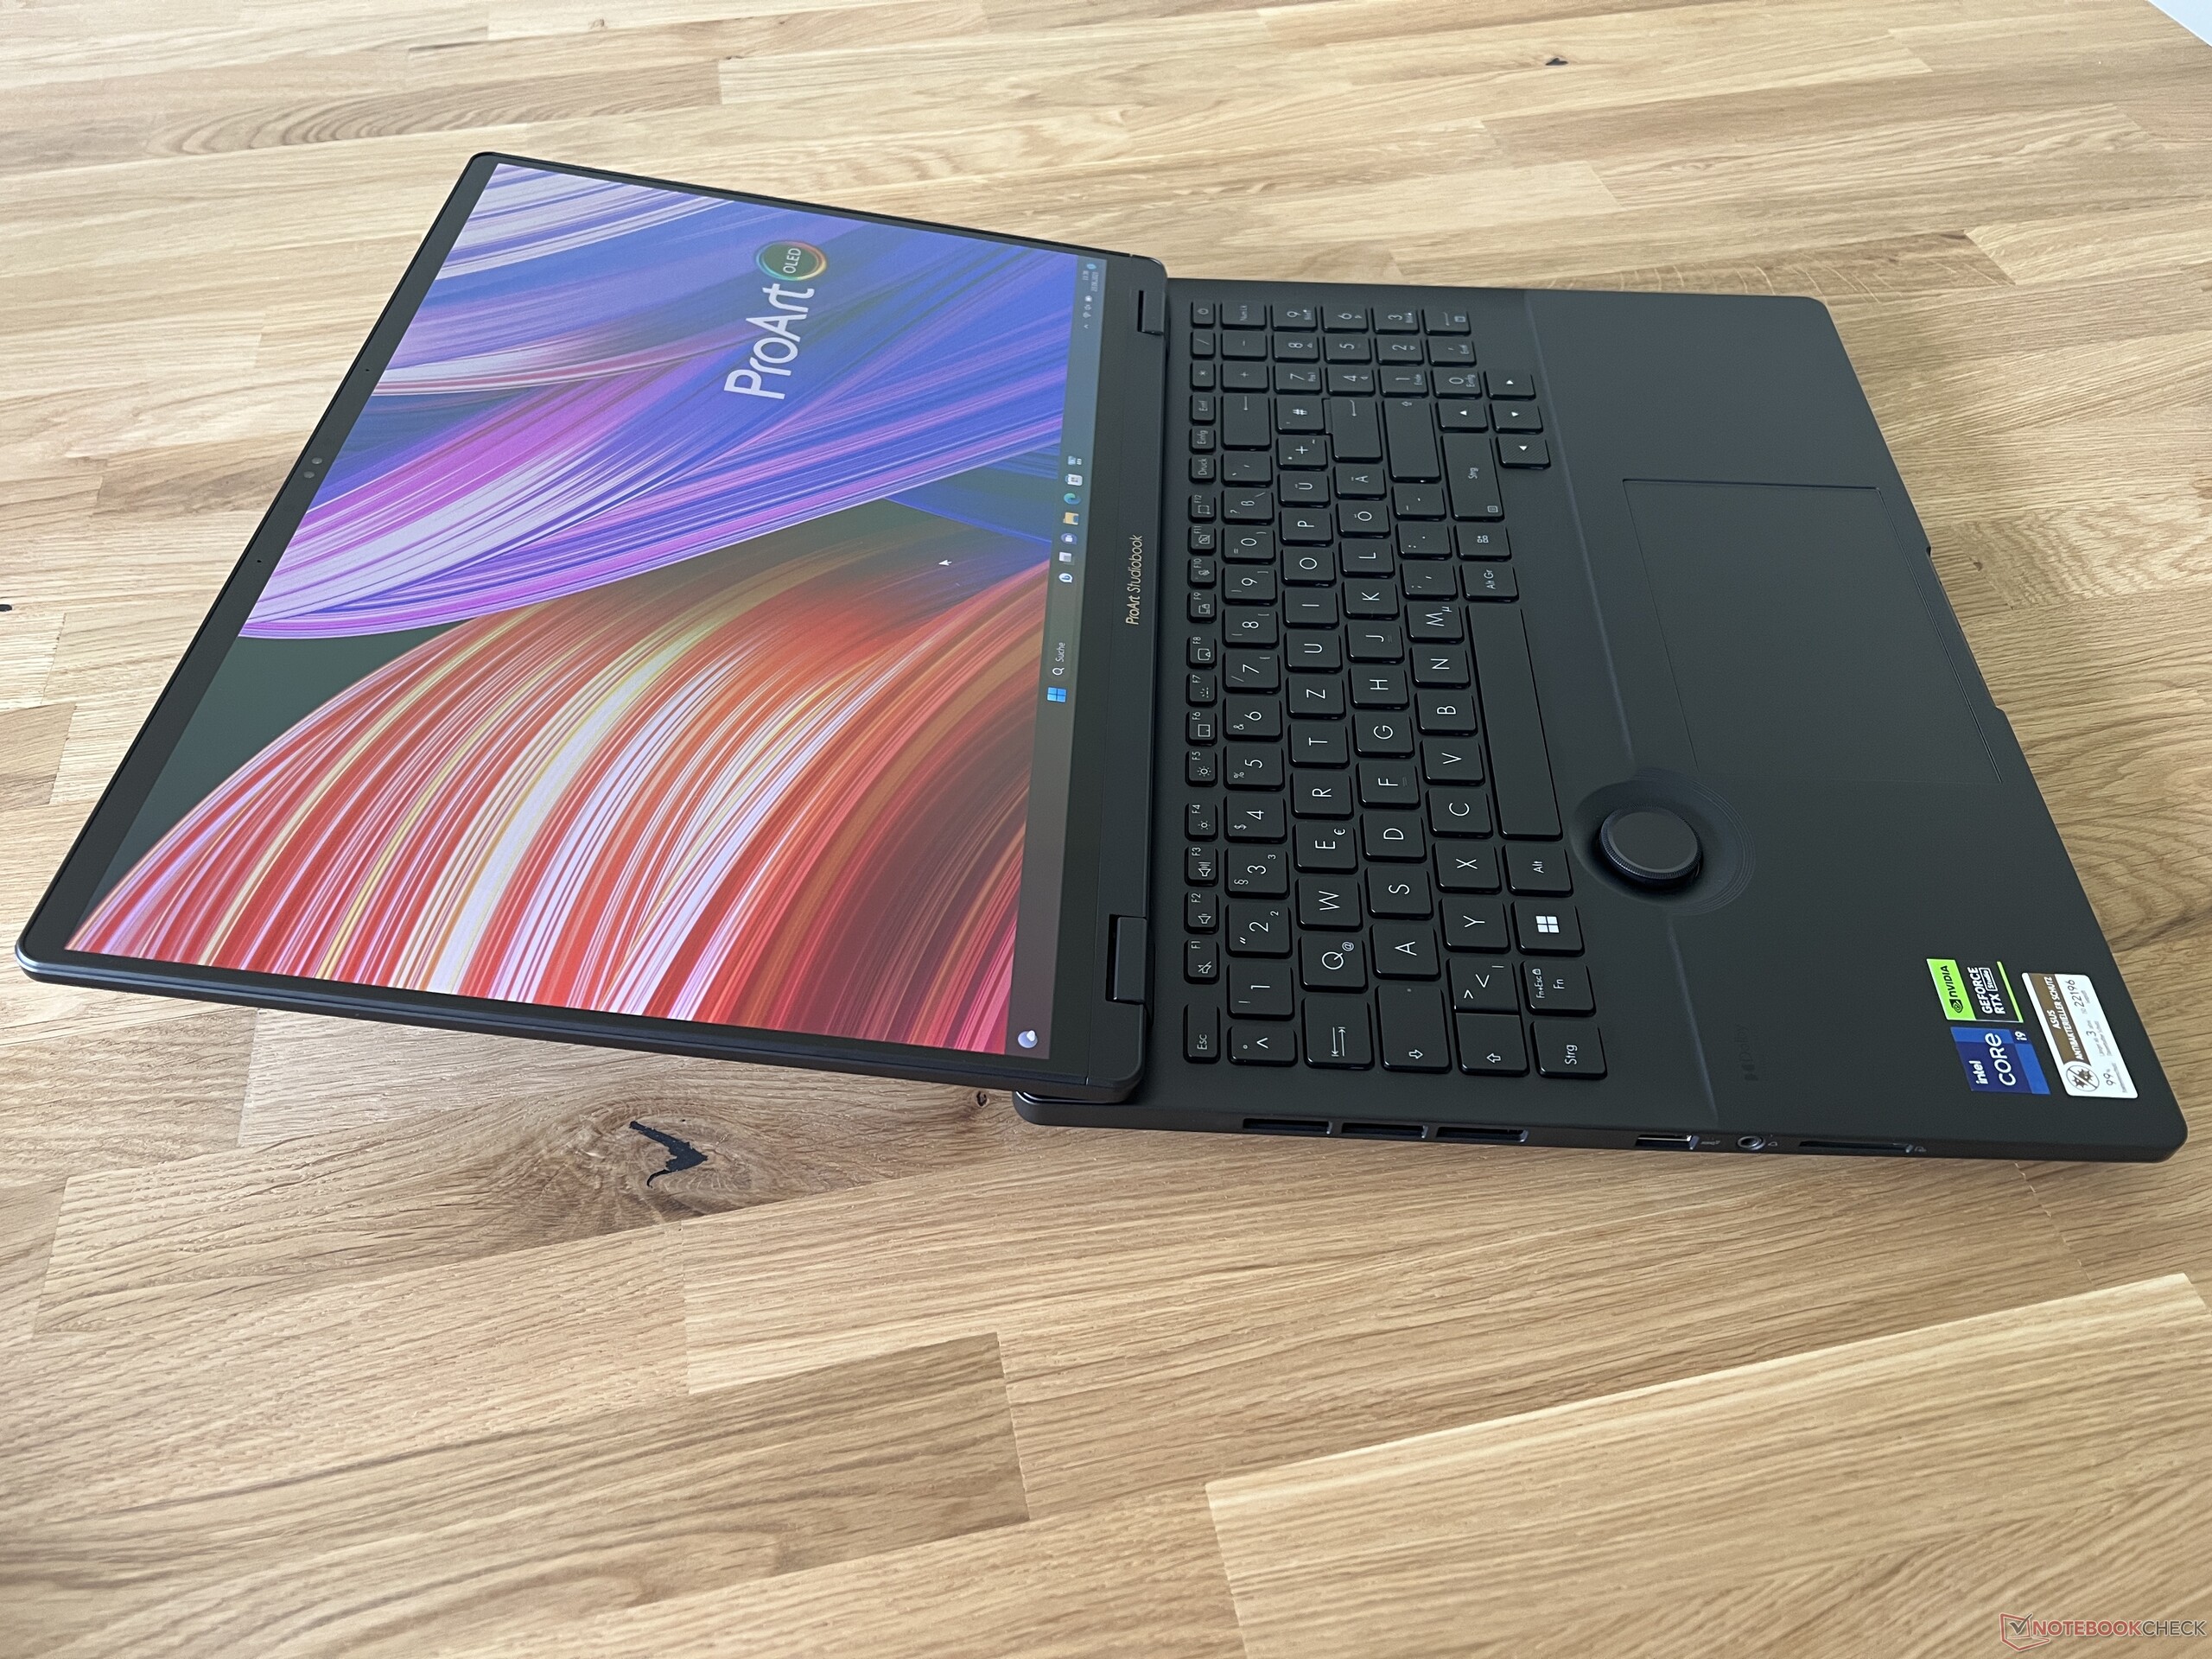
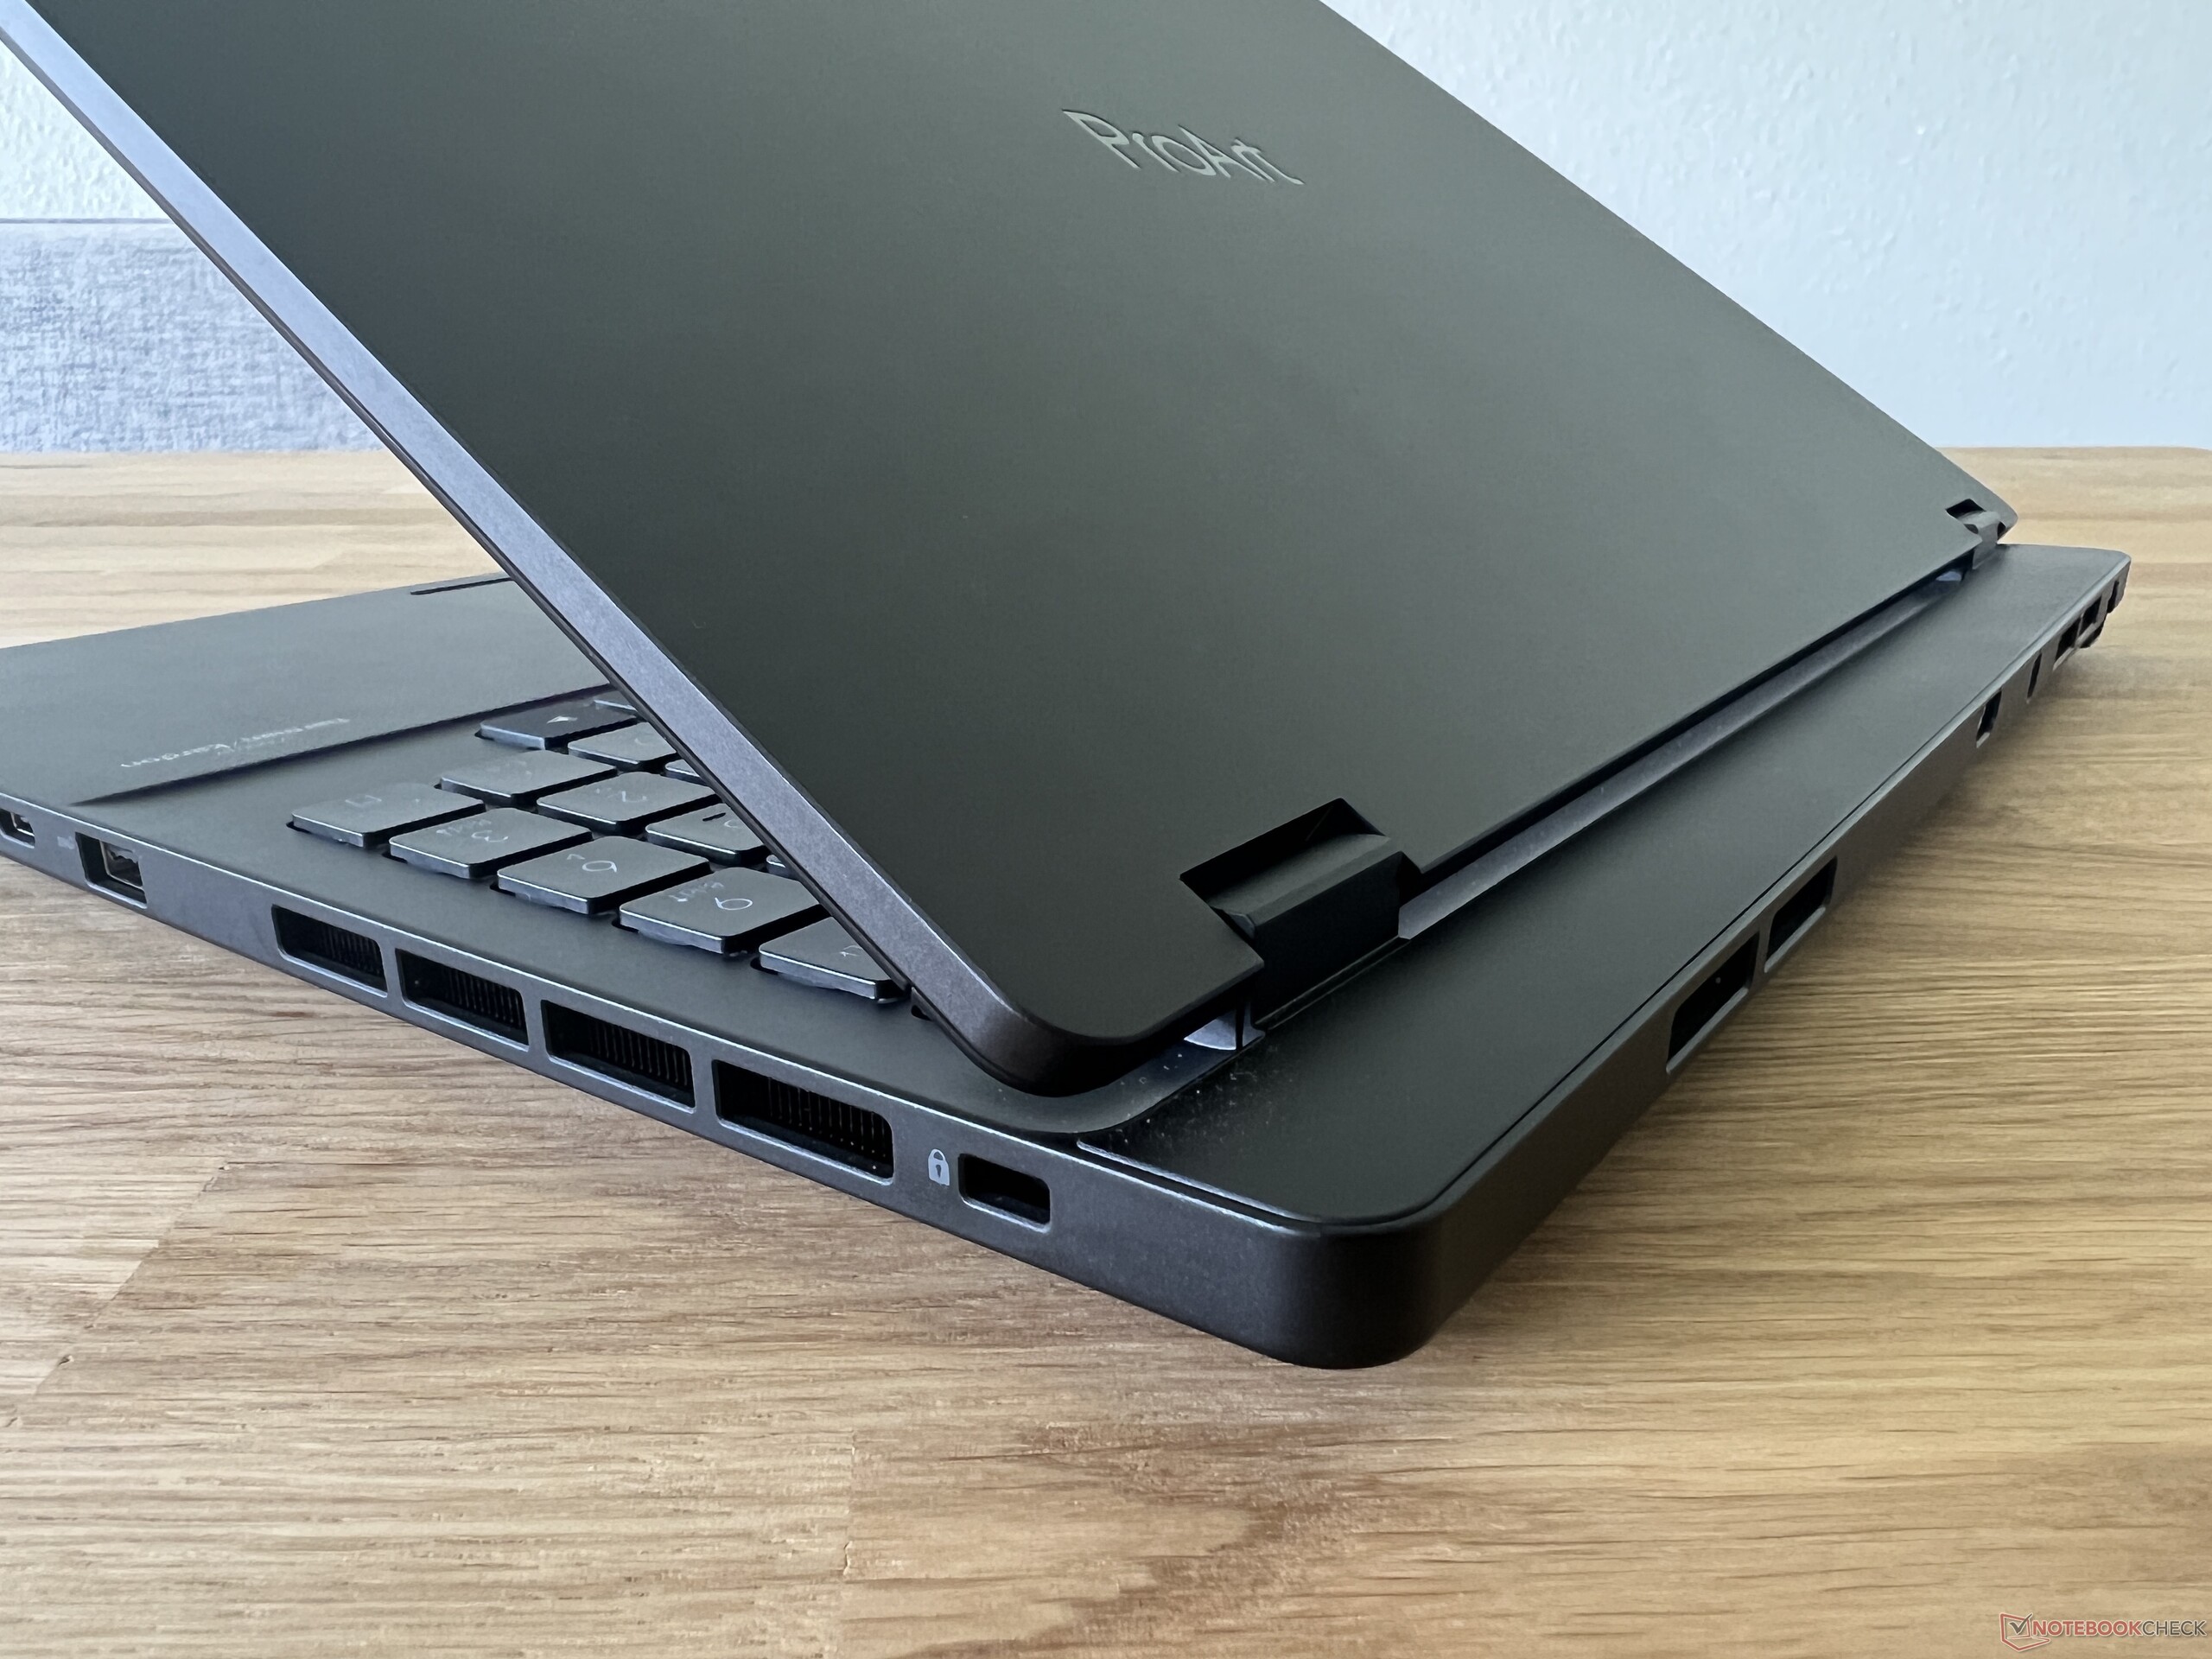
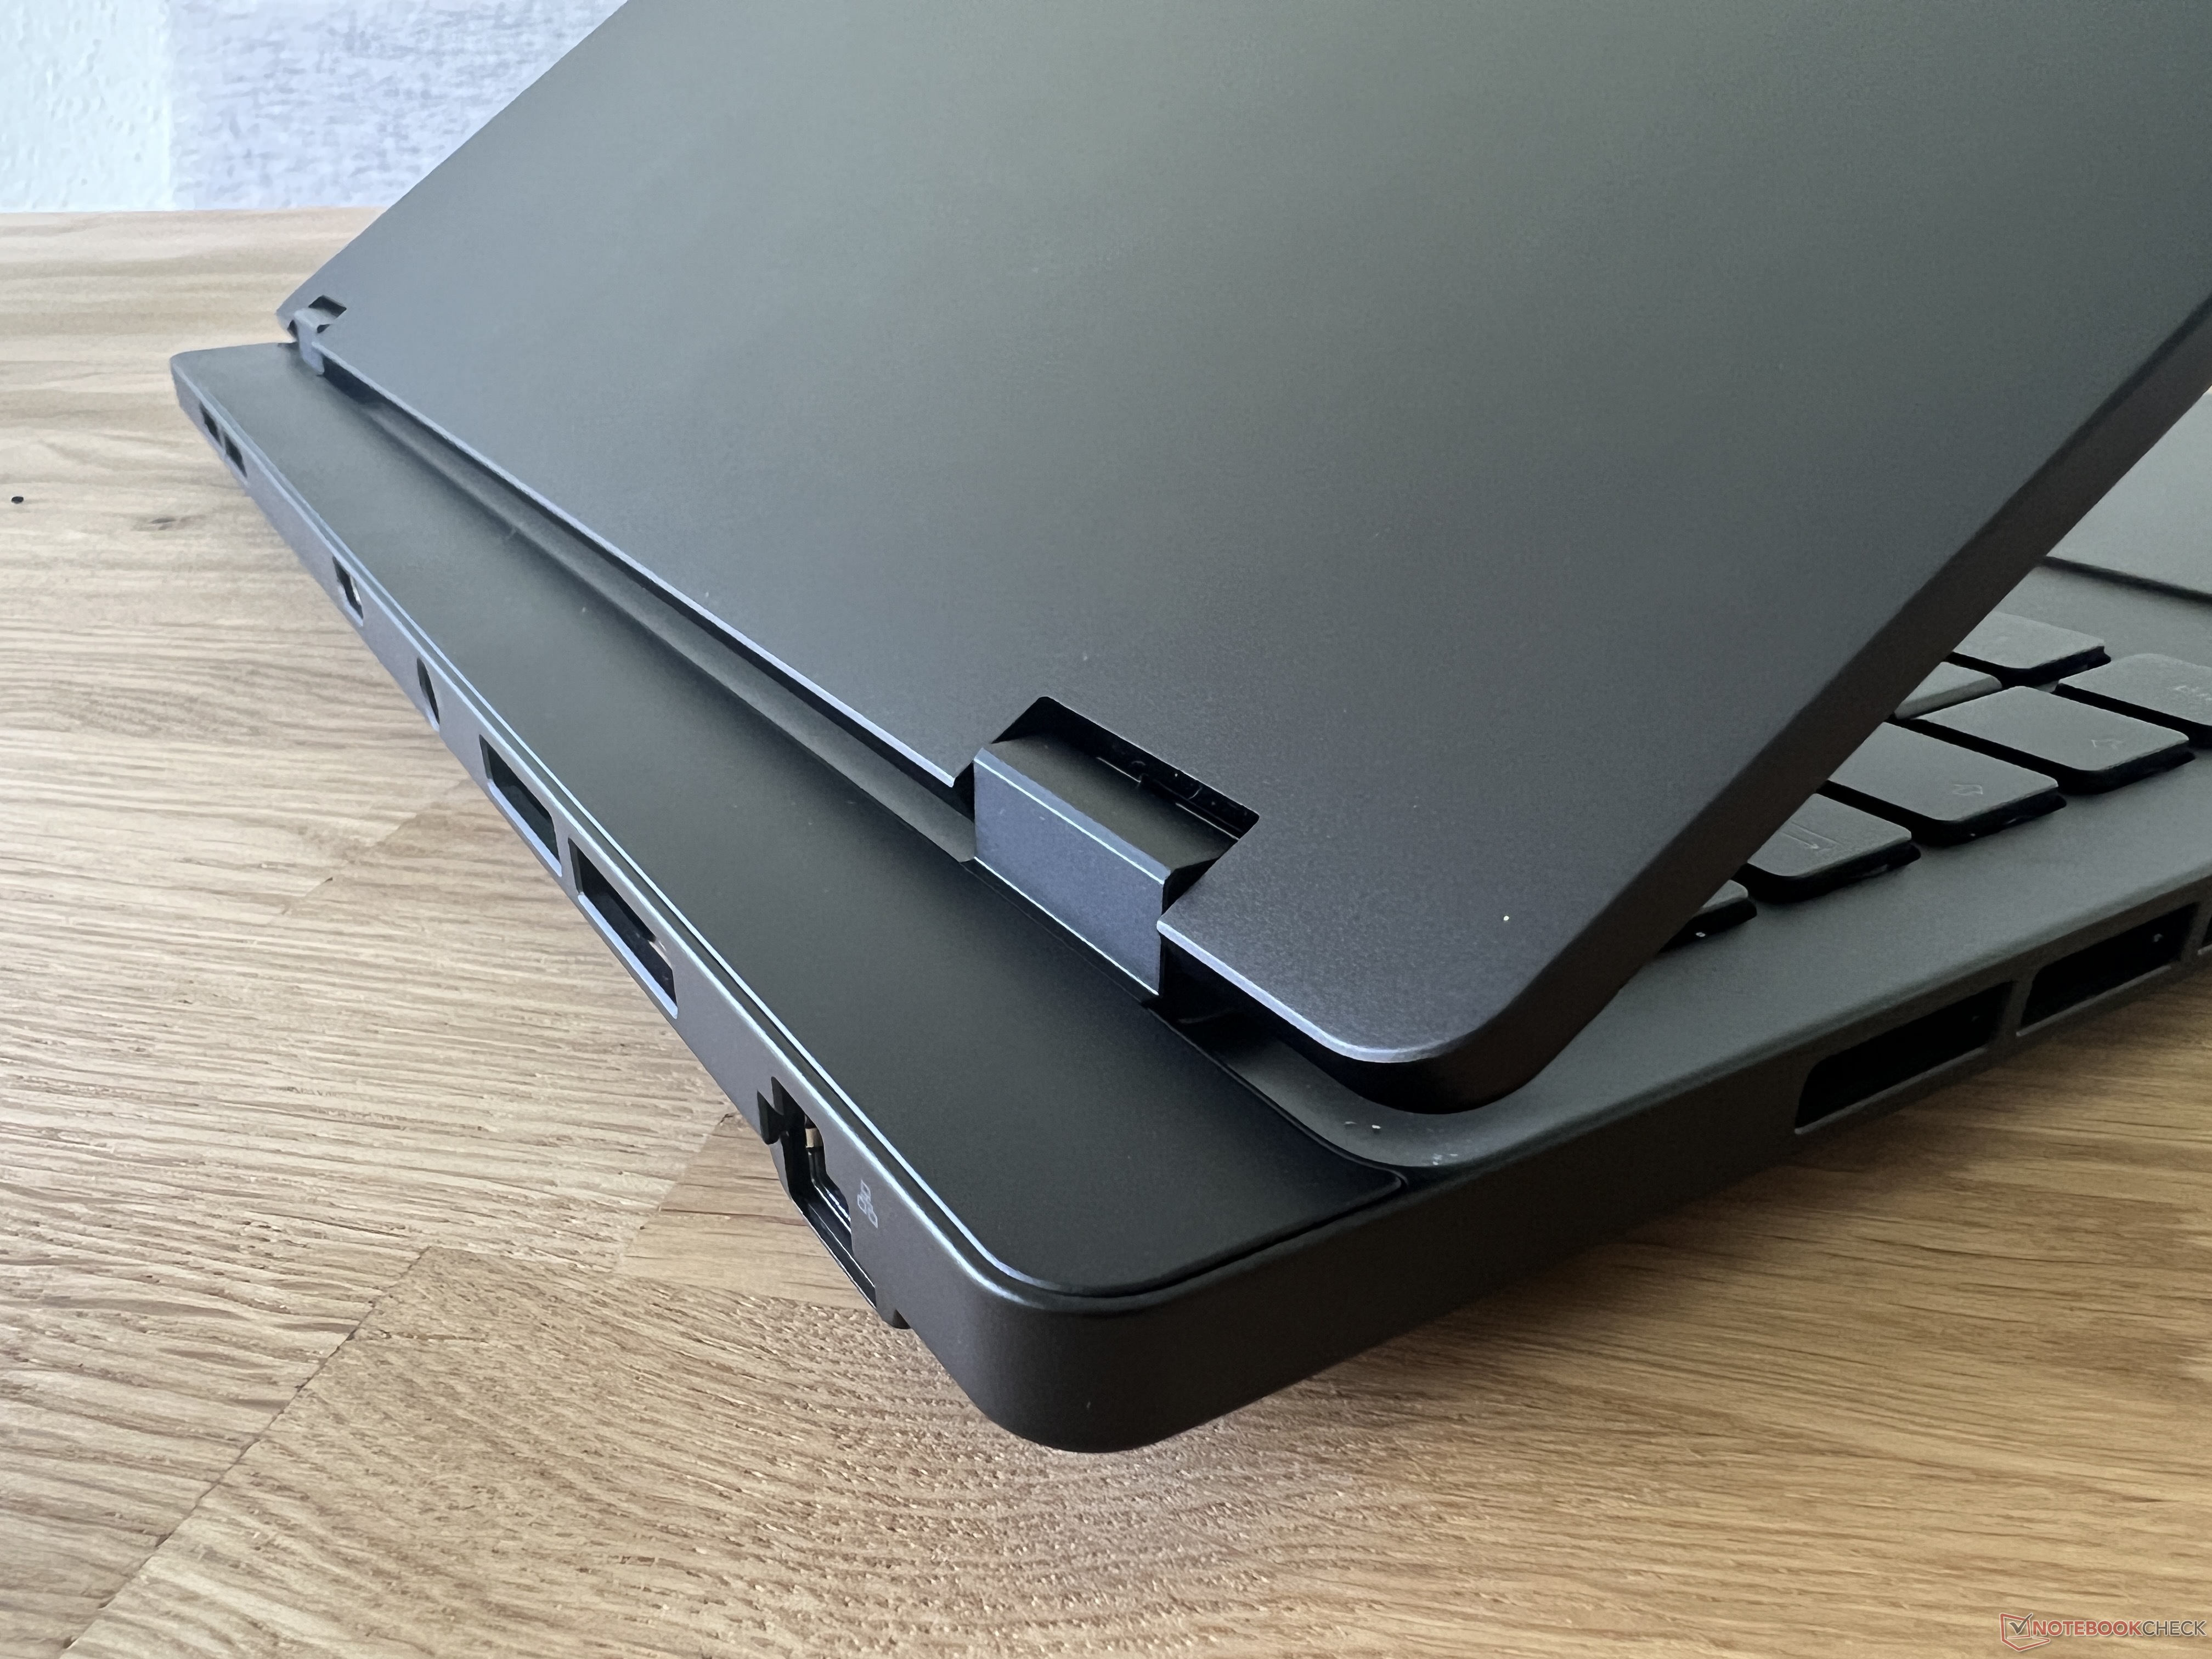
Asus uses black plastic for the ProArt Studiobook 16, which feels quite high-quality. The only problem is the smooth surfaces, which are very susceptible to fingerprints. Overall, the design is very restrained and apart from the ProArt logo on the lid there are no other visual accents. As soon as you open the lid, the large DialPad under the keyboard immediately catches your eye. The lid sits slightly in front of the base unit, but this also allows for a maximum opening angle of almost 180 degrees.
Stability is excellent, both of the base unit and the lid. No creaking noises are emitted under torsional stress and nothing can be dented either. The hinges are well adjusted: they effectively prevent teetering and keep the screen securely in place. Only at very small angles (less than 20 degrees) does the lid fall shut on its own due to the weight.
At just under 2.5 kg, the Studiobook is not lightweight and, due to its size, not particularly portable either. The notebook still fits into large backpacks, but naturally takes up a lot of space as a 16-incher. It is also the largest 16-incher in the comparison group and not much smaller than 17-inch devices either. The laptop is also quite thick at around 2.5 cm and is only surpassed by the Zephyrus Duo with its second screen. For the 240-watt power supply, you'll have to factor in an additional 740 grams for transport.
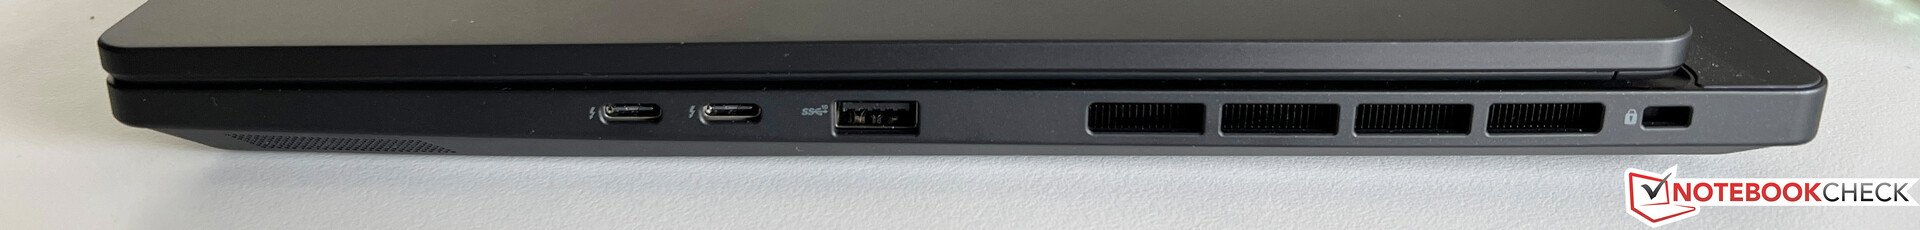
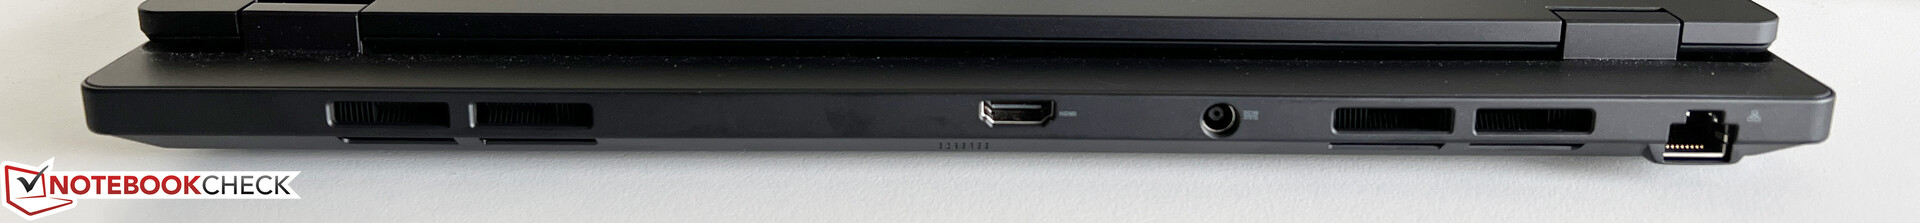
Equipment - Thunderbolt 4 and HDMI 2.1
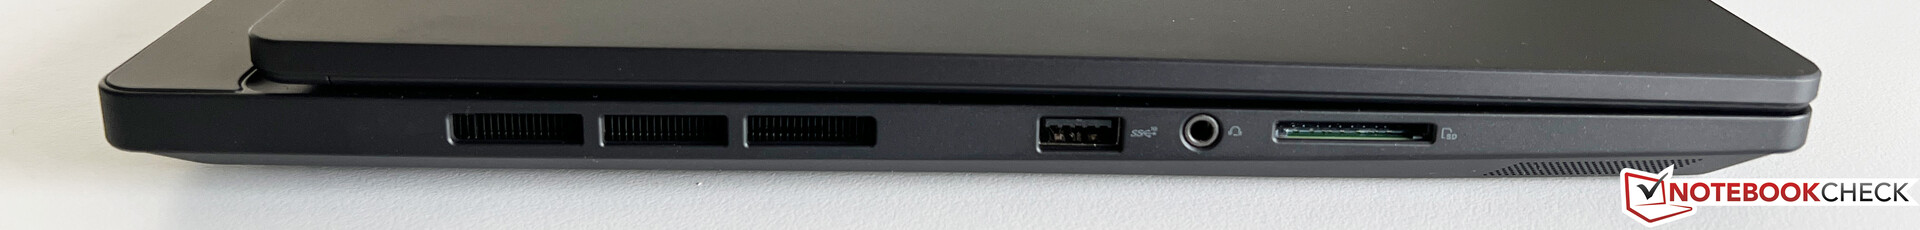
The ports are distributed over the front areas of both sides and the rear. Most of the USB ports are on the front right, which can get crowded when fully occupied. On the other hand, Asus has placed the power jack, the Ethernet port and the HDMI output on the back, where they do not get in the way.
SD Card Reader
On the left side is the full-fledged SD card reader, which only achieves average transfer rates via our reference card (Angelbird AV Pro V60). Much more is possible here, as the competition shows.
| SD Card Reader | |
| average JPG Copy Test (av. of 3 runs) | |
| Apple MacBook Pro 16 2023 M2 Max (Angelbird AV Pro V60) | |
| Asus Zephyrus Duo 16 GX650PY-NM006W (Angelbird AV Pro V60) | |
| Gigabyte AERO 16 OLED BSF | |
| Average of class Multimedia (22.2 - 531, n=45, last 2 years) | |
| Samsung Galaxy Book3 Ultra 16 (AV PRO microSD 128 GB V60) | |
| Asus ProArt Studiobook 16 OLED H7604 (Angelibird AV Pro V60) | |
| MSI Stealth 17 Studio A13VH-014 | |
| maximum AS SSD Seq Read Test (1GB) | |
| Asus Zephyrus Duo 16 GX650PY-NM006W (Angelbird AV Pro V60) | |
| Apple MacBook Pro 16 2023 M2 Max (Angelbird AV Pro V60) | |
| Gigabyte AERO 16 OLED BSF | |
| Average of class Multimedia (27.9 - 1455, n=44, last 2 years) | |
| Asus ProArt Studiobook 16 OLED H7604 (Angelibird AV Pro V60) | |
| Samsung Galaxy Book3 Ultra 16 (AV PRO microSD 128 GB V60) | |
| MSI Stealth 17 Studio A13VH-014 | |
Communication
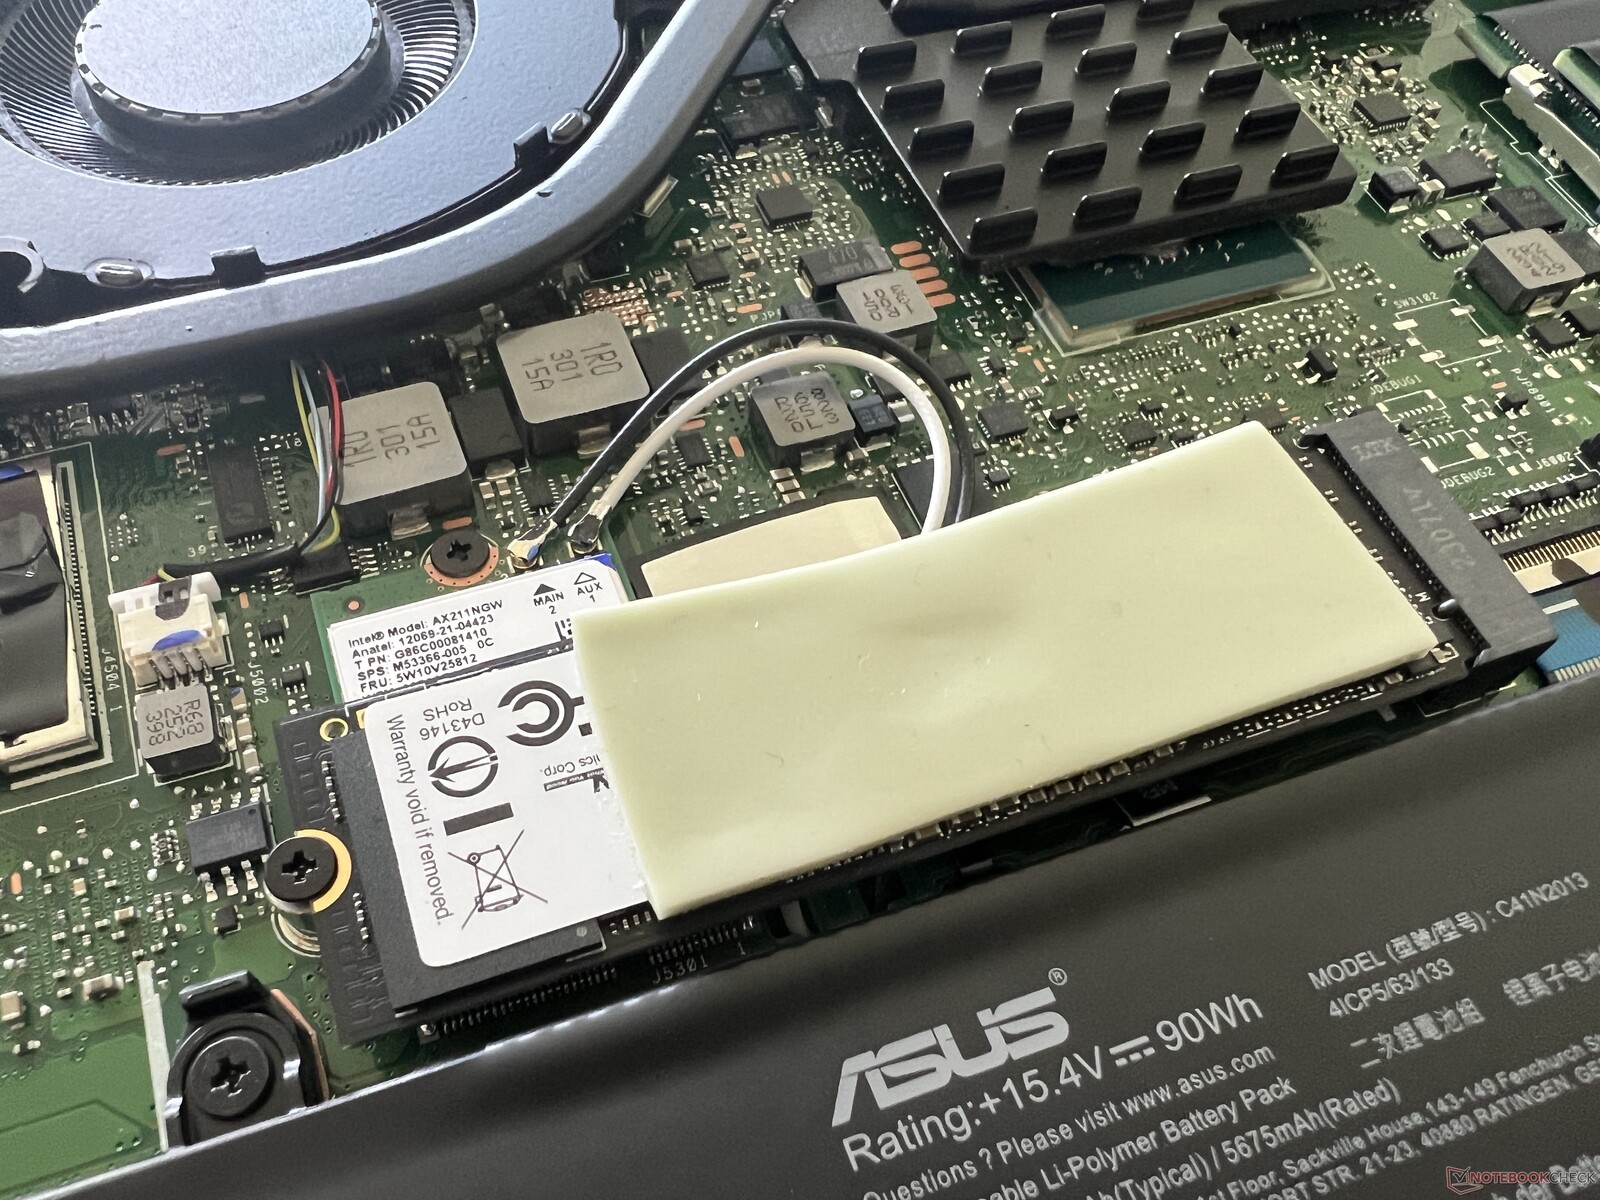
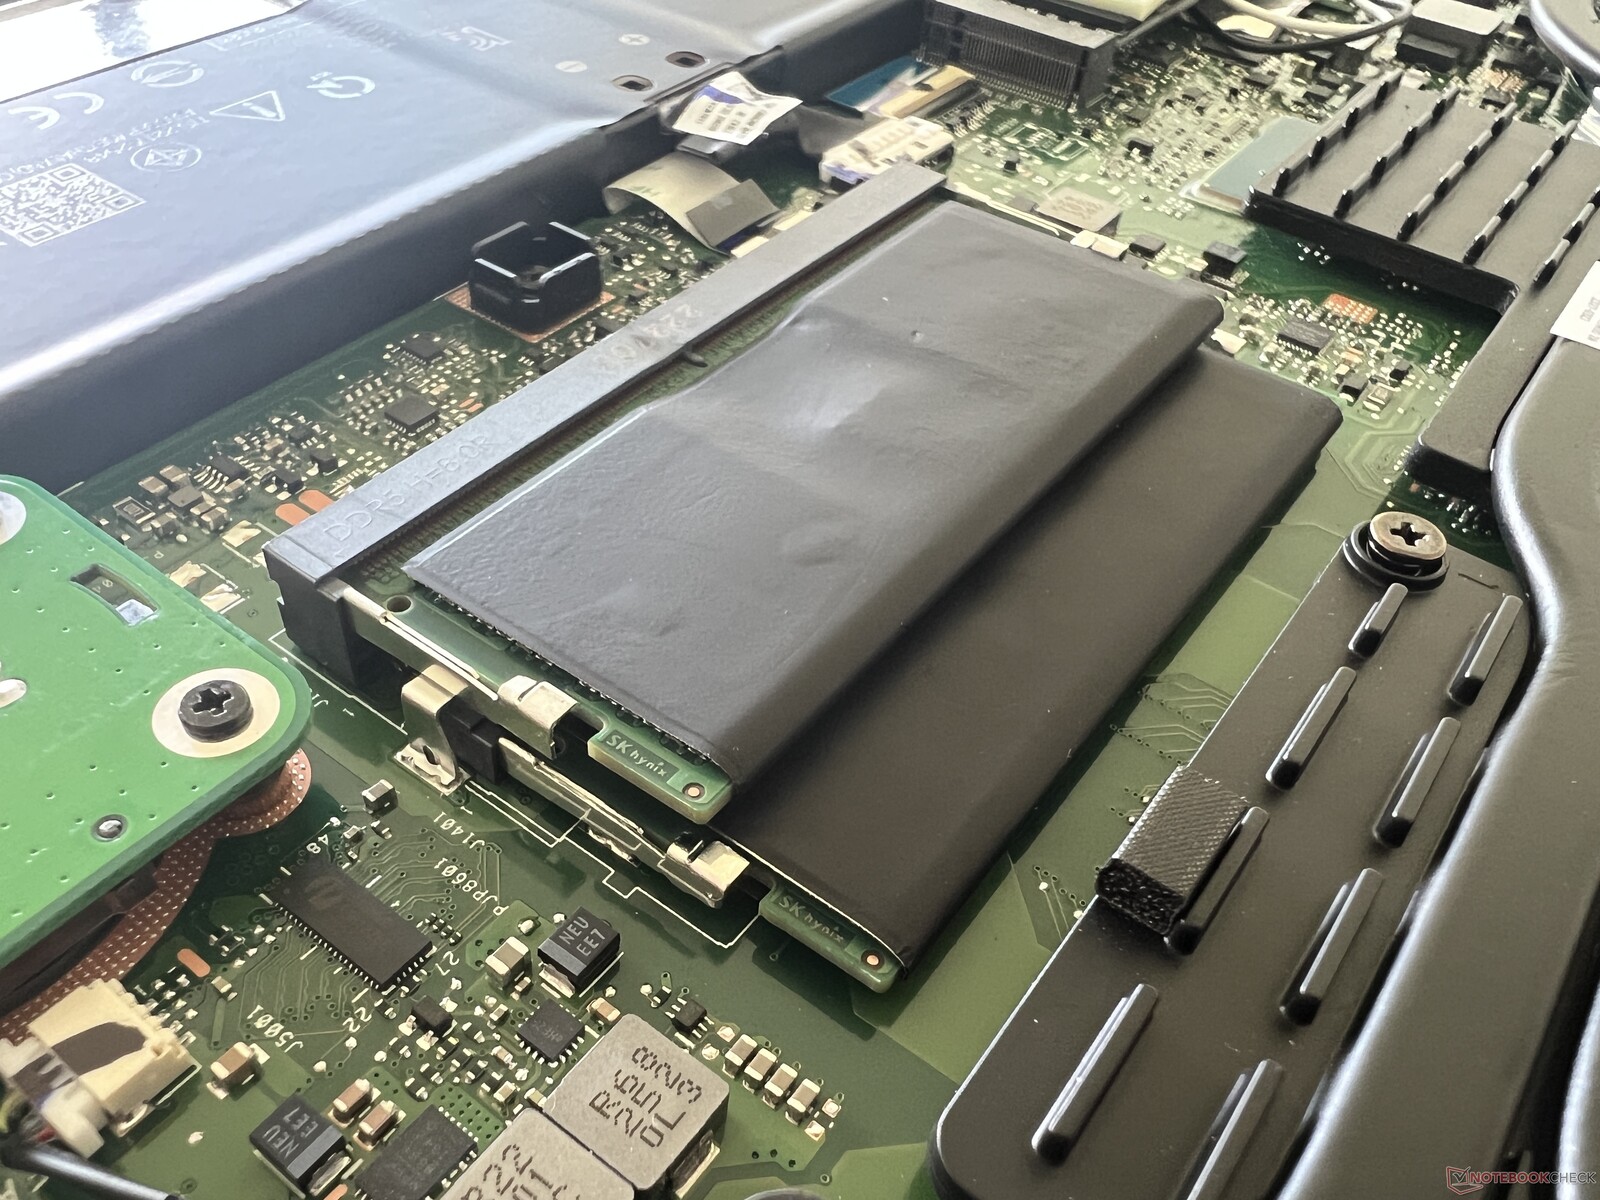
Asus installs Intel's modern AX211 WLAN module, which is located below the primary SSD and can be replaced. In tandem with our reference router from Asus, the transfer rates are very high and stable. We did not experience any WLAN stability issues during our review. A 2.5 Gbit/s Ethernet port for wired networks is also available on the back.
| Networking | |
| Asus ProArt Studiobook 16 OLED H7604 | |
| iperf3 transmit AXE11000 | |
| iperf3 receive AXE11000 | |
| Gigabyte AERO 16 OLED BSF | |
| iperf3 transmit AXE11000 6GHz | |
| iperf3 receive AXE11000 6GHz | |
| Samsung Galaxy Book3 Ultra 16 | |
| iperf3 transmit AXE11000 | |
| iperf3 receive AXE11000 | |
| MSI Stealth 17 Studio A13VH-014 | |
| iperf3 transmit AXE11000 | |
| iperf3 receive AXE11000 | |
| iperf3 transmit AXE11000 6GHz | |
| iperf3 receive AXE11000 6GHz | |
| Apple MacBook Pro 16 2023 M2 Max | |
| iperf3 transmit AXE11000 6GHz | |
| iperf3 receive AXE11000 6GHz | |
| Asus Zephyrus Duo 16 GX650PY-NM006W | |
| iperf3 transmit AXE11000 6GHz | |
| iperf3 receive AXE11000 6GHz | |
Webcam
The 1080p webcam takes decent pictures in good lighting conditions, but they are also somewhat distorted. An IR module is also installed, which supports facial recognition via Windows Hello.


Accessories
Our test device was shipped with the Asus Pen 2.0 as well as the wireless ProArt mouse MD300, which has an RRP of US$180. Like the laptop itself, the mouse has a small DialPad installed on the side. Whether you can use this meaningfully depends on the software in use. It's a little annoying that you have to install ArmoryCrate to adjust the mouse settings and that you can't do this in the ProArt Creator Hub. In testing, the mouse worked perfectly and the clicks were very precise, but also loud. The silent buttons of Logitech mice, for example, are much quieter.
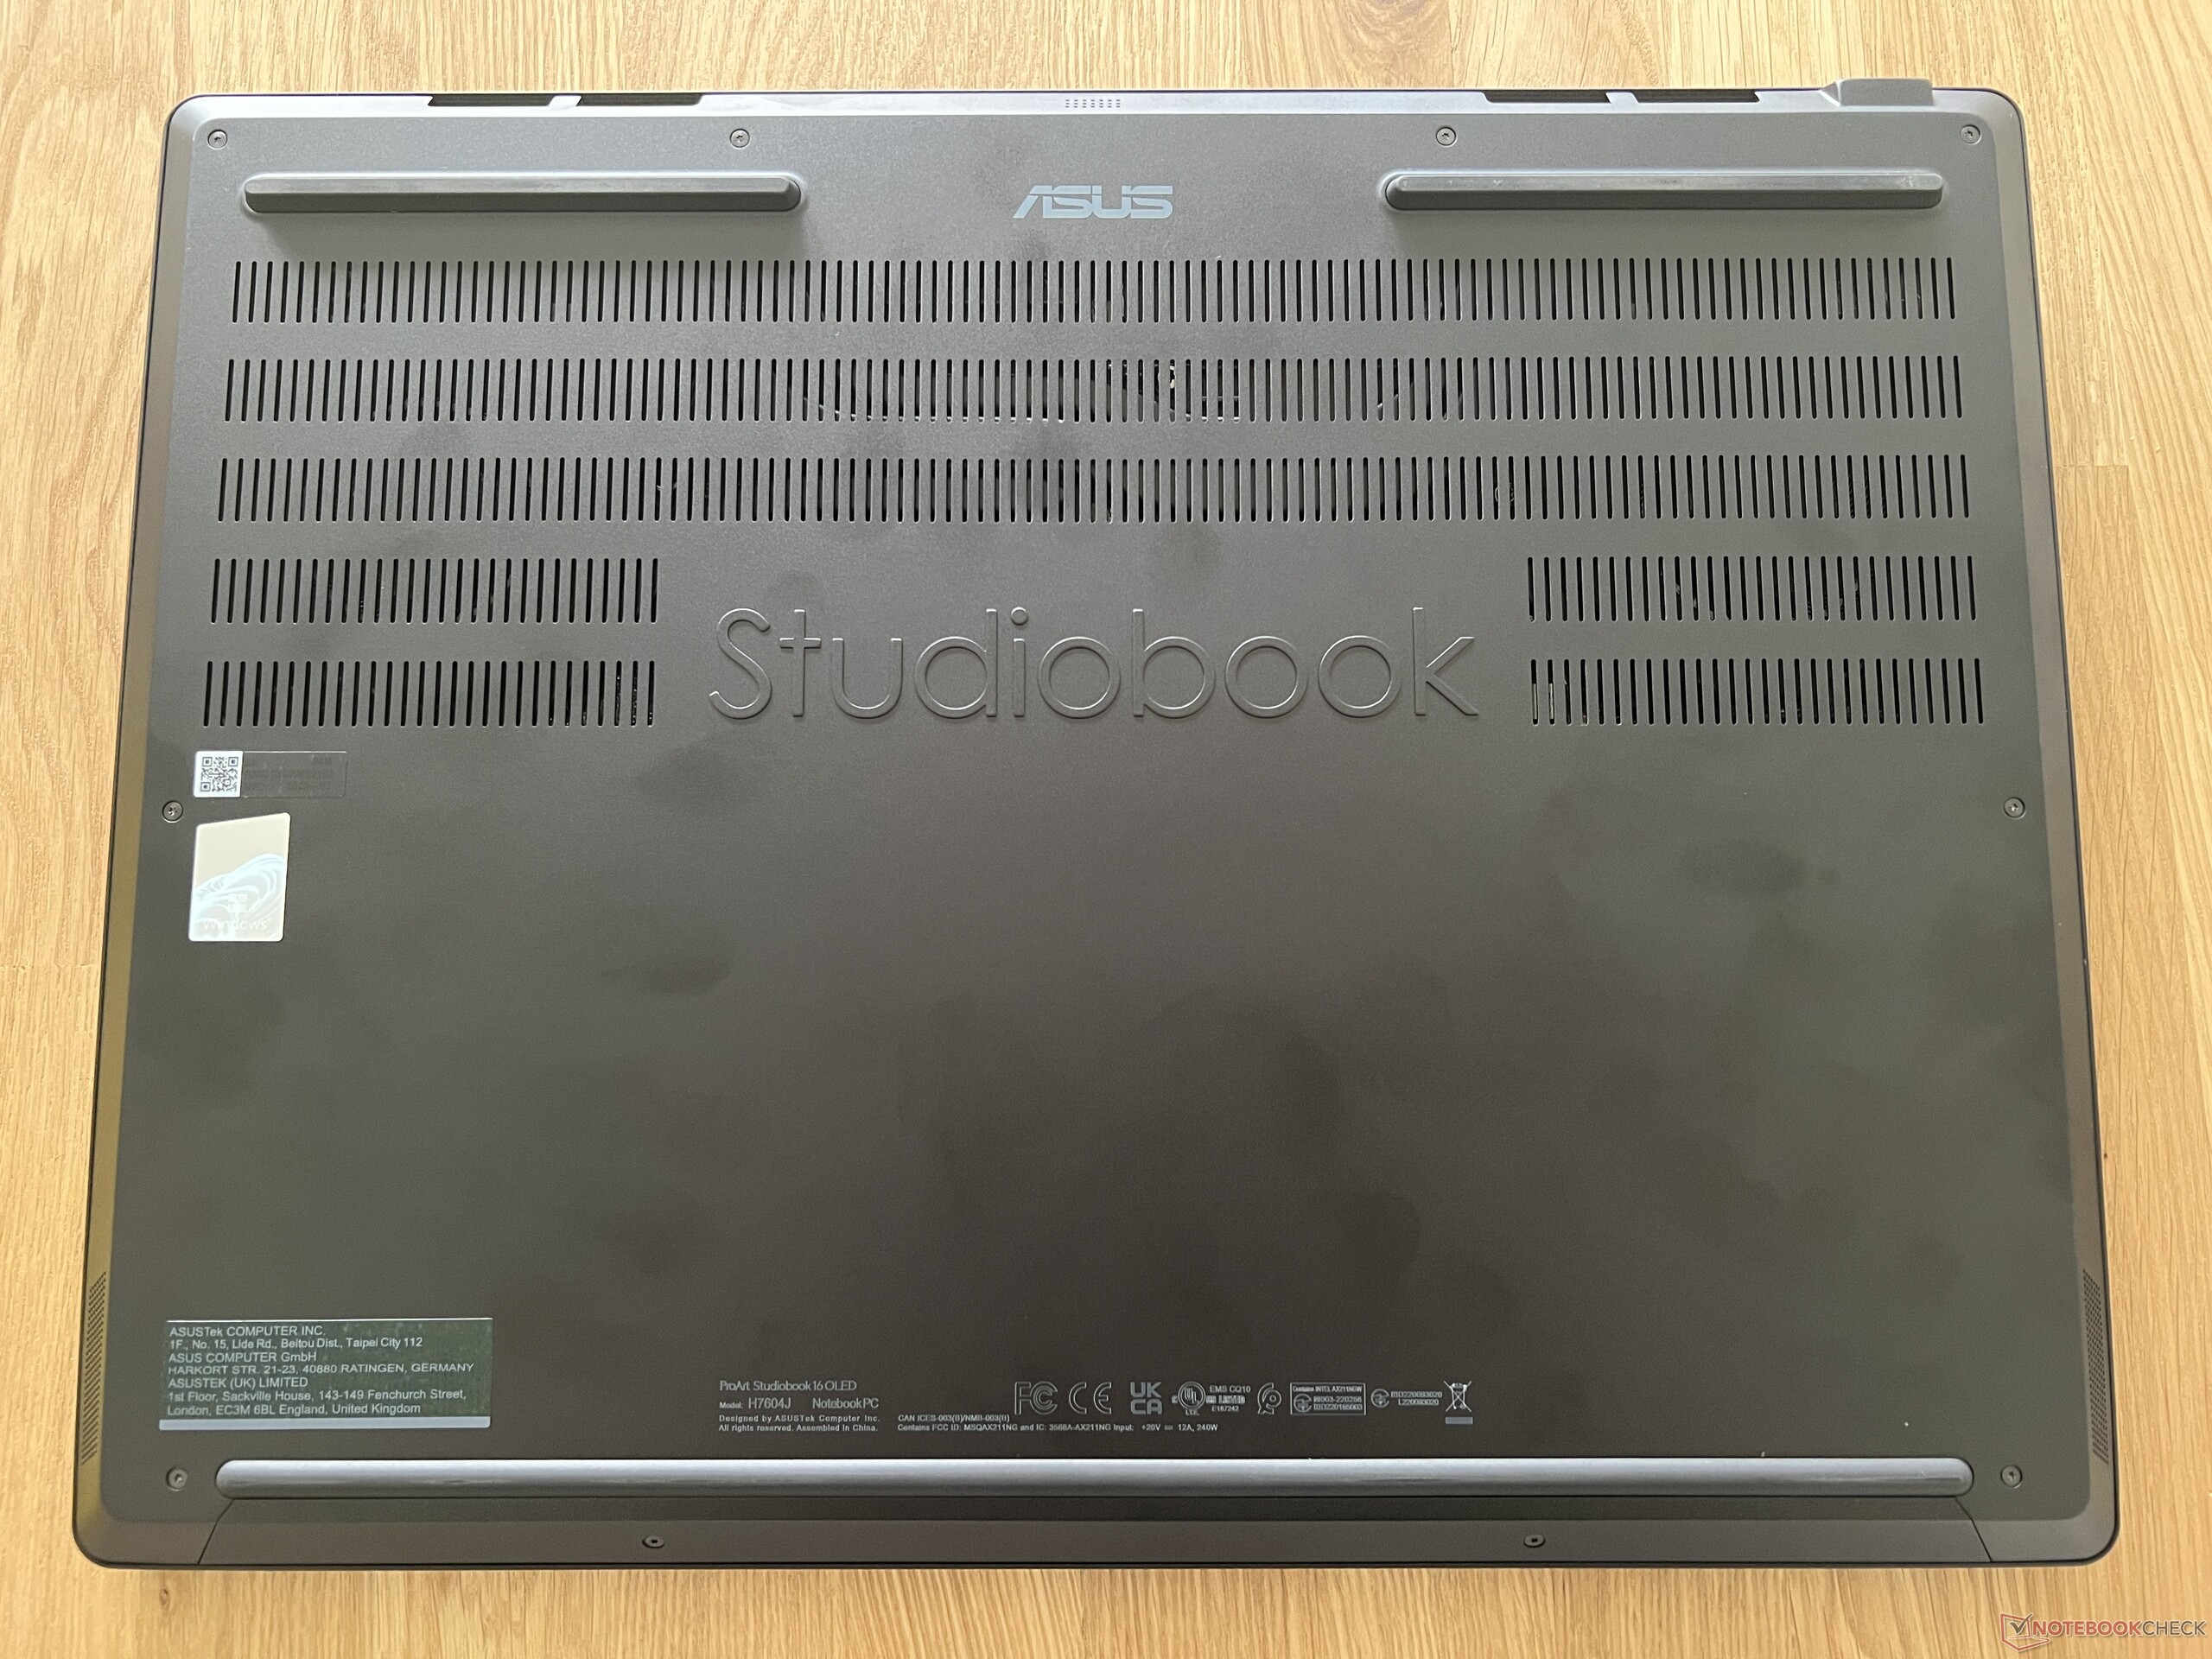
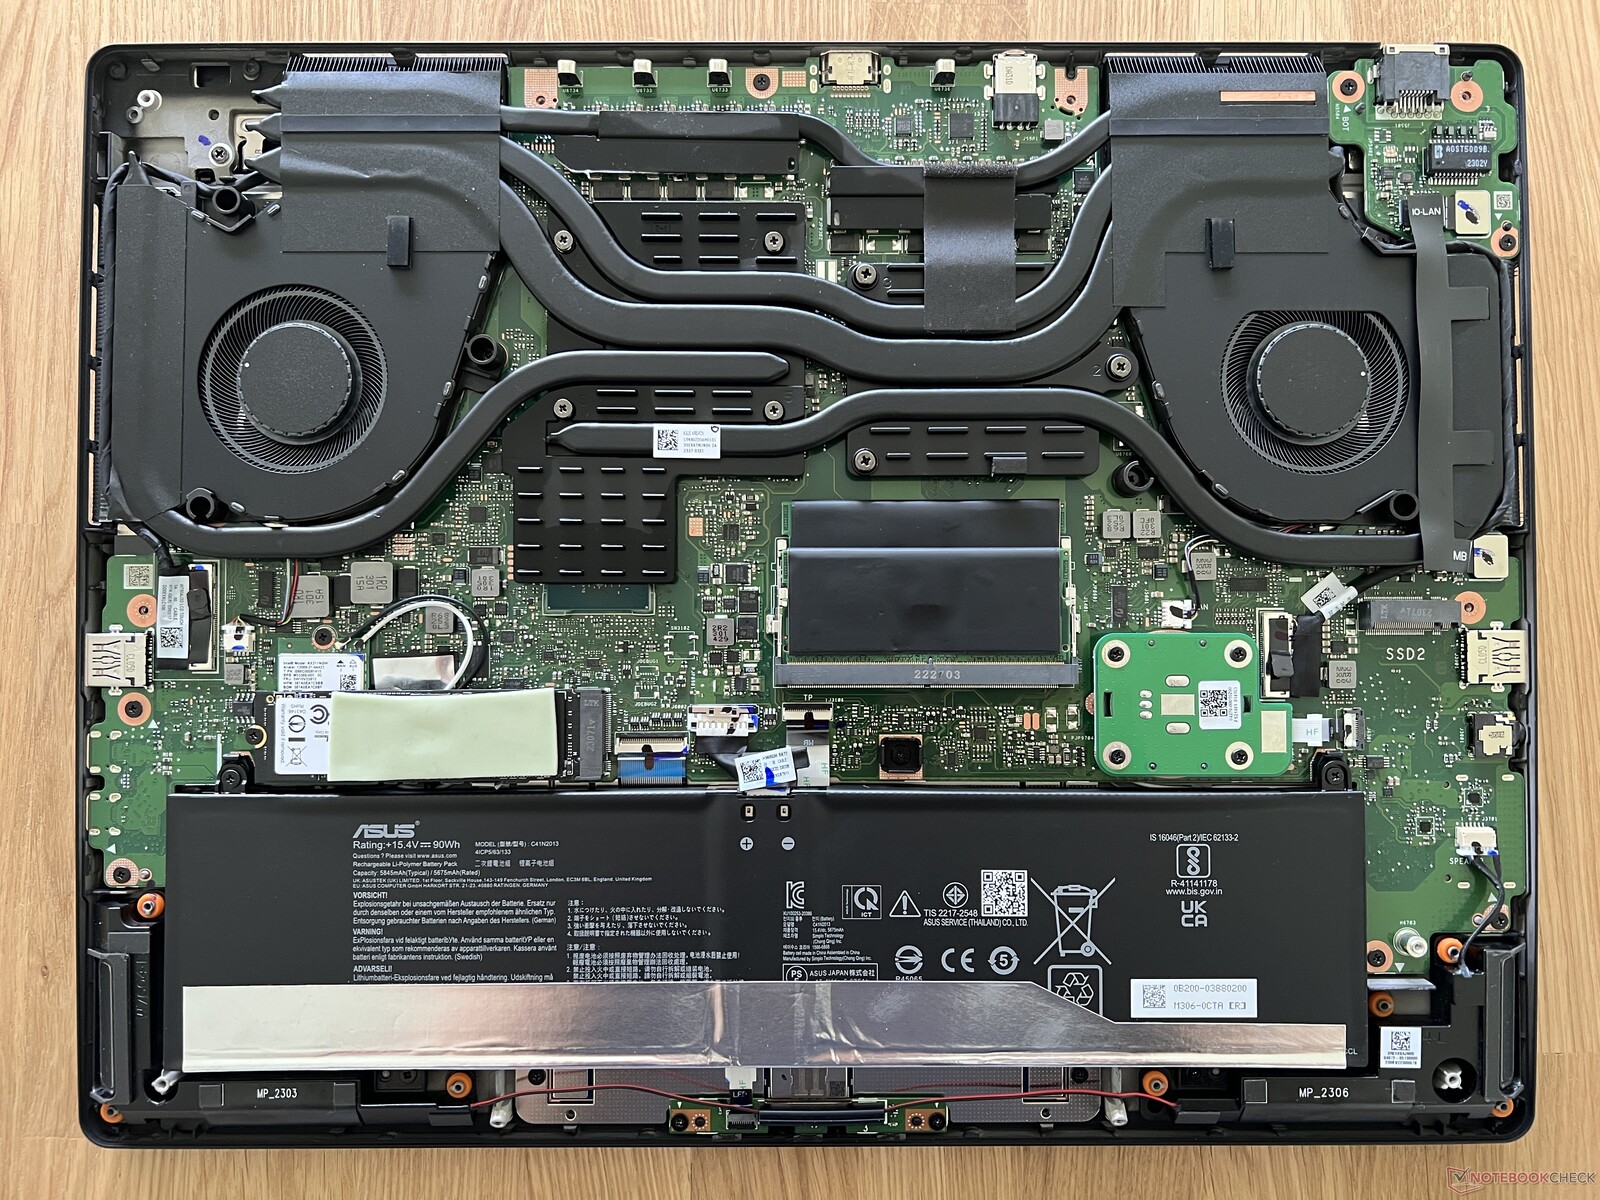
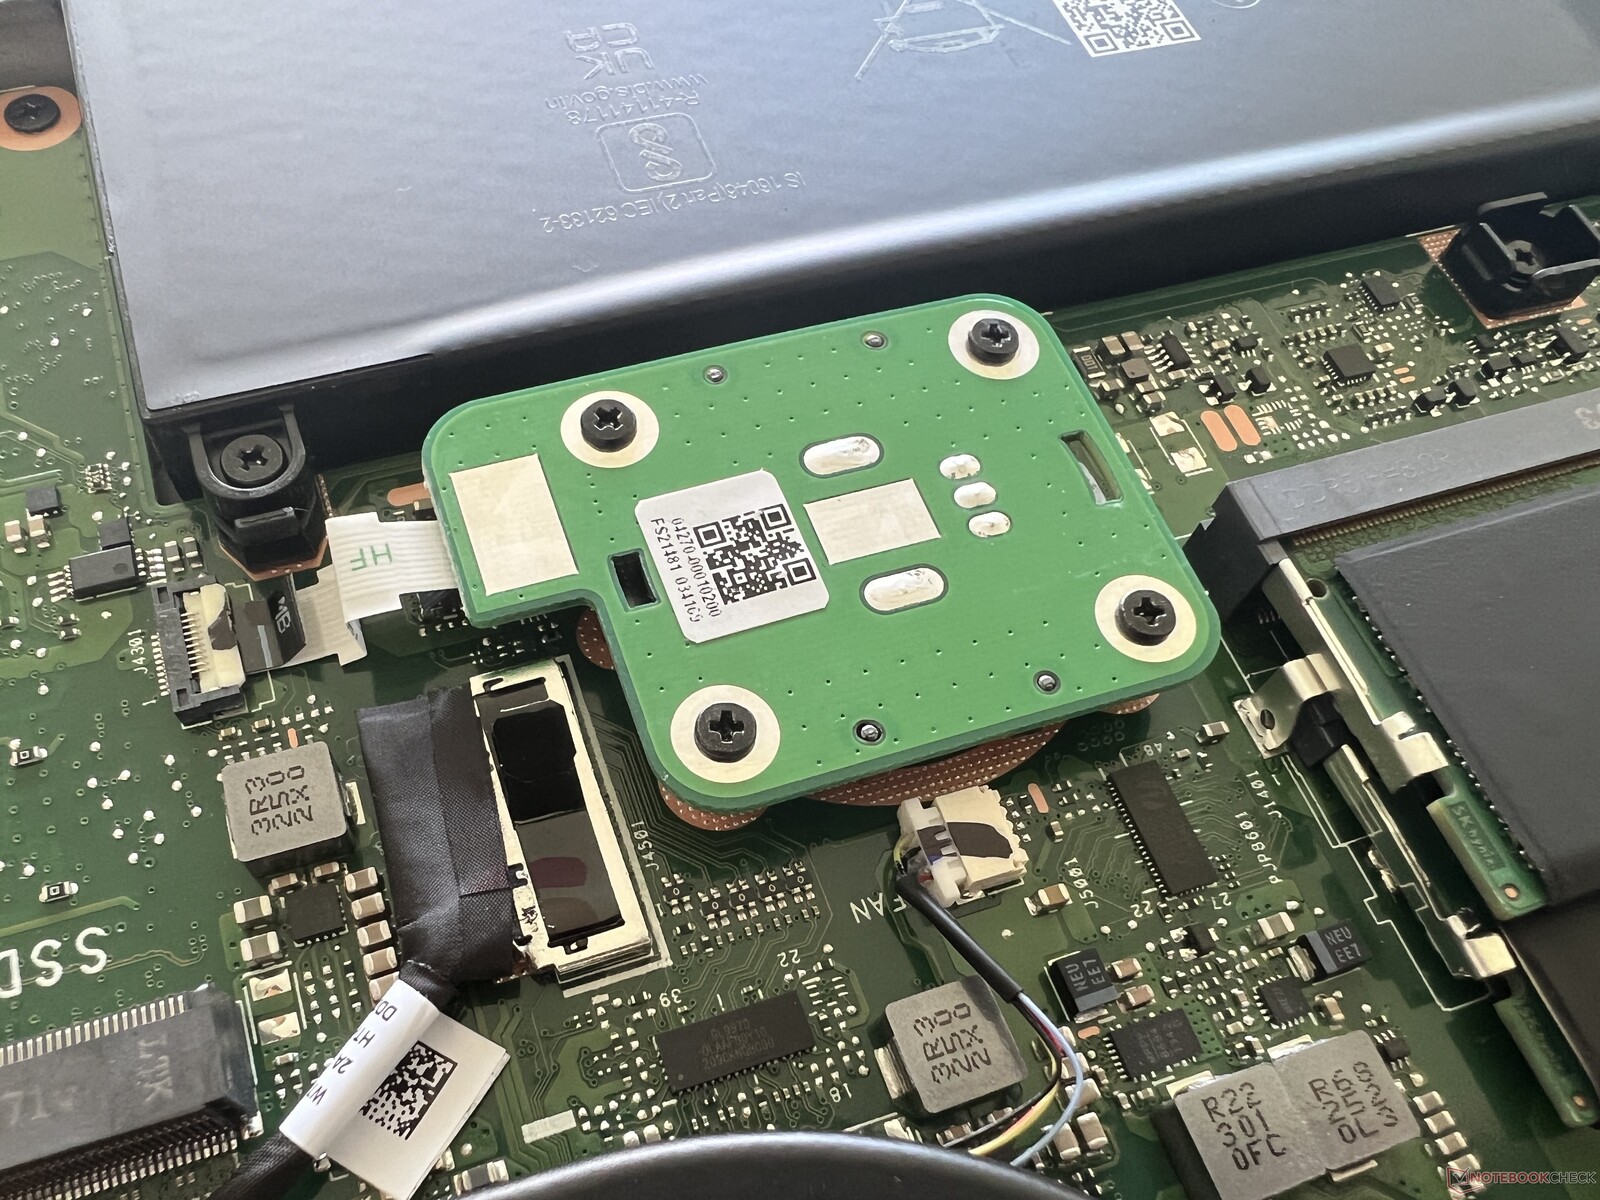
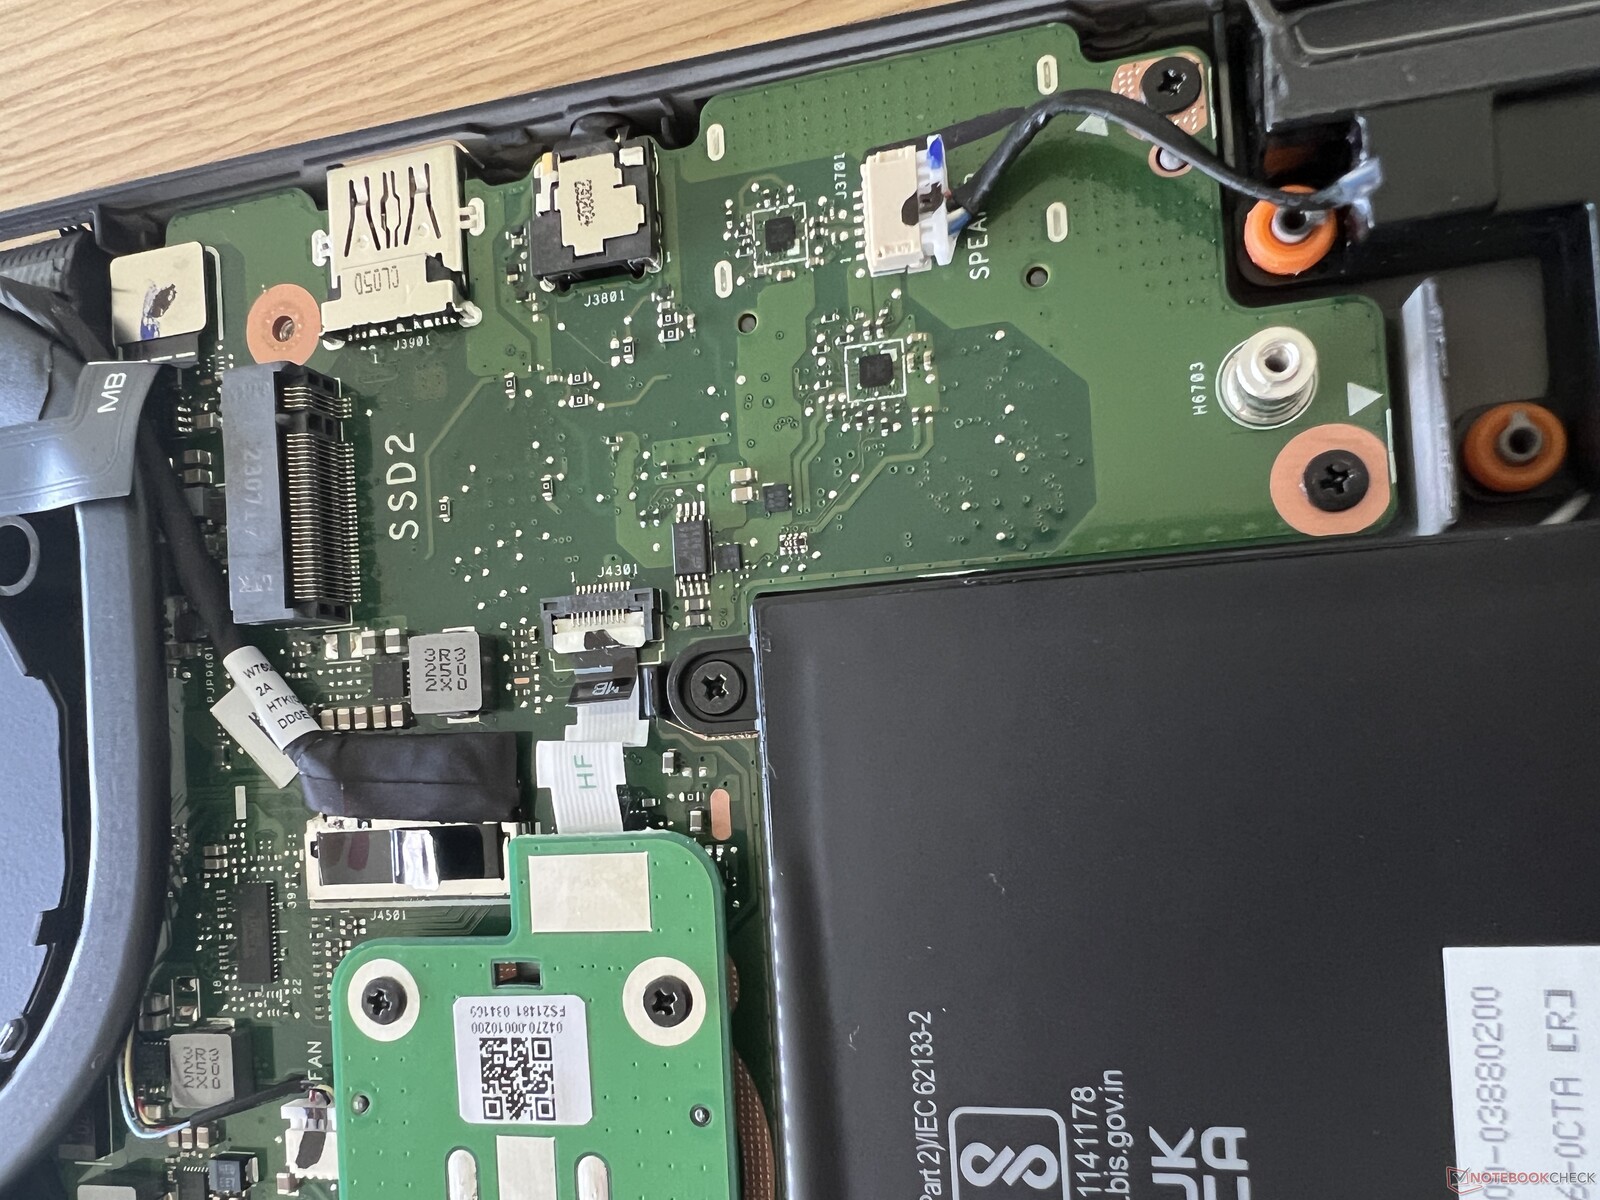
Maintenance
The bottom case cover is secured with 10 Torx screws (T5) and is still very tight after these screws are removed. The easiest way to pry open the cover is at the rear fan outlets. Inside, the large cooling system dominates, and the maintenance options are also very good, ranging from the WLAN module (below the primary SSD), two SO DIMM slots to the two M.2 2280 slots for SSDs. What is also striking here is how much space the additional DialPad takes up
Input Devices - DialPad and numpad
Keyboard
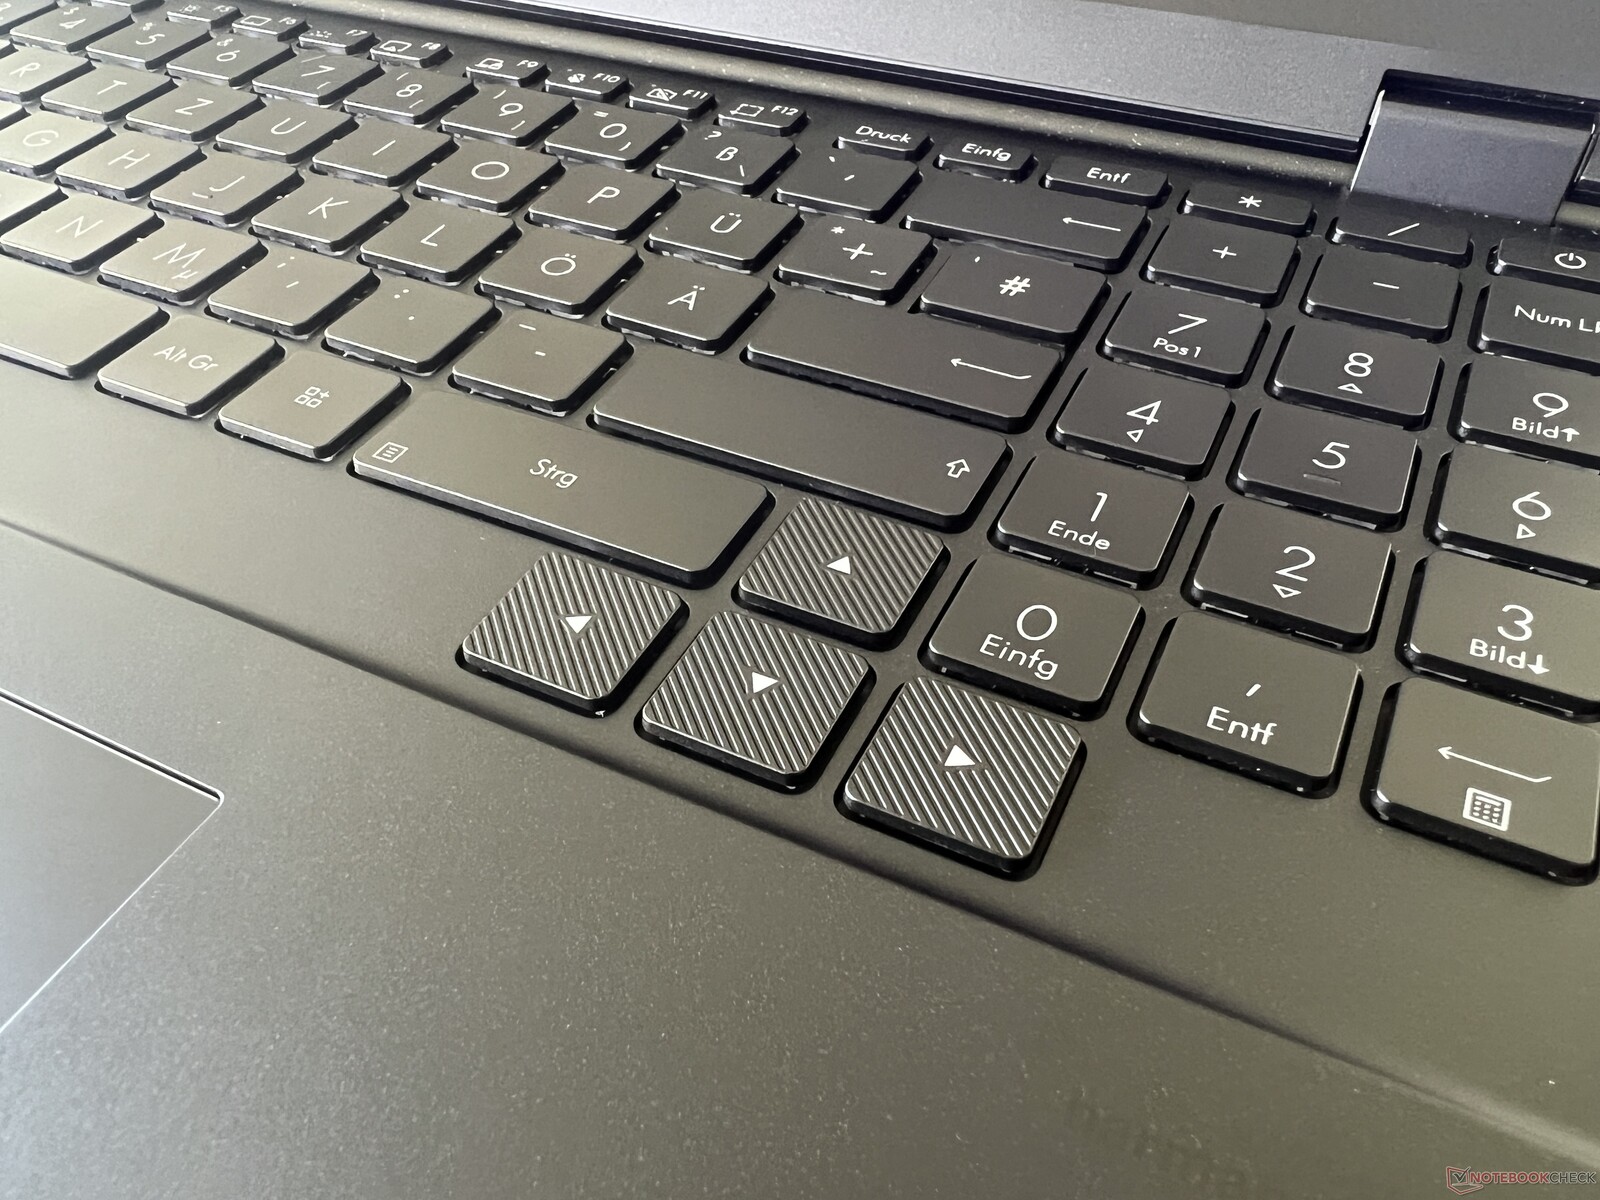
The keyboard has a travel of 1.4 mm and a dedicated numpad. The typing feel is decent, but the keystrokes are not the quietest and the space bar in particular is quite loud. The layout also takes a bit of getting used to, because the arrow keys are large, but have been shifted downwards. The single-row Enter key isn't perfect either. There is a three-stage white illumination, but it is not automatically activated via sensor.
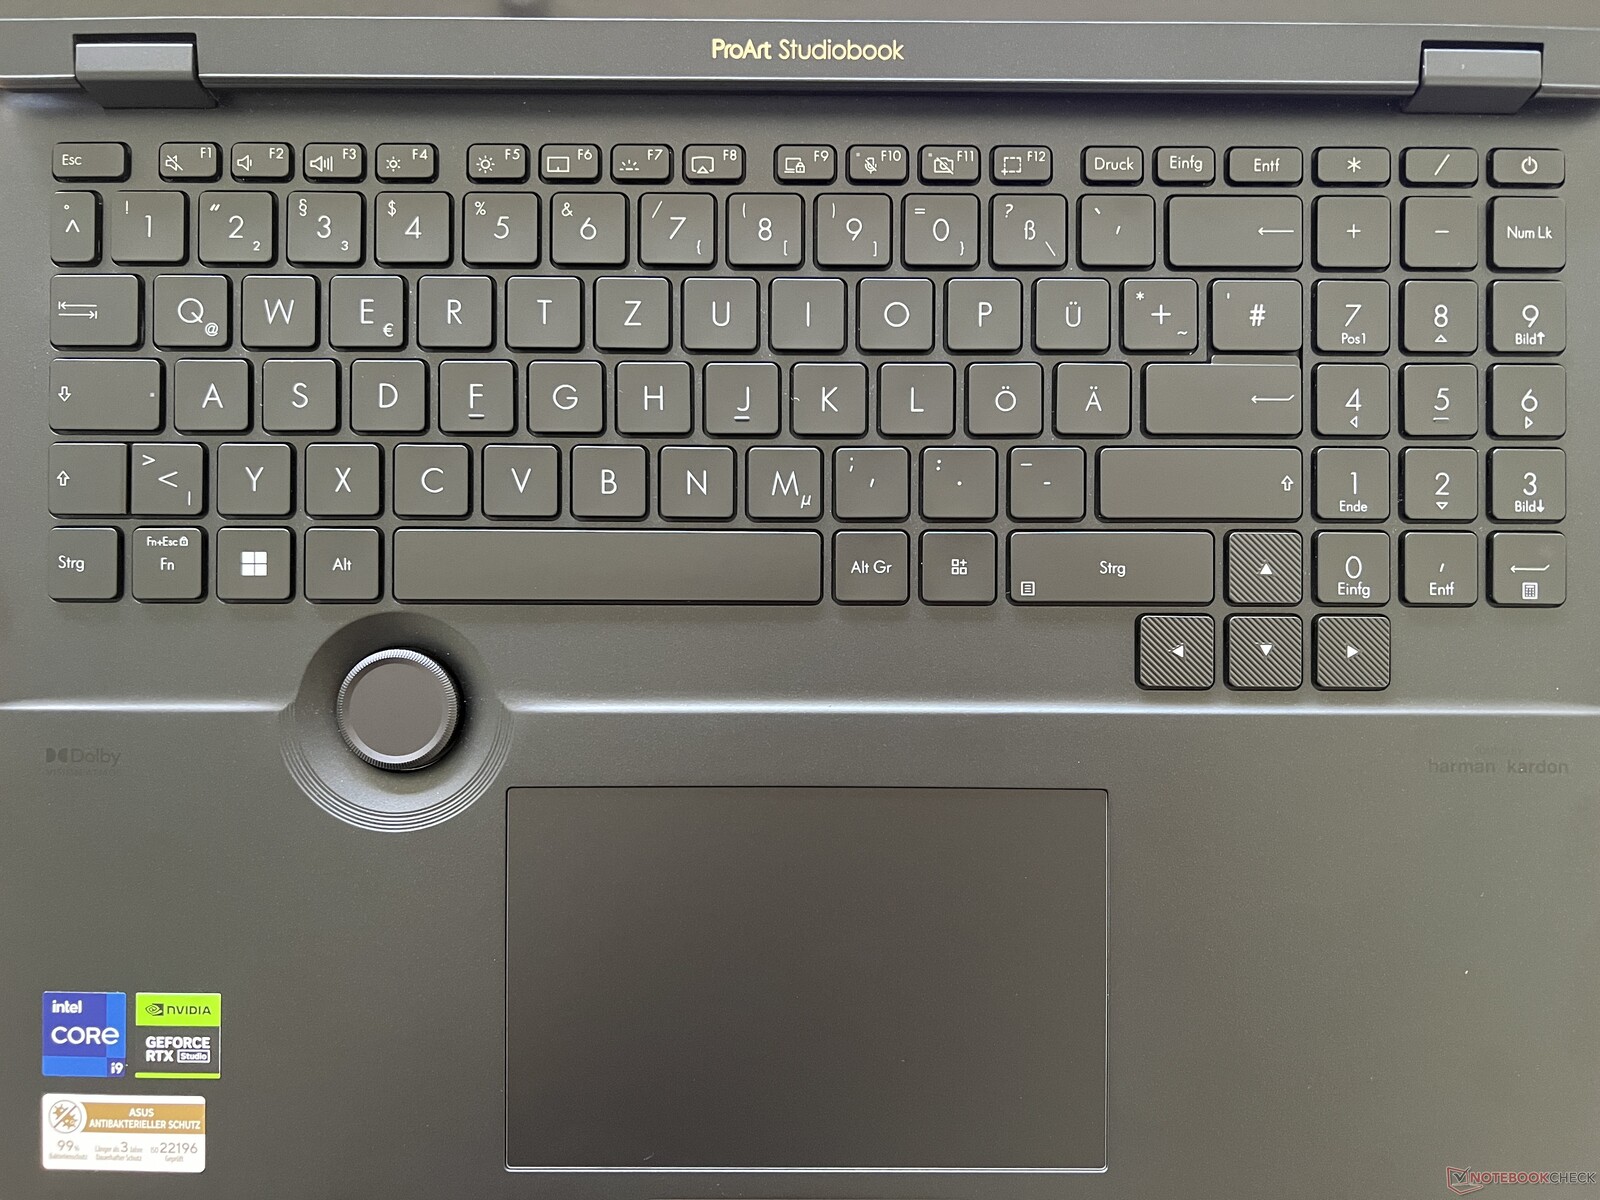
Touchpad

The large touchpad works excellently and can be clicked everywhere, which is characterized by a rich and quiet clicking noise. The special feature is the DialPad, a large rotary pushbutton between the touchpad and keyboard. The implementation with the Adobe apps works well, but the mouse and key combo is usually faster. In normal desktop use, the brightness and volume can also be adjusted via the DialPad, but this is much faster via the normal special keys or F-keys.
Display - OLED panel at 120 Hz
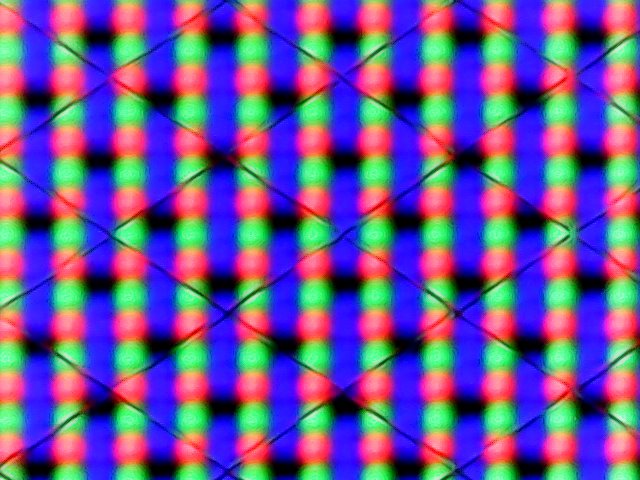
Asus is currently fully committed to OLED screens and the Studiobook is no exception. In contrast to the predecessor with its 4K OLED display, an OLED touchscreen with 3,200 x 2,000 pixels and a higher frequency of 120 Hz is used here. The subjective image quality is very good, but like in the recently reviewed ZenBook Pro 14, bright areas appear a little grainy upon closer inspection, which is due to the touch layer. The brightness does not automatically adjust to the ambient light.
We determined an average brightness of 350 cd/m² in normal SDR mode, but thanks to the extremely low black value of OLED panels, the contrast ratio is very high. In HDR mode, the maximum is almost 580 cd/m² in a small image section and around 480 cd/m² in an almost completely white image. However, HDR mode has to be enabled manually in the Windows settings first, after which the color profiles can no longer be used. There are no halos on OLED panels.
| |||||||||||||||||||||||||
Brightness Distribution: 95 %
Center on Battery: 346 cd/m²
Contrast: 17450:1 (Black: 0.02 cd/m²)
ΔE ColorChecker Calman: 2.1 | ∀{0.5-29.43 Ø4.73}
calibrated: 2.1
ΔE Greyscale Calman: 1.2 | ∀{0.09-98 Ø4.98}
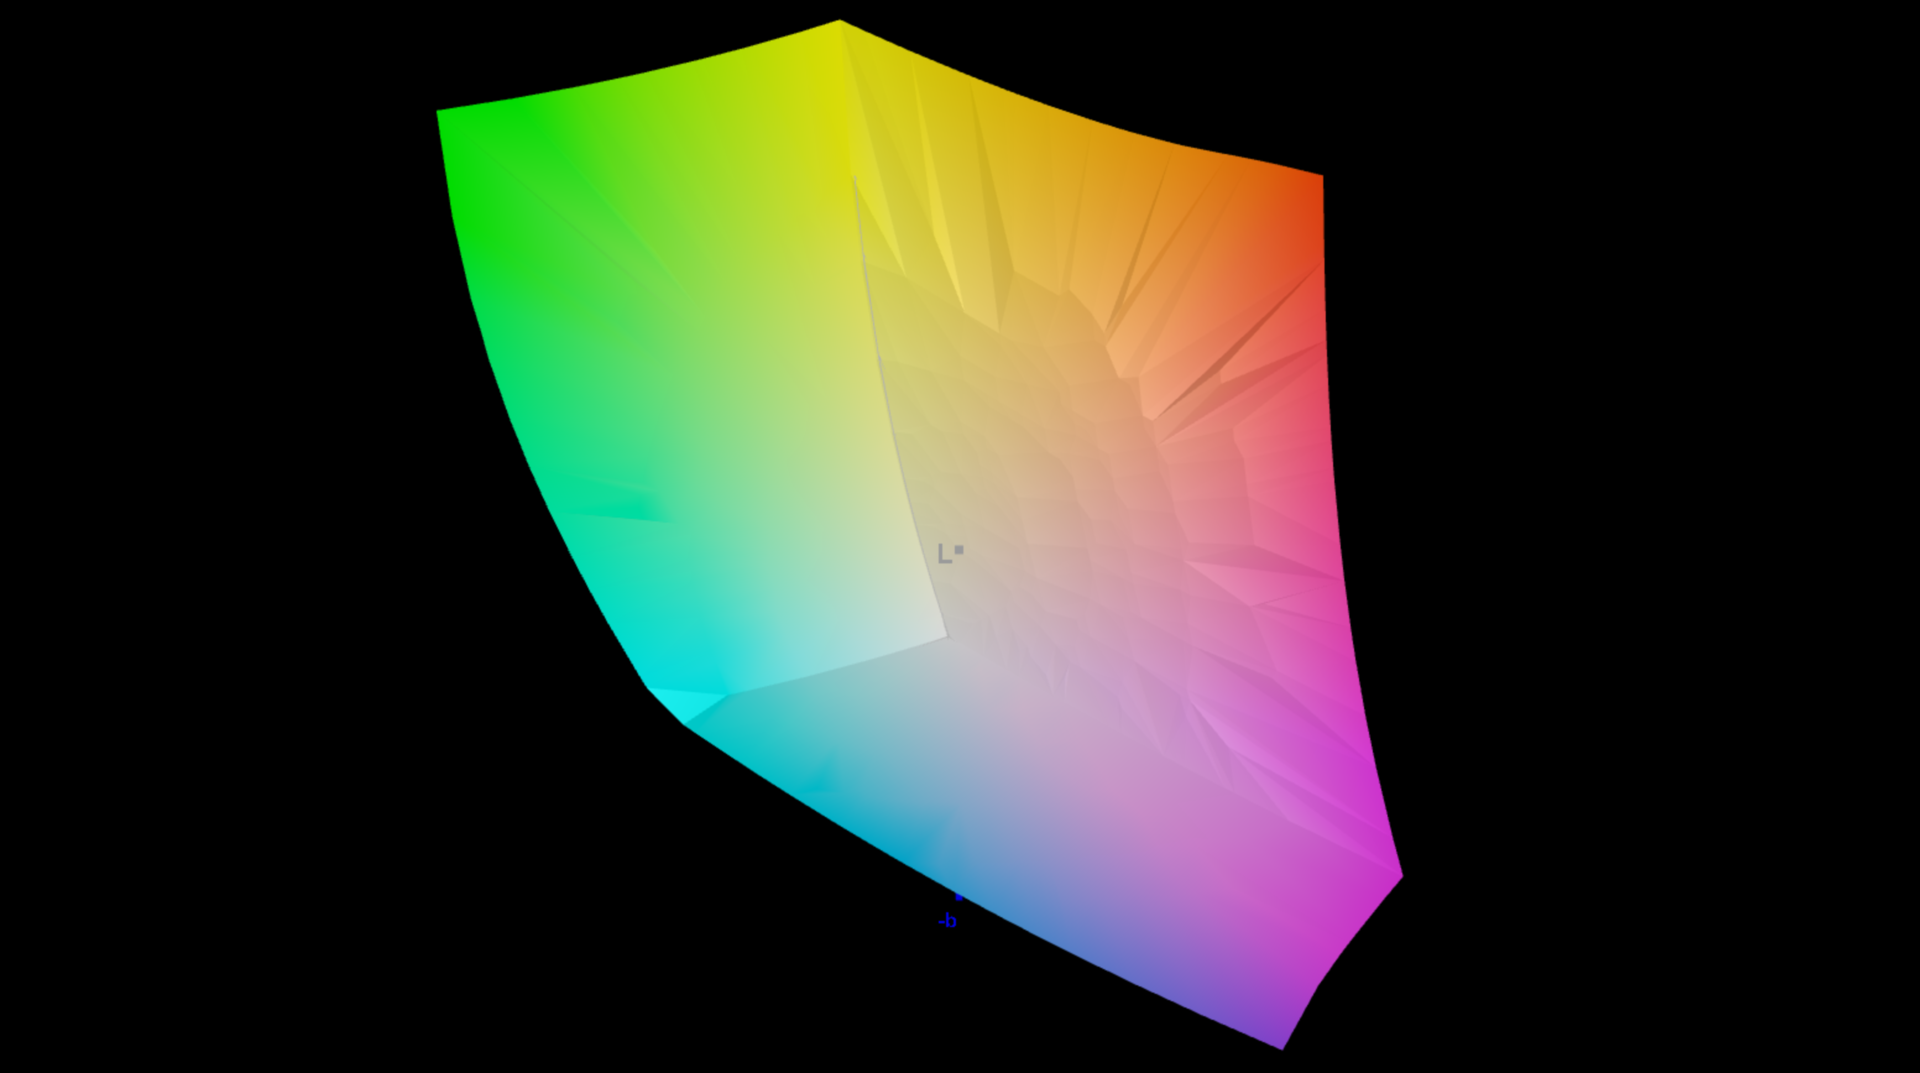
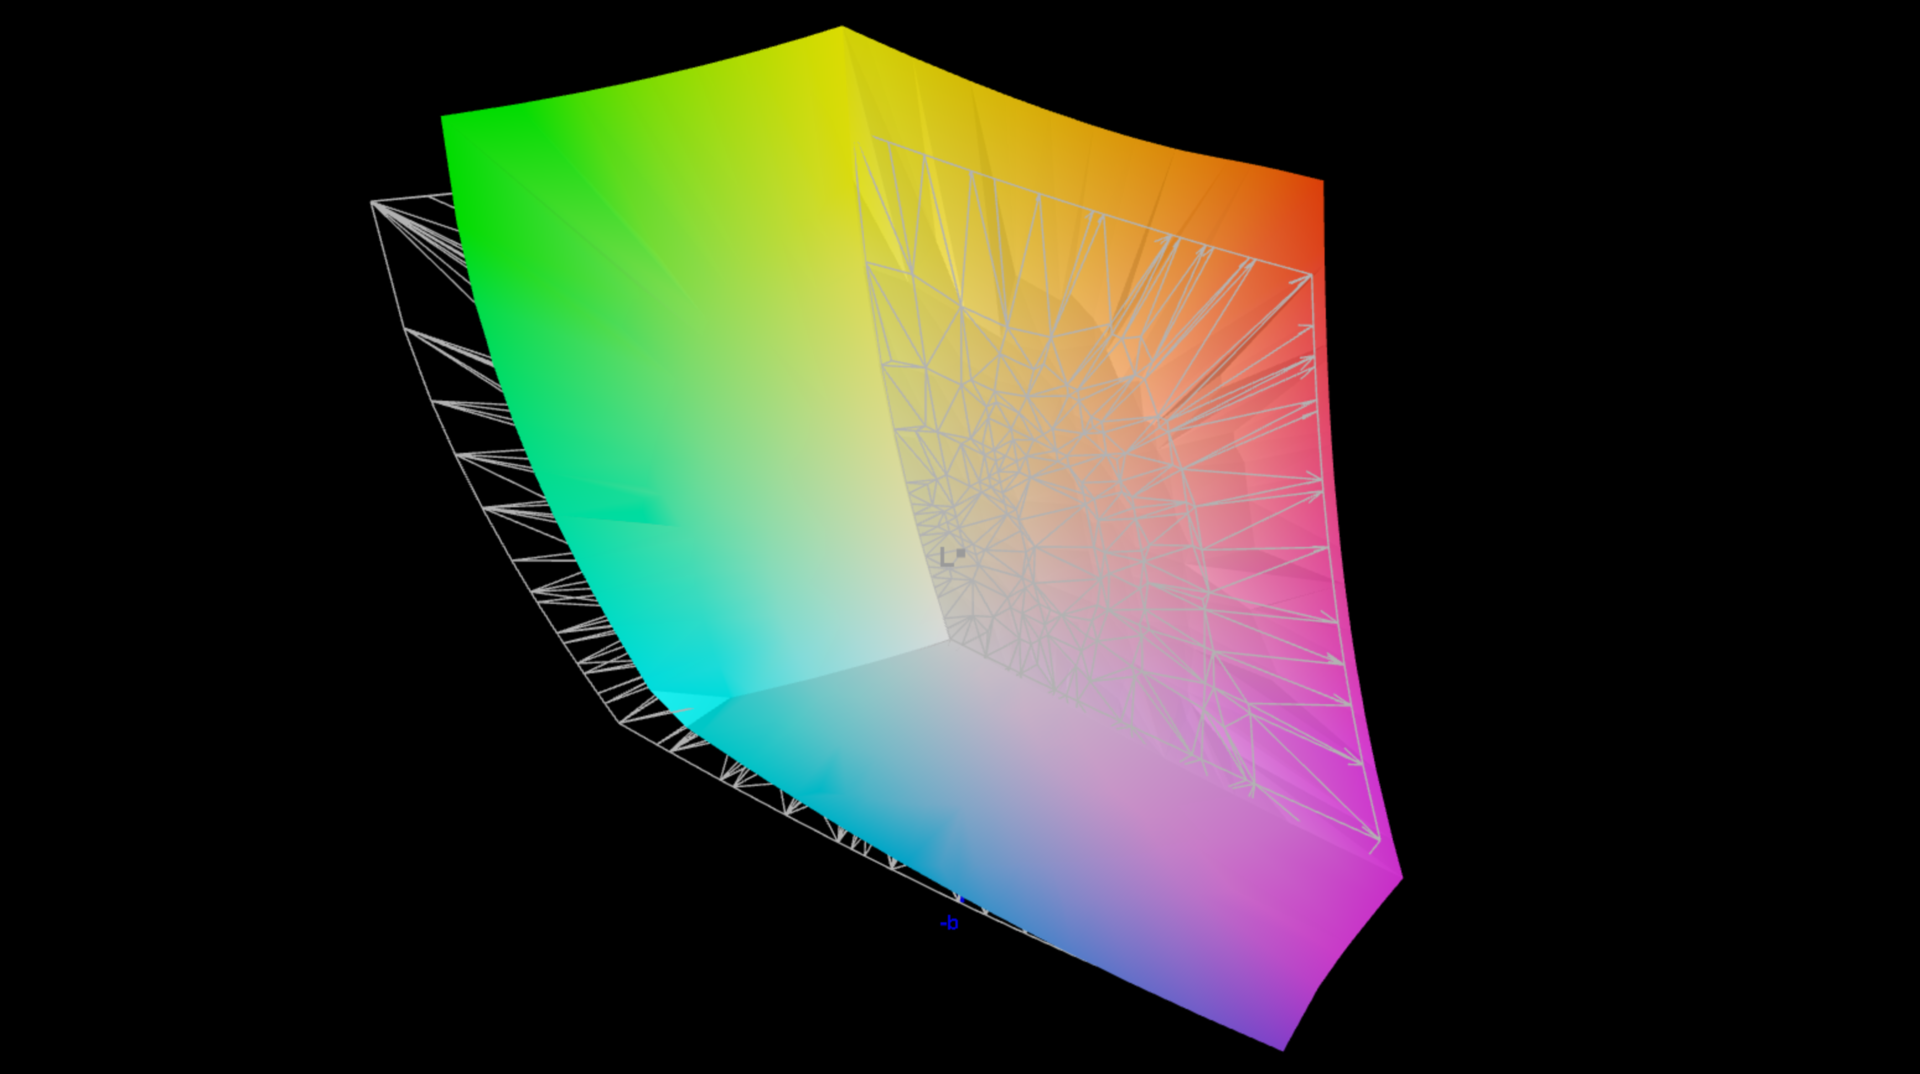
89.4% AdobeRGB 1998 (Argyll 3D)
100% sRGB (Argyll 3D)
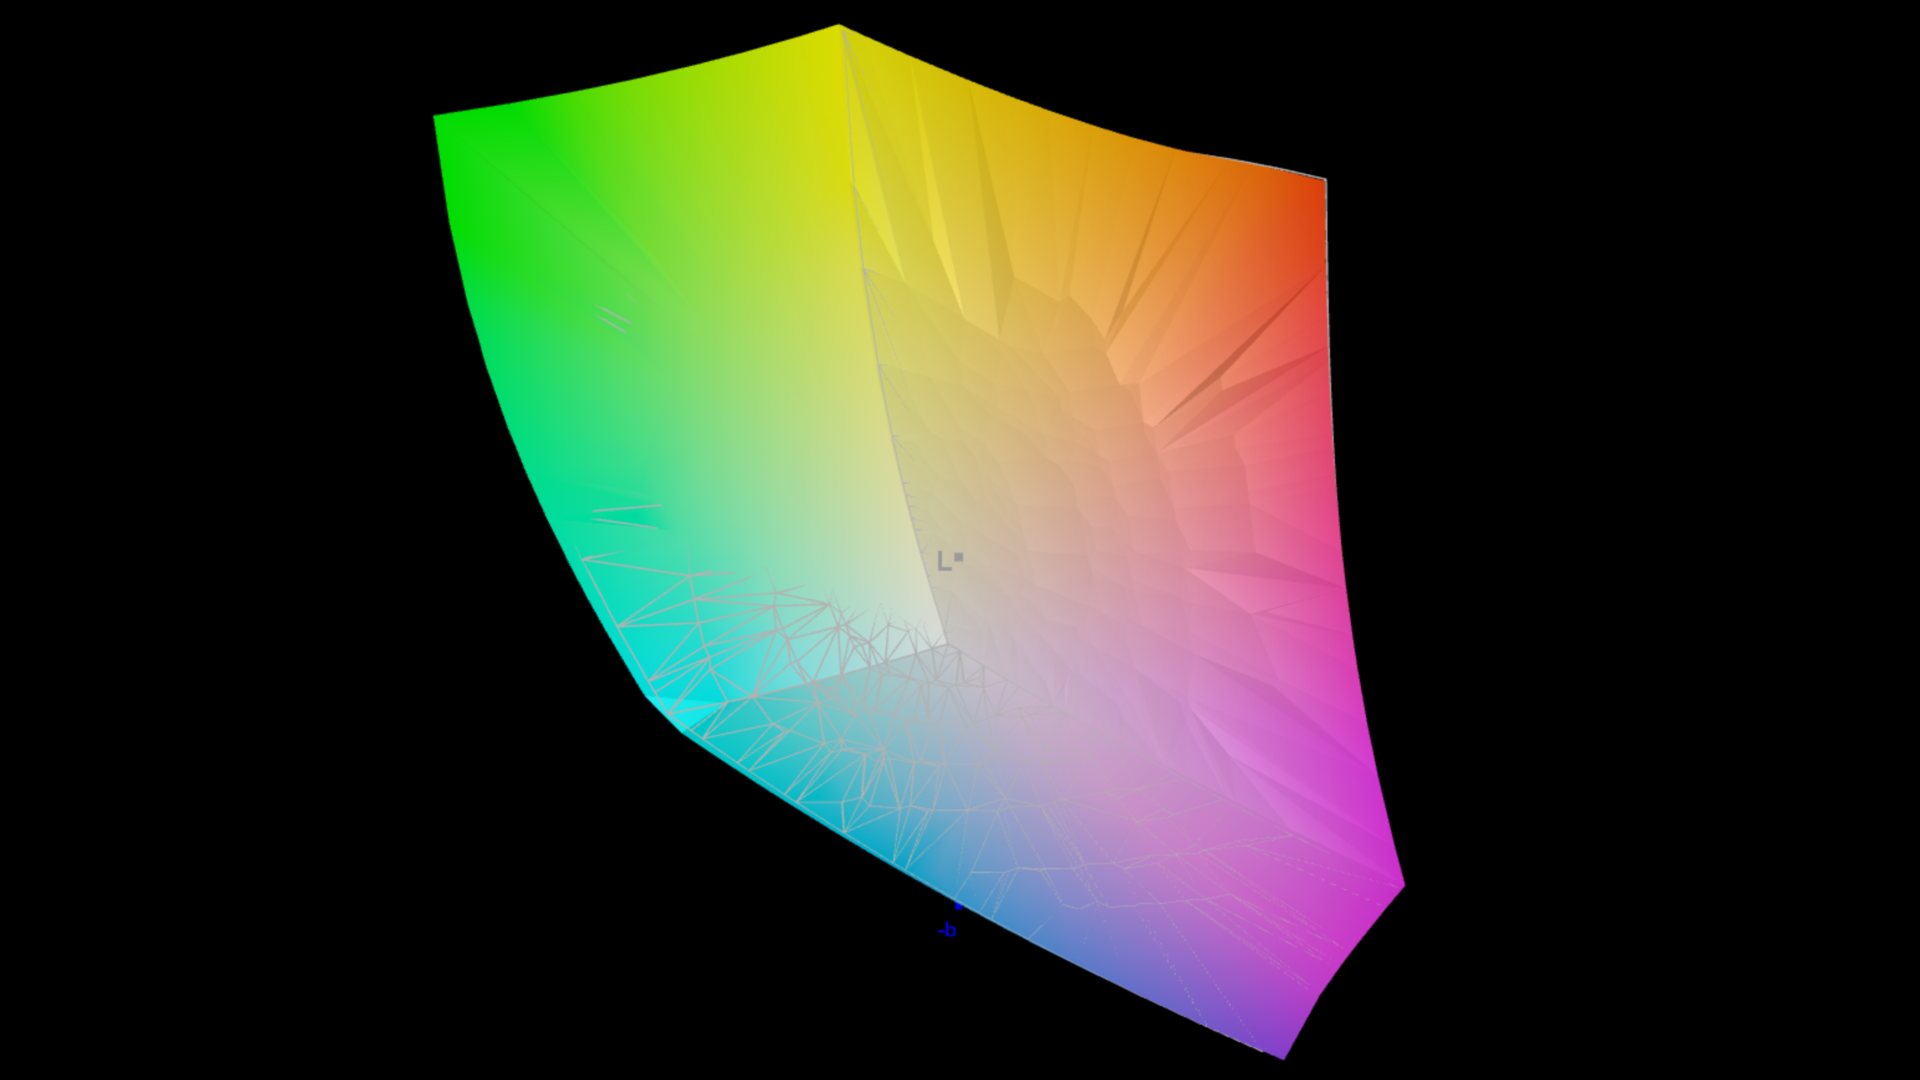
99.6% Display P3 (Argyll 3D)
Gamma: 2.19
CCT: 6545 K
| Asus ProArt Studiobook 16 OLED H7604 ATNA60BX01-1, OLED, 3200x2000, 16" | Gigabyte AERO 16 OLED BSF Samsung SDC4191 (ATNA60YV09-0, OLED, 3840x2400, 16" | Samsung Galaxy Book3 Ultra 16 Samsung ATNA60CL03-0, AMOLED, 2880x1800, 16" | MSI Stealth 17 Studio A13VH-014 AUO41A2 B173ZAN06.C, Mini LED, 3840x2160, 17.3" | Apple MacBook Pro 16 2023 M2 Max Mini-LED, 3456x2234, 16.2" | Asus Zephyrus Duo 16 GX650PY-NM006W NE160QDM-NM4, MiniLED, 2560x1600, 16" | |
|---|---|---|---|---|---|---|
| Display | 3% | 3% | -1% | -1% | 1% | |
| Display P3 Coverage (%) | 99.6 | 99.9 0% | 99.9 0% | 92 -8% | 99 -1% | 99.4 0% |
| sRGB Coverage (%) | 100 | 100 0% | 100 0% | 99.1 -1% | 100 0% | 100 0% |
| AdobeRGB 1998 Coverage (%) | 89.4 | 96.4 8% | 96.3 8% | 94.07 5% | 88.5 -1% | 90.8 2% |
| Response Times | -195% | 18% | -3871% | -9710% | -2391% | |
| Response Time Grey 50% / Grey 80% * (ms) | 0.59 ? | 2 ? -239% | 0.49 ? 17% | 46.4 ? -7764% | 80.5 ? -13544% | 15.2 ? -2476% |
| Response Time Black / White * (ms) | 0.79 ? | 1.98 ? -151% | 0.65 ? 18% | 0.62 ? 22% | 47.2 ? -5875% | 19 ? -2305% |
| PWM Frequency (Hz) | 240 ? | 60 | 240 ? | 2400 | 14880 ? | 12000 ? |
| Screen | -9% | -15% | -12% | 370% | -15% | |
| Brightness middle (cd/m²) | 349 | 389.97 12% | 400 15% | 397.29 14% | 504 44% | 712 104% |
| Brightness (cd/m²) | 350 | 395 13% | 399 14% | 392 12% | 487 39% | 703 101% |
| Brightness Distribution (%) | 95 | 97 2% | 93 -2% | 93 -2% | 94 -1% | 95 0% |
| Black Level * (cd/m²) | 0.02 | 0.03 -50% | 0.03 -50% | 0.02 -0% | 0.001 95% | 0.07 -250% |
| Contrast (:1) | 17450 | 12999 -26% | 13333 -24% | 19865 14% | 504000 2788% | 10171 -42% |
| Colorchecker dE 2000 * | 2.1 | 2 5% | 2.3 -10% | 2.52 -20% | 1.5 29% | 1.7 19% |
| Colorchecker dE 2000 max. * | 5.5 | 4.1 25% | 4.15 25% | 3.91 29% | 3.3 40% | 4 27% |
| Colorchecker dE 2000 calibrated * | 2.1 | 1.68 20% | 1.66 21% | 2.52 -20% | 1.2 43% | |
| Greyscale dE 2000 * | 1.2 | 2.23 -86% | 2.7 -125% | 2.78 -132% | 2.1 -75% | 2.8 -133% |
| Gamma | 2.19 100% | 2.41 91% | 2.266 97% | 2.63 84% | 2.25 98% | 2.21 100% |
| CCT | 6545 99% | 6323 103% | 7047 92% | 6412 101% | 6882 94% | 6978 93% |
| Total Average (Program / Settings) | -67% /
-33% | 2% /
-7% | -1295% /
-561% | -3114% /
-1266% | -802% /
-351% |
* ... smaller is better
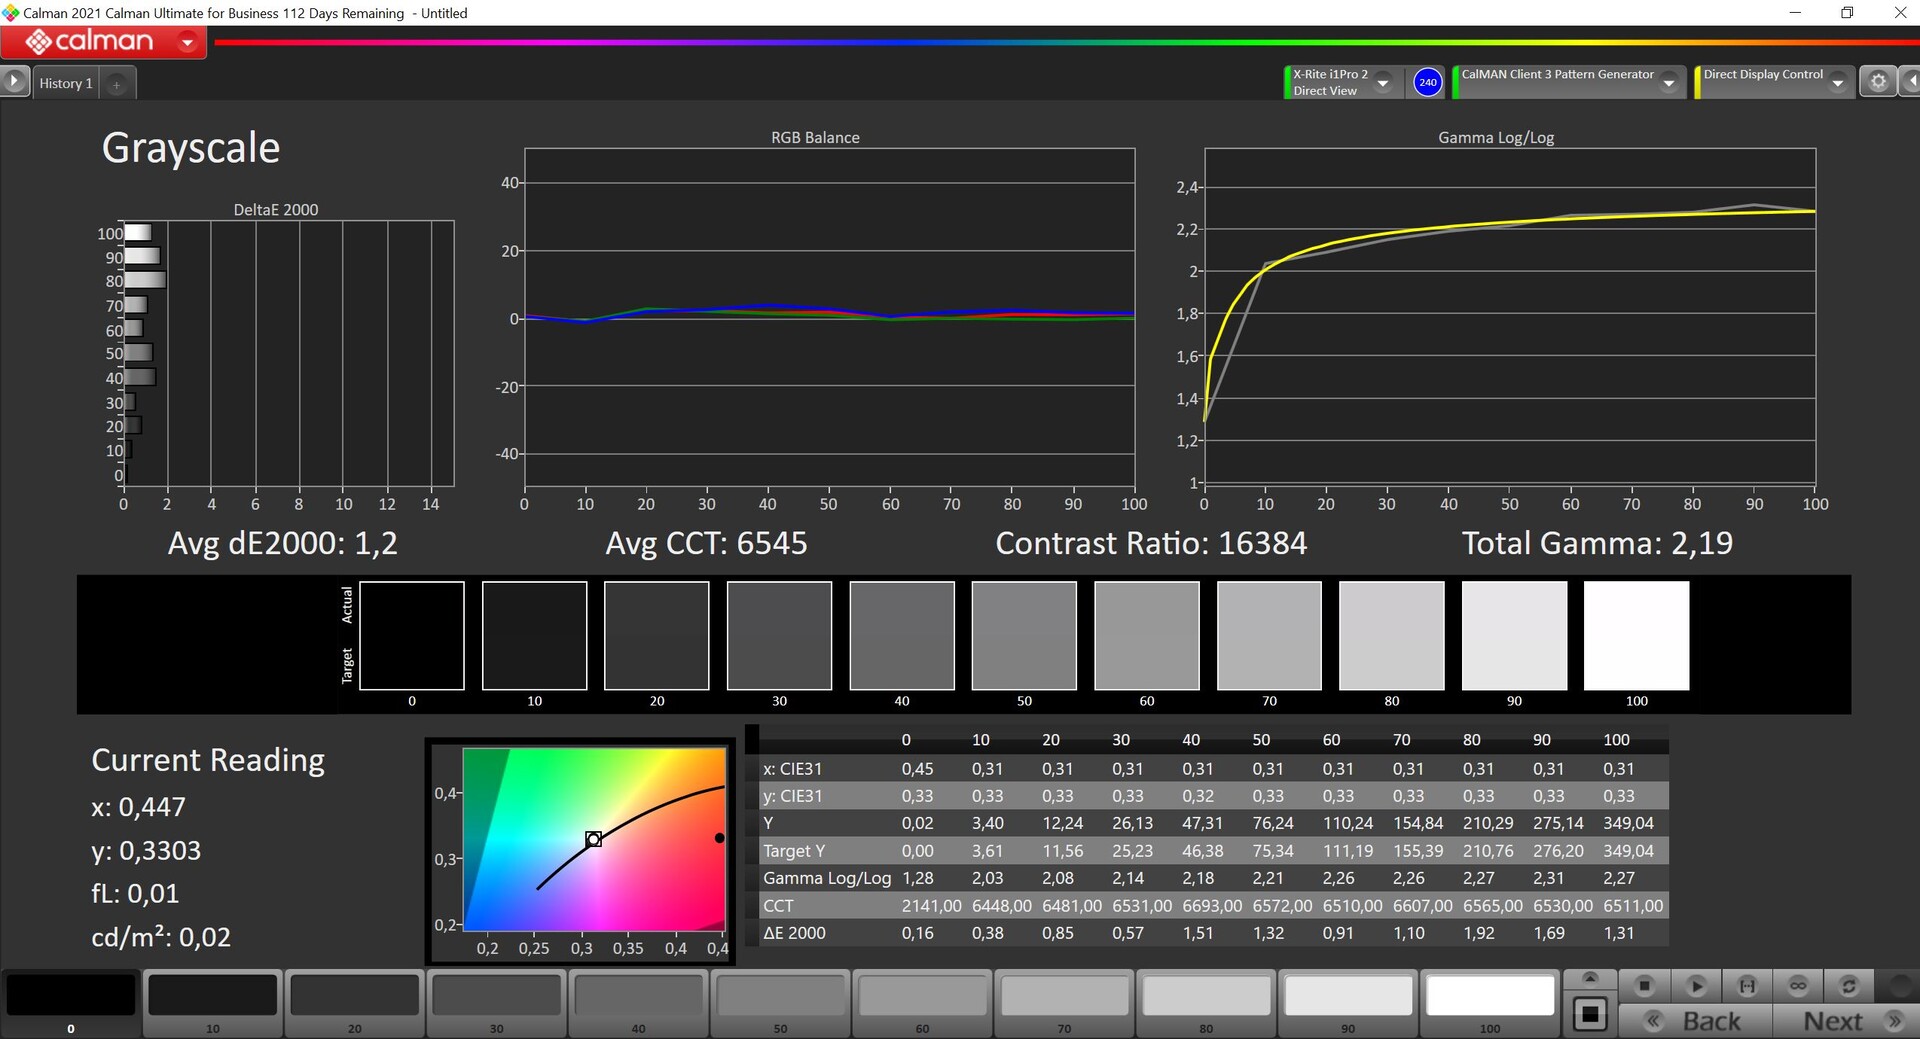
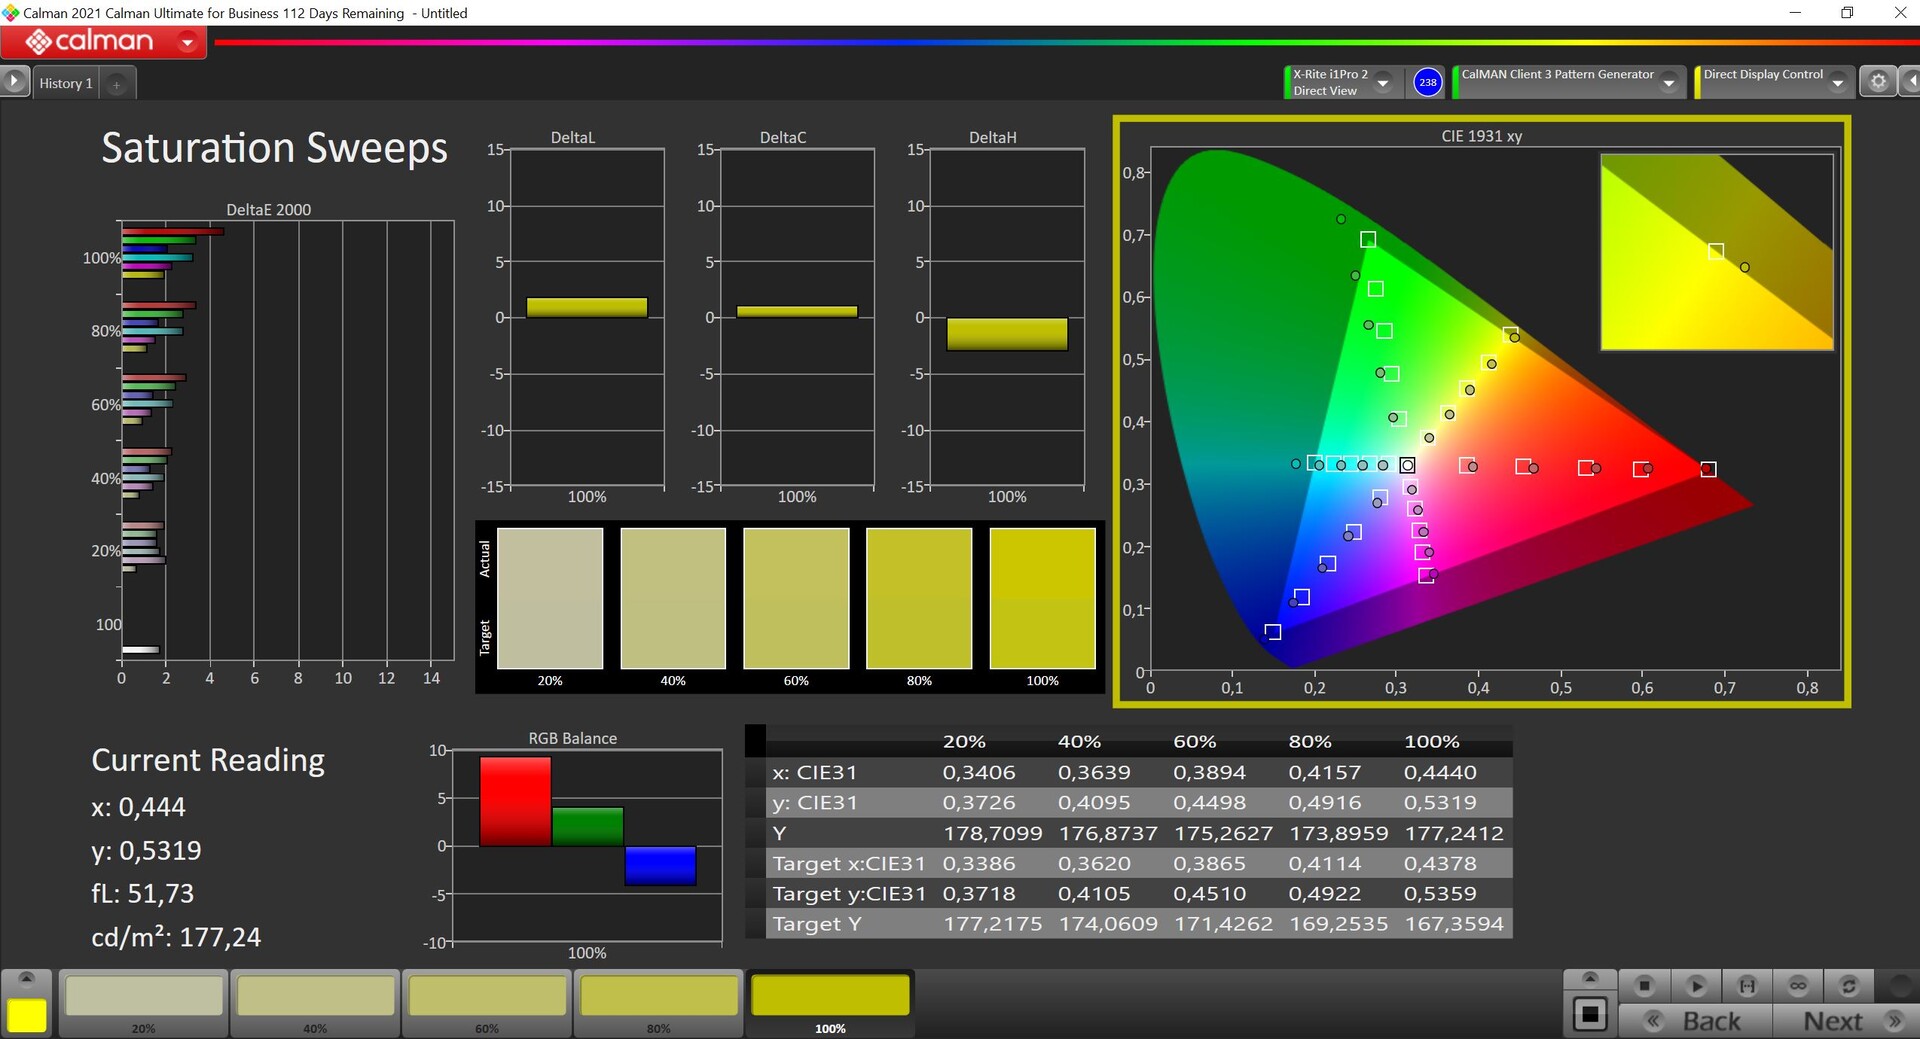
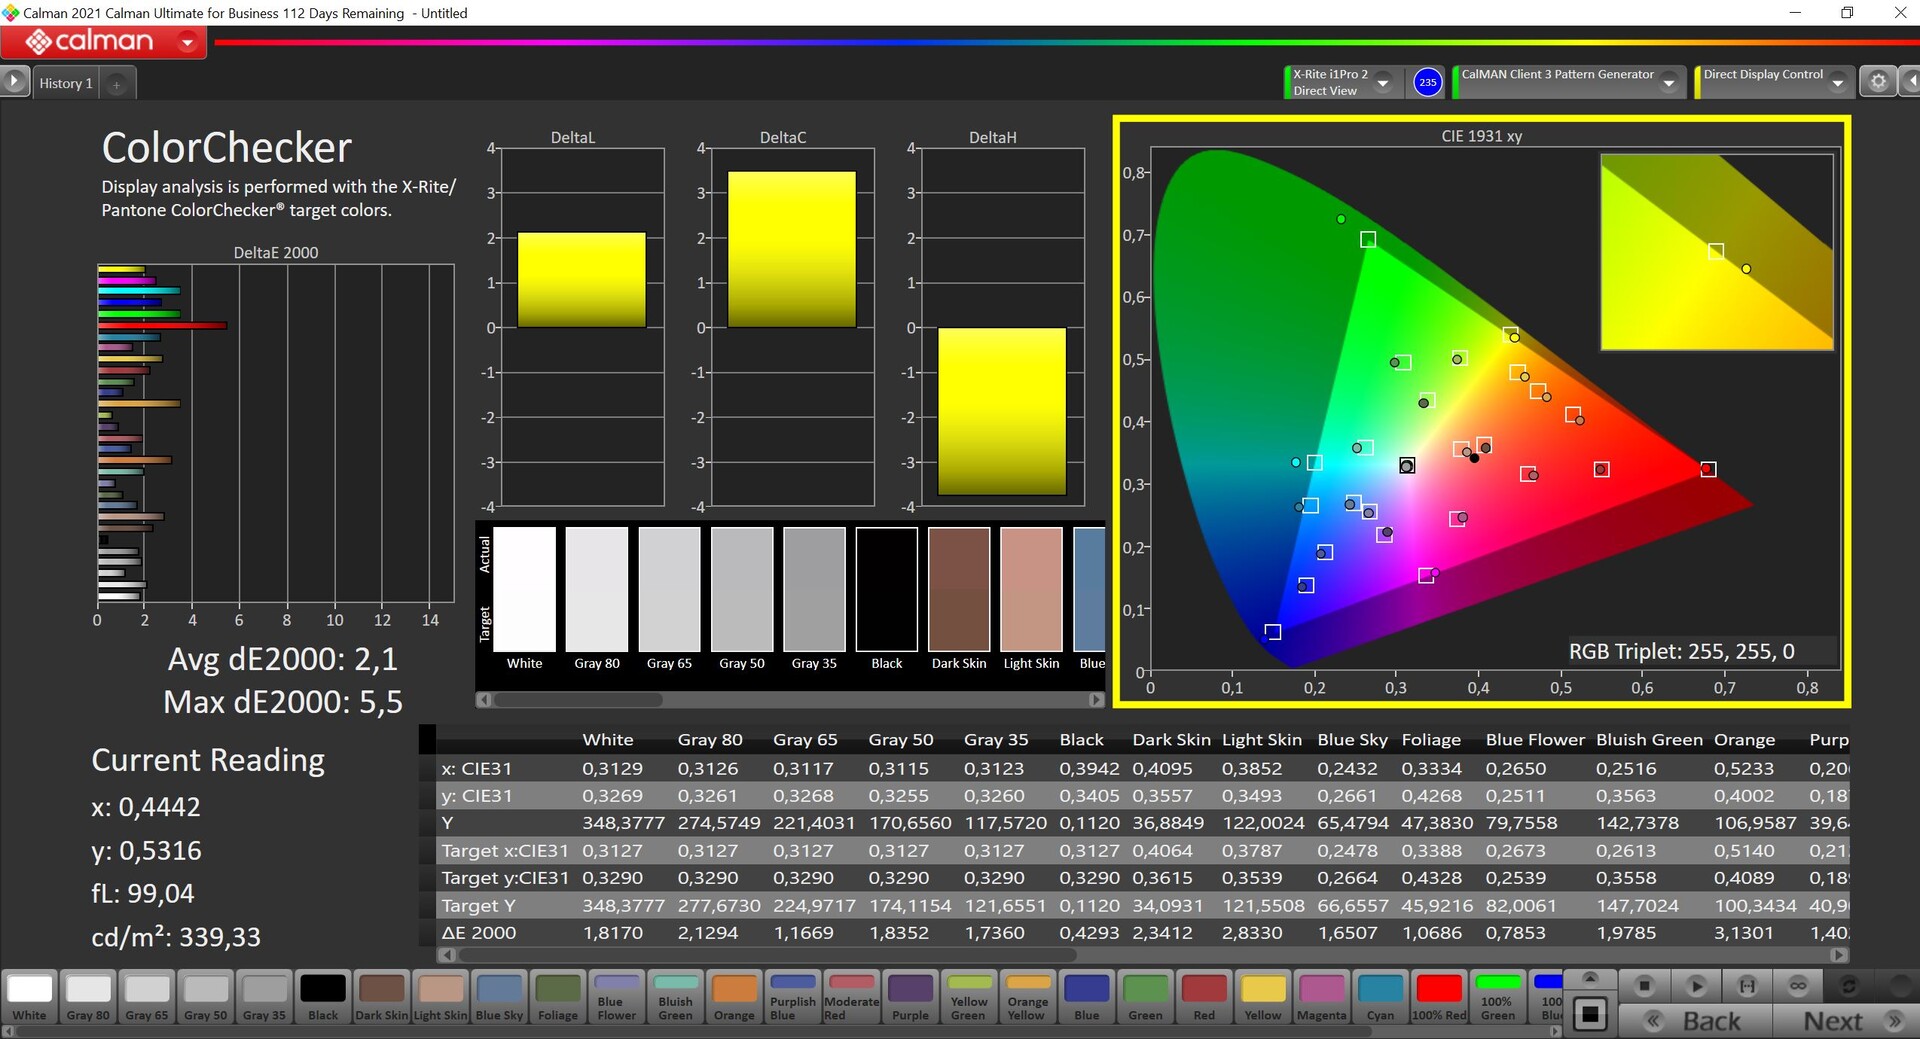
As usual, there are several color profiles in the MyAsus software, where 'Native' is preset by default. Here, the colors are somewhat oversaturated, which should result in a somewhat more powerful image in practice. The most accurate profile is DisplayP3, which we also used for our measurements with the professional CalMAN softwrae (X-Rite i1 Pro 2). Basically, the results are already very good and no issues in terms of color cast or color temperature are present, although some individual colors are above the important deviation of 3. We were unable to correct this with our own calibration, which is why we do not provide a profile for download in this particular case. The P3 color space is completely covered.
Display Response Times
| ↔ Response Time Black to White | ||
|---|---|---|
| 0.79 ms ... rise ↗ and fall ↘ combined | ↗ 0.34 ms rise |  |
| ↘ 0.45 ms fall | ||
| The screen shows very fast response rates in our tests and should be very well suited for fast-paced gaming. In comparison, all tested devices range from 0.1 (minimum) to 240 (maximum) ms. » 2 % of all devices are better. This means that the measured response time is better than the average of all tested devices (19.9 ms). | ||
| ↔ Response Time 50% Grey to 80% Grey | ||
| 0.59 ms ... rise ↗ and fall ↘ combined | ↗ 0.29 ms rise |  |
| ↘ 0.3 ms fall | ||
| The screen shows very fast response rates in our tests and should be very well suited for fast-paced gaming. In comparison, all tested devices range from 0.165 (minimum) to 636 (maximum) ms. » 1 % of all devices are better. This means that the measured response time is better than the average of all tested devices (31.1 ms). | ||
Screen Flickering / PWM (Pulse-Width Modulation)
| Screen flickering / PWM detected | 240 Hz | ≤ 100 % brightness setting |  |
The display backlight flickers at 240 Hz (worst case, e.g., utilizing PWM) Flickering detected at a brightness setting of 100 % and below. There should be no flickering or PWM above this brightness setting. The frequency of 240 Hz is relatively low, so sensitive users will likely notice flickering and experience eyestrain at the stated brightness setting and below. In comparison: 52 % of all tested devices do not use PWM to dim the display. If PWM was detected, an average of 7819 (minimum: 5 - maximum: 343500) Hz was measured. | |||

DC dimming is used in the brightness range from 100 to 60%, and classic PWM flickering at 240 Hz below that. As soon as the brightness drops below 60%, a warning appears that DC dimming is no longer available. As an alternative, the so-called flicker-free OLED dimming is available in the MyAsus software, which we examined in our review of the Zenbook S 13 OLED. Indeed, it is a useful addition, but it is also cumbersome to have to go through the software all the time.
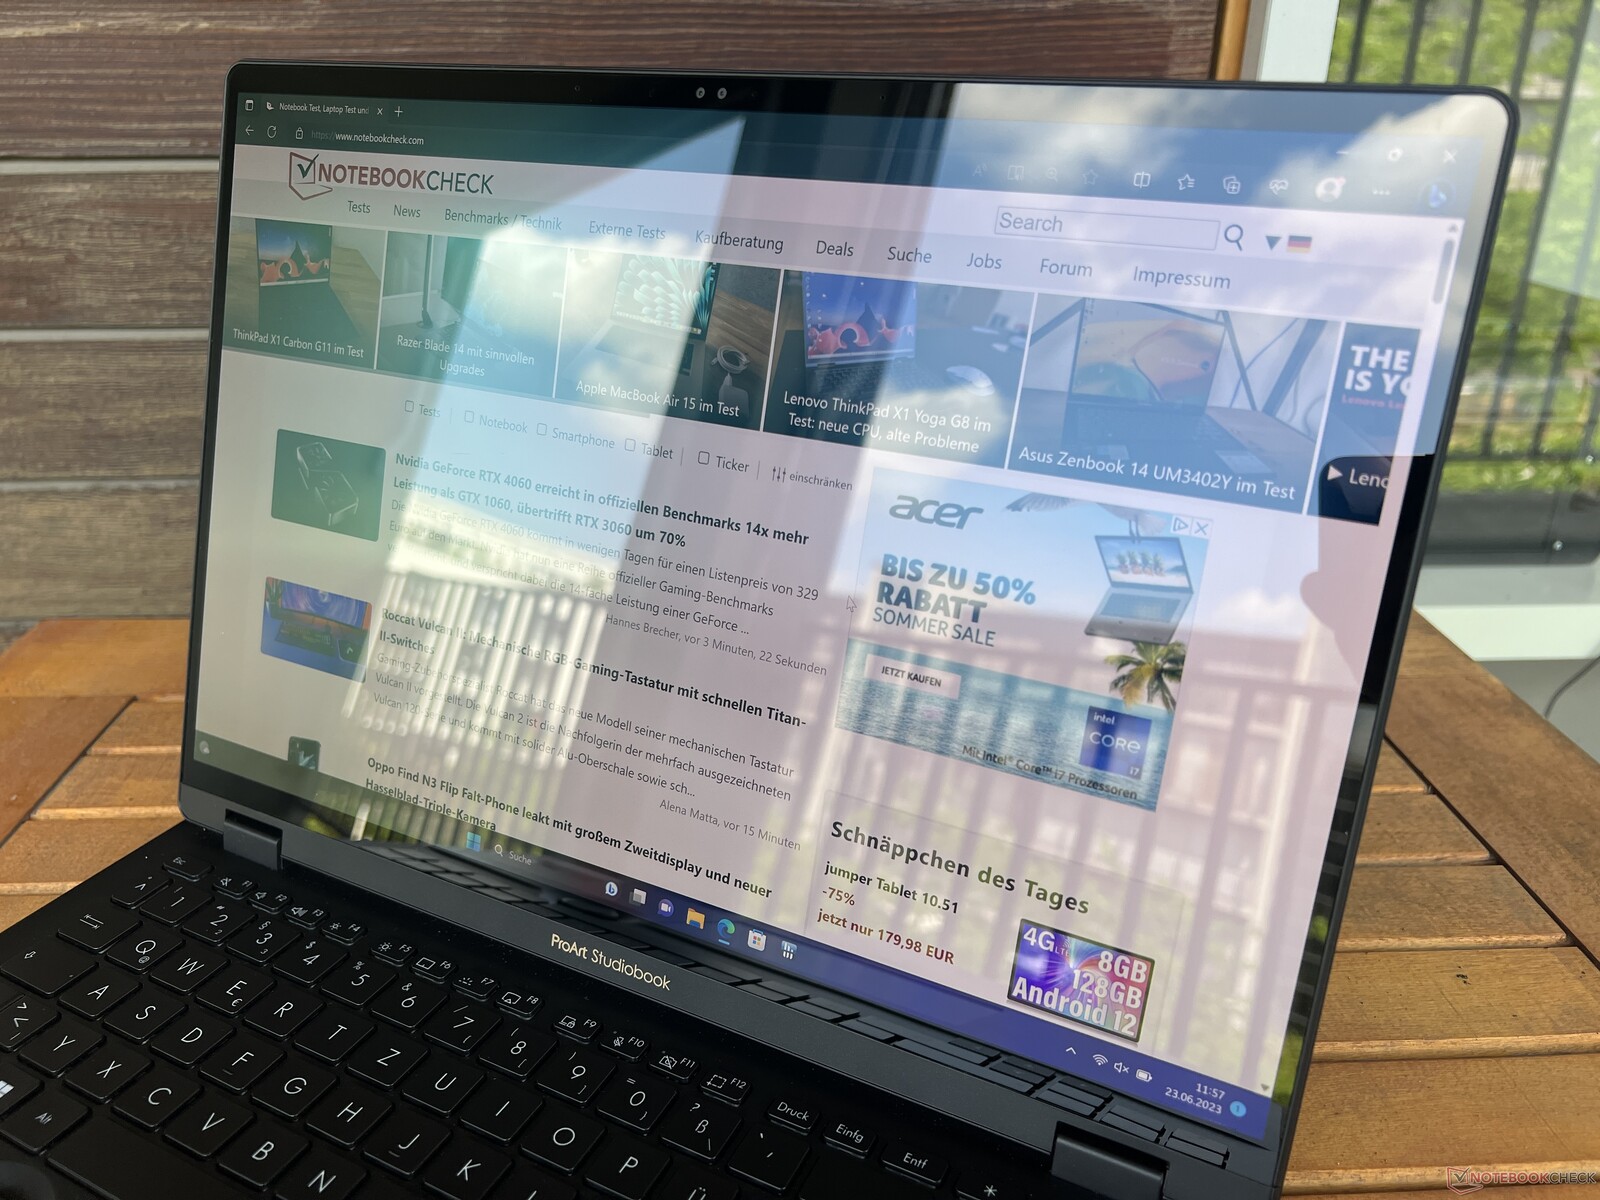
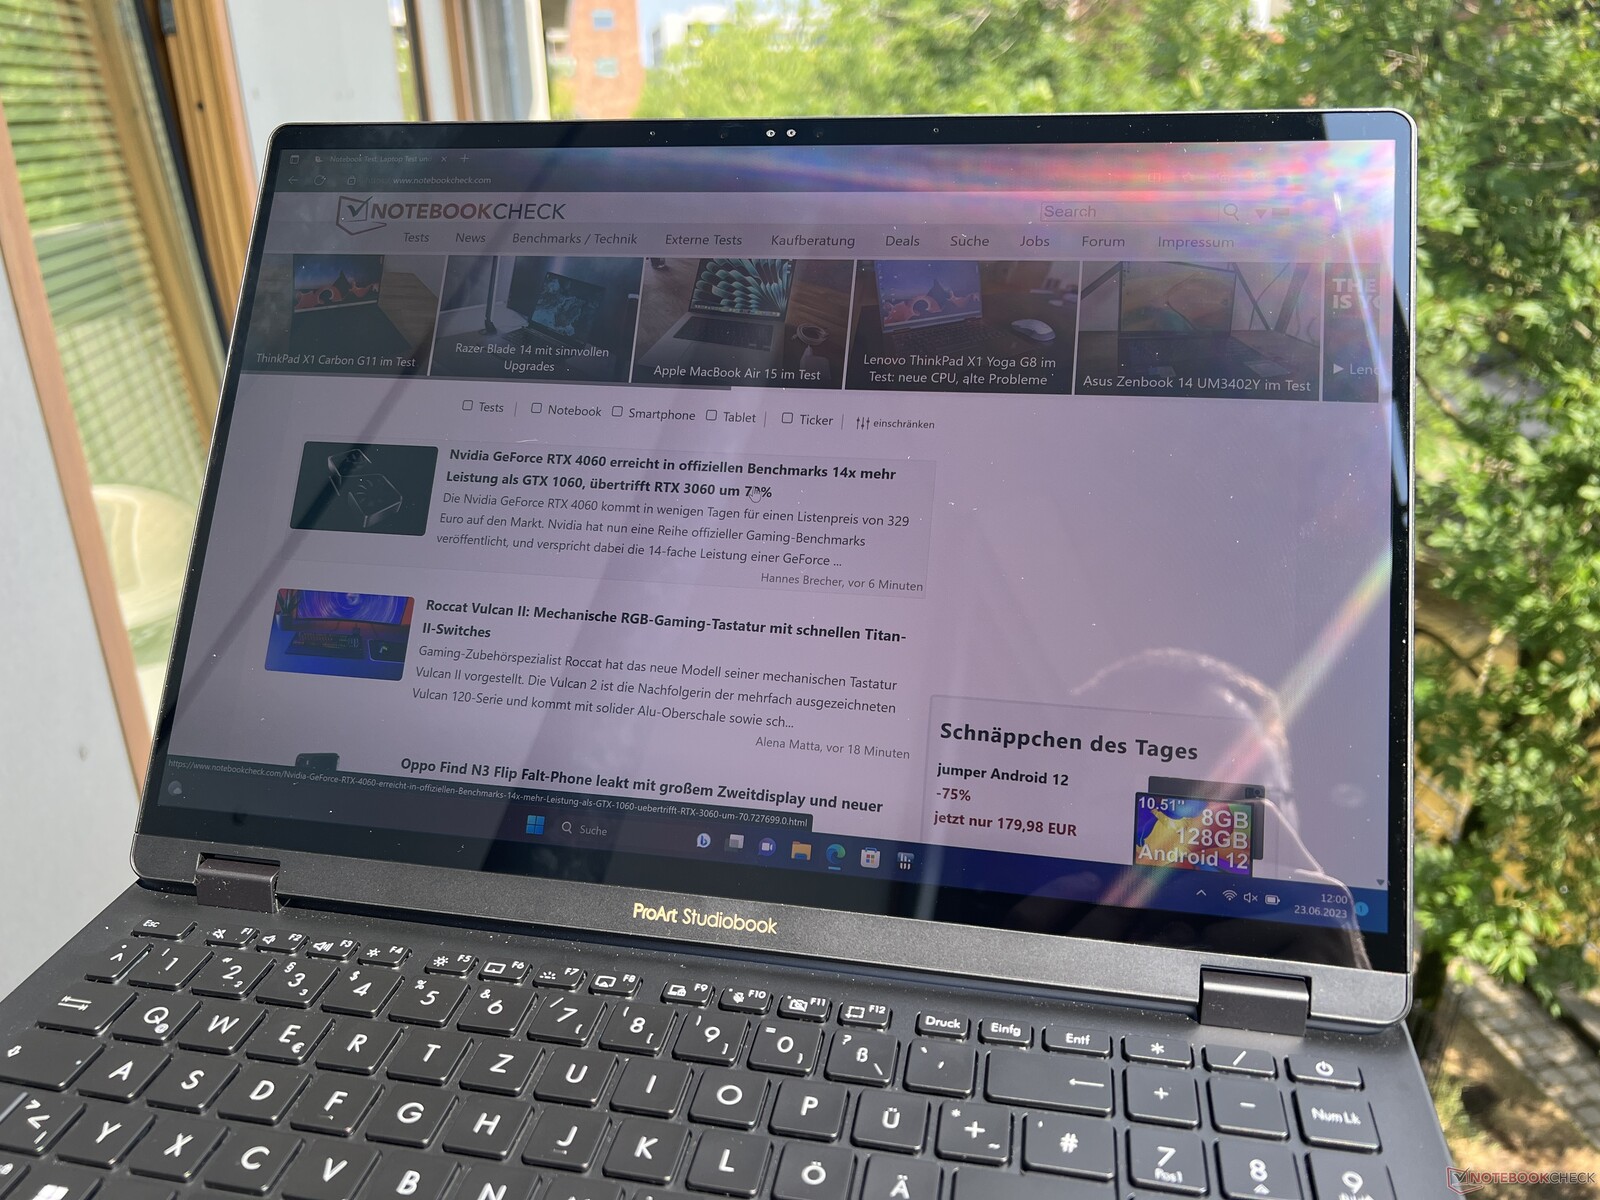
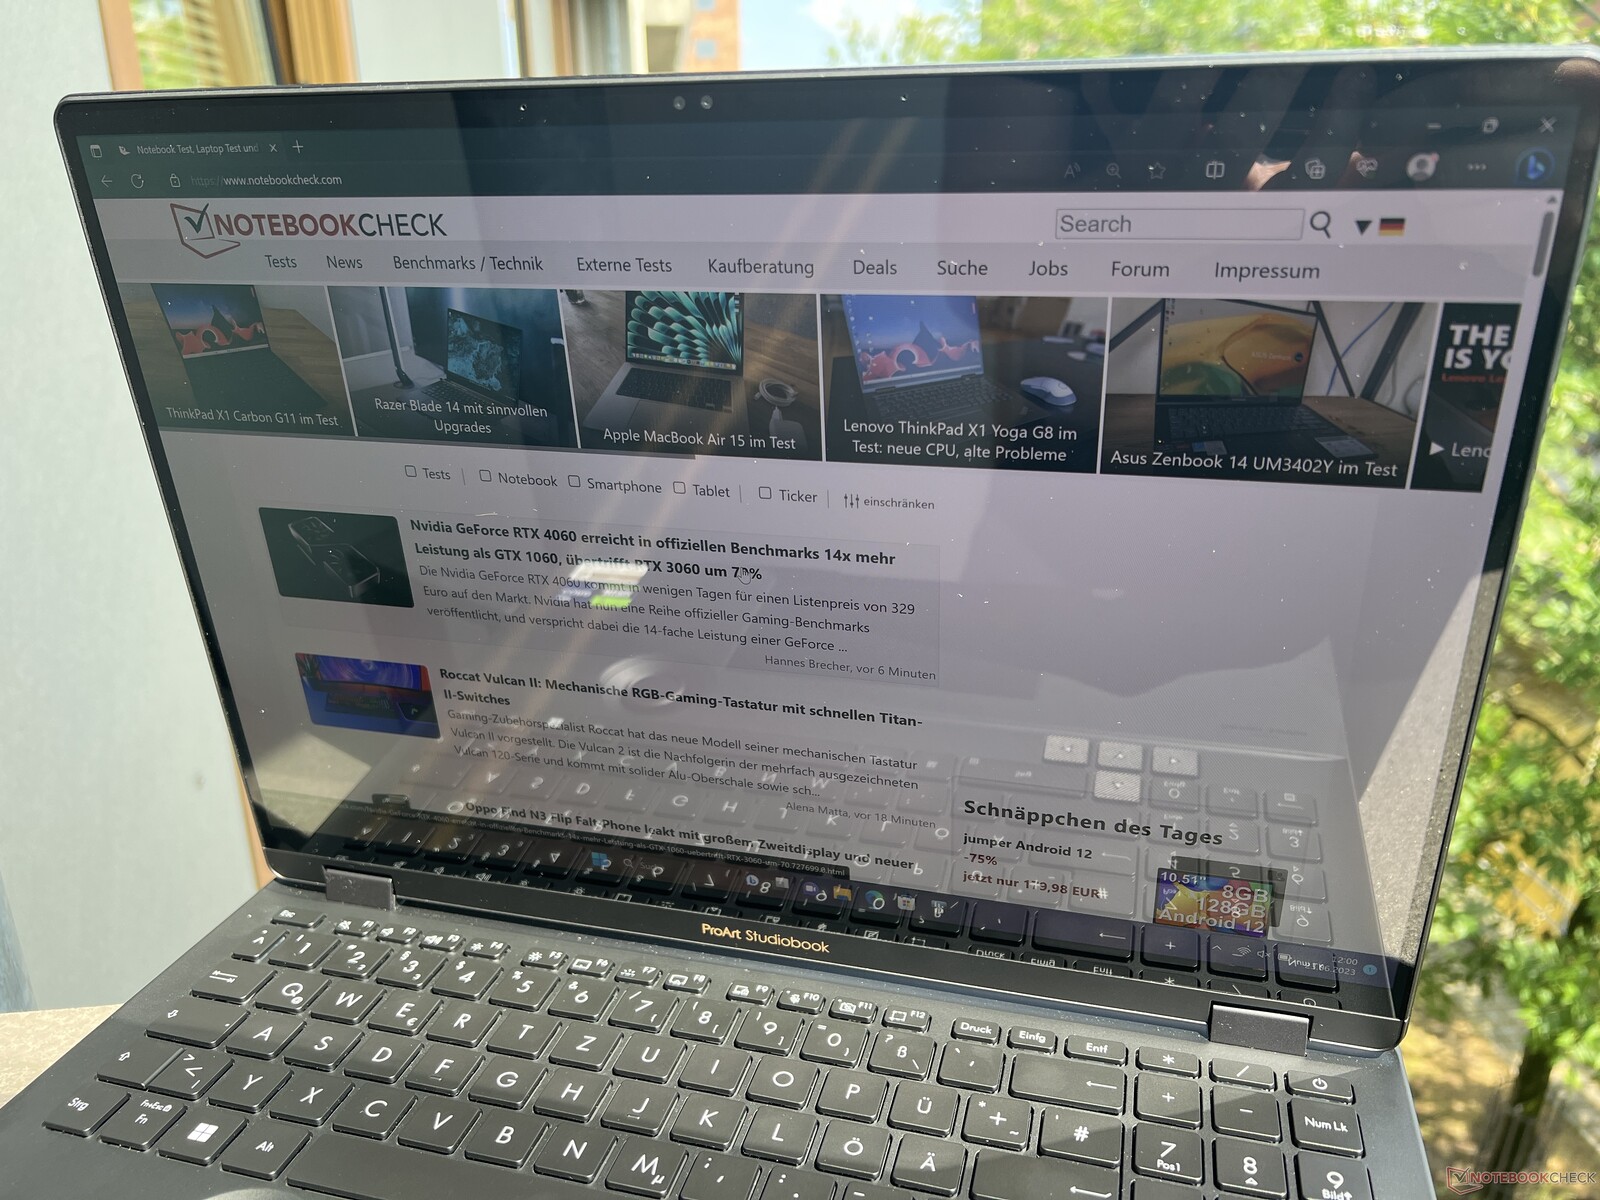
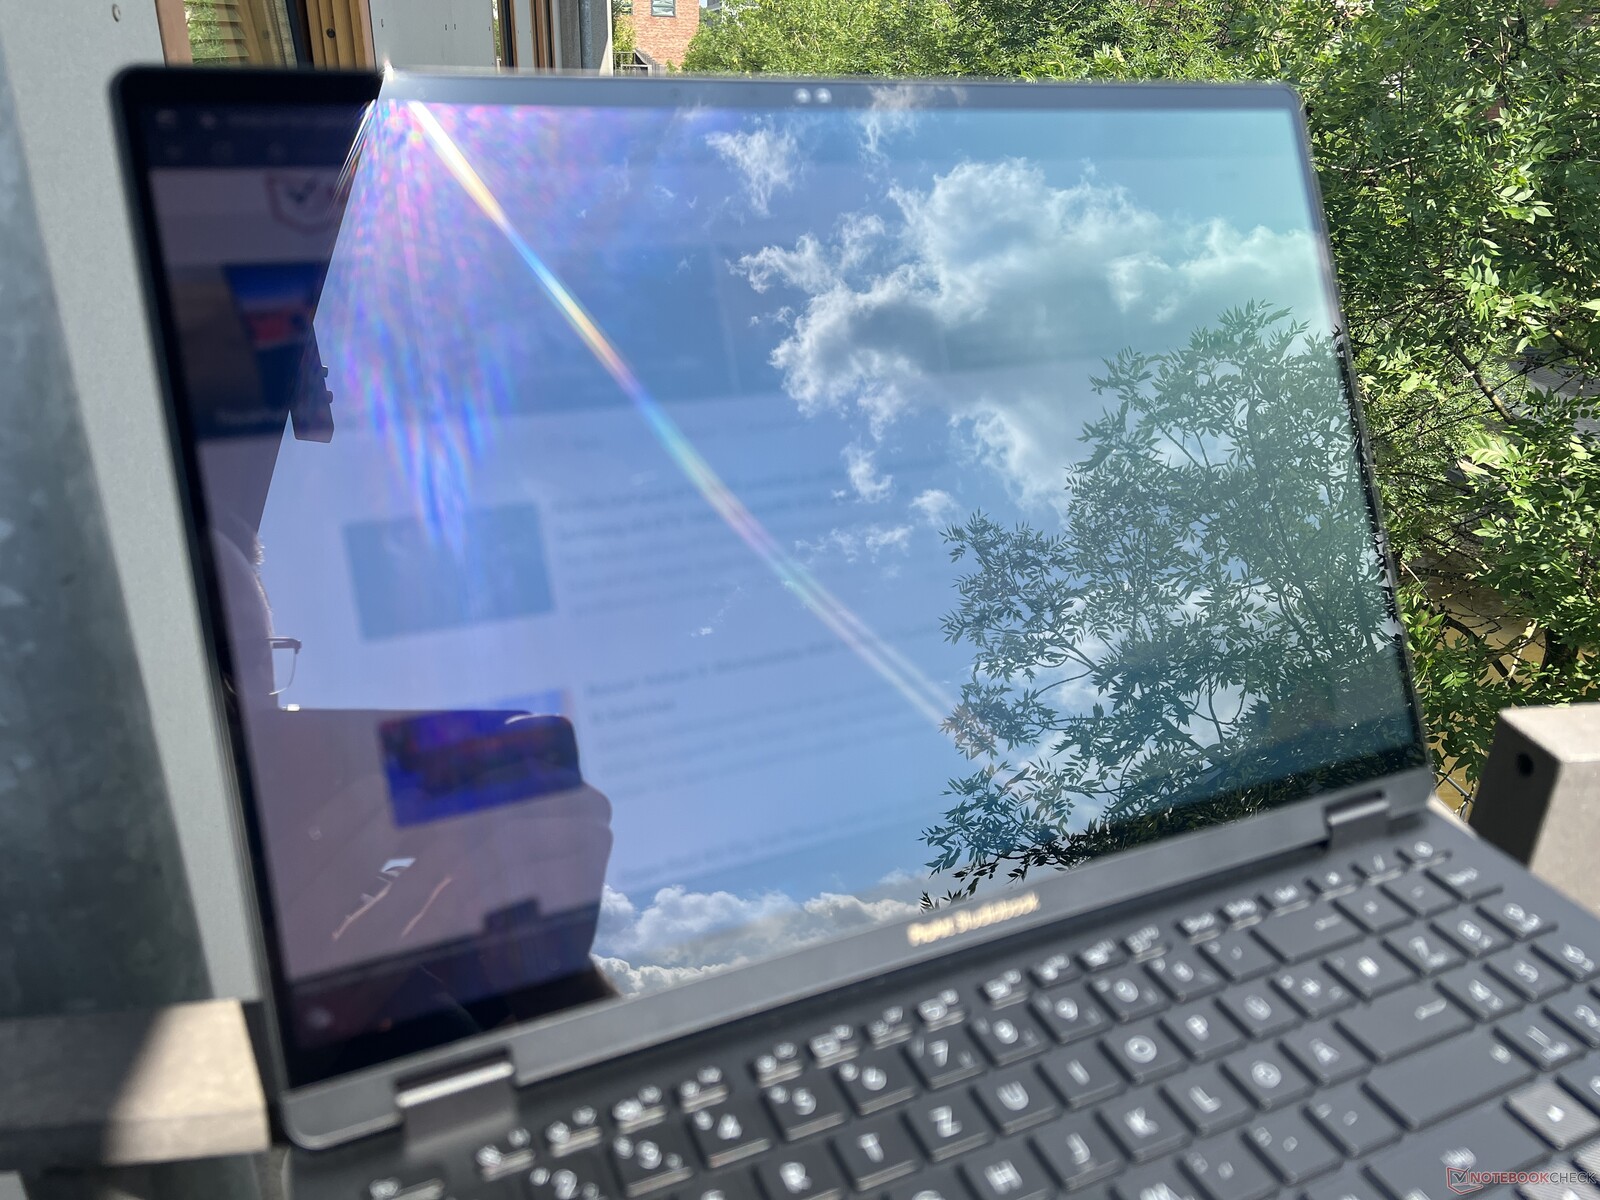
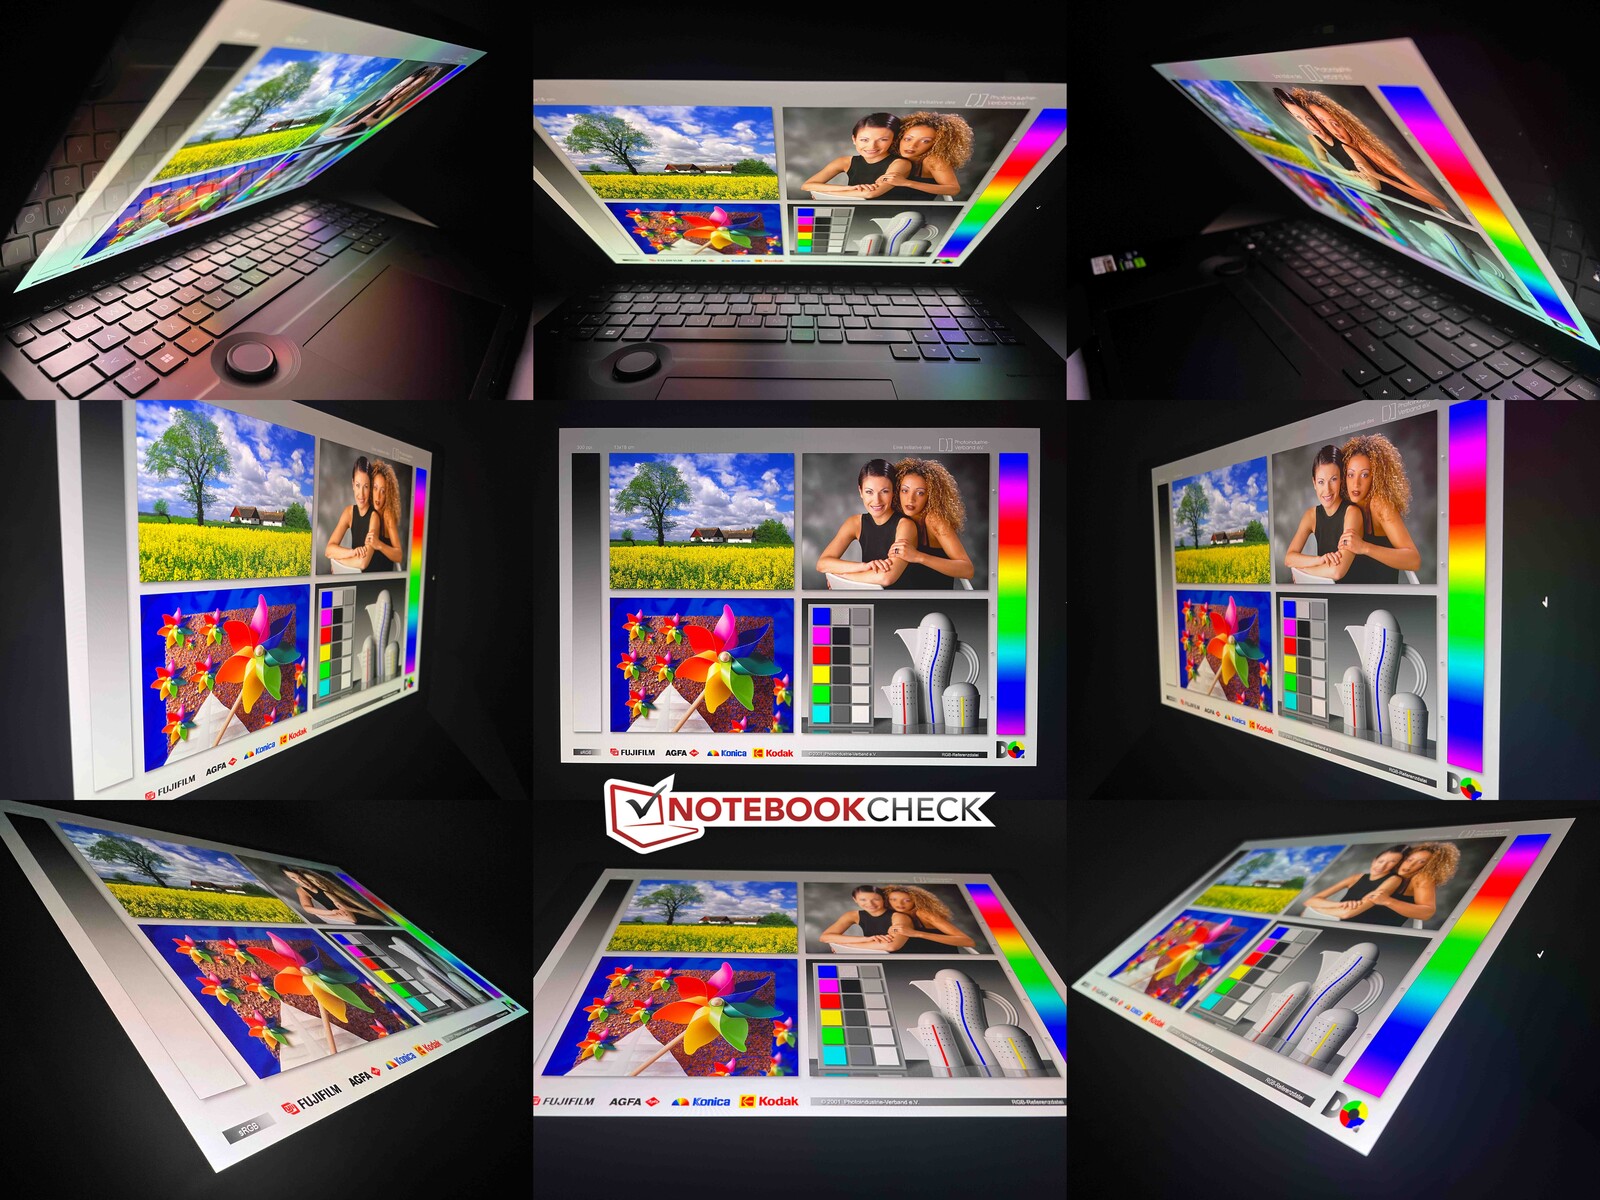
The touchscreen is very reflective outdoors, so you should avoid reflections from windows or light sources both indoors and outdoors. This isn't easy, especially when the sun is shining. The viewing angle stability is very good overall. Only at very extreme angles does the typical OLED blue cast appear.
Performance - Raptor Lake-HX & Ada Lovelace
Testing Conditions
Various energy profiles are available in the preinstalled ProArt Creator Hub, which we have listed in the table below. We carried out the measurements and benchmarks mostly in Performance mode, but we also look at the effects of the other two modes in some sections.
| Energy profile | CPU load | GPU load | Stress test | Max. fan volume |
|---|---|---|---|---|
| Standard | 157/80 watts | 90 watts | CPU: 30 watts GPU: 80 watts |
47.6 dB(A) |
| Performance | 170/130 watts | 130 watts | CPU: 55 watts GPU: 105 watts |
56.7 dB(A) |
| Full Speed | 170/130 watts | 130 watts | CPU: 64 watts 95 watts |
58.9 dB(A) |
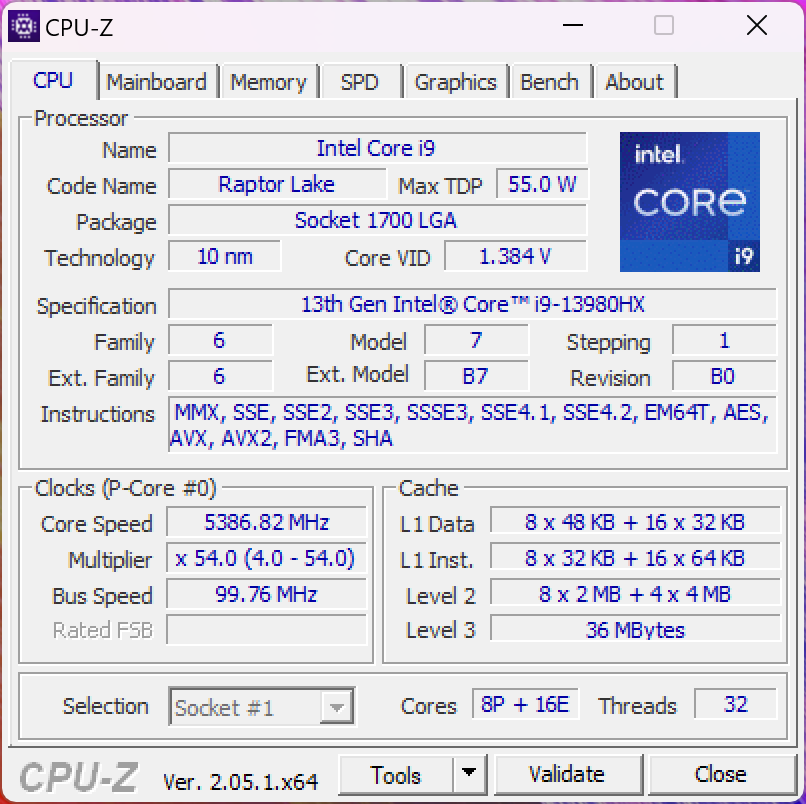
Processor - Core i9-13980HX
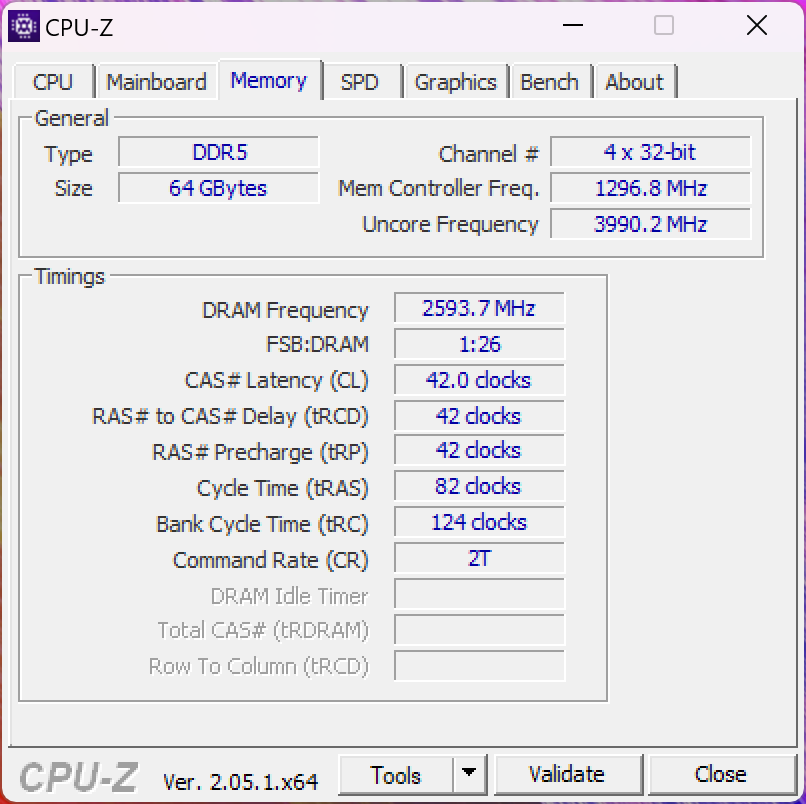
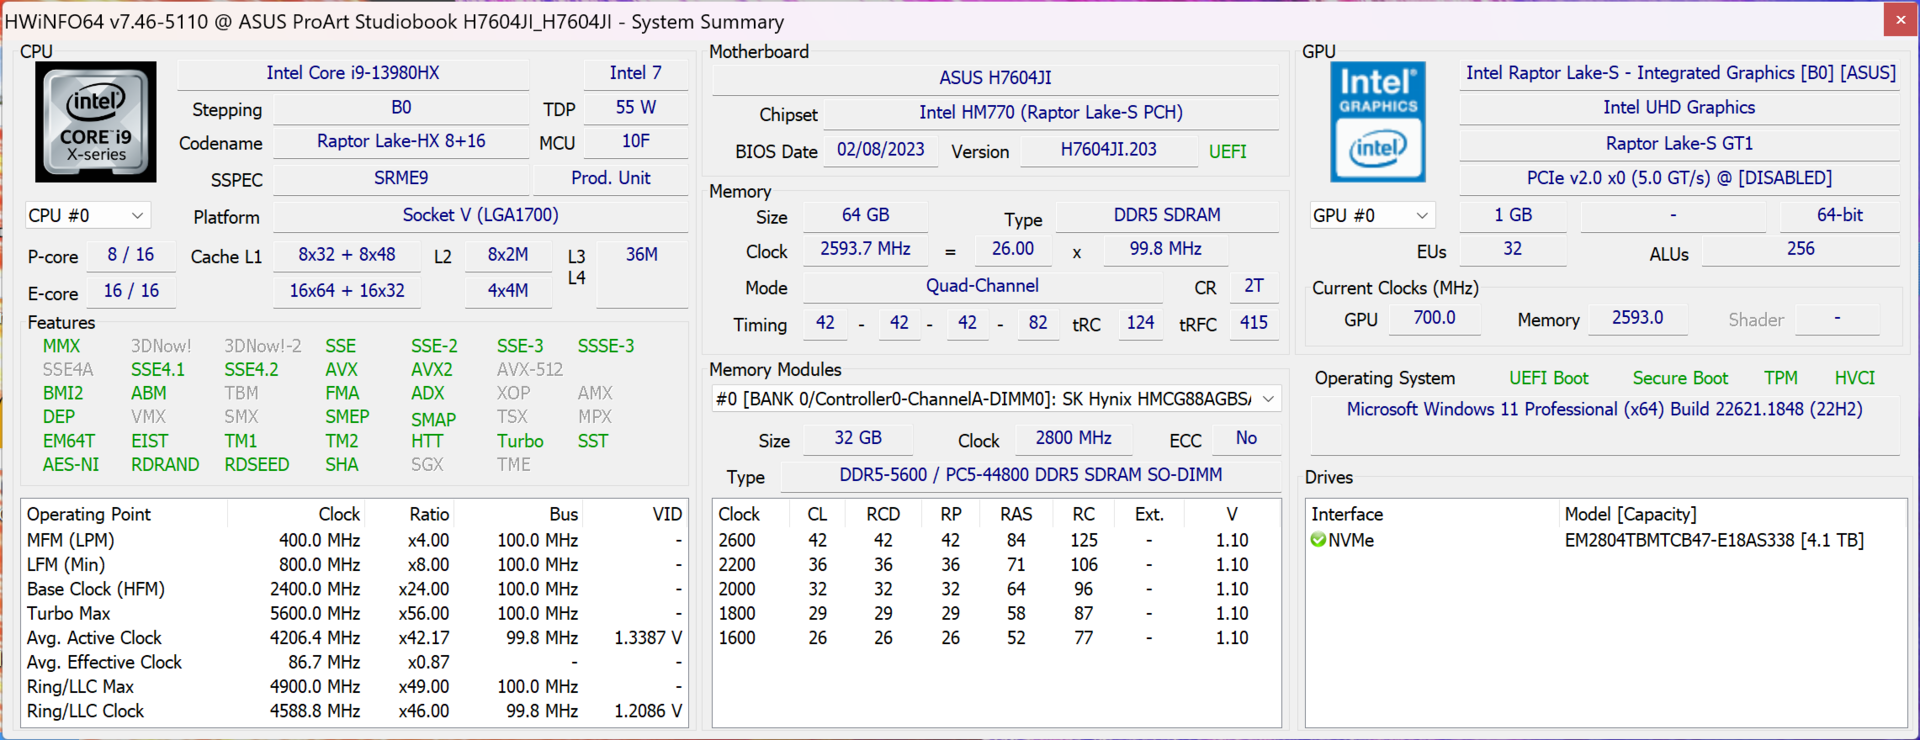
Intel's current high-end model of the Raptor Lake series for notebooks, the Core i9-13980HX, is used as the processor. This offers 8 fast performance cores and 16 efficiency cores, which is why the chip is able to process a total of 32 threads simultaneously. In the Studiobook, the processor consumes up to ~170 watts and levels off at 130 watts after a few minutes of sustained load. In large gaming notebooks, the CPU operates a little faster, but compared to the comparison group with normal Intel CPUs or the Apple M2 Max, the Studiobook has a big advantage. In terms of single-core performance, the Core i9 is also ahead of the new AMD Ryzen 9 7945HX, but the latter offers even more performance in the multi-core tests while also working more efficiently.
Away from the socket, not much remains to be seen of the laptop's performance capabilities as the CPU is only allowed to consume a meager 34/26 watts here. In the CB R23 multi-test, it scores only 11,576 points, which corresponds to a deficit of 63%. The StudioBook is thus slower on battery power than the MacBook Pro 16 with its M2 Max, where there is no performance reduction on battery power. More CPU benchmarks are available in our tech section.
Cinebench R15 Multi Sustained Load
Cinebench R23: Multi Core | Single Core
Cinebench R20: CPU (Multi Core) | CPU (Single Core)
Cinebench R15: CPU Multi 64Bit | CPU Single 64Bit
Blender: v2.79 BMW27 CPU
7-Zip 18.03: 7z b 4 | 7z b 4 -mmt1
Geekbench 5.5: Multi-Core | Single-Core
HWBOT x265 Benchmark v2.2: 4k Preset
LibreOffice : 20 Documents To PDF
R Benchmark 2.5: Overall mean
| CPU Performance rating | |
| Asus Zephyrus Duo 16 GX650PY-NM006W | |
| Asus ProArt Studiobook 16 OLED H7604 | |
| Average Intel Core i9-13980HX | |
| Apple MacBook Pro 16 2023 M2 Max -6! | |
| MSI Stealth 17 Studio A13VH-014 | |
| Gigabyte AERO 16 OLED BSF | |
| Average of class Multimedia | |
| Samsung Galaxy Book3 Ultra 16 | |
| Cinebench R23 / Multi Core | |
| Asus Zephyrus Duo 16 GX650PY-NM006W | |
| Asus ProArt Studiobook 16 OLED H7604 | |
| Average Intel Core i9-13980HX (28301 - 33052, n=11) | |
| MSI Stealth 17 Studio A13VH-014 | |
| Gigabyte AERO 16 OLED BSF | |
| Average of class Multimedia (4861 - 33362, n=83, last 2 years) | |
| Samsung Galaxy Book3 Ultra 16 | |
| Apple MacBook Pro 16 2023 M2 Max | |
| Cinebench R23 / Single Core | |
| Asus ProArt Studiobook 16 OLED H7604 | |
| Average Intel Core i9-13980HX (1825 - 2169, n=9) | |
| Asus Zephyrus Duo 16 GX650PY-NM006W | |
| Average of class Multimedia (1128 - 2459, n=75, last 2 years) | |
| Gigabyte AERO 16 OLED BSF | |
| MSI Stealth 17 Studio A13VH-014 | |
| Samsung Galaxy Book3 Ultra 16 | |
| Apple MacBook Pro 16 2023 M2 Max | |
| Cinebench R20 / CPU (Multi Core) | |
| Asus Zephyrus Duo 16 GX650PY-NM006W | |
| Asus ProArt Studiobook 16 OLED H7604 | |
| Average Intel Core i9-13980HX (10353 - 12437, n=10) | |
| MSI Stealth 17 Studio A13VH-014 | |
| Gigabyte AERO 16 OLED BSF | |
| Average of class Multimedia (1887 - 12912, n=66, last 2 years) | |
| Samsung Galaxy Book3 Ultra 16 | |
| Apple MacBook Pro 16 2023 M2 Max | |
| Cinebench R20 / CPU (Single Core) | |
| Asus ProArt Studiobook 16 OLED H7604 | |
| Average Intel Core i9-13980HX (717 - 825, n=10) | |
| Asus Zephyrus Duo 16 GX650PY-NM006W | |
| Average of class Multimedia (420 - 853, n=66, last 2 years) | |
| MSI Stealth 17 Studio A13VH-014 | |
| Samsung Galaxy Book3 Ultra 16 | |
| Gigabyte AERO 16 OLED BSF | |
| Apple MacBook Pro 16 2023 M2 Max | |
| Cinebench R15 / CPU Multi 64Bit | |
| Asus Zephyrus Duo 16 GX650PY-NM006W | |
| Average Intel Core i9-13980HX (4358 - 5172, n=11) | |
| Asus ProArt Studiobook 16 OLED H7604 | |
| MSI Stealth 17 Studio A13VH-014 | |
| Gigabyte AERO 16 OLED BSF | |
| Average of class Multimedia (856 - 5224, n=70, last 2 years) | |
| Samsung Galaxy Book3 Ultra 16 | |
| Apple MacBook Pro 16 2023 M2 Max | |
| Cinebench R15 / CPU Single 64Bit | |
| Asus ProArt Studiobook 16 OLED H7604 | |
| Asus Zephyrus Duo 16 GX650PY-NM006W | |
| Average Intel Core i9-13980HX (289 - 312, n=11) | |
| MSI Stealth 17 Studio A13VH-014 | |
| Average of class Multimedia (184.8 - 326, n=68, last 2 years) | |
| Samsung Galaxy Book3 Ultra 16 | |
| Gigabyte AERO 16 OLED BSF | |
| Apple MacBook Pro 16 2023 M2 Max | |
| Blender / v2.79 BMW27 CPU | |
| Average of class Multimedia (100 - 557, n=67, last 2 years) | |
| Samsung Galaxy Book3 Ultra 16 | |
| Gigabyte AERO 16 OLED BSF | |
| MSI Stealth 17 Studio A13VH-014 | |
| Average Intel Core i9-13980HX (97 - 136, n=10) | |
| Asus ProArt Studiobook 16 OLED H7604 | |
| Asus Zephyrus Duo 16 GX650PY-NM006W | |
| 7-Zip 18.03 / 7z b 4 | |
| Asus Zephyrus Duo 16 GX650PY-NM006W | |
| Asus ProArt Studiobook 16 OLED H7604 | |
| Average Intel Core i9-13980HX (104616 - 129804, n=10) | |
| MSI Stealth 17 Studio A13VH-014 | |
| Gigabyte AERO 16 OLED BSF | |
| Samsung Galaxy Book3 Ultra 16 | |
| Average of class Multimedia (29095 - 130368, n=64, last 2 years) | |
| 7-Zip 18.03 / 7z b 4 -mmt1 | |
| Asus Zephyrus Duo 16 GX650PY-NM006W | |
| Asus ProArt Studiobook 16 OLED H7604 | |
| Average Intel Core i9-13980HX (6230 - 7163, n=10) | |
| MSI Stealth 17 Studio A13VH-014 | |
| Average of class Multimedia (3666 - 7545, n=65, last 2 years) | |
| Gigabyte AERO 16 OLED BSF | |
| Samsung Galaxy Book3 Ultra 16 | |
| Geekbench 5.5 / Multi-Core | |
| Average Intel Core i9-13980HX (18475 - 22200, n=10) | |
| Asus ProArt Studiobook 16 OLED H7604 | |
| Asus Zephyrus Duo 16 GX650PY-NM006W | |
| Apple MacBook Pro 16 2023 M2 Max | |
| Gigabyte AERO 16 OLED BSF | |
| MSI Stealth 17 Studio A13VH-014 | |
| Average of class Multimedia (4652 - 20422, n=64, last 2 years) | |
| Samsung Galaxy Book3 Ultra 16 | |
| Geekbench 5.5 / Single-Core | |
| Asus ProArt Studiobook 16 OLED H7604 | |
| Asus Zephyrus Duo 16 GX650PY-NM006W | |
| Average Intel Core i9-13980HX (1796 - 2139, n=10) | |
| MSI Stealth 17 Studio A13VH-014 | |
| Apple MacBook Pro 16 2023 M2 Max | |
| Average of class Multimedia (805 - 2974, n=64, last 2 years) | |
| Gigabyte AERO 16 OLED BSF | |
| Samsung Galaxy Book3 Ultra 16 | |
| HWBOT x265 Benchmark v2.2 / 4k Preset | |
| Asus Zephyrus Duo 16 GX650PY-NM006W | |
| Average Intel Core i9-13980HX (27 - 33.4, n=9) | |
| Asus ProArt Studiobook 16 OLED H7604 | |
| MSI Stealth 17 Studio A13VH-014 | |
| Gigabyte AERO 16 OLED BSF | |
| Average of class Multimedia (5.26 - 36.1, n=65, last 2 years) | |
| Samsung Galaxy Book3 Ultra 16 | |
| LibreOffice / 20 Documents To PDF | |
| Asus Zephyrus Duo 16 GX650PY-NM006W | |
| Gigabyte AERO 16 OLED BSF | |
| MSI Stealth 17 Studio A13VH-014 | |
| Average of class Multimedia (23.9 - 146.7, n=66, last 2 years) | |
| Samsung Galaxy Book3 Ultra 16 | |
| Asus ProArt Studiobook 16 OLED H7604 | |
| Average Intel Core i9-13980HX (35 - 51.4, n=10) | |
| R Benchmark 2.5 / Overall mean | |
| Gigabyte AERO 16 OLED BSF | |
| Samsung Galaxy Book3 Ultra 16 | |
| Average of class Multimedia (0.3604 - 0.947, n=65, last 2 years) | |
| MSI Stealth 17 Studio A13VH-014 | |
| Asus Zephyrus Duo 16 GX650PY-NM006W | |
| Average Intel Core i9-13980HX (0.3793 - 0.4462, n=10) | |
| Asus ProArt Studiobook 16 OLED H7604 | |
* ... smaller is better
AIDA64: FP32 Ray-Trace | FPU Julia | CPU SHA3 | CPU Queen | FPU SinJulia | FPU Mandel | CPU AES | CPU ZLib | FP64 Ray-Trace | CPU PhotoWorxx
| Performance rating | |
| Asus ProArt Studiobook 16 OLED H7604 | |
| Average Intel Core i9-13980HX | |
| Gigabyte AERO 16 OLED BSF | |
| MSI Stealth 17 Studio A13VH-014 | |
| Average of class Multimedia | |
| Samsung Galaxy Book3 Ultra 16 | |
| AIDA64 / FP32 Ray-Trace | |
| Asus ProArt Studiobook 16 OLED H7604 | |
| Average Intel Core i9-13980HX (21332 - 29553, n=9) | |
| MSI Stealth 17 Studio A13VH-014 | |
| Gigabyte AERO 16 OLED BSF | |
| Average of class Multimedia (2214 - 50388, n=62, last 2 years) | |
| Samsung Galaxy Book3 Ultra 16 | |
| AIDA64 / FPU Julia | |
| Asus ProArt Studiobook 16 OLED H7604 | |
| Average Intel Core i9-13980HX (108001 - 148168, n=9) | |
| MSI Stealth 17 Studio A13VH-014 | |
| Gigabyte AERO 16 OLED BSF | |
| Average of class Multimedia (12867 - 201874, n=63, last 2 years) | |
| Samsung Galaxy Book3 Ultra 16 | |
| AIDA64 / CPU SHA3 | |
| Asus ProArt Studiobook 16 OLED H7604 | |
| Average Intel Core i9-13980HX (5264 - 7142, n=9) | |
| MSI Stealth 17 Studio A13VH-014 | |
| Gigabyte AERO 16 OLED BSF | |
| Average of class Multimedia (653 - 8623, n=63, last 2 years) | |
| Samsung Galaxy Book3 Ultra 16 | |
| AIDA64 / CPU Queen | |
| Average Intel Core i9-13980HX (126758 - 143409, n=9) | |
| Asus ProArt Studiobook 16 OLED H7604 | |
| Samsung Galaxy Book3 Ultra 16 | |
| MSI Stealth 17 Studio A13VH-014 | |
| Gigabyte AERO 16 OLED BSF | |
| Average of class Multimedia (13483 - 181505, n=51, last 2 years) | |
| AIDA64 / FPU SinJulia | |
| Average Intel Core i9-13980HX (13785 - 17117, n=9) | |
| Asus ProArt Studiobook 16 OLED H7604 | |
| MSI Stealth 17 Studio A13VH-014 | |
| Gigabyte AERO 16 OLED BSF | |
| Samsung Galaxy Book3 Ultra 16 | |
| Average of class Multimedia (1240 - 28794, n=63, last 2 years) | |
| AIDA64 / FPU Mandel | |
| Asus ProArt Studiobook 16 OLED H7604 | |
| Average Intel Core i9-13980HX (53398 - 73758, n=9) | |
| MSI Stealth 17 Studio A13VH-014 | |
| Gigabyte AERO 16 OLED BSF | |
| Average of class Multimedia (6395 - 105740, n=62, last 2 years) | |
| Samsung Galaxy Book3 Ultra 16 | |
| AIDA64 / CPU AES | |
| Gigabyte AERO 16 OLED BSF | |
| Asus ProArt Studiobook 16 OLED H7604 | |
| Average Intel Core i9-13980HX (105169 - 136520, n=9) | |
| MSI Stealth 17 Studio A13VH-014 | |
| Samsung Galaxy Book3 Ultra 16 | |
| Average of class Multimedia (13243 - 126790, n=63, last 2 years) | |
| AIDA64 / CPU ZLib | |
| Asus ProArt Studiobook 16 OLED H7604 | |
| Average Intel Core i9-13980HX (1513 - 2039, n=9) | |
| MSI Stealth 17 Studio A13VH-014 | |
| Gigabyte AERO 16 OLED BSF | |
| Samsung Galaxy Book3 Ultra 16 | |
| Average of class Multimedia (167.2 - 2022, n=63, last 2 years) | |
| AIDA64 / FP64 Ray-Trace | |
| Average Intel Core i9-13980HX (11431 - 16325, n=9) | |
| Asus ProArt Studiobook 16 OLED H7604 | |
| MSI Stealth 17 Studio A13VH-014 | |
| Gigabyte AERO 16 OLED BSF | |
| Average of class Multimedia (1014 - 26875, n=63, last 2 years) | |
| Samsung Galaxy Book3 Ultra 16 | |
| AIDA64 / CPU PhotoWorxx | |
| MSI Stealth 17 Studio A13VH-014 | |
| Average of class Multimedia (12860 - 88154, n=63, last 2 years) | |
| Asus ProArt Studiobook 16 OLED H7604 | |
| Samsung Galaxy Book3 Ultra 16 | |
| Average Intel Core i9-13980HX (37069 - 52949, n=9) | |
| Gigabyte AERO 16 OLED BSF | |
System Performance
System performance is excellent, both in the synthetic benchmarks and in practice. No issues were encountered during testing either.
CrossMark: Overall | Productivity | Creativity | Responsiveness
| PCMark 10 / Score | |
| Asus Zephyrus Duo 16 GX650PY-NM006W | |
| Gigabyte AERO 16 OLED BSF | |
| Average of class Multimedia (4325 - 10386, n=59, last 2 years) | |
| Asus ProArt Studiobook 16 OLED H7604 | |
| Average Intel Core i9-13980HX, NVIDIA GeForce RTX 4070 Laptop GPU (n=1) | |
| MSI Stealth 17 Studio A13VH-014 | |
| Samsung Galaxy Book3 Ultra 16 | |
| PCMark 10 / Essentials | |
| Asus Zephyrus Duo 16 GX650PY-NM006W | |
| Gigabyte AERO 16 OLED BSF | |
| Asus ProArt Studiobook 16 OLED H7604 | |
| Average Intel Core i9-13980HX, NVIDIA GeForce RTX 4070 Laptop GPU (n=1) | |
| Samsung Galaxy Book3 Ultra 16 | |
| Average of class Multimedia (8025 - 11664, n=58, last 2 years) | |
| MSI Stealth 17 Studio A13VH-014 | |
| PCMark 10 / Productivity | |
| Asus Zephyrus Duo 16 GX650PY-NM006W | |
| Average of class Multimedia (7323 - 18233, n=58, last 2 years) | |
| MSI Stealth 17 Studio A13VH-014 | |
| Asus ProArt Studiobook 16 OLED H7604 | |
| Average Intel Core i9-13980HX, NVIDIA GeForce RTX 4070 Laptop GPU (n=1) | |
| Gigabyte AERO 16 OLED BSF | |
| Samsung Galaxy Book3 Ultra 16 | |
| PCMark 10 / Digital Content Creation | |
| Asus Zephyrus Duo 16 GX650PY-NM006W | |
| Gigabyte AERO 16 OLED BSF | |
| MSI Stealth 17 Studio A13VH-014 | |
| Asus ProArt Studiobook 16 OLED H7604 | |
| Average Intel Core i9-13980HX, NVIDIA GeForce RTX 4070 Laptop GPU (n=1) | |
| Average of class Multimedia (3651 - 16240, n=58, last 2 years) | |
| Samsung Galaxy Book3 Ultra 16 | |
| CrossMark / Overall | |
| Asus ProArt Studiobook 16 OLED H7604 | |
| Average Intel Core i9-13980HX, NVIDIA GeForce RTX 4070 Laptop GPU (n=1) | |
| Asus Zephyrus Duo 16 GX650PY-NM006W | |
| Apple MacBook Pro 16 2023 M2 Max | |
| Gigabyte AERO 16 OLED BSF | |
| Average of class Multimedia (866 - 2728, n=69, last 2 years) | |
| MSI Stealth 17 Studio A13VH-014 | |
| Samsung Galaxy Book3 Ultra 16 | |
| CrossMark / Productivity | |
| Asus ProArt Studiobook 16 OLED H7604 | |
| Average Intel Core i9-13980HX, NVIDIA GeForce RTX 4070 Laptop GPU (n=1) | |
| Asus Zephyrus Duo 16 GX650PY-NM006W | |
| Gigabyte AERO 16 OLED BSF | |
| Average of class Multimedia (913 - 2489, n=69, last 2 years) | |
| MSI Stealth 17 Studio A13VH-014 | |
| Apple MacBook Pro 16 2023 M2 Max | |
| Samsung Galaxy Book3 Ultra 16 | |
| CrossMark / Creativity | |
| Apple MacBook Pro 16 2023 M2 Max | |
| Asus ProArt Studiobook 16 OLED H7604 | |
| Average Intel Core i9-13980HX, NVIDIA GeForce RTX 4070 Laptop GPU (n=1) | |
| Asus Zephyrus Duo 16 GX650PY-NM006W | |
| Average of class Multimedia (907 - 3465, n=69, last 2 years) | |
| Gigabyte AERO 16 OLED BSF | |
| MSI Stealth 17 Studio A13VH-014 | |
| Samsung Galaxy Book3 Ultra 16 | |
| CrossMark / Responsiveness | |
| Gigabyte AERO 16 OLED BSF | |
| Asus ProArt Studiobook 16 OLED H7604 | |
| Average Intel Core i9-13980HX, NVIDIA GeForce RTX 4070 Laptop GPU (n=1) | |
| Asus Zephyrus Duo 16 GX650PY-NM006W | |
| MSI Stealth 17 Studio A13VH-014 | |
| Average of class Multimedia (605 - 2024, n=69, last 2 years) | |
| Samsung Galaxy Book3 Ultra 16 | |
| Apple MacBook Pro 16 2023 M2 Max | |
| PCMark 10 Score | 7491 points | |
Help | ||
| AIDA64 / Memory Copy | |
| Average of class Multimedia (21158 - 132135, n=63, last 2 years) | |
| Asus ProArt Studiobook 16 OLED H7604 | |
| MSI Stealth 17 Studio A13VH-014 | |
| Samsung Galaxy Book3 Ultra 16 | |
| Average Intel Core i9-13980HX (62189 - 80776, n=9) | |
| Gigabyte AERO 16 OLED BSF | |
| AIDA64 / Memory Read | |
| Average of class Multimedia (19699 - 174586, n=63, last 2 years) | |
| Asus ProArt Studiobook 16 OLED H7604 | |
| Average Intel Core i9-13980HX (62624 - 89096, n=9) | |
| MSI Stealth 17 Studio A13VH-014 | |
| Samsung Galaxy Book3 Ultra 16 | |
| Gigabyte AERO 16 OLED BSF | |
| AIDA64 / Memory Write | |
| Samsung Galaxy Book3 Ultra 16 | |
| Average of class Multimedia (17733 - 134998, n=63, last 2 years) | |
| MSI Stealth 17 Studio A13VH-014 | |
| Asus ProArt Studiobook 16 OLED H7604 | |
| Average Intel Core i9-13980HX (59912 - 79917, n=9) | |
| Gigabyte AERO 16 OLED BSF | |
| AIDA64 / Memory Latency | |
| Average of class Multimedia (7 - 535, n=62, last 2 years) | |
| Samsung Galaxy Book3 Ultra 16 | |
| Gigabyte AERO 16 OLED BSF | |
| MSI Stealth 17 Studio A13VH-014 | |
| Average Intel Core i9-13980HX (79.4 - 93.2, n=9) | |
| Asus ProArt Studiobook 16 OLED H7604 | |
* ... smaller is better
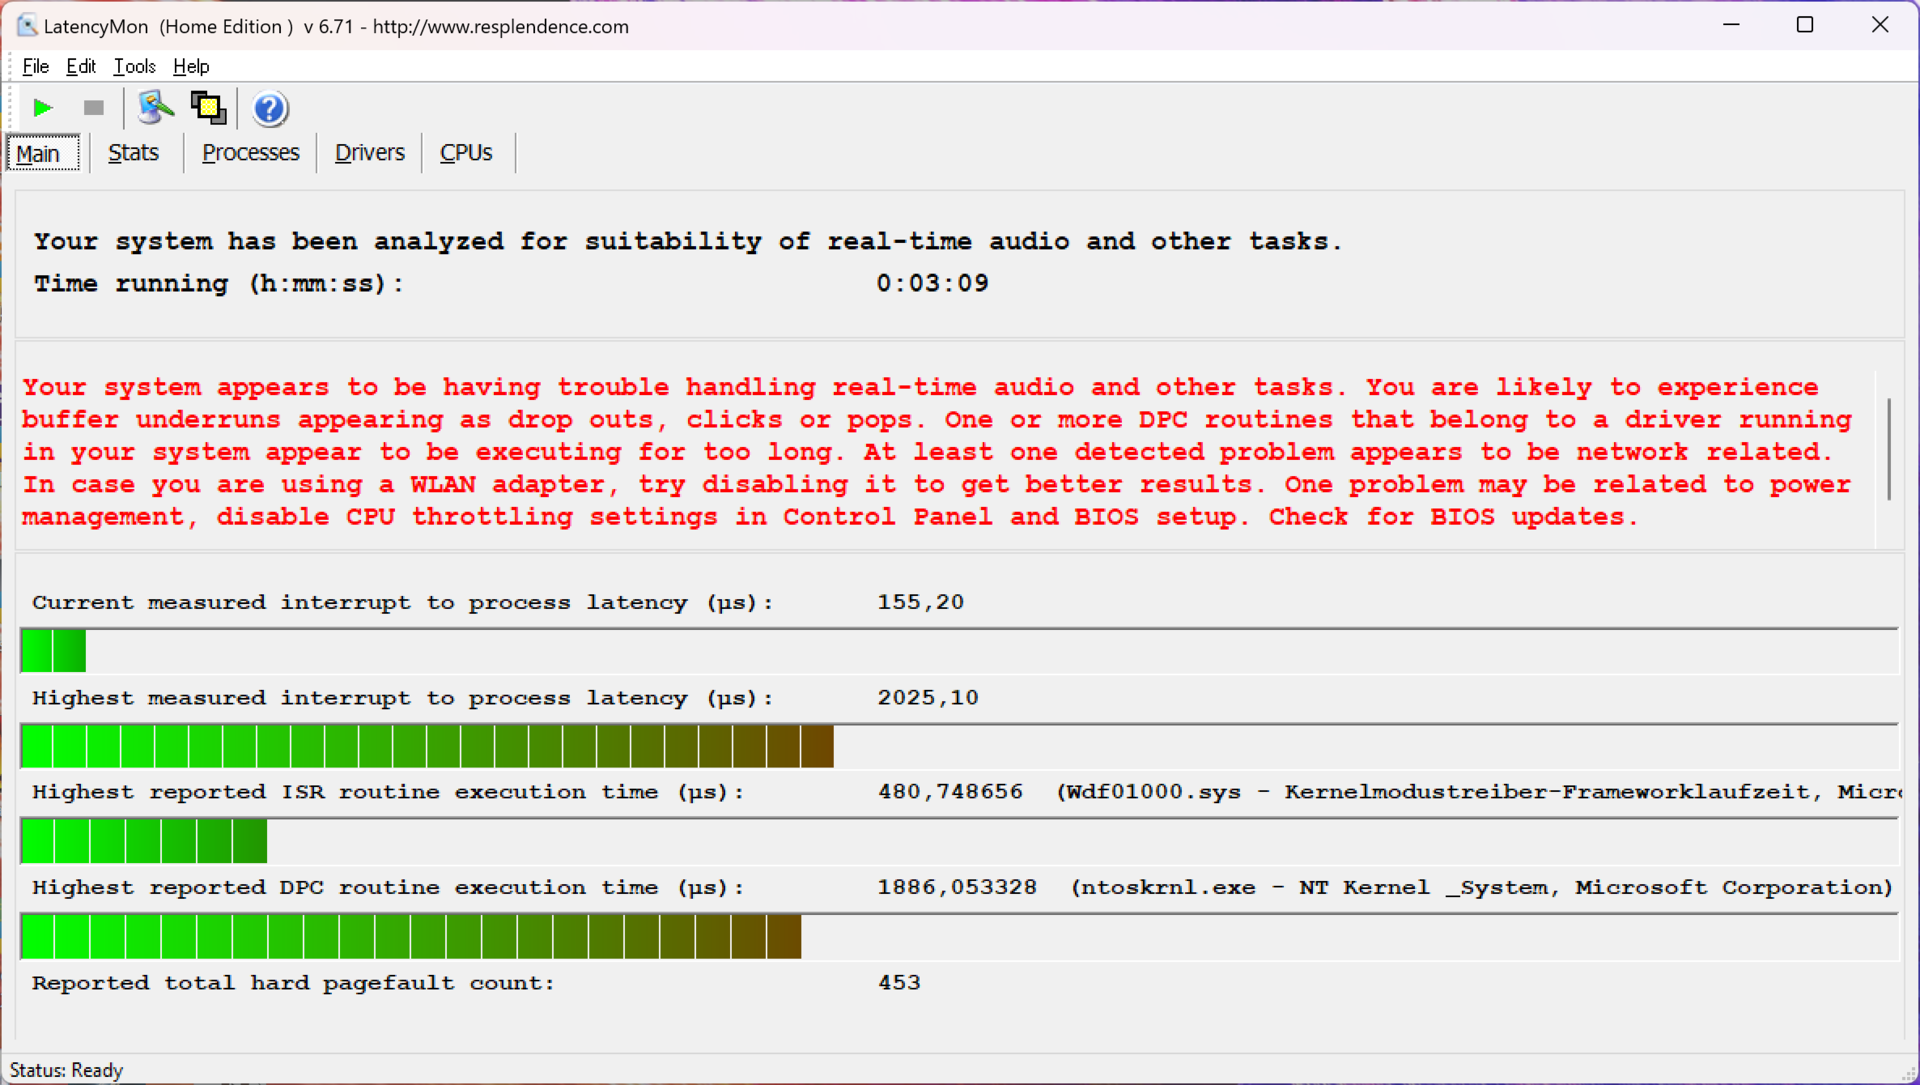
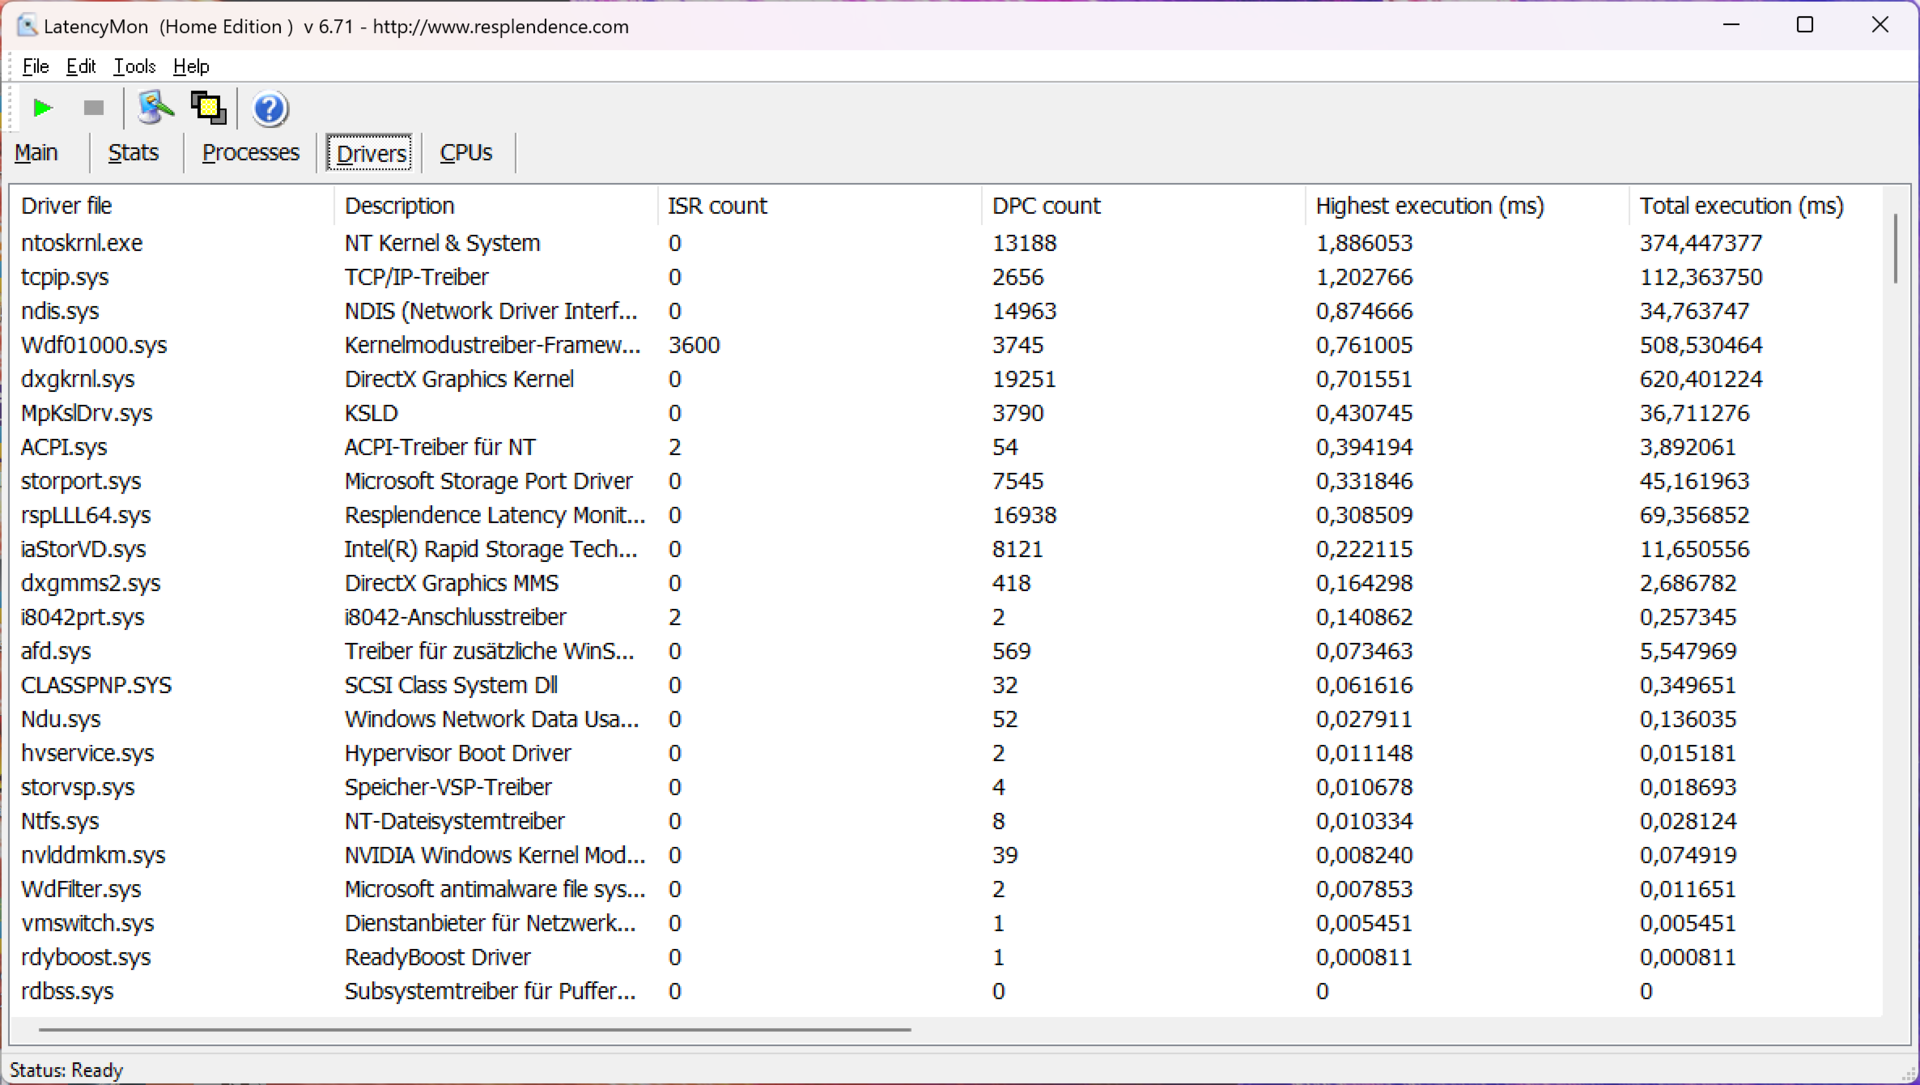
DPC Latency
The Studiobook is not particularly suitable for real-time audio applications. High latencies occurred under the present BIOS version in our standardized latency test.
| DPC Latencies / LatencyMon - interrupt to process latency (max), Web, Youtube, Prime95 | |
| Asus Zephyrus Duo 16 GX650PY-NM006W | |
| Samsung Galaxy Book3 Ultra 16 | |
| MSI Stealth 17 Studio A13VH-014 | |
| Asus ProArt Studiobook 16 OLED H7604 | |
| Gigabyte AERO 16 OLED BSF | |
* ... smaller is better
Storage Devices
A fast PCIe 4.0 SSD from Phison is used in our test device, which offers an enormous storage capacity of 4 TB. Of this, 3.63 TB is still available after the first startup. The drive is very fast with transfer rates of more than 7 GB/s and, above all, performance can be maintained constantly, even under permanent load. This is by no means standard. Additionally, the Studiobook 16 offers another M.2 2280 slot, which is also connected via the fast PCIe 4.0 interface. More SSD benchmarks are listed here.
