Asus ROG Zephyrus G16 laptop review - A slim gamer with an RTX 4090 and unfulfilled potential
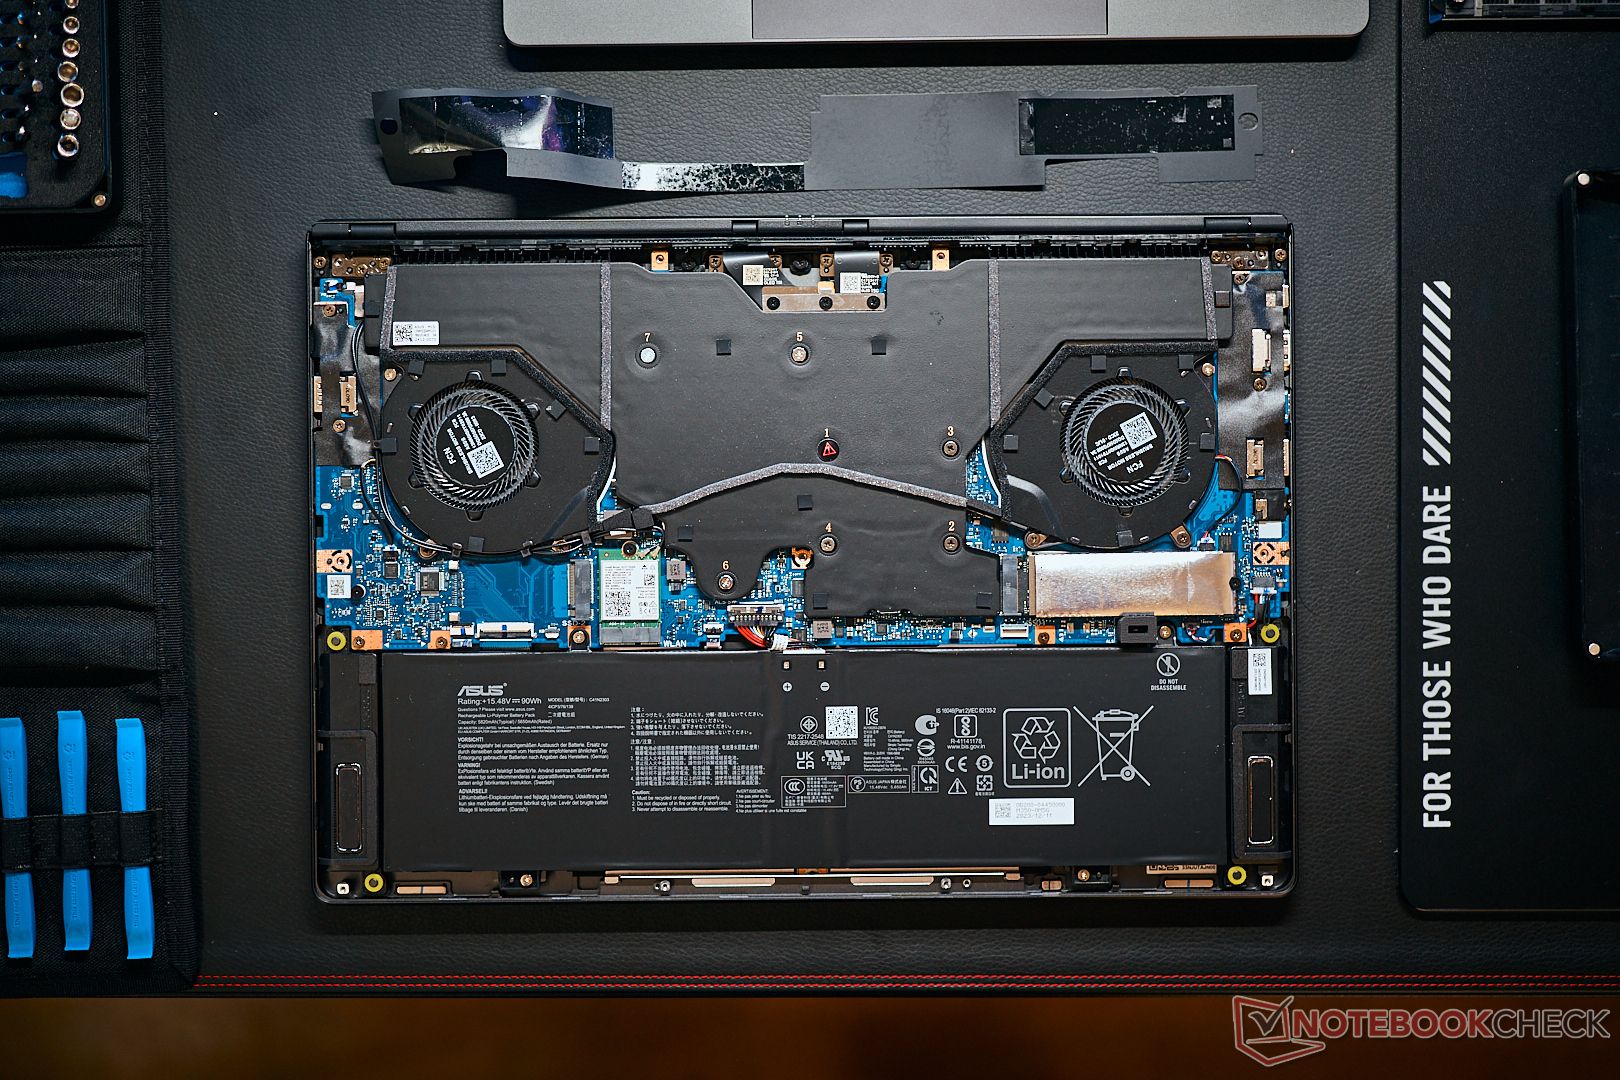
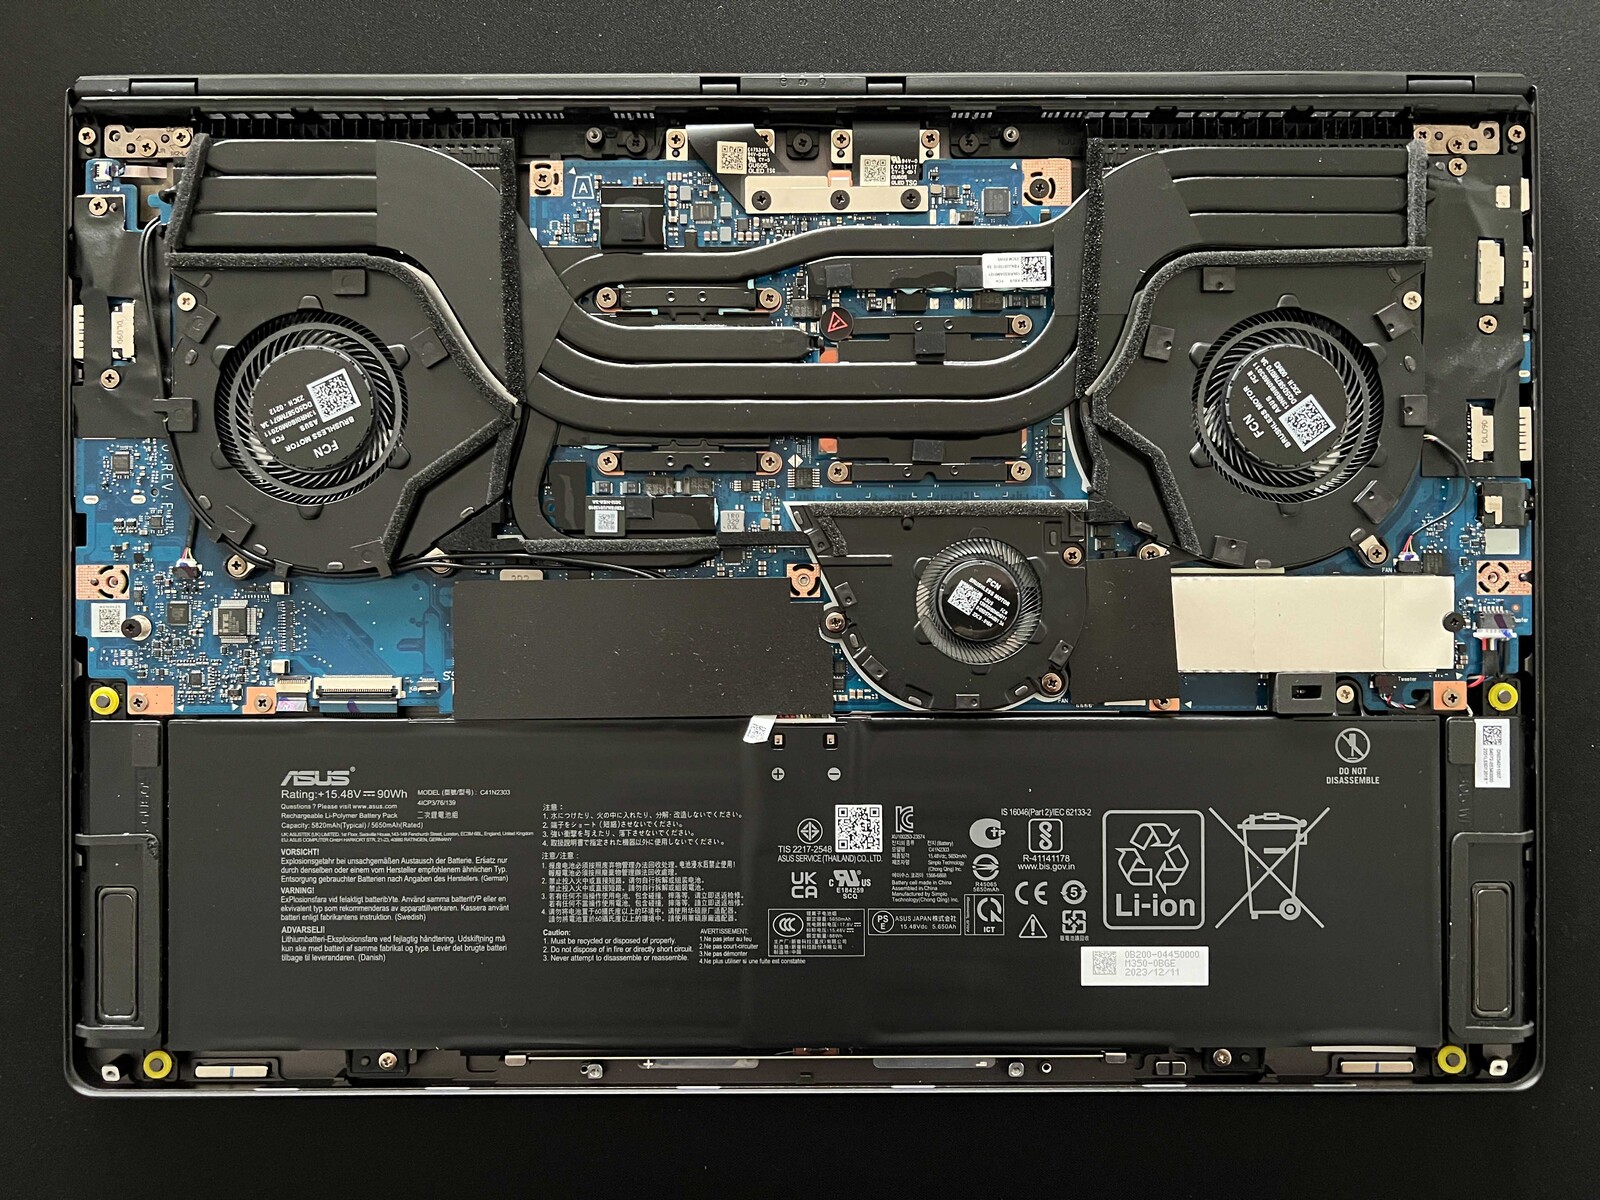
The ROG Zephyrus G16 is currently the shooting star when it comes to thin Asus gaming laptops. A few months ago, we reviewed the variant with the Core Ultra 7 155H and the Nvidia GeForce RTX 4070. Now we are looking at the high-end model with the Core Ultra 9 185H and the GeForce RTX 4090 laptop. In addition to the more powerful components, we are dealing with different cooling. Although the configurations up to the RTX 4070 laptop use a conventional cooling unit consisting of three fans and heat pipes, the high-end models (RTX 4080/4090 laptop) use vapor chamber cooling. Of course, we want to know how the new cooling affects both the performance and emissions.
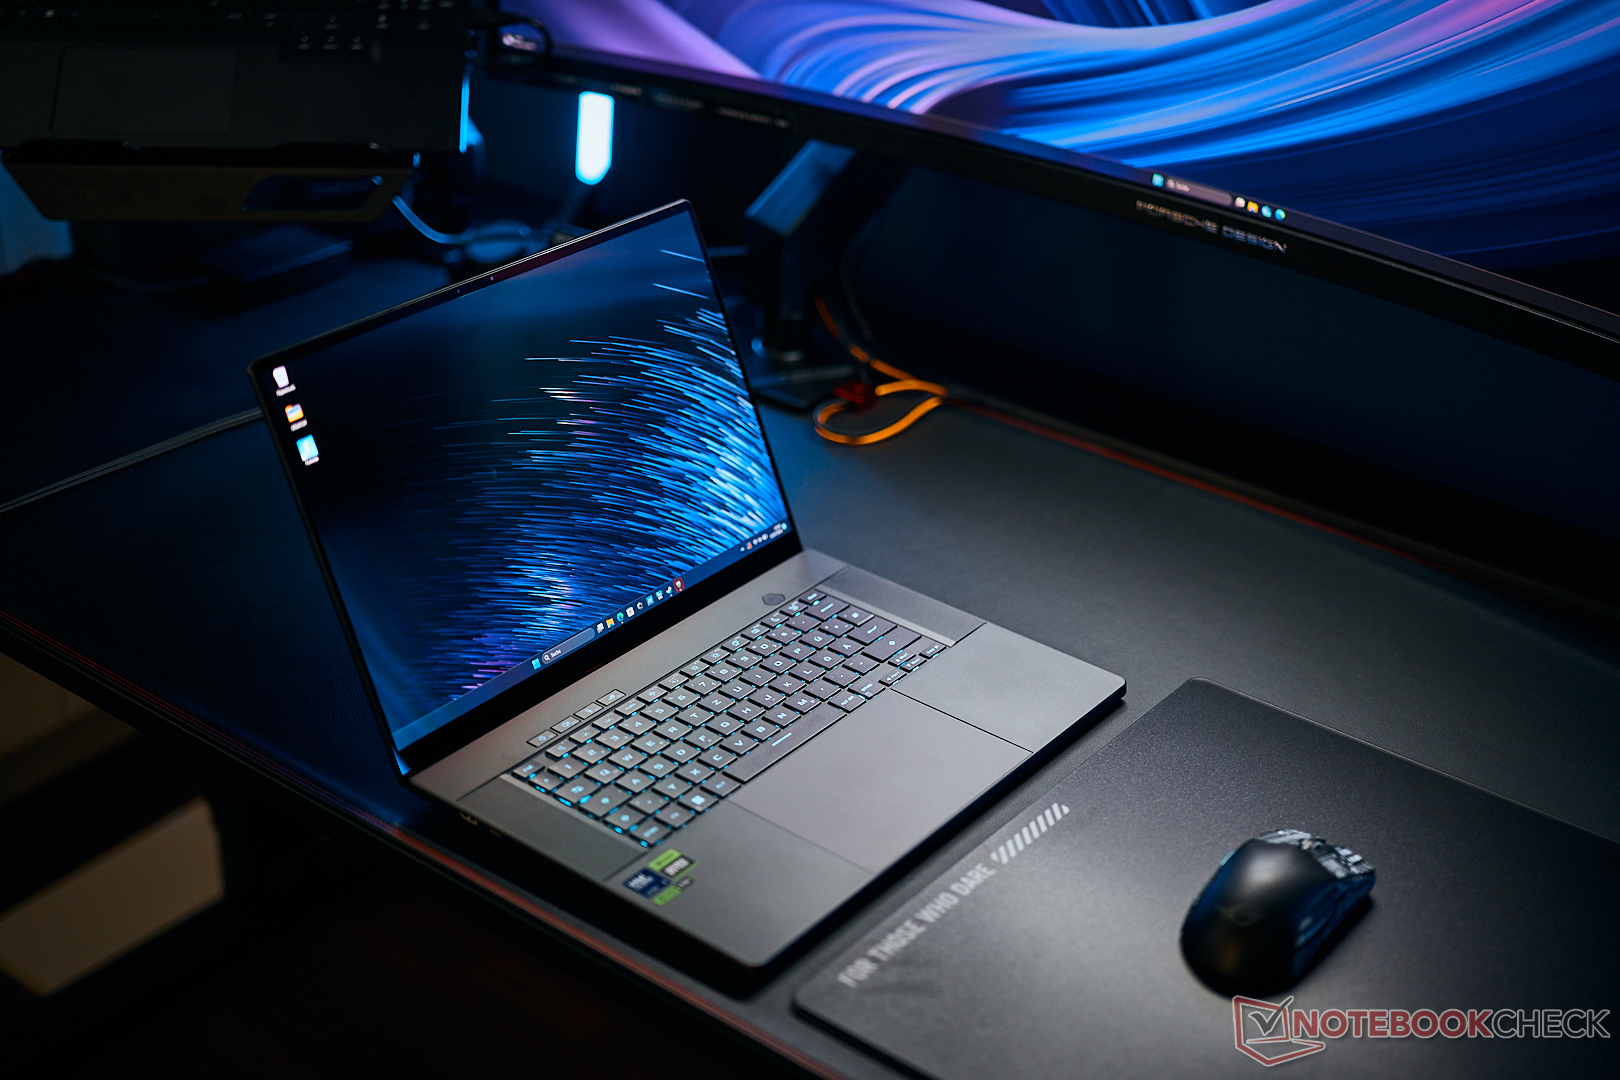
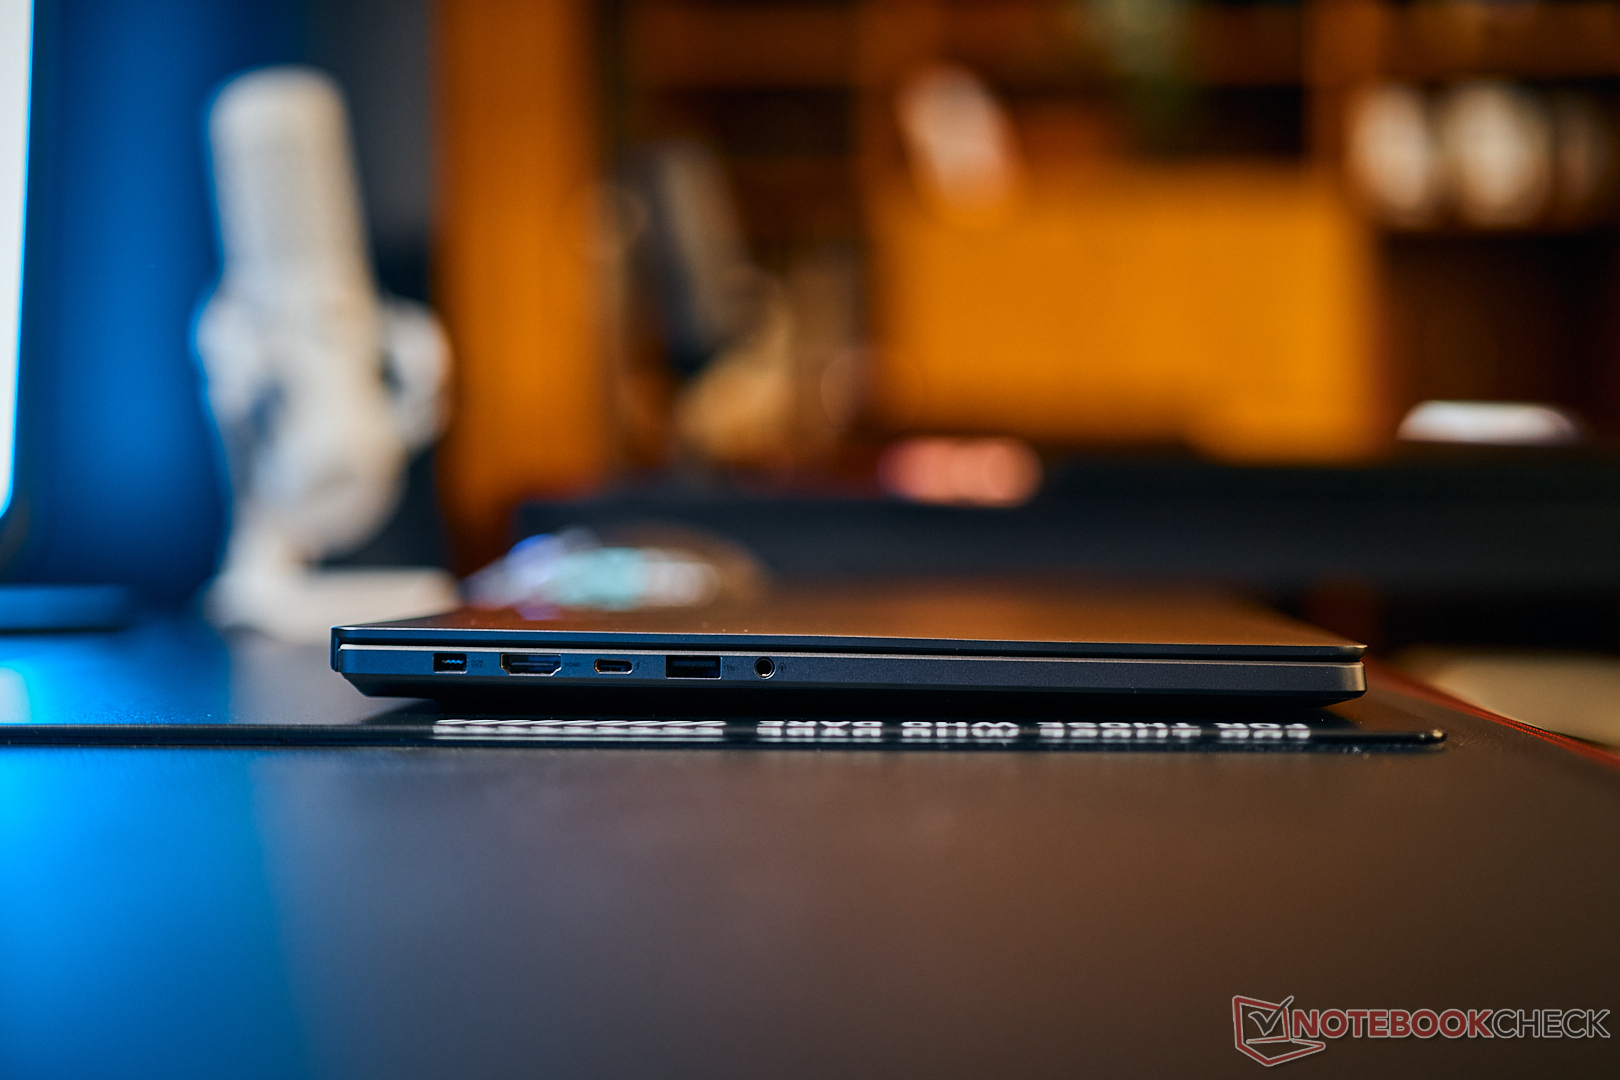
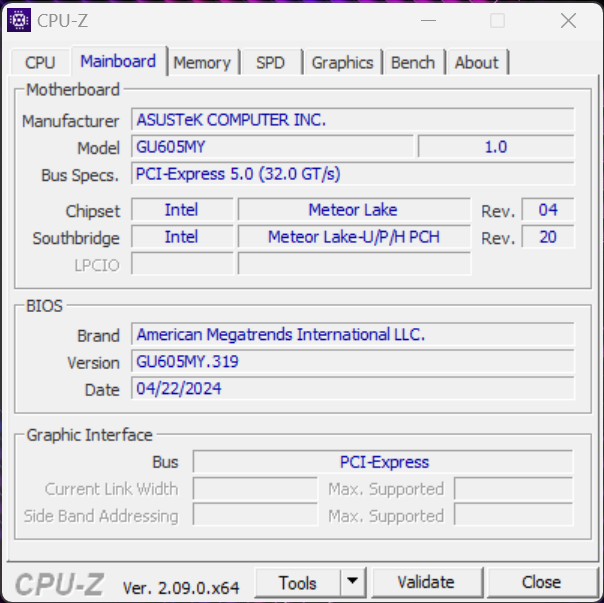
Our review device possesses the number GU605MY, costs $3,649 and, in addition to the Core Ultra 9 185H and the GeForce RTX 4090 laptop, it also comes with 32 GB of RAM and the already familiar 240 Hz OLED screen. In this review, we will pay particular attention to the differences between the RTX 4070 laptop configuration and the performance as well as the high-end variant’s emissions. All the additional information regarding the case, input devices, display and speakers can be found in our review of the ROG Zephyrus G16 with the RTX 4070 laptop.
Asus will soon be launching an update with AMD’s new Strix Point processors (Zen5), however, these models will only be equipped with the GeForce RTX 4070 laptop.
Possible competitors compared
Rating | Version | Date | Model | Weight | Height | Size | Resolution | Price |
|---|---|---|---|---|---|---|---|---|
| 86.1 % | v8 | 07 / 2024 | Asus ROG Zephyrus G16 GU605MY Ultra 9 185H, GeForce RTX 4090 Laptop GPU | 1.9 kg | 16.4 mm | 16.00" | 2560x1600 | |
| 85.5 % | v8 | 06 / 2024 | Schenker XMG Neo 16 (Early 24) i9-14900HX, GeForce RTX 4090 Laptop GPU | 2.5 kg | 26.6 mm | 16.00" | 2560x1600 | |
| 83.9 % | v8 | 06 / 2024 | Lenovo Legion 9 16IRX9, RTX 4090 i9-14900HX, GeForce RTX 4090 Laptop GPU | 2.5 kg | 22.7 mm | 16.00" | 3200x2000 | |
| 88.4 % v7 (old) | v7 (old) | 05 / 2024 | Alienware x16 R2 P120F Ultra 9 185H, GeForce RTX 4080 Laptop GPU | 2.7 kg | 18.57 mm | 16.00" | 2560x1600 | |
| 91.1 % v7 (old) | v7 (old) | 02 / 2024 | Razer Blade 16 2024, RTX 4090 i9-14900HX, GeForce RTX 4090 Laptop GPU | 2.5 kg | 22 mm | 16.00" | 2560x1600 |
Note: We have recently updated our rating system and the results of version 8 are not comparable with the results of version 7. More information is available here .
Differences to the G16 with the RTX 4070 laptop
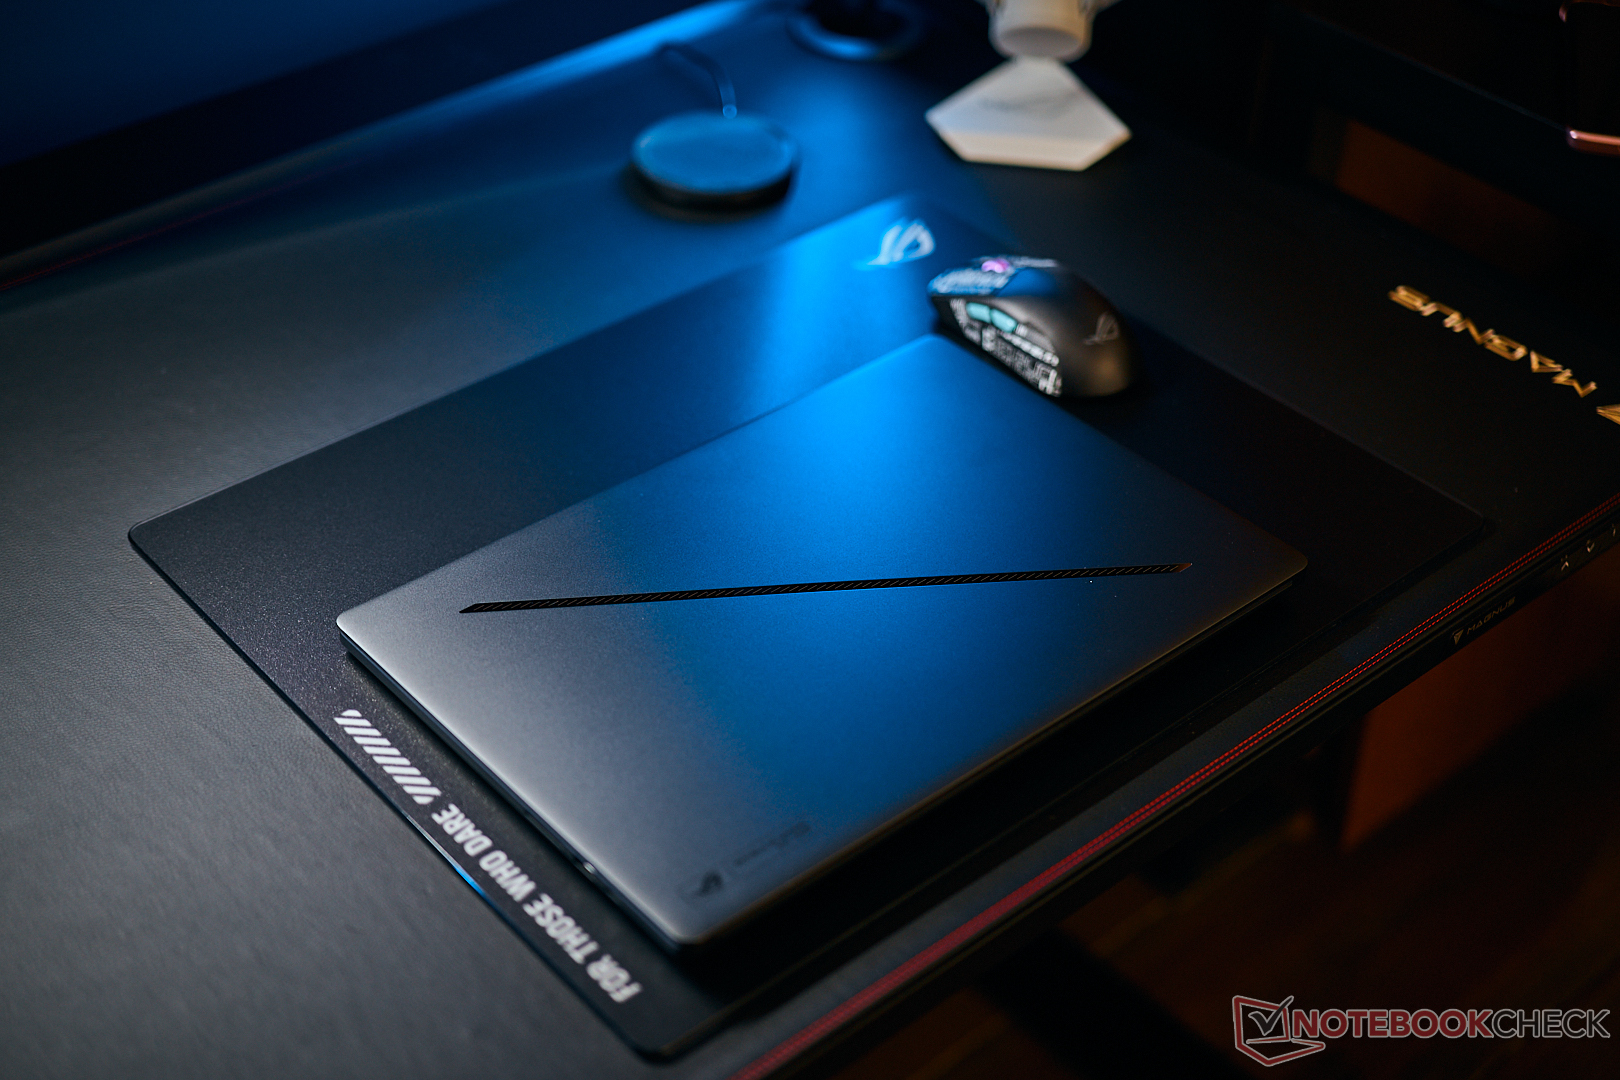


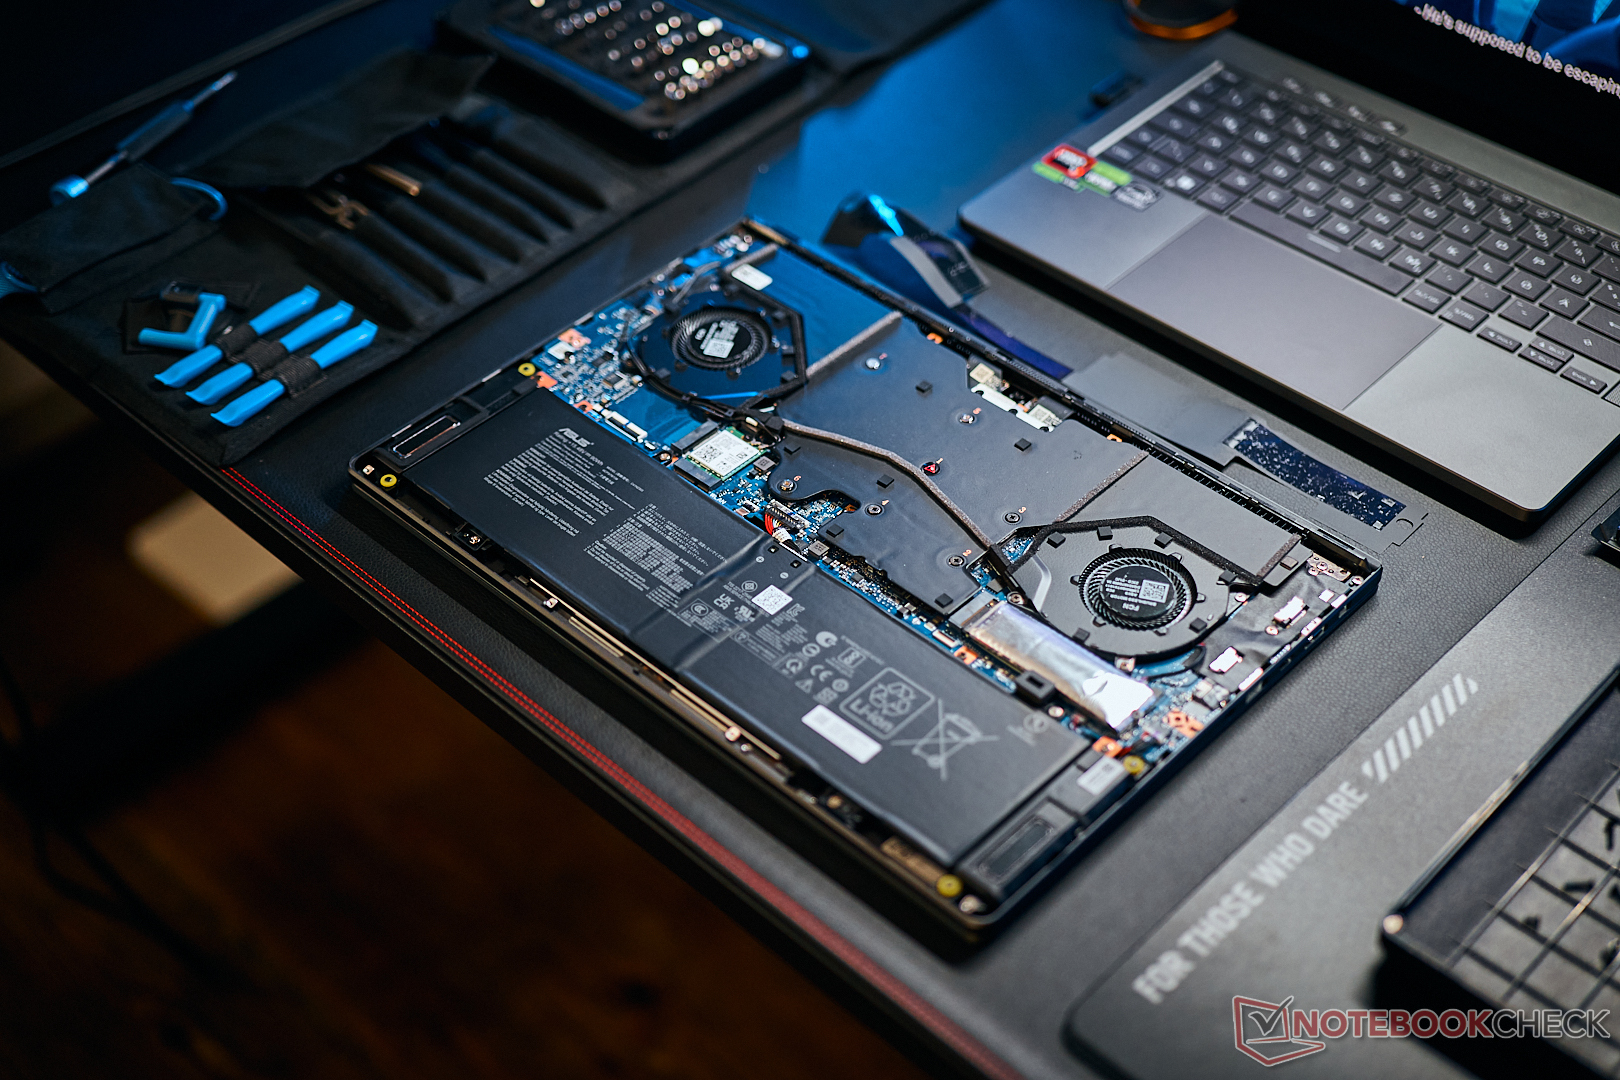

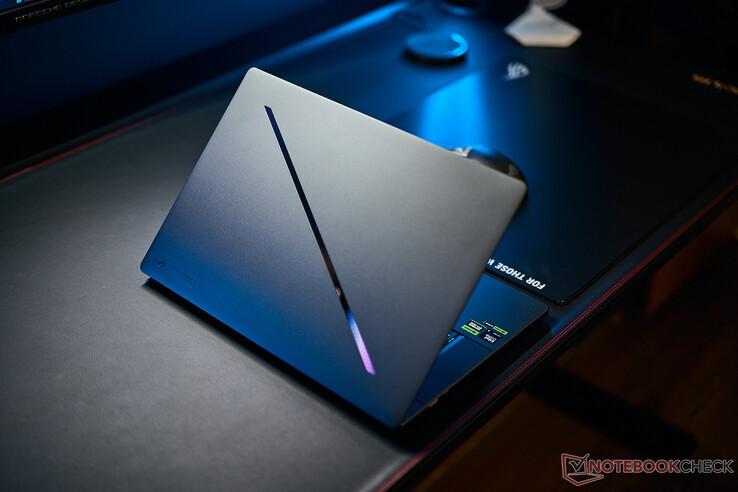
The high-end model of the ROG Zephyrus G16 is visually indistinguishable from the weaker model equipped with the RTX 4070/4060 laptop. However, internally the cooling system differences become apparent. While the weaker models use a total of three fans and regular heat pipes, Asus has gone for vapor chamber cooling with two fans for its more expensive models.
The cooling increases the weight from 1.817 kg to 1.908 kg which is still light compared to the other RTX 4090 laptops in the 16-inch segment since the comparison devices are at least half a kilo heavier. On top of that, the Zephyrus is also simultaneously one of the thinnest and most compact models. Configurations up to the RTX 4070 laptop come with a 200-watt PSU (583 grams) and from the RTX 4080 laptop onwards it's a more powerful 240-watt one (745 grams).
Performance - Meteor Lake and RTX 4090 laptop
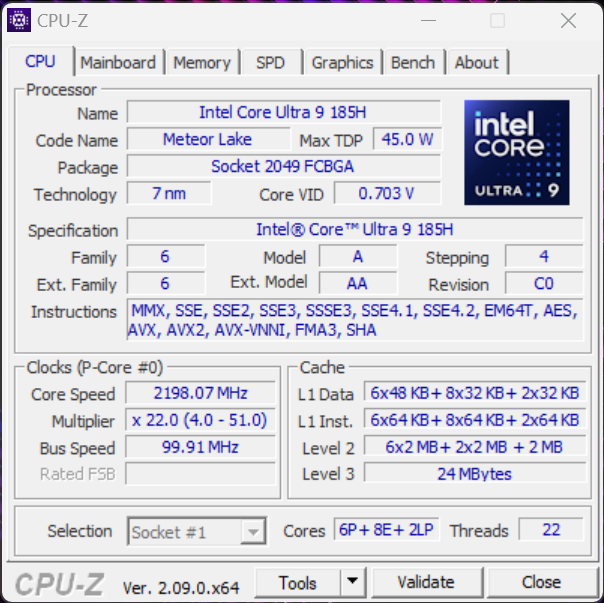
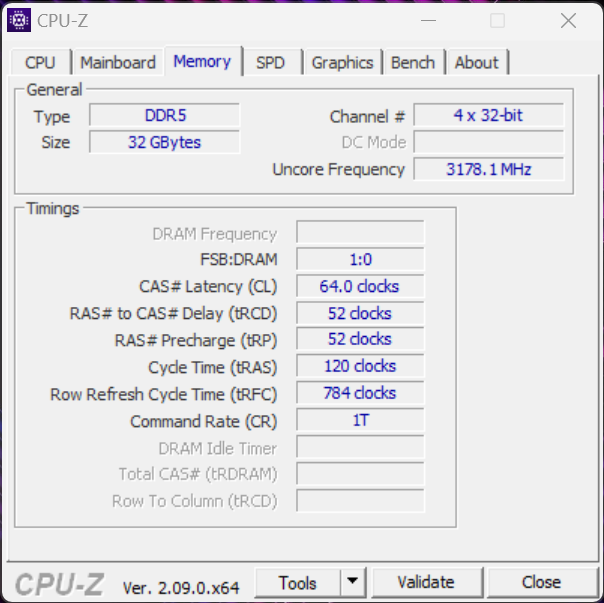
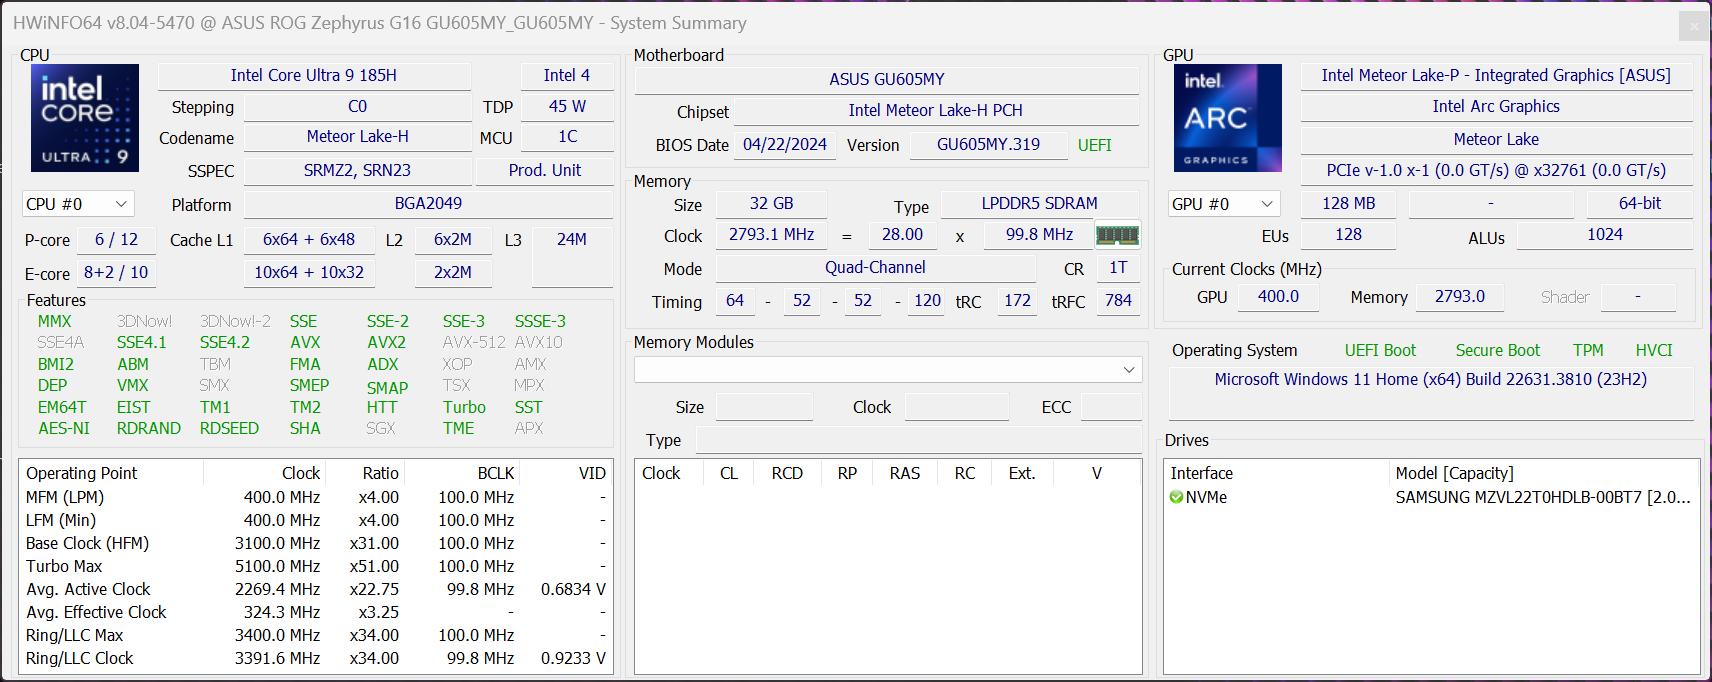
The high-end variant of the Zephyrus is currently equipped with the fastest Meteor Lake processor, the Core Ultra 9 185H. When it comes to the CPU performance, it lags behind Intel's HX CPUs. In the 115-watt version found here, the Nvidia GeForce RTX 4090 laptop is quite a bit away from reaching maximum performance. The installed RAM sits at 32 GB (LPDDR5x 7467) but, due to the price and lack of upgradeability, we would have preferred 64 GB.
Test conditions
The basic energy profiles remain identical and the more powerful model with the RTX 4090 laptop also offers the profiles Quiet, Performance and Turbo. In the following table, we have listed their corresponding TDP/TGP values as well as the effect on the performance. Below this, we have also added the values from the RTX 4070 model of the Zephyrus G16 so you can see a direct comparison. In principle, the models with the more powerful vapor chamber cooling are allowed to consume a little more power but the difference is fairly small, especially when it comes to the processor. In both the Quiet and Performance profiles, the vapor chamber cooling even manages to get somewhat louder than the weaker RTX 4070 variant. As standard, we carried out the benchmarks and measurements using the turbo mode which is, however, only available when connected to the mains.
| Energy profile | CPU load | CB R23 Multi | GPU load | Time Spy Graphics | Cyberpunk 2077 QHD Ultra | max. fan volume |
|---|---|---|---|---|---|---|
| Quiet | 60 watts | 15,750 points | 55 watts | 9,731 points | 40.2fps | 41.4 dB(A) |
| Performance | 100->70 Watt | 17,452 points | 90 watts | 15,205 points | 60.2fps | 48.1 dB(A) |
| Turbo | 110->80 watts | 19,109 points | 115 watts | 19,109 points | 68.1fps | 52.3 dB(A) |
| Energy profile | CPU load | CB R23 Multi | GPU load | Time Spy Graphics | Cyberpunk 2077 QHD Ultra | max. fan volume |
|---|---|---|---|---|---|---|
| Quiet | 60->45 watts | 15,869 points | 65 watta | 9,042 points | 32.6fps | 41.5 dB(A) |
| Performance | 70->50 watts | 17,133 points | 80 watts | 10,989 points | 43.7fps | 46.4 dB(A) |
| Turbo | 95->70 watts | 18,372 points | 105 watts | 12,312 points | 48.7fps | 52.4 dB(A) |
Processor - Intel Core Ultra 9 185H
The Core Ultra 9 185H is the fastest mobile processor from Intel's Meteor Lake generation, nevertheless, it finds itself ranked clearly behind the HX processors (Raptor Lake refresh). As we just observed in the comparison table, there are also no tangible differences between the Core Ultra 9 and the Core Ultra 7 in both models of the Zephyrus G16 2024 as well as the Alienware x16 R2. The latter also has the Core Ultra 9 185H.
However, the other RTX 4090 competitors with the Core i9 14900HX offer significantly higher CPU performance, especially in the multi-core tests. The ROG Zephyrus G16's multi-core performance doesn't always remain entirely stable, although a deficit of around 10 % under sustained load can be considered quite small. In battery mode, the processor is allowed to draw a maximum of 75 watts but this has hardly any effect on the multi-core performance (~8 %). Additional CPU benchmarks can be found here.
Cinebench R15 Multi Continuous Test
Cinebench R23: Multi Core | Single Core
Cinebench R20: CPU (Multi Core) | CPU (Single Core)
Cinebench R15: CPU Multi 64Bit | CPU Single 64Bit
Blender: v2.79 BMW27 CPU
7-Zip 18.03: 7z b 4 | 7z b 4 -mmt1
Geekbench 6.7: Multi-Core | Single-Core
Geekbench 5.5: Multi-Core | Single-Core
HWBOT x265 Benchmark v2.2: 4k Preset
LibreOffice : 20 Documents To PDF
R Benchmark 2.5: Overall mean
| CPU Performance rating | |
| Schenker XMG Neo 16 (Early 24) | |
| Razer Blade 16 2024, RTX 4090 | |
| Lenovo Legion 9 16IRX9, RTX 4090 | |
| Average of class Gaming | |
| Asus ROG Zephyrus G16 GU605MY | |
| Average Intel Core Ultra 9 185H | |
| Asus ROG Zephyrus G16 2024 GU605M | |
| Alienware x16 R2 P120F | |
| Cinebench R23 / Multi Core | |
| Schenker XMG Neo 16 (Early 24) | |
| Lenovo Legion 9 16IRX9, RTX 4090 | |
| Razer Blade 16 2024, RTX 4090 | |
| Average of class Gaming (10488 - 40970, n=106, last 2 years) | |
| Asus ROG Zephyrus G16 GU605MY | |
| Alienware x16 R2 P120F | |
| Average Intel Core Ultra 9 185H (11072 - 19851, n=21) | |
| Asus ROG Zephyrus G16 2024 GU605M | |
| Cinebench R23 / Single Core | |
| Schenker XMG Neo 16 (Early 24) | |
| Razer Blade 16 2024, RTX 4090 | |
| Average of class Gaming (1166 - 2387, n=106, last 2 years) | |
| Asus ROG Zephyrus G16 GU605MY | |
| Average Intel Core Ultra 9 185H (1166 - 1912, n=21) | |
| Lenovo Legion 9 16IRX9, RTX 4090 | |
| Asus ROG Zephyrus G16 2024 GU605M | |
| Alienware x16 R2 P120F | |
| Cinebench R20 / CPU (Multi Core) | |
| Schenker XMG Neo 16 (Early 24) | |
| Lenovo Legion 9 16IRX9, RTX 4090 | |
| Razer Blade 16 2024, RTX 4090 | |
| Average of class Gaming (4029 - 16108, n=105, last 2 years) | |
| Asus ROG Zephyrus G16 GU605MY | |
| Alienware x16 R2 P120F | |
| Asus ROG Zephyrus G16 2024 GU605M | |
| Average Intel Core Ultra 9 185H (4198 - 7651, n=21) | |
| Cinebench R20 / CPU (Single Core) | |
| Schenker XMG Neo 16 (Early 24) | |
| Razer Blade 16 2024, RTX 4090 | |
| Average of class Gaming (442 - 904, n=105, last 2 years) | |
| Asus ROG Zephyrus G16 GU605MY | |
| Asus ROG Zephyrus G16 2024 GU605M | |
| Average Intel Core Ultra 9 185H (442 - 735, n=21) | |
| Lenovo Legion 9 16IRX9, RTX 4090 | |
| Alienware x16 R2 P120F | |
| Cinebench R15 / CPU Multi 64Bit | |
| Schenker XMG Neo 16 (Early 24) | |
| Lenovo Legion 9 16IRX9, RTX 4090 | |
| Razer Blade 16 2024, RTX 4090 | |
| Average of class Gaming (1578 - 6271, n=104, last 2 years) | |
| Asus ROG Zephyrus G16 GU605MY | |
| Alienware x16 R2 P120F | |
| Asus ROG Zephyrus G16 2024 GU605M | |
| Average Intel Core Ultra 9 185H (1582 - 3165, n=23) | |
| Cinebench R15 / CPU Single 64Bit | |
| Razer Blade 16 2024, RTX 4090 | |
| Schenker XMG Neo 16 (Early 24) | |
| Average of class Gaming (188.8 - 344, n=105, last 2 years) | |
| Asus ROG Zephyrus G16 GU605MY | |
| Asus ROG Zephyrus G16 2024 GU605M | |
| Average Intel Core Ultra 9 185H (191.9 - 281, n=21) | |
| Lenovo Legion 9 16IRX9, RTX 4090 | |
| Alienware x16 R2 P120F | |
| Blender / v2.79 BMW27 CPU | |
| Average Intel Core Ultra 9 185H (163 - 285, n=21) | |
| Asus ROG Zephyrus G16 2024 GU605M | |
| Alienware x16 R2 P120F | |
| Asus ROG Zephyrus G16 GU605MY | |
| Average of class Gaming (80 - 330, n=103, last 2 years) | |
| Razer Blade 16 2024, RTX 4090 | |
| Lenovo Legion 9 16IRX9, RTX 4090 | |
| Schenker XMG Neo 16 (Early 24) | |
| 7-Zip 18.03 / 7z b 4 | |
| Schenker XMG Neo 16 (Early 24) | |
| Lenovo Legion 9 16IRX9, RTX 4090 | |
| Razer Blade 16 2024, RTX 4090 | |
| Average of class Gaming (33491 - 148086, n=104, last 2 years) | |
| Asus ROG Zephyrus G16 GU605MY | |
| Asus ROG Zephyrus G16 2024 GU605M | |
| Average Intel Core Ultra 9 185H (51289 - 76331, n=21) | |
| Alienware x16 R2 P120F | |
| 7-Zip 18.03 / 7z b 4 -mmt1 | |
| Schenker XMG Neo 16 (Early 24) | |
| Razer Blade 16 2024, RTX 4090 | |
| Average of class Gaming (4199 - 7436, n=104, last 2 years) | |
| Asus ROG Zephyrus G16 GU605MY | |
| Lenovo Legion 9 16IRX9, RTX 4090 | |
| Asus ROG Zephyrus G16 2024 GU605M | |
| Average Intel Core Ultra 9 185H (4199 - 5781, n=21) | |
| Alienware x16 R2 P120F | |
| Geekbench 6.7 / Multi-Core | |
| Schenker XMG Neo 16 (Early 24) | |
| Razer Blade 16 2024, RTX 4090 | |
| Lenovo Legion 9 16IRX9, RTX 4090 | |
| Average of class Gaming (6625 - 22104, n=105, last 2 years) | |
| Asus ROG Zephyrus G16 GU605MY | |
| Average Intel Core Ultra 9 185H (9140 - 14540, n=21) | |
| Asus ROG Zephyrus G16 2024 GU605M | |
| Alienware x16 R2 P120F | |
| Geekbench 6.7 / Single-Core | |
| Schenker XMG Neo 16 (Early 24) | |
| Razer Blade 16 2024, RTX 4090 | |
| Average of class Gaming (1490 - 3259, n=105, last 2 years) | |
| Asus ROG Zephyrus G16 GU605MY | |
| Lenovo Legion 9 16IRX9, RTX 4090 | |
| Average Intel Core Ultra 9 185H (1490 - 2573, n=21) | |
| Asus ROG Zephyrus G16 2024 GU605M | |
| Alienware x16 R2 P120F | |
| Geekbench 5.5 / Multi-Core | |
| Schenker XMG Neo 16 (Early 24) | |
| Lenovo Legion 9 16IRX9, RTX 4090 | |
| Razer Blade 16 2024, RTX 4090 | |
| Average of class Gaming (6460 - 27010, n=104, last 2 years) | |
| Asus ROG Zephyrus G16 GU605MY | |
| Average Intel Core Ultra 9 185H (9330 - 14230, n=21) | |
| Asus ROG Zephyrus G16 2024 GU605M | |
| Alienware x16 R2 P120F | |
| Geekbench 5.5 / Single-Core | |
| Schenker XMG Neo 16 (Early 24) | |
| Razer Blade 16 2024, RTX 4090 | |
| Average of class Gaming (986 - 2474, n=104, last 2 years) | |
| Asus ROG Zephyrus G16 GU605MY | |
| Average Intel Core Ultra 9 185H (986 - 1902, n=21) | |
| Asus ROG Zephyrus G16 2024 GU605M | |
| Lenovo Legion 9 16IRX9, RTX 4090 | |
| Alienware x16 R2 P120F | |
| HWBOT x265 Benchmark v2.2 / 4k Preset | |
| Schenker XMG Neo 16 (Early 24) | |
| Lenovo Legion 9 16IRX9, RTX 4090 | |
| Razer Blade 16 2024, RTX 4090 | |
| Average of class Gaming (11.5 - 44.3, n=104, last 2 years) | |
| Asus ROG Zephyrus G16 GU605MY | |
| Alienware x16 R2 P120F | |
| Asus ROG Zephyrus G16 2024 GU605M | |
| Average Intel Core Ultra 9 185H (13.7 - 22.7, n=21) | |
| LibreOffice / 20 Documents To PDF | |
| Lenovo Legion 9 16IRX9, RTX 4090 | |
| Asus ROG Zephyrus G16 2024 GU605M | |
| Average of class Gaming (33.2 - 88.8, n=104, last 2 years) | |
| Razer Blade 16 2024, RTX 4090 | |
| Average Intel Core Ultra 9 185H (34.5 - 73.5, n=21) | |
| Alienware x16 R2 P120F | |
| Asus ROG Zephyrus G16 GU605MY | |
| Schenker XMG Neo 16 (Early 24) | |
| R Benchmark 2.5 / Overall mean | |
| Alienware x16 R2 P120F | |
| Lenovo Legion 9 16IRX9, RTX 4090 | |
| Average Intel Core Ultra 9 185H (0.4313 - 0.759, n=22) | |
| Asus ROG Zephyrus G16 2024 GU605M | |
| Asus ROG Zephyrus G16 GU605MY | |
| Average of class Gaming (0.3439 - 0.759, n=105, last 2 years) | |
| Razer Blade 16 2024, RTX 4090 | |
| Schenker XMG Neo 16 (Early 24) | |
* ... smaller is better
AIDA64: FP32 Ray-Trace | FPU Julia | CPU SHA3 | CPU Queen | FPU SinJulia | FPU Mandel | CPU AES | CPU ZLib | FP64 Ray-Trace | CPU PhotoWorxx
| Performance rating | |
| Schenker XMG Neo 16 (Early 24) | |
| Lenovo Legion 9 16IRX9, RTX 4090 | |
| Average of class Gaming | |
| Razer Blade 16 2024, RTX 4090 | |
| Alienware x16 R2 P120F | |
| Asus ROG Zephyrus G16 GU605MY | |
| Asus ROG Zephyrus G16 2024 GU605M | |
| Average Intel Core Ultra 9 185H | |
| AIDA64 / FP32 Ray-Trace | |
| Average of class Gaming (10227 - 85542, n=103, last 2 years) | |
| Schenker XMG Neo 16 (Early 24) | |
| Lenovo Legion 9 16IRX9, RTX 4090 | |
| Razer Blade 16 2024, RTX 4090 | |
| Alienware x16 R2 P120F | |
| Asus ROG Zephyrus G16 GU605MY | |
| Asus ROG Zephyrus G16 2024 GU605M | |
| Average Intel Core Ultra 9 185H (9220 - 18676, n=22) | |
| AIDA64 / FPU Julia | |
| Schenker XMG Neo 16 (Early 24) | |
| Average of class Gaming (51376 - 238426, n=103, last 2 years) | |
| Lenovo Legion 9 16IRX9, RTX 4090 | |
| Razer Blade 16 2024, RTX 4090 | |
| Alienware x16 R2 P120F | |
| Asus ROG Zephyrus G16 GU605MY | |
| Asus ROG Zephyrus G16 2024 GU605M | |
| Average Intel Core Ultra 9 185H (48865 - 96463, n=22) | |
| AIDA64 / CPU SHA3 | |
| Schenker XMG Neo 16 (Early 24) | |
| Lenovo Legion 9 16IRX9, RTX 4090 | |
| Average of class Gaming (2180 - 9817, n=103, last 2 years) | |
| Razer Blade 16 2024, RTX 4090 | |
| Alienware x16 R2 P120F | |
| Asus ROG Zephyrus G16 GU605MY | |
| Average Intel Core Ultra 9 185H (2394 - 4534, n=22) | |
| Asus ROG Zephyrus G16 2024 GU605M | |
| AIDA64 / CPU Queen | |
| Schenker XMG Neo 16 (Early 24) | |
| Razer Blade 16 2024, RTX 4090 | |
| Lenovo Legion 9 16IRX9, RTX 4090 | |
| Average of class Gaming (49785 - 173351, n=89, last 2 years) | |
| Alienware x16 R2 P120F | |
| Asus ROG Zephyrus G16 GU605MY | |
| Asus ROG Zephyrus G16 2024 GU605M | |
| Average Intel Core Ultra 9 185H (66785 - 95241, n=21) | |
| AIDA64 / FPU SinJulia | |
| Schenker XMG Neo 16 (Early 24) | |
| Lenovo Legion 9 16IRX9, RTX 4090 | |
| Razer Blade 16 2024, RTX 4090 | |
| Average of class Gaming (4424 - 33636, n=103, last 2 years) | |
| Alienware x16 R2 P120F | |
| Asus ROG Zephyrus G16 GU605MY | |
| Asus ROG Zephyrus G16 2024 GU605M | |
| Average Intel Core Ultra 9 185H (7255 - 11392, n=22) | |
| AIDA64 / FPU Mandel | |
| Schenker XMG Neo 16 (Early 24) | |
| Average of class Gaming (25115 - 128721, n=103, last 2 years) | |
| Lenovo Legion 9 16IRX9, RTX 4090 | |
| Razer Blade 16 2024, RTX 4090 | |
| Alienware x16 R2 P120F | |
| Asus ROG Zephyrus G16 GU605MY | |
| Asus ROG Zephyrus G16 2024 GU605M | |
| Average Intel Core Ultra 9 185H (24004 - 48020, n=22) | |
| AIDA64 / CPU AES | |
| Schenker XMG Neo 16 (Early 24) | |
| Lenovo Legion 9 16IRX9, RTX 4090 | |
| Razer Blade 16 2024, RTX 4090 | |
| Average of class Gaming (39258 - 247074, n=103, last 2 years) | |
| Alienware x16 R2 P120F | |
| Average Intel Core Ultra 9 185H (53116 - 154066, n=22) | |
| Asus ROG Zephyrus G16 GU605MY | |
| Asus ROG Zephyrus G16 2024 GU605M | |
| AIDA64 / CPU ZLib | |
| Schenker XMG Neo 16 (Early 24) | |
| Lenovo Legion 9 16IRX9, RTX 4090 | |
| Razer Blade 16 2024, RTX 4090 | |
| Average of class Gaming (574 - 2531, n=103, last 2 years) | |
| Alienware x16 R2 P120F | |
| Asus ROG Zephyrus G16 GU605MY | |
| Average Intel Core Ultra 9 185H (678 - 1341, n=22) | |
| Asus ROG Zephyrus G16 2024 GU605M | |
| AIDA64 / FP64 Ray-Trace | |
| Average of class Gaming (5509 - 45446, n=103, last 2 years) | |
| Schenker XMG Neo 16 (Early 24) | |
| Lenovo Legion 9 16IRX9, RTX 4090 | |
| Razer Blade 16 2024, RTX 4090 | |
| Alienware x16 R2 P120F | |
| Asus ROG Zephyrus G16 GU605MY | |
| Asus ROG Zephyrus G16 2024 GU605M | |
| Average Intel Core Ultra 9 185H (4428 - 10078, n=22) | |
| AIDA64 / CPU PhotoWorxx | |
| Lenovo Legion 9 16IRX9, RTX 4090 | |
| Alienware x16 R2 P120F | |
| Asus ROG Zephyrus G16 GU605MY | |
| Razer Blade 16 2024, RTX 4090 | |
| Schenker XMG Neo 16 (Early 24) | |
| Asus ROG Zephyrus G16 2024 GU605M | |
| Average Intel Core Ultra 9 185H (44547 - 53918, n=22) | |
| Average of class Gaming (12271 - 89891, n=103, last 2 years) | |
System performance
Slightly less than surprising is that the high-end variant of the Zephyrus G16 is a very responsive laptop. Although the benchmark results are also good, once again, the HX processor-equipped competition performs better. However, this is not noticeable in everyday situations. Due to the Advanced Optimus graphics switching, there is an occasional short freeze when booting games when the system switches to the dGPU, however, that is completely normal.
CrossMark: Overall | Productivity | Creativity | Responsiveness
WebXPRT 3: Overall
WebXPRT 4: Overall
Mozilla Kraken 1.1: Total
| PCMark 10 / Score | |
| Schenker XMG Neo 16 (Early 24) | |
| Average of class Gaming (5828 - 11730, n=92, last 2 years) | |
| Razer Blade 16 2024, RTX 4090 | |
| Lenovo Legion 9 16IRX9, RTX 4090 | |
| Asus ROG Zephyrus G16 GU605MY | |
| Average Intel Core Ultra 9 185H, NVIDIA GeForce RTX 4090 Laptop GPU (n=1) | |
| Alienware x16 R2 P120F | |
| Asus ROG Zephyrus G16 2024 GU605M | |
| PCMark 10 / Essentials | |
| Schenker XMG Neo 16 (Early 24) | |
| Lenovo Legion 9 16IRX9, RTX 4090 | |
| Razer Blade 16 2024, RTX 4090 | |
| Asus ROG Zephyrus G16 GU605MY | |
| Average Intel Core Ultra 9 185H, NVIDIA GeForce RTX 4090 Laptop GPU (n=1) | |
| Average of class Gaming (8810 - 11935, n=96, last 2 years) | |
| Asus ROG Zephyrus G16 2024 GU605M | |
| Alienware x16 R2 P120F | |
| PCMark 10 / Productivity | |
| Schenker XMG Neo 16 (Early 24) | |
| Razer Blade 16 2024, RTX 4090 | |
| Average of class Gaming (6845 - 21327, n=94, last 2 years) | |
| Lenovo Legion 9 16IRX9, RTX 4090 | |
| Asus ROG Zephyrus G16 GU605MY | |
| Average Intel Core Ultra 9 185H, NVIDIA GeForce RTX 4090 Laptop GPU (n=1) | |
| Asus ROG Zephyrus G16 2024 GU605M | |
| Alienware x16 R2 P120F | |
| PCMark 10 / Digital Content Creation | |
| Schenker XMG Neo 16 (Early 24) | |
| Average of class Gaming (7602 - 19954, n=94, last 2 years) | |
| Lenovo Legion 9 16IRX9, RTX 4090 | |
| Razer Blade 16 2024, RTX 4090 | |
| Alienware x16 R2 P120F | |
| Asus ROG Zephyrus G16 GU605MY | |
| Average Intel Core Ultra 9 185H, NVIDIA GeForce RTX 4090 Laptop GPU (n=1) | |
| Asus ROG Zephyrus G16 2024 GU605M | |
| CrossMark / Overall | |
| Schenker XMG Neo 16 (Early 24) | |
| Razer Blade 16 2024, RTX 4090 | |
| Average of class Gaming (1366 - 2409, n=93, last 2 years) | |
| Lenovo Legion 9 16IRX9, RTX 4090 | |
| Asus ROG Zephyrus G16 GU605MY | |
| Average Intel Core Ultra 9 185H, NVIDIA GeForce RTX 4090 Laptop GPU (n=1) | |
| Asus ROG Zephyrus G16 2024 GU605M | |
| Alienware x16 R2 P120F | |
| CrossMark / Productivity | |
| Schenker XMG Neo 16 (Early 24) | |
| Razer Blade 16 2024, RTX 4090 | |
| Average of class Gaming (1386 - 2254, n=93, last 2 years) | |
| Lenovo Legion 9 16IRX9, RTX 4090 | |
| Asus ROG Zephyrus G16 GU605MY | |
| Average Intel Core Ultra 9 185H, NVIDIA GeForce RTX 4090 Laptop GPU (n=1) | |
| Asus ROG Zephyrus G16 2024 GU605M | |
| Alienware x16 R2 P120F | |
| CrossMark / Creativity | |
| Schenker XMG Neo 16 (Early 24) | |
| Razer Blade 16 2024, RTX 4090 | |
| Average of class Gaming (1343 - 2729, n=93, last 2 years) | |
| Lenovo Legion 9 16IRX9, RTX 4090 | |
| Asus ROG Zephyrus G16 GU605MY | |
| Average Intel Core Ultra 9 185H, NVIDIA GeForce RTX 4090 Laptop GPU (n=1) | |
| Asus ROG Zephyrus G16 2024 GU605M | |
| Alienware x16 R2 P120F | |
| CrossMark / Responsiveness | |
| Schenker XMG Neo 16 (Early 24) | |
| Razer Blade 16 2024, RTX 4090 | |
| Lenovo Legion 9 16IRX9, RTX 4090 | |
| Average of class Gaming (1226 - 2334, n=93, last 2 years) | |
| Alienware x16 R2 P120F | |
| Asus ROG Zephyrus G16 GU605MY | |
| Average Intel Core Ultra 9 185H, NVIDIA GeForce RTX 4090 Laptop GPU (n=1) | |
| Asus ROG Zephyrus G16 2024 GU605M | |
| WebXPRT 3 / Overall | |
| Schenker XMG Neo 16 (Early 24) | |
| Razer Blade 16 2024, RTX 4090 | |
| Average of class Gaming (220 - 532, n=97, last 2 years) | |
| Asus ROG Zephyrus G16 2024 GU605M | |
| Asus ROG Zephyrus G16 GU605MY | |
| Average Intel Core Ultra 9 185H, NVIDIA GeForce RTX 4090 Laptop GPU (n=1) | |
| Lenovo Legion 9 16IRX9, RTX 4090 | |
| Alienware x16 R2 P120F | |
| WebXPRT 4 / Overall | |
| Schenker XMG Neo 16 (Early 24) | |
| Average of class Gaming (165 - 354, n=97, last 2 years) | |
| Asus ROG Zephyrus G16 GU605MY | |
| Average Intel Core Ultra 9 185H, NVIDIA GeForce RTX 4090 Laptop GPU (n=1) | |
| Asus ROG Zephyrus G16 2024 GU605M | |
| Lenovo Legion 9 16IRX9, RTX 4090 | |
| Alienware x16 R2 P120F | |
| Mozilla Kraken 1.1 / Total | |
| Alienware x16 R2 P120F | |
| Asus ROG Zephyrus G16 2024 GU605M | |
| Lenovo Legion 9 16IRX9, RTX 4090 | |
| Asus ROG Zephyrus G16 GU605MY | |
| Average Intel Core Ultra 9 185H, NVIDIA GeForce RTX 4090 Laptop GPU (n=1) | |
| Average of class Gaming (391 - 590, n=99, last 2 years) | |
| Razer Blade 16 2024, RTX 4090 | |
| Schenker XMG Neo 16 (Early 24) | |
* ... smaller is better
| PCMark 10 Score | 7993 points | |
Help | ||
| AIDA64 / Memory Copy | |
| Asus ROG Zephyrus G16 GU605MY | |
| Alienware x16 R2 P120F | |
| Asus ROG Zephyrus G16 2024 GU605M | |
| Average Intel Core Ultra 9 185H (69929 - 95718, n=22) | |
| Lenovo Legion 9 16IRX9, RTX 4090 | |
| Schenker XMG Neo 16 (Early 24) | |
| Razer Blade 16 2024, RTX 4090 | |
| Average of class Gaming (21750 - 129946, n=103, last 2 years) | |
| AIDA64 / Memory Read | |
| Schenker XMG Neo 16 (Early 24) | |
| Asus ROG Zephyrus G16 2024 GU605M | |
| Razer Blade 16 2024, RTX 4090 | |
| Asus ROG Zephyrus G16 GU605MY | |
| Alienware x16 R2 P120F | |
| Lenovo Legion 9 16IRX9, RTX 4090 | |
| Average Intel Core Ultra 9 185H (64619 - 87768, n=22) | |
| Average of class Gaming (22956 - 118858, n=103, last 2 years) | |
| AIDA64 / Memory Write | |
| Lenovo Legion 9 16IRX9, RTX 4090 | |
| Schenker XMG Neo 16 (Early 24) | |
| Asus ROG Zephyrus G16 GU605MY | |
| Average of class Gaming (22297 - 135096, n=103, last 2 years) | |
| Razer Blade 16 2024, RTX 4090 | |
| Asus ROG Zephyrus G16 2024 GU605M | |
| Alienware x16 R2 P120F | |
| Average Intel Core Ultra 9 185H (51114 - 93871, n=22) | |
| AIDA64 / Memory Latency | |
| Average Intel Core Ultra 9 185H (121.4 - 259, n=22) | |
| Alienware x16 R2 P120F | |
| Asus ROG Zephyrus G16 2024 GU605M | |
| Asus ROG Zephyrus G16 GU605MY | |
| Average of class Gaming (75.3 - 259, n=103, last 2 years) | |
| Lenovo Legion 9 16IRX9, RTX 4090 | |
| Razer Blade 16 2024, RTX 4090 | |
| Schenker XMG Neo 16 (Early 24) | |
* ... smaller is better
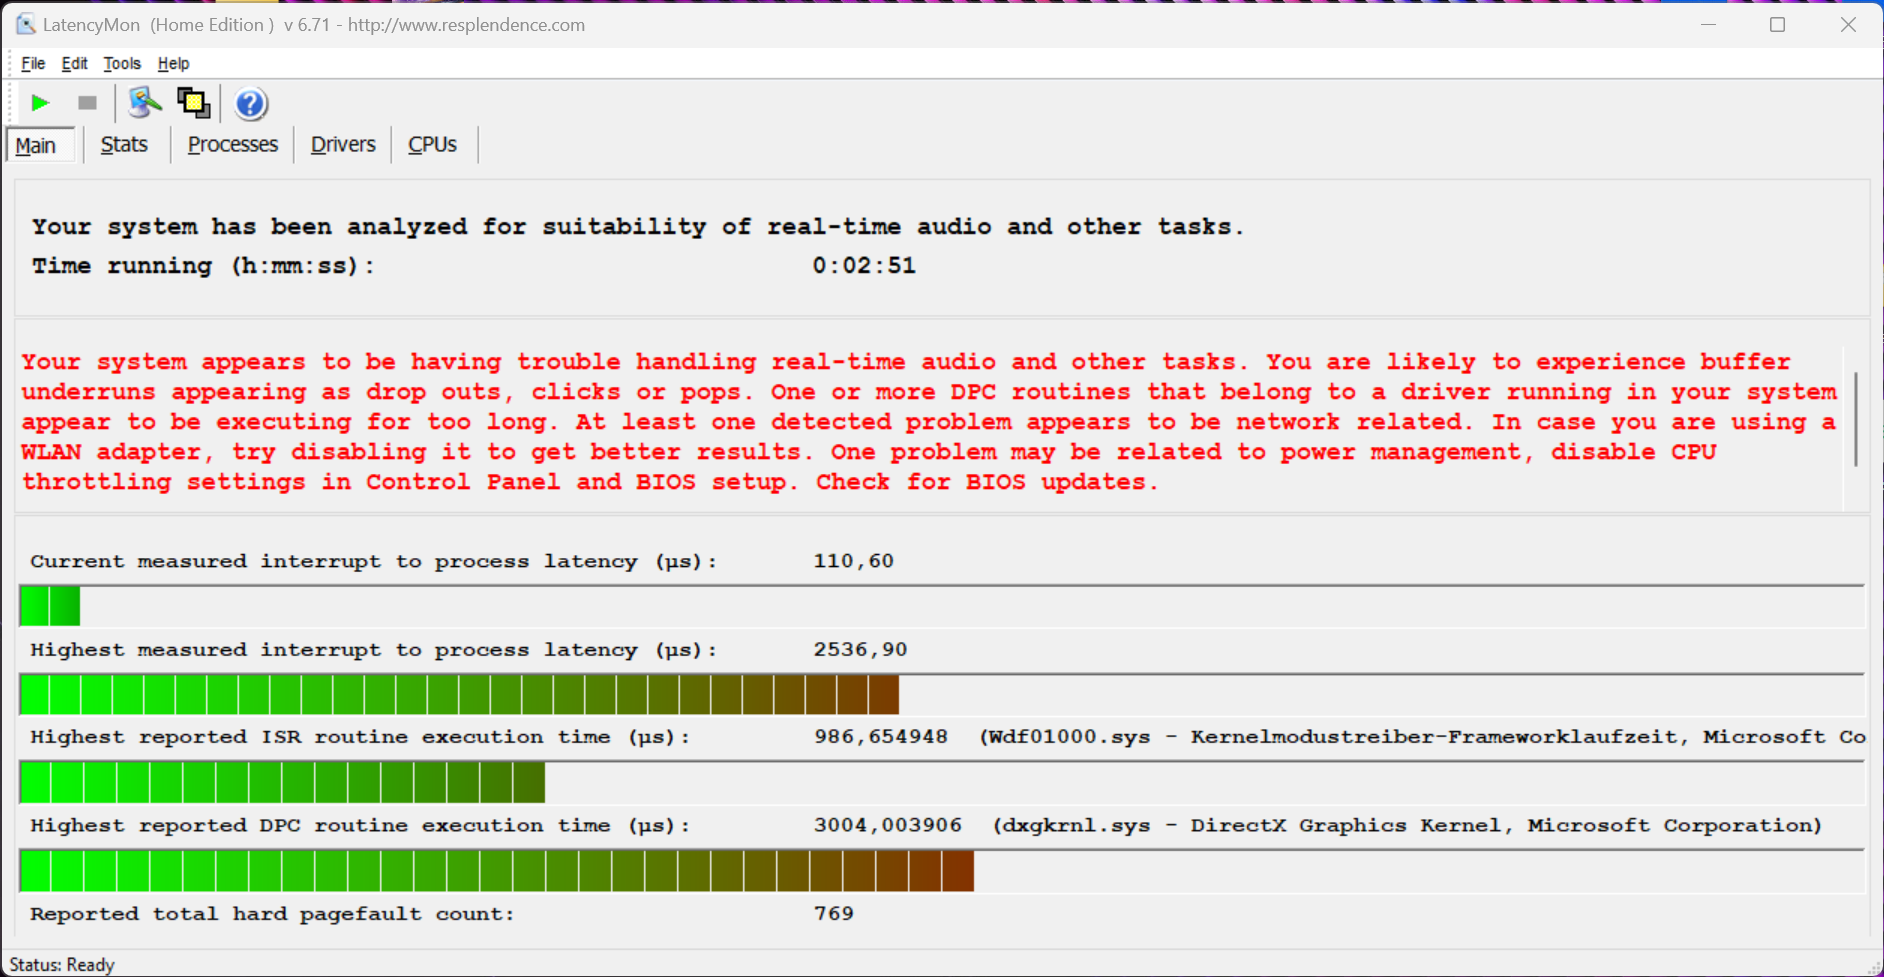
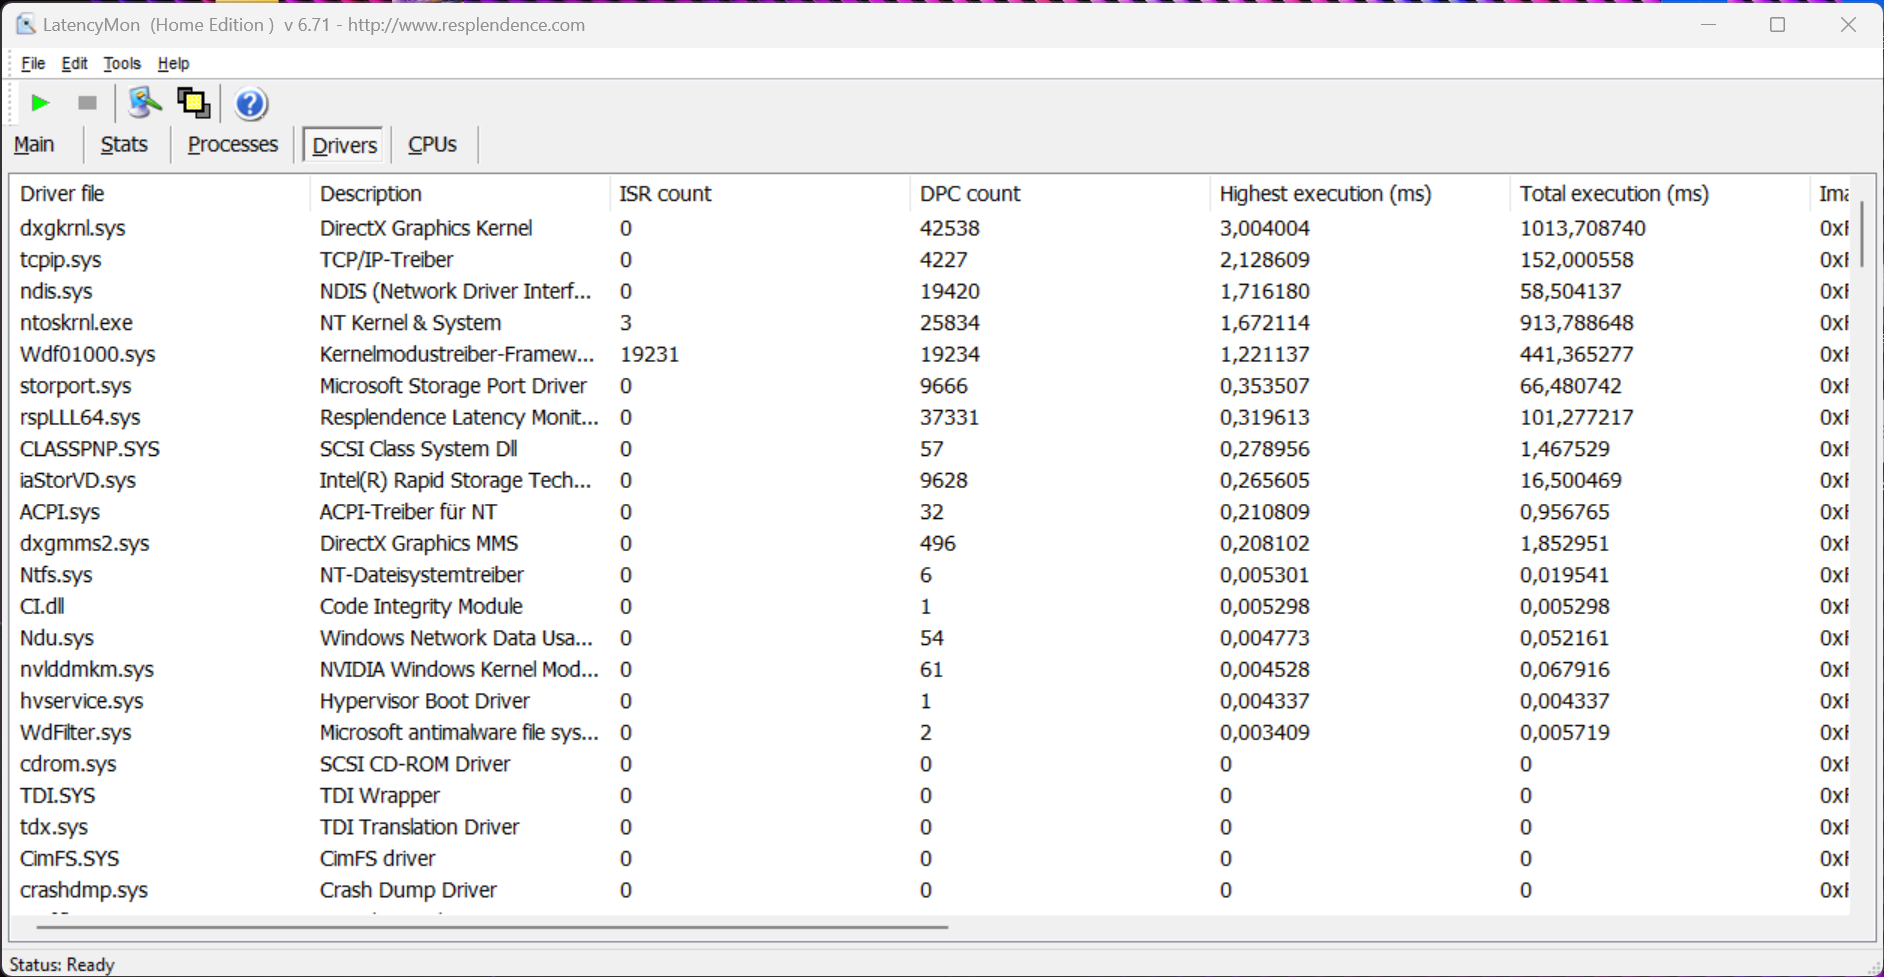
DPC latencies
In our standardized latency test (surfing the internet, 4K YouTube playback, CPU load), with the current BIOS, the review device displayed limitations when it came to using real-time audio applications. However, that was already the case with the RTX 4070 model.
| DPC Latencies / LatencyMon - interrupt to process latency (max), Web, Youtube, Prime95 | |
| Alienware x16 R2 P120F | |
| Asus ROG Zephyrus G16 GU605MY | |
| Asus ROG Zephyrus G16 2024 GU605M | |
| Schenker XMG Neo 16 (Early 24) | |
| Lenovo Legion 9 16IRX9, RTX 4090 | |
| Razer Blade 16 2024, RTX 4090 | |
* ... smaller is better
Mass storage
The Zephyrus G16 offers two, fast PCIe 4.0 slots for M.2 2280 SSDs meaning the storage capacity can be upgraded quickly and affordably. Our review device comes with a 2 TB, Samsung PM9A1a although 1.76 TB are available to the user after the first installation. In the synthetic tests, the SSD didn't quite meet our expectations but we are still dealing with a very fast storage drive with transfer speeds remaining perfectly consistent even under sustained load. Additional SSD benchmarks can be found here.

* ... smaller is better
Continuous Performance Read: DiskSpd Read Loop, Queue Depth 8
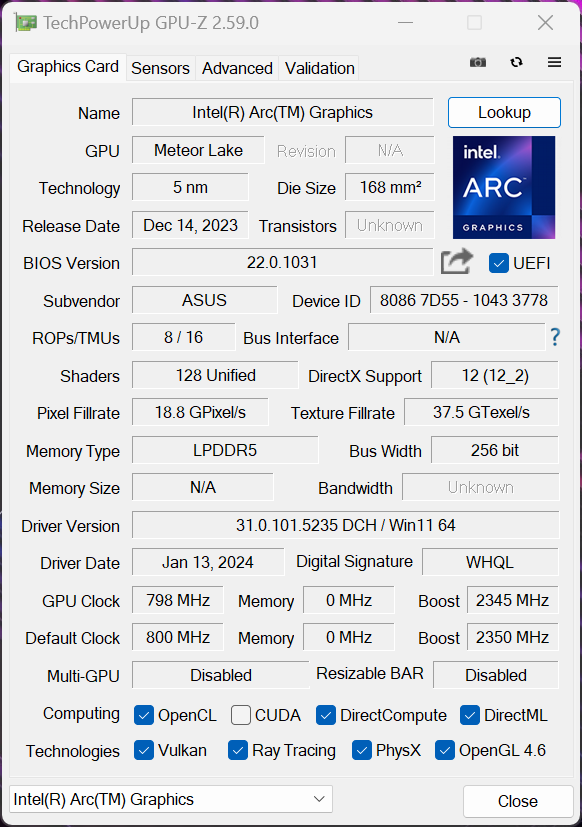
Graphics card - GeForce RTX 4090 laptop
The Zephyrus G16 is available with the full range of current GeForce RTX laptop models (4050-4090), however, the thin design makes itself known in the fast variants. In the turbo mode, the GeForce RTX 4090 laptop only operates with a TGP of 95 watts + 20 watts of dynamic boost meaning it is quite a bit off the maximum configuration of 175 watts (150 TGP + 25 watts of dynamic boost). That is something potential buyers should know to avoid later disappointment. In the GPU benchmarks, we can clearly see the disadvantage compared to other RTX 4090 laptop models which are between 15-26 % faster. Even the RTX 4080 laptop found in the Alienware x16 R2 (175W) is a touch quicker than the RTX 4090 housed in the Zephyrus G16.
The advantage compared to the Zephyrus G16 with the RTX 4070 laptop sits at 50 % which is still, of course, huge - especially considering the compact case. Basically, the RTX 4070 laptop (and also the weaker versions) can better reach its potential when paired with the Zephyrus G16. Depending on the use case, a larger amount of video memory (16 GB) can be an additional advantage, for example, when editing videos.
Under sustained load, the GPU performance remains stable, however, in battery mode, the GPU is allowed to draw a maximum of 55 watts and this is why the GPU performance drops significantly here (-52 %). Additional GPU benchmarks can be found here.
| 3DMark 11 Performance | 38012 points | |
| 3DMark Fire Strike Score | 30964 points | |
| 3DMark Time Spy Score | 15660 points | |
| 3DMark Steel Nomad Score | 3915 points | |
Help | ||
| Blender / v3.3 Classroom OPTIX/RTX | |
| Asus ROG Zephyrus G16 2024 GU605M | |
| Average of class Gaming (9 - 32, n=105, last 2 years) | |
| Alienware x16 R2 P120F | |
| Asus ROG Zephyrus G16 GU605MY | |
| Lenovo Legion 9 16IRX9, RTX 4090 | |
| Schenker XMG Neo 16 (Early 24) | |
| Average NVIDIA GeForce RTX 4090 Laptop GPU (9 - 19, n=39) | |
| Razer Blade 16 2024, RTX 4090 | |
| Blender / v3.3 Classroom CUDA | |
| Asus ROG Zephyrus G16 2024 GU605M | |
| Average of class Gaming (15 - 228, n=105, last 2 years) | |
| Alienware x16 R2 P120F | |
| Asus ROG Zephyrus G16 GU605MY | |
| Average NVIDIA GeForce RTX 4090 Laptop GPU (16 - 24, n=39) | |
| Razer Blade 16 2024, RTX 4090 | |
| Lenovo Legion 9 16IRX9, RTX 4090 | |
| Schenker XMG Neo 16 (Early 24) | |
| Blender / v3.3 Classroom CPU | |
| Asus ROG Zephyrus G16 2024 GU605M | |
| Asus ROG Zephyrus G16 GU605MY | |
| Alienware x16 R2 P120F | |
| Average of class Gaming (122 - 565, n=101, last 2 years) | |
| Razer Blade 16 2024, RTX 4090 | |
| Average NVIDIA GeForce RTX 4090 Laptop GPU (144 - 305, n=39) | |
| Lenovo Legion 9 16IRX9, RTX 4090 | |
| Schenker XMG Neo 16 (Early 24) | |
* ... smaller is better
Gaming performance
The picture painted in the GPU tests also continues in the gaming benchmarks since the RTX 4090 laptop found in the Zephyrus G16 combined with the Core Ultra 185H lags noticeably behind the competition equipped with both the HX CPUs and the RTX 4090 laptop. The Alienware x16 R2 paired with the Core Ultra 9 and the RTX 4080 laptop also offer slightly better gaming performance. Once more, the Zephyrus G16 with the RTX 4070 laptop gets roundly beaten, especially in the QHD tests.
All in all, the Zephyrus G16 with the RTX 4090 laptop and the fast OLED panel are wonderfully suited to gaming. In its native QHD resolution, you can, without hesitation, play all current titles smoothly at maximum details. However, our Cyberpunk 2077 loop shows that the gaming performance when running demanding titles isn't entirely stable and that there are small performance dips. Further gaming benchmarks can be found here.
| Horizon Forbidden West | |
| 1920x1080 Very High Preset AA:T | |
| Schenker XMG Neo 16 (Early 24) | |
| Average NVIDIA GeForce RTX 4090 Laptop GPU (81 - 125.2, n=3) | |
| Asus ROG Zephyrus G16 GU605MY | |
| Average of class Gaming (14.7 - 140.3, n=12, last 2 years) | |
| 2560x1440 Very High Preset AA:T | |
| Schenker XMG Neo 16 (Early 24) | |
| Average NVIDIA GeForce RTX 4090 Laptop GPU (66 - 98, n=3) | |
| Average of class Gaming (45.7 - 100.9, n=9, last 2 years) | |
| Asus ROG Zephyrus G16 GU605MY | |
Cyberpunk 2077 ultra FPS diagram
| low | med. | high | ultra | QHD DLSS | QHD | 4K DLSS | 4K | |
|---|---|---|---|---|---|---|---|---|
| GTA V (2015) | 172.6 | 107.1 | 103.4 | 139.9 | ||||
| Dota 2 Reborn (2015) | 172.2 | 150.8 | 150.3 | 138.7 | 135.8 | |||
| Final Fantasy XV Benchmark (2018) | 183.5 | 168.4 | 138 | 113.3 | 68.9 | |||
| X-Plane 11.11 (2018) | 138.3 | 111.7 | 90 | 75.7 | ||||
| Far Cry 5 (2018) | 138 | 128 | 117 | 115 | 80 | |||
| Strange Brigade (2018) | 431 | 340 | 314 | 288 | 225 | 120 | ||
| Star Wars Jedi Survivor (2023) | 173 | 166 | 154 | 148 | 114 | 59 | ||
| F1 23 (2023) | 215 | 217 | 211 | 86.2 | 58 | 50.1 | 30.2 | |
| Baldur's Gate 3 (2023) | 144 | 126 | 123 | 118 | 99 | 57 | ||
| Cyberpunk 2077 (2023) | 119.8 | 106.6 | 109.6 | 93.1 | 68.1 | 32.9 | ||
| Call of Duty Modern Warfare 3 2023 (2023) | 204 | 189 | 155 | 148 | 113 | 73 | ||
| Horizon Forbidden West (2024) | 117 | 110 | 89 | 81 | 66 | 42.5 | ||
| F1 24 (2024) | 230 | 232 | 216 | 88 | 88.3 | 58.5 | 49.8 | 30.3 |
| Black Myth: Wukong (2024) | 67 | 40 | 44 | 39 |
Emissions - Vapor Chamber is often louder
Noise emissions
The fan volume depends largely on the selected energy profile. In idle use and under low load, the Zephyrus G16 remains very quiet, even in the faster profiles. When gaming and using both the Quiet and Performance profiles, the vapor chamber cooling gets a little louder than the RTX 4070 model, and, without headphones, it’s only really possible to play properly using the Quiet profile. In the turbo mode, this reaches 52.3 dB(A) which represents the RTX 4070 variant’s maximum fan volume. However, the competition gets even slightly louder with the only exception being the Blade 16 - although, you can’t really call 50 dB(A) quiet. Our review device didn’t emit any other electronic noises. According to Asus, the problem we encountered with the third fan in our review of the RTX 4070 variant should have now been fixed via a BIOS update.
| Energy profile | 3DMark 06 | Cyberpunk 2077 | stress test |
|---|---|---|---|
| Quiet | 30.9 dB(A) | 41.4 dB(A) | 41.4 dB(A) |
| Performance | 36.1 dB(A) | 48.1 dB(A) | 48.1 dB(A) |
| Turbo | 49.2 dB(A) | 52.3 dB(A) | 52.3 dB(A) |
| Energy profile | 3DMark 06 | Cyberpunk 2077 | stress test |
|---|---|---|---|
| Quiet | 30.4 dB(A) | 41.5 dB(A) | 41.5 dB(A) |
| Performance | 34.2 dB(A) | 46.4 dB(A) | 46.4 dB(A) |
| Turbo | 41.5 dB(A) | 52.4 dB(A) | 52.4 dB(A) |
Noise level
| Idle |
| 24.6 / 27.8 / 31.9 dB(A) |
| Load |
| 49.2 / 52.3 dB(A) |
 | ||
30 dB silent 40 dB(A) audible 50 dB(A) loud |
||
min: | ||
| Asus ROG Zephyrus G16 GU605MY GeForce RTX 4090 Laptop GPU, Ultra 9 185H, Samsung PM9A1a MZVL22T0HDLB | Schenker XMG Neo 16 (Early 24) GeForce RTX 4090 Laptop GPU, i9-14900HX, Samsung 990 Pro 1 TB | Lenovo Legion 9 16IRX9, RTX 4090 GeForce RTX 4090 Laptop GPU, i9-14900HX, Micron 3400 2TB MTFDKBA2T0TFH | Alienware x16 R2 P120F GeForce RTX 4080 Laptop GPU, Ultra 9 185H, WDC PC SN810 1TB | Razer Blade 16 2024, RTX 4090 GeForce RTX 4090 Laptop GPU, i9-14900HX, Samsung PM9A1 MZVL22T0HBLB | Asus ROG Zephyrus G16 2024 GU605M GeForce RTX 4070 Laptop GPU, Ultra 7 155H, WD PC SN560 SDDPNQE-1T00 | |
|---|---|---|---|---|---|---|
| Noise | -5% | 12% | 9% | 10% | 9% | |
| off / environment * (dB) | 24.6 | 26 -6% | 23 7% | 23.4 5% | 23 7% | 23.9 3% |
| Idle Minimum * (dB) | 24.6 | 28 -14% | 23 7% | 23.8 3% | 23 7% | 23.9 3% |
| Idle Average * (dB) | 27.8 | 29 -4% | 23 17% | 28.5 -3% | 23 17% | 27.8 -0% |
| Idle Maximum * (dB) | 31.9 | 31 3% | 23 28% | 28.5 11% | 27.66 13% | 30.1 6% |
| Load Average * (dB) | 49.2 | 51 -4% | 39 21% | 28.8 41% | 43.76 11% | 34.2 30% |
| Cyberpunk 2077 ultra * (dB) | 52.3 | |||||
| Load Maximum * (dB) | 52.3 | 56 -7% | 55.56 -6% | 54.2 -4% | 50.37 4% | 46.4 11% |
| Witcher 3 ultra * (dB) | 54 | 55.32 | 49.5 | 46.81 | 46.4 |
* ... smaller is better
Temperature
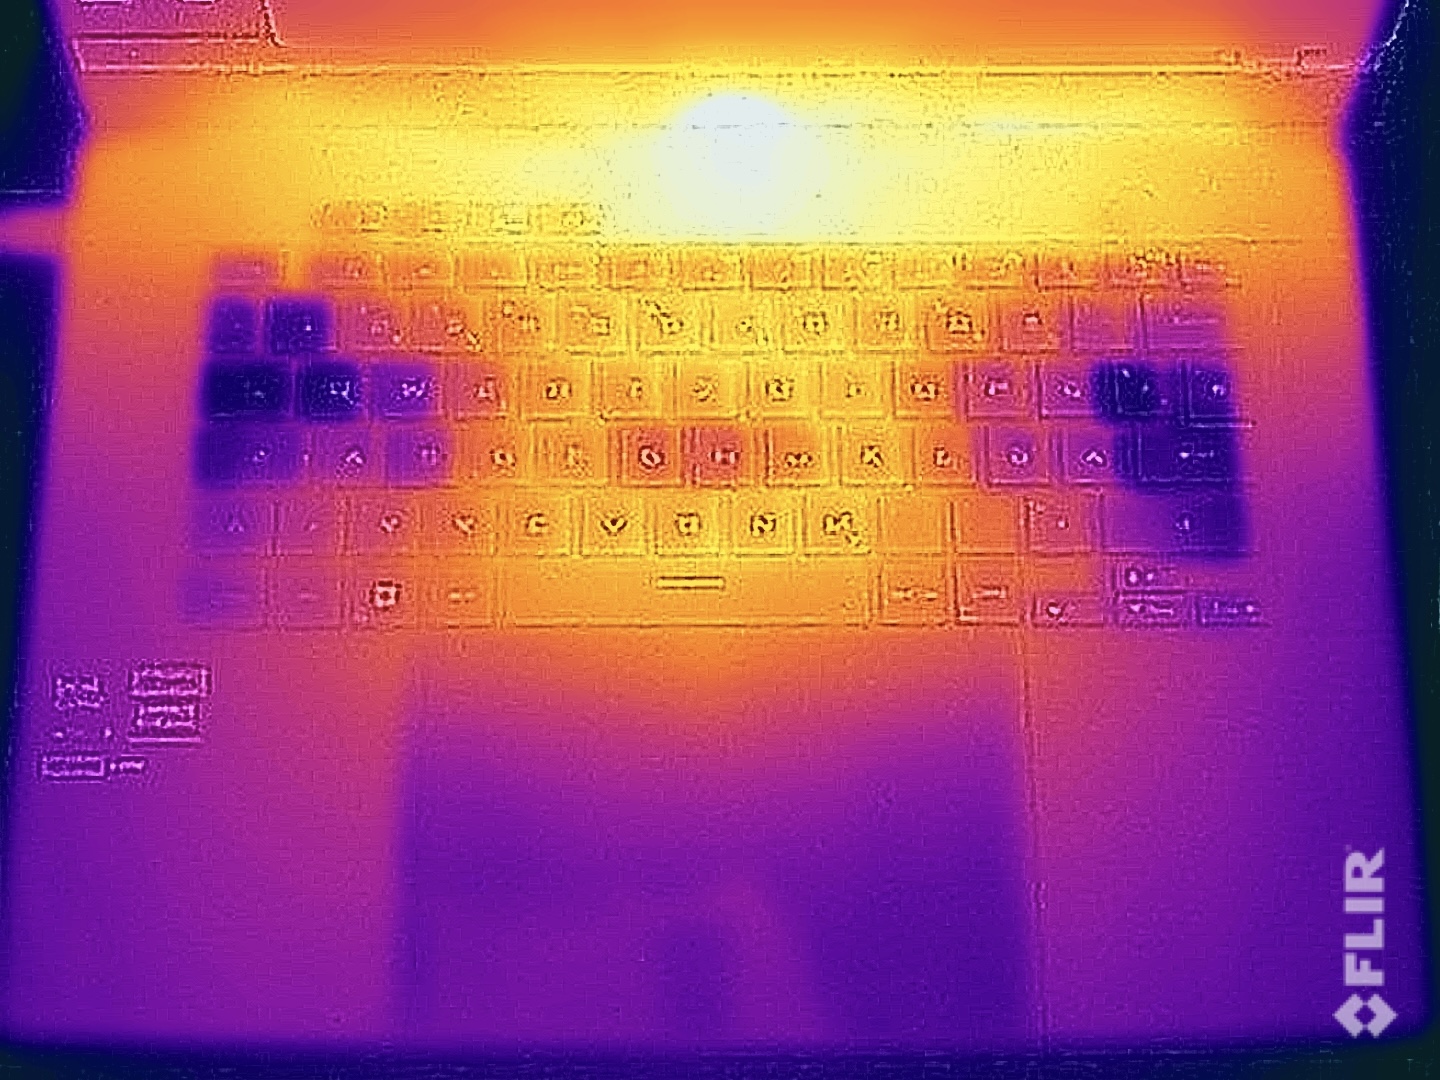
In idele use and running simple tasks, the case’s metal surfaces remain very cool and you can place the device on your lap without any hesitation. When playing games and in the stress test, we measured base unit temperatures of up to 47 °C in the middle of the rear area. That is not a cause for concern but you shouldn’t use the device on your lap in such scenarios. On the upper side of the base unit, the middle area above the keyboard is prone to heating up but the keyboard itself remains significantly cooler with maximum temperatures of 40 °C in the middle and around 36 °C on both sides. This means typing goes without a hitch and gaming is also an unrestricted experience.
(-) The maximum temperature on the upper side is 45.9 °C / 115 F, compared to the average of 40.4 °C / 105 F, ranging from 21.2 to 68.8 °C for the class Gaming.
(-) The bottom heats up to a maximum of 47.5 °C / 118 F, compared to the average of 43.2 °C / 110 F
(+) In idle usage, the average temperature for the upper side is 25.3 °C / 78 F, compared to the device average of 33.9 °C / 93 F.
(±) 3: The average temperature for the upper side is 36.7 °C / 98 F, compared to the average of 33.9 °C / 93 F for the class Gaming.
(+) The palmrests and touchpad are cooler than skin temperature with a maximum of 30.8 °C / 87.4 F and are therefore cool to the touch.
(±) The average temperature of the palmrest area of similar devices was 28.8 °C / 83.8 F (-2 °C / -3.6 F).

| Asus ROG Zephyrus G16 GU605MY Intel Core Ultra 9 185H, NVIDIA GeForce RTX 4090 Laptop GPU | Schenker XMG Neo 16 (Early 24) Intel Core i9-14900HX, NVIDIA GeForce RTX 4090 Laptop GPU | Lenovo Legion 9 16IRX9, RTX 4090 Intel Core i9-14900HX, NVIDIA GeForce RTX 4090 Laptop GPU | Alienware x16 R2 P120F Intel Core Ultra 9 185H, NVIDIA GeForce RTX 4080 Laptop GPU | Razer Blade 16 2024, RTX 4090 Intel Core i9-14900HX, NVIDIA GeForce RTX 4090 Laptop GPU | Asus ROG Zephyrus G16 2024 GU605M Intel Core Ultra 7 155H, NVIDIA GeForce RTX 4070 Laptop GPU | |
|---|---|---|---|---|---|---|
| Heat | -6% | -32% | -23% | -4% | -8% | |
| Maximum Upper Side * (°C) | 45.9 | 47 -2% | 56 -22% | 51 -11% | 45 2% | 50.3 -10% |
| Maximum Bottom * (°C) | 47.5 | 56 -18% | 53 -12% | 50.8 -7% | 45 5% | 48 -1% |
| Idle Upper Side * (°C) | 26.1 | 27 -3% | 38 -46% | 36.6 -40% | 29 -11% | 28.8 -10% |
| Idle Bottom * (°C) | 26.6 | 27 -2% | 39 -47% | 35.2 -32% | 30 -13% | 29.8 -12% |
* ... smaller is better
Stress test
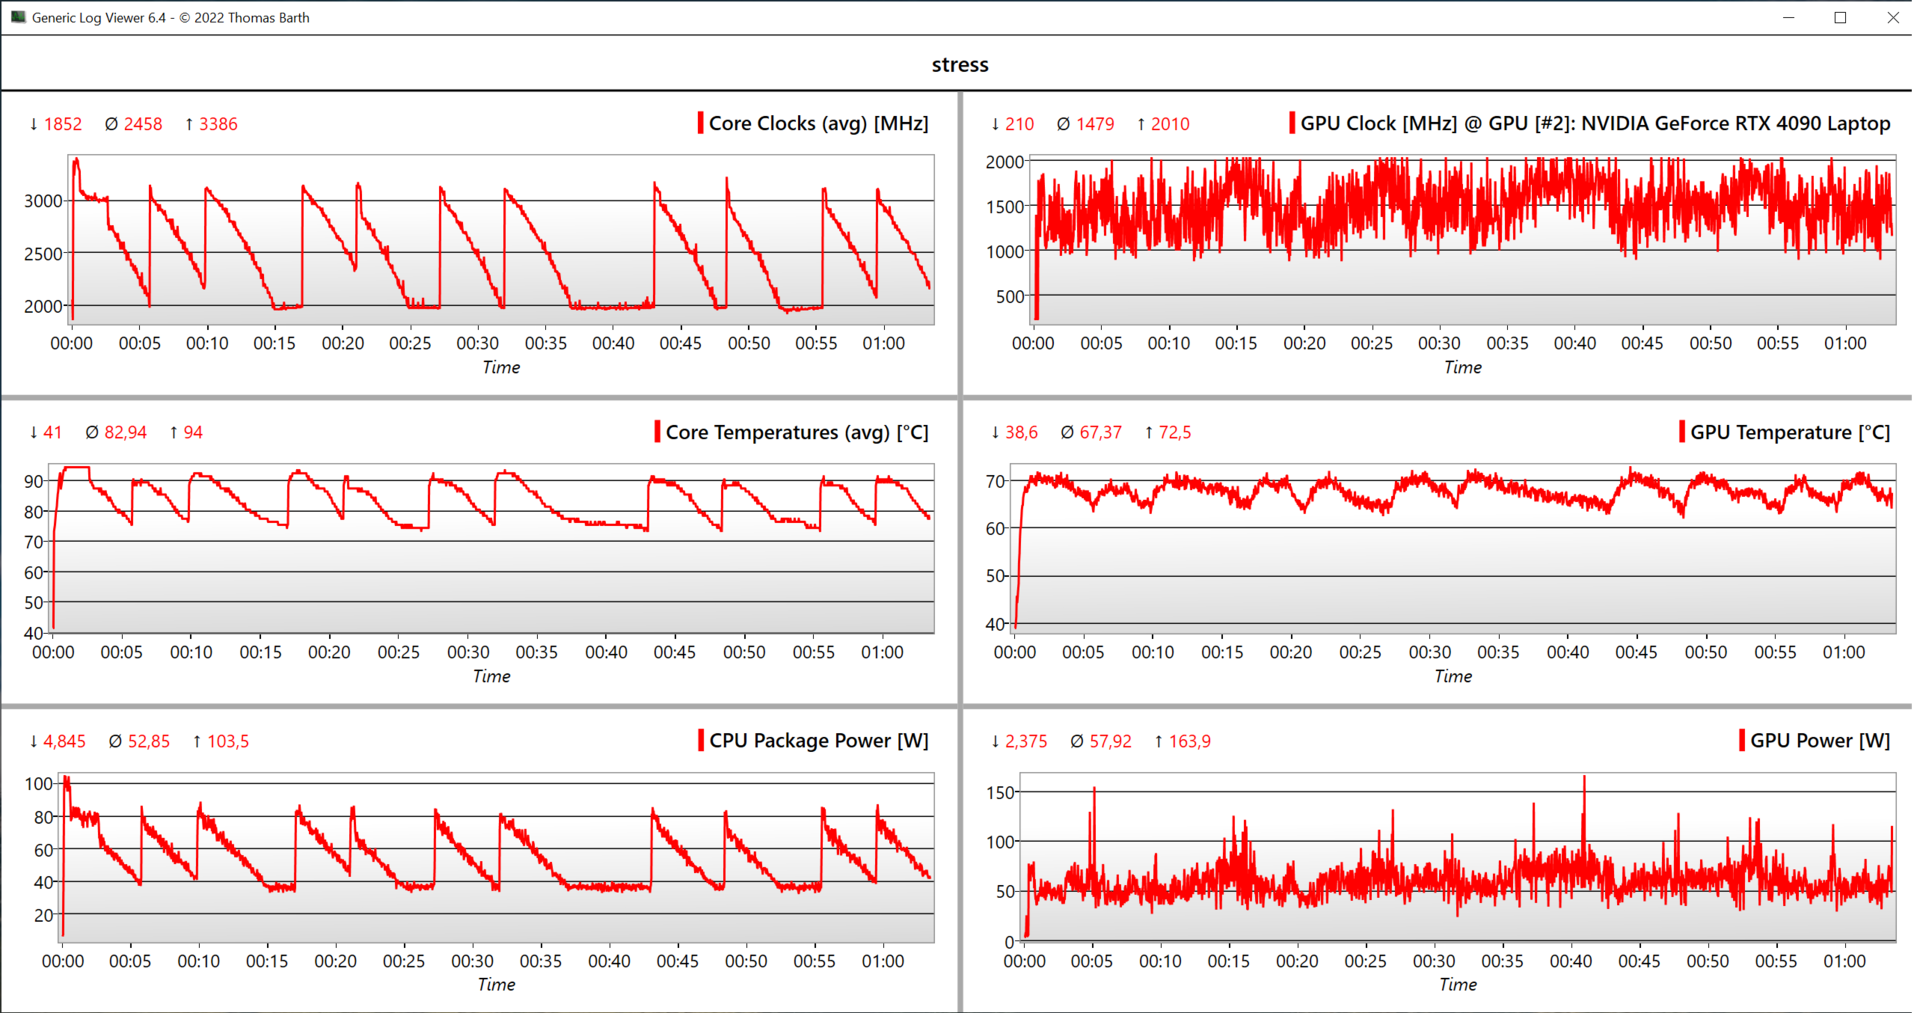
In the stress test with combined CPU/GPU load, the Zephyrus top model was unable to perform consistently. The CPU power consumption periodically fluctuated between 40-80 watts and, after one hour, it sat at an average of 53 watts. The graphics card is not subject to such large fluctuations but still “only” operates at around 58 watts. According to Asus, in this scenario, these values should be 35 watts for the processor and 95 watts for the graphics card, however, we were unable to reproduce these values.
Speakers
Asus ROG Zephyrus G16 GU605MY audio analysis
(+) | speakers can play relatively loud (83 dB)
Bass 100 - 315 Hz
(+) | good bass - only 3.3% away from median
(±) | linearity of bass is average (7.6% delta to prev. frequency)
Mids 400 - 2000 Hz
(+) | balanced mids - only 3.4% away from median
(+) | mids are linear (3.1% delta to prev. frequency)
Highs 2 - 16 kHz
(+) | balanced highs - only 1.7% away from median
(+) | highs are linear (4.6% delta to prev. frequency)
Overall 100 - 16.000 Hz
(+) | overall sound is linear (6.5% difference to median)
Compared to same class
» 0% of all tested devices in this class were better, 0% similar, 100% worse
» The best had a delta of 6%, average was 18%, worst was 132%
Compared to all devices tested
» 1% of all tested devices were better, 0% similar, 99% worse
» The best had a delta of 4%, average was 23%, worst was 134%
Schenker XMG Neo 16 (Early 24) audio analysis
(+) | speakers can play relatively loud (86 dB)
Bass 100 - 315 Hz
(-) | nearly no bass - on average 16.3% lower than median
(±) | linearity of bass is average (8.6% delta to prev. frequency)
Mids 400 - 2000 Hz
(+) | balanced mids - only 3% away from median
(+) | mids are linear (3.6% delta to prev. frequency)
Highs 2 - 16 kHz
(+) | balanced highs - only 2.5% away from median
(+) | highs are linear (4.9% delta to prev. frequency)
Overall 100 - 16.000 Hz
(+) | overall sound is linear (12.4% difference to median)
Compared to same class
» 15% of all tested devices in this class were better, 4% similar, 82% worse
» The best had a delta of 6%, average was 18%, worst was 132%
Compared to all devices tested
» 11% of all tested devices were better, 2% similar, 87% worse
» The best had a delta of 4%, average was 23%, worst was 134%
Lenovo Legion 9 16IRX9, RTX 4090 audio analysis
(±) | speaker loudness is average but good (78.96 dB)
Bass 100 - 315 Hz
(±) | reduced bass - on average 13.2% lower than median
(±) | linearity of bass is average (8.9% delta to prev. frequency)
Mids 400 - 2000 Hz
(+) | balanced mids - only 3.2% away from median
(+) | mids are linear (3.4% delta to prev. frequency)
Highs 2 - 16 kHz
(+) | balanced highs - only 1.8% away from median
(+) | highs are linear (4% delta to prev. frequency)
Overall 100 - 16.000 Hz
(+) | overall sound is linear (11.3% difference to median)
Compared to same class
» 8% of all tested devices in this class were better, 4% similar, 88% worse
» The best had a delta of 6%, average was 18%, worst was 132%
Compared to all devices tested
» 7% of all tested devices were better, 2% similar, 91% worse
» The best had a delta of 4%, average was 23%, worst was 134%
Alienware x16 R2 P120F audio analysis
(+) | speakers can play relatively loud (89.9 dB)
Bass 100 - 315 Hz
(±) | reduced bass - on average 7.4% lower than median
(±) | linearity of bass is average (7.6% delta to prev. frequency)
Mids 400 - 2000 Hz
(+) | balanced mids - only 2.6% away from median
(+) | mids are linear (3.6% delta to prev. frequency)
Highs 2 - 16 kHz
(+) | balanced highs - only 3.4% away from median
(+) | highs are linear (2.8% delta to prev. frequency)
Overall 100 - 16.000 Hz
(+) | overall sound is linear (8.2% difference to median)
Compared to same class
» 1% of all tested devices in this class were better, 1% similar, 97% worse
» The best had a delta of 6%, average was 18%, worst was 132%
Compared to all devices tested
» 2% of all tested devices were better, 1% similar, 97% worse
» The best had a delta of 4%, average was 23%, worst was 134%
Razer Blade 16 2024, RTX 4090 audio analysis
(±) | speaker loudness is average but good (81.16 dB)
Bass 100 - 315 Hz
(±) | reduced bass - on average 8.2% lower than median
(±) | linearity of bass is average (7.4% delta to prev. frequency)
Mids 400 - 2000 Hz
(+) | balanced mids - only 3.3% away from median
(+) | mids are linear (5.9% delta to prev. frequency)
Highs 2 - 16 kHz
(+) | balanced highs - only 1.6% away from median
(+) | highs are linear (3.1% delta to prev. frequency)
Overall 100 - 16.000 Hz
(+) | overall sound is linear (9.2% difference to median)
Compared to same class
» 3% of all tested devices in this class were better, 1% similar, 96% worse
» The best had a delta of 6%, average was 18%, worst was 132%
Compared to all devices tested
» 3% of all tested devices were better, 1% similar, 96% worse
» The best had a delta of 4%, average was 23%, worst was 134%
Energy management - More stamina than the competition
Power consumption
Running idle, the consumption values represent the weaker variant of the ROG Zephyrus G16 and this is also not surprising considering the identical OLED panels. When gaming, at around 170 watts, the Zephyrus G16 is considerably more efficient than the RTX 4090 competition which consumes at least 230 watts when gaming. In the stress test, we briefly observed a maximum power consumption of 232 watts which then quickly settled to around 160 watts. This means the supplied 240-watt PSU is suitably sized.
| Off / Standby | |
| Idle | |
| Load |
|
Key:
min: | |
| Asus ROG Zephyrus G16 GU605MY Ultra 9 185H, GeForce RTX 4090 Laptop GPU, Samsung PM9A1a MZVL22T0HDLB, OLED, 2560x1600, 16" | Schenker XMG Neo 16 (Early 24) i9-14900HX, GeForce RTX 4090 Laptop GPU, Samsung 990 Pro 1 TB, IPS, 2560x1600, 16" | Lenovo Legion 9 16IRX9, RTX 4090 i9-14900HX, GeForce RTX 4090 Laptop GPU, Micron 3400 2TB MTFDKBA2T0TFH, MiniLED, 3200x2000, 16" | Alienware x16 R2 P120F Ultra 9 185H, GeForce RTX 4080 Laptop GPU, WDC PC SN810 1TB, IPS, 2560x1600, 16" | Razer Blade 16 2024, RTX 4090 i9-14900HX, GeForce RTX 4090 Laptop GPU, Samsung PM9A1 MZVL22T0HBLB, OLED, 2560x1600, 16" | Asus ROG Zephyrus G16 2024 GU605M Ultra 7 155H, GeForce RTX 4070 Laptop GPU, WD PC SN560 SDDPNQE-1T00, OLED, 2560x1600, 16" | Average NVIDIA GeForce RTX 4090 Laptop GPU | Average of class Gaming | |
|---|---|---|---|---|---|---|---|---|
| Power Consumption | -51% | -108% | -57% | -64% | 5% | -97% | -54% | |
| Idle Minimum * (Watt) | 7.8 | 6 23% | 20.5 -163% | 9.9 -27% | 16.9 -117% | 8.3 -6% | 16.2 ? -108% | 13 ? -67% |
| Idle Average * (Watt) | 10.9 | 16 -47% | 27.7 -154% | 14.5 -33% | 17.8 -63% | 12.5 -15% | 23.1 ? -112% | 18.7 ? -72% |
| Idle Maximum * (Watt) | 11.6 | 28 -141% | 32.1 -177% | 33.5 -189% | 19.6 -69% | 12.8 -10% | 34.2 ? -195% | 24.3 ? -109% |
| Load Average * (Watt) | 98.7 | 130 -32% | 105 -6% | 97.5 1% | 128 -30% | 71.3 28% | 130.5 ? -32% | 110.2 ? -12% |
| Cyberpunk 2077 ultra * (Watt) | 157.3 | |||||||
| Cyberpunk 2077 ultra external monitor * (Watt) | 165.5 | |||||||
| Load Maximum * (Watt) | 232 | 361 -56% | 323 -39% | 315.2 -36% | 328 -41% | 169.1 27% | 324 ? -40% | 258 ? -11% |
| Witcher 3 ultra * (Watt) | 302 | 246 | 230 | 243 | 127.5 |
* ... smaller is better
Power consumption Cyberpunk / stress test
Power consumption with an external monitor
Battery life
The 90-watt-hour battery is identical in every version of the Zephyrus G16 2024 but, in the Wi-Fi test, the battery runtimes are around 30 minutes shorter than was the case with the RTX 4070 variant. The direct gaming competition with the RTX 4090 laptop is still outperformed. In the Wi-Fi test at 150 cd/m² and 60 Hz, you can get 6.5 hours (5.5 hours at 120 Hz) and 5 hours (60 Hz) at full brightness (4.5 hours at 120 Hz). With the device switched on, a complete charging cycle takes 104 minutes; 80 % of the capacity is available after 47 minutes.
Pros
Cons
Verdict - The RTX 4090 laptop doesn’t fulfil its potential
The Asus Zephyrus G16 2024 is a thin and comparatively light gaming laptop that is also suitable for other target groups such as content creators and multimedia users. Having gone with the RTX 4090 laptop means, of course, that graphics performance is the main focus, but, this is also exactly where a problem lies. In principle, it is good that Asus offers the fastest GPU models but the thin case demands compromises despite the improved vapor chamber cooling. With a maximum power consumption of 115 watts in the Turbo mode, the RTX 4090 laptop is simply unable to exploit its potential, generally lagging 20-25 % behind the competition (even the RTX 4080 laptop found in the Alienware x16 is slightly faster). Despite this, the RTX 4090 laptop will set you back the full asking price. That is simply a compromise you have to accept for the more compact case but it is something potential buyers should be aware of.
The vapor chamber increases the weight compared to conventional cooling (models up to RTX 4070 laptop) by around 100 grams and is somewhat louder in both the Quiet and Performance energy profiles. Both configurations are only indistinguishable from one another in the Turbo mode. Effectively, this means you should wear headphones when gaming.
With the ROG Zephyrus G16, Asus is offering a very compact, 16-inch laptop with the GeForce RTX 4090 laptop. However, good mobility demands compromises in terms of performance and other RTX 4090 models have advantages when it comes to gaming performance.
The Zephyrus G16’s other advantages and disadvantages also apply to the high-end configuration, including the wonderful speakers and brilliant, 240 Hz OLED panel. But, a big disadvantage is the soldered RAM and you don’t even get 64 GB of RAM in the $3,649, high-end variant.
Anyone on the hunt for maximum graphics performance in a potentially compact, 16-inch laptop will be well served by the ROG Zephyrus G16. However, you shouldn’t expect the same performance you would find in the heavier/larger competitors. If it’s all about pure gaming performance, models such as the XMG Neo 16 or the Alienware x16 R2 simply offer more power.
Price and availability
The ROG Zephyrus G16 with the Intel Core Ultra 9 185H and an Nvidia GeForce RTX 4090 laptop has an RRP of $3,649 and the device can currently be purchased on Amazon.
Note: We have recently updated our rating system and the results of version 8 are not comparable with the results of version 7. More information is available here .
Asus ROG Zephyrus G16 GU605MY
- 07/12/2024 v8
Andreas Osthoff
 Total Sustainability Score:
 Transparency
The selection of devices to be reviewed is made by our editorial team. The test sample was provided to the author as a loan by the manufacturer or retailer for the purpose of this review. The lender had no influence on this review, nor did the manufacturer receive a copy of this review before publication. There was no obligation to publish this review. As an independent media company, Notebookcheck is not subjected to the authority of manufacturers, retailers or publishers.
This is how Notebookcheck is testing
Every year, Notebookcheck independently reviews hundreds of laptops and smartphones using standardized procedures to ensure that all results are comparable. We have continuously developed our test methods for around 20 years and set industry standards in the process. In our test labs, high-quality measuring equipment is utilized by experienced technicians and editors. These tests involve a multi-stage validation process. Our complex rating system is based on hundreds of well-founded measurements and benchmarks, which maintains objectivity. Further information on our test methods can be found here.
Price comparison

