Asus TUF Gaming A16 Review: Cool, quiet, and affordable gaming laptop with a prominent but workable weakness
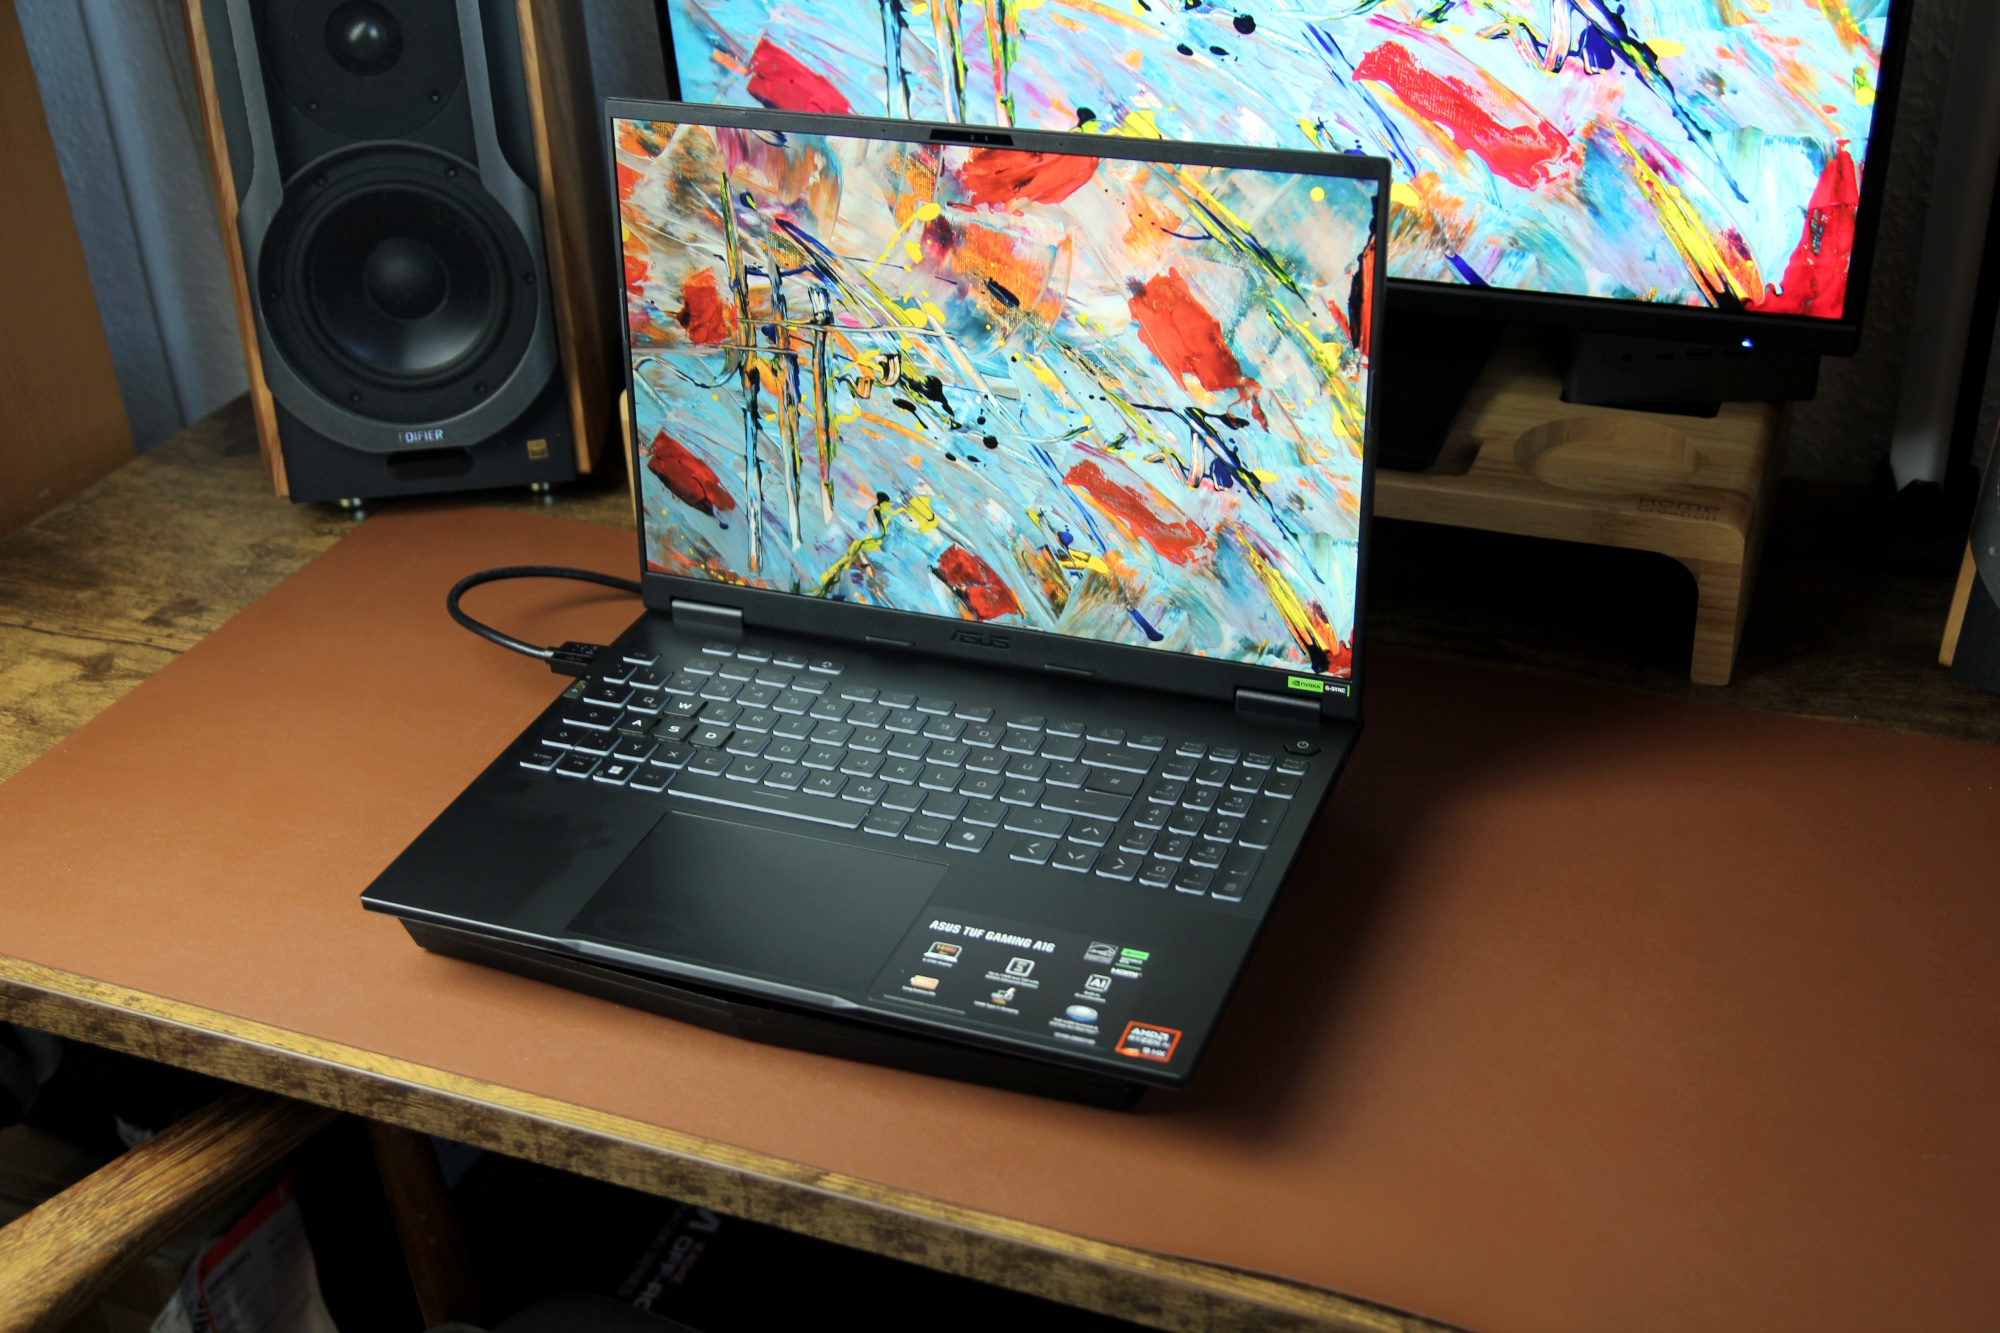
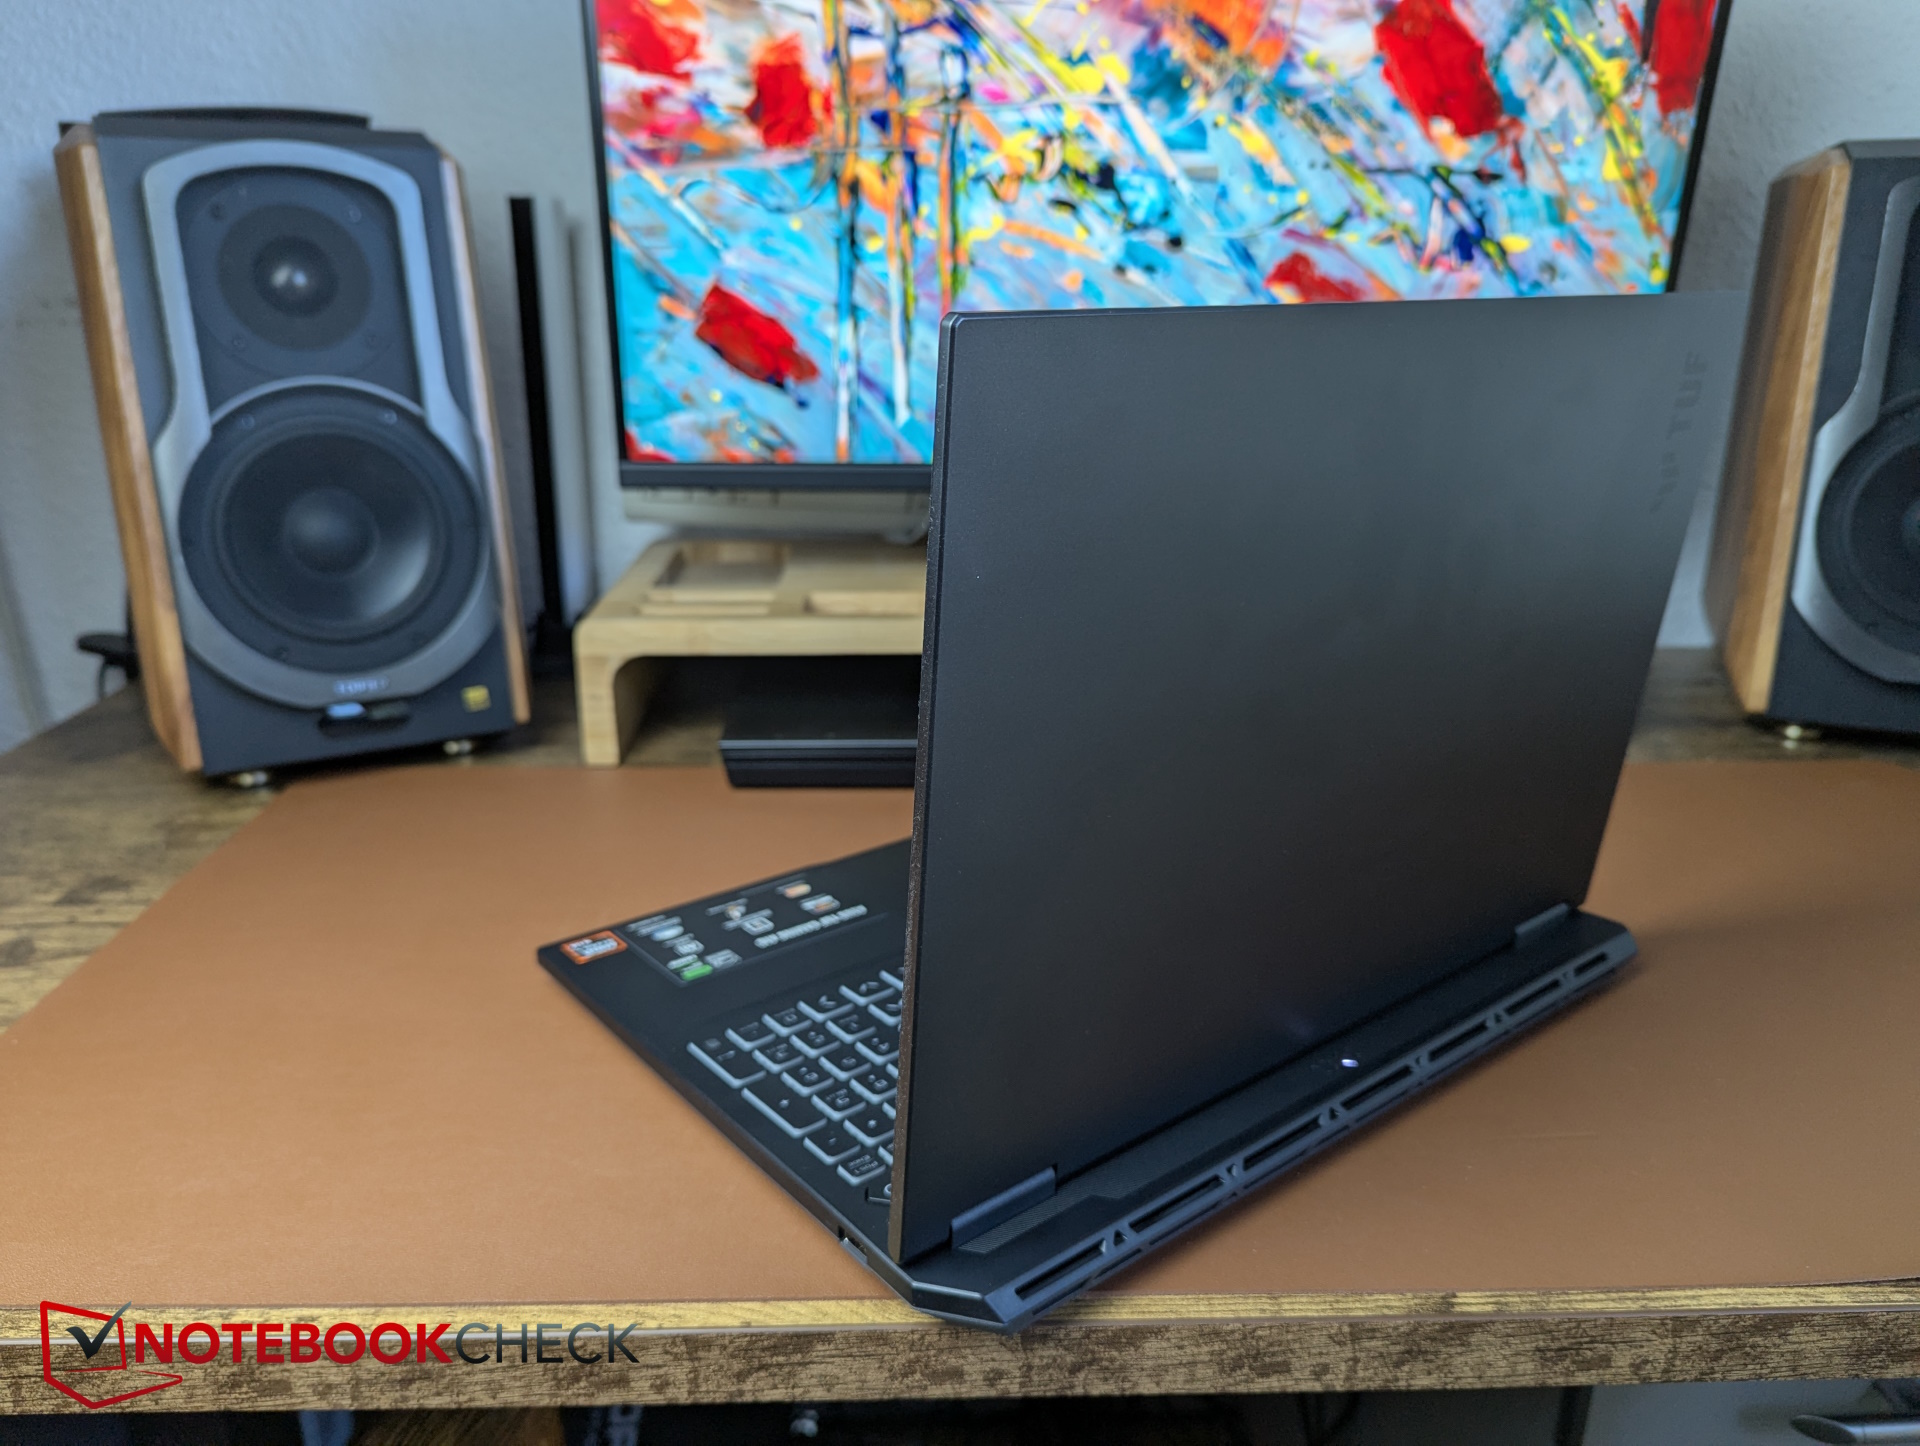
Hints of Alienware.
A Ryzen AI 9 HX 370 plus an RTX 4060, and a 144 Hz display with 1,200p resolution are the primary draws for the Asus TUF Gaming A16. We test this relatively affordable 16-inch gaming laptop and take a look at its performance against the competition.Christian Hintze, 👁 Christian Hintze, ✓ Vaidyanathan Subramaniam (translated by DeepL / Ninh Duy) Published 🇩🇪 🇫🇷 ...
Verdict: Inexpensive gaming laptop with long battery runtimes
The Asus TUF Gaming A16's redesigned case has proven effective, keeping the laptop relatively cool and quiet—unless Turbo mode is enabled.
Overall, the TUF Gaming A16 gets a lot right. However, when it comes to the display, it is best to avoid the cheaper model with inaccurate colors and opt for the slightly more expensive 1,600p panel instead.
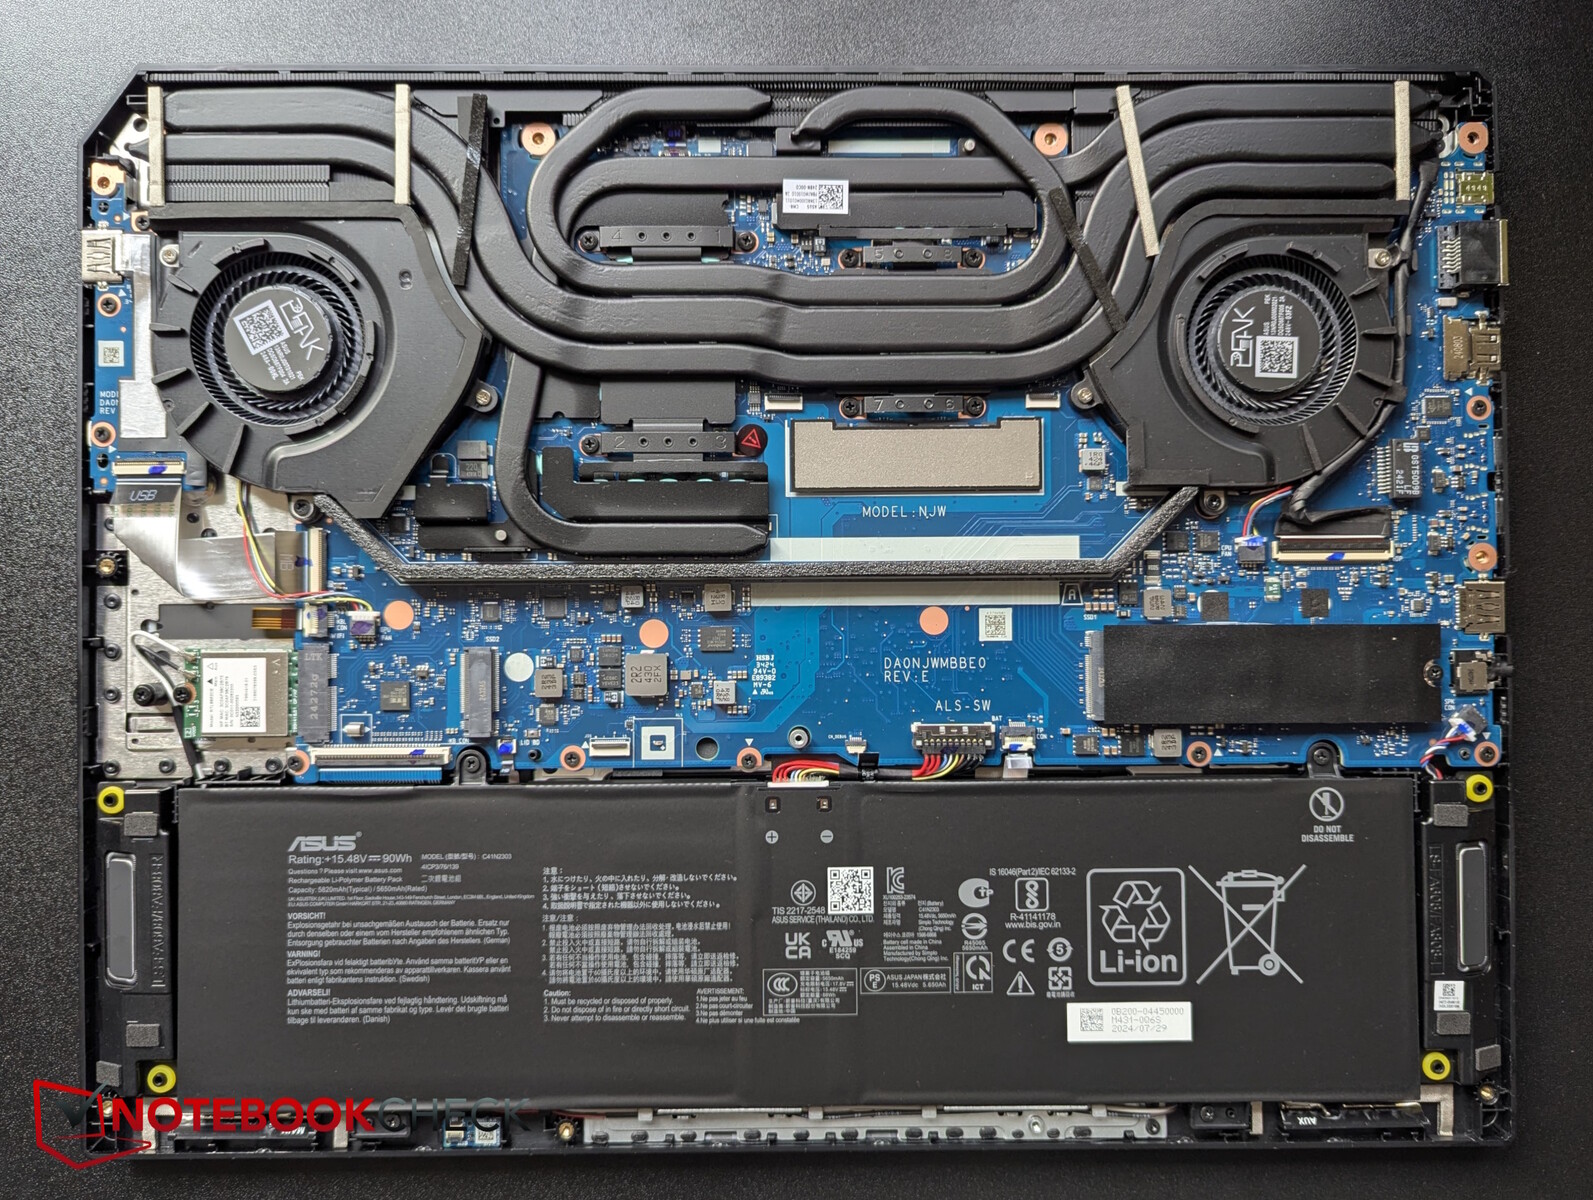
Unfortunately, the 16 GB RAM is soldered in, making upgrades impossible which is a huge drawback considering this is a gaming laptop.
Pros
Cons
Price and Availability
In Germany, our partner Alternate is selling the TUF Gaming A16 for €1,399.
The Asus TUF Gaming A16 with a 165 Hz 2.5K display can be had on Amazon.com for $1,399.99. A variant of the TUF Gaming A16 with RTX 4070 and 32 GB LPDDR5X RAM is also available on Amazon.com for $1,699.99.
Potential competitors in comparison
Image | Model / Review | Price | Weight | Height | Display |
|---|---|---|---|---|---|
1. 83%  | Asus TUF Gaming A16 FA608WV AMD Ryzen AI 9 HX 370 ⎘ NVIDIA GeForce RTX 4060 Laptop GPU ⎘ 16 GB Memory, 1024 GB SSD | Amazon: List Price: 1399 Euro | 2.2 kg | 25.7 mm | 16.00" 1920x1200 142 PPI IPS |
2. 82.3%  | Lenovo Legion Pro 5 16IRX9 G9 Intel Core i7-14700HX ⎘ NVIDIA GeForce RTX 4060 Laptop GPU ⎘ 32 GB Memory, 1024 GB SSD | Amazon: List Price: 1.432 Euro | 2.5 kg | 26.55 mm | 16.00" 2560x1600 189 PPI IPS |
3. 85.5% v7 (old)  | Dell G16, i7-13650HX, RTX 4060 Intel Core i7-13650HX ⎘ NVIDIA GeForce RTX 4060 Laptop GPU ⎘ 16 GB Memory, 1024 GB SSD | Amazon: List Price: 1.599 Euro | 2.8 kg | 25.65 mm | 16.00" 2560x1600 189 PPI IPS |
4. 84.3% v7 (old)  | HP Victus 16 (2024) Intel Core i7-14700HX ⎘ NVIDIA GeForce RTX 4060 Laptop GPU ⎘ 16 GB Memory, 512 GB SSD | Amazon: List Price: 1499 Euro | 2.4 kg | 23.9 mm | 16.10" 1920x1080 137 PPI IPS |
5. 76.3%  | Acer Nitro V 16 ANV16-41-R5AT AMD Ryzen 7 8845HS ⎘ NVIDIA GeForce RTX 4060 Laptop GPU ⎘ 16 GB Memory, 1024 GB SSD | Amazon: List Price: 1100 EUR | 2.5 kg | 25.5 mm | 16.00" 1920x1200 142 PPI IPS |
6. 85.1%  | Lenovo ThinkBook 16p G5 IRX 21N50011GE Intel Core i9-14900HX ⎘ NVIDIA GeForce RTX 4060 Laptop GPU ⎘ 32 GB Memory, 1024 GB SSD | Amazon: List Price: 2120 Euro | 2.2 kg | 23.1 mm | 16.00" 3200x2000 236 PPI IPS LCD |
Table of Contents
- Verdict: Inexpensive gaming laptop with long battery runtimes
- Specifications
- Case and features: Asus TUF Gaming A16 gives Alienware feels
- Input devices: Gaming keyboard and larger touchpad
- Display: 1,200p panel with inaccurate colors
- Performance: Good combination of Ryzen AI 9 and RTX 4060
- Emissions and energy: Relatively quiet and cool TUF Gaming A16
- Notebookcheck overall rating
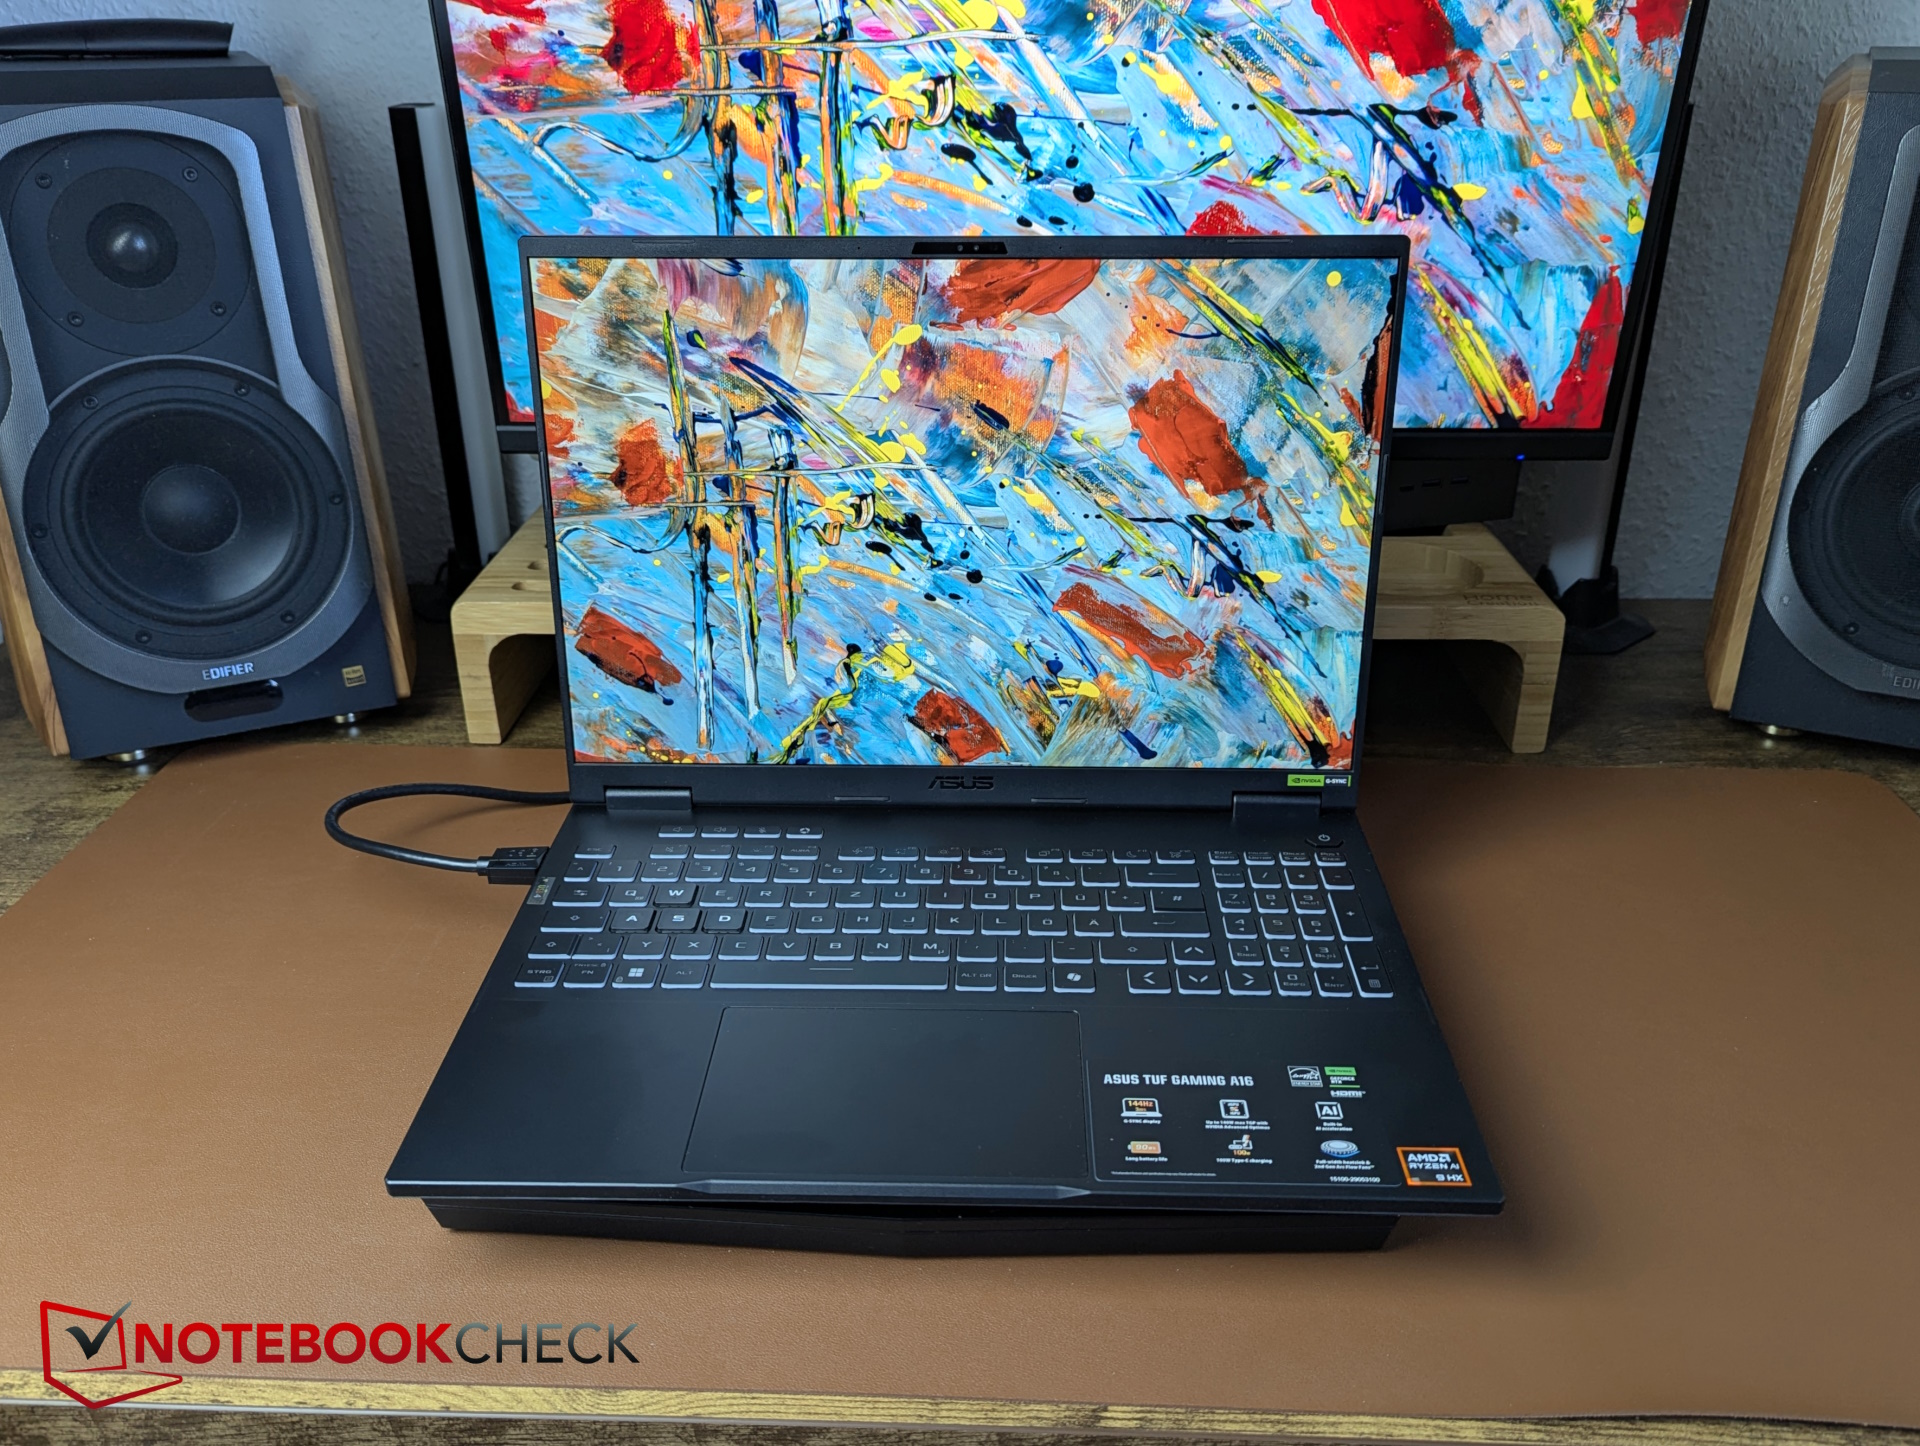
The Asus TUF series designed to cater to entry-level gamers. A lot has happened since last year's TUF Gaming A16. The chassis is now completely redesigned, interfaces updated, and the CPU and GPU replaced with the latest offerings from AMD and Nvidia.
There are two variants of the Asus TUF Gaming A16 — the FA608WI featuring the RTX 4070 Laptop GPU and a 1,600p display and our test unit FA608WV with the RTX 4060 Laptop GPU and a choice between the same 1,600p or, as in our case, a 1,200p display.
Specifications
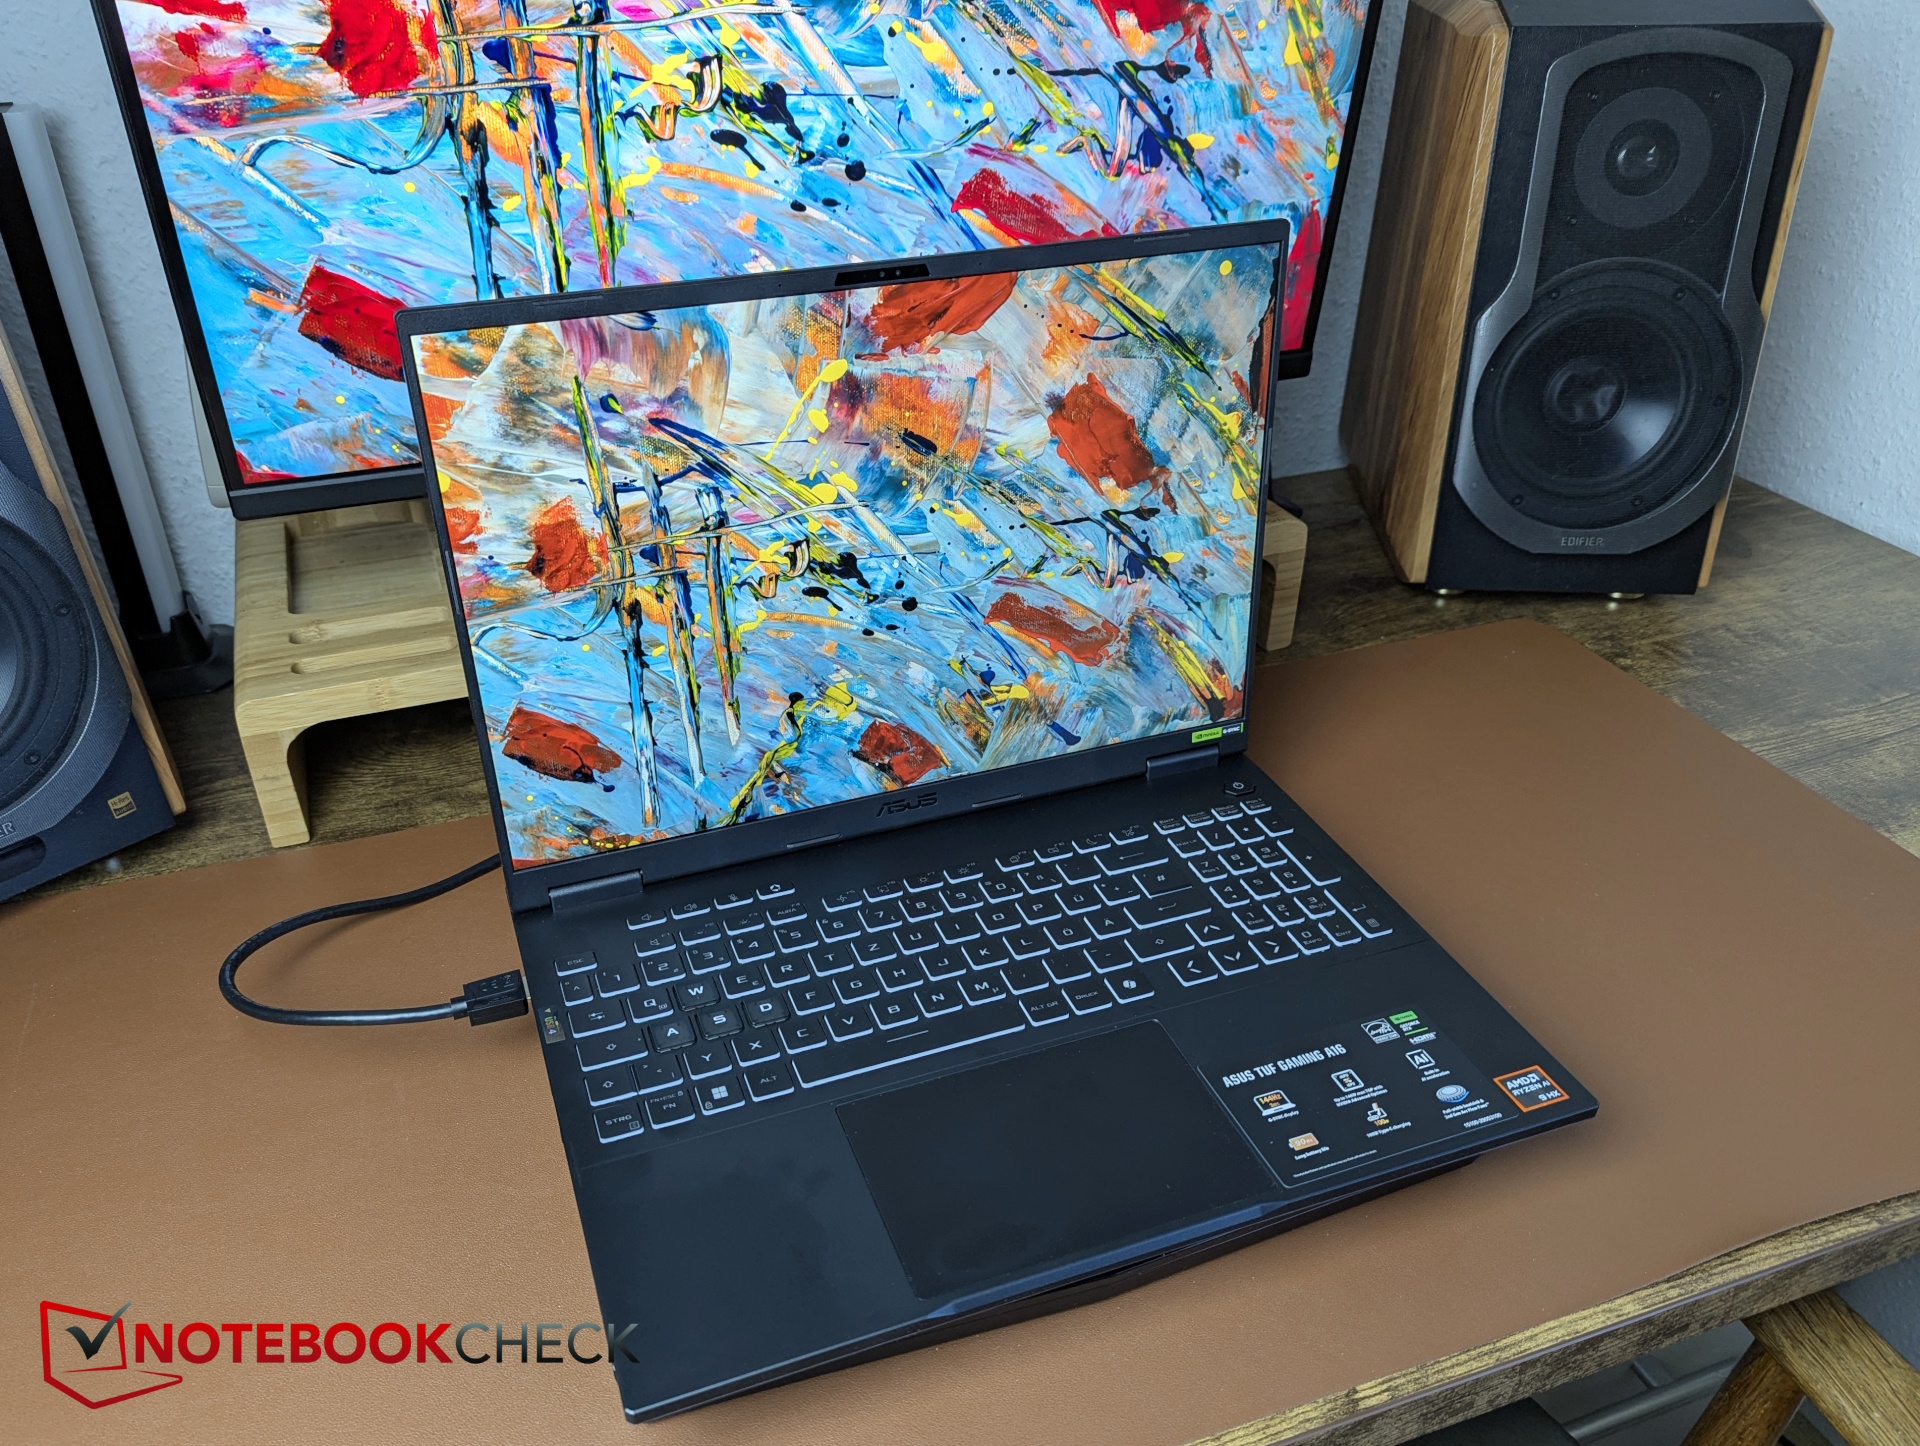
Case and features: Asus TUF Gaming A16 gives Alienware feels
Thanks to the redesign, the TUF Gaming A16 now has a cooling system that protrudes slightly to the rear similar to the Alienware models or the Dell G16 (2024), although this is somewhat more subtle on the A16.
As a result, the TUF Gaming A16 has noticeably smaller dimensions, while the aforementioned G16 is larger. The black plastic housing with a 180° cover is quite stable thanks to the laptop's many military certifications.
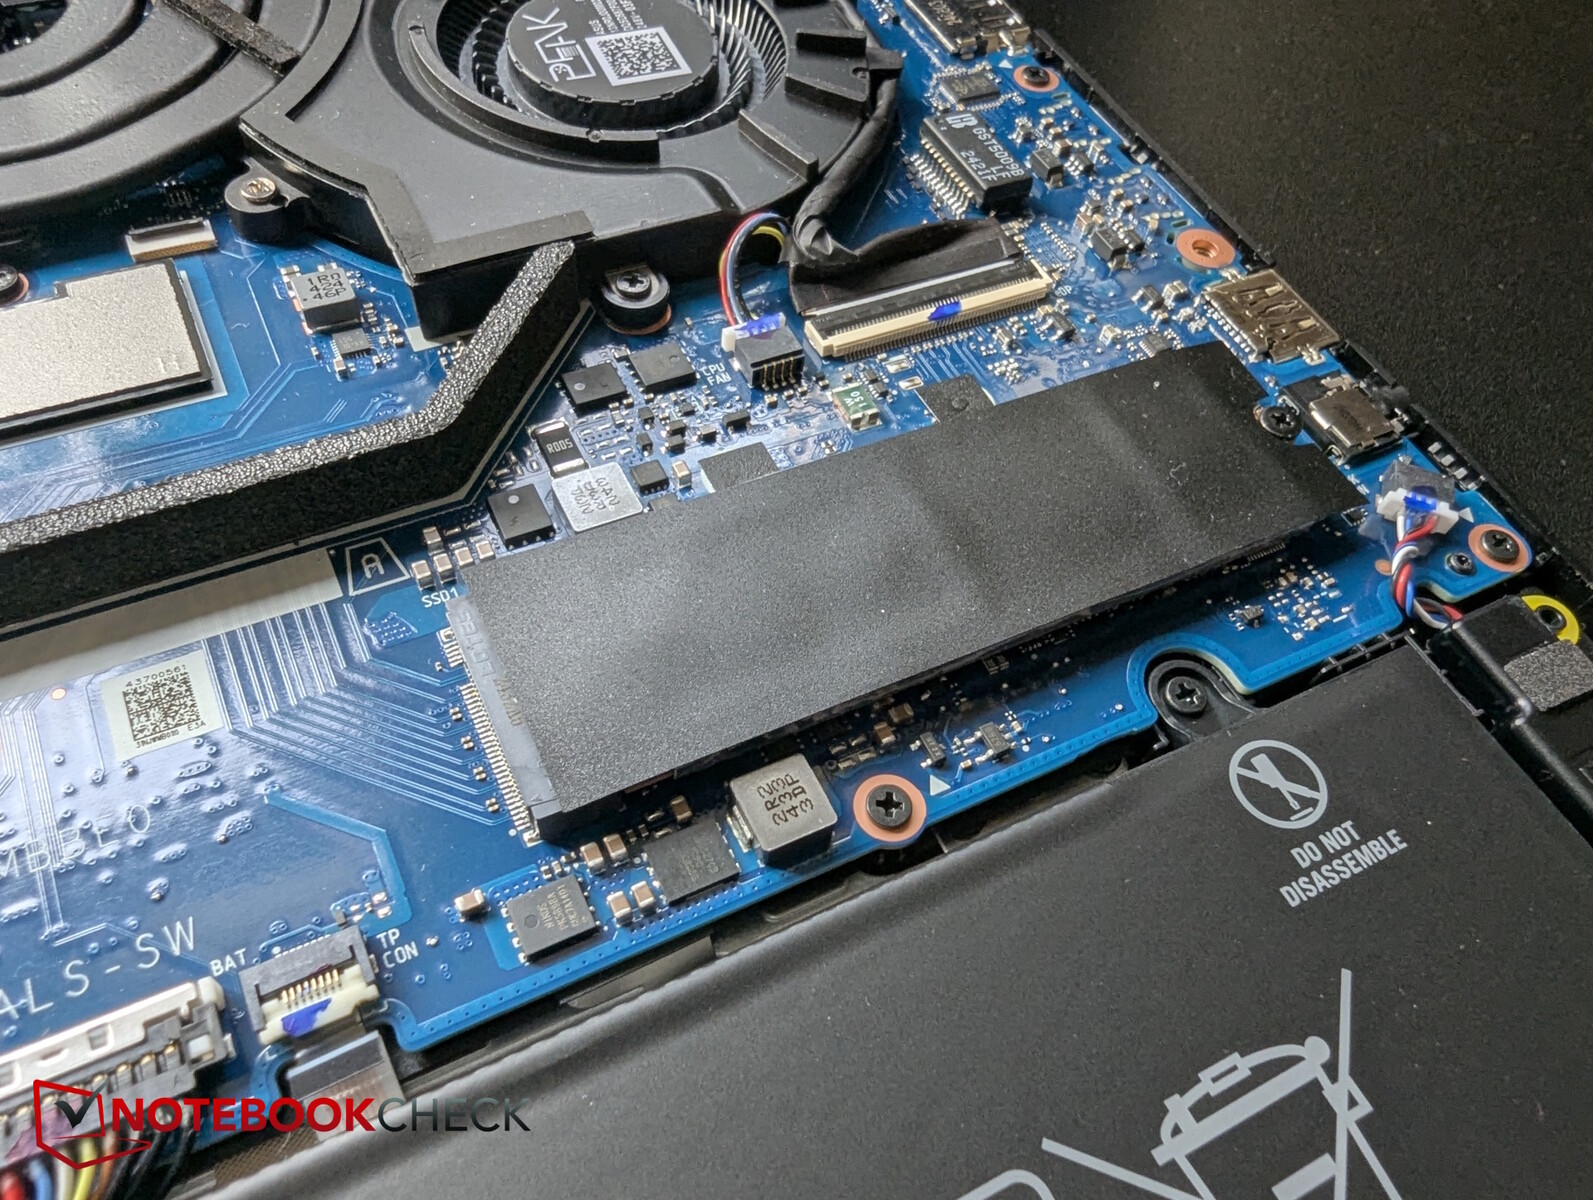
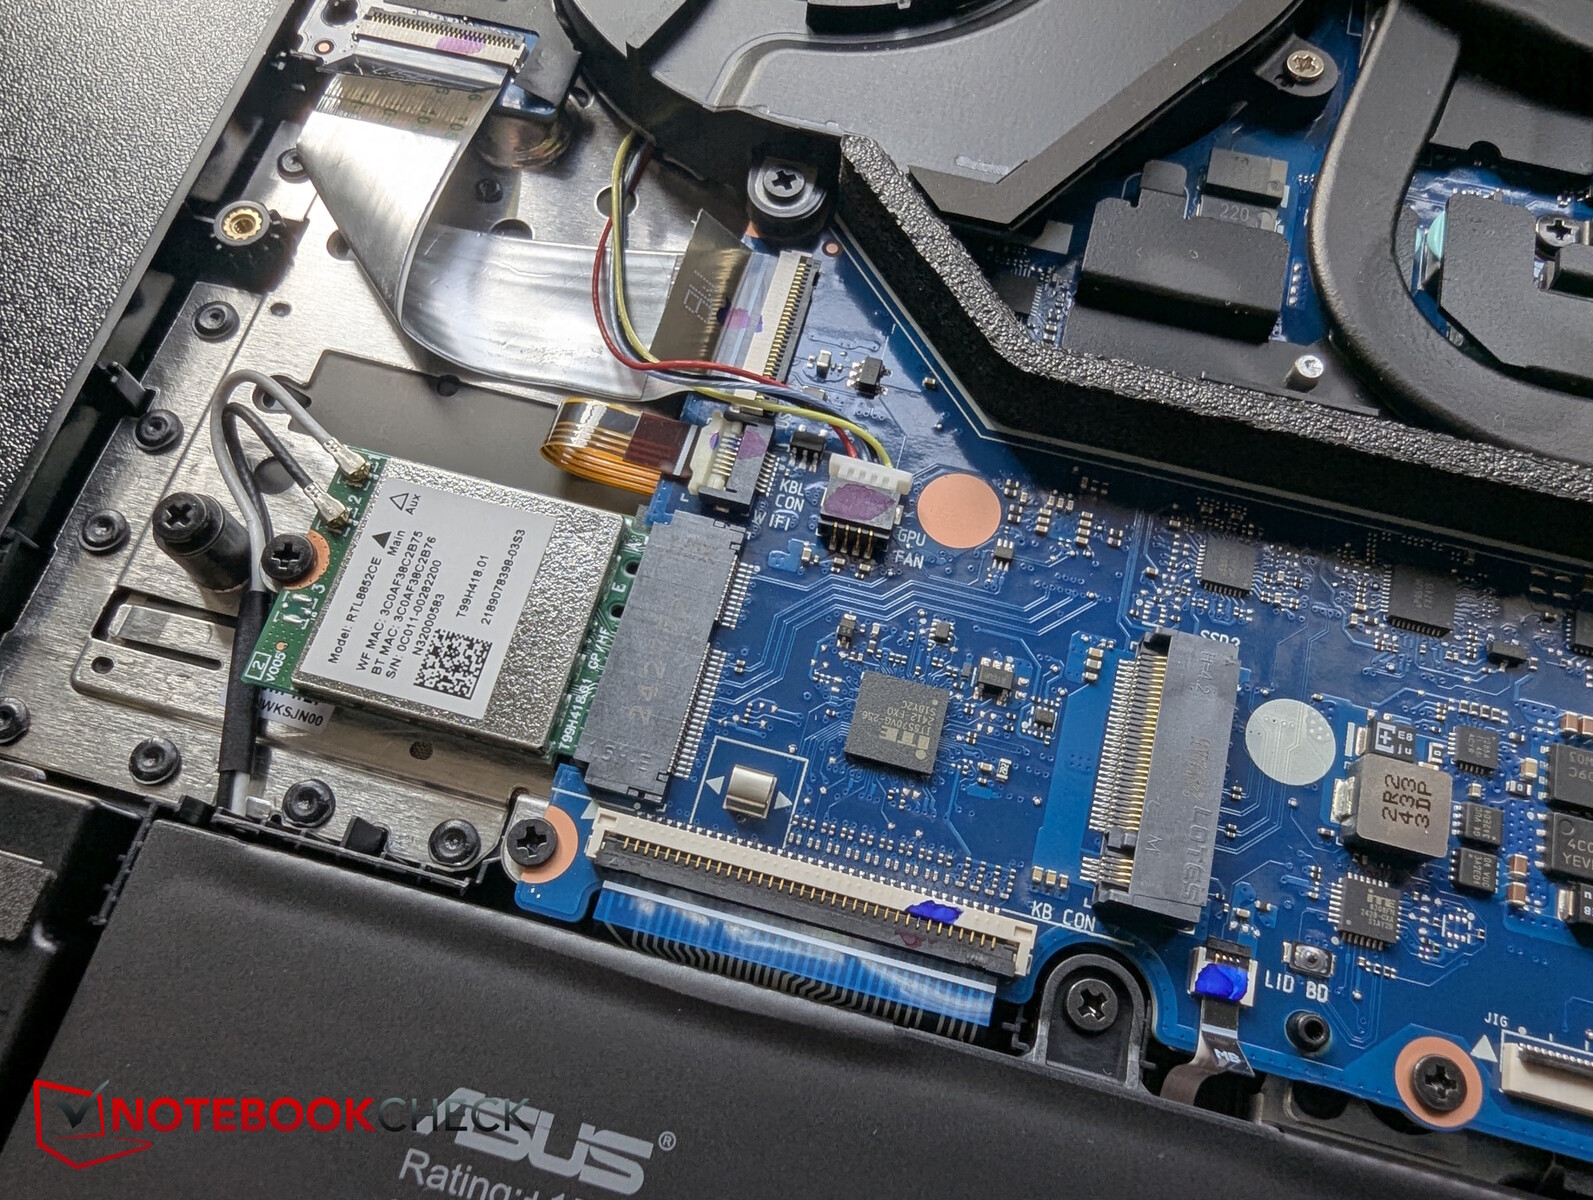
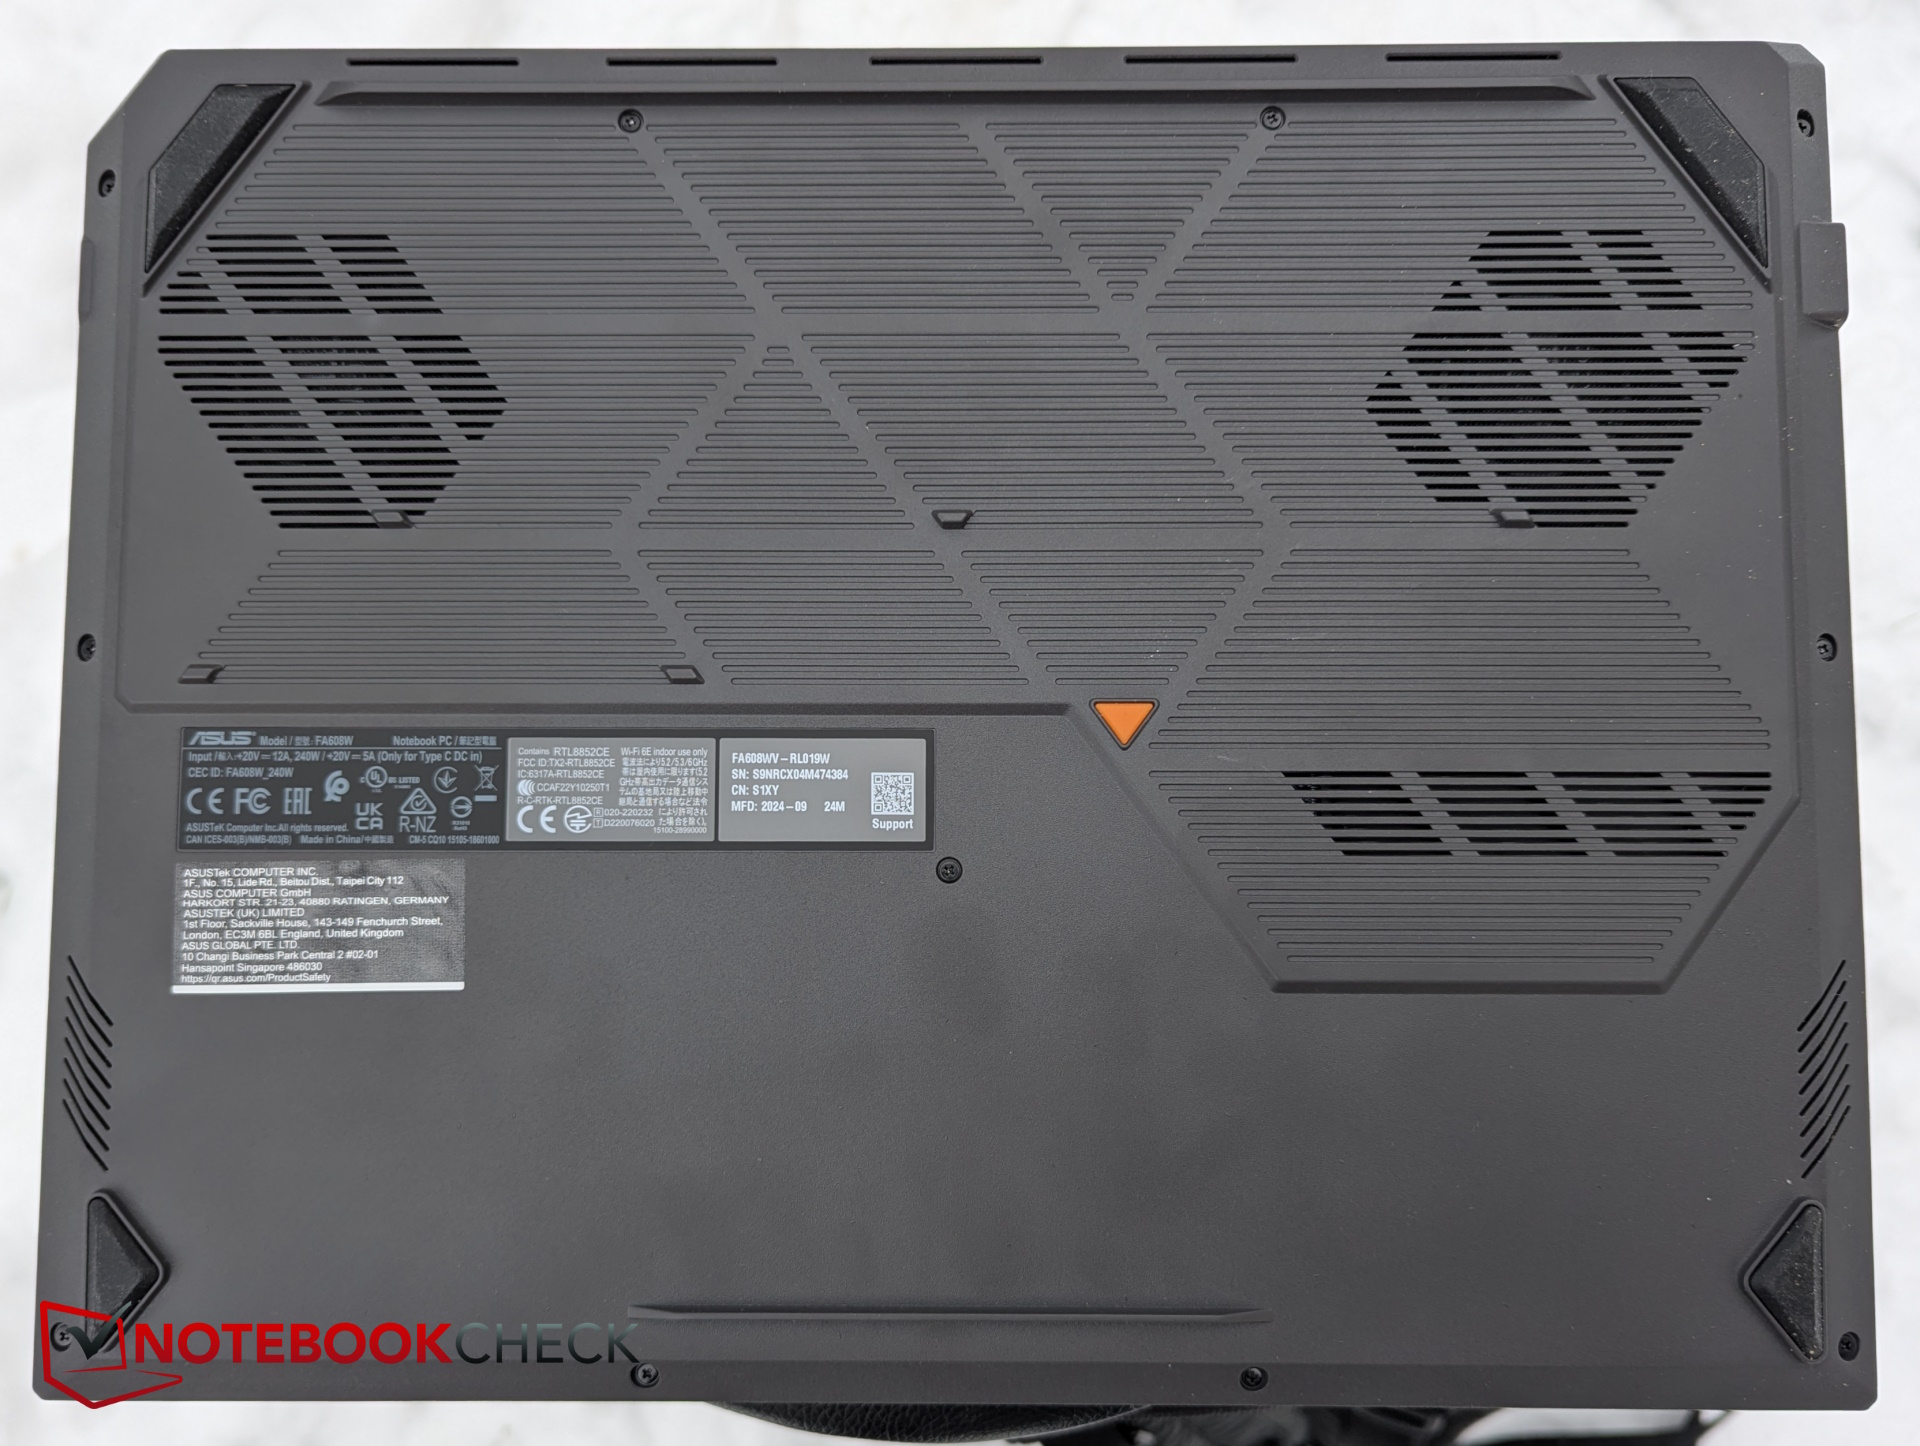
11 Phillips screws in three different lengths secure the underside. Inside, there are two M.2 SSD slots and a replaceable Wi-Fi module.
However, we miss an upgrade option for the RAM. The RAM is permanently installed, a rather impractical solution for a gaming laptop.
The Full HD webcam does not have a physical shutter and has to contend with large color deviations in the blue and red shades, generally with noise and therefore with blurring as well.
The Wi-Fi transmission rates, on the other hand, are comparatively high in both the 6 GHz and 5 GHz networks and score with consistent wireless performance without throughput drops.
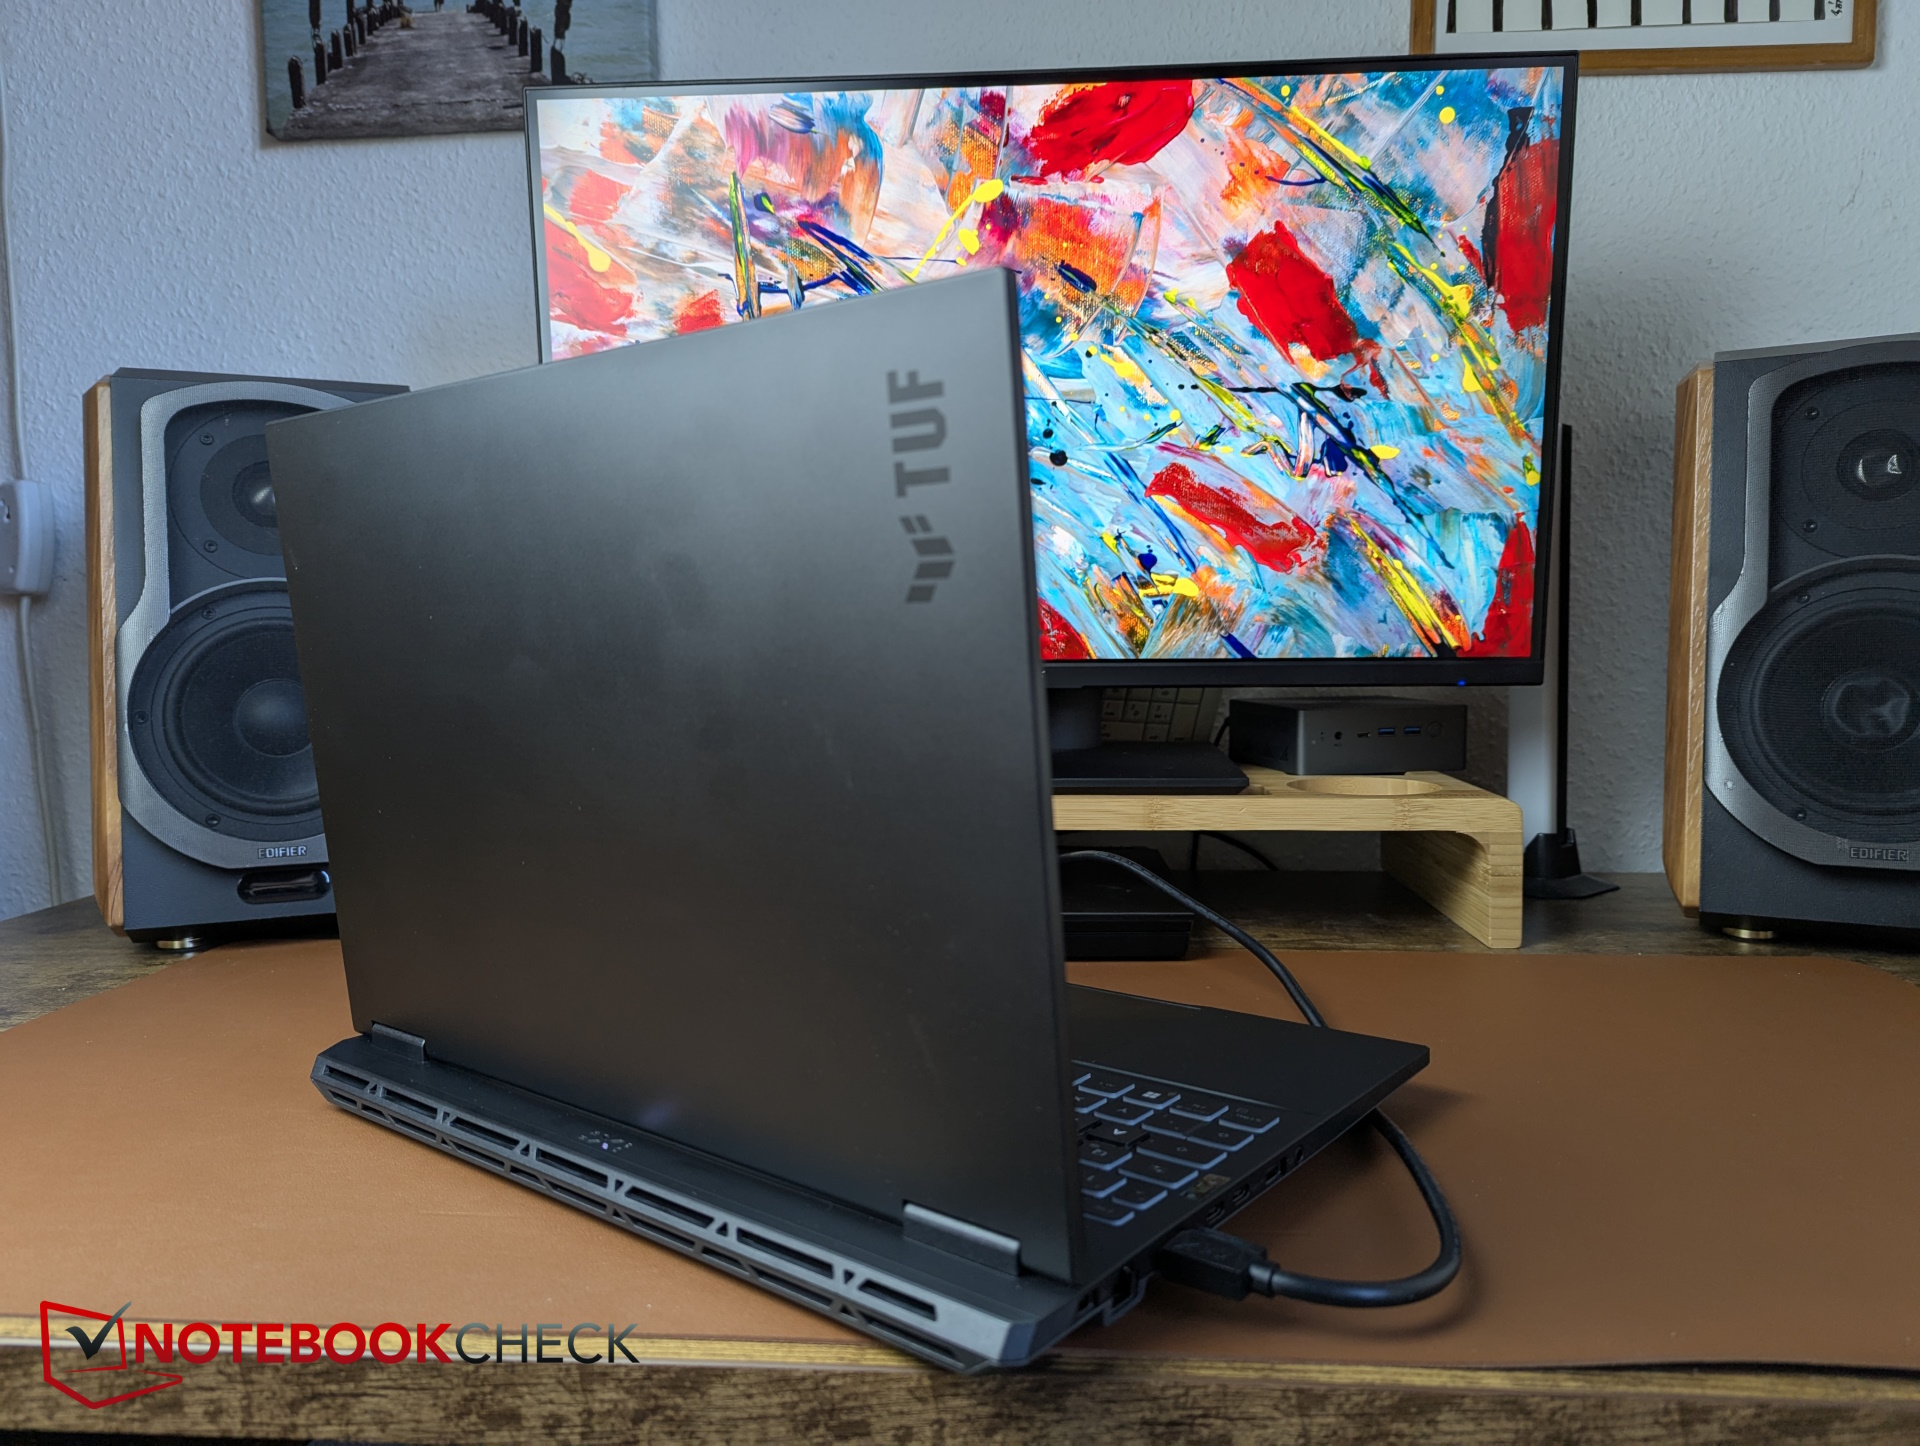
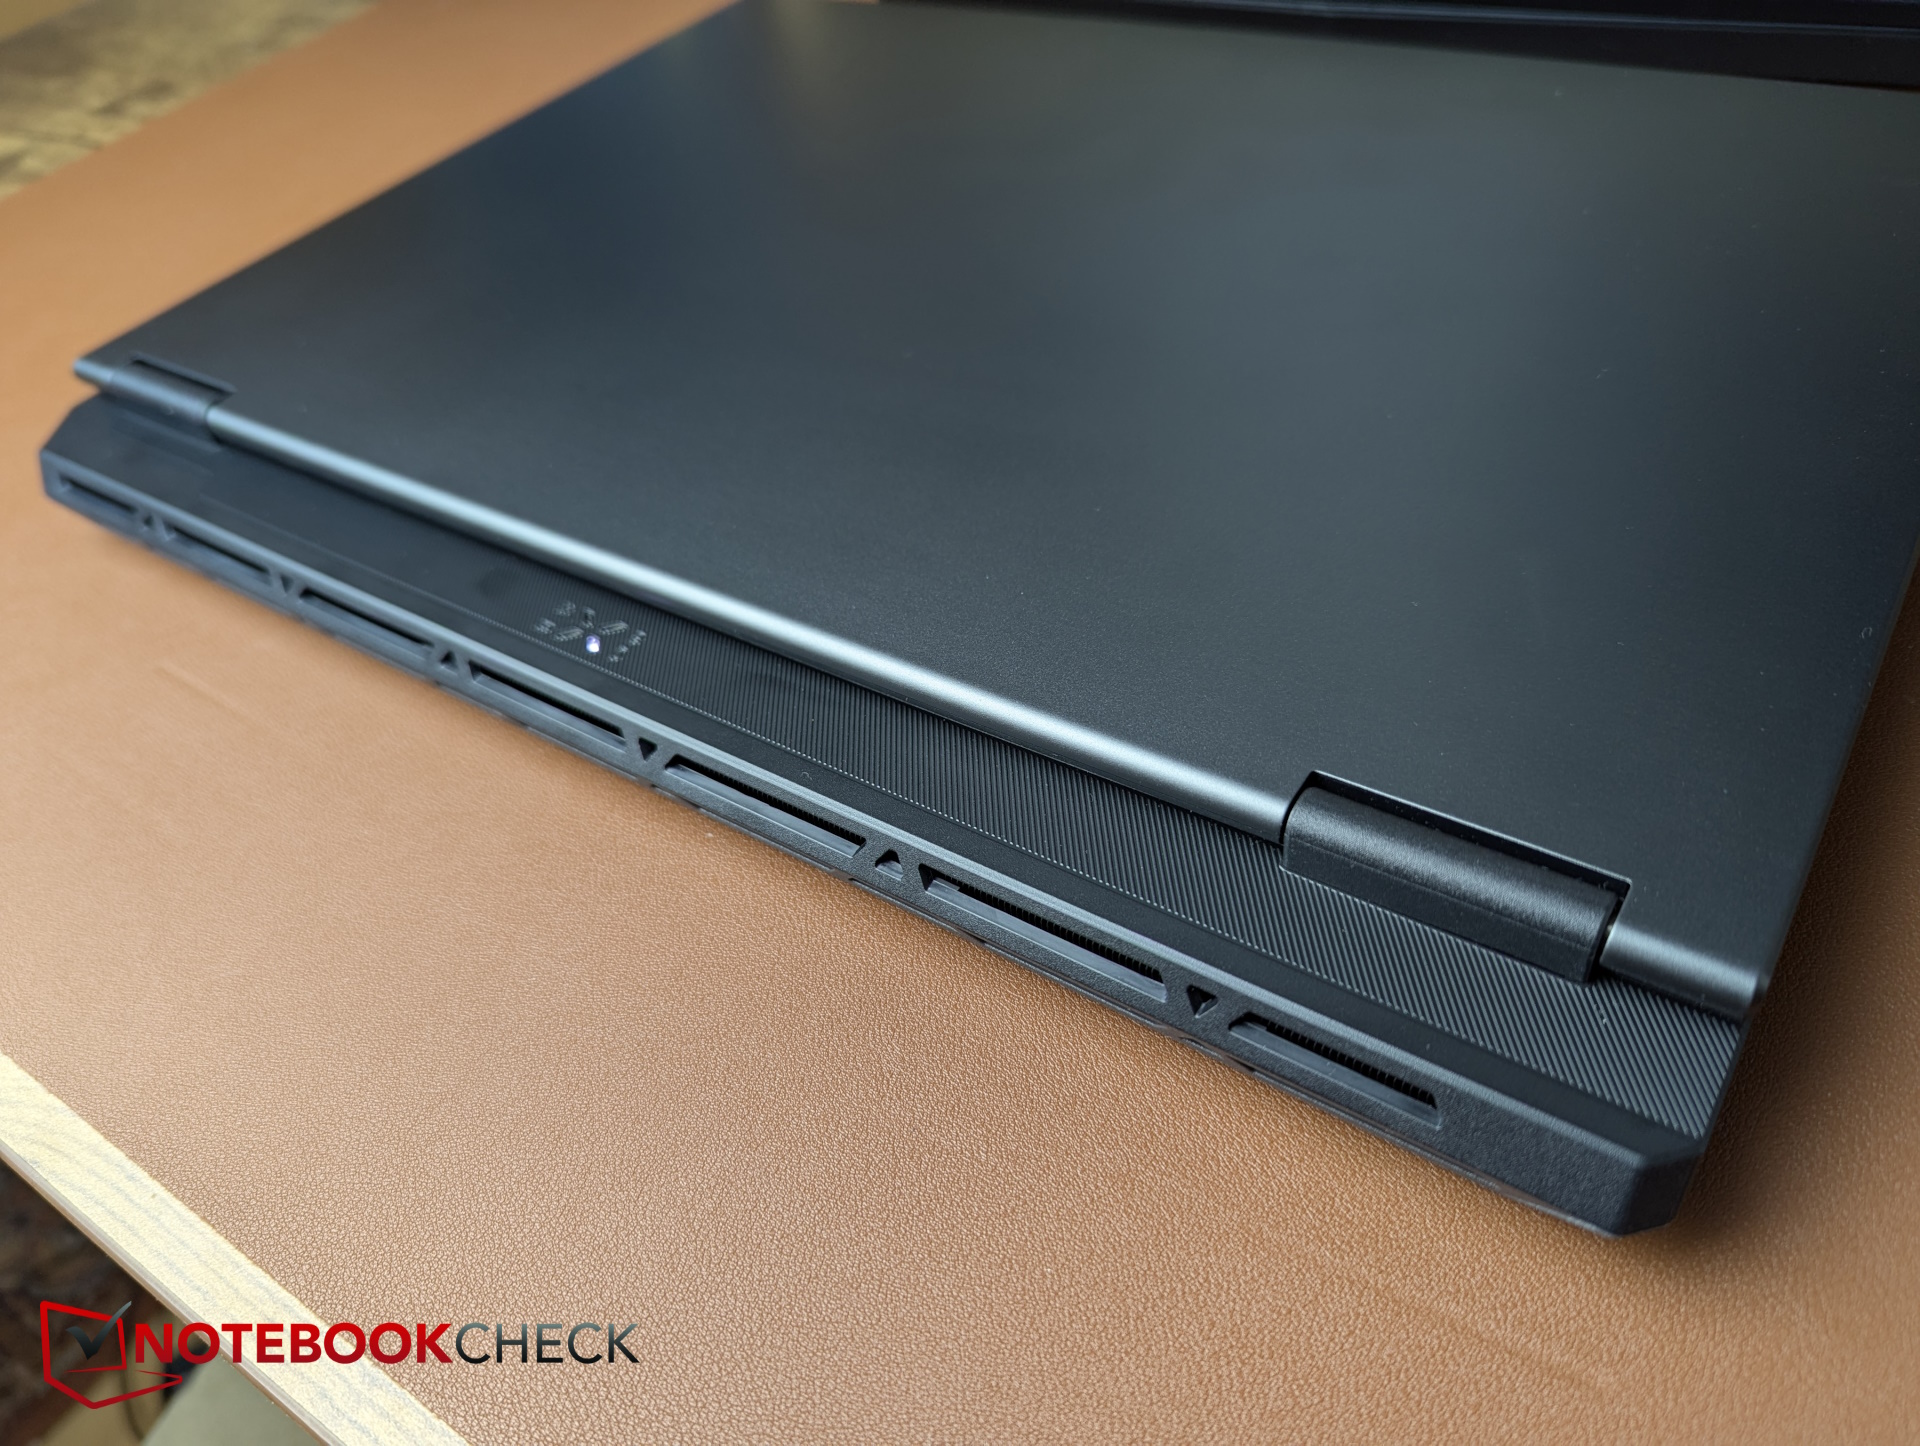
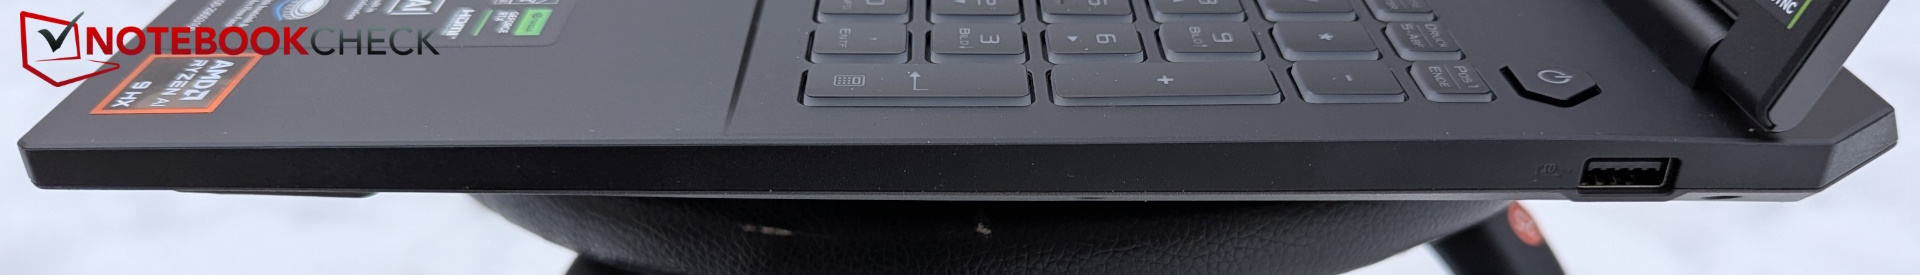
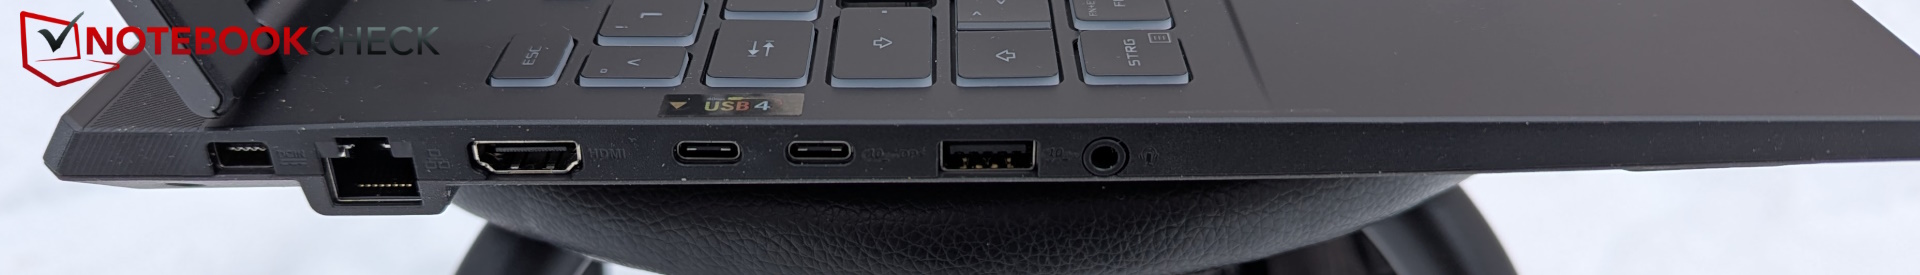
Almost all the ports have been moved to the left side, with only a single USB Type-A on the right. This can make things a bit cramped on the left side, but only the USB-A slot and the headphone jack further forward could get in each other's way with larger plugs.
Of the two adjacent USB-C slots, only the first one supports USB4, while the one after only supports USB 3.2 Gen2 and DisplayPort 1.4-out instead of 2.1 but offers 100 W power delivery.


Sustainability
Asus states that they are Energy Star and EPEAT compliant. In addition, the packaging of the TUF Gaming A16 is largely made of cardboard and paper.
Asus does not provide any information about the specific CO2 footprint of the A16 or whether recycled materials are used in the device's construction.
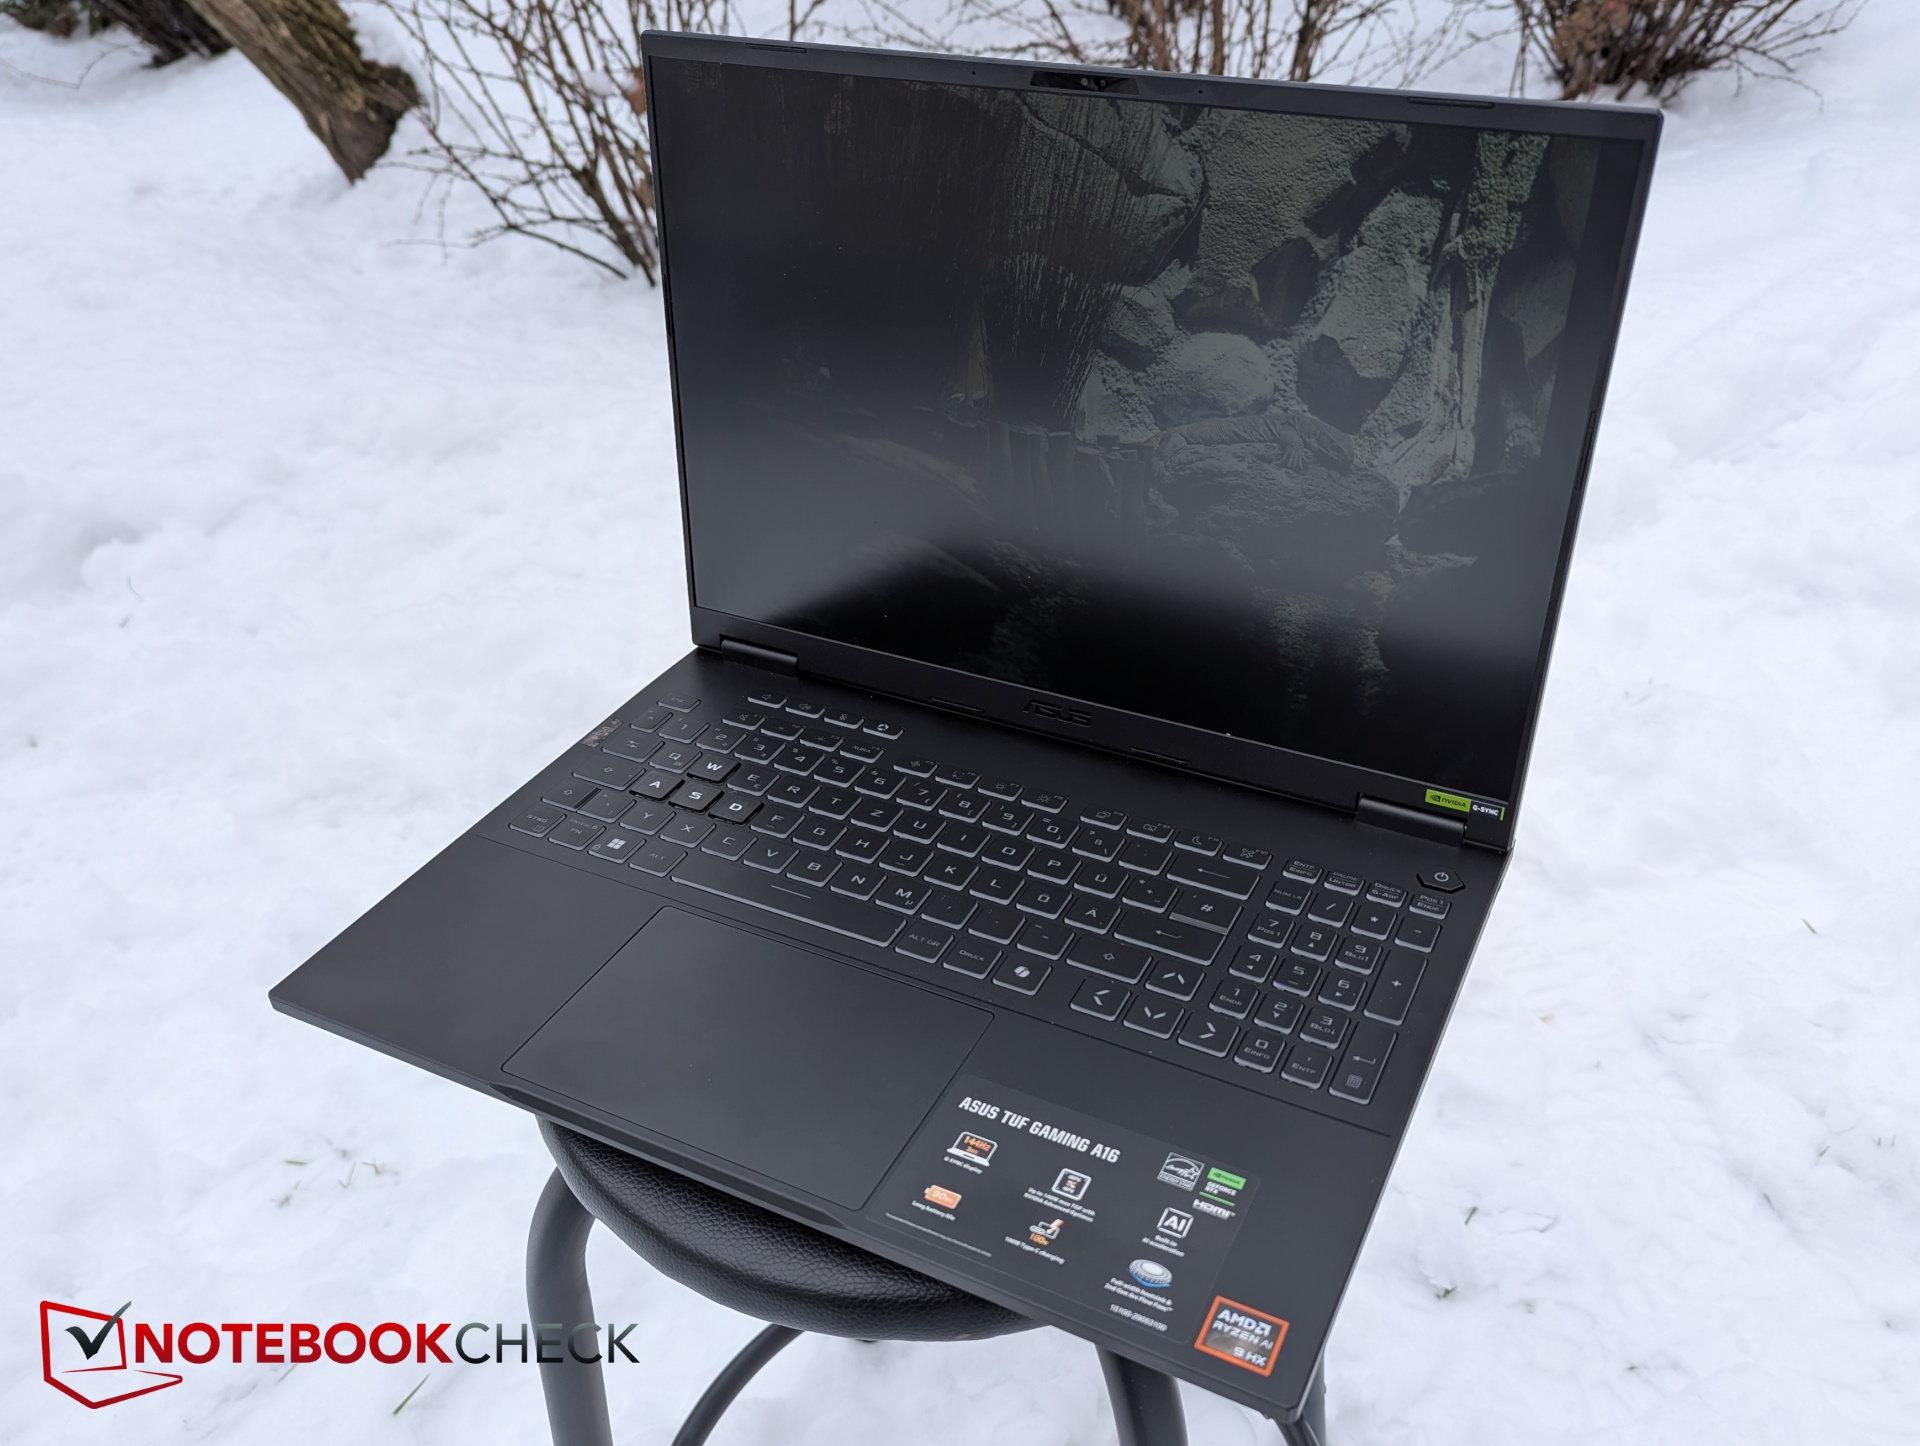
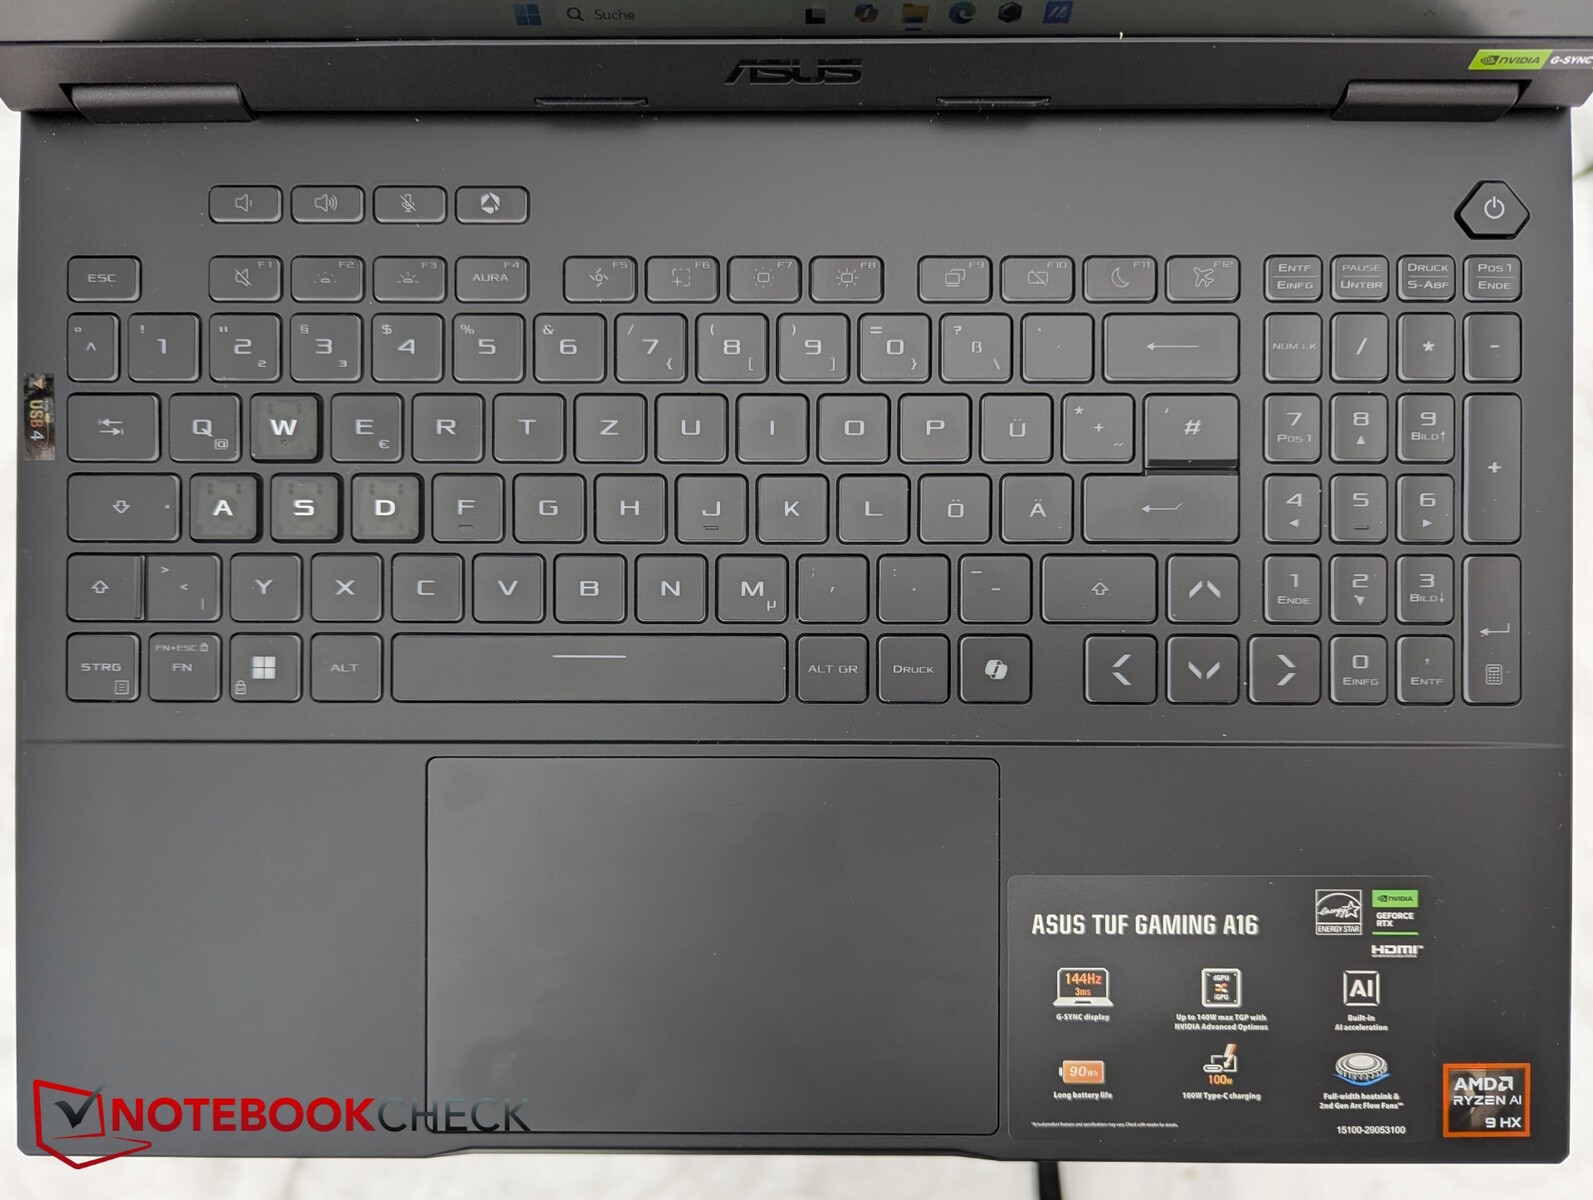
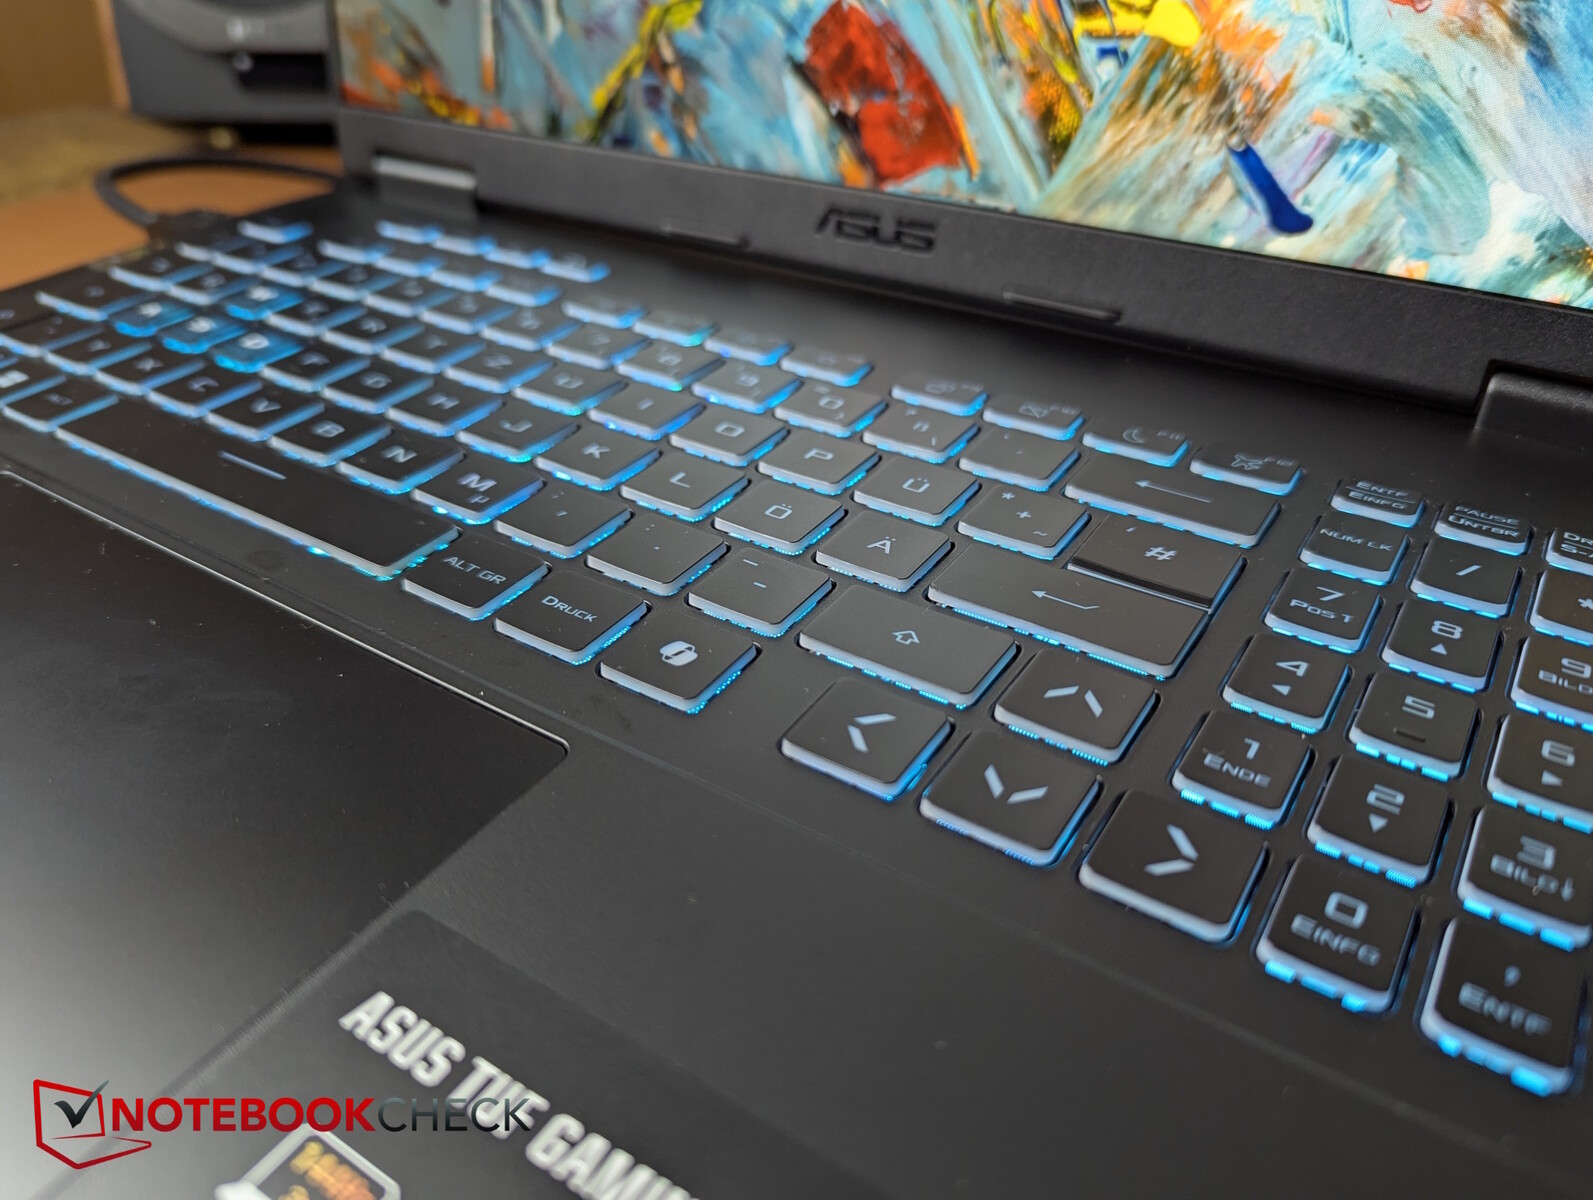
Input devices: Gaming keyboard and larger touchpad
The four special keys (volume down/up, mic mute, and Armory Crate) and the full-format arrow keys are back. In addition, there is now a dedicated Copilot key. Asus claims that the latency of key actuation has been improved by 17%.
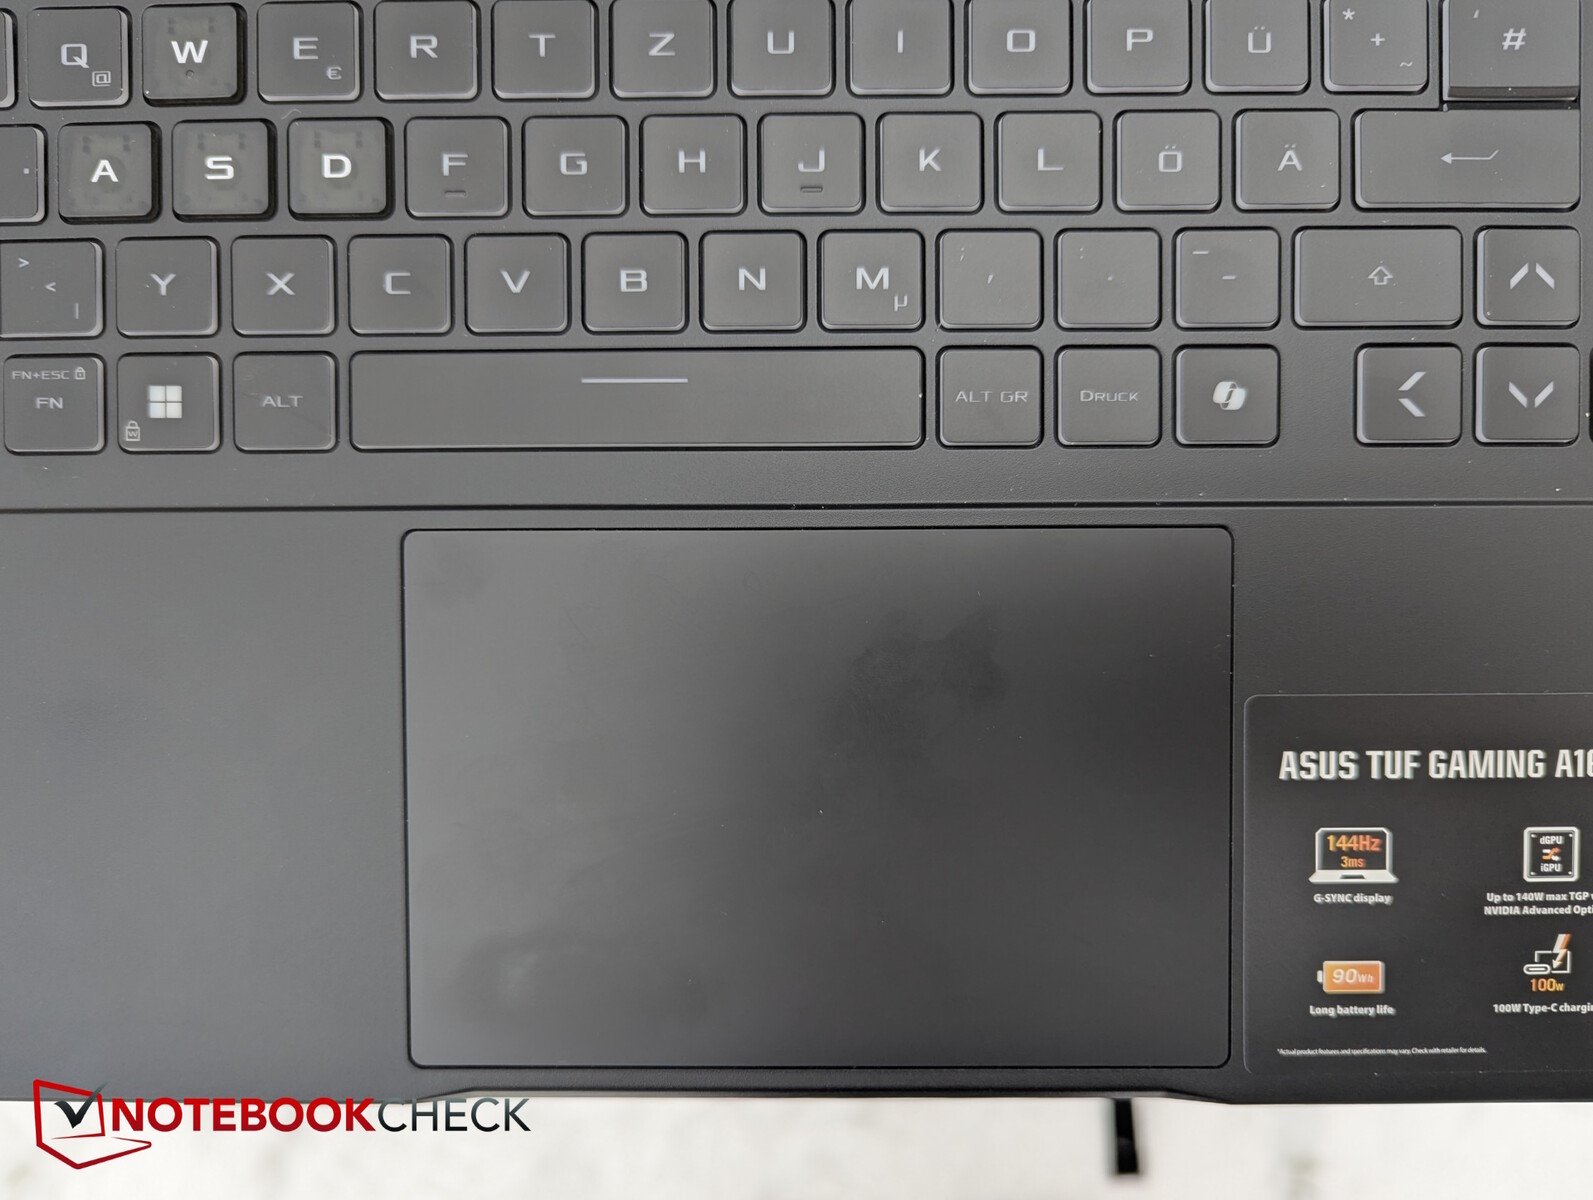
Asus specifies a key travel of 1.7 mm. The feedback is clearly noticeable, and the keystroke noise is moderate. As is usually the case with Asus gaming laptops, the WASD keys are visually highlighted, but the rest of the lettering is a little too dark with their thin gray coloring. A single RGB backlight helps in low-light situations.
The slippery touchpad surface has been enlarged by 10%, so there is now more space for gestures. The clicks trigger reliably and have good feedback, and their noise remains moderate.

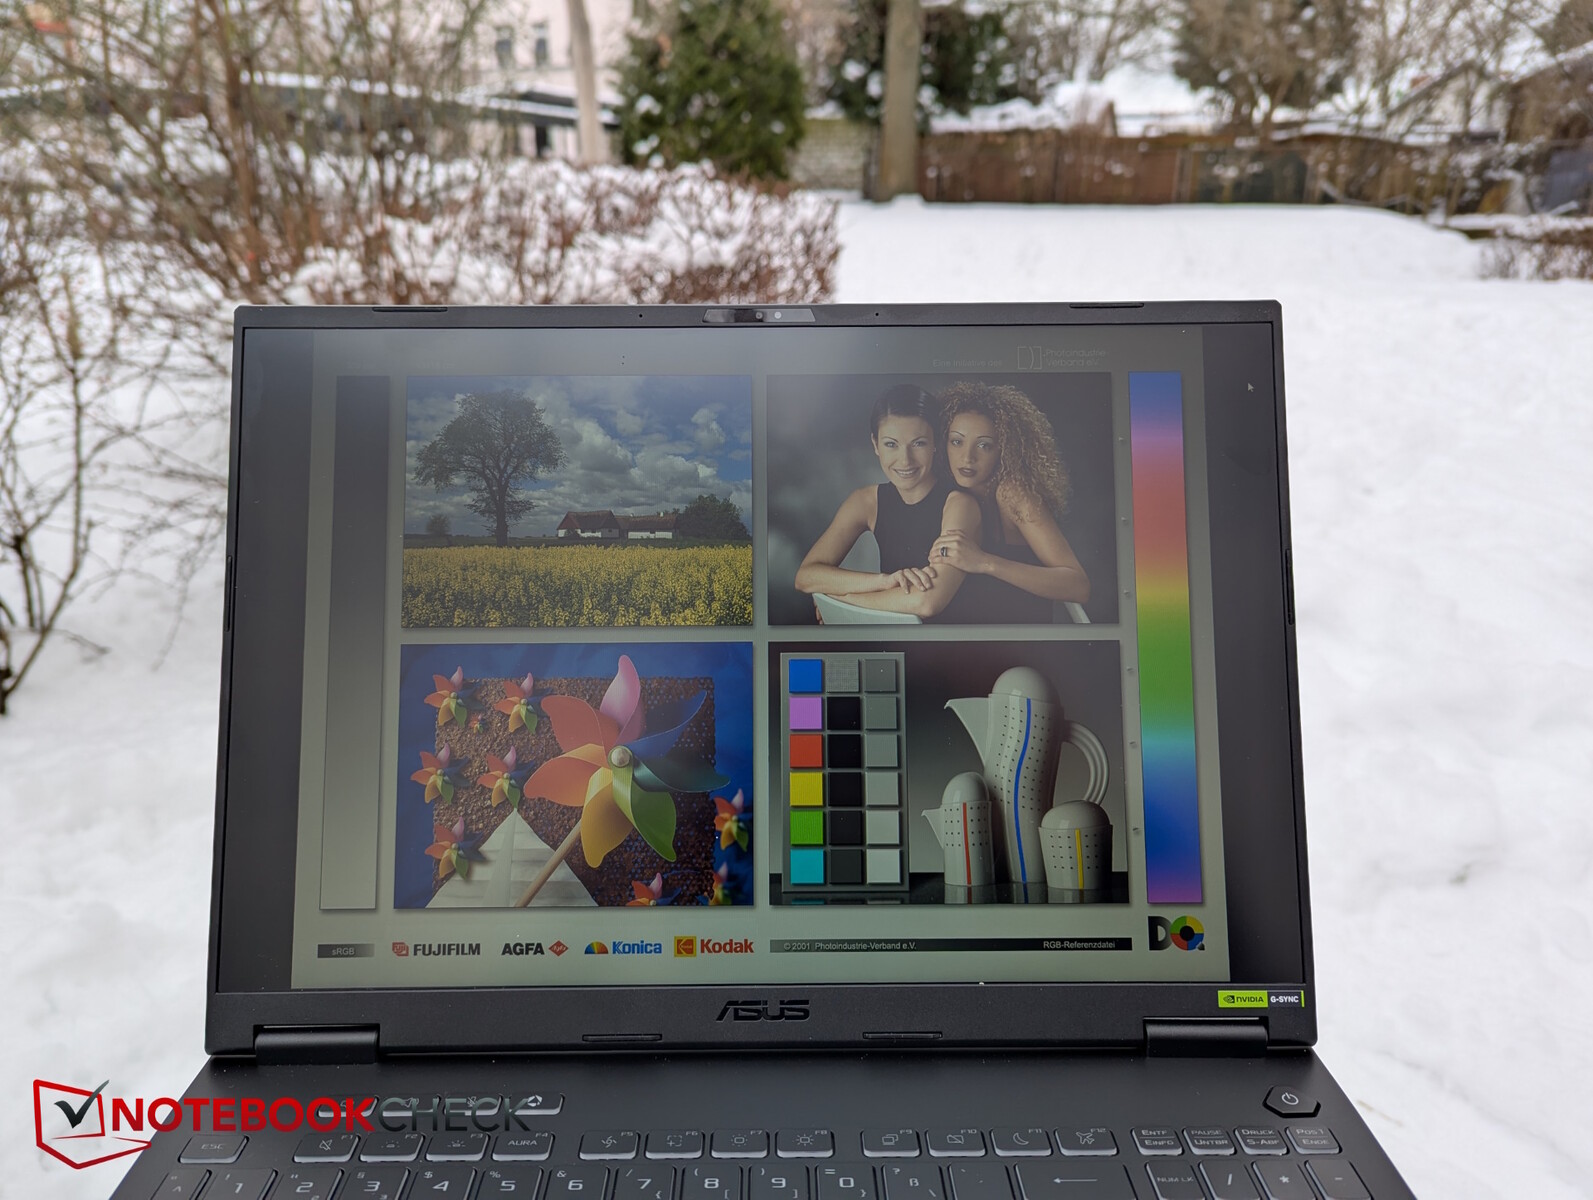
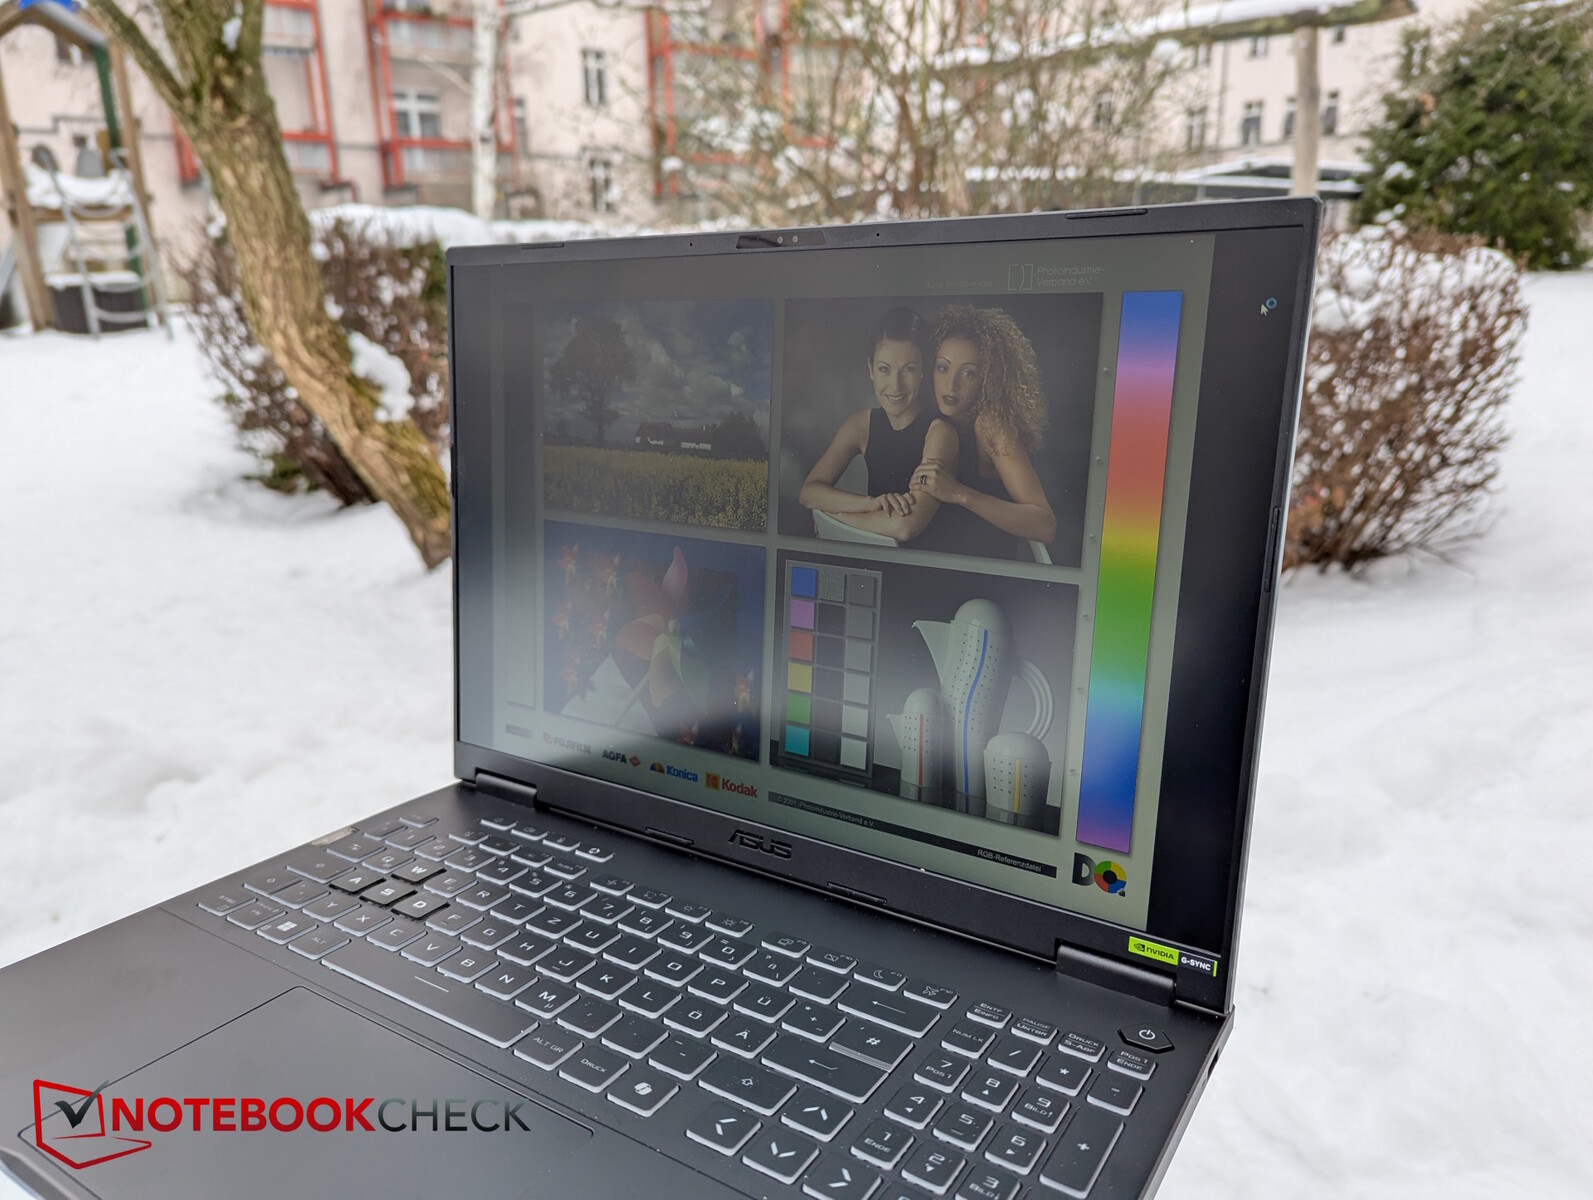
Display: 1,200p panel with inaccurate colors

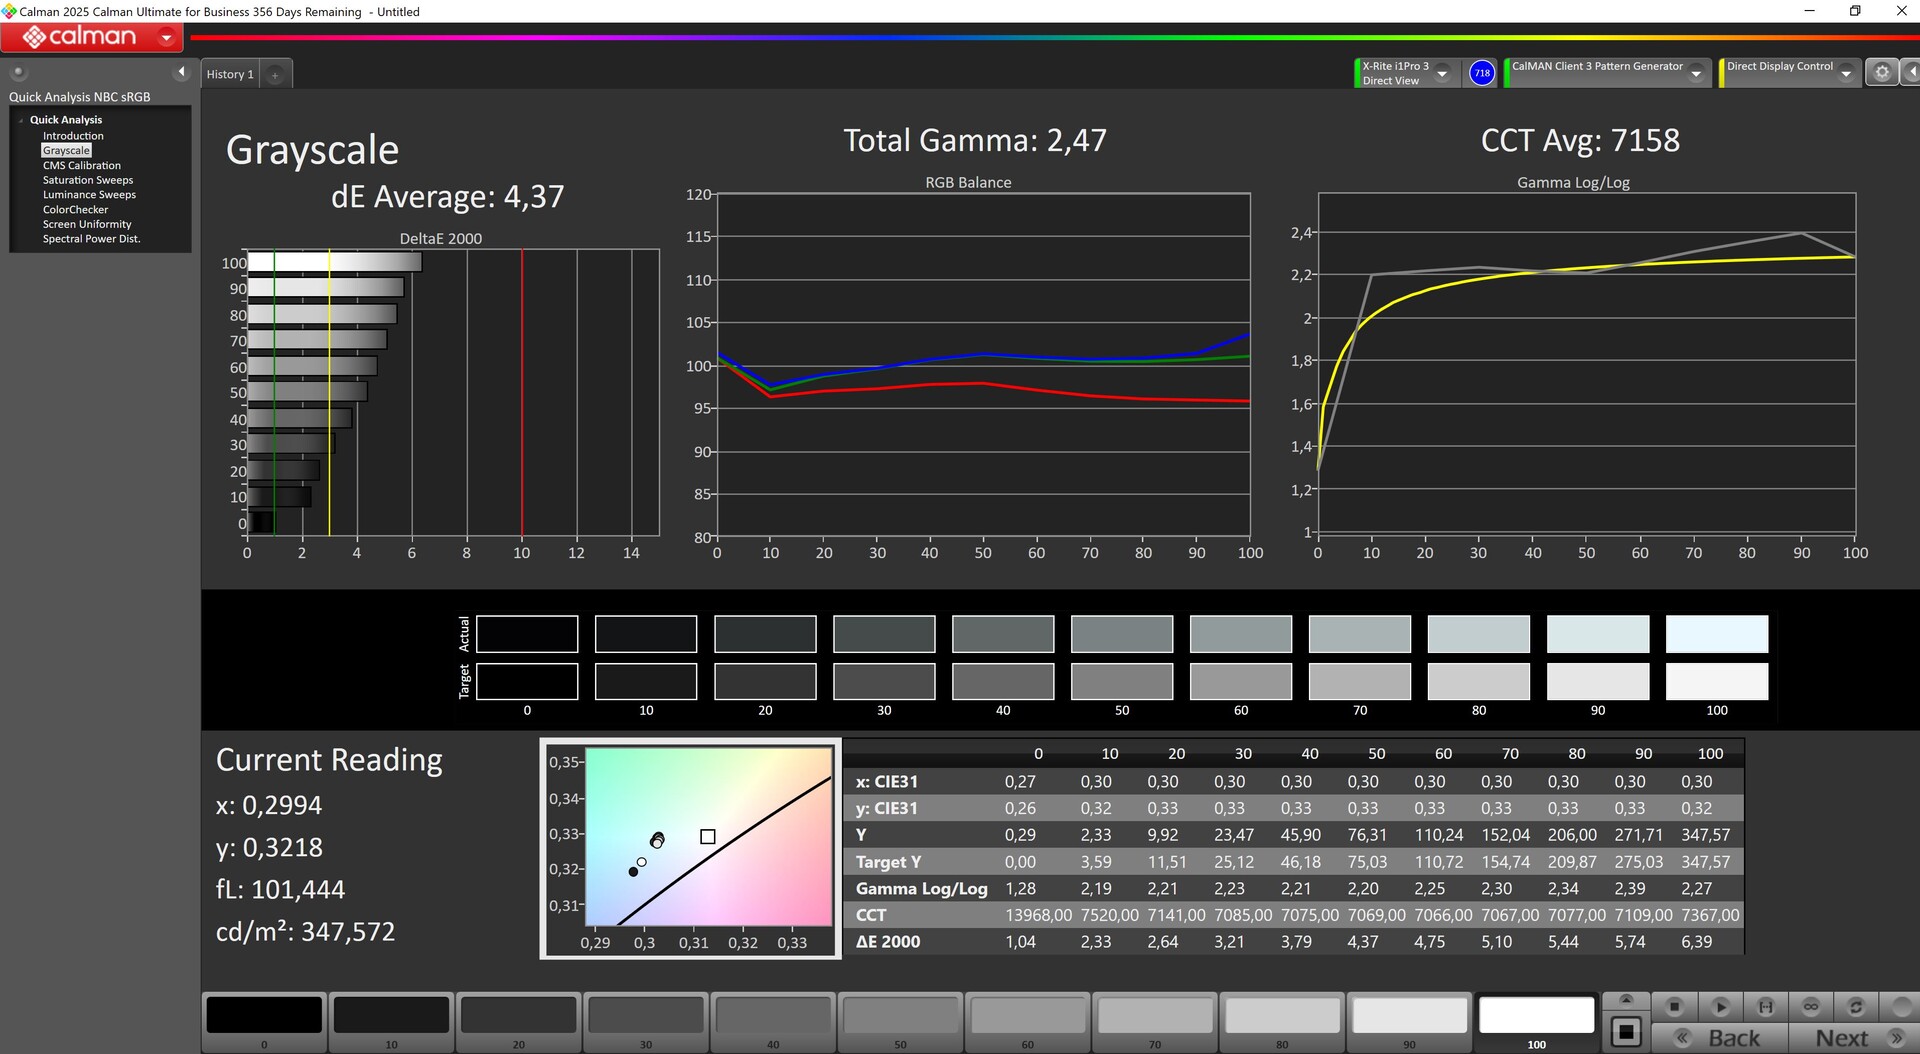
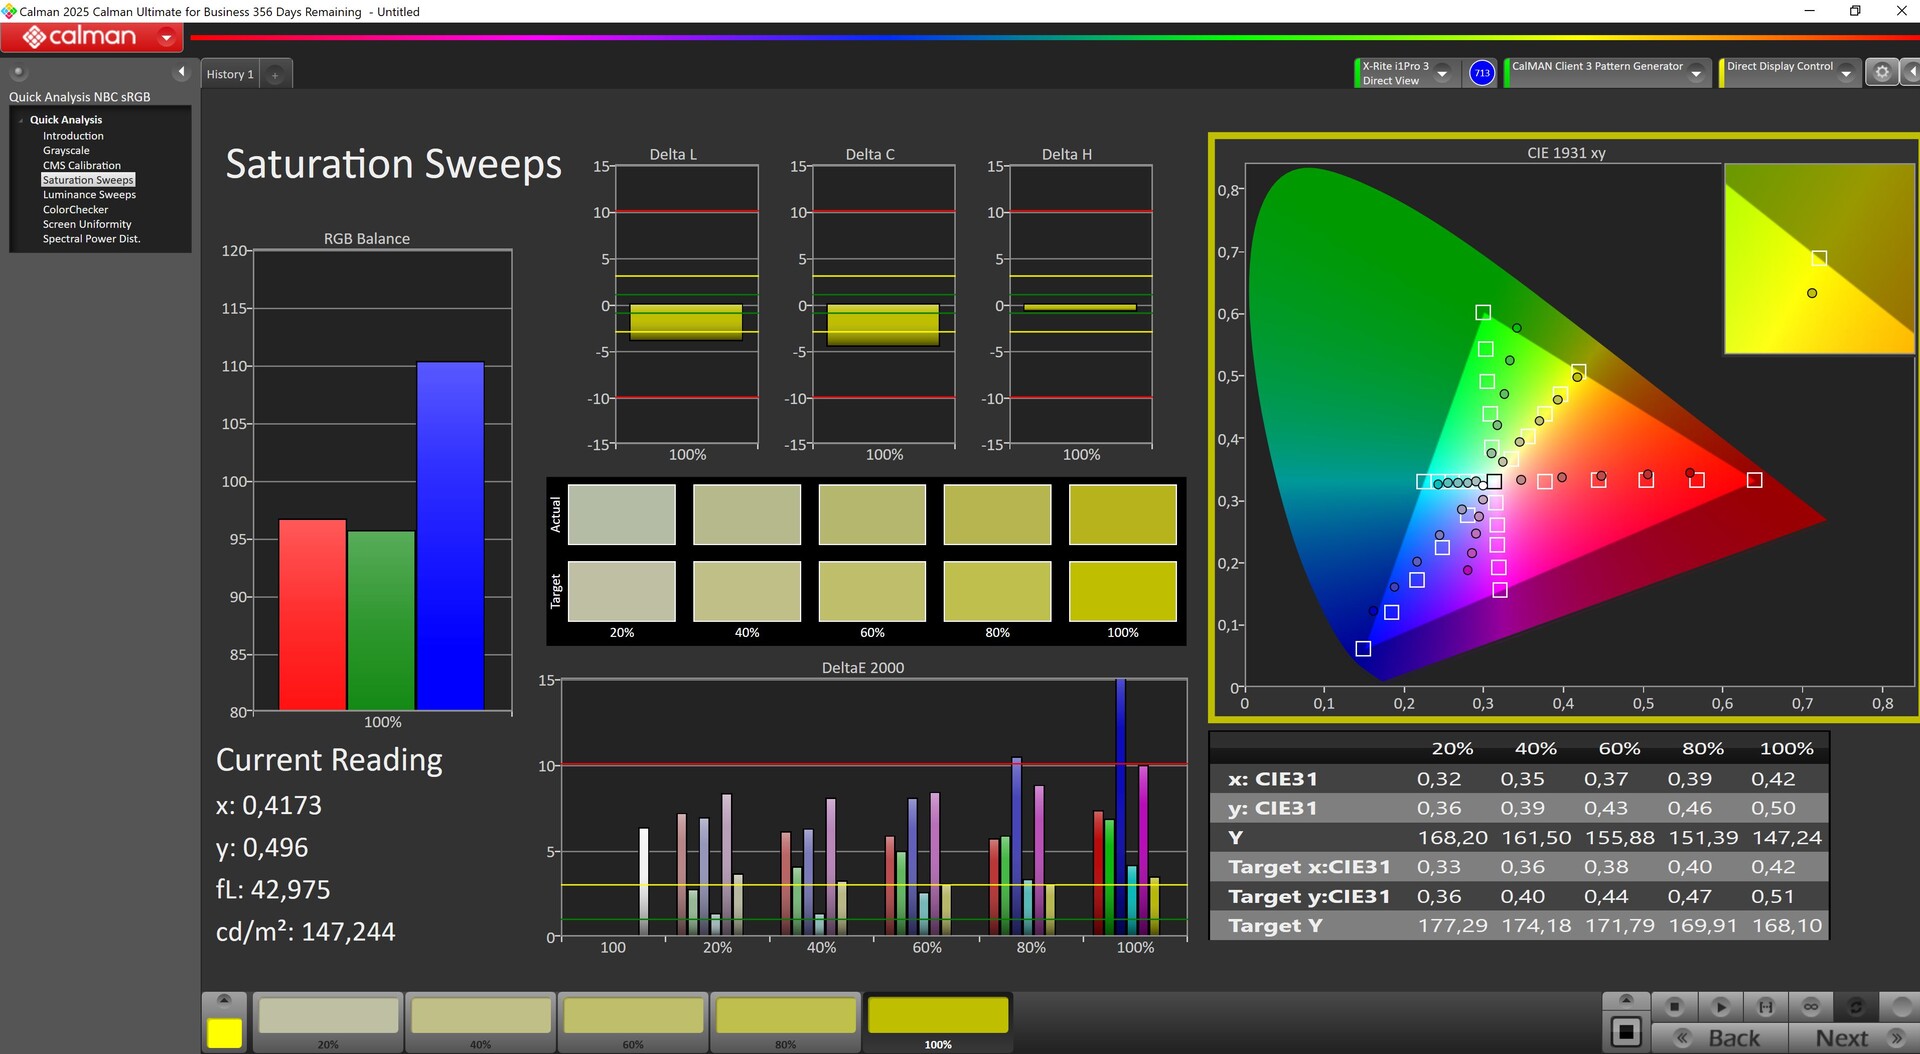
The TUF Gaming A16's screen is a matte 16-inch IPS display in 16:10 aspect ratio with a resolution of 1,920 x 1,200 and a maximum refresh rate of 144 Hz. Alternatively, the laptop can be fitted with a better 1,600p panel if desired.
We measured an average brightness of 321 nits. Unlike the other panels, Asus does not specify the color space for the 1,200p version. No wonder, our measurements don't even cover sRGB! Therefore, we recommend you rather opt for the purportedly better 1,600p display.
The response times are also mediocre, but there is no noticeable backlight bleeding.
| |||||||||||||||||||||||||
Brightness Distribution: 88 %
Center on Battery: 345 cd/m²
Contrast: 1157:1 (Black: 0.3 cd/m²)
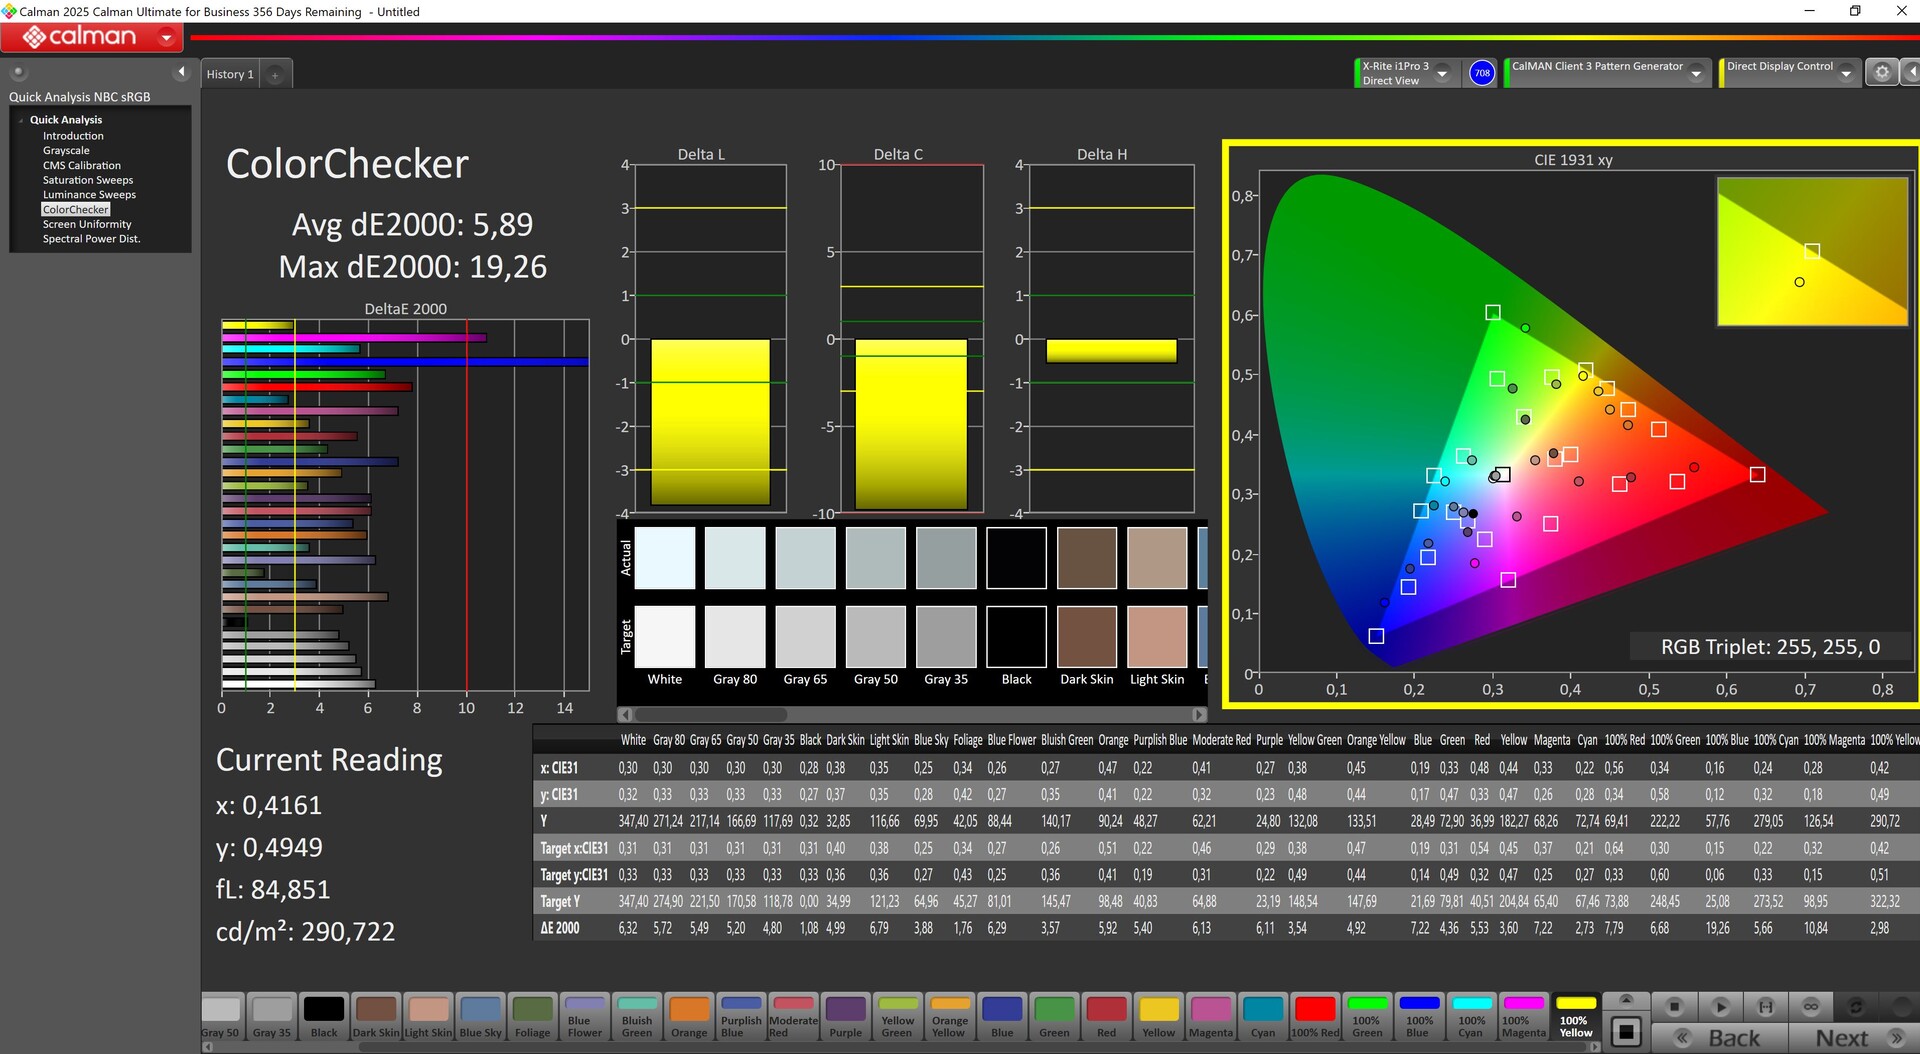
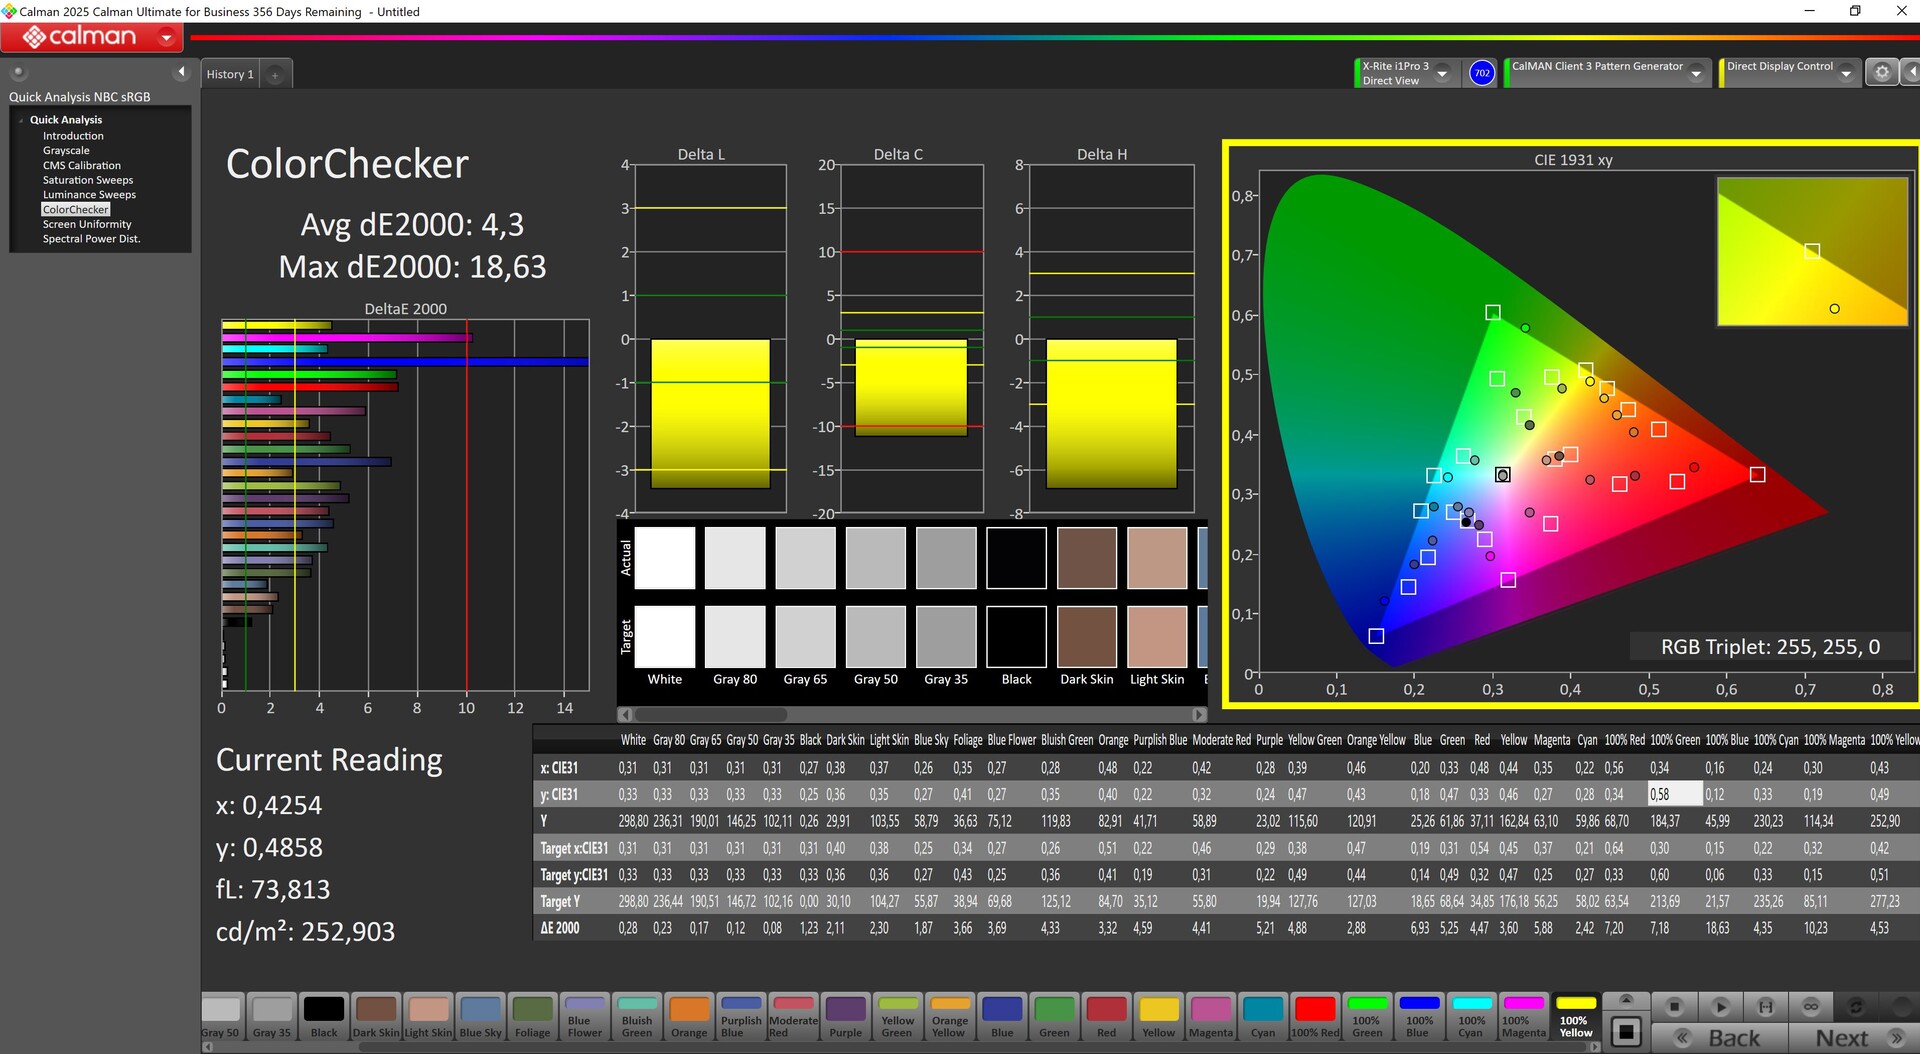
ΔE ColorChecker Calman: 5.89 | ∀{0.5-29.43 Ø4.72}
calibrated: 4.3
ΔE Greyscale Calman: 4.27 | ∀{0.09-98 Ø4.97}
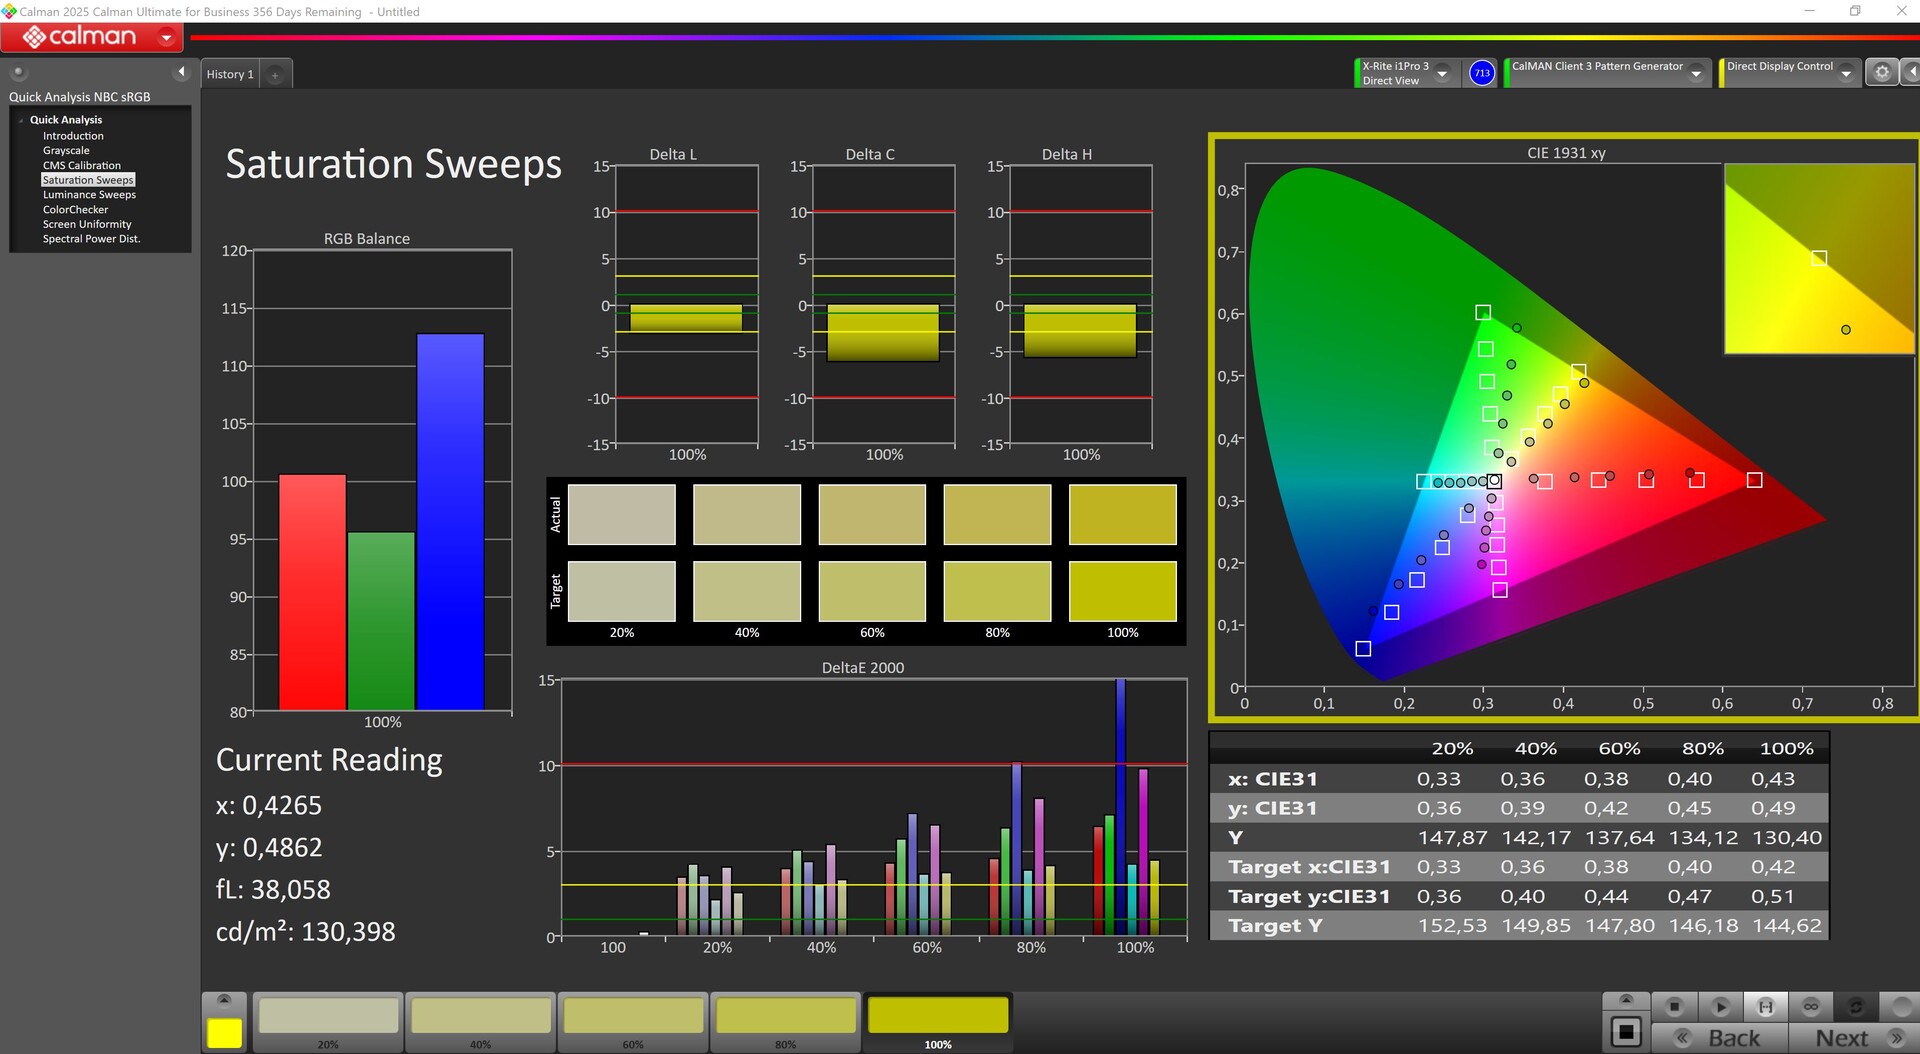
41.1% AdobeRGB 1998 (Argyll 3D)
59.7% sRGB (Argyll 3D)
39.8% Display P3 (Argyll 3D)
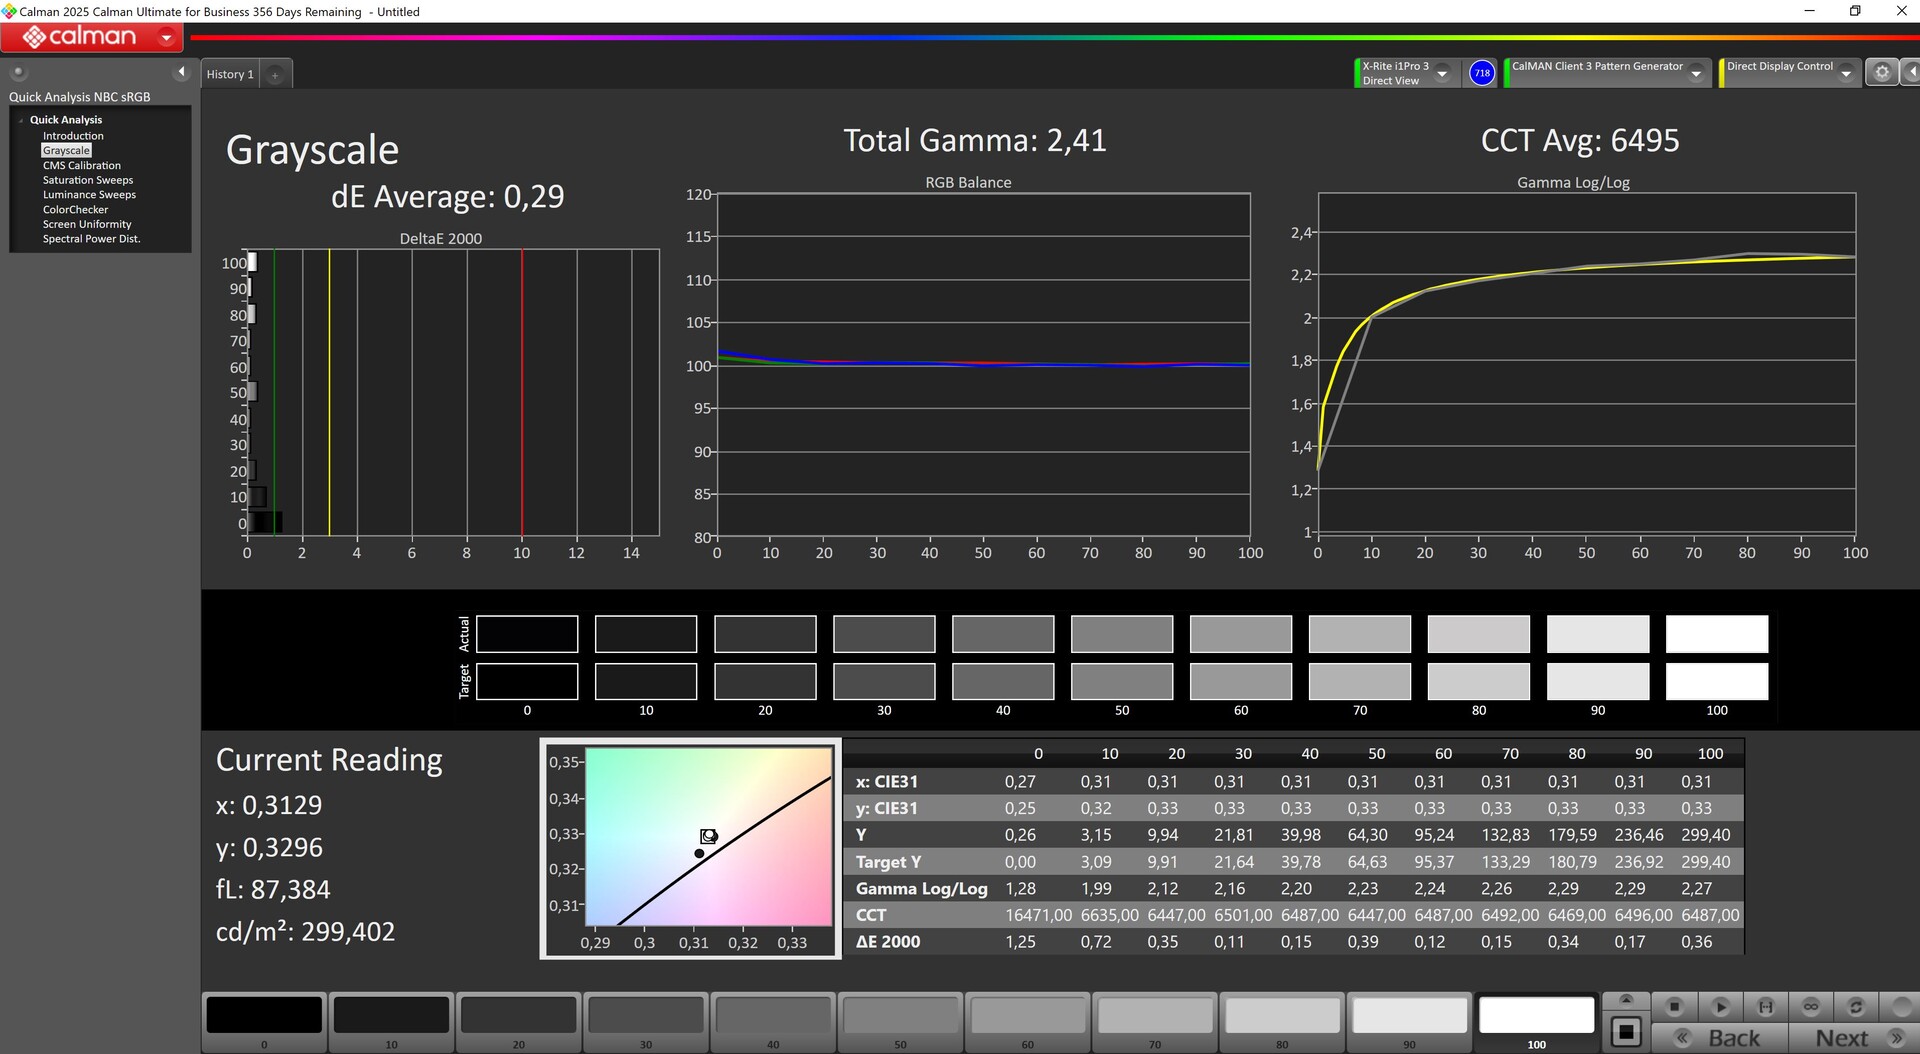
Gamma: 2.47
CCT: 7158 K
| Asus TUF Gaming A16 FA608WV B160UAN08.1 (AUO9BB0), IPS, 1920x1200, 16", 144 Hz | Asus TUF Gaming A16 FA617XS BOE NE160WUM-NX2, IPS, 1920x1200, 16", 165 Hz | Lenovo Legion Pro 5 16IRX9 G9 BOE NE160QDM-NZB, IPS, 2560x1600, 16", 240 Hz | Dell G16, i7-13650HX, RTX 4060 Chi Mei CMN161D (160GME), IPS, 2560x1600, 16", 165 Hz | HP Victus 16 (2024) Chi Mei CMN163E, IPS, 1920x1080, 16.1", 144 Hz | Acer Nitro V 16 ANV16-41-R5AT AUO B160UAN05.B (AUOD8B1), IPS, 1920x1200, 16", 165 Hz | |
|---|---|---|---|---|---|---|
| Display | 70% | 110% | 68% | 4% | -4% | |
| Display P3 Coverage (%) | 39.8 | 69.3 74% | 99.22 149% | 67.5 70% | 41.3 4% | 38.3 -4% |
| sRGB Coverage (%) | 59.7 | 97.3 63% | 99.93 67% | 98.5 65% | 61.7 3% | 57.4 -4% |
| AdobeRGB 1998 Coverage (%) | 41.1 | 70.7 72% | 87.81 114% | 69.3 69% | 42.7 4% | 39.6 -4% |
| Response Times | -17% | 28% | 10% | -117% | -114% | |
| Response Time Grey 50% / Grey 80% * (ms) | 13.6 ? | 15.6 ? -15% | 4.8 ? 65% | 7.6 ? 44% | 28.6 ? -110% | 26.5 ? -95% |
| Response Time Black / White * (ms) | 8.4 ? | 10 ? -19% | 9.2 ? -10% | 10.4 ? -24% | 18.7 ? -123% | 19.6 ? -133% |
| PWM Frequency (Hz) | ||||||
| Screen | 34% | 33% | 26% | 5% | -4% | |
| Brightness middle (cd/m²) | 347 | 301 -13% | 518 49% | 369 6% | 287 -17% | 303 -13% |
| Brightness (cd/m²) | 321 | 294 -8% | 491 53% | 344 7% | 288 -10% | 305 -5% |
| Brightness Distribution (%) | 88 | 94 7% | 90 2% | 89 1% | 86 -2% | 93 6% |
| Black Level * (cd/m²) | 0.3 | 0.21 30% | 0.36 -20% | 0.26 13% | 0.19 37% | 0.32 -7% |
| Contrast (:1) | 1157 | 1433 24% | 1439 24% | 1419 23% | 1511 31% | 947 -18% |
| Colorchecker dE 2000 * | 5.89 | 1.79 70% | 4.32 27% | 3.04 48% | 5.46 7% | 5.74 3% |
| Colorchecker dE 2000 max. * | 19.26 | 3.48 82% | 6.37 67% | 5.56 71% | 20.36 -6% | 22.69 -18% |
| Colorchecker dE 2000 calibrated * | 4.3 | 1.2 72% | 0.75 83% | 2.35 45% | 3.52 18% | 3.78 12% |
| Greyscale dE 2000 * | 4.27 | 2.5 41% | 3.66 14% | 3.38 21% | 4.8 -12% | 4 6% |
| Gamma | 2.47 89% | 2.265 97% | 2.19 100% | 2.47 89% | 2.108 104% | 2.372 93% |
| CCT | 7158 91% | 6157 106% | 6841 95% | 6040 108% | 6442 101% | 7461 87% |
| Total Average (Program / Settings) | 29% /
34% | 57% /
49% | 35% /
33% | -36% /
-13% | -41% /
-20% |
* ... smaller is better
The color accuracy in particular leaves a lot to be desired. The panel struggles with high deviations in the Grayscale and ColorChecker values ex-works.
After our manual calibration, the DeltaE values in the grayscale levels drop significantly, but the deviations in the colors unfortunately remain at a relatively high level; the 60% sRGB panel cannot provide anything more than this.
Display Response Times
| ↔ Response Time Black to White | ||
|---|---|---|
| 8.4 ms ... rise ↗ and fall ↘ combined | ↗ 4.2 ms rise | 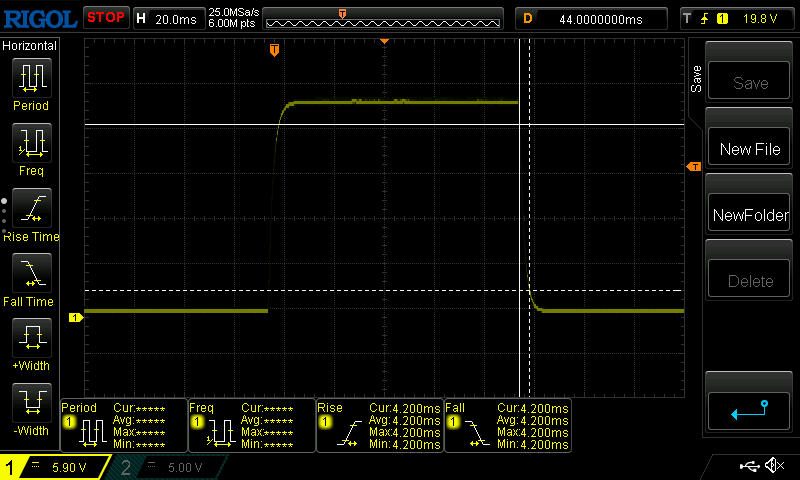 |
| ↘ 4.2 ms fall | ||
| The screen shows fast response rates in our tests and should be suited for gaming. In comparison, all tested devices range from 0.1 (minimum) to 240 (maximum) ms. » 24 % of all devices are better. This means that the measured response time is better than the average of all tested devices (19.8 ms). | ||
| ↔ Response Time 50% Grey to 80% Grey | ||
| 13.6 ms ... rise ↗ and fall ↘ combined | ↗ 6.6 ms rise | 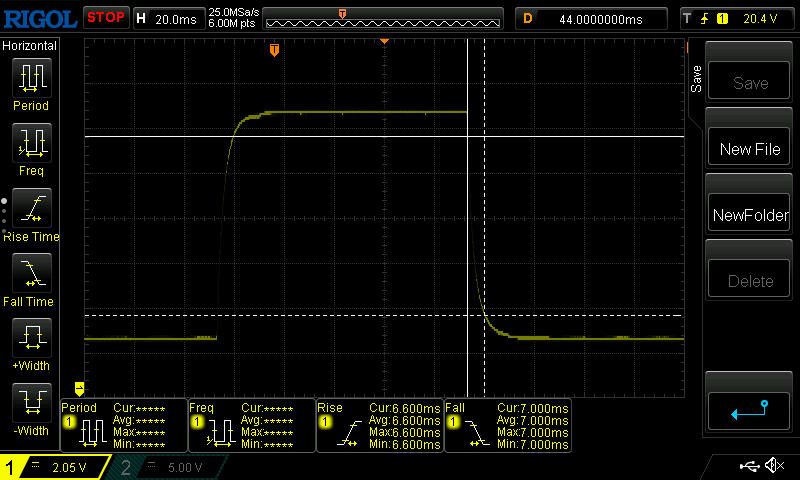 |
| ↘ 7 ms fall | ||
| The screen shows good response rates in our tests, but may be too slow for competitive gamers. In comparison, all tested devices range from 0.165 (minimum) to 636 (maximum) ms. » 27 % of all devices are better. This means that the measured response time is better than the average of all tested devices (31 ms). | ||
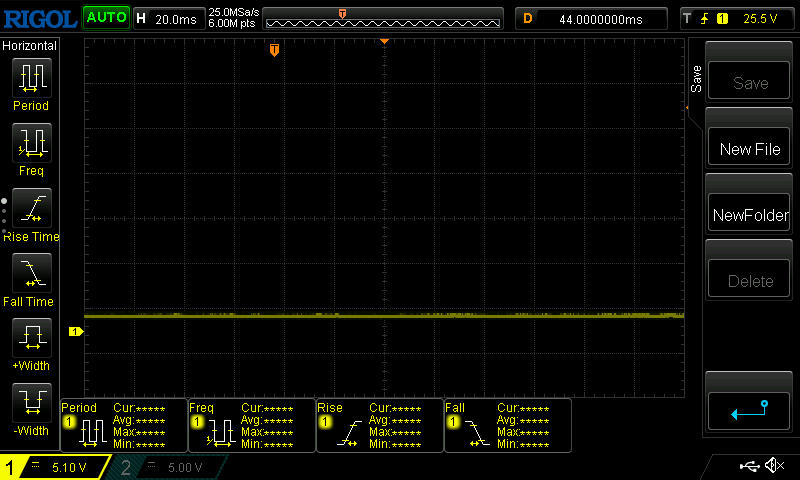
Screen Flickering / PWM (Pulse-Width Modulation)
| Screen flickering / PWM not detected |  | ||
In comparison: 52 % of all tested devices do not use PWM to dim the display. If PWM was detected, an average of 7750 (minimum: 5 - maximum: 343500) Hz was measured. | |||
Despite the 300 nits luminance and the matte panel, the TUF Gaming A16's picture looks rather pale and low-contrast outdoors. It is possible to work under shade, but the viewing experience is not really enjoyable.

Performance: Good combination of Ryzen AI 9 and RTX 4060
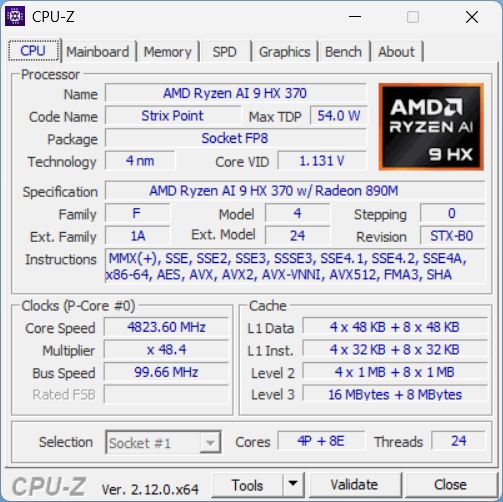
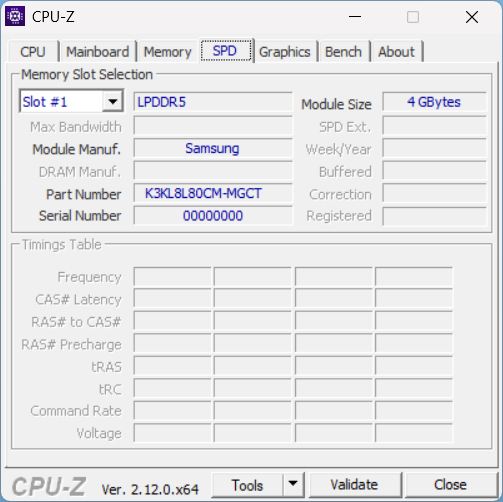
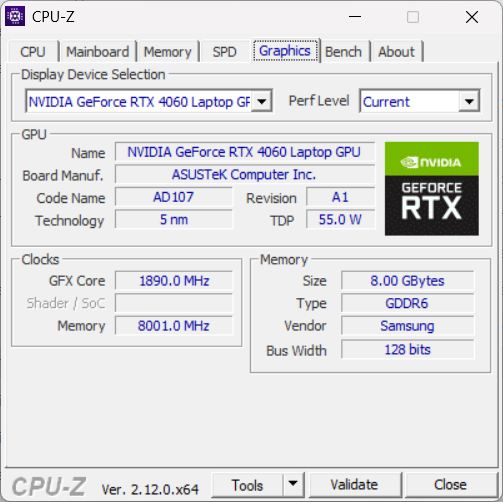
Our review model is equipped with an AMD Ryzen AI 9 HX 370 APU and the Nvidia GeForce RTX 4060 Laptop GPU along with 16 GB RAM and a 1 TB SSD.
The CPU is the same in both configuration variants, but instead of the RTX 4060, a more powerful RTX 4070 Laptop GPU is also possible with the FA608WI SKU.

Test conditions
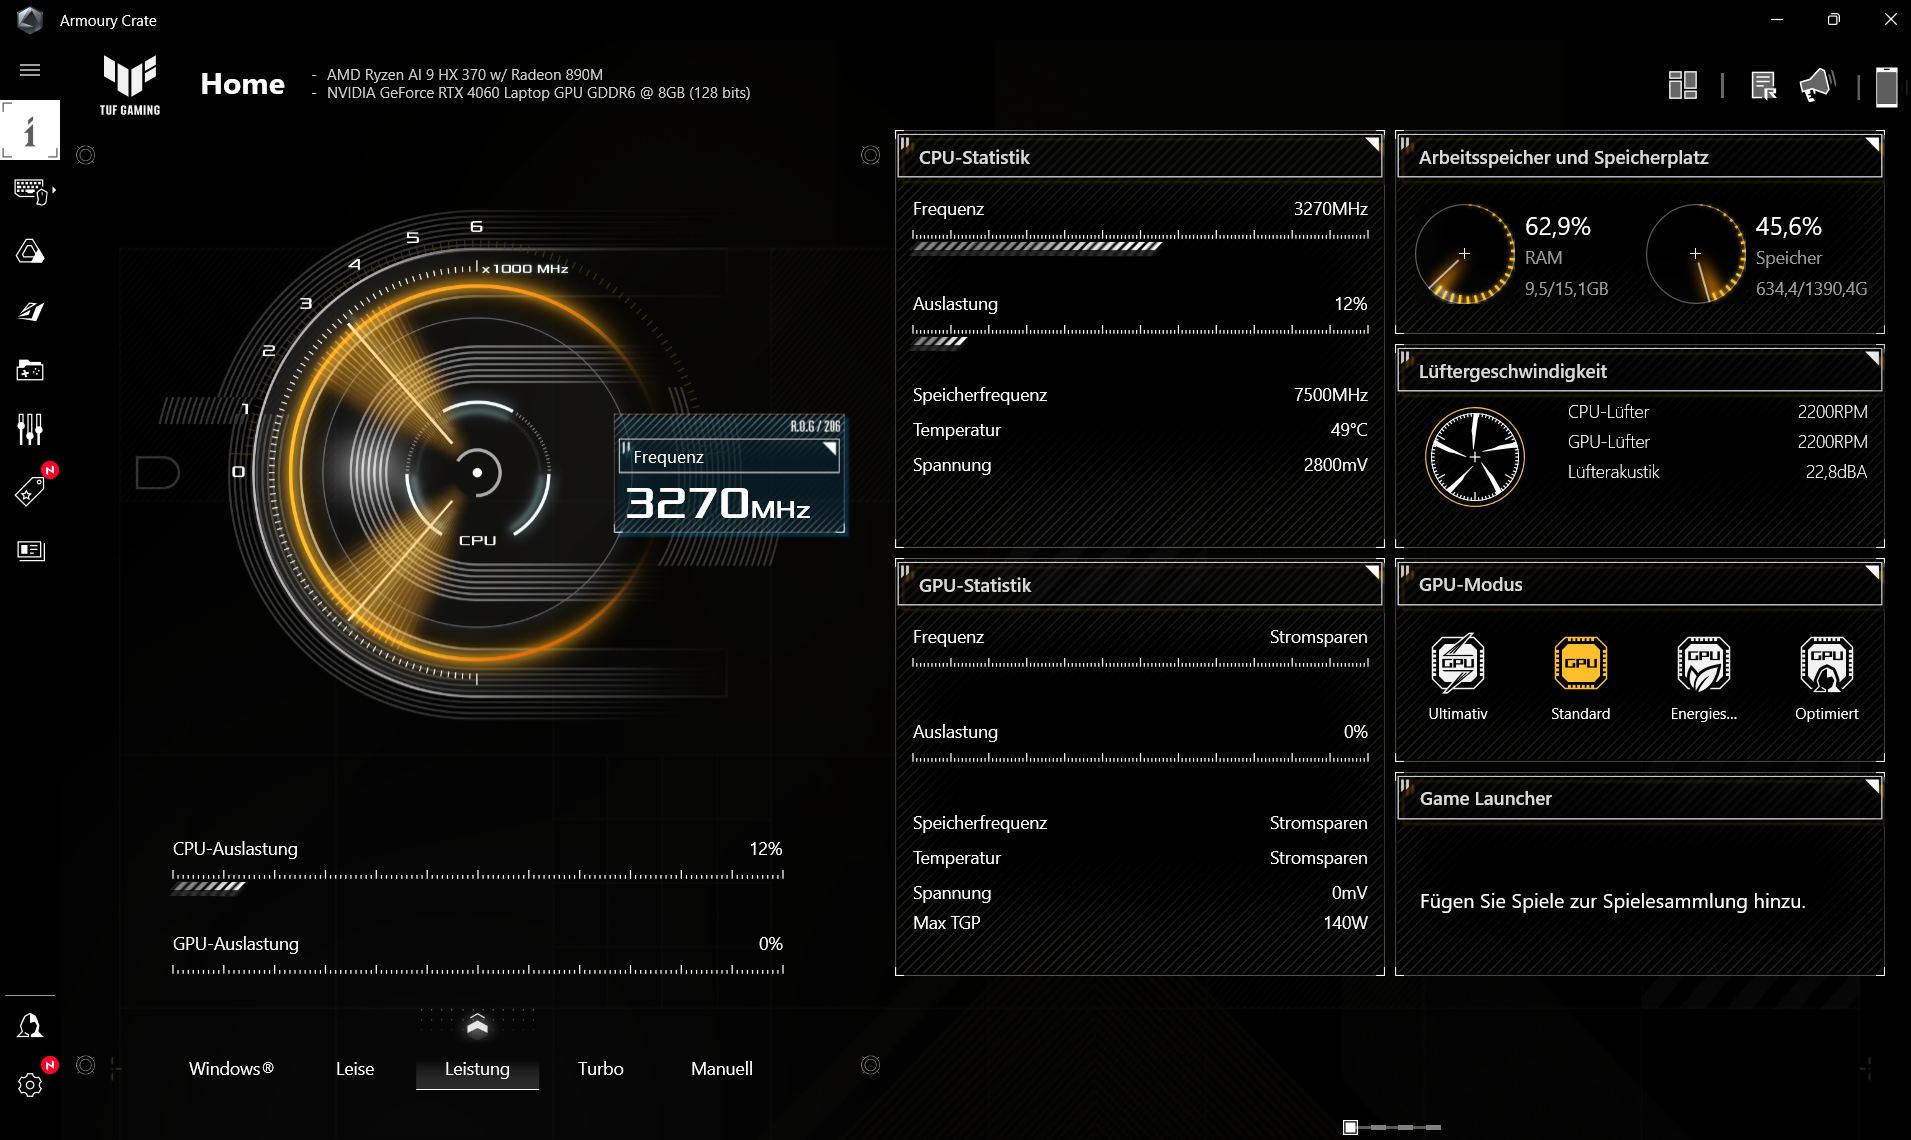
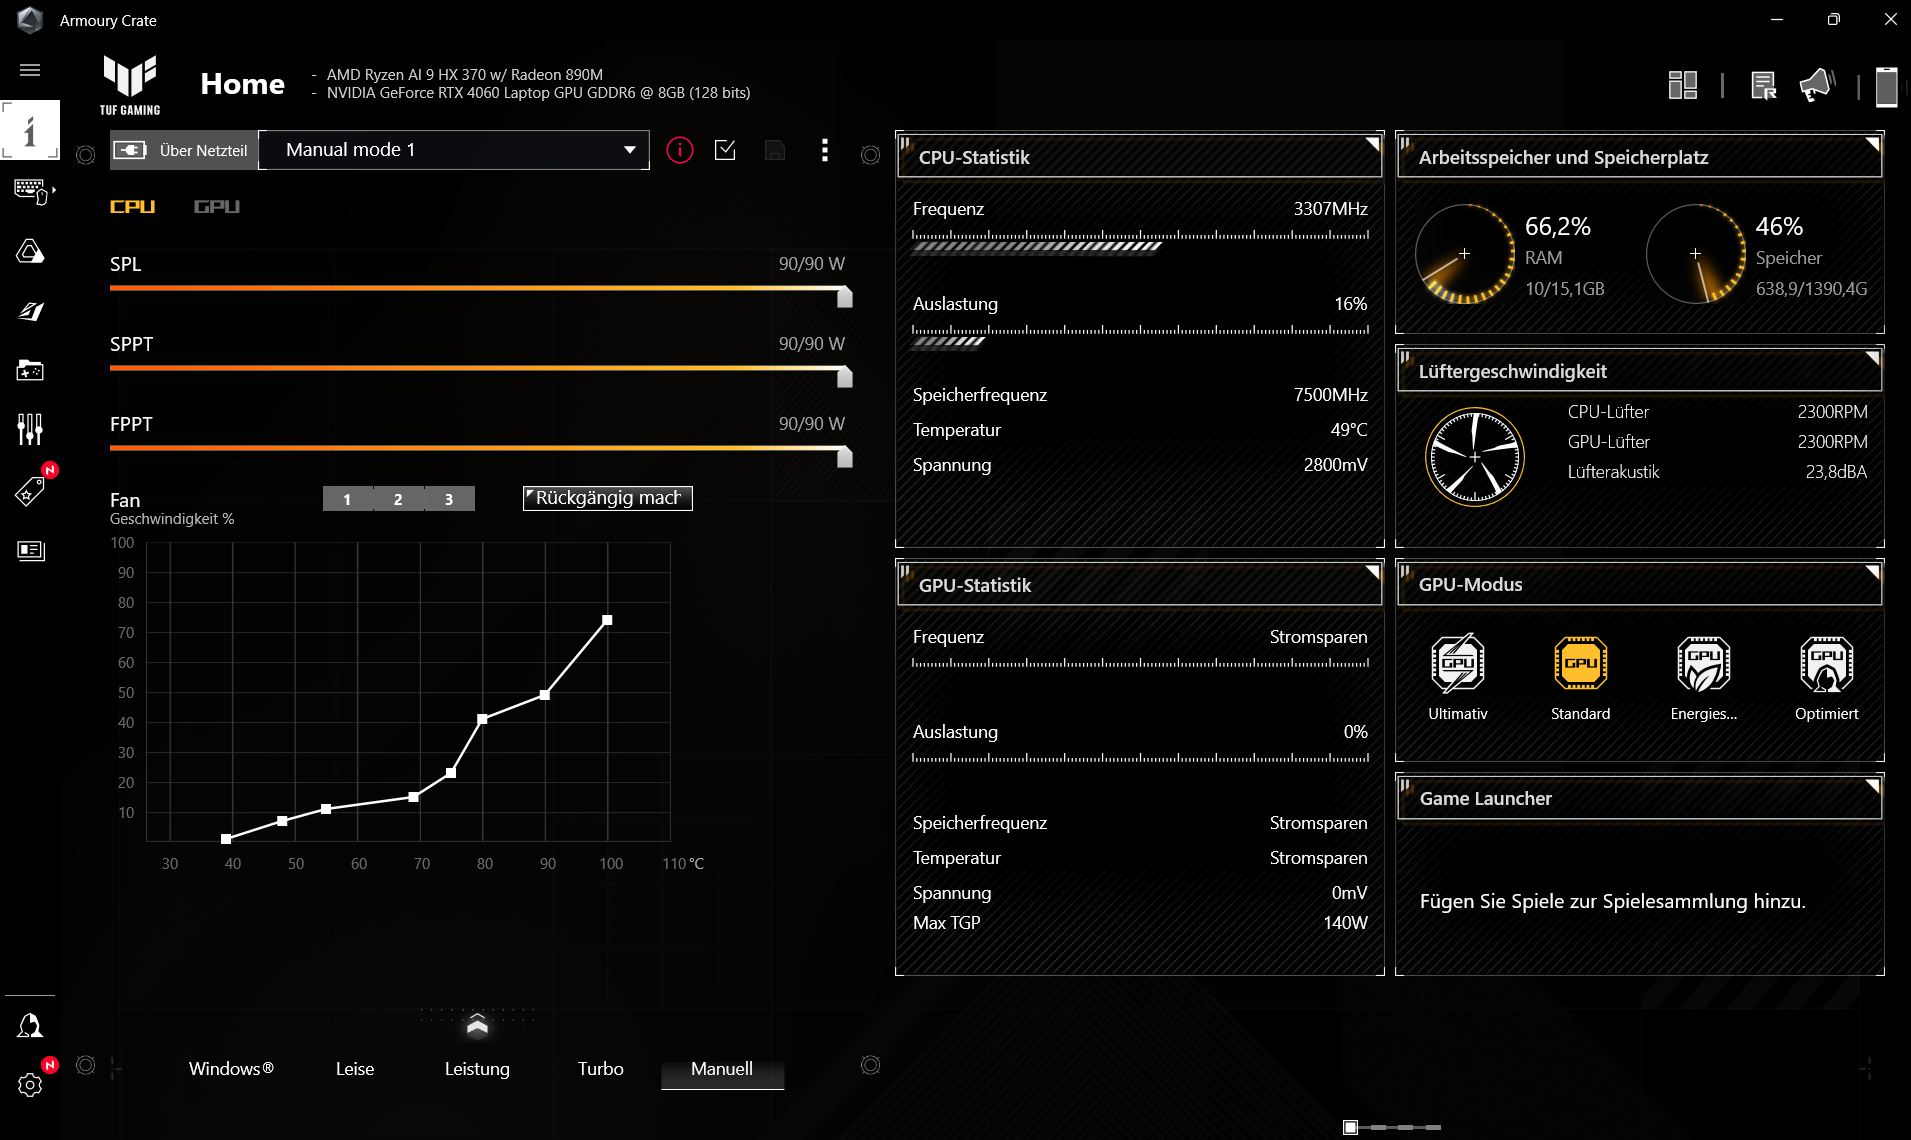
Asus's Armoury Crate acts as a control center. It offers four power modes (Quiet, Power, Turbo, and Manual).
There are other settings like MUX, lighting effects, etc. We use the Power mode for all benchmarks.
Additionally, Asus also bundles the MyAsus app, where we can find system updates and customer support.
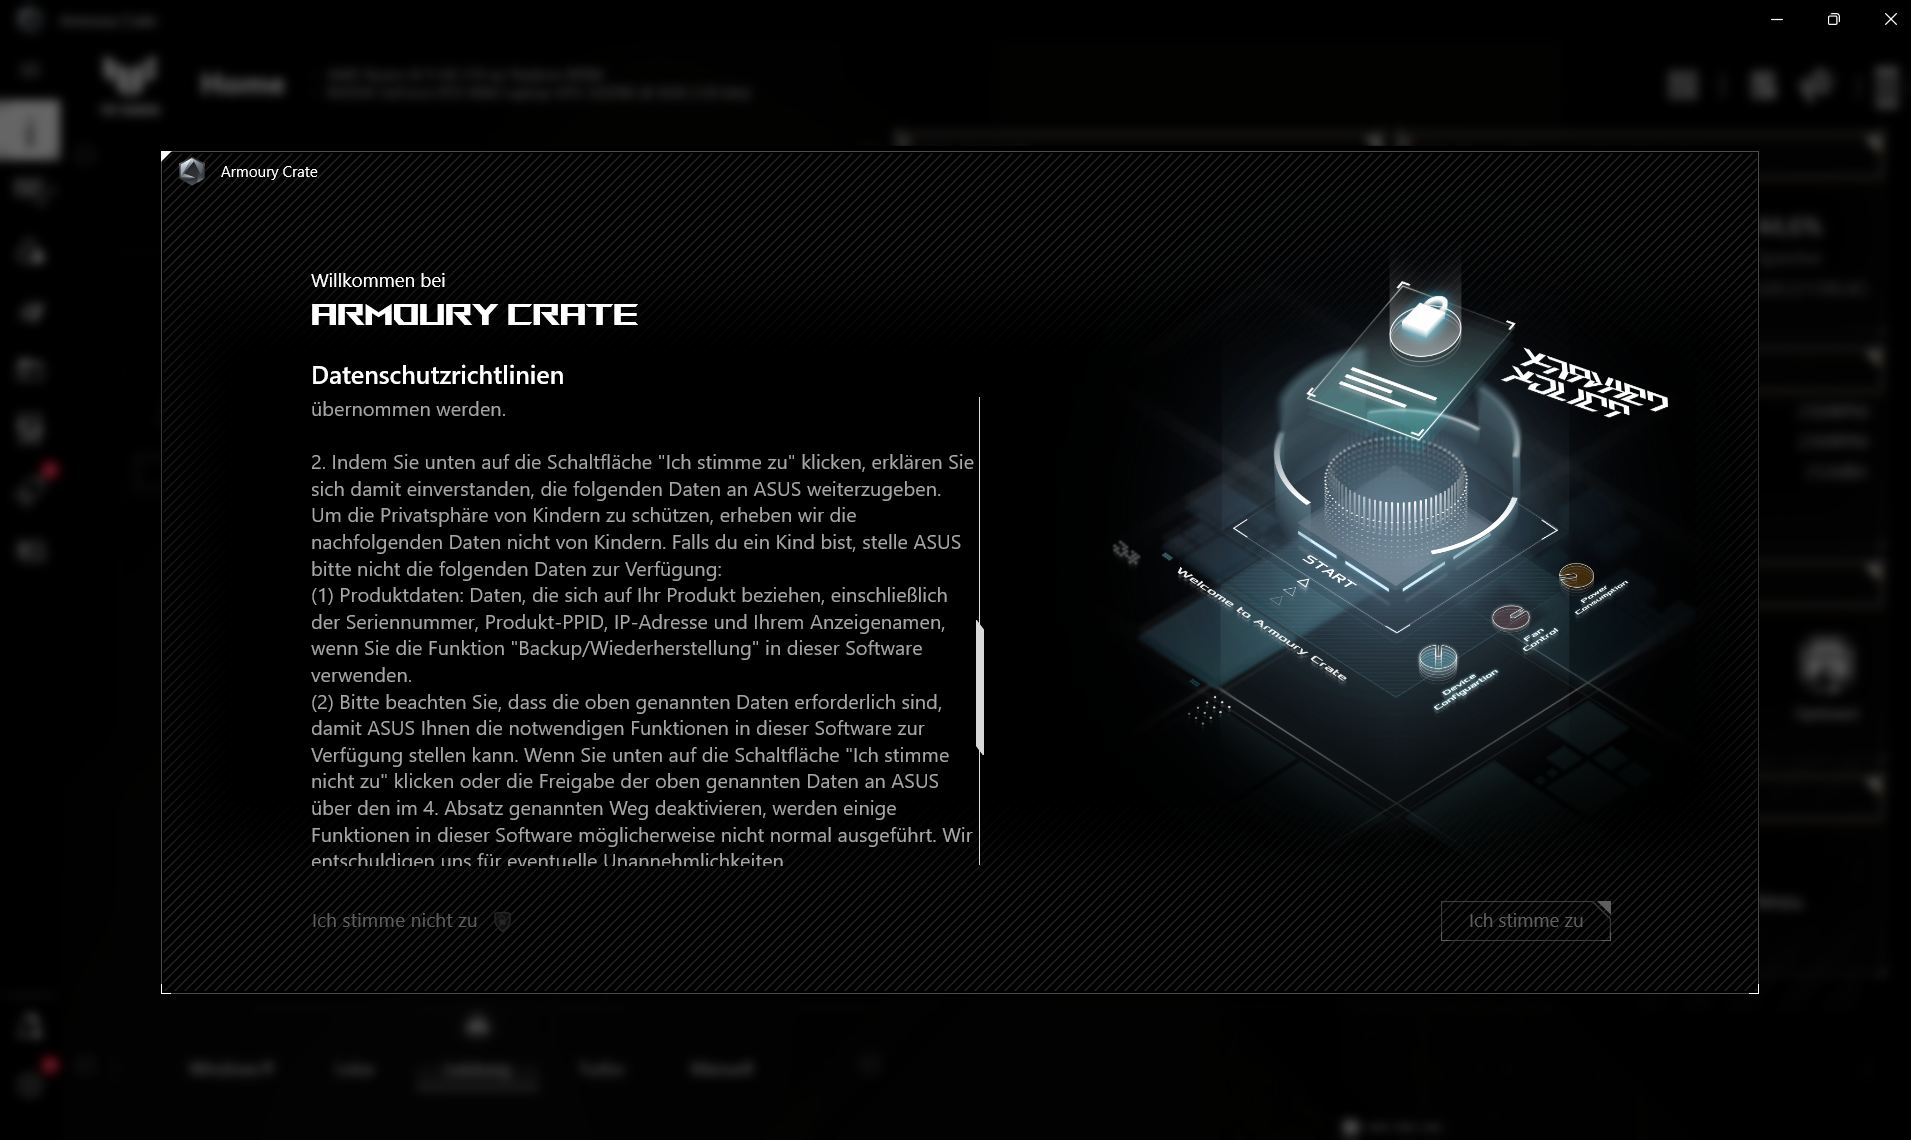
Various data is sent to Asus during the use of Armory Crate. Absurd detail: Asus states in the declaration of consent that data from children will not be collected. As a child, you should forbid Asus to collect this data. However, this is only possible if you do not agree and then do not use Armory Crate to its full extent. Are the "children" aware of this?
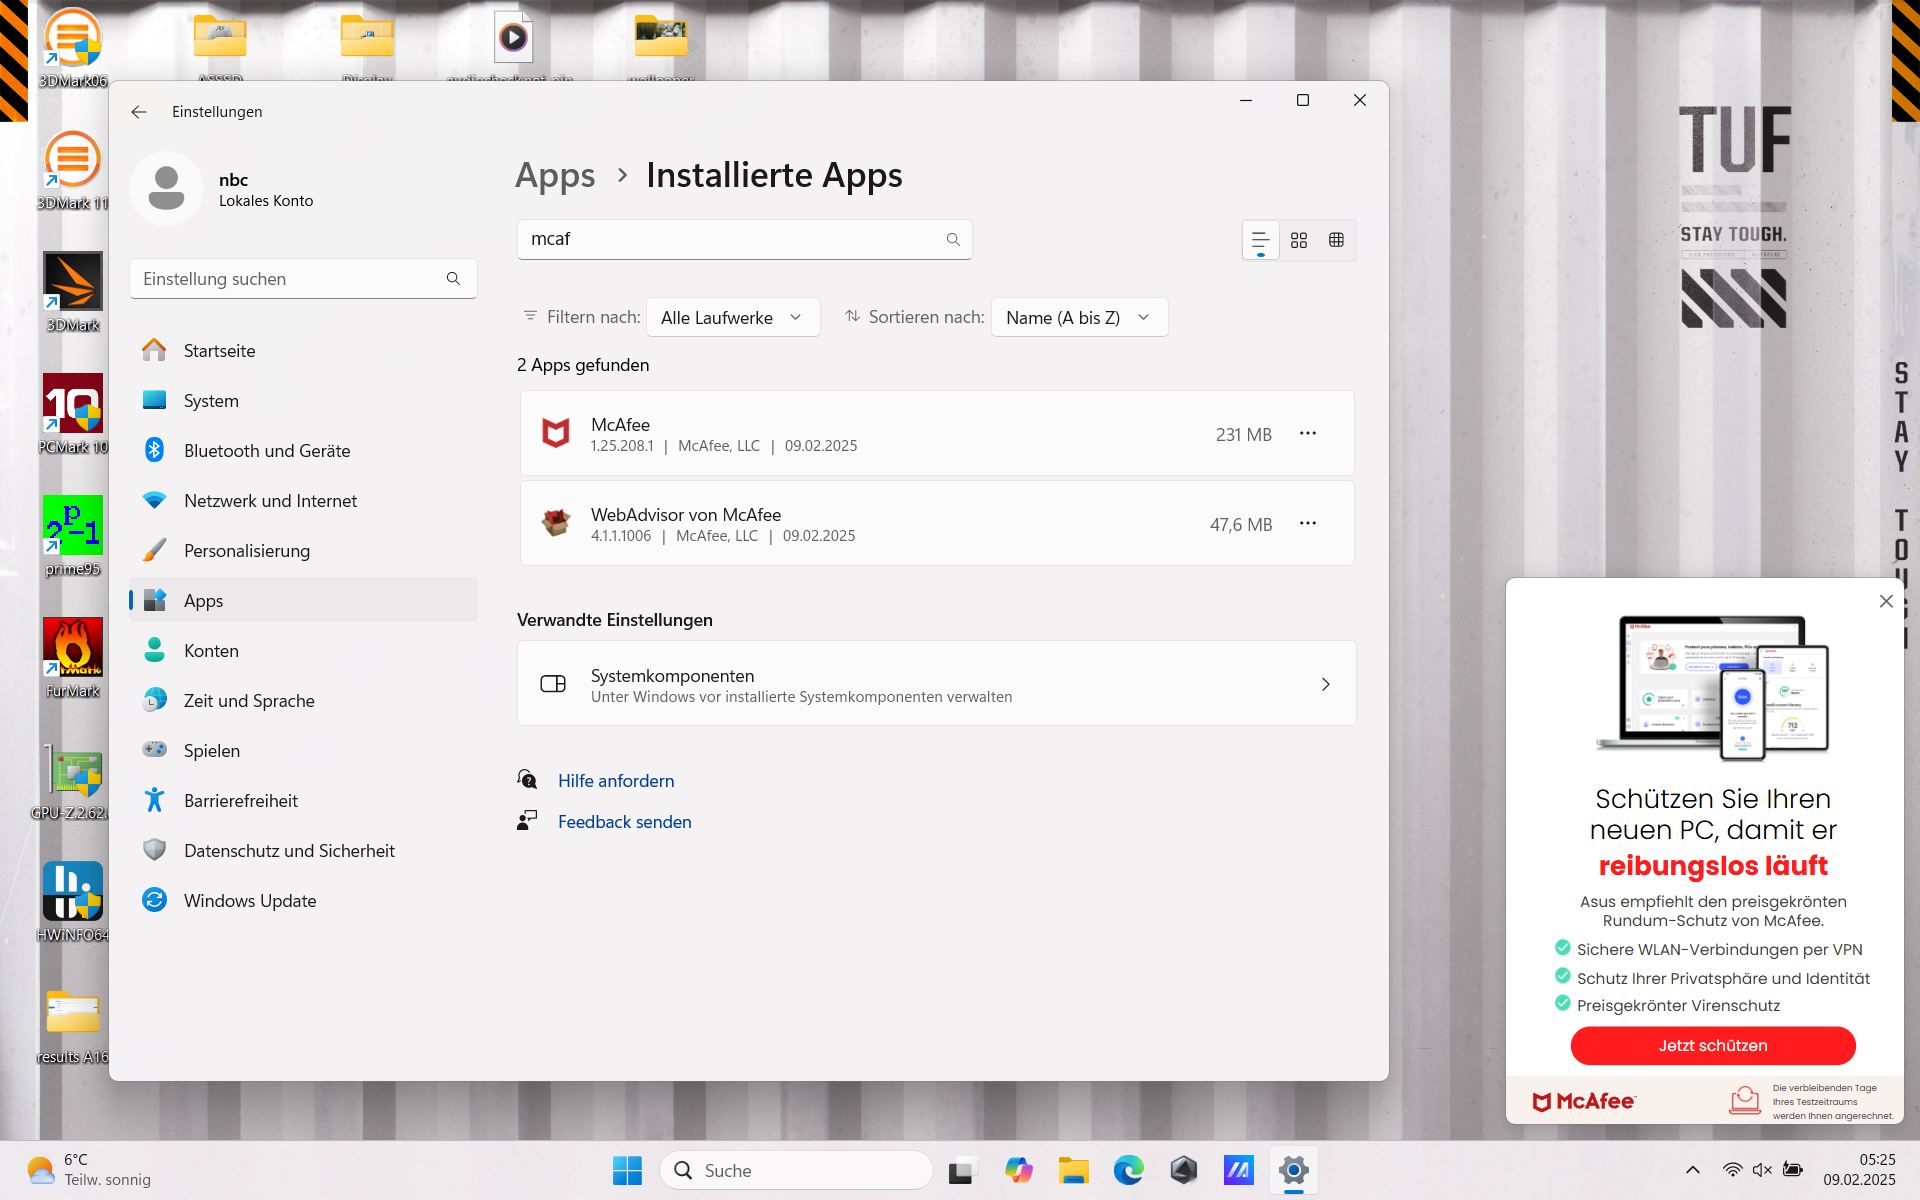
Asus not only installs a test version of McAfee, but also a corresponding "Web advisor" from the company, and banner ads for the software are displayed until it is uninstalled.
Processor
The AMD Ryzen AI 9 HX 370 APU is offered in all configurations of the TUF Gaming A16. Its 12 processor cores clock from 2 GHz to 5.1 GHz, and it also integrates a 50 TOPS NPU and an RDNA3+ graphics unit.
In the Cinebench R15 multi-core endurance test, the CPU shows a highly consistent performance without drops, unlike the Intel Core i7-14700HX in the HP Victus 16. However, the Core i7-14700HX in the Lenovo Legion Pro 5 performs slightly better.
Across all CPU tests, the TUF Gaming A16 comes 2nd place behind the Legion Pro 5, while leading in AIDA64. Compared to its predecessor, the current CPU performs around 20% faster.
The A16 loses performance in battery mode, especially in the long term. For example, we measured a drop of almost 40% in Cinebench R15 on battery.
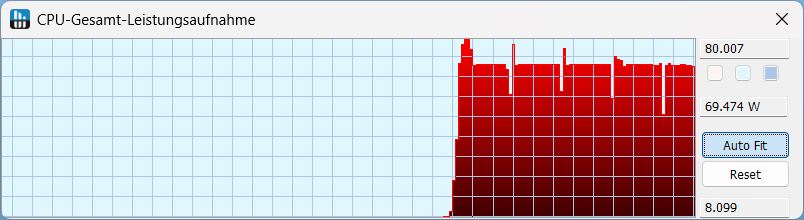
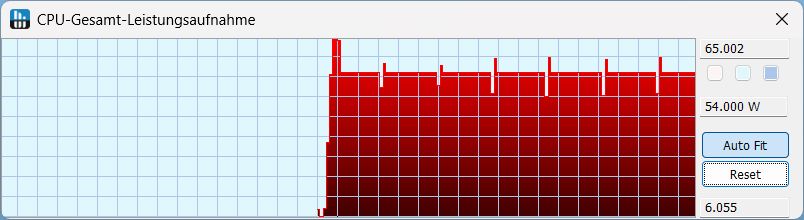
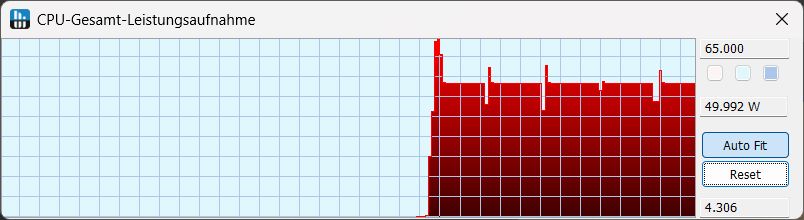
| Cinebench R23 | Turbo | Performance | Quiet | Battery |
|---|---|---|---|---|
| Power consumption (W) | 70+ | 54+ | 50+ | 55 - 15 |
Cinebench R15 Multi loop
Cinebench R23: Multi Core | Single Core
Cinebench R20: CPU (Multi Core) | CPU (Single Core)
Cinebench R15: CPU Multi 64Bit | CPU Single 64Bit
Blender: v2.79 BMW27 CPU
7-Zip 18.03: 7z b 4 | 7z b 4 -mmt1
Geekbench 6.7: Multi-Core | Single-Core
Geekbench 5.5: Multi-Core | Single-Core
HWBOT x265 Benchmark v2.2: 4k Preset
LibreOffice : 20 Documents To PDF
R Benchmark 2.5: Overall mean
| CPU Performance rating | |
| Lenovo Legion Pro 5 16IRX9 G9 | |
| Average of class Gaming | |
| Asus TUF Gaming A16 FA608WV | |
| Average AMD Ryzen AI 9 HX 370 | |
| HP Victus 16 (2024) | |
| Dell G16, i7-13650HX, RTX 4060 | |
| Asus TUF Gaming A16 FA617XS -2! | |
| Acer Nitro V 16 ANV16-41-R5AT | |
| Cinebench R23 / Multi Core | |
| Lenovo Legion Pro 5 16IRX9 G9 | |
| Average of class Gaming (10488 - 40970, n=107, last 2 years) | |
| HP Victus 16 (2024) | |
| Asus TUF Gaming A16 FA608WV | |
| Average AMD Ryzen AI 9 HX 370 (10435 - 23902, n=32) | |
| Dell G16, i7-13650HX, RTX 4060 | |
| Asus TUF Gaming A16 FA617XS | |
| Acer Nitro V 16 ANV16-41-R5AT | |
| Cinebench R23 / Single Core | |
| Lenovo Legion Pro 5 16IRX9 G9 | |
| Asus TUF Gaming A16 FA608WV | |
| Average AMD Ryzen AI 9 HX 370 (1921 - 2049, n=25) | |
| Average of class Gaming (1166 - 2387, n=107, last 2 years) | |
| Dell G16, i7-13650HX, RTX 4060 | |
| Asus TUF Gaming A16 FA617XS | |
| Acer Nitro V 16 ANV16-41-R5AT | |
| HP Victus 16 (2024) | |
| Cinebench R20 / CPU (Multi Core) | |
| Lenovo Legion Pro 5 16IRX9 G9 | |
| Average of class Gaming (4029 - 16108, n=106, last 2 years) | |
| HP Victus 16 (2024) | |
| Asus TUF Gaming A16 FA608WV | |
| Average AMD Ryzen AI 9 HX 370 (6449 - 9280, n=24) | |
| Dell G16, i7-13650HX, RTX 4060 | |
| Asus TUF Gaming A16 FA617XS | |
| Acer Nitro V 16 ANV16-41-R5AT | |
| Cinebench R20 / CPU (Single Core) | |
| Lenovo Legion Pro 5 16IRX9 G9 | |
| Asus TUF Gaming A16 FA608WV | |
| Average AMD Ryzen AI 9 HX 370 (737 - 804, n=24) | |
| Average of class Gaming (442 - 904, n=106, last 2 years) | |
| Dell G16, i7-13650HX, RTX 4060 | |
| Asus TUF Gaming A16 FA617XS | |
| Acer Nitro V 16 ANV16-41-R5AT | |
| HP Victus 16 (2024) | |
| Cinebench R15 / CPU Multi 64Bit | |
| Lenovo Legion Pro 5 16IRX9 G9 | |
| Average of class Gaming (1578 - 6271, n=105, last 2 years) | |
| HP Victus 16 (2024) | |
| Asus TUF Gaming A16 FA608WV | |
| Average AMD Ryzen AI 9 HX 370 (2498 - 3551, n=24) | |
| Dell G16, i7-13650HX, RTX 4060 | |
| Asus TUF Gaming A16 FA617XS | |
| Acer Nitro V 16 ANV16-41-R5AT | |
| Cinebench R15 / CPU Single 64Bit | |
| Asus TUF Gaming A16 FA608WV | |
| Lenovo Legion Pro 5 16IRX9 G9 | |
| Average of class Gaming (188.8 - 344, n=106, last 2 years) | |
| Average AMD Ryzen AI 9 HX 370 (188.8 - 315, n=24) | |
| Asus TUF Gaming A16 FA617XS | |
| Acer Nitro V 16 ANV16-41-R5AT | |
| Dell G16, i7-13650HX, RTX 4060 | |
| HP Victus 16 (2024) | |
| Blender / v2.79 BMW27 CPU | |
| Acer Nitro V 16 ANV16-41-R5AT | |
| Asus TUF Gaming A16 FA617XS | |
| HP Victus 16 (2024) | |
| Dell G16, i7-13650HX, RTX 4060 | |
| Average AMD Ryzen AI 9 HX 370 (139 - 192, n=25) | |
| Average of class Gaming (80 - 330, n=104, last 2 years) | |
| Asus TUF Gaming A16 FA608WV | |
| Lenovo Legion Pro 5 16IRX9 G9 | |
| 7-Zip 18.03 / 7z b 4 | |
| Lenovo Legion Pro 5 16IRX9 G9 | |
| Average of class Gaming (33491 - 148086, n=105, last 2 years) | |
| HP Victus 16 (2024) | |
| Asus TUF Gaming A16 FA608WV | |
| Average AMD Ryzen AI 9 HX 370 (66154 - 84735, n=24) | |
| Dell G16, i7-13650HX, RTX 4060 | |
| Acer Nitro V 16 ANV16-41-R5AT | |
| Asus TUF Gaming A16 FA617XS | |
| 7-Zip 18.03 / 7z b 4 -mmt1 | |
| Lenovo Legion Pro 5 16IRX9 G9 | |
| Asus TUF Gaming A16 FA617XS | |
| Acer Nitro V 16 ANV16-41-R5AT | |
| Average of class Gaming (4199 - 7436, n=105, last 2 years) | |
| Average AMD Ryzen AI 9 HX 370 (5859 - 6497, n=24) | |
| Asus TUF Gaming A16 FA608WV | |
| Dell G16, i7-13650HX, RTX 4060 | |
| HP Victus 16 (2024) | |
| Geekbench 6.7 / Multi-Core | |
| Lenovo Legion Pro 5 16IRX9 G9 | |
| Average of class Gaming (6625 - 22104, n=106, last 2 years) | |
| HP Victus 16 (2024) | |
| Average AMD Ryzen AI 9 HX 370 (11973 - 16311, n=26) | |
| Asus TUF Gaming A16 FA608WV | |
| Dell G16, i7-13650HX, RTX 4060 | |
| Acer Nitro V 16 ANV16-41-R5AT | |
| Geekbench 6.7 / Single-Core | |
| Average AMD Ryzen AI 9 HX 370 (2780 - 2965, n=26) | |
| Lenovo Legion Pro 5 16IRX9 G9 | |
| Asus TUF Gaming A16 FA608WV | |
| Average of class Gaming (1490 - 3259, n=106, last 2 years) | |
| Acer Nitro V 16 ANV16-41-R5AT | |
| Dell G16, i7-13650HX, RTX 4060 | |
| HP Victus 16 (2024) | |
| Geekbench 5.5 / Multi-Core | |
| Lenovo Legion Pro 5 16IRX9 G9 | |
| Average of class Gaming (6460 - 27010, n=105, last 2 years) | |
| HP Victus 16 (2024) | |
| Average AMD Ryzen AI 9 HX 370 (11394 - 16322, n=25) | |
| Asus TUF Gaming A16 FA608WV | |
| Dell G16, i7-13650HX, RTX 4060 | |
| Asus TUF Gaming A16 FA617XS | |
| Acer Nitro V 16 ANV16-41-R5AT | |
| Geekbench 5.5 / Single-Core | |
| Lenovo Legion Pro 5 16IRX9 G9 | |
| Asus TUF Gaming A16 FA608WV | |
| Average AMD Ryzen AI 9 HX 370 (1957 - 2175, n=25) | |
| Average of class Gaming (986 - 2474, n=105, last 2 years) | |
| Asus TUF Gaming A16 FA617XS | |
| Acer Nitro V 16 ANV16-41-R5AT | |
| Dell G16, i7-13650HX, RTX 4060 | |
| HP Victus 16 (2024) | |
| HWBOT x265 Benchmark v2.2 / 4k Preset | |
| Average of class Gaming (11.5 - 44.3, n=105, last 2 years) | |
| Lenovo Legion Pro 5 16IRX9 G9 | |
| Asus TUF Gaming A16 FA608WV | |
| Average AMD Ryzen AI 9 HX 370 (20.3 - 28.7, n=24) | |
| HP Victus 16 (2024) | |
| Asus TUF Gaming A16 FA617XS | |
| Acer Nitro V 16 ANV16-41-R5AT | |
| Dell G16, i7-13650HX, RTX 4060 | |
| LibreOffice / 20 Documents To PDF | |
| HP Victus 16 (2024) | |
| Acer Nitro V 16 ANV16-41-R5AT | |
| Average AMD Ryzen AI 9 HX 370 (46.8 - 66.6, n=24) | |
| Dell G16, i7-13650HX, RTX 4060 | |
| Lenovo Legion Pro 5 16IRX9 G9 | |
| Average of class Gaming (33.2 - 88.8, n=105, last 2 years) | |
| Asus TUF Gaming A16 FA608WV | |
| Asus TUF Gaming A16 FA617XS | |
| R Benchmark 2.5 / Overall mean | |
| HP Victus 16 (2024) | |
| Acer Nitro V 16 ANV16-41-R5AT | |
| Average of class Gaming (0.3439 - 0.759, n=106, last 2 years) | |
| Asus TUF Gaming A16 FA617XS | |
| Dell G16, i7-13650HX, RTX 4060 | |
| Dell G16, i7-13650HX, RTX 4060 | |
| Average AMD Ryzen AI 9 HX 370 (0.3892 - 0.529, n=24) | |
| Asus TUF Gaming A16 FA608WV | |
| Lenovo Legion Pro 5 16IRX9 G9 | |
* ... smaller is better
AIDA64: FP32 Ray-Trace | FPU Julia | CPU SHA3 | CPU Queen | FPU SinJulia | FPU Mandel | CPU AES | CPU ZLib | FP64 Ray-Trace | CPU PhotoWorxx
| Performance rating | |
| Asus TUF Gaming A16 FA608WV | |
| Average of class Gaming | |
| Average AMD Ryzen AI 9 HX 370 | |
| Lenovo Legion Pro 5 16IRX9 G9 | |
| Asus TUF Gaming A16 FA617XS | |
| Acer Nitro V 16 ANV16-41-R5AT | |
| Dell G16, i7-13650HX, RTX 4060 | |
| HP Victus 16 (2024) | |
| AIDA64 / FP32 Ray-Trace | |
| Asus TUF Gaming A16 FA608WV | |
| Average AMD Ryzen AI 9 HX 370 (24673 - 37804, n=25) | |
| Average of class Gaming (10227 - 85542, n=104, last 2 years) | |
| Asus TUF Gaming A16 FA617XS | |
| Acer Nitro V 16 ANV16-41-R5AT | |
| Lenovo Legion Pro 5 16IRX9 G9 | |
| Dell G16, i7-13650HX, RTX 4060 | |
| HP Victus 16 (2024) | |
| AIDA64 / FPU Julia | |
| Asus TUF Gaming A16 FA608WV | |
| Average of class Gaming (51376 - 238426, n=104, last 2 years) | |
| Average AMD Ryzen AI 9 HX 370 (95655 - 148045, n=26) | |
| Asus TUF Gaming A16 FA617XS | |
| Lenovo Legion Pro 5 16IRX9 G9 | |
| Acer Nitro V 16 ANV16-41-R5AT | |
| Dell G16, i7-13650HX, RTX 4060 | |
| HP Victus 16 (2024) | |
| AIDA64 / CPU SHA3 | |
| Average of class Gaming (2180 - 9817, n=104, last 2 years) | |
| Asus TUF Gaming A16 FA608WV | |
| Lenovo Legion Pro 5 16IRX9 G9 | |
| Average AMD Ryzen AI 9 HX 370 (4421 - 5932, n=26) | |
| Acer Nitro V 16 ANV16-41-R5AT | |
| Asus TUF Gaming A16 FA617XS | |
| Dell G16, i7-13650HX, RTX 4060 | |
| HP Victus 16 (2024) | |
| AIDA64 / CPU Queen | |
| Lenovo Legion Pro 5 16IRX9 G9 | |
| HP Victus 16 (2024) | |
| Asus TUF Gaming A16 FA617XS | |
| Acer Nitro V 16 ANV16-41-R5AT | |
| Average of class Gaming (49785 - 173351, n=90, last 2 years) | |
| Dell G16, i7-13650HX, RTX 4060 | |
| Asus TUF Gaming A16 FA608WV | |
| Average AMD Ryzen AI 9 HX 370 (41744 - 99088, n=24) | |
| AIDA64 / FPU SinJulia | |
| Asus TUF Gaming A16 FA608WV | |
| Average AMD Ryzen AI 9 HX 370 (16445 - 19120, n=26) | |
| Asus TUF Gaming A16 FA617XS | |
| Acer Nitro V 16 ANV16-41-R5AT | |
| Average of class Gaming (4424 - 33636, n=104, last 2 years) | |
| Lenovo Legion Pro 5 16IRX9 G9 | |
| HP Victus 16 (2024) | |
| Dell G16, i7-13650HX, RTX 4060 | |
| AIDA64 / FPU Mandel | |
| Asus TUF Gaming A16 FA608WV | |
| Average of class Gaming (25115 - 128721, n=104, last 2 years) | |
| Average AMD Ryzen AI 9 HX 370 (50357 - 93798, n=25) | |
| Asus TUF Gaming A16 FA617XS | |
| Acer Nitro V 16 ANV16-41-R5AT | |
| Lenovo Legion Pro 5 16IRX9 G9 | |
| Dell G16, i7-13650HX, RTX 4060 | |
| HP Victus 16 (2024) | |
| AIDA64 / CPU AES | |
| Lenovo Legion Pro 5 16IRX9 G9 | |
| Average of class Gaming (39258 - 247074, n=104, last 2 years) | |
| Asus TUF Gaming A16 FA617XS | |
| Average AMD Ryzen AI 9 HX 370 (67015 - 118993, n=26) | |
| Dell G16, i7-13650HX, RTX 4060 | |
| HP Victus 16 (2024) | |
| Asus TUF Gaming A16 FA608WV | |
| Acer Nitro V 16 ANV16-41-R5AT | |
| AIDA64 / CPU ZLib | |
| Lenovo Legion Pro 5 16IRX9 G9 | |
| Average of class Gaming (574 - 2531, n=104, last 2 years) | |
| Asus TUF Gaming A16 FA608WV | |
| Average AMD Ryzen AI 9 HX 370 (1077 - 1530, n=26) | |
| Dell G16, i7-13650HX, RTX 4060 | |
| HP Victus 16 (2024) | |
| Asus TUF Gaming A16 FA617XS | |
| Acer Nitro V 16 ANV16-41-R5AT | |
| AIDA64 / FP64 Ray-Trace | |
| Asus TUF Gaming A16 FA608WV | |
| Average AMD Ryzen AI 9 HX 370 (13665 - 20648, n=26) | |
| Average of class Gaming (5509 - 45446, n=104, last 2 years) | |
| Asus TUF Gaming A16 FA617XS | |
| Acer Nitro V 16 ANV16-41-R5AT | |
| Lenovo Legion Pro 5 16IRX9 G9 | |
| Dell G16, i7-13650HX, RTX 4060 | |
| HP Victus 16 (2024) | |
| AIDA64 / CPU PhotoWorxx | |
| Lenovo Legion Pro 5 16IRX9 G9 | |
| Average AMD Ryzen AI 9 HX 370 (36752 - 52671, n=26) | |
| Average of class Gaming (12271 - 89891, n=104, last 2 years) | |
| HP Victus 16 (2024) | |
| Asus TUF Gaming A16 FA608WV | |
| Dell G16, i7-13650HX, RTX 4060 | |
| Acer Nitro V 16 ANV16-41-R5AT | |
| Asus TUF Gaming A16 FA617XS | |
System performance
The system runs subjectively smooth, and the measurement results also attest to good values in PCMark 10, but the TUF Gaming A16 is not faster than its predecessor with a Ryzen 9 7940HS and Radeon RX 7600S. The same applies to CrossMark.
The AIDA memory values, on the other hand, are very good.
CrossMark: Overall | Productivity | Creativity | Responsiveness
WebXPRT 3: Overall
WebXPRT 4: Overall
Mozilla Kraken 1.1: Total
| PCMark 10 / Score | |
| Average of class Gaming (5828 - 11730, n=93, last 2 years) | |
| Lenovo Legion Pro 5 16IRX9 G9 | |
| Asus TUF Gaming A16 FA617XS | |
| Asus TUF Gaming A16 FA608WV | |
| Average AMD Ryzen AI 9 HX 370, NVIDIA GeForce RTX 4060 Laptop GPU (7645 - 7915, n=3) | |
| Acer Nitro V 16 ANV16-41-R5AT | |
| HP Victus 16 (2024) | |
| Dell G16, i7-13650HX, RTX 4060 | |
| PCMark 10 / Essentials | |
| Lenovo Legion Pro 5 16IRX9 G9 | |
| Asus TUF Gaming A16 FA617XS | |
| HP Victus 16 (2024) | |
| Average of class Gaming (8810 - 11935, n=97, last 2 years) | |
| Asus TUF Gaming A16 FA608WV | |
| Average AMD Ryzen AI 9 HX 370, NVIDIA GeForce RTX 4060 Laptop GPU (10140 - 10543, n=3) | |
| Acer Nitro V 16 ANV16-41-R5AT | |
| Dell G16, i7-13650HX, RTX 4060 | |
| PCMark 10 / Productivity | |
| Average of class Gaming (6845 - 21327, n=95, last 2 years) | |
| Asus TUF Gaming A16 FA617XS | |
| Dell G16, i7-13650HX, RTX 4060 | |
| Asus TUF Gaming A16 FA608WV | |
| Average AMD Ryzen AI 9 HX 370, NVIDIA GeForce RTX 4060 Laptop GPU (9925 - 10030, n=3) | |
| HP Victus 16 (2024) | |
| Lenovo Legion Pro 5 16IRX9 G9 | |
| Acer Nitro V 16 ANV16-41-R5AT | |
| PCMark 10 / Digital Content Creation | |
| Lenovo Legion Pro 5 16IRX9 G9 | |
| Average of class Gaming (7602 - 19954, n=95, last 2 years) | |
| Average AMD Ryzen AI 9 HX 370, NVIDIA GeForce RTX 4060 Laptop GPU (12351 - 13395, n=3) | |
| Asus TUF Gaming A16 FA608WV | |
| Acer Nitro V 16 ANV16-41-R5AT | |
| Asus TUF Gaming A16 FA617XS | |
| Dell G16, i7-13650HX, RTX 4060 | |
| HP Victus 16 (2024) | |
| CrossMark / Overall | |
| Lenovo Legion Pro 5 16IRX9 G9 | |
| Average of class Gaming (1366 - 2409, n=94, last 2 years) | |
| HP Victus 16 (2024) | |
| Dell G16, i7-13650HX, RTX 4060 | |
| Asus TUF Gaming A16 FA617XS | |
| Asus TUF Gaming A16 FA608WV | |
| Average AMD Ryzen AI 9 HX 370, NVIDIA GeForce RTX 4060 Laptop GPU (1710 - 1819, n=3) | |
| CrossMark / Productivity | |
| Lenovo Legion Pro 5 16IRX9 G9 | |
| Average of class Gaming (1386 - 2254, n=94, last 2 years) | |
| HP Victus 16 (2024) | |
| Dell G16, i7-13650HX, RTX 4060 | |
| Asus TUF Gaming A16 FA617XS | |
| Average AMD Ryzen AI 9 HX 370, NVIDIA GeForce RTX 4060 Laptop GPU (1574 - 1637, n=3) | |
| Asus TUF Gaming A16 FA608WV | |
| CrossMark / Creativity | |
| Lenovo Legion Pro 5 16IRX9 G9 | |
| Average of class Gaming (1343 - 2729, n=94, last 2 years) | |
| Average AMD Ryzen AI 9 HX 370, NVIDIA GeForce RTX 4060 Laptop GPU (2077 - 2264, n=3) | |
| Asus TUF Gaming A16 FA608WV | |
| HP Victus 16 (2024) | |
| Dell G16, i7-13650HX, RTX 4060 | |
| Asus TUF Gaming A16 FA617XS | |
| CrossMark / Responsiveness | |
| Lenovo Legion Pro 5 16IRX9 G9 | |
| HP Victus 16 (2024) | |
| Average of class Gaming (1226 - 2334, n=94, last 2 years) | |
| Dell G16, i7-13650HX, RTX 4060 | |
| Asus TUF Gaming A16 FA617XS | |
| Asus TUF Gaming A16 FA608WV | |
| Average AMD Ryzen AI 9 HX 370, NVIDIA GeForce RTX 4060 Laptop GPU (1226 - 1385, n=3) | |
| WebXPRT 3 / Overall | |
| Average of class Gaming (220 - 532, n=98, last 2 years) | |
| Acer Nitro V 16 ANV16-41-R5AT | |
| Lenovo Legion Pro 5 16IRX9 G9 | |
| Average AMD Ryzen AI 9 HX 370, NVIDIA GeForce RTX 4060 Laptop GPU (274 - 288, n=2) | |
| HP Victus 16 (2024) | |
| Asus TUF Gaming A16 FA608WV | |
| Dell G16, i7-13650HX, RTX 4060 | |
| WebXPRT 4 / Overall | |
| Average of class Gaming (165 - 354, n=98, last 2 years) | |
| Lenovo Legion Pro 5 16IRX9 G9 | |
| Asus TUF Gaming A16 FA608WV | |
| Asus TUF Gaming A16 FA617XS | |
| Average AMD Ryzen AI 9 HX 370, NVIDIA GeForce RTX 4060 Laptop GPU (252 - 271, n=3) | |
| HP Victus 16 (2024) | |
| Acer Nitro V 16 ANV16-41-R5AT | |
| Mozilla Kraken 1.1 / Total | |
| HP Victus 16 (2024) | |
| Acer Nitro V 16 ANV16-41-R5AT | |
| Dell G16, i7-13650HX, RTX 4060 | |
| Asus TUF Gaming A16 FA617XS | |
| Lenovo Legion Pro 5 16IRX9 G9 | |
| Average of class Gaming (391 - 590, n=100, last 2 years) | |
| Average AMD Ryzen AI 9 HX 370, NVIDIA GeForce RTX 4060 Laptop GPU (430 - 450, n=3) | |
| Asus TUF Gaming A16 FA608WV | |
* ... smaller is better
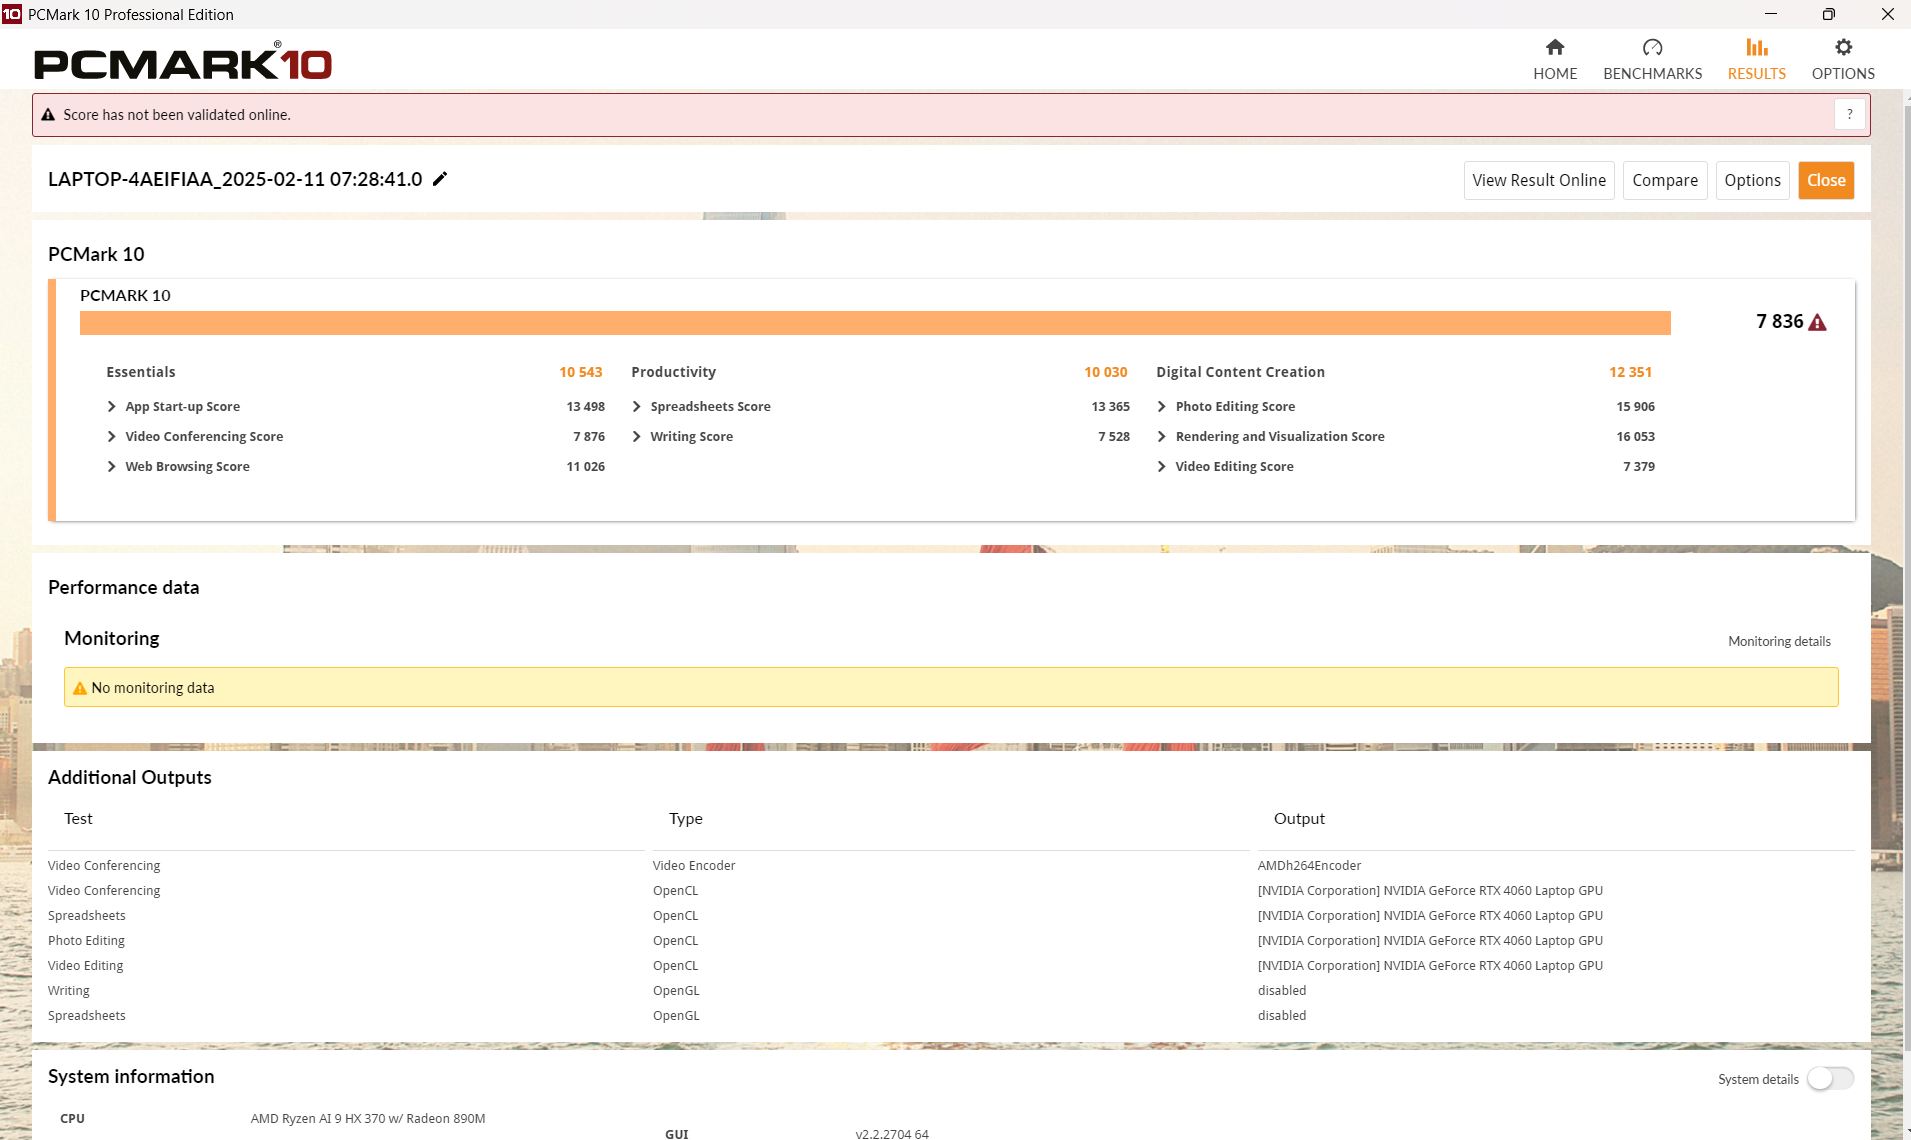
| PCMark 10 Score | 7836 points | |
Help | ||
| AIDA64 / Memory Copy | |
| Asus TUF Gaming A16 FA608WV | |
| Average AMD Ryzen AI 9 HX 370 (71902 - 93640, n=26) | |
| Lenovo Legion Pro 5 16IRX9 G9 | |
| Average of class Gaming (21750 - 129946, n=104, last 2 years) | |
| HP Victus 16 (2024) | |
| Acer Nitro V 16 ANV16-41-R5AT | |
| Asus TUF Gaming A16 FA617XS | |
| Dell G16, i7-13650HX, RTX 4060 | |
| AIDA64 / Memory Read | |
| Asus TUF Gaming A16 FA608WV | |
| Average AMD Ryzen AI 9 HX 370 (81367 - 102937, n=26) | |
| Lenovo Legion Pro 5 16IRX9 G9 | |
| HP Victus 16 (2024) | |
| Average of class Gaming (22956 - 118858, n=104, last 2 years) | |
| Dell G16, i7-13650HX, RTX 4060 | |
| Asus TUF Gaming A16 FA617XS | |
| Acer Nitro V 16 ANV16-41-R5AT | |
| AIDA64 / Memory Write | |
| Asus TUF Gaming A16 FA608WV | |
| Average AMD Ryzen AI 9 HX 370 (78939 - 108954, n=26) | |
| Acer Nitro V 16 ANV16-41-R5AT | |
| Lenovo Legion Pro 5 16IRX9 G9 | |
| Average of class Gaming (22297 - 135096, n=104, last 2 years) | |
| Asus TUF Gaming A16 FA617XS | |
| HP Victus 16 (2024) | |
| Dell G16, i7-13650HX, RTX 4060 | |
| AIDA64 / Memory Latency | |
| Asus TUF Gaming A16 FA608WV | |
| Average of class Gaming (75.3 - 259, n=104, last 2 years) | |
| Average AMD Ryzen AI 9 HX 370 (86.7 - 119.4, n=26) | |
| HP Victus 16 (2024) | |
| Dell G16, i7-13650HX, RTX 4060 | |
| Asus TUF Gaming A16 FA617XS | |
| Acer Nitro V 16 ANV16-41-R5AT | |
| Lenovo Legion Pro 5 16IRX9 G9 | |
* ... smaller is better
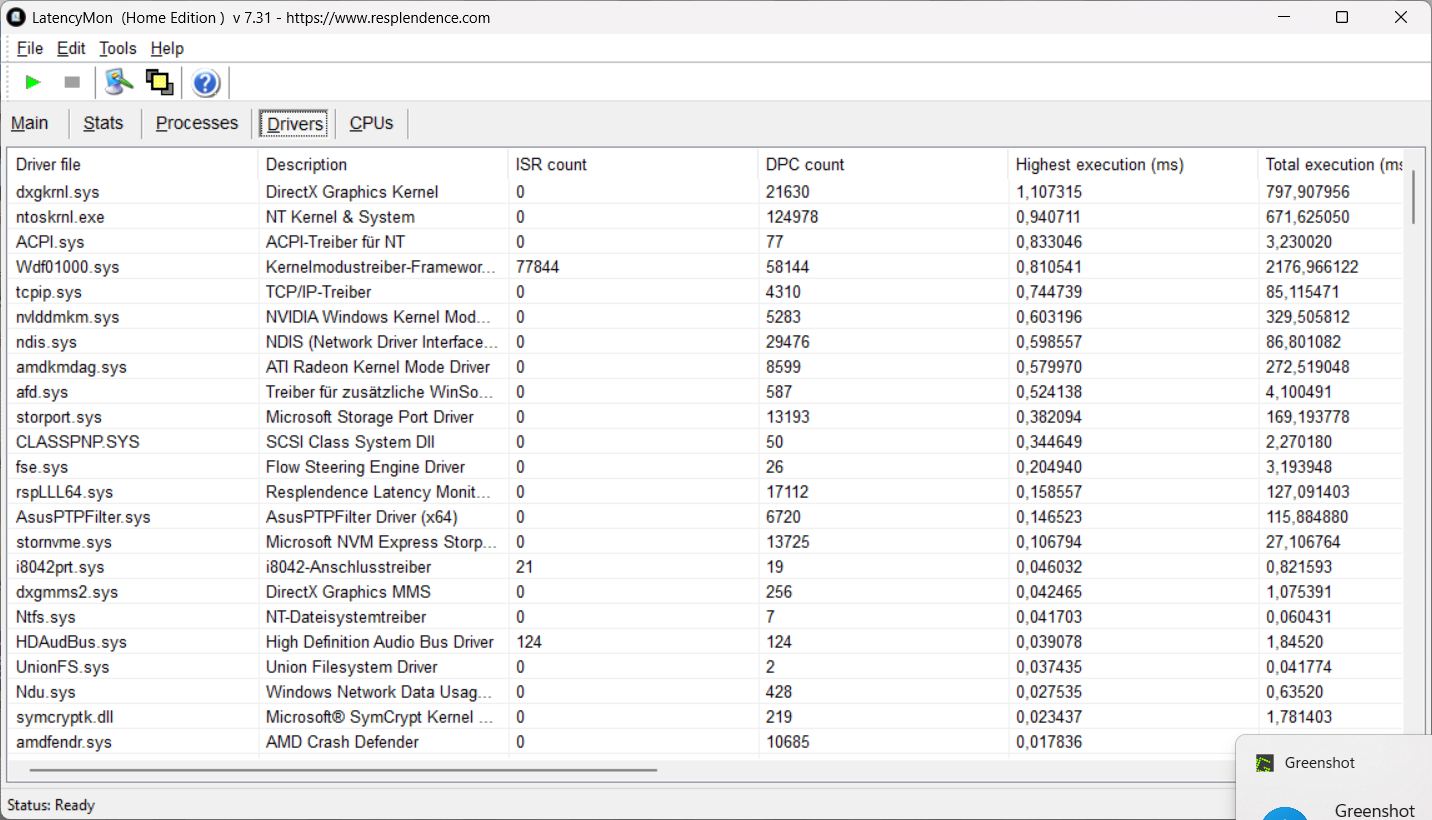
DPC latency
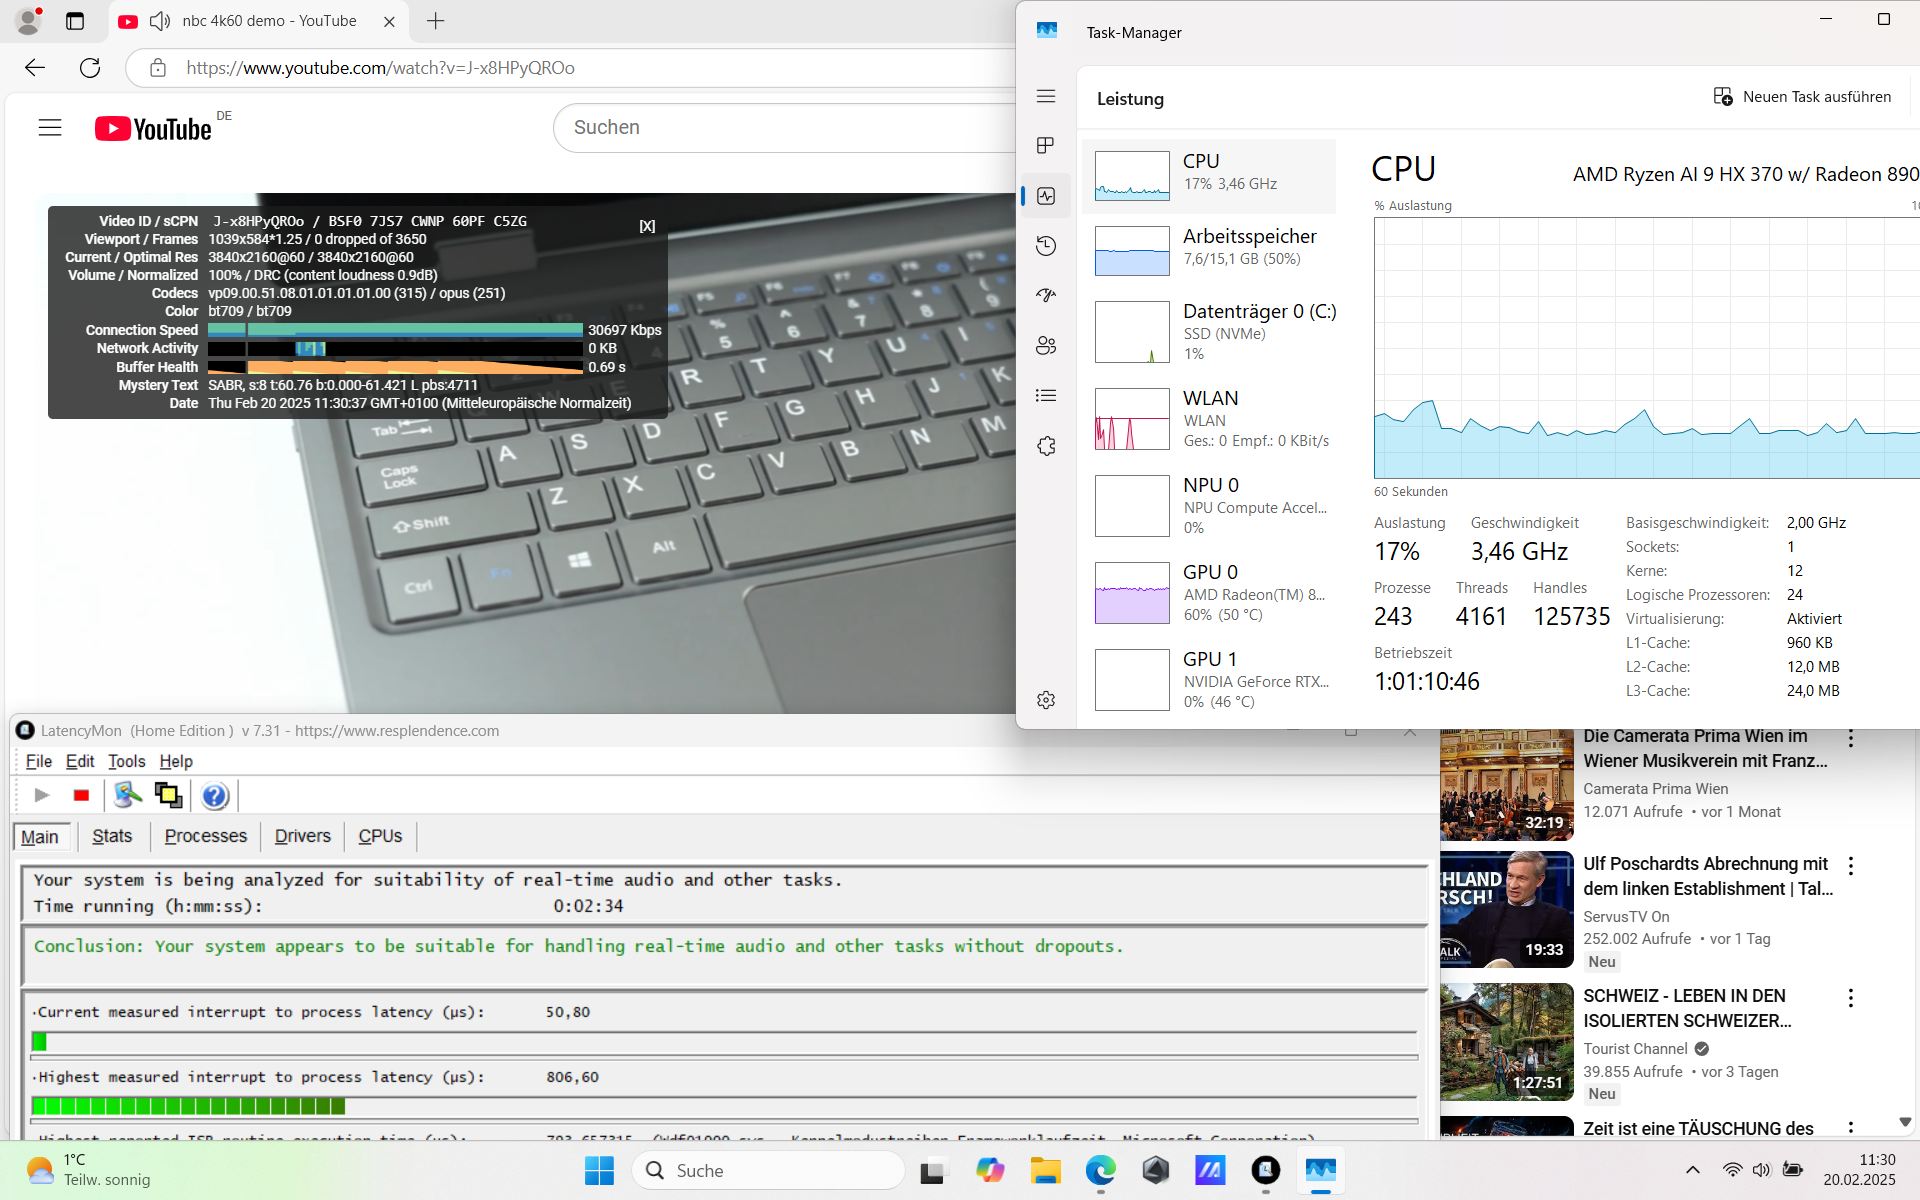
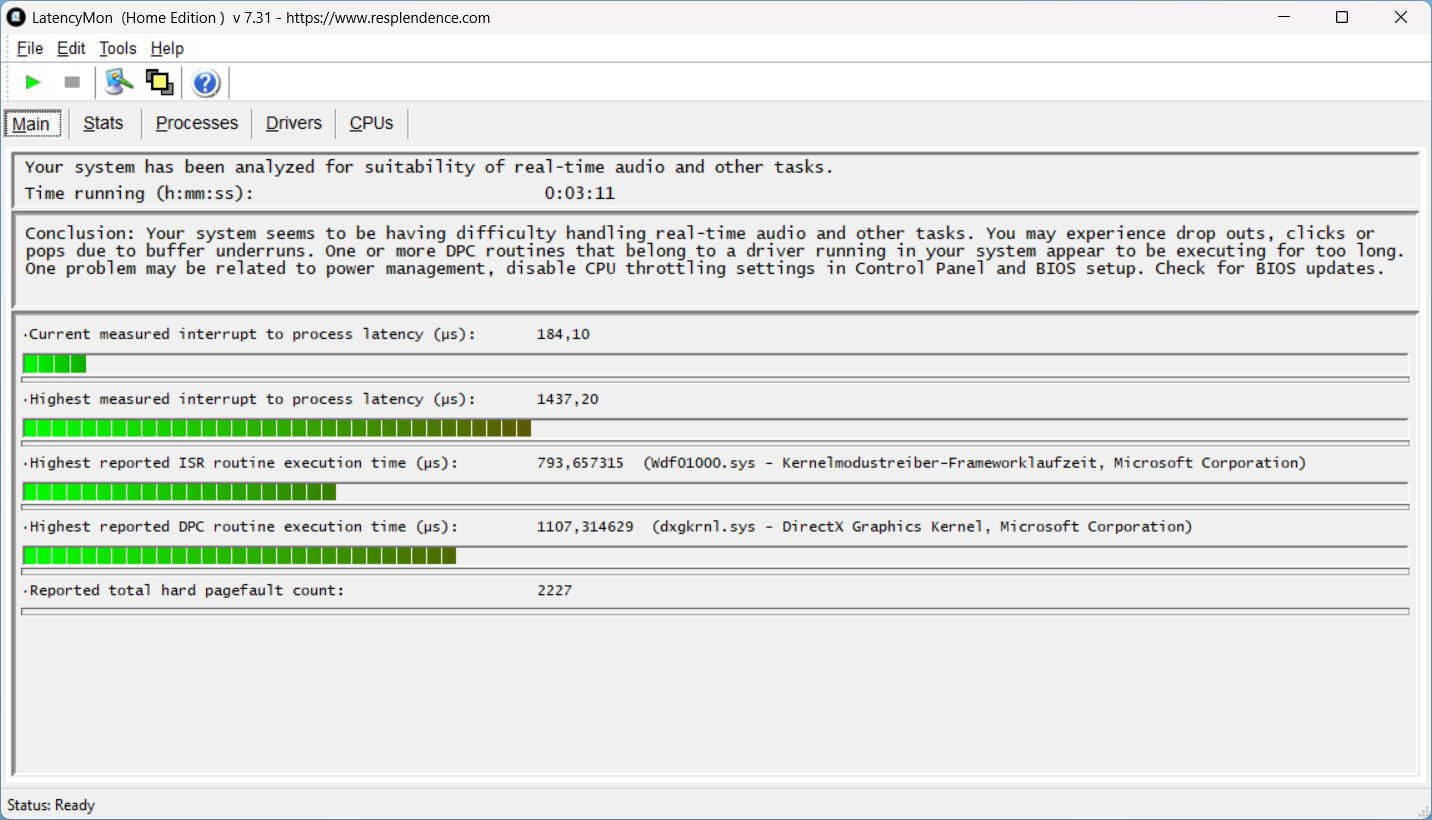
There is no significant latency either when opening the browser or when opening multiple tabs. Playback of our 4K/60 fps YouTube test video is quite smooth as well. We see higher latency only when starting Prime95 stress.
| DPC Latencies / LatencyMon - interrupt to process latency (max), Web, Youtube, Prime95 | |
| Acer Nitro V 16 ANV16-41-R5AT | |
| Asus TUF Gaming A16 FA608WV | |
| Asus TUF Gaming A16 FA617XS | |
| Dell G16, i7-13650HX, RTX 4060 | |
| Lenovo Legion Pro 5 16IRX9 G9 | |
| HP Victus 16 (2024) | |
* ... smaller is better
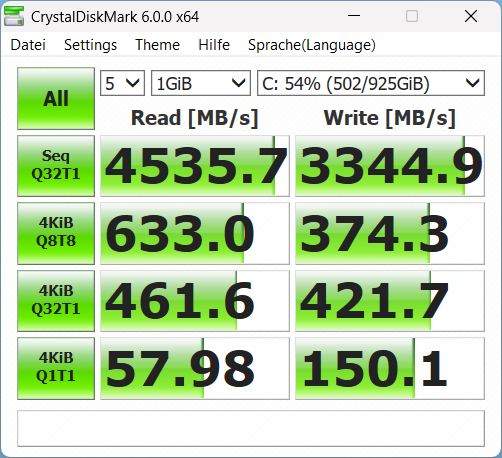
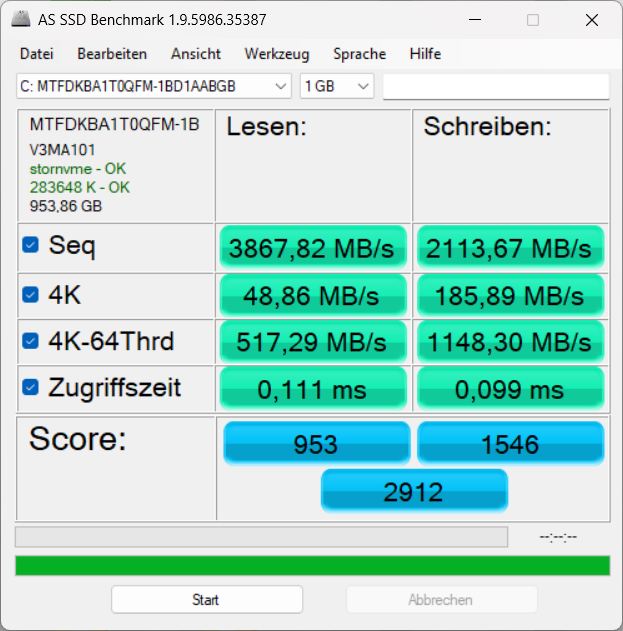
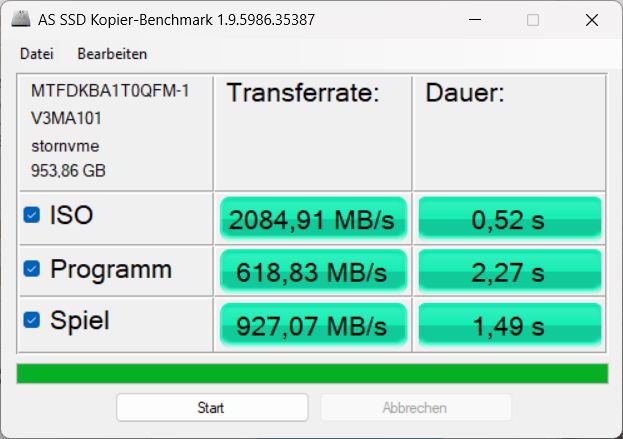
Mass storage
Unfortunately, the Micron SSD with 1 TB is not quite convincing in our test model, it falls short of expectations and is slower than in the predecessor. Nevertheless, the performance is very consistent.

* ... smaller is better
Disk throttling: DiskSpd Read Loop, Queue Depth 8
Graphics card
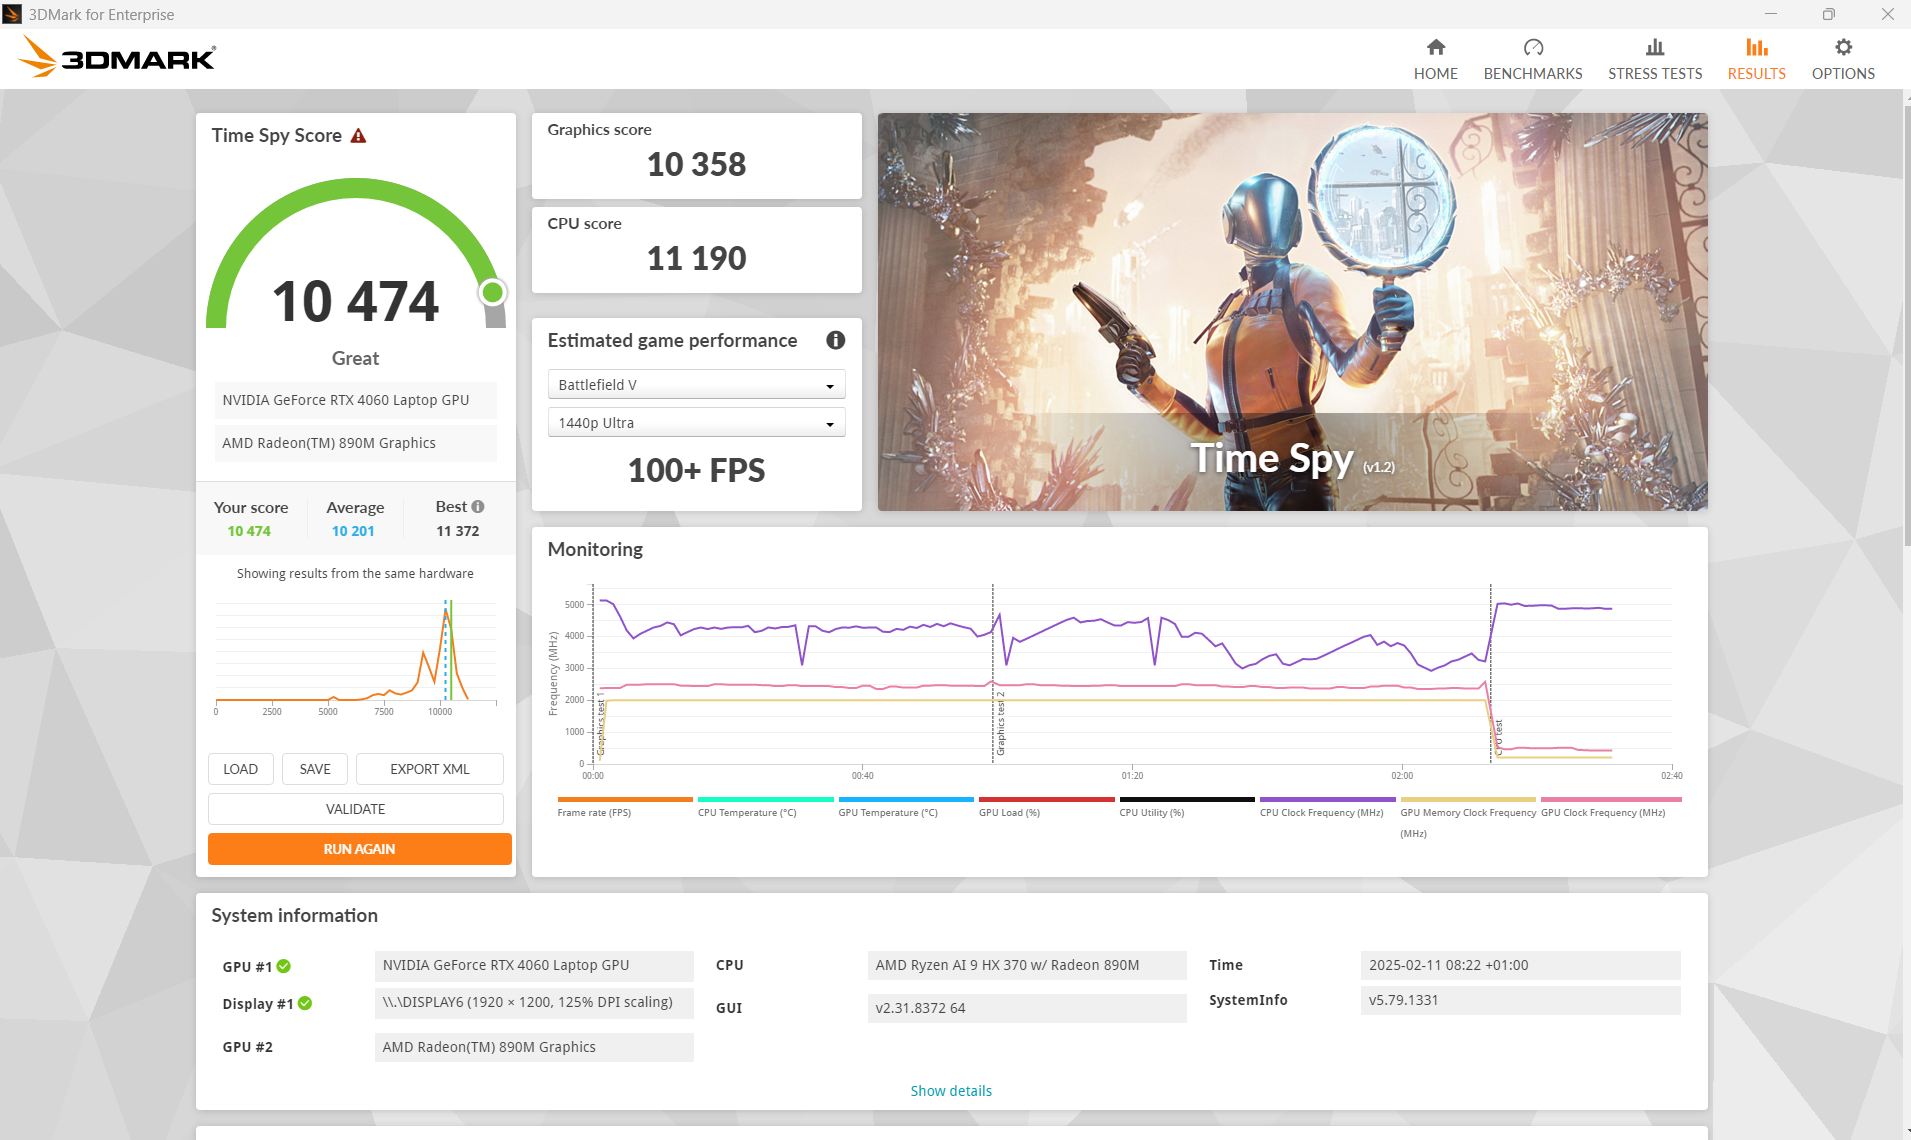
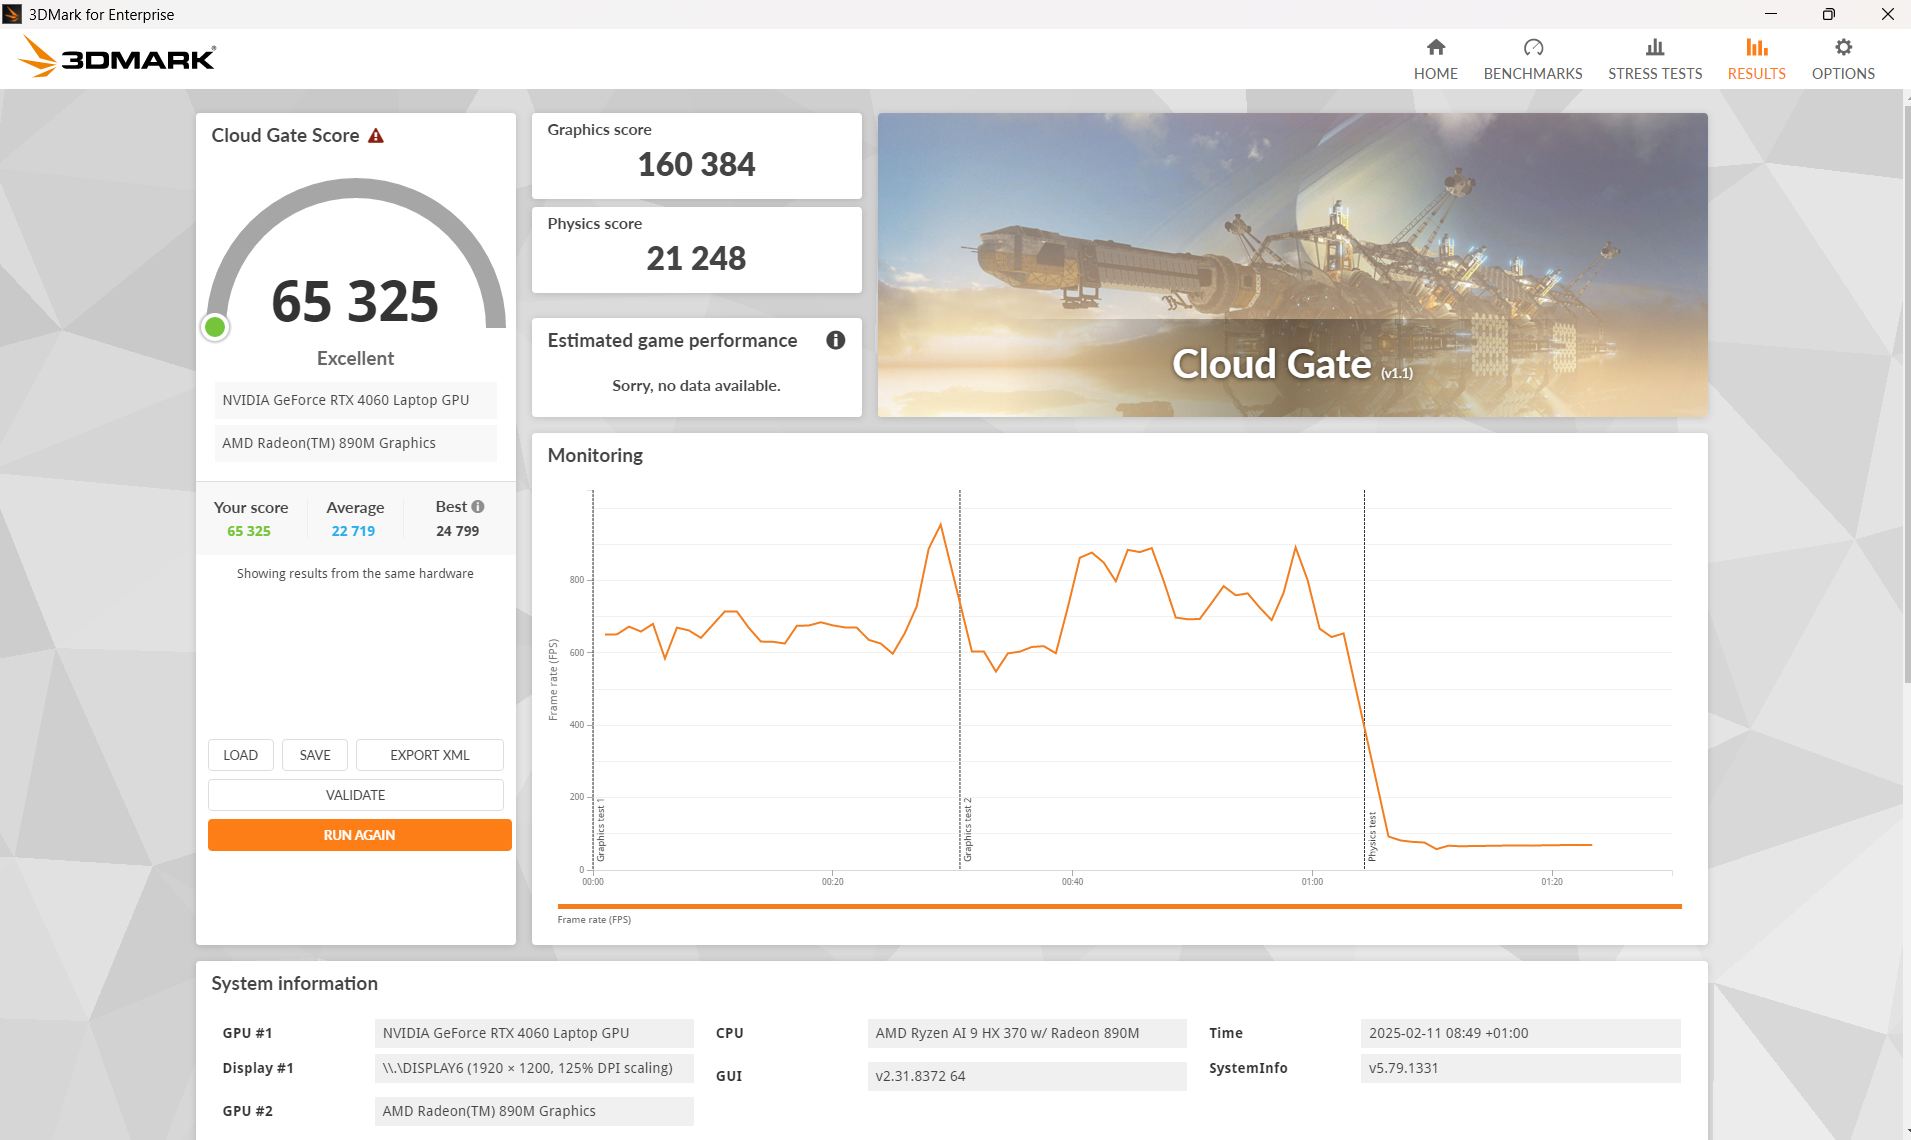
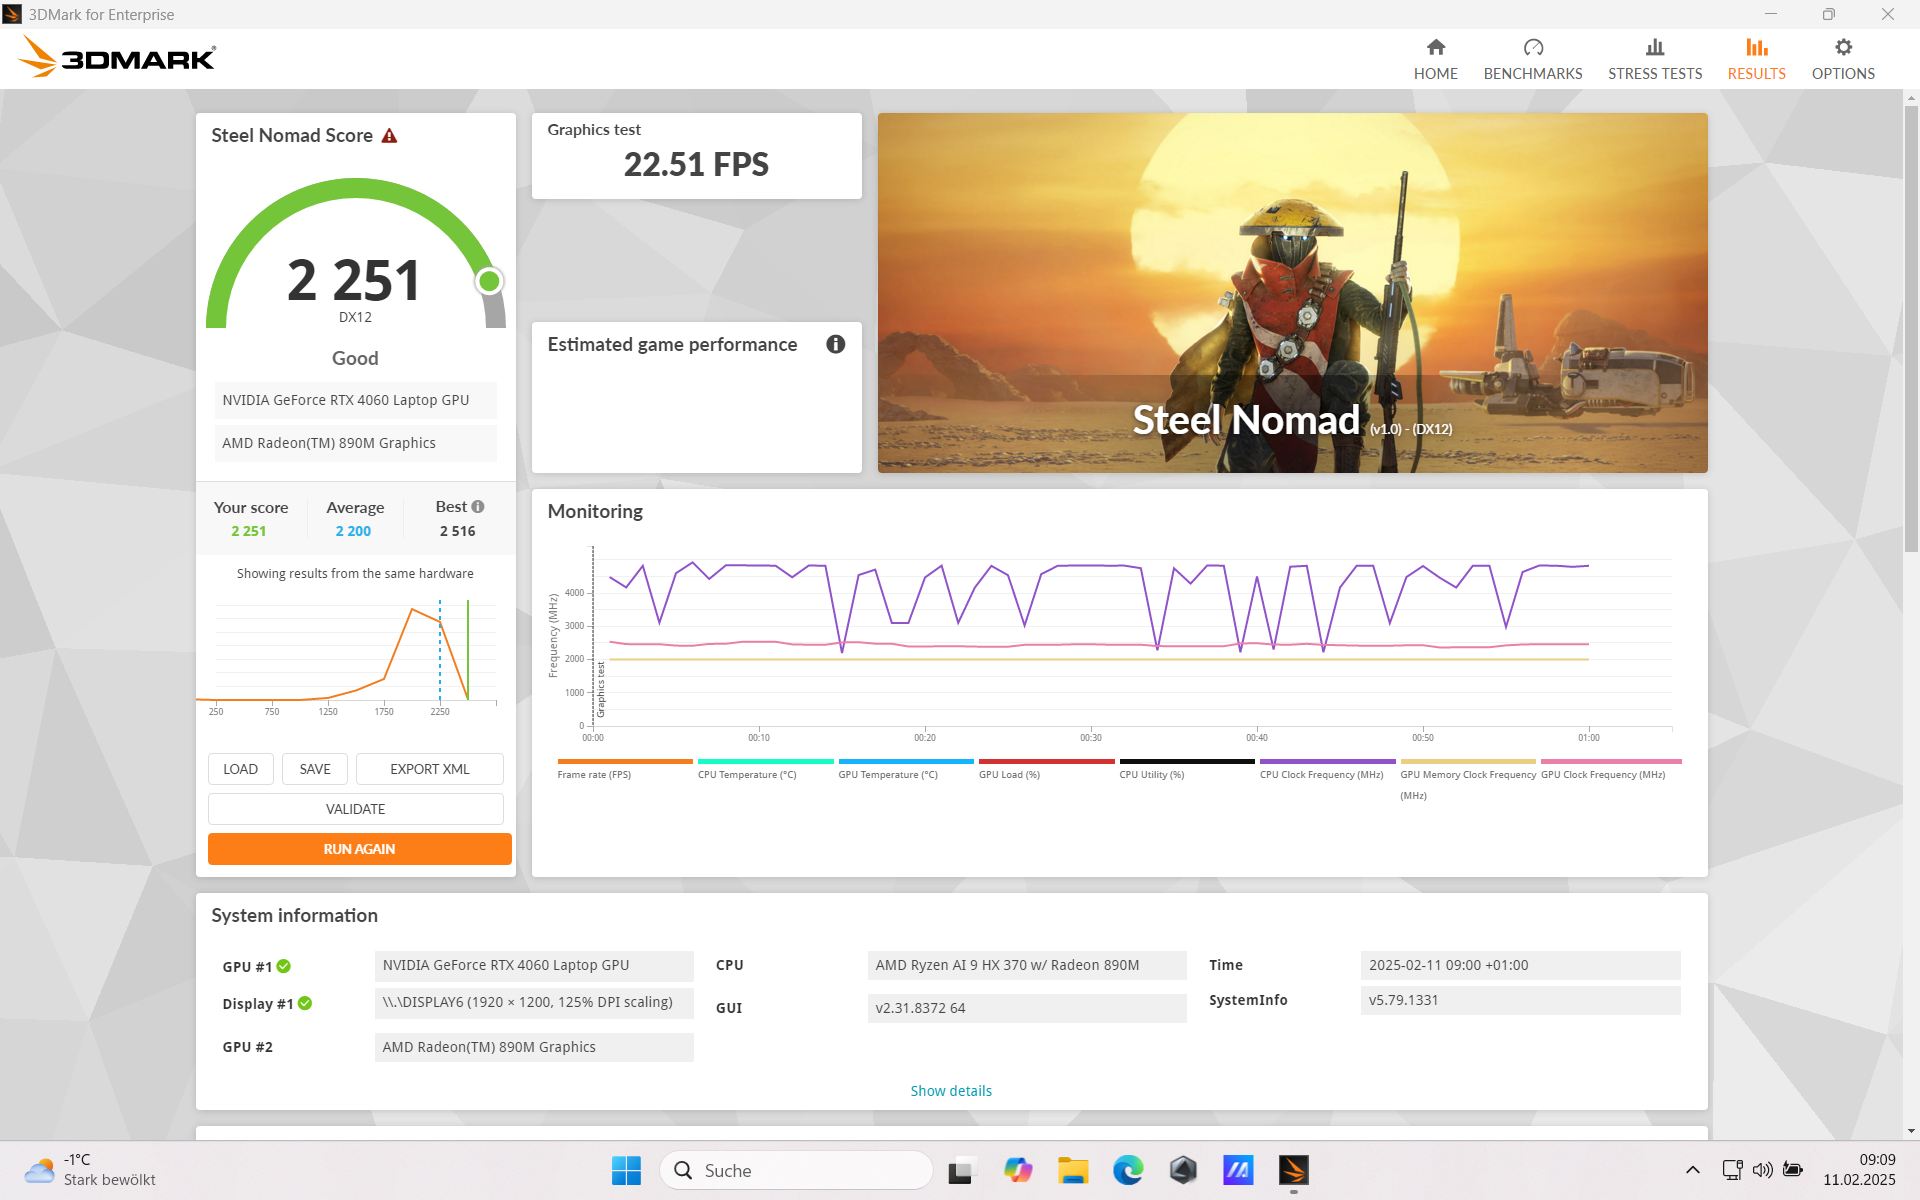
The Nvidia Geforce RTX 4060 in the TUF Gaming A16 performs around 6% above average in the 3DMarks. Nevertheless, at least in games, the Legion Pro 5 is clearly ahead. In battery mode, the A16 loses a full 75% in 3D performance, measured in another 3DMark Fire Strike run.
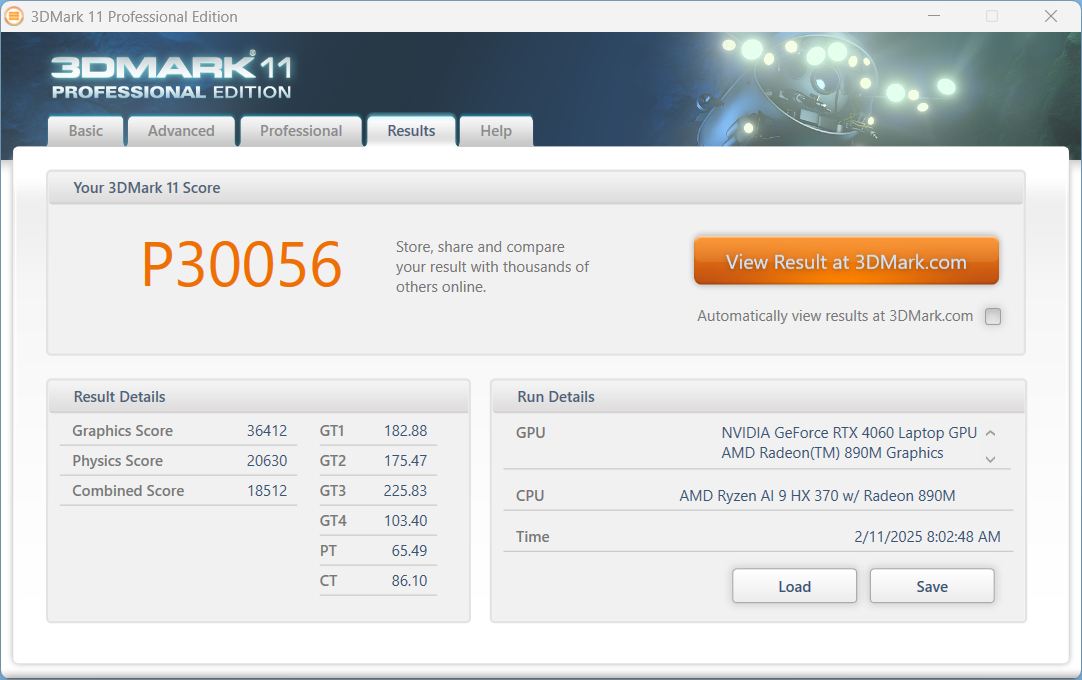

| 3DMark 11 Performance | 30056 points | |
| 3DMark Cloud Gate Standard Score | 65325 points | |
| 3DMark Fire Strike Score | 24503 points | |
| 3DMark Time Spy Score | 10474 points | |
| 3DMark Steel Nomad Score | 2251 points | |
Help | ||
* ... smaller is better
| Cyberpunk 2077 - 1920x1080 Ultra Preset (FSR off) | |
| Average of class Gaming (17.7 - 169.9, n=115, last 2 years) | |
| Lenovo Legion Pro 5 16IRX9 G9 | |
| Asus TUF Gaming A16 FA608WV | |
| Dell G16, i7-13650HX, RTX 4060 | |
| HP Victus 16 (2024) | |
| Acer Nitro V 16 ANV16-41-R5AT | |
| Baldur's Gate 3 - 1920x1080 Ultra Preset AA:T | |
| Average of class Gaming (59.4 - 246, n=102, last 2 years) | |
| Asus TUF Gaming A16 FA608WV | |
| Acer Nitro V 16 ANV16-41-R5AT | |
| Lenovo Legion Pro 5 16IRX9 G9 | |
| Final Fantasy XV Benchmark - 1920x1080 High Quality | |
| Average of class Gaming (41 - 215, n=95, last 2 years) | |
| Lenovo Legion Pro 5 16IRX9 G9 | |
| Dell G16, i7-13650HX, RTX 4060 | |
| Asus TUF Gaming A16 FA608WV | |
| HP Victus 16 (2024) | |
| Acer Nitro V 16 ANV16-41-R5AT | |
| Asus TUF Gaming A16 FA617XS | |
| Dota 2 Reborn - 1920x1080 ultra (3/3) best looking | |
| Lenovo Legion Pro 5 16IRX9 G9 | |
| Average of class Gaming (84.8 - 248, n=107, last 2 years) | |
| HP Victus 16 (2024) | |
| Dell G16, i7-13650HX, RTX 4060 | |
| Asus TUF Gaming A16 FA608WV | |
| Acer Nitro V 16 ANV16-41-R5AT | |
| Asus TUF Gaming A16 FA617XS | |
Cyberpunk 2077 1080p Ultra FPS chart
| low | med. | high | ultra | |
|---|---|---|---|---|
| GTA V (2015) | 179 | 177 | 170.7 | 114 |
| Dota 2 Reborn (2015) | 166.9 | 145.9 | 141.7 | 136.2 |
| Final Fantasy XV Benchmark (2018) | 179.7 | 139.6 | 102.5 | |
| X-Plane 11.11 (2018) | 95.3 | 86 | 69.9 | |
| Strange Brigade (2018) | 415 | 281 | 224 | 191.9 |
| Baldur's Gate 3 (2023) | 144 | 115 | 103 | 99 |
| Cyberpunk 2077 (2023) | 117.8 | 100.2 | 86.9 | 75.6 |
| F1 24 (2024) | 177.4 | 61.6 |
Emissions and energy: Relatively quiet and cool TUF Gaming A16
Noise emissions
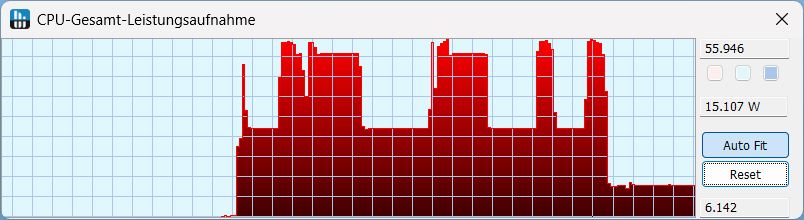
The fans are mostly off in idle, only in Turbo mode do they begin whispering at 29 dB(A). In the stress test, the fan noise ranges between 36 and 39 dB(A). The change is periodic and gradual without any pulsation.
The TUF Gaming A16 does get significantly louder in Turbo mode, but the 3D performance hardly benefits from it.
| Cyberpunk 2077 | Quiet | Performance | Turbo |
|---|---|---|---|
| Noise level in dB(A) | 30.7 | 36.23 | 50.97 |
| Average fps | 59.6 | 68.8 | 69.4 |
Noise level
| Idle |
| 23 / 23 / 29.11 dB(A) |
| Load |
| 31 / 39.44 dB(A) |
 | ||
30 dB silent 40 dB(A) audible 50 dB(A) loud |
||
min: | ||
| Asus TUF Gaming A16 FA608WV GeForce RTX 4060 Laptop GPU, Ryzen AI 9 HX 370, Micron 2400 MTFDKBA1T0QFM | Asus TUF Gaming A16 FA617XS Radeon RX 7600S, R9 7940HS, Micron 2400 MTFDKBA512QFM | Lenovo Legion Pro 5 16IRX9 G9 GeForce RTX 4060 Laptop GPU, i7-14700HX, Samsung PM9A1 MZVL21T0HCLR | Dell G16, i7-13650HX, RTX 4060 GeForce RTX 4060 Laptop GPU, i7-13650HX, WD PC SN740 SDDPNQD-1T00 | HP Victus 16 (2024) GeForce RTX 4060 Laptop GPU, i7-14700HX, Kioxia XG8 KXG80ZNV512G | Acer Nitro V 16 ANV16-41-R5AT GeForce RTX 4060 Laptop GPU, R7 8845HS, Micron 2550 1TB | |
|---|---|---|---|---|---|---|
| Noise | -17% | -16% | -1% | -23% | -30% | |
| off / environment * (dB) | 23 | 25 -9% | 23 -0% | 23 -0% | 25 -9% | 25 -9% |
| Idle Minimum * (dB) | 23 | 25 -9% | 23 -0% | 23 -0% | 28 -22% | 25 -9% |
| Idle Average * (dB) | 23 | 26 -13% | 23 -0% | 23 -0% | 29 -26% | 28 -22% |
| Idle Maximum * (dB) | 29.11 | 28 4% | 25 14% | 27.96 4% | 33 -13% | 37 -27% |
| Load Average * (dB) | 31 | 43 -39% | 45.18 -46% | 27.96 10% | 45 -45% | 51 -65% |
| Cyberpunk 2077 ultra * (dB) | 36.23 | 52.69 -45% | 54 -49% | |||
| Load Maximum * (dB) | 39.44 | 53 -34% | 53.13 -35% | 47.89 -21% | 48 -22% | 52 -32% |
| Witcher 3 ultra * (dB) | 51 | 47.89 | 43 |
* ... smaller is better
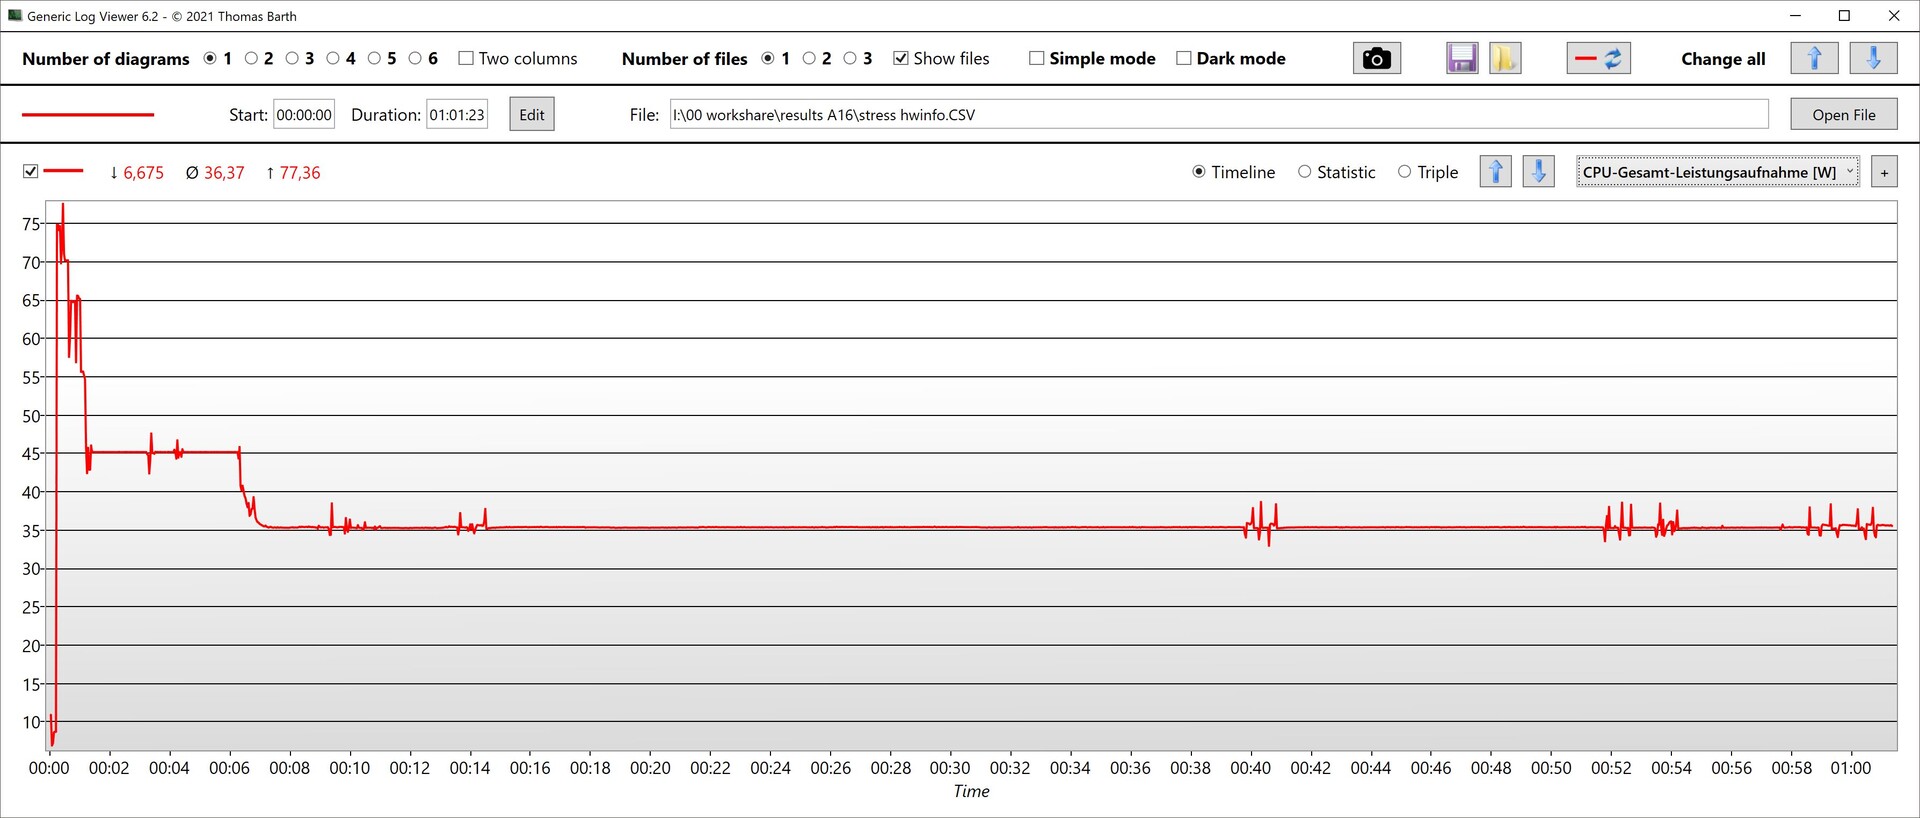
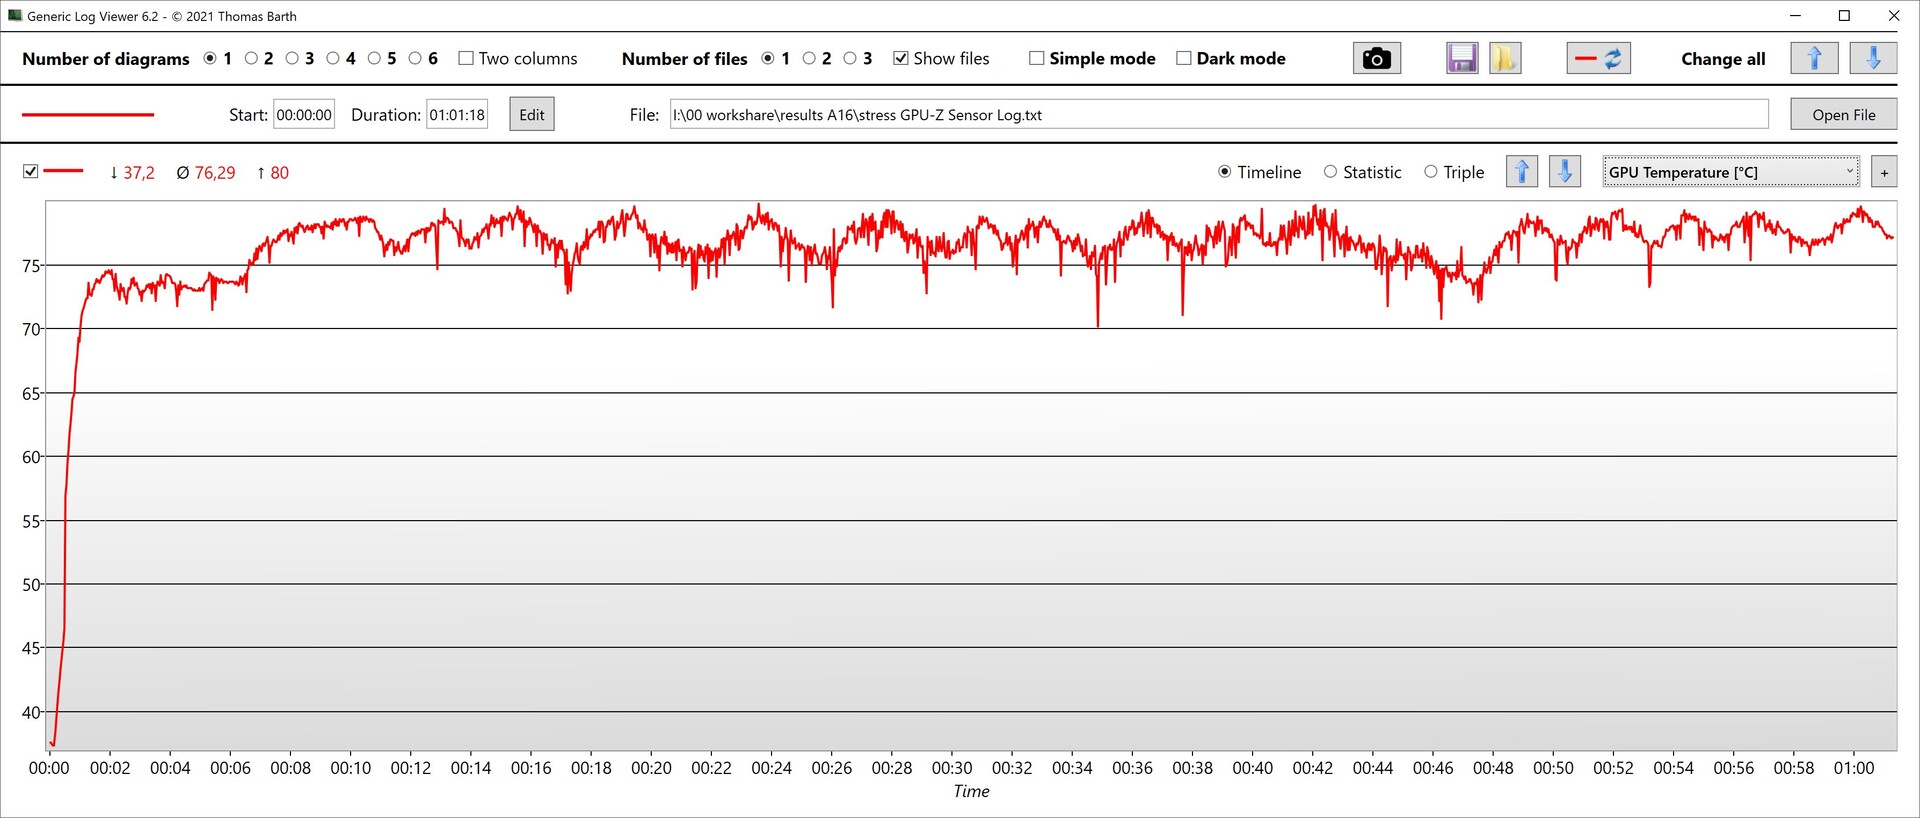
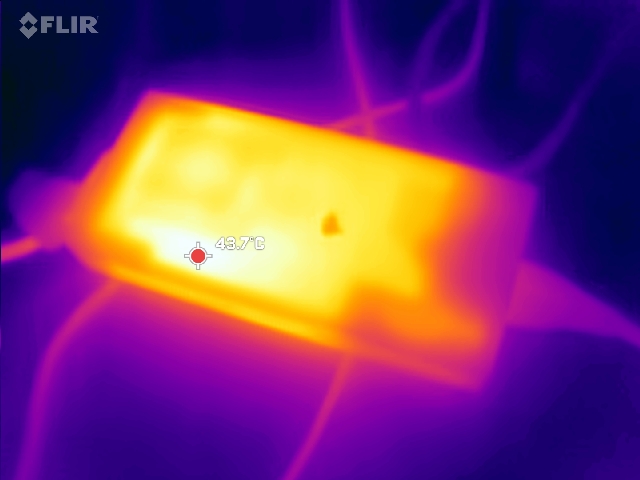
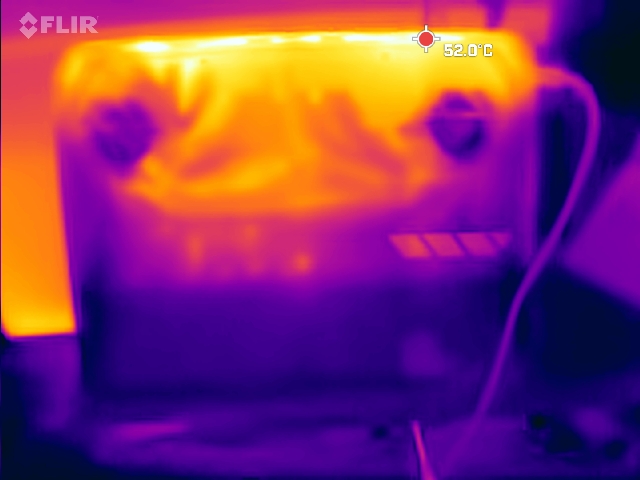
Temperature
Even in the stress test, the A16 remains quite cool, which also has to do with the fact that the CPU's TDP is soon reduced from around 80 W to a constant 35 W.
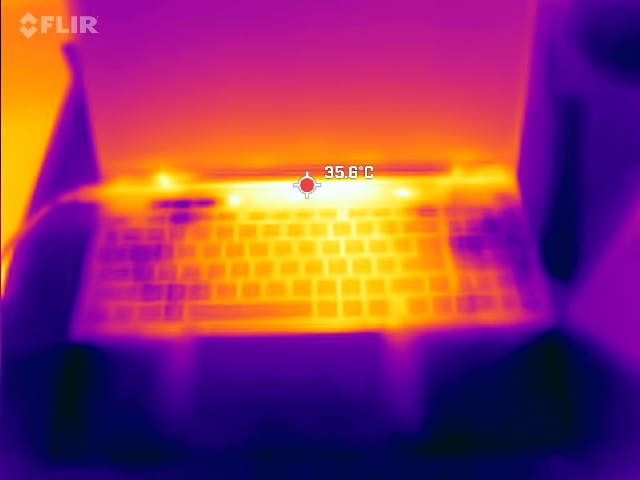
While it does get a little warmer towards the center of the display, the palm rests and the WASD keys range from being cool to slightly warm.

(+) The maximum temperature on the upper side is 38 °C / 100 F, compared to the average of 40.4 °C / 105 F, ranging from 21.2 to 68.8 °C for the class Gaming.
(+) The bottom heats up to a maximum of 37 °C / 99 F, compared to the average of 43.2 °C / 110 F
(+) In idle usage, the average temperature for the upper side is 24.7 °C / 76 F, compared to the device average of 33.9 °C / 93 F.
(+) 3: The average temperature for the upper side is 30.8 °C / 87 F, compared to the average of 33.9 °C / 93 F for the class Gaming.
(+) The palmrests and touchpad are cooler than skin temperature with a maximum of 22 °C / 71.6 F and are therefore cool to the touch.
(+) The average temperature of the palmrest area of similar devices was 28.8 °C / 83.8 F (+6.8 °C / 12.2 F).
| Asus TUF Gaming A16 FA608WV AMD Ryzen AI 9 HX 370, NVIDIA GeForce RTX 4060 Laptop GPU | Asus TUF Gaming A16 FA617XS AMD Ryzen 9 7940HS, AMD Radeon RX 7600S | Lenovo Legion Pro 5 16IRX9 G9 Intel Core i7-14700HX, NVIDIA GeForce RTX 4060 Laptop GPU | Dell G16, i7-13650HX, RTX 4060 Intel Core i7-13650HX, NVIDIA GeForce RTX 4060 Laptop GPU | HP Victus 16 (2024) Intel Core i7-14700HX, NVIDIA GeForce RTX 4060 Laptop GPU | Acer Nitro V 16 ANV16-41-R5AT AMD Ryzen 7 8845HS, NVIDIA GeForce RTX 4060 Laptop GPU | |
|---|---|---|---|---|---|---|
| Heat | -19% | -36% | -32% | -11% | -19% | |
| Maximum Upper Side * (°C) | 38 | 53 -39% | 50 -32% | 49 -29% | 50 -32% | 41 -8% |
| Maximum Bottom * (°C) | 37 | 48 -30% | 57 -54% | 58 -57% | 50 -35% | 49 -32% |
| Idle Upper Side * (°C) | 28 | 30 -7% | 36 -29% | 35 -25% | 25 11% | 32 -14% |
| Idle Bottom * (°C) | 30 | 30 -0% | 39 -30% | 35 -17% | 26 13% | 37 -23% |
* ... smaller is better
Loudspeaker
The somewhat quiet speakers lack bass but offer balanced highs. A 3.5 mm jack connection is available for external audio devices.
Asus TUF Gaming A16 FA608WV audio analysis
(±) | speaker loudness is average but good (79.84 dB)
Bass 100 - 315 Hz
(-) | nearly no bass - on average 18.3% lower than median
(+) | bass is linear (6.8% delta to prev. frequency)
Mids 400 - 2000 Hz
(±) | higher mids - on average 5.6% higher than median
(+) | mids are linear (5.5% delta to prev. frequency)
Highs 2 - 16 kHz
(+) | balanced highs - only 4.4% away from median
(+) | highs are linear (5.4% delta to prev. frequency)
Overall 100 - 16.000 Hz
(±) | linearity of overall sound is average (18.8% difference to median)
Compared to same class
» 62% of all tested devices in this class were better, 8% similar, 30% worse
» The best had a delta of 6%, average was 18%, worst was 132%
Compared to all devices tested
» 43% of all tested devices were better, 8% similar, 49% worse
» The best had a delta of 4%, average was 23%, worst was 134%
Lenovo Legion Pro 5 16IRX9 G9 audio analysis
(±) | speaker loudness is average but good (77.13 dB)
Bass 100 - 315 Hz
(-) | nearly no bass - on average 18.3% lower than median
(±) | linearity of bass is average (12% delta to prev. frequency)
Mids 400 - 2000 Hz
(±) | higher mids - on average 6.9% higher than median
(+) | mids are linear (4.9% delta to prev. frequency)
Highs 2 - 16 kHz
(+) | balanced highs - only 4.5% away from median
(±) | linearity of highs is average (9.5% delta to prev. frequency)
Overall 100 - 16.000 Hz
(±) | linearity of overall sound is average (21.6% difference to median)
Compared to same class
» 77% of all tested devices in this class were better, 5% similar, 18% worse
» The best had a delta of 6%, average was 18%, worst was 132%
Compared to all devices tested
» 61% of all tested devices were better, 7% similar, 32% worse
» The best had a delta of 4%, average was 23%, worst was 134%
Power consumption
Despite the faster CPU, idle power consumption does not increase. The same applies to medium load (3DMark06) or gaming, where the A16 is relatively economical compared to the competition.
We measured very short load peaks of up to 199 W in the stress test, which is no problem for the somewhat clunky 240 W power supply unit.
| Off / Standby | |
| Idle | |
| Load |
|
Key:
min: | |
| Asus TUF Gaming A16 FA608WV Ryzen AI 9 HX 370, GeForce RTX 4060 Laptop GPU | Asus TUF Gaming A16 FA617XS R9 7940HS, Radeon RX 7600S | Lenovo Legion Pro 5 16IRX9 G9 i7-14700HX, GeForce RTX 4060 Laptop GPU | Dell G16, i7-13650HX, RTX 4060 i7-13650HX, GeForce RTX 4060 Laptop GPU | HP Victus 16 (2024) i7-14700HX, GeForce RTX 4060 Laptop GPU | Acer Nitro V 16 ANV16-41-R5AT R7 8845HS, GeForce RTX 4060 Laptop GPU | Average of class Gaming | |
|---|---|---|---|---|---|---|---|
| Power Consumption | 6% | -53% | -28% | -33% | 14% | -51% | |
| Idle Minimum * (Watt) | 6.8 | 7 -3% | 13.7 -101% | 11 -62% | 9 -32% | 9 -32% | 13 ? -91% |
| Idle Average * (Watt) | 12.7 | 10 21% | 17.7 -39% | 14.8 -17% | 15 -18% | 10 21% | 18.7 ? -47% |
| Idle Maximum * (Watt) | 15.2 | 15 1% | 18.5 -22% | 16.8 -11% | 23 -51% | 13 14% | 24.3 ? -60% |
| Load Average * (Watt) | 85 | 86 -1% | 124 -46% | 103.7 -22% | 123 -45% | 61 28% | 109.7 ? -29% |
| Cyberpunk 2077 ultra * (Watt) | 145 | 229 -58% | 118.9 18% | ||||
| Cyberpunk 2077 ultra external monitor * (Watt) | 143 | 224 -57% | 116.3 19% | ||||
| Load Maximum * (Watt) | 199 | 172 14% | 297 -49% | 255 -28% | 241 -21% | 134 33% | 257 ? -29% |
| Witcher 3 ultra * (Watt) | 160.6 | 185 | 143.7 |
* ... smaller is better
Power consumption: Cyberpunk 2077 / Stress test
Power consumption: External monitor
Battery life
Despite the budget price, Asus installs a slightly larger battery (90 Wh) battery than most of its competitors. This gives the A16 a very good runtime of over 14 hours in the video and Wi-Fi test with reduced brightness.
| Asus TUF Gaming A16 FA608WV Ryzen AI 9 HX 370, GeForce RTX 4060 Laptop GPU, 90 Wh | Asus TUF Gaming A16 FA617XS R9 7940HS, Radeon RX 7600S, 90 Wh | Lenovo Legion Pro 5 16IRX9 G9 i7-14700HX, GeForce RTX 4060 Laptop GPU, 80 Wh | Dell G16, i7-13650HX, RTX 4060 i7-13650HX, GeForce RTX 4060 Laptop GPU, 86 Wh | HP Victus 16 (2024) i7-14700HX, GeForce RTX 4060 Laptop GPU, 83 Wh | Acer Nitro V 16 ANV16-41-R5AT R7 8845HS, GeForce RTX 4060 Laptop GPU, 57 Wh | Average of class Gaming | |
|---|---|---|---|---|---|---|---|
| Battery runtime | -29% | -48% | -50% | -40% | -58% | -40% | |
| H.264 (h) | 14.7 | 12.4 -16% | 5.2 -65% | 6.4 -56% | 8.64 ? -41% | ||
| WiFi v1.3 (h) | 14.2 | 12.4 -13% | 5.1 -64% | 6.3 -56% | 8.5 -40% | 5.9 -58% | 7.11 ? -50% |
| Load (h) | 2.1 | 0.9 -57% | 1.8 -14% | 1.3 -38% | 1.502 ? -28% | ||
| Reader / Idle (h) | 20.3 | 8.71 ? |
Notebookcheck overall rating
The Asus TUF Gaming A16 is a capable and comparatively affordable gaming laptop with long battery life, mainly thanks to the Ryzen AI 9 HX 370. Its main weakness is the low-color 1,200p display, but fortunately there is a better option to choose from.
Asus TUF Gaming A16 FA608WV
- 02/20/2025 v8
Christian Hintze
 Total Sustainability Score:
 Transparency
The selection of devices to be reviewed is made by our editorial team. The test sample was provided to the author as a loan by the manufacturer or retailer for the purpose of this review. The lender had no influence on this review, nor did the manufacturer receive a copy of this review before publication. There was no obligation to publish this review. As an independent media company, Notebookcheck is not subjected to the authority of manufacturers, retailers or publishers.
This is how Notebookcheck is testing
Every year, Notebookcheck independently reviews hundreds of laptops and smartphones using standardized procedures to ensure that all results are comparable. We have continuously developed our test methods for around 20 years and set industry standards in the process. In our test labs, high-quality measuring equipment is utilized by experienced technicians and editors. These tests involve a multi-stage validation process. Our complex rating system is based on hundreds of well-founded measurements and benchmarks, which maintains objectivity. Further information on our test methods can be found here.

