Dell G16 (2024) laptop review: An affordable Alienware alternative from the same manufacturer?
At the end of 2022, we last (and, coincidentally, for the first time) took a look at the 16-inch model of the relatively new G-series, Dell's budget-to-mid-range gaming laptops. At the time, the Dell G16 was equipped with an Intel Gen-12 CPU and the RTX 3060. The 2024 model sees the manufacturer making the switch to Intel Gen 13 and the RTX 4060 (there are further GPU options available). The display has received a slightly more powerful variant as an option.
We will also be taking a look at whether Dell has managed to further slim down the laptop's relatively thick case. Moreover, the G16 of course has to compete with other budget and mid-range gamers such as the MSI Raider GE68 HX 13VF, the Lenovo Legion Slim 5 16APH8 and the Lenovo LOQ 16—plus, we will naturally be comparing it to its predecessor as well as to the slightly more expensive Alienware m16 R1.
Possible competitors compared
Rating | Date | Model | Weight | Height | Size | Resolution | Price |
|---|---|---|---|---|---|---|---|
| 85.5 % v7 (old) | 02 / 2024 | Dell G16, i7-13650HX, RTX 4060 i7-13650HX, GeForce RTX 4060 Laptop GPU | 2.8 kg | 25.65 mm | 16.00" | 2560x1600 | |
| 86.1 % v7 (old) | 10 / 2022 | Dell G16 7620 i7-12700H, GeForce RTX 3060 Laptop GPU | 2.6 kg | 26.9 mm | 16.00" | 2560x1600 | |
| 86.9 % v7 (old) | 09 / 2023 | MSI Raider GE68HX 13VF i9-13950HX, GeForce RTX 4060 Laptop GPU | 2.7 kg | 27.9 mm | 16.00" | 1900x1200 | |
| 87.7 % v7 (old) | 08 / 2023 | Lenovo Legion Slim 5 16APH8 R7 7840HS, GeForce RTX 4060 Laptop GPU | 2.4 kg | 25.2 mm | 16.00" | 2560x1600 | |
| 88.3 % v7 (old) | 09 / 2023 | Alienware m16 R1 Intel i7-13700HX, GeForce RTX 4060 Laptop GPU | 3 kg | 25.4 mm | 16.00" | 2560x1600 | |
| 87.3 % v7 (old) | 09 / 2023 | Lenovo LOQ 16IRH8 i7-13620H, GeForce RTX 4060 Laptop GPU | 2.7 kg | 25.9 mm | 16.00" | 2560x1600 |
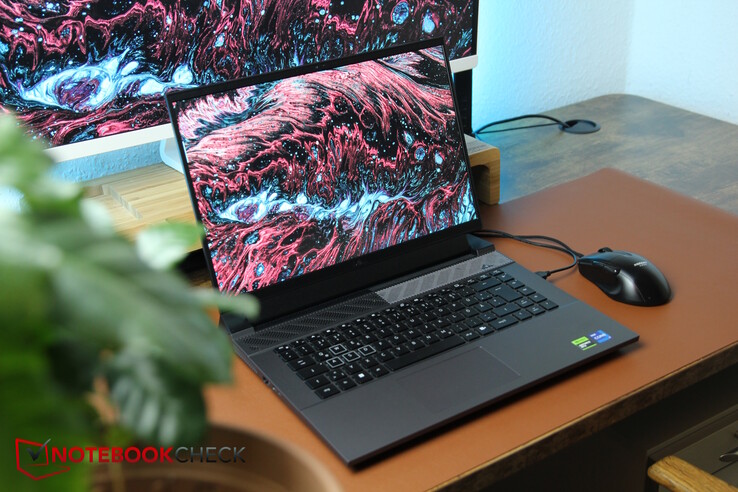
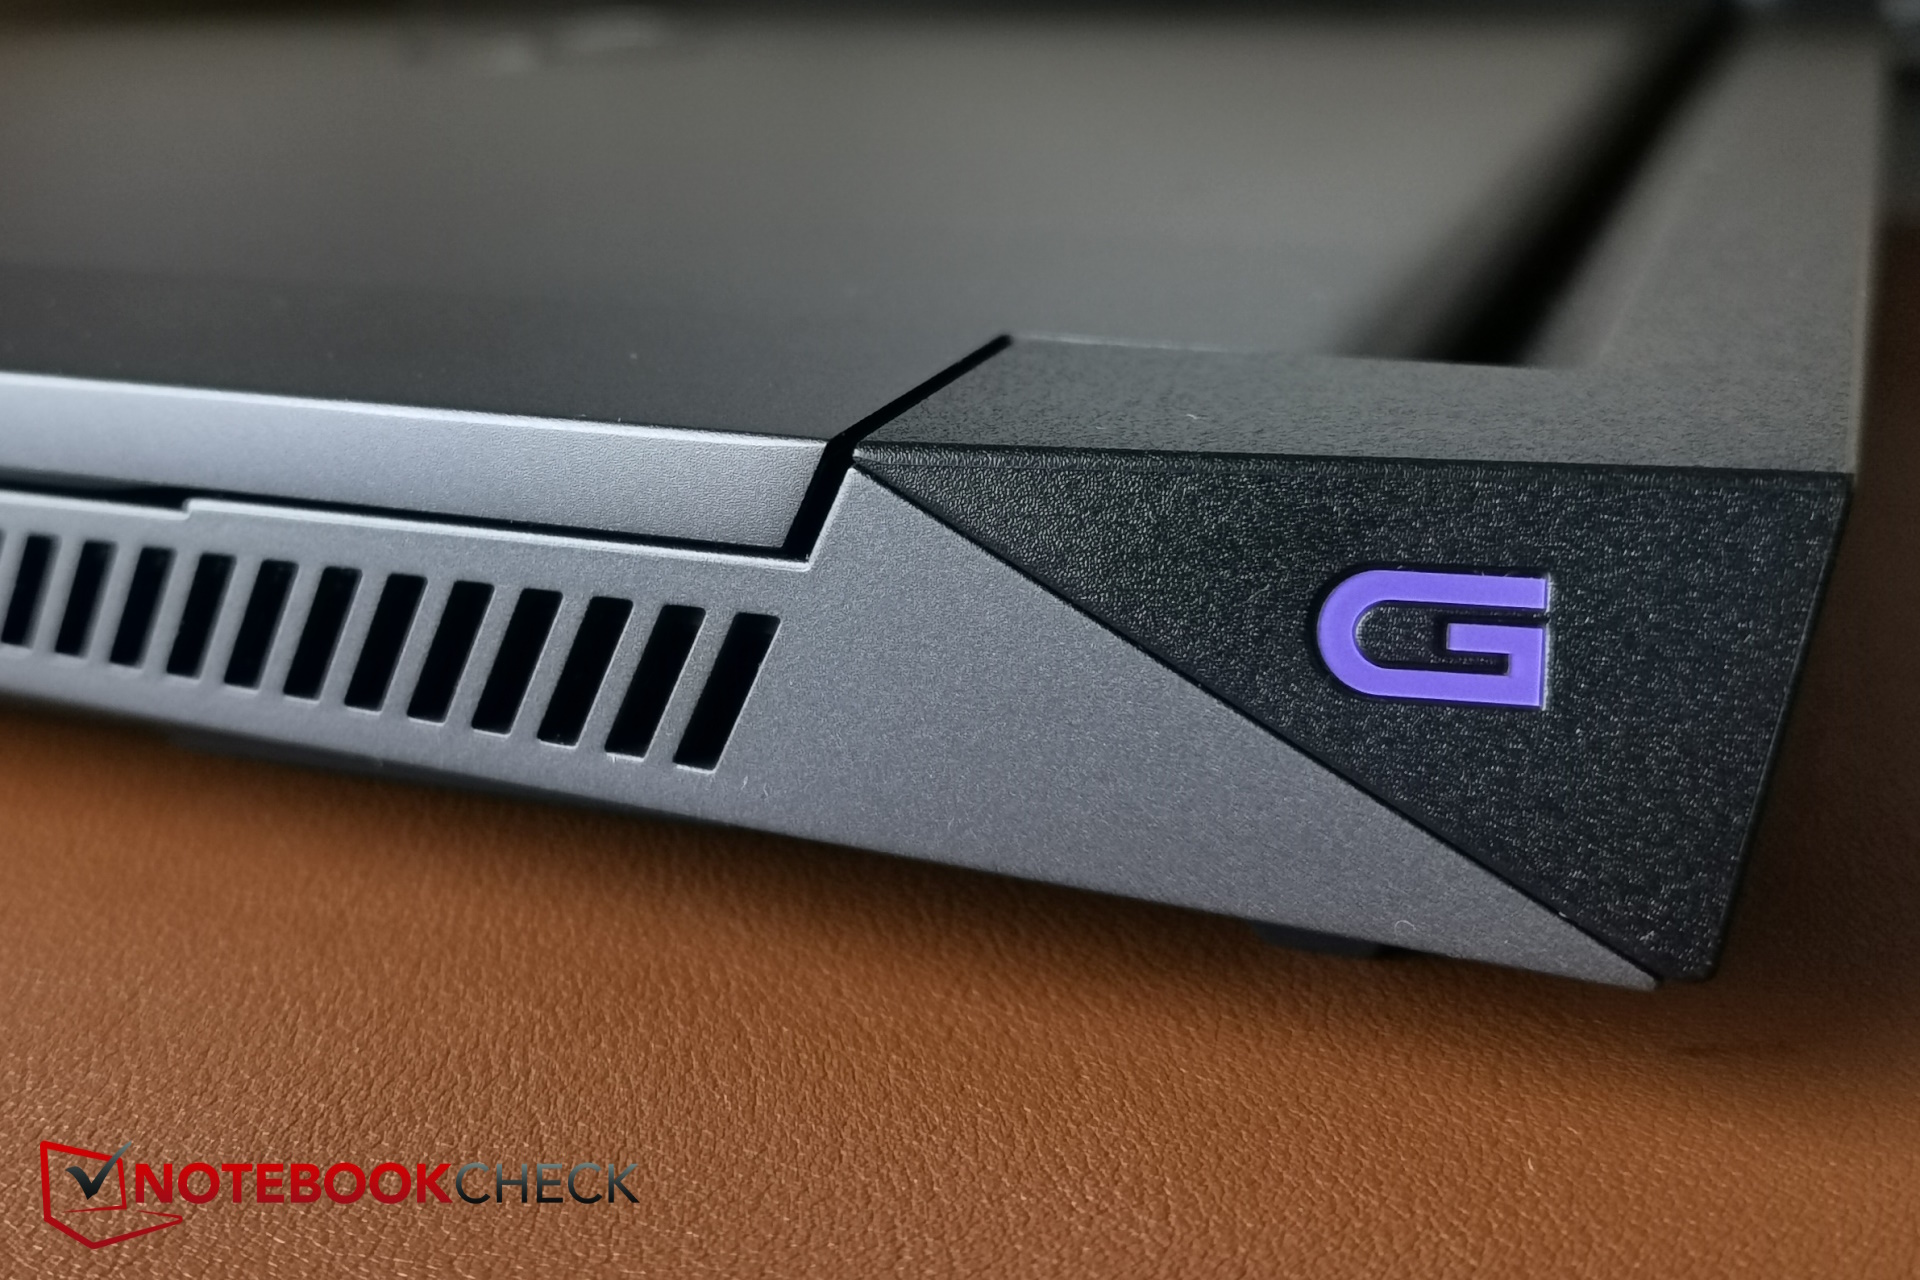
Case - Aluminum lid and the rest is gray plastic
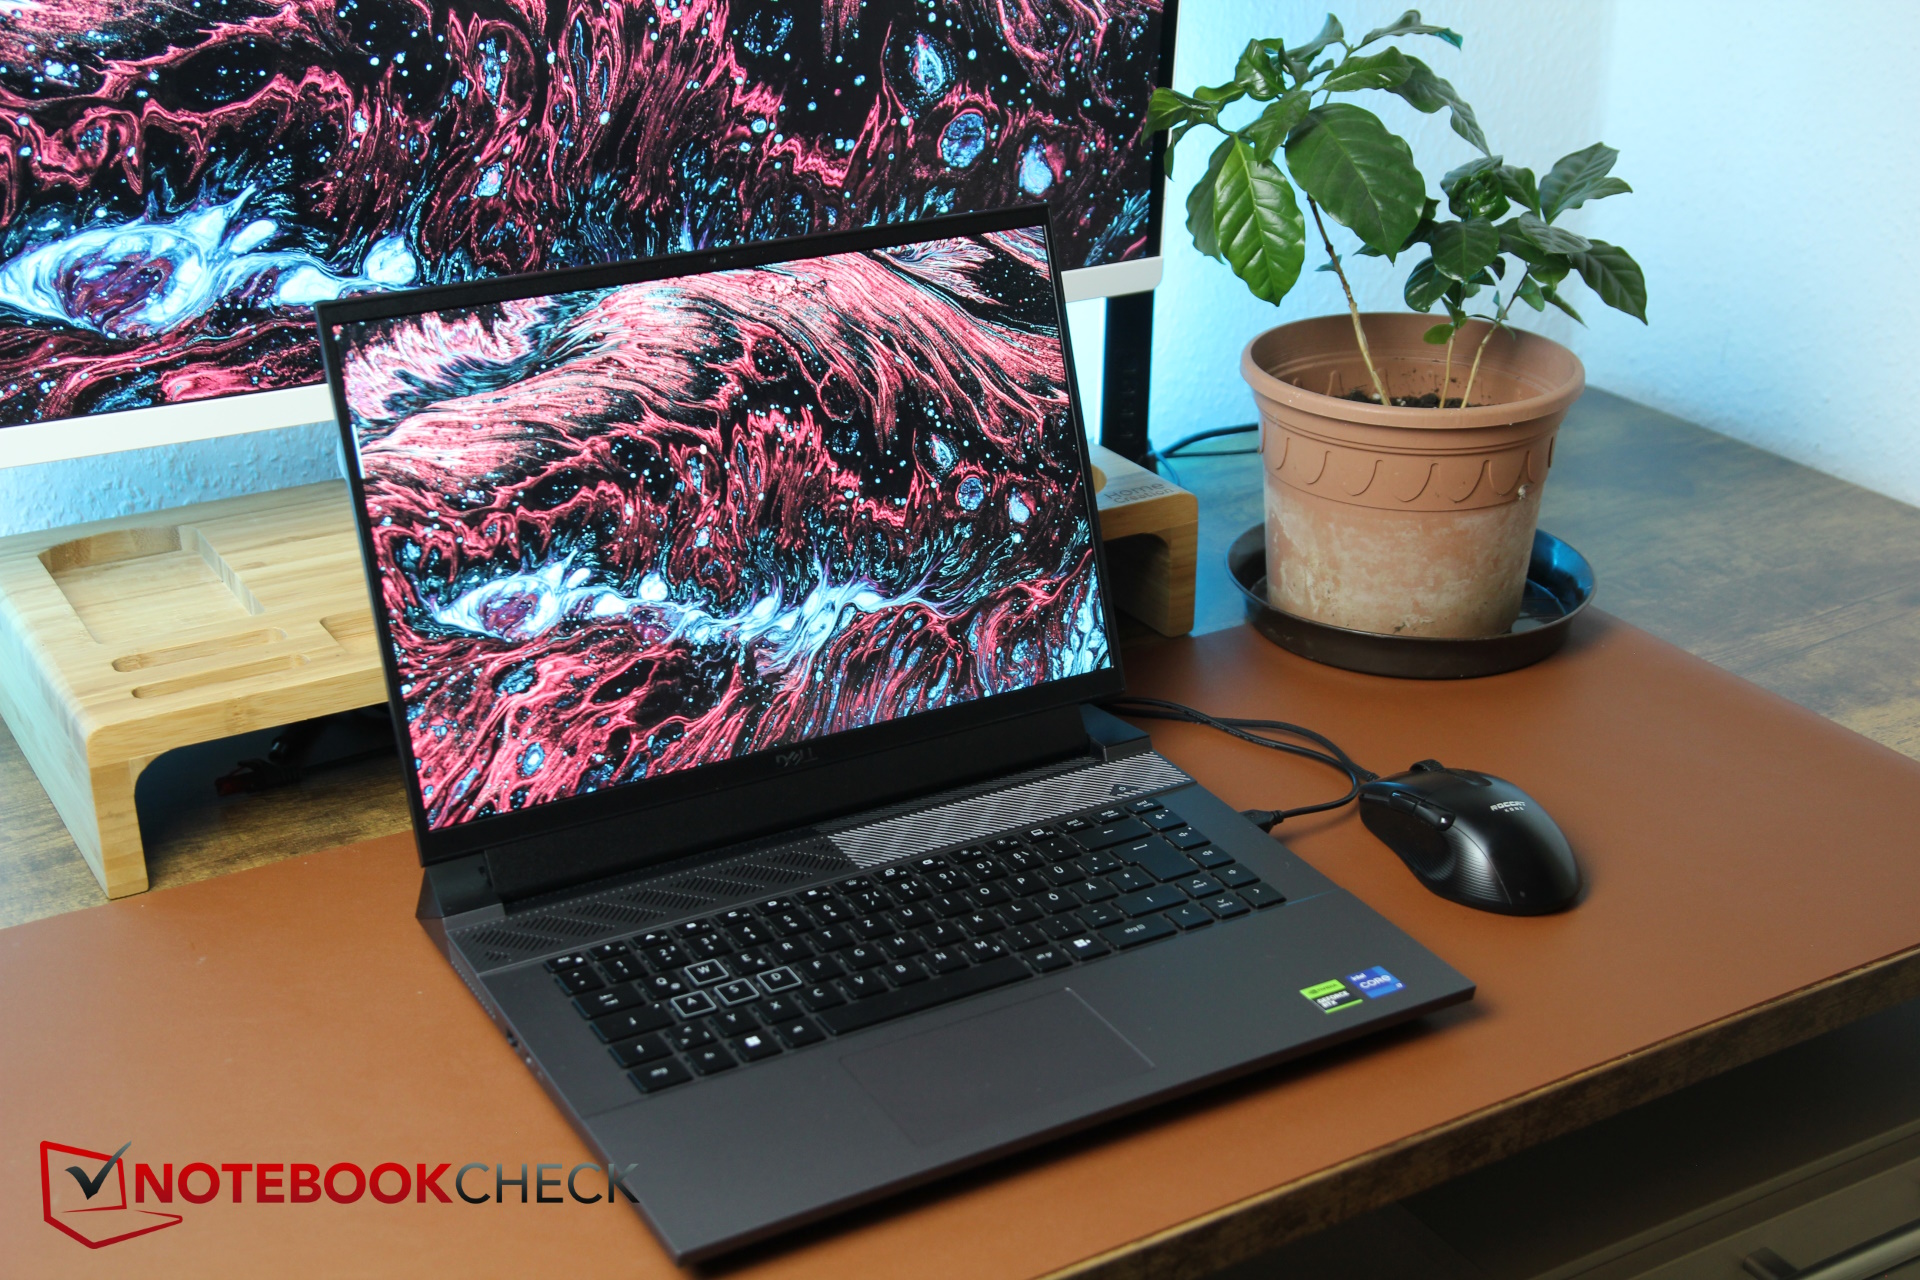
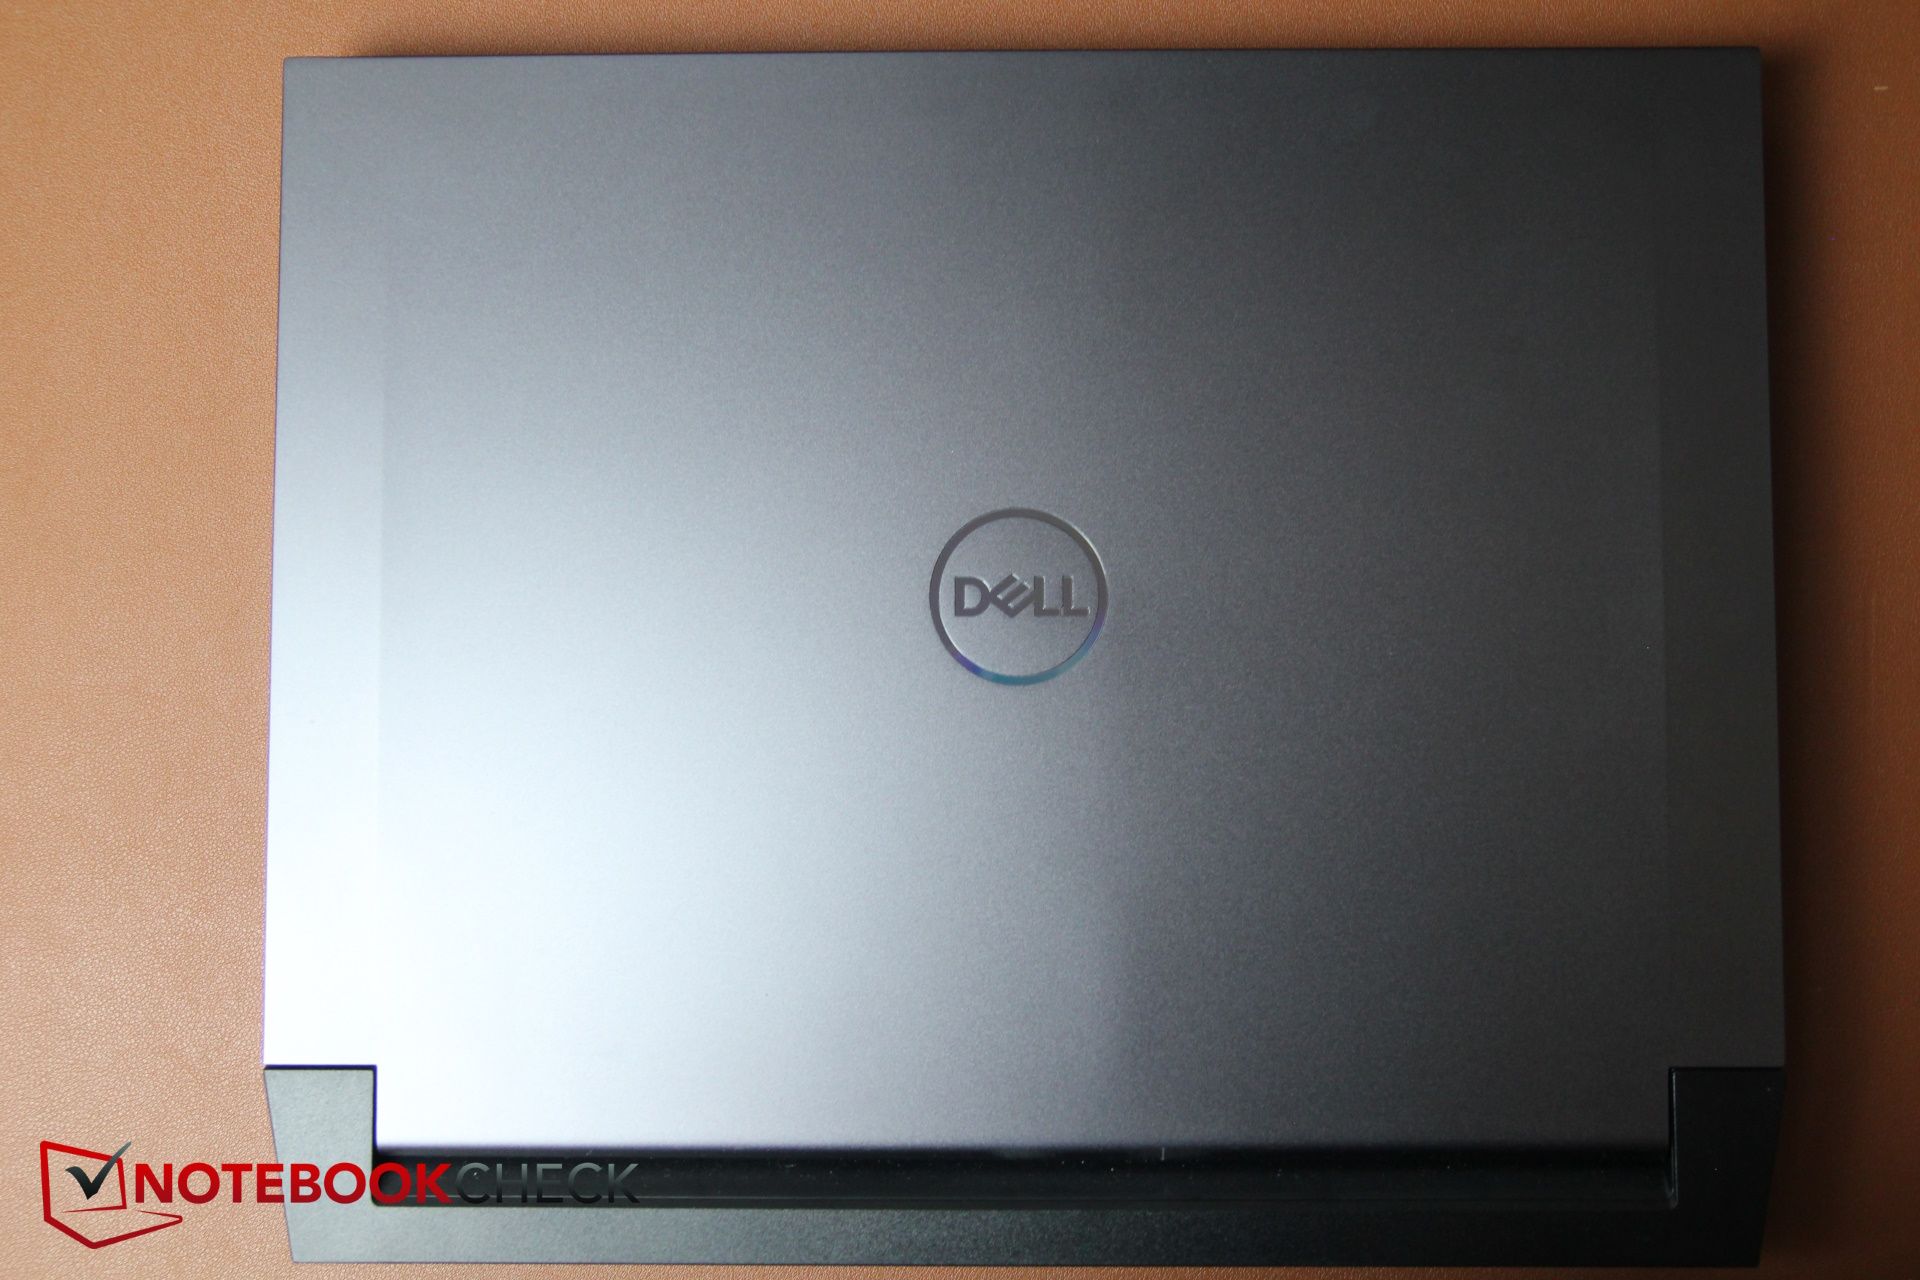
The laptop's case, which differs to that of its predecessor, is mostly made from gray plastic—only the lid uses aluminum, giving it good stability. The base unit is stable, too, and can barely be twisted. The long hinge holds the display in place well, however, we noted some slight friction noises and squeaking when opening and closing it. Hopefully this won't affect the device's longevity. Its build is decent but it doesn't feel as high-quality as the more expensive Dell and Alienware models.
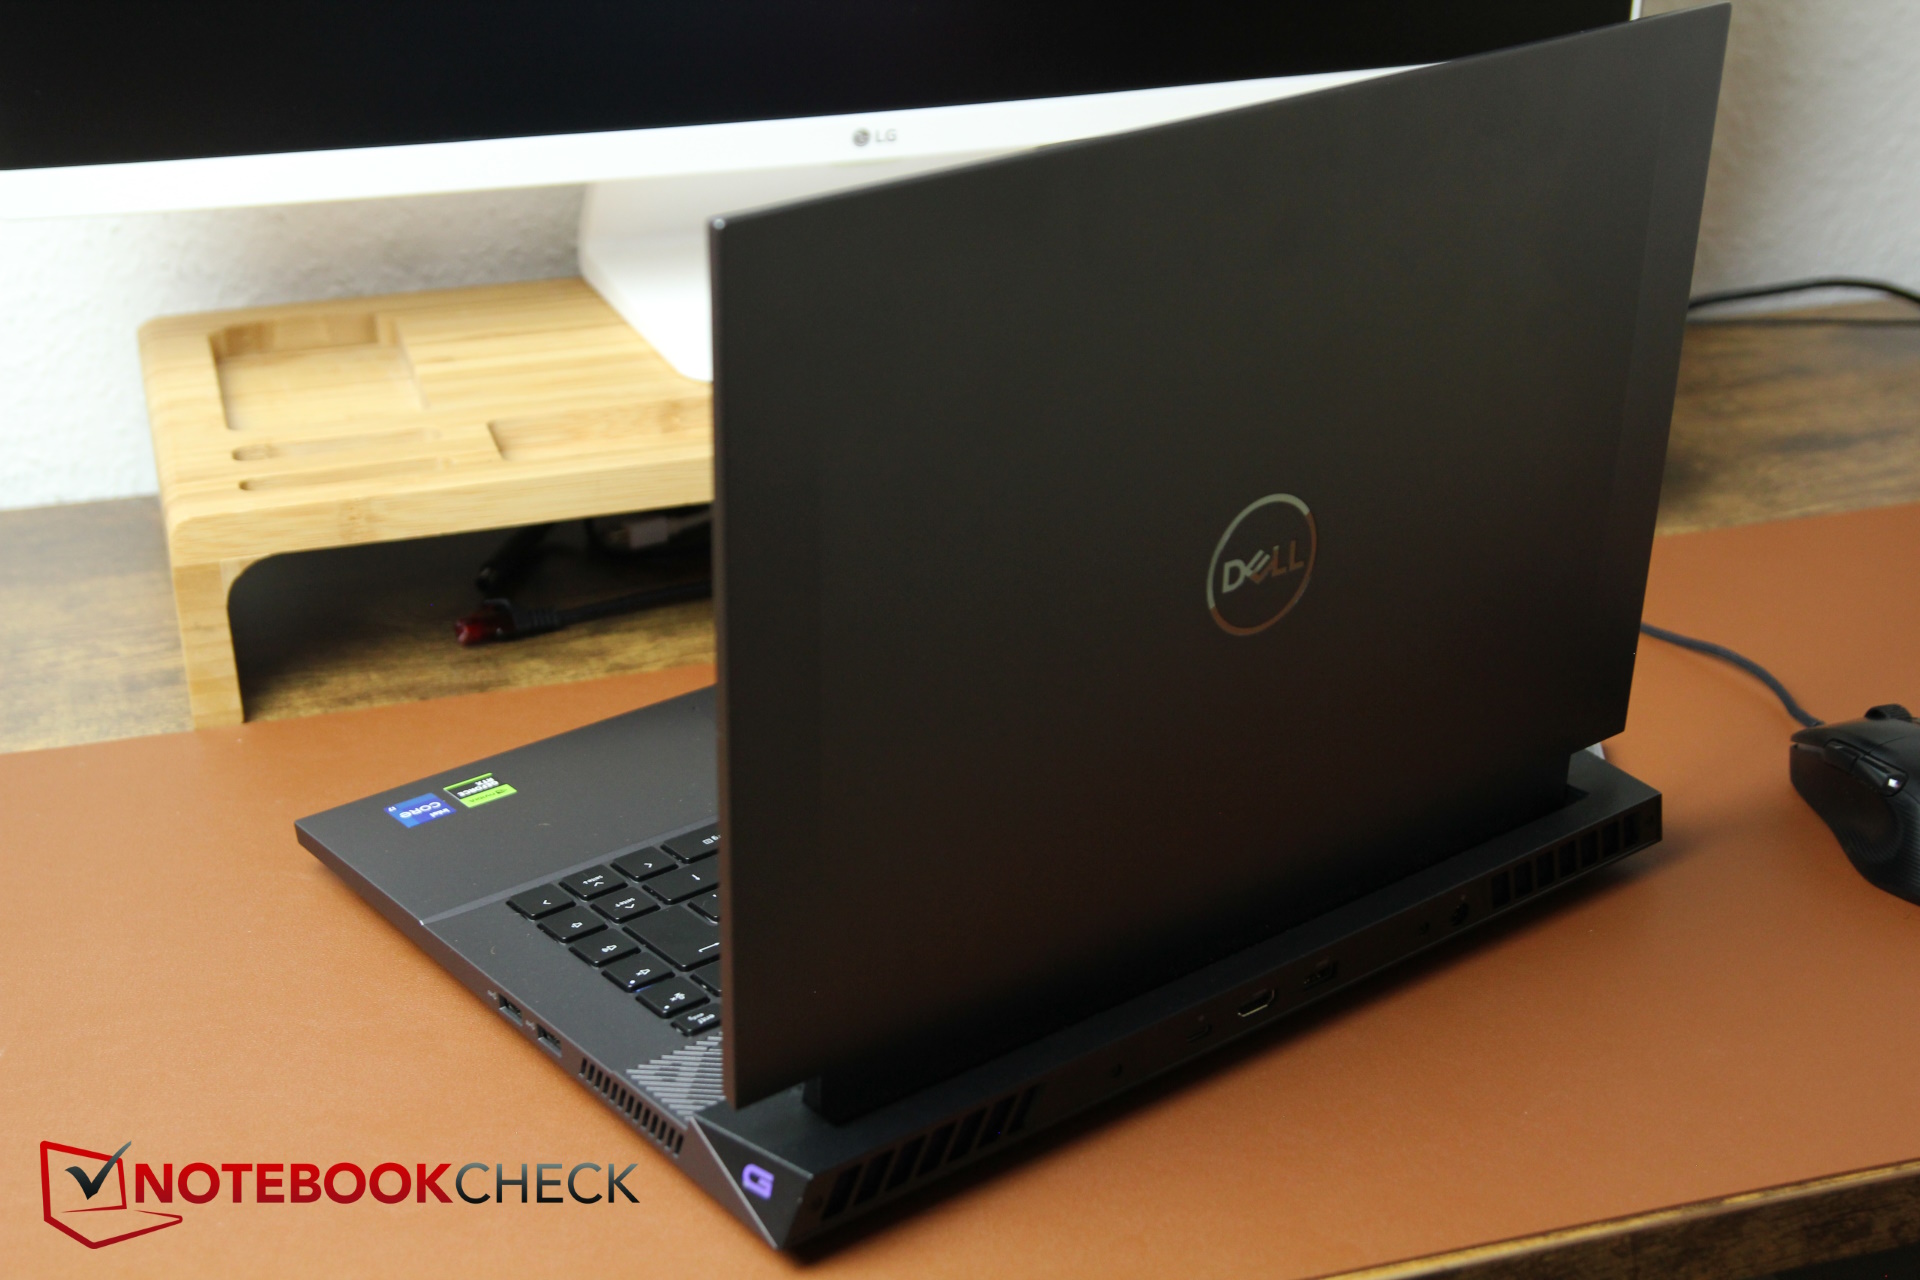
The Dell logo stands out on the top of the laptop and apart from this, it doesn't feature any additional color accents. Nevertheless, the obvious gamer doesn't look terribly sleek either, which is mainly due to the cooling unit protruding towards the back. Overall, the G16 doesn't look very elegant but rather clunky and heavy.

The more expensive Alienware m16 R1 is actually a little wider than our G16 and similarly thick. The MSI Raider GE68HX is a little thicker still, whereas the rest of their measurements are almost identical. Even the Lenovo Legion Slim 5 isn't a lot slimmer although the G16 appears quite thick, but the former is slightly smaller.
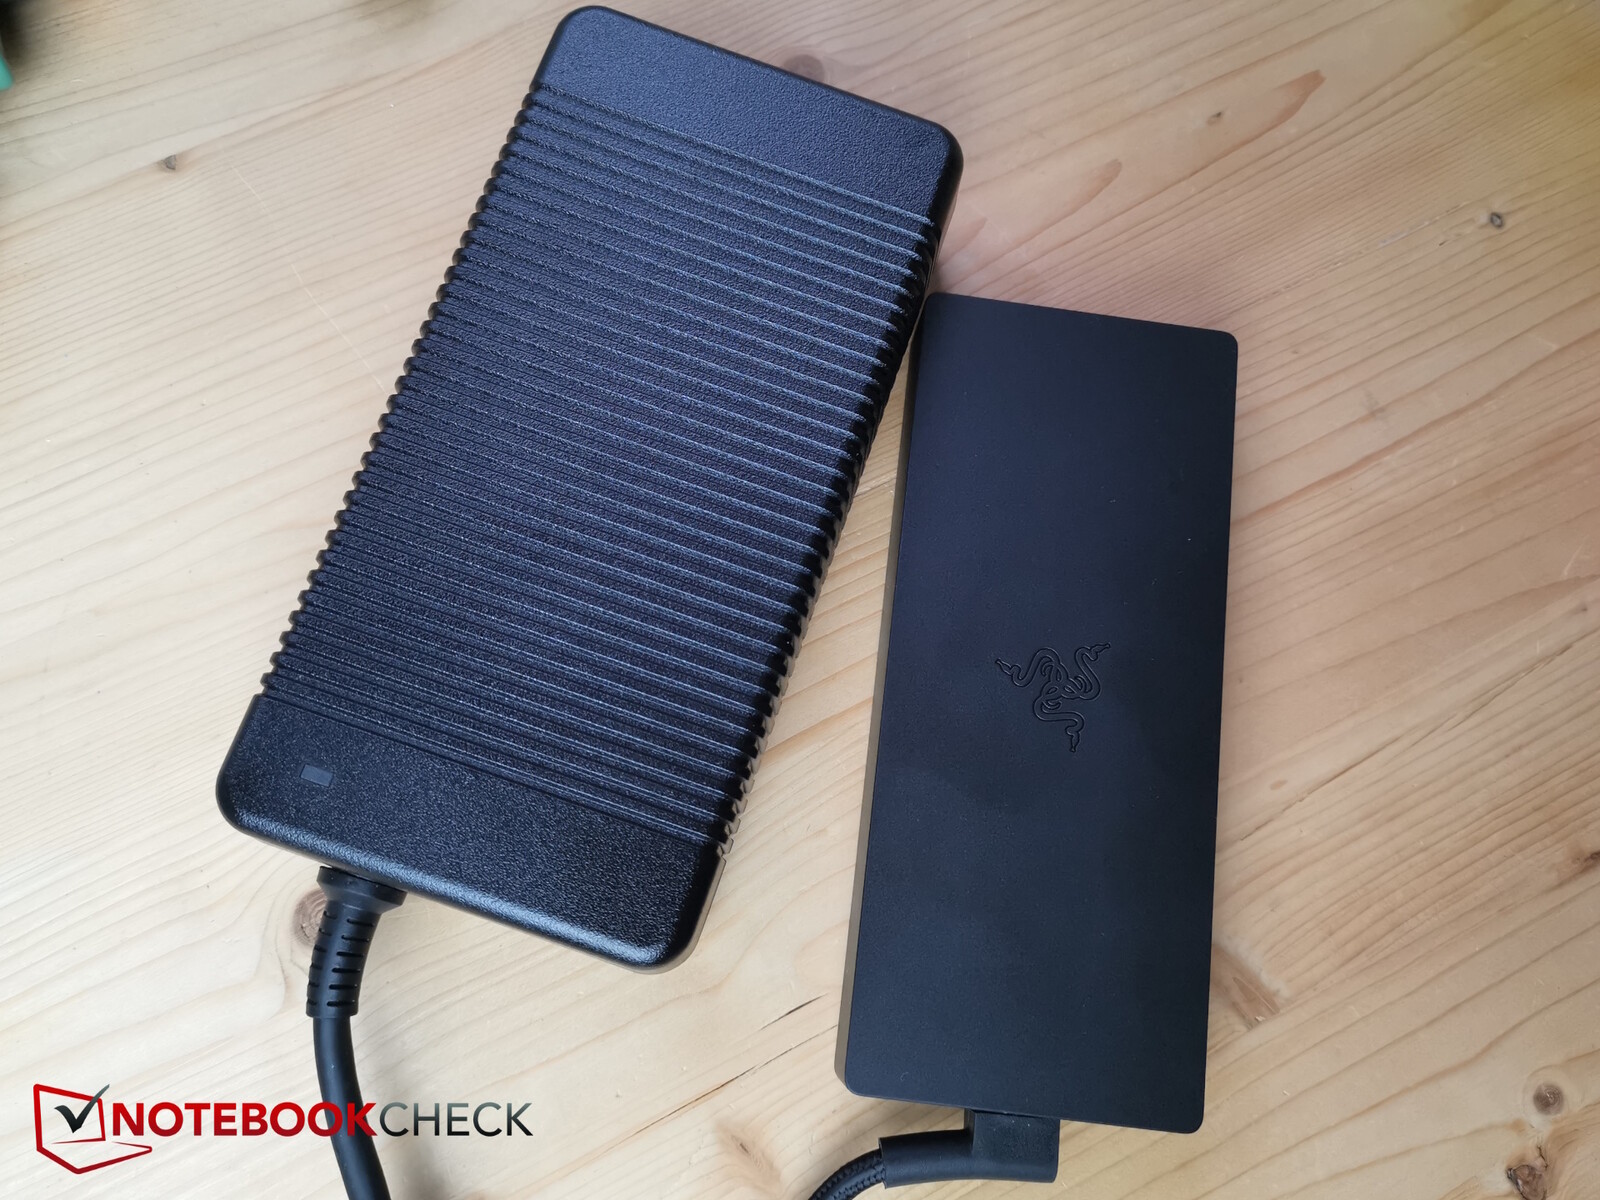
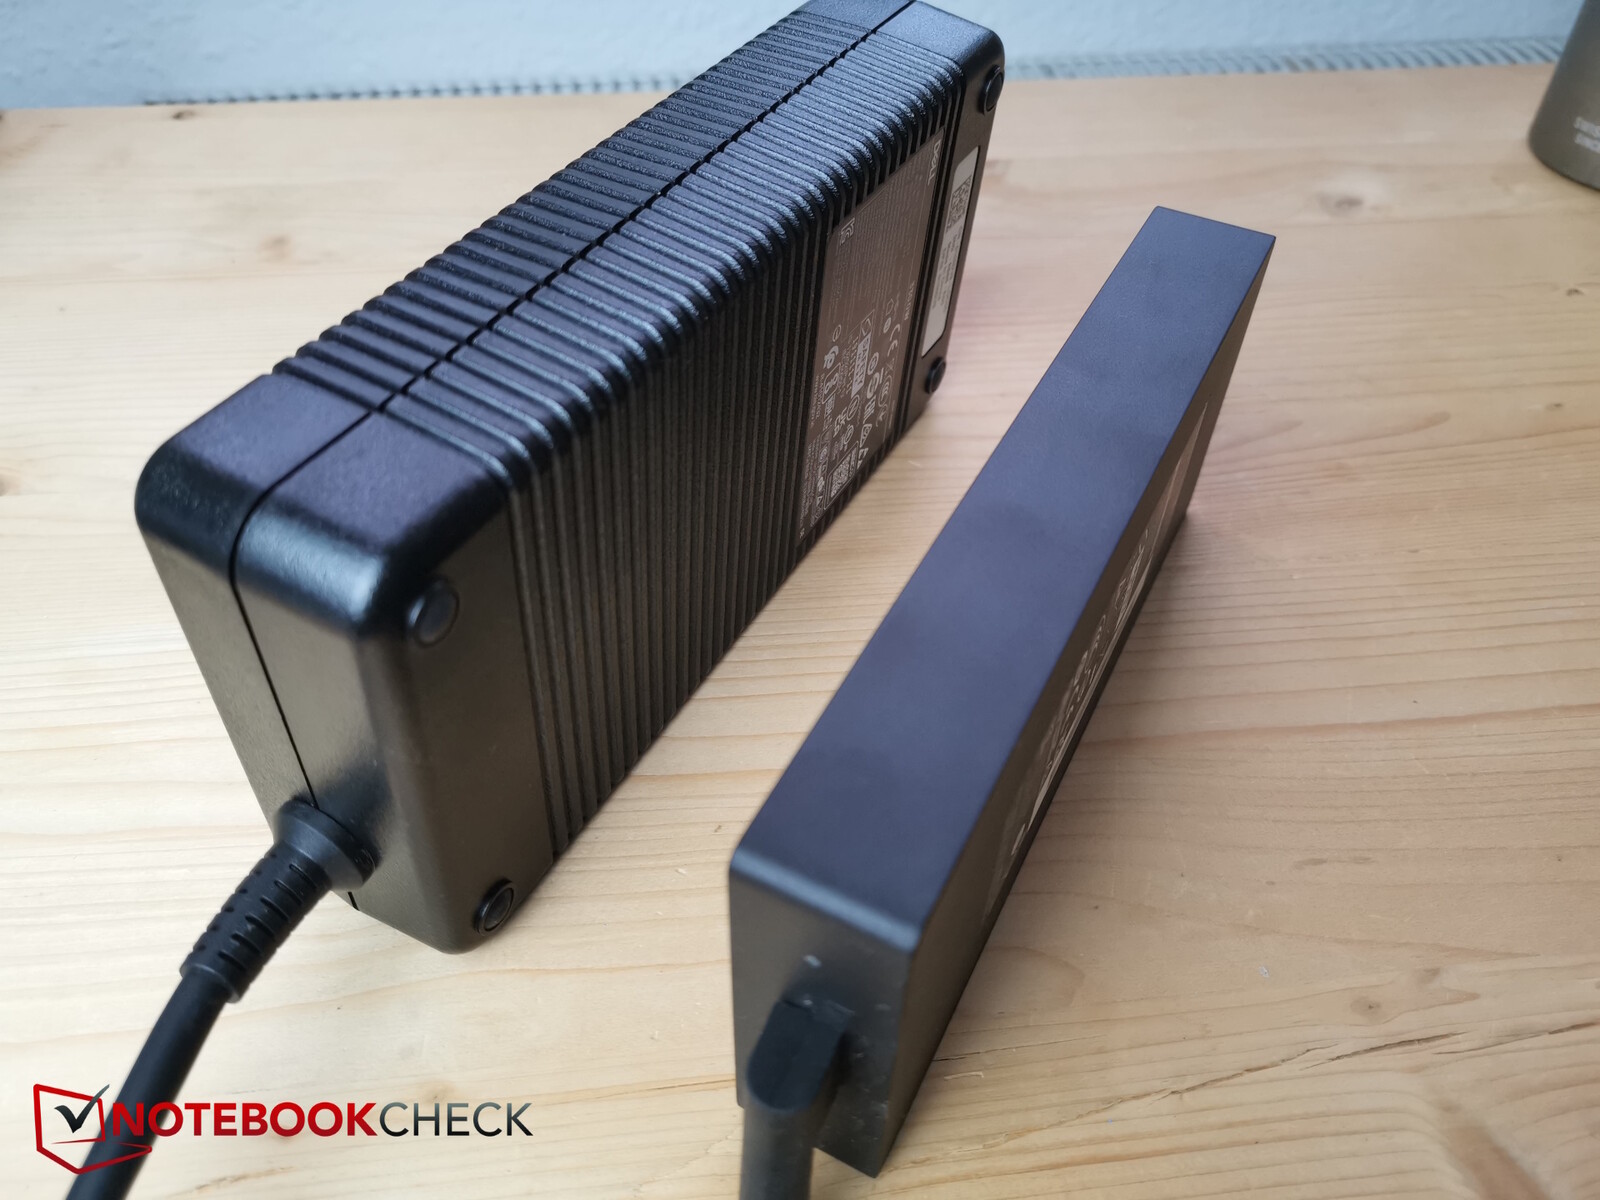
Compared to its predecessor, this model has, in fact, gotten slightly slimmer but at the same time, it has increased in depth. It is also heavier (+ 200 g), meaning the G16 is now the second-heaviest 16-inch gamer with an RTX 4060, after the Alienware from the same manufacturer. In addition, Dell even delivers the version with an RTX 4060 with a huge and heavy 330-watt power supply—this alone weighs over 1.5 kg.
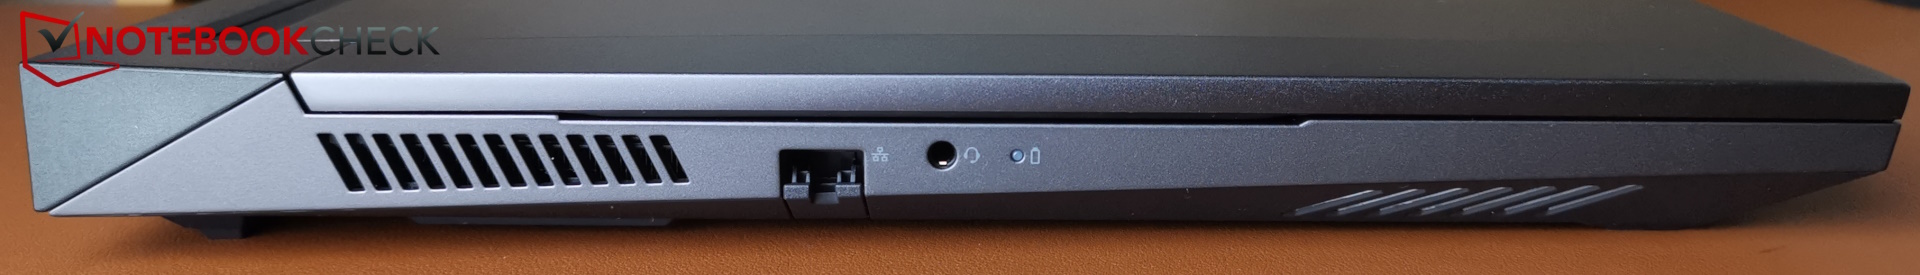
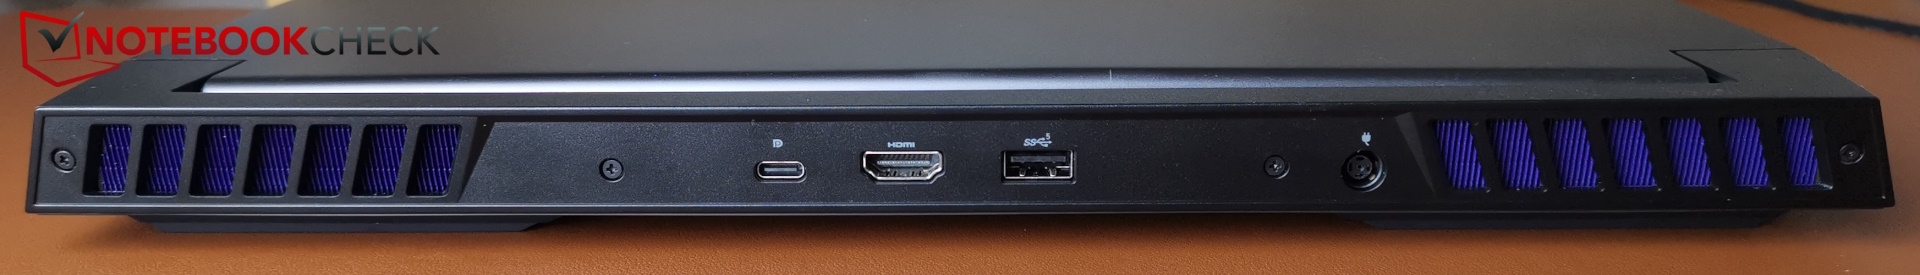
Connectivity - Thunderbolt not on all G16 models
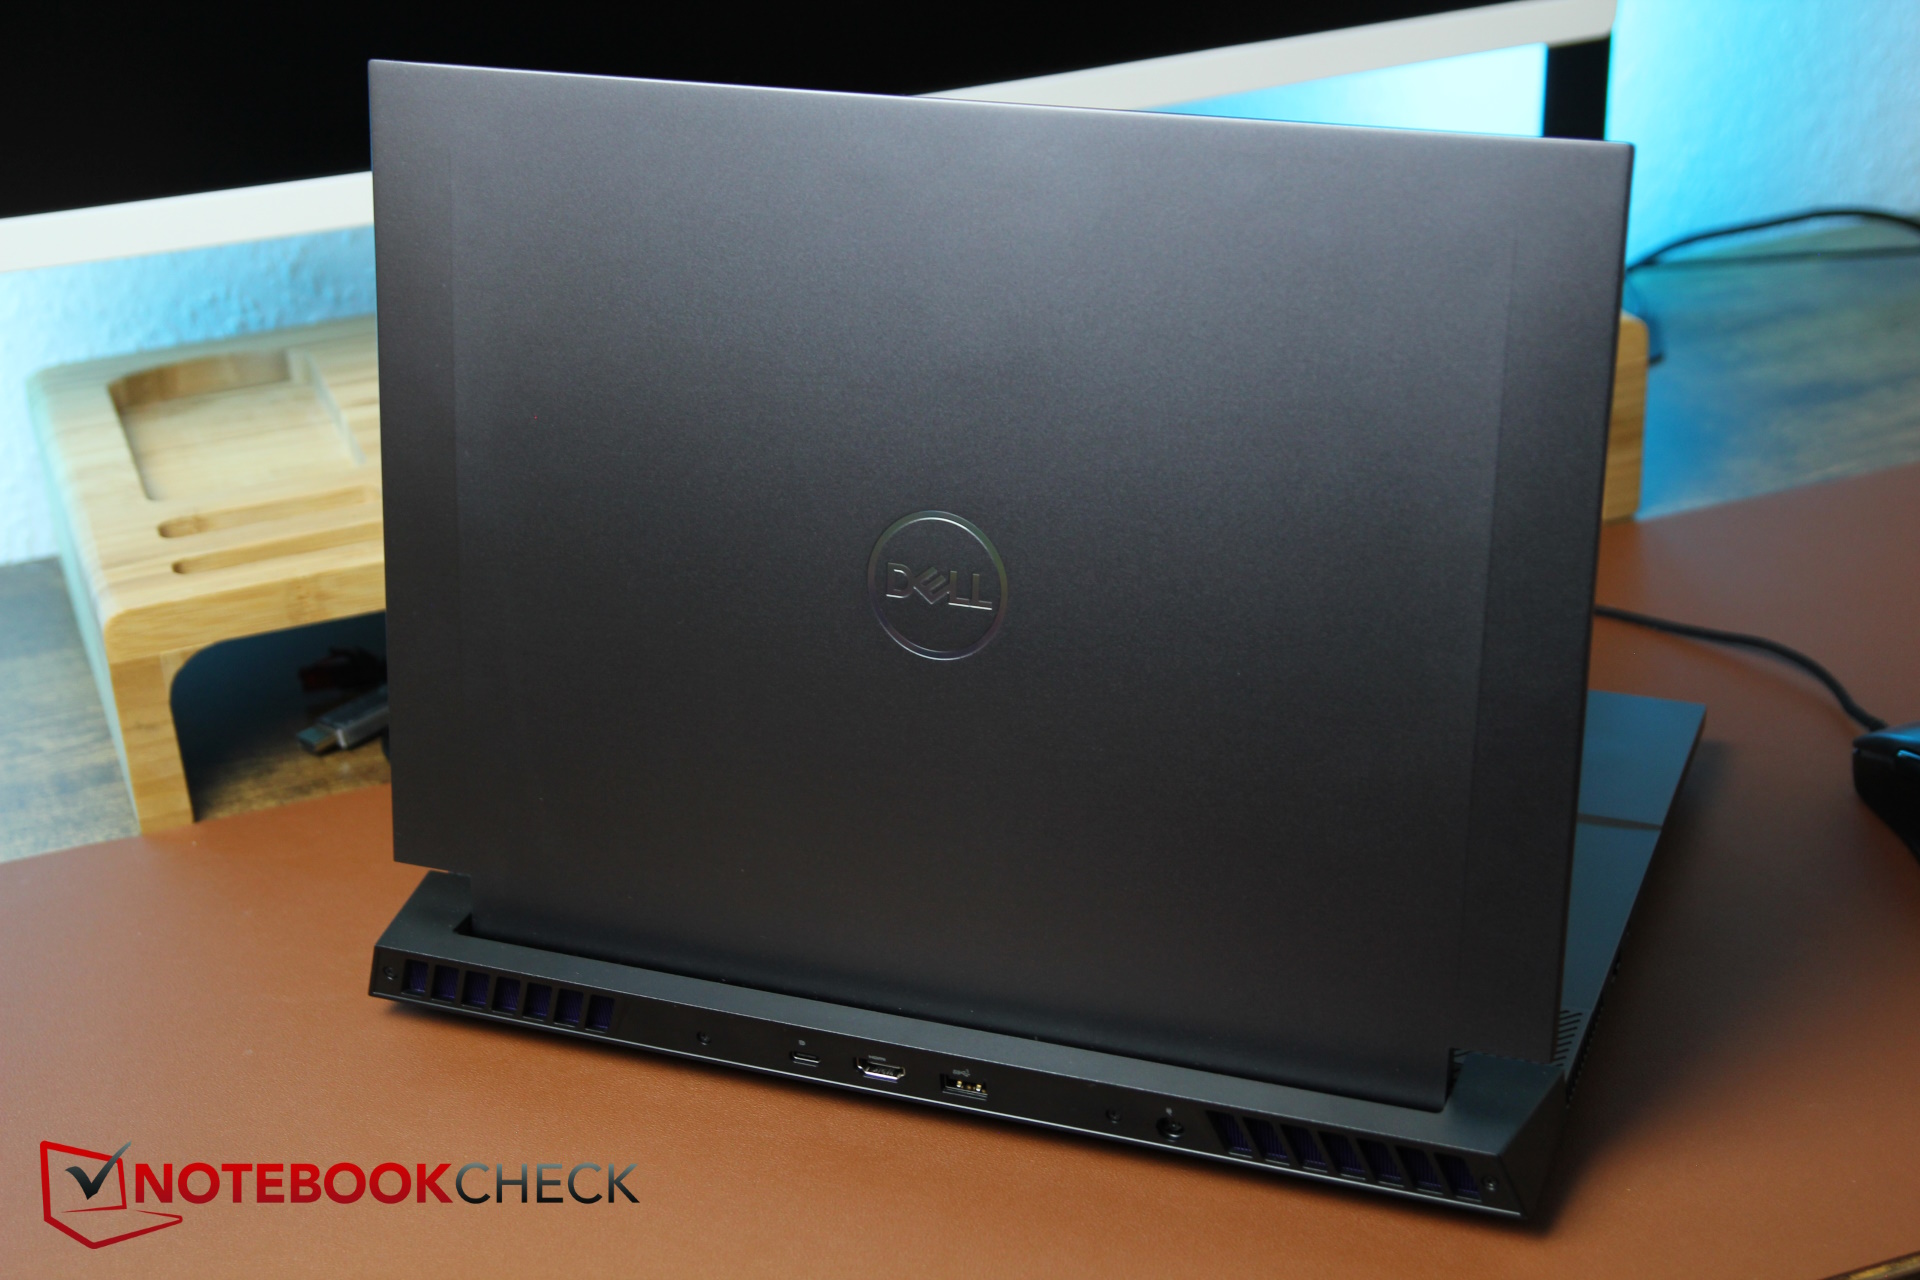
The laptop's port layout has remained the same, bar one exception: On the back, the connections have been shuffled about a bit. While the HDMI port had a lot of space on the predecessor model, it now sits right between the USB-A port and the USB-C port—the former could lead to some space issues when used with larger plugs. This decision from Dell is rather questionable.
Caution: The power plug doesn't sit very firmly and when the laptop is moved, it slips out quite easily. The heavy power supply further contributes to this issue.
Just as questionable is the device's Thunderbolt (4) support which was included in its predecessor. Now, it apparently depends on the installed graphics card. According to Dell, Thunderbolt isn't supported on models using up to an RTX 4060, whereas an RTX 4070 or beyond does feature it. This is unusual and for customers purchasing the smaller configurations, it is frustrating. The port doesn't support PowerDelivery.


Communication

The Intel AX201 WiFi module supports WiFi 6 but not yet WiFi 6E.
Its transfer rates within the 5-GHz band are exceptional, whereas its 2.4-GHz rates of 210 Mb/s are disappointing.
Webcam
At the latest its meagre 720p webcam shows where Dell has made savings. Many competitors feature a Full-HD camera or better by now. There are better models when it comes to color deviations and picture sharpness, too.


Security
The G16 doesn't really feature any physical security functions, as it neither has a fingerprint sensor nor a Kensington lock. TPM is, of course, integrated into the processor.
Accessories and warranty
The packaging doesn't include any extras. Dell gives this device a standard 12-month warranty with on-site basic service and hardware support and the special conditions can be seen in the following screenshot.

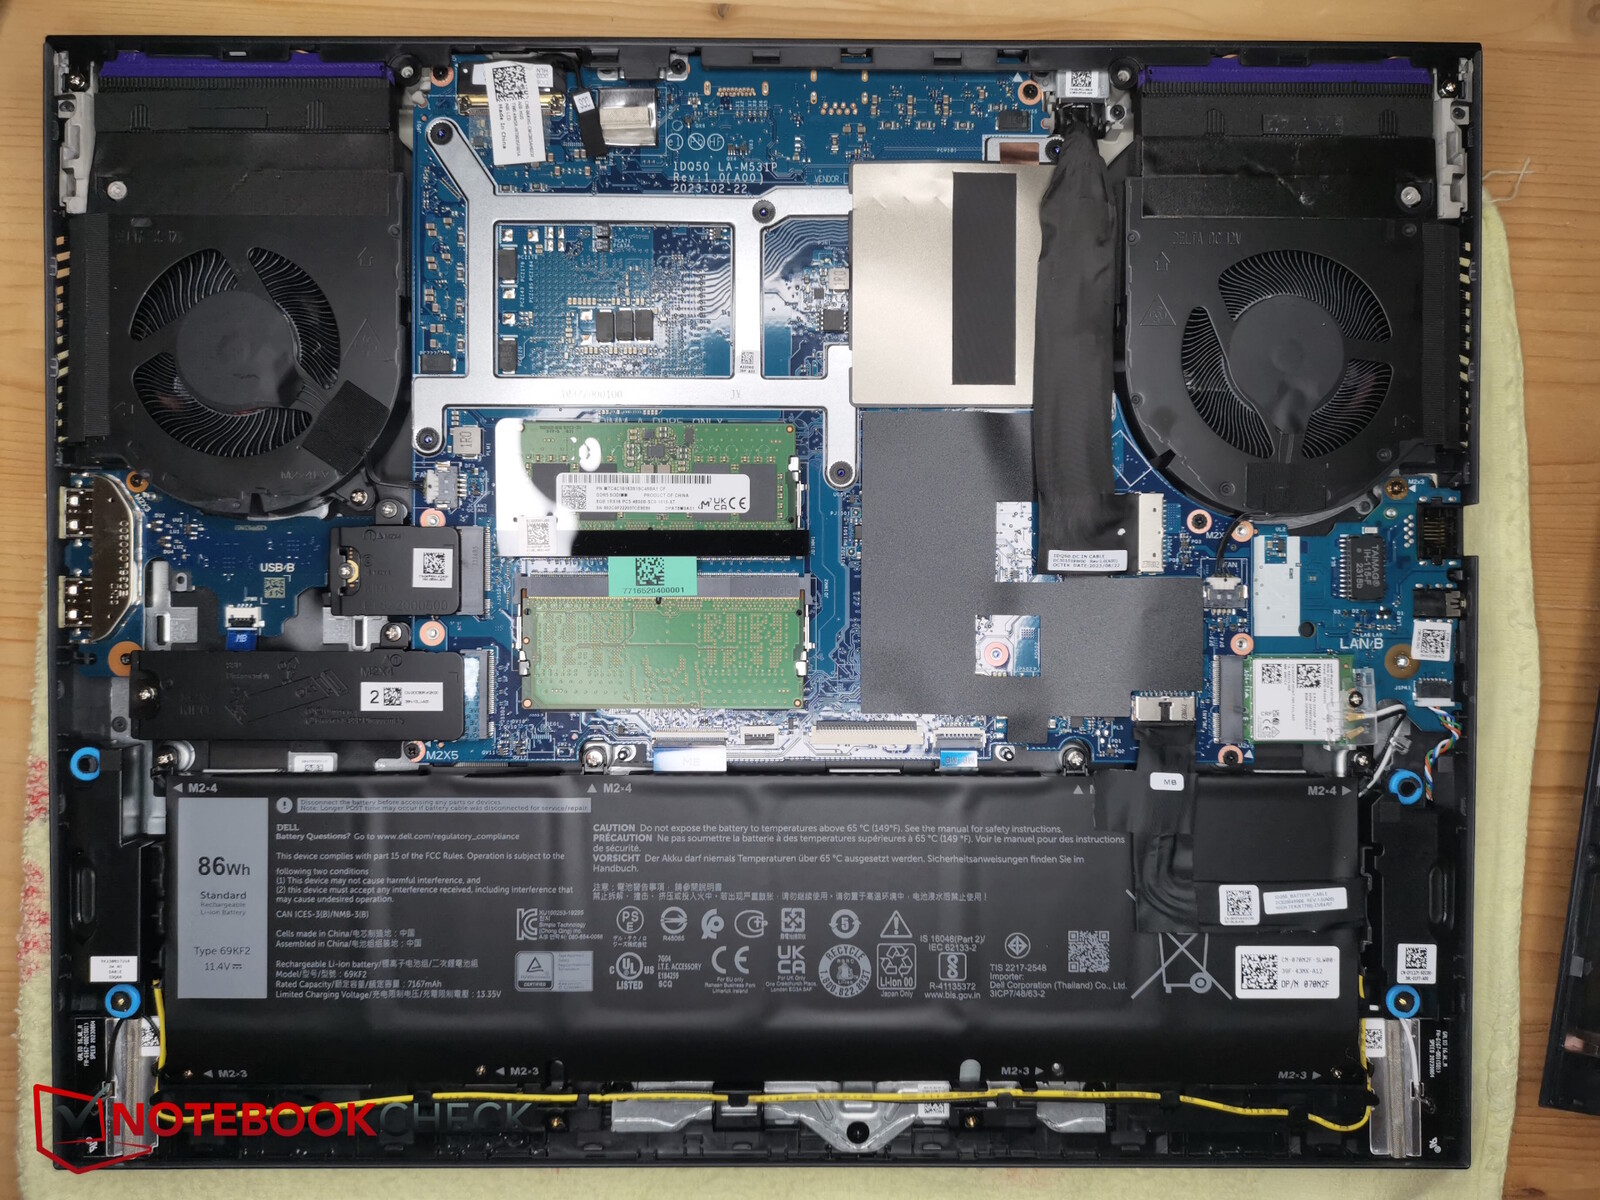
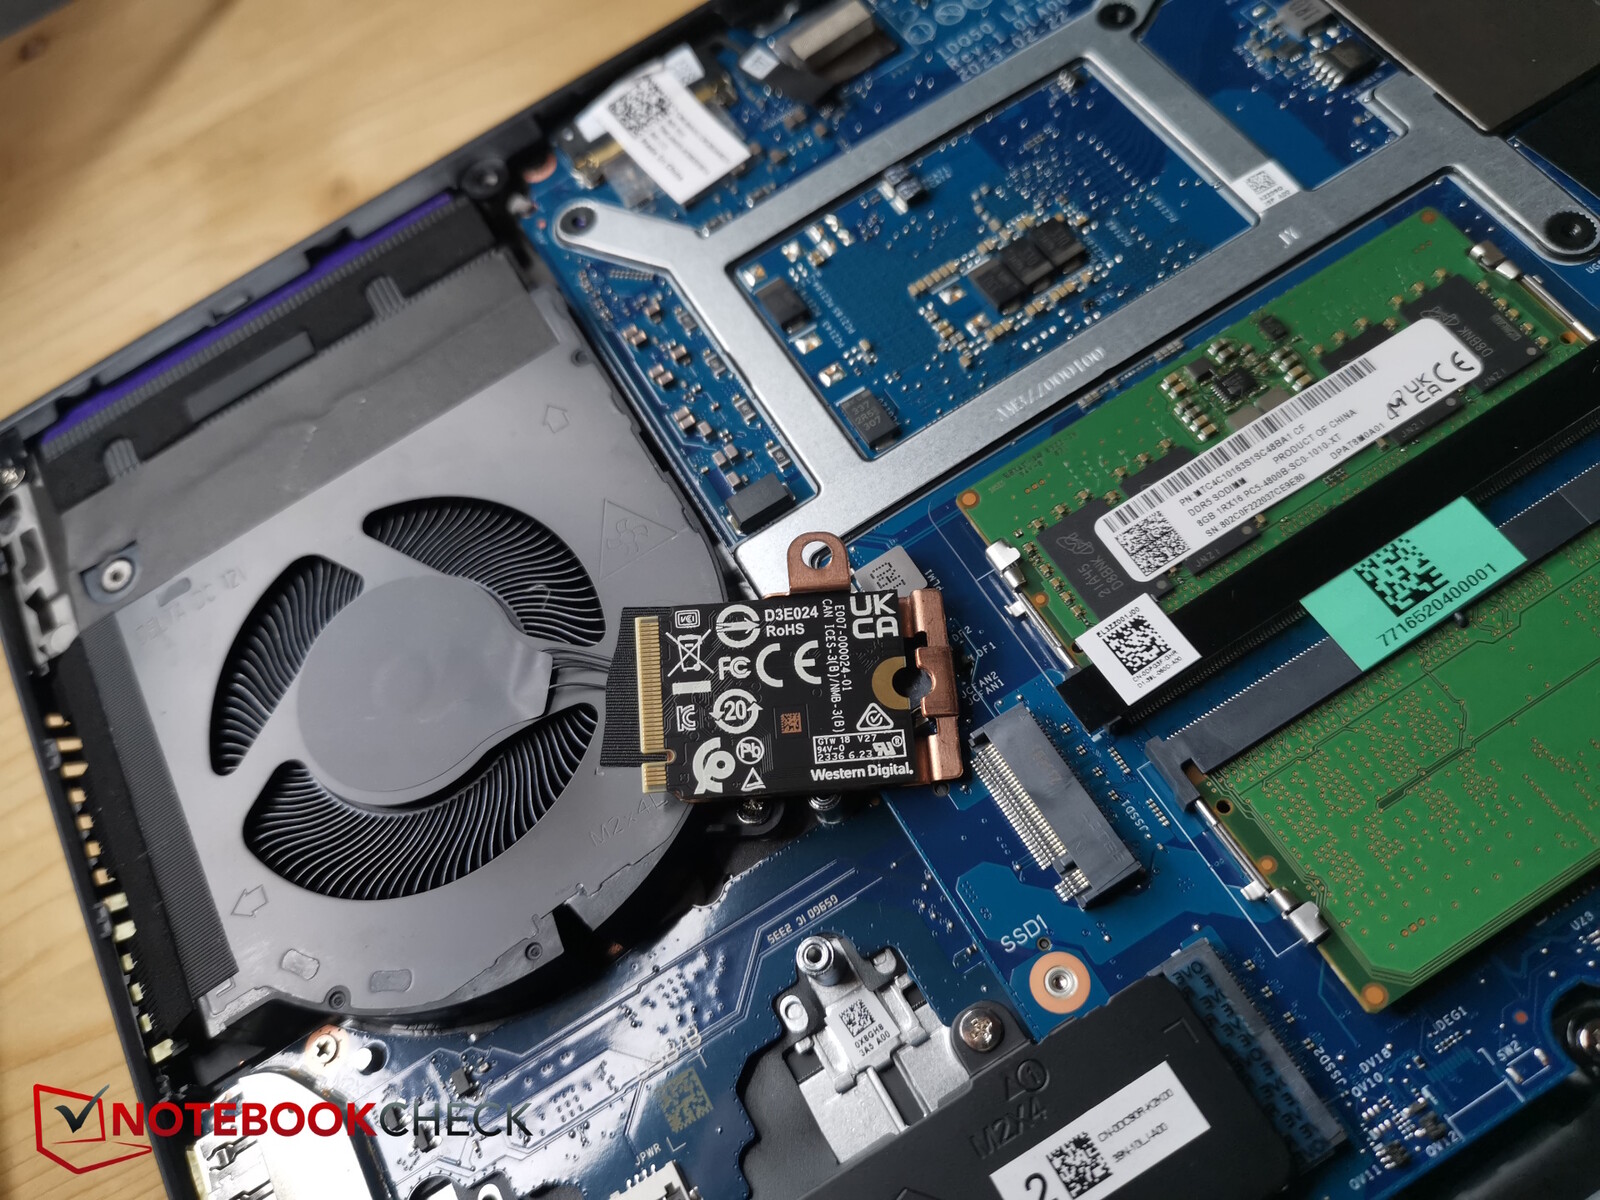
Maintenance
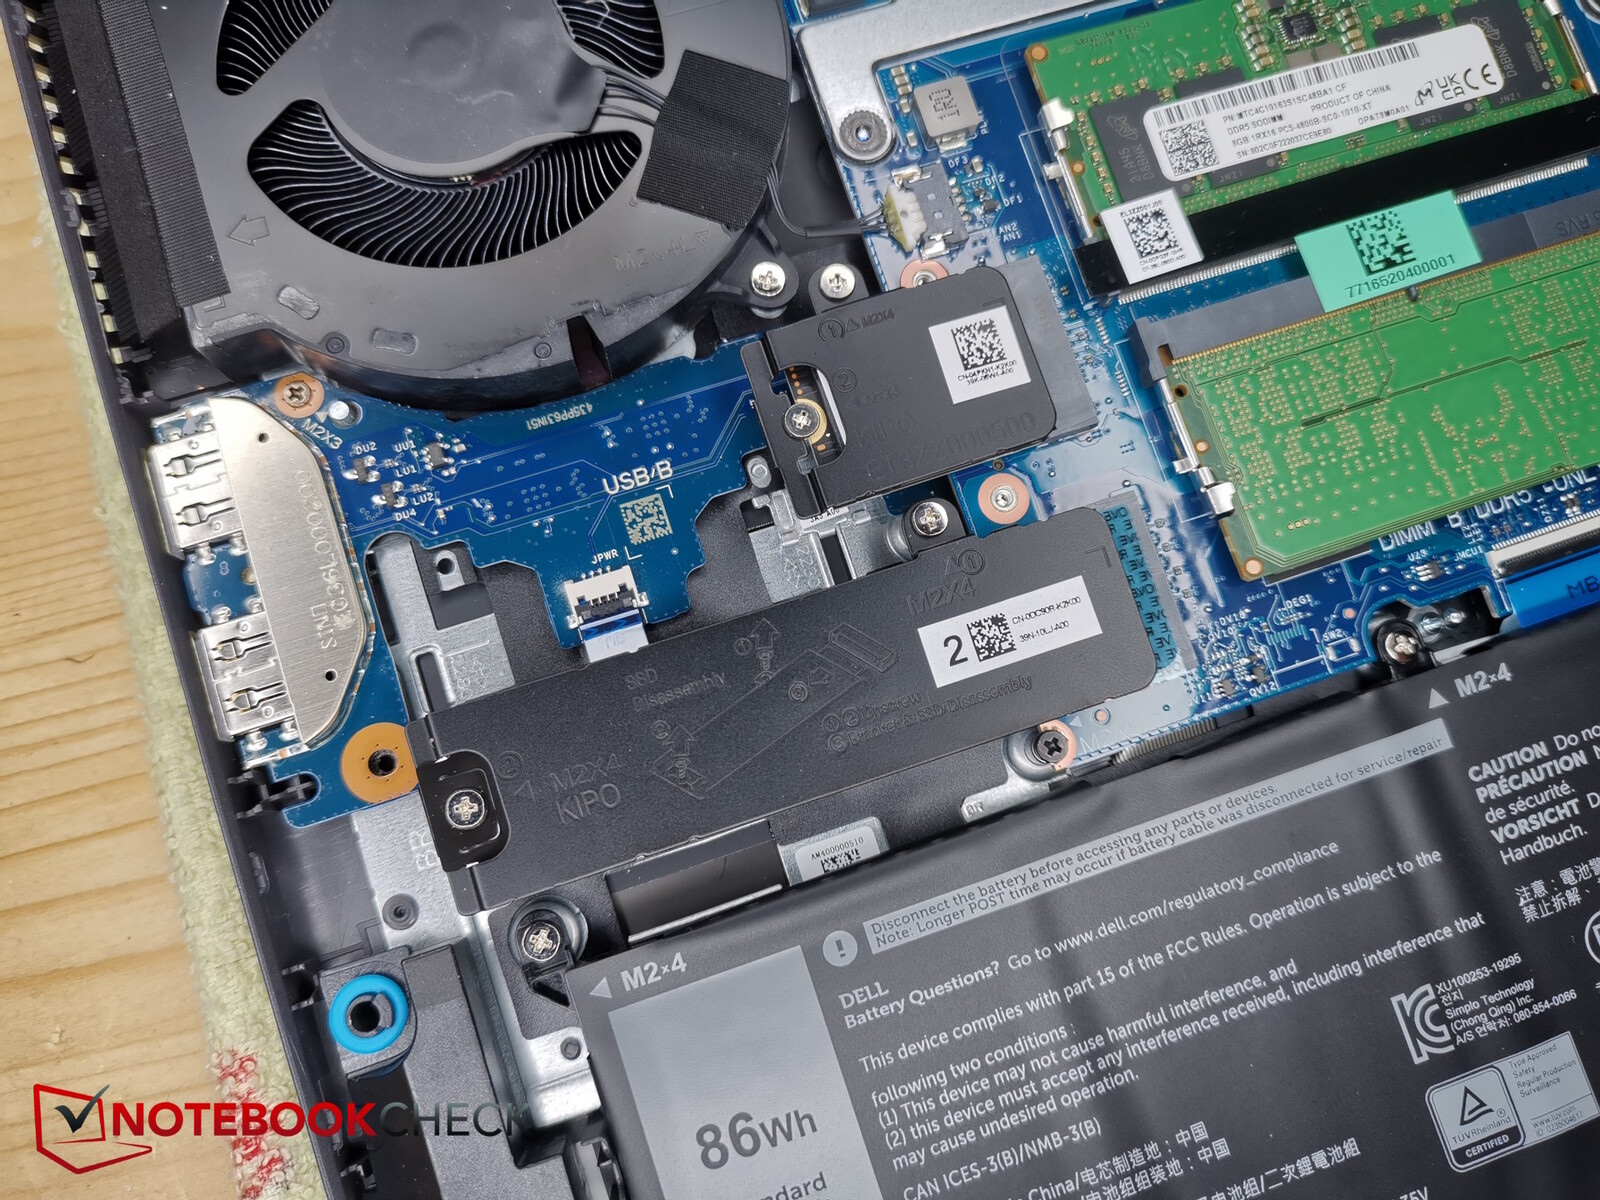
10 cross-headed screws hold the bottom plate in place. Four are longer than the rest but they don't fall out of their holes, so there isn't any concern about them getting mixed up. If you remove the screws, the bottom part of the case almost detaches by itself, so you won't need any additional tools.
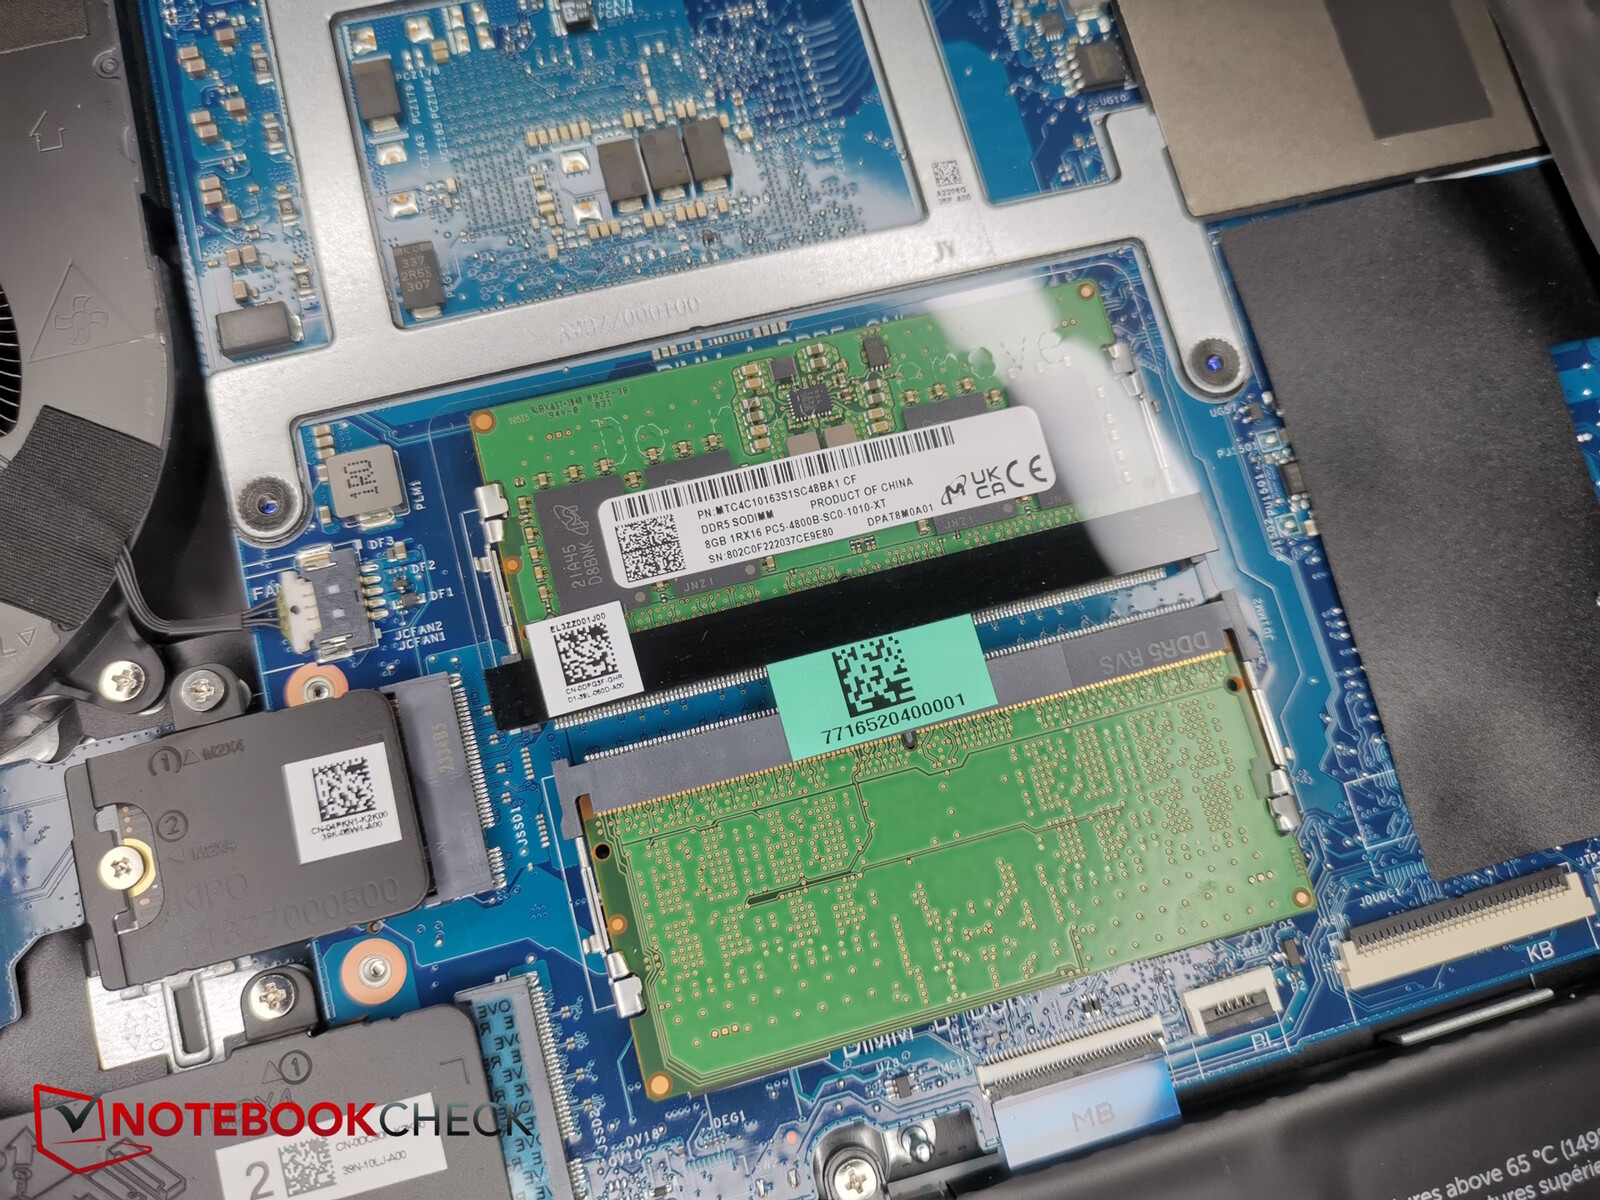
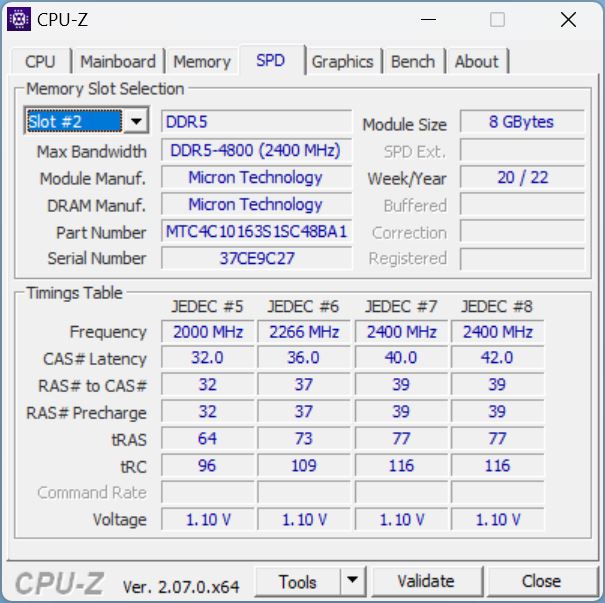
On the inside, there are no noticeable copper heat pipes as can be seen in most gaming competitors. You can access the fans, both RAM slots, the WiFi module, the battery and both M.2-SSD slots of which only the smaller format 2230 one is occupied.

Input devices - 5 configurable special keys
Keyboard
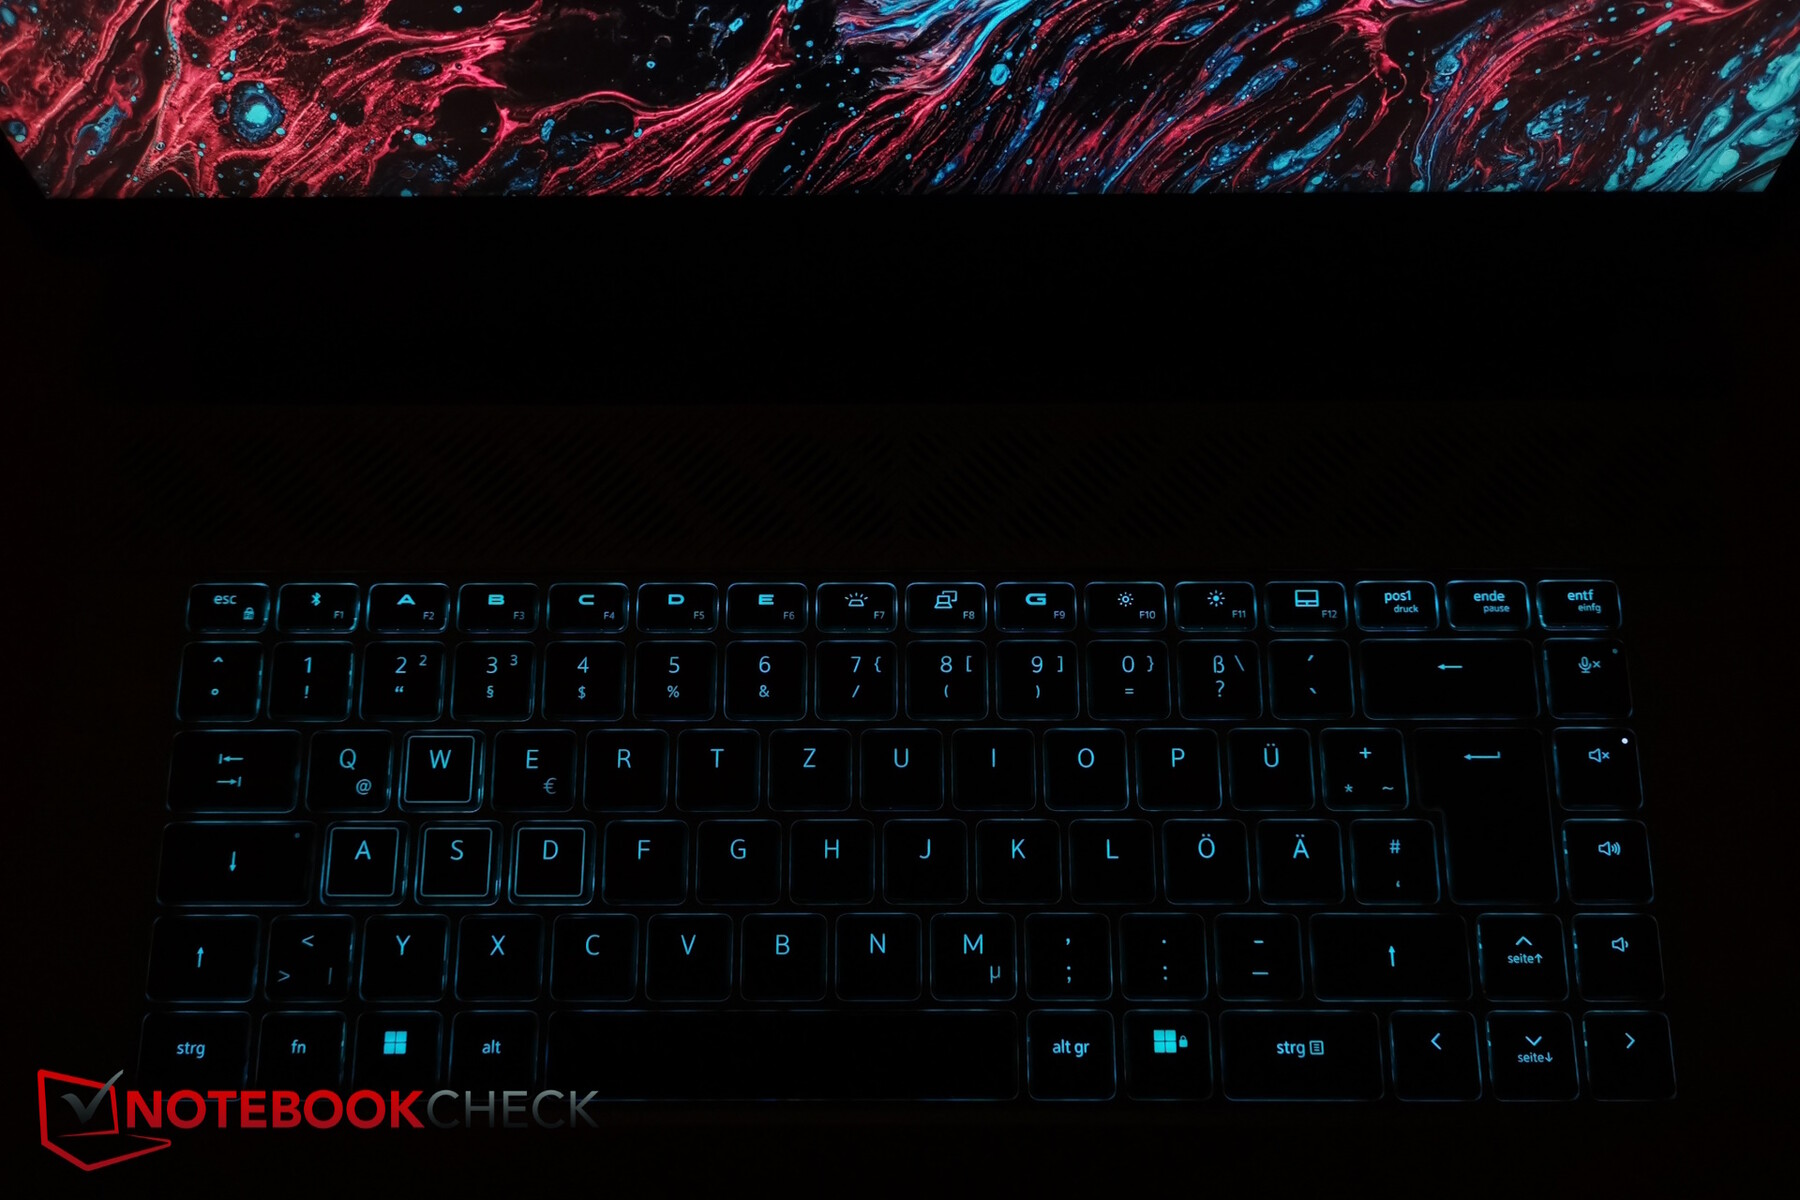
The G16 doesn't feature a number pad but this means that all the keys have enough space—this includes the normally-sized arrow keys. On the right side, there are a few special keys (volume, microphone mute button). The normal keys are around 1.6 x 1.6 cm in size and the F keys are half the height. The WASD keys feature a white outline.
As some special keys are located on the right, F2 to F6 can be configured manually, e.g. with macros.
The keys' lift isn't very high, but their feedback is fine and you can type comfortably and quickly on them. The resulting noises are very moderate. The left arrow key on our test device sounds a little different to the other (arrow) keys—slightly hollow as if something is resonating on the inside. This could be a production error that hopefully only affects our device.
The keyboard features a background illumination with two intensity levels. It only has one zone, but you can select a range of RGB effects via the Command Center (raindrop, pulsating etc.).


Touchpad
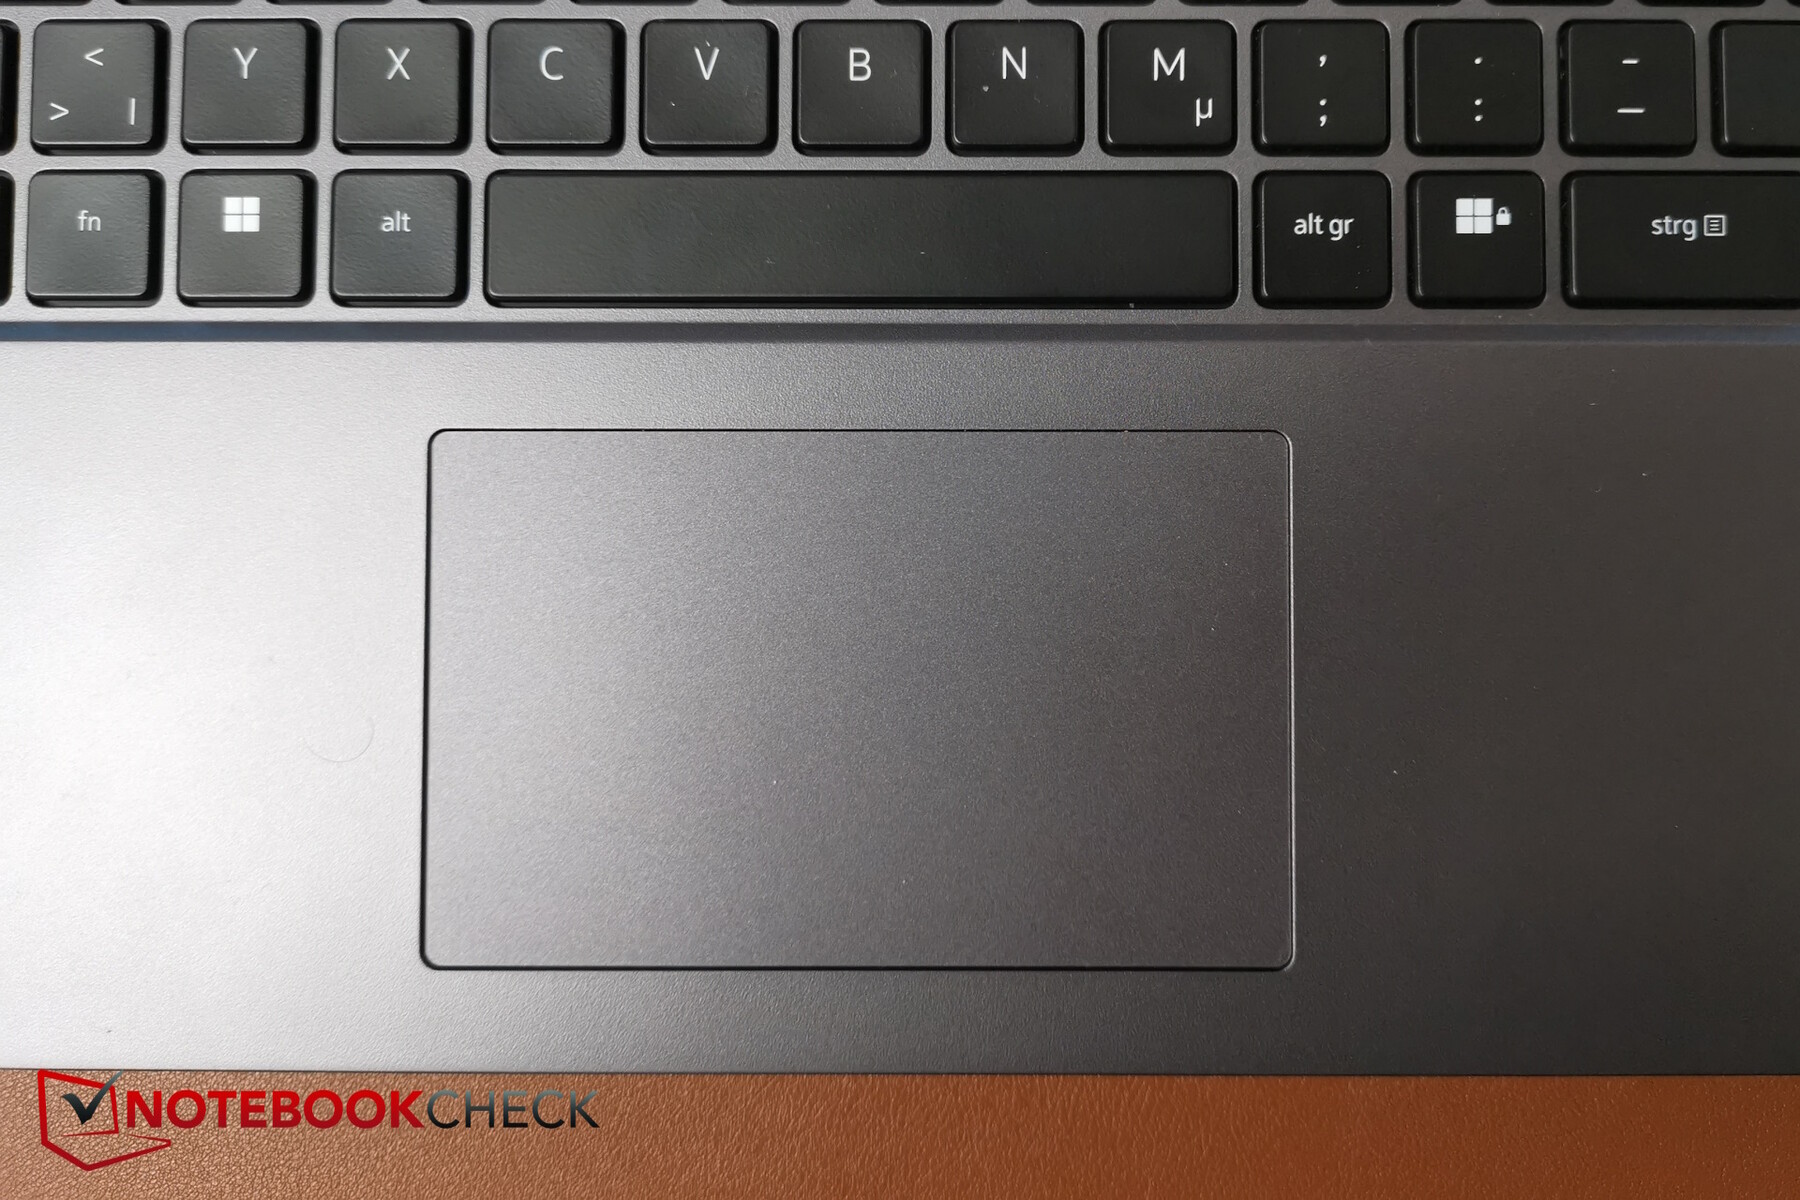
The touchpad is a bit on the small side (around 10.5 x 6.5 cm) but most gamers will likely use a mouse, Dell might assume. Its surface is nice and smooth but during very slow movements or if your fingers are moist, it might stick a little.
The integrated buttons trigger reliably—the clicking noise is slightly louder than that of the buttons, but it is by no means annoying.
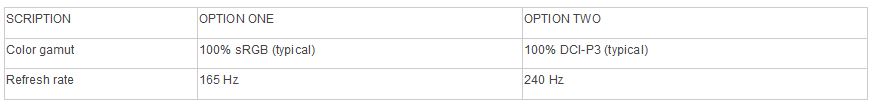
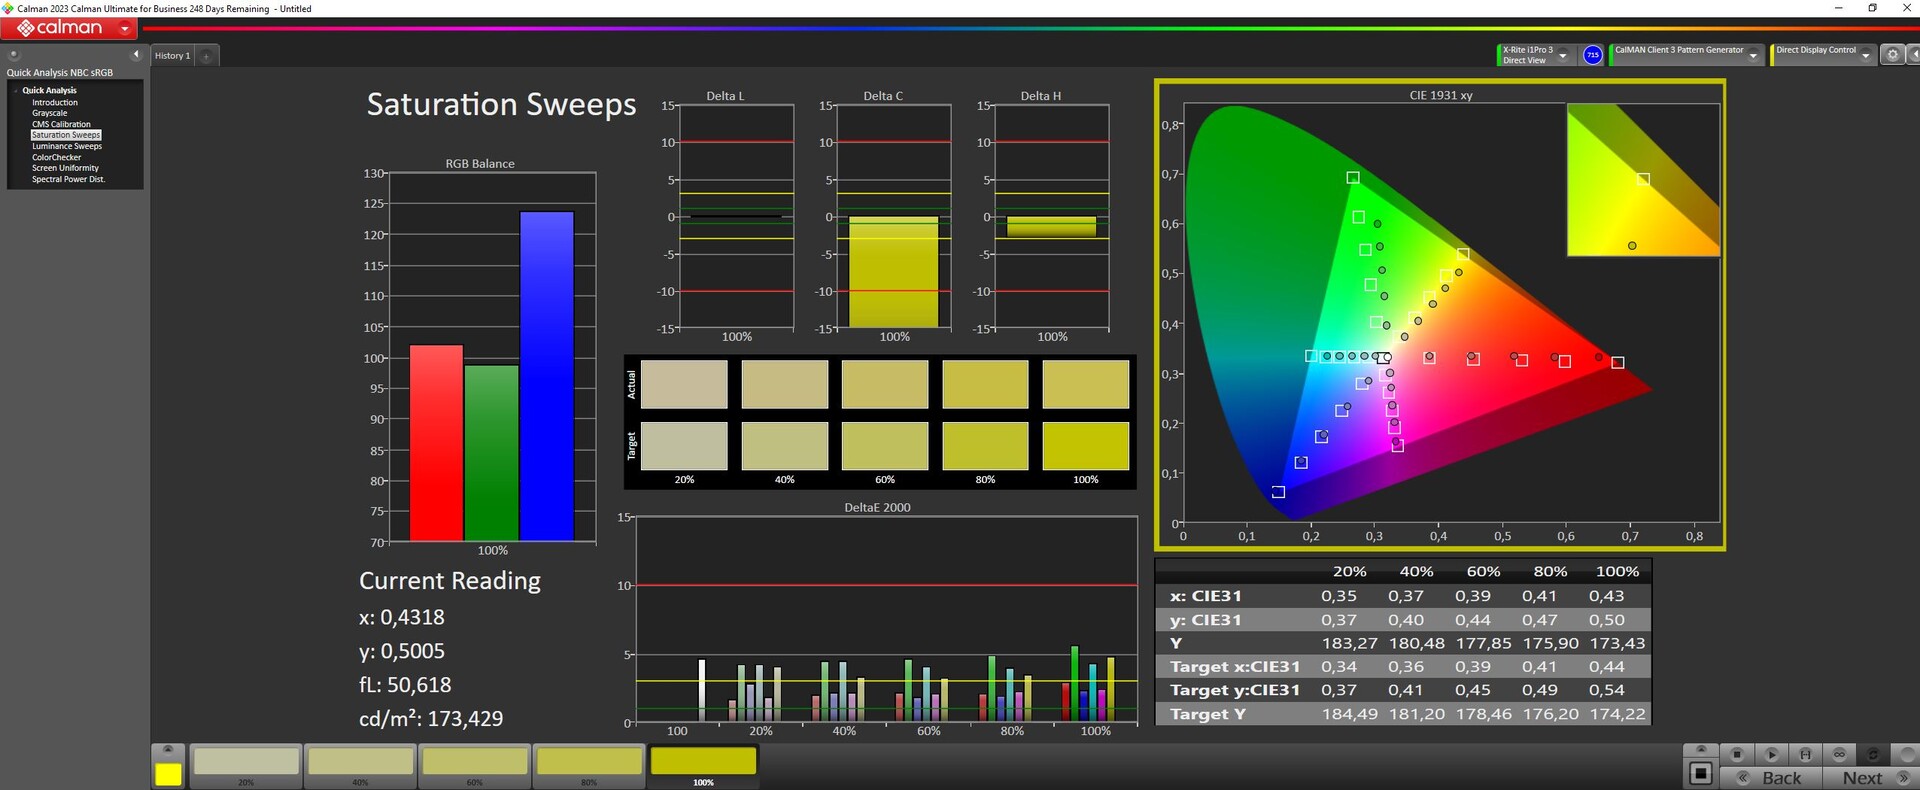
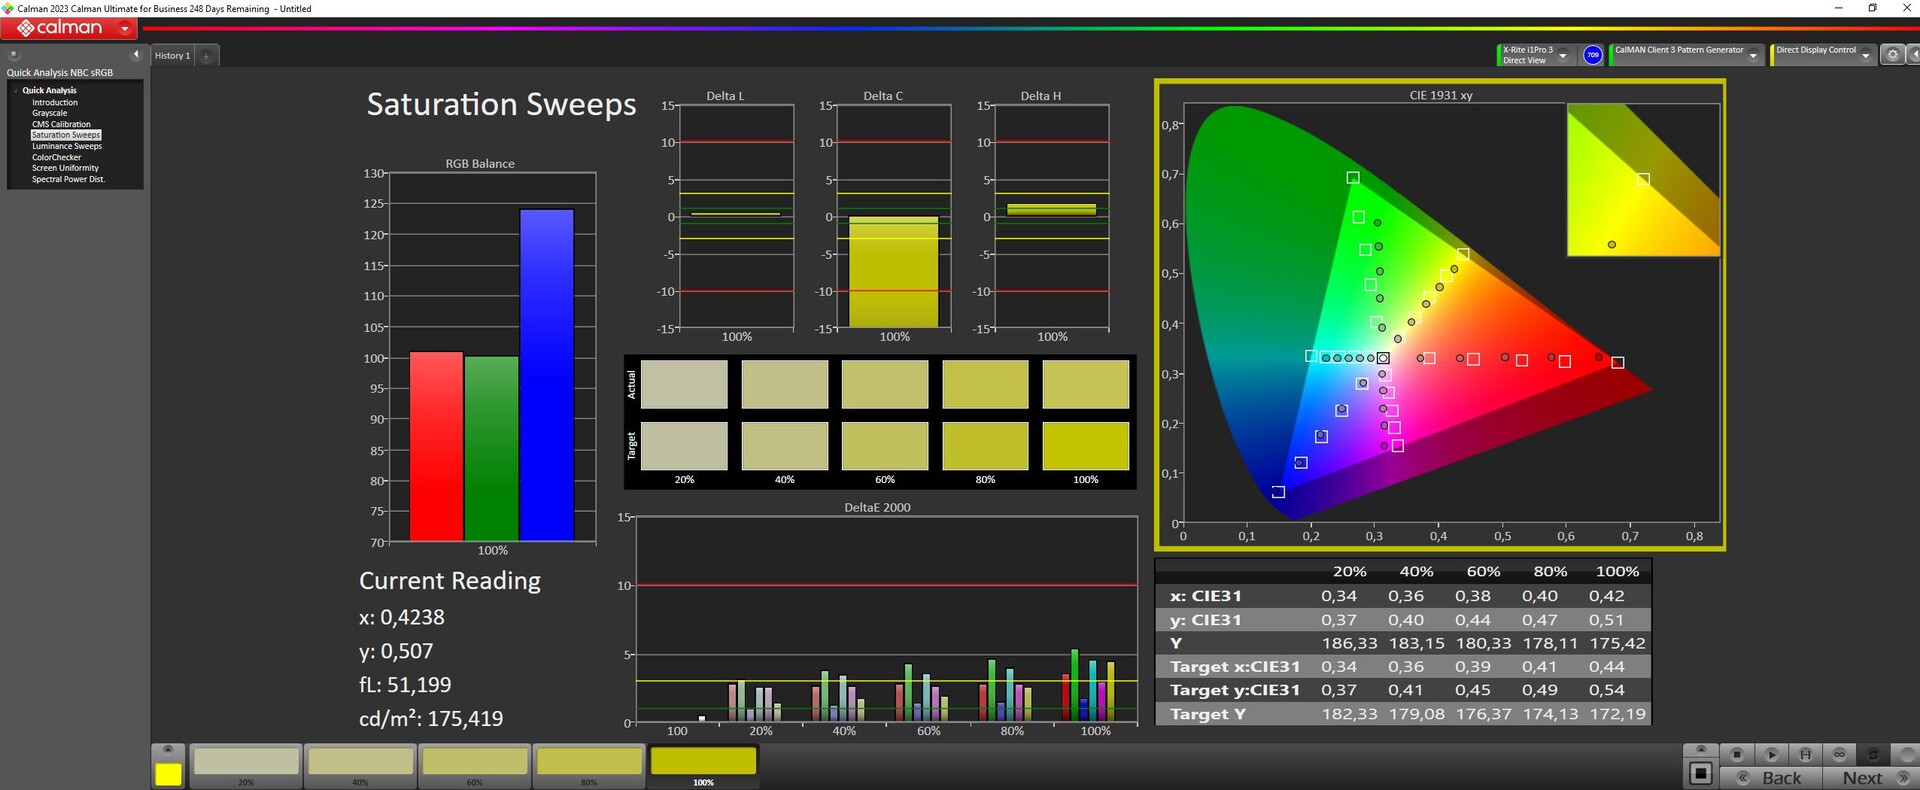
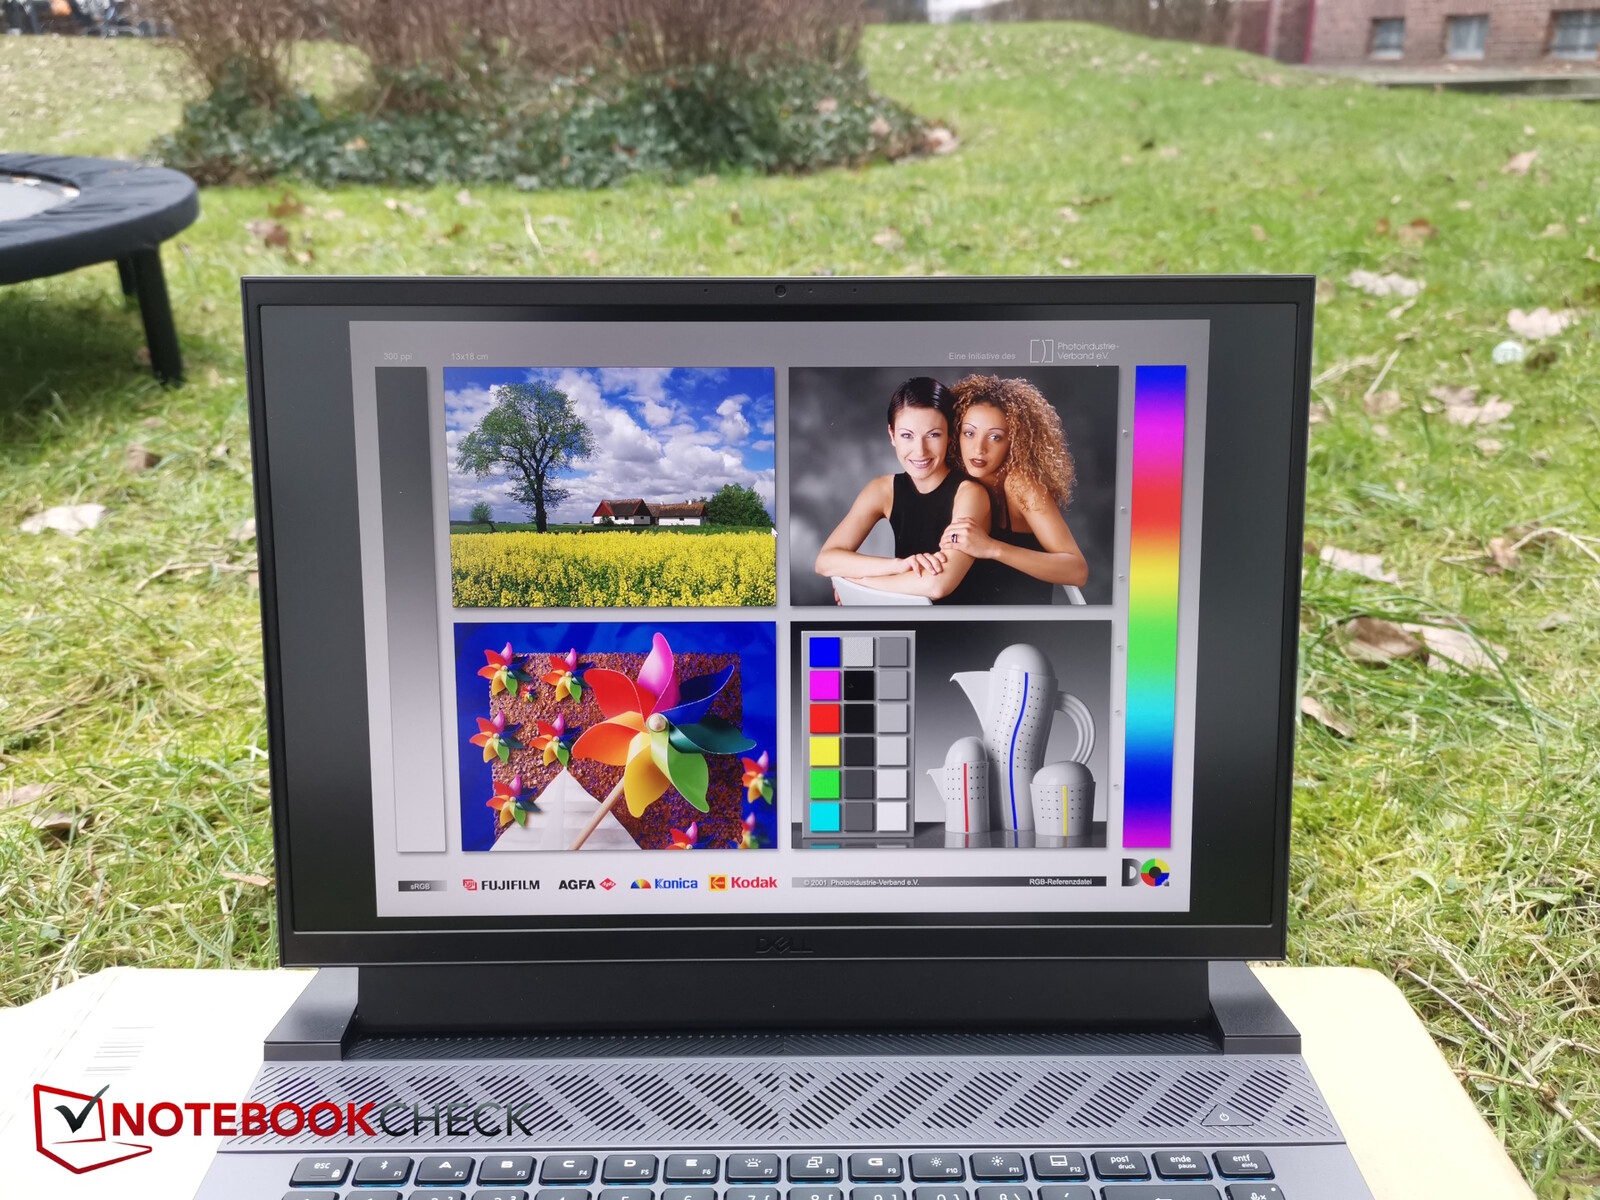
Display - DCI-P3 or just sRGB after all?
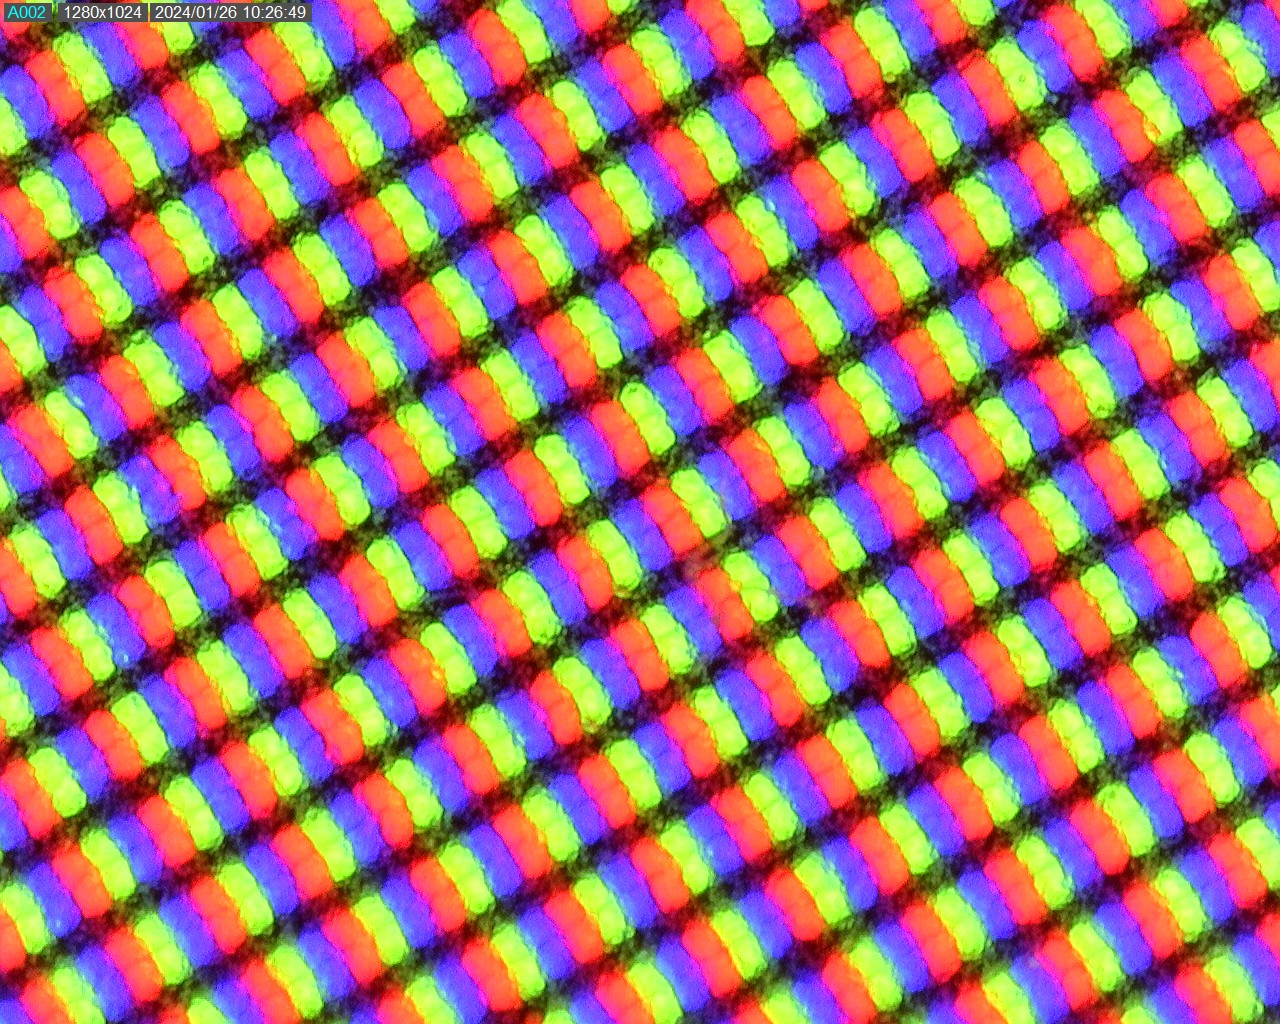

Despite it featuring the same resolution, Dell has switched from BOE to Chi Mei. The matte IPS display has a 2,560 x 1,600 pixel resolution. But beware: Although the website currently only offers one display for the G16—namely the QHD+ display (2,560 x 1,600) with a 240-Hz refresh rate, 3 ms, NVIDIA G-SYNC and 100 % DCI-P3 coverage)—our test sample is fitted with a panel with the same resolution but a refresh rate of "only" 165 Hz and, more importantly, only sRGB coverage and not DCI-P3! You have to take a look at the device's manual to discover both variants.
We measured an average brightness of 344 nits with a good 89 % illumination. However, when depicting dark scenes, we noted some subtle backlight bleeding along practically every edge.
Despite it having the same brightness, the screen shows an improved black value which also benefits its contrast. All-in-all, this is quite a good sRGB display and its response times are fast enough, too.
| |||||||||||||||||||||||||
Brightness Distribution: 89 %
Center on Battery: 369 cd/m²
Contrast: 1419:1 (Black: 0.26 cd/m²)
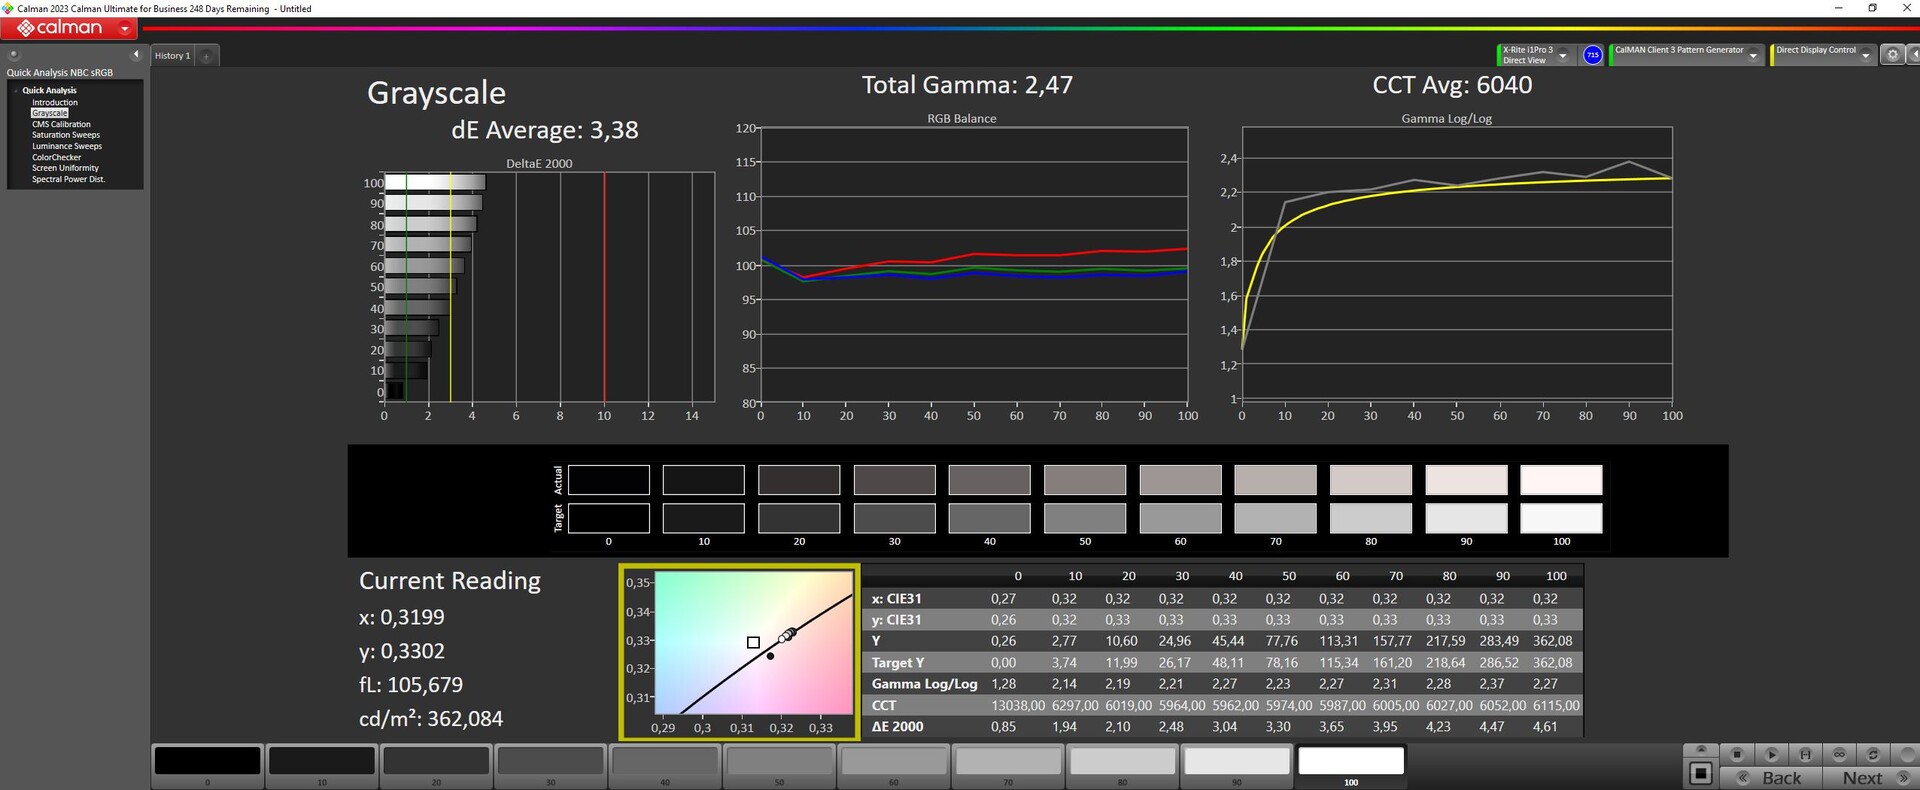
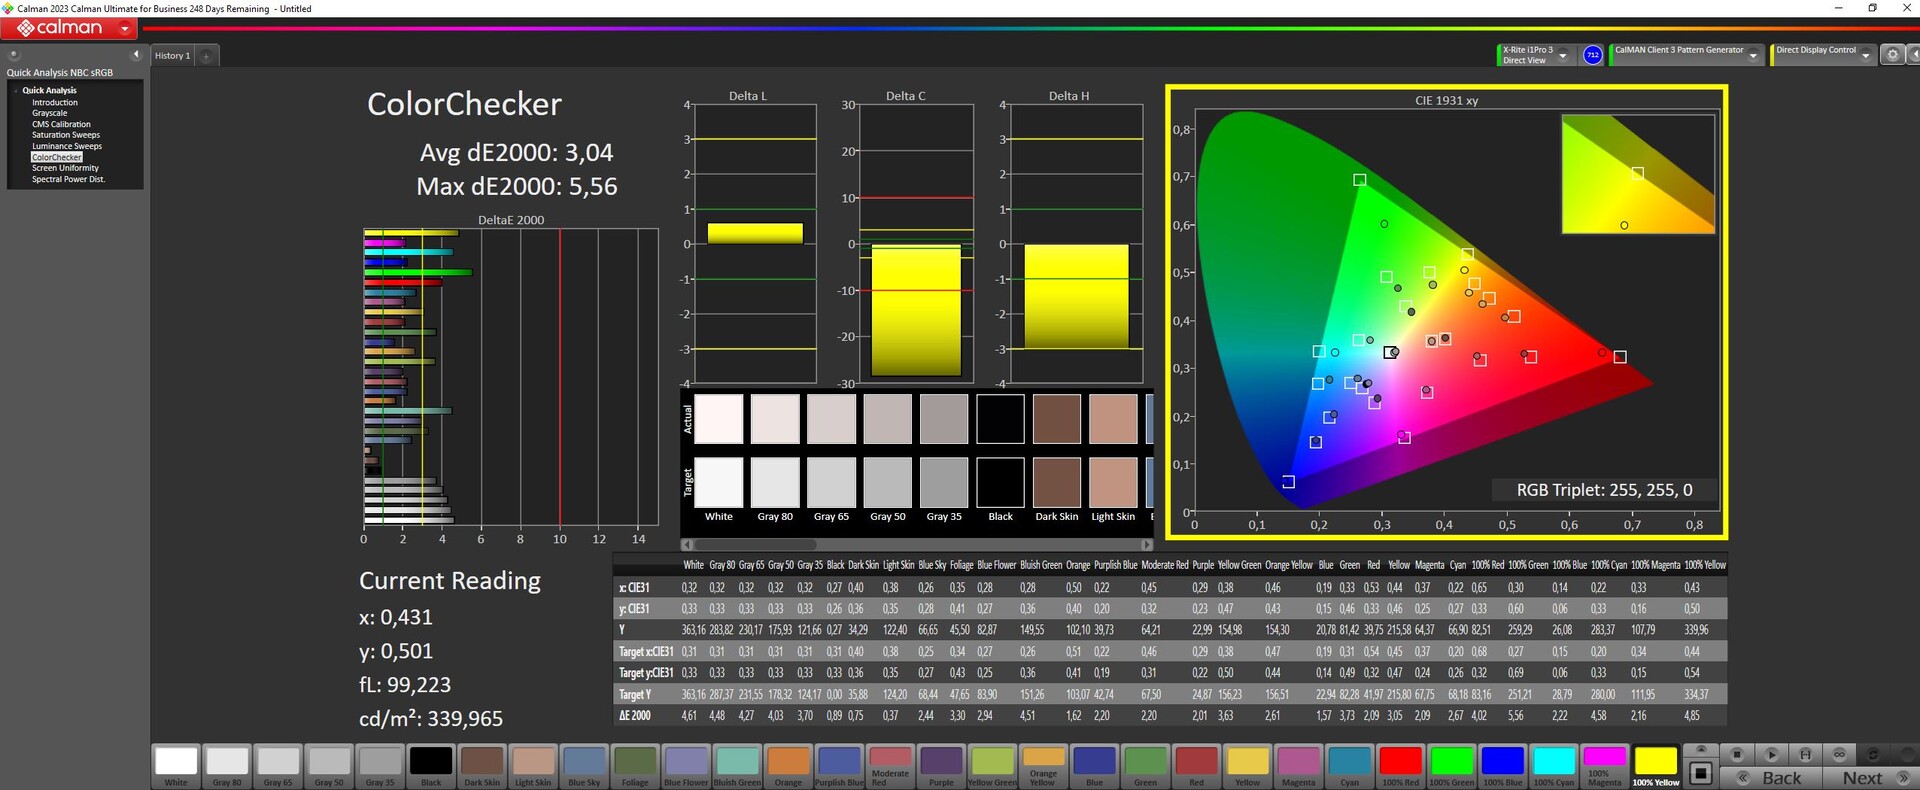
ΔE ColorChecker Calman: 3.04 | ∀{0.5-29.43 Ø4.73}
calibrated: 2.35
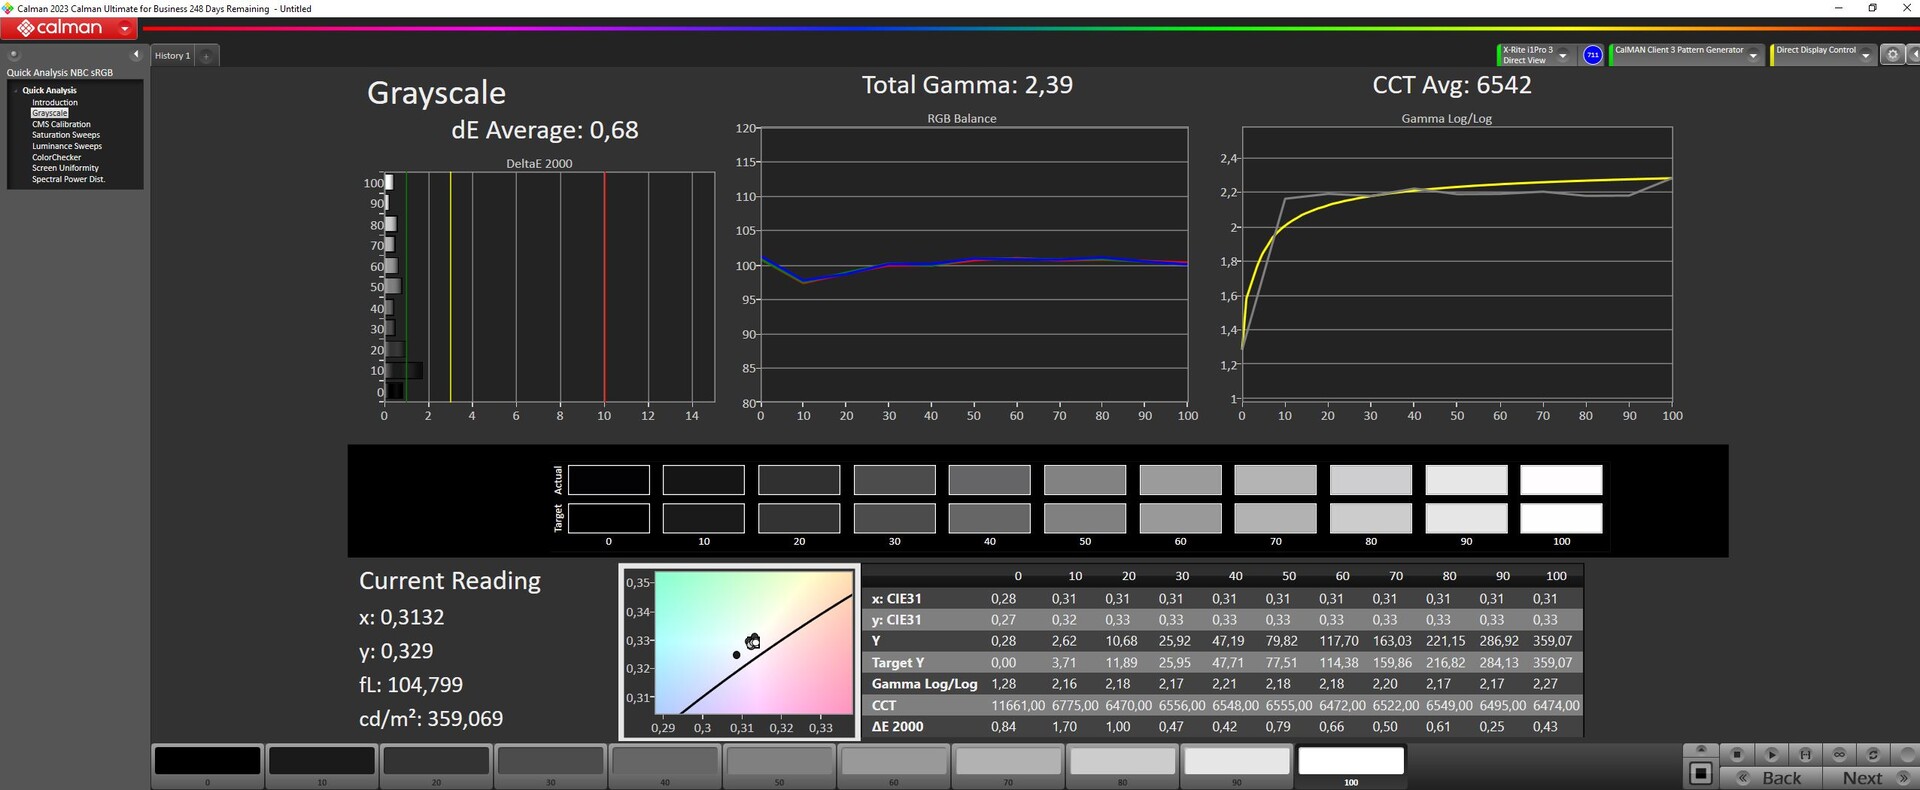
ΔE Greyscale Calman: 3.38 | ∀{0.09-98 Ø4.97}
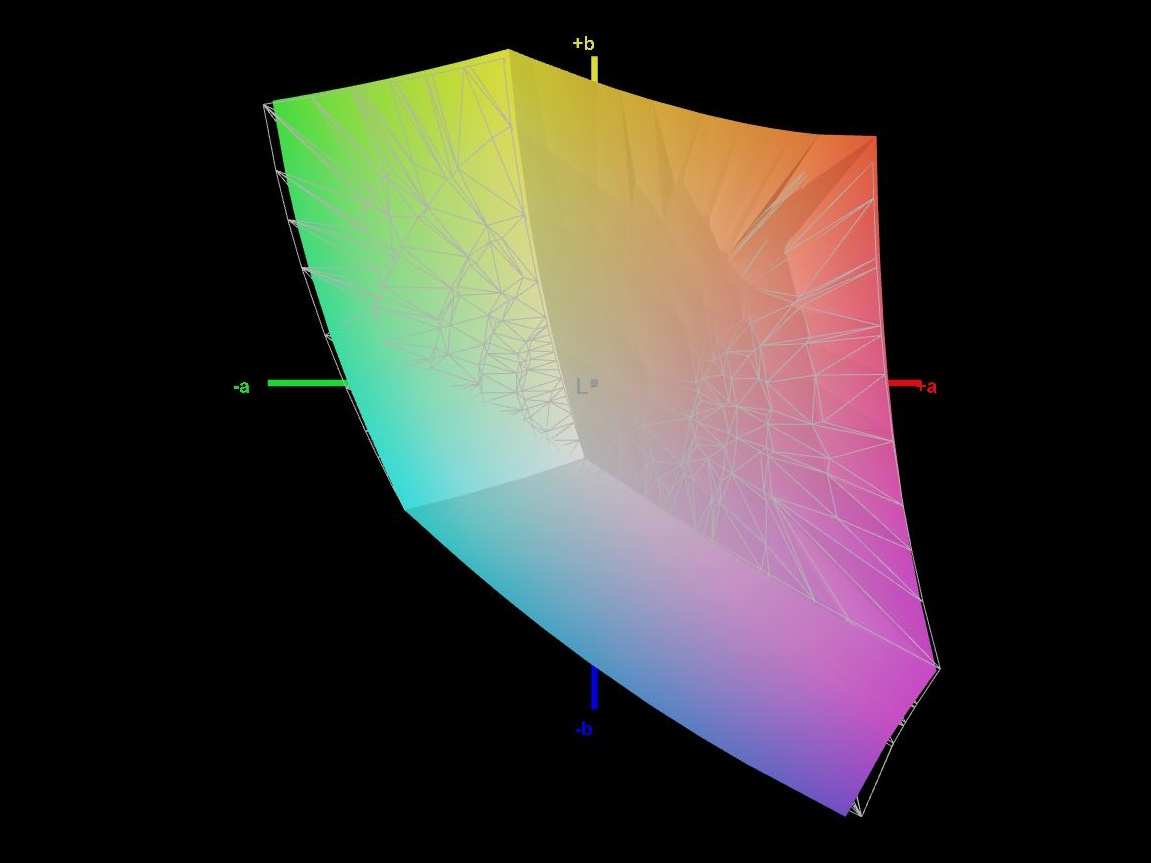
69.3% AdobeRGB 1998 (Argyll 3D)
98.5% sRGB (Argyll 3D)
67.5% Display P3 (Argyll 3D)
Gamma: 2.47
CCT: 6040 K
| Dell G16, i7-13650HX, RTX 4060 Chi Mei CMN161D (160GME), IPS, 2560x1600, 16" | Dell G16 7620 BOE NE16QDM, IPS, 2560x1600, 16" | MSI Raider GE68HX 13VF Chi Mei N160JME-GTK, IPS, 1900x1200, 16" | Lenovo Legion Slim 5 16APH8 BOE NJ NE160QDM-NYC, IPS, 2560x1600, 16" | Alienware m16 R1 Intel BOE NE16NYB, IPS, 2560x1600, 16" | Lenovo LOQ 16IRH8 AUOC1A5 (B160QAN03.L), IPS, 2560x1600, 16" | |
|---|---|---|---|---|---|---|
| Display | 1% | -38% | 2% | 0% | 3% | |
| Display P3 Coverage (%) | 67.5 | 68.3 1% | 41.6 -38% | 69.3 3% | 67.7 0% | 70.5 4% |
| sRGB Coverage (%) | 98.5 | 98 -1% | 62.2 -37% | 100 2% | 97.2 -1% | 98.9 0% |
| AdobeRGB 1998 Coverage (%) | 69.3 | 70.5 2% | 43 -38% | 70 1% | 70 1% | 72.6 5% |
| Response Times | -7% | -131% | -8% | 39% | 17% | |
| Response Time Grey 50% / Grey 80% * (ms) | 7.6 ? | 8.6 ? -13% | 17.3 ? -128% | 10.7 ? -41% | 4 ? 47% | 7.2 ? 5% |
| Response Time Black / White * (ms) | 10.4 ? | 10.4 ? -0% | 24.2 ? -133% | 7.8 ? 25% | 7.3 ? 30% | 7.4 ? 29% |
| PWM Frequency (Hz) | ||||||
| Screen | 7% | -37% | 15% | 4% | 13% | |
| Brightness middle (cd/m²) | 369 | 369.4 0% | 300.9 -18% | 371.6 1% | 306 -17% | 407 10% |
| Brightness (cd/m²) | 344 | 348 1% | 302 -12% | 343 0% | 302 -12% | 369 7% |
| Brightness Distribution (%) | 89 | 83 -7% | 93 4% | 84 -6% | 89 0% | 85 -4% |
| Black Level * (cd/m²) | 0.26 | 0.32 -23% | 0.31 -19% | 0.44 -69% | 0.3 -15% | 0.45 -73% |
| Contrast (:1) | 1419 | 1154 -19% | 971 -32% | 845 -40% | 1020 -28% | 904 -36% |
| Colorchecker dE 2000 * | 3.04 | 1.78 41% | 4.6 -51% | 1.52 50% | 2.57 15% | 1.43 53% |
| Colorchecker dE 2000 max. * | 5.56 | 4.41 21% | 17.6 -217% | 2.68 52% | 4.26 23% | 3.58 36% |
| Colorchecker dE 2000 calibrated * | 2.35 | 1.22 48% | 2.04 13% | 0.33 86% | 0.85 64% | 1.07 54% |
| Greyscale dE 2000 * | 3.38 | 3.2 5% | 3.3 2% | 1.2 64% | 3.3 2% | 1.13 67% |
| Gamma | 2.47 89% | 2.2 100% | 2.09 105% | 2.1 105% | 1.997 110% | 2.5 88% |
| CCT | 6040 108% | 6750 96% | 7151 91% | 6503 100% | 6895 94% | 6526 100% |
| Total Average (Program / Settings) | 0% /
4% | -69% /
-50% | 3% /
9% | 14% /
8% | 11% /
11% |
* ... smaller is better
We measured around 70 % DisplayP3 and AdobeRGB coverage, while sRGB is almost completely covered. The old display achieved similar values; the version offered on the website is said to cover 100 % of DCI-P3.


Straight out of the box, the display isn't optimally calibrated. Our calibration using an X-Rite measuring device and the Calman software thoroughly improved grayscale deviations, while the colors weren't improved quite as well.

Display Response Times
| ↔ Response Time Black to White | ||
|---|---|---|
| 10.4 ms ... rise ↗ and fall ↘ combined | ↗ 5.8 ms rise | 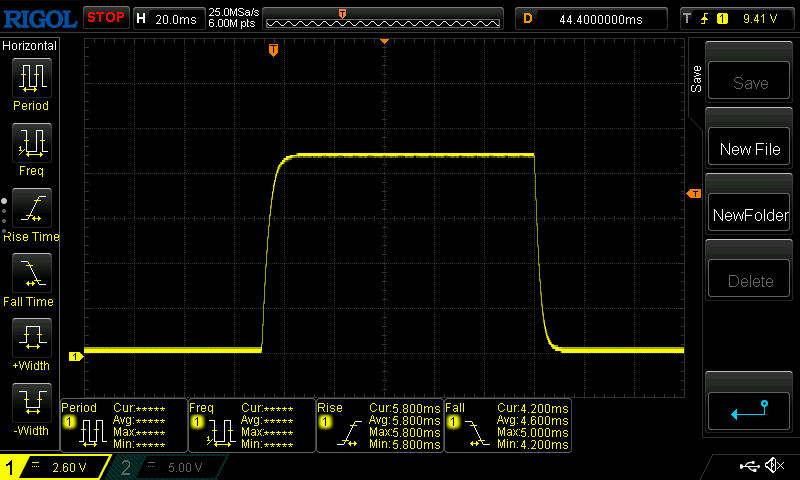 |
| ↘ 4.6 ms fall | ||
| The screen shows good response rates in our tests, but may be too slow for competitive gamers. In comparison, all tested devices range from 0.1 (minimum) to 240 (maximum) ms. » 28 % of all devices are better. This means that the measured response time is better than the average of all tested devices (19.9 ms). | ||
| ↔ Response Time 50% Grey to 80% Grey | ||
| 7.6 ms ... rise ↗ and fall ↘ combined | ↗ 3.8 ms rise | 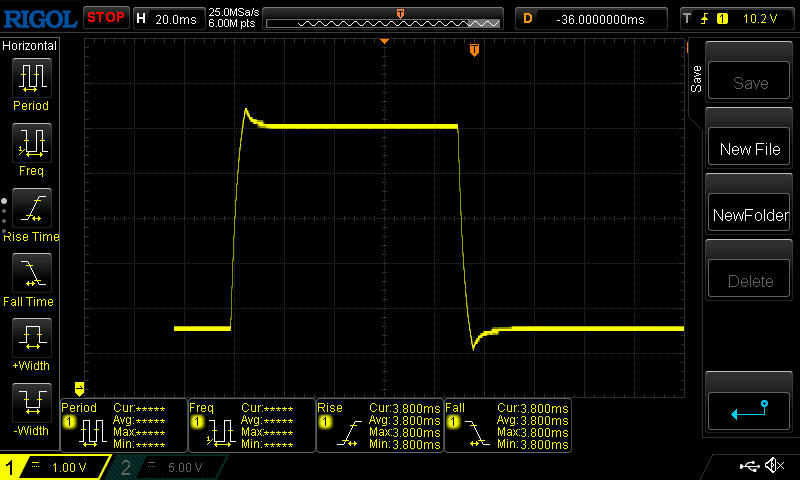 |
| ↘ 3.8 ms fall | ||
| The screen shows very fast response rates in our tests and should be very well suited for fast-paced gaming. In comparison, all tested devices range from 0.165 (minimum) to 636 (maximum) ms. » 20 % of all devices are better. This means that the measured response time is better than the average of all tested devices (31.1 ms). | ||
Screen Flickering / PWM (Pulse-Width Modulation)
| Screen flickering / PWM not detected | 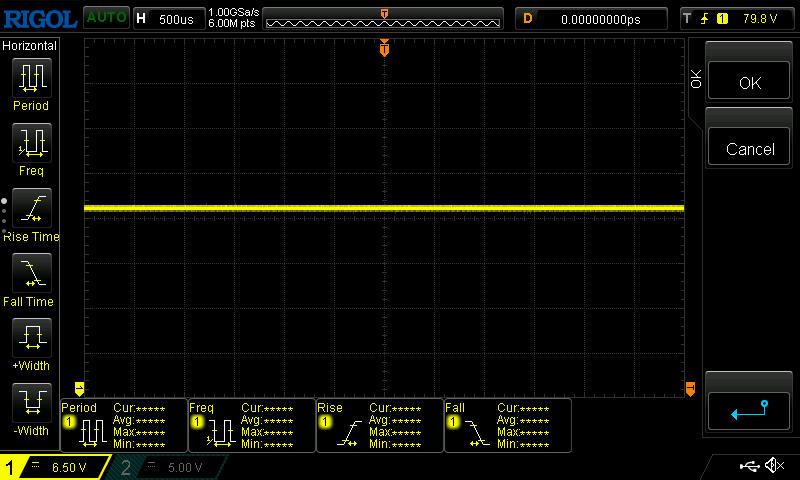 | ||
In comparison: 52 % of all tested devices do not use PWM to dim the display. If PWM was detected, an average of 7798 (minimum: 5 - maximum: 343500) Hz was measured. | |||
The display is bright enough to be used outside—at least in shaded surroundings—plus, its matte surface eliminates most big reflections.


Performance - The G16 is just as expected
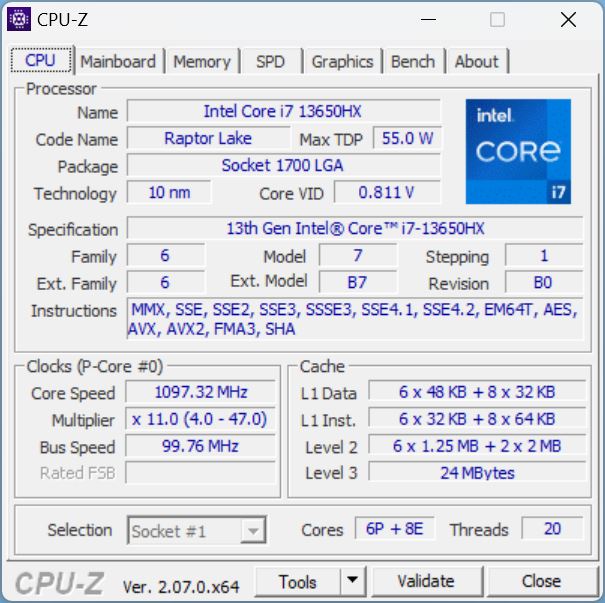
The Dell G16 is a typical budget-to-mid-range gaming laptop. Its CPU is the Intel Core i7-13650HX and adding to this is an RTX 4060 at 140 watts, 16 GB RAM and a 1-TB NVMe SSD. As a result, most current games should be playable in Full HD. The decent-to-good 16:10 display compliments the laptop's hardware configuration.
Testing conditions
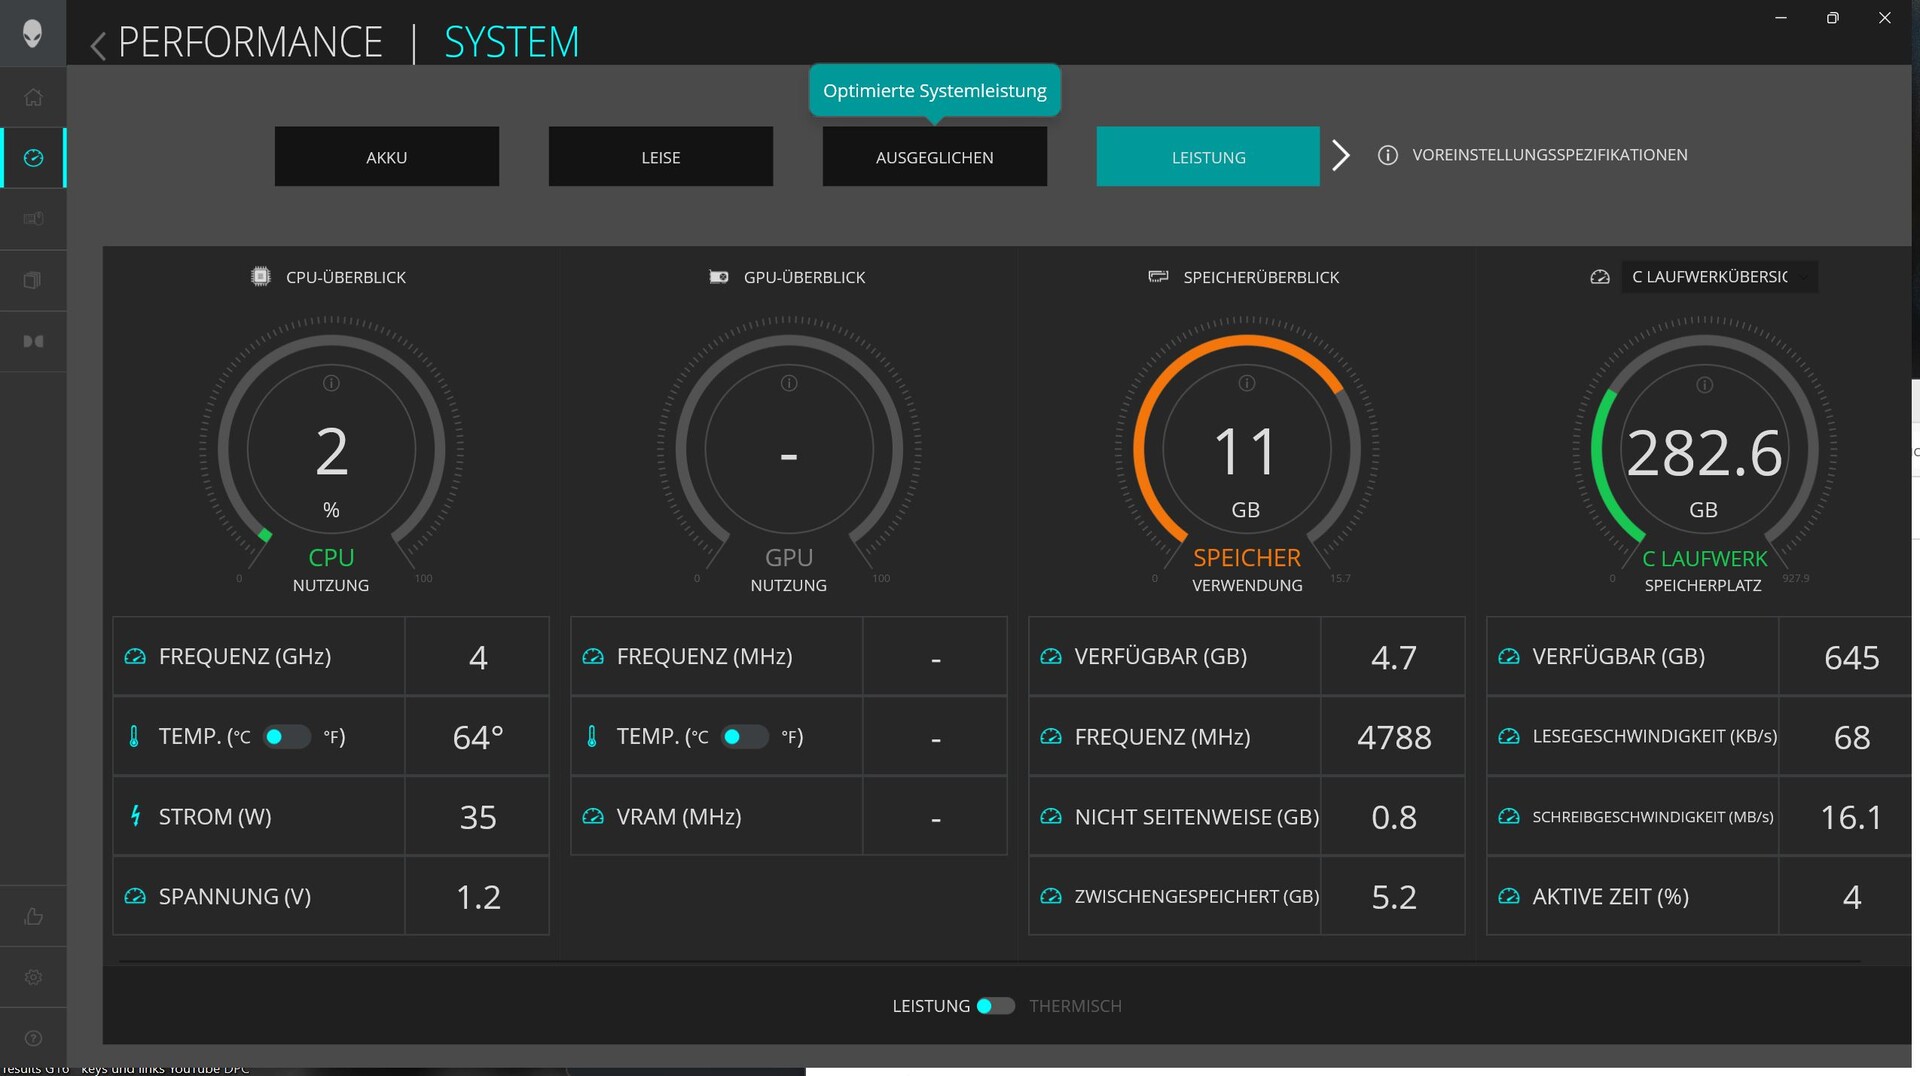
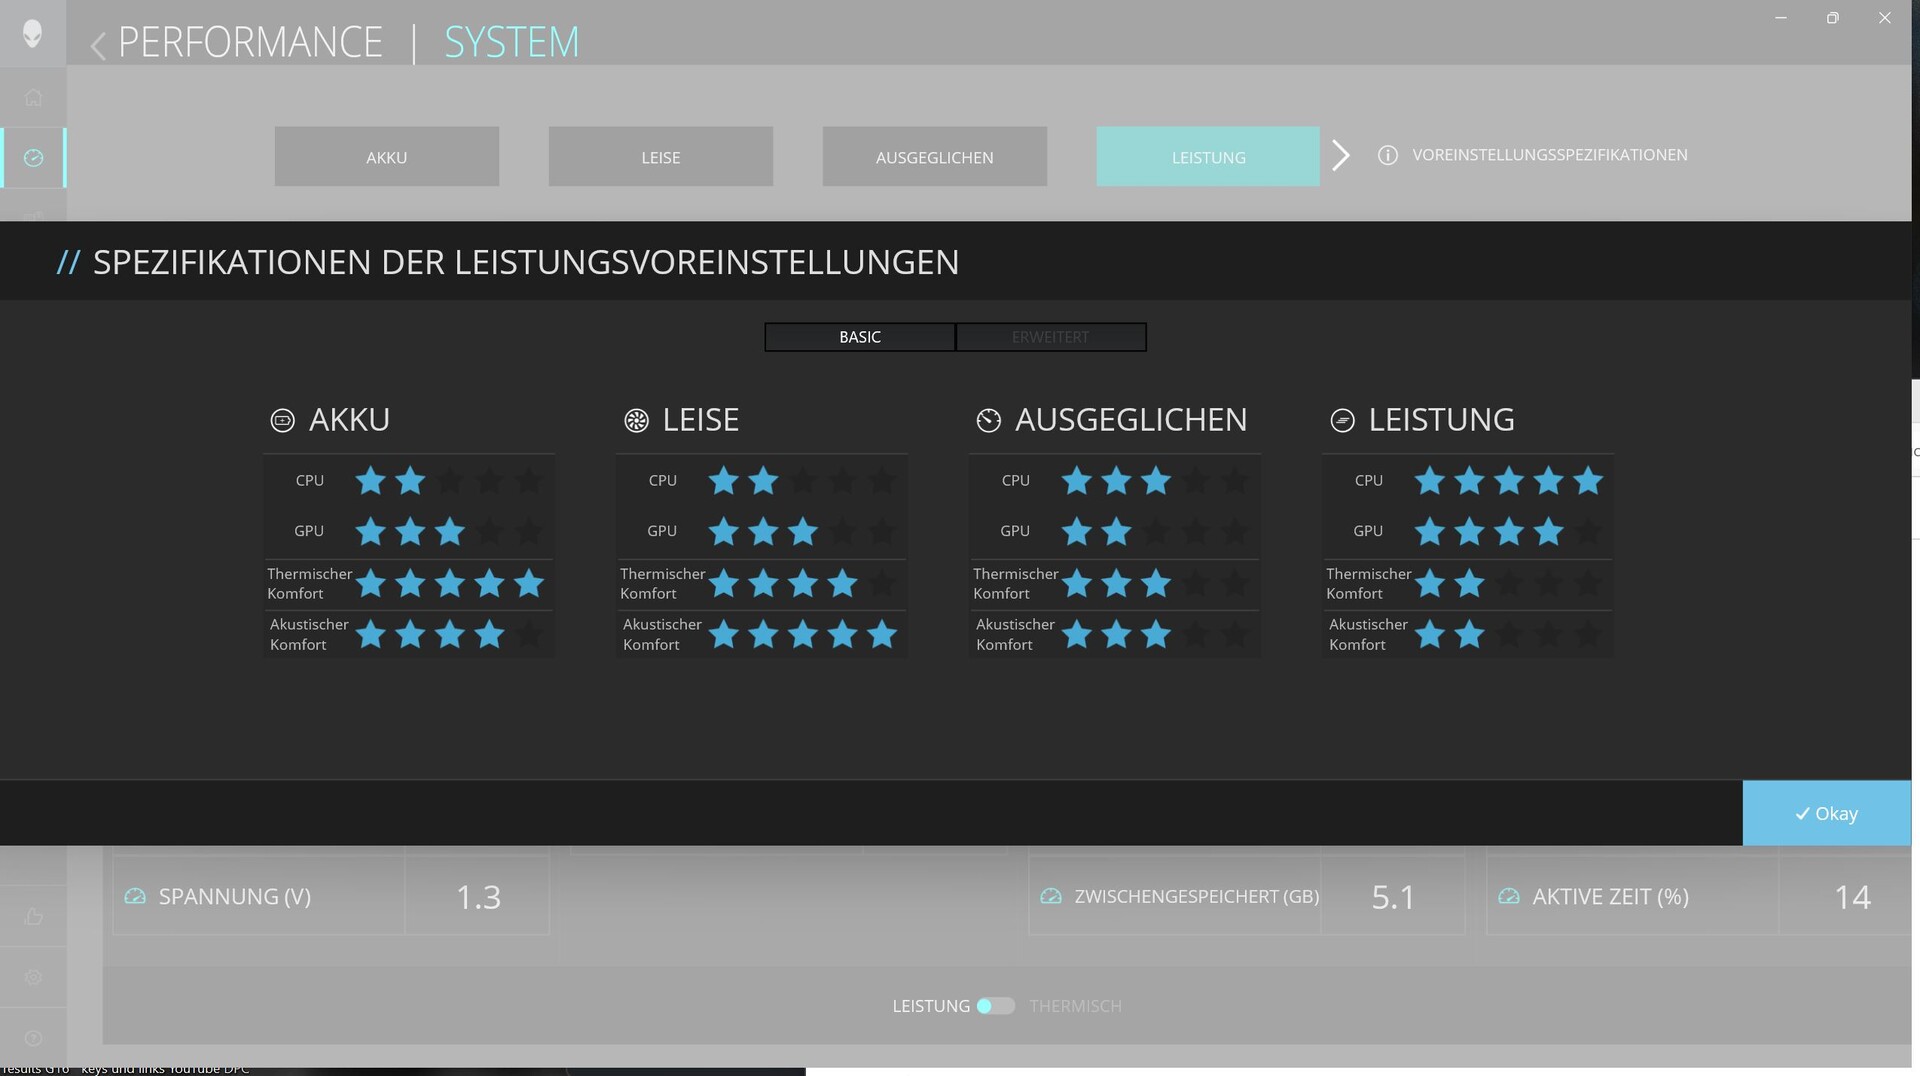
Dell has pre-installed at least two apps (see McAffee) onto the G16. One is My Dell, which also comes pre-installed on its non-gamers, and the other is the Alienware Command Center on the Alienware models. My Dell includes service, updates, etc., while the Command Center allows you to set different performance modes (battery, quiet, balanced, performance, manual), key lighting and other options.
Despite many years of development, the Command Center is still not fully developed. For example, the window cannot be maximized properly; you can still see the desktop at the bottom.
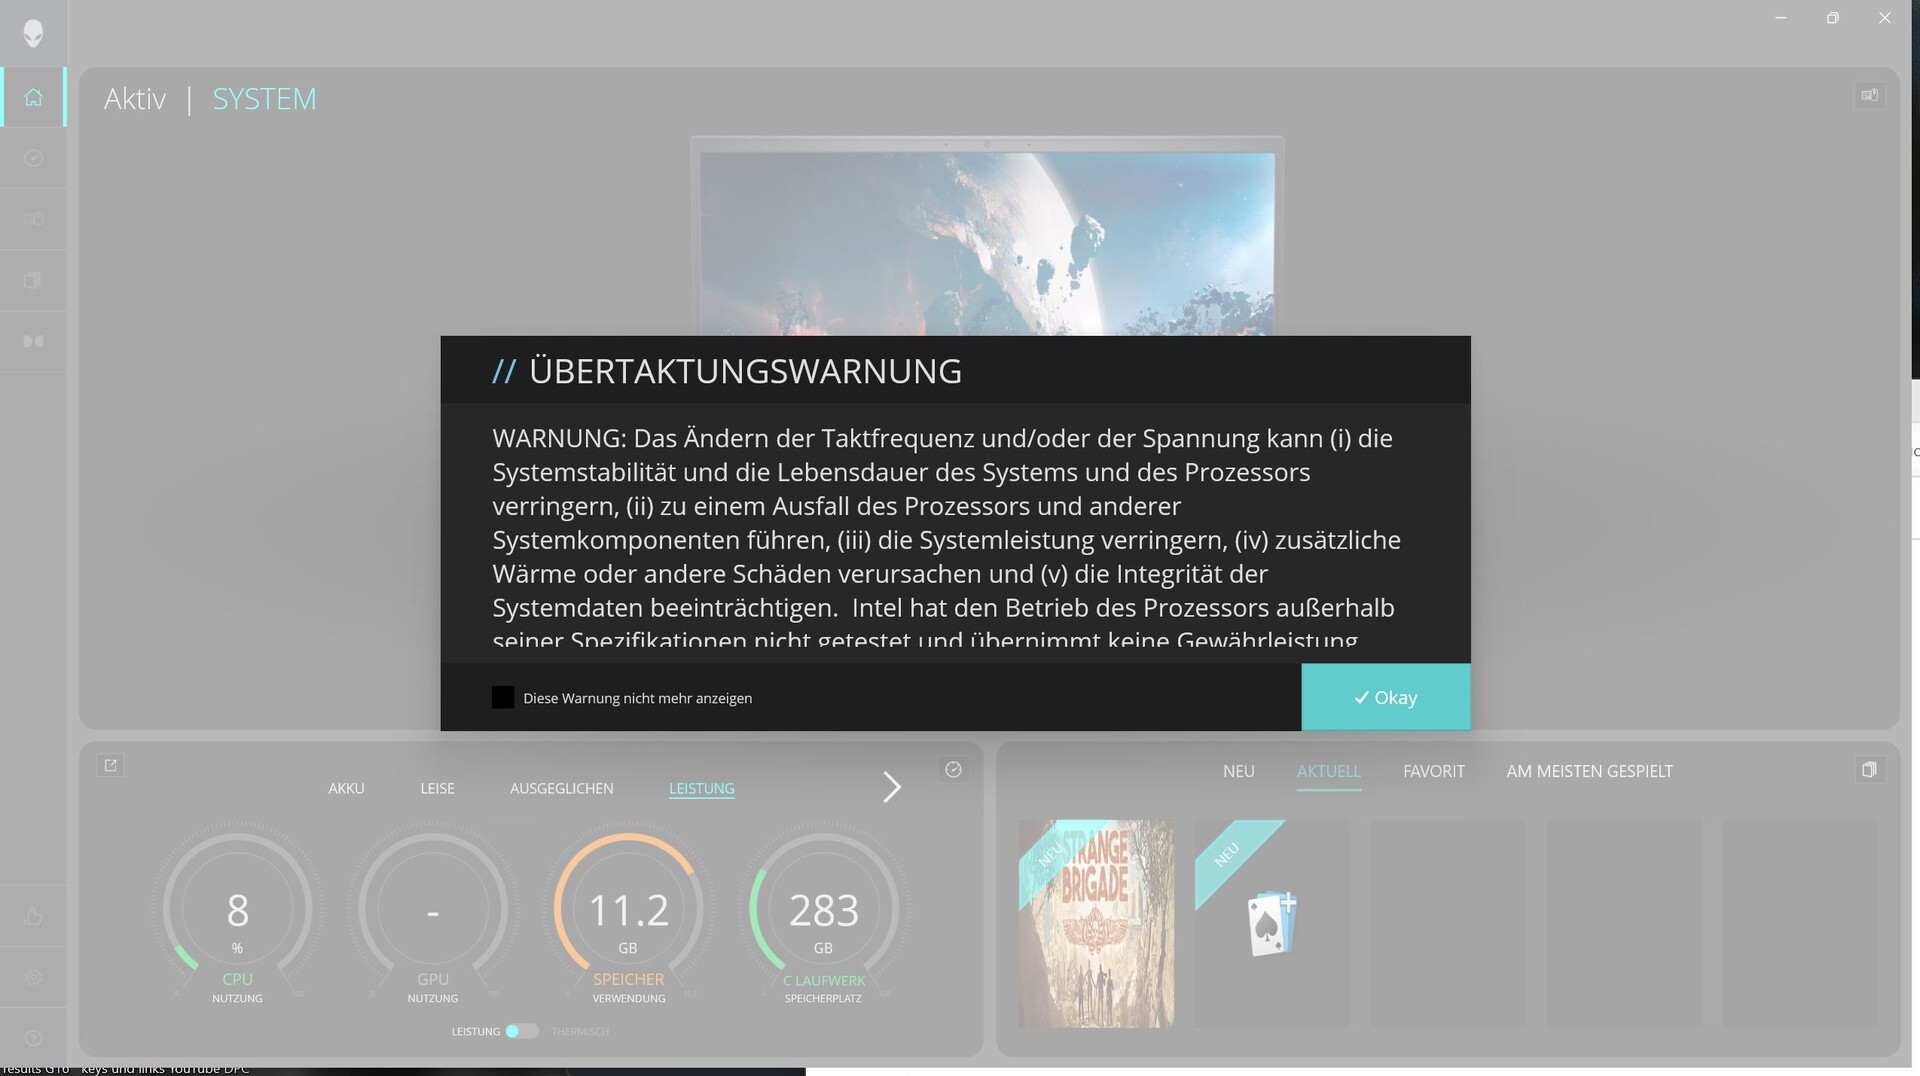
Likely another bug is that we get a warning as soon as we switch to performance mode. This is very unsettling, as it suggests that the warranty could be voided if the hardware is operated outside of the recommended specifications. However, we suspect that the warning refers to the manual mode, not the performance mode specified by Dell itself—very confusing!
What is annoying, however, is that McAffee is not only pre-installed, but Dell also regularly sends us a message asking us to use this service (we have uninstalled it) and this message keeps coming back every day at the latest.


Processor
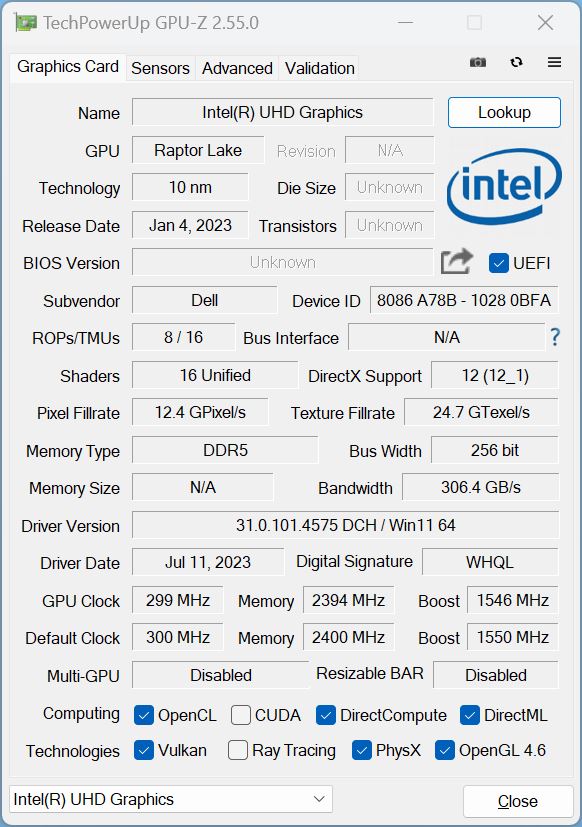
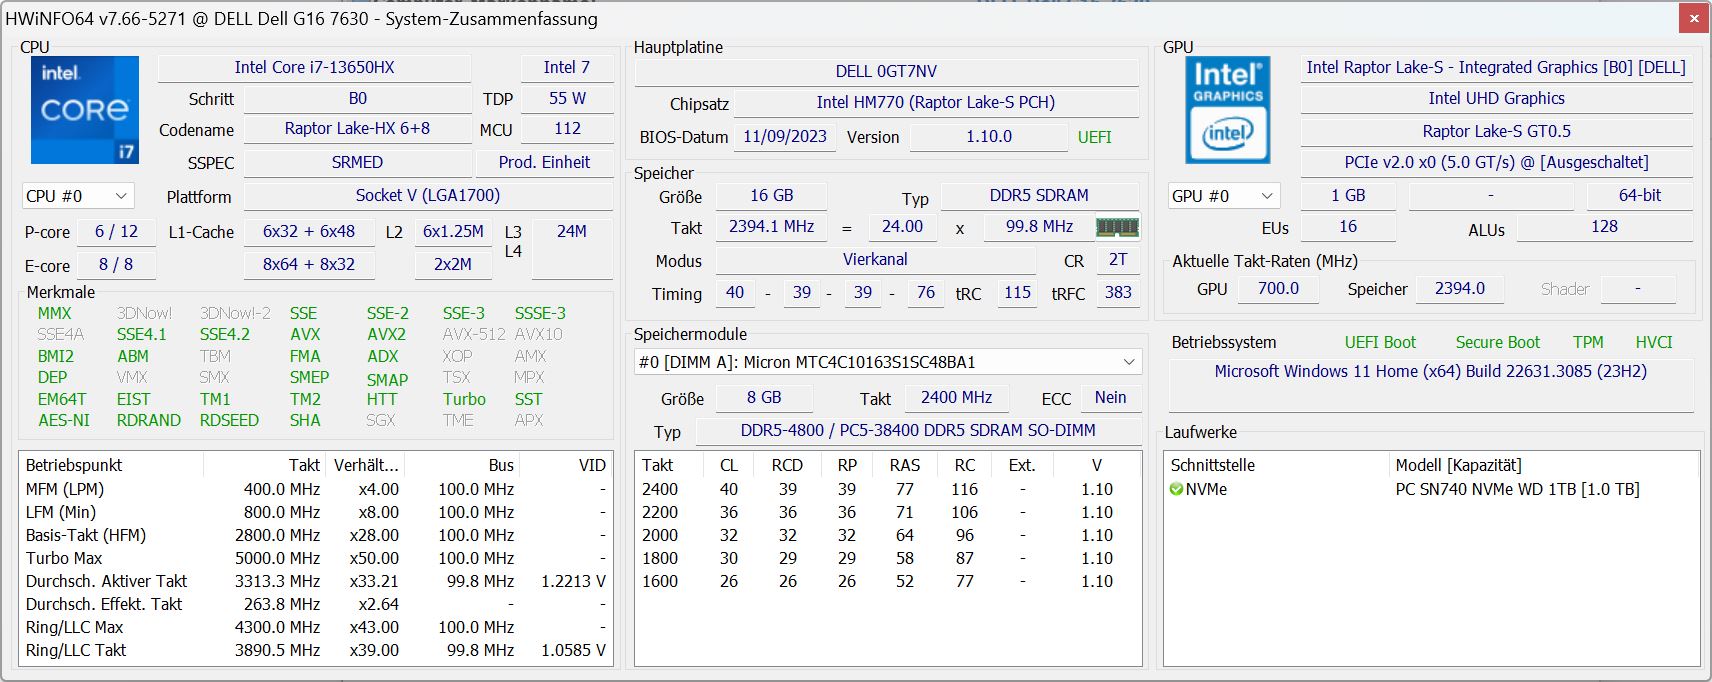
The Dell laptop houses a Raptor-Lake CPU, the Intel Core i7-13650HX with 14 cores (6 P, 8 E) and 20 threads. The P cores can individually clock at up to 4.9 GHz and the efficiency cores' base clock rate is 1.9 GHz. You can only get the more powerful i9-13900HX in combination with the RTX 4070, which costs quite a bit more.
During the Cinebench-R15 loop, the G16 ran at consistently high performance levels without suffering from any performance loss after the first few runs.
Across all our CPU benchmarks, the i7-13650HX performed at about the expected level and around 15 to 19 % faster than the i7-12700H in the device's predecessor.
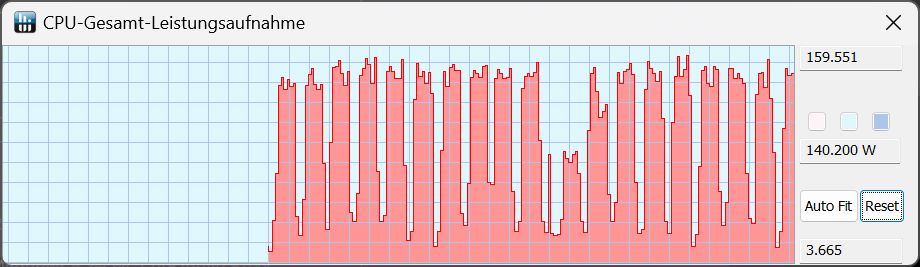
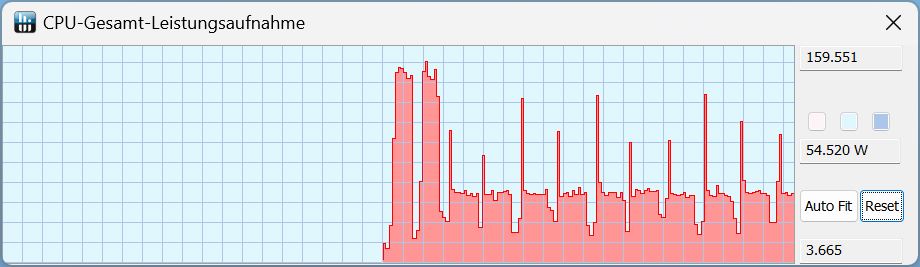
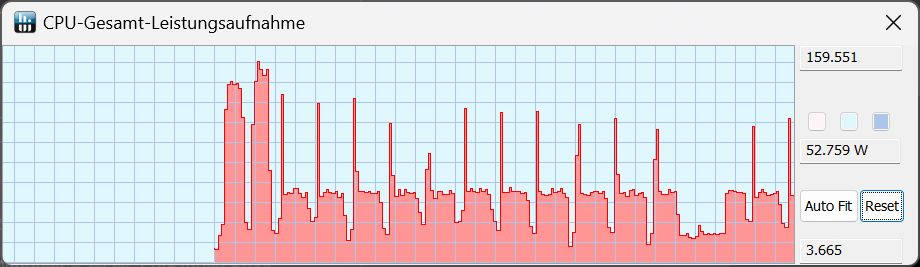
Using the modes performance, balanced and quiet, the laptop reached power consumption values of 159 watts at the beginning of a Cinebench run, resulting in the same score using all modes when measured a single time. During the further course, this TDP only remained constant using performance mode. In all other modes, the TDP sank to about 50 watts from the second run.
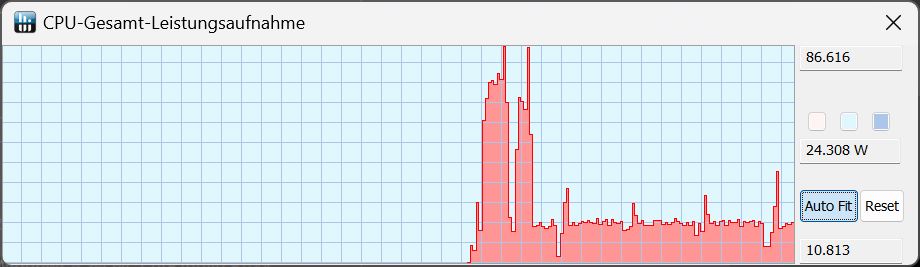
If you disconnect the laptop from the power, the system automatically switches to battery mode. It only achieved an output TDP of 86 watts during Cinebench R15 Multi, and after the first run, the TDP dropped to just 24 watts.
Cinebench R15 Multi continuous test
Cinebench R23: Multi Core | Single Core
Cinebench R20: CPU (Multi Core) | CPU (Single Core)
Cinebench R15: CPU Multi 64Bit | CPU Single 64Bit
Blender: v2.79 BMW27 CPU
7-Zip 18.03: 7z b 4 | 7z b 4 -mmt1
Geekbench 6.7: Multi-Core | Single-Core
Geekbench 5.5: Multi-Core | Single-Core
HWBOT x265 Benchmark v2.2: 4k Preset
LibreOffice : 20 Documents To PDF
R Benchmark 2.5: Overall mean
| CPU Performance rating | |
| MSI Raider GE68HX 13VF | |
| Average of class Gaming | |
| Alienware m16 R1 Intel | |
| Average Intel Core i7-13650HX | |
| Dell G16, i7-13650HX, RTX 4060 | |
| Lenovo Legion Slim 5 16APH8 -2! | |
| Lenovo LOQ 16IRH8 | |
| Dell G16 7620 -2! | |
| Cinebench R23 / Multi Core | |
| MSI Raider GE68HX 13VF | |
| Average of class Gaming (10488 - 40970, n=113, last 2 years) | |
| Alienware m16 R1 Intel | |
| Dell G16, i7-13650HX, RTX 4060 | |
| Average Intel Core i7-13650HX (18744 - 21006, n=6) | |
| Dell G16 7620 | |
| Lenovo Legion Slim 5 16APH8 | |
| Lenovo LOQ 16IRH8 | |
| Cinebench R23 / Single Core | |
| MSI Raider GE68HX 13VF | |
| Average of class Gaming (1166 - 2356, n=113, last 2 years) | |
| Alienware m16 R1 Intel | |
| Dell G16, i7-13650HX, RTX 4060 | |
| Lenovo LOQ 16IRH8 | |
| Average Intel Core i7-13650HX (1693 - 1903, n=6) | |
| Lenovo Legion Slim 5 16APH8 | |
| Dell G16 7620 | |
| Cinebench R20 / CPU (Multi Core) | |
| MSI Raider GE68HX 13VF | |
| Average of class Gaming (4029 - 16108, n=112, last 2 years) | |
| Alienware m16 R1 Intel | |
| Dell G16, i7-13650HX, RTX 4060 | |
| Average Intel Core i7-13650HX (7197 - 8021, n=5) | |
| Lenovo Legion Slim 5 16APH8 | |
| Dell G16 7620 | |
| Lenovo LOQ 16IRH8 | |
| Cinebench R20 / CPU (Single Core) | |
| MSI Raider GE68HX 13VF | |
| Average of class Gaming (442 - 895, n=112, last 2 years) | |
| Alienware m16 R1 Intel | |
| Dell G16, i7-13650HX, RTX 4060 | |
| Average Intel Core i7-13650HX (700 - 728, n=5) | |
| Lenovo LOQ 16IRH8 | |
| Lenovo Legion Slim 5 16APH8 | |
| Dell G16 7620 | |
| Cinebench R15 / CPU Multi 64Bit | |
| MSI Raider GE68HX 13VF | |
| Average of class Gaming (1578 - 6271, n=113, last 2 years) | |
| Alienware m16 R1 Intel | |
| Average Intel Core i7-13650HX (2864 - 3147, n=5) | |
| Dell G16, i7-13650HX, RTX 4060 | |
| Lenovo Legion Slim 5 16APH8 | |
| Dell G16 7620 | |
| Lenovo LOQ 16IRH8 | |
| Cinebench R15 / CPU Single 64Bit | |
| MSI Raider GE68HX 13VF | |
| Average of class Gaming (188.8 - 343, n=112, last 2 years) | |
| Lenovo Legion Slim 5 16APH8 | |
| Alienware m16 R1 Intel | |
| Dell G16, i7-13650HX, RTX 4060 | |
| Average Intel Core i7-13650HX (256 - 275, n=5) | |
| Lenovo LOQ 16IRH8 | |
| Dell G16 7620 | |
| Blender / v2.79 BMW27 CPU | |
| Lenovo LOQ 16IRH8 | |
| Lenovo Legion Slim 5 16APH8 | |
| Dell G16 7620 | |
| Average Intel Core i7-13650HX (158 - 226, n=5) | |
| Dell G16, i7-13650HX, RTX 4060 | |
| Alienware m16 R1 Intel | |
| Average of class Gaming (80 - 330, n=110, last 2 years) | |
| MSI Raider GE68HX 13VF | |
| 7-Zip 18.03 / 7z b 4 | |
| MSI Raider GE68HX 13VF | |
| Average of class Gaming (33491 - 148086, n=111, last 2 years) | |
| Alienware m16 R1 Intel | |
| Average Intel Core i7-13650HX (73927 - 80057, n=5) | |
| Dell G16, i7-13650HX, RTX 4060 | |
| Lenovo Legion Slim 5 16APH8 | |
| Dell G16 7620 | |
| Lenovo LOQ 16IRH8 | |
| 7-Zip 18.03 / 7z b 4 -mmt1 | |
| MSI Raider GE68HX 13VF | |
| Lenovo Legion Slim 5 16APH8 | |
| Alienware m16 R1 Intel | |
| Average of class Gaming (4199 - 7436, n=111, last 2 years) | |
| Average Intel Core i7-13650HX (5828 - 6125, n=5) | |
| Dell G16, i7-13650HX, RTX 4060 | |
| Lenovo LOQ 16IRH8 | |
| Dell G16 7620 | |
| Geekbench 6.7 / Multi-Core | |
| MSI Raider GE68HX 13VF | |
| Average of class Gaming (6625 - 22104, n=112, last 2 years) | |
| Alienware m16 R1 Intel | |
| Average Intel Core i7-13650HX (13554 - 14378, n=3) | |
| Dell G16, i7-13650HX, RTX 4060 | |
| Lenovo LOQ 16IRH8 | |
| Geekbench 6.7 / Single-Core | |
| MSI Raider GE68HX 13VF | |
| Average of class Gaming (1490 - 3259, n=112, last 2 years) | |
| Alienware m16 R1 Intel | |
| Lenovo LOQ 16IRH8 | |
| Dell G16, i7-13650HX, RTX 4060 | |
| Average Intel Core i7-13650HX (2505 - 2595, n=3) | |
| Geekbench 5.5 / Multi-Core | |
| MSI Raider GE68HX 13VF | |
| Average of class Gaming (6460 - 27010, n=111, last 2 years) | |
| Alienware m16 R1 Intel | |
| Average Intel Core i7-13650HX (12509 - 14778, n=5) | |
| Dell G16, i7-13650HX, RTX 4060 | |
| Lenovo LOQ 16IRH8 | |
| Dell G16 7620 | |
| Lenovo Legion Slim 5 16APH8 | |
| Geekbench 5.5 / Single-Core | |
| MSI Raider GE68HX 13VF | |
| Average of class Gaming (986 - 2474, n=111, last 2 years) | |
| Lenovo Legion Slim 5 16APH8 | |
| Dell G16, i7-13650HX, RTX 4060 | |
| Alienware m16 R1 Intel | |
| Average Intel Core i7-13650HX (1810 - 1866, n=5) | |
| Lenovo LOQ 16IRH8 | |
| Dell G16 7620 | |
| HWBOT x265 Benchmark v2.2 / 4k Preset | |
| MSI Raider GE68HX 13VF | |
| Average of class Gaming (11.5 - 44.3, n=111, last 2 years) | |
| Alienware m16 R1 Intel | |
| Lenovo Legion Slim 5 16APH8 | |
| Average Intel Core i7-13650HX (18.9 - 23.6, n=5) | |
| Dell G16, i7-13650HX, RTX 4060 | |
| Dell G16 7620 | |
| Lenovo LOQ 16IRH8 | |
| LibreOffice / 20 Documents To PDF | |
| Dell G16 7620 | |
| Dell G16, i7-13650HX, RTX 4060 | |
| Average of class Gaming (19 - 88.8, n=111, last 2 years) | |
| Average Intel Core i7-13650HX (38.9 - 58.8, n=5) | |
| Lenovo LOQ 16IRH8 | |
| Alienware m16 R1 Intel | |
| Lenovo Legion Slim 5 16APH8 | |
| MSI Raider GE68HX 13VF | |
| R Benchmark 2.5 / Overall mean | |
| Dell G16 7620 | |
| Lenovo LOQ 16IRH8 | |
| Alienware m16 R1 Intel | |
| Lenovo Legion Slim 5 16APH8 | |
| Average Intel Core i7-13650HX (0.4217 - 0.4461, n=6) | |
| Average of class Gaming (0.3439 - 0.759, n=112, last 2 years) | |
| Dell G16, i7-13650HX, RTX 4060 | |
| Dell G16, i7-13650HX, RTX 4060 | |
| MSI Raider GE68HX 13VF | |
* ... smaller is better
AIDA64: FP32 Ray-Trace | FPU Julia | CPU SHA3 | CPU Queen | FPU SinJulia | FPU Mandel | CPU AES | CPU ZLib | FP64 Ray-Trace | CPU PhotoWorxx
| Performance rating | |
| MSI Raider GE68HX 13VF | |
| Average of class Gaming | |
| Lenovo Legion Slim 5 16APH8 | |
| Alienware m16 R1 Intel | |
| Dell G16, i7-13650HX, RTX 4060 | |
| Average Intel Core i7-13650HX | |
| Dell G16 7620 | |
| Lenovo LOQ 16IRH8 | |
| AIDA64 / FP32 Ray-Trace | |
| Average of class Gaming (10227 - 85542, n=110, last 2 years) | |
| Lenovo Legion Slim 5 16APH8 | |
| MSI Raider GE68HX 13VF | |
| Alienware m16 R1 Intel | |
| Dell G16, i7-13650HX, RTX 4060 | |
| Average Intel Core i7-13650HX (13404 - 20012, n=5) | |
| Dell G16 7620 | |
| Lenovo LOQ 16IRH8 | |
| AIDA64 / FPU Julia | |
| MSI Raider GE68HX 13VF | |
| Average of class Gaming (51376 - 238426, n=110, last 2 years) | |
| Lenovo Legion Slim 5 16APH8 | |
| Alienware m16 R1 Intel | |
| Dell G16, i7-13650HX, RTX 4060 | |
| Average Intel Core i7-13650HX (68241 - 97317, n=5) | |
| Dell G16 7620 | |
| Lenovo LOQ 16IRH8 | |
| AIDA64 / CPU SHA3 | |
| MSI Raider GE68HX 13VF | |
| Average of class Gaming (2180 - 9817, n=110, last 2 years) | |
| Lenovo Legion Slim 5 16APH8 | |
| Alienware m16 R1 Intel | |
| Dell G16, i7-13650HX, RTX 4060 | |
| Average Intel Core i7-13650HX (3127 - 4487, n=5) | |
| Dell G16 7620 | |
| Lenovo LOQ 16IRH8 | |
| AIDA64 / CPU Queen | |
| MSI Raider GE68HX 13VF | |
| Lenovo Legion Slim 5 16APH8 | |
| Average of class Gaming (49785 - 173351, n=101, last 2 years) | |
| Alienware m16 R1 Intel | |
| Average Intel Core i7-13650HX (108627 - 110589, n=5) | |
| Dell G16, i7-13650HX, RTX 4060 | |
| Dell G16 7620 | |
| Lenovo LOQ 16IRH8 | |
| AIDA64 / FPU SinJulia | |
| MSI Raider GE68HX 13VF | |
| Lenovo Legion Slim 5 16APH8 | |
| Average of class Gaming (4424 - 33636, n=110, last 2 years) | |
| Alienware m16 R1 Intel | |
| Dell G16, i7-13650HX, RTX 4060 | |
| Average Intel Core i7-13650HX (9134 - 10887, n=5) | |
| Dell G16 7620 | |
| Lenovo LOQ 16IRH8 | |
| AIDA64 / FPU Mandel | |
| Average of class Gaming (25115 - 128721, n=110, last 2 years) | |
| MSI Raider GE68HX 13VF | |
| Lenovo Legion Slim 5 16APH8 | |
| Alienware m16 R1 Intel | |
| Dell G16, i7-13650HX, RTX 4060 | |
| Average Intel Core i7-13650HX (33391 - 48323, n=5) | |
| Dell G16 7620 | |
| Lenovo LOQ 16IRH8 | |
| AIDA64 / CPU AES | |
| Alienware m16 R1 Intel | |
| MSI Raider GE68HX 13VF | |
| Average of class Gaming (39258 - 247074, n=110, last 2 years) | |
| Dell G16, i7-13650HX, RTX 4060 | |
| Average Intel Core i7-13650HX (64436 - 85343, n=5) | |
| Dell G16 7620 | |
| Lenovo Legion Slim 5 16APH8 | |
| Lenovo LOQ 16IRH8 | |
| AIDA64 / CPU ZLib | |
| MSI Raider GE68HX 13VF | |
| Average of class Gaming (574 - 2531, n=110, last 2 years) | |
| Alienware m16 R1 Intel | |
| Dell G16, i7-13650HX, RTX 4060 | |
| Average Intel Core i7-13650HX (1136 - 1285, n=5) | |
| Lenovo Legion Slim 5 16APH8 | |
| Dell G16 7620 | |
| Lenovo LOQ 16IRH8 | |
| AIDA64 / FP64 Ray-Trace | |
| Average of class Gaming (5509 - 45446, n=110, last 2 years) | |
| Lenovo Legion Slim 5 16APH8 | |
| MSI Raider GE68HX 13VF | |
| Alienware m16 R1 Intel | |
| Dell G16, i7-13650HX, RTX 4060 | |
| Average Intel Core i7-13650HX (7270 - 10900, n=5) | |
| Dell G16 7620 | |
| Lenovo LOQ 16IRH8 | |
| AIDA64 / CPU PhotoWorxx | |
| MSI Raider GE68HX 13VF | |
| Average of class Gaming (12271 - 89891, n=110, last 2 years) | |
| Average Intel Core i7-13650HX (36170 - 43289, n=5) | |
| Dell G16, i7-13650HX, RTX 4060 | |
| Alienware m16 R1 Intel | |
| Dell G16 7620 | |
| Lenovo LOQ 16IRH8 | |
| Lenovo Legion Slim 5 16APH8 | |
System performance
The G16 did generally well during PCMark 10, but it did show some weaknesses in the Essentials sub-test. The same can be said for the Productivity test from CrossMark. Throughout all tests, our test model did manage to come slightly above all laptops in our database that feature the same CPU/GPU configuration, so these outliers aren't all too significant.

CrossMark: Overall | Productivity | Creativity | Responsiveness
WebXPRT 3: Overall
WebXPRT 4: Overall
Mozilla Kraken 1.1: Total
| PCMark 10 / Score | |
| Average of class Gaming (5828 - 11574, n=96, last 2 years) | |
| MSI Raider GE68HX 13VF | |
| Lenovo Legion Slim 5 16APH8 | |
| Dell G16, i7-13650HX, RTX 4060 | |
| Average Intel Core i7-13650HX, NVIDIA GeForce RTX 4060 Laptop GPU (6984 - 7613, n=3) | |
| Alienware m16 R1 Intel | |
| Dell G16 7620 | |
| Lenovo LOQ 16IRH8 | |
| PCMark 10 / Essentials | |
| MSI Raider GE68HX 13VF | |
| Lenovo Legion Slim 5 16APH8 | |
| Alienware m16 R1 Intel | |
| Average of class Gaming (8810 - 12600, n=100, last 2 years) | |
| Average Intel Core i7-13650HX, NVIDIA GeForce RTX 4060 Laptop GPU (9532 - 11151, n=3) | |
| Dell G16 7620 | |
| Lenovo LOQ 16IRH8 | |
| Dell G16, i7-13650HX, RTX 4060 | |
| PCMark 10 / Productivity | |
| Average of class Gaming (6845 - 18766, n=98, last 2 years) | |
| Lenovo Legion Slim 5 16APH8 | |
| Average Intel Core i7-13650HX, NVIDIA GeForce RTX 4060 Laptop GPU (9961 - 10204, n=3) | |
| Dell G16, i7-13650HX, RTX 4060 | |
| MSI Raider GE68HX 13VF | |
| Alienware m16 R1 Intel | |
| Dell G16 7620 | |
| Lenovo LOQ 16IRH8 | |
| PCMark 10 / Digital Content Creation | |
| Average of class Gaming (7602 - 19657, n=98, last 2 years) | |
| MSI Raider GE68HX 13VF | |
| Lenovo Legion Slim 5 16APH8 | |
| Dell G16, i7-13650HX, RTX 4060 | |
| Dell G16 7620 | |
| Average Intel Core i7-13650HX, NVIDIA GeForce RTX 4060 Laptop GPU (8323 - 11686, n=3) | |
| Alienware m16 R1 Intel | |
| Lenovo LOQ 16IRH8 | |
| CrossMark / Overall | |
| Alienware m16 R1 Intel | |
| Average of class Gaming (1366 - 2409, n=98, last 2 years) | |
| MSI Raider GE68HX 13VF | |
| Lenovo LOQ 16IRH8 | |
| Average Intel Core i7-13650HX, NVIDIA GeForce RTX 4060 Laptop GPU (1839 - 1951, n=3) | |
| Dell G16, i7-13650HX, RTX 4060 | |
| Lenovo Legion Slim 5 16APH8 | |
| Dell G16 7620 | |
| CrossMark / Productivity | |
| Alienware m16 R1 Intel | |
| Lenovo LOQ 16IRH8 | |
| Average of class Gaming (1386 - 2254, n=98, last 2 years) | |
| MSI Raider GE68HX 13VF | |
| Average Intel Core i7-13650HX, NVIDIA GeForce RTX 4060 Laptop GPU (1730 - 1864, n=3) | |
| Lenovo Legion Slim 5 16APH8 | |
| Dell G16, i7-13650HX, RTX 4060 | |
| Dell G16 7620 | |
| CrossMark / Creativity | |
| MSI Raider GE68HX 13VF | |
| Alienware m16 R1 Intel | |
| Average of class Gaming (1343 - 2729, n=98, last 2 years) | |
| Average Intel Core i7-13650HX, NVIDIA GeForce RTX 4060 Laptop GPU (2020 - 2063, n=3) | |
| Lenovo LOQ 16IRH8 | |
| Dell G16, i7-13650HX, RTX 4060 | |
| Lenovo Legion Slim 5 16APH8 | |
| Dell G16 7620 | |
| CrossMark / Responsiveness | |
| Alienware m16 R1 Intel | |
| Lenovo LOQ 16IRH8 | |
| Average Intel Core i7-13650HX, NVIDIA GeForce RTX 4060 Laptop GPU (1544 - 1907, n=3) | |
| Average of class Gaming (1226 - 2334, n=98, last 2 years) | |
| Dell G16, i7-13650HX, RTX 4060 | |
| MSI Raider GE68HX 13VF | |
| Dell G16 7620 | |
| Lenovo Legion Slim 5 16APH8 | |
| WebXPRT 3 / Overall | |
| MSI Raider GE68HX 13VF | |
| Lenovo Legion Slim 5 16APH8 | |
| Lenovo LOQ 16IRH8 | |
| Lenovo LOQ 16IRH8 | |
| Average of class Gaming (242 - 532, n=101, last 2 years) | |
| Alienware m16 R1 Intel | |
| Average Intel Core i7-13650HX, NVIDIA GeForce RTX 4060 Laptop GPU (268 - 302, n=3) | |
| Dell G16 7620 | |
| Dell G16, i7-13650HX, RTX 4060 | |
| WebXPRT 4 / Overall | |
| MSI Raider GE68HX 13VF | |
| Average of class Gaming (176.4 - 354, n=101, last 2 years) | |
| Alienware m16 R1 Intel | |
| Average Intel Core i7-13650HX, NVIDIA GeForce RTX 4060 Laptop GPU (260 - 276, n=2) | |
| Lenovo Legion Slim 5 16APH8 | |
| Dell G16 7620 | |
| Mozilla Kraken 1.1 / Total | |
| Dell G16 7620 | |
| Average Intel Core i7-13650HX, NVIDIA GeForce RTX 4060 Laptop GPU (507 - 511, n=3) | |
| Lenovo LOQ 16IRH8 | |
| Lenovo LOQ 16IRH8 | |
| Dell G16, i7-13650HX, RTX 4060 | |
| Alienware m16 R1 Intel | |
| Lenovo Legion Slim 5 16APH8 | |
| Average of class Gaming (391 - 590, n=106, last 2 years) | |
| MSI Raider GE68HX 13VF | |
* ... smaller is better
| PCMark 10 Score | 7449 points | |
Help | ||
| AIDA64 / Memory Copy | |
| MSI Raider GE68HX 13VF | |
| Average of class Gaming (21750 - 129946, n=110, last 2 years) | |
| Lenovo Legion Slim 5 16APH8 | |
| Average Intel Core i7-13650HX (59266 - 66372, n=5) | |
| Dell G16, i7-13650HX, RTX 4060 | |
| Alienware m16 R1 Intel | |
| Dell G16 7620 | |
| Lenovo LOQ 16IRH8 | |
| AIDA64 / Memory Read | |
| MSI Raider GE68HX 13VF | |
| Average of class Gaming (22956 - 118858, n=110, last 2 years) | |
| Average Intel Core i7-13650HX (67305 - 71022, n=5) | |
| Alienware m16 R1 Intel | |
| Dell G16, i7-13650HX, RTX 4060 | |
| Dell G16 7620 | |
| Lenovo LOQ 16IRH8 | |
| Lenovo Legion Slim 5 16APH8 | |
| AIDA64 / Memory Write | |
| Lenovo Legion Slim 5 16APH8 | |
| MSI Raider GE68HX 13VF | |
| Average of class Gaming (22297 - 135096, n=110, last 2 years) | |
| Average Intel Core i7-13650HX (58028 - 68225, n=5) | |
| Alienware m16 R1 Intel | |
| Dell G16, i7-13650HX, RTX 4060 | |
| Dell G16 7620 | |
| Lenovo LOQ 16IRH8 | |
| AIDA64 / Memory Latency | |
| Lenovo LOQ 16IRH8 | |
| Average of class Gaming (75.3 - 259, n=110, last 2 years) | |
| Dell G16 7620 | |
| Lenovo Legion Slim 5 16APH8 | |
| Dell G16, i7-13650HX, RTX 4060 | |
| Average Intel Core i7-13650HX (83.7 - 90.8, n=5) | |
| Alienware m16 R1 Intel | |
| MSI Raider GE68HX 13VF | |
* ... smaller is better
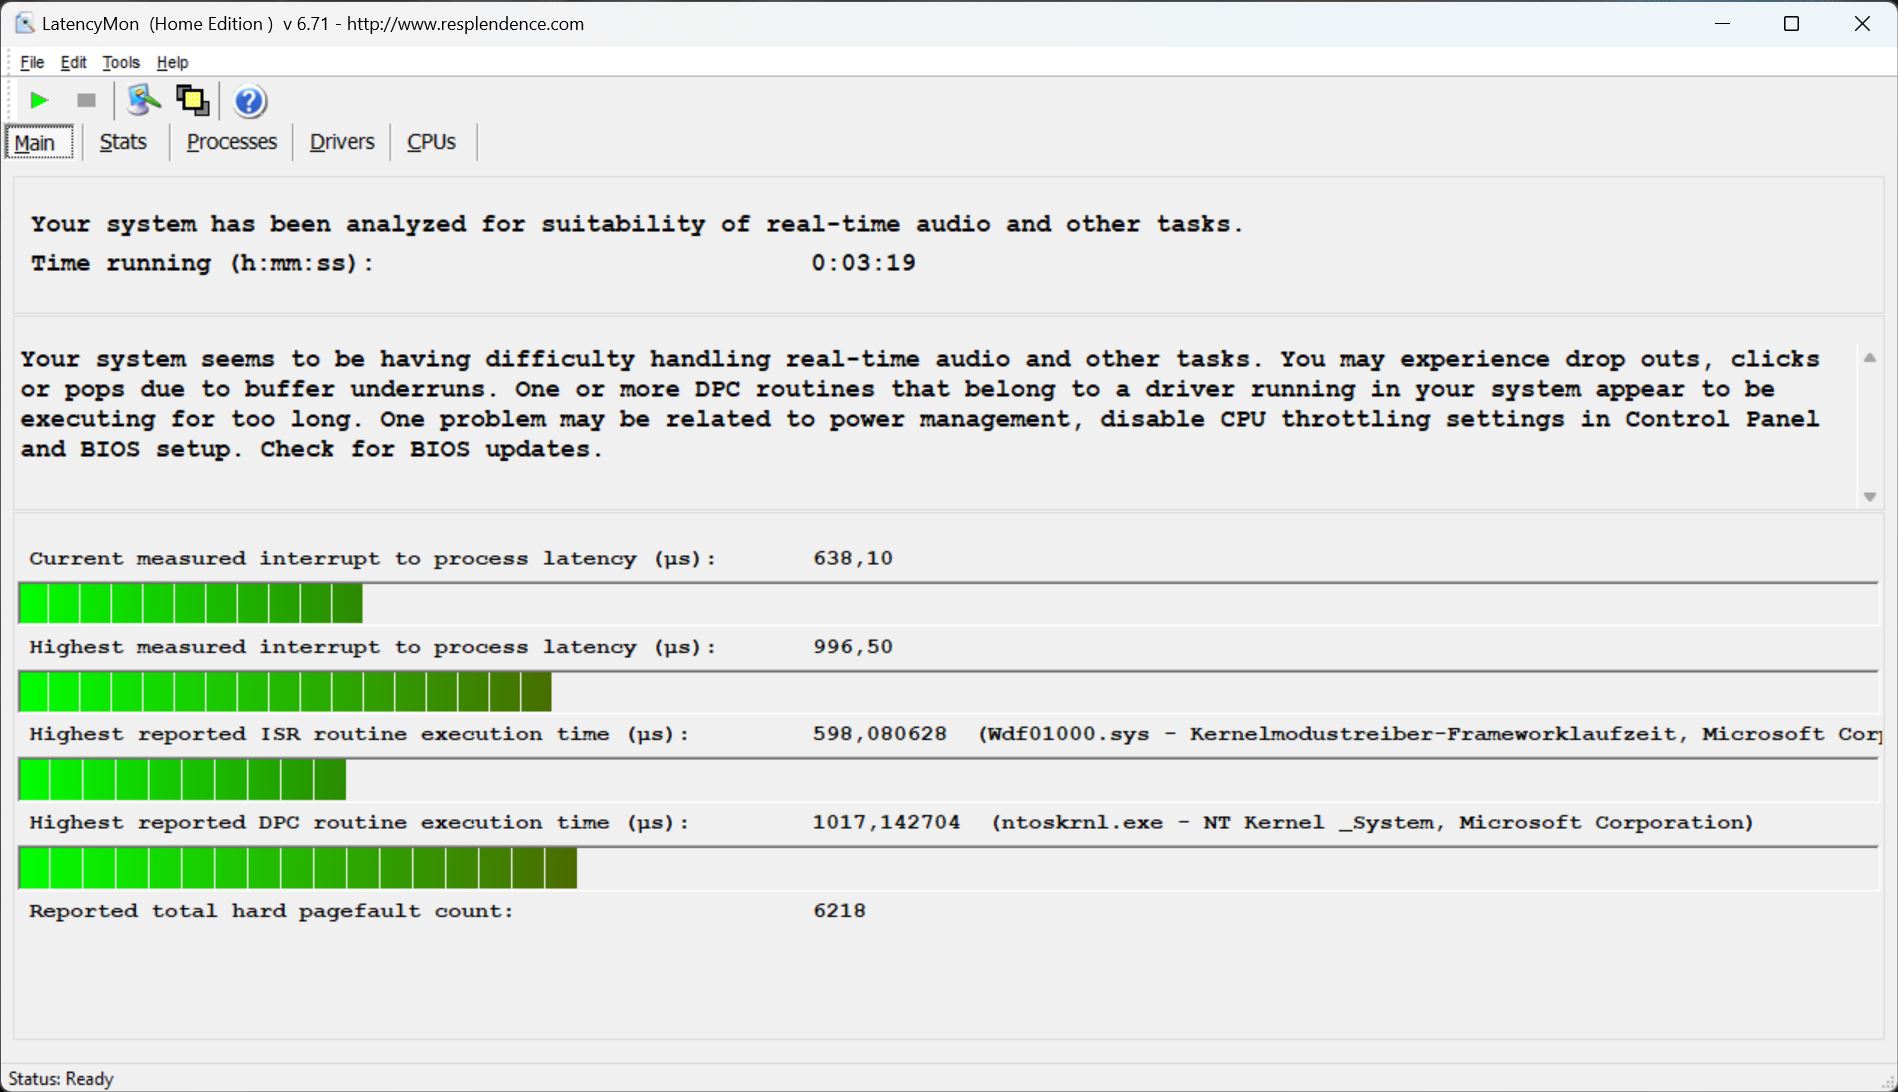
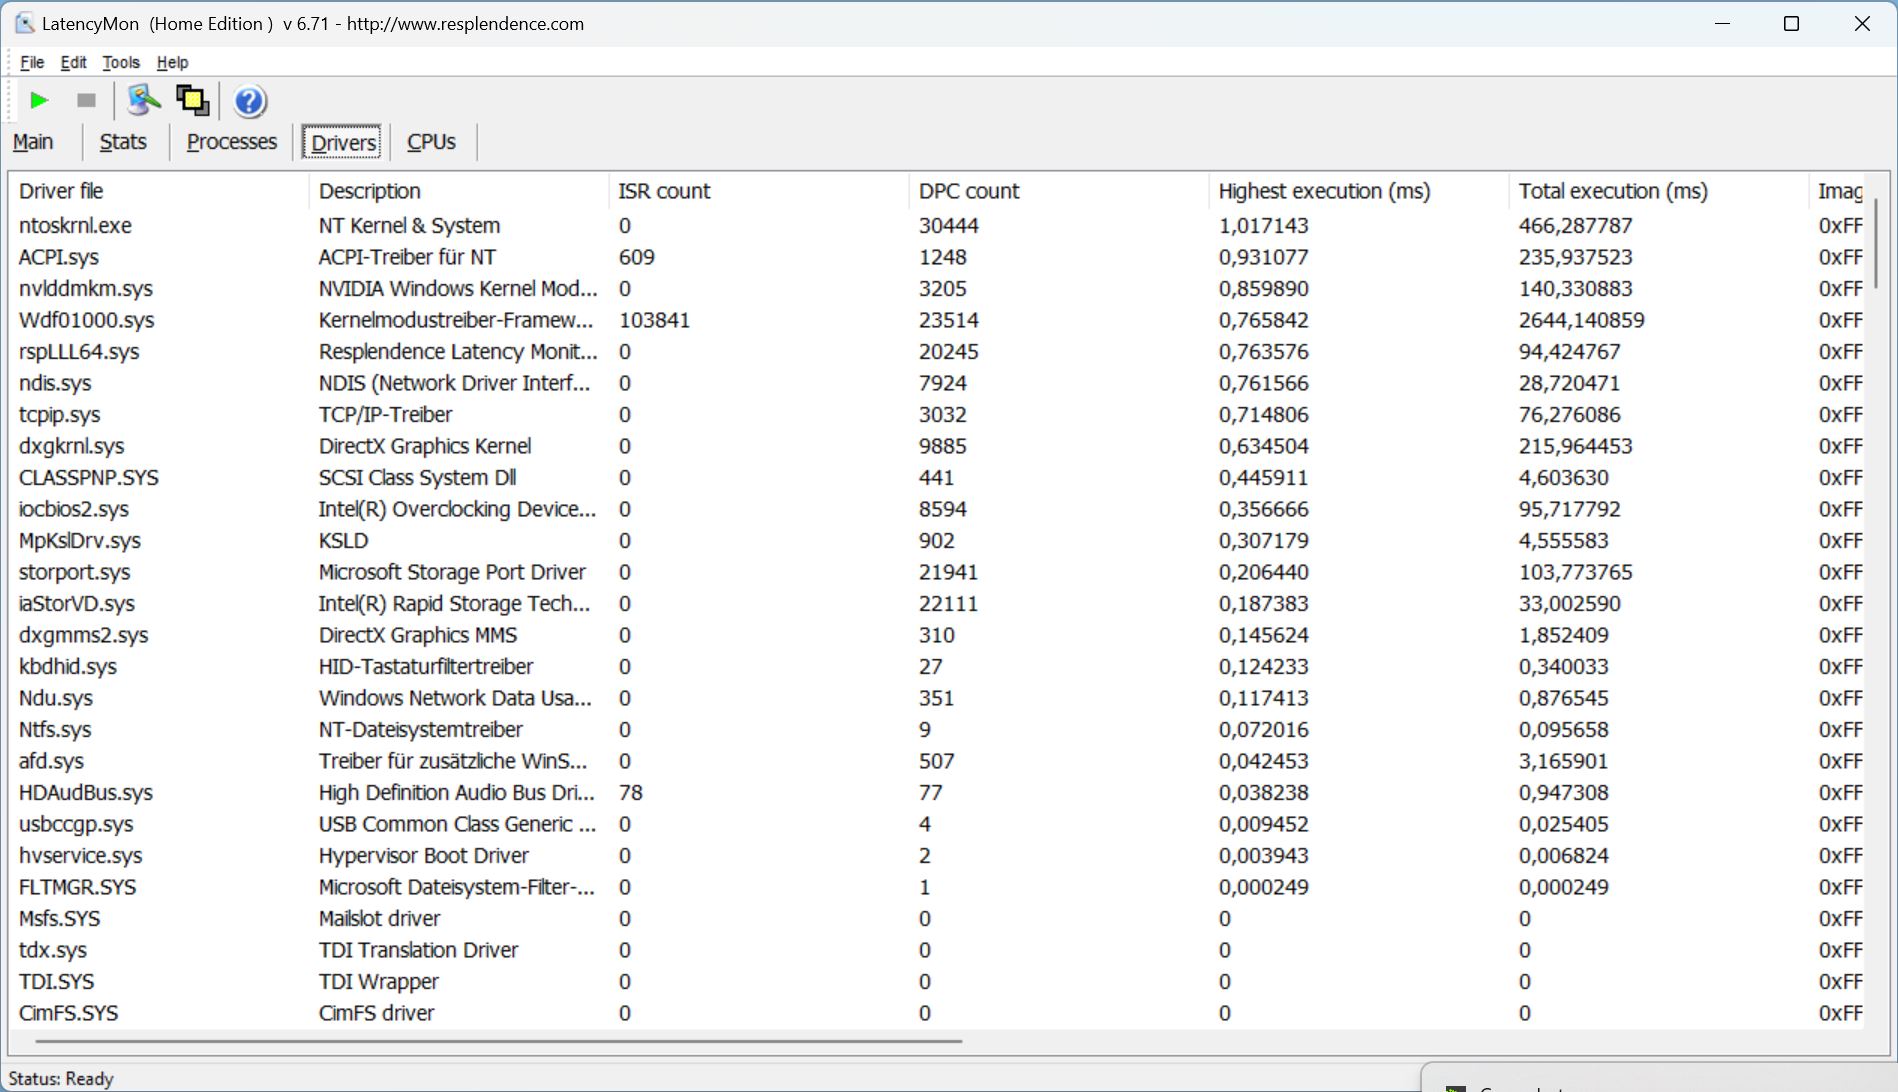
DPC latency
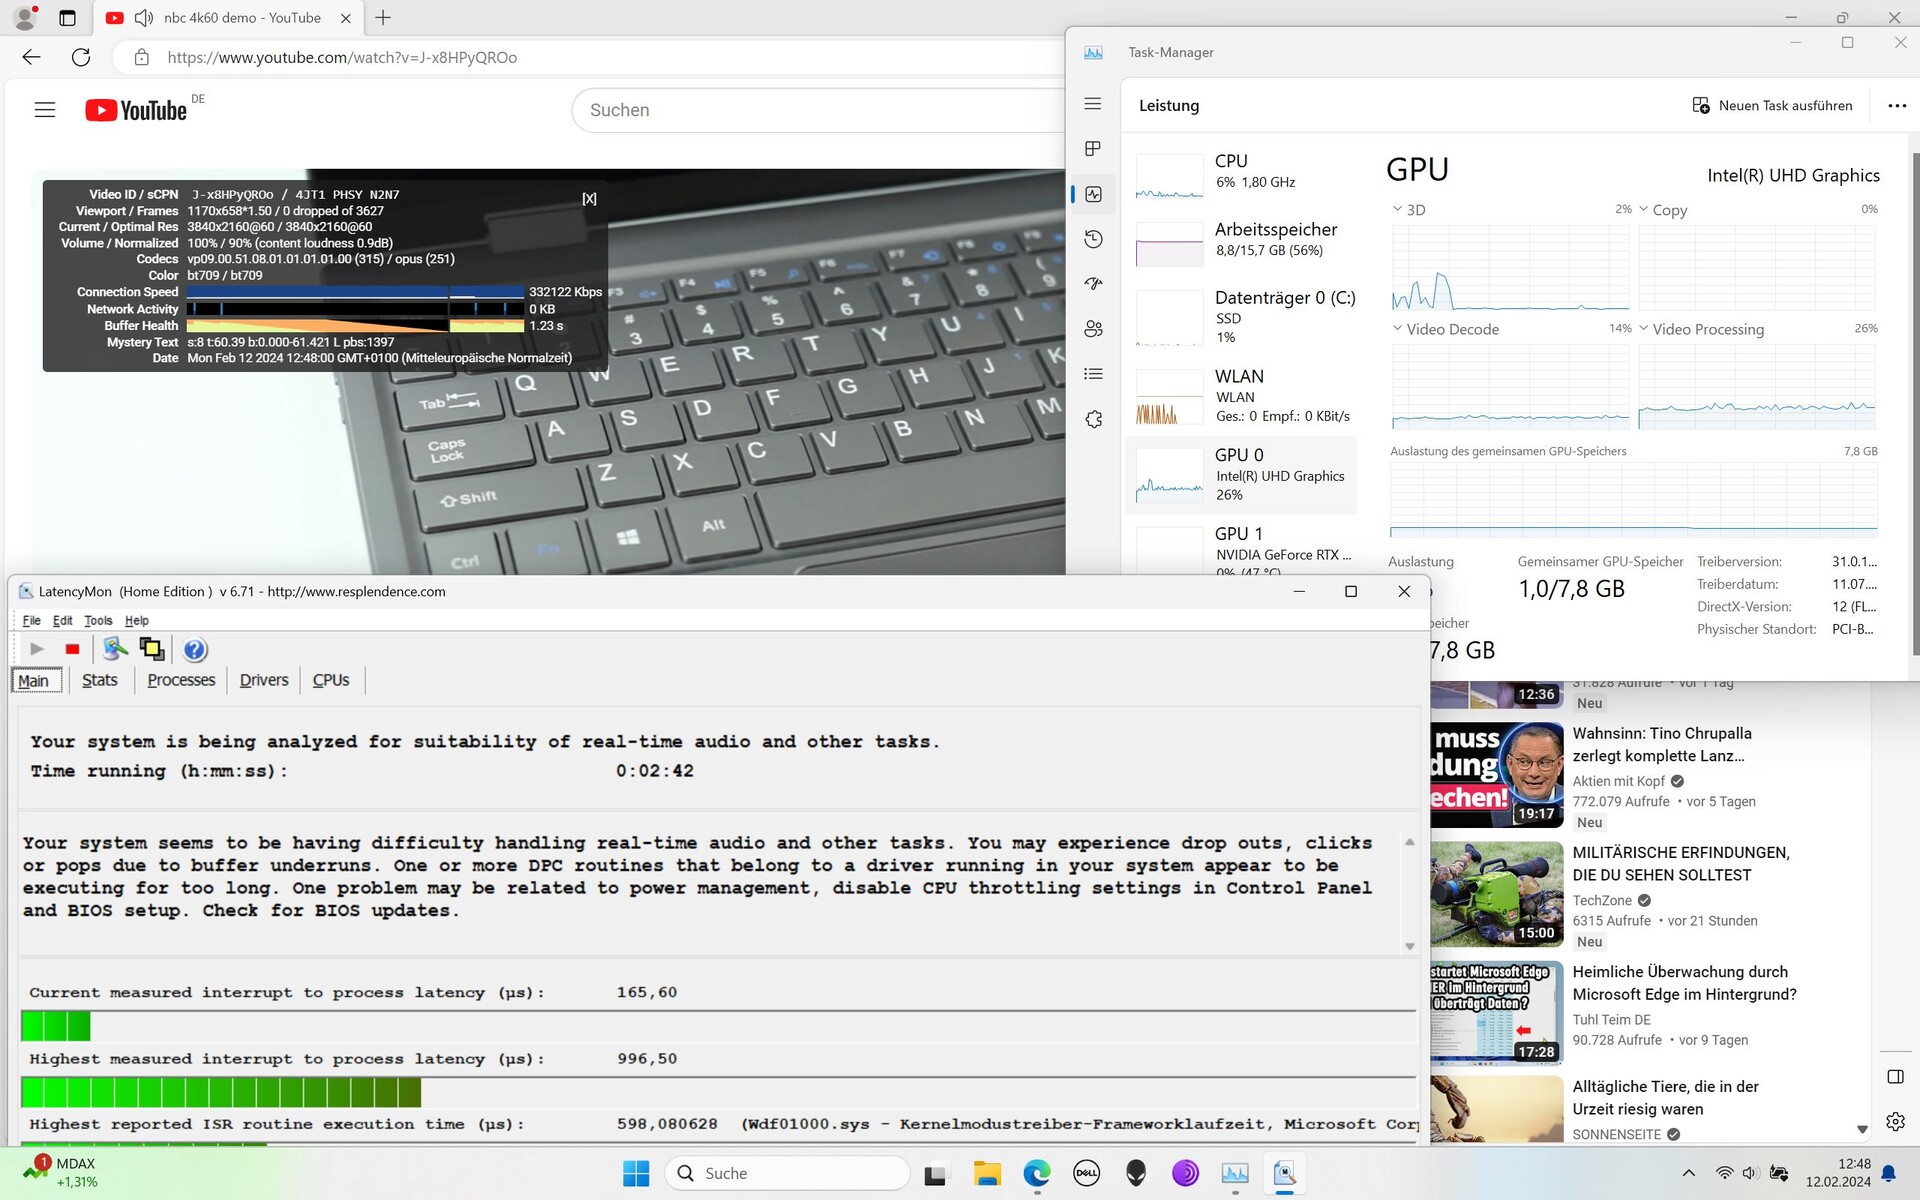
When opening our website, the laptop showed some slight latencies, but the software LatencyMon didn't flag these as critical. This didn't change when opening multiple tabs. Its latencies rose ever so slightly when playing our 4K/60-fps YouTube video, leading our measurement tool to indicate some problems. In comparison, however, these latencies are quite low and the test video was played without any dropped frames.
| DPC Latencies / LatencyMon - interrupt to process latency (max), Web, Youtube, Prime95 | |
| Alienware m16 R1 Intel | |
| MSI Raider GE68HX 13VF | |
| Lenovo LOQ 16IRH8 | |
| Lenovo Legion Slim 5 16APH8 | |
| Dell G16, i7-13650HX, RTX 4060 | |
| Dell G16 7620 | |
* ... smaller is better
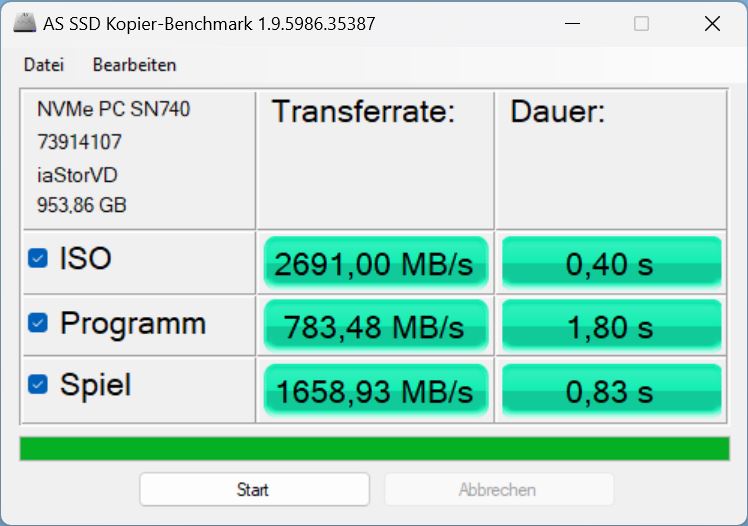
Storage devices
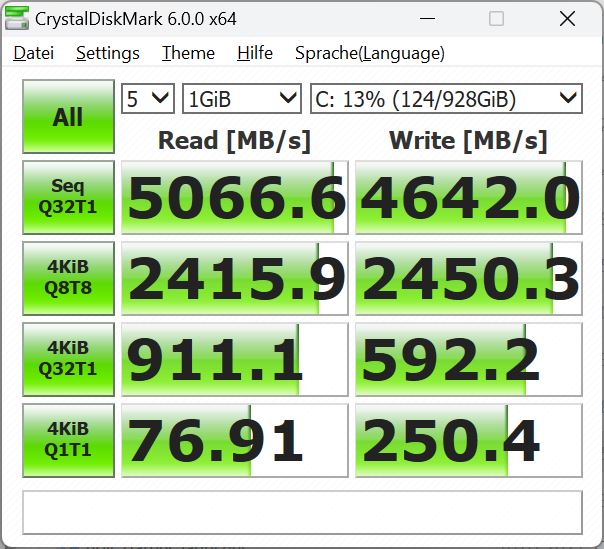
Dell has installed an SN740 from Western Digital featuring the small M.2 2230 form factor. A second, larger M.2-2280 slot is also free. The PCIe 4 SSD occupies position 142 in our best SSD list. Its performance is actually better than that of the SSDs in the MSI Raider or the Lenovo LOQ 16. In contrast to these and the other competitors, however, the storage medium in the G16 is thermally throttled after a very short time.
Its transfer rates then drop by more than half. Incidentally, its predecessor had a faster model installed—even if it was also affected by throttling problems. However, these began much later.


* ... smaller is better
Reading continuous performance: DiskSpd Read Loop, Queue Depth 8
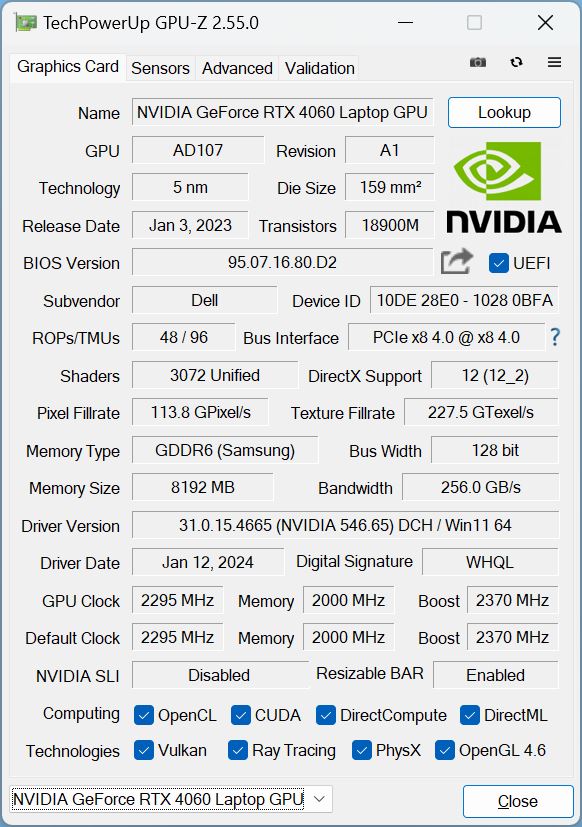
Graphics card
Dell has given the G16 an RTX 4060 at 140 watts. Whisper Mode, Max-Q, Dynamic Boost and even Advanced Optimus are supported. However, the latter gets annoying quite regularly, as the graphics-switching process takes a good few seconds during every 3D application (booting and closing), during which the screen freezes.
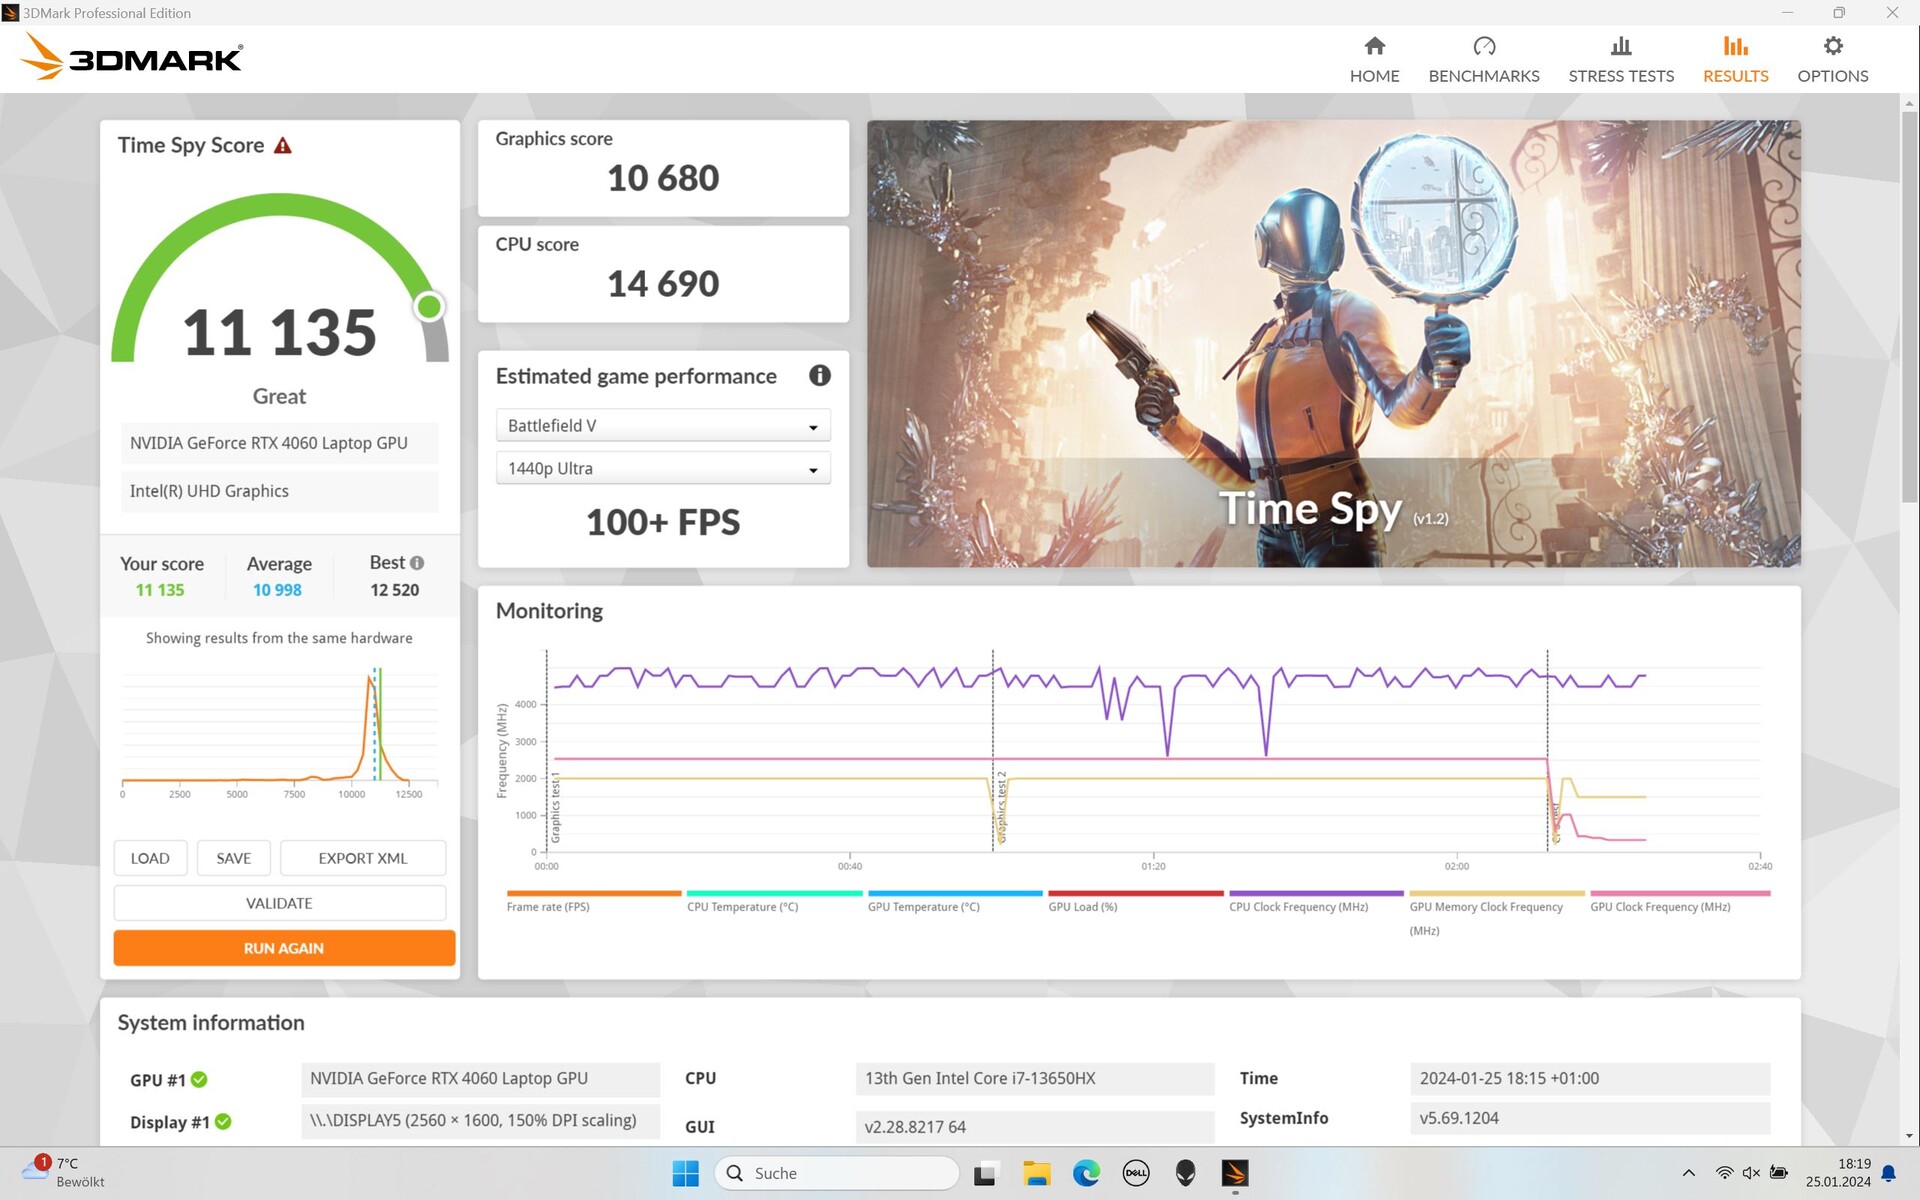
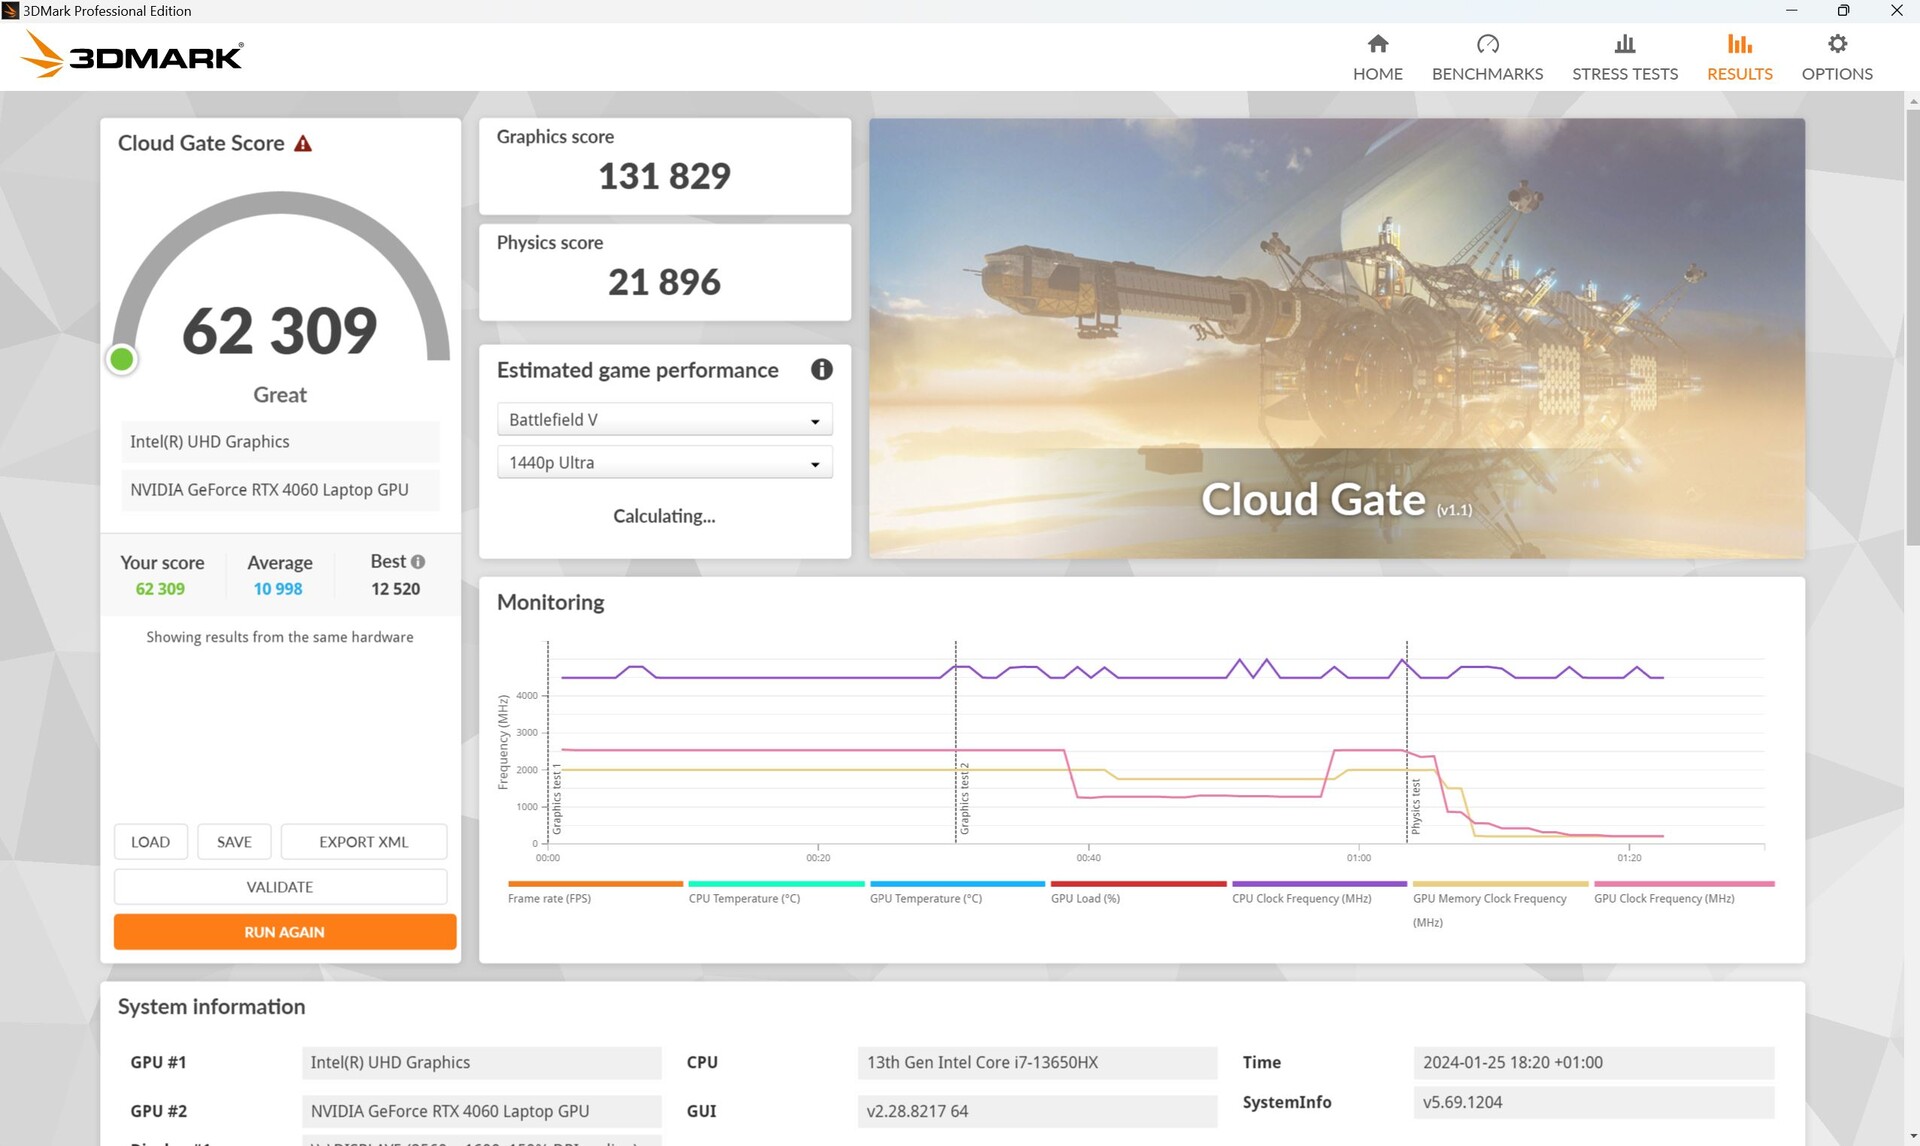
Still, its performance during the synthetic 3DMarks was as we expected, if not slightly better. Its lead over the laptop's predecessor with the RTX 3060 and the i7-12700H is around 22 %.
Disconnected from the power, its 3D performance dropped less drastically than expected. In another Fire Strike run, we measured a drop of around 20 %.


| 3DMark 11 Performance | 31722 points | |
| 3DMark Cloud Gate Standard Score | 62309 points | |
| 3DMark Fire Strike Score | 24764 points | |
| 3DMark Time Spy Score | 11135 points | |
Help | ||
* ... smaller is better
Gaming performance
When we switched on the Nvidia-GPU-only mode for our gaming benchmarks via the control panel, we noticed that certain settings (e.g. Witcher 3 Full HD Ultra, Strange Brigade QHD) resulted in significantly lower frame rates than in Optimus or automatic mode. This is rather unusual and could lead to some frustration.
Otherwise, we can't complain about the laptop's gaming performance. In comparison, our G16 came five per cent behind the MSI Raider with an i9-13950HX and an RTX 4060, but the Alienware and Lenovo LOQ trailed just behind.
Ultimately, all current games can be played in FHD using Ultra settings at over 60fps. Using the native 1,600p resolution, you often won't be able to achieve anything over 60fps, but the games still run smoothly at over 40 fps.
| Performance rating - Percent | |
| Average of class Gaming | |
| MSI Raider GE68HX 13VF -1! | |
| Dell G16, i7-13650HX, RTX 4060 | |
| Lenovo LOQ 16IRH8 | |
| Alienware m16 R1 Intel -1! | |
| Dell G16 7620 | |
| Lenovo Legion Slim 5 16APH8 | |
| The Witcher 3 - 1920x1080 Ultra Graphics & Postprocessing (HBAO+) | |
| Average of class Gaming (95 - 240, n=8, last 2 years) | |
| Dell G16, i7-13650HX, RTX 4060 | |
| Alienware m16 R1 Intel | |
| Lenovo LOQ 16IRH8 | |
| MSI Raider GE68HX 13VF | |
| Lenovo Legion Slim 5 16APH8 | |
| Dell G16 7620 | |
| GTA V - 1920x1080 Highest AA:4xMSAA + FX AF:16x | |
| Average of class Gaming (48.3 - 186.9, n=103, last 2 years) | |
| Dell G16, i7-13650HX, RTX 4060 | |
| Lenovo LOQ 16IRH8 | |
| Dell G16 7620 | |
| Lenovo Legion Slim 5 16APH8 | |
| Final Fantasy XV Benchmark - 1920x1080 High Quality | |
| Average of class Gaming (41 - 215, n=104, last 2 years) | |
| Alienware m16 R1 Intel | |
| Dell G16, i7-13650HX, RTX 4060 | |
| MSI Raider GE68HX 13VF | |
| Lenovo LOQ 16IRH8 | |
| Lenovo Legion Slim 5 16APH8 | |
| Dell G16 7620 | |
| Strange Brigade - 1920x1080 ultra AA:ultra AF:16 | |
| Average of class Gaming (76.3 - 456, n=94, last 2 years) | |
| Dell G16, i7-13650HX, RTX 4060 | |
| MSI Raider GE68HX 13VF | |
| Alienware m16 R1 Intel | |
| Lenovo LOQ 16IRH8 | |
| Lenovo Legion Slim 5 16APH8 | |
| Dell G16 7620 | |
| Dota 2 Reborn - 1920x1080 ultra (3/3) best looking | |
| MSI Raider GE68HX 13VF | |
| Alienware m16 R1 Intel | |
| Lenovo LOQ 16IRH8 | |
| Average of class Gaming (84.8 - 248, n=113, last 2 years) | |
| Dell G16, i7-13650HX, RTX 4060 | |
| Dell G16 7620 | |
| Lenovo Legion Slim 5 16APH8 | |
| X-Plane 11.11 - 1920x1080 high (fps_test=3) | |
| MSI Raider GE68HX 13VF | |
| Alienware m16 R1 Intel | |
| Dell G16, i7-13650HX, RTX 4060 | |
| Lenovo LOQ 16IRH8 | |
| Dell G16 7620 | |
| Average of class Gaming (52.1 - 143.5, n=116, last 2 years) | |
| Lenovo Legion Slim 5 16APH8 | |
In The Witcher 3 Ultra, our G16 delivered its best performance and it surpassed the competition's frame rates from slightly (Alienware) to considerably (Legion Slim 5, GPU automatic).
The following table lists the Witcher 3 (FHD Ultra) fps values as well as our noise emission and consumption measurements dependent on the three performance modes.
| Performance mode/value | fps beginning | fps average | noise emissions | consumption |
|---|---|---|---|---|
| Performance | 108 | 105.6 | 47.89 dB | 185 watts |
| Balanced | 100 | 97.6 | 39 - 43 dB | 178 watts |
| Quiet | 99 | 97.6 | 35.52 dB | 168 watts |
Witcher 3 FPS diagram
| low | med. | high | ultra | QHD | 4K | |
|---|---|---|---|---|---|---|
| GTA V (2015) | 185.8 | 183.2 | 176.2 | 117.4 | 50.8 | |
| The Witcher 3 (2015) | 340.4 | 193.1 | 110 | 108 | 42.4 | |
| Dota 2 Reborn (2015) | 177 | 168.7 | 160.8 | 149 | 126.2 | |
| Final Fantasy XV Benchmark (2018) | 219 | 150.1 | 103.7 | 75.9 | ||
| X-Plane 11.11 (2018) | 160.4 | 144.6 | 114.9 | 119.6 | ||
| Far Cry 5 (2018) | 176 | 148 | 141 | 135 | 105 | |
| Strange Brigade (2018) | 478 | 291 | 228 | 194.9 | 129 | |
| Cyberpunk 2077 (2023) | 131.1 | 75.6 | 69.8 | 45.6 |
Emissions - Quite quiet even when gaming
Noise emissions
In idle mode, the fans are off when using all modes except performance. In 3DMark06, our average load scenario, the laptop has the same noise emissions as in idle mode (performance mode, approx. 28 dB), so the fans don't spin any faster.
Even when gaming and under full load, the Dell G16 remains noticeably quieter than the competition at well below 50 dB, which seems to be where its massive cooling system pays off.
Noise level
| Idle |
| 23 / 23 / 27.96 dB(A) |
| Load |
| 27.96 / 47.89 dB(A) |
 | ||
30 dB silent 40 dB(A) audible 50 dB(A) loud |
||
min: | ||
| Dell G16, i7-13650HX, RTX 4060 GeForce RTX 4060 Laptop GPU, i7-13650HX, WD PC SN740 SDDPNQD-1T00 | Dell G16 7620 GeForce RTX 3060 Laptop GPU, i7-12700H, WDC PC SN810 512GB | MSI Raider GE68HX 13VF GeForce RTX 4060 Laptop GPU, i9-13950HX, Samsung PM9B1 1024GB MZVL41T0HBLB | Lenovo Legion Slim 5 16APH8 GeForce RTX 4060 Laptop GPU, R7 7840HS, SK hynix PC801 HFS512GEJ9X115N | Alienware m16 R1 Intel GeForce RTX 4060 Laptop GPU, i7-13700HX, Kioxia KXG70ZNV512G | Lenovo LOQ 16IRH8 GeForce RTX 4060 Laptop GPU, i7-13620H, Solidigm SSDPFINW512GZL | |
|---|---|---|---|---|---|---|
| Noise | -10% | -26% | -6% | -19% | -16% | |
| off / environment * (dB) | 23 | 23.2 -1% | 23.3 -1% | 22.9 -0% | 25 -9% | 23 -0% |
| Idle Minimum * (dB) | 23 | 28.3 -23% | 25 -9% | 23.1 -0% | 25 -9% | 23 -0% |
| Idle Average * (dB) | 23 | 28.8 -25% | 31.3 -36% | 23.1 -0% | 26 -13% | 23 -0% |
| Idle Maximum * (dB) | 27.96 | 28.9 -3% | 37.5 -34% | 27.7 1% | 27 3% | 27.66 1% |
| Load Average * (dB) | 27.96 | 32.4 -16% | 44 -57% | 33.3 -19% | 52 -86% | 53.62 -92% |
| Witcher 3 ultra * (dB) | 47.89 | 48.3 -1% | 57 -19% | 54 -13% | 51 -6% | 53.5 -12% |
| Load Maximum * (dB) | 47.89 | 48.1 -0% | 60.1 -25% | 54 -13% | 53 -11% | 53.5 -12% |
* ... smaller is better
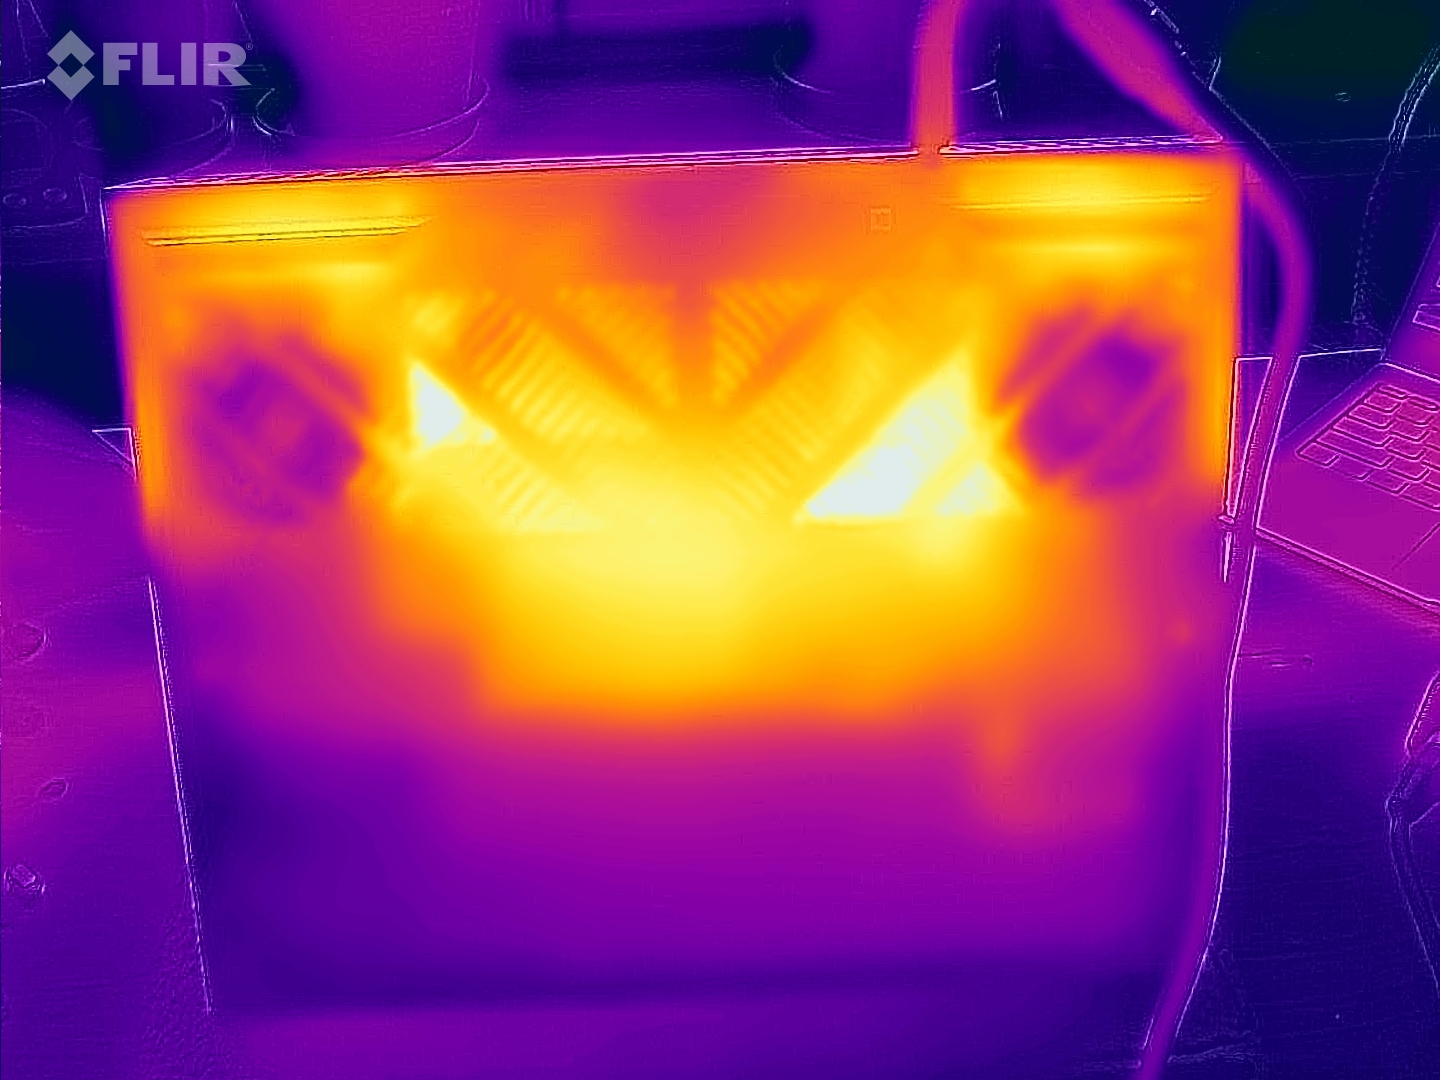
Temperature
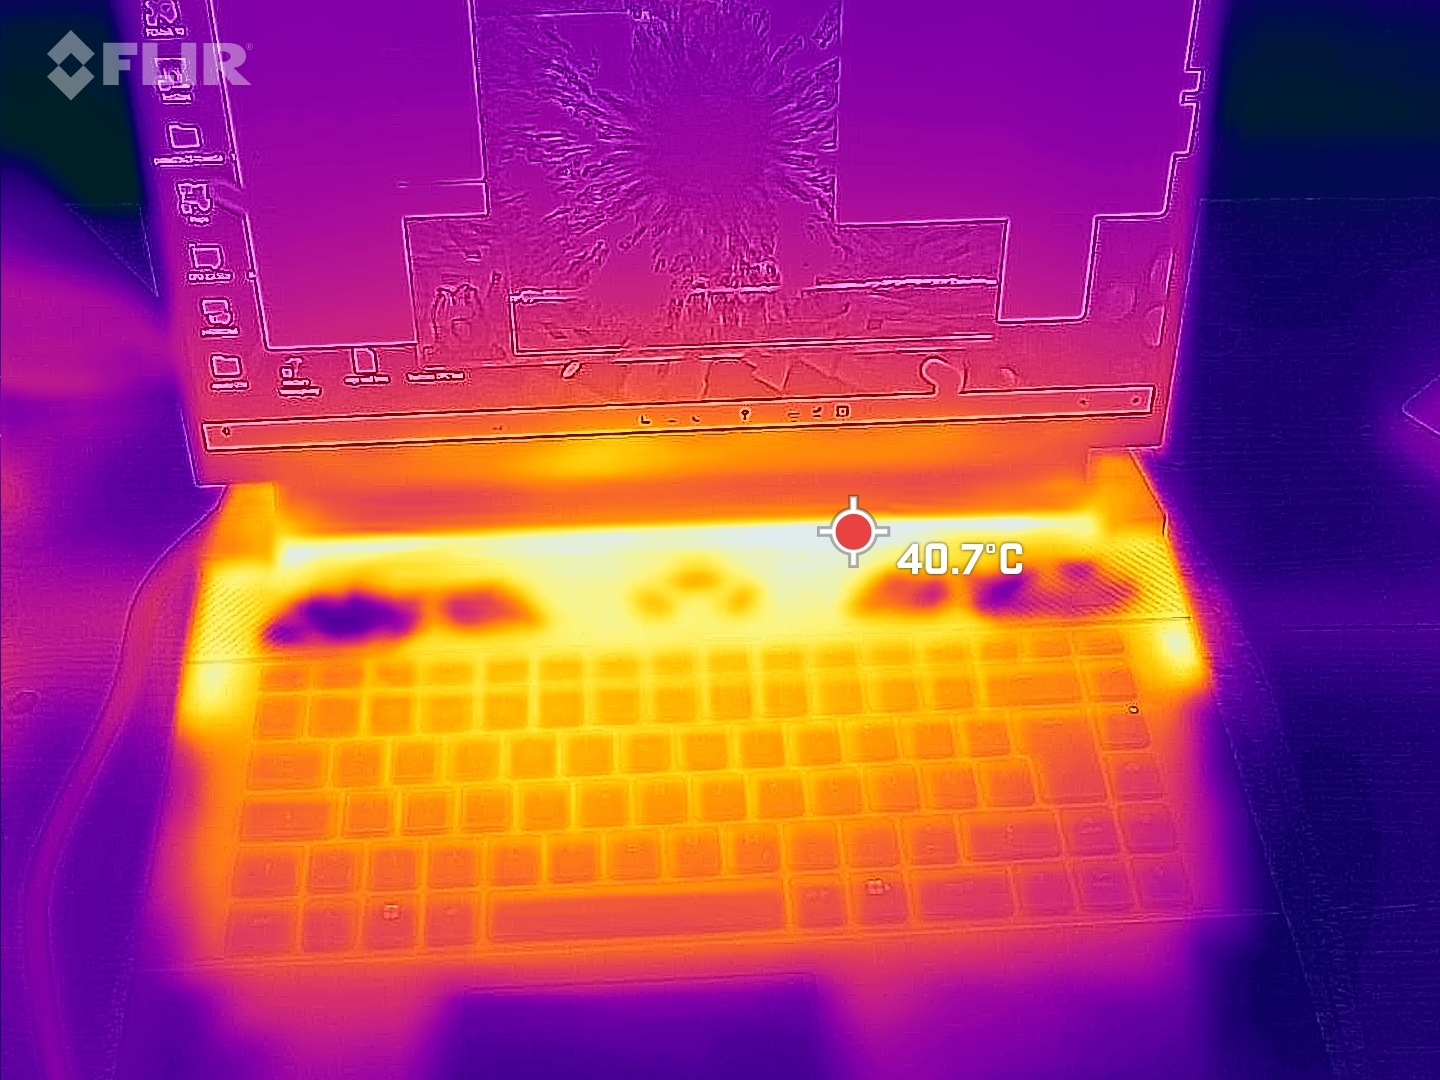
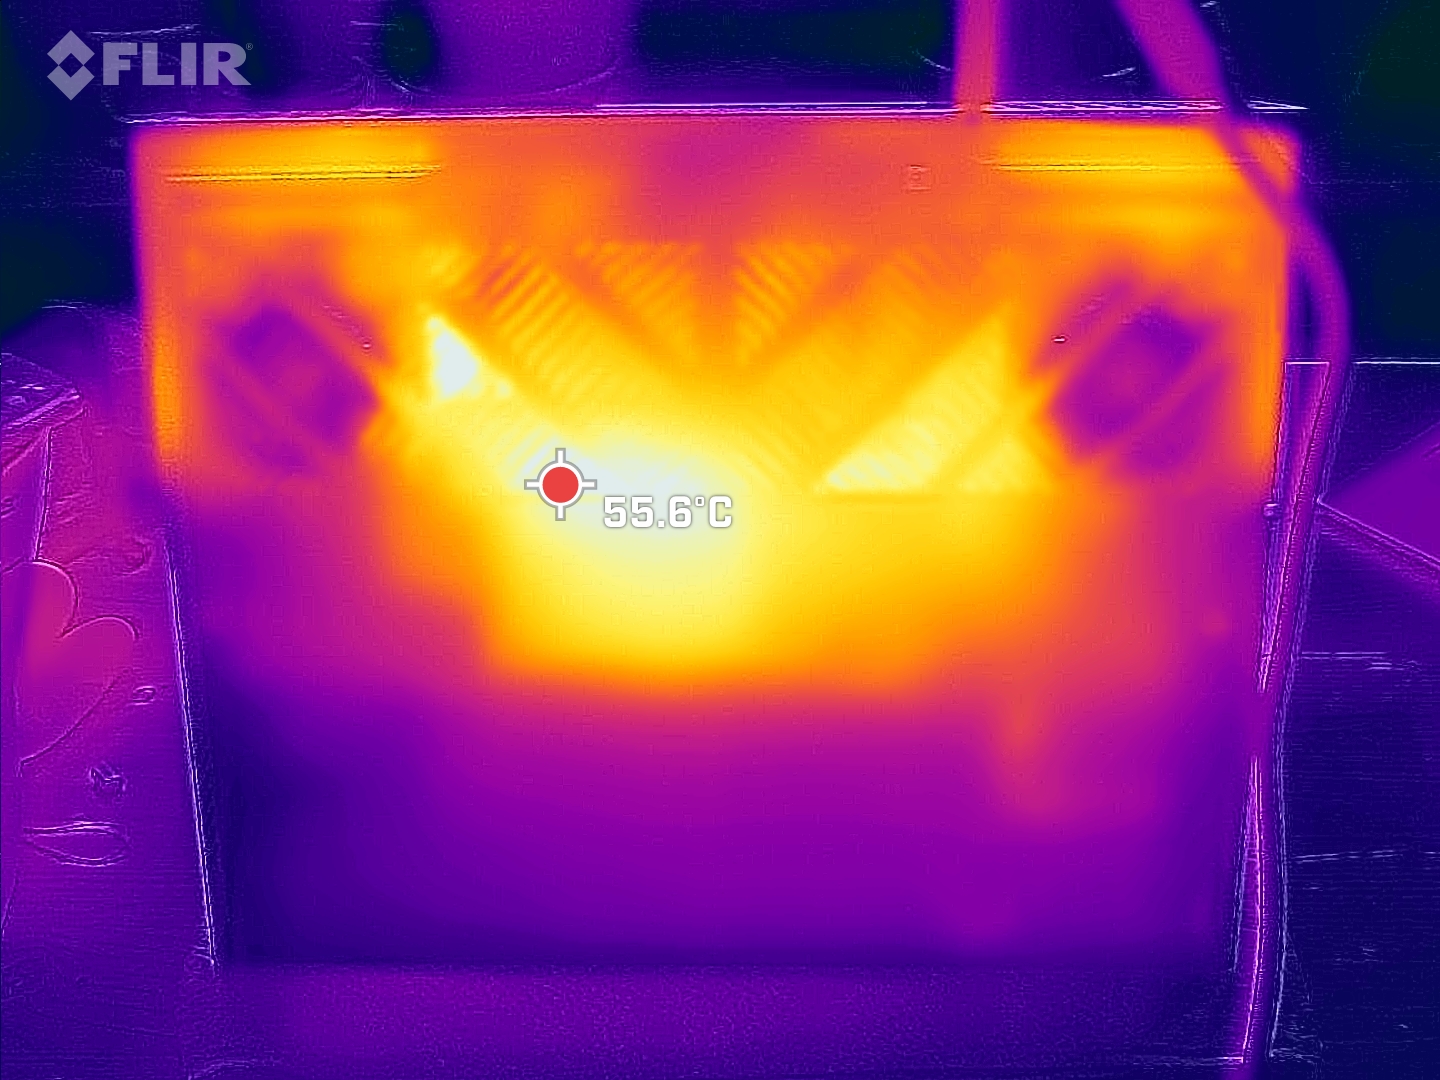
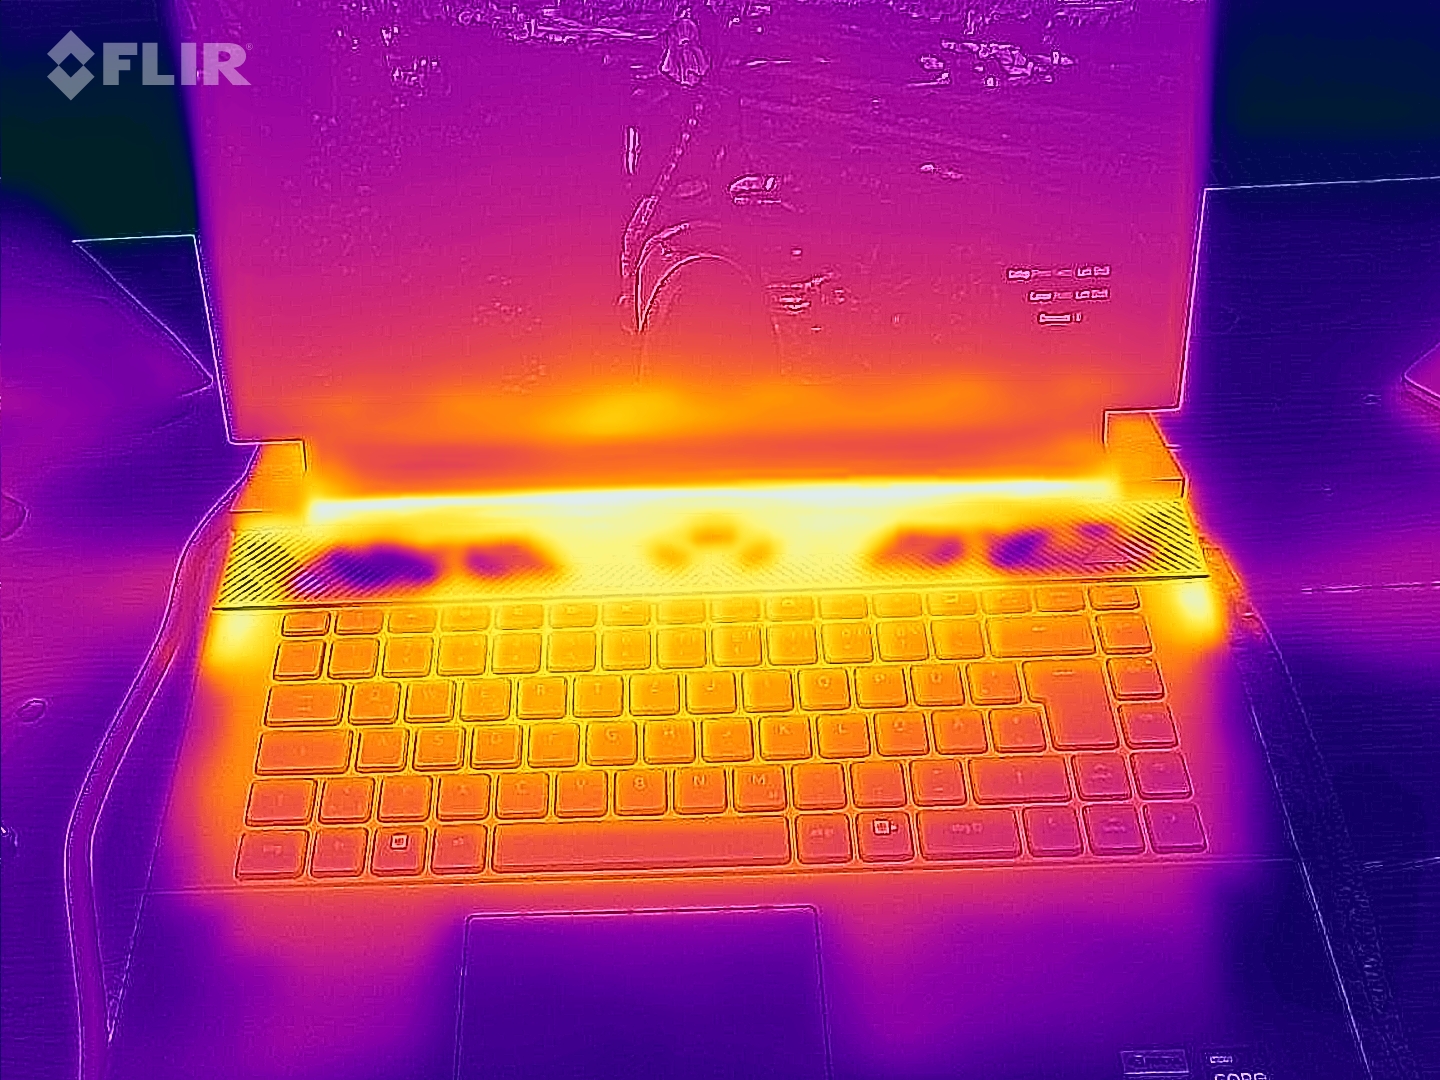
However, the device's comparatively low noise emissions also have some slight disadvantages. The surface of the G16 tends to heat up more than that of its competitors. We measured hot spots of up to 58 °C on the underside under maximum load! Only the Lenovo LOQ 16 and the G16's predecessor get similarly hot, while the other comparison devices stay just below 50 °C. At least the palm rests are always cool, and the area surrounding the WASD keys also remains within an acceptable range.
(-) The maximum temperature on the upper side is 49 °C / 120 F, compared to the average of 40.4 °C / 105 F, ranging from 21.2 to 68.8 °C for the class Gaming.
(-) The bottom heats up to a maximum of 58 °C / 136 F, compared to the average of 43.2 °C / 110 F
(+) In idle usage, the average temperature for the upper side is 30 °C / 86 F, compared to the device average of 33.9 °C / 93 F.
(±) Playing The Witcher 3, the average temperature for the upper side is 34.4 °C / 94 F, compared to the device average of 33.9 °C / 93 F.
(+) The palmrests and touchpad are cooler than skin temperature with a maximum of 25 °C / 77 F and are therefore cool to the touch.
(+) The average temperature of the palmrest area of similar devices was 28.8 °C / 83.8 F (+3.8 °C / 6.8 F).
| Dell G16, i7-13650HX, RTX 4060 Intel Core i7-13650HX, NVIDIA GeForce RTX 4060 Laptop GPU | Dell G16 7620 Intel Core i7-12700H, NVIDIA GeForce RTX 3060 Laptop GPU | MSI Raider GE68HX 13VF Intel Core i9-13950HX, NVIDIA GeForce RTX 4060 Laptop GPU | Lenovo Legion Slim 5 16APH8 AMD Ryzen 7 7840HS, NVIDIA GeForce RTX 4060 Laptop GPU | Alienware m16 R1 Intel Intel Core i7-13700HX, NVIDIA GeForce RTX 4060 Laptop GPU | Lenovo LOQ 16IRH8 Intel Core i7-13620H, NVIDIA GeForce RTX 4060 Laptop GPU | |
|---|---|---|---|---|---|---|
| Heat | 19% | 16% | 23% | -2% | 10% | |
| Maximum Upper Side * (°C) | 49 | 47.6 3% | 41.4 16% | 40.6 17% | 49 -0% | 48 2% |
| Maximum Bottom * (°C) | 58 | 54 7% | 45.4 22% | 42 28% | 48 17% | 59 -2% |
| Idle Upper Side * (°C) | 35 | 23 34% | 29.8 15% | 27.8 21% | 40 -14% | 28 20% |
| Idle Bottom * (°C) | 35 | 24.6 30% | 31.4 10% | 26.6 24% | 39 -11% | 28 20% |
* ... smaller is better
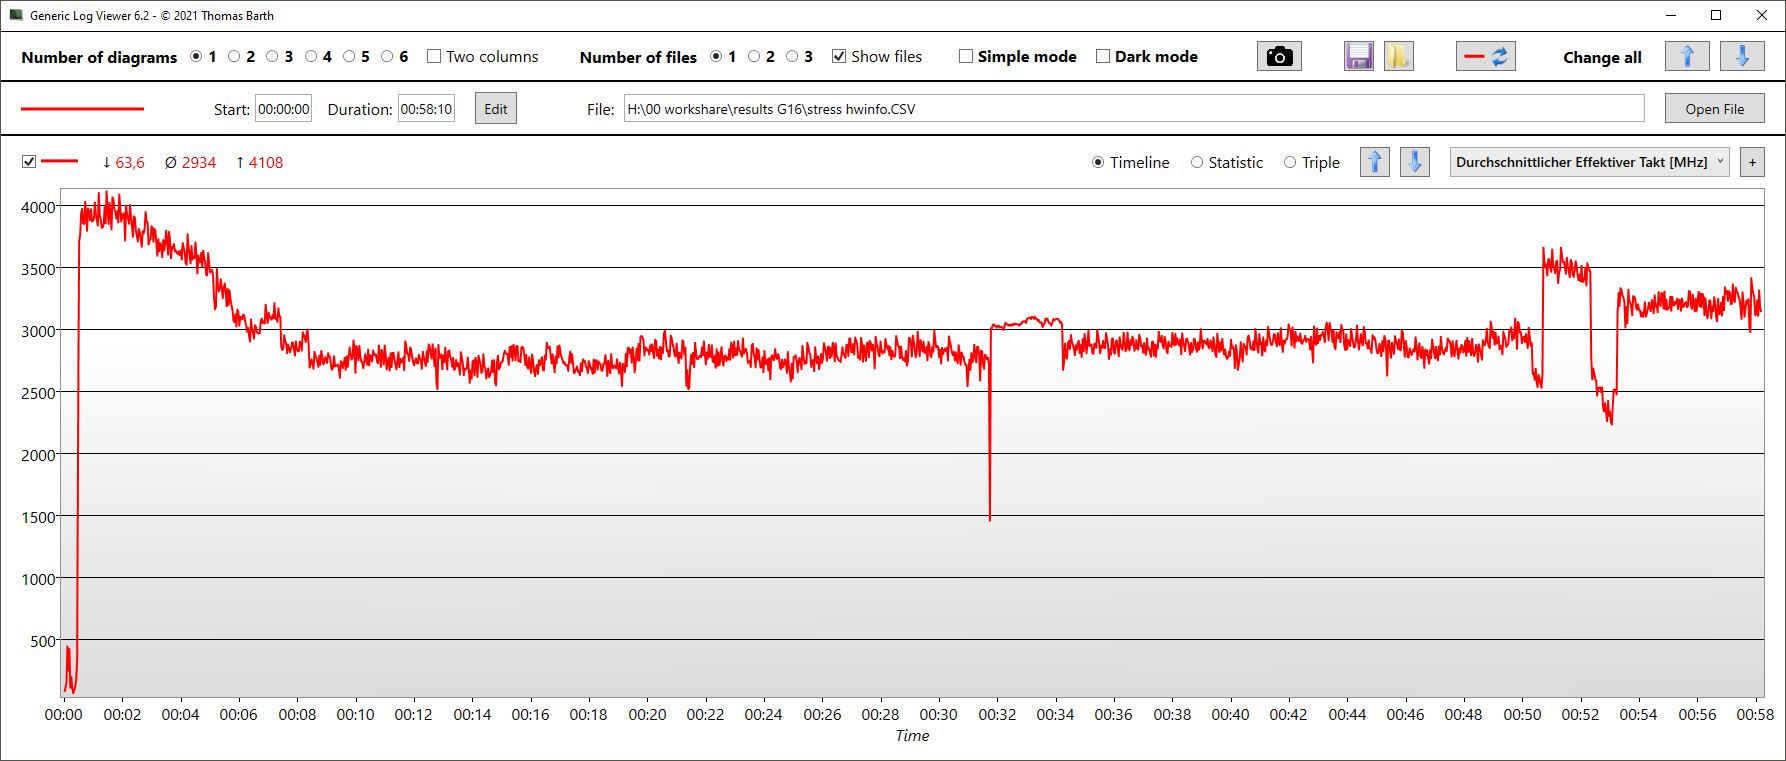
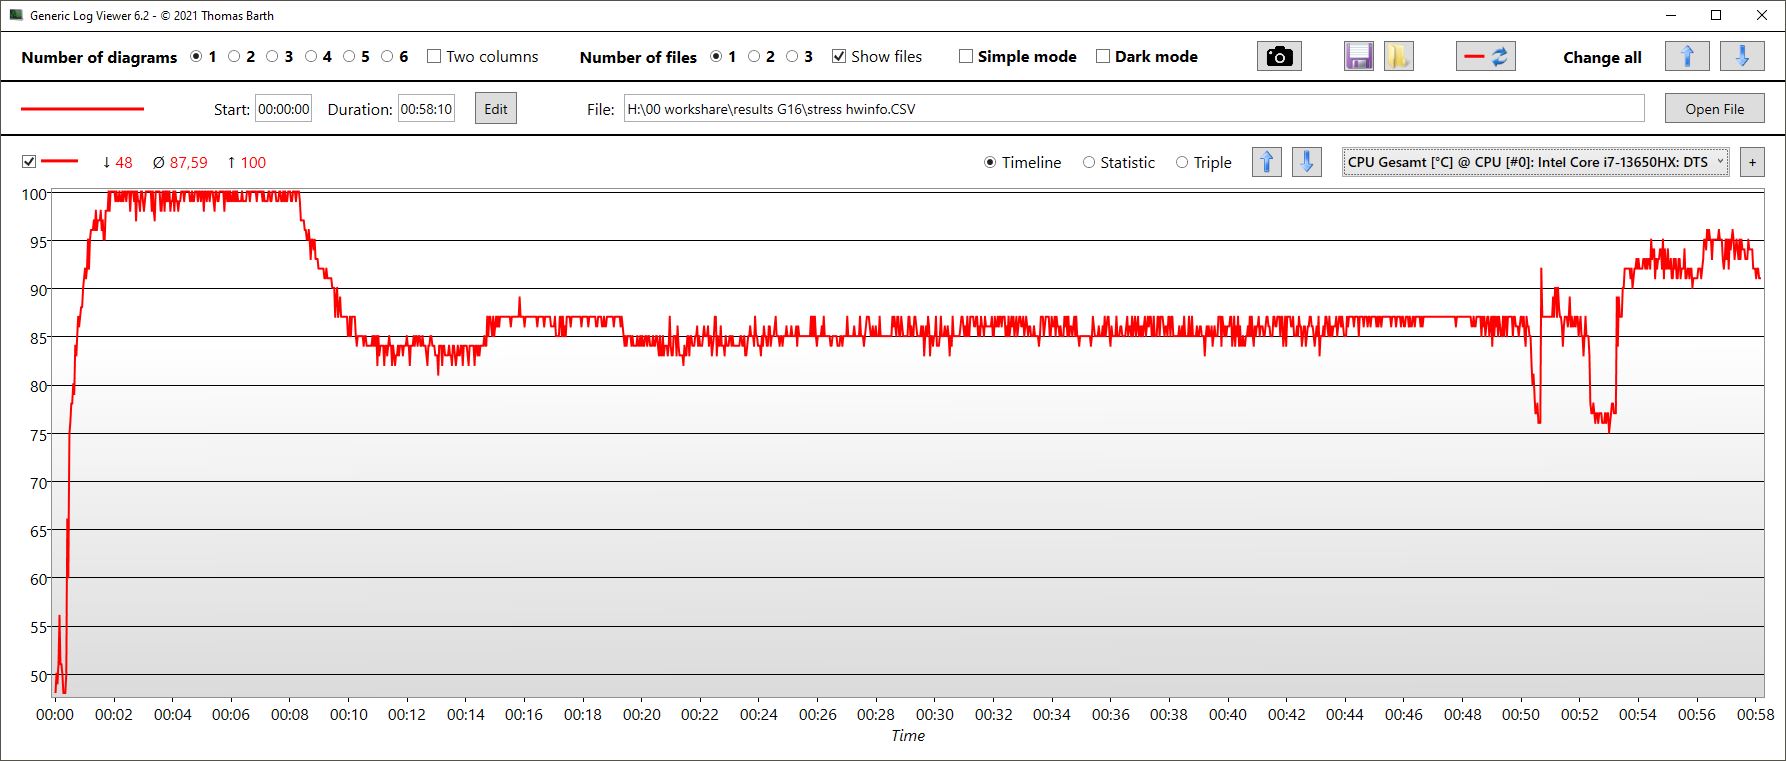
Stress test
During the stress test, the cores briefly clocked at up to 4.1 GHz. Unfortunately, this caused the CPU to heat up to 100 °C, whereupon the device's power consumption dropped from its original 128 watts and stabilized at around 70 watts. The CPU clock rate stabilized at around 2.9 GHz and the temperatures at around 85 °C.
In contrast, the GPU clock rates remained quite stable at around 2.4 to 2.5 GHz over the entire runtime. The same applies to the memory clock (2 GHz). The chip temperature levelled off at around 72 °C and the average power consumption was 71 watts.
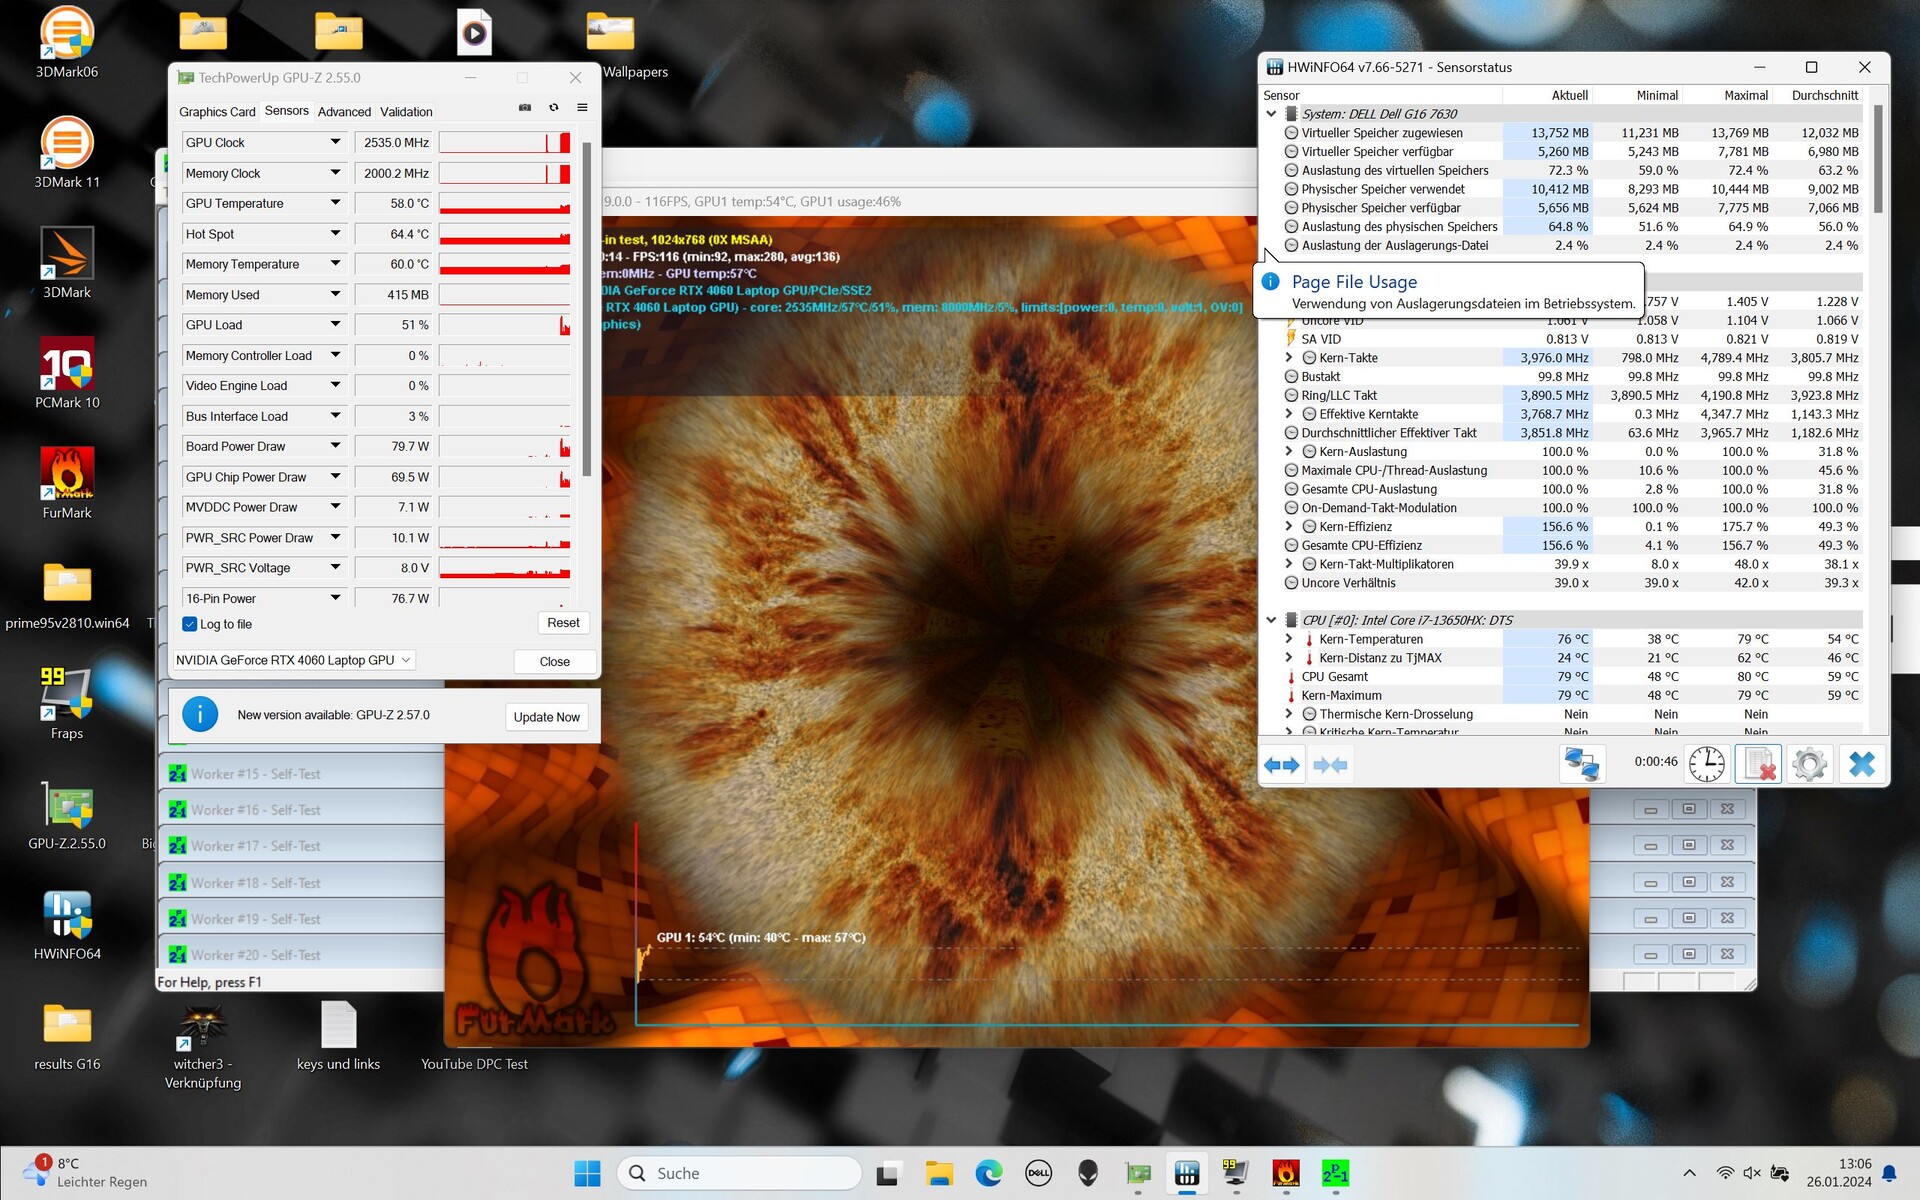
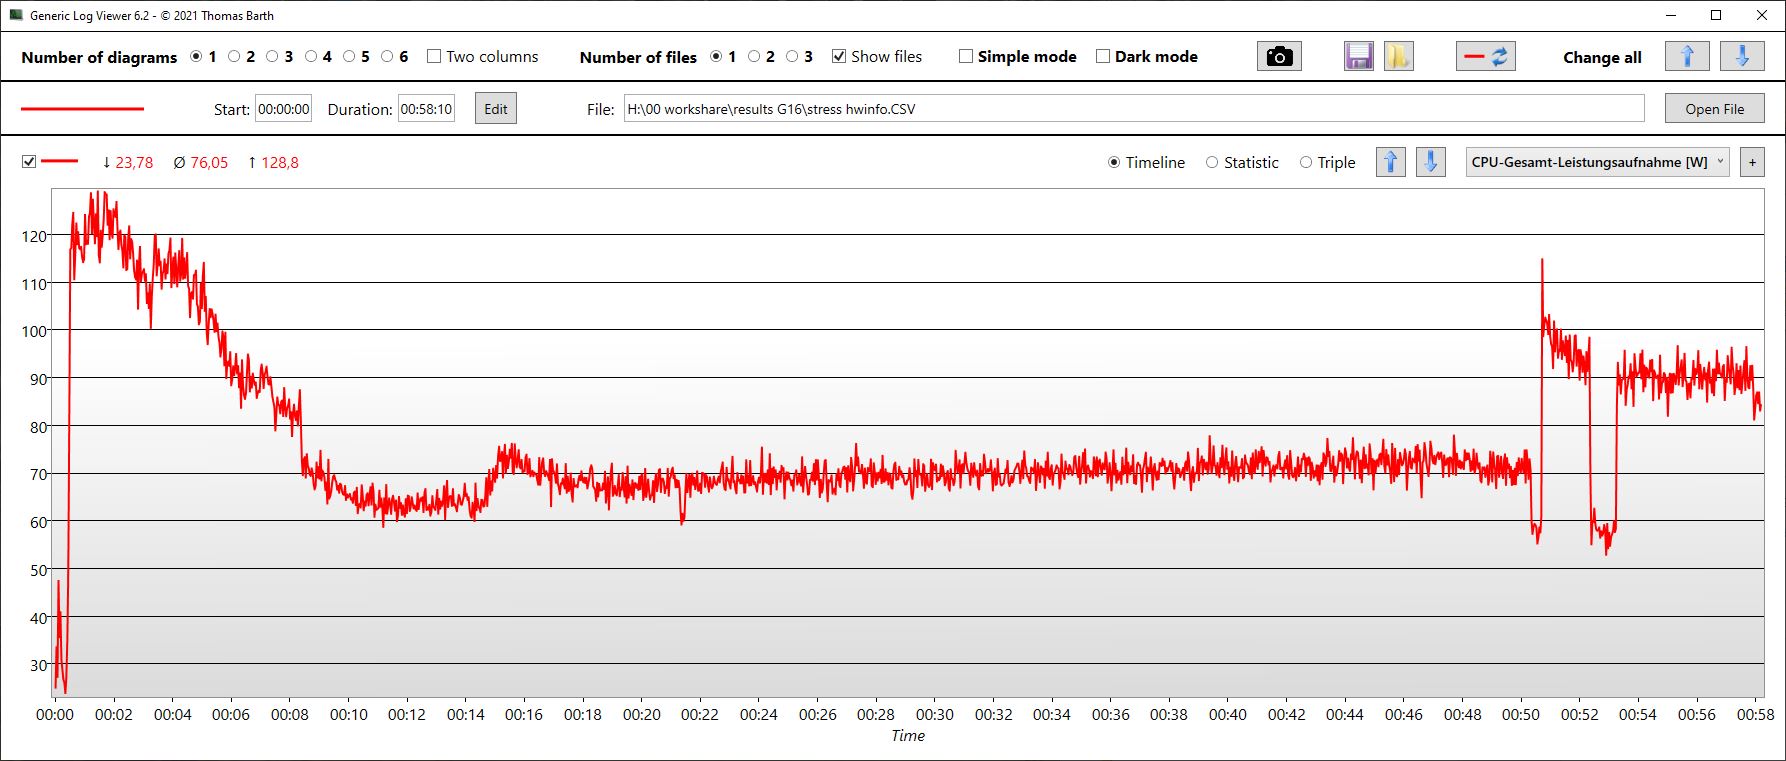

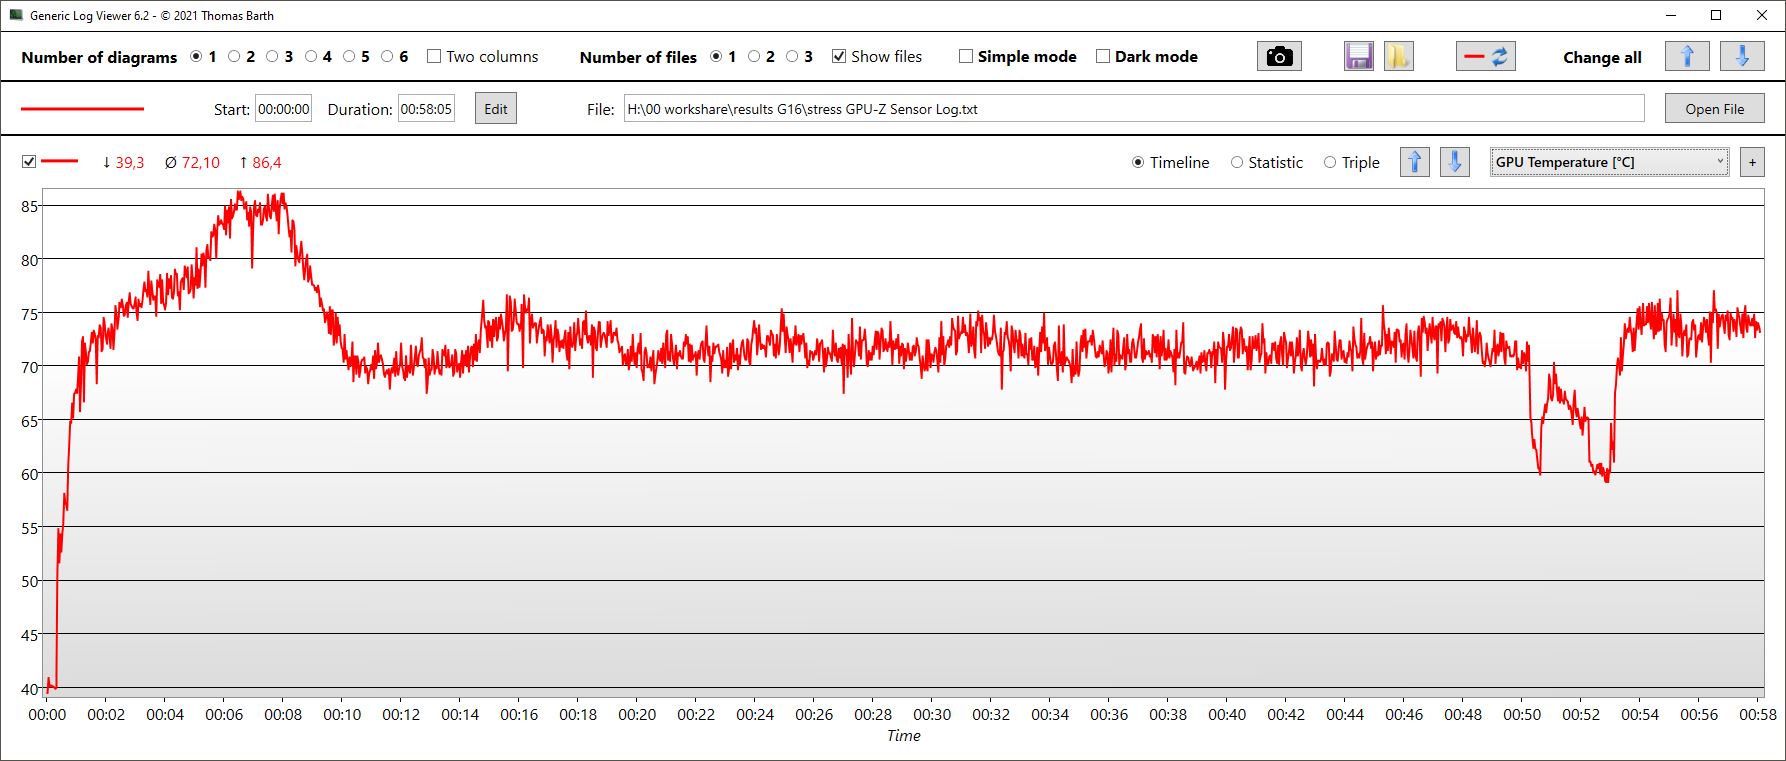

| CPU Clock (GHz) | GPU Clock (MHz) | Average CPU Temperature (°C) | Average GPU Temperature (°C) | |
| Prime95 + FurMark Stress | 2.9 | 2,490 | 85 | 72 |
| Witcher 3 Stress | 0.538 | 2,500 | 81 | 73 |
Speakers
The laptop's stereo speakers aren't the best: There is hardly any bass, they tend to be too quiet and even the mids and highs are not very balanced or linear. Only a 3.5 mm headset connection is available as an analogue audio connection.
Dell G16, i7-13650HX, RTX 4060 audio analysis
(±) | speaker loudness is average but good (80.55 dB)
Bass 100 - 315 Hz
(-) | nearly no bass - on average 25.1% lower than median
(-) | bass is not linear (18.9% delta to prev. frequency)
Mids 400 - 2000 Hz
(±) | higher mids - on average 8% higher than median
(+) | mids are linear (5.9% delta to prev. frequency)
Highs 2 - 16 kHz
(+) | balanced highs - only 3.5% away from median
(±) | linearity of highs is average (8.6% delta to prev. frequency)
Overall 100 - 16.000 Hz
(±) | linearity of overall sound is average (23.4% difference to median)
Compared to same class
» 85% of all tested devices in this class were better, 5% similar, 11% worse
» The best had a delta of 6%, average was 18%, worst was 132%
Compared to all devices tested
» 70% of all tested devices were better, 6% similar, 24% worse
» The best had a delta of 4%, average was 24%, worst was 134%
Apple MacBook Pro 16 2021 M1 Pro audio analysis
(+) | speakers can play relatively loud (84.7 dB)
Bass 100 - 315 Hz
(+) | good bass - only 3.8% away from median
(+) | bass is linear (5.2% delta to prev. frequency)
Mids 400 - 2000 Hz
(+) | balanced mids - only 1.3% away from median
(+) | mids are linear (2.1% delta to prev. frequency)
Highs 2 - 16 kHz
(+) | balanced highs - only 1.9% away from median
(+) | highs are linear (2.7% delta to prev. frequency)
Overall 100 - 16.000 Hz
(+) | overall sound is linear (4.6% difference to median)
Compared to same class
» 0% of all tested devices in this class were better, 0% similar, 100% worse
» The best had a delta of 5%, average was 17%, worst was 45%
Compared to all devices tested
» 0% of all tested devices were better, 0% similar, 100% worse
» The best had a delta of 4%, average was 24%, worst was 134%
Power management - The Dell G16 achieves class-average results
Power consumption
Measured against its performance, the G16's consumption is more than okay. Overall, the device has even become more efficient. It now consumes less than its predecessor, especially when idle. When gaming, it only consumes about 5 % more with a simultaneous increase in performance of about 14 %.
When gaming, the similarly fast Alienware and MSI Raider consume almost as much, namely an average of 185 watts when playing The Witcher 3. Its short-term maximum consumption is 255 watts.
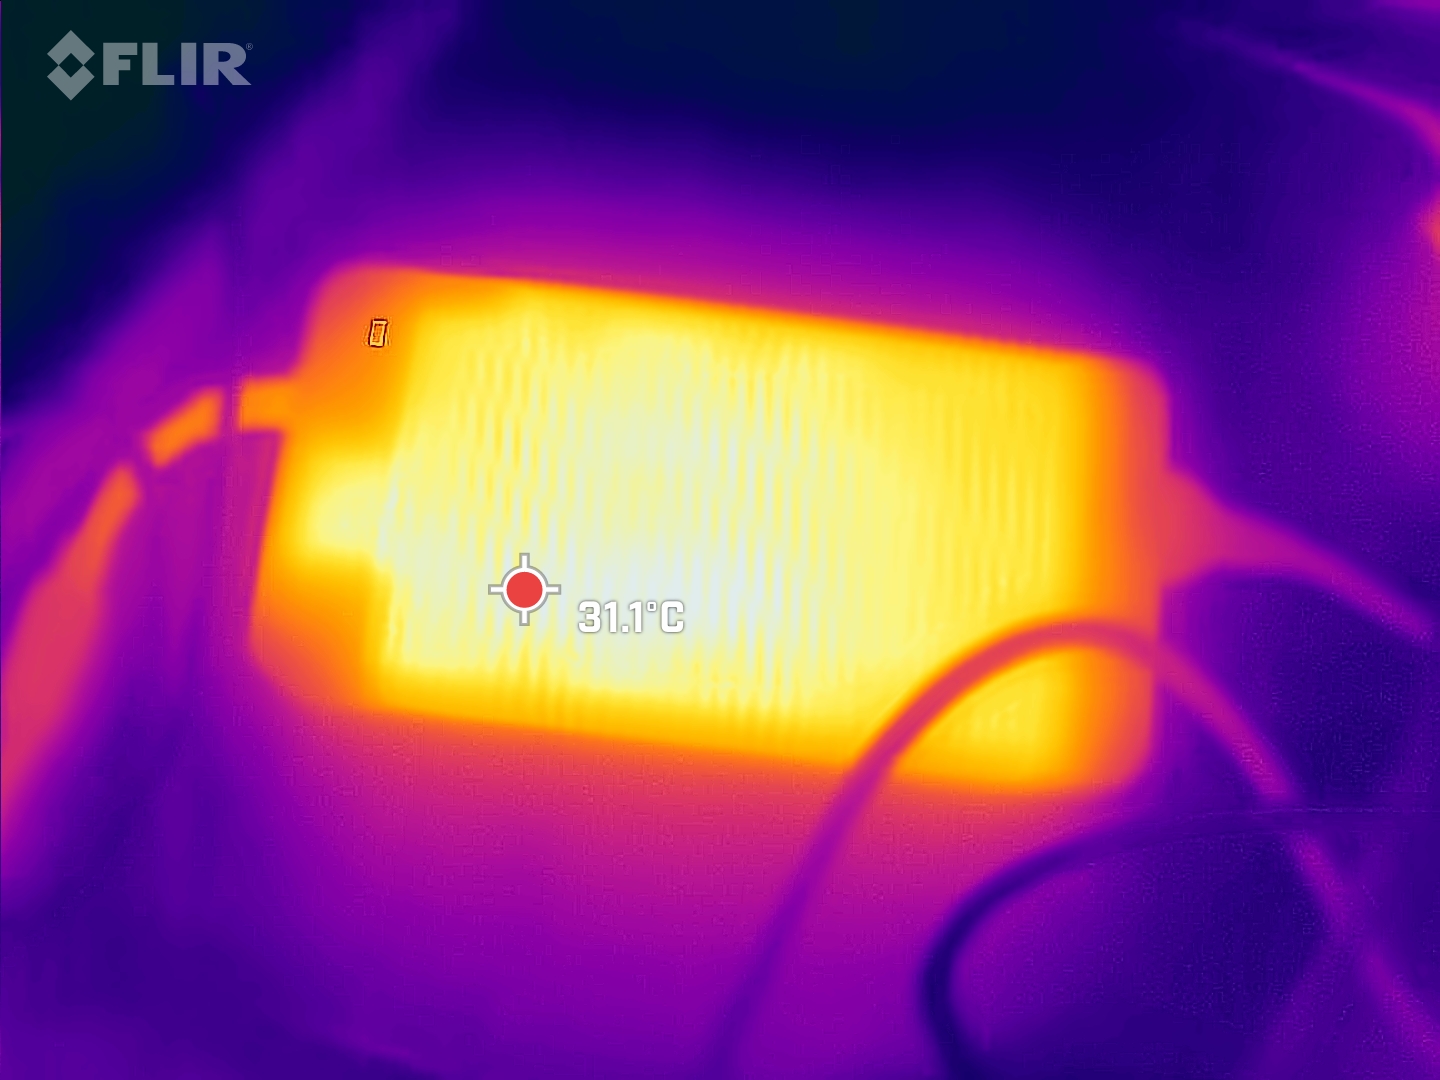
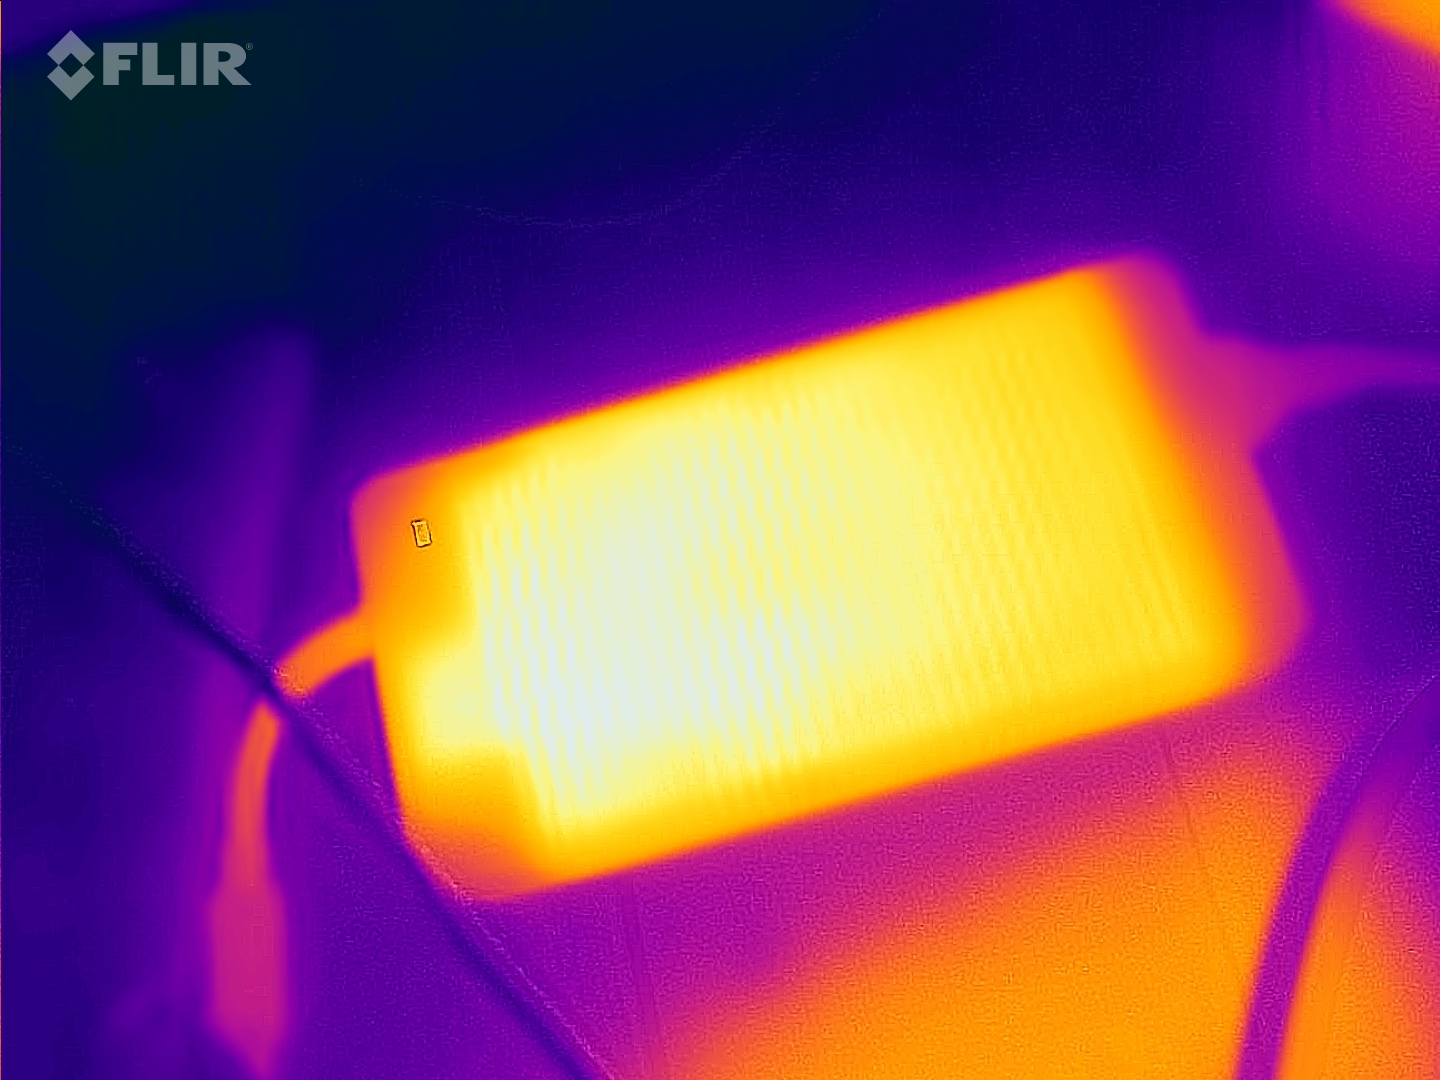
With this in mind, it is very surprising that Dell has included a huge, clunky and heavy 330-watt power supply with the G16 with an RTX 4060. This is completely oversized for the hardware installed. Presumably, Dell simply ships the same power supply with all configurations so that it is also equipped for the i9-13900HX and RTX 4070. A smaller, lighter power supply unit would have been more convenient for customers purchasing this model.
| Off / Standby | |
| Idle | |
| Load |
|
Key:
min: | |
| Dell G16, i7-13650HX, RTX 4060 i7-13650HX, GeForce RTX 4060 Laptop GPU, WD PC SN740 SDDPNQD-1T00, IPS, 2560x1600, 16" | Dell G16 7620 i7-12700H, GeForce RTX 3060 Laptop GPU, WDC PC SN810 512GB, IPS, 2560x1600, 16" | MSI Raider GE68HX 13VF i9-13950HX, GeForce RTX 4060 Laptop GPU, Samsung PM9B1 1024GB MZVL41T0HBLB, IPS, 1900x1200, 16" | Lenovo Legion Slim 5 16APH8 R7 7840HS, GeForce RTX 4060 Laptop GPU, SK hynix PC801 HFS512GEJ9X115N, IPS, 2560x1600, 16" | Alienware m16 R1 Intel i7-13700HX, GeForce RTX 4060 Laptop GPU, Kioxia KXG70ZNV512G, IPS, 2560x1600, 16" | Lenovo LOQ 16IRH8 i7-13620H, GeForce RTX 4060 Laptop GPU, Solidigm SSDPFINW512GZL, IPS, 2560x1600, 16" | Average NVIDIA GeForce RTX 4060 Laptop GPU | Average of class Gaming | |
|---|---|---|---|---|---|---|---|---|
| Power Consumption | -21% | -32% | 9% | -9% | -12% | -1% | -20% | |
| Idle Minimum * (Watt) | 11 | 14.4 -31% | 15.8 -44% | 9.4 15% | 10 9% | 17.2 -56% | 11.5 ? -5% | 13.3 ? -21% |
| Idle Average * (Watt) | 14.8 | 17.8 -20% | 19.4 -31% | 15.5 -5% | 14 5% | 19.3 -30% | 16 ? -8% | 19 ? -28% |
| Idle Maximum * (Watt) | 16.8 | 31.5 -88% | 27.3 -63% | 24.4 -45% | 21 -25% | 21.2 -26% | 20.3 ? -21% | 24.5 ? -46% |
| Load Average * (Watt) | 103.7 | 101.2 2% | 114.7 -11% | 74.1 29% | 119 -15% | 90 13% | 92.9 ? 10% | 108.1 ? -4% |
| Witcher 3 ultra * (Watt) | 185 | 176.9 4% | 185.5 -0% | 112.9 39% | 186.7 -1% | 168 9% | ||
| Load Maximum * (Watt) | 255 | 242.9 5% | 364.2 -43% | 206.5 19% | 323 -27% | 211 17% | 210 ? 18% | 254 ? -0% |
* ... smaller is better
Power consumption Witcher 3 / stress test
Power consumption with external monitor
Runtimes
Dell has installed an 86-Wh battery into the laptop. The competition is similarly-equipped. This is enough for the G16 to achieve runtimes of about 5.5 hours (maximum brightness) to almost 6.5 hours (150 nits) when surfing the web or watching videos. This makes the Dell gamer about class average.
| Dell G16, i7-13650HX, RTX 4060 i7-13650HX, GeForce RTX 4060 Laptop GPU, 86 Wh | Dell G16 7620 i7-12700H, GeForce RTX 3060 Laptop GPU, 84 Wh | MSI Raider GE68HX 13VF i9-13950HX, GeForce RTX 4060 Laptop GPU, 99.9 Wh | Lenovo Legion Slim 5 16APH8 R7 7840HS, GeForce RTX 4060 Laptop GPU, 80 Wh | Alienware m16 R1 Intel i7-13700HX, GeForce RTX 4060 Laptop GPU, 86 Wh | Lenovo LOQ 16IRH8 i7-13620H, GeForce RTX 4060 Laptop GPU, 80 Wh | Average of class Gaming | |
|---|---|---|---|---|---|---|---|
| Battery runtime | -34% | 23% | 3% | -20% | 5% | 18% | |
| H.264 (h) | 6.4 | 5.6 -13% | 6.4 0% | 8.26 ? 29% | |||
| WiFi v1.3 (h) | 6.3 | 5 -21% | 6.8 8% | 7.1 13% | 4.8 -24% | 6.3 0% | 7.01 ? 11% |
| Load (h) | 1.3 | 0.7 -46% | 1.8 38% | 1.2 -8% | 1 -23% | 1.5 15% | 1.47 ? 13% |
| Reader / Idle (h) | 7.1 | 8.8 | 11.7 | 6.4 | 8.71 ? |
Pros
Cons
Verdict - Affordable Alienware alternative with some small issues
The Dell G16 7630 appears slightly sleeker and more affordable than the Alienware series from Dell. Its performance is still good and one very positive aspect is how quiet the gamer remains while playing games compared to many competitors.
Dell has made some savings when it comes to its webcam and build especially, which is most likely bearable for customers on a tight budget, but still annoying at times: Examples include the laptop's power connection that slips out bit by bit when the device moves, its bulky and heavy power supply or the fact that only the version with an i9-13900HX and an RTX 4070 supports Thunderbolt. Our test sample with an i7-13650H and an RTX 4060, on the other hand, doesn't and the latter lacks just as much transparency for customers as the two different display types that are only listed in the manual and solely differ in color spaces and refresh rates.
The Dell G16 7630 is quite a large and heavy mid-range gaming laptop which benefits from good performance and quiet operation. When it comes to its connectivity and build, Dell could do with being more generous.
If you like things even sleeker and more efficient, then it might be worth taking a look at the slightly weaker Dell Inspiron 16 Plus 7630. A further alternative could be the Lenovo Legion Slim 5 and, if you don't have as tight a budget, the Legion Pro 5 16.
Price and availability
The Dell G16 7630 is currently on offer on Amazon for US$1,401.84. This version comes with an Intel Core i9-13900HX, an RTX 4070, 16 GB RAM and a 1-TB SSD.
Dell G16, i7-13650HX, RTX 4060
- 02/13/2024 v7 (old)
Christian Hintze
Transparency
The selection of devices to be reviewed is made by our editorial team. The test sample was provided to the author as a loan by the manufacturer or retailer for the purpose of this review. The lender had no influence on this review, nor did the manufacturer receive a copy of this review before publication. There was no obligation to publish this review. As an independent media company, Notebookcheck is not subjected to the authority of manufacturers, retailers or publishers.
This is how Notebookcheck is testing
Every year, Notebookcheck independently reviews hundreds of laptops and smartphones using standardized procedures to ensure that all results are comparable. We have continuously developed our test methods for around 20 years and set industry standards in the process. In our test labs, high-quality measuring equipment is utilized by experienced technicians and editors. These tests involve a multi-stage validation process. Our complex rating system is based on hundreds of well-founded measurements and benchmarks, which maintains objectivity. Further information on our test methods can be found here.
Price comparison

