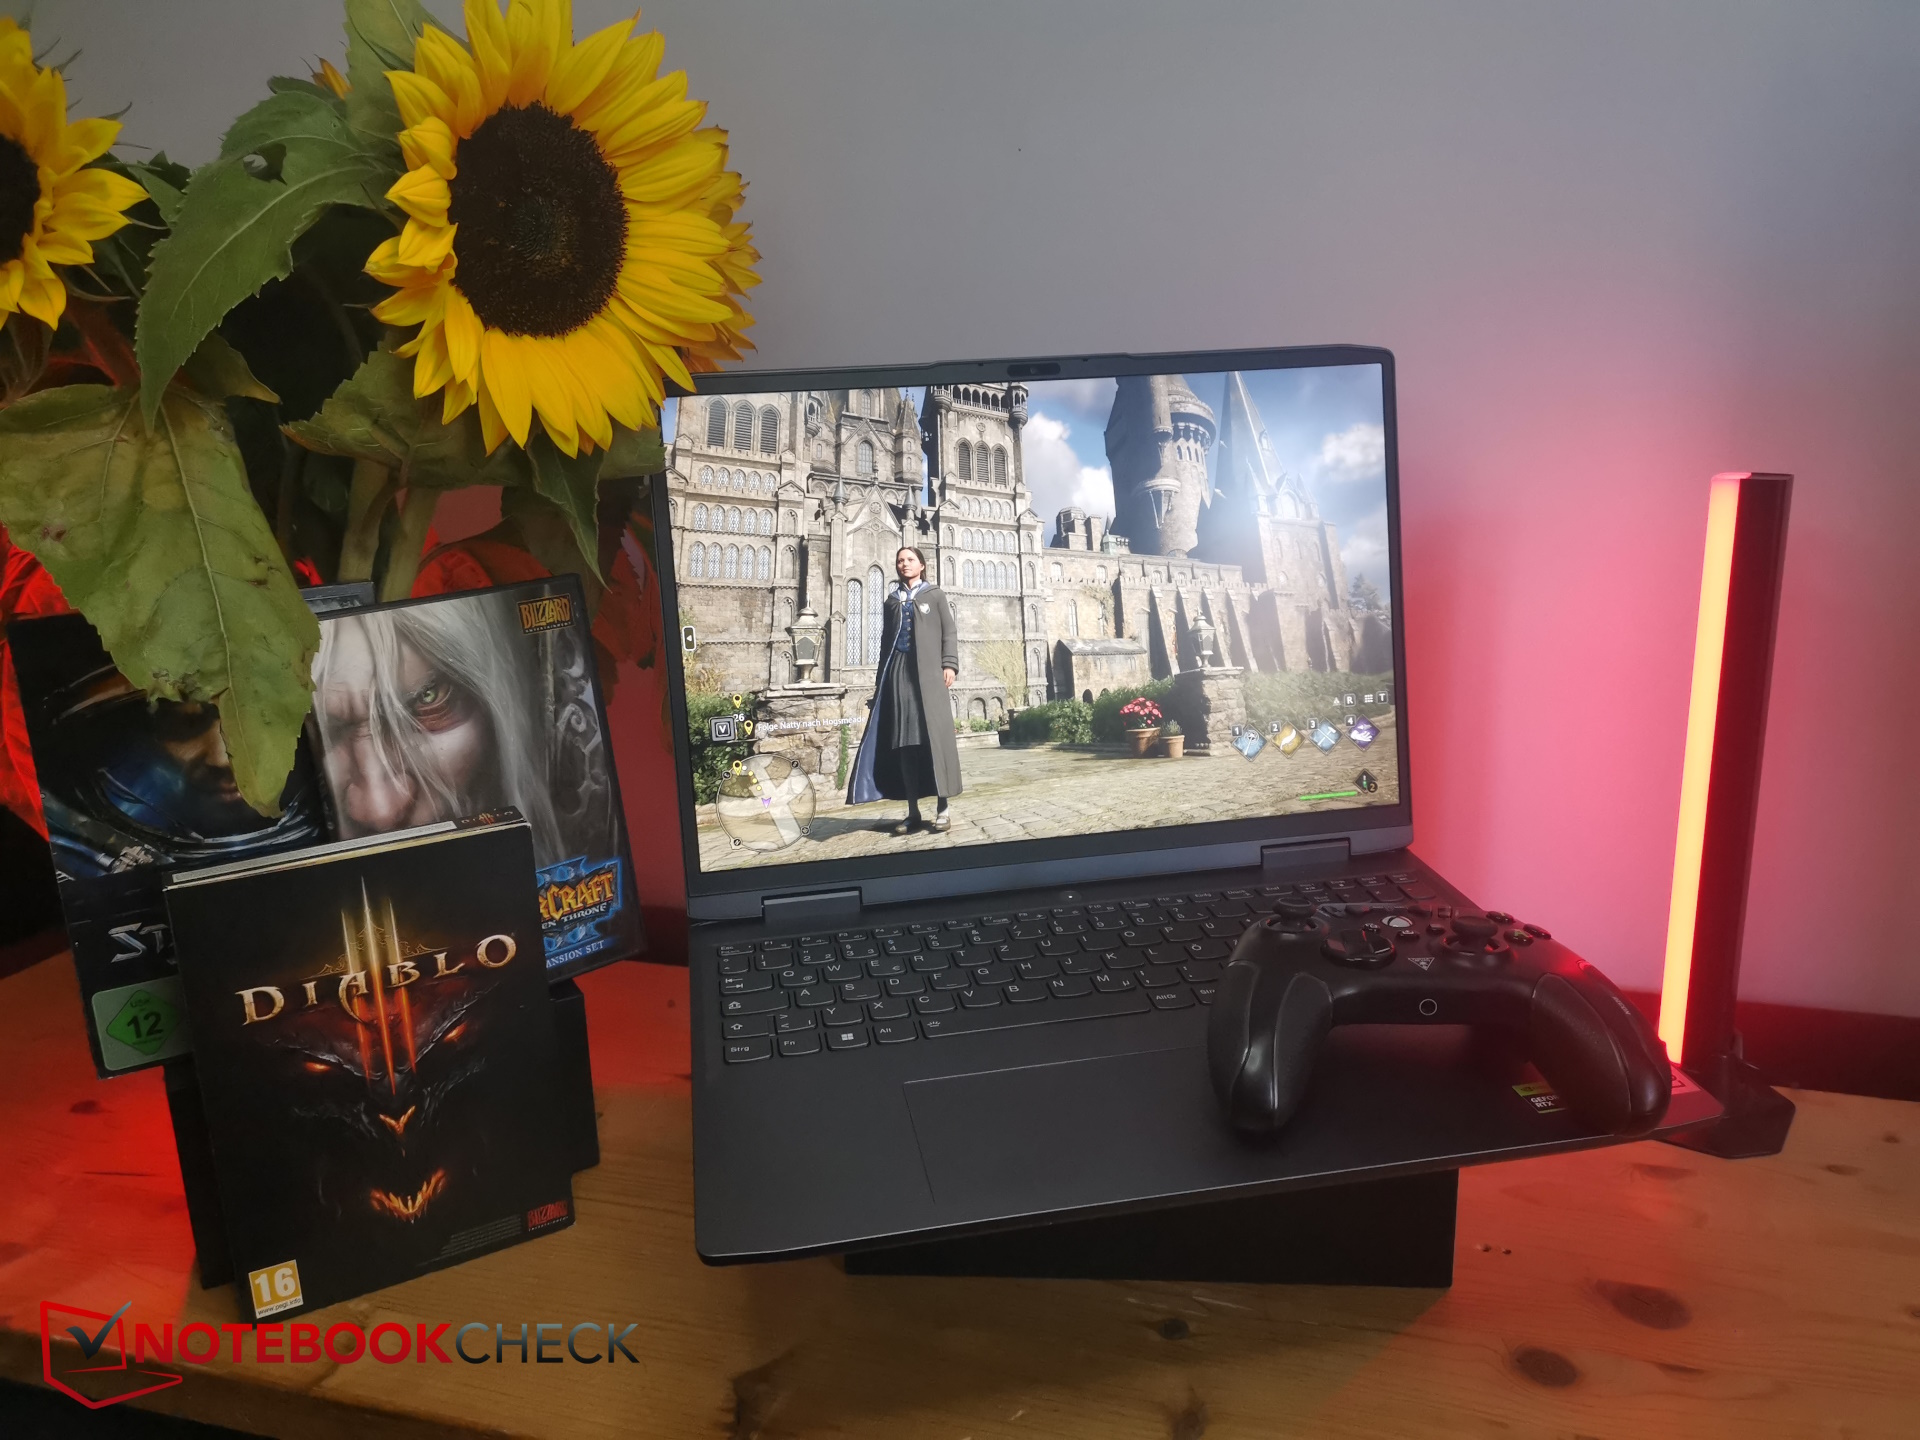
Lenovo LOQ 16 gaming laptop review: Where is the hitch compared to the more expensive Legion?
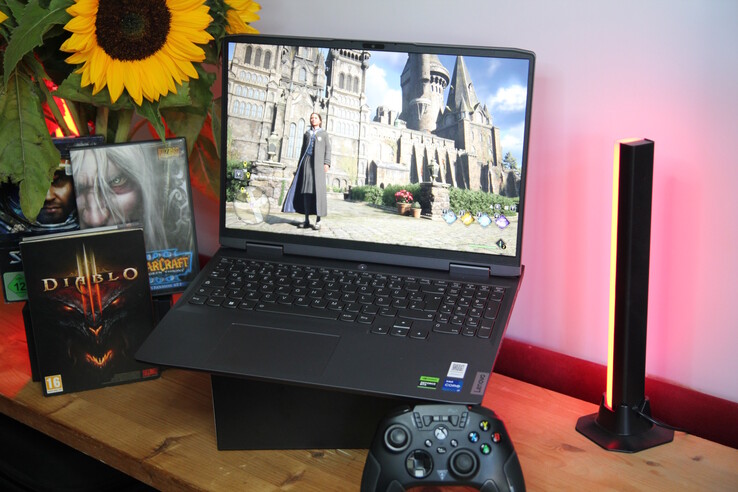
With the new LOQ series, Lenovo offers especially affordable gaming laptops that replace the IdeaPad Gaming series of prior years. We were already able to test the 15-inch LOQ 15 with an AMD processor and are now taking a look at the slightly larger LOQ 16 with an Intel CPU, 16 inch display, and 16:10 form factor. How does the laptop fare against the competitors, and are gamers getting a real bargain here?
We basically go one category higher than with the LOQ 15 here, since instead of an RTX 4050, our test model uses an RTX 4060, instead of only 8 GB of RAM, there are 16 GB, and instead of the Full-HD display, we now get QHD.
The competitors include other budget gaming laptops with a similar graphics card, such as the Dell Inspiron 16 Plus 7630, the Acer Nitro 16 AN16-41 (unfortunately only with an RTX 4050), and also the Captiva Advanced Gaming I74-121. Things get slightly more expensive with the Legion Slim 5 16APH8 inhouse competitor and the Asus TUF Gaming A16 Advantage Edition FA617XS.
Possible Competitors in Comparison
Rating | Date | Model | Weight | Height | Size | Resolution | Price |
|---|---|---|---|---|---|---|---|
| 87.3 % v7 (old) | 09 / 2023 | Lenovo LOQ 16IRH8 i7-13620H, GeForce RTX 4060 Laptop GPU | 2.7 kg | 25.9 mm | 16.00" | 2560x1600 | |
| 87.1 % v7 (old) | 08 / 2023 | Dell Inspiron 16 Plus 7630 i7-13700H, GeForce RTX 4060 Laptop GPU | 2.2 kg | 19.95 mm | 16.00" | 2560x1600 | |
| 86.7 % v7 (old) | 08 / 2023 | Acer Nitro 16 AN16-41-R7YE R5 7535HS, GeForce RTX 4050 Laptop GPU | 2.6 kg | 27.9 mm | 16.00" | 1920x1200 | |
| 85.7 % v7 (old) | 09 / 2023 | Captiva Advanced Gaming I74-121 i5-13500H, GeForce RTX 4060 Laptop GPU | 2.3 kg | 29 mm | 15.60" | 1920x1080 | |
| 87.7 % v7 (old) | 08 / 2023 | Lenovo Legion Slim 5 16APH8 R7 7840HS, GeForce RTX 4060 Laptop GPU | 2.4 kg | 25.2 mm | 16.00" | 2560x1600 | |
| 86.9 % v7 (old) | 06 / 2023 | Asus TUF Gaming A16 FA617XS R9 7940HS, Radeon RX 7600S | 2.2 kg | 22.1 mm | 16.00" | 1920x1200 |
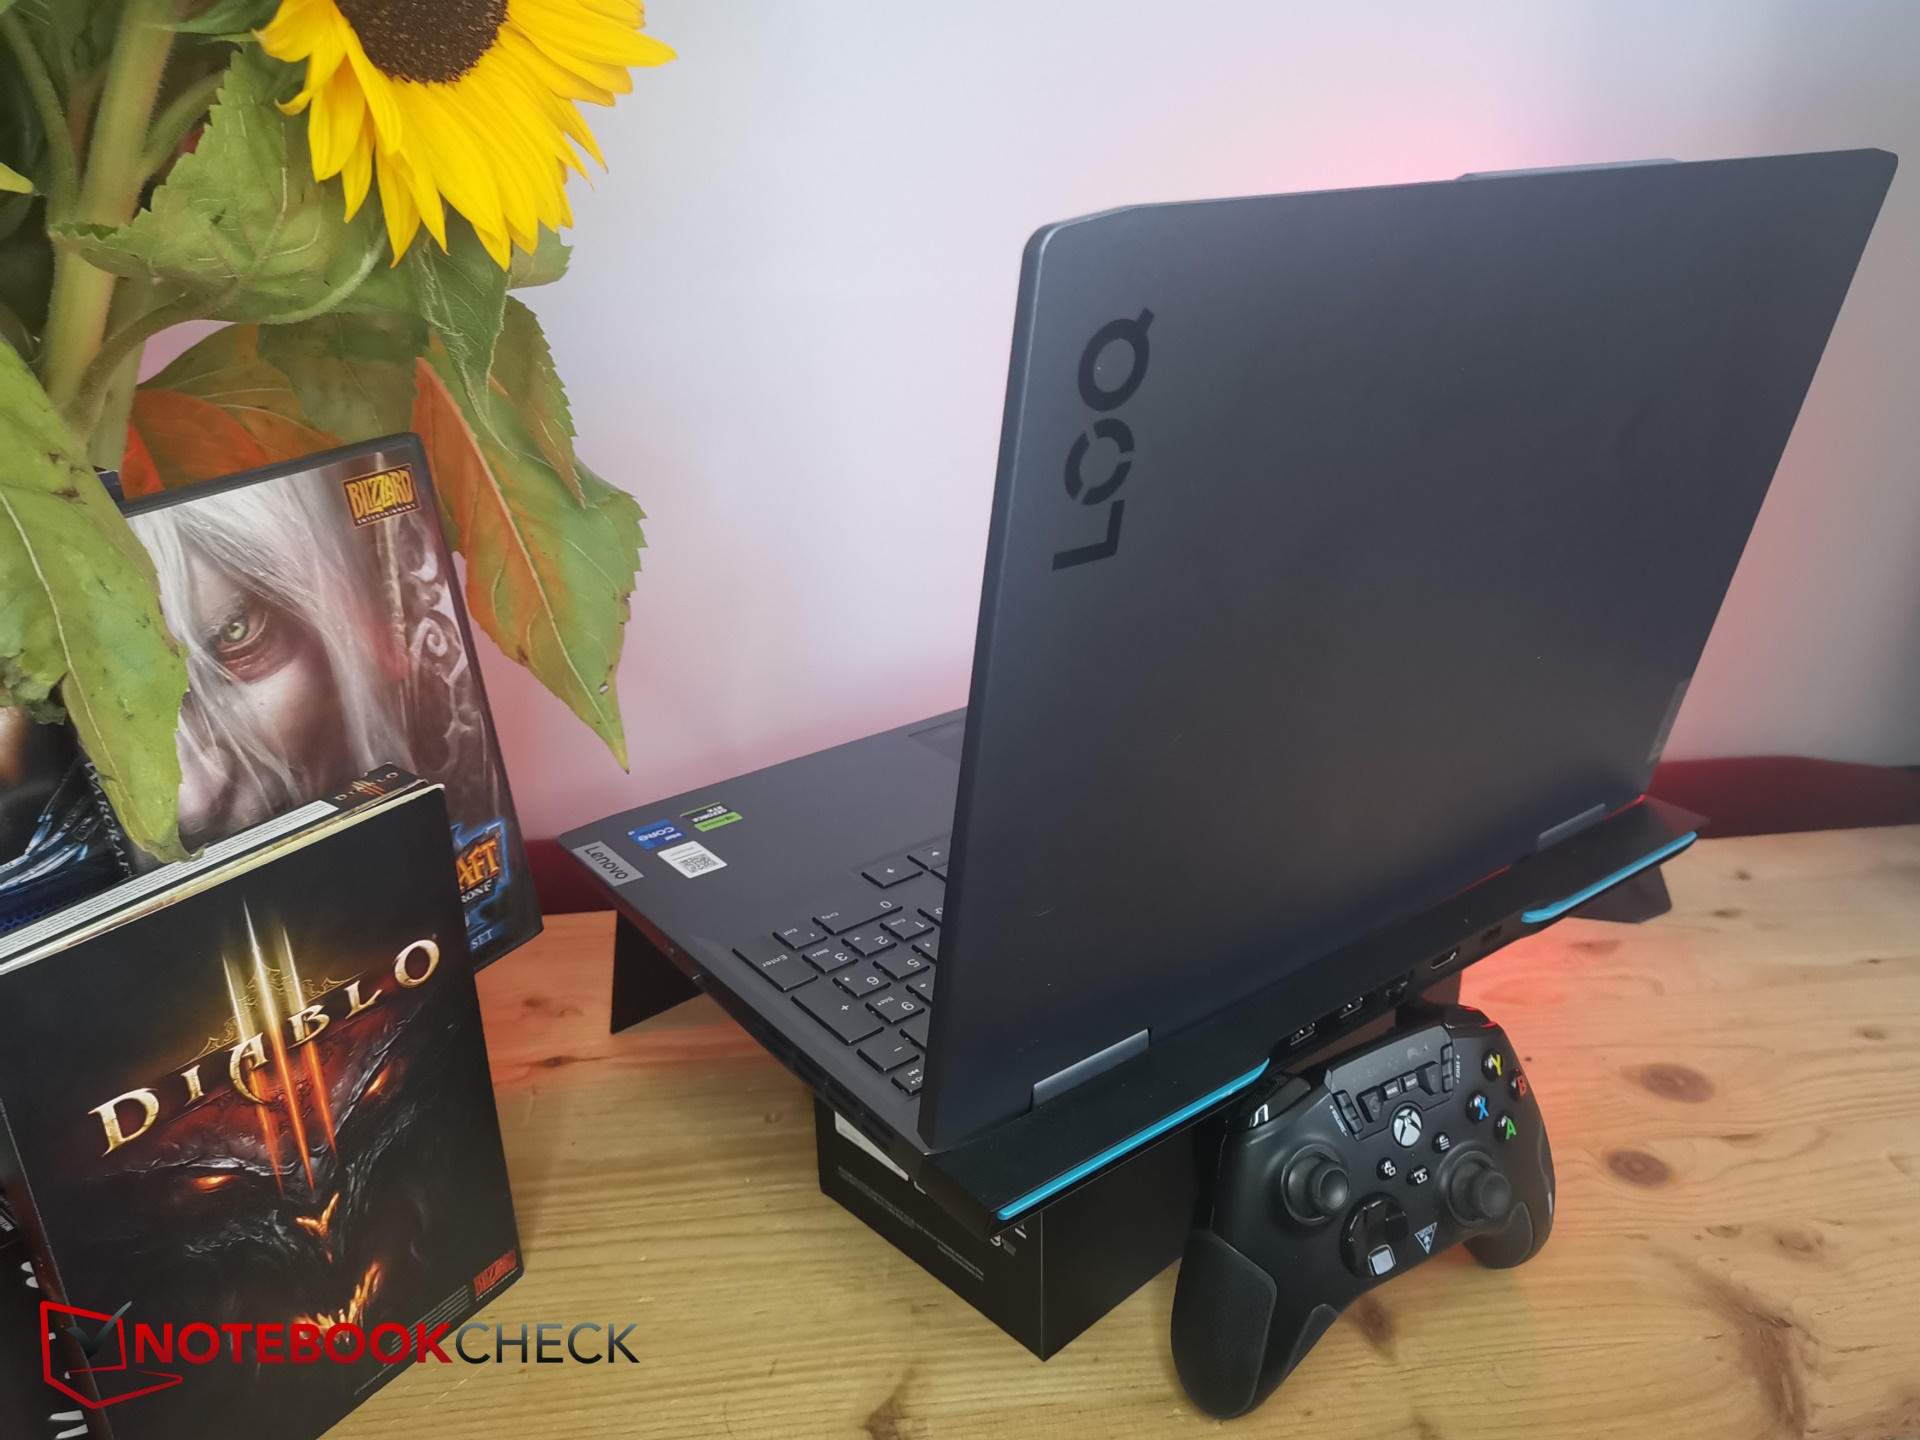
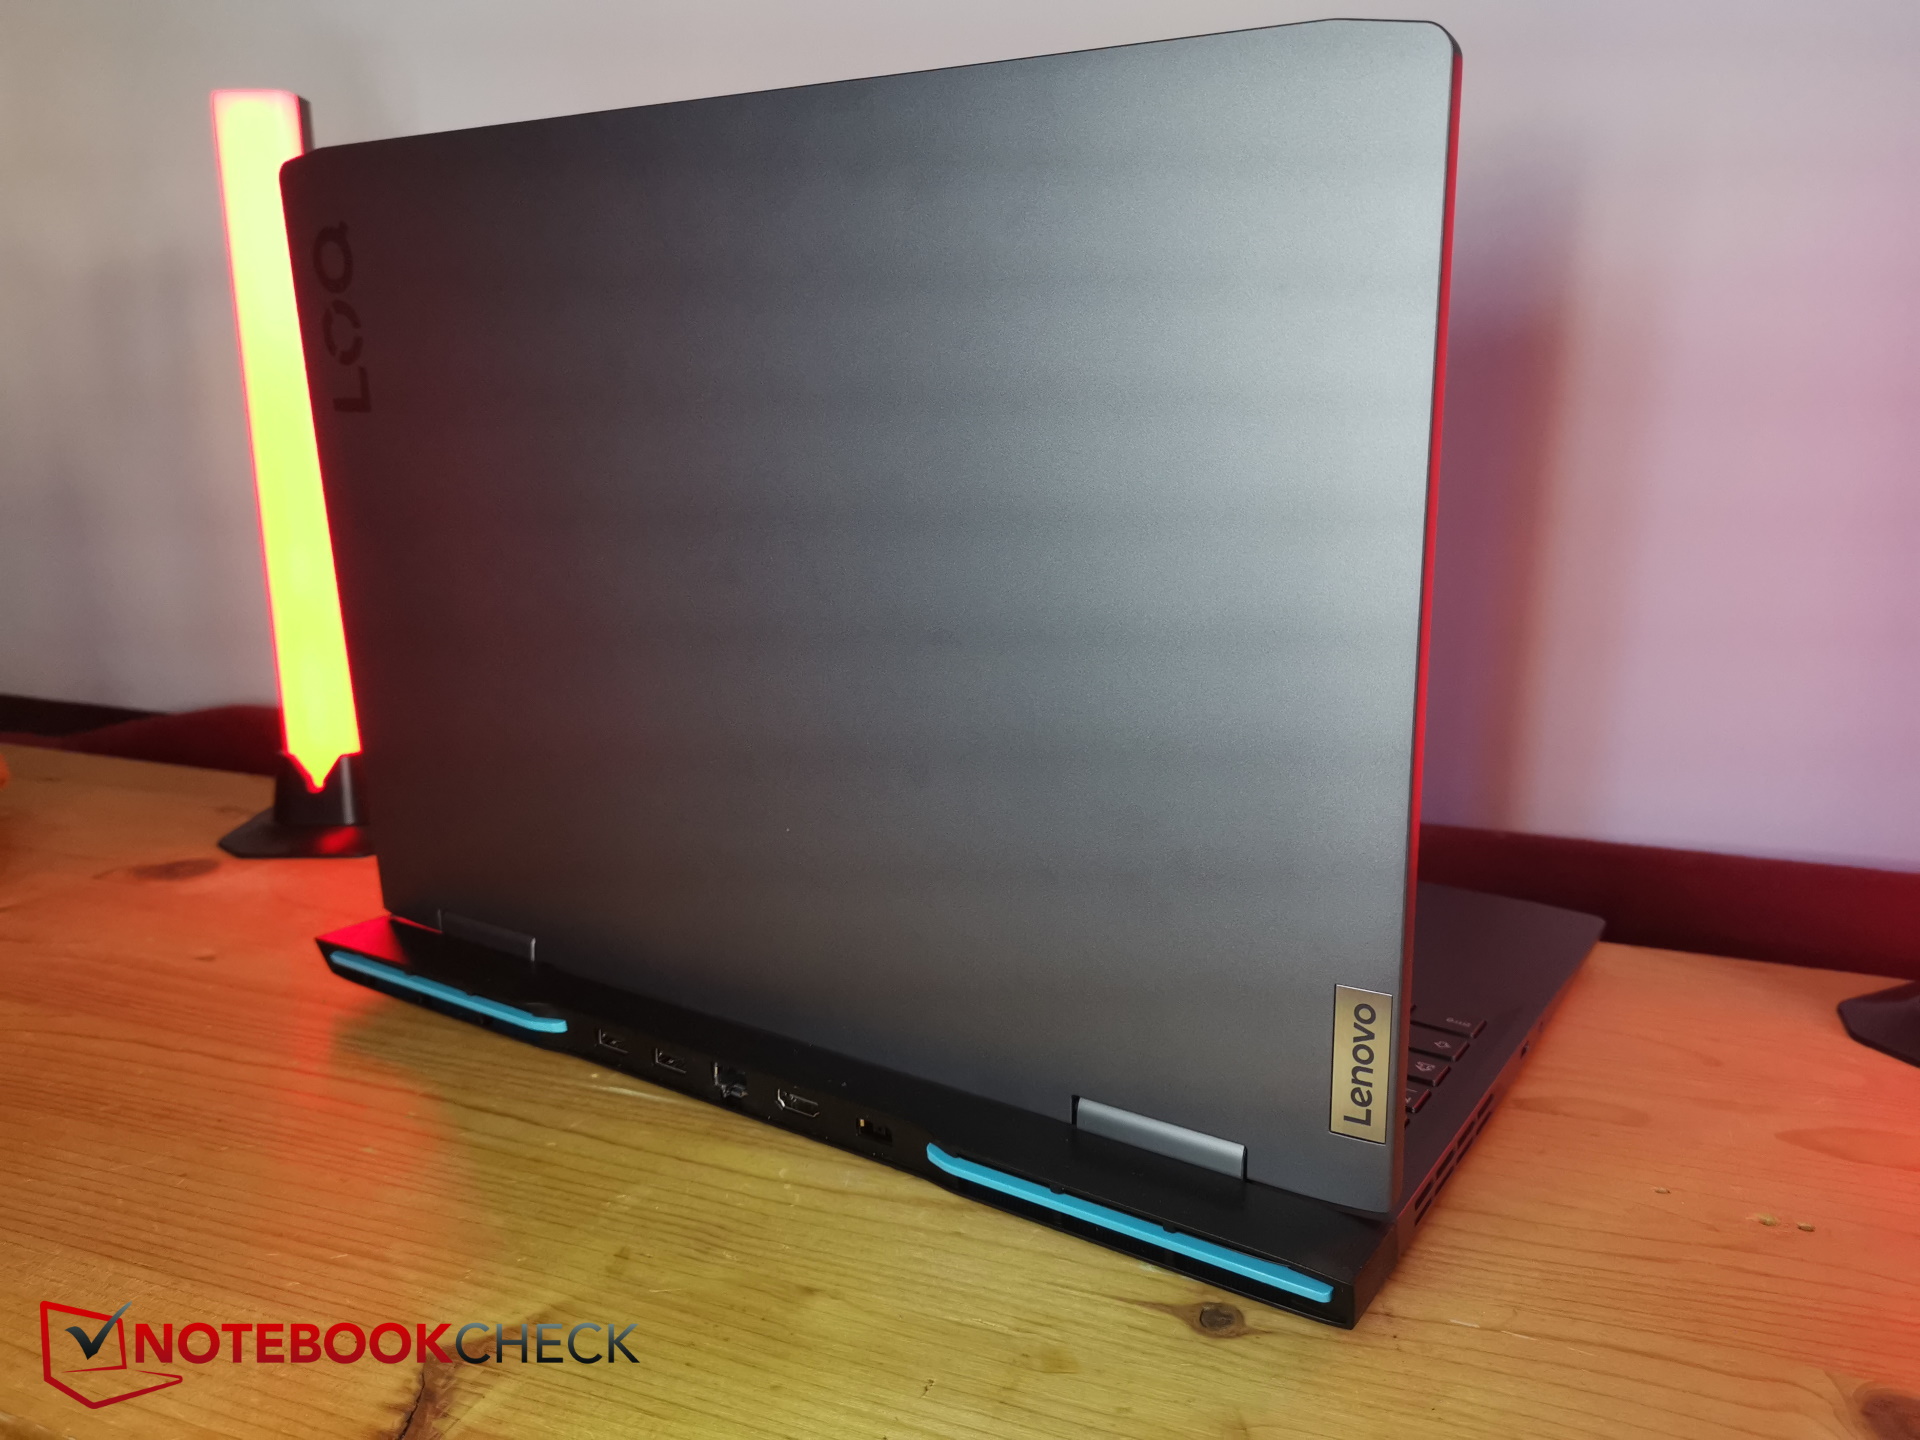
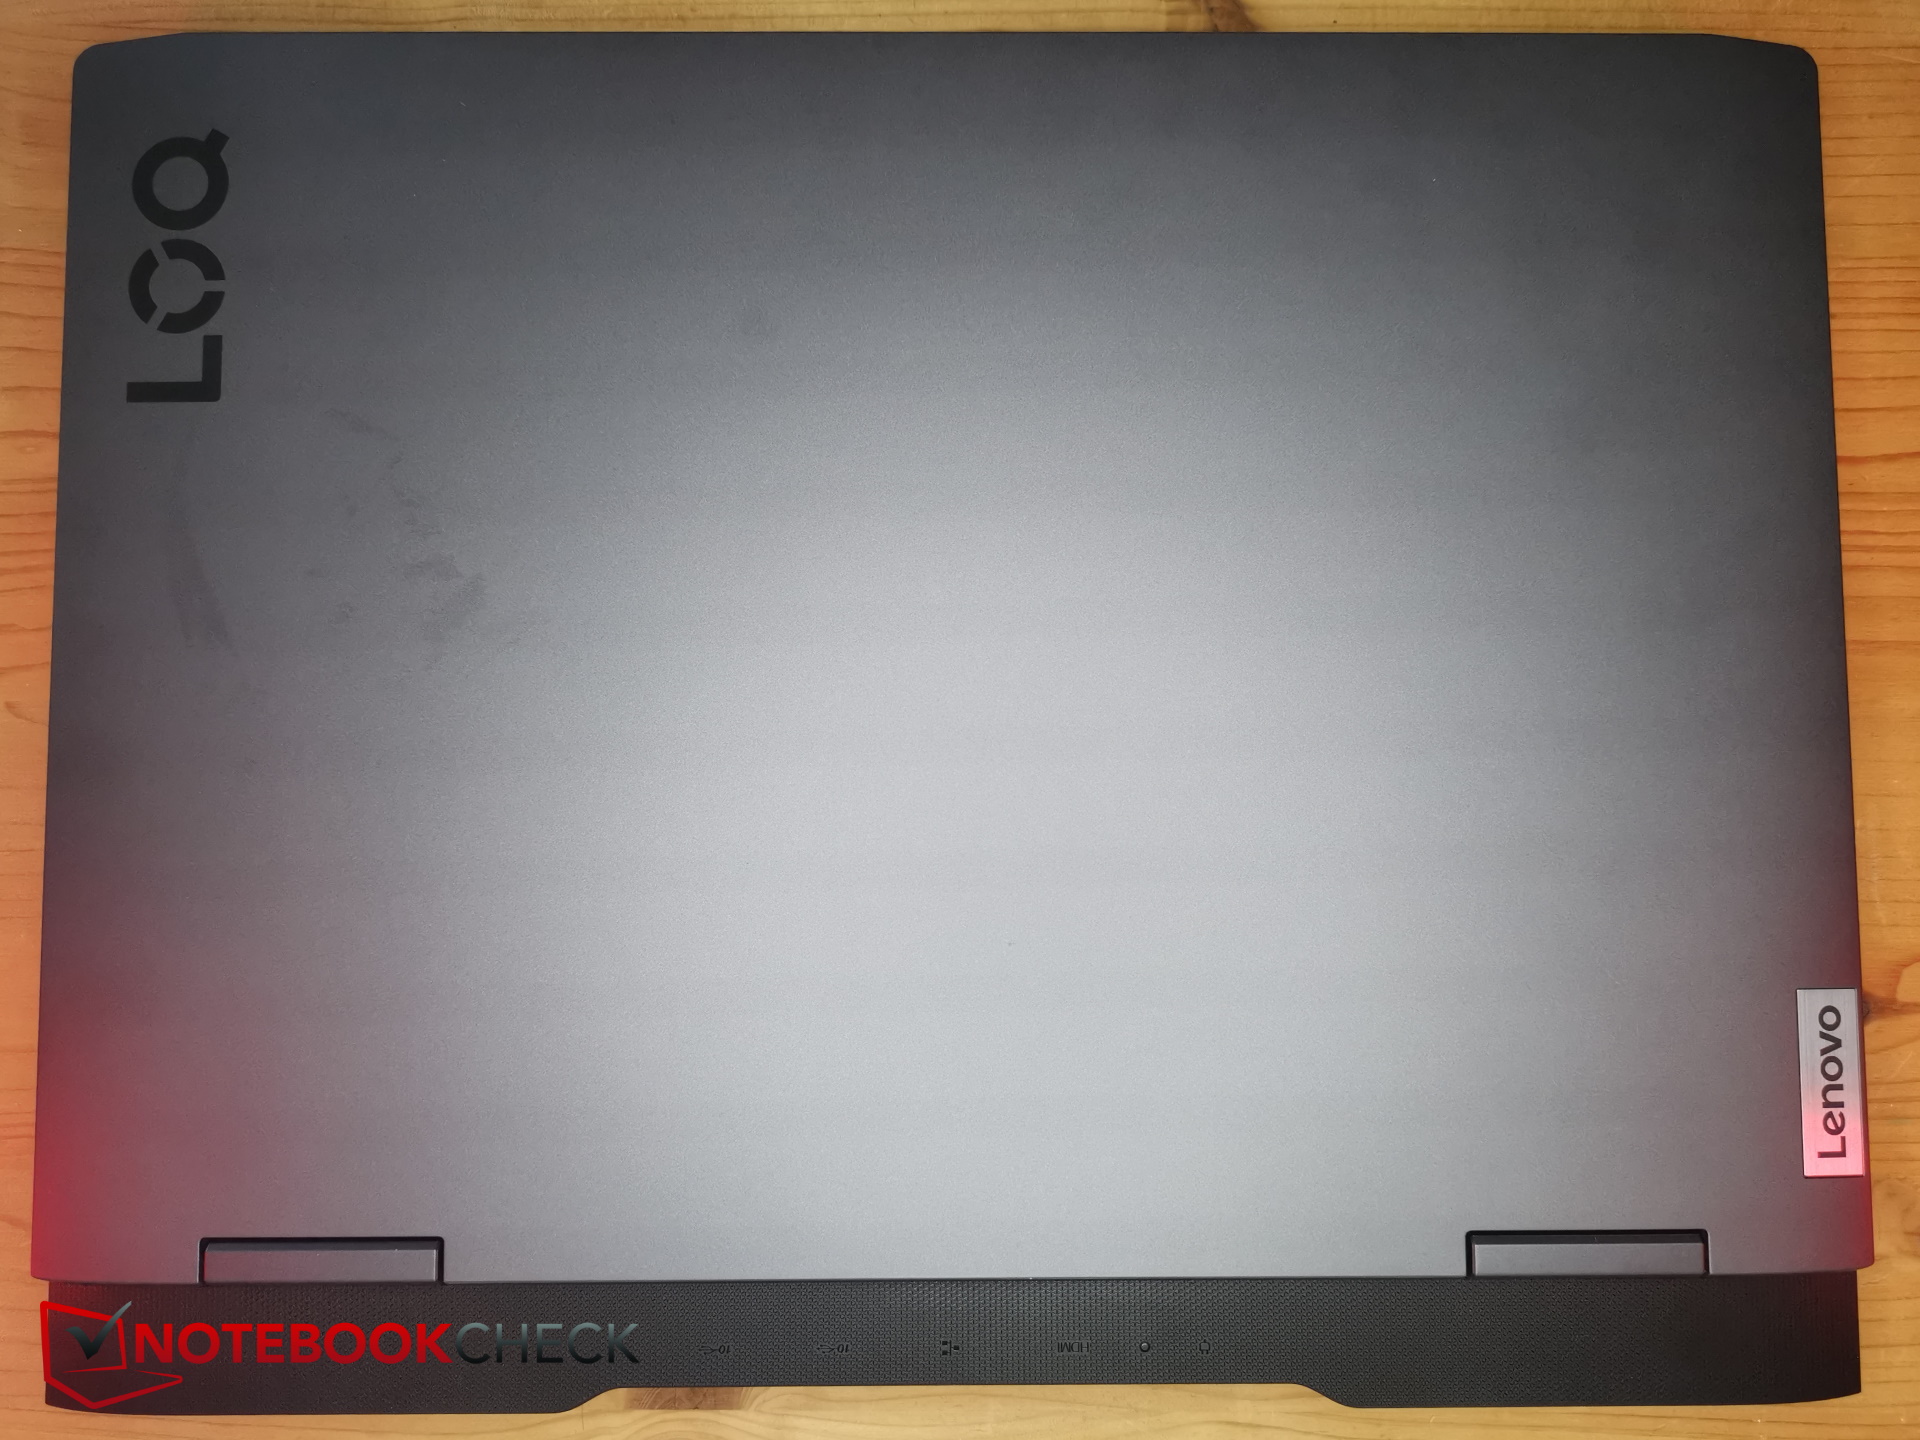
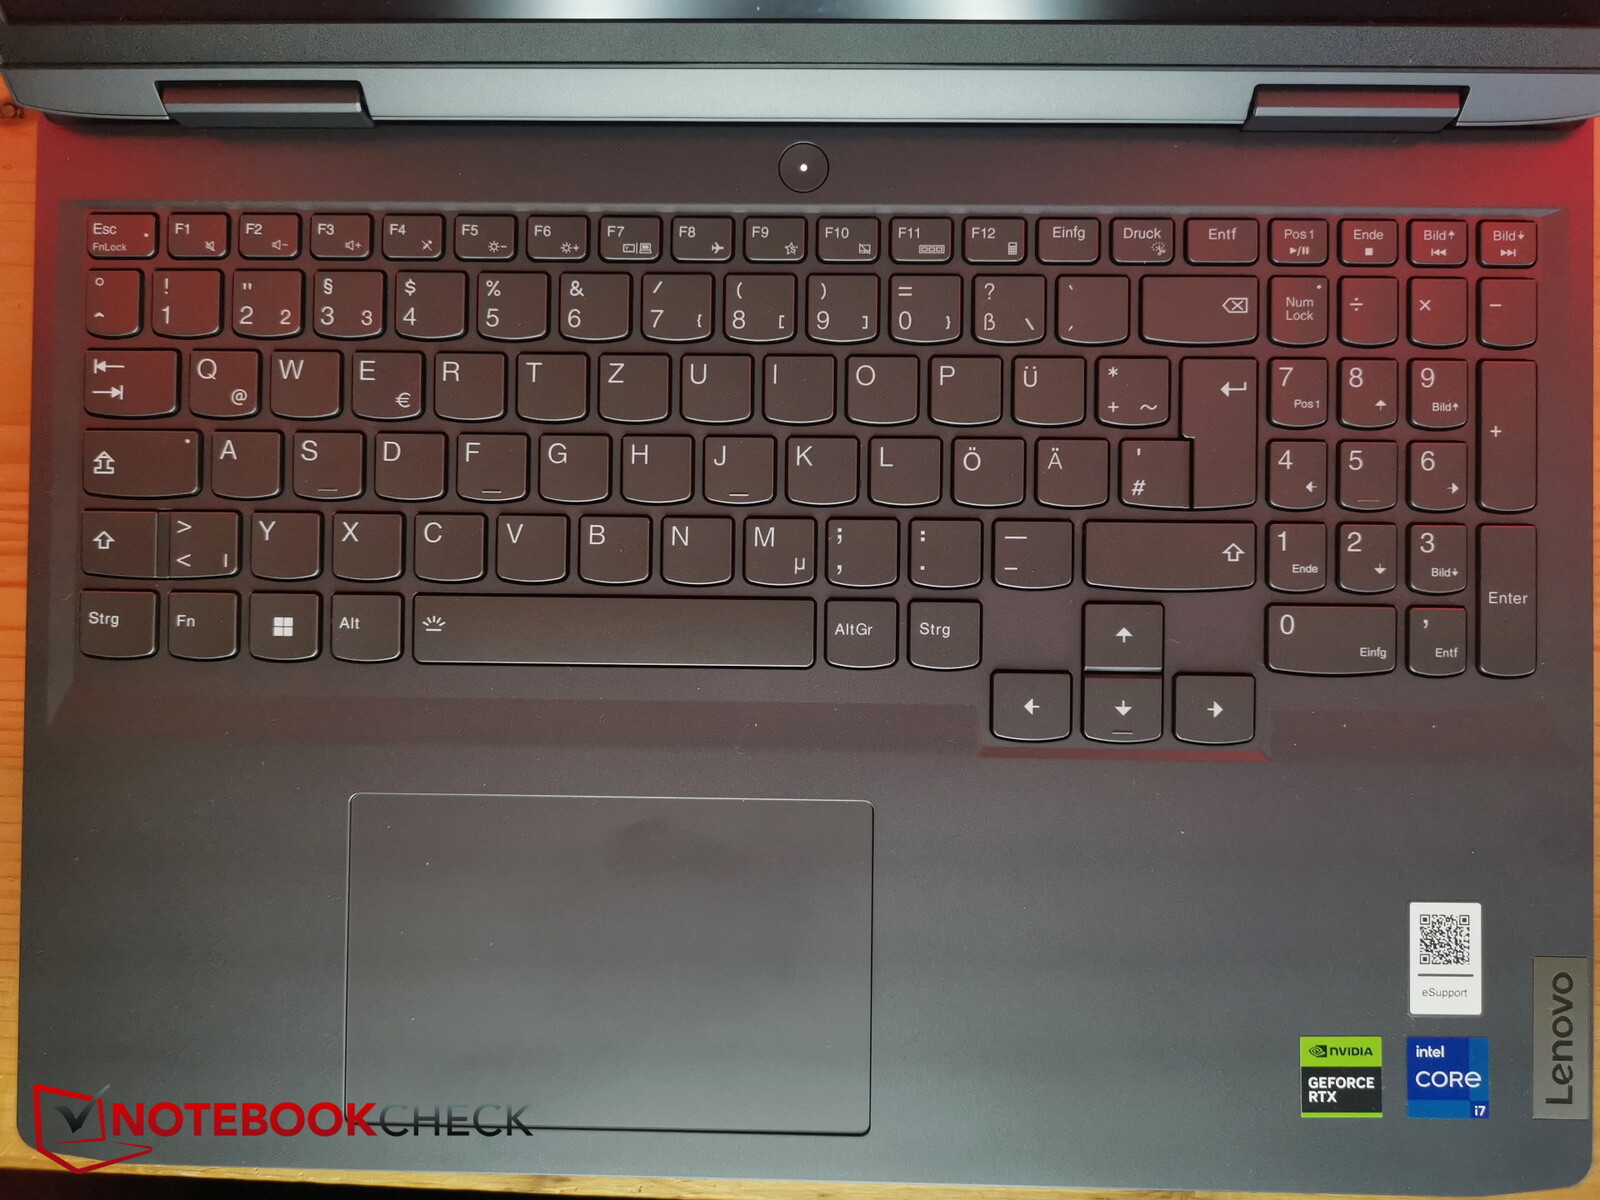
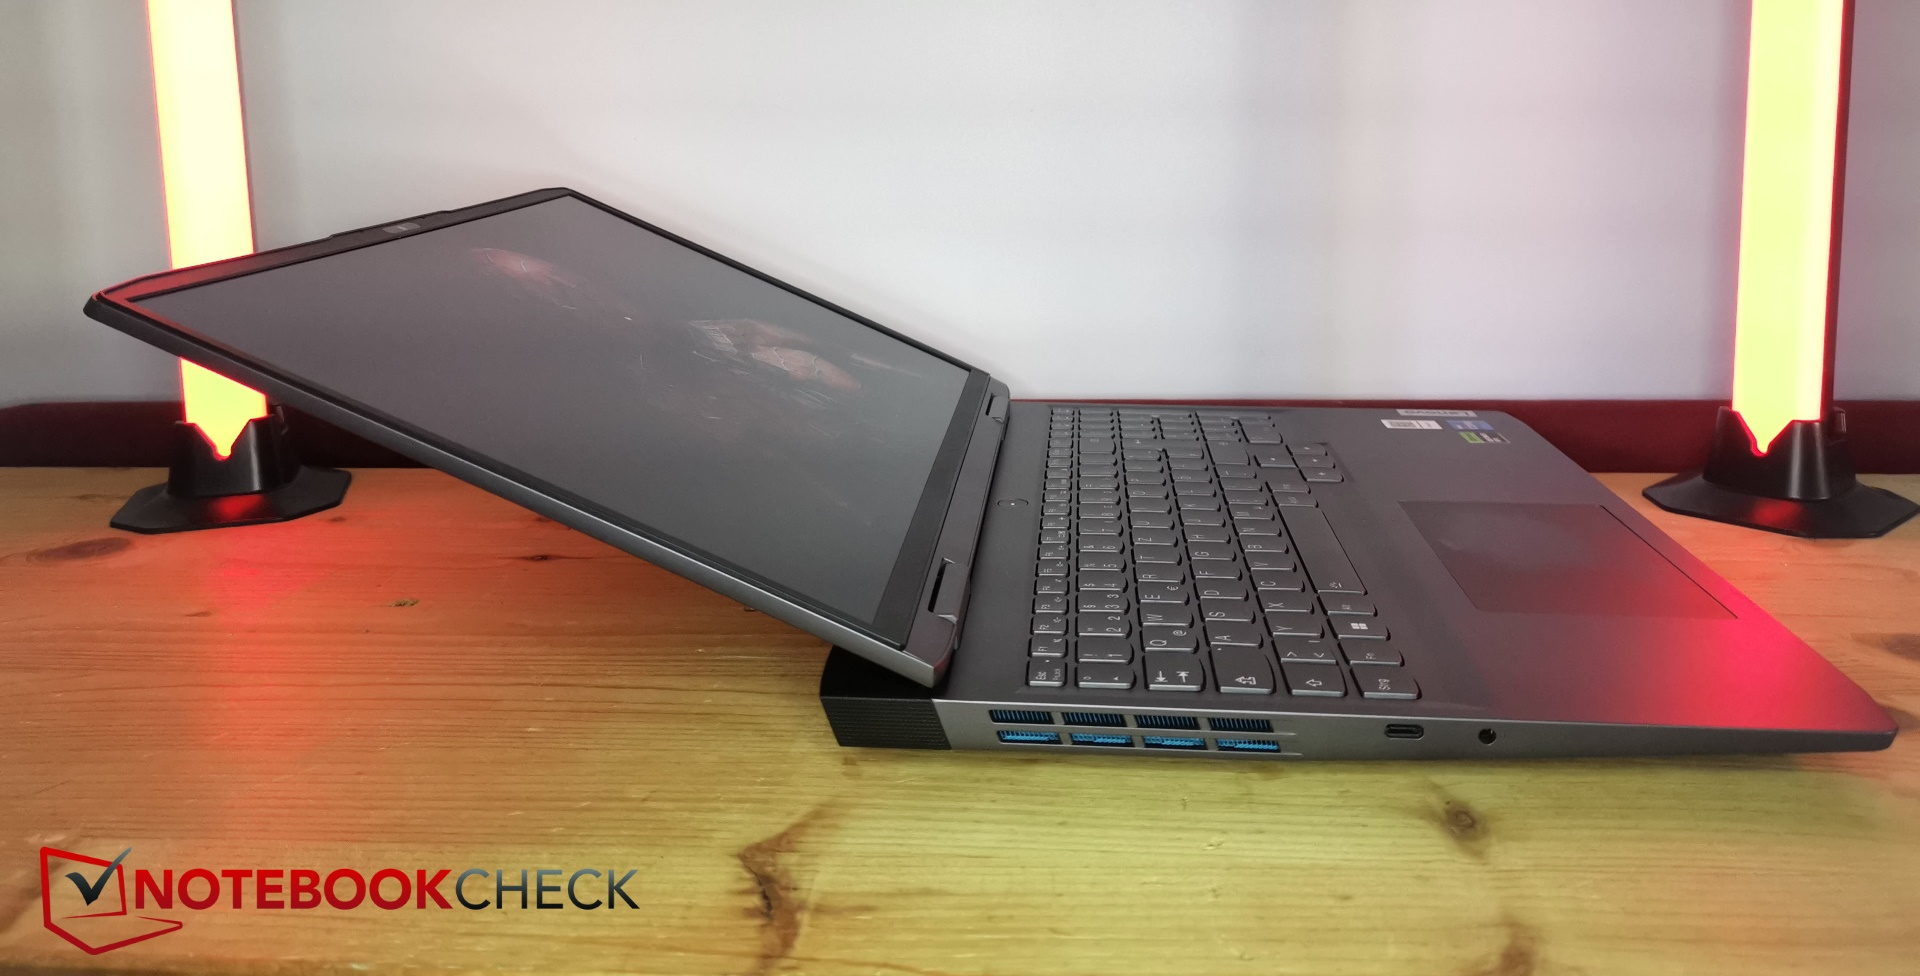
Case - A large and heavy LOQ 16
The Lenovo LOQ series looks more bulky and massive than the more expensive Legion series. This is not least due to the cooling system protruding in the back that reminds us of the Alienware models. The back fan vent also holds the only colorful accents that stand out in bright blue from the otherwise gray design. The front edge is slightly rounded, and the top shows the Lenovo and LOQ logos. The surfaces are kept very smooth, and there are no metal elements like in the Legion.
While the laptop can be opened easily with a single hand up to a maximum opening angle of 160 degrees, the two hinges still hold the display in place fairly well. The palm rests and keyboard surface consist of a single plate with the latter being minimally lowered.
Even though the base produces a few creaking noises when we try to warp it, everything is still sufficiently robust overall. The workmanship is decent, and we do not notice any larger gaps between the materials.
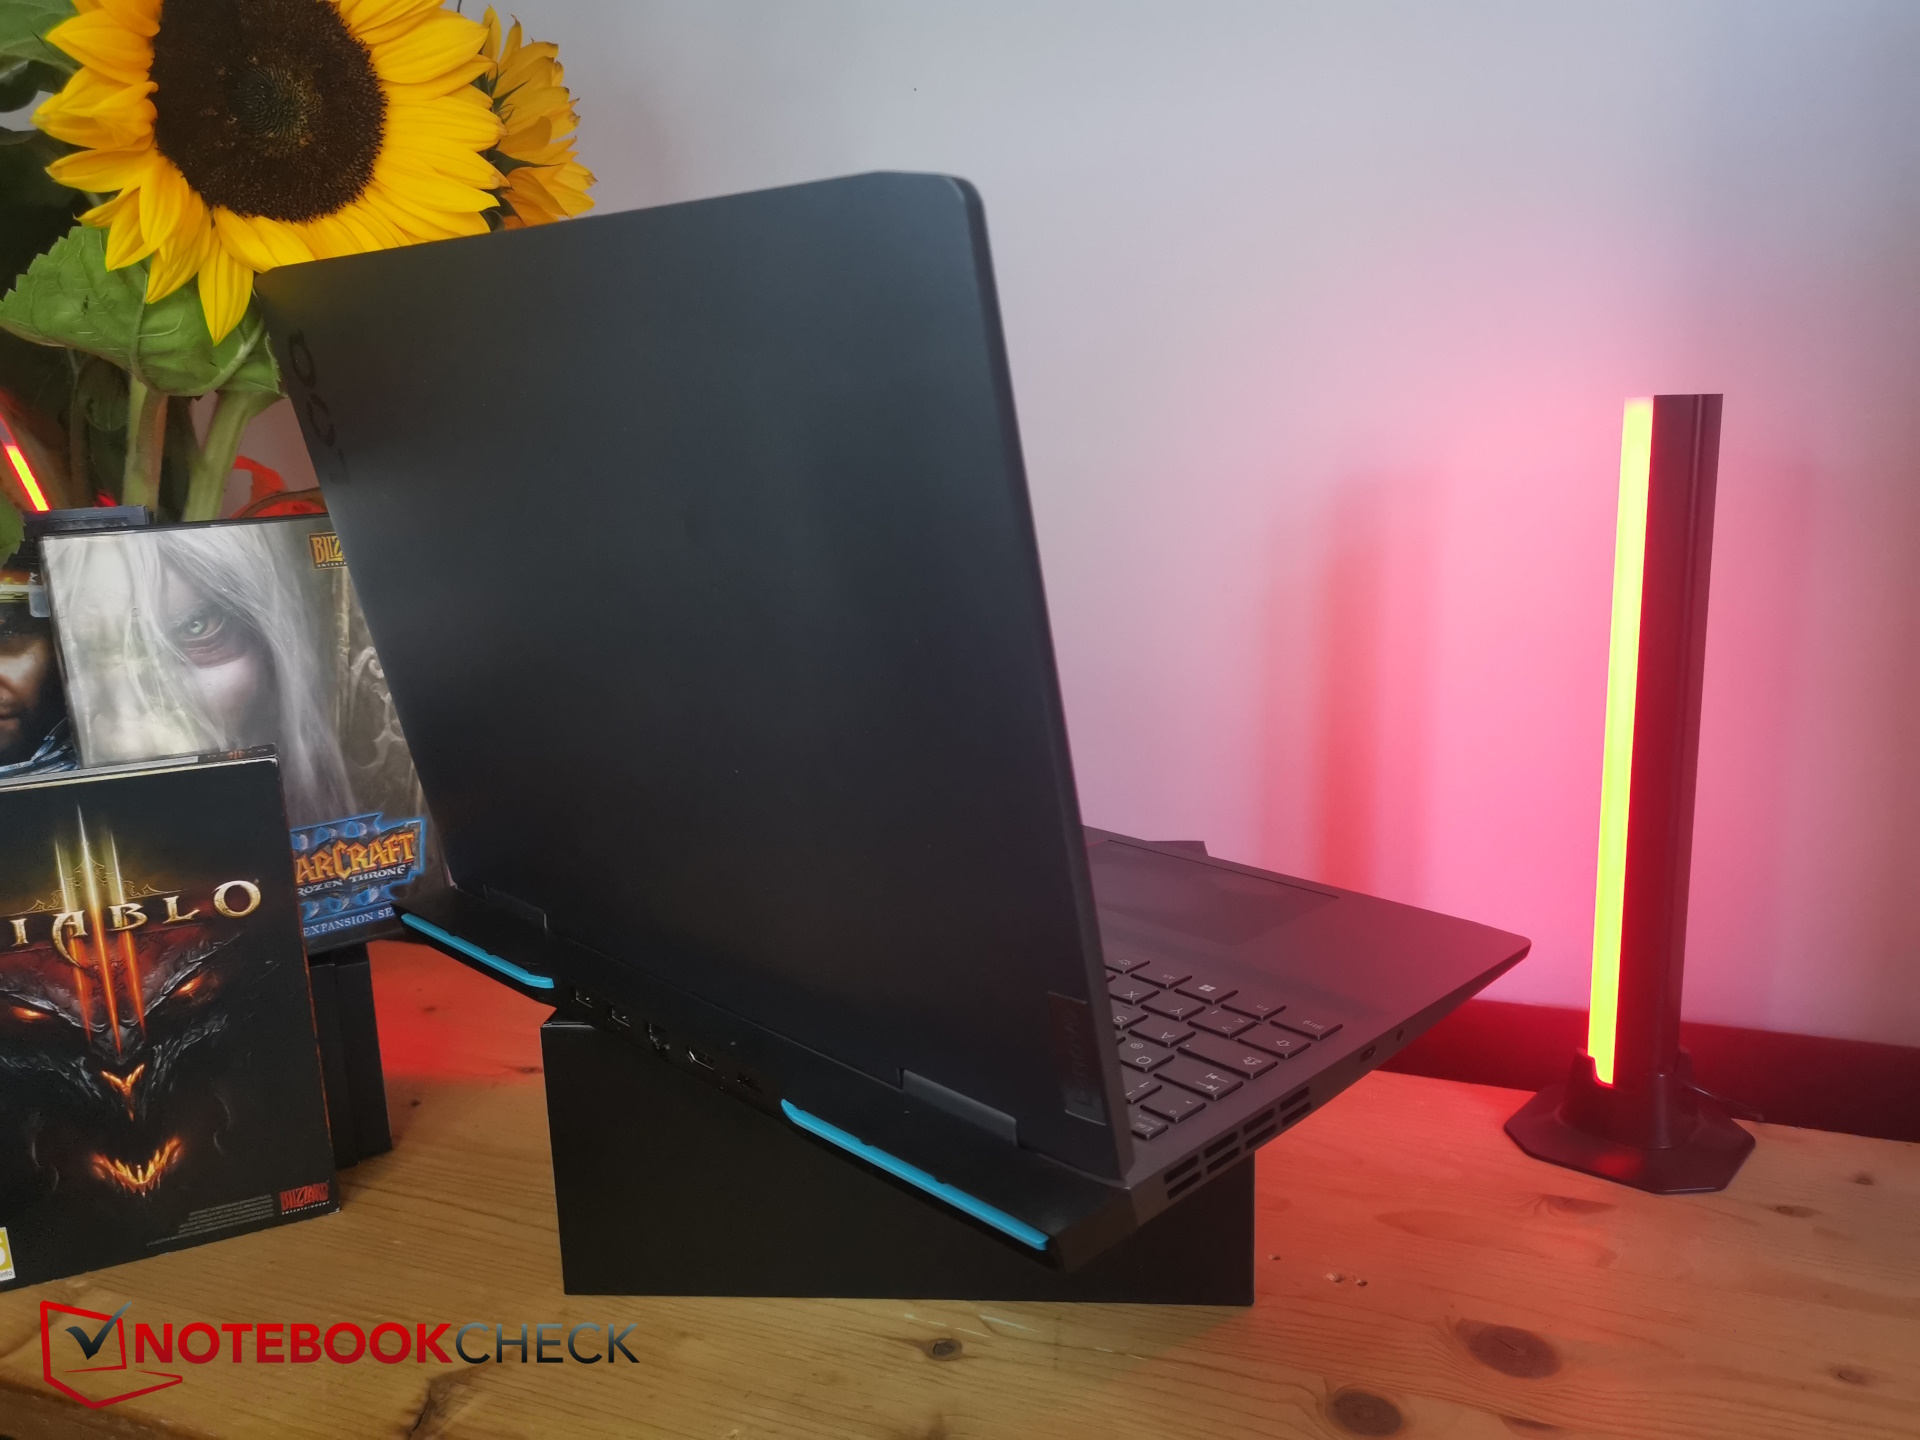
In our comparison, the LOQ 16 is one of the largest and particularly also heaviest 16-inch devices. Due to the cooling system protruding in the back, the laptop is much deeper than most of the competitors. Only the Acer Nitro 16 has a similar size, but it still weighs 100 gram (~3.5 oz) less than our LOQ test unit. All the other models are lighter than that.
Equipment - Without Thunderbolt or SD card reader
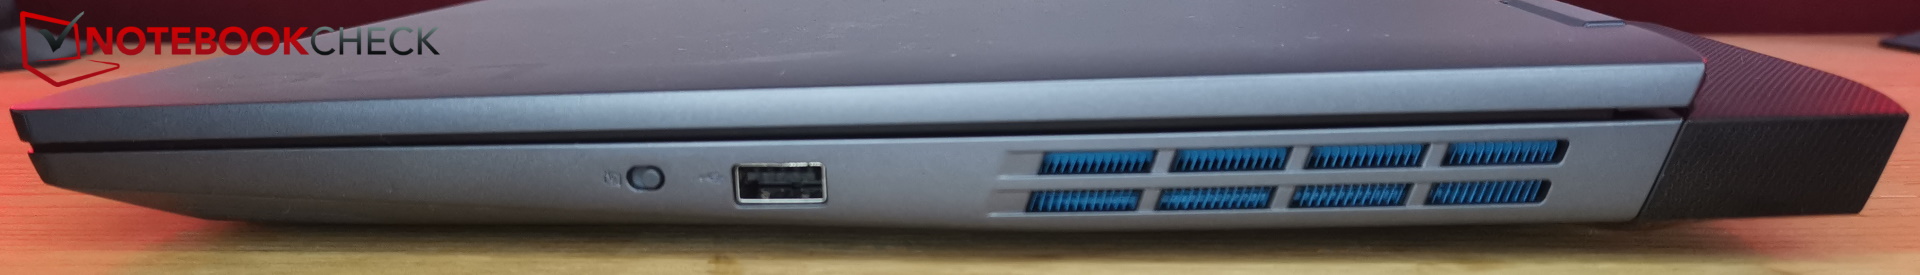
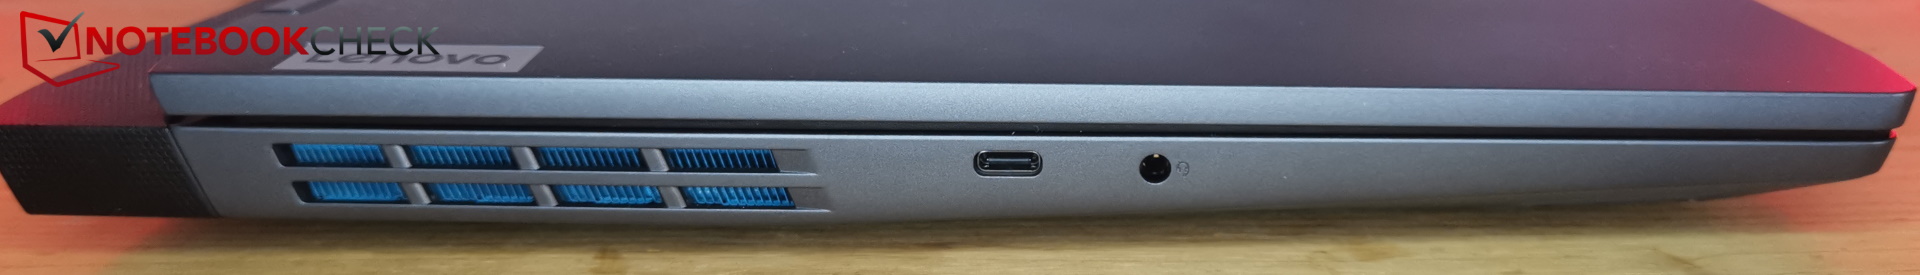
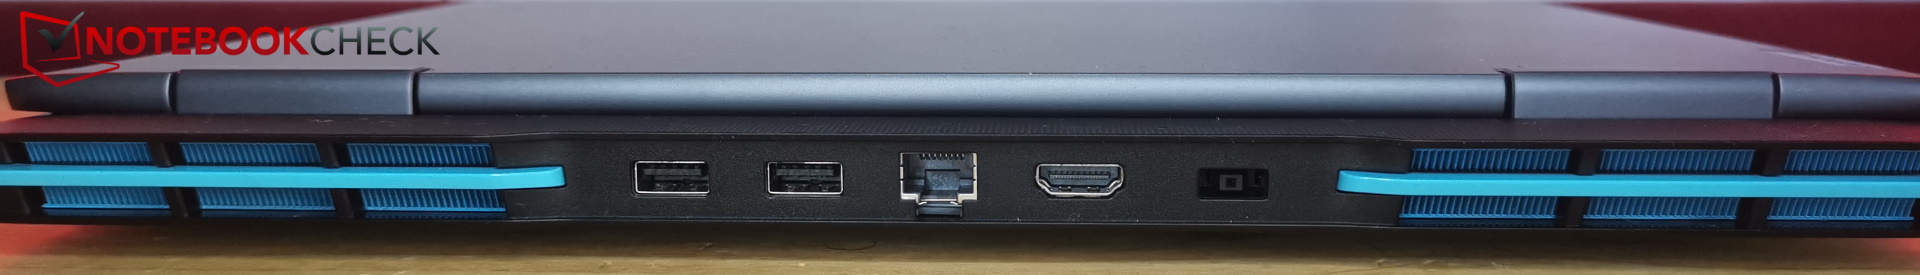
In terms of connection equipment, the budget gaming laptop only offers the most necessary. You get a total of four USB ports with three of them running at 10 Gbit/s. Although there is a single USB-C port, it lacks Thunderbolt. We also look in vain for an SD card reader.
We like the placement of the ports that are positioned on three sides, offering sufficient space in between. Most of the ports are in the back, with only two ports on the left and a single port on the right leaving plenty of space for the mouse hand.
Communication
Even though the Intel AX203 module delivers Wi-Fi 6, its speed is surpassed by the AX211 used by most of the competitors. It is also unable to connect to the 6-GHz network.
While the transfer rates are constant, at around 800 MB/s, they remain behind those of the competitors, which often reach more than 1 GB/s.
Webcam
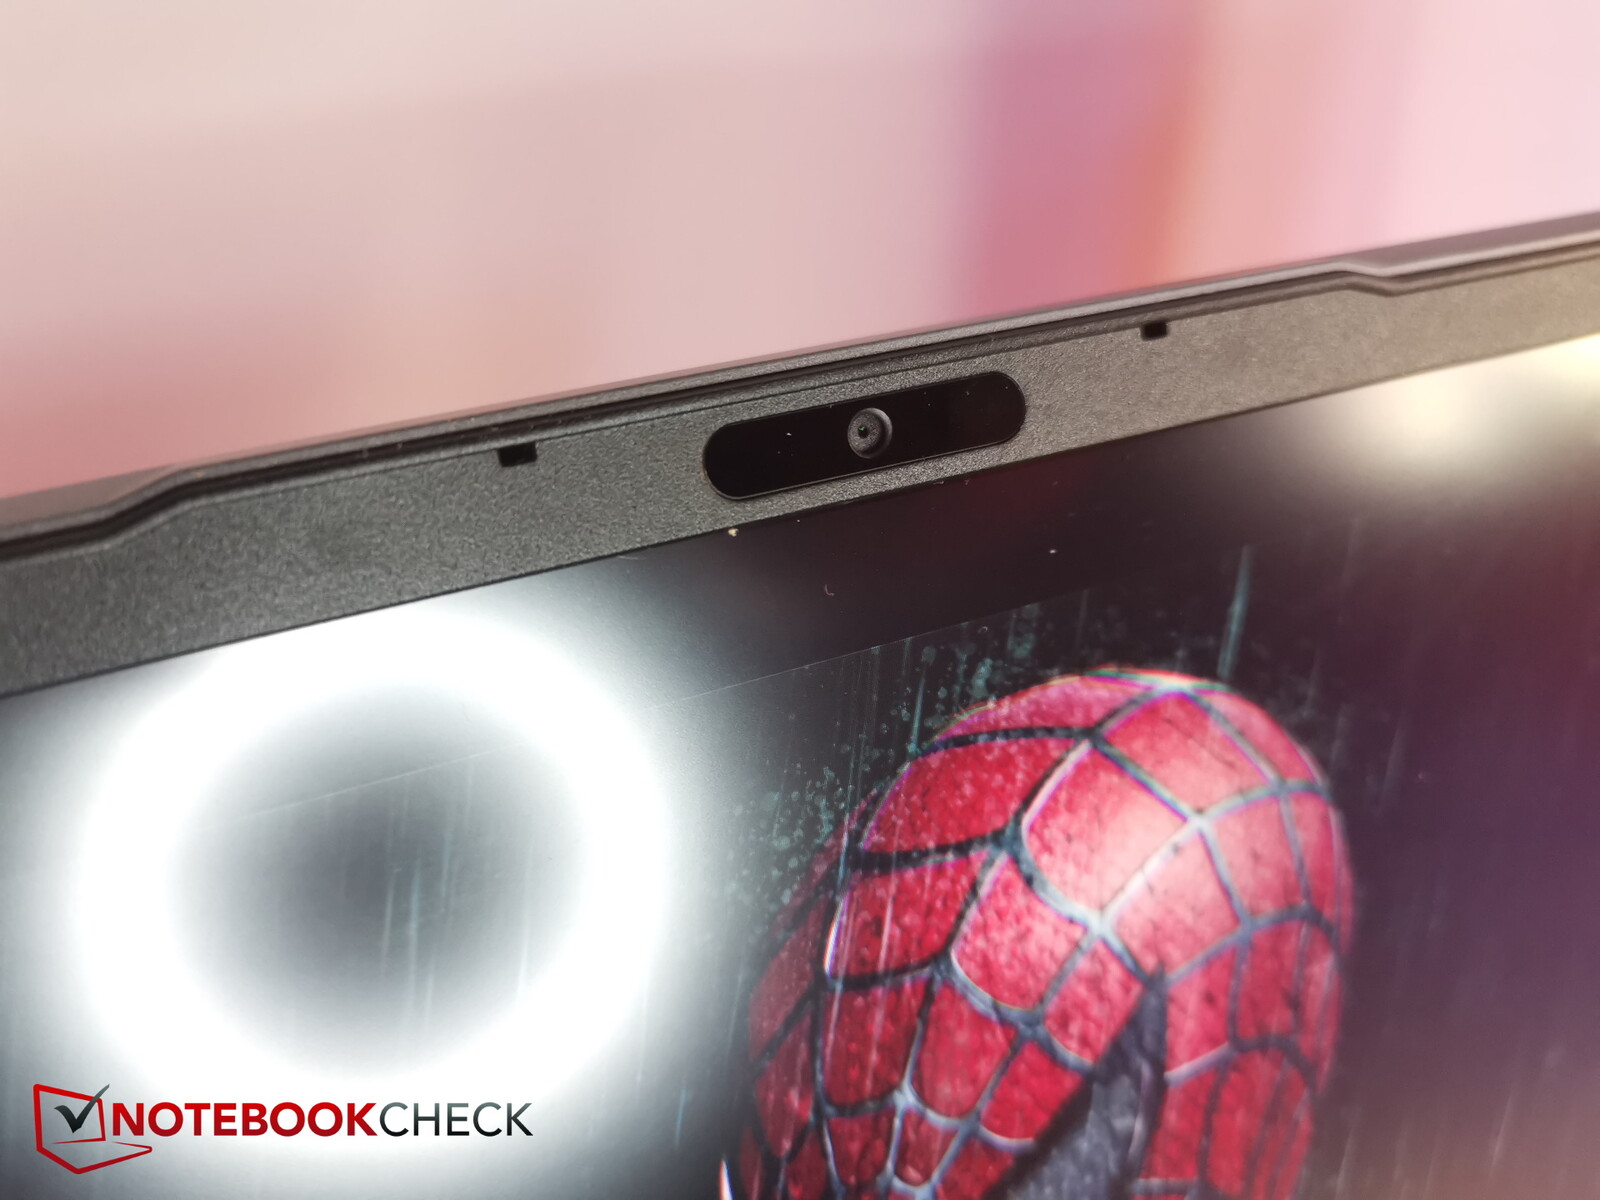
Lenovo has placed a Full-HD camera in the top edge of the display bezel. We appreciate the existence of an (electronic) privacy shutter on the right side.
The camera itself produces some fairly high color deviations, but it is still sufficient for making the occasional video call in good light conditions.


Security
TPM is of course included, although the LOQ lacks a fingerprint sensor or a Kensington lock.
Accessories and Warranty
Those who expect some accessories should look a few price classes higher. Except for the laptop itself and its charger, the box only includes some paperwork.
In Europe, Lenovo offers two years of warranty with courier pickup or shipping by the customer. At an additional cost, you can also purchase Lenovo Premium Care (Plus) with 24-hour customer support.
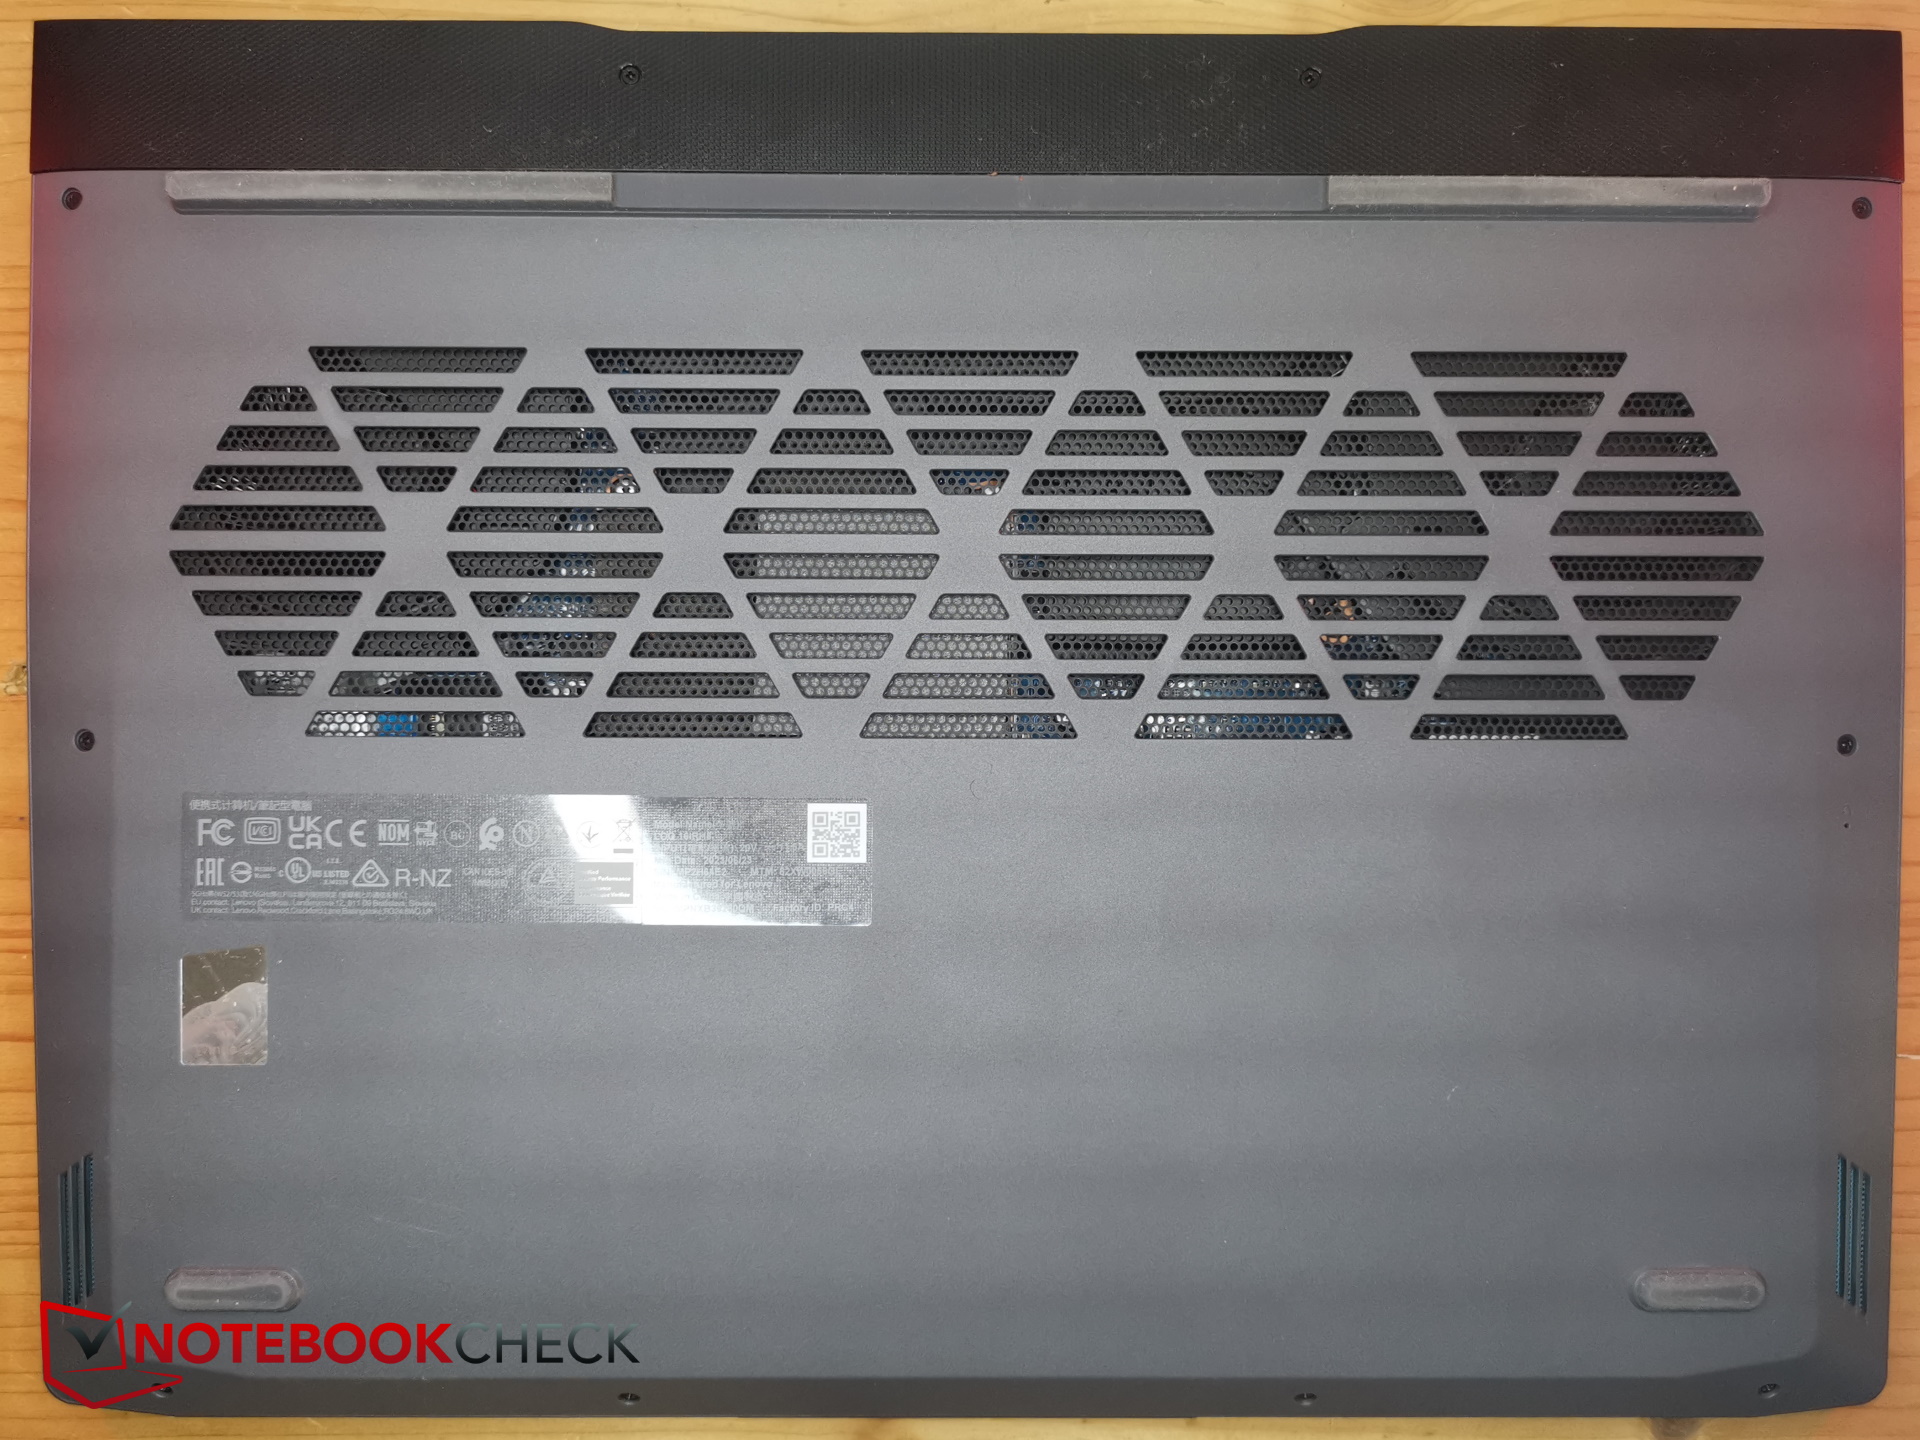
Maintenance
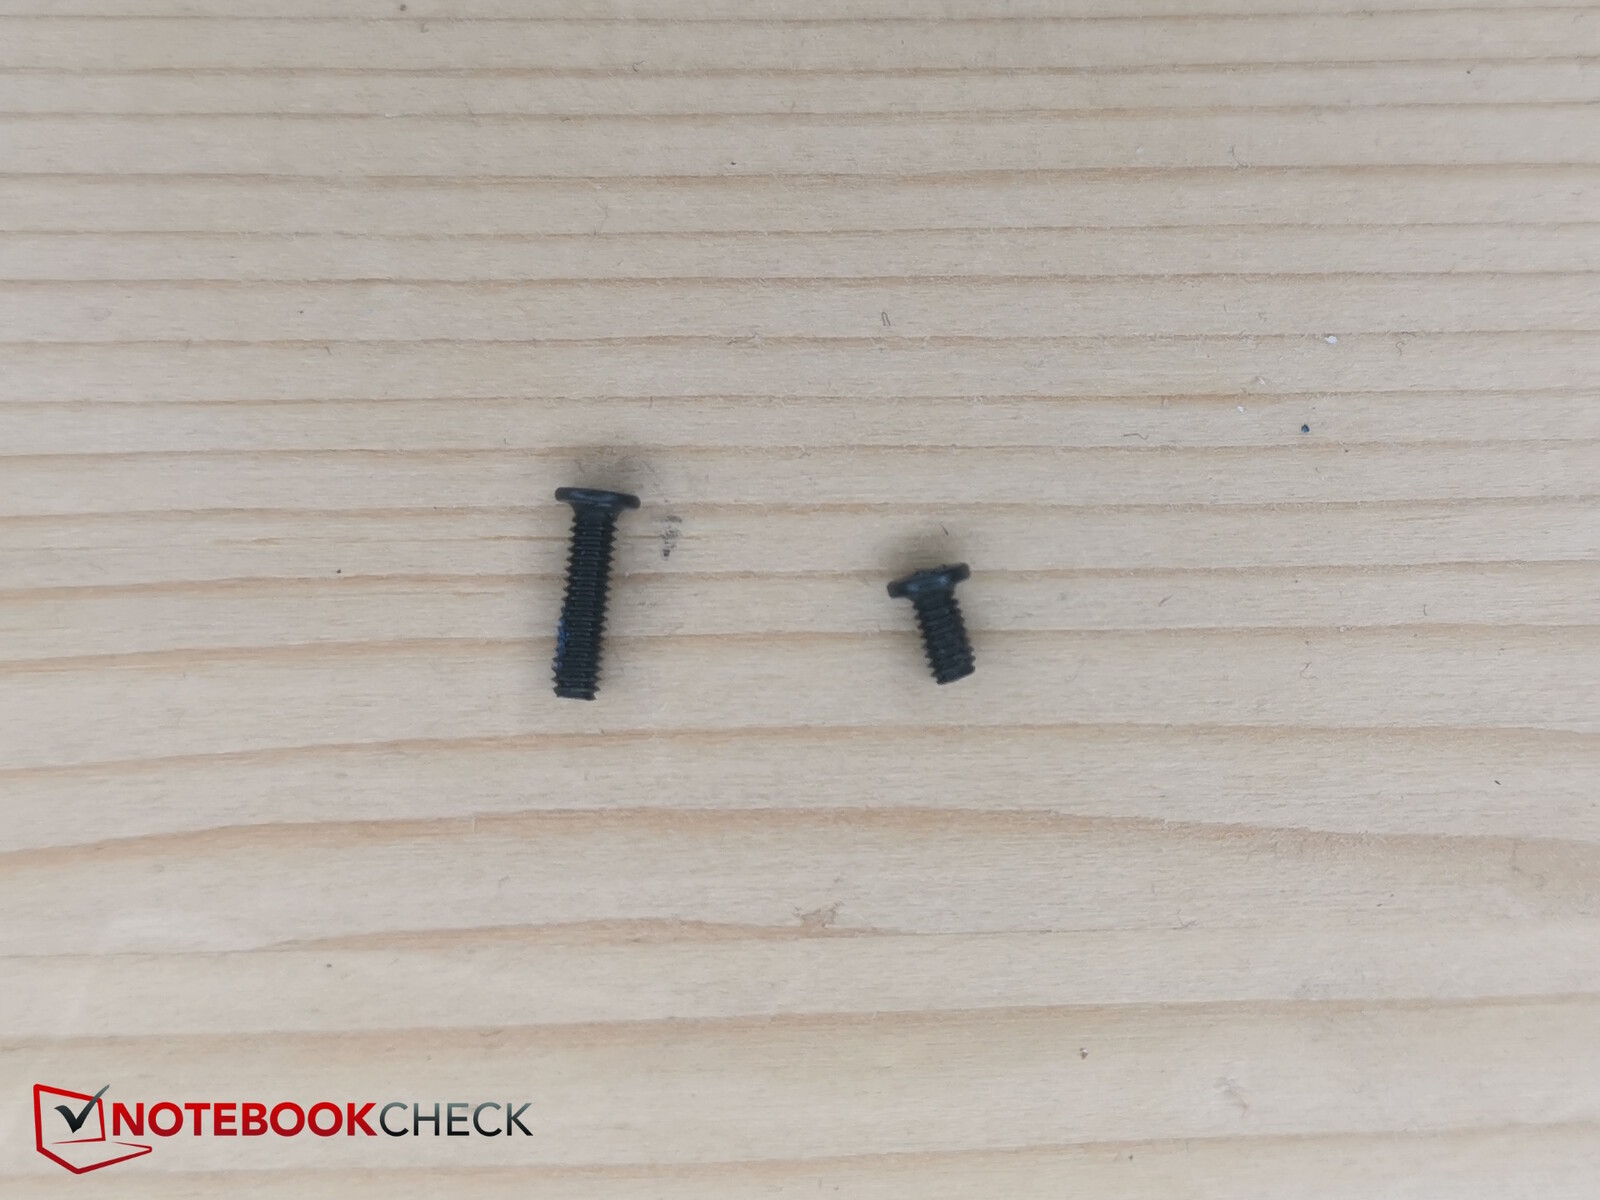
The cooling system protruding in the back makes removing the bottom of the case slightly more difficult than in other laptops. You first have to remove ten Philips screws. But be careful: The four screws in front are significantly shorter and set at an angle, so you should not make the mistake of trying to use one of the longer screws here.
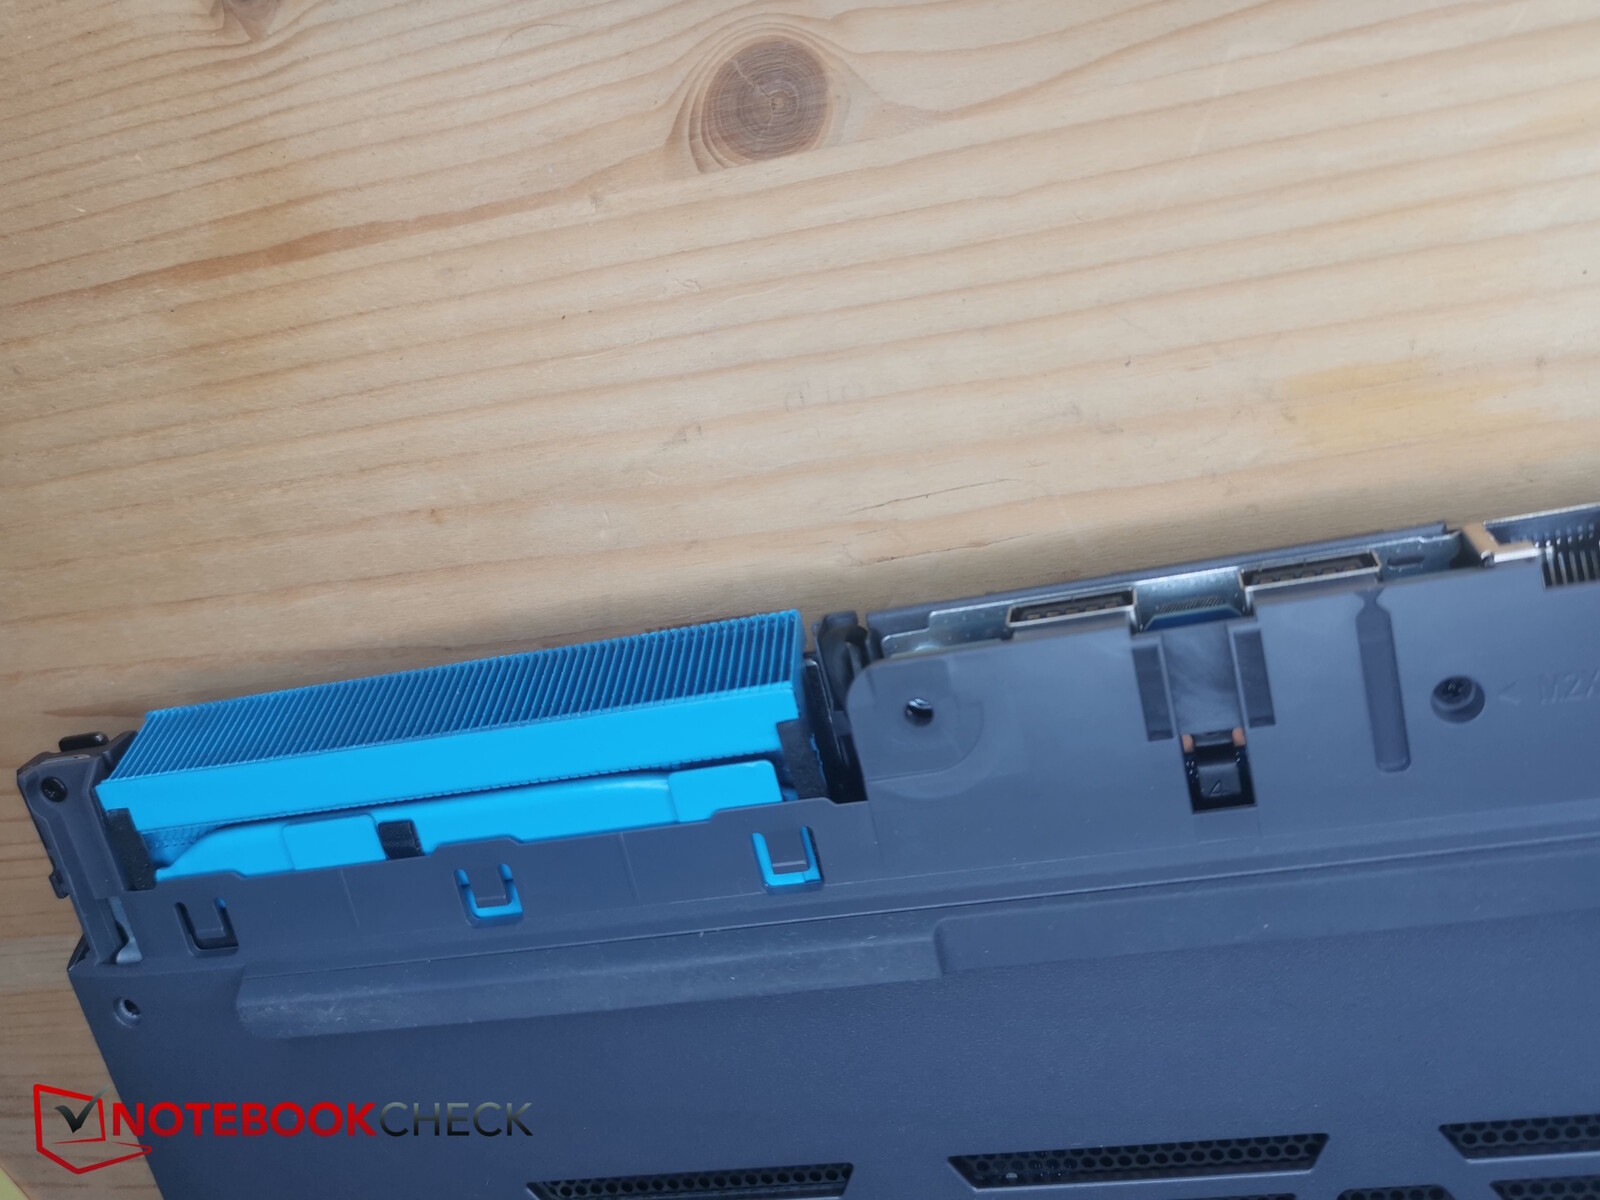
Before you can remove the bottom plate, you first have to slide the cover of the protruding cooling system toward the back, since below that, the bottom plate is fastened with three additional screws. After removing those, you can pry open the bottom plate starting from the front without having to use any additional tools.
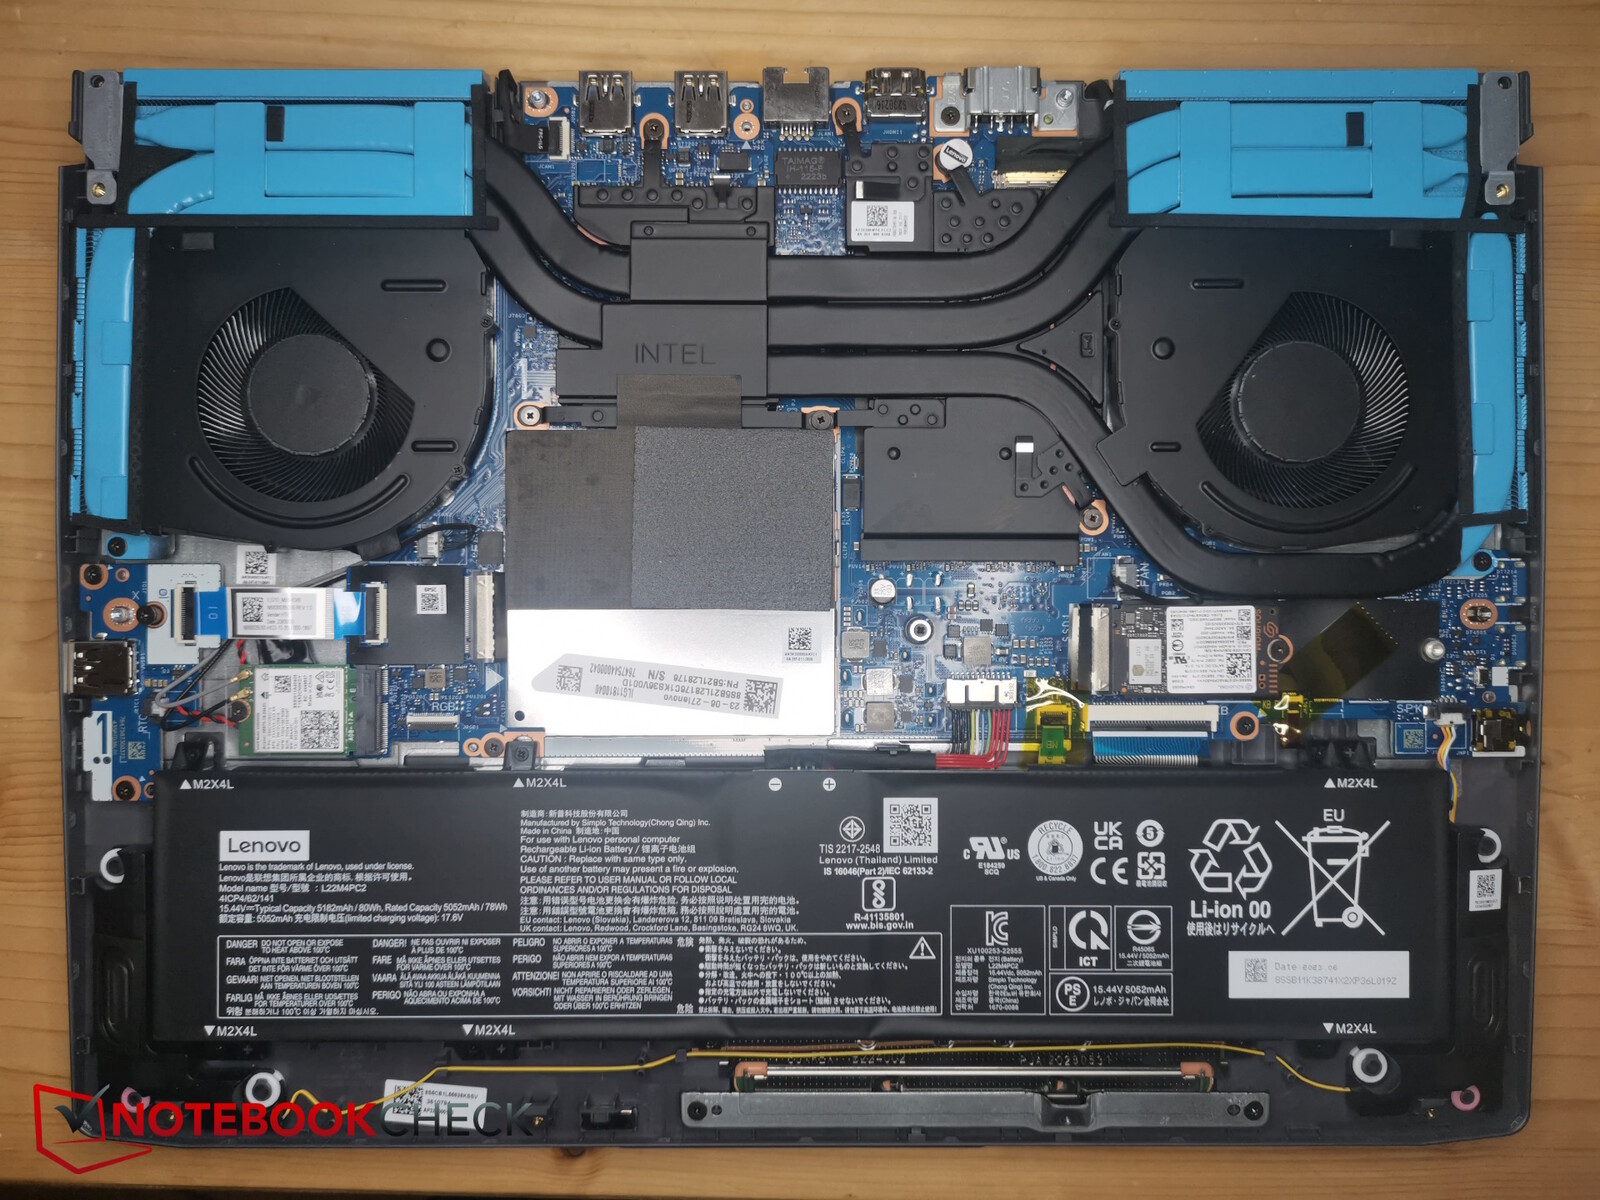
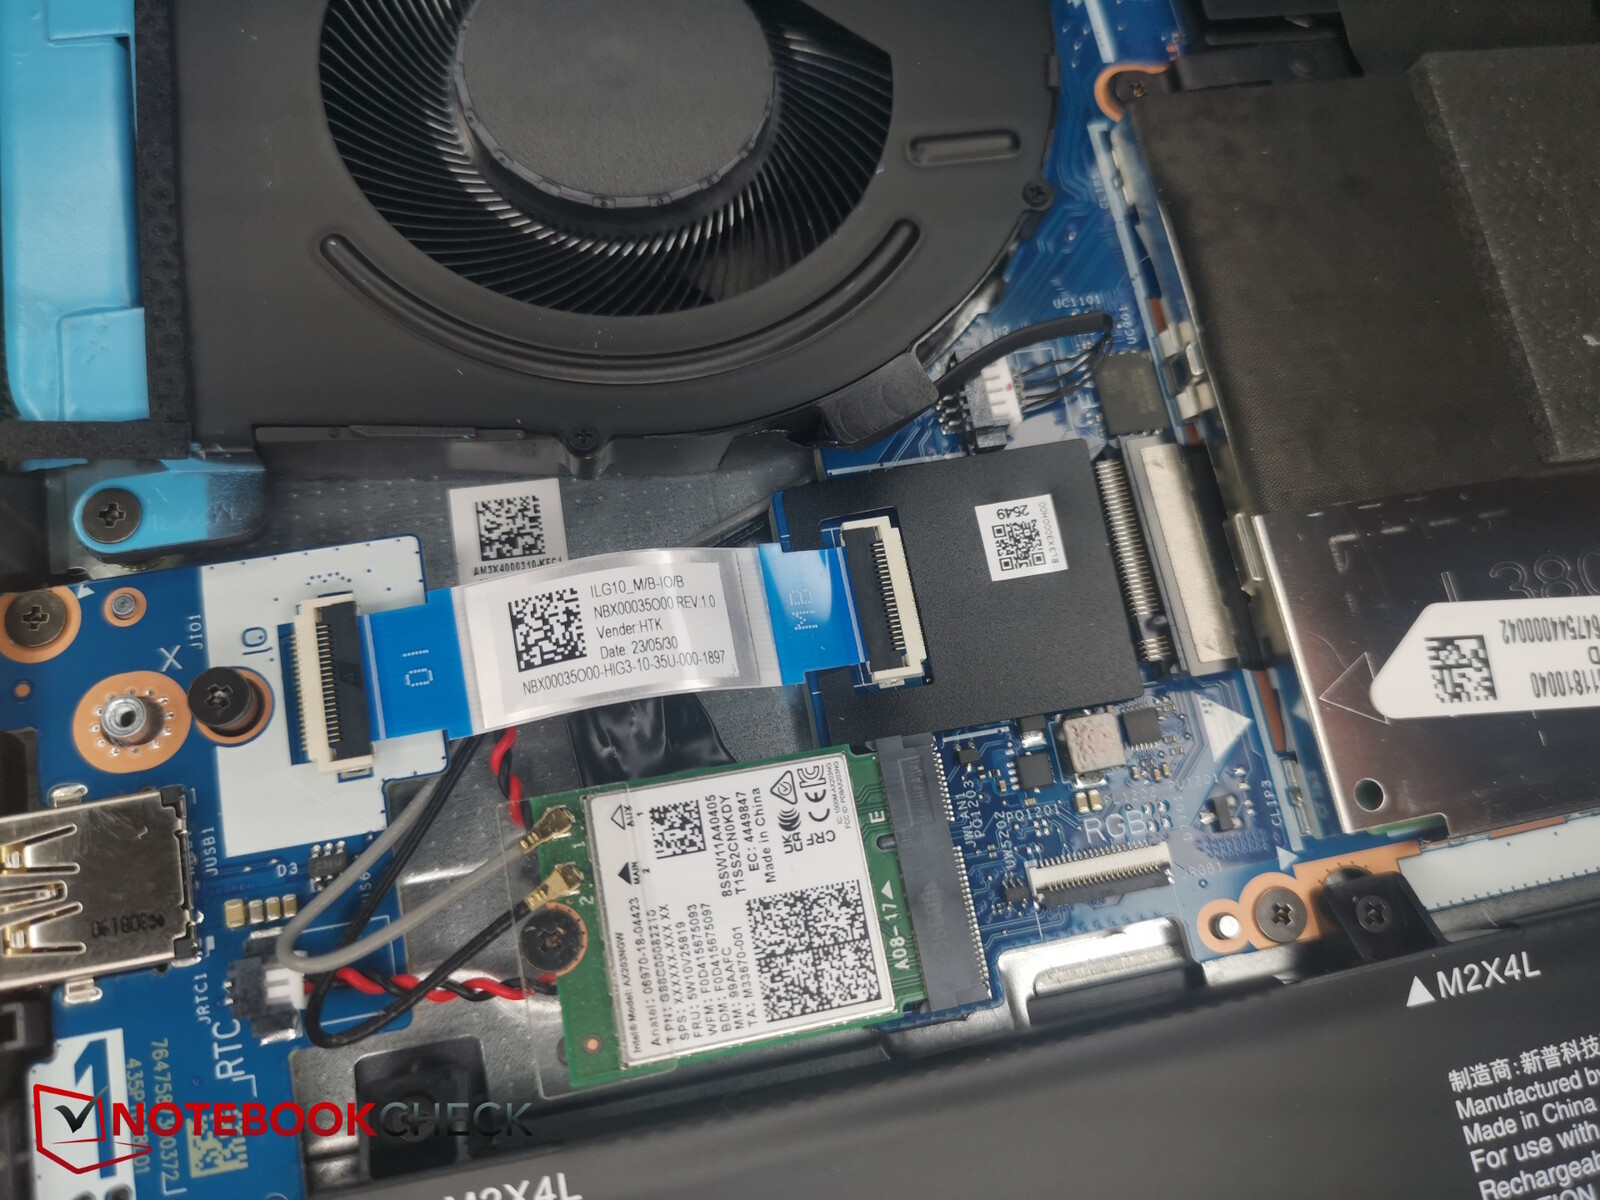
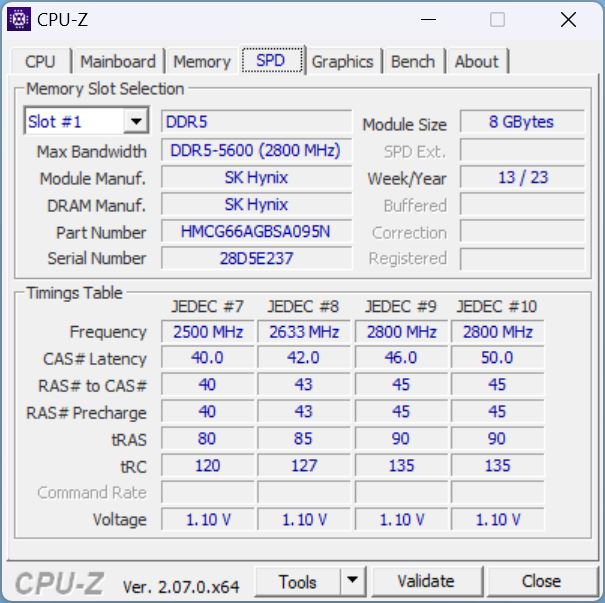
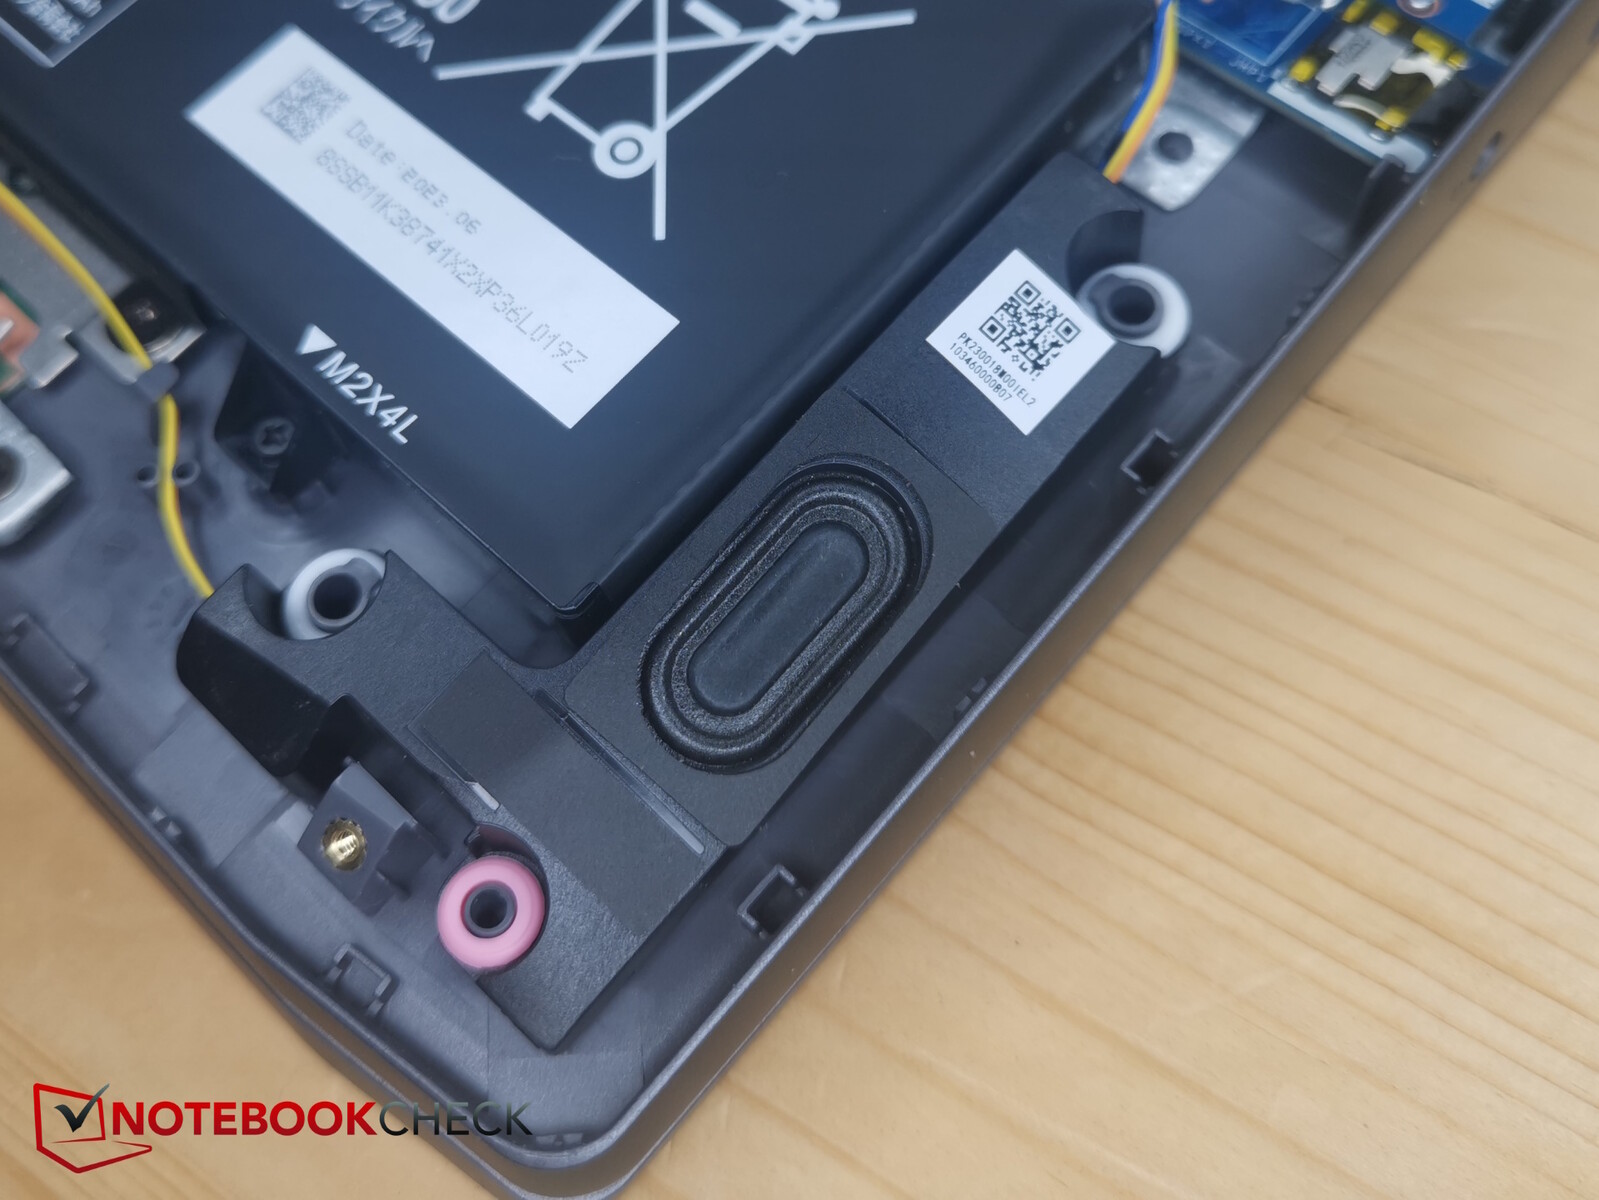
Inside, you get access to the fans, the battery, the Wi-Fi module, the two RAM slots that are covered by some foil, the SSD, and the second SSD slot. Interestingly, Lenovo uses a short SSD in the M.2 2230 form factor, even though there would be sufficient space for a regular-size M.2 2280 SSD and the screwing frame for it is also already there.
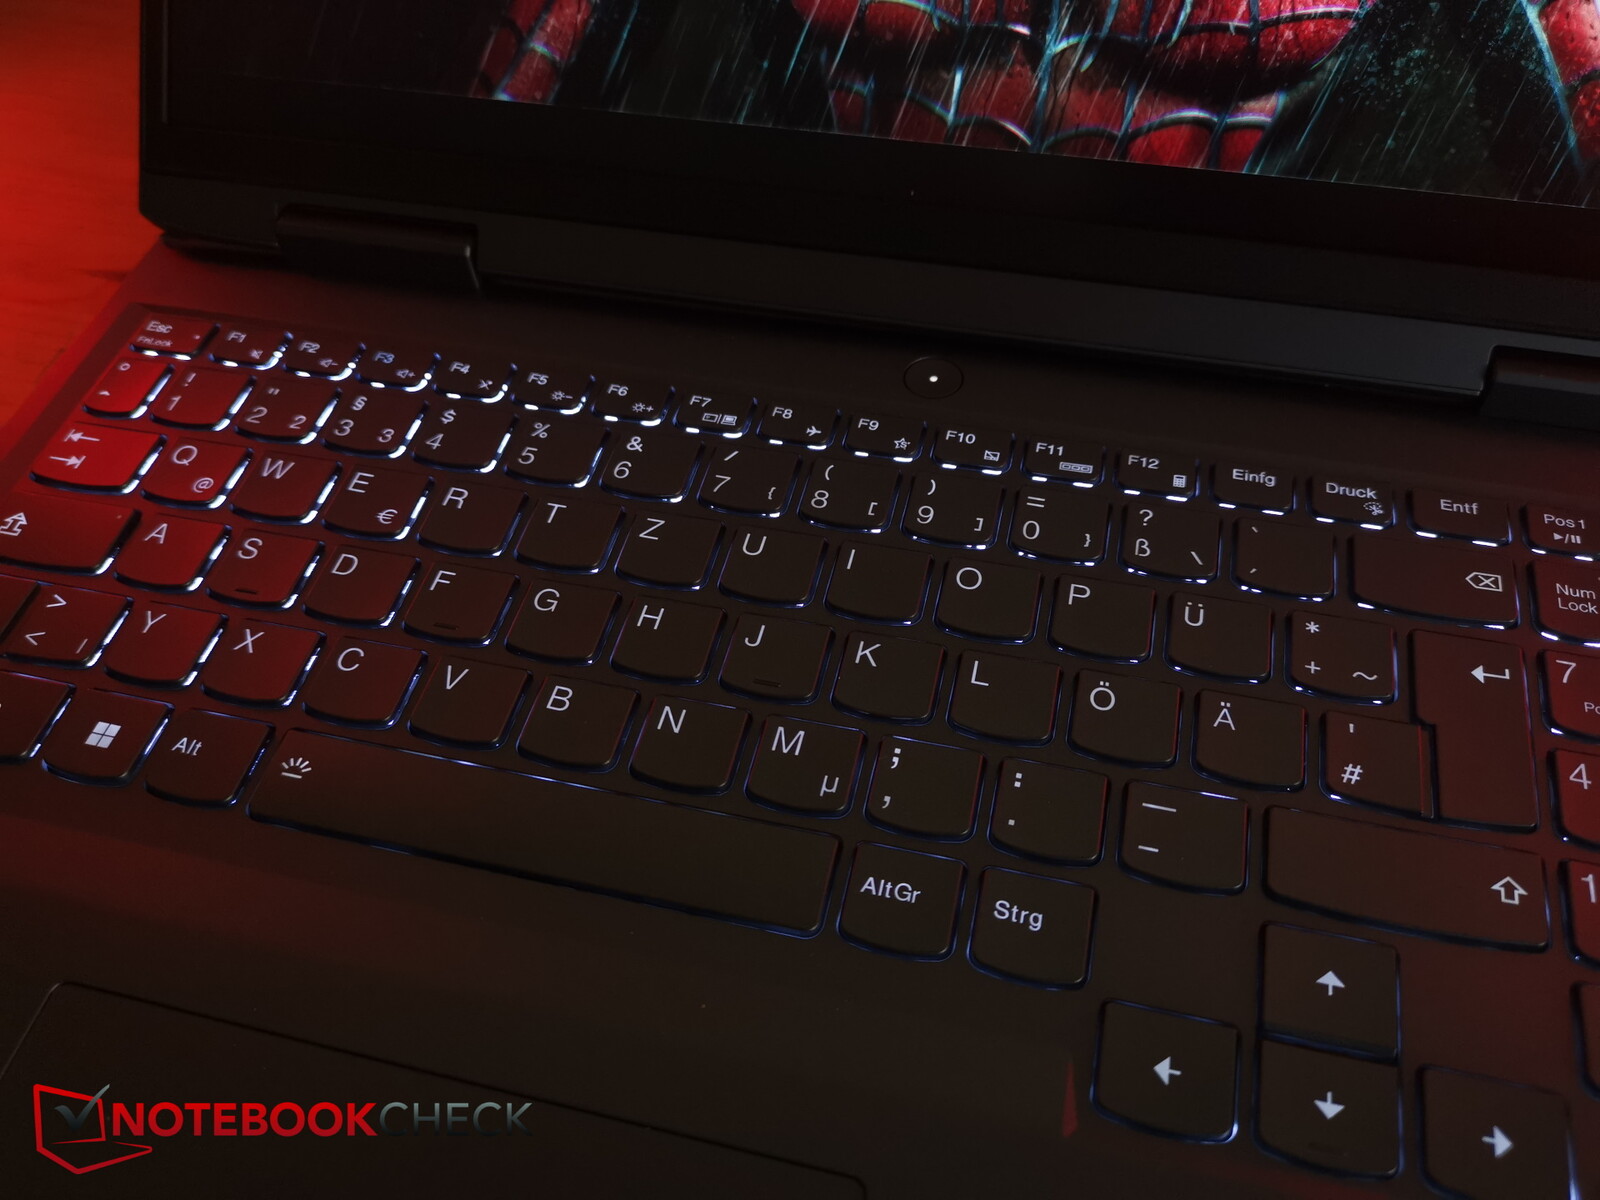
Input Devices - Solid and with 2-step illumination
Keyboard
Despite having a new name, the LOQ quasi inherits the keyboard of the IdeaPad Gaming 3. The layout looks clean, with the arrow keys separated and moved toward the bottom, allowing them to have full size. A slim number pad is squeezed in on the right.
The regular keys have a good size and are rounded on their bottom edges. The key stroke isn't particularly long, and the feedback could have been a bit tighter, although it is still okay. The keyboard allows for quick typing, but some users might find the stroke a bit soft. The typing noise is very moderate.
In dark surroundings, the white, two-level keyboard illumination helps, but there are no light effects, separate zones, or RGB.
Touchpad
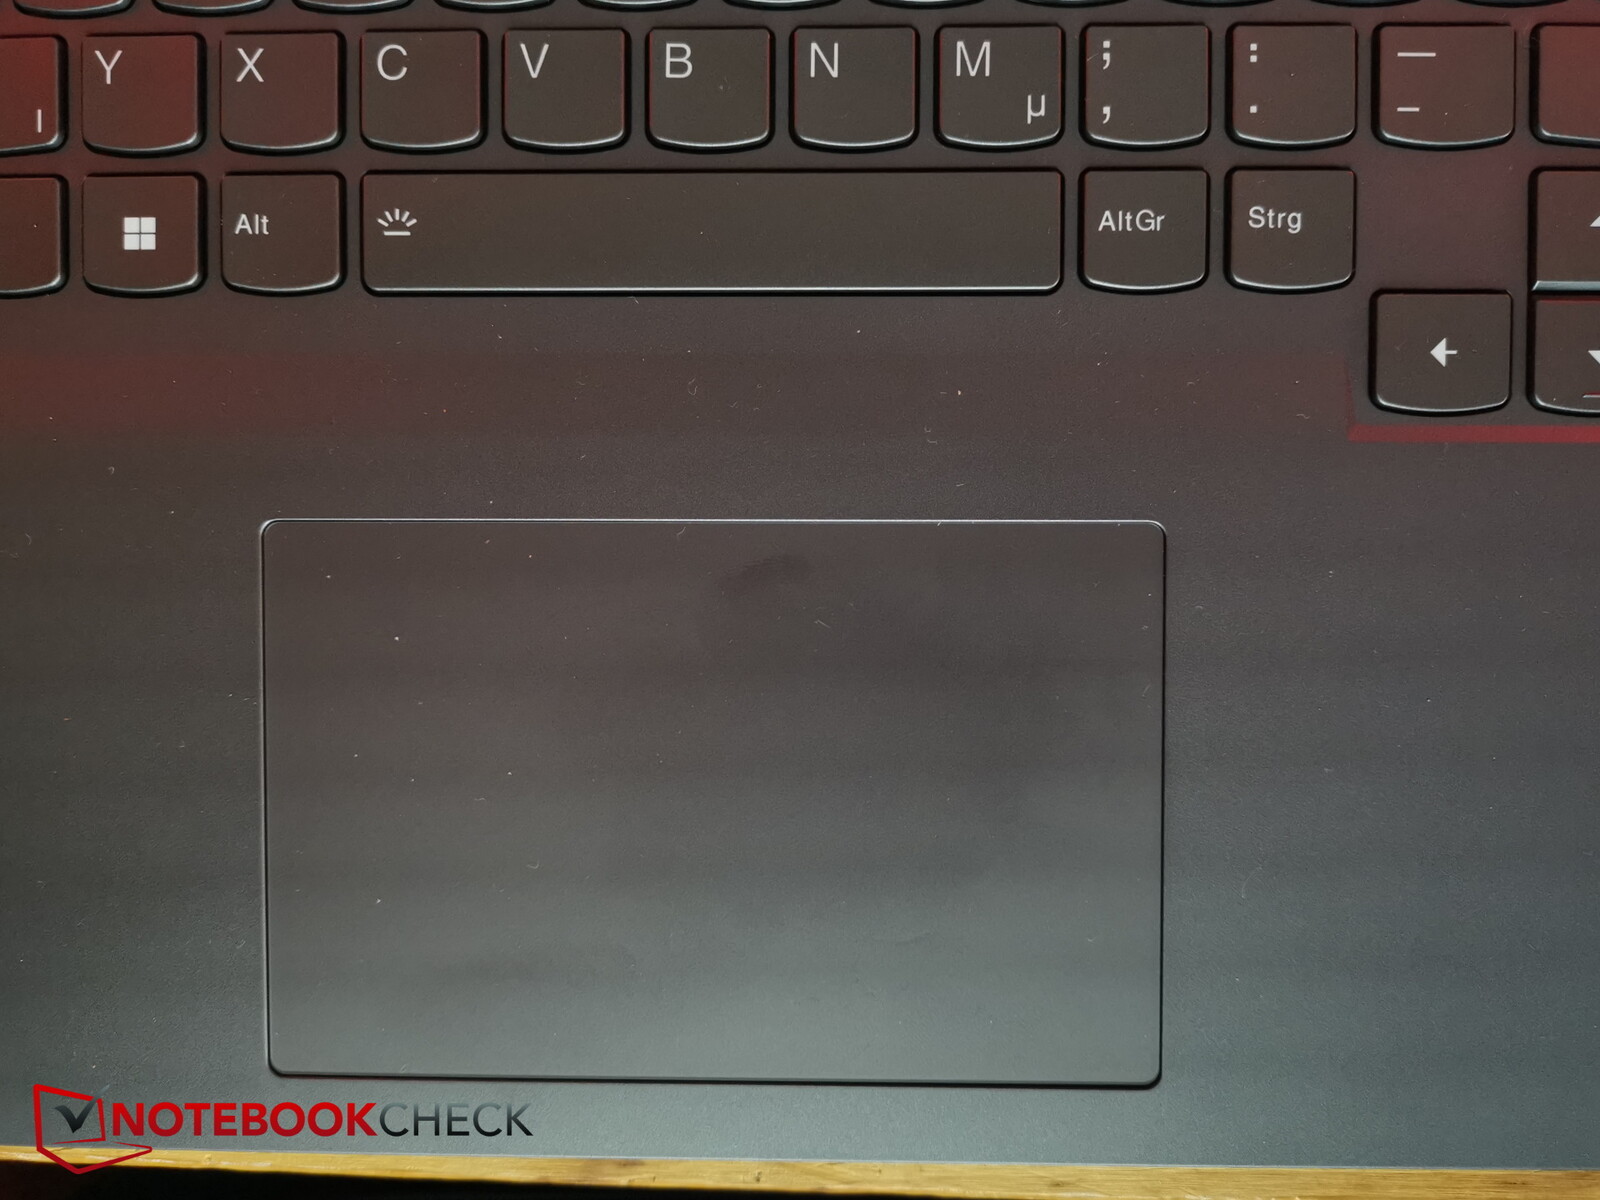
The touchpad has a good size with about 12 x 7.5 cm (~4.7 x 3 in). It offers good sliding characteristics for dry fingers, but movement of moist fingers can stutter easily.
The clicking areas integrated at the bottom are rather hard, with only a very short stroke. The feedback is still clear. Clicking noises are louder than typing, but still acceptable.
Display - Solid QHD with 165 Hz
The matte 16:10 IPS display in our test unit comes from AU Optronics, offers a resolution of 2,560 x 1,600 pixels, and supports 165 Hz. However, you should still take a closer look before a purchase, since there is also an alternative version that offers only a 1,920 x 1,200 pixel resolution and 144 Hz refresh rate.
The brightness is 369 nits on average, but at 85%, the brightness distribution isn't very even, and we measure more than 400 nits in the center.
Unfortunately, the black value is a bit high, preventing higher contrast values.
But overall, the display is decent. The response times are fairly fast, and PWM isn't used for brightness control. Backlight bleeding also doesn't appear to be a problem in our test unit.
| |||||||||||||||||||||||||
Brightness Distribution: 85 %
Center on Battery: 407 cd/m²
Contrast: 904:1 (Black: 0.45 cd/m²)
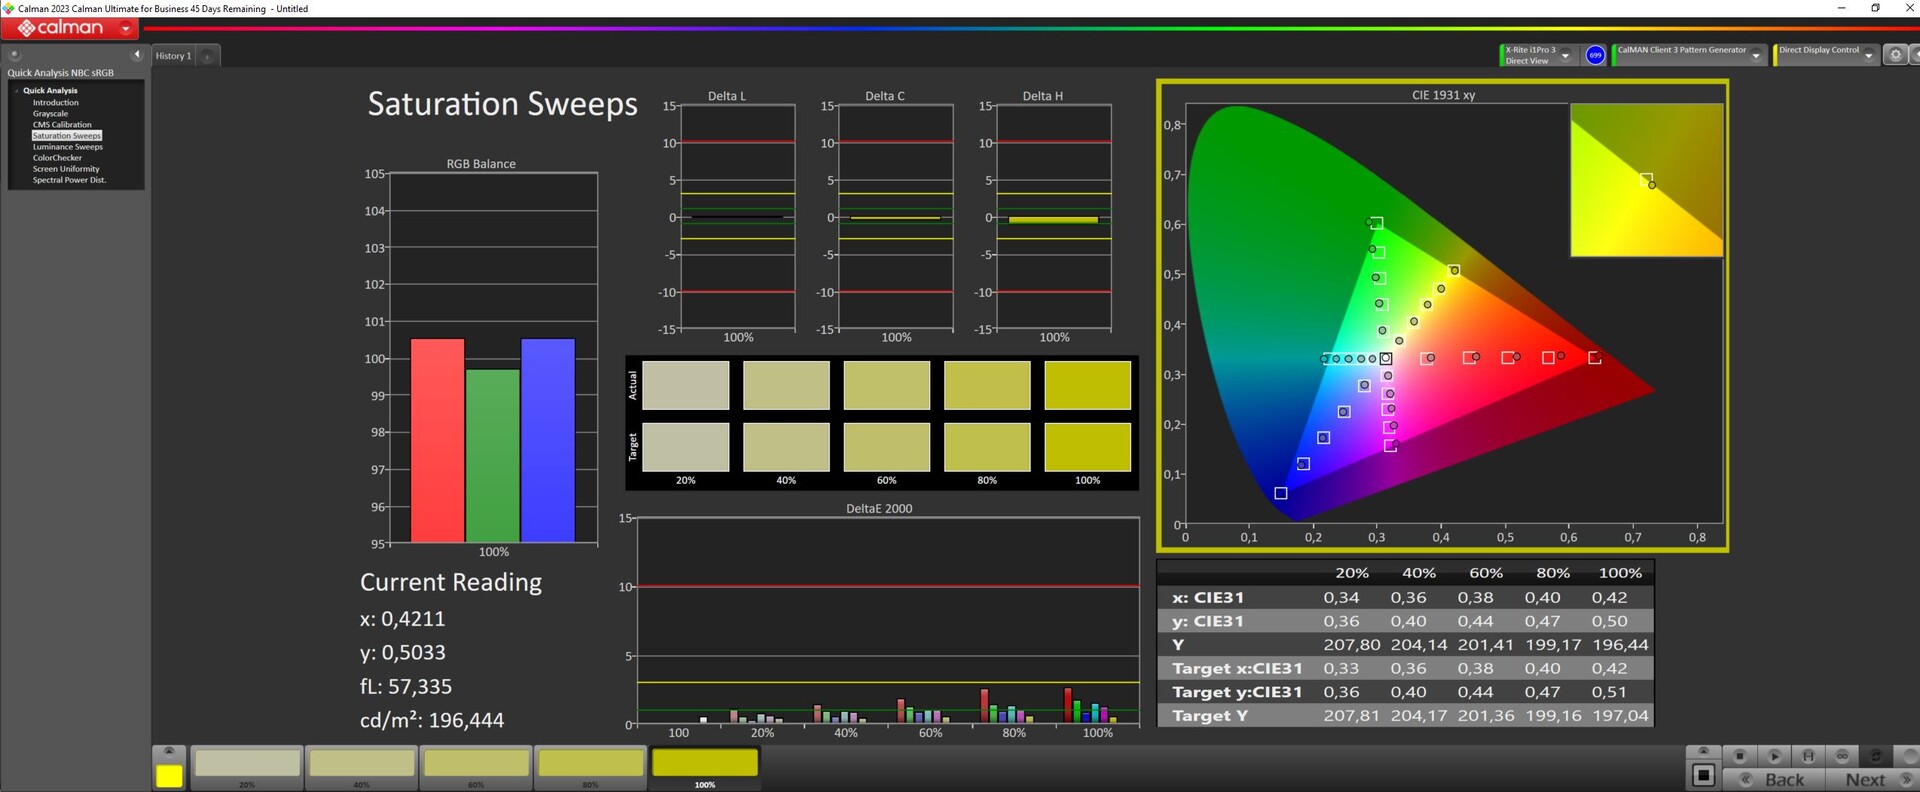
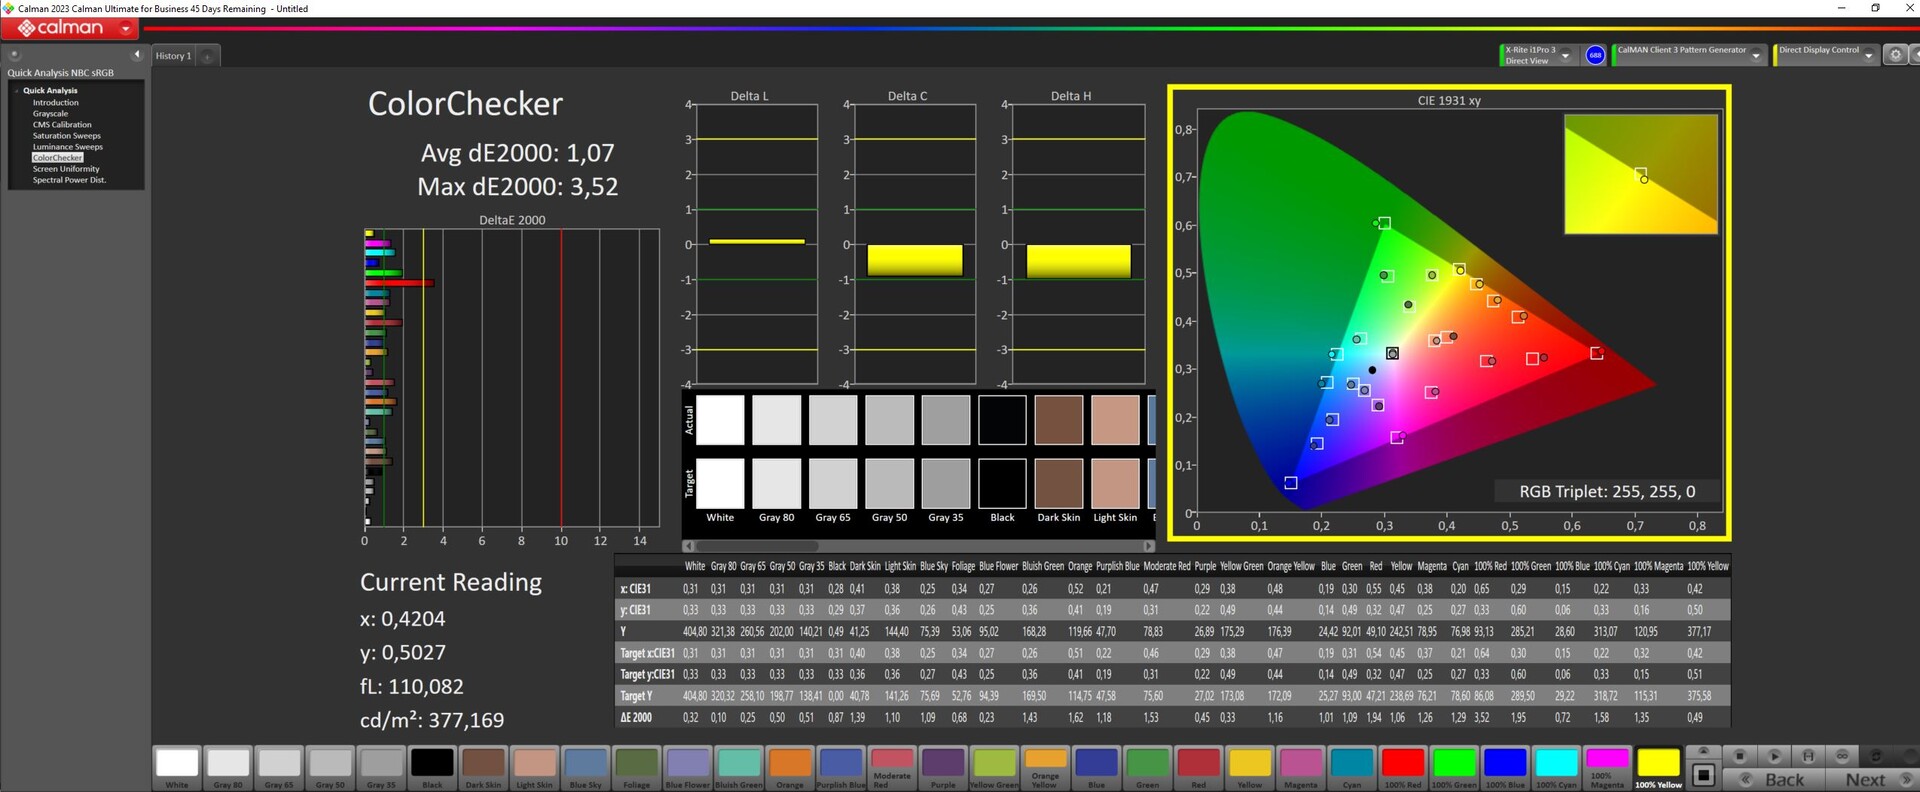
ΔE ColorChecker Calman: 1.43 | ∀{0.5-29.43 Ø4.72}
calibrated: 1.07
ΔE Greyscale Calman: 1.13 | ∀{0.09-98 Ø4.97}
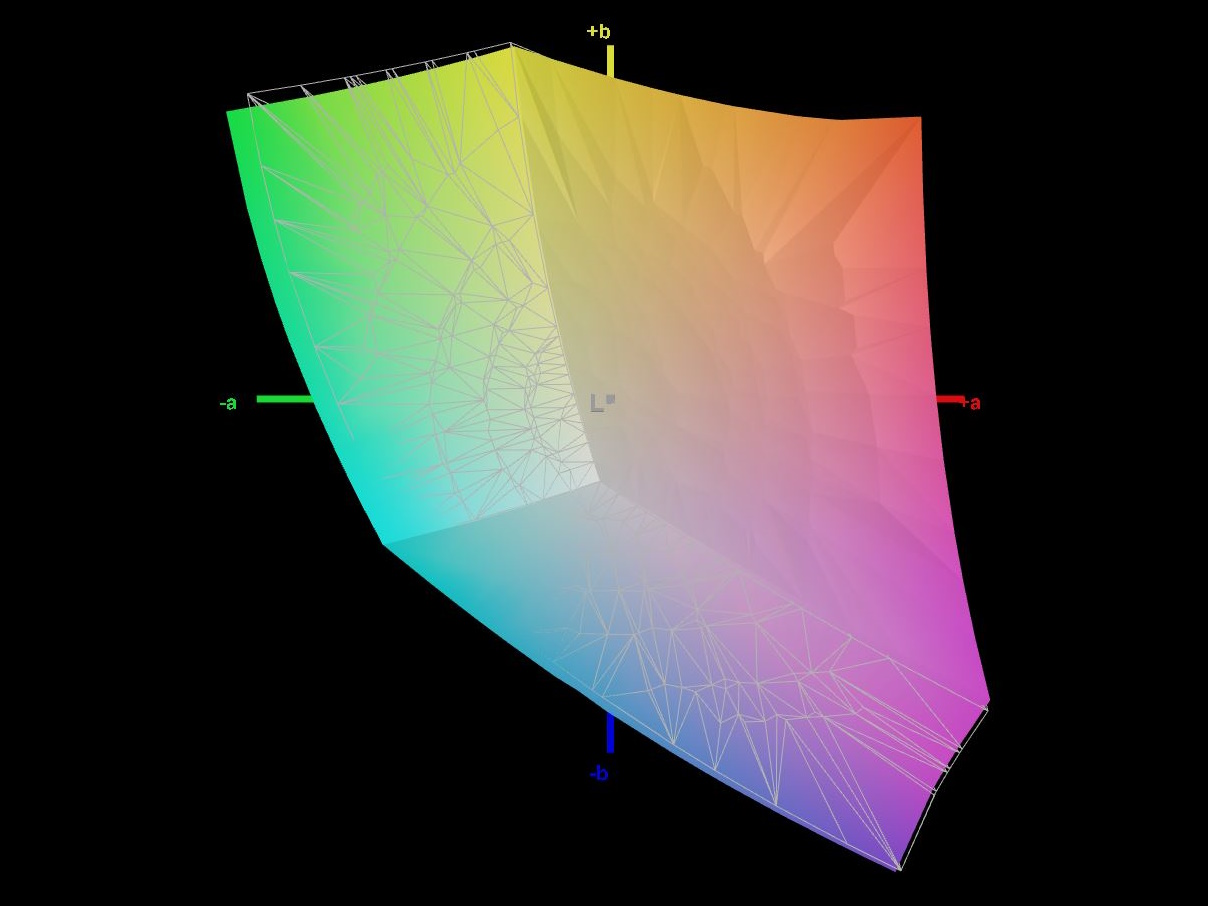
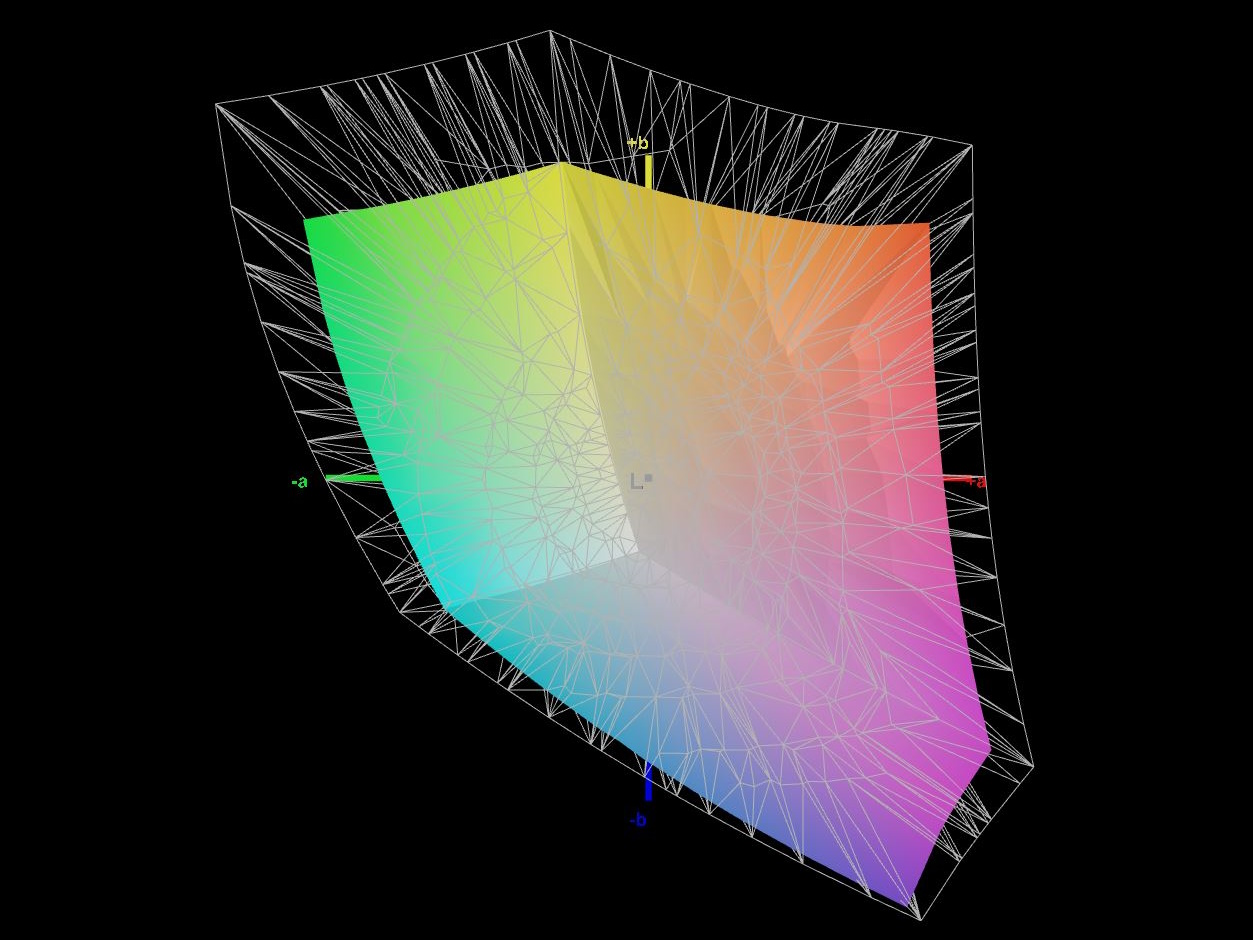
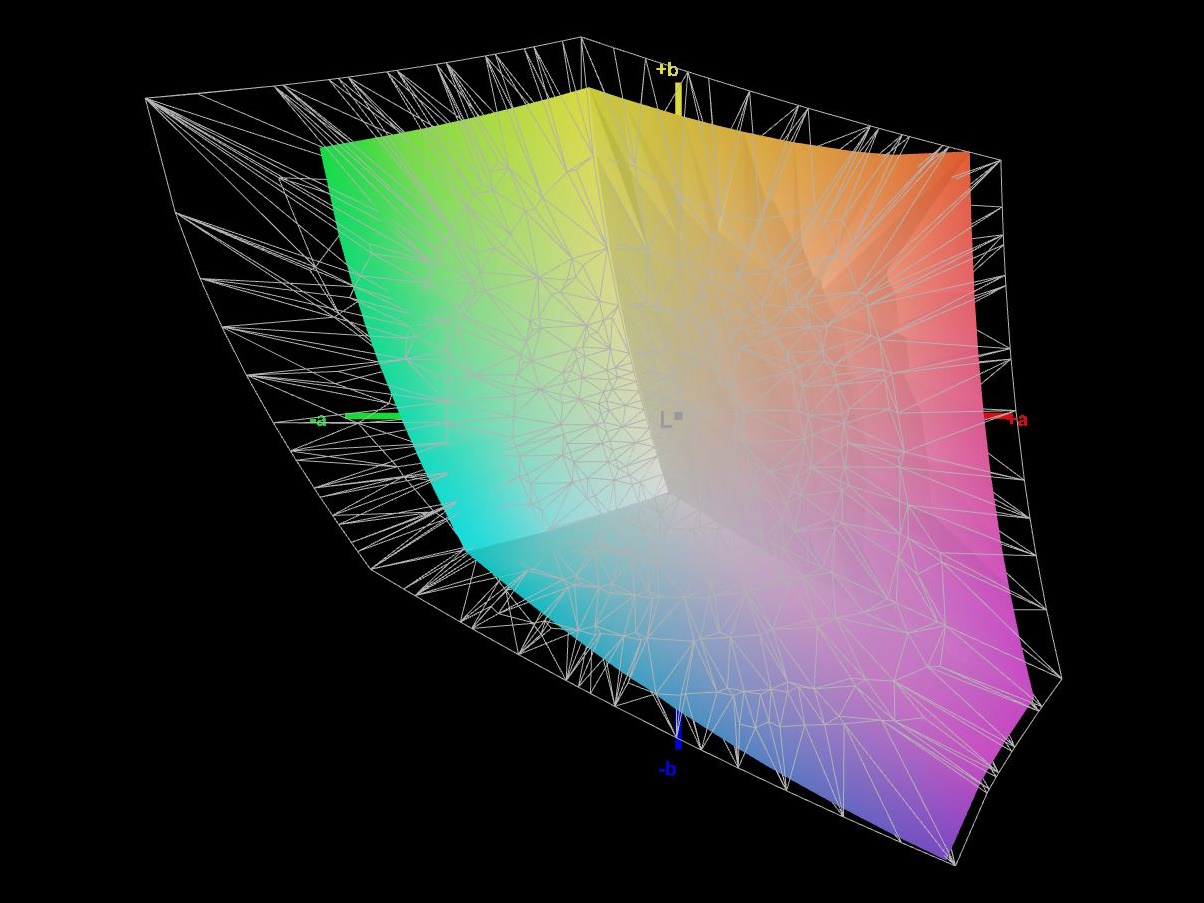
72.6% AdobeRGB 1998 (Argyll 3D)
98.9% sRGB (Argyll 3D)
70.5% Display P3 (Argyll 3D)
Gamma: 2.5
CCT: 6526 K
| Lenovo LOQ 16IRH8 AUOC1A5 (B160QAN03.L), IPS, 2560x1600, 16" | Dell Inspiron 16 Plus 7630 LG Philips 160WQ2, IPS, 2560x1600, 16" | Acer Nitro 16 AN16-41-R7YE AU Optronics B160UAN01.Q, IPS, 1920x1200, 16" | Captiva Advanced Gaming I74-121 BOE08B3, IPS, 1920x1080, 15.6" | Lenovo Legion Slim 5 16APH8 BOE NJ NE160QDM-NYC, IPS, 2560x1600, 16" | Asus TUF Gaming A16 FA617XS BOE NE160WUM-NX2, IPS, 1920x1200, 16" | |
|---|---|---|---|---|---|---|
| Display | 0% | 7% | -8% | -2% | -2% | |
| Display P3 Coverage (%) | 70.5 | 70.1 -1% | 80 13% | 64 -9% | 69.3 -2% | 69.3 -2% |
| sRGB Coverage (%) | 98.9 | 99.6 1% | 99.4 1% | 93.2 -6% | 100 1% | 97.3 -2% |
| AdobeRGB 1998 Coverage (%) | 72.6 | 72.3 0% | 77.4 7% | 66 -9% | 70 -4% | 70.7 -3% |
| Response Times | -307% | -13% | 15% | -27% | -76% | |
| Response Time Grey 50% / Grey 80% * (ms) | 7.2 ? | 35 ? -386% | 11.2 ? -56% | 5 ? 31% | 10.7 ? -49% | 15.6 ? -117% |
| Response Time Black / White * (ms) | 7.4 ? | 24.2 ? -227% | 5.2 ? 30% | 7.55 ? -2% | 7.8 ? -5% | 10 ? -35% |
| PWM Frequency (Hz) | ||||||
| Screen | -61% | -71% | -71% | 7% | -9% | |
| Brightness middle (cd/m²) | 407 | 299.4 -26% | 415 2% | 346 -15% | 371.6 -9% | 301 -26% |
| Brightness (cd/m²) | 369 | 290 -21% | 380 3% | 324 -12% | 343 -7% | 294 -20% |
| Brightness Distribution (%) | 85 | 92 8% | 84 -1% | 90 6% | 84 -1% | 94 11% |
| Black Level * (cd/m²) | 0.45 | 0.21 53% | 0.36 20% | 0.35 22% | 0.44 2% | 0.21 53% |
| Contrast (:1) | 904 | 1426 58% | 1153 28% | 989 9% | 845 -7% | 1433 59% |
| Colorchecker dE 2000 * | 1.43 | 4.25 -197% | 4.71 -229% | 4.12 -188% | 1.52 -6% | 1.79 -25% |
| Colorchecker dE 2000 max. * | 3.58 | 6.71 -87% | 6.98 -95% | 7.78 -117% | 2.68 25% | 3.48 3% |
| Colorchecker dE 2000 calibrated * | 1.07 | 0.52 51% | 2.68 -150% | 1.22 -14% | 0.33 69% | 1.2 -12% |
| Greyscale dE 2000 * | 1.13 | 5.5 -387% | 3.6 -219% | 4.81 -326% | 1.2 -6% | 2.5 -121% |
| Gamma | 2.5 88% | 2.35 94% | 2.182 101% | 2.31 95% | 2.1 105% | 2.265 97% |
| CCT | 6526 100% | 6368 102% | 7153 91% | 7633 85% | 6503 100% | 6157 106% |
| Total Average (Program / Settings) | -123% /
-83% | -26% /
-46% | -21% /
-45% | -7% /
0% | -29% /
-17% |
* ... smaller is better
At least, the sRGB color space is covered almost completely. But AdobeRGB and DisplayP3 are covered to only 70%. While this makes the display of the LOQ 16 suitable for gaming for sure, it is also okay for the occasional, non-professional photo and video processing.
The display already offers a decent calibration in the state of delivery, and we measure only low deviations in the colors and grayscale. An additional calibration using our Xrite color measurement device and Calman software is able to slightly decrease the DeltaE deviations even further.
You can download our calibrated ICC color profile for free using the link above.

Display Response Times
| ↔ Response Time Black to White | ||
|---|---|---|
| 7.4 ms ... rise ↗ and fall ↘ combined | ↗ 3 ms rise | 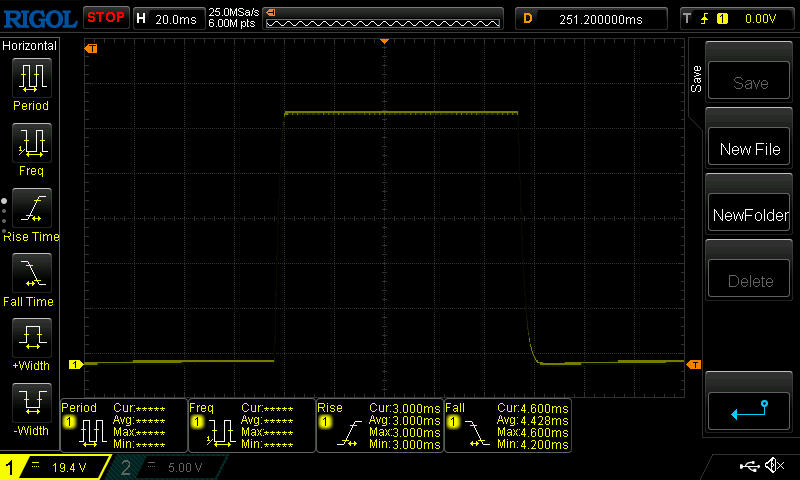 |
| ↘ 4.4 ms fall | ||
| The screen shows very fast response rates in our tests and should be very well suited for fast-paced gaming. In comparison, all tested devices range from 0.1 (minimum) to 240 (maximum) ms. » 22 % of all devices are better. This means that the measured response time is better than the average of all tested devices (19.8 ms). | ||
| ↔ Response Time 50% Grey to 80% Grey | ||
| 7.2 ms ... rise ↗ and fall ↘ combined | ↗ 4 ms rise | 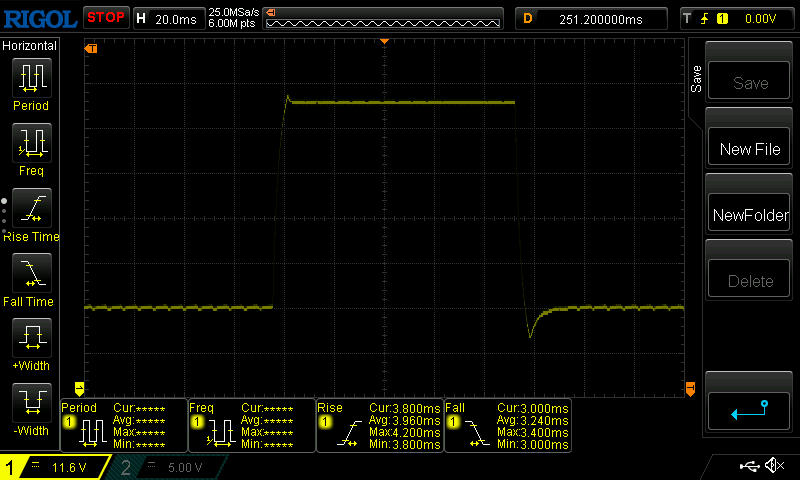 |
| ↘ 3.2 ms fall | ||
| The screen shows very fast response rates in our tests and should be very well suited for fast-paced gaming. In comparison, all tested devices range from 0.165 (minimum) to 636 (maximum) ms. » 20 % of all devices are better. This means that the measured response time is better than the average of all tested devices (31 ms). | ||
Screen Flickering / PWM (Pulse-Width Modulation)
| Screen flickering / PWM not detected |  | ||
In comparison: 52 % of all tested devices do not use PWM to dim the display. If PWM was detected, an average of 7747 (minimum: 5 - maximum: 343500) Hz was measured. | |||
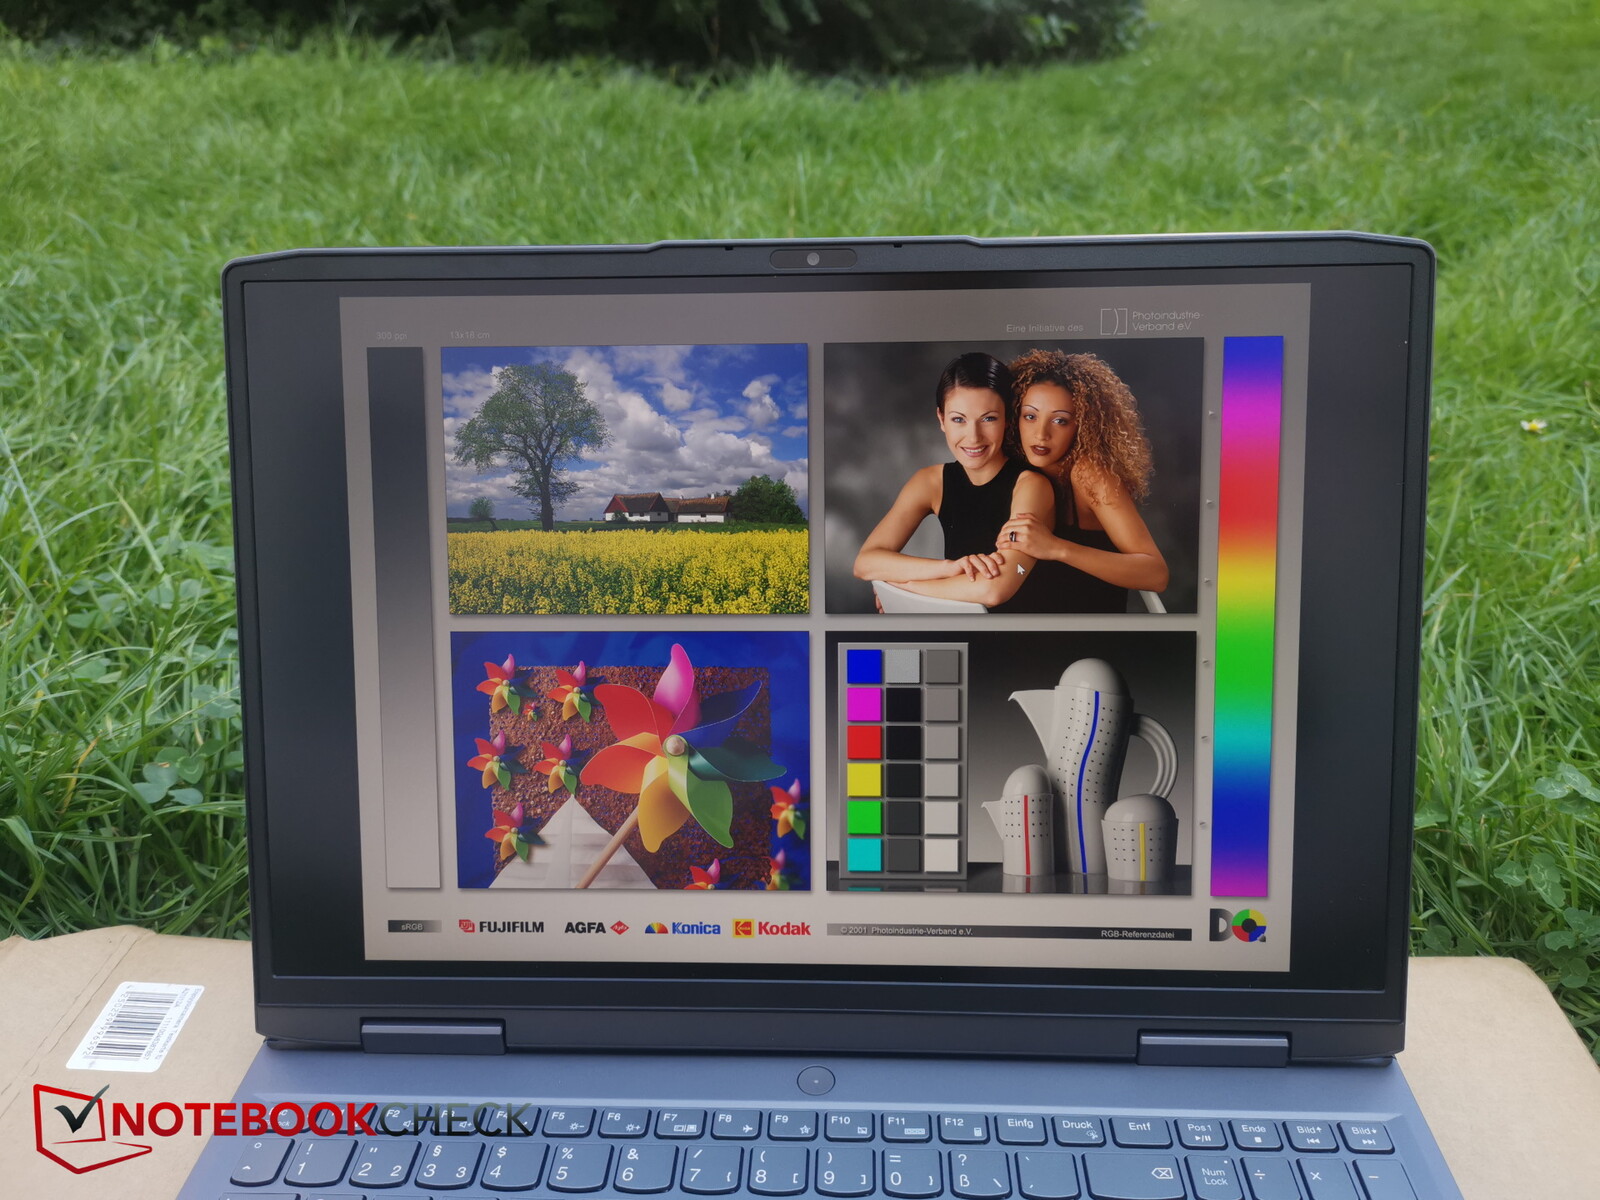
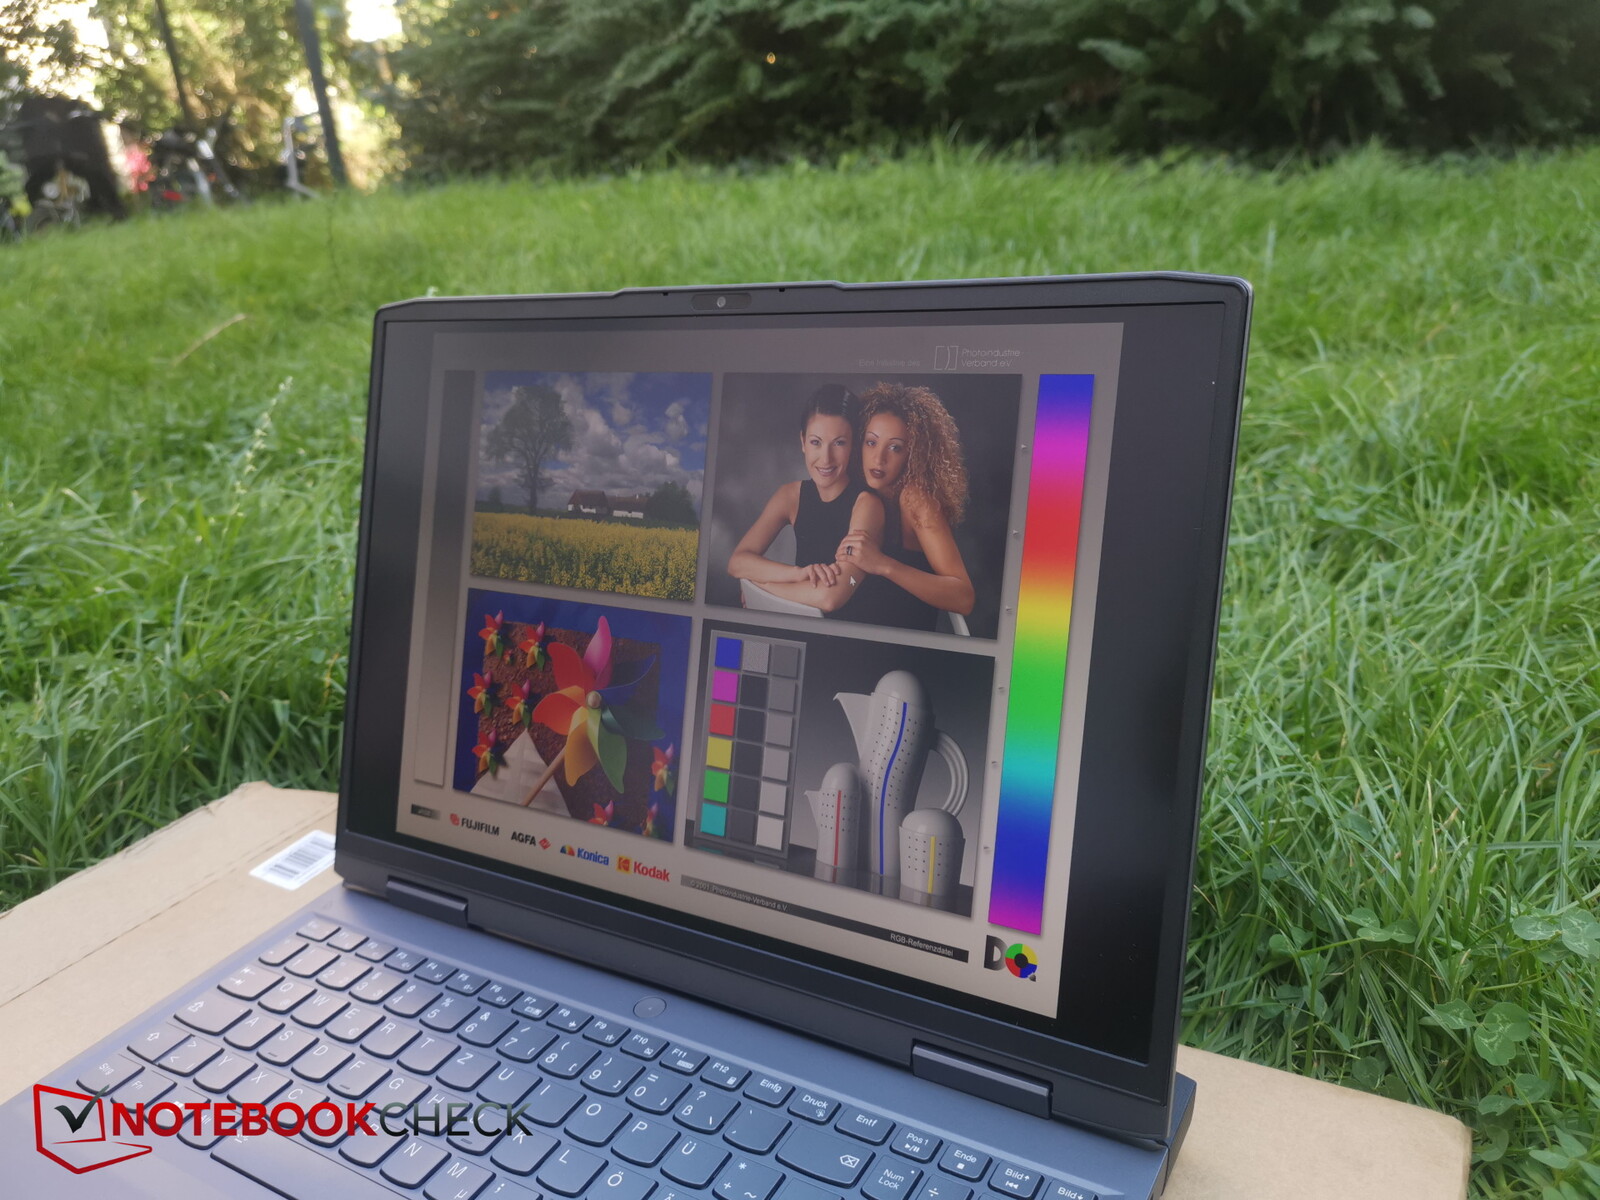
Due to the matte display surface and at least decent brightness, you can also see the display contents easily outdoors. What is required though, is a shady place and avoiding direct sunlight or very steep viewing angles.

Performance - A powerful RTX 4060 despite 115 W
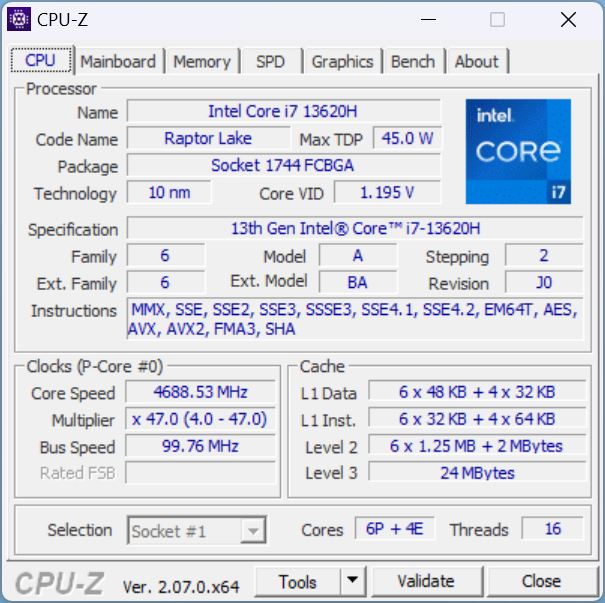
The Core i7-13620H in combination with an RTX 4060 identifies the device as a gaming laptop that should allow playing almost all the current games in at least Full-HD resolution and also at full detail settings. Even in the native QHD resolution, the laptop shouldn't start losing its breath in many games. 16 GB of working memory are appropriate for an affordable gaming laptop.
However at 512 GB, the storage is a bit tight considering the immense space requirements of current AAA games, but fortunately you can upgrade here later.
Test Conditions
The manufacturer of our test unit calls its control center Lenovo Vantage. Lenovo has overdone it here, since in addition to the important performance options and additional settings, the software includes a lot of advertisements. The ads not only include inhouse ads for warranty extensions, for other services such as "cloud-based security solutions," and for insurance in case of water damage, damage from falls, and so forth, but also for software from third-party vendors such as Spotify, Amazon, YouTube, for the Legion Games Shop, for McAffee - the list goes on and on.
In addition, there are various preinstalled software apps such as Lenovo Arena, Lenovo Hotkeys, Lenovo Now, and trial versions of Office and McAffee, and so forth.
With all this unnecessary stuff, you almost forget that the manufacturer of course uses the control center software to offer the obligatory performance settings and other important options to justify its existence. The LOQ 16 comes with three power modes: Quiet Mode, Balanced (with and without AI), and Performance Mode. In addition, there is also a manual mode, which allows you to adjust many parameters individually. We run all the benchmarks in the Performance Mode.


Processor
The Core i7-13620H comes from the current Raptor Lake generation and offers all six P cores but only four of the eight E cores compared to the i7-13700H. In addition, only 64 of the 96 EUs are activated in the 13620H, offering a clock speed of up to 1.5 GHz. In the configurator from Lenovo, the i7-13700H only costs 20 Euros (~$21) more, while on the other hand, the i5-13500H costs 110 Euros (~$117) less and the i5-13420H, 120 Euros (~$127).
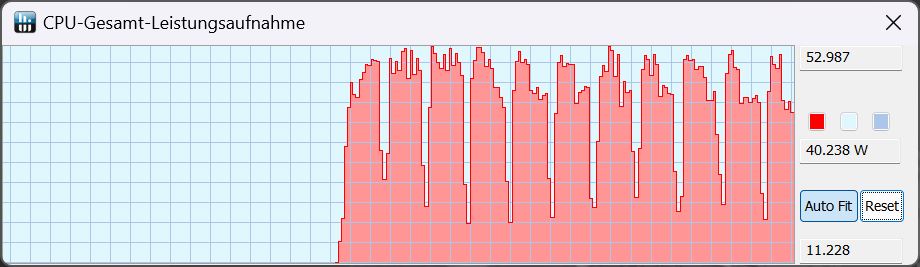
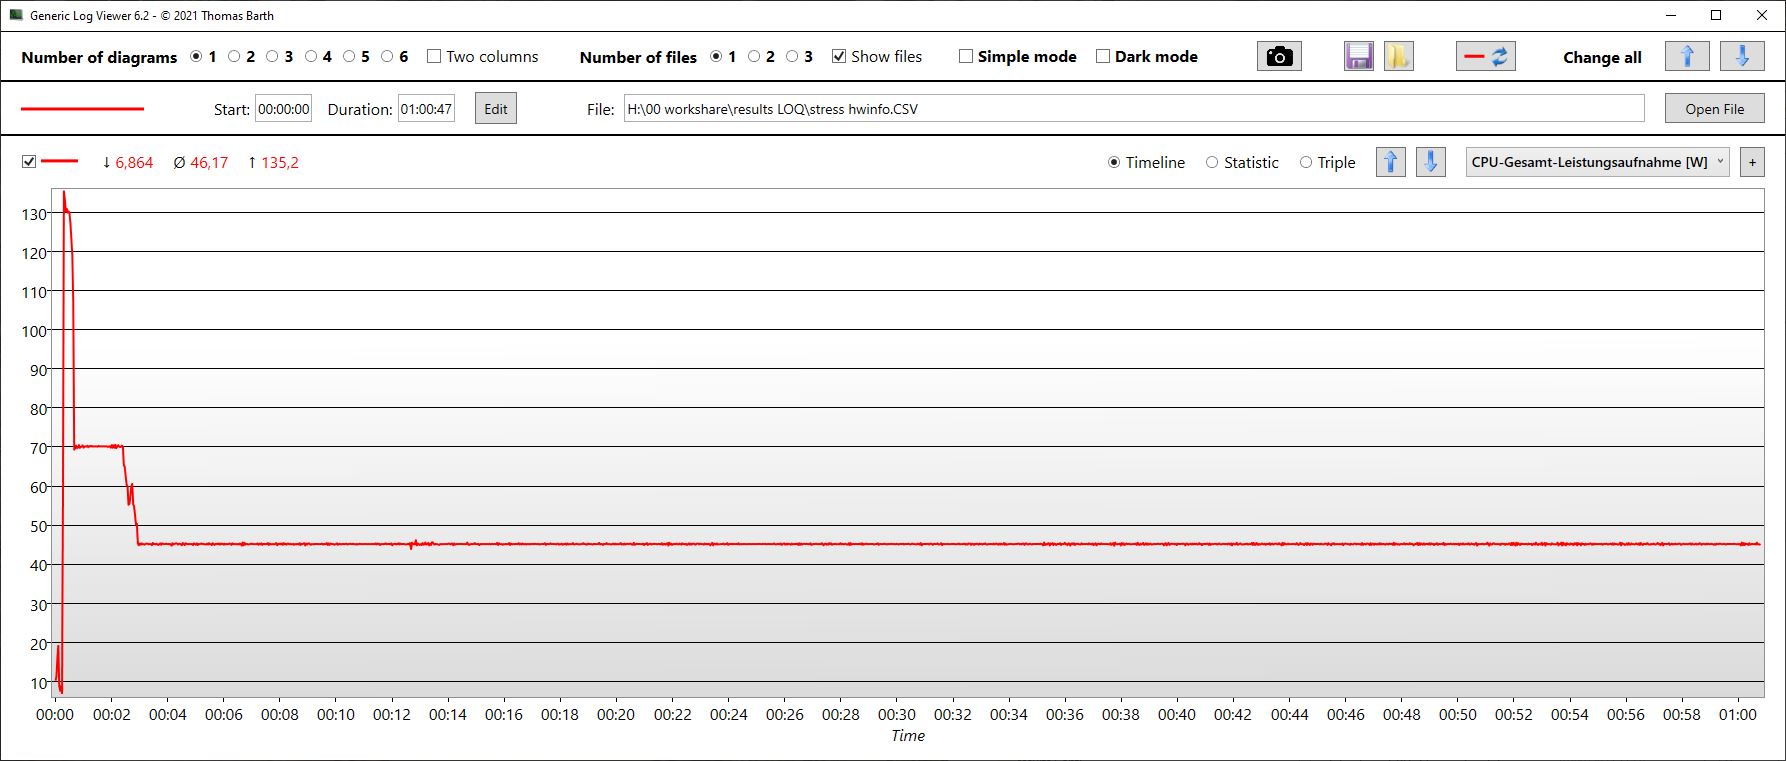
In the Cinebench R15 loop, the performance drops after the first two runs, before it stabilizes. Across all tests, the LOQ 16 performs almost exactly at the expected level. The TDP in Performance Mode only briefly reaches 135 W in the first run. In the remaining runs it is briefly at 120 W, before dropping to 70 W for the rest of the run.
In Balanced Mode with AI support, an initial TDP of 110 W is reached, before it continues to drop to almost 60 W during the rest of the run. The Quiet Mode starts at almost 60 W, then dropping to 45 W.
In the comparison, our test unit places in the middle of the field. Interestingly, the performance is at the level of the i7-13700H in the Inspiron 16 in Cinebench R15, while at the same time, the i5-13500H performs better in the Captiva.
If you unplug the laptop from the power, the TDP remains stably between 40 and 50 W, resulting in a score of 1,704 instead of 2,492, which corresponds to a performance drop of about 38%.
Cinebench R15 Multi Constant Load Test
Cinebench R23: Multi Core | Single Core
Cinebench R20: CPU (Multi Core) | CPU (Single Core)
Cinebench R15: CPU Multi 64Bit | CPU Single 64Bit
Blender: v2.79 BMW27 CPU
7-Zip 18.03: 7z b 4 | 7z b 4 -mmt1
Geekbench 5.5: Multi-Core | Single-Core
HWBOT x265 Benchmark v2.2: 4k Preset
LibreOffice : 20 Documents To PDF
R Benchmark 2.5: Overall mean
| CPU Performance rating | |
| Average of class Gaming | |
| Lenovo Legion Slim 5 16APH8 | |
| Asus TUF Gaming A16 FA617XS | |
| Dell Inspiron 16 Plus 7630 | |
| Lenovo LOQ 16IRH8 | |
| Captiva Advanced Gaming I74-121 | |
| Average Intel Core i7-13620H | |
| Acer Nitro 16 AN16-41-R7YE | |
| Cinebench R23 / Multi Core | |
| Average of class Gaming (10488 - 40970, n=106, last 2 years) | |
| Lenovo Legion Slim 5 16APH8 | |
| Asus TUF Gaming A16 FA617XS | |
| Captiva Advanced Gaming I74-121 | |
| Dell Inspiron 16 Plus 7630 | |
| Lenovo LOQ 16IRH8 | |
| Average Intel Core i7-13620H (10819 - 15496, n=7) | |
| Acer Nitro 16 AN16-41-R7YE | |
| Cinebench R23 / Single Core | |
| Average of class Gaming (1166 - 2387, n=106, last 2 years) | |
| Dell Inspiron 16 Plus 7630 | |
| Lenovo LOQ 16IRH8 | |
| Average Intel Core i7-13620H (1716 - 1871, n=7) | |
| Lenovo Legion Slim 5 16APH8 | |
| Asus TUF Gaming A16 FA617XS | |
| Captiva Advanced Gaming I74-121 | |
| Acer Nitro 16 AN16-41-R7YE | |
| Cinebench R20 / CPU (Multi Core) | |
| Average of class Gaming (4029 - 16108, n=105, last 2 years) | |
| Lenovo Legion Slim 5 16APH8 | |
| Asus TUF Gaming A16 FA617XS | |
| Captiva Advanced Gaming I74-121 | |
| Dell Inspiron 16 Plus 7630 | |
| Lenovo LOQ 16IRH8 | |
| Average Intel Core i7-13620H (4214 - 5905, n=7) | |
| Acer Nitro 16 AN16-41-R7YE | |
| Cinebench R20 / CPU (Single Core) | |
| Average of class Gaming (442 - 904, n=105, last 2 years) | |
| Dell Inspiron 16 Plus 7630 | |
| Lenovo LOQ 16IRH8 | |
| Asus TUF Gaming A16 FA617XS | |
| Lenovo Legion Slim 5 16APH8 | |
| Average Intel Core i7-13620H (657 - 719, n=7) | |
| Captiva Advanced Gaming I74-121 | |
| Acer Nitro 16 AN16-41-R7YE | |
| Cinebench R15 / CPU Multi 64Bit | |
| Average of class Gaming (1578 - 6271, n=104, last 2 years) | |
| Lenovo Legion Slim 5 16APH8 | |
| Asus TUF Gaming A16 FA617XS | |
| Lenovo LOQ 16IRH8 | |
| Captiva Advanced Gaming I74-121 | |
| Dell Inspiron 16 Plus 7630 | |
| Average Intel Core i7-13620H (1681 - 2492, n=7) | |
| Acer Nitro 16 AN16-41-R7YE | |
| Cinebench R15 / CPU Single 64Bit | |
| Average of class Gaming (188.8 - 344, n=105, last 2 years) | |
| Asus TUF Gaming A16 FA617XS | |
| Lenovo Legion Slim 5 16APH8 | |
| Dell Inspiron 16 Plus 7630 | |
| Lenovo LOQ 16IRH8 | |
| Captiva Advanced Gaming I74-121 | |
| Average Intel Core i7-13620H (250 - 269, n=7) | |
| Acer Nitro 16 AN16-41-R7YE | |
| Blender / v2.79 BMW27 CPU | |
| Acer Nitro 16 AN16-41-R7YE | |
| Average Intel Core i7-13620H (215 - 297, n=7) | |
| Lenovo LOQ 16IRH8 | |
| Dell Inspiron 16 Plus 7630 | |
| Captiva Advanced Gaming I74-121 | |
| Asus TUF Gaming A16 FA617XS | |
| Lenovo Legion Slim 5 16APH8 | |
| Average of class Gaming (80 - 330, n=103, last 2 years) | |
| 7-Zip 18.03 / 7z b 4 | |
| Average of class Gaming (33491 - 148086, n=104, last 2 years) | |
| Asus TUF Gaming A16 FA617XS | |
| Lenovo Legion Slim 5 16APH8 | |
| Dell Inspiron 16 Plus 7630 | |
| Lenovo LOQ 16IRH8 | |
| Captiva Advanced Gaming I74-121 | |
| Average Intel Core i7-13620H (45092 - 62324, n=7) | |
| Acer Nitro 16 AN16-41-R7YE | |
| 7-Zip 18.03 / 7z b 4 -mmt1 | |
| Asus TUF Gaming A16 FA617XS | |
| Lenovo Legion Slim 5 16APH8 | |
| Average of class Gaming (4199 - 7436, n=104, last 2 years) | |
| Average Intel Core i7-13620H (5648 - 6326, n=7) | |
| Lenovo LOQ 16IRH8 | |
| Captiva Advanced Gaming I74-121 | |
| Dell Inspiron 16 Plus 7630 | |
| Acer Nitro 16 AN16-41-R7YE | |
| Geekbench 5.5 / Multi-Core | |
| Average of class Gaming (6460 - 27010, n=104, last 2 years) | |
| Dell Inspiron 16 Plus 7630 | |
| Lenovo LOQ 16IRH8 | |
| Asus TUF Gaming A16 FA617XS | |
| Lenovo Legion Slim 5 16APH8 | |
| Average Intel Core i7-13620H (8112 - 12223, n=7) | |
| Captiva Advanced Gaming I74-121 | |
| Acer Nitro 16 AN16-41-R7YE | |
| Geekbench 5.5 / Single-Core | |
| Average of class Gaming (986 - 2474, n=104, last 2 years) | |
| Asus TUF Gaming A16 FA617XS | |
| Lenovo Legion Slim 5 16APH8 | |
| Dell Inspiron 16 Plus 7630 | |
| Lenovo LOQ 16IRH8 | |
| Average Intel Core i7-13620H (1703 - 1865, n=7) | |
| Captiva Advanced Gaming I74-121 | |
| Acer Nitro 16 AN16-41-R7YE | |
| HWBOT x265 Benchmark v2.2 / 4k Preset | |
| Average of class Gaming (11.5 - 44.3, n=104, last 2 years) | |
| Lenovo Legion Slim 5 16APH8 | |
| Asus TUF Gaming A16 FA617XS | |
| Captiva Advanced Gaming I74-121 | |
| Lenovo LOQ 16IRH8 | |
| Dell Inspiron 16 Plus 7630 | |
| Average Intel Core i7-13620H (12.2 - 17.7, n=7) | |
| Acer Nitro 16 AN16-41-R7YE | |
| LibreOffice / 20 Documents To PDF | |
| Captiva Advanced Gaming I74-121 | |
| Average Intel Core i7-13620H (41.5 - 78.9, n=7) | |
| Average of class Gaming (33.2 - 88.8, n=104, last 2 years) | |
| Acer Nitro 16 AN16-41-R7YE | |
| Lenovo LOQ 16IRH8 | |
| Dell Inspiron 16 Plus 7630 | |
| Asus TUF Gaming A16 FA617XS | |
| Lenovo Legion Slim 5 16APH8 | |
| R Benchmark 2.5 / Overall mean | |
| Acer Nitro 16 AN16-41-R7YE | |
| Captiva Advanced Gaming I74-121 | |
| Average Intel Core i7-13620H (0.4438 - 0.4762, n=7) | |
| Lenovo LOQ 16IRH8 | |
| Dell Inspiron 16 Plus 7630 | |
| Lenovo Legion Slim 5 16APH8 | |
| Average of class Gaming (0.3439 - 0.759, n=105, last 2 years) | |
| Asus TUF Gaming A16 FA617XS | |
* ... smaller is better
AIDA64: FP32 Ray-Trace | FPU Julia | CPU SHA3 | CPU Queen | FPU SinJulia | FPU Mandel | CPU AES | CPU ZLib | FP64 Ray-Trace | CPU PhotoWorxx
| Performance rating | |
| Average of class Gaming | |
| Asus TUF Gaming A16 FA617XS | |
| Lenovo Legion Slim 5 16APH8 | |
| Captiva Advanced Gaming I74-121 | |
| Acer Nitro 16 AN16-41-R7YE | |
| Dell Inspiron 16 Plus 7630 | |
| Lenovo LOQ 16IRH8 | |
| Average Intel Core i7-13620H | |
| AIDA64 / FP32 Ray-Trace | |
| Average of class Gaming (10227 - 85542, n=103, last 2 years) | |
| Lenovo Legion Slim 5 16APH8 | |
| Asus TUF Gaming A16 FA617XS | |
| Captiva Advanced Gaming I74-121 | |
| Dell Inspiron 16 Plus 7630 | |
| Acer Nitro 16 AN16-41-R7YE | |
| Lenovo LOQ 16IRH8 | |
| Average Intel Core i7-13620H (10779 - 13601, n=7) | |
| AIDA64 / FPU Julia | |
| Average of class Gaming (51376 - 238426, n=103, last 2 years) | |
| Asus TUF Gaming A16 FA617XS | |
| Lenovo Legion Slim 5 16APH8 | |
| Acer Nitro 16 AN16-41-R7YE | |
| Captiva Advanced Gaming I74-121 | |
| Dell Inspiron 16 Plus 7630 | |
| Lenovo LOQ 16IRH8 | |
| Average Intel Core i7-13620H (54287 - 67187, n=7) | |
| AIDA64 / CPU SHA3 | |
| Average of class Gaming (2180 - 9817, n=103, last 2 years) | |
| Lenovo Legion Slim 5 16APH8 | |
| Asus TUF Gaming A16 FA617XS | |
| Captiva Advanced Gaming I74-121 | |
| Dell Inspiron 16 Plus 7630 | |
| Acer Nitro 16 AN16-41-R7YE | |
| Lenovo LOQ 16IRH8 | |
| Average Intel Core i7-13620H (2327 - 2773, n=7) | |
| AIDA64 / CPU Queen | |
| Asus TUF Gaming A16 FA617XS | |
| Lenovo Legion Slim 5 16APH8 | |
| Average of class Gaming (49785 - 173351, n=89, last 2 years) | |
| Dell Inspiron 16 Plus 7630 | |
| Captiva Advanced Gaming I74-121 | |
| Acer Nitro 16 AN16-41-R7YE | |
| Lenovo LOQ 16IRH8 | |
| Average Intel Core i7-13620H (66885 - 78867, n=7) | |
| AIDA64 / FPU SinJulia | |
| Asus TUF Gaming A16 FA617XS | |
| Lenovo Legion Slim 5 16APH8 | |
| Average of class Gaming (4424 - 33636, n=103, last 2 years) | |
| Acer Nitro 16 AN16-41-R7YE | |
| Dell Inspiron 16 Plus 7630 | |
| Lenovo LOQ 16IRH8 | |
| Captiva Advanced Gaming I74-121 | |
| Average Intel Core i7-13620H (6737 - 8421, n=7) | |
| AIDA64 / FPU Mandel | |
| Average of class Gaming (25115 - 128721, n=103, last 2 years) | |
| Lenovo Legion Slim 5 16APH8 | |
| Asus TUF Gaming A16 FA617XS | |
| Acer Nitro 16 AN16-41-R7YE | |
| Captiva Advanced Gaming I74-121 | |
| Dell Inspiron 16 Plus 7630 | |
| Lenovo LOQ 16IRH8 | |
| Average Intel Core i7-13620H (27242 - 32787, n=7) | |
| AIDA64 / CPU AES | |
| Captiva Advanced Gaming I74-121 | |
| Average of class Gaming (39258 - 247074, n=103, last 2 years) | |
| Acer Nitro 16 AN16-41-R7YE | |
| Asus TUF Gaming A16 FA617XS | |
| Lenovo Legion Slim 5 16APH8 | |
| Dell Inspiron 16 Plus 7630 | |
| Average Intel Core i7-13620H (48646 - 85895, n=7) | |
| Lenovo LOQ 16IRH8 | |
| AIDA64 / CPU ZLib | |
| Average of class Gaming (574 - 2531, n=103, last 2 years) | |
| Lenovo Legion Slim 5 16APH8 | |
| Asus TUF Gaming A16 FA617XS | |
| Captiva Advanced Gaming I74-121 | |
| Lenovo LOQ 16IRH8 | |
| Dell Inspiron 16 Plus 7630 | |
| Average Intel Core i7-13620H (688 - 835, n=7) | |
| Acer Nitro 16 AN16-41-R7YE | |
| AIDA64 / FP64 Ray-Trace | |
| Average of class Gaming (5509 - 45446, n=103, last 2 years) | |
| Lenovo Legion Slim 5 16APH8 | |
| Asus TUF Gaming A16 FA617XS | |
| Captiva Advanced Gaming I74-121 | |
| Dell Inspiron 16 Plus 7630 | |
| Lenovo LOQ 16IRH8 | |
| Acer Nitro 16 AN16-41-R7YE | |
| Average Intel Core i7-13620H (5919 - 7364, n=7) | |
| AIDA64 / CPU PhotoWorxx | |
| Average of class Gaming (12271 - 89891, n=103, last 2 years) | |
| Dell Inspiron 16 Plus 7630 | |
| Lenovo LOQ 16IRH8 | |
| Lenovo Legion Slim 5 16APH8 | |
| Asus TUF Gaming A16 FA617XS | |
| Acer Nitro 16 AN16-41-R7YE | |
| Average Intel Core i7-13620H (19421 - 34544, n=7) | |
| Captiva Advanced Gaming I74-121 | |
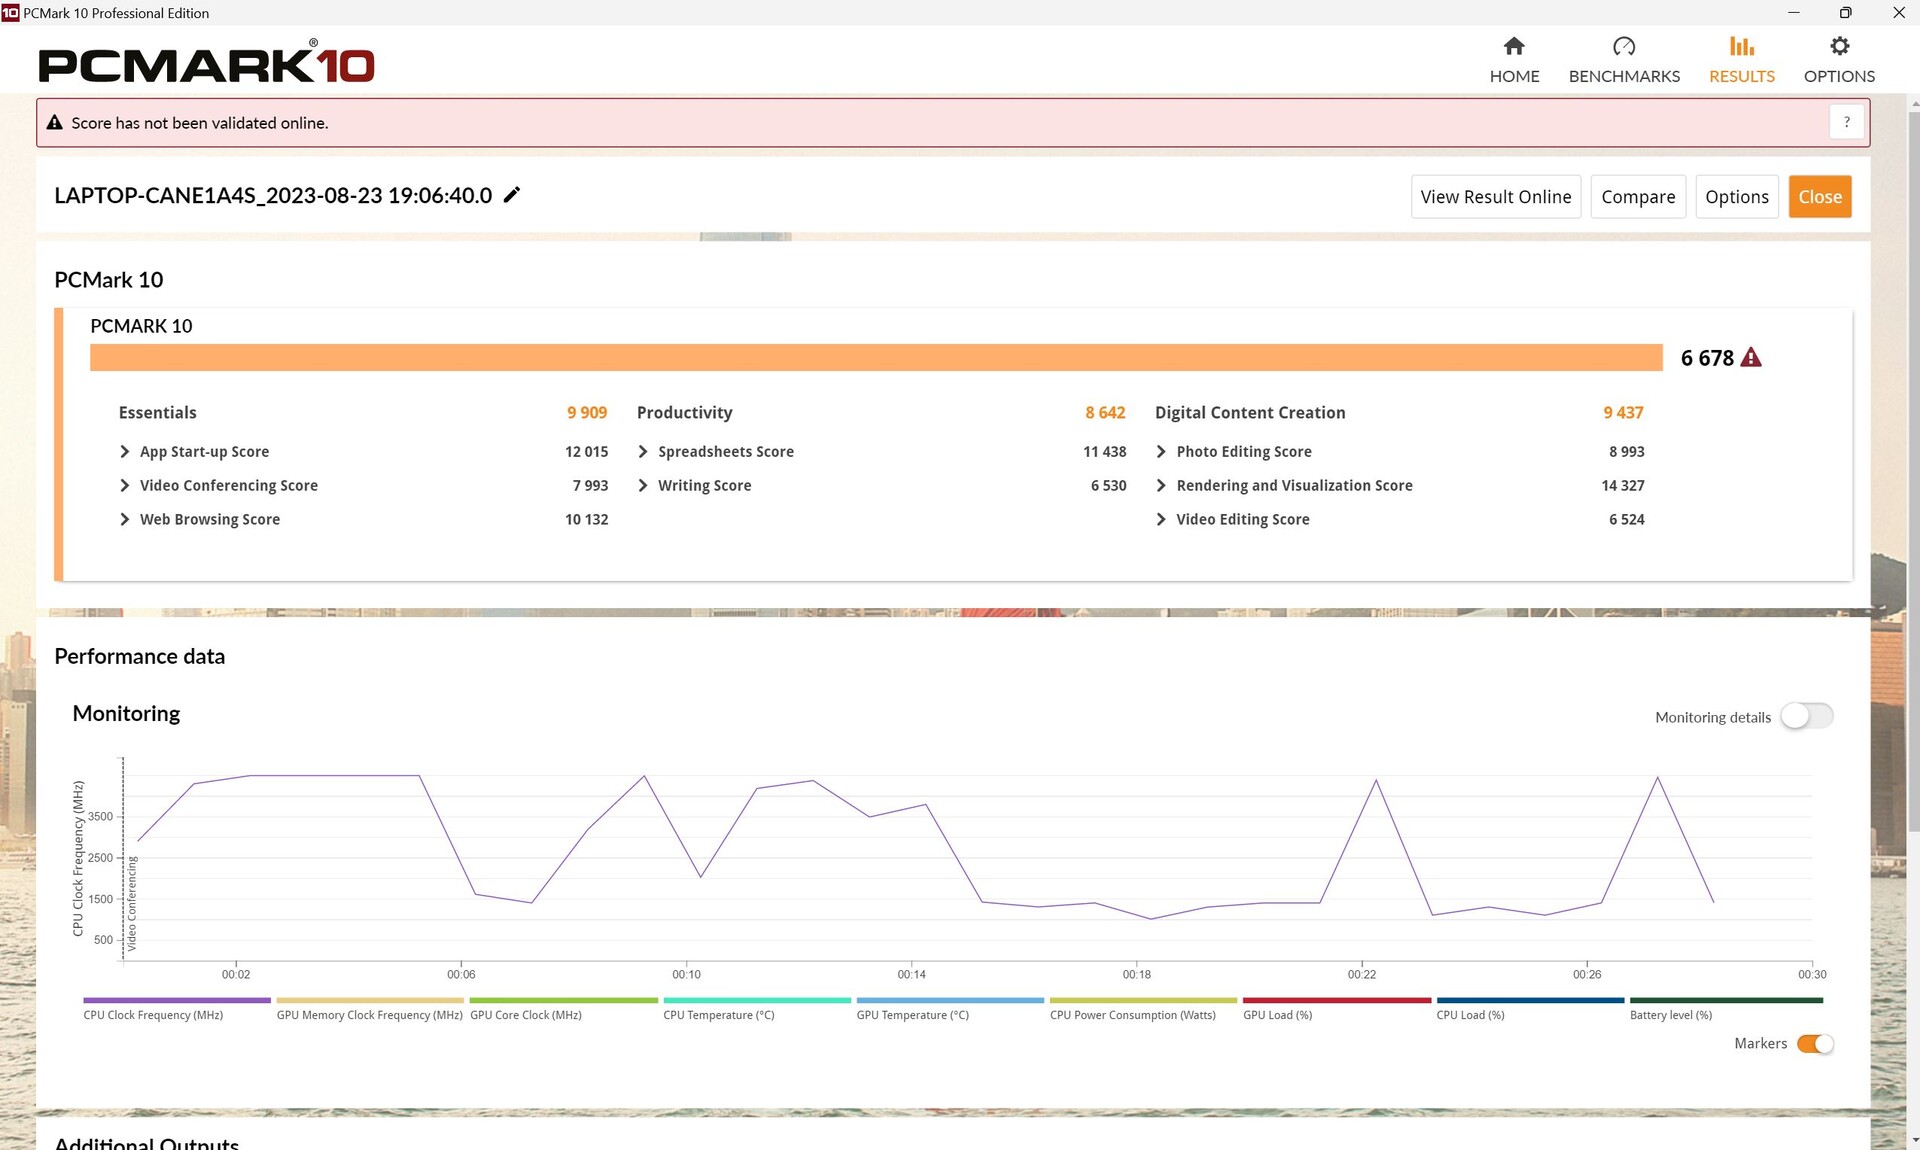
System Performance
Although the laptop performance is only minimally less than the average in PCMark 10, all the comparison devices place ahead of the LOQ 16. This shows that the i7-13620H lacks a few threads compared to the i7-13700H.
Subjectively, the system runs smoothly and fast, and we do not notice any unusual delays.
CrossMark: Overall | Productivity | Creativity | Responsiveness
| PCMark 10 / Score | |
| Average of class Gaming (5828 - 11730, n=92, last 2 years) | |
| Lenovo Legion Slim 5 16APH8 | |
| Asus TUF Gaming A16 FA617XS | |
| Dell Inspiron 16 Plus 7630 | |
| Captiva Advanced Gaming I74-121 | |
| Average Intel Core i7-13620H, NVIDIA GeForce RTX 4060 Laptop GPU (6678 - 7256, n=3) | |
| Acer Nitro 16 AN16-41-R7YE | |
| Lenovo LOQ 16IRH8 | |
| PCMark 10 / Essentials | |
| Captiva Advanced Gaming I74-121 | |
| Dell Inspiron 16 Plus 7630 | |
| Lenovo Legion Slim 5 16APH8 | |
| Asus TUF Gaming A16 FA617XS | |
| Average of class Gaming (8810 - 11935, n=96, last 2 years) | |
| Average Intel Core i7-13620H, NVIDIA GeForce RTX 4060 Laptop GPU (9909 - 10809, n=3) | |
| Lenovo LOQ 16IRH8 | |
| Acer Nitro 16 AN16-41-R7YE | |
| PCMark 10 / Productivity | |
| Average of class Gaming (6845 - 21327, n=94, last 2 years) | |
| Asus TUF Gaming A16 FA617XS | |
| Lenovo Legion Slim 5 16APH8 | |
| Dell Inspiron 16 Plus 7630 | |
| Average Intel Core i7-13620H, NVIDIA GeForce RTX 4060 Laptop GPU (8642 - 9781, n=3) | |
| Captiva Advanced Gaming I74-121 | |
| Lenovo LOQ 16IRH8 | |
| Acer Nitro 16 AN16-41-R7YE | |
| PCMark 10 / Digital Content Creation | |
| Average of class Gaming (7602 - 19954, n=94, last 2 years) | |
| Asus TUF Gaming A16 FA617XS | |
| Lenovo Legion Slim 5 16APH8 | |
| Dell Inspiron 16 Plus 7630 | |
| Captiva Advanced Gaming I74-121 | |
| Acer Nitro 16 AN16-41-R7YE | |
| Average Intel Core i7-13620H, NVIDIA GeForce RTX 4060 Laptop GPU (9437 - 10204, n=3) | |
| Lenovo LOQ 16IRH8 | |
| CrossMark / Overall | |
| Average of class Gaming (1366 - 2409, n=93, last 2 years) | |
| Lenovo LOQ 16IRH8 | |
| Average Intel Core i7-13620H, NVIDIA GeForce RTX 4060 Laptop GPU (1857 - 1986, n=3) | |
| Dell Inspiron 16 Plus 7630 | |
| Lenovo Legion Slim 5 16APH8 | |
| Asus TUF Gaming A16 FA617XS | |
| Captiva Advanced Gaming I74-121 | |
| Acer Nitro 16 AN16-41-R7YE | |
| CrossMark / Productivity | |
| Lenovo LOQ 16IRH8 | |
| Average of class Gaming (1386 - 2254, n=93, last 2 years) | |
| Average Intel Core i7-13620H, NVIDIA GeForce RTX 4060 Laptop GPU (1765 - 1908, n=3) | |
| Lenovo Legion Slim 5 16APH8 | |
| Dell Inspiron 16 Plus 7630 | |
| Asus TUF Gaming A16 FA617XS | |
| Captiva Advanced Gaming I74-121 | |
| Acer Nitro 16 AN16-41-R7YE | |
| CrossMark / Creativity | |
| Average of class Gaming (1343 - 2729, n=93, last 2 years) | |
| Dell Inspiron 16 Plus 7630 | |
| Lenovo LOQ 16IRH8 | |
| Average Intel Core i7-13620H, NVIDIA GeForce RTX 4060 Laptop GPU (2013 - 2067, n=3) | |
| Asus TUF Gaming A16 FA617XS | |
| Lenovo Legion Slim 5 16APH8 | |
| Captiva Advanced Gaming I74-121 | |
| Acer Nitro 16 AN16-41-R7YE | |
| CrossMark / Responsiveness | |
| Lenovo LOQ 16IRH8 | |
| Average Intel Core i7-13620H, NVIDIA GeForce RTX 4060 Laptop GPU (1734 - 1989, n=3) | |
| Average of class Gaming (1226 - 2334, n=93, last 2 years) | |
| Captiva Advanced Gaming I74-121 | |
| Dell Inspiron 16 Plus 7630 | |
| Lenovo Legion Slim 5 16APH8 | |
| Asus TUF Gaming A16 FA617XS | |
| Acer Nitro 16 AN16-41-R7YE | |
| PCMark 10 Score | 6678 points | |
Help | ||
| AIDA64 / Memory Copy | |
| Average of class Gaming (21750 - 129946, n=103, last 2 years) | |
| Lenovo Legion Slim 5 16APH8 | |
| Asus TUF Gaming A16 FA617XS | |
| Dell Inspiron 16 Plus 7630 | |
| Lenovo LOQ 16IRH8 | |
| Acer Nitro 16 AN16-41-R7YE | |
| Average Intel Core i7-13620H (31629 - 53927, n=7) | |
| Captiva Advanced Gaming I74-121 | |
| AIDA64 / Memory Read | |
| Average of class Gaming (22956 - 118858, n=103, last 2 years) | |
| Dell Inspiron 16 Plus 7630 | |
| Lenovo LOQ 16IRH8 | |
| Asus TUF Gaming A16 FA617XS | |
| Lenovo Legion Slim 5 16APH8 | |
| Average Intel Core i7-13620H (35115 - 61853, n=7) | |
| Acer Nitro 16 AN16-41-R7YE | |
| Captiva Advanced Gaming I74-121 | |
| AIDA64 / Memory Write | |
| Lenovo Legion Slim 5 16APH8 | |
| Average of class Gaming (22297 - 135096, n=103, last 2 years) | |
| Asus TUF Gaming A16 FA617XS | |
| Dell Inspiron 16 Plus 7630 | |
| Acer Nitro 16 AN16-41-R7YE | |
| Lenovo LOQ 16IRH8 | |
| Average Intel Core i7-13620H (30611 - 54111, n=7) | |
| Captiva Advanced Gaming I74-121 | |
| AIDA64 / Memory Latency | |
| Lenovo LOQ 16IRH8 | |
| Average of class Gaming (75.3 - 259, n=103, last 2 years) | |
| Average Intel Core i7-13620H (75.9 - 108.2, n=7) | |
| Lenovo Legion Slim 5 16APH8 | |
| Dell Inspiron 16 Plus 7630 | |
| Asus TUF Gaming A16 FA617XS | |
| Acer Nitro 16 AN16-41-R7YE | |
| Captiva Advanced Gaming I74-121 | |
* ... smaller is better
DPC Latencies
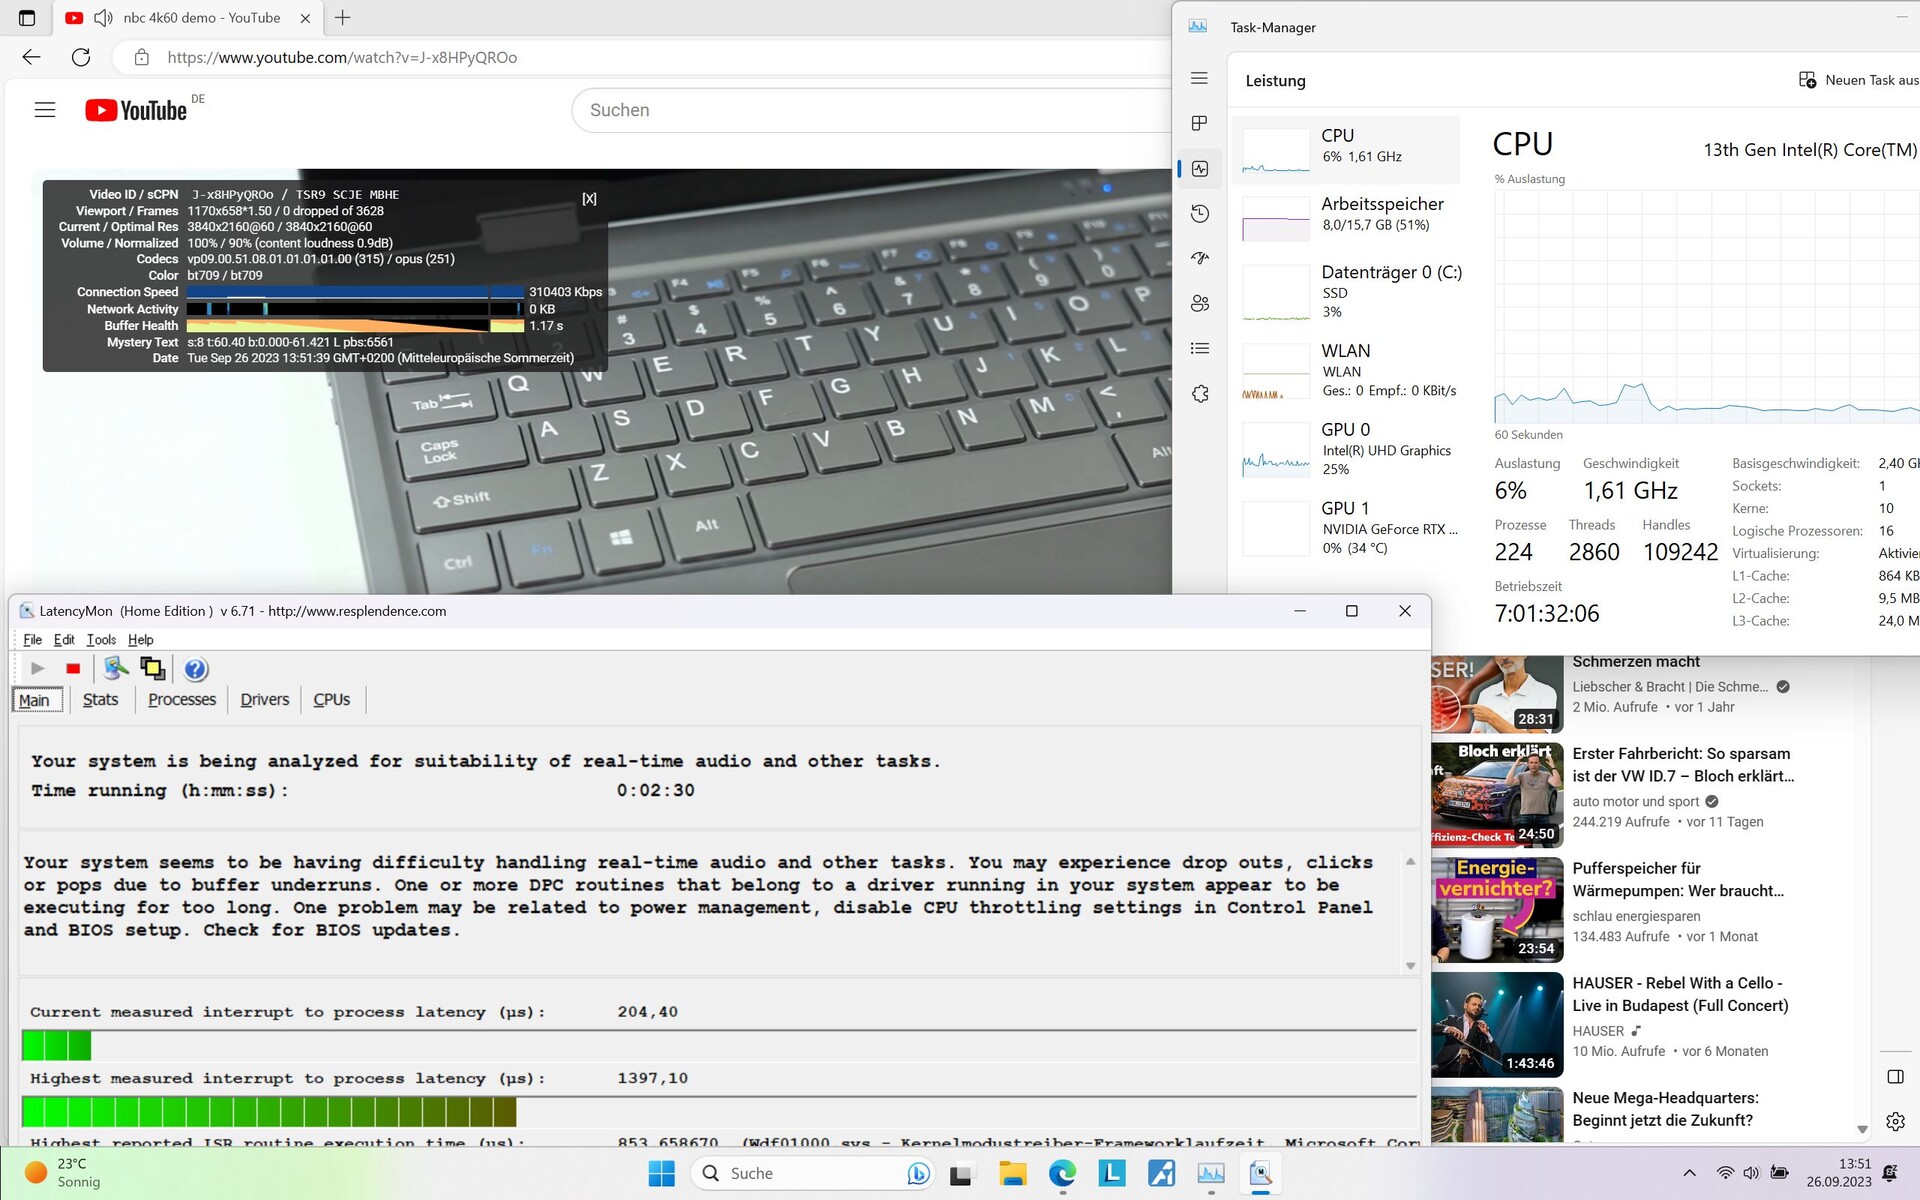
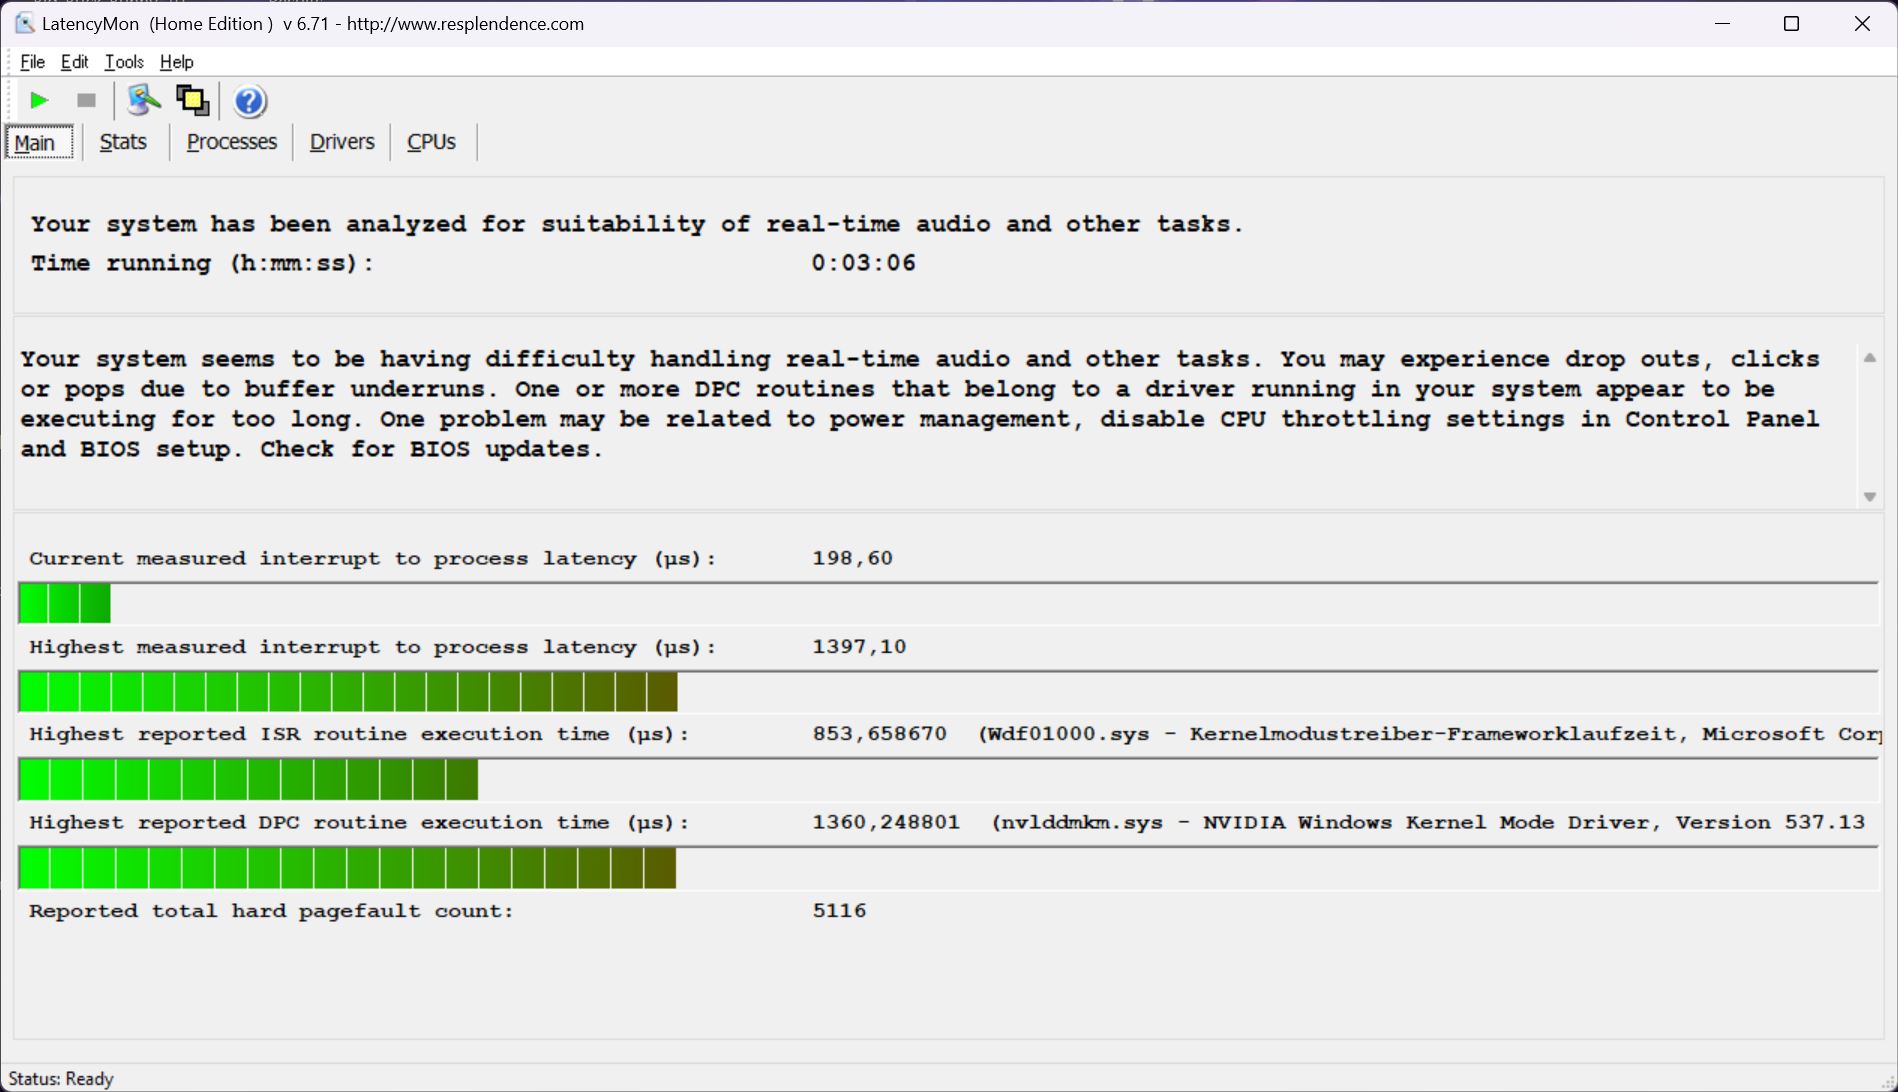
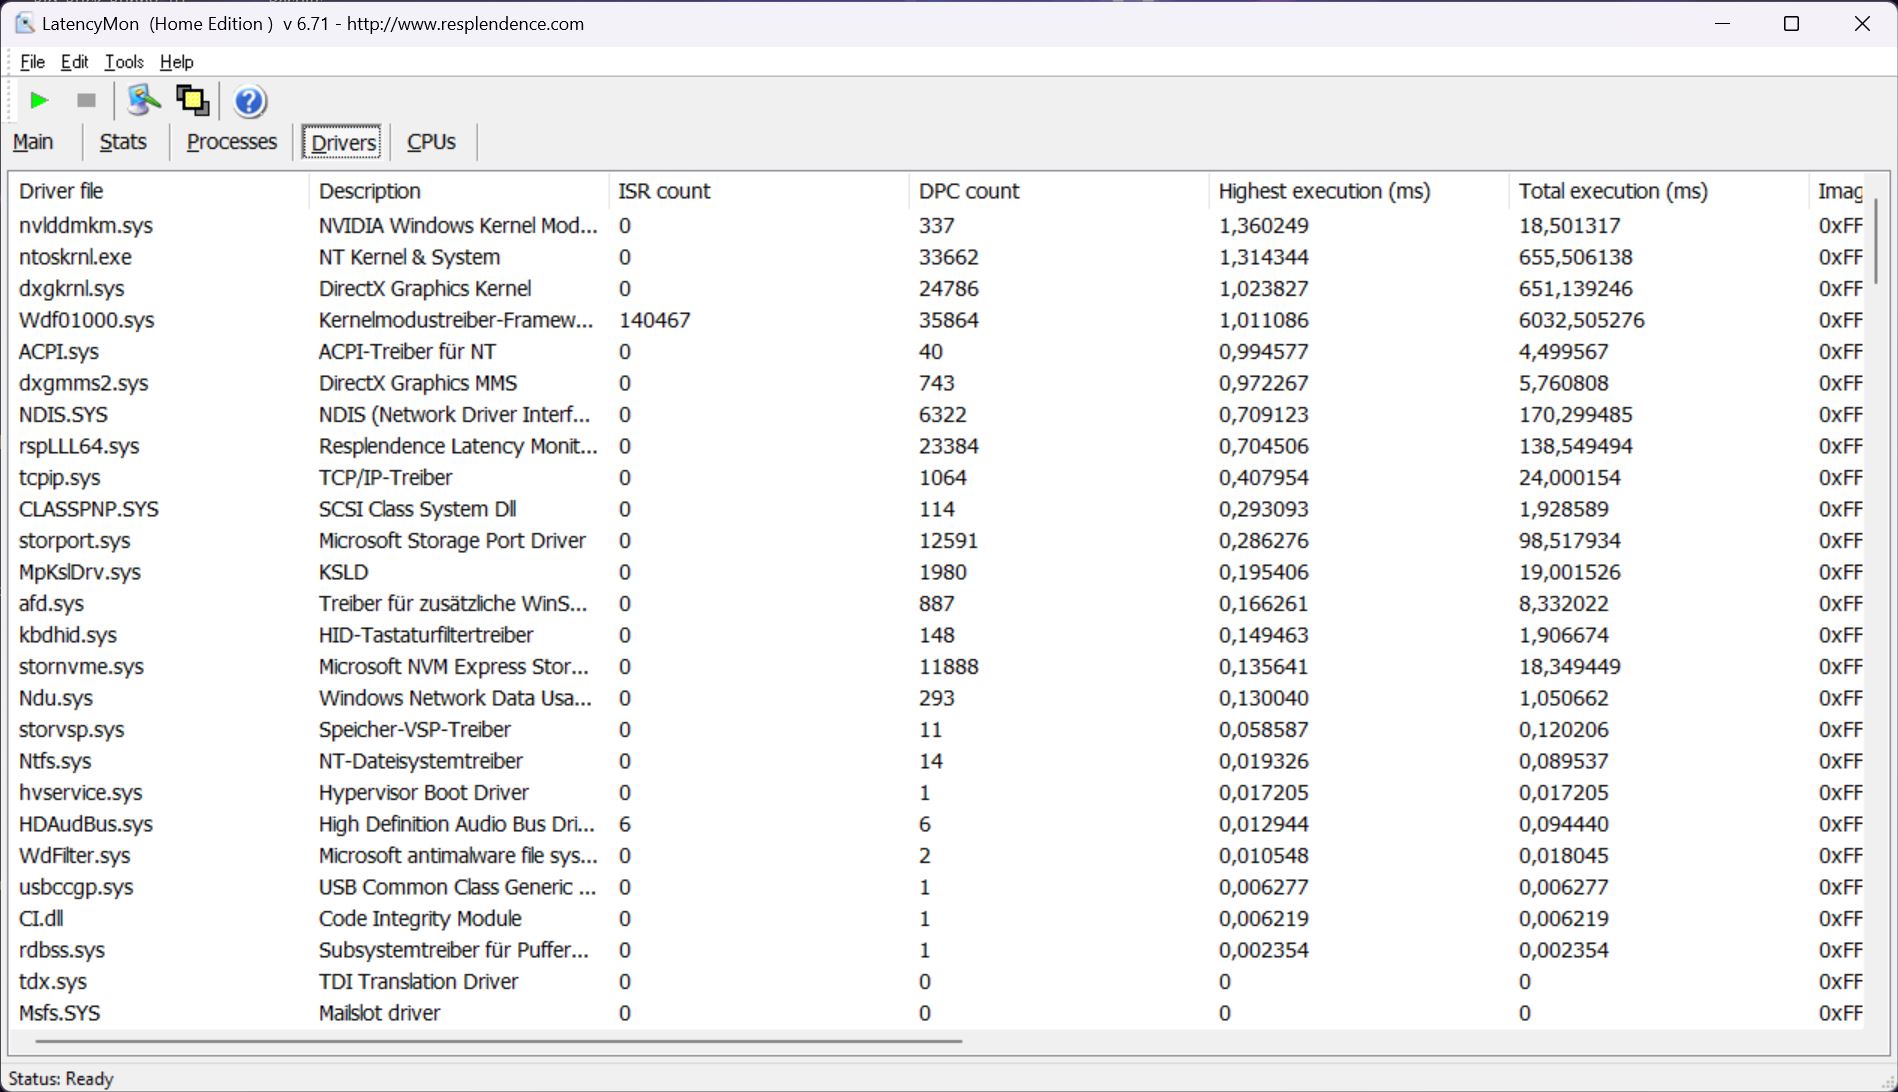
The LOQ 16 doesn't have any problems opening the browser but only opening several browser tabs on our Homepage, and the LatencyMon tool notes the first latencies here.
Playing our 4K/60-fps YouTube videos, these are again increased. But at least, we cannot complain about any dropped frames. Prime95 doesn't increase the latencies further. While the competitors have latency values that are similarly high, the LOQ 16 takes the unfortunate first place in this category.
| DPC Latencies / LatencyMon - interrupt to process latency (max), Web, Youtube, Prime95 | |
| Lenovo LOQ 16IRH8 | |
| Asus TUF Gaming A16 FA617XS | |
| Captiva Advanced Gaming I74-121 | |
| Lenovo Legion Slim 5 16APH8 | |
| Dell Inspiron 16 Plus 7630 | |
| Acer Nitro 16 AN16-41-R7YE | |
* ... smaller is better
Storage Solution
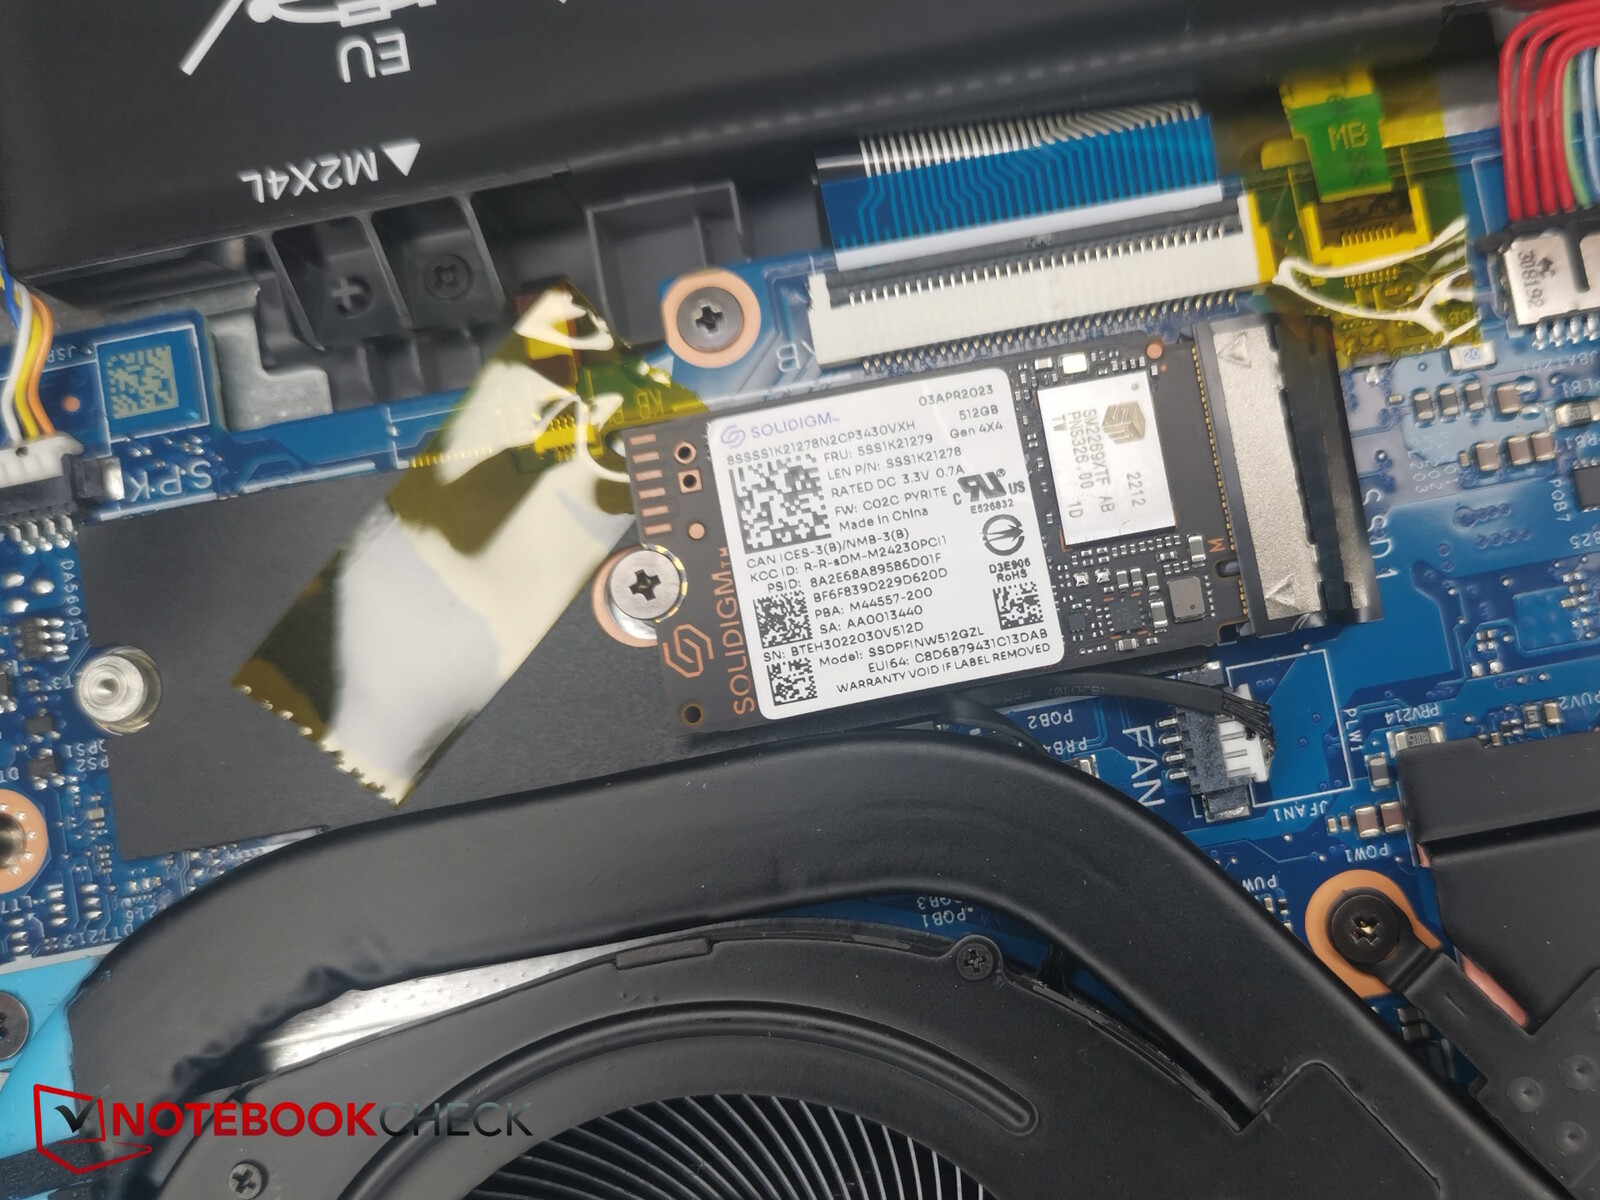
Lenovo uses a fairly unknown SSD with 512 GB of storage space in the small M.2 2230 form factor.
Even though there are faster storage modules available, particularly in comparison with the SSD in the Legion Slim 5, the performance is still okay here, especially considering that it remains constant over a longer time period.

* ... smaller is better
Disk Throttling: DiskSpd Read Loop, Queue Depth 8
Graphics Card
You have the choice between an RTX 4050 and an RTX 4060. Our test unit uses the latter, and it is allowed to consume a maximum of 115 W including Dynamic Boost, which is not much. For example, the same GPU is allowed to consume 140 W in the Captiva Advanced Gaming.
However, the GPU in the LOQ 16 is still able to do what it needs to do, or even more than that. Compared to the competitors, it reaches second place in the 3DMarks behind the Captiva.
| 3DMark 11 Performance | 30250 points | |
| 3DMark Cloud Gate Standard Score | 56287 points | |
| 3DMark Fire Strike Score | 22013 points | |
| 3DMark Time Spy Score | 10608 points | |
Help | ||
* ... smaller is better
Gaming Performance
When gaming, the LOQ 16 does an even better job, surpassing even the Captiva with its 140-W RTX-4060 and just barely reaching first place. Even the more expensive Legion Slim 5 is beaten by about 14%.
The gaming performance is not impacted negatively at all by the affordable price of the LOQ 16. Current games should run smoothly in Full-HD resolution even using the highest quality settings, and in parts this also goes for the native QHD resolution.
| The Witcher 3 - 1920x1080 Ultra Graphics & Postprocessing (HBAO+) | |
| Average of class Gaming (104.7 - 240, n=6, last 2 years) | |
| Lenovo LOQ 16IRH8 | |
| Captiva Advanced Gaming I74-121 | |
| Asus TUF Gaming A16 FA617XS | |
| Lenovo Legion Slim 5 16APH8 | |
| Dell Inspiron 16 Plus 7630 | |
| Acer Nitro 16 AN16-41-R7YE | |
| GTA V - 1920x1080 Highest AA:4xMSAA + FX AF:16x | |
| Average of class Gaming (48.3 - 186.9, n=93, last 2 years) | |
| Captiva Advanced Gaming I74-121 | |
| Lenovo LOQ 16IRH8 | |
| Lenovo Legion Slim 5 16APH8 | |
| Asus TUF Gaming A16 FA617XS | |
| Final Fantasy XV Benchmark - 1920x1080 High Quality | |
| Average of class Gaming (41 - 215, n=94, last 2 years) | |
| Captiva Advanced Gaming I74-121 | |
| Lenovo LOQ 16IRH8 | |
| Lenovo Legion Slim 5 16APH8 | |
| Dell Inspiron 16 Plus 7630 | |
| Asus TUF Gaming A16 FA617XS | |
| Acer Nitro 16 AN16-41-R7YE | |
| Strange Brigade - 1920x1080 ultra AA:ultra AF:16 | |
| Average of class Gaming (76.3 - 456, n=86, last 2 years) | |
| Captiva Advanced Gaming I74-121 | |
| Lenovo LOQ 16IRH8 | |
| Lenovo Legion Slim 5 16APH8 | |
| Asus TUF Gaming A16 FA617XS | |
| Dell Inspiron 16 Plus 7630 | |
| Acer Nitro 16 AN16-41-R7YE | |
| Dota 2 Reborn - 1920x1080 ultra (3/3) best looking | |
| Average of class Gaming (84.8 - 248, n=106, last 2 years) | |
| Lenovo LOQ 16IRH8 | |
| Dell Inspiron 16 Plus 7630 | |
| Captiva Advanced Gaming I74-121 | |
| Lenovo Legion Slim 5 16APH8 | |
| Acer Nitro 16 AN16-41-R7YE | |
| Asus TUF Gaming A16 FA617XS | |
| The Witcher 3 | |
| 1920x1080 High Graphics & Postprocessing (Nvidia HairWorks Off) | |
| Average of class Gaming (n=1last 2 years) | |
| Captiva Advanced Gaming I74-121 | |
| Lenovo LOQ 16IRH8 | |
| Average NVIDIA GeForce RTX 4060 Laptop GPU (110 - 229, n=36) | |
| Lenovo Legion Slim 5 16APH8 | |
| Dell Inspiron 16 Plus 7630 | |
| Asus TUF Gaming A16 FA617XS | |
| Acer Nitro 16 AN16-41-R7YE | |
| 1920x1080 Ultra Graphics & Postprocessing (HBAO+) | |
| Average of class Gaming (104.7 - 240, n=6, last 2 years) | |
| Lenovo LOQ 16IRH8 | |
| Captiva Advanced Gaming I74-121 | |
| Average NVIDIA GeForce RTX 4060 Laptop GPU (77 - 159.7, n=42) | |
| Asus TUF Gaming A16 FA617XS | |
| Lenovo Legion Slim 5 16APH8 | |
| Dell Inspiron 16 Plus 7630 | |
| Acer Nitro 16 AN16-41-R7YE | |
| Hogwarts Legacy | |
| 1920x1080 High Preset AA:High T | |
| Average NVIDIA GeForce RTX 4060 Laptop GPU (70.8 - 107.7, n=6) | |
| Lenovo LOQ 16IRH8 | |
| Asus TUF Gaming A16 FA617XS | |
| 1920x1080 Ultra Preset AA:High T | |
| Average of class Gaming (n=1last 2 years) | |
| Average NVIDIA GeForce RTX 4060 Laptop GPU (61.9 - 91.9, n=6) | |
| Lenovo LOQ 16IRH8 | |
| Asus TUF Gaming A16 FA617XS | |
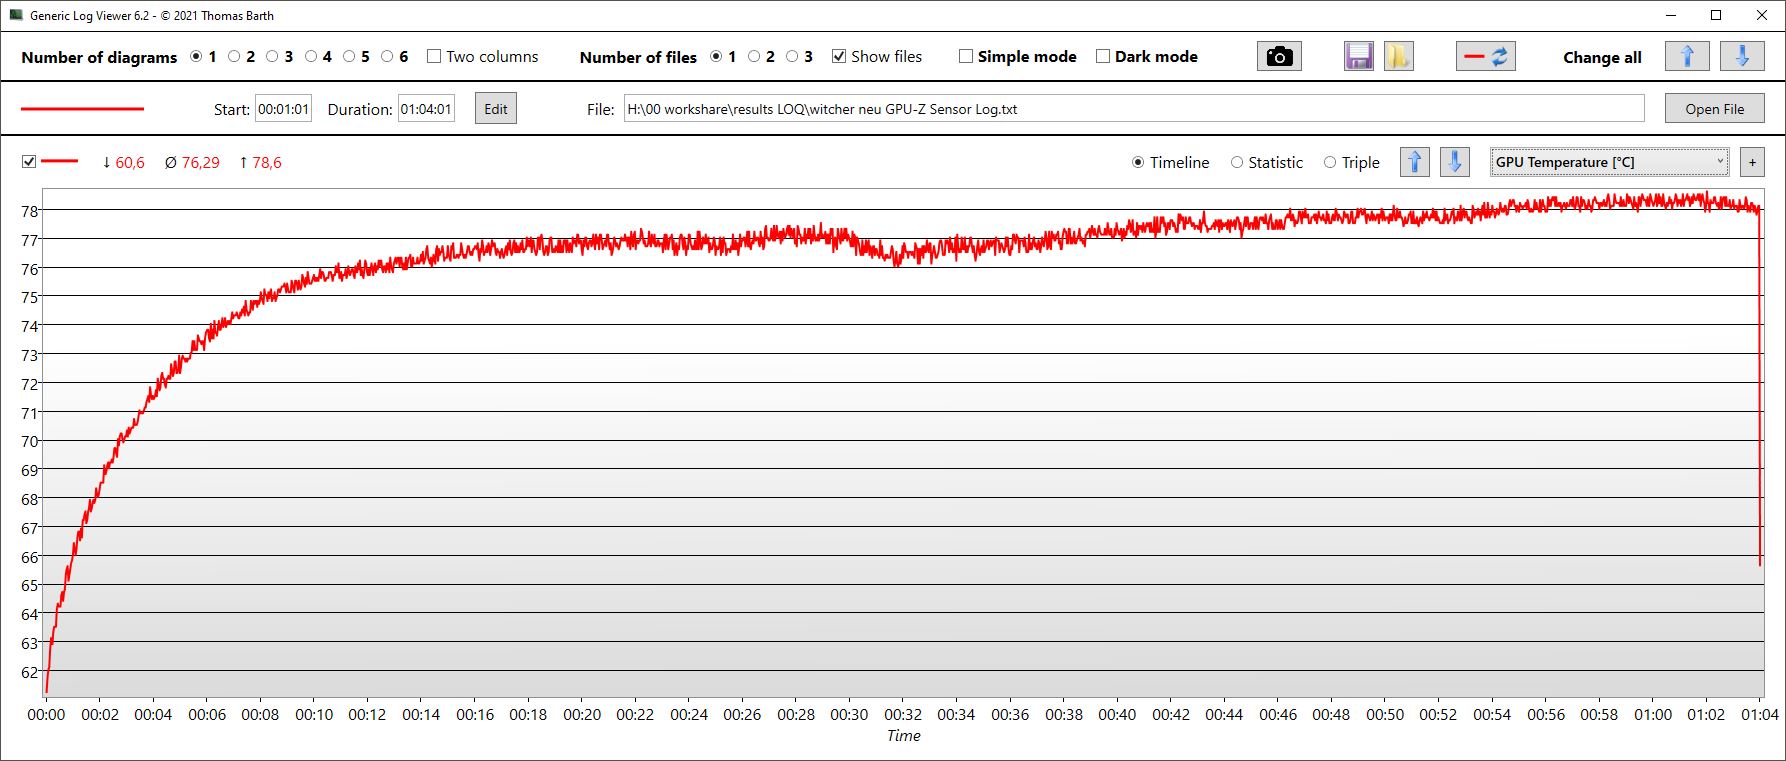
The frame rate of The Witcher 3 remains very constant across one hour, only showing the usual day/night variations during the game.
The TDP of the CPU lies at 35 W on average, and it reaches a temperature of about 75 °C (167 °F).
In Balanced Mode, the GPU clock speed decreases continuously during the hour, but the total drop is only 100 MHz, from 2.4 to 2.3 GHz. The temperatures increase continuously up to 72 °C (162 °F) in the end. The average TGP that is reached is 80 W.
In Quiet Mode, the GPU clock speeds starts only slightly higher than 2 GHz but also doesn't drop to any value below that. At the same time, the temperature only increase to 65 °C (149 °F), with a TGP of about 45 W. However, the noise level is significantly lower, as you can see in the table below:
| Power Mode | GPU Clock Speed (MHz) | Temperature | Power Consumption | Average FPS | Noise Level |
|---|---|---|---|---|---|
| Quiet Mode | 2,050 | up to 65 °C (149 °F) | 45 W | 83 fps | 37.29 dB |
| Balanced Mode | 2,340 | up to 72 °C (162 °F) | 80 W | 91 fps | 46.81 dB |
| Performance Mode | 2,475 | up to 78 °C (172 °F) | 95 W | 95 fps | 53.50 dB |
The Witcher 3 FPS Chart
| low | med. | high | ultra | QHD | 4K | |
|---|---|---|---|---|---|---|
| GTA V (2015) | 184.3 | 179.6 | 114.5 | |||
| The Witcher 3 (2015) | 427.7 | 301.1 | 195.3 | 103.7 | 78.3 | |
| Dota 2 Reborn (2015) | 188.7 | 171.4 | 167.2 | 153.1 | 125.3 | |
| Final Fantasy XV Benchmark (2018) | 203 | 143.4 | 101.4 | 74.8 | ||
| X-Plane 11.11 (2018) | 159.7 | 139.3 | 109.2 | 100.9 | ||
| Far Cry 5 (2018) | 180 | 152 | 143 | 133 | 104 | |
| Strange Brigade (2018) | 511 | 274 | 218 | 186.9 | ||
| Hogwarts Legacy (2023) | 116 | 96.7 | 75.7 | 61.9 | 44.1 |
Emissions - It quickly gets loud
Noise Levels
During idle operation, the fans often - but not always - remain quiet. Under load, the fan behavior is less than optimal. Already in 3DMark 06, the fans roar at full volume toward the end of the run, and they won't even get louder during the hour-long stress test. Other laptops do a better job here, producing less than the maximum noise level under average load.
However, the maximum noise level isn't unusually high, and aside from the quieter Acer Nitro 16, the competitors produce a similar maximum noise level. The difference is that they stay quieter longer.
Noise level
| Idle |
| 23 / 23 / 27.66 dB(A) |
| Load |
| 53.62 / 53.5 dB(A) |
 | ||
30 dB silent 40 dB(A) audible 50 dB(A) loud |
||
min: | ||
| Lenovo LOQ 16IRH8 GeForce RTX 4060 Laptop GPU, i7-13620H, Solidigm SSDPFINW512GZL | Dell Inspiron 16 Plus 7630 GeForce RTX 4060 Laptop GPU, i7-13700H, WD PC SN740 SDDPTQD-1T00 | Acer Nitro 16 AN16-41-R7YE GeForce RTX 4050 Laptop GPU, R5 7535HS, SK hynix HFS512GEJ9X125N | Captiva Advanced Gaming I74-121 GeForce RTX 4060 Laptop GPU, i5-13500H, Samsung SSD 980 1TB MZ-V8V1T0BW | Lenovo Legion Slim 5 16APH8 GeForce RTX 4060 Laptop GPU, R7 7840HS, SK hynix PC801 HFS512GEJ9X115N | Asus TUF Gaming A16 FA617XS Radeon RX 7600S, R9 7940HS, Micron 2400 MTFDKBA512QFM | |
|---|---|---|---|---|---|---|
| Noise | 7% | 5% | 3% | 5% | -1% | |
| off / environment * (dB) | 23 | 23.2 -1% | 24 -4% | 23 -0% | 22.9 -0% | 25 -9% |
| Idle Minimum * (dB) | 23 | 23.2 -1% | 25 -9% | 23 -0% | 23.1 -0% | 25 -9% |
| Idle Average * (dB) | 23 | 23.2 -1% | 26 -13% | 25.67 -12% | 23.1 -0% | 26 -13% |
| Idle Maximum * (dB) | 27.66 | 23.2 16% | 27 2% | 25.67 7% | 27.7 -0% | 28 -1% |
| Load Average * (dB) | 53.62 | 35.1 35% | 42 22% | 38.52 28% | 33.3 38% | 43 20% |
| Witcher 3 ultra * (dB) | 53.5 | 52.5 2% | 43 20% | 54.17 -1% | 54 -1% | 51 5% |
| Load Maximum * (dB) | 53.5 | 52.5 2% | 45 16% | 54.17 -1% | 54 -1% | 53 1% |
* ... smaller is better
Temperatures
The hottest place in the LOQ 16 is at the bottom, where we measure almost 60 °C (140 °F) during the stress test in the central area toward the display. The top stays at least 10 degrees cooler (up to 122 °F). The hotspots are also in the center toward the display here. The WASD keys get less hot at up to 40 °C (104 °F), while the palm rests stay cool.
(-) The maximum temperature on the upper side is 48 °C / 118 F, compared to the average of 40.4 °C / 105 F, ranging from 21.2 to 68.8 °C for the class Gaming.
(-) The bottom heats up to a maximum of 59 °C / 138 F, compared to the average of 43.2 °C / 110 F
(+) In idle usage, the average temperature for the upper side is 25.6 °C / 78 F, compared to the device average of 33.9 °C / 93 F.
(±) Playing The Witcher 3, the average temperature for the upper side is 37.3 °C / 99 F, compared to the device average of 33.9 °C / 93 F.
(+) The palmrests and touchpad are cooler than skin temperature with a maximum of 31 °C / 87.8 F and are therefore cool to the touch.
(-) The average temperature of the palmrest area of similar devices was 28.8 °C / 83.8 F (-2.2 °C / -4 F).
| Lenovo LOQ 16IRH8 Intel Core i7-13620H, NVIDIA GeForce RTX 4060 Laptop GPU | Dell Inspiron 16 Plus 7630 Intel Core i7-13700H, NVIDIA GeForce RTX 4060 Laptop GPU | Acer Nitro 16 AN16-41-R7YE AMD Ryzen 5 7535HS, NVIDIA GeForce RTX 4050 Laptop GPU | Captiva Advanced Gaming I74-121 Intel Core i5-13500H, NVIDIA GeForce RTX 4060 Laptop GPU | Lenovo Legion Slim 5 16APH8 AMD Ryzen 7 7840HS, NVIDIA GeForce RTX 4060 Laptop GPU | Asus TUF Gaming A16 FA617XS AMD Ryzen 9 7940HS, AMD Radeon RX 7600S | |
|---|---|---|---|---|---|---|
| Heat | -6% | -12% | 1% | 13% | -1% | |
| Maximum Upper Side * (°C) | 48 | 47.8 -0% | 51 -6% | 41 15% | 40.6 15% | 53 -10% |
| Maximum Bottom * (°C) | 59 | 42.2 28% | 63 -7% | 42 29% | 42 29% | 48 19% |
| Idle Upper Side * (°C) | 28 | 35.2 -26% | 34 -21% | 32 -14% | 27.8 1% | 30 -7% |
| Idle Bottom * (°C) | 28 | 35 -25% | 32 -14% | 35 -25% | 26.6 5% | 30 -7% |
* ... smaller is better
Stress Test
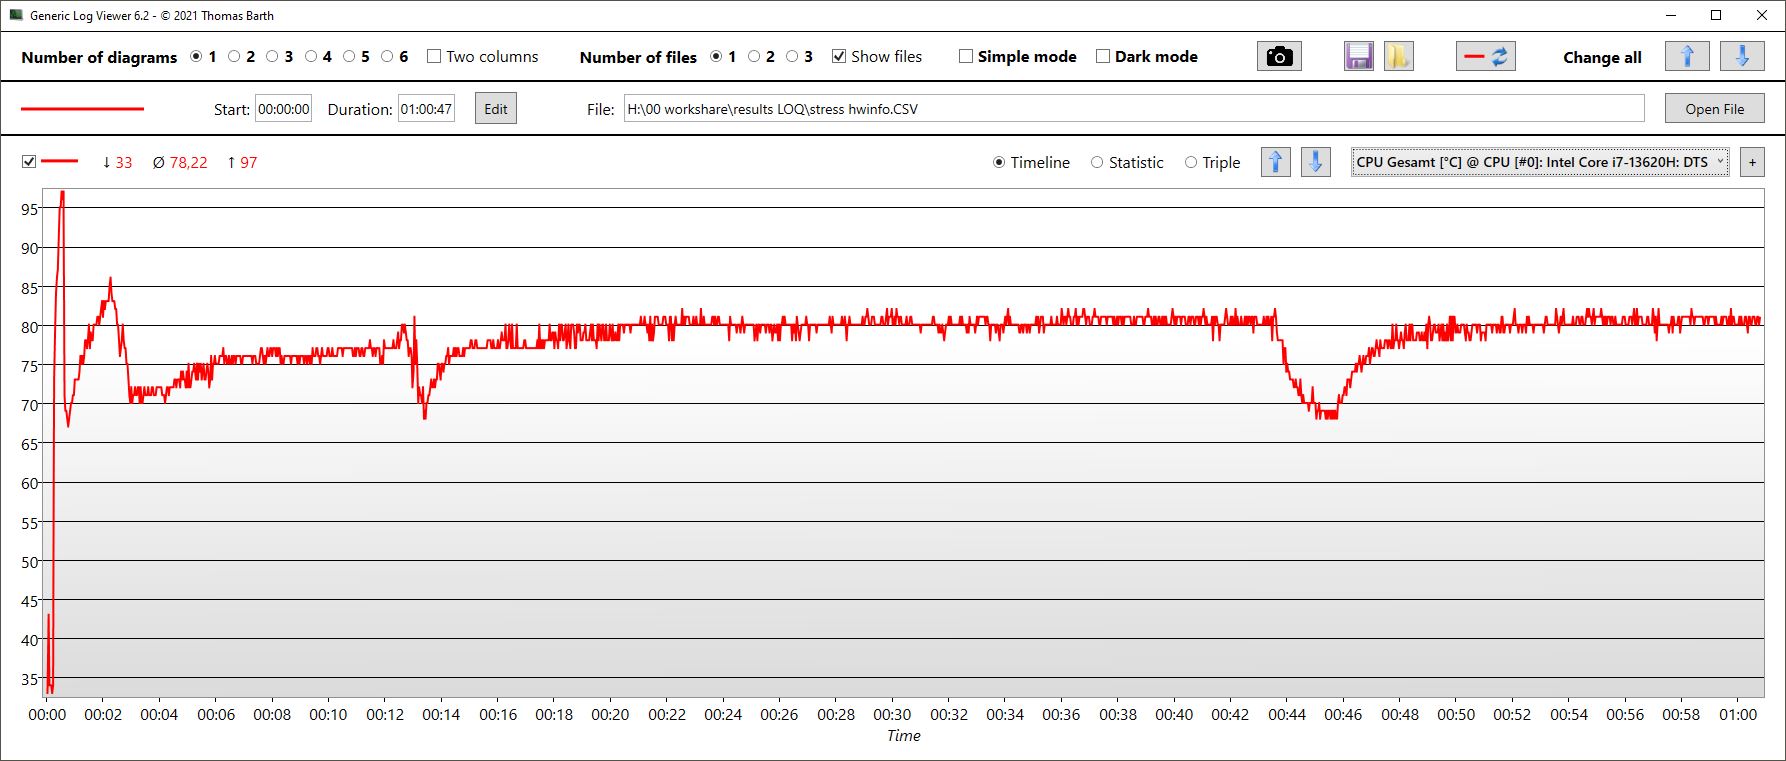
The CPU cores begin the hour-long stress test with Prime95 and Furmark running simultaneously briefly with a clock speed above 4 GHz. After about 30 seconds, the clock speed drops, before leveling out at 2,300 MHz after about 3 minutes. At the same time, the TDP drops from 135 to a finally constant 45 W. The CPU heats up to about 80 ºC (176 ºF).
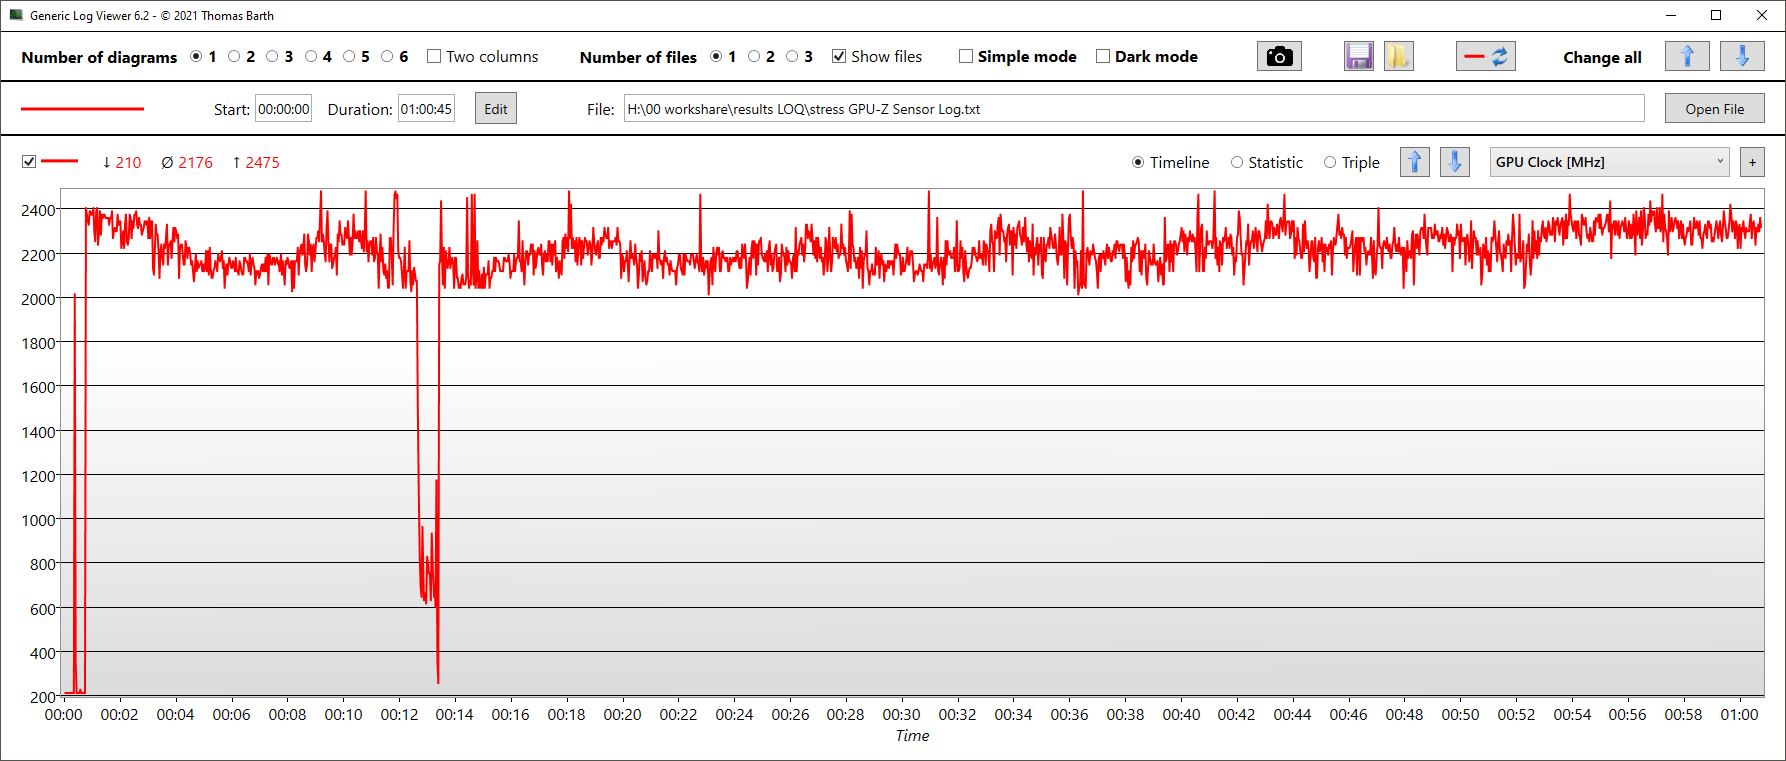
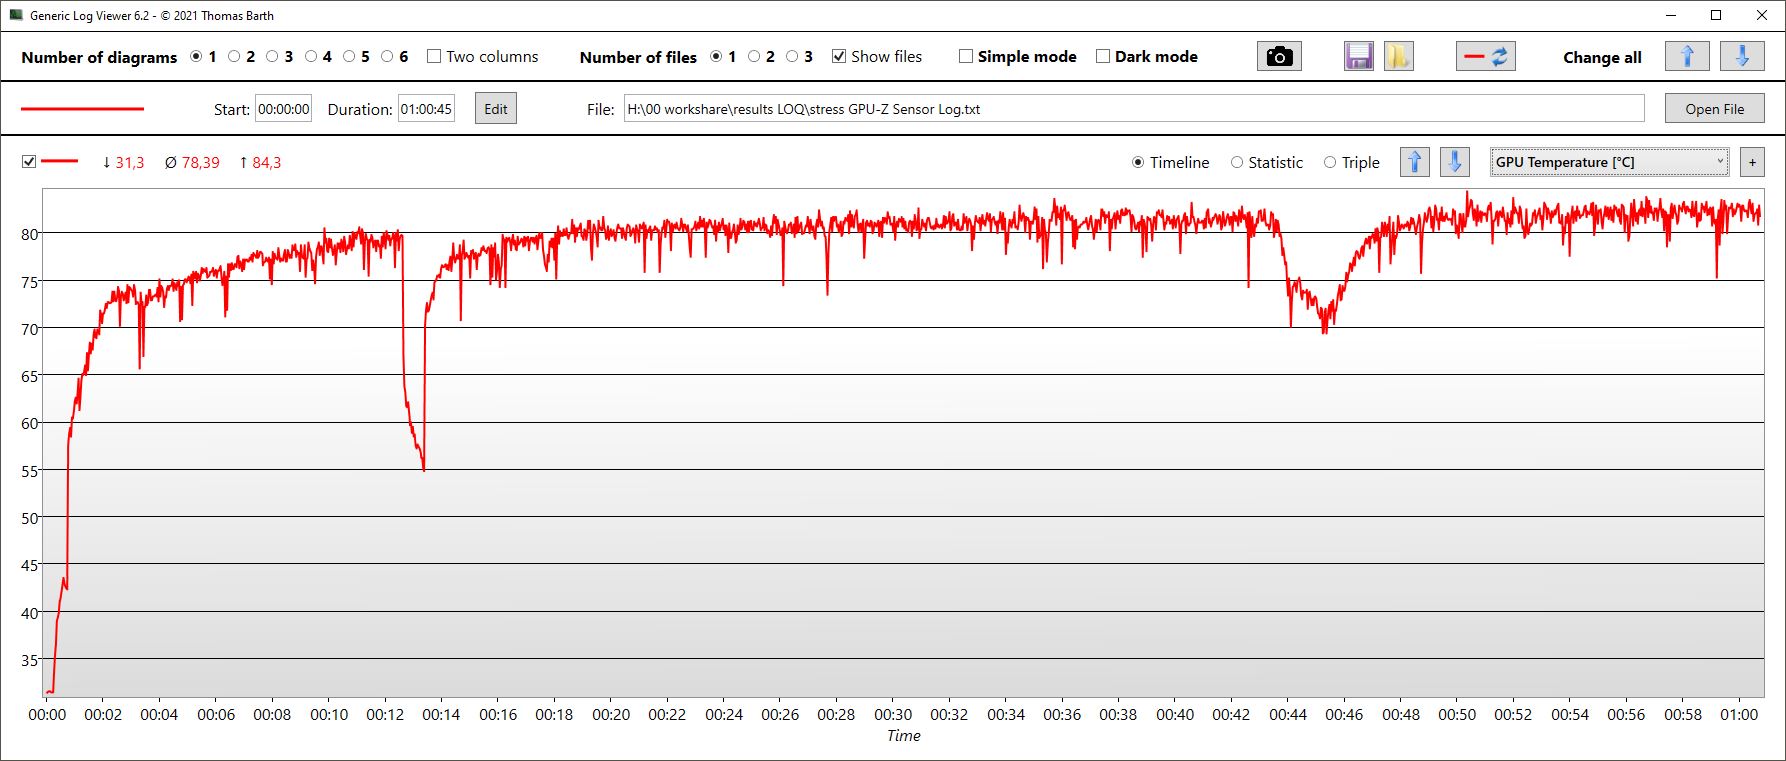
On the other hand, the GPU clock speed remains at a relatively constant 2,200 MHz over the whole test period, and the storage speed is 2 GHz. During this time, the GPU heats up to a maximum of 84 ºC (183 ºF). The power consumption is 87 W on average.
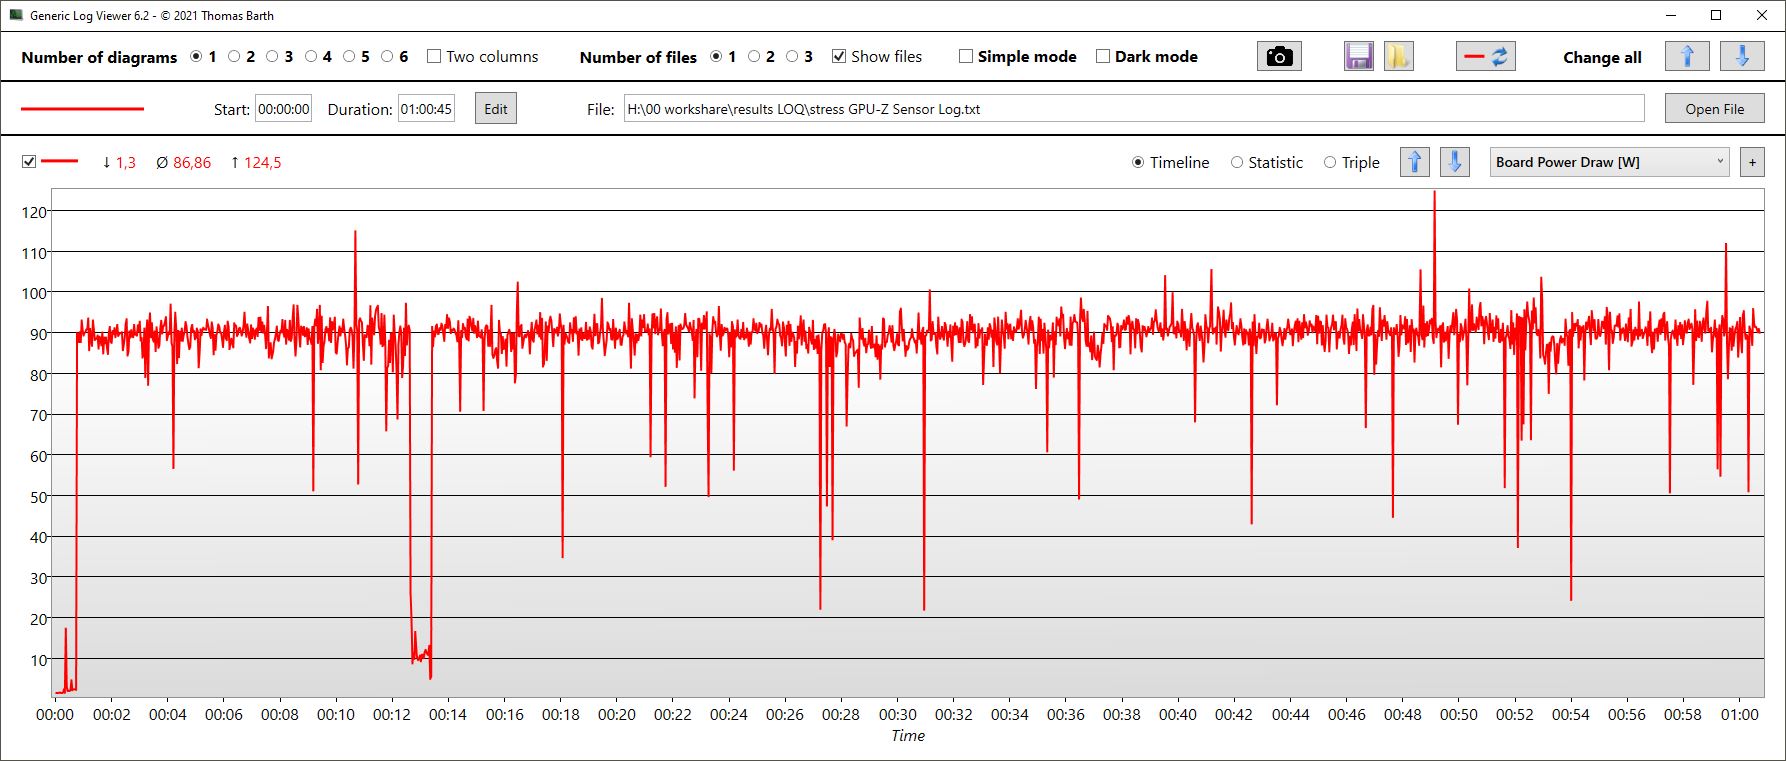
| CPU Clock (MHz) | GPU Clock (MHz) | Average CPU Temperature (°C) | Average GPU Temperature (°C) | |
| Prime95 + FurMark Stress | 2,300 | 2,200 | 80 | 84 |
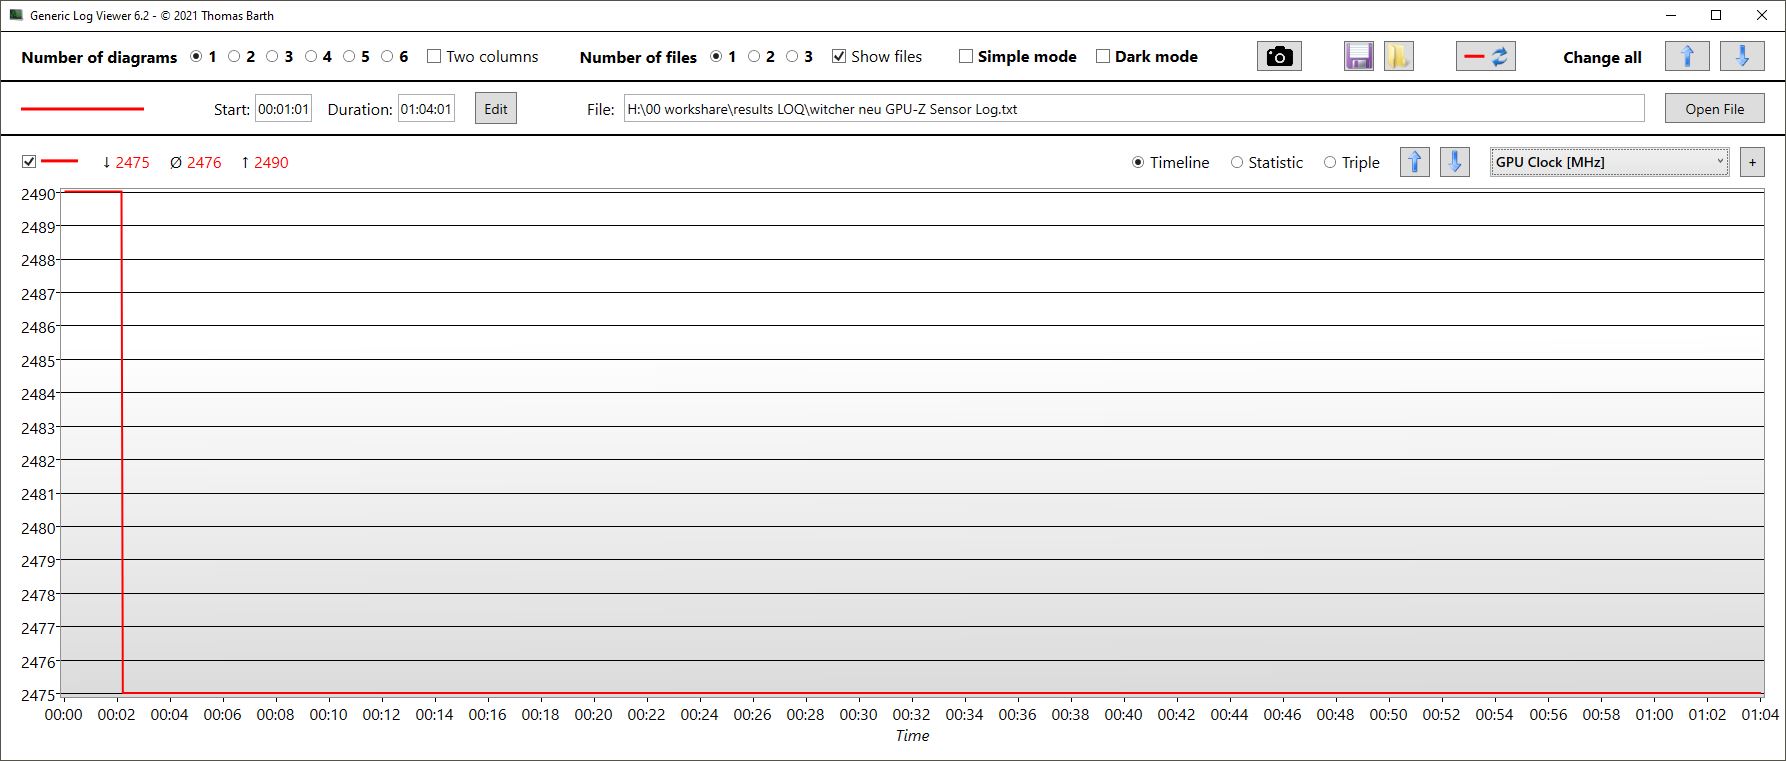
| The Witcher 3 Stress | 540 | 2,475 | 75 | 78 |
Speakers
The speakers suffer from the usual symptoms of affordable laptop models: too quiet, hardly any bass, and the highs are the only frequencies you can only call linear and balanced.
A solution is to connect headphones or other external audio devices via the combined audio port, among other options.
Lenovo LOQ 16IRH8 audio analysis
(±) | speaker loudness is average but good (81.33 dB)
Bass 100 - 315 Hz
(-) | nearly no bass - on average 15% lower than median
(±) | linearity of bass is average (10% delta to prev. frequency)
Mids 400 - 2000 Hz
(±) | higher mids - on average 11.8% higher than median
(±) | linearity of mids is average (7.3% delta to prev. frequency)
Highs 2 - 16 kHz
(+) | balanced highs - only 4.9% away from median
(+) | highs are linear (5.7% delta to prev. frequency)
Overall 100 - 16.000 Hz
(±) | linearity of overall sound is average (22.8% difference to median)
Compared to same class
» 82% of all tested devices in this class were better, 5% similar, 13% worse
» The best had a delta of 6%, average was 18%, worst was 132%
Compared to all devices tested
» 68% of all tested devices were better, 5% similar, 27% worse
» The best had a delta of 4%, average was 23%, worst was 134%
Acer Nitro 16 AN16-41-R7YE audio analysis
(+) | speakers can play relatively loud (82 dB)
Bass 100 - 315 Hz
(-) | nearly no bass - on average 28.2% lower than median
(±) | linearity of bass is average (12.9% delta to prev. frequency)
Mids 400 - 2000 Hz
(+) | balanced mids - only 2.2% away from median
(+) | mids are linear (3.8% delta to prev. frequency)
Highs 2 - 16 kHz
(+) | balanced highs - only 3.5% away from median
(+) | highs are linear (4.6% delta to prev. frequency)
Overall 100 - 16.000 Hz
(±) | linearity of overall sound is average (17.3% difference to median)
Compared to same class
» 47% of all tested devices in this class were better, 12% similar, 41% worse
» The best had a delta of 6%, average was 18%, worst was 132%
Compared to all devices tested
» 32% of all tested devices were better, 8% similar, 59% worse
» The best had a delta of 4%, average was 23%, worst was 134%
Power Management - High idle consumption and a less than optimal battery life
Power Consumption
The LOQ 16 isn't an efficient laptop and particularly during idle operation, the consumption is too high. Under load, the consumption is appropriate considering the performance.
With a similar performance, the Captiva consumes just as much power, and likewise the Asus TUF. During gaming, the Dell Inspiron 16, the Acer Nitro 16, and the Legion Slim 5 consume significantly less power, but they also have a lower 3D performance.
We measure a temporary maximum peak of 211 W, which the included 230-W power supply has no trouble handling.
| Off / Standby | |
| Idle | |
| Load |
|
Key:
min: | |
| Lenovo LOQ 16IRH8 i7-13620H, GeForce RTX 4060 Laptop GPU, Solidigm SSDPFINW512GZL, IPS, 2560x1600, 16" | Dell Inspiron 16 Plus 7630 i7-13700H, GeForce RTX 4060 Laptop GPU, WD PC SN740 SDDPTQD-1T00, IPS, 2560x1600, 16" | Acer Nitro 16 AN16-41-R7YE R5 7535HS, GeForce RTX 4050 Laptop GPU, SK hynix HFS512GEJ9X125N, IPS, 1920x1200, 16" | Captiva Advanced Gaming I74-121 i5-13500H, GeForce RTX 4060 Laptop GPU, Samsung SSD 980 1TB MZ-V8V1T0BW, IPS, 1920x1080, 15.6" | Lenovo Legion Slim 5 16APH8 R7 7840HS, GeForce RTX 4060 Laptop GPU, SK hynix PC801 HFS512GEJ9X115N, IPS, 2560x1600, 16" | Asus TUF Gaming A16 FA617XS R9 7940HS, Radeon RX 7600S, Micron 2400 MTFDKBA512QFM, IPS, 1920x1200, 16" | Average NVIDIA GeForce RTX 4060 Laptop GPU | Average of class Gaming | |
|---|---|---|---|---|---|---|---|---|
| Power Consumption | 14% | 5% | -1% | 17% | 27% | 10% | -6% | |
| Idle Minimum * (Watt) | 17.2 | 15.6 9% | 19 -10% | 18.4 -7% | 9.4 45% | 7 59% | 11.5 ? 33% | 13 ? 24% |
| Idle Average * (Watt) | 19.3 | 17.7 8% | 20 -4% | 20 -4% | 15.5 20% | 10 48% | 16 ? 17% | 18.7 ? 3% |
| Idle Maximum * (Watt) | 21.2 | 20.6 3% | 23 -8% | 20.7 2% | 24.4 -15% | 15 29% | 20.3 ? 4% | 24.3 ? -15% |
| Load Average * (Watt) | 90 | 87.4 3% | 80 11% | 85 6% | 74.1 18% | 86 4% | 92.9 ? -3% | 110.2 ? -22% |
| Witcher 3 ultra * (Watt) | 168 | 121.7 28% | 125.8 25% | 164 2% | 112.9 33% | 160.6 4% | ||
| Load Maximum * (Watt) | 211 | 138 35% | 184 13% | 219 -4% | 206.5 2% | 172 18% | 210 ? -0% | 258 ? -22% |
* ... smaller is better
Power Consumption The Witcher 3 / Stress Test
Power Consumption With External Monitor
Battery Life
Our test unit contains a battery with a 80 Wh capacity, but Lenovo also uses a battery with only 60 Wh capacity, so you have to be careful. In the configurator, the larger battery costs only a few Euros more.
With the larger battery, the LOQ lasts more than 6 hours in our Wi-Fi and video tests at an adjusted brightness. At full display brightness, it only lasts for 5.5 hours. This is surprisingly short, since some of the competitors with similarly large batteries last significantly longer. Only the Legion Slim 5 is similarly weak. Apparently, the power saving mechanisms aren't perfect with Lenovo yet. Particularly the idle consumption still needs to be lower. Perhaps the overloaded Control Center that we complained about earlier has a part in this.
| Lenovo LOQ 16IRH8 i7-13620H, GeForce RTX 4060 Laptop GPU, 80 Wh | Dell Inspiron 16 Plus 7630 i7-13700H, GeForce RTX 4060 Laptop GPU, 86 Wh | Acer Nitro 16 AN16-41-R7YE R5 7535HS, GeForce RTX 4050 Laptop GPU, 90 Wh | Captiva Advanced Gaming I74-121 i5-13500H, GeForce RTX 4060 Laptop GPU, 53 Wh | Lenovo Legion Slim 5 16APH8 R7 7840HS, GeForce RTX 4060 Laptop GPU, 80 Wh | Asus TUF Gaming A16 FA617XS R9 7940HS, Radeon RX 7600S, 90 Wh | Average of class Gaming | |
|---|---|---|---|---|---|---|---|
| Battery runtime | 21% | 64% | -11% | -4% | 50% | 16% | |
| H.264 (h) | 6.4 | 10.8 69% | 4.9 -23% | 12.4 94% | 8.64 ? 35% | ||
| WiFi v1.3 (h) | 6.3 | 9.4 49% | 11 75% | 5.3 -16% | 7.1 13% | 12.4 97% | 7.15 ? 13% |
| Load (h) | 1.5 | 1.4 -7% | 2.2 47% | 1.6 7% | 1.2 -20% | 0.9 -40% | 1.502 ? 0% |
| Reader / Idle (h) | 17.6 | 12 | 11.7 | 20.3 | 8.71 ? |
Pros
Cons
Verdict - A capable budget gaming laptop
Gaming laptops with an RTX 4060 are available starting from about 1,000 Euros (~$1,060), even in 16-inch format. For the supposedly affordable Lenovo LOQ 16 (1,500 Euros, ~$1,591), the manufacturer particularly saves in the equipment and materials compared to the more expensive Legion series. In addition, the LOQ is slightly heavier and more bulky.
What remains is anything but a laptop full of difficult compromises. Instead, this is a more than solid gaming laptop that focusses on the 3D performance. While the QHD display is also able to keep up with the Legion series, the Full-HD version is less able to do that.
The fan behavior and battery life give reasons for complaint: The fans quickly start roaring at maximum noise level even under average load. And despite the fairly large battery, we only get below average runtimes. Perhaps Lenovo should get rid of the advertisings in its Control Center and preinstall less bloatware.
The Lenovo LOQ 16 with QHD display is a capable and relatively affordable gaming laptop that hardly lacks anything in this price range, but that still needs some optimizations of the battery, the fan behavior, or the Control Center.
Some alternatives are also available: The Dell Inspiron 16 Plus 7630 costs just as much, and even though the performance is slightly lower, it is more efficient and offers a longer battery life and a 1,600p display. The slightly more affordable Acer Nitro 16 is also slightly slower, but shines with a good battery life and its display supports G-Sync.
Price and Availability
You can purchase the Lenovo LOQ 16 directly from Lenovo for ~$1,160. Various versions are available starting from $880, and Amazon also offers multiple configurations.
Lenovo LOQ 16IRH8
- 09/27/2023 v7 (old)
Christian Hintze

