BMAX B7 Power review: A frugal mini PC with Intel Core i7 for US$400
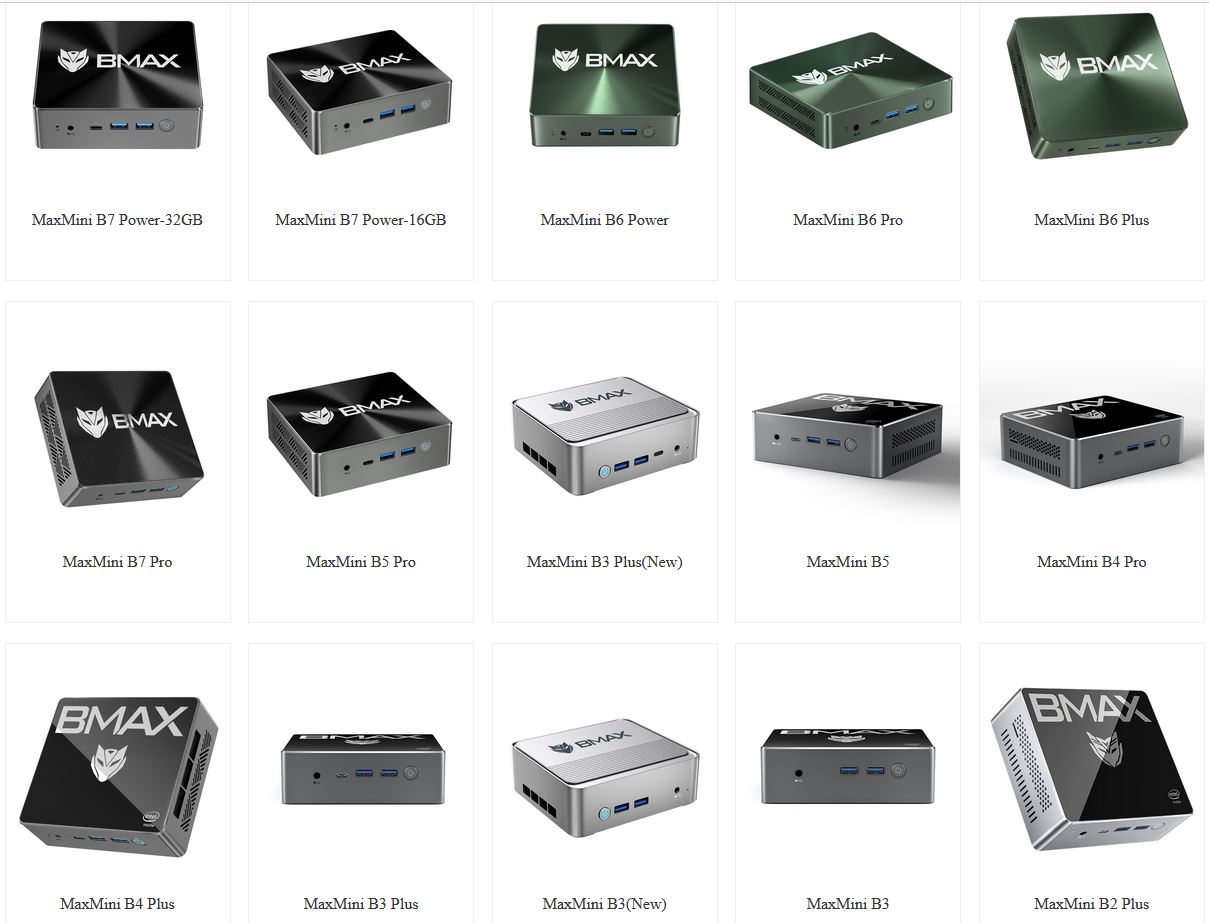
The (MaxMini) B7 Power isn't the first device we have tested from BMAX. The BMAX MaxBook Y11 H1M6 Convertible got 75 percentage points in our test. We also tested a predecessor of the B7 Power, the BMAX B5 Pro, but without giving it a rating. At the end of 2022, the B5 with Intel Gen8 was still its top-of-the-range model but now, the B7 Power is fitted with Intel Gen11. This may not make it the most modern but in turn, it keeps the price nice and low. It currently retails for just under US$400. BMAX also offers a B7 Pro which features an Intel Core i5-1145G7 instead of an Intel Core i7-11390H.
The B7 Power has to compete with other mini PCs. The Geekom Mini IT11 is one candidate with the same GPU - but we will also be analyzing the difference in performance compared to more up-to-date GPU generations such as the Intel NUC 13 Pro Kit. In between, you can find the Intel NUC 12 Pro Kit with Intel Gen12. Further comparison devices include the Beelink SEi11 and the B7 Power's predecessor of sorts, the B5 Pro.
Possible competitors compared
Rating | Date | Model | Weight | Height | Size | Resolution | Price |
|---|---|---|---|---|---|---|---|
| 78.4 % v7 (old) | 09 / 2023 | BMAX B7 Power G7A2 i7-11390H, Iris Xe G7 96EUs | 363 g | 44 mm | x | ||
| 80.6 % v7 (old) | 07 / 2023 | Geekom Mini IT11, i7-11390H i7-11390H, Iris Xe G7 96EUs | 536 g | 48 mm | x | ||
| 80.8 % v7 (old) | 04 / 2023 | Intel NUC 13 Pro Kit NUC13ANK i7-1360P, Iris Xe G7 96EUs | 538 g | 37 mm | x | ||
v (old) | 03 / 2023 | Intel NUC 12 Pro Kit NUC12WSBi5 i5-1240P, Iris Xe G7 80EUs | 549 g | 45.6 mm | x | ||
v (old) | 09 / 2022 | Beelink SEi11 Pro i5-11320H, Iris Xe G7 96EUs | 440 g | 40 mm | x | ||
v (old) | 11 / 2022 | BMAX B5 Pro G7H8 i5-8260U, UHD Graphics 620 | 369 g | 43.2 mm | x |
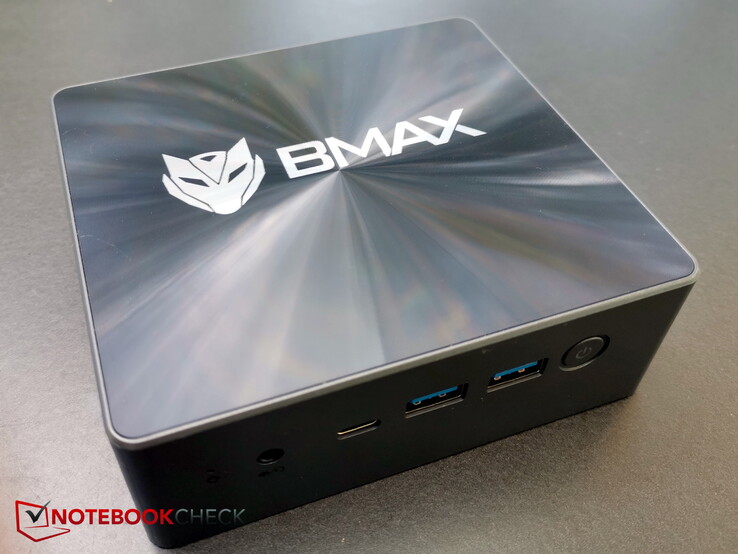
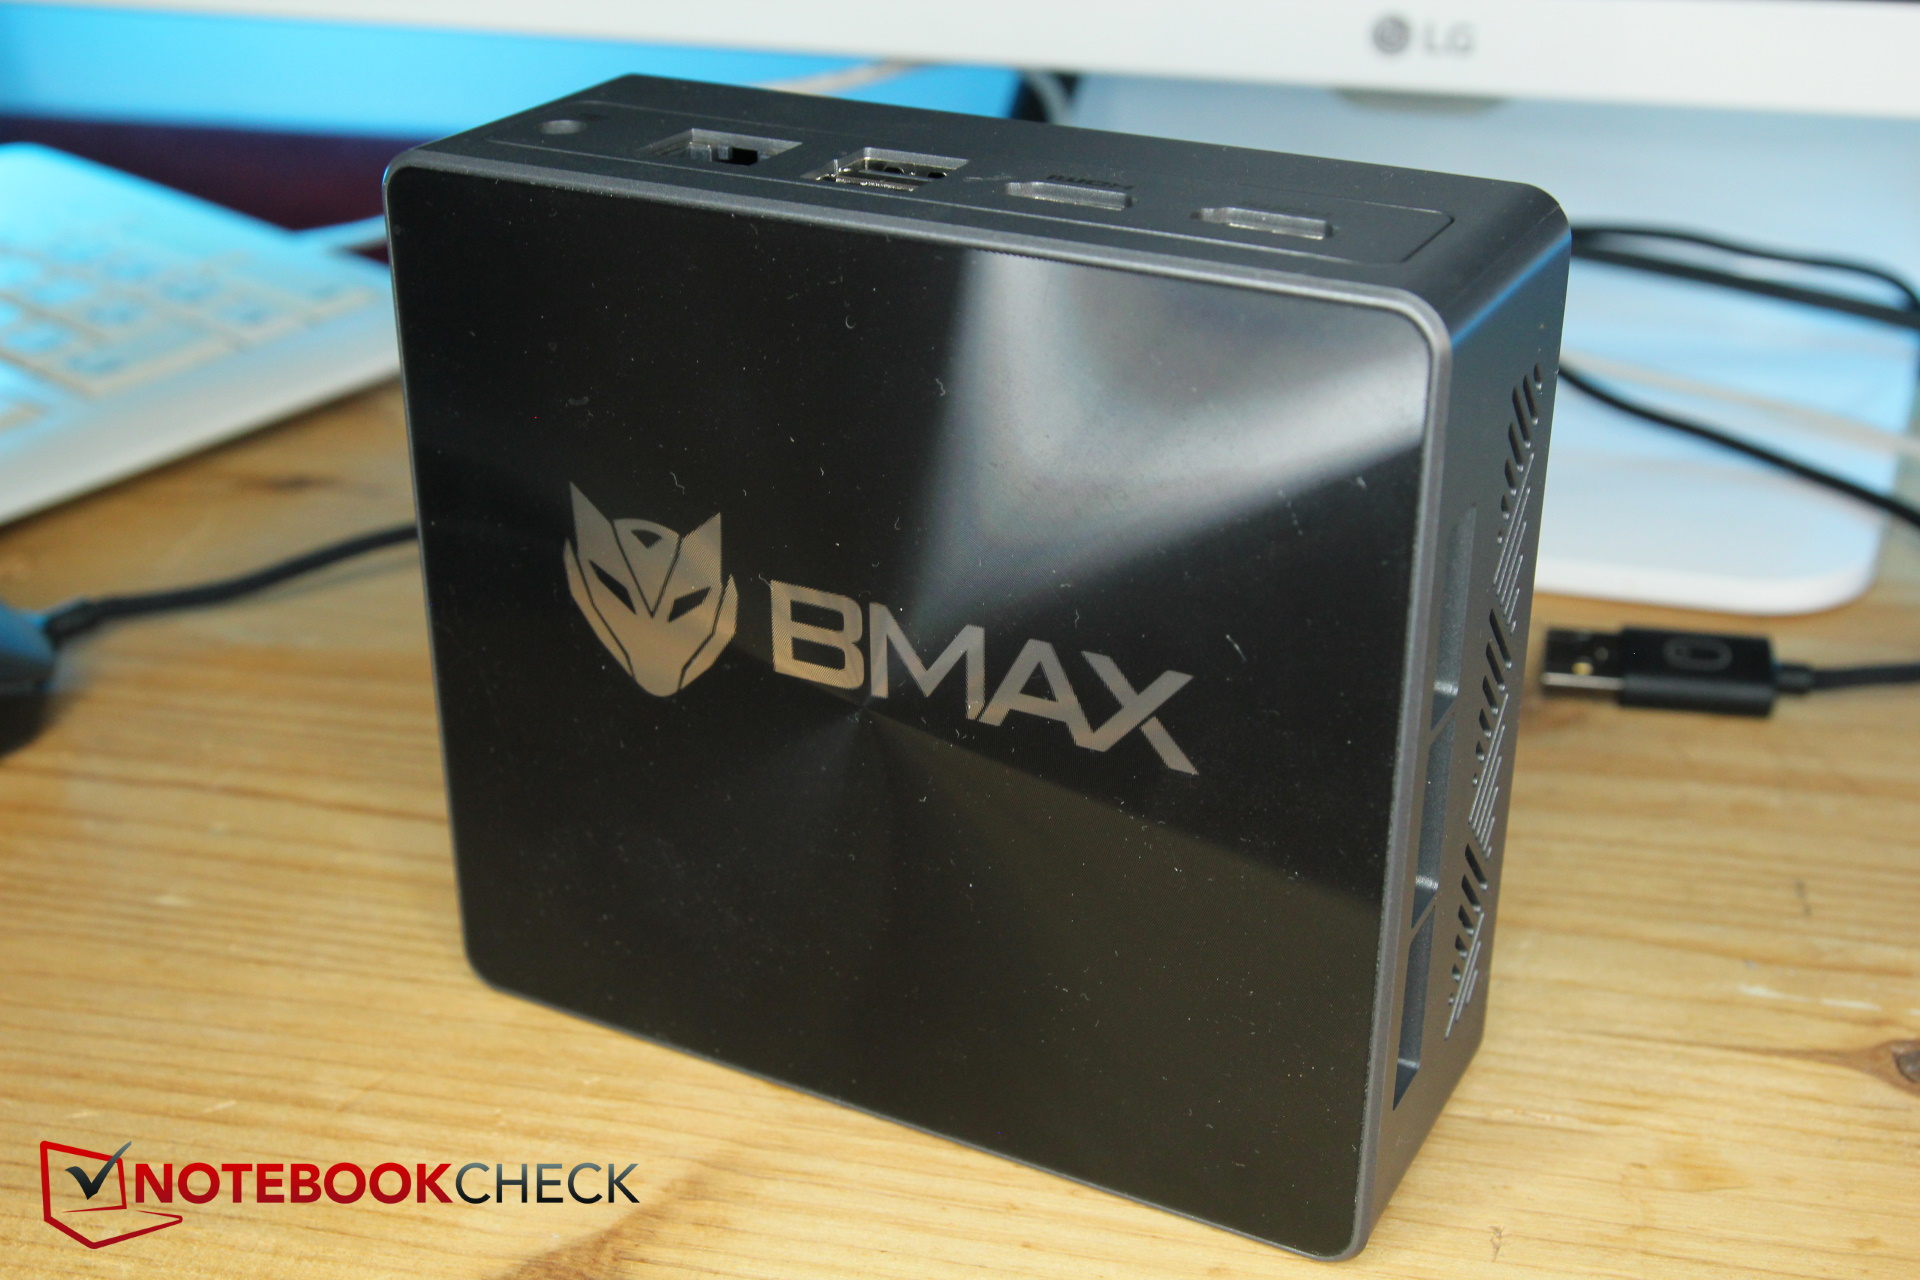
Case - The B7 Power is made from plastic
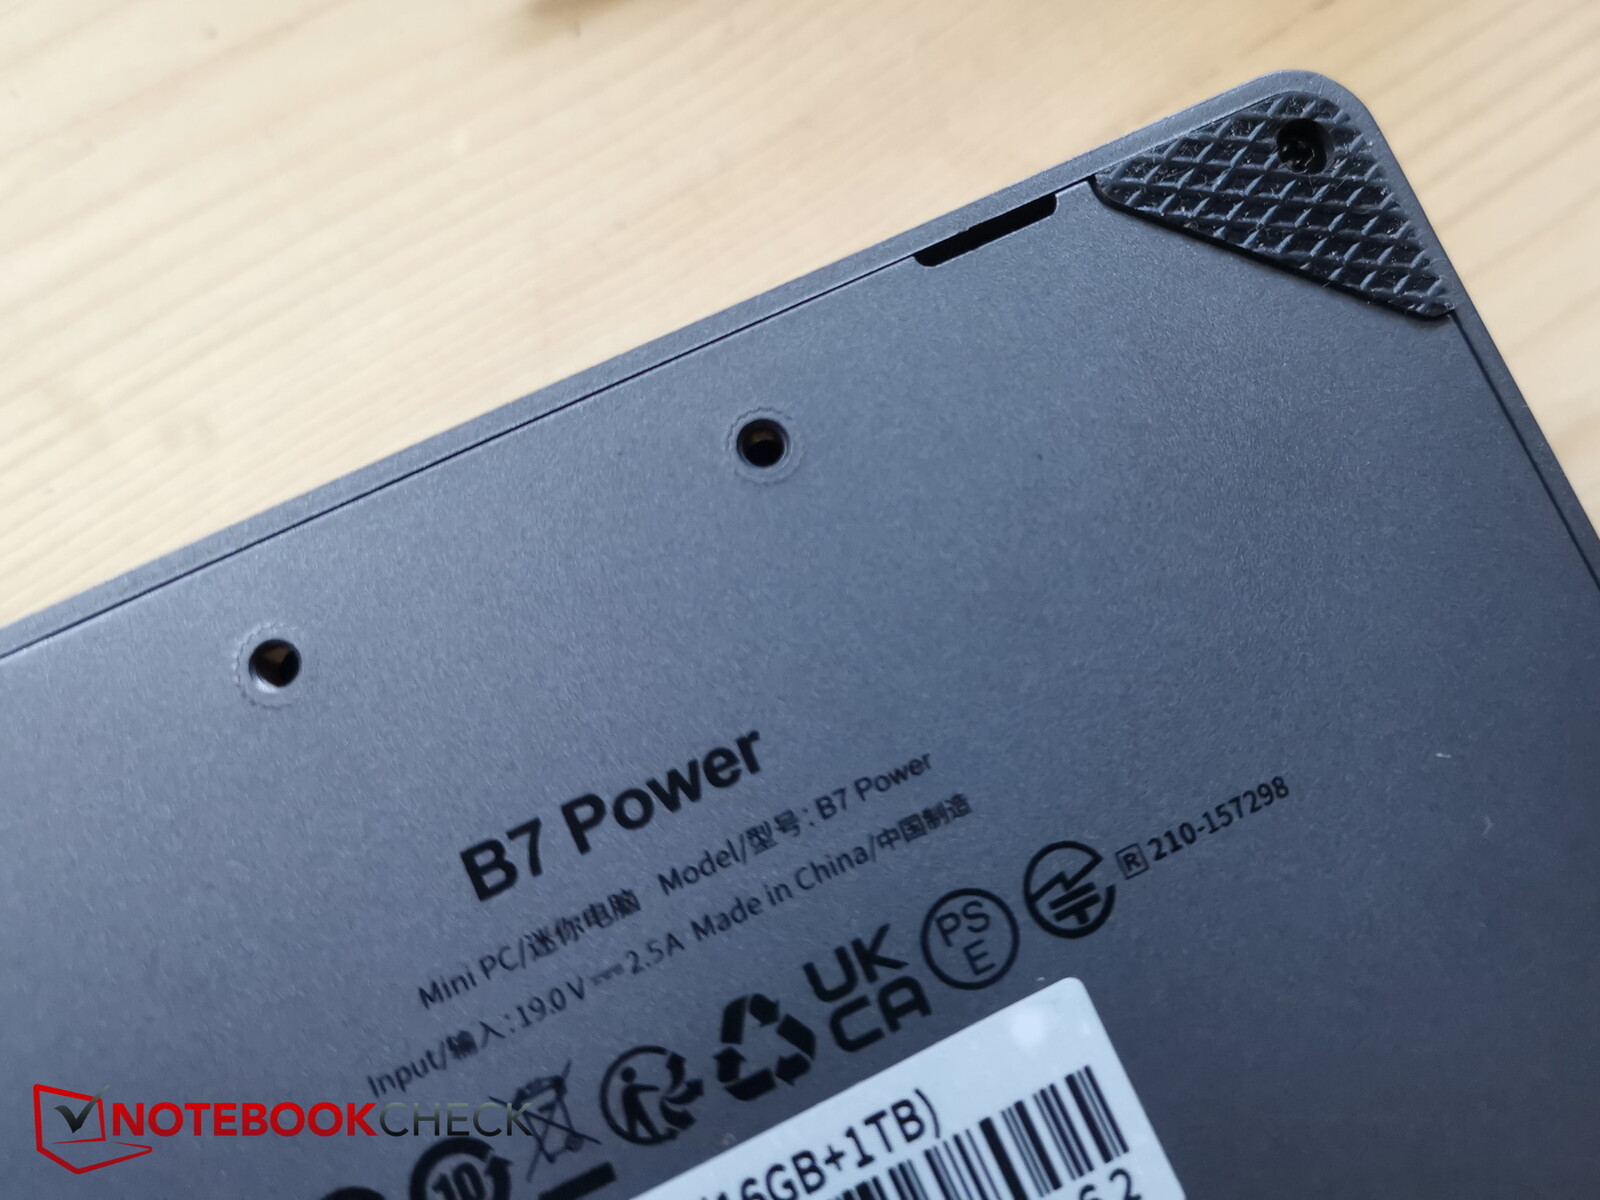
The PC's case is basically completely made from dark gray to black plastic. As a result of its compact rectangular shape, it is still pretty sturdy. Although, you shouldn't try to bend it too much, as you quickly begin to hear the plastic creaking. At the same time, the plastic gives the device a nice low weight of only 363 grams.
The top of the B7 Power is a bit of an eye-catcher because there is a sort of Fresnel-lens-structured print above the BMAX logo, which makes the upper side shimmer differently depending on the viewing angle.

The B7 Power is also the lightest of the mini PCs in this comparison. At 363 grams, it weighs significantly less than the Intel NUC models (at least 538 grams). The next lightest competitor is the mini PC from Beelink, but with a weight of 440 grams, it is already quite a bit heavier.
On the other hand, some competitors such as the Intel NUCs are a little bit smaller - their front is about 8 mm shorter. The Beelink has similar measurements.
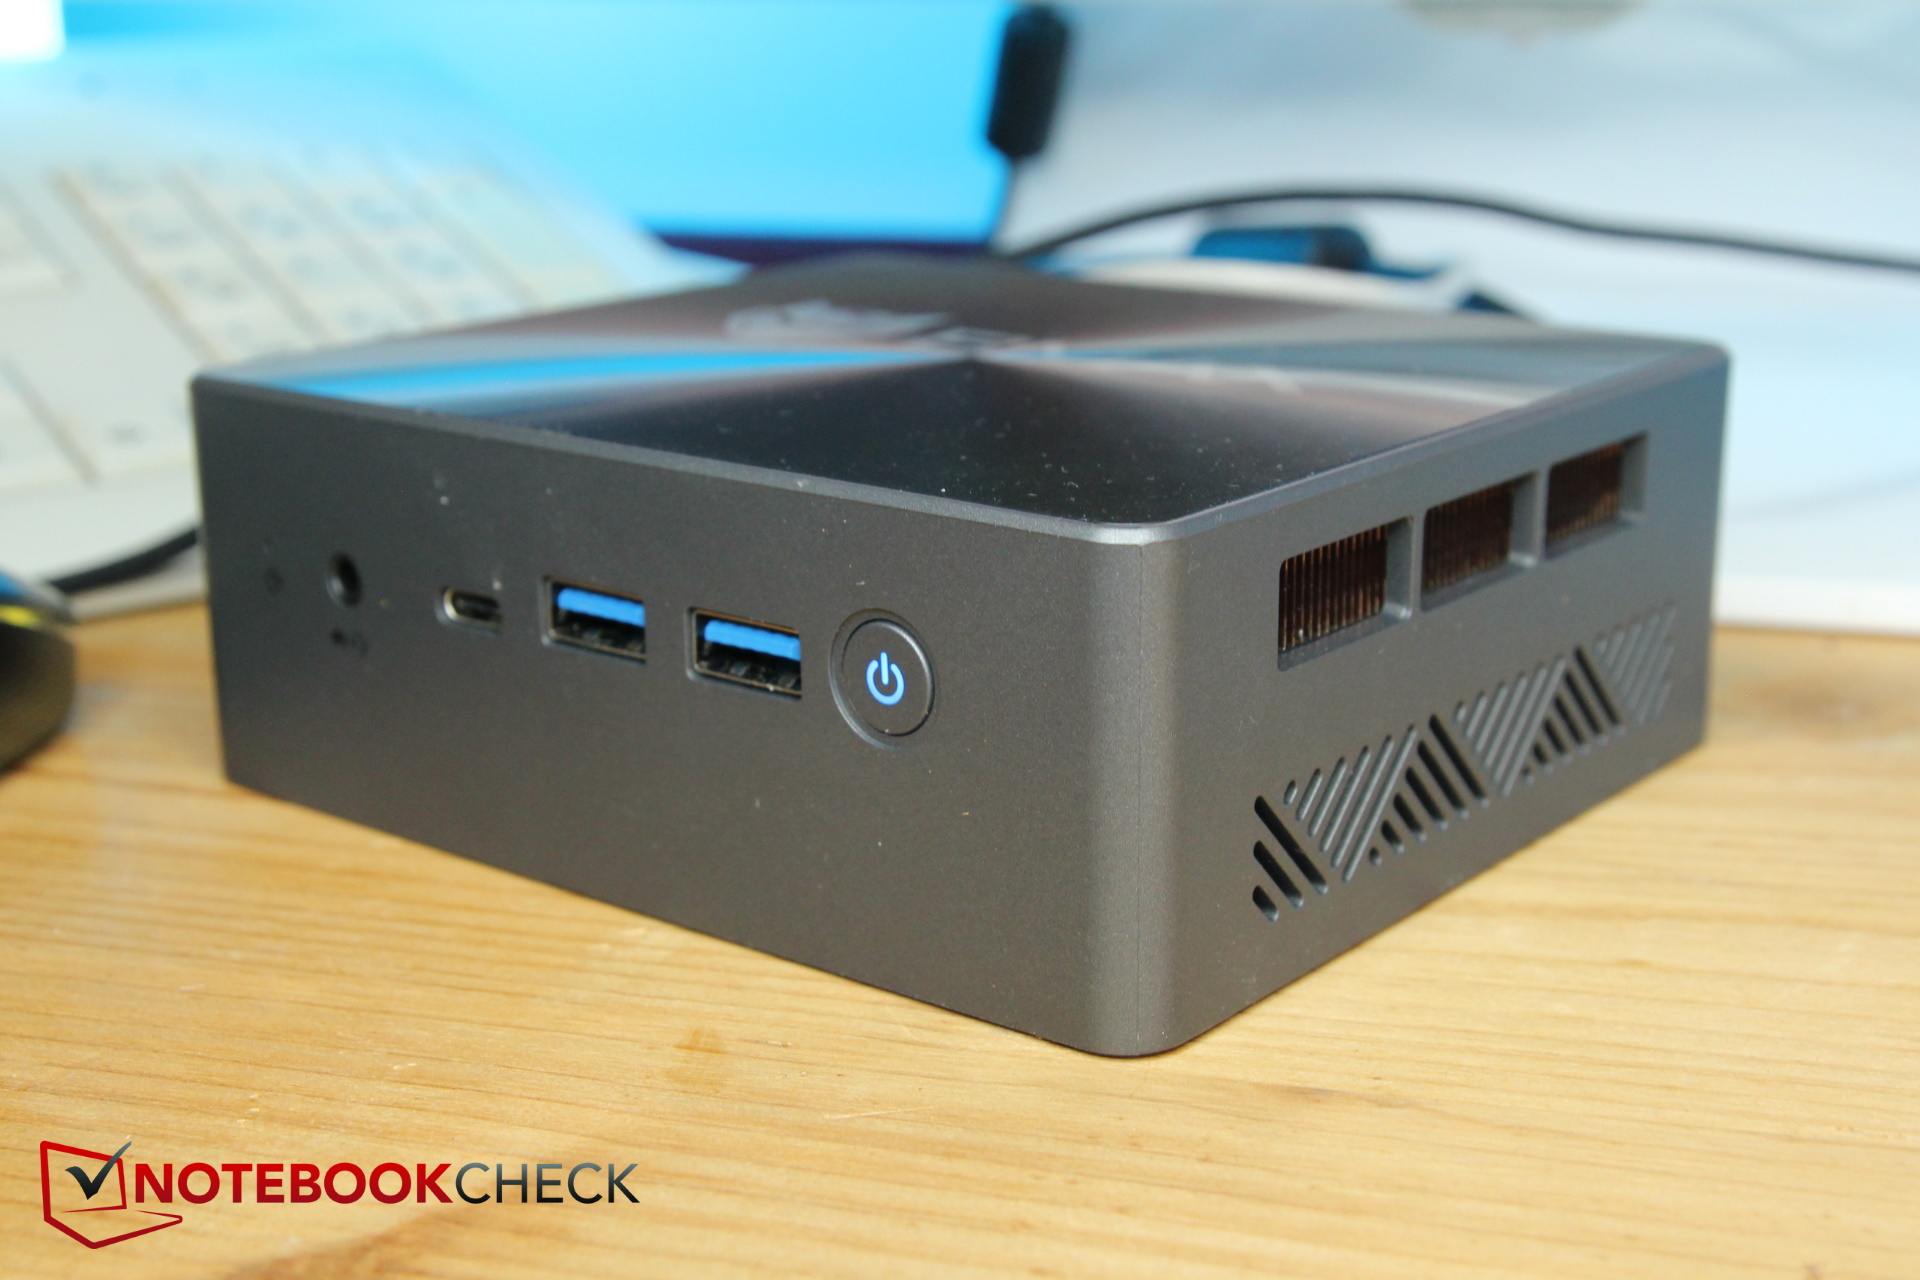
Connectivity - USB-C without Thunderbolt but with PD
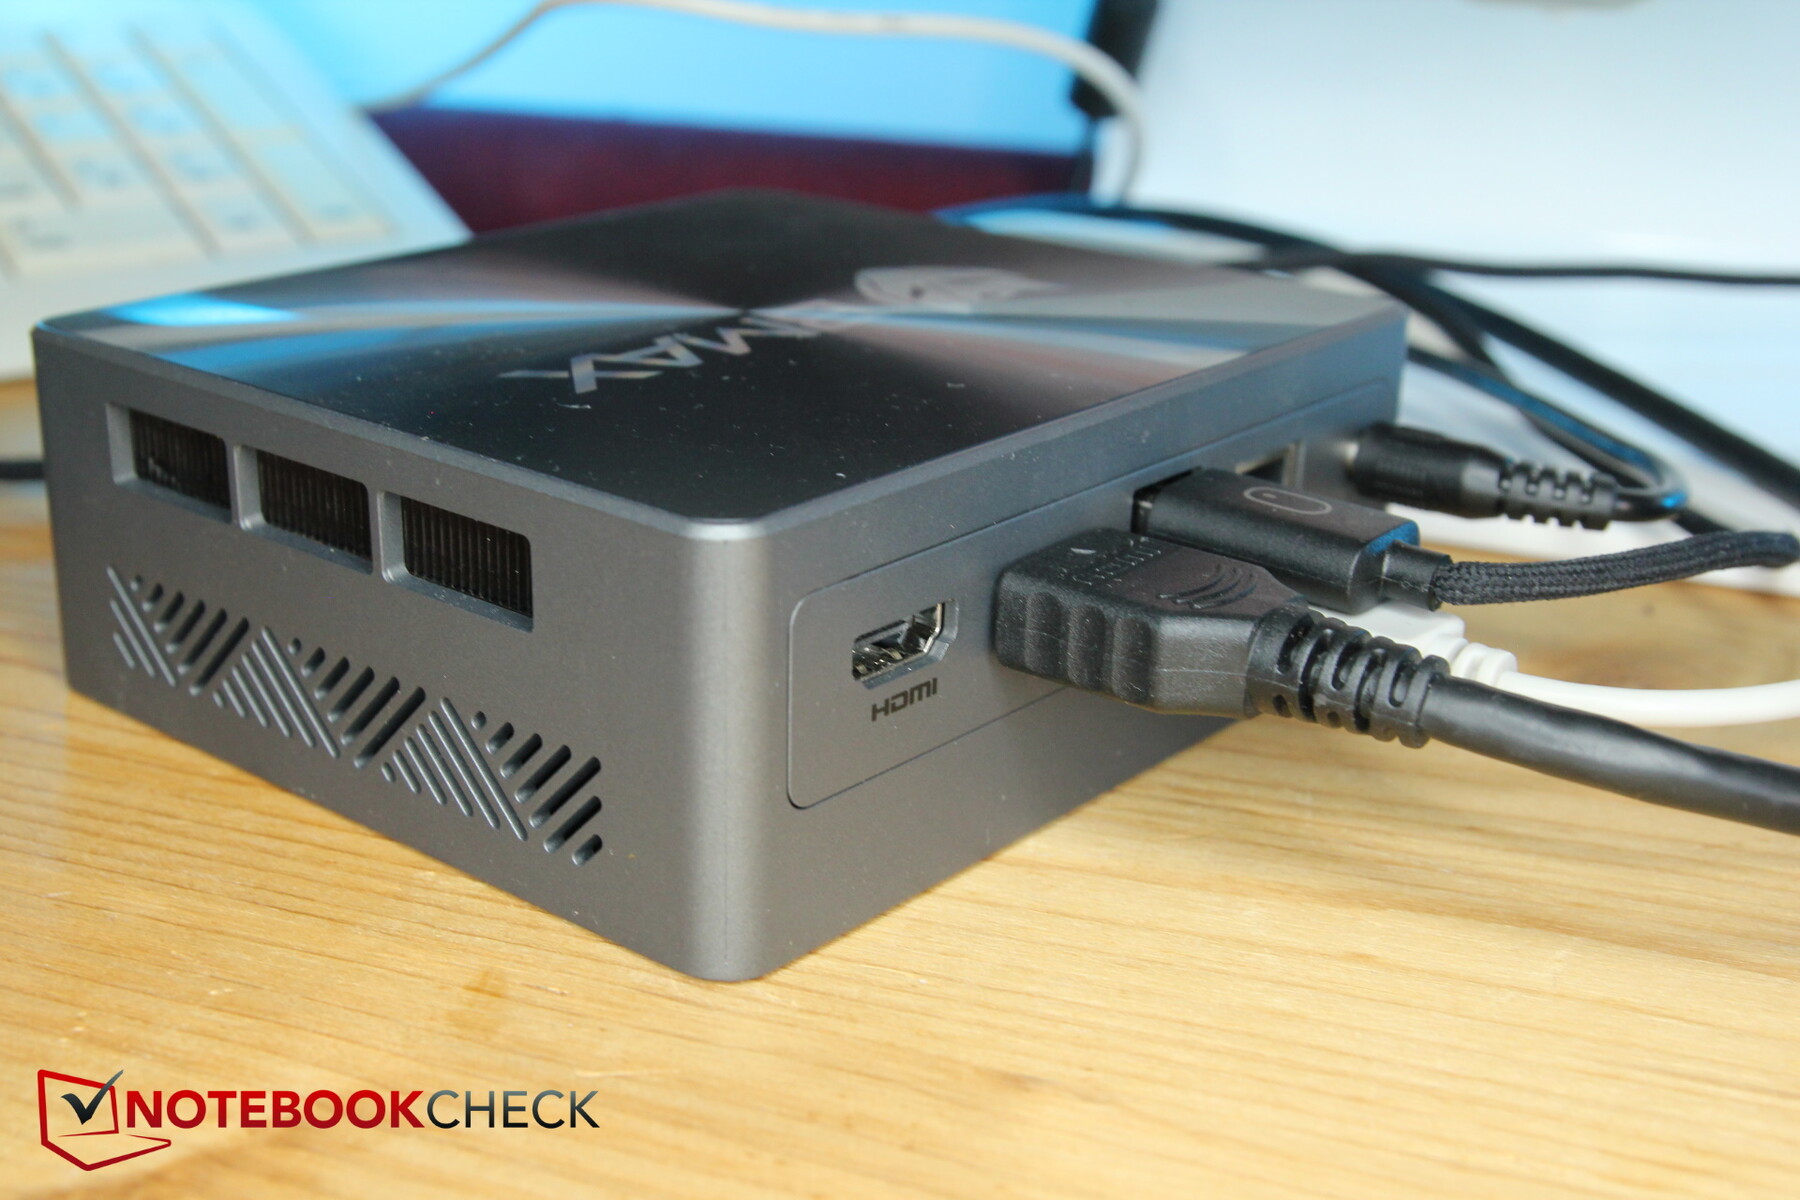
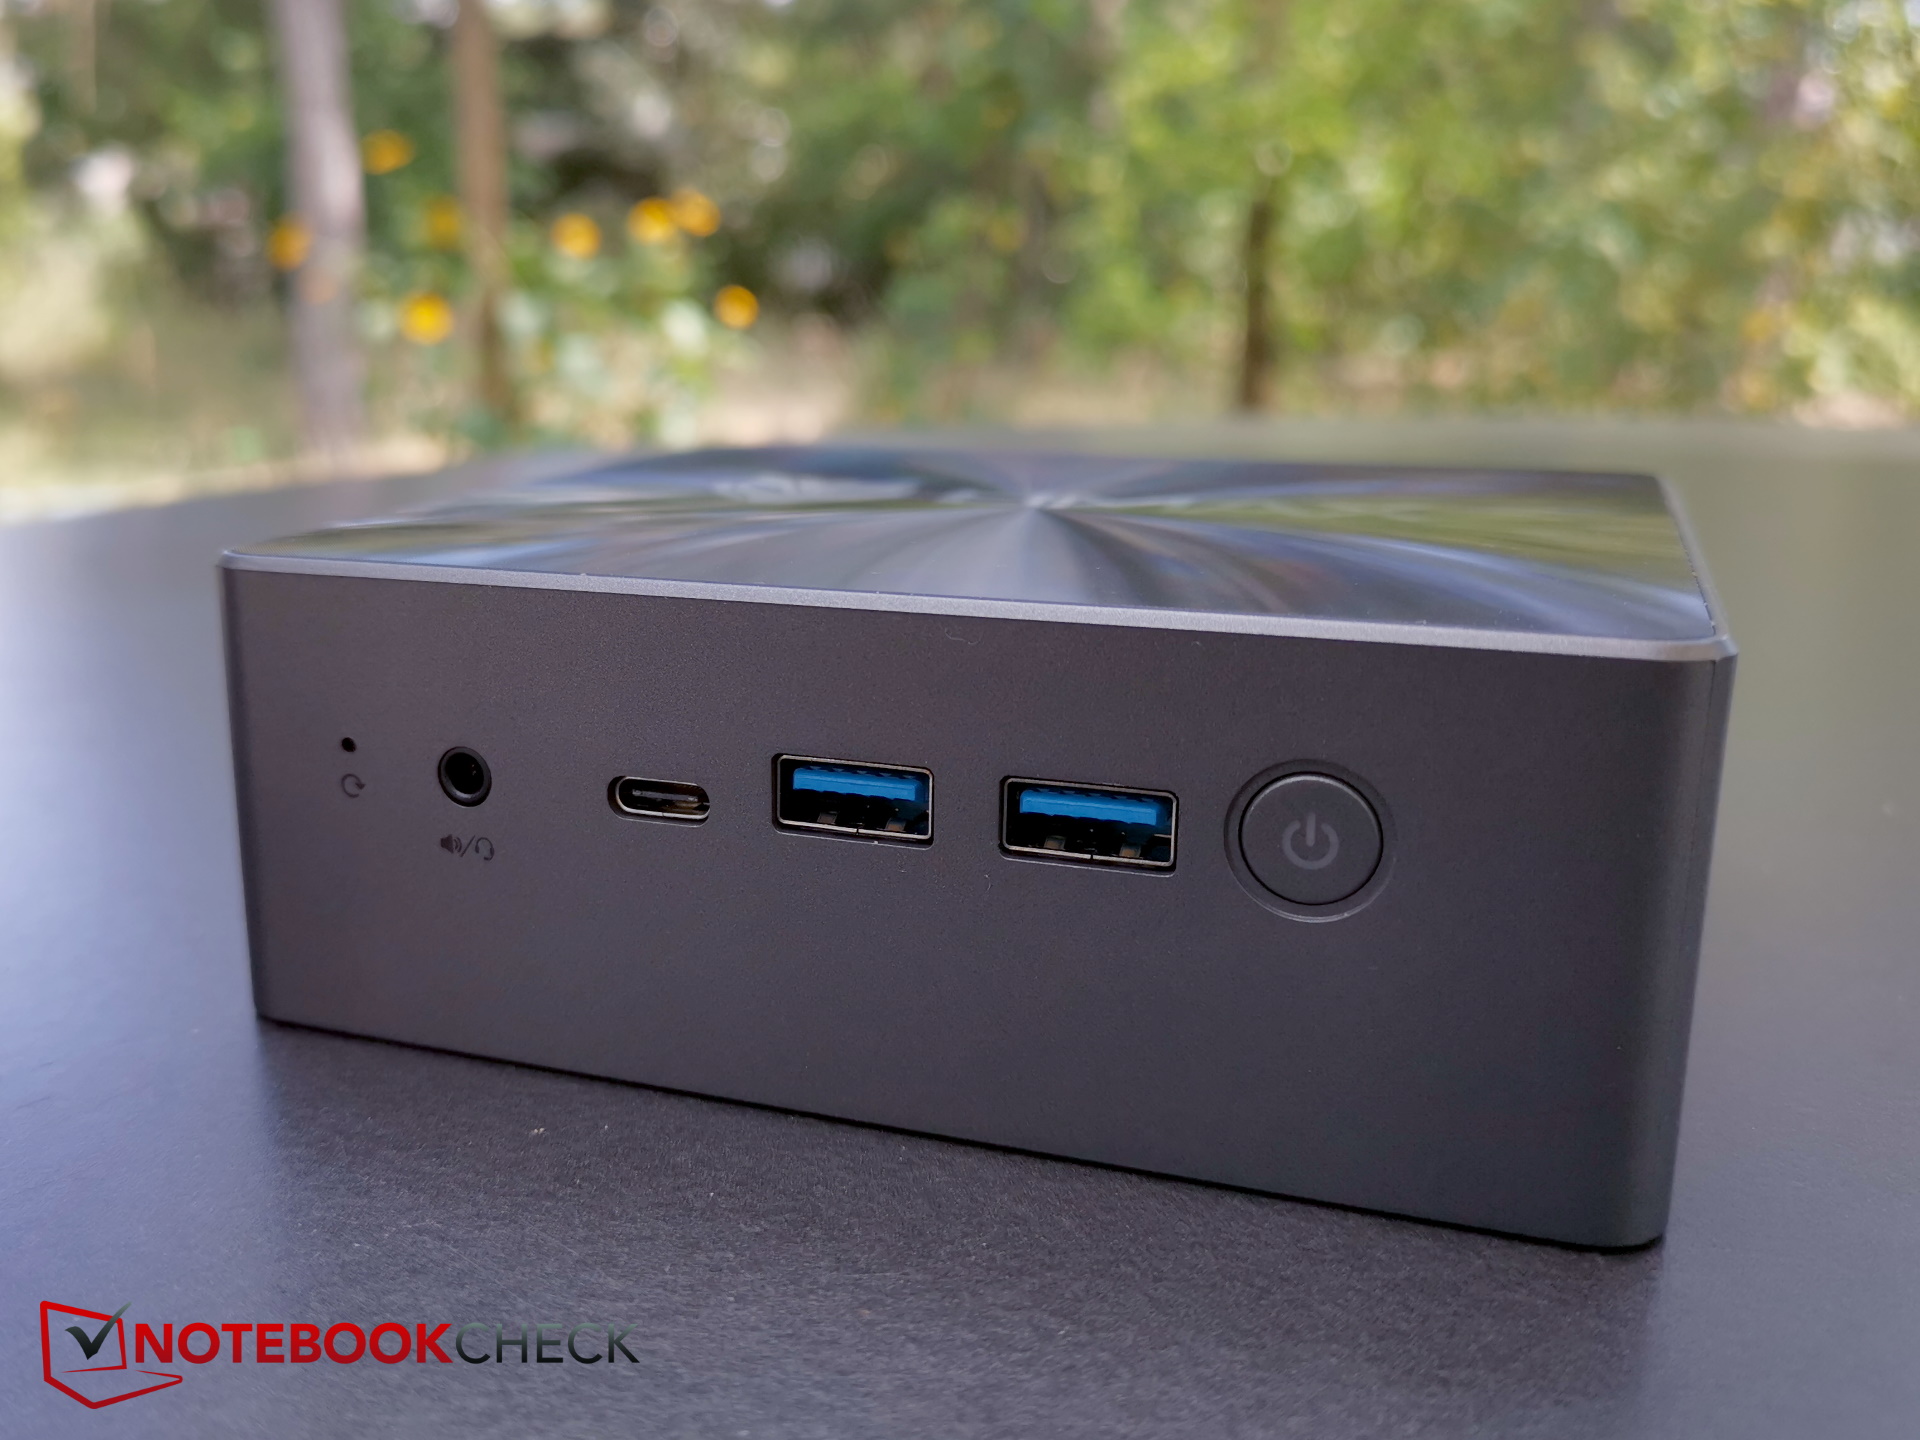
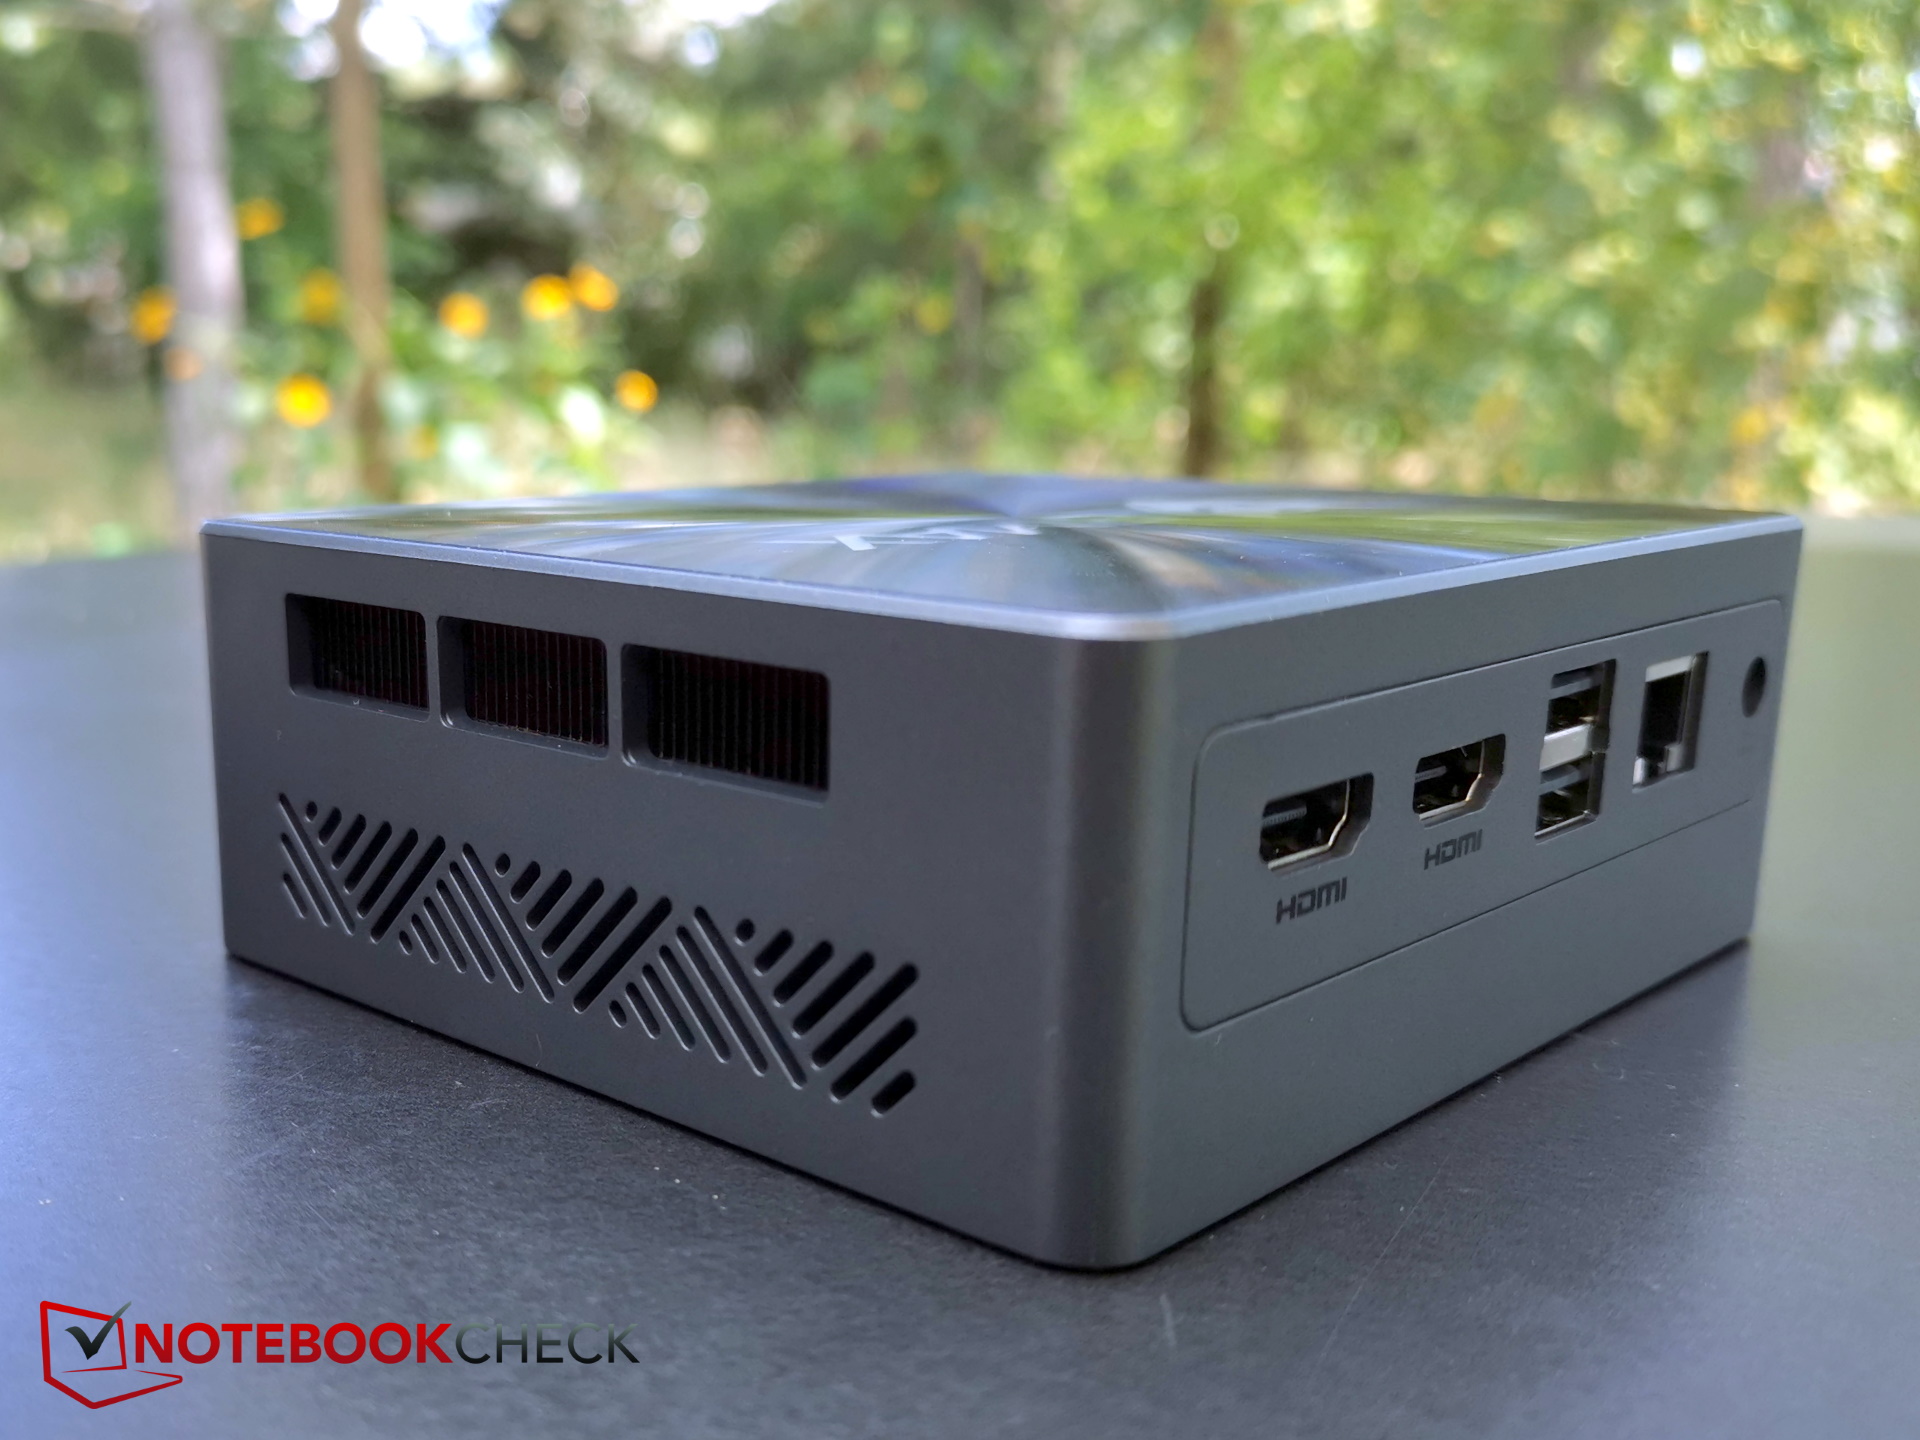
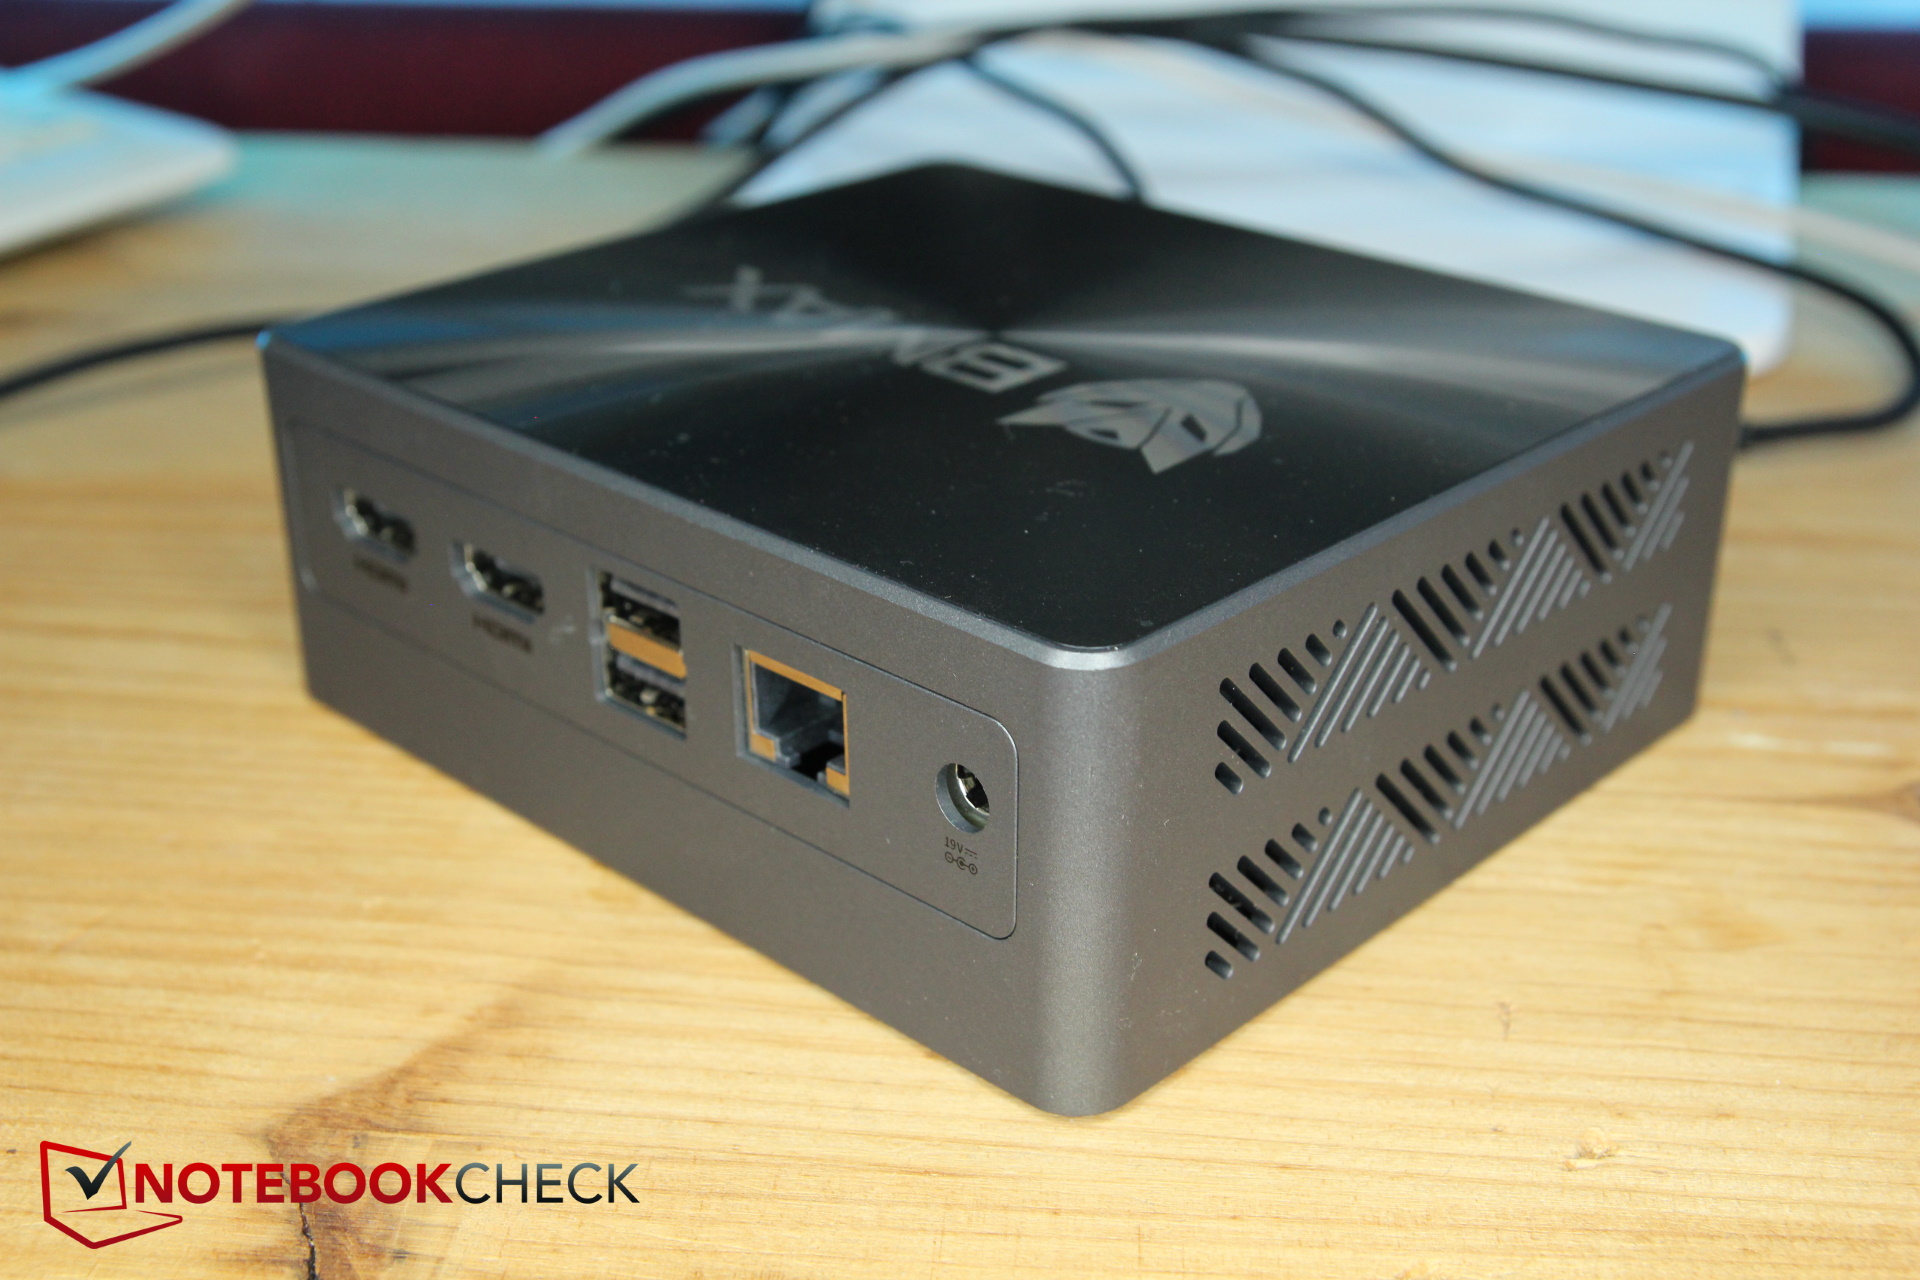
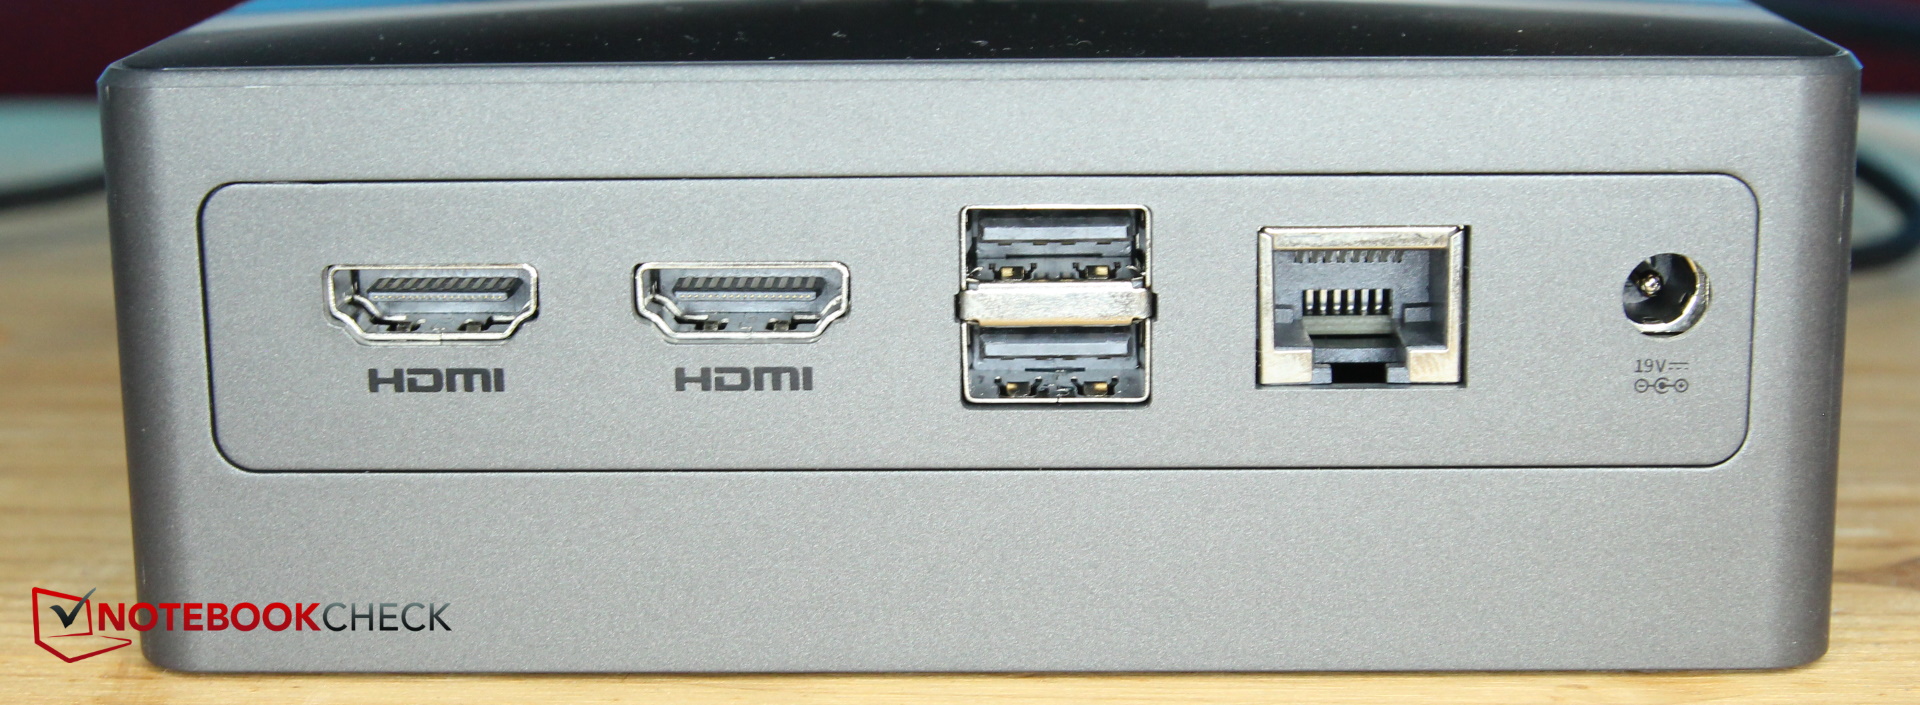
The back of the PC is where all the necessary ports for permanent connections can be found, including two USB-A ports to connect a mouse and keyboard, two HDMI 2.0 ports to connect up to two monitors, as well as a LAN port and power connection.
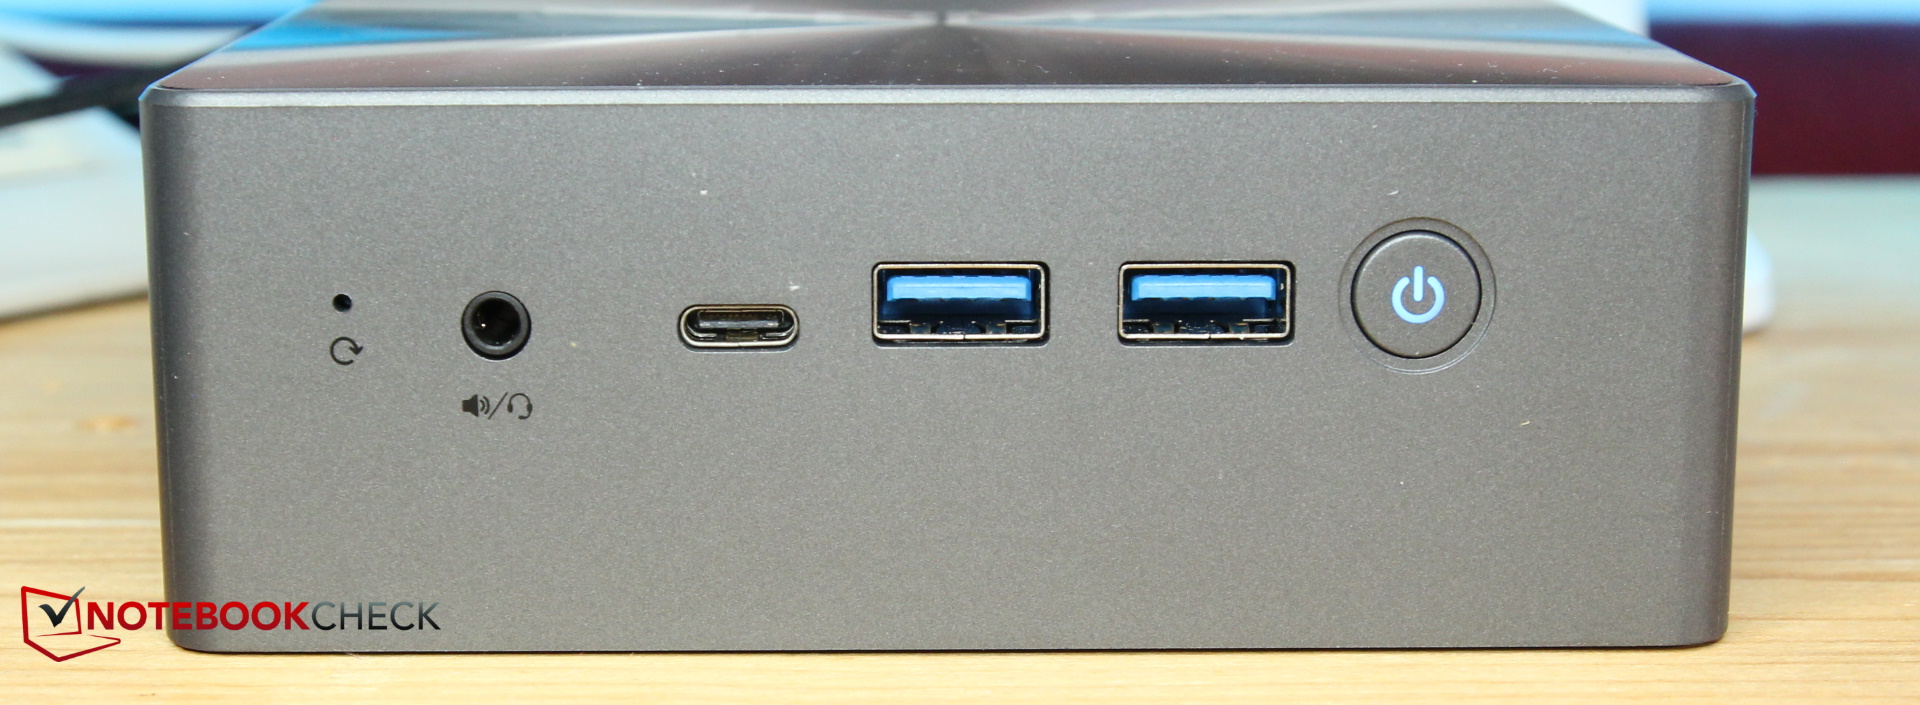
On the front, there are additional ports to connect external USB devices or headphones. Here, you can also find a USB-C port. BMAX has indicated it as being "full-featured". It is clear that it doesn't support Thunderbolt - but it does support DisplayPort, meaning that a total of three monitors can be connected to the B7 Power at once.
This port also supports Power Delivery, as our test with two USB-C chargers confirmed. A MacBook Air's 30-watt charger didn't work - but a 45-watt charger did. Officially, the B7 requires 19 V and 2.5 A (47.5 W).
The B7 doesn't feature an SD card reader. There are some screw holes on the bottom of the device which you can use to connect the mini PC to the back of a monitor using the supplied VESA mount.
Communication
Aside from the Gigabit LAN connection, the B7 Power can also connect via WiFi. In order to do so, the manufacturer has installed a chip from Realtek which supposedly also supports WiFi 6. This means you can connect to the 5 GHz network - but not 6 GHz.
The mini PC is quite fast when it comes to 5 GHz. However, using "regular" 2.4 GHz gives us an entirely different impression. Here, the PC's transfer rates in our test surroundings (rental property, multiple overlapping networks in the vicinity) were abominable - we only measured 100 to 150 MB/s.
Safety
TPM is, of course, also supported thanks to its Intel chip but apart from this, the B7 Power doesn't even offer a Kensington lock. However, it is likely that not many people will miss this on a mini PC.
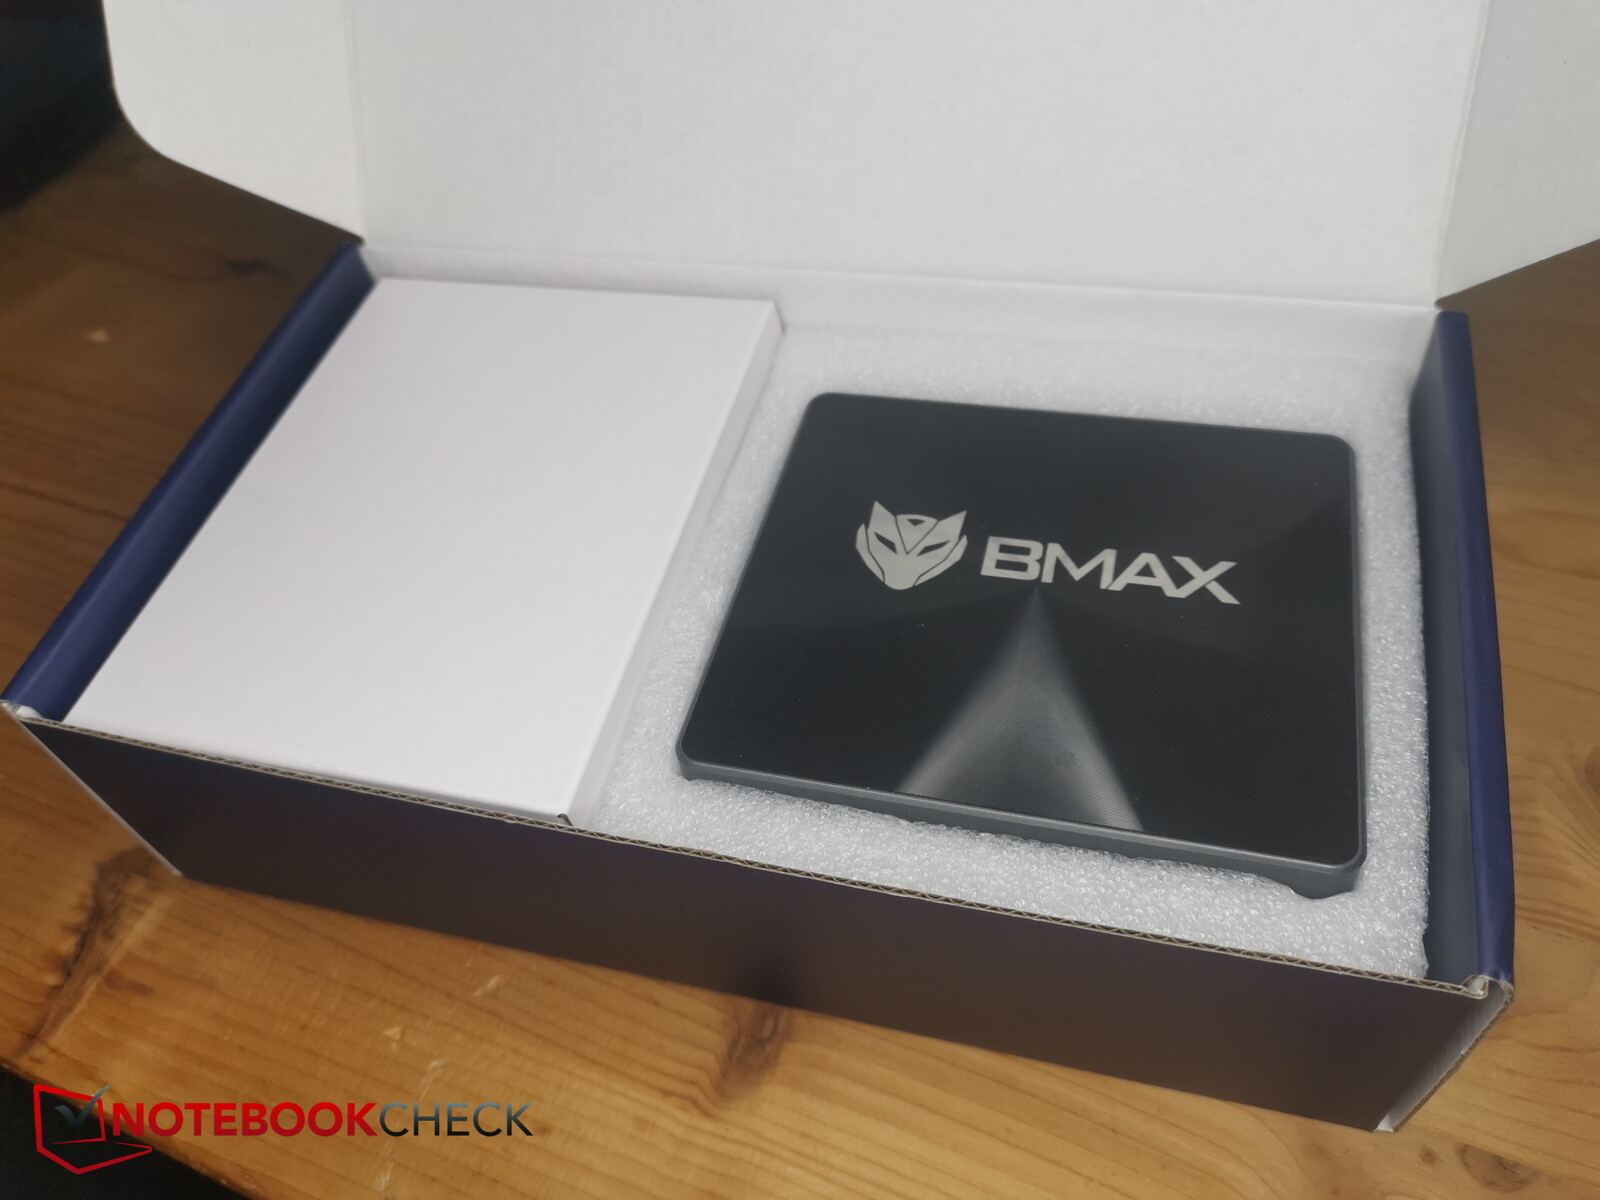
Scope of delivery & warranty
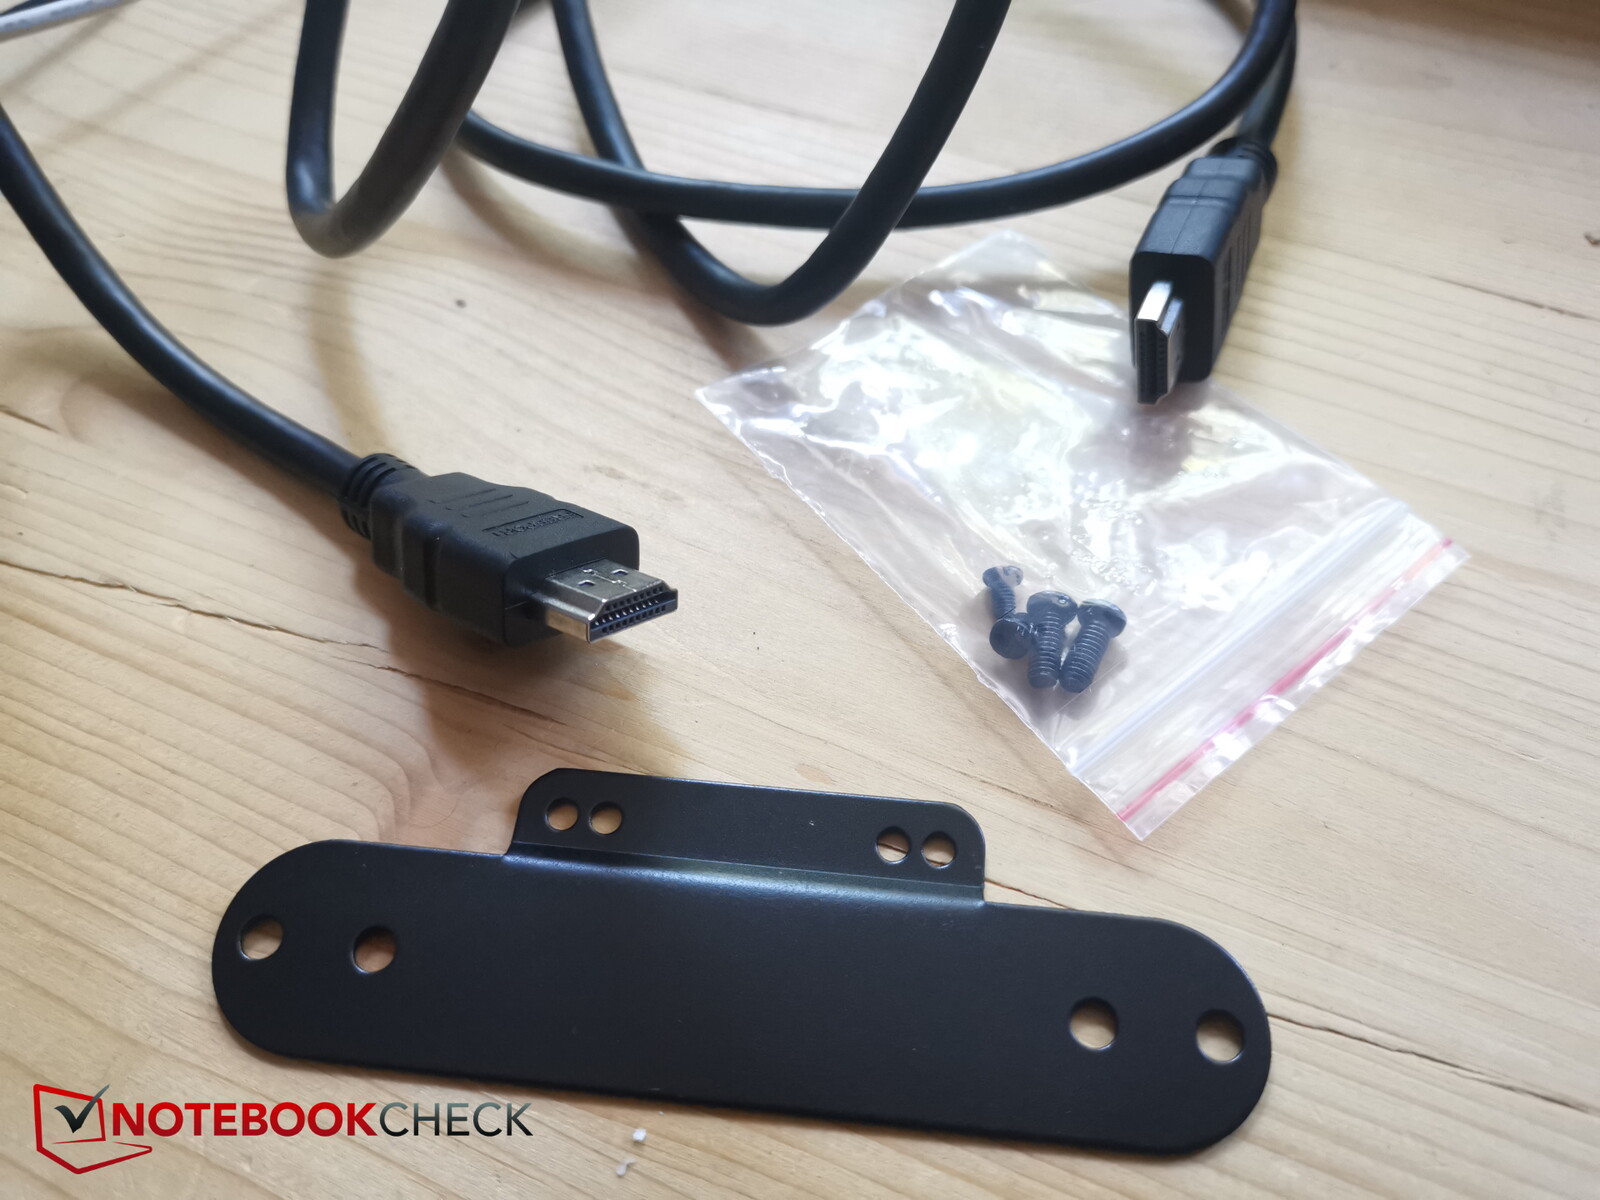
Aside from the mini PC itself, the manufacturer has also included a proprietary power supply, an HDMI cable and a VESA mount including the required screws.
The manufacturer has currently made no comment on whether the PC comes with a warranty. Your relevant local warranty laws should cover this.
Maintenance
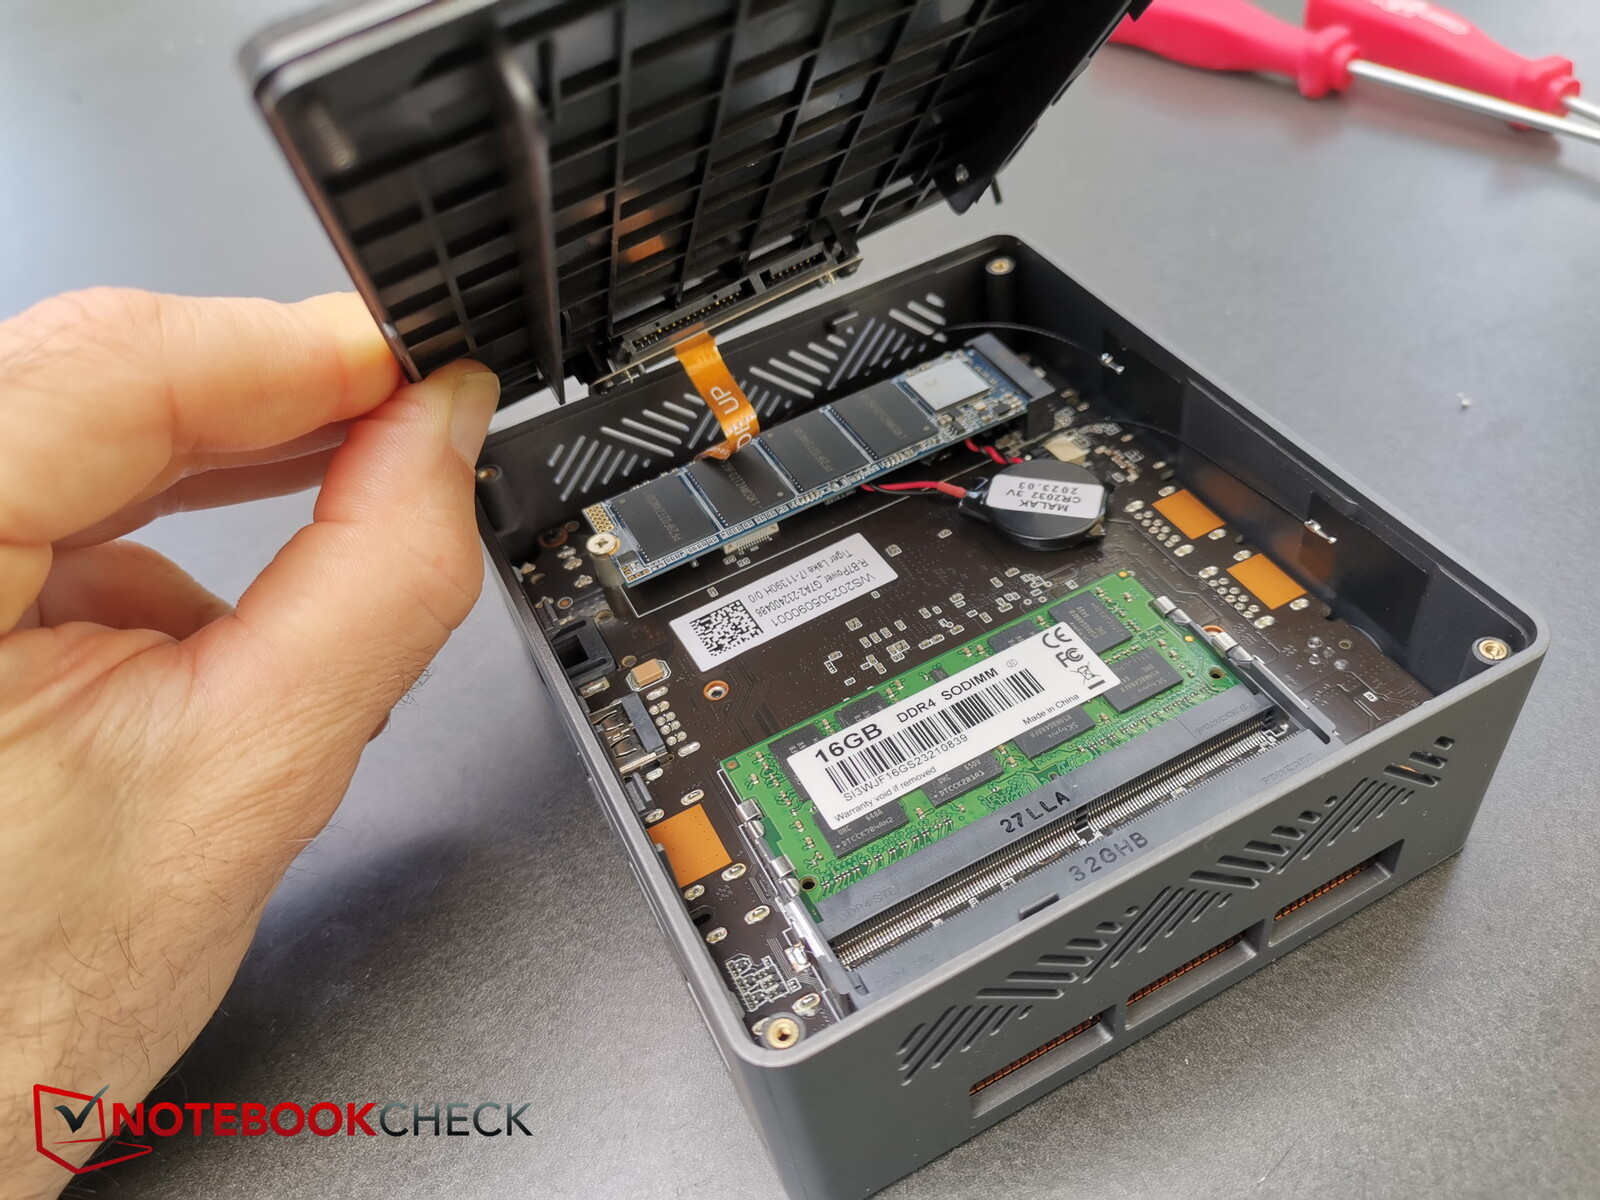
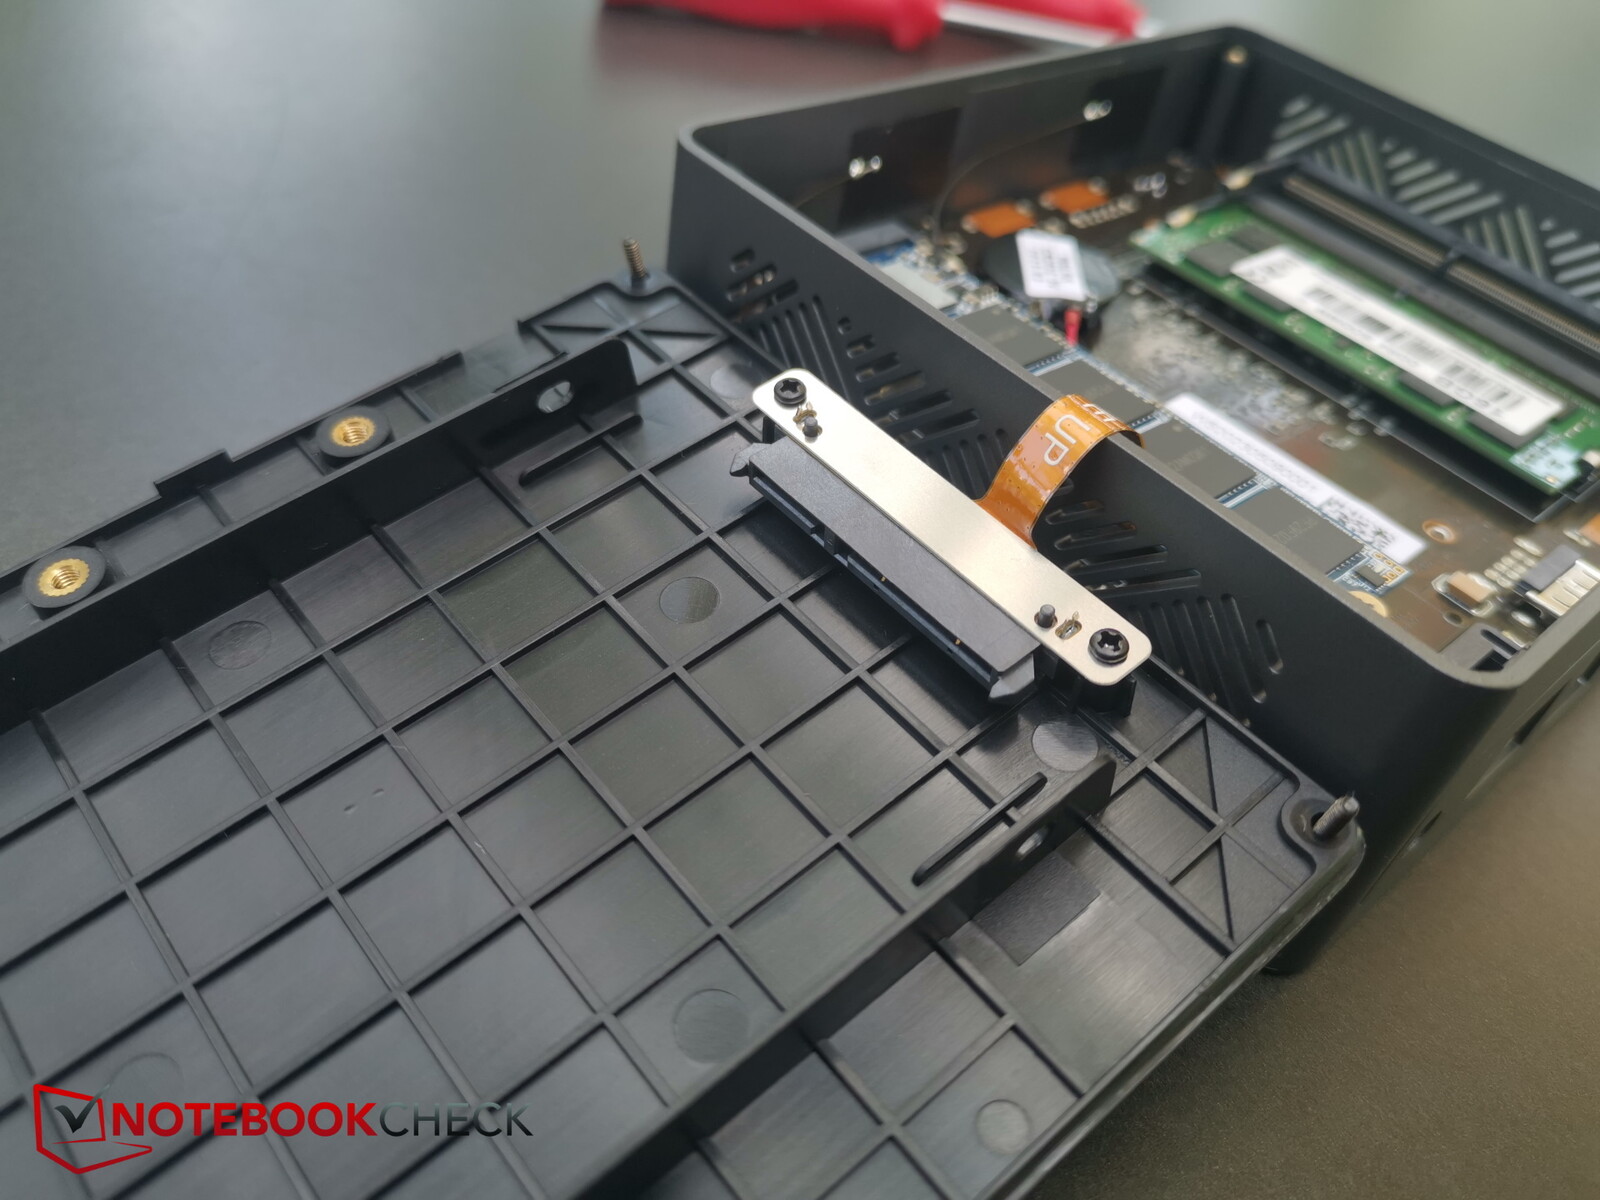
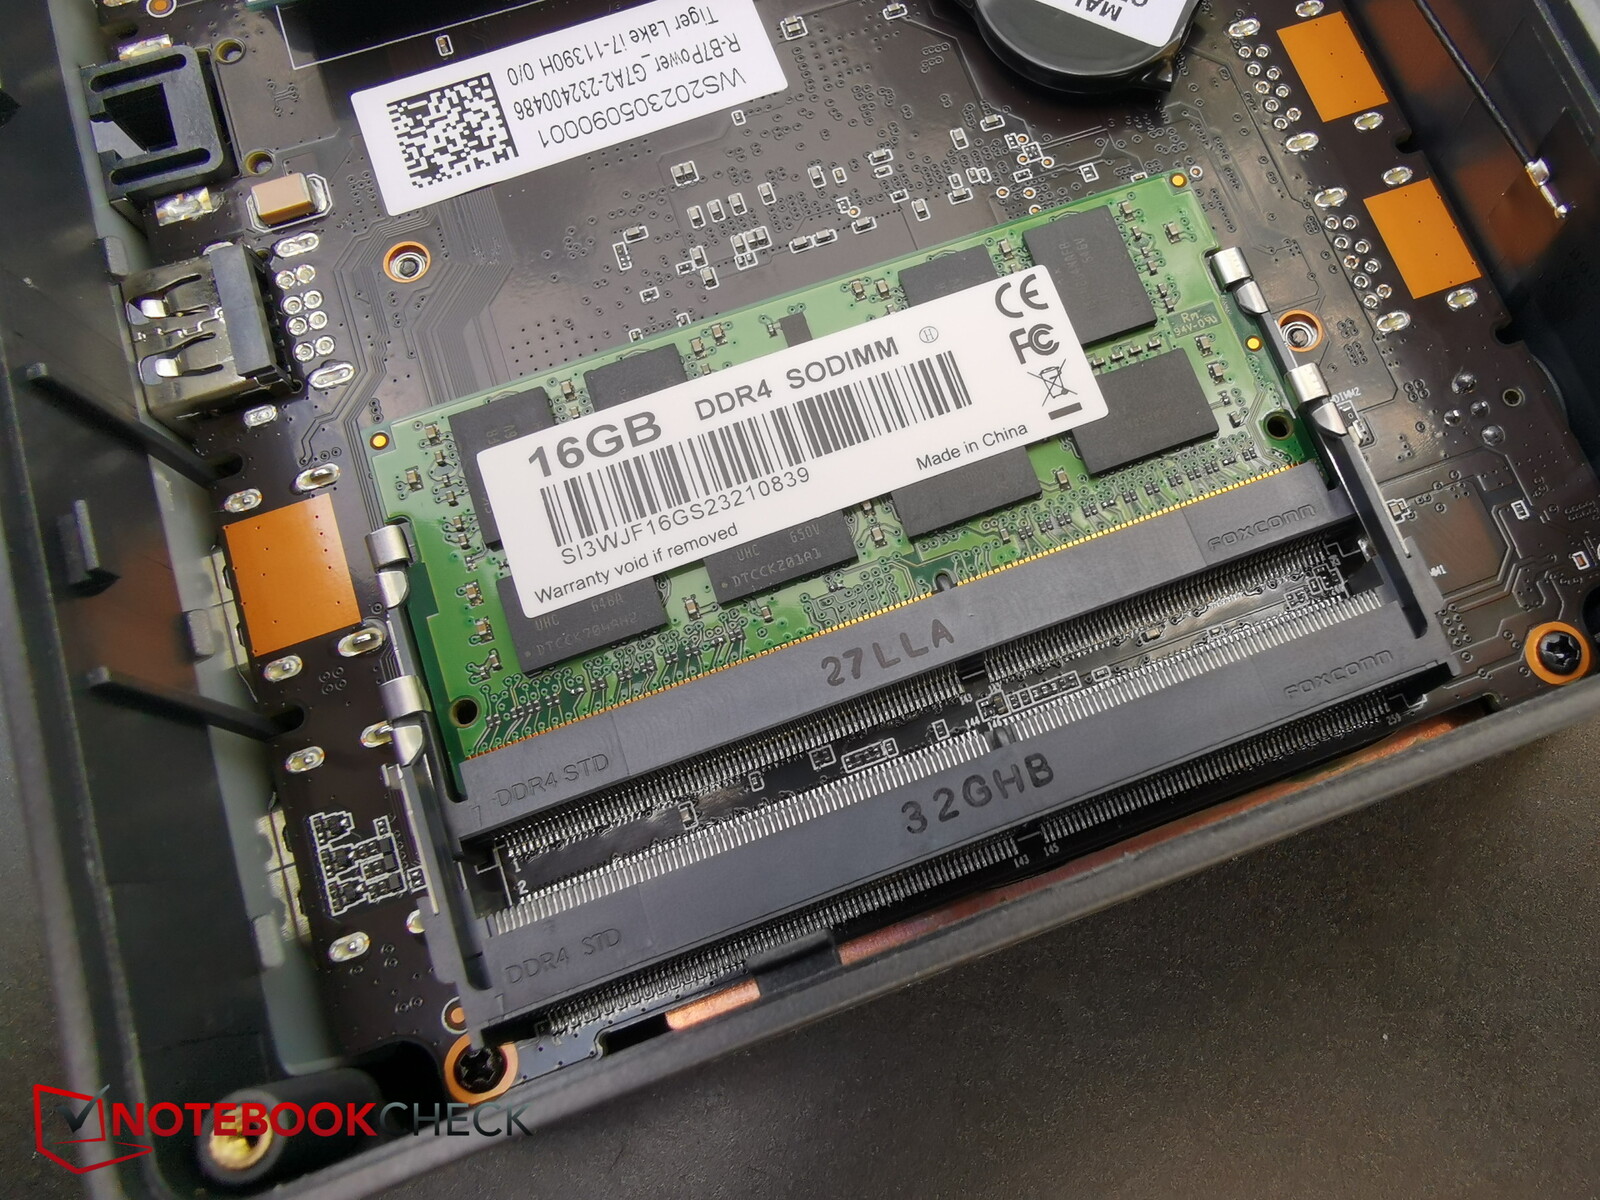
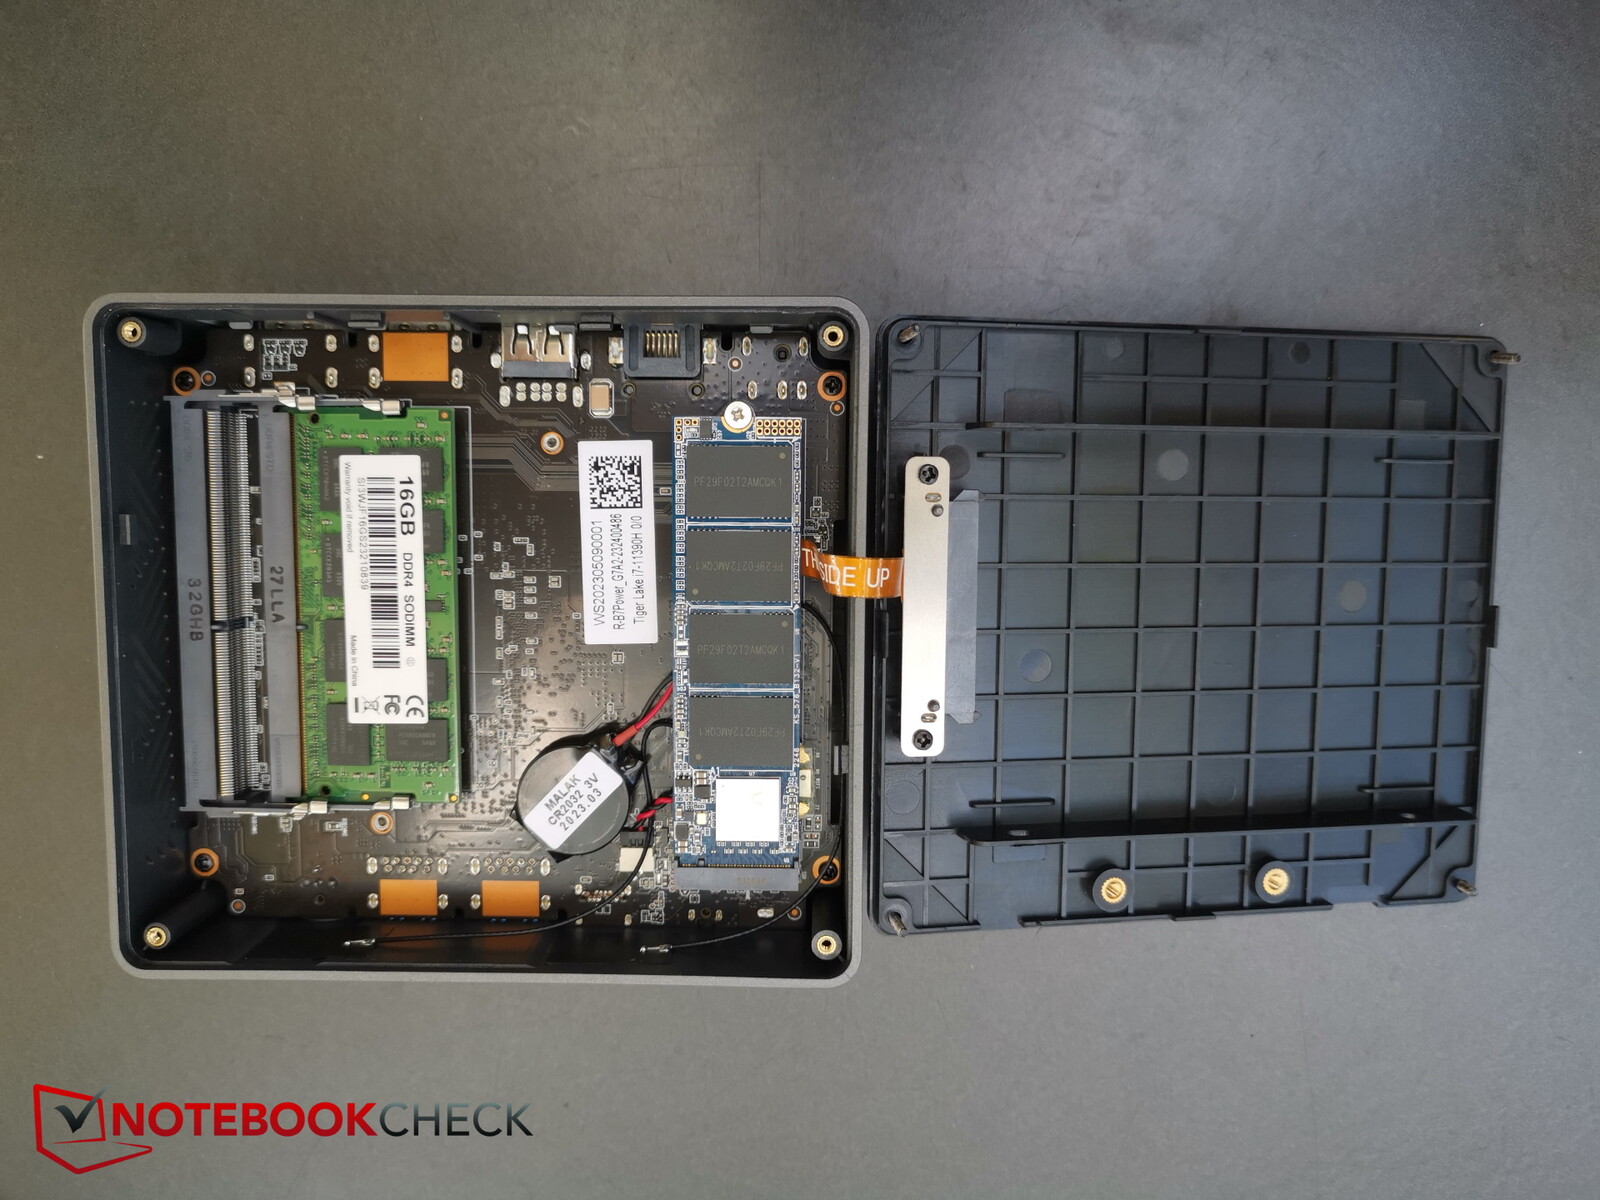
Performing maintenance on the device is nice and easy. Only 4 cross screws hold the bottom plate in place. Once they have been removed, you can carefully flip the bottom up to the side (left if viewed from the front and above). There is a cable connecting the two parts which connects the SATA port on the inner bottom plate to the motherboard.
Subsequently, you can access both of the RAM slots, the NVMe SSD as well as the previously mentioned SATA port for 2.5-inch HDDs or SSDs. In order to access the fans, you would have to further take apart the device.
Performance - Slow even for Gen11
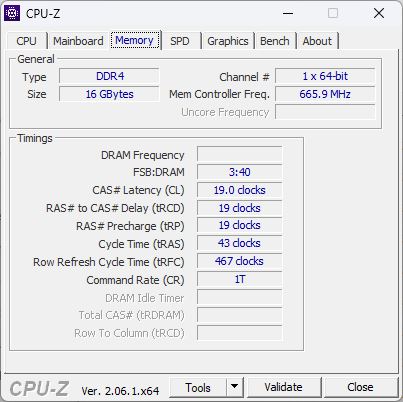
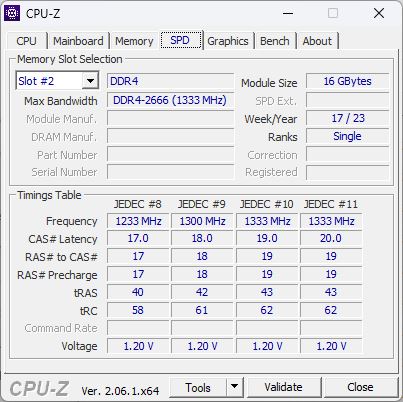
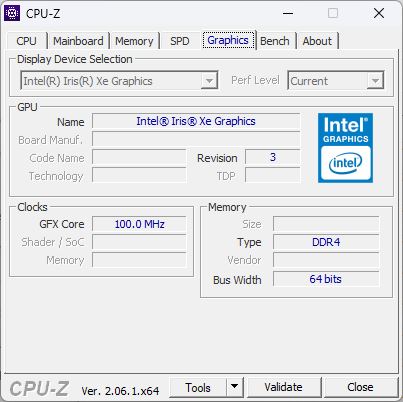
Intel Gen 11, specifically the Intel Core i7-11390H, is generally a decent CPU - but it is a few years behind the current technology surrounding Intel Gen13, which can be found in the Intel NUC 13 Pro Kit. Completing the setup are 16 GB RAM with the option to upgrade and a 1-TB no-name SSD. The PC doesn't feature a dedicated graphics card but the XE Graphics integrated into the CPU runs with 96 EUs at full capacity. The PC is primarily suited for everyday office uses and maybe also as a retro console.
There are a whole range of other mini PCs offered on BMAX's website, including the B7 Pro with an i5-1145G7. However, the B7 Power is already the manufacturer's current top-of-the-range model.
Testing conditions
The B7 Power feels pleasantly spacious, as you won't find any bloatware or the manufacturer's own software, such as Control Center, installed onto the PC. For the best benchmark results, we tested the best performance in Windows mode.
Our screen remained black during the first start-up. This was solved by pressing the Windows + P key combination.
Processor
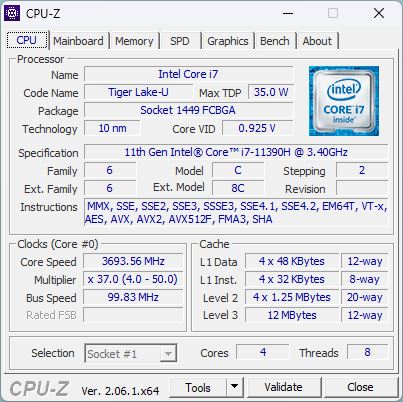
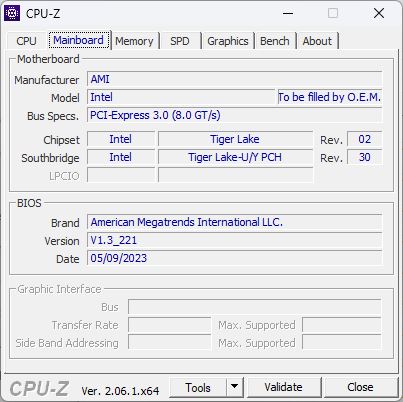
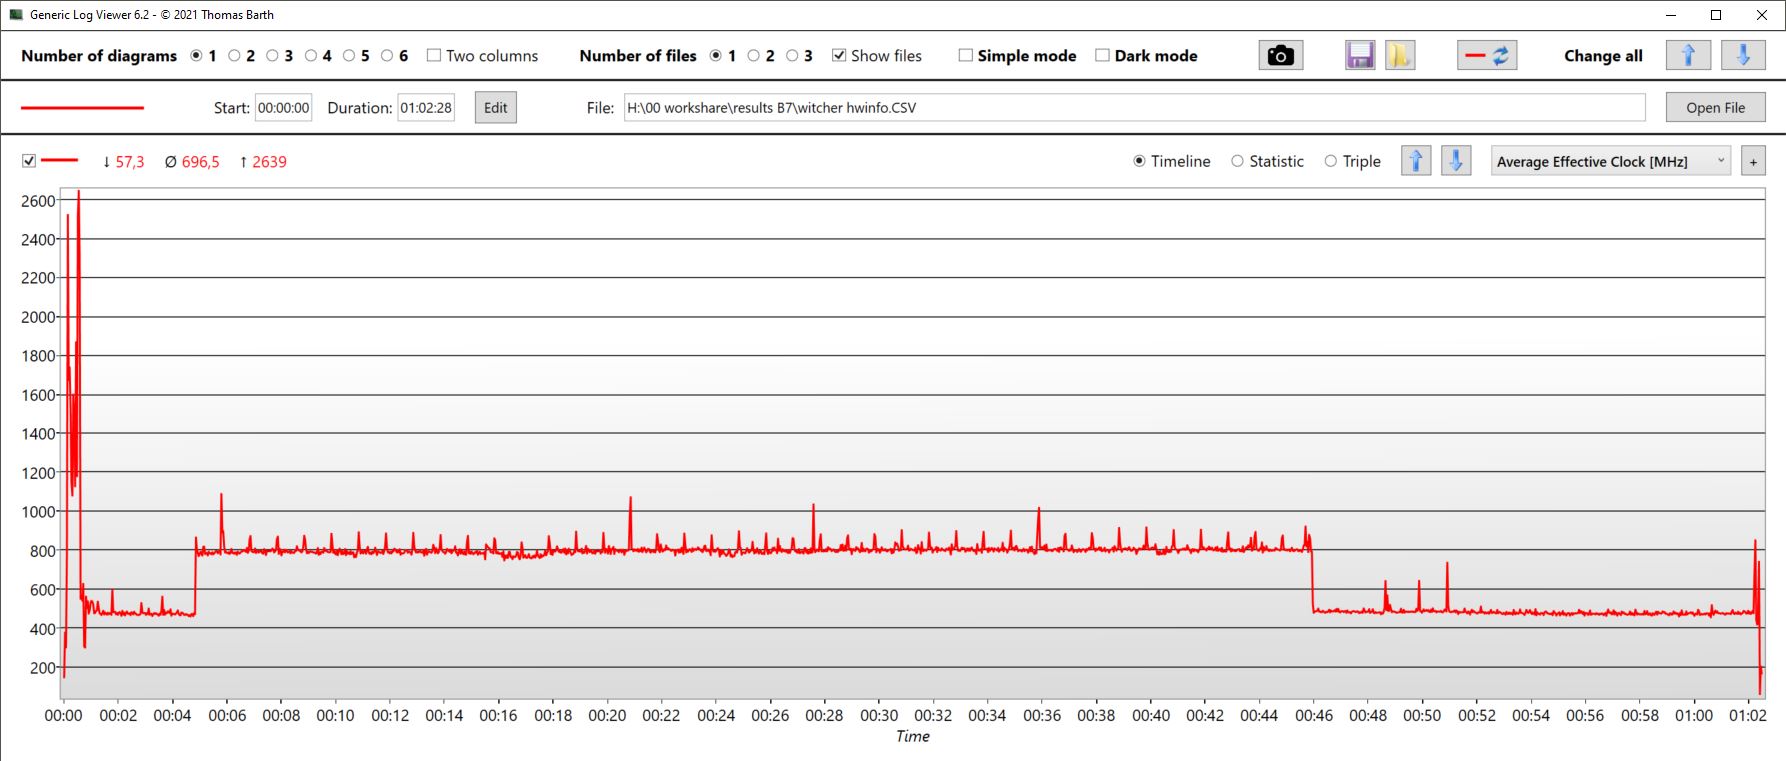
The Intel Core i7-11390H is still part of the Tiger Lake series - two of its 4 cores can individually clock at up to 5 GHz. All 4 cores are hyper-threading enabled, meaning 8 threads can be processed at once.
The chip can be configured from 28 to 35 watts (TDP), depending on which is the guaranteed base clock, which can range from 2.9 (28 W) to 3.4 GHz (35 W). The lower TDP end seems to be configured a bit more for the B7 Power. In our Cinebench R15 loop, the PC's power consumption was around 30 watts during the first run. From the second run onwards, the B7 only reached 25 watts and that only very briefly; for the majority of the rest of each run, the mini-PC only reached just under 20 watts.
After the first Cinebench R15 run, the device's performance dropped by about 10 per cent and remained stable afterwards. However, this performance is rather disappointing overall. Of course, the NUC 12 and 13 are clearly ahead, but even the Geekom Mini with the same CPU was a full 17 per cent faster across all CPU tests. Compared to the average i7-11390H results in our database, the B7 Power's CPU performance is about 13 per cent weaker. This means that the CPU's potential is by no means exhausted. Even the B5 Power with Intel Gen8 could barely be outperformed in the Cinebench test. The two devices are separated by a massive 87 per cent in the overall CPU score, but there is only about 18 per cent between them when it comes to the Cinebench loop.
Cinebench R15 Multi continuous test
Cinebench R23: Multi Core | Single Core
Cinebench R20: CPU (Multi Core) | CPU (Single Core)
Cinebench R15: CPU Multi 64Bit | CPU Single 64Bit
Blender: v2.79 BMW27 CPU
7-Zip 18.03: 7z b 4 | 7z b 4 -mmt1
Geekbench 5.5: Multi-Core | Single-Core
HWBOT x265 Benchmark v2.2: 4k Preset
LibreOffice : 20 Documents To PDF
R Benchmark 2.5: Overall mean
| CPU Performance rating | |
| Average of class Mini PC | |
| Intel NUC 13 Pro Kit NUC13ANK | |
| Intel NUC 12 Pro Kit NUC12WSBi5 -2! | |
| Geekom Mini IT11, i7-11390H | |
| Average Intel Core i7-11390H | |
| Beelink SEi11 Pro | |
| BMAX B7 Power G7A2 | |
| BMAX B5 Pro G7H8 | |
| Cinebench R23 / Multi Core | |
| Average of class Mini PC (1571 - 39416, n=90, last 2 years) | |
| Intel NUC 13 Pro Kit NUC13ANK | |
| Intel NUC 12 Pro Kit NUC12WSBi5 | |
| Intel NUC 12 Pro Kit NUC12WSBi5 | |
| Intel NUC 12 Pro Kit NUC12WSBi5 | |
| Geekom Mini IT11, i7-11390H | |
| Beelink SEi11 Pro | |
| Average Intel Core i7-11390H (4570 - 6379, n=3) | |
| BMAX B7 Power G7A2 | |
| BMAX B5 Pro G7H8 | |
| Cinebench R23 / Single Core | |
| Intel NUC 13 Pro Kit NUC13ANK | |
| Average of class Mini PC (455 - 2303, n=90, last 2 years) | |
| Intel NUC 12 Pro Kit NUC12WSBi5 | |
| Geekom Mini IT11, i7-11390H | |
| Average Intel Core i7-11390H (1407 - 1602, n=3) | |
| Beelink SEi11 Pro | |
| BMAX B7 Power G7A2 | |
| BMAX B5 Pro G7H8 | |
| Cinebench R20 / CPU (Multi Core) | |
| Average of class Mini PC (555 - 15041, n=90, last 2 years) | |
| Intel NUC 13 Pro Kit NUC13ANK | |
| Intel NUC 12 Pro Kit NUC12WSBi5 | |
| Geekom Mini IT11, i7-11390H | |
| Beelink SEi11 Pro | |
| Average Intel Core i7-11390H (1767 - 2362, n=3) | |
| BMAX B7 Power G7A2 | |
| BMAX B5 Pro G7H8 | |
| Cinebench R20 / CPU (Single Core) | |
| Intel NUC 13 Pro Kit NUC13ANK | |
| Average of class Mini PC (173.6 - 884, n=90, last 2 years) | |
| Intel NUC 12 Pro Kit NUC12WSBi5 | |
| Geekom Mini IT11, i7-11390H | |
| Average Intel Core i7-11390H (550 - 620, n=3) | |
| Beelink SEi11 Pro | |
| BMAX B7 Power G7A2 | |
| BMAX B5 Pro G7H8 | |
| Cinebench R15 / CPU Multi 64Bit | |
| Average of class Mini PC (254 - 5881, n=90, last 2 years) | |
| Intel NUC 13 Pro Kit NUC13ANK | |
| Intel NUC 12 Pro Kit NUC12WSBi5 | |
| Intel NUC 12 Pro Kit NUC12WSBi5 | |
| Geekom Mini IT11, i7-11390H | |
| Average Intel Core i7-11390H (775 - 1041, n=3) | |
| Beelink SEi11 Pro | |
| BMAX B7 Power G7A2 | |
| BMAX B5 Pro G7H8 | |
| Cinebench R15 / CPU Single 64Bit | |
| Intel NUC 13 Pro Kit NUC13ANK | |
| Average of class Mini PC (78.3 - 340, n=90, last 2 years) | |
| Intel NUC 12 Pro Kit NUC12WSBi5 | |
| Intel NUC 12 Pro Kit NUC12WSBi5 | |
| Geekom Mini IT11, i7-11390H | |
| Average Intel Core i7-11390H (209 - 239, n=3) | |
| Beelink SEi11 Pro | |
| BMAX B7 Power G7A2 | |
| BMAX B5 Pro G7H8 | |
| Blender / v2.79 BMW27 CPU | |
| BMAX B5 Pro G7H8 | |
| BMAX B7 Power G7A2 | |
| Average Intel Core i7-11390H (495 - 665, n=3) | |
| Beelink SEi11 Pro | |
| Geekom Mini IT11, i7-11390H | |
| Intel NUC 12 Pro Kit NUC12WSBi5 | |
| Average of class Mini PC (86 - 2330, n=86, last 2 years) | |
| Intel NUC 13 Pro Kit NUC13ANK | |
| 7-Zip 18.03 / 7z b 4 | |
| Average of class Mini PC (8146 - 136872, n=85, last 2 years) | |
| Intel NUC 13 Pro Kit NUC13ANK | |
| Intel NUC 12 Pro Kit NUC12WSBi5 | |
| Geekom Mini IT11, i7-11390H | |
| Average Intel Core i7-11390H (20822 - 28173, n=3) | |
| Beelink SEi11 Pro | |
| BMAX B7 Power G7A2 | |
| BMAX B5 Pro G7H8 | |
| 7-Zip 18.03 / 7z b 4 -mmt1 | |
| Intel NUC 13 Pro Kit NUC13ANK | |
| Geekom Mini IT11, i7-11390H | |
| Average of class Mini PC (2454 - 7462, n=86, last 2 years) | |
| Average Intel Core i7-11390H (5539 - 5895, n=3) | |
| BMAX B7 Power G7A2 | |
| Intel NUC 12 Pro Kit NUC12WSBi5 | |
| Beelink SEi11 Pro | |
| BMAX B5 Pro G7H8 | |
| Geekbench 5.5 / Multi-Core | |
| Average of class Mini PC (1638 - 24593, n=89, last 2 years) | |
| Intel NUC 13 Pro Kit NUC13ANK | |
| Average Intel Core i7-11390H (4457 - 6297, n=4) | |
| Geekom Mini IT11, i7-11390H | |
| Beelink SEi11 Pro | |
| BMAX B7 Power G7A2 | |
| BMAX B5 Pro G7H8 | |
| Geekbench 5.5 / Single-Core | |
| Intel NUC 13 Pro Kit NUC13ANK | |
| Average of class Mini PC (466 - 2395, n=89, last 2 years) | |
| Geekom Mini IT11, i7-11390H | |
| Average Intel Core i7-11390H (1486 - 1677, n=4) | |
| Beelink SEi11 Pro | |
| BMAX B7 Power G7A2 | |
| BMAX B5 Pro G7H8 | |
| HWBOT x265 Benchmark v2.2 / 4k Preset | |
| Average of class Mini PC (1.5 - 40.3, n=86, last 2 years) | |
| Intel NUC 13 Pro Kit NUC13ANK | |
| Intel NUC 12 Pro Kit NUC12WSBi5 | |
| Geekom Mini IT11, i7-11390H | |
| Beelink SEi11 Pro | |
| Average Intel Core i7-11390H (5.84 - 7.86, n=3) | |
| BMAX B7 Power G7A2 | |
| BMAX B5 Pro G7H8 | |
| LibreOffice / 20 Documents To PDF | |
| BMAX B5 Pro G7H8 | |
| Average of class Mini PC (33.1 - 132.6, n=86, last 2 years) | |
| BMAX B7 Power G7A2 | |
| Beelink SEi11 Pro | |
| Intel NUC 12 Pro Kit NUC12WSBi5 | |
| Average Intel Core i7-11390H (43.2 - 52.6, n=3) | |
| Geekom Mini IT11, i7-11390H | |
| Intel NUC 13 Pro Kit NUC13ANK | |
| R Benchmark 2.5 / Overall mean | |
| BMAX B5 Pro G7H8 | |
| Beelink SEi11 Pro | |
| BMAX B7 Power G7A2 | |
| Average Intel Core i7-11390H (0.537 - 0.571, n=3) | |
| Geekom Mini IT11, i7-11390H | |
| Intel NUC 12 Pro Kit NUC12WSBi5 | |
| Average of class Mini PC (0.3517 - 1.56, n=87, last 2 years) | |
| Intel NUC 13 Pro Kit NUC13ANK | |
* ... smaller is better
AIDA64: FP32 Ray-Trace | FPU Julia | CPU SHA3 | CPU Queen | FPU SinJulia | FPU Mandel | CPU AES | CPU ZLib | FP64 Ray-Trace | CPU PhotoWorxx
| Performance rating | |
| Average of class Mini PC | |
| Intel NUC 13 Pro Kit NUC13ANK | |
| Intel NUC 12 Pro Kit NUC12WSBi5 | |
| Beelink SEi11 Pro | |
| Average Intel Core i7-11390H | |
| Geekom Mini IT11, i7-11390H | |
| BMAX B7 Power G7A2 | |
| BMAX B5 Pro G7H8 | |
| AIDA64 / FP32 Ray-Trace | |
| Average of class Mini PC (974 - 82725, n=98, last 2 years) | |
| Intel NUC 13 Pro Kit NUC13ANK | |
| Beelink SEi11 Pro | |
| Average Intel Core i7-11390H (5904 - 7741, n=4) | |
| Geekom Mini IT11, i7-11390H | |
| Intel NUC 12 Pro Kit NUC12WSBi5 | |
| BMAX B7 Power G7A2 | |
| BMAX B5 Pro G7H8 | |
| AIDA64 / FPU Julia | |
| Average of class Mini PC (6115 - 363782, n=98, last 2 years) | |
| Intel NUC 13 Pro Kit NUC13ANK | |
| Beelink SEi11 Pro | |
| Average Intel Core i7-11390H (25054 - 32624, n=4) | |
| Intel NUC 12 Pro Kit NUC12WSBi5 | |
| Geekom Mini IT11, i7-11390H | |
| BMAX B7 Power G7A2 | |
| BMAX B5 Pro G7H8 | |
| AIDA64 / CPU SHA3 | |
| Average of class Mini PC (385 - 9475, n=98, last 2 years) | |
| Intel NUC 13 Pro Kit NUC13ANK | |
| Intel NUC 12 Pro Kit NUC12WSBi5 | |
| Beelink SEi11 Pro | |
| Average Intel Core i7-11390H (1747 - 2168, n=4) | |
| Geekom Mini IT11, i7-11390H | |
| BMAX B7 Power G7A2 | |
| BMAX B5 Pro G7H8 | |
| AIDA64 / CPU Queen | |
| Average of class Mini PC (20501 - 154404, n=81, last 2 years) | |
| Intel NUC 13 Pro Kit NUC13ANK | |
| Intel NUC 12 Pro Kit NUC12WSBi5 | |
| Average Intel Core i7-11390H (47355 - 58761, n=4) | |
| Geekom Mini IT11, i7-11390H | |
| BMAX B7 Power G7A2 | |
| Beelink SEi11 Pro | |
| BMAX B5 Pro G7H8 | |
| AIDA64 / FPU SinJulia | |
| Average of class Mini PC (1116 - 31931, n=98, last 2 years) | |
| Intel NUC 13 Pro Kit NUC13ANK | |
| Intel NUC 12 Pro Kit NUC12WSBi5 | |
| Beelink SEi11 Pro | |
| Average Intel Core i7-11390H (4106 - 5412, n=4) | |
| Geekom Mini IT11, i7-11390H | |
| BMAX B5 Pro G7H8 | |
| BMAX B7 Power G7A2 | |
| AIDA64 / FPU Mandel | |
| Average of class Mini PC (3322 - 192994, n=98, last 2 years) | |
| Intel NUC 13 Pro Kit NUC13ANK | |
| Beelink SEi11 Pro | |
| Average Intel Core i7-11390H (15441 - 19348, n=4) | |
| Geekom Mini IT11, i7-11390H | |
| Intel NUC 12 Pro Kit NUC12WSBi5 | |
| BMAX B7 Power G7A2 | |
| BMAX B5 Pro G7H8 | |
| AIDA64 / CPU AES | |
| Intel NUC 13 Pro Kit NUC13ANK | |
| Average of class Mini PC (9915 - 204742, n=97, last 2 years) | |
| Beelink SEi11 Pro | |
| Intel NUC 12 Pro Kit NUC12WSBi5 | |
| Average Intel Core i7-11390H (57644 - 77817, n=4) | |
| BMAX B7 Power G7A2 | |
| Geekom Mini IT11, i7-11390H | |
| BMAX B5 Pro G7H8 | |
| AIDA64 / CPU ZLib | |
| Average of class Mini PC (127.2 - 2431, n=98, last 2 years) | |
| Intel NUC 12 Pro Kit NUC12WSBi5 | |
| Intel NUC 13 Pro Kit NUC13ANK | |
| Average Intel Core i7-11390H (362 - 424, n=4) | |
| Geekom Mini IT11, i7-11390H | |
| Beelink SEi11 Pro | |
| BMAX B7 Power G7A2 | |
| BMAX B5 Pro G7H8 | |
| AIDA64 / FP64 Ray-Trace | |
| Average of class Mini PC (537 - 43587, n=98, last 2 years) | |
| Intel NUC 13 Pro Kit NUC13ANK | |
| Beelink SEi11 Pro | |
| Geekom Mini IT11, i7-11390H | |
| Average Intel Core i7-11390H (3138 - 4197, n=4) | |
| Intel NUC 12 Pro Kit NUC12WSBi5 | |
| BMAX B7 Power G7A2 | |
| BMAX B5 Pro G7H8 | |
| AIDA64 / CPU PhotoWorxx | |
| Average of class Mini PC (8069 - 96843, n=98, last 2 years) | |
| Intel NUC 13 Pro Kit NUC13ANK | |
| Intel NUC 12 Pro Kit NUC12WSBi5 | |
| Beelink SEi11 Pro | |
| Geekom Mini IT11, i7-11390H | |
| Average Intel Core i7-11390H (11409 - 39871, n=4) | |
| BMAX B5 Pro G7H8 | |
| BMAX B7 Power G7A2 | |
System performance
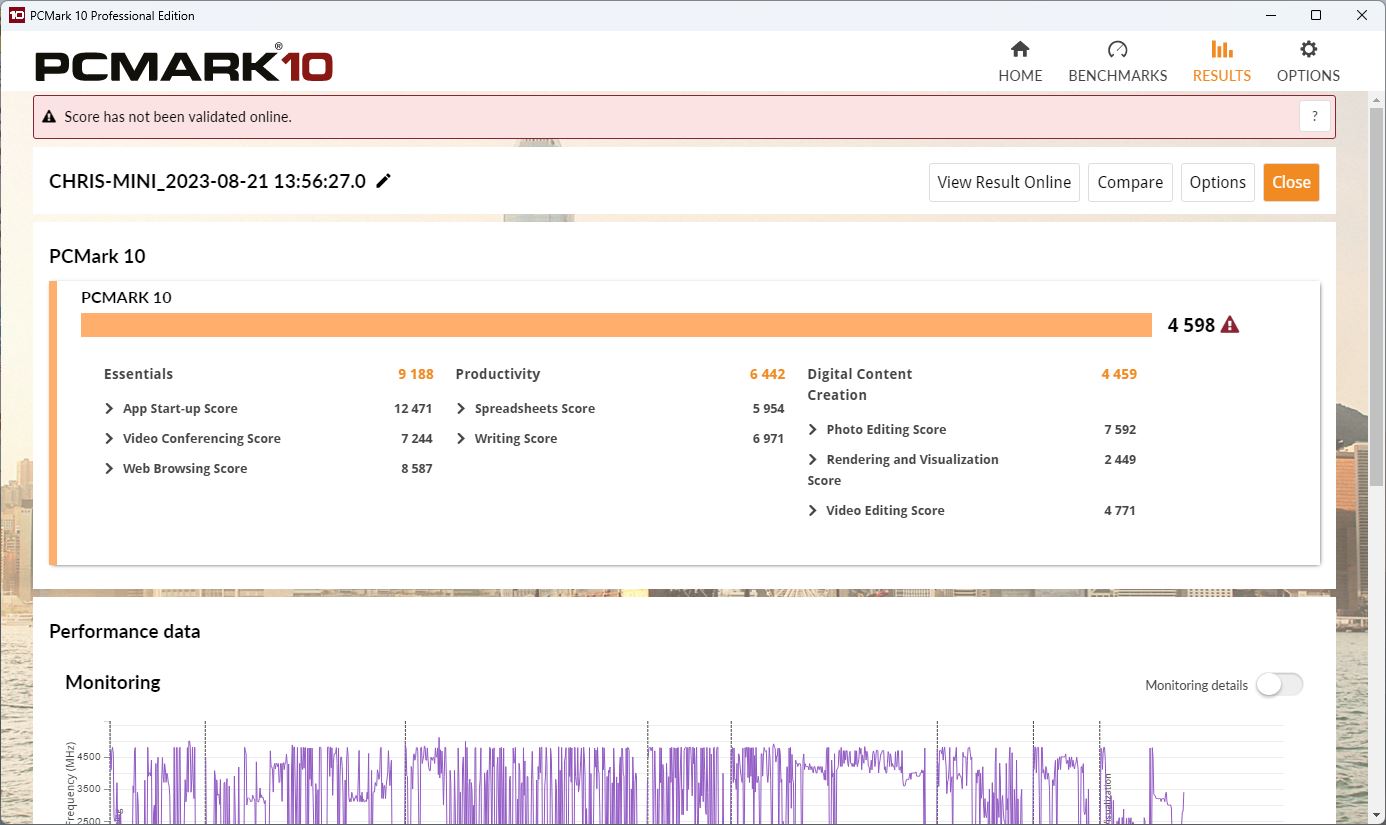
Its performance also lagged behind a typical i7-11390H's performance by 9 per cent in PCMark. In CrossMark, it was only 6 per cent behind.
Subjectively, the PC still performs well in everyday use when it comes to browsing the web and completing office tasks.
CrossMark: Overall | Productivity | Creativity | Responsiveness
| PCMark 10 / Score | |
| Average of class Mini PC (2191 - 9326, n=96, last 2 years) | |
| Intel NUC 13 Pro Kit NUC13ANK | |
| Intel NUC 12 Pro Kit NUC12WSBi5 | |
| Beelink SEi11 Pro | |
| Average Intel Core i7-11390H, Intel Iris Xe Graphics G7 96EUs (4598 - 5475, n=3) | |
| Geekom Mini IT11, i7-11390H | |
| BMAX B7 Power G7A2 | |
| BMAX B5 Pro G7H8 | |
| PCMark 10 / Essentials | |
| Intel NUC 13 Pro Kit NUC13ANK | |
| Intel NUC 12 Pro Kit NUC12WSBi5 | |
| Beelink SEi11 Pro | |
| Average of class Mini PC (5031 - 11997, n=95, last 2 years) | |
| Average Intel Core i7-11390H, Intel Iris Xe Graphics G7 96EUs (9188 - 10451, n=3) | |
| Geekom Mini IT11, i7-11390H | |
| BMAX B7 Power G7A2 | |
| BMAX B5 Pro G7H8 | |
| PCMark 10 / Productivity | |
| Average of class Mini PC (3646 - 17739, n=95, last 2 years) | |
| Intel NUC 13 Pro Kit NUC13ANK | |
| Intel NUC 12 Pro Kit NUC12WSBi5 | |
| Beelink SEi11 Pro | |
| Average Intel Core i7-11390H, Intel Iris Xe Graphics G7 96EUs (6442 - 7197, n=3) | |
| Geekom Mini IT11, i7-11390H | |
| BMAX B7 Power G7A2 | |
| BMAX B5 Pro G7H8 | |
| PCMark 10 / Digital Content Creation | |
| Average of class Mini PC (1558 - 17556, n=95, last 2 years) | |
| Intel NUC 13 Pro Kit NUC13ANK | |
| Intel NUC 12 Pro Kit NUC12WSBi5 | |
| Average Intel Core i7-11390H, Intel Iris Xe Graphics G7 96EUs (4459 - 5920, n=3) | |
| Beelink SEi11 Pro | |
| Geekom Mini IT11, i7-11390H | |
| BMAX B7 Power G7A2 | |
| BMAX B5 Pro G7H8 | |
| CrossMark / Overall | |
| Intel NUC 13 Pro Kit NUC13ANK | |
| Average of class Mini PC (385 - 2244, n=88, last 2 years) | |
| Geekom Mini IT11, i7-11390H | |
| Average Intel Core i7-11390H, Intel Iris Xe Graphics G7 96EUs (1274 - 1438, n=2) | |
| Beelink SEi11 Pro | |
| BMAX B7 Power G7A2 | |
| BMAX B5 Pro G7H8 | |
| CrossMark / Productivity | |
| Intel NUC 13 Pro Kit NUC13ANK | |
| Average of class Mini PC (446 - 2790, n=88, last 2 years) | |
| Geekom Mini IT11, i7-11390H | |
| Average Intel Core i7-11390H, Intel Iris Xe Graphics G7 96EUs (1399 - 1523, n=2) | |
| Beelink SEi11 Pro | |
| BMAX B7 Power G7A2 | |
| BMAX B5 Pro G7H8 | |
| CrossMark / Creativity | |
| Intel NUC 13 Pro Kit NUC13ANK | |
| Average of class Mini PC (340 - 2879, n=88, last 2 years) | |
| Geekom Mini IT11, i7-11390H | |
| Average Intel Core i7-11390H, Intel Iris Xe Graphics G7 96EUs (1198 - 1359, n=2) | |
| Beelink SEi11 Pro | |
| BMAX B7 Power G7A2 | |
| BMAX B5 Pro G7H8 | |
| CrossMark / Responsiveness | |
| Intel NUC 13 Pro Kit NUC13ANK | |
| Average of class Mini PC (363 - 2191, n=88, last 2 years) | |
| Geekom Mini IT11, i7-11390H | |
| Beelink SEi11 Pro | |
| Average Intel Core i7-11390H, Intel Iris Xe Graphics G7 96EUs (1159 - 1434, n=2) | |
| BMAX B7 Power G7A2 | |
| BMAX B5 Pro G7H8 | |
| PCMark 10 Score | 4598 points | |
Help | ||
| AIDA64 / Memory Copy | |
| Average of class Mini PC (15933 - 163031, n=98, last 2 years) | |
| Intel NUC 13 Pro Kit NUC13ANK | |
| Intel NUC 12 Pro Kit NUC12WSBi5 | |
| Geekom Mini IT11, i7-11390H | |
| Average Intel Core i7-11390H (19409 - 64750, n=4) | |
| Beelink SEi11 Pro | |
| BMAX B5 Pro G7H8 | |
| BMAX B7 Power G7A2 | |
| AIDA64 / Memory Read | |
| Average of class Mini PC (14143 - 123769, n=98, last 2 years) | |
| Intel NUC 12 Pro Kit NUC12WSBi5 | |
| Geekom Mini IT11, i7-11390H | |
| Beelink SEi11 Pro | |
| Intel NUC 13 Pro Kit NUC13ANK | |
| Average Intel Core i7-11390H (21253 - 59793, n=4) | |
| BMAX B5 Pro G7H8 | |
| BMAX B7 Power G7A2 | |
| AIDA64 / Memory Write | |
| Average of class Mini PC (10630 - 216693, n=98, last 2 years) | |
| Geekom Mini IT11, i7-11390H | |
| Intel NUC 12 Pro Kit NUC12WSBi5 | |
| Beelink SEi11 Pro | |
| Intel NUC 13 Pro Kit NUC13ANK | |
| Average Intel Core i7-11390H (19684 - 66881, n=4) | |
| BMAX B5 Pro G7H8 | |
| BMAX B7 Power G7A2 | |
| AIDA64 / Memory Latency | |
| Average of class Mini PC (88.1 - 170, n=99, last 2 years) | |
| Intel NUC 13 Pro Kit NUC13ANK | |
| BMAX B5 Pro G7H8 | |
| Intel NUC 12 Pro Kit NUC12WSBi5 | |
| Beelink SEi11 Pro | |
| Average Intel Core i7-11390H (66.3 - 95.3, n=4) | |
| Geekom Mini IT11, i7-11390H | |
| BMAX B7 Power G7A2 | |
* ... smaller is better
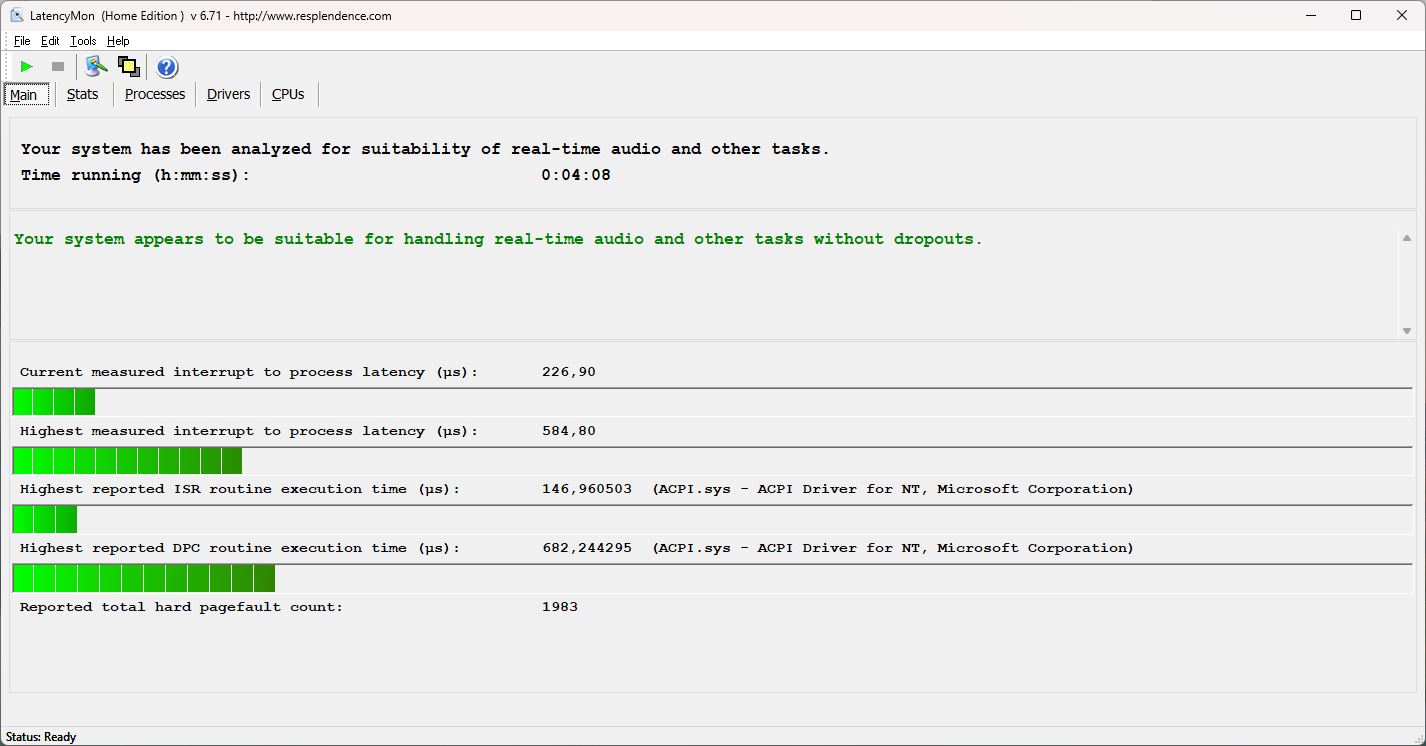
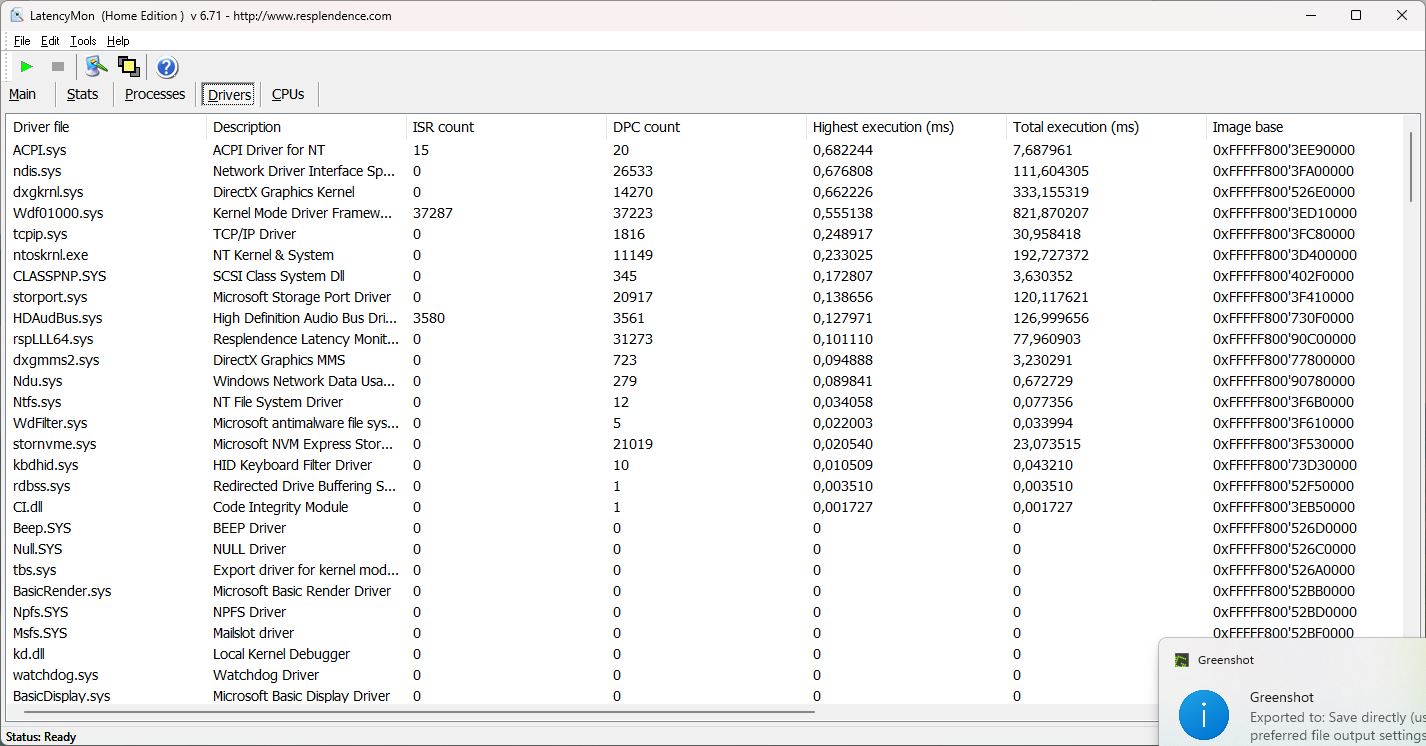
DPC latency
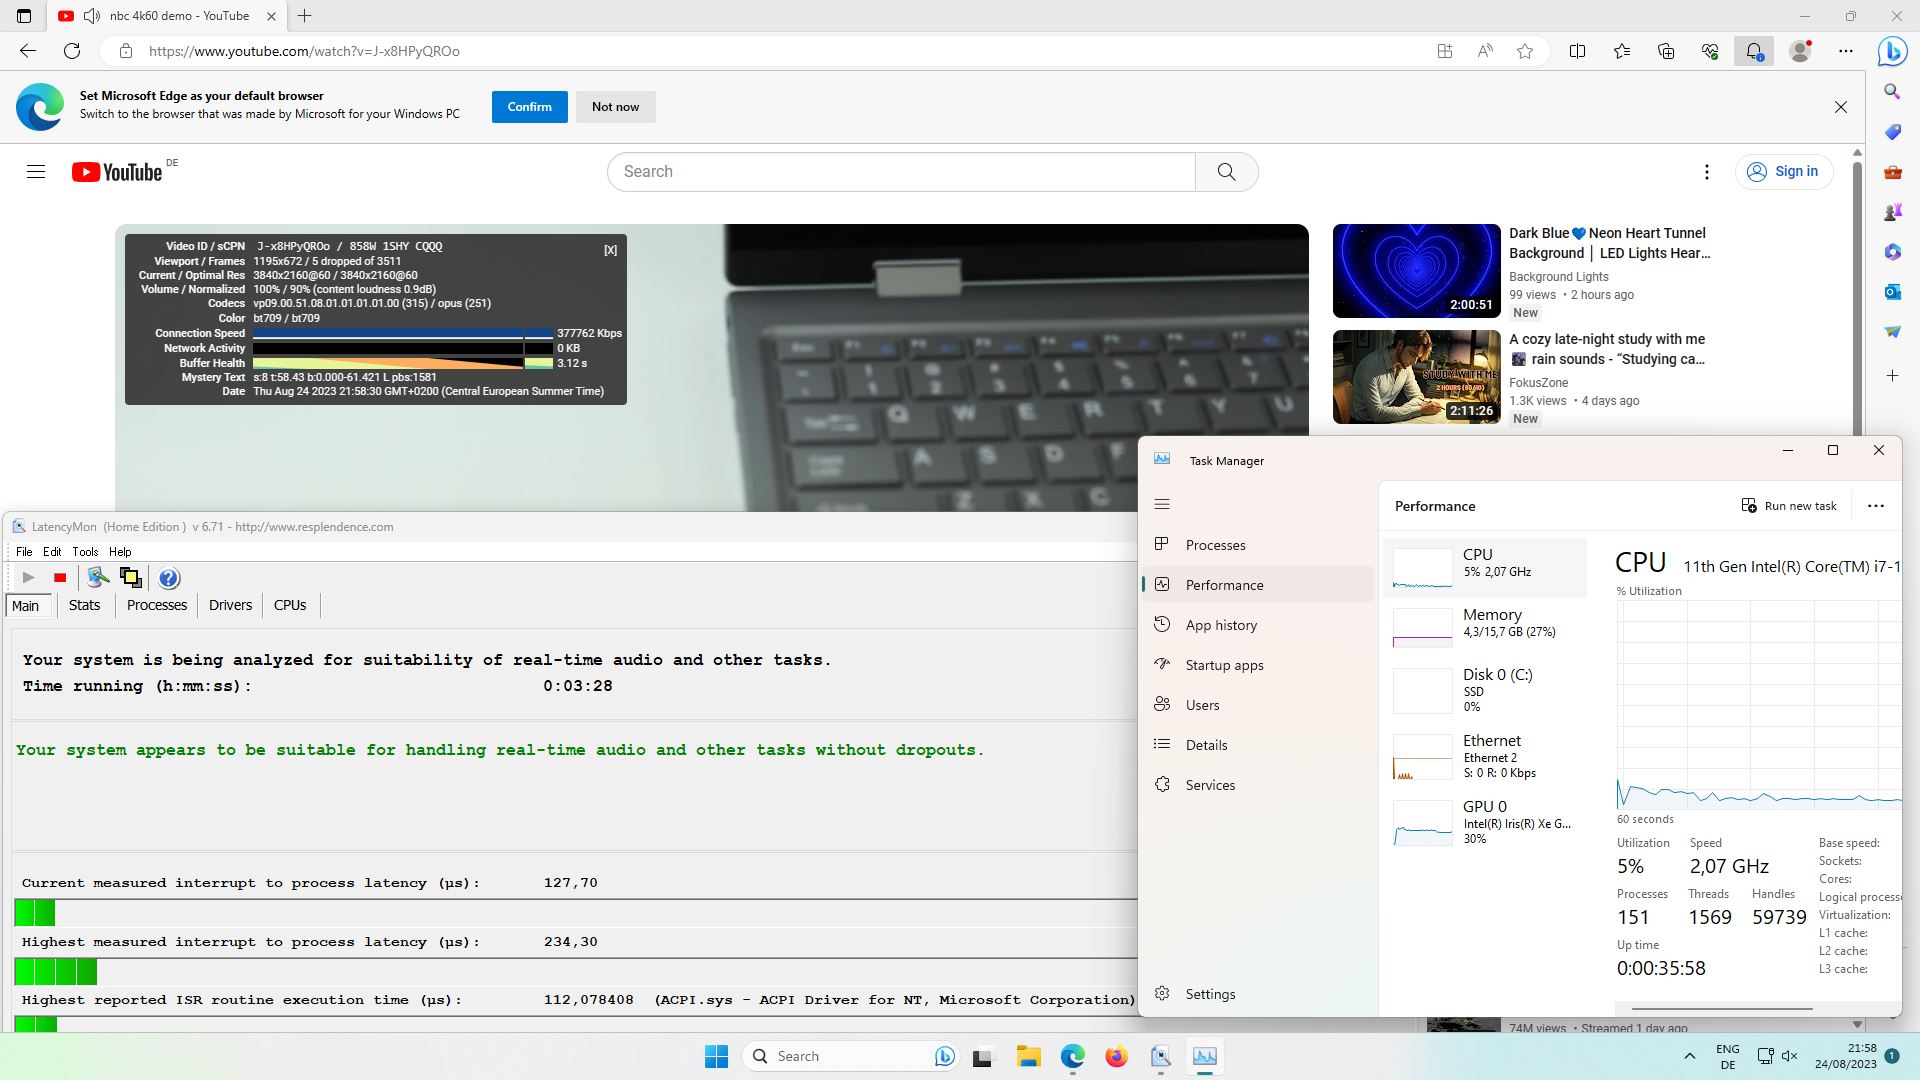
Loading websites proves to be no issue for the cuboid PC. It even easily managed to open multiple tabs on our website - a stark contrast to most current gaming laptops.
In turn, it didn't manage to play our 4K/60 fps video perfectly - we noted three dropped frames - but apart from that, it ran pretty smoothly. This makes the B7 suitable for real-time audio playback & co.
In comparison, the Intel NUCs' latencies were higher but the last-gen mini PCs from Geekom and Beelink did a little better.
| DPC Latencies / LatencyMon - interrupt to process latency (max), Web, Youtube, Prime95 | |
| Intel NUC 13 Pro Kit NUC13ANK | |
| Intel NUC 12 Pro Kit NUC12WSBi5 | |
| BMAX B7 Power G7A2 | |
| Geekom Mini IT11, i7-11390H | |
| BMAX B5 Pro G7H8 | |
| Beelink SEi11 Pro | |
* ... smaller is better
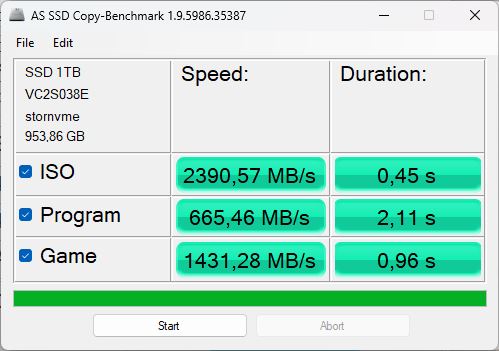
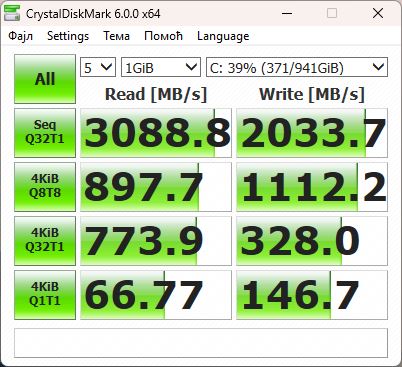
Storage devices
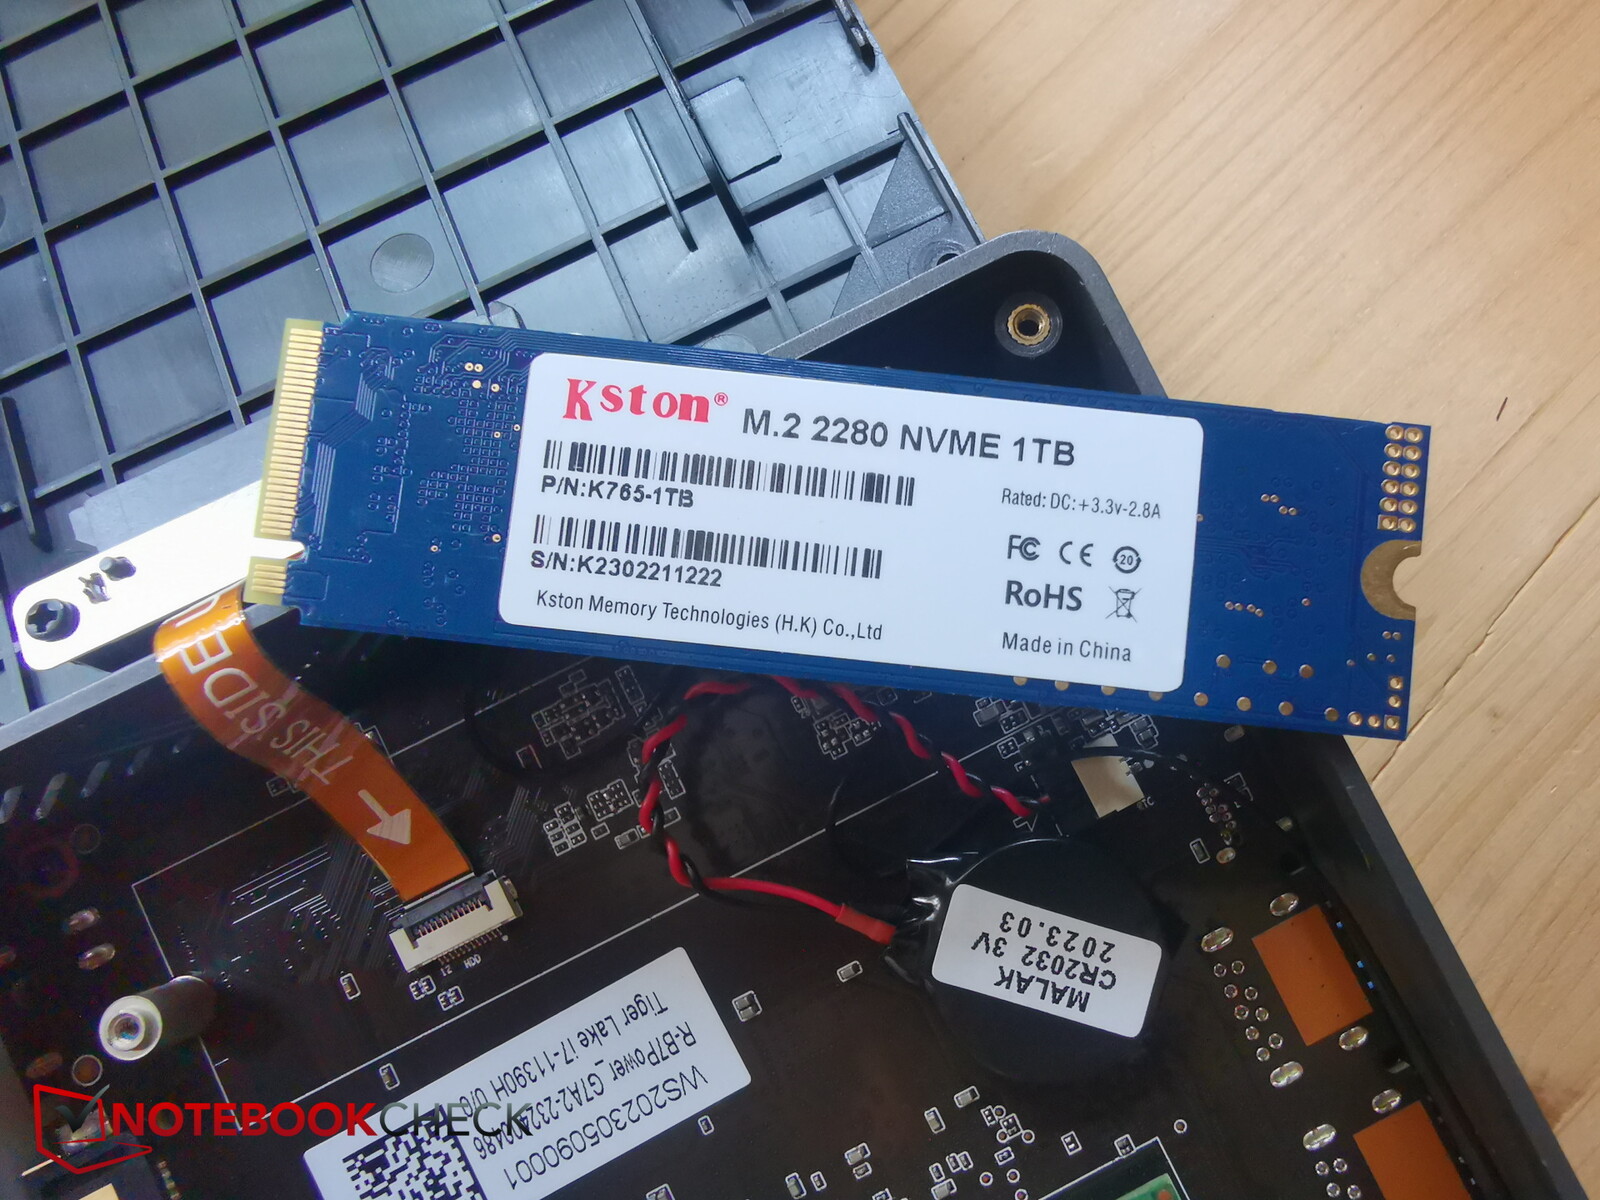
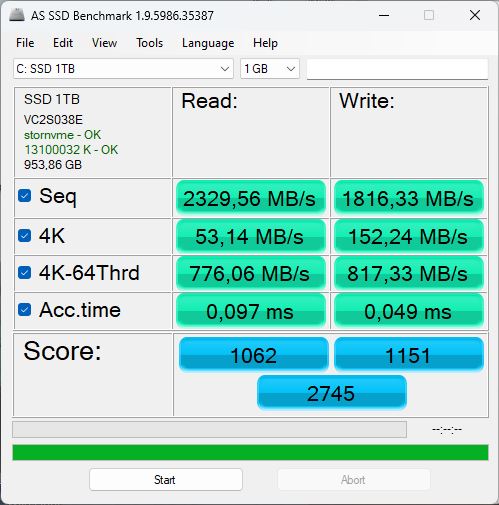
BMAX has installed a 1-TB SSD into the device - this is also how it is labelled everywhere on Windows and even in the BIOS. It just says "SSD 1 TB" everywhere. In order to determine the installed model and its manufacturer, you have to open up the B7 Power and remove the SSD. There is a label on the back. A "Kston K765-1TB" isn't very well known here. It really shouldn't have any reason to hide - in comparison, this model still achieved decent transmission rates. Only the Samsung SSD within the NUC 13 did considerably better in all the tests.
Unfortunately, its performance was throttled a little during periods of longer load due to thermal limits. A cooling unit is not installed, but this would be recommended.

* ... smaller is better
Reading continuous performance: DiskSpd Read Loop, Queue Depth 8
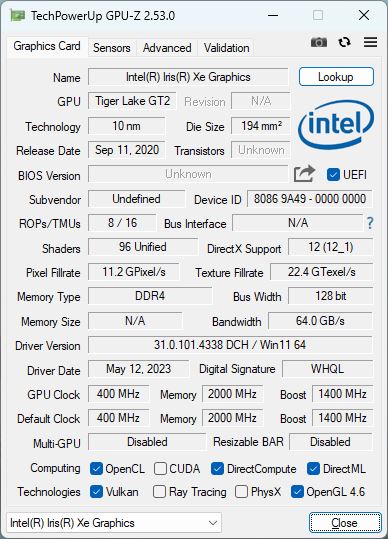
Graphics card
An Intel Iris Xe Graphics G7 96EUs integrated within the processor acts as the PC's graphics card. Depending on the processor and power consumption, its performance varies quite a bit.
Even in the 3D benchmarks, its performance was well below average. On average, the Xe Graphics G7 with 96 EUs in our database performed 51 per cent better! Even so, the B7 Power managed to do 118 per cent better than the B5 with an Intel UHD Graphics 620. Its performance is still far too weak and the installed hardware is heavily throttled. Its competitors with the same iGPU remained much closer to the average values and, as a result, far ahead of the B7. Unsurprisingly, the NUC 13 Pro was the reigning champion in this field.
| 3DMark 11 Performance | 4743 points | |
| 3DMark Cloud Gate Standard Score | 13442 points | |
| 3DMark Fire Strike Score | 2546 points | |
| 3DMark Time Spy Score | 1103 points | |
Help | ||
* ... smaller is better
Gaming performance
Despite its name containing the term "power", the B7 really isn't made for gaming. It is much more suited for everyday uses as an office device.
While running The Witcher 3 Ultra, the PC only managed 8 to 9 fps on average. The Geekom Mini IT11 with the same CPU/iGPU was 30 per cent faster. The Beelink SEi11 Pro - despite its slightly weaker CPU - came ahead of both of the others.
In the lowest resolution and with the lowest detail settings, you could achieve an average of 48 fps while playing The Witcher 3. In 720p and and with medium details, you can reach 30 fps.
Far Cry 5 could also barely be played in the lowest settings (1,280 x 720, Low, ~ 29 fps). You will have to make do with older or less demanding games and often only while playing these with reduced settings. On the other hand, we would recommend using this PC as a retro console, e.g. in combination with RetroArch.
| Performance rating - Percent | |
| Average of class Mini PC | |
| Intel NUC 13 Pro Kit NUC13ANK -3! | |
| Beelink SEi11 Pro -1! | |
| Intel NUC 12 Pro Kit NUC12WSBi5 -5! | |
| Geekom Mini IT11, i7-11390H -2! | |
| BMAX B7 Power G7A2 | |
| BMAX B5 Pro G7H8 -5! | |
| The Witcher 3 - 1920x1080 Ultra Graphics & Postprocessing (HBAO+) | |
| Average of class Mini PC (11.9 - 271, n=51, last 2 years) | |
| Intel NUC 13 Pro Kit NUC13ANK | |
| Beelink SEi11 Pro | |
| Geekom Mini IT11, i7-11390H | |
| BMAX B7 Power G7A2 | |
| GTA V - 1920x1080 Highest AA:4xMSAA + FX AF:16x | |
| Average of class Mini PC (2.71 - 124.7, n=74, last 2 years) | |
| Geekom Mini IT11, i7-11390H | |
| Geekom Mini IT11, i7-11390H | |
| BMAX B7 Power G7A2 | |
| Final Fantasy XV Benchmark - 1920x1080 High Quality | |
| Average of class Mini PC (5.3 - 209, n=87, last 2 years) | |
| Beelink SEi11 Pro | |
| BMAX B7 Power G7A2 | |
| Strange Brigade - 1920x1080 ultra AA:ultra AF:16 | |
| Average of class Mini PC (17 - 245, n=44, last 2 years) | |
| Intel NUC 13 Pro Kit NUC13ANK | |
| Beelink SEi11 Pro | |
| Geekom Mini IT11, i7-11390H | |
| BMAX B7 Power G7A2 | |
| Dota 2 Reborn - 1920x1080 ultra (3/3) best looking | |
| Average of class Mini PC (8.2 - 213, n=96, last 2 years) | |
| Intel NUC 13 Pro Kit NUC13ANK | |
| Beelink SEi11 Pro | |
| Geekom Mini IT11, i7-11390H | |
| Intel NUC 12 Pro Kit NUC12WSBi5 | |
| BMAX B7 Power G7A2 | |
| BMAX B5 Pro G7H8 | |
| X-Plane 11.11 - 1920x1080 high (fps_test=3) | |
| Average of class Mini PC (4.77 - 147.9, n=81, last 2 years) | |
| Beelink SEi11 Pro | |
| BMAX B7 Power G7A2 | |
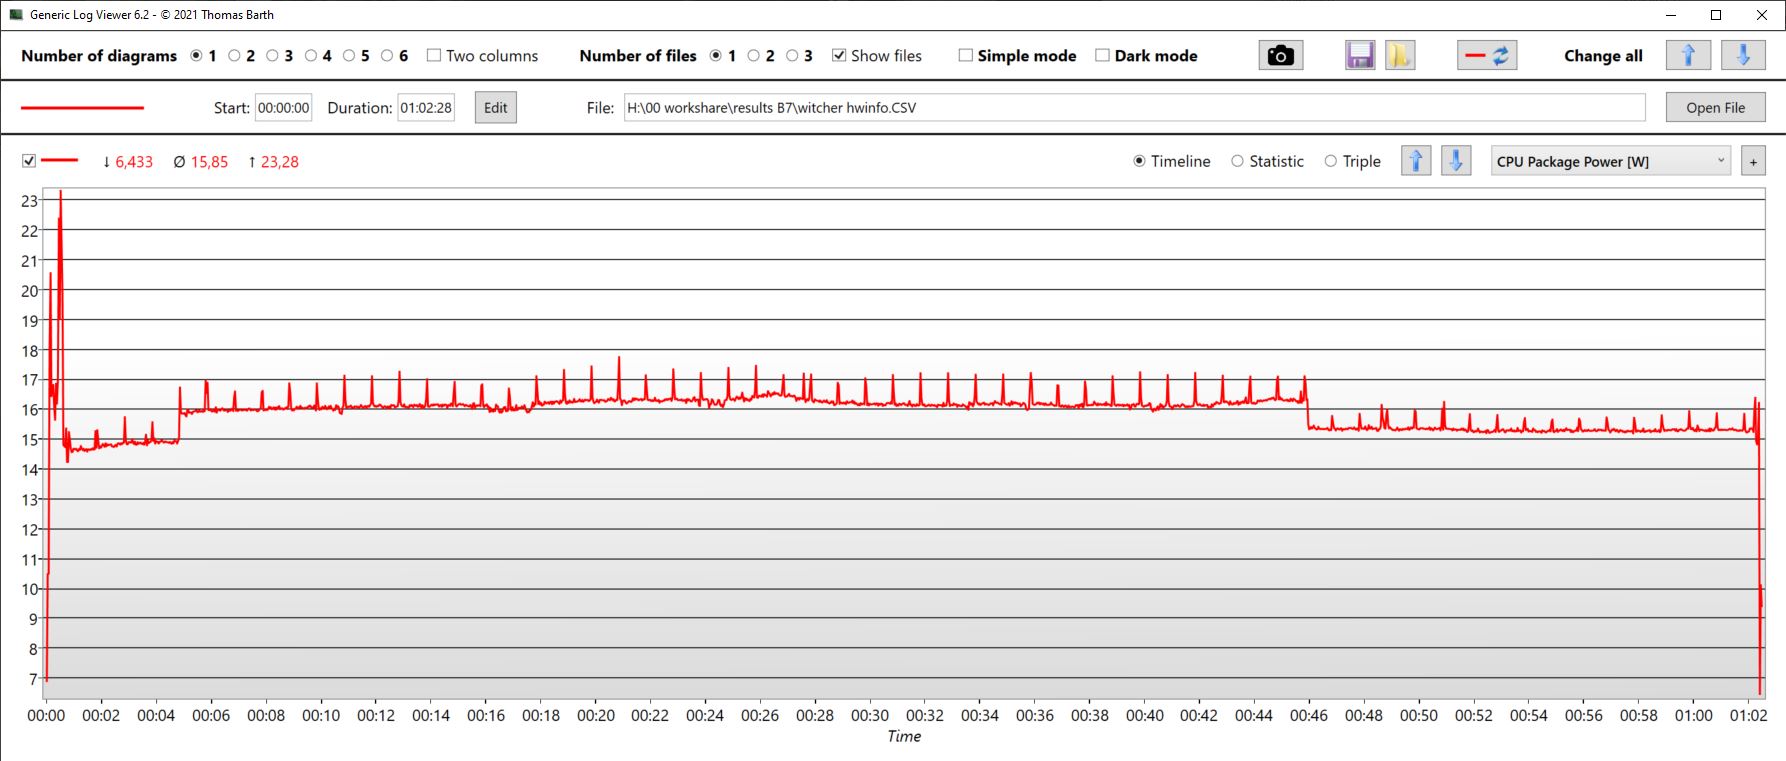
Over the course of an hour, its performance fluctuated a lot when playing The Witcher 3, which suggests thermal throttling. At least, the tool CapframeX measured fluctuating values between 7 and around 20 fps. The latter was only achieved for short bursts - the average fps number lay at 8.8.
Witcher 3 FPS diagram
| low | med. | high | ultra | |
|---|---|---|---|---|
| GTA V (2015) | 56.4 | 44.8 | 4.13 | |
| The Witcher 3 (2015) | 48.4 | 31.3 | 8.8 | |
| Dota 2 Reborn (2015) | 92.3 | 64.9 | 32.9 | 29.6 |
| Final Fantasy XV Benchmark (2018) | 22.1 | 10.5 | 8.15 | |
| X-Plane 11.11 (2018) | 38 | 30 | 27.9 | |
| Far Cry 5 (2018) | 29 | |||
| Strange Brigade (2018) | 49 | 18.2 | 15.4 | 13.2 |
| Diablo 4 (2023) | 16.3 |
Emissions - The quiet B7 Power
Noise emissions
Okay - it's performance is sub-par, but can the B7 Power at least redeem itself in the shape of its emissions and show itself as being a quiet, frugal mini PC?
The B7 Power only has one fan. Even in idle mode, it is activated after a short time. Although, you do have to put your ear up close to the case in order to hear these 25 dB. Even under maximum load, the fan doesn't make much noise - we measured 27 dB.
The more powerful NUC13 is a lot louder with noise emissions surpassing 40 dB. The B7 Power is by far the quietest mini PC in this comparison.
Noise level
| Idle |
| 23 / 25.12 / 25.12 dB(A) |
| Load |
| 27.15 / 27.15 dB(A) |
 | ||
30 dB silent 40 dB(A) audible 50 dB(A) loud |
||
min: | ||
| BMAX B7 Power G7A2 Iris Xe G7 96EUs, i7-11390H, Kston K765-1TB | Geekom Mini IT11, i7-11390H Iris Xe G7 96EUs, i7-11390H, Lexar 1024GB LNM6A1X001T-HNNNG | Intel NUC 13 Pro Kit NUC13ANK Iris Xe G7 96EUs, i7-1360P, Samsung PM9A1 MZVL2512HCJQ | Beelink SEi11 Pro Iris Xe G7 96EUs, i5-11320H, Kingston NV1 SNVS/500GCN | BMAX B5 Pro G7H8 UHD Graphics 620, i5-8260U | |
|---|---|---|---|---|---|
| Noise | -23% | -35% | -13% | -7% | |
| off / environment * (dB) | 23 | 29.7 -29% | 29.8 -30% | 22.8 1% | 23 -0% |
| Idle Minimum * (dB) | 23 | 30.2 -31% | 30.2 -31% | 24.7 -7% | 25.1 -9% |
| Idle Average * (dB) | 25.12 | 30.2 -20% | 31.1 -24% | 24.7 2% | 25.1 -0% |
| Idle Maximum * (dB) | 25.12 | 30.2 -20% | 31.9 -27% | 25.3 -1% | 25.1 -0% |
| Load Average * (dB) | 27.15 | 30.6 -13% | 40 -47% | 33.2 -22% | 28.6 -5% |
| Witcher 3 ultra * (dB) | 27.15 | 30.5 -12% | 34.5 -27% | 30.1 -11% | |
| Load Maximum * (dB) | 27.15 | 36.4 -34% | 40.5 -49% | 37.8 -39% | 34 -25% |
* ... smaller is better
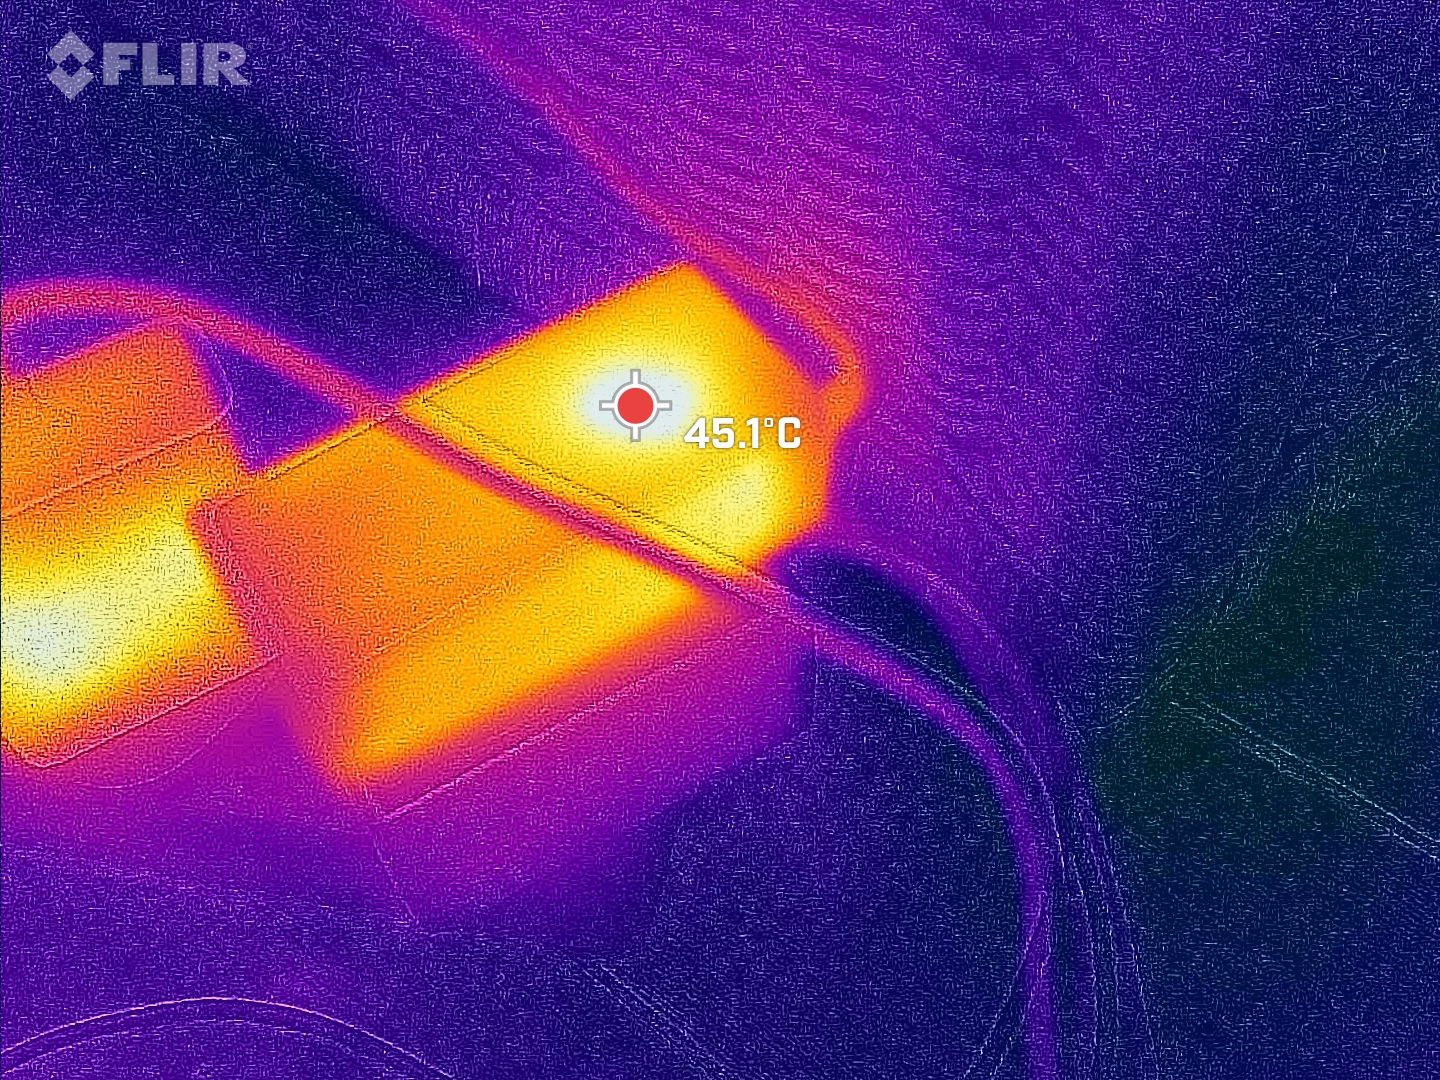
Temperature
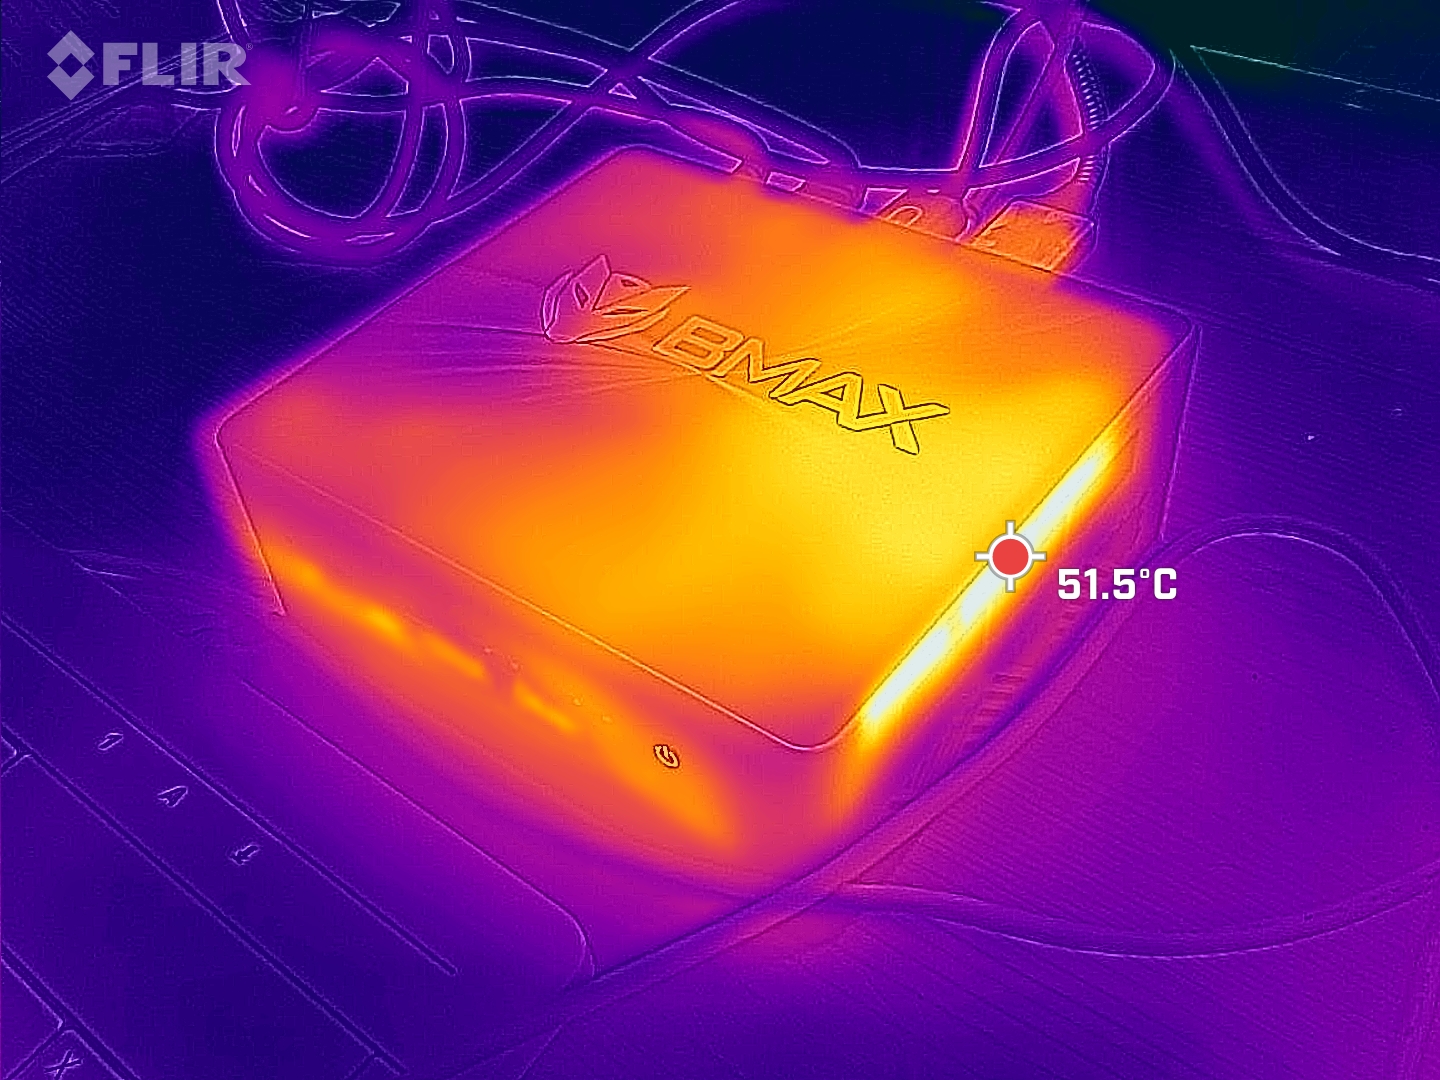
On the other hand, the quiet fan also leads to quite high temperatures - but thankfully, just where the air grill sits. The top and bottom of the case only reached average temperatures of 43 °C during the gaming and stress tests. Where air is blown out of the case on the right side, we measured up to 54 °C.
(±) The maximum temperature on the upper side is 43 °C / 109 F, compared to the average of 35.4 °C / 96 F, ranging from 20.6 to 69.5 °C for the class Mini PC.
(±) The bottom heats up to a maximum of 42 °C / 108 F, compared to the average of 36.1 °C / 97 F
(±) In idle usage, the average temperature for the upper side is 35.2 °C / 95 F, compared to the device average of 32.1 °C / 90 F.
Stress test
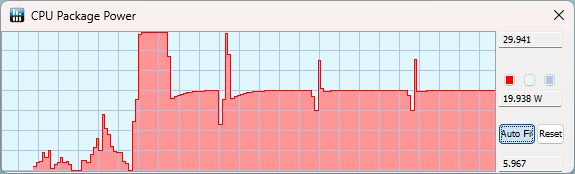
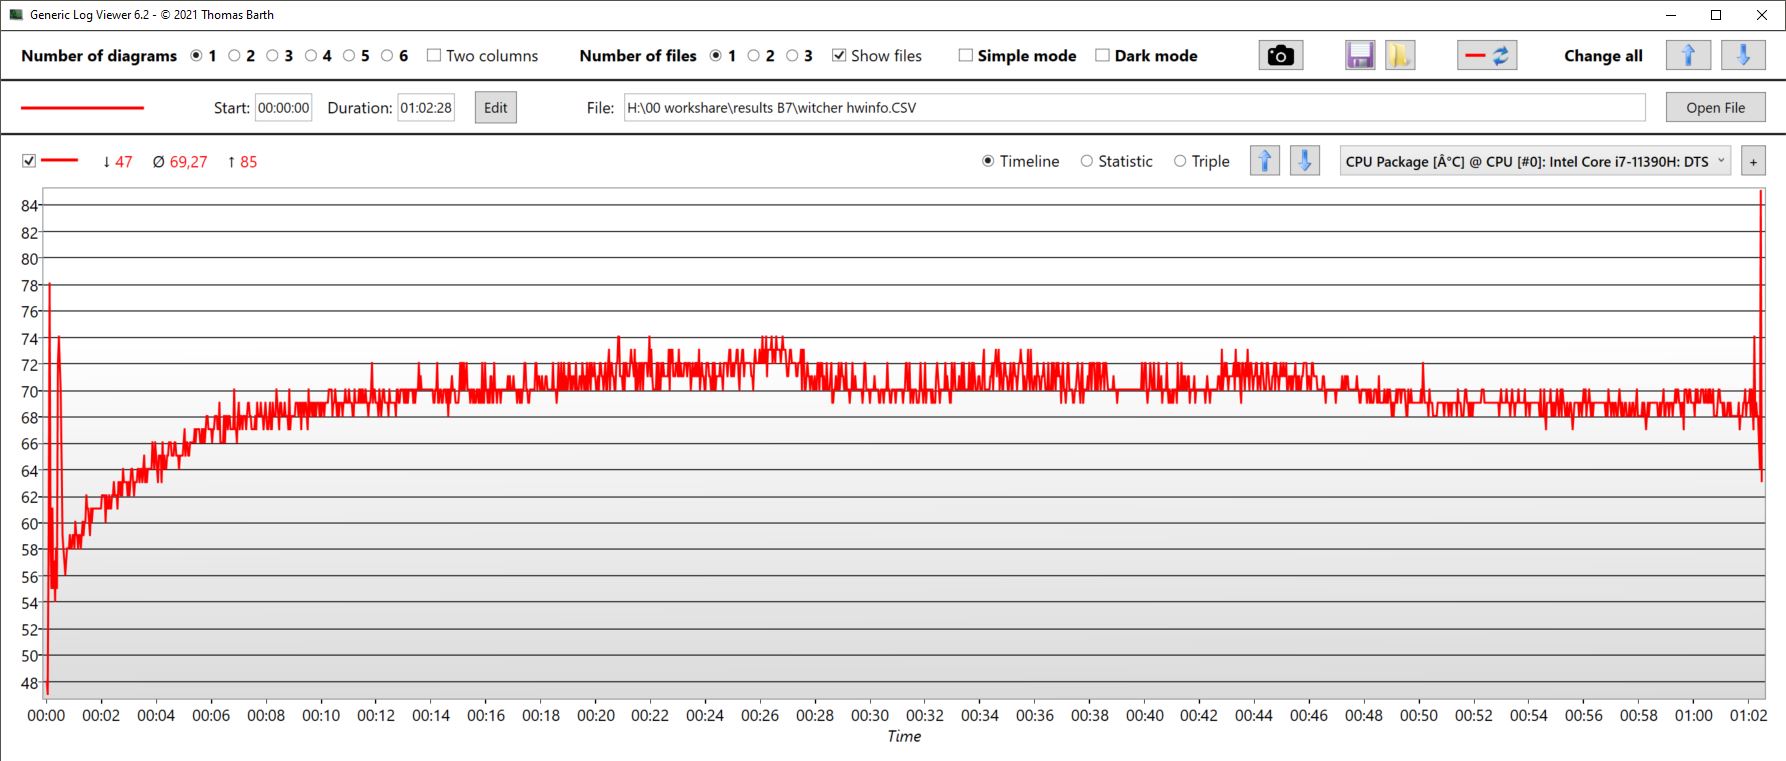
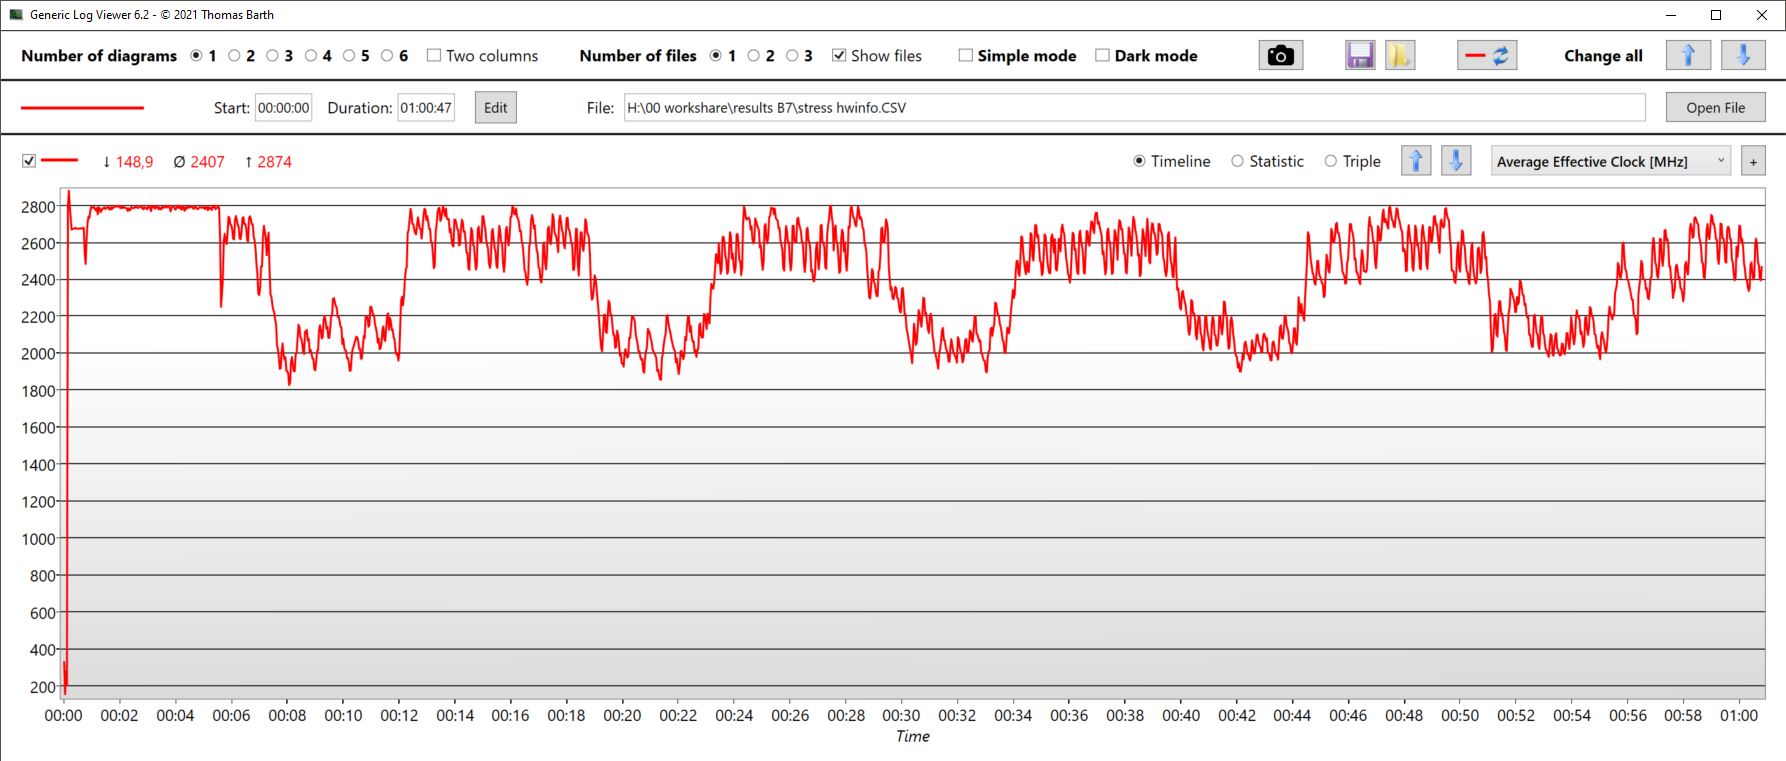
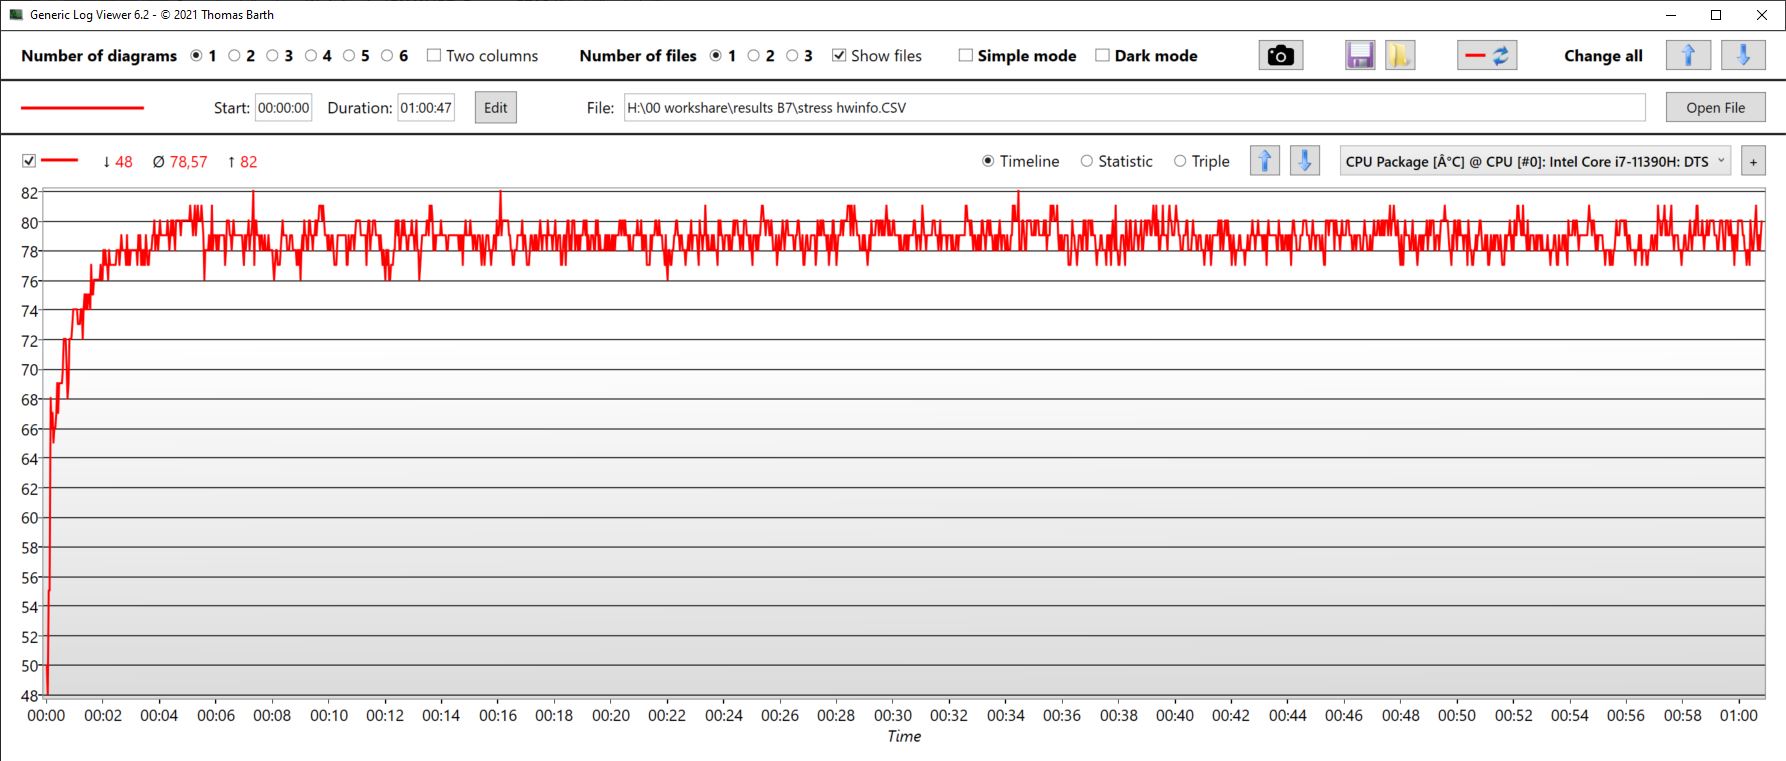
Prime95 and Furmark ran simultaneously in the stress test. The CPU briefly clocked at up to over 2.8 GHz. After a short drop, the processor maintained a clock of 2.8 GHz for the following five minutes, after which it repeatedly dropped to 1.8 to 2.3 GHz in cycles. The individual core temperatures never rose higher than 78°C. However, the CPU as a whole heated up to 82 °C, but 78 °C was maintained on average.
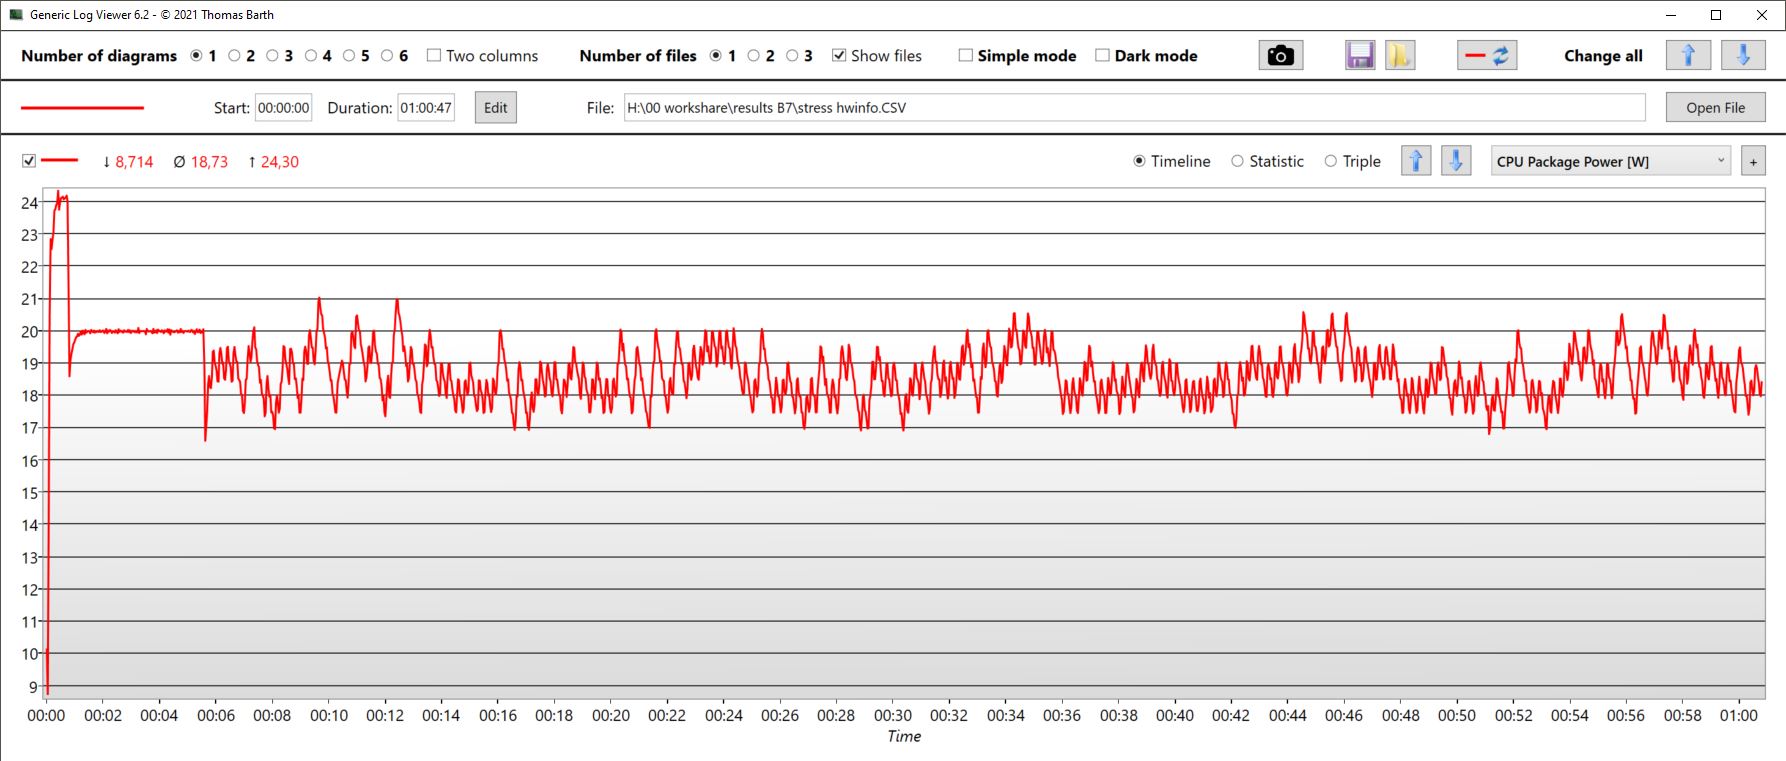
The CPU power consumption was 24 watts at the beginning, but only about 19 watts on average.
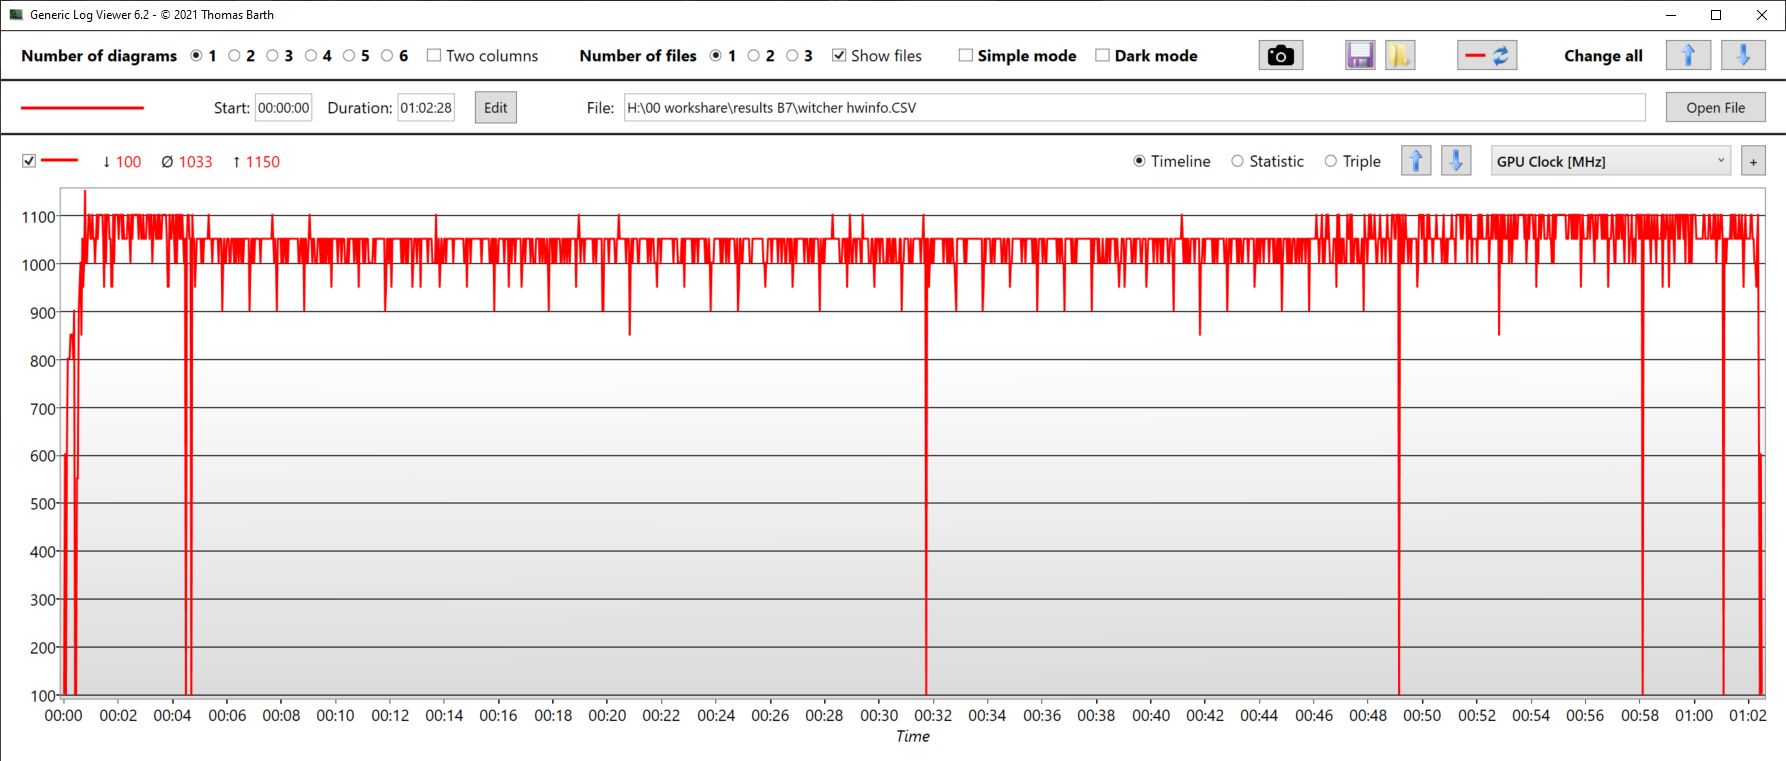
The integrated GPU clocked at 1.4 GHz for a very short time, after which the same periodic clock drop from about 600 MHz to 100 to 350 MHz took place here. On average, the graphics unit clocked at 400 MHz.
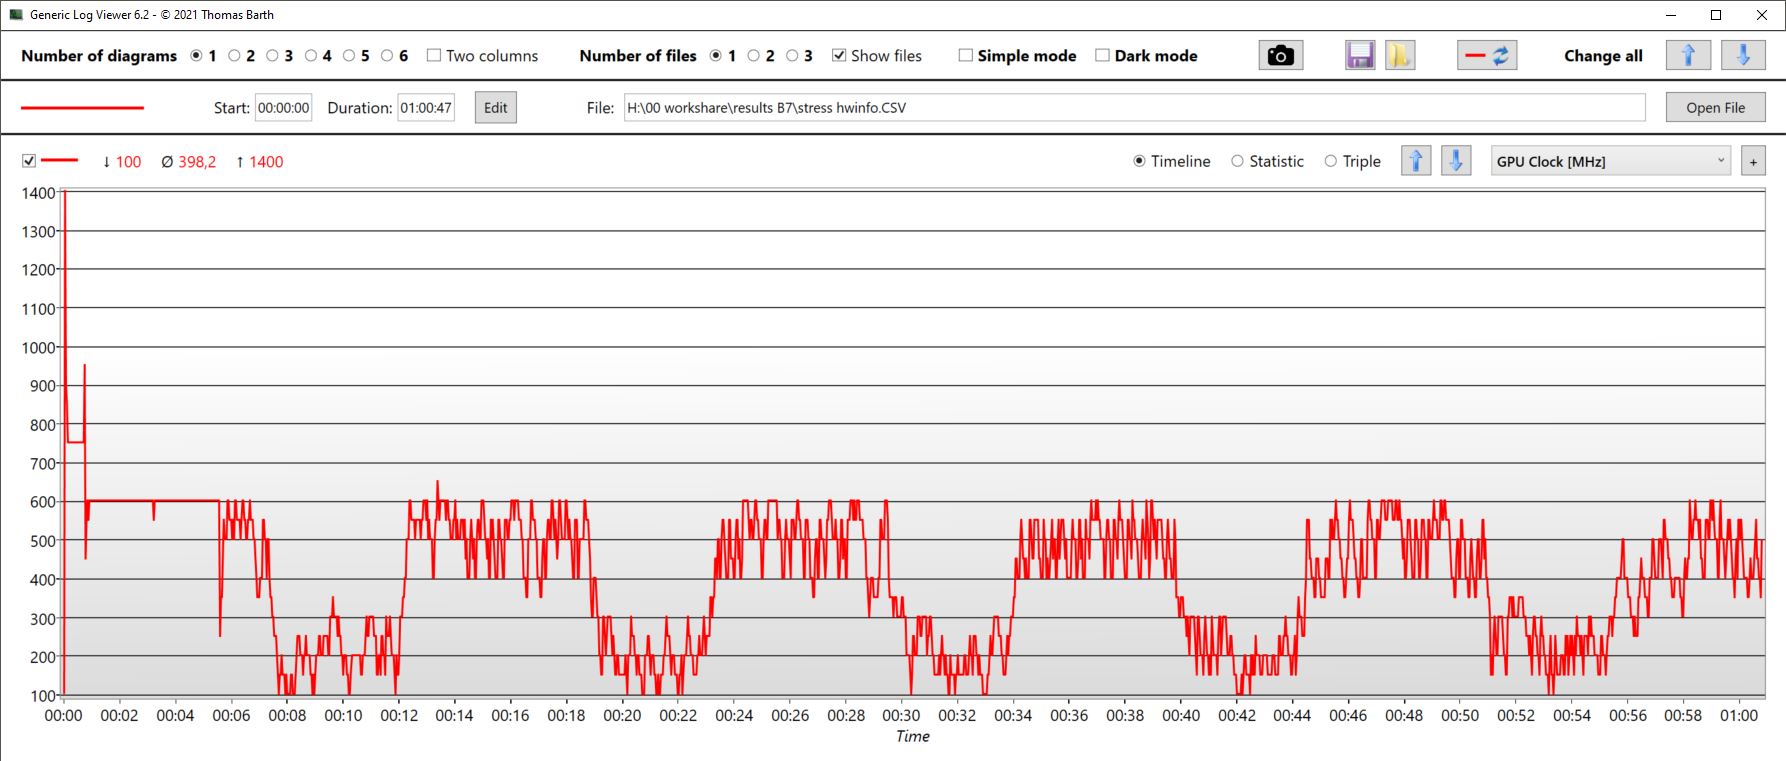
| CPU clock (GHz) | GPU clock (MHz) | Average CPU temperature (°C) | Average GPU temperature (°C) | |
| Prime95 + FurMark stress | 2.4 | 400 | 79 | 79 |
| Witcher 3 stress | 0.7 | 1033 | 69 | 69 |
Power management - The very frugal BMAX B7
Power consumption
Generally, the B7 Power is very frugal. Depending on the power mode, we measured between 9 and 10 watts in idle mode. The B7 really shows how frugal it is under load.
Its absolute maximum consumption was temporarily just under 44 watts - however, on average, the B7 power doesn't continually use more than 35 watts. Its small power supply is rated at 47.5 watts (19 V and 2.5 A). Alternatively, you can power the B7 via its USB-C connection, as long as the charger meets the minimum specifications.
Be aware: If the B7 is switched off, it still uses almost 1 watt. In addition, the USB ports loop power through them. As a result, our RGB mouse still gets illuminated even when it is turned off. Without the keyboard and mouse, the B7 consumes 830 mW when turned off. With the mouse and keyboard, its consumption is partly over 1 watt. Depending on the application, we would recommend a switchable power socket for the B7 Power.
| Off / Standby | |
| Idle | |
| Load |
|
Key:
min: | |
| BMAX B7 Power G7A2 i7-11390H, Iris Xe G7 96EUs, Kston K765-1TB, , x, | Geekom Mini IT11, i7-11390H i7-11390H, Iris Xe G7 96EUs, Lexar 1024GB LNM6A1X001T-HNNNG, , x, | Intel NUC 13 Pro Kit NUC13ANK i7-1360P, Iris Xe G7 96EUs, Samsung PM9A1 MZVL2512HCJQ, , x, | Beelink SEi11 Pro i5-11320H, Iris Xe G7 96EUs, Kingston NV1 SNVS/500GCN, , x, | BMAX B5 Pro G7H8 i5-8260U, UHD Graphics 620, , , x, | Average Intel Iris Xe Graphics G7 96EUs | Average of class Mini PC | |
|---|---|---|---|---|---|---|---|
| Power Consumption | -8% | -61% | -48% | -8% | -28% | -84% | |
| Idle Minimum * (Watt) | 9.1 | 7.3 20% | 5.1 44% | 9.8 -8% | 6 34% | 5.51 ? 39% | 8.6 ? 5% |
| Idle Average * (Watt) | 9.5 | 7.8 18% | 5.8 39% | 10.3 -8% | 6.2 35% | 8.66 ? 9% | 10.7 ? -13% |
| Idle Maximum * (Watt) | 10 | 8.4 16% | 10.2 -2% | 10.5 -5% | 6.3 37% | 10.9 ? -9% | 13.5 ? -35% |
| Load Average * (Watt) | 27.1 | 28.7 -6% | 68.1 -151% | 54.2 -100% | 42.8 -58% | 45.6 ? -68% | 63.5 ? -134% |
| Witcher 3 ultra * (Watt) | 29.1 | 53.1 -82% | 35 -20% | ||||
| Load Maximum * (Watt) | 32.3 | 61.1 -89% | 108.3 -235% | 59 -83% | 55.8 -73% | 67.8 ? -110% | 110.7 ? -243% |
* ... smaller is better
Power consumption with external monitor
Pros
Cons
Verdict - More like "B7 Economical"
The BMAX B7 Power unnecessarily creates a false impression. The installed processor is one from two generations ago and is very slow even for its standards, since it is throttled. At the same time, the B7 doesn't have to be ashamed of itself, as its strengths - such as how quiet and frugal it is - speak for the PC being used for totally different purposes.
The X86 mini PC is suited for all uses requiring a certain performance level while keeping power consumption and noise emissions low. These include quite a few scenarios, such as using it as a home server, retro console, and so on. The B7 Power is simply marketed wrongly. If you are still buying an Intel Gen11 in this day and age, then you'll not likely have your eyes on the highest performance anyway - as a result, the B7's true strengths should be marketed more. It would be much more fitting to give it a name such as B7 Power Server, B7 Home Server or B7 Efficient.
If you are looking for maximum "power", you are looking in the wrong place with the BMAX B7 Power with its throttled Gen11 GPU. On the flip side, if you are on the hunt for a home server or similar, then this device is perfect for you.
Price and availability
The B7 Power can be purchased directly from Bmax's website for US$399.99. The mini PC can also be purchased from Amazon for the same price.
BMAX B7 Power G7A2
- 09/12/2023 v7 (old)
Christian Hintze
Transparency
The selection of devices to be reviewed is made by our editorial team. The test sample was provided to the author as a loan by the manufacturer or retailer for the purpose of this review. The lender had no influence on this review, nor did the manufacturer receive a copy of this review before publication. There was no obligation to publish this review. As an independent media company, Notebookcheck is not subjected to the authority of manufacturers, retailers or publishers.
This is how Notebookcheck is testing
Every year, Notebookcheck independently reviews hundreds of laptops and smartphones using standardized procedures to ensure that all results are comparable. We have continuously developed our test methods for around 20 years and set industry standards in the process. In our test labs, high-quality measuring equipment is utilized by experienced technicians and editors. These tests involve a multi-stage validation process. Our complex rating system is based on hundreds of well-founded measurements and benchmarks, which maintains objectivity. Further information on our test methods can be found here.
Price comparison

