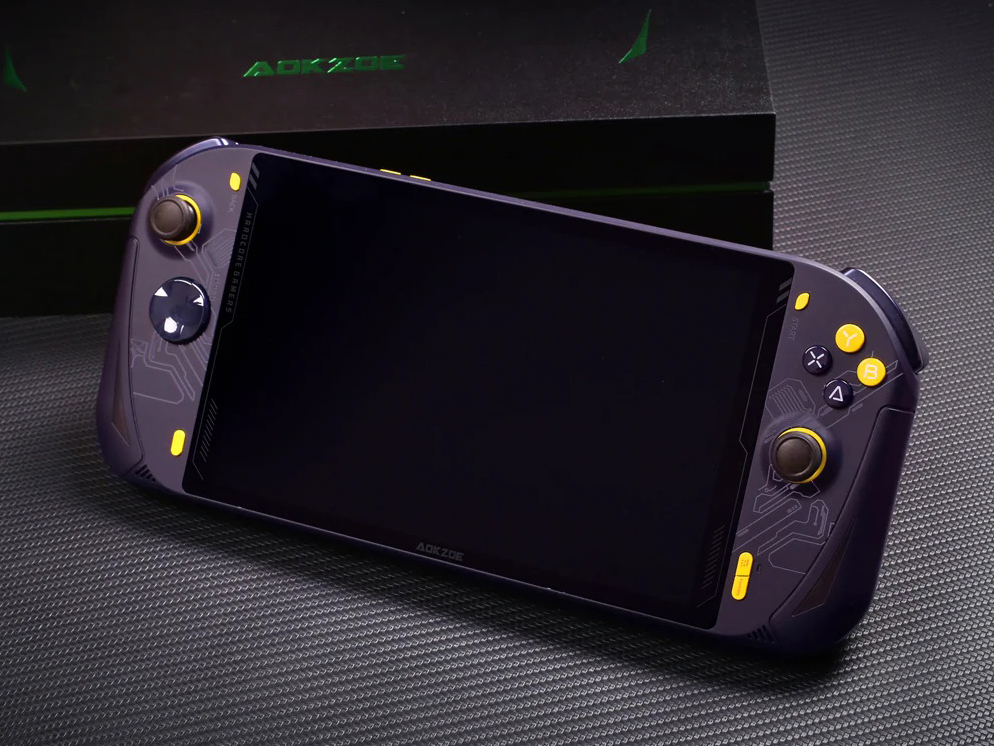
Aokzoe A1 gaming handheld review: Ambitious with room for improvement

Handheld Windows PCs in the style of the Nintendo Switch are quickly becoming popular now that ULV CPUs and GPUs are powerful enough to run modern games at 1080p resolutions. Our latest is the A1 from Chinese manufacturer Aokzoe sporting the Zen 3+ Ryzen 7 6800U CPU and integrated Radeon 680M graphics for approximately $900 to $1300 USD retail. An updated version called the A1 Pro with the Zen 4 Ryzen 7 7840U and Radeon 780M is also expected to be available in the weeks ahead, but both the A1 and A1 Pro are otherwise physically identical when it comes to the chassis design, display, and controls.
Alternatives to the Aokzoe A1 include other Windows PC handhelds like the GPD Win 4, Steam Deck, OneXPlayer 2, or the Asus ROG Ally.
Potential Competitors in Comparison
Rating | Date | Model | Weight | Height | Size | Resolution | Price |
|---|---|---|---|---|---|---|---|
| 80.1 % v7 (old) | 09 / 2023 | Aokzoe A1 R7 6800U, Radeon 680M | 735 g | 21 mm | 8.00" | 1920x1200 | |
| 84 % v7 (old) | 07 / 2023 | One Netbook XPlayer 2 R7 6800U, Radeon 680M | 864 g | 23 mm | 8.40" | 2560x1600 | |
| 87.5 % v7 (old) | 05 / 2023 | Asus ROG Ally Z1 Extreme Z1 Extreme, Radeon 780M | 611 g | 21.22 mm | 7.00" | 1920x1080 | |
| 80.3 % v7 (old) | 03 / 2023 | GPD Win 4 R7 6800U, Radeon 680M | 607 g | 28 mm | 6.00" | 1920x1080 | |
v (old) | 01 / 2021 | GPD Win 3 i5-1135G7, Iris Xe G7 80EUs | 553 g | 27 mm | 5.50" | 1280x720 |
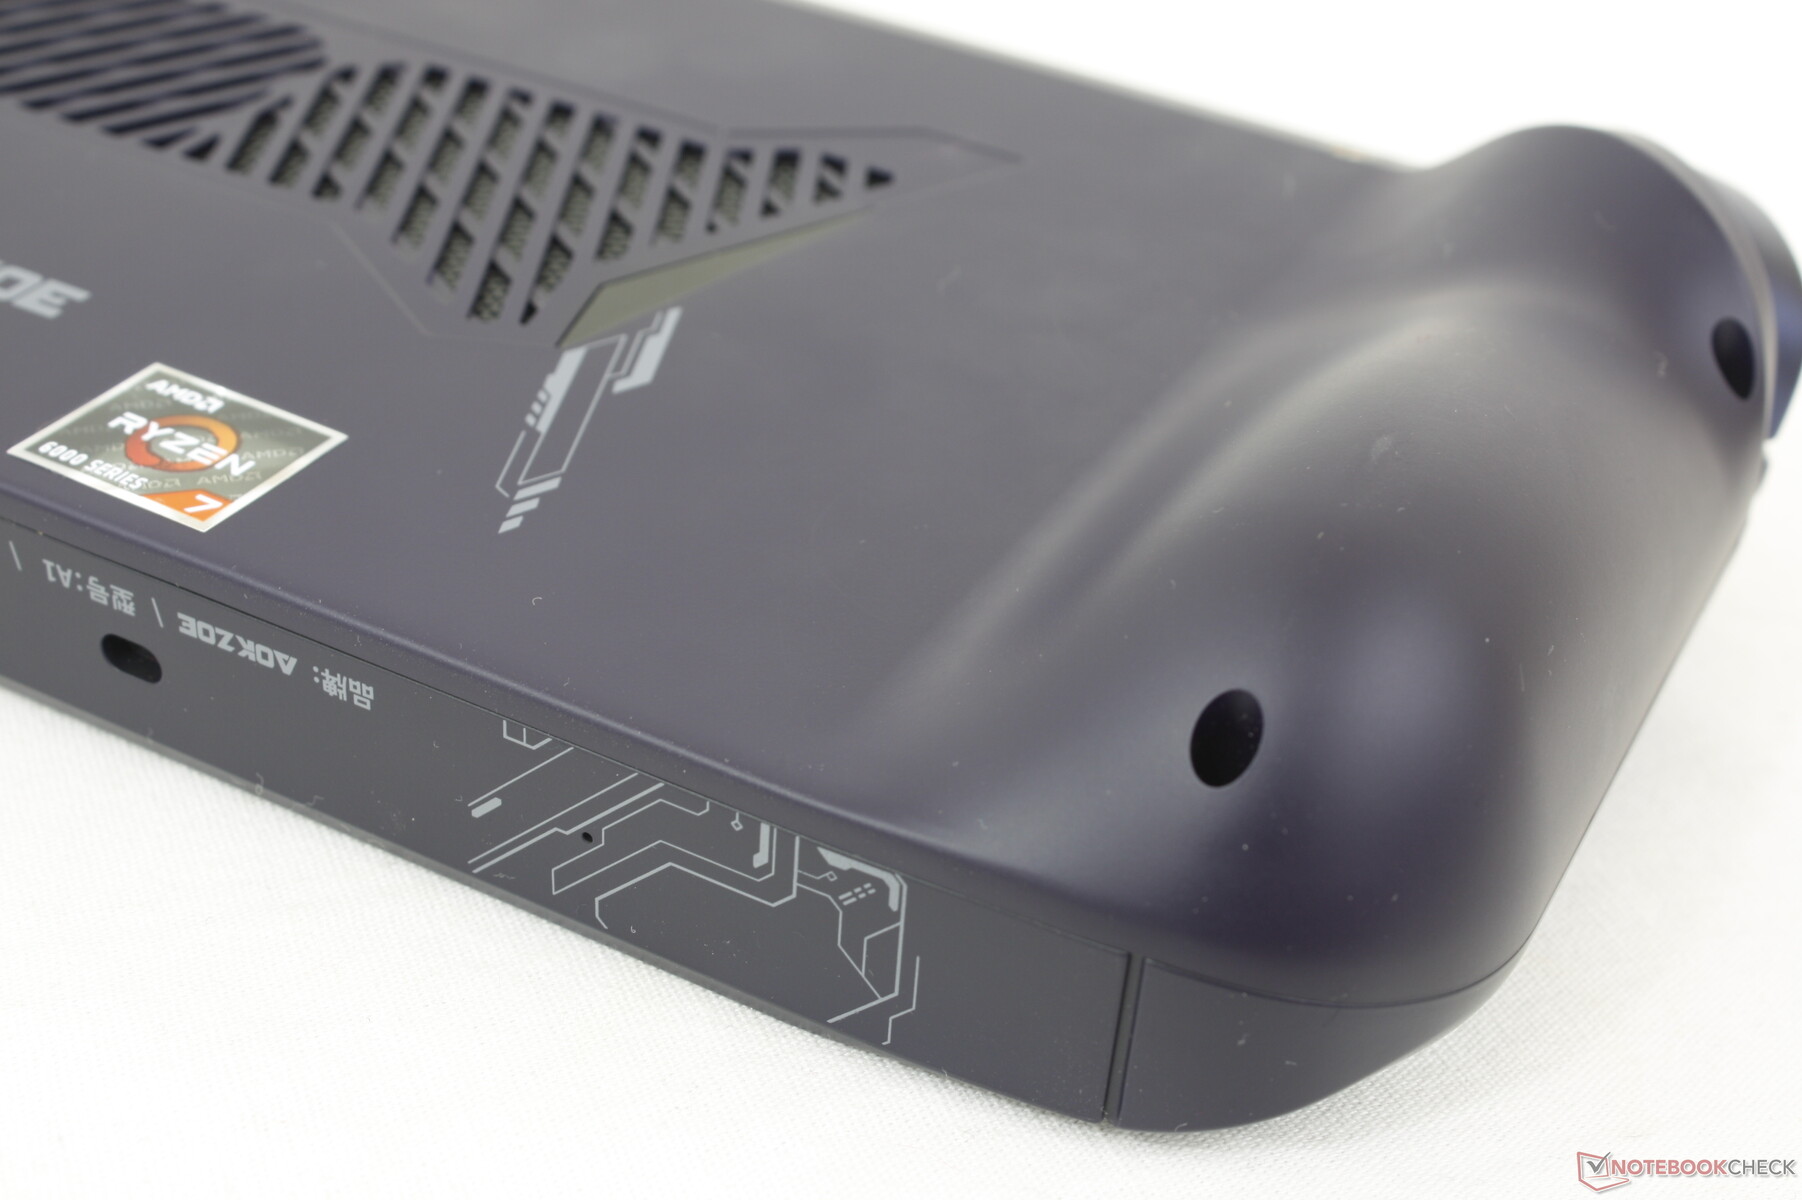
Case
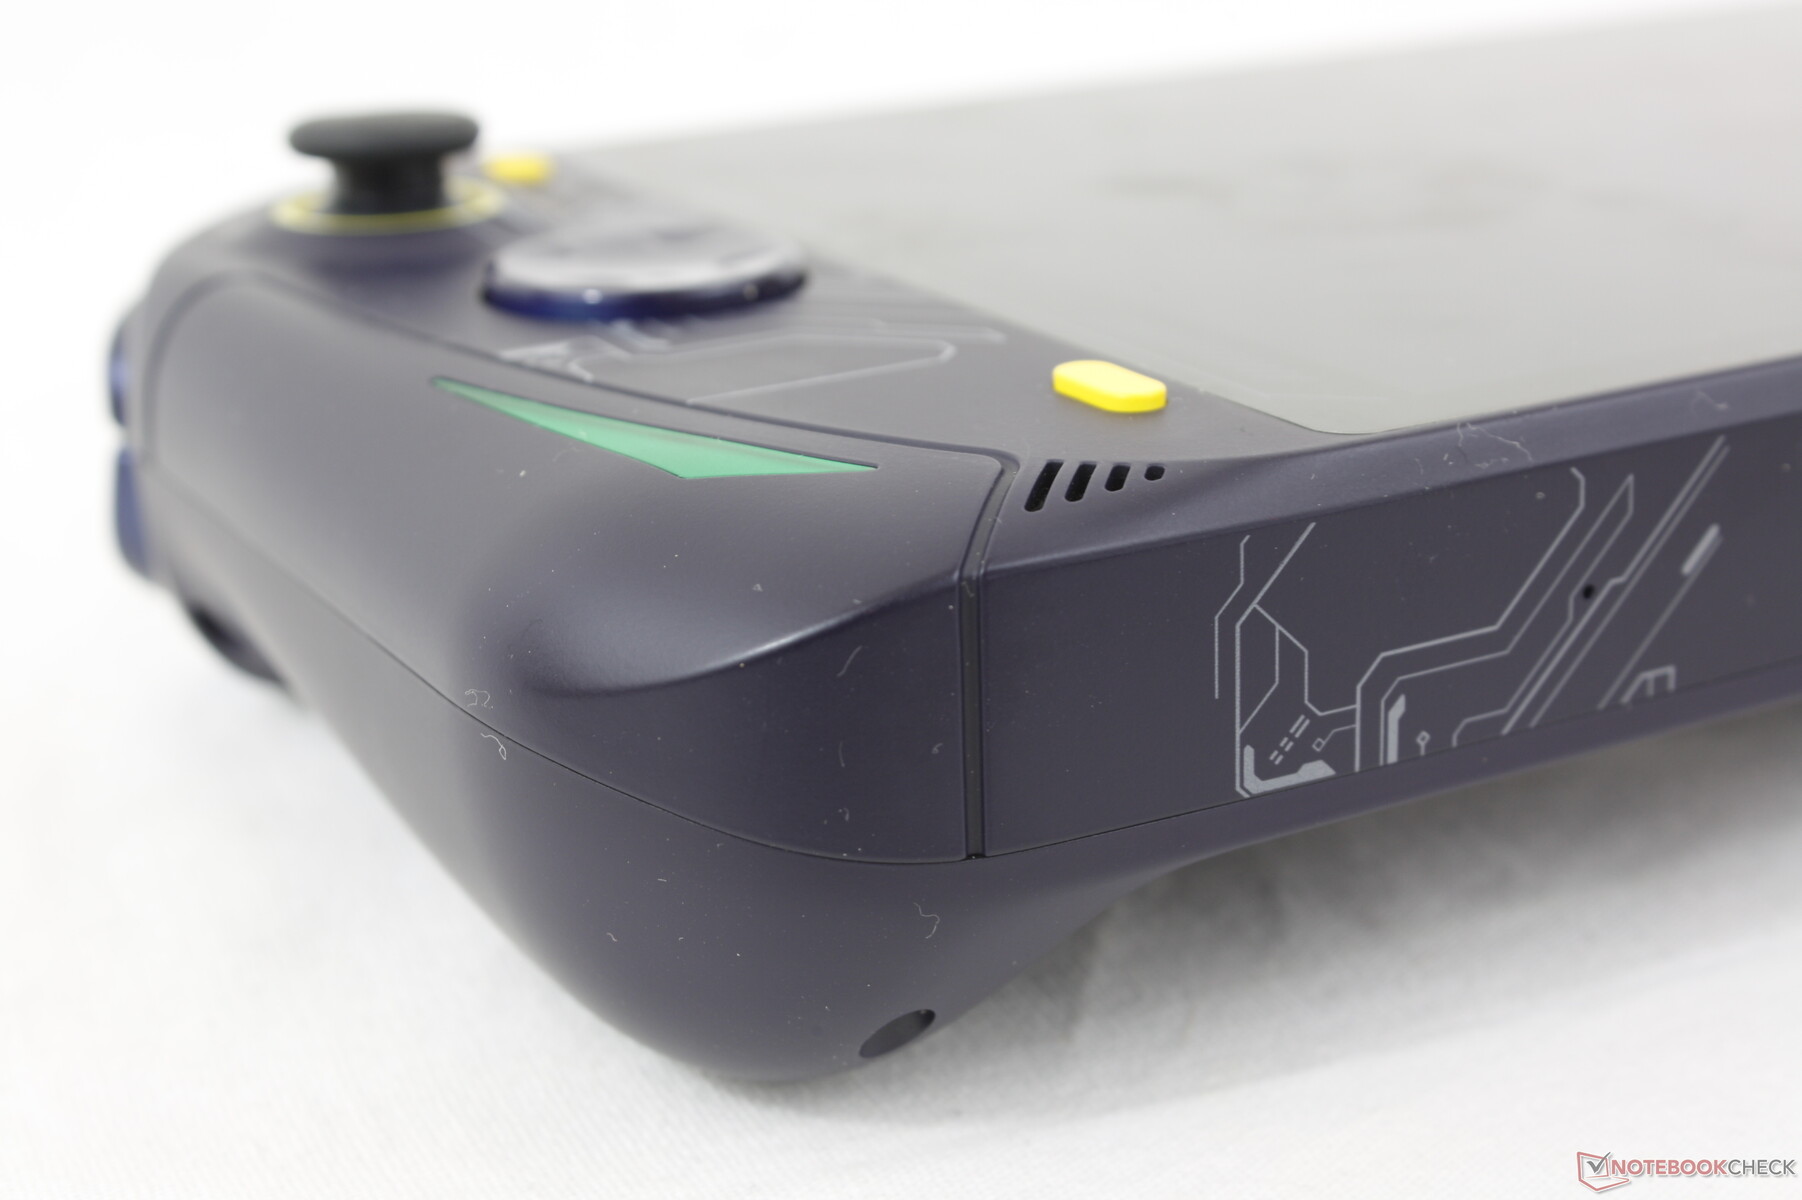
The chassis is predominantly plastic unlike on the mostly metal GPD Win 4. Chassis quality is still excellent with no major creaking or twisting issues for solid first impressions. The feel of the buttons, however, can be a mixed bag as we will detail in the Input section below.
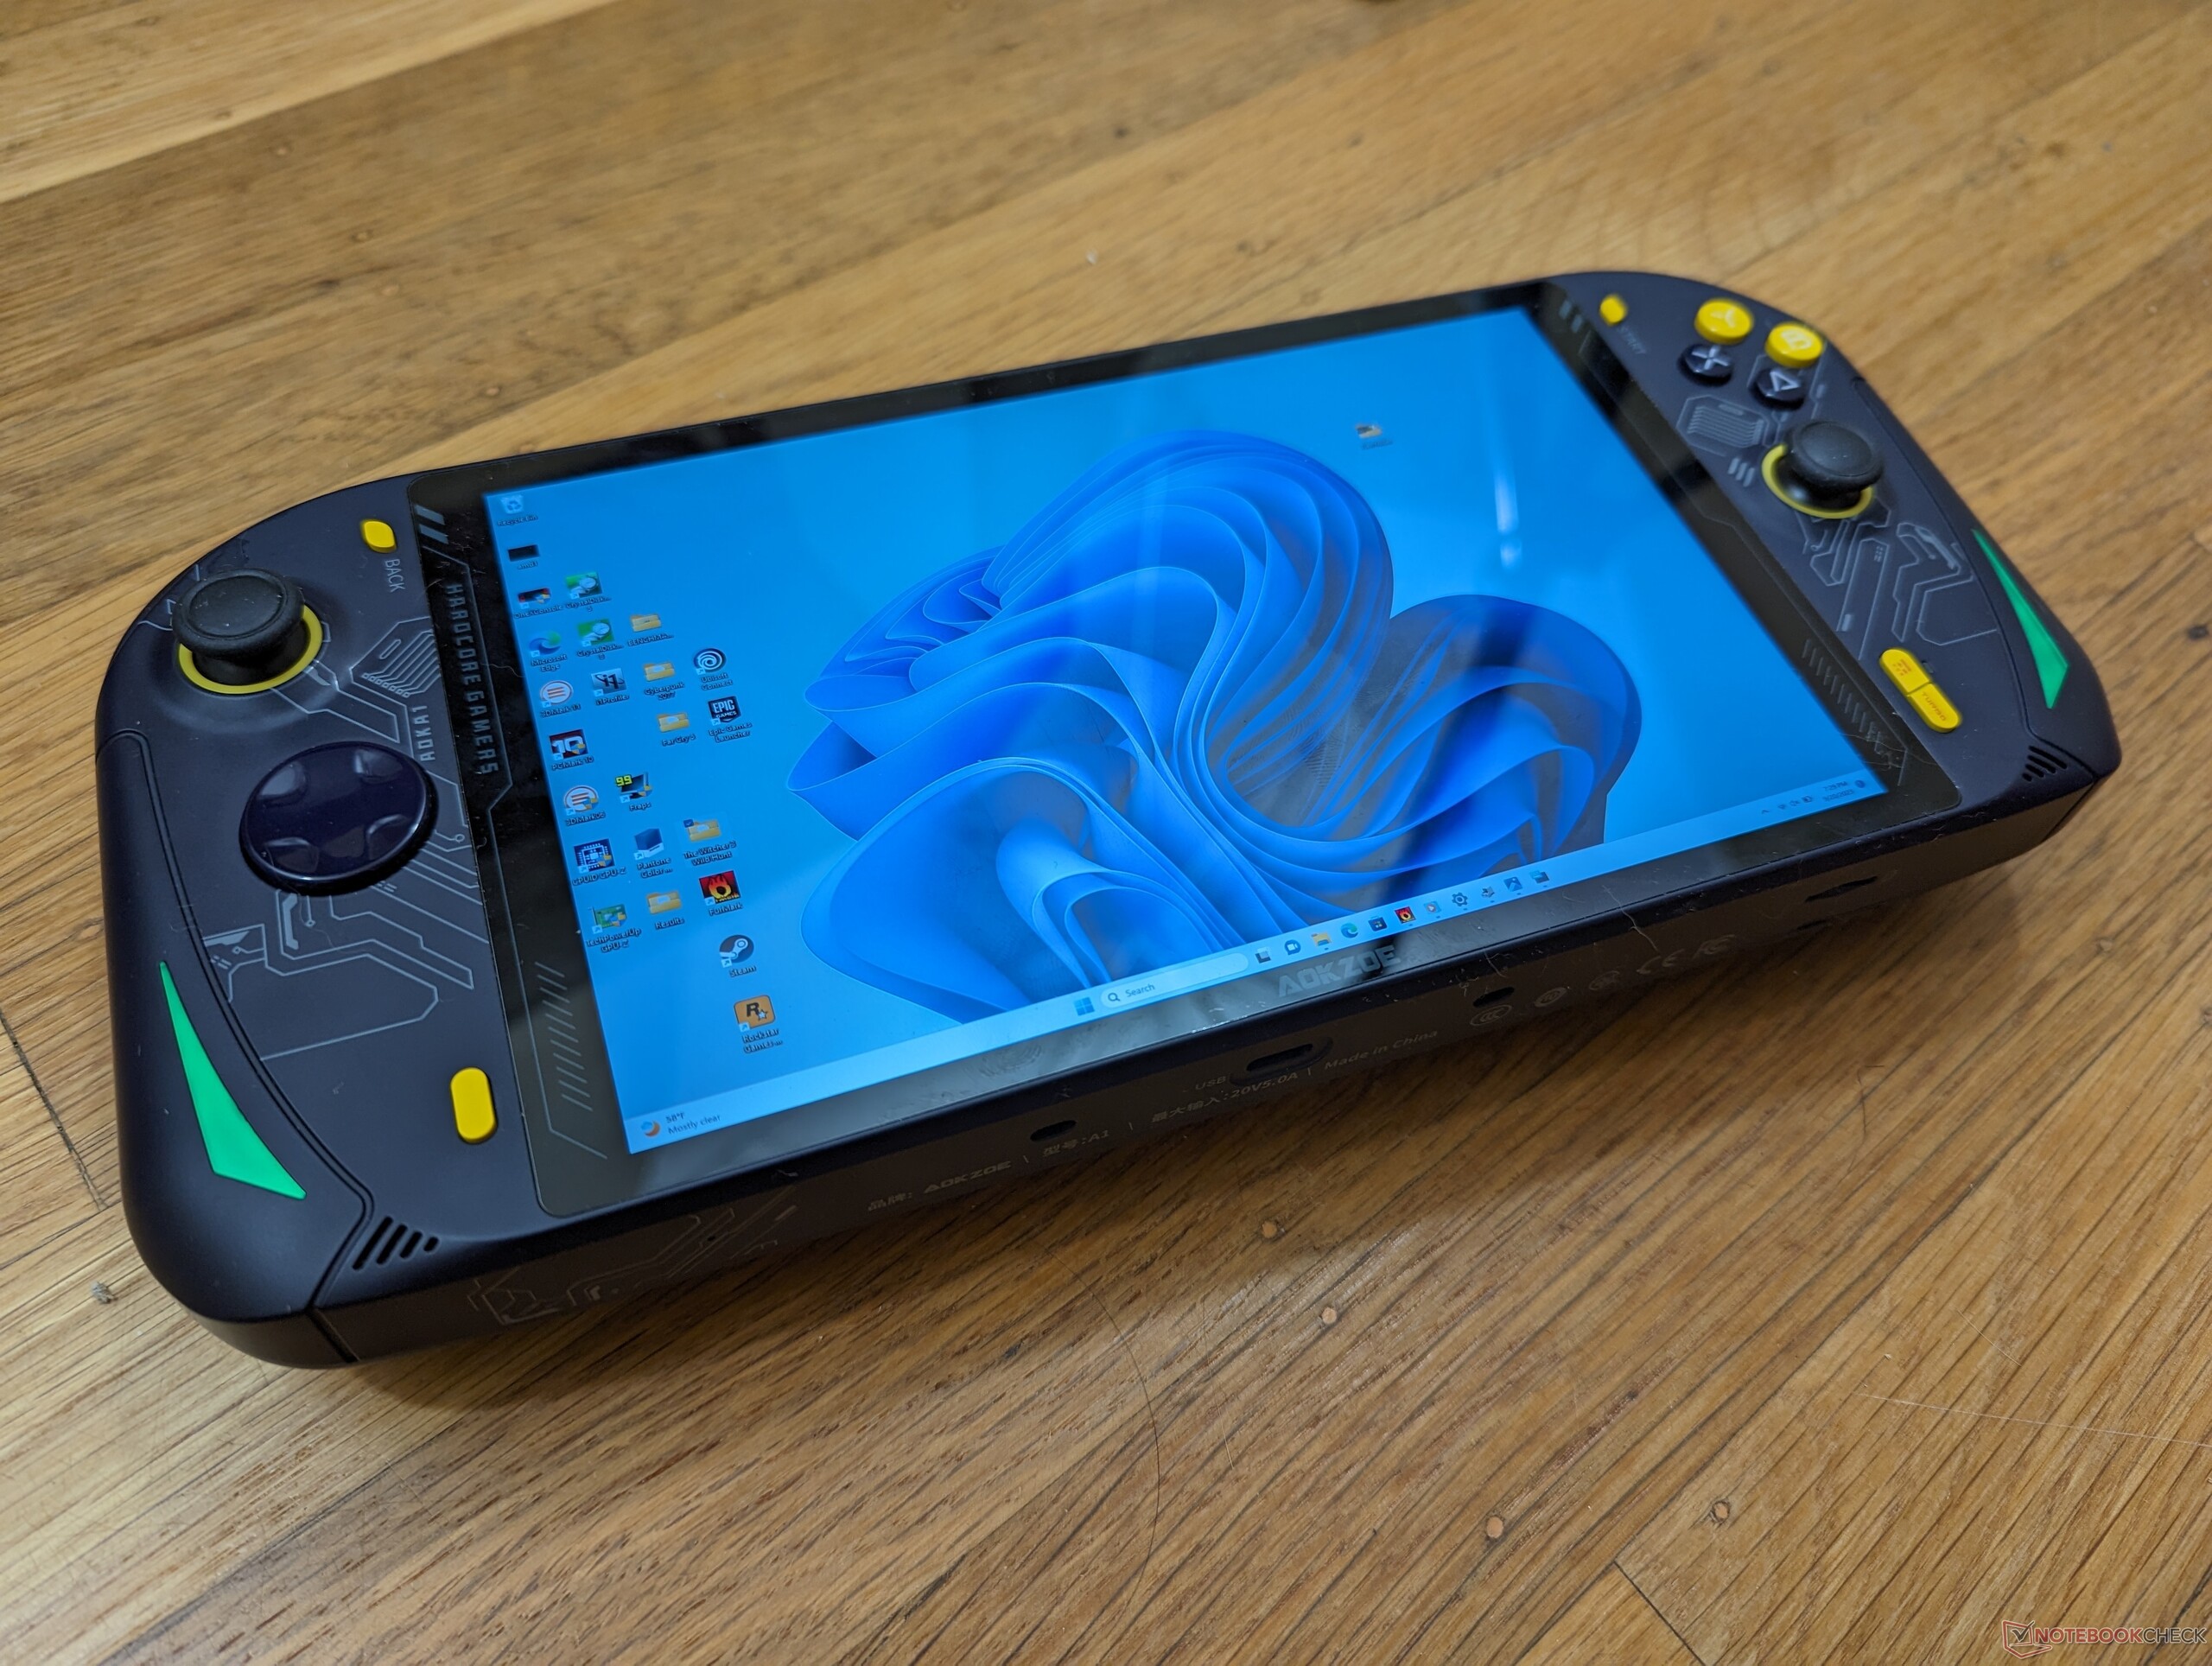
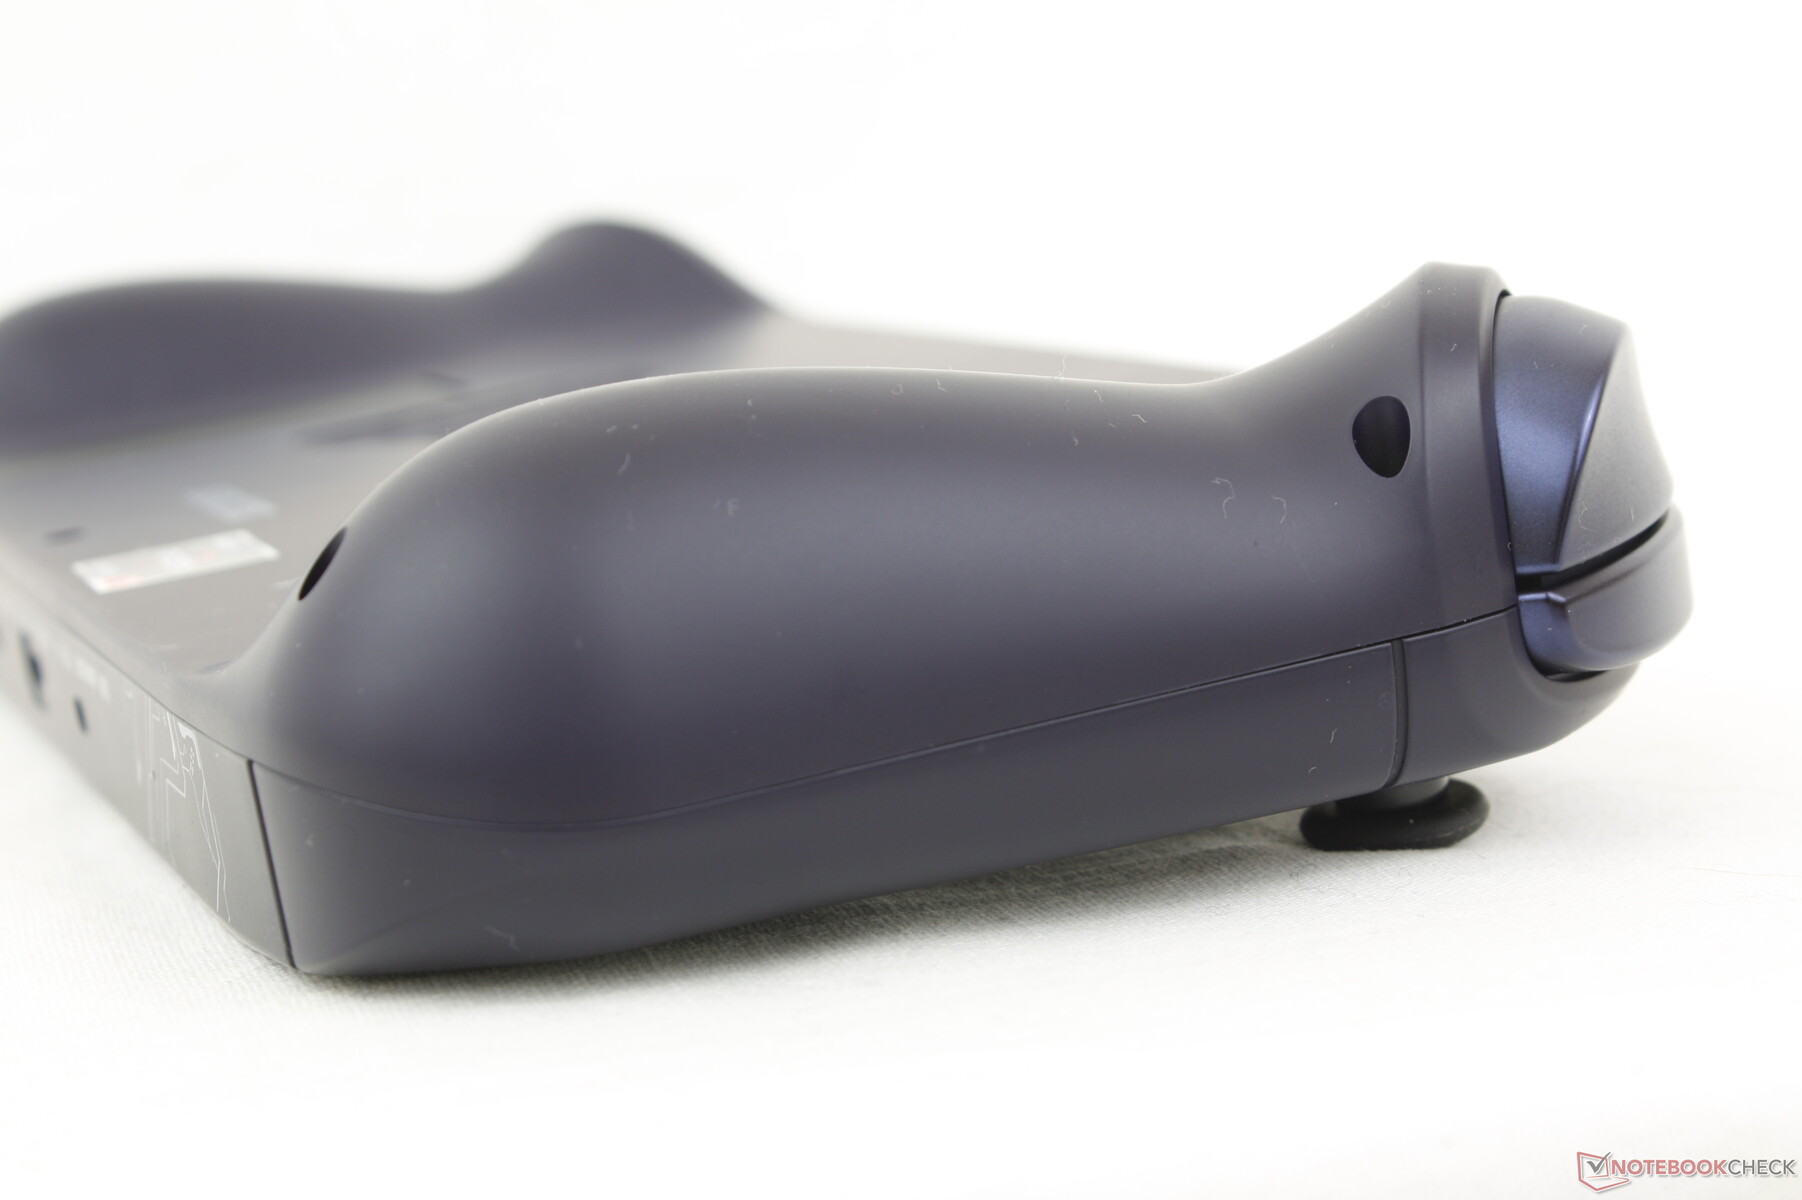
The A1 is larger and heavier than many alternatives including the ROG Ally since it sports a larger 8-inch screen. It's about 41 mm thick at its thickest point if you include the bulging palm grips or just 21 mm thin from the front of the screen to the back. Because of its weight, the A1 is more suited for play while sitting down on the train or car rather than standing or walking.
Connectivity
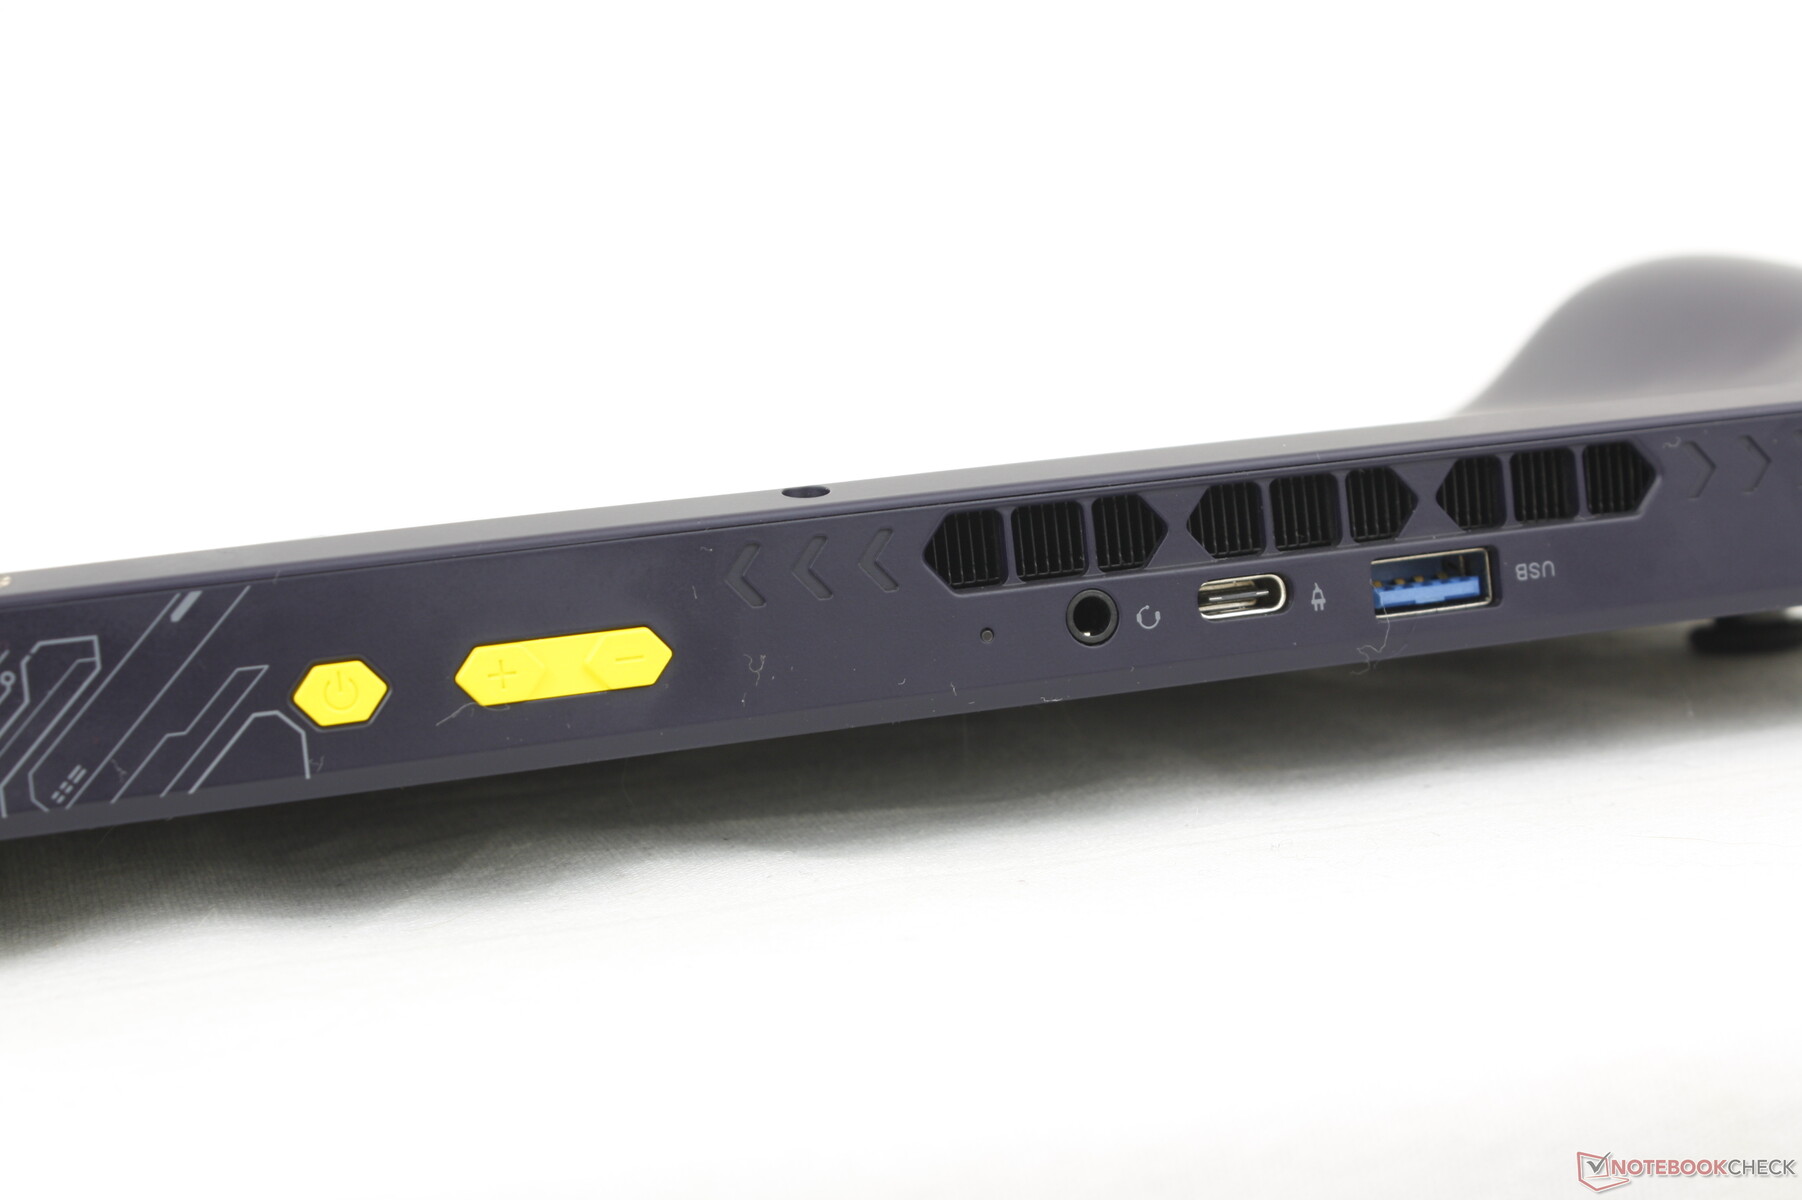
The two USB-C ports are conveniently positioned along the top and bottom edges of the unit. Each can be used to charge the device or output to an external display while only the top port is USB4-compatible for eGPUs.
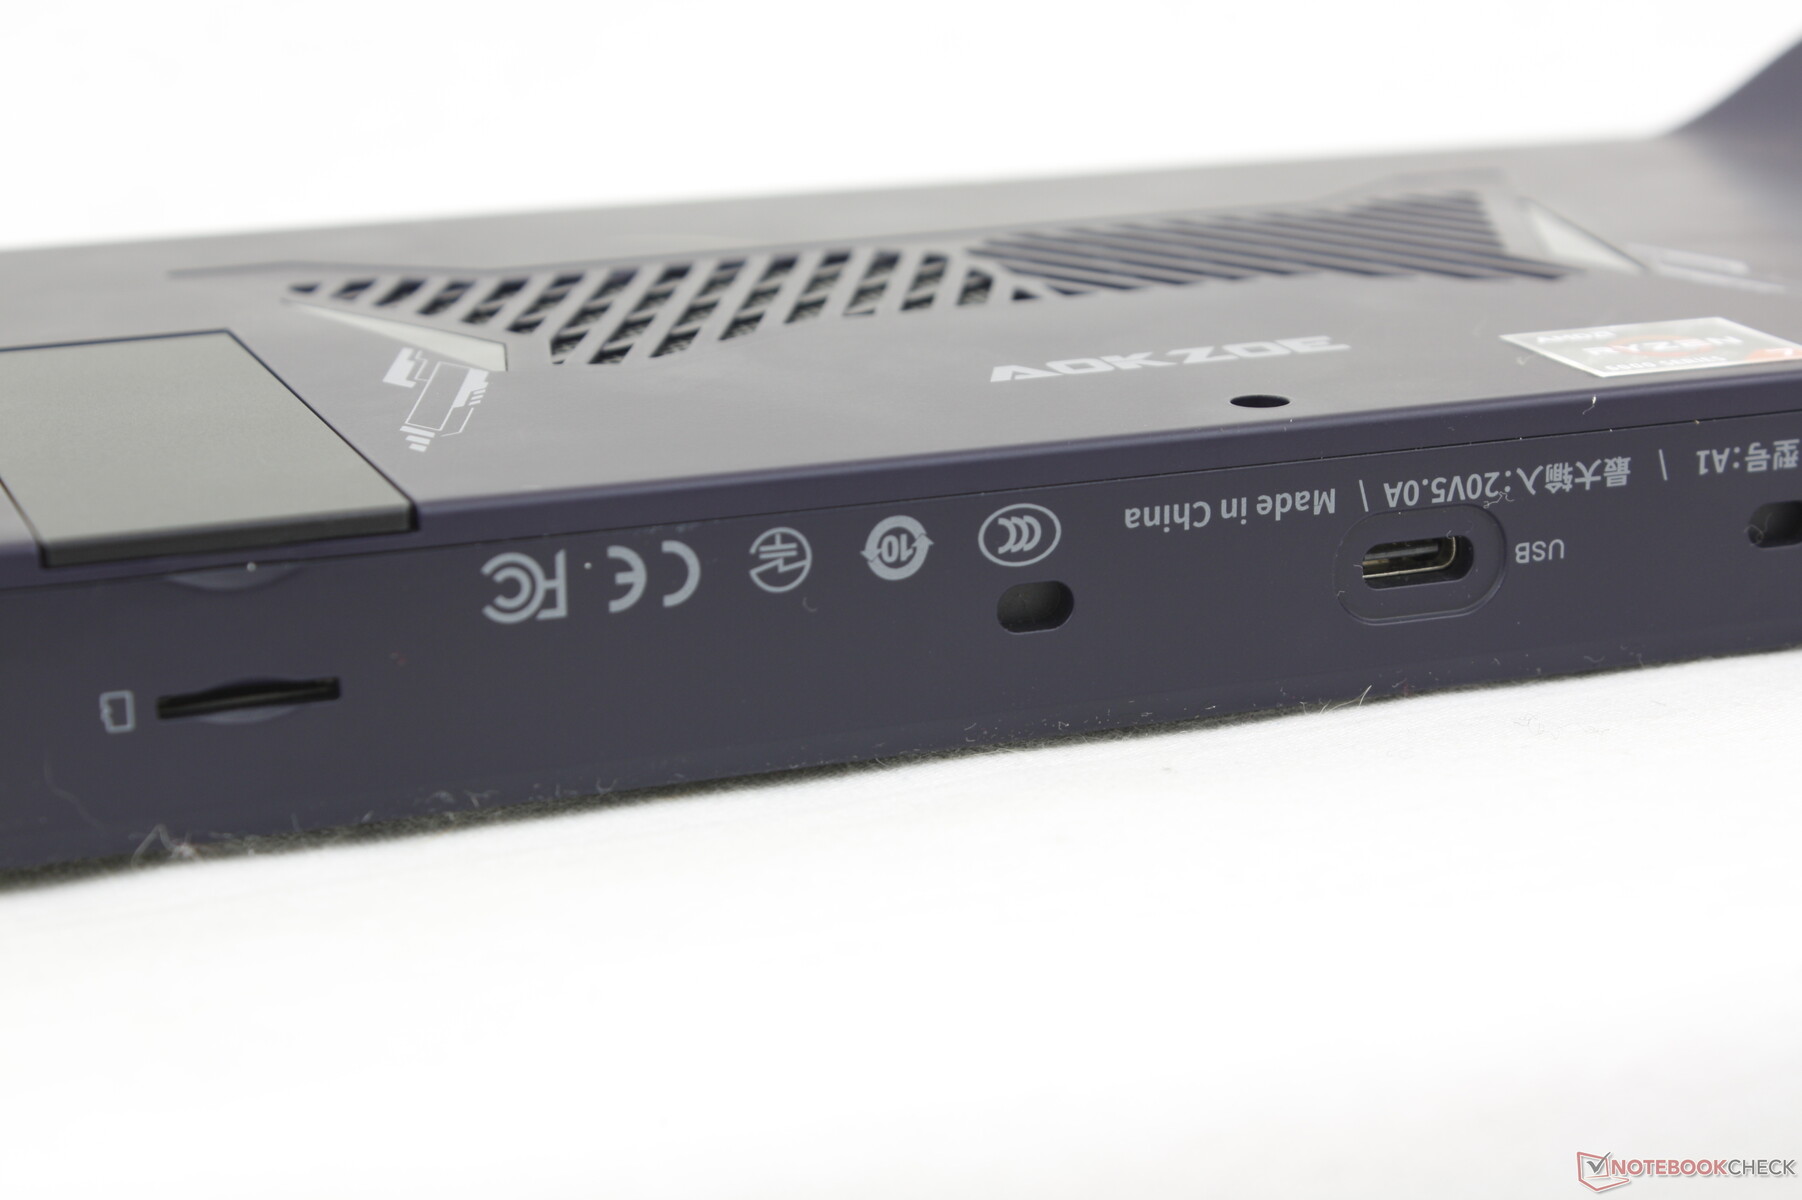
SD Card Reader
While read rates are fast at almost 200 MB/s with our UHS-II test card, transfer rates are noticeably slower. Moving 1 GB of pictures from our card to desktop would take almost 20 seconds compared to just 6 to 7 seconds on the ROG Ally.
| SD Card Reader | |
| average JPG Copy Test (av. of 3 runs) | |
| Asus ROG Ally Z1 Extreme (Angelbird AV Pro V60) | |
| One Netbook XPlayer 2 (Angelbird AV Pro V60) | |
| GPD Win 3 (Toshiba Exceria Pro M501 32 GB UHS-II) | |
| GPD Win 4 (AV Pro SD microSD 128 GB V60) | |
| Aokzoe A1 (Angelbird AV Pro V60) | |
| maximum AS SSD Seq Read Test (1GB) | |
| Asus ROG Ally Z1 Extreme (Angelbird AV Pro V60) | |
| One Netbook XPlayer 2 (Angelbird AV Pro V60) | |
| Aokzoe A1 (Angelbird AV Pro V60) | |
| GPD Win 4 (AV Pro SD microSD 128 GB V60) | |
| GPD Win 3 (Toshiba Exceria Pro M501 32 GB UHS-II) | |
Communication
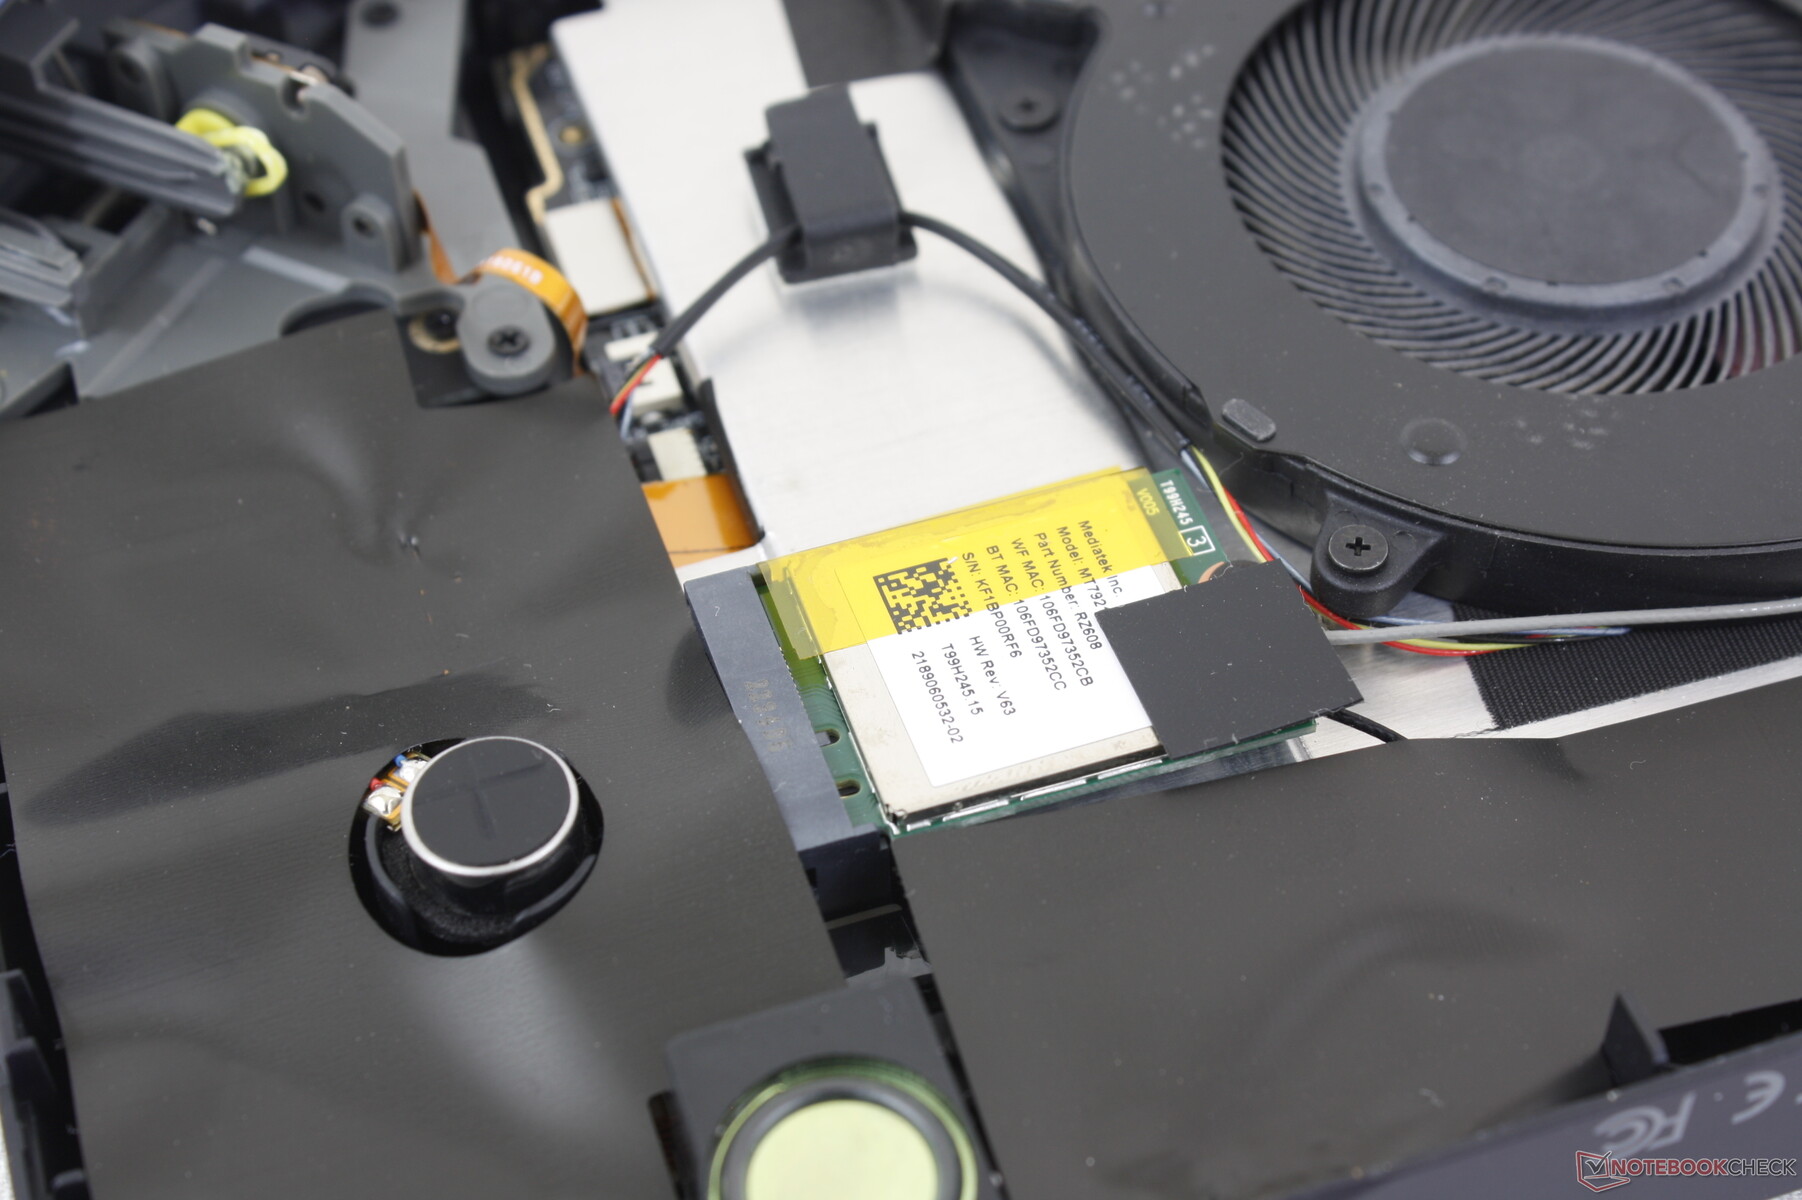
A MediaTek RZ608 comes standard for Wi-Fi 6E connectivity. When compared to Wi-Fi 6, Wi-Fi 6E offers faster latency to help reduce lag when streaming games via cloud. Transfer rates aren't necessarily much faster than Wi-Fi 6 is most scenarios, however.
| Networking | |
| iperf3 transmit AX12 | |
| GPD Win 3 | |
| iperf3 receive AX12 | |
| GPD Win 3 | |
| iperf3 transmit AXE11000 | |
| Asus ROG Ally Z1 Extreme | |
| One Netbook XPlayer 2 | |
| Aokzoe A1 | |
| GPD Win 4 | |
| iperf3 receive AXE11000 | |
| Asus ROG Ally Z1 Extreme | |
| One Netbook XPlayer 2 | |
| GPD Win 4 | |
| Aokzoe A1 | |
| iperf3 transmit AXE11000 6GHz | |
| Aokzoe A1 | |
| GPD Win 4 | |
| iperf3 receive AXE11000 6GHz | |
| GPD Win 4 | |
| Aokzoe A1 | |
Maintenance
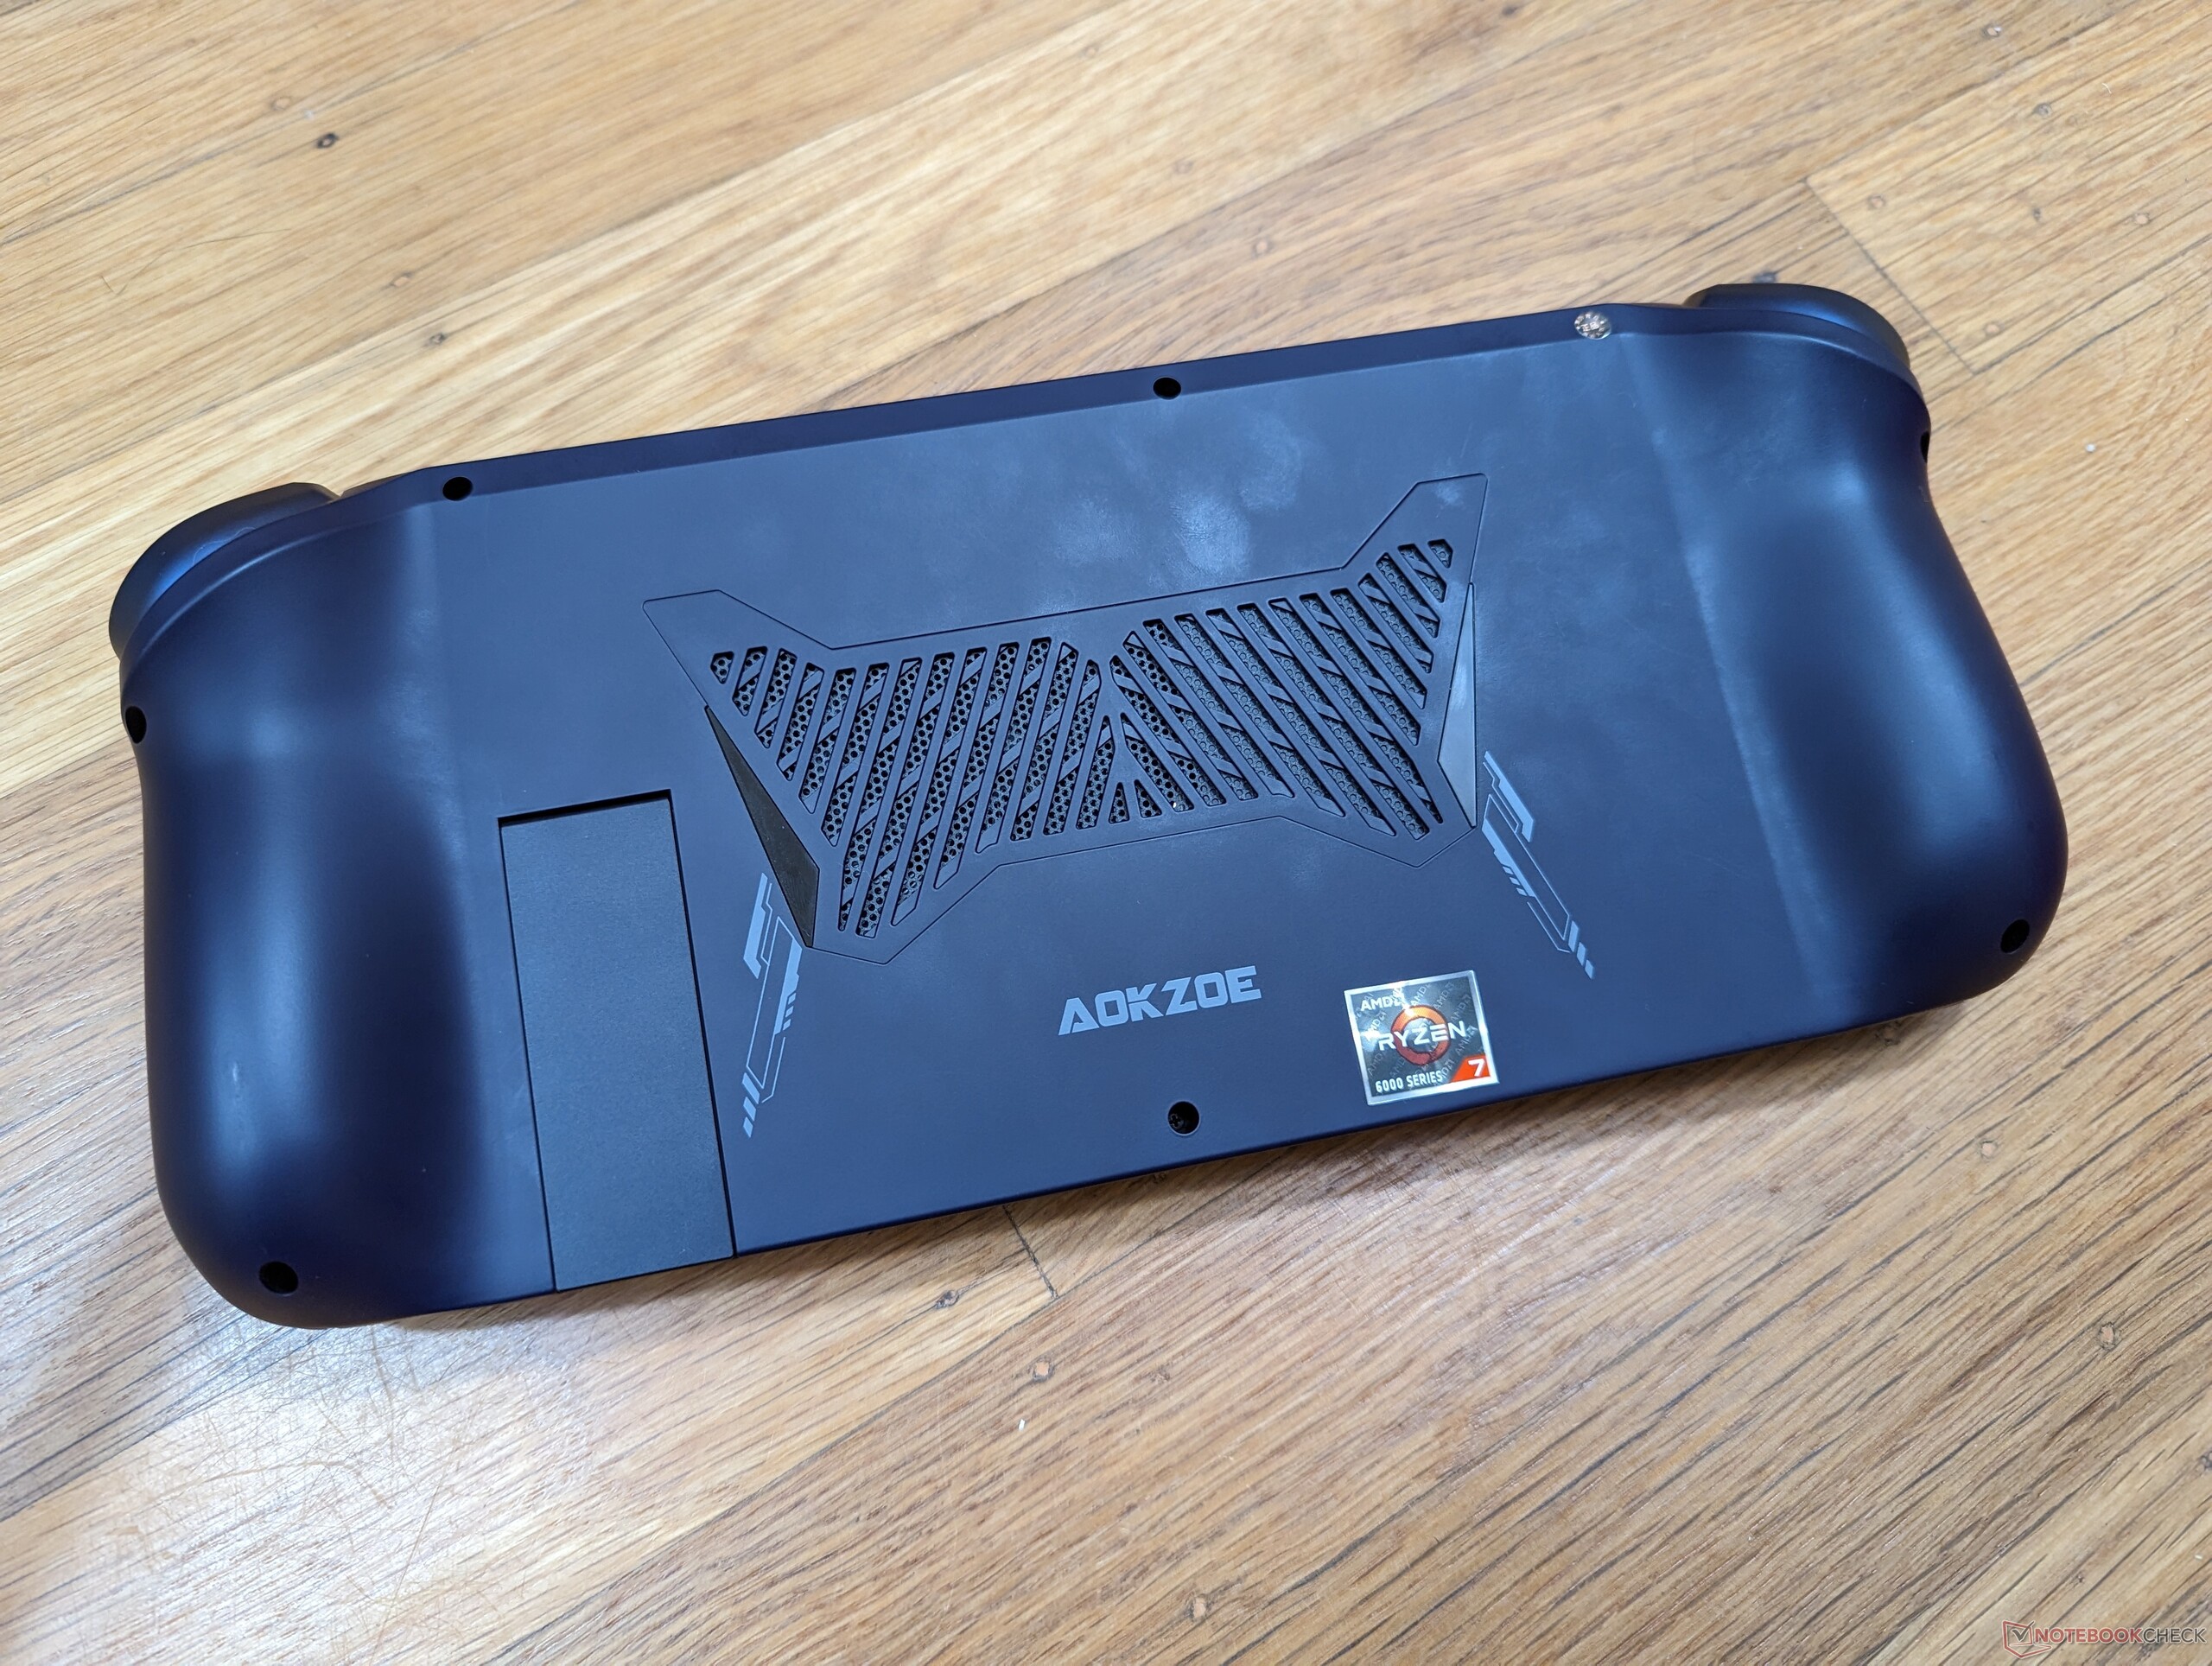
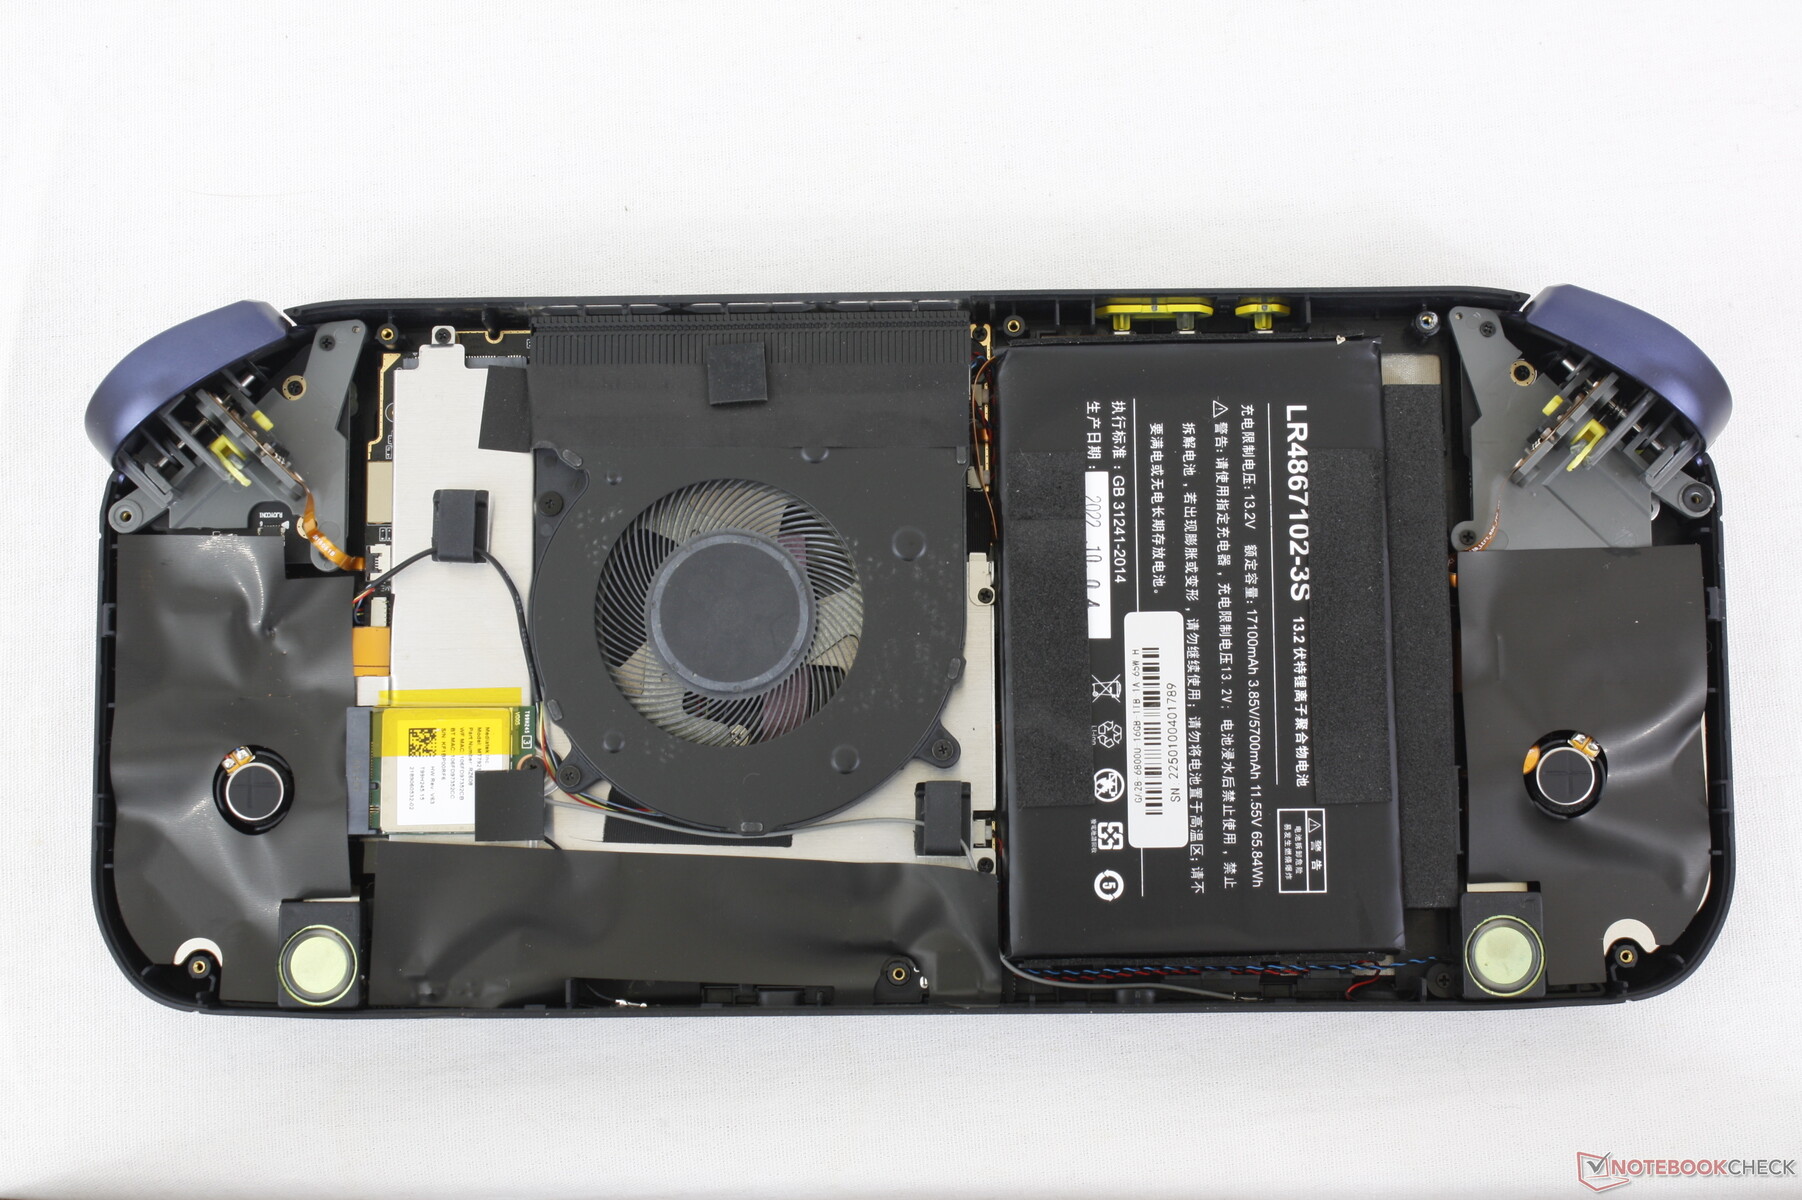
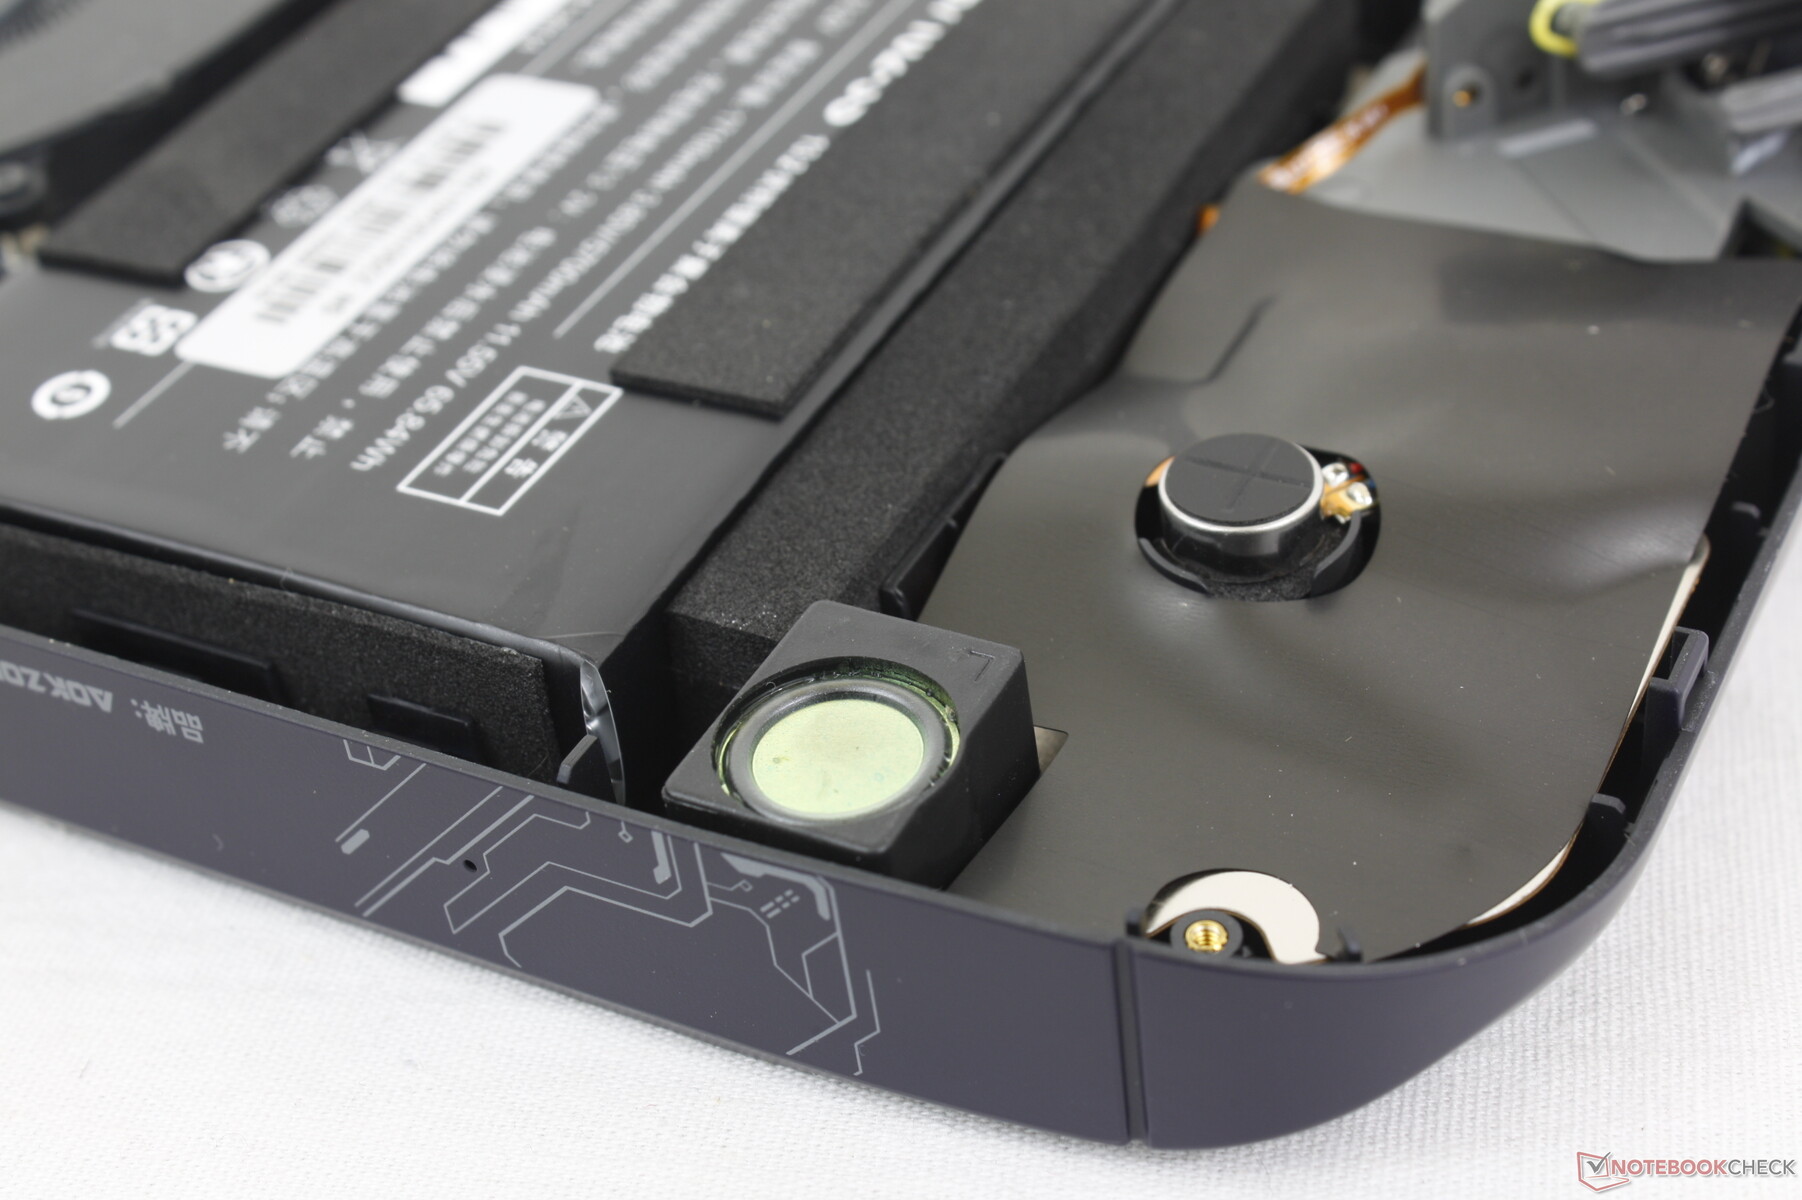
Serviceability is generally very good for a handheld PC. While the RAM modules are soldered, other components like the battery, WLAN, M.2 2280 SSD, and cooling fan can be replaced if needed. The SSD, however, is buried underneath the aluminum heat spreader, WLAN module, and system fan to make it both more difficult and time consuming to access.
Accessories And Warranty
There are no extras in the box other than the AC adapter and paperwork. The usual one-year limited manufacturer warranty applies.
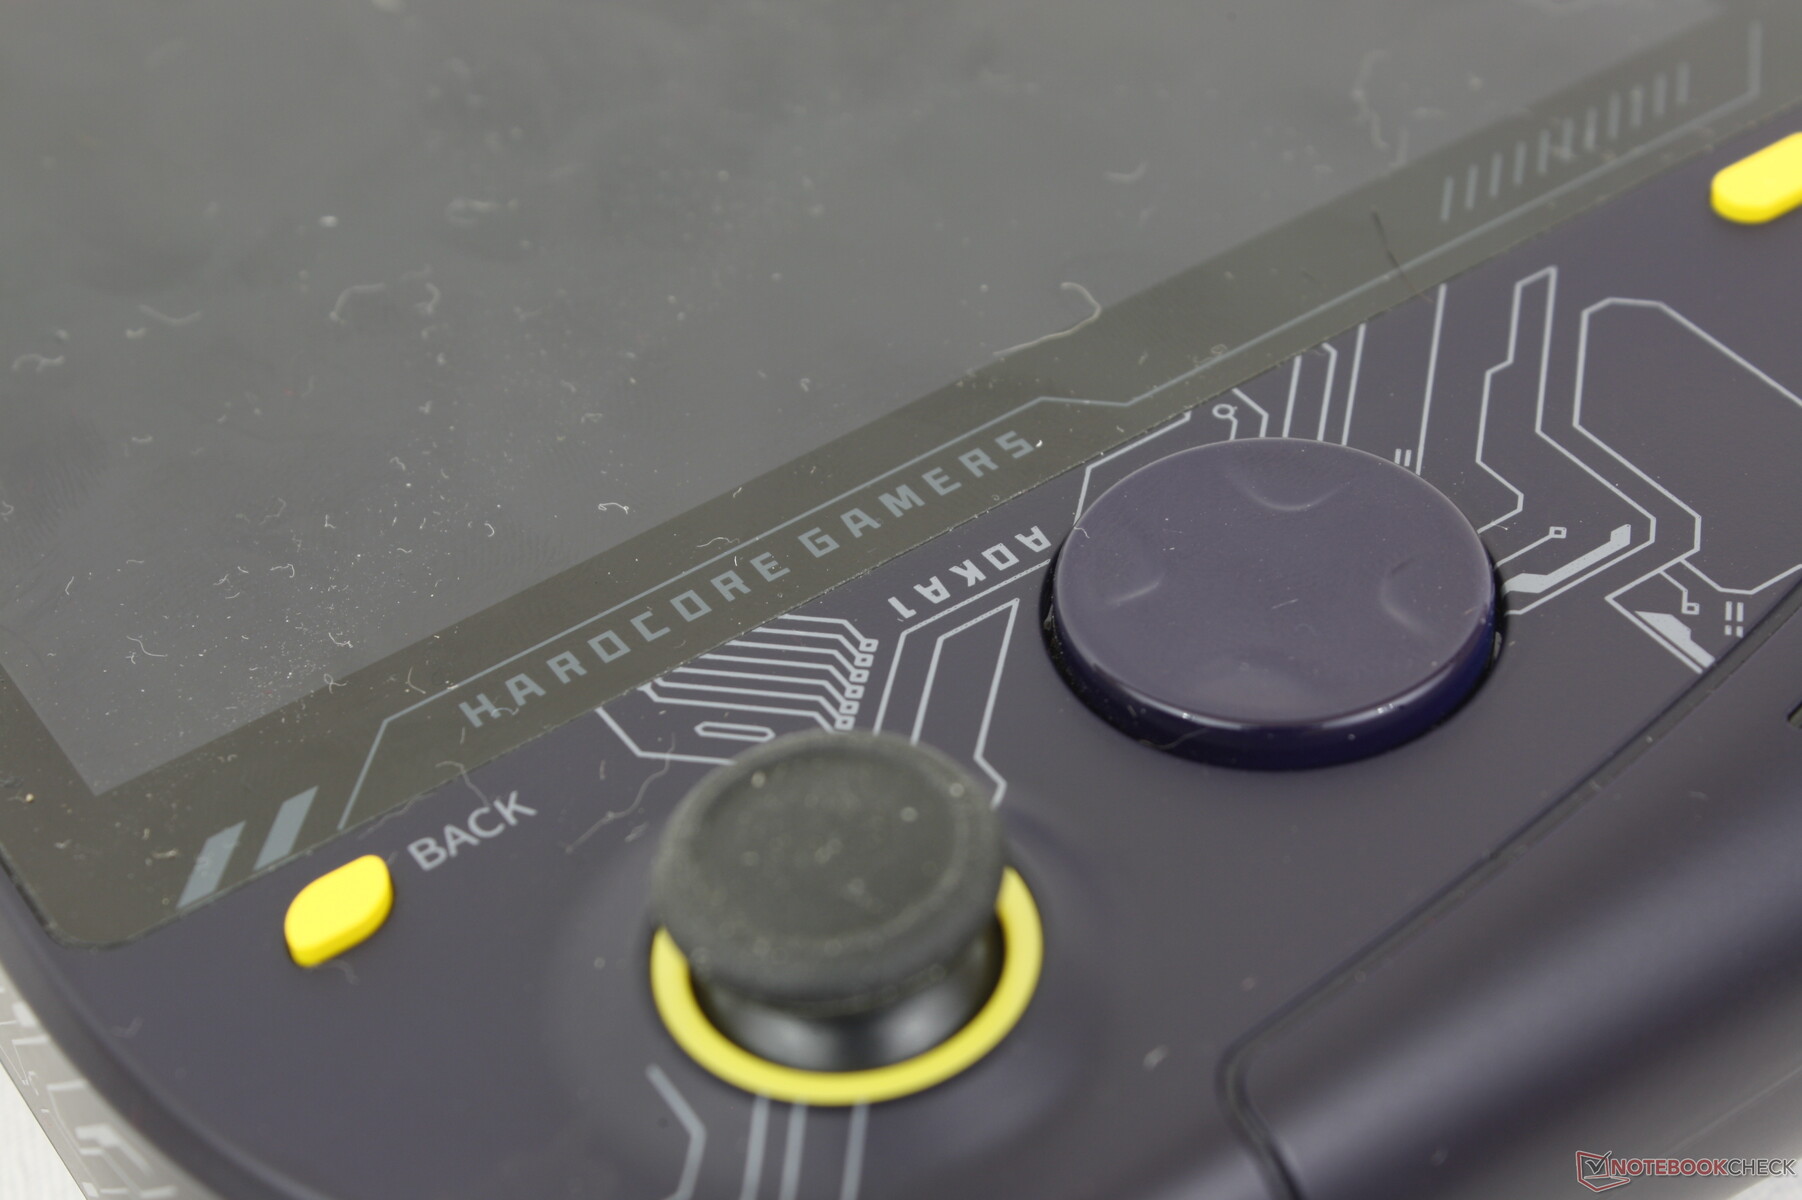
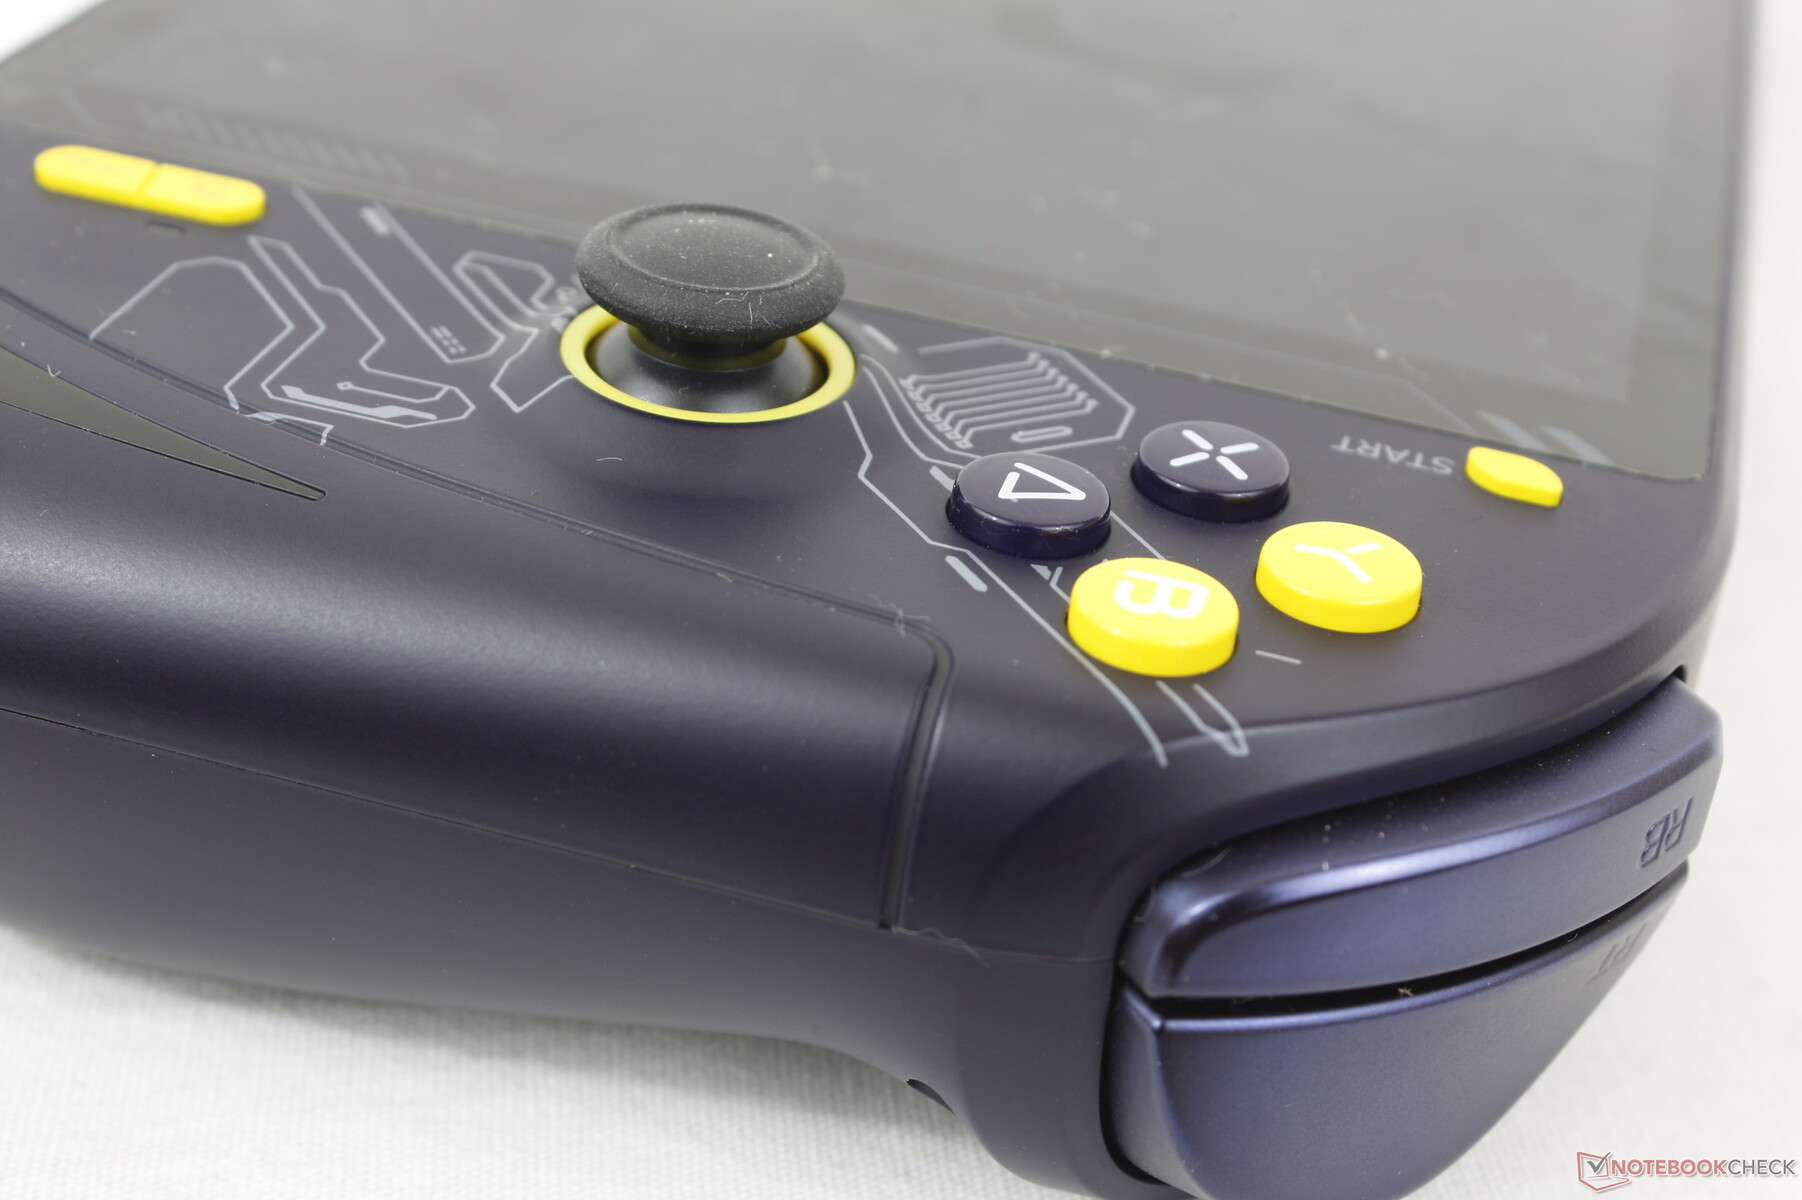
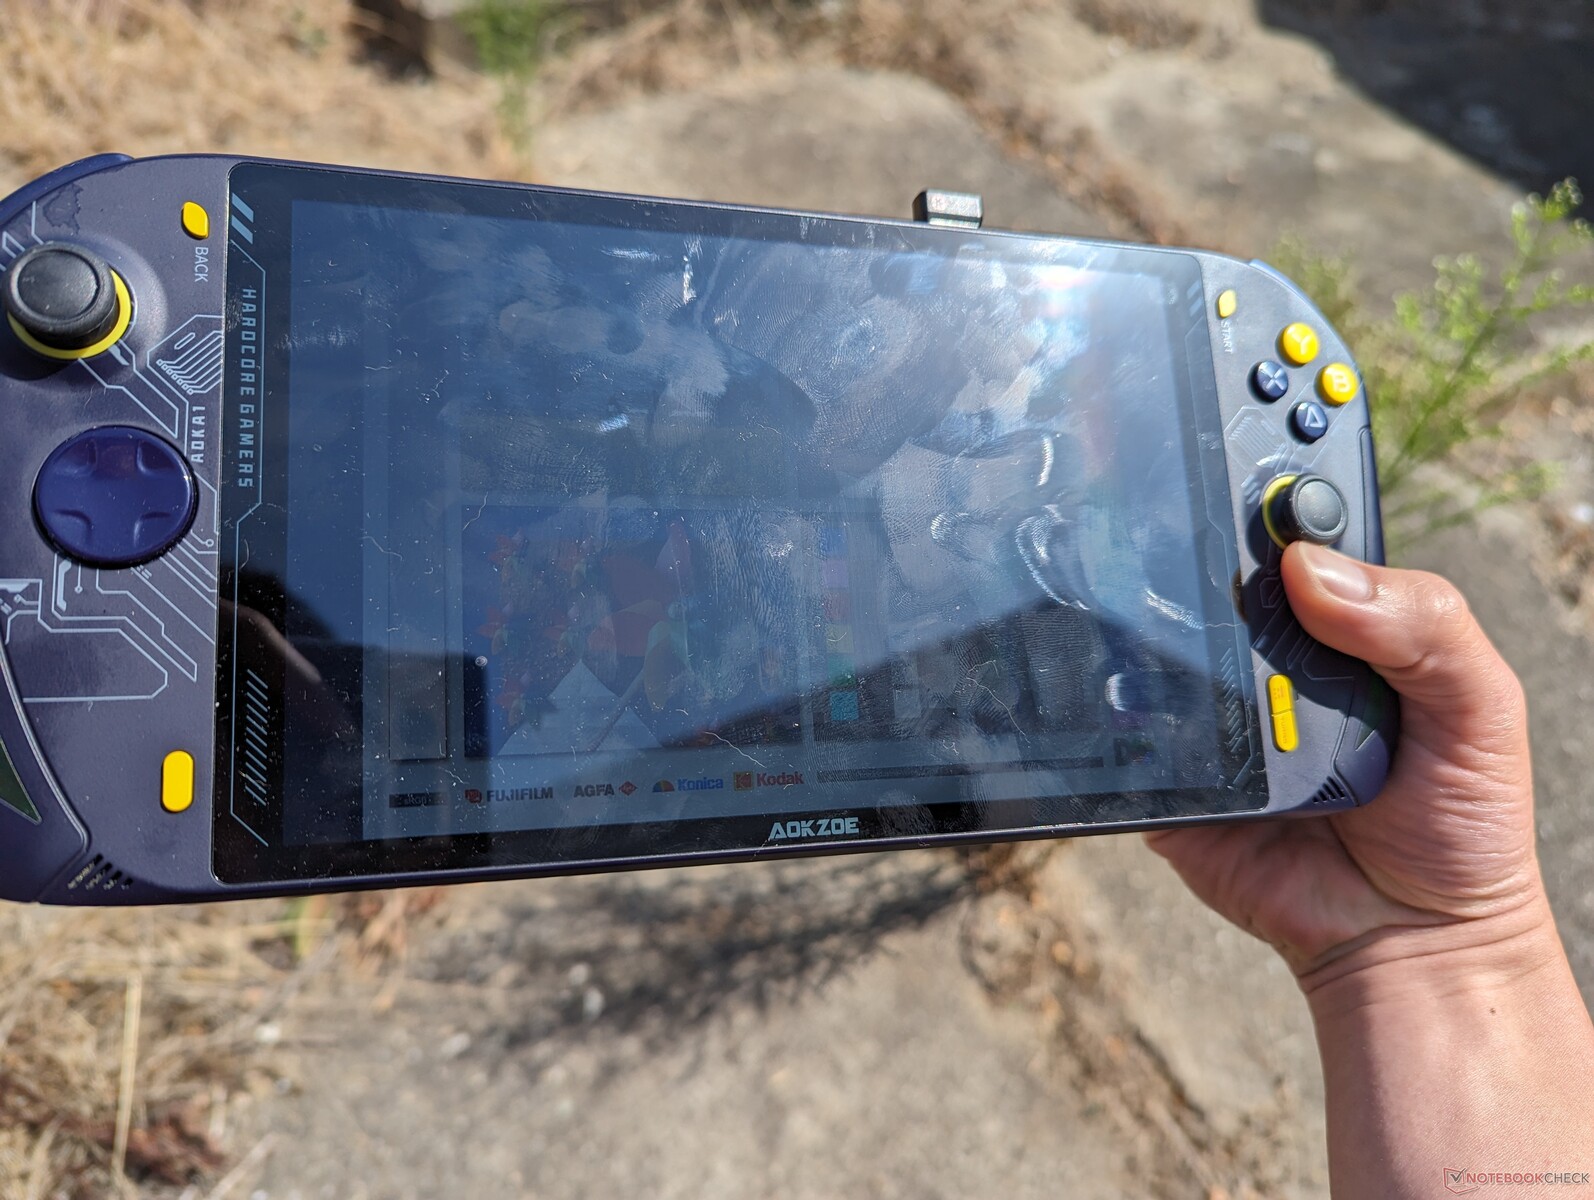
Input Devices
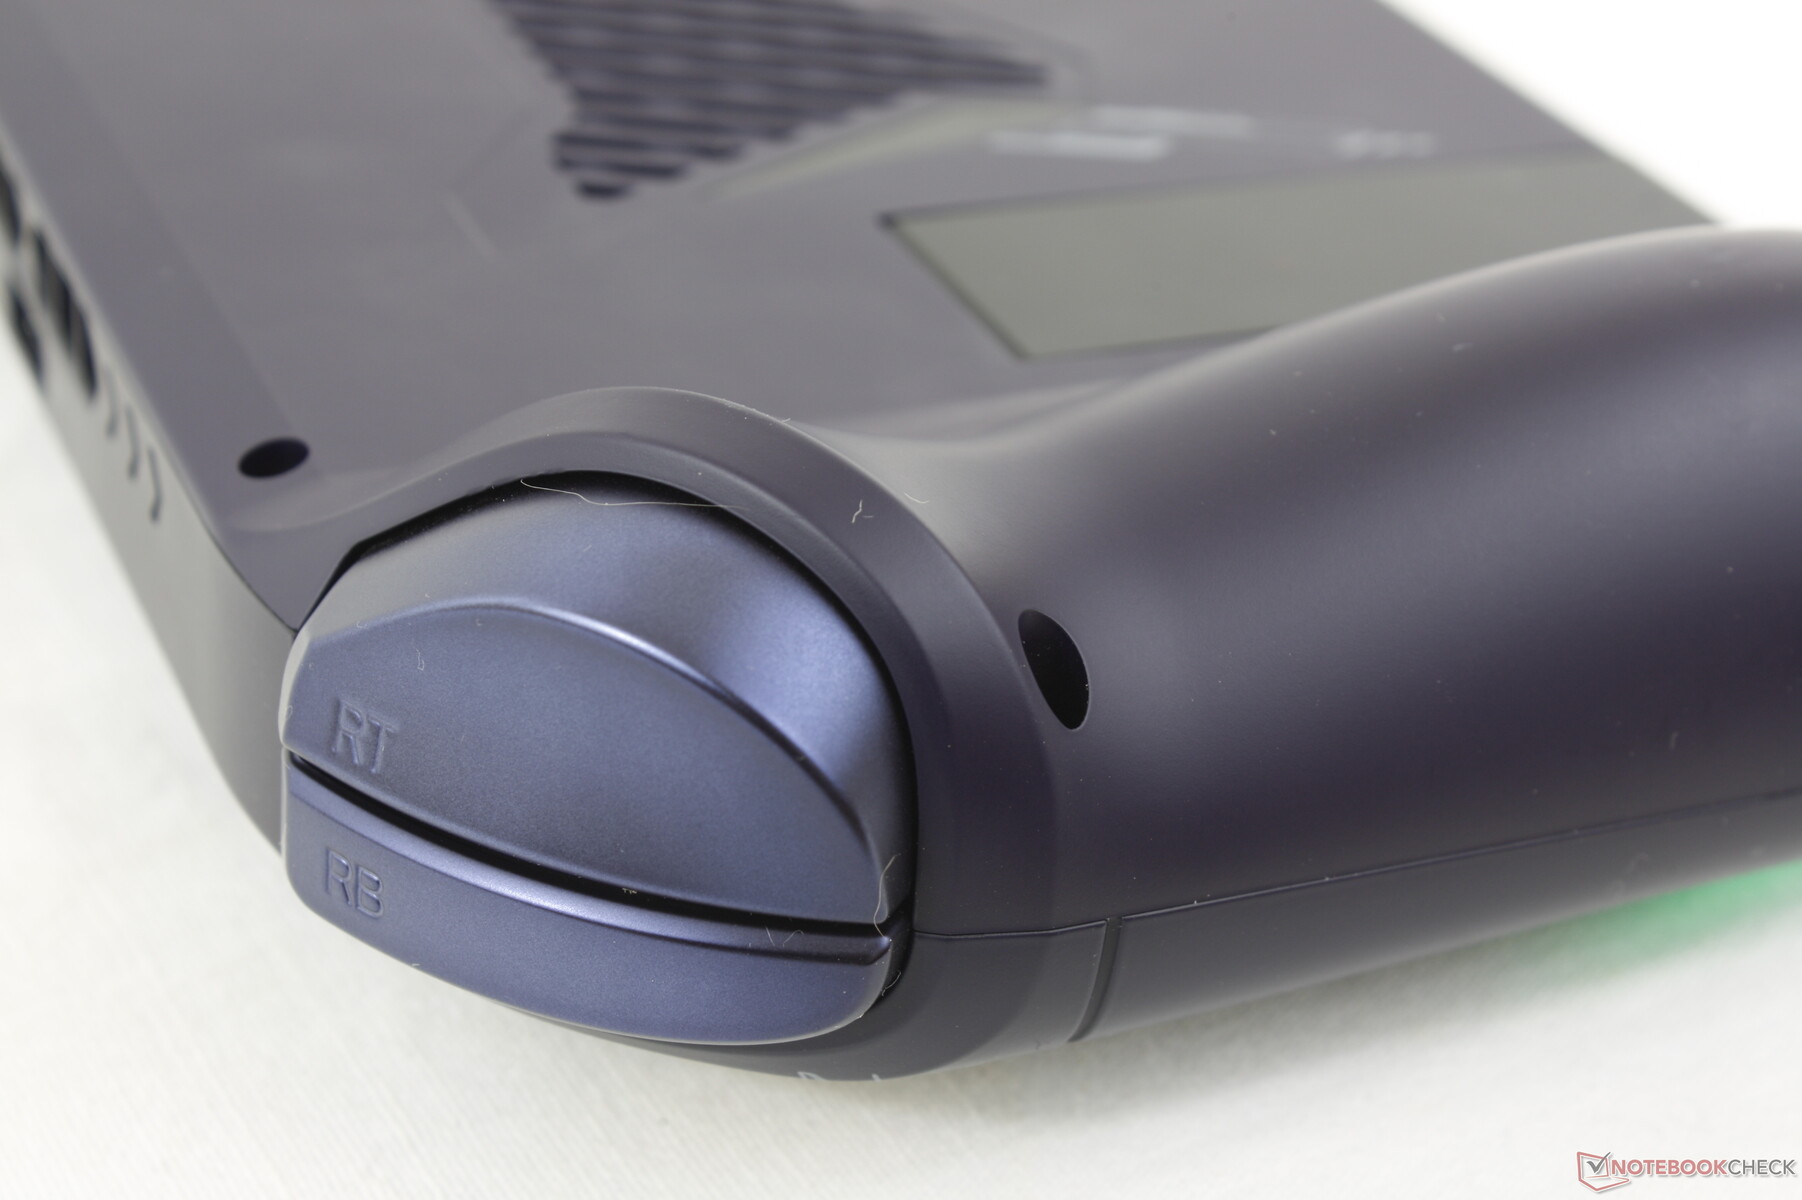
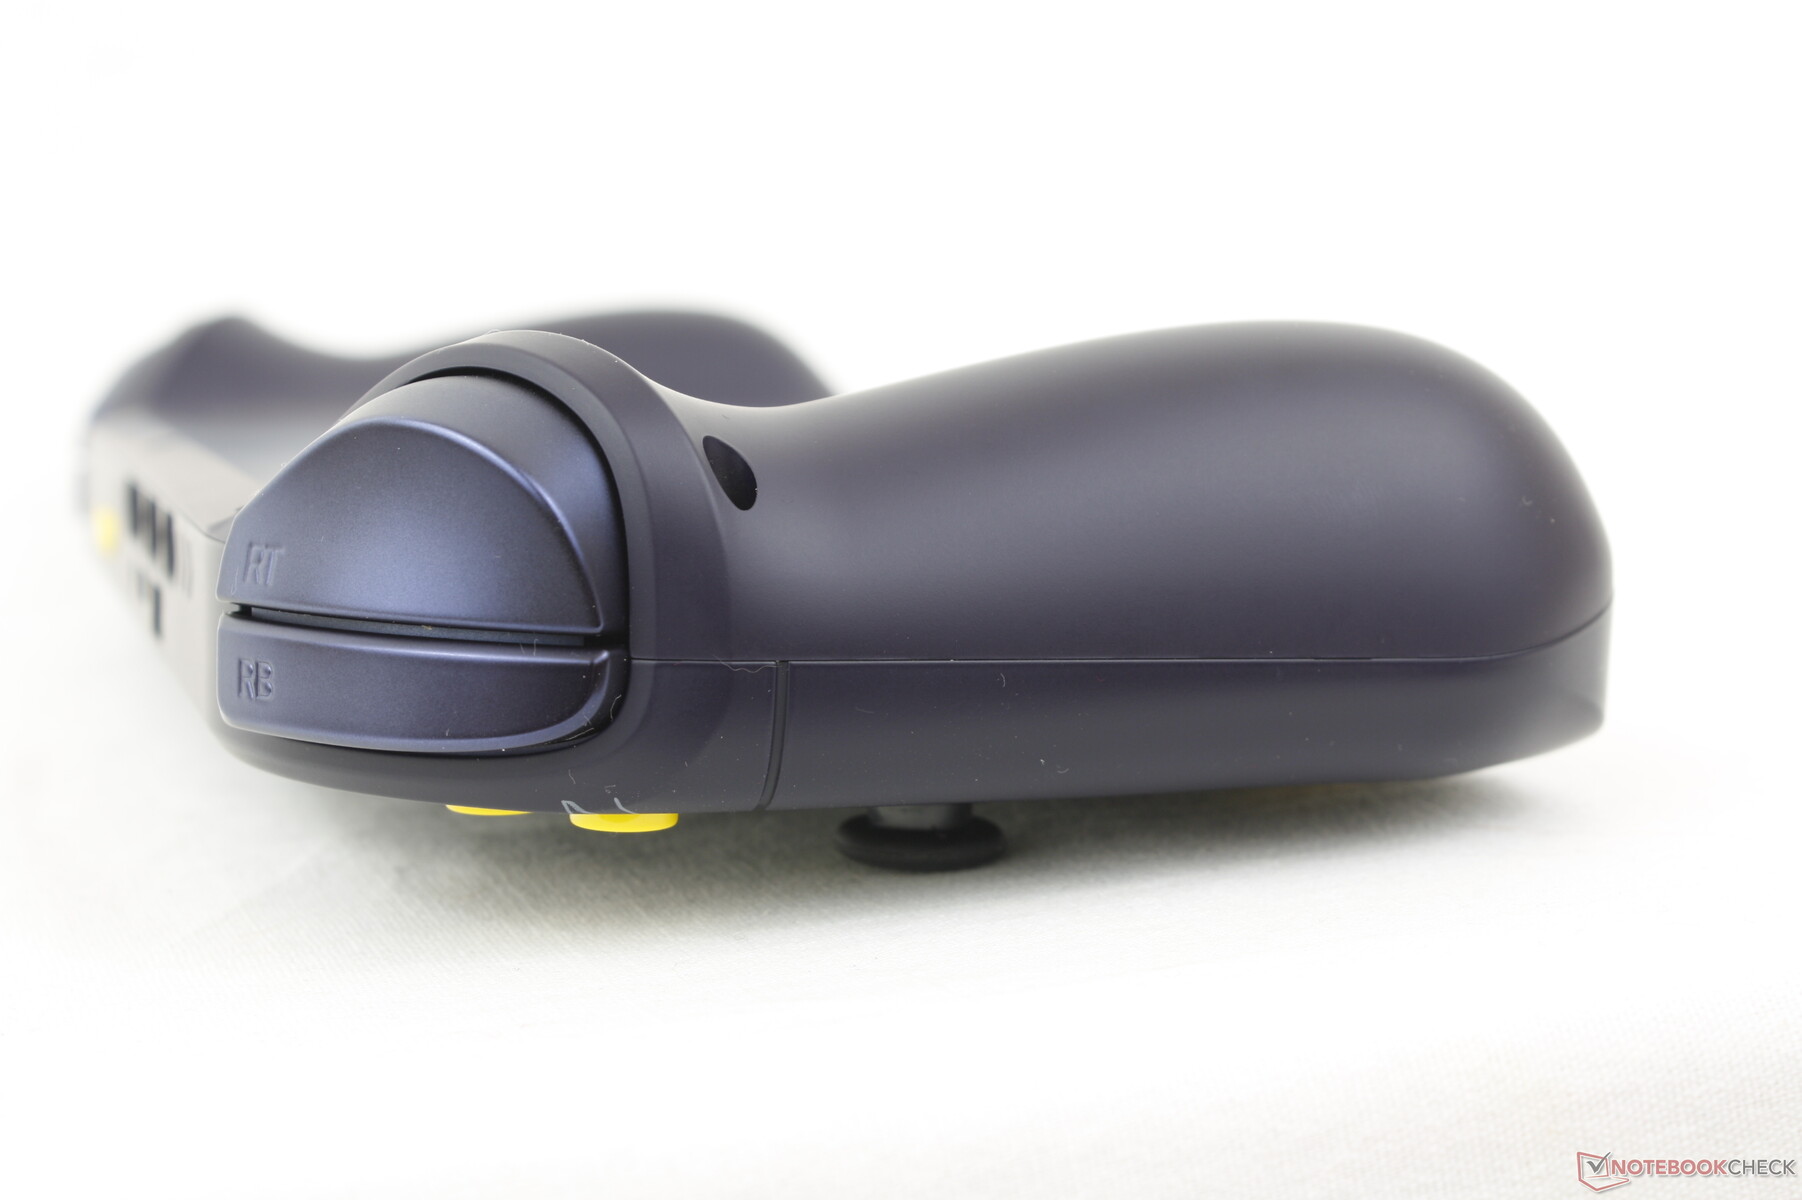
It only takes one uncomfortable button on a controller to leave a bad impression and, unfortunately for the A1, that button happens to be the shoulder button. The LB and RB buttons more specifically are difficult to press as they require a lot of force before an input is registered. Where you press on the button matters as well as feedback is not uniform. For example, pressing the buttons near their top edges is more difficult than pressing the buttons near their bottom edges for a very uneven feel. In contrast, the shoulder buttons on the Switch or Playstation are more easy to depress no matter which corner you push.
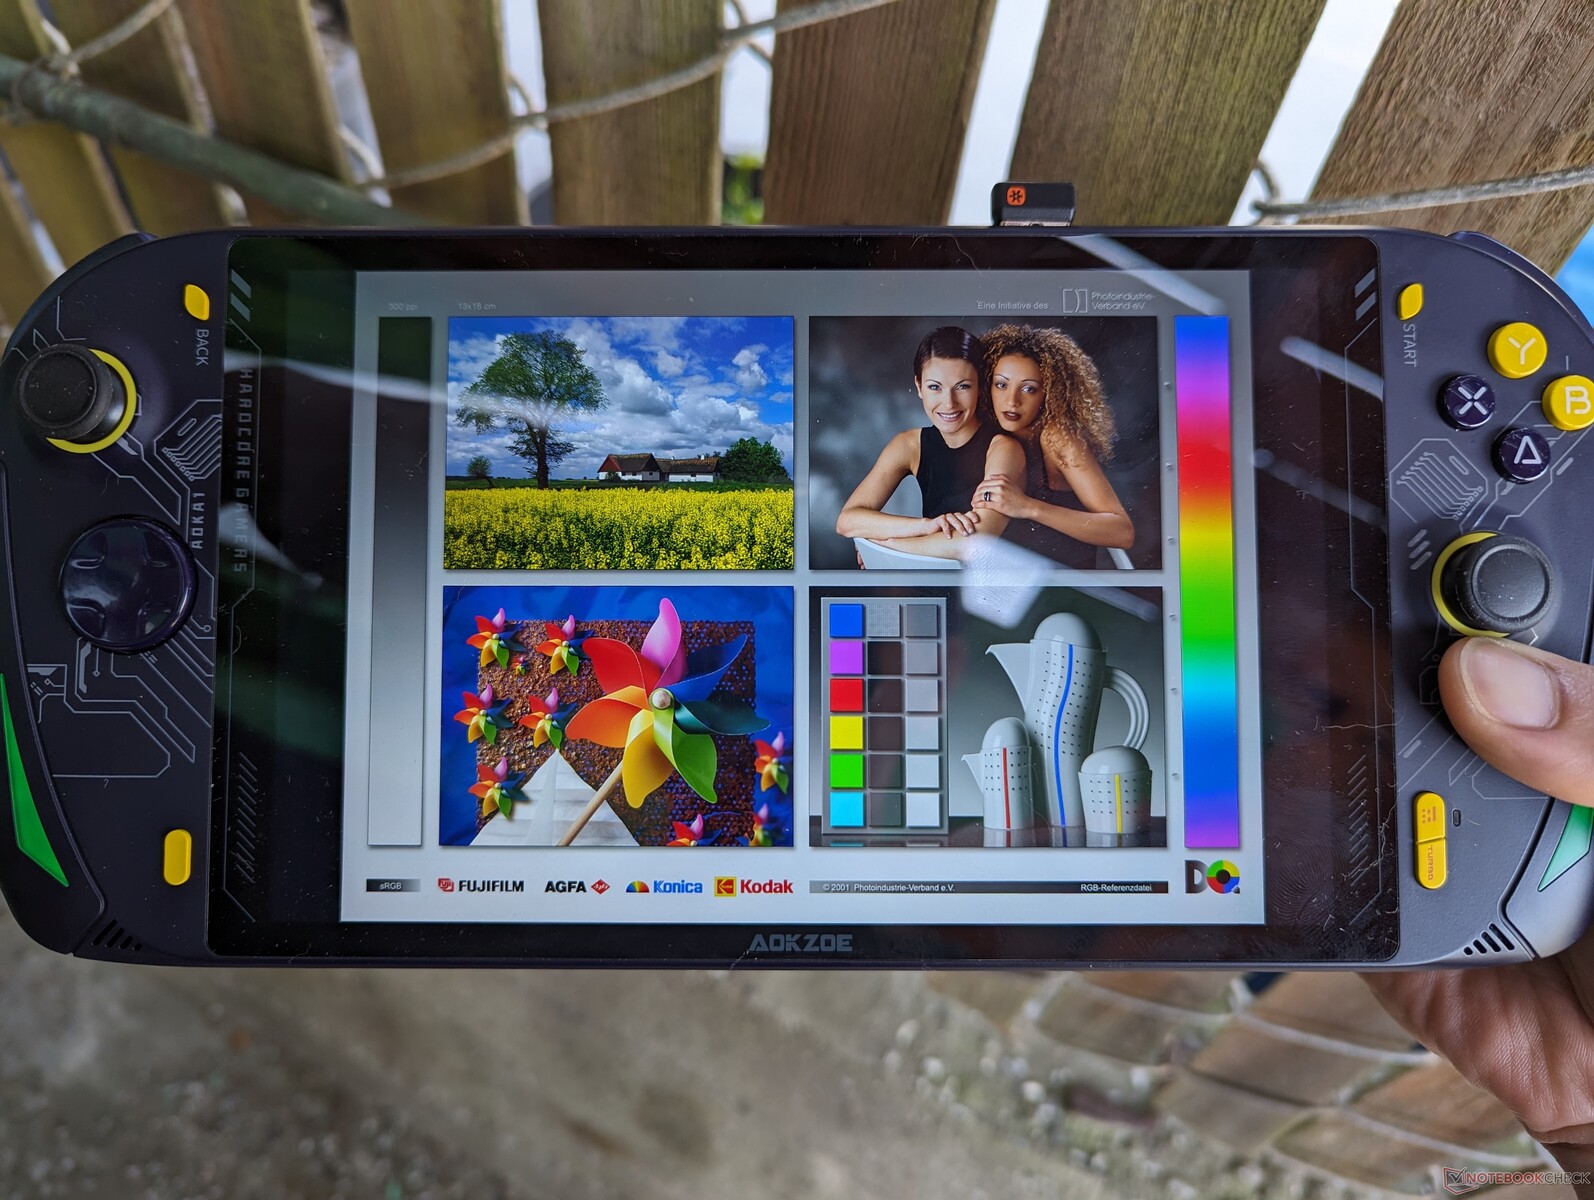
Display — Large And Crisp IPS
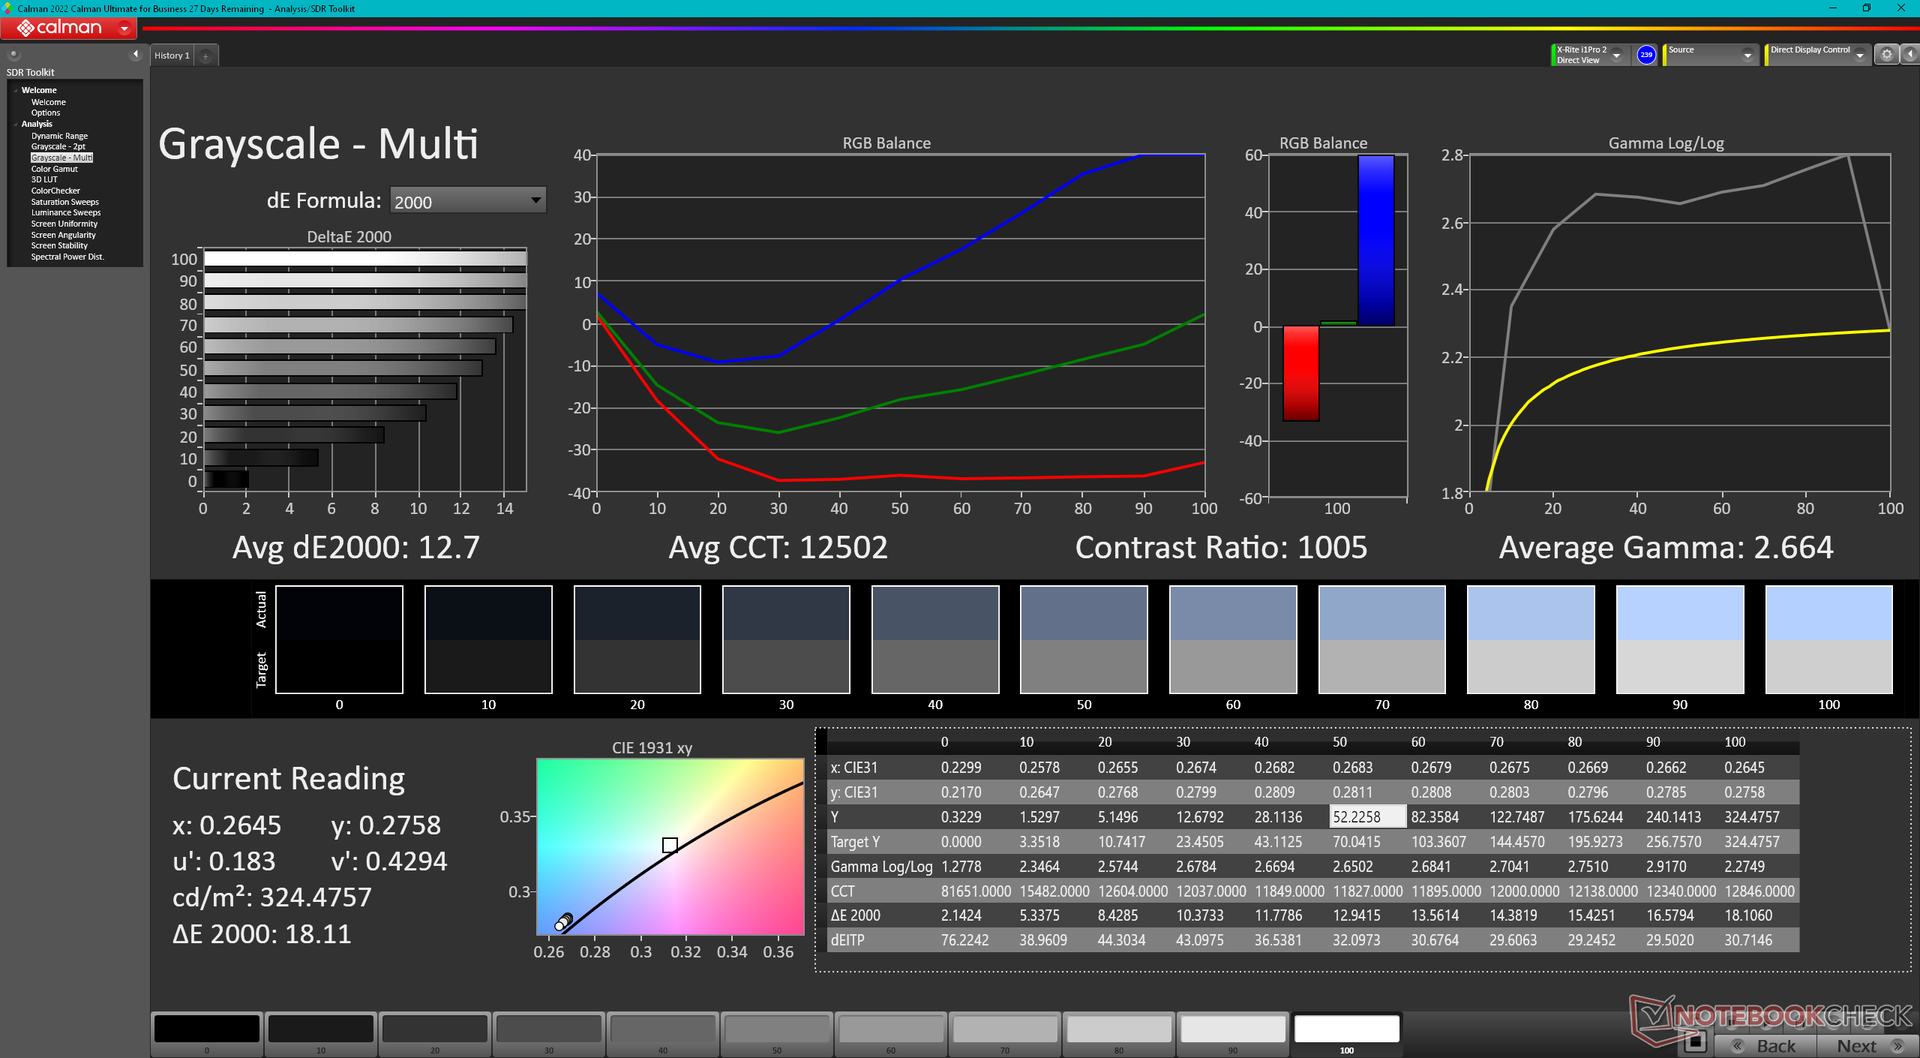
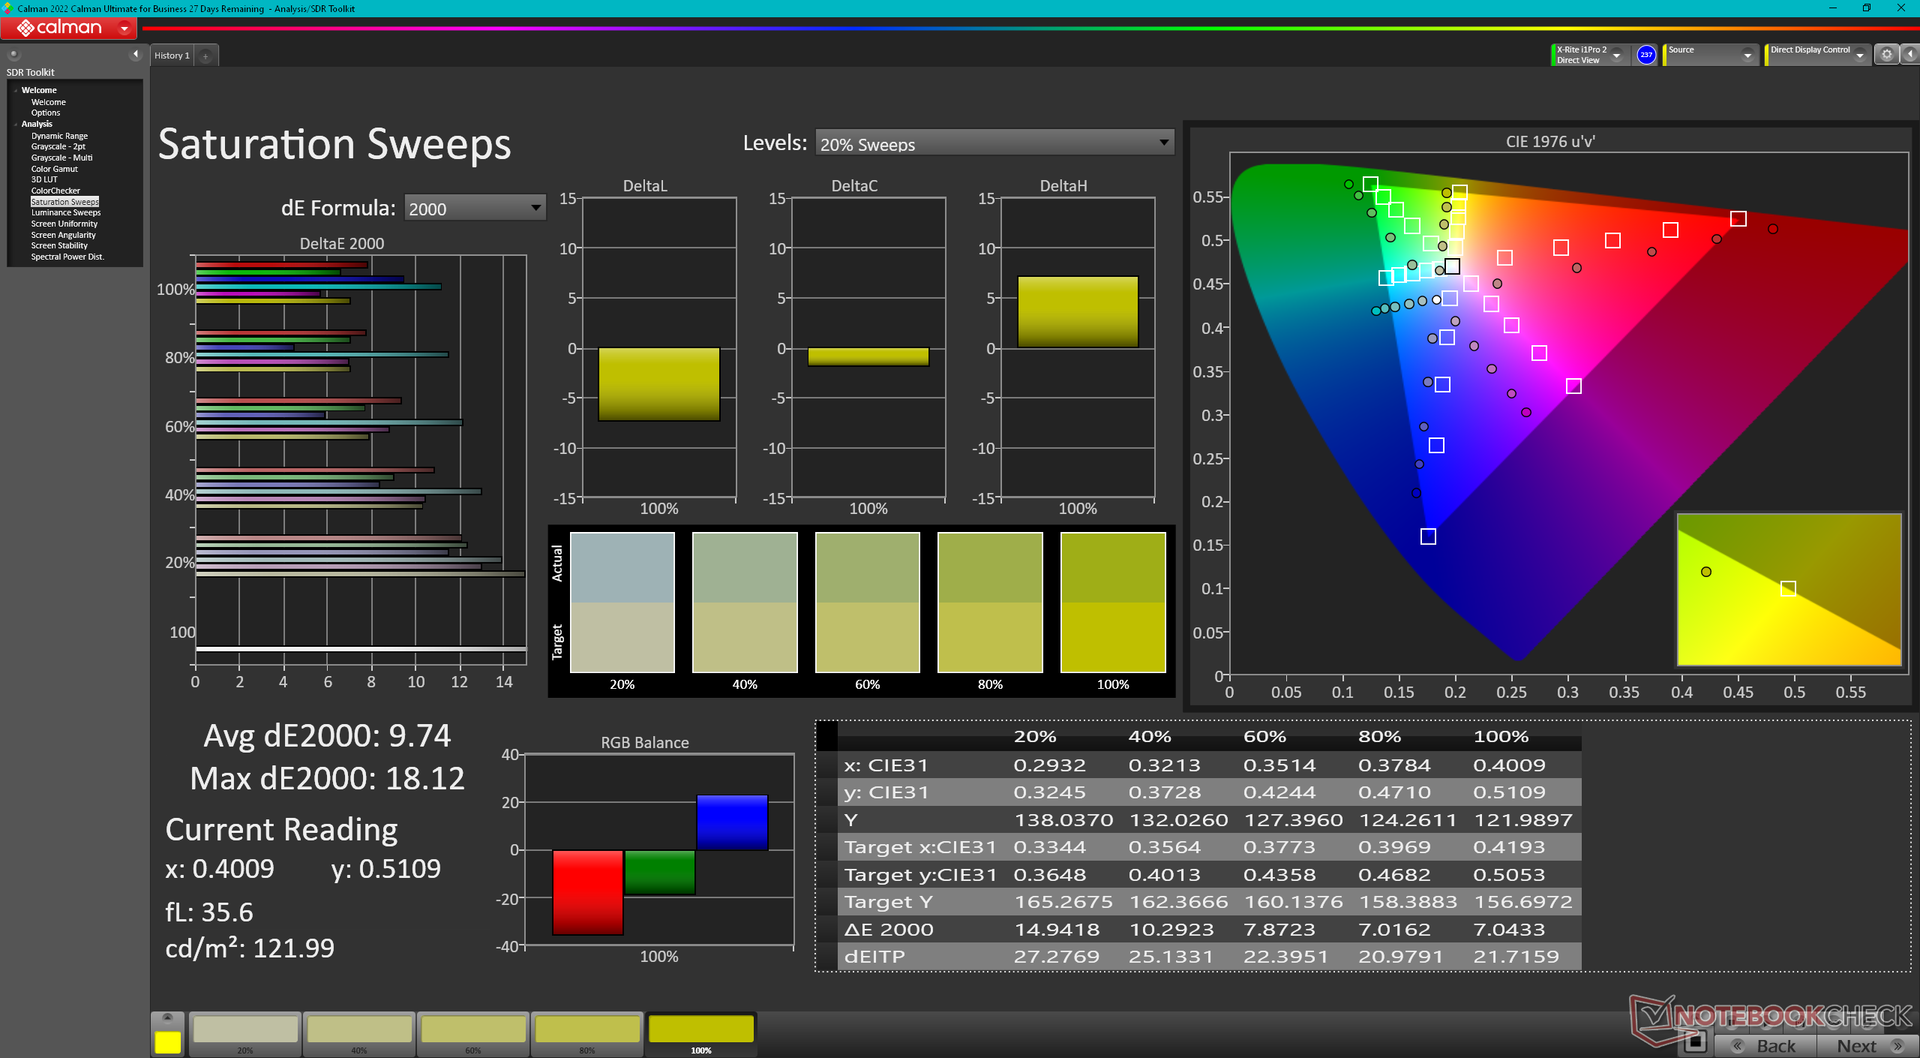
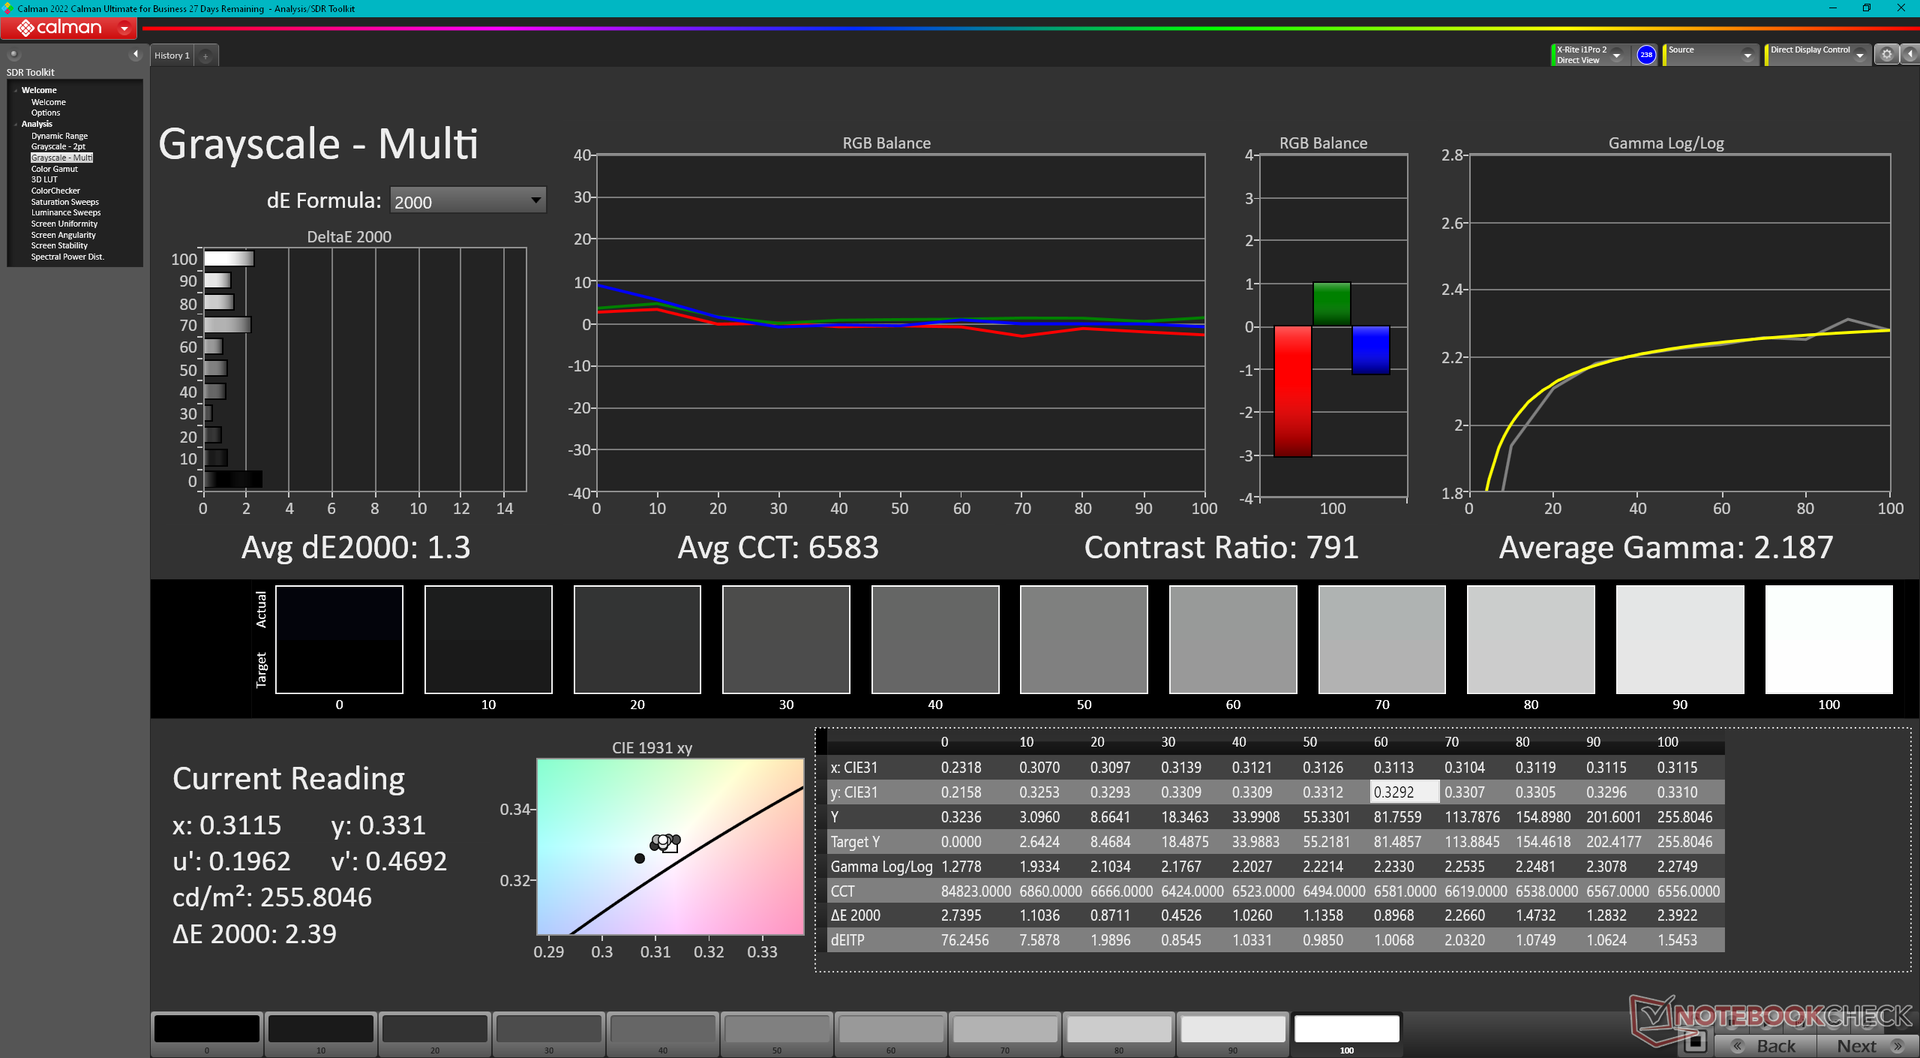
The 1200p BOE IPS touchscreen offers crisp images, good colors, and decent response times and contrast ratio fit for gaming purposes. Its main drawbacks are the average brightness levels, 60 Hz refresh rate, and presence of PWM which can impact outdoor visibility and cause eyestrain to sensitive users, respectively. It lacks FreeSync support as well.

| |||||||||||||||||||||||||
Brightness Distribution: 92 %
Center on Battery: 328.4 cd/m²
Contrast: 842:1 (Black: 0.39 cd/m²)
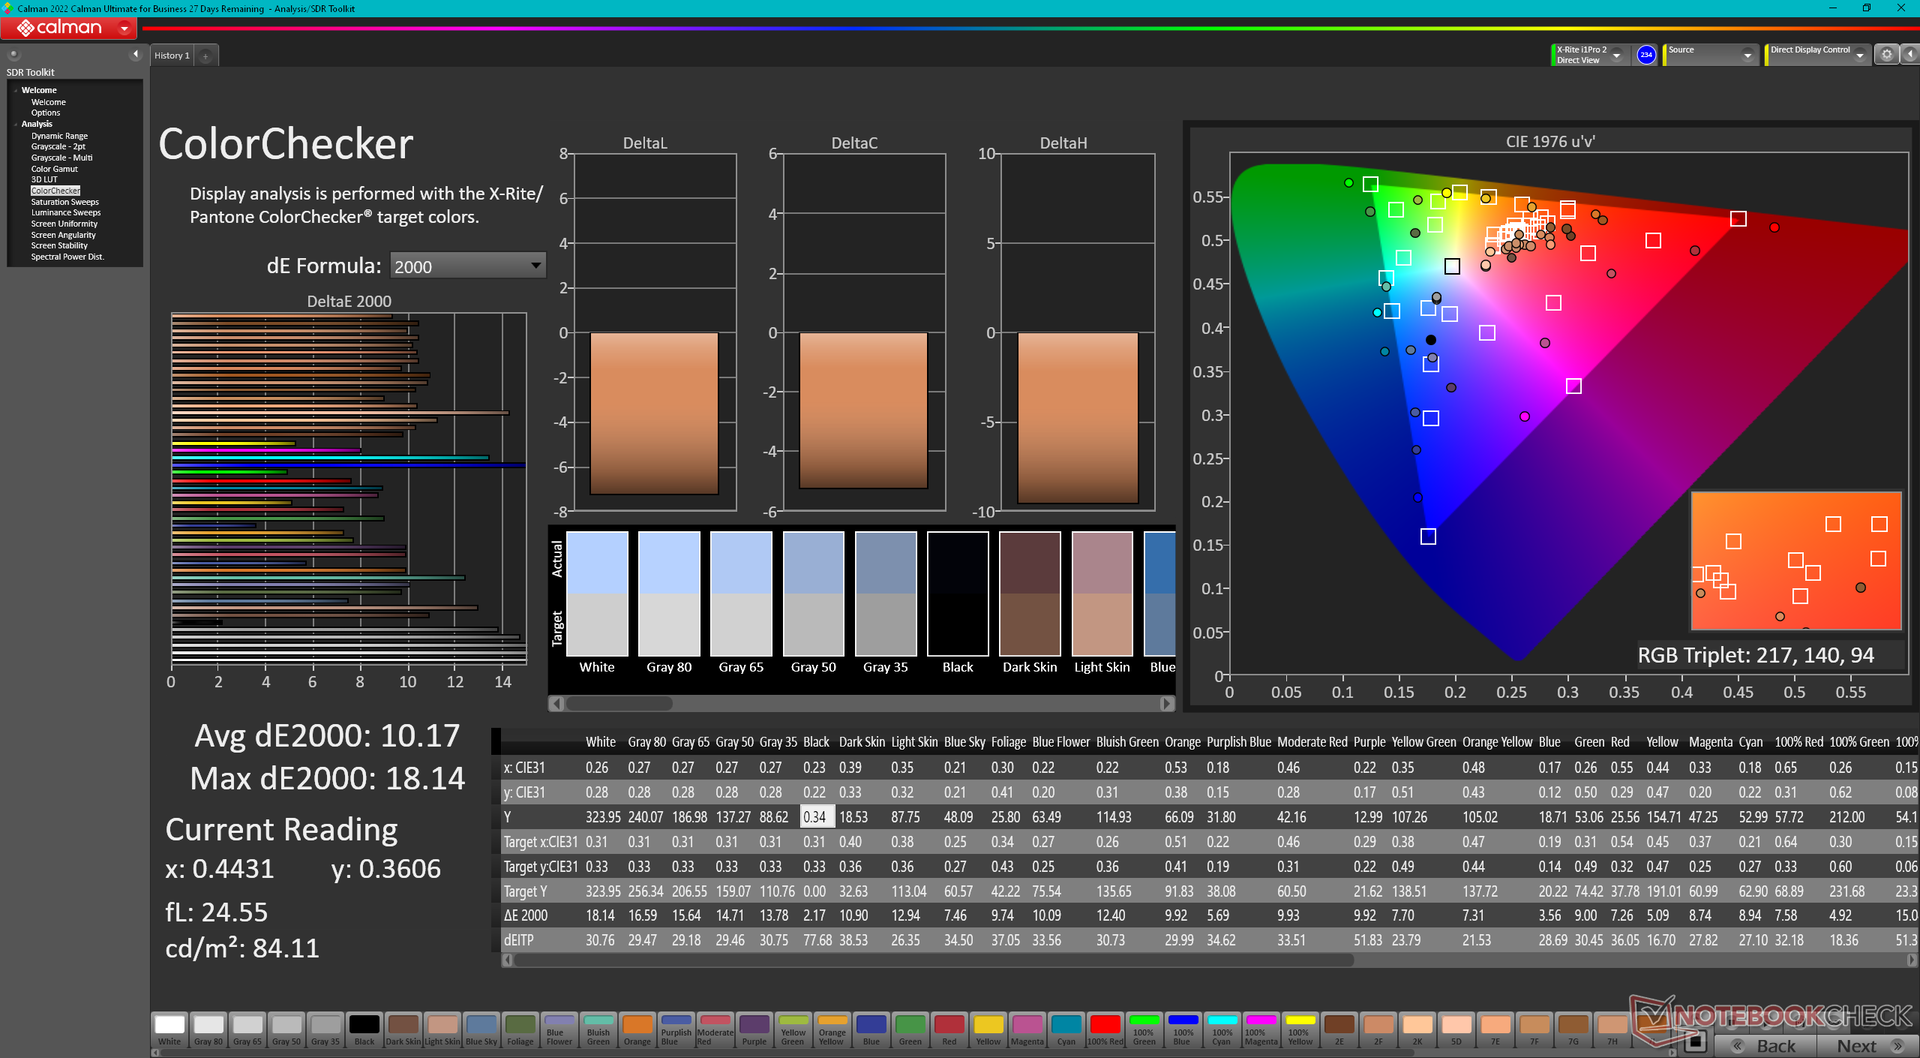
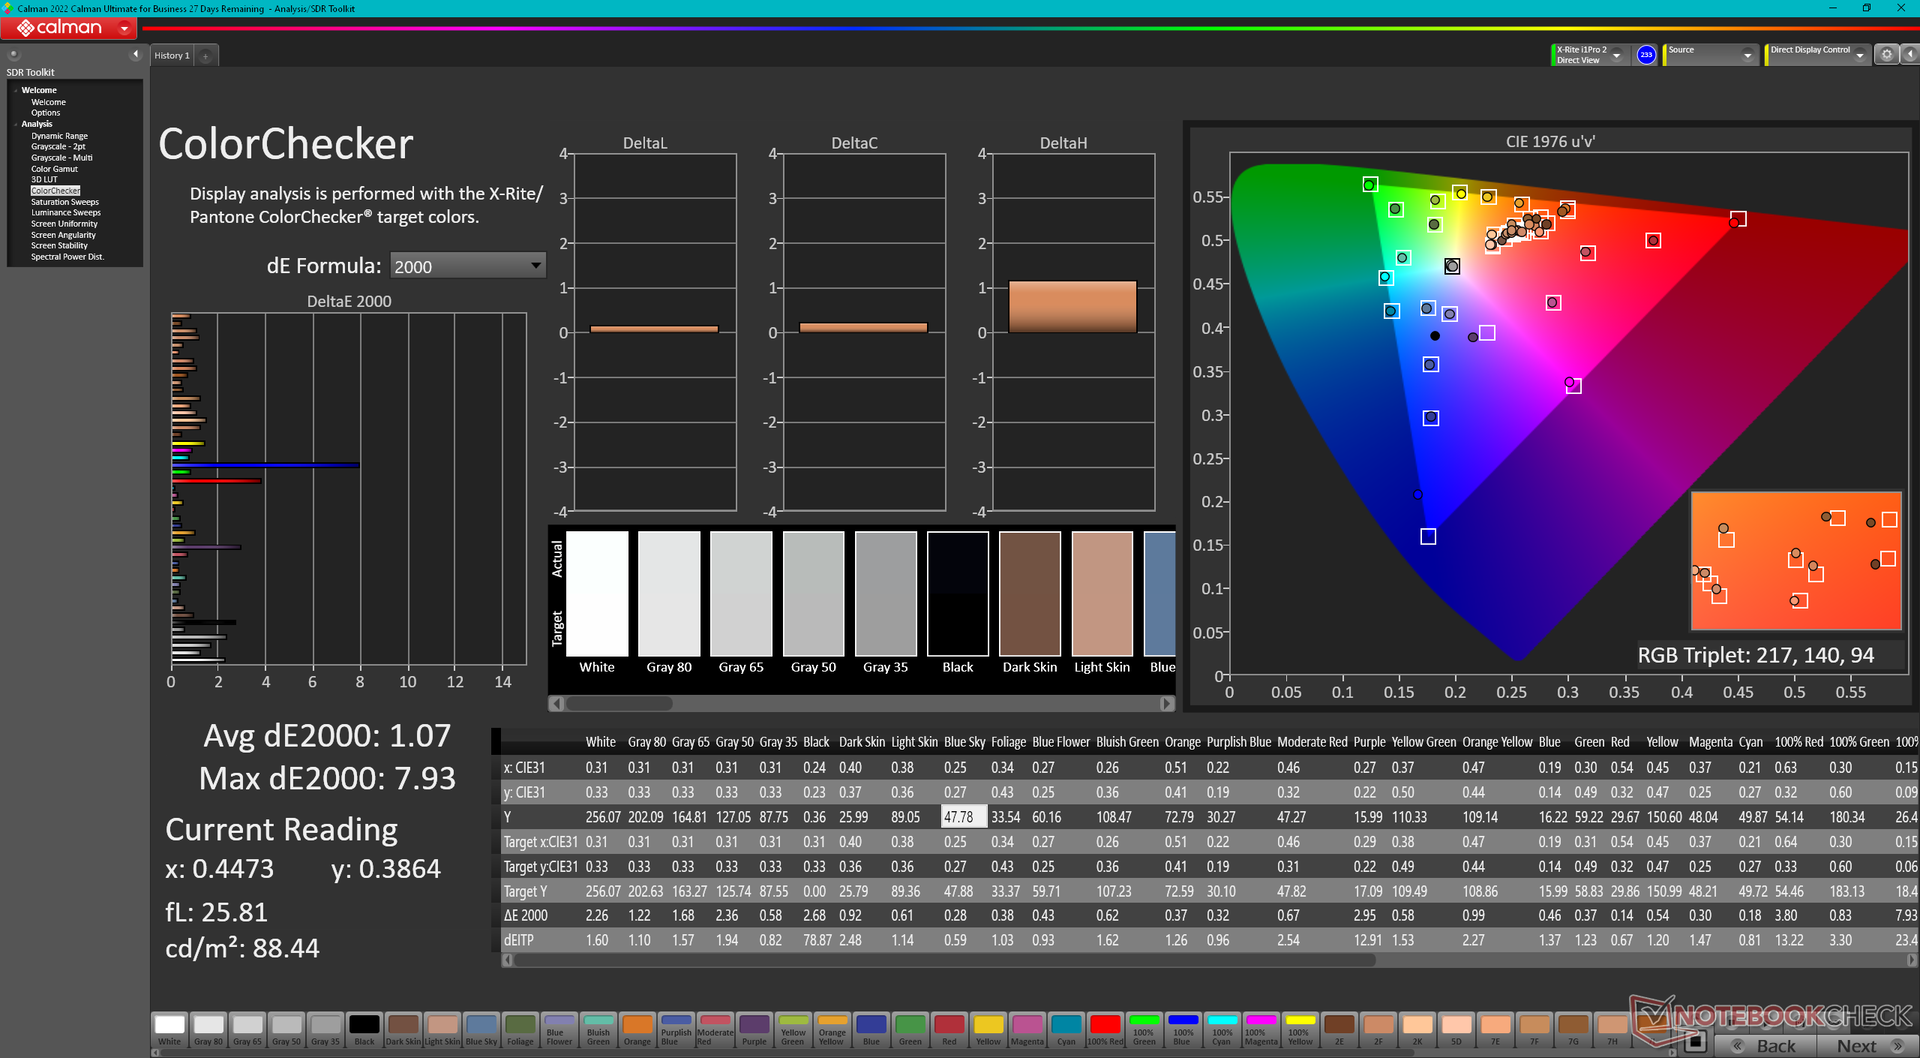
ΔE ColorChecker Calman: 10.17 | ∀{0.5-29.43 Ø4.72}
calibrated: 1.07
ΔE Greyscale Calman: 12.7 | ∀{0.09-98 Ø4.97}
73.4% AdobeRGB 1998 (Argyll 3D)
92.6% sRGB (Argyll 3D)
72.3% Display P3 (Argyll 3D)
Gamma: 2.7
CCT: 12502 K
| Aokzoe A1 BOE0207, IPS, 1920x1200, 8" | One Netbook XPlayer 2 FLQ8423, IPS, 2560x1600, 8.4" | Asus ROG Ally Z1 Extreme TL070FVSX01-0, IPS, 1920x1080, 7" | GPD Win 4 G1618-04, IPS, 1920x1080, 6" | GPD Win 3 IPS, 1280x720, 5.5" | |
|---|---|---|---|---|---|
| Display | 2% | -6% | -9% | -12% | |
| Display P3 Coverage (%) | 72.3 | 75.4 4% | 65.6 -9% | 63.1 -13% | 59.5 -18% |
| sRGB Coverage (%) | 92.6 | 97 5% | 92.1 -1% | 92 -1% | 89.6 -3% |
| AdobeRGB 1998 Coverage (%) | 73.4 | 71.1 -3% | 67.9 -7% | 64.6 -12% | 61.4 -16% |
| Response Times | -18% | 68% | 4% | -30% | |
| Response Time Grey 50% / Grey 80% * (ms) | 28.9 ? | 36.8 ? -27% | 10.5 ? 64% | 26.8 ? 7% | 40 ? -38% |
| Response Time Black / White * (ms) | 21.1 ? | 22.8 ? -8% | 6 ? 72% | 20.9 ? 1% | 25.6 ? -21% |
| PWM Frequency (Hz) | 9970.7 | ||||
| Screen | 8% | 42% | 14% | 6% | |
| Brightness middle (cd/m²) | 328.4 | 369 12% | 513 56% | 413.1 26% | 468.8 43% |
| Brightness (cd/m²) | 323 | 363 12% | 474 47% | 407 26% | 460 42% |
| Brightness Distribution (%) | 92 | 89 -3% | 84 -9% | 81 -12% | 93 1% |
| Black Level * (cd/m²) | 0.39 | 0.28 28% | 0.38 3% | 0.39 -0% | 0.45 -15% |
| Contrast (:1) | 842 | 1318 57% | 1350 60% | 1059 26% | 1042 24% |
| Colorchecker dE 2000 * | 10.17 | 7.1 30% | 3.7 64% | 6.97 31% | 9 12% |
| Colorchecker dE 2000 max. * | 18.14 | 10.9 40% | 8.3 54% | 14.11 22% | 15.5 15% |
| Colorchecker dE 2000 calibrated * | 1.07 | 2.6 -143% | 1.24 -16% | 1.91 -79% | |
| Greyscale dE 2000 * | 12.7 | 8.3 35% | 5.1 60% | 9.9 22% | 10.9 14% |
| Gamma | 2.7 81% | 2.01 109% | 2.14 103% | 2.04 108% | 2.13 103% |
| CCT | 12502 52% | 8838 74% | 7732 84% | 9571 68% | 10972 59% |
| Color Space (Percent of AdobeRGB 1998) (%) | 56.6 | ||||
| Color Space (Percent of sRGB) (%) | 89.2 | ||||
| Total Average (Program / Settings) | -3% /
3% | 35% /
35% | 3% /
8% | -12% /
-3% |
* ... smaller is better
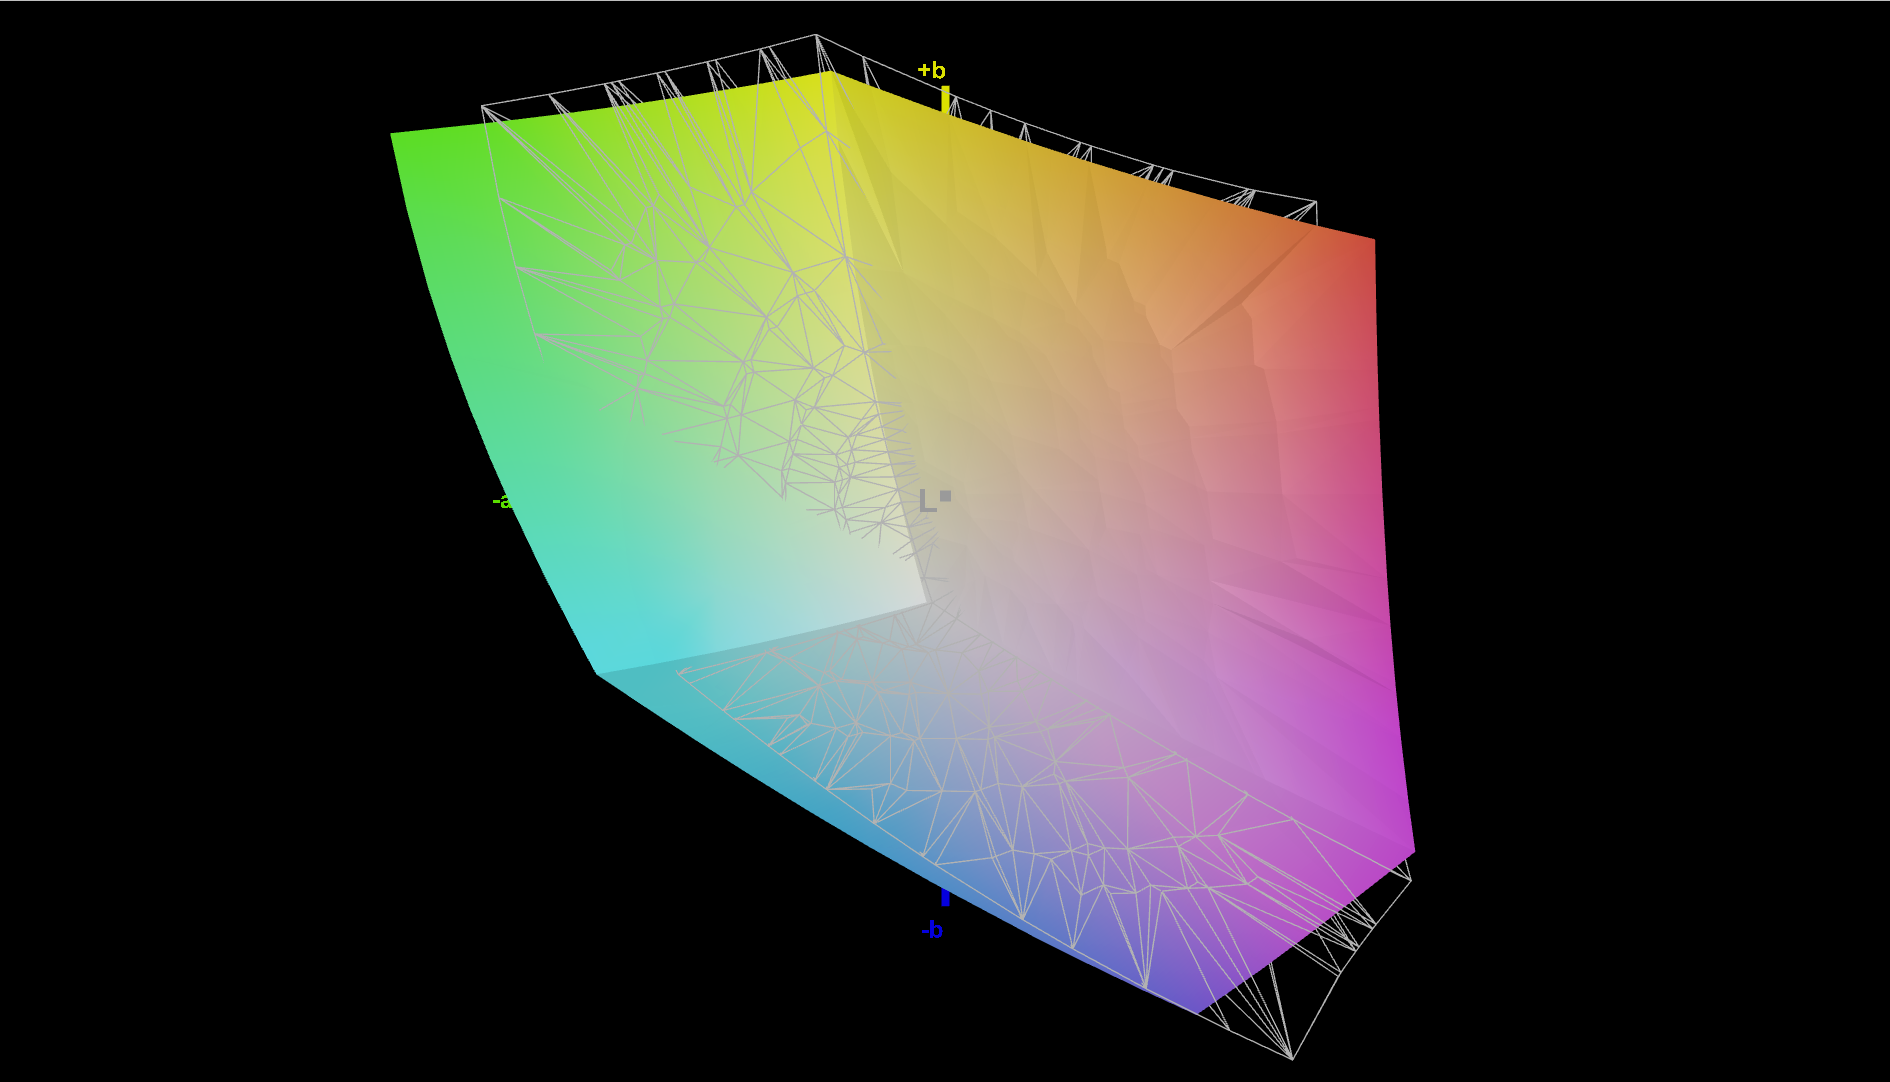
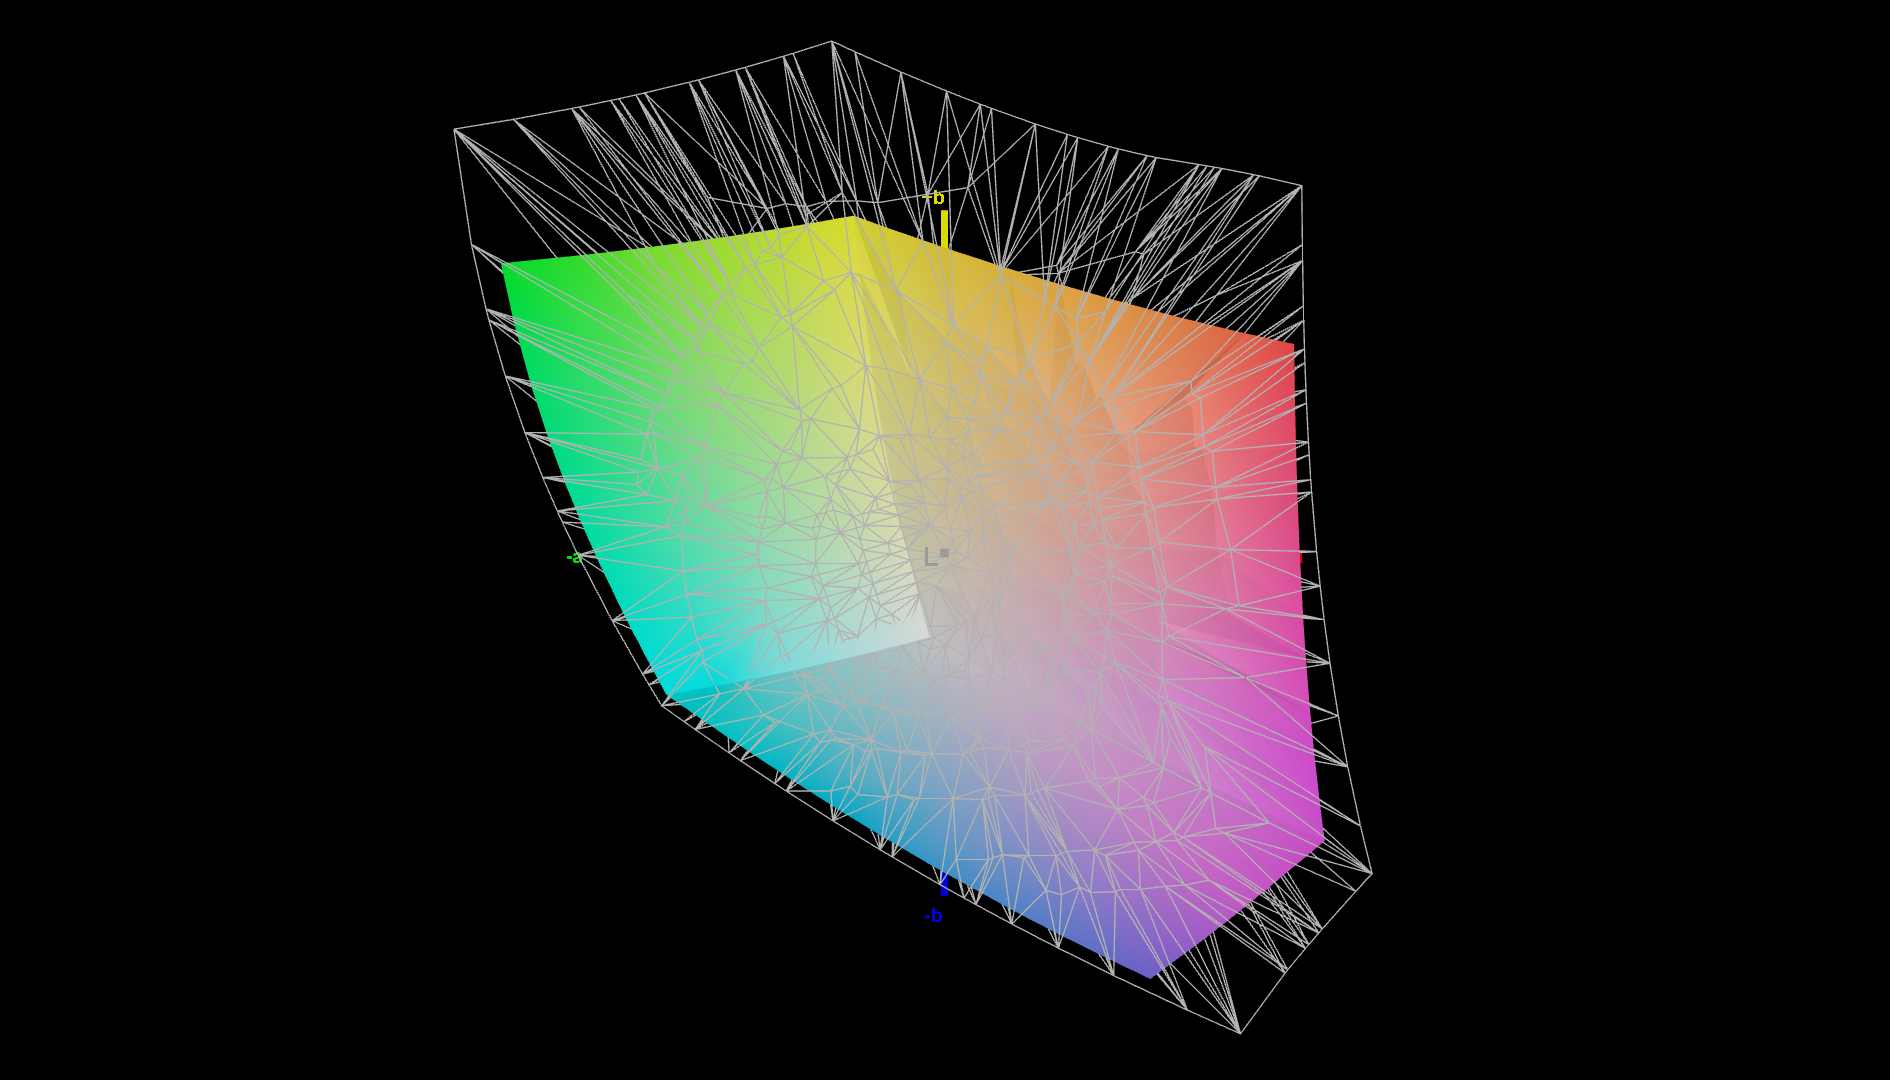
The display is very poorly calibrated out of the box as color temperature is far too cool. We recommended applying our calibrated ICM profile above to get more out of the display especially since it covers over 90 percent of the sRGB standard.
Display Response Times
| ↔ Response Time Black to White | ||
|---|---|---|
| 21.1 ms ... rise ↗ and fall ↘ combined | ↗ 11.1 ms rise | 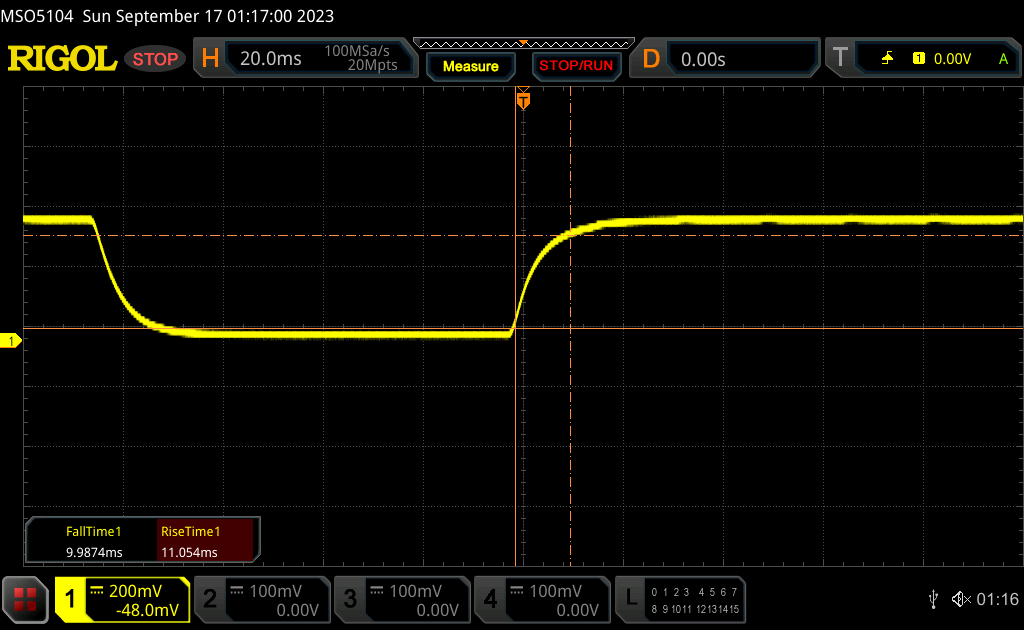 |
| ↘ 10 ms fall | ||
| The screen shows good response rates in our tests, but may be too slow for competitive gamers. In comparison, all tested devices range from 0.1 (minimum) to 240 (maximum) ms. » 47 % of all devices are better. This means that the measured response time is similar to the average of all tested devices (19.9 ms). | ||
| ↔ Response Time 50% Grey to 80% Grey | ||
| 28.9 ms ... rise ↗ and fall ↘ combined | ↗ 13.8 ms rise | 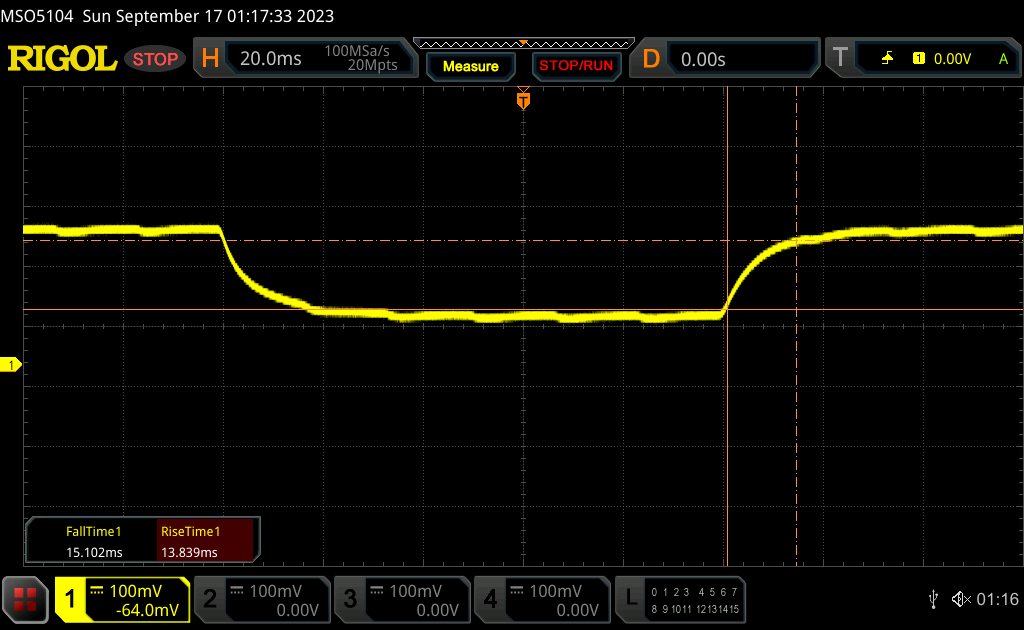 |
| ↘ 15.1 ms fall | ||
| The screen shows relatively slow response rates in our tests and may be too slow for gamers. In comparison, all tested devices range from 0.165 (minimum) to 636 (maximum) ms. » 39 % of all devices are better. This means that the measured response time is similar to the average of all tested devices (31.1 ms). | ||
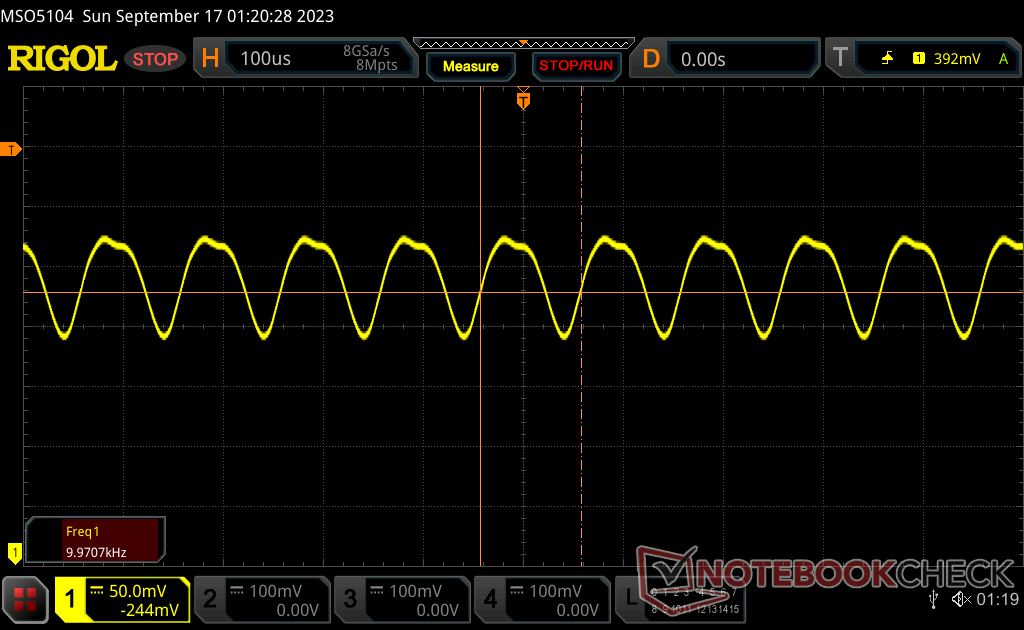
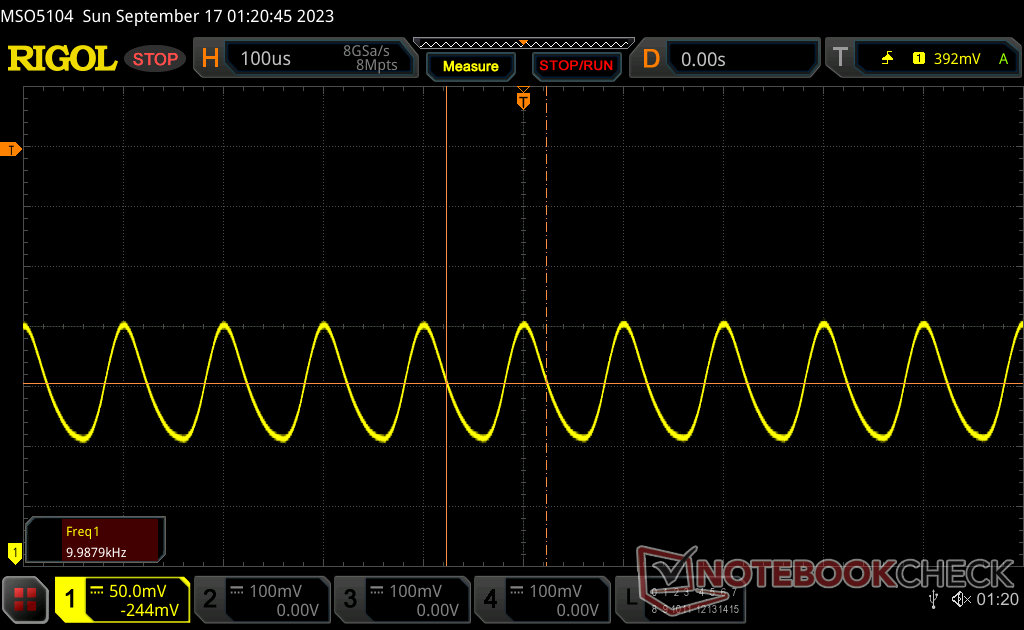
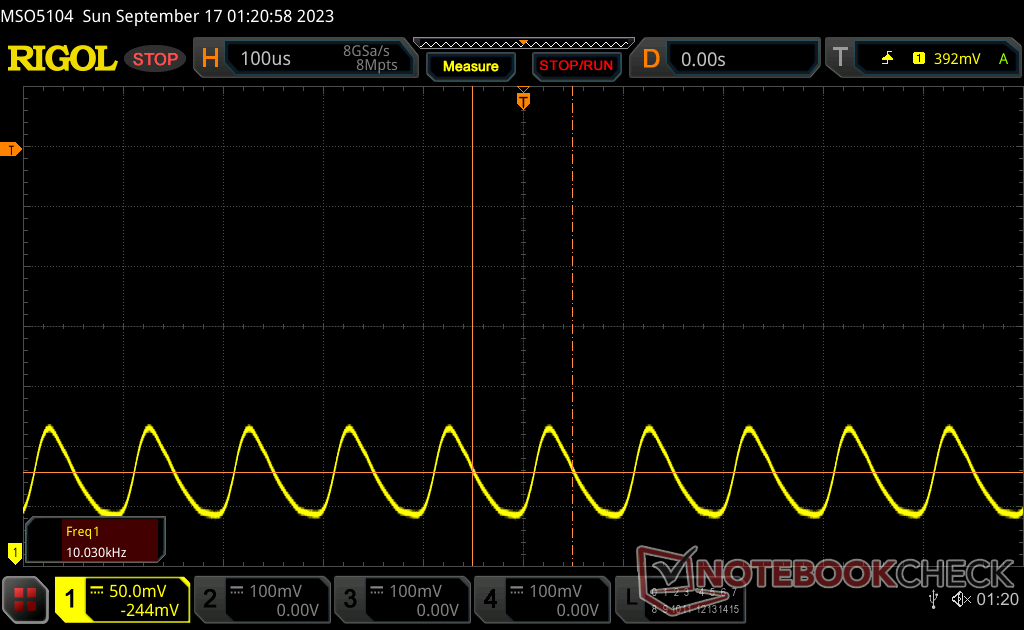
Screen Flickering / PWM (Pulse-Width Modulation)
| Screen flickering / PWM detected | 9970.7 Hz | 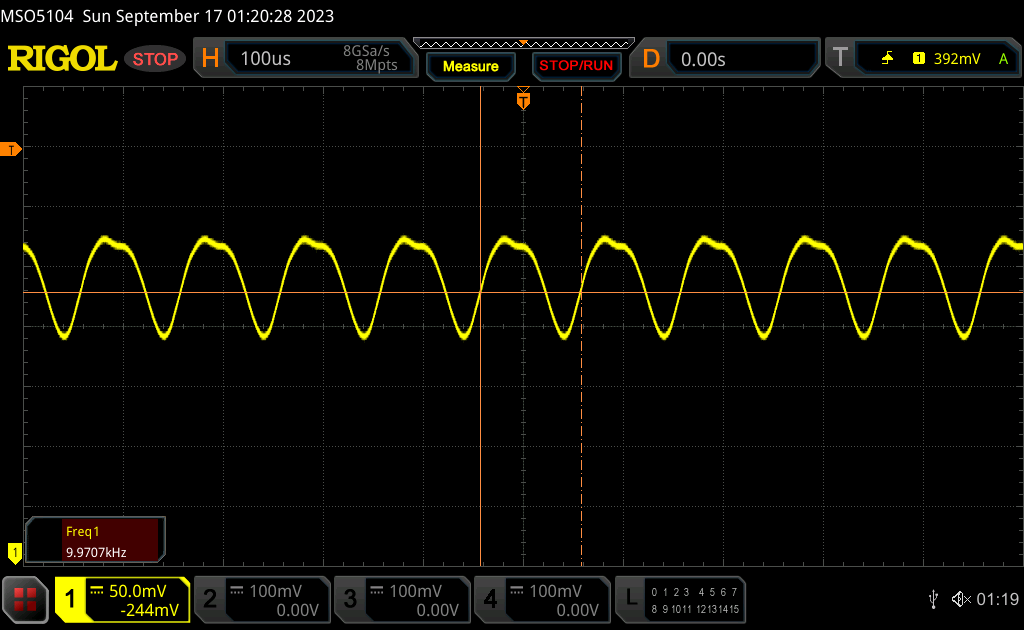 | |
The display backlight flickers at 9970.7 Hz (worst case, e.g., utilizing PWM) . The frequency of 9970.7 Hz is quite high, so most users sensitive to PWM should not notice any flickering. In comparison: 52 % of all tested devices do not use PWM to dim the display. If PWM was detected, an average of 7784 (minimum: 5 - maximum: 343500) Hz was measured. | |||
Pulse-width modulation (PWM) is present on all brightness levels up to 99 percent. This unfortunately makes the A1 IPS panel one of the very few to have PWM as most other IPS displays do not exhibit any flickering no matter the brightness setting.
Outdoor visibility is decent at best even when under shade. The glossy screen invites glare and colors look washed out from the limited backlight brightness. Texts and HUD items are especially difficult to read when gaming outdoors since they are so much smaller and dimmer than on a desktop monitor. The ROG Ally has a much brighter screen for comparison.
Make sure to disable AMD Vari-Bright or else maximum brightness will drop if running on battery power.

Performance — As Fast As Modern Ultrabooks
Testing Conditions
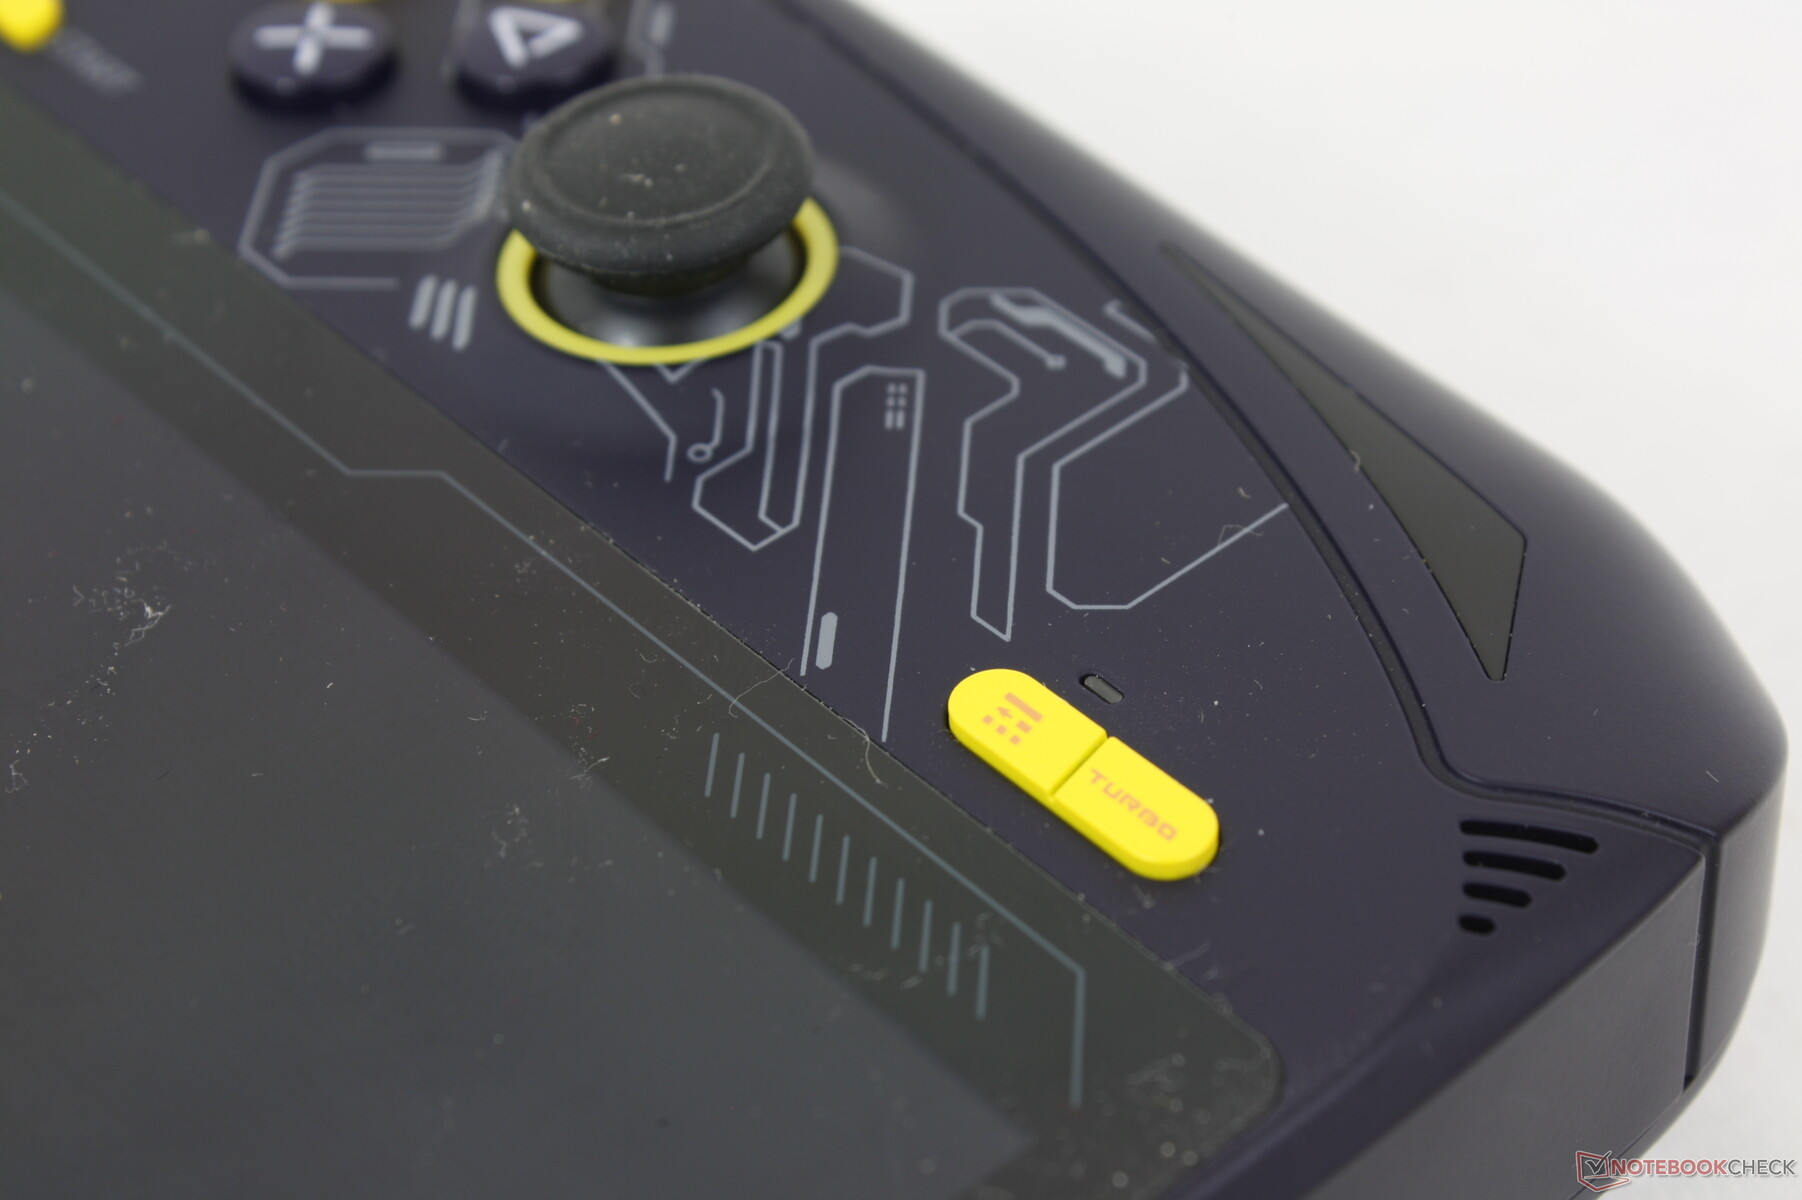
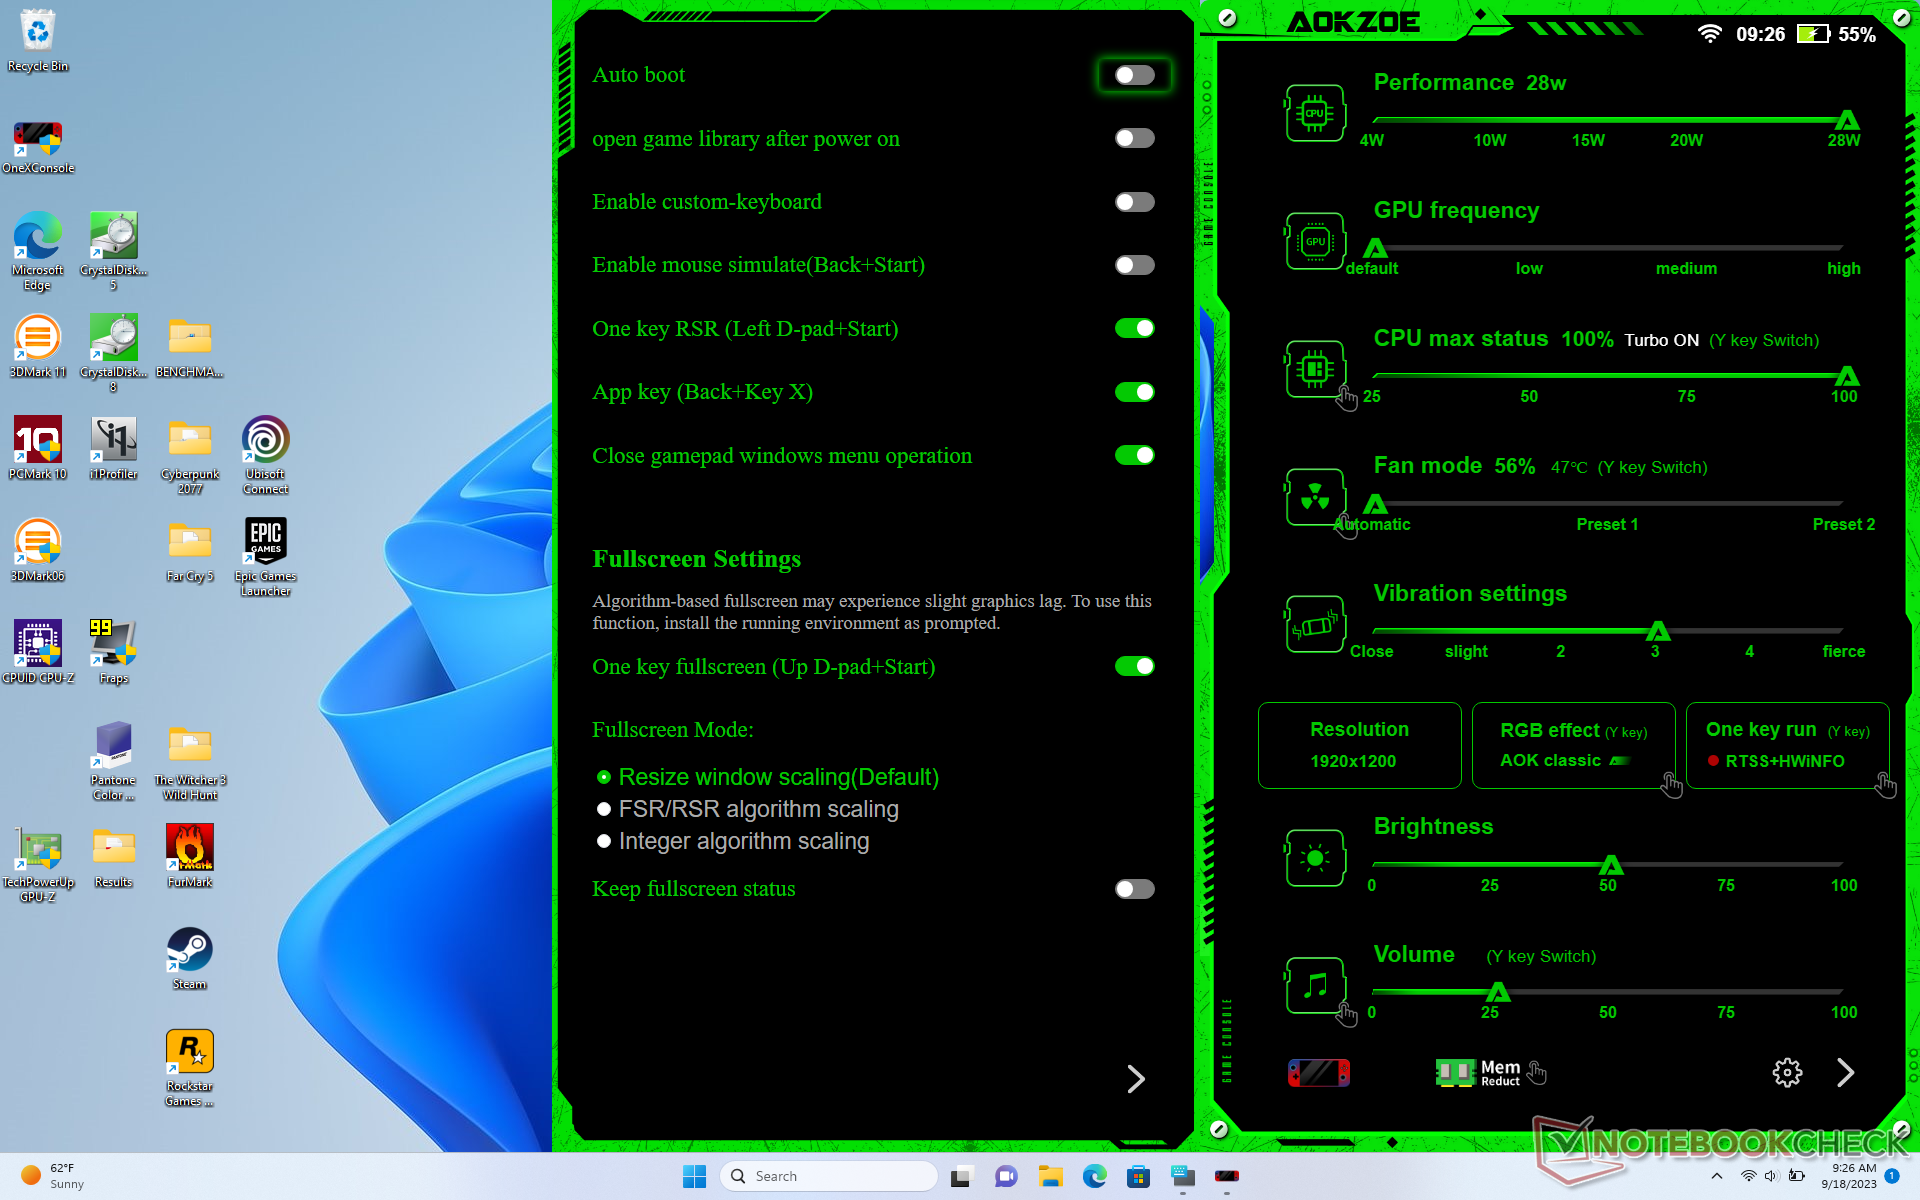
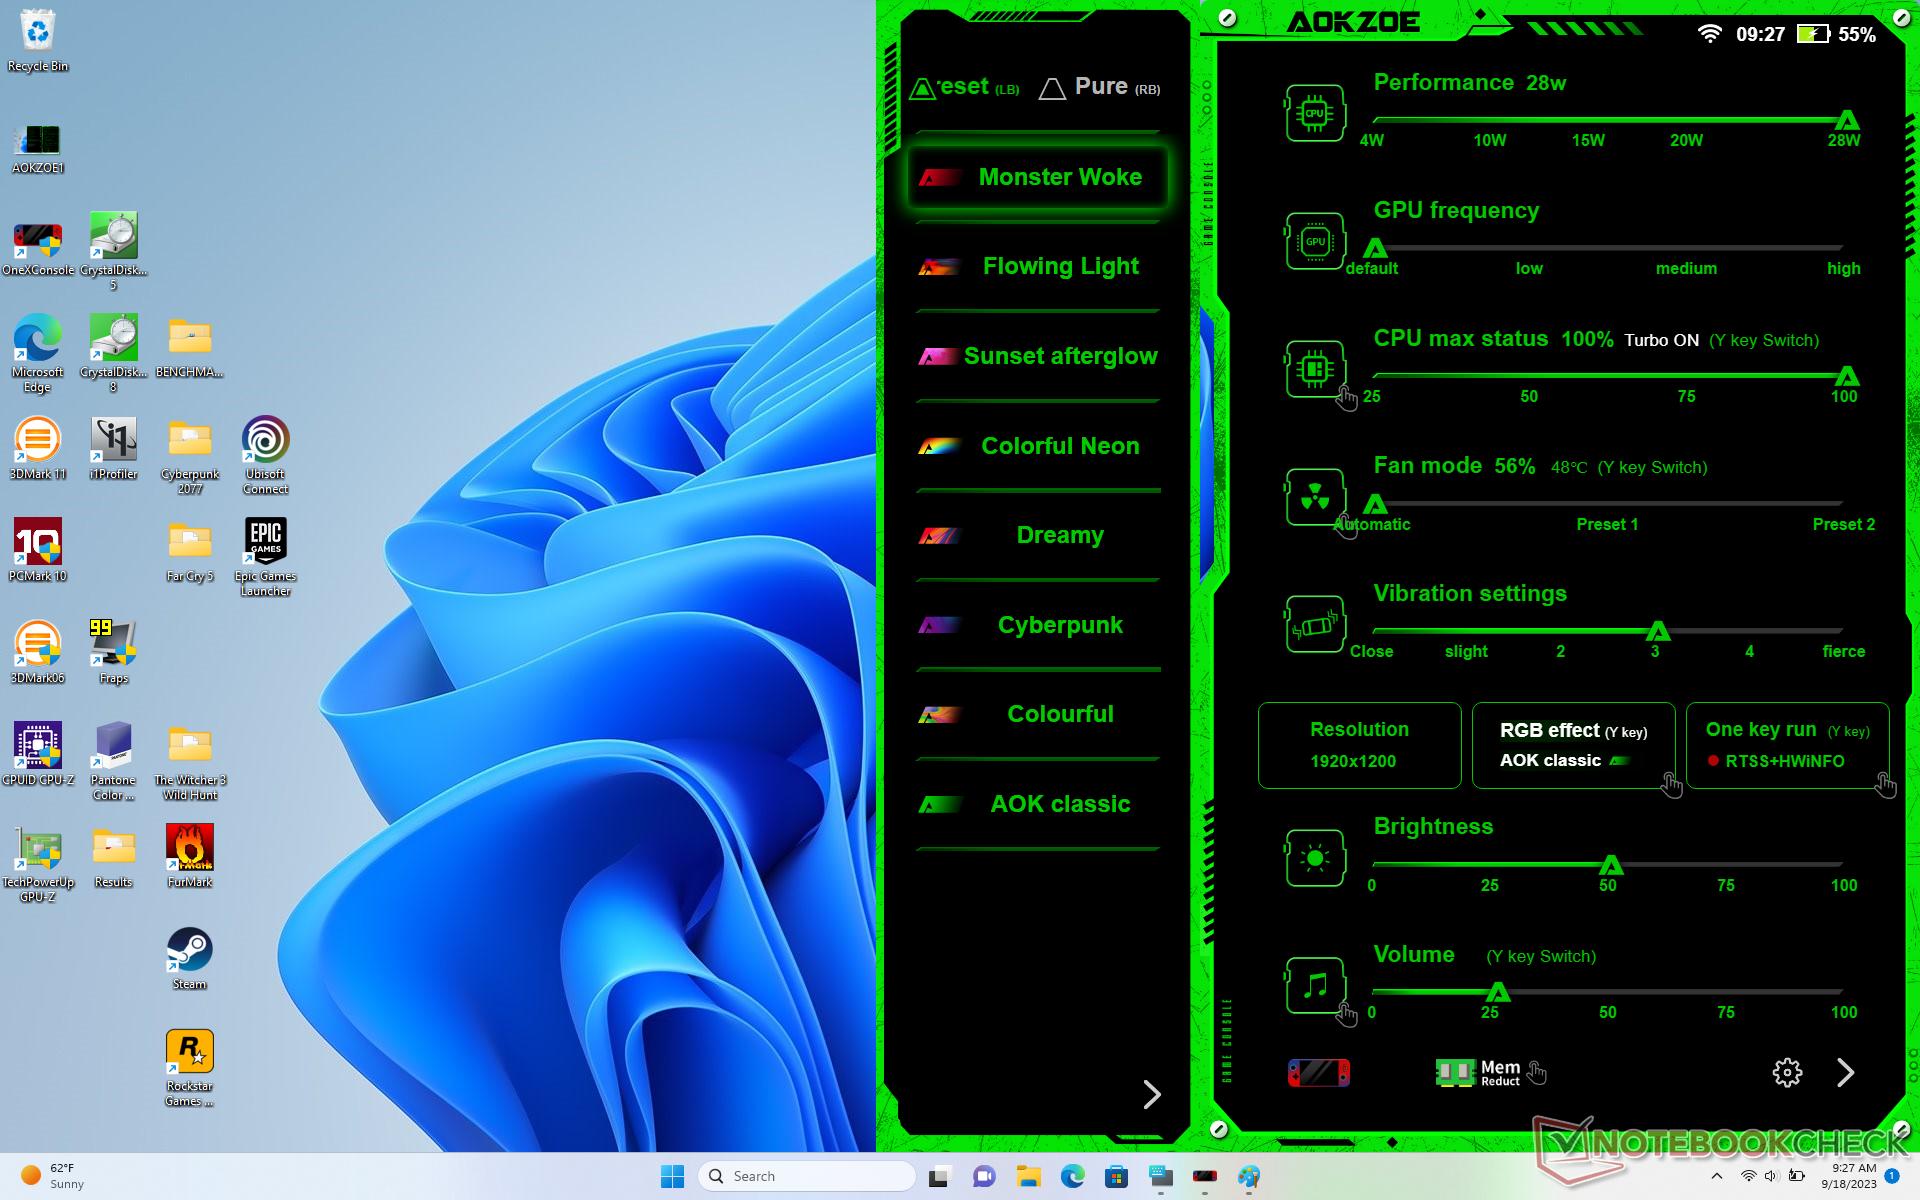
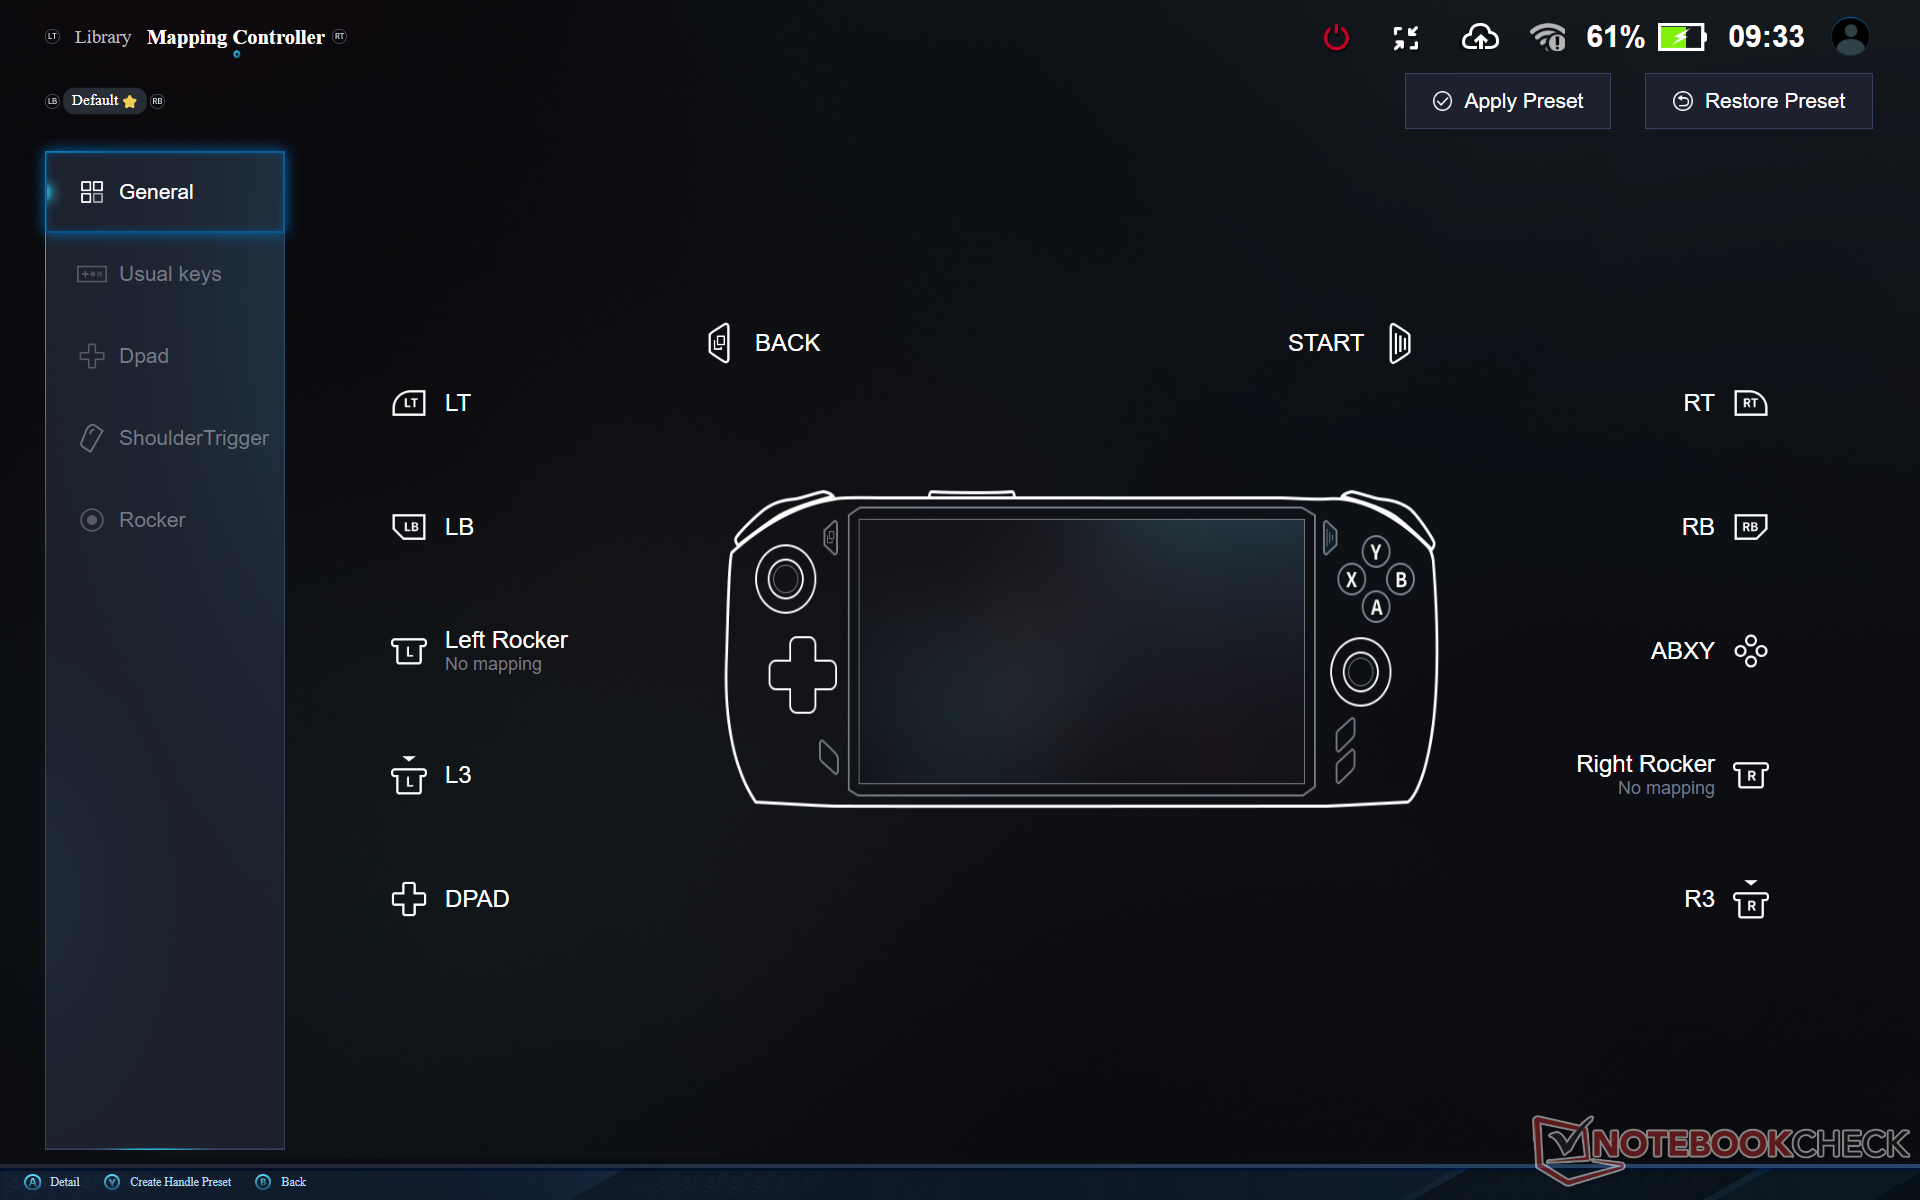
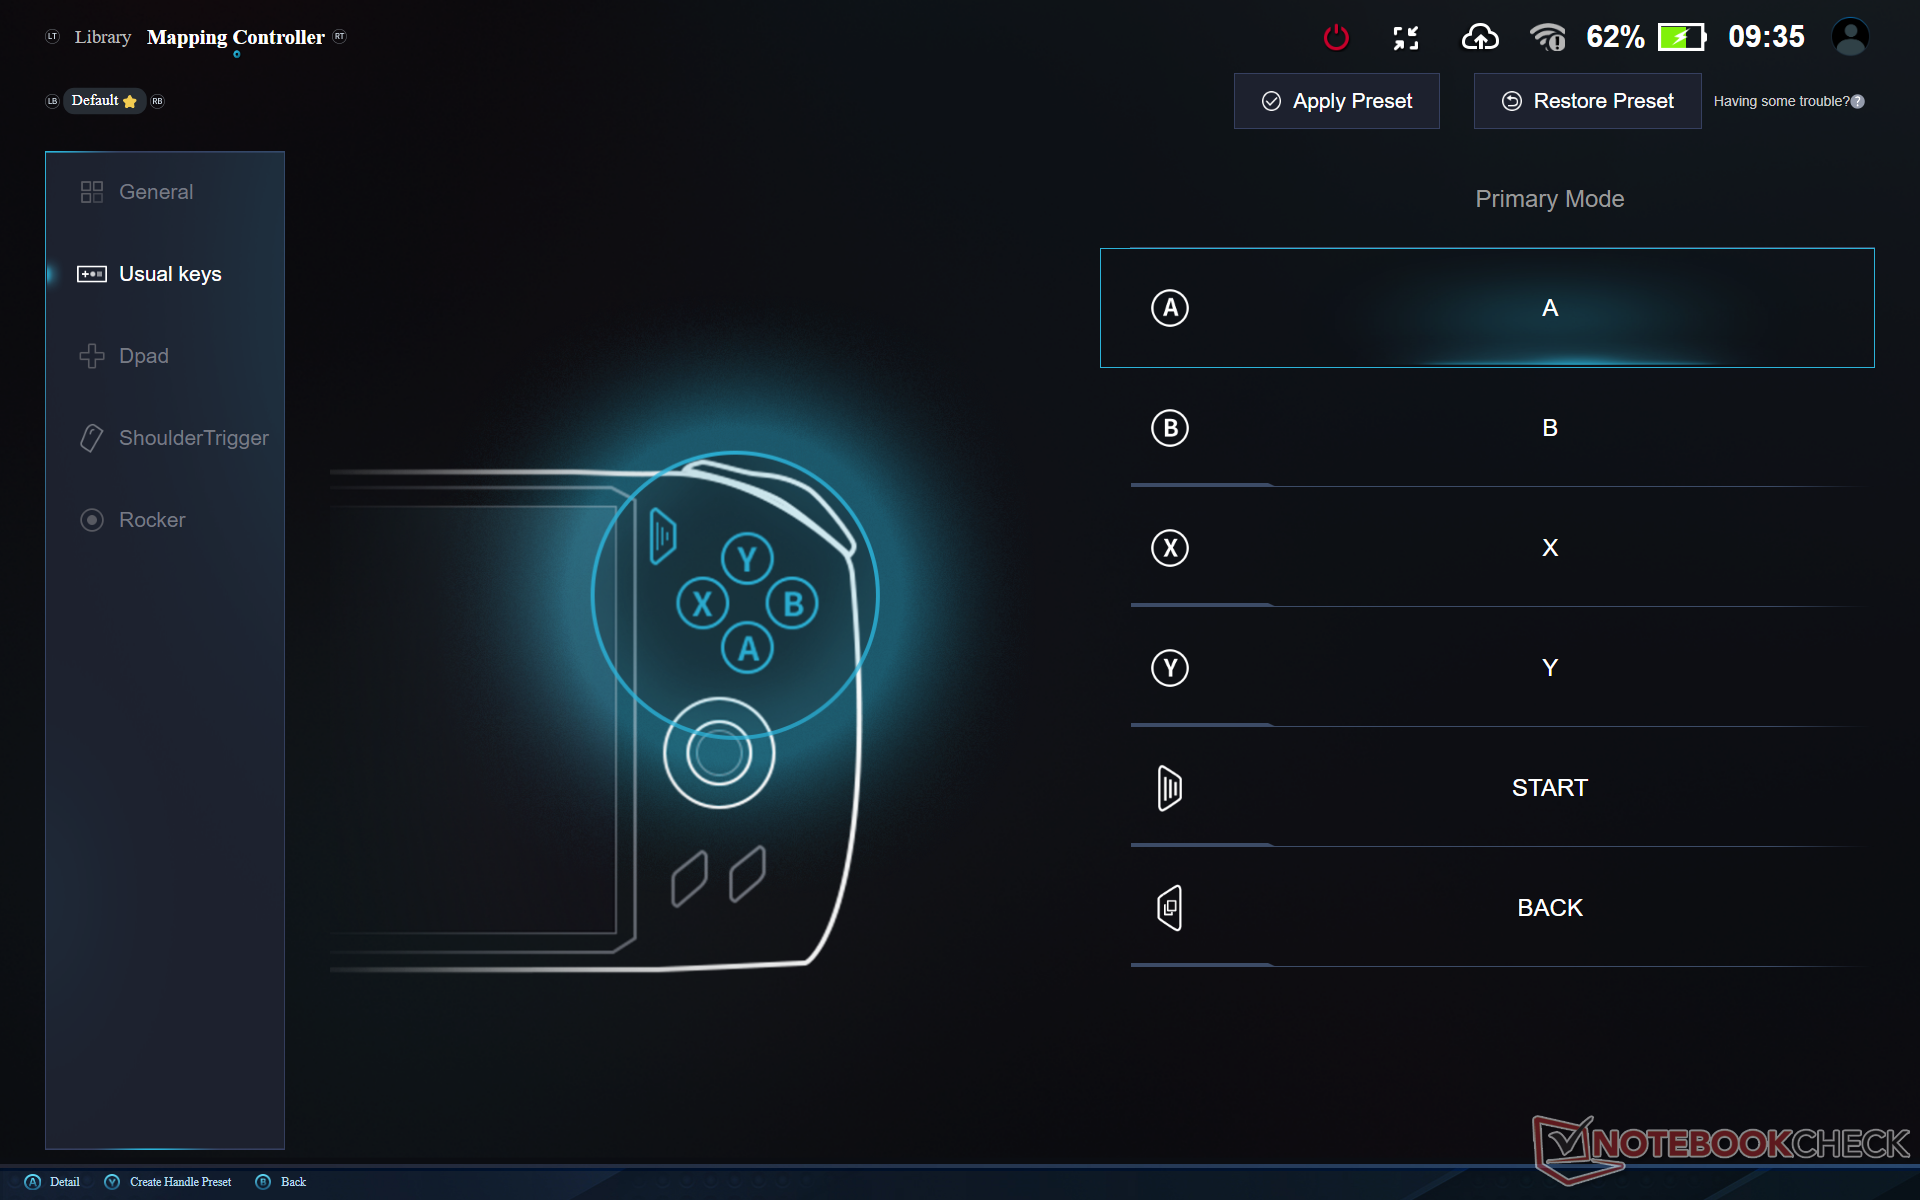
By default, the system is set to Balanced mode and the CPU to 15 W only. We instead set Windows to Performance mode and the CPU to 28 W prior to running the benchmarks below. The latter can be accessed by pressing the yellow Turbo button near the bottom right corner of the screen. It's recommended that users become familiar with the pre-installed Turbo menu and OneXConsole applications for customizing auxiliary functions like the front LEDs or button mapping.
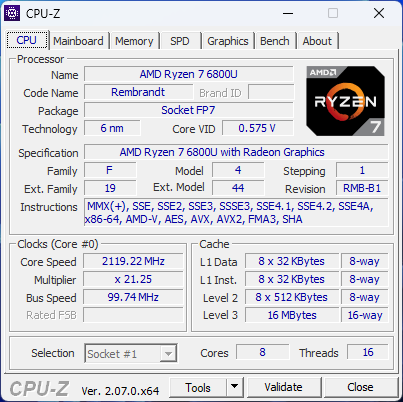
Processor
CPU performance is excellent and comparable to laptops running on the same Ryzen 7 6800U CPU despite the smaller size of our A1 handheld. Nonetheless, the Ryzen Z1 Extreme in the ROG Ally is 30 percent faster while the Ryzen 7 7840HS is even faster still at 40 percent over our Aokzoe.
It's worth noting that processor performance is 25 percent faster than on the OneXPlayer 2 even though both models use the same Ryzen 7 6800U processor. This suggests that the CPU in the OneXPlayer throttles more heavily than on our A1 model.
Cinebench R15 Multi Loop
Cinebench R23: Multi Core | Single Core
Cinebench R20: CPU (Multi Core) | CPU (Single Core)
Cinebench R15: CPU Multi 64Bit | CPU Single 64Bit
Blender: v2.79 BMW27 CPU
7-Zip 18.03: 7z b 4 | 7z b 4 -mmt1
Geekbench 5.5: Multi-Core | Single-Core
HWBOT x265 Benchmark v2.2: 4k Preset
LibreOffice : 20 Documents To PDF
R Benchmark 2.5: Overall mean
* ... smaller is better
AIDA64: FP32 Ray-Trace | FPU Julia | CPU SHA3 | CPU Queen | FPU SinJulia | FPU Mandel | CPU AES | CPU ZLib | FP64 Ray-Trace | CPU PhotoWorxx
| Performance rating | |
| Asus ROG Ally Z1 Extreme | |
| Aokzoe A1 | |
| Average AMD Ryzen 7 6800U | |
| GPD Win 4 | |
| One Netbook XPlayer 2 | |
| AIDA64 / FP32 Ray-Trace | |
| Asus ROG Ally Z1 Extreme | |
| Aokzoe A1 | |
| Average AMD Ryzen 7 6800U (10902 - 12818, n=6) | |
| GPD Win 4 | |
| One Netbook XPlayer 2 | |
| AIDA64 / FPU Julia | |
| Asus ROG Ally Z1 Extreme | |
| Aokzoe A1 | |
| Average AMD Ryzen 7 6800U (67503 - 84031, n=6) | |
| GPD Win 4 | |
| One Netbook XPlayer 2 | |
| AIDA64 / CPU SHA3 | |
| Asus ROG Ally Z1 Extreme | |
| Aokzoe A1 | |
| Average AMD Ryzen 7 6800U (2296 - 2818, n=6) | |
| GPD Win 4 | |
| One Netbook XPlayer 2 | |
| AIDA64 / CPU Queen | |
| Asus ROG Ally Z1 Extreme | |
| Aokzoe A1 | |
| GPD Win 4 | |
| Average AMD Ryzen 7 6800U (62082 - 96306, n=6) | |
| One Netbook XPlayer 2 | |
| AIDA64 / FPU SinJulia | |
| Asus ROG Ally Z1 Extreme | |
| Aokzoe A1 | |
| GPD Win 4 | |
| Average AMD Ryzen 7 6800U (7753 - 11982, n=6) | |
| One Netbook XPlayer 2 | |
| AIDA64 / FPU Mandel | |
| Asus ROG Ally Z1 Extreme | |
| Aokzoe A1 | |
| Average AMD Ryzen 7 6800U (37417 - 45748, n=6) | |
| GPD Win 4 | |
| One Netbook XPlayer 2 | |
| AIDA64 / CPU AES | |
| Aokzoe A1 | |
| GPD Win 4 | |
| Average AMD Ryzen 7 6800U (50547 - 115681, n=6) | |
| One Netbook XPlayer 2 | |
| Asus ROG Ally Z1 Extreme | |
| AIDA64 / CPU ZLib | |
| Asus ROG Ally Z1 Extreme | |
| Aokzoe A1 | |
| Average AMD Ryzen 7 6800U (554 - 755, n=6) | |
| GPD Win 4 | |
| One Netbook XPlayer 2 | |
| AIDA64 / FP64 Ray-Trace | |
| Asus ROG Ally Z1 Extreme | |
| Aokzoe A1 | |
| Average AMD Ryzen 7 6800U (5825 - 6694, n=6) | |
| GPD Win 4 | |
| One Netbook XPlayer 2 | |
| AIDA64 / CPU PhotoWorxx | |
| Asus ROG Ally Z1 Extreme | |
| GPD Win 4 | |
| One Netbook XPlayer 2 | |
| Average AMD Ryzen 7 6800U (24728 - 27274, n=6) | |
| Aokzoe A1 | |
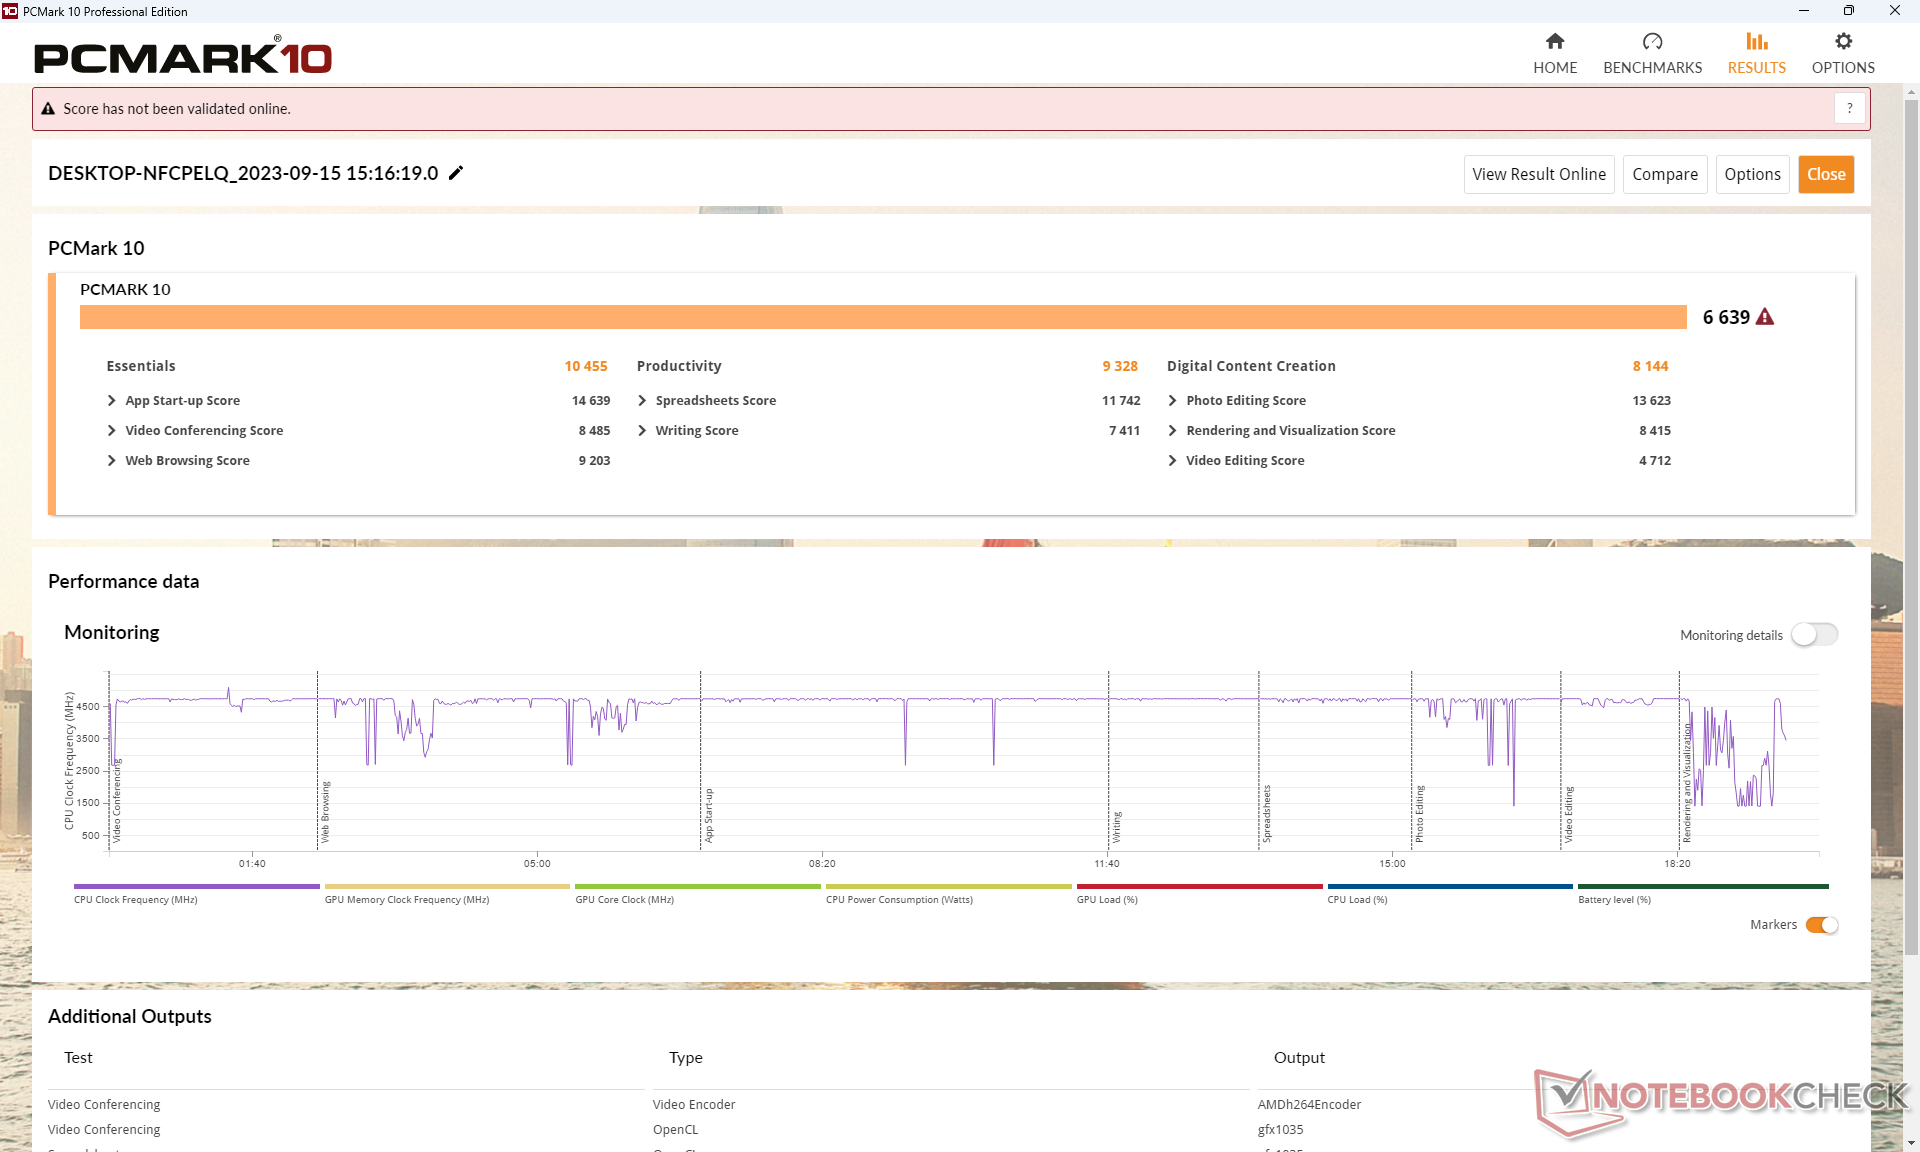
System Performance
PCMark scores are very high and comparable to many newer high-end laptops like the Lenovo Yoga 7 14. The ROG Ally Z1 Extreme scores even better due to its faster processor.
We experienced a couple of bugs on our test unit with the most prominent being wake-from-sleep issues. Pressing the power button turns off the screen for sleep mode, but the screen would sometimes fail to turn back on even though the fan would continue running. A forced reboot would then be required to return to Windows.
CrossMark: Overall | Productivity | Creativity | Responsiveness
| PCMark 10 / Score | |
| Asus ROG Ally Z1 Extreme | |
| Aokzoe A1 | |
| GPD Win 4 | |
| Average AMD Ryzen 7 6800U, AMD Radeon 680M (5057 - 6639, n=7) | |
| One Netbook XPlayer 2 | |
| GPD Win 3 | |
| PCMark 10 / Essentials | |
| Aokzoe A1 | |
| Asus ROG Ally Z1 Extreme | |
| GPD Win 4 | |
| Average AMD Ryzen 7 6800U, AMD Radeon 680M (8143 - 10766, n=6) | |
| GPD Win 3 | |
| One Netbook XPlayer 2 | |
| PCMark 10 / Productivity | |
| Asus ROG Ally Z1 Extreme | |
| Aokzoe A1 | |
| GPD Win 4 | |
| Average AMD Ryzen 7 6800U, AMD Radeon 680M (6089 - 9328, n=6) | |
| GPD Win 3 | |
| One Netbook XPlayer 2 | |
| PCMark 10 / Digital Content Creation | |
| Asus ROG Ally Z1 Extreme | |
| Aokzoe A1 | |
| GPD Win 4 | |
| Average AMD Ryzen 7 6800U, AMD Radeon 680M (6066 - 8144, n=6) | |
| One Netbook XPlayer 2 | |
| GPD Win 3 | |
| CrossMark / Overall | |
| Asus ROG Ally Z1 Extreme | |
| GPD Win 4 | |
| Aokzoe A1 | |
| Average AMD Ryzen 7 6800U, AMD Radeon 680M (1009 - 1575, n=7) | |
| One Netbook XPlayer 2 | |
| CrossMark / Productivity | |
| Asus ROG Ally Z1 Extreme | |
| GPD Win 4 | |
| Aokzoe A1 | |
| Average AMD Ryzen 7 6800U, AMD Radeon 680M (971 - 1596, n=7) | |
| One Netbook XPlayer 2 | |
| CrossMark / Creativity | |
| Asus ROG Ally Z1 Extreme | |
| GPD Win 4 | |
| Aokzoe A1 | |
| Average AMD Ryzen 7 6800U, AMD Radeon 680M (1054 - 1686, n=7) | |
| One Netbook XPlayer 2 | |
| CrossMark / Responsiveness | |
| GPD Win 4 | |
| Asus ROG Ally Z1 Extreme | |
| Aokzoe A1 | |
| Average AMD Ryzen 7 6800U, AMD Radeon 680M (994 - 1473, n=7) | |
| One Netbook XPlayer 2 | |
| PCMark 10 Score | 6639 points | |
Help | ||
| AIDA64 / Memory Copy | |
| Asus ROG Ally Z1 Extreme | |
| GPD Win 4 | |
| Average AMD Ryzen 7 6800U (47010 - 52159, n=6) | |
| One Netbook XPlayer 2 | |
| Aokzoe A1 | |
| AIDA64 / Memory Read | |
| Asus ROG Ally Z1 Extreme | |
| GPD Win 4 | |
| One Netbook XPlayer 2 | |
| Average AMD Ryzen 7 6800U (39197 - 45084, n=6) | |
| Aokzoe A1 | |
| AIDA64 / Memory Write | |
| Asus ROG Ally Z1 Extreme | |
| GPD Win 4 | |
| One Netbook XPlayer 2 | |
| Average AMD Ryzen 7 6800U (48723 - 51117, n=6) | |
| Aokzoe A1 | |
| AIDA64 / Memory Latency | |
| One Netbook XPlayer 2 | |
| Asus ROG Ally Z1 Extreme | |
| Average AMD Ryzen 7 6800U (106.3 - 123.1, n=6) | |
| GPD Win 4 | |
| Aokzoe A1 | |
* ... smaller is better
DPC Latency
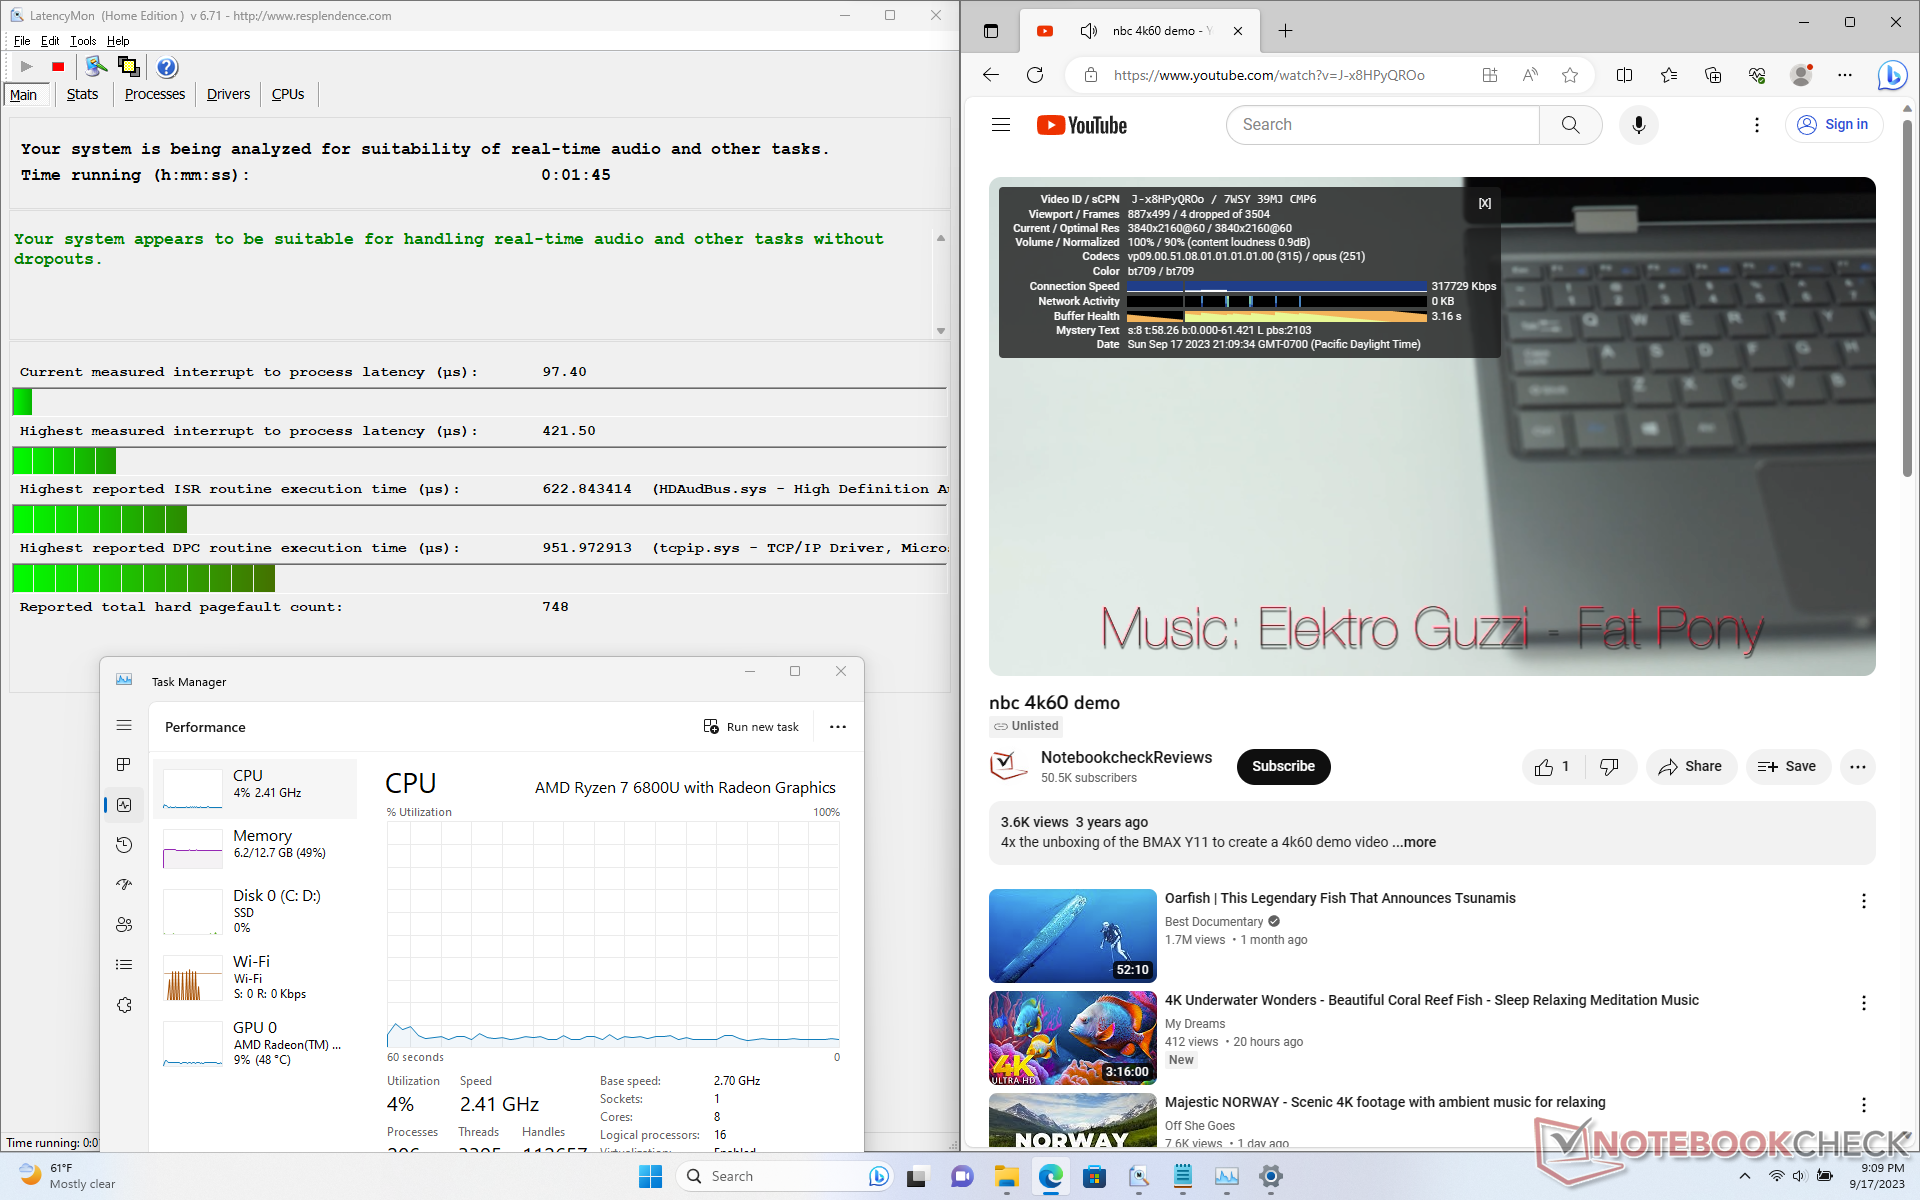
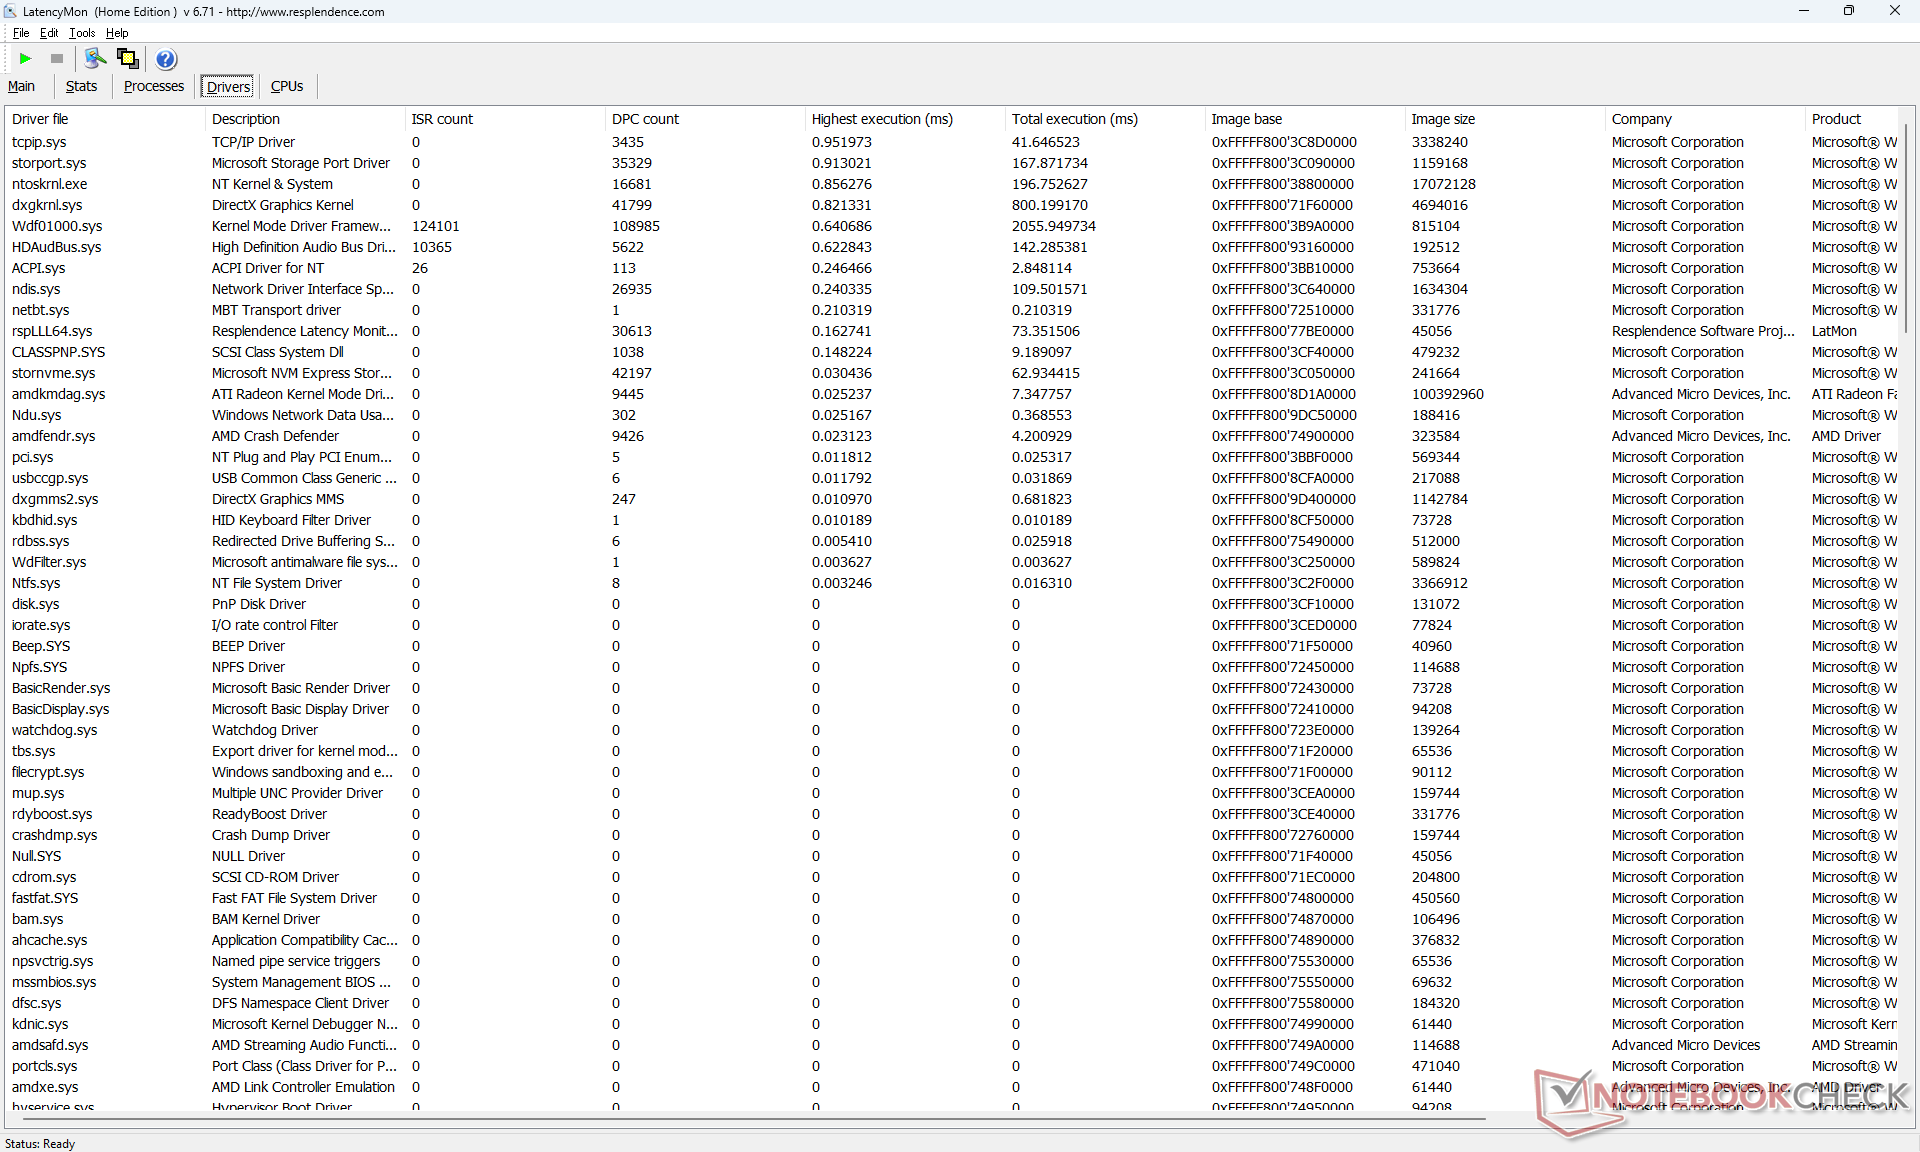
LatencyMon shows no major DPC issues when opening multiple tabs of our homepage. 4K video playback at 60 FPS is good but not perfect with 4 dropped frames during a one-minute test video.
| DPC Latencies / LatencyMon - interrupt to process latency (max), Web, Youtube, Prime95 | |
| One Netbook XPlayer 2 | |
| Asus ROG Ally Z1 Extreme | |
| GPD Win 3 | |
| GPD Win 4 | |
| Aokzoe A1 | |
* ... smaller is better
Storage Devices
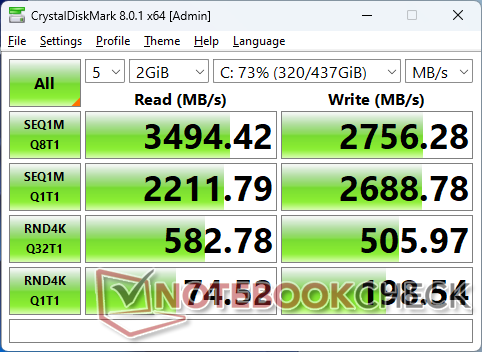
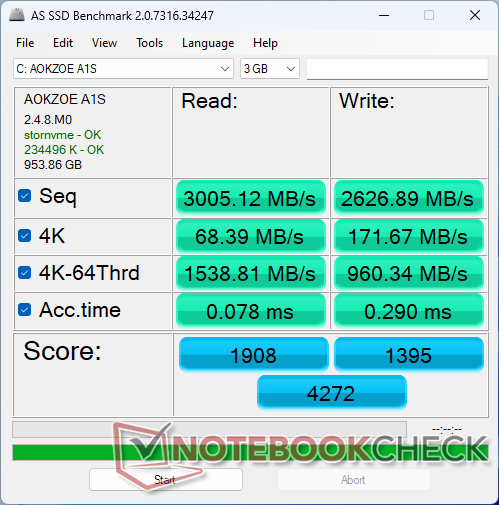
The A1 supports full-size M.2 2280 SSDs whereas some other handheld PCs like the Steam Deck only support the shorter 2230 form factor. The Biwin Aokzoe A1S PCIe3 x4 drive in our test unit would exhibit no issues maintaining maximum transfer rates of 3400 MB/s for extended periods.

| Drive Performance rating - Percent | |
| One Netbook XPlayer 2 | |
| GPD Win 4 | |
| Aokzoe A1 | |
| GPD Win 3 | |
| Asus ROG Ally Z1 Extreme | |
* ... smaller is better
Disk Throttling: DiskSpd Read Loop, Queue Depth 8
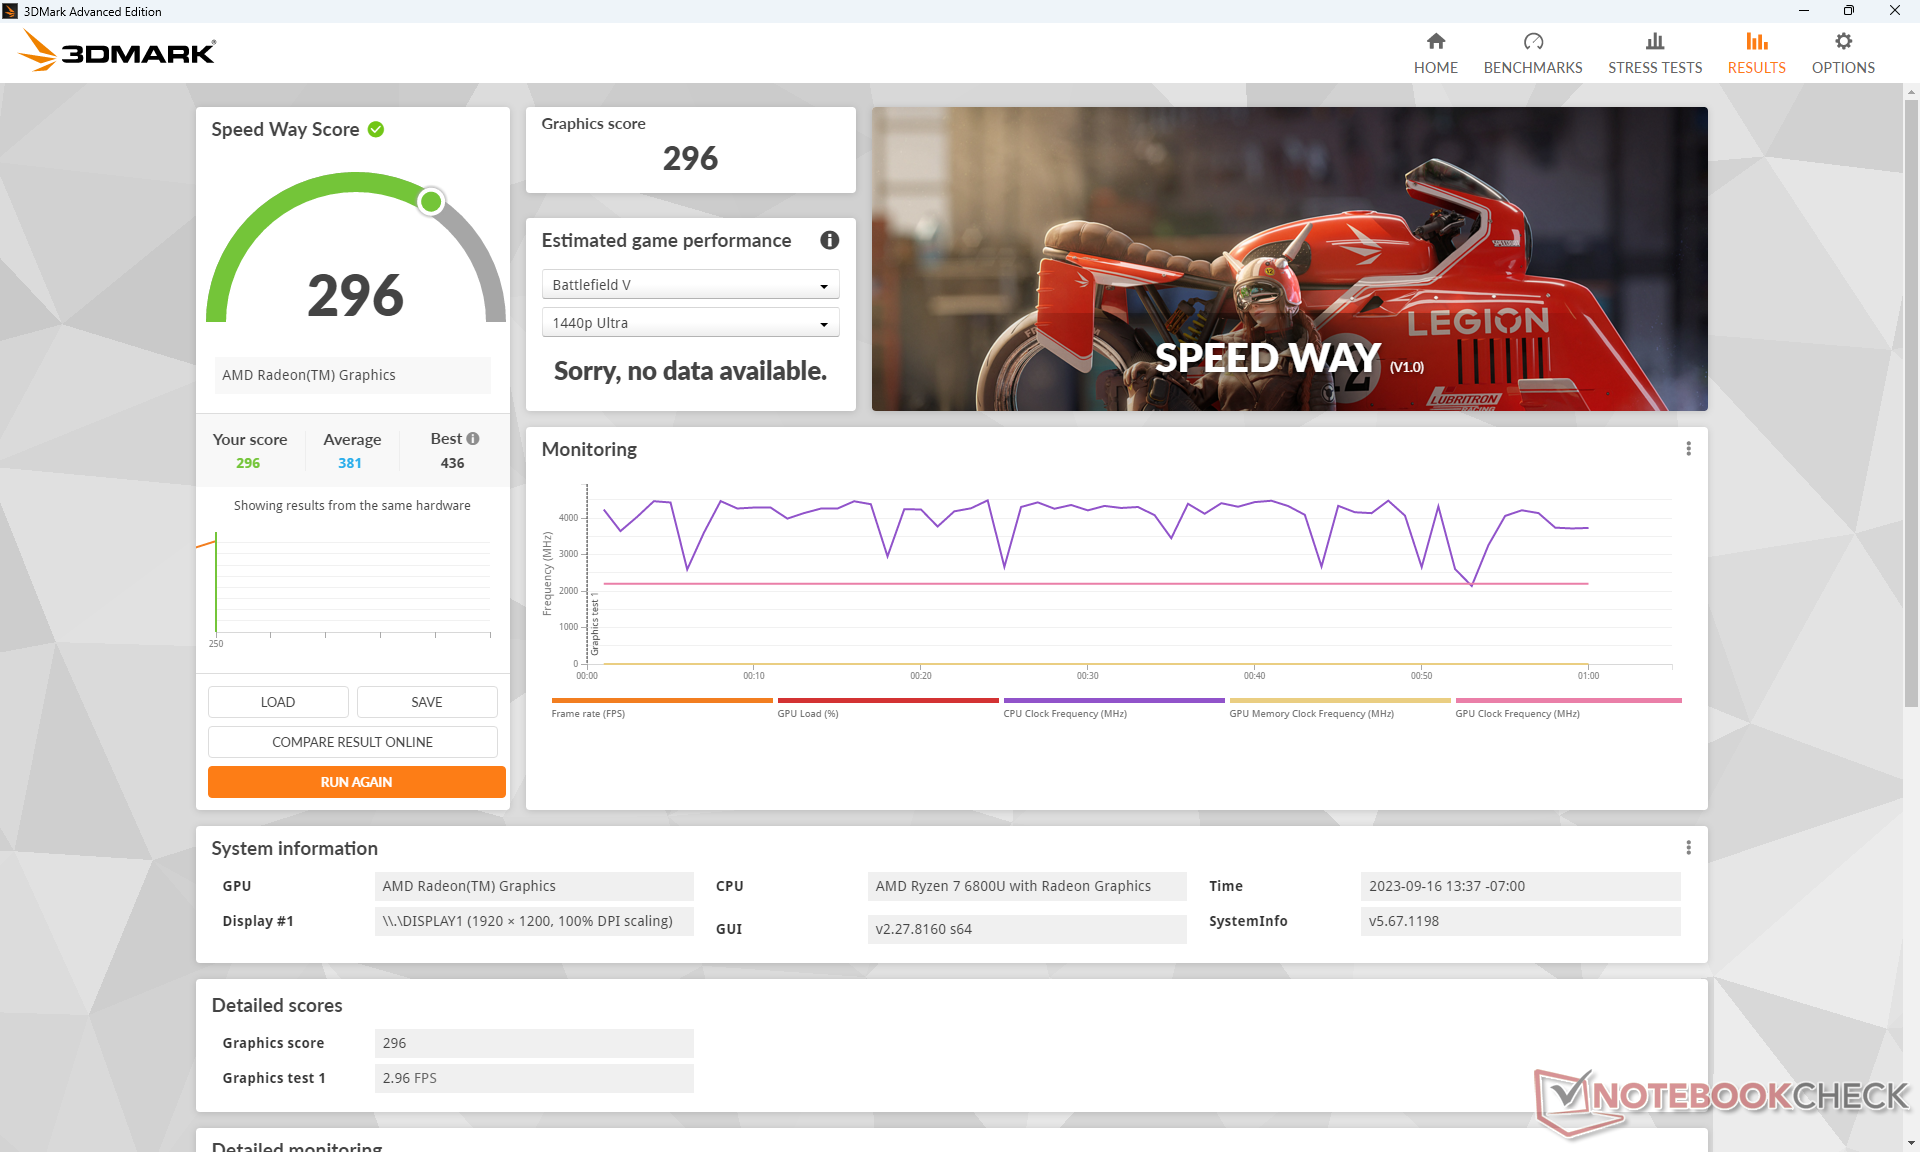
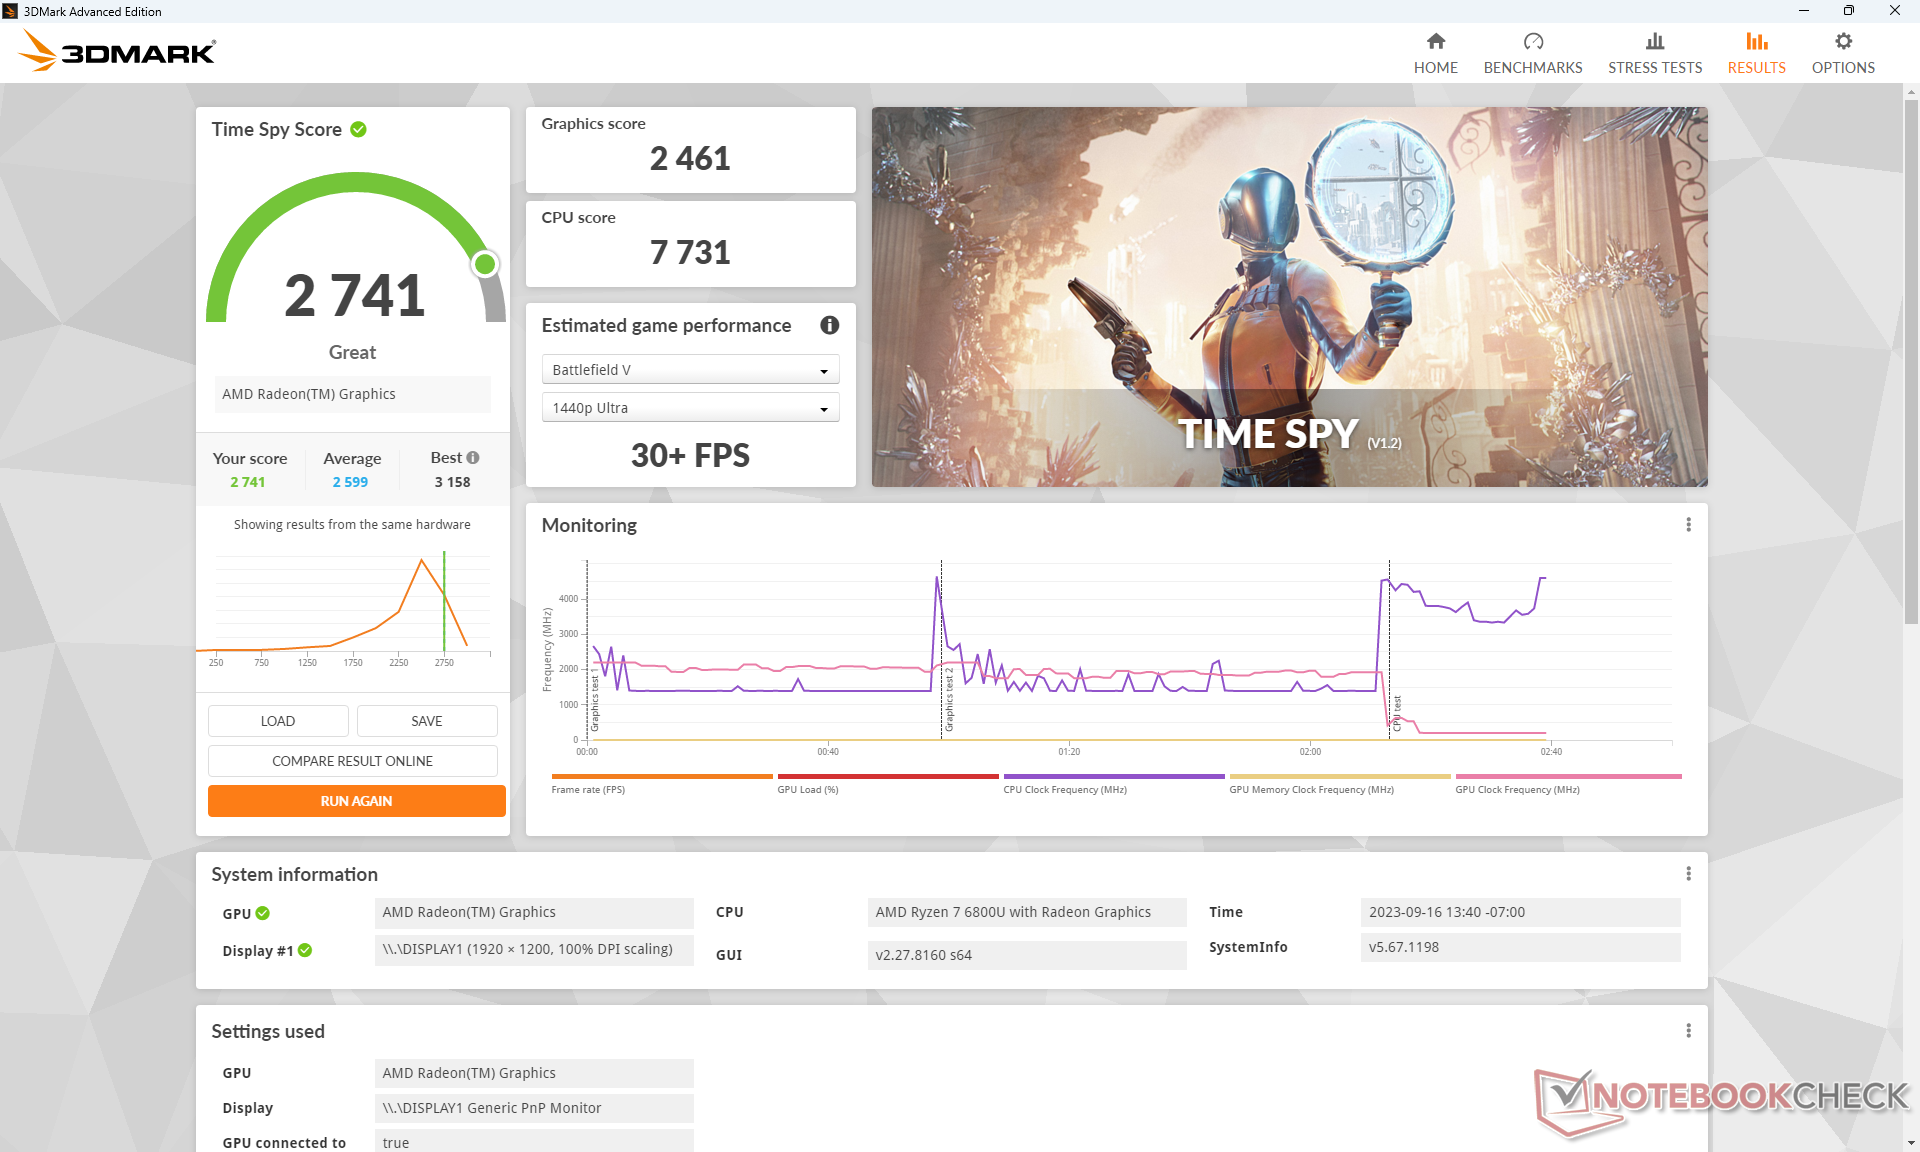
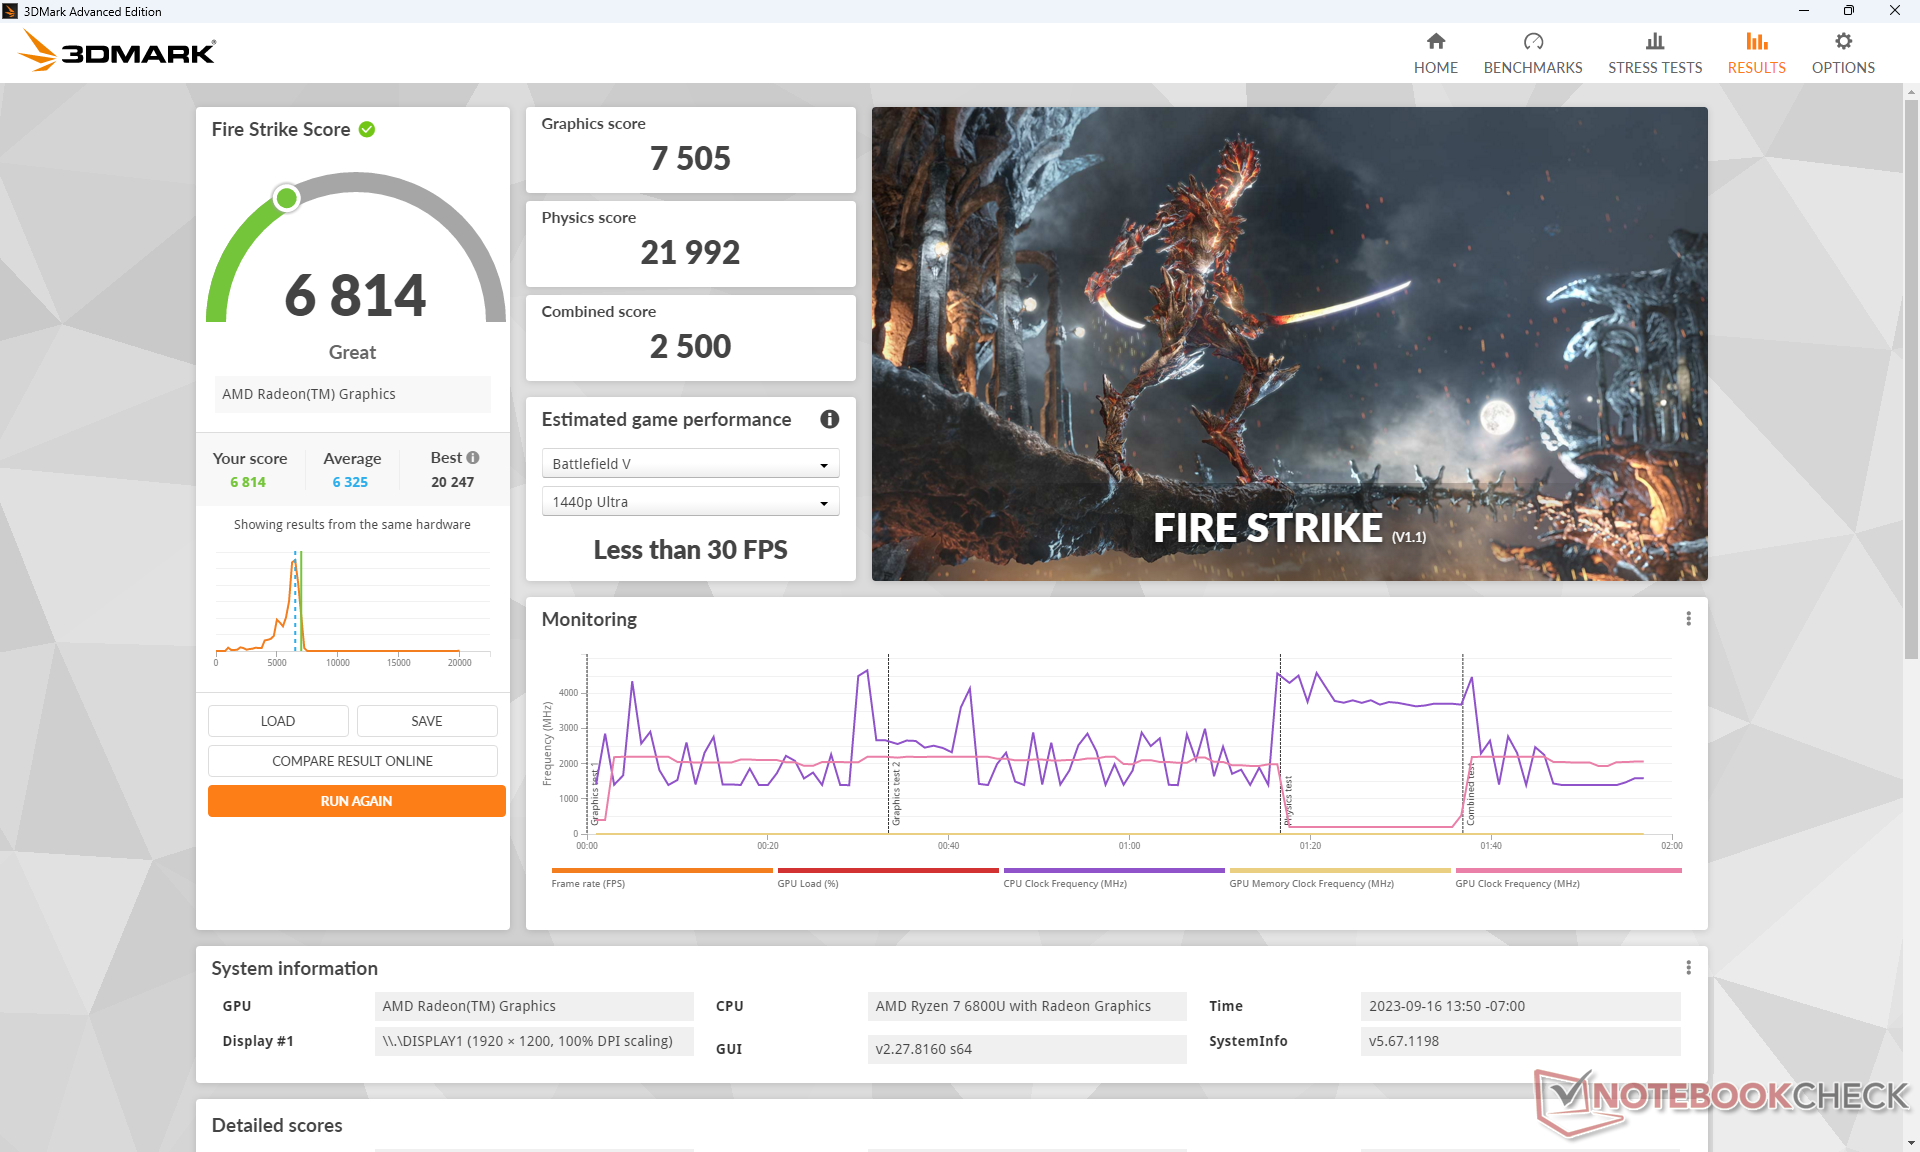
GPU Performance
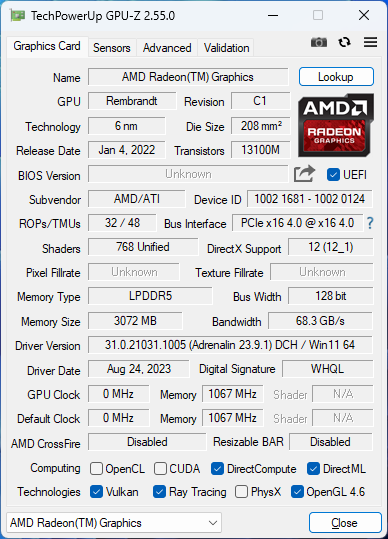
The Radeon 680M is still very fast despite the availability of the newer Radeon 780M. 3DMark results are where we expect them to be relative to laptops with the same GPU if not slightly faster to show no major throttling issues.
Full performance is available on battery power. However, note that graphics performance can decrease by as much as 30 percent if the power profile is set to Balanced mode instead of Performance mode as shown by our 3DMark 11 results table below even if connected to mains.
Upgrading to the Aokzoe A1 Pro with the Radeon 780M is expected to boost graphics performance by about 10 to 20 percent.
| Power Profile | Physics Score | Graphics Score | Combined Score |
| Performance Profile | 14280 | 10741 | 6407 |
| Battery Power | 14732 (-0%) | 10884 (-0%) | 6486 (-0%) |
| Balanced Profile | 11954 (-16%) | 7652 (-30%) | 5591 (-13%) |
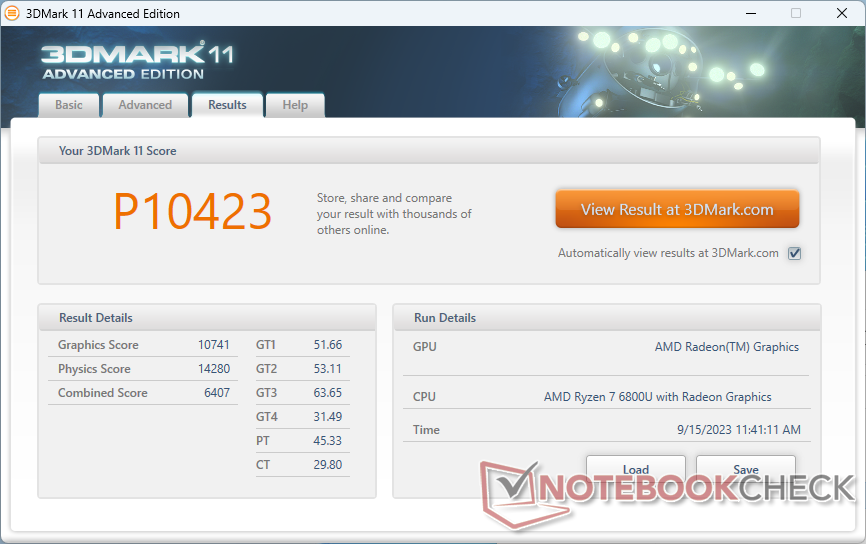
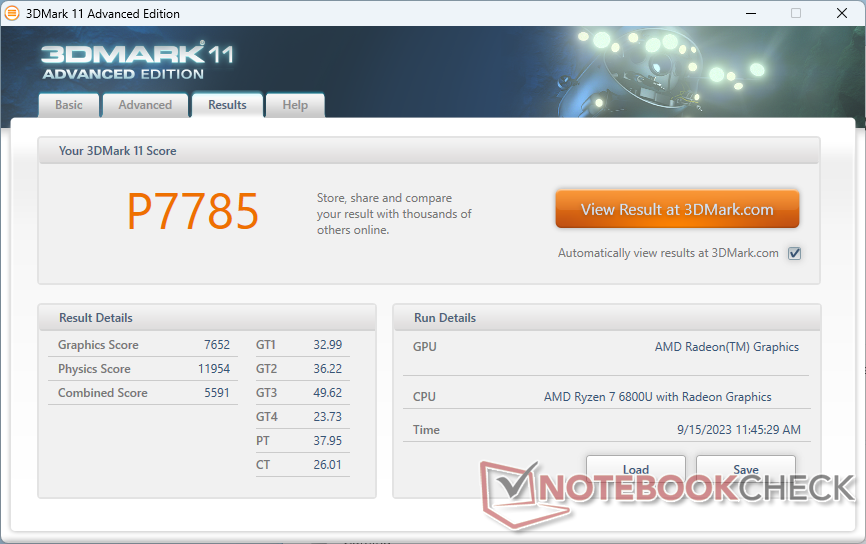
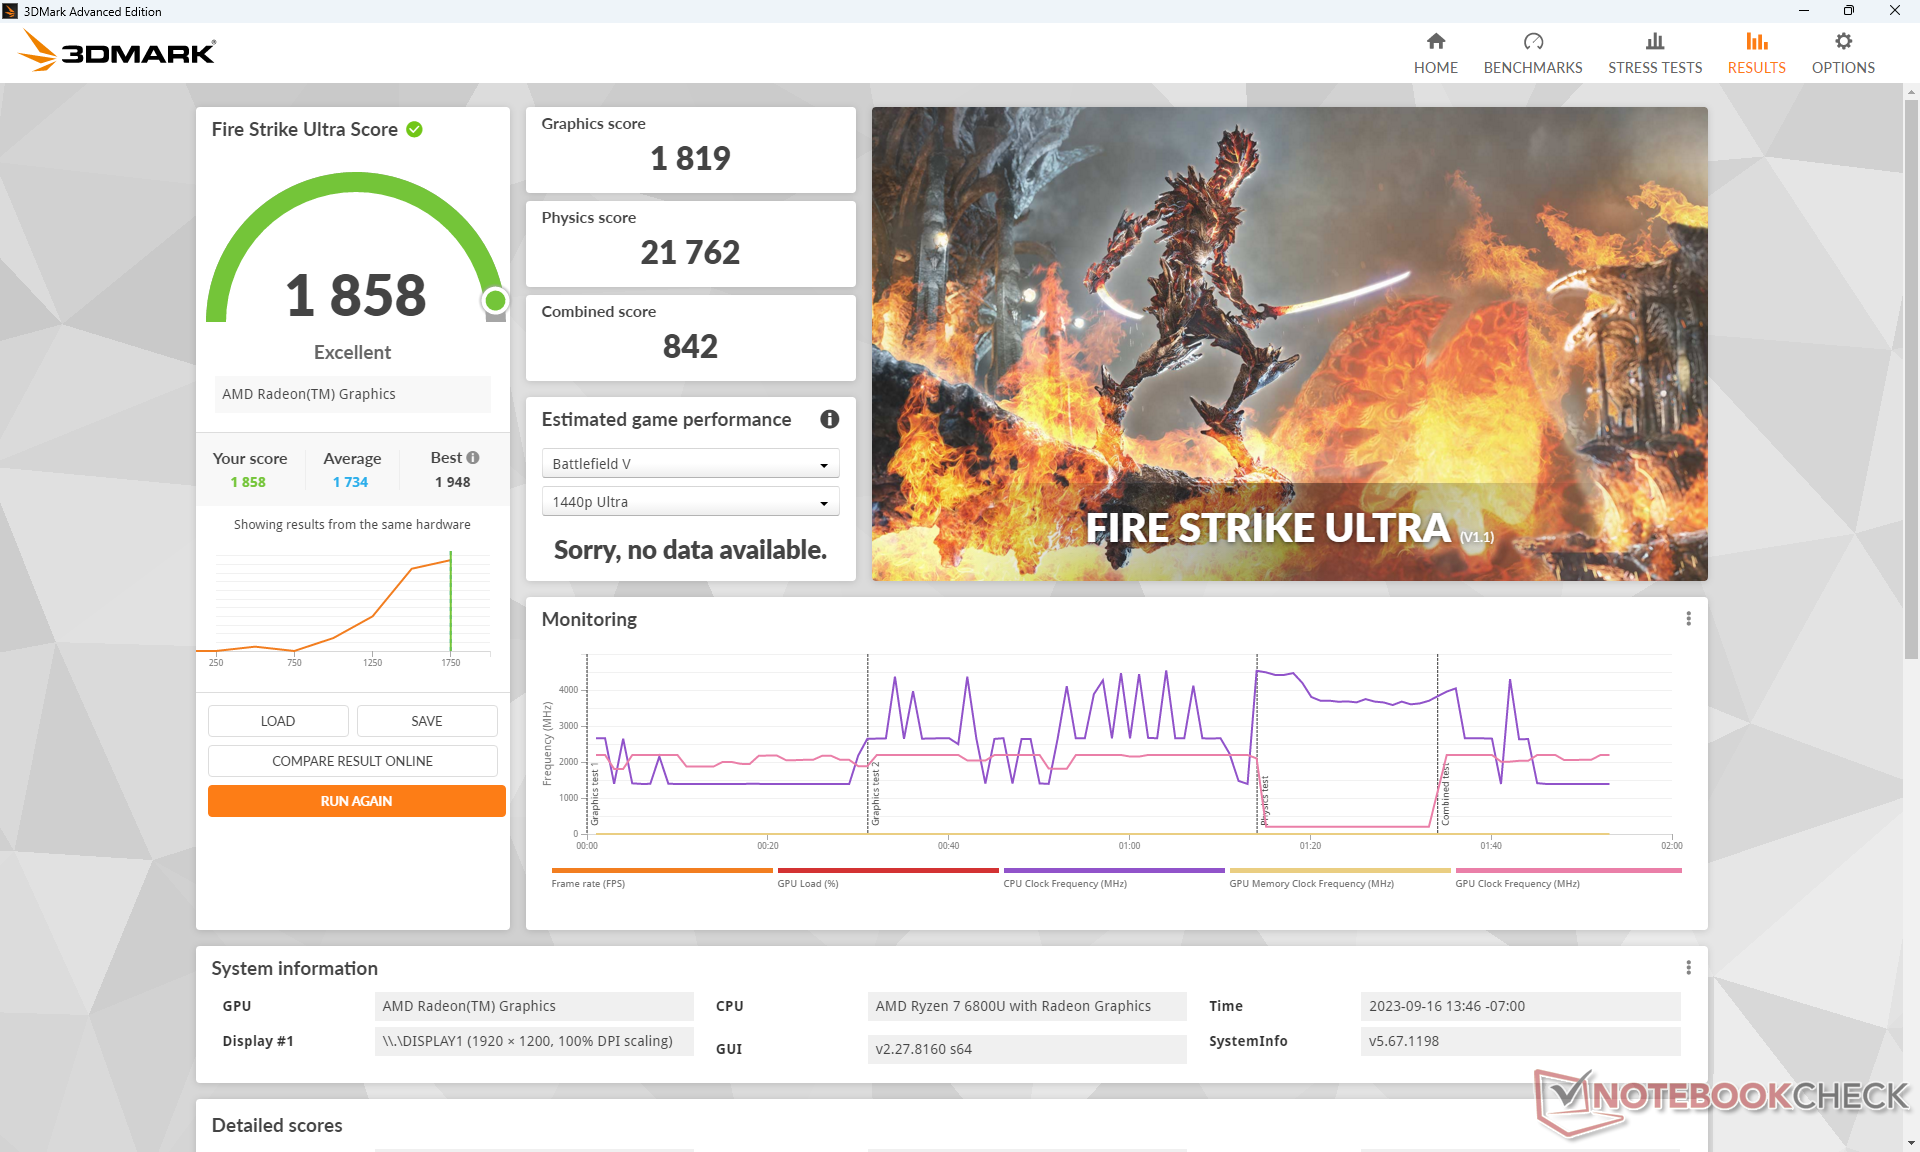
| 3DMark 11 Performance | 10423 points | |
| 3DMark Fire Strike Score | 6814 points | |
| 3DMark Time Spy Score | 2741 points | |
Help | ||
* ... smaller is better
Gaming Performance
Modern titles are playable at the native 1200p resolution and some can even reach a 60 FPS average including F1 22. Nonetheless, we recommend dialing down the settings to low especially for demanding titles like Cyberpunk 2077 to reduce frame dips. The internal display does not support FreeSync which is very unfortunate as it would have paired very well with the Radeon 680M.
| Tiny Tina's Wonderlands | |
| 1280x720 Lowest Preset (DX12) | |
| Beelink SER7 | |
| Average AMD Radeon 680M (59.3 - 126.2, n=17) | |
| Aokzoe A1 | |
| Acer Swift Edge SFE16-42-R1GM | |
| 1920x1080 Low Preset (DX12) | |
| Beelink SER7 | |
| Aokzoe A1 | |
| Average AMD Radeon 680M (37.7 - 65.8, n=18) | |
| Asus ZenBook 14X OLED UX5400EA-L7154W | |
| Acer Swift Edge SFE16-42-R1GM | |
| 1920x1080 Medium Preset (DX12) | |
| Beelink SER7 | |
| Aokzoe A1 | |
| Average AMD Radeon 680M (28.2 - 47.7, n=18) | |
| Acer Swift Edge SFE16-42-R1GM | |
| Asus ZenBook 14X OLED UX5400EA-L7154W | |
| 1920x1080 High Preset (DX12) | |
| Beelink SER7 | |
| Aokzoe A1 | |
| Average AMD Radeon 680M (19.8 - 32.3, n=18) | |
| Acer Swift Edge SFE16-42-R1GM | |
| Asus ZenBook 14X OLED UX5400EA-L7154W | |
| 1920x1080 Badass Preset (DX12) | |
| Beelink SER7 | |
| Aokzoe A1 | |
| Average AMD Radeon 680M (16 - 26.1, n=18) | |
| Acer Swift Edge SFE16-42-R1GM | |
| Asus ZenBook 14X OLED UX5400EA-L7154W | |
| Cyberpunk 2077 1.6 | |
| 1280x720 Low Preset | |
| Beelink SER7 | |
| Average AMD Radeon 680M (46.1 - 77.6, n=14) | |
| GPD Win 4 | |
| Ayaneo Air 1S Retro Power | |
| Aokzoe A1 | |
| 1920x1080 Low Preset | |
| Beelink SER7 | |
| Asus ROG Ally Z1 Extreme | |
| Ayaneo Air 1S Retro Power | |
| Average AMD Radeon 680M (26 - 50.6, n=15) | |
| GPD Win 4 | |
| Aokzoe A1 | |
| 1920x1080 Medium Preset | |
| Beelink SER7 | |
| Asus ROG Ally Z1 Extreme | |
| Ayaneo Air 1S Retro Power | |
| Average AMD Radeon 680M (20.1 - 41.8, n=15) | |
| GPD Win 4 | |
| Aokzoe A1 | |
| 1920x1080 High Preset | |
| Beelink SER7 | |
| Asus ROG Ally Z1 Extreme | |
| Ayaneo Air 1S Retro Power | |
| GPD Win 4 | |
| Average AMD Radeon 680M (16.3 - 33.6, n=15) | |
| Aokzoe A1 | |
| 1920x1080 Ultra Preset | |
| Beelink SER7 | |
| Asus ROG Ally Z1 Extreme | |
| Average AMD Radeon 680M (14 - 23.8, n=15) | |
| GPD Win 4 | |
| Aokzoe A1 | |
Witcher 3 FPS Chart
| low | med. | high | ultra | |
|---|---|---|---|---|
| GTA V (2015) | 136.6 | 50.5 | 23.5 | |
| The Witcher 3 (2015) | 108.2 | 40.1 | 24.5 | |
| Dota 2 Reborn (2015) | 108.3 | 96.3 | 73 | 69.7 |
| Final Fantasy XV Benchmark (2018) | 63.6 | 33.5 | 24.1 | |
| X-Plane 11.11 (2018) | 57.2 | 46.1 | 36 | |
| Far Cry 5 (2018) | 62 | 38 | 35 | 34 |
| Strange Brigade (2018) | 146.2 | 61.7 | 50.6 | 43.4 |
| Cyberpunk 2077 1.6 (2022) | 34 | 25.8 | 19 | 16.7 |
| Tiny Tina's Wonderlands (2022) | 57.3 | 44 | 28.3 | 22.3 |
| F1 22 (2022) | 78.4 | 69 | 50.5 | 13.2 |
Emissions
System Noise — Persistent Pulsing Problems
Fan noise is one of the weaker aspects of the A1. It pulses very frequently between silence and 37 dB(A) every minute or so to be noticeable and even bothersome in quieter indoor environments. This behavior would occur when on battery mode or even when simply idling on desktop. Setting the system to Balanced mode does not appear to fix the pulsing issue.
Fan noise when gaming is also quite loud, but that is unsurprising given the performance and size of the A1. However, gaming on Balanced mode is quieter at around 37 dB(A) compared to 41 dB(A) or louder if on Performance mode. These ranges are comparable to the ROG Ally or OneXPlayer 2 while being generally quieter than the Win 4.

Noise level
| Idle |
| 23.3 / 27.1 / 37.3 dB(A) |
| Load |
| 37.4 / 46.2 dB(A) |
 | ||
30 dB silent 40 dB(A) audible 50 dB(A) loud |
||
min: | ||
| Aokzoe A1 Radeon 680M, R7 6800U | One Netbook XPlayer 2 Radeon 680M, R7 6800U | Asus ROG Ally Z1 Extreme Radeon 780M, Z1 Extreme, Micron 2400 MTFDKBK512QFM | GPD Win 4 Radeon 680M, R7 6800U, BiWin CE480Y2D100-1TB | GPD Win 3 Iris Xe G7 80EUs, i5-1135G7, BIWIN NS200 1TB CNF82GS1G02-1TB | |
|---|---|---|---|---|---|
| Noise | -3% | 8% | -13% | -6% | |
| off / environment * (dB) | 23 | 26.1 -13% | 23.3 -1% | 24 -4% | 27.4 -19% |
| Idle Minimum * (dB) | 23.3 | 26.1 -12% | 23.3 -0% | 31.2 -34% | 29.1 -25% |
| Idle Average * (dB) | 27.1 | 31.6 -17% | 23.3 14% | 31.2 -15% | 29.1 -7% |
| Idle Maximum * (dB) | 37.3 | 31.6 15% | 27.3 27% | 33.5 10% | 29.1 22% |
| Load Average * (dB) | 37.4 | 35.7 5% | 39.2 -5% | 45.5 -22% | 40.7 -9% |
| Witcher 3 ultra * (dB) | 41.2 | 43.3 -5% | 39.2 5% | 48.6 -18% | 42.8 -4% |
| Load Maximum * (dB) | 46.2 | 43.3 6% | 39.2 15% | 49 -6% | 46.3 -0% |
* ... smaller is better
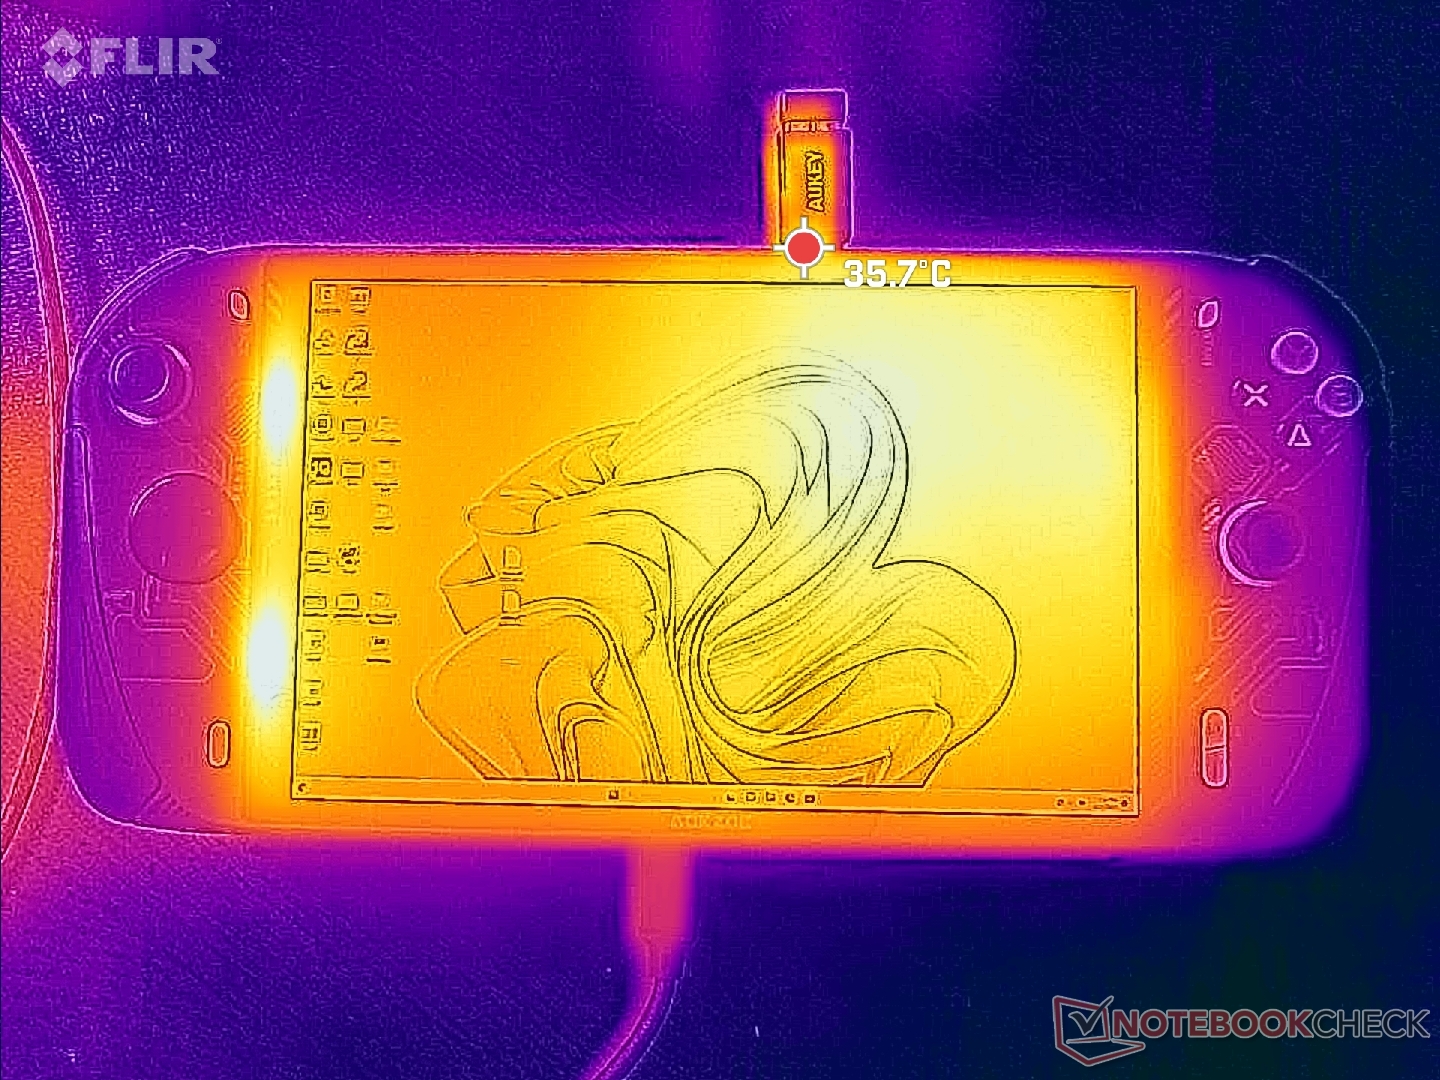
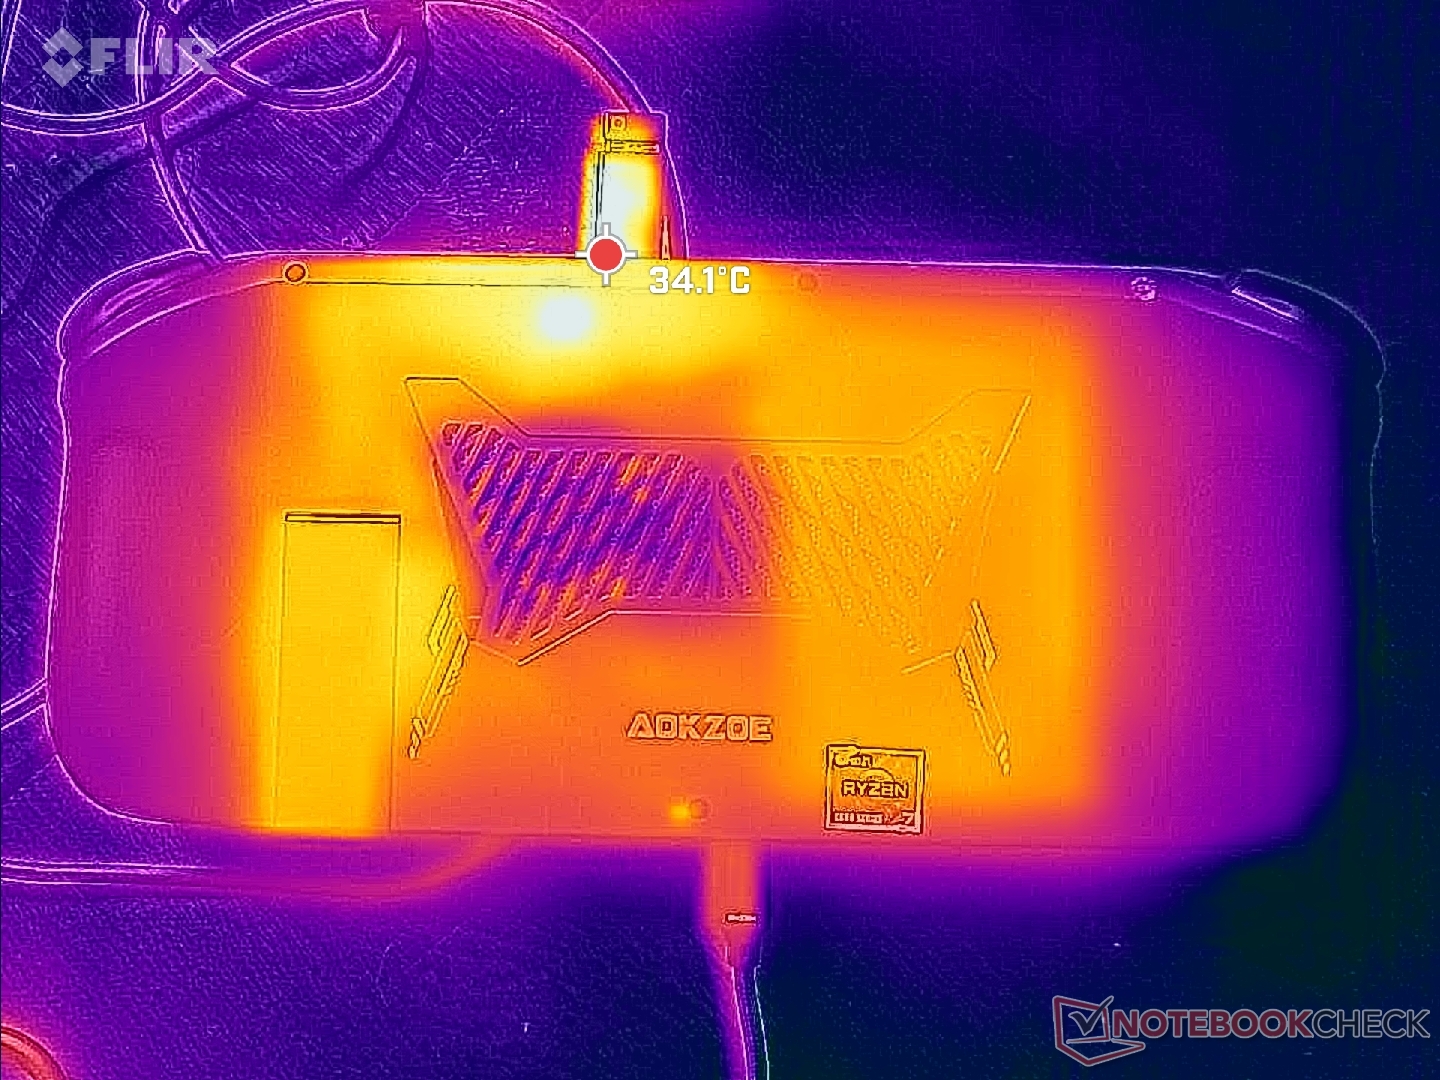
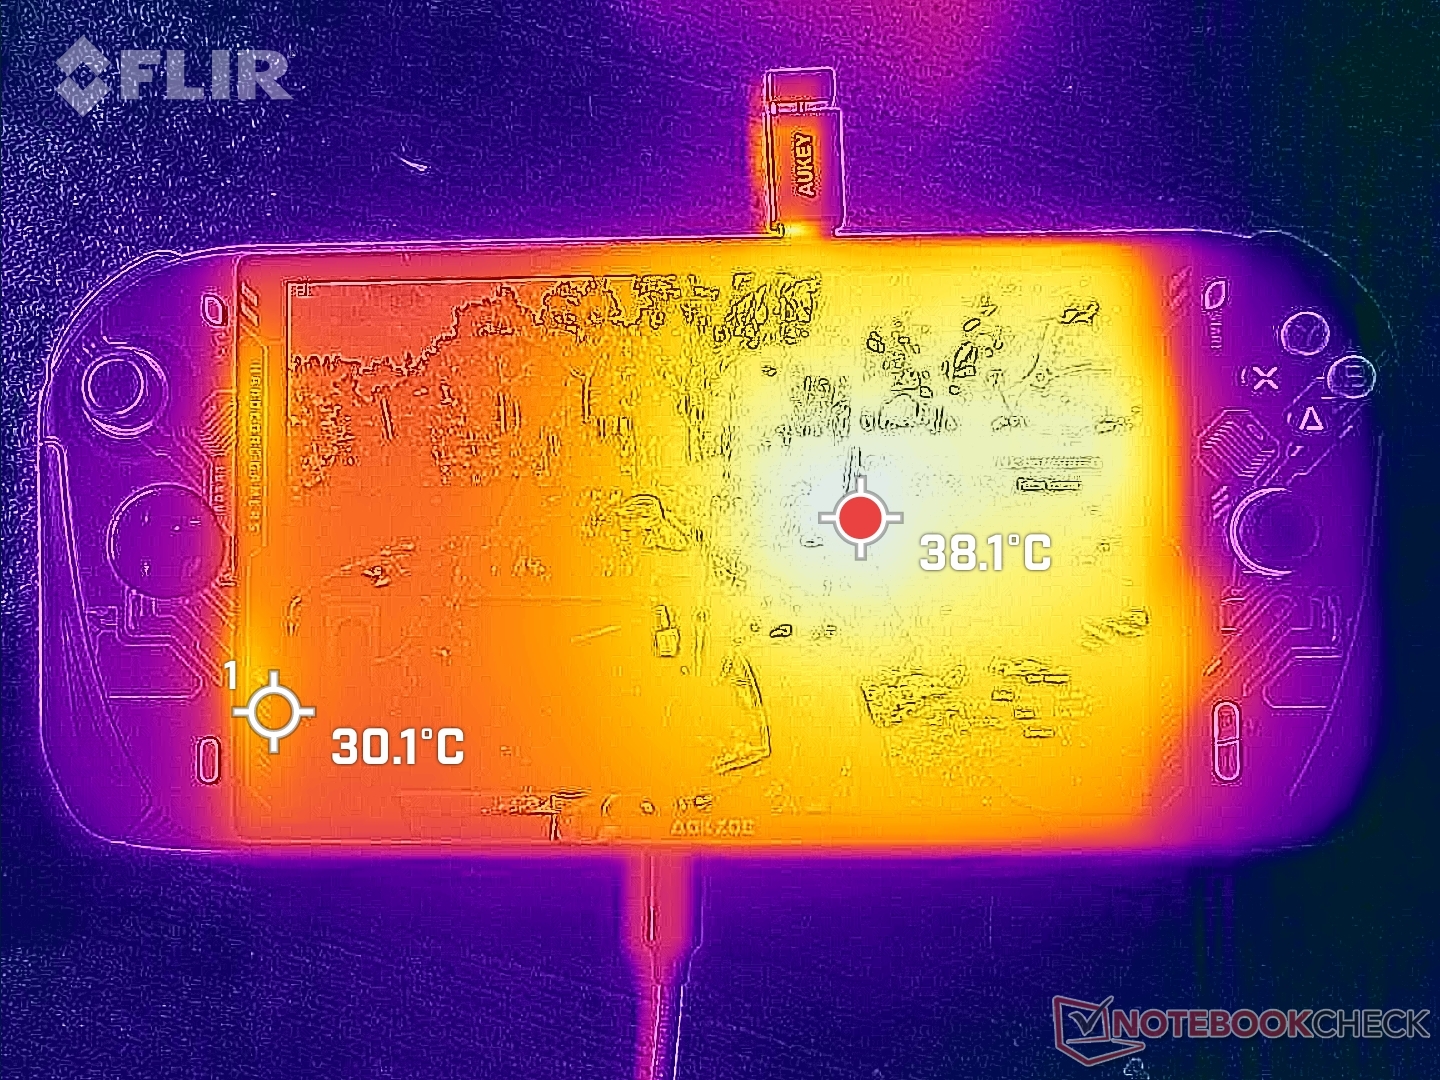
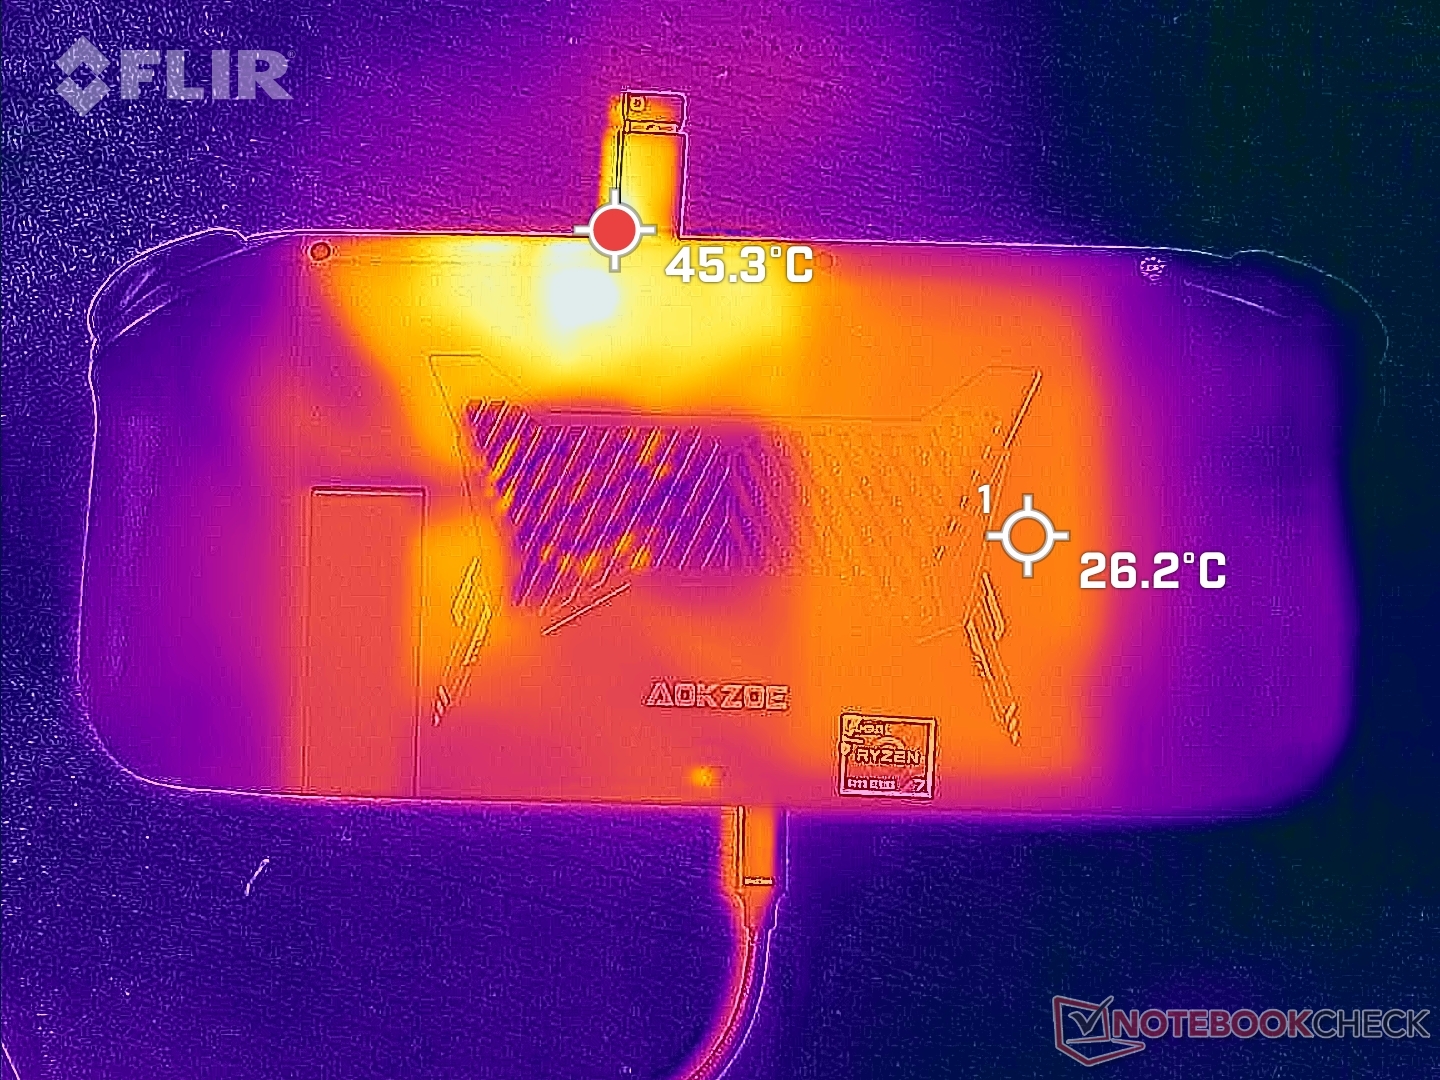
Temperature
Surface temperatures can reach over 39 C on the front and 45 C on the back when gaming. Fortunately, these hot spots are toward the center of the screen or top edge where fingers are unlikely to touch when handing the unit. The controller and button portions remain cooler in the high 20 C to low 30 C range. Our hands would never be uncomfortably warm no matter how long we would play on the A1.
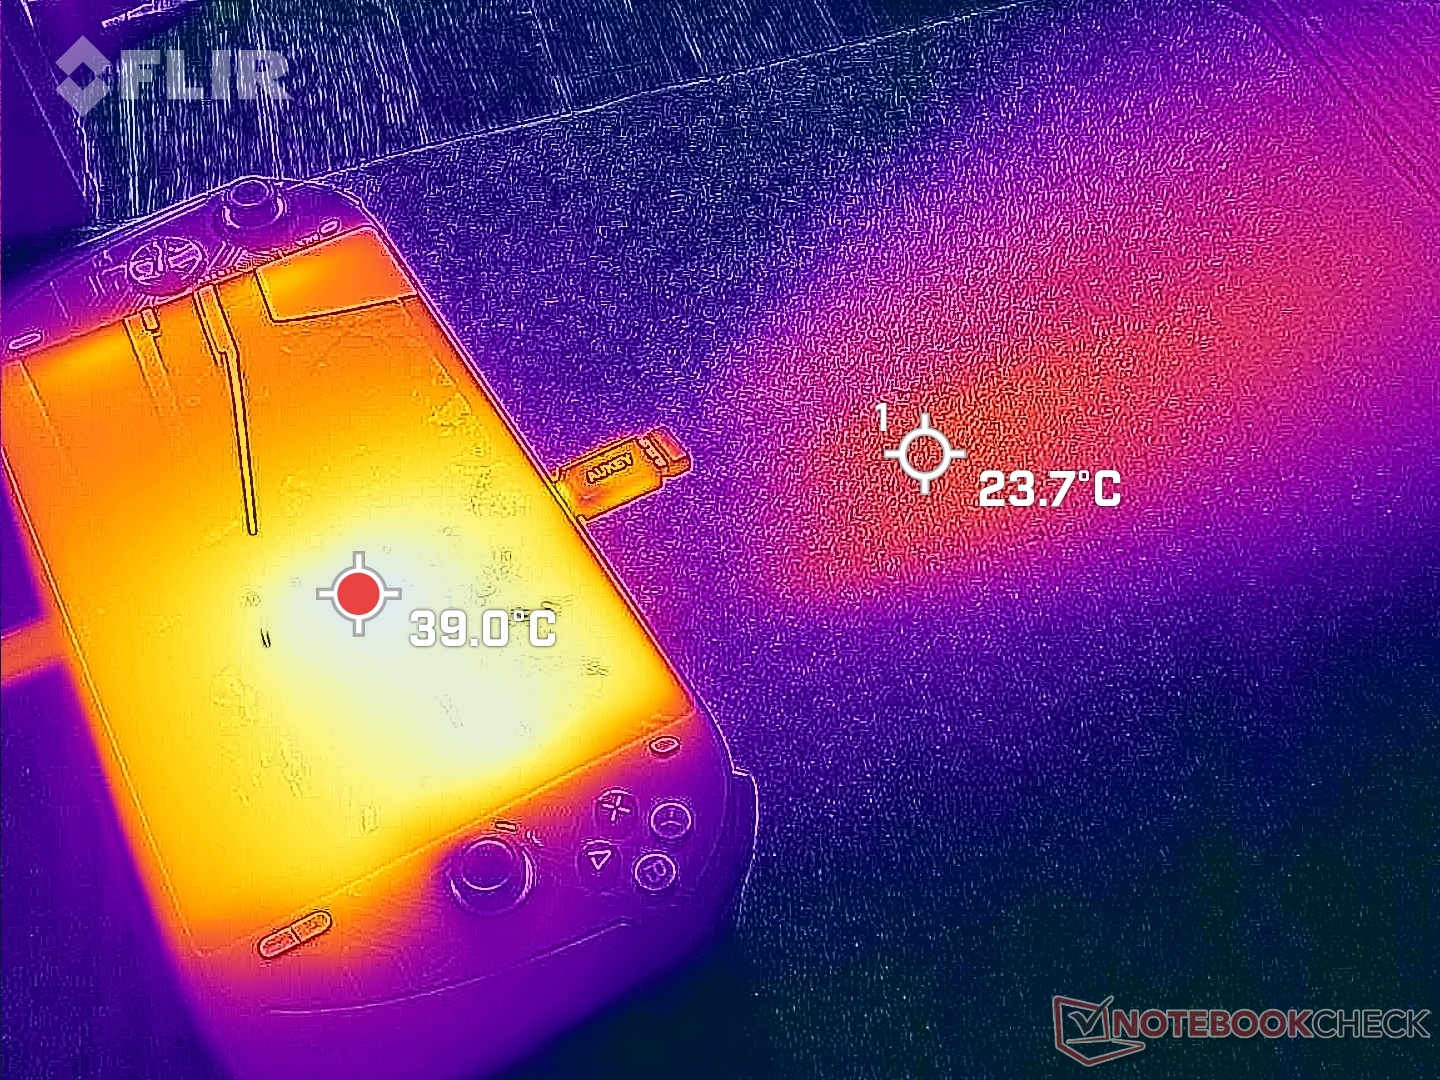
(±) The maximum temperature on the upper side is 41.6 °C / 107 F, compared to the average of 40.4 °C / 105 F, ranging from 21.2 to 68.8 °C for the class Gaming.
(±) The bottom heats up to a maximum of 41.6 °C / 107 F, compared to the average of 43.2 °C / 110 F
(+) In idle usage, the average temperature for the upper side is 31.2 °C / 88 F, compared to the device average of 33.9 °C / 93 F.
(±) The palmrests and touchpad can get very hot to the touch with a maximum of 38.8 °C / 101.8 F.
(-) The average temperature of the palmrest area of similar devices was 28.8 °C / 83.8 F (-10 °C / -18 F).
| Aokzoe A1 AMD Ryzen 7 6800U, AMD Radeon 680M | One Netbook XPlayer 2 AMD Ryzen 7 6800U, AMD Radeon 680M | Asus ROG Ally Z1 Extreme AMD Ryzen Z1 Extreme, AMD Radeon 780M | GPD Win 4 AMD Ryzen 7 6800U, AMD Radeon 680M | GPD Win Max 2 Intel Core i7-1260P, Intel Iris Xe Graphics G7 96EUs | |
|---|---|---|---|---|---|
| Heat | 2% | 8% | 24% | 25% | |
| Maximum Upper Side * (°C) | 41.6 | 42.6 -2% | 44.4 -7% | 35 16% | 28.6 31% |
| Maximum Bottom * (°C) | 41.6 | 39.6 5% | 37.9 9% | 26.8 36% | 33 21% |
| Idle Upper Side * (°C) | 34.8 | 32.4 7% | 29.9 14% | 28.4 18% | 24.6 29% |
| Idle Bottom * (°C) | 33.6 | 34.3 -2% | 28.3 16% | 25 26% | 27.6 18% |
* ... smaller is better
Stress Test
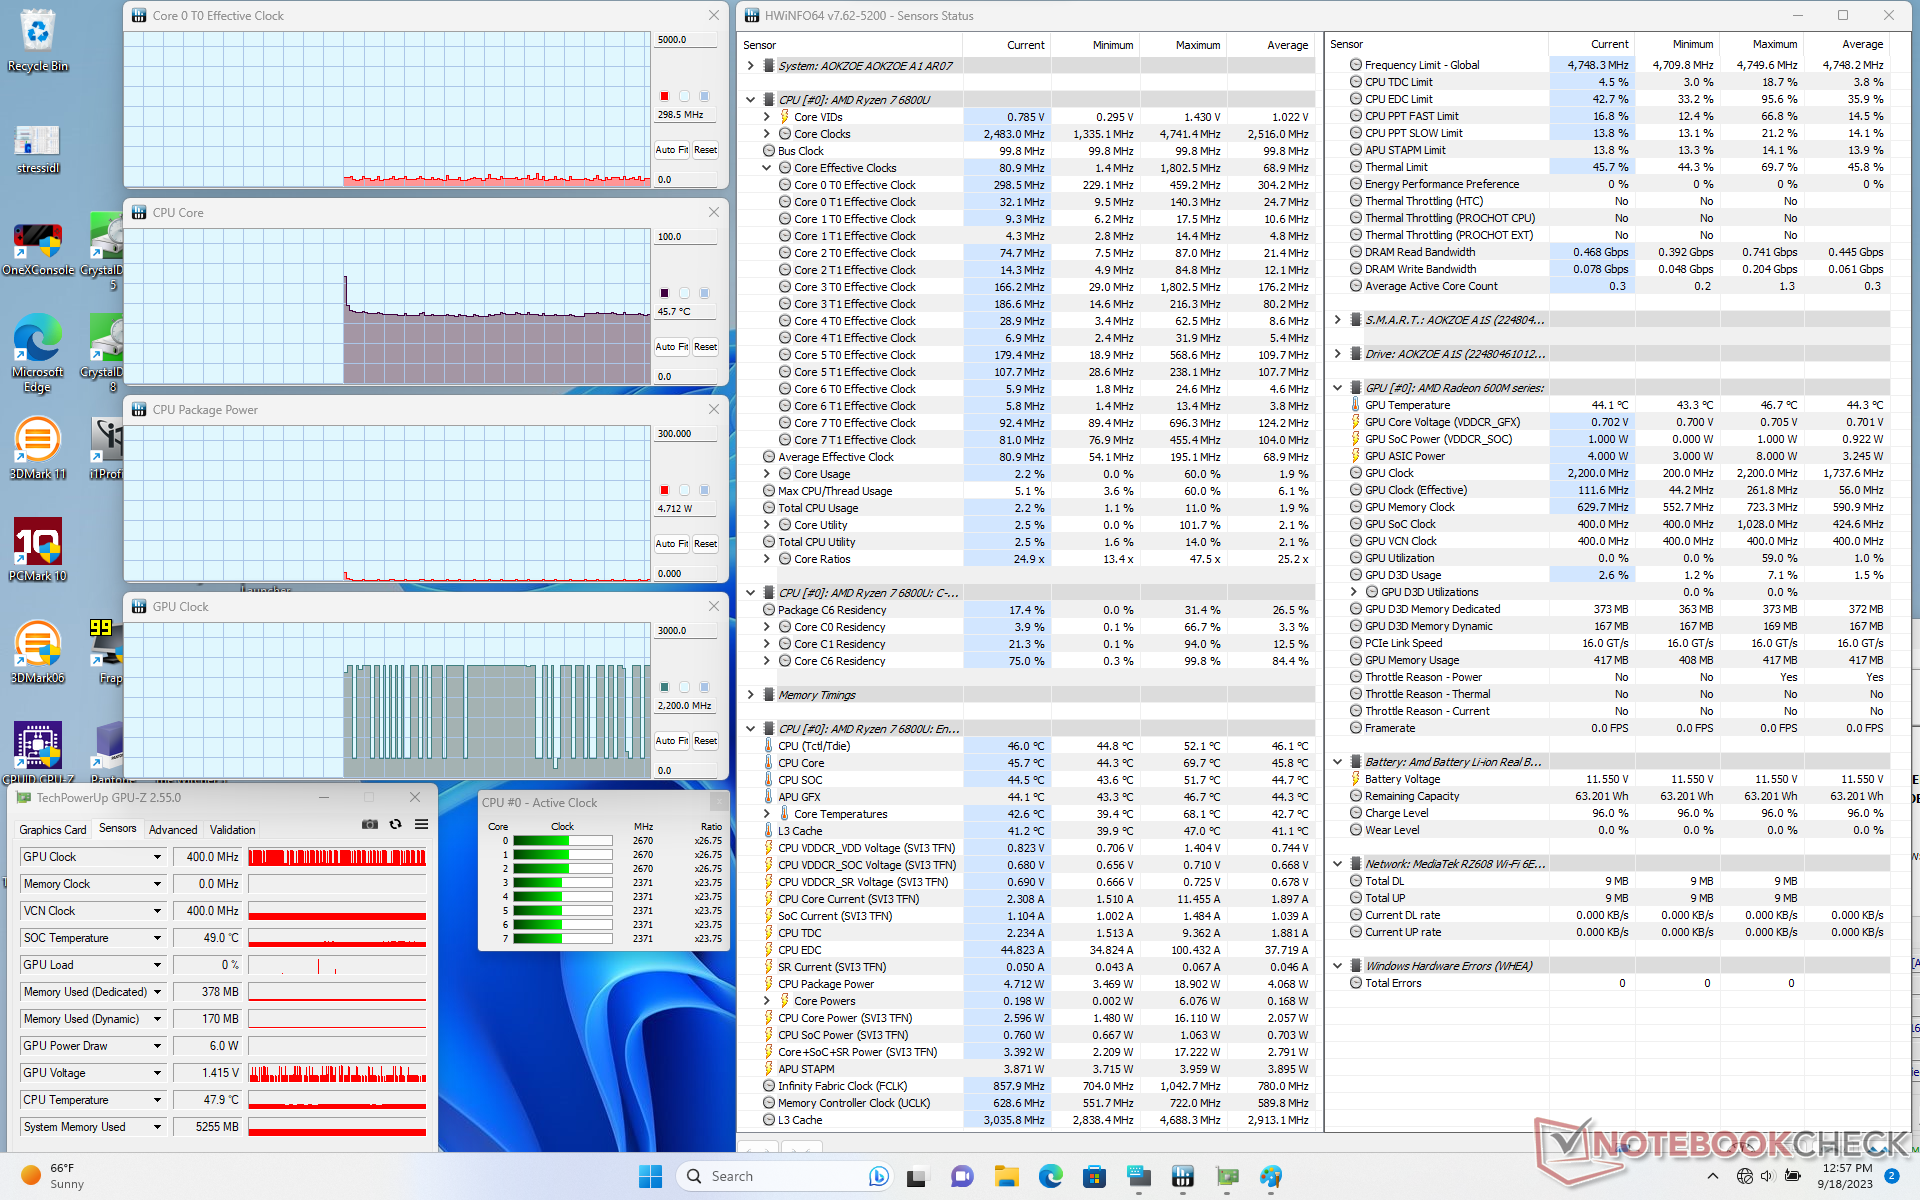
CPU clock rates, board power draw, and core temperature would stabilize at 2.8 GHz, 28 W, and 79 C, respectively, when initiating Prime95 stress. The system is able to maintain the 28 W TDP target for extended periods in contrast to the same processor in the Win 4 which would drop to just 2.2 GHz and 18 W when under similar conditions even when set to Performance mode.
GPU clock rate and power draw would be as high as 1923 MHz and 27 W, respectively, when running Witcher 3 on Performance mode. If on Balanced mode, the GPU would drop to just 984 MHz and 14 W which correlates with our 3DMark and fan noise observations above.
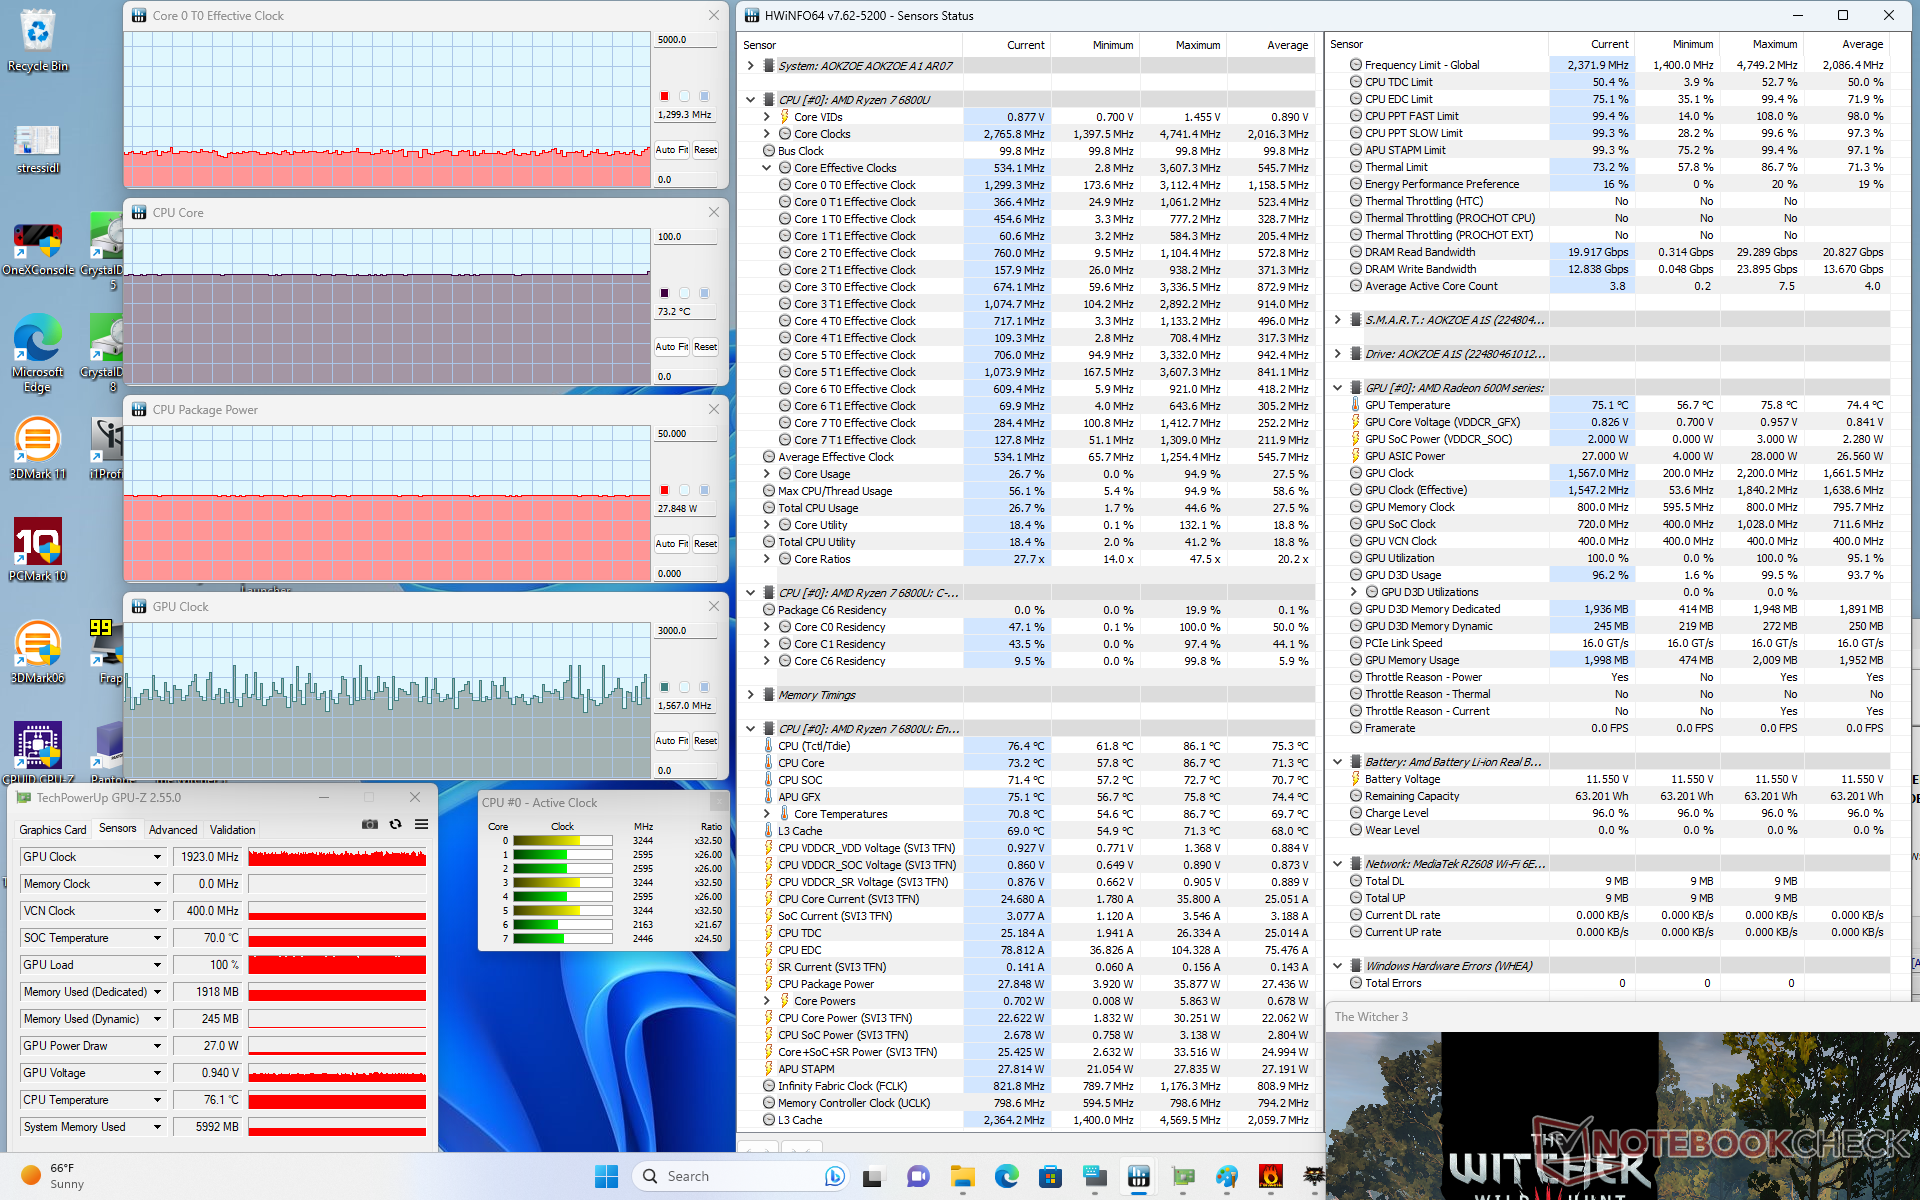
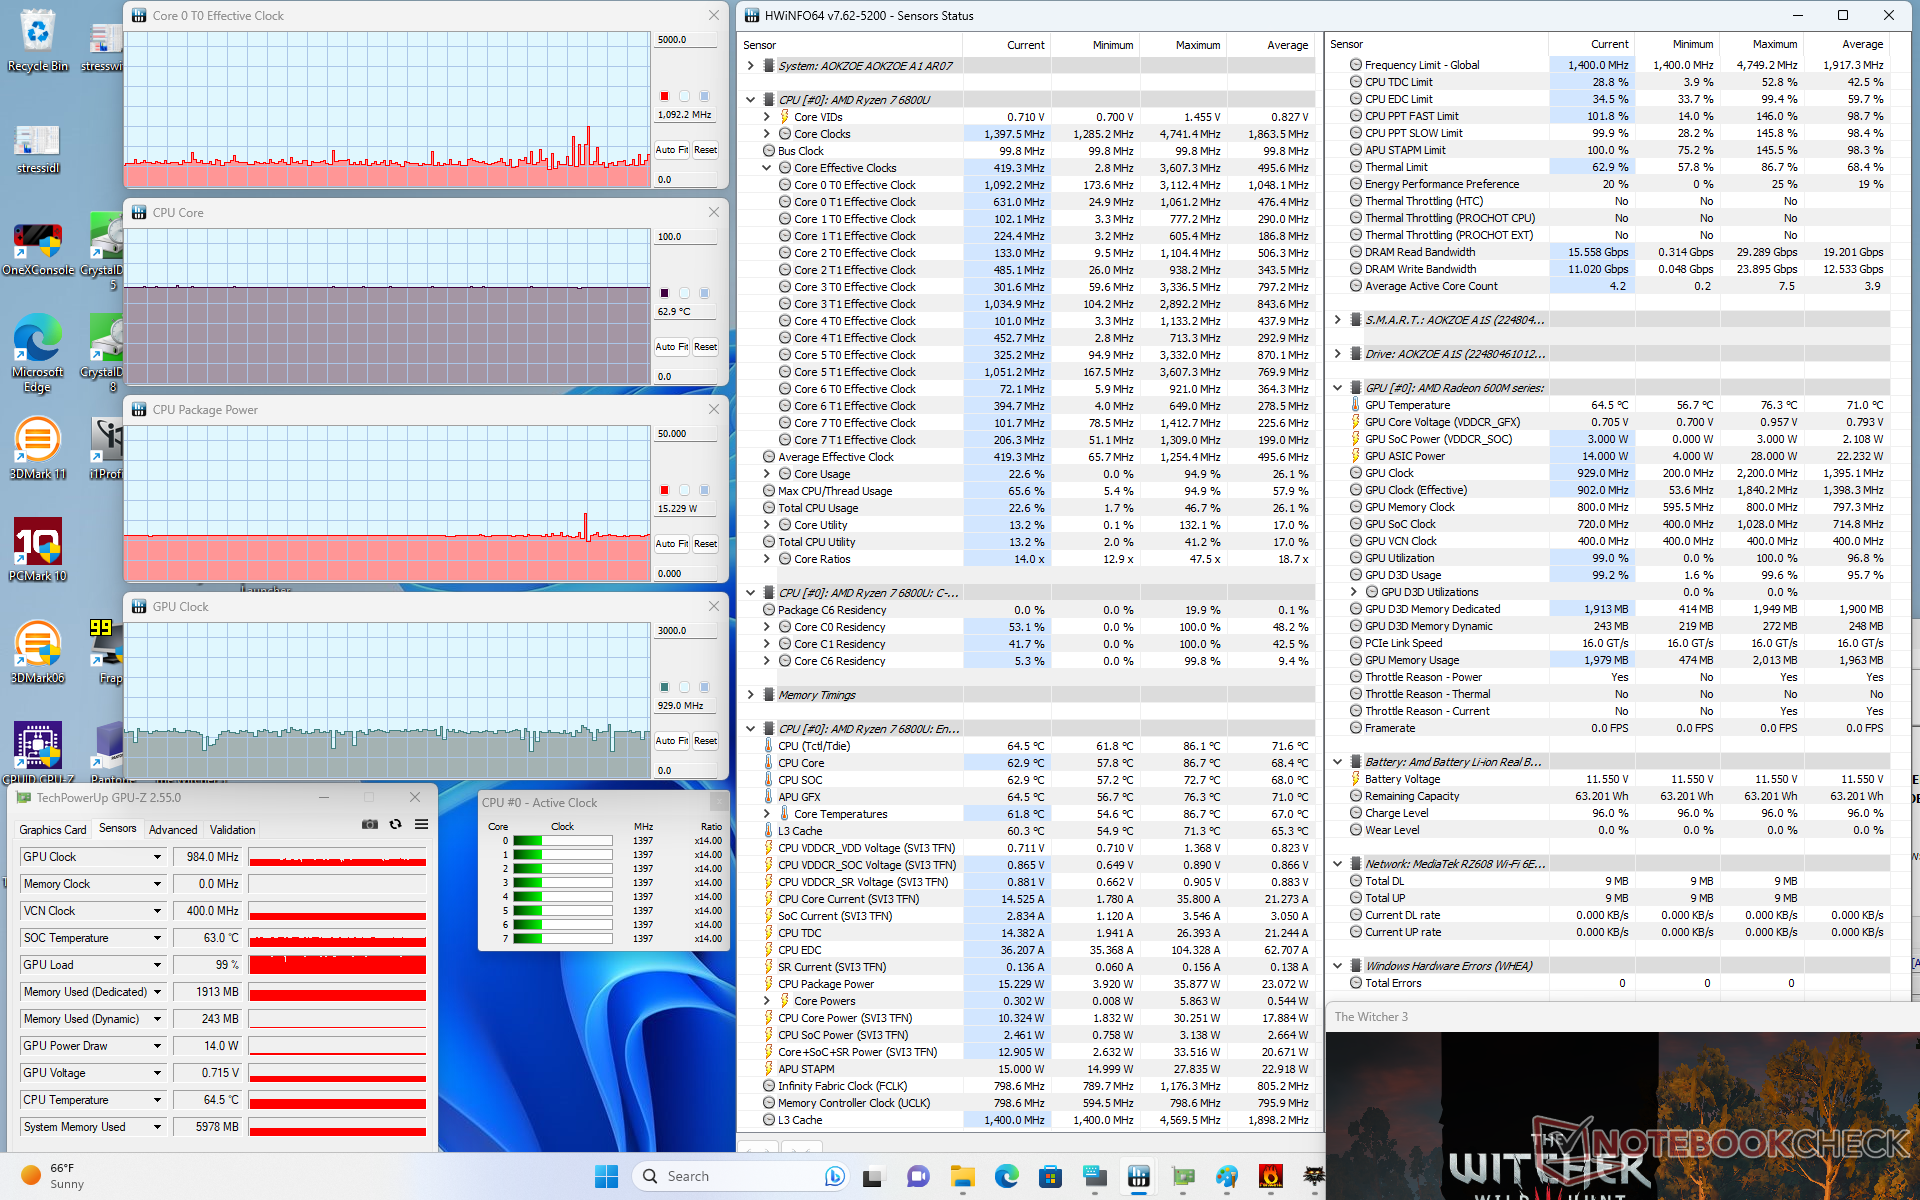
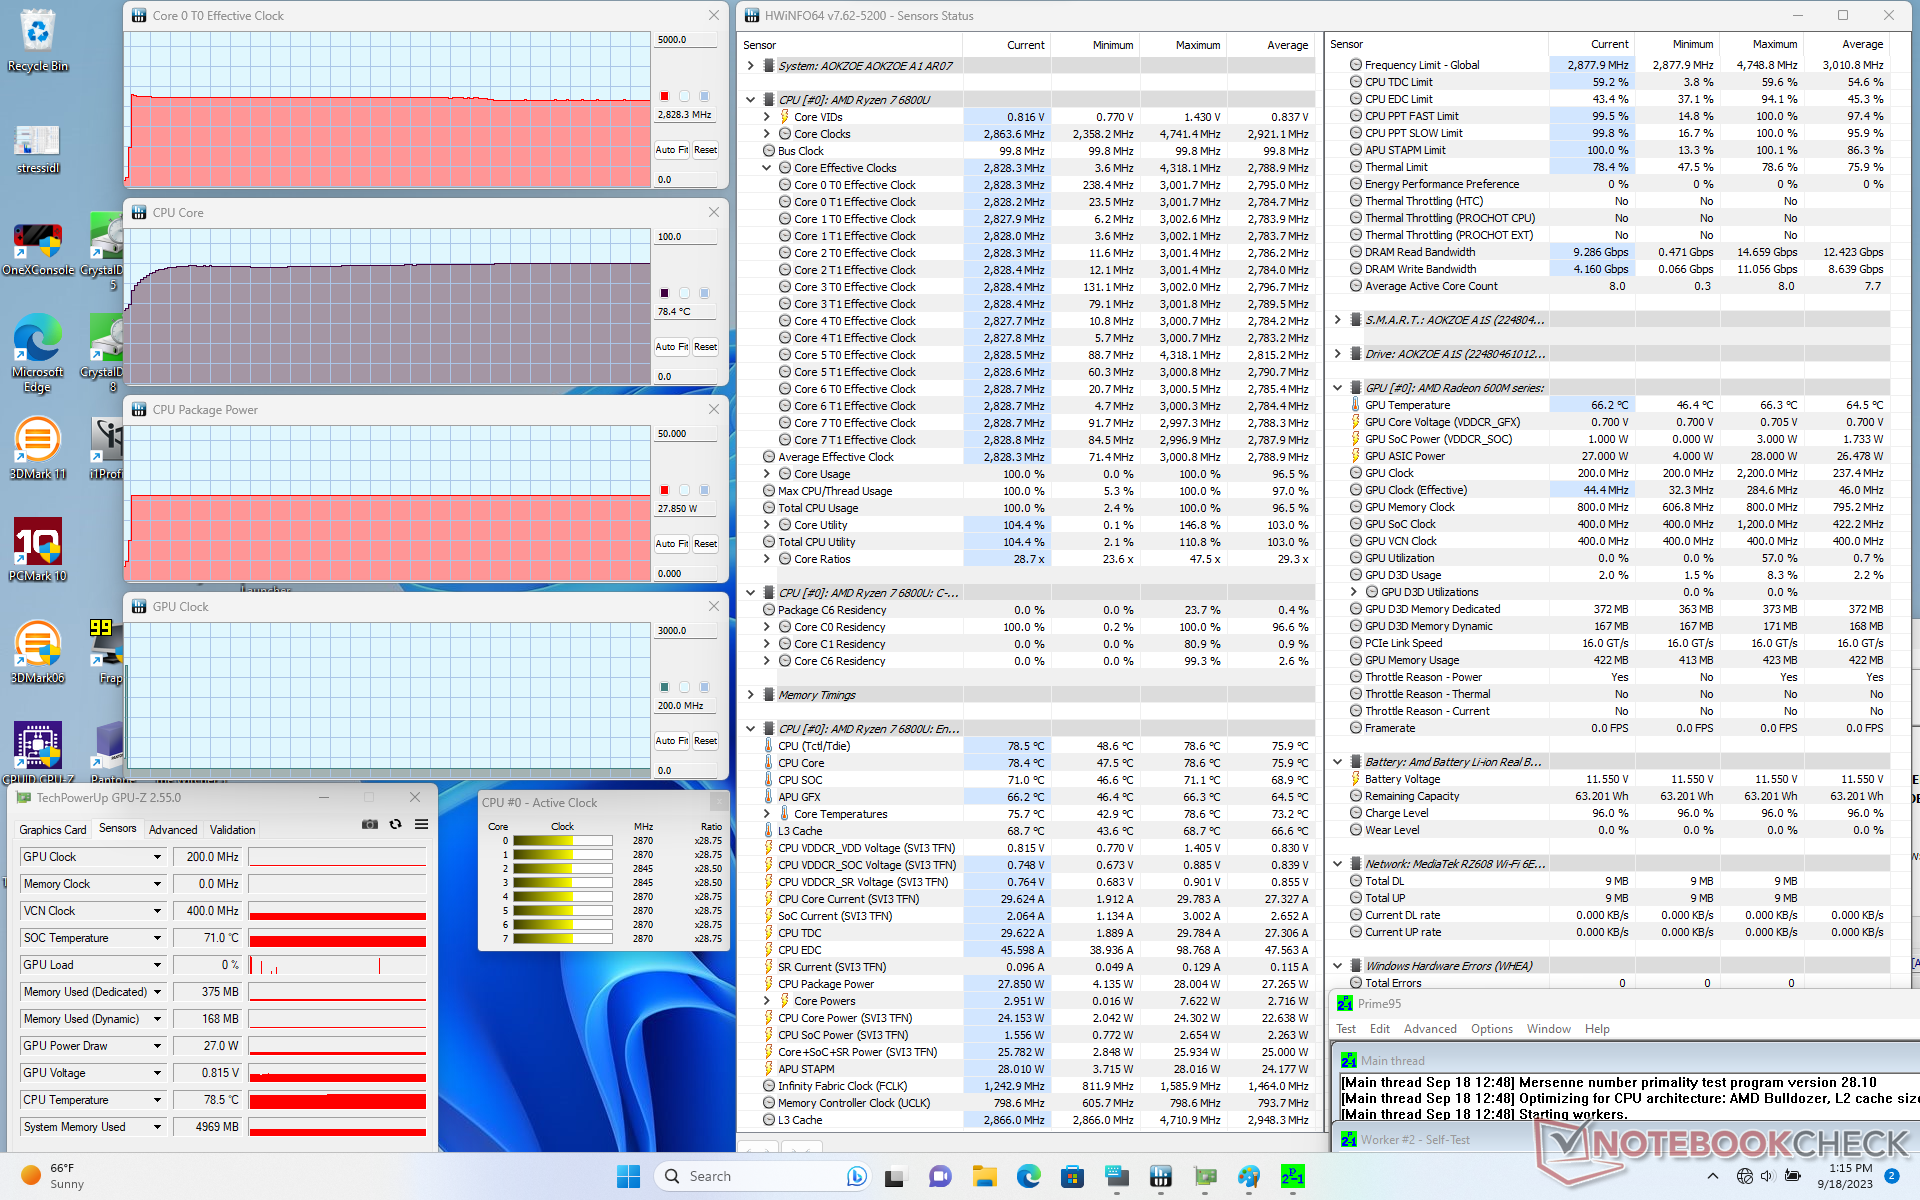
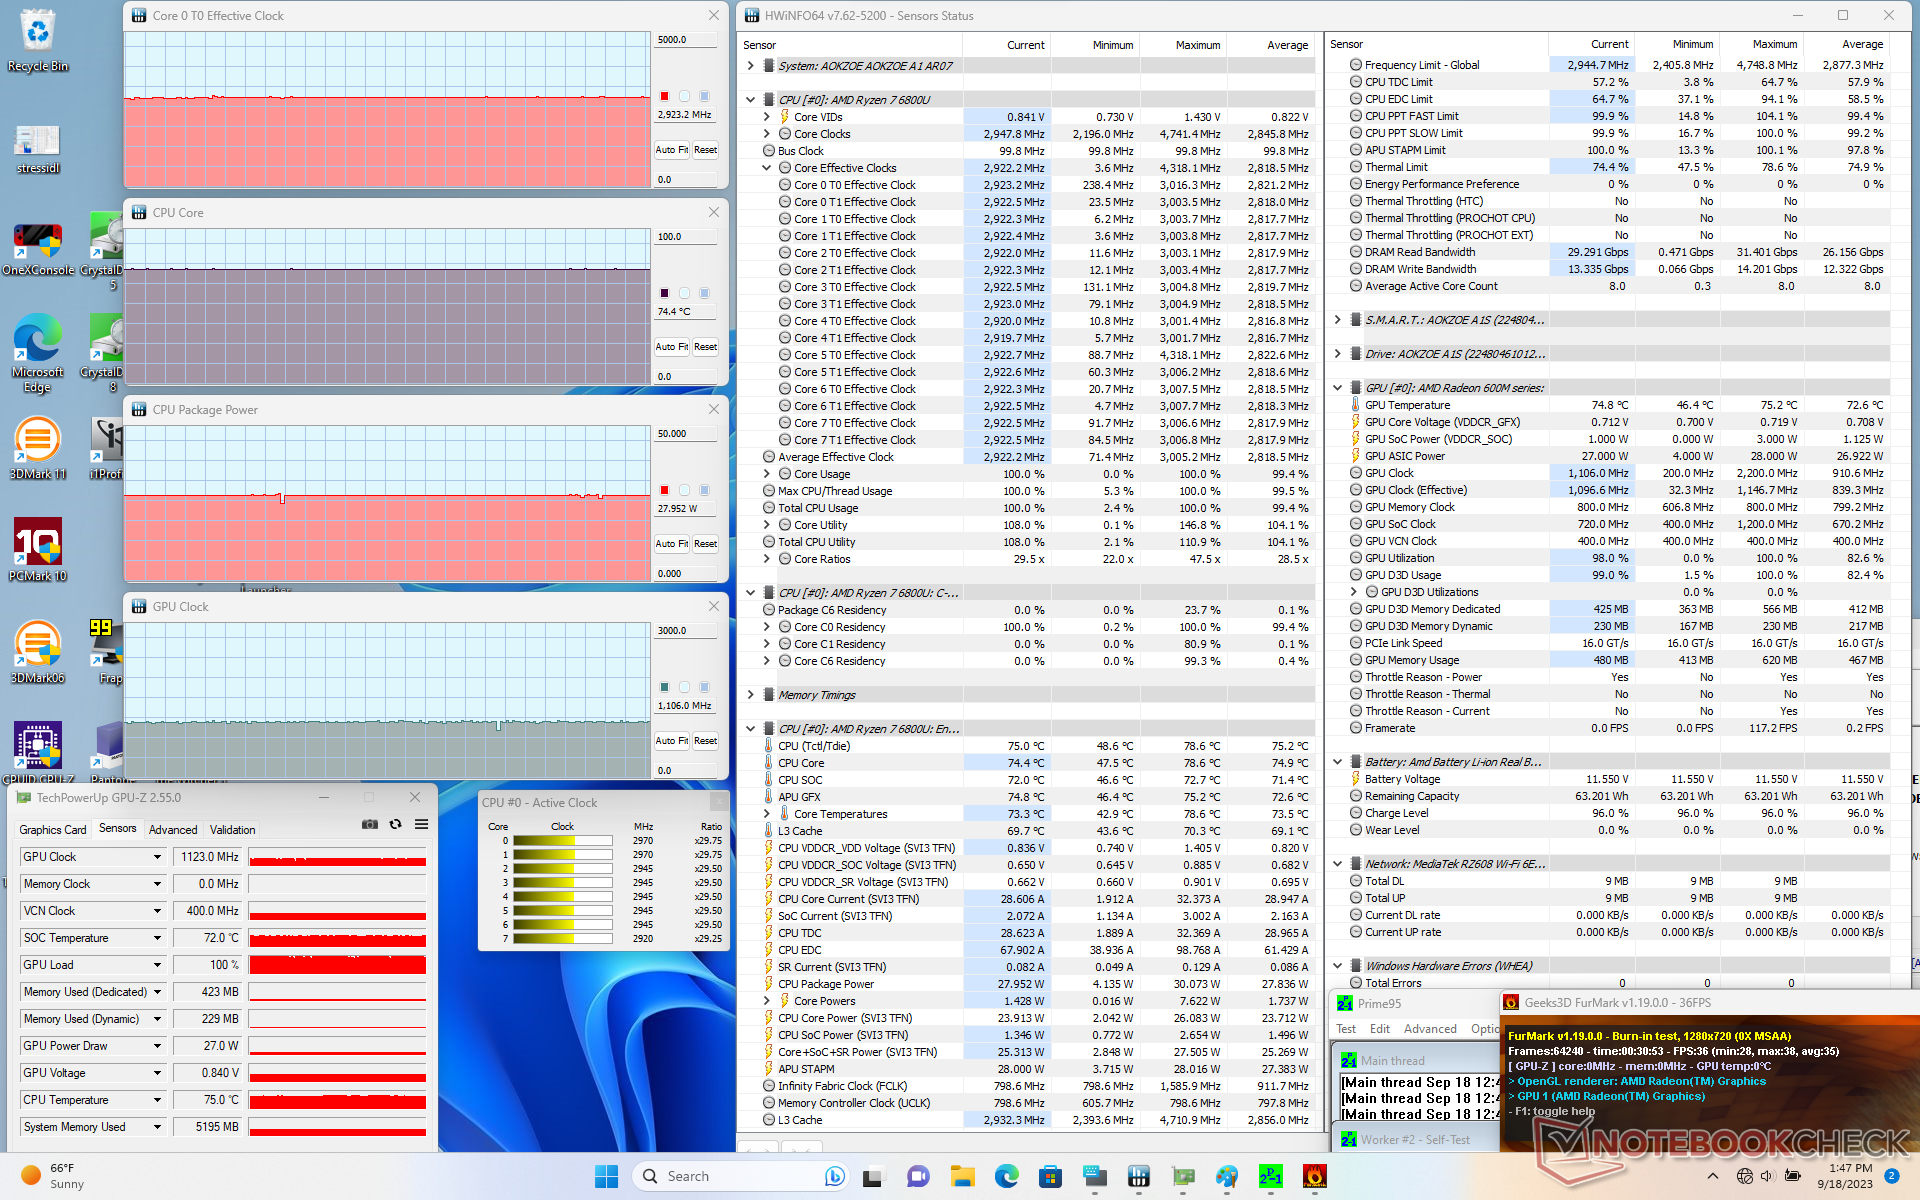
| CPU Clock (GHz) | GPU Clock (MHz) | Average CPU Temperature (°C) | |
| System Idle | -- | -- | 46 |
| Prime95 Stress | 2.8 | -- | 79 |
| Prime95 + FurMark Stress | 2.9 | 1106 | 75 |
| Witcher 3 Stress (Balanced mode) | ~1.1 | 929 | 63 |
| Witcher 3 Stress (Performance mode) | ~1.3 | ~1567 | 73 |
Speakers
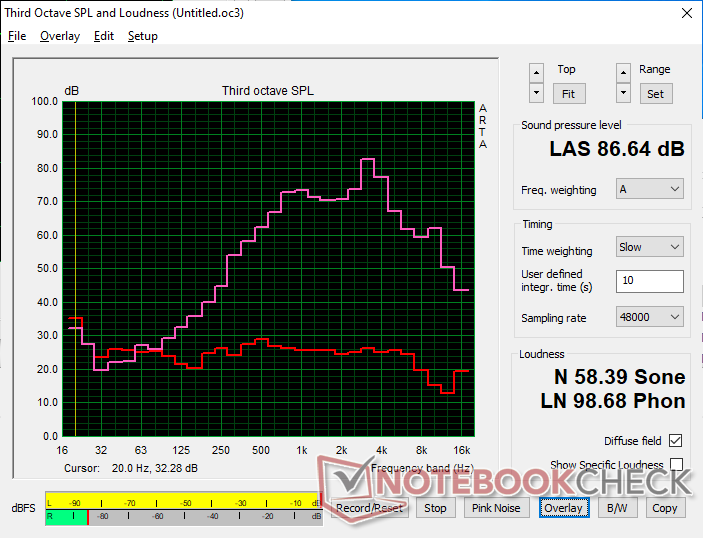
Aokzoe A1 audio analysis
(+) | speakers can play relatively loud (86.6 dB)
Bass 100 - 315 Hz
(-) | nearly no bass - on average 22.7% lower than median
(±) | linearity of bass is average (12.6% delta to prev. frequency)
Mids 400 - 2000 Hz
(±) | higher mids - on average 7.2% higher than median
(±) | linearity of mids is average (7.6% delta to prev. frequency)
Highs 2 - 16 kHz
(±) | higher highs - on average 7.9% higher than median
(±) | linearity of highs is average (14.5% delta to prev. frequency)
Overall 100 - 16.000 Hz
(-) | overall sound is not linear (33.1% difference to median)
Compared to same class
» 98% of all tested devices in this class were better, 1% similar, 1% worse
» The best had a delta of 6%, average was 18%, worst was 132%
Compared to all devices tested
» 92% of all tested devices were better, 1% similar, 7% worse
» The best had a delta of 4%, average was 24%, worst was 134%
Apple MacBook Pro 16 2021 M1 Pro audio analysis
(+) | speakers can play relatively loud (84.7 dB)
Bass 100 - 315 Hz
(+) | good bass - only 3.8% away from median
(+) | bass is linear (5.2% delta to prev. frequency)
Mids 400 - 2000 Hz
(+) | balanced mids - only 1.3% away from median
(+) | mids are linear (2.1% delta to prev. frequency)
Highs 2 - 16 kHz
(+) | balanced highs - only 1.9% away from median
(+) | highs are linear (2.7% delta to prev. frequency)
Overall 100 - 16.000 Hz
(+) | overall sound is linear (4.6% difference to median)
Compared to same class
» 0% of all tested devices in this class were better, 0% similar, 100% worse
» The best had a delta of 5%, average was 17%, worst was 45%
Compared to all devices tested
» 0% of all tested devices were better, 0% similar, 100% worse
» The best had a delta of 4%, average was 24%, worst was 134%
Energy Management
Power Consumption
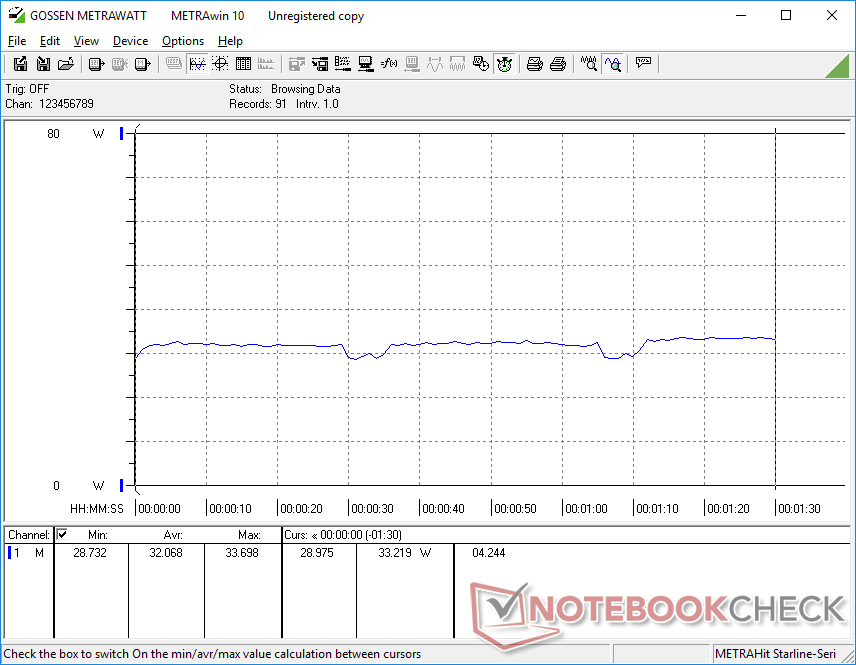
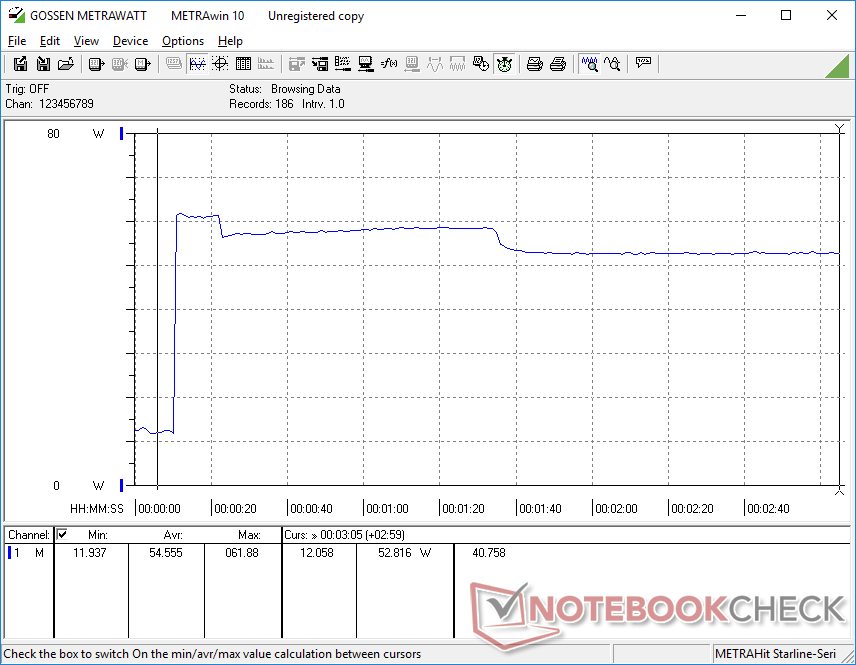
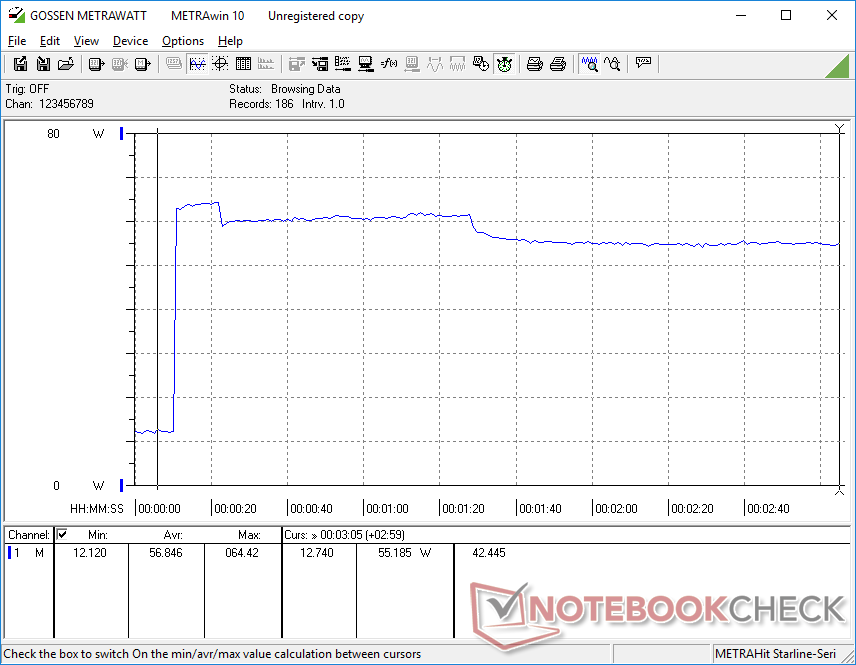
Power consumption is slightly higher than on the OneXPlayer 2 likely due to the higher performance of our Ryzen 7 6800U CPU. The ROG Ally is even more demanding to reflect its higher performance targets.
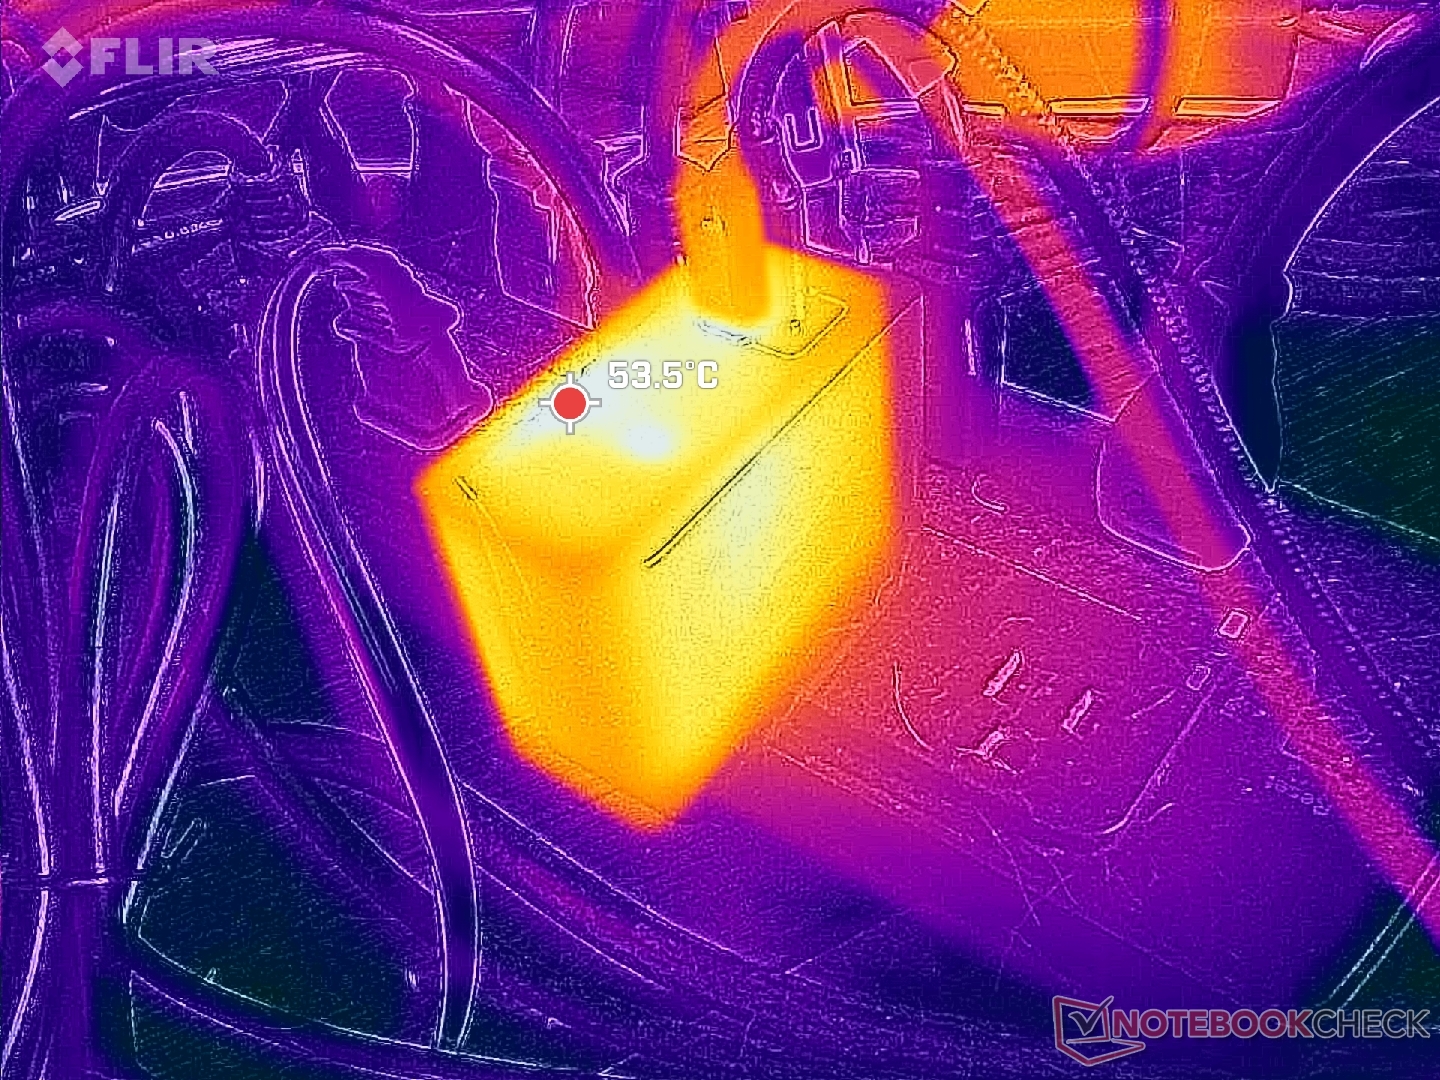
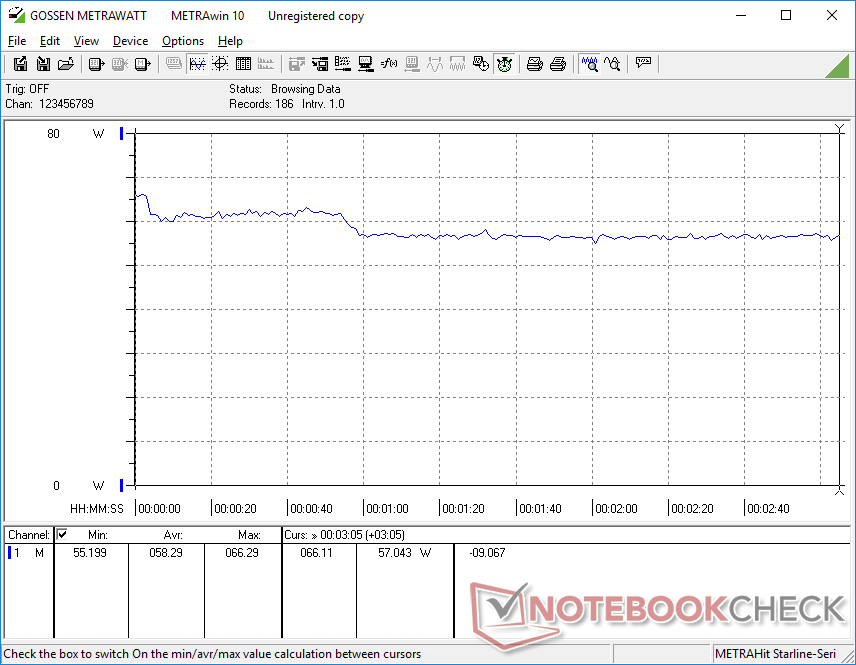
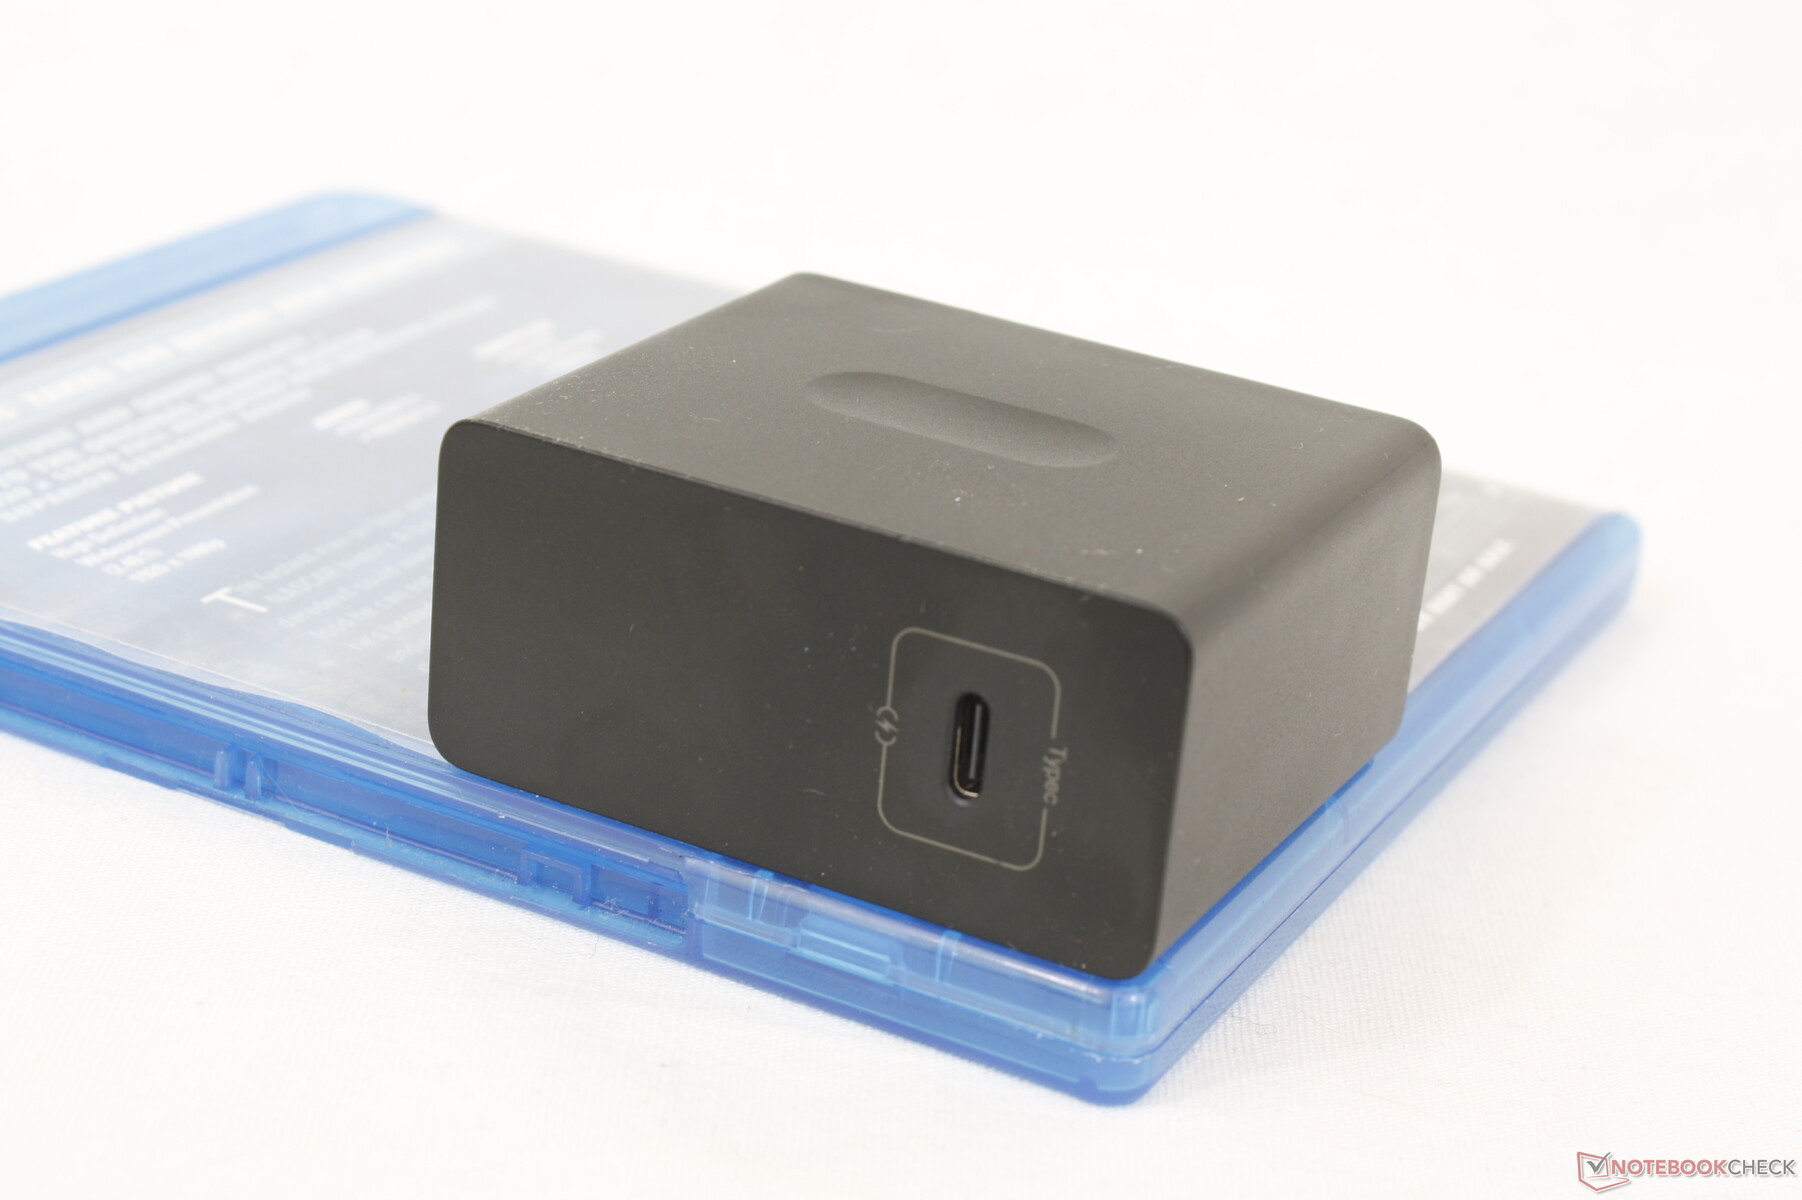
We're able to measure a maximum consumption of 65 W from the small (6.6 x 5.4 x 3.1 cm) 100 W GaN USB-C adapter when the CPU is at 100 percent utilization. Gaming draws around 58 W on average and so there is a lot of headroom to spare for charging and powering any USB devices.
| Off / Standby | |
| Idle | |
| Load |
|
Key:
min: | |
| Aokzoe A1 R7 6800U, Radeon 680M, , IPS, 1920x1200, 8" | One Netbook XPlayer 2 R7 6800U, Radeon 680M, , IPS, 2560x1600, 8.4" | Asus ROG Ally Z1 Extreme Z1 Extreme, Radeon 780M, Micron 2400 MTFDKBK512QFM, IPS, 1920x1080, 7" | GPD Win 4 R7 6800U, Radeon 680M, BiWin CE480Y2D100-1TB, IPS, 1920x1080, 6" | GPD Win 3 i5-1135G7, Iris Xe G7 80EUs, BIWIN NS200 1TB CNF82GS1G02-1TB, IPS, 1280x720, 5.5" | |
|---|---|---|---|---|---|
| Power Consumption | 14% | 9% | -3% | 42% | |
| Idle Minimum * (Watt) | 8.8 | 7.2 18% | 4.2 52% | 7.5 15% | 2.9 67% |
| Idle Average * (Watt) | 11.3 | 9.3 18% | 6.1 46% | 12.4 -10% | 4.5 60% |
| Idle Maximum * (Watt) | 11.5 | 9.7 16% | 6.3 45% | 13 -13% | 4.5 61% |
| Load Average * (Watt) | 32.1 | 33.1 -3% | 56.6 -76% | 46 -43% | 38.5 -20% |
| Witcher 3 ultra * (Watt) | 58.3 | 49.6 15% | 64.1 -10% | 45.2 22% | 28.9 50% |
| Load Maximum * (Watt) | 64.5 | 50.7 21% | 67.2 -4% | 56 13% | 41.4 36% |
* ... smaller is better
Power Consumption Witcher 3 / Stresstest
Power Consumption external Monitor
Battery Life
(September 21, 2023 update: The RGB lighting can be disabled by pressing the "Y" key when navigating to the RGB options. There is no button to disable the RGB on the software itself.)
The 65 Wh battery is fairly large for a portable console considering that some laptops like the Lenovo IdeaPad 3 14 come with smaller capacities. Battery life, however, is only average at just under 6.5 hours of WLAN browsing on Balanced mode compared to 8 hours or 10+ hours on the ROG Ally or OneXPlayer 2, respectively. This can be partly attributed to the fan which pulses frequently for seemingly no reason as mentioned above. The RGB lighting cannot be disabled either to impact battery life further.
If gaming, expect the A1 to only last for about 80 minutes or just under 2 hours at best. The short lifespan is shared across other gaming handhelds as well like the OneXPlayer 2 or GPD Win 4.
Charging from empty to full capacity with the included AC adapter takes just over 2 full hours.
| Aokzoe A1 R7 6800U, Radeon 680M, 65 Wh | One Netbook XPlayer 2 R7 6800U, Radeon 680M, 65.5 Wh | Asus ROG Ally Z1 Extreme Z1 Extreme, Radeon 780M, 40 Wh | GPD Win 4 R7 6800U, Radeon 680M, 46 Wh | GPD Win 3 i5-1135G7, Iris Xe G7 80EUs, 44 Wh | |
|---|---|---|---|---|---|
| Battery runtime | 64% | 22% | 17% | 39% | |
| Reader / Idle (h) | 7.2 | 9.7 35% | |||
| WiFi v1.3 (h) | 6.4 | 10.5 64% | 7.8 22% | 7.5 17% | 11.3 77% |
| Load (h) | 1.3 | 1.3 0% | 1.3 0% | ||
| Witcher 3 ultra (h) | 1.6 | 1 | |||
| H.264 (h) | 9.5 |
Pros
Cons
Verdict — Could Be Worthwhile After Some Price Cuts
The Aokzoe A1 excels at maximizing performance relative to its small form factor. Handheld console-like designs have a tendency to underclock their processors or run on slower Turbo Boost clock rates because of their size, but the Ryzen 7 6800U in the A1 performs extremely well even when under stress. It also doesn't exhibit any frame stuttering issues that we experienced on the GPD Win 4.
While the A1 is impressive from a performance perspective, its hardware and features could use more TLC. The shoulder buttons in particular are unreliably difficult to press when compared to the shoulder buttons on controllers from the Nintendo Switch or GPD Win 4. The fan pulses too frequently and loudly even when on Power Saver mode. The wake-from-sleep issues, PWM, poorly calibrated colors, and limited outdoor viewability might turn off a lot of potential buyers as well. Some drawbacks are to be expected, but they tend to be more noticeable on the A1 especially when compared to the similarly-priced Asus ROG Ally.
The Aokzoe A1 nails it when it comes to performance. Unfortunately, many of its features are lacking the polish and attention to detail that we've come to expect from PCs retailing for $1000 USD.
There is a lot of room for improvement should there be a rework in the future. Better buttons, a brighter display, and improved fan behavior are all on the top of our list. The A1 is a good option for those who want the relatively large 8-inch touchscreen and steady Ryzen 7 6800U performance, but more serious gamers will find better value and performance from the highly competitive Asus ROG Ally which costs about the same.
Price and Availability
Aokzoe is now shipping the A1 directly to customers for $1000 USD for the 32 GB+2 TB configuration. Alternatively, Amazon has the same configuration for $1300 while the lesser 16 GB+512 GB configuration can be found for as low as $930.
Aokzoe A1
- 09/20/2023 v7 (old)
Allen Ngo
Transparency
The selection of devices to be reviewed is made by our editorial team. The test sample was provided to the author as a loan by the manufacturer or retailer for the purpose of this review. The lender had no influence on this review, nor did the manufacturer receive a copy of this review before publication. There was no obligation to publish this review. As an independent media company, Notebookcheck is not subjected to the authority of manufacturers, retailers or publishers.
This is how Notebookcheck is testing
Every year, Notebookcheck independently reviews hundreds of laptops and smartphones using standardized procedures to ensure that all results are comparable. We have continuously developed our test methods for around 20 years and set industry standards in the process. In our test labs, high-quality measuring equipment is utilized by experienced technicians and editors. These tests involve a multi-stage validation process. Our complex rating system is based on hundreds of well-founded measurements and benchmarks, which maintains objectivity. Further information on our test methods can be found here.
Price comparison
