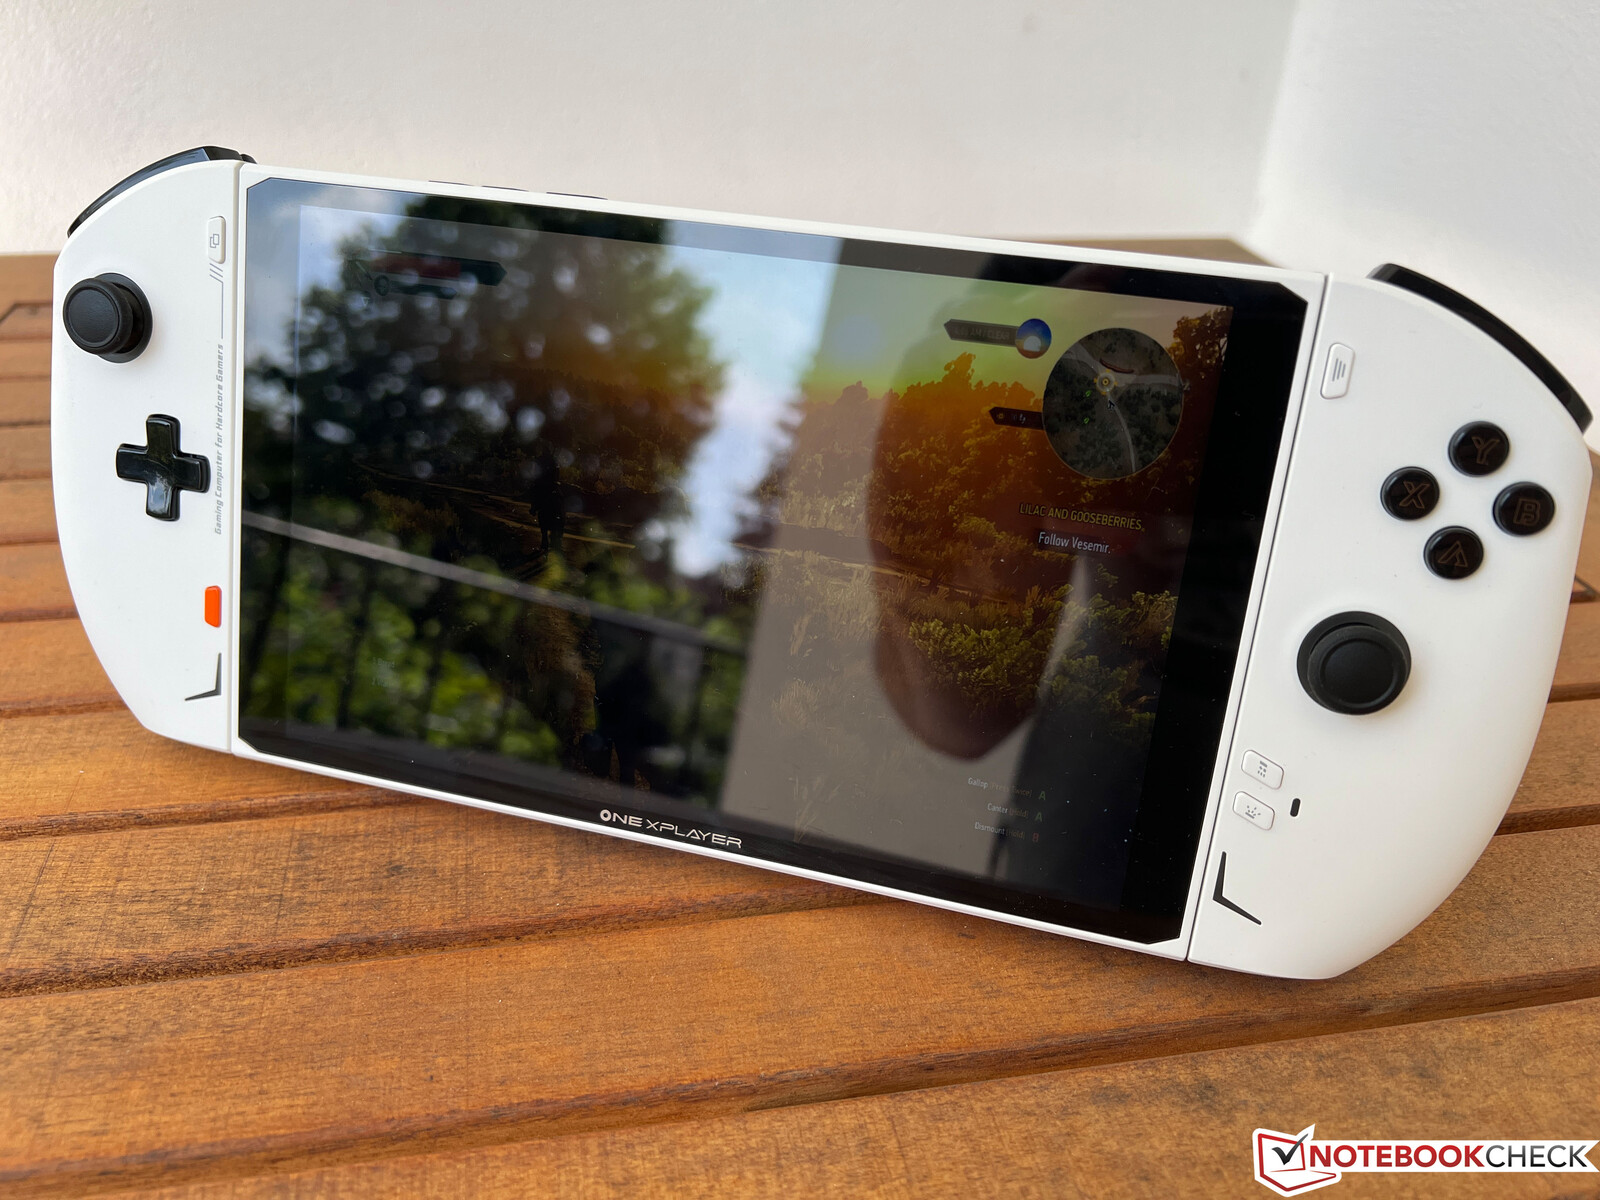
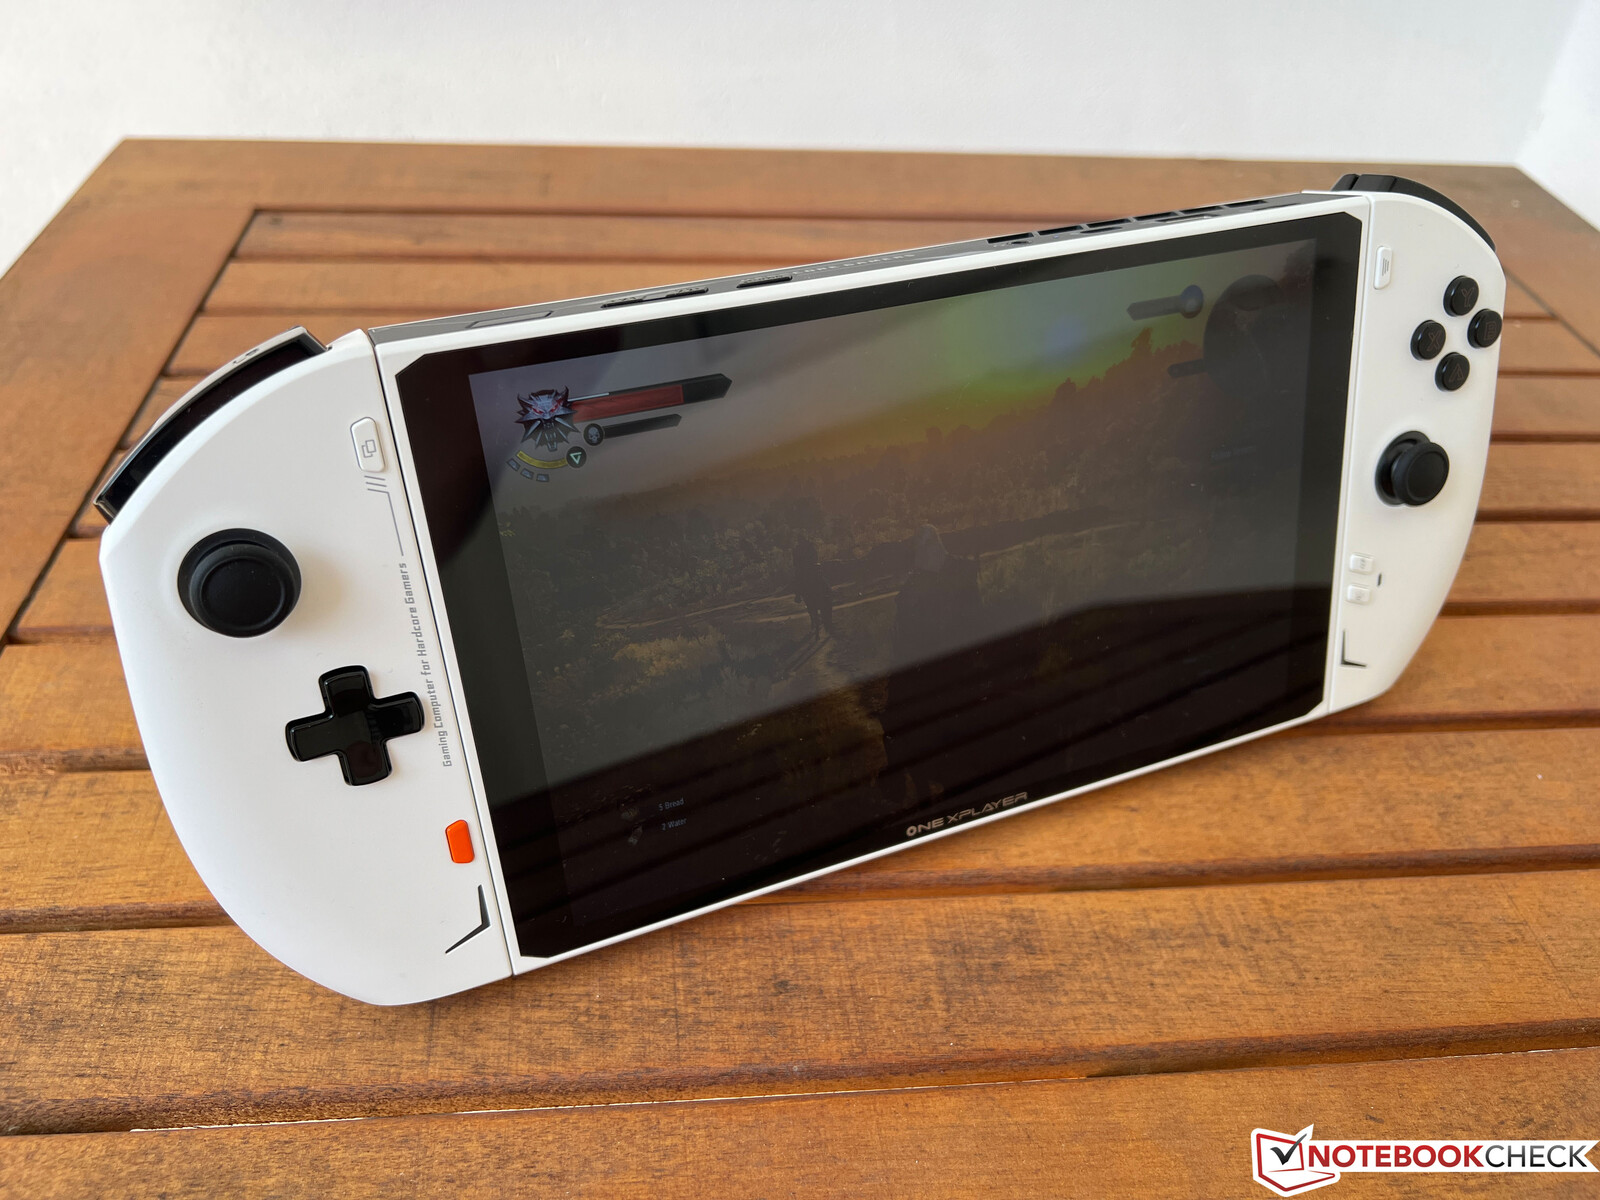
OneXPlayer 2 review - Gaming handheld with AMD Zen3+ and detachable controllers
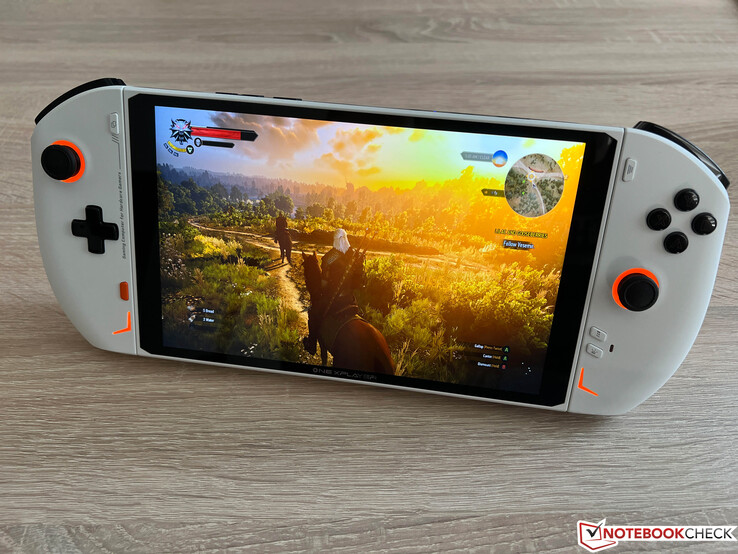
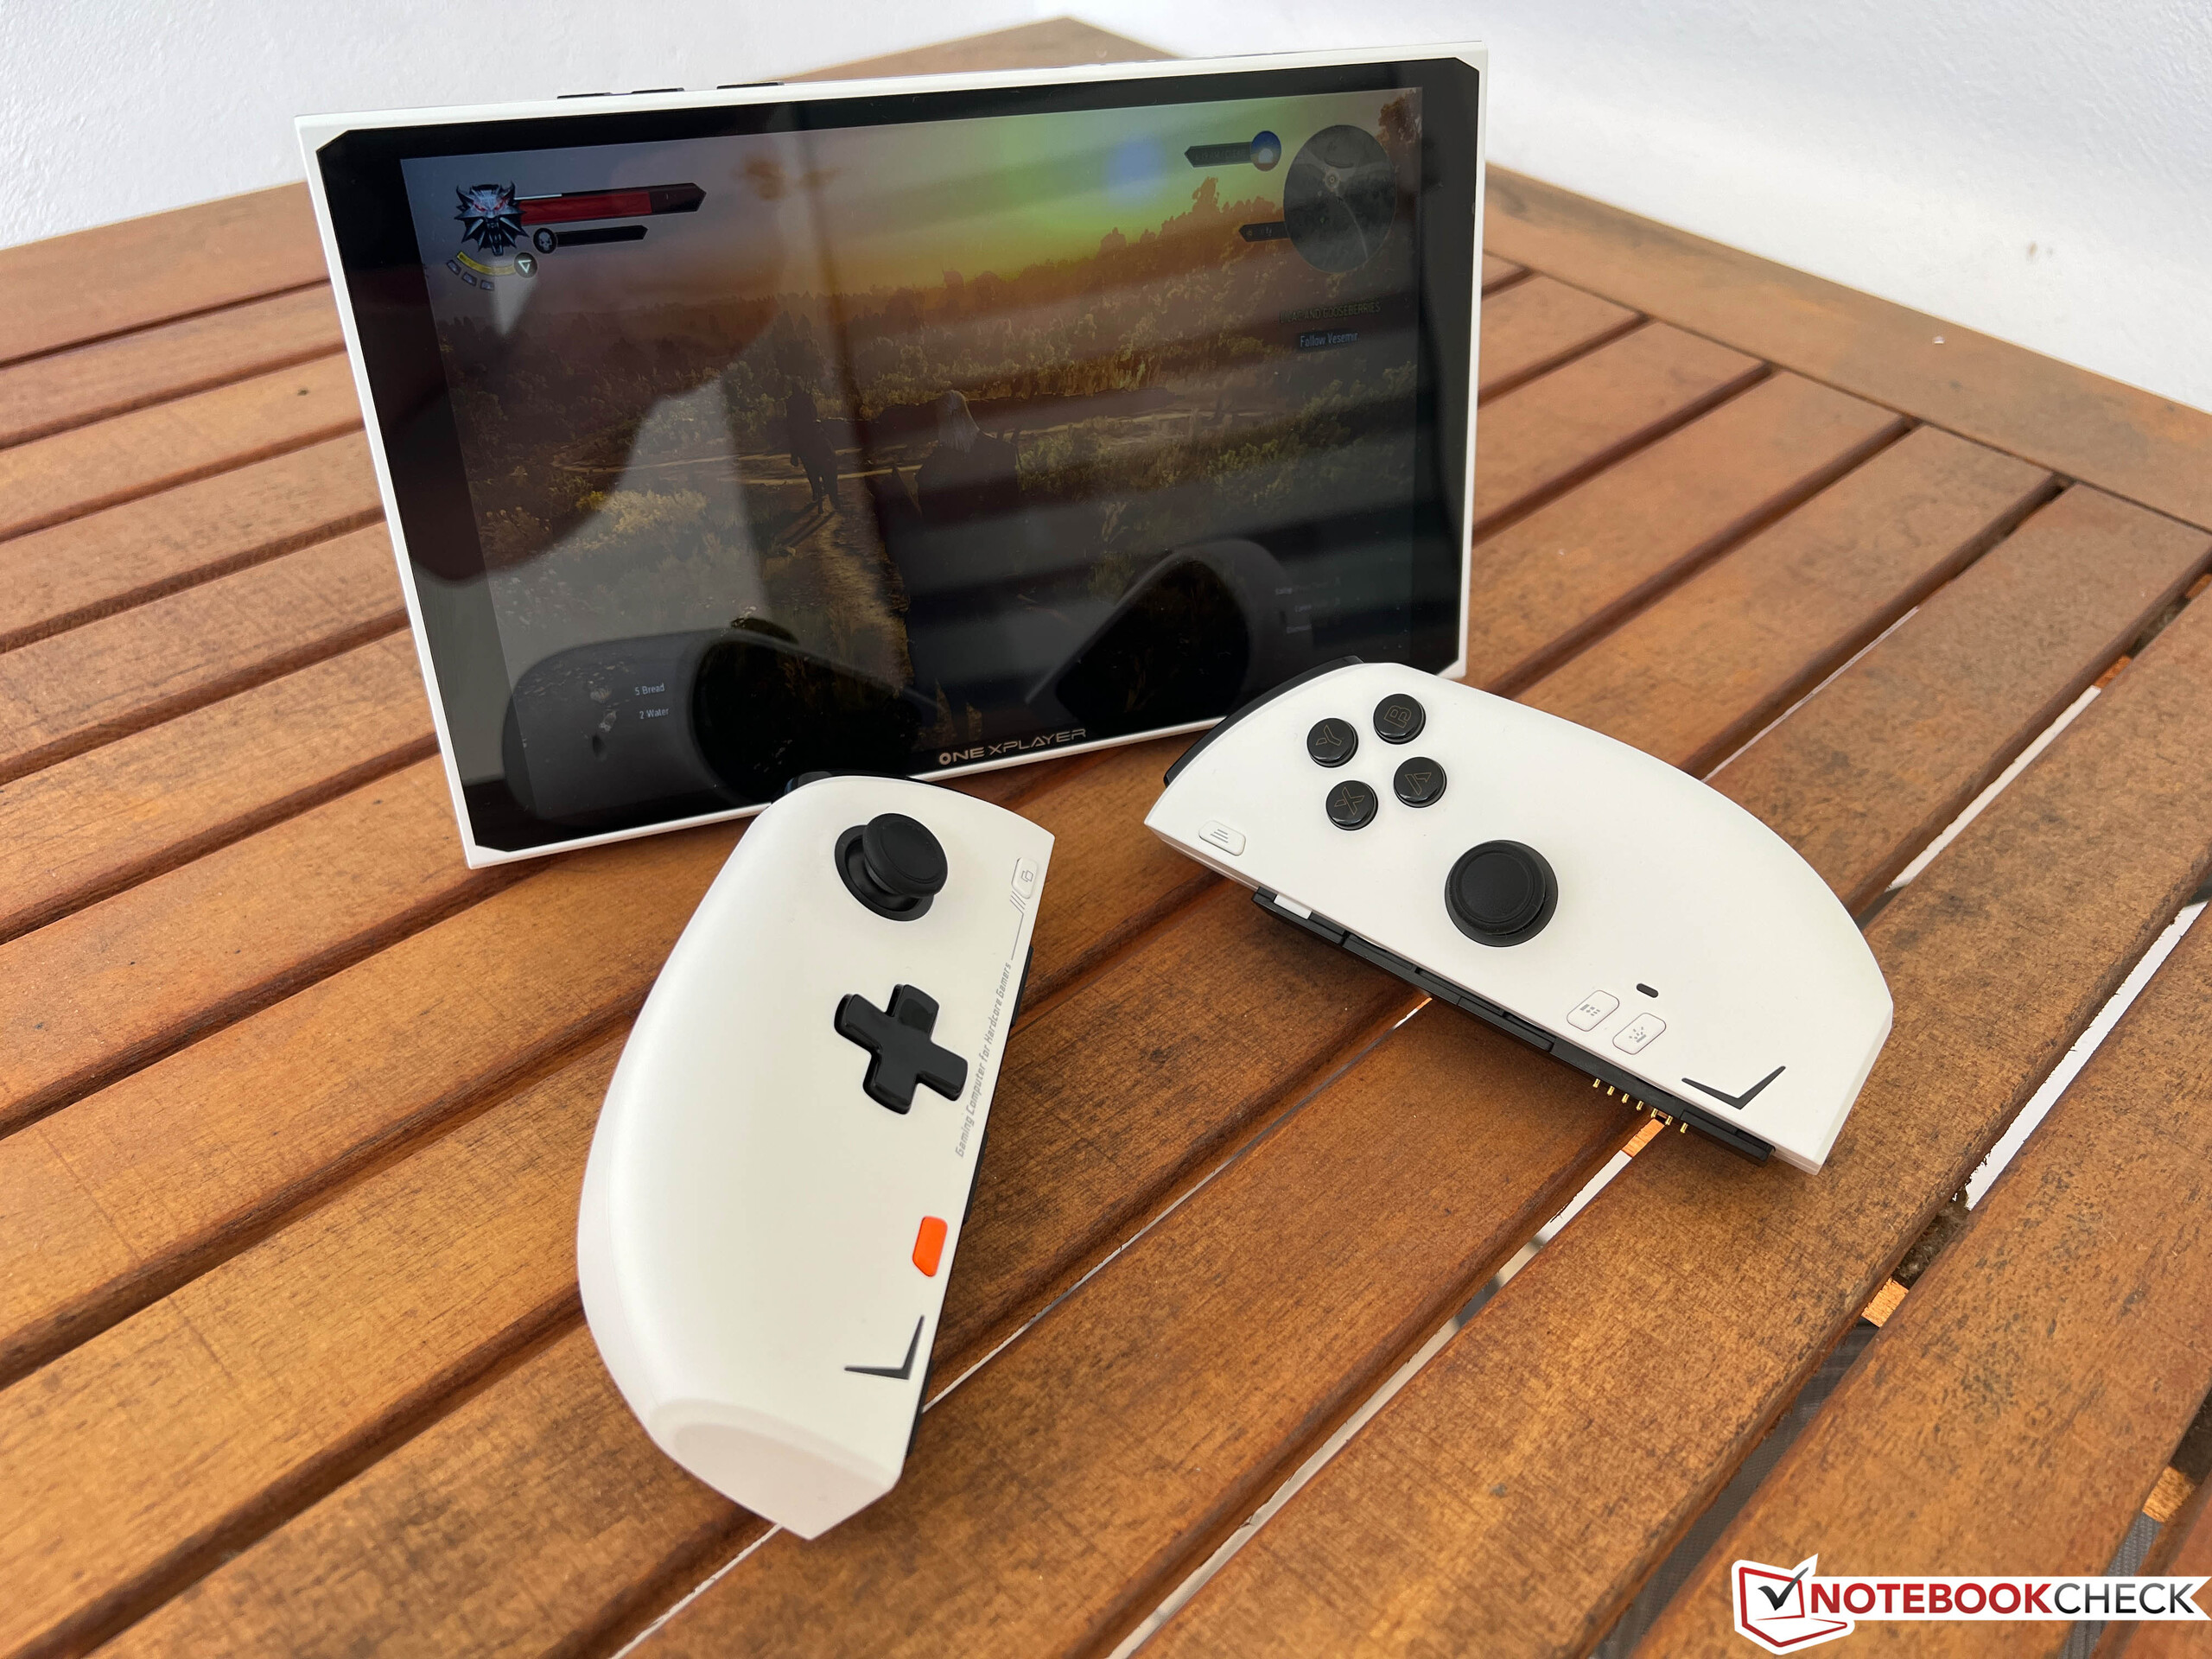
Gaming handhelds are slowly coming out of their niche existence and at the latest since the success of the Steam Deck last year, the selection is getting bigger. The manufacturer One-Netbook also offers several handhelds, including the OneXPlayer 2, which we are testing today. In contrast to devices like the Steam Deck or also the recently tested ROG Ally, the OneXPlayer 2 looks more like the Nintendo Switch because the two controllers on the side can be removed.
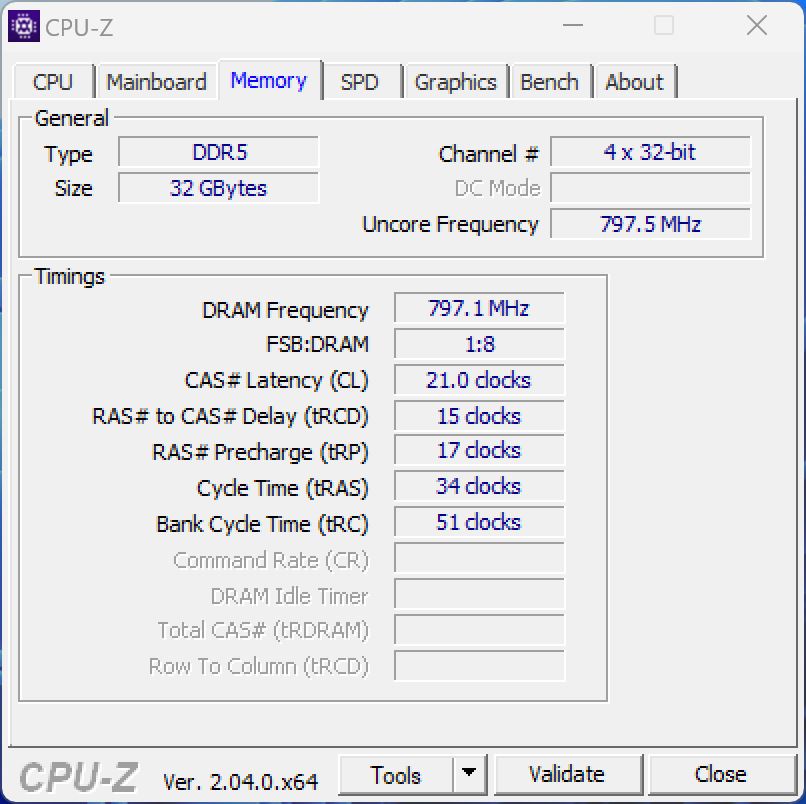
The hardware is the well-known AMD Ryzen 7 6800U together with the fast Radeon 680M iGPU, which drives an 8.4-inch IPS display with a resolution of 2,560 x 1,600 pixels. There are several options for RAM and SSD up to 32 GB/2 TB. Our review sample is equipped with 16 GB and a 1 TB SSD, respectively. The price for the device is currently around 1,100 Euros.
Possible competitors in comparison
Rating | Date | Model | Weight | Height | Size | Resolution | Price |
|---|---|---|---|---|---|---|---|
| 84 % v7 (old) | 07 / 2023 | One Netbook XPlayer 2 R7 6800U, Radeon 680M | 864 g | 23 mm | 8.40" | 2560x1600 | |
| 87.5 % v7 (old) | 05 / 2023 | Asus ROG Ally Z1 Extreme Z1 Extreme, Radeon 780M | 611 g | 21.22 mm | 7.00" | 1920x1080 | |
v (old) | 09 / 2025 | Valve Steam Deck 512 GB LCD | 669 g | 49 mm | 7.00" | 1280x800 | |
| 80.3 % v7 (old) | 03 / 2023 | GPD Win 4 R7 6800U, Radeon 680M | 607 g | 28 mm | 6.00" | 1920x1080 | |
| 84.5 % v7 (old) | 07 / 2022 | GPD Win Max 2 i7-1260P, Iris Xe G7 96EUs | 1 kg | 23 mm | 10.10" | 2560x1600 | |
| 86.3 % v7 (old) | 11 / 2021 | GPD Pocket 3 i7-1195G7, Iris Xe G7 96EUs | 730 g | 20 mm | 8.00" | 1920x1200 |
Case & Equipment
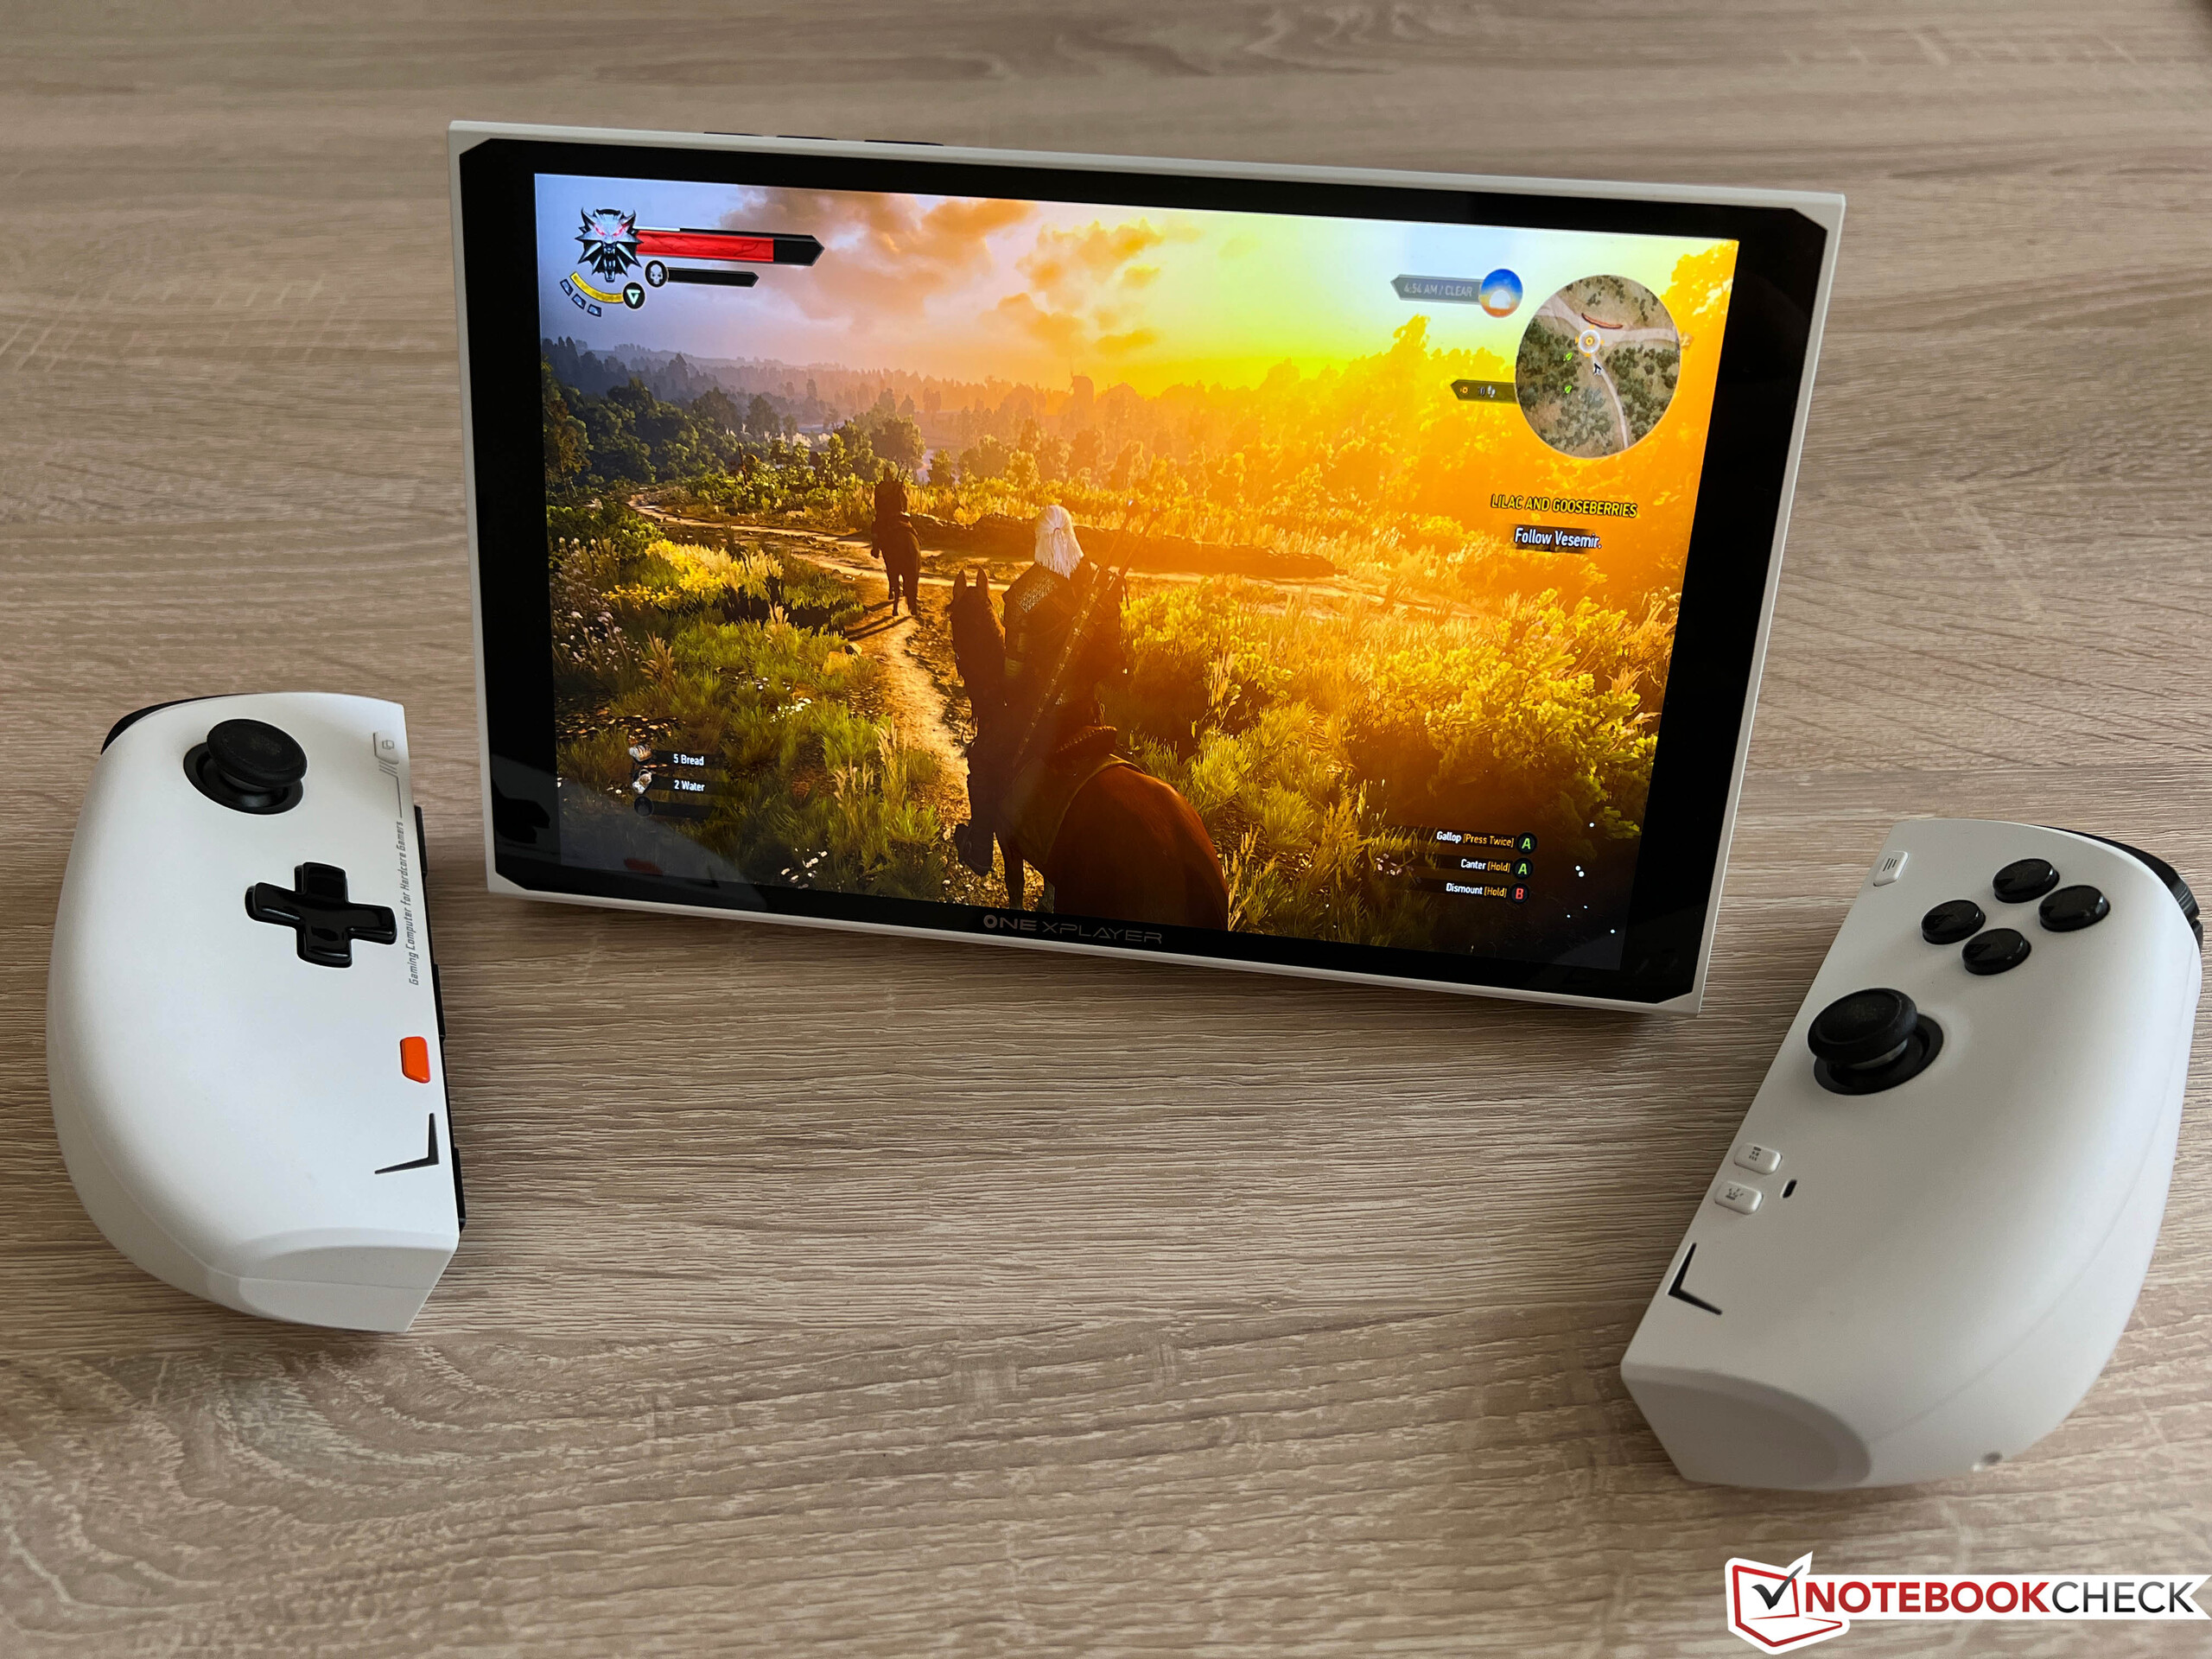
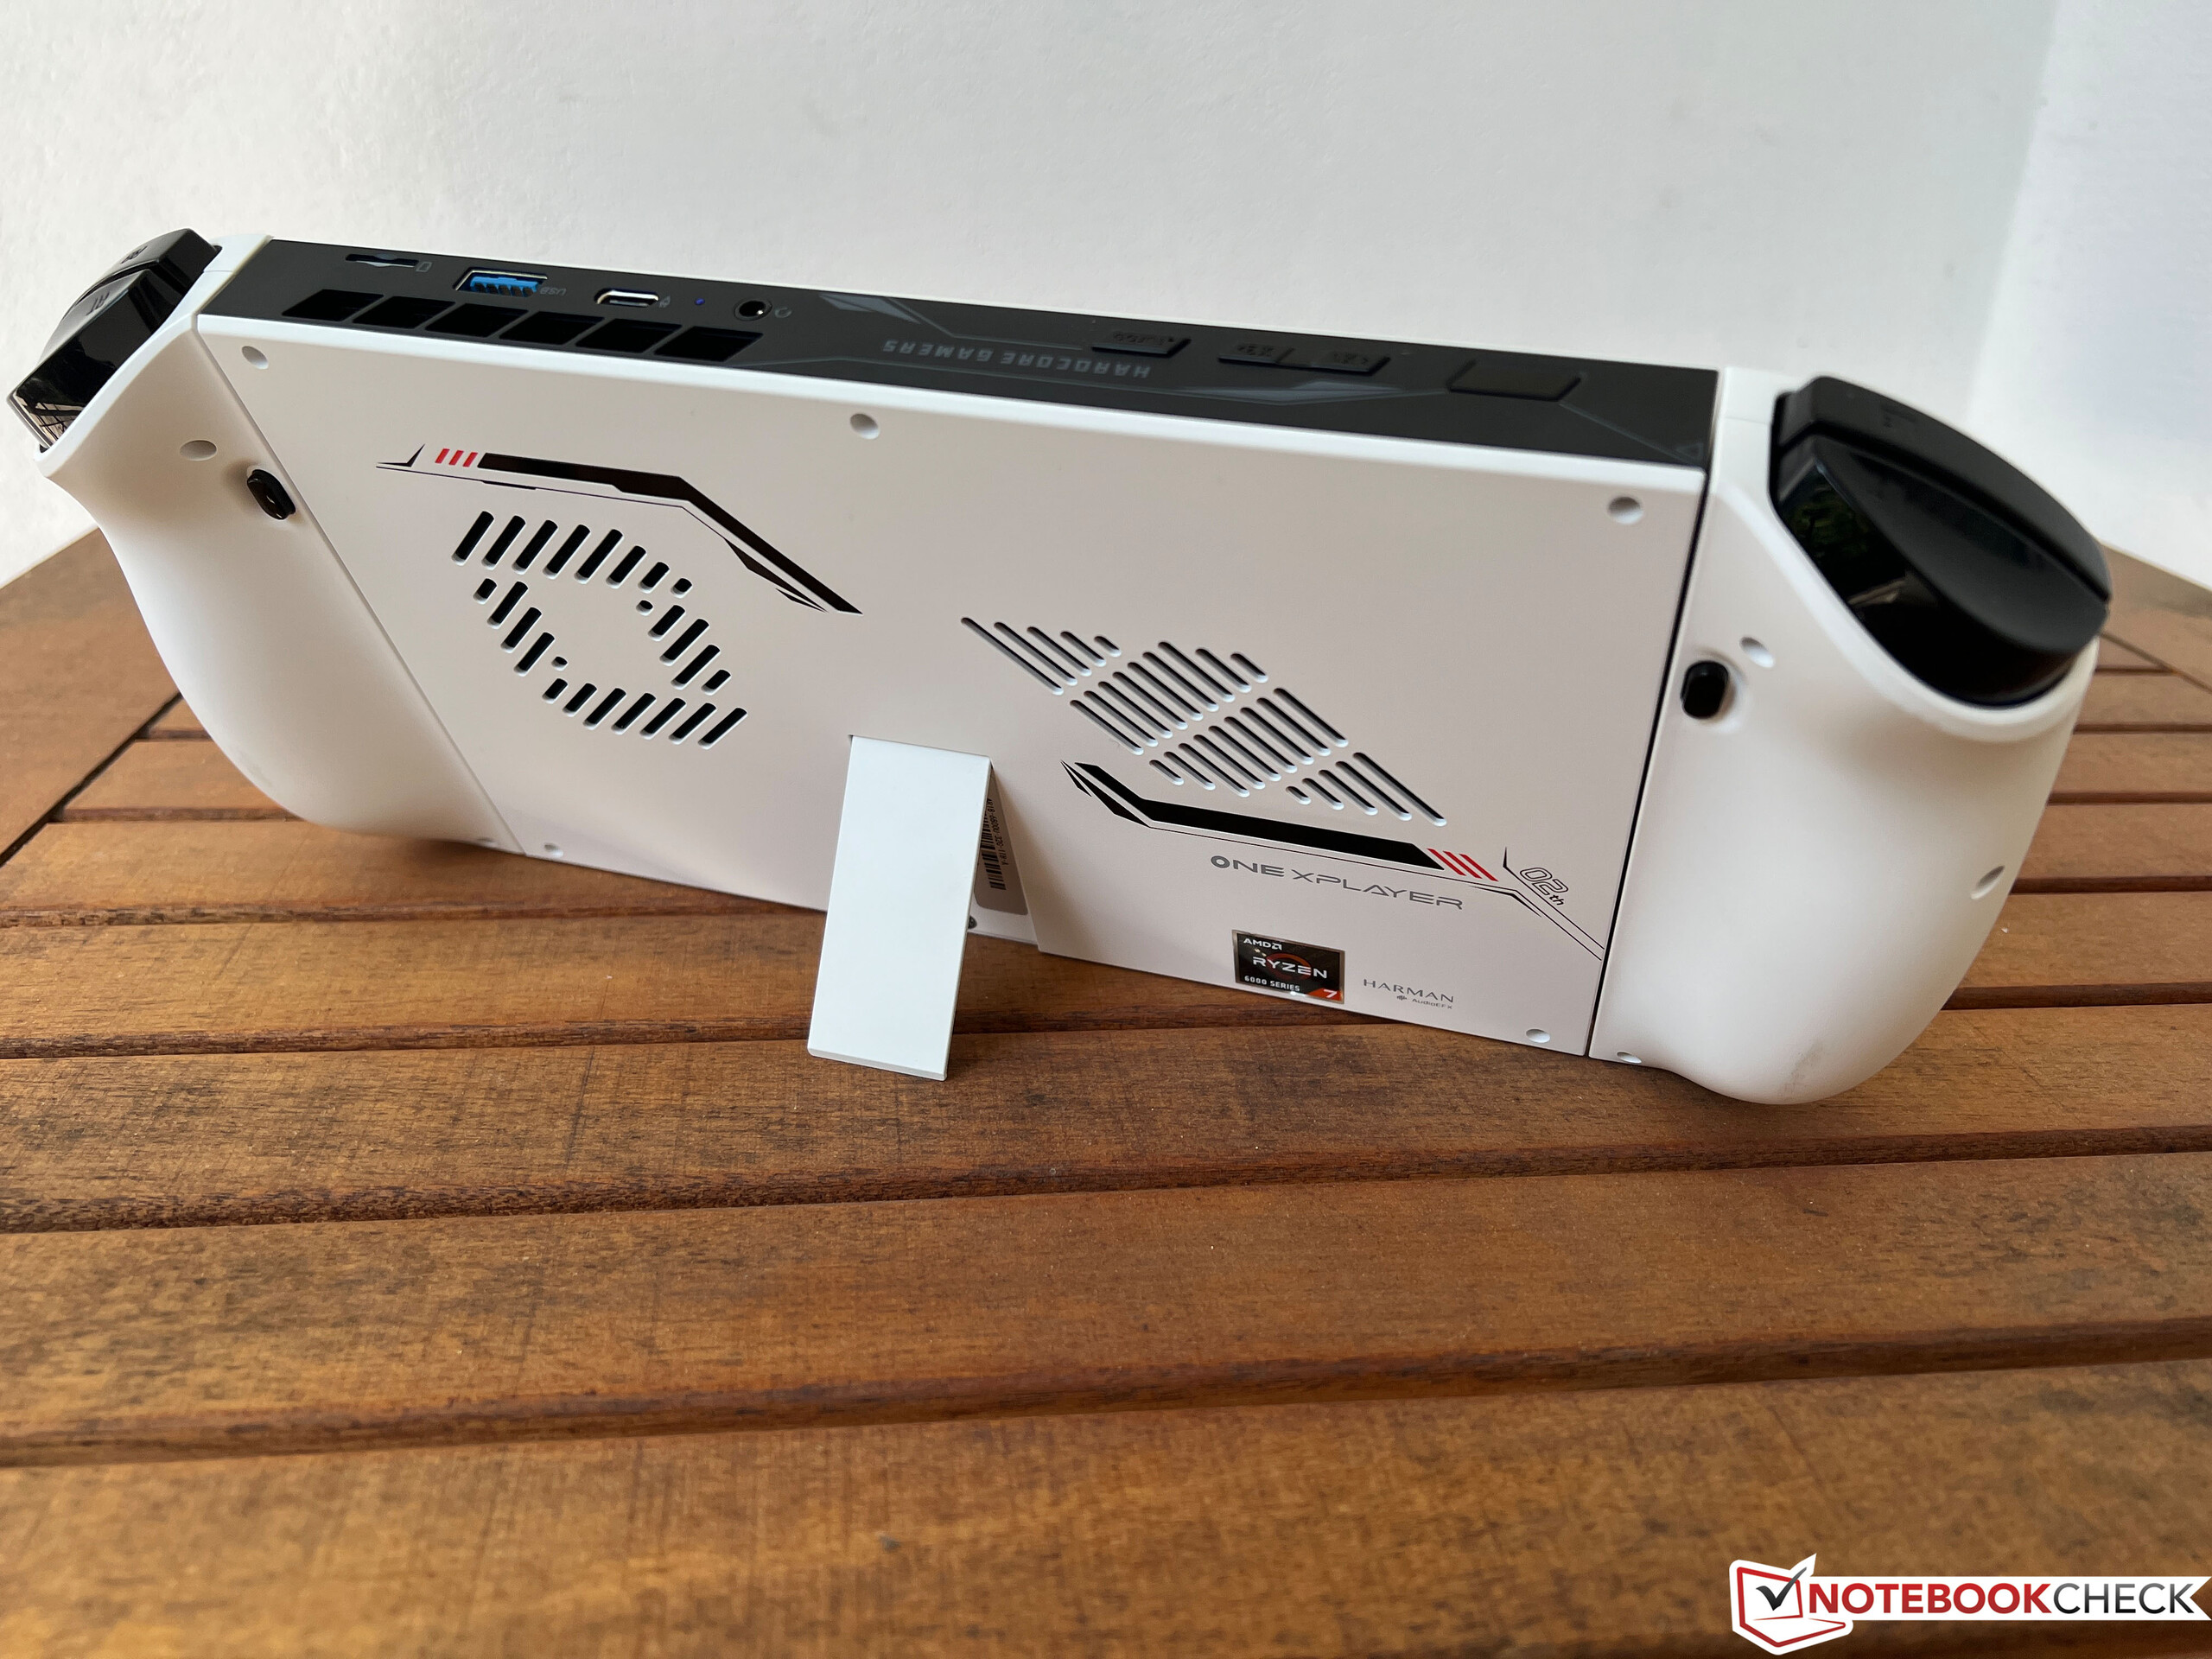
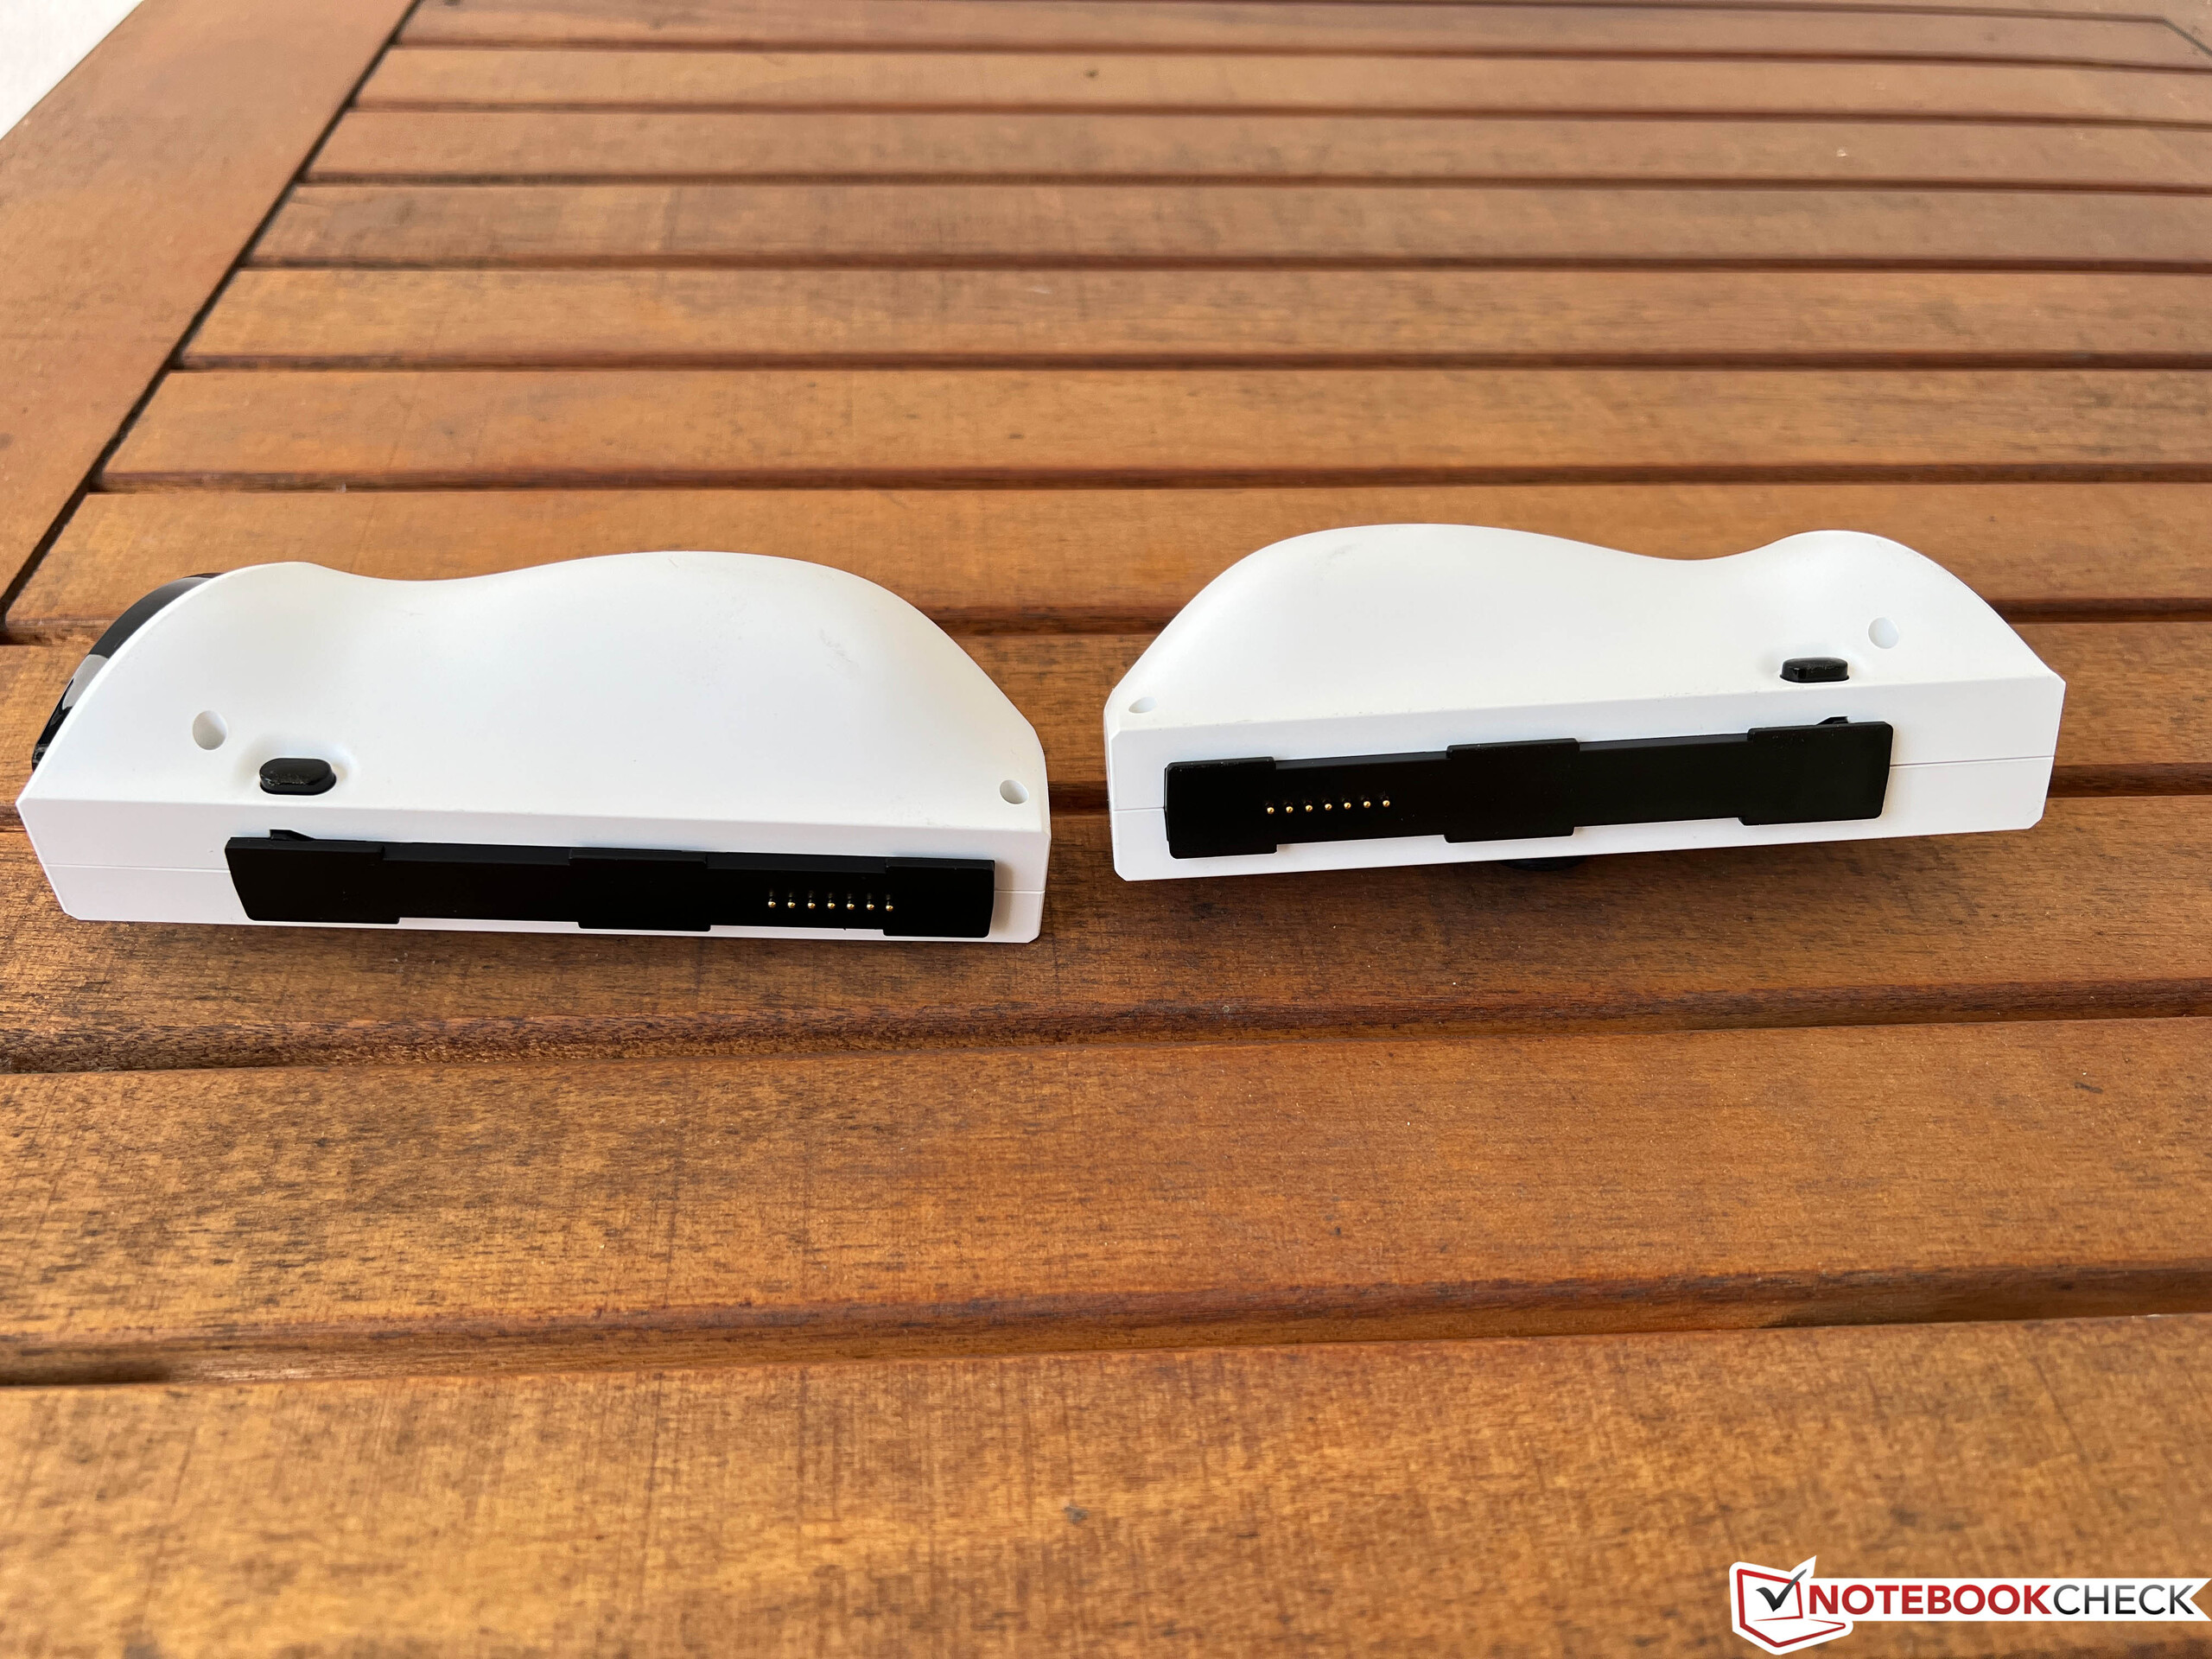
The OneXPlayer 2 is available in either white or black, with orange light elements in each case (but they can be disabled). The casing is made of plastic and the workmanship is okay, but the two connections of the side controllers cause minimal play in the construction. The connection mechanism itself works well, though, and the controllers also snap in neatly. The central part is ultimately a small tablet with an integrated kickstand, in which all components are installed. A bit annoying is the fact that the two controllers do not have a battery, and thus only work with an additional adapter when disconnected, which has to be purchased separately. Alternatively, you can of course connect a regular controller via USB or Bluetooth.
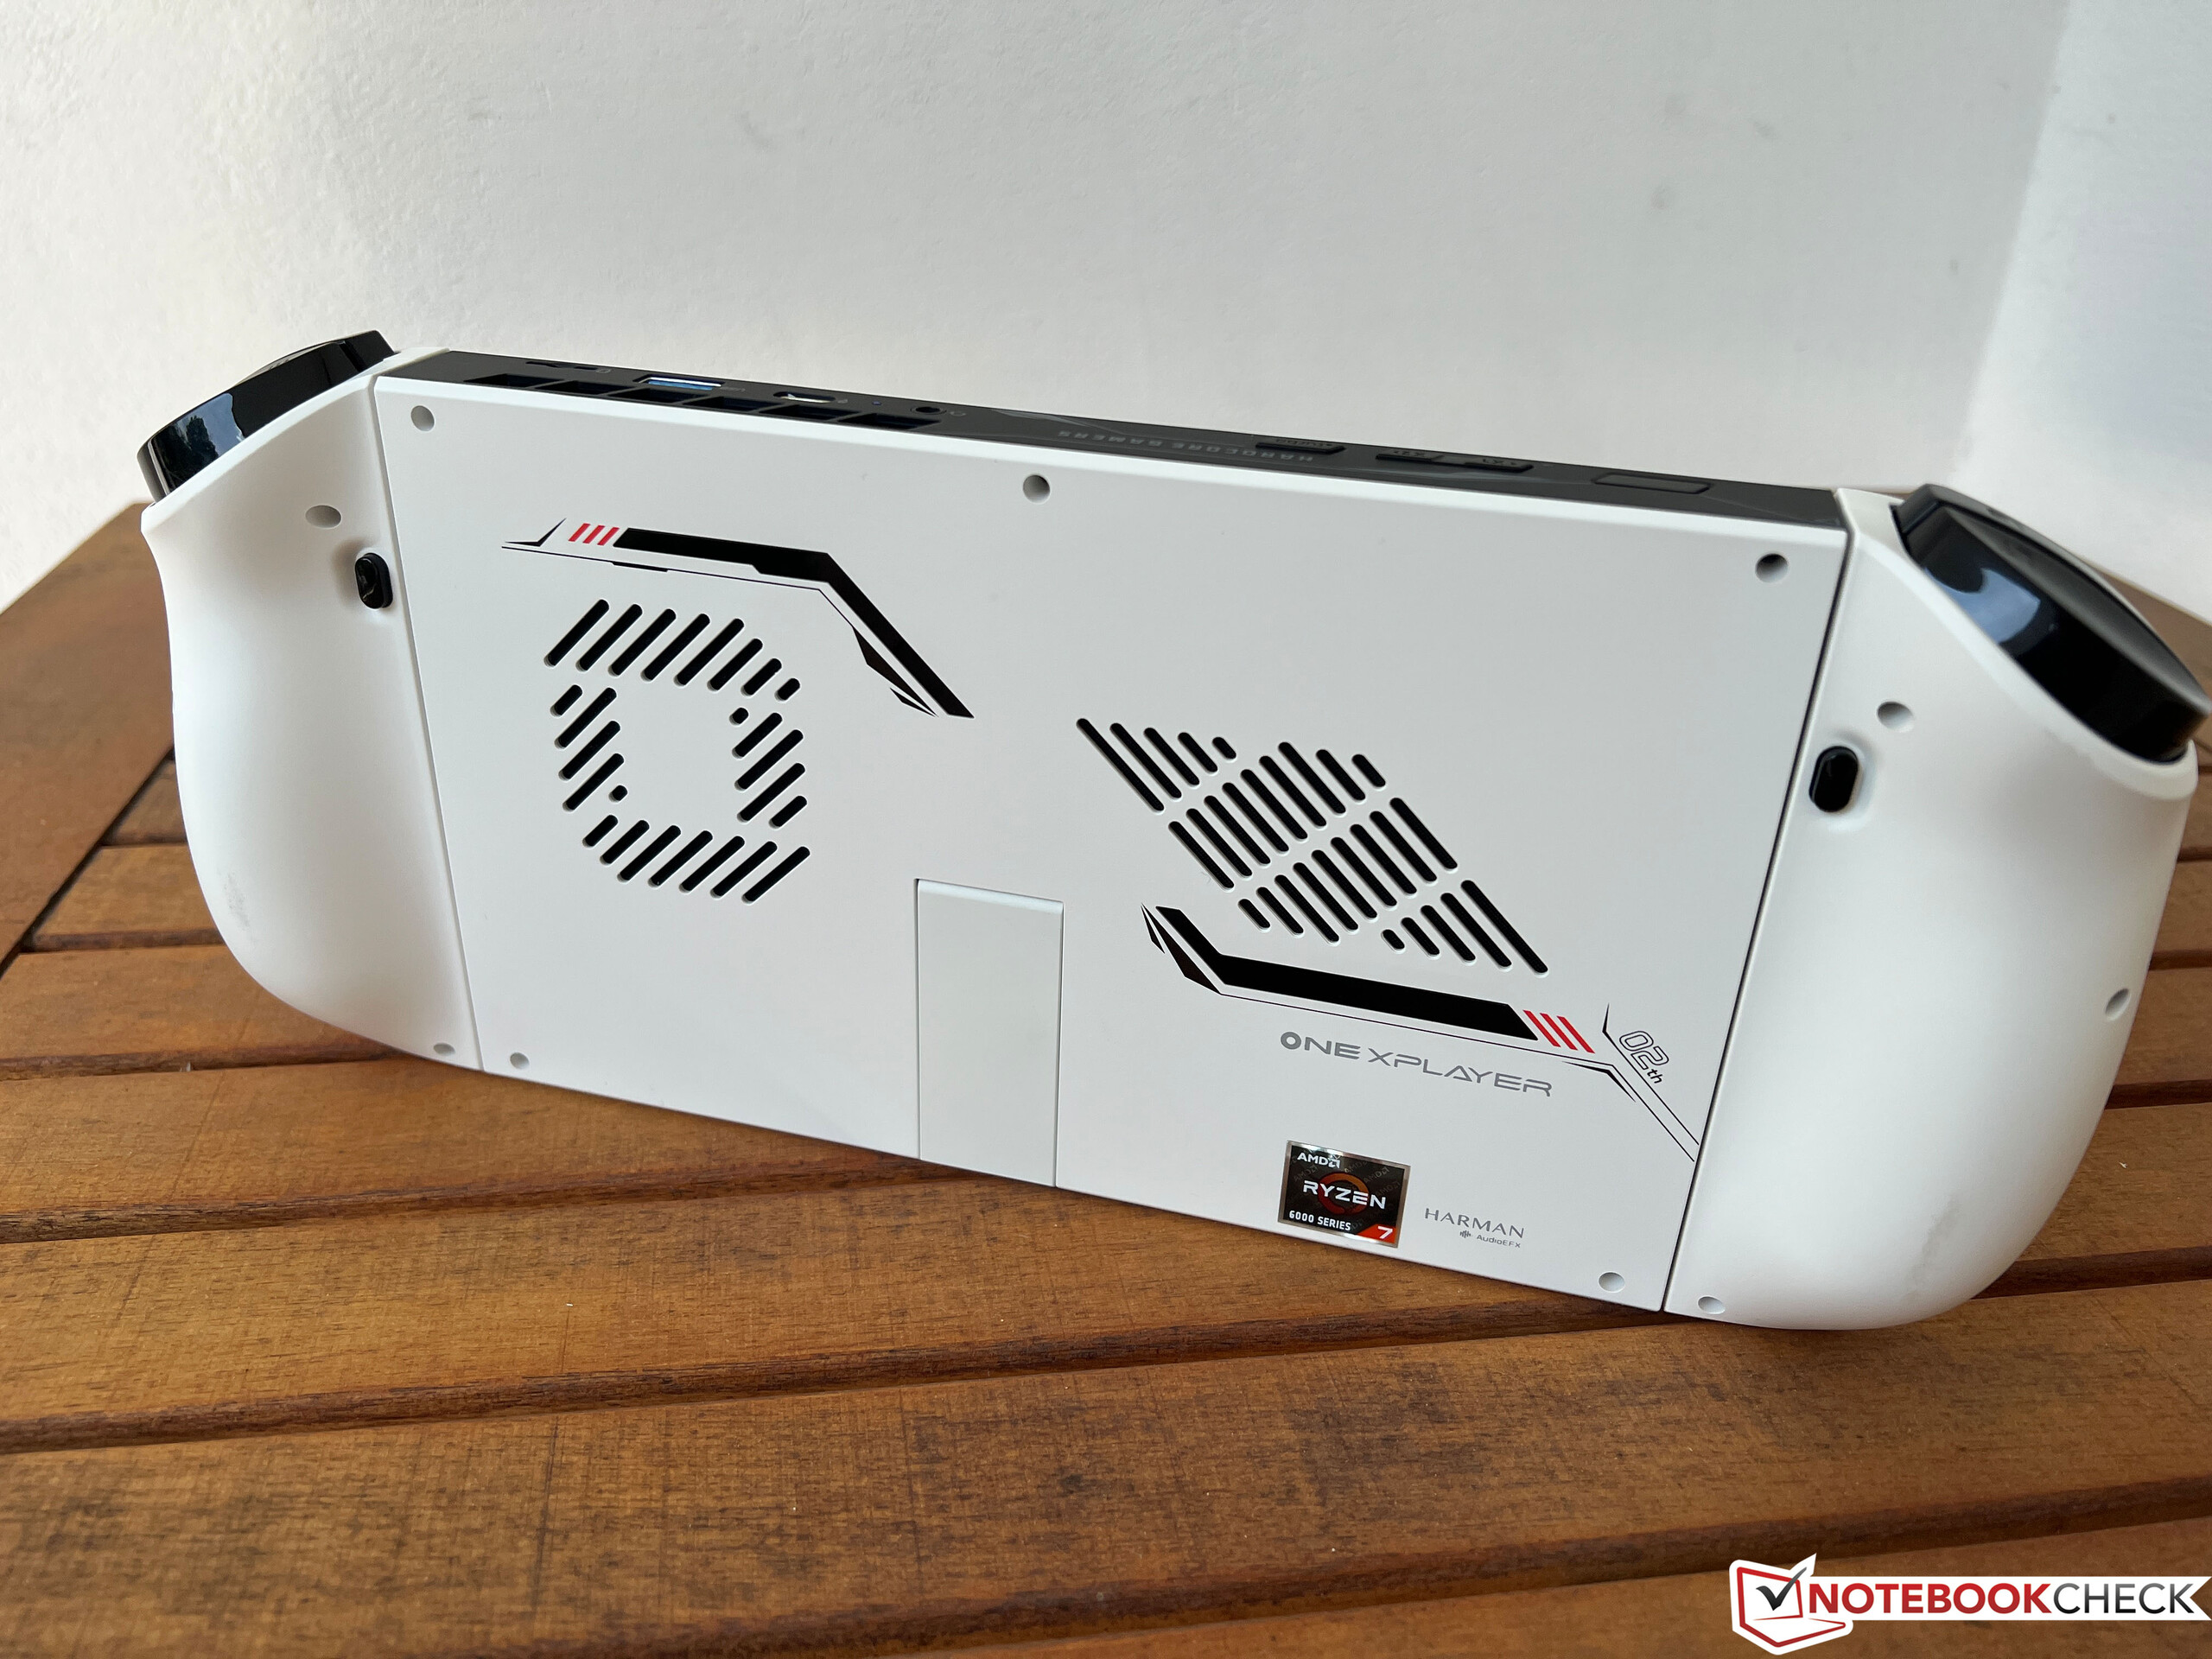
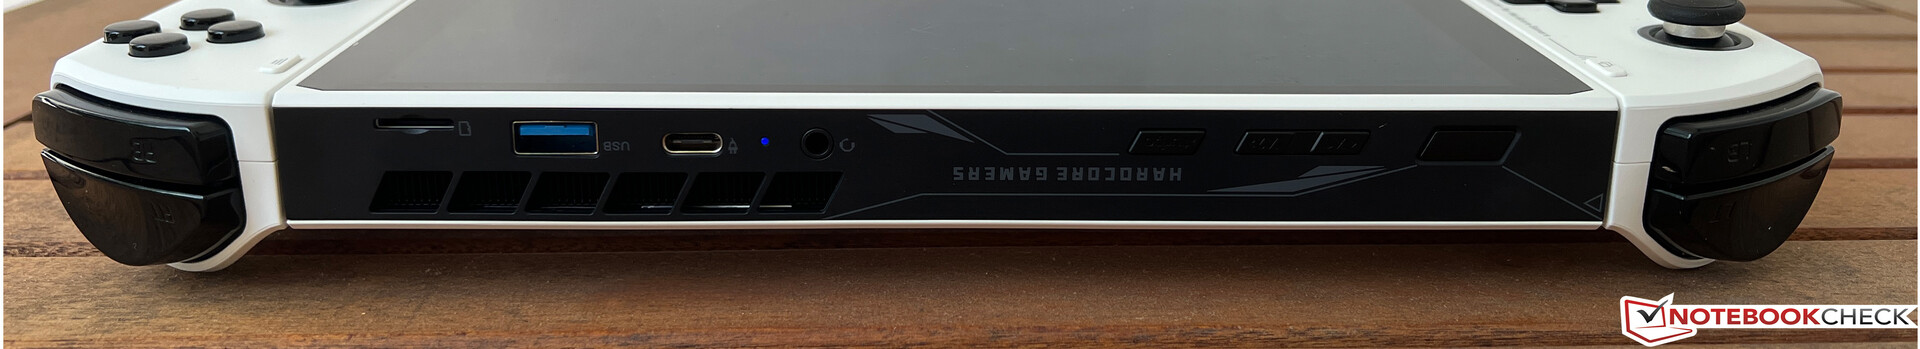
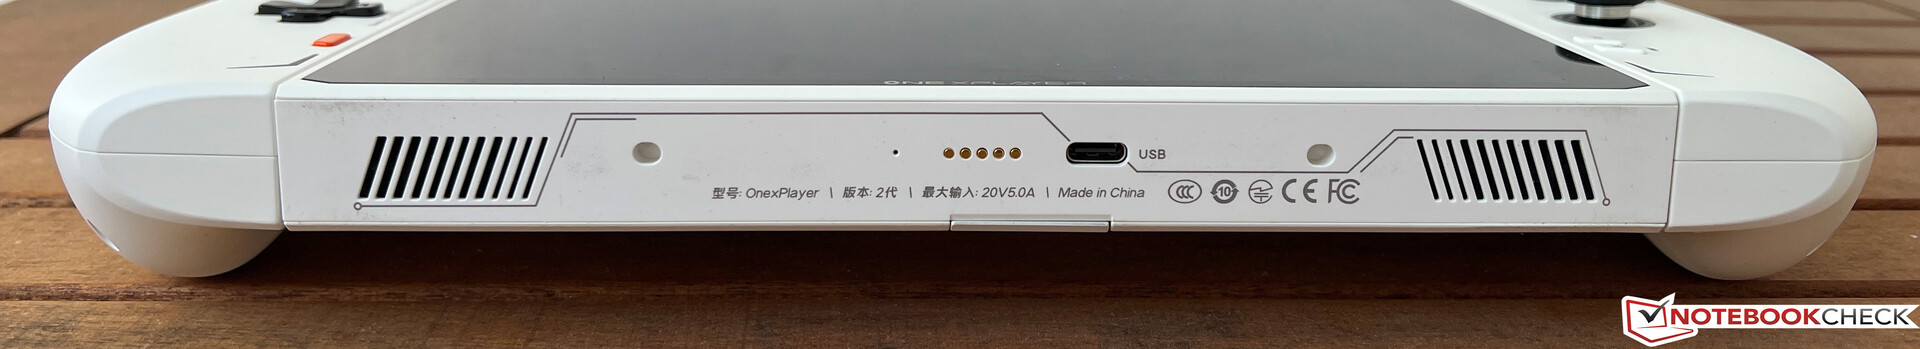
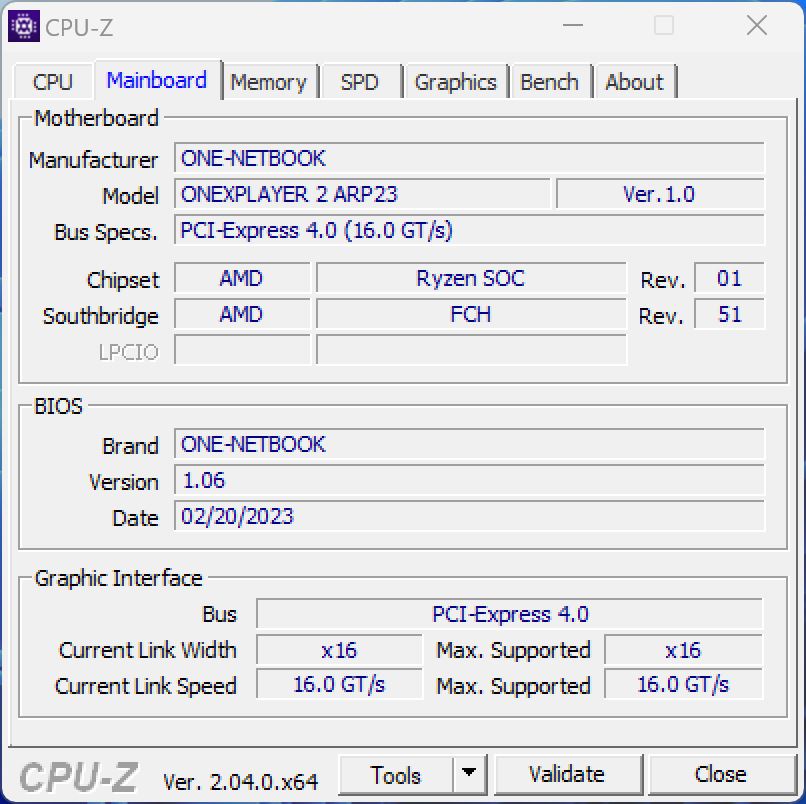
The OneXPlayer 2 offers a wide range of ports including 2x USB-C (1x USB 4.0), a microSD reader and even a regular USB-A port. A regular M.2-2280 SSD is also installed, but the entire device has to be removed for access. Thanks to USB 4.0, even an external graphics card can be connected to the device at home. The microSD card reader is even really fast with a maximum of 246 MB/s and could therefore also be used as a memory expansion. Intel's AX210 card serves as the WLAN module, so modern Wi-Fi 6 connections are also supported. We did not have any connection problems in our test and the transfer rates are also good. The handheld does not offer a webcam.

| SD Card Reader | |
| average JPG Copy Test (av. of 3 runs) | |
| GPD Win Max 2 (Toshiba Exceria Pro SDXC 64 GB UHS-II) | |
| Asus ROG Ally Z1 Extreme (Angelbird AV Pro V60) | |
| One Netbook XPlayer 2 (Angelbird AV Pro V60) | |
| Average of class Multimedia (23 - 531, n=42, last 2 years) | |
| GPD Win 4 (AV Pro SD microSD 128 GB V60) | |
| Valve Steam Deck 512 GB LCD (Angelbird AV Pro V60) | |
| maximum AS SSD Seq Read Test (1GB) | |
| Asus ROG Ally Z1 Extreme (Angelbird AV Pro V60) | |
| One Netbook XPlayer 2 (Angelbird AV Pro V60) | |
| GPD Win Max 2 (Toshiba Exceria Pro SDXC 64 GB UHS-II) | |
| Average of class Multimedia (37.3 - 1455, n=41, last 2 years) | |
| GPD Win 4 (AV Pro SD microSD 128 GB V60) | |
| Networking | |
| One Netbook XPlayer 2 | |
| iperf3 transmit AXE11000 | |
| iperf3 receive AXE11000 | |
| Asus ROG Ally Z1 Extreme | |
| iperf3 transmit AXE11000 | |
| iperf3 receive AXE11000 | |
| GPD Win 4 | |
| iperf3 transmit AXE11000 | |
| iperf3 receive AXE11000 | |
| iperf3 transmit AXE11000 6GHz | |
| iperf3 receive AXE11000 6GHz | |
| GPD Win Max 2 | |
| iperf3 transmit AXE11000 6GHz | |
| iperf3 receive AXE11000 6GHz | |
| GPD Pocket 3 | |
| iperf3 transmit AX12 | |
| iperf3 receive AX12 | |
Operation - Windows without optimizations
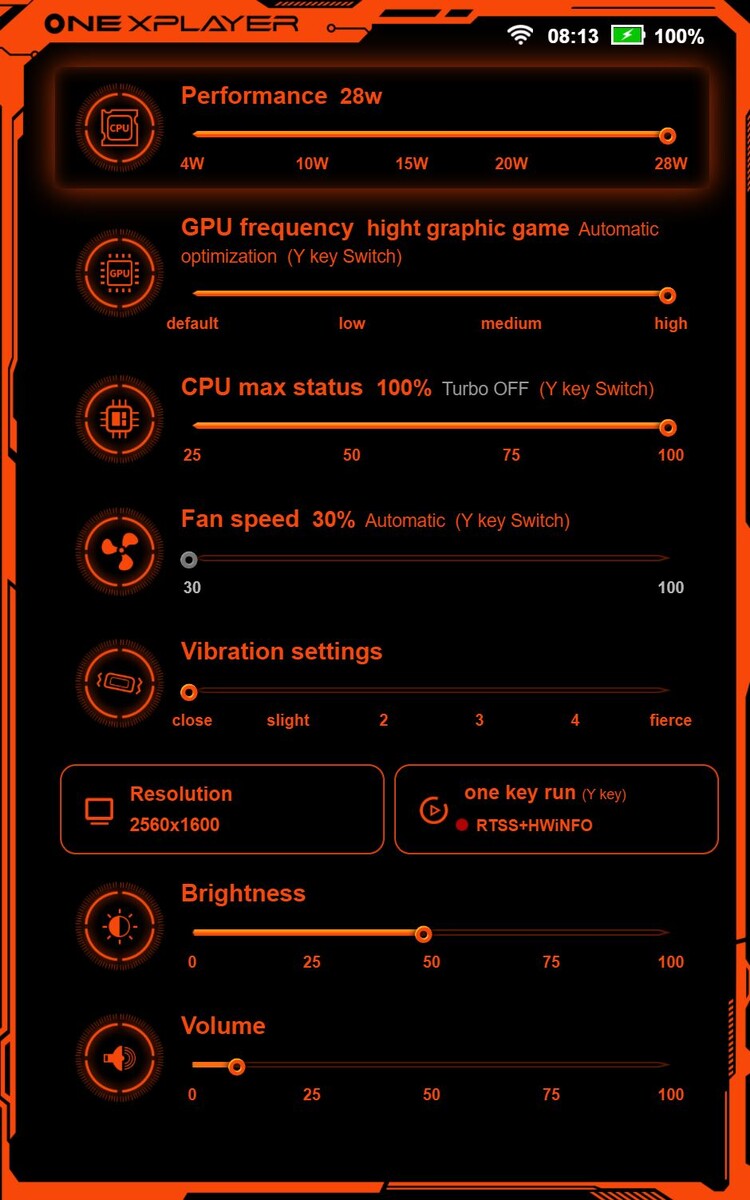
Windows 11 Home is used as the operating system, but without any adjustments for touch operation. The two joysticks can be used for pointer control and scrolling, which is a bit awkward, but basically works. Unlike the Steam Deck or the ROG Ally, however, there is no central software that can be used to install/start games or adjust settings, for example. Here, it is limited to a small control center called Gamer Zone, which allows you to change the CPU's performance, the vibration and brightness, and the volume. This menu is quite practical and always accessible via a dedicated button, but we would have liked to see an FPS lock here as well, for example. Another drawback is that it is a separate app and not an overlay, which is why you cannot use it in the game, but it is thrown onto the desktop.
The joysticks themselves leave a decent impression, and we didn't have any problems with the buttons during our tests. However, especially the triggers on the upper side do not leave a particularly high-quality impression and the controllers support a vibration function. The capacitive touchscreen itself works without problems, as expected. All in all, you simply notice that there was no special software optimization and Windows is unfortunately still not ideal to be primarily operated via the touchscreen.
Display - IPS panel with WQHD resolution
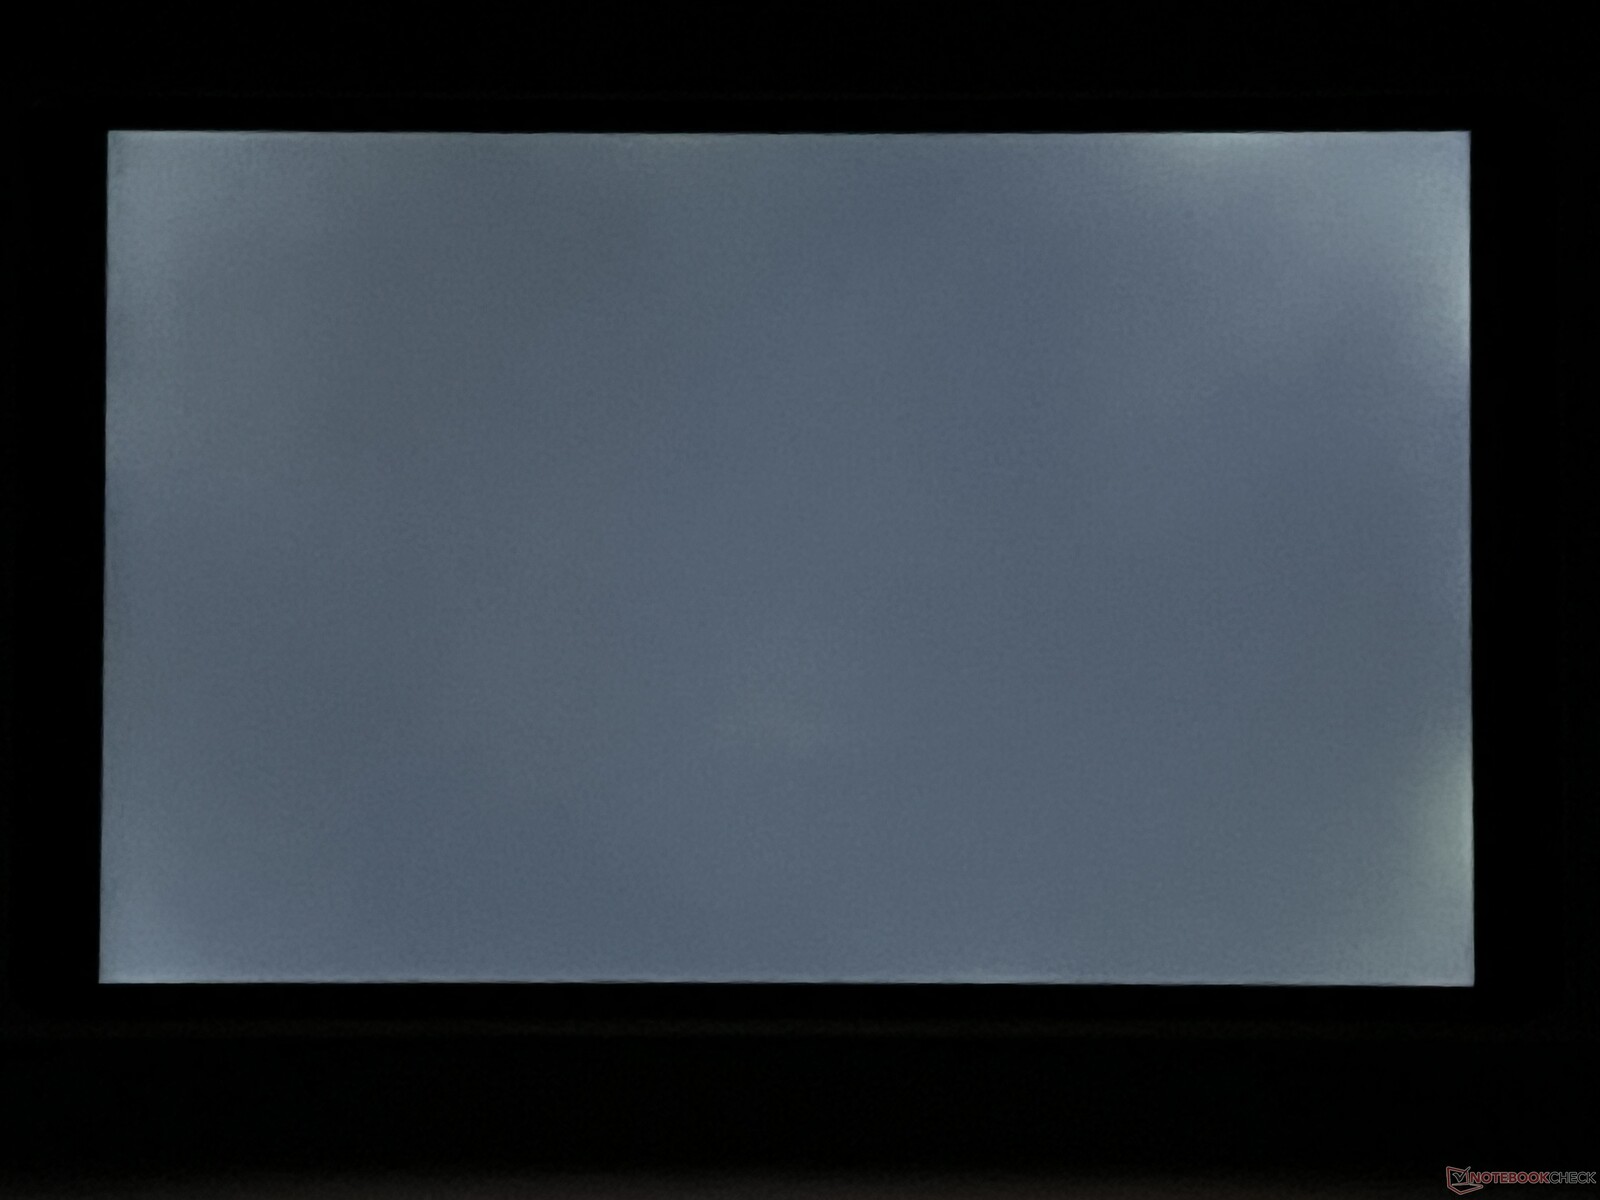
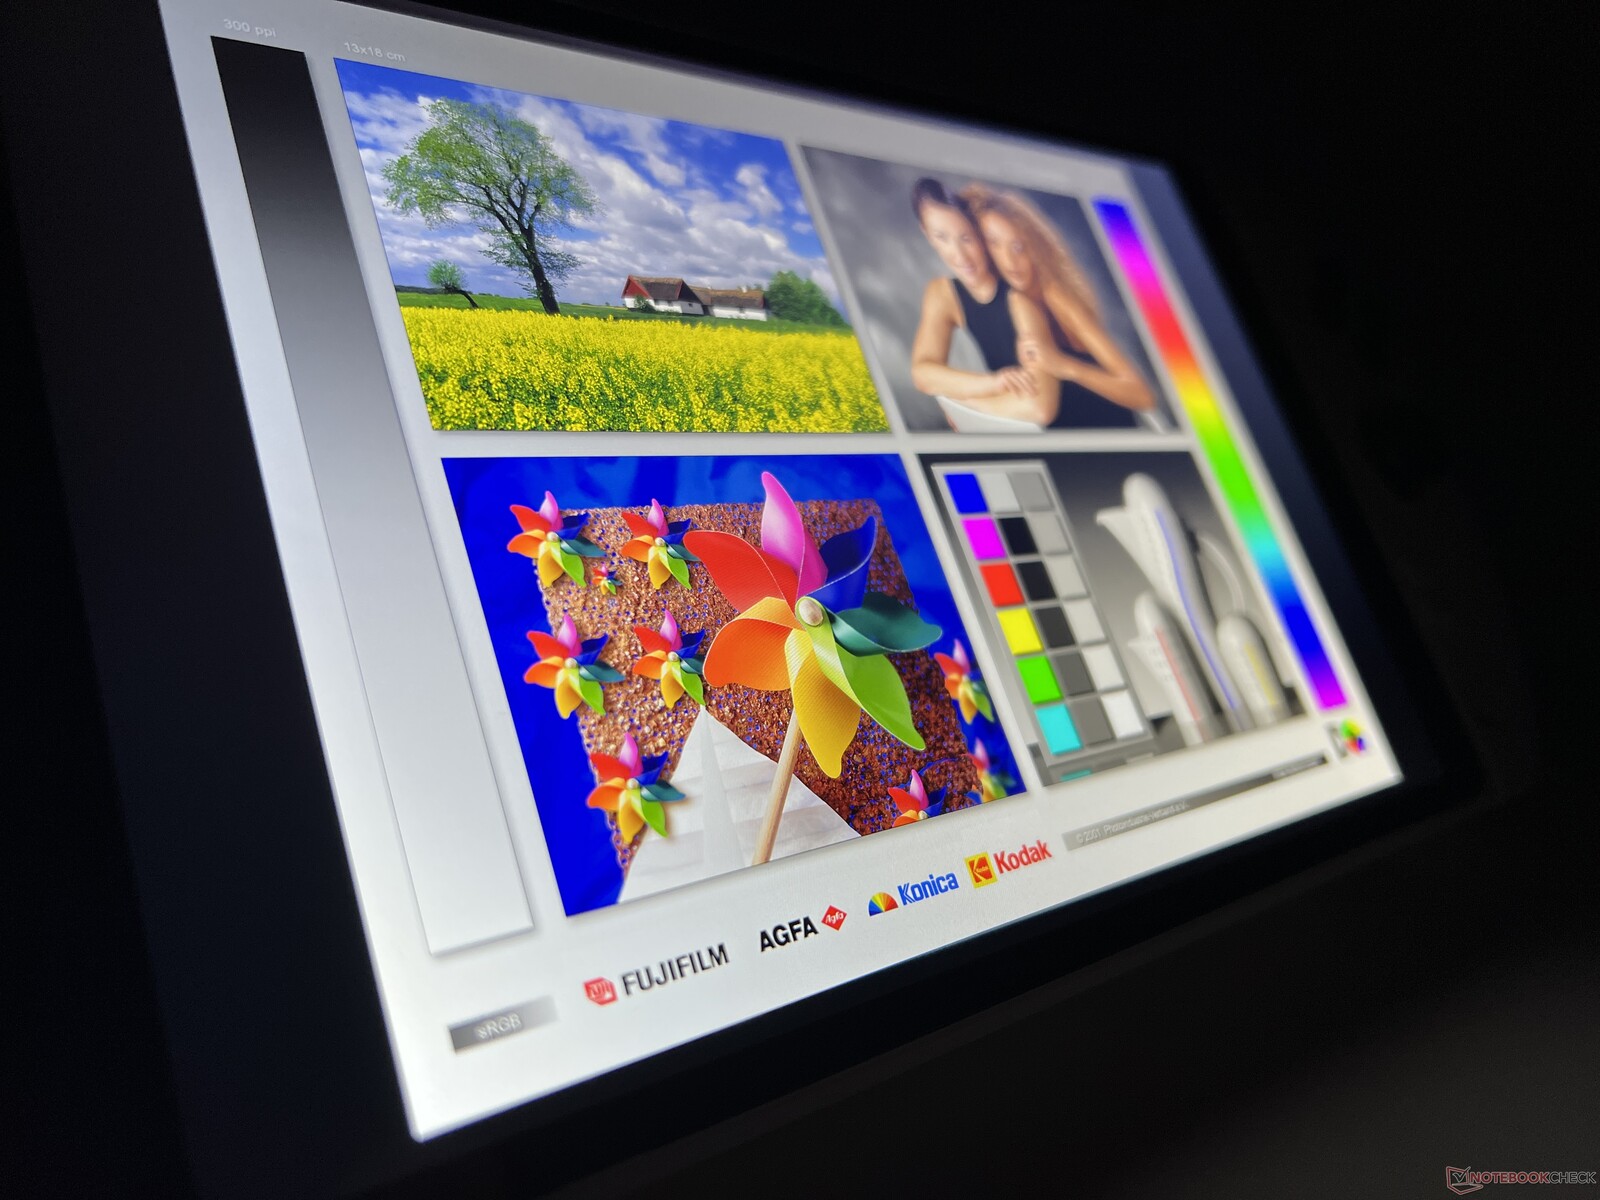
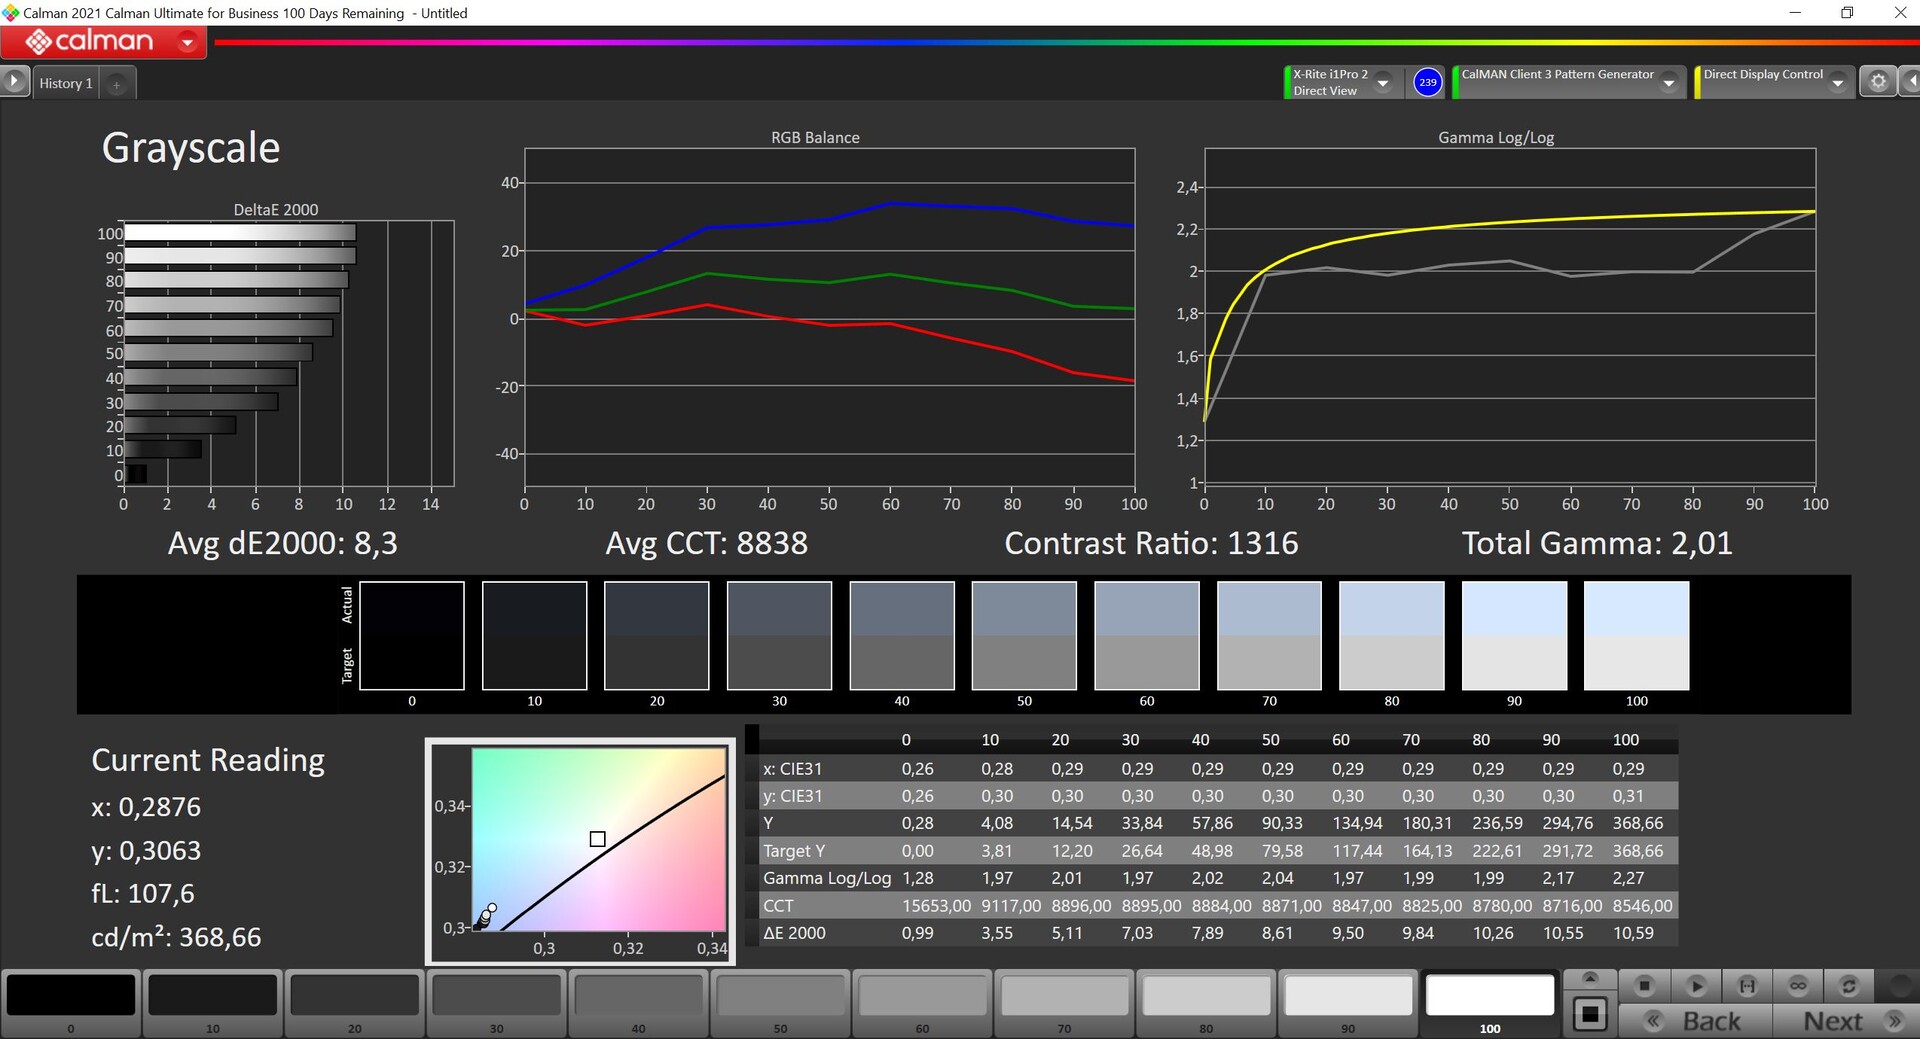
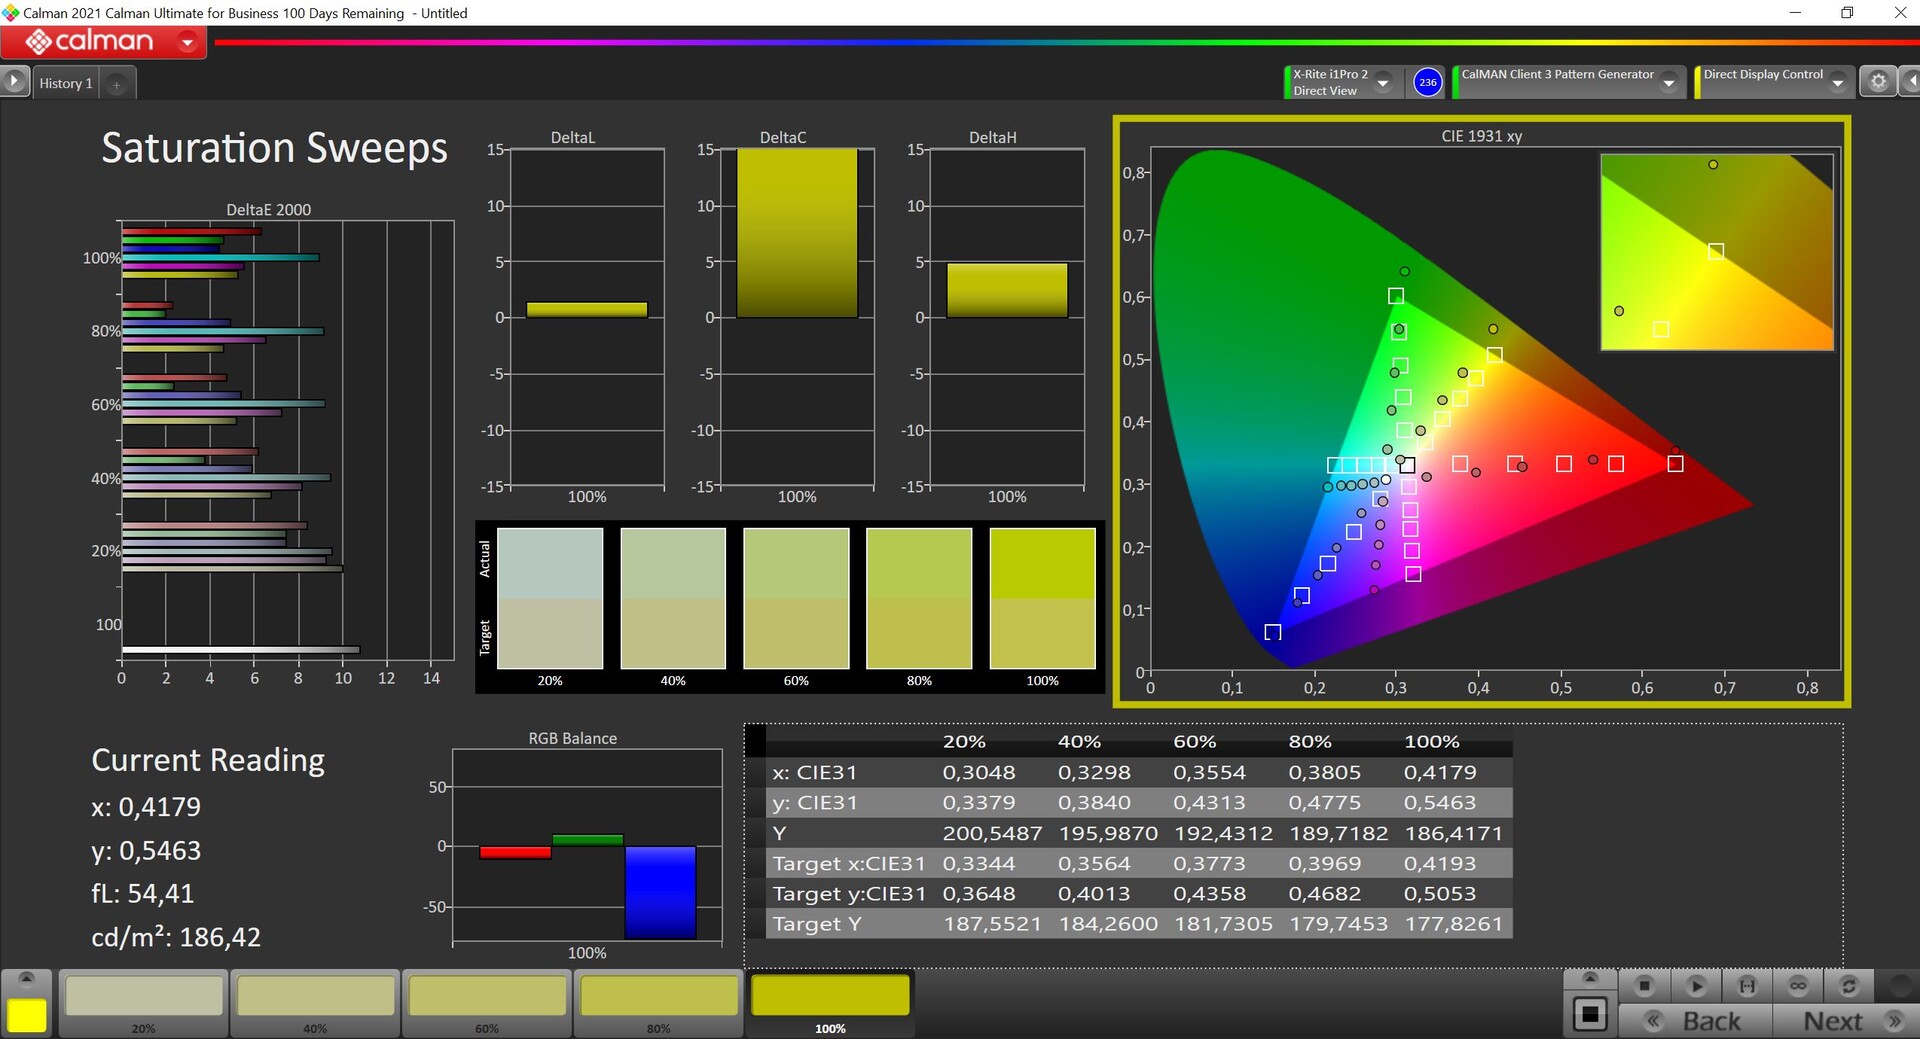
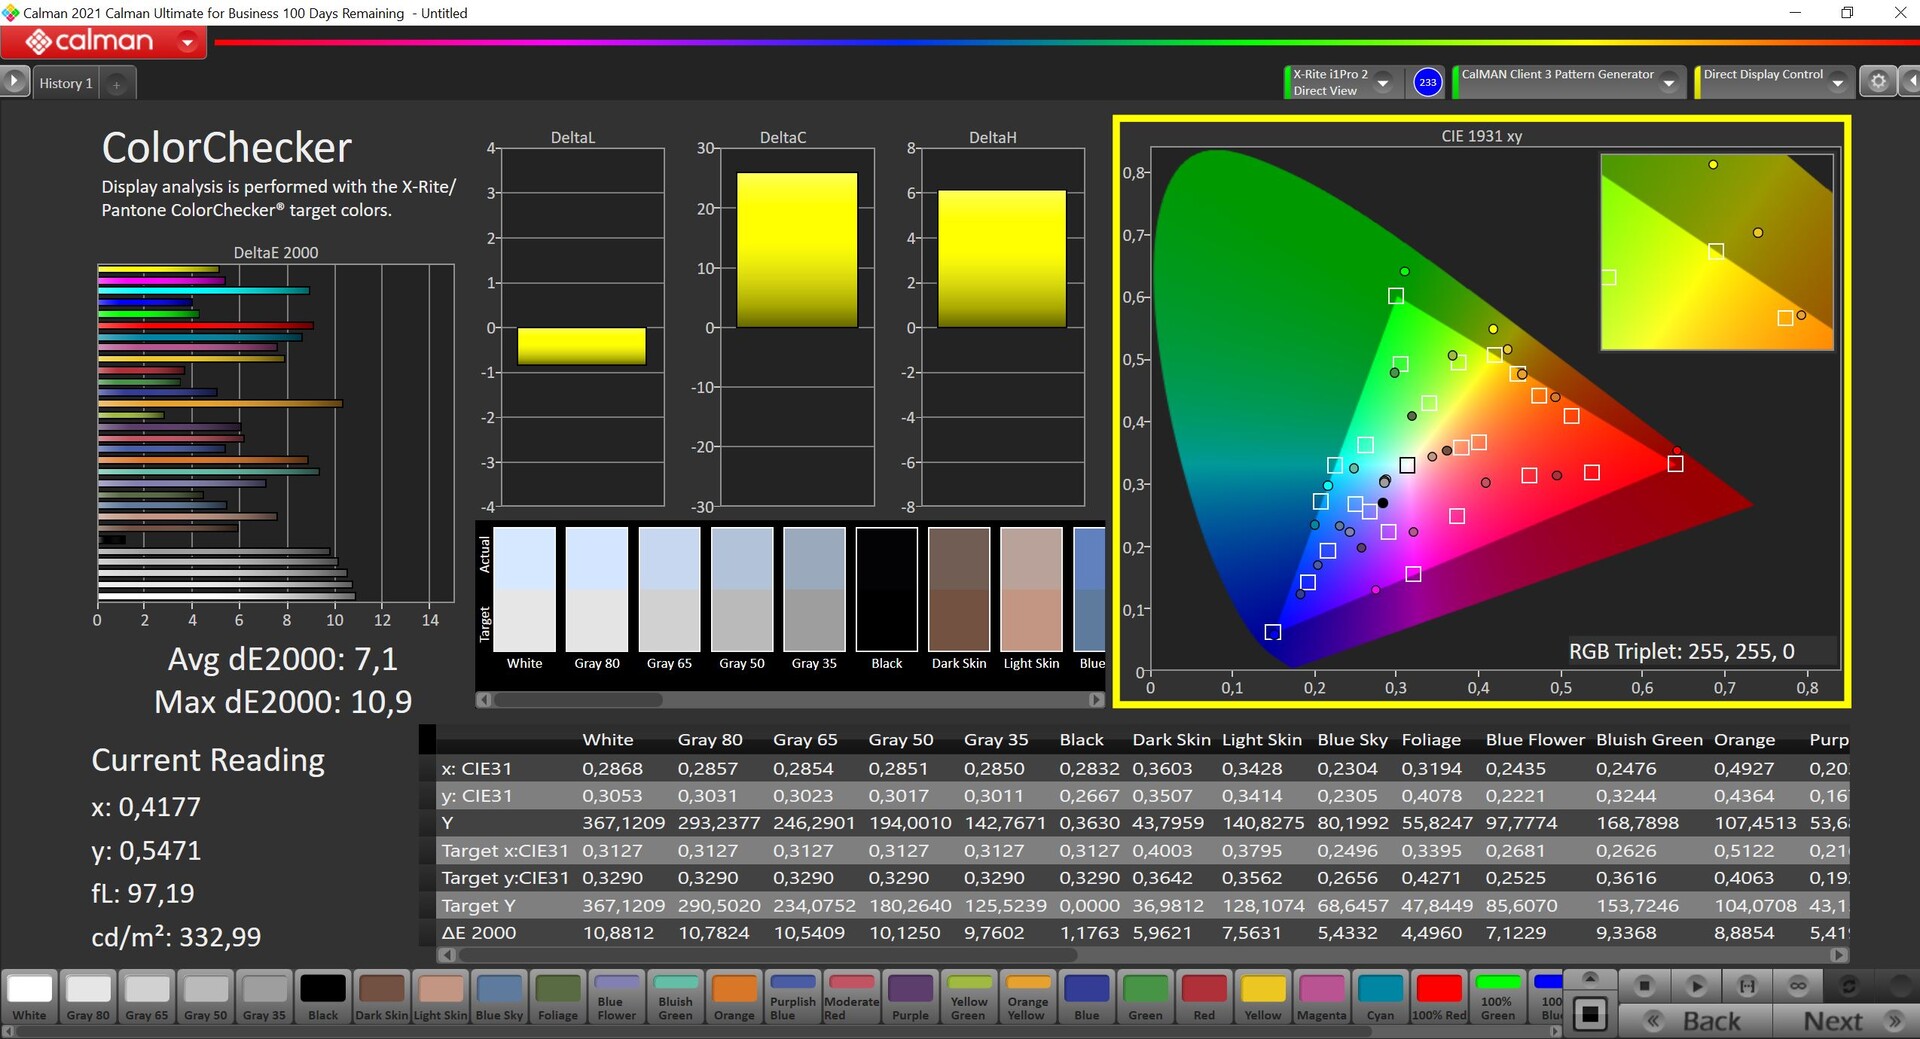
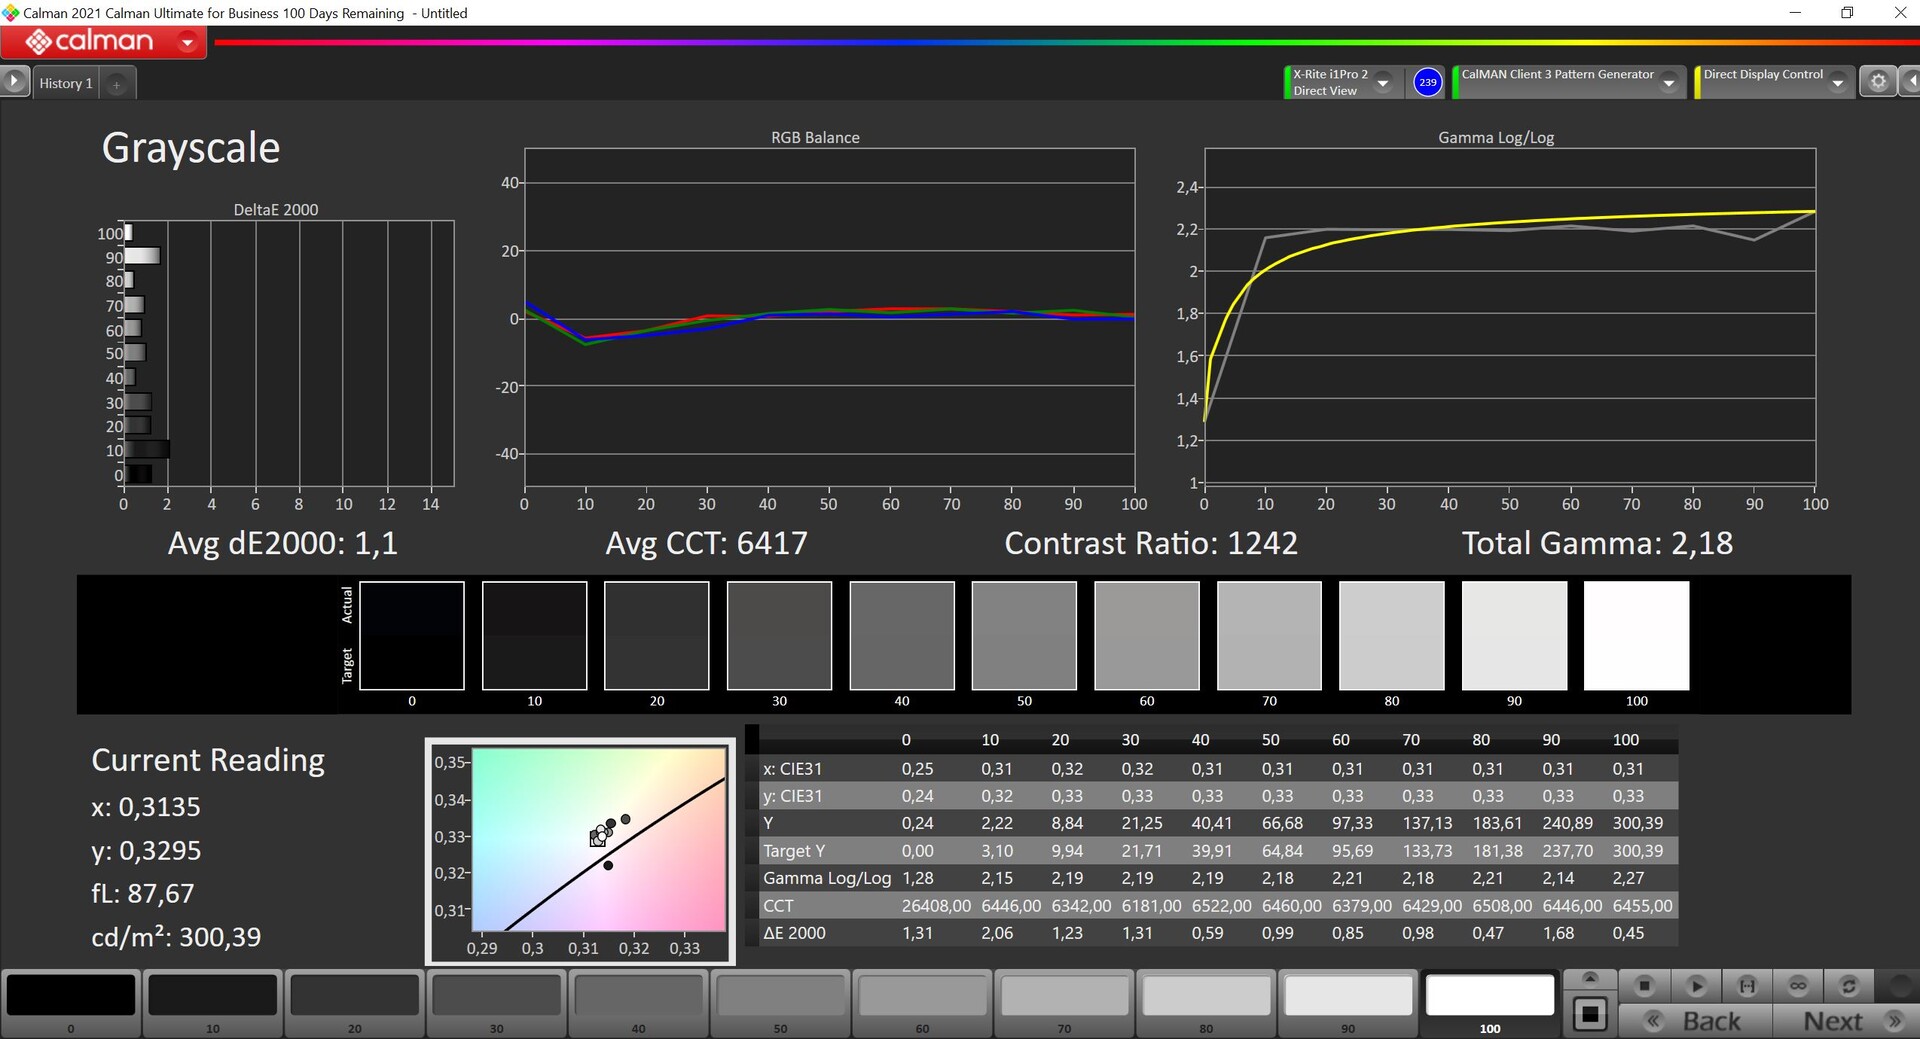
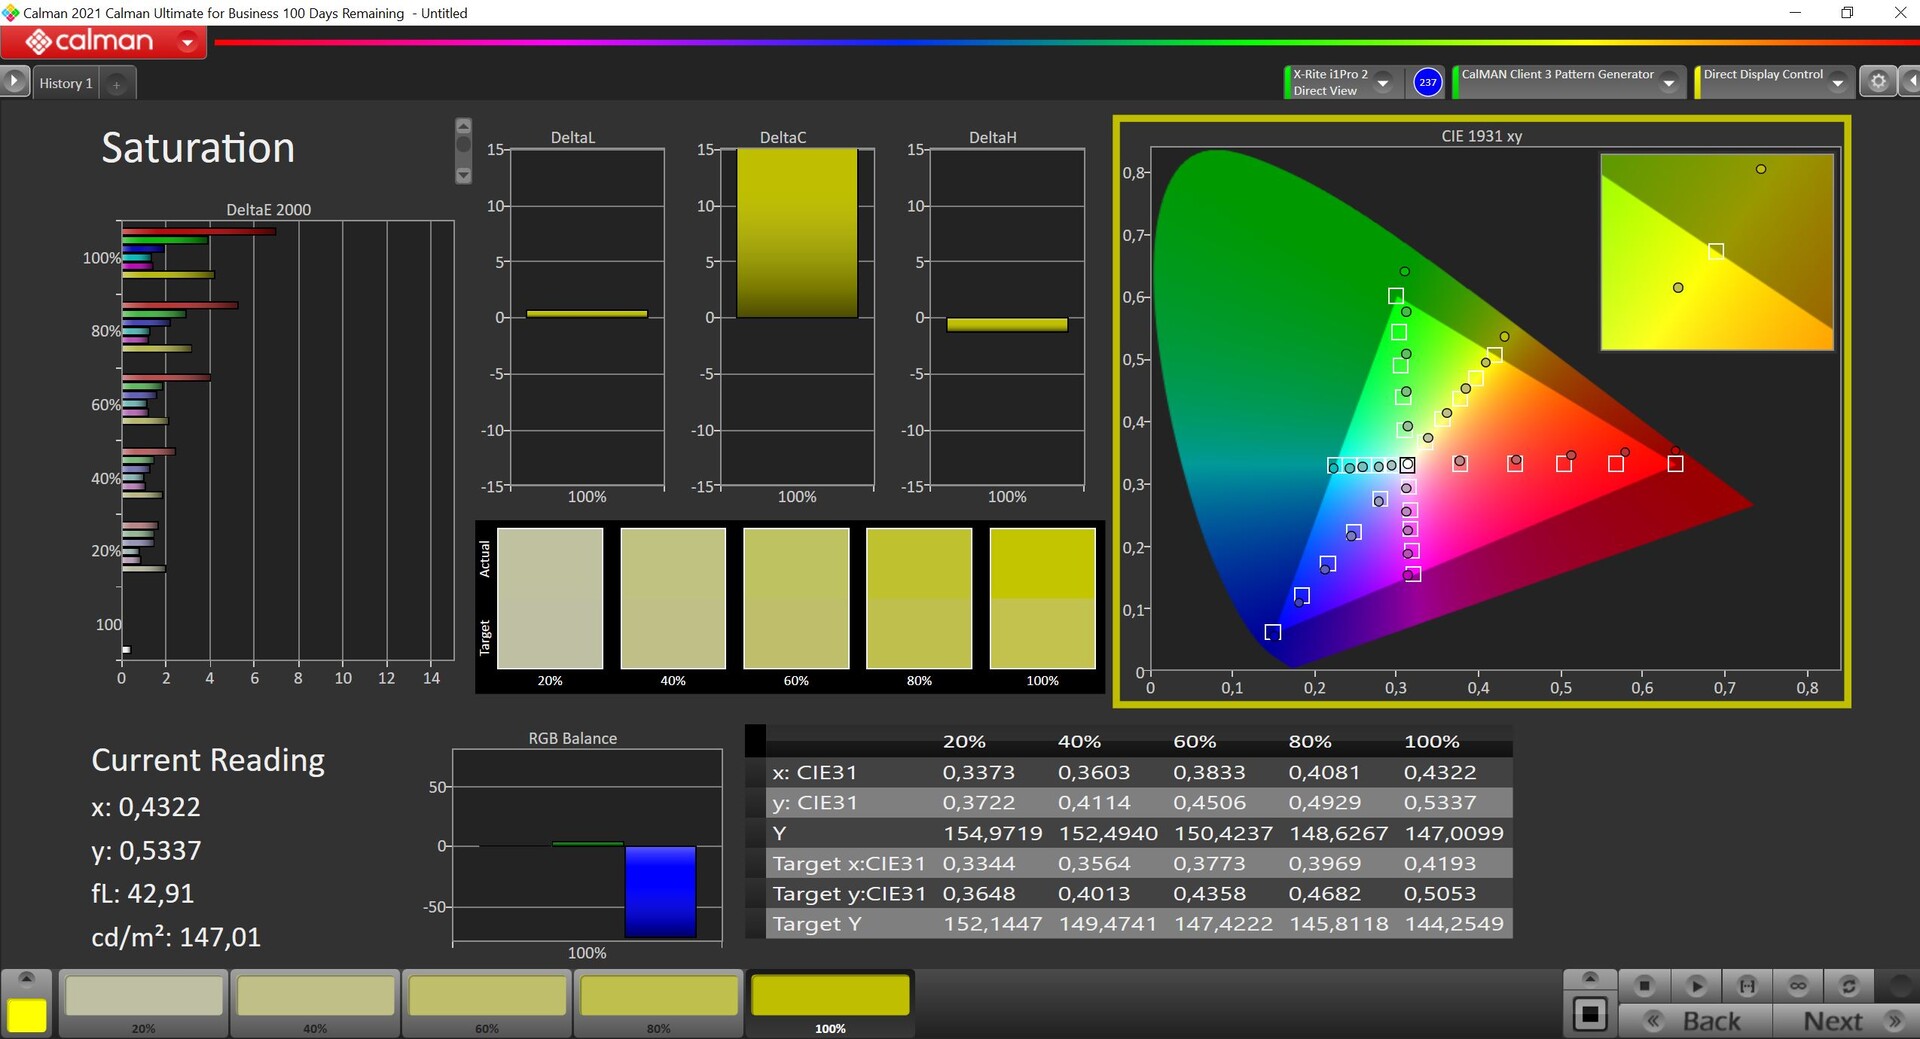
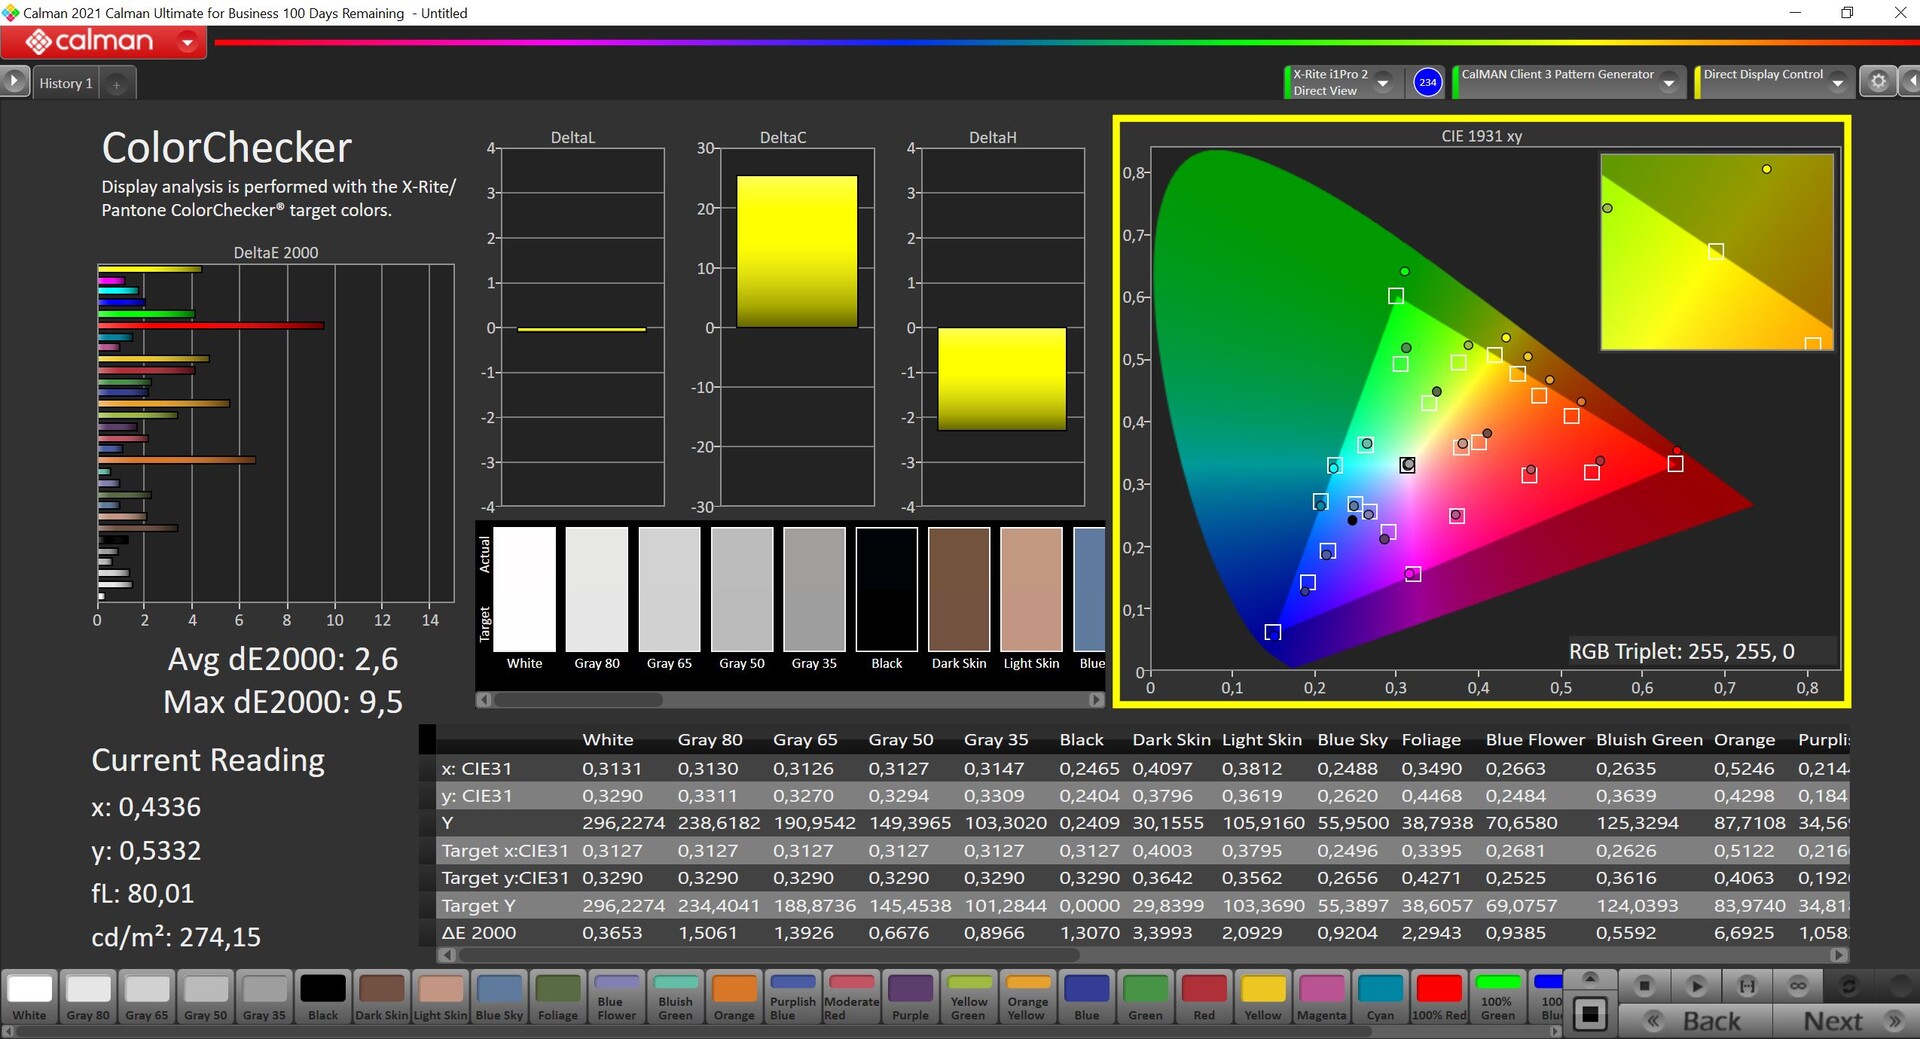
The 8.4-inch IPS panel offers a high resolution of 2,560 x 1,600 pixels (16:10, WQHD), but only 60 Hz. The subjective picture impression is very good and all content is sharp. Furthermore, bright surfaces do not look grainy. However, there is also a visible blue cast and the colors look very cool overall. Our analysis confirms this, but the manufacturer manages to achieve the advertised brightness of 250 cd/m². In fact, the average brightness of our sample is a bit over 360 cd/m² and a maximum of almost 390 cd/m². The black value is just as decent and the maximum contrast ratio is more than 1300:1.
However, the color accuracy leaves much to be desired and even after our calibration there is still significant deviation. The grayscale and the color cast including the color temperature are under control, but the brightness drops by about 70 cd/m². The competition offers better rates overall, also in terms of response times. We could not detect PWM. The viewing angle stability is good, but there are problems with reflections outdoors due to the highly reflective touchscreen.

| |||||||||||||||||||||||||
Brightness Distribution: 89 %
Center on Battery: 369 cd/m²
Contrast: 1318:1 (Black: 0.28 cd/m²)
ΔE ColorChecker Calman: 7.1 | ∀{0.5-29.43 Ø4.72}
calibrated: 2.6
ΔE Greyscale Calman: 8.3 | ∀{0.09-98 Ø4.97}
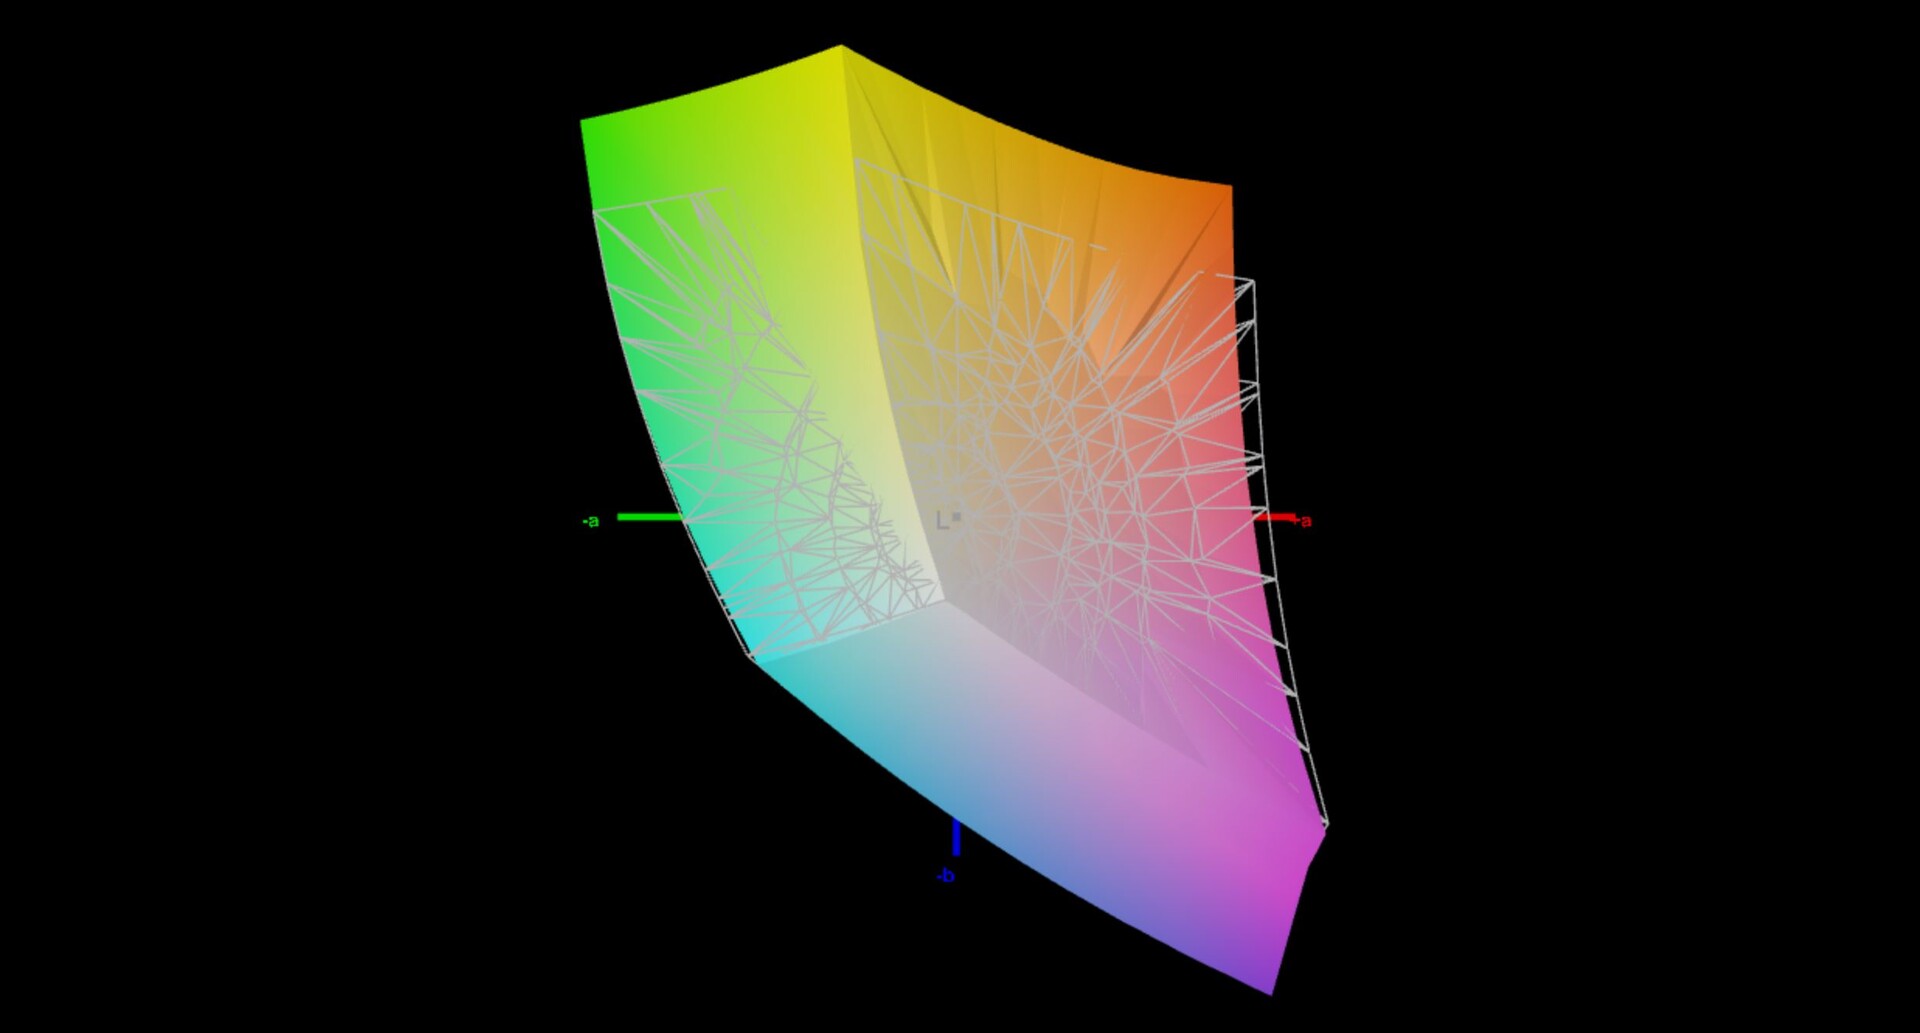
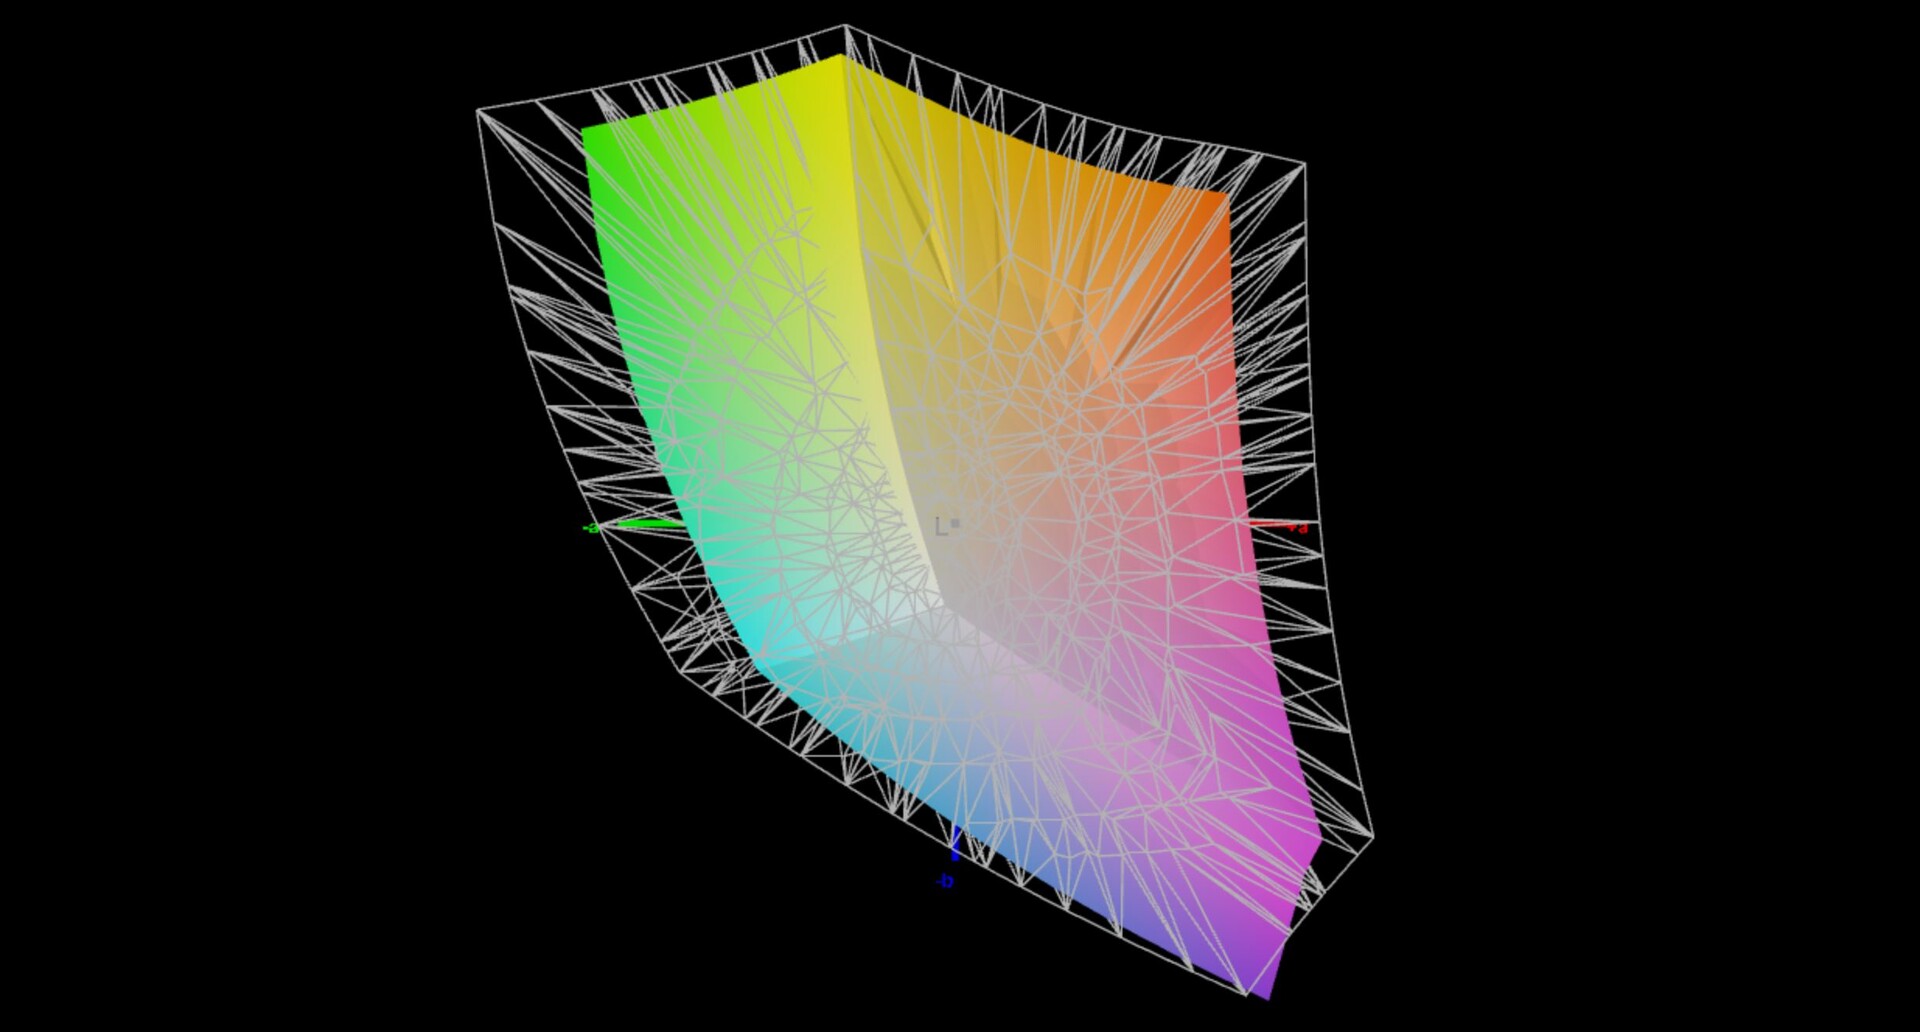
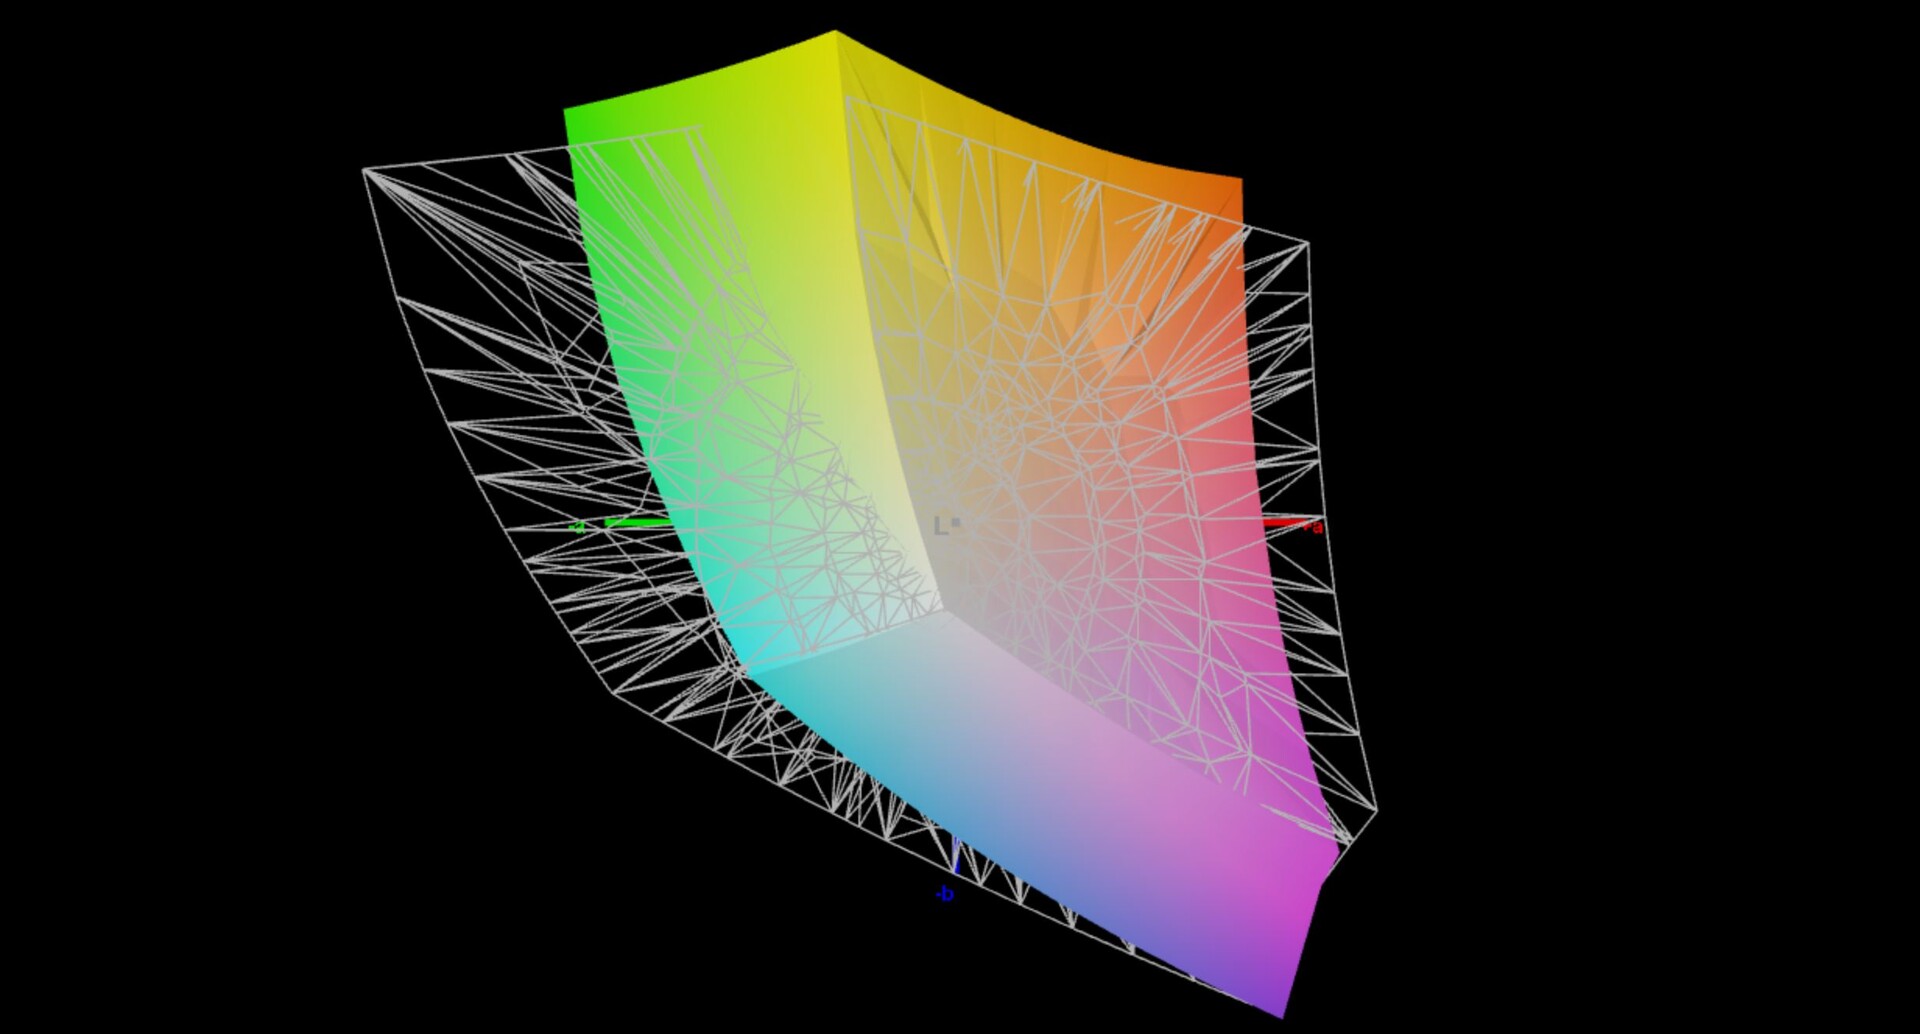
71.1% AdobeRGB 1998 (Argyll 3D)
97% sRGB (Argyll 3D)
75.4% Display P3 (Argyll 3D)
Gamma: 2.01
CCT: 8838 K
| One Netbook XPlayer 2 FLQ8423, IPS, 2560x1600, 8.4" | Asus ROG Ally Z1 Extreme TL070FVSX01-0, IPS, 1920x1080, 7" | Valve Steam Deck 512 GB LCD 1280x800, 7" | GPD Win 4 G1618-04, IPS, 1920x1080, 6" | GPD Win Max 2 Toshiba HX_10.1_LCD, IPS, 2560x1600, 10.1" | GPD Pocket 3 Digital Flat Panel, IPS, 1920x1200, 8" | |
|---|---|---|---|---|---|---|
| Display | -8% | -10% | -6% | -27% | ||
| Display P3 Coverage (%) | 75.4 | 65.6 -13% | 63.1 -16% | 69.8 -7% | 51.1 -32% | |
| sRGB Coverage (%) | 97 | 92.1 -5% | 92 -5% | 91 -6% | 74.7 -23% | |
| AdobeRGB 1998 Coverage (%) | 71.1 | 67.9 -5% | 64.6 -9% | 66.6 -6% | 52.8 -26% | |
| Response Times | 73% | 27% | 18% | 30% | -19% | |
| Response Time Grey 50% / Grey 80% * (ms) | 36.8 ? | 10.5 ? 71% | 30.1 ? 18% | 26.8 ? 27% | 21.2 ? 42% | 37.2 ? -1% |
| Response Time Black / White * (ms) | 22.8 ? | 6 ? 74% | 14.5 ? 36% | 20.9 ? 8% | 18.7 ? 18% | 31.2 ? -37% |
| PWM Frequency (Hz) | 1080 ? | |||||
| Screen | 18% | 8% | -4% | 7% | 2% | |
| Brightness middle (cd/m²) | 369 | 513 39% | 517 40% | 413.1 12% | 396.7 8% | 438.4 19% |
| Brightness (cd/m²) | 363 | 474 31% | 524 44% | 407 12% | 381 5% | 421 16% |
| Brightness Distribution (%) | 89 | 84 -6% | 97 9% | 81 -9% | 89 0% | 92 3% |
| Black Level * (cd/m²) | 0.28 | 0.38 -36% | 0.47 -68% | 0.39 -39% | 0.36 -29% | 0.4 -43% |
| Contrast (:1) | 1318 | 1350 2% | 1100 -17% | 1059 -20% | 1102 -16% | 1096 -17% |
| Colorchecker dE 2000 * | 7.1 | 3.7 48% | 5.7 20% | 6.97 2% | 6.31 11% | 5.02 29% |
| Colorchecker dE 2000 max. * | 10.9 | 8.3 24% | 10.5 4% | 14.11 -29% | 10.23 6% | 9.59 12% |
| Colorchecker dE 2000 calibrated * | 2.6 | 1.24 52% | 1.44 45% | 4.05 -56% | ||
| Greyscale dE 2000 * | 8.3 | 5.1 39% | 5.7 31% | 9.9 -19% | 5.5 34% | 4 52% |
| Gamma | 2.01 109% | 2.14 103% | 2.18 101% | 2.04 108% | 2.17 101% | 2.29 96% |
| CCT | 8838 74% | 7732 84% | 7733 84% | 9571 68% | 7502 87% | 7087 92% |
| Total Average (Program / Settings) | 28% /
20% | 18% /
12% | 1% /
-2% | 10% /
8% | -15% /
-7% |
* ... smaller is better
Display Response Times
| ↔ Response Time Black to White | ||
|---|---|---|
| 22.8 ms ... rise ↗ and fall ↘ combined | ↗ 10.4 ms rise | 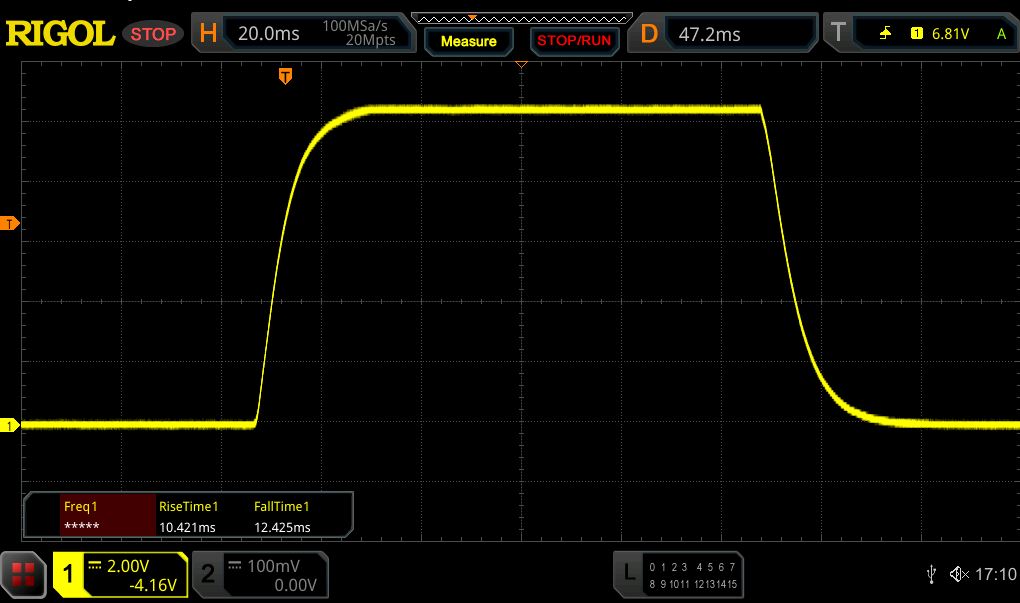 |
| ↘ 12.4 ms fall | ||
| The screen shows good response rates in our tests, but may be too slow for competitive gamers. In comparison, all tested devices range from 0.1 (minimum) to 240 (maximum) ms. » 51 % of all devices are better. This means that the measured response time is worse than the average of all tested devices (19.8 ms). | ||
| ↔ Response Time 50% Grey to 80% Grey | ||
| 36.8 ms ... rise ↗ and fall ↘ combined | ↗ 16.9 ms rise | 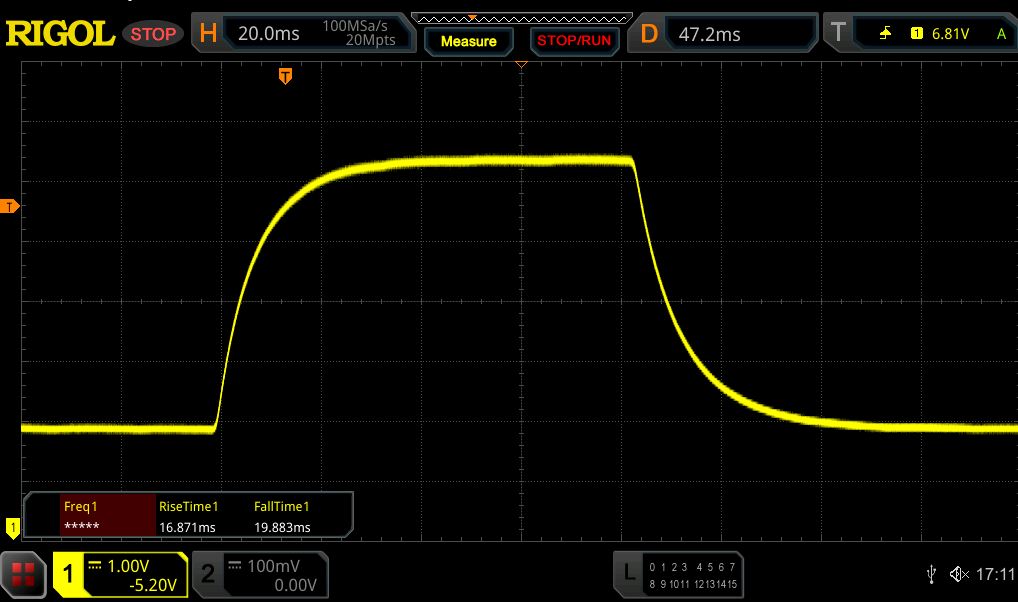 |
| ↘ 19.9 ms fall | ||
| The screen shows slow response rates in our tests and will be unsatisfactory for gamers. In comparison, all tested devices range from 0.165 (minimum) to 636 (maximum) ms. » 53 % of all devices are better. This means that the measured response time is worse than the average of all tested devices (31 ms). | ||
Screen Flickering / PWM (Pulse-Width Modulation)
| Screen flickering / PWM not detected | 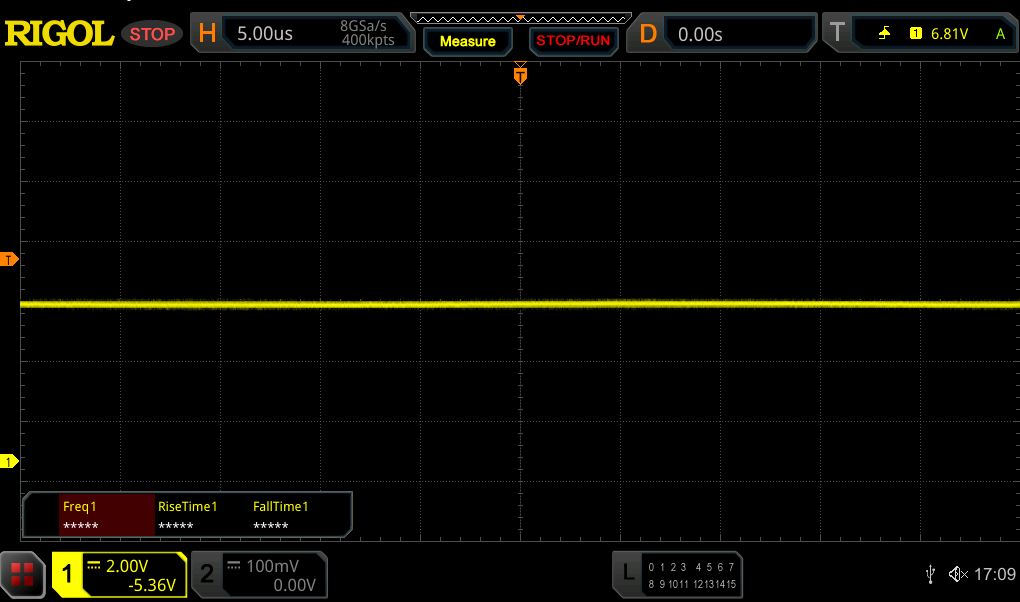 | ||
In comparison: 52 % of all tested devices do not use PWM to dim the display. If PWM was detected, an average of 7753 (minimum: 5 - maximum: 343500) Hz was measured. | |||
Performance - AMD Zen3+
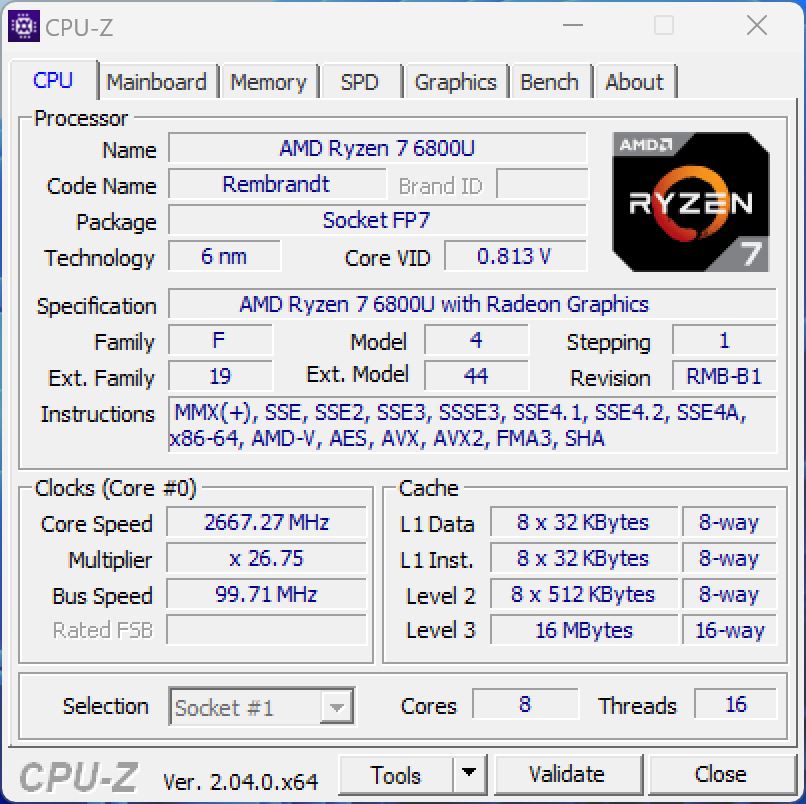
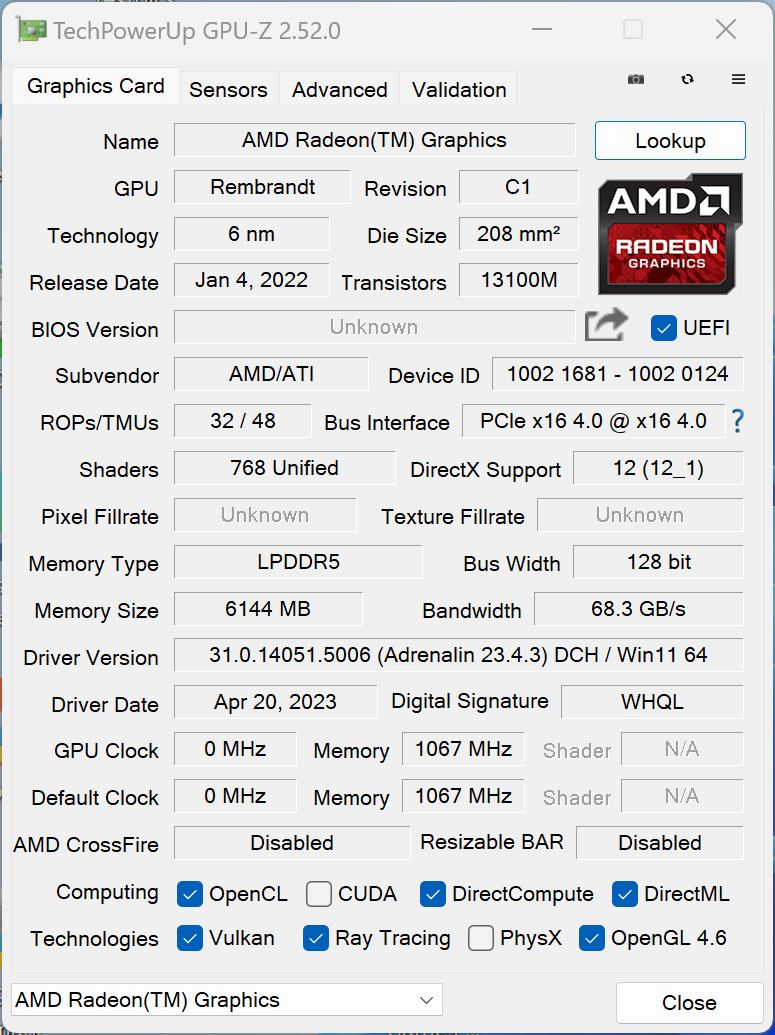
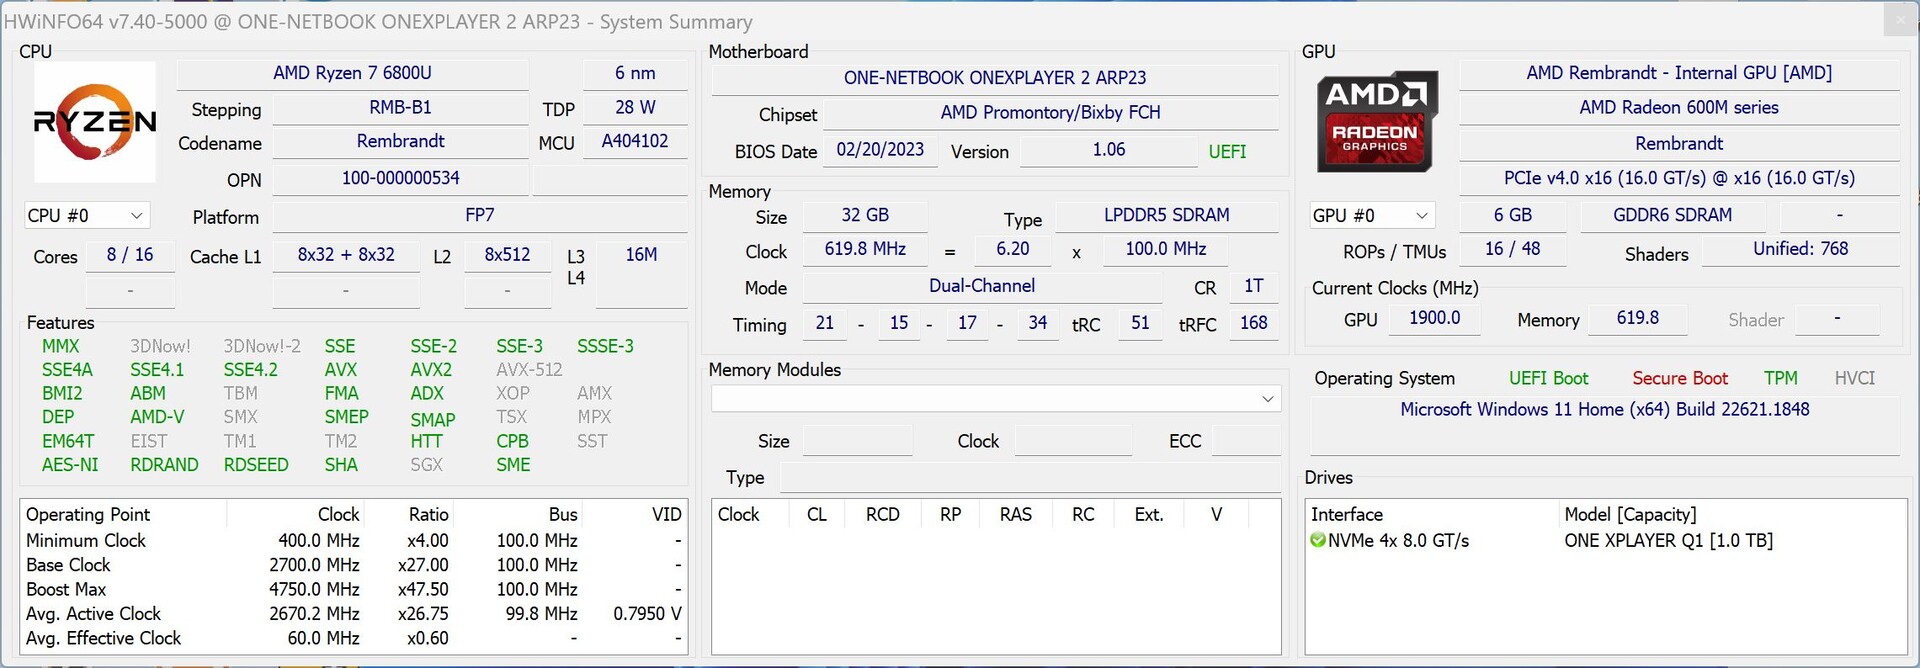
We used a TDP of 28 watts by default for the following benchmarks and measurements, which is the highest performance value. The AMD Ryzen 7 6800U offers 8 Zen3+ cores and the multi-core performance is also very good and above all stable. However, the single-core performance is below average in all benchmarks, but this is hardly noticed, at least in everyday use. Here, the OneXPlayer is still responsive and especially when you also use it on an external screen (ideally via USB-C), then you can use it as a completely normal PC.
The graphics performance of the Radeon 680M meets our expectations exactly and is also on par with the GPD Win4, the ROG Ally with the new Ryzen Z1 Extreme however, is faster in both the CPU and GPU tests. There is no performance reduction in the OneXPlayer 2 during prolonged load as well as in battery mode.
The 1 TB SSD is split into two partitions ex-factory (409 GB + 499 GB free after the first start-up) and the transfer rates of the PCIe 3.0 x4 SSD are decent at around 3 GB/s. Moreover, the performance remains stable here even under a longer load.
Cinebench R15 Multi Loop
Cinebench R23: Multi Core | Single Core
Cinebench R20: CPU (Multi Core) | CPU (Single Core)
Cinebench R15: CPU Multi 64Bit | CPU Single 64Bit
Blender: v2.79 BMW27 CPU
7-Zip 18.03: 7z b 4 | 7z b 4 -mmt1
Geekbench 5.5: Multi-Core | Single-Core
HWBOT x265 Benchmark v2.2: 4k Preset
LibreOffice : 20 Documents To PDF
| CPU Performance rating | |
| Average of class Multimedia | |
| Asus ROG Ally Z1 Extreme | |
| GPD Win 4 | |
| Average AMD Ryzen 7 6800U | |
| GPD Win Max 2 | |
| One Netbook XPlayer 2 | |
| GPD Pocket 3 -2! | |
| Cinebench R23 / Multi Core | |
| Average of class Multimedia (4861 - 33362, n=79, last 2 years) | |
| Asus ROG Ally Z1 Extreme | |
| Average AMD Ryzen 7 6800U (9130 - 11741, n=7) | |
| GPD Win 4 | |
| One Netbook XPlayer 2 | |
| GPD Win Max 2 | |
| GPD Pocket 3 | |
| Cinebench R23 / Single Core | |
| Average of class Multimedia (1128 - 2459, n=71, last 2 years) | |
| GPD Win Max 2 | |
| Asus ROG Ally Z1 Extreme | |
| GPD Win 4 | |
| Average AMD Ryzen 7 6800U (878 - 1534, n=7) | |
| GPD Pocket 3 | |
| One Netbook XPlayer 2 | |
| Cinebench R20 / CPU (Multi Core) | |
| Average of class Multimedia (1887 - 12912, n=62, last 2 years) | |
| Asus ROG Ally Z1 Extreme | |
| Average AMD Ryzen 7 6800U (3529 - 4574, n=8) | |
| GPD Win 4 | |
| One Netbook XPlayer 2 | |
| GPD Win Max 2 | |
| GPD Pocket 3 | |
| Cinebench R20 / CPU (Single Core) | |
| Average of class Multimedia (425 - 853, n=62, last 2 years) | |
| Asus ROG Ally Z1 Extreme | |
| GPD Win Max 2 | |
| GPD Win 4 | |
| Average AMD Ryzen 7 6800U (341 - 602, n=8) | |
| GPD Pocket 3 | |
| One Netbook XPlayer 2 | |
| Cinebench R15 / CPU Multi 64Bit | |
| Average of class Multimedia (856 - 5224, n=66, last 2 years) | |
| Asus ROG Ally Z1 Extreme | |
| GPD Win 4 | |
| Average AMD Ryzen 7 6800U (1463 - 1979, n=7) | |
| One Netbook XPlayer 2 | |
| GPD Win Max 2 | |
| GPD Pocket 3 | |
| GPD Pocket 3 | |
| Cinebench R15 / CPU Single 64Bit | |
| Asus ROG Ally Z1 Extreme | |
| Average of class Multimedia (184.8 - 326, n=64, last 2 years) | |
| GPD Win Max 2 | |
| GPD Win 4 | |
| Average AMD Ryzen 7 6800U (142.6 - 246, n=6) | |
| GPD Pocket 3 | |
| GPD Pocket 3 | |
| One Netbook XPlayer 2 | |
| Blender / v2.79 BMW27 CPU | |
| GPD Pocket 3 | |
| GPD Win Max 2 | |
| One Netbook XPlayer 2 | |
| GPD Win 4 | |
| Average AMD Ryzen 7 6800U (272 - 347, n=7) | |
| Average of class Multimedia (100 - 557, n=63, last 2 years) | |
| Asus ROG Ally Z1 Extreme | |
| 7-Zip 18.03 / 7z b 4 | |
| Asus ROG Ally Z1 Extreme | |
| Average of class Multimedia (26062 - 130368, n=60, last 2 years) | |
| GPD Win 4 | |
| Average AMD Ryzen 7 6800U (40058 - 53934, n=6) | |
| One Netbook XPlayer 2 | |
| GPD Win Max 2 | |
| GPD Pocket 3 | |
| 7-Zip 18.03 / 7z b 4 -mmt1 | |
| Asus ROG Ally Z1 Extreme | |
| Average of class Multimedia (3666 - 7545, n=61, last 2 years) | |
| GPD Win Max 2 | |
| GPD Win 4 | |
| GPD Pocket 3 | |
| Average AMD Ryzen 7 6800U (3398 - 5511, n=6) | |
| One Netbook XPlayer 2 | |
| Geekbench 5.5 / Multi-Core | |
| Average of class Multimedia (4652 - 20422, n=60, last 2 years) | |
| Asus ROG Ally Z1 Extreme | |
| GPD Win 4 | |
| Average AMD Ryzen 7 6800U (6854 - 8935, n=9) | |
| One Netbook XPlayer 2 | |
| GPD Win Max 2 | |
| Geekbench 5.5 / Single-Core | |
| Average of class Multimedia (805 - 2974, n=60, last 2 years) | |
| Asus ROG Ally Z1 Extreme | |
| GPD Win Max 2 | |
| GPD Win 4 | |
| Average AMD Ryzen 7 6800U (926 - 1555, n=9) | |
| One Netbook XPlayer 2 | |
| HWBOT x265 Benchmark v2.2 / 4k Preset | |
| Asus ROG Ally Z1 Extreme | |
| Average of class Multimedia (5.26 - 36.1, n=61, last 2 years) | |
| Average AMD Ryzen 7 6800U (11.8 - 14.2, n=6) | |
| GPD Win 4 | |
| One Netbook XPlayer 2 | |
| GPD Win Max 2 | |
| GPD Pocket 3 | |
| LibreOffice / 20 Documents To PDF | |
| One Netbook XPlayer 2 | |
| Average AMD Ryzen 7 6800U (50.1 - 84.9, n=6) | |
| GPD Win 4 | |
| Average of class Multimedia (23.9 - 146.7, n=62, last 2 years) | |
| GPD Pocket 3 | |
| GPD Win Max 2 | |
| Asus ROG Ally Z1 Extreme | |
* ... smaller is better
AIDA64: FP32 Ray-Trace | FPU Julia | CPU SHA3 | CPU Queen | FPU SinJulia | FPU Mandel | CPU AES | CPU ZLib | FP64 Ray-Trace | CPU PhotoWorxx
| Performance rating | |
| Asus ROG Ally Z1 Extreme | |
| Average of class Multimedia | |
| Average AMD Ryzen 7 6800U | |
| GPD Win 4 | |
| One Netbook XPlayer 2 | |
| GPD Win Max 2 | |
| GPD Pocket 3 | |
| AIDA64 / FP32 Ray-Trace | |
| Asus ROG Ally Z1 Extreme | |
| Average of class Multimedia (2214 - 50388, n=58, last 2 years) | |
| Average AMD Ryzen 7 6800U (10902 - 12818, n=6) | |
| GPD Win 4 | |
| One Netbook XPlayer 2 | |
| GPD Pocket 3 | |
| GPD Win Max 2 | |
| AIDA64 / FPU Julia | |
| Asus ROG Ally Z1 Extreme | |
| Average of class Multimedia (12867 - 201874, n=59, last 2 years) | |
| Average AMD Ryzen 7 6800U (67503 - 84031, n=6) | |
| GPD Win 4 | |
| One Netbook XPlayer 2 | |
| GPD Pocket 3 | |
| GPD Win Max 2 | |
| AIDA64 / CPU SHA3 | |
| Asus ROG Ally Z1 Extreme | |
| Average of class Multimedia (626 - 8623, n=59, last 2 years) | |
| Average AMD Ryzen 7 6800U (2296 - 2818, n=6) | |
| GPD Win 4 | |
| One Netbook XPlayer 2 | |
| GPD Pocket 3 | |
| GPD Win Max 2 | |
| AIDA64 / CPU Queen | |
| Asus ROG Ally Z1 Extreme | |
| GPD Win 4 | |
| Average AMD Ryzen 7 6800U (62082 - 96306, n=6) | |
| Average of class Multimedia (13483 - 181505, n=46, last 2 years) | |
| GPD Win Max 2 | |
| One Netbook XPlayer 2 | |
| GPD Pocket 3 | |
| AIDA64 / FPU SinJulia | |
| Asus ROG Ally Z1 Extreme | |
| GPD Win 4 | |
| Average AMD Ryzen 7 6800U (7753 - 11982, n=6) | |
| Average of class Multimedia (886 - 28794, n=59, last 2 years) | |
| One Netbook XPlayer 2 | |
| GPD Win Max 2 | |
| GPD Pocket 3 | |
| AIDA64 / FPU Mandel | |
| Asus ROG Ally Z1 Extreme | |
| Average of class Multimedia (6395 - 105740, n=58, last 2 years) | |
| Average AMD Ryzen 7 6800U (37417 - 45748, n=6) | |
| GPD Win 4 | |
| One Netbook XPlayer 2 | |
| GPD Pocket 3 | |
| GPD Win Max 2 | |
| AIDA64 / CPU AES | |
| GPD Win 4 | |
| Average AMD Ryzen 7 6800U (50547 - 115681, n=6) | |
| One Netbook XPlayer 2 | |
| Asus ROG Ally Z1 Extreme | |
| Average of class Multimedia (8171 - 126790, n=59, last 2 years) | |
| GPD Pocket 3 | |
| GPD Win Max 2 | |
| AIDA64 / CPU ZLib | |
| Average of class Multimedia (143.8 - 2022, n=59, last 2 years) | |
| Asus ROG Ally Z1 Extreme | |
| Average AMD Ryzen 7 6800U (554 - 755, n=6) | |
| GPD Win 4 | |
| One Netbook XPlayer 2 | |
| GPD Win Max 2 | |
| GPD Pocket 3 | |
| AIDA64 / FP64 Ray-Trace | |
| Asus ROG Ally Z1 Extreme | |
| Average of class Multimedia (1014 - 26875, n=59, last 2 years) | |
| Average AMD Ryzen 7 6800U (5825 - 6694, n=6) | |
| GPD Win 4 | |
| One Netbook XPlayer 2 | |
| GPD Pocket 3 | |
| GPD Win Max 2 | |
| AIDA64 / CPU PhotoWorxx | |
| Average of class Multimedia (8187 - 88154, n=59, last 2 years) | |
| Asus ROG Ally Z1 Extreme | |
| GPD Win Max 2 | |
| GPD Pocket 3 | |
| GPD Win 4 | |
| One Netbook XPlayer 2 | |
| Average AMD Ryzen 7 6800U (24728 - 27274, n=6) | |
CrossMark: Overall | Productivity | Creativity | Responsiveness
| PCMark 10 / Score | |
| Average of class Multimedia (4325 - 10386, n=56, last 2 years) | |
| Asus ROG Ally Z1 Extreme | |
| GPD Win 4 | |
| Average AMD Ryzen 7 6800U, AMD Radeon 680M (5057 - 6639, n=7) | |
| GPD Win Max 2 | |
| GPD Pocket 3 | |
| One Netbook XPlayer 2 | |
| PCMark 10 / Essentials | |
| GPD Win Max 2 | |
| GPD Pocket 3 | |
| Average of class Multimedia (8025 - 11664, n=55, last 2 years) | |
| Asus ROG Ally Z1 Extreme | |
| GPD Win 4 | |
| Average AMD Ryzen 7 6800U, AMD Radeon 680M (8143 - 10766, n=6) | |
| One Netbook XPlayer 2 | |
| PCMark 10 / Productivity | |
| Average of class Multimedia (7323 - 18233, n=55, last 2 years) | |
| Asus ROG Ally Z1 Extreme | |
| GPD Win 4 | |
| Average AMD Ryzen 7 6800U, AMD Radeon 680M (6089 - 9328, n=6) | |
| GPD Pocket 3 | |
| GPD Win Max 2 | |
| One Netbook XPlayer 2 | |
| PCMark 10 / Digital Content Creation | |
| Average of class Multimedia (3651 - 16240, n=55, last 2 years) | |
| Asus ROG Ally Z1 Extreme | |
| GPD Win 4 | |
| Average AMD Ryzen 7 6800U, AMD Radeon 680M (6066 - 8144, n=6) | |
| One Netbook XPlayer 2 | |
| GPD Win Max 2 | |
| GPD Pocket 3 | |
| CrossMark / Overall | |
| Average of class Multimedia (866 - 2728, n=65, last 2 years) | |
| Asus ROG Ally Z1 Extreme | |
| GPD Win Max 2 | |
| GPD Win 4 | |
| Average AMD Ryzen 7 6800U, AMD Radeon 680M (1009 - 1575, n=7) | |
| One Netbook XPlayer 2 | |
| CrossMark / Productivity | |
| Average of class Multimedia (931 - 2489, n=65, last 2 years) | |
| Asus ROG Ally Z1 Extreme | |
| GPD Win Max 2 | |
| GPD Win 4 | |
| Average AMD Ryzen 7 6800U, AMD Radeon 680M (971 - 1596, n=7) | |
| One Netbook XPlayer 2 | |
| CrossMark / Creativity | |
| Average of class Multimedia (907 - 3465, n=65, last 2 years) | |
| Asus ROG Ally Z1 Extreme | |
| GPD Win Max 2 | |
| GPD Win 4 | |
| Average AMD Ryzen 7 6800U, AMD Radeon 680M (1054 - 1686, n=7) | |
| One Netbook XPlayer 2 | |
| CrossMark / Responsiveness | |
| GPD Win Max 2 | |
| Average of class Multimedia (605 - 2024, n=65, last 2 years) | |
| GPD Win 4 | |
| Asus ROG Ally Z1 Extreme | |
| Average AMD Ryzen 7 6800U, AMD Radeon 680M (994 - 1473, n=7) | |
| One Netbook XPlayer 2 | |
| PCMark 10 Score | 5057 points | |
Help | ||
| AIDA64 / Memory Copy | |
| Asus ROG Ally Z1 Extreme | |
| Average of class Multimedia (11299 - 132135, n=59, last 2 years) | |
| GPD Win Max 2 | |
| GPD Pocket 3 | |
| GPD Win 4 | |
| Average AMD Ryzen 7 6800U (47010 - 52159, n=6) | |
| One Netbook XPlayer 2 | |
| AIDA64 / Memory Read | |
| Average of class Multimedia (11624 - 174586, n=59, last 2 years) | |
| GPD Win Max 2 | |
| GPD Pocket 3 | |
| Asus ROG Ally Z1 Extreme | |
| GPD Win 4 | |
| One Netbook XPlayer 2 | |
| Average AMD Ryzen 7 6800U (39197 - 45084, n=6) | |
| AIDA64 / Memory Write | |
| Asus ROG Ally Z1 Extreme | |
| Average of class Multimedia (11755 - 134998, n=59, last 2 years) | |
| GPD Win Max 2 | |
| GPD Pocket 3 | |
| GPD Win 4 | |
| One Netbook XPlayer 2 | |
| Average AMD Ryzen 7 6800U (48723 - 51117, n=6) | |
| AIDA64 / Memory Latency | |
| One Netbook XPlayer 2 | |
| Average of class Multimedia (7 - 535, n=58, last 2 years) | |
| Asus ROG Ally Z1 Extreme | |
| Average AMD Ryzen 7 6800U (106.3 - 123.1, n=6) | |
| GPD Win 4 | |
| GPD Win Max 2 | |
| GPD Pocket 3 | |
* ... smaller is better
| DPC Latencies / LatencyMon - interrupt to process latency (max), Web, Youtube, Prime95 | |
| One Netbook XPlayer 2 | |
| Asus ROG Ally Z1 Extreme | |
| GPD Win 4 | |
| GPD Pocket 3 | |
| GPD Win Max 2 | |
* ... smaller is better

| Drive Performance rating - Percent | |
| Average of class Multimedia | |
| GPD Win Max 2 | |
| GPD Pocket 3 | |
| GPD Win 4 | |
| One Netbook XPlayer 2 | |
| Asus ROG Ally Z1 Extreme | |
| Global Average -3 | |
* ... smaller is better
Continuous Read: DiskSpd Read Loop, Queue Depth 8
| 3DMark Performance rating - Percent | |
| Average of class Multimedia | |
| Asus ROG Ally Z1 Extreme | |
| GPD Win 4 | |
| One Netbook XPlayer 2 | |
| Average AMD Radeon 680M | |
| GPD Win Max 2 | |
| GPD Pocket 3 | |
| 3DMark 11 Performance | 9184 points | |
| 3DMark Fire Strike Score | 6490 points | |
| 3DMark Time Spy Score | 2673 points | |
Help | ||
| Blender / v3.3 Classroom HIP/AMD | |
| Average AMD Radeon 680M (270 - 555, n=34) | |
| One Netbook XPlayer 2 | |
| GPD Win 4 | |
| Blender / v3.3 Classroom CPU | |
| One Netbook XPlayer 2 | |
| GPD Win 4 | |
| Average AMD Radeon 680M (389 - 980, n=37) | |
| Average of class Multimedia (134.5 - 1042, n=65, last 2 years) | |
| Asus ROG Ally Z1 Extreme | |
* ... smaller is better
| Performance rating - Percent | |
| Average of class Multimedia | |
| Asus ROG Ally Z1 Extreme | |
| GPD Win 4 | |
| One Netbook XPlayer 2 | |
| GPD Win Max 2 | |
| GPD Pocket 3 | |
| The Witcher 3 - 1920x1080 Ultra Graphics & Postprocessing (HBAO+) | |
| Average of class Multimedia (11 - 121, n=11, last 2 years) | |
| Asus ROG Ally Z1 Extreme | |
| One Netbook XPlayer 2 | |
| GPD Win 4 | |
| GPD Win Max 2 | |
| GPD Pocket 3 | |
| GTA V - 1920x1080 Highest AA:4xMSAA + FX AF:16x | |
| Average of class Multimedia (7.92 - 141.6, n=61, last 2 years) | |
| Asus ROG Ally Z1 Extreme | |
| GPD Win 4 | |
| One Netbook XPlayer 2 | |
| GPD Win Max 2 | |
| GPD Pocket 3 | |
| Final Fantasy XV Benchmark - 1920x1080 High Quality | |
| Average of class Multimedia (7.61 - 144.4, n=63, last 2 years) | |
| Asus ROG Ally Z1 Extreme | |
| GPD Win 4 | |
| One Netbook XPlayer 2 | |
| GPD Win Max 2 | |
| GPD Pocket 3 | |
| Strange Brigade - 1920x1080 ultra AA:ultra AF:16 | |
| Average of class Multimedia (13.3 - 303, n=63, last 2 years) | |
| Asus ROG Ally Z1 Extreme | |
| GPD Win 4 | |
| One Netbook XPlayer 2 | |
| GPD Win Max 2 | |
| GPD Pocket 3 | |
| Dota 2 Reborn - 1920x1080 ultra (3/3) best looking | |
| Average of class Multimedia (29 - 179.9, n=65, last 2 years) | |
| Asus ROG Ally Z1 Extreme | |
| GPD Win 4 | |
| One Netbook XPlayer 2 | |
| GPD Win Max 2 | |
| GPD Pocket 3 | |
| X-Plane 11.11 - 1920x1080 high (fps_test=3) | |
| Average of class Multimedia (16.9 - 141.1, n=59, last 2 years) | |
| GPD Win 4 | |
| One Netbook XPlayer 2 | |
| GPD Win Max 2 | |
| Asus ROG Ally Z1 Extreme | |
| GPD Pocket 3 | |
Witcher 3 FPS Chart
| low | med. | high | ultra | |
|---|---|---|---|---|
| GTA V (2015) | 138.6 | 60.7 | 49.6 | 24.5 |
| The Witcher 3 (2015) | 36 | 23.1 | ||
| Dota 2 Reborn (2015) | 93.7 | 86.7 | 71.7 | 63.1 |
| Final Fantasy XV Benchmark (2018) | 32.5 | 23.9 | ||
| X-Plane 11.11 (2018) | 53.1 | 39 | 33.5 | |
| Strange Brigade (2018) | 143.5 | 56.7 | 47 | 40.9 |
| F1 2021 (2021) | 133.1 | 92.3 | 64.4 | |
| F1 22 (2022) | 77.3 | 65.4 | 52.5 | 13.1 |
Emissions & Energy
The fan of the OneXPlayer 2 is very often active even during less demanding tasks and then also runs with almost 32 dB(A), which can be clearly noticed. Reducing the TDP setting helps a bit, but it is not a really quiet device in everyday use. When gaming, it then depends on the processor's configuration again, because we measured 43 dB(A) with the full 28 watts. If you throttle the processor to 15 watts, it is a much more pleasant 35.7 dB(A).
The battery life when gaming also benefits from a reduced TDP to 15 watts, because The Witcher 3 (high settings, 150 cd/m²) runs for 142 minutes, while with 28 watts and ultra details, it is only 96 minutes. Here, the large 65.5 Wh battery has a positive effect, which also enables very good runtimes in the WLAN test (10.5 hours @150 cd/m², 8.5 hours @max. brightness).
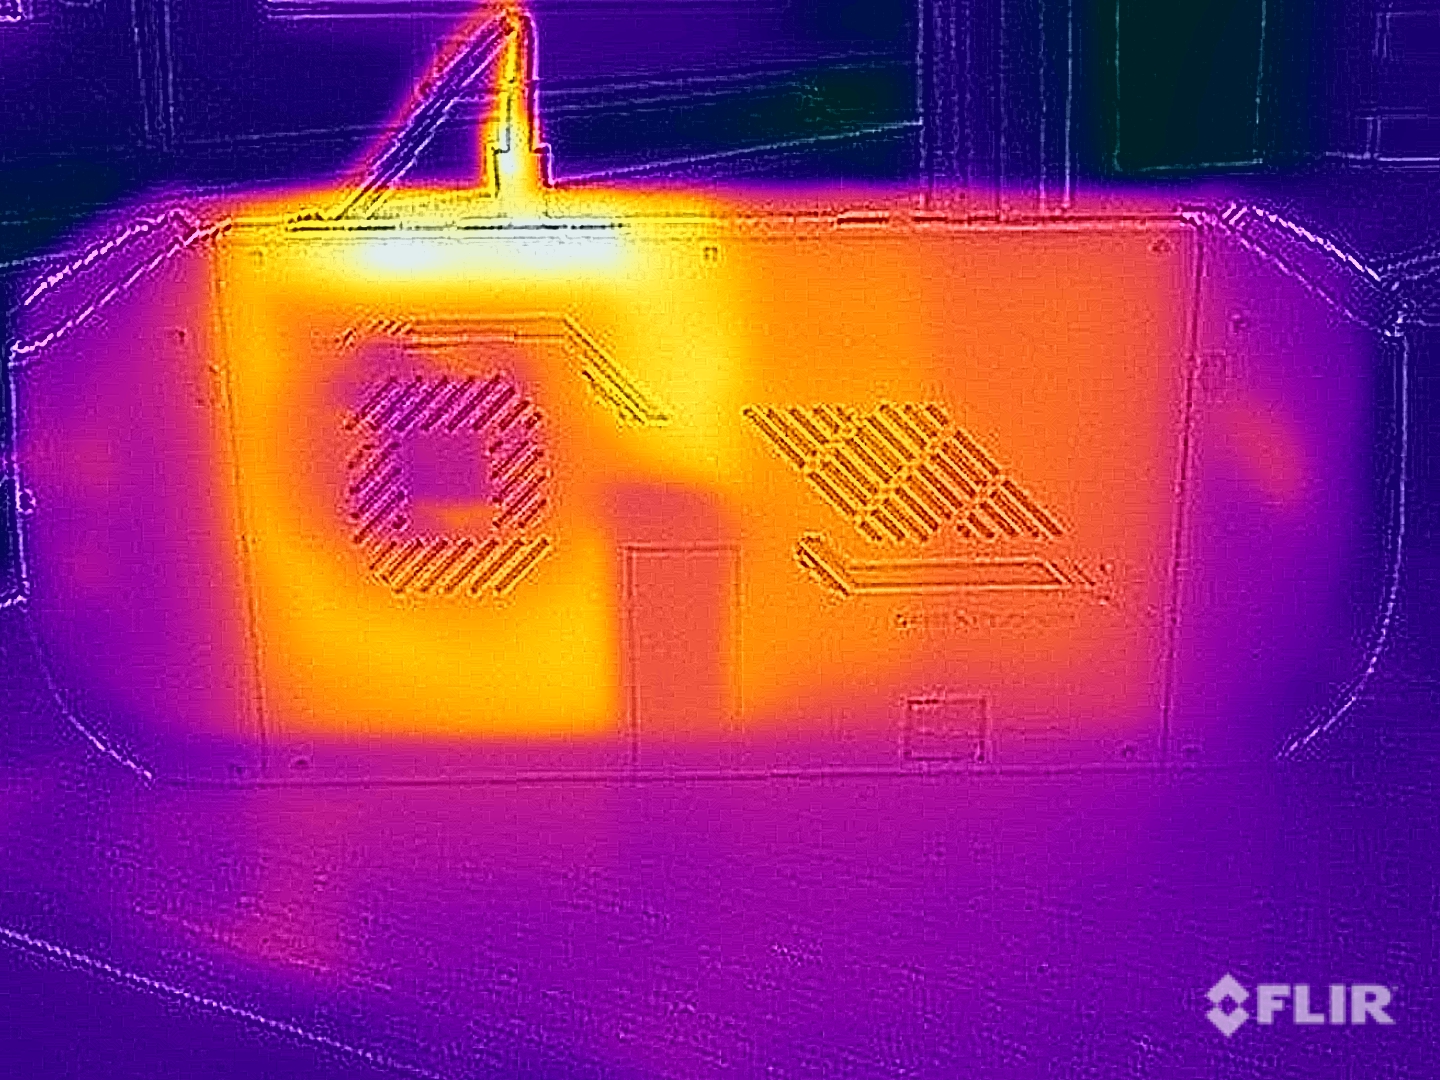
The surface temperatures are not a problem at all when gaming because only the central part gets warm and the controllers always stay pleasantly cool. The two stereo speakers on the bottom can get very loud and the sound is alright overall, but it lacks bass and the result is just not very powerful.
Noise level
| Idle |
| 26.1 / 31.6 / 31.6 dB(A) |
| Load |
| 35.7 / 43.3 dB(A) |
 | ||
30 dB silent 40 dB(A) audible 50 dB(A) loud |
||
min: | ||
| One Netbook XPlayer 2 Radeon 680M, R7 6800U | Asus ROG Ally Z1 Extreme Radeon 780M, Z1 Extreme, Micron 2400 MTFDKBK512QFM | Valve Steam Deck 512 GB LCD , | GPD Win 4 Radeon 680M, R7 6800U, BiWin CE480Y2D100-1TB | GPD Win Max 2 Iris Xe G7 96EUs, i7-1260P, BiWin NQ200 1TB CNF82GS1D00-1TB | GPD Pocket 3 Iris Xe G7 96EUs, i7-1195G7, BiWin NQ200 1TB CNF82GS1D00-1TB | |
|---|---|---|---|---|---|---|
| Noise | 10% | 9% | -10% | 10% | 9% | |
| off / environment * (dB) | 26.1 | 23.3 11% | 24.3 7% | 24 8% | 22.6 13% | 23.4 10% |
| Idle Minimum * (dB) | 26.1 | 23.3 11% | 24.3 7% | 31.2 -20% | 23.7 9% | 24.3 7% |
| Idle Average * (dB) | 31.6 | 23.3 26% | 24.3 23% | 31.2 1% | 23.7 25% | 25.6 19% |
| Idle Maximum * (dB) | 31.6 | 27.3 14% | 30 5% | 33.5 -6% | 28.5 10% | 25.6 19% |
| Load Average * (dB) | 35.7 | 39.2 -10% | 45.5 -27% | 36.5 -2% | 38.3 -7% | |
| Witcher 3 ultra * (dB) | 43.3 | 39.2 9% | 40.7 6% | 48.6 -12% | 39.8 8% | 40.7 6% |
| Load Maximum * (dB) | 43.3 | 39.2 9% | 40.7 6% | 49 -13% | 40.5 6% | 40.7 6% |
* ... smaller is better
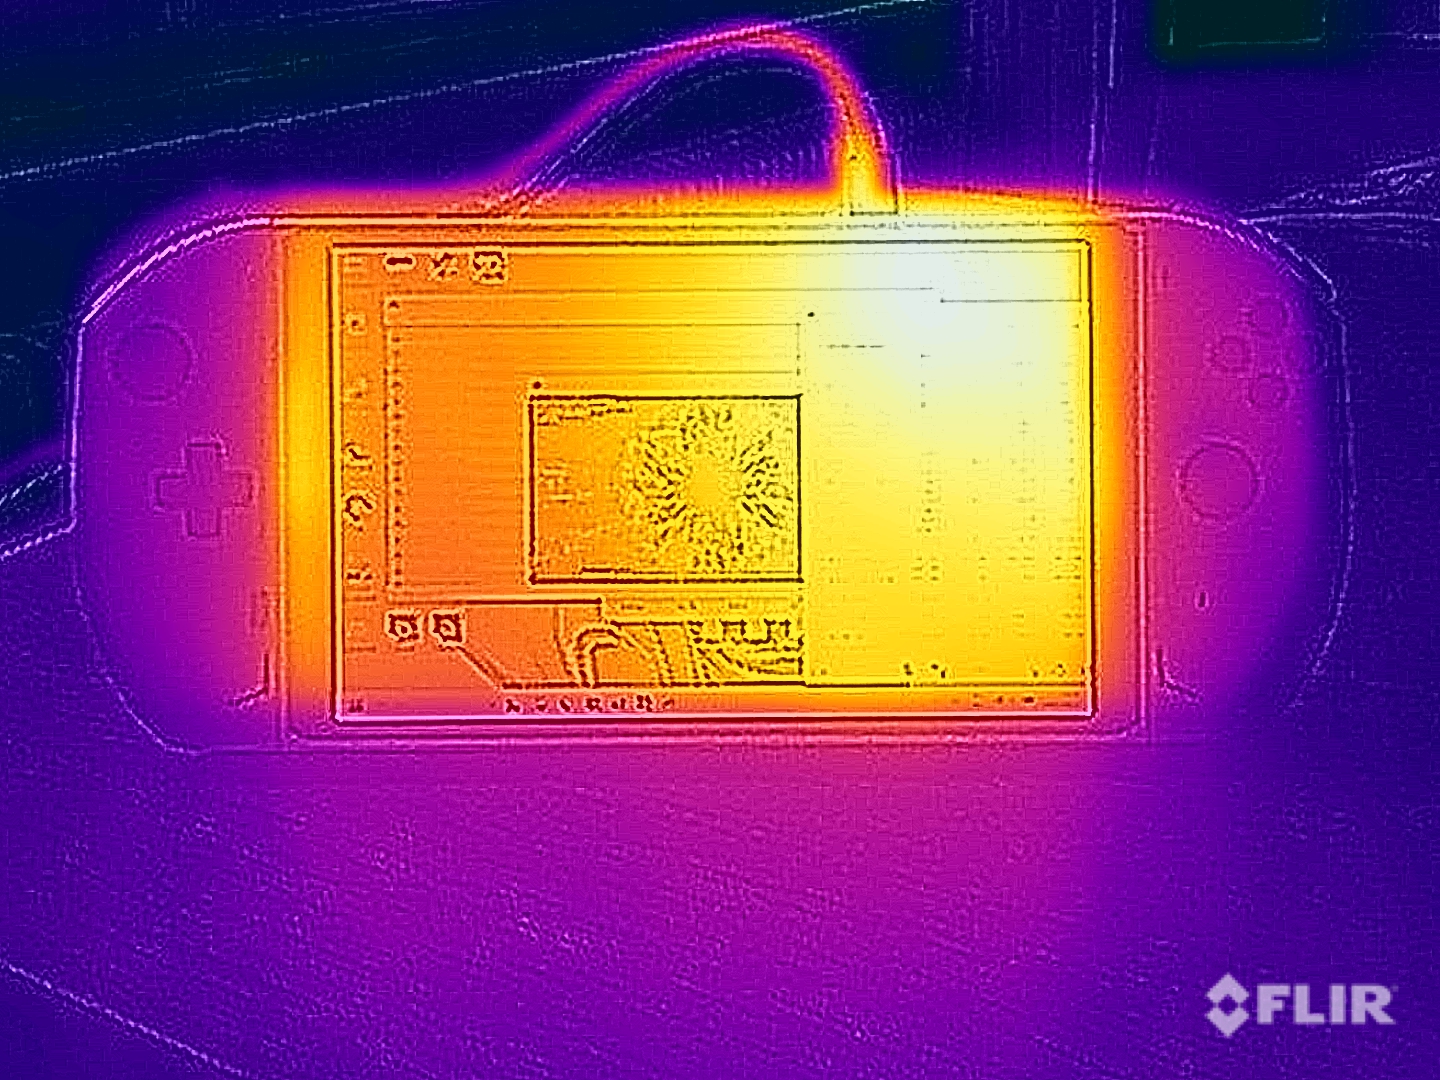
(±) The maximum temperature on the upper side is 42.6 °C / 109 F, compared to the average of 36.8 °C / 98 F, ranging from 21 to 71 °C for the class Multimedia.
(+) The bottom heats up to a maximum of 39.6 °C / 103 F, compared to the average of 39.1 °C / 102 F
(+) In idle usage, the average temperature for the upper side is 29.2 °C / 85 F, compared to the device average of 31.3 °C / 88 F.
(-) Playing The Witcher 3, the average temperature for the upper side is 38.2 °C / 101 F, compared to the device average of 31.3 °C / 88 F.
(-) The palmrests and touchpad can get very hot to the touch with a maximum of 41 °C / 105.8 F.
(-) The average temperature of the palmrest area of similar devices was 28.7 °C / 83.7 F (-12.3 °C / -22.1 F).
| One Netbook XPlayer 2 AMD Ryzen 7 6800U, AMD Radeon 680M | Asus ROG Ally Z1 Extreme AMD Ryzen Z1 Extreme, AMD Radeon 780M | GPD Win 4 AMD Ryzen 7 6800U, AMD Radeon 680M | GPD Win Max 2 Intel Core i7-1260P, Intel Iris Xe Graphics G7 96EUs | GPD Pocket 3 Intel Core i7-1195G7, Intel Iris Xe Graphics G7 96EUs | |
|---|---|---|---|---|---|
| Heat | 6% | 22% | 24% | 1% | |
| Maximum Upper Side * (°C) | 42.6 | 44.4 -4% | 35 18% | 28.6 33% | 40.4 5% |
| Maximum Bottom * (°C) | 39.6 | 37.9 4% | 26.8 32% | 33 17% | 39.4 1% |
| Idle Upper Side * (°C) | 32.4 | 29.9 8% | 28.4 12% | 24.6 24% | 32.6 -1% |
| Idle Bottom * (°C) | 34.3 | 28.3 17% | 25 27% | 27.6 20% | 34.4 -0% |
* ... smaller is better
One Netbook XPlayer 2 audio analysis
(+) | speakers can play relatively loud (87.2 dB)
Bass 100 - 315 Hz
(-) | nearly no bass - on average 25.2% lower than median
(±) | linearity of bass is average (8.5% delta to prev. frequency)
Mids 400 - 2000 Hz
(+) | balanced mids - only 3.4% away from median
(+) | mids are linear (5.9% delta to prev. frequency)
Highs 2 - 16 kHz
(+) | balanced highs - only 1.9% away from median
(+) | highs are linear (2.2% delta to prev. frequency)
Overall 100 - 16.000 Hz
(+) | overall sound is linear (14.8% difference to median)
Compared to same class
» 35% of all tested devices in this class were better, 4% similar, 61% worse
» The best had a delta of 5%, average was 17%, worst was 45%
Compared to all devices tested
» 20% of all tested devices were better, 4% similar, 76% worse
» The best had a delta of 4%, average was 23%, worst was 134%
Asus ROG Ally Z1 Extreme audio analysis
(+) | speakers can play relatively loud (82.1 dB)
Bass 100 - 315 Hz
(-) | nearly no bass - on average 15.5% lower than median
(±) | linearity of bass is average (8.4% delta to prev. frequency)
Mids 400 - 2000 Hz
(+) | balanced mids - only 3.1% away from median
(+) | mids are linear (3% delta to prev. frequency)
Highs 2 - 16 kHz
(+) | balanced highs - only 1.9% away from median
(+) | highs are linear (2.3% delta to prev. frequency)
Overall 100 - 16.000 Hz
(+) | overall sound is linear (13.5% difference to median)
Compared to same class
» 29% of all tested devices in this class were better, 4% similar, 67% worse
» The best had a delta of 5%, average was 17%, worst was 45%
Compared to all devices tested
» 14% of all tested devices were better, 4% similar, 82% worse
» The best had a delta of 4%, average was 23%, worst was 134%
| Off / Standby | |
| Idle | |
| Load |
|
Key:
min: | |
Power consumption Witcher 3 / Stress test
| One Netbook XPlayer 2 R7 6800U, Radeon 680M, 65.5 Wh | Asus ROG Ally Z1 Extreme Z1 Extreme, Radeon 780M, 40 Wh | GPD Win 4 R7 6800U, Radeon 680M, 46 Wh | GPD Win Max 2 i7-1260P, Iris Xe G7 96EUs, 70 Wh | GPD Pocket 3 i7-1195G7, Iris Xe G7 96EUs, 39 Wh | Average of class Multimedia | |
|---|---|---|---|---|---|---|
| Battery runtime | -32% | -29% | -17% | -43% | 14% | |
| WiFi v1.3 (h) | 10.5 | 7.8 -26% | 7.5 -29% | 8.7 -17% | 6 -43% | 12 ? 14% |
| Witcher 3 ultra (h) | 1.6 | 1 -37% |
Pros
Cons
Verdict - Interesting handheld with a lack of optimization

The OneXPlayer 2 is, in effect, a small mini-PC with a touchscreen and attachable controllers and thus differs from other handhelds like the Steam Deck or the Asus ROG Ally. This brings some advantages, for example in the temperatures of the grips or the application possibilities. For example, the controllers can be removed like Nintendo's Switch and used separately, for example as a controller from the couch. However, the situation was not quite thought through here because the controllers do not offer batteries and require an adapter that has to be purchased separately.
The device also looks relatively bulky and thick, but this in turn also enables the large battery and a large number of ports including USB-C 4.0. Thus, the OneXPlayer 2 can also be operated with an external GPU, for example at the desk at home. The performance yield of the AMD Ryzen 7 6800U and the handheld do not have to throttle the performance under permanent load or in battery mode. The battery life depends largely on the selected settings and the TDP when gaming. The included control software offers the most important settings, but we are missing further optimizations, a central software for the game libraries or simply an overlay with which you can also change the settings while gaming. We could play reasonably for around 1.5-2.5 hours depending on the setting, which is not a bad performance. The handheld also easily lasts more than 10 hours in WLAN or video mode with adjusted brightness.
Good performance, but weaknesses in operation and not a particularly good display: The OneXPlayer 2 is an exciting gaming handheld with extensive application possibilities, but not all functions have been fully thought through. In addition, the device is very expensive at more than 1,000 Euros.
Besides the lack of software optimizations, the display including poor calibration is also somewhat disappointing as it offers neither a higher frequency nor fast response times. The price is certainly a big hurdle as well because while you can buy the smaller ROG Ally you can already get a new Zen4 processor including a 120 Hz display for 800 Euros, you will have to pay around 1,100 Euros for our test device and versions with more memory quickly end up at 1,500 Euros.
Price and availability
The OneXPlayer2 is currently available at various retailers. Our test device with 16 GB RAM/1 TB is available on Amazon US for around $1,480.
One Netbook XPlayer 2
- 07/06/2023 v7 (old)
Andreas Osthoff
Transparency
The selection of devices to be reviewed is made by our editorial team. The test sample was provided to the author as a loan by the manufacturer or retailer for the purpose of this review. The lender had no influence on this review, nor did the manufacturer receive a copy of this review before publication. There was no obligation to publish this review. As an independent media company, Notebookcheck is not subjected to the authority of manufacturers, retailers or publishers.
This is how Notebookcheck is testing
Every year, Notebookcheck independently reviews hundreds of laptops and smartphones using standardized procedures to ensure that all results are comparable. We have continuously developed our test methods for around 20 years and set industry standards in the process. In our test labs, high-quality measuring equipment is utilized by experienced technicians and editors. These tests involve a multi-stage validation process. Our complex rating system is based on hundreds of well-founded measurements and benchmarks, which maintains objectivity. Further information on our test methods can be found here.
Price comparison

