Asus ROG Ally Z1 Extreme Review - Gaming handheld with 120 Hz display and AMD Zen4
It seemed to be an April Fools’ joke when Asus teased the new ROG Ally gaming handheld on April 1st, but the manufacturer really enters the segment. Valve revived this device segment last year with the Steam Deck and now it seems all the other big manufacturers want a piece of the cake as well.
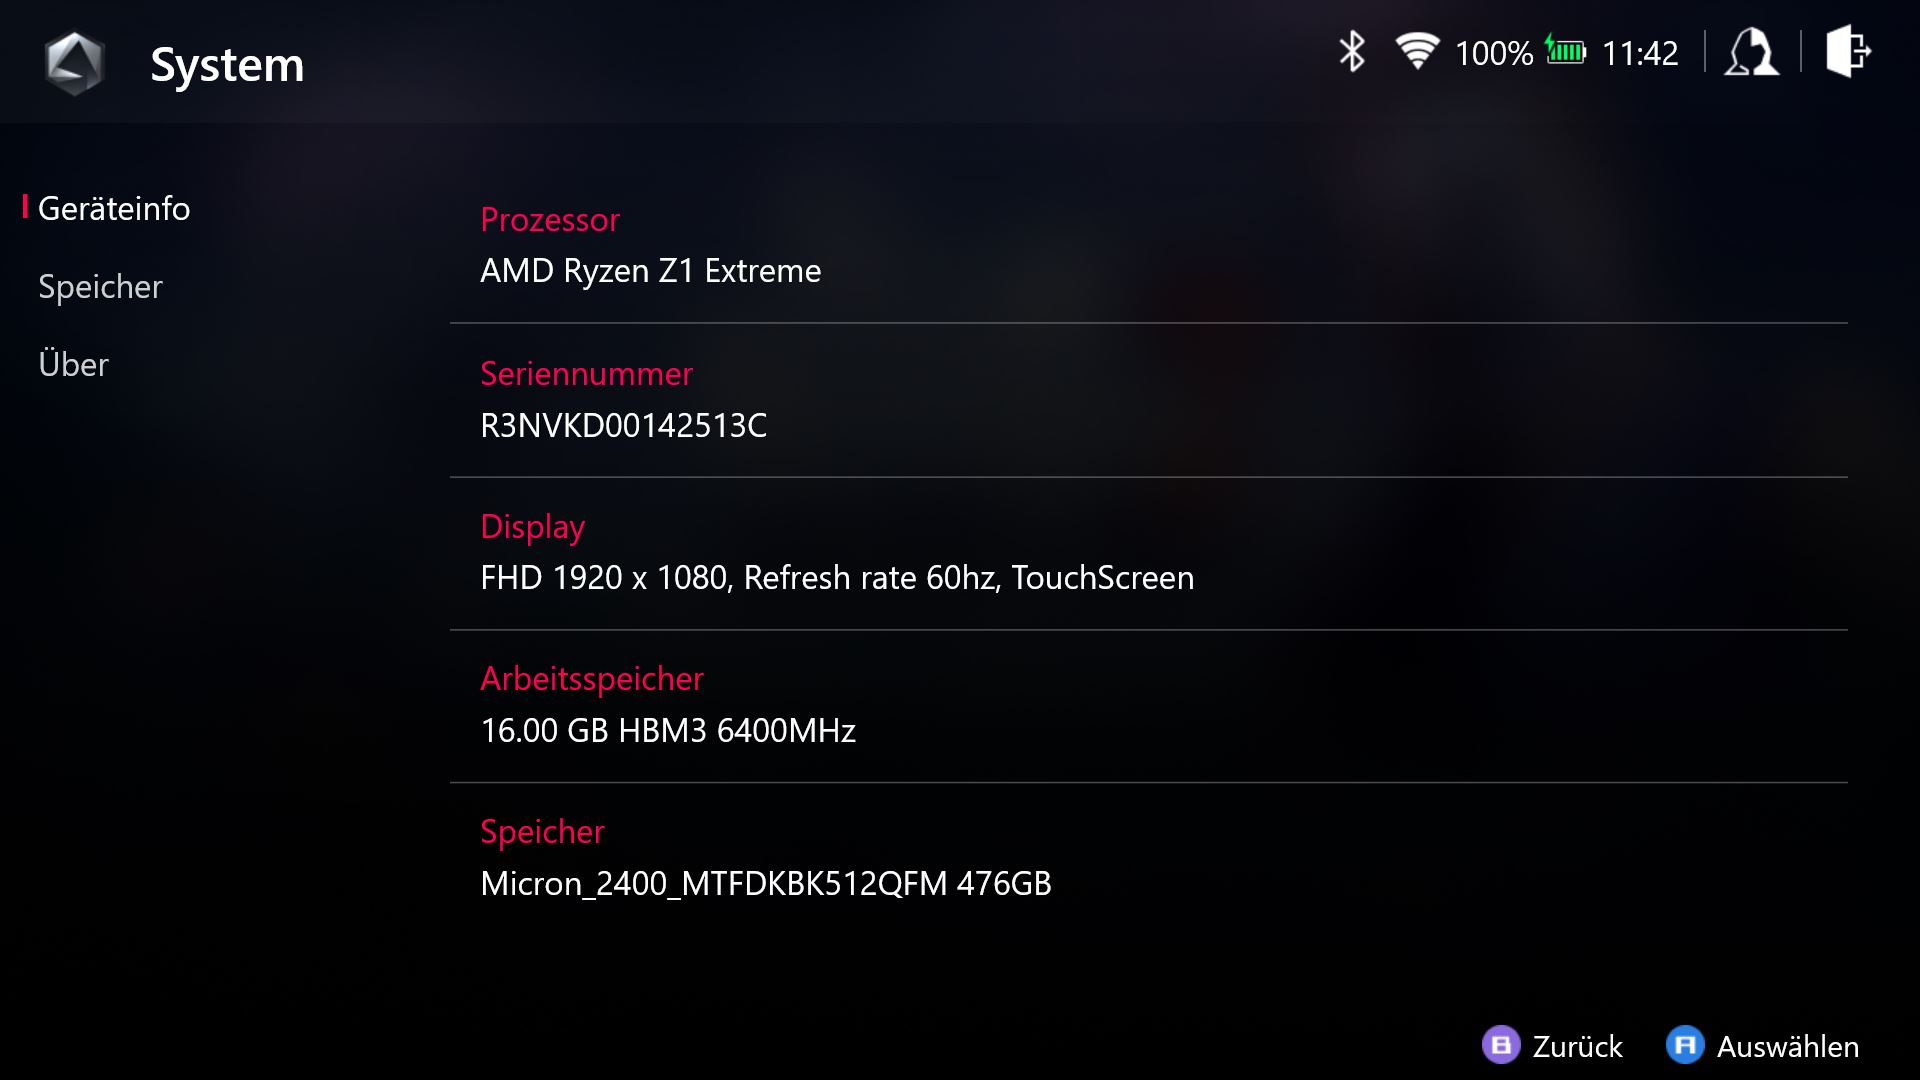
Asus uses the latest and greatest AMD Ryzen mobile processors for the ROG Ally. They are called Z1 and Z1 Extreme, respectively, and the Z1 Extreme in our review unit is pretty much the new Ryzen 7 7840U (AMD Phoenix, 4 nm, Zen4), but more on that later. This means there should be a considerable performance advantage over the Steam Deck. Otherwise, the ROG Ally comes with 16 GB RAM, 512 GB NVMe-SSD storage (which can be replaced) and a 7-inch 1080p IPS screen with 120 Hz and 500 nits brightness. The German RRP is 799 Euro for the Ally Z1 Extreme and 699 Euros for the less powerful Ally Z1.
| ROG Ally Z1 Extreme | ROG Ally Z1 | |
|---|---|---|
| CPU | AMD Ryzen Z1 Extreme 8 Zen4 cores(4 nm) up to 5.1 GHz |
AMD Ryzen Z1 6 Zen4 cores (4 nm) up to 4.9 GHz |
| GPU | AMD Radeon Graphics RDNA 3 & 4 GB RAM/8.6 TFlops 12 CUs / up to 2.7 GHz |
AMD Radeon Graphics RDNA 3 & 4 GB RAM/2.8 TFlops 4 CUs / up to 2.5 GHz |
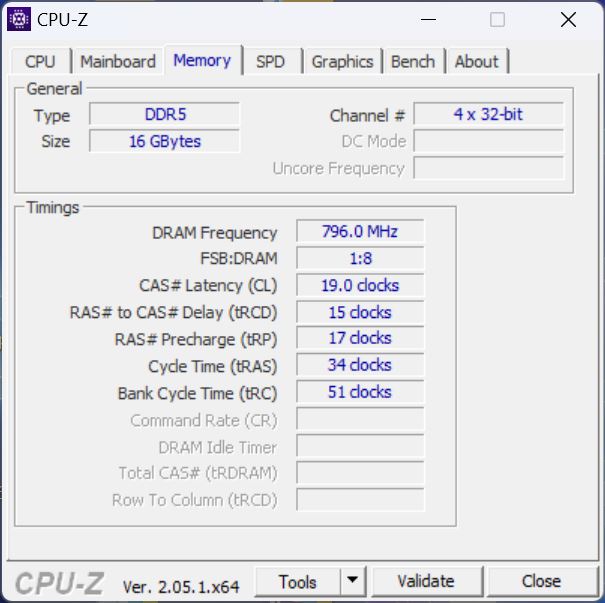
| RAM | 16 GB LPDDR5-6400 (Dual-Channel) | 16 GB LPDDR5-6400 (Dual-Channel) |
| SSD | 512 GB NVMe PCIe 4.0 / M.2-2230 |
256 GB NVMe PCIe 4.0 / M.2-2230 |
| Display | 7 Zoll IPS, 120 Hz, 500 nits FreeSync Premium, sRGB |
7 Zoll IPS, 120 Hz, 500 nits FreeSync Premium, sRGB |
| Price | 799 Euros | 699 Euros |
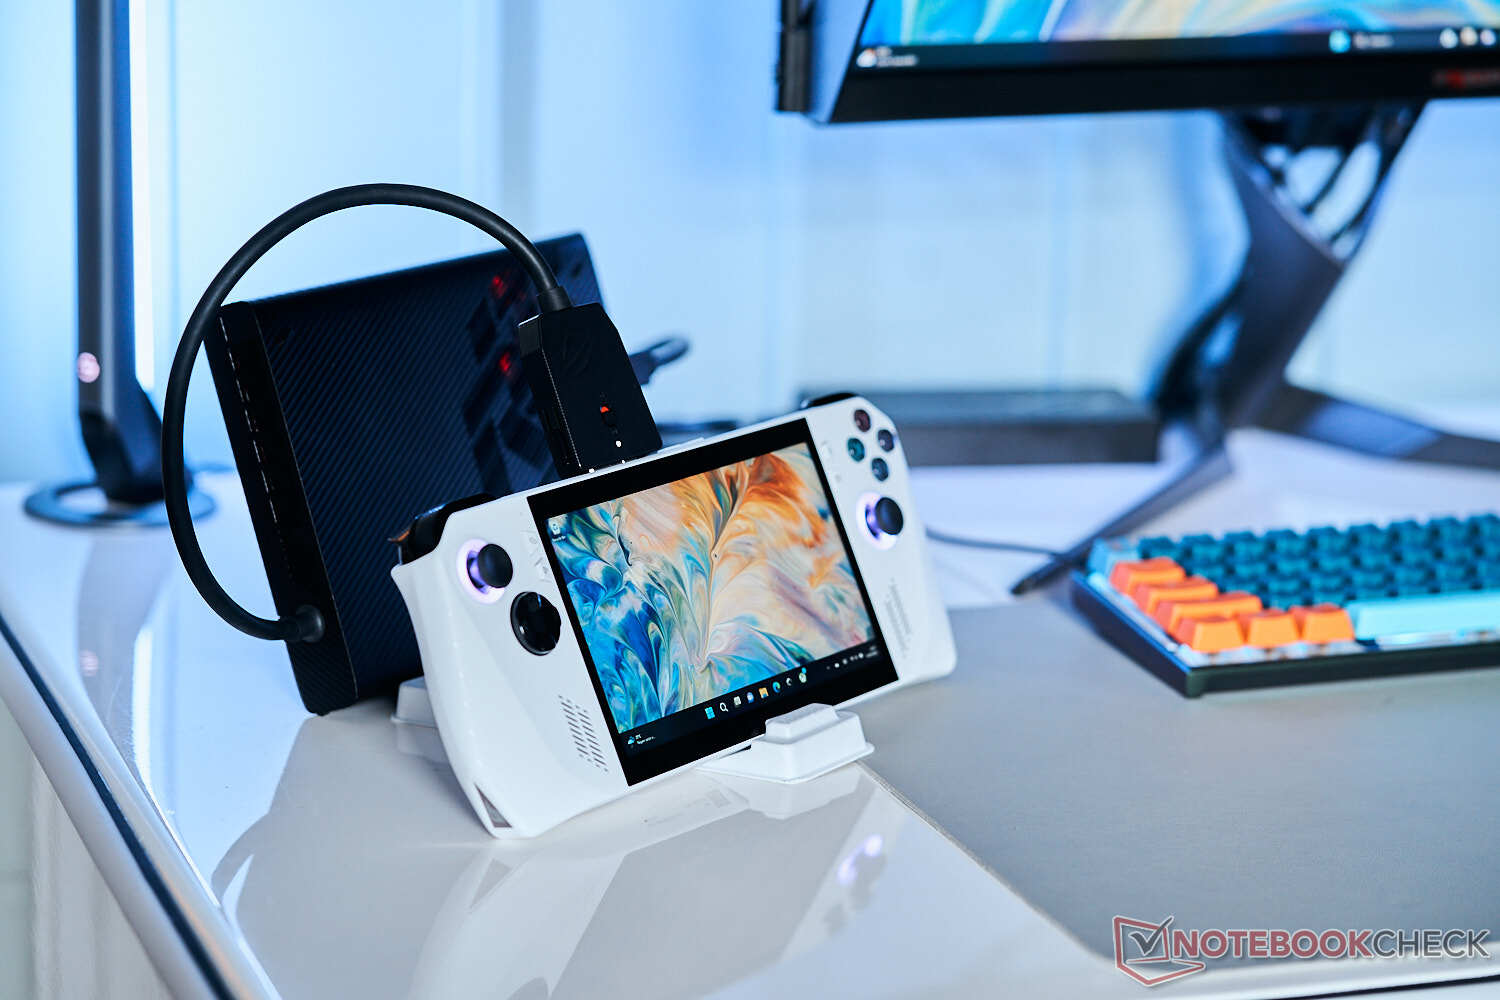
You can even attach the XG Mobile external graphics card to the ROG Ally handheld, so you can combine the Ally with the GeForce RTX 4090 Laptop at home. Our XG Mobile sample did not arrive on time, but we will add gaming benchmarks with the 4090 in a couple of days. The combination should work very well when you use the Turbo mode since the CPU performance is not much worse compared to the recently reviewed ROG Zephyrus G14 (more on that later).
Update May 16th: We have performed synthetic and gaming benchmarks with the ROG Ally and the 2023 Asus XG Mobile, which is equipped with the new Nvidia GeForce RTX 4090 Laptop. The results are available in the GPU section.
Potential rivals
Rating | Date | Model | Weight | Height | Size | Resolution | Price |
|---|---|---|---|---|---|---|---|
| 87.5 % v7 (old) | 05 / 2023 | Asus ROG Ally Z1 Extreme Z1 Extreme, Radeon 780M | 611 g | 21.22 mm | 7.00" | 1920x1080 | |
v (old) | 09 / 2025 | Valve Steam Deck 512 GB LCD | 669 g | 49 mm | 7.00" | 1280x800 | |
| 80.3 % v7 (old) | 03 / 2023 | GPD Win 4 R7 6800U, Radeon 680M | 607 g | 28 mm | 6.00" | 1920x1080 | |
| 84.5 % v7 (old) | 07 / 2022 | GPD Win Max 2 i7-1260P, Iris Xe G7 96EUs | 1 kg | 23 mm | 10.10" | 2560x1600 |
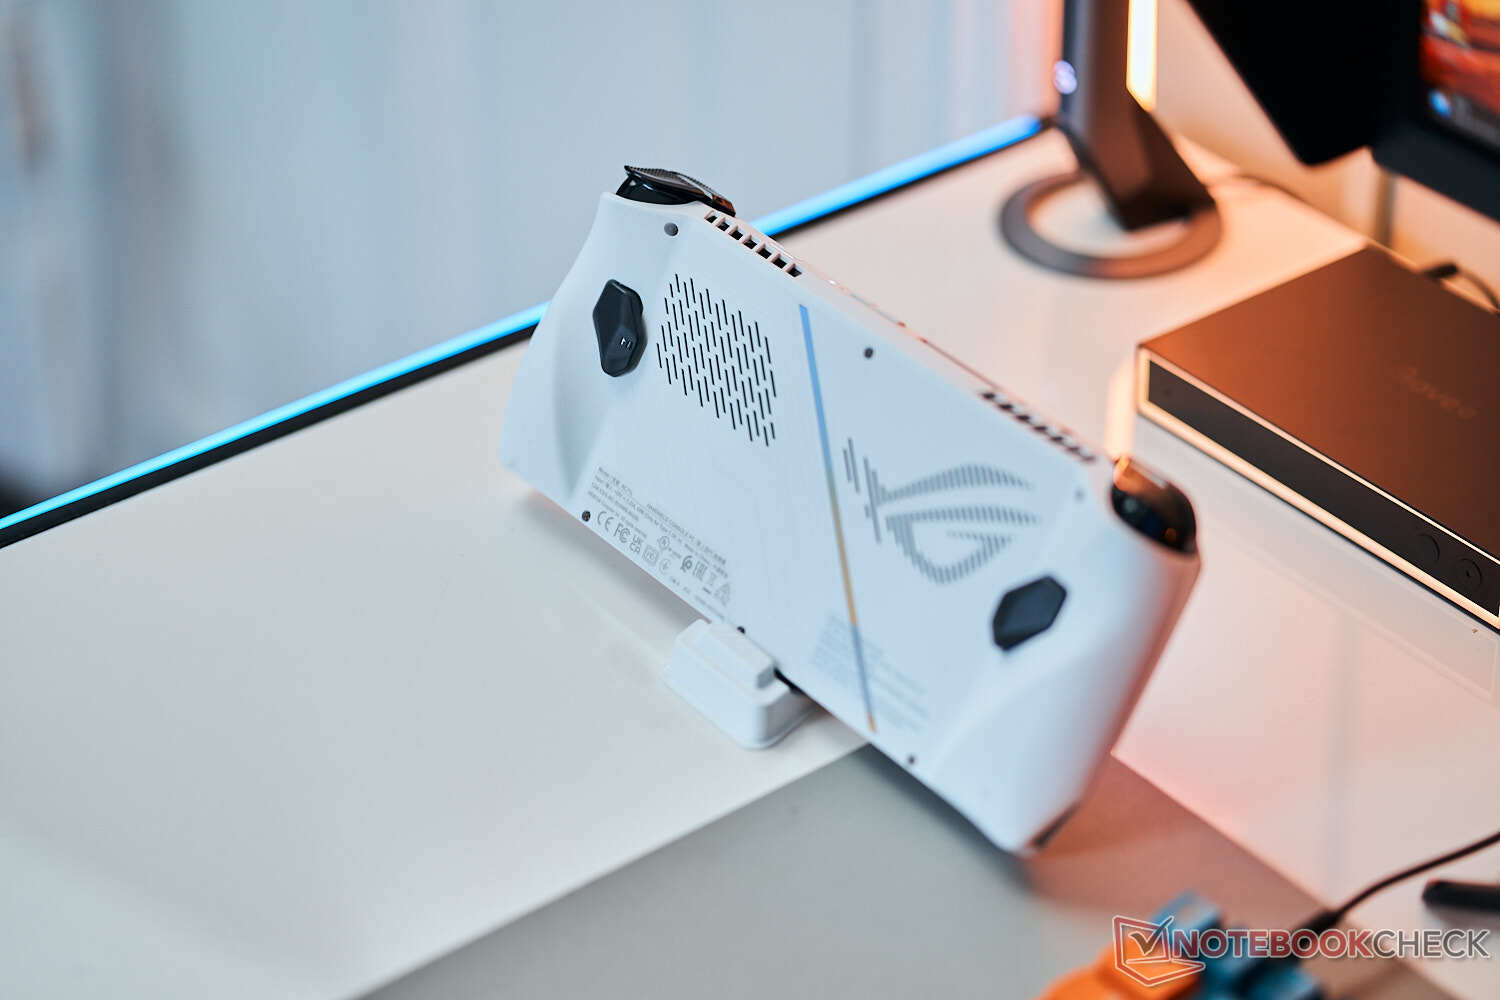
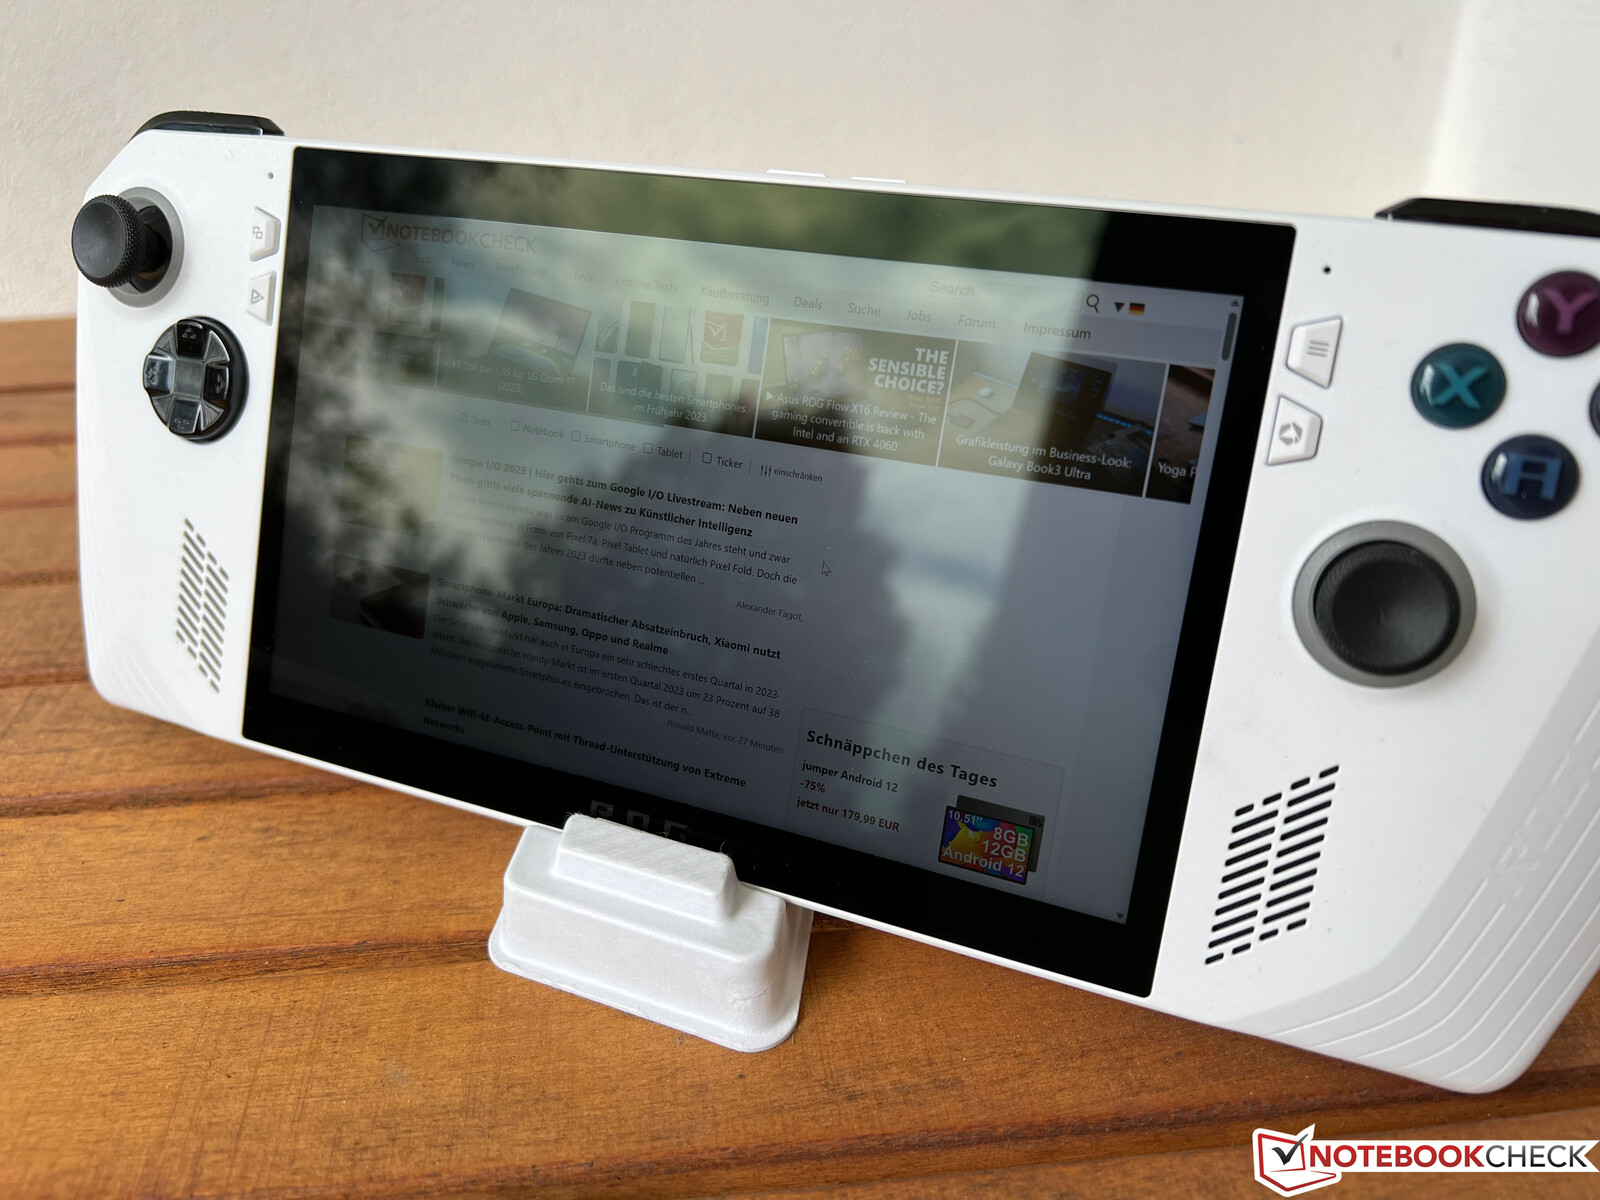
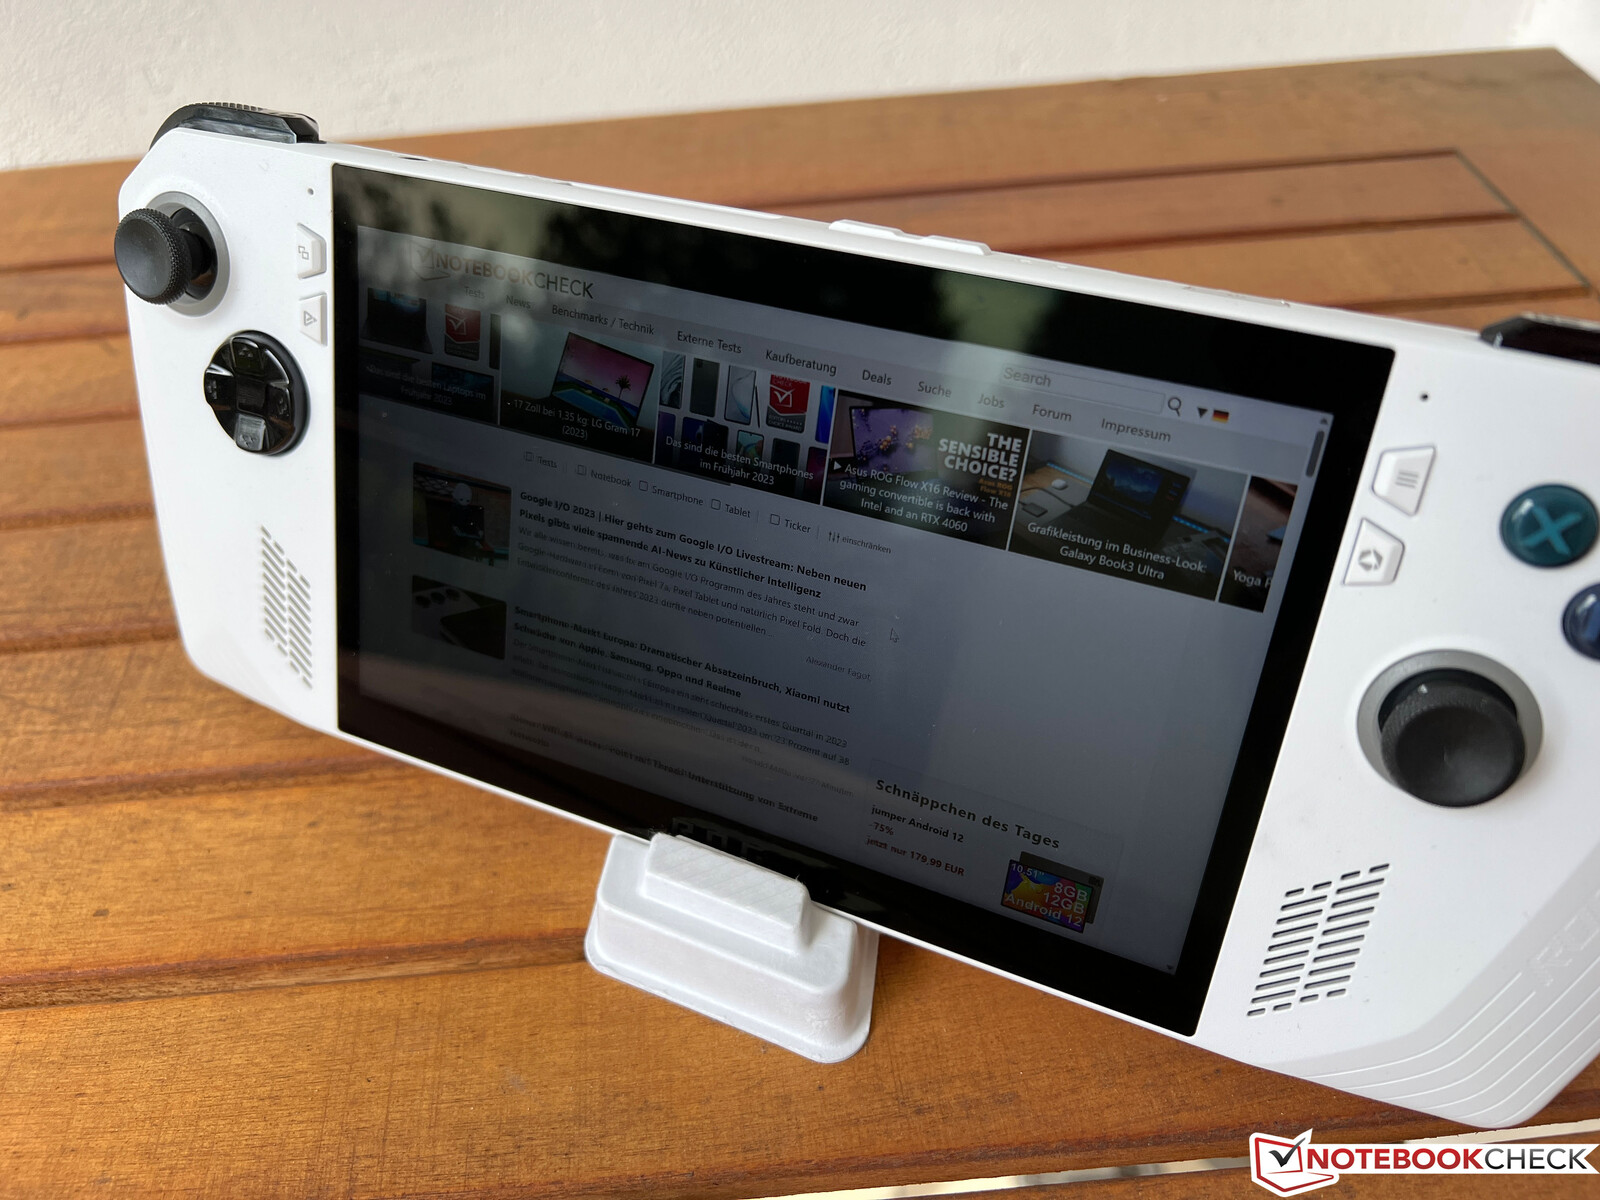
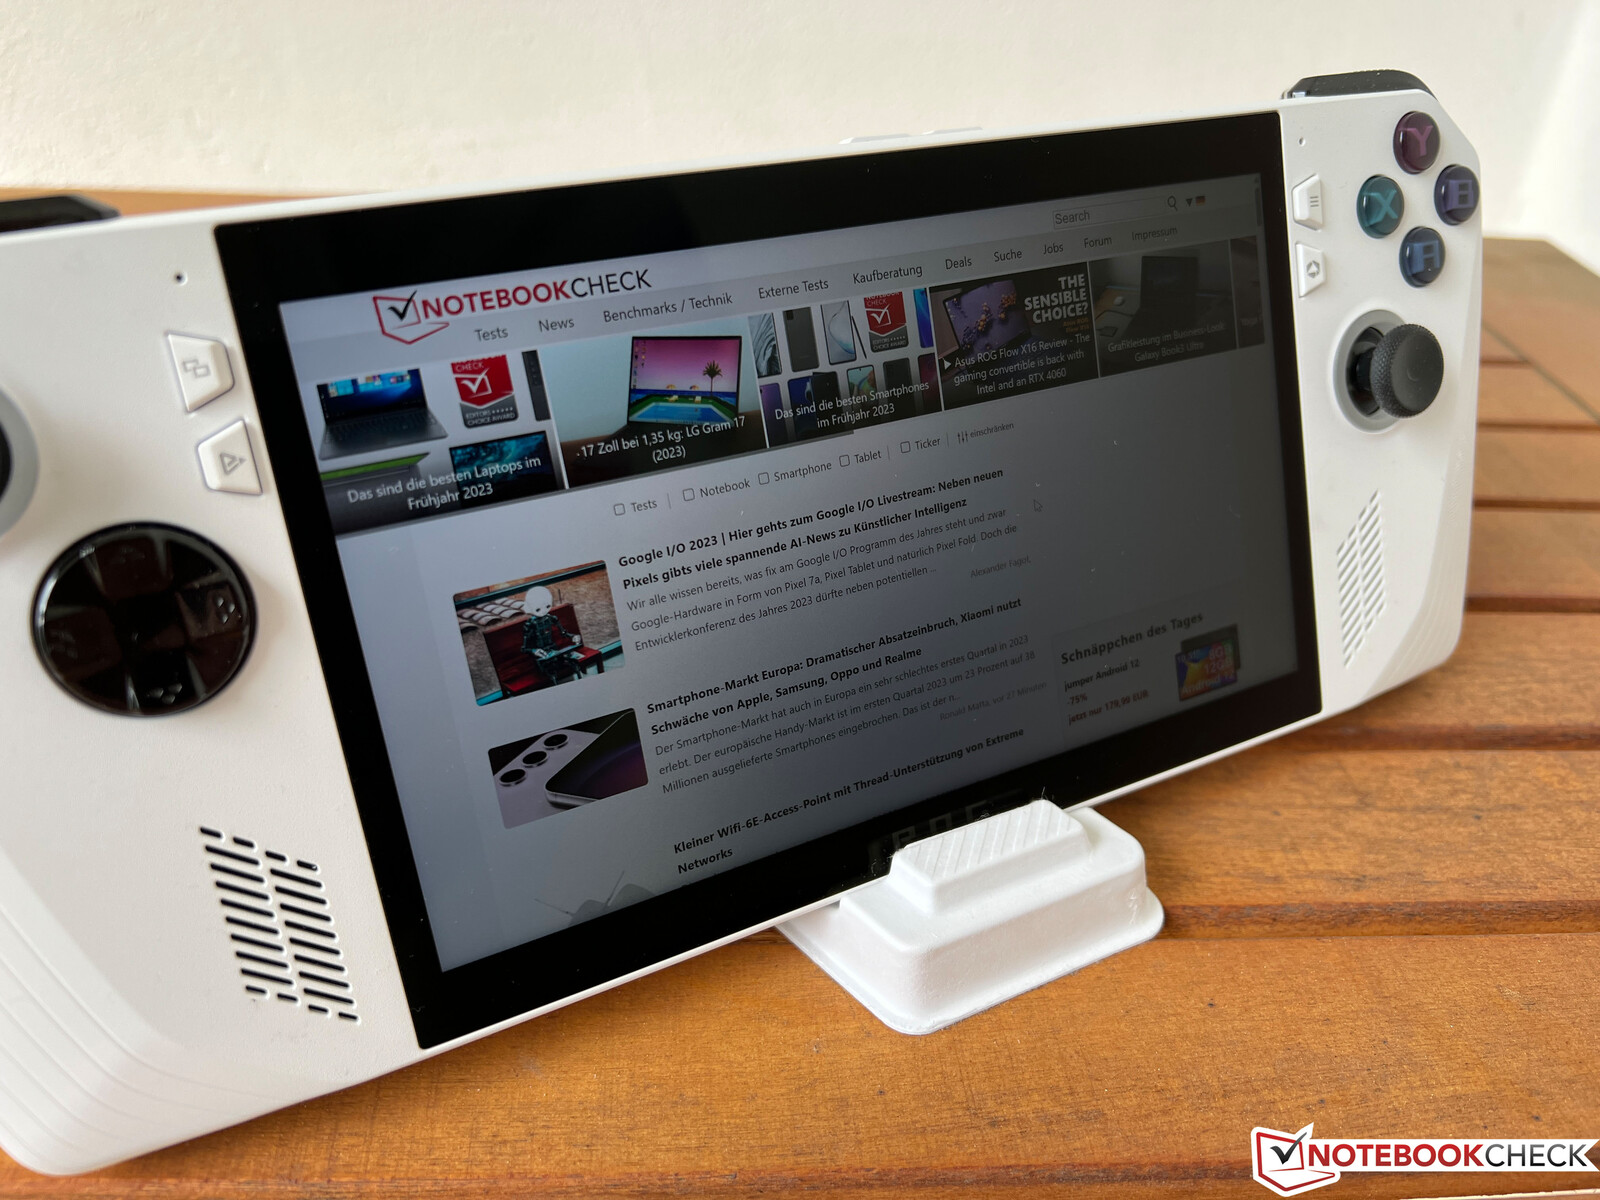
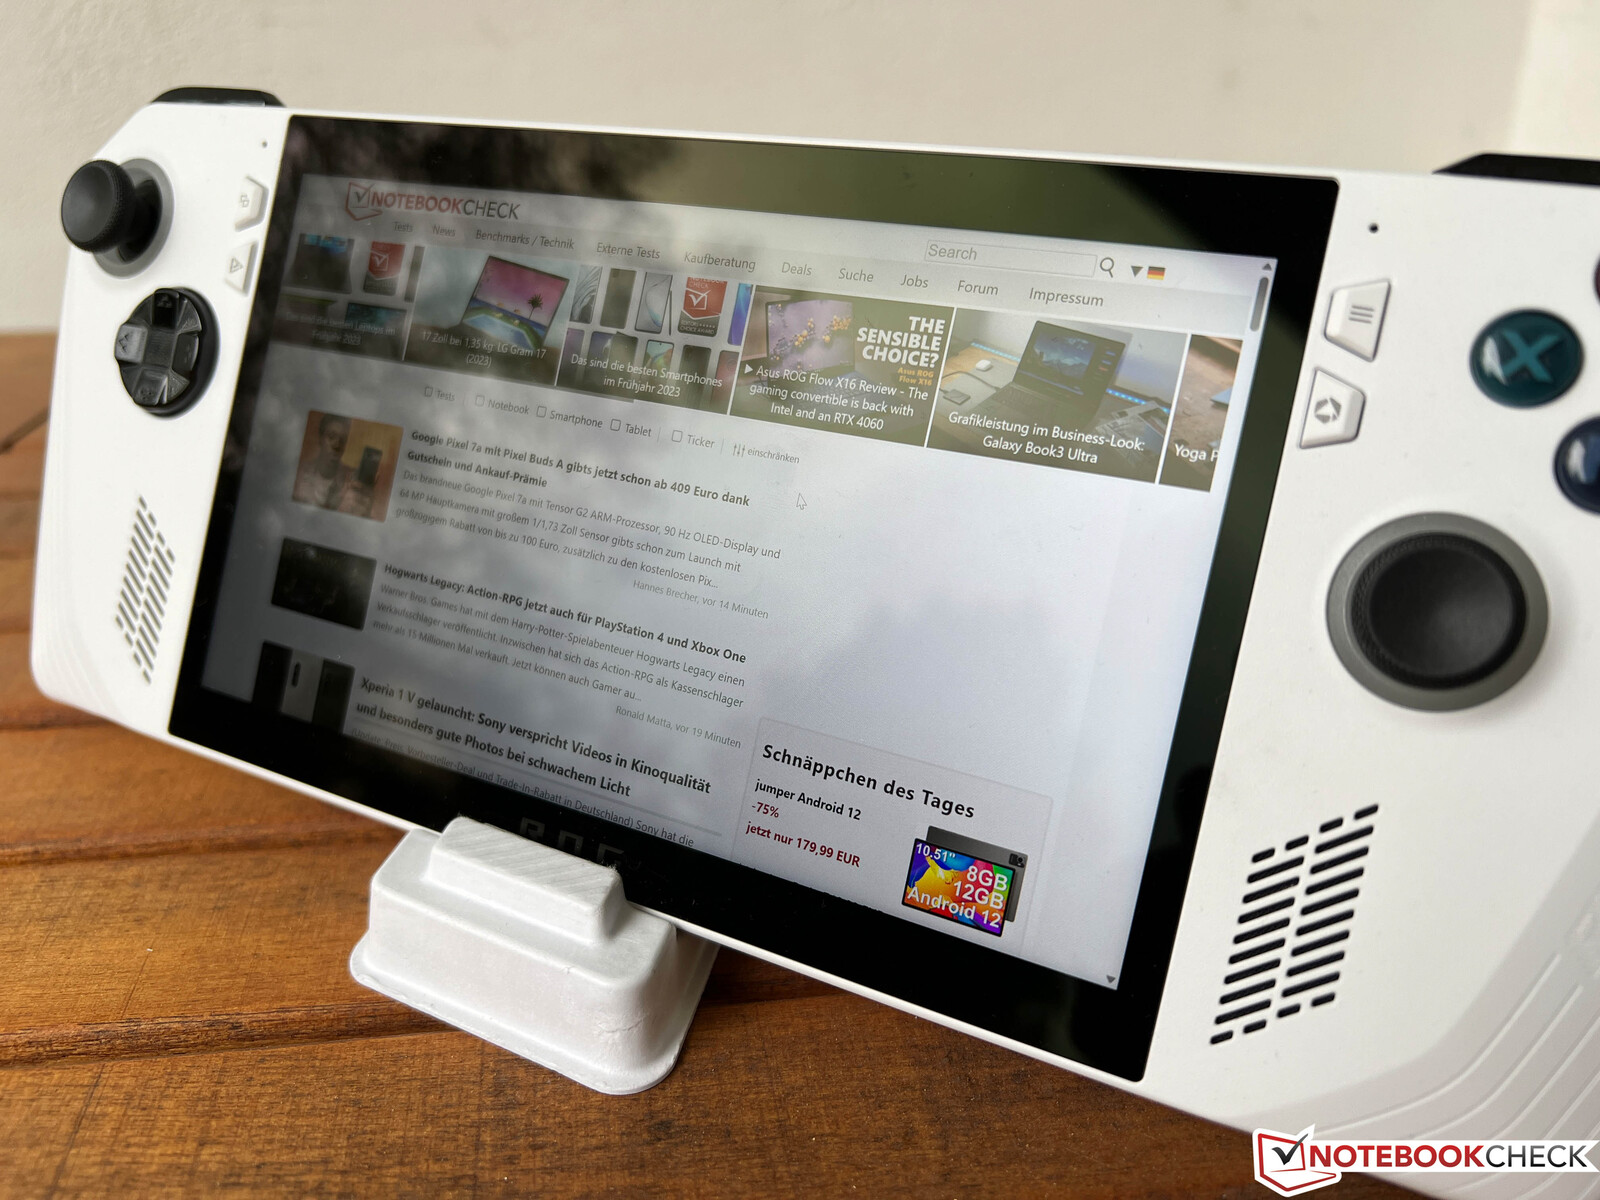
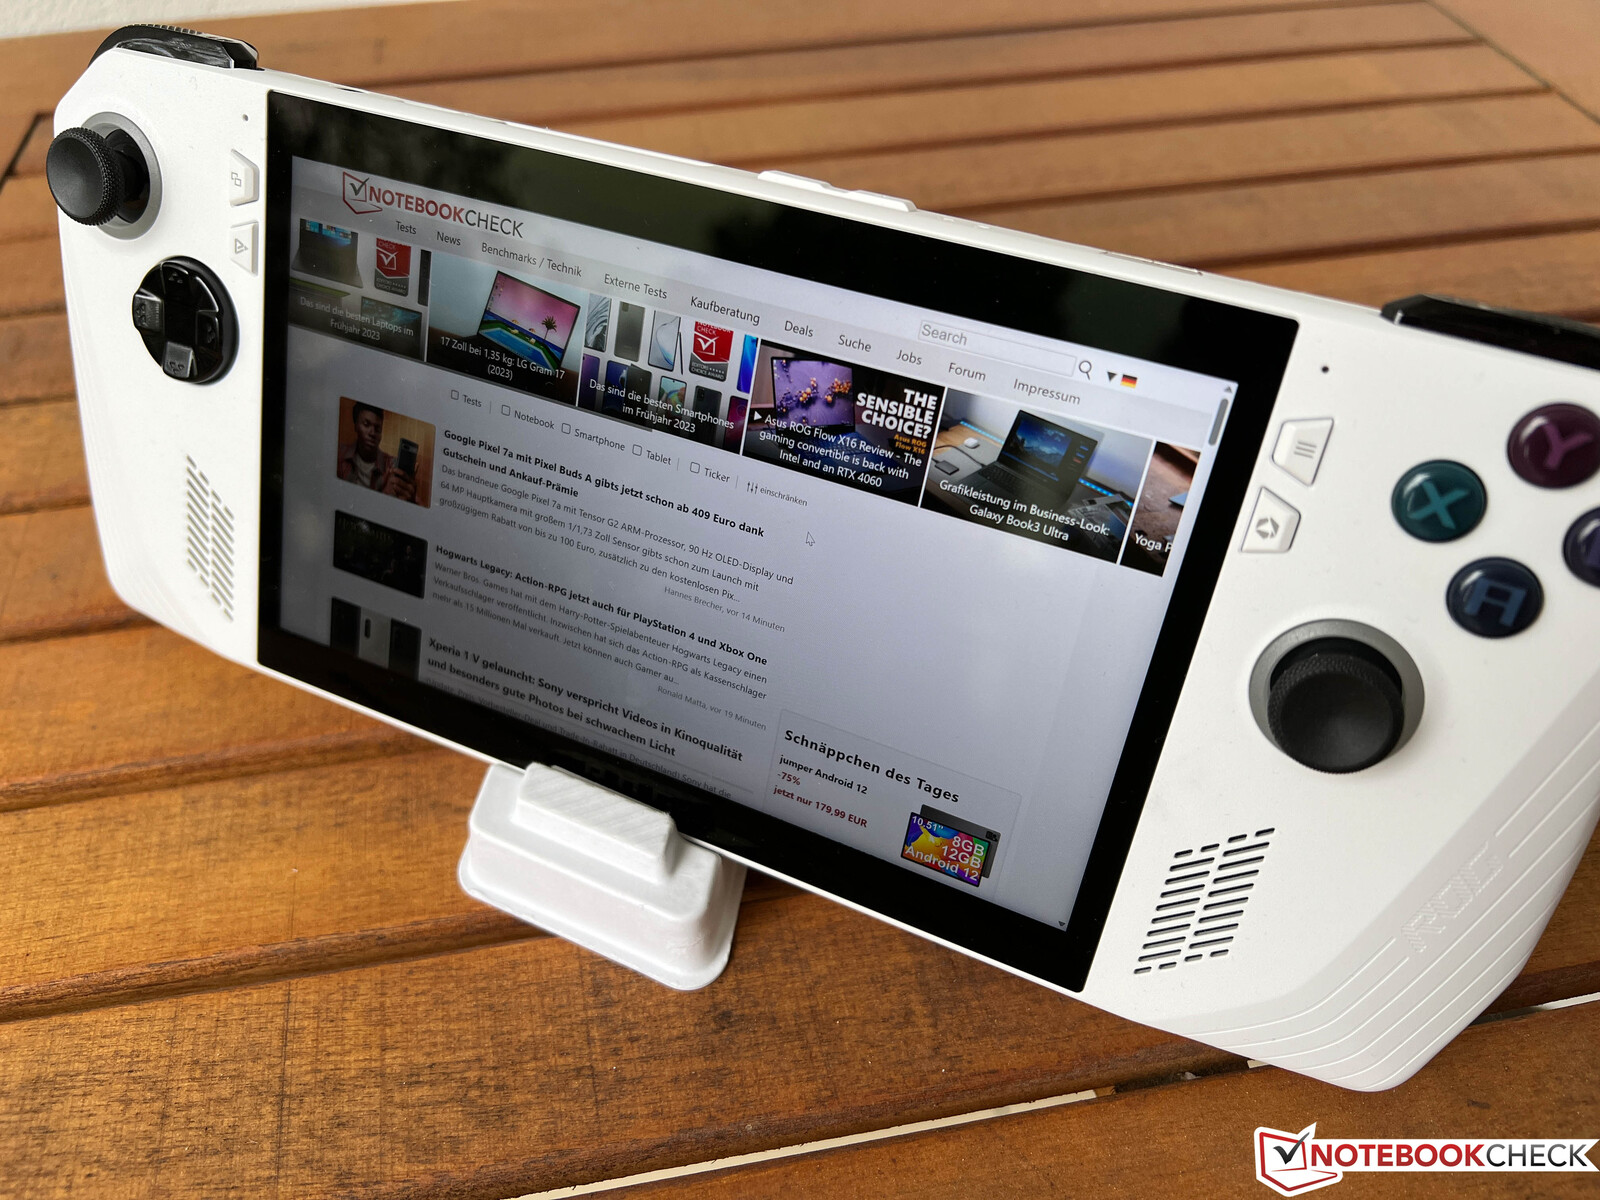
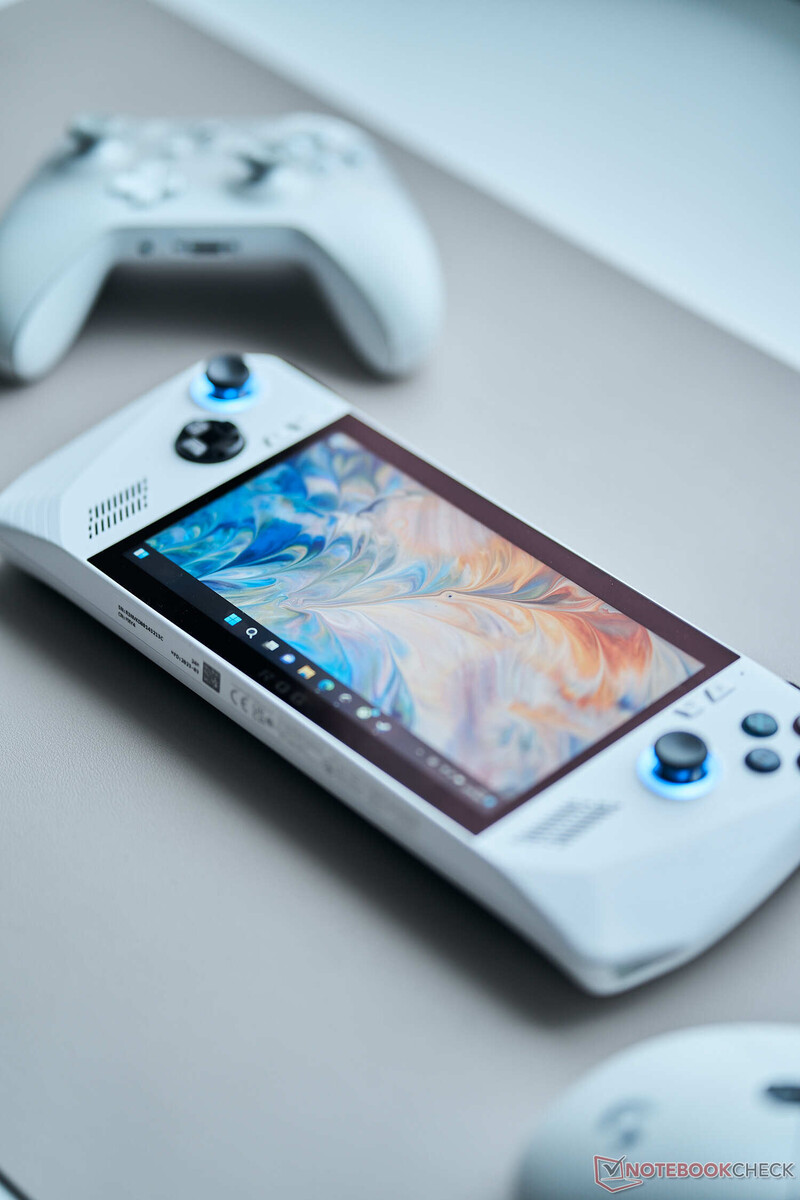
Case - Functional plastic design
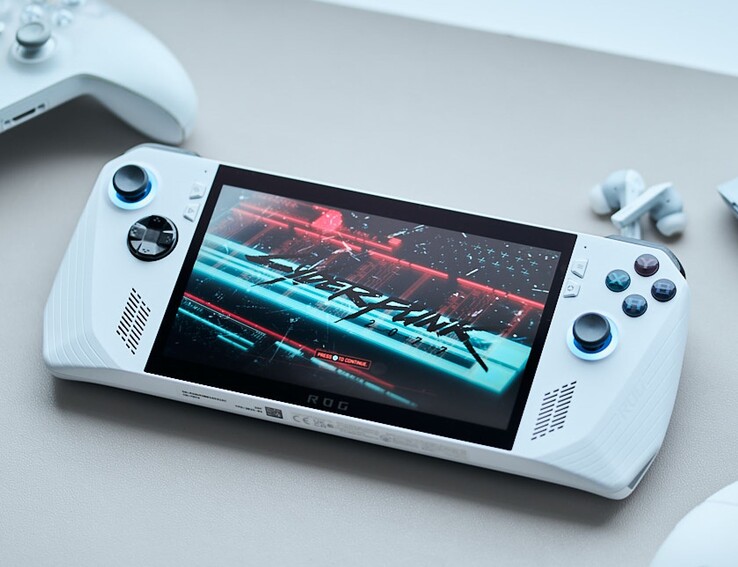
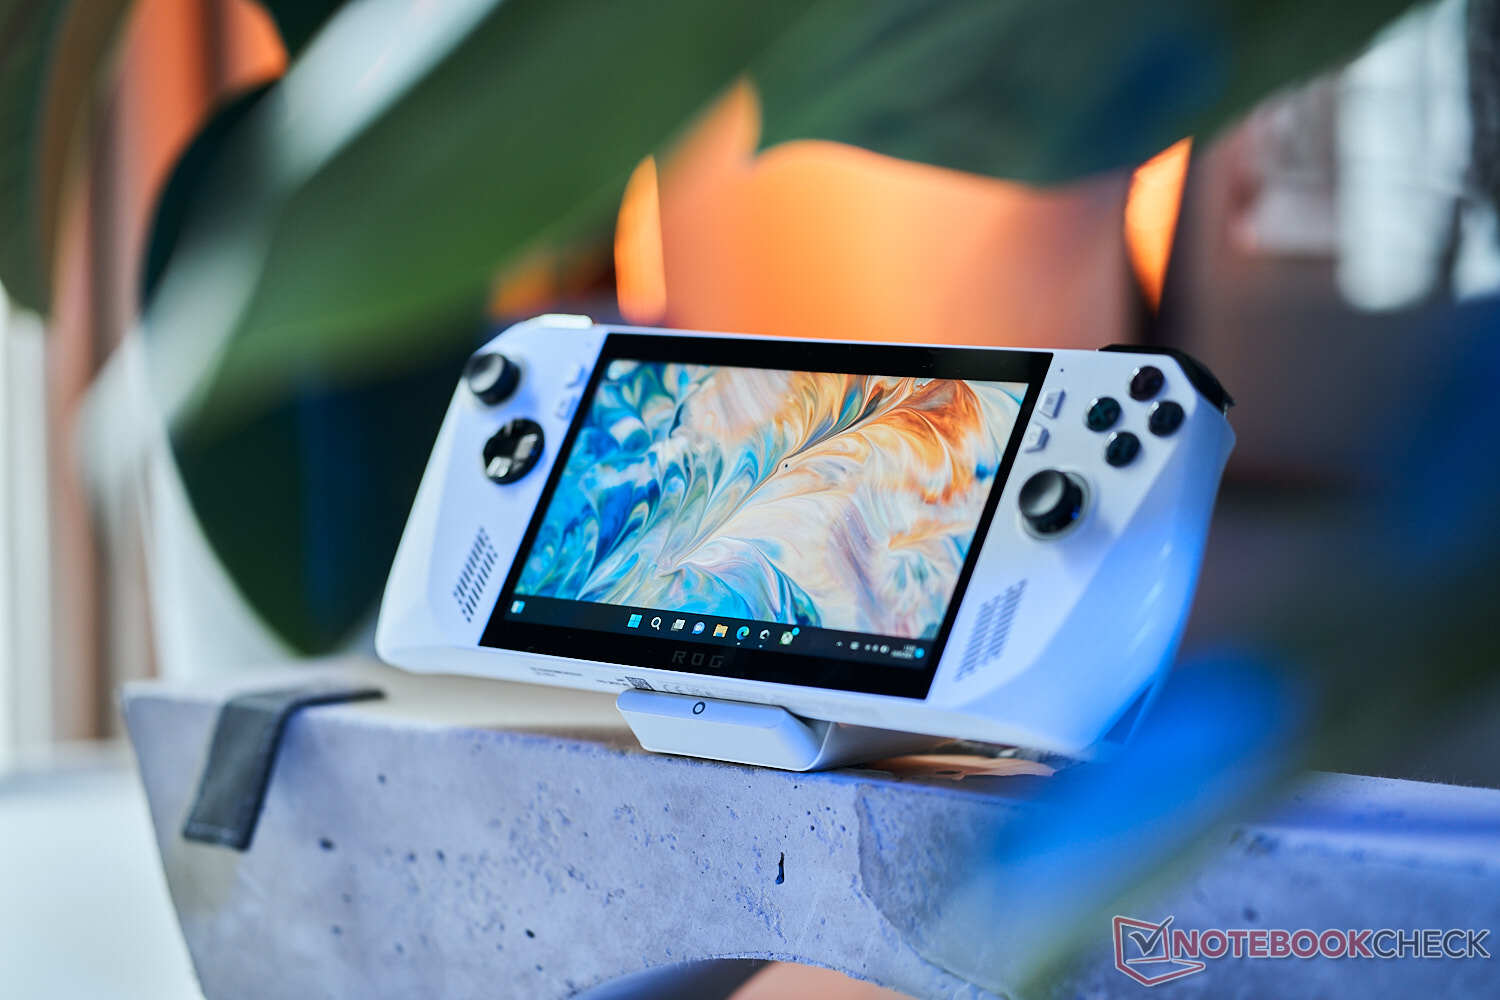
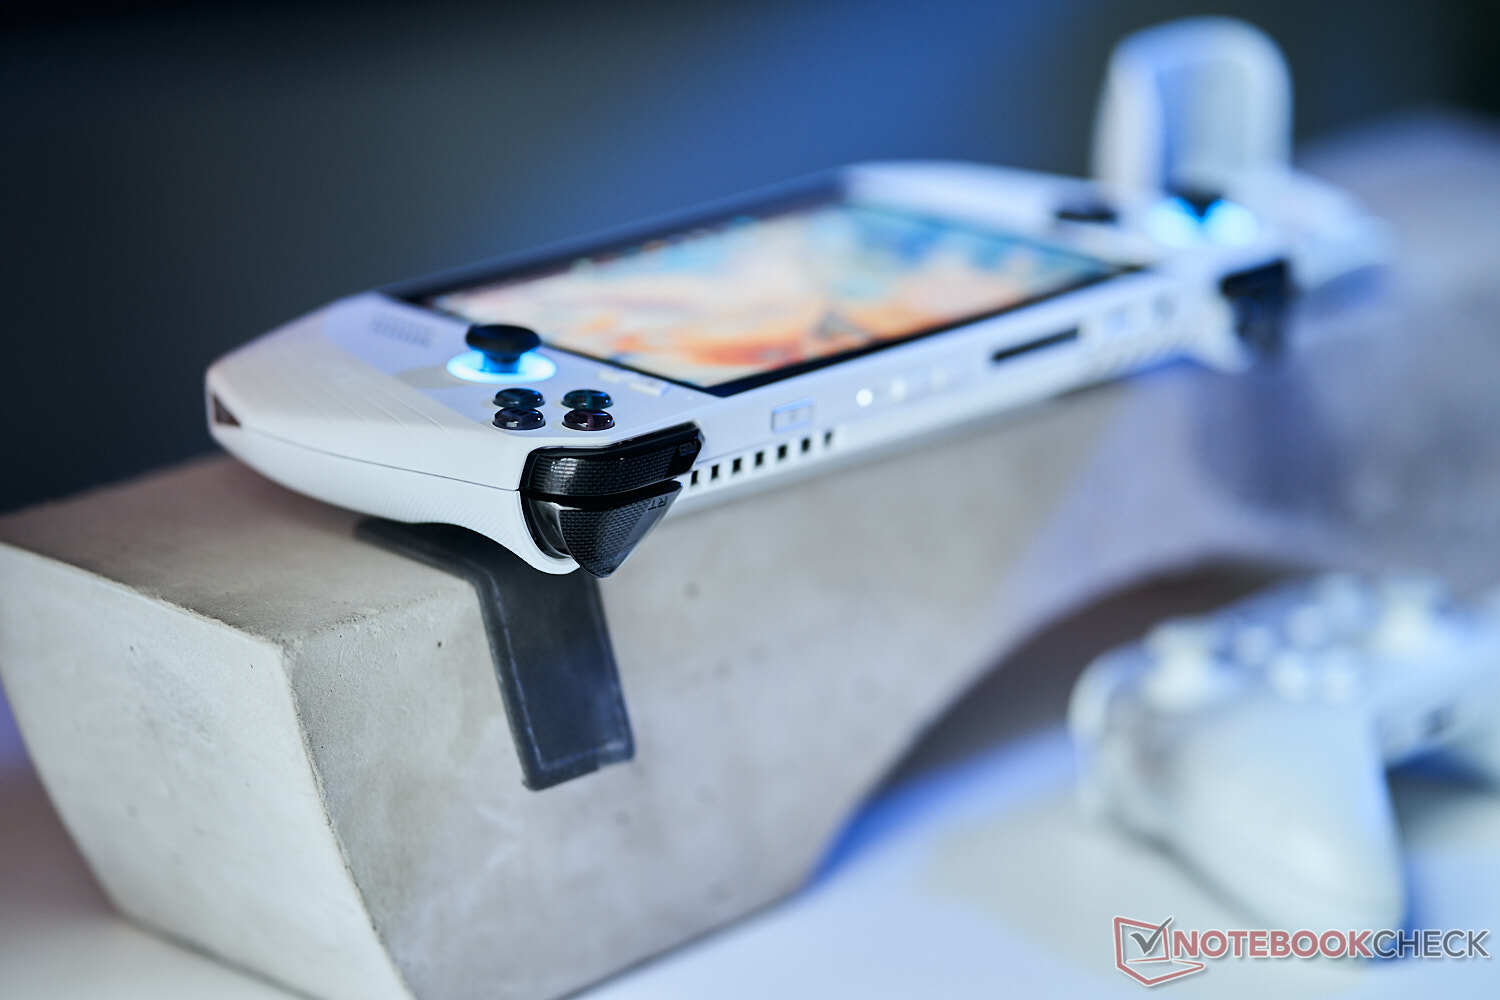
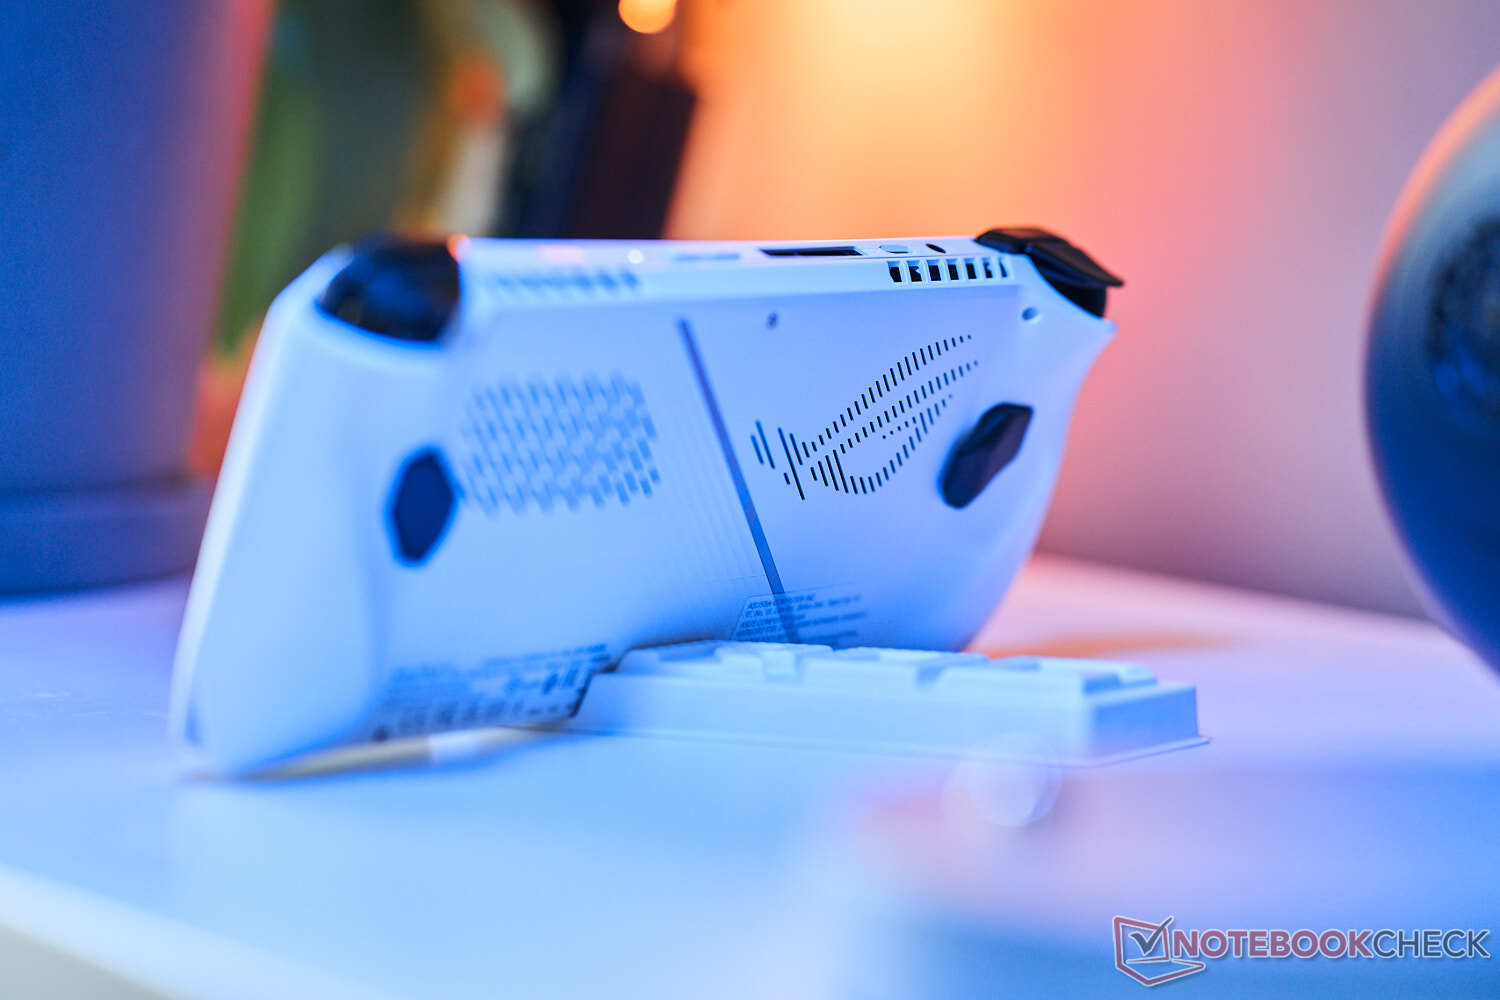
The ROG Ally uses a white plastic chassis with different design elements. The surfaces at the grips are textured for better grip (stripes at the front, triangle pattern at the back). This works well and the Ally is very comfortable to hold. Compared to the Steam Deck, the Ally is much more compact and denser since the weight is comparable. However, the grips on the Steam Deck are thicker, which is better for ergonomics. The chassis quality is comparable on both units.
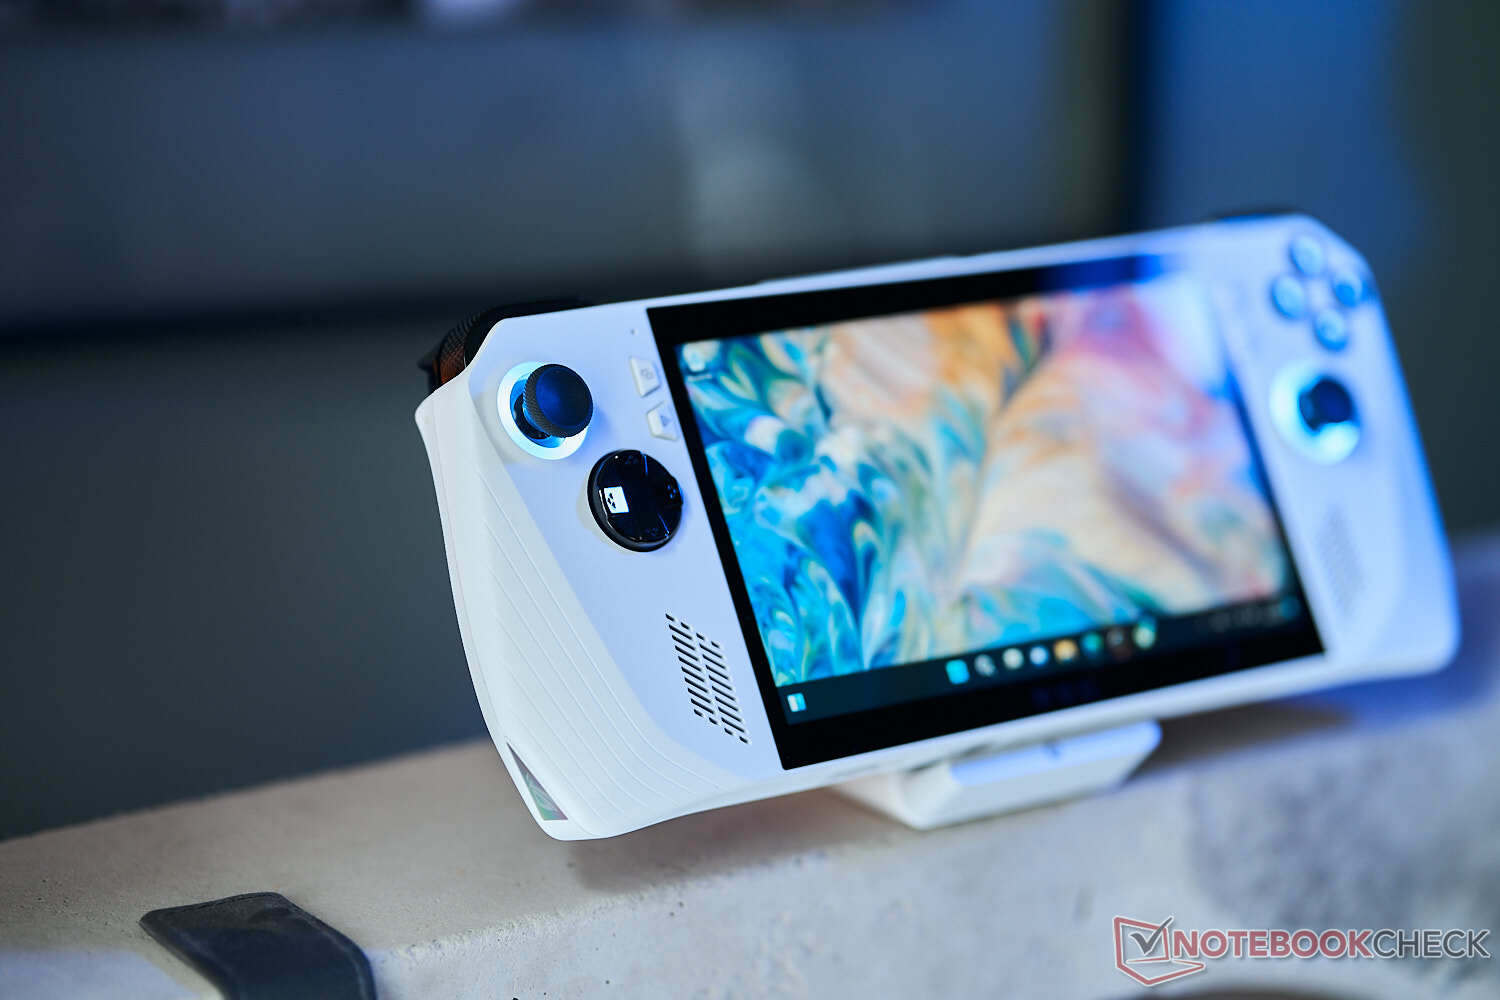
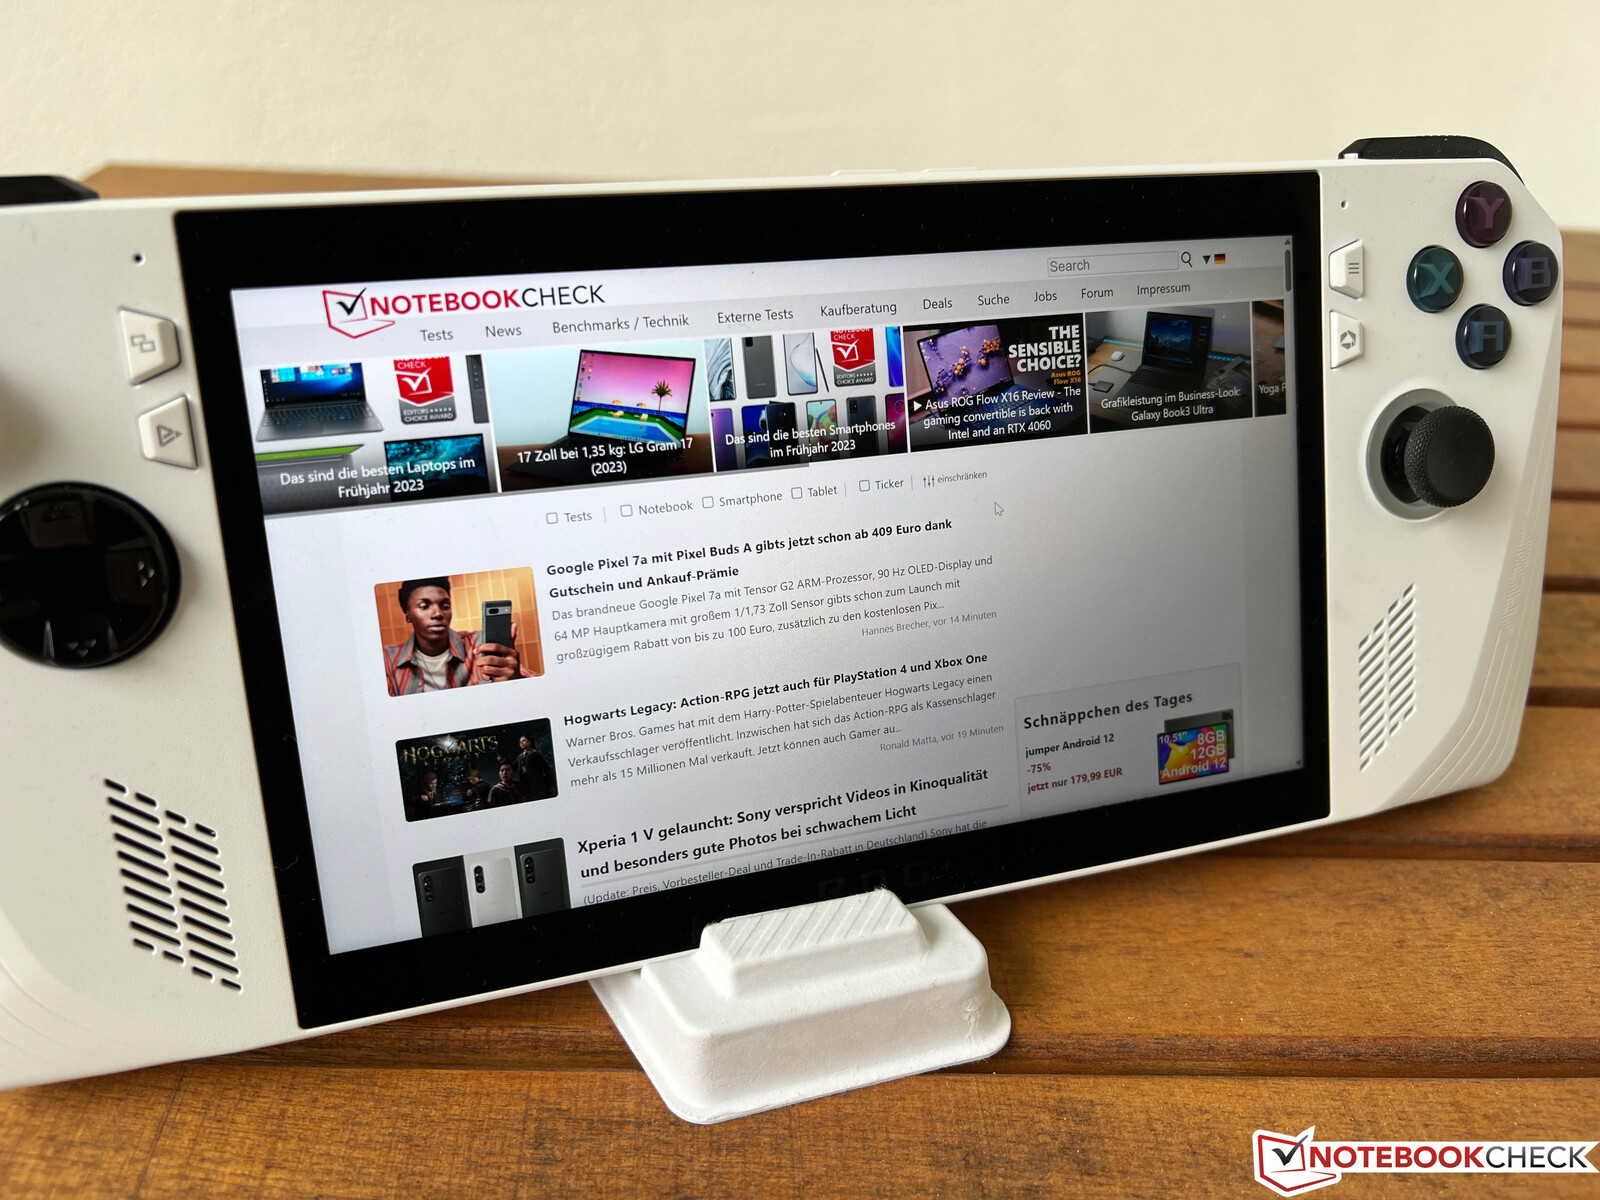
The build quality of the ROG Ally is very good and you cannot twist or dent the case. We were not able to provoke creaking sounds on our review unit, either. There is no built-in kickstand, which can be a problem. There is a little white stand (made of cardboard) including ROG lettering, which is functional and looks good.
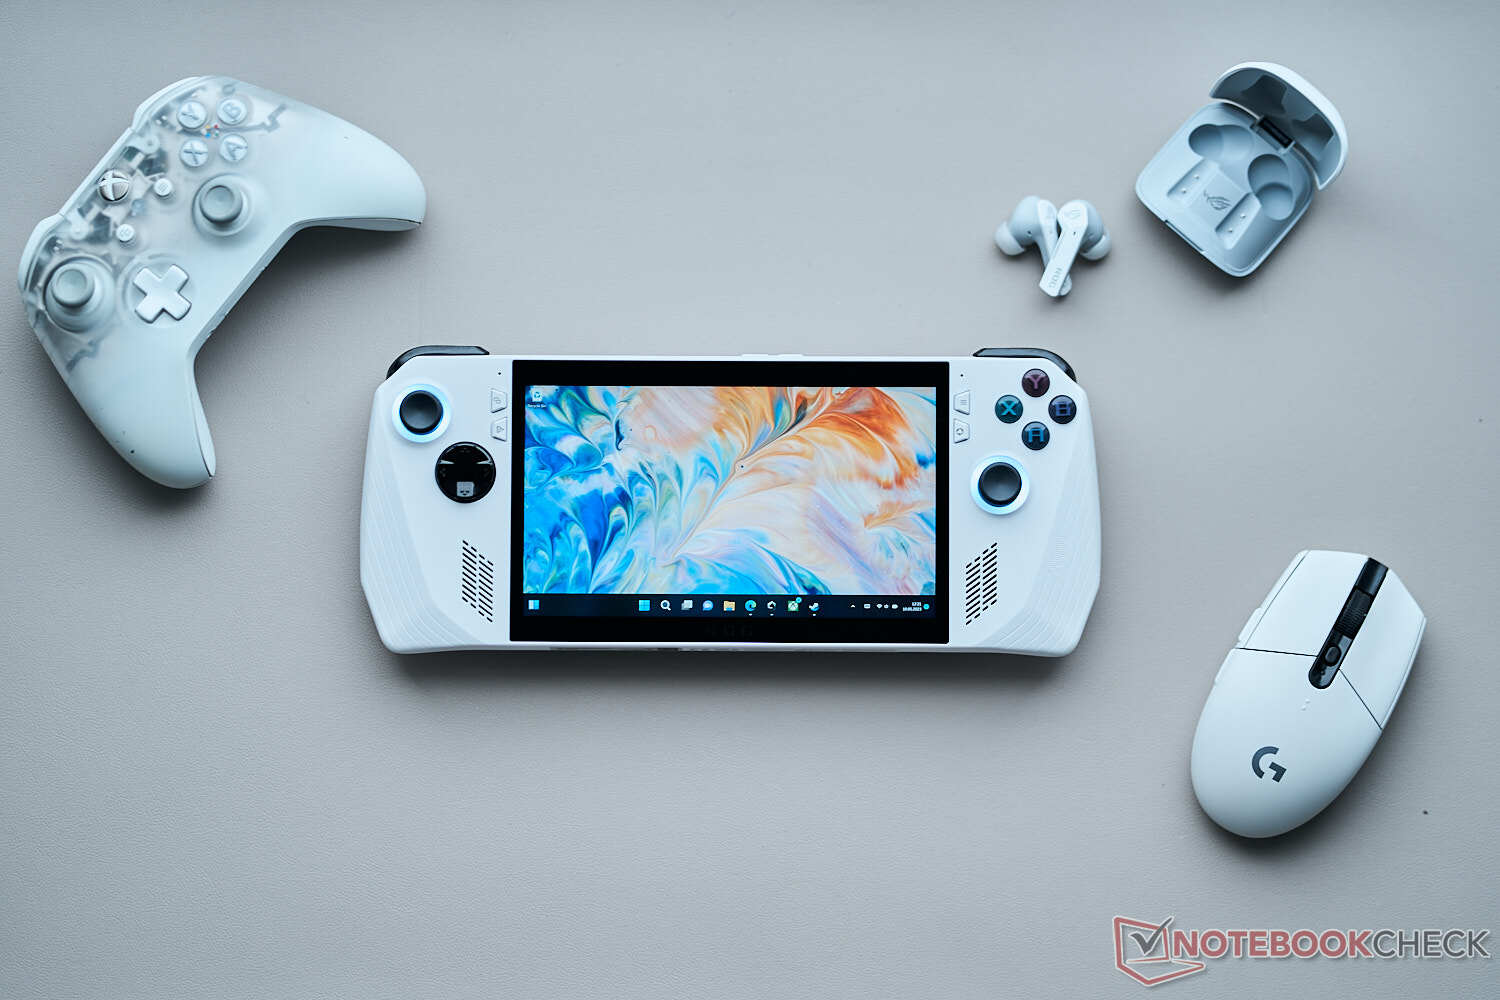
We like the overall design and the black buttons as well as the black bezels create a nice contrast. Fans of Aura Sync technology will be happy about the illuminated circles around the thumb sticks.


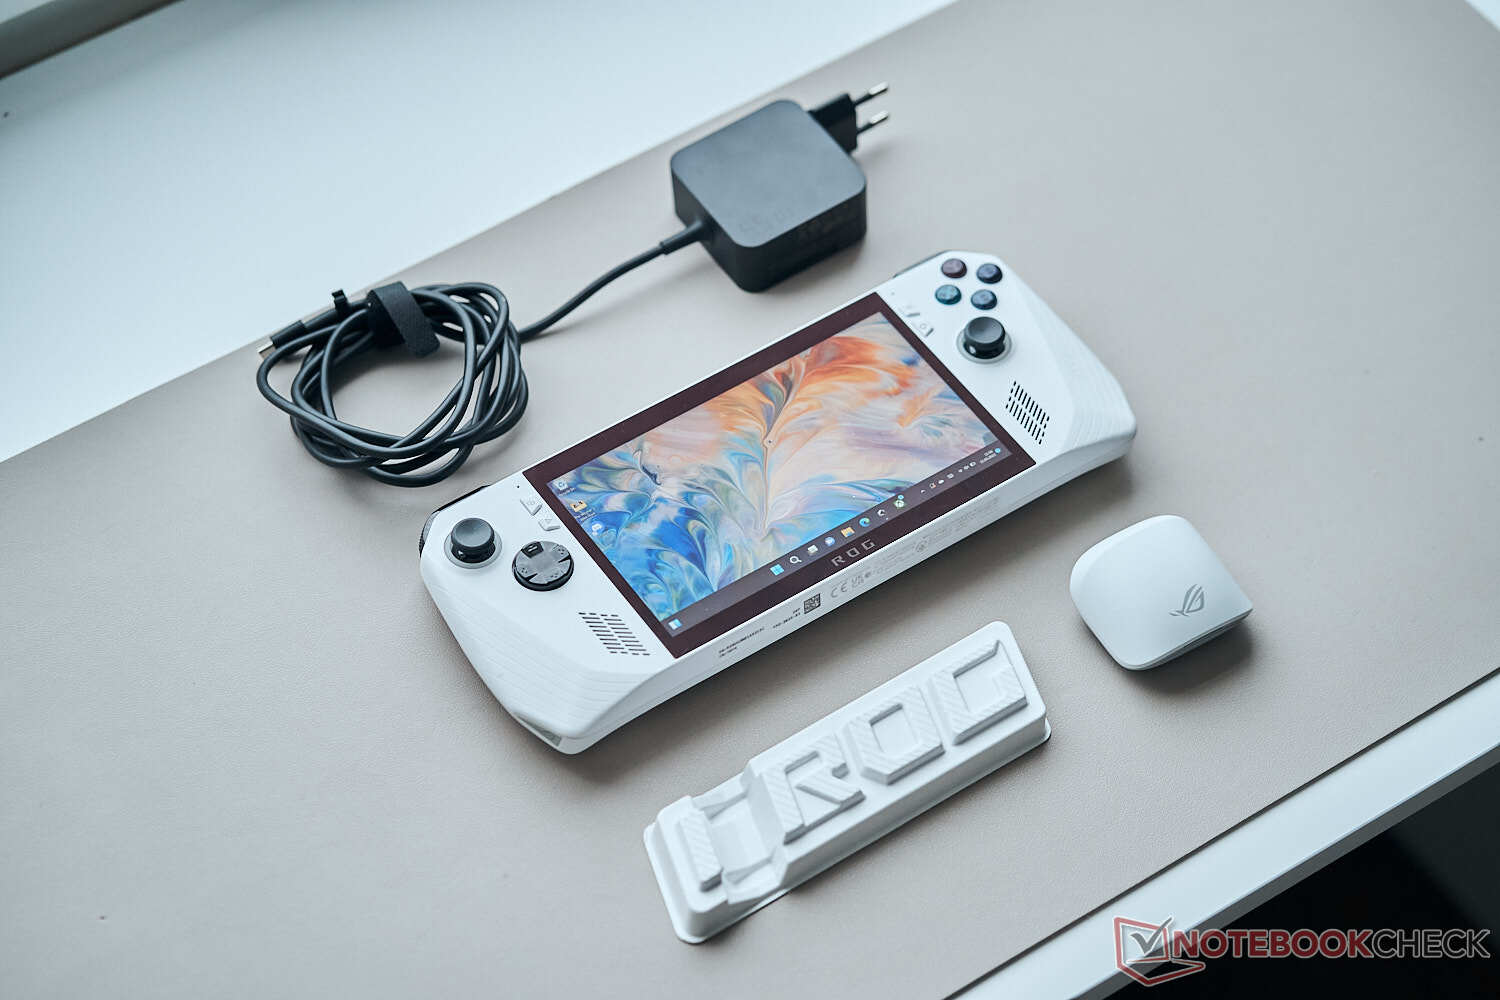
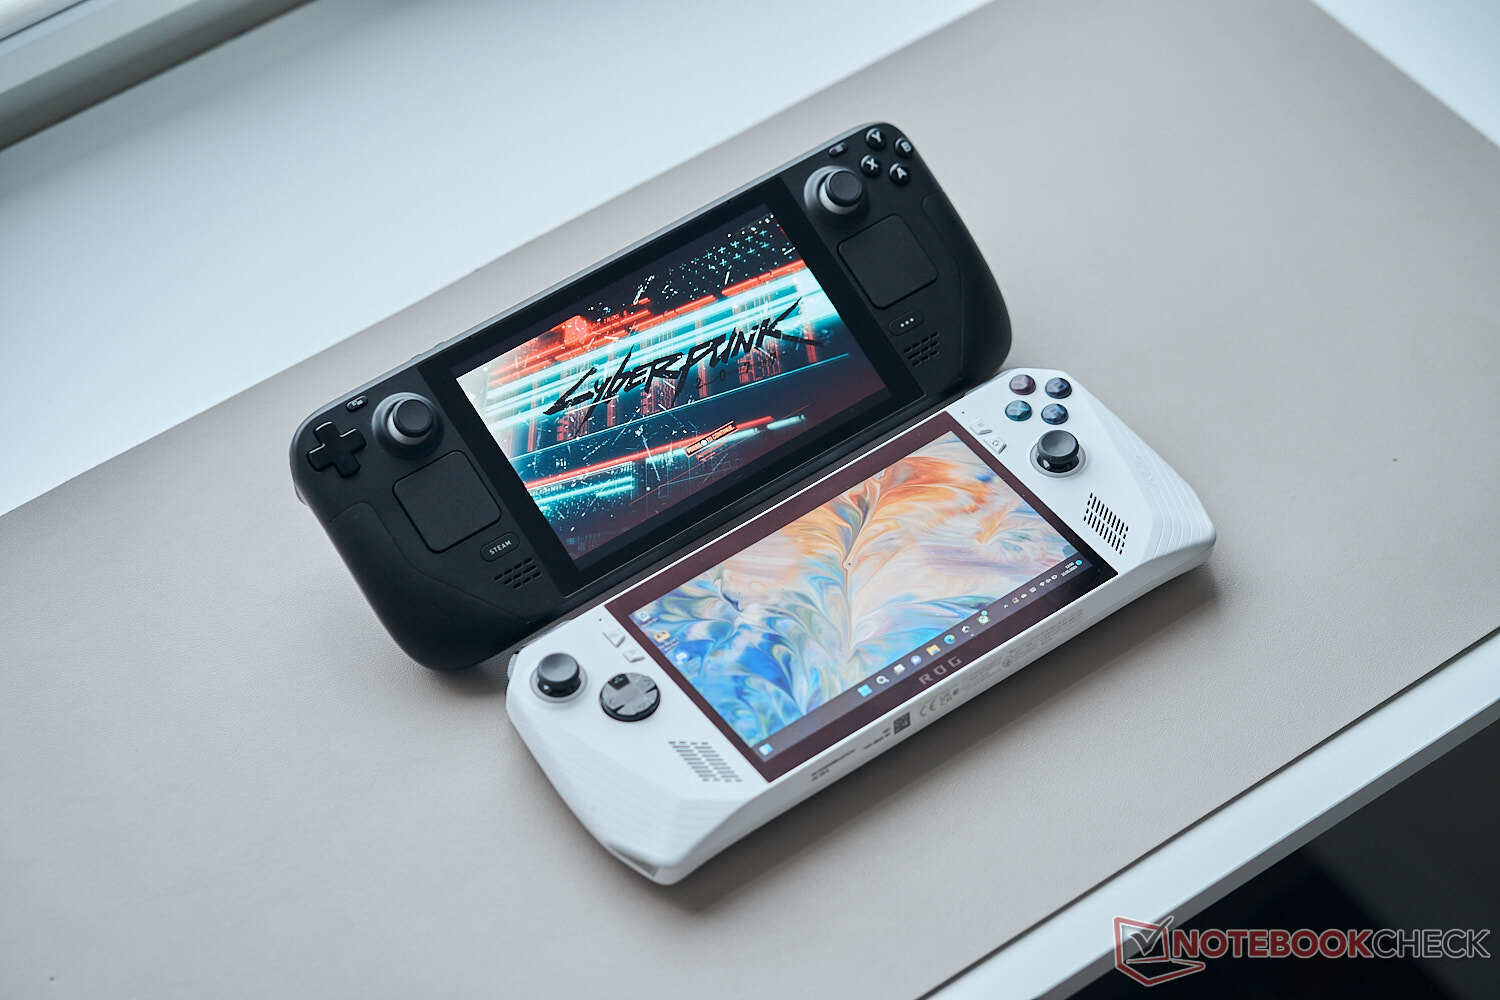


The ROG Ally is noticeably more compact compared to the Steam Deck, even though both weigh pretty much the same at little more than 600 grams. The GPD Win 4 on the other hand is even smaller with its 6-inch screen. Asus ships the ROG Ally with a 65W power adapter.
Connectivity - XG Mobile and microSD
You are very limited in terms of ports since there is only a single USB-C port or the connector for the XG Mobile eGPU, respectively. This means you have to remove the power adapter when you want to attach an external hard drive, for example. Asus did not include USB 4.0, but the lack of an additional port at the bottom (for a simple docking station) was a bigger issue in practice. There is no webcam, but the power button features a fingerprint scanner. It takes a bit longer to set-up due to the small surface area, but it works flawlessly once the fingerprint is registered.
The USB-C port supports video output via DisplayPort and we had no problems to use the ROG Ally connected to our Eizo 2795 screen via USB-C including USB hub, so we could use the input devices, network connection and connected speakers of the screen. Even though this is definitely no the primary use case, the ROG Ally pretty much works like every other laptop with Windows 11 and can also be used for productive workloads.
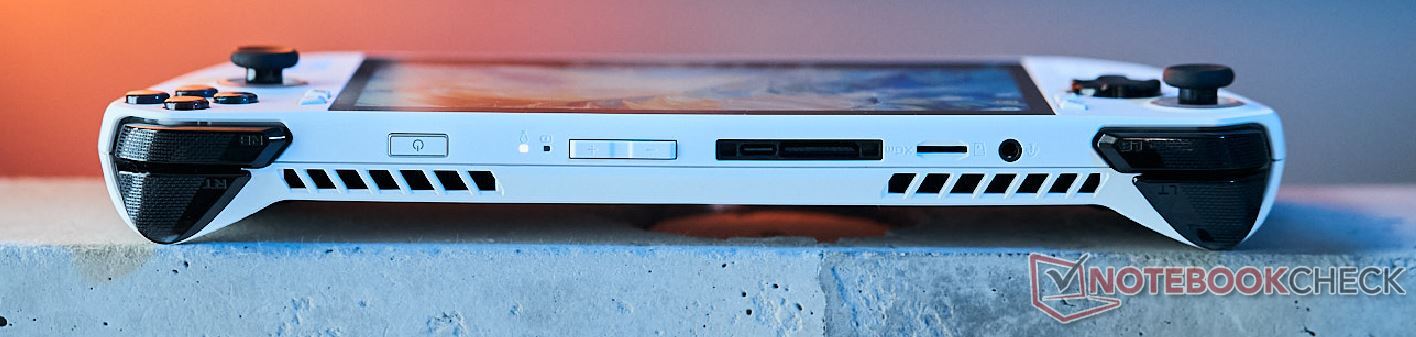
SD Card Reader
The microSD card reader at the top is much faster compared to the Steam Deck and the GPD Win 4. We managed transfer rates of more than 260 MB/s in combination with our reference card (Angelbird AV Pro V60), which means you can also store games on fast microSD cards.
| SD Card Reader | |
| average JPG Copy Test (av. of 3 runs) | |
| GPD Win Max 2 (Toshiba Exceria Pro SDXC 64 GB UHS-II) | |
| Asus ROG Ally Z1 Extreme (Angelbird AV Pro V60) | |
| Average of class Multimedia (23 - 531, n=43, last 2 years) | |
| GPD Win 4 (AV Pro SD microSD 128 GB V60) | |
| Valve Steam Deck 512 GB LCD (Angelbird AV Pro V60) | |
| maximum AS SSD Seq Read Test (1GB) | |
| Asus ROG Ally Z1 Extreme (Angelbird AV Pro V60) | |
| GPD Win Max 2 (Toshiba Exceria Pro SDXC 64 GB UHS-II) | |
| Average of class Multimedia (27.9 - 1455, n=42, last 2 years) | |
| GPD Win 4 (AV Pro SD microSD 128 GB V60) | |
Communication
Asus equips the ROG Ally with the current MT9722 Wi-Fi module from MediaTek, which supports Bluetooth 5.2 as well as the latest Wi-Fi 6E standard. During our test, we could not connect to the corresponding 6 GHz network of our reference router from Asus, but the 5 GHz performance was impressive with fast and stable transfer rates and the Ally does not have to hide behind full-size laptops. This is good news if you want to use streaming services for games like Xbox Game Pass.
| Networking | |
| Asus ROG Ally Z1 Extreme | |
| iperf3 transmit AXE11000 | |
| iperf3 receive AXE11000 | |
| GPD Win 4 | |
| iperf3 transmit AXE11000 | |
| iperf3 receive AXE11000 | |
| iperf3 transmit AXE11000 6GHz | |
| iperf3 receive AXE11000 6GHz | |
| GPD Win Max 2 | |
| iperf3 transmit AXE11000 6GHz | |
| iperf3 receive AXE11000 6GHz | |
Accessories
We already mentioned that the box includes a small cardboard stand, but Asus offers additional accessories like protective cases or headsets. There is also the external graphics card XG Mobile with the GeForce RTX 4090 Laptop, even though this is a very costly investment at 2500 Euros.
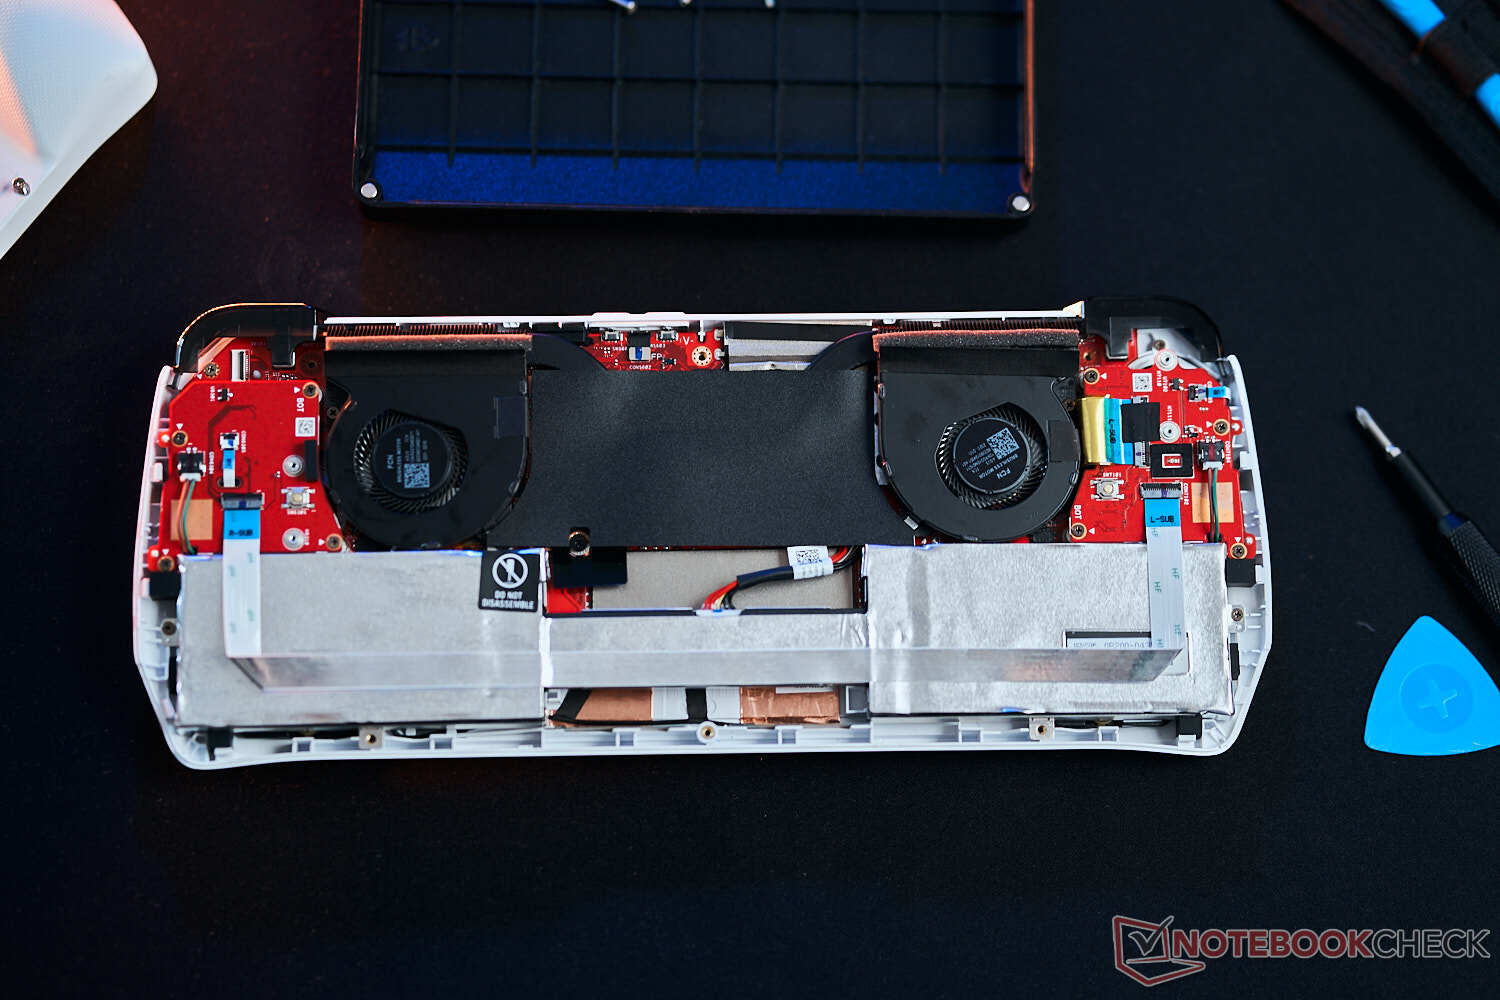
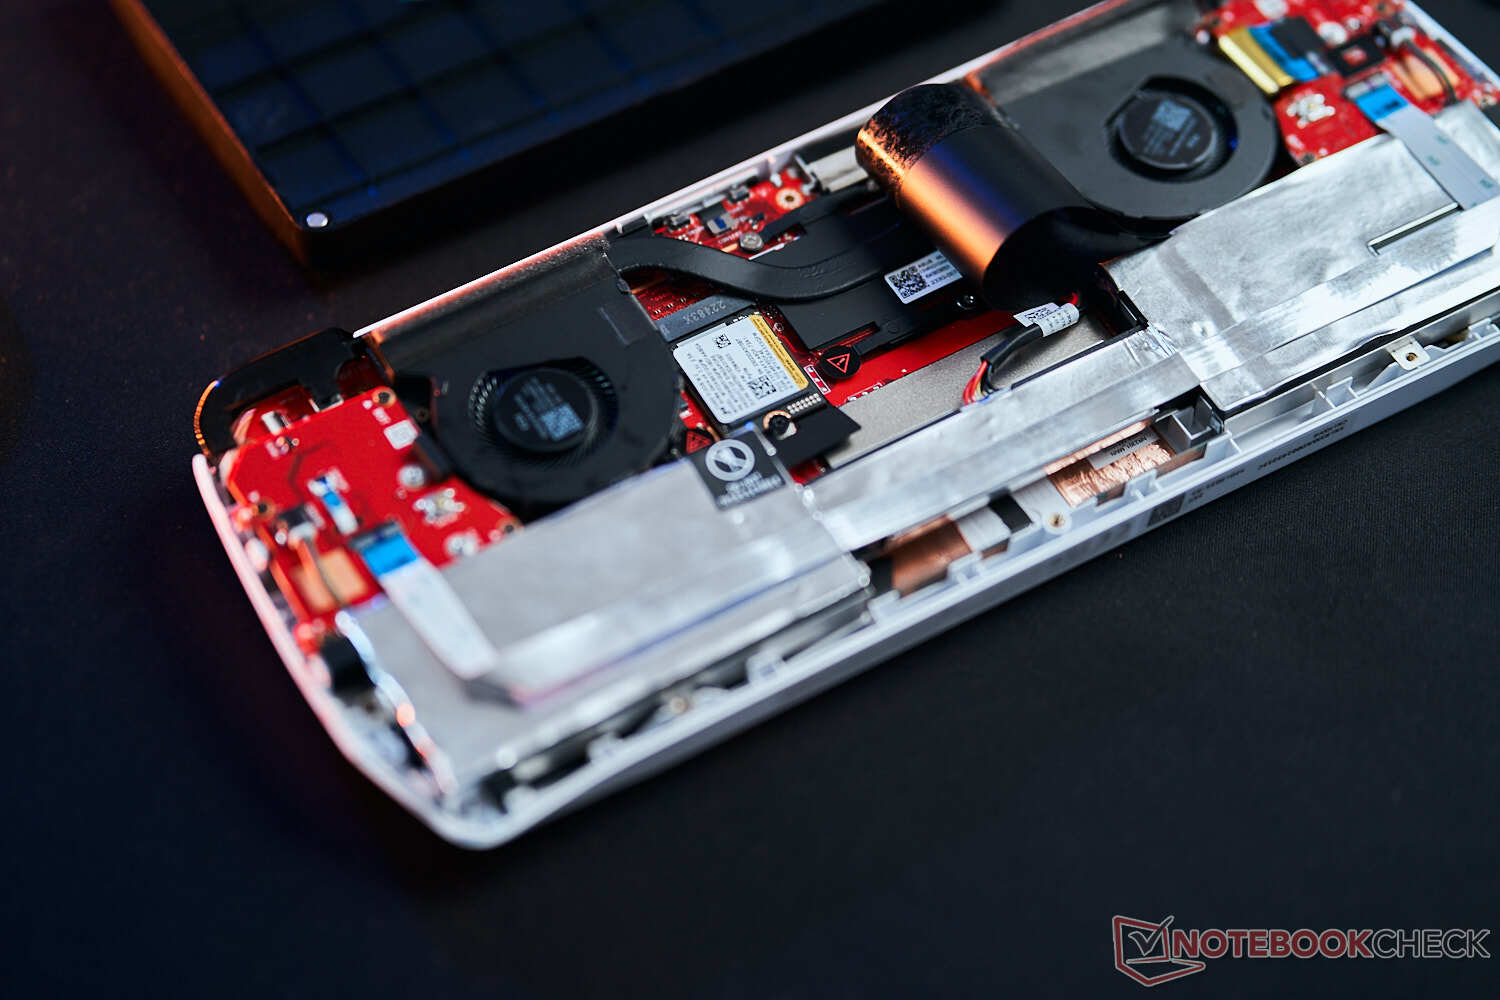
Maintenance
The back panel is secured by a couple of Philips screws and can be removed very easily. Inside you get access to both fans, the battery as well as the compact M.2-2230 SSD (PCIe 4.0), which can be replaced. Currently (in Sept. 2023) Asus offers an extensive range of spare parts like thumb sticks, so experienced users can replace the parts and so not have to send it in for repairs.
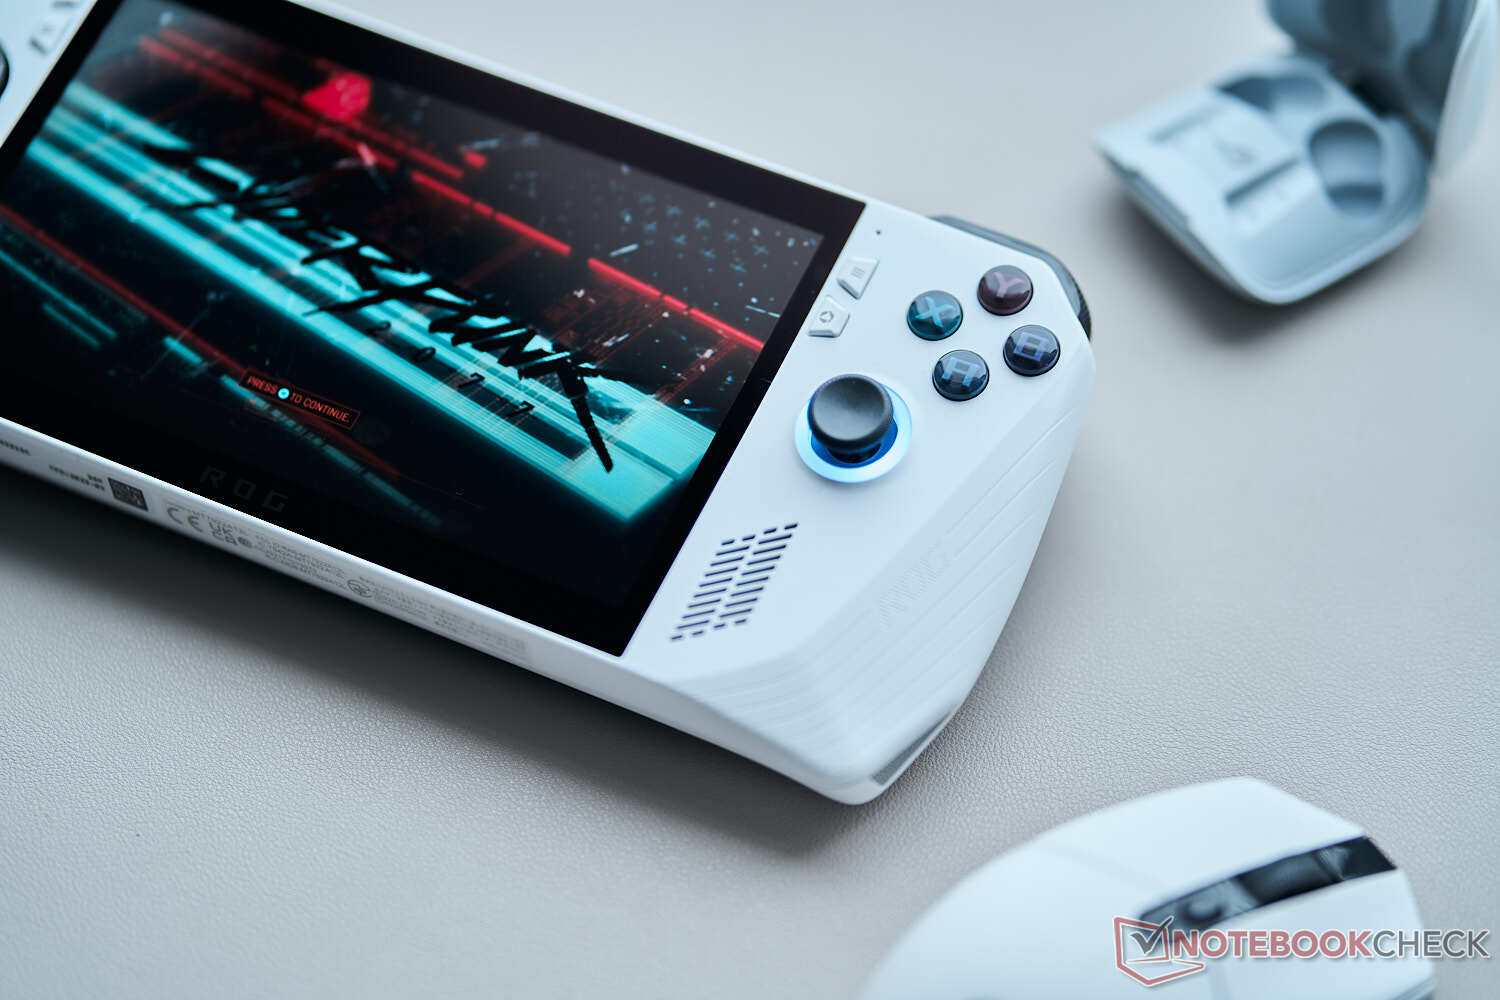
Input Devices & Handling
Now we are coming to one of the most important aspects, the input devices and the handling. First of all, there is obviously the capacitive touchscreen with Corning Gorilla Glass Victus, and it works just as you would expect. But there are also plenty of buttons, a D-pad and two large sticks, which resemble the layout of the Xbox controller. The triggers at the top use hall sensors, so there are no hall sensors for the sticks (also to reduce costs).
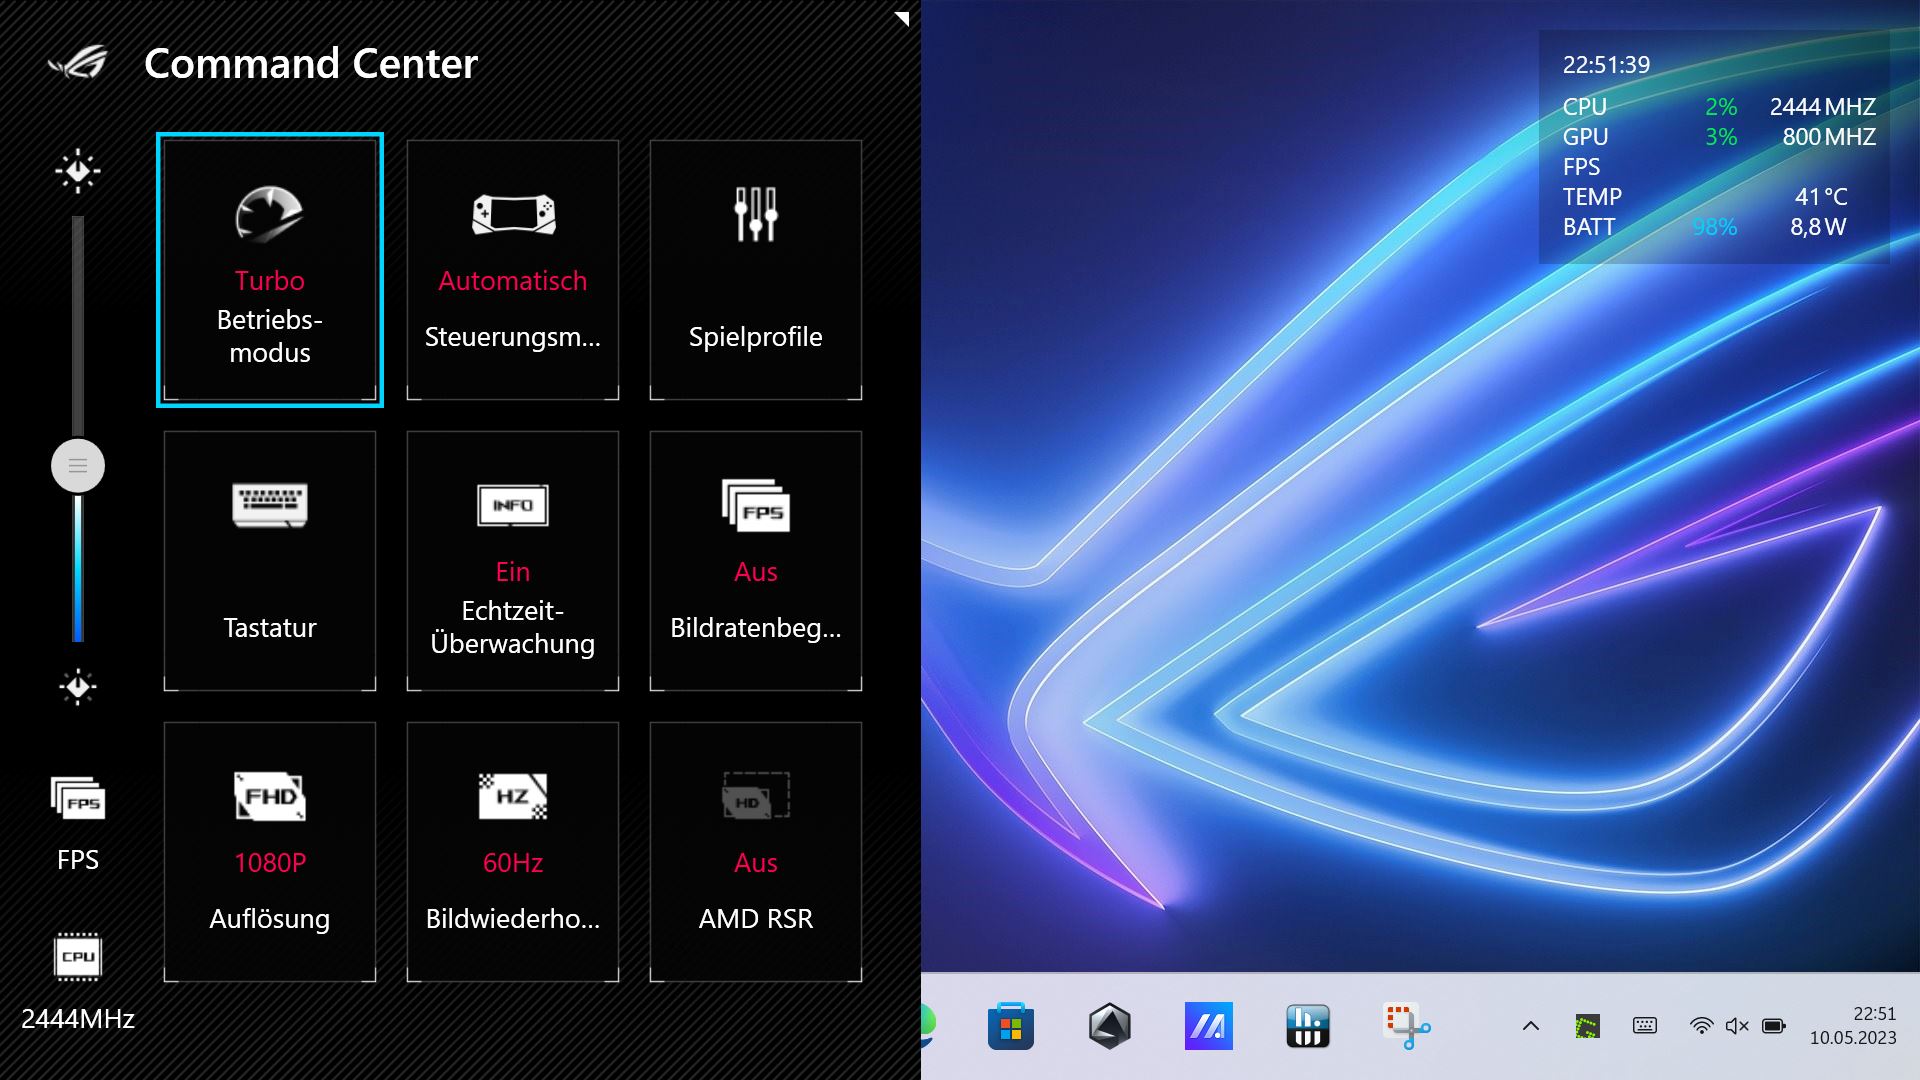
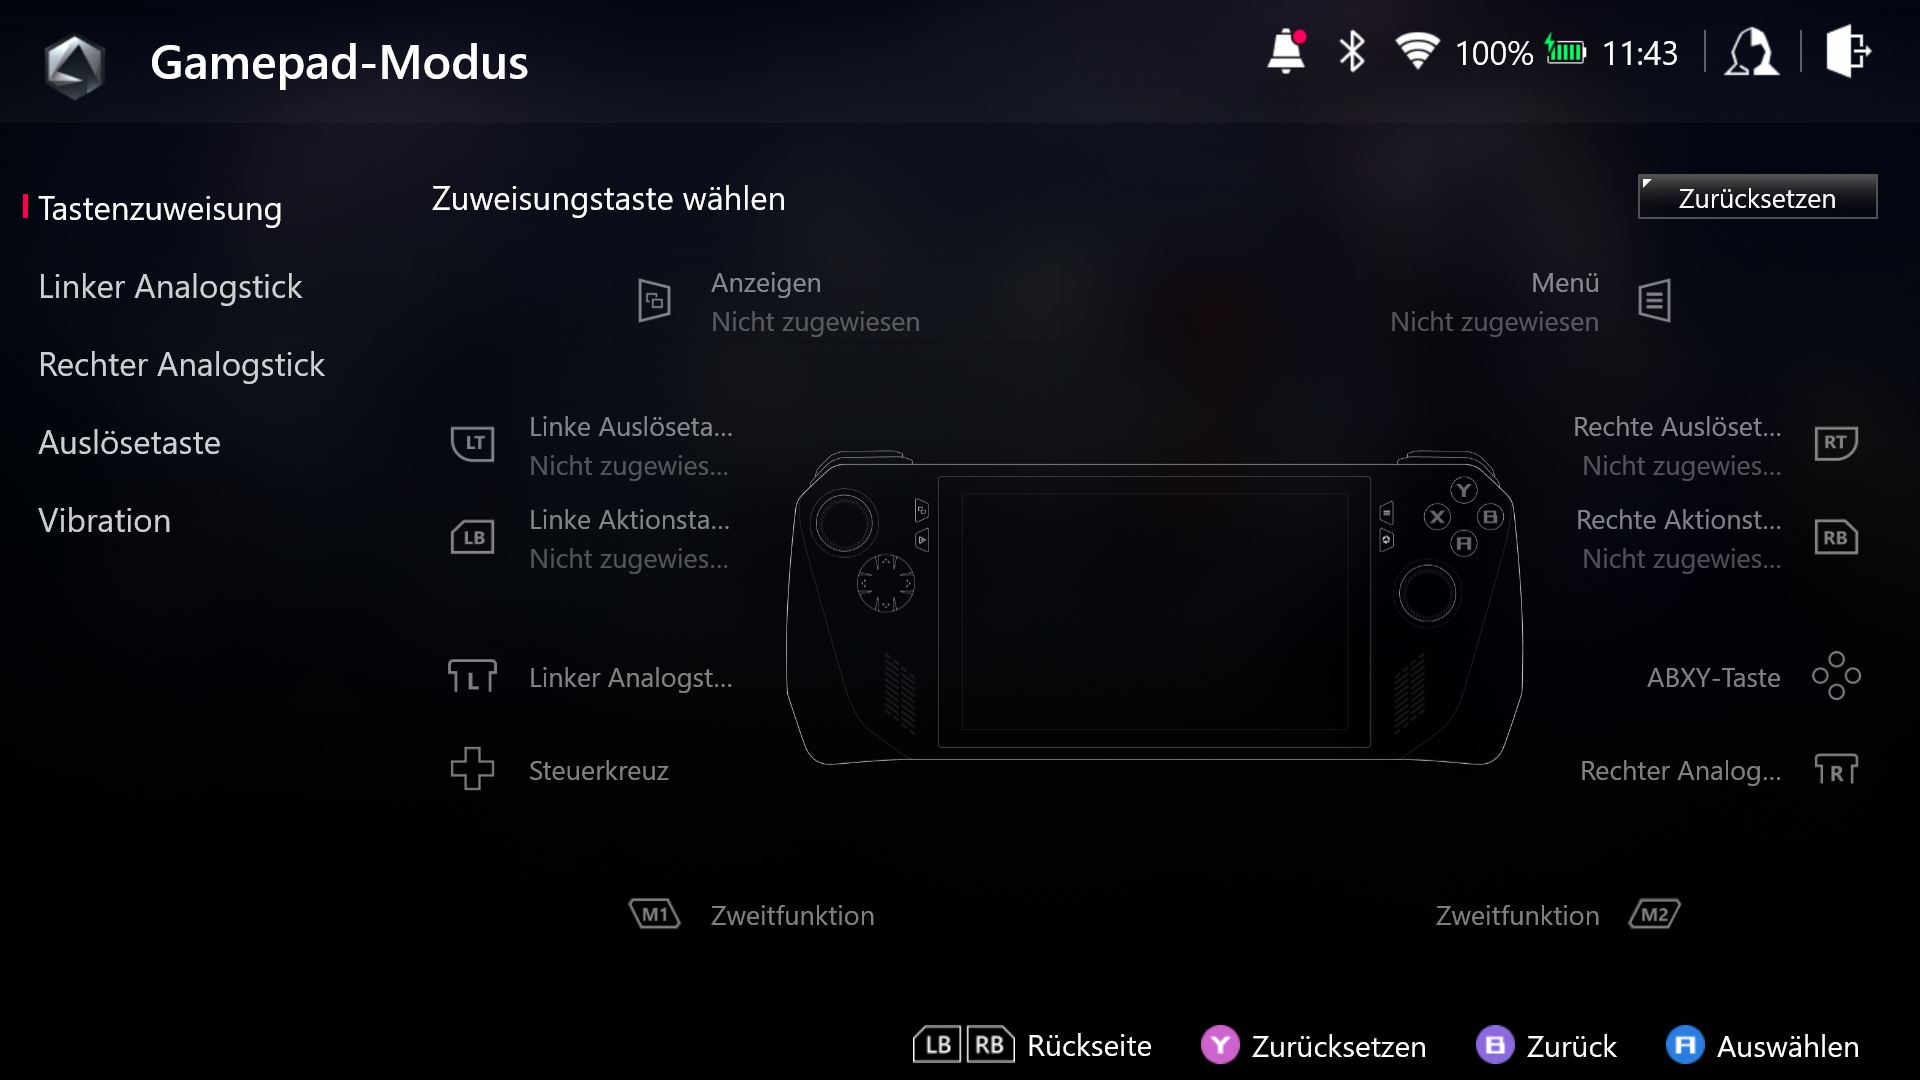
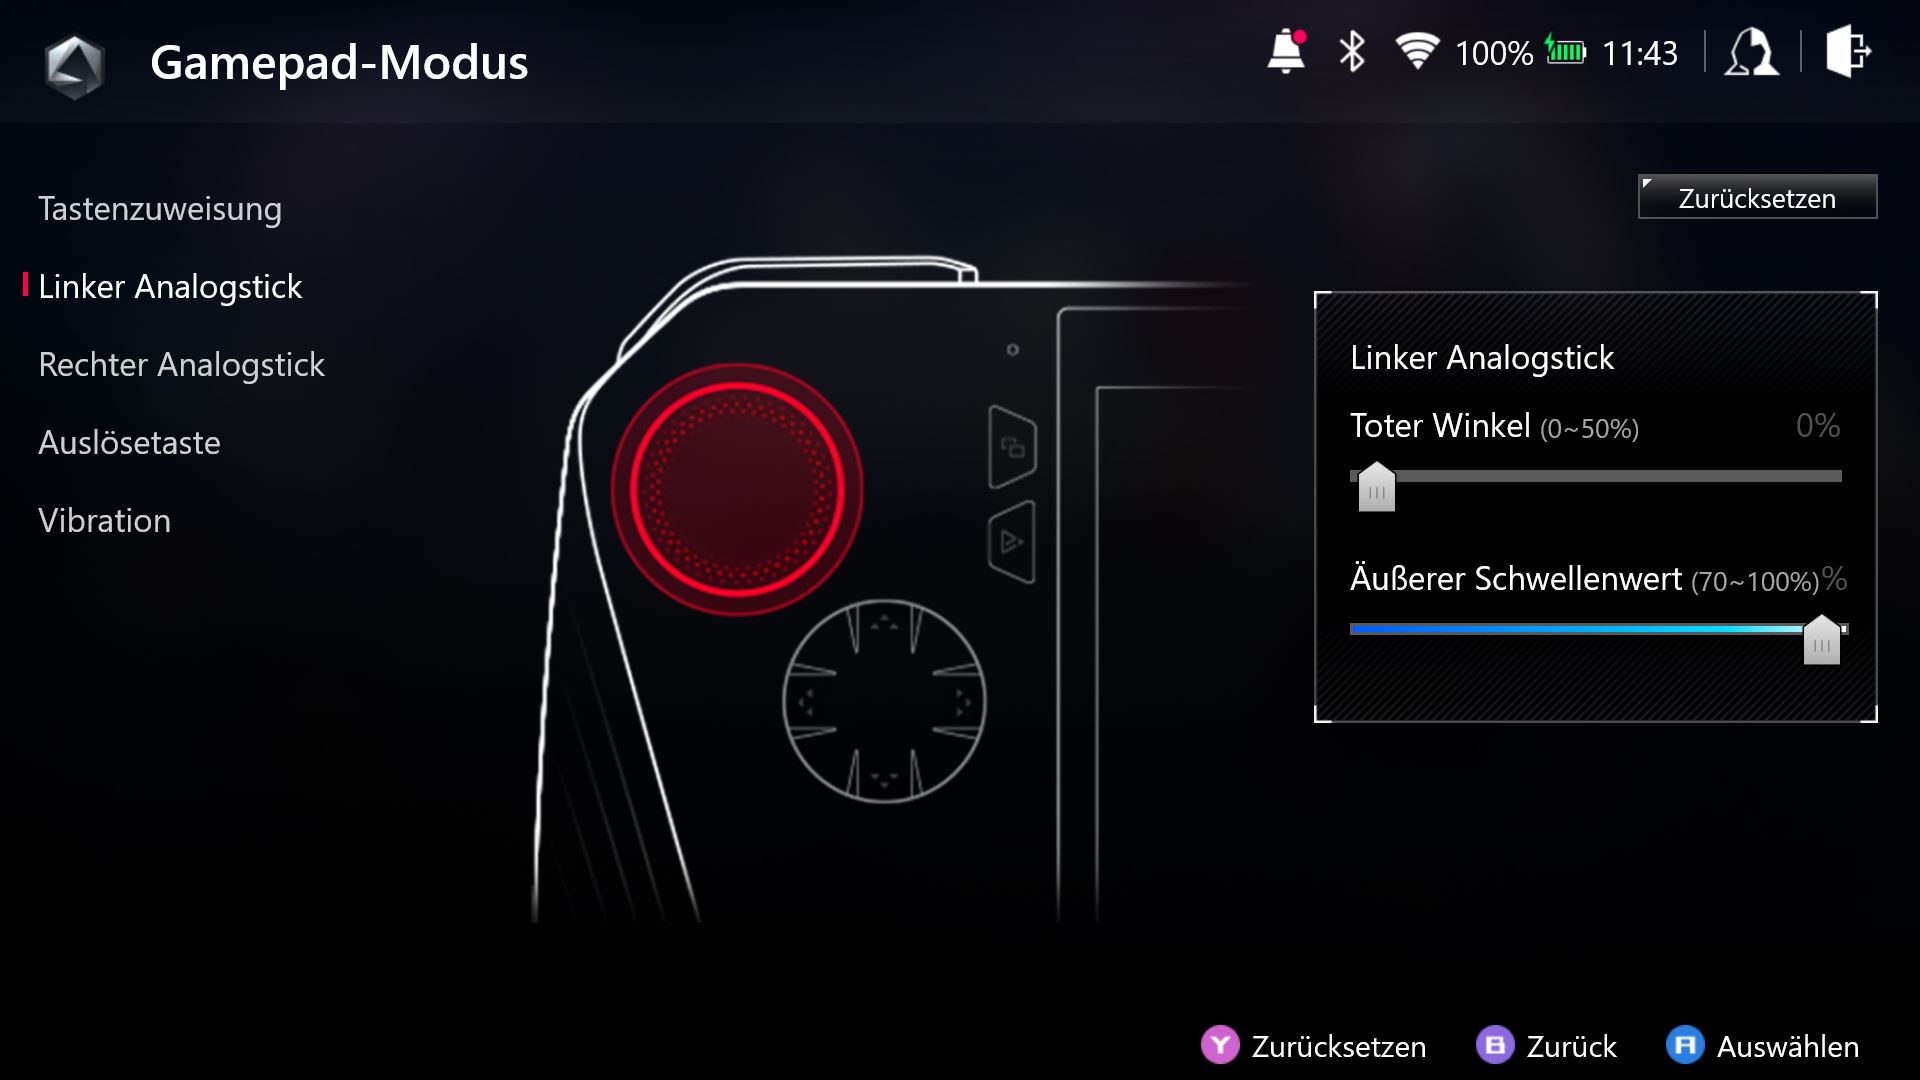
Then there are four smaller buttons along the screen, one of which open the extremely handy Command Center. Asus also implemented two macro buttons at the rear, which act as kind of Fn keys and allow quick actions with other keys like launching the on-screen keyboard, task manager or taking a screenshot. There is definitely a learning curve here, but even the standard Windows control works well once you are used to it.

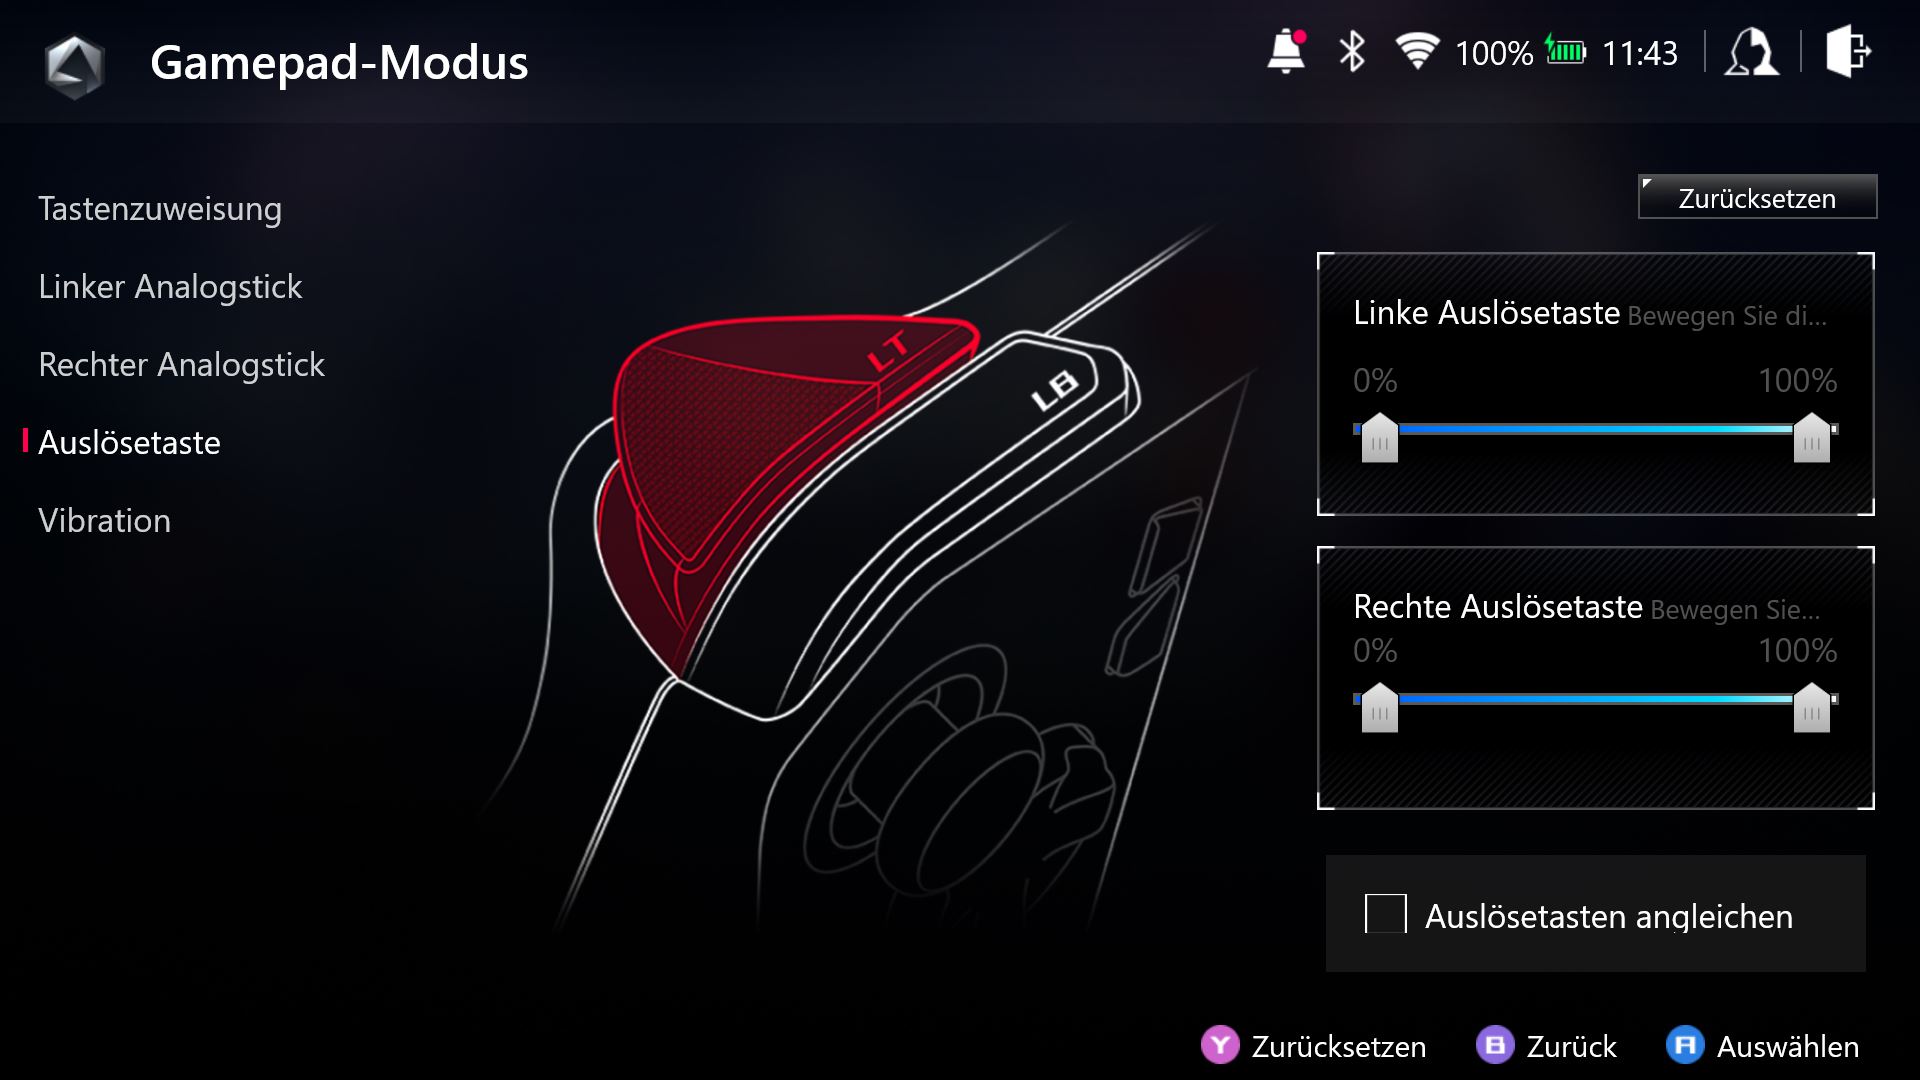
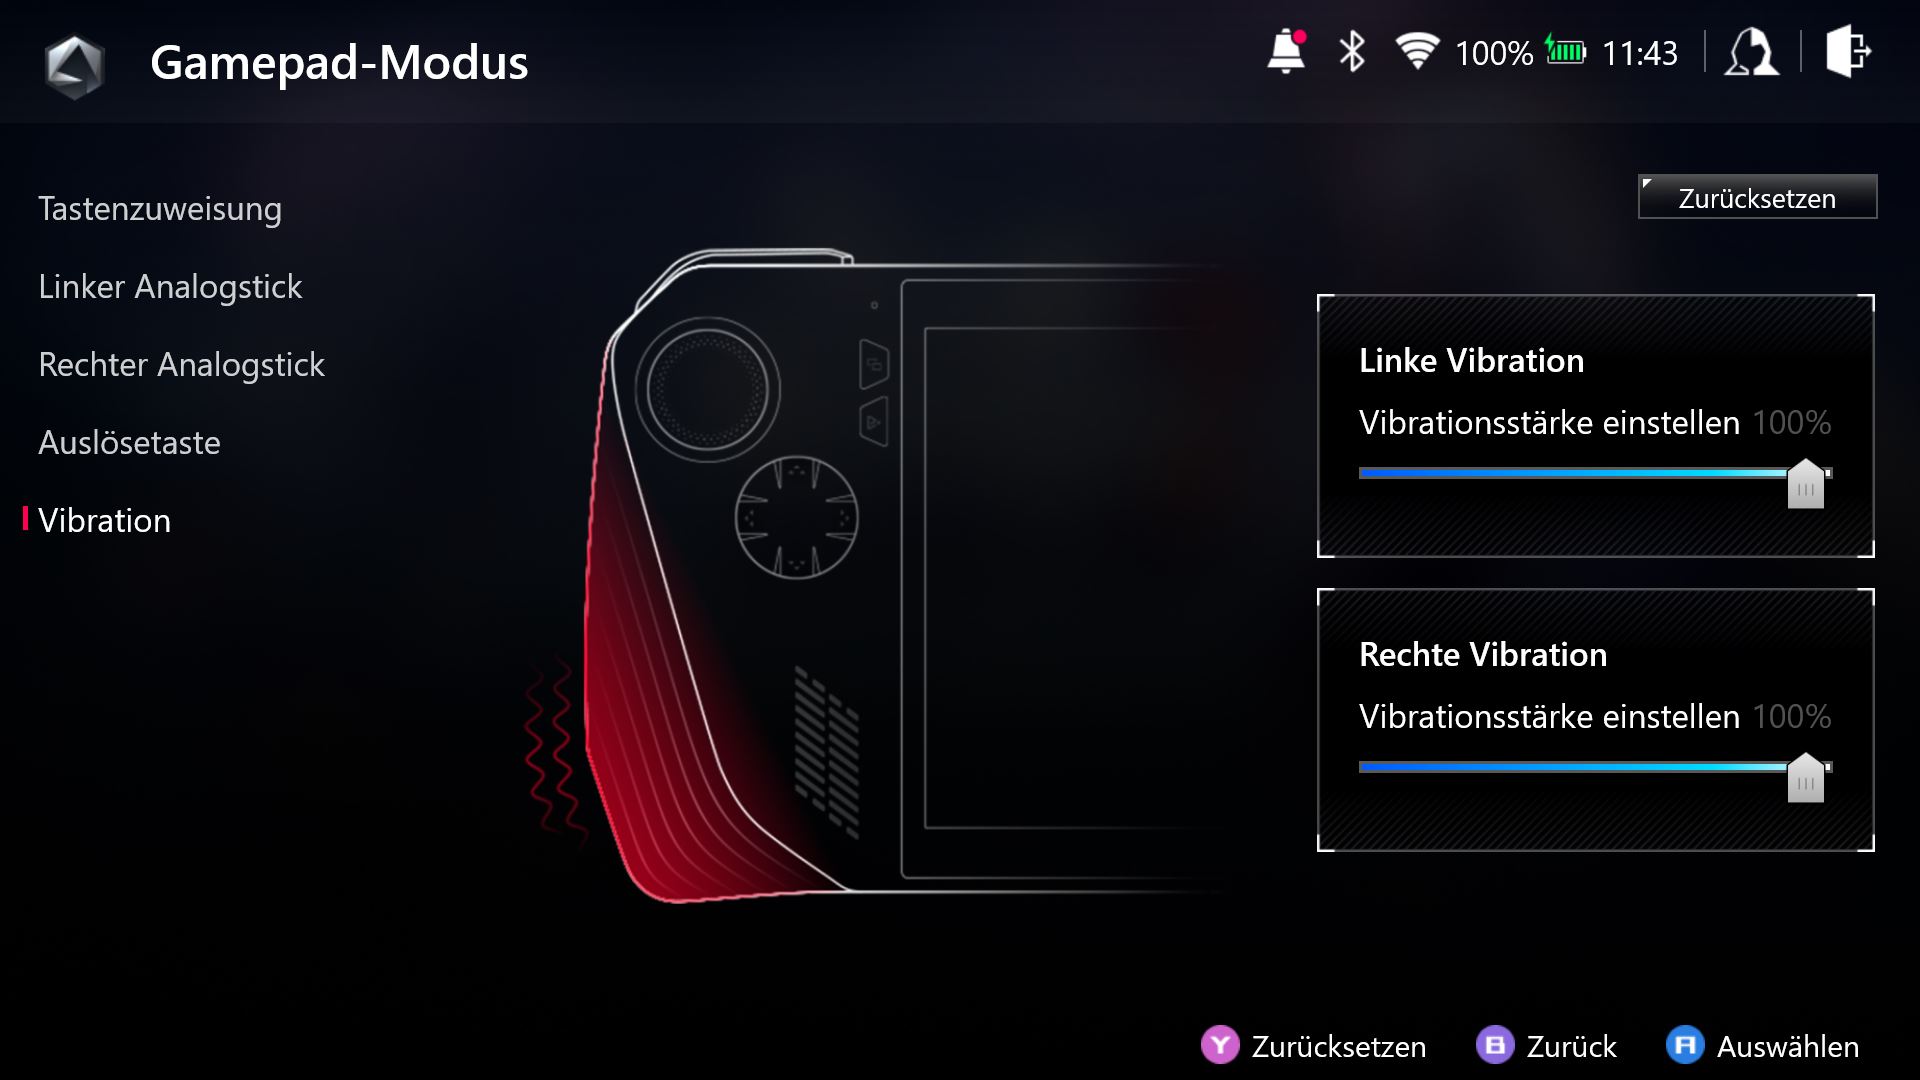
The quality of the buttons and sticks also reminds us of the current Xbox controller, which also means the buttons are rather loud. The configuration options for the sticks and the trigger are excellent and you can create custom button layouts for every game individually. Asus really put some thought into this and it all worked really well during our time with the unit. There is also haptic feedback in the grips and you can also adjust the intensity of the vibration. It is also possible to use other game pads or controllers with the ROG Ally (when it is attached to a TV, for instance), since it is a regular Windows device.
Display - 120 Hz IPS Panel

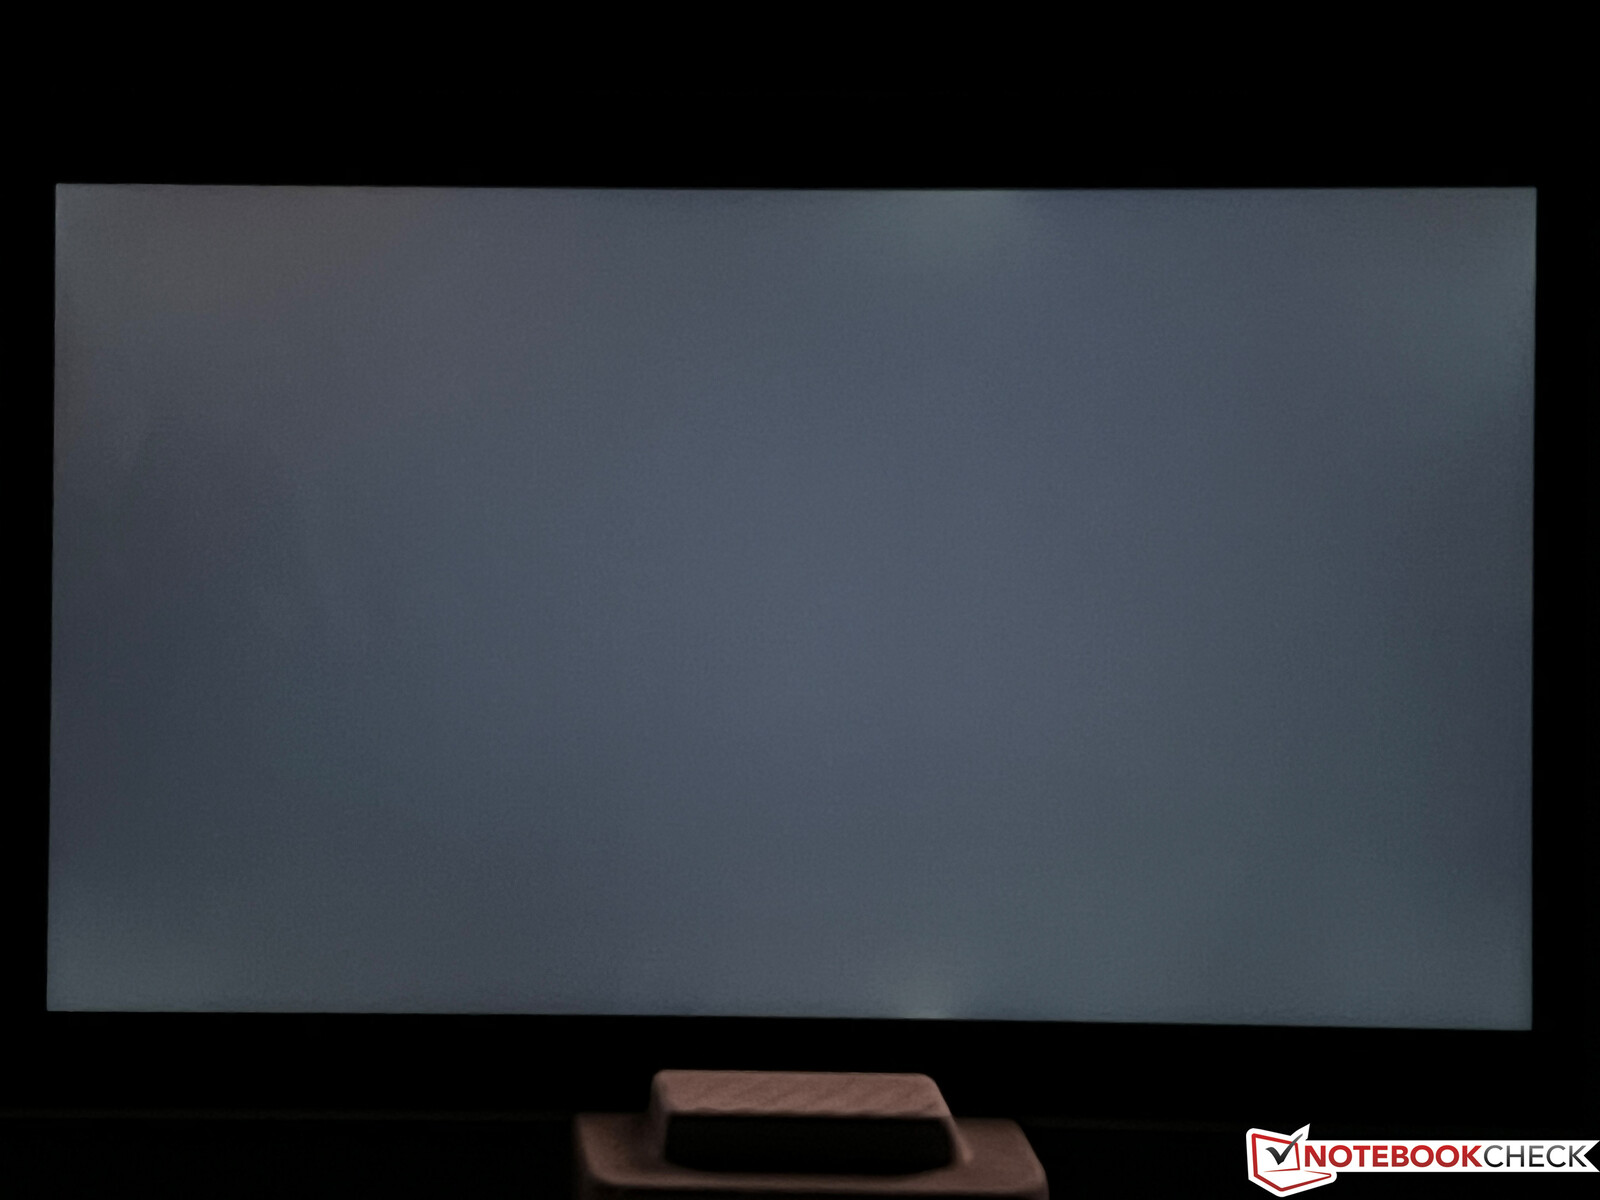
Asus uses a 7-inch IPS screen with the Full-HD resolution (1920 x 1080 pixels, 16:9). The subjective picture impression is very good, but bright surfaces look a bit grainy due to the touchscreen layer. However, this is a minor inconvenience and it did not really bother us and you have to be very close to see it. Movements are very smooth thanks to the 120 Hz refresh rate and you also benefit from fast response times as well as FreeSync Premium during gaming. There is no PWM flicker and backlight bleeding is almost non-existent.
Asus advertises a brightness of 500 nits, which is confirmed by our review unit in the center of the screen. The average result is 475 nits, which means the Ally is not quite as bright as the Steam Deck (which offers less features). The drawback of the bright IPS panel is the slightly raised black value of 0.38 cd/m². The resulting contrast ratio of more than 1300:1 is still very good, but black contents are more dark-gray, especially compared to OLED screens.
| |||||||||||||||||||||||||
Brightness Distribution: 84 %
Center on Battery: 512 cd/m²
Contrast: 1350:1 (Black: 0.38 cd/m²)
ΔE ColorChecker Calman: 3.7 | ∀{0.5-29.43 Ø4.73}
ΔE Greyscale Calman: 5.1 | ∀{0.09-98 Ø4.97}
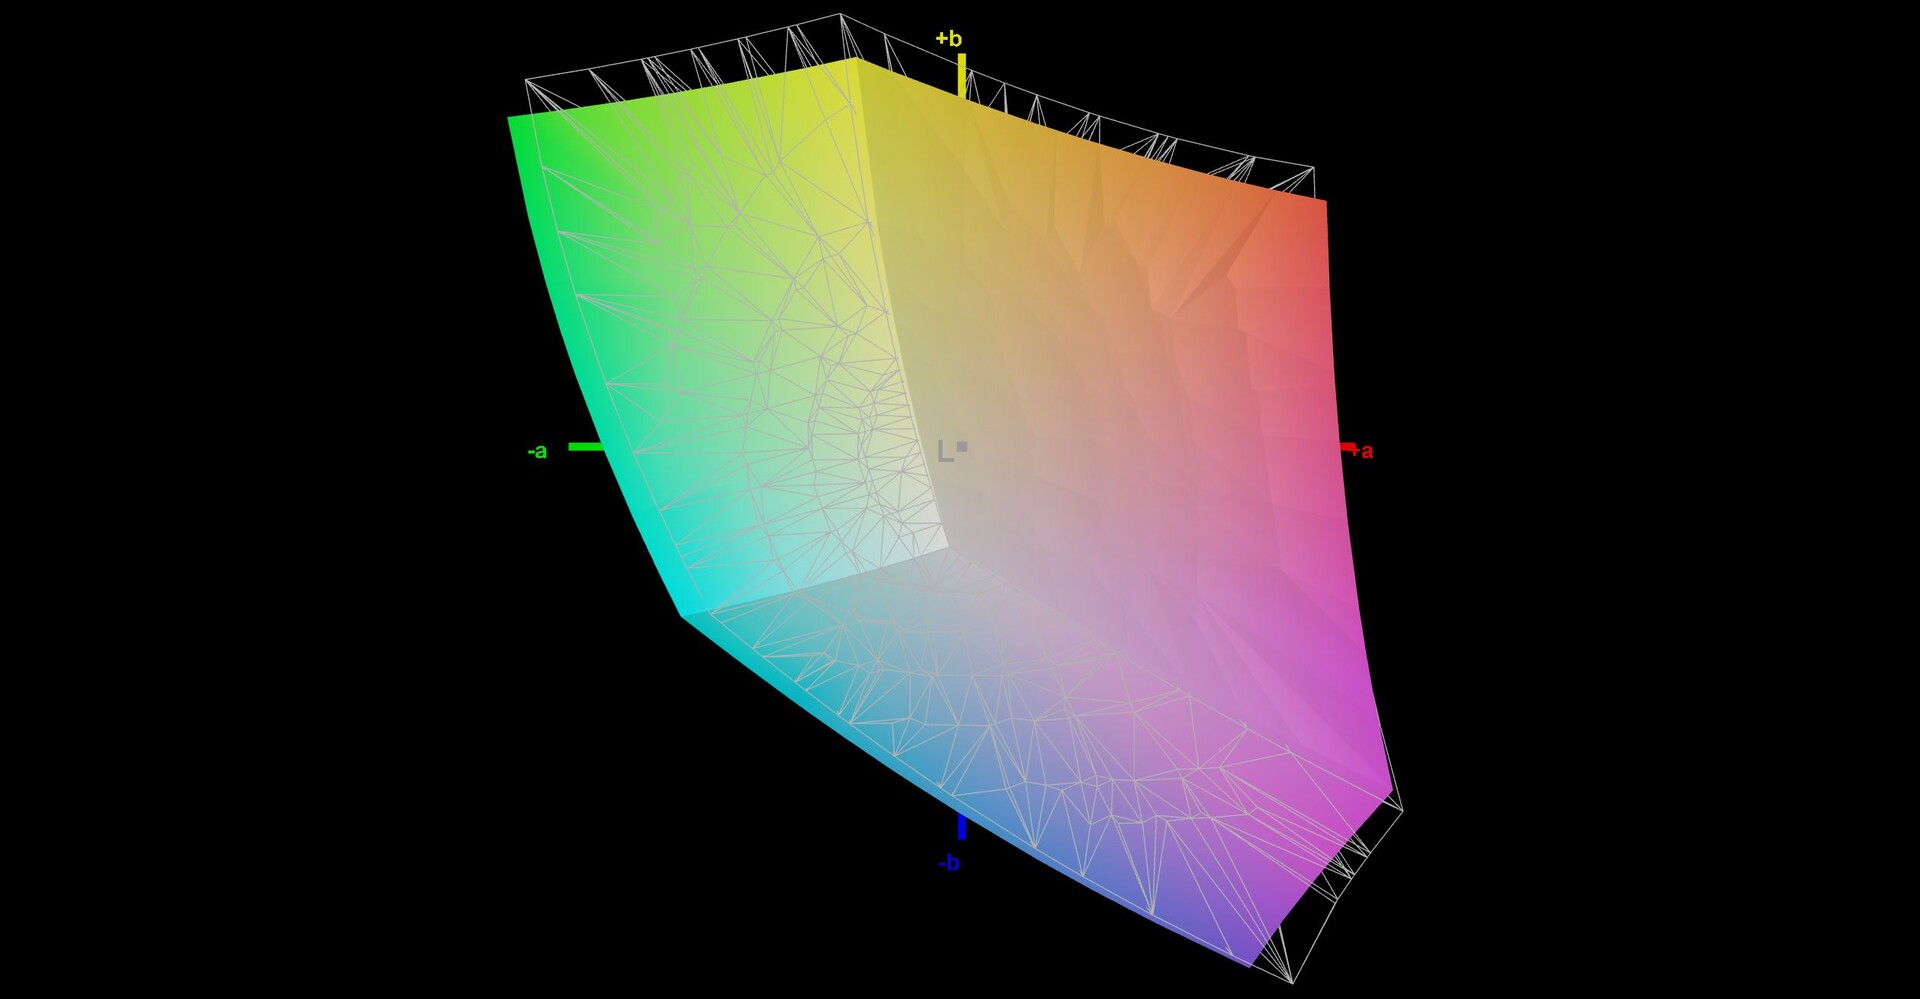
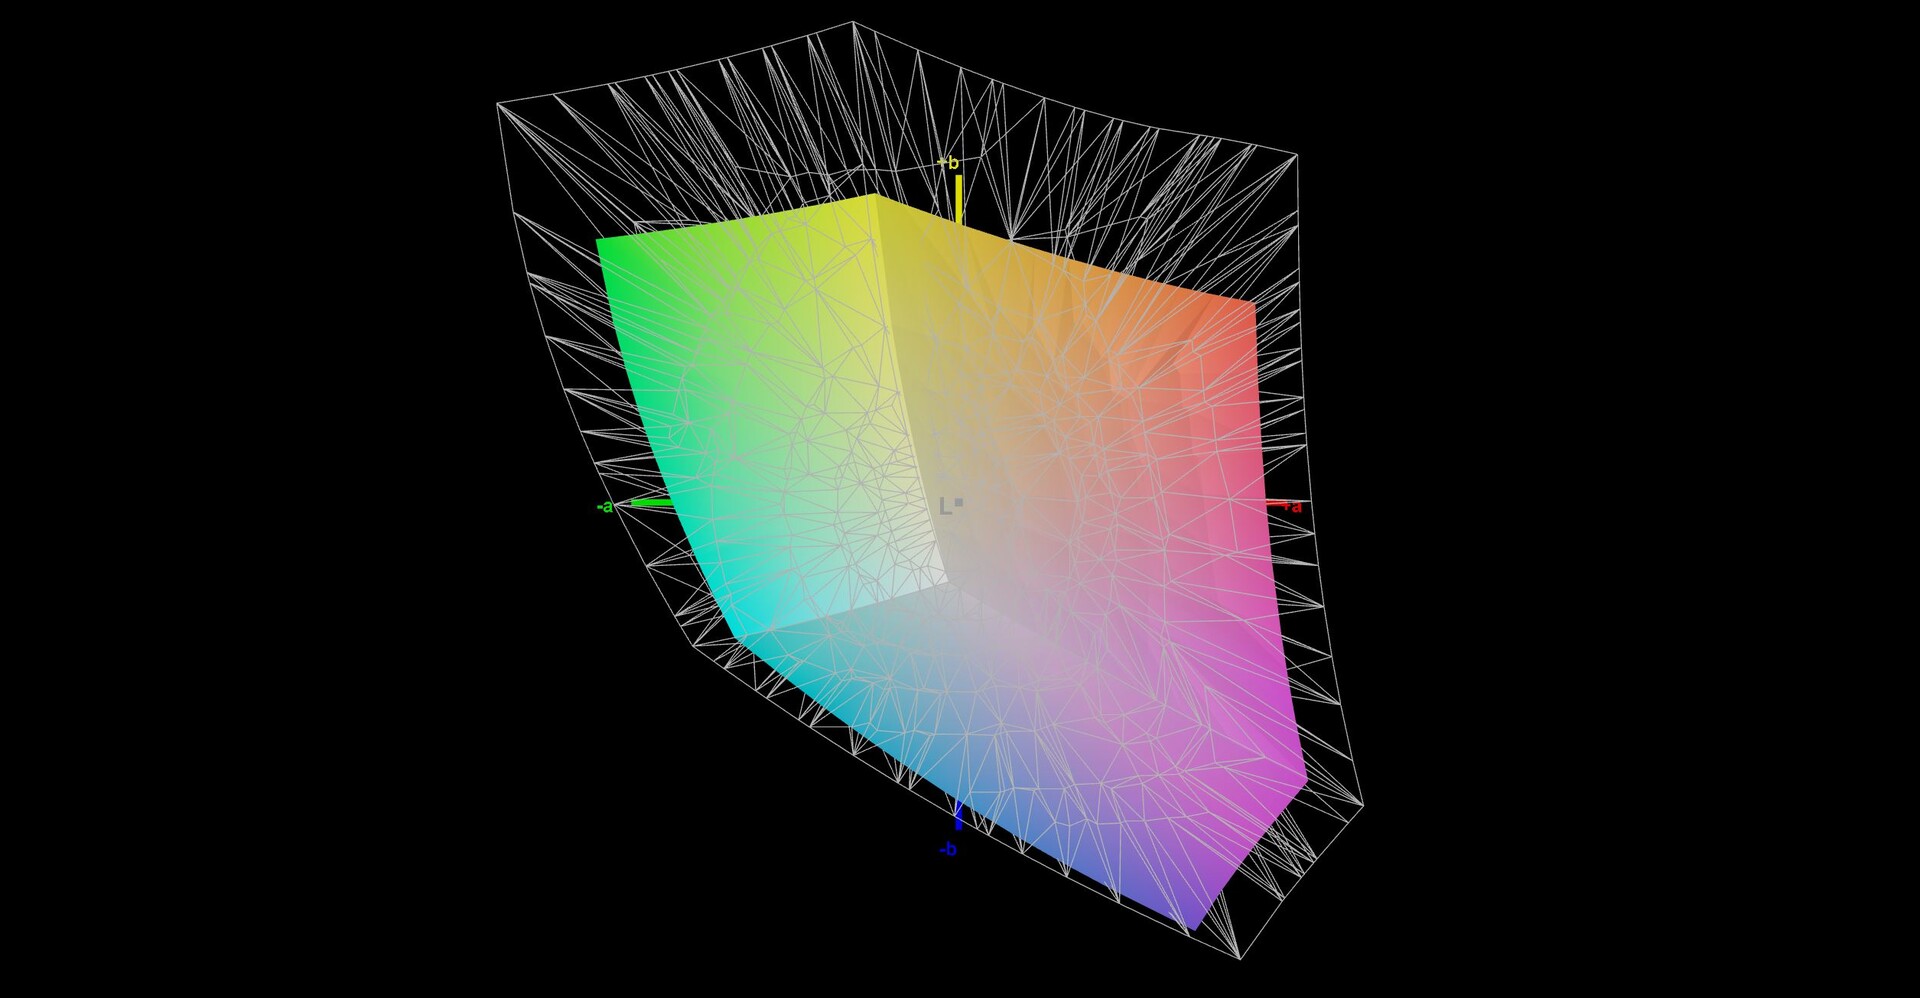
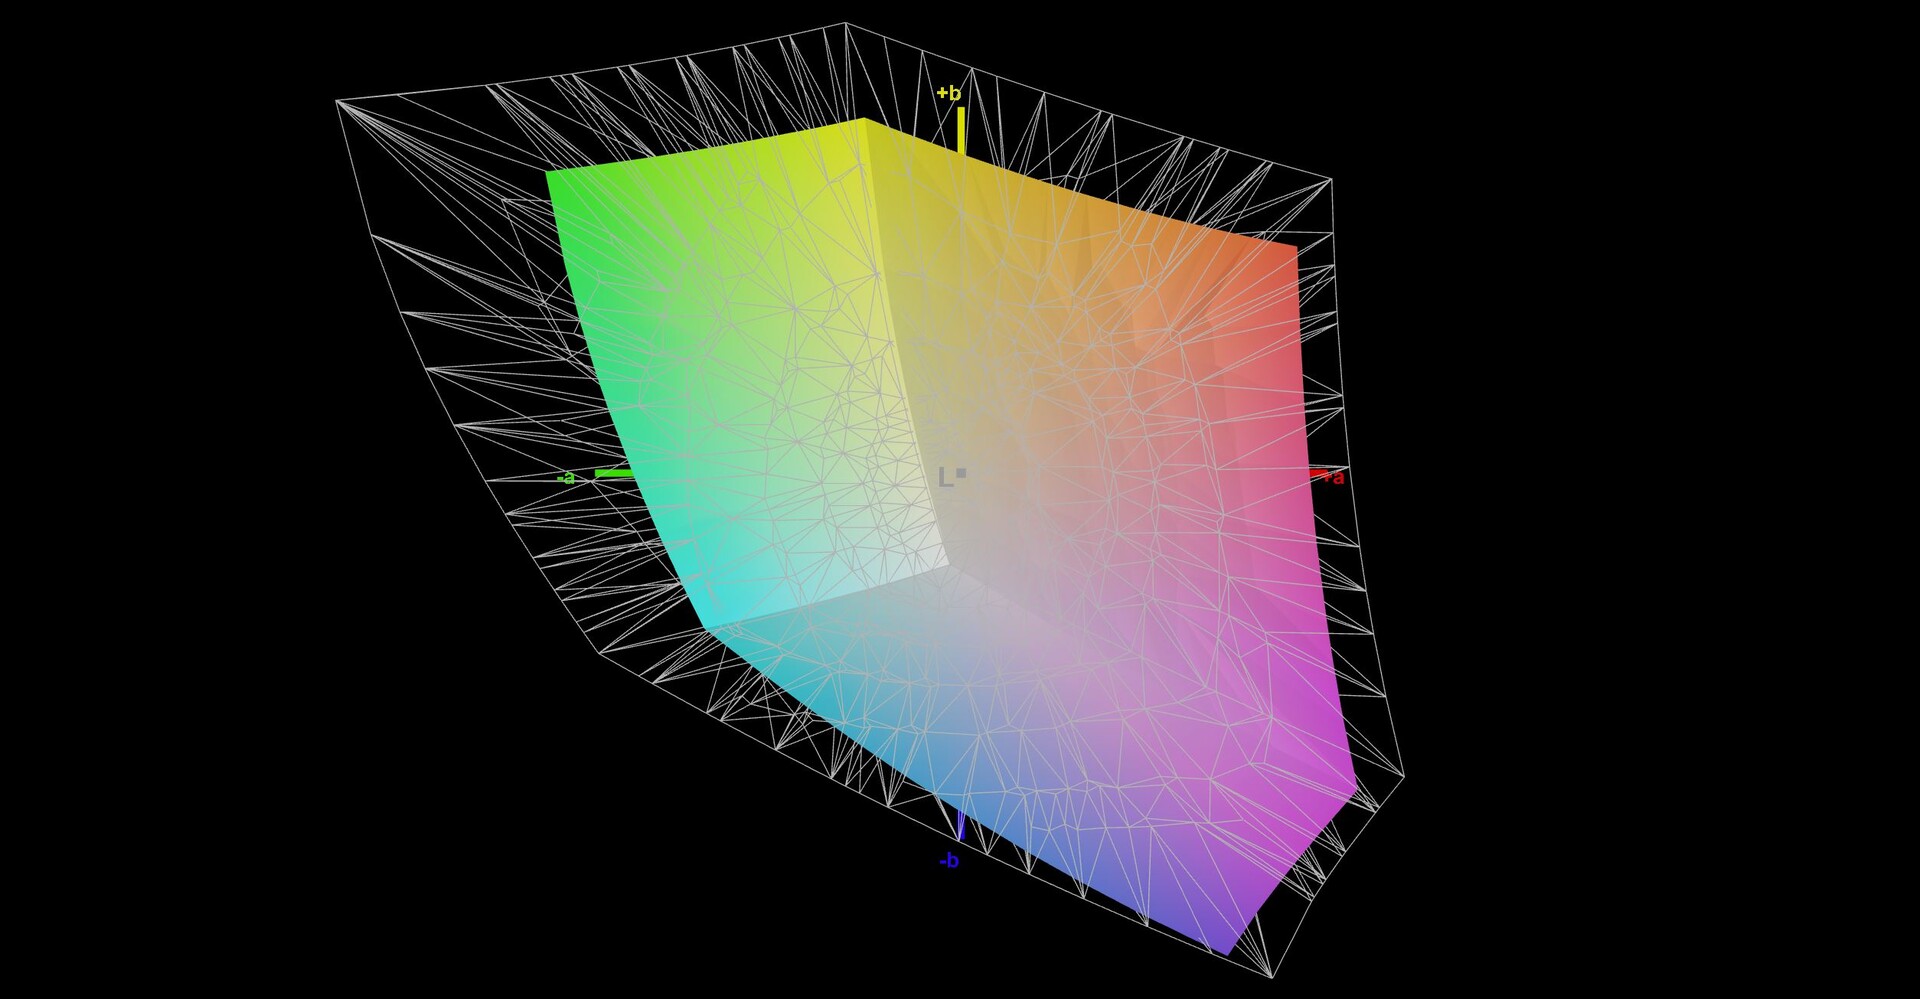
67.9% AdobeRGB 1998 (Argyll 3D)
92.1% sRGB (Argyll 3D)
65.6% Display P3 (Argyll 3D)
Gamma: 2.14
CCT: 7732 K
| Asus ROG Ally Z1 Extreme TL070FVSX01-0, IPS, 1920x1080, 7" | Valve Steam Deck 512 GB LCD 1280x800, 7" | GPD Win 4 G1618-04, IPS, 1920x1080, 6" | GPD Win Max 2 Toshiba HX_10.1_LCD, IPS, 2560x1600, 10.1" | |
|---|---|---|---|---|
| Display | -3% | 1% | ||
| Display P3 Coverage (%) | 65.6 | 63.1 -4% | 69.8 6% | |
| sRGB Coverage (%) | 92.1 | 92 0% | 91 -1% | |
| AdobeRGB 1998 Coverage (%) | 67.9 | 64.6 -5% | 66.6 -2% | |
| Response Times | -165% | -202% | -157% | |
| Response Time Grey 50% / Grey 80% * (ms) | 10.5 ? | 30.1 ? -187% | 26.8 ? -155% | 21.2 ? -102% |
| Response Time Black / White * (ms) | 6 ? | 14.5 ? -142% | 20.9 ? -248% | 18.7 ? -212% |
| PWM Frequency (Hz) | 1080 ? | |||
| Screen | -14% | -39% | -19% | |
| Brightness middle (cd/m²) | 513 | 517 1% | 413.1 -19% | 396.7 -23% |
| Brightness (cd/m²) | 474 | 524 11% | 407 -14% | 381 -20% |
| Brightness Distribution (%) | 84 | 97 15% | 81 -4% | 89 6% |
| Black Level * (cd/m²) | 0.38 | 0.47 -24% | 0.39 -3% | 0.36 5% |
| Contrast (:1) | 1350 | 1100 -19% | 1059 -22% | 1102 -18% |
| Colorchecker dE 2000 * | 3.7 | 5.7 -54% | 6.97 -88% | 6.31 -71% |
| Colorchecker dE 2000 max. * | 8.3 | 10.5 -27% | 14.11 -70% | 10.23 -23% |
| Greyscale dE 2000 * | 5.1 | 5.7 -12% | 9.9 -94% | 5.5 -8% |
| Gamma | 2.14 103% | 2.18 101% | 2.04 108% | 2.17 101% |
| CCT | 7732 84% | 7733 84% | 9571 68% | 7502 87% |
| Colorchecker dE 2000 calibrated * | 1.24 | 1.44 | ||
| Total Average (Program / Settings) | -90% /
-44% | -81% /
-56% | -58% /
-36% |
* ... smaller is better
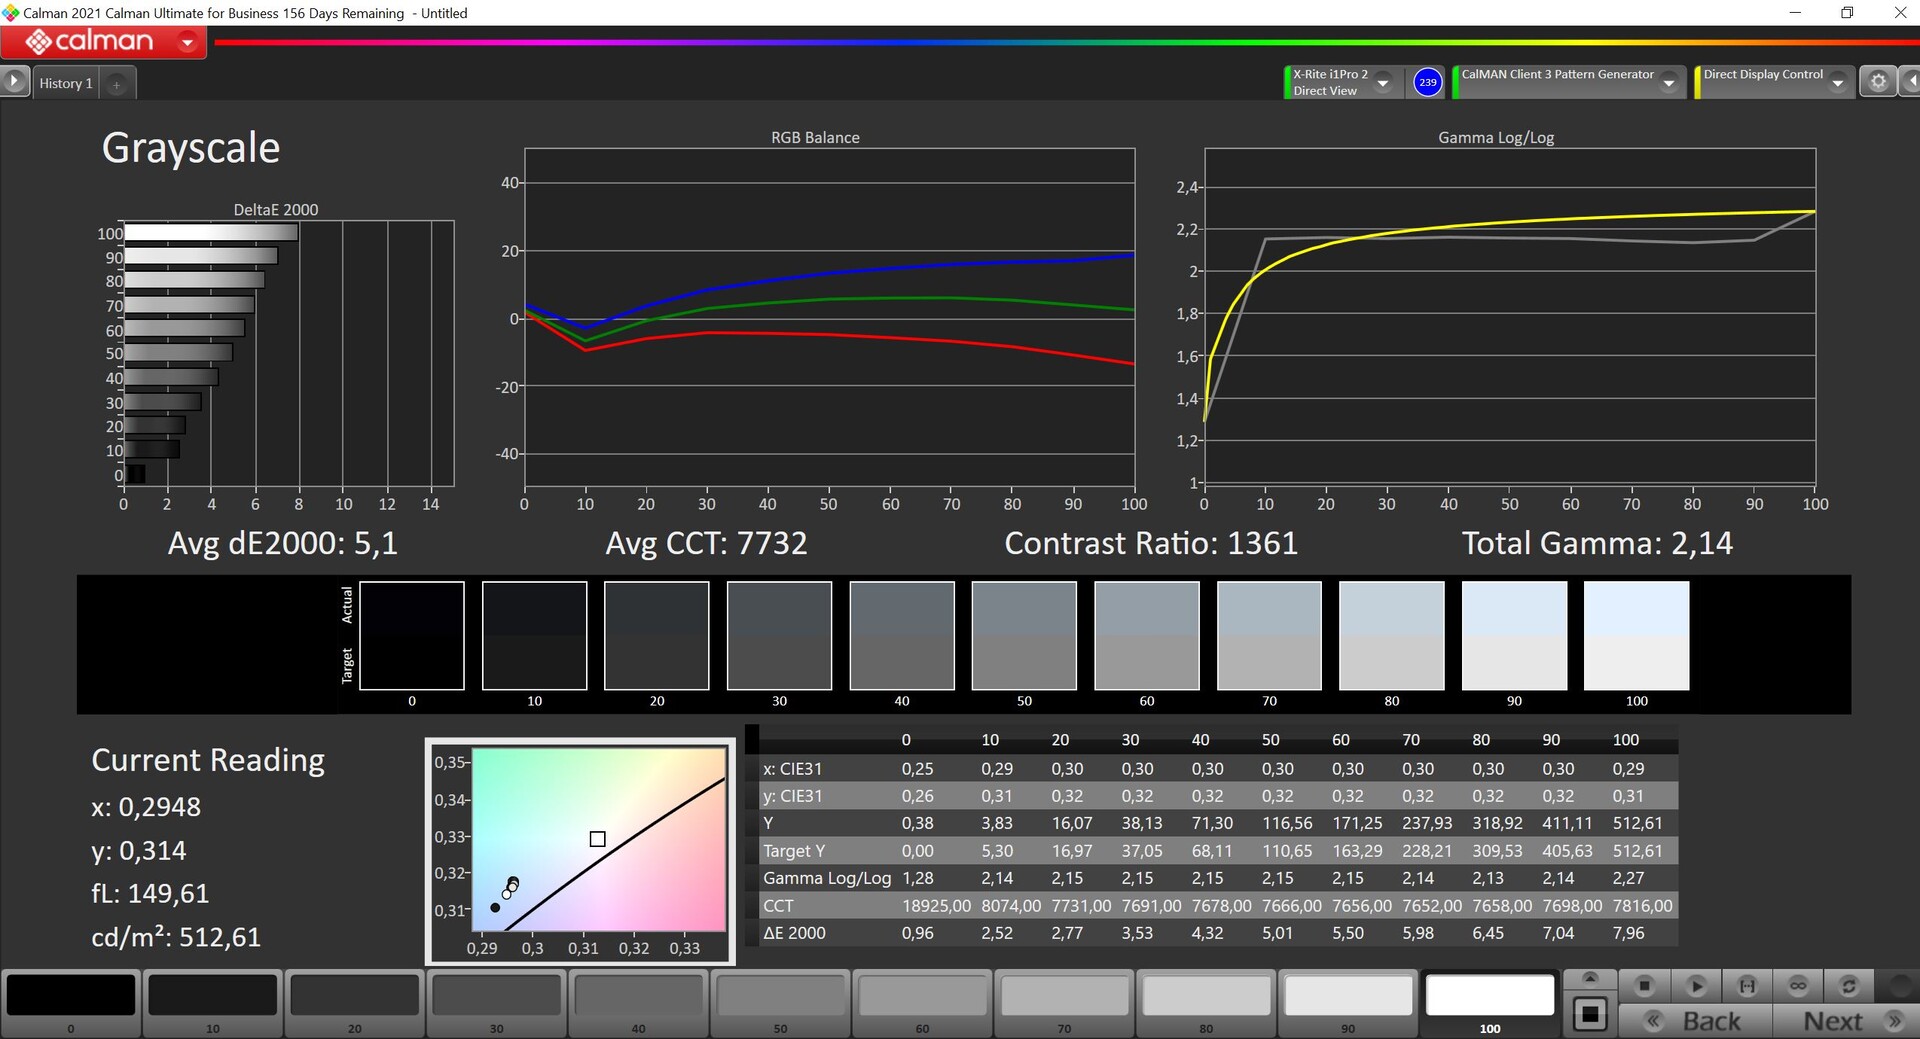
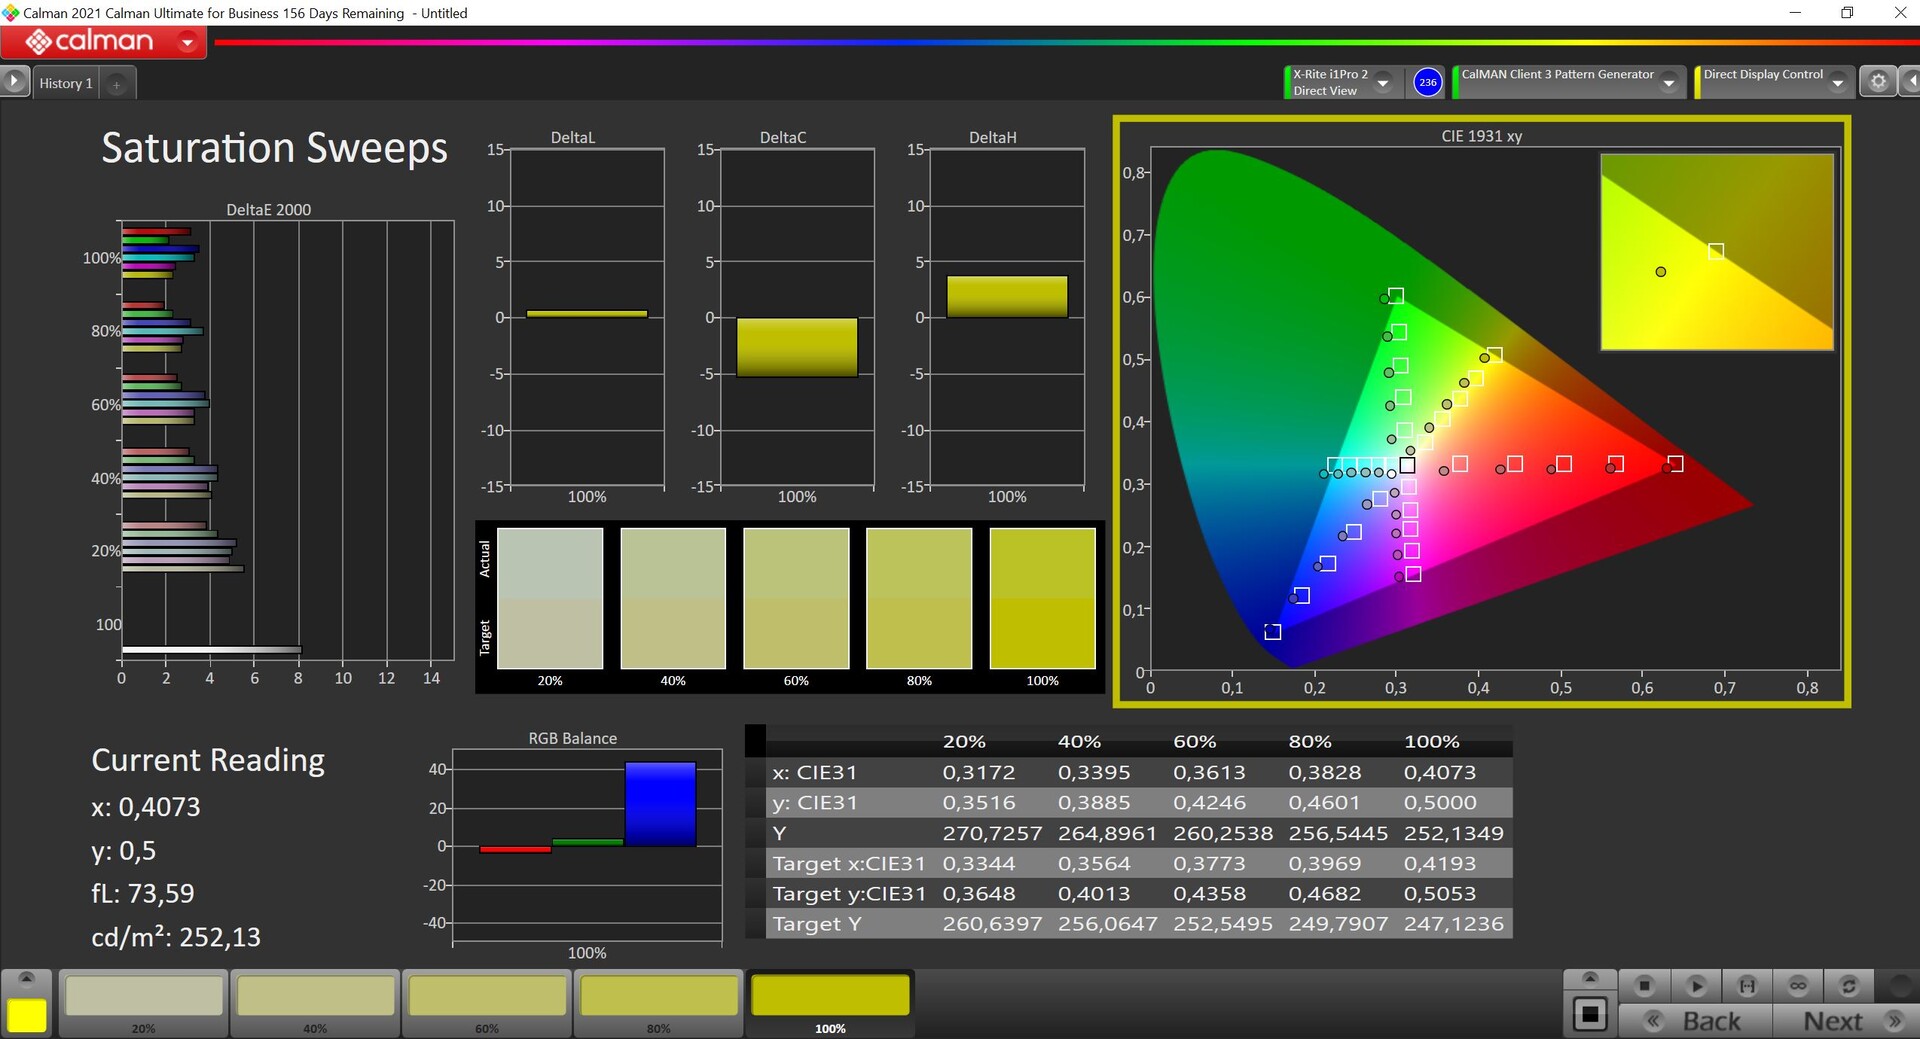
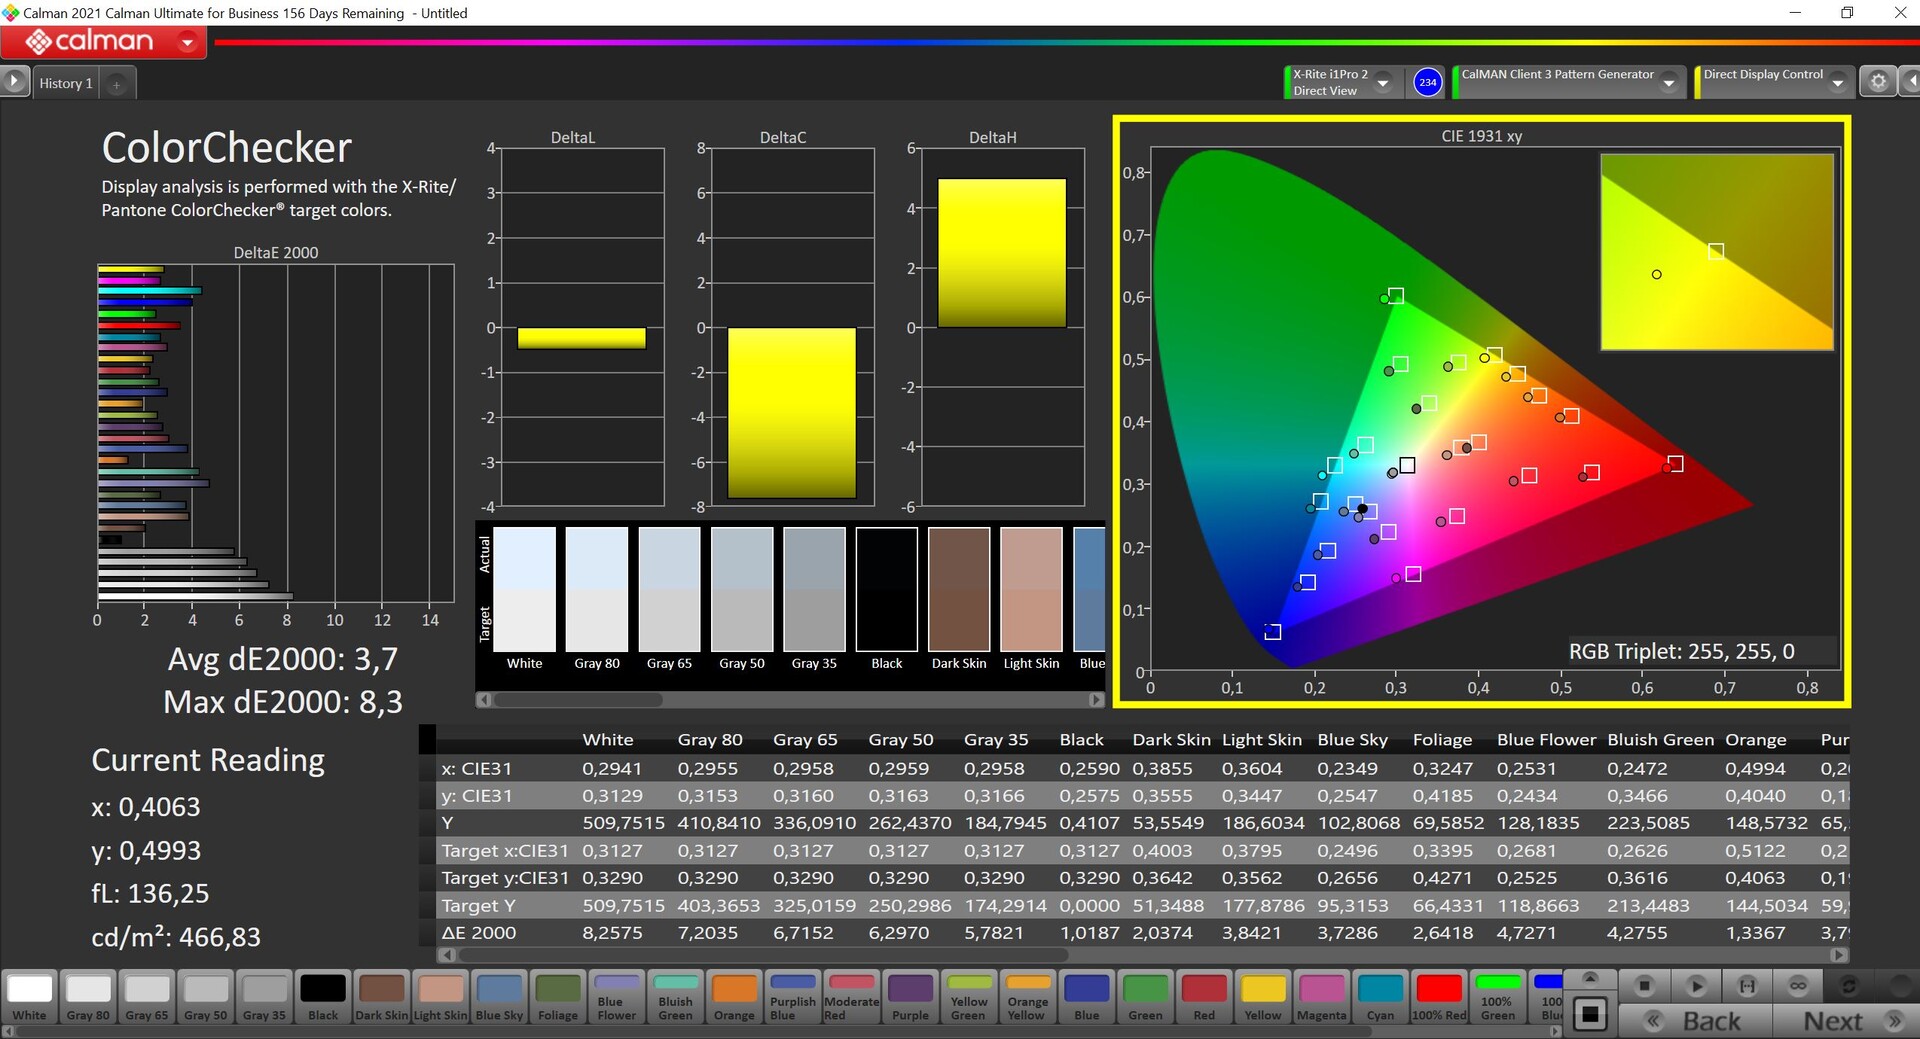
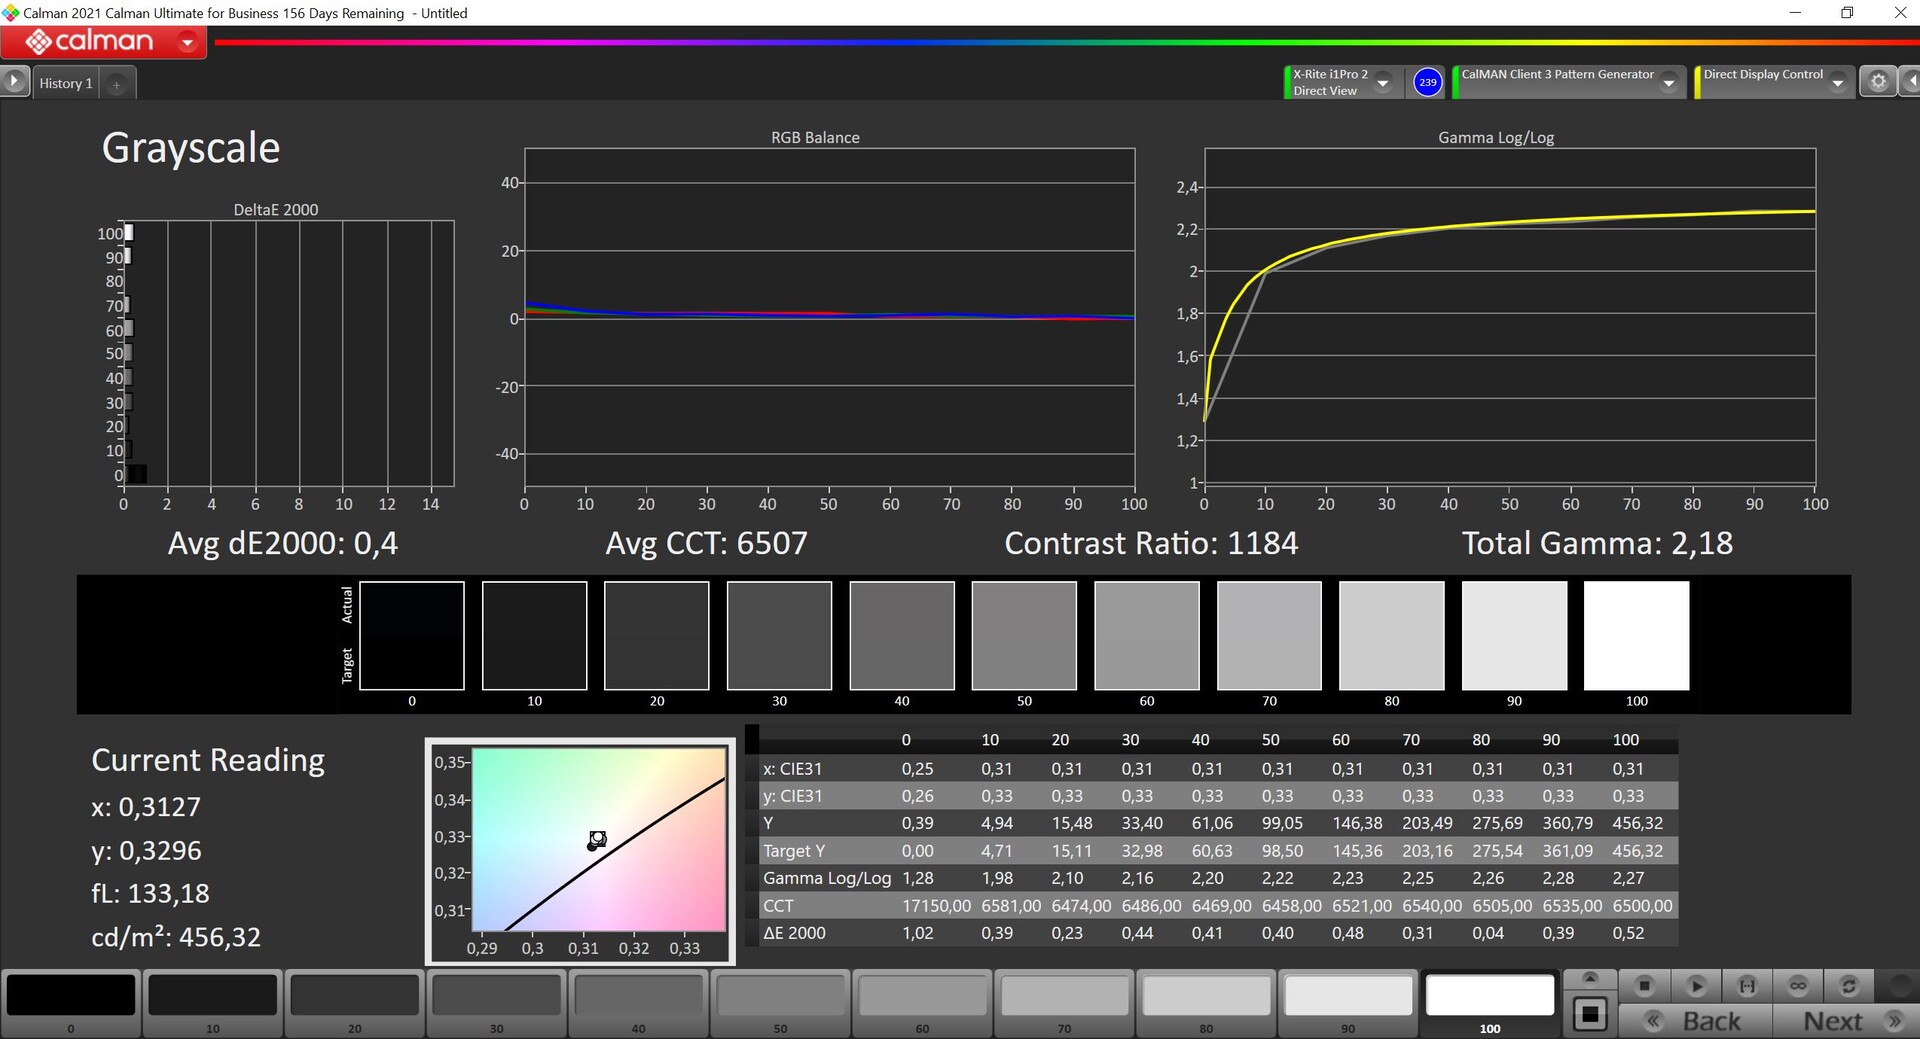
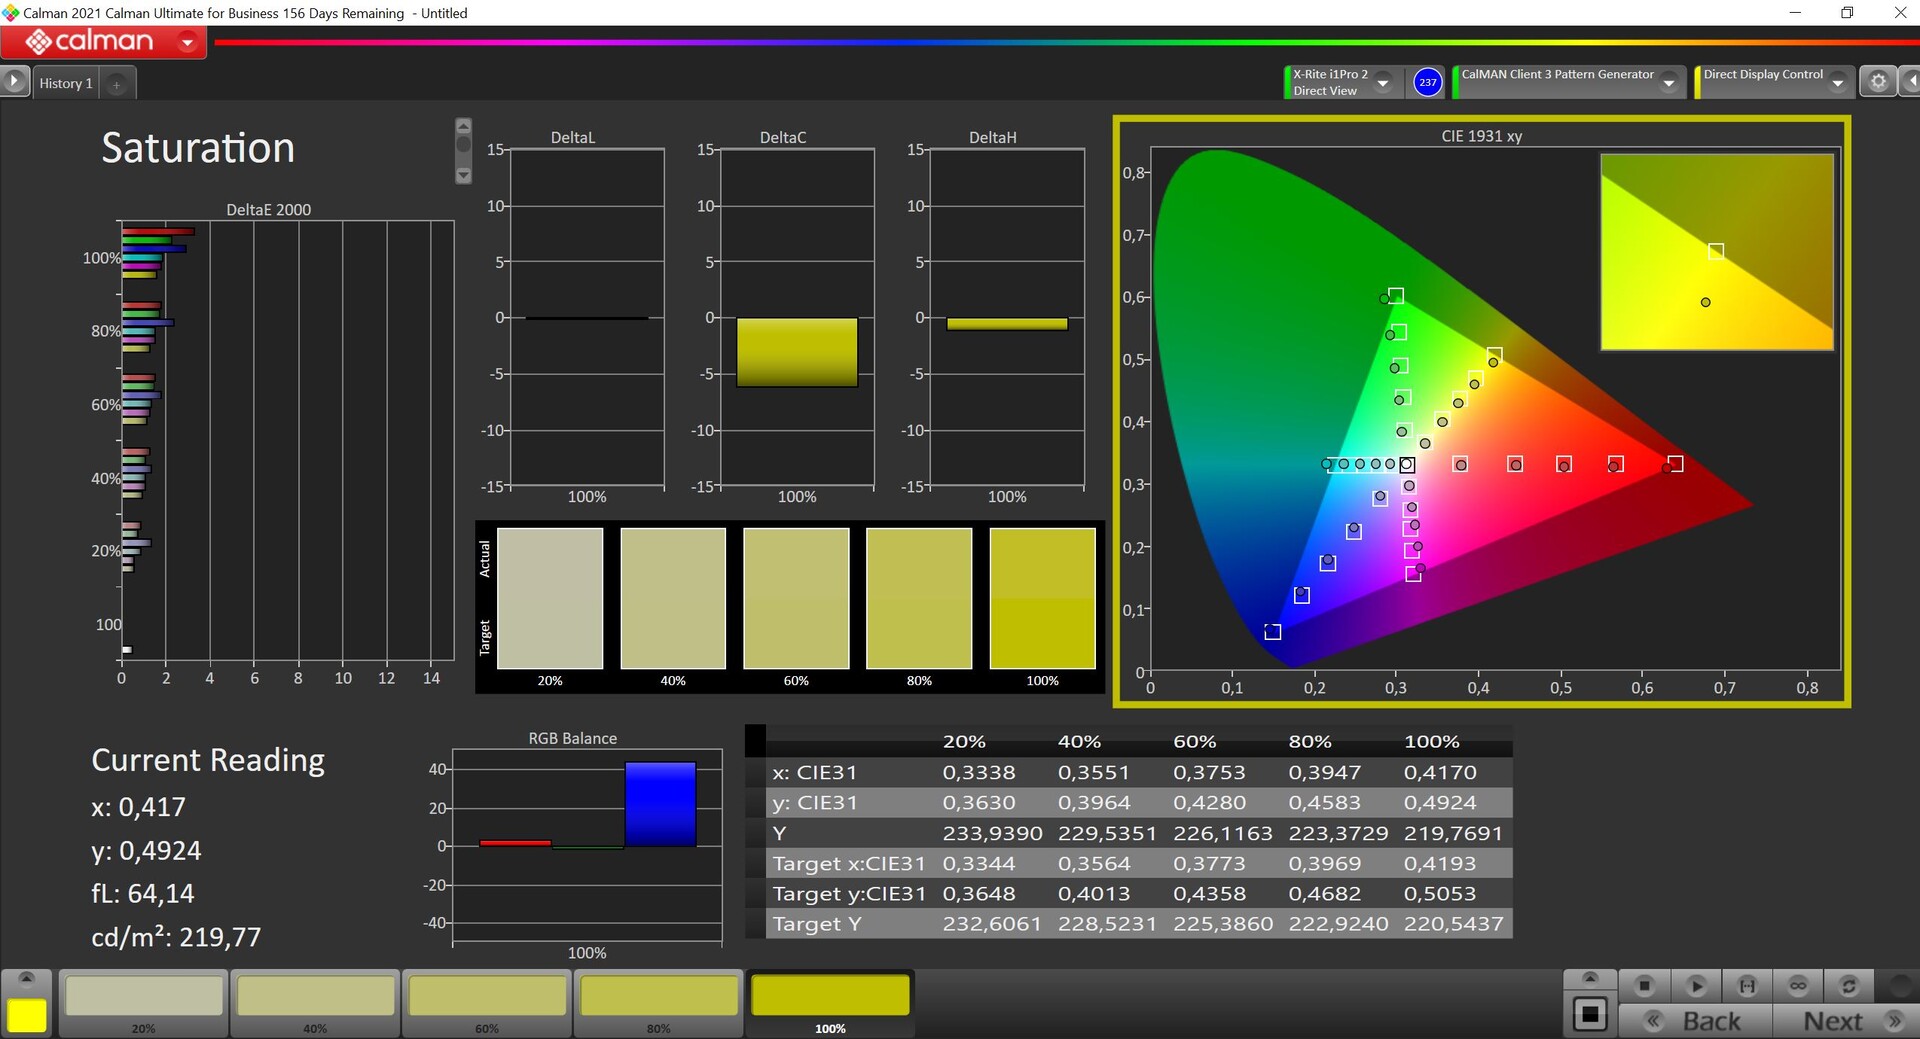
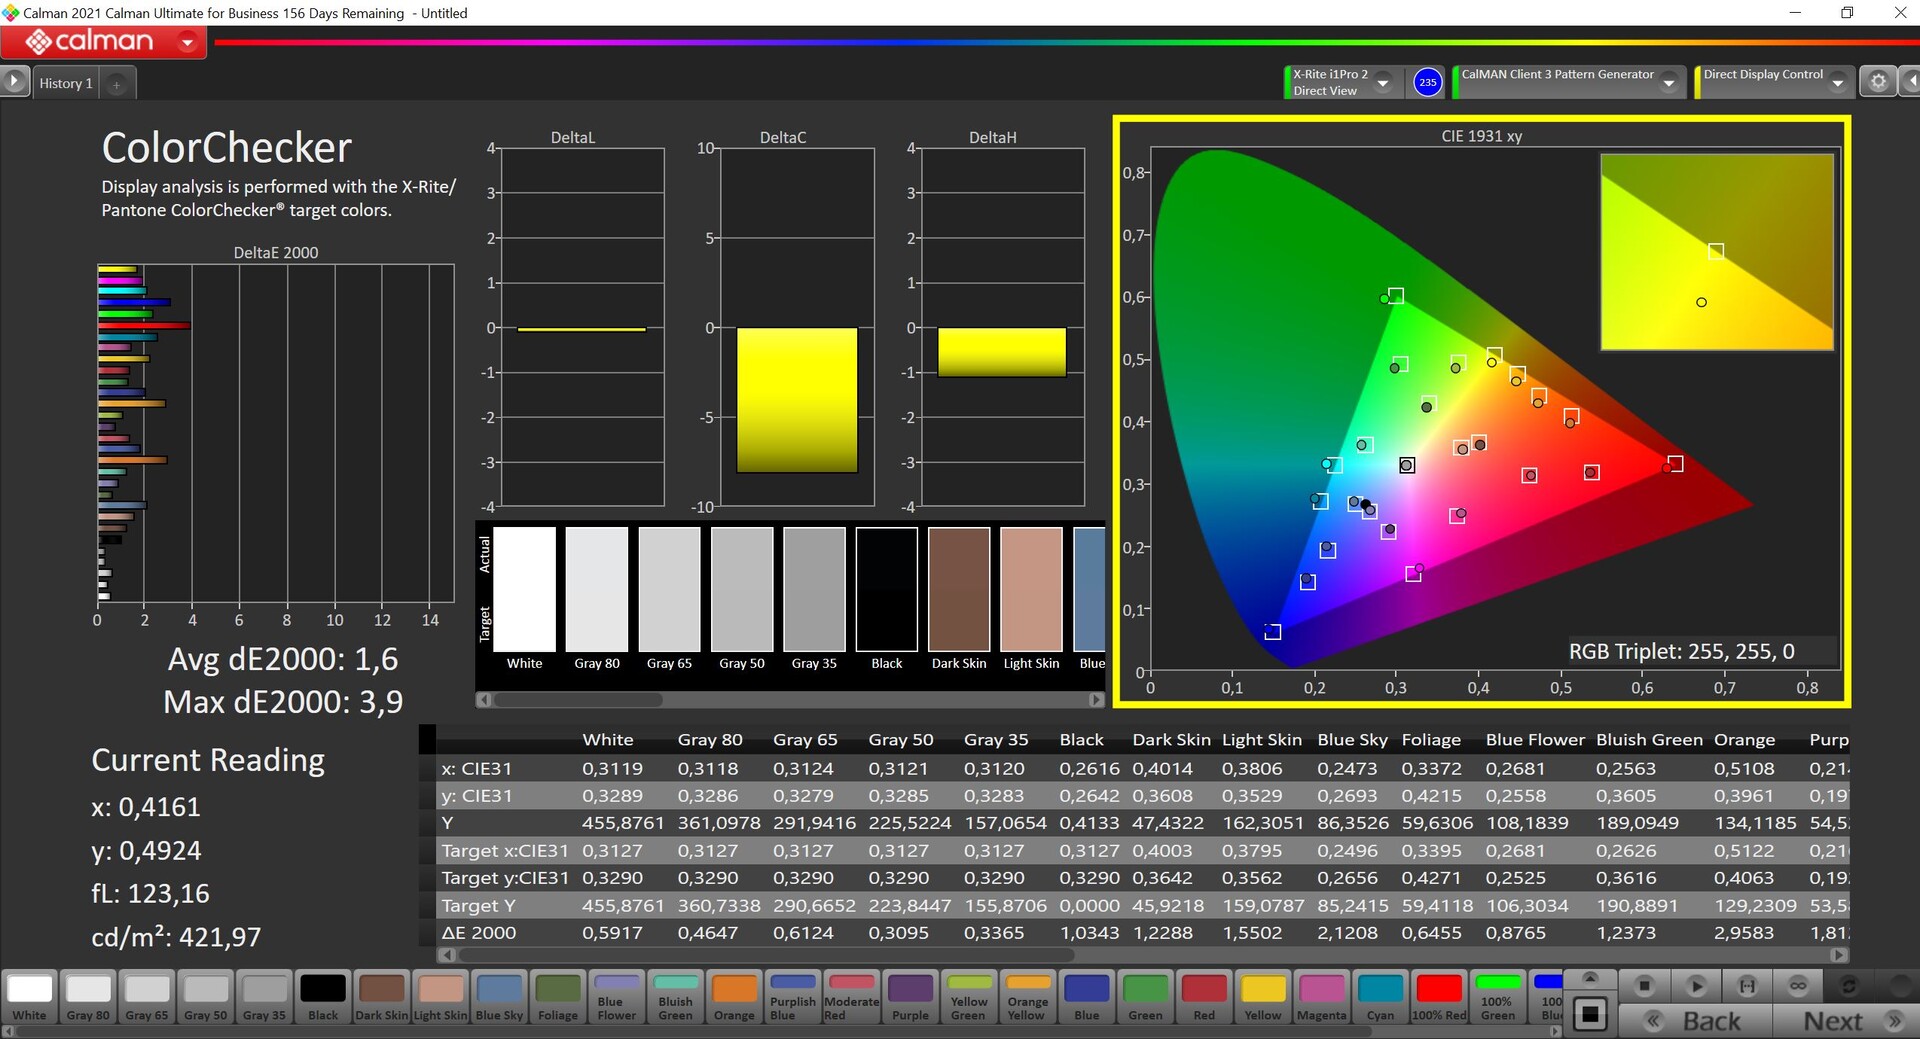
The Armoury Crate SE software offers different presets for the display (like vivid with higher saturations or EyeCare with reduced blue light). We used the default preset for our analysis with the professional CalMAN software. The color deviations are okay for a gaming device, but the picture is noticeably too cool and there is a distinct blue cast. The advantage of this calibration is a higher maximum brightness, which drops by ~50 nits after our own calibration. But the result is an excellent grayscale performance and we also managed to improve the color accuracy. The small sRGB reference is covered by 92 %, which is completely sufficient for gaming handheld. We do not believe any user will use the Ally for serious picture/video editing.
Display Response Times
| ↔ Response Time Black to White | ||
|---|---|---|
| 6 ms ... rise ↗ and fall ↘ combined | ↗ 2.7 ms rise | 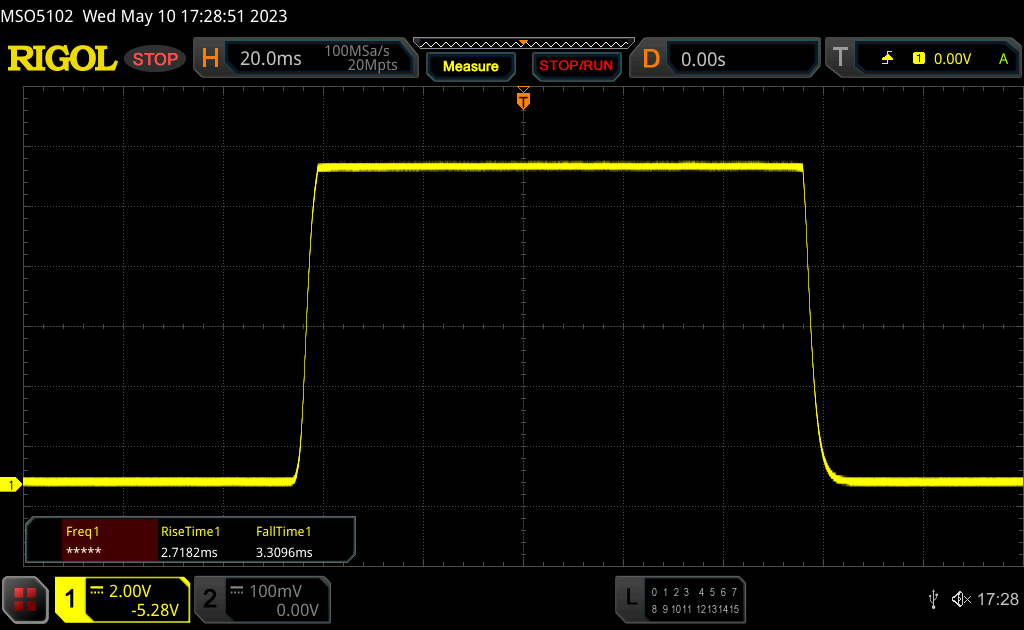 |
| ↘ 3.3 ms fall | ||
| The screen shows very fast response rates in our tests and should be very well suited for fast-paced gaming. In comparison, all tested devices range from 0.1 (minimum) to 240 (maximum) ms. » 18 % of all devices are better. This means that the measured response time is better than the average of all tested devices (19.9 ms). | ||
| ↔ Response Time 50% Grey to 80% Grey | ||
| 10.5 ms ... rise ↗ and fall ↘ combined | ↗ 5 ms rise | 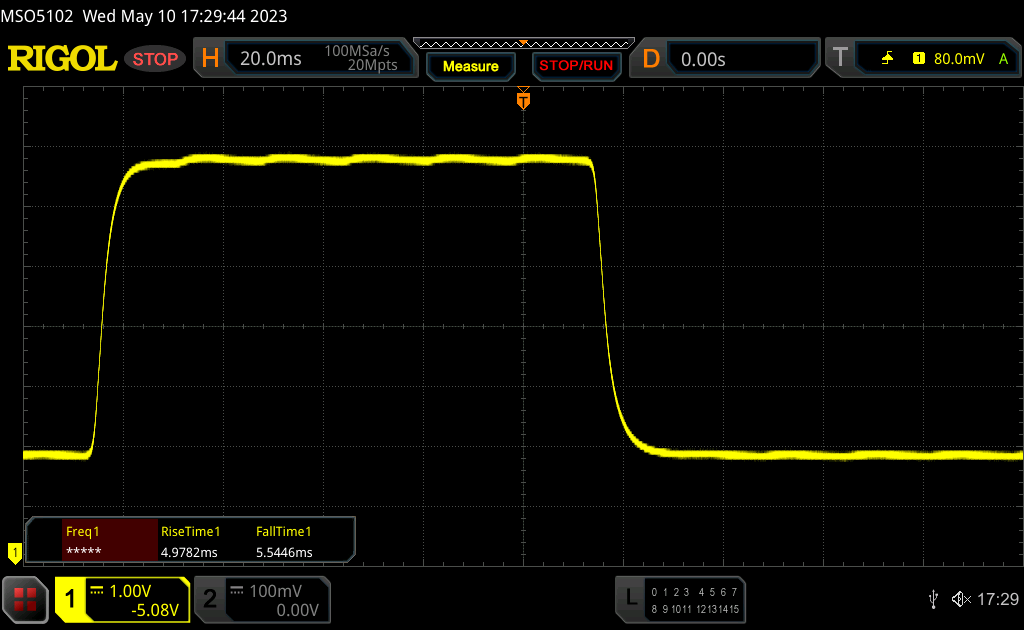 |
| ↘ 5.5 ms fall | ||
| The screen shows good response rates in our tests, but may be too slow for competitive gamers. In comparison, all tested devices range from 0.165 (minimum) to 636 (maximum) ms. » 24 % of all devices are better. This means that the measured response time is better than the average of all tested devices (31.1 ms). | ||
Screen Flickering / PWM (Pulse-Width Modulation)
| Screen flickering / PWM not detected | 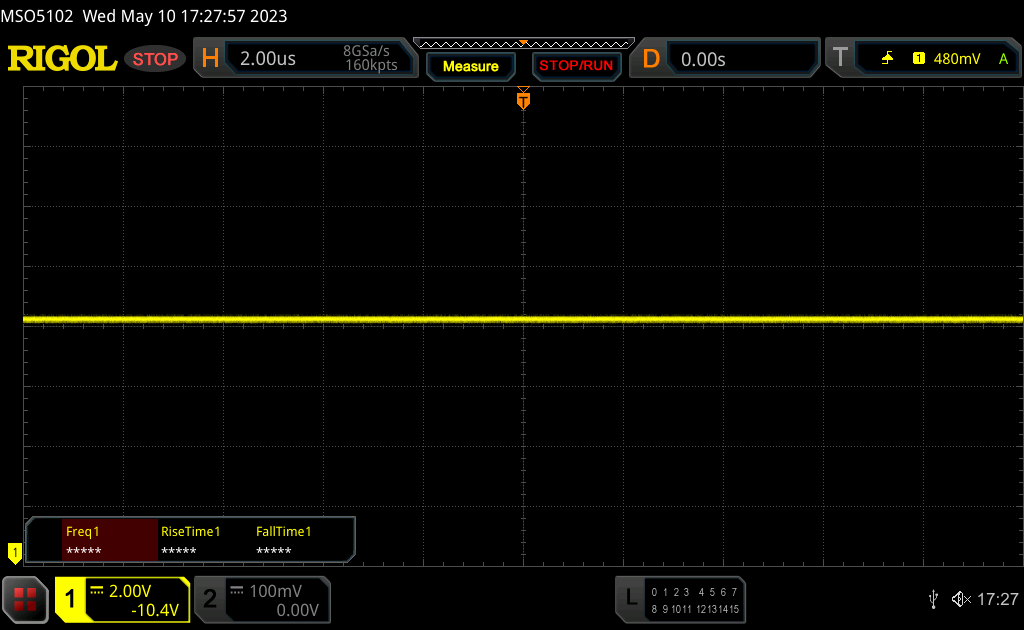 | ||
In comparison: 52 % of all tested devices do not use PWM to dim the display. If PWM was detected, an average of 7791 (minimum: 5 - maximum: 343500) Hz was measured. | |||
To reduce reflections from the touchscreen, Asus also uses a Corning Gorilla Glass DXC coating. This works pretty well and the screen is not as reflective as many other touchscreens out there. You can still see the picture contents reasonably well even on a bright sunny day, even though you will have to use the full panel brightness. The viewing angle stability is good.

Performance - Debut for the Ryzen Z1 Extreme/Ryzen 7 7840U
We have already listed the specs of the two different ROG Ally SKUs, and the less expensive model with the AMD Ryzen Z1 should be noticeably slower in terms of GPU performance since it only uses 4 instead of 12 CUs. The Z1 Extreme in our review unit has pretty much the same specs as the new Ryzen 7 7840U, but the Z1 Extreme can be operated at a lower TDP of 9 Watts (7840U: 15W). The regular Ryzen Z1 also has two fewer CPU cores. Both models are equipped with 16 GB LPDDR5-6400 RAM in a dual-channel configuration and get 256 GB or 512 GB SSD storage (M.2-2230).
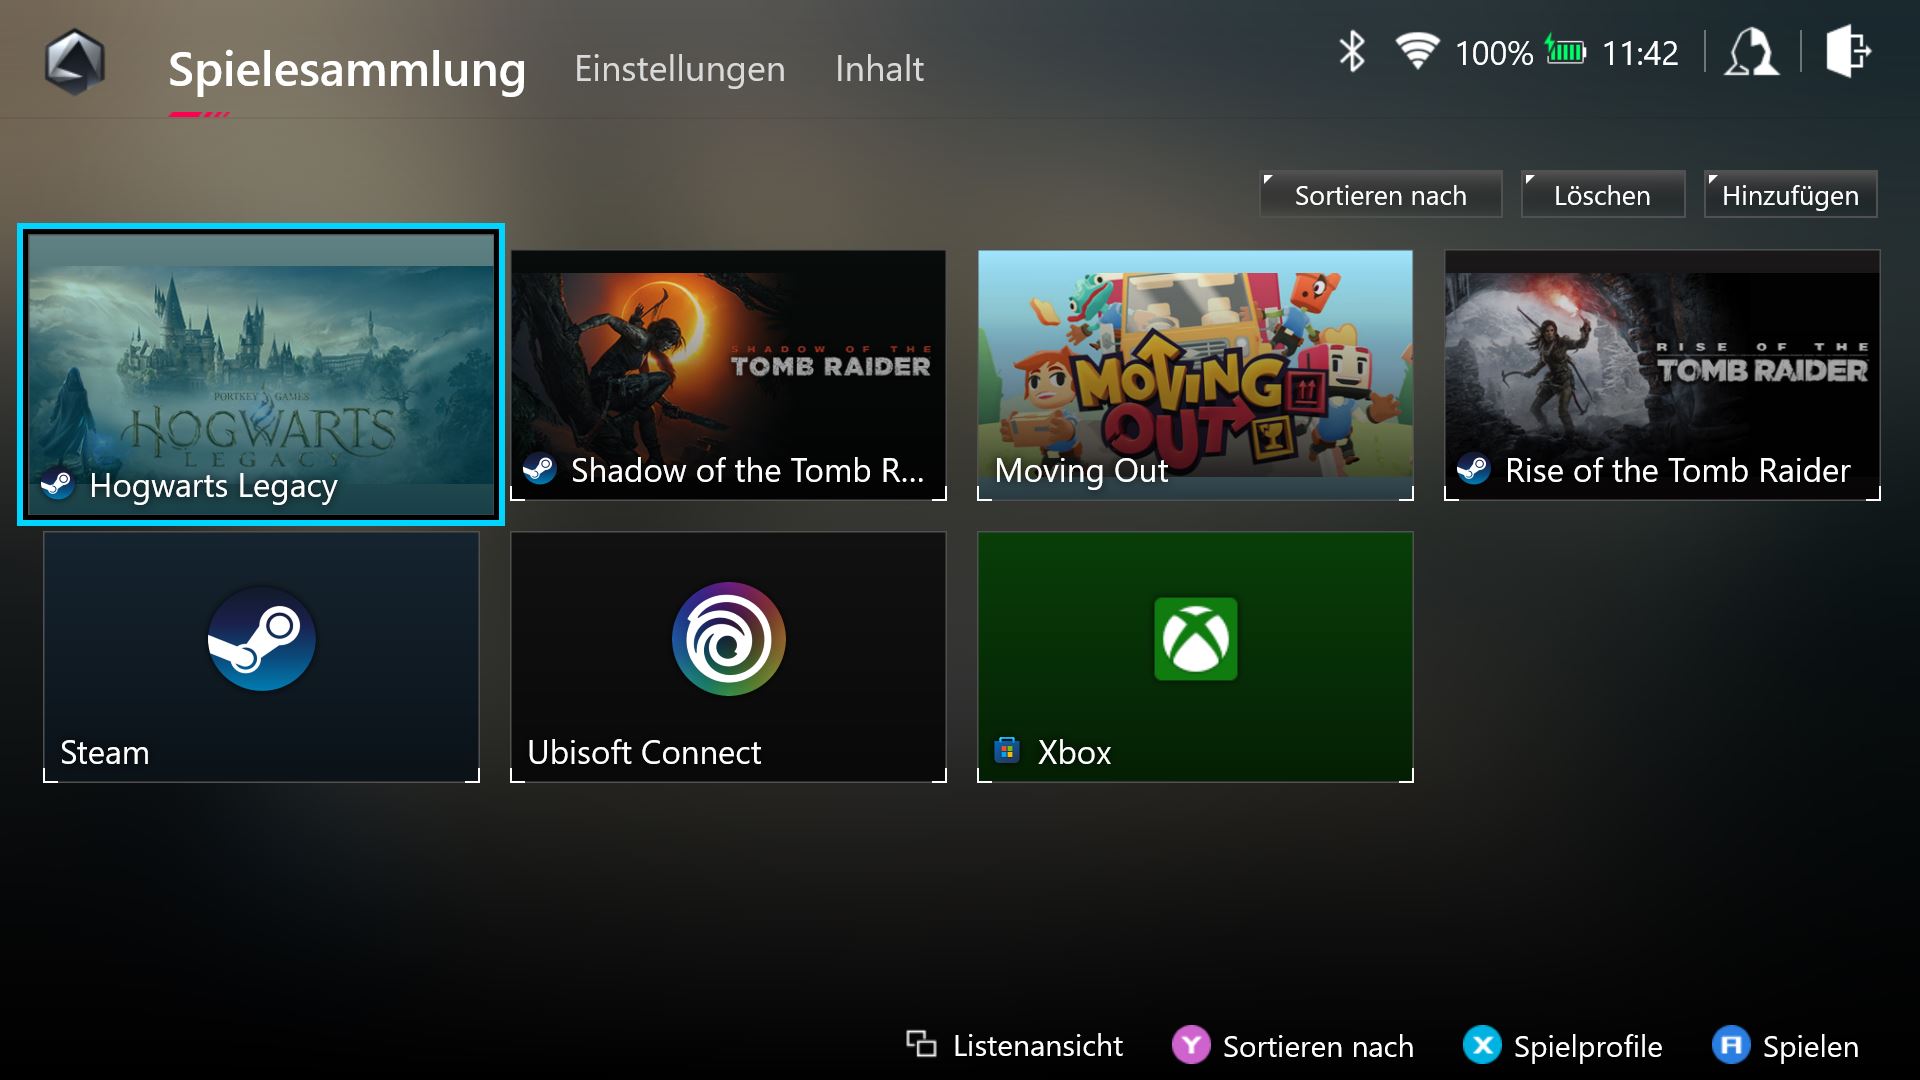
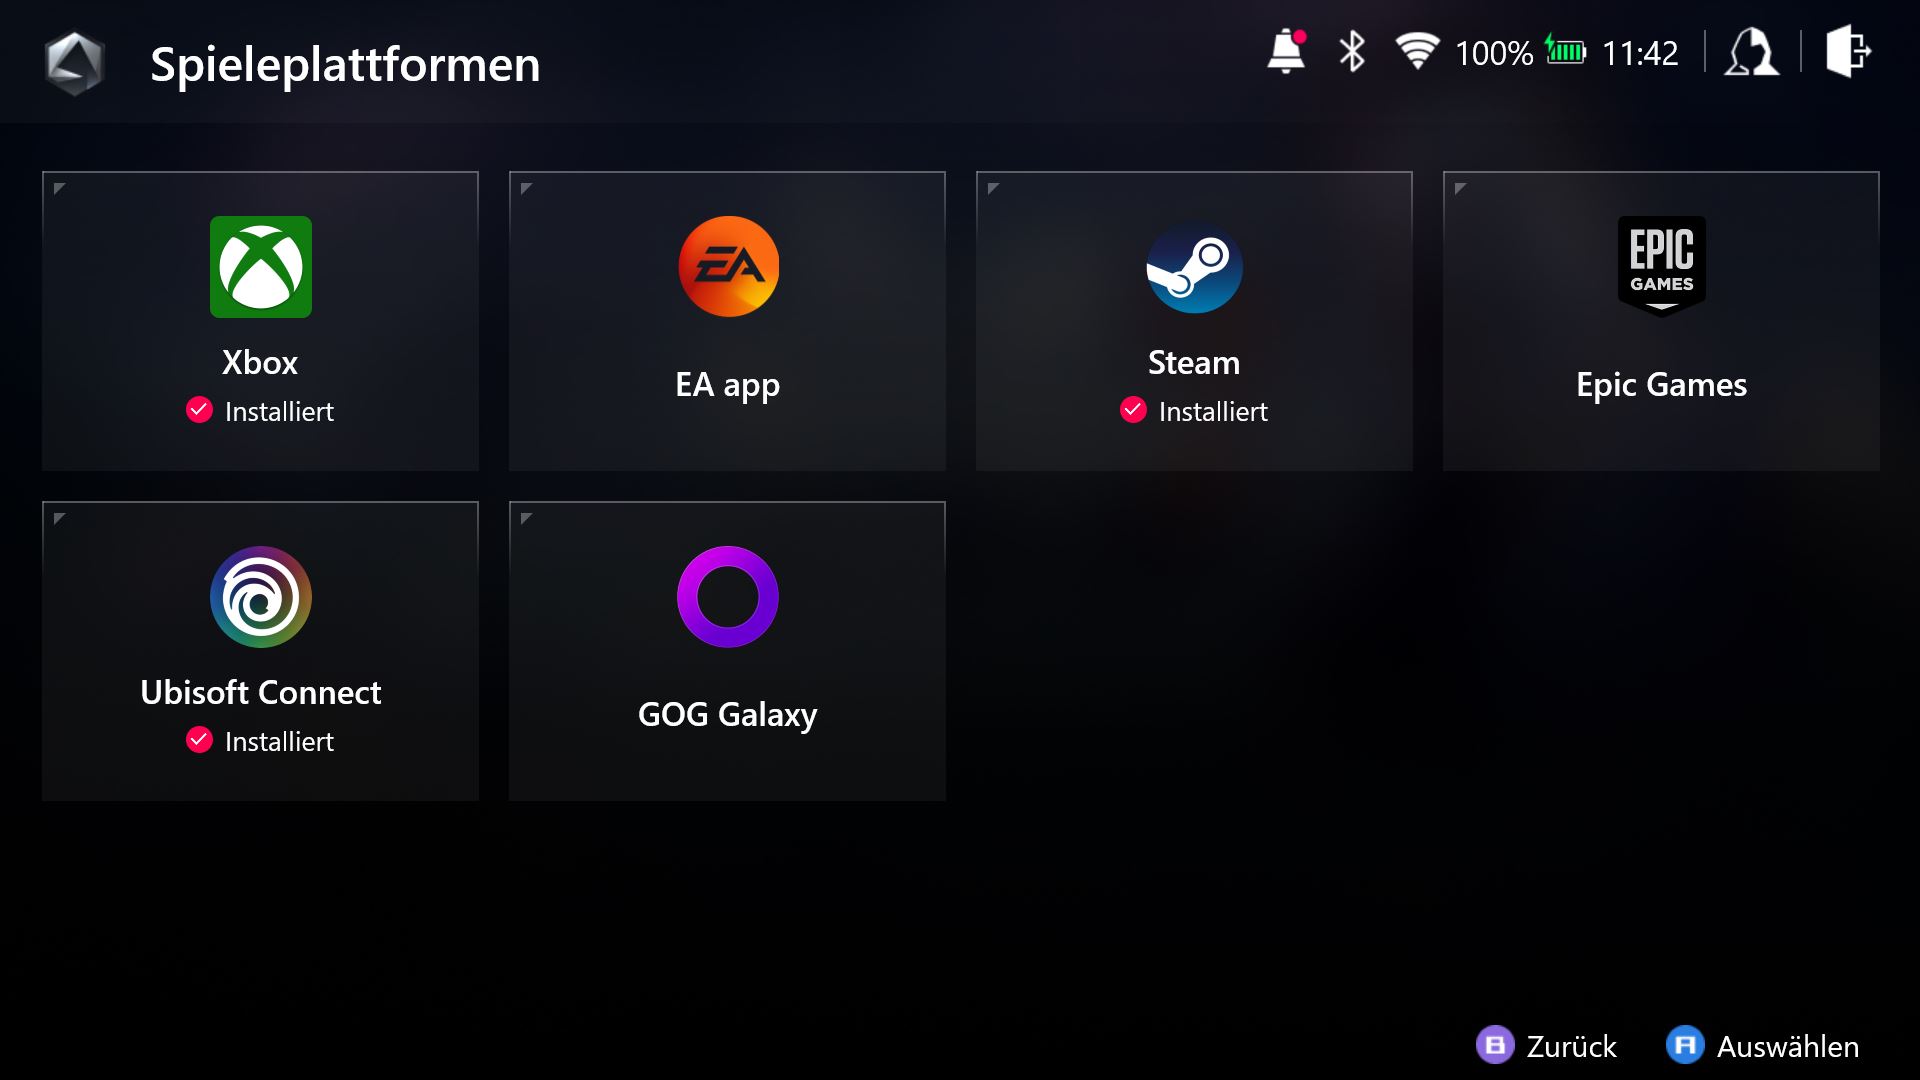
The ROG Ally uses a standard Windows 11 installation, so we had no problems to perform our standard benchmark suite. The Ally will automatically launch the Armoury Crate SE software when you start the device, which gives you direct access to the most important system settings as well as gaming services (like Steam, Origin, etc.) and installed games. This means you really do not have to fiddle much with Windows if you don’t want to.
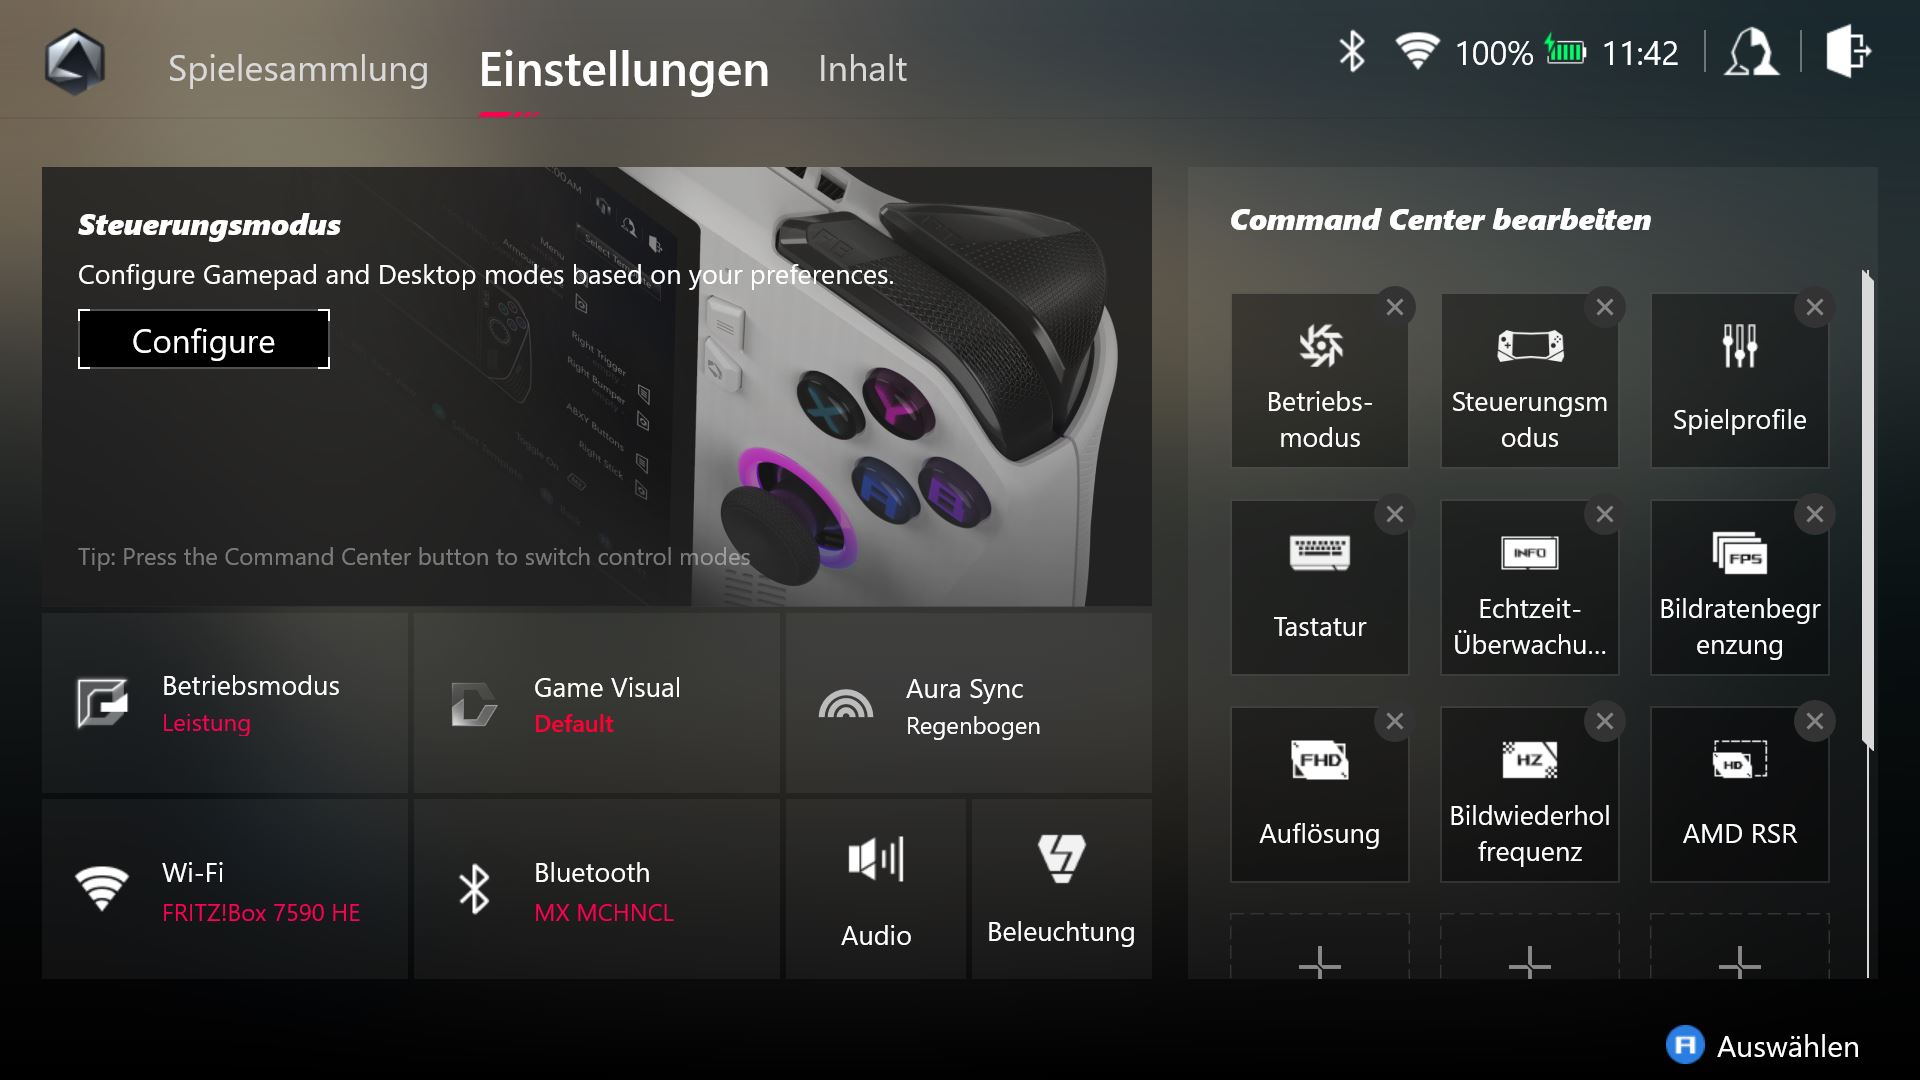
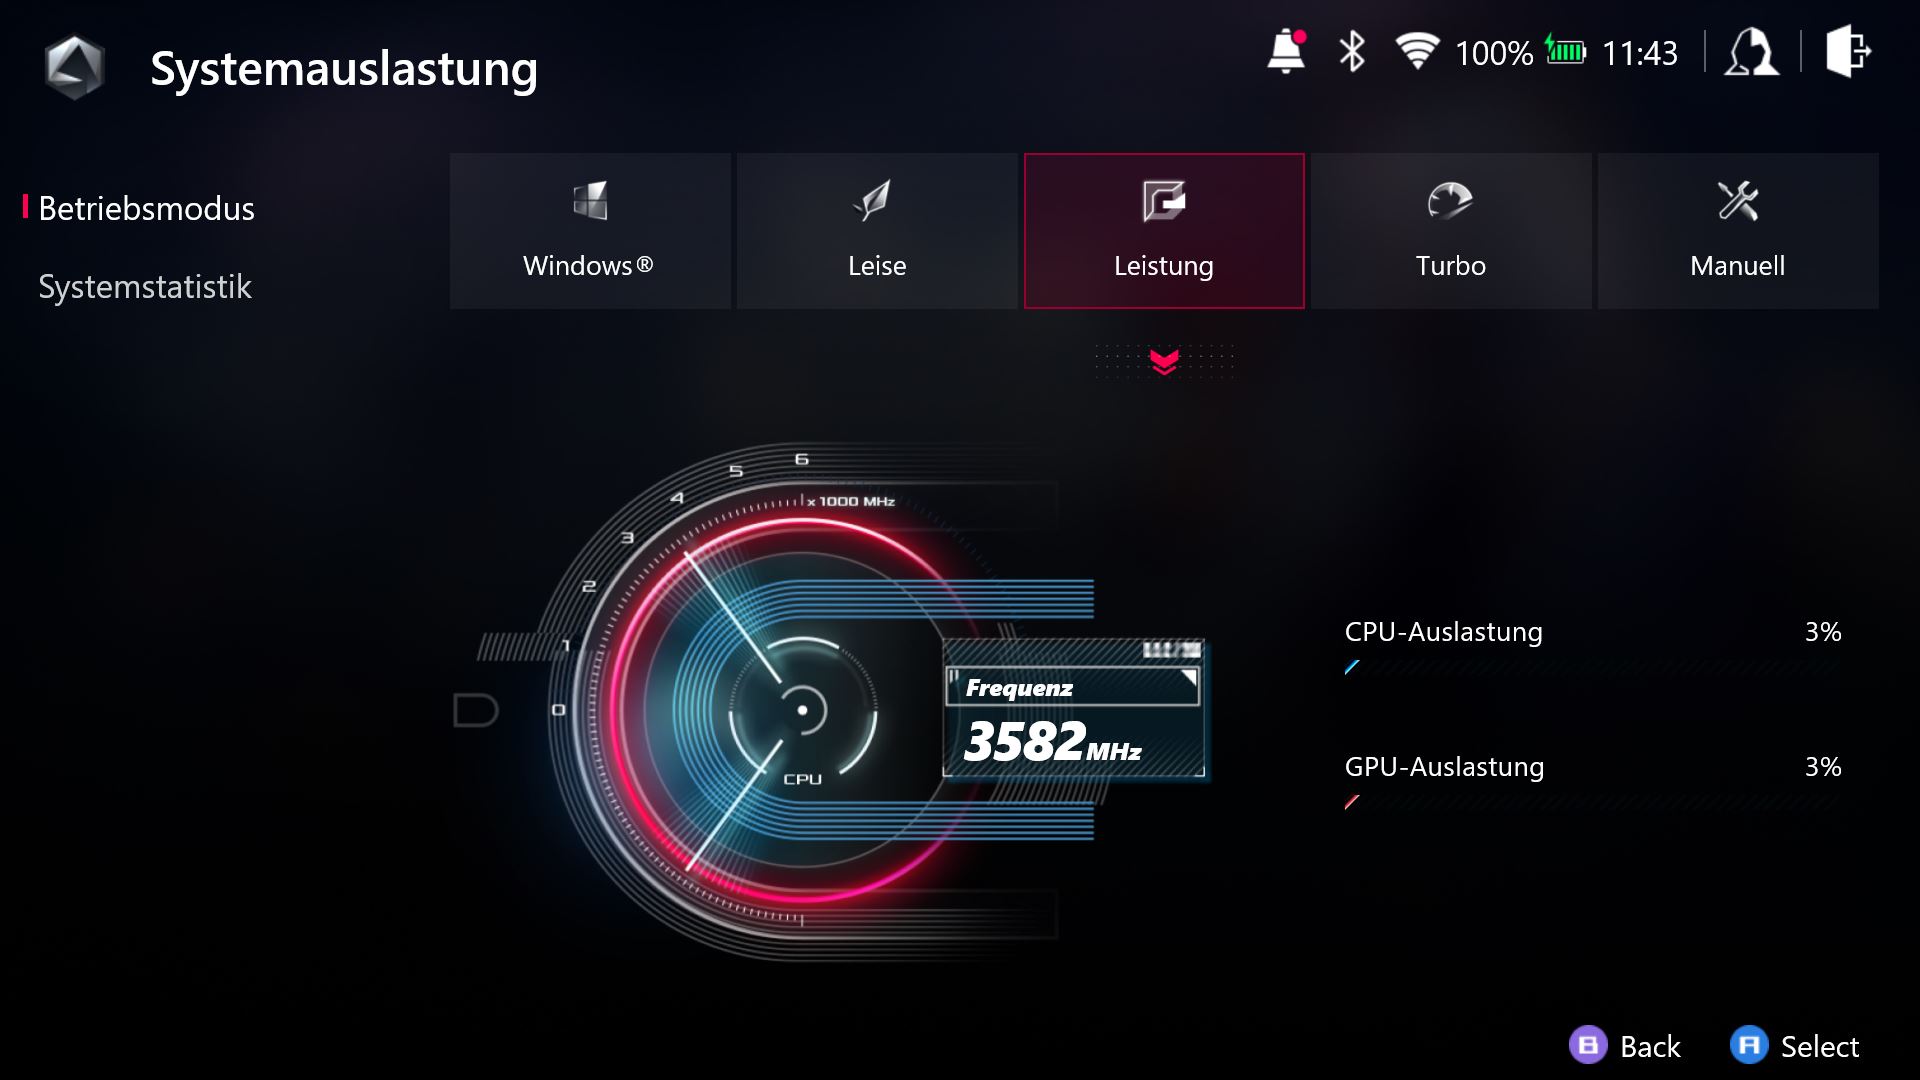
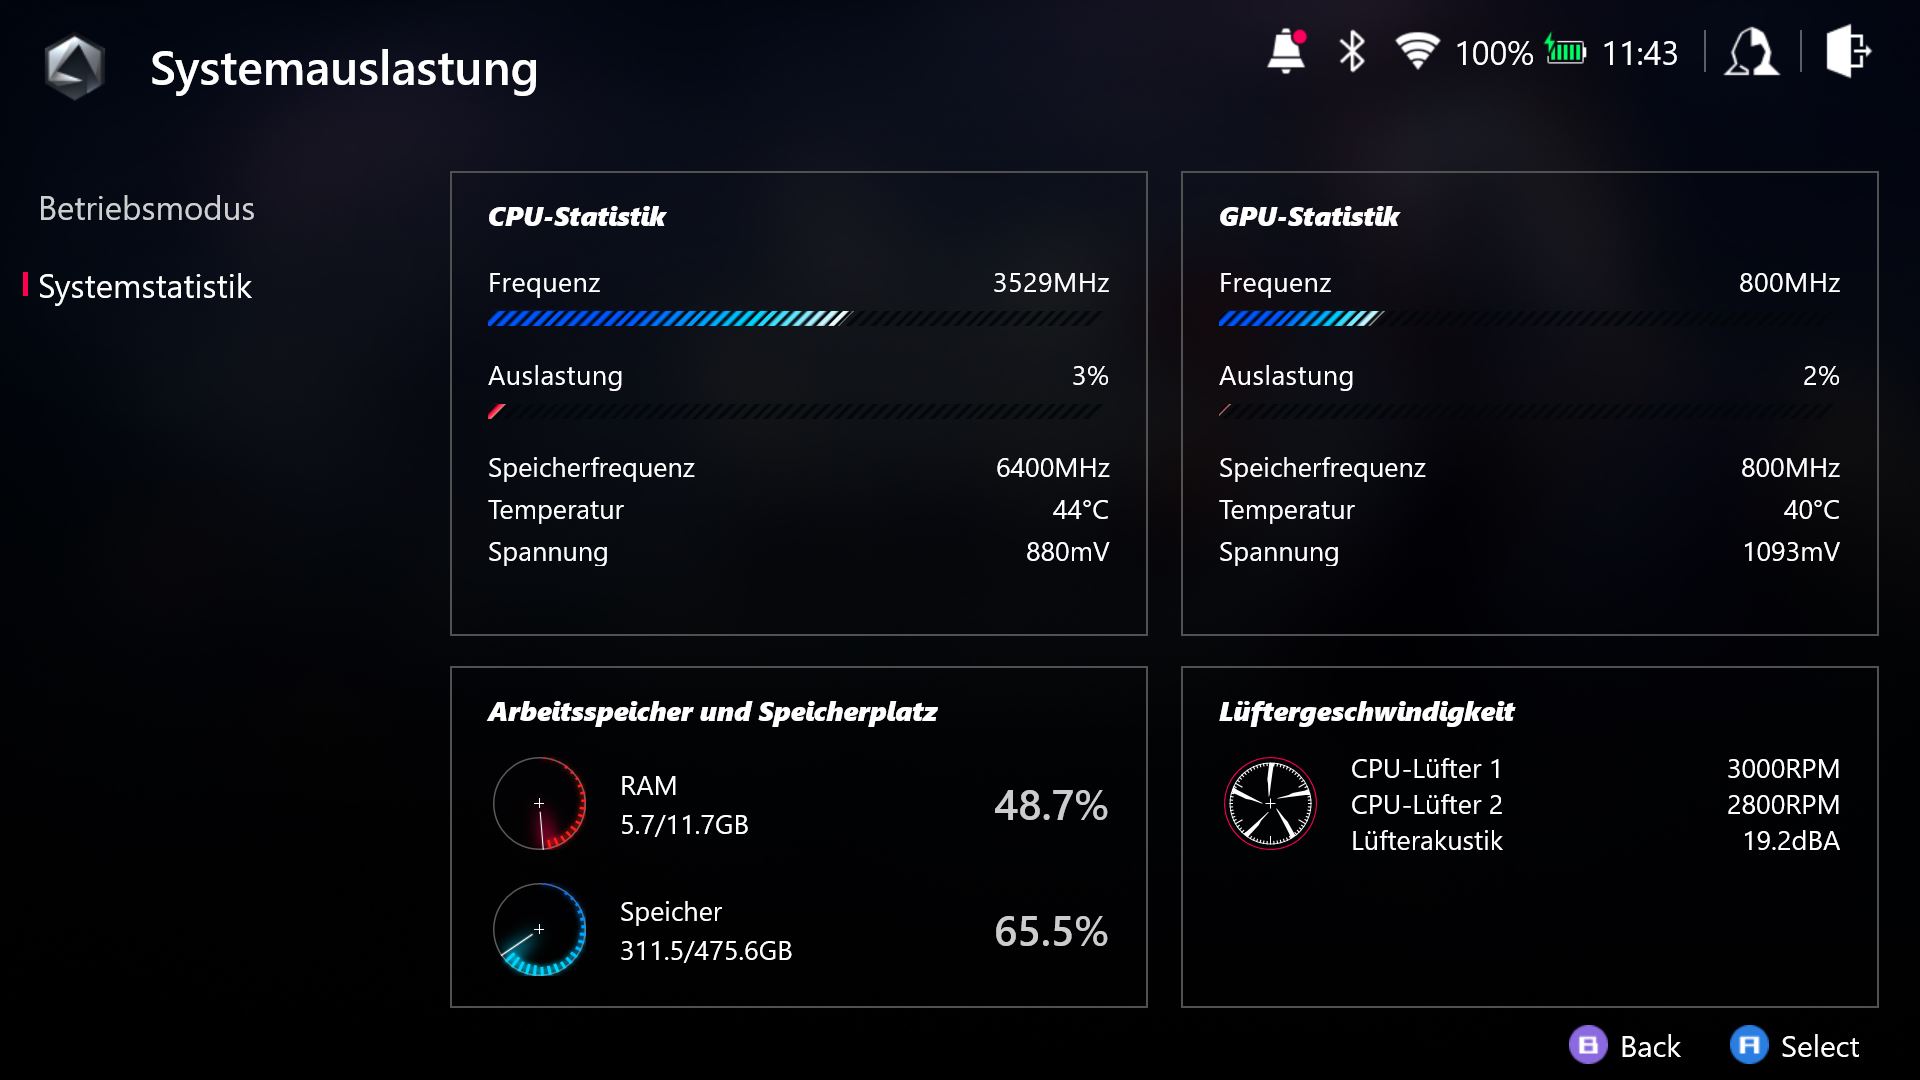
The Asus software includes a very handy real-time monitoring tool, which shows CPU & GPU load, the current fps number and also the current power consumption on battery power, which can be extremely useful. Our review unit was still shipped with a preview version of the Armoury Crate SE software, and final retail units with get some small improvements (like the actual TDP values for the power modes). You also get a 90-day free trial of Xbox Game Pass Ultimate, which worked very well during our review (even though it mainly depends on your network connection).
Review Settings
You can quickly change the power mode via Command Center, which is obviously also possible via Armoury Crate software. There is even a manual mode where you can adjust the TDP values for the Ryzen Z1 Extreme. We performed the following benchmarks and measurements with the Turbo power mode, because it is the only way to get the maximum power. The Performance power mode is already noticeably slower during gaming, which can often be the difference between smooth gameplay and stutters in modern games considering the limited iGPU performance. We listed the TDP values of the different power modes in the following table:
| Power Mode | Quiet | Performance | Turbo/with PSU | Manual/with PSU |
|---|---|---|---|---|
| SoC SPL (= PL1) | 9 Watts | 15 Watts | 25 / 30 Watts | 15 / 30 Watts |
| SoC sPPT (= PL2) | 14 Watts | 20 Watts | 30 / 43 Watts | 20 / 43 Watts |
| SoC fPPT (= PL4) | 17 Watts | 25 Watts | 35 / 53 Watts | 25 / 53 Watts |
We also repeated all of our gaming benchmarks with the Performance power mode, so you can directly compare the results. The TDP on battery power is a bit lower, but our gaming results were only1-2 fps slower. The Quiet power mode is not suited for gaming since the performance is just too low.
Processor - Ryzen Z1 Extreme with Zen4 Phoenix
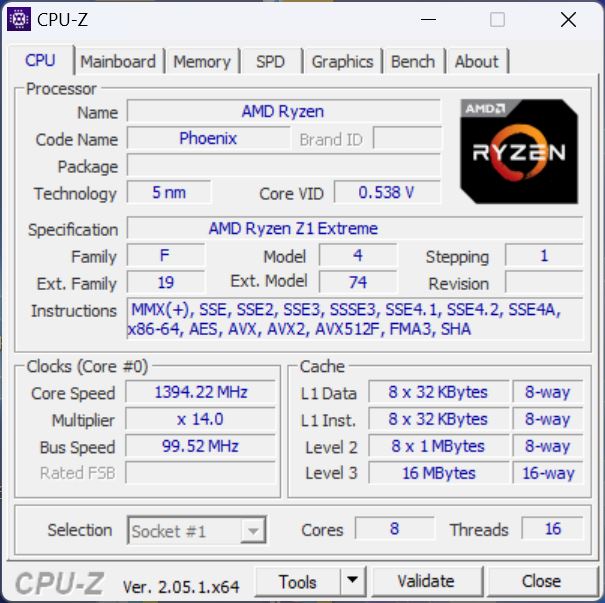
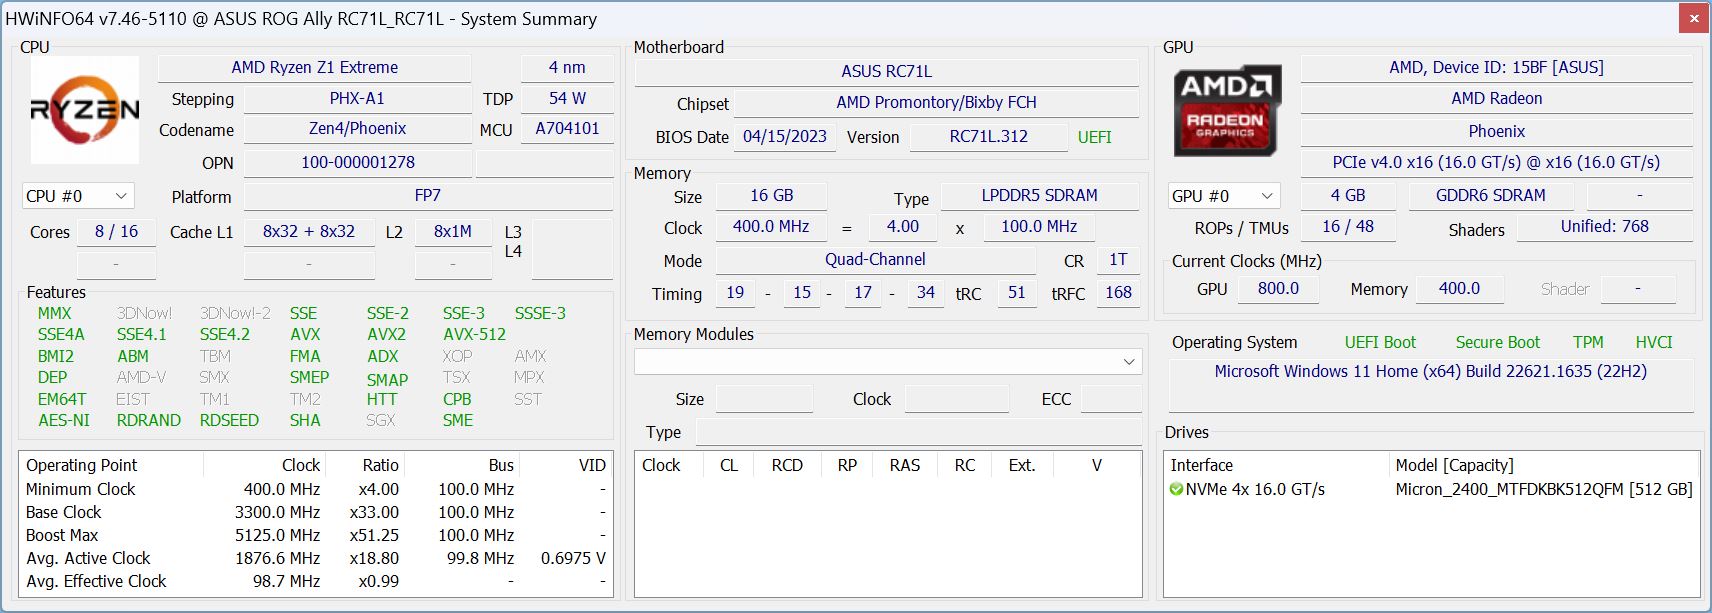
Asus did not cheap out in terms of CPU and equips the ROG Ally with the brand-new AMD Ryzen Z1 Extreme, which is effectively the new Ryzen 7 7840U. We are still waiting for corresponding laptop models, but the compact gaming handheld already gives us the chance to check the performance of AMD’s latest U-series mobile processor.
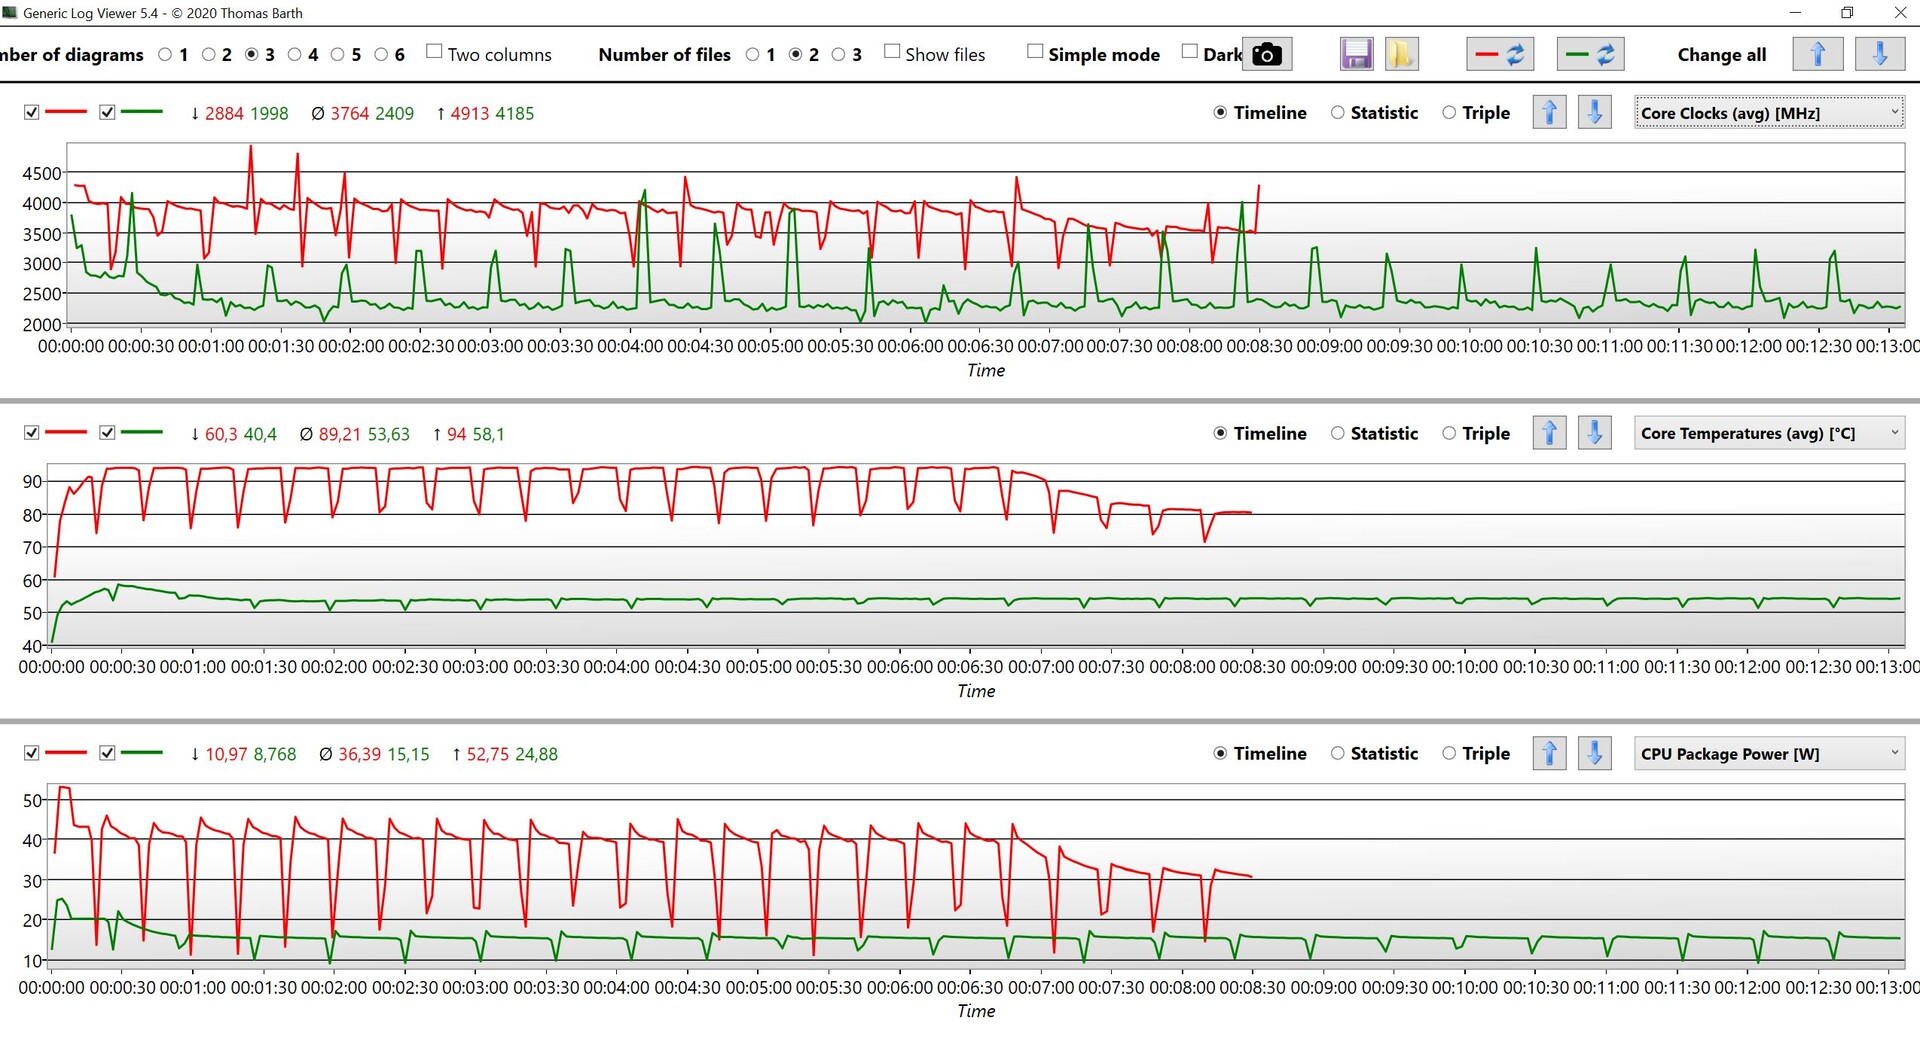
The Ryzen Z1 Extreme uses eight Zen4 cores and is manufactured in a modern 4 nm process. It can execute up to 16 threads simultaneously and the maximum clock is 5.1 GHz. We were quite surprised by the benchmark results, because the CPU performance is excellent considering the small chassis dimensions. The Z1 Extreme can consume up to 53 Watts in Turbo mode for a brief period during the first CB R15 run, then levels off at around 40 Watts for a couple of minutes an eventually drops to around 30 Watts at the end of our loop. At 40 Watts, the Z1 Extreme wipes the floor with the with the current Raptor Lake Core i7-1360P running at 38W (Lenovo Yoga 9 14) in the multi-core benchmarks. It is even much faster at 30 Watts and there is also a noticeable advantage over the old Ryzen 7 6800U. The new Ryzen 9 7940HS (65 Watts) is the only chip in our comparison group with better multi-core performance (but not by much).
Cinebench R15 Multi Loop
The multi-core performance at 25/15 Watts is even more impressive, because the Ryzen Z1 Extreme is still faster than the current Raptor Lake Core i7-1355U at 50/25 Watts. We will have a closer look at the performance of the new Ryzen Z1 Extreme/Ryzen 7 7840U in our Zen4 analysis article soon and also include results for different power limits.
| Quiet | Performance | Turbo | Turbo battery | |
|---|---|---|---|---|
| CB R15 Multi | 1180 points | 1727 points | 2397 points | 2153 points |
| CB R15 Single | 222 points | 280 points | 280 points | 280 points |
AMD managed to improve the single-core performance of the new Zen4 chips noticeable (around 20 % faster than Ryzen 7 6800U). Intel still has an advantage in this respect with their performance cores, but the gap is not that big anymore. More CPU benchmarks are available in our tech section.
Cinebench R23: Multi Core | Single Core
Cinebench R20: CPU (Multi Core) | CPU (Single Core)
Cinebench R15: CPU Multi 64Bit | CPU Single 64Bit
Blender: v2.79 BMW27 CPU
7-Zip 18.03: 7z b 4 | 7z b 4 -mmt1
Geekbench 5.5: Multi-Core | Single-Core
HWBOT x265 Benchmark v2.2: 4k Preset
LibreOffice : 20 Documents To PDF
R Benchmark 2.5: Overall mean
| CPU Performance rating | |
| Asus ROG Zephyrus G14 GA402XY -2! | |
| Average of class Multimedia | |
| Asus ROG Ally Z1 Extreme | |
| Average AMD Ryzen Z1 Extreme | |
| Lenovo Yoga 9 14IRP G8 | |
| Lenovo Yoga 7 16IRL8 | |
| GPD Win 4 | |
| Asus Zenbook S 13 OLED | |
| GPD Win Max 2 | |
| Cinebench R23 / Multi Core | |
| Asus ROG Zephyrus G14 GA402XY | |
| Average of class Multimedia (4861 - 33362, n=81, last 2 years) | |
| Asus ROG Ally Z1 Extreme | |
| Average AMD Ryzen Z1 Extreme (13004 - 15120, n=3) | |
| Lenovo Yoga 9 14IRP G8 | |
| GPD Win 4 | |
| Asus Zenbook S 13 OLED | |
| Lenovo Yoga 7 16IRL8 | |
| GPD Win Max 2 | |
| Cinebench R23 / Single Core | |
| Average of class Multimedia (1128 - 2459, n=73, last 2 years) | |
| Lenovo Yoga 9 14IRP G8 | |
| Lenovo Yoga 7 16IRL8 | |
| GPD Win Max 2 | |
| Asus ROG Zephyrus G14 GA402XY | |
| Asus ROG Ally Z1 Extreme | |
| Average AMD Ryzen Z1 Extreme (1733 - 1779, n=3) | |
| GPD Win 4 | |
| Asus Zenbook S 13 OLED | |
| Cinebench R20 / CPU (Multi Core) | |
| Asus ROG Zephyrus G14 GA402XY | |
| Average of class Multimedia (1887 - 12912, n=64, last 2 years) | |
| Asus ROG Ally Z1 Extreme | |
| Average AMD Ryzen Z1 Extreme (5109 - 5825, n=3) | |
| Lenovo Yoga 9 14IRP G8 | |
| GPD Win 4 | |
| Asus Zenbook S 13 OLED | |
| Lenovo Yoga 7 16IRL8 | |
| GPD Win Max 2 | |
| Cinebench R20 / CPU (Single Core) | |
| Lenovo Yoga 9 14IRP G8 | |
| Average of class Multimedia (425 - 853, n=64, last 2 years) | |
| Lenovo Yoga 7 16IRL8 | |
| Asus ROG Zephyrus G14 GA402XY | |
| Asus ROG Ally Z1 Extreme | |
| GPD Win Max 2 | |
| Average AMD Ryzen Z1 Extreme (672 - 692, n=3) | |
| GPD Win 4 | |
| Asus Zenbook S 13 OLED | |
| Cinebench R15 / CPU Multi 64Bit | |
| Asus ROG Zephyrus G14 GA402XY | |
| Average of class Multimedia (856 - 5224, n=68, last 2 years) | |
| Asus ROG Ally Z1 Extreme | |
| Average AMD Ryzen Z1 Extreme (2050 - 2397, n=3) | |
| Lenovo Yoga 9 14IRP G8 | |
| GPD Win 4 | |
| Asus Zenbook S 13 OLED | |
| Lenovo Yoga 7 16IRL8 | |
| GPD Win Max 2 | |
| Cinebench R15 / CPU Single 64Bit | |
| Asus ROG Zephyrus G14 GA402XY | |
| Asus ROG Ally Z1 Extreme | |
| Average of class Multimedia (184.8 - 326, n=66, last 2 years) | |
| Lenovo Yoga 9 14IRP G8 | |
| Average AMD Ryzen Z1 Extreme (262 - 280, n=3) | |
| Lenovo Yoga 7 16IRL8 | |
| GPD Win Max 2 | |
| GPD Win 4 | |
| Asus Zenbook S 13 OLED | |
| Blender / v2.79 BMW27 CPU | |
| GPD Win Max 2 | |
| Lenovo Yoga 7 16IRL8 | |
| Asus Zenbook S 13 OLED | |
| GPD Win 4 | |
| Lenovo Yoga 9 14IRP G8 | |
| Average of class Multimedia (100 - 557, n=65, last 2 years) | |
| Average AMD Ryzen Z1 Extreme (213 - 214, n=2) | |
| Asus ROG Ally Z1 Extreme | |
| 7-Zip 18.03 / 7z b 4 | |
| Asus ROG Zephyrus G14 GA402XY | |
| Asus ROG Ally Z1 Extreme | |
| Average AMD Ryzen Z1 Extreme (56966 - 64454, n=3) | |
| Average of class Multimedia (29095 - 130368, n=62, last 2 years) | |
| GPD Win 4 | |
| Lenovo Yoga 9 14IRP G8 | |
| Asus Zenbook S 13 OLED | |
| Lenovo Yoga 7 16IRL8 | |
| GPD Win Max 2 | |
| 7-Zip 18.03 / 7z b 4 -mmt1 | |
| Asus ROG Zephyrus G14 GA402XY | |
| Asus ROG Ally Z1 Extreme | |
| Average AMD Ryzen Z1 Extreme (6077 - 6316, n=2) | |
| Average of class Multimedia (3666 - 7545, n=63, last 2 years) | |
| Lenovo Yoga 9 14IRP G8 | |
| Lenovo Yoga 7 16IRL8 | |
| GPD Win Max 2 | |
| GPD Win 4 | |
| Asus Zenbook S 13 OLED | |
| Geekbench 5.5 / Multi-Core | |
| Average of class Multimedia (4652 - 20422, n=62, last 2 years) | |
| Asus ROG Zephyrus G14 GA402XY | |
| Asus ROG Ally Z1 Extreme | |
| Lenovo Yoga 9 14IRP G8 | |
| Average AMD Ryzen Z1 Extreme (9589 - 10917, n=4) | |
| Lenovo Yoga 7 16IRL8 | |
| GPD Win 4 | |
| Asus Zenbook S 13 OLED | |
| GPD Win Max 2 | |
| Geekbench 5.5 / Single-Core | |
| Asus ROG Zephyrus G14 GA402XY | |
| Average of class Multimedia (805 - 2974, n=62, last 2 years) | |
| Asus ROG Ally Z1 Extreme | |
| Average AMD Ryzen Z1 Extreme (1896 - 1956, n=4) | |
| Lenovo Yoga 9 14IRP G8 | |
| Lenovo Yoga 7 16IRL8 | |
| GPD Win Max 2 | |
| GPD Win 4 | |
| Asus Zenbook S 13 OLED | |
| HWBOT x265 Benchmark v2.2 / 4k Preset | |
| Average of class Multimedia (5.26 - 36.1, n=63, last 2 years) | |
| Asus ROG Ally Z1 Extreme | |
| Average AMD Ryzen Z1 Extreme (16.3 - 18.7, n=3) | |
| Lenovo Yoga 9 14IRP G8 | |
| GPD Win 4 | |
| Asus Zenbook S 13 OLED | |
| Lenovo Yoga 7 16IRL8 | |
| GPD Win Max 2 | |
| LibreOffice / 20 Documents To PDF | |
| Asus Zenbook S 13 OLED | |
| GPD Win 4 | |
| Average of class Multimedia (23.9 - 146.7, n=64, last 2 years) | |
| Average AMD Ryzen Z1 Extreme (43 - 52.3, n=3) | |
| Lenovo Yoga 9 14IRP G8 | |
| Lenovo Yoga 7 16IRL8 | |
| GPD Win Max 2 | |
| Asus ROG Ally Z1 Extreme | |
| Asus ROG Zephyrus G14 GA402XY | |
| R Benchmark 2.5 / Overall mean | |
| Asus Zenbook S 13 OLED | |
| GPD Win 4 | |
| Average of class Multimedia (0.3604 - 0.947, n=63, last 2 years) | |
| GPD Win Max 2 | |
| Lenovo Yoga 9 14IRP G8 | |
| Lenovo Yoga 7 16IRL8 | |
| Average AMD Ryzen Z1 Extreme (0.4447 - 0.4662, n=3) | |
| Asus ROG Ally Z1 Extreme | |
| Asus ROG Zephyrus G14 GA402XY | |
* ... smaller is better
AIDA64: FP32 Ray-Trace | FPU Julia | CPU SHA3 | CPU Queen | FPU SinJulia | FPU Mandel | CPU AES | CPU ZLib | FP64 Ray-Trace | CPU PhotoWorxx
| Performance rating | |
| Asus ROG Ally Z1 Extreme | |
| Average AMD Ryzen Z1 Extreme | |
| Average of class Multimedia | |
| GPD Win 4 | |
| Asus Zenbook S 13 OLED | |
| Lenovo Yoga 9 14IRP G8 | |
| Lenovo Yoga 7 16IRL8 | |
| GPD Win Max 2 | |
| AIDA64 / FP32 Ray-Trace | |
| Asus ROG Ally Z1 Extreme | |
| Average AMD Ryzen Z1 Extreme (20714 - 24519, n=3) | |
| Average of class Multimedia (2214 - 50388, n=60, last 2 years) | |
| GPD Win 4 | |
| Asus Zenbook S 13 OLED | |
| Lenovo Yoga 9 14IRP G8 | |
| Lenovo Yoga 7 16IRL8 | |
| GPD Win Max 2 | |
| AIDA64 / FPU Julia | |
| Asus ROG Ally Z1 Extreme | |
| Average AMD Ryzen Z1 Extreme (86738 - 103637, n=3) | |
| Average of class Multimedia (12867 - 201874, n=61, last 2 years) | |
| GPD Win 4 | |
| Asus Zenbook S 13 OLED | |
| Lenovo Yoga 9 14IRP G8 | |
| Lenovo Yoga 7 16IRL8 | |
| GPD Win Max 2 | |
| AIDA64 / CPU SHA3 | |
| Asus ROG Ally Z1 Extreme | |
| Average AMD Ryzen Z1 Extreme (3854 - 4465, n=3) | |
| Average of class Multimedia (653 - 8623, n=61, last 2 years) | |
| GPD Win 4 | |
| Asus Zenbook S 13 OLED | |
| Lenovo Yoga 9 14IRP G8 | |
| Lenovo Yoga 7 16IRL8 | |
| GPD Win Max 2 | |
| AIDA64 / CPU Queen | |
| Asus ROG Ally Z1 Extreme | |
| Average AMD Ryzen Z1 Extreme (95153 - 107867, n=3) | |
| Lenovo Yoga 9 14IRP G8 | |
| GPD Win 4 | |
| Asus Zenbook S 13 OLED | |
| Average of class Multimedia (13483 - 181505, n=49, last 2 years) | |
| GPD Win Max 2 | |
| Lenovo Yoga 7 16IRL8 | |
| AIDA64 / FPU SinJulia | |
| Asus ROG Ally Z1 Extreme | |
| Average AMD Ryzen Z1 Extreme (12936 - 14281, n=3) | |
| GPD Win 4 | |
| Asus Zenbook S 13 OLED | |
| Average of class Multimedia (1240 - 28794, n=61, last 2 years) | |
| Lenovo Yoga 9 14IRP G8 | |
| GPD Win Max 2 | |
| Lenovo Yoga 7 16IRL8 | |
| AIDA64 / FPU Mandel | |
| Asus ROG Ally Z1 Extreme | |
| Average AMD Ryzen Z1 Extreme (46180 - 55457, n=3) | |
| Average of class Multimedia (6395 - 105740, n=60, last 2 years) | |
| GPD Win 4 | |
| Asus Zenbook S 13 OLED | |
| Lenovo Yoga 9 14IRP G8 | |
| Lenovo Yoga 7 16IRL8 | |
| GPD Win Max 2 | |
| AIDA64 / CPU AES | |
| GPD Win 4 | |
| Asus Zenbook S 13 OLED | |
| Asus ROG Ally Z1 Extreme | |
| Average AMD Ryzen Z1 Extreme (57678 - 80158, n=3) | |
| Average of class Multimedia (13243 - 126790, n=61, last 2 years) | |
| GPD Win Max 2 | |
| Lenovo Yoga 9 14IRP G8 | |
| Lenovo Yoga 7 16IRL8 | |
| AIDA64 / CPU ZLib | |
| Average of class Multimedia (167.2 - 2022, n=61, last 2 years) | |
| Asus ROG Ally Z1 Extreme | |
| Average AMD Ryzen Z1 Extreme (687 - 987, n=3) | |
| Lenovo Yoga 9 14IRP G8 | |
| Lenovo Yoga 7 16IRL8 | |
| GPD Win 4 | |
| Asus Zenbook S 13 OLED | |
| GPD Win Max 2 | |
| AIDA64 / FP64 Ray-Trace | |
| Asus ROG Ally Z1 Extreme | |
| Average AMD Ryzen Z1 Extreme (10740 - 13049, n=3) | |
| Average of class Multimedia (1014 - 26875, n=61, last 2 years) | |
| GPD Win 4 | |
| Asus Zenbook S 13 OLED | |
| Lenovo Yoga 9 14IRP G8 | |
| Lenovo Yoga 7 16IRL8 | |
| GPD Win Max 2 | |
| AIDA64 / CPU PhotoWorxx | |
| Average of class Multimedia (12860 - 88154, n=61, last 2 years) | |
| Lenovo Yoga 7 16IRL8 | |
| Lenovo Yoga 9 14IRP G8 | |
| Asus ROG Ally Z1 Extreme | |
| Average AMD Ryzen Z1 Extreme (34764 - 39932, n=3) | |
| GPD Win Max 2 | |
| GPD Win 4 | |
| Asus Zenbook S 13 OLED | |
System Performance
The system performance is very good, which is hardly surprising considering the powerful components. The performance advantage over the Steam Deck is very noticeable and the ROG Ally is much snappier and faster in every situation. Our synthetic benchmark scores are also excellent and we did not notice any issues during our review period.
CrossMark: Overall | Productivity | Creativity | Responsiveness
| PCMark 10 / Score | |
| Average of class Multimedia (4325 - 10386, n=58, last 2 years) | |
| Asus ROG Ally Z1 Extreme | |
| Average AMD Ryzen Z1 Extreme, AMD Radeon 780M (6439 - 7149, n=3) | |
| GPD Win 4 | |
| Asus Zenbook S 13 OLED | |
| Lenovo Yoga 9 14IRP G8 | |
| Lenovo Yoga 7 16IRL8 | |
| GPD Win Max 2 | |
| PCMark 10 / Essentials | |
| Lenovo Yoga 9 14IRP G8 | |
| Lenovo Yoga 7 16IRL8 | |
| GPD Win Max 2 | |
| Asus Zenbook S 13 OLED | |
| Average of class Multimedia (8025 - 11664, n=57, last 2 years) | |
| Average AMD Ryzen Z1 Extreme, AMD Radeon 780M (10081 - 10633, n=3) | |
| Asus ROG Ally Z1 Extreme | |
| GPD Win 4 | |
| PCMark 10 / Productivity | |
| Average of class Multimedia (7323 - 18233, n=57, last 2 years) | |
| Asus ROG Ally Z1 Extreme | |
| Average AMD Ryzen Z1 Extreme, AMD Radeon 780M (8996 - 10074, n=3) | |
| GPD Win 4 | |
| Asus Zenbook S 13 OLED | |
| GPD Win Max 2 | |
| Lenovo Yoga 7 16IRL8 | |
| Lenovo Yoga 9 14IRP G8 | |
| PCMark 10 / Digital Content Creation | |
| Average of class Multimedia (3651 - 16240, n=57, last 2 years) | |
| Average AMD Ryzen Z1 Extreme, AMD Radeon 780M (7990 - 9408, n=3) | |
| Asus ROG Ally Z1 Extreme | |
| GPD Win 4 | |
| Lenovo Yoga 9 14IRP G8 | |
| Asus Zenbook S 13 OLED | |
| Lenovo Yoga 7 16IRL8 | |
| GPD Win Max 2 | |
| CrossMark / Overall | |
| Average of class Multimedia (866 - 2728, n=67, last 2 years) | |
| Lenovo Yoga 9 14IRP G8 | |
| Asus ROG Ally Z1 Extreme | |
| Average AMD Ryzen Z1 Extreme, AMD Radeon 780M (1693 - 1718, n=2) | |
| GPD Win Max 2 | |
| Lenovo Yoga 7 16IRL8 | |
| GPD Win 4 | |
| Asus Zenbook S 13 OLED | |
| CrossMark / Productivity | |
| Average of class Multimedia (931 - 2489, n=67, last 2 years) | |
| Lenovo Yoga 9 14IRP G8 | |
| Asus ROG Ally Z1 Extreme | |
| GPD Win Max 2 | |
| Average AMD Ryzen Z1 Extreme, AMD Radeon 780M (1639 - 1662, n=2) | |
| GPD Win 4 | |
| Lenovo Yoga 7 16IRL8 | |
| Asus Zenbook S 13 OLED | |
| CrossMark / Creativity | |
| Average of class Multimedia (907 - 3465, n=67, last 2 years) | |
| Lenovo Yoga 9 14IRP G8 | |
| Asus ROG Ally Z1 Extreme | |
| Average AMD Ryzen Z1 Extreme, AMD Radeon 780M (1868 - 1878, n=2) | |
| Lenovo Yoga 7 16IRL8 | |
| GPD Win Max 2 | |
| GPD Win 4 | |
| Asus Zenbook S 13 OLED | |
| CrossMark / Responsiveness | |
| GPD Win Max 2 | |
| Average of class Multimedia (605 - 2024, n=67, last 2 years) | |
| Lenovo Yoga 9 14IRP G8 | |
| GPD Win 4 | |
| Asus ROG Ally Z1 Extreme | |
| Average AMD Ryzen Z1 Extreme, AMD Radeon 780M (1392 - 1451, n=2) | |
| Lenovo Yoga 7 16IRL8 | |
| Asus Zenbook S 13 OLED | |
| PCMark 10 Score | 6907 points | |
Help | ||
| AIDA64 / Memory Copy | |
| Asus ROG Ally Z1 Extreme | |
| Average of class Multimedia (21158 - 132135, n=61, last 2 years) | |
| Average AMD Ryzen Z1 Extreme (74414 - 92447, n=3) | |
| Lenovo Yoga 9 14IRP G8 | |
| Lenovo Yoga 7 16IRL8 | |
| GPD Win Max 2 | |
| GPD Win 4 | |
| Asus Zenbook S 13 OLED | |
| AIDA64 / Memory Read | |
| Average of class Multimedia (19699 - 174586, n=61, last 2 years) | |
| GPD Win Max 2 | |
| Lenovo Yoga 7 16IRL8 | |
| Lenovo Yoga 9 14IRP G8 | |
| Average AMD Ryzen Z1 Extreme (50337 - 58713, n=3) | |
| Asus ROG Ally Z1 Extreme | |
| GPD Win 4 | |
| Asus Zenbook S 13 OLED | |
| AIDA64 / Memory Write | |
| Average AMD Ryzen Z1 Extreme (92869 - 108872, n=3) | |
| Asus ROG Ally Z1 Extreme | |
| Average of class Multimedia (17733 - 134998, n=61, last 2 years) | |
| Lenovo Yoga 7 16IRL8 | |
| Lenovo Yoga 9 14IRP G8 | |
| GPD Win Max 2 | |
| GPD Win 4 | |
| Asus Zenbook S 13 OLED | |
| AIDA64 / Memory Latency | |
| Asus Zenbook S 13 OLED | |
| Average AMD Ryzen Z1 Extreme (113.7 - 122.1, n=3) | |
| Average of class Multimedia (7 - 535, n=60, last 2 years) | |
| Asus ROG Ally Z1 Extreme | |
| GPD Win 4 | |
| GPD Win Max 2 | |
| Lenovo Yoga 9 14IRP G8 | |
| Lenovo Yoga 7 16IRL8 | |
* ... smaller is better
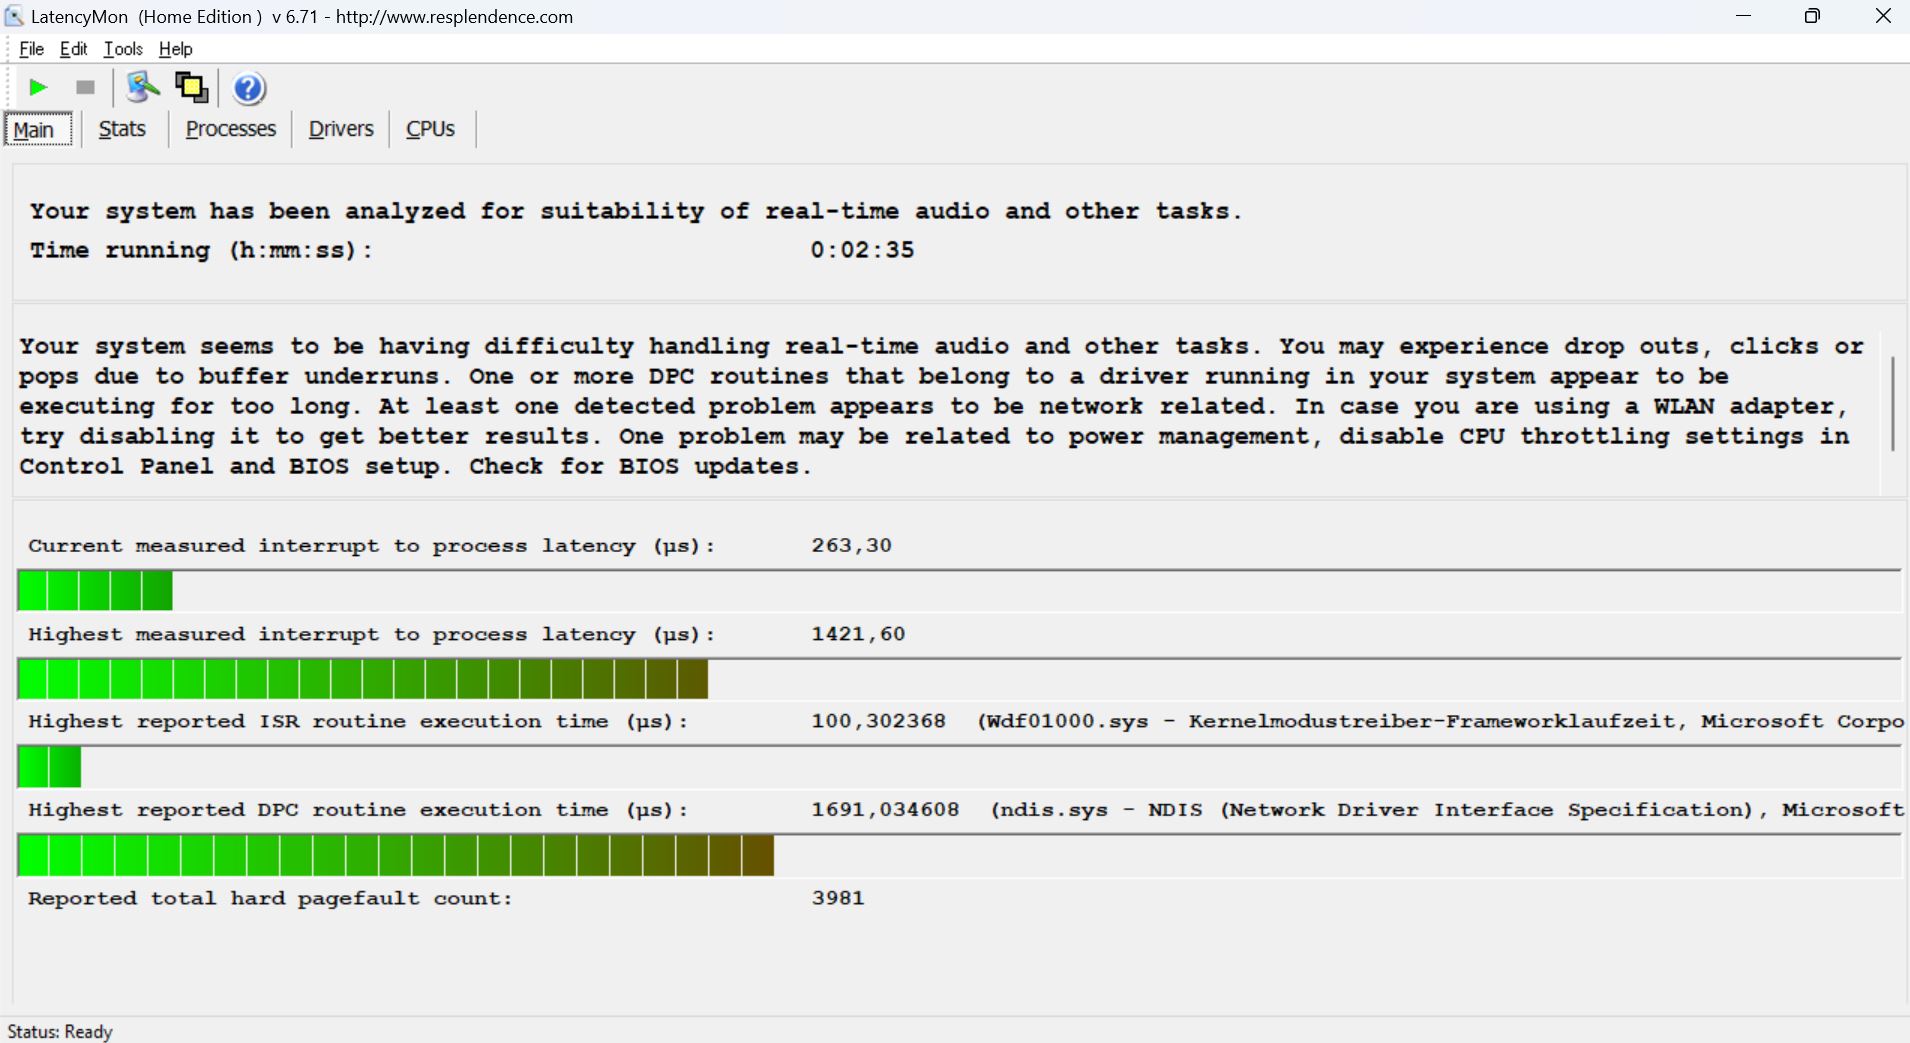
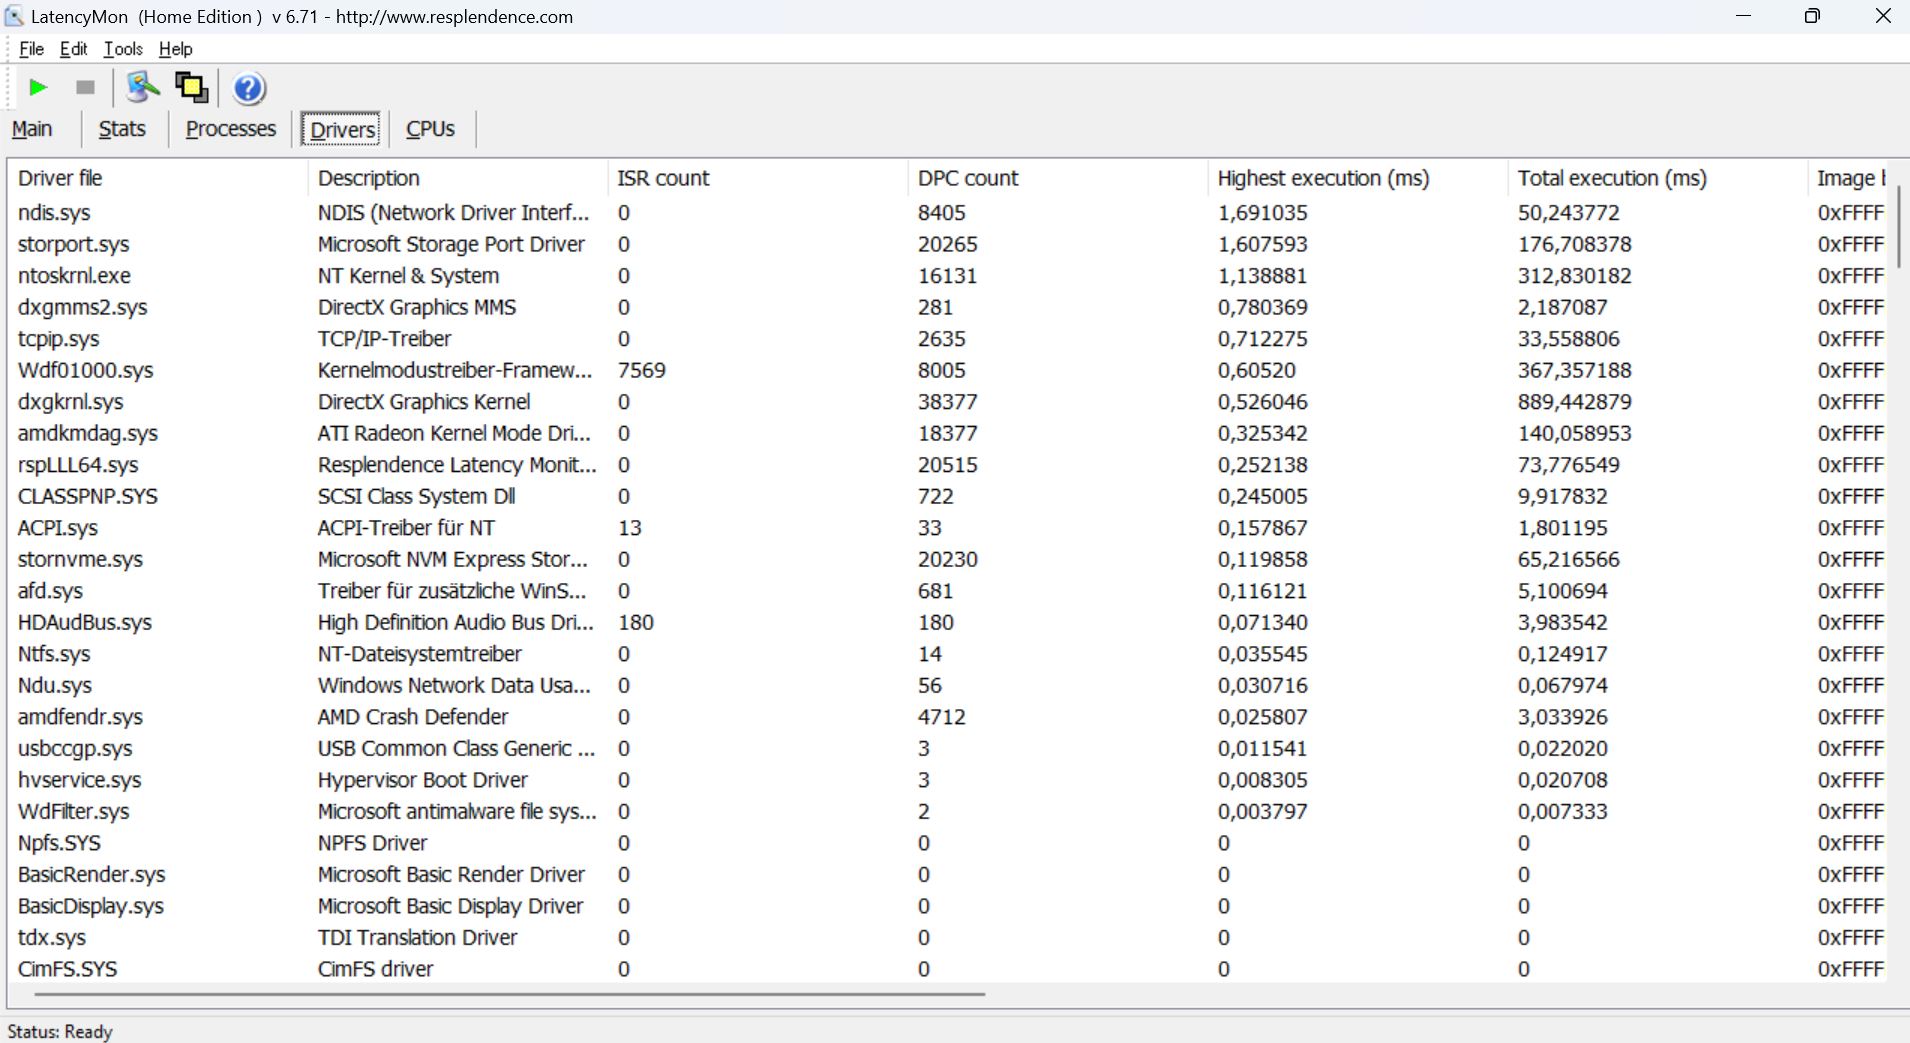
DPC Latency
Our standardized latency test (web browsing, 4K YouTube playback, CPU load) show some limitations for the review unit with the current BIOS version when you want to use real-time audio applications.
| DPC Latencies / LatencyMon - interrupt to process latency (max), Web, Youtube, Prime95 | |
| Lenovo Yoga 9 14IRP G8 | |
| Asus ROG Ally Z1 Extreme | |
| Lenovo Yoga 7 16IRL8 | |
| GPD Win 4 | |
| Asus Zenbook S 13 OLED | |
| GPD Win Max 2 | |
* ... smaller is better
Storage Devices
The compact M.2-2230 SSD is attached via PCIe 4.0 and reaches a maximum transfer rate of 4.5 GB/s according to Asus. Our review unit is equipped with the 512 GB version of the Micron 2400, and you can use 428 GB for your own files after the initial setup. Our benchmarks show maximum transfer rates of more than 4.2 GB/s and the overall performance is good, even though there are larger M.2-2280 drives with higher transfer rates on the market. We notice some small performance drops after a couple of minutes of sustained workloads, but this is not noticeable in practice. More SSD benchmarks are listed here.

* ... smaller is better
Disk Throttling: DiskSpd Read Loop, Queue Depth 8
GPU Performance
We already got a first glimpse of the new integrated Radeon 780M during our review of the Asus ROG Zephyrus G14, but the powerful iGPU was combined with slow DDR5-4800 memory. The ROG Ally on the other hand combines the Radeon 780M with 16 GB LPDDR5-6400 RAM (dual-channel), but the performance is actually not that much better. The Ally is only between 3 and 9 % faster the 780M with the slower RAM.
This means the Radeon 780M is obviously much faster than the Iris Xe Graphics G7 and roughly on par with the GeForce GTX 1650 Mobile, but stays behind the GeForce RTX 2050. Compared to the old Radeon 680M, we can see an advantage of roughly 10 % for the new 780M when the power levels are similar. The GPU performance is not much slower when you use the Performance power mode (see table below), but the impact on the gaming performance is bigger since the CPU performance is also lower.
| Quiet | Performance | Turbo | Turbo battery | |
|---|---|---|---|---|
| Time Spy Graphics | 1073 points | 2565 points | 2854 points | 2706 points |
The GPU performance is almost completely stable under sustained workloads and the Ally passes the demanding Time Spy stress test at 97.7 %. The performance on battery power is slightly reduced, but we still determined a Time Spy Graphics score of 2706 points, which is a deficit of just 5 %. Please see our tech section for more GPU benchmarks.
| 3DMark 11 Performance | 12465 points | |
| 3DMark Fire Strike Score | 7353 points | |
| 3DMark Time Spy Score | 3191 points | |
Help | ||
| Blender / v3.3 Classroom HIP/AMD | |
| GPD Win 4 | |
| Blender / v3.3 Classroom CPU | |
| Lenovo Yoga 7 16IRL8 | |
| GPD Win 4 | |
| Lenovo Yoga 9 14IRP G8 | |
| Average of class Multimedia (134.5 - 1042, n=68, last 2 years) | |
| Average AMD Radeon 780M (300 - 664, n=76) | |
| Asus ROG Ally Z1 Extreme | |
| Asus ROG Zephyrus G14 GA402XY | |
* ... smaller is better
Gaming Performance
We have finally reached the most important aspect of a gamin g handheld – the gaming performance. You have to remember that this is still an integrated GPU, but the Radeon 780M is powerful enough to run modern titles smoothly in 1080p at least with low or medium details. While the pure GPU performance was similar in the 3DMark tests, we can see bigger differences between the Turbo and Performance power modes during gaming. Our default set of gaming tests shows that the ROG Ally is faster than its direct rivals and can beat the GeForce GTX 1050 Max-Q, but it is still beaten by the MX550, GTX 1650 Mobile, and RTX 2050 Mobile.
Witcher 3 FPS Chart
The battery runtime is obviously important for a gaming handheld. The ROG Ally offers a number of features including upscaling and fps limitations. It definitely makes more sense to limit the frame rate instead of the power limit, which could result in fps drops during demanding gaming scenes. We fiddled around quite a lot with all these settings, but the impact on the actual power consumption was pretty small. The only real difference was between the Turbo and Performance power mode. The system consumes around 40-42 Watts in Turbo mode, which results in a runtime of roughly an hour considering the 40 Wh battery. Our Witcher 3 battery test at 150 nits confirms this with a runtime of just 57 minutes. If you select the Performance mode, however, the consumption drops to around 22-24 Watts, so you can expect a runtime of about 1 hour and 45 minutes.
It is possible to improve the runtime with a large power bank. We tested it with a 99 Wh model (even though it is old and we are pretty sure it does not provide the rated capacity anymore) and improved the Witcher 3 runtime in Turbo mode from 57 minutes to almost 3 hours. We are pretty sure that you can get close to 4 hours in Turbo mode and 6-7 hours in Performance mode with a new power bank.
You can obviously fiddle around with the settings and the resolution to reduce the consumption a bit (1-2 Watts should be possible), but we definitely recommend using the Performance power mode on battery and then adjust the settings so you can enjoy smooth gameplay. More gaming benchmarks are available here.
Gaming Benchmarks Turbo mode
| low | med. | high | ultra | |
|---|---|---|---|---|
| GTA V (2015) | 126.9 | 122.2 | 59.5 | 25.7 |
| The Witcher 3 (2015) | 47.2 | 27.5 | ||
| Dota 2 Reborn (2015) | 127.2 | 105.8 | 85.6 | 75.5 |
| Final Fantasy XV Benchmark (2018) | 75.2 | 37.4 | 27.7 | |
| X-Plane 11.11 (2018) | 50.8 | 37.3 | 29.9 | |
| Far Cry 5 (2018) | 73 | 43 | 40 | 37 |
| Strange Brigade (2018) | 147.6 | 64.8 | 54.8 | 46.3 |
| Shadow of the Tomb Raider (2018) | 97 | 43 | 38 | 33 |
| Horizon Zero Dawn (2020) | 37 | |||
| F1 2021 (2021) | 190.3 | 96.2 | 75.4 | 31.5 |
| Far Cry 6 (2021) | 80 | 48 | 41 | 30 |
| Forza Horizon 5 (2021) | 100 | 65 | 56 | 0 () |
| Cyberpunk 2077 1.6 (2022) | 38.6 | 31.2 | 24.4 | 23.3 |
| F1 22 (2022) | 86.6 | 77.9 | 57.9 | 15.1 |
| Hogwarts Legacy (2023) | 37.8 | 24.8 | 19.5 | 14.8 |
| Baldur's Gate 3 (2023) | 39.6 | 30.8 | 25.1 | 24 |
| Cyberpunk 2077 (2023) | 39.1 | 29.9 | 23.8 | 20.3 |
| Ghost of Tsushima (2024) | 32.5 | 25.6 | 21.8 | 0 () |
Gaming Benchmarks Performance mode
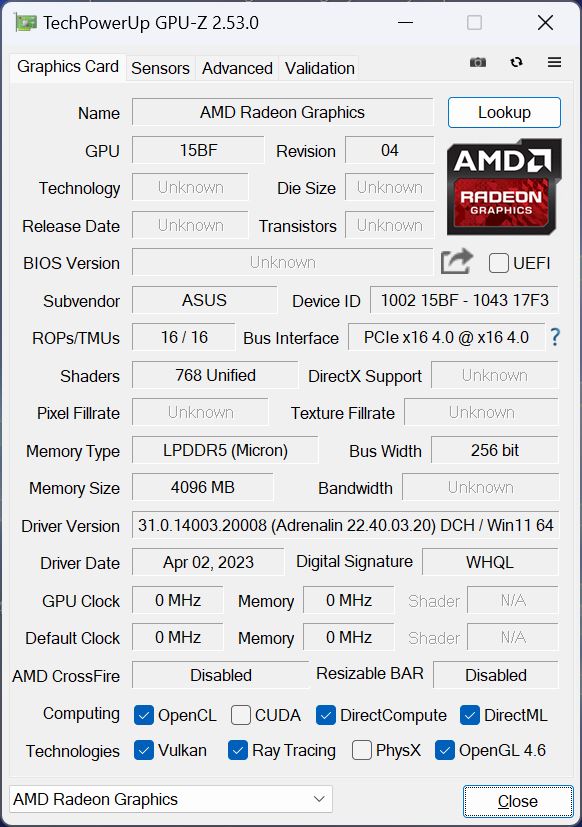
Update - Gaming benchmarks with the GeForce RTX 4090 Laptop
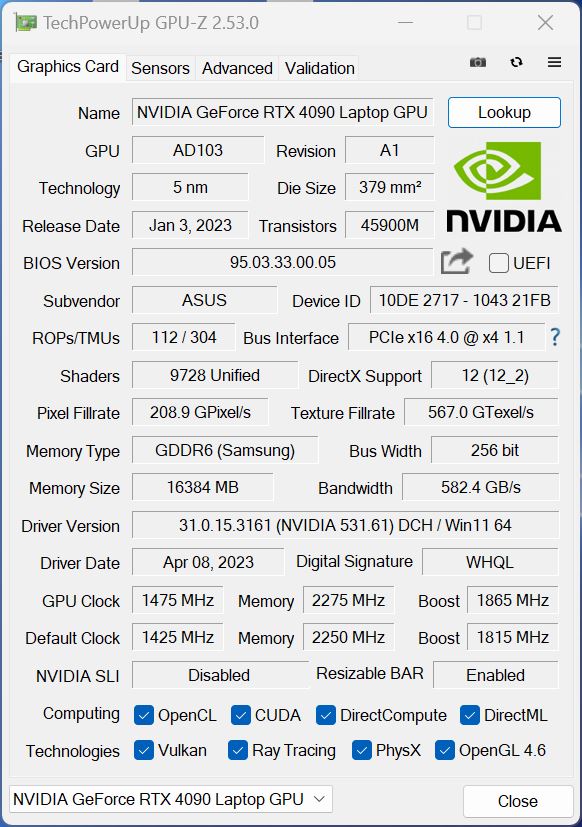
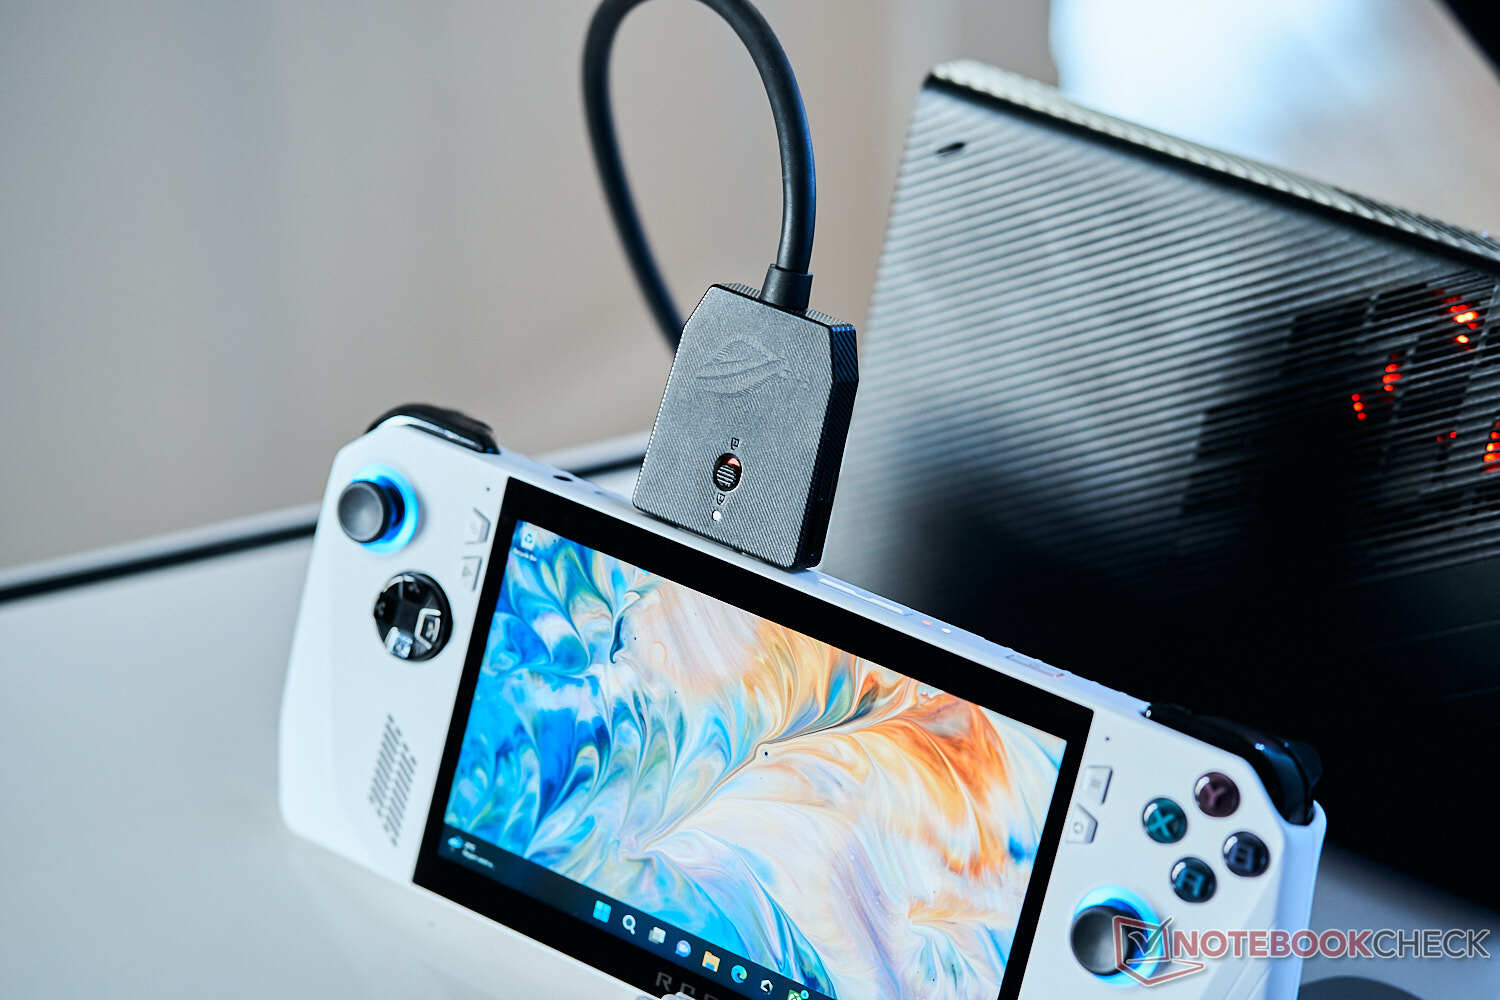
We now had the opportunity to check the performance of the ROG Ally in combination with the external graphics card Asus XG Mobile 2023, which is equipped with the new Nvidia GeForce RTX 4090 Laptop. The XG Mobile also acts as a docking station at the same time and offers multiple video outputs (DisplayPort & HDMI) as well as USB ports. However, the connector itself is very bulky and it also has a very short and stiff cable. Combined with the ROG Ally, where the docking port is located at the upper edge, this means there are not that many positions that work. It is not really a plug-&-play system, either, because the XG Mobile has to be initiated and removed via Armoury Crate software. If you have the Ally sitting on your desk and want to remove it quickly, you might have to boot the device first and then remove the XG Mobile first. We also had repeated crashes or major performance issues when we tried to play F1 2021 & F1 2022 and the two titles were not playable when the XG Mobile was attached.
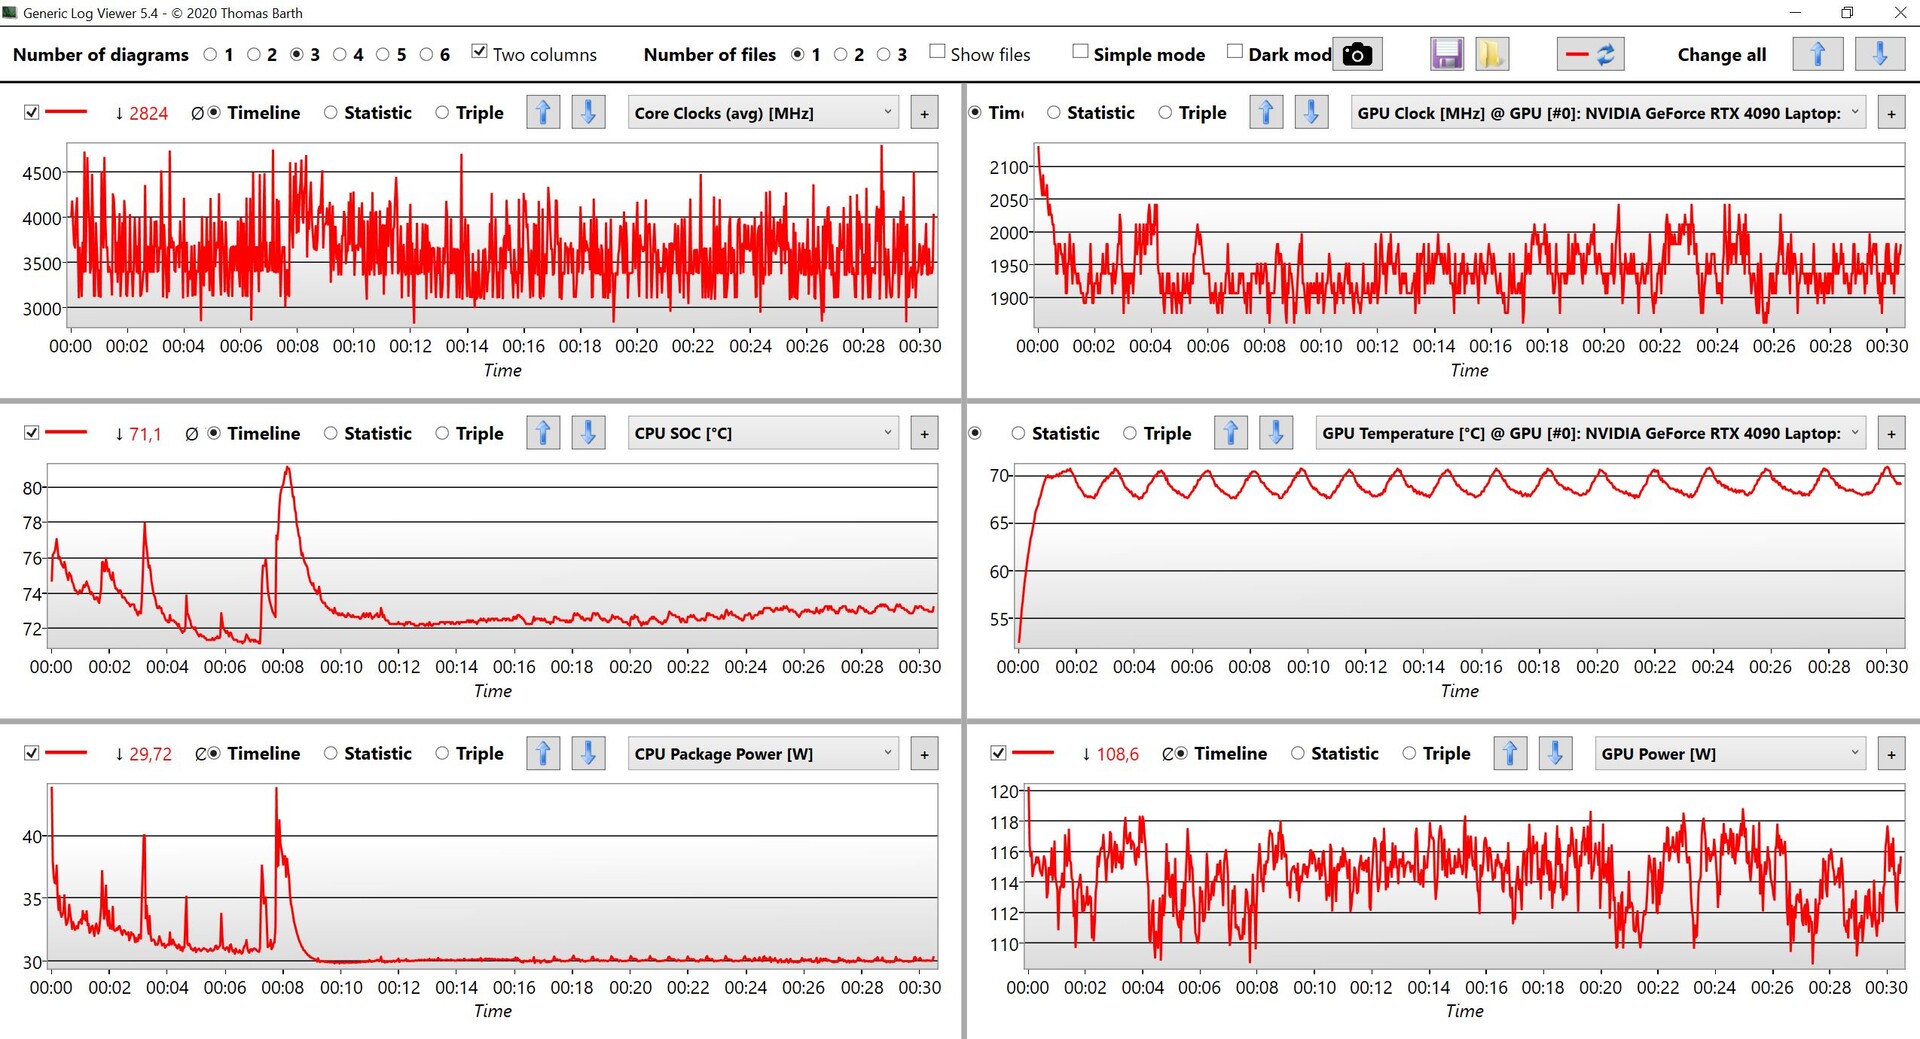
It is basically the 150W version of the RTX 4090 Laptop with an indicated TGP of 150 Watts, but the external GPU only reached a maximum of 120 Watts during our tests. We are already in contact wie Asus, but did not find a solution so far. All of the following benchmarks are therefore with a 120W TGP. We used the Turbo profile on the ROG Ally to get the maximum CPU performance. Our Witcher 3 loop clearly shows that the external GPU cannot utilize its full potential of 150 Watts, but the processor behaves like we expected and settles at 30 Watts after a couple of minutes.
Let's have a look at the graphics performance compared to other models like the Asus ROG Zephyrus G14 with the Ryzen 9 7940HS and the GeForce RTX 4090 Laptop (up to 125W TGP or 100W in combined workloads, respectively). We can also compare the performance with the ROG Z13, where we also had the chance to perform some benchmarks with the XG Mobile RTX 4090 Laptop. The synthetic benchmark results are very good overall, but the Time Spy test at QHD is a bit lower than expected.
| 3DMark Performance rating - Percent | |
| Asus ROG Flow Z13 ACRNM | |
| Asus ROG Ally Z1 Extreme | |
| Lenovo Legion Pro 7 16IRX8H | |
| Asus ROG Zephyrus M16 GU604VY-NM042X | |
| Asus ROG Zephyrus G14 GA402XY | |
| Razer Blade 16 Early 2023 | |
| Asus ROG Ally Z1 Extreme | |
| 3DMark 11 - 1280x720 Performance GPU | |
| Asus ROG Flow Z13 ACRNM | |
| Asus ROG Ally Z1 Extreme | |
| Lenovo Legion Pro 7 16IRX8H | |
| Asus ROG Zephyrus M16 GU604VY-NM042X | |
| Asus ROG Zephyrus G14 GA402XY | |
| Razer Blade 16 Early 2023 | |
| Asus ROG Ally Z1 Extreme | |
| 3DMark | |
| 2560x1440 Time Spy Graphics | |
| Asus ROG Flow Z13 ACRNM | |
| Razer Blade 16 Early 2023 | |
| Lenovo Legion Pro 7 16IRX8H | |
| Asus ROG Zephyrus G14 GA402XY | |
| Asus ROG Zephyrus M16 GU604VY-NM042X | |
| Asus ROG Ally Z1 Extreme | |
| Asus ROG Ally Z1 Extreme | |
| 1920x1080 Fire Strike Graphics | |
| Asus ROG Ally Z1 Extreme | |
| Asus ROG Zephyrus M16 GU604VY-NM042X | |
| Lenovo Legion Pro 7 16IRX8H | |
| Asus ROG Zephyrus G14 GA402XY | |
| Asus ROG Flow Z13 ACRNM | |
| Razer Blade 16 Early 2023 | |
| Asus ROG Ally Z1 Extreme | |
Our gaming benchmarks show that the processor can limit the performance and the 1080p results in particular are often much lower compared to the rivals. When you use the QHD or 4K resolution, however, the deficit is much smaller and the Ally with the XG Mobile is even ahead in titles like Cyberpunk 2077. The Ally is also pretty much on par with the ROG Zephyrus G14 in 4K, even though the RTX 4090 Laptop should be a bit slower. All in all, the addition of the XG Mobile is obviously a massive performance boost compared to the integrated Radeon 780M, but you should be aware that there can still be issues despite the high price and the short cable means that possible desk setups are very limited. You can also expect the fan noise of a powerful gaming laptop and we definitely recommend headphones or a headset when you play games. The price-performance ratio of the XG Mobile is obviously not great and it will stay a niche product, but we are still happy that such an option exists and you can transform the Ally (or other ROG devices like the Z13) into a 4K gaming device at home if you are willing to pay the high price.
| GTA V | |
| 1920x1080 Highest AA:4xMSAA + FX AF:16x | |
| Lenovo Legion Pro 7 16IRX8H | |
| Razer Blade 16 Early 2023 | |
| Asus ROG Zephyrus M16 GU604VY-NM042X | |
| Asus ROG Zephyrus G14 GA402XY | |
| Asus ROG Flow Z13 ACRNM | |
| Asus ROG Ally Z1 Extreme | |
| Asus ROG Ally Z1 Extreme | |
| 2560x1440 Highest AA:4xMSAA + FX AF:16x | |
| Razer Blade 16 Early 2023 | |
| Asus ROG Zephyrus M16 GU604VY-NM042X | |
| Asus ROG Zephyrus G14 GA402XY | |
| Asus ROG Flow Z13 ACRNM | |
| Asus ROG Ally Z1 Extreme | |
| 3840x2160 Highest AA:4xMSAA + FX AF:16x | |
| Asus ROG Ally Z1 Extreme | |
| Asus ROG Zephyrus G14 GA402XY | |
| Razer Blade 16 Early 2023 | |
| Asus ROG Flow Z13 ACRNM | |
| The Witcher 3 | |
| 1920x1080 Ultra Graphics & Postprocessing (HBAO+) | |
| Asus ROG Flow Z13 ACRNM | |
| Asus ROG Zephyrus M16 GU604VY-NM042X | |
| Lenovo Legion Pro 7 16IRX8H | |
| Razer Blade 16 Early 2023 | |
| Asus ROG Zephyrus G14 GA402XY | |
| Asus ROG Ally Z1 Extreme | |
| Asus ROG Ally Z1 Extreme | |
| 3840x2160 High Graphics & Postprocessing (Nvidia HairWorks Off) | |
| Asus ROG Flow Z13 ACRNM | |
| Razer Blade 16 Early 2023 | |
| Asus ROG Ally Z1 Extreme | |
| Asus ROG Zephyrus G14 GA402XY | |
| Far Cry 6 | |
| 1920x1080 Ultra Graphics Quality + HD Textures AA:T | |
| Razer Blade 16 Early 2023 | |
| Asus ROG Zephyrus M16 GU604VY-NM042X | |
| Asus ROG Flow Z13 ACRNM | |
| Asus ROG Zephyrus G14 GA402XY | |
| Asus ROG Ally Z1 Extreme | |
| Asus ROG Ally Z1 Extreme | |
| 2560x1440 Ultra Graphics Quality + HD Textures AA:T | |
| Razer Blade 16 Early 2023 | |
| Asus ROG Zephyrus M16 GU604VY-NM042X | |
| Asus ROG Flow Z13 ACRNM | |
| Asus ROG Zephyrus G14 GA402XY | |
| Asus ROG Ally Z1 Extreme | |
| 3840x2160 Ultra Graphics Quality + HD Textures AA:T | |
| Asus ROG Flow Z13 ACRNM | |
| Asus ROG Zephyrus M16 GU604VY-NM042X | |
| Razer Blade 16 Early 2023 | |
| Asus ROG Ally Z1 Extreme | |
| Asus ROG Zephyrus G14 GA402XY | |
| Hogwarts Legacy | |
| 1920x1080 Ultra Preset AA:High T | |
| Asus ROG Zephyrus G14 GA402XY | |
| Asus ROG Ally Z1 Extreme | |
| Asus ROG Ally Z1 Extreme | |
| 2560x1440 Ultra Preset AA:High T | |
| Asus ROG Zephyrus G14 GA402XY | |
| Asus ROG Ally Z1 Extreme | |
| 3840x2160 Ultra Preset AA:High T | |
| Asus ROG Zephyrus G14 GA402XY | |
| Asus ROG Ally Z1 Extreme | |
| Cyberpunk 2077 1.6 | |
| 1920x1080 Ultra Preset | |
| Asus ROG Flow Z13 ACRNM | |
| Razer Blade 16 Early 2023 | |
| Asus ROG Zephyrus G14 GA402XY | |
| Asus ROG Zephyrus M16 GU604VY-NM042X | |
| Asus ROG Ally Z1 Extreme | |
| Asus ROG Ally Z1 Extreme | |
| 2560x1440 Ultra Preset | |
| Asus ROG Flow Z13 ACRNM | |
| Asus ROG Ally Z1 Extreme | |
| Razer Blade 16 Early 2023 | |
| Asus ROG Zephyrus G14 GA402XY | |
| Asus ROG Zephyrus M16 GU604VY-NM042X | |
| 3840x2160 Ultra Preset | |
| Asus ROG Flow Z13 ACRNM | |
| Asus ROG Ally Z1 Extreme | |
| Asus ROG Zephyrus M16 GU604VY-NM042X | |
| Razer Blade 16 Early 2023 | |
| Asus ROG Zephyrus G14 GA402XY | |
Gaming Benchmarks XG Mobile RTX 4090 Laptop
| low | med. | high | ultra | QHD | 4K | |
|---|---|---|---|---|---|---|
| GTA V (2015) | 154.1 | 91.1 | 90.4 | 143 | ||
| The Witcher 3 (2015) | 290 | 139.2 | 117 | |||
| Dota 2 Reborn (2015) | 138.1 | 125.9 | 121.2 | 115.7 | 120.2 | |
| Final Fantasy XV Benchmark (2018) | 141.8 | 132.7 | 81.9 | |||
| X-Plane 11.11 (2018) | 113.6 | 99.5 | 77.8 | 67.6 | ||
| Strange Brigade (2018) | 243 | 233 | 217 | 127.8 | ||
| Shadow of the Tomb Raider (2018) | 146 | 144 | 134 | 81 | ||
| Far Cry 6 (2021) | 91 | 85 | 71 | |||
| Cyberpunk 2077 1.6 (2022) | 104 | 103 | 89 | 45 | ||
| Hogwarts Legacy (2023) | 44.8 | 41.2 | 40.6 | 26.8 |
Emissions - Temperatures and fan noise are acceptable
System Noise
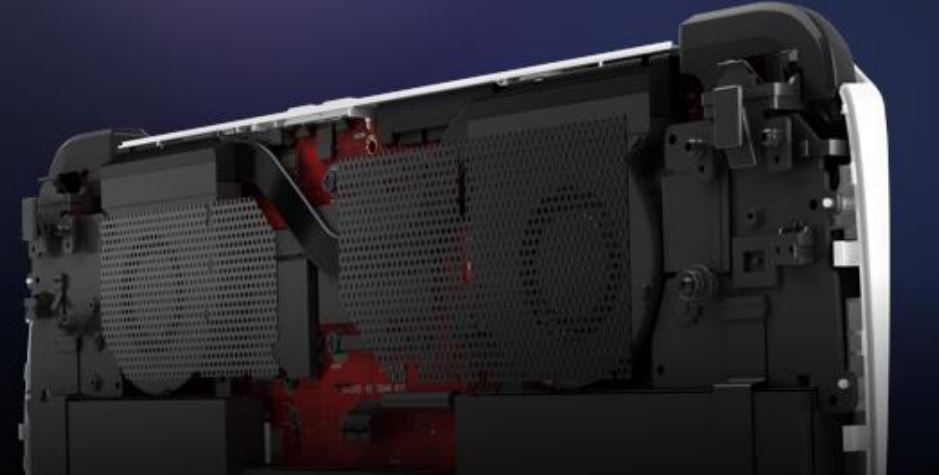
Asus uses a cooling solution with two fans, which works at every tilt angle (the manufacturer calls it Zero Gravity cooling). Fresh air is sucked in from the back and the warm air is dissipates via fan exhausts at the top of the unit. There is a dust cover at the intake to prevent dirty fans. A look at the small fans might raise concerns about a high-pitched fan noise, but this is fortunately not the case.
The two fans are pretty sensible to load changes in general (independent of the power mode), also during light workloads. This is not really an issue since the fan noise is very quiet at around 27 dB(A), but it shows that the passive cooling performance is very low due to the limited space. The fan noise under load only depends on the power mode with 39.2 dB(A) in Turbo mode for all tests and 31.2 dB(A) in Performance mode. This difference is very noticeable, but the performance is also noticeably better in Turbo mode. We were not able to get higher fan noise and there were no electronic noises (like coil whine), either.
Noise level
| Idle |
| 23.3 / 23.3 / 27.3 dB(A) |
| Load |
| 39.2 / 39.2 dB(A) |
 | ||
30 dB silent 40 dB(A) audible 50 dB(A) loud |
||
min: | ||
| Asus ROG Ally Z1 Extreme Radeon 780M, Z1 Extreme, Micron 2400 MTFDKBK512QFM | Valve Steam Deck 512 GB LCD , | GPD Win 4 Radeon 680M, R7 6800U, BiWin CE480Y2D100-1TB | GPD Win Max 2 Iris Xe G7 96EUs, i7-1260P, BiWin NQ200 1TB CNF82GS1D00-1TB | Asus Zenbook S 13 OLED Radeon 680M, R7 6800U, Samsung PM9A1 MZVL21T0HCLR | Lenovo Yoga 9 14IRP G8 Iris Xe G7 96EUs, i7-1360P, SK hynix PC801 HFS512GEJ9X101N BF | Lenovo Yoga 7 16IRL8 Iris Xe G7 96EUs, i7-1355U, WD PC SN740 512GB SDDPMQD-512G-1101 | |
|---|---|---|---|---|---|---|---|
| Noise | -5% | -23% | -0% | 1% | -5% | -2% | |
| off / environment * (dB) | 23.3 | 24.3 -4% | 24 -3% | 22.6 3% | 24 -3% | 23.6 -1% | 22.8 2% |
| Idle Minimum * (dB) | 23.3 | 24.3 -4% | 31.2 -34% | 23.7 -2% | 24 -3% | 23.6 -1% | 22.9 2% |
| Idle Average * (dB) | 23.3 | 24.3 -4% | 31.2 -34% | 23.7 -2% | 24 -3% | 23.6 -1% | 22.9 2% |
| Idle Maximum * (dB) | 27.3 | 30 -10% | 33.5 -23% | 28.5 -4% | 24 12% | 24.6 10% | 26.9 1% |
| Load Average * (dB) | 39.2 | 45.5 -16% | 36.5 7% | 33.1 16% | 45 -15% | 41.7 -6% | |
| Witcher 3 ultra * (dB) | 39.2 | 40.7 -4% | 48.6 -24% | 39.8 -2% | 40.2 -3% | 45 -15% | 41.5 -6% |
| Load Maximum * (dB) | 39.2 | 40.7 -4% | 49 -25% | 40.5 -3% | 41.7 -6% | 45 -15% | 43.6 -11% |
* ... smaller is better
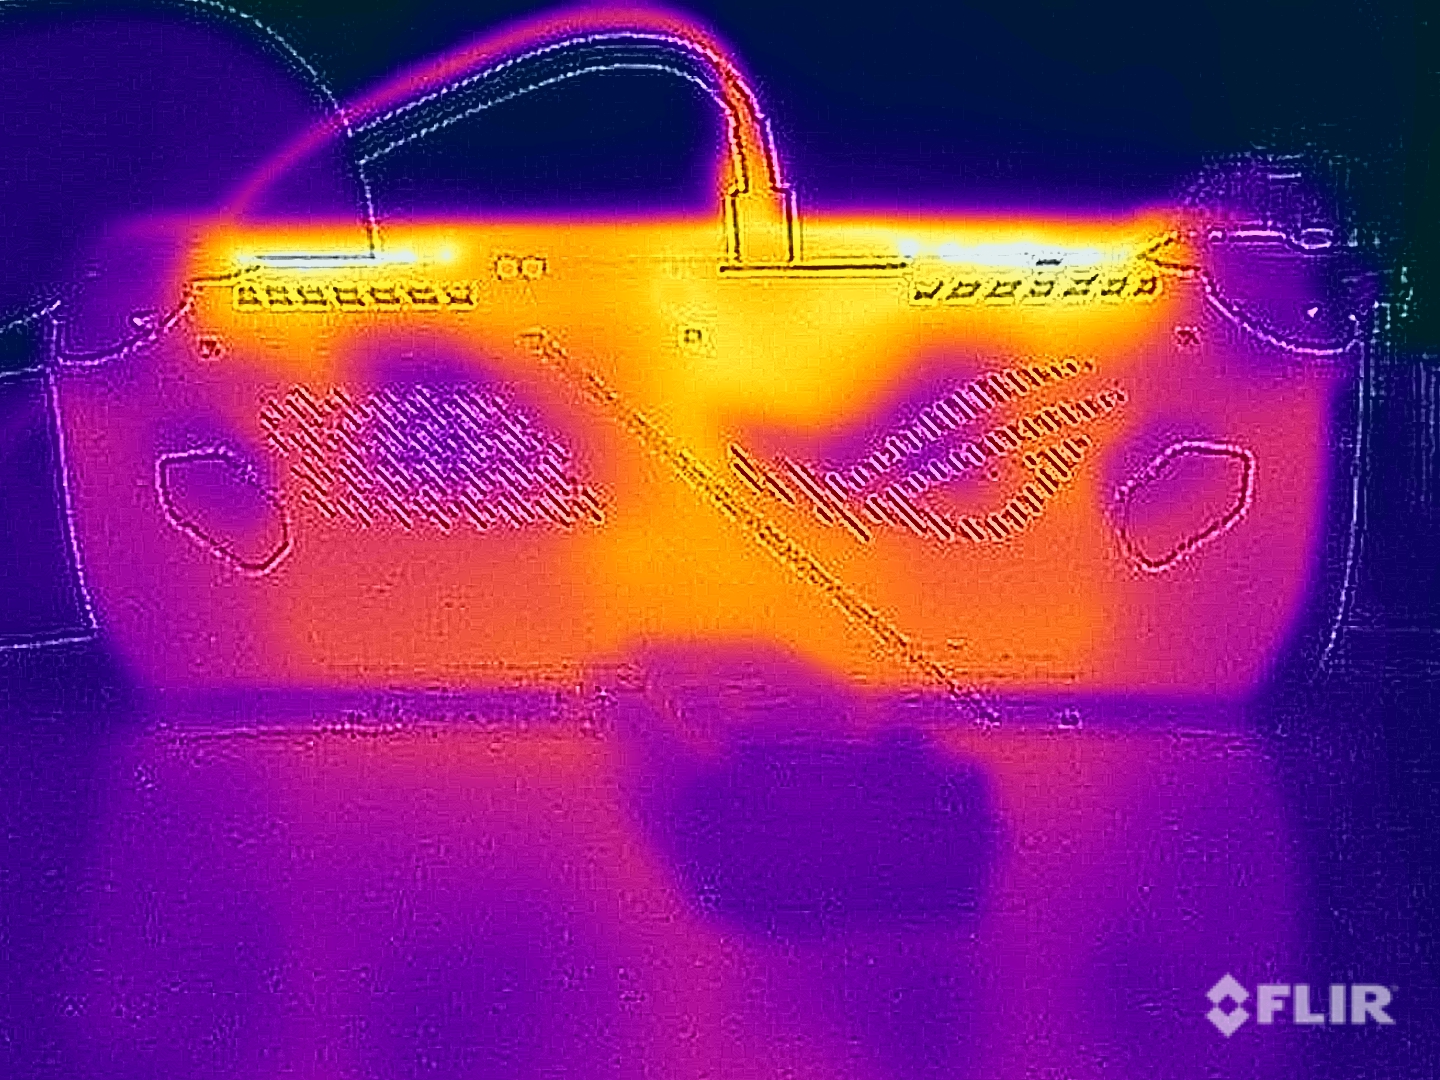
Temperature
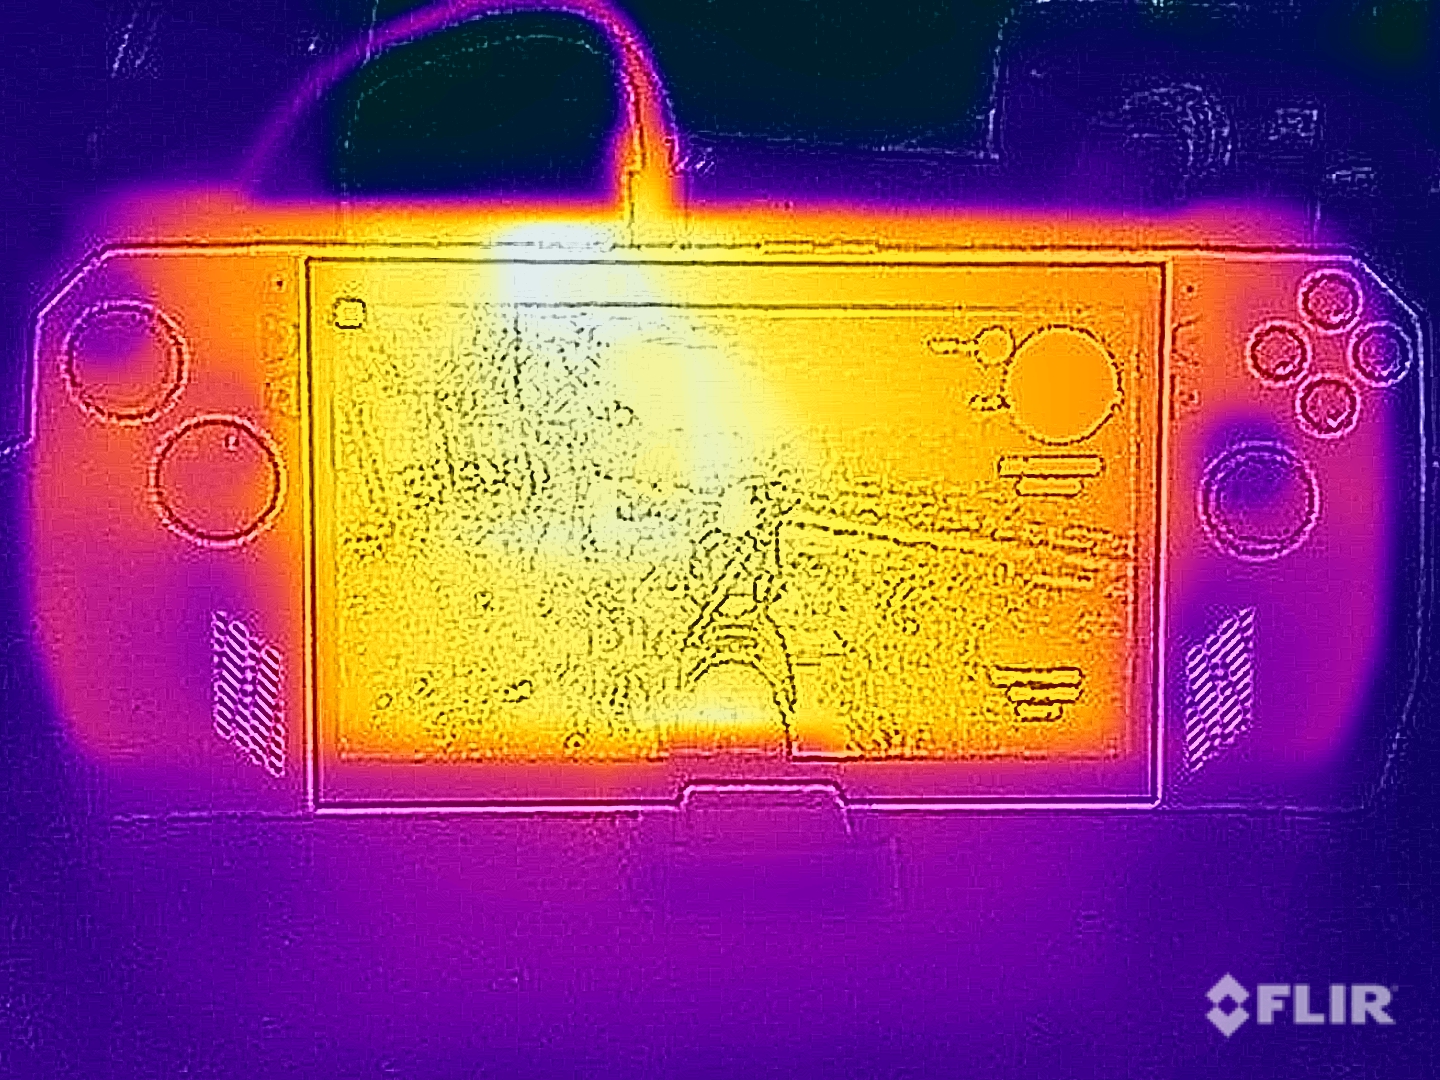
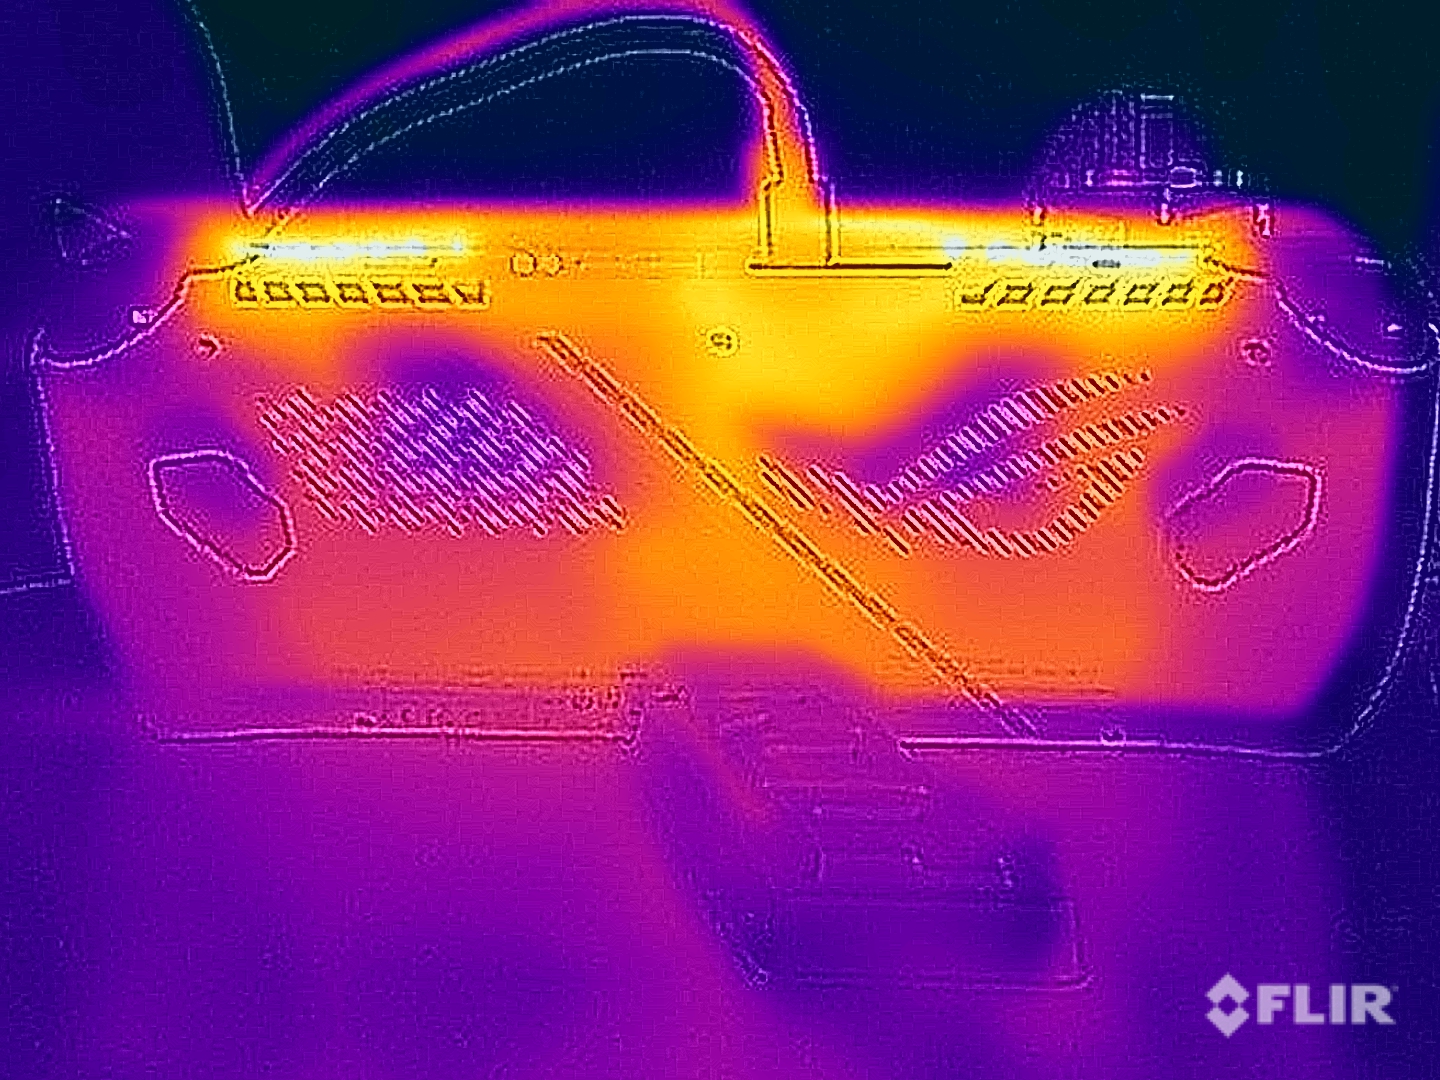
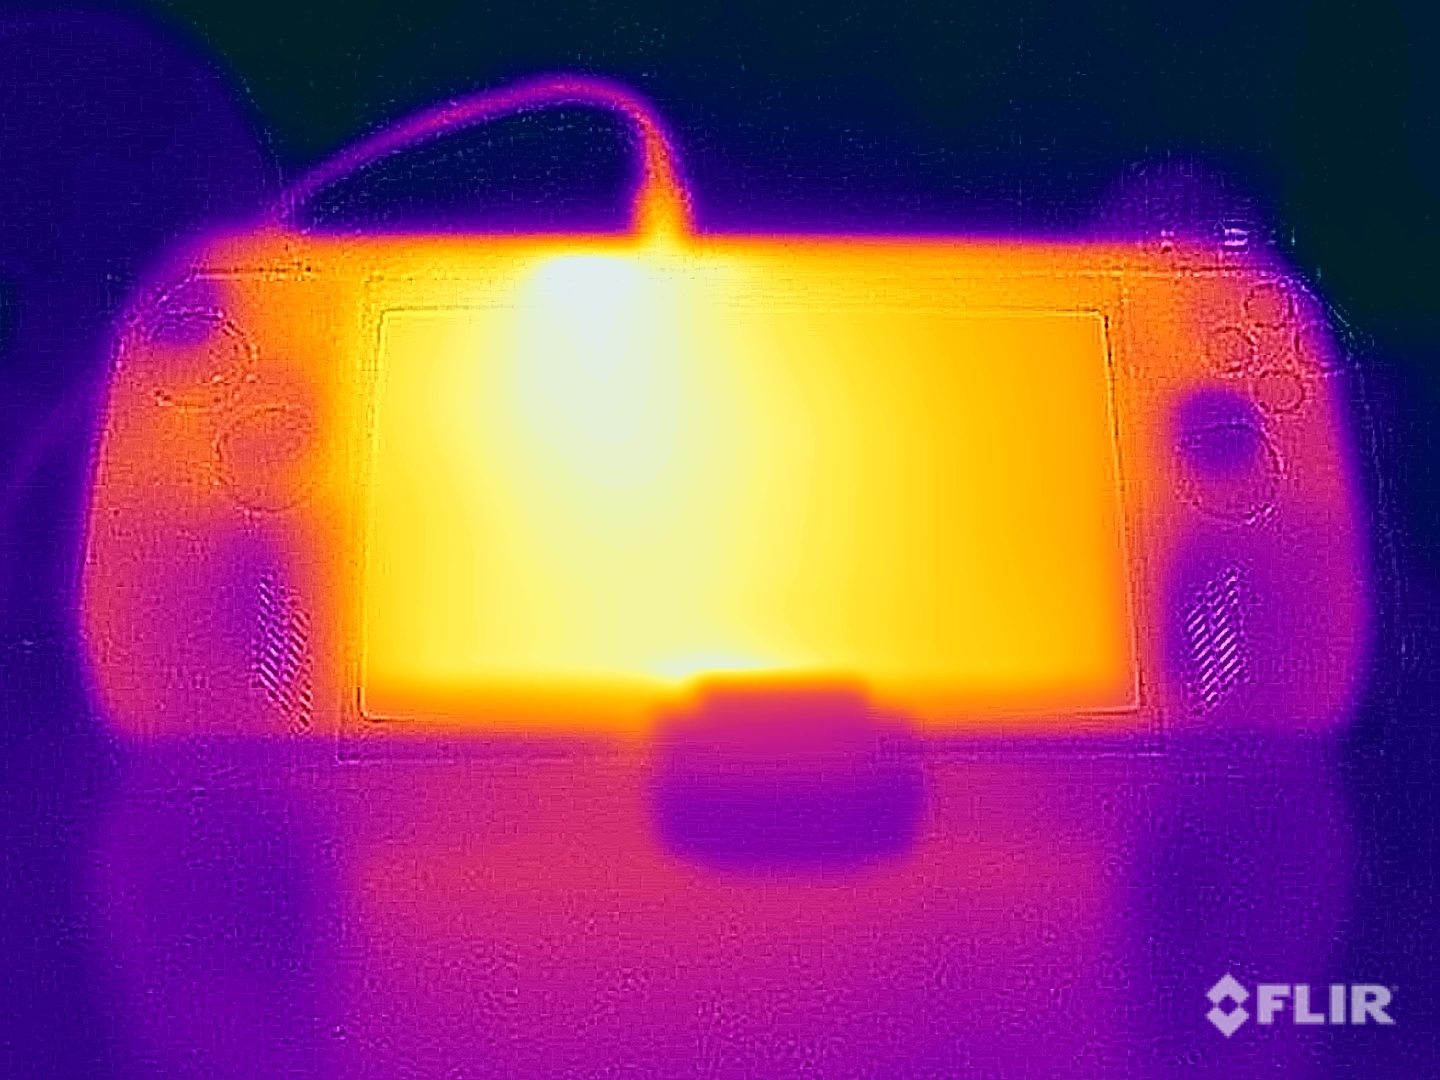
There are no issues with the surface temperatures despite the high performance since the two grips are always comfortably cool (which is also well-illustrated on the thermal images below). The back panel obviously warms up quite a bit and the hot spots are the areas around the fan exhausts on the top with up to 49 °C in Turbo mode. However, there is usually no skin contact in these areas, and the warm air is directed away from the user when you hold the Ally in front of your body. The surface temperatures stay below 30 °C in light workloads, so there are no limitations.
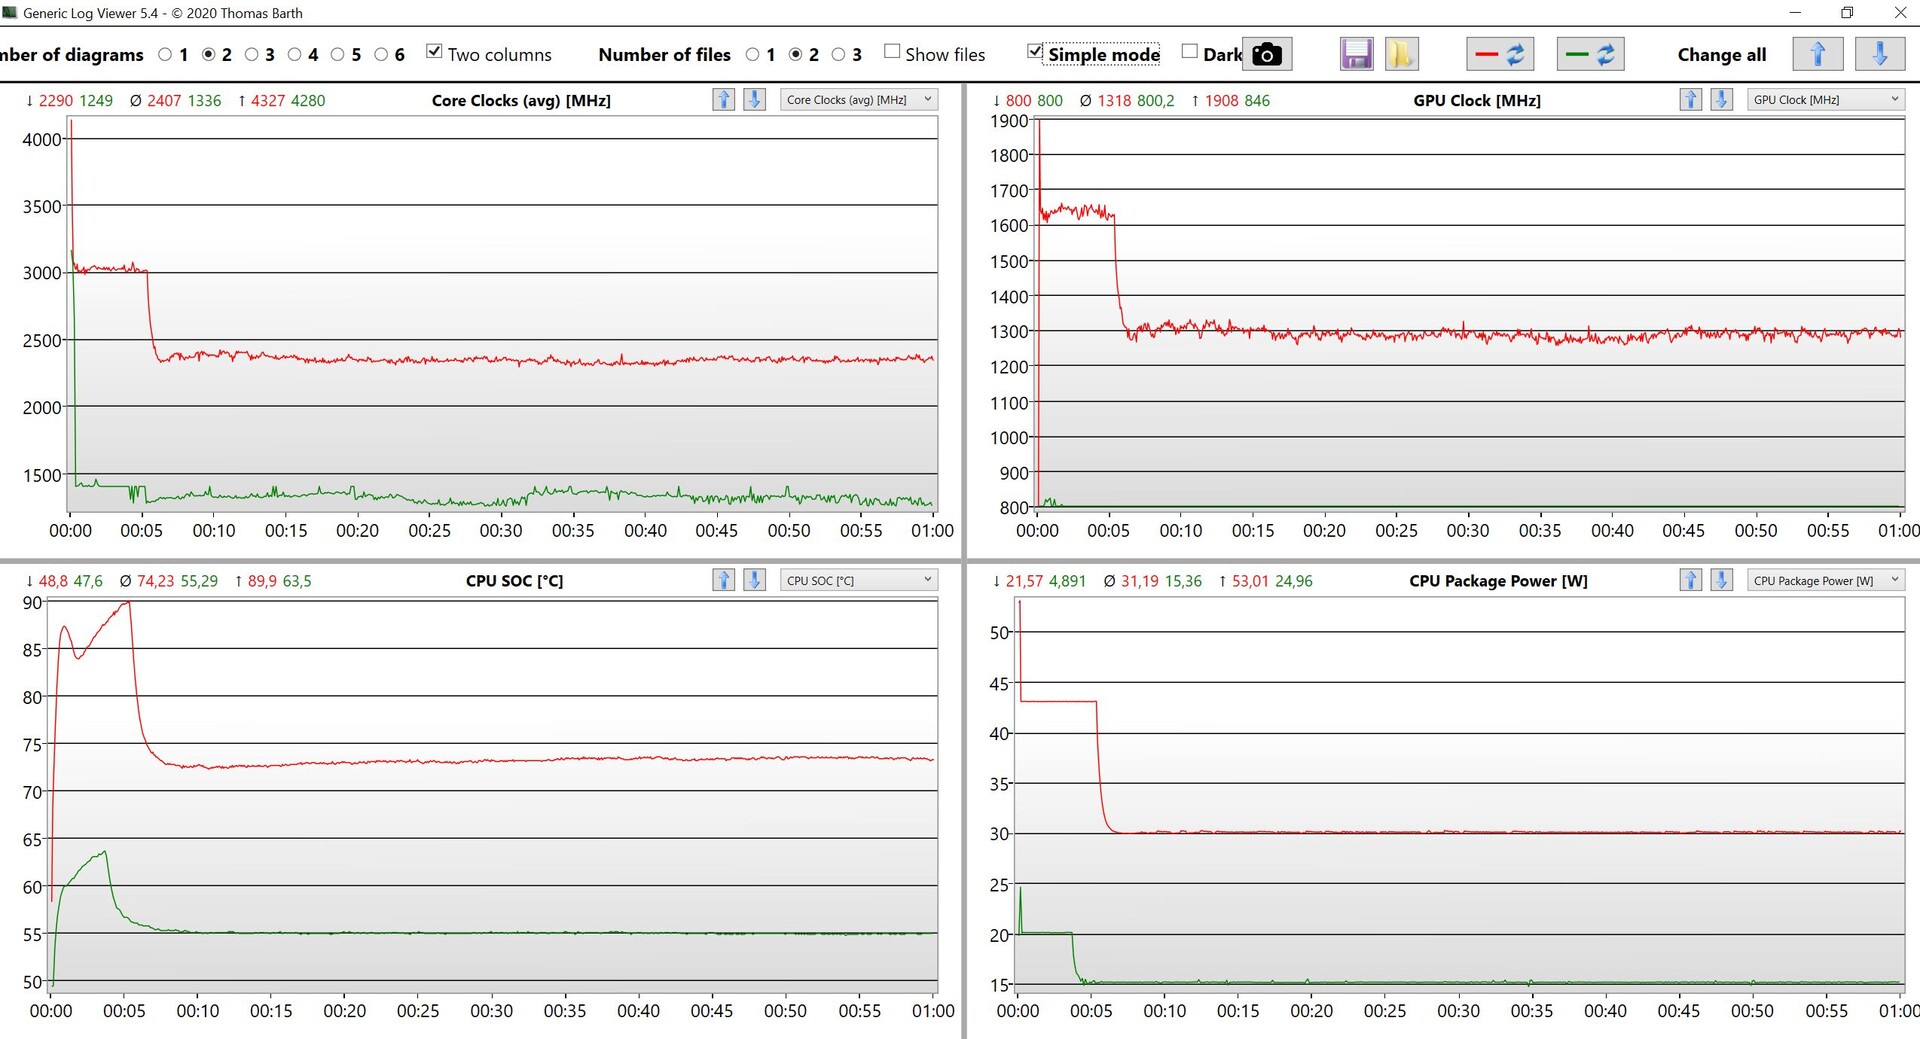
Our stress test once again shows a big difference between the Turbo and Performance power mode. After a couple of minutes, the SoC will level off at the advertised 30 and 15 Watts, respectively, and stay at this level for the rest of the test. This is a very good result that some compact laptops do not manage. The performance is not reduced immediately after the stress test.
Surface temperatures Turbo mode
(±) The maximum temperature on the upper side is 44.4 °C / 112 F, compared to the average of 36.8 °C / 98 F, ranging from 21 to 71 °C for the class Multimedia.
(+) The bottom heats up to a maximum of 37.9 °C / 100 F, compared to the average of 39.1 °C / 102 F
(+) In idle usage, the average temperature for the upper side is 29 °C / 84 F, compared to the device average of 31.3 °C / 88 F.
(-) Playing The Witcher 3, the average temperature for the upper side is 41.9 °C / 107 F, compared to the device average of 31.3 °C / 88 F.
(-) The palmrests and touchpad can get very hot to the touch with a maximum of 43.3 °C / 109.9 F.
(-) The average temperature of the palmrest area of similar devices was 28.7 °C / 83.7 F (-14.6 °C / -26.2 F).
Surface temperatures Performance mode
(±) The maximum temperature on the upper side is 40.7 °C / 105 F, compared to the average of 36.8 °C / 98 F, ranging from 21 to 71 °C for the class Multimedia.
(+) The bottom heats up to a maximum of 30.1 °C / 86 F, compared to the average of 39.1 °C / 102 F
(-) Playing The Witcher 3, the average temperature for the upper side is 40 °C / 104 F, compared to the device average of 31.3 °C / 88 F.
(-) The palmrests and touchpad can get very hot to the touch with a maximum of 41.8 °C / 107.2 F.
(-) The average temperature of the palmrest area of similar devices was 28.7 °C / 83.7 F (-13.1 °C / -23.5 F).
| Asus ROG Ally Z1 Extreme AMD Ryzen Z1 Extreme, AMD Radeon 780M | GPD Win 4 AMD Ryzen 7 6800U, AMD Radeon 680M | GPD Win Max 2 Intel Core i7-1260P, Intel Iris Xe Graphics G7 96EUs | |
|---|---|---|---|
| Heat | 17% | 17% | |
| Maximum Upper Side * (°C) | 44.4 | 35 21% | 28.6 36% |
| Maximum Bottom * (°C) | 37.9 | 26.8 29% | 33 13% |
| Idle Upper Side * (°C) | 29.9 | 28.4 5% | 24.6 18% |
| Idle Bottom * (°C) | 28.3 | 25 12% | 27.6 2% |
* ... smaller is better
Speakers
There are two stereo speakers (1W each) at the front of the device, so the sound is directed towards the user. The modules manage good volume and the overall quality is decent, but the sound lacks punch, even though this is not surprising for a small device. Our analysis also shows that the overall quality is better compared to the Steam Deck.
You can actually use the speakers for game sound when you play in the Performance power mode. Otherwise, there is a 3.5 mm stereo jack for headphones or external speakers.
Asus ROG Ally Z1 Extreme audio analysis
(+) | speakers can play relatively loud (82.1 dB)
Bass 100 - 315 Hz
(-) | nearly no bass - on average 15.5% lower than median
(±) | linearity of bass is average (8.4% delta to prev. frequency)
Mids 400 - 2000 Hz
(+) | balanced mids - only 3.1% away from median
(+) | mids are linear (3% delta to prev. frequency)
Highs 2 - 16 kHz
(+) | balanced highs - only 1.9% away from median
(+) | highs are linear (2.3% delta to prev. frequency)
Overall 100 - 16.000 Hz
(+) | overall sound is linear (13.5% difference to median)
Compared to same class
» 29% of all tested devices in this class were better, 4% similar, 67% worse
» The best had a delta of 5%, average was 17%, worst was 45%
Compared to all devices tested
» 14% of all tested devices were better, 4% similar, 82% worse
» The best had a delta of 4%, average was 24%, worst was 134%
Valve Steam Deck 512 GB LCD audio analysis
(±) | speaker loudness is average but good (79.2 dB)
Bass 100 - 315 Hz
(-) | nearly no bass - on average 21.6% lower than median
(±) | linearity of bass is average (12% delta to prev. frequency)
Mids 400 - 2000 Hz
(+) | balanced mids - only 3.3% away from median
(+) | mids are linear (6.1% delta to prev. frequency)
Highs 2 - 16 kHz
(+) | balanced highs - only 3.4% away from median
(+) | highs are linear (5.4% delta to prev. frequency)
Overall 100 - 16.000 Hz
(±) | linearity of overall sound is average (17.9% difference to median)
Compared to same class
» 46% of all tested devices in this class were better, 17% similar, 38% worse
» The best had a delta of 12%, average was 17%, worst was 23%
Compared to all devices tested
» 37% of all tested devices were better, 8% similar, 55% worse
» The best had a delta of 4%, average was 24%, worst was 134%
Energy Management - Ally with limited battery runtime
Power Consumption
The minimum idle power consumption of the ROG Ally is not that efficient with 4.2 Watts. There are some laptops with larger screens that manage similar or even better results. The value is increased to 6.3 Watts at maximum brightness. The load results are very similar to a regular AMD powered subnotebook with around 50 Watts during gaming and our stress test after a couple of minutes. We measure a maximum consumption of 67 Watts for the 65W power adapter, but the battery is not drained.
| Off / Standby | |
| Idle | |
| Load |
|
Key:
min: | |
| Asus ROG Ally Z1 Extreme Z1 Extreme, Radeon 780M, Micron 2400 MTFDKBK512QFM, IPS, 1920x1080, 7" | Valve Steam Deck 512 GB LCD 1280x800, 7" | GPD Win 4 R7 6800U, Radeon 680M, BiWin CE480Y2D100-1TB, IPS, 1920x1080, 6" | GPD Win Max 2 i7-1260P, Iris Xe G7 96EUs, BiWin NQ200 1TB CNF82GS1D00-1TB, IPS, 2560x1600, 10.1" | Average of class Multimedia | |
|---|---|---|---|---|---|
| Power Consumption | -7% | -37% | -26% | -56% | |
| Idle Minimum * (Watt) | 4.2 | 5.4 -29% | 7.5 -79% | 5.8 -38% | 5.71 ? -36% |
| Idle Average * (Watt) | 6.1 | 7.6 -25% | 12.4 -103% | 10.2 -67% | 10.1 ? -66% |
| Idle Maximum * (Watt) | 6.3 | 7.8 -24% | 13 -106% | 11.5 -83% | 12.4 ? -97% |
| Load Average * (Watt) | 56.6 | 46 19% | 47.7 16% | 65 ? -15% | |
| Witcher 3 ultra * (Watt) | 64.1 | 31.1 51% | 45.2 29% | 45.6 29% | |
| Load Maximum * (Watt) | 67.2 | 56 17% | 76.8 -14% | 112.2 ? -67% |
* ... smaller is better
Power consumption Witcher 3 / Stress test
Battery Runtime
We already talked about the battery runtime during gaming and you can expect between 1 hour up to 1 hour and 45 minutes depending on the power mode. If you use the device for video playback or web browsing, the 40 Wh battery manages much longer runtimes. At an adjusted brightness of 150 nits (40 % of the maximum brightness on our review unit), our video test ran for around 9.5 hours. We tested different brightness levels at 60 and 120 Hz for our Wi-Fi test with results between 6 and almost 8 hours:
| Brightness | 60 Hz | 120 Hz |
|---|---|---|
| 150 nits | 465 minutes | 444 minutes |
| Maximum | 397 minutes | 355 minutes |
A full charge takes 90 minutes when the device is turned on. The charging speed drops when the battery level hits 60 %, which takes 34 minutes. (0 % of the capacity is available after around 50 minutes.
| Asus ROG Ally Z1 Extreme Z1 Extreme, Radeon 780M, 40 Wh | GPD Win 4 R7 6800U, Radeon 680M, 46 Wh | GPD Win Max 2 i7-1260P, Iris Xe G7 96EUs, 70 Wh | Average of class Multimedia | |
|---|---|---|---|---|
| Battery runtime | -4% | 12% | 64% | |
| H.264 (h) | 9.5 | 16.4 ? 73% | ||
| WiFi v1.3 (h) | 7.8 | 7.5 -4% | 8.7 12% | 12 ? 54% |
| Witcher 3 ultra (h) | 1 | |||
| Reader / Idle (h) | 9.7 | 15.4 | 25.2 ? | |
| Load (h) | 1.3 | 1.7 | 1.675 ? |
Pros
Cons
Verdict - ROG Ally is a very good gaming handheld
The new Asus ROG Ally is very successful first attempt of a gaming handheld. Not only the hardware is very convincing, but we are also impressed by the excellent controls and handling with a focus on the gaming experience. The specifically designed Armoury Crate SE software is very well thought-out (and optimized for touch) user interface as well as control center for all your games, which is launched by default when you start the ROG Ally. You can comfortably manage all your games in one place and even create custom control schemes for every individual game. The Command Center, which is always accessible with the touch of a button (and configurable) is also extremely handy and even includes real-time hardware monitoring. Someone really put some thought into all this. Armoury Crate SE is still just a single application with a completely stock Windows 11 operating system, so you can just attach the Ally to your USB-C screen or a docking station and be productive.
Asus does not make any compromises in terms of hardware, either, and you get the latest and greatest AMD mobile processor for 799 Euros. It is actually the first device and we are still waiting on laptops with these CPUs. The AMD Ryzen Z1 Extreme is effectively the new Ryzen 7 7840U with 8 powerful Zen4 cores (4 nm, Phoenix) including the new Radeon 780M iGPU. The CPU performance in Turbo mode is particularly impressive and the compact handheld device easily beats most compact laptop in terms of multi-core performance. We are already very eager to test the Ally with the external GeForce RTX 4090 Laptop and we will add the benchmark results in a couple of days. We suspect the CPU will not be a huge bottleneck for the gaming performance when you consider the Asus ROG Zephyrus G14, where the Ryzen 9 7940HS was also limited to 45 Watts during gaming.
The Asus ROG Ally is an excellent gaming handheld. Thanks to the powerful AMD Zen4 processor and the fast iGPU, the compact device manages smooth frame rates even in modern games and you can enjoy the 1080p screen with fast response times and 120 Hz. We were particularly impressed by the well though-out controls and the only real drawback of the ROG Ally is the limited battery runtime while playing games, because the battery will be drained after around 1.5 hours.
Asus uses a plastic chassis, but the overall quality is completely okay and both the build quality as well as the stability are excellent. You can replace the compact M.2-2230 SSD, clean the fans and expand the storage capacity thanks to the fast microSD card reader. The 7-inch IPS screen with fast response times and adaptive sync is excellent for gaming and also sufficiently bright at almost 500 nits.
Our biggest criticism is the lack of a webcam as well as the short battery runtime when you actually play games. If you use the highest performance in Turbo mode, the battery will be empty after one hour at most. You can stretch the runtime to 1:45 hours in Performance mode, but this is pretty much the maximum runtime. Otherwise, it is not easy to find drawbacks. A built-in kickstand would be nice on the go and we would appreciate a docking port at the bottom, so cable do not stick out from the top.
Note: We rated the device in the Multimedia category since we do not have a category for gaming handhelds yet. We will add a corresponding category when we can review more devices.
Price and Availability
Compared to the Steam Deck, the new ROG Ally is superior in pretty much every respect except for the price (Steam Deck with 16 GB RAM and 512 GB SSD has an RRP of 679 Euros). We are currently also reviewing the One X Player 2 with AMD Ryzen 7 6800U and a larger 8.4-inch screen, but it is also more expensive (1099 Euros) with 16/512 GB. The GPD Win 4 with the 6800U is much more compact, but also more expensive. The less expensive SKU of the ROG Ally will be much slower during gaming due to the less powerful iGPU, so we want to wait with a verdict. The segment of gaming handhelds seems to be revived and we expect more devices from big manufacturers over the next couple of months. Until then, the new Asus ROG Ally is the best gaming handheld you can currently get.
Asus ROG Ally Z1 Extreme
- 05/11/2023 v7 (old)
Andreas Osthoff
