
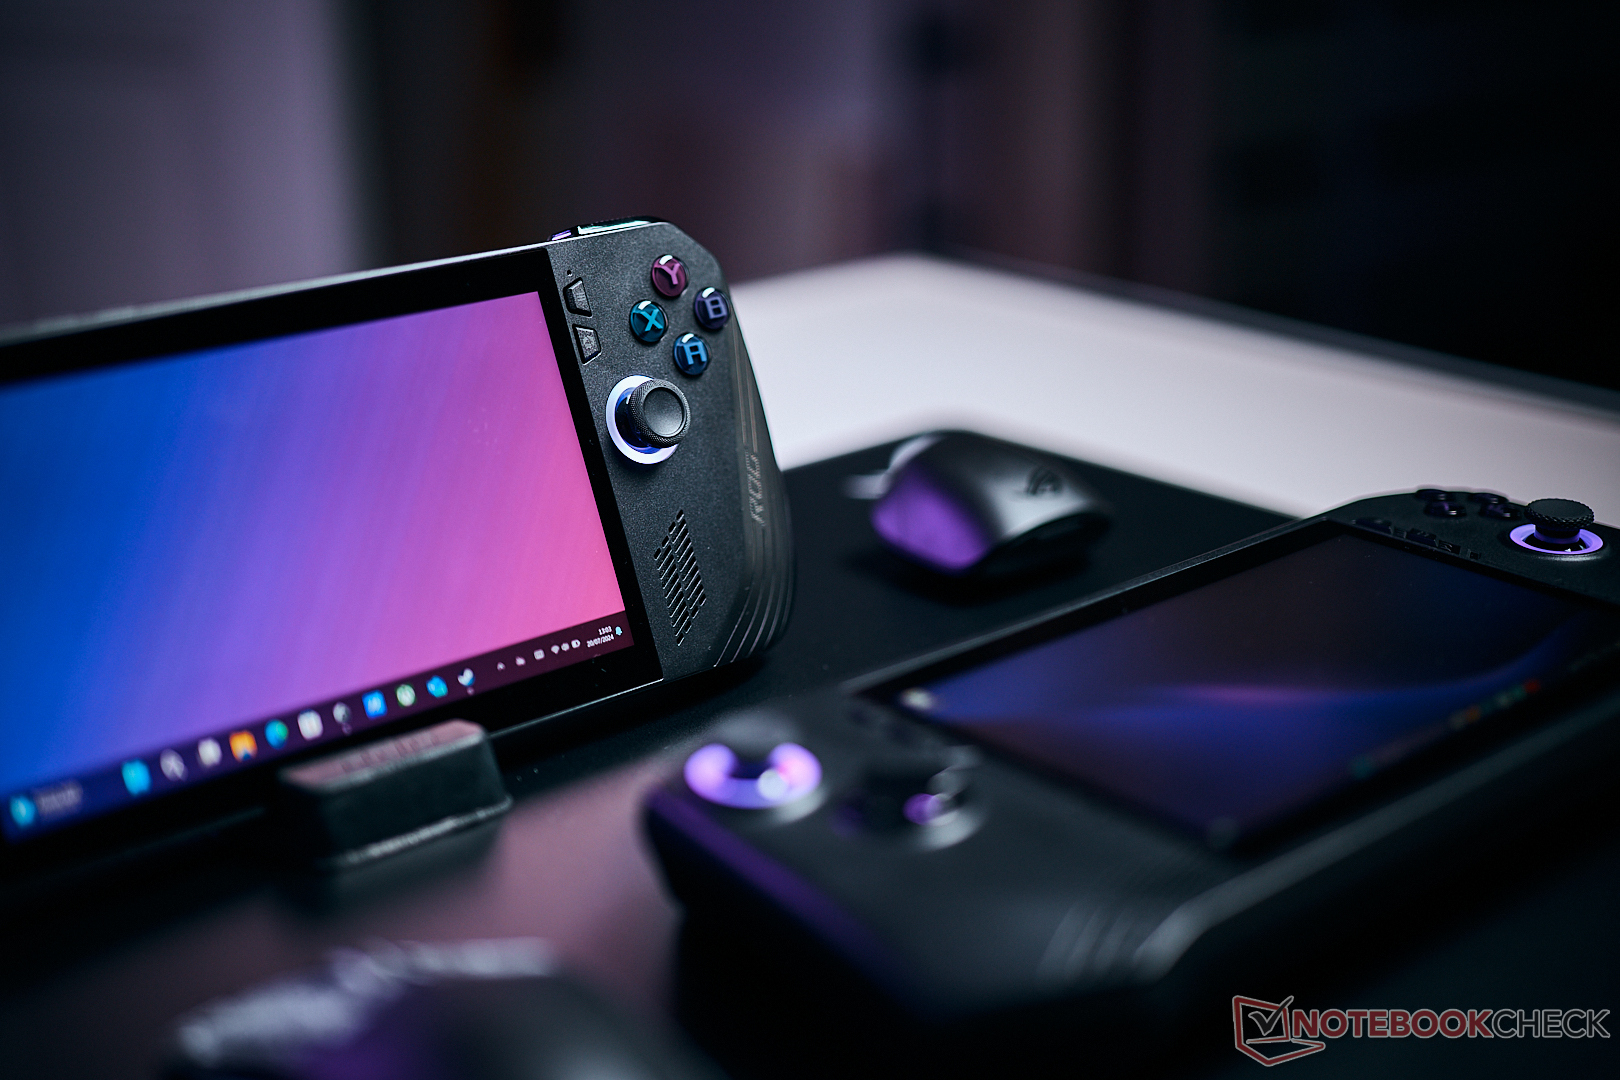
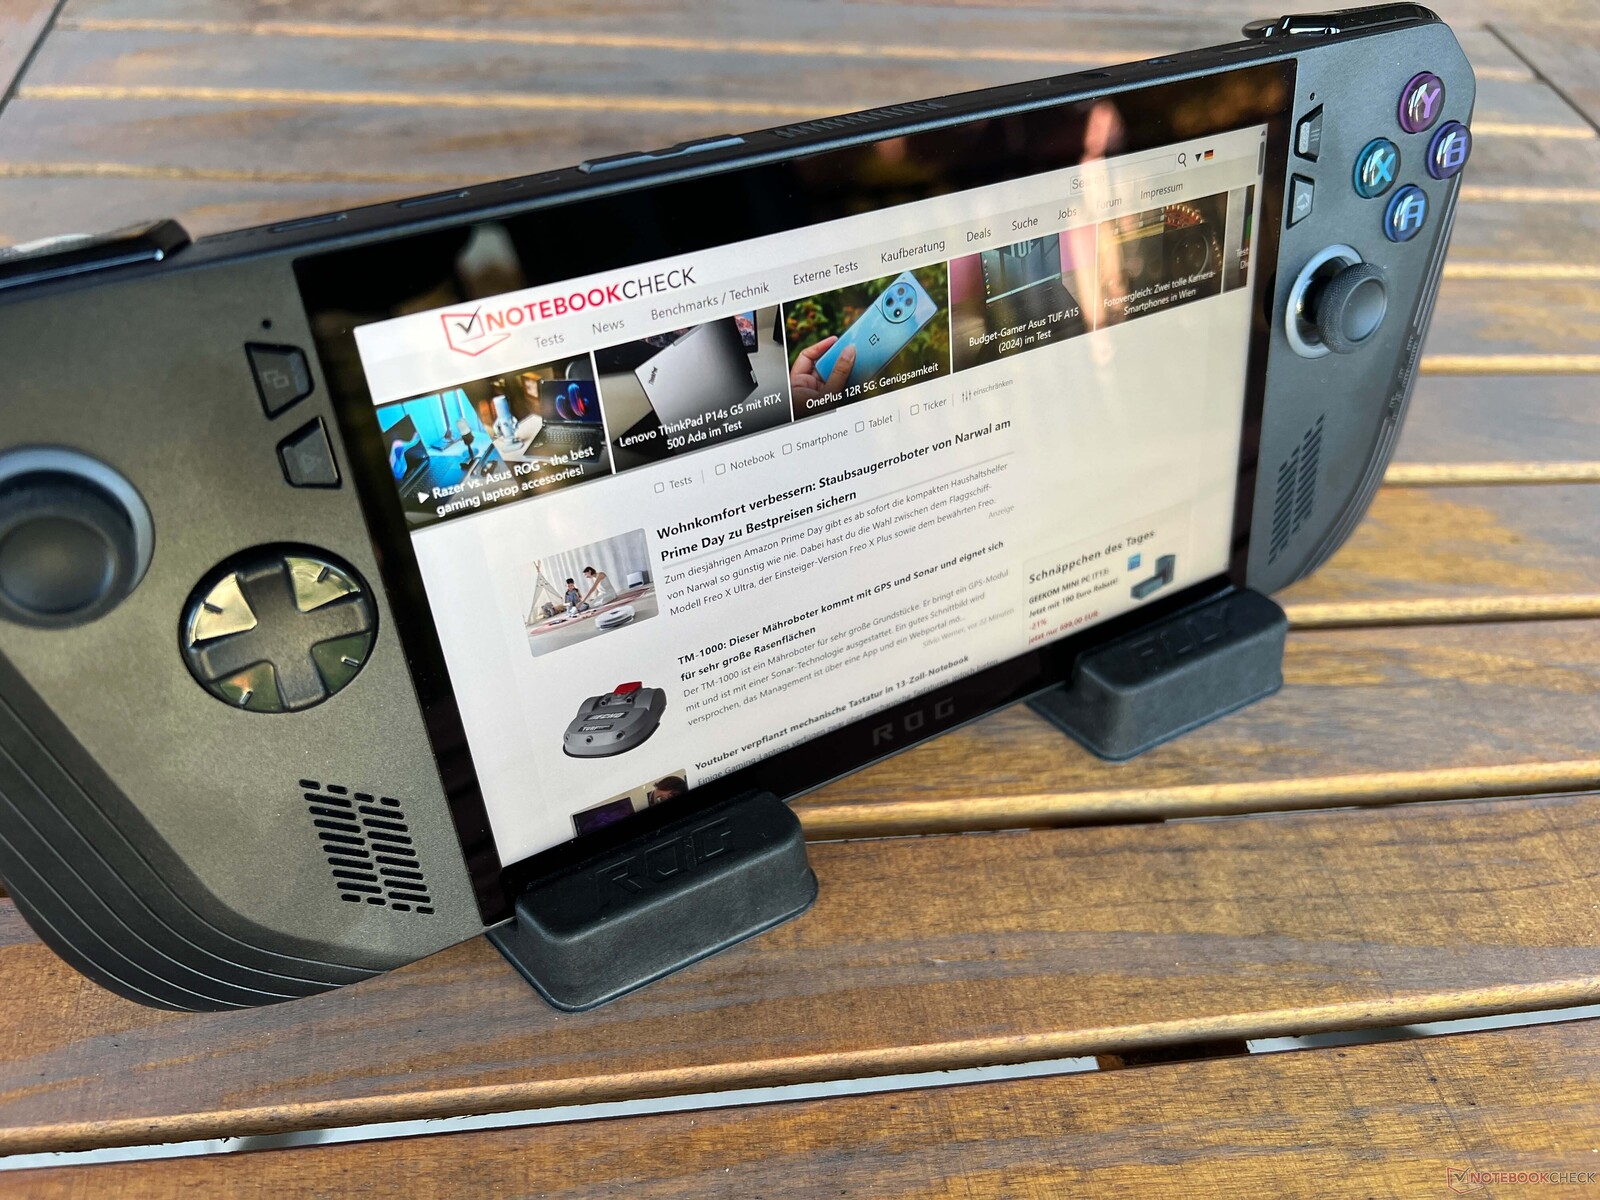
One year ago, Asus launched its first gaming handheld, the ROG Ally. Now we get an updated version called ROG Ally X, which is once again equipped with the same AMD Ryzen Z1 Extreme processor as well as the 7-inch IPS screen with VRR. All other aspects, however, have been improved compared to the original Ally. The most important upgrades include improved ergonomics, larger battery size, and improved performance thanks to faster memory.
There will be only SKU for 899 Euros ($799), so the RRP is 100 Euros ($100) higher compared to the original ROG Ally. In addition to the larger 80-Wh battery, Asus also put in 24 GB RAM as well as 1 TB SSD storage. We want to find out whether the ROG Ally X is really an improvement or if you should hurry and buy the original ROG Ally, which is already available for under 600 Euros (and might drop even further after the Ally X goes on sale).
Update 07/24: We added more gaming benchmarks and also tested FSR 3 for Call of Duty: Modern Warfare 3 and Horizon Forbidden West (plus Frame Generation).
Potential Rivals
Rating | Version | Date | Model | Weight | Height | Size | Resolution | Price |
|---|---|---|---|---|---|---|---|---|
| 84.6 % | v8 | 07 / 2024 | Asus ROG Ally X Z1 Extreme, Radeon 780M | 685 g | 36.9 mm | 7.00" | 1920x1080 | |
| 76.9 % | v8 | 06 / 2024 | GPD Win Mini 2024 7" R7 8840U, Radeon 780M | 526 g | 26 mm | 7.00" | 1920x1080 | |
| 77.4 % | v8 | 06 / 2024 | MSI Claw Ultra 7 155H, Arc 8-Core | 672 g | 33 mm | 7.00" | 1920x1080 | |
| 88.9 % v7 (old) | v7 (old) | 02 / 2024 | Valve Steam Deck 1 TB OLED Steam Deck OLED APU, Radeon Radeon Steam Deck 8CU | 640 g | 49 mm | 7.40" | 1280x800 | |
| 66.3 % | v8 | 01 / 2024 | Lenovo Legion Go Z1 Extreme, Radeon 780M | 845 g | 41 mm | 8.80" | 2560x1600 | |
| 85.2 % v7 (old) | v7 (old) | 01 / 2024 | Ayaneo Kun R7 7840U, Radeon 780M | 942 g | 22 mm | 8.40" | 2560x1600 | |
| 87.5 % v7 (old) | v7 (old) | 05 / 2023 | Asus ROG Ally Z1 Extreme Z1 Extreme, Radeon 780M | 611 g | 21.22 mm | 7.00" | 1920x1080 |
Note: We have recently updated our rating system and the results of version 8 are not comparable with the results of version 7. More information is available here .
Case - Larger grips for more comfort
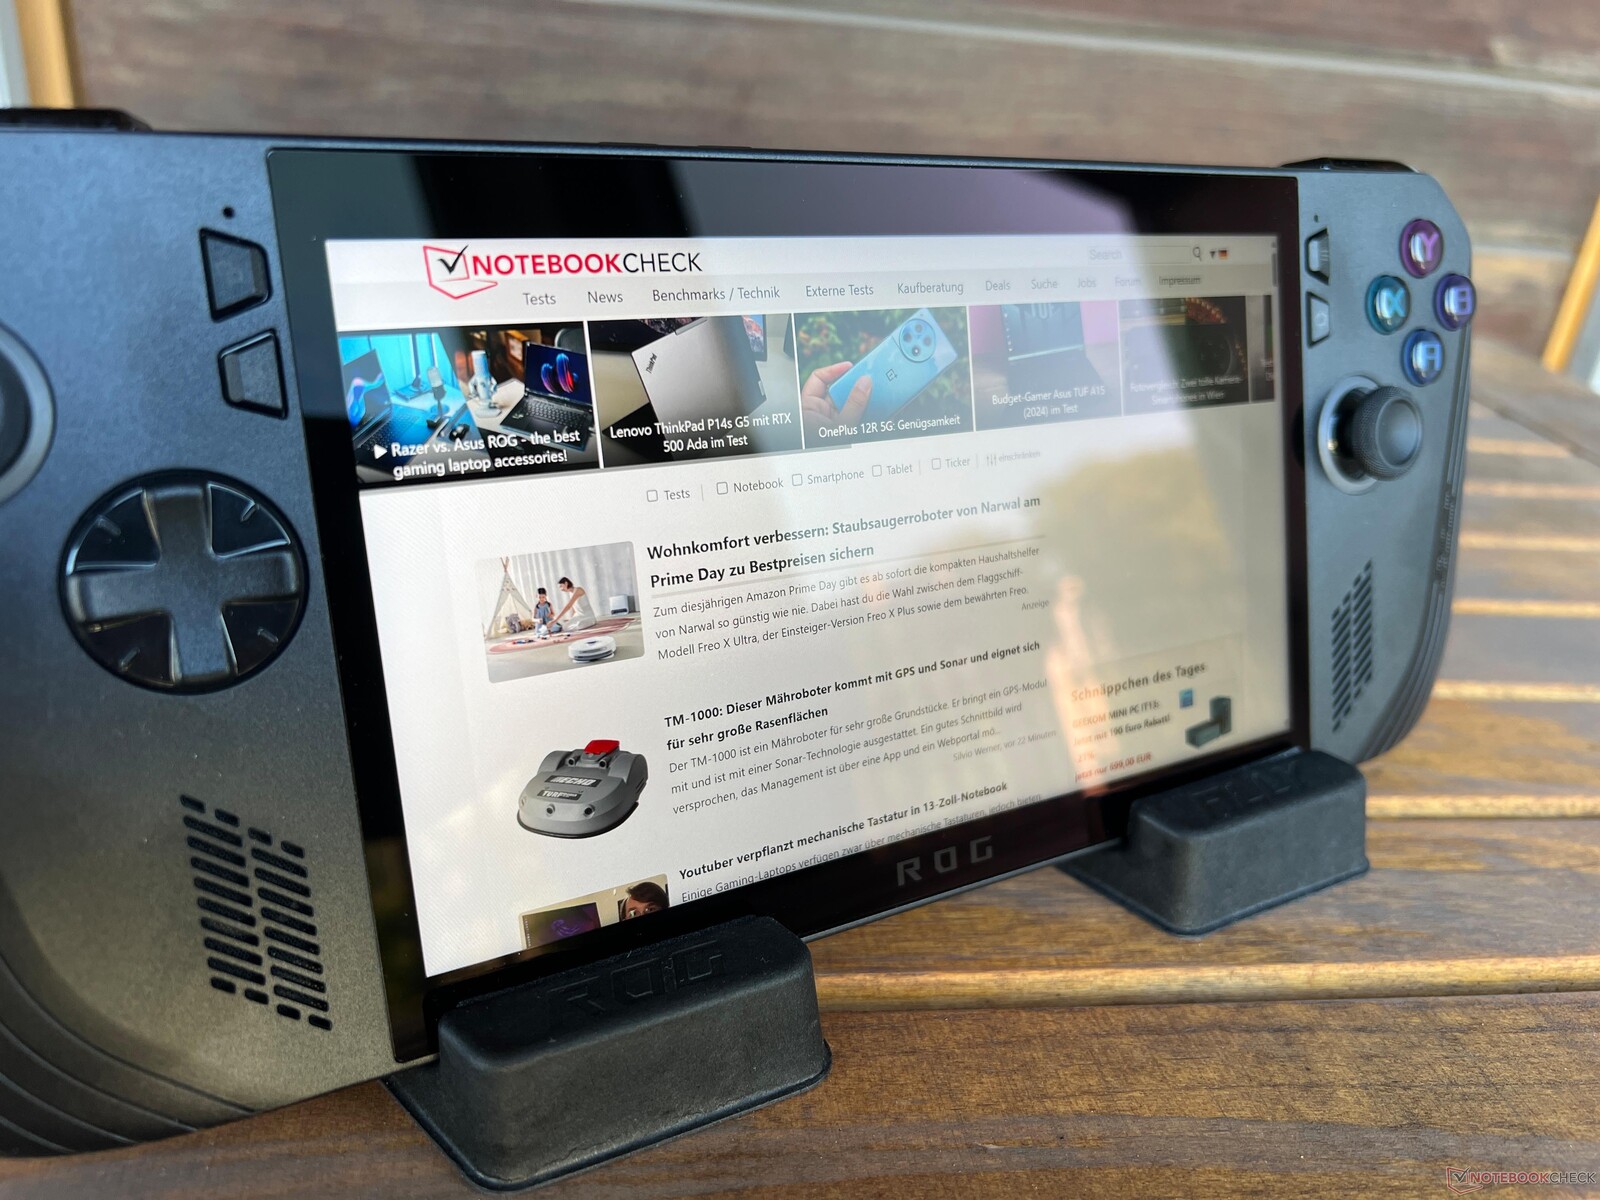
There are two major differences in terms of chassis design. The most striking aspect is the color since the new Ally X drops the white body in favor of a black one. This is neither good, nor bad, but a matter of taste. The black surfaces do not easily collect fingerprints, which is good. The second new aspect are larger grips. The original ROG Ally was comparatively flat, which can be tiresome after a while, especially for larger hands. The grips are now thicker and the new ROG Ally X is more comfortable to hold, especially during longer gaming sessions. The back of the grips is covered with tiny ROG letters for improved handling.
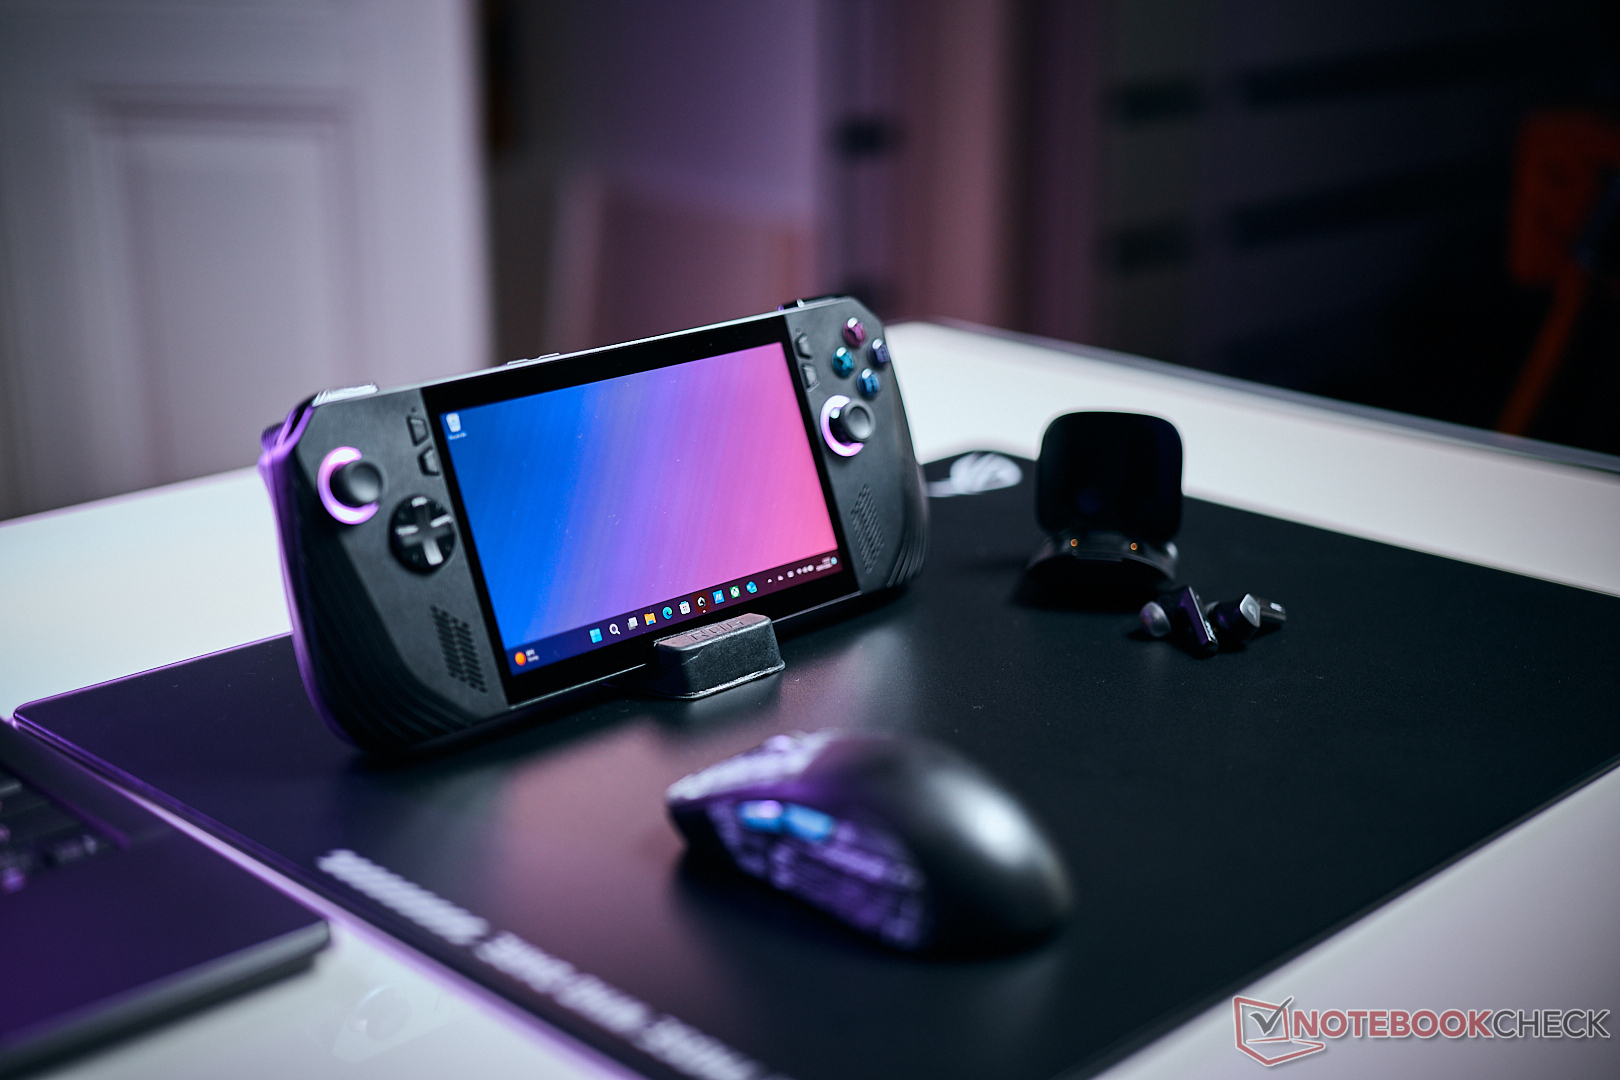
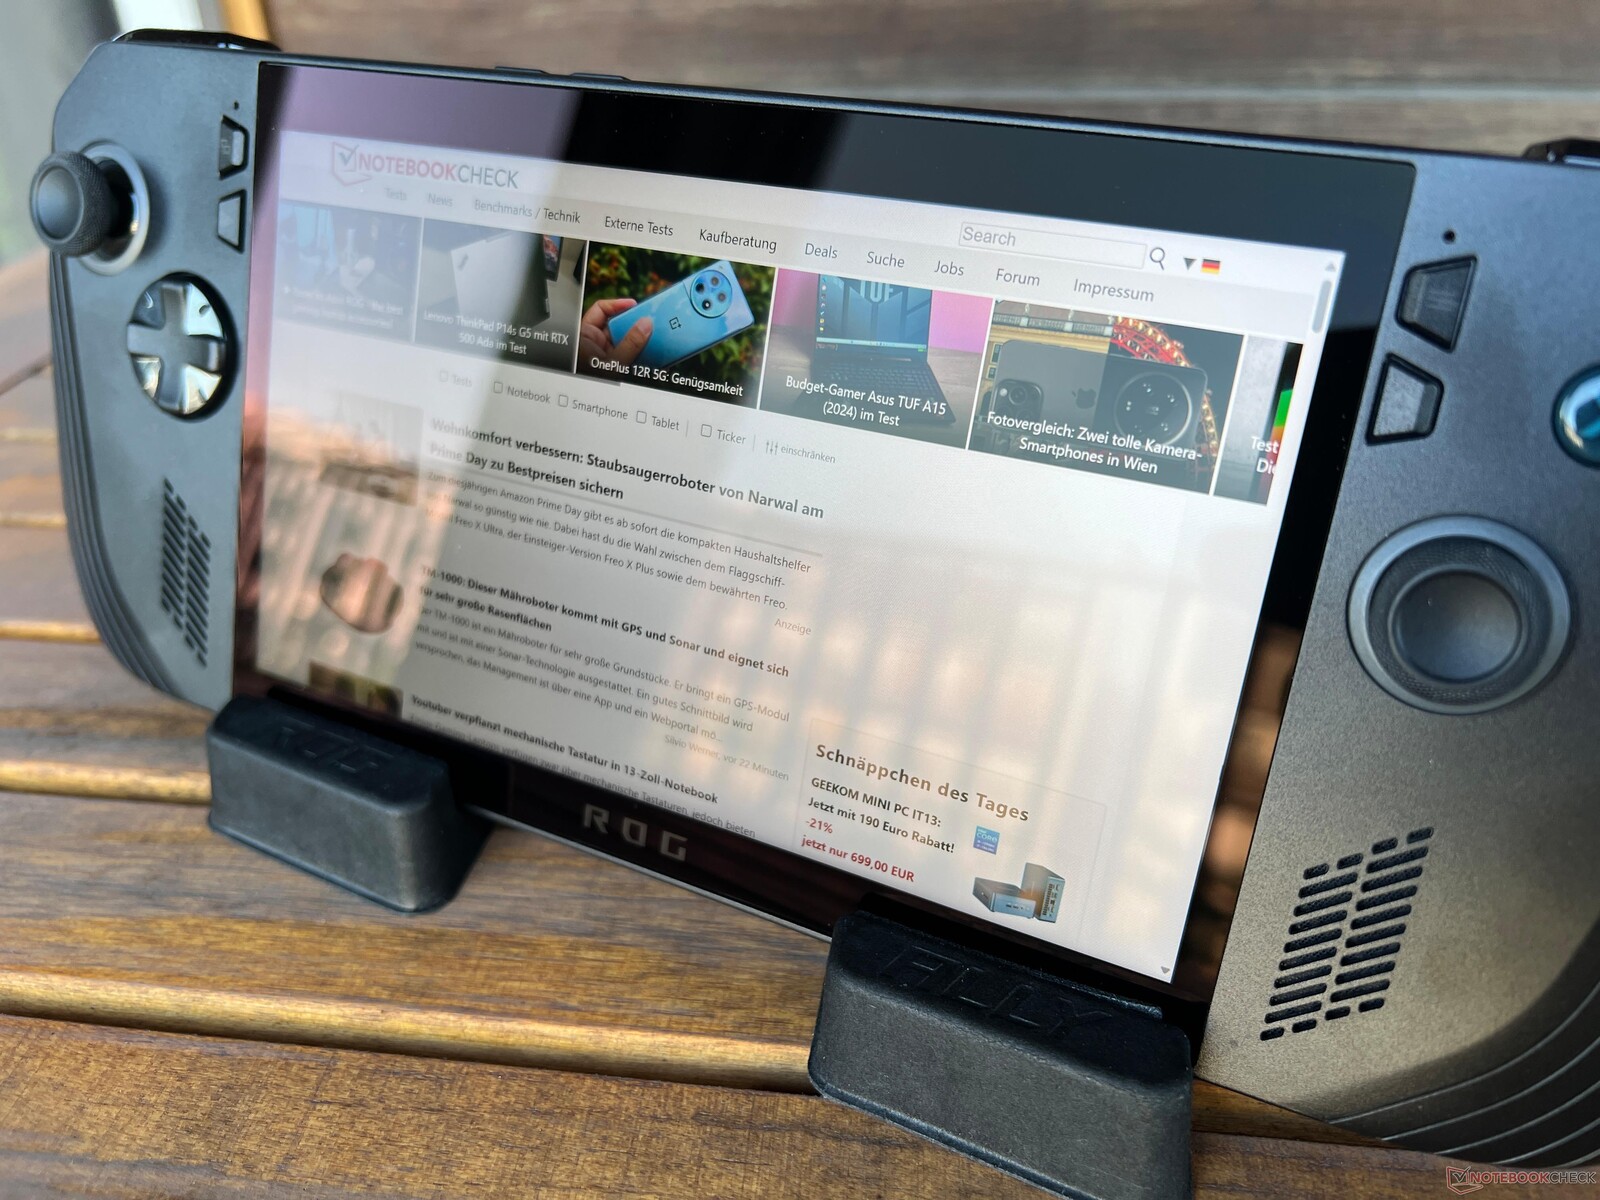
Looking at the quality, you still get a sturdy and decent plastic chassis, which is functional. We can provoke minor creaking sounds, but this does not happen when you just use the device and there is no twisting at all. The box includes two small black cardboard stands, which hold the Ally X well on a desk, for example.

Asus tried to reduce the weight as much as possible to compensate for the larger 80-Wh battery. The new version tips the scale at 685 grams compared to 611 grams for the original ROG Ally. This is noticeable in a direct comparison, but we git used to the additional weight quickly and it did not bother us at all. The 65W PSU weighs 224 grams.
Due to the thicker grips, the ROG Ally X requires more space in your bag and it is not as easy to carry around. Due to the improved ergonomics, however, we are very happy with this compromise.
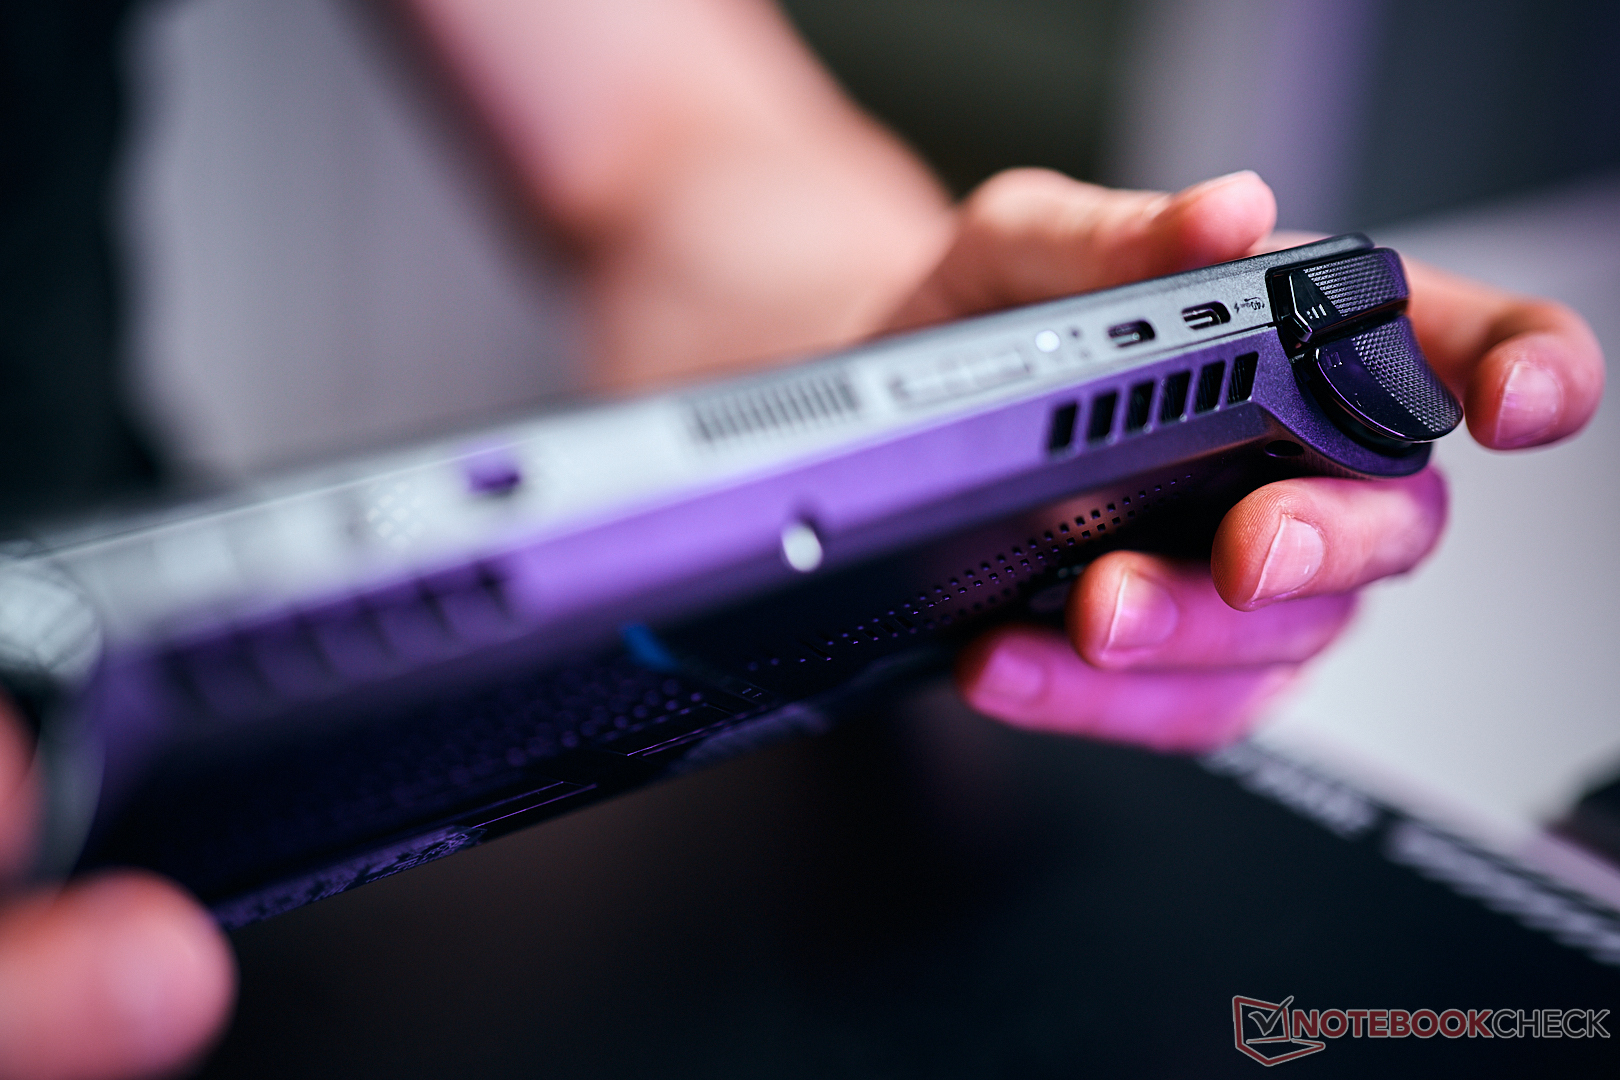
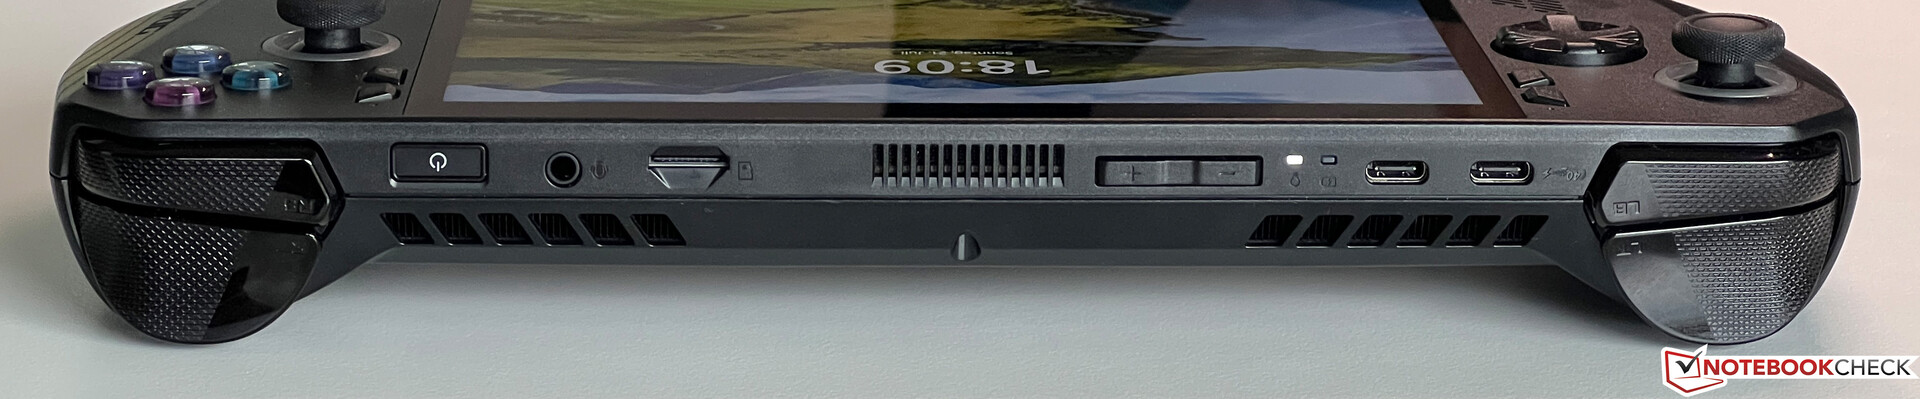
Connectivity - Gaming handheld now with USB 4.0
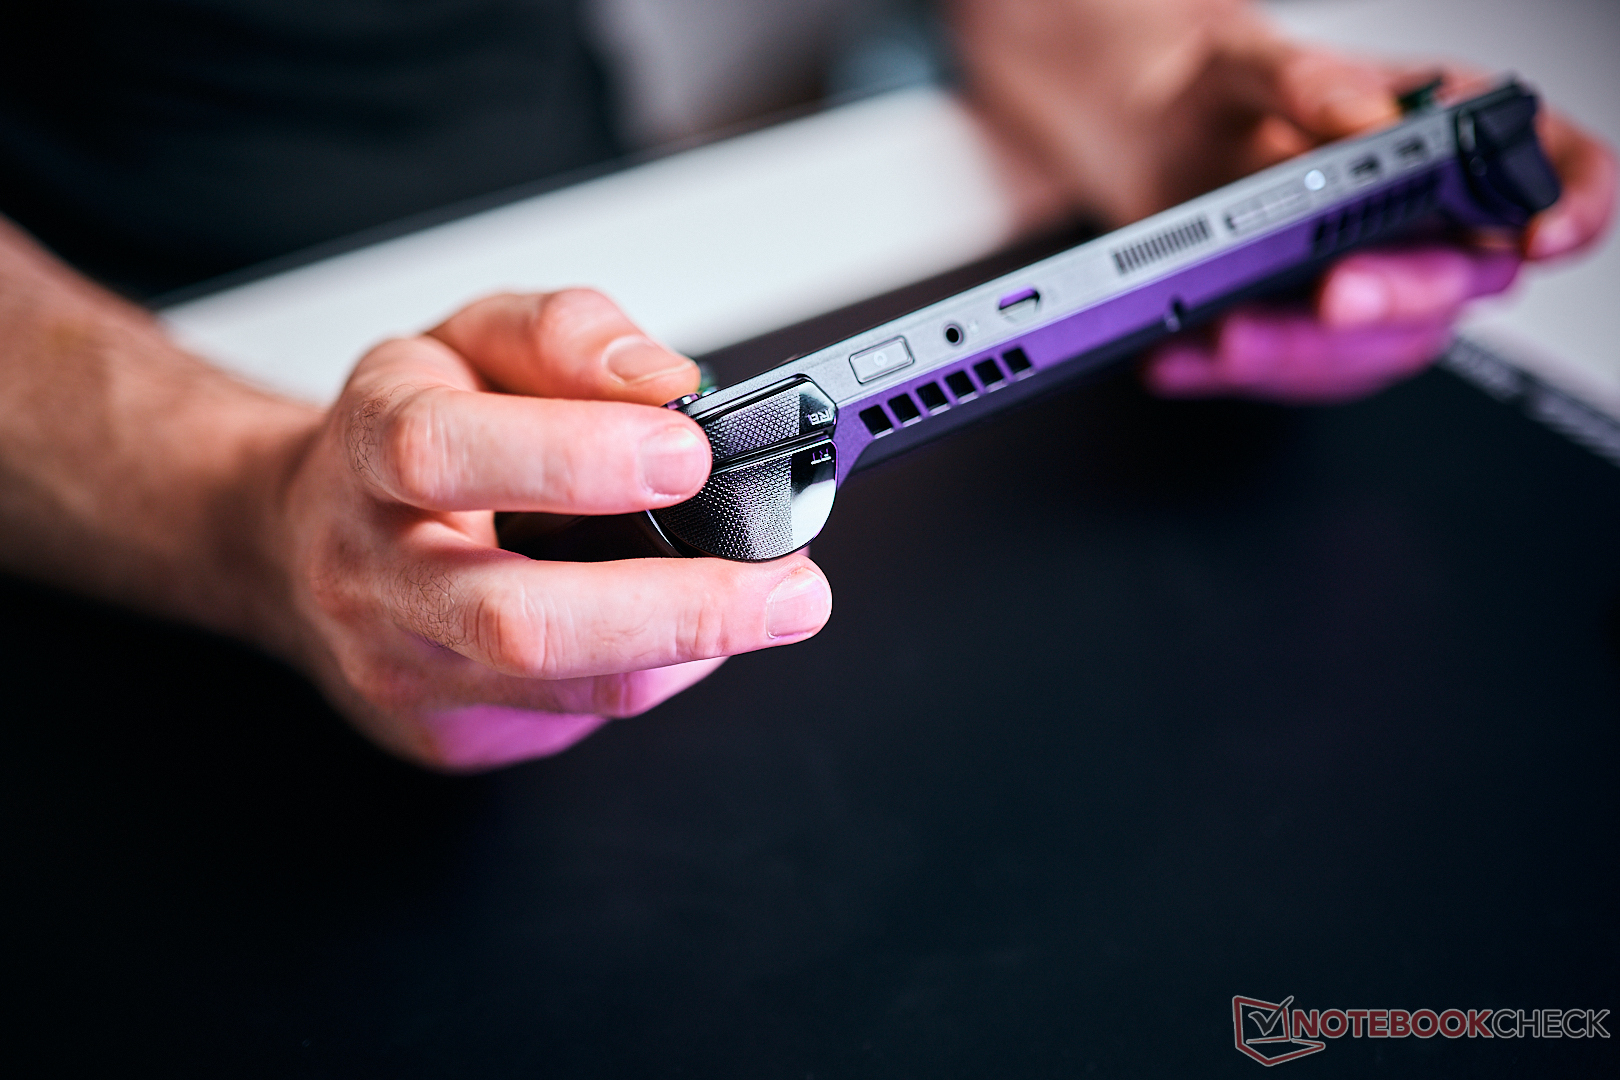
Asus got rid off the XG Mobile connector and replaced it with two standard USB-C ports. One of them supports the 4.0 standard, so it can be used for external GPUs. This means the new ROG Ally X is much more versatile and interesting as a regular PC connected to a monitor with power delivery, for example. This works with the ROG Ally as well, but now you can connect additional drives or USB dongles, for example. The power button is once again also the fingerprint scanner, but there is no webcam.
SD Card Reader
The microSD card reader (spring mechanism) is easily accessible at the top and manages excellent maximum transfer rated of 260 MB/s (drops to 90 MB/s when you copy files) in combination with our reference card (Angelbird AV Pro V60).
| SD Card Reader | |
| average JPG Copy Test (av. of 3 runs) | |
| Average of class Handheld / UMPC (32.9 - 569, n=10, last 2 years) | |
| Lenovo Legion Go | |
| Ayaneo Kun | |
| Asus ROG Ally Z1 Extreme (Angelbird AV Pro V60) | |
| MSI Claw (Angelbird AV Pro V60) | |
| Asus ROG Ally X (Angelbird AV Pro v60) | |
| Valve Steam Deck 1 TB OLED | |
| GPD Win Mini 2024 7" (AV Pro SD microSD 128 GB V60) | |
| maximum AS SSD Seq Read Test (1GB) | |
| Asus ROG Ally Z1 Extreme (Angelbird AV Pro V60) | |
| Asus ROG Ally X (Angelbird AV Pro v60) | |
| Average of class Handheld / UMPC (74.7 - 817, n=10, last 2 years) | |
| MSI Claw (Angelbird AV Pro V60) | |
| Ayaneo Kun | |
| Lenovo Legion Go | |
| GPD Win Mini 2024 7" (AV Pro SD microSD 128 GB V60) | |
Communication
The Wi-Fi module did not change, either, which means the Ally X does not support the latest Wi-Fi 7 standard. However, this not really a big issue and the MediaTek module (Wi-Fi 6E) still manages excellent and stable transfer rates. We also streamed some games during our review period, which worked flawlessly without any connection dropouts.
| Networking | |
| Asus ROG Ally X | |
| iperf3 transmit AXE11000 | |
| iperf3 receive AXE11000 | |
| GPD Win Mini 2024 7" | |
| iperf3 transmit AXE11000 | |
| iperf3 receive AXE11000 | |
| iperf3 transmit AXE11000 6GHz | |
| iperf3 receive AXE11000 6GHz | |
| MSI Claw | |
| iperf3 transmit AXE11000 | |
| iperf3 receive AXE11000 | |
| Valve Steam Deck 1 TB OLED | |
| iperf3 transmit AXE11000 | |
| iperf3 receive AXE11000 | |
| iperf3 transmit AXE11000 6GHz | |
| iperf3 receive AXE11000 6GHz | |
| Lenovo Legion Go | |
| iperf3 transmit AXE11000 | |
| iperf3 receive AXE11000 | |
| iperf3 transmit AXE11000 6GHz | |
| iperf3 receive AXE11000 6GHz | |
| Ayaneo Kun | |
| iperf3 transmit AXE11000 | |
| iperf3 receive AXE11000 | |
| iperf3 transmit AXE11000 6GHz | |
| iperf3 receive AXE11000 6GHz | |
| Asus ROG Ally Z1 Extreme | |
| iperf3 transmit AXE11000 | |
| iperf3 receive AXE11000 | |
Maintenance
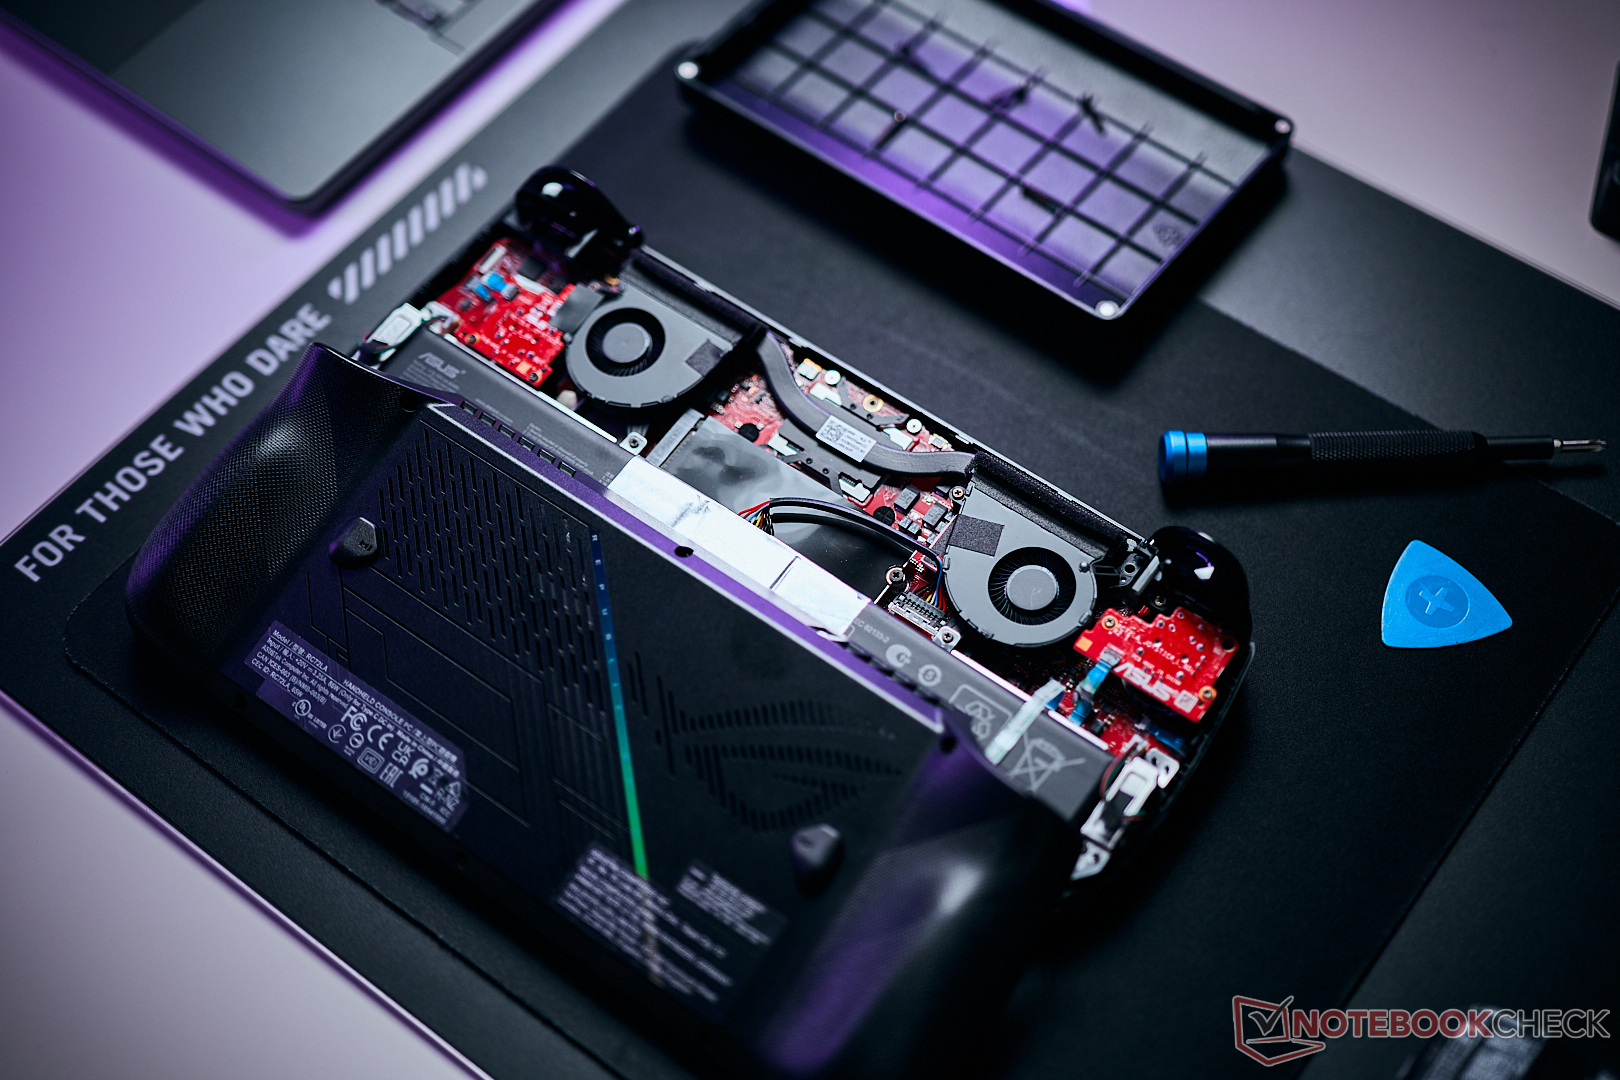
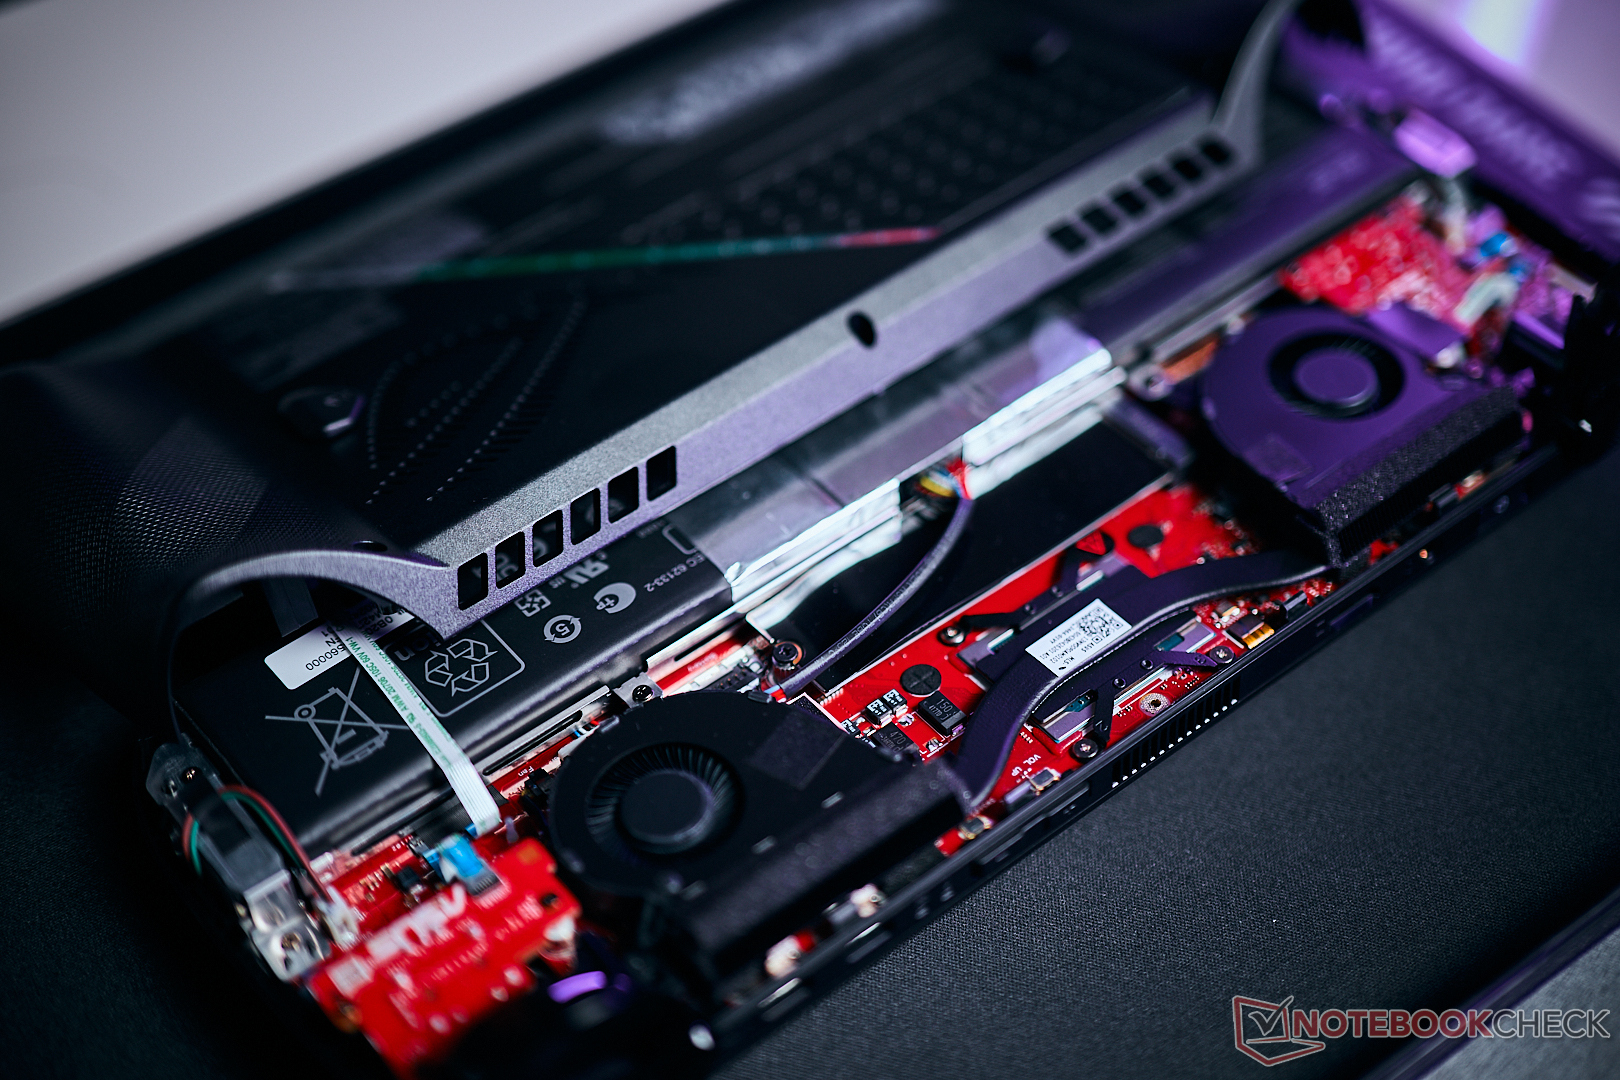
It is pretty simple to remove the back cover of the new ROG Ally X, but be aware of the single ribbon cable that connects the additional buttons on the back to the motherboard. You should carefully remove it with a tweezer. Good news is that you do not have to remove the cable in order to access the new M.2-2280 SSD. The new form factor also allows simple and cheap upgrades as well as larger storage capacities compared to the previous M.2-2230 SSD.
Input Devices - Joysticks and D-pad are improved

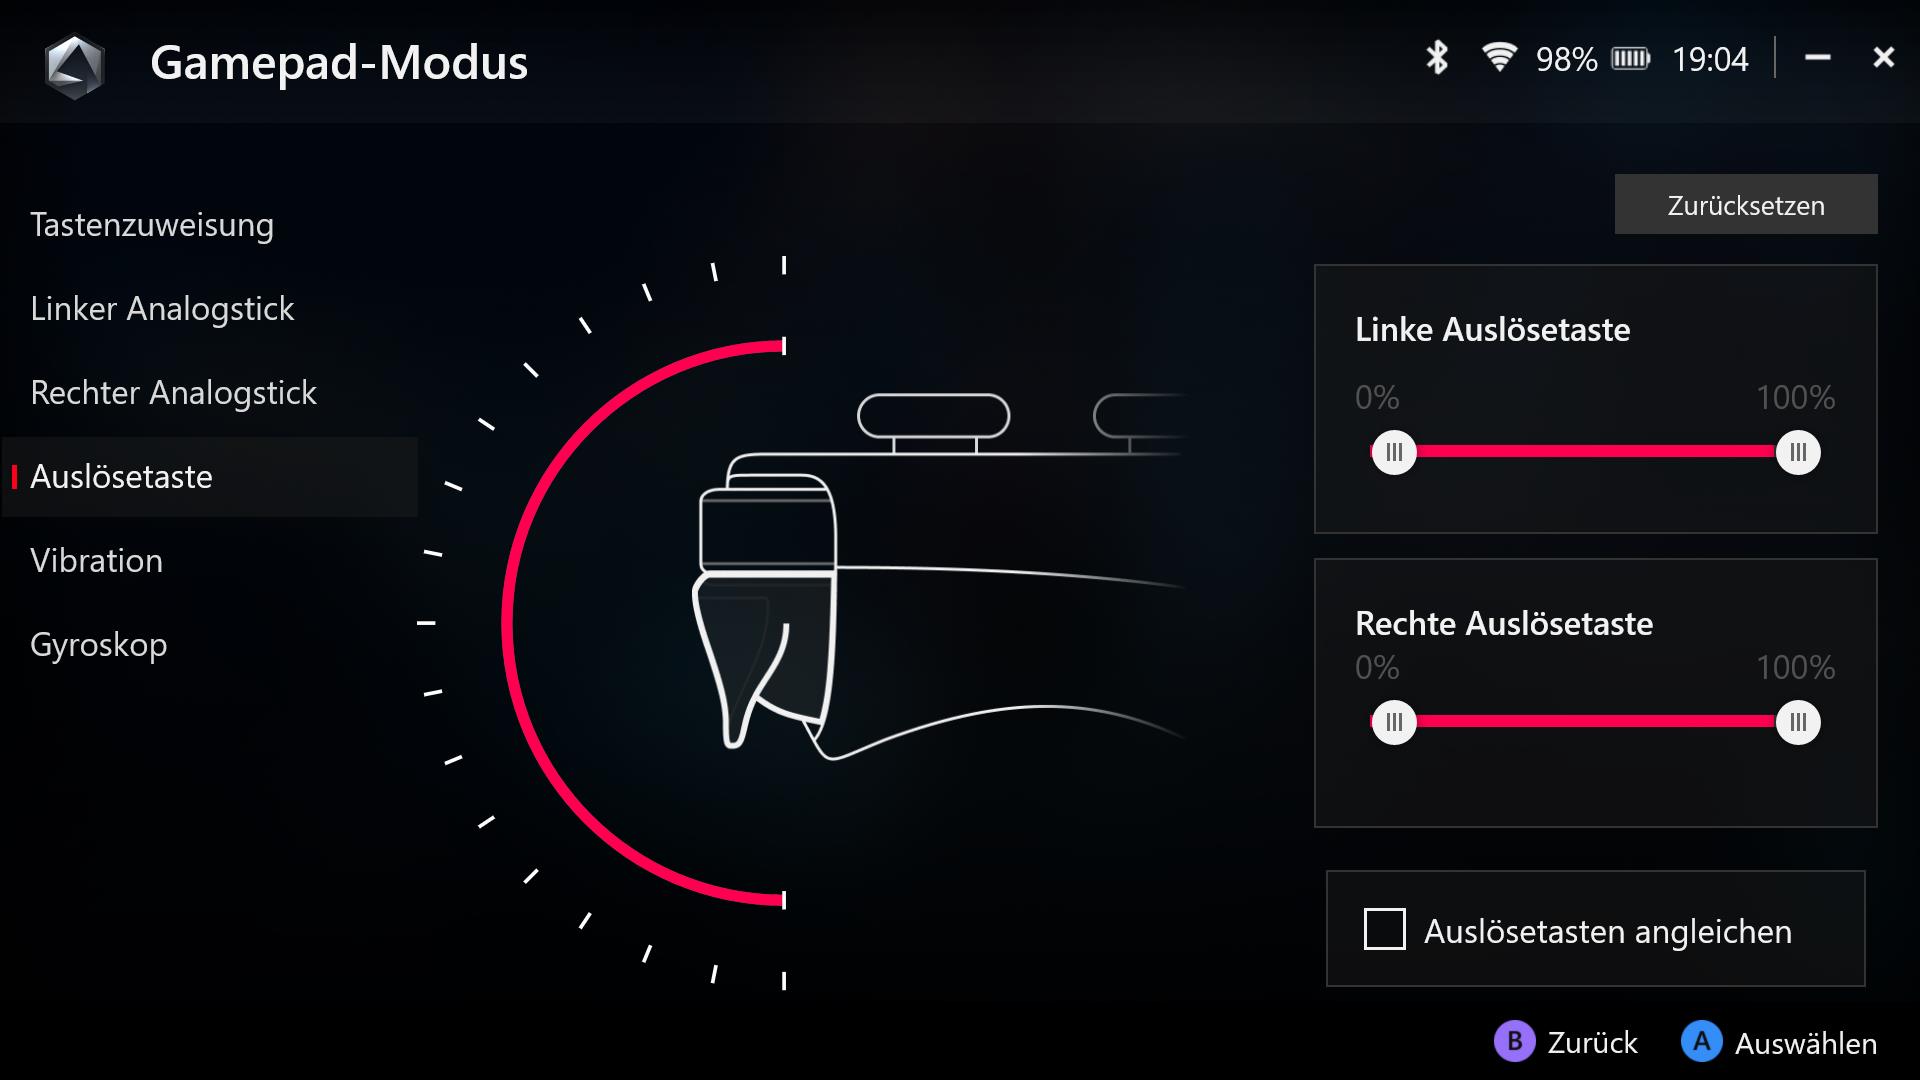
In addition to the capacitive touchscreen (with Corning Gorilla Glass) a gaming handheld obviously requires good buttons and joysticks. Asus changed some components and you immediately notice the increased resistance from the joysticks, which enables more precise movements around the zero position. The D-pad was also reworked and feels better to use. We are not completely sure about the new triggers (once again hall effect), though. There is actually less resistance compared to the original ROG Ally, which can make it harder to use for the first few millimeters (especially noticeable in racing games) and the noise when you release the trigger is also a bit louder. This is obviously also a matter of personal preference and we dd not run into any issues during our gaming sessions. All the other buttons feel pretty much the same. The rings around the joysticks can once again be illuminated (also depending on the screen content).
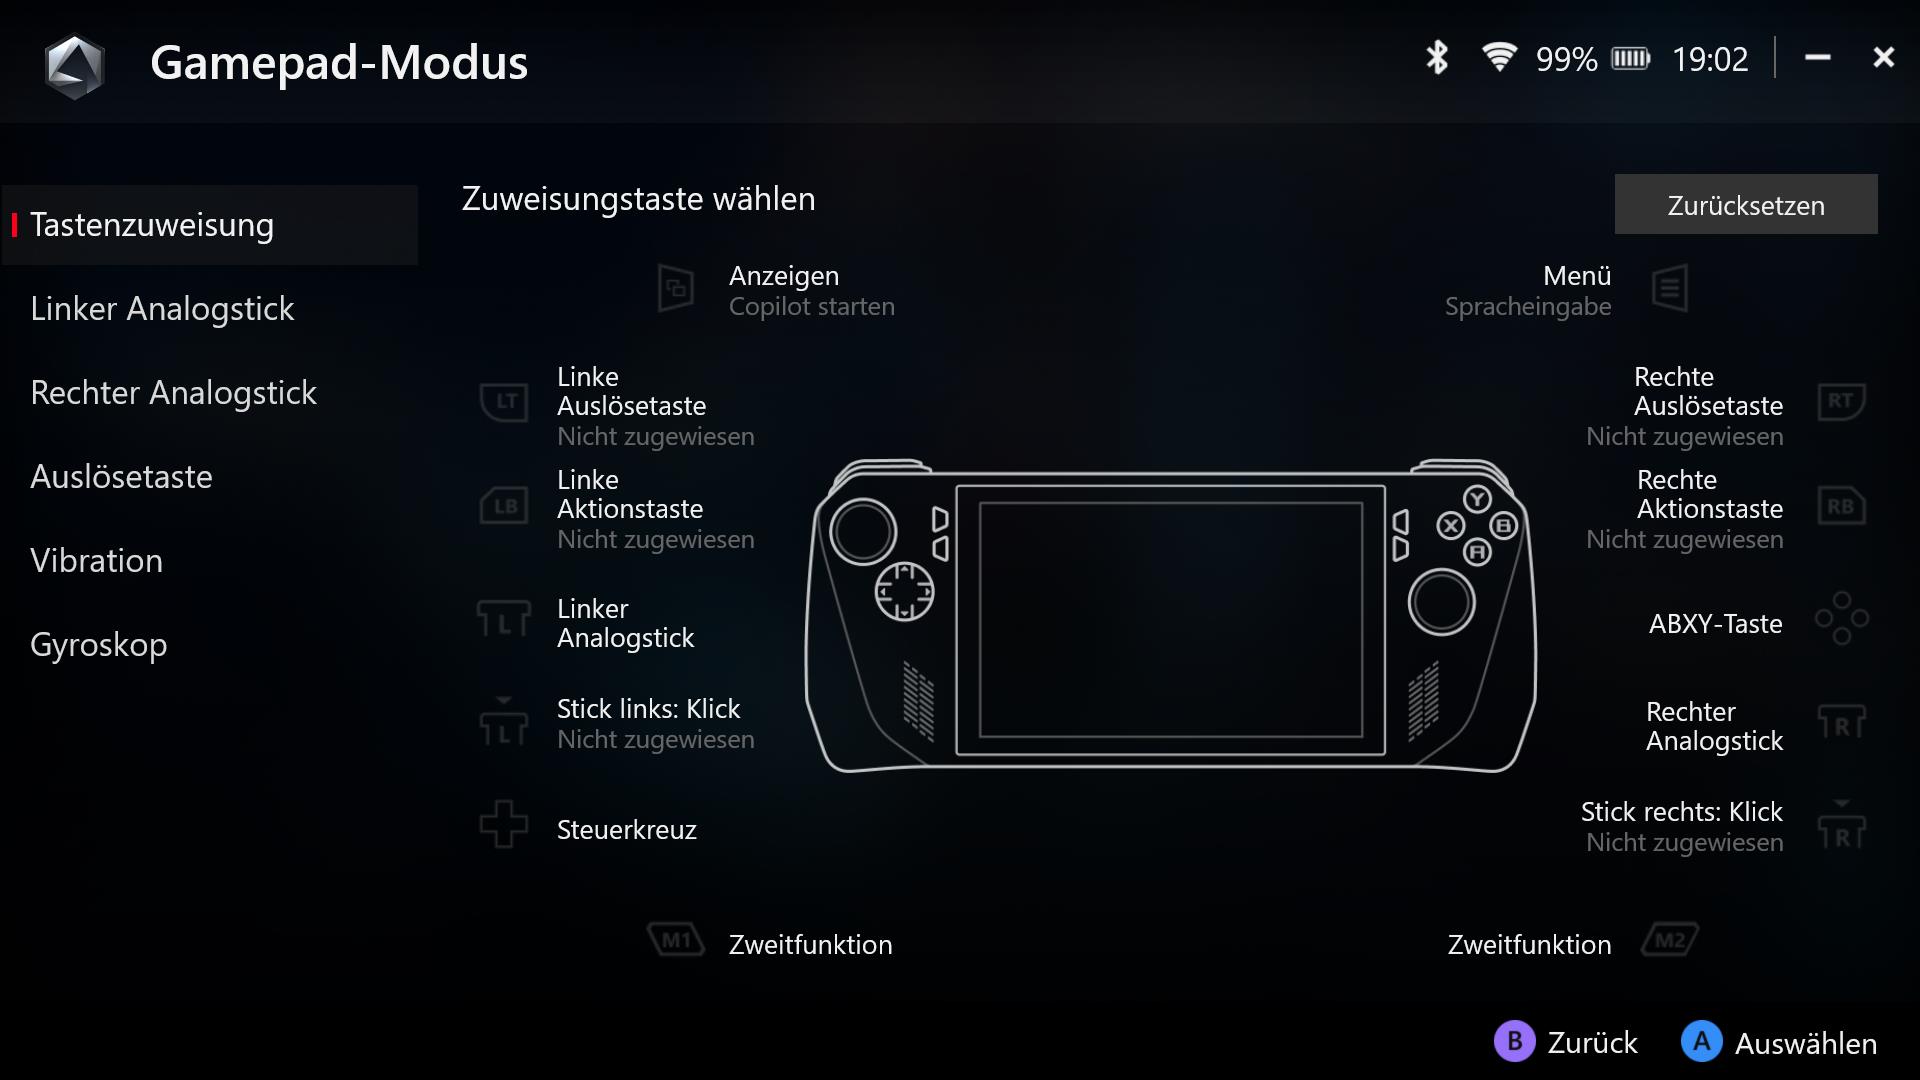
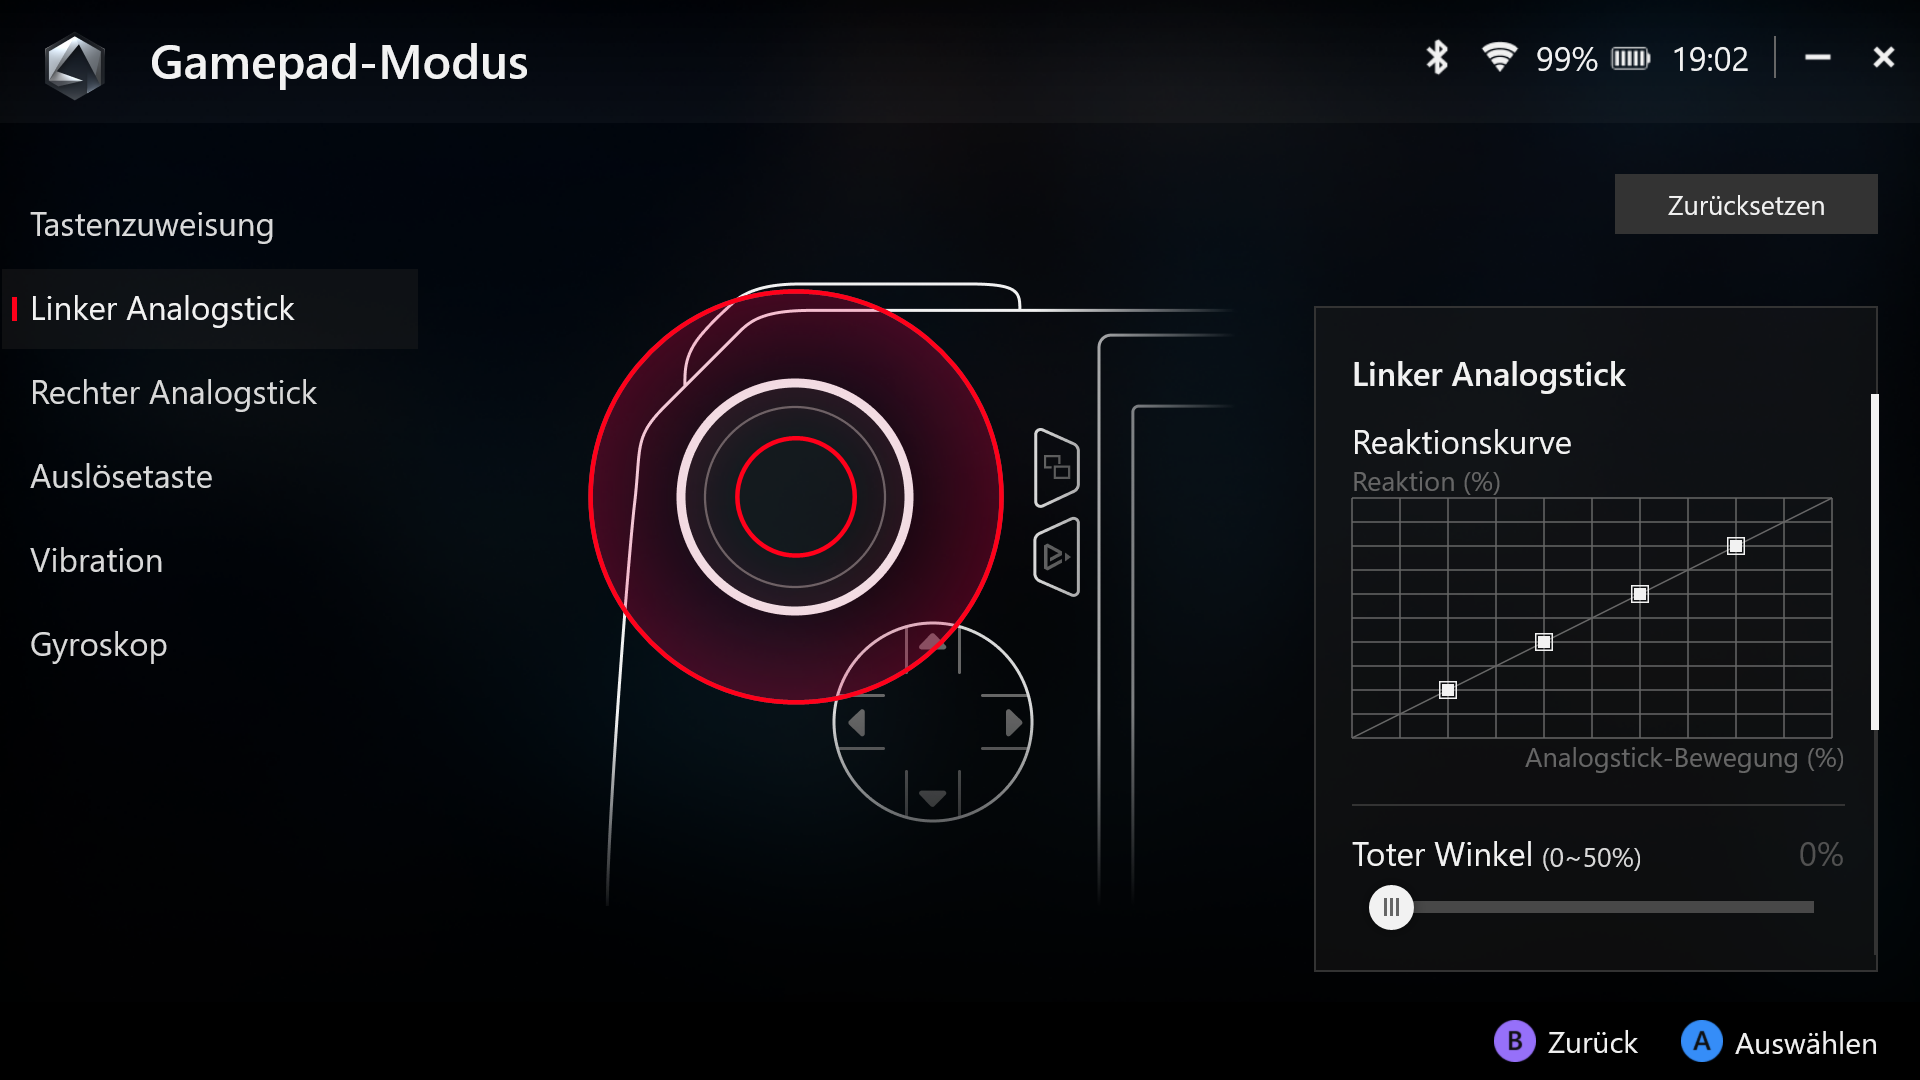
You can customize the controls comprehensively within the Armoury Crate SE software. This starts with simple button mapping and continues with reaction curves for the joysticks, dead zones, travel for the triggers (individually for left/right side), vibration (individually for left/right side) and gyroscope controls. This is already very good, but the best part is that you can customize and store all of that for every game individually.

The two additional buttons at the back are now much smaller. They still activate useful functions in combination with the D-pad and the buttons (like show desktop, take a screenshot, pen Task manager). Using Windows on a small touchscreen with some buttons and joysticks is still quite cumbersome, though, especially the initial setup can be really annoying. We recommend to make it as simple as possible and use a mouse/keyboard or even an external screen with power delivery and attached input devices. Once everything is set up, you can focus on the Armoury Crate SE software, which brings us to the next section.
Software - Armoury Crate SE 1.5
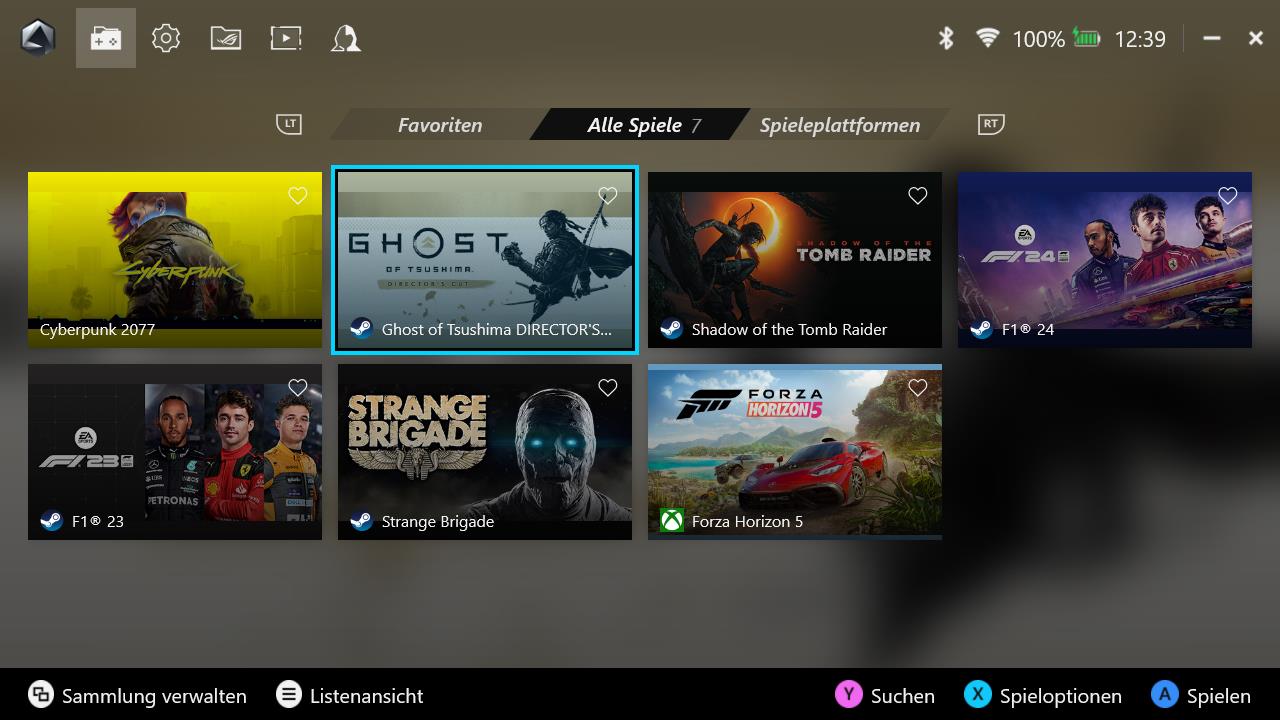
Once everything is installed and configured, the Armoury Crate SE software becomes the main hub for your gaming purposes. The ROG Ally X is equipped with version 1.5 of the software (the ROG Ally will get the update at a later point) and it is designed to work with a touchscreen and handheld buttons. In addition to your game library, you can also manage all of your settings. Games you have installed via popular launchers like Steam, Origin, etc. are automatically added to the library, but it is also possible to add games manually. The software can launch automatically when the device is booted up, so you can ignore Windows for the most part.
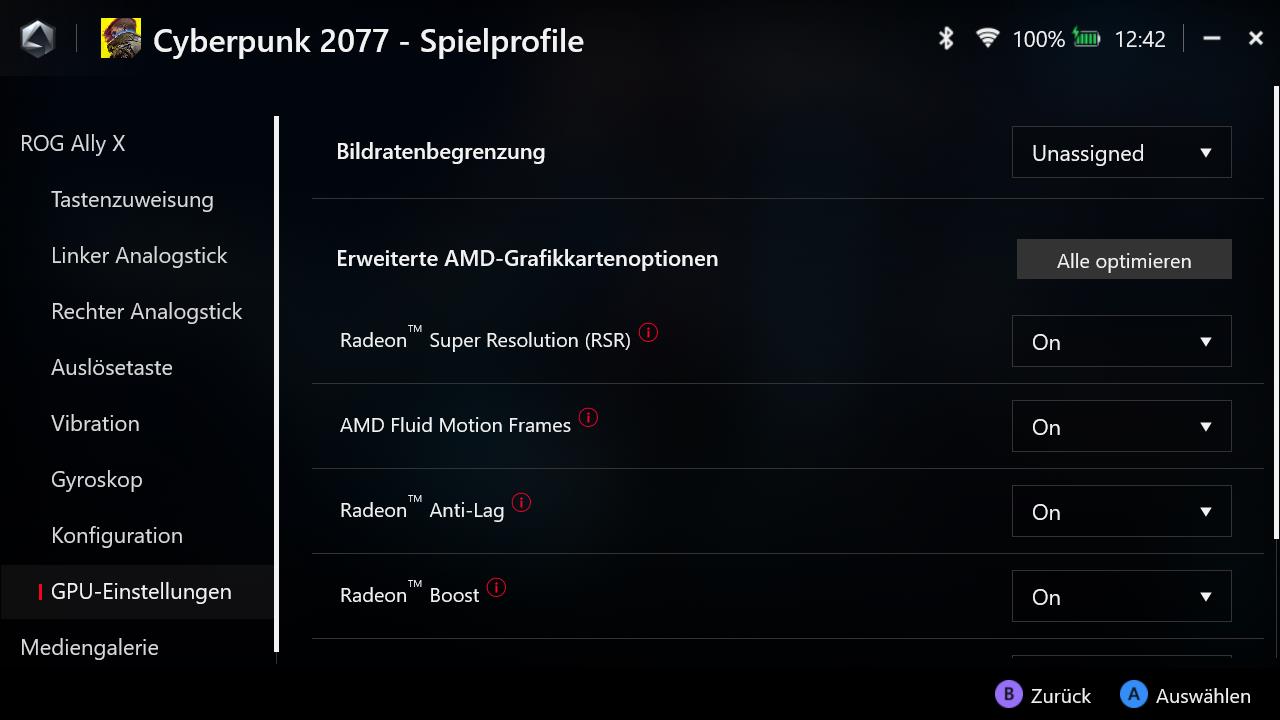
We already talked about the comprehensive customization options for the controls, but the Armoury Crate SE software does not stop there. Just like the controls you can set performance profiles for each game (both mains and battery) and adjust GPU settings from the Radeon GPU driver without using the Radeon software.
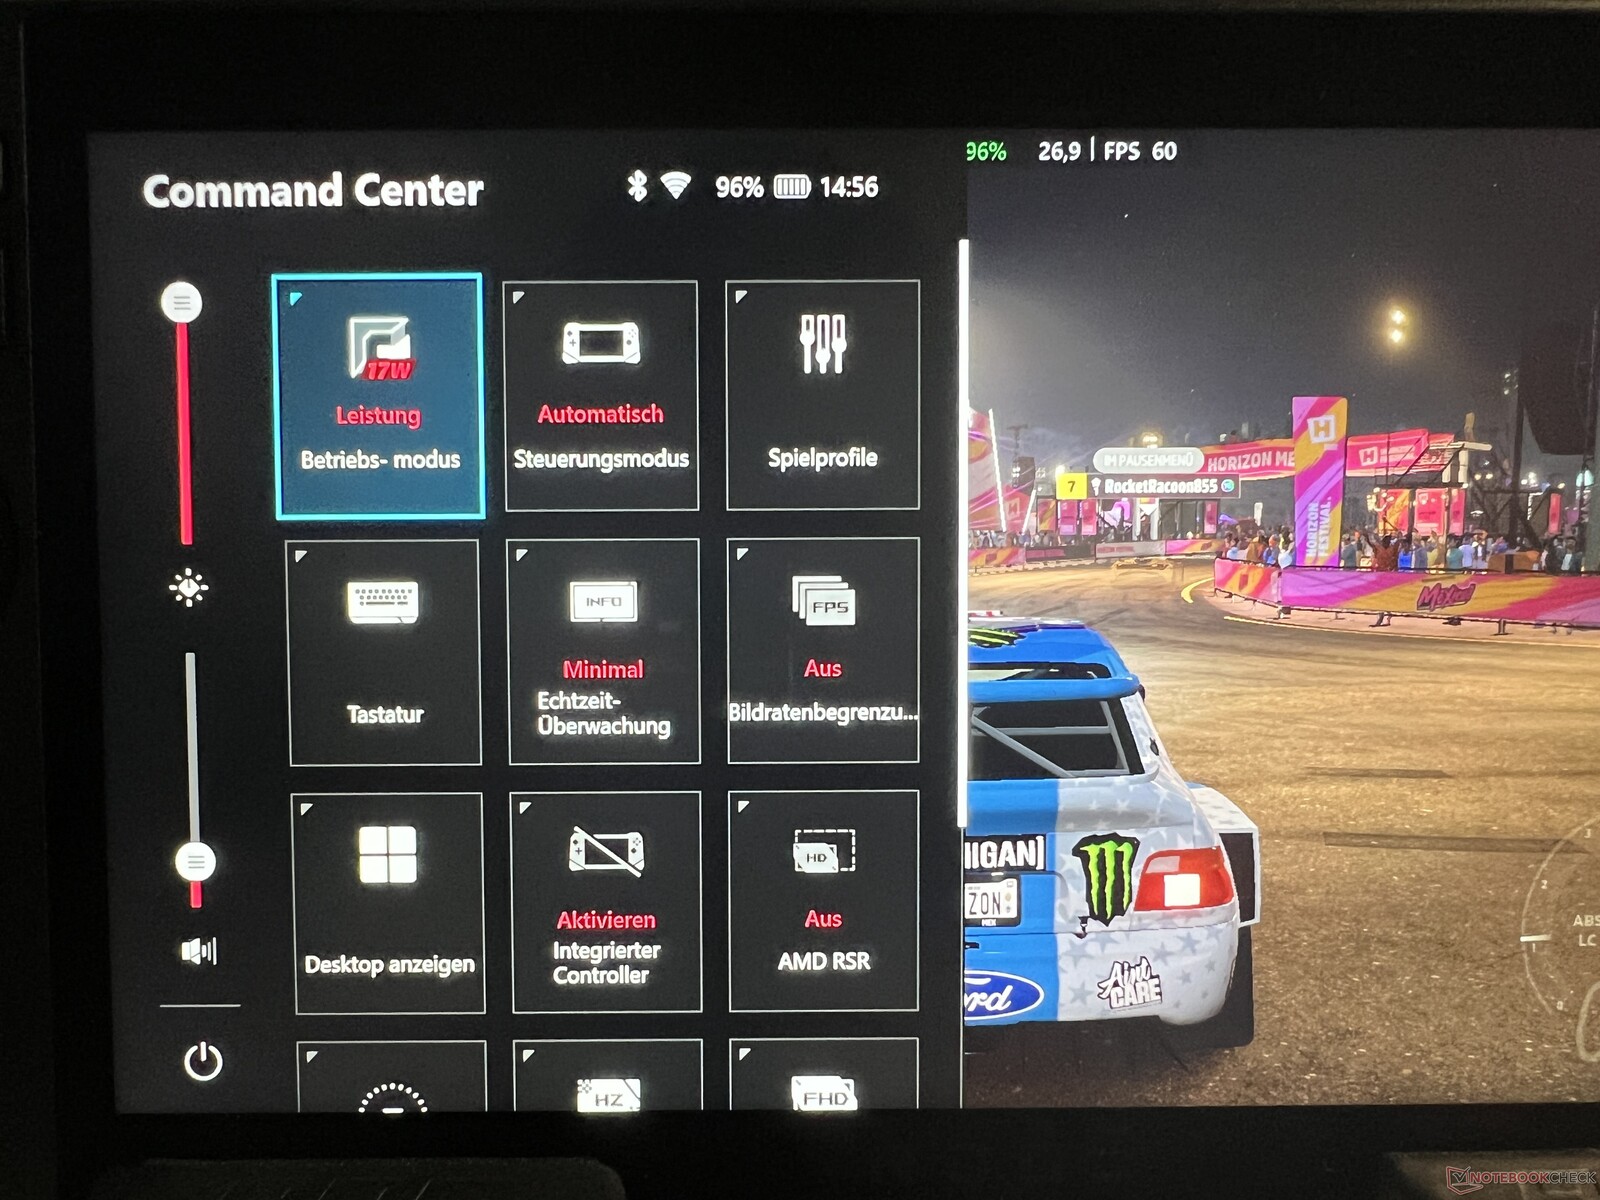
The lower button left next to the screen opens the Command Center at any time, which can be configured with 15 options (that you can choose from a total of 23 options). This is a super easy and comfortable way to adjust important settings like the power profile, brightness, volume, resolution, GPU options or the brightness of the illuminated joystick rings, for instance.
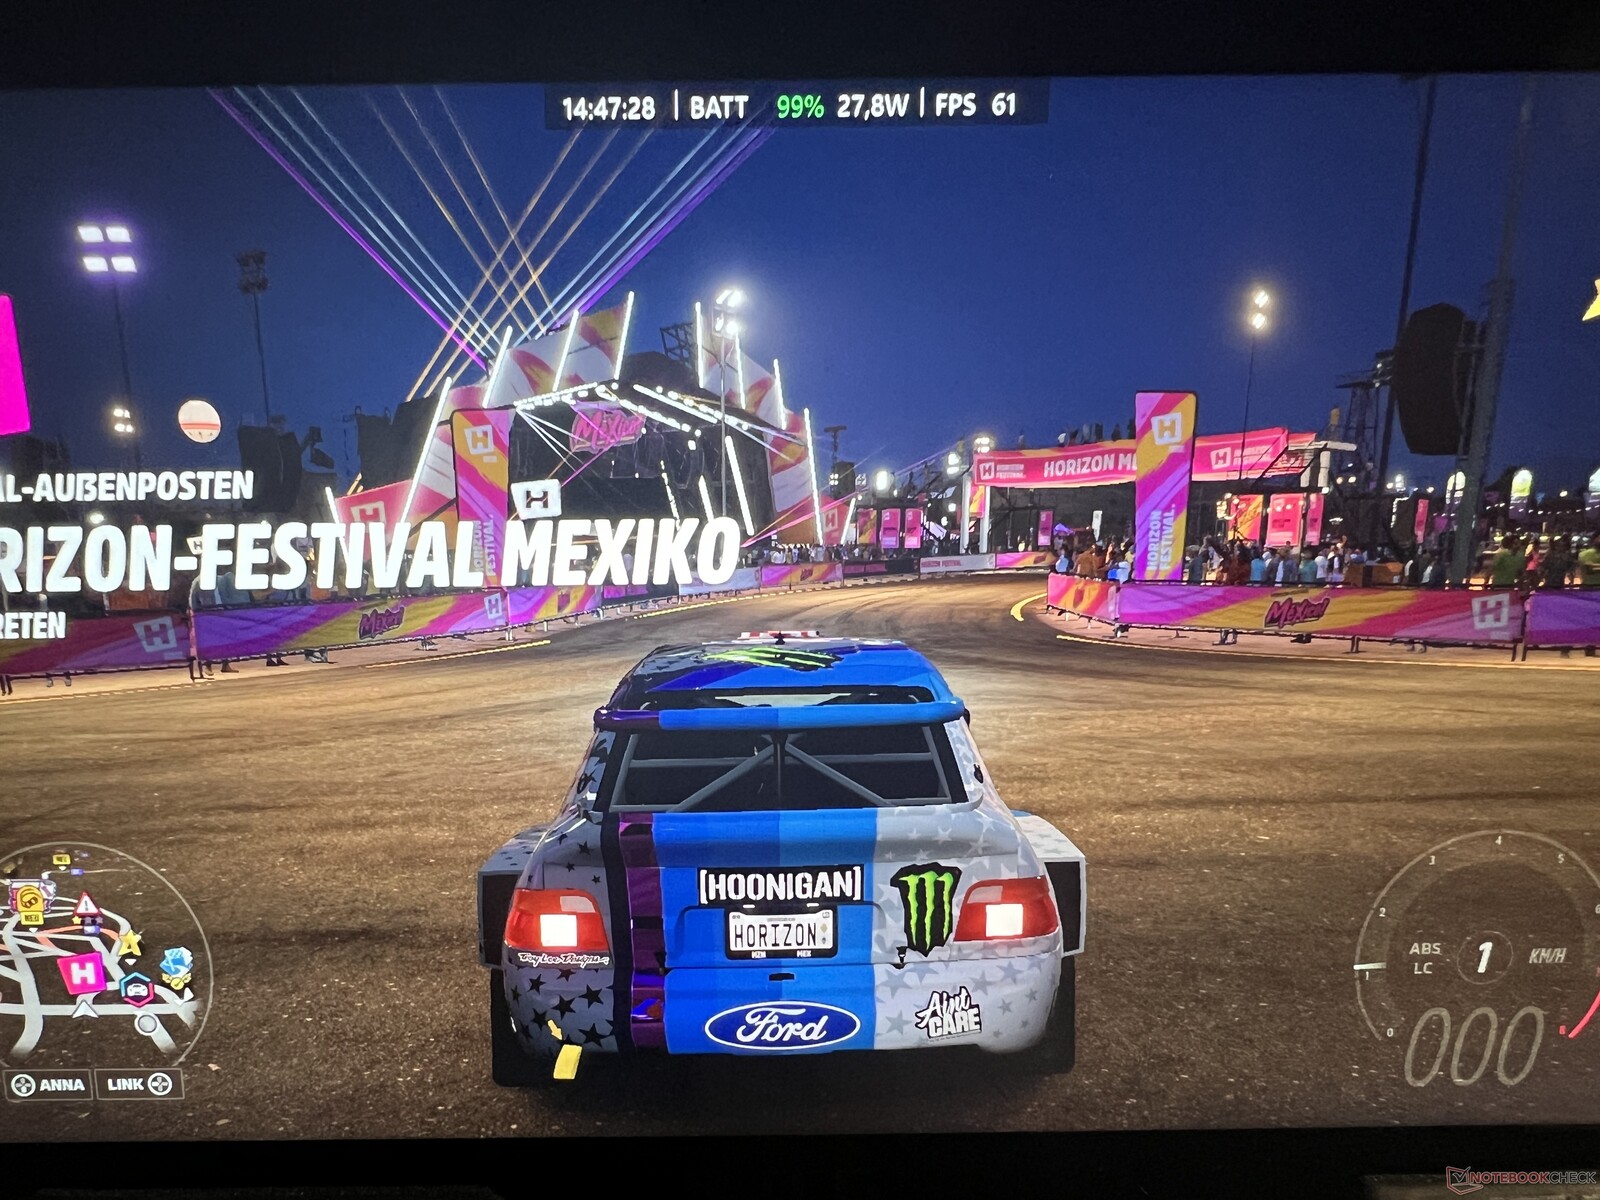
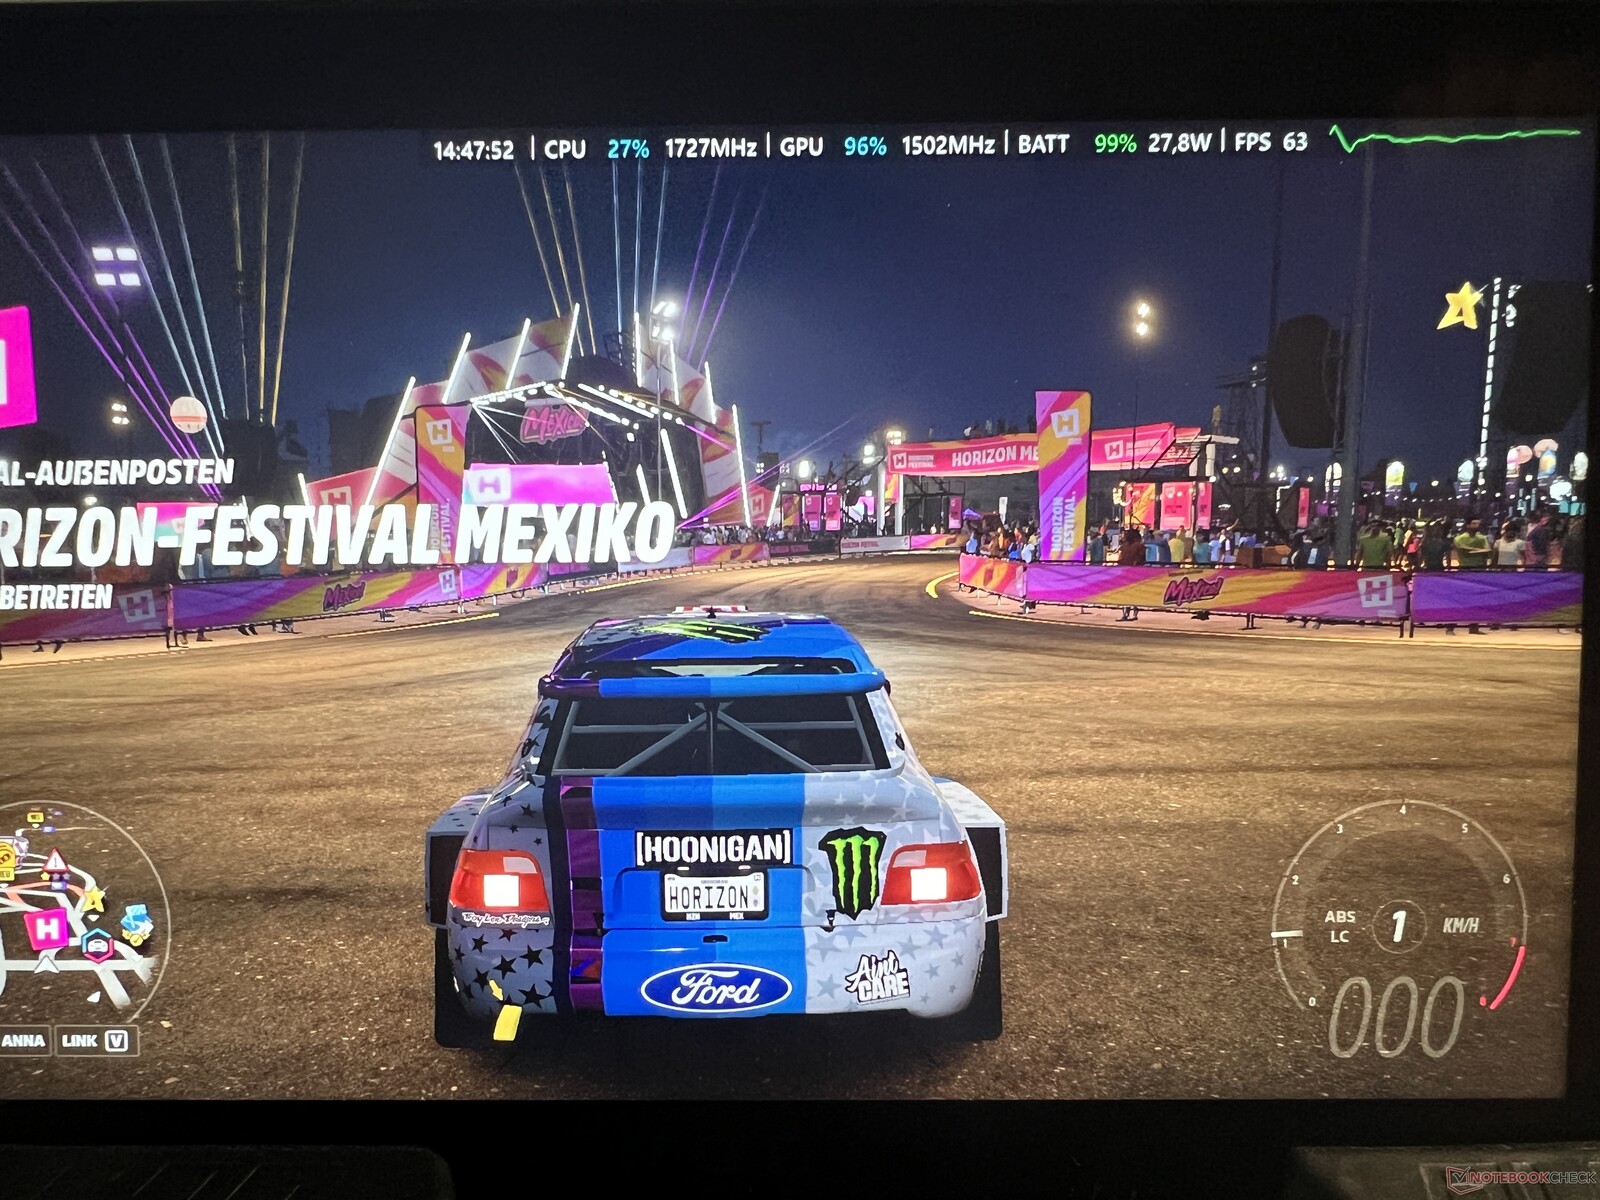
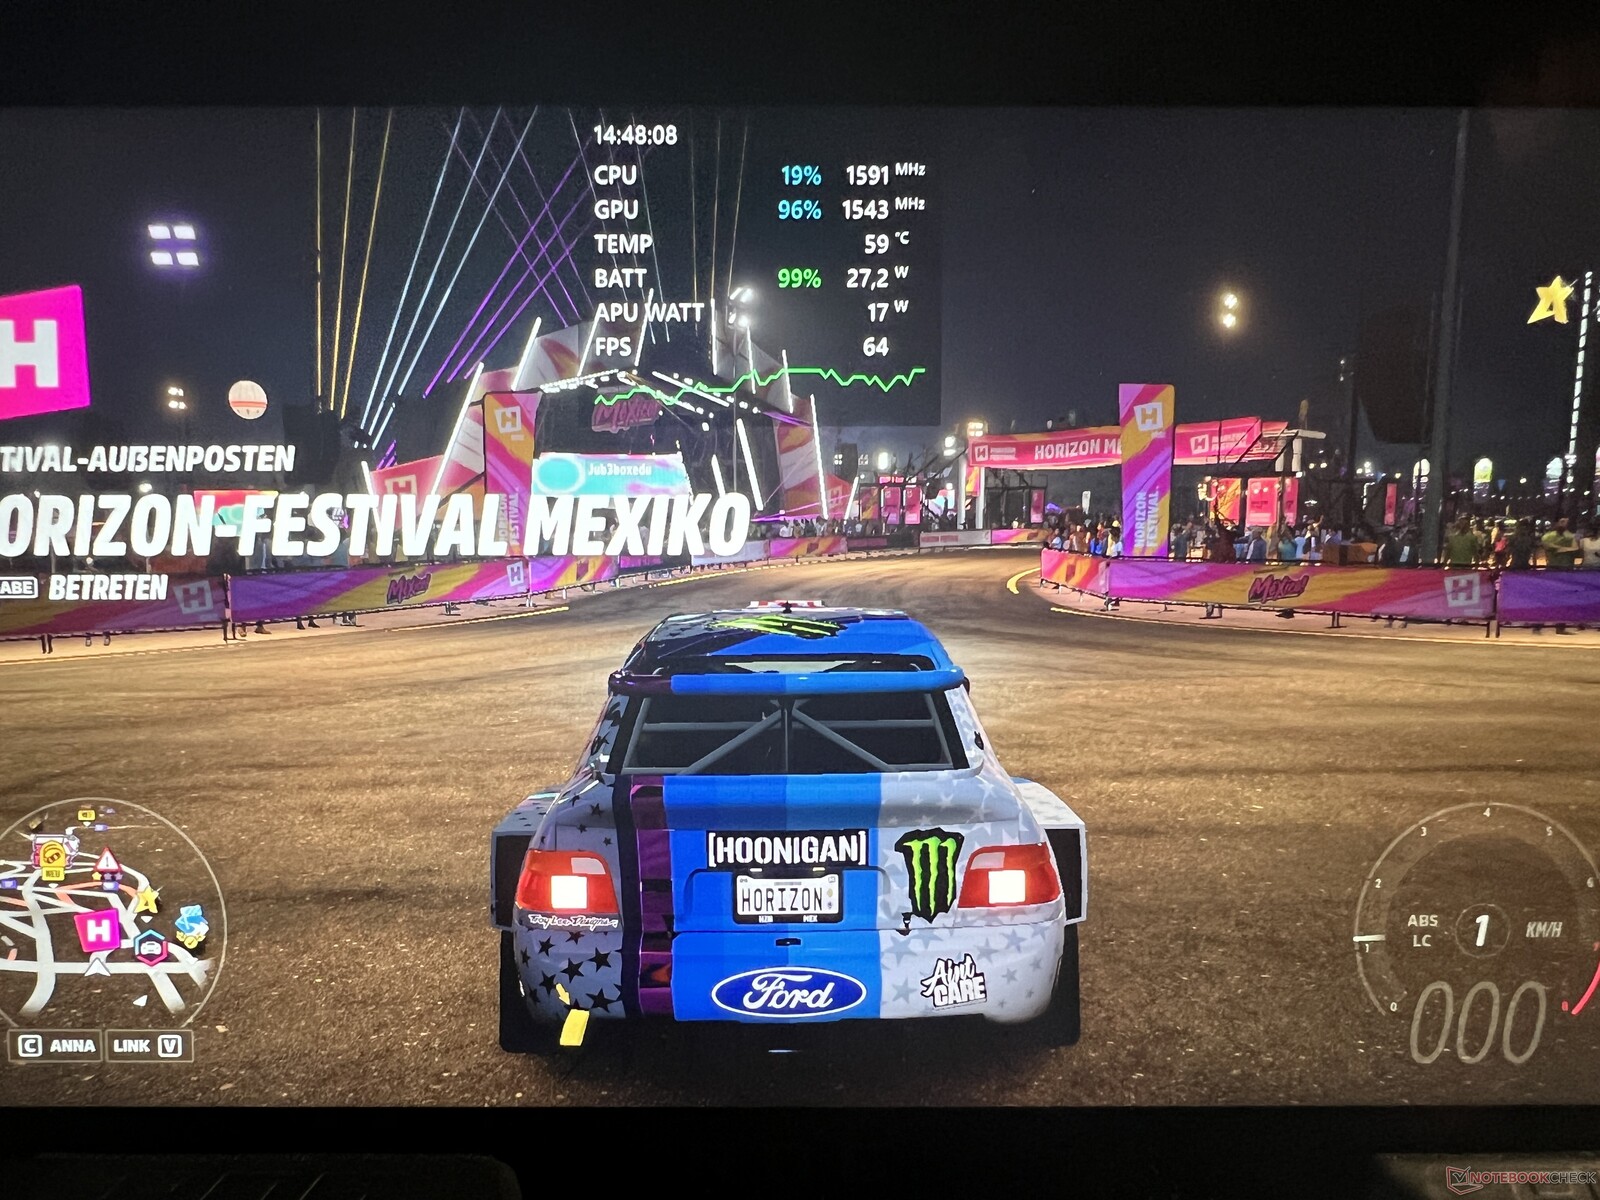
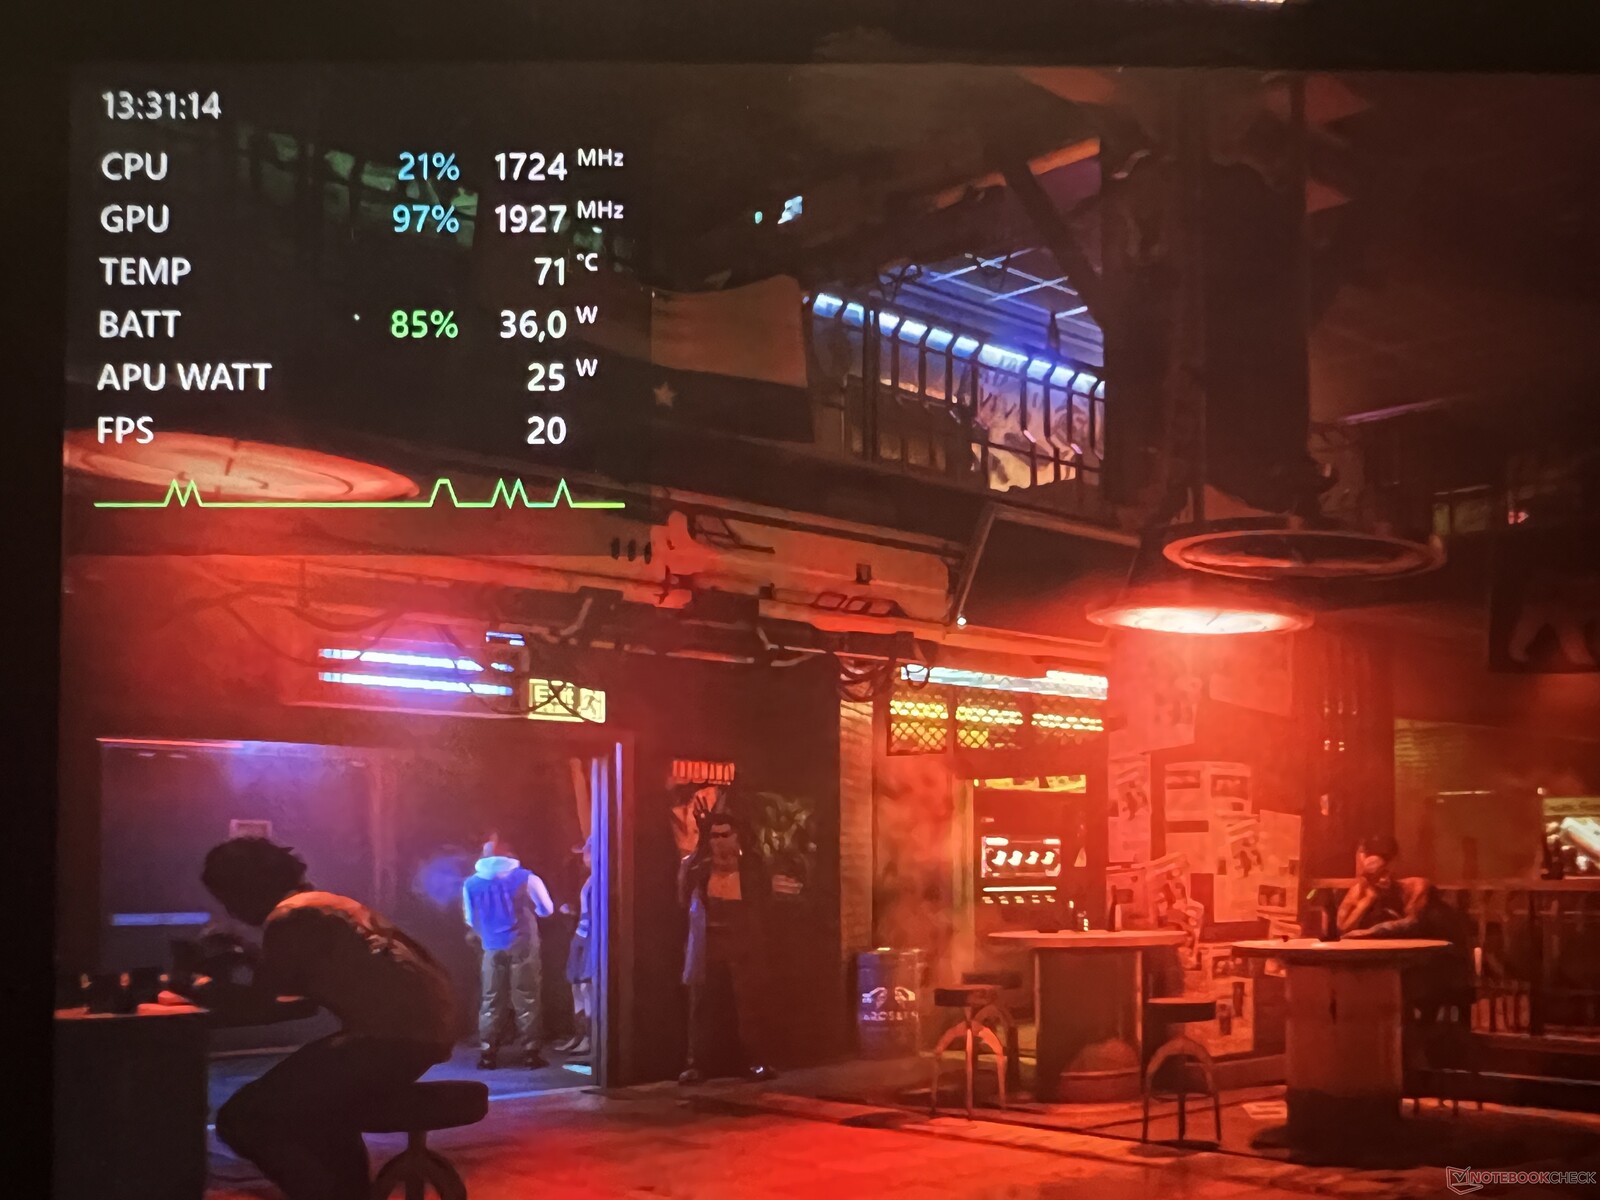
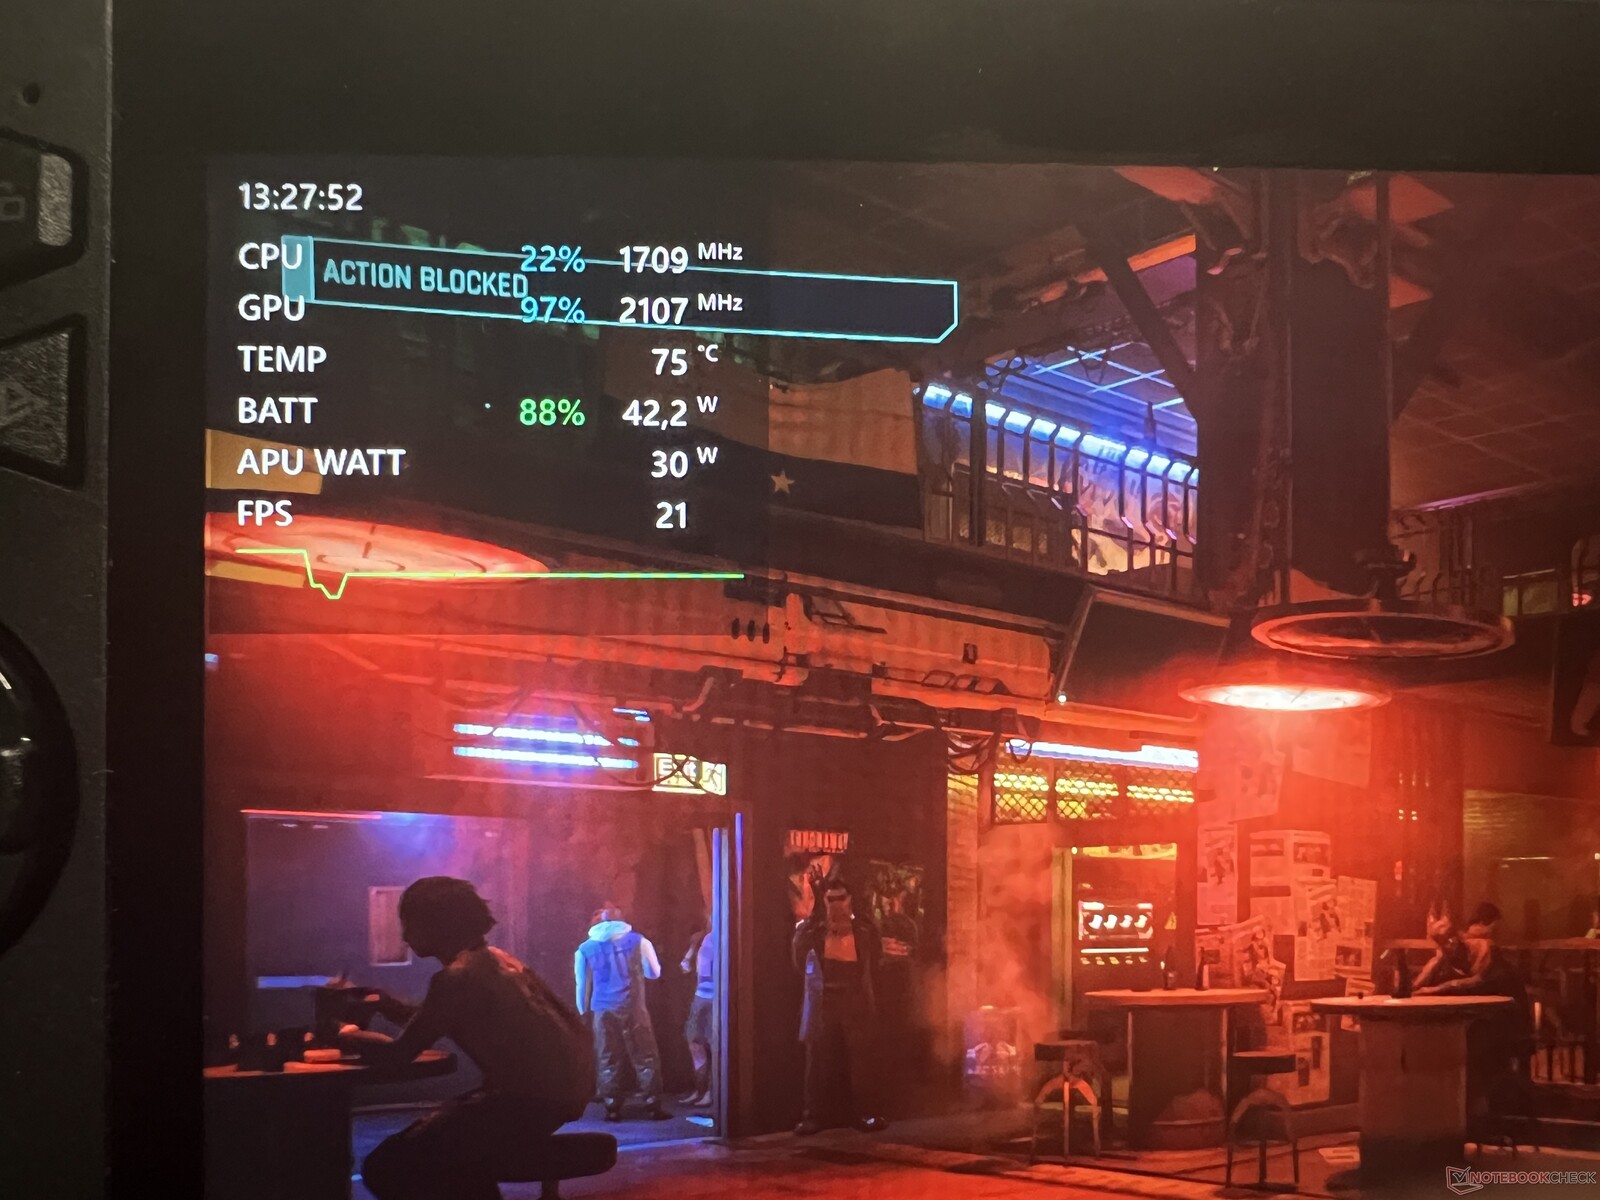
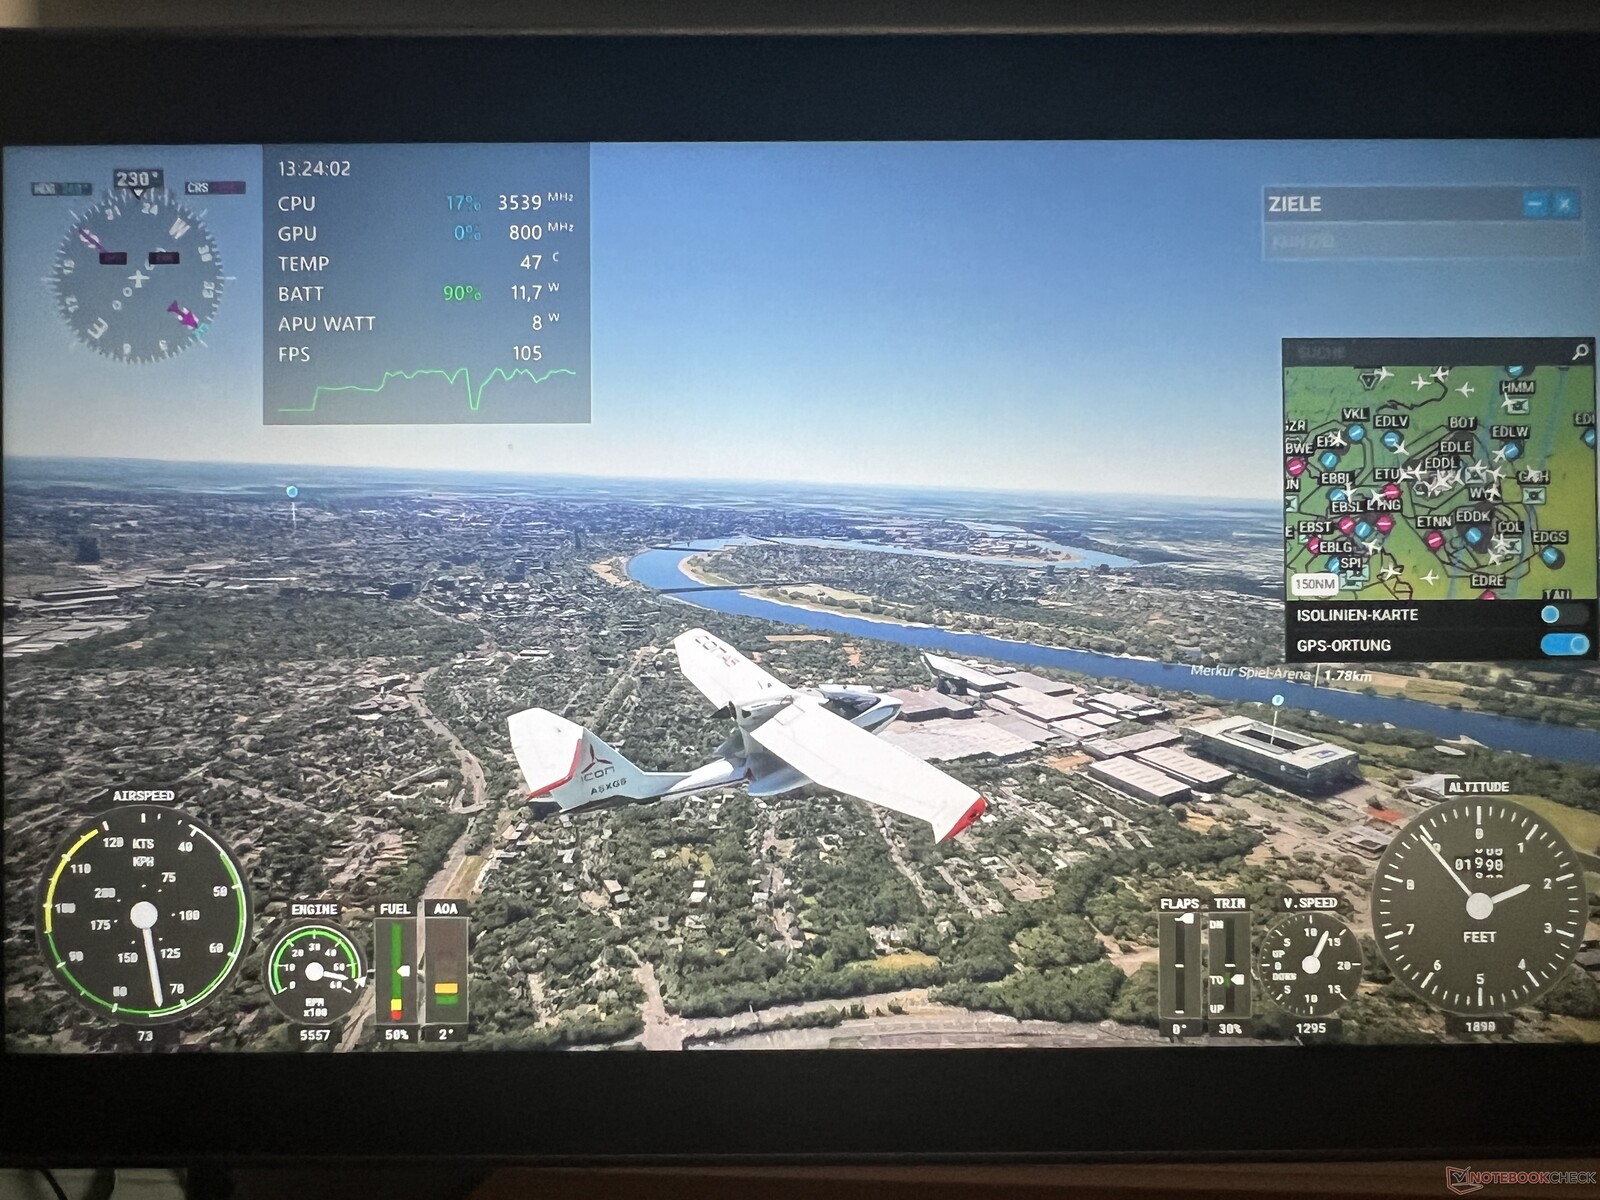
One of these options is real-time monitoring with three different settings: Minimal, Line and Box. Every option increases the number of data shown on the screen and all the important performance data is shown. The FPS monitor was very reliable (as it already was on the previous model) and is a tremendous help when you try to find the right settings for your favorite game. We prefer the Minimal option with current time, battery charge, total system consumption as well as FPS number. The pictures above show all the versions and they can be moved around the screen freely.
Display - Still 7-inch IPS w/ VRR


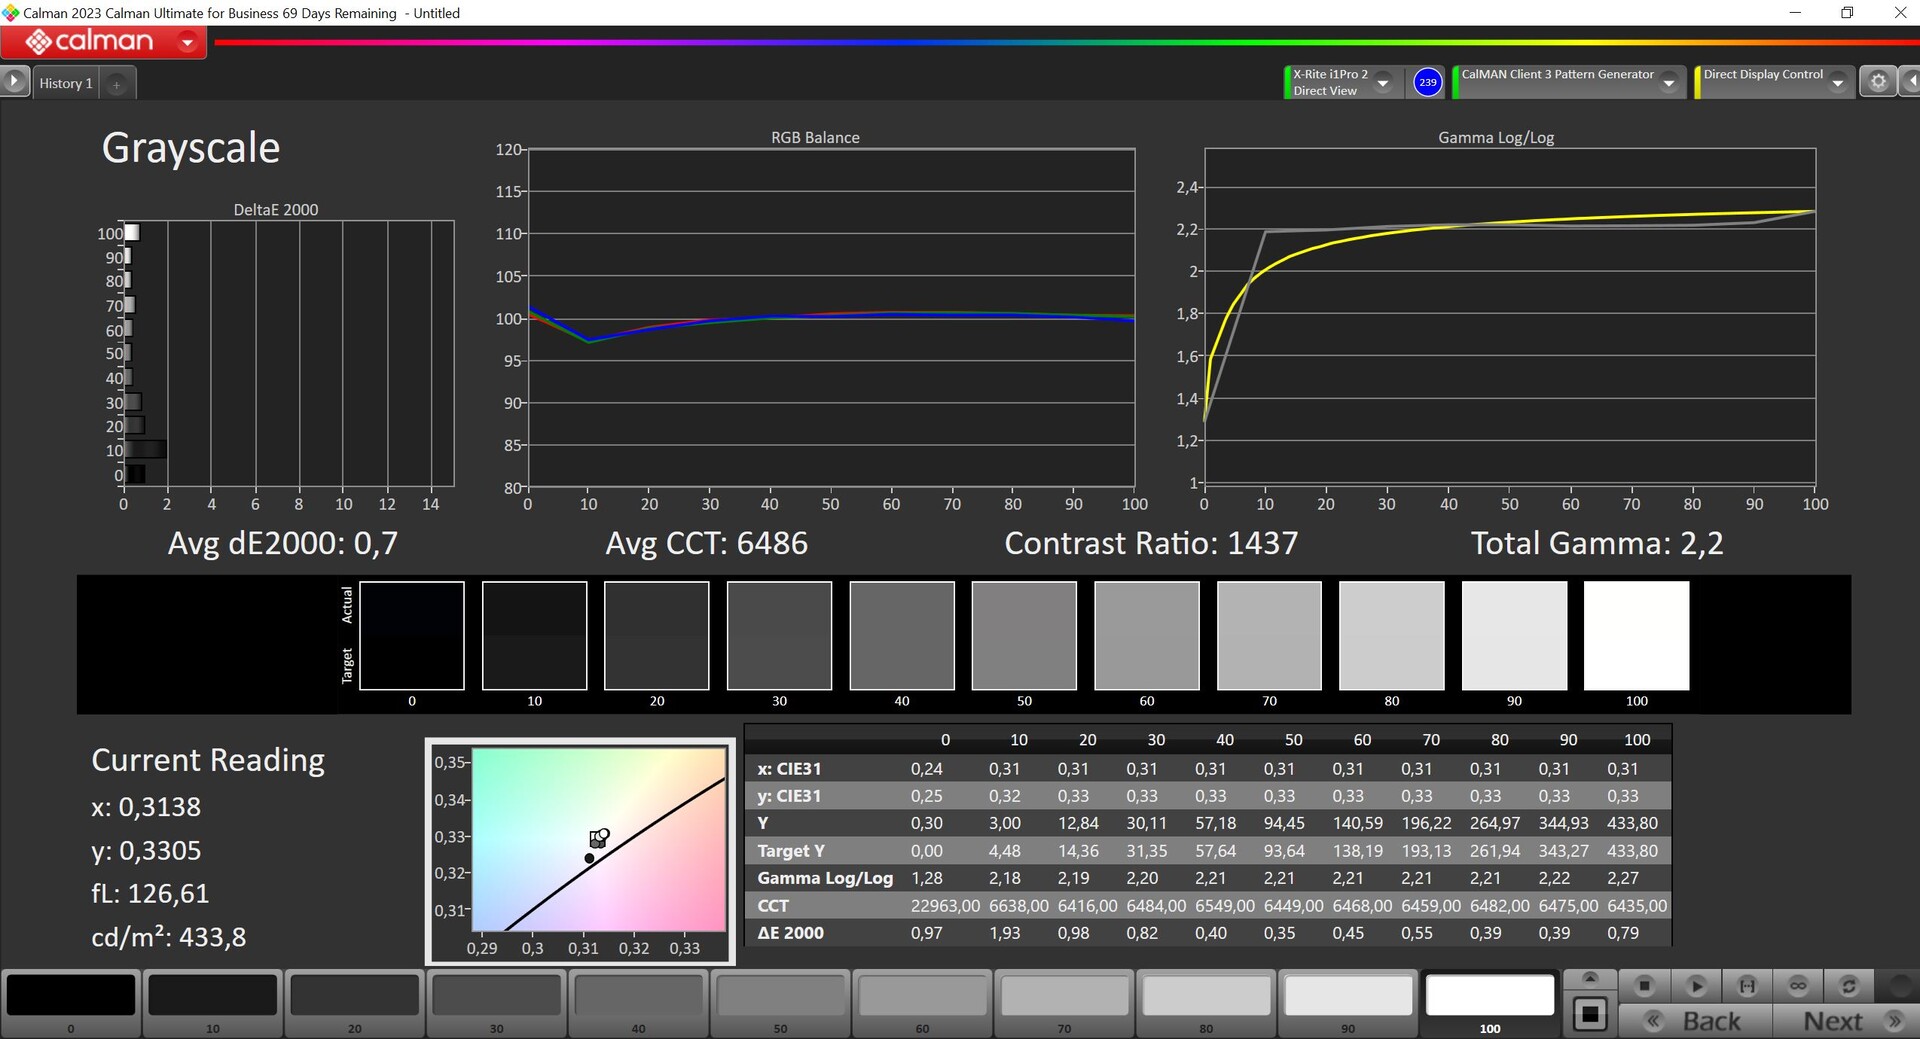
There are no changes for the 7-inch IPS screen and the overall image quality is very good. The OLED panel of the Steam Deck might have a small advantage, but the panel of the Ally X offers VRR (variable refresh rate) in return, which is a big improvement when you play games with comparatively low fps numbers. All in all, the 120 Hz IPS screen with fast response times is still a very good choice for gaming. There is also now PWM and Asus reduced the minimum brightness from 25 to 10 cd/m², which helps in dark environments.
The advertised brightness is still 500 nits, but our review unit is a bit darker with 456 nits on average. It looks like we have a weaker panel in our unit, while last year’s ROG Ally (identical panel-ID) was slightly brighter. The black value is 0.35 cd/m², which results in a maximum contrast ratio of almost 1400:1. HDR contents are not supported by the screen and there is no automatic control for the brightness or the color temperature.
| |||||||||||||||||||||||||
Brightness Distribution: 88 %
Center on Battery: 484 cd/m²
Contrast: 1383:1 (Black: 0.35 cd/m²)
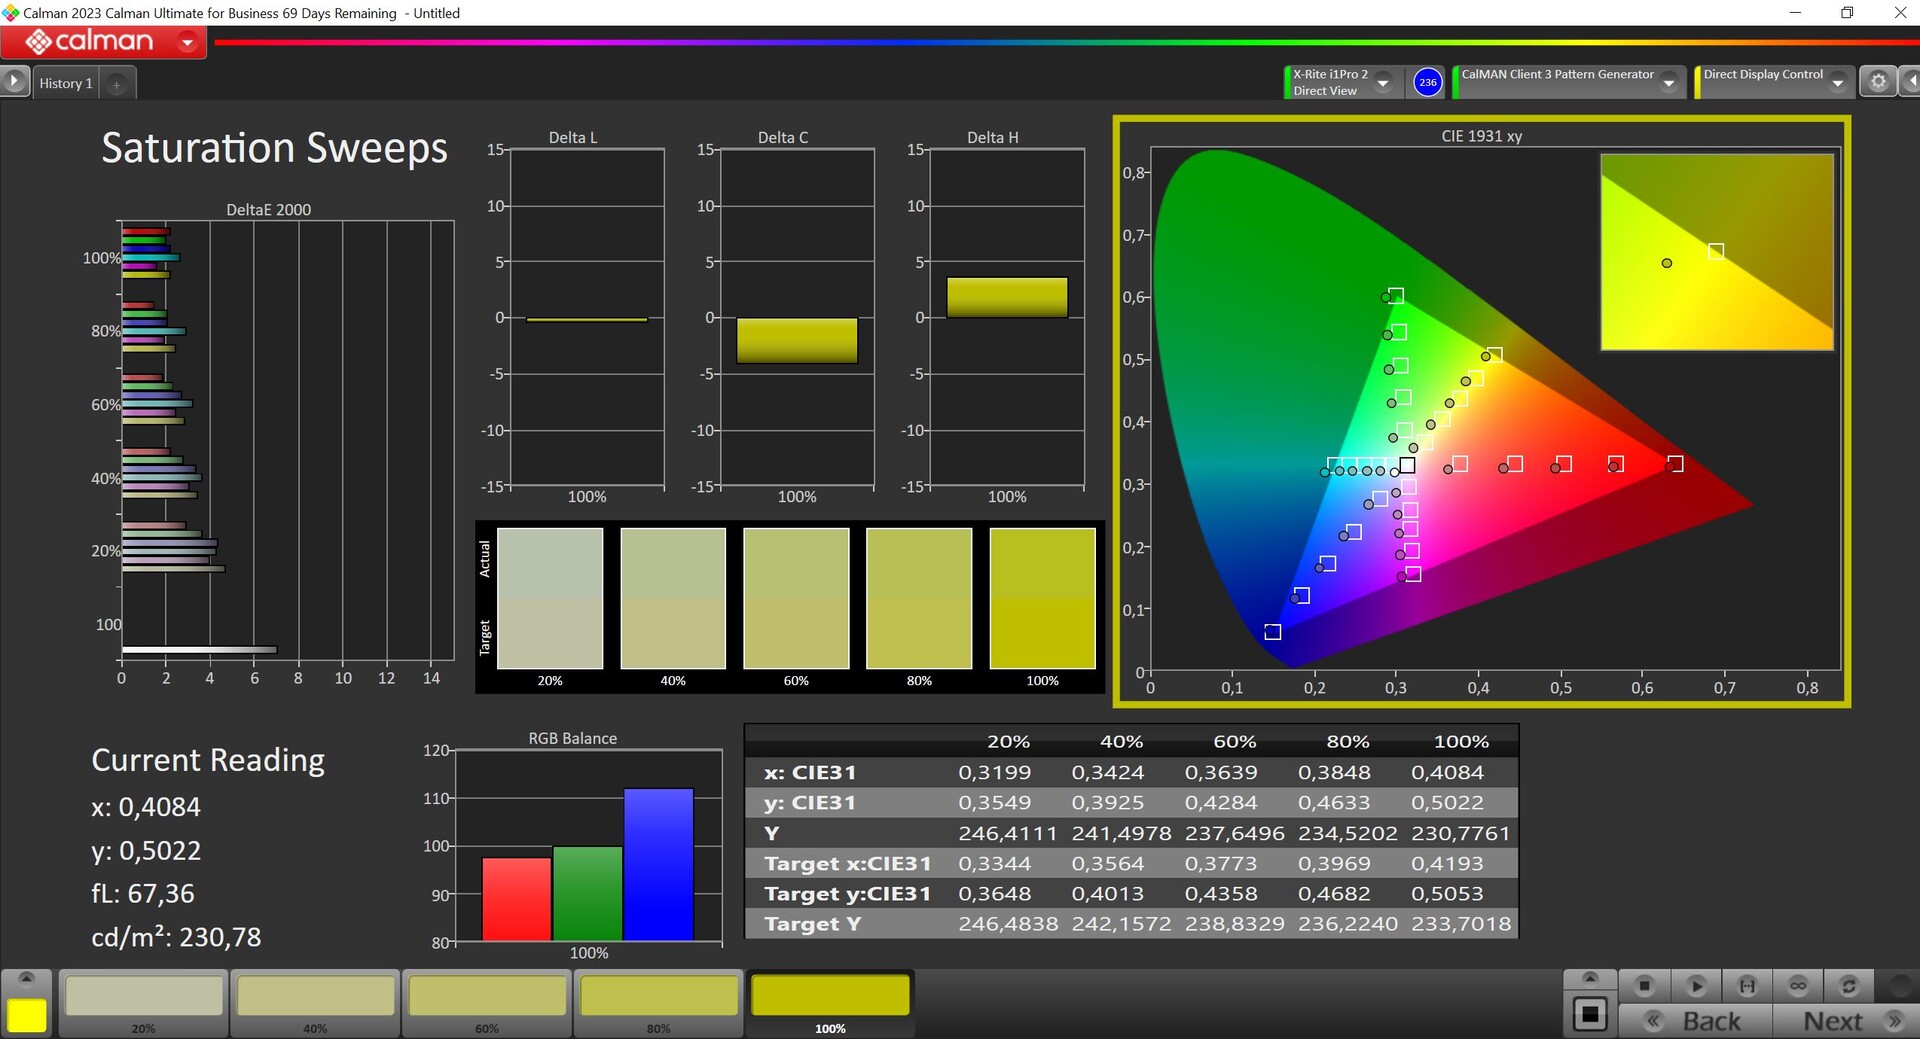
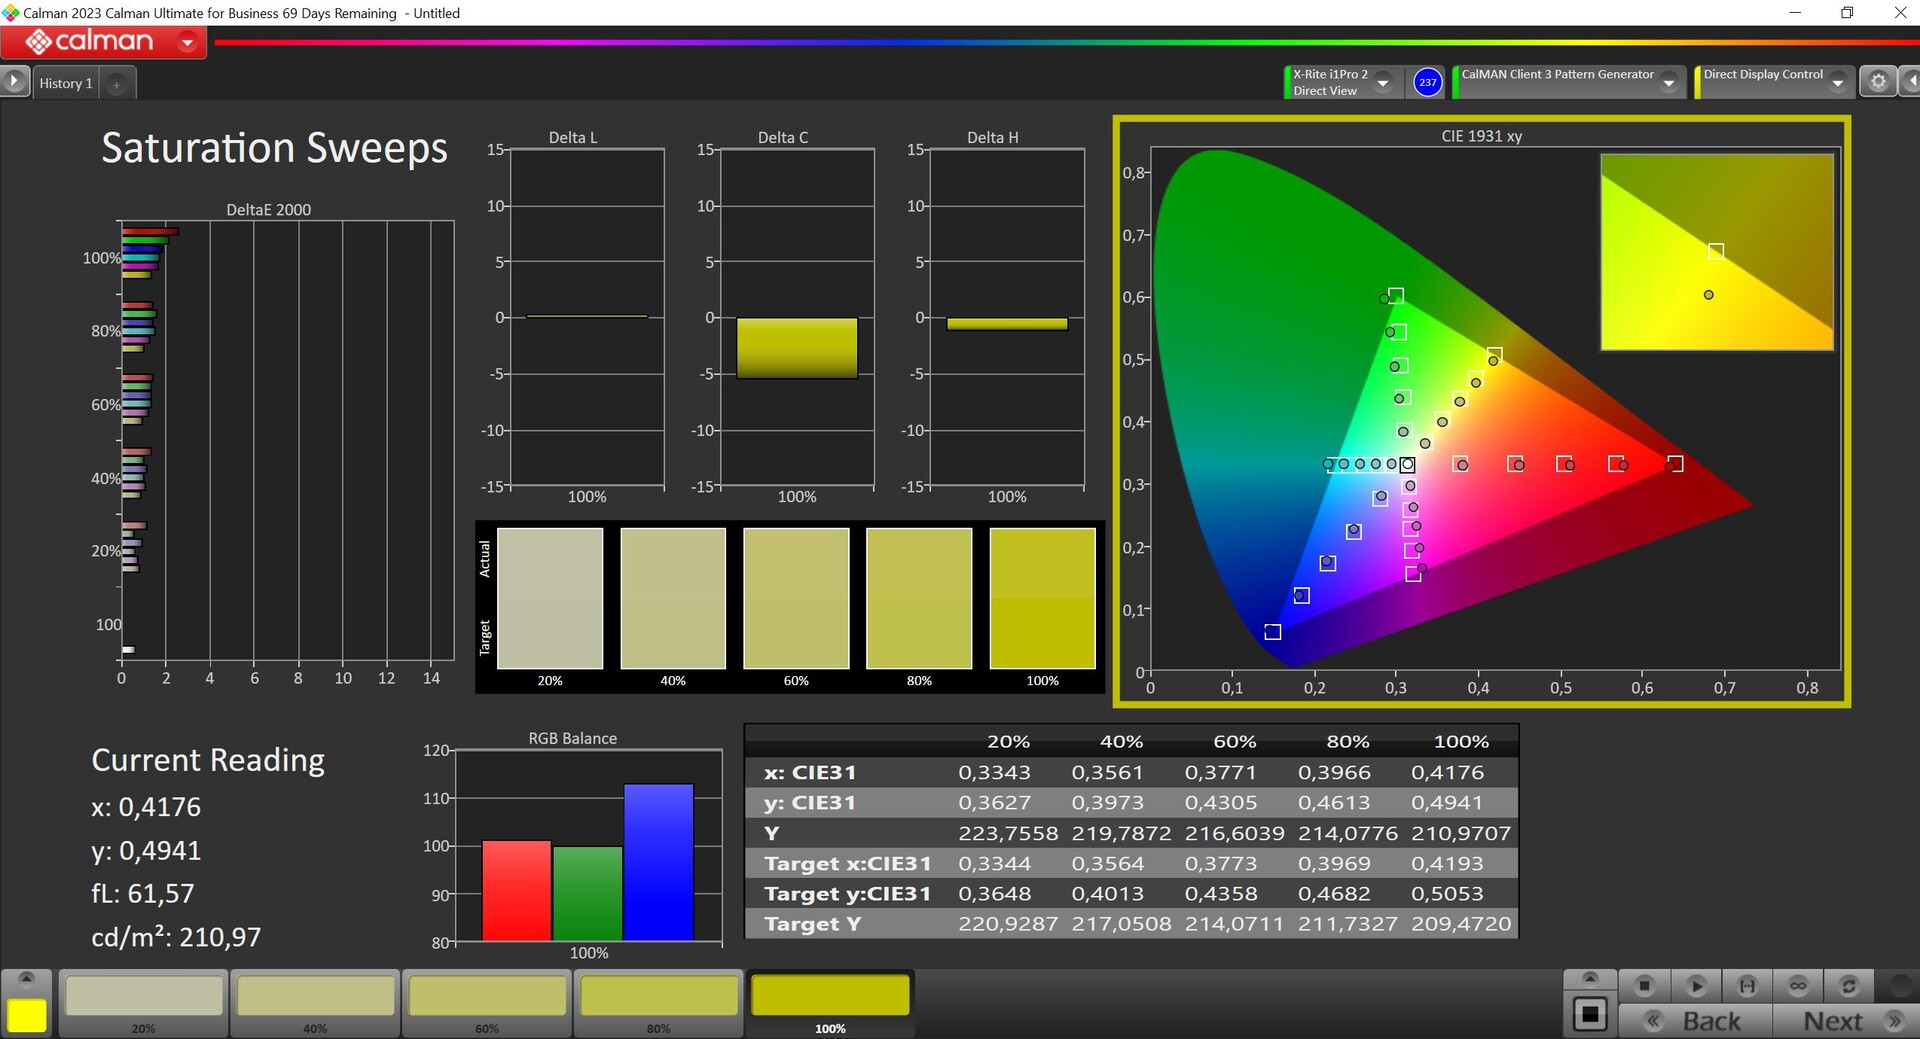
ΔE ColorChecker Calman: 2.9 | ∀{0.5-29.43 Ø4.72}
calibrated: 1.4
ΔE Greyscale Calman: 4.5 | ∀{0.09-98 Ø4.97}
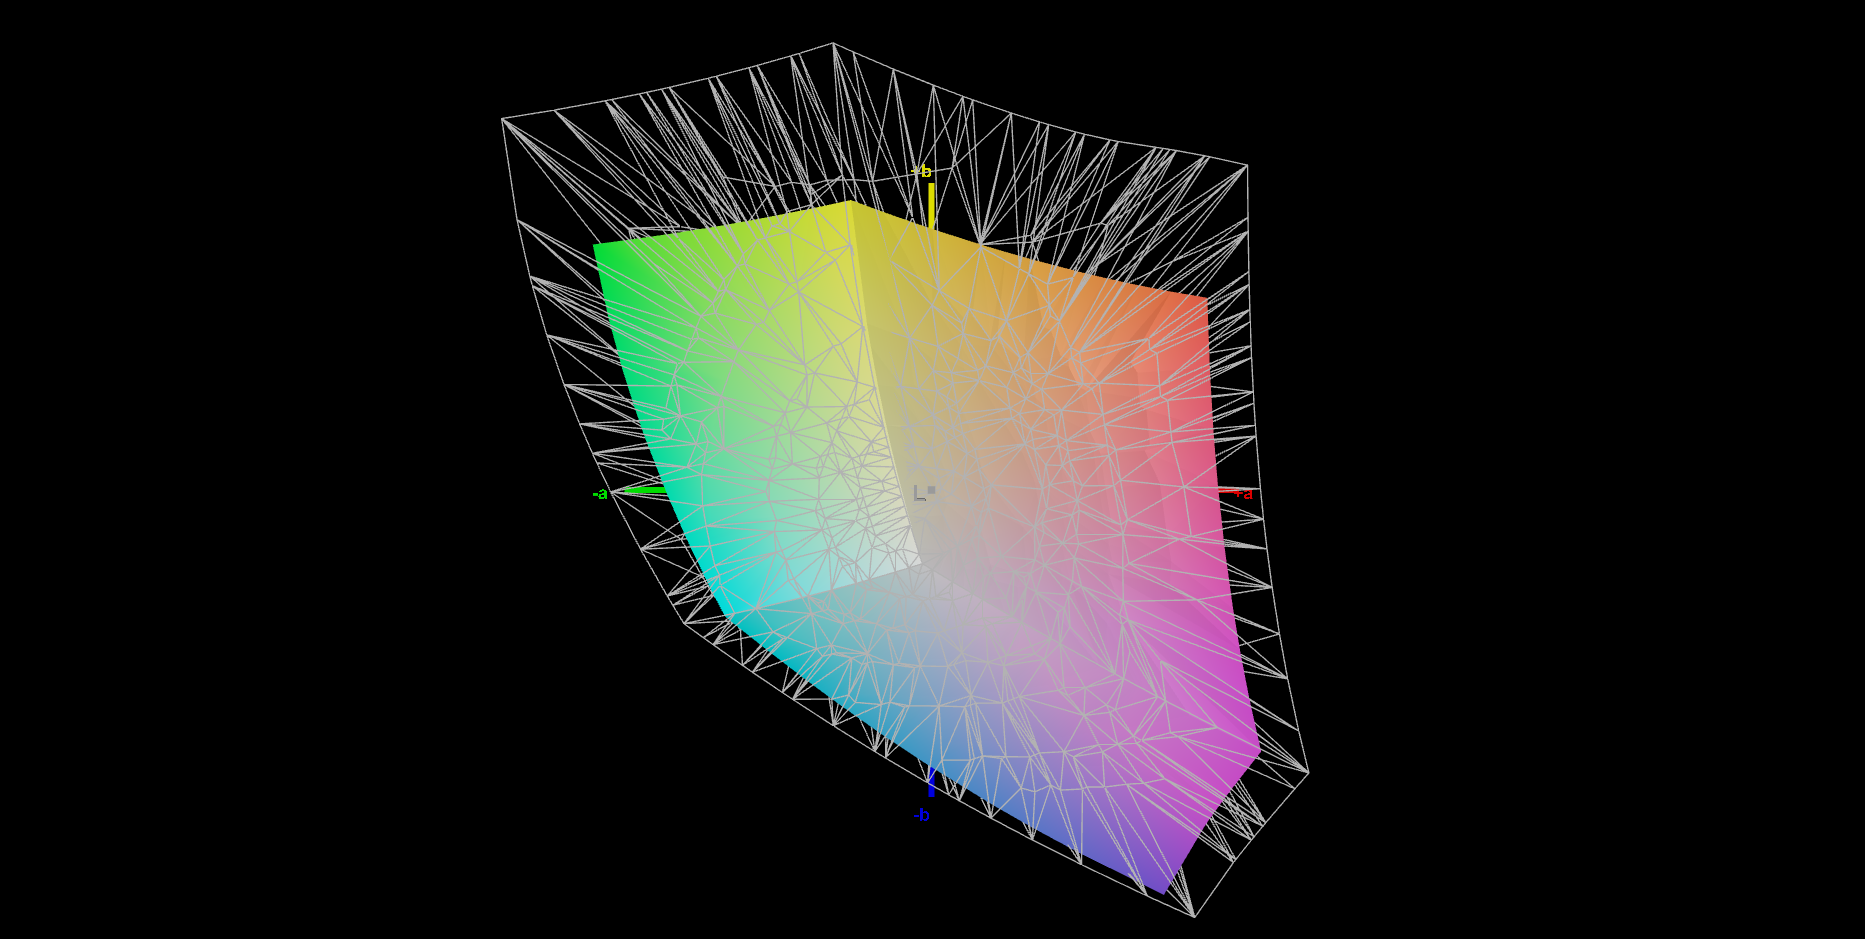
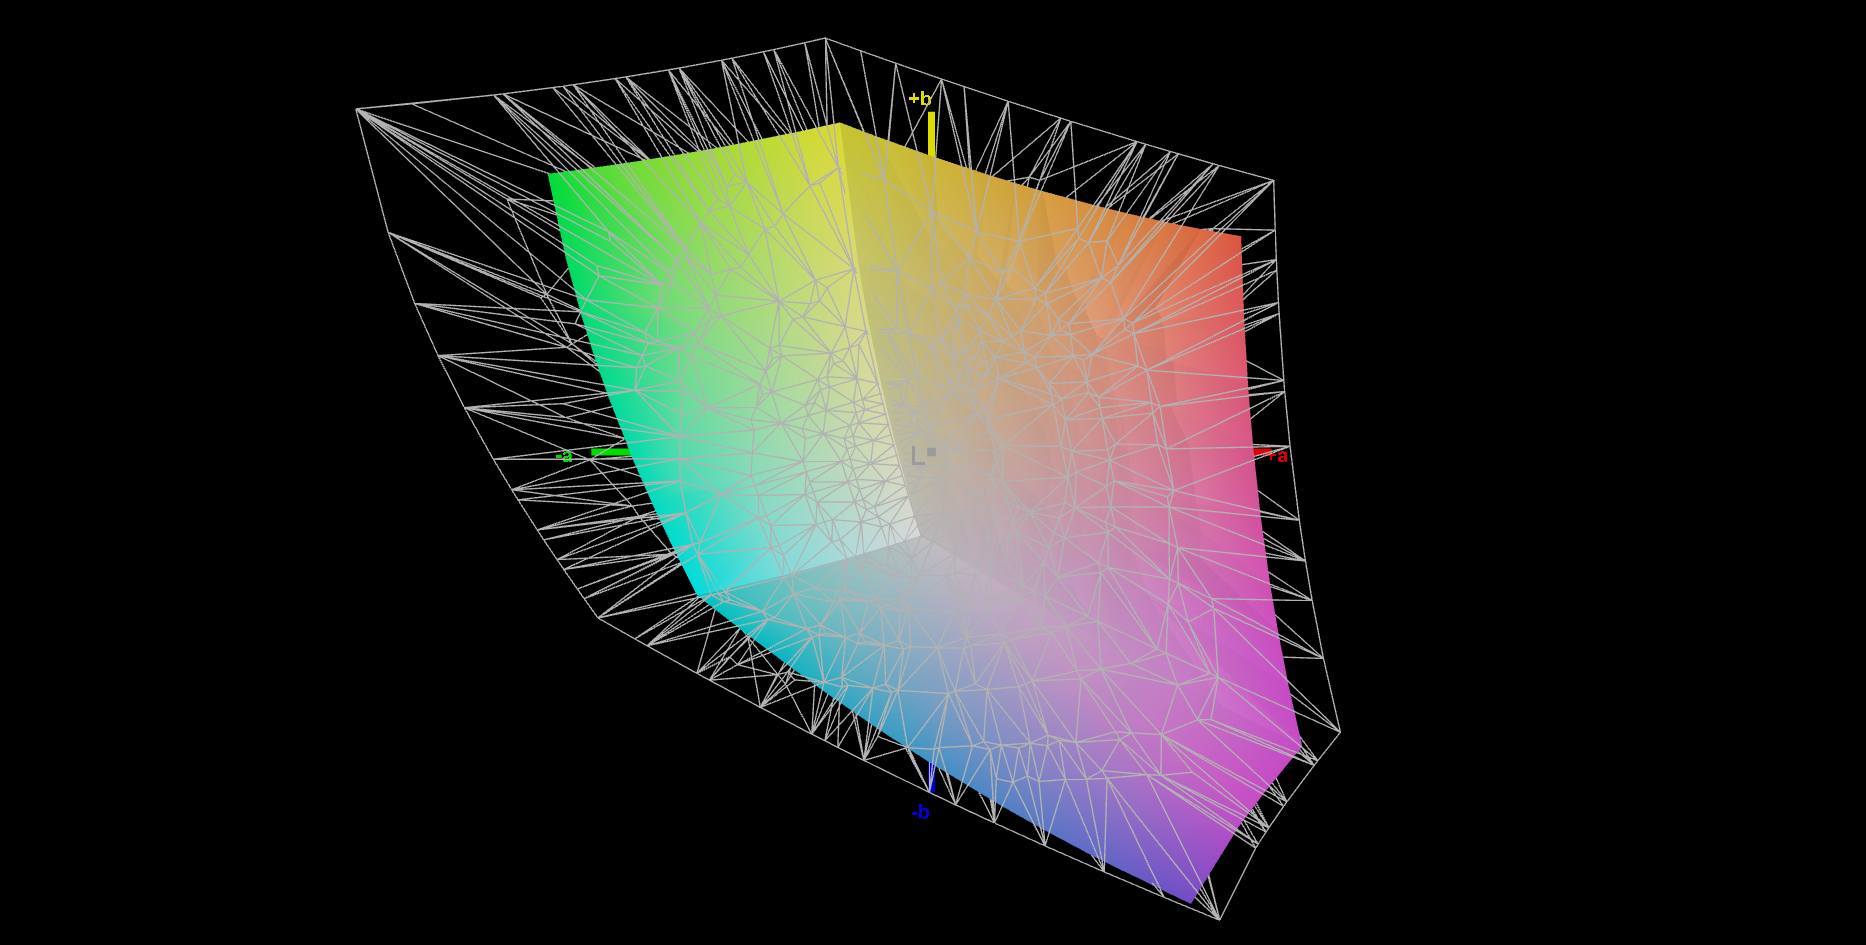
68.5% AdobeRGB 1998 (Argyll 3D)
93.4% sRGB (Argyll 3D)
66.2% Display P3 (Argyll 3D)
Gamma: 2.24
CCT: 7534 K
| Asus ROG Ally X TL070FVXS01-0, IPS, 1920x1080, 7", 120 Hz | GPD Win Mini 2024 7" TL070FVSX01-0, IPS, 1920x1080, 7", 120 Hz | MSI Claw TL070FVXS02-0, IPS, 1920x1080, 7", 120 Hz | Valve Steam Deck 1 TB OLED ANX7530 U, OLED, 1280x800, 7.4", 90 Hz | Lenovo Legion Go Legion Go Display, IPS, 2560x1600, 8.8", 144 Hz | Ayaneo Kun Ayaneo 2K, IPS, 2560x1600, 8.4", 60 Hz | Asus ROG Ally Z1 Extreme TL070FVSX01-0, IPS, 1920x1080, 7", 120 Hz | |
|---|---|---|---|---|---|---|---|
| Display | -1% | 1% | 32% | 26% | 27% | -1% | |
| Display P3 Coverage (%) | 66.2 | 64.8 -2% | 67 1% | 99.6 50% | 92.1 39% | 93.52 41% | 65.6 -1% |
| sRGB Coverage (%) | 93.4 | 93.3 0% | 94.4 1% | 100 7% | 99.56 7% | 99.4 6% | 92.1 -1% |
| AdobeRGB 1998 Coverage (%) | 68.5 | 67 -2% | 69.4 1% | 96.1 40% | 90.09 32% | 91.2 33% | 67.9 -1% |
| Response Times | -2% | -6% | -26% | -134% | -167% | -7% | |
| Response Time Grey 50% / Grey 80% * (ms) | 9.7 ? | 8.9 ? 8% | 9.2 ? 5% | 9 ? 7% | 20.8 ? -114% | 24.2 ? -149% | 10.5 ? -8% |
| Response Time Black / White * (ms) | 5.7 ? | 6.3 ? -11% | 6.6 ? -16% | 9 ? -58% | 14.4 ? -153% | 16.2 ? -184% | 6 ? -5% |
| PWM Frequency (Hz) | 360 ? | 700 | 20000 | ||||
| Screen | -2% | 6% | 162% | -30% | -10% | -8% | |
| Brightness middle (cd/m²) | 484 | 493 2% | 477 -1% | 485 0% | 411 -15% | 680 40% | 513 6% |
| Brightness (cd/m²) | 456 | 470 3% | 461 1% | 482 6% | 413 -9% | 678 49% | 474 4% |
| Brightness Distribution (%) | 88 | 86 -2% | 88 0% | 98 11% | 80 -9% | 91 3% | 84 -5% |
| Black Level * (cd/m²) | 0.35 | 0.47 -34% | 0.32 9% | 0.03 91% | 0.42 -20% | 0.5 -43% | 0.38 -9% |
| Contrast (:1) | 1383 | 1049 -24% | 1491 8% | 16167 1069% | 979 -29% | 1360 -2% | 1350 -2% |
| Colorchecker dE 2000 * | 2.9 | 2.36 19% | 2.6 10% | 2 31% | 5.94 -105% | 4 -38% | 3.7 -28% |
| Colorchecker dE 2000 max. * | 7.1 | 6.36 10% | 5.8 18% | 5 30% | 10.56 -49% | 9 -27% | 8.3 -17% |
| Colorchecker dE 2000 calibrated * | 1.4 | 1.3 7% | 1.5 -7% | 2.95 -111% | 1 29% | ||
| Greyscale dE 2000 * | 4.5 | 4.4 2% | 3.9 13% | 2 56% | 0.92 80% | 9 -100% | 5.1 -13% |
| Gamma | 2.24 98% | 2.28 96% | 2.17 101% | 2 110% | 1.93 114% | 2 110% | 2.14 103% |
| CCT | 7534 86% | 7142 91% | 7250 90% | 6336 103% | 8064 81% | 7188 90% | 7732 84% |
| Total Average (Program / Settings) | -2% /
-2% | 0% /
3% | 56% /
103% | -46% /
-33% | -50% /
-24% | -5% /
-6% |
* ... smaller is better
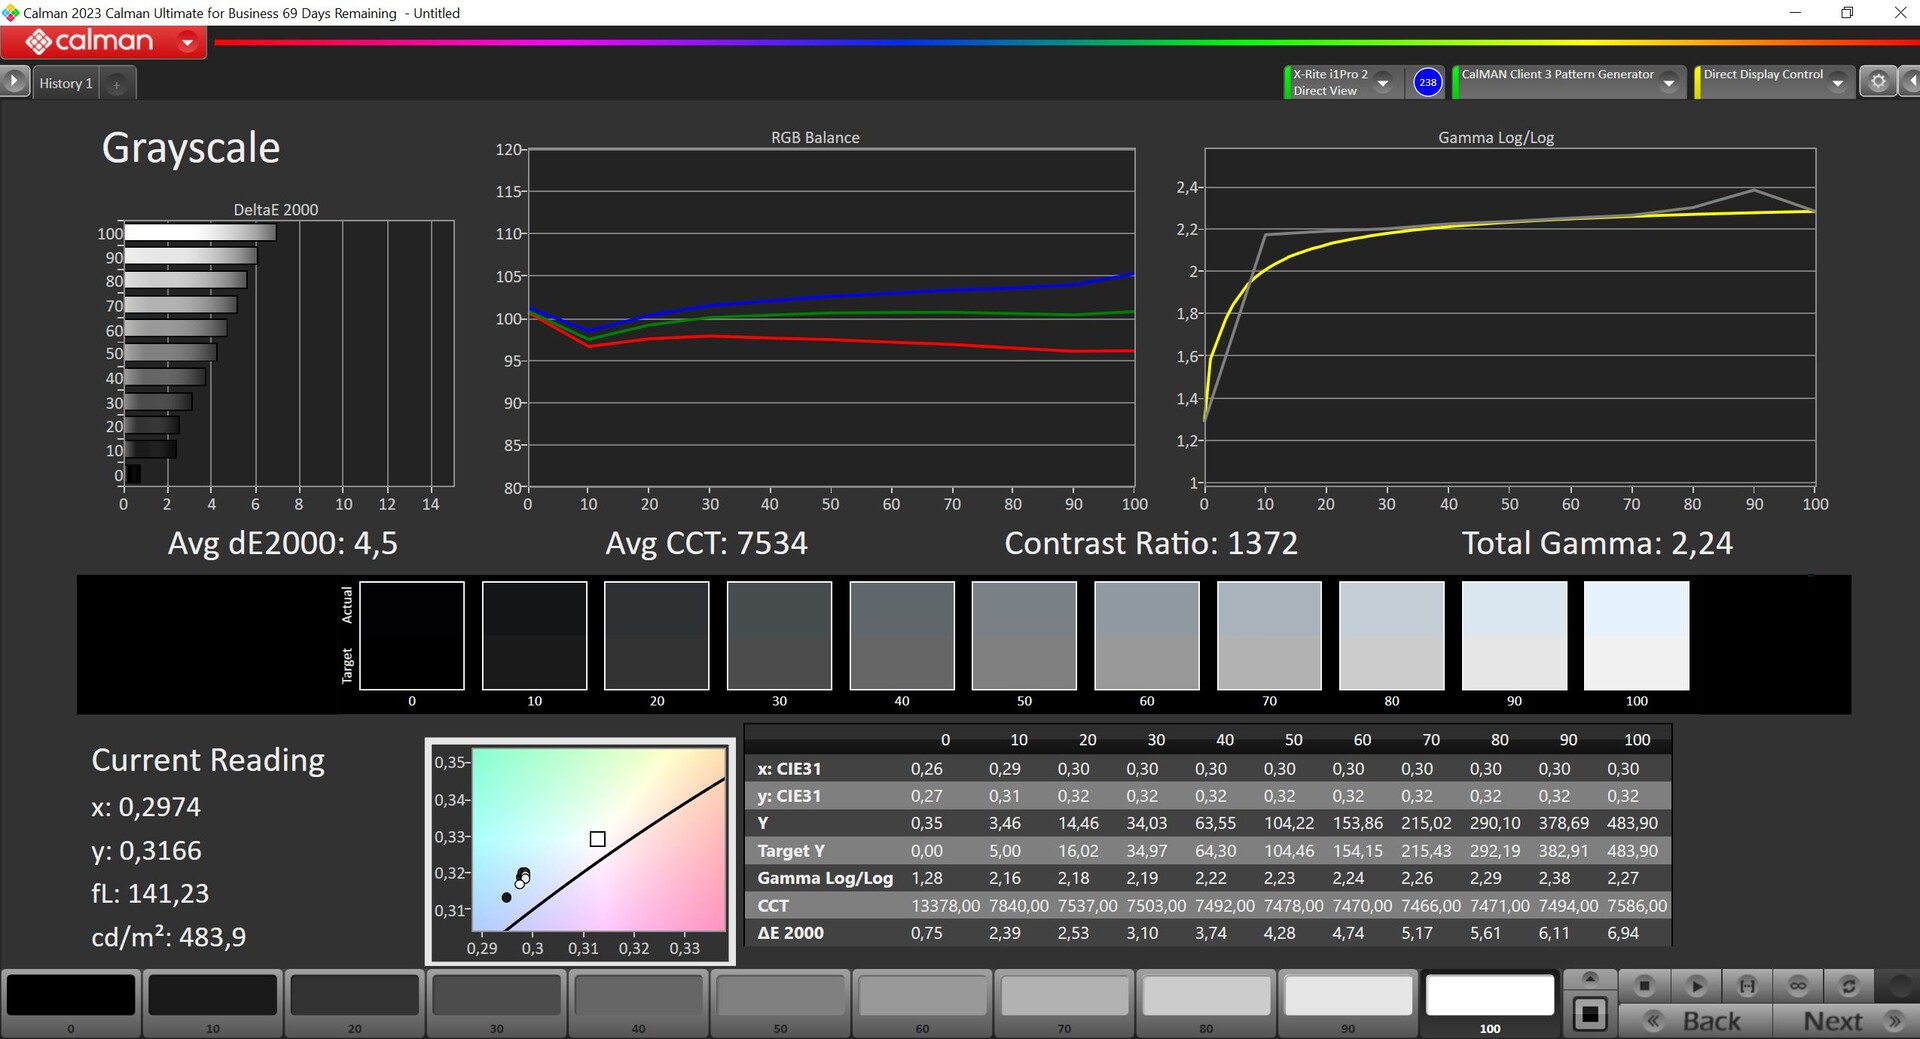
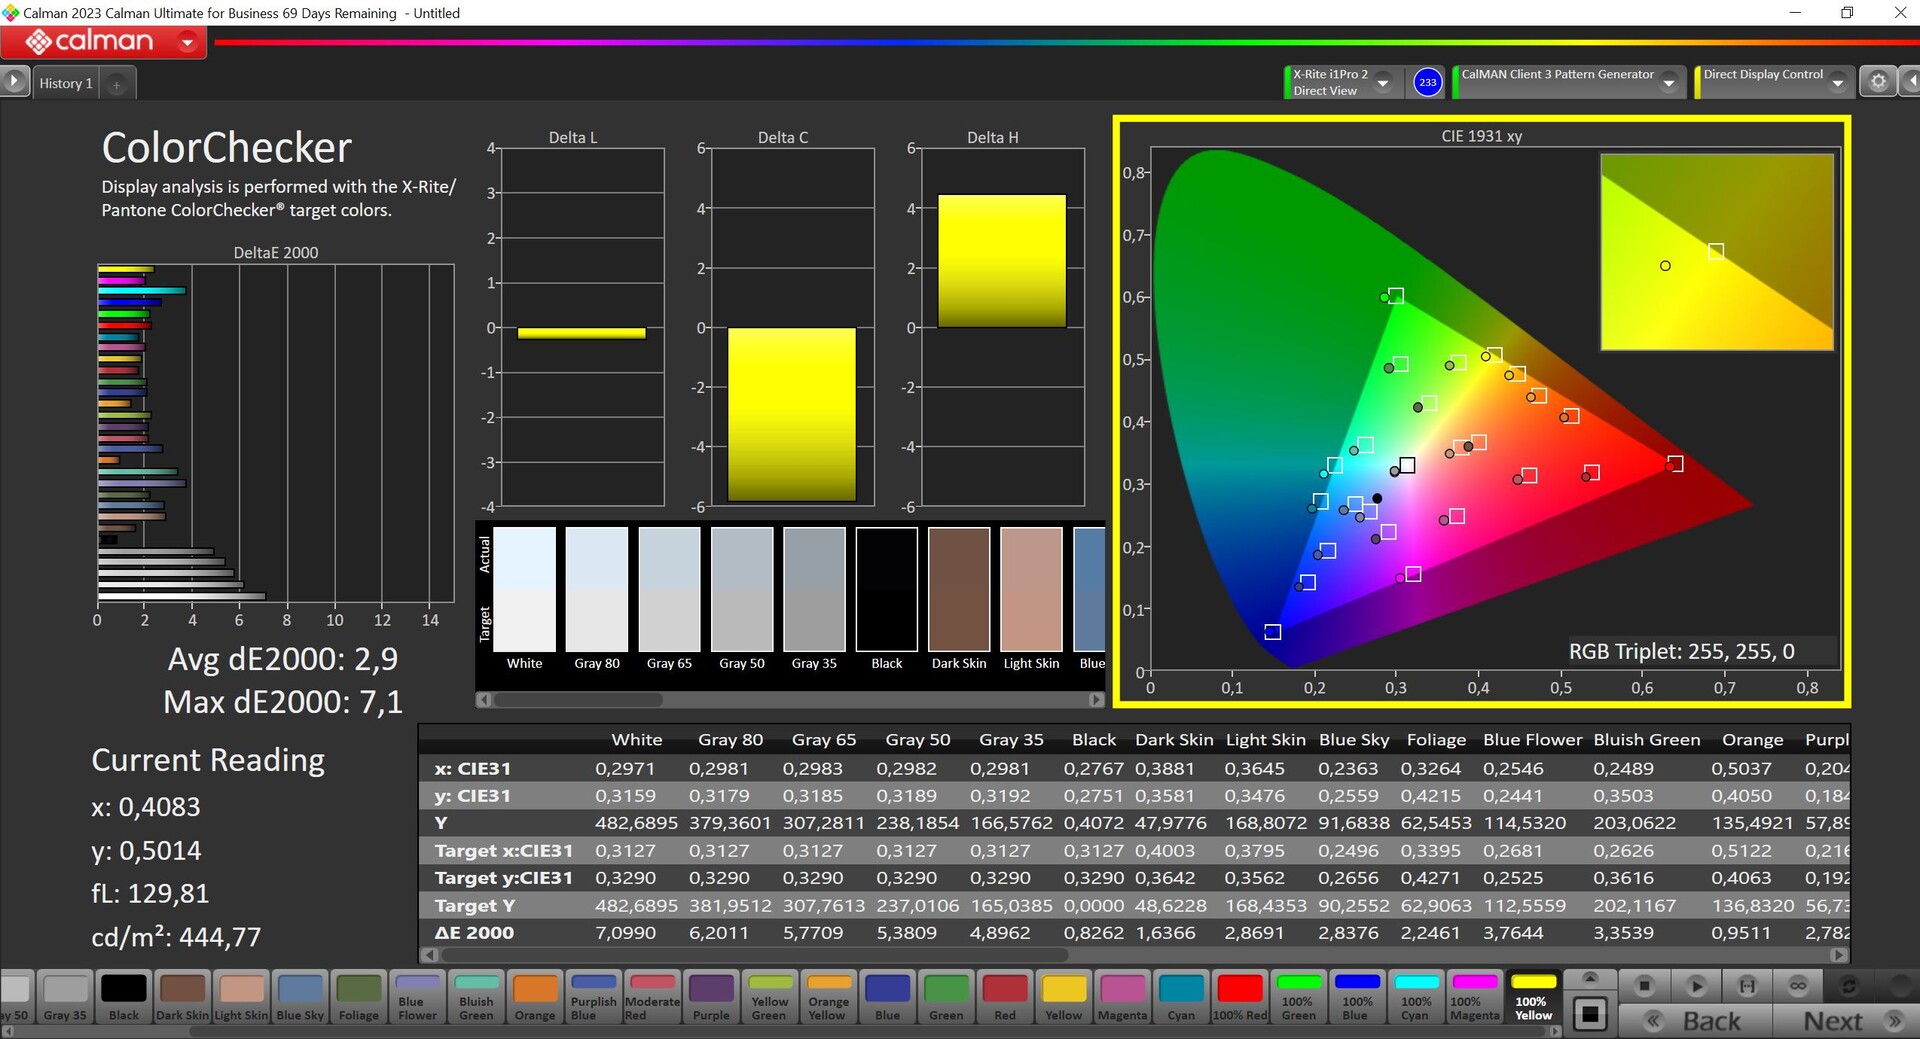

Asus does not ship the ROG Ally X with color profiles and the factory settings show a noticeable blue cast in combination with a cool color temperature, but the color deviations are okay. This combination helps to maximize the brightness. You will hardly edit any pictures on the small screen, so the situation is not ideal, but it is not as important as on a larger laptop screen. Our own calibration (profile is linked in the box above and can be downloaded for free) improves the picture quality noticeably, but the maximum brightness in the center drops from 484 to 434 nits as a result.
Display Response Times
| ↔ Response Time Black to White | ||
|---|---|---|
| 5.7 ms ... rise ↗ and fall ↘ combined | ↗ 2.5 ms rise | 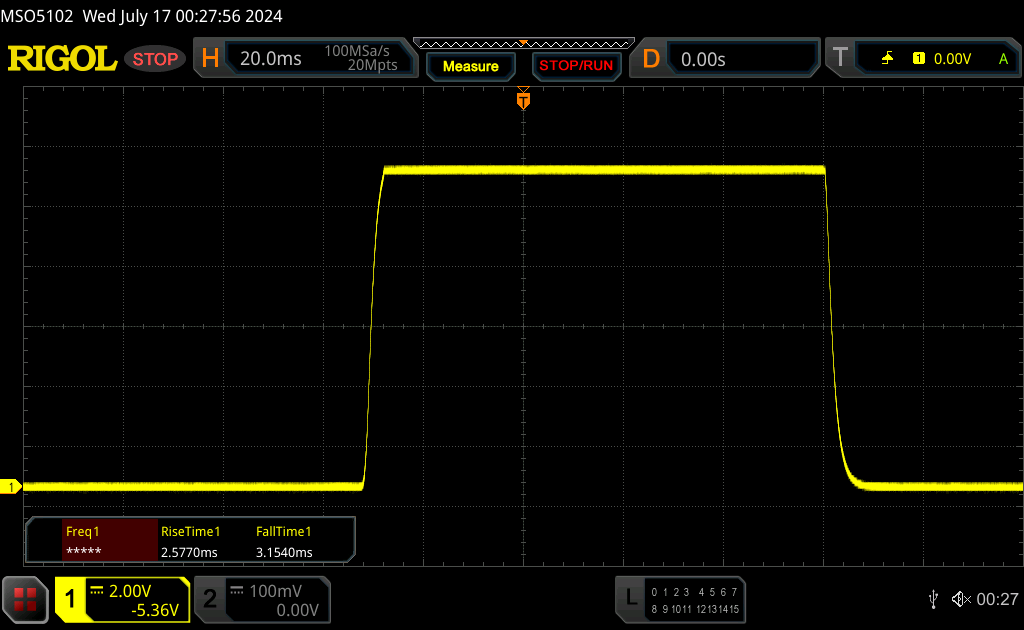 |
| ↘ 3.2 ms fall | ||
| The screen shows very fast response rates in our tests and should be very well suited for fast-paced gaming. In comparison, all tested devices range from 0.1 (minimum) to 240 (maximum) ms. » 18 % of all devices are better. This means that the measured response time is better than the average of all tested devices (19.8 ms). | ||
| ↔ Response Time 50% Grey to 80% Grey | ||
| 9.7 ms ... rise ↗ and fall ↘ combined | ↗ 4.4 ms rise | 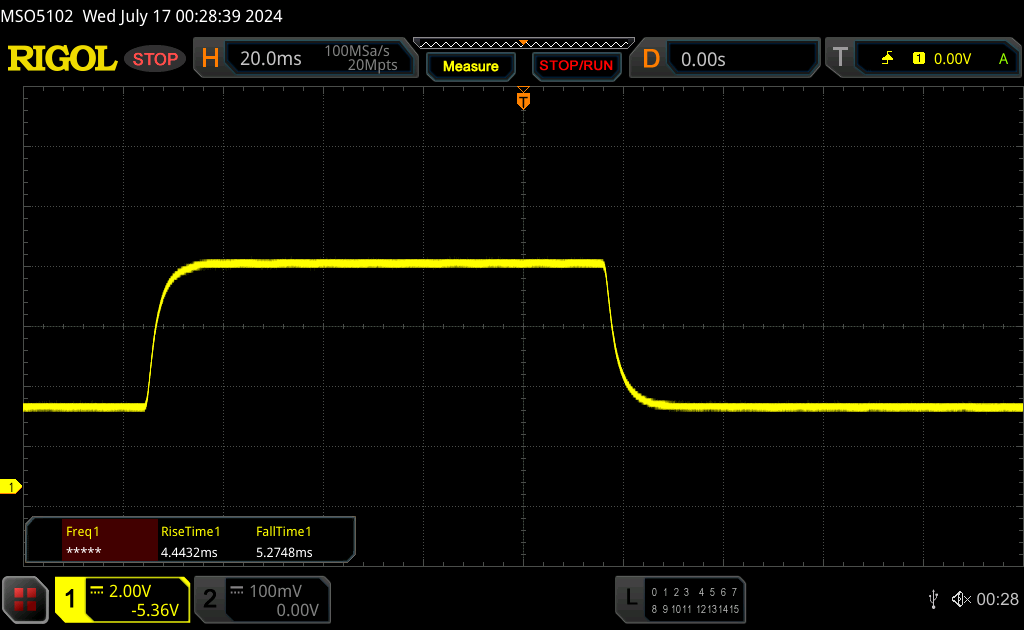 |
| ↘ 5.3 ms fall | ||
| The screen shows fast response rates in our tests and should be suited for gaming. In comparison, all tested devices range from 0.165 (minimum) to 636 (maximum) ms. » 23 % of all devices are better. This means that the measured response time is better than the average of all tested devices (31 ms). | ||
Screen Flickering / PWM (Pulse-Width Modulation)
| Screen flickering / PWM not detected |  | ||
In comparison: 52 % of all tested devices do not use PWM to dim the display. If PWM was detected, an average of 7753 (minimum: 5 - maximum: 343500) Hz was measured. | |||
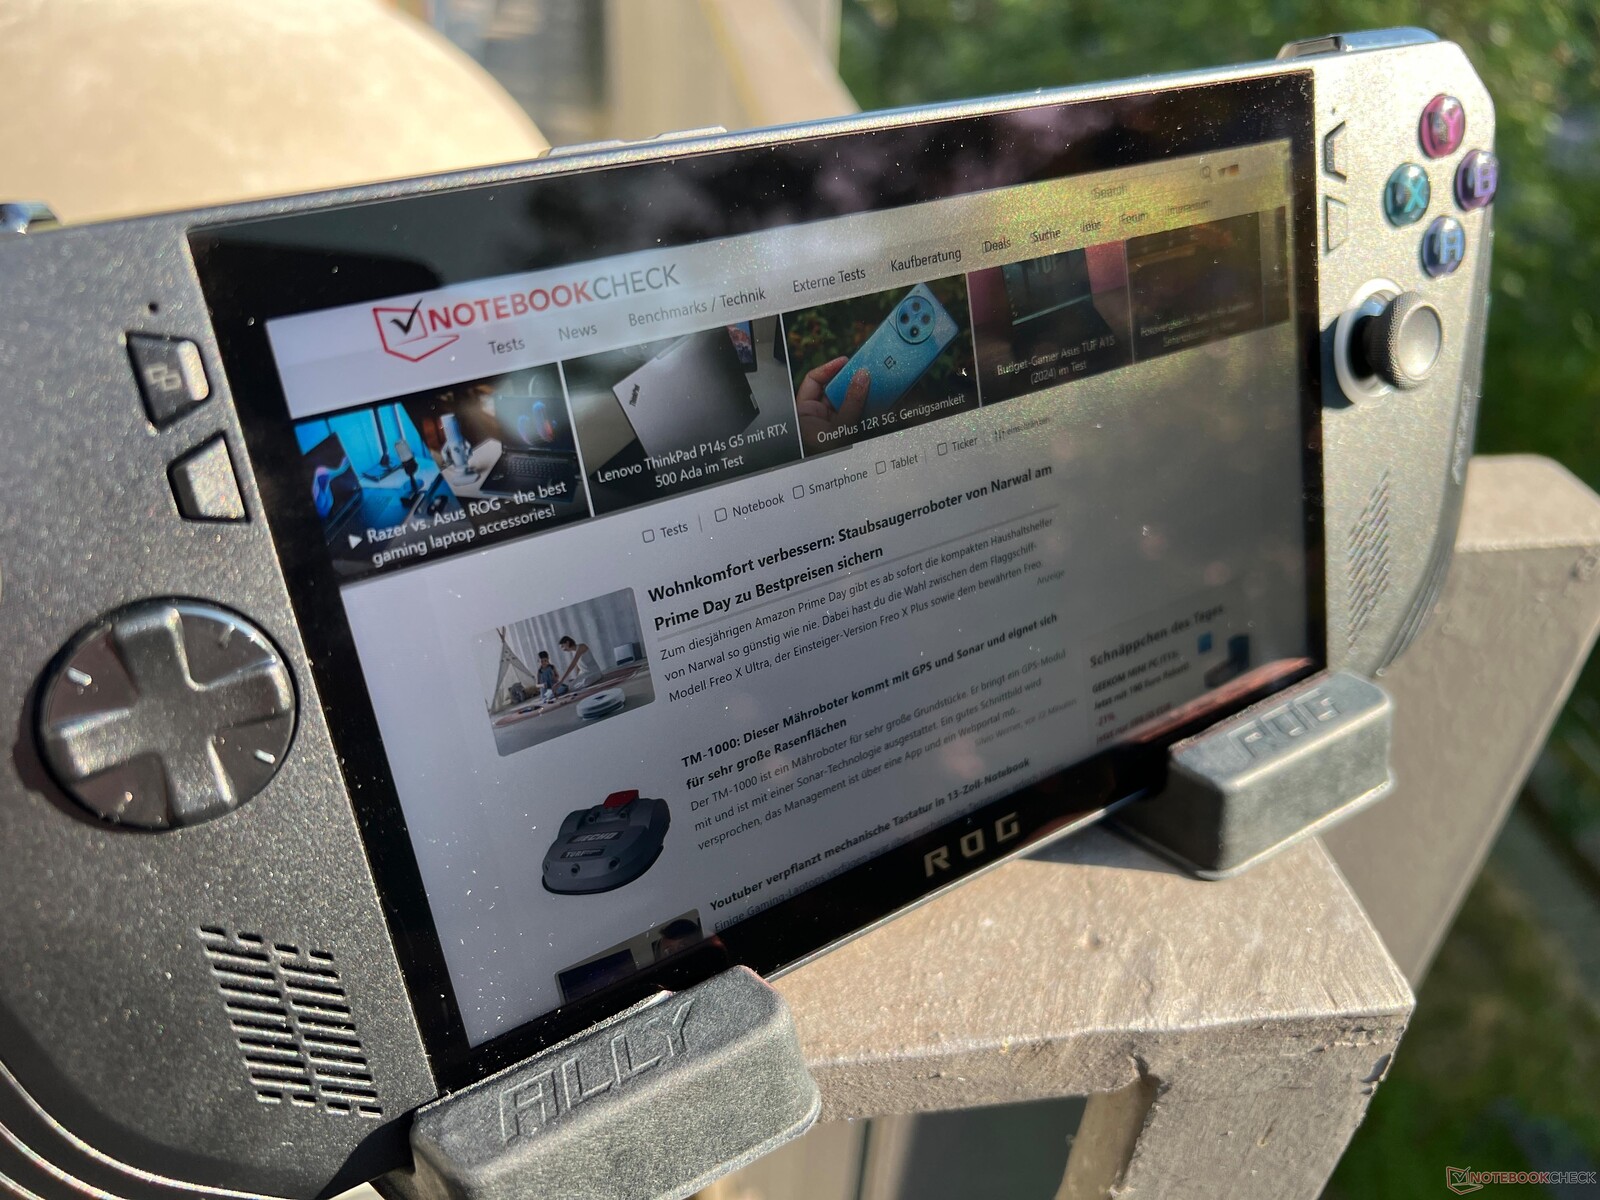
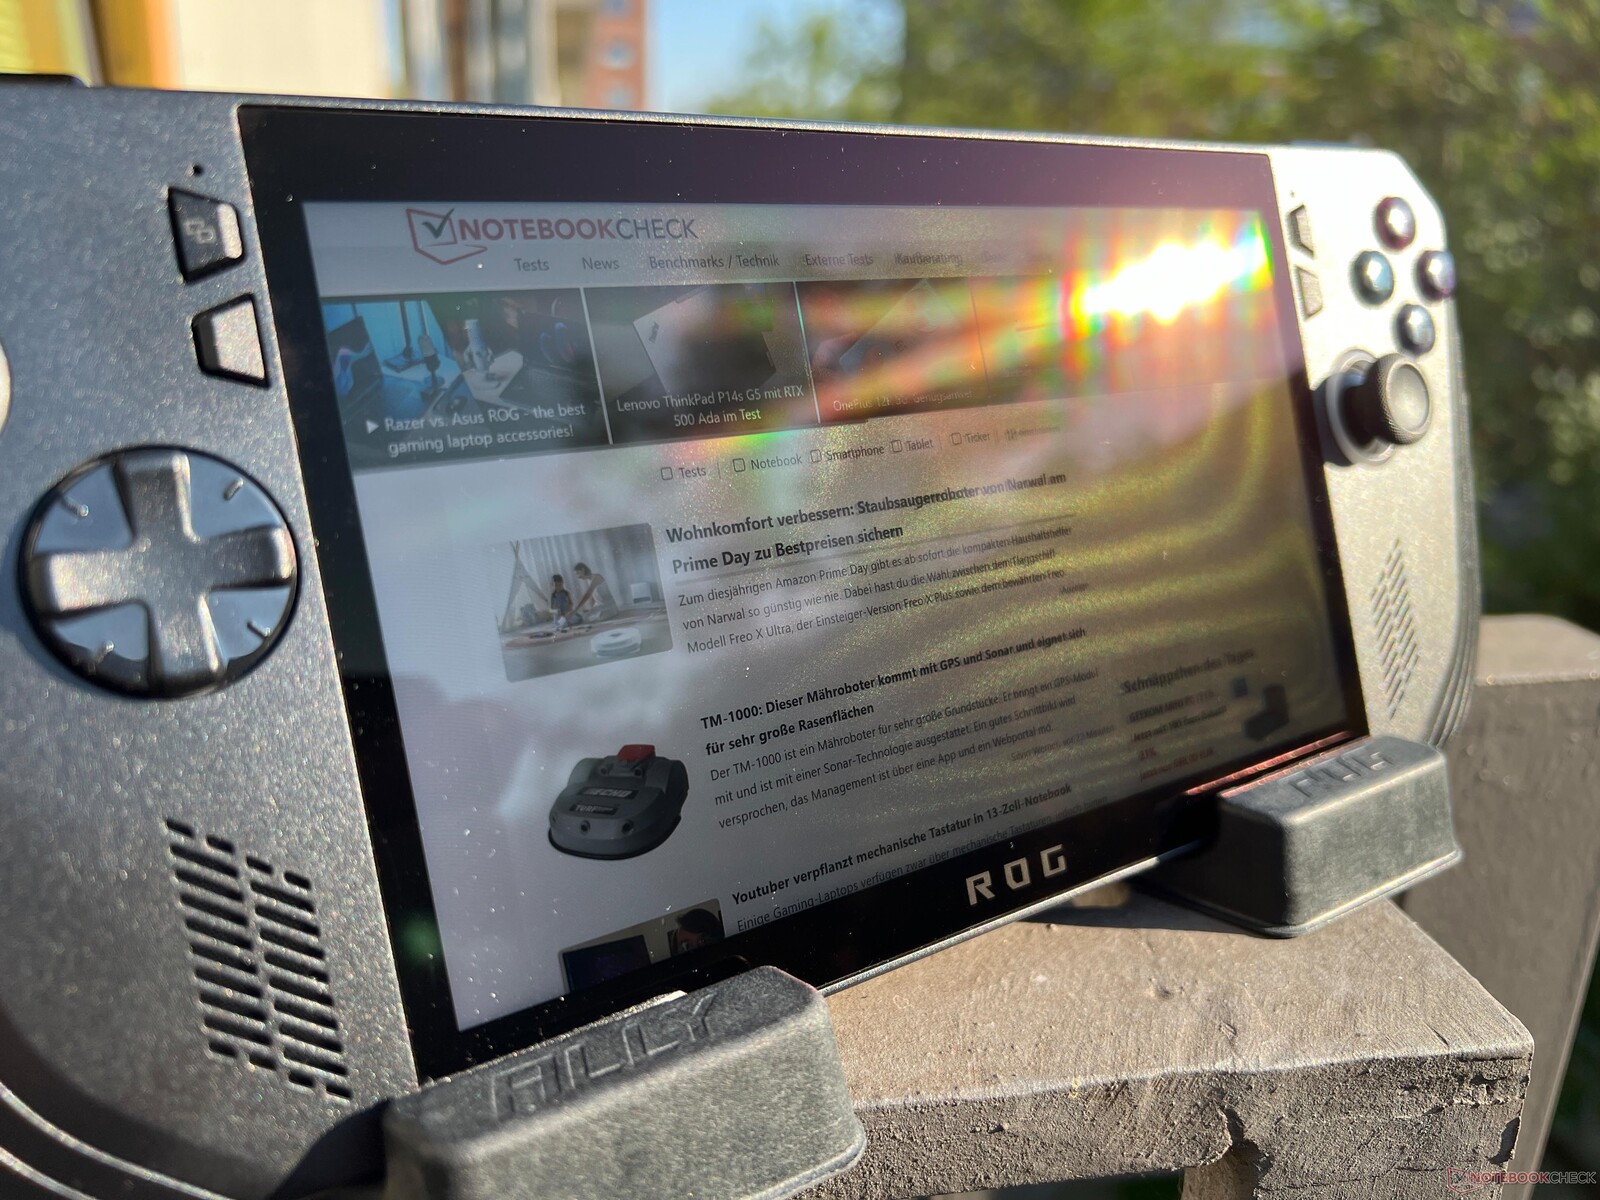
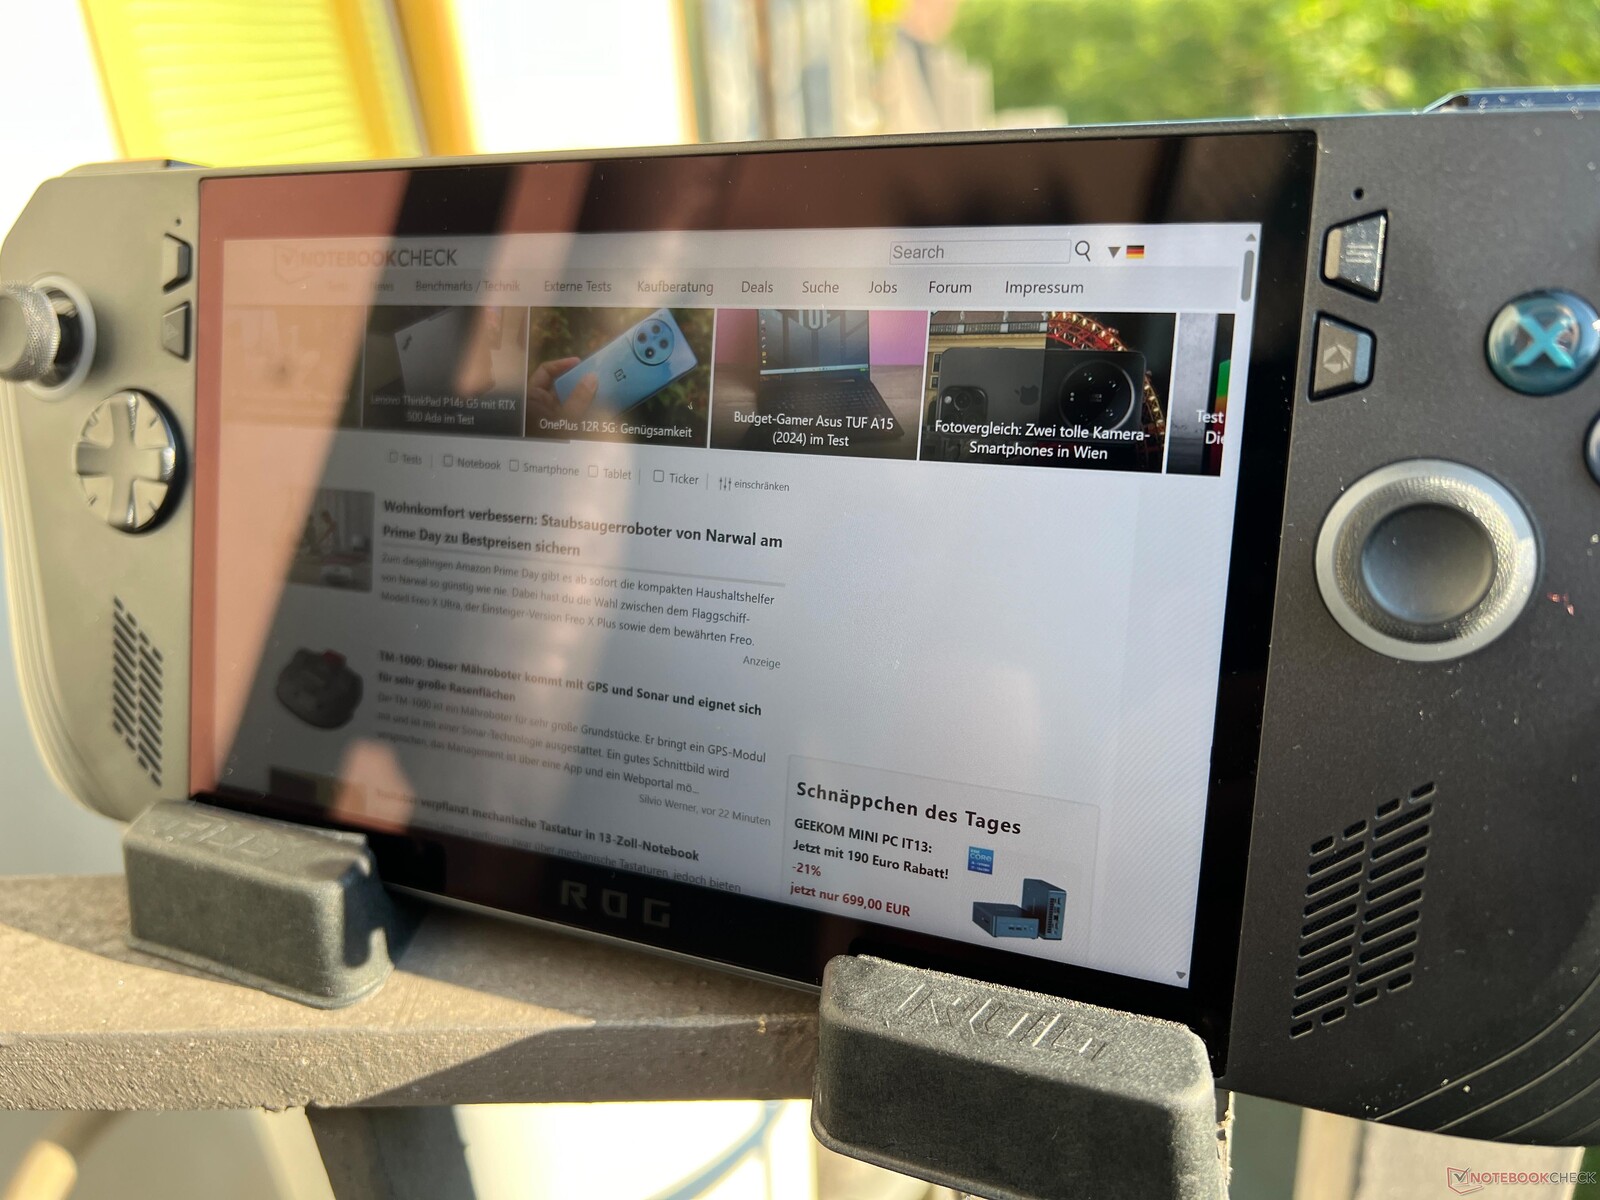
The touchscreen of the Ally X is glossy, but it is easy to find a suitable position outdoors with the small device. Based on our own experiences with the original ROG Ally we can say that the gaming is still comfortable on bright days as long as you avoid direct sunlight. There are no problems in terms of viewing angle stability.

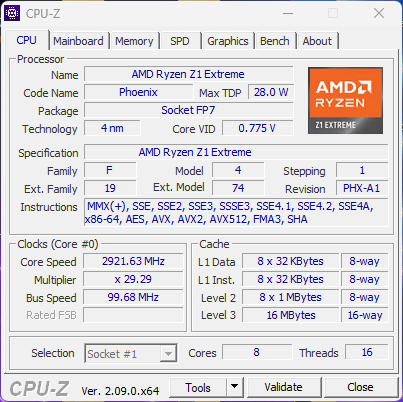
Performance - AMD Zen4 with faster RAM
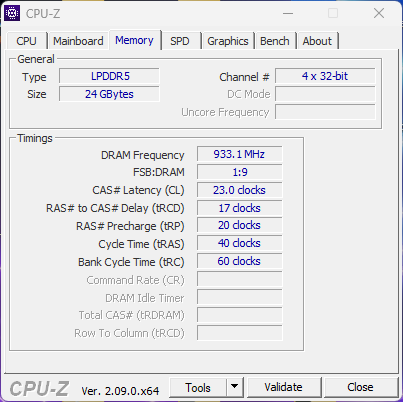
The new ROG Ally X still uses the AMD Ryzen Z1 Extreme with the integrated Radeon 780M. Asus changed the memory configuration though: Instead of 16 GB LPDDR5-6400 RAM, you now get 24 GB of the faster LPDDR5x-7500 RAM. 8 of 24 GB are assigned to the iGPU by default, the other 16 GB are for the system.
Review Settings
Asus adjusted the familiar power profiles for the ROG Ally X and both the profile Quiet (10 to 13 Watts) as well as Performance (15 to 17 Watts) have a higher SoC consumption. The Turbo mode still uses 30 Watts on mains and 25 Watts on battery. Please note that these values indicate the sustained power consumption of the APU, but the Ryzen chip can consume more power for short periods of time. We summarized the power profiles and the performance numbers in the following table:
| Power profile | APU TDP | CB R23 Multi | Time Spy Graphics | CP 2077 1080p Med | max. fan noise |
|---|---|---|---|---|---|
| Quiet | 15/13 W | 8446 pt | 1840 pt | 16.3 FPS | 32.2 dB(A) |
| Performance | 29/24/17 W | 12254 pt | 2800 pt | 26.4 FPS | 33.8 dB(A) |
| Turbo (battery) | 35/30/25 W | 13425 pt | 3017 pt | 31.1 FPS | 37.4 dB(A) |
| Turbo | 53/43/30 W | 15120 Pkt. | 3196 pt | 34.3 FPS | 42.6 dB(A) |
We used the Turbo mode on mains by default for our benchmarks and measurements, so we get an idea of the best possible performance. All of the additional features like super resolution, fluid motion frames and the like were deactivated for our gaming benchmarks, but we will also cover them in the gaming section.
Processor - Ryzen Z1 Extreme
AMD’s Ryzen Z1 Extreme (which is basically the Ryzen 7 7840U) has eight Zen4 cores (16 threads) with a maximum frequency of 5.1 GHz. It is still a powerful mobile processor, which offers more performance than the Core Ultra 7 155H you get in MSI's Claw handheld. All in all, the benchmarks results are very good and the performance drop under sustained workloads is very small at around 10 %. There are also just minor differences compared to the original ROG Ally, which is not surprising. Due to the lower maximum TDP in Turbo mode on battery power, the CPU multi-core performance is around 11 % lower without the PSU. Additional CPU benchmarks are listed in our tech section.
Cinebench R15 Multi Loop
Cinebench R23: Multi Core | Single Core
Cinebench R20: CPU (Multi Core) | CPU (Single Core)
Cinebench R15: CPU Multi 64Bit | CPU Single 64Bit
Blender: v2.79 BMW27 CPU
7-Zip 18.03: 7z b 4 | 7z b 4 -mmt1
Geekbench 6.7: Multi-Core | Single-Core
Geekbench 5.5: Multi-Core | Single-Core
HWBOT x265 Benchmark v2.2: 4k Preset
LibreOffice : 20 Documents To PDF
R Benchmark 2.5: Overall mean
| CPU Performance rating | |
| Asus ROG Ally Z1 Extreme | |
| Asus ROG Ally X | |
| Average AMD Ryzen Z1 Extreme | |
| Lenovo Legion Go -2! | |
| MSI Claw | |
| Ayaneo Kun | |
| GPD Win Mini 2024 7" | |
| Average of class Handheld / UMPC | |
| Valve Steam Deck 1 TB OLED -6! | |
| Cinebench R23 / Multi Core | |
| Asus ROG Ally X | |
| Ayaneo Kun | |
| Asus ROG Ally Z1 Extreme | |
| MSI Claw | |
| Average AMD Ryzen Z1 Extreme (13004 - 15120, n=3) | |
| Lenovo Legion Go | |
| Average of class Handheld / UMPC (4953 - 16841, n=14, last 2 years) | |
| GPD Win Mini 2024 7" | |
| Valve Steam Deck 1 TB OLED | |
| Cinebench R23 / Single Core | |
| Asus ROG Ally Z1 Extreme | |
| MSI Claw | |
| Average AMD Ryzen Z1 Extreme (1733 - 1779, n=3) | |
| Lenovo Legion Go | |
| Asus ROG Ally X | |
| GPD Win Mini 2024 7" | |
| Average of class Handheld / UMPC (1071 - 2006, n=14, last 2 years) | |
| Ayaneo Kun | |
| Cinebench R20 / CPU (Multi Core) | |
| Ayaneo Kun | |
| Asus ROG Ally Z1 Extreme | |
| Asus ROG Ally X | |
| Average AMD Ryzen Z1 Extreme (5109 - 5825, n=3) | |
| Lenovo Legion Go | |
| MSI Claw | |
| Average of class Handheld / UMPC (1904 - 6577, n=12, last 2 years) | |
| GPD Win Mini 2024 7" | |
| Valve Steam Deck 1 TB OLED | |
| Cinebench R20 / CPU (Single Core) | |
| Asus ROG Ally Z1 Extreme | |
| MSI Claw | |
| Average AMD Ryzen Z1 Extreme (672 - 692, n=3) | |
| Lenovo Legion Go | |
| Asus ROG Ally X | |
| GPD Win Mini 2024 7" | |
| Average of class Handheld / UMPC (390 - 787, n=12, last 2 years) | |
| Ayaneo Kun | |
| Valve Steam Deck 1 TB OLED | |
| Cinebench R15 / CPU Multi 64Bit | |
| Ayaneo Kun | |
| Asus ROG Ally Z1 Extreme | |
| Asus ROG Ally X | |
| Average AMD Ryzen Z1 Extreme (2050 - 2397, n=3) | |
| Lenovo Legion Go | |
| MSI Claw | |
| Average of class Handheld / UMPC (855 - 2533, n=12, last 2 years) | |
| GPD Win Mini 2024 7" | |
| Valve Steam Deck 1 TB OLED | |
| Cinebench R15 / CPU Single 64Bit | |
| Asus ROG Ally Z1 Extreme | |
| Average AMD Ryzen Z1 Extreme (262 - 280, n=3) | |
| Lenovo Legion Go | |
| GPD Win Mini 2024 7" | |
| Asus ROG Ally X | |
| MSI Claw | |
| Ayaneo Kun | |
| Average of class Handheld / UMPC (155.1 - 304, n=12, last 2 years) | |
| Blender / v2.79 BMW27 CPU | |
| GPD Win Mini 2024 7" | |
| Average of class Handheld / UMPC (189 - 588, n=12, last 2 years) | |
| MSI Claw | |
| Asus ROG Ally X | |
| Average AMD Ryzen Z1 Extreme (213 - 214, n=2) | |
| Asus ROG Ally Z1 Extreme | |
| Ayaneo Kun | |
| 7-Zip 18.03 / 7z b 4 | |
| Asus ROG Ally X | |
| Asus ROG Ally Z1 Extreme | |
| Ayaneo Kun | |
| Average AMD Ryzen Z1 Extreme (56966 - 64454, n=3) | |
| Lenovo Legion Go | |
| MSI Claw | |
| GPD Win Mini 2024 7" | |
| Average of class Handheld / UMPC (23417 - 66618, n=11, last 2 years) | |
| Valve Steam Deck 1 TB OLED | |
| 7-Zip 18.03 / 7z b 4 -mmt1 | |
| Asus ROG Ally Z1 Extreme | |
| Average AMD Ryzen Z1 Extreme (6077 - 6316, n=2) | |
| Asus ROG Ally X | |
| GPD Win Mini 2024 7" | |
| Ayaneo Kun | |
| MSI Claw | |
| Average of class Handheld / UMPC (3675 - 6143, n=12, last 2 years) | |
| Valve Steam Deck 1 TB OLED | |
| Geekbench 6.7 / Multi-Core | |
| Asus ROG Ally X | |
| Asus ROG Ally Z1 Extreme | |
| Average AMD Ryzen Z1 Extreme (10872 - 12026, n=4) | |
| Lenovo Legion Go | |
| Lenovo Legion Go | |
| MSI Claw | |
| Average of class Handheld / UMPC (3950 - 13426, n=13, last 2 years) | |
| GPD Win Mini 2024 7" | |
| Ayaneo Kun | |
| Valve Steam Deck 1 TB OLED | |
| Geekbench 6.7 / Single-Core | |
| Asus ROG Ally X | |
| Lenovo Legion Go | |
| Lenovo Legion Go | |
| Average AMD Ryzen Z1 Extreme (2530 - 2550, n=4) | |
| Asus ROG Ally Z1 Extreme | |
| GPD Win Mini 2024 7" | |
| MSI Claw | |
| Average of class Handheld / UMPC (1333 - 2904, n=13, last 2 years) | |
| Ayaneo Kun | |
| Valve Steam Deck 1 TB OLED | |
| Geekbench 5.5 / Multi-Core | |
| Asus ROG Ally Z1 Extreme | |
| Asus ROG Ally X | |
| Average AMD Ryzen Z1 Extreme (9589 - 10917, n=4) | |
| MSI Claw | |
| Lenovo Legion Go | |
| Lenovo Legion Go | |
| Average of class Handheld / UMPC (3932 - 13086, n=13, last 2 years) | |
| Ayaneo Kun | |
| GPD Win Mini 2024 7" | |
| Valve Steam Deck 1 TB OLED | |
| Geekbench 5.5 / Single-Core | |
| Asus ROG Ally Z1 Extreme | |
| Asus ROG Ally X | |
| Average AMD Ryzen Z1 Extreme (1896 - 1956, n=4) | |
| Lenovo Legion Go | |
| Lenovo Legion Go | |
| GPD Win Mini 2024 7" | |
| MSI Claw | |
| Average of class Handheld / UMPC (875 - 2134, n=13, last 2 years) | |
| Valve Steam Deck 1 TB OLED | |
| Ayaneo Kun | |
| HWBOT x265 Benchmark v2.2 / 4k Preset | |
| Asus ROG Ally X | |
| Ayaneo Kun | |
| Asus ROG Ally Z1 Extreme | |
| Average AMD Ryzen Z1 Extreme (16.3 - 18.7, n=3) | |
| Lenovo Legion Go | |
| MSI Claw | |
| Average of class Handheld / UMPC (6.21 - 20.8, n=12, last 2 years) | |
| GPD Win Mini 2024 7" | |
| LibreOffice / 20 Documents To PDF | |
| Average of class Handheld / UMPC (41.1 - 92.8, n=12, last 2 years) | |
| Ayaneo Kun | |
| Lenovo Legion Go | |
| Asus ROG Ally X | |
| GPD Win Mini 2024 7" | |
| Average AMD Ryzen Z1 Extreme (43 - 52.3, n=3) | |
| MSI Claw | |
| Asus ROG Ally Z1 Extreme | |
| R Benchmark 2.5 / Overall mean | |
| Average of class Handheld / UMPC (0.4167 - 0.756, n=12, last 2 years) | |
| Ayaneo Kun | |
| Ayaneo Kun | |
| GPD Win Mini 2024 7" | |
| MSI Claw | |
| Lenovo Legion Go | |
| Asus ROG Ally X | |
| Average AMD Ryzen Z1 Extreme (0.4447 - 0.4662, n=3) | |
| Asus ROG Ally Z1 Extreme | |
* ... smaller is better
AIDA64: FP32 Ray-Trace | FPU Julia | CPU SHA3 | CPU Queen | FPU SinJulia | FPU Mandel | CPU AES | CPU ZLib | FP64 Ray-Trace | CPU PhotoWorxx
| Performance rating | |
| Ayaneo Kun | |
| Asus ROG Ally X | |
| Asus ROG Ally Z1 Extreme | |
| Average AMD Ryzen Z1 Extreme | |
| Lenovo Legion Go | |
| GPD Win Mini 2024 7" | |
| Average of class Handheld / UMPC | |
| MSI Claw | |
| AIDA64 / FP32 Ray-Trace | |
| Ayaneo Kun | |
| Ayaneo Kun | |
| Asus ROG Ally X | |
| Asus ROG Ally Z1 Extreme | |
| Average AMD Ryzen Z1 Extreme (20714 - 24519, n=3) | |
| Lenovo Legion Go | |
| Average of class Handheld / UMPC (6544 - 26450, n=12, last 2 years) | |
| GPD Win Mini 2024 7" | |
| MSI Claw | |
| AIDA64 / FPU Julia | |
| Ayaneo Kun | |
| Ayaneo Kun | |
| Asus ROG Ally X | |
| Asus ROG Ally Z1 Extreme | |
| Average AMD Ryzen Z1 Extreme (86738 - 103637, n=3) | |
| Lenovo Legion Go | |
| Average of class Handheld / UMPC (36464 - 99389, n=12, last 2 years) | |
| GPD Win Mini 2024 7" | |
| MSI Claw | |
| AIDA64 / CPU SHA3 | |
| Ayaneo Kun | |
| Ayaneo Kun | |
| Asus ROG Ally X | |
| Asus ROG Ally Z1 Extreme | |
| Average AMD Ryzen Z1 Extreme (3854 - 4465, n=3) | |
| Lenovo Legion Go | |
| GPD Win Mini 2024 7" | |
| Average of class Handheld / UMPC (1157 - 4484, n=12, last 2 years) | |
| MSI Claw | |
| AIDA64 / CPU Queen | |
| Ayaneo Kun | |
| Ayaneo Kun | |
| Asus ROG Ally X | |
| Asus ROG Ally Z1 Extreme | |
| Average AMD Ryzen Z1 Extreme (95153 - 107867, n=3) | |
| Lenovo Legion Go | |
| GPD Win Mini 2024 7" | |
| MSI Claw | |
| Average of class Handheld / UMPC (41744 - 95230, n=11, last 2 years) | |
| AIDA64 / FPU SinJulia | |
| Ayaneo Kun | |
| Ayaneo Kun | |
| Asus ROG Ally X | |
| Asus ROG Ally Z1 Extreme | |
| Average AMD Ryzen Z1 Extreme (12936 - 14281, n=3) | |
| Lenovo Legion Go | |
| GPD Win Mini 2024 7" | |
| Average of class Handheld / UMPC (4023 - 16980, n=12, last 2 years) | |
| MSI Claw | |
| AIDA64 / FPU Mandel | |
| Ayaneo Kun | |
| Ayaneo Kun | |
| Asus ROG Ally X | |
| Asus ROG Ally Z1 Extreme | |
| Average AMD Ryzen Z1 Extreme (46180 - 55457, n=3) | |
| Lenovo Legion Go | |
| Average of class Handheld / UMPC (19153 - 52245, n=12, last 2 years) | |
| GPD Win Mini 2024 7" | |
| MSI Claw | |
| AIDA64 / CPU AES | |
| Ayaneo Kun | |
| Ayaneo Kun | |
| GPD Win Mini 2024 7" | |
| Asus ROG Ally X | |
| Asus ROG Ally Z1 Extreme | |
| Average AMD Ryzen Z1 Extreme (57678 - 80158, n=3) | |
| MSI Claw | |
| Average of class Handheld / UMPC (18552 - 119040, n=11, last 2 years) | |
| Lenovo Legion Go | |
| AIDA64 / CPU ZLib | |
| Ayaneo Kun | |
| Ayaneo Kun | |
| Asus ROG Ally X | |
| Asus ROG Ally Z1 Extreme | |
| Average AMD Ryzen Z1 Extreme (687 - 987, n=3) | |
| MSI Claw | |
| Average of class Handheld / UMPC (356 - 1112, n=12, last 2 years) | |
| Lenovo Legion Go | |
| GPD Win Mini 2024 7" | |
| AIDA64 / FP64 Ray-Trace | |
| Ayaneo Kun | |
| Ayaneo Kun | |
| Asus ROG Ally X | |
| Asus ROG Ally Z1 Extreme | |
| Average AMD Ryzen Z1 Extreme (10740 - 13049, n=3) | |
| Lenovo Legion Go | |
| Average of class Handheld / UMPC (3585 - 14181, n=12, last 2 years) | |
| GPD Win Mini 2024 7" | |
| MSI Claw | |
| AIDA64 / CPU PhotoWorxx | |
| MSI Claw | |
| Average of class Handheld / UMPC (19472 - 59897, n=12, last 2 years) | |
| Asus ROG Ally X | |
| GPD Win Mini 2024 7" | |
| Asus ROG Ally Z1 Extreme | |
| Average AMD Ryzen Z1 Extreme (34764 - 39932, n=3) | |
| Lenovo Legion Go | |
| Ayaneo Kun | |
| Ayaneo Kun | |
System Performance
The ROG Ally X offers the performance of a modern subnotebook/laptop without dGPU and can easily be used as a mini-PC or even primary device, especially in combination with an external screen and connected input devices. The benchmark results are very good and we did not experience any stability problems during our review period.
CrossMark: Overall | Productivity | Creativity | Responsiveness
WebXPRT 3: Overall
WebXPRT 4: Overall
Mozilla Kraken 1.1: Total
| PCMark 10 / Score | |
| Asus ROG Ally X | |
| Asus ROG Ally Z1 Extreme | |
| Average of class Handheld / UMPC (3592 - 9701, n=12, last 2 years) | |
| Average AMD Ryzen Z1 Extreme, AMD Radeon 780M (6439 - 7149, n=3) | |
| GPD Win Mini 2024 7" | |
| MSI Claw | |
| Lenovo Legion Go | |
| Ayaneo Kun | |
| PCMark 10 / Essentials | |
| Asus ROG Ally X | |
| GPD Win Mini 2024 7" | |
| Average AMD Ryzen Z1 Extreme, AMD Radeon 780M (10081 - 10633, n=3) | |
| Asus ROG Ally Z1 Extreme | |
| Lenovo Legion Go | |
| Average of class Handheld / UMPC (7542 - 11262, n=12, last 2 years) | |
| MSI Claw | |
| Ayaneo Kun | |
| PCMark 10 / Productivity | |
| Average of class Handheld / UMPC (5015 - 19236, n=12, last 2 years) | |
| Asus ROG Ally Z1 Extreme | |
| Asus ROG Ally X | |
| GPD Win Mini 2024 7" | |
| Average AMD Ryzen Z1 Extreme, AMD Radeon 780M (8996 - 10074, n=3) | |
| Lenovo Legion Go | |
| MSI Claw | |
| Ayaneo Kun | |
| PCMark 10 / Digital Content Creation | |
| Asus ROG Ally X | |
| MSI Claw | |
| Ayaneo Kun | |
| Average of class Handheld / UMPC (3326 - 12612, n=12, last 2 years) | |
| Average AMD Ryzen Z1 Extreme, AMD Radeon 780M (7990 - 9408, n=3) | |
| Asus ROG Ally Z1 Extreme | |
| Lenovo Legion Go | |
| GPD Win Mini 2024 7" | |
| CrossMark / Overall | |
| Asus ROG Ally Z1 Extreme | |
| Average AMD Ryzen Z1 Extreme, AMD Radeon 780M (1693 - 1718, n=2) | |
| MSI Claw | |
| Asus ROG Ally X | |
| GPD Win Mini 2024 7" | |
| Average of class Handheld / UMPC (865 - 1881, n=11, last 2 years) | |
| Ayaneo Kun | |
| Valve Steam Deck 1 TB OLED | |
| CrossMark / Productivity | |
| Asus ROG Ally Z1 Extreme | |
| Average AMD Ryzen Z1 Extreme, AMD Radeon 780M (1639 - 1662, n=2) | |
| MSI Claw | |
| Asus ROG Ally X | |
| GPD Win Mini 2024 7" | |
| Average of class Handheld / UMPC (878 - 1719, n=11, last 2 years) | |
| Ayaneo Kun | |
| Valve Steam Deck 1 TB OLED | |
| CrossMark / Creativity | |
| Asus ROG Ally Z1 Extreme | |
| Average AMD Ryzen Z1 Extreme, AMD Radeon 780M (1868 - 1878, n=2) | |
| Asus ROG Ally X | |
| MSI Claw | |
| Average of class Handheld / UMPC (891 - 2150, n=11, last 2 years) | |
| GPD Win Mini 2024 7" | |
| Ayaneo Kun | |
| Valve Steam Deck 1 TB OLED | |
| CrossMark / Responsiveness | |
| MSI Claw | |
| Ayaneo Kun | |
| Asus ROG Ally Z1 Extreme | |
| Average AMD Ryzen Z1 Extreme, AMD Radeon 780M (1392 - 1451, n=2) | |
| Asus ROG Ally X | |
| Average of class Handheld / UMPC (759 - 1677, n=11, last 2 years) | |
| GPD Win Mini 2024 7" | |
| Valve Steam Deck 1 TB OLED | |
| WebXPRT 3 / Overall | |
| Asus ROG Ally Z1 Extreme | |
| Average AMD Ryzen Z1 Extreme, AMD Radeon 780M (300 - 432, n=3) | |
| GPD Win Mini 2024 7" | |
| Asus ROG Ally X | |
| Lenovo Legion Go | |
| MSI Claw | |
| Average of class Handheld / UMPC (170.3 - 325, n=13, last 2 years) | |
| Ayaneo Kun | |
| Ayaneo Kun | |
| WebXPRT 4 / Overall | |
| Asus ROG Ally Z1 Extreme | |
| Average AMD Ryzen Z1 Extreme, AMD Radeon 780M (248 - 277, n=2) | |
| MSI Claw | |
| Asus ROG Ally X | |
| Average of class Handheld / UMPC (134.4 - 291, n=13, last 2 years) | |
| Ayaneo Kun | |
| Valve Steam Deck 1 TB OLED | |
| Mozilla Kraken 1.1 / Total | |
| Ayaneo Kun | |
| Ayaneo Kun | |
| Average of class Handheld / UMPC (428 - 931, n=12, last 2 years) | |
| Lenovo Legion Go | |
| Average AMD Ryzen Z1 Extreme, AMD Radeon 780M (536 - 556, n=2) | |
| GPD Win Mini 2024 7" | |
| Asus ROG Ally X | |
| MSI Claw | |
* ... smaller is better
| PCMark 10 Score | 7149 points | |
Help | ||
| AIDA64 / Memory Copy | |
| Asus ROG Ally Z1 Extreme | |
| MSI Claw | |
| Average AMD Ryzen Z1 Extreme (74414 - 92447, n=3) | |
| Average of class Handheld / UMPC (33517 - 107929, n=12, last 2 years) | |
| Lenovo Legion Go | |
| Asus ROG Ally X | |
| GPD Win Mini 2024 7" | |
| Ayaneo Kun | |
| Ayaneo Kun | |
| Valve Steam Deck 1 TB OLED | |
| AIDA64 / Memory Read | |
| MSI Claw | |
| Average of class Handheld / UMPC (25476 - 103022, n=12, last 2 years) | |
| Asus ROG Ally X | |
| Lenovo Legion Go | |
| Average AMD Ryzen Z1 Extreme (50337 - 58713, n=3) | |
| Asus ROG Ally Z1 Extreme | |
| GPD Win Mini 2024 7" | |
| Ayaneo Kun | |
| Valve Steam Deck 1 TB OLED | |
| AIDA64 / Memory Write | |
| Lenovo Legion Go | |
| Asus ROG Ally X | |
| Average AMD Ryzen Z1 Extreme (92869 - 108872, n=3) | |
| Asus ROG Ally Z1 Extreme | |
| GPD Win Mini 2024 7" | |
| Average of class Handheld / UMPC (25595 - 117883, n=12, last 2 years) | |
| MSI Claw | |
| Ayaneo Kun | |
| Ayaneo Kun | |
| Ayaneo Kun | |
| Valve Steam Deck 1 TB OLED | |
| AIDA64 / Memory Latency | |
| MSI Claw | |
| Ayaneo Kun | |
| Ayaneo Kun | |
| Asus ROG Ally X | |
| Lenovo Legion Go | |
| GPD Win Mini 2024 7" | |
| Average AMD Ryzen Z1 Extreme (113.7 - 122.1, n=3) | |
| Average of class Handheld / UMPC (99.8 - 147.6, n=12, last 2 years) | |
| Asus ROG Ally Z1 Extreme | |
| Valve Steam Deck 1 TB OLED | |
* ... smaller is better
DPC Latency
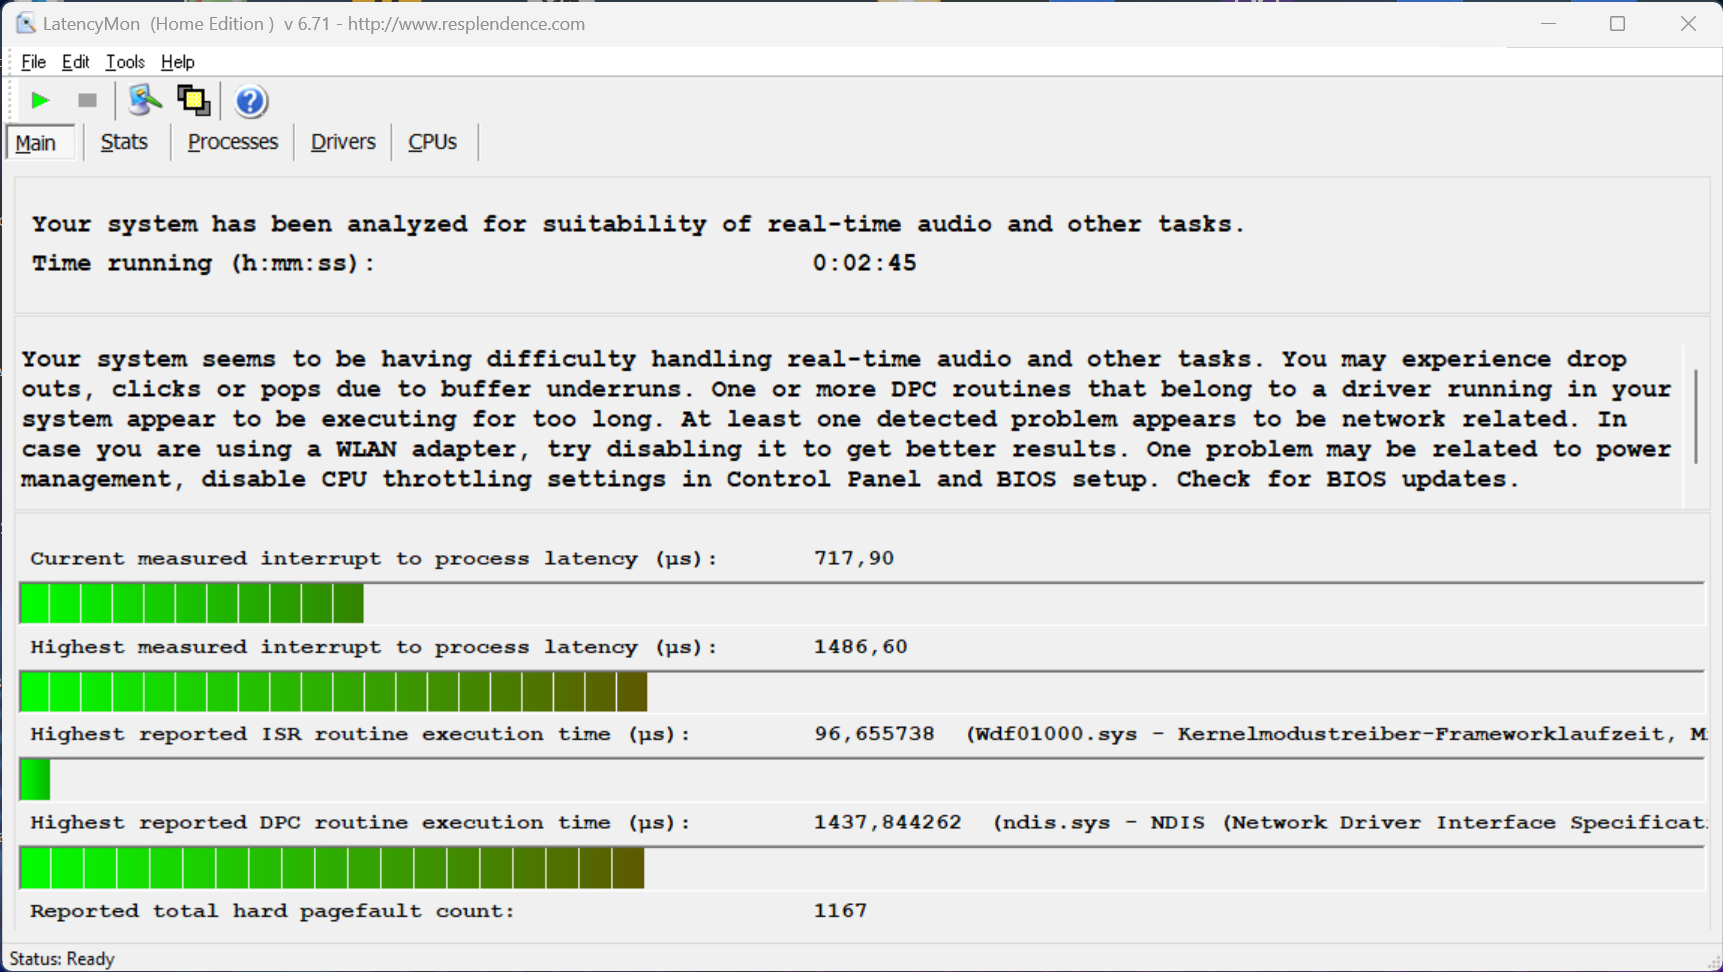
Our standardized latency test (web browsing, 4K YouTube playback, CPU load) show some limitations for the review unit with the current BIOS version when you want to use real-time audio applications. However, this should not be a very common scenario for a gaming handheld.
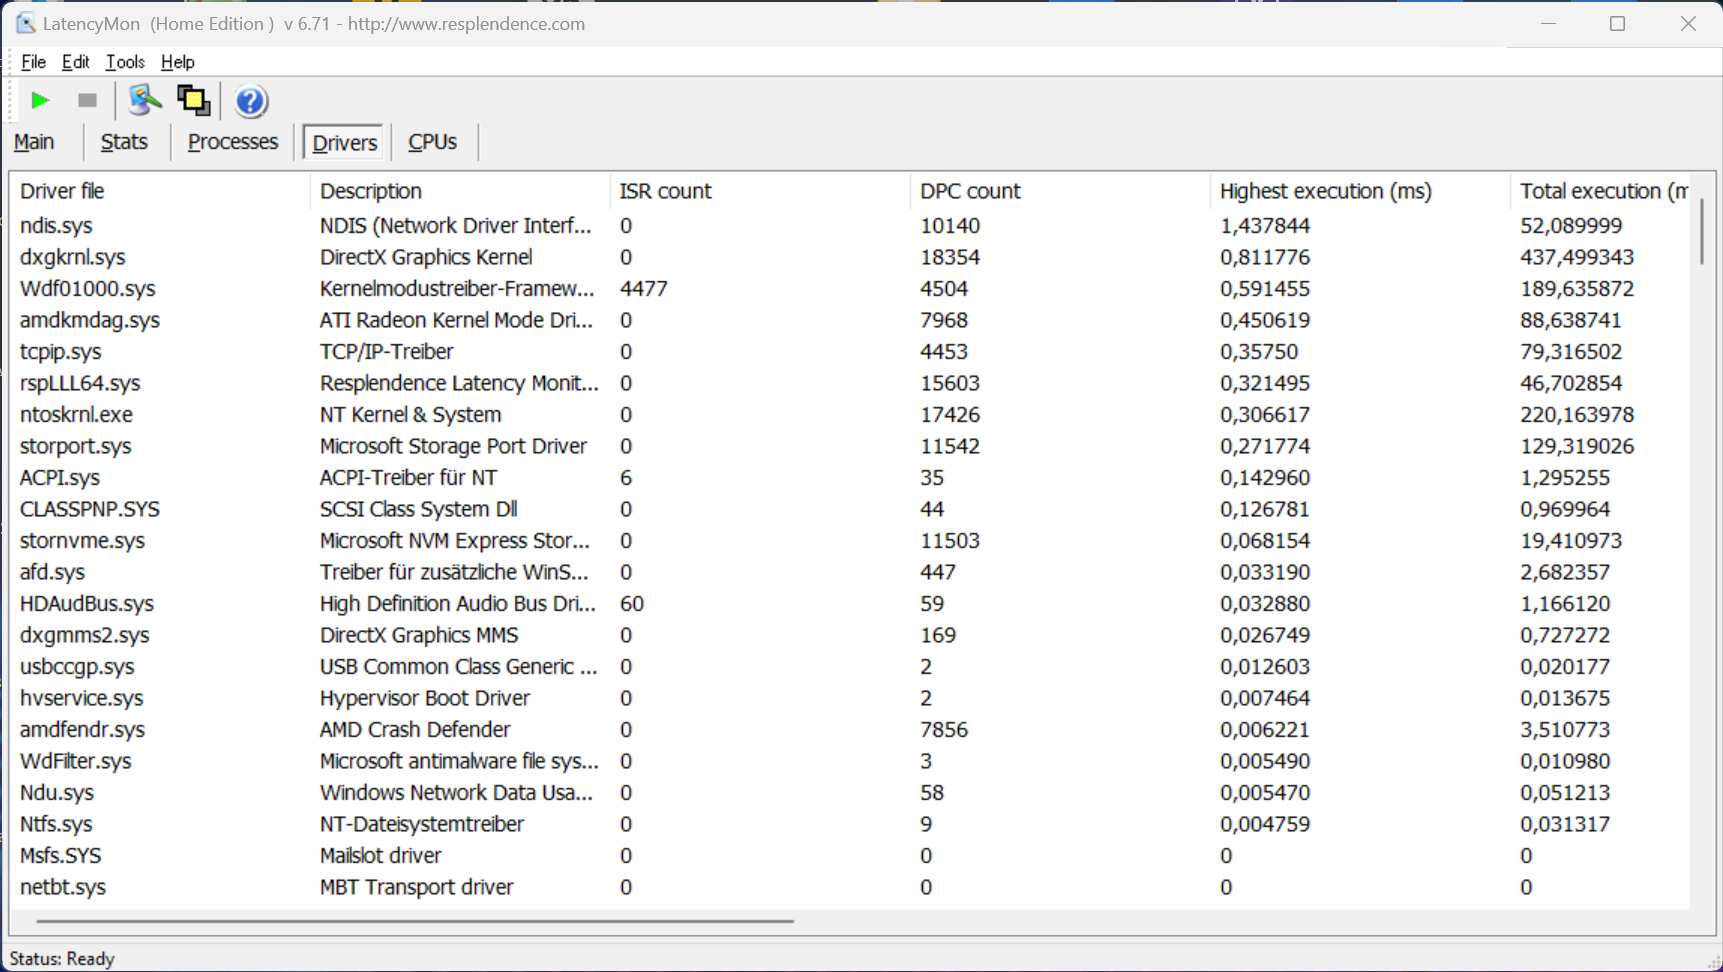
| DPC Latencies / LatencyMon - interrupt to process latency (max), Web, Youtube, Prime95 | |
| GPD Win Mini 2024 7" | |
| MSI Claw | |
| Asus ROG Ally X | |
| Asus ROG Ally Z1 Extreme | |
| Ayaneo Kun | |
* ... smaller is better
Storage Devices
The new ROG Ally X is equipped with a regular M.2-2280 SSD attached via PCIe 4.0. It is equipped with a 1 TB drive by default, and our drive was provided by Western Digital (SN560). You can use 891 GB for your own files/apps after the initial setup. The transfer rates are good and there is just a small performance drop under sustained workloads. It is easy to upgrade the drive if you have a comprehensive games library. More SSD benchmarks are listed here.

| Drive Performance rating - Percent | |
| Average of class Handheld / UMPC | |
| Ayaneo Kun | |
| Lenovo Legion Go | |
| MSI Claw | |
| Average WD PC SN560 SDDPNQE-1T00 | |
| Asus ROG Ally X | |
| GPD Win Mini 2024 7" -11! | |
| Valve Steam Deck 1 TB OLED -11! | |
| Asus ROG Ally Z1 Extreme | |
* ... smaller is better
Disk Throttling: DiskSpd Read Loop, Queue Depth 8
GPU Performance - Radeon 780M
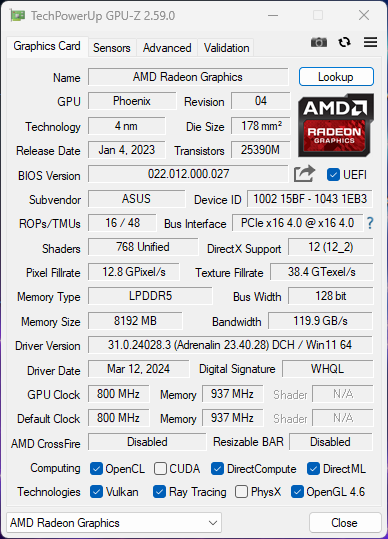
AMD’s Radeon 780M did not change compared to last year’s ROG Ally, but the faster memory makes a difference. The result is the fastest Radeon 780M we have tested so far. This means the Radeon iGPU is still slightly behind the Intel Arc Graphics in the MSI Claw in the Time Spy test, but ahead in the overall performance rating. The Ally X is usually also ahead of the other AMD rivals.
We have already said that that 8 GB RAM are now allocated to the GPU by default, but you can also adjust this value manually. There are also driver options like super resolution, fluid motion frames, Radeon chill, etc., which can be accessed directly from the Armoury Crate SE software and these options can be configured for each game individually without using the Radeon software.
The Turbo mode has a reduced consumption on battery power, so the maximum GPU performance on battery is also affected. The difference, however, is small at just 6 %. More GPU benchmarks are available here.
| 3DMark Performance rating - Percent | |
| Average of class Handheld / UMPC | |
| Asus ROG Ally X | |
| MSI Claw | |
| Ayaneo Kun | |
| Asus ROG Ally Z1 Extreme | |
| Lenovo Legion Go | |
| Average AMD Radeon 780M | |
| GPD Win Mini 2024 7" | |
| 3DMark 11 Performance | 13368 points | |
| 3DMark Fire Strike Score | 8172 points | |
| 3DMark Time Spy Score | 3507 points | |
| 3DMark Steel Nomad Score | 519 points | |
| 3DMark Steel Nomad Light Score | 2972 points | |
Help | ||
| Blender / v3.3 Classroom CPU | |
| GPD Win Mini 2024 7" | |
| Average of class Handheld / UMPC (290 - 1026, n=12, last 2 years) | |
| Lenovo Legion Go | |
| MSI Claw | |
| Ayaneo Kun | |
| Ayaneo Kun | |
| Average AMD Radeon 780M (300 - 664, n=76) | |
| Asus ROG Ally Z1 Extreme | |
| Asus ROG Ally X | |
* ... smaller is better
Gaming Performance

This is the most important section for a gaming handheld. We obviously performed our standard gaming benchmarks and the ROG Ally X is at the top of the comparison charts and is also ahead of the MSI Claw with Intel CPU. Depending on the title there can be small variations, but the overall gaming performance is very good.
We had two review units of the ROG Ally X and both editors (which used the original ROG Ally a lot) think that the Performance profile represents the best compromise between performance/power consumption/fan noise. This is due to the slightly increased power limit, but also the improved performance thanks to more/faster RAM. We want to mention two specific examples: Forza Horizon 5 required the Turbo mode for steady 60 fps in 1080p and medium settings. The new Ally X can do this with the Performance profile, which makes a huge difference in terms of fan noise and battery life. This is also the case for Ghost of Tsushima (1080p, medium settings, FSR + FG): Where we had to use the Turbo mode before, we can now use the Performance mode.
| Performance rating - Percent | |
| Asus ROG Ally X | |
| Average of class Handheld / UMPC | |
| Lenovo Legion Go | |
| Asus ROG Ally Z1 Extreme | |
| Ayaneo Kun | |
| MSI Claw -1! | |
| GPD Win Mini 2024 7" -1! | |
| Valve Steam Deck 1 TB OLED -3! | |
| The Witcher 3 - 1920x1080 Ultra Graphics & Postprocessing (HBAO+) | |
| Ayaneo Kun | |
| Asus ROG Ally X | |
| Lenovo Legion Go | |
| Asus ROG Ally Z1 Extreme | |
| MSI Claw | |
| GPD Win Mini 2024 7" | |
| Average of class Handheld / UMPC (n=1last 2 years) | |
| GTA V - 1920x1080 Highest AA:4xMSAA + FX AF:16x | |
| Average of class Handheld / UMPC (14 - 39.2, n=11, last 2 years) | |
| Asus ROG Ally X | |
| Ayaneo Kun | |
| Ayaneo Kun | |
| Asus ROG Ally Z1 Extreme | |
| Lenovo Legion Go | |
| Valve Steam Deck 1 TB OLED | |
| Final Fantasy XV Benchmark - 1920x1080 High Quality | |
| Average of class Handheld / UMPC (17.9 - 50.3, n=16, last 2 years) | |
| Asus ROG Ally X (1.3) | |
| Ayaneo Kun (1.3) | |
| Asus ROG Ally Z1 Extreme (1.3) | |
| Lenovo Legion Go (1.3) | |
| MSI Claw (1.3) | |
| GPD Win Mini 2024 7" (1.3) | |
| Valve Steam Deck 1 TB OLED (1.3) | |
| Strange Brigade - 1920x1080 ultra AA:ultra AF:16 | |
| Average of class Handheld / UMPC (33.6 - 96.8, n=17, last 2 years) | |
| Asus ROG Ally X (1.47.22.14 D3D12) | |
| Ayaneo Kun (1.47.22.14 D3D12) | |
| Asus ROG Ally Z1 Extreme (1.47.22.14 D3D12) | |
| MSI Claw | |
| Lenovo Legion Go (1.47.22.14 D3D12) | |
| GPD Win Mini 2024 7" (1.47.22.14 D3D12) | |
| Valve Steam Deck 1 TB OLED | |
| Dota 2 Reborn - 1920x1080 ultra (3/3) best looking | |
| Lenovo Legion Go | |
| Asus ROG Ally X | |
| Asus ROG Ally Z1 Extreme | |
| Average of class Handheld / UMPC (30.8 - 103.8, n=16, last 2 years) | |
| MSI Claw | |
| GPD Win Mini 2024 7" | |
| Ayaneo Kun | |
| Ayaneo Kun | |
| X-Plane 11.11 - 1920x1080 high (fps_test=3) | |
| MSI Claw | |
| Average of class Handheld / UMPC (22.7 - 50.5, n=16, last 2 years) | |
| Lenovo Legion Go | |
| Asus ROG Ally X | |
| Asus ROG Ally Z1 Extreme | |
| GPD Win Mini 2024 7" | |
| Ayaneo Kun | |
| Ayaneo Kun | |
| F1 23 | |
| 1920x1080 Low Preset AA:T AF:16x | |
| Ayaneo Kun | |
| Asus ROG Ally X | |
| Average of class Handheld / UMPC (n=1last 2 years) | |
| Average AMD Radeon 780M (42.4 - 95.4, n=30) | |
| MSI Claw | |
| 1920x1080 Medium Preset AA:T AF:16x | |
| Ayaneo Kun | |
| Asus ROG Ally X | |
| Average of class Handheld / UMPC (n=1last 2 years) | |
| Average AMD Radeon 780M (38.1 - 84.4, n=30) | |
| MSI Claw | |
| 1920x1080 High Preset AA:T AF:16x | |
| Ayaneo Kun | |
| Lenovo Legion Go | |
| Asus ROG Ally X | |
| Average of class Handheld / UMPC (n=1last 2 years) | |
| Average AMD Radeon 780M (27.3 - 61.1, n=31) | |
| MSI Claw | |
| 1920x1080 Ultra High Preset AA:T AF:16x | |
| Ayaneo Kun | |
| Asus ROG Ally X | |
| Average AMD Radeon 780M (6.25 - 14.7, n=22) | |
| Average of class Handheld / UMPC (n=1last 2 years) | |
| F1 24 | |
| 1920x1080 Low Preset AA:T AF:16x | |
| Ayaneo Kun | |
| Asus ROG Ally X | |
| Average of class Handheld / UMPC (49.8 - 131, n=11, last 2 years) | |
| Average AMD Radeon 780M (43.3 - 94.8, n=31) | |
| 1920x1080 Medium Preset AA:T AF:16x | |
| Ayaneo Kun | |
| Asus ROG Ally X | |
| Average of class Handheld / UMPC (46 - 122.2, n=11, last 2 years) | |
| Average AMD Radeon 780M (36.4 - 80.2, n=32) | |
| 1920x1080 High Preset AA:T AF:16x | |
| Ayaneo Kun | |
| Average of class Handheld / UMPC (31.6 - 101.1, n=13, last 2 years) | |
| Asus ROG Ally X | |
| Average AMD Radeon 780M (23.3 - 59.9, n=31) | |
| 1920x1080 Ultra High Preset AA:T AF:16x | |
| Average of class Handheld / UMPC (6.91 - 36.5, n=10, last 2 years) | |
| Ayaneo Kun | |
| Asus ROG Ally X | |
| Average AMD Radeon 780M (6.39 - 14.5, n=20) | |
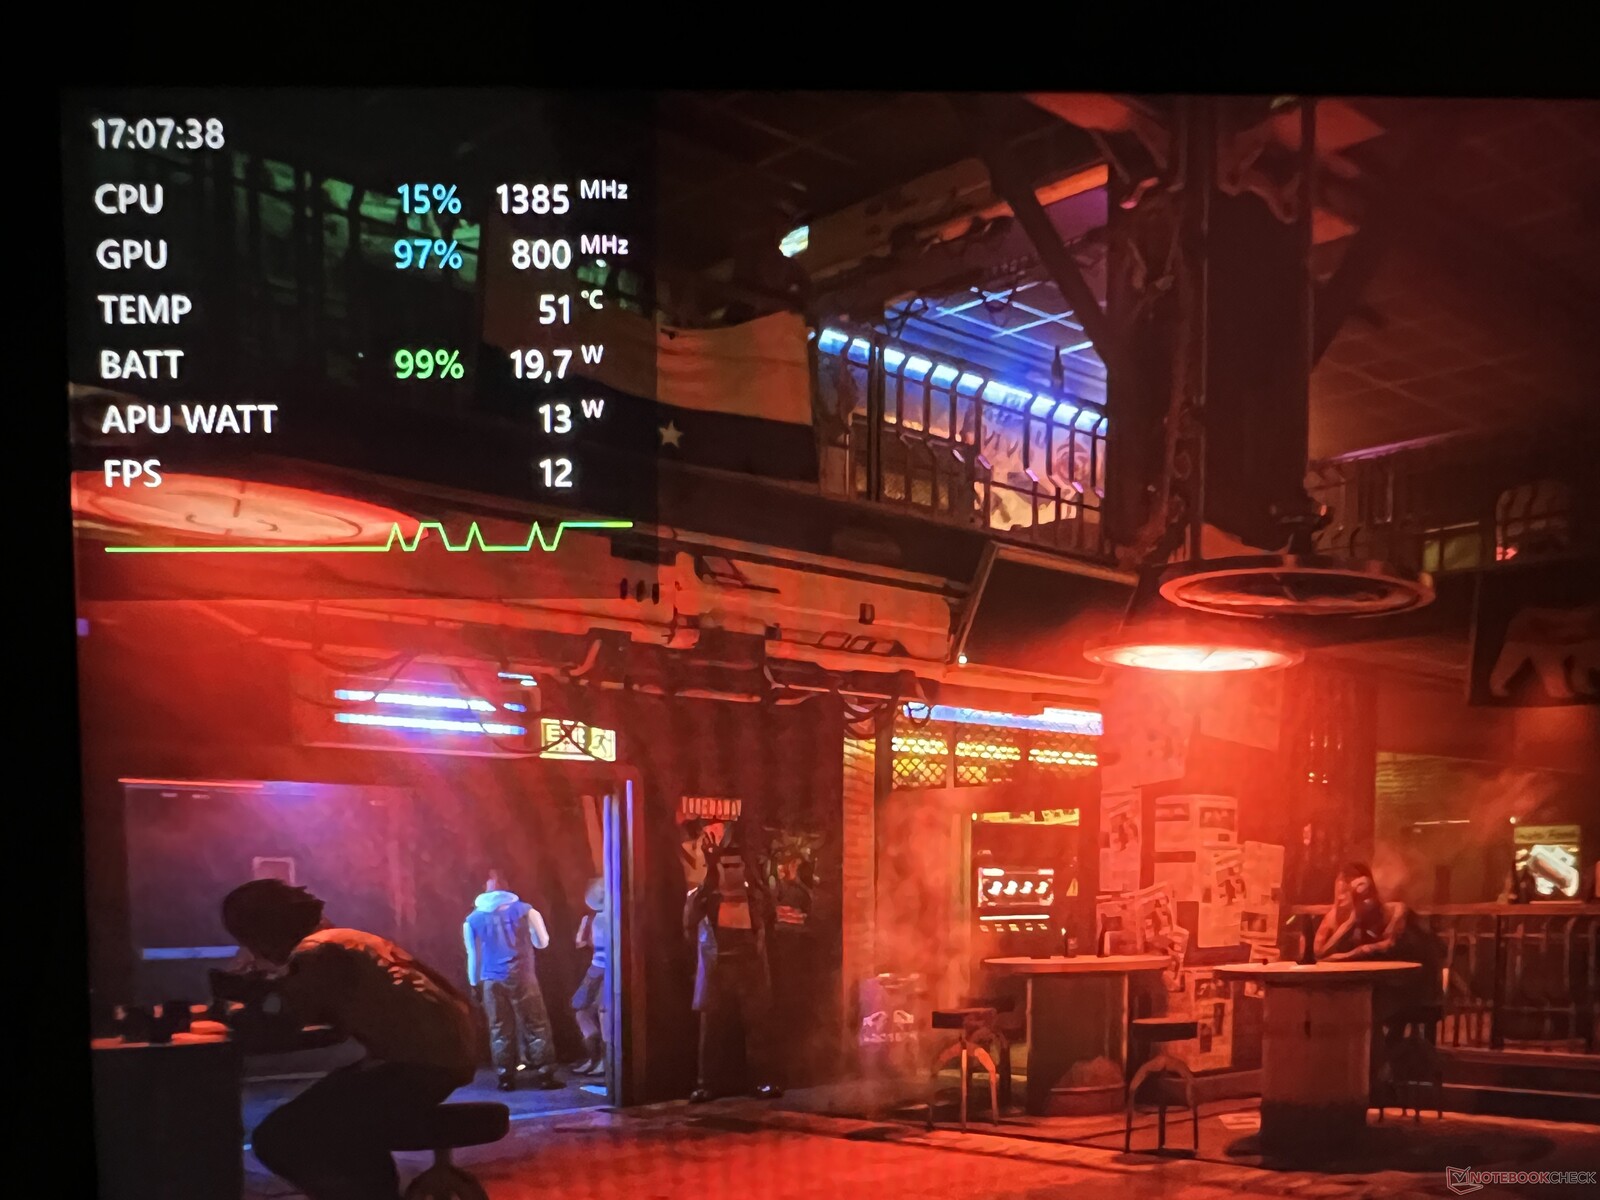
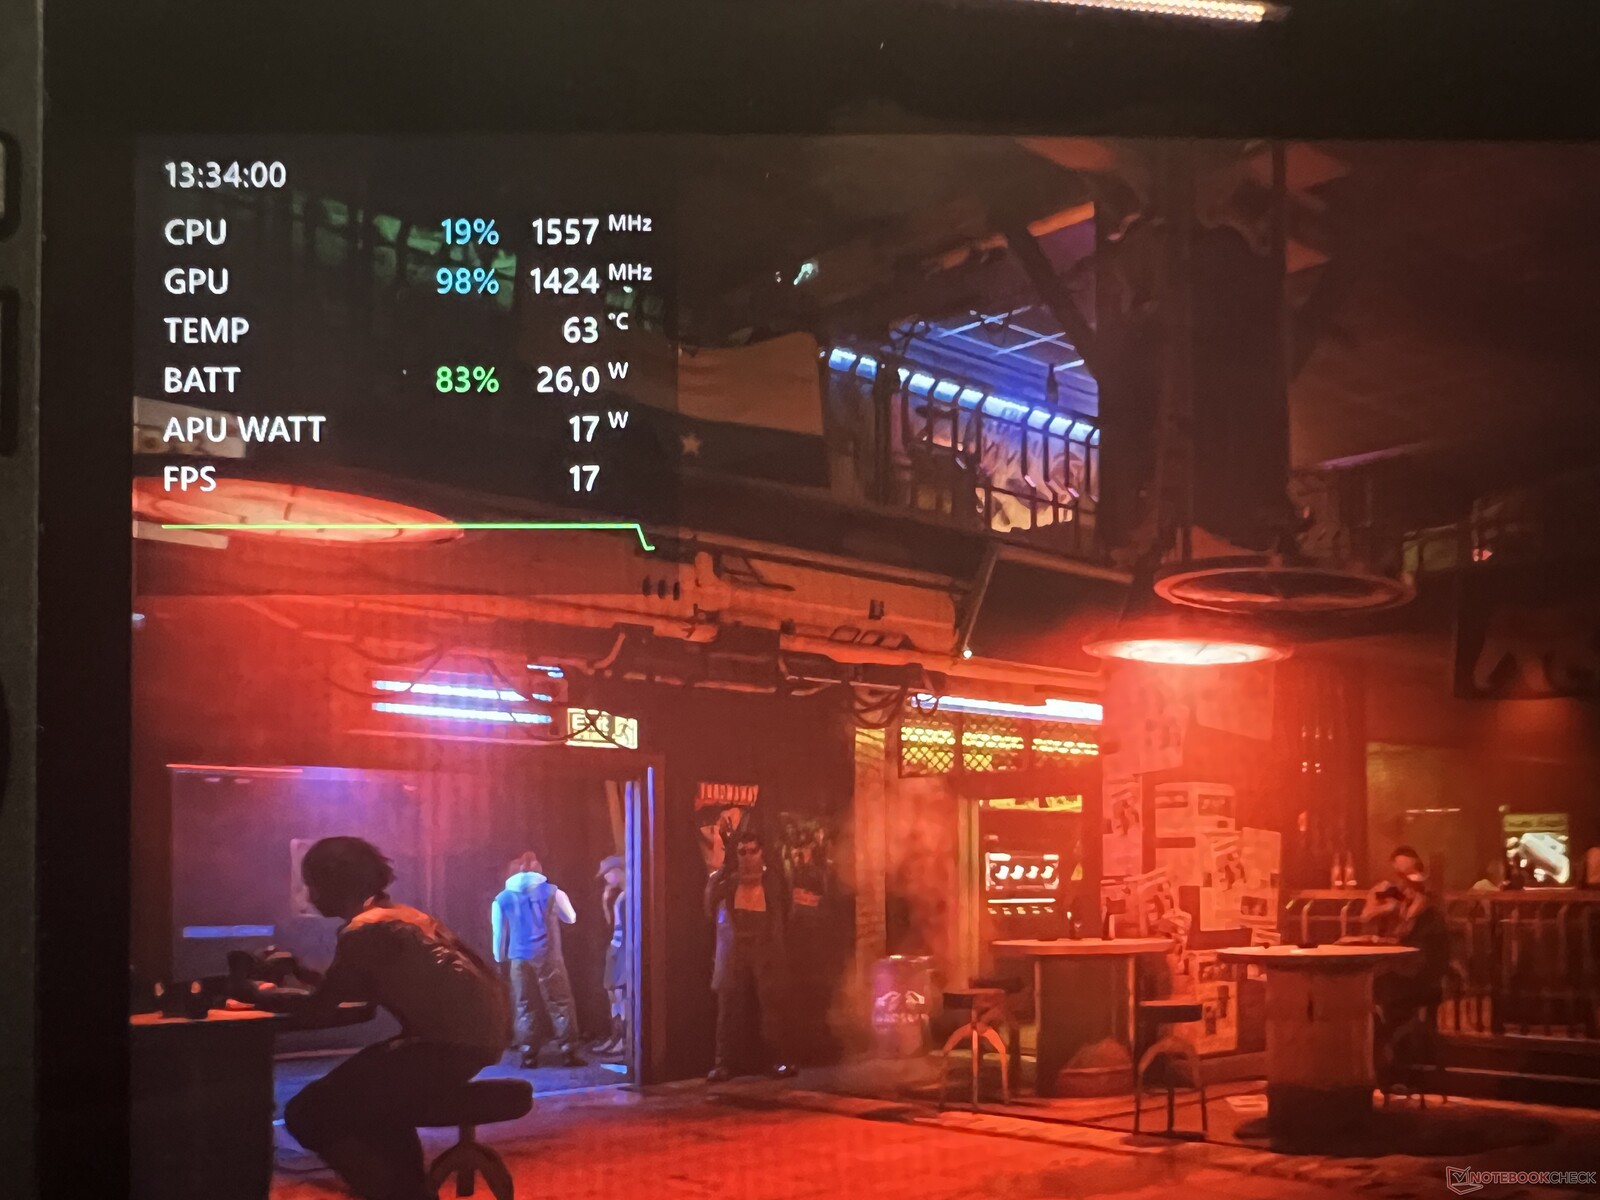
The gaming performance is completely stable once the TDP settles at its designated value. This is clearly visible in the chart below, where we list the FPS numbers during our 30-minute Cyberpunk test with three different power profiles. All of them show the small performance drop, but the performance is stable afterwards. This is also the case for battery power.
Cyberpunk 2077 ultra FPS chart
In addition to the Turbo mode, we also performed our gaming benchmarks with all the other power profiles. If you play modern and demanding titles like Cyberpunk 2077, Ghost of Tsushima, or Baldur’s Gate 3, the Turbo mode can make the difference between smooth gameplay and a bad experience. All in all, though, the Performance mode also manages good fps numbers. The Quiet mode on the other hand is noticeably slower and requires additional adjustments of the settings.
| Performance rating - Percent | |
| ROG Ally X Turbo 30W | |
| ROG Ally X Turbo 25W | |
| ROG Ally X Performance 17W | |
| ROG Ally X Quiet 13W | |
| The Witcher 3 | |
| 1920x1080 High Graphics & Postprocessing (Nvidia HairWorks Off) | |
| ROG Ally X Turbo 30W | |
| ROG Ally X Turbo 25W | |
| ROG Ally X Performance 17W | |
| ROG Ally X Quiet 13W | |
| 1920x1080 Ultra Graphics & Postprocessing (HBAO+) | |
| ROG Ally X Turbo 30W | |
| ROG Ally X Turbo 25W | |
| ROG Ally X Performance 17W | |
| ROG Ally X Quiet 13W | |
| GTA V | |
| 1366x768 Normal/Off AF:4x | |
| ROG Ally X Turbo 30W | |
| ROG Ally X Turbo 25W | |
| ROG Ally X Performance 17W | |
| ROG Ally X Quiet 13W | |
| 1920x1080 High/On (Advanced Graphics Off) AA:2xMSAA + FX AF:8x | |
| ROG Ally X Turbo 30W | |
| ROG Ally X Turbo 25W | |
| ROG Ally X Performance 17W | |
| ROG Ally X Quiet 13W | |
| 1920x1080 Highest AA:4xMSAA + FX AF:16x | |
| ROG Ally X Turbo 30W | |
| ROG Ally X Turbo 25W | |
| ROG Ally X Performance 17W | |
| ROG Ally X Quiet 13W | |
| Final Fantasy XV Benchmark | |
| 1280x720 Lite Quality | |
| ROG Ally X Turbo 30W | |
| ROG Ally X Turbo 25W | |
| ROG Ally X Performance 17W | |
| ROG Ally X Quiet 13W | |
| 1920x1080 Standard Quality | |
| ROG Ally X Turbo 30W | |
| ROG Ally X Turbo 25W | |
| ROG Ally X Performance 17W | |
| ROG Ally X Quiet 13W | |
| 1920x1080 High Quality | |
| ROG Ally X Turbo 30W | |
| ROG Ally X Turbo 25W | |
| ROG Ally X Performance 17W | |
| ROG Ally X Quiet 13W | |
| Strange Brigade | |
| 1920x1080 medium AA:medium AF:4 | |
| ROG Ally X Turbo 30W | |
| ROG Ally X Turbo 25W | |
| ROG Ally X Performance 17W | |
| ROG Ally X Quiet 13W | |
| 1920x1080 high AA:high AF:8 | |
| ROG Ally X Turbo 30W | |
| ROG Ally X Turbo 25W | |
| ROG Ally X Performance 17W | |
| ROG Ally X Quiet 13W | |
| 1920x1080 ultra AA:ultra AF:16 | |
| ROG Ally X Turbo 30W | |
| ROG Ally X Turbo 25W | |
| ROG Ally X Performance 17W | |
| ROG Ally X Quiet 13W | |
| F1 23 | |
| 1920x1080 Medium Preset AA:T AF:16x | |
| ROG Ally X Turbo 30W | |
| ROG Ally X Turbo 25W | |
| ROG Ally X Performance 17W | |
| ROG Ally X Quiet 13W | |
| 1920x1080 High Preset AA:T AF:16x | |
| ROG Ally X Turbo 30W | |
| ROG Ally X Turbo 25W | |
| ROG Ally X Performance 17W | |
| ROG Ally X Quiet 13W | |
| F1 24 | |
| 1920x1080 Medium Preset AA:T AF:16x | |
| ROG Ally X Turbo 30W | |
| ROG Ally X Turbo 25W | |
| ROG Ally X Performance 17W | |
| ROG Ally X Quiet 13W | |
| 1920x1080 High Preset AA:T AF:16x | |
| ROG Ally X Turbo 30W | |
| ROG Ally X Turbo 25W | |
| ROG Ally X Performance 17W | |
| ROG Ally X Quiet 13W | |
| Cyberpunk 2077 | |
| 1920x1080 Low Preset (FSR off) | |
| ROG Ally X Turbo 30W | |
| ROG Ally X Turbo 25W | |
| ROG Ally X Performance 17W | |
| ROG Ally X Quiet 13W | |
| 1920x1080 Medium Preset (FSR off) | |
| ROG Ally X Turbo 30W | |
| ROG Ally X Turbo 25W | |
| ROG Ally X Performance 17W | |
| ROG Ally X Quiet 13W | |
| Far Cry 5 | |
| 1920x1080 Medium Preset AA:T | |
| ROG Ally X Turbo 30W | |
| ROG Ally X Turbo 25W | |
| ROG Ally X Performance 17W | |
| ROG Ally X Quiet 13W | |
| 1920x1080 High Preset AA:T | |
| ROG Ally X Turbo 30W | |
| ROG Ally X Turbo 25W | |
| ROG Ally X Performance 17W | |
| ROG Ally X Quiet 13W | |
| 1920x1080 Ultra Preset AA:T | |
| ROG Ally X Turbo 30W | |
| ROG Ally X Turbo 25W | |
| ROG Ally X Performance 17W | |
| ROG Ally X Quiet 13W | |
| Baldur's Gate 3 | |
| 1920x1080 Low Preset AA:SM | |
| ROG Ally X Turbo 30W | |
| ROG Ally X Turbo 25W | |
| ROG Ally X Performance 17W | |
| ROG Ally X Quiet 13W | |
| 1920x1080 Medium Preset AA:T | |
| ROG Ally X Turbo 30W | |
| ROG Ally X Turbo 25W | |
| ROG Ally X Performance 17W | |
| ROG Ally X Quiet 13W | |
| Forza Horizon 5 | |
| 1920x1080 Medium Preset | |
| ROG Ally X Turbo 30W | |
| ROG Ally X Turbo 25W | |
| ROG Ally X Performance 17W | |
| ROG Ally X Quiet 13W | |
| 1920x1080 High Preset | |
| ROG Ally X Turbo 30W | |
| ROG Ally X Turbo 25W | |
| ROG Ally X Performance 17W | |
| ROG Ally X Quiet 13W | |
| Shadow of the Tomb Raider | |
| 1920x1080 Medium Preset | |
| ROG Ally X Turbo 30W | |
| ROG Ally X Turbo 25W | |
| ROG Ally X Performance 17W | |
| ROG Ally X Quiet 13W | |
| 1920x1080 High Preset AA:SM | |
| ROG Ally X Turbo 30W | |
| ROG Ally X Turbo 25W | |
| ROG Ally X Performance 17W | |
| ROG Ally X Quiet 13W | |
| Ghost of Tsushima | |
| 1920x1080 Low Preset | |
| ROG Ally X Turbo 30W | |
| ROG Ally X Turbo 25W | |
| ROG Ally X Performance 17W | |
| ROG Ally X Quiet 13W | |
| 1920x1080 Medium Preset AA:T | |
| ROG Ally X Turbo 30W | |
| ROG Ally X Turbo 25W | |
| ROG Ally X Performance 17W | |
| ROG Ally X Quiet 13W | |
| 1920x1080 High Preset AA:T | |
| ROG Ally X Turbo 30W | |
| ROG Ally X Turbo 25W | |
| ROG Ally X Performance 17W | |
| ROG Ally X Quiet 13W | |
| Dota 2 Reborn | |
| 1920x1080 high (2/3) | |
| ROG Ally X Turbo 25W | |
| ROG Ally X Turbo 30W | |
| ROG Ally X Performance 17W | |
| ROG Ally X Quiet 13W | |
| 1920x1080 ultra (3/3) best looking | |
| ROG Ally X Turbo 30W | |
| ROG Ally X Turbo 25W | |
| ROG Ally X Performance 17W | |
| ROG Ally X Quiet 13W | |
It is also possible to improve the gaming performance with additional features. The AMD driver offers features like super resolution (scaling from 720p to 1080p) and frame generation, for example. There is also AMD’s FSR technology, but it is not supported by all games. We took Cyberpunk 2077 as an example for all the AMD features and also added FSR 2.1 via in-game settings. Cyberpunk is also supposed to get FSR 3 support in the near future. Our results clearly show that you can improve the gaming performance significantly. Ghost of Tsushima is one example where we turned the AMD driver features off and used FSR plus frame generation via in-game settings. Frame generation in particular works really well with this title and increases the performance substantially, so you can play with the Performance profile in 1080p /High with more than 40 fps. Thanks to these technologies, the ROG Ally X can easily handle all AAA-titles.
| Power profile | 1080p Low | 1080p Medium | 1080p High |
|---|---|---|---|
| Performance (FSR 3) | 39.8 FPS | 33.4 FPS | 28.8 FPS |
| Performance (FSR 3 + FG) | 59.2 FPS | 52.9 FPS | 44.5 FPS |
| Turbo (FSR 3) | 42.9 FPS | 36 FPS | 31.4 FPS |
| Turbo (FSR 3 + FG) | 70.9 FPS | 61.6 FPS | 53.8 FPS |
| Power profile | Medium | High | Ultra |
|---|---|---|---|
| Performance | 39.9 FPS | 33 FPS | 30.3 FPS |
| Performance (FSR 2.1) | 59 FPS | 39.4 FPS | 35.5 FPS |
| Turbo | 52.4 FPS | 38 FPS | 35.3 FPS |
| Turbo (FSR 2.1) | 64 FPS | 44.2 FPS | 40.9 FPS |
Update 07/24: We added more gaming benchmarks for Call of Duty: Modern Warfare 3 as well as Horizon Forbidden West, both of which support FSR 3. Call of Duty shows noticeable performance gains and you are close to 60 fps with medium settings in Performance mode. The benefits of FSR 3 in Horizon Forbidden West are smaller, but Frame Generation offers a big boost.
| Power profile | 1080p Low | 1080p Medium | 1080p High | 1080p Ultra |
|---|---|---|---|---|
| Performance | 52 FPS | 39 FPS | 29 FPS | 27 FPS |
| Performance (FSR 3) | 67 FPS | 58 FPS | 45 FPS | 41 FPS |
| Turbo | 68 FPS | 57 FPS | 38 FPS | 37 FPS |
| Turbo (FSR 3) | 87 FPS | 71 FPS | 59 FPS | 52 FPS |
| Power profile | 1080p Low | 1080p Medium | 1080p High | 1080p Ultra |
|---|---|---|---|---|
| Turbo | 29.4 FPS | 26 FPS | 18.7 FPS | 16.3 FPS |
| Turbo (FSR 3) | 36.6 FPS | 31.9 FPS | 21.6 FPS | 18.8 FPS |
| Turbo (FSR 3 + FG) | 59.1 FPS | 51.7 FPS | 37.3 FPS | 32.5 FPS |
The following overview tables show the gaming benchmarks we performed with the four different power profiles.
Gaming Benchmarks Turbo (30 Watts)
| low | med. | high | ultra | |
|---|---|---|---|---|
| GTA V (2015) | 144.5 | 144 | 66.5 | 27.1 |
| The Witcher 3 (2015) | 149 | 49 | 31.1 | |
| Dota 2 Reborn (2015) | 120.7 | 105.3 | 86.5 | 76.2 |
| Final Fantasy XV Benchmark (2018) | 80.7 | 39.6 | 30 | |
| X-Plane 11.11 (2018) | 54 | 40.6 | 33.2 | |
| Far Cry 5 (2018) | 78 | 46 | 42 | 40 |
| Strange Brigade (2018) | 161.1 | 70.1 | 60 | 51.6 |
| Shadow of the Tomb Raider (2018) | 104 | 47 | 42 | 37 |
| Forza Horizon 5 (2021) | 113 | 78 | 69 | 36 |
| F1 22 (2022) | 94.9 | 86.7 | 64.6 | 17.8 |
| Star Wars Jedi Survivor (2023) | 23.1 | 20.8 | 19.5 | 18.3 |
| F1 23 (2023) | 89.6 | 79 | 56.6 | 13 |
| Baldur's Gate 3 (2023) | 41.1 | 32.1 | 26.6 | 25.8 |
| Cyberpunk 2077 (2023) | 44.1 | 34.3 | 27.2 | 22.9 |
| Total War Pharaoh (2023) | 92.2 | 68 | 40.4 | 32 |
| Call of Duty Modern Warfare 3 2023 (2023) | 68 | 57 | 38 | 37 |
| Horizon Forbidden West (2024) | 29.4 | 26 | 18.7 | 16.3 |
| Ghost of Tsushima (2024) | 36.1 | 29.4 | 26.1 | 20.6 |
| F1 24 (2024) | 90.9 | 75.5 | 55.1 | 13.4 |
Gaming Benchmarks Turbo (25 Watts)
| low | med. | high | ultra | |
|---|---|---|---|---|
| GTA V (2015) | 141.1 | 137.9 | 65.8 | 26.8 |
| The Witcher 3 (2015) | 47.1 | 29.6 | ||
| Dota 2 Reborn (2015) | 114.3 | 93.9 | 86.9 | 71.9 |
| Final Fantasy XV Benchmark (2018) | 77.9 | 38.2 | 28.9 | |
| X-Plane 11.11 (2018) | 39.3 | 27.1 | 28.2 | |
| Far Cry 5 (2018) | 72 | 45 | 41 | 39 |
| Strange Brigade (2018) | 163.6 | 68.1 | 58.1 | 50 |
| Shadow of the Tomb Raider (2018) | 100 | 46 | 40 | 35 |
| Forza Horizon 5 (2021) | 106 | 74 | 62 | 32 |
| F1 23 (2023) | 85.5 | 76.4 | 53.8 | 12.1 |
| Baldur's Gate 3 (2023) | 39.2 | 30.4 | 25.3 | 25.1 |
| Cyberpunk 2077 (2023) | 41.5 | 31.1 | 25.1 | 21.7 |
| Ghost of Tsushima (2024) | 34.9 | 28.3 | 25.3 | 19.7 |
| F1 24 (2024) | 83.4 | 72.1 | 52.3 | 12.6 |
Gaming Benchmarks Performance (17 Watts)
| low | med. | high | ultra | |
|---|---|---|---|---|
| GTA V (2015) | 130.4 | 124.8 | 58.7 | 25.3 |
| The Witcher 3 (2015) | 45.7 | 25.7 | ||
| Dota 2 Reborn (2015) | 121.3 | 105.2 | 81.9 | 66.7 |
| Final Fantasy XV Benchmark (2018) | 67 | 34.8 | 26.6 | |
| X-Plane 11.11 (2018) | 51.9 | 38.4 | 32.3 | |
| Far Cry 5 (2018) | 73 | 40 | 37 | 35 |
| Strange Brigade (2018) | 156.3 | 64.9 | 53.9 | 45.1 |
| Shadow of the Tomb Raider (2018) | 91 | 41 | 38 | 33 |
| Forza Horizon 5 (2021) | 102 | 61 | 60 | 31 |
| F1 23 (2023) | 67.3 | 62.5 | 44.1 | 9.98 |
| Baldur's Gate 3 (2023) | 33 | 25.7 | 21.6 | 21.2 |
| Cyberpunk 2077 (2023) | 33.9 | 26.4 | 21.9 | 18.7 |
| Call of Duty Modern Warfare 3 2023 (2023) | 52 | 39 | 29 | 27 |
| Ghost of Tsushima (2024) | 33.3 | 24.6 | 21.4 | 16.7 |
| F1 24 (2024) | 69 | 61.1 | 43.8 | 10.1 |
Gaming Benchmarks Quiet (13 Watts)
| low | med. | high | ultra | |
|---|---|---|---|---|
| GTA V (2015) | 121 | 100.6 | 41.4 | 18.6 |
| The Witcher 3 (2015) | 27.5 | 17.5 | ||
| Dota 2 Reborn (2015) | 116.4 | 102.4 | 61.1 | 55 |
| Final Fantasy XV Benchmark (2018) | 44.7 | 24 | 19.3 | |
| X-Plane 11.11 (2018) | 48.7 | 35.6 | 30.3 | |
| Far Cry 5 (2018) | 47 | 25 | 23 | 22 |
| Strange Brigade (2018) | 141 | 46.2 | 38.8 | 32.8 |
| Shadow of the Tomb Raider (2018) | 61 | 27 | 24 | 21 |
| Forza Horizon 5 (2021) | 66 | 39 | 35 | 19 |
| F1 23 (2023) | 43.2 | 38.6 | 27.3 | 6.25 |
| Baldur's Gate 3 (2023) | 20.2 | 15.7 | 13.8 | 13.5 |
| Cyberpunk 2077 (2023) | 32.6 | 16.3 | 13.8 | 11.5 |
| Ghost of Tsushima (2024) | 10.6 | 16.5 | 14.6 | 11.8 |
| F1 24 (2024) | 43.3 | 37.1 | 27.1 | 6.39 |
Emissions - Only the Turbo mode (30 Watts) is loud
System Noise
The two fans are usually turned off while idling and light workloads (web browsing, YouTube as desktop PC) and there are no unwanted electronic sounds, either. When you start to stress the system, it depends solely on the power profile. The Turbo mode on mains is a negative example and can be annoying in quiet gaming scenes at around 43 dB(A). The noise is already much more pleasing in Turbo on battery power and there is only a quiet murmur (or nothing at all with game sound) when you use the Performance mode.
| Power profile | 3DMark 06 | Cyberpunk 2077 | Stress test |
|---|---|---|---|
| Quiet | 32.2 dB(A) | 32.2 dB(A) | 32.2 dB(A) |
| Performance | 33.8 dB(A) | 33.8 dB(A) | 33.8 dB(A) |
| Turbo (battery) | 37.4 dB(A) | 37.4 dB(A) | 37.4 dB(A) |
| Turbo | 42.6 dB(A) | 42.6 dB(A) | 42.6 dB(A) |
Noise level
| Idle |
| 24.7 / 24.7 / 28.5 dB(A) |
| Load |
| 42.6 / 42.6 dB(A) |
 | ||
30 dB silent 40 dB(A) audible 50 dB(A) loud |
||
min: | ||
| Asus ROG Ally X Radeon 780M, Z1 Extreme, WD PC SN560 SDDPNQE-1T00 | GPD Win Mini 2024 7" Radeon 780M, R7 8840U, Kioxia BG5 KBG50ZNS512G | MSI Claw Arc 8-Core, Ultra 7 155H, Kioxia BG5 KBG50ZNS1T02 | Valve Steam Deck 1 TB OLED Radeon Radeon Steam Deck 8CU, Steam Deck OLED APU, Phison ESMP001TKB5C3 | Lenovo Legion Go Radeon 780M, Z1 Extreme, WD PC SN740 512GB SDDPMQD-512G-1101 | Ayaneo Kun Radeon 780M, R7 7840U, Phison M.2 2280 E18 4000GB | Asus ROG Ally Z1 Extreme Radeon 780M, Z1 Extreme, Micron 2400 MTFDKBK512QFM | |
|---|---|---|---|---|---|---|---|
| Noise | 3% | -7% | 7% | 10% | -5% | 6% | |
| off / environment * (dB) | 24.7 | 24.2 2% | 25.7 -4% | 24.7 -0% | 23 7% | 23.3 6% | |
| Idle Minimum * (dB) | 24.7 | 24.7 -0% | 25.7 -4% | 25 -1% | 23 7% | 25.31 -2% | 23.3 6% |
| Idle Average * (dB) | 24.7 | 26.2 -6% | 31.7 -28% | 25 -1% | 23 7% | 25.31 -2% | 23.3 6% |
| Idle Maximum * (dB) | 28.5 | 28 2% | 31.7 -11% | 25 12% | 25 12% | 34.5 -21% | 27.3 4% |
| Load Average * (dB) | 42.6 | 34.2 20% | 36.6 14% | 31.3 27% | 37 13% | 34.9 18% | 39.2 8% |
| Cyberpunk 2077 ultra * (dB) | 42.6 | 45.5 -7% | |||||
| Load Maximum * (dB) | 42.6 | 42.5 -0% | 45.5 -7% | 40.8 4% | 37 13% | 50.78 -19% | 39.2 8% |
| Witcher 3 ultra * (dB) | 43 | 46 | 39.2 |
* ... smaller is better
Temperature

We can keep it short here since there are no issues with surface temperatures. The touchscreen does get warm while gaming, but the grips hardly warm up at all, which is also very easy to see on the thermal images. The fan exhausts at the top are no problem, either, and the whole back side stays very cool.
(±) The maximum temperature on the upper side is 42.7 °C / 109 F, compared to the average of 37.9 °C / 100 F, ranging from 26.6 to 55 °C for the class Handheld / UMPC.
(+) The bottom heats up to a maximum of 39.7 °C / 103 F, compared to the average of 36.7 °C / 98 F
(+) In idle usage, the average temperature for the upper side is 27.4 °C / 81 F, compared to the device average of 32.8 °C / 91 F.
(-) 3: The average temperature for the upper side is 40 °C / 104 F, compared to the average of 32.8 °C / 91 F for the class Handheld / UMPC.
(-) The palmrests and touchpad can get very hot to the touch with a maximum of 42.2 °C / 108 F.
(-) The average temperature of the palmrest area of similar devices was 32.4 °C / 90.3 F (-9.8 °C / -17.7 F).


| Asus ROG Ally X AMD Ryzen Z1 Extreme, AMD Radeon 780M | GPD Win Mini 2024 7" AMD Ryzen 7 8840U, AMD Radeon 780M | MSI Claw Intel Core Ultra 7 155H, Intel Arc 8-Core iGPU | Valve Steam Deck 1 TB OLED AMD Steam Deck OLED APU, AMD Radeon Steam Deck 8CU | Lenovo Legion Go AMD Ryzen Z1 Extreme, AMD Radeon 780M | Ayaneo Kun AMD Ryzen 7 7840U, AMD Radeon 780M | Asus ROG Ally Z1 Extreme AMD Ryzen Z1 Extreme, AMD Radeon 780M | |
|---|---|---|---|---|---|---|---|
| Heat | -18% | -6% | -3% | ||||
| Maximum Upper Side * (°C) | 42.7 | 46.6 -9% | 41.8 2% | 44.4 -4% | |||
| Maximum Bottom * (°C) | 39.7 | 48 -21% | 35.9 10% | 37.9 5% | |||
| Idle Upper Side * (°C) | 28 | 32.6 -16% | 31.6 -13% | 29.9 -7% | |||
| Idle Bottom * (°C) | 27.2 | 33.6 -24% | 33.6 -24% | 28.3 -4% |
* ... smaller is better
Speakers
The two stereo speakers are located at the front and perform well. Asus even managed to improve the performance compared to the original ROG Ally. The new Ally X is only beaten by the Steam Deck OLED within our comparison group.
Asus ROG Ally X audio analysis
(+) | speakers can play relatively loud (88.2 dB)
Bass 100 - 315 Hz
(-) | nearly no bass - on average 26% lower than median
(±) | linearity of bass is average (7.7% delta to prev. frequency)
Mids 400 - 2000 Hz
(+) | balanced mids - only 3.9% away from median
(+) | mids are linear (3.6% delta to prev. frequency)
Highs 2 - 16 kHz
(+) | balanced highs - only 1.1% away from median
(+) | highs are linear (1.8% delta to prev. frequency)
Overall 100 - 16.000 Hz
(+) | overall sound is linear (14.7% difference to median)
Compared to same class
» 25% of all tested devices in this class were better, 13% similar, 63% worse
» The best had a delta of 12%, average was 17%, worst was 23%
Compared to all devices tested
» 19% of all tested devices were better, 4% similar, 77% worse
» The best had a delta of 4%, average was 23%, worst was 134%
GPD Win Mini 2024 7" audio analysis
(±) | speaker loudness is average but good (81.6 dB)
Bass 100 - 315 Hz
(-) | nearly no bass - on average 24.4% lower than median
(±) | linearity of bass is average (10.7% delta to prev. frequency)
Mids 400 - 2000 Hz
(+) | balanced mids - only 4.2% away from median
(+) | mids are linear (6.6% delta to prev. frequency)
Highs 2 - 16 kHz
(+) | balanced highs - only 4.5% away from median
(+) | highs are linear (4.5% delta to prev. frequency)
Overall 100 - 16.000 Hz
(±) | linearity of overall sound is average (21.7% difference to median)
Compared to same class
» 83% of all tested devices in this class were better, 8% similar, 8% worse
» The best had a delta of 12%, average was 17%, worst was 23%
Compared to all devices tested
» 62% of all tested devices were better, 7% similar, 31% worse
» The best had a delta of 4%, average was 23%, worst was 134%
MSI Claw audio analysis
(+) | speakers can play relatively loud (87.2 dB)
Bass 100 - 315 Hz
(-) | nearly no bass - on average 17.2% lower than median
(±) | linearity of bass is average (9.2% delta to prev. frequency)
Mids 400 - 2000 Hz
(+) | balanced mids - only 4.3% away from median
(+) | mids are linear (4.3% delta to prev. frequency)
Highs 2 - 16 kHz
(+) | balanced highs - only 3.7% away from median
(+) | highs are linear (4.5% delta to prev. frequency)
Overall 100 - 16.000 Hz
(+) | overall sound is linear (14.9% difference to median)
Compared to same class
» 29% of all tested devices in this class were better, 8% similar, 63% worse
» The best had a delta of 12%, average was 17%, worst was 23%
Compared to all devices tested
» 20% of all tested devices were better, 4% similar, 76% worse
» The best had a delta of 4%, average was 23%, worst was 134%
Valve Steam Deck 1 TB OLED audio analysis
(+) | speakers can play relatively loud (82.7 dB)
Bass 100 - 315 Hz
(-) | nearly no bass - on average 22% lower than median
(±) | linearity of bass is average (14.7% delta to prev. frequency)
Mids 400 - 2000 Hz
(+) | balanced mids - only 1% away from median
(+) | mids are linear (2.1% delta to prev. frequency)
Highs 2 - 16 kHz
(+) | balanced highs - only 1.9% away from median
(+) | highs are linear (6.1% delta to prev. frequency)
Overall 100 - 16.000 Hz
(+) | overall sound is linear (12.9% difference to median)
Compared to same class
» 17% of all tested devices in this class were better, 8% similar, 75% worse
» The best had a delta of 12%, average was 17%, worst was 23%
Compared to all devices tested
» 12% of all tested devices were better, 3% similar, 85% worse
» The best had a delta of 4%, average was 23%, worst was 134%
Lenovo Legion Go audio analysis
(±) | speaker loudness is average but good (73.1 dB)
Bass 100 - 315 Hz
(-) | nearly no bass - on average 16.4% lower than median
(±) | linearity of bass is average (8.1% delta to prev. frequency)
Mids 400 - 2000 Hz
(±) | higher mids - on average 5.2% higher than median
(+) | mids are linear (6% delta to prev. frequency)
Highs 2 - 16 kHz
(±) | higher highs - on average 5.7% higher than median
(±) | linearity of highs is average (9.7% delta to prev. frequency)
Overall 100 - 16.000 Hz
(±) | linearity of overall sound is average (22.7% difference to median)
Compared to same class
» 92% of all tested devices in this class were better, 4% similar, 4% worse
» The best had a delta of 12%, average was 17%, worst was 23%
Compared to all devices tested
» 67% of all tested devices were better, 6% similar, 27% worse
» The best had a delta of 4%, average was 23%, worst was 134%
Ayaneo Kun audio analysis
(+) | speakers can play relatively loud (82.4 dB)
Bass 100 - 315 Hz
(-) | nearly no bass - on average 24.3% lower than median
(±) | linearity of bass is average (7% delta to prev. frequency)
Mids 400 - 2000 Hz
(+) | balanced mids - only 2.1% away from median
(+) | mids are linear (6% delta to prev. frequency)
Highs 2 - 16 kHz
(+) | balanced highs - only 4.7% away from median
(±) | linearity of highs is average (8.3% delta to prev. frequency)
Overall 100 - 16.000 Hz
(±) | linearity of overall sound is average (17.5% difference to median)
Compared to same class
» 46% of all tested devices in this class were better, 13% similar, 42% worse
» The best had a delta of 12%, average was 17%, worst was 23%
Compared to all devices tested
» 34% of all tested devices were better, 8% similar, 58% worse
» The best had a delta of 4%, average was 23%, worst was 134%
Asus ROG Ally Z1 Extreme audio analysis
(+) | speakers can play relatively loud (82.1 dB)
Bass 100 - 315 Hz
(-) | nearly no bass - on average 15.5% lower than median
(±) | linearity of bass is average (8.4% delta to prev. frequency)
Mids 400 - 2000 Hz
(+) | balanced mids - only 3.1% away from median
(+) | mids are linear (3% delta to prev. frequency)
Highs 2 - 16 kHz
(+) | balanced highs - only 1.9% away from median
(+) | highs are linear (2.3% delta to prev. frequency)
Overall 100 - 16.000 Hz
(+) | overall sound is linear (13.5% difference to median)
Compared to same class
» 29% of all tested devices in this class were better, 4% similar, 67% worse
» The best had a delta of 5%, average was 17%, worst was 45%
Compared to all devices tested
» 14% of all tested devices were better, 4% similar, 82% worse
» The best had a delta of 4%, average was 23%, worst was 134%
Energy Management - Now with a massive 80 Wh battery
Power Consumption
The idle consumption of the ROG Ally X is a bit higher compared to the old ROG Ally, but the 7-inch handheld is still one of the most efficient devices. The consumption during gaming depends on the power profile, which is visible on the following images as well as the table below. We took these images after the APU settled at its intended consumption (the value is higher during the initial moments of the gaming session).
| Power profile | Power consumption APS | Power consumption system |
|---|---|---|
| Leise | 13 Watts | ~19-20 Watts |
| Leistung | 17 Watts | 25.5-26.5 Watts |
| Turbo Akku | 25 Watts | 35-36 Watts |
| Turbo | 30 Watts | 42-43 Watts |
| Cloud Gaming | 8 Watts | 11-12 Watts |
The real-time monitoring of the Ally X shows the APU consumption, but also the total system consumption, which is good indicator for battery life. The consumption figures during cloud gaming are also interesting. We tested Microsoft’s Flight Simulator 2020 via Xbox Game pass and while the consumption can be quite high during the loading screens and menus, the APU consumption during actual gameplay is very low at 8 Watts (total system 11-12 Watts). You can also see that the iGPU load is 0 %. The Ally X is even more efficient when you emulate games. We played some SNES classics like Super Mario or Super Mario Kart and the total system consumption was between 8-9 Watts.
We measure up to 66.8 Watts during the stress test, but this value quickly levels off at around 50 Watts. The included 65W power adapter is therefor just sufficient.
| Off / Standby | |
| Idle | |
| Load |
|
Key:
min: | |
| Asus ROG Ally X Z1 Extreme, Radeon 780M, WD PC SN560 SDDPNQE-1T00, IPS, 1920x1080, 7" | GPD Win Mini 2024 7" R7 8840U, Radeon 780M, Kioxia BG5 KBG50ZNS512G, IPS, 1920x1080, 7" | MSI Claw Ultra 7 155H, Arc 8-Core, Kioxia BG5 KBG50ZNS1T02, IPS, 1920x1080, 7" | Valve Steam Deck 1 TB OLED Steam Deck OLED APU, Radeon Radeon Steam Deck 8CU, Phison ESMP001TKB5C3, OLED, 1280x800, 7.4" | Lenovo Legion Go Z1 Extreme, Radeon 780M, WD PC SN740 512GB SDDPMQD-512G-1101, IPS, 2560x1600, 8.8" | Ayaneo Kun R7 7840U, Radeon 780M, Phison M.2 2280 E18 4000GB, IPS, 2560x1600, 8.4" | Asus ROG Ally Z1 Extreme Z1 Extreme, Radeon 780M, Micron 2400 MTFDKBK512QFM, IPS, 1920x1080, 7" | Average AMD Radeon 780M | Average of class Handheld / UMPC | |
|---|---|---|---|---|---|---|---|---|---|
| Power Consumption | 0% | -34% | 14% | -70% | -136% | 2% | -27% | -18% | |
| Idle Minimum * (Watt) | 4.3 | 6.1 -42% | 7.8 -81% | 4.5 -5% | 11.5 -167% | 14 -226% | 4.2 2% | 6.01 ? -40% | 6.19 ? -44% |
| Idle Average * (Watt) | 6.7 | 7.9 -18% | 11.5 -72% | 7.21 -8% | 12 -79% | 17.56 -162% | 6.1 9% | 8.15 ? -22% | 8.61 ? -29% |
| Idle Maximum * (Watt) | 7.5 | 9 -20% | 11.8 -57% | 9.66 -29% | 17.4 -132% | 27 -260% | 6.3 16% | 10.3 ? -37% | 10.4 ? -39% |
| Load Average * (Watt) | 48.2 | 32.6 32% | 53.1 -10% | 22.86 53% | 45 7% | 38.1 21% | 56.6 -17% | 57.6 ? -20% | 43.5 ? 10% |
| Cyberpunk 2077 ultra * (Watt) | 61.3 | 54.4 11% | |||||||
| Cyberpunk 2077 ultra external monitor * (Watt) | 53.9 | ||||||||
| Load Maximum * (Watt) | 66.8 | 34.9 48% | 64.6 3% | 27.8 58% | 54 19% | 101 -51% | 67.2 -1% | 77 ? -15% | 57.5 ? 14% |
| Witcher 3 ultra * (Watt) | 33.3 | 42.6 | 83.5 | 64.1 |
* ... smaller is better
Power consumption Cyberpunk / Stress test
Power consumption external screen
Battery Runtime
Asus doubled the battery capacity from 40 Wh to 80 Wh for the new ROG Ally. We have already seen the consumption values during gaming, and you can expect slightly more than two hours in Turbo mode, about 3 hours in Performance mode, and about 4 hours in Quiet mode. This is confirmed by our tests. During cloud gaming, you will get around 7 hours and even 8 hours for emulated games. This is a huge improvement over the original ROG Ally and you are just way more relaxed when it comes to the battery status. This means the Ally X is on par with the Steam Deck (also 2-4 hours depending on the setting.
The Ally X also performance really well in our default battery tests, which is not really surprising when you combine an 80 Wh battery (which is more than most laptops have) with a small 7-inch screen. Our Wi-Fi test at 150 nits (43 % of the maximum brightness) runs for almost 16 hours at 60 Hz and almost 15 hours at 120 Hz. At maximum brightness, we still get ~12.5 hours (60 Hz) and ~12 hours (120 Hz), respectively. Video playback at 150 nits is possible for 19.5 hours.


The charging time with the included 65W adapter is 128 minutes when the device is turned on (50 % after 53 minutes, 80 % after 84 minutes). Both USB-C ports supports quick charging at up to 100 Watts, which is supposed to reduce the charging time between 0-50 %. We obviously tested this claim with a 100W PSU and can confirm faster charging, but also for battery levels above 50 %. A full recharge took 93 minutes and 50 % is available after just 29 minutes (80 % after 51 minutes).
| Asus ROG Ally X Z1 Extreme, Radeon 780M, 80 Wh | GPD Win Mini 2024 7" R7 8840U, Radeon 780M, 44 Wh | MSI Claw Ultra 7 155H, Arc 8-Core, 53 Wh | Valve Steam Deck 1 TB OLED Steam Deck OLED APU, Radeon Radeon Steam Deck 8CU, 50 Wh | Lenovo Legion Go Z1 Extreme, Radeon 780M, 49.2 Wh | Ayaneo Kun R7 7840U, Radeon 780M, 75 Wh | Asus ROG Ally Z1 Extreme Z1 Extreme, Radeon 780M, 40 Wh | Average of class Handheld / UMPC | |
|---|---|---|---|---|---|---|---|---|
| Battery runtime | -35% | -46% | -41% | -62% | -50% | -52% | -38% | |
| H.264 (h) | 19.6 | 8.8 -55% | 9.5 -52% | |||||
| WiFi v1.3 (h) | 15.8 | 8.6 -46% | 7.8 -51% | 9.3 -41% | 6 -62% | 10 -37% | 7.8 -51% | 11.7 ? -26% |
| Cyberpunk 2077 ultra 150cd (h) | 2.1 | 1.3 -38% | ||||||
| Load (h) | 2.1 | 1.6 -24% | 1.3 -38% | 0.8 -62% | 1.05 ? -50% | |||
| Gaming (h) | 4.2 | 1.6 | 2 | 1.683 ? | ||||
| Witcher 3 ultra (h) | 1.7 | 1 |
Pros
Cons
Verdict - ROG Ally X is the best gaming handheld right now
The original ROG Ally was already a very good gaming handheld and Asus uses the new ROG Ally X to remove the drawbacks of the first model, especially in terms of ergonomics and battery life. The new chassis has larger grips, so even longer gaming sessions are more comfortable. The stamina for longer gaming sessions is provided by the massive 80 Wh battery and the tuned Performance mode turns out to be the ideal setting for mobile gaming. You will have to reduce some details (especially in modern AAA-titles), but in return you get a runtime of almost three hours as well as almost inaudible fans.
The AMD SoC offer basically the same CPU performance as before, but the iGPU benefits from the faster RAM and you get 8 GB more (8 GB allocated to the Radeon 780M, 16 GB to the rest of the system. Thanks to comprehensive GPU features, you can play all modern titles smoothly on the ROG Ally X. Improved input devices help as well; especially the joysticks and the D-pad leave are much better than before. The IPS display is unchanged and it is great for gaming thanks to features like 120 Hz and VRR.
More performance, improved ergonomics and much longer battery life: The new ROG Ally X offers the best overall package among gaming handhelds and Asus managed to fix pretty much every complaint we had with the original ROG Ally. The higher RRP of 899 Euros is therefore justified.
Asus managed to improve the mobile gamer in almost every way and the overall package is tough to beat right now. In addition to the mentioned advantages, you also get a regular M.2-2280 SSD, which makes SSD upgrades very easy. There are two USB-C ports now, so it is even easier to use the Ally X as a small PC. The software implementation was continuously improved since the launch of the original ROG Ally and it all just works very well.
There are not many drawbacks left. A webcam would be nice and a Wi-Fi 7 module is most certainly already on the to-do list for the next iteration. We are not sure about the display, though, because the IPS panel is very good for gaming. An OLED screen would improve the picture quality, but you would have to waive features like VRR. There is also no problem with PWM on the IPS screen. Then there is the processor, where we would have loved to see one of the new AMD Zen5 APUs, but this would have most likely increased the cost. And we still have to wait one week to see the actual performance of the new chips.
Among the rivals, the new ROG Ally X is one of the most expensive units at 899 Euros ($799), but we think it is justified. MSI' Claw handheld recently dropped to 749 Euros ($649), but is simply not as good in many regards. The Steam Deck OLED is still a strong competitor, but the performance is much lower. Devices like the Legion Go only make sense if you must have a larger screen. Price-conscious users should keep an eye on the original ROG Ally. It is already available for under 600 Euros and prices will most likely drop even further once the ROG Ally X hits the shelves. You could a small portion of the savings to get a large-capacity power bank to increase the battery runtime.
Price and Availability
You can order the new Asus ROG Ally X from Best Buy for $799.
Note: We have recently updated our rating system and the results of version 8 are not comparable with the results of version 7. More information is available here .
Asus ROG Ally X
- 07/22/2024 v8
Andreas Osthoff
 Total Sustainability Score:
 Transparency
The selection of devices to be reviewed is made by our editorial team. The test sample was provided to the author as a loan by the manufacturer or retailer for the purpose of this review. The lender had no influence on this review, nor did the manufacturer receive a copy of this review before publication. There was no obligation to publish this review. As an independent media company, Notebookcheck is not subjected to the authority of manufacturers, retailers or publishers.
This is how Notebookcheck is testing
Every year, Notebookcheck independently reviews hundreds of laptops and smartphones using standardized procedures to ensure that all results are comparable. We have continuously developed our test methods for around 20 years and set industry standards in the process. In our test labs, high-quality measuring equipment is utilized by experienced technicians and editors. These tests involve a multi-stage validation process. Our complex rating system is based on hundreds of well-founded measurements and benchmarks, which maintains objectivity. Further information on our test methods can be found here.
Price comparison
