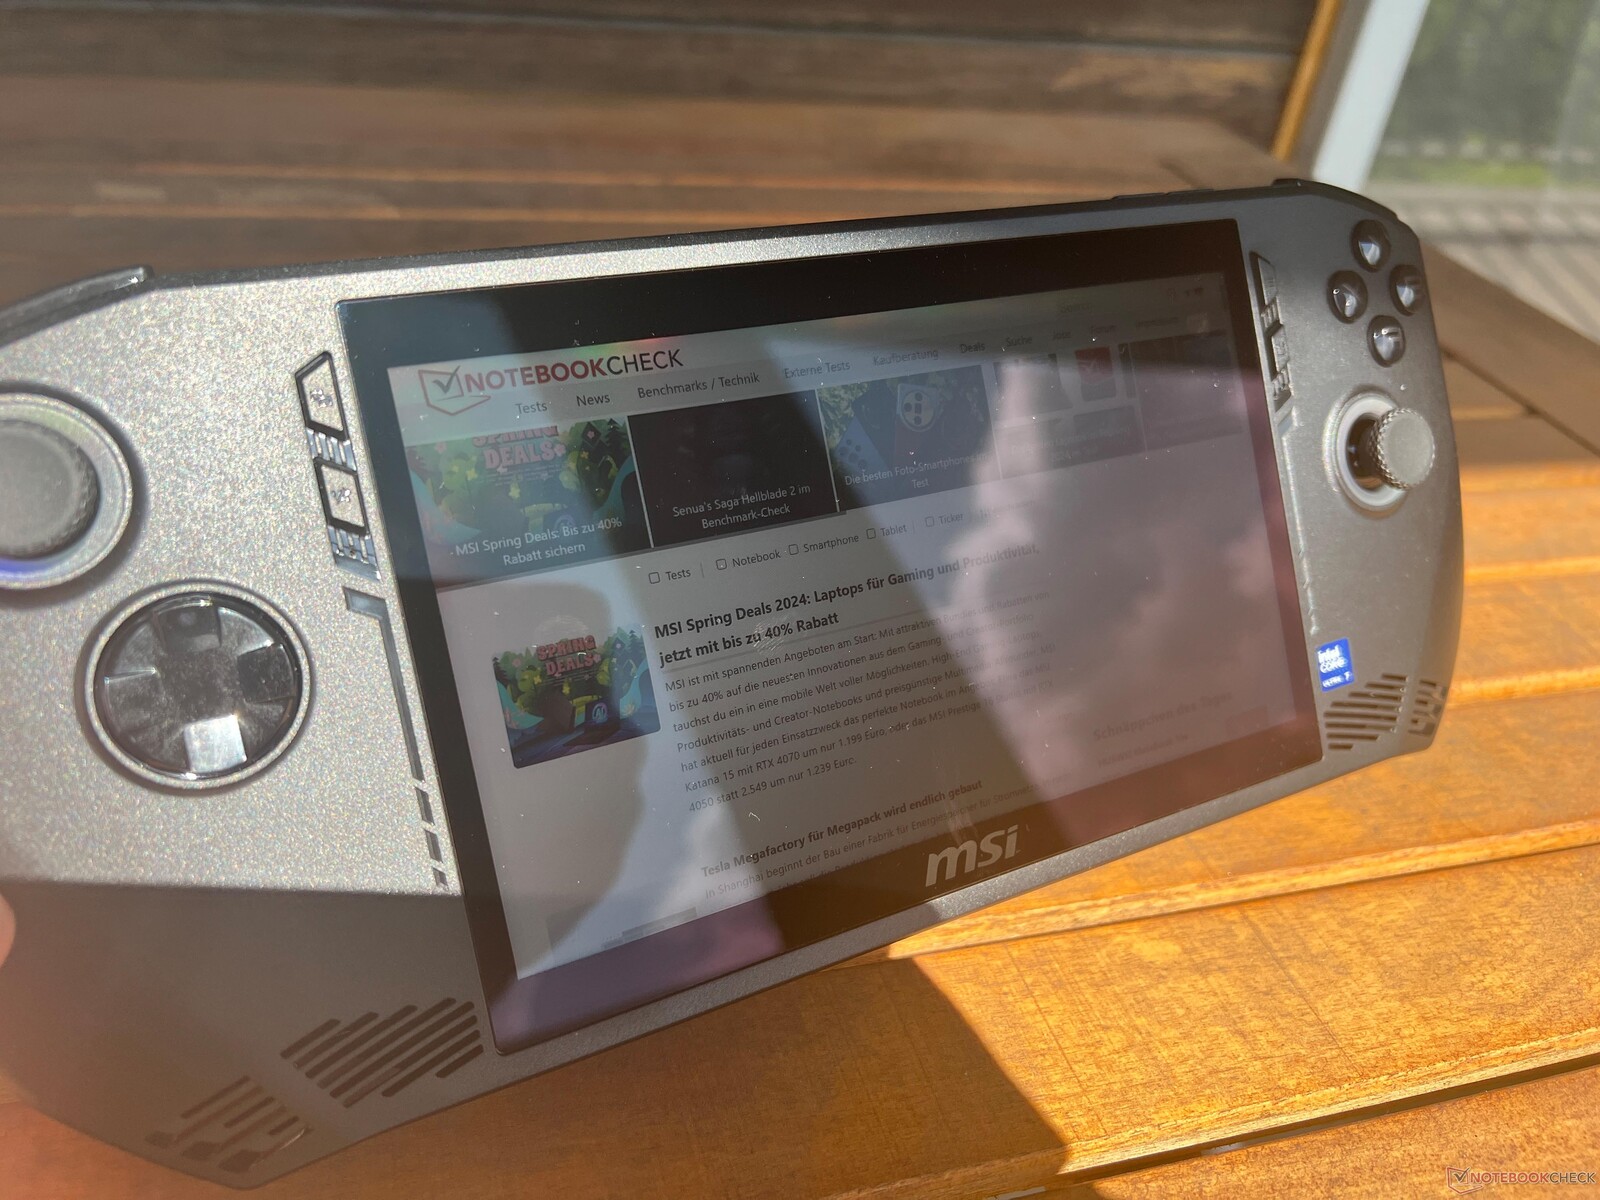
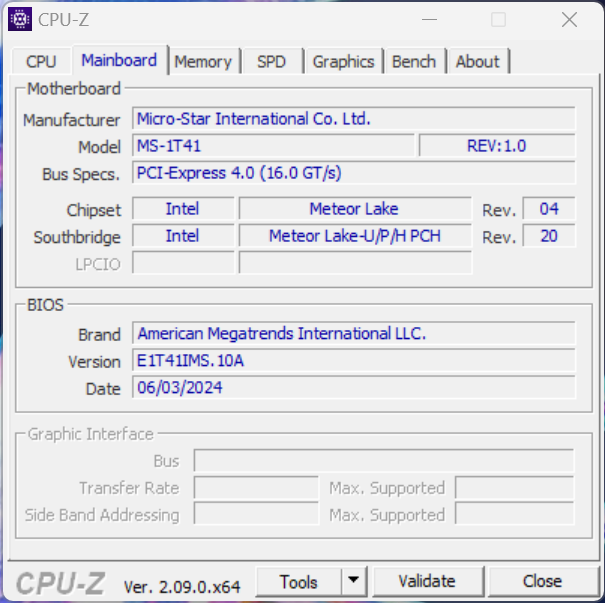
MSI Claw review - The gaming handheld with an Intel Core Ultra processor disappoints
Gaming handhelds are currently all the rage and every major manufacturer is trying to jump on the bandwagon. MSI is no exception, although it has come onto the market quite late with its new Claw and in contrast to most of its competitors which feature an AMD processor, MSI has opted for an Intel Core Ultra model. It is also fitted with a 7-inch IPS display and Hall Effect joysticks and triggers.
MSI currently has two models on offer: The Claw A1M-036 which comes with the Core Ultra 5 135H, 16 GB RAM and a 512 GB SSD, and the Claw A1M-059 with the more powerful Core Ultra 7 155H, 16 GB RAM and a 1 TB SSD for US$899, which is the one we are testing.
Update: There was a bug with our new rating system, which has been corrected. The overall score in the category Handheld / UMPC is increased from 69 to 77 %. In addition, the panel supports VRR and the corresponding section was corrected.
Possible competitors compared
Rating | Version | Date | Model | Weight | Height | Size | Resolution | Price |
|---|---|---|---|---|---|---|---|---|
| 77.4 % | v8 | 06 / 2024 | MSI Claw Ultra 7 155H, Arc 8-Core | 672 g | 33 mm | 7.00" | 1920x1080 | |
| 88.9 % v7 (old) | v7 (old) | 02 / 2024 | Valve Steam Deck 1 TB OLED Steam Deck OLED APU, Radeon Radeon Steam Deck 8CU | 640 g | 49 mm | 7.40" | 1280x800 | |
| 66.3 % | v8 | 01 / 2024 | Lenovo Legion Go Z1 Extreme, Radeon 780M | 845 g | 41 mm | 8.80" | 2560x1600 | |
| 87.5 % v7 (old) | v7 (old) | 05 / 2023 | Asus ROG Ally Z1 Extreme Z1 Extreme, Radeon 780M | 611 g | 21.22 mm | 7.00" | 1920x1080 | |
| 84.9 % v7 (old) | v7 (old) | 01 / 2024 | ONEXPLAYER 2 Pro AR18 R7 7840U, Radeon 780M | 876 g | 43 mm | 8.40" | 2560x1600 | |
| 85.2 % v7 (old) | v7 (old) | 01 / 2024 | Ayaneo Kun R7 7840U, Radeon 780M | 942 g | 22 mm | 8.40" | 2560x1600 |
Note: We have recently updated our rating system and the results of version 8 are not comparable with the results of version 7. More information is available here .
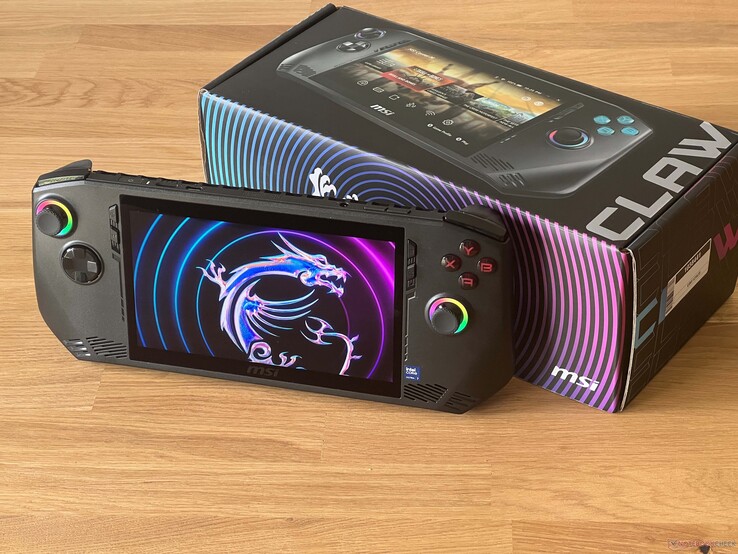
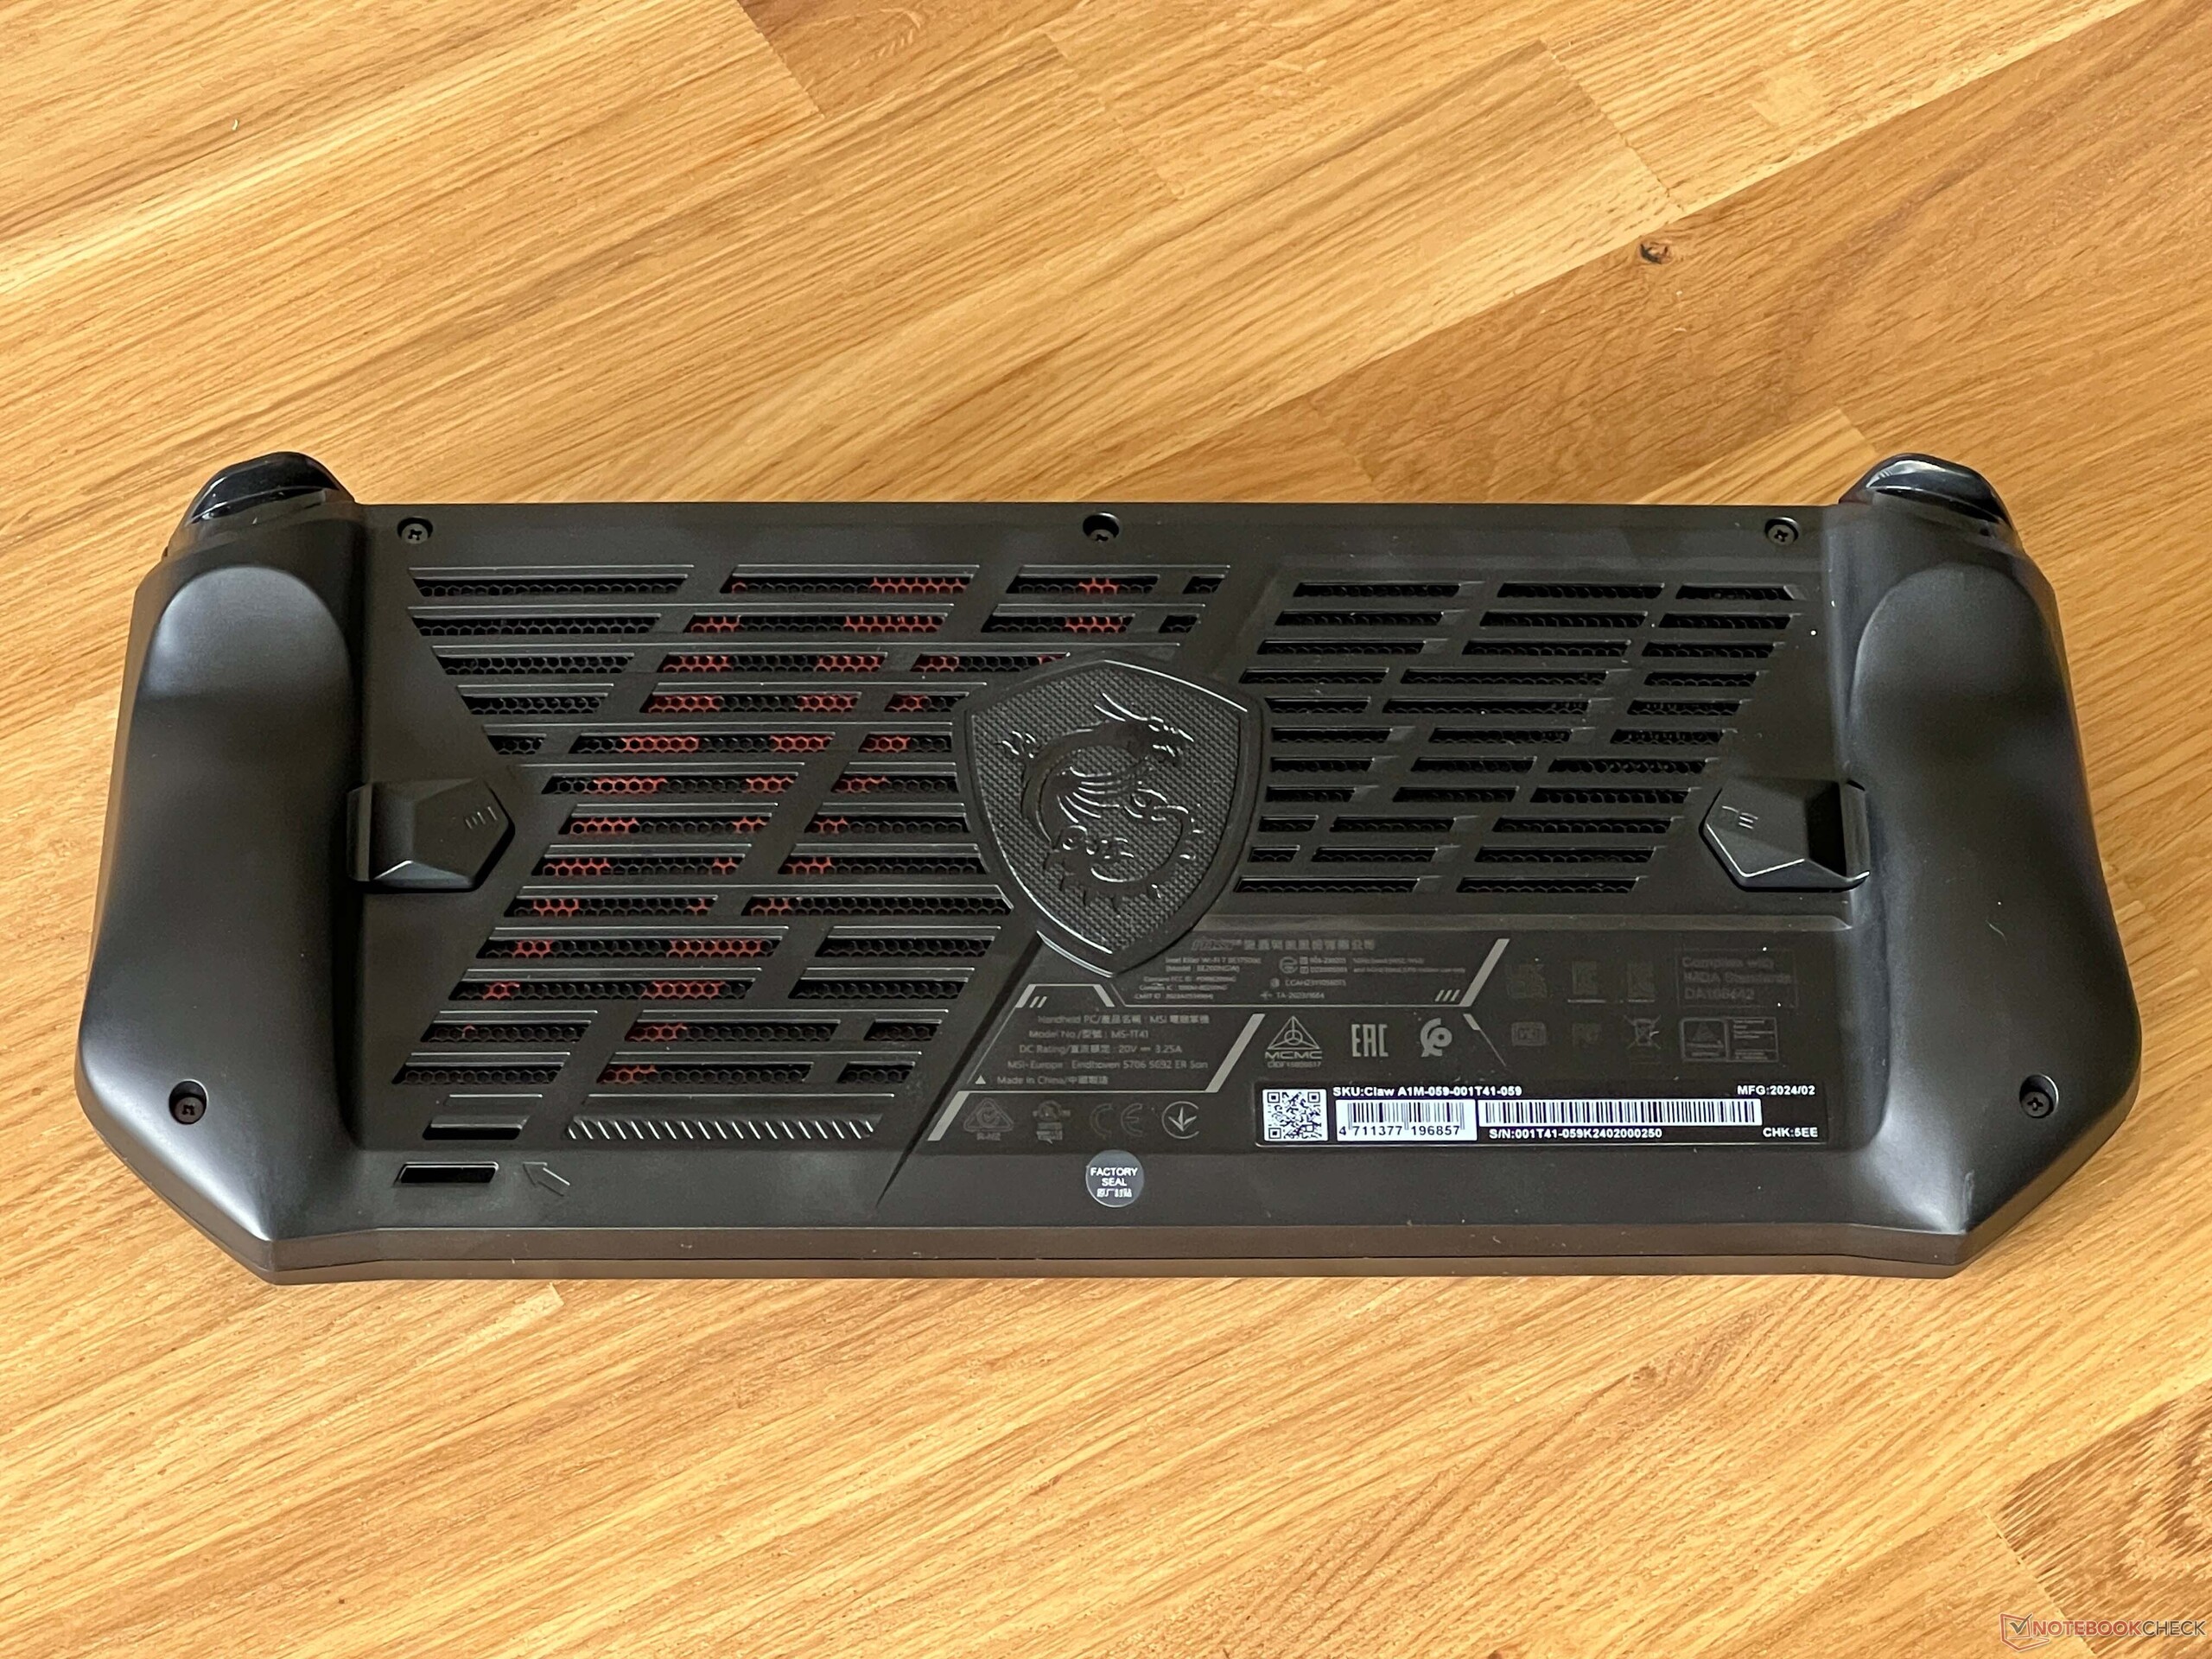
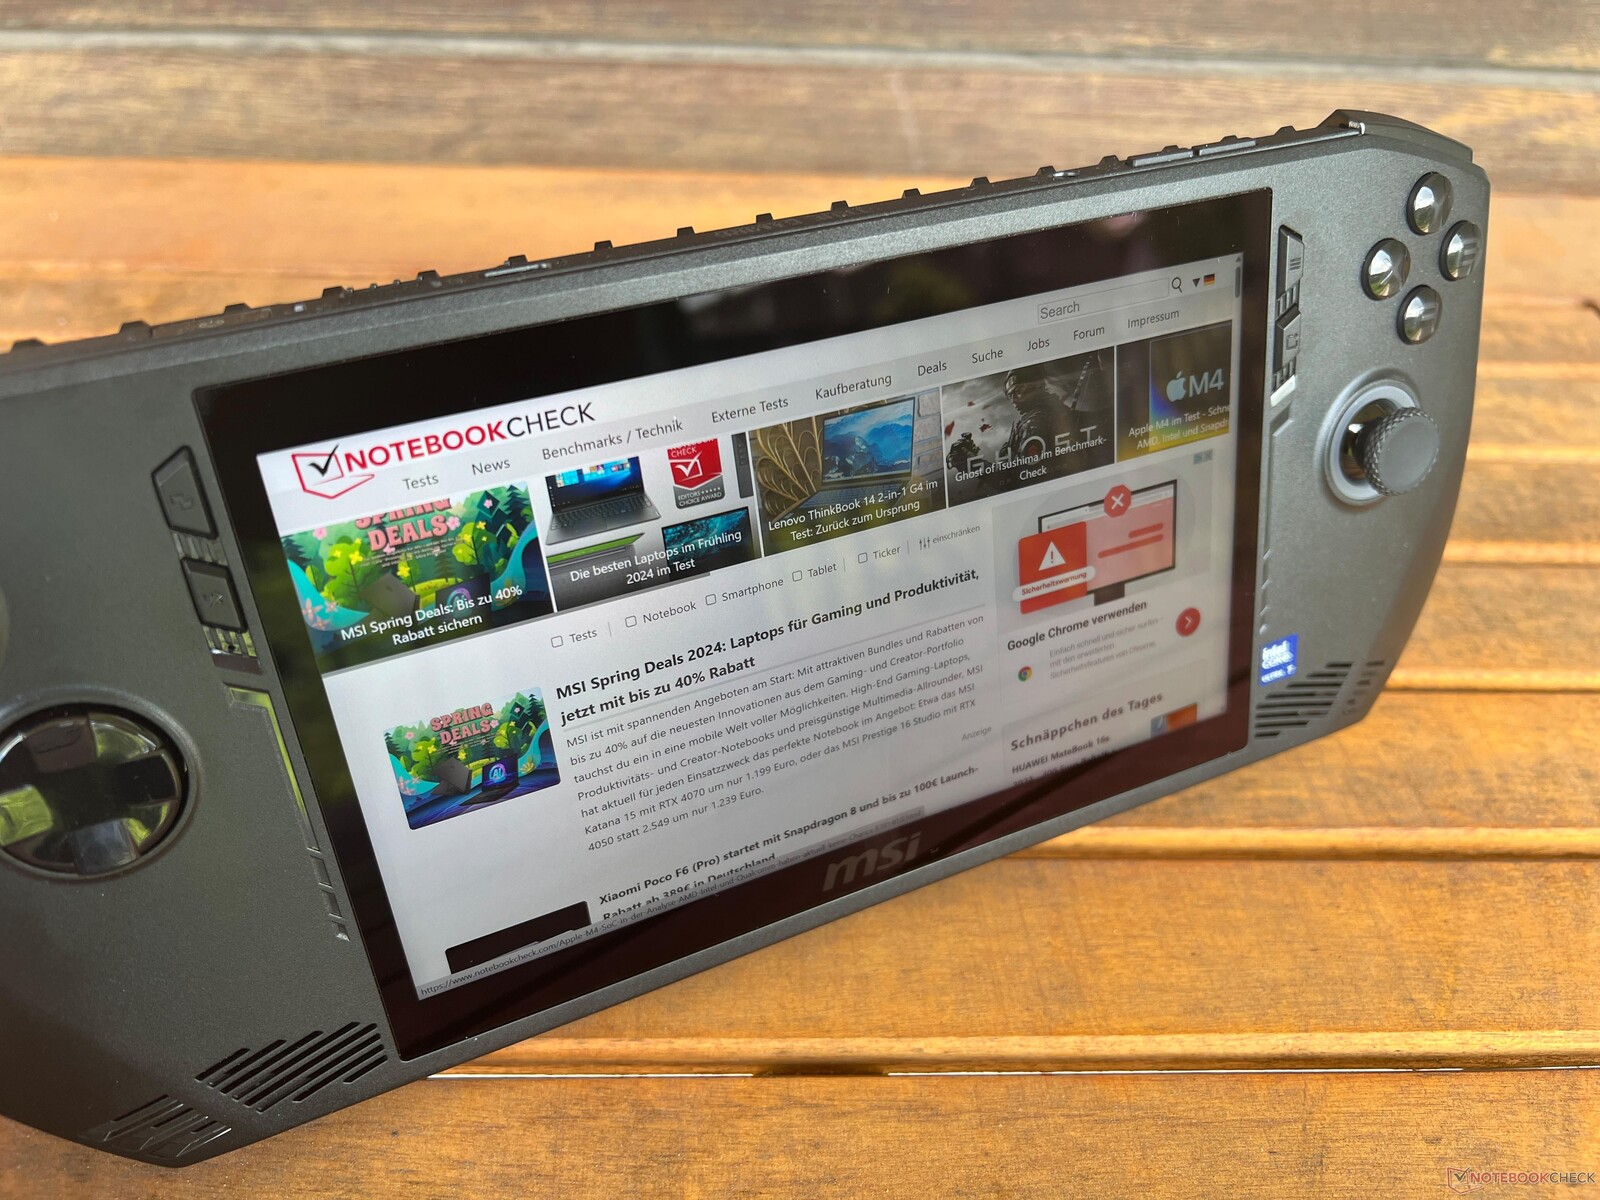
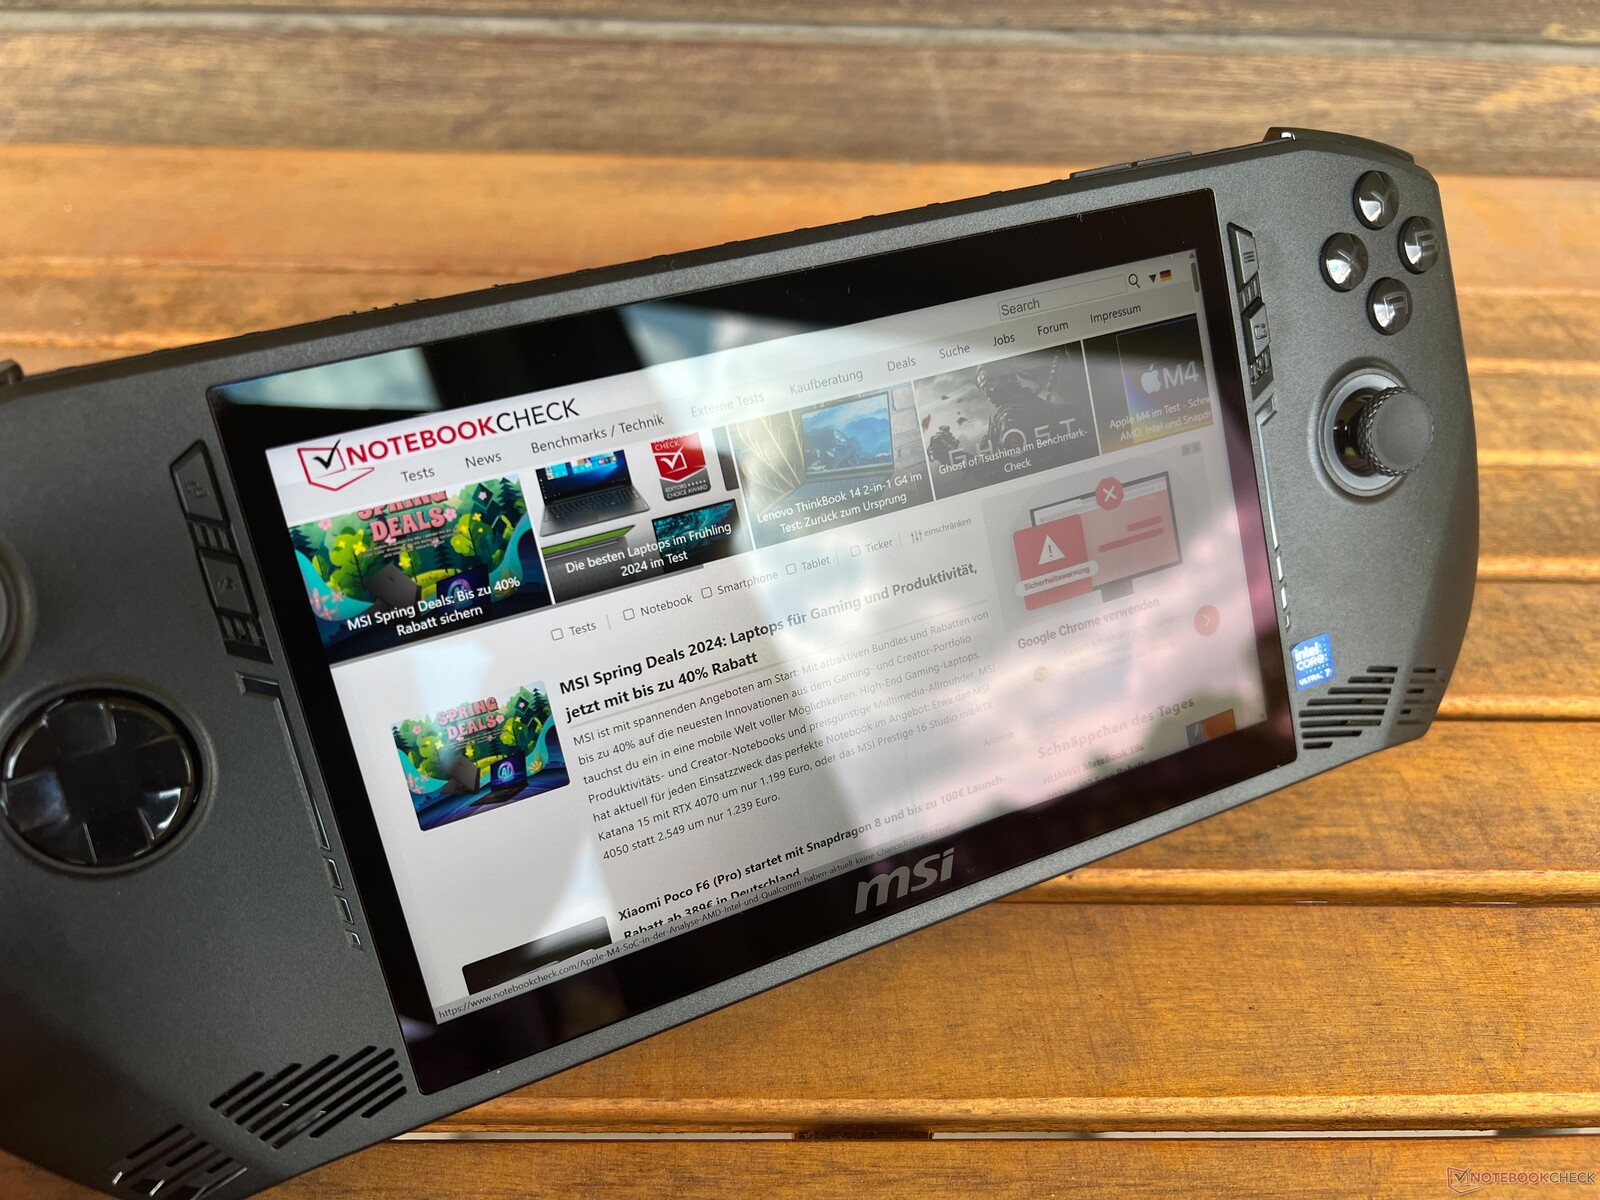
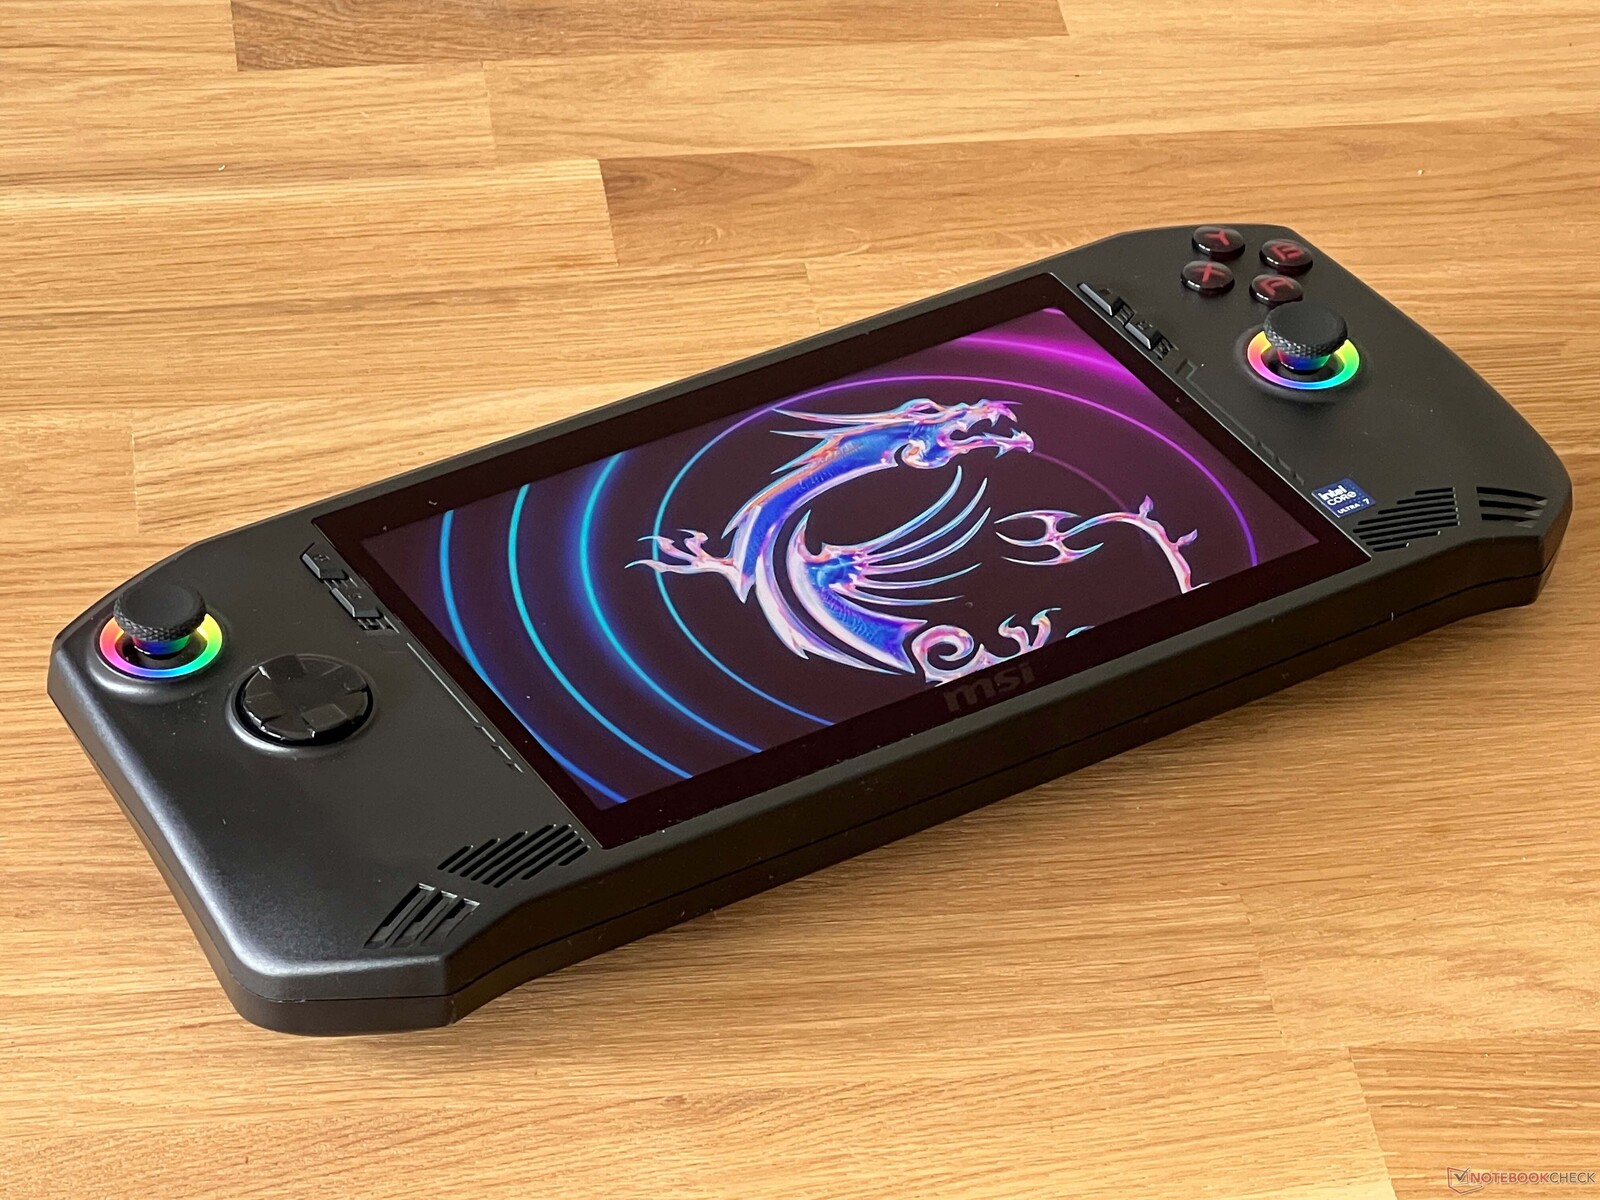
Case - The Claw with lit-up joysticks and buttons
The MSI Claw is a typical gaming handheld like the ROG Ally from Asus that, in comparison to the Lenovo Legion Go for example, doesn't feature detachable controllers. The MSI Claw uses a black plastic case with smooth surfaces—only the back has lots of fan grilles. It is generally built well, but you can elicit some creaking noises from the device. Fingerprint marks, on the other hand, aren't a big problem. The two rings around the joysticks as well as the buttons on the right side can additionally be illuminated. Its wide black bezels are a little annoying (especially on the top and bottom of the screen), although its good impression is reinforced by its use of additional case material.
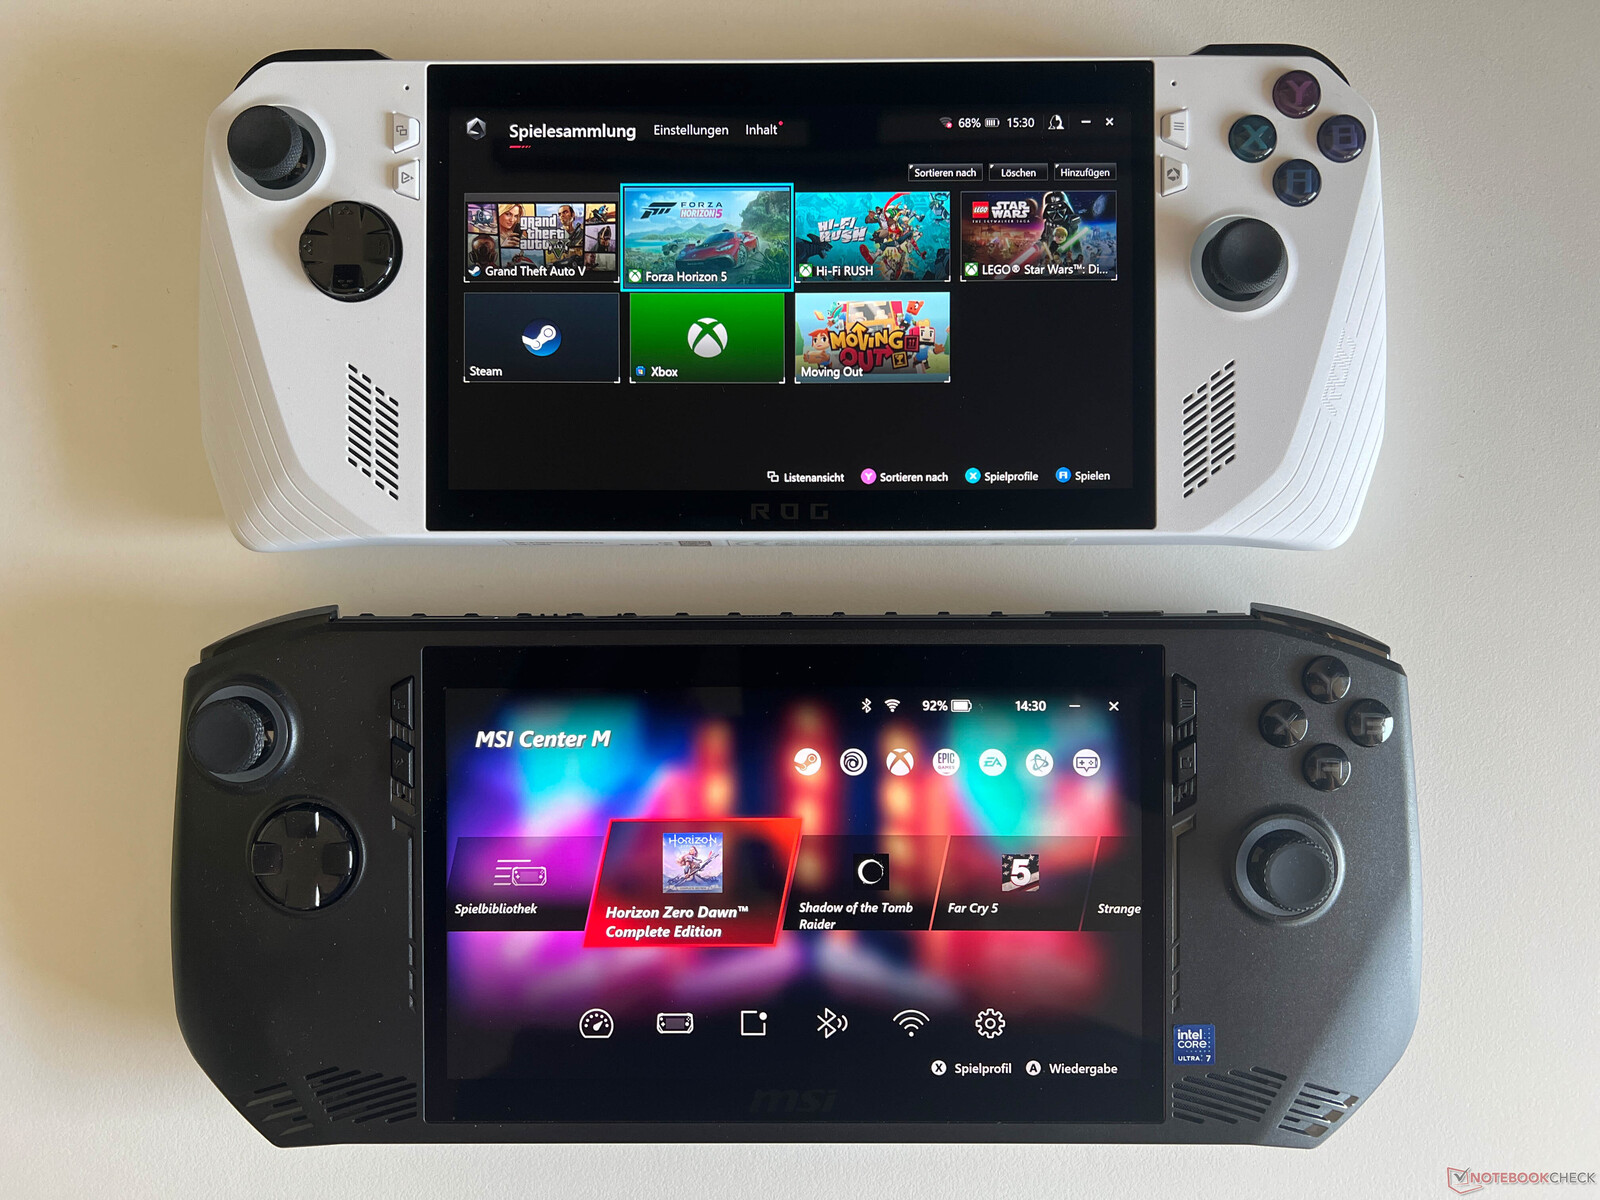
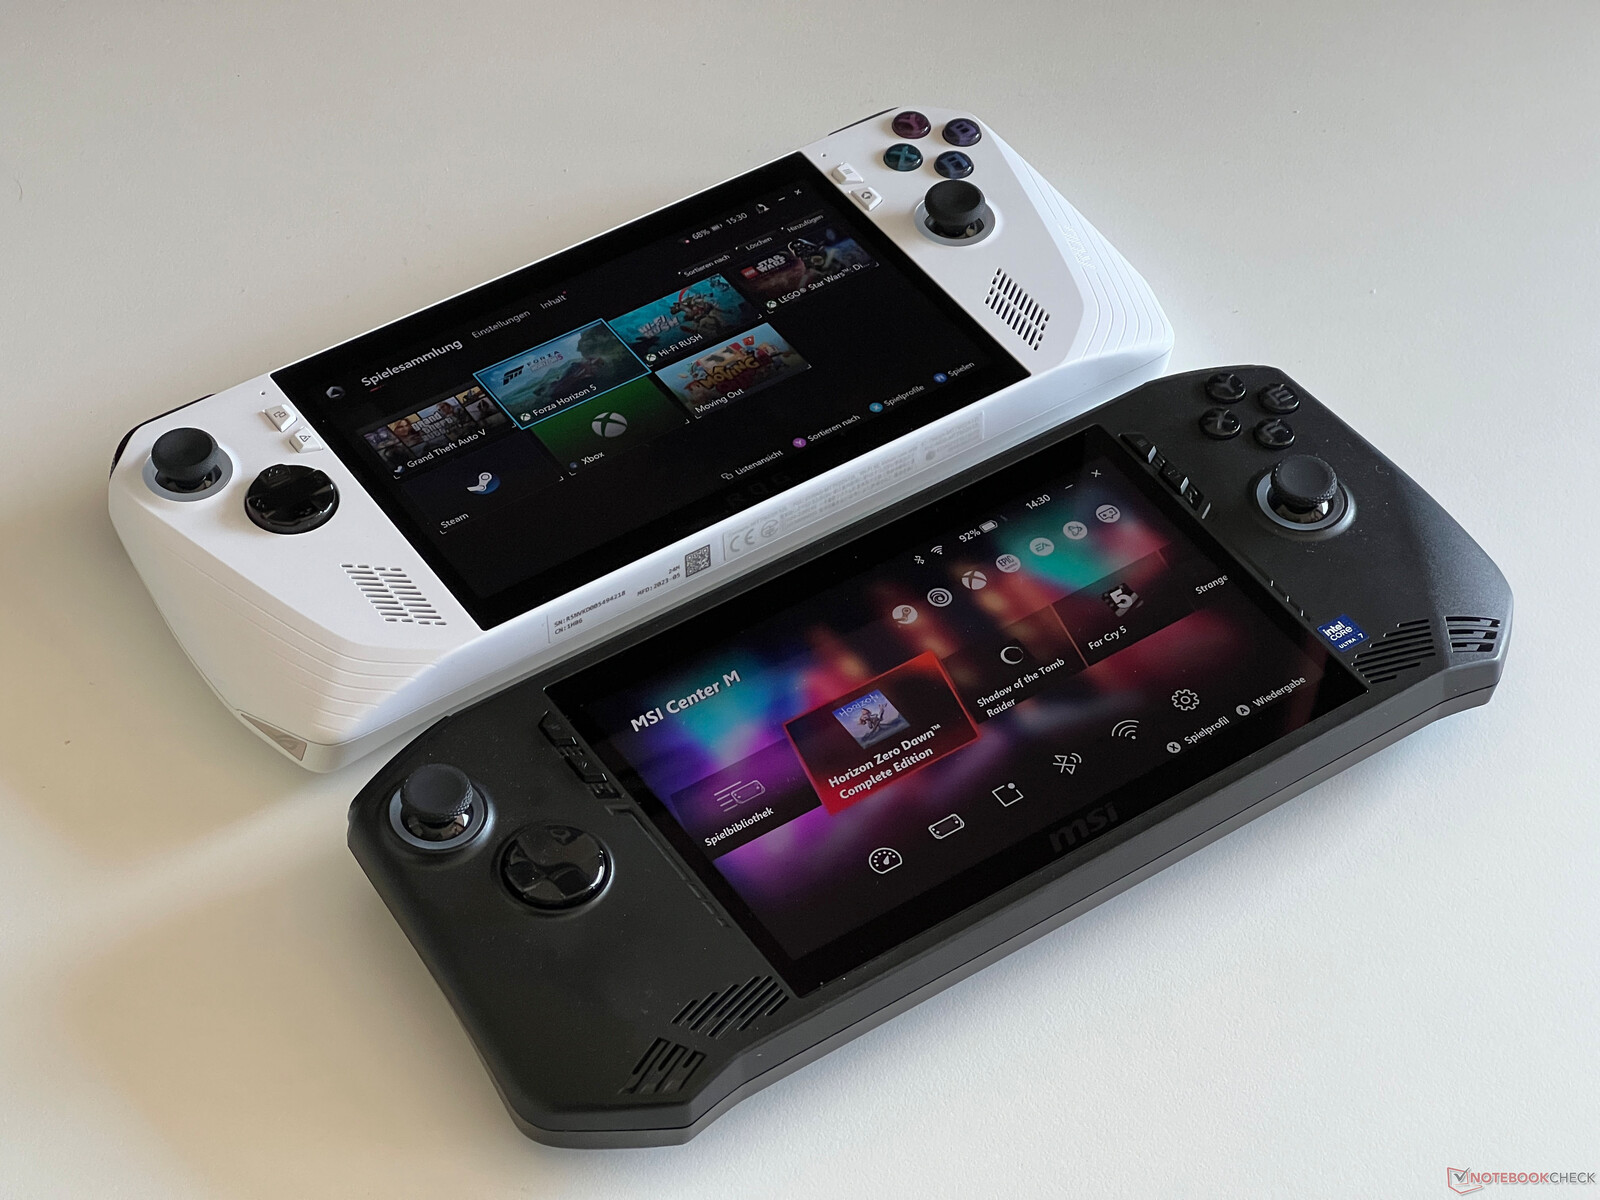
The bezels on the ROG Ally, for example, are just as wide but in turn, its case is a little narrower above and beneath the display. All-in-all, the MSI Claw is a little larger and its grips are formed differently. As a result, its ergonomics are better and you can hold the device easier with larger hands in particular, resulting in it being slightly more comfortable than the ROG Ally.
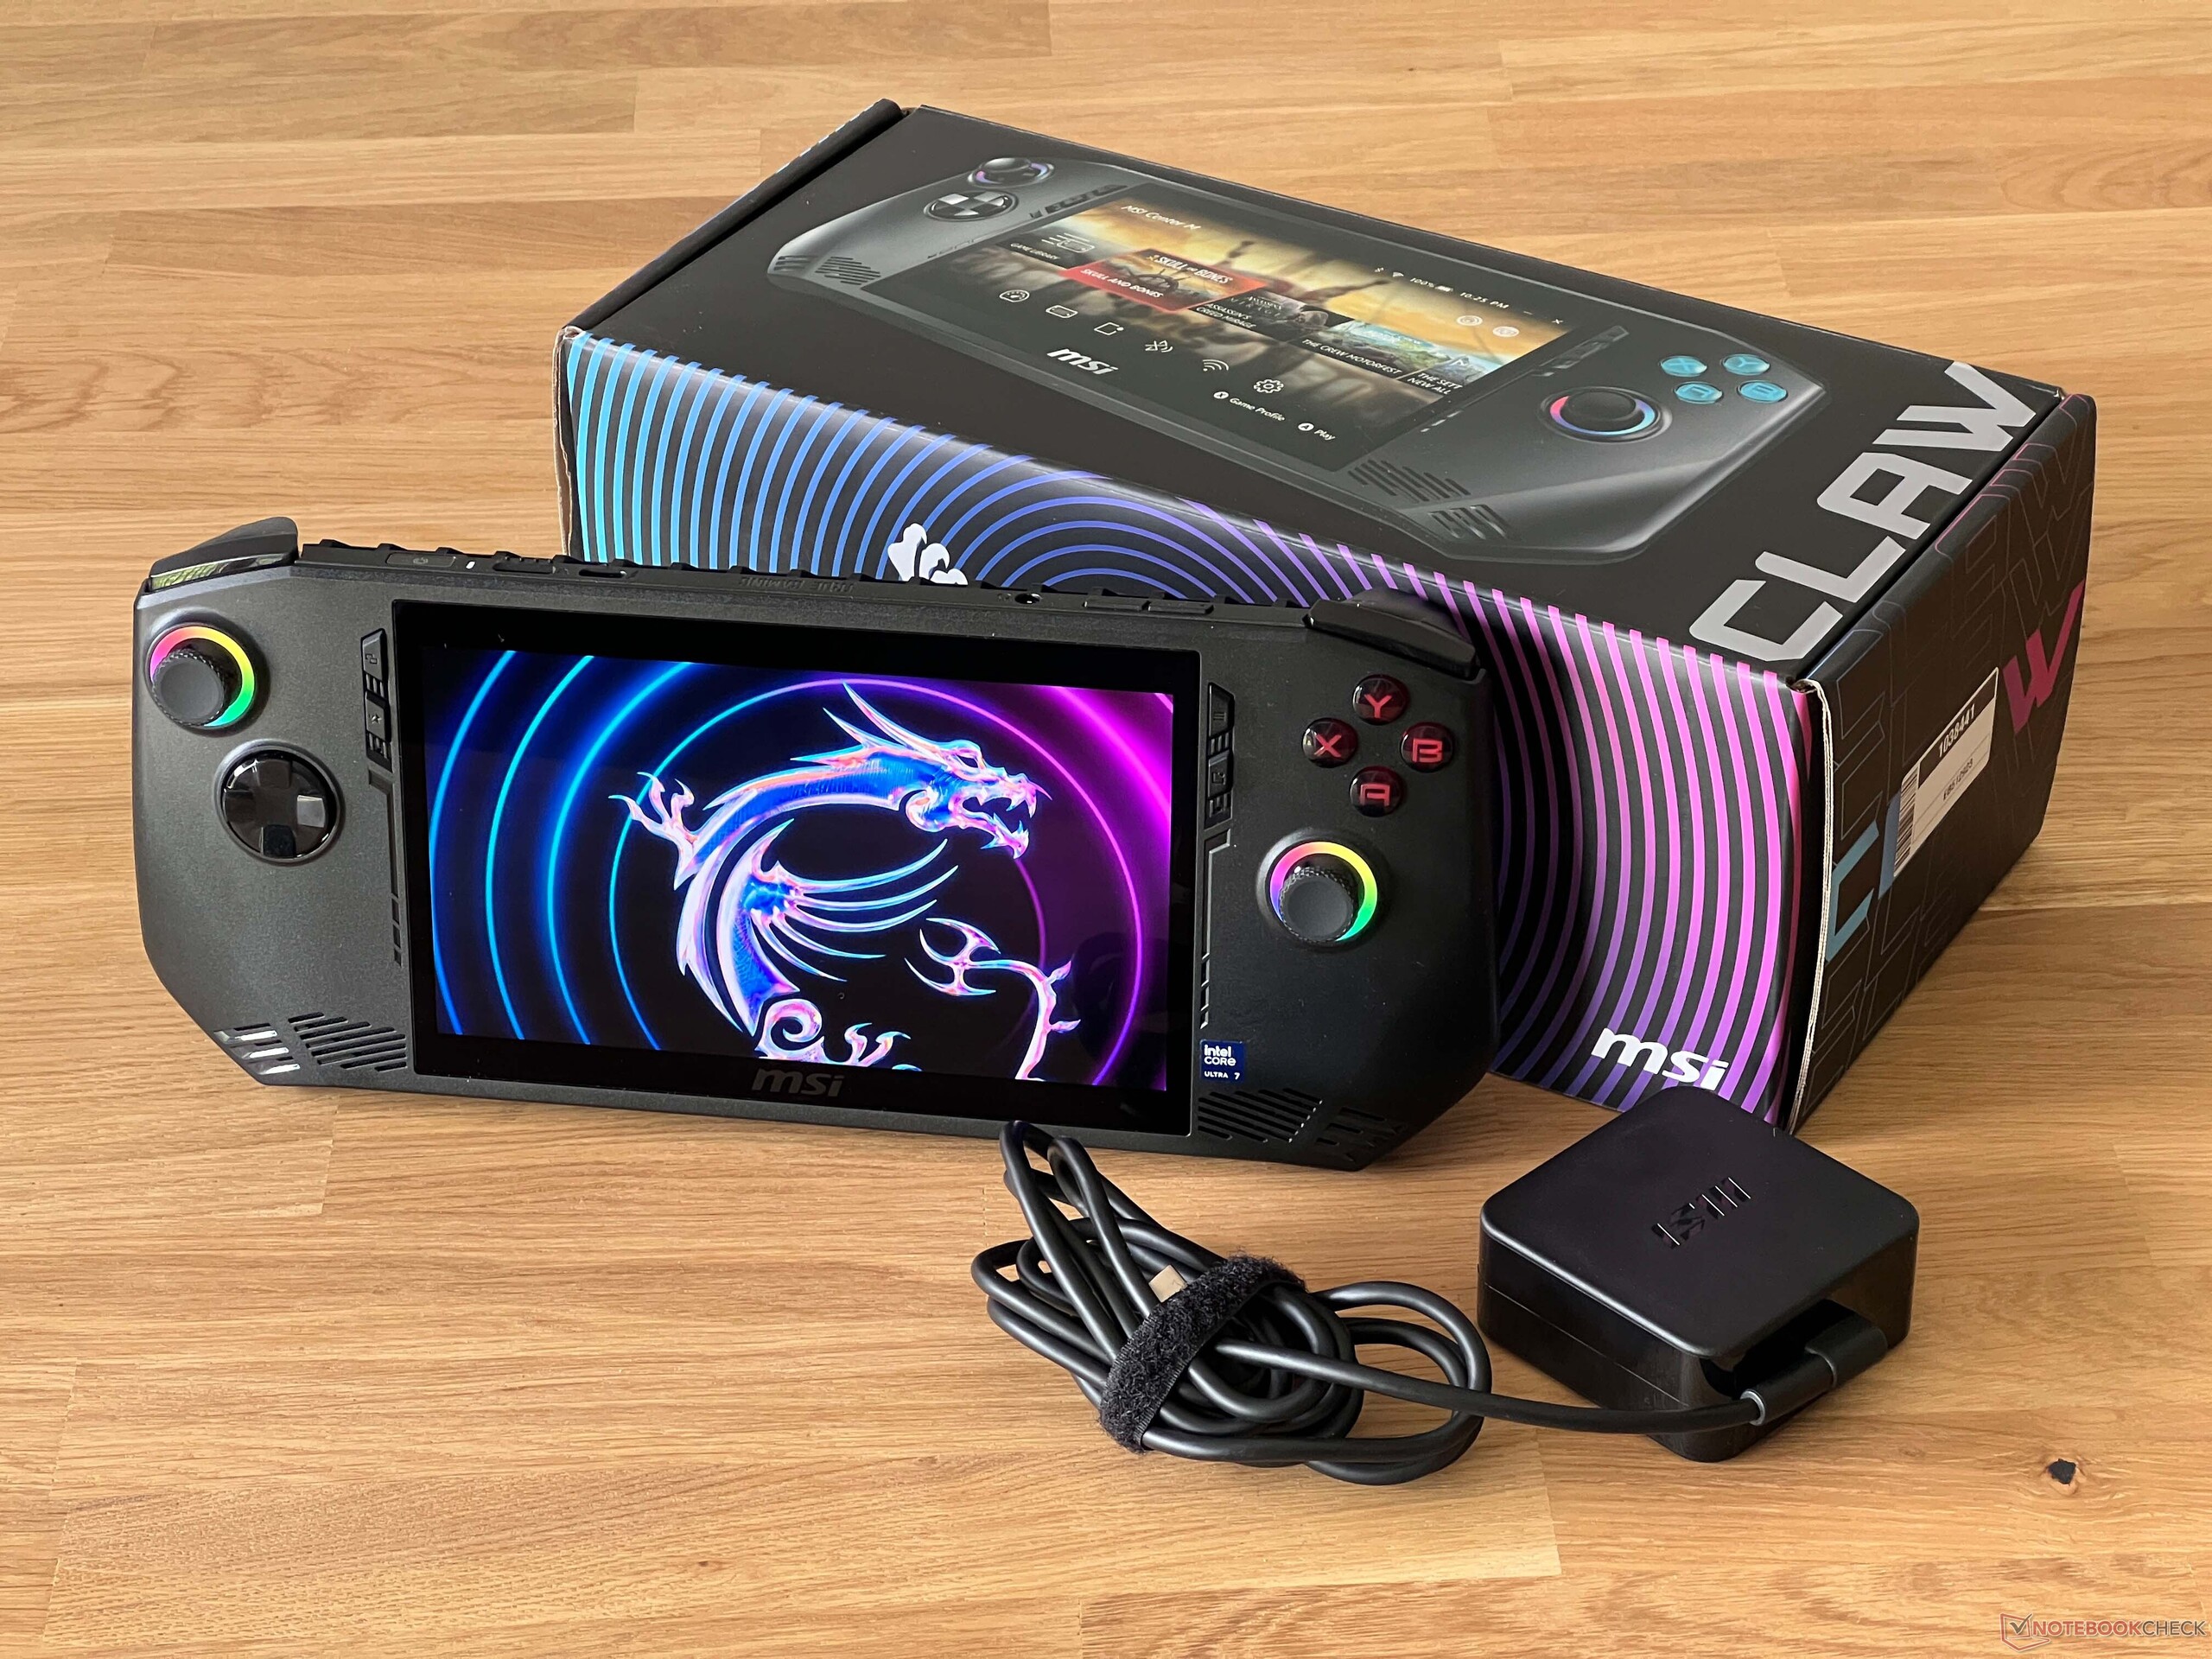

Weighing in at 672 grams, the MSI Claw is one of the more lightweight handhelds in the comparison field and even when using it for longer periods of time, you shouldn't have any problems with its weight. With the grips included, its case thickness is about 3.4 cm. The included 65-watt power supply weighs 341 grams.
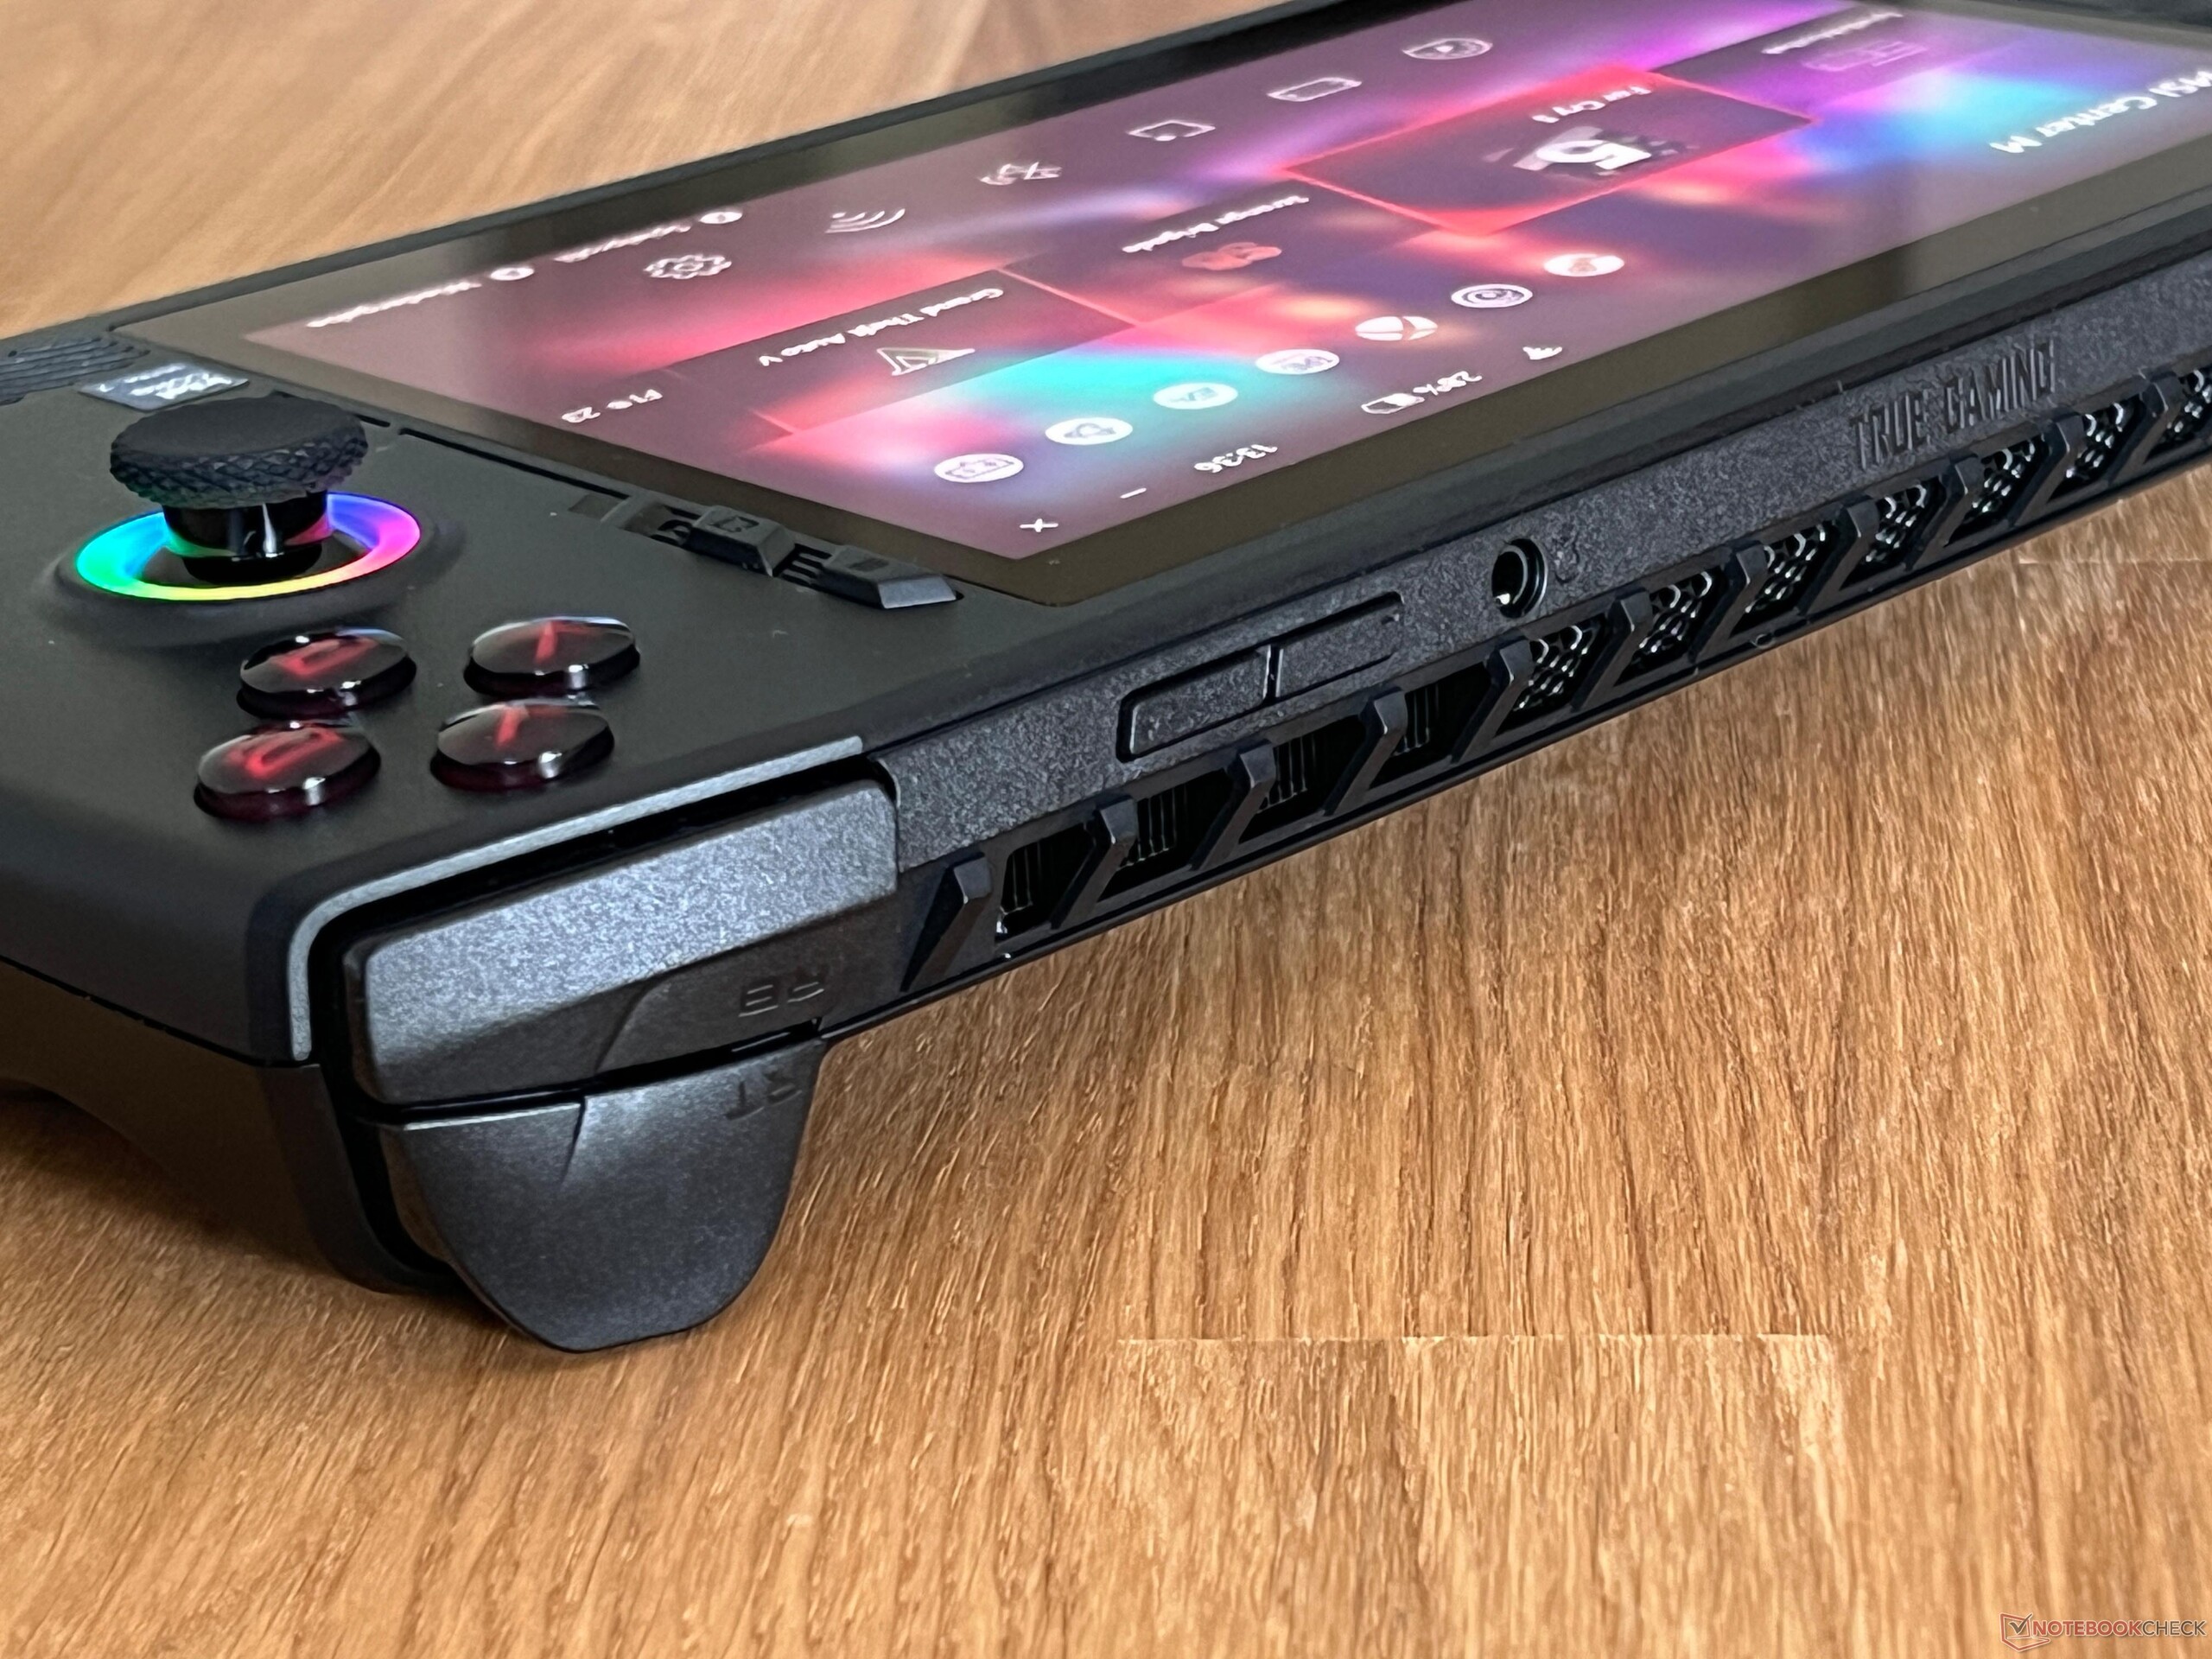
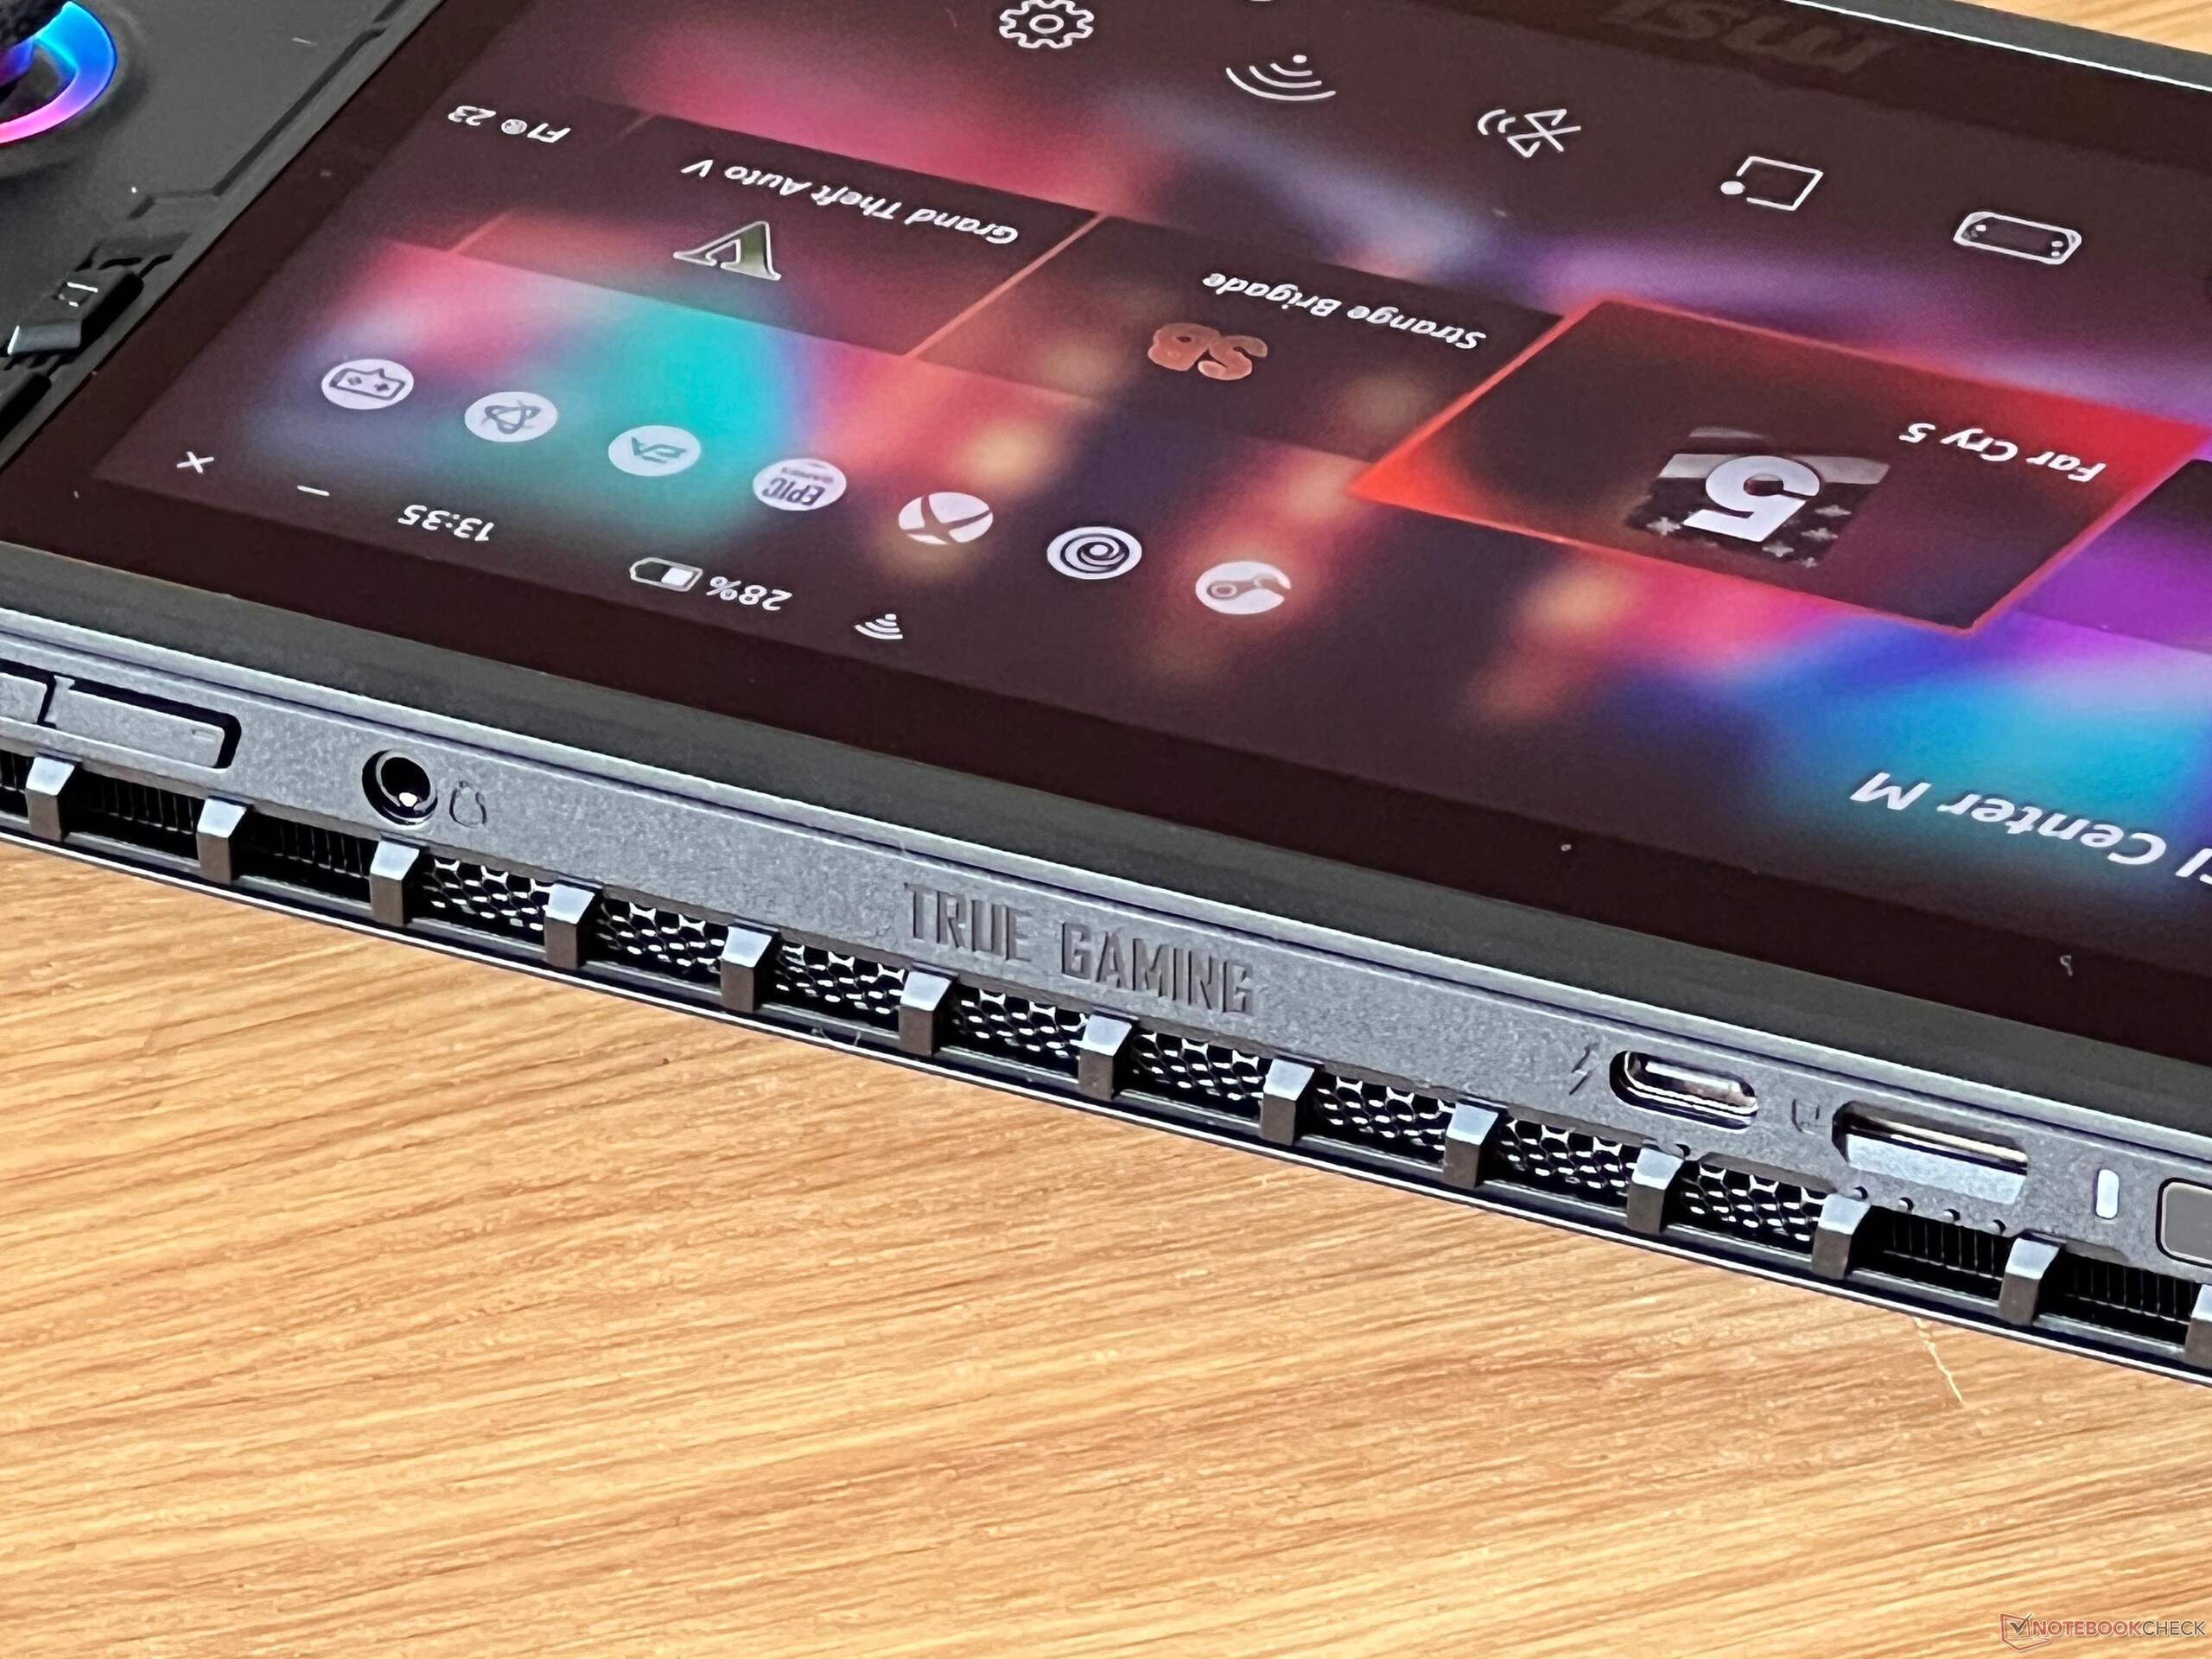
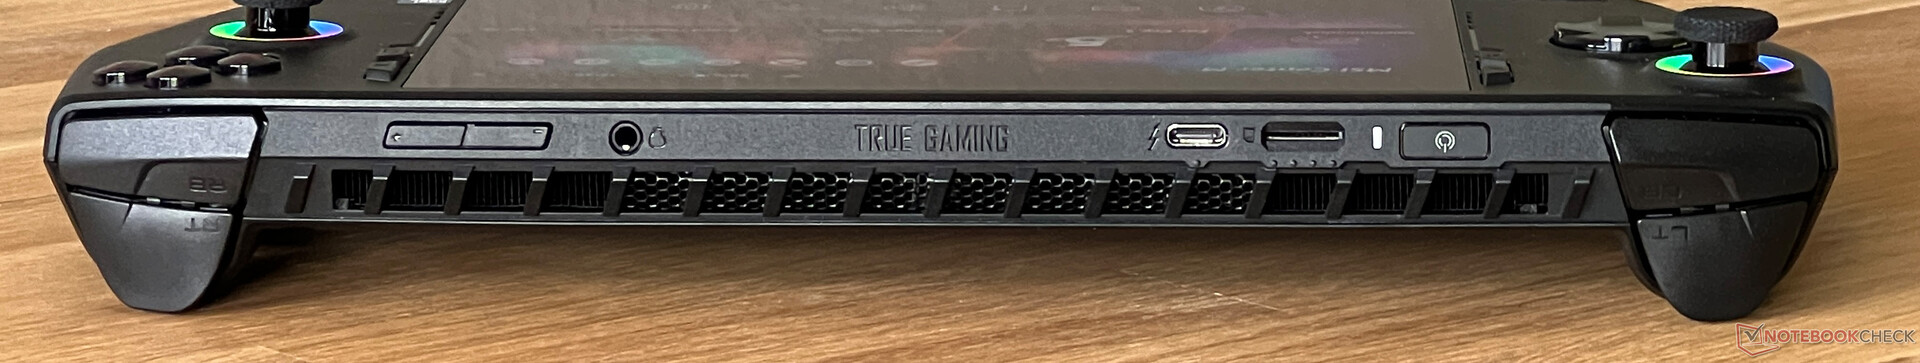
Connectivity - Thunderbolt 4
MSI has installed a USB-C port on the top of the device that also supports Thunderbolt 4. We would like to have seen a second USB connection in order to quickly connect external SSDs or USB sticks, for example. This is especially important when the device is connected to the mains or powered alongside an external monitor. We performed part of our test with the gamer connected to an external monitor and it worked great as long as the screen supports power delivery via USB-C. It doesn't have a webcam, but the power button can also be used as a fingerprint scanner.
SD card reader
You can expand the device's storage by inserting a microSD card into the slot on the top. In our test using our reference card (Angelbird AV Pro V60), the card reader's transfer rates of over 200 MB/s were very good and even when copying image files from the card, we still measured around 120 MB/s.
| SD Card Reader | |
| average JPG Copy Test (av. of 3 runs) | |
| ONEXPLAYER 2 Pro AR18 (Angelbird AV PRO microSD) | |
| Lenovo Legion Go | |
| Average of class Handheld / UMPC (32.9 - 201, n=10, last 2 years) | |
| Ayaneo Kun | |
| Asus ROG Ally Z1 Extreme (Angelbird AV Pro V60) | |
| MSI Claw (Angelbird AV Pro V60) | |
| Valve Steam Deck 1 TB OLED | |
| maximum AS SSD Seq Read Test (1GB) | |
| Asus ROG Ally Z1 Extreme (Angelbird AV Pro V60) | |
| ONEXPLAYER 2 Pro AR18 (Angelbird AV PRO microSD) | |
| MSI Claw (Angelbird AV Pro V60) | |
| Average of class Handheld / UMPC (74.7 - 261, n=10, last 2 years) | |
| Ayaneo Kun | |
| Lenovo Legion Go | |
Communication
MSI has equipped the Claw handheld with the Killer BE1750x BE200NGW, a modern Wi-Fi 7 module, meaning the device is prepared for the newest WLAN networks. We don't yet use a corresponding Wi-Fi 7 router in our tests, but its performance using our reference router from Asus was still very good and stable, although it couldn't quite live up to that of larger laptops. In everyday use, we noted no issues with its signal quality and downloading even large games took no time.
| Networking | |
| MSI Claw | |
| iperf3 transmit AXE11000 | |
| iperf3 receive AXE11000 | |
| Valve Steam Deck 1 TB OLED | |
| iperf3 transmit AXE11000 | |
| iperf3 receive AXE11000 | |
| iperf3 transmit AXE11000 6GHz | |
| iperf3 receive AXE11000 6GHz | |
| Lenovo Legion Go | |
| iperf3 transmit AXE11000 | |
| iperf3 receive AXE11000 | |
| iperf3 transmit AXE11000 6GHz | |
| iperf3 receive AXE11000 6GHz | |
| Asus ROG Ally Z1 Extreme | |
| iperf3 transmit AXE11000 | |
| iperf3 receive AXE11000 | |
| ONEXPLAYER 2 Pro AR18 | |
| iperf3 transmit AXE11000 | |
| iperf3 receive AXE11000 | |
| iperf3 transmit AXE11000 6GHz | |
| iperf3 receive AXE11000 6GHz | |
| Ayaneo Kun | |
| iperf3 transmit AXE11000 | |
| iperf3 receive AXE11000 | |
| iperf3 transmit AXE11000 6GHz | |
| iperf3 receive AXE11000 6GHz | |
Maintenance
The back is secured by a total of six Phillips screws. As is usual on MSI devices, one screw is covered by a sticker labelled with the words Factory Seal. Proper use does not void the handheld's warranty, but since our test device is a store device, we did not want to damage the seal. In order to replace the small M.2 2230 SSD, both the battery and the entire cooling unit must be removed, which makes it necessary to reapply thermal paste when you put it back together again.
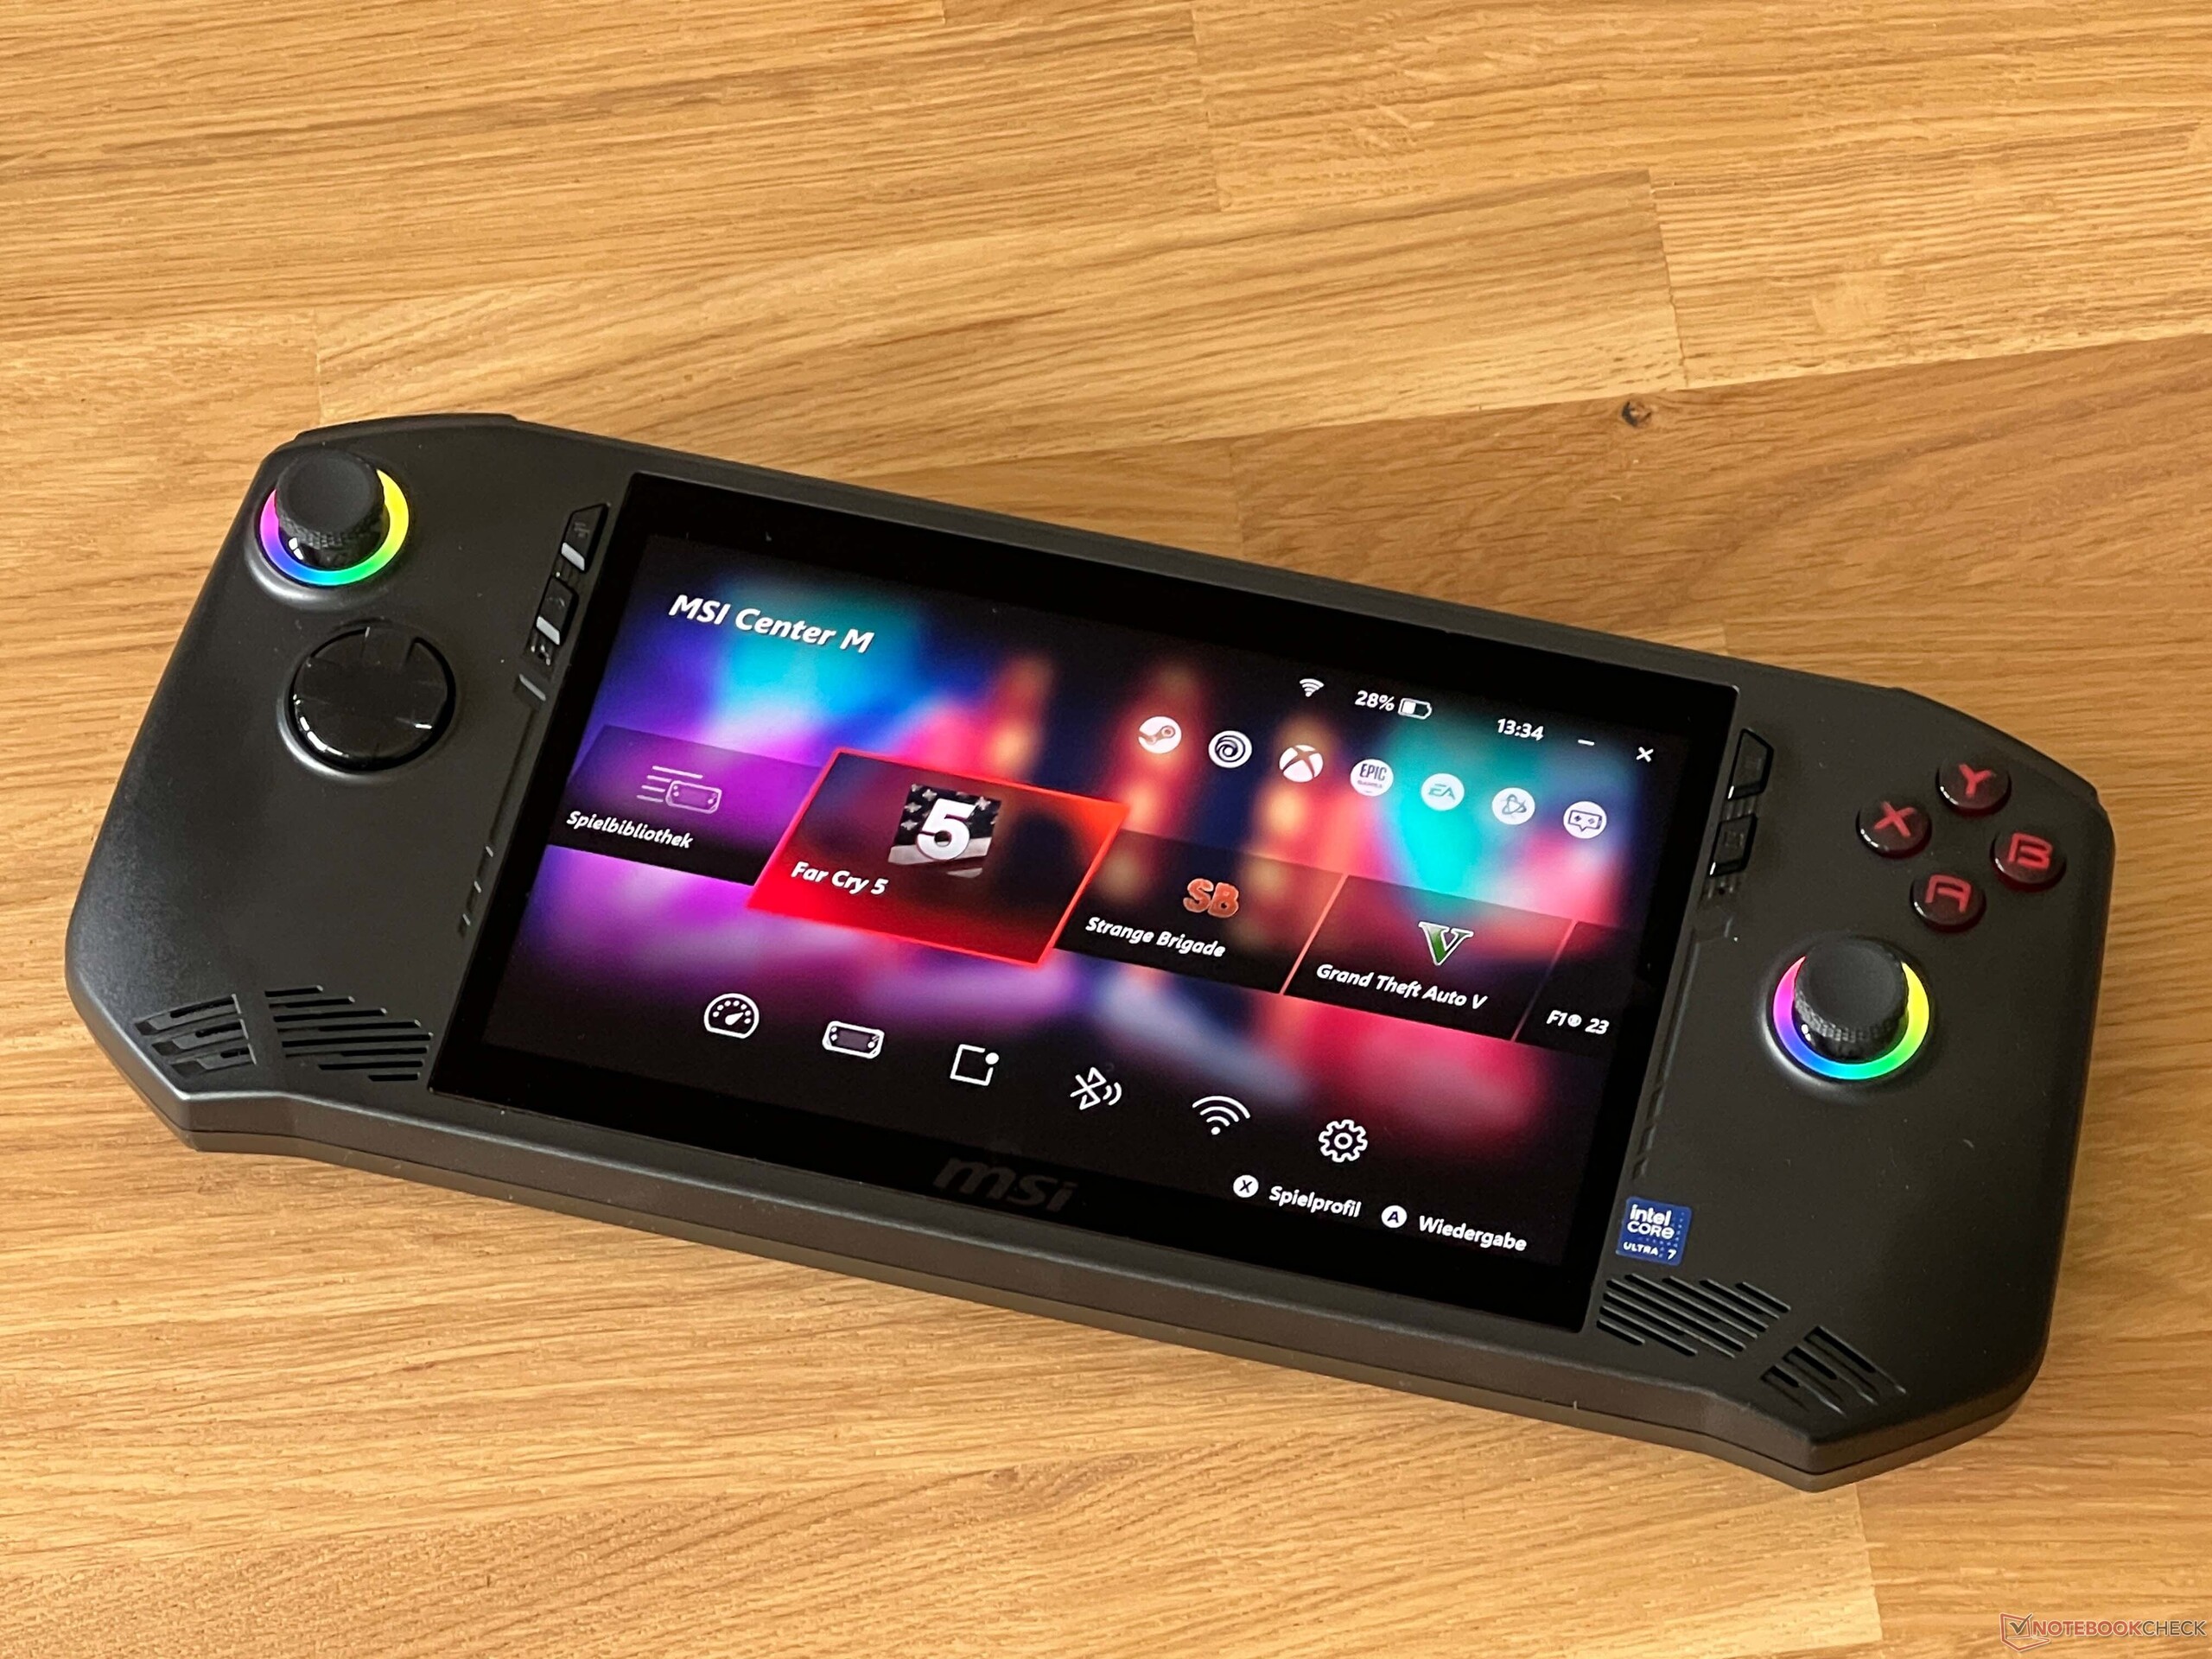
Input devices & operation
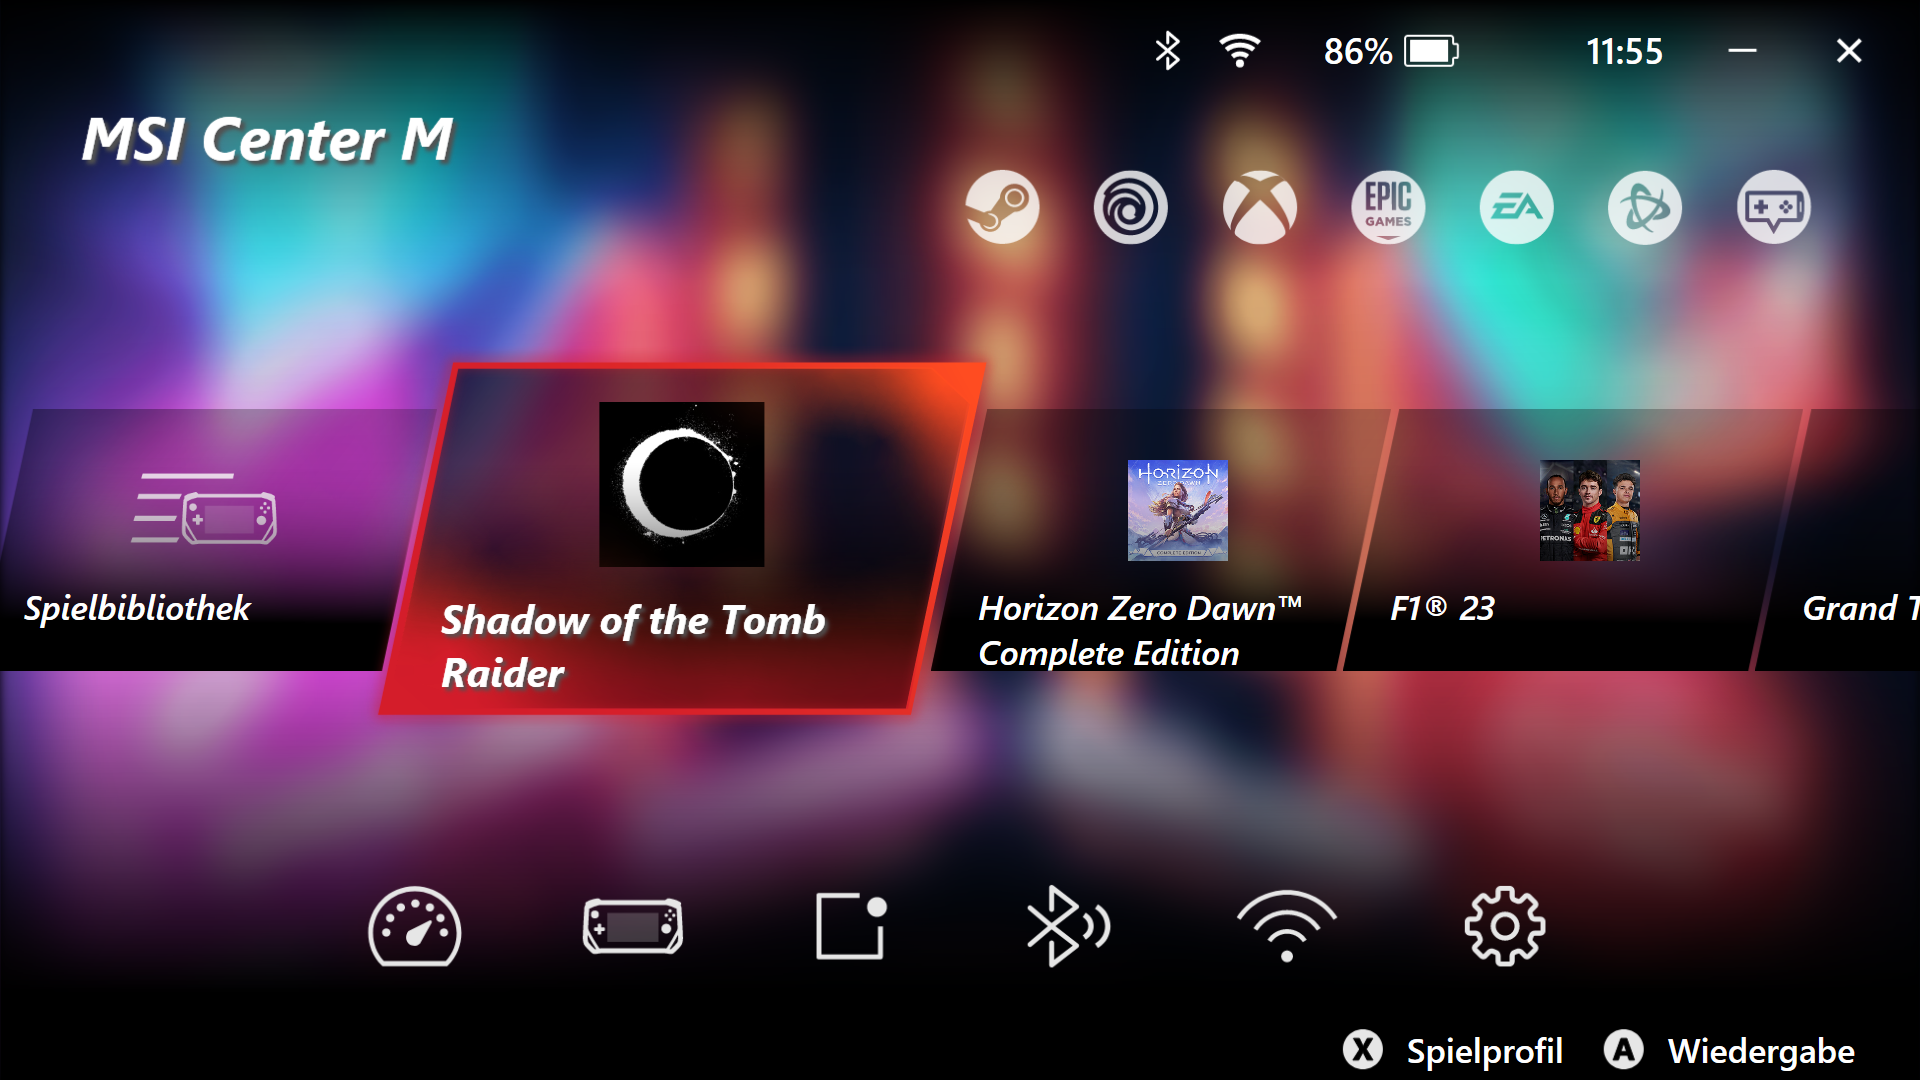
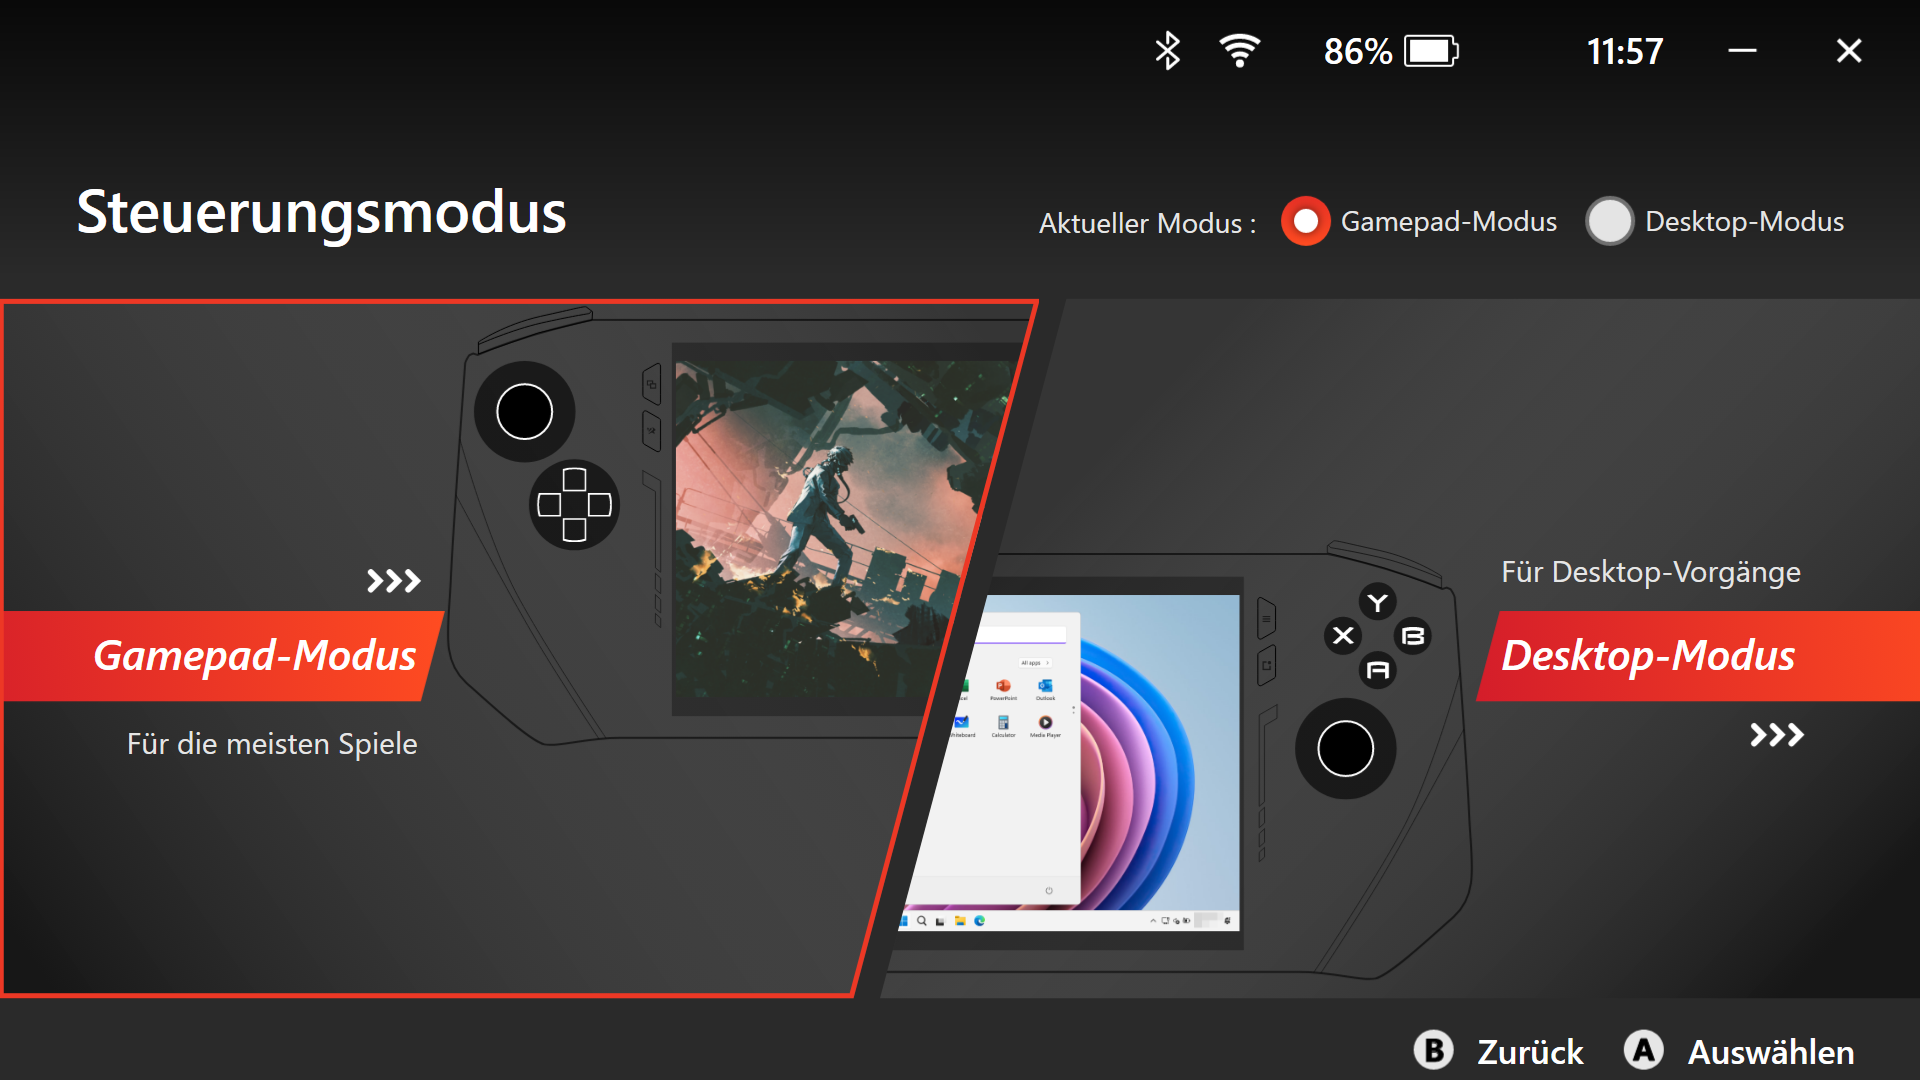
Its primary input methods are the device's capacitive as well as its "gamepad" controls such as its two joysticks, the D-pad and the additional buttons. The touchscreen itself works perfectly, but using Windows with just a touchscreen (especially a small one) is still very tiring and the initial setup is not terribly fun. Ideally, you should have a monitor available that supplies the device with power and to which a mouse and keyboard can also be directly connected. As soon as you have finished with Windows, everything revolves around the manufacturer's software—in this case, MSI Center M. The launcher can be started automatically when the device is booted up and changes to all settings can be made here. In addition, all important gaming services such as Steam, UPlay, XBox, Epic, EA and Battlenet are already integrated, making it very easy to install games. There is also a quick menu, which can be displayed at any time and can be used to quickly change the most important settings (energy profile, brightness, Wi-Fi connection). The menu is also highly customizable and overall, the Center-M software works flawlessly and appears to be very well developed. Only its real-time monitoring (three different modes) is linked to the top left corner and the FPS display did not work in any of the games we tested.
MSI uses Hall Effect analog sticks and triggers, so there won't be any problems with stick drift. The buttons are slightly louder in total compared to on the ROG Ally and the loud noise when the triggers return to their original position can be a little annoying. However, we didn't note any functional problems when playing games.
Display - 7-inch IPS with a 120-Hz refresh rate


The 7-inch 16:9 IPS screen features a resolution of 1,920 x 1,080 pixels. Its refresh rate is 120 Hz and it supports variable refresh rate like the ROG Ally. All-in-all, the screen makes a good impression, although bright surfaces tend to appear slightly grainy. Its response times are nice and fast and we noted only slight backlight bleeding at full brightness—plus, there is no PWM flickering.
We measured a maximum brightness of 483 cd/m² and an average of 461 cd/m². Its black level is 0.32 cd/m², which results in a very good maximum contrast ratio of almost 1,500:1.
| |||||||||||||||||||||||||
Brightness Distribution: 88 %
Contrast: 1491:1 (Black: 0.32 cd/m²)
ΔE ColorChecker Calman: 2.6 | ∀{0.5-29.43 Ø4.73}
calibrated: 1.5
ΔE Greyscale Calman: 3.9 | ∀{0.09-98 Ø4.97}
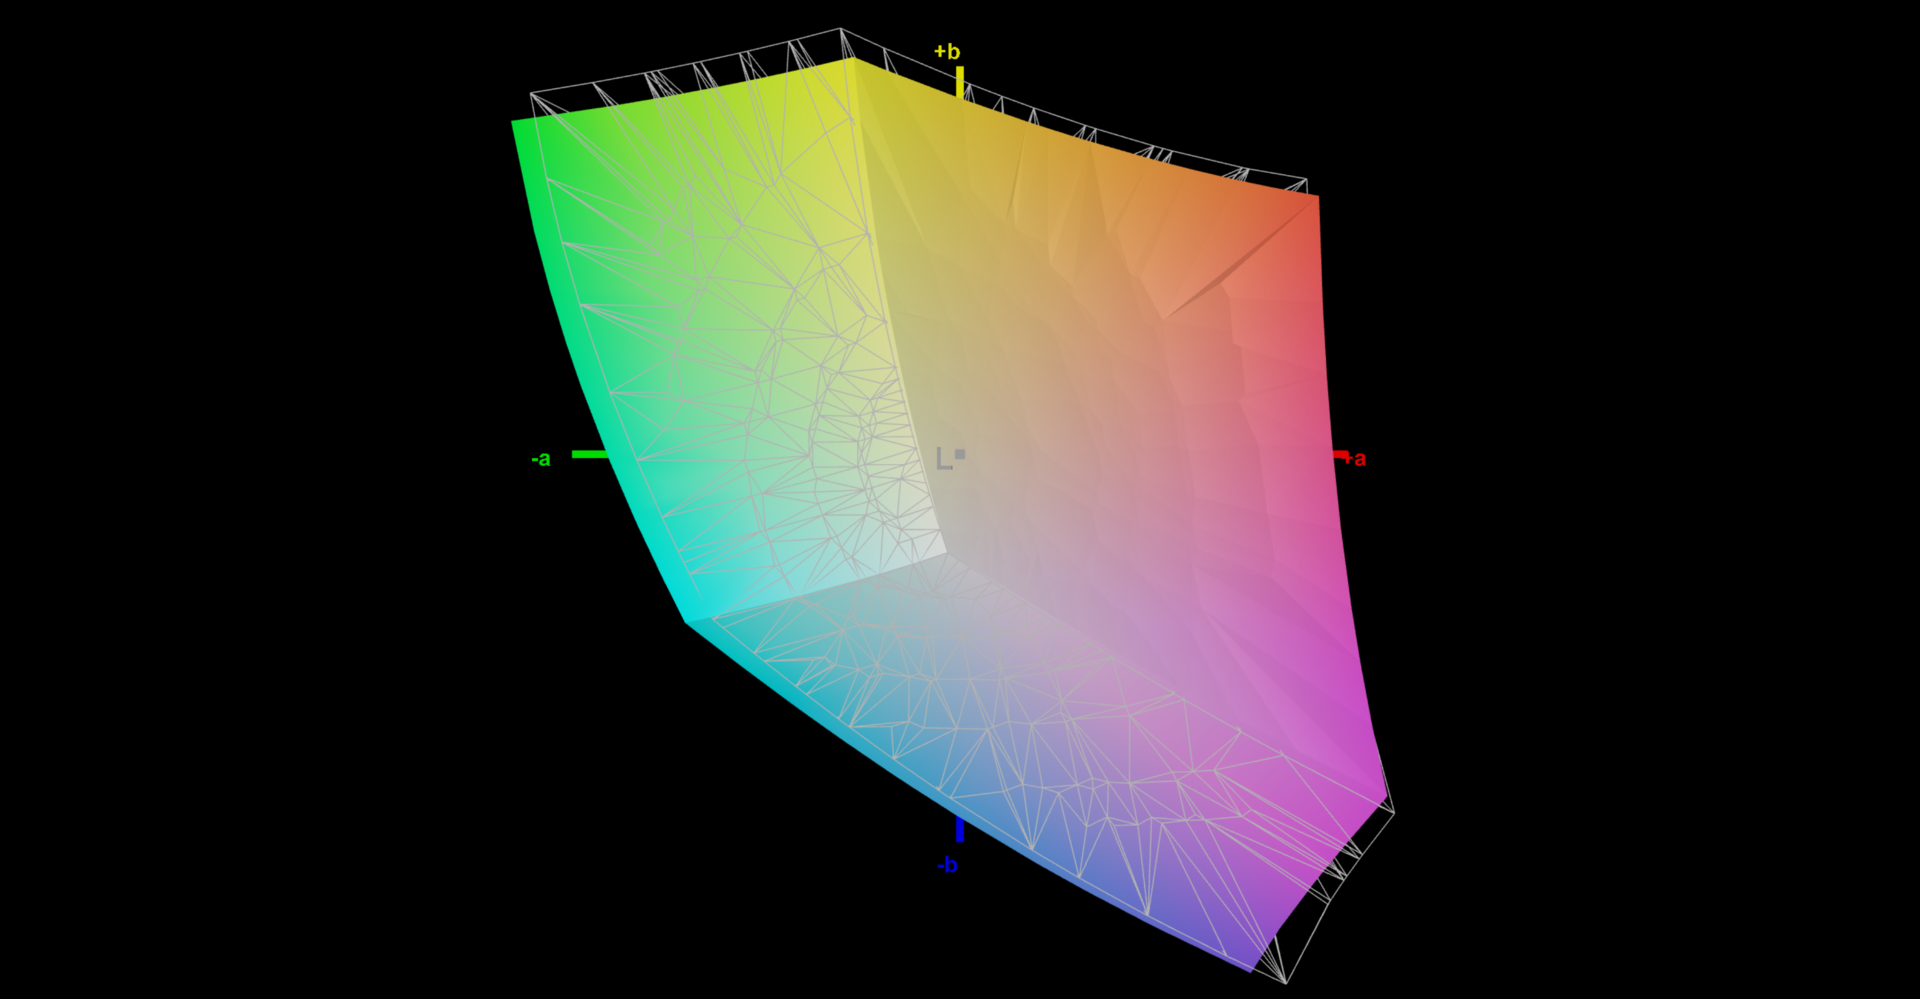
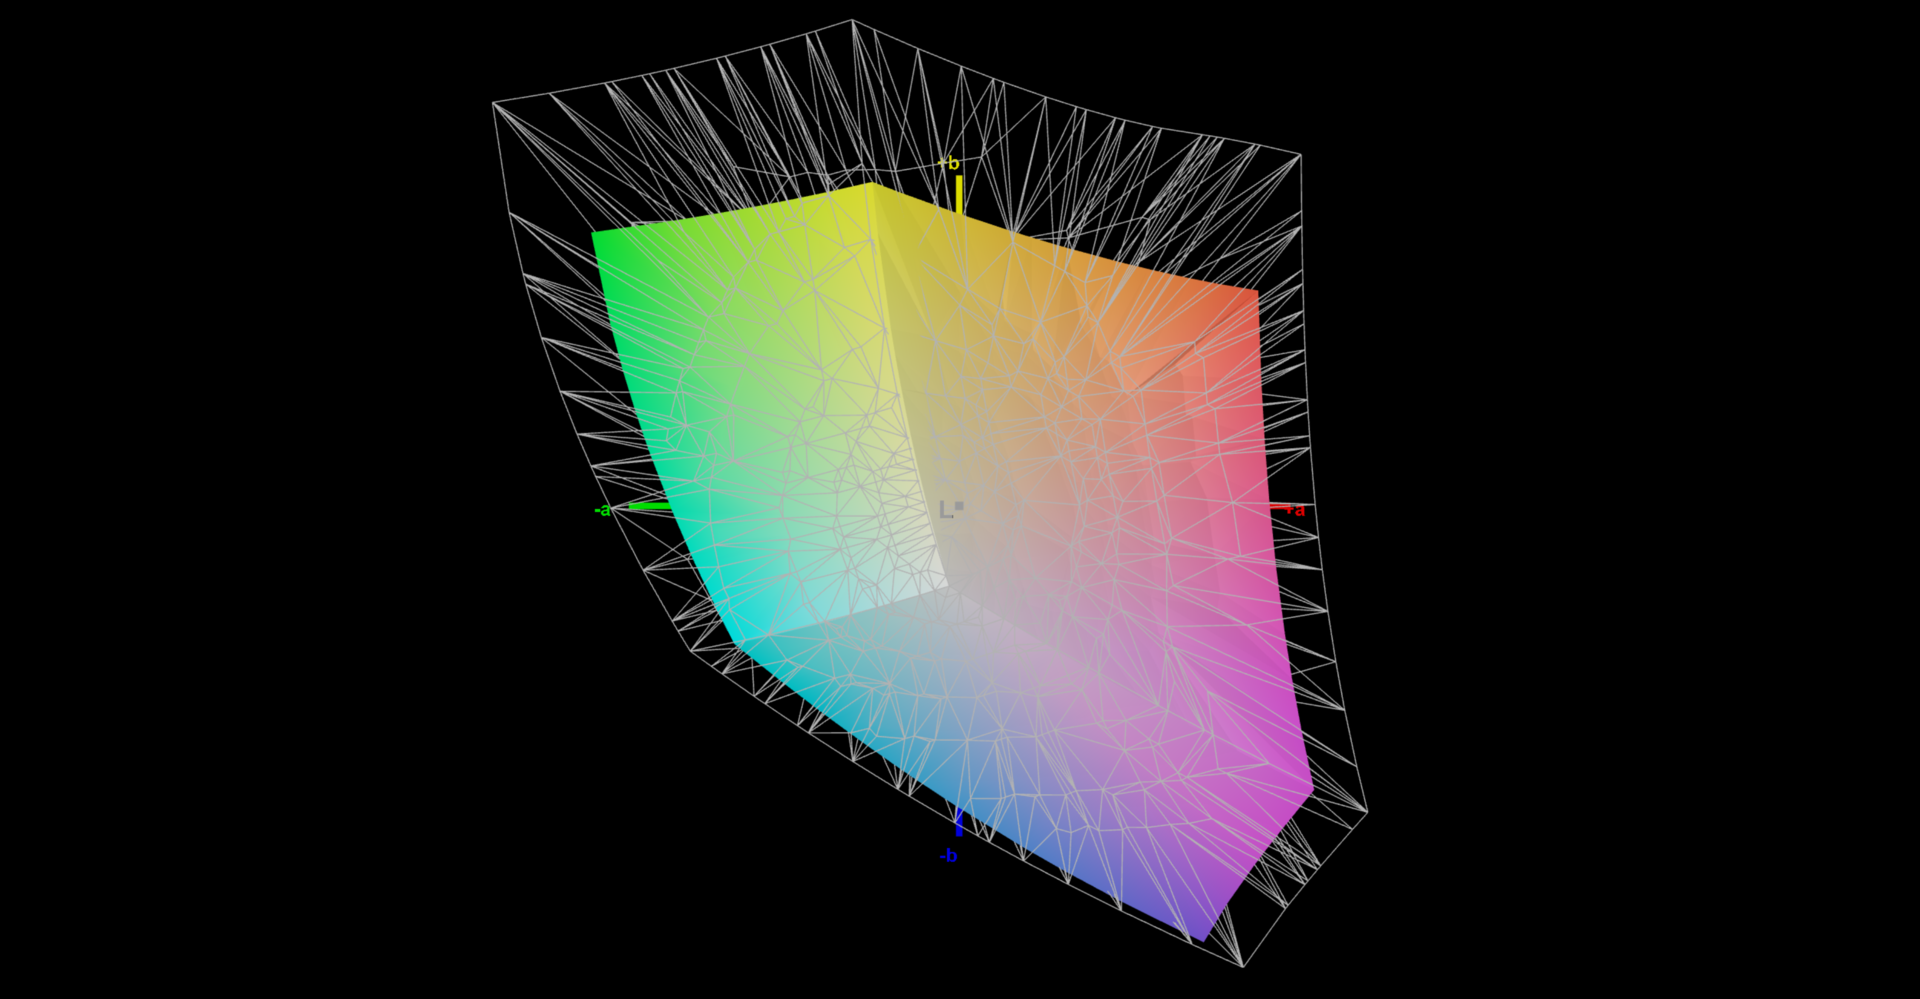
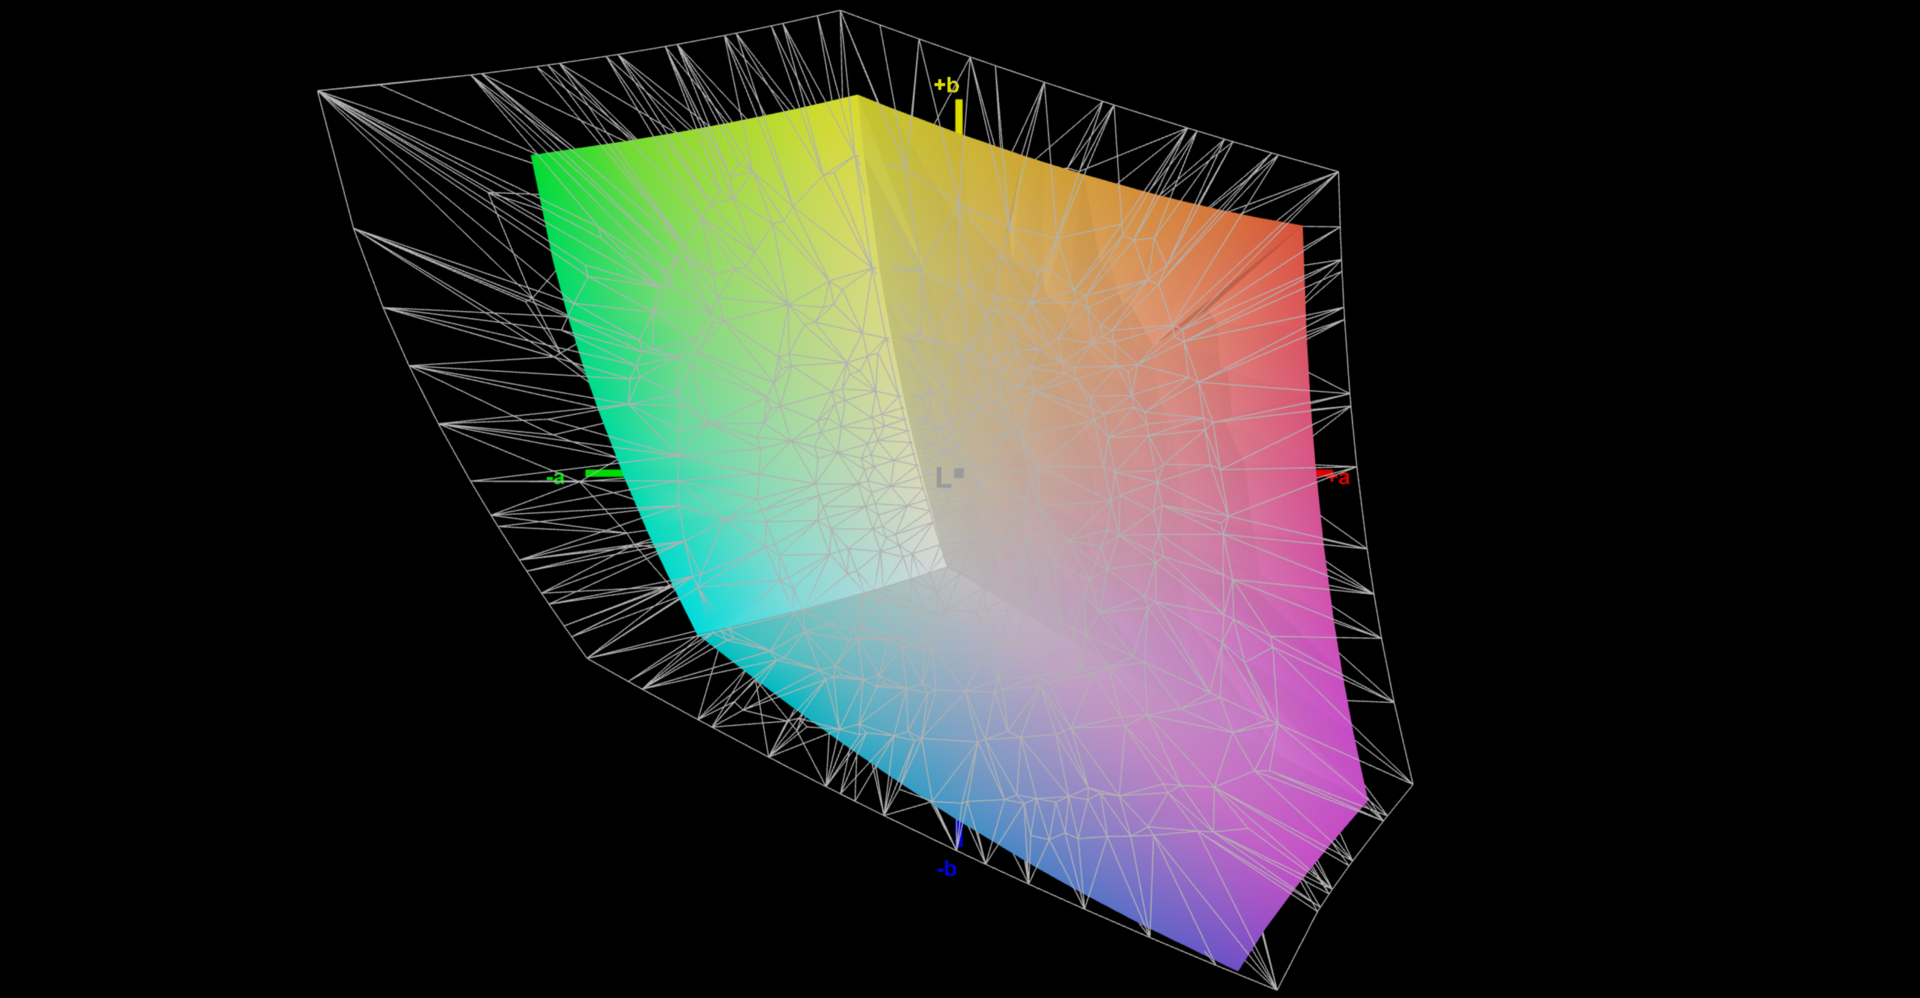
69.4% AdobeRGB 1998 (Argyll 3D)
94.4% sRGB (Argyll 3D)
67% Display P3 (Argyll 3D)
Gamma: 2.17
CCT: 7250 K
| MSI Claw TL070FVXS02-0, IPS, 1920x1080, 7" | Valve Steam Deck 1 TB OLED ANX7530 U, OLED, 1280x800, 7.4" | Lenovo Legion Go Legion Go Display, IPS, 2560x1600, 8.8" | Asus ROG Ally Z1 Extreme TL070FVSX01-0, IPS, 1920x1080, 7" | ONEXPLAYER 2 Pro AR18 FLQ8423-24L0, IPS, 2560x1600, 8.4" | Ayaneo Kun Ayaneo 2K, IPS, 2560x1600, 8.4" | |
|---|---|---|---|---|---|---|
| Display | 31% | 24% | -2% | 20% | 25% | |
| Display P3 Coverage (%) | 67 | 99.6 49% | 92.1 37% | 65.6 -2% | 91.9 37% | 93.52 40% |
| sRGB Coverage (%) | 94.4 | 100 6% | 99.56 5% | 92.1 -2% | 99.3 5% | 99.4 5% |
| AdobeRGB 1998 Coverage (%) | 69.4 | 96.1 38% | 90.09 30% | 67.9 -2% | 81.6 18% | 91.2 31% |
| Response Times | -17% | -122% | -3% | -211% | -154% | |
| Response Time Grey 50% / Grey 80% * (ms) | 9.2 ? | 9 ? 2% | 20.8 ? -126% | 10.5 ? -14% | 25.5 ? -177% | 24.2 ? -163% |
| Response Time Black / White * (ms) | 6.6 ? | 9 ? -36% | 14.4 ? -118% | 6 ? 9% | 22.73 ? -244% | 16.2 ? -145% |
| PWM Frequency (Hz) | 360 ? | 700 | 20000 | |||
| Screen | 147% | -37% | -17% | -14% | -20% | |
| Brightness middle (cd/m²) | 477 | 485 2% | 411 -14% | 513 8% | 318 -33% | 680 43% |
| Brightness (cd/m²) | 461 | 482 5% | 413 -10% | 474 3% | 287 -38% | 678 47% |
| Brightness Distribution (%) | 88 | 98 11% | 80 -9% | 84 -5% | 48 -45% | 91 3% |
| Black Level * (cd/m²) | 0.32 | 0.03 91% | 0.42 -31% | 0.38 -19% | 0.1118 65% | 0.5 -56% |
| Contrast (:1) | 1491 | 16167 984% | 979 -34% | 1350 -9% | 2844 91% | 1360 -9% |
| Colorchecker dE 2000 * | 2.6 | 2 23% | 5.94 -128% | 3.7 -42% | 4.81 -85% | 4 -54% |
| Colorchecker dE 2000 max. * | 5.8 | 5 14% | 10.56 -82% | 8.3 -43% | 6.93 -19% | 9 -55% |
| Colorchecker dE 2000 calibrated * | 1.5 | 2.95 -97% | 1.53 -2% | 1 33% | ||
| Greyscale dE 2000 * | 3.9 | 2 49% | 0.92 76% | 5.1 -31% | 6.12 -57% | 9 -131% |
| Gamma | 2.17 101% | 2 110% | 1.93 114% | 2.14 103% | 2.003 110% | 2 110% |
| CCT | 7250 90% | 6336 103% | 8064 81% | 7732 84% | 7707 84% | 7188 90% |
| Total Average (Program / Settings) | 54% /
95% | -45% /
-36% | -7% /
-11% | -68% /
-35% | -50% /
-29% |
* ... smaller is better
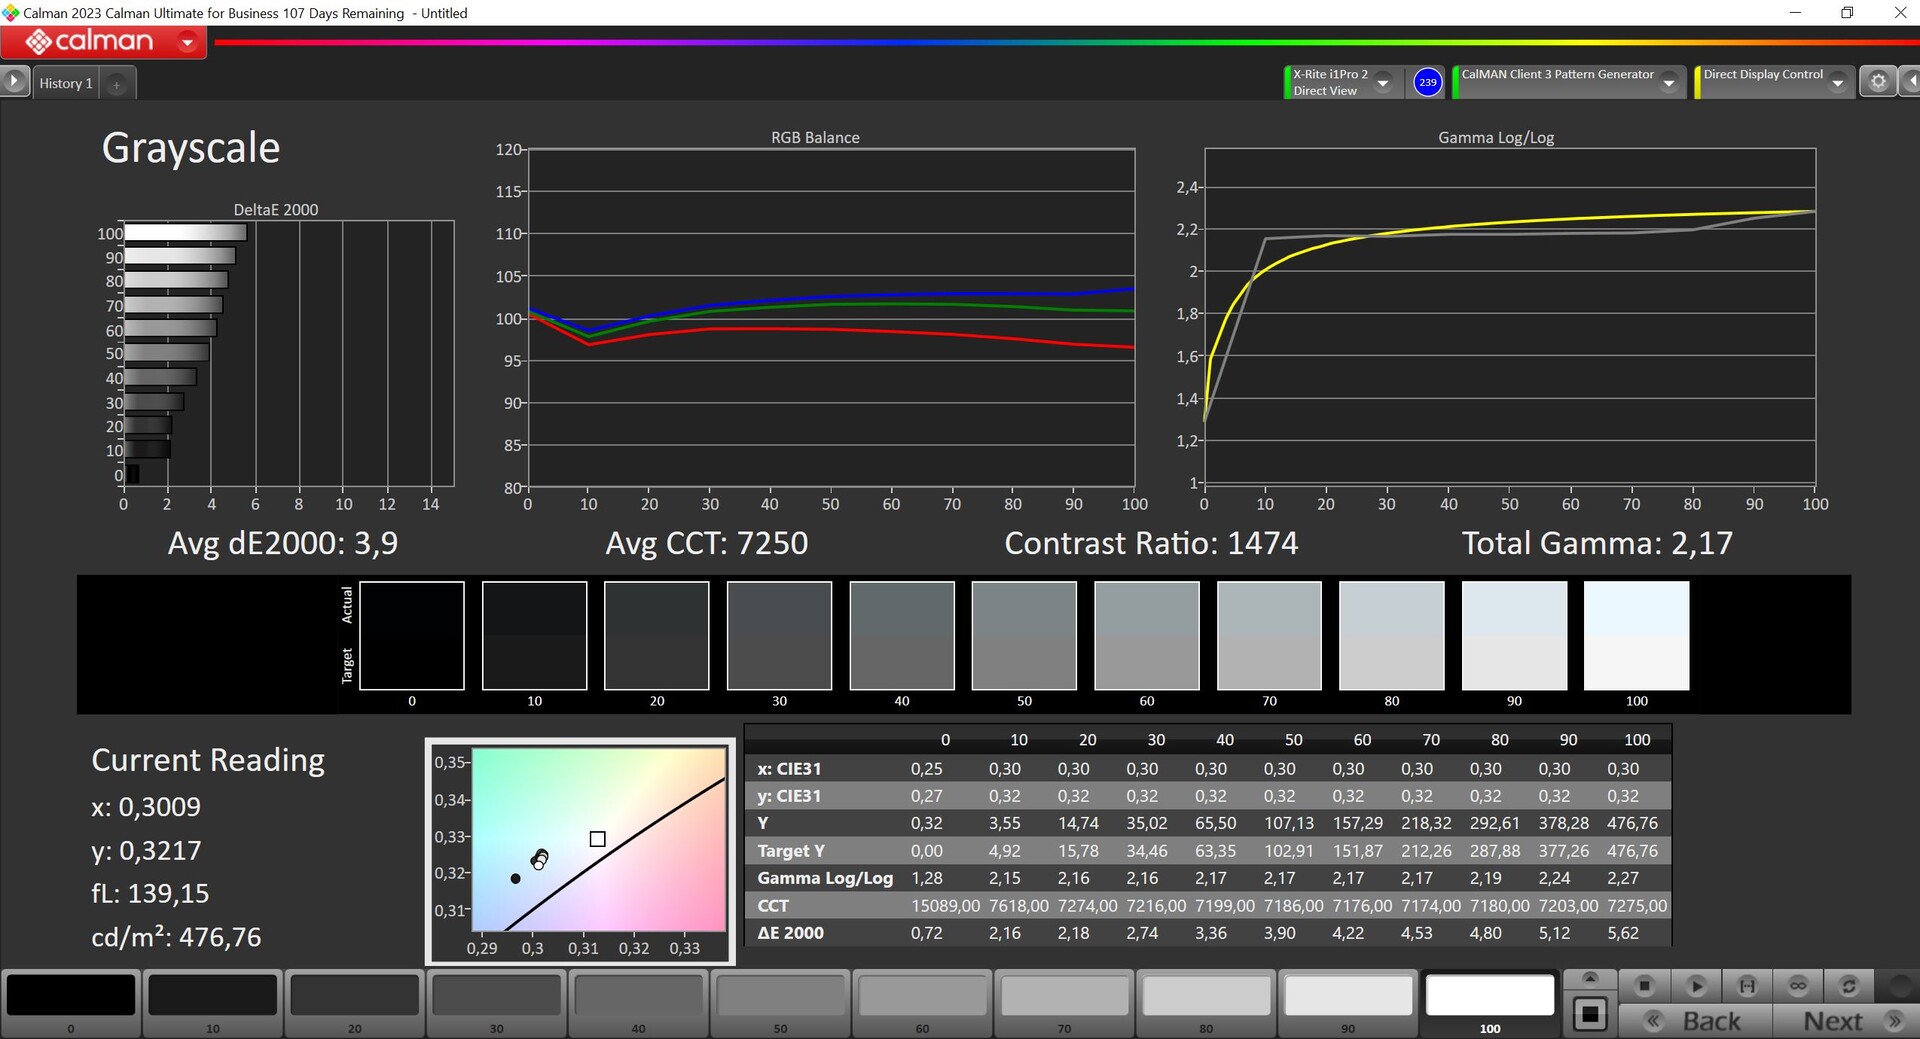

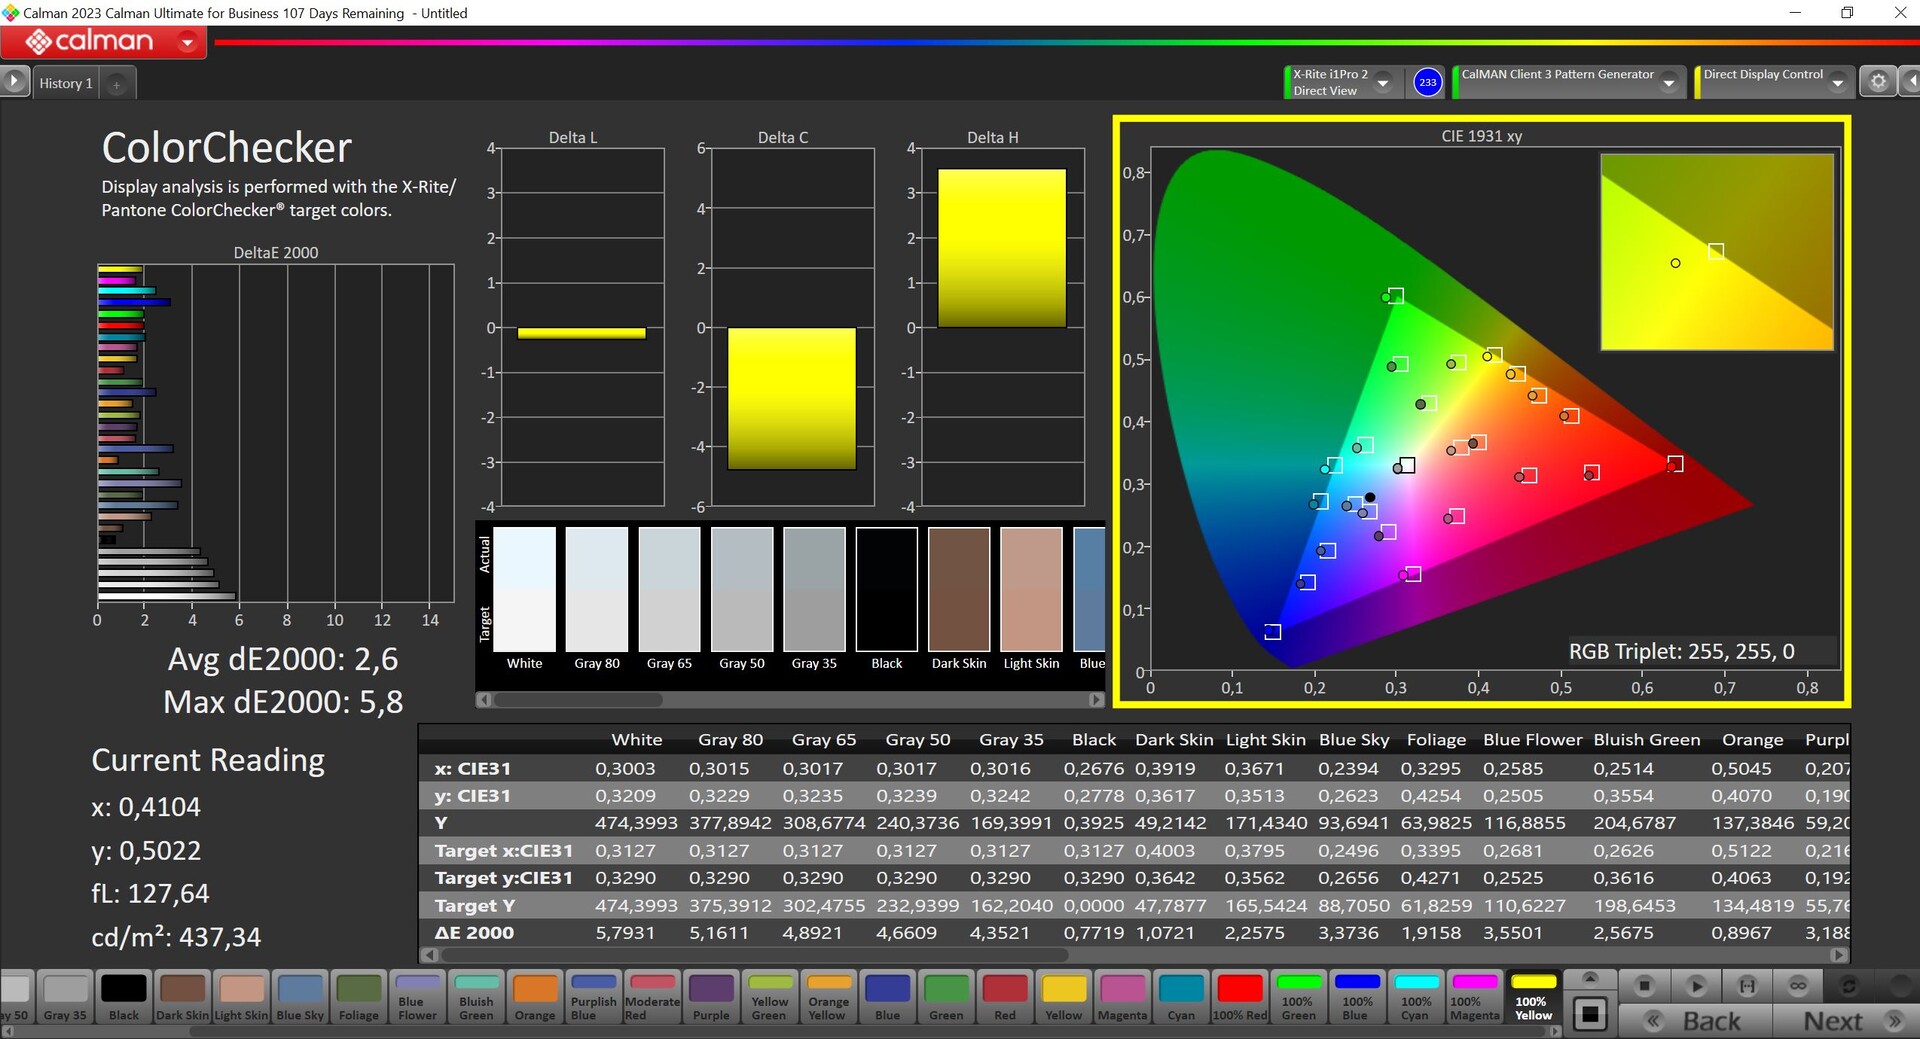
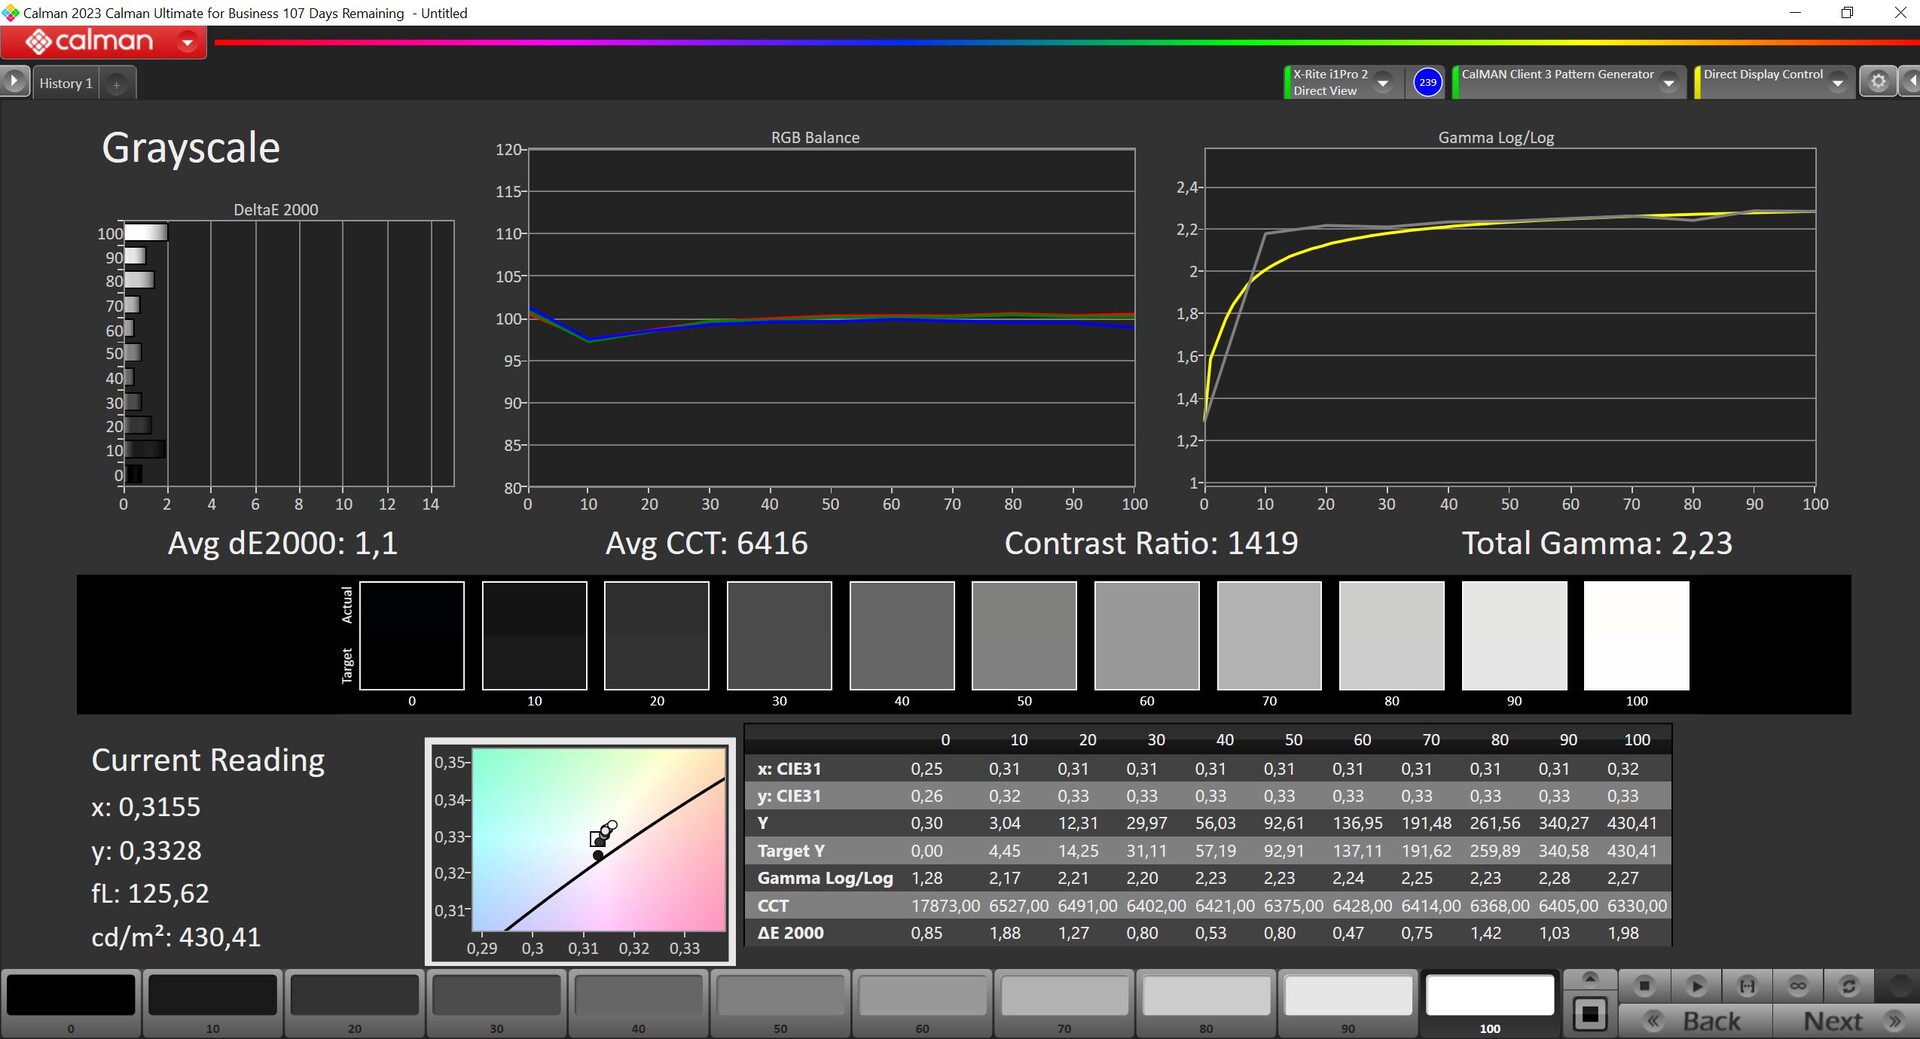
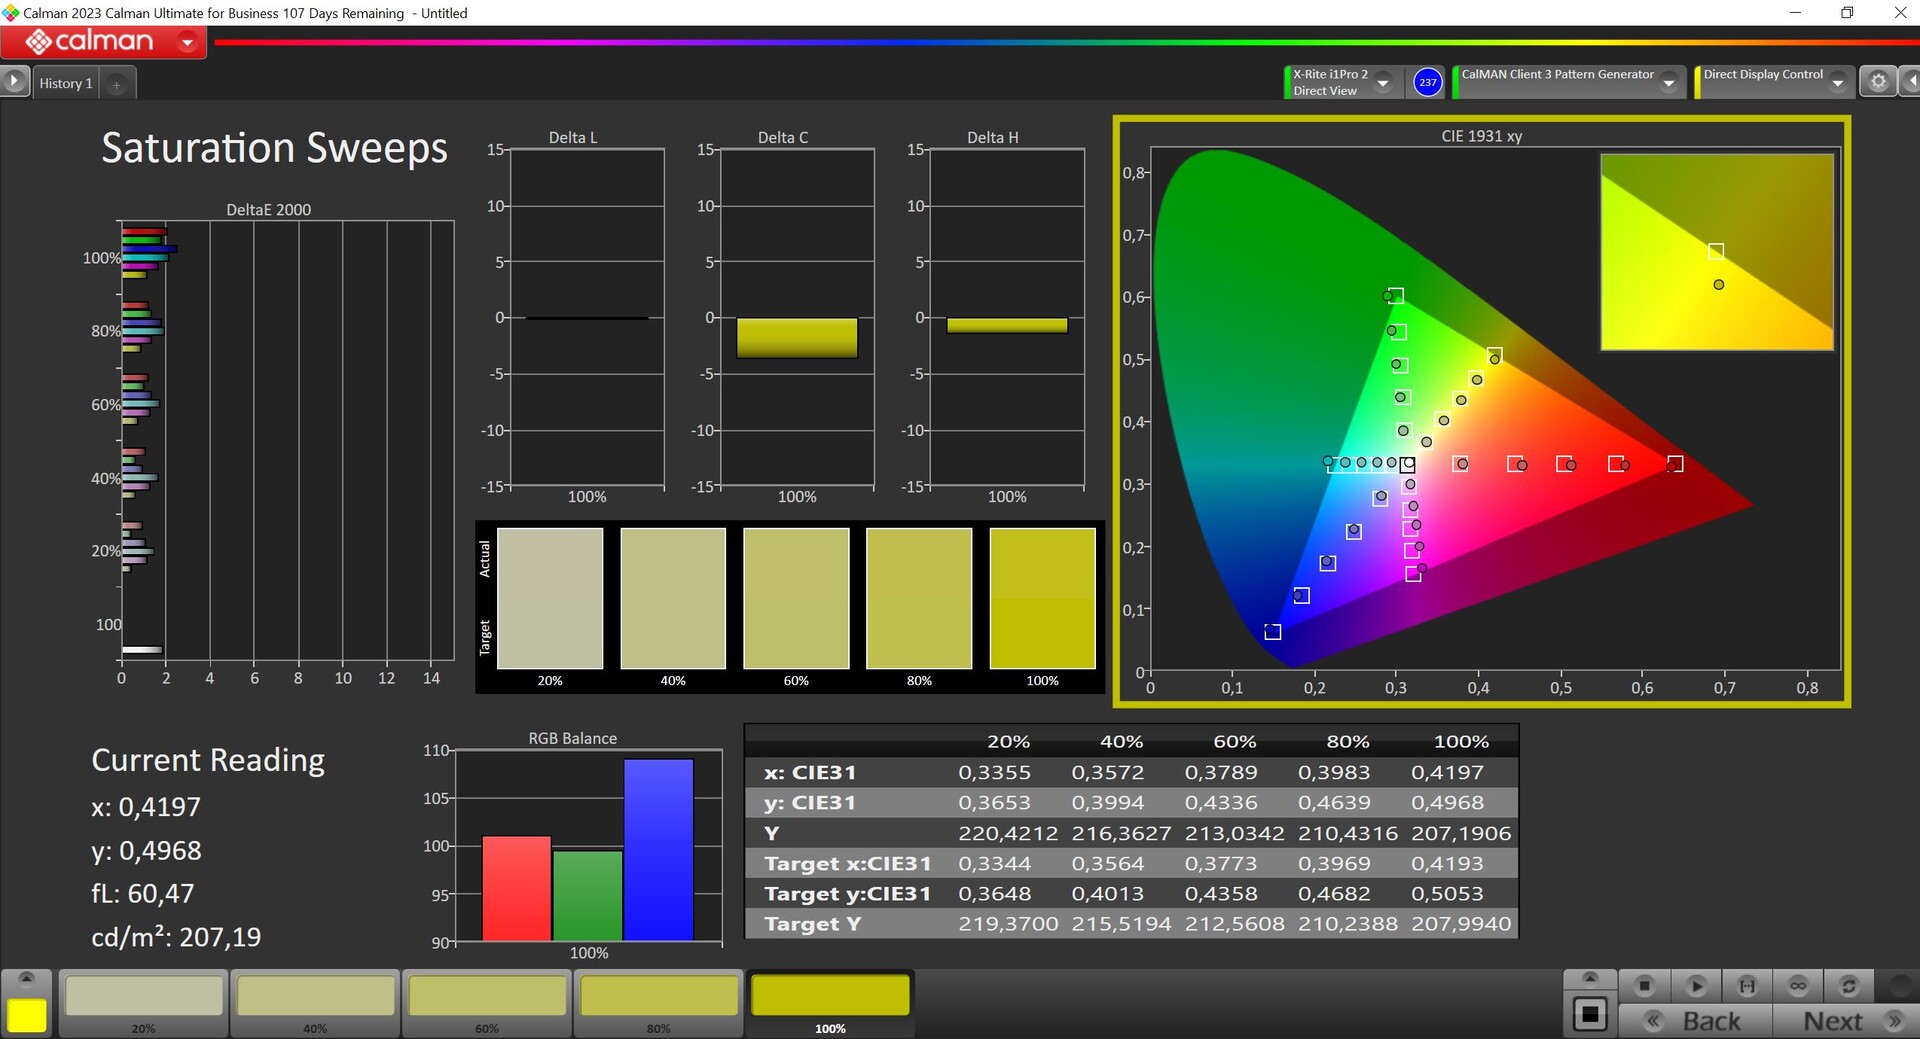

MSI does not offer any color profiles and during our analysis with the professional CalMAN software (X-Rite i1 Pro 2), the panel showed a slight blue cast in connection with a color temperature that was too cool. Its color deviations, on the other hand, are okay. MSI uses these settings to achieve a higher brightness. With our calibration (profile is available to download for free further above), we were able to improve its grayscale in particular, rendering its color cast a thing of the past—but its maximum brightness was then almost 50 cd/m² lower. The sRGB color space is covered by 95 % and theoretically, you could even edit images on the device, but this is obviously not a realistic use scenario for a gaming handheld.
Display Response Times
| ↔ Response Time Black to White | ||
|---|---|---|
| 6.6 ms ... rise ↗ and fall ↘ combined | ↗ 3.1 ms rise | 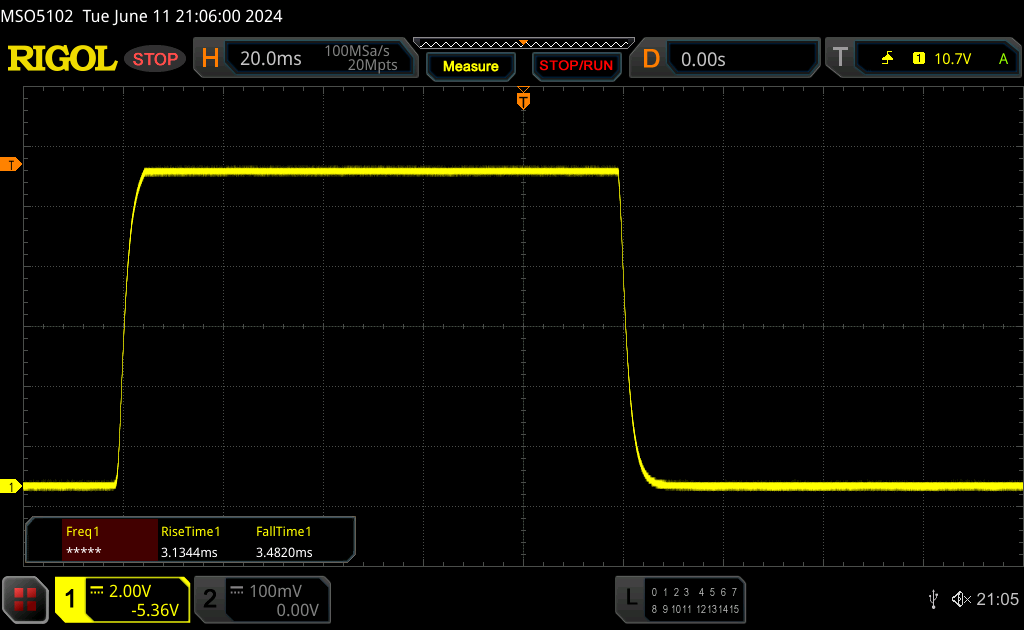 |
| ↘ 3.5 ms fall | ||
| The screen shows very fast response rates in our tests and should be very well suited for fast-paced gaming. In comparison, all tested devices range from 0.1 (minimum) to 240 (maximum) ms. » 20 % of all devices are better. This means that the measured response time is better than the average of all tested devices (19.9 ms). | ||
| ↔ Response Time 50% Grey to 80% Grey | ||
| 9.2 ms ... rise ↗ and fall ↘ combined | ↗ 4.6 ms rise | 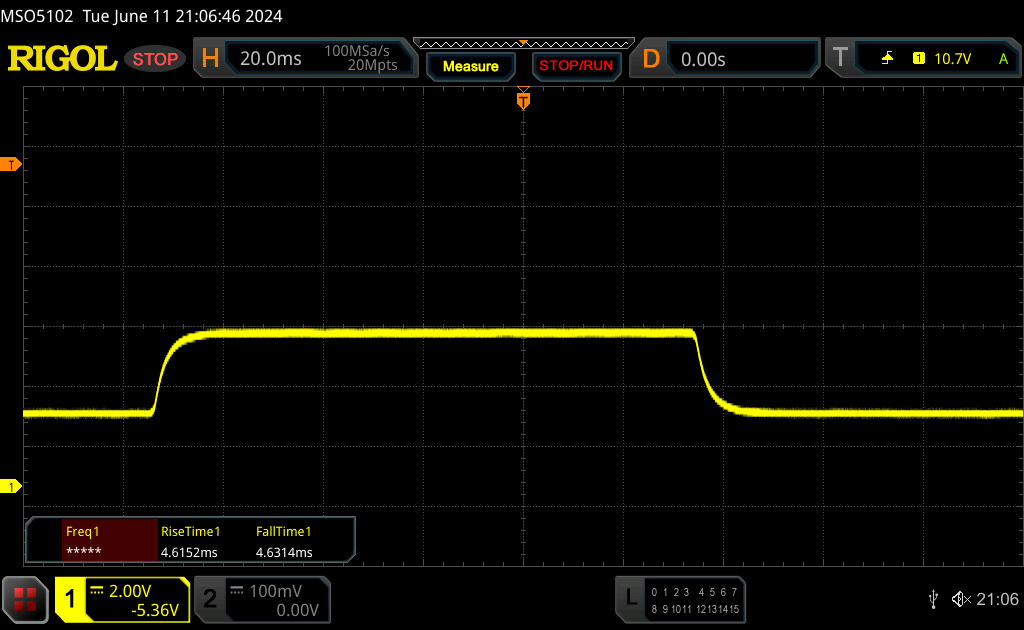 |
| ↘ 4.6 ms fall | ||
| The screen shows fast response rates in our tests and should be suited for gaming. In comparison, all tested devices range from 0.165 (minimum) to 636 (maximum) ms. » 23 % of all devices are better. This means that the measured response time is better than the average of all tested devices (31.1 ms). | ||
Screen Flickering / PWM (Pulse-Width Modulation)
| Screen flickering / PWM not detected | 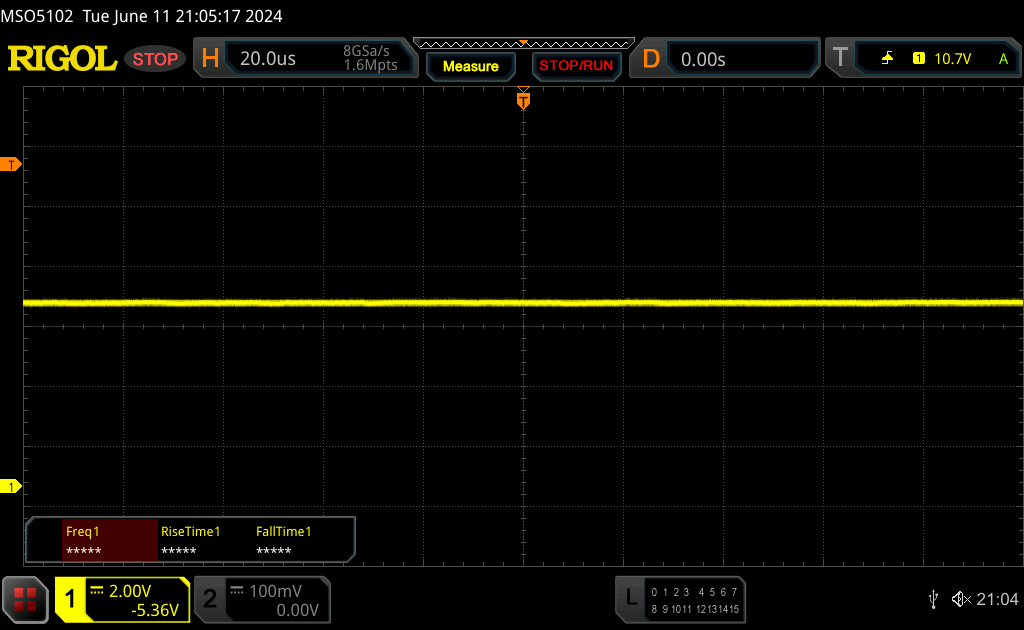 | ||
In comparison: 52 % of all tested devices do not use PWM to dim the display. If PWM was detected, an average of 7798 (minimum: 5 - maximum: 343500) Hz was measured. | |||
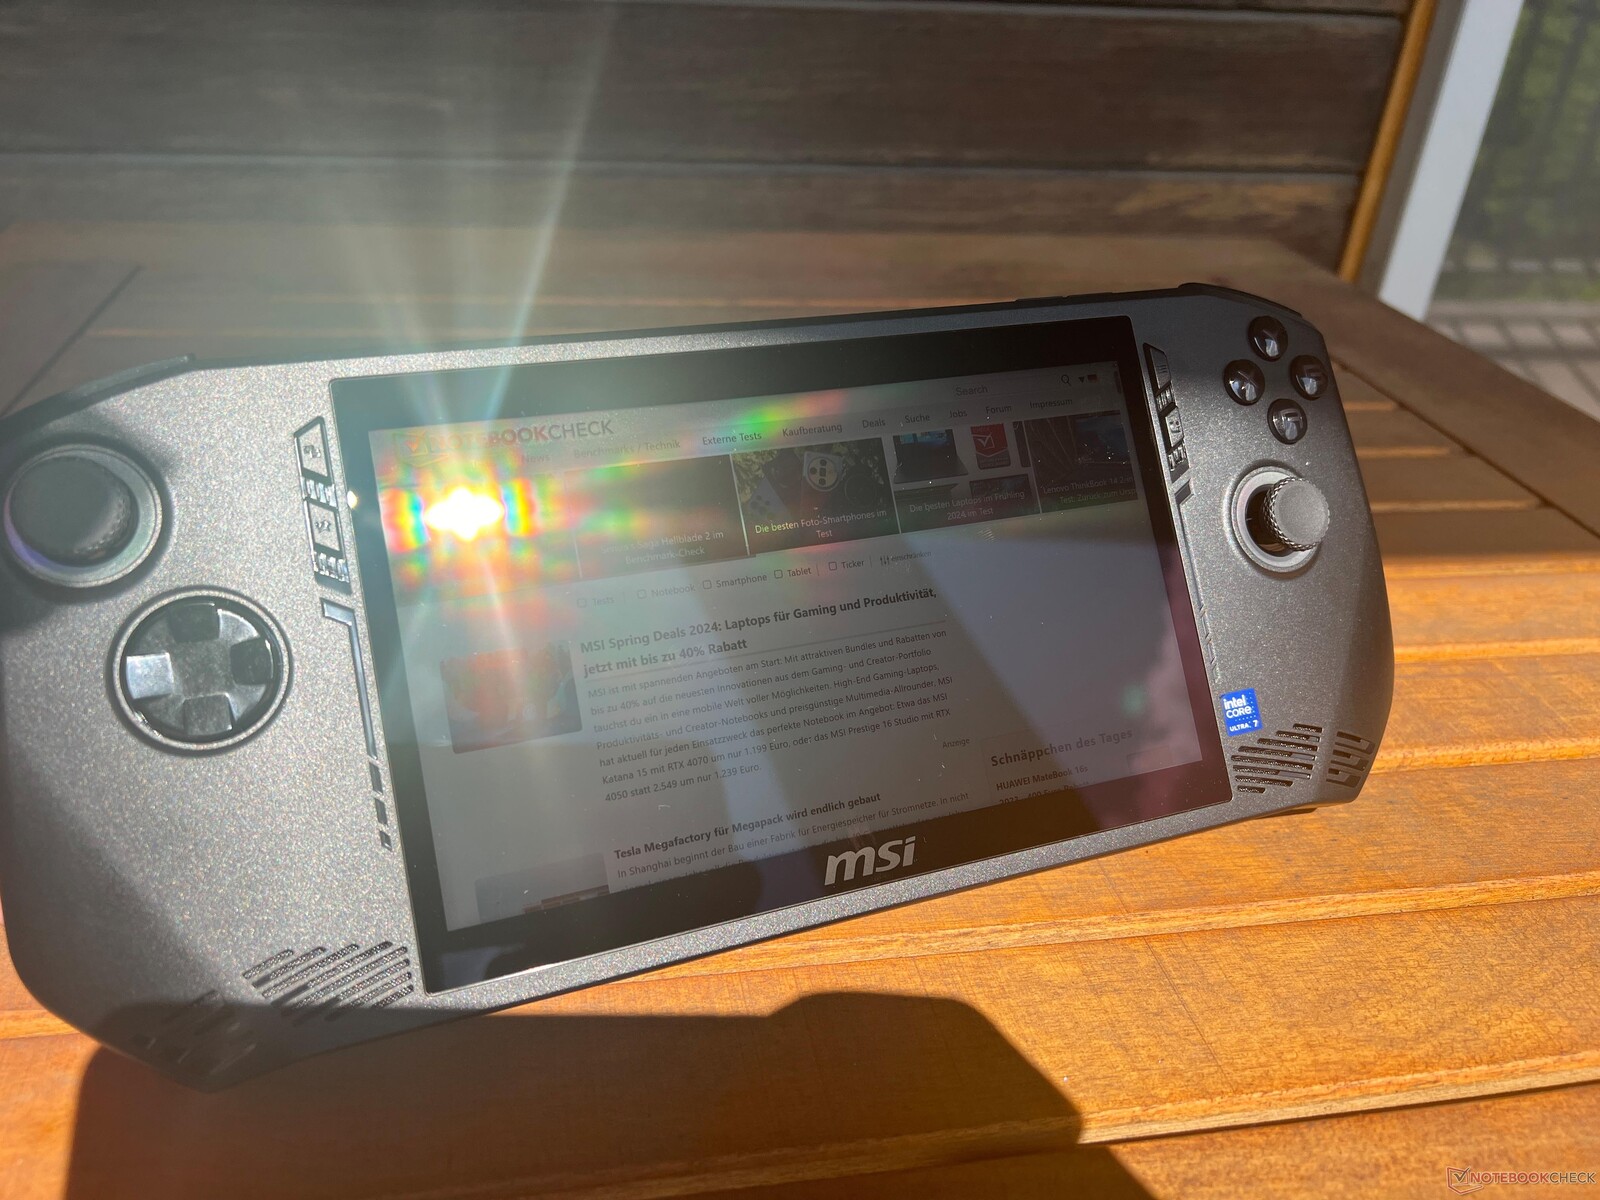
Of course, reflections on the shiny touchscreen are to be expected and on very bright days, it becomes a little hard to use the device. However, in most cases, you should be able to find a position that works. There are no problems when it comes to its viewing angles.

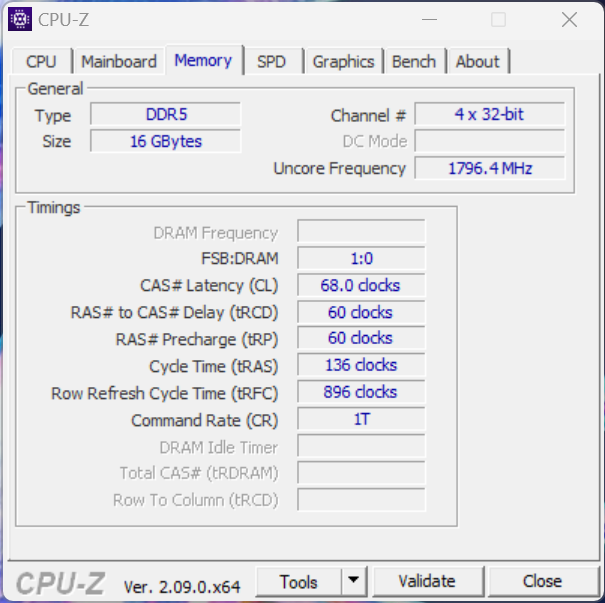
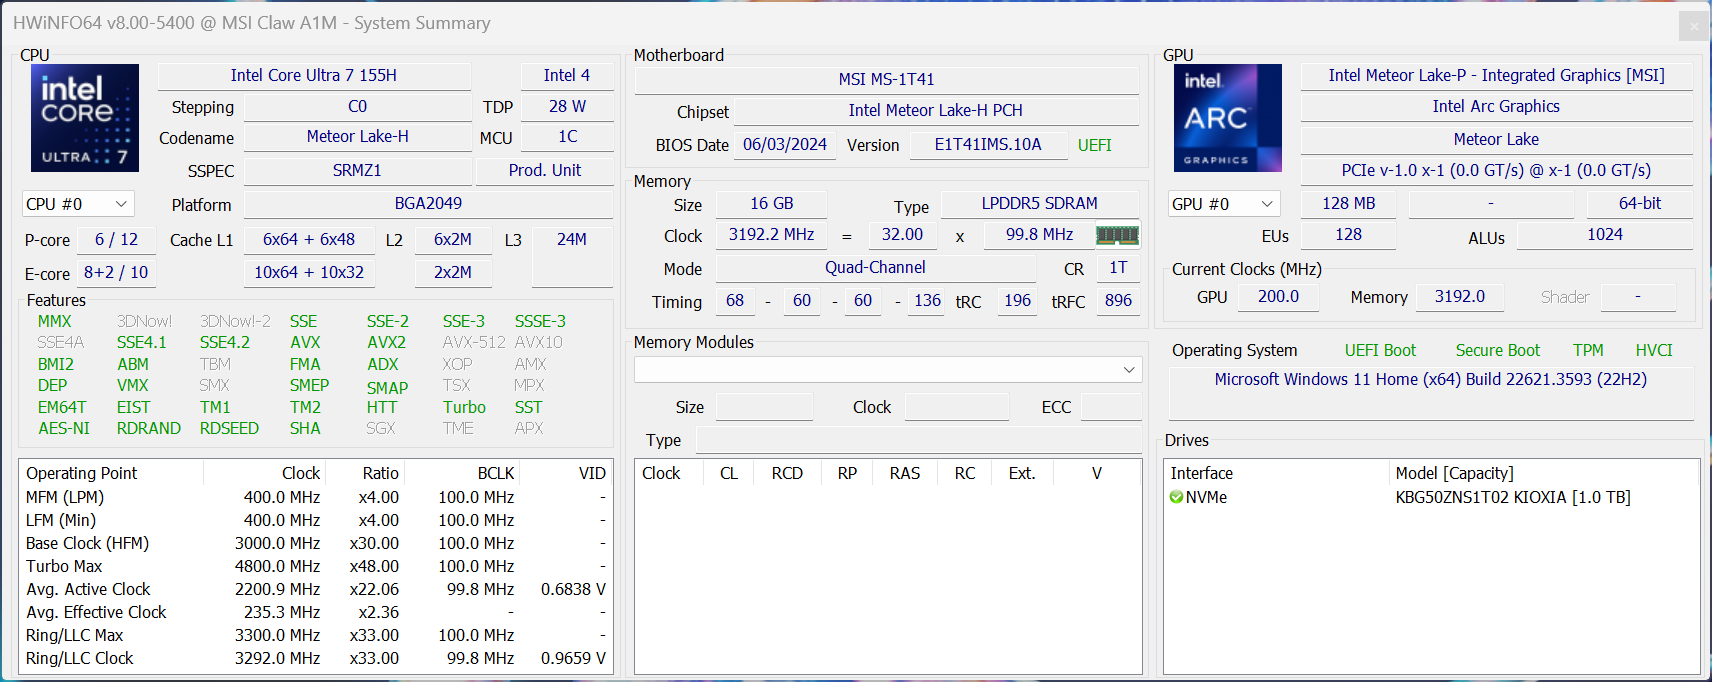
Performance - Intel Core Ultra & 16 GB RAM
As previously mentioned, you can get the MSI Claw gaming handheld with the Core Ultra 7 155H or the weaker Core Ultra 5 135H, with the latter then also coming with a slightly weaker iGPU. Both models are equipped with 16 GB RAM and there is no option to manually assign the VRAM.
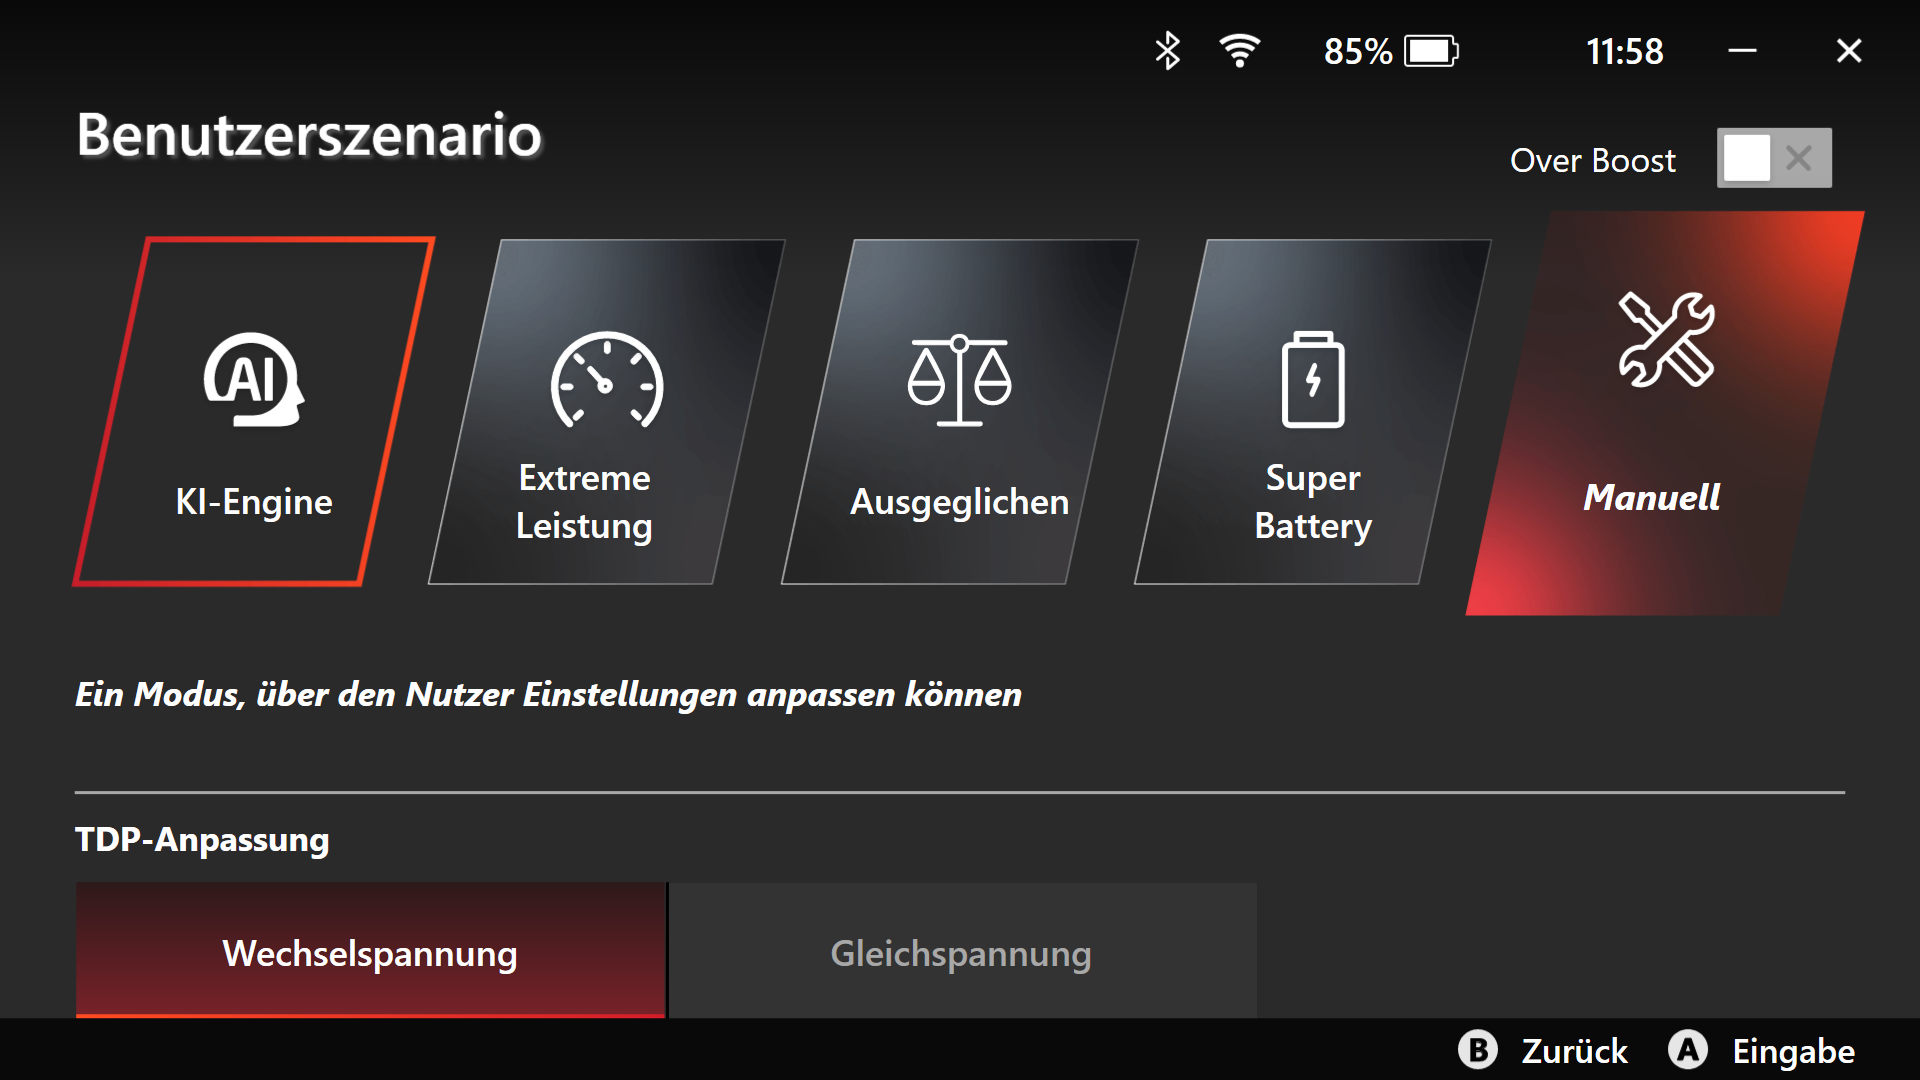
Testing conditions
MSI offers various energy profiles, whereby the mode AI Engine is active by default. This should automatically select the best settings according to the load scenario and we also used this mode for the following benchmarks and tests. We have listed the TDP and performance values of the various profiles in the following table.
| Energy profile | TDP mains | TDP battery | CB R23 multi | Time Spy graphics | Cyberpunk 2077 1080p Low | max. fan noise emissions |
|---|---|---|---|---|---|---|
| Super Battery | 20 watts | 20 watts | 7,270 points | 2,581 points | 23.3fps | 36.6 dB(A) |
| Balanced | 35 watts | 30 watts | 12,523 points | 3,517 points | 31fps | 45.5 dB(A) |
| AI | 45 -> 43 watts | 35 watts | 14,463 points | 3,491 points | 31fps | 45.5 dB(A) |
| Extreme Performance | 45 -> 43 watts | 35 watts | 14,550 points | 4,461 points | 31fps | 48.5 dB(A) |
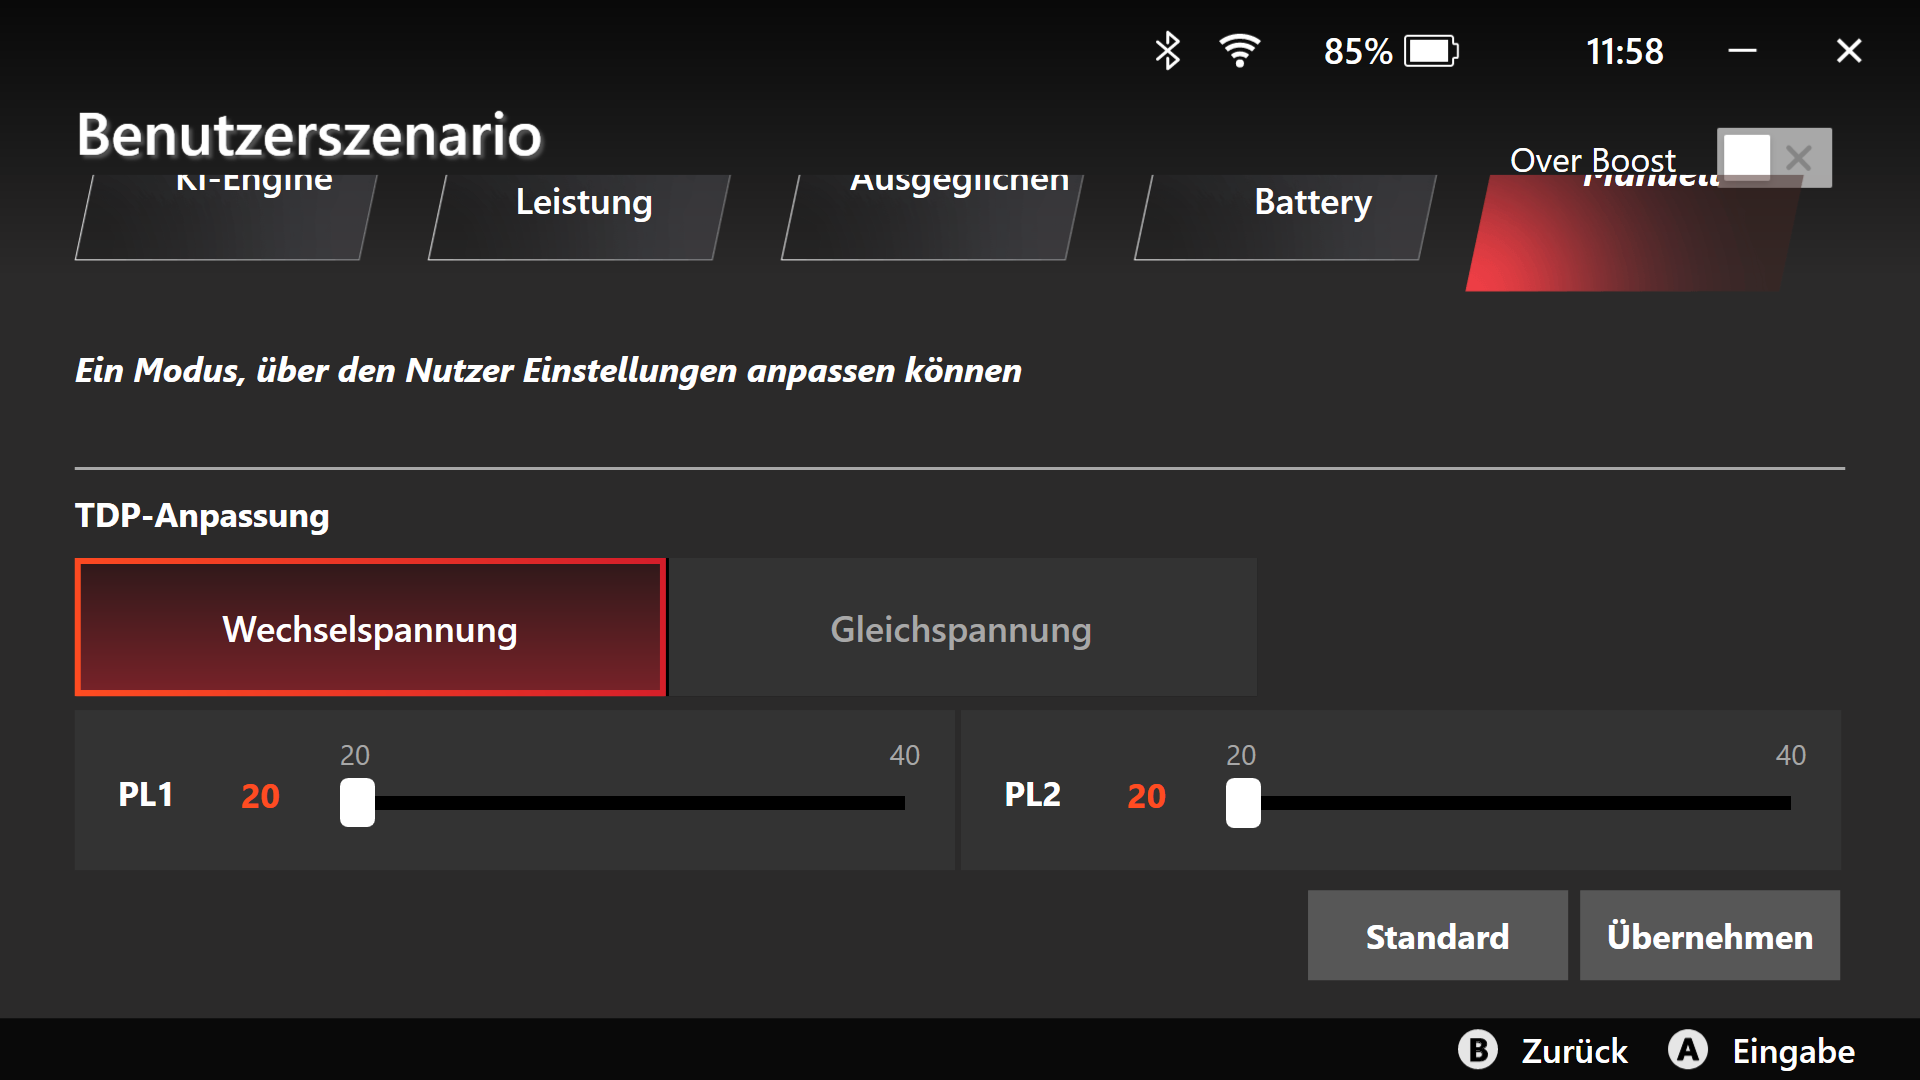
There is also a manual mode in which you can adjust the TDP values, but only within the range of 20-35 watts and thus within the range of the existing profiles. Other handhelds offer more flexibility in this aspect.
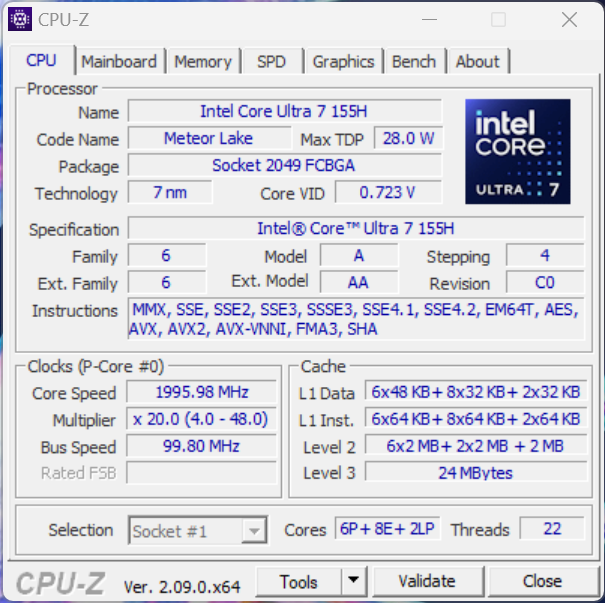
Processor - Core Ultra 7 155H
The Core Ultra 7 155H from Intel's current Meteor Lake generation is used in a lot of laptops at the moment. Its performance within the MSI Claw is also stable and generally decent, although the Intel processor simply requires more power than other AMD handhelds to deliver comparable performance, which of course isn't ideal for a handheld. In addition, its cooling unit has a lot of work to do, but we will talk more about this in the emissions section a little later. During battery operation, the processor is allowed to consume a maximum of 35 watts, which is why its multi-core performance is around 14 % lower in this case. Further CPU benchmarks can be found in our tech section.
Cinebench R15 Multi continuous test
Cinebench R23: Multi Core | Single Core
Cinebench R20: CPU (Multi Core) | CPU (Single Core)
Cinebench R15: CPU Multi 64Bit | CPU Single 64Bit
Blender: v2.79 BMW27 CPU
7-Zip 18.03: 7z b 4 | 7z b 4 -mmt1
Geekbench 6.7: Multi-Core | Single-Core
Geekbench 5.5: Multi-Core | Single-Core
HWBOT x265 Benchmark v2.2: 4k Preset
LibreOffice : 20 Documents To PDF
R Benchmark 2.5: Overall mean
| CPU Performance rating | |
| Asus ROG Ally Z1 Extreme | |
| Average Intel Core Ultra 7 155H | |
| Lenovo Legion Go -2! | |
| MSI Claw | |
| Ayaneo Kun | |
| ONEXPLAYER 2 Pro AR18 | |
| Average of class Handheld / UMPC | |
| Valve Steam Deck 1 TB OLED -6! | |
| Cinebench R23 / Multi Core | |
| Ayaneo Kun | |
| Average Intel Core Ultra 7 155H (9769 - 19007, n=52) | |
| Asus ROG Ally Z1 Extreme | |
| MSI Claw | |
| ONEXPLAYER 2 Pro AR18 | |
| Lenovo Legion Go | |
| Average of class Handheld / UMPC (4953 - 16841, n=14, last 2 years) | |
| Valve Steam Deck 1 TB OLED | |
| Cinebench R23 / Single Core | |
| Asus ROG Ally Z1 Extreme | |
| MSI Claw | |
| Lenovo Legion Go | |
| ONEXPLAYER 2 Pro AR18 | |
| Average Intel Core Ultra 7 155H (1496 - 1815, n=52) | |
| Average of class Handheld / UMPC (1071 - 2006, n=14, last 2 years) | |
| Ayaneo Kun | |
| Cinebench R20 / CPU (Multi Core) | |
| Ayaneo Kun | |
| Asus ROG Ally Z1 Extreme | |
| Average Intel Core Ultra 7 155H (3798 - 7409, n=50) | |
| ONEXPLAYER 2 Pro AR18 | |
| Lenovo Legion Go | |
| MSI Claw | |
| Average of class Handheld / UMPC (1904 - 6577, n=12, last 2 years) | |
| Valve Steam Deck 1 TB OLED | |
| Cinebench R20 / CPU (Single Core) | |
| Asus ROG Ally Z1 Extreme | |
| MSI Claw | |
| ONEXPLAYER 2 Pro AR18 | |
| Lenovo Legion Go | |
| Average Intel Core Ultra 7 155H (601 - 696, n=50) | |
| Average of class Handheld / UMPC (390 - 787, n=12, last 2 years) | |
| Ayaneo Kun | |
| Valve Steam Deck 1 TB OLED | |
| Cinebench R15 / CPU Multi 64Bit | |
| Average Intel Core Ultra 7 155H (1932 - 2880, n=56) | |
| Ayaneo Kun | |
| Asus ROG Ally Z1 Extreme | |
| ONEXPLAYER 2 Pro AR18 | |
| Lenovo Legion Go | |
| MSI Claw | |
| Average of class Handheld / UMPC (855 - 2533, n=12, last 2 years) | |
| Valve Steam Deck 1 TB OLED | |
| Cinebench R15 / CPU Single 64Bit | |
| Asus ROG Ally Z1 Extreme | |
| Lenovo Legion Go | |
| ONEXPLAYER 2 Pro AR18 | |
| MSI Claw | |
| Average Intel Core Ultra 7 155H (99.6 - 268, n=52) | |
| Ayaneo Kun | |
| Average of class Handheld / UMPC (155.1 - 304, n=12, last 2 years) | |
| Blender / v2.79 BMW27 CPU | |
| Average of class Handheld / UMPC (189 - 588, n=12, last 2 years) | |
| MSI Claw | |
| ONEXPLAYER 2 Pro AR18 | |
| Average Intel Core Ultra 7 155H (175 - 381, n=47) | |
| Asus ROG Ally Z1 Extreme | |
| Ayaneo Kun | |
| 7-Zip 18.03 / 7z b 4 | |
| Asus ROG Ally Z1 Extreme | |
| Ayaneo Kun | |
| Average Intel Core Ultra 7 155H (41739 - 70254, n=50) | |
| Lenovo Legion Go | |
| ONEXPLAYER 2 Pro AR18 | |
| MSI Claw | |
| Average of class Handheld / UMPC (23417 - 66618, n=11, last 2 years) | |
| Valve Steam Deck 1 TB OLED | |
| 7-Zip 18.03 / 7z b 4 -mmt1 | |
| Asus ROG Ally Z1 Extreme | |
| ONEXPLAYER 2 Pro AR18 | |
| Ayaneo Kun | |
| Average Intel Core Ultra 7 155H (4594 - 5621, n=50) | |
| MSI Claw | |
| Average of class Handheld / UMPC (3675 - 6143, n=12, last 2 years) | |
| Valve Steam Deck 1 TB OLED | |
| Geekbench 6.7 / Multi-Core | |
| Average Intel Core Ultra 7 155H (7732 - 13656, n=55) | |
| Asus ROG Ally Z1 Extreme | |
| Lenovo Legion Go | |
| Lenovo Legion Go | |
| MSI Claw | |
| Average of class Handheld / UMPC (3950 - 13426, n=13, last 2 years) | |
| Ayaneo Kun | |
| ONEXPLAYER 2 Pro AR18 | |
| Valve Steam Deck 1 TB OLED | |
| Geekbench 6.7 / Single-Core | |
| Lenovo Legion Go | |
| Lenovo Legion Go | |
| Asus ROG Ally Z1 Extreme | |
| MSI Claw | |
| Average Intel Core Ultra 7 155H (1901 - 2473, n=52) | |
| Average of class Handheld / UMPC (1333 - 2904, n=13, last 2 years) | |
| ONEXPLAYER 2 Pro AR18 | |
| Ayaneo Kun | |
| Valve Steam Deck 1 TB OLED | |
| Geekbench 5.5 / Multi-Core | |
| Average Intel Core Ultra 7 155H (10017 - 13556, n=52) | |
| Asus ROG Ally Z1 Extreme | |
| MSI Claw | |
| Lenovo Legion Go | |
| Lenovo Legion Go | |
| Average of class Handheld / UMPC (3932 - 11975, n=13, last 2 years) | |
| Ayaneo Kun | |
| ONEXPLAYER 2 Pro AR18 | |
| Valve Steam Deck 1 TB OLED | |
| Geekbench 5.5 / Single-Core | |
| Asus ROG Ally Z1 Extreme | |
| Lenovo Legion Go | |
| Lenovo Legion Go | |
| MSI Claw | |
| Average Intel Core Ultra 7 155H (1462 - 1824, n=52) | |
| Average of class Handheld / UMPC (875 - 2134, n=13, last 2 years) | |
| ONEXPLAYER 2 Pro AR18 | |
| Valve Steam Deck 1 TB OLED | |
| Ayaneo Kun | |
| HWBOT x265 Benchmark v2.2 / 4k Preset | |
| Ayaneo Kun | |
| Asus ROG Ally Z1 Extreme | |
| Average Intel Core Ultra 7 155H (9.93 - 21.2, n=50) | |
| Lenovo Legion Go | |
| ONEXPLAYER 2 Pro AR18 | |
| Average of class Handheld / UMPC (6.21 - 20.8, n=12, last 2 years) | |
| MSI Claw | |
| LibreOffice / 20 Documents To PDF | |
| Average of class Handheld / UMPC (41.1 - 92.8, n=12, last 2 years) | |
| ONEXPLAYER 2 Pro AR18 | |
| Ayaneo Kun | |
| Lenovo Legion Go | |
| Average Intel Core Ultra 7 155H (37.5 - 79.2, n=49) | |
| MSI Claw | |
| Asus ROG Ally Z1 Extreme | |
| R Benchmark 2.5 / Overall mean | |
| Average of class Handheld / UMPC (0.4167 - 0.756, n=12, last 2 years) | |
| Ayaneo Kun | |
| Ayaneo Kun | |
| Average Intel Core Ultra 7 155H (0.4457 - 0.53, n=49) | |
| ONEXPLAYER 2 Pro AR18 | |
| MSI Claw | |
| Lenovo Legion Go | |
| Asus ROG Ally Z1 Extreme | |
* ... smaller is better
AIDA64: FP32 Ray-Trace | FPU Julia | CPU SHA3 | CPU Queen | FPU SinJulia | FPU Mandel | CPU AES | CPU ZLib | FP64 Ray-Trace | CPU PhotoWorxx
| Performance rating | |
| Ayaneo Kun | |
| Asus ROG Ally Z1 Extreme | |
| ONEXPLAYER 2 Pro AR18 | |
| Lenovo Legion Go | |
| Average of class Handheld / UMPC | |
| Average Intel Core Ultra 7 155H | |
| MSI Claw | |
| AIDA64 / FP32 Ray-Trace | |
| Ayaneo Kun | |
| Ayaneo Kun | |
| Asus ROG Ally Z1 Extreme | |
| ONEXPLAYER 2 Pro AR18 | |
| ONEXPLAYER 2 Pro AR18 | |
| Lenovo Legion Go | |
| Average of class Handheld / UMPC (6544 - 26450, n=12, last 2 years) | |
| Average Intel Core Ultra 7 155H (6670 - 18470, n=50) | |
| MSI Claw | |
| AIDA64 / FPU Julia | |
| Ayaneo Kun | |
| Ayaneo Kun | |
| Asus ROG Ally Z1 Extreme | |
| ONEXPLAYER 2 Pro AR18 | |
| ONEXPLAYER 2 Pro AR18 | |
| Lenovo Legion Go | |
| Average of class Handheld / UMPC (36464 - 103637, n=12, last 2 years) | |
| Average Intel Core Ultra 7 155H (40905 - 93181, n=50) | |
| MSI Claw | |
| AIDA64 / CPU SHA3 | |
| Ayaneo Kun | |
| Ayaneo Kun | |
| Asus ROG Ally Z1 Extreme | |
| ONEXPLAYER 2 Pro AR18 | |
| ONEXPLAYER 2 Pro AR18 | |
| Lenovo Legion Go | |
| Average Intel Core Ultra 7 155H (1940 - 4436, n=50) | |
| Average of class Handheld / UMPC (1157 - 4484, n=12, last 2 years) | |
| MSI Claw | |
| AIDA64 / CPU Queen | |
| Ayaneo Kun | |
| Ayaneo Kun | |
| Asus ROG Ally Z1 Extreme | |
| ONEXPLAYER 2 Pro AR18 | |
| Lenovo Legion Go | |
| Average Intel Core Ultra 7 155H (64698 - 94181, n=50) | |
| Average of class Handheld / UMPC (41744 - 107867, n=12, last 2 years) | |
| MSI Claw | |
| AIDA64 / FPU SinJulia | |
| Ayaneo Kun | |
| Ayaneo Kun | |
| Asus ROG Ally Z1 Extreme | |
| ONEXPLAYER 2 Pro AR18 | |
| ONEXPLAYER 2 Pro AR18 | |
| Lenovo Legion Go | |
| Average of class Handheld / UMPC (4425 - 16980, n=12, last 2 years) | |
| Average Intel Core Ultra 7 155H (5639 - 10647, n=50) | |
| MSI Claw | |
| AIDA64 / FPU Mandel | |
| Ayaneo Kun | |
| Ayaneo Kun | |
| Asus ROG Ally Z1 Extreme | |
| ONEXPLAYER 2 Pro AR18 | |
| ONEXPLAYER 2 Pro AR18 | |
| Lenovo Legion Go | |
| Average of class Handheld / UMPC (19153 - 55457, n=12, last 2 years) | |
| Average Intel Core Ultra 7 155H (18236 - 47685, n=50) | |
| MSI Claw | |
| AIDA64 / CPU AES | |
| Ayaneo Kun | |
| Ayaneo Kun | |
| ONEXPLAYER 2 Pro AR18 | |
| ONEXPLAYER 2 Pro AR18 | |
| Average Intel Core Ultra 7 155H (45713 - 152179, n=50) | |
| Asus ROG Ally Z1 Extreme | |
| Average of class Handheld / UMPC (18552 - 119040, n=11, last 2 years) | |
| MSI Claw | |
| Lenovo Legion Go | |
| AIDA64 / CPU ZLib | |
| Ayaneo Kun | |
| Ayaneo Kun | |
| Asus ROG Ally Z1 Extreme | |
| Average Intel Core Ultra 7 155H (557 - 1250, n=50) | |
| ONEXPLAYER 2 Pro AR18 | |
| ONEXPLAYER 2 Pro AR18 | |
| MSI Claw | |
| Average of class Handheld / UMPC (356 - 1112, n=12, last 2 years) | |
| Lenovo Legion Go | |
| AIDA64 / FP64 Ray-Trace | |
| Ayaneo Kun | |
| Ayaneo Kun | |
| Asus ROG Ally Z1 Extreme | |
| ONEXPLAYER 2 Pro AR18 | |
| ONEXPLAYER 2 Pro AR18 | |
| Lenovo Legion Go | |
| Average of class Handheld / UMPC (3585 - 14181, n=12, last 2 years) | |
| Average Intel Core Ultra 7 155H (3569 - 9802, n=50) | |
| MSI Claw | |
| AIDA64 / CPU PhotoWorxx | |
| MSI Claw | |
| Average Intel Core Ultra 7 155H (32719 - 54223, n=50) | |
| Average of class Handheld / UMPC (19472 - 54726, n=12, last 2 years) | |
| Asus ROG Ally Z1 Extreme | |
| Lenovo Legion Go | |
| Ayaneo Kun | |
| Ayaneo Kun | |
| ONEXPLAYER 2 Pro AR18 | |
| ONEXPLAYER 2 Pro AR18 | |
System performance
Apart from the still awkward touch operation of Windows, the MSI Claw is a fast device with modern components. We also had no problems with crashes or other limitations during our test. In addition, there were no bottlenecks during the synthetic tests.
CrossMark: Overall | Productivity | Creativity | Responsiveness
WebXPRT 3: Overall
WebXPRT 4: Overall
Mozilla Kraken 1.1: Total
| PCMark 10 / Score | |
| Asus ROG Ally Z1 Extreme | |
| Average Intel Core Ultra 7 155H, Intel Arc 8-Core iGPU (4809 - 7529, n=34) | |
| Average of class Handheld / UMPC (3592 - 8082, n=12, last 2 years) | |
| MSI Claw | |
| Lenovo Legion Go | |
| Ayaneo Kun | |
| ONEXPLAYER 2 Pro AR18 | |
| PCMark 10 / Essentials | |
| Average Intel Core Ultra 7 155H, Intel Arc 8-Core iGPU (7605 - 11289, n=34) | |
| Asus ROG Ally Z1 Extreme | |
| Lenovo Legion Go | |
| Average of class Handheld / UMPC (7542 - 11262, n=12, last 2 years) | |
| MSI Claw | |
| Ayaneo Kun | |
| ONEXPLAYER 2 Pro AR18 | |
| PCMark 10 / Productivity | |
| Asus ROG Ally Z1 Extreme | |
| Average of class Handheld / UMPC (5015 - 14802, n=12, last 2 years) | |
| Lenovo Legion Go | |
| Average Intel Core Ultra 7 155H, Intel Arc 8-Core iGPU (6042 - 10591, n=34) | |
| MSI Claw | |
| Ayaneo Kun | |
| ONEXPLAYER 2 Pro AR18 | |
| PCMark 10 / Digital Content Creation | |
| MSI Claw | |
| Ayaneo Kun | |
| Average Intel Core Ultra 7 155H, Intel Arc 8-Core iGPU (4985 - 10709, n=34) | |
| Asus ROG Ally Z1 Extreme | |
| Average of class Handheld / UMPC (3326 - 10026, n=12, last 2 years) | |
| ONEXPLAYER 2 Pro AR18 | |
| Lenovo Legion Go | |
| CrossMark / Overall | |
| Asus ROG Ally Z1 Extreme | |
| MSI Claw | |
| Average Intel Core Ultra 7 155H, Intel Arc 8-Core iGPU (1366 - 1903, n=34) | |
| Average of class Handheld / UMPC (865 - 1847, n=11, last 2 years) | |
| Ayaneo Kun | |
| ONEXPLAYER 2 Pro AR18 | |
| Valve Steam Deck 1 TB OLED | |
| CrossMark / Productivity | |
| Asus ROG Ally Z1 Extreme | |
| MSI Claw | |
| Average Intel Core Ultra 7 155H, Intel Arc 8-Core iGPU (1291 - 1798, n=33) | |
| Average of class Handheld / UMPC (878 - 1719, n=11, last 2 years) | |
| Ayaneo Kun | |
| ONEXPLAYER 2 Pro AR18 | |
| Valve Steam Deck 1 TB OLED | |
| CrossMark / Creativity | |
| Asus ROG Ally Z1 Extreme | |
| Average Intel Core Ultra 7 155H, Intel Arc 8-Core iGPU (1519 - 1929, n=33) | |
| MSI Claw | |
| Average of class Handheld / UMPC (891 - 2077, n=11, last 2 years) | |
| ONEXPLAYER 2 Pro AR18 | |
| Ayaneo Kun | |
| Valve Steam Deck 1 TB OLED | |
| CrossMark / Responsiveness | |
| MSI Claw | |
| Ayaneo Kun | |
| Asus ROG Ally Z1 Extreme | |
| Average Intel Core Ultra 7 155H, Intel Arc 8-Core iGPU (939 - 1802, n=33) | |
| Average of class Handheld / UMPC (759 - 1610, n=11, last 2 years) | |
| ONEXPLAYER 2 Pro AR18 | |
| Valve Steam Deck 1 TB OLED | |
| WebXPRT 3 / Overall | |
| Asus ROG Ally Z1 Extreme | |
| Lenovo Legion Go | |
| Average Intel Core Ultra 7 155H, Intel Arc 8-Core iGPU (252 - 299, n=34) | |
| MSI Claw | |
| Average of class Handheld / UMPC (170.3 - 325, n=13, last 2 years) | |
| ONEXPLAYER 2 Pro AR18 | |
| Ayaneo Kun | |
| Ayaneo Kun | |
| WebXPRT 4 / Overall | |
| Asus ROG Ally Z1 Extreme | |
| MSI Claw | |
| Average Intel Core Ultra 7 155H, Intel Arc 8-Core iGPU (166.4 - 309, n=29) | |
| Average of class Handheld / UMPC (134.4 - 291, n=13, last 2 years) | |
| Ayaneo Kun | |
| Valve Steam Deck 1 TB OLED | |
| Mozilla Kraken 1.1 / Total | |
| Ayaneo Kun | |
| Ayaneo Kun | |
| Average of class Handheld / UMPC (428 - 931, n=12, last 2 years) | |
| Lenovo Legion Go | |
| Average Intel Core Ultra 7 155H, Intel Arc 8-Core iGPU (517 - 614, n=35) | |
| MSI Claw | |
| ONEXPLAYER 2 Pro AR18 | |
* ... smaller is better
| PCMark 10 Score | 6504 points | |
Help | ||
| AIDA64 / Memory Copy | |
| Asus ROG Ally Z1 Extreme | |
| Average Intel Core Ultra 7 155H (62397 - 96791, n=50) | |
| MSI Claw | |
| Average of class Handheld / UMPC (33517 - 107929, n=12, last 2 years) | |
| Lenovo Legion Go | |
| Ayaneo Kun | |
| Ayaneo Kun | |
| ONEXPLAYER 2 Pro AR18 | |
| ONEXPLAYER 2 Pro AR18 | |
| Valve Steam Deck 1 TB OLED | |
| AIDA64 / Memory Read | |
| MSI Claw | |
| Average Intel Core Ultra 7 155H (60544 - 90647, n=50) | |
| Average of class Handheld / UMPC (25476 - 103022, n=12, last 2 years) | |
| Lenovo Legion Go | |
| Asus ROG Ally Z1 Extreme | |
| Ayaneo Kun | |
| ONEXPLAYER 2 Pro AR18 | |
| ONEXPLAYER 2 Pro AR18 | |
| Valve Steam Deck 1 TB OLED | |
| AIDA64 / Memory Write | |
| Lenovo Legion Go | |
| Asus ROG Ally Z1 Extreme | |
| Average of class Handheld / UMPC (25595 - 117883, n=12, last 2 years) | |
| MSI Claw | |
| Average Intel Core Ultra 7 155H (58692 - 93451, n=50) | |
| Ayaneo Kun | |
| Ayaneo Kun | |
| Ayaneo Kun | |
| ONEXPLAYER 2 Pro AR18 | |
| ONEXPLAYER 2 Pro AR18 | |
| Valve Steam Deck 1 TB OLED | |
| AIDA64 / Memory Latency | |
| Average Intel Core Ultra 7 155H (116.2 - 233, n=50) | |
| MSI Claw | |
| Ayaneo Kun | |
| Ayaneo Kun | |
| ONEXPLAYER 2 Pro AR18 | |
| ONEXPLAYER 2 Pro AR18 | |
| Lenovo Legion Go | |
| Average of class Handheld / UMPC (99.8 - 147.6, n=12, last 2 years) | |
| Asus ROG Ally Z1 Extreme | |
| Valve Steam Deck 1 TB OLED | |
* ... smaller is better
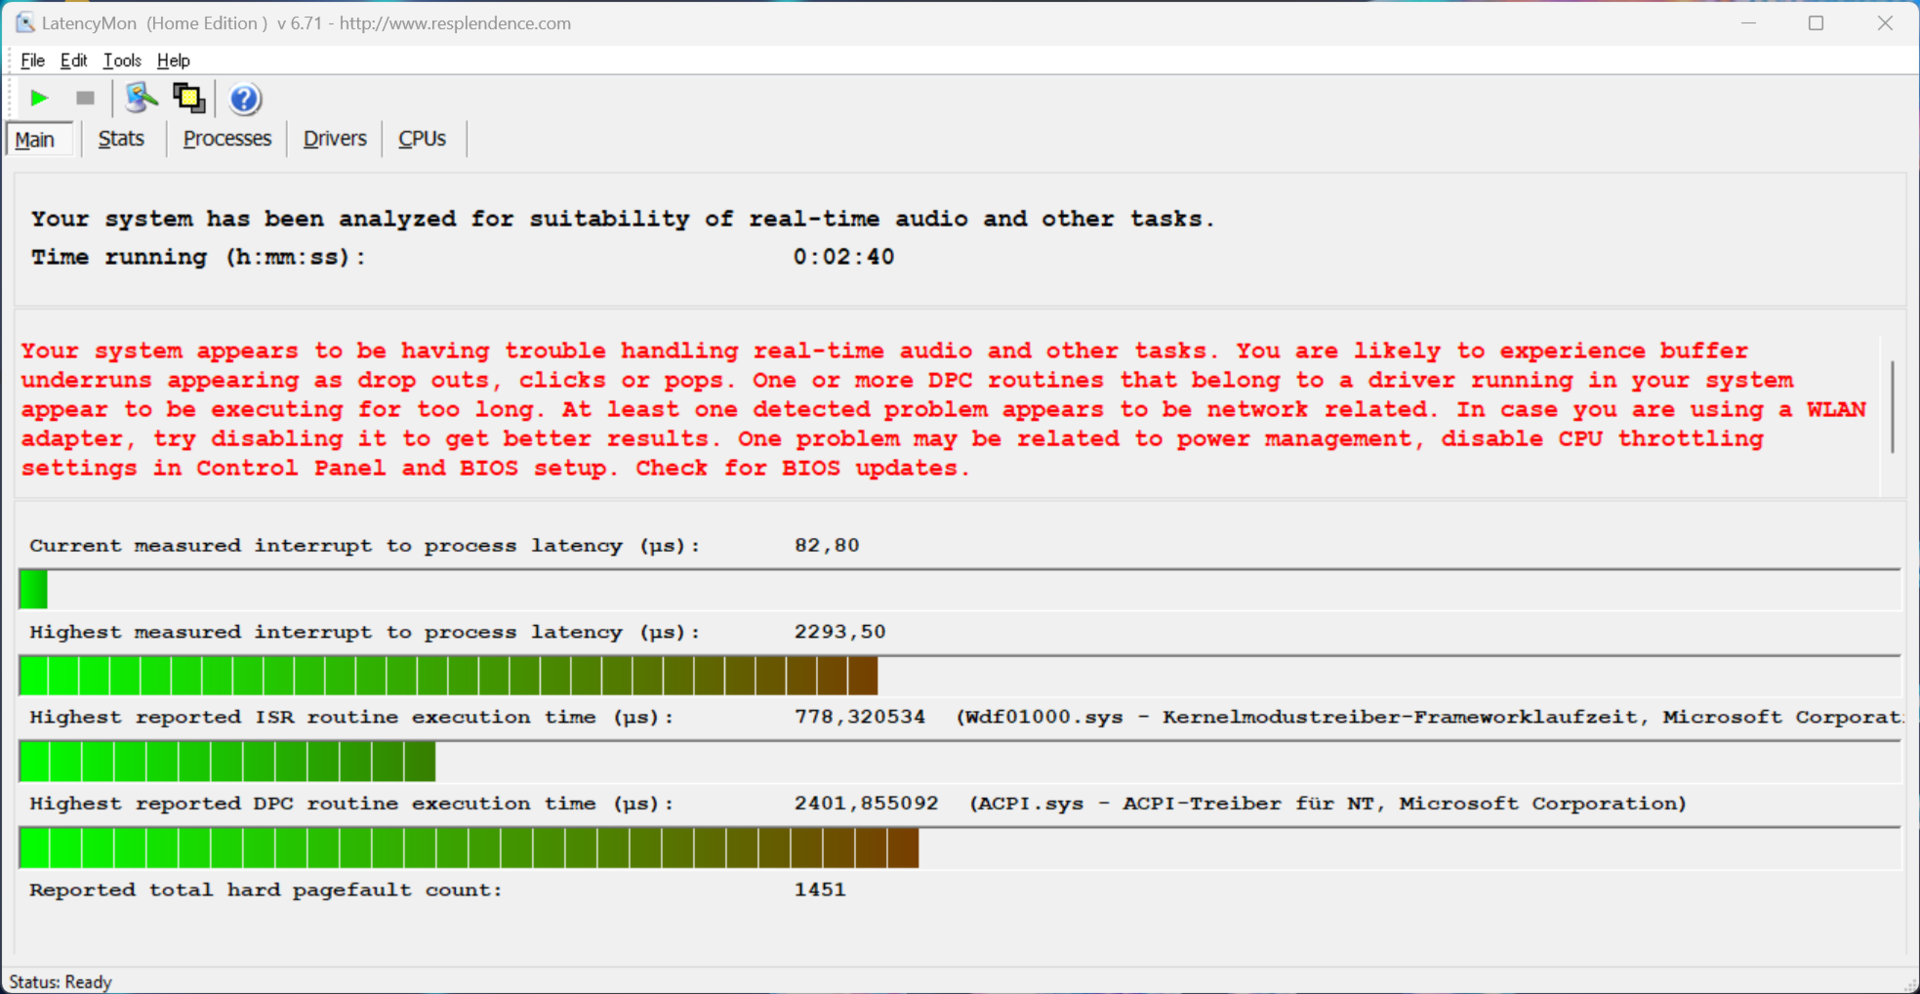
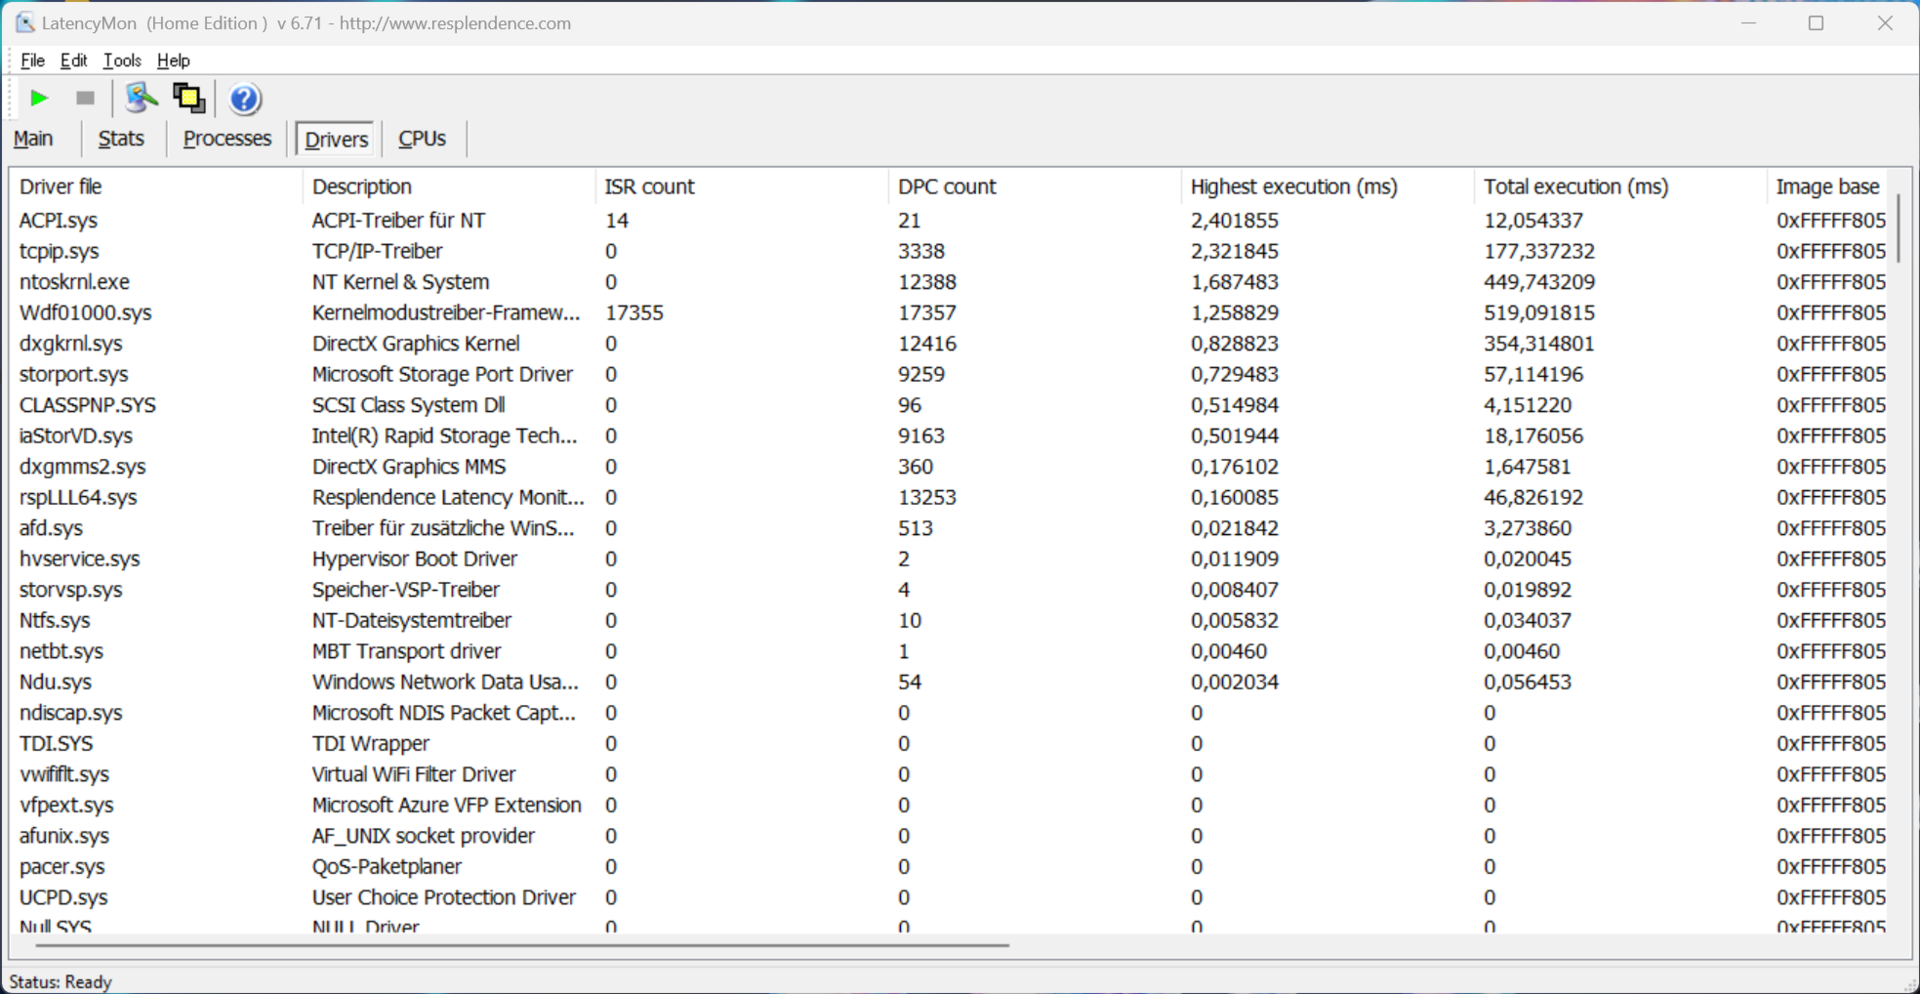
DPC latencies
In our standardized latency test (surfing the web, 4K YouTube playback, CPU load), the test device with the current BIOS version showed some limitations when using real-time audio applications.
| DPC Latencies / LatencyMon - interrupt to process latency (max), Web, Youtube, Prime95 | |
| MSI Claw | |
| Asus ROG Ally Z1 Extreme | |
| ONEXPLAYER 2 Pro AR18 | |
| Ayaneo Kun | |
* ... smaller is better
Storage device
The Claw is fitted with a compact M.2 2230 SSD—in our case one from Kioxia (BG5)—which offers a storage capacity of 1 TB, whereby users have 871 GB free to use after first starting up the device. Although it is a PCIe 4.0 SSD, its maximum transfer rates are only listed as being 3.5 GB/s at best and our benchmark results mostly showed values around the 3 GB/s mark as well. Still, this is completely sufficient for a gaming handheld and even under longer periods of load, we noted no drop in performance. Further SSD benchmarks can be found here.

| Drive Performance rating - Percent | |
| ONEXPLAYER 2 Pro AR18 -11! | |
| Ayaneo Kun | |
| Lenovo Legion Go | |
| Average of class Handheld / UMPC | |
| MSI Claw | |
| Average Kioxia BG5 KBG50ZNS1T02 | |
| Valve Steam Deck 1 TB OLED -11! | |
| Asus ROG Ally Z1 Extreme | |
* ... smaller is better
Reading continuous performance: DiskSpd Read Loop, Queue Depth 8
Graphics card
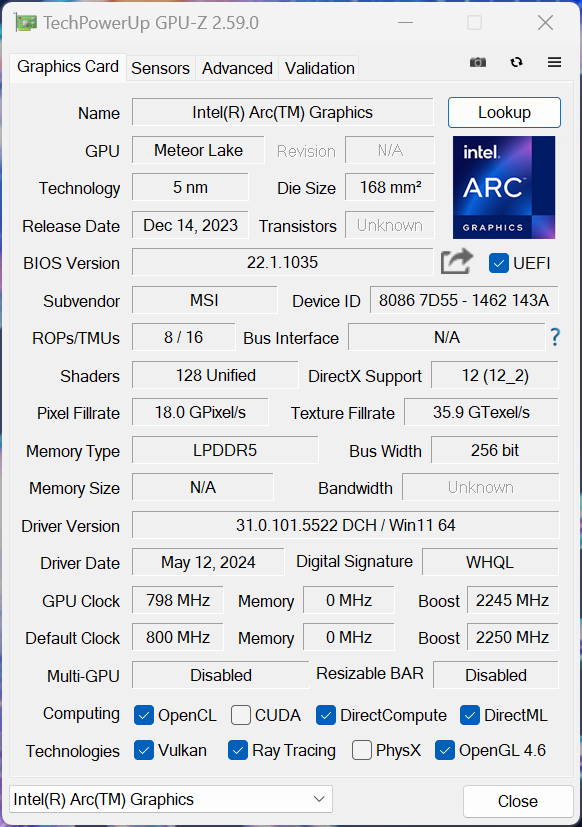
Our test device with the Intel Core Ultra 7 155H features the fast Arc Graphics iGPU with 8 Xe cores that can achieve a maximum clock rate of 2.25 GHz. In the synthetic 3DMark tests, Intel was able to improve its performance considerably compared to the old Iris Xe Graphics G7 and AMD's Radeon 780M was narrowly beaten, too. The iGPU is very well equipped for everyday tasks such as playing back high-resolution videos.
The device's graphics performance remains stable in battery use as well as under continuous load. Further GPU benchmarks can be found here.
| 3DMark 11 Performance | 12271 points | |
| 3DMark Fire Strike Score | 7988 points | |
| 3DMark Time Spy Score | 3829 points | |
Help | ||
* ... smaller is better
Gaming performance
Now it is time to talk about the handheld's gaming performance. In this aspect, the MSI Claw was not able to repeat its good GPU results from the synthetic tests and instead, it fell behind the AMD competition in almost every single game. It was only able to beat the Steam Deck. This means that in its native 1080p resolution, you can only play a lot of games using medium to high details and demanding games such as Cyberpunk 2077 or Baldurs Gate 3 are difficult to run without using upscaling technology—even with low detail settings. Adding to this is the fact that the Intel driver offers fewer features compared to the AMD software (for example Frame Generation) to further improve its performance or depiction quality.
| Performance rating - Percent | |
| Lenovo Legion Go | |
| Average of class Handheld / UMPC | |
| Asus ROG Ally Z1 Extreme | |
| Ayaneo Kun | |
| ONEXPLAYER 2 Pro AR18 | |
| MSI Claw -1! | |
| Valve Steam Deck 1 TB OLED -3! | |
| The Witcher 3 - 1920x1080 Ultra Graphics & Postprocessing (HBAO+) | |
| Ayaneo Kun | |
| ONEXPLAYER 2 Pro AR18 | |
| Lenovo Legion Go | |
| Asus ROG Ally Z1 Extreme | |
| MSI Claw | |
| Average of class Handheld / UMPC (17.5 - 31.1, n=5, last 2 years) | |
| GTA V - 1920x1080 Highest AA:4xMSAA + FX AF:16x | |
| Ayaneo Kun | |
| Ayaneo Kun | |
| Average of class Handheld / UMPC (14 - 32.8, n=13, last 2 years) | |
| Asus ROG Ally Z1 Extreme | |
| ONEXPLAYER 2 Pro AR18 | |
| Lenovo Legion Go | |
| Valve Steam Deck 1 TB OLED | |
| Final Fantasy XV Benchmark - 1920x1080 High Quality | |
| Ayaneo Kun | |
| ONEXPLAYER 2 Pro AR18 | |
| Average of class Handheld / UMPC (17.9 - 34.8, n=18, last 2 years) | |
| Asus ROG Ally Z1 Extreme | |
| Lenovo Legion Go | |
| MSI Claw | |
| Valve Steam Deck 1 TB OLED | |
| Strange Brigade - 1920x1080 ultra AA:ultra AF:16 | |
| Ayaneo Kun | |
| ONEXPLAYER 2 Pro AR18 | |
| Average of class Handheld / UMPC (32.8 - 58.8, n=19, last 2 years) | |
| Asus ROG Ally Z1 Extreme | |
| MSI Claw | |
| Lenovo Legion Go | |
| Valve Steam Deck 1 TB OLED | |
| Dota 2 Reborn - 1920x1080 ultra (3/3) best looking | |
| Lenovo Legion Go | |
| Asus ROG Ally Z1 Extreme | |
| Average of class Handheld / UMPC (30.8 - 85, n=18, last 2 years) | |
| MSI Claw | |
| ONEXPLAYER 2 Pro AR18 | |
| Ayaneo Kun | |
| Ayaneo Kun | |
| X-Plane 11.11 - 1920x1080 high (fps_test=3) | |
| MSI Claw | |
| Average of class Handheld / UMPC (22.7 - 50.5, n=18, last 2 years) | |
| Lenovo Legion Go | |
| Asus ROG Ally Z1 Extreme | |
| ONEXPLAYER 2 Pro AR18 | |
| Ayaneo Kun | |
| Ayaneo Kun | |
| Baldur's Gate 3 | |
| 1920x1080 Medium Preset AA:T | |
| Ayaneo Kun | |
| Asus ROG Ally Z1 Extreme | |
| Average of class Handheld / UMPC (15.7 - 39.8, n=18, last 2 years) | |
| Average Intel Arc 8-Core iGPU (16.3 - 31.1, n=27) | |
| MSI Claw | |
| 1920x1080 High Preset AA:T | |
| Ayaneo Kun | |
| Asus ROG Ally Z1 Extreme | |
| Average of class Handheld / UMPC (13.8 - 33.2, n=17, last 2 years) | |
| Average Intel Arc 8-Core iGPU (15.4 - 27.7, n=26) | |
| MSI Claw | |
Witcher 3 FPS diagram
Our Cyberpunk 2077 loop shows that the MSI handheld's gaming performance remains constant under longer periods of load. We additionally tested its gaming performance using the various energy profiles and have summarized our findings in the following table. The efficient mode Super Battery is well suited for older or less demanding games—otherwise, its performance is not enough.
| Game (1080p) | Super Battery | Balanced | AI | Extreme Performance |
|---|---|---|---|---|
| Witcher 3 (Ultra) | 20.7fps | 25.8fps | 25.6fps | 25.6fps |
| Far Cry 5 (Ultra) | 28fps | 32fps | 34fps | 33fps |
| Shadow of the Tomb Raider (Ultra) | 23fps | 27fps | 27fps | 26fps |
| GTA V (High) | 34.2fps | 40.8fps | 39.6fps | 39.6fps |
| Cyberpunk 2077 (Low) | 23.3fps | 31fps | 30.9fps | 31.1fps |
| Baldurs Gate 3 (Low) | 28.7fps | 33.1fps | 31.7fps | 33.3fps |
| low | med. | high | ultra | |
|---|---|---|---|---|
| GTA V (2015) | 158.1 | 147.9 | 39.6 | |
| The Witcher 3 (2015) | 135 | 51 | 25.6 | |
| Dota 2 Reborn (2015) | 98.6 | 84.1 | 67.4 | 63.6 |
| Final Fantasy XV Benchmark (2018) | 58.5 | 35.9 | 25.4 | |
| X-Plane 11.11 (2018) | 51.6 | 45.1 | 38.9 | |
| Far Cry 5 (2018) | 67 | 40 | 37 | 34 |
| Strange Brigade (2018) | 163 | 71 | 59 | 46 |
| Shadow of the Tomb Raider (2018) | 69 | 33 | 31 | 27 |
| F1 23 (2023) | 64.4 | 59.4 | 41.2 | |
| Baldur's Gate 3 (2023) | 31.7 | 24.8 | 20.7 | 20.3 |
| Cyberpunk 2077 (2023) | 30.9 | 25.3 | 21.9 | 19.8 |
| Horizon Forbidden West (2024) | 52 | 34 | 29 | 25 |
Emissions - Annoying fans
Noise emissions
The cooling unit consisting of two fans manages to maintain the Intel processor's high power limits, but the result is a gaming handheld with fans that run practically constantly—even when using the most efficient mode. It is relatively rare that the fans are actually deactivated and normally, there is always a hissing noise—even when the handheld is idling. The situation gets even worse under load and the MSI Claw is then one of the loudest devices. We measured 45-48 dB(A) while gaming and still just under 37 dB(A) when using the most efficient Super Battery mode (20-watt TDP).
| Energy profile | Cyberpunk 2077 Phantom Liberty | Stress test | max. battery operation |
|---|---|---|---|
| Super Battery | 36.6 dB(A) | 36.6 dB(A) | 36.6 dB(A) |
| Balanced | 45.5 dB(A) | 45.5 dB(A) | 45.5 dB(A) |
| AI | 45.5 dB(A) | 45.5 dB(A) | 45.5 dB(A) |
| Extreme Performance | 48.5 dB(A) | 48.5 dB(A) | 46.3 dB(A) |
Noise level
| Idle |
| 25.7 / 31.7 / 31.7 dB(A) |
| Load |
| 36.6 / 45.5 dB(A) |
 | ||
30 dB silent 40 dB(A) audible 50 dB(A) loud |
||
min: | ||
| MSI Claw Arc 8-Core, Ultra 7 155H, Kioxia BG5 KBG50ZNS1T02 | Valve Steam Deck 1 TB OLED Radeon Radeon Steam Deck 8CU, Steam Deck OLED APU, Phison ESMP001TKB5C3 | Lenovo Legion Go Radeon 780M, Z1 Extreme, WD PC SN740 512GB SDDPMQD-512G-1101 | Asus ROG Ally Z1 Extreme Radeon 780M, Z1 Extreme, Micron 2400 MTFDKBK512QFM | ONEXPLAYER 2 Pro AR18 Radeon 780M, R7 7840U | Ayaneo Kun Radeon 780M, R7 7840U, Phison M.2 2280 E18 4000GB | |
|---|---|---|---|---|---|---|
| Noise | 12% | 15% | 11% | 9% | 1% | |
| off / environment * (dB) | 25.7 | 24.7 4% | 23 11% | 23.3 9% | 24.4 5% | |
| Idle Minimum * (dB) | 25.7 | 25 3% | 23 11% | 23.3 9% | 24.4 5% | 25.31 2% |
| Idle Average * (dB) | 31.7 | 25 21% | 23 27% | 23.3 26% | 24.4 23% | 25.31 20% |
| Idle Maximum * (dB) | 31.7 | 25 21% | 25 21% | 27.3 14% | 30.6 3% | 34.5 -9% |
| Load Average * (dB) | 36.6 | 31.3 14% | 37 -1% | 39.2 -7% | 36 2% | 34.9 5% |
| Cyberpunk 2077 ultra * (dB) | 45.5 | |||||
| Load Maximum * (dB) | 45.5 | 40.8 10% | 37 19% | 39.2 14% | 39.3 14% | 50.78 -12% |
| Witcher 3 ultra * (dB) | 46 | 39.2 |
* ... smaller is better
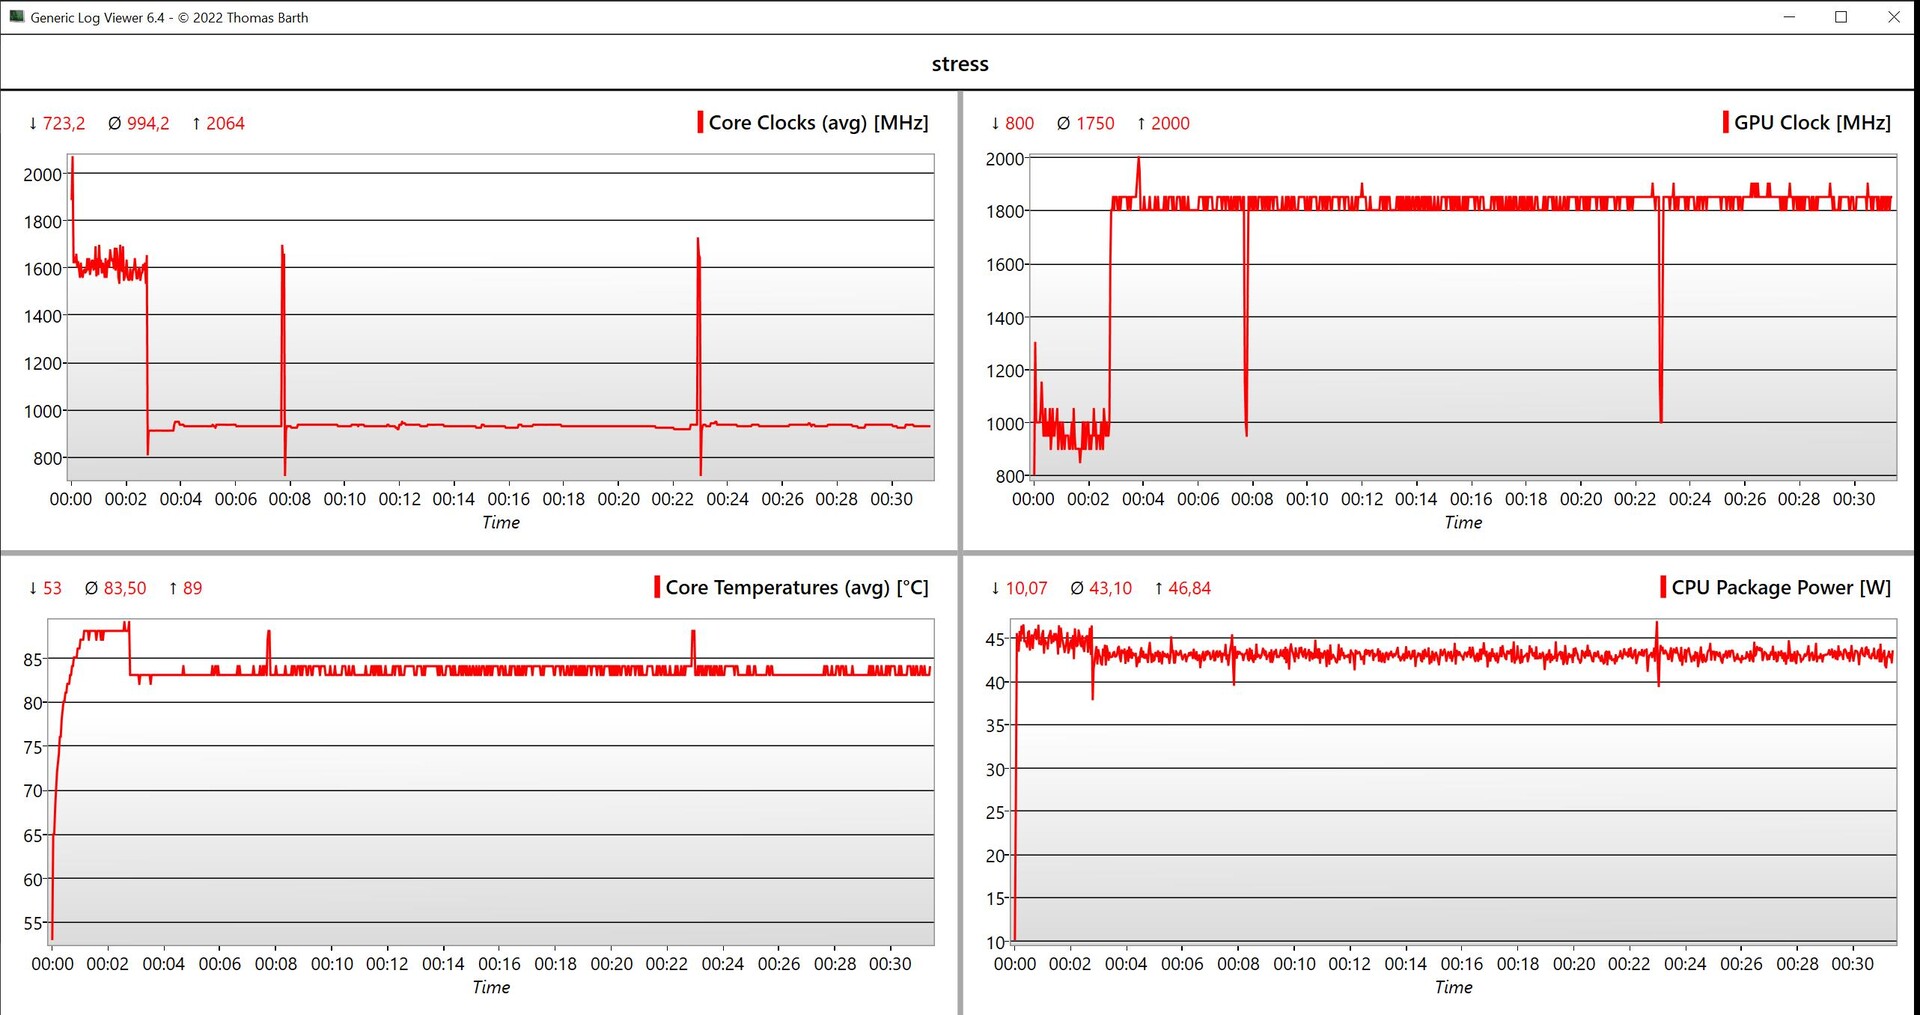
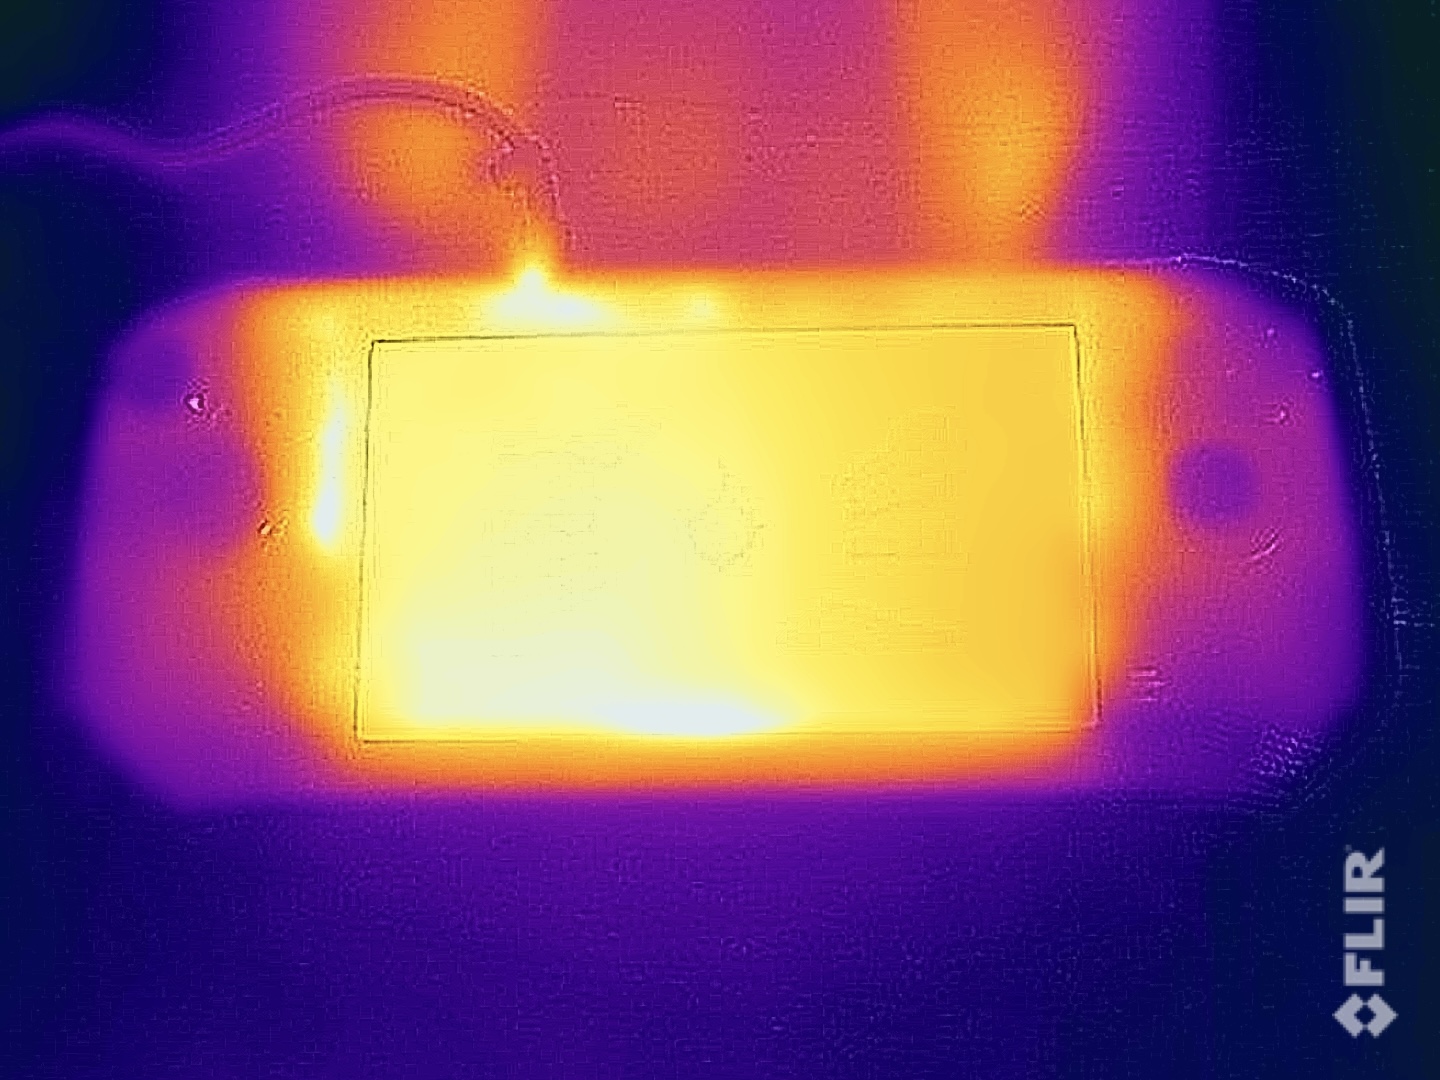
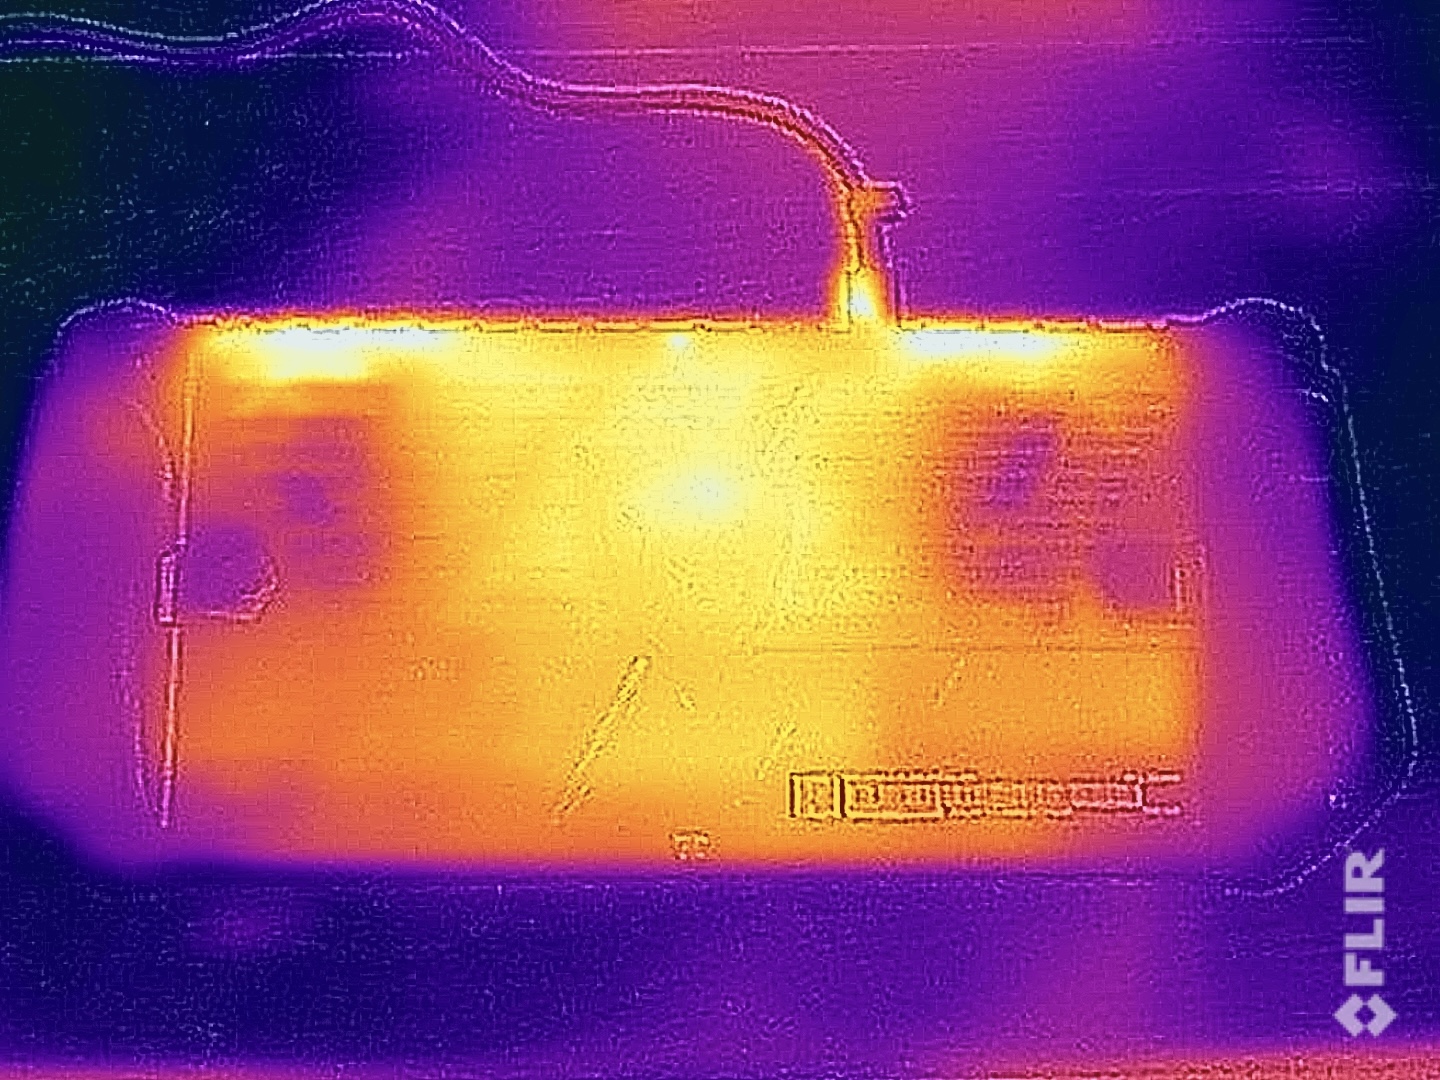
Temperature

The middle area of the Claw heats up considerably, but this doesn't matter because the grips stay nice and cool at all times and we noted no restrictions when playing games. The fan outlets are located on the top and are therefore not in the way. During the stress test, the processor briefly operated at 45 watts and then stabilized at 43 watts.
(±) The maximum temperature on the upper side is 41.8 °C / 107 F, compared to the average of 38 °C / 100 F, ranging from 26.6 to 55 °C for the class Handheld / UMPC.
(+) The bottom heats up to a maximum of 35.9 °C / 97 F, compared to the average of 37.1 °C / 99 F
(+) In idle usage, the average temperature for the upper side is 30.9 °C / 88 F, compared to the device average of 32.8 °C / 91 F.
(-) 3: The average temperature for the upper side is 39.9 °C / 104 F, compared to the average of 32.8 °C / 91 F for the class Handheld / UMPC.
(-) The palmrests and touchpad can get very hot to the touch with a maximum of 41.8 °C / 107.2 F.
(-) The average temperature of the palmrest area of similar devices was 32.2 °C / 90 F (-9.6 °C / -17.2 F).
Speakers
The two stereo speakers on the front do a pretty good job and get very loud. However, it is still difficult to block out the constant fan noise when playing games. The sound is clear but it lacks some punch, which is also the case with the other handhelds. The ROG Ally is on a comparable level, but Valve's Steam Deck OLED performs slightly better.
MSI Claw audio analysis
(+) | speakers can play relatively loud (87.2 dB)
Bass 100 - 315 Hz
(-) | nearly no bass - on average 17.2% lower than median
(±) | linearity of bass is average (9.2% delta to prev. frequency)
Mids 400 - 2000 Hz
(+) | balanced mids - only 4.3% away from median
(+) | mids are linear (4.3% delta to prev. frequency)
Highs 2 - 16 kHz
(+) | balanced highs - only 3.7% away from median
(+) | highs are linear (4.5% delta to prev. frequency)
Overall 100 - 16.000 Hz
(+) | overall sound is linear (14.9% difference to median)
Compared to same class
» 26% of all tested devices in this class were better, 9% similar, 65% worse
» The best had a delta of 12%, average was 17%, worst was 23%
Compared to all devices tested
» 20% of all tested devices were better, 4% similar, 76% worse
» The best had a delta of 4%, average was 24%, worst was 134%
Asus ROG Ally Z1 Extreme audio analysis
(+) | speakers can play relatively loud (82.1 dB)
Bass 100 - 315 Hz
(-) | nearly no bass - on average 15.5% lower than median
(±) | linearity of bass is average (8.4% delta to prev. frequency)
Mids 400 - 2000 Hz
(+) | balanced mids - only 3.1% away from median
(+) | mids are linear (3% delta to prev. frequency)
Highs 2 - 16 kHz
(+) | balanced highs - only 1.9% away from median
(+) | highs are linear (2.3% delta to prev. frequency)
Overall 100 - 16.000 Hz
(+) | overall sound is linear (13.5% difference to median)
Compared to same class
» 29% of all tested devices in this class were better, 4% similar, 67% worse
» The best had a delta of 5%, average was 17%, worst was 45%
Compared to all devices tested
» 14% of all tested devices were better, 4% similar, 82% worse
» The best had a delta of 4%, average was 24%, worst was 134%
Lenovo Legion Go audio analysis
(±) | speaker loudness is average but good (73.1 dB)
Bass 100 - 315 Hz
(-) | nearly no bass - on average 16.4% lower than median
(±) | linearity of bass is average (8.1% delta to prev. frequency)
Mids 400 - 2000 Hz
(±) | higher mids - on average 5.2% higher than median
(+) | mids are linear (6% delta to prev. frequency)
Highs 2 - 16 kHz
(±) | higher highs - on average 5.7% higher than median
(±) | linearity of highs is average (9.7% delta to prev. frequency)
Overall 100 - 16.000 Hz
(±) | linearity of overall sound is average (22.7% difference to median)
Compared to same class
» 91% of all tested devices in this class were better, 4% similar, 4% worse
» The best had a delta of 12%, average was 17%, worst was 23%
Compared to all devices tested
» 67% of all tested devices were better, 6% similar, 27% worse
» The best had a delta of 4%, average was 24%, worst was 134%
Valve Steam Deck 1 TB OLED audio analysis
(+) | speakers can play relatively loud (82.7 dB)
Bass 100 - 315 Hz
(-) | nearly no bass - on average 22% lower than median
(±) | linearity of bass is average (14.7% delta to prev. frequency)
Mids 400 - 2000 Hz
(+) | balanced mids - only 1% away from median
(+) | mids are linear (2.1% delta to prev. frequency)
Highs 2 - 16 kHz
(+) | balanced highs - only 1.9% away from median
(+) | highs are linear (6.1% delta to prev. frequency)
Overall 100 - 16.000 Hz
(+) | overall sound is linear (12.9% difference to median)
Compared to same class
» 13% of all tested devices in this class were better, 9% similar, 78% worse
» The best had a delta of 12%, average was 17%, worst was 23%
Compared to all devices tested
» 12% of all tested devices were better, 3% similar, 85% worse
» The best had a delta of 4%, average was 24%, worst was 134%
Power management - Short battery life
Power consumption
MSI's gaming handheld isn't particularly efficient. At full brightness, the test device already uses 12 watts when idling. During the stress test, it only reached 65 watts momentarily before balancing out at around 54 watts after several seconds. When gaming, it also reaches around 55 watts, so the included 65-watt power supply is powerful enough.
| Off / Standby | |
| Idle | |
| Load |
|
Key:
min: | |
| MSI Claw Ultra 7 155H, Arc 8-Core, Kioxia BG5 KBG50ZNS1T02, IPS, 1920x1080, 7" | Valve Steam Deck 1 TB OLED Steam Deck OLED APU, Radeon Radeon Steam Deck 8CU, Phison ESMP001TKB5C3, OLED, 1280x800, 7.4" | Lenovo Legion Go Z1 Extreme, Radeon 780M, WD PC SN740 512GB SDDPMQD-512G-1101, IPS, 2560x1600, 8.8" | Asus ROG Ally Z1 Extreme Z1 Extreme, Radeon 780M, Micron 2400 MTFDKBK512QFM, IPS, 1920x1080, 7" | ONEXPLAYER 2 Pro AR18 R7 7840U, Radeon 780M, , IPS, 2560x1600, 8.4" | Ayaneo Kun R7 7840U, Radeon 780M, Phison M.2 2280 E18 4000GB, IPS, 2560x1600, 8.4" | Average Intel Arc 8-Core iGPU | Average of class Handheld / UMPC | |
|---|---|---|---|---|---|---|---|---|
| Power Consumption | 42% | -13% | 26% | 16% | -58% | 5% | 18% | |
| Idle Minimum * (Watt) | 7.8 | 4.5 42% | 11.5 -47% | 4.2 46% | 6.66 15% | 14 -79% | 5.36 ? 31% | 6.01 ? 23% |
| Idle Average * (Watt) | 11.5 | 7.21 37% | 12 -4% | 6.1 47% | 7.11 38% | 17.56 -53% | 8.53 ? 26% | 8.41 ? 27% |
| Idle Maximum * (Watt) | 11.8 | 9.66 18% | 17.4 -47% | 6.3 47% | 11.7 1% | 27 -129% | 11.8 ? -0% | 10.3 ? 13% |
| Load Average * (Watt) | 53.1 | 22.86 57% | 45 15% | 56.6 -7% | 46.708 12% | 38.1 28% | 53.7 ? -1% | 44.6 ? 16% |
| Cyberpunk 2077 ultra * (Watt) | 54.4 | |||||||
| Load Maximum * (Watt) | 64.6 | 27.8 57% | 54 16% | 67.2 -4% | 56.7 12% | 101 -56% | 84.4 ? -31% | 58.6 ? 9% |
| Witcher 3 ultra * (Watt) | 42.6 | 64.1 | 53.1 | 83.5 |
* ... smaller is better
Power consumption Witcher 3 / stress test
Runtimes
MSI has installed a 53-Wh battery into the device, so we of course carried out our normal battery tests. During the WLAN test, the two competitors were still on par but in the video test, the Claw handheld had to admit defeat to the ROG Ally with the significantly smaller battery. Much more important, on the other hand, is its battery life when playing games and here, the test ended after around 80 minutes when playing AAA titles. You can play a little longer using Super Battery mode (20-watt TDP), but then you have to reduce the resolution and details further and games like Cyberpunk 2077 no longer run smoothly even in 1080p with low details. For emulators, on the other hand, we would have liked to be able to manually reduce the TDP further in order to make runtimes of several hours possible. It takes 106 minutes to charge the device fully with it switched on; 80 % is available again after around an hour.
| MSI Claw Ultra 7 155H, Arc 8-Core, 53 Wh | Valve Steam Deck 1 TB OLED Steam Deck OLED APU, Radeon Radeon Steam Deck 8CU, 50 Wh | Lenovo Legion Go Z1 Extreme, Radeon 780M, 49.2 Wh | Asus ROG Ally Z1 Extreme Z1 Extreme, Radeon 780M, 40 Wh | ONEXPLAYER 2 Pro AR18 R7 7840U, Radeon 780M, 65 Wh | Ayaneo Kun R7 7840U, Radeon 780M, 75 Wh | Average of class Handheld / UMPC | |
|---|---|---|---|---|---|---|---|
| Battery runtime | 19% | -23% | 4% | 38% | -5% | 66% | |
| H.264 (h) | 8.8 | 9.5 8% | 19.6 ? 123% | ||||
| WiFi v1.3 (h) | 7.8 | 9.3 19% | 6 -23% | 7.8 0% | 10.8 38% | 10 28% | 11.9 ? 53% |
| Cyberpunk 2077 ultra 150cd (h) | 1.3 | ||||||
| Load (h) | 1.3 | 0.8 -38% | 1.592 ? 22% | ||||
| Witcher 3 ultra (h) | 1 | 1.2 | 1.7 |
Pros
Cons
Verdict - The MSI Claw suffers as a result of the Intel Meteor Lake processor

The MSI Claw gaming handheld wasn't able to impress us during our thorough test. In general, its concept is similar to that of the Asus ROG Ally with its 7-inch display, which was released over a year ago. However, MSI hasn't gone for a chip from AMD—instead, it relies on an Intel Meteor Lake processor. This brings a few problems and shows why other manufacturers haven't taken the same route. Despite its higher power consumption, its gaming performance is slightly worse than on other AMD handhelds and at the same time, its cooling unit has its work cut out for it. The fans are practically always active and in total, the Claw is one of the loudest handhelds on the market.
In other fields such as its joysticks/buttons and its gaming software, on the other hand, the MSI Claw left a good impression on us. Its screen is good overall, but an additional USB connection would've been beneficial. In theory, its M.2 2230 SSD can be swapped out but in order to do so, you would have to take apart the entire case and when putting it back together, you'd even have to reapply some new thermal paste.
The MSI Claw gaming handheld impressively demonstrates that the current Intel CPUs are not suitable for gaming handhelds. Due to its weaker gaming performance compared to the AMD competition as well as its higher price, the Intel handheld is not worthy of our recommendation.
It seems that MSI has already identified this problem and only three months after the release of the Claw, it has already announced its successor, which will be fitted with a larger display in combination with a more efficient Intel Lunar Lake processor and a faster iGPU. However, it will take a good few months before this model is released.
Due to its high price of over US$800, it makes absolutely no sense to go for the Claw handheld. The larger Legion Go costs only US$750 (with the smaller SSD) and even the ROG Ally can already be found for below US$700. Furthermore, its successor—the ROG Ally X—is already being brought out next month, and it will feature significant improvements (more comfortable case, 80-Wh battery, 1-TB M.2 2280 SSD, 24 GB RAM, 2x USB) for just under US$1,000. The latest Steam Deck OLED with a 1-TB SSD is a lot cheaper too, costing around US$630.
Update: There was a bug with our new rating system, which has been corrected. The overall score in the category Handheld / UMPC is increased from 69 to 77 %.
Price and availability
Currently, our test configuration of the MSI Claw but with a 512-GB SSD can be purchased from Amazon for a reduced price of US$649.
Note: We have recently updated our rating system and the results of version 8 are not comparable with the results of version 7. More information is available here .
MSI Claw
- 06/19/2024 v8
Andreas Osthoff
Transparency
The selection of devices to be reviewed is made by our editorial team. The test sample was provided to the author as a loan by the manufacturer or retailer for the purpose of this review. The lender had no influence on this review, nor did the manufacturer receive a copy of this review before publication. There was no obligation to publish this review. As an independent media company, Notebookcheck is not subjected to the authority of manufacturers, retailers or publishers.
This is how Notebookcheck is testing
Every year, Notebookcheck independently reviews hundreds of laptops and smartphones using standardized procedures to ensure that all results are comparable. We have continuously developed our test methods for around 20 years and set industry standards in the process. In our test labs, high-quality measuring equipment is utilized by experienced technicians and editors. These tests involve a multi-stage validation process. Our complex rating system is based on hundreds of well-founded measurements and benchmarks, which maintains objectivity. Further information on our test methods can be found here.
Price comparison

