Lenovo Legion Go gaming handheld review: Good idea, not quite perfectly executed

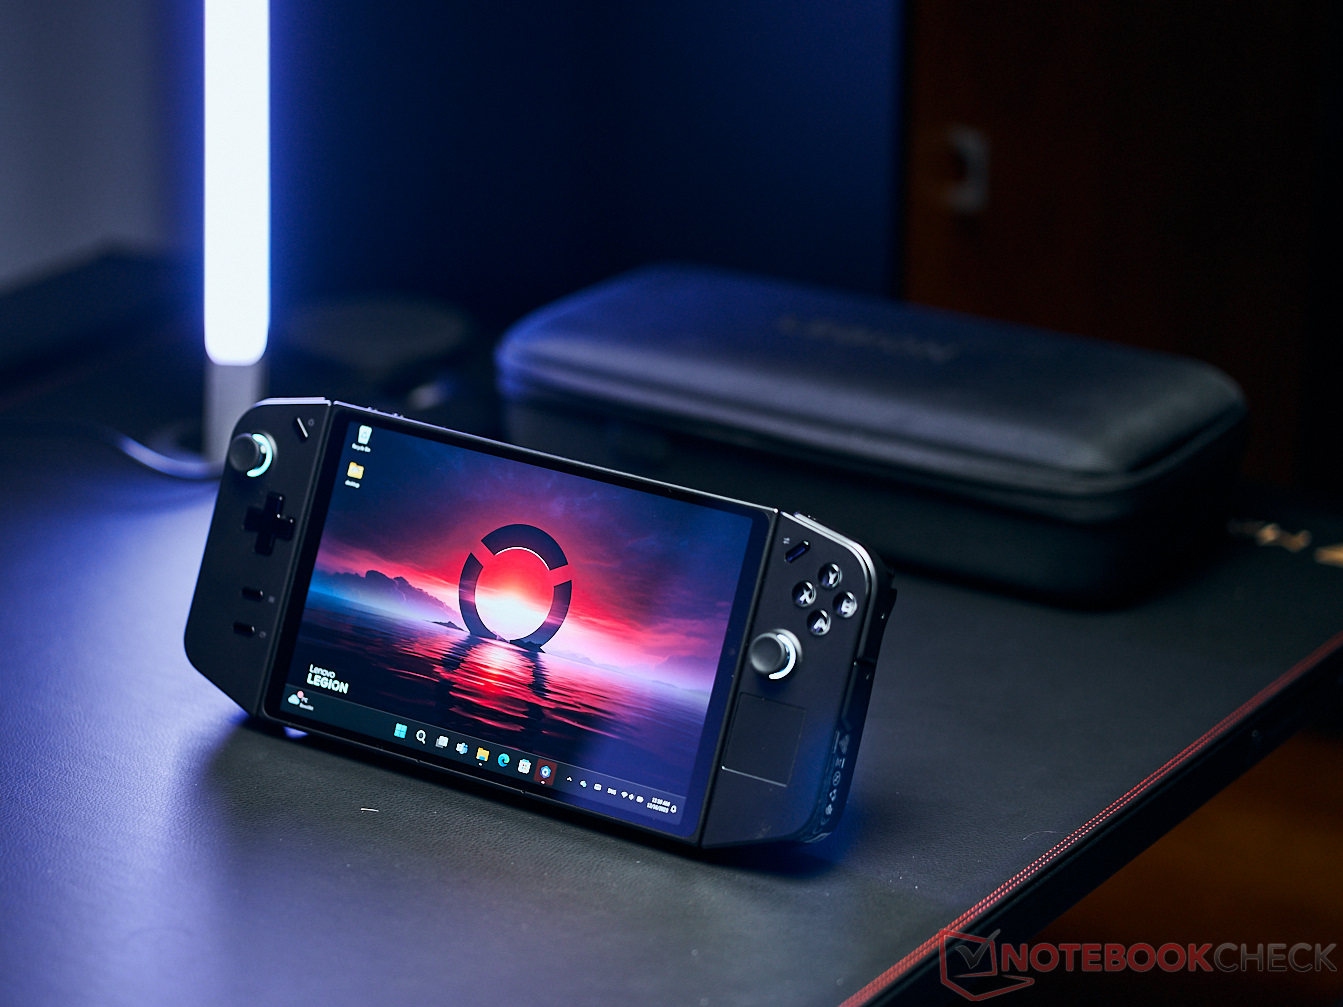
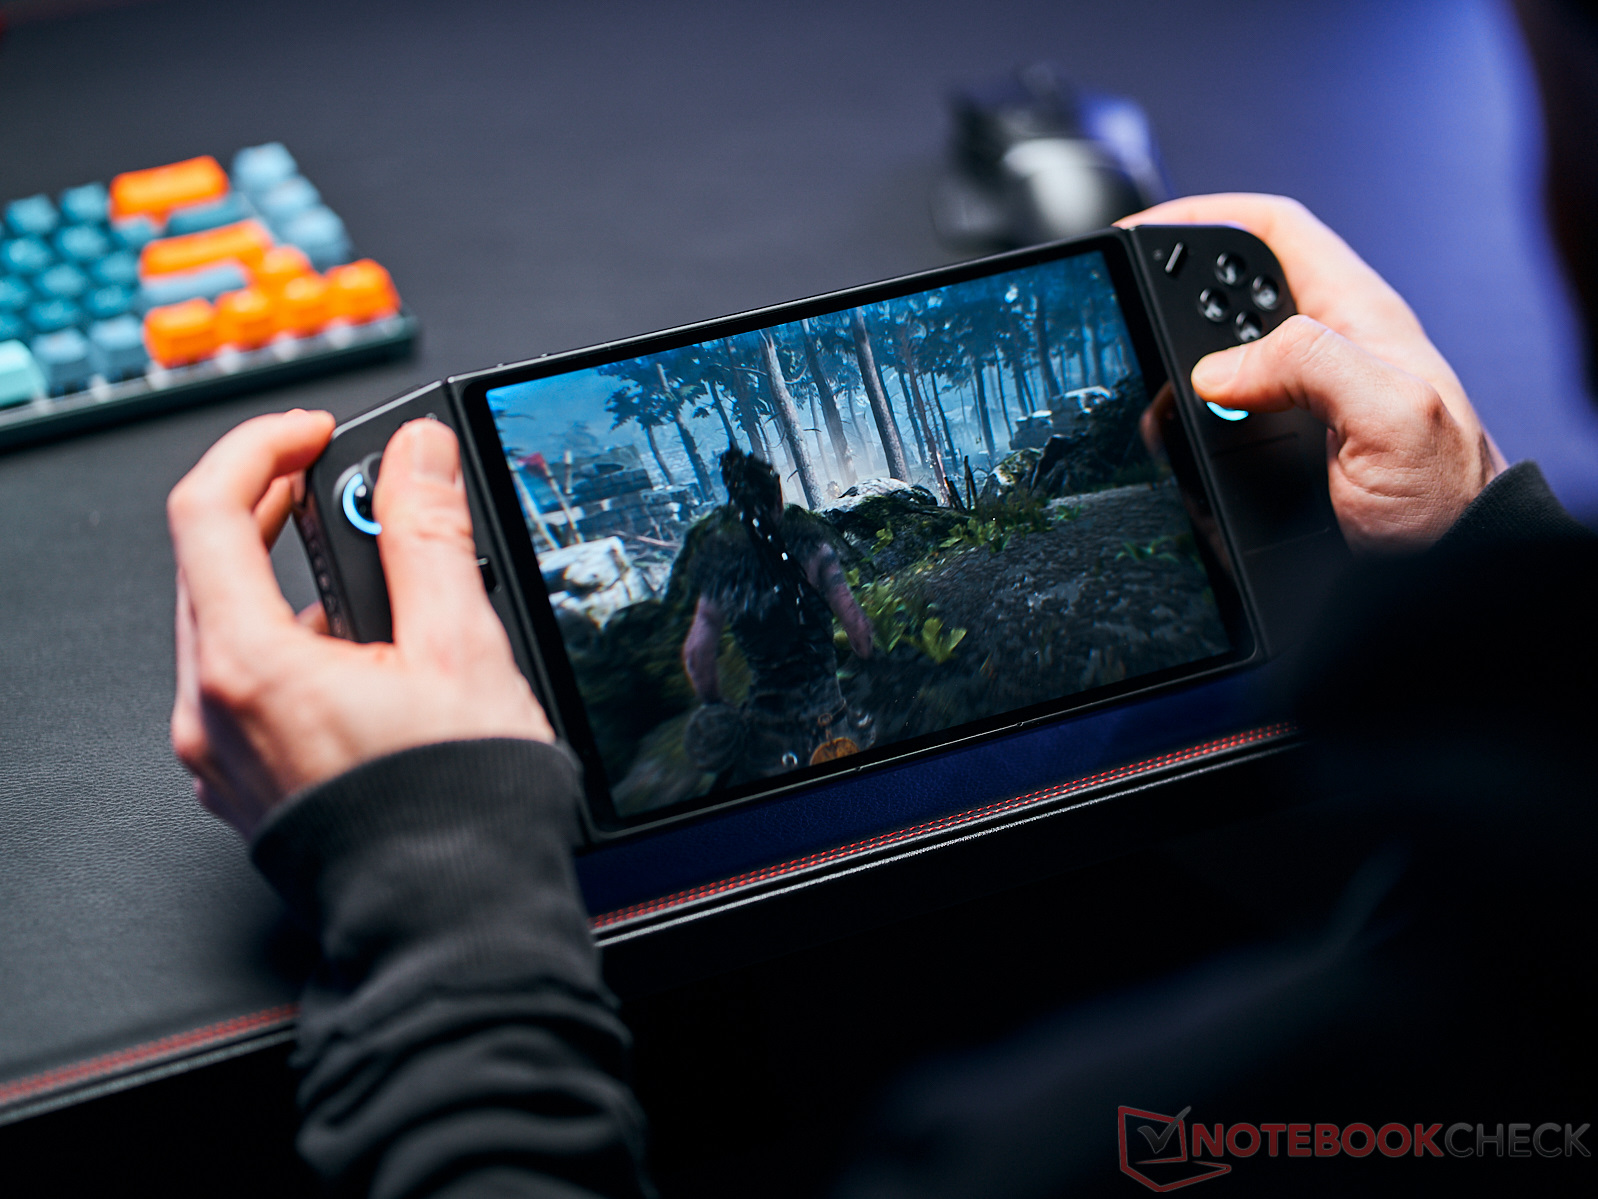
The AMD Z1 Extreme and the AMD Ryzen 7 7840U have brought a breath of fresh air into the world of gaming-handheld development. What Valve started with its Steam Deck is now running full steam ahead. As a result, the Legion Go is entering a market filled to the brim with strong competition. Even so, Lenovo offers a lot of interesting features which aim to help the gaming handheld stand out from the masses. Thanks to its detachable controllers, the Legion Go can also be used as a tablet. In doing so, an integrated kickstand keeps the device steady. However, the controllers' FPS mode is the real star of the show. FPS stands for first-person shooter. This means that the right controller half becomes a mouse and the keys of a Windows keyboard are mirrored on the left half. Supposedly, this should evoke feelings of desktop gaming. If you don't want to control a game using the two controllers, then you can simply switch to using them like a mouse and keyboard. Additionally, the Legion Go boasts a high-res 144-Hz display.
But in practical use, not everything attempted by the manufacturer works as intended. Many small weaknesses could add up to make one of its competitor devices seem the more attractive choice. We recently tested the Ayaneo Air 1S, the Asus ROG Ally Z1 Extreme and the OneXPlayer 2 which are also very strong handhelds. The latter also features wireless controllers similar to the Legion Go.
Possible competitors compared
Rating | Date | Model | Weight | Height | Size | Resolution | Price |
|---|---|---|---|---|---|---|---|
| 66.3 % | 01 / 2024 | Lenovo Legion Go Z1 Extreme, Radeon 780M | 845 g | 41 mm | 8.80" | 2560x1600 | |
| 88.2 % v7 (old) | 10 / 2023 | Ayaneo Air 1S Retro Power R7 7840U, Radeon 780M | 443.8 g | 21 mm | 5.50" | 1920x1080 | |
| 87.5 % v7 (old) | 05 / 2023 | Asus ROG Ally Z1 Extreme Z1 Extreme, Radeon 780M | 611 g | 21.22 mm | 7.00" | 1920x1080 | |
| 84 % v7 (old) | 07 / 2023 | One Netbook XPlayer 2 R7 6800U, Radeon 680M | 864 g | 23 mm | 8.40" | 2560x1600 | |
v (old) | 05 / 2023 | Asus ROG Zephyrus G14 GA402XY R9 7940HS, Radeon 780M | 14.00" | 2560x1600 | |||
| 80.1 % v7 (old) | 09 / 2023 | Aokzoe A1 R7 6800U, Radeon 680M | 735 g | 21 mm | 8.00" | 1920x1200 |
Case - The Legion Go is clad in black plastic
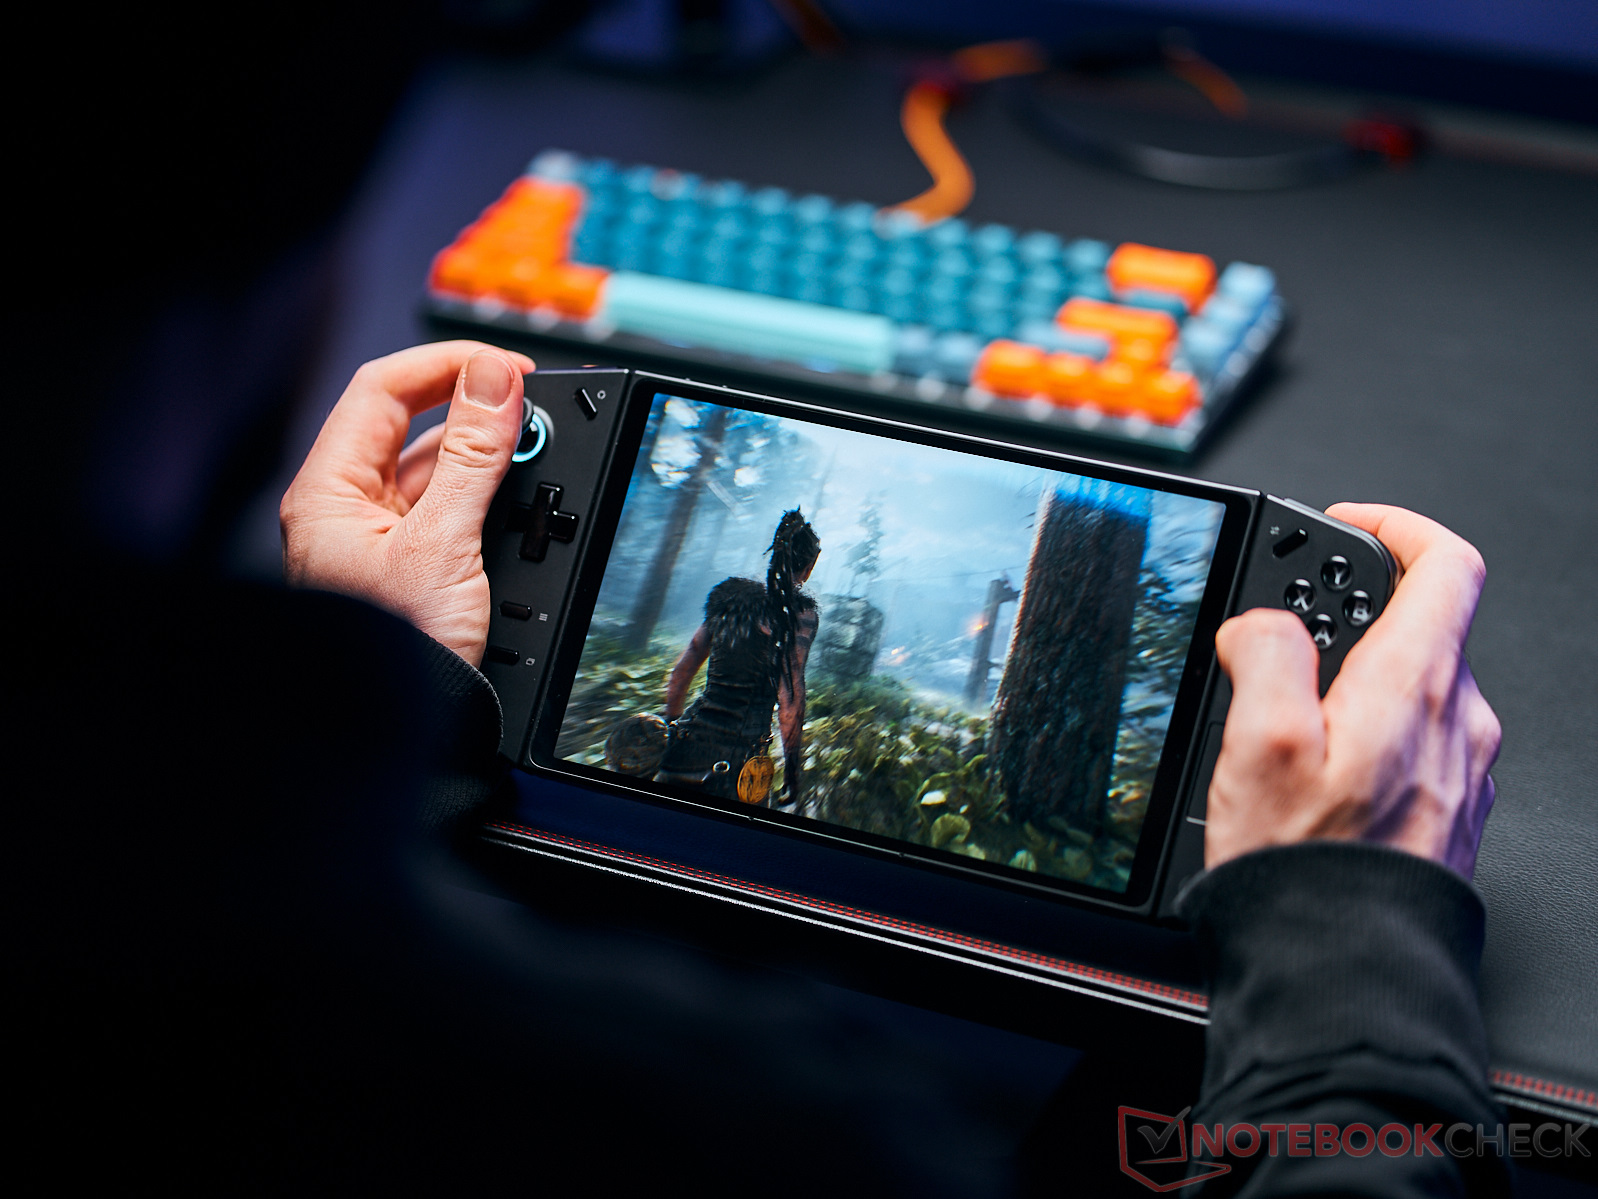
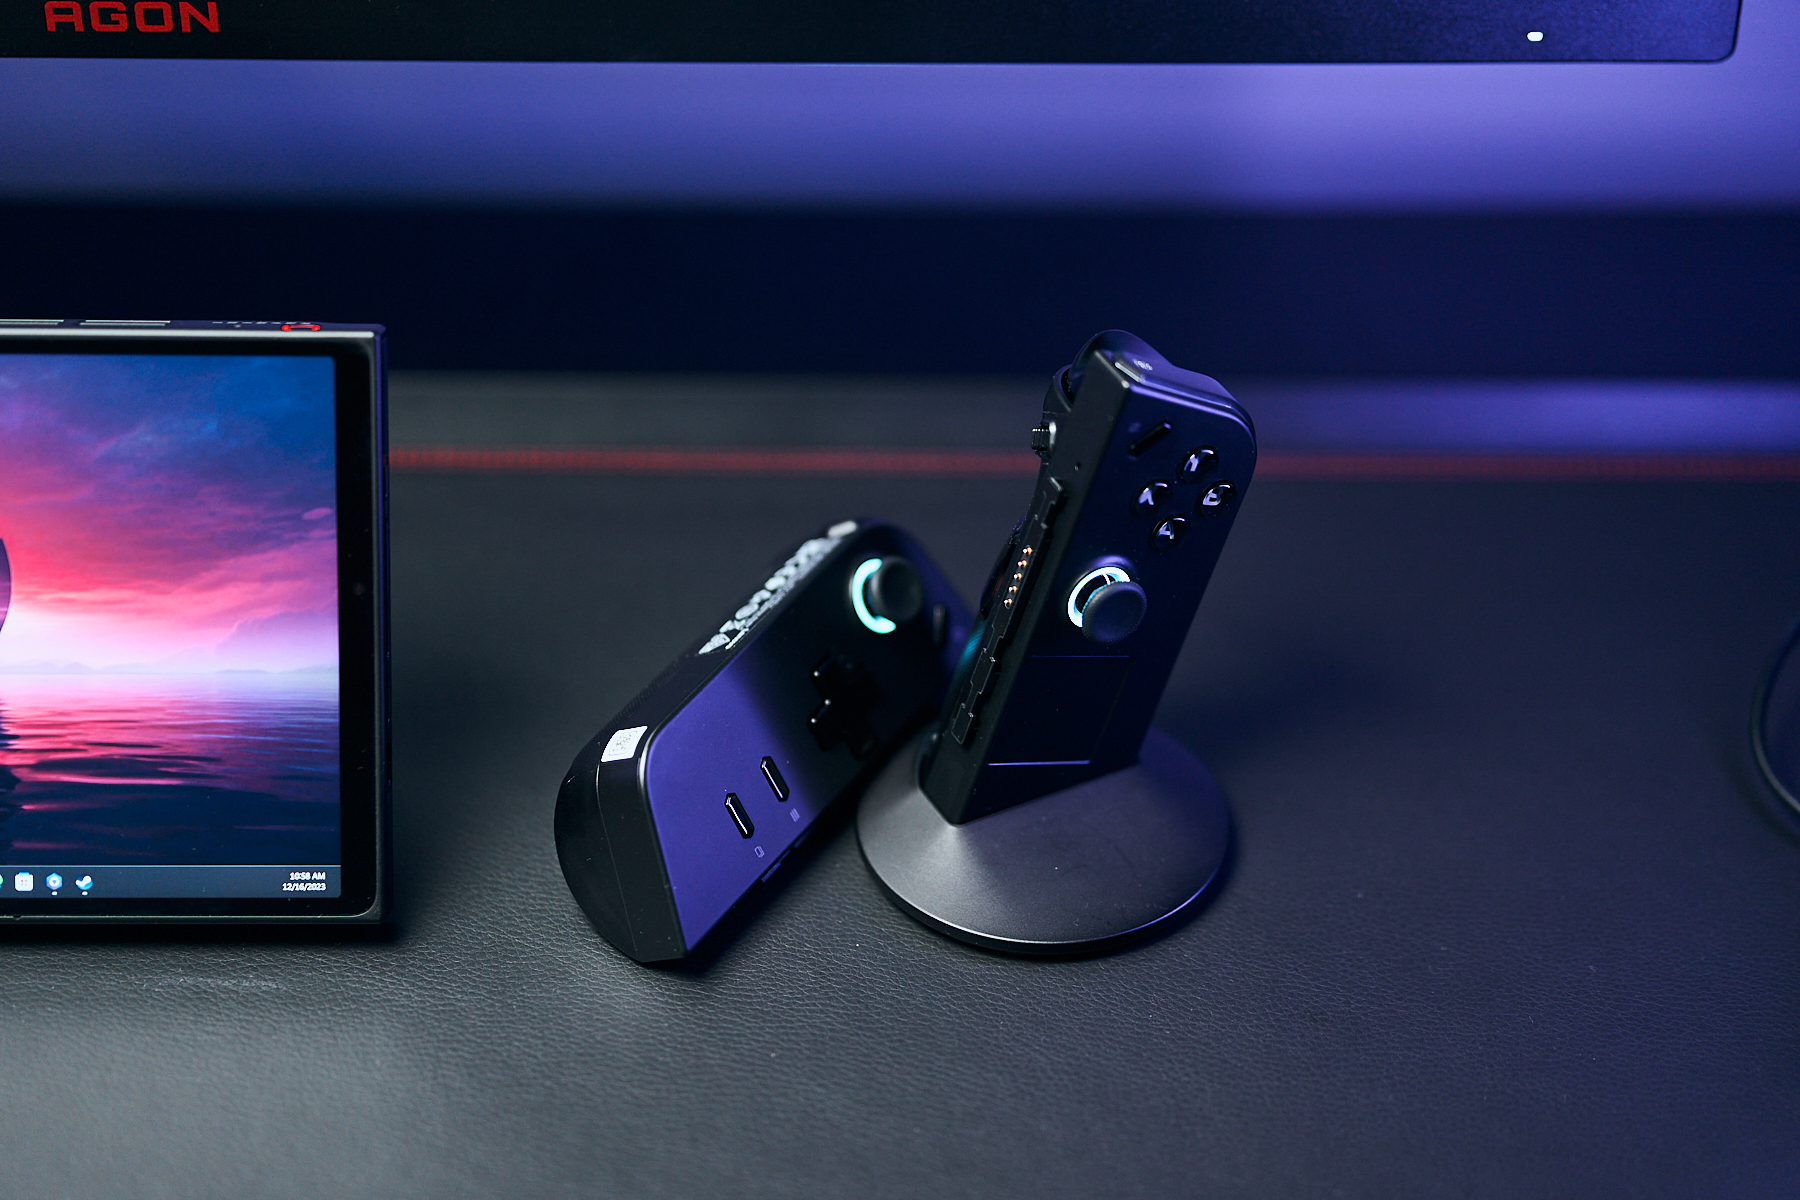
The Lenovo Legion Go's 8.8-inch display makes it one of the biggest gaming handhelds on the market. The left and right controller halves can be detached. Both feel nice to hold—on their own and also attached to the tablet. However, it weighs quite a bit in total. At 855 grams, playing games might soon feel like a bit of a workout. If you have a table in front of you, you can thankfully just hold both of the controller halves in your hands, making gaming feel much easier.
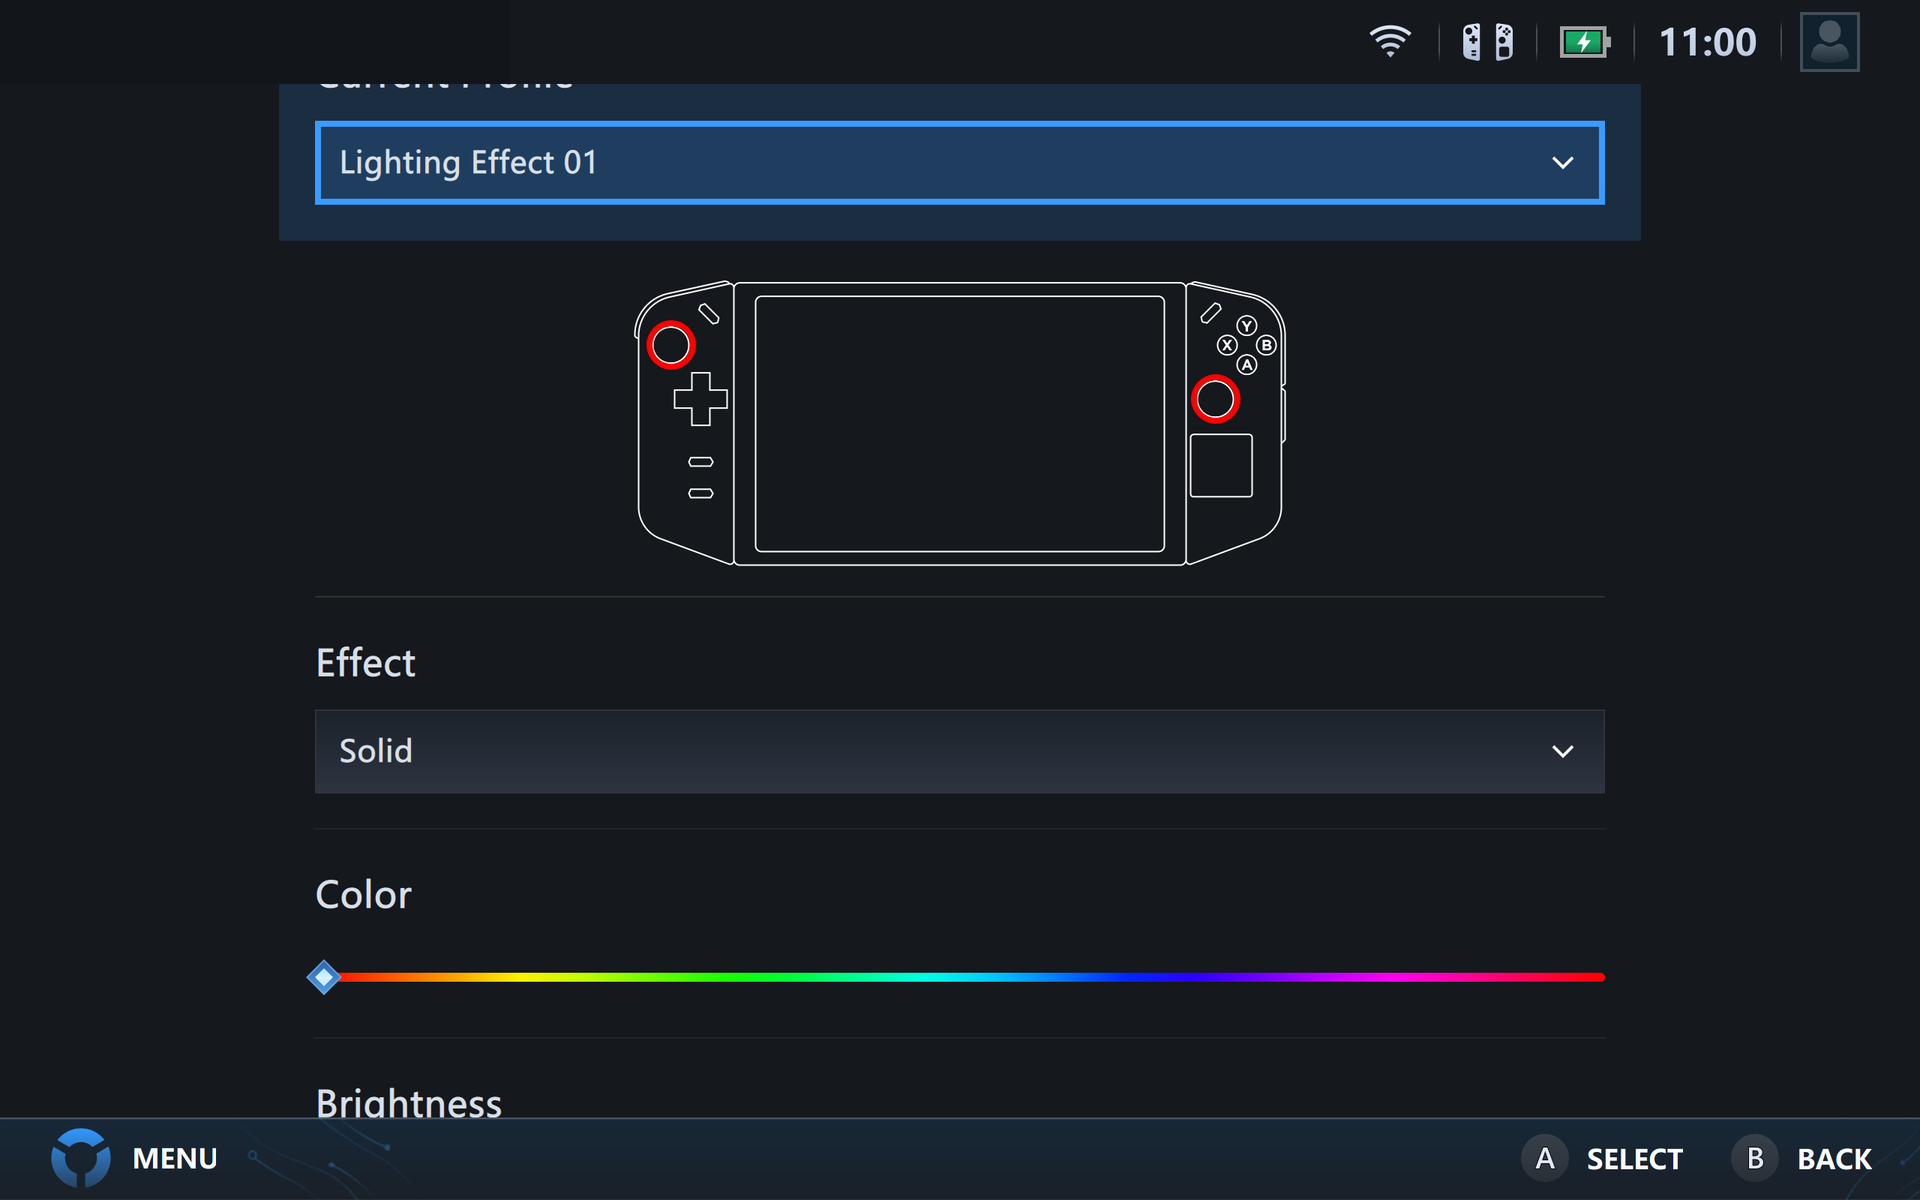
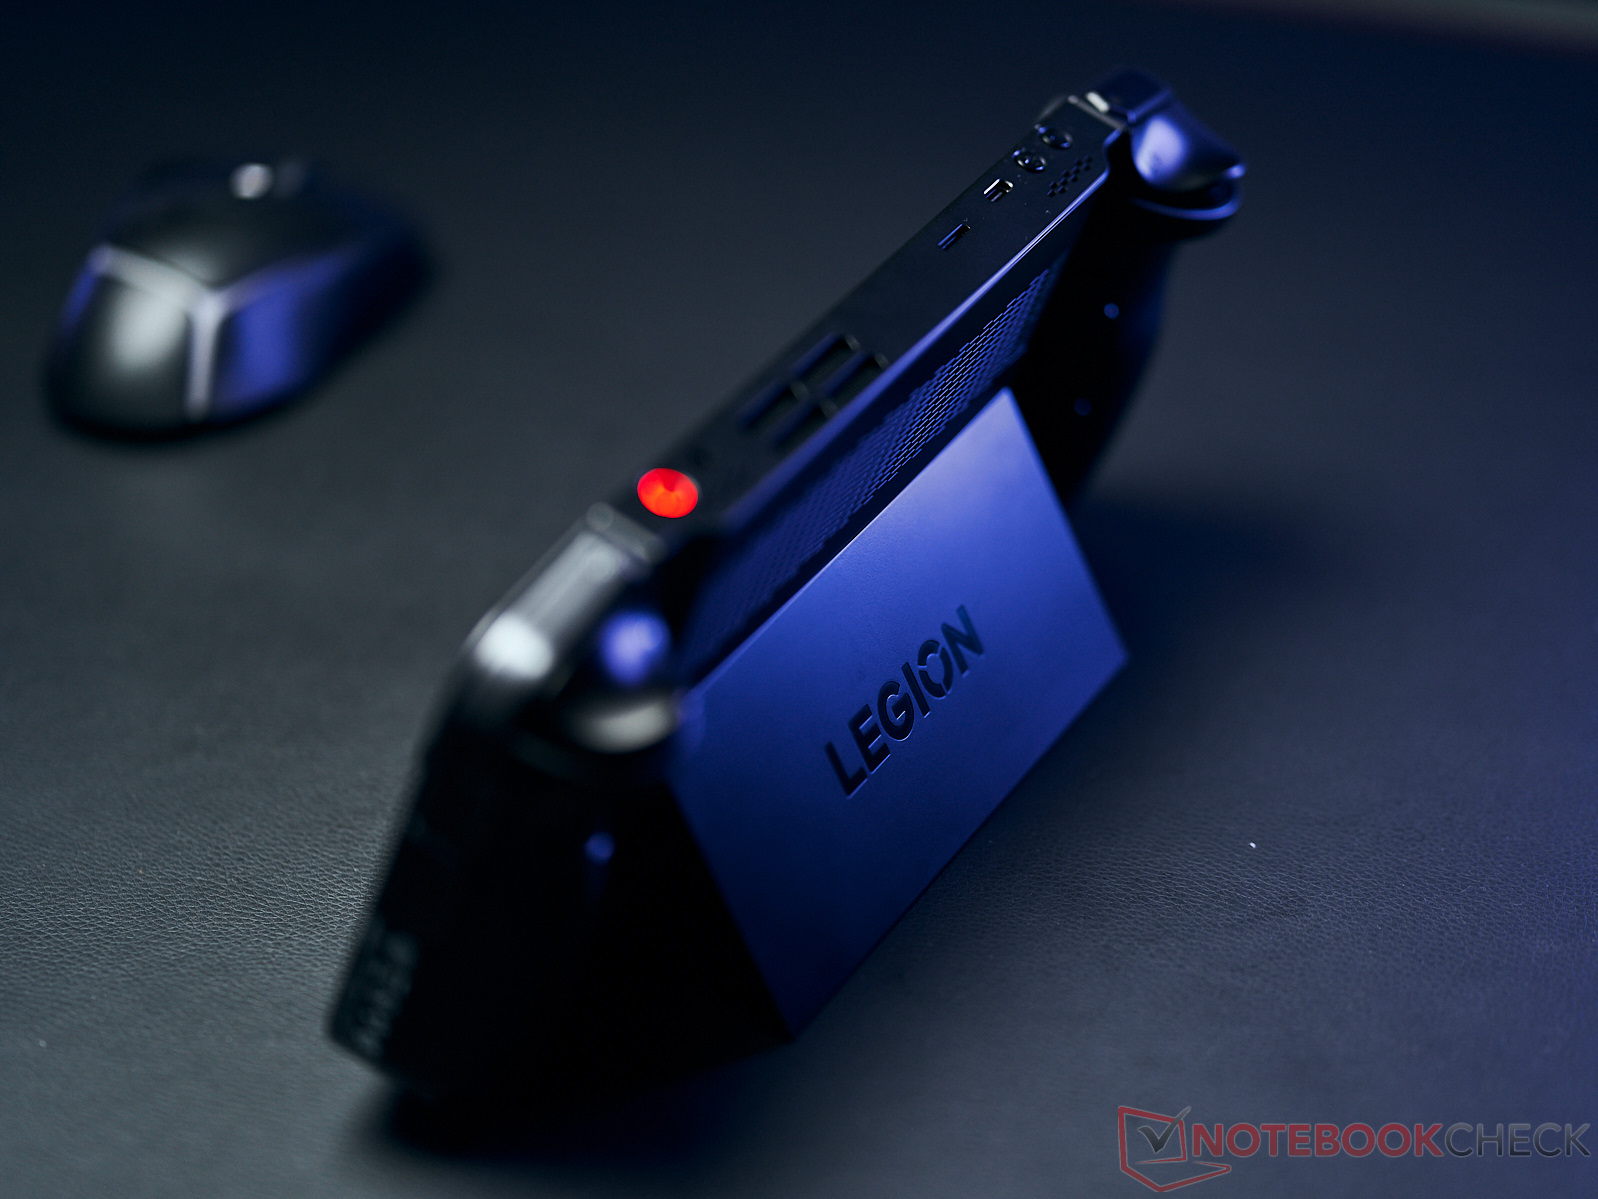
Lenovo has included some RGB lighting in its on/off button as well as around the controllers' thumb sticks. Users can adjust the lighting via Legion Space and you can optionally set it to provide information on the device's charging status or other status updates.
The various case components are made from black plastic. Only the screen is protected by a plate of glass. If both controllers are connected properly, nothing appears loose and the device feels as if it has been cast from a single mould. The tablet element itself is stable as well. Using the integrated stand, the device can be held securely at lots of different angles. However, as the kickstand is only made from thin plastic, it can be bent ever so slightly. As a result, we would advise holding it in the middle when folding the stand outward.
The Legion Go weighs about 855 grams, making it considerably heavier than the Asus ROG Ally or the small Ayaneo Air 1S. The tablet itself weighs 641 grams, while the left controller weighs 99 grams, and the right one weighs 115 grams without the FPS ring and 146 grams with the ring included. The scope of delivery includes a soft-shell case and if the handheld is transported within this, it adds another 400 grams to the scales. In total, this means you'll be lugging around 1.3 kg with you—and that doesn't include the power supply.
One thing should be made clear: The Legion Go has the biggest screen with the comparison field. Of course, its detachable controllers also add a certain amount of weight.
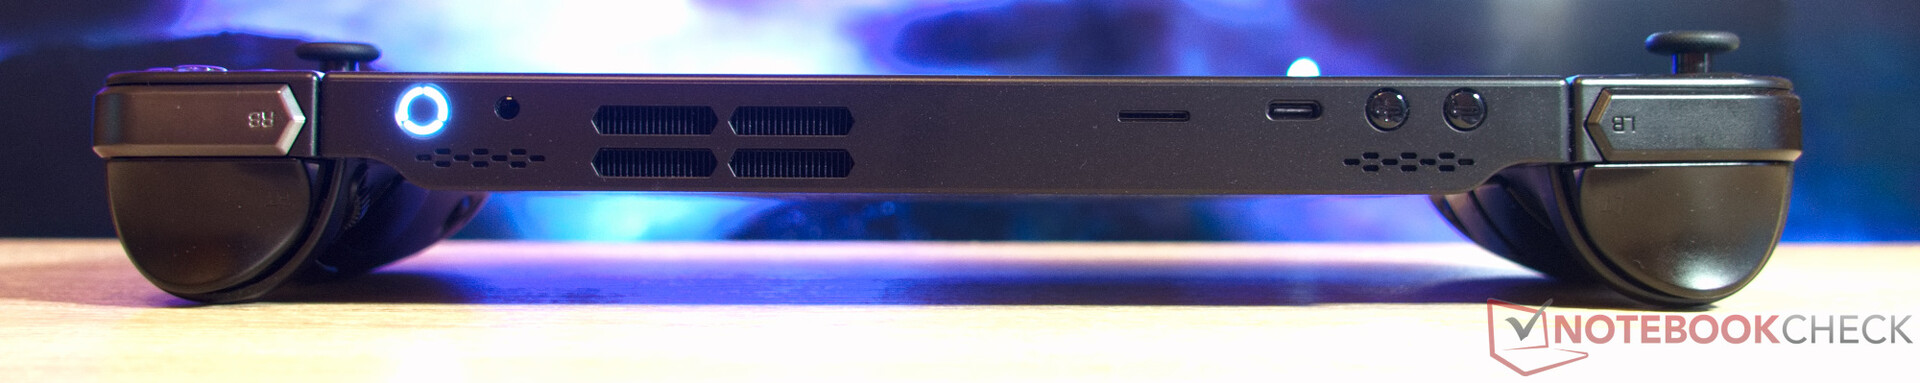
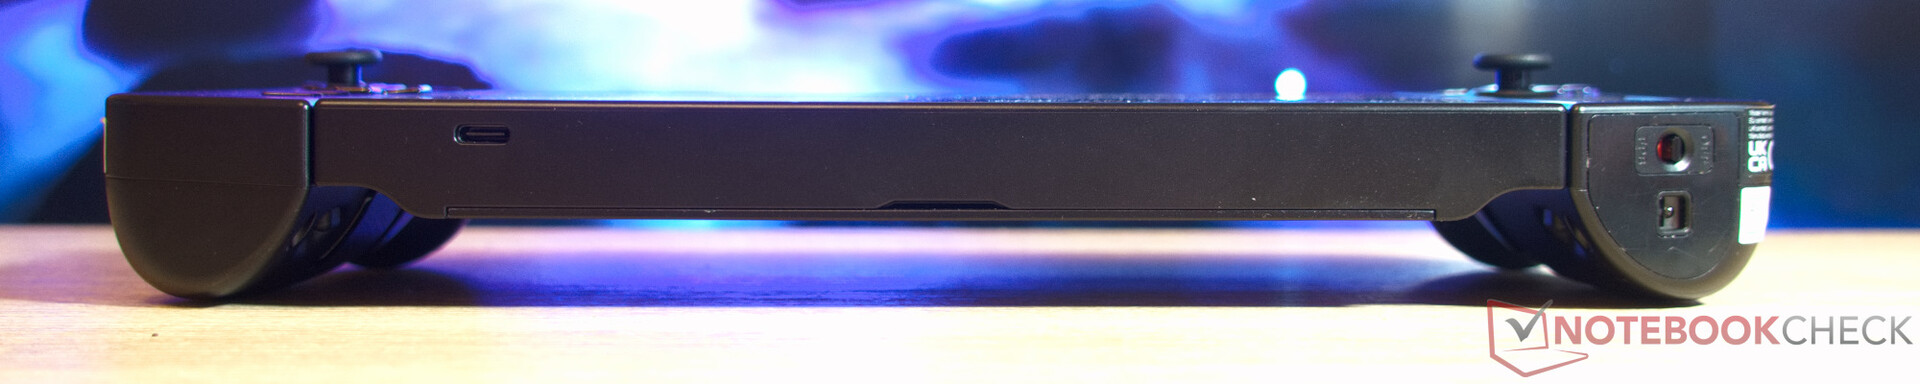
Connectivity - Two fully equipped USB-C ports
Two fully equipped USB-C ports and a fast microSD card are standard for most gaming handhelds—with this model being no exception. However, the Legion Go is missing a webcam. Only practical use can show whether the positioning of the individual ports is ideal. We would at least have liked for the SD card reader to be a little more protected. microSD cards would be housed more safely under the kickstand or with an extra covering.
SD card reader
Our AV Pro V60 microSD offers transfer speeds of up to 280 MB/s. The Legion Go reads our memory card at up to 146 MB/s, which is excellent compared to the comparison devices.
| SD Card Reader | |
| average JPG Copy Test (av. of 3 runs) | |
| Lenovo Legion Go | |
| Average of class Handheld / UMPC (32.9 - 201, n=10, last 2 years) | |
| Asus ROG Ally Z1 Extreme (Angelbird AV Pro V60) | |
| One Netbook XPlayer 2 (Angelbird AV Pro V60) | |
| Ayaneo Air 1S Retro Power | |
| Aokzoe A1 (Angelbird AV Pro V60) | |
| Valve Steam Deck 512 GB LCD (Angelbird AV Pro V60) | |
| maximum AS SSD Seq Read Test (1GB) | |
| Asus ROG Ally Z1 Extreme (Angelbird AV Pro V60) | |
| One Netbook XPlayer 2 (Angelbird AV Pro V60) | |
| Aokzoe A1 (Angelbird AV Pro V60) | |
| Average of class Handheld / UMPC (74.7 - 261, n=10, last 2 years) | |
| Lenovo Legion Go | |
| Ayaneo Air 1S Retro Power | |
Communication
Lenovo's gaming handheld did really well in our Wi-Fi tests. The high transfer speeds never suffered any major drops.
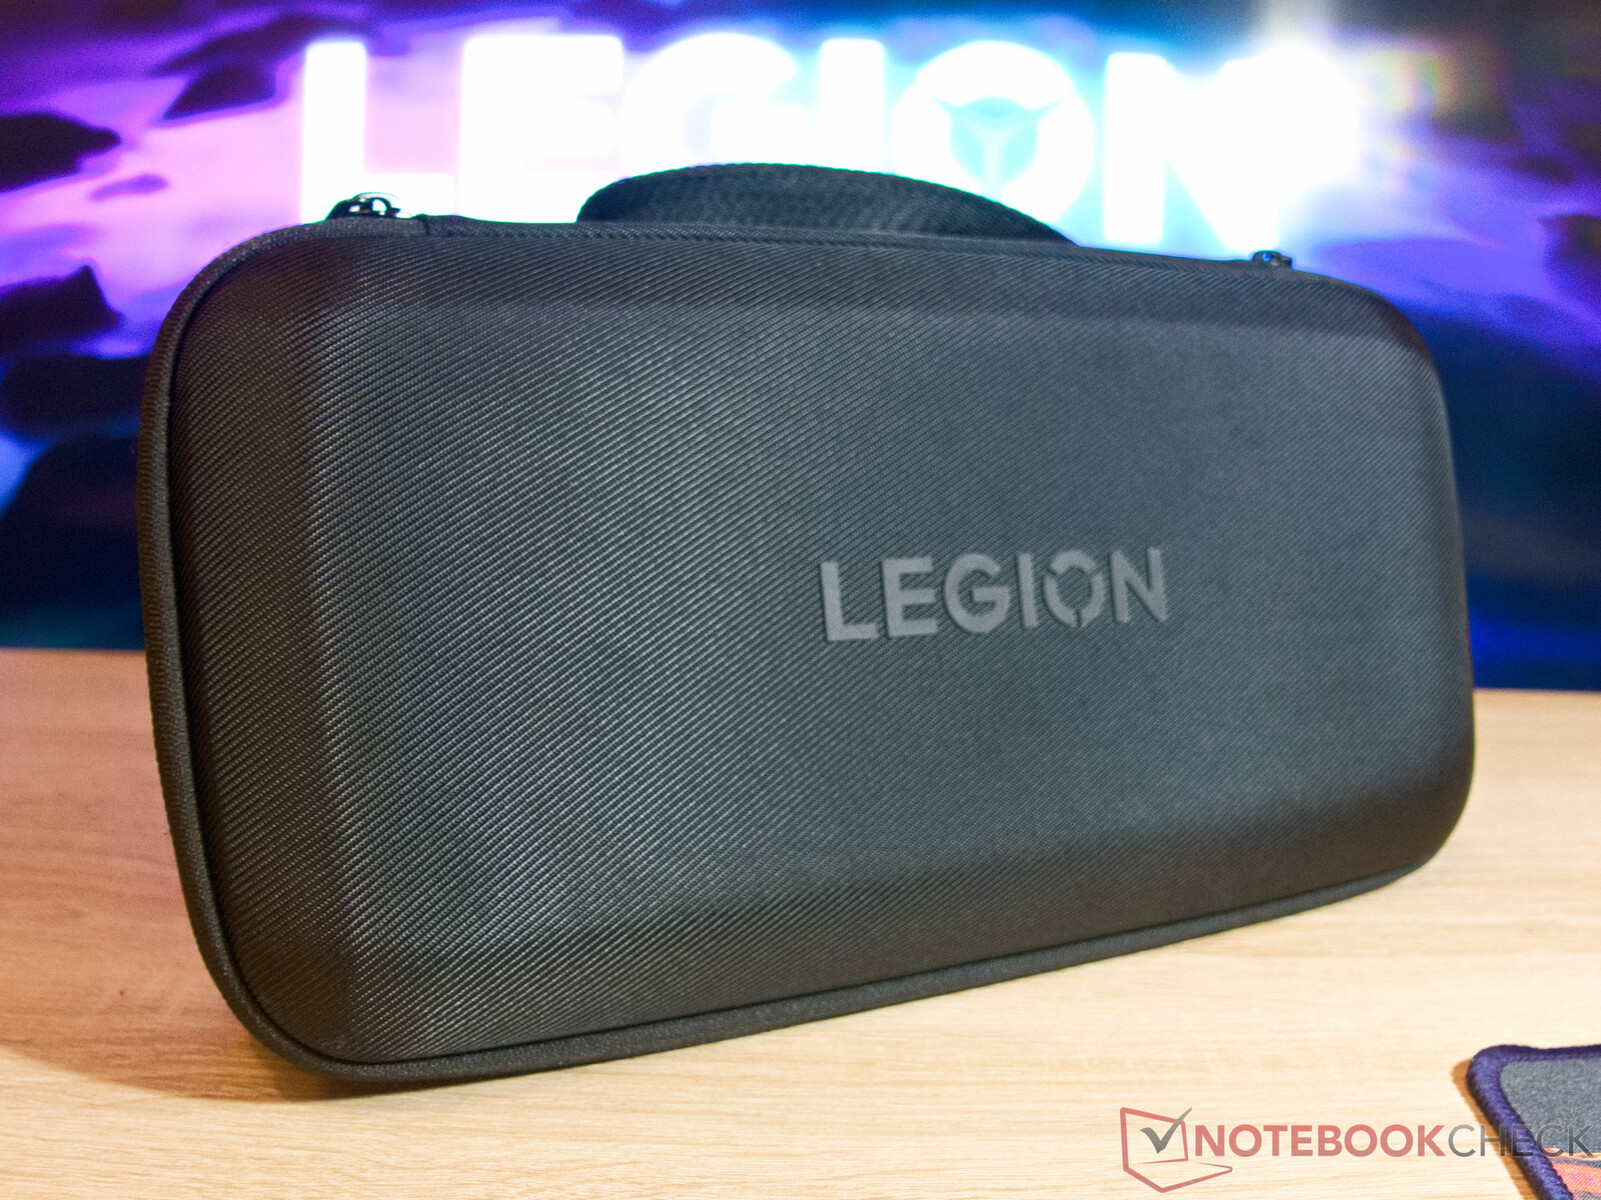
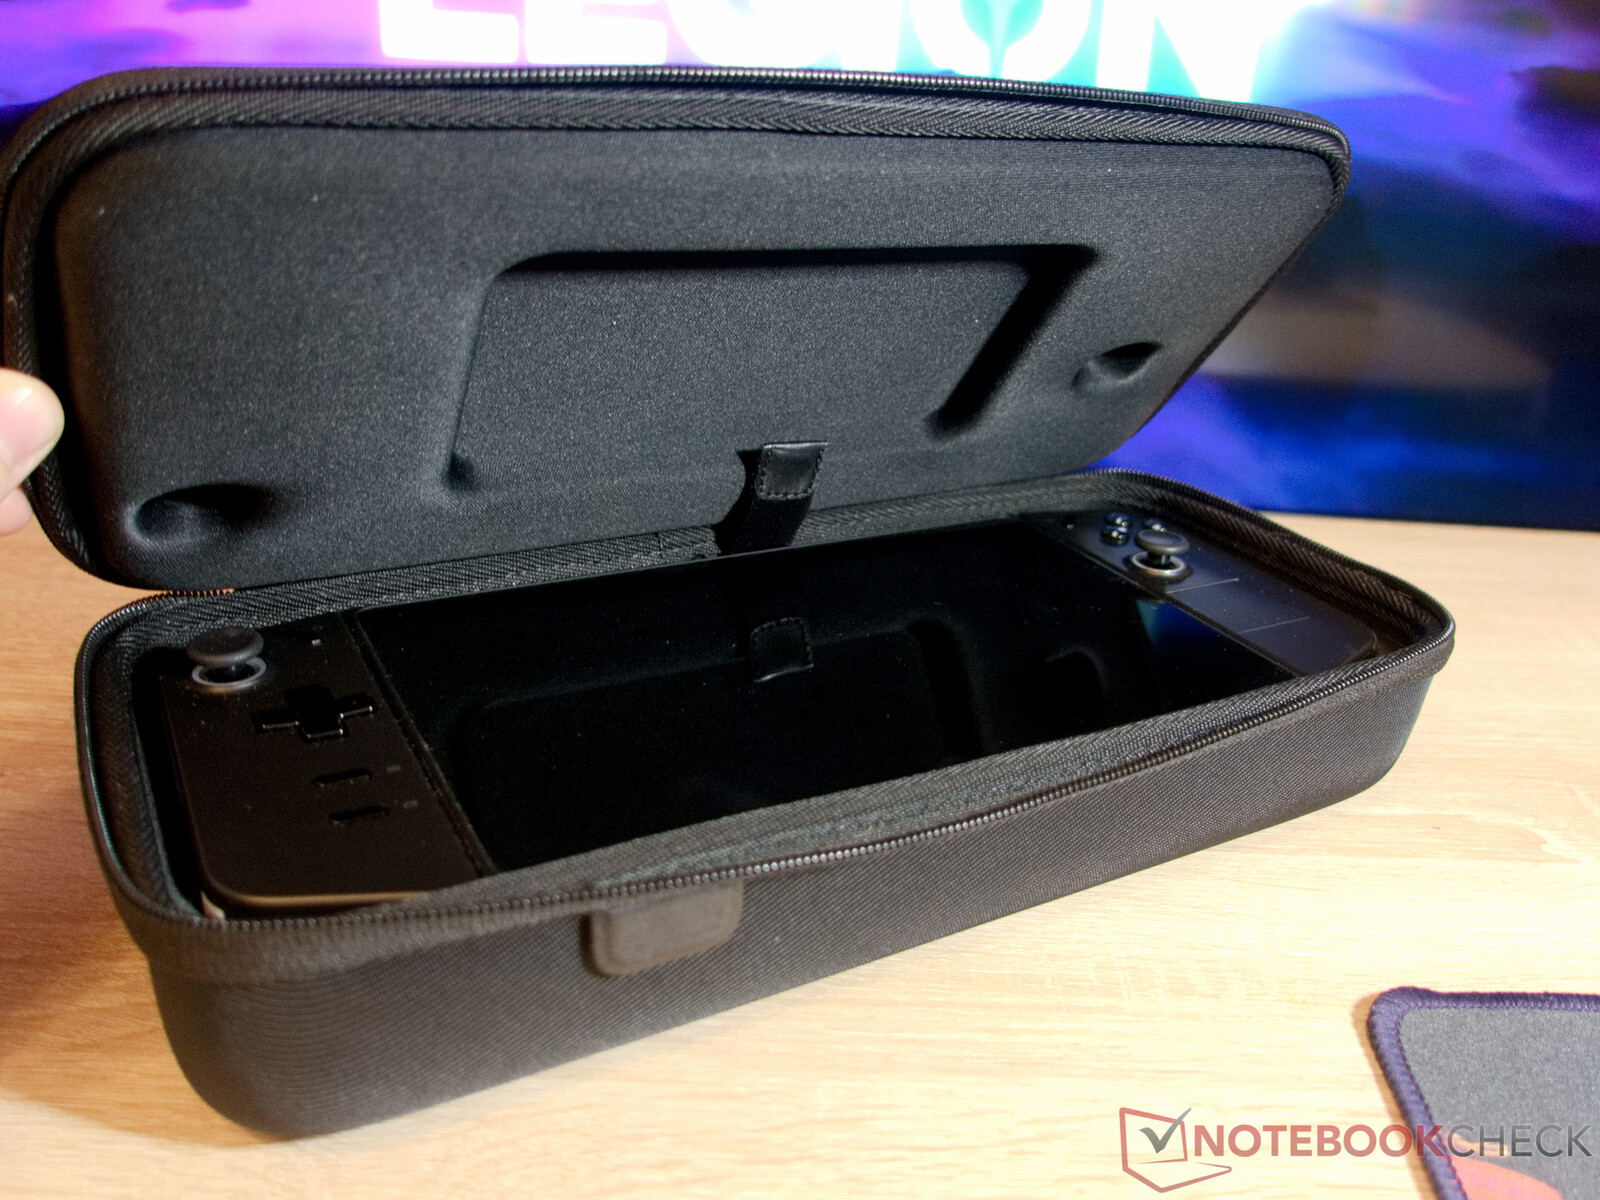
Accessories
The Legion Go comes delivered inside a soft-shell case which also has space for the right controller's FPS ring. However, the supplied 65-watt power supply doesn't fit inside the large case. In turn, the charging cable can be connected to the device through an eyelet when the case is shut. However, whether you should charge the device when it is inside its case is a little questionable due to the fact the battery might heat up when doing so.
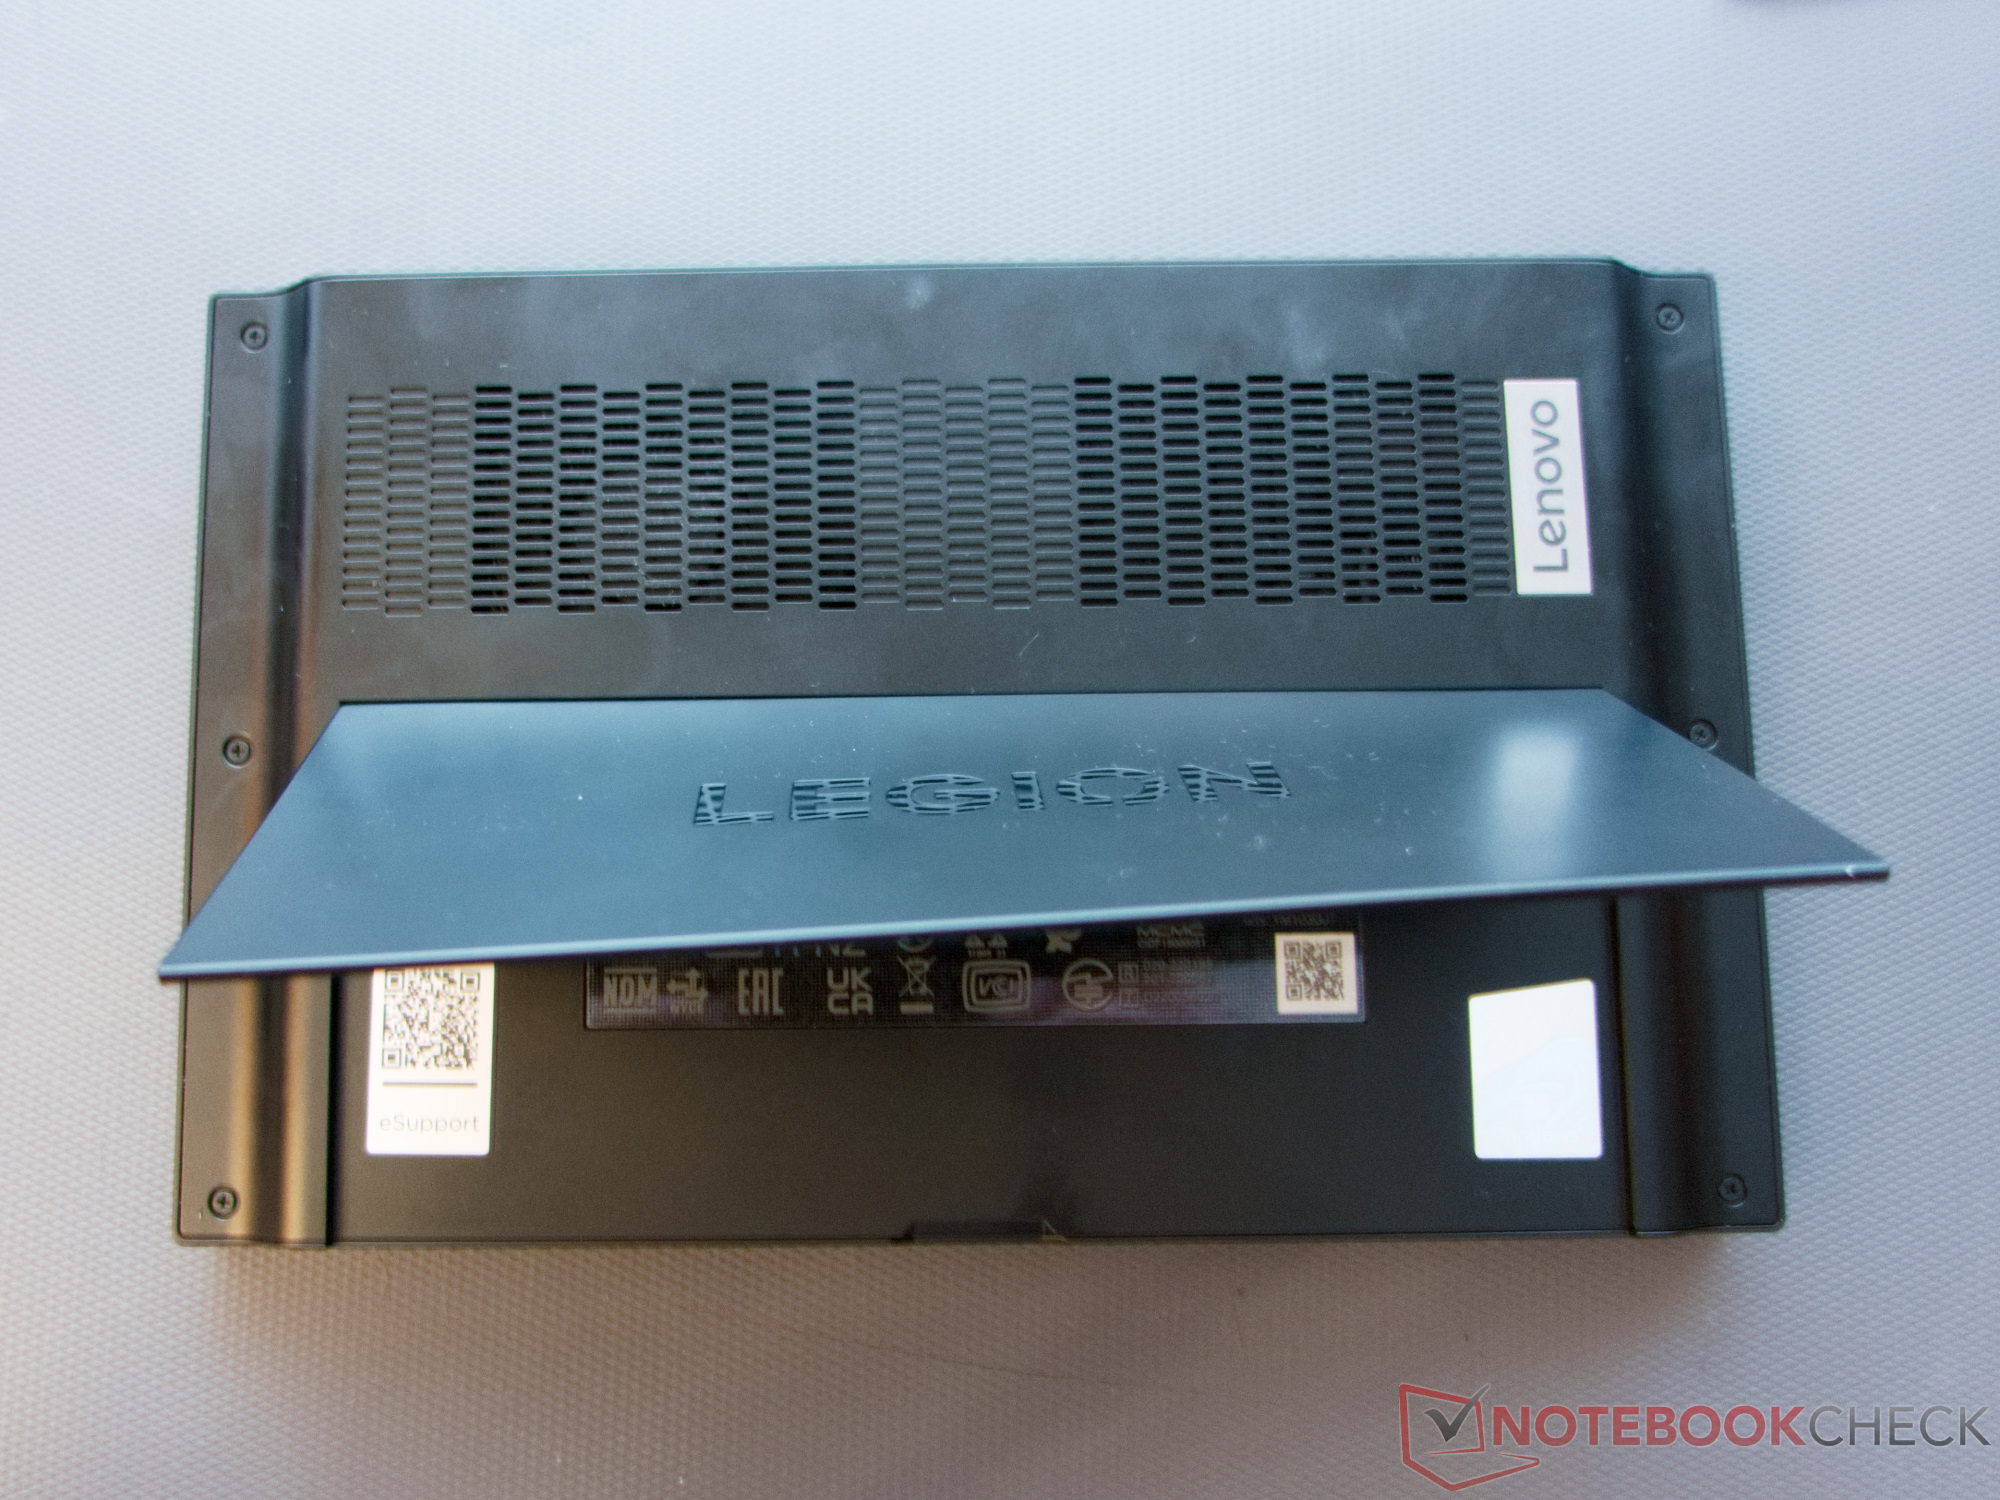
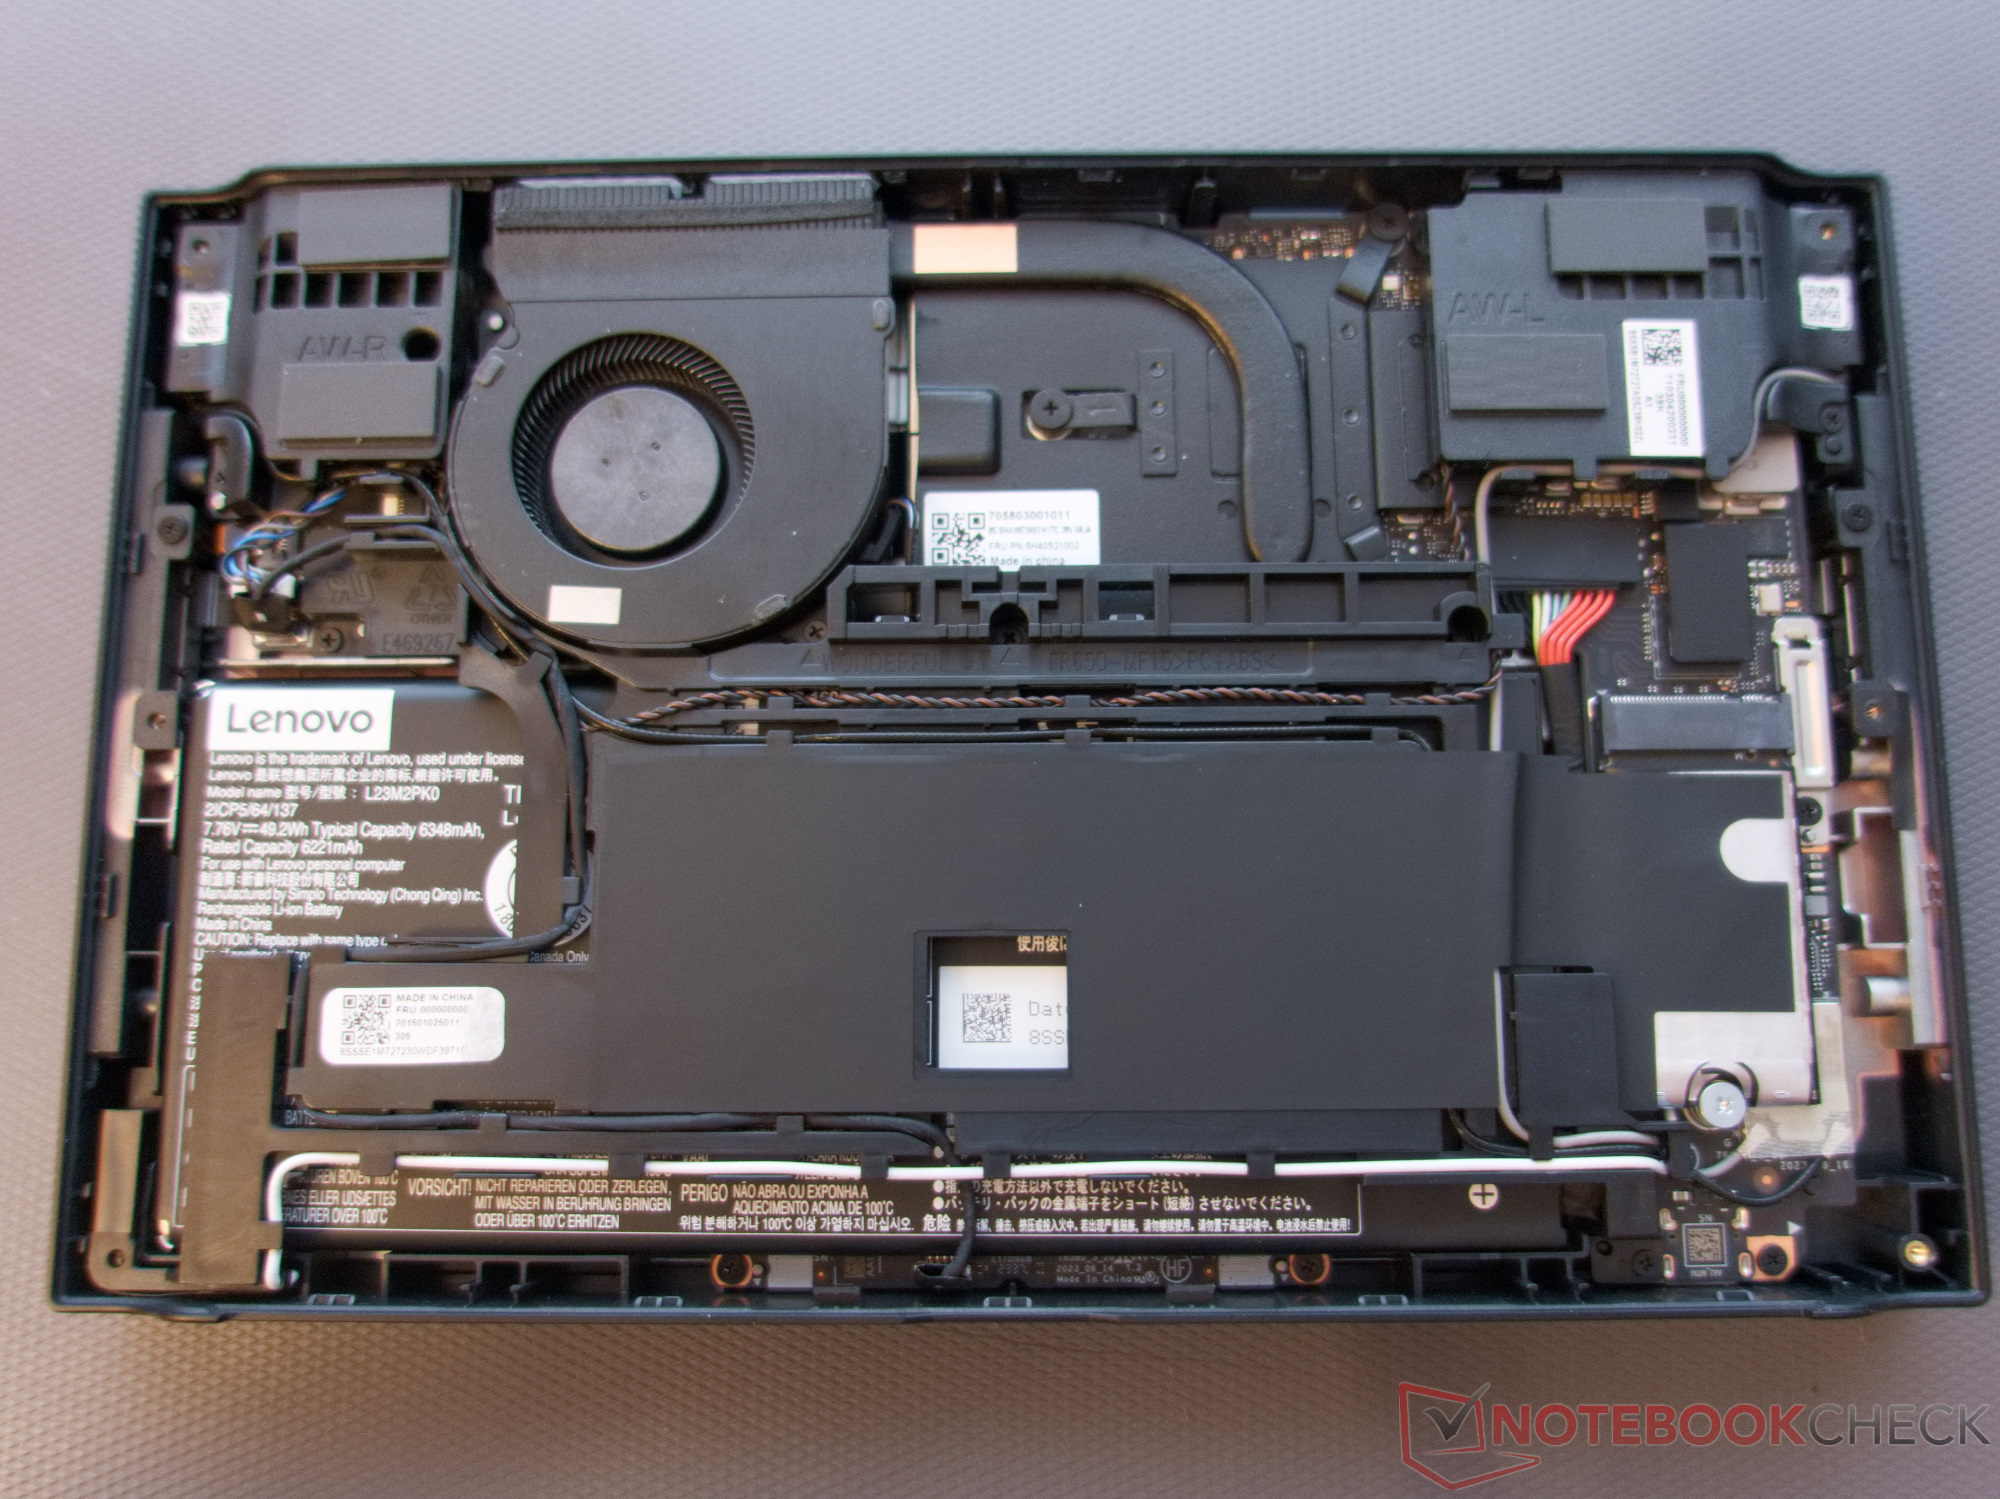
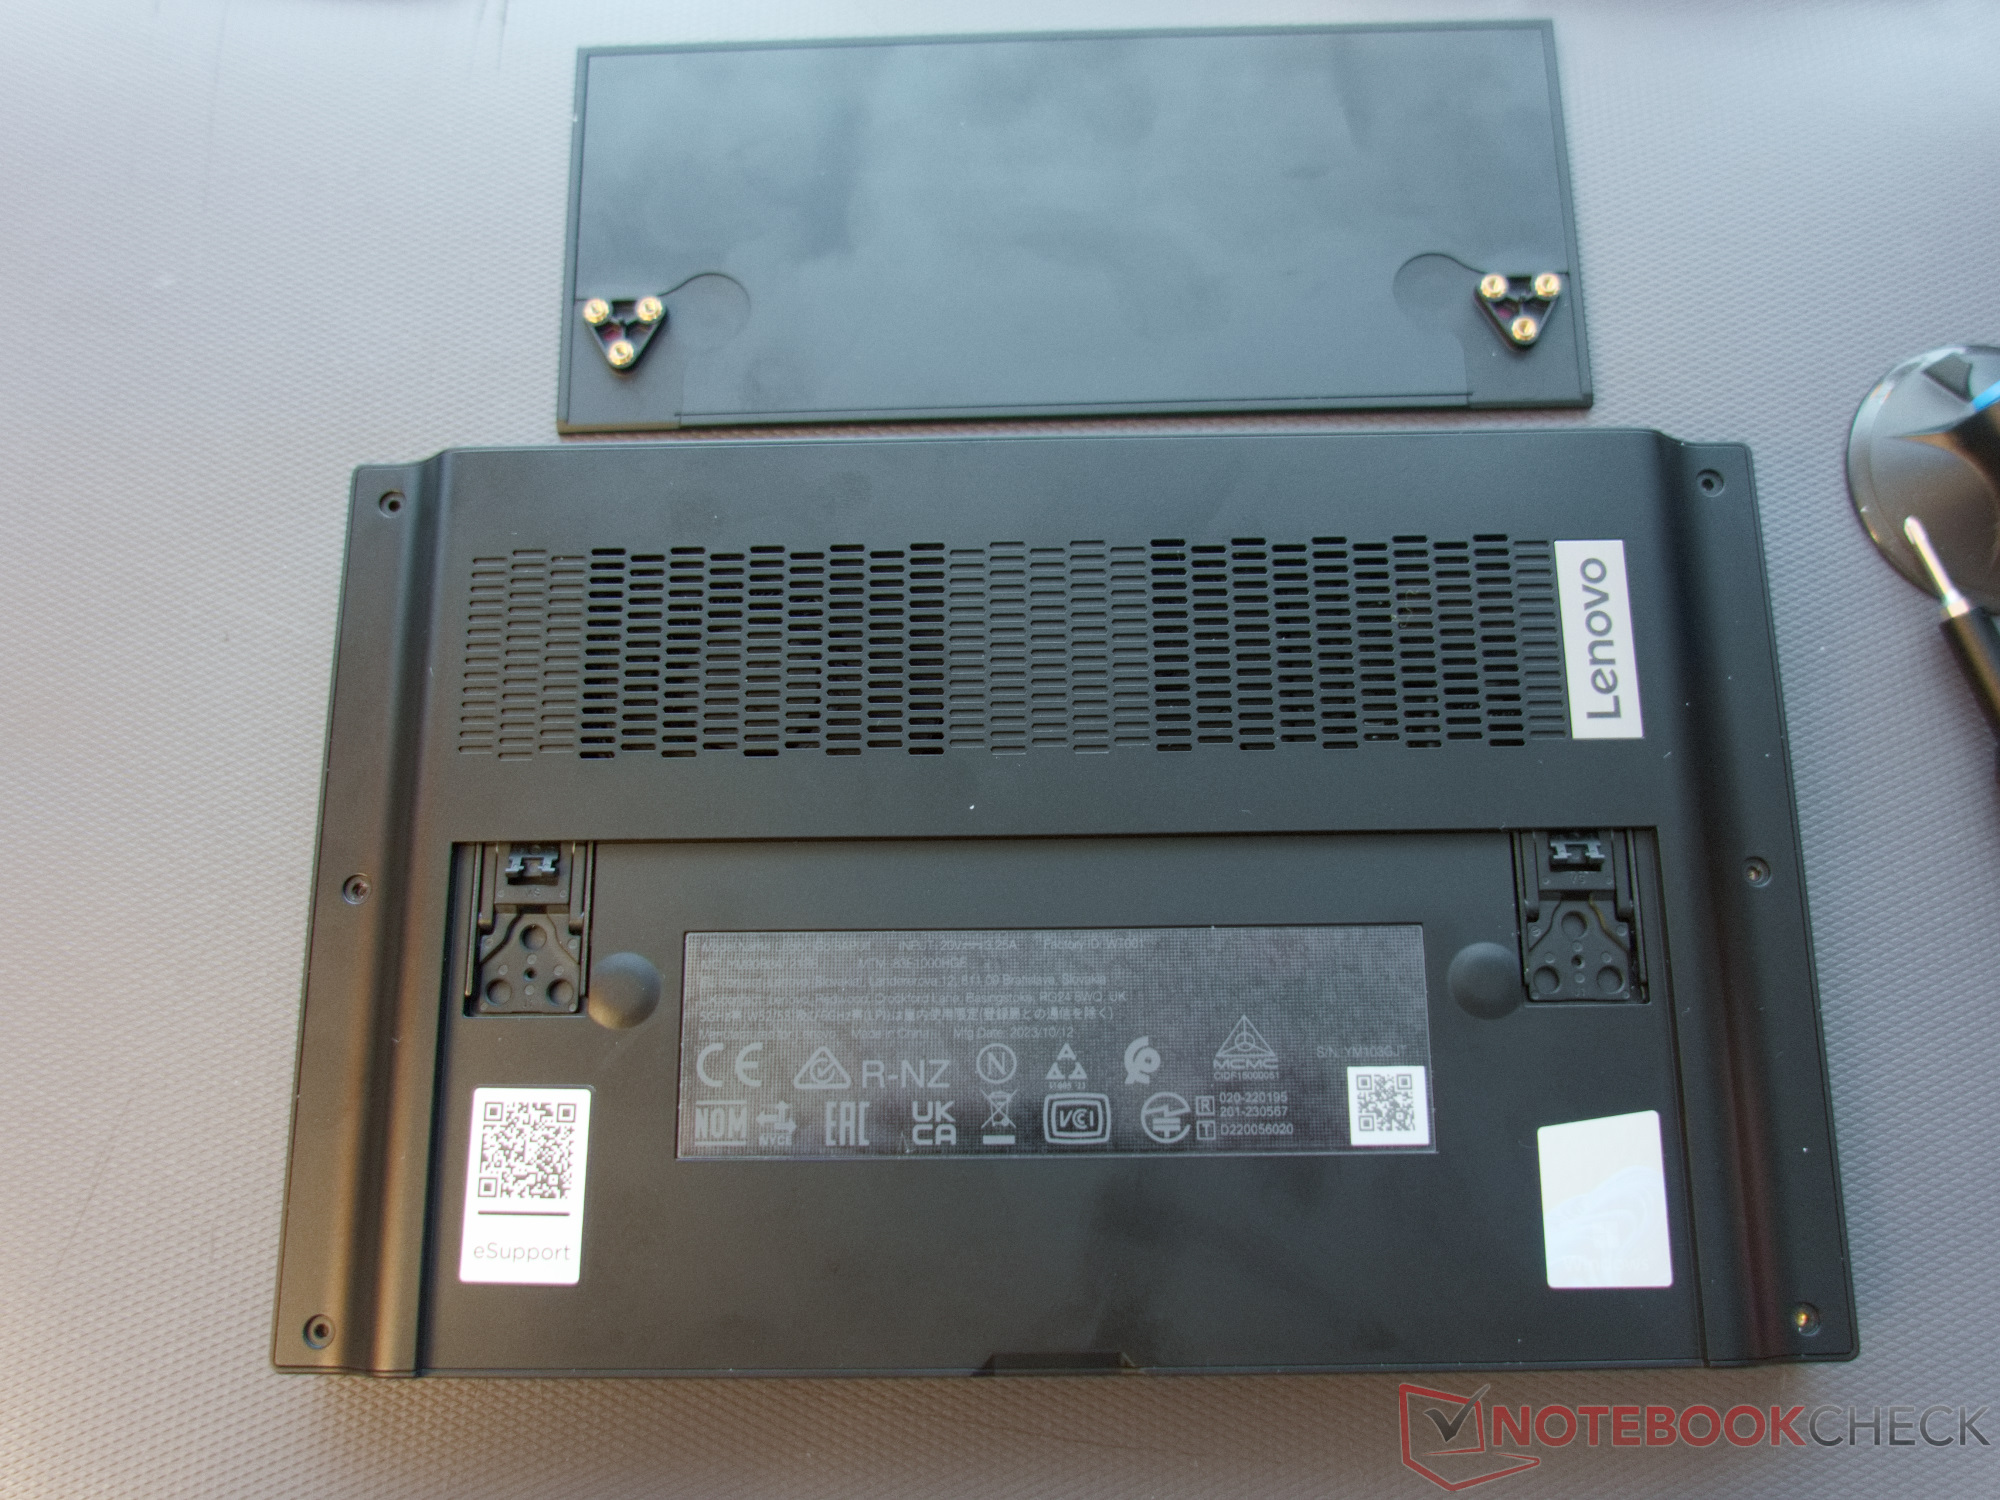
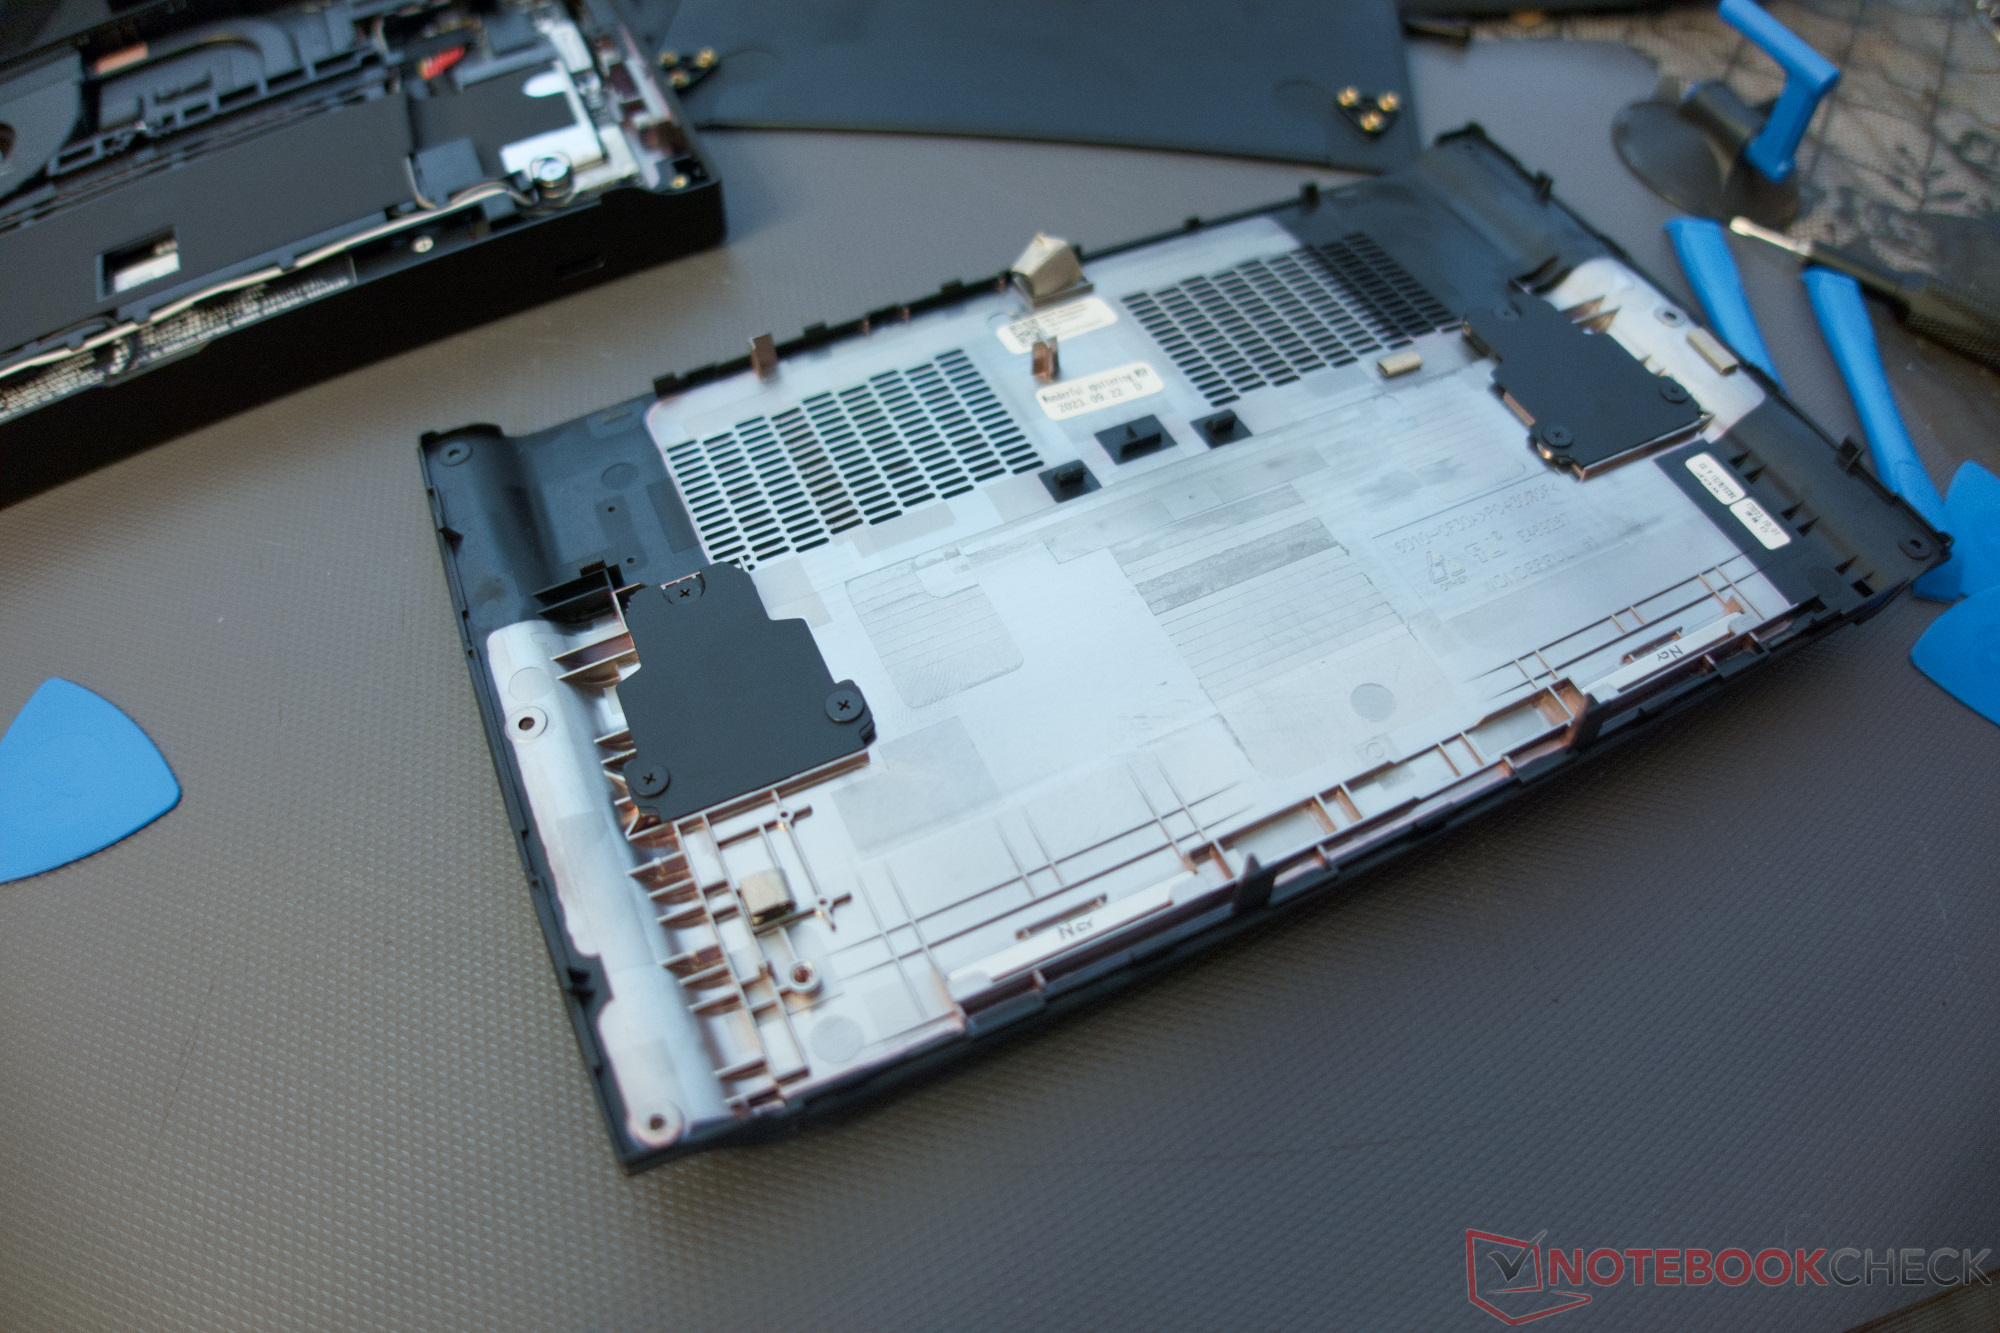
Maintenance
It takes a lot of effort to remove the back cover of the tablet, although it is only held on using six screws. Unfortunately, countless plastic chips hold the plastic component in place, which means you have to work with several picks to pry them out. Incidentally, you don't have to unscrew the kickstand to remove the rear cover, but it does make the job easier. Although it almost isn't even worth the effort, as on the inside, you can only swap out the M.2-2242 NVMe SSD—if you can unpeel all the various adhesive foils beforehand, that is. All the other components are soldered or glued on.

Input devices - FPS mode is a unique selling point
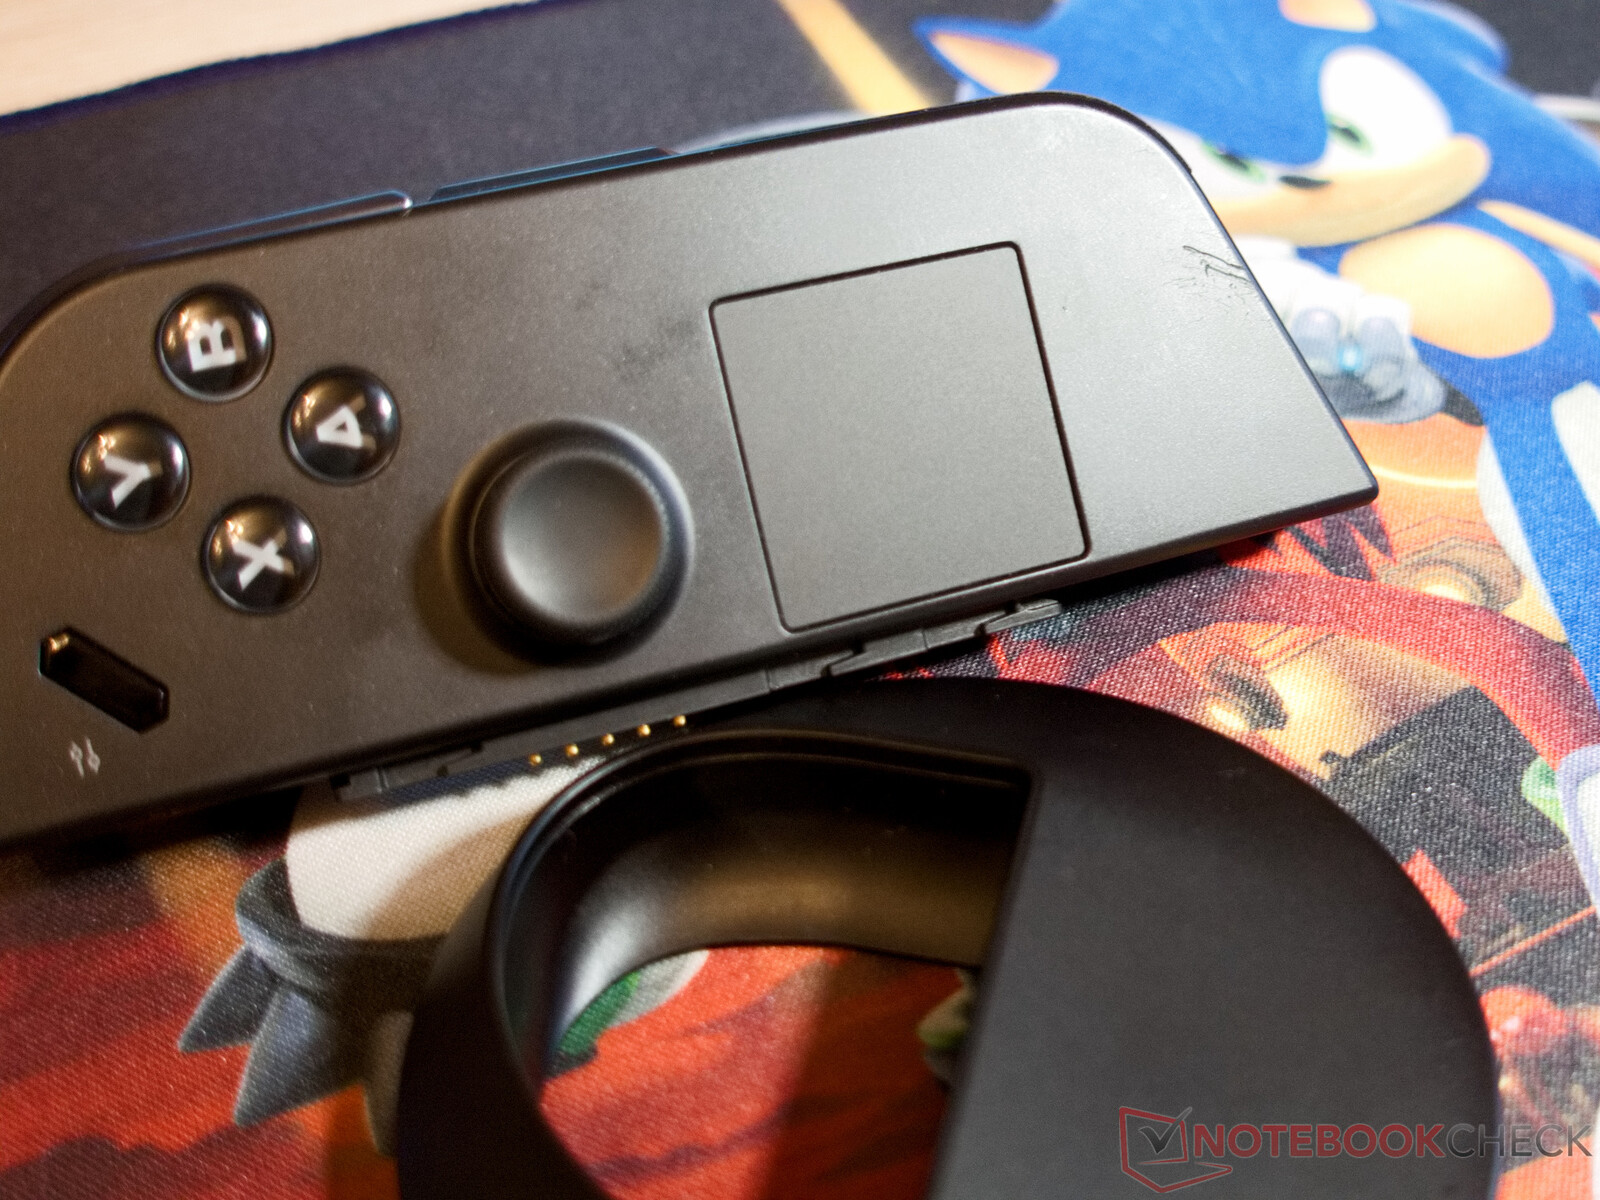
The gaming handheld's controllers feel comfortable to hold. You can reach all the buttons well even if you have smaller hands. The shoulder buttons, as well as the A, B, X and Y buttons and the control pad, show a little bit of resistance and have a clear pressure point. Lenovo has placed a function key on the top of each side of the controller. There are two further keys on each side on the bottom which can be assigned functions via Legion Space. The Legion Go's controllers have Hall Effect joysticks which shouldn't show any signs of wear. As a result, stick drift is virtually impossible. When gaming, we noticed that the controller's deadzones are set to be quite large. Especially in games that let you set the deadzone, the controls quickly become imprecise unless you adjust them.
Lenovo has installed a function button into both controller halves. These either activate Legion Space or the quick settings. Furthermore, a large number of button combinations are made possible through both of these. A few examples include taking screenshots, opening the task manager, closing apps and switching the controllers on and off when used wirelessly.
Touchpad and touchscreen
The right controller features a small touchpad which lets you control the desktop cursor. It can also be used to control certain games. When testing this out, we noted that the touchpad doesn't offer a right-click function. At the end of the day, the touchpad seems to get in the way a bit, rather than actually making it easier to control the cursor. The FPS mode is more suitable for this.
Barely any Windows games support input via touchscreen, but this isn't the case when it comes to Android games. Nowadays, they can also be downloaded onto Windows devices via the Amazon app store. The Legion Go really shows its strengths here, as it allows for fast and precise inputs.
Wireless controllers and FPS mode
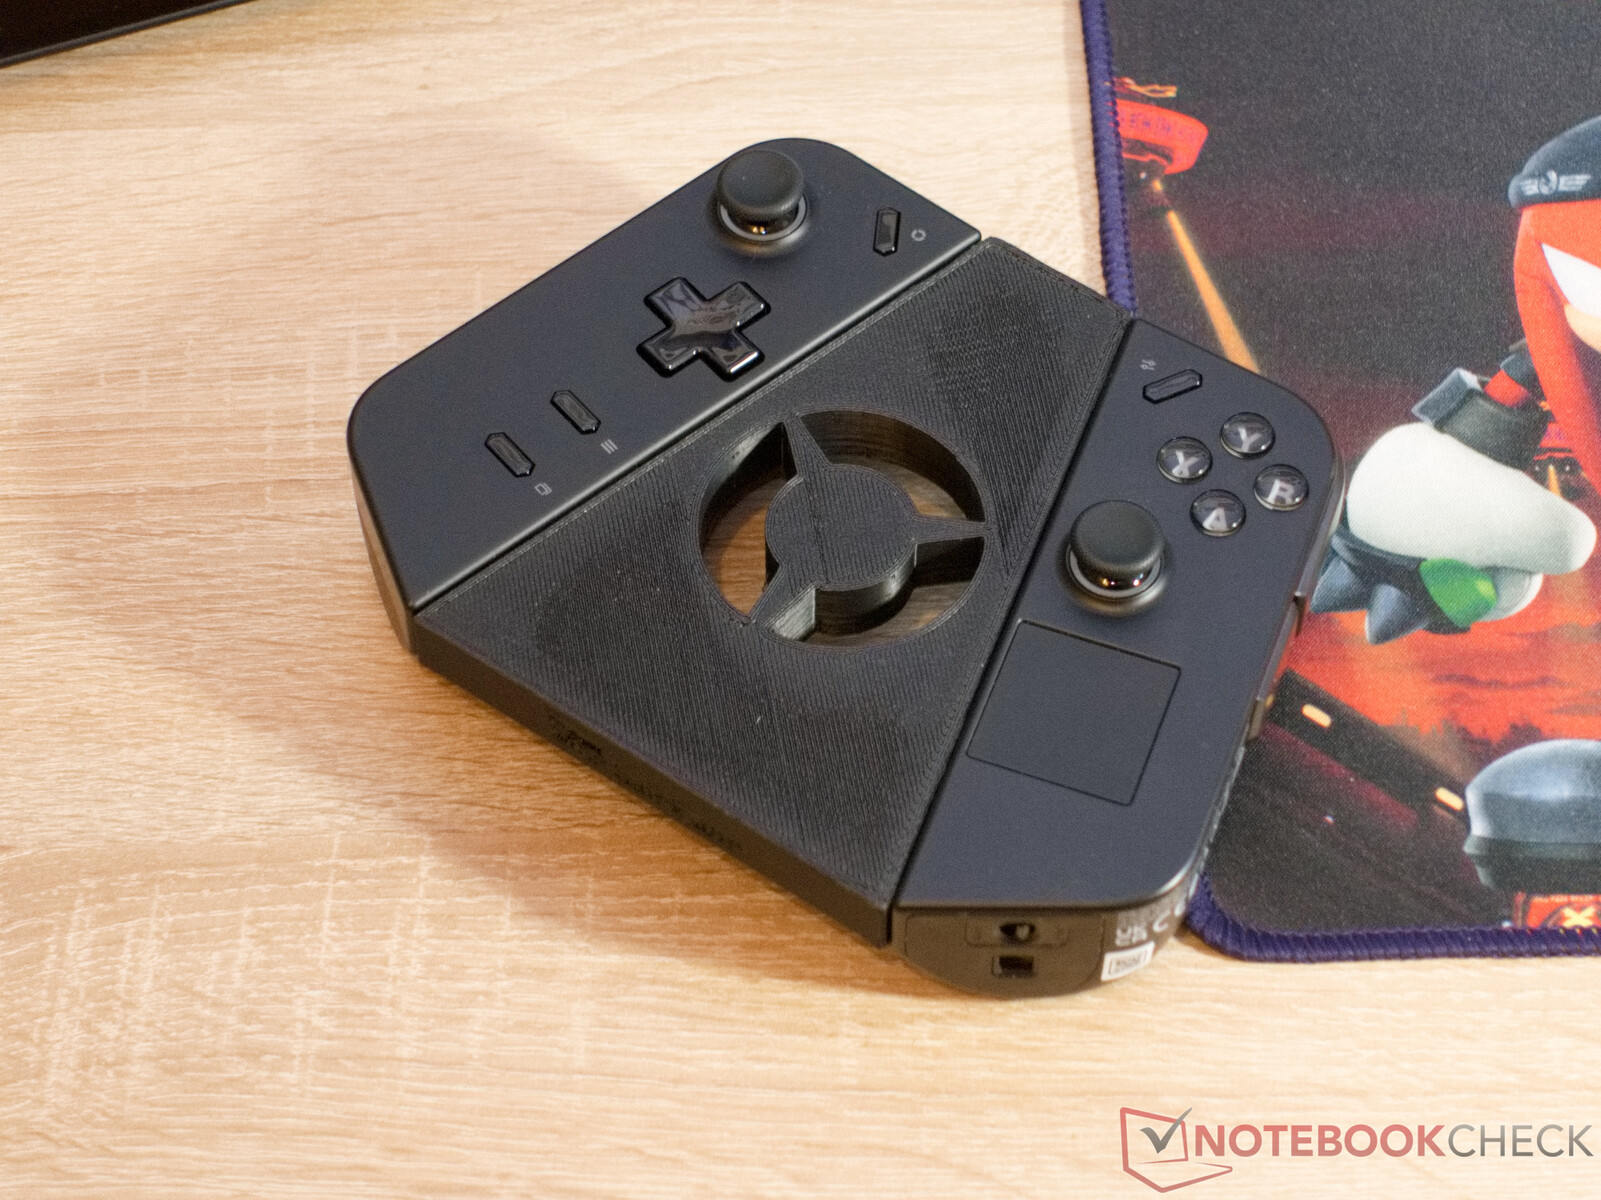
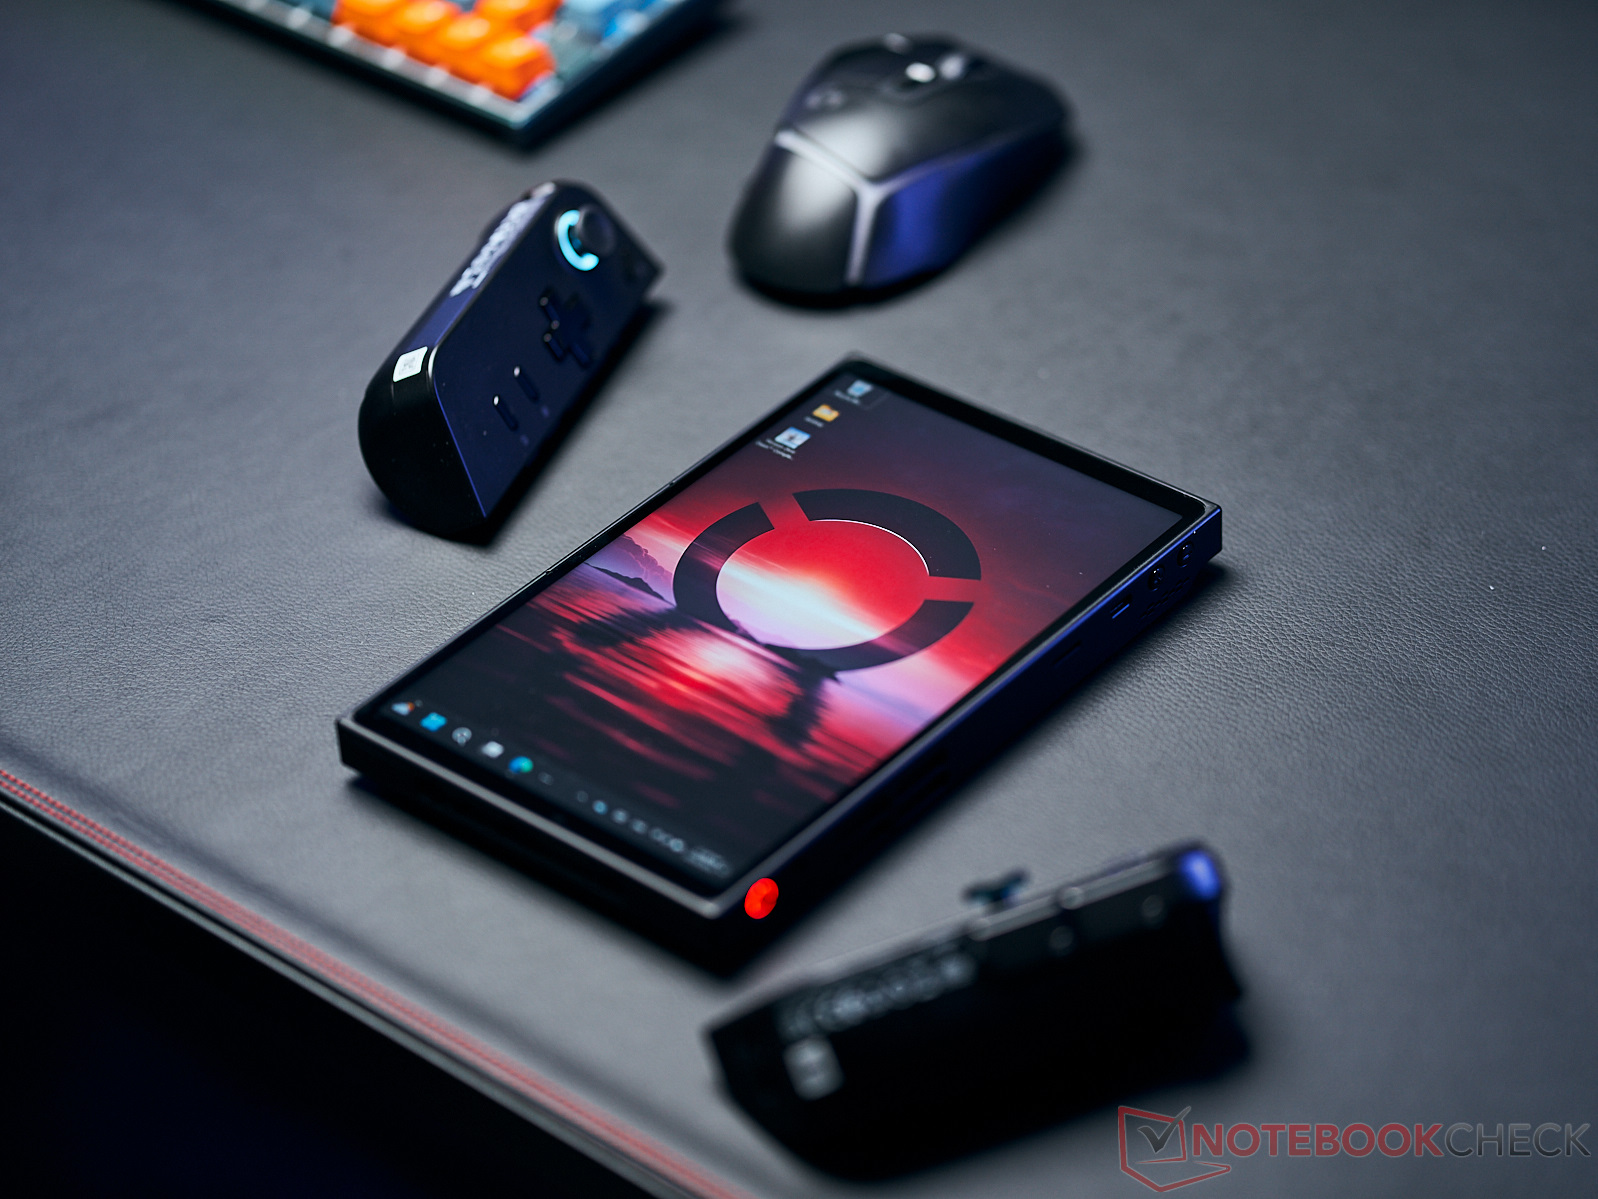
Both of the Legion Go's controller halves automatically connect to the tablet once you remove them—without any noticeable latency. Moreover, the two controllers are nice and lightweight. They don't quite feel as ergonomic when held by themselves compared to having them connected to the tablet. This is mostly because you end up crossing your arms with both controllers held in your hands. Trying out a 3D-printed adapter from Prusa Printables massively improved the feel.
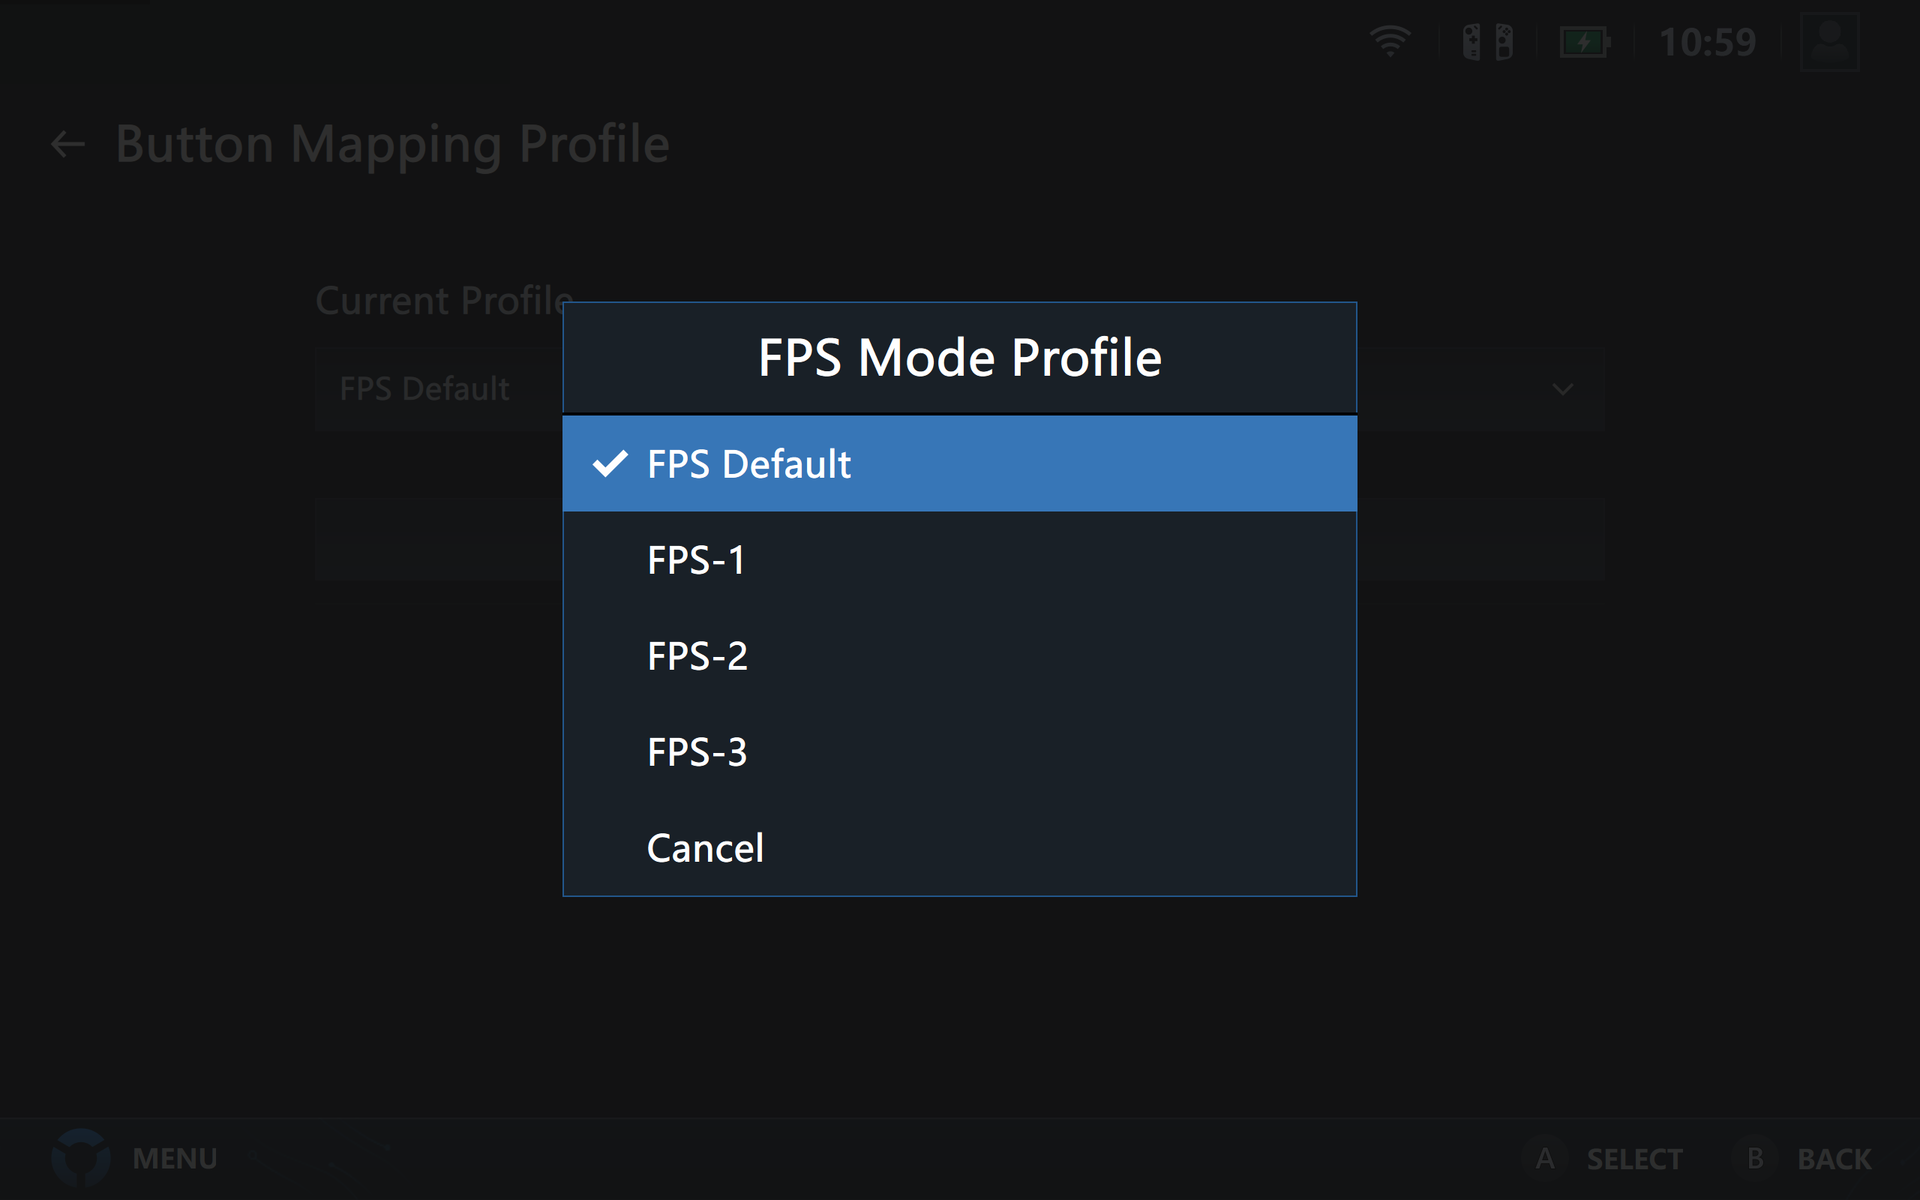
Compared to other gaming handhelds, the Legion Go offers a considerable advantage when it comes to playing first-person shooters. When using FPS mode, the right controller is transformed into a wireless mouse and the left controller becomes a keyboard replacement. As strange as this may seem at first, the FPS mode actually feels surprisingly comfortable. The biggest problem which we identified has nothing to do with how it feels or how accurate it is. The left controller can accommodate up to 11 input keys. As most games which are played using FPS mode are traditionally ones which use a mouse and keyboard, it might get a little tight trying to assign keys. For example, you would have to assign about 20 functions to the Legion Pro's 11 keys when playing Cyberpunk 2077. In CS:Go, it's about 16 functions and even in the much-loved game PUBG, it's 12 functions which require individual keys. As a result, you will often find yourself having to assign some functions to the right controller, but this just impedes your gaming. Four preconfigured profiles can be selected via Legion Space. Then, more precise configurations have to be set in-game. This, too, doesn't work in every game.
One real issue is also how the FPS ring is connected to the controller. It is held on magnetically and in our test, this resulted in some unsightly scratches on our controller, as tiny metal pieces managed to get trapped in between the two parts. We can only recommend keeping both parts (as well as your table) extremely clean, as dust particles can get lodged between the two parts, resulting in scratches.
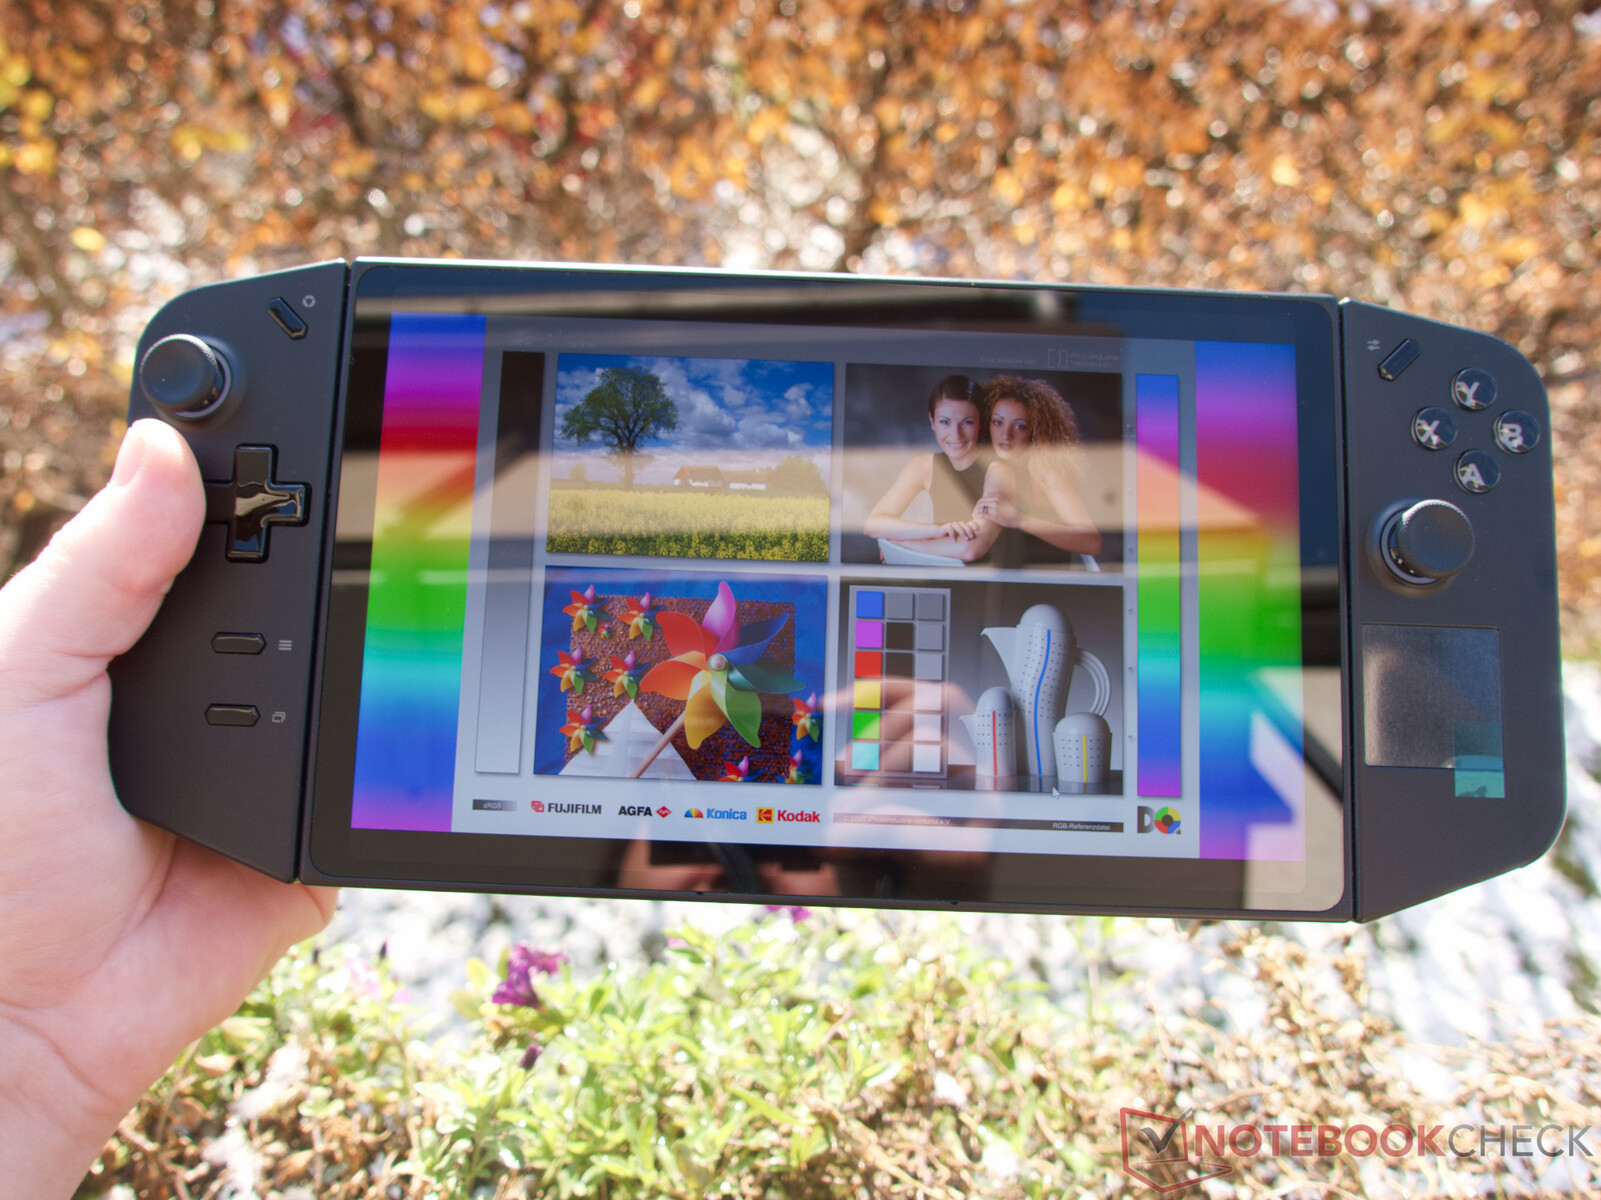
Display - 144-Hz QHD+ display


The Legion Go's 8.8-inch display features up to 1600p, 10 touchpoints and a refresh rate of 144 Hz. Lenovo advertizes a maximum brightness of 500 cd/m², whereas we measured a maximum of 460 cd/m² with a rather uneven distribution. Similar to many other handhelds, the Legion Go's screen is a vertical tablet screen that is refreshed from left to right instead of top to bottom. During some games with deactivated V-Sync or Frame Buffer, this may be more noticeable compared to horizontal displays.
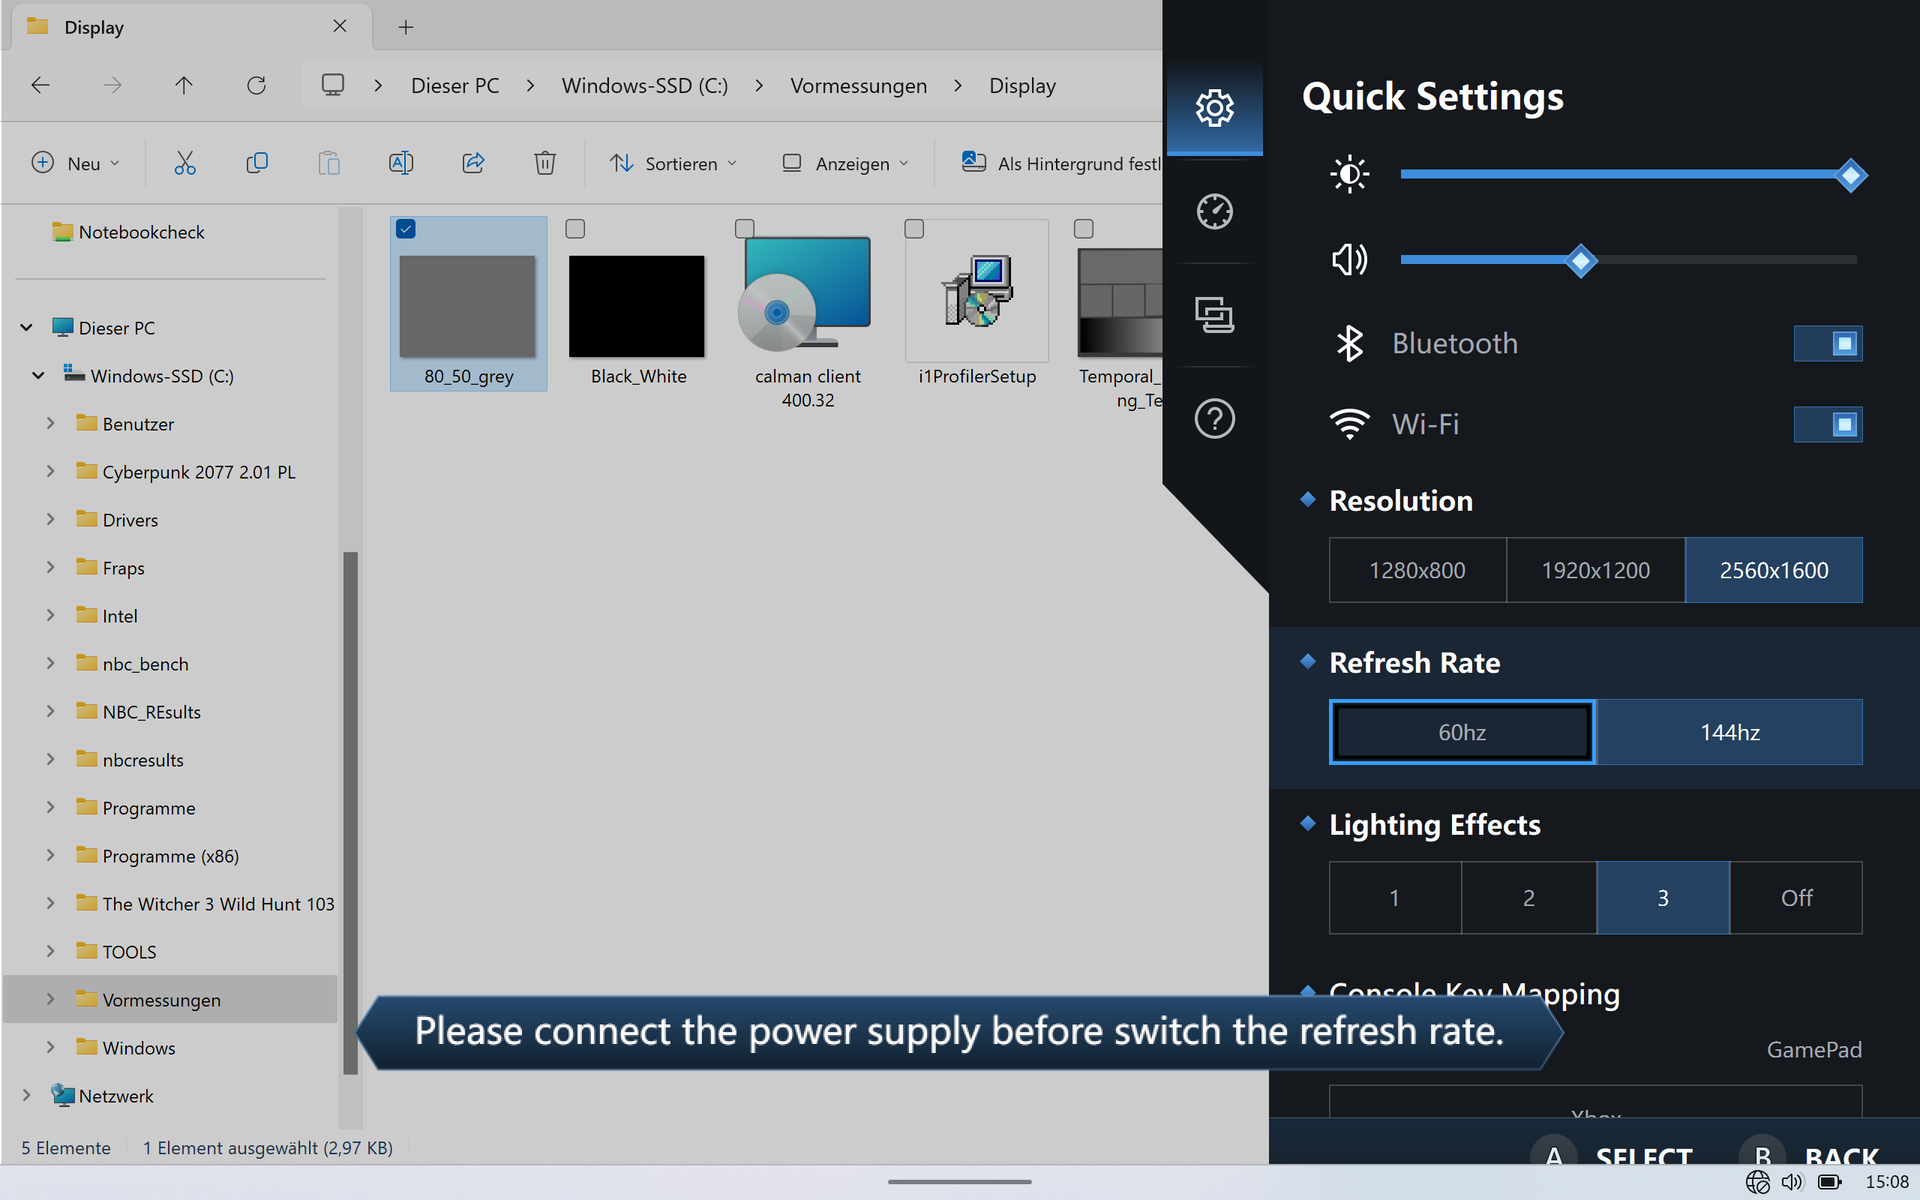
The display's resolution can be switched between 1200p and 800p via Legion Space or Windows. This makes more demanding games run a lot smoother. The FullHD+ resolution offers a good alternative in particular, as even at the lowest resolution, you can hardly make out individual pixels on its comparatively small display.
One big negative aspect which we noticed is that the screen's refresh rate is locked in battery mode. As soon as you pull the plug on the device, it doesn't automatically switch to 60 Hz to save energy—instead, it simply doesn't allow you to change it at all.
| |||||||||||||||||||||||||
Brightness Distribution: 80 %
Center on Battery: 444 cd/m²
Contrast: 979:1 (Black: 0.42 cd/m²)
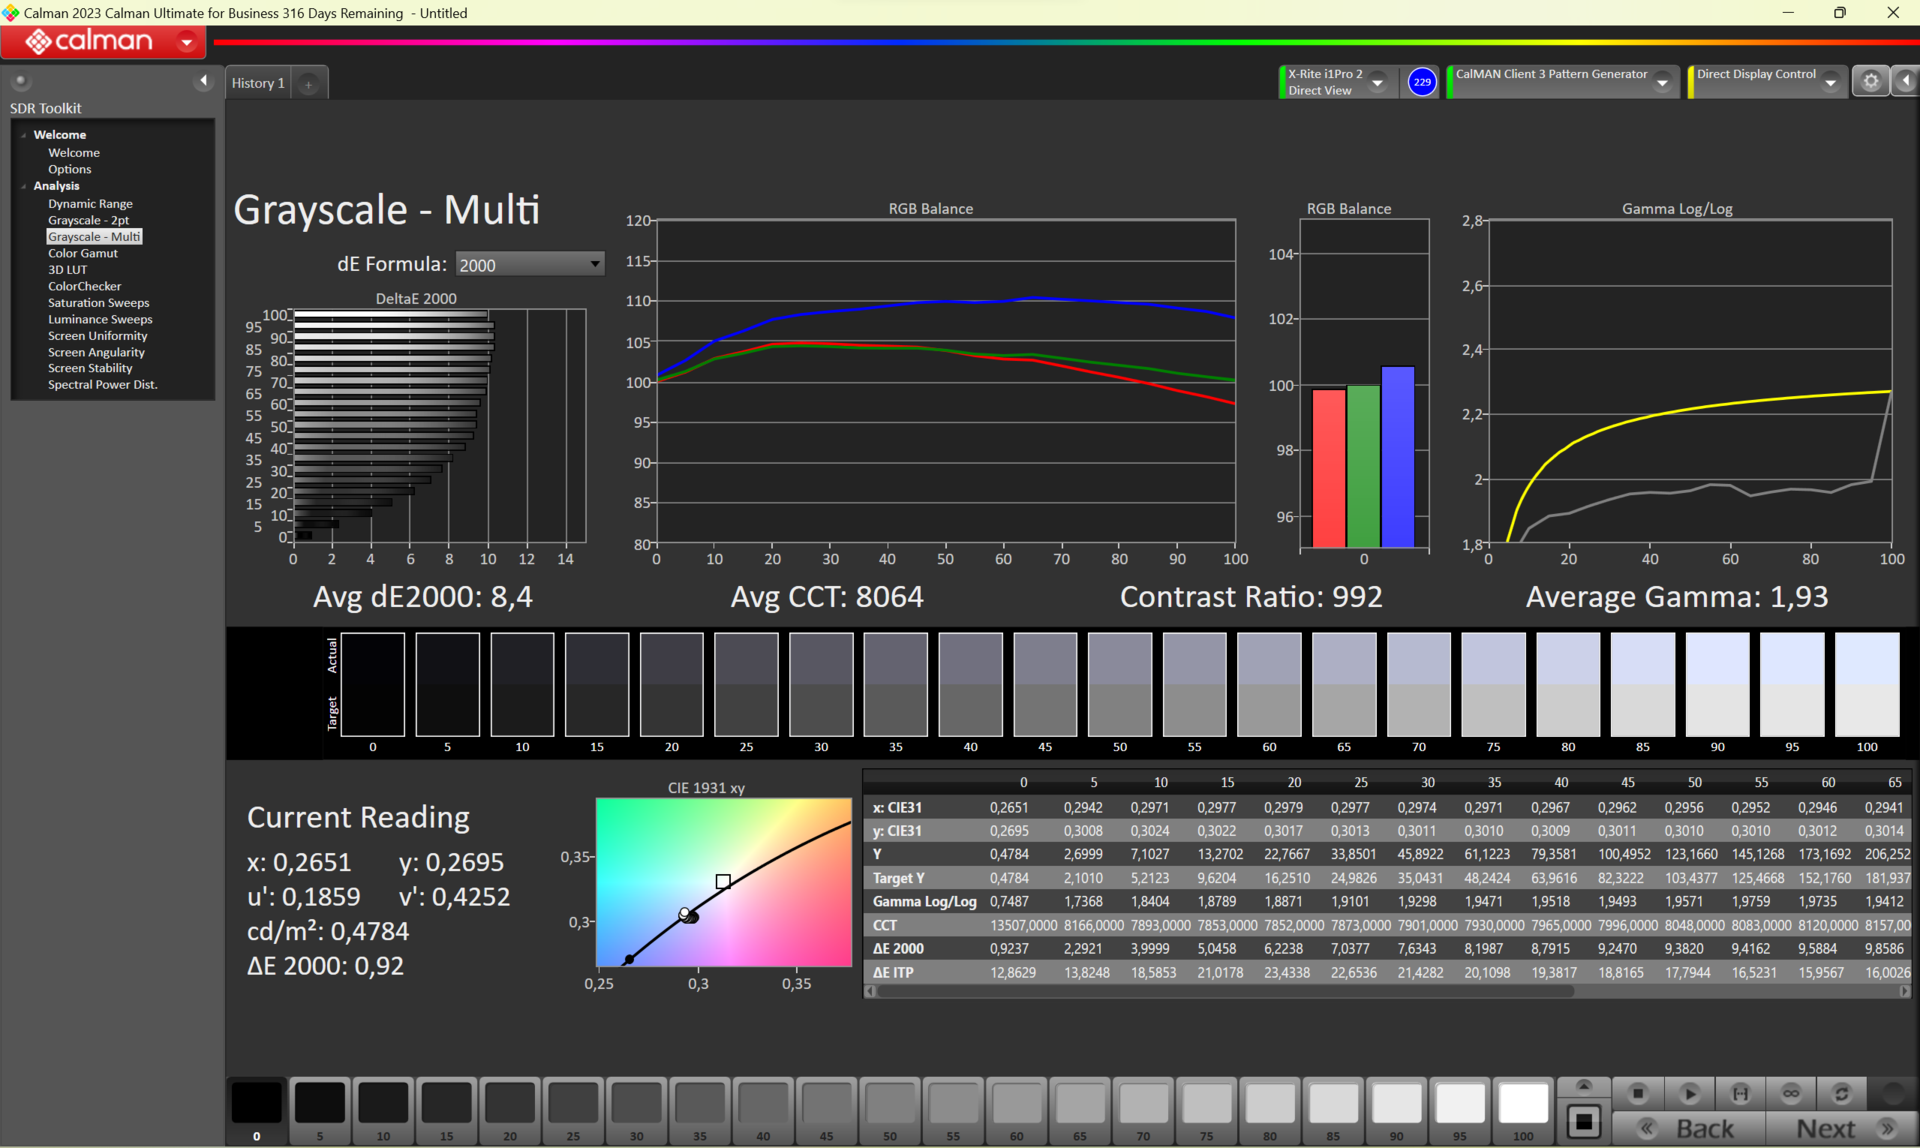
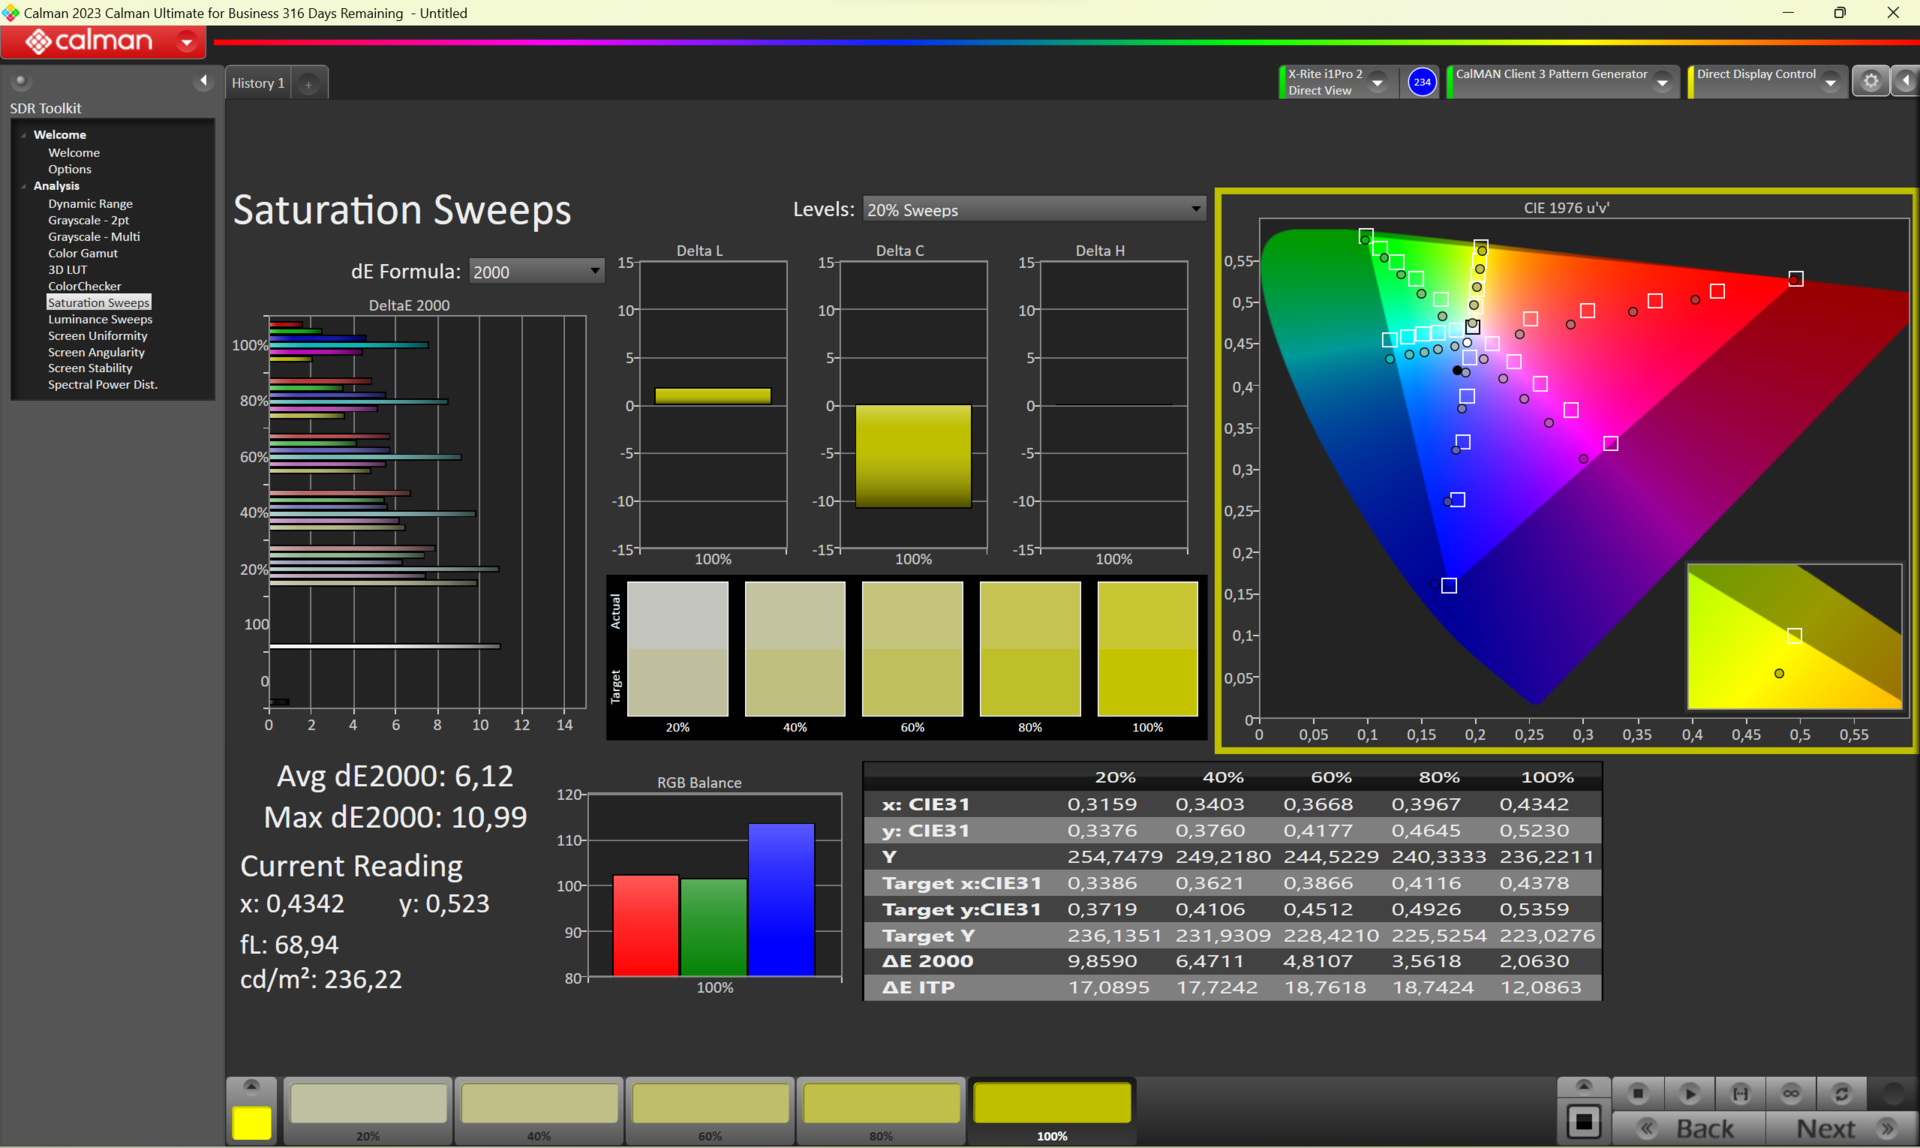
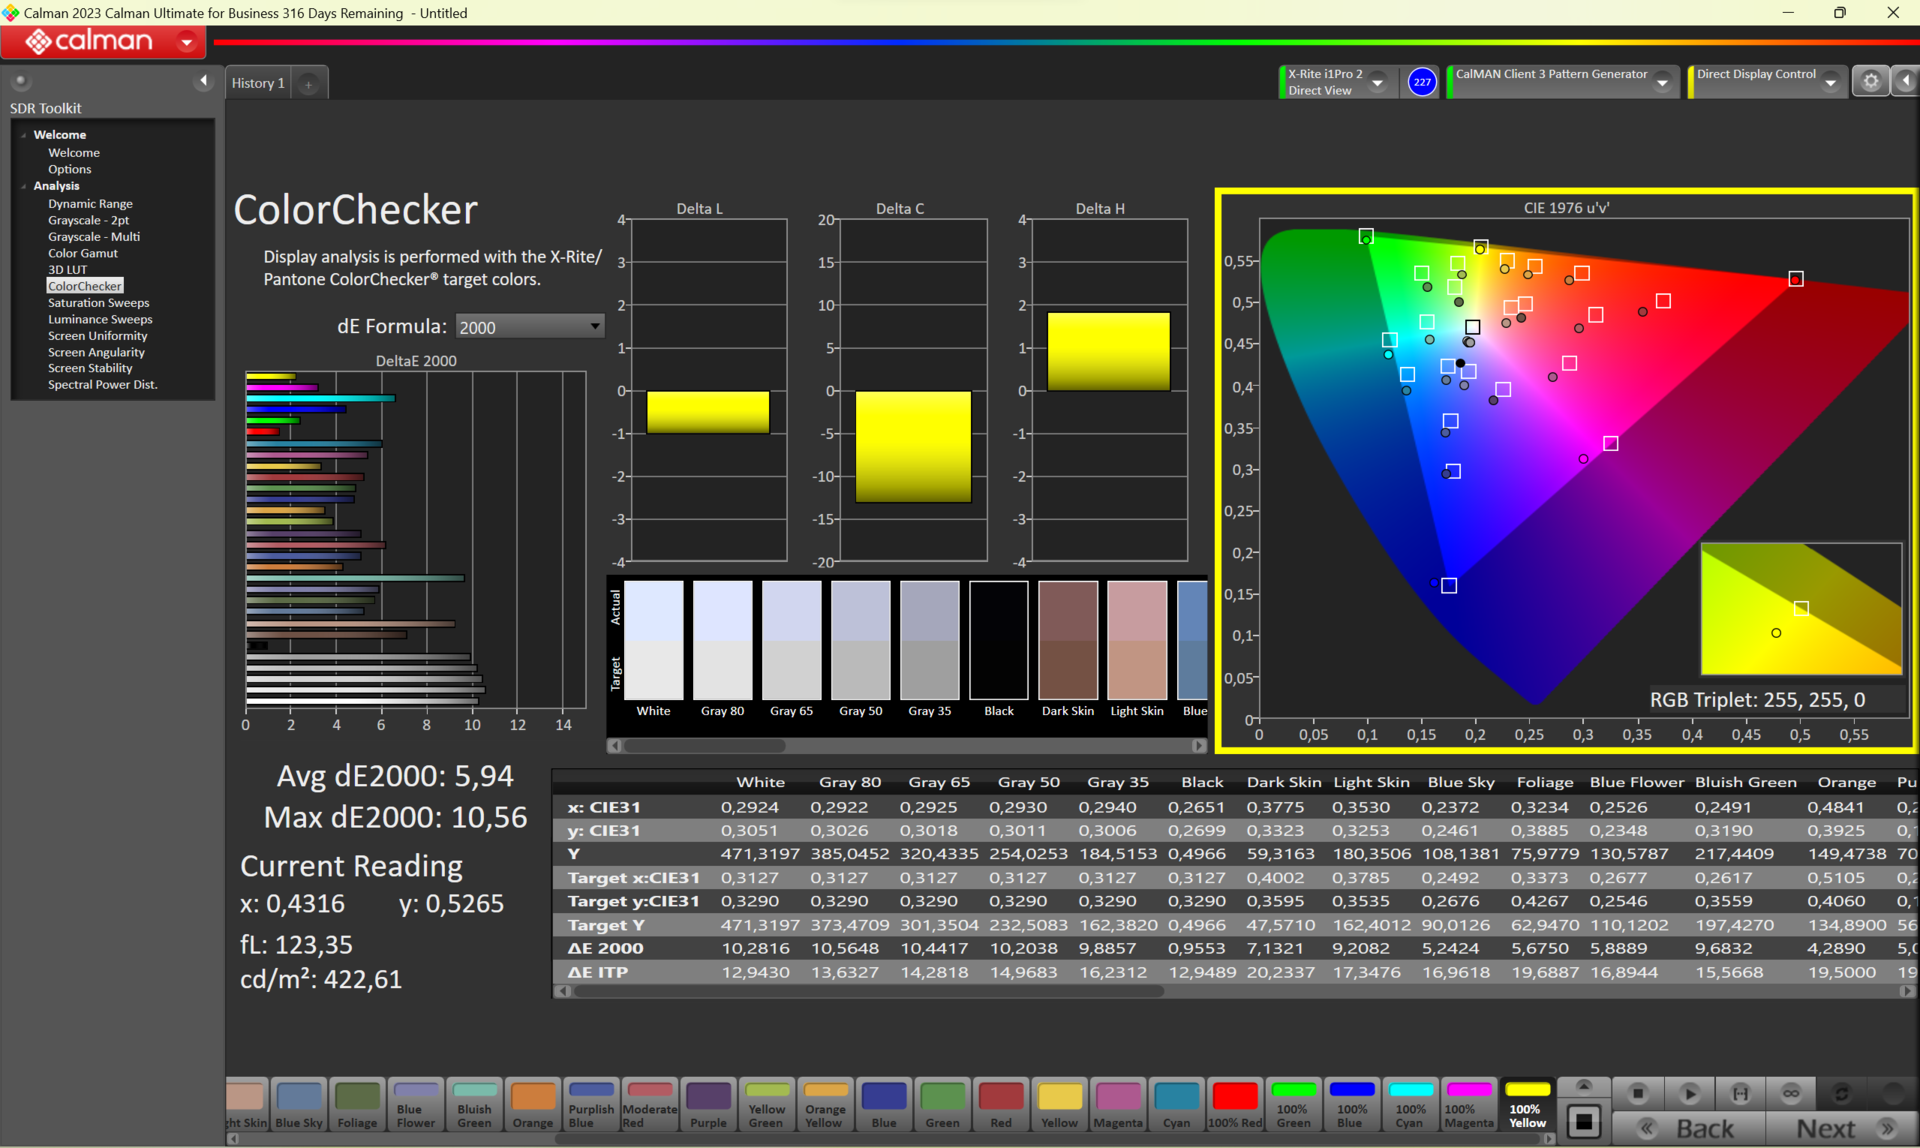
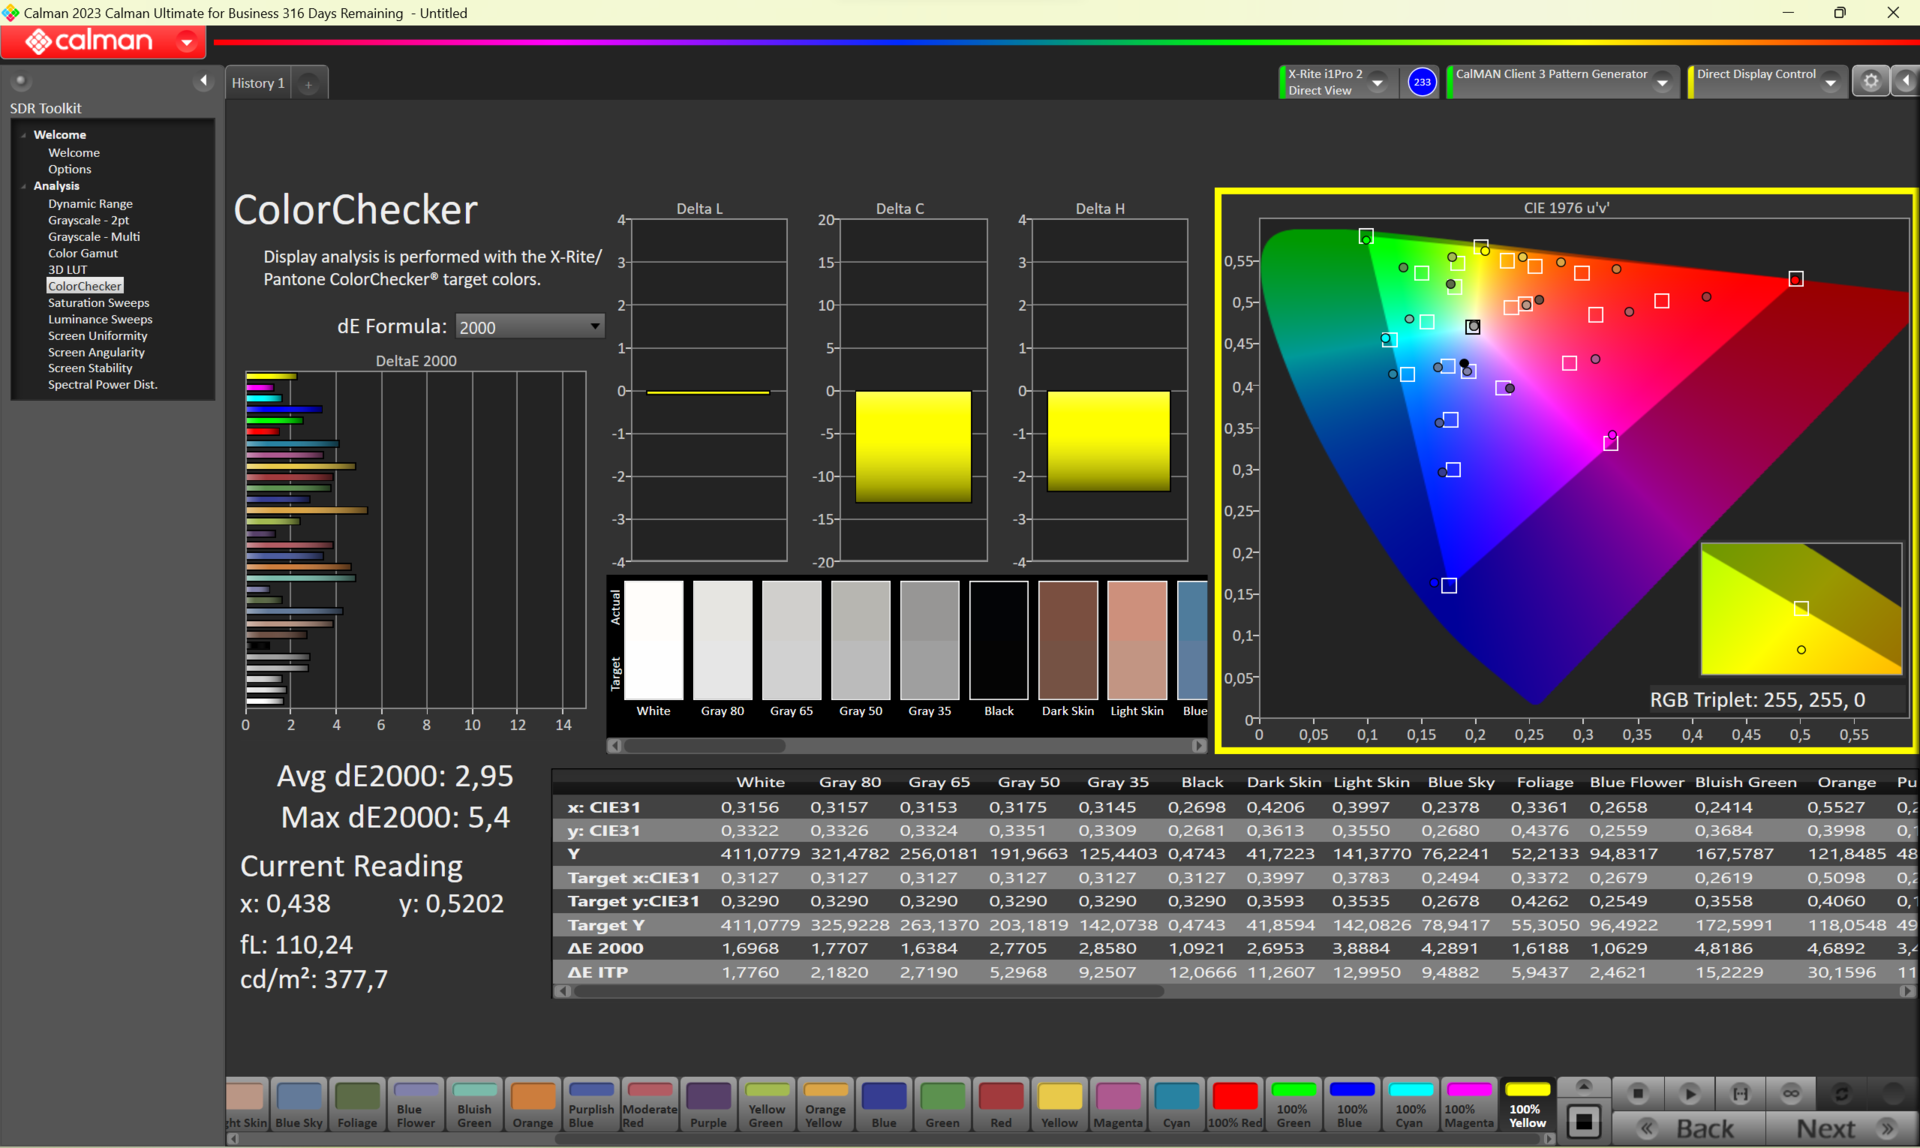
ΔE ColorChecker Calman: 5.94 | ∀{0.5-29.43 Ø4.73}
calibrated: 2.95
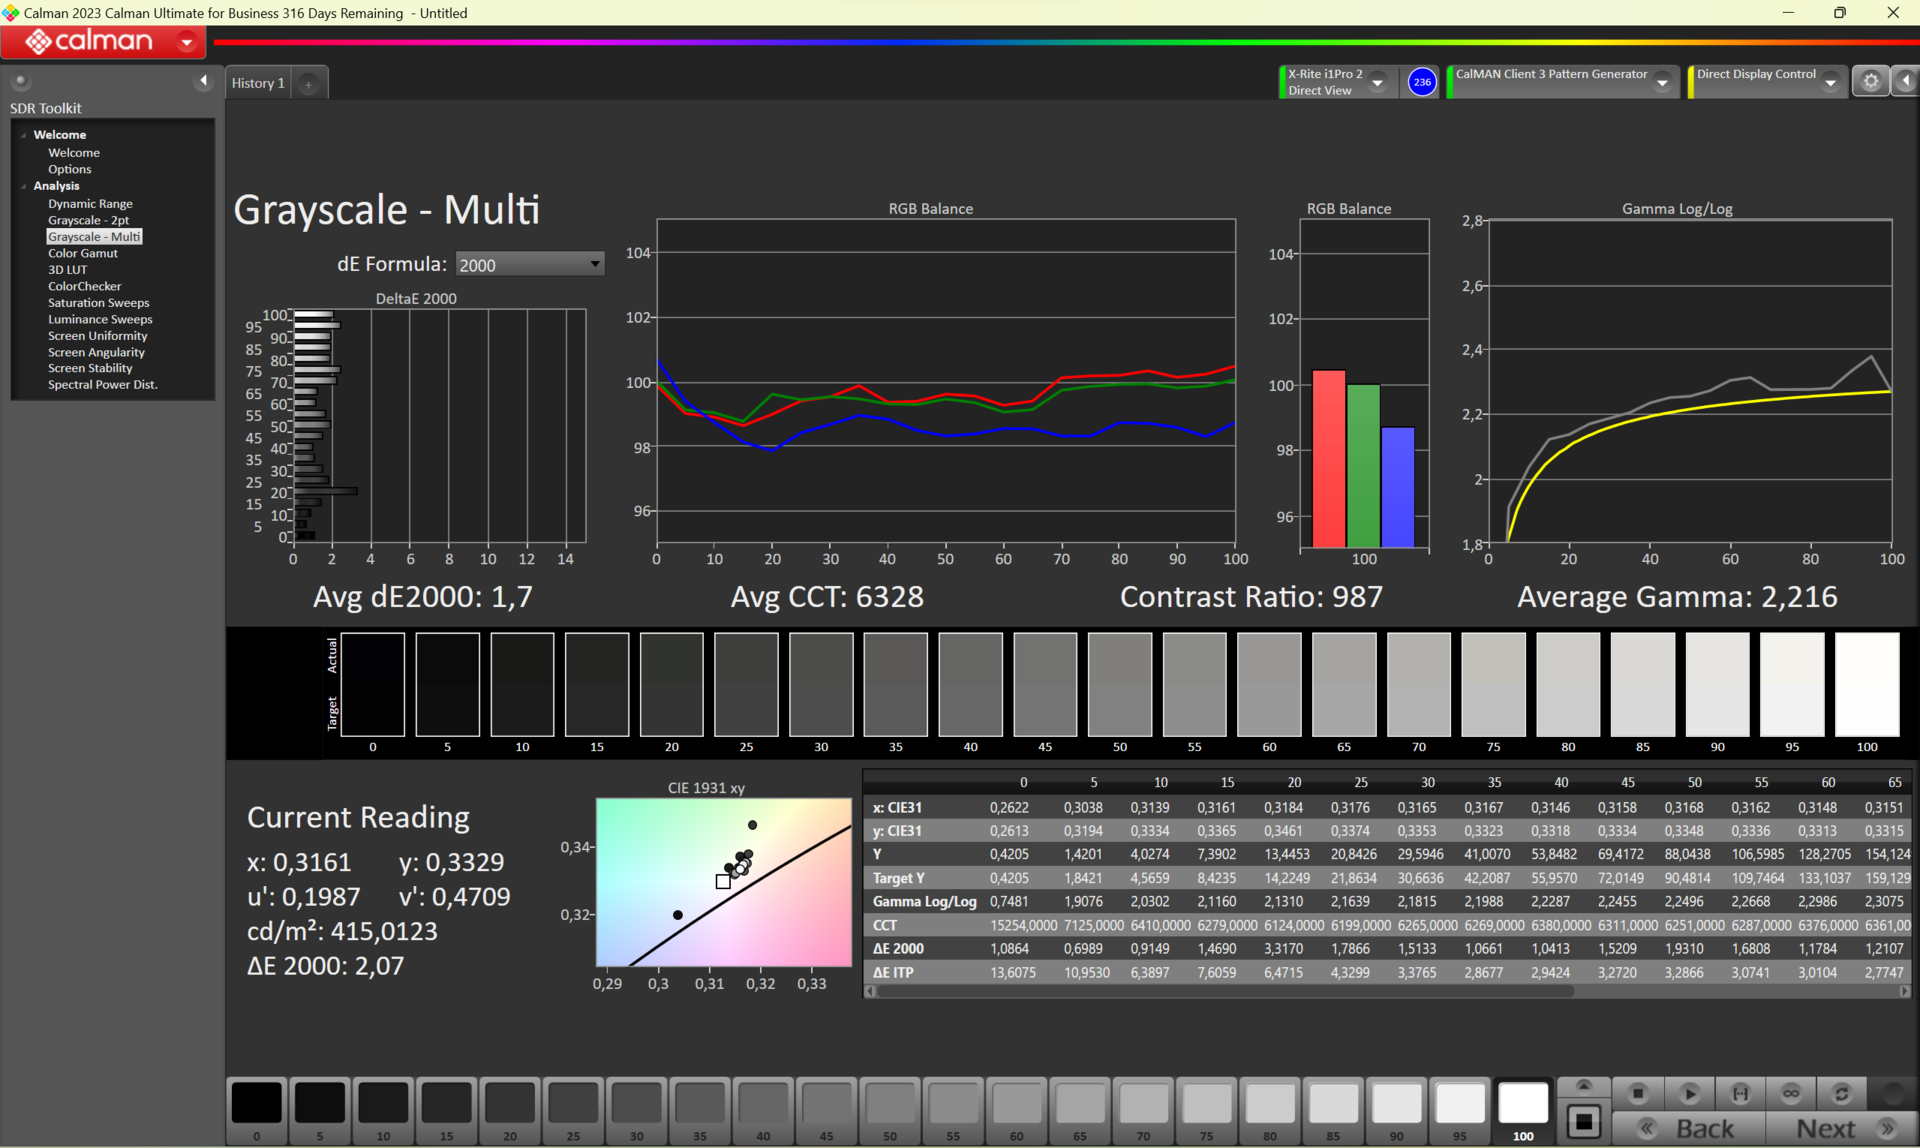
ΔE Greyscale Calman: 0.92 | ∀{0.09-98 Ø4.97}
90.09% AdobeRGB 1998 (Argyll 3D)
99.56% sRGB (Argyll 3D)
92.1% Display P3 (Argyll 3D)
Gamma: 1.93
CCT: 8064 K
| Lenovo Legion Go Legion Go Display, IPS, 2560x1600, 8.8" | Ayaneo Air 1S Retro Power Ayaneo-OLED, OLED, 1920x1080, 5.5" | Asus ROG Ally Z1 Extreme TL070FVSX01-0, IPS, 1920x1080, 7" | One Netbook XPlayer 2 FLQ8423, IPS, 2560x1600, 8.4" | Aokzoe A1 BOE0207, IPS, 1920x1200, 8" | Ayaneo Kun Ayaneo 2K, IPS, 2560x1600, 8.4" | |
|---|---|---|---|---|---|---|
| Display | 6% | -20% | -14% | -16% | 1% | |
| Display P3 Coverage (%) | 92.1 | 99.85 8% | 65.6 -29% | 75.4 -18% | 72.3 -21% | 93.52 2% |
| sRGB Coverage (%) | 99.56 | 100 0% | 92.1 -7% | 97 -3% | 92.6 -7% | 99.4 0% |
| AdobeRGB 1998 Coverage (%) | 90.09 | 99.71 11% | 67.9 -25% | 71.1 -21% | 73.4 -19% | 91.2 1% |
| Response Times | 72% | 54% | -68% | -43% | -15% | |
| Response Time Grey 50% / Grey 80% * (ms) | 20.8 ? | 4.4 ? 79% | 10.5 ? 50% | 36.8 ? -77% | 28.9 ? -39% | 24.2 ? -16% |
| Response Time Black / White * (ms) | 14.4 ? | 5 ? 65% | 6 ? 58% | 22.8 ? -58% | 21.1 ? -47% | 16.2 ? -13% |
| PWM Frequency (Hz) | 700 | 240 ? | 9970.7 | 20000 | ||
| Screen | -50% | -38% | -84% | -155% | -67% | |
| Brightness middle (cd/m²) | 411 | 331 -19% | 513 25% | 369 -10% | 328.4 -20% | 680 65% |
| Brightness (cd/m²) | 413 | 339 -18% | 474 15% | 363 -12% | 323 -22% | 678 64% |
| Brightness Distribution (%) | 80 | 90 13% | 84 5% | 89 11% | 92 15% | 91 14% |
| Black Level * (cd/m²) | 0.42 | 0.07 83% | 0.38 10% | 0.28 33% | 0.39 7% | 0.5 -19% |
| Contrast (:1) | 979 | 4729 383% | 1350 38% | 1318 35% | 842 -14% | 1360 39% |
| Colorchecker dE 2000 * | 5.94 | 4.76 20% | 3.7 38% | 7.1 -20% | 10.17 -71% | 4 33% |
| Colorchecker dE 2000 max. * | 10.56 | 9.2 13% | 8.3 21% | 10.9 -3% | 18.14 -72% | 9 15% |
| Colorchecker dE 2000 calibrated * | 2.95 | 5.04 -71% | 2.6 12% | 1.07 64% | 1 66% | |
| Greyscale dE 2000 * | 0.92 | 8.79 -855% | 5.1 -454% | 8.3 -802% | 12.7 -1280% | 9 -878% |
| Gamma | 1.93 114% | 2.155 102% | 2.14 103% | 2.01 109% | 2.7 81% | 2 110% |
| CCT | 8064 81% | 7571 86% | 7732 84% | 8838 74% | 12502 52% | 7188 90% |
| Total Average (Program / Settings) | 9% /
-21% | -1% /
-20% | -55% /
-67% | -71% /
-109% | -27% /
-45% |
* ... smaller is better
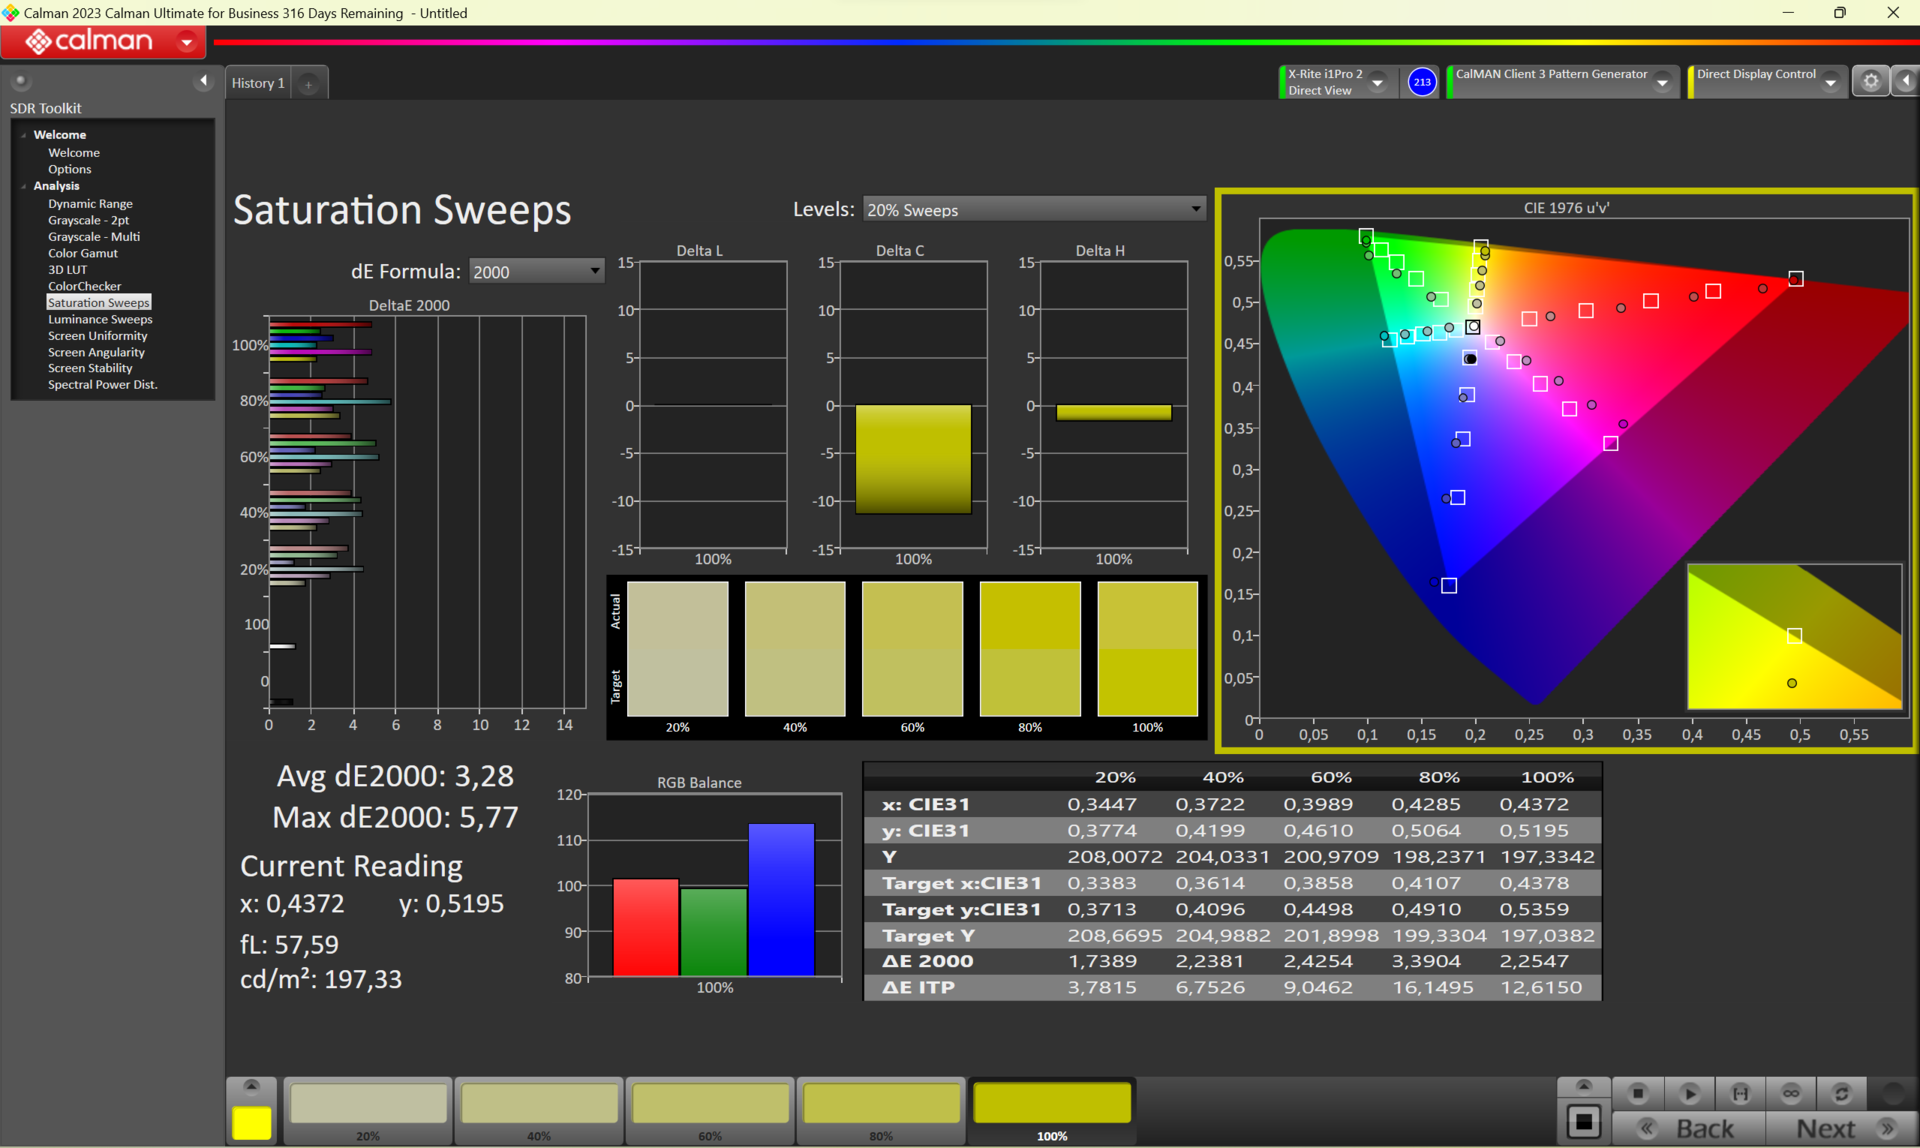
If you are looking to depict games in all their true glory, then a screen should at least master sRGB. The Legion Go's display covers this almost entirely and in addition, it offers good AdobeRGB and DisplayP3 coverage.
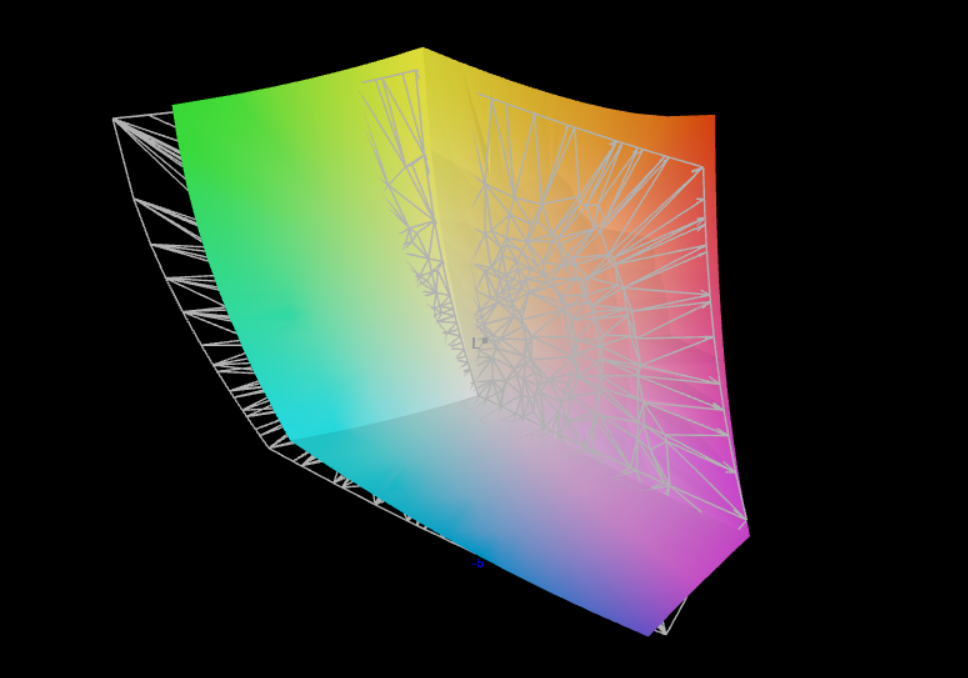
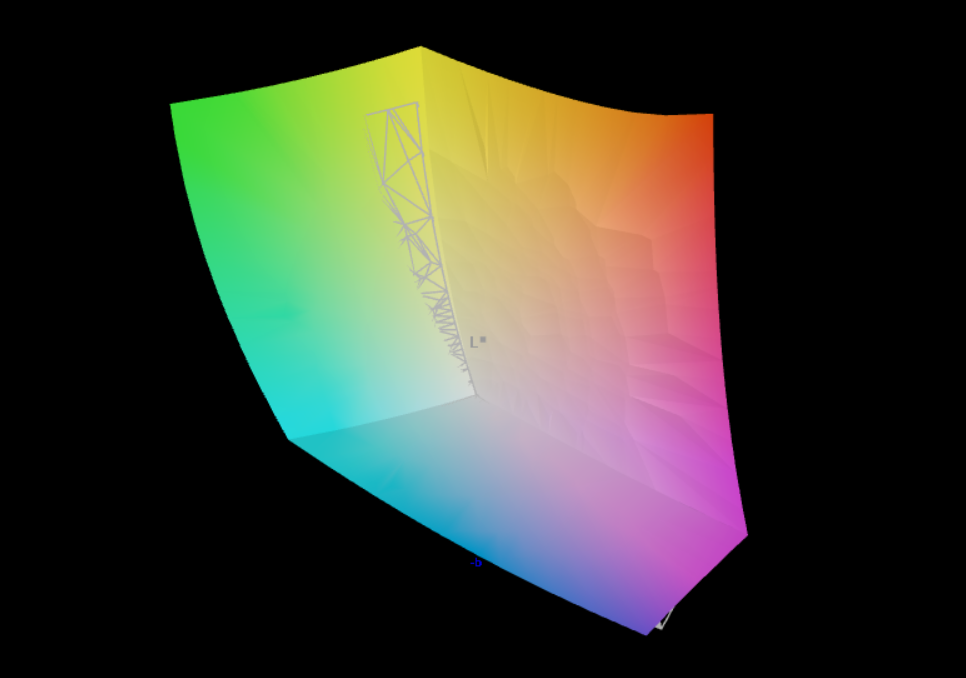
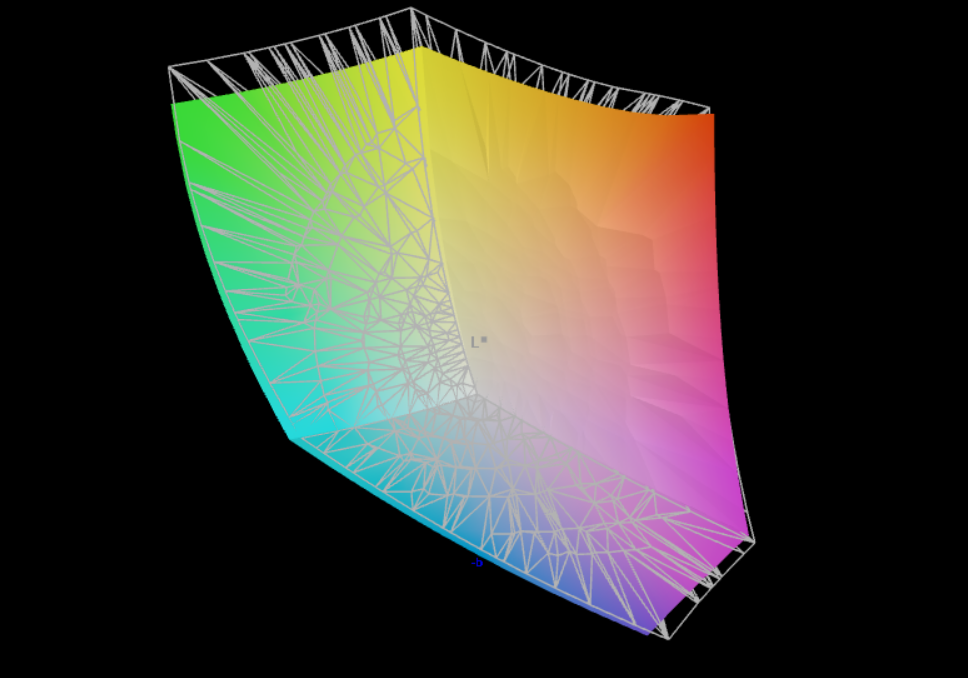
We unfortunately noted that the screen of Lenovo's gaming handheld suffers from a slight blue tint straight out of the box. After applying our ICC profile, this blue tint was improved considerably and its color depiction was improved to a good value with a ΔΕ2000 of below 3.
Display Response Times
| ↔ Response Time Black to White | ||
|---|---|---|
| 14.4 ms ... rise ↗ and fall ↘ combined | ↗ 7 ms rise | 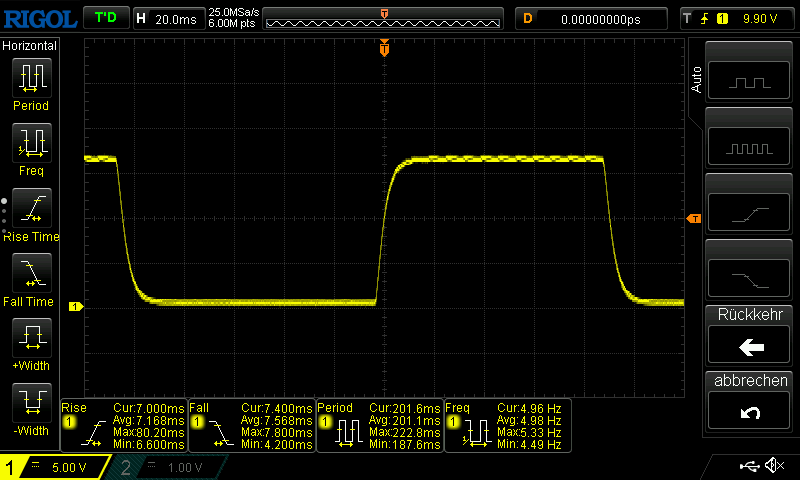 |
| ↘ 7.4 ms fall | ||
| The screen shows good response rates in our tests, but may be too slow for competitive gamers. In comparison, all tested devices range from 0.1 (minimum) to 240 (maximum) ms. » 35 % of all devices are better. This means that the measured response time is better than the average of all tested devices (19.9 ms). | ||
| ↔ Response Time 50% Grey to 80% Grey | ||
| 20.8 ms ... rise ↗ and fall ↘ combined | ↗ 9.4 ms rise | 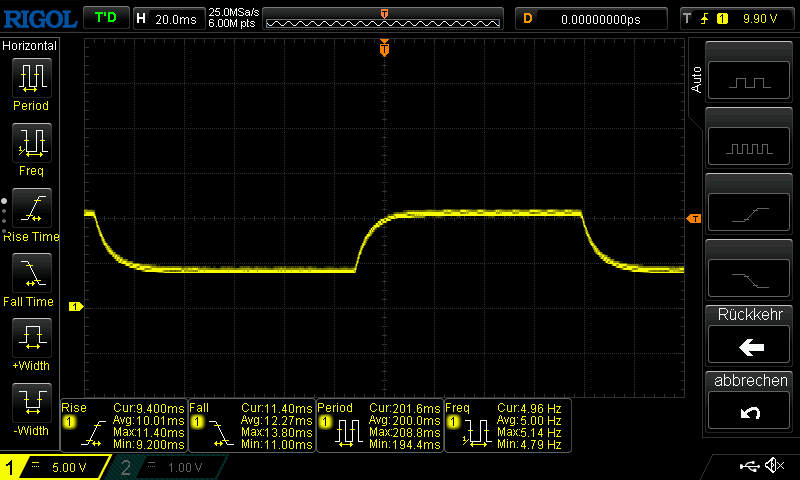 |
| ↘ 11.4 ms fall | ||
| The screen shows good response rates in our tests, but may be too slow for competitive gamers. In comparison, all tested devices range from 0.165 (minimum) to 636 (maximum) ms. » 33 % of all devices are better. This means that the measured response time is better than the average of all tested devices (31.1 ms). | ||
Screen Flickering / PWM (Pulse-Width Modulation)
| Screen flickering / PWM detected | 700 Hz | 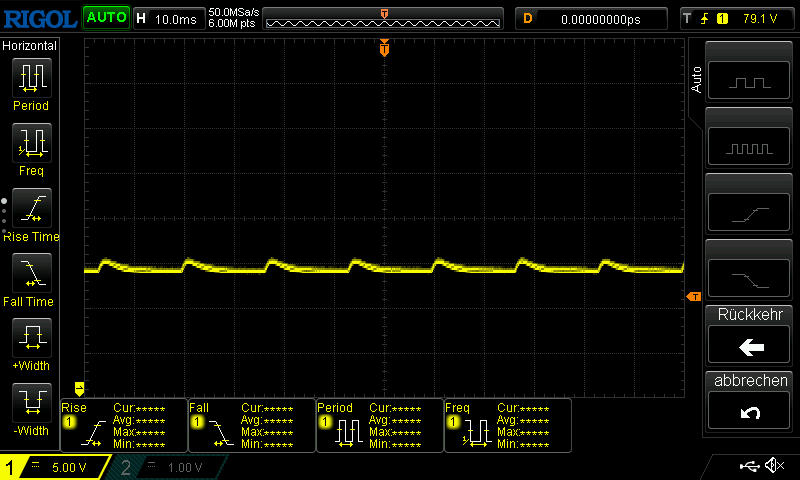 | |
The display backlight flickers at 700 Hz (worst case, e.g., utilizing PWM) . The frequency of 700 Hz is quite high, so most users sensitive to PWM should not notice any flickering. In comparison: 52 % of all tested devices do not use PWM to dim the display. If PWM was detected, an average of 7801 (minimum: 5 - maximum: 343500) Hz was measured. | |||
We measured the screen's response times at 144 Hz and 60 Hz. Both modes showed identical values. It is a shame that at 144 Hz, one individual frame is depicted for about 7 milliseconds. As a result, the Legion Go's response times don't quite live up to our expectations, however, they are surely enough for most gamers.
It turned out to be a little difficult to evaluate the background lighting's flickering. We measured a slight flicker at lots of different brightness levels on the Legion Go. We can't definitively say whether this will be an issue for sensitive users. The brightness fluctuations remained within the single-digit percentage range.
The display's reflective surface makes using the handheld outdoors a bit of a nuisance. At the end of the day, you will more often than not find an angle that works for you thanks to its high display brightness and good viewing angles.

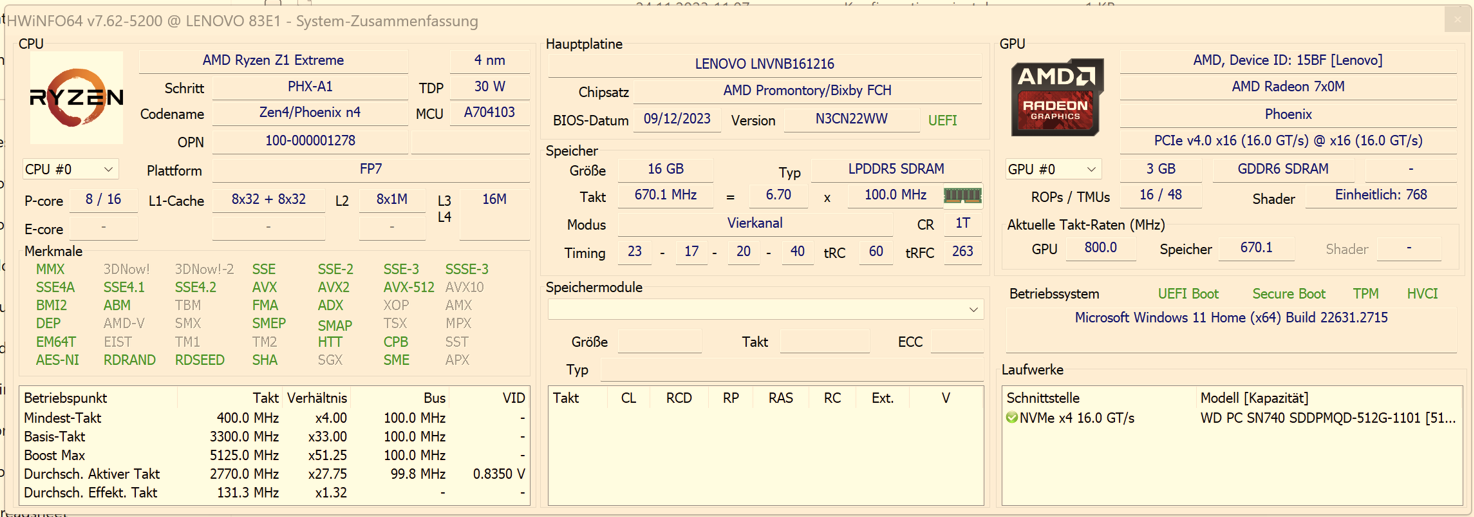
Performance - Impressive graphics
The AMD Ryzen Z1 Extreme and 16 GB RAM power the gaming handheld. An RX 780M also sits within the Z1. This is a comparatively powerful iGPU that actually even managed to beat a few dGPUs in our benchmarks. As a result, you can enjoy lots of current games at about 60fps with high detail settings and at Full-HD resolution.
Testing conditions
The Lenovo Legion Go's TDP can be configured by users, as can the fans. We decided to let the gaming handheld decide what to do with its fans, selecting the automatic high cooling mode. We also left its maximum TDP at 30 watts. You can change quite a few settings within Legion Space and the Control Center. We noticed that Legion Space could mostly do with some improvements. Controlling the application via mouse and keyboard or using FPS mode is made more difficult by some small bugs.
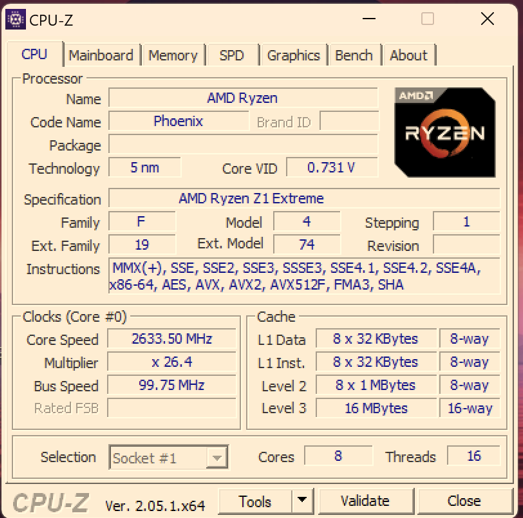
Processor
The Phoenix-series AMD Ryzen Z1 Extreme is one of AMD's most powerful laptop processors. This processor has been optimized for gaming and does its job well within the Asus ROG Ally, too. Compared to the technically-similar AMD Ryzen 7 7840U, the Z1 Extreme is missing the AI core Ryzen AI. Although as a result, the Z1 Extreme should be a little more efficient while gaming.
Within the Lenovo Legion Go, the processor is supplied with slightly less power than in the ROG Ally Z1 Extreme. Subsequently, Lenovo's gaming handheld is at roughly a 10 % disadvantage over the ROG Ally. In the long run, the Legion Go can't retain its performance at 30 watts, as the Cinebench loop revealed. After several runs, its performance sank to the level of the Ayaneo Air 1S with the Ryzen 7 7840U. This handheld ran at 20 watts during our test. Still, the Lenovo handheld's processor performance is more than enough for gaming, as our further benchmarks confirmed.
Cinebench R15 Multi continuous test
Cinebench R23: Multi Core | Single Core
Cinebench R20: CPU (Multi Core) | CPU (Single Core)
Cinebench R15: CPU Multi 64Bit | CPU Single 64Bit
Blender: v3.3 Classroom CPU
7-Zip 18.03: 7z b 4
Geekbench 5.5: Multi-Core | Single-Core
HWBOT x265 Benchmark v2.2: 4k Preset
LibreOffice : 20 Documents To PDF
R Benchmark 2.5: Overall mean
| CPU Performance rating | |
| Asus ROG Zephyrus G14 GA402XY -1! | |
| Asus ROG Ally Z1 Extreme | |
| Average AMD Ryzen Z1 Extreme | |
| Ayaneo Kun | |
| Lenovo Legion Go | |
| Ayaneo Air 1S Retro Power | |
| Average of class Handheld / UMPC | |
| Aokzoe A1 | |
| One Netbook XPlayer 2 -1! | |
| Cinebench R23 / Multi Core | |
| Asus ROG Zephyrus G14 GA402XY | |
| Ayaneo Kun | |
| Asus ROG Ally Z1 Extreme | |
| Average AMD Ryzen Z1 Extreme (13004 - 15120, n=3) | |
| Lenovo Legion Go | |
| Average of class Handheld / UMPC (4953 - 16841, n=14, last 2 years) | |
| Ayaneo Air 1S Retro Power | |
| Aokzoe A1 | |
| One Netbook XPlayer 2 | |
| Cinebench R23 / Single Core | |
| Asus ROG Zephyrus G14 GA402XY | |
| Asus ROG Ally Z1 Extreme | |
| Average AMD Ryzen Z1 Extreme (1733 - 1779, n=3) | |
| Lenovo Legion Go | |
| Ayaneo Air 1S Retro Power | |
| Average of class Handheld / UMPC (1071 - 2006, n=14, last 2 years) | |
| Ayaneo Kun | |
| Aokzoe A1 | |
| One Netbook XPlayer 2 | |
| Cinebench R20 / CPU (Multi Core) | |
| Asus ROG Zephyrus G14 GA402XY | |
| Ayaneo Kun | |
| Asus ROG Ally Z1 Extreme | |
| Average AMD Ryzen Z1 Extreme (5109 - 5825, n=3) | |
| Lenovo Legion Go | |
| Ayaneo Air 1S Retro Power | |
| Average of class Handheld / UMPC (1904 - 6577, n=12, last 2 years) | |
| Aokzoe A1 | |
| One Netbook XPlayer 2 | |
| Cinebench R20 / CPU (Single Core) | |
| Asus ROG Zephyrus G14 GA402XY | |
| Asus ROG Ally Z1 Extreme | |
| Average AMD Ryzen Z1 Extreme (672 - 692, n=3) | |
| Lenovo Legion Go | |
| Ayaneo Air 1S Retro Power | |
| Average of class Handheld / UMPC (390 - 787, n=12, last 2 years) | |
| Ayaneo Kun | |
| Aokzoe A1 | |
| One Netbook XPlayer 2 | |
| Cinebench R15 / CPU Multi 64Bit | |
| Asus ROG Zephyrus G14 GA402XY | |
| Ayaneo Kun | |
| Asus ROG Ally Z1 Extreme | |
| Average AMD Ryzen Z1 Extreme (2050 - 2397, n=3) | |
| Lenovo Legion Go | |
| Average of class Handheld / UMPC (855 - 2533, n=12, last 2 years) | |
| Ayaneo Air 1S Retro Power | |
| Aokzoe A1 | |
| One Netbook XPlayer 2 | |
| Cinebench R15 / CPU Single 64Bit | |
| Asus ROG Zephyrus G14 GA402XY | |
| Asus ROG Ally Z1 Extreme | |
| Average AMD Ryzen Z1 Extreme (262 - 280, n=3) | |
| Lenovo Legion Go | |
| Ayaneo Air 1S Retro Power | |
| Ayaneo Kun | |
| Aokzoe A1 | |
| Average of class Handheld / UMPC (155.1 - 304, n=12, last 2 years) | |
| One Netbook XPlayer 2 | |
| Blender / v3.3 Classroom CPU | |
| One Netbook XPlayer 2 | |
| Average of class Handheld / UMPC (290 - 1026, n=12, last 2 years) | |
| Aokzoe A1 | |
| Lenovo Legion Go | |
| Ayaneo Air 1S Retro Power | |
| Ayaneo Kun | |
| Ayaneo Kun | |
| Average AMD Ryzen Z1 Extreme (365 - 446, n=3) | |
| Asus ROG Ally Z1 Extreme | |
| Asus ROG Zephyrus G14 GA402XY | |
| 7-Zip 18.03 / 7z b 4 | |
| Asus ROG Zephyrus G14 GA402XY | |
| Asus ROG Ally Z1 Extreme | |
| Ayaneo Kun | |
| Average AMD Ryzen Z1 Extreme (56966 - 64454, n=3) | |
| Lenovo Legion Go | |
| Ayaneo Air 1S Retro Power | |
| Aokzoe A1 | |
| Average of class Handheld / UMPC (23417 - 66618, n=11, last 2 years) | |
| One Netbook XPlayer 2 | |
| Geekbench 5.5 / Multi-Core | |
| Asus ROG Zephyrus G14 GA402XY | |
| Asus ROG Ally Z1 Extreme | |
| Average AMD Ryzen Z1 Extreme (9589 - 10917, n=4) | |
| Lenovo Legion Go | |
| Lenovo Legion Go | |
| Average of class Handheld / UMPC (3932 - 11975, n=13, last 2 years) | |
| Ayaneo Kun | |
| Aokzoe A1 | |
| Ayaneo Air 1S Retro Power | |
| One Netbook XPlayer 2 | |
| Geekbench 5.5 / Single-Core | |
| Asus ROG Zephyrus G14 GA402XY | |
| Asus ROG Ally Z1 Extreme | |
| Average AMD Ryzen Z1 Extreme (1896 - 1956, n=4) | |
| Lenovo Legion Go | |
| Lenovo Legion Go | |
| Average of class Handheld / UMPC (875 - 2134, n=13, last 2 years) | |
| Ayaneo Air 1S Retro Power | |
| Aokzoe A1 | |
| Ayaneo Kun | |
| One Netbook XPlayer 2 | |
| HWBOT x265 Benchmark v2.2 / 4k Preset | |
| Ayaneo Kun | |
| Asus ROG Ally Z1 Extreme | |
| Average AMD Ryzen Z1 Extreme (16.3 - 18.7, n=3) | |
| Lenovo Legion Go | |
| Average of class Handheld / UMPC (6.21 - 20.8, n=12, last 2 years) | |
| Ayaneo Air 1S Retro Power | |
| Aokzoe A1 | |
| One Netbook XPlayer 2 | |
| LibreOffice / 20 Documents To PDF | |
| One Netbook XPlayer 2 | |
| Average of class Handheld / UMPC (41.1 - 92.8, n=12, last 2 years) | |
| Ayaneo Kun | |
| Lenovo Legion Go | |
| Aokzoe A1 | |
| Average AMD Ryzen Z1 Extreme (43 - 52.3, n=3) | |
| Ayaneo Air 1S Retro Power | |
| Asus ROG Ally Z1 Extreme | |
| Asus ROG Zephyrus G14 GA402XY | |
| R Benchmark 2.5 / Overall mean | |
| Average of class Handheld / UMPC (0.4167 - 0.756, n=12, last 2 years) | |
| Aokzoe A1 | |
| Ayaneo Kun | |
| Ayaneo Kun | |
| Lenovo Legion Go | |
| Ayaneo Air 1S Retro Power | |
| Average AMD Ryzen Z1 Extreme (0.4447 - 0.4662, n=3) | |
| Asus ROG Ally Z1 Extreme | |
| Asus ROG Zephyrus G14 GA402XY | |
* ... smaller is better
AIDA64: FP32 Ray-Trace | FPU Julia | CPU SHA3 | CPU Queen | FPU SinJulia | FPU Mandel | CPU AES | CPU ZLib | FP64 Ray-Trace | CPU PhotoWorxx
| Performance rating | |
| Ayaneo Kun | |
| Asus ROG Ally Z1 Extreme | |
| Average AMD Ryzen Z1 Extreme | |
| Lenovo Legion Go | |
| Ayaneo Air 1S Retro Power | |
| Average of class Handheld / UMPC | |
| Aokzoe A1 | |
| One Netbook XPlayer 2 | |
| AIDA64 / FP32 Ray-Trace | |
| Ayaneo Kun | |
| Ayaneo Kun | |
| Asus ROG Ally Z1 Extreme | |
| Average AMD Ryzen Z1 Extreme (20714 - 24519, n=3) | |
| Lenovo Legion Go | |
| Ayaneo Air 1S Retro Power | |
| Average of class Handheld / UMPC (6544 - 26450, n=12, last 2 years) | |
| Aokzoe A1 | |
| One Netbook XPlayer 2 | |
| AIDA64 / FPU Julia | |
| Ayaneo Kun | |
| Ayaneo Kun | |
| Asus ROG Ally Z1 Extreme | |
| Average AMD Ryzen Z1 Extreme (86738 - 103637, n=3) | |
| Lenovo Legion Go | |
| Aokzoe A1 | |
| Ayaneo Air 1S Retro Power | |
| Average of class Handheld / UMPC (36464 - 103637, n=12, last 2 years) | |
| One Netbook XPlayer 2 | |
| AIDA64 / CPU SHA3 | |
| Ayaneo Kun | |
| Ayaneo Kun | |
| Asus ROG Ally Z1 Extreme | |
| Average AMD Ryzen Z1 Extreme (3854 - 4465, n=3) | |
| Lenovo Legion Go | |
| Ayaneo Air 1S Retro Power | |
| Average of class Handheld / UMPC (1157 - 4484, n=12, last 2 years) | |
| Aokzoe A1 | |
| One Netbook XPlayer 2 | |
| AIDA64 / CPU Queen | |
| Ayaneo Kun | |
| Ayaneo Kun | |
| Asus ROG Ally Z1 Extreme | |
| Average AMD Ryzen Z1 Extreme (95153 - 107867, n=3) | |
| Lenovo Legion Go | |
| Aokzoe A1 | |
| Ayaneo Air 1S Retro Power | |
| Average of class Handheld / UMPC (41744 - 107867, n=12, last 2 years) | |
| One Netbook XPlayer 2 | |
| AIDA64 / FPU SinJulia | |
| Ayaneo Kun | |
| Ayaneo Kun | |
| Asus ROG Ally Z1 Extreme | |
| Average AMD Ryzen Z1 Extreme (12936 - 14281, n=3) | |
| Lenovo Legion Go | |
| Ayaneo Air 1S Retro Power | |
| Aokzoe A1 | |
| Average of class Handheld / UMPC (4425 - 16980, n=12, last 2 years) | |
| One Netbook XPlayer 2 | |
| AIDA64 / FPU Mandel | |
| Ayaneo Kun | |
| Ayaneo Kun | |
| Asus ROG Ally Z1 Extreme | |
| Average AMD Ryzen Z1 Extreme (46180 - 55457, n=3) | |
| Lenovo Legion Go | |
| Aokzoe A1 | |
| Ayaneo Air 1S Retro Power | |
| Average of class Handheld / UMPC (19153 - 55457, n=12, last 2 years) | |
| One Netbook XPlayer 2 | |
| AIDA64 / CPU AES | |
| Ayaneo Kun | |
| Ayaneo Kun | |
| Aokzoe A1 | |
| One Netbook XPlayer 2 | |
| Asus ROG Ally Z1 Extreme | |
| Average AMD Ryzen Z1 Extreme (57678 - 80158, n=3) | |
| Ayaneo Air 1S Retro Power | |
| Average of class Handheld / UMPC (18552 - 119040, n=11, last 2 years) | |
| Lenovo Legion Go | |
| AIDA64 / CPU ZLib | |
| Ayaneo Kun | |
| Ayaneo Kun | |
| Asus ROG Ally Z1 Extreme | |
| Average AMD Ryzen Z1 Extreme (687 - 987, n=3) | |
| Ayaneo Air 1S Retro Power | |
| Average of class Handheld / UMPC (356 - 1112, n=12, last 2 years) | |
| Aokzoe A1 | |
| Lenovo Legion Go | |
| One Netbook XPlayer 2 | |
| AIDA64 / FP64 Ray-Trace | |
| Ayaneo Kun | |
| Ayaneo Kun | |
| Asus ROG Ally Z1 Extreme | |
| Average AMD Ryzen Z1 Extreme (10740 - 13049, n=3) | |
| Lenovo Legion Go | |
| Ayaneo Air 1S Retro Power | |
| Average of class Handheld / UMPC (3585 - 14181, n=12, last 2 years) | |
| Aokzoe A1 | |
| One Netbook XPlayer 2 | |
| AIDA64 / CPU PhotoWorxx | |
| Average of class Handheld / UMPC (19472 - 54726, n=12, last 2 years) | |
| Asus ROG Ally Z1 Extreme | |
| Average AMD Ryzen Z1 Extreme (34764 - 39932, n=3) | |
| Lenovo Legion Go | |
| Ayaneo Kun | |
| Ayaneo Kun | |
| Ayaneo Air 1S Retro Power | |
| One Netbook XPlayer 2 | |
| Aokzoe A1 | |
System performance
The PCMark 10 benchmarks, which focus mostly on office and creative uses, shouldn't be too interesting for most users of the Legion Go, however, they do still tell us a lot about the gaming handheld. This is because PCMark also tests RAM and SSDs. It quickly became clear that the Legion Go has a clear advantage over the Ayaneo Kun, although it can supply its AMD Ryzen 7 7840U with up to 54 watts. As a result, the Ayaneo handheld should actually have managed to achieve more points in this benchmark—but the Kun's SSD quickly gets hot and slow. It only did better in the benchmark focussing on content creation, where graphics performance counts the most. The further PCMark 10 results show that the Legion Go and Asus ROG Ally's memory and processors are similarly fast—their resulting point scores lie quite close together.
| PCMark 10 / Score | |
| Asus ROG Ally Z1 Extreme | |
| Average AMD Ryzen Z1 Extreme, AMD Radeon 780M (6439 - 7149, n=3) | |
| Aokzoe A1 | |
| Average of class Handheld / UMPC (3592 - 8082, n=12, last 2 years) | |
| Lenovo Legion Go | |
| Ayaneo Kun | |
| Ayaneo Air 1S Retro Power | |
| One Netbook XPlayer 2 | |
| PCMark 10 / Essentials | |
| Aokzoe A1 | |
| Average AMD Ryzen Z1 Extreme, AMD Radeon 780M (10081 - 10633, n=3) | |
| Asus ROG Ally Z1 Extreme | |
| Lenovo Legion Go | |
| Average of class Handheld / UMPC (7542 - 11262, n=12, last 2 years) | |
| Ayaneo Kun | |
| Ayaneo Air 1S Retro Power | |
| One Netbook XPlayer 2 | |
| PCMark 10 / Productivity | |
| Asus ROG Ally Z1 Extreme | |
| Average AMD Ryzen Z1 Extreme, AMD Radeon 780M (8996 - 10074, n=3) | |
| Average of class Handheld / UMPC (5015 - 14802, n=12, last 2 years) | |
| Aokzoe A1 | |
| Lenovo Legion Go | |
| Ayaneo Air 1S Retro Power | |
| Ayaneo Kun | |
| One Netbook XPlayer 2 | |
| PCMark 10 / Digital Content Creation | |
| Ayaneo Kun | |
| Average AMD Ryzen Z1 Extreme, AMD Radeon 780M (7990 - 9408, n=3) | |
| Asus ROG Ally Z1 Extreme | |
| Average of class Handheld / UMPC (3326 - 10026, n=12, last 2 years) | |
| Aokzoe A1 | |
| Lenovo Legion Go | |
| Ayaneo Air 1S Retro Power | |
| One Netbook XPlayer 2 | |
| PCMark 10 Score | 6439 points | |
Help | ||
| AIDA64 / Memory Copy | |
| Asus ROG Ally Z1 Extreme | |
| Average AMD Ryzen Z1 Extreme (74414 - 92447, n=3) | |
| Average of class Handheld / UMPC (33517 - 107929, n=12, last 2 years) | |
| Lenovo Legion Go | |
| One Netbook XPlayer 2 | |
| Aokzoe A1 | |
| Ayaneo Kun | |
| Ayaneo Kun | |
| Ayaneo Air 1S Retro Power | |
| AIDA64 / Memory Read | |
| Average of class Handheld / UMPC (25476 - 103022, n=12, last 2 years) | |
| Lenovo Legion Go | |
| Average AMD Ryzen Z1 Extreme (50337 - 58713, n=3) | |
| Asus ROG Ally Z1 Extreme | |
| Ayaneo Kun | |
| One Netbook XPlayer 2 | |
| Aokzoe A1 | |
| Ayaneo Air 1S Retro Power | |
| AIDA64 / Memory Write | |
| Lenovo Legion Go | |
| Average AMD Ryzen Z1 Extreme (92869 - 108872, n=3) | |
| Asus ROG Ally Z1 Extreme | |
| Average of class Handheld / UMPC (25595 - 117883, n=12, last 2 years) | |
| One Netbook XPlayer 2 | |
| Ayaneo Kun | |
| Ayaneo Kun | |
| Ayaneo Kun | |
| Ayaneo Air 1S Retro Power | |
| Aokzoe A1 | |
| AIDA64 / Memory Latency | |
| Ayaneo Kun | |
| Ayaneo Kun | |
| Ayaneo Air 1S Retro Power | |
| One Netbook XPlayer 2 | |
| Lenovo Legion Go | |
| Average AMD Ryzen Z1 Extreme (113.7 - 122.1, n=3) | |
| Average of class Handheld / UMPC (99.8 - 147.6, n=12, last 2 years) | |
| Asus ROG Ally Z1 Extreme | |
| Aokzoe A1 | |
* ... smaller is better
Storage devices
The small NVMe SSD from Western Digital that's installed in the Legion Go had a tendency to overheat quickly in our DiskSPD read loop. After a short while, the SSD's read speeds dropped significantly, resulting in average values. During short periods of load, the storage device can provide fast data access. However, the Legion Go isn't the only device susceptible to this; the SSD within the Ayaneo Kun is also prone to overheating.

* ... smaller is better
Reading continuous performance: DiskSpd Read Loop, Queue Depth 8
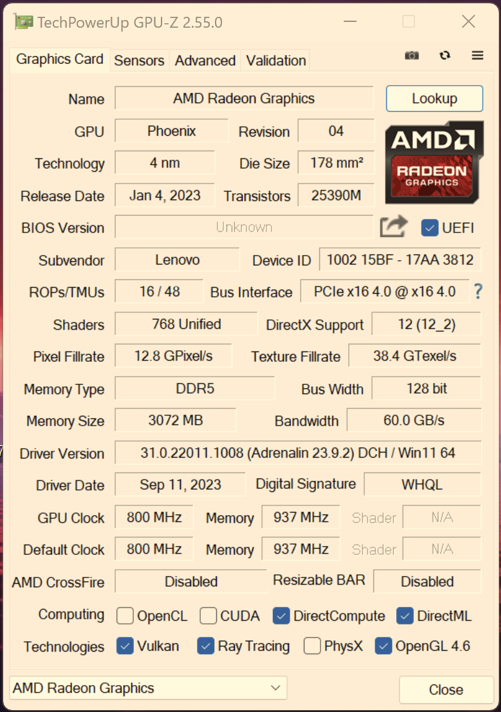
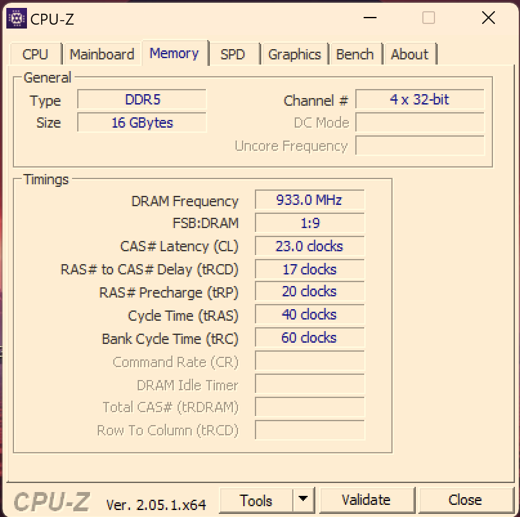
Graphics card
The AMD Radeon 780M is classed as one of the most powerful iGPUs but in the meantime, the 14th gen Intel Arc iGPUs in AMD's graphics units can keep up well. Our recent review of the Acer Swift Go 14 and the MSI Prestige 16 showed this. 3 GB of the 16 GB RAM inside the Legion Go are reserved for graphics. In the Asus ROG Ally, 4 GB are reserved for its RX 780M. The Ayaneo Kun and the Air S1 reserve a standard 6 GB RAM for their iGPUs. Depending on the application, this, in combination with the higher TDP values, sometimes resulted in slightly better or worse performance in the individual graphics benchmarks. The Legion Go's small RAM becomes particularly noticeable in games which only want to use the dedicated VRAM. In Lenovo's handheld, allocation can be changed via the UEFI settings.
| 3DMark Performance rating - Percent | |
| Average of class Handheld / UMPC | |
| Ayaneo Kun | |
| Average AMD Radeon 780M | |
| Lenovo Legion Go | |
| Asus ROG Ally Z1 Extreme -1! | |
| Asus ROG Zephyrus G14 GA402XY -2! | |
| Ayaneo Air 1S Retro Power | |
| One Netbook XPlayer 2 -1! | |
| 3DMark 11 Performance | 11738 points | |
| 3DMark Cloud Gate Standard Score | 34005 points | |
| 3DMark Fire Strike Score | 7285 points | |
| 3DMark Time Spy Score | 2897 points | |
Help | ||
Gaming performance
First of all, we can state that all the games we tested can be run on the Legion Go. Still, you might want to limit yourself to Full HD resolution if you want to achieve smooth gameplay. Compared to the other handhelds, significant downward performance deviations were only noticeable when it came to individual settings in several of the games. This included Shadow of the Tomb Raider, GTA V and Far Cry 5 with the highest settings selected. We estimate that this is connected to how much RAM is allocated to the device's iGPU, because we noted similar deviations on the Ayaneo Air 1S as soon as we reduced its VRAM to 3 GB. We would therefore recommend to adjust this within the Legion Go's BIOS/UEFI.
Even so, most of the frame rates achieved by the Legion Go in the individual benchmarks are fine for Full HD and most importantly, they are without a doubt playable. Furthermore, the handheld is able to keep its performance stable, which the Witcher 3 fps graphic shows. On the other hand, you can barely make use of the display's full resolution when playing current games. Although, you can't really make out the difference to Full HD resolution on its 8.8-inch screen. Plus, thanks to its 144-Hz display, the Legion Go is not quite as prone to screen tearing as other handhelds, but we would still recommend V-Sync for pretty much every game.
| Performance rating - Percent | |
| Lenovo Legion Go | |
| Average of class Handheld / UMPC | |
| Asus ROG Ally Z1 Extreme | |
| Ayaneo Kun | |
| Aokzoe A1 | |
| Asus ROG Zephyrus G14 GA402XY | |
| Ayaneo Air 1S Retro Power | |
| One Netbook XPlayer 2 | |
| The Witcher 3 - 1920x1080 Ultra Graphics & Postprocessing (HBAO+) | |
| Ayaneo Kun | |
| Lenovo Legion Go | |
| Asus ROG Ally Z1 Extreme | |
| Asus ROG Zephyrus G14 GA402XY | |
| Ayaneo Air 1S Retro Power | |
| Average of class Handheld / UMPC (17.5 - 31.1, n=5, last 2 years) | |
| Aokzoe A1 | |
| One Netbook XPlayer 2 | |
| GTA V - 1920x1080 Highest AA:4xMSAA + FX AF:16x | |
| Ayaneo Kun | |
| Ayaneo Kun | |
| Ayaneo Air 1S Retro Power | |
| Average of class Handheld / UMPC (14 - 32.8, n=13, last 2 years) | |
| Asus ROG Ally Z1 Extreme | |
| Lenovo Legion Go | |
| One Netbook XPlayer 2 | |
| Aokzoe A1 | |
| Asus ROG Zephyrus G14 GA402XY | |
| Final Fantasy XV Benchmark - 1920x1080 High Quality | |
| Ayaneo Kun | |
| Average of class Handheld / UMPC (17.9 - 34.8, n=18, last 2 years) | |
| Asus ROG Ally Z1 Extreme | |
| Lenovo Legion Go | |
| Asus ROG Zephyrus G14 GA402XY | |
| Ayaneo Air 1S Retro Power | |
| Aokzoe A1 | |
| One Netbook XPlayer 2 | |
| Strange Brigade - 1920x1080 ultra AA:ultra AF:16 | |
| Ayaneo Kun | |
| Average of class Handheld / UMPC (32.8 - 58.8, n=19, last 2 years) | |
| Asus ROG Ally Z1 Extreme | |
| Ayaneo Air 1S Retro Power | |
| Aokzoe A1 | |
| Lenovo Legion Go | |
| Asus ROG Zephyrus G14 GA402XY | |
| One Netbook XPlayer 2 | |
| Dota 2 Reborn - 1920x1080 ultra (3/3) best looking | |
| Lenovo Legion Go | |
| Asus ROG Ally Z1 Extreme | |
| Asus ROG Zephyrus G14 GA402XY | |
| Aokzoe A1 | |
| Average of class Handheld / UMPC (30.8 - 85, n=18, last 2 years) | |
| One Netbook XPlayer 2 | |
| Ayaneo Kun | |
| Ayaneo Kun | |
| Ayaneo Air 1S Retro Power | |
| The Witcher 3 | |
| 1920x1080 High Graphics & Postprocessing (Nvidia HairWorks Off) | |
| Asus ROG Ally Z1 Extreme | |
| Lenovo Legion Go | |
| Average AMD Radeon 780M (21.3 - 52.2, n=57) | |
| Ayaneo Kun | |
| Average of class Handheld / UMPC (27.5 - 49, n=5, last 2 years) | |
| Aokzoe A1 | |
| One Netbook XPlayer 2 | |
| Ayaneo Air 1S Retro Power | |
| 1920x1080 Ultra Graphics & Postprocessing (HBAO+) | |
| Ayaneo Kun | |
| Lenovo Legion Go | |
| Average AMD Radeon 780M (14.3 - 36, n=59) | |
| Asus ROG Ally Z1 Extreme | |
| Ayaneo Air 1S Retro Power | |
| Average of class Handheld / UMPC (17.5 - 31.1, n=5, last 2 years) | |
| Aokzoe A1 | |
| One Netbook XPlayer 2 | |
| Horizon Zero Dawn | |
| 1920x1080 Favor Quality | |
| Ayaneo Kun | |
| Average AMD Radeon 780M (36 - 44, n=4) | |
| Asus ROG Ally Z1 Extreme | |
| Lenovo Legion Go | |
| 1920x1080 Ultimate Quality | |
| Ayaneo Kun | |
| Average AMD Radeon 780M (31 - 38, n=3) | |
| Lenovo Legion Go | |
| Shadow of the Tomb Raider | |
| 1920x1080 High Preset AA:SM | |
| Ayaneo Kun | |
| Asus ROG Ally Z1 Extreme | |
| Average AMD Radeon 780M (23.4 - 42, n=18) | |
| Average of class Handheld / UMPC (24 - 45, n=8, last 2 years) | |
| Lenovo Legion Go | |
| 1920x1080 Highest Preset AA:T | |
| Ayaneo Kun | |
| Asus ROG Ally Z1 Extreme | |
| Average of class Handheld / UMPC (21 - 39, n=8, last 2 years) | |
| Average AMD Radeon 780M (12 - 37, n=18) | |
| Lenovo Legion Go | |
| 1920x1080 Medium Preset | |
| Asus ROG Ally Z1 Extreme | |
| Ayaneo Kun | |
| Average AMD Radeon 780M (26.5 - 48, n=20) | |
| Average of class Handheld / UMPC (27 - 48, n=10, last 2 years) | |
| Lenovo Legion Go | |
| Cyberpunk 2077 - 1920x1080 High Preset (FSR off) | |
| Lenovo Legion Go | |
| Ayaneo Kun | |
| Ayaneo Kun | |
| Average of class Handheld / UMPC (13.8 - 31.9, n=19, last 2 years) | |
| Average AMD Radeon 780M (13.8 - 29.6, n=59) | |
| Ayaneo Air 1S Retro Power | |
| Asus ROG Ally Z1 Extreme | |
Witcher 3 FPS diagram
| low | med. | high | ultra | QHD | 4K | |
|---|---|---|---|---|---|---|
| GTA V (2015) | 132.3 | 106.7 | 43.3 | 25.1 | ||
| The Witcher 3 (2015) | 46.4 | 29.4 | ||||
| Dota 2 Reborn (2015) | 133.2 | 109.2 | 86.1 | 78.7 | ||
| Final Fantasy XV Benchmark (2018) | 72.7 | 35.7 | 27.3 | 18.8 | ||
| X-Plane 11.11 (2018) | 47.3 | 40.9 | 33.8 | 33.7 | ||
| Far Cry 5 (2018) | 39 | 36 | 33 | 23 | ||
| Strange Brigade (2018) | 151.1 | 63.4 | 51.3 | 42.6 | ||
| Shadow of the Tomb Raider (2018) | 40 | 32 | 12 | |||
| Horizon Zero Dawn (2020) | 41 | 36 | 31 | 22 | ||
| F1 23 (2023) | 57.2 | |||||
| Cyberpunk 2077 (2023) | 52.1 | 29 |
Emissions - Fans and speakers point in the same direction
Noise emissions
The Legion Go features a variety of fan settings. In our test, we selected the high cooling option but with this mode selected, the fans at no point reached their full rotation speed and as a result, didn't reach their full noise emission levels. Even so, the device's temperatures remained relatively comfortable. We noted a maximum noise emission rate of 37.5 dB(A) 15 cm away from the device—this was as long as the automatic fan control was active. However, you can also set the fan settings manually. At 100 % power, we noted 46 dB(A) when playing The Witcher 3 Ultra. At the same time, the Legion Go never produced any high-frequency noises but rather a subtle whirring sound.
Noise level
| Idle |
| 23 / 23 / 25 dB(A) |
| Load |
| 37 / 37 dB(A) |
 | ||
30 dB silent 40 dB(A) audible 50 dB(A) loud |
||
min: | ||
| Lenovo Legion Go Radeon 780M, Z1 Extreme, WD PC SN740 512GB SDDPMQD-512G-1101 | Ayaneo Air 1S Retro Power Radeon 780M, R7 7840U, Ayaneo CyberThunder-2TB | Asus ROG Ally Z1 Extreme Radeon 780M, Z1 Extreme, Micron 2400 MTFDKBK512QFM | One Netbook XPlayer 2 Radeon 680M, R7 6800U | Aokzoe A1 Radeon 680M, R7 6800U | Ayaneo Kun Radeon 780M, R7 7840U, Phison M.2 2280 E18 4000GB | |
|---|---|---|---|---|---|---|
| Noise | -5% | -1% | -14% | -12% | -18% | |
| off / environment * (dB) | 23 | 23 -0% | 23.3 -1% | 26.1 -13% | 23 -0% | |
| Idle Minimum * (dB) | 23 | 24.7 -7% | 23.3 -1% | 26.1 -13% | 23.3 -1% | 25.31 -10% |
| Idle Average * (dB) | 23 | 25.2 -10% | 23.3 -1% | 31.6 -37% | 27.1 -18% | 25.31 -10% |
| Idle Maximum * (dB) | 25 | 25.2 -1% | 27.3 -9% | 31.6 -26% | 37.3 -49% | 34.5 -38% |
| Load Average * (dB) | 37 | 32.1 13% | 39.2 -6% | 35.7 4% | 37.4 -1% | 34.9 6% |
| Witcher 3 ultra * (dB) | 46 | 39.2 15% | 43.3 6% | 41.2 10% | ||
| Load Maximum * (dB) | 37 | 47.1 -27% | 39.2 -6% | 43.3 -17% | 46.2 -25% | 50.78 -37% |
* ... smaller is better
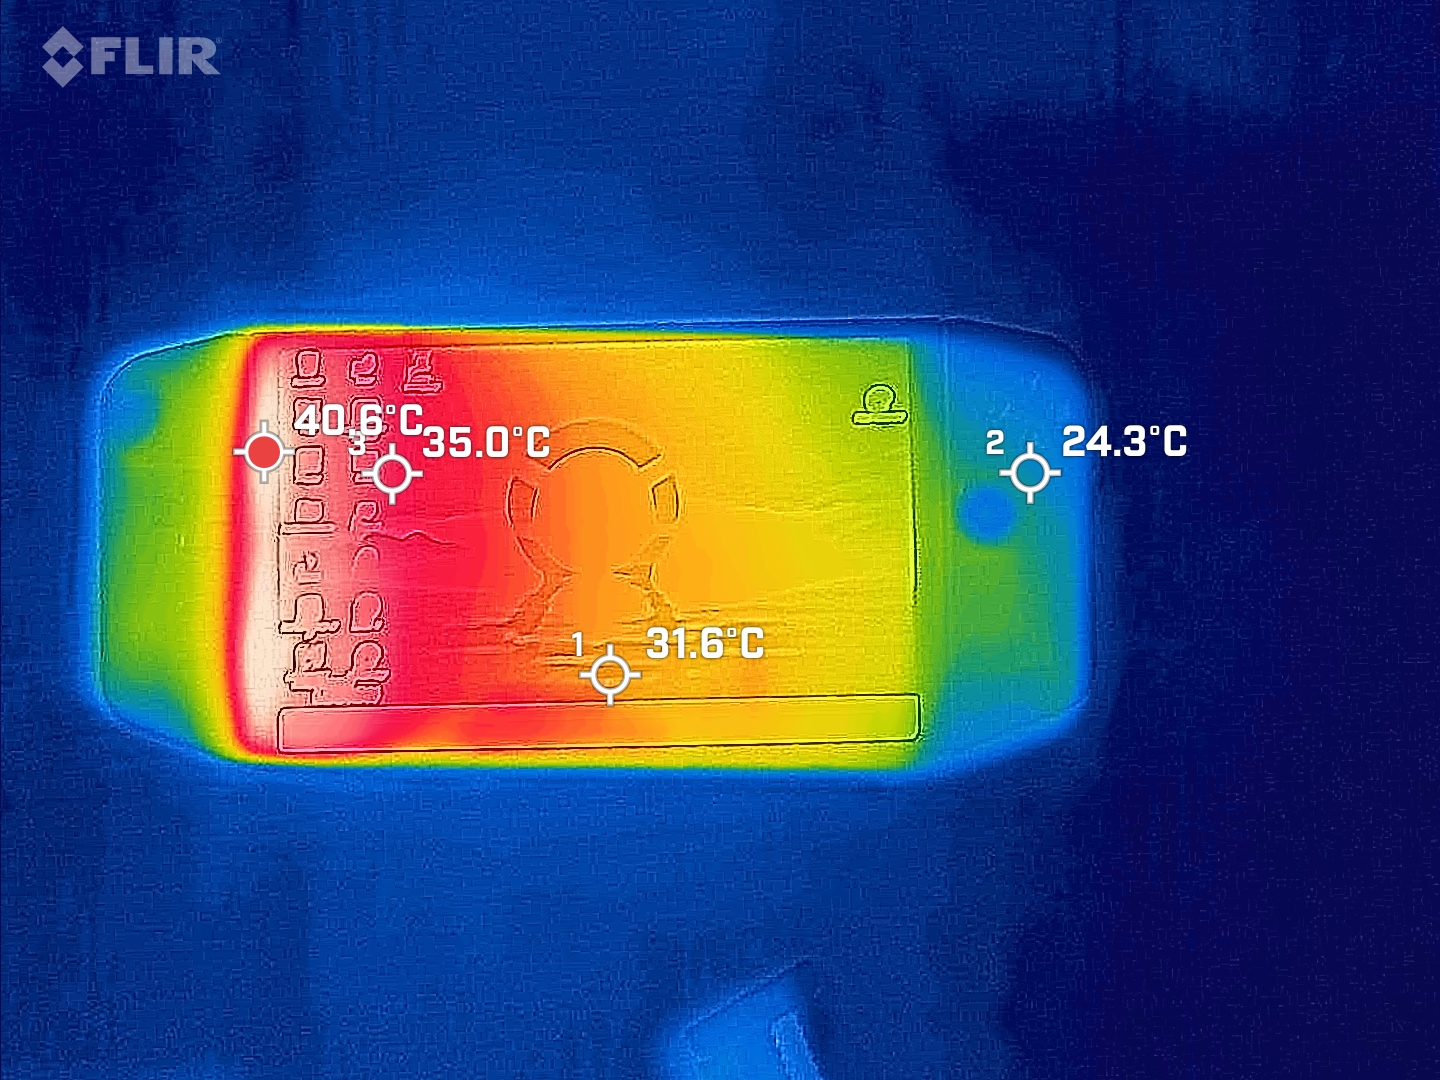
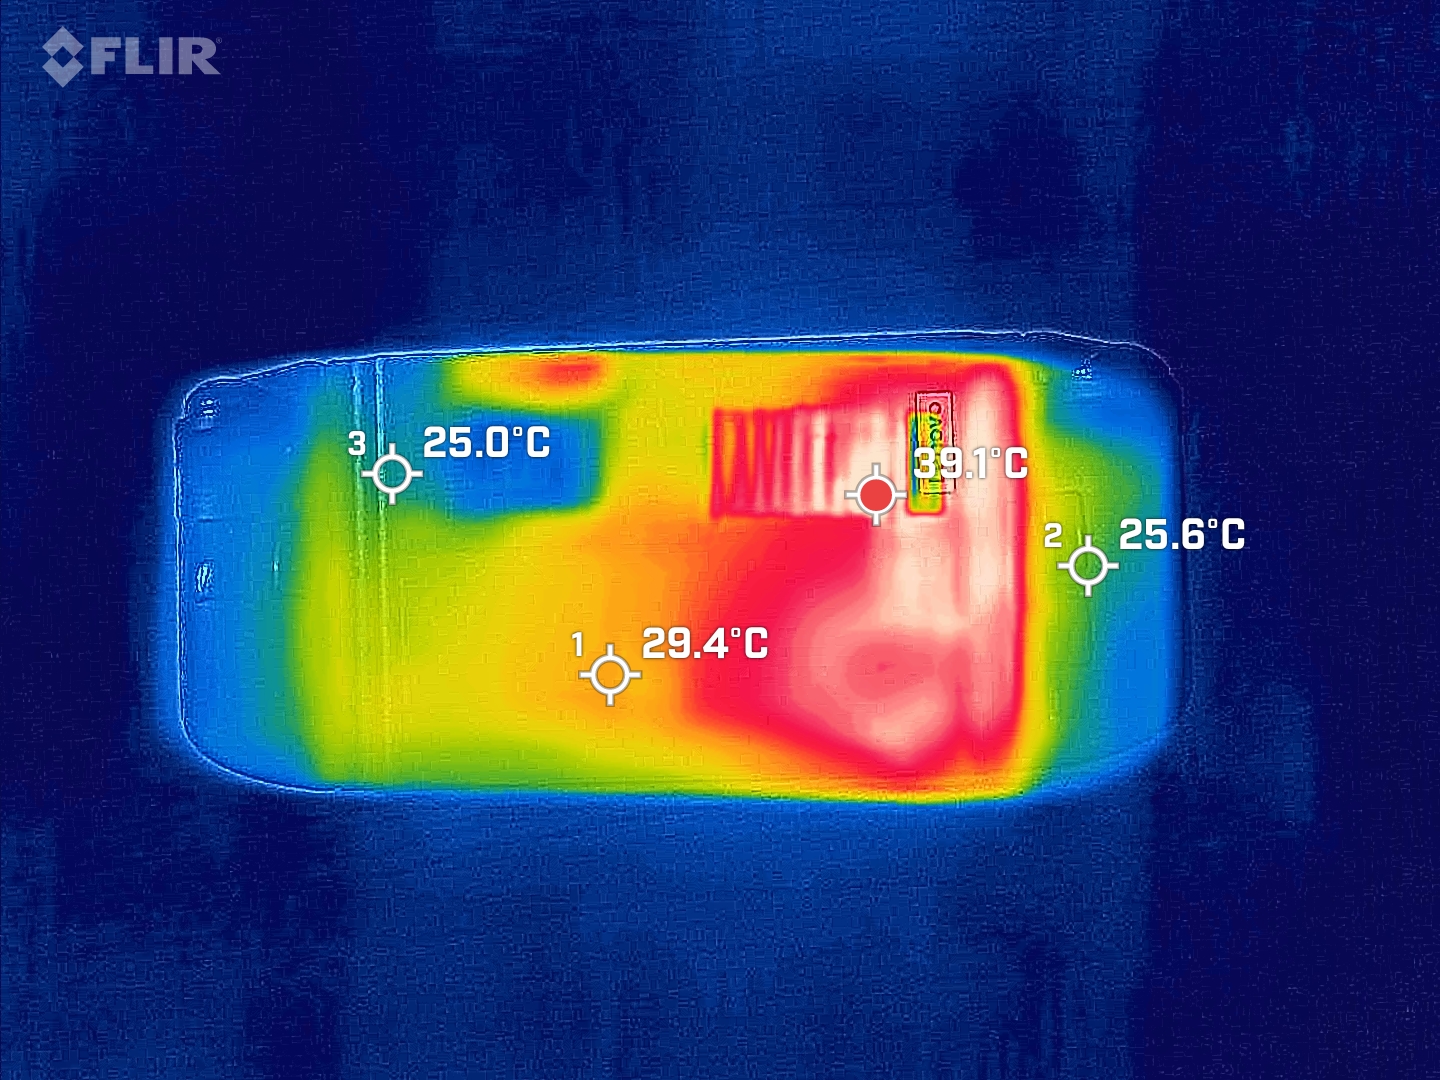
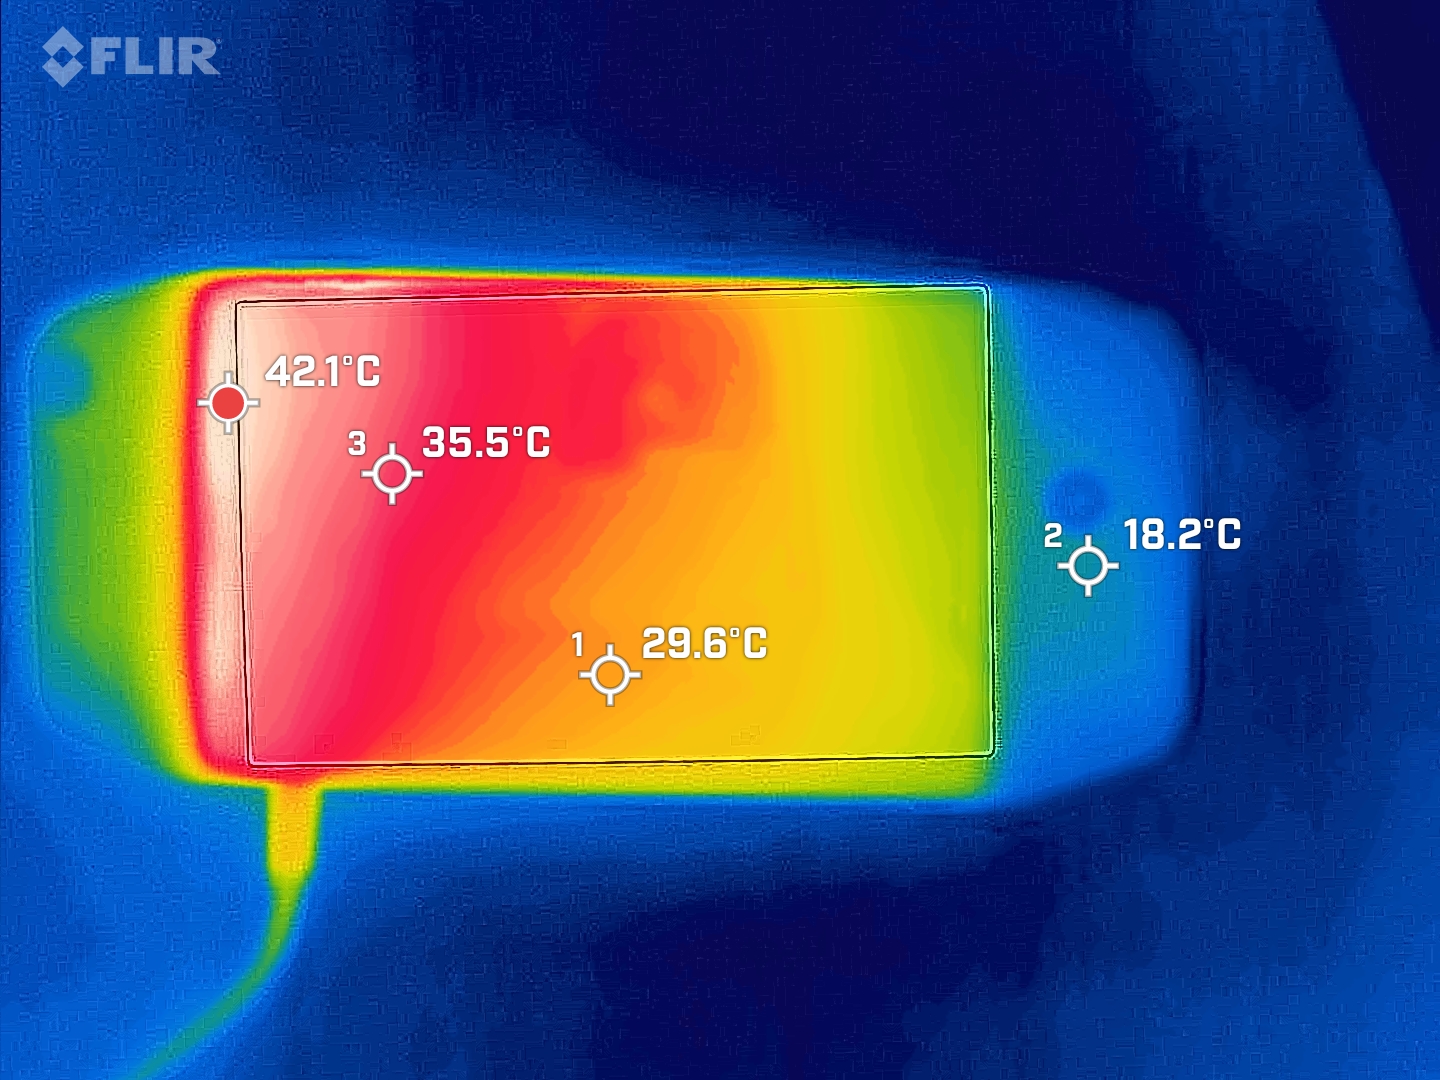
Temperature
As is the case with many tablets and handhelds, the Legion Go dissipates lots of heat via its screen. In all test situations, the detachable controllers remained cool. However, the Legion Go's display begins to heat up considerably in idle mode already. We actually barely noted a difference in front-facing heat emissions when comparing idle mode and load scenarios.
In our stress test, we measured notable heat emissions near the fan outlet which sits above the processor and the cooling unit compared to in idle mode. On the heat map, the processor with a temperature of 60 °C shines through the fan outlet. The back surfaces reach maximum temperatures of a manageable 40 °C. When gaming, your hands rarely come near the device's hotspots.

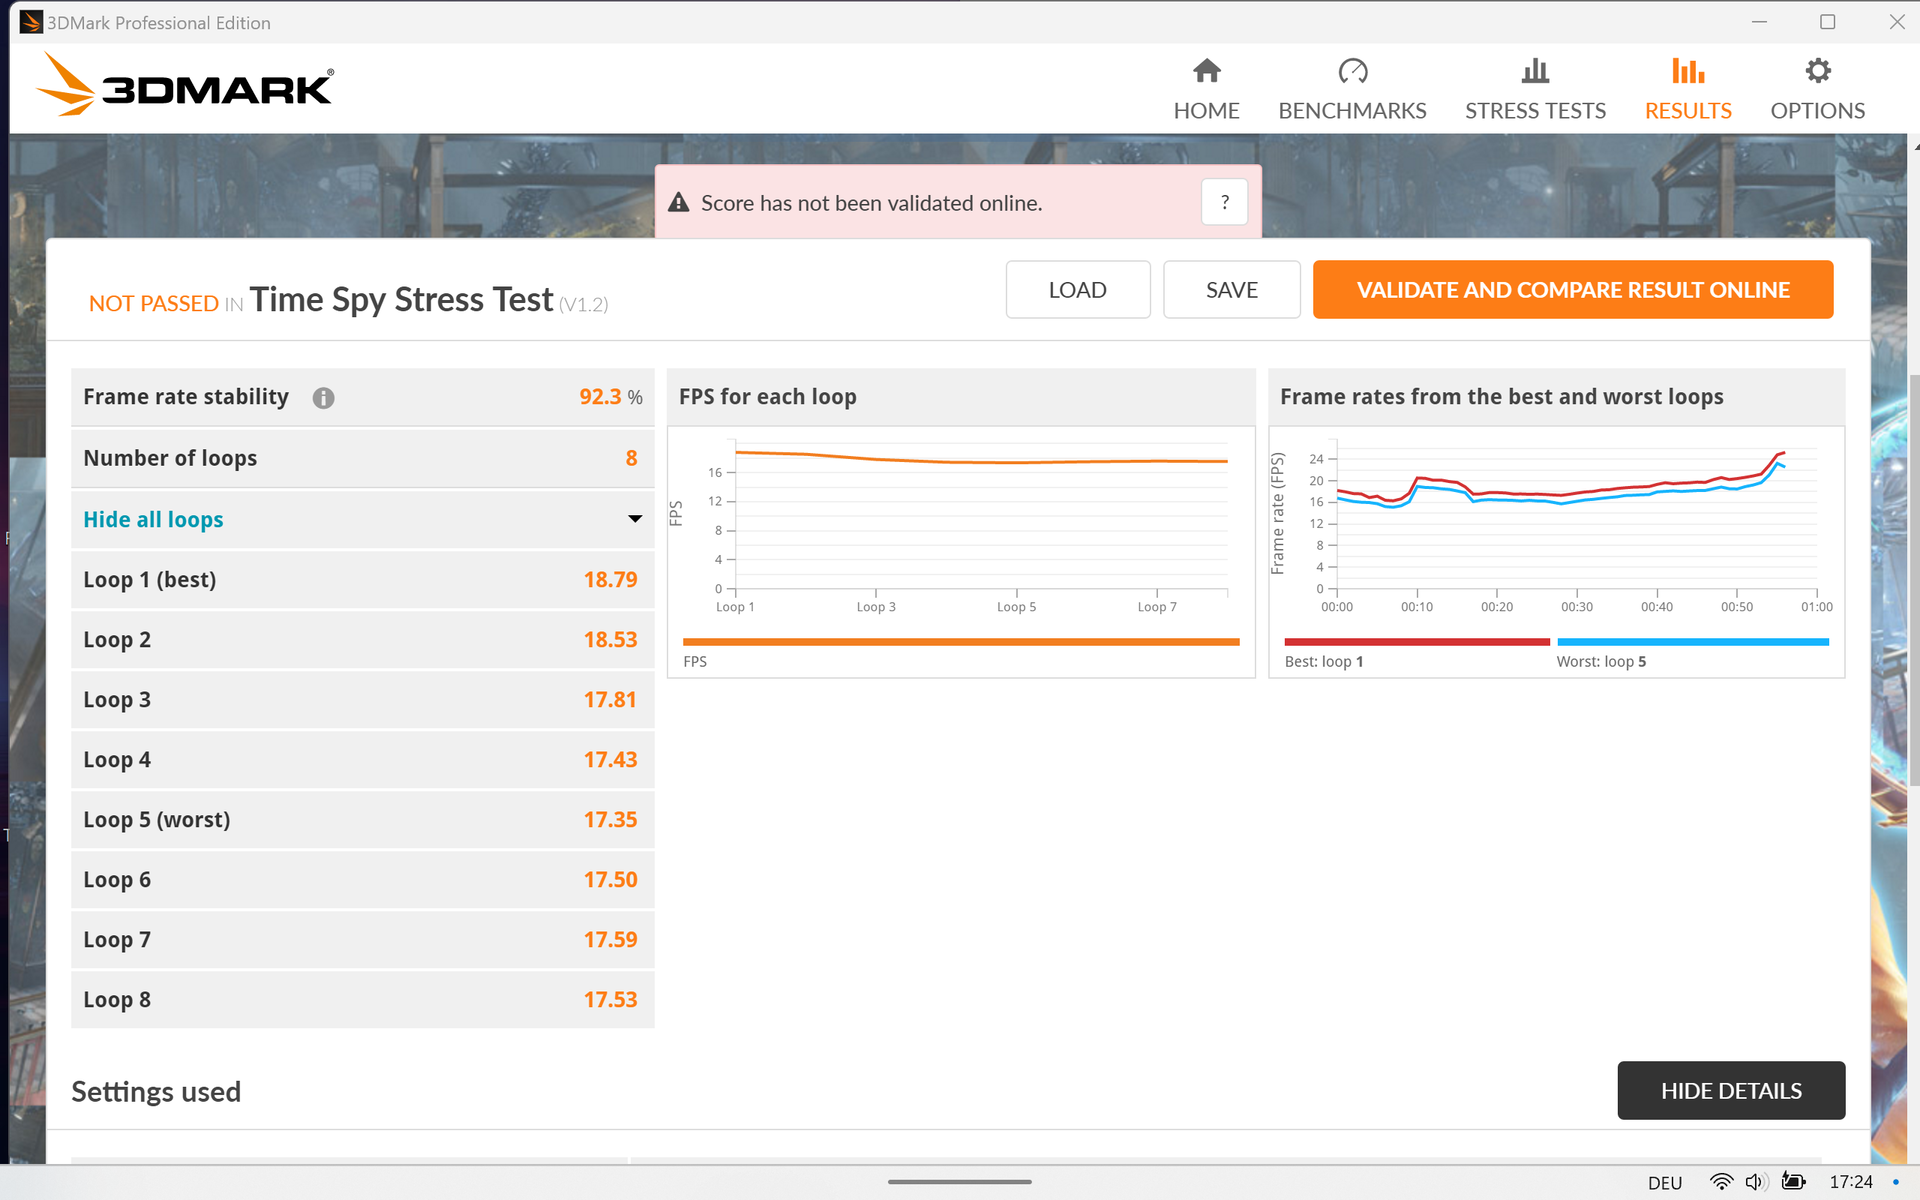
Stress test
After a short boost phase, the processor's power consumption balanced out quite quickly between 25 and 28 watts. This performance remained steady throughout. The stress test using 3DMark's Time Spy benchmark also showed hardly any changes between the individual runs.
Speakers
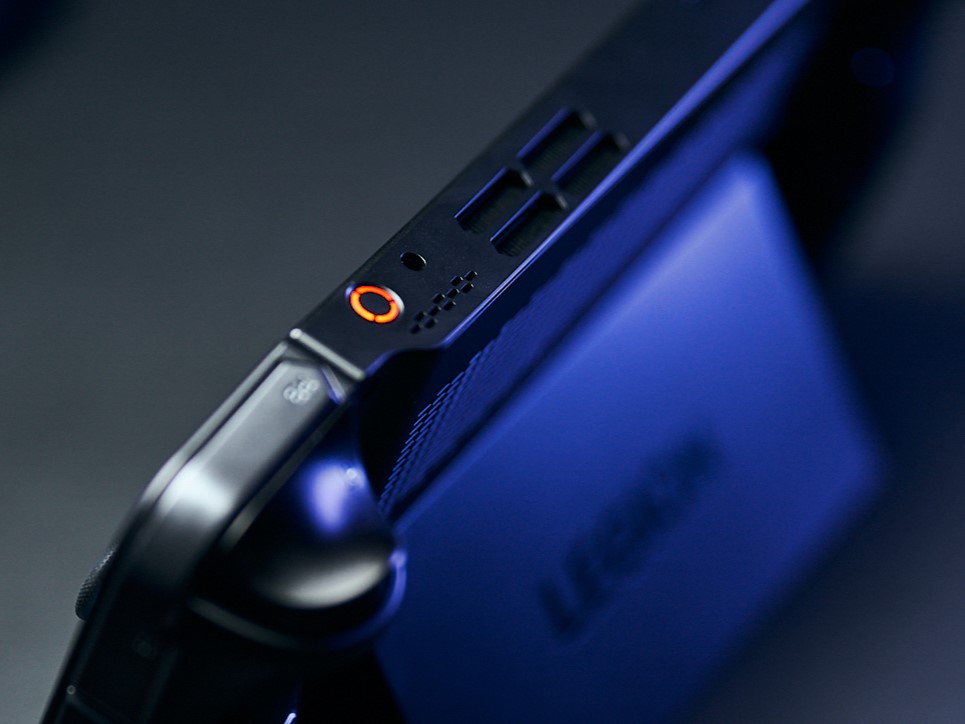
The Legion Go's speakers don't get all too loud and with regard to sound quality in particular, they leave a lot to be desired. High tones and bass sounds are played back considerably reduced. However, this would be tolerable if it wasn't for the fact that the speakers are situated on the top of the device. What results from this is the sound being blasted into the room surrounding you rather than directly toward you and in addition, it has to compete with the noise coming from the fan outlet.
Lenovo Legion Go audio analysis
(±) | speaker loudness is average but good (73.1 dB)
Bass 100 - 315 Hz
(-) | nearly no bass - on average 16.4% lower than median
(±) | linearity of bass is average (8.1% delta to prev. frequency)
Mids 400 - 2000 Hz
(±) | higher mids - on average 5.2% higher than median
(+) | mids are linear (6% delta to prev. frequency)
Highs 2 - 16 kHz
(±) | higher highs - on average 5.7% higher than median
(±) | linearity of highs is average (9.7% delta to prev. frequency)
Overall 100 - 16.000 Hz
(±) | linearity of overall sound is average (22.7% difference to median)
Compared to same class
» 91% of all tested devices in this class were better, 4% similar, 4% worse
» The best had a delta of 12%, average was 17%, worst was 23%
Compared to all devices tested
» 67% of all tested devices were better, 6% similar, 27% worse
» The best had a delta of 4%, average was 24%, worst was 134%
Ayaneo Air 1S Retro Power audio analysis
(+) | speakers can play relatively loud (91.7 dB)
Bass 100 - 315 Hz
(-) | nearly no bass - on average 16% lower than median
(±) | linearity of bass is average (10.5% delta to prev. frequency)
Mids 400 - 2000 Hz
(±) | higher mids - on average 7.4% higher than median
(+) | mids are linear (6.7% delta to prev. frequency)
Highs 2 - 16 kHz
(+) | balanced highs - only 4.2% away from median
(+) | highs are linear (6.4% delta to prev. frequency)
Overall 100 - 16.000 Hz
(±) | linearity of overall sound is average (18.1% difference to median)
Compared to same class
» 48% of all tested devices in this class were better, 13% similar, 39% worse
» The best had a delta of 12%, average was 17%, worst was 23%
Compared to all devices tested
» 38% of all tested devices were better, 8% similar, 54% worse
» The best had a delta of 4%, average was 24%, worst was 134%
Asus ROG Ally Z1 Extreme audio analysis
(+) | speakers can play relatively loud (82.1 dB)
Bass 100 - 315 Hz
(-) | nearly no bass - on average 15.5% lower than median
(±) | linearity of bass is average (8.4% delta to prev. frequency)
Mids 400 - 2000 Hz
(+) | balanced mids - only 3.1% away from median
(+) | mids are linear (3% delta to prev. frequency)
Highs 2 - 16 kHz
(+) | balanced highs - only 1.9% away from median
(+) | highs are linear (2.3% delta to prev. frequency)
Overall 100 - 16.000 Hz
(+) | overall sound is linear (13.5% difference to median)
Compared to same class
» 29% of all tested devices in this class were better, 4% similar, 67% worse
» The best had a delta of 5%, average was 17%, worst was 45%
Compared to all devices tested
» 14% of all tested devices were better, 4% similar, 82% worse
» The best had a delta of 4%, average was 24%, worst was 134%
Power management - Small battery, short runtimes
Power consumption
A 65-watt USB-C power supply is included in the Legion Go's scope of delivery and it has all the power that is needed—the Legion Go's maximum power consumption is about 55 watts. We just have to criticize the gaming handheld's high power consumption in idle mode, namely just over 11 watts. Most laptops and handhelds deliver lower values when it comes to this. One reason for this could be to do with Legion Space which runs continuously in the background, while also being in charge of controlling the device's power and translating the controllers' function keys and key combinations. With the application deactivated, the Legion Go requires 3 to 6 watts less energy but in turn, the handheld's range of functions is restricted.
| Off / Standby | |
| Idle | |
| Load |
|
Key:
min: | |
| Lenovo Legion Go Z1 Extreme, Radeon 780M, WD PC SN740 512GB SDDPMQD-512G-1101, IPS, 2560x1600, 8.8" | Ayaneo Air 1S Retro Power R7 7840U, Radeon 780M, Ayaneo CyberThunder-2TB, OLED, 1920x1080, 5.5" | Asus ROG Ally Z1 Extreme Z1 Extreme, Radeon 780M, Micron 2400 MTFDKBK512QFM, IPS, 1920x1080, 7" | One Netbook XPlayer 2 R7 6800U, Radeon 680M, , IPS, 2560x1600, 8.4" | Aokzoe A1 R7 6800U, Radeon 680M, , IPS, 1920x1200, 8" | Ayaneo Kun R7 7840U, Radeon 780M, Phison M.2 2280 E18 4000GB, IPS, 2560x1600, 8.4" | Average AMD Radeon 780M | Average of class Handheld / UMPC | |
|---|---|---|---|---|---|---|---|---|
| Power Consumption | 29% | 13% | 20% | 6% | -49% | 10% | 22% | |
| Idle Minimum * (Watt) | 11.5 | 7.01 39% | 4.2 63% | 7.2 37% | 8.8 23% | 14 -22% | 6.01 ? 48% | 6.01 ? 48% |
| Idle Average * (Watt) | 12 | 7.91 34% | 6.1 49% | 9.3 22% | 11.3 6% | 17.56 -46% | 8.15 ? 32% | 8.41 ? 30% |
| Idle Maximum * (Watt) | 17.4 | 12.3 29% | 6.3 64% | 9.7 44% | 11.5 34% | 27 -55% | 10.3 ? 41% | 10.3 ? 41% |
| Load Average * (Watt) | 45 | 19.66 56% | 56.6 -26% | 33.1 26% | 32.1 29% | 38.1 15% | 57.6 ? -28% | 44.6 ? 1% |
| Witcher 3 ultra * (Watt) | 42.6 | 38.2 10% | 64.1 -50% | 49.6 -16% | 58.3 -37% | 83.5 -96% | ||
| Load Maximum * (Watt) | 54 | 50 7% | 67.2 -24% | 50.7 6% | 64.5 -19% | 101 -87% | 77 ? -43% | 58.6 ? -9% |
* ... smaller is better
Power consumption Witcher 3 / stress test
Power consumption with external monitor
Runtimes
The Legion Go's small battery only holds around 50 Wh. The largest device amongst the handhelds also features one of the smallest batteries. The Ayaneo Kun and OneXPlayer 2's batteries are especially powerful.
Subsequently, the Lenovo Legion's runtimes are disappointing. The handheld's battery lasts for just over 5 hours while surfing and 1.5 hours when playing The Witcher 3. We would like to have seen a bit more stamina, in particular when you take into account the portability you expect from a gaming handheld. You will likely feel a bit uneasy if you aren't anywhere near an outlet during your gaming sessions.
| Lenovo Legion Go Z1 Extreme, Radeon 780M, 49.2 Wh | Ayaneo Air 1S Retro Power R7 7840U, Radeon 780M, 37.5 Wh | Asus ROG Ally Z1 Extreme Z1 Extreme, Radeon 780M, 40 Wh | One Netbook XPlayer 2 R7 6800U, Radeon 680M, 65.5 Wh | Aokzoe A1 R7 6800U, Radeon 680M, 65 Wh | Ayaneo Kun R7 7840U, Radeon 780M, 75 Wh | Average of class Handheld / UMPC | |
|---|---|---|---|---|---|---|---|
| Battery runtime | -14% | 30% | 75% | 7% | 46% | 52% | |
| WiFi v1.3 (h) | 6 | 5.9 -2% | 7.8 30% | 10.5 75% | 6.4 7% | 10 67% | 11.9 ? 98% |
| Gaming (h) | 1.6 | 1.2 -25% | 2 25% | 1.683 ? 5% | |||
| H.264 (h) | 3.1 | 9.5 | 19.6 ? | ||||
| Load (h) | 1.1 | 1.3 | 0.8 | 1.592 ? | |||
| Witcher 3 ultra (h) | 1 | 1.6 | 1.7 | ||||
| Reader / Idle (h) | 7.2 |
Pros
Cons
Verdict - Minor flaws spoil the overall impression
The Lenovo Legion Go's ergonomics and design are impressive—without any ifs and buts. Thanks to the strong AMD Ryzen Z1 Extreme and its corresponding iGPU, the handheld is clearly in the position to play the most current games smoothly and in good quality. Its FPS mode and 144-Hz display earn the device extra plus points for comfort. Unfortunately, we concluded that Lenovo hasn't gone the full length needed to deliver a perfect device. Its worst issue seems to be its poor battery life—similarly sized devices such as the ROG Ally, Ayaneo Kun and the OneXPlayer all have much larger batteries. We noted many smaller issues on this gaming handheld, too. This includes its wobbly stand, how much the FPS ring attracts scratches, the speakers which are directed away from users and Legion Space, which sometimes takes ages to start up resulting in the system being blocked or simply facing some small bugs.
In general, the gaming handheld just doesn't show exceedingly good performance, stamina or functions. Its FPS mode, which is the only unique selling point this device has to offer, could easily be replaced by a Bluetooth mouse and keyboard—plus, it would probably even end up feeling more ergonomic. In order to be played fully via a mouse and keyboard, many games simply require more keys than the Legion Go can offer.
The Lenovo Legion Go is a strong gaming handheld 95% of the time. Its many small weaknesses tarnish its overall impression much more than necessary.
By now, the handheld market is pretty oversaturated. One disadvantage which Lenovo faces is that the manufacturer has made quite a delayed entry into the mobile console market. What started with the Steam Deck (which has now been rereleased with an OLED display) very quickly attracted other manufacturers. Ayaneo, OneXPlayer and Aokzoe are just a few examples within the Asian market and they have been able to gather years worth of experience in developing and manufacturing handhelds. As a handheld newcomer, Lenovo will surely find it difficult to keep up.
Purely in terms of computing power, the Ayaneo Kun and Asus ROG Ally Z1 Extreme are quite a bit stronger. If you are looking for something particularly compact and lightweight, then you might prefer the Ayaneo Air 1S. Thanks to their accessories such as a keyboard, input pen and wireless transmitters for their detachable controllers, the OneXPlayer 2 and the OneXPlayer 2 Pro show much more versatility compared to other handhelds. For all those who have a large Steam library or who get along relatively well with Linux, there is of course the Steam Deck.
Price and availability
Currently, the Lenovo Legion Go can be purchased from major online retailers such as Amazon for $699.99.
Lenovo Legion Go
- 02/14/2025 v8
Marc Herter
Transparency
The selection of devices to be reviewed is made by our editorial team. The test sample was provided to the author as a loan by the manufacturer or retailer for the purpose of this review. The lender had no influence on this review, nor did the manufacturer receive a copy of this review before publication. There was no obligation to publish this review. As an independent media company, Notebookcheck is not subjected to the authority of manufacturers, retailers or publishers.
This is how Notebookcheck is testing
Every year, Notebookcheck independently reviews hundreds of laptops and smartphones using standardized procedures to ensure that all results are comparable. We have continuously developed our test methods for around 20 years and set industry standards in the process. In our test labs, high-quality measuring equipment is utilized by experienced technicians and editors. These tests involve a multi-stage validation process. Our complex rating system is based on hundreds of well-founded measurements and benchmarks, which maintains objectivity. Further information on our test methods can be found here.
Price comparison

