Notebookcheck Logo

Acer Swift Go 14 review - The Meteor Lake Core Ultra 7 impresses with its AI core

CPU, GPU and now NPU At least since the Pixel 6, co-processors for AI applications have found their way onto smartphones. Now the neural network accelerators can also be found on Windows laptops such as the Acer Swift Go 14 with the Intel Core Ultra 7 155H. This is one of the first laptop processors with an NPU.

It hasn't even been two months since we reviewed an Acer Swift Go 14. That one impressed us with good performance at an affordable price. Our current review device comes with Intel's latest processor generation. The Acer Swift Go 14 - which will be available next spring - houses an Intel Core Ultra 155H. From a hardware point of view, Acer has provided us with a laptop based on the standard spec device. However, by spring, there will still be minor improvements to the accompanying software, the performance management and the BIOS. For this reason, we will stop short of awarding a rating until we see which future improvements Intel's latest processor generation brings to this premium, OLED-display model.  

In some benchmarks, we recorded more than double the performance compared to the predecessor which packed an Intel Core i5-1335U. Also, Intel's new Arc iGPU will no doubt please many gamers with Intel's graphics now at least on par with the Radeon RX 780M.

Acer Swift Go 14 SFG14-72 (Swift Go 14 Series)
Processor
Intel Core Ultra 7 155H 16 x 3.8 - 4.8 GHz, 55 W PL2 / Short Burst, 45 W PL1 / Sustained, Meteor Lake-H
Graphics adapter
Memory
32 GB 
, LPDDR5
Display
14.00 inch 16:10, 2880 x 1800 pixel 243 PPI, ATNA40YK11-0, OLED, glossy: yes, 90 Hz
Mainboard
Intel Meteor Lake-U/P/H PCH
Storage
SK hynix HFS001TEJ9X110NA, 1024 GB 
, 850 GB free
Soundcard
Intel Meteor Lake-U/P/H PCH - cAVS (Audio, Voice, Speech)
Connections
1 USB 3.0 / 3.1 Gen1, 2 USB 4.0 40 Gbps, 2 Thunderbolt, USB-C Power Delivery (PD), 2 DisplayPort, 1 Kensington Lock, Audio Connections: 3.5 mm Headset, Card Reader: microSD, 1 Fingerprint Reader
Networking
Killer Wi-Fi 6E AX1675i 160MHz Wireless Network Adapter (a/b/g/n = Wi-Fi 4/ac = Wi-Fi 5/ax = Wi-Fi 6/), Bluetooth 5.1
Size
height x width x depth (in mm): 14.9 x 312.9 x 217.9 ( = 0.59 x 12.32 x 8.58 in)
Battery
65 Wh Lithium-Ion
Operating System
Microsoft Windows 11 Home
Camera
Webcam: QHD
Primary Camera: 3.7 MPix
Additional features
Speakers: 2, Keyboard Light: yes
Weight
1.3338 kg ( = 47.05 oz / 2.94 pounds), Power Supply: 360 g ( = 12.7 oz / 0.79 pounds)
Price
999 Euro
Note: The manufacturer may use components from different suppliers including display panels, drives or memory sticks with similar specifications.


Intel itself often compares its new processors with AMD's Ryzen R7 7840U and, for this reason, we will be taking a look at the HP Pavillon Plus 14 which comes with both Intel and AMD processor variants, as part of our comparison. A rather unusual representative could come in the shape of the Ayaneo Air 1S but this device also comes with AMD's powerful competing chip. And, finally, the LG Gram 2in1 and the Acer Swift Go 14 SFG14-71 and their 13th generation processor concludes our illustrious group.

Possible competitors compared

Rating
Date
Model
Weight
Height
Size
Resolution
Best Price
12/2023
Acer Swift Go 14 SFG14-72
Ultra 7 155H, Arc 8-Cores
1.3 kg14.9 mm14.00"2880x1800
85.6 %
11/2023
Acer Swift Go 14 SFG14-71
i5-1335U, Iris Xe G7 80EUs
1.3 kg14.9 mm14.00"2880x1800
85.8 %
11/2023
LG Gram 2in1 16 16T90R - G.AA78G
i7-1360P, Iris Xe G7 96EUs
1.5 kg17.2 mm16.00"2560x1600
87.5 %
12/2023
HP Pavilion Plus 14-ew0153TU
i7-1355U, Iris Xe G7 96EUs
1.4 kg17.5 mm14.00"2880x1800
90.4 %
12/2023
Lenovo ThinkPad T14 G4 21K4S02000
R7 PRO 7840U, Radeon 780M
1.5 kg17.9 mm14.00"1920x1200
88.2 %
10/2023
Ayaneo Air 1S Retro Power
R7 7840U, Radeon 780M
443.8 g21 mm5.50"1920x1080
87.8 %
11/2023
HP Pavilion Plus 14-ey0095cl
R7 7840U, Radeon 780M
1.4 kg18.8 mm14.00"2880x1800

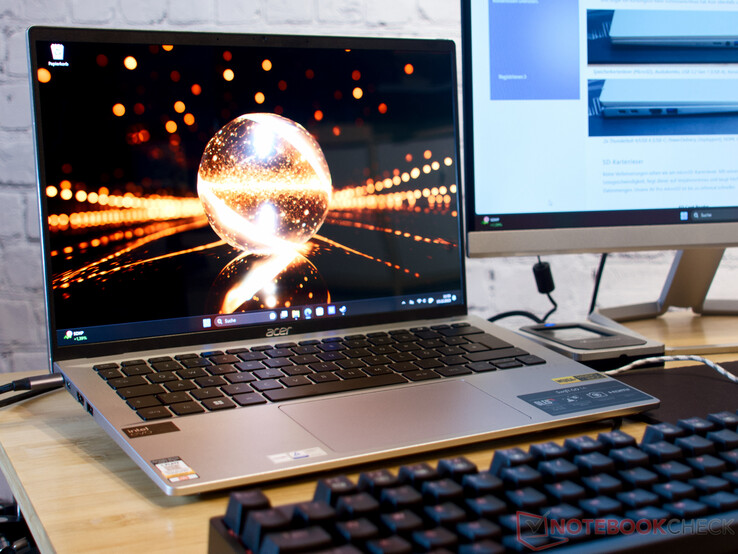
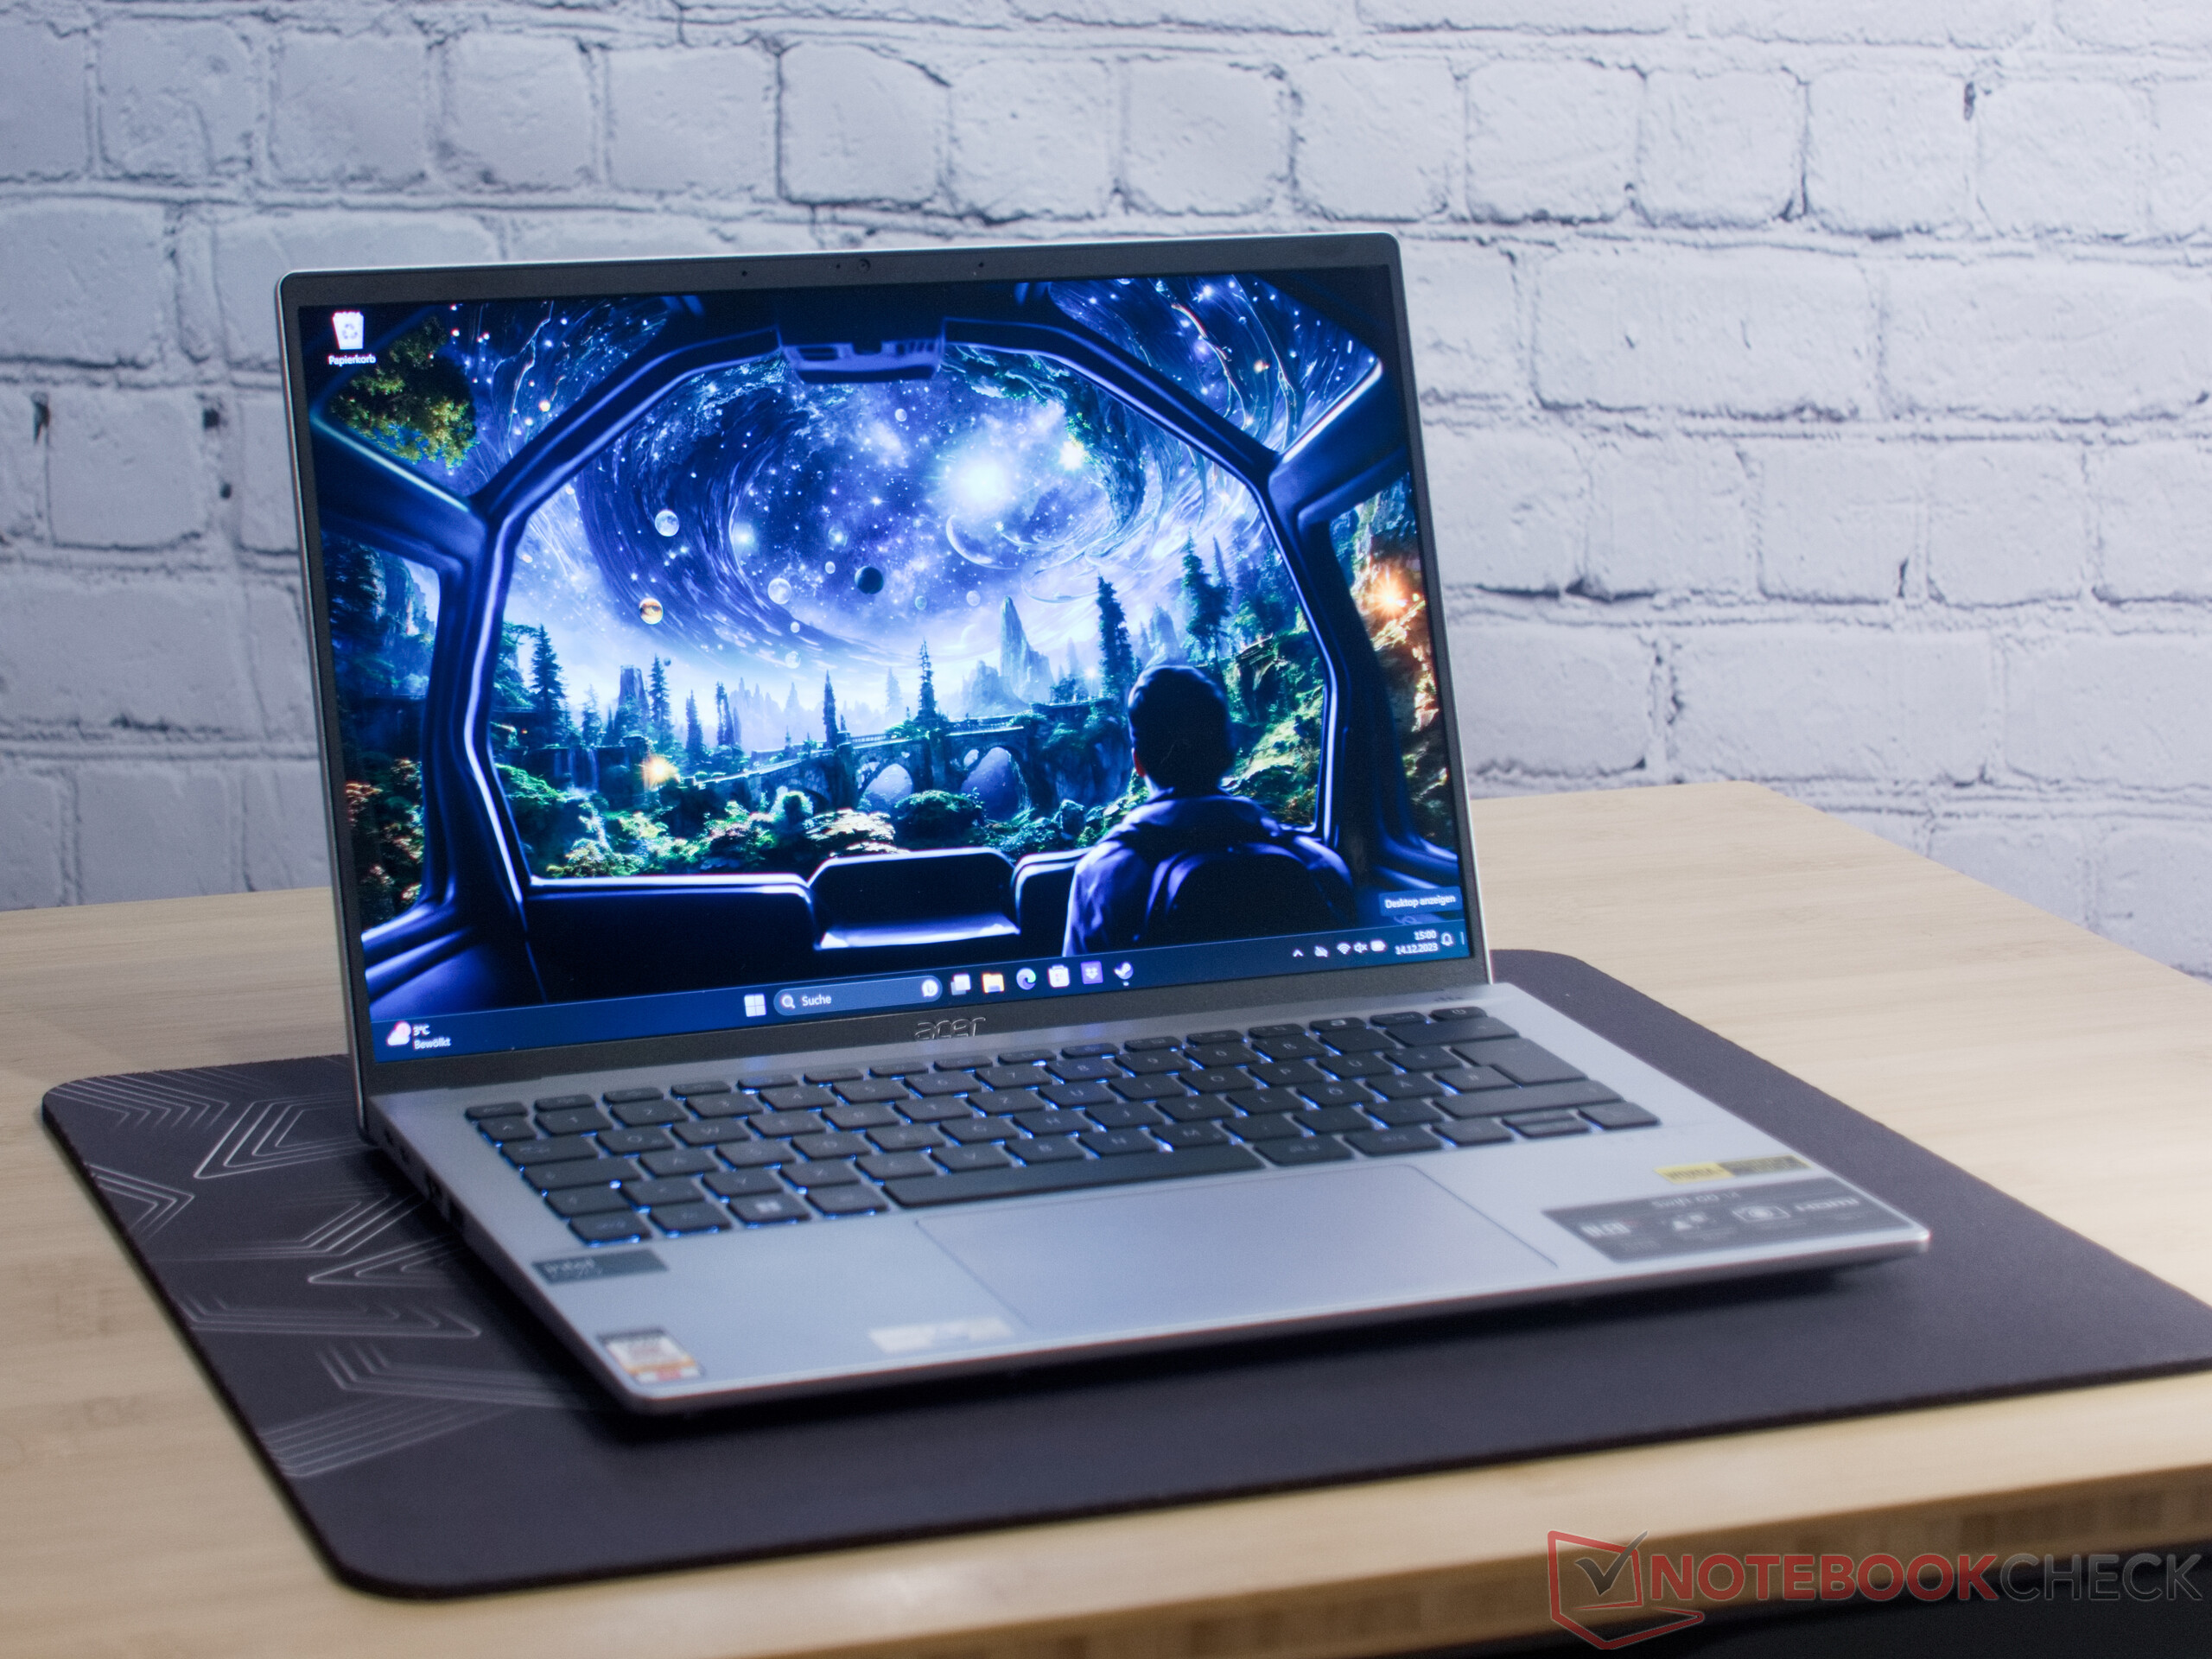
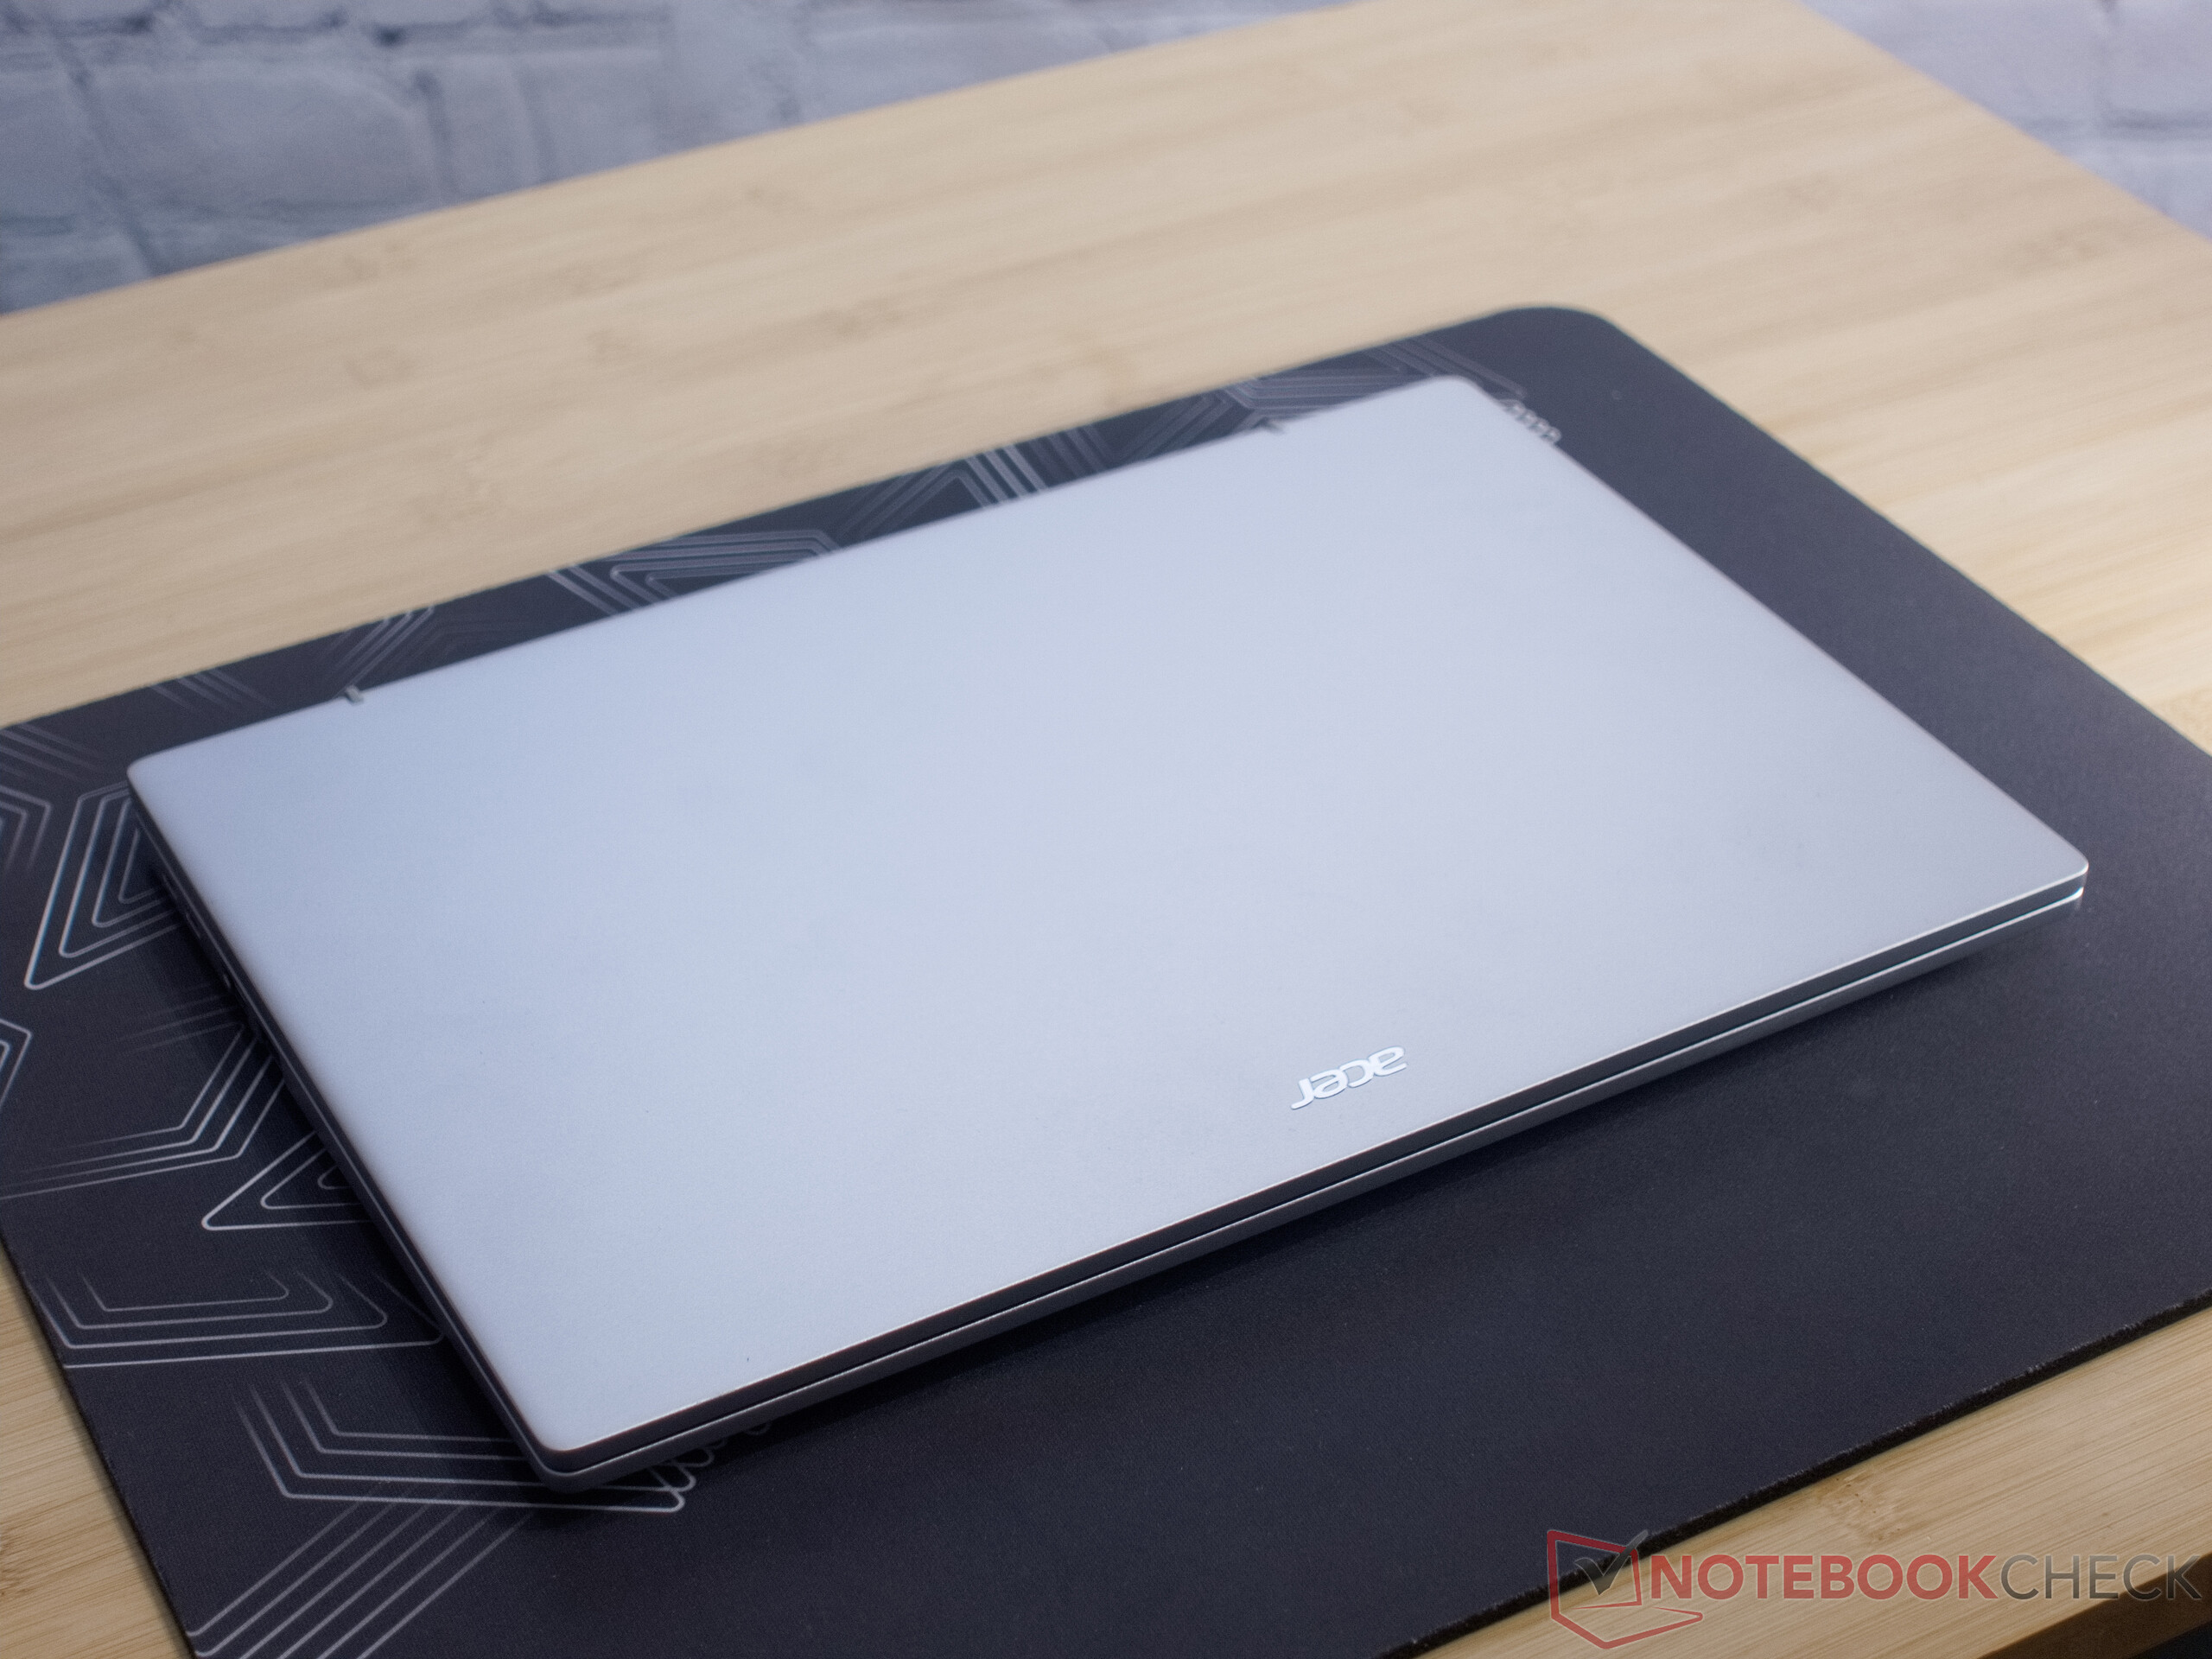
Case - Angular aluminum

Even though first impressions would suggest the device hasn't undergone any changes, we still noticed that Acer has undertaken detailed improvements to the aluminum case. The angular frame design doesn't reveal any manufacturing flaws and this means we could almost copy and paste the predecessor's entire description. However, Acer has managed to install a significantly larger touchpad resulting in a noticeable improvement to the laptop's usability. 

Size comparison

355 mm / 14 inch 248 mm / 9.76 inch 17.2 mm / 0.677 inch 1.5 kg3.25 lbs317.7 mm / 12.5 inch 226.9 mm / 8.93 inch 17.9 mm / 0.705 inch 1.5 kg3.23 lbs314 mm / 12.4 inch 227 mm / 8.94 inch 18.8 mm / 0.74 inch 1.4 kg3.06 lbs314 mm / 12.4 inch 227 mm / 8.94 inch 17.5 mm / 0.689 inch 1.4 kg3.17 lbs312.9 mm / 12.3 inch 217.9 mm / 8.58 inch 14.9 mm / 0.587 inch 1.3 kg2.94 lbs224 mm / 8.82 inch 90 mm / 3.54 inch 21 mm / 0.827 inch 443.8 g0.978 lbs297 mm / 11.7 inch 210 mm / 8.27 inch 1 mm / 0.03937 inch 5.7 g0.01257 lbs

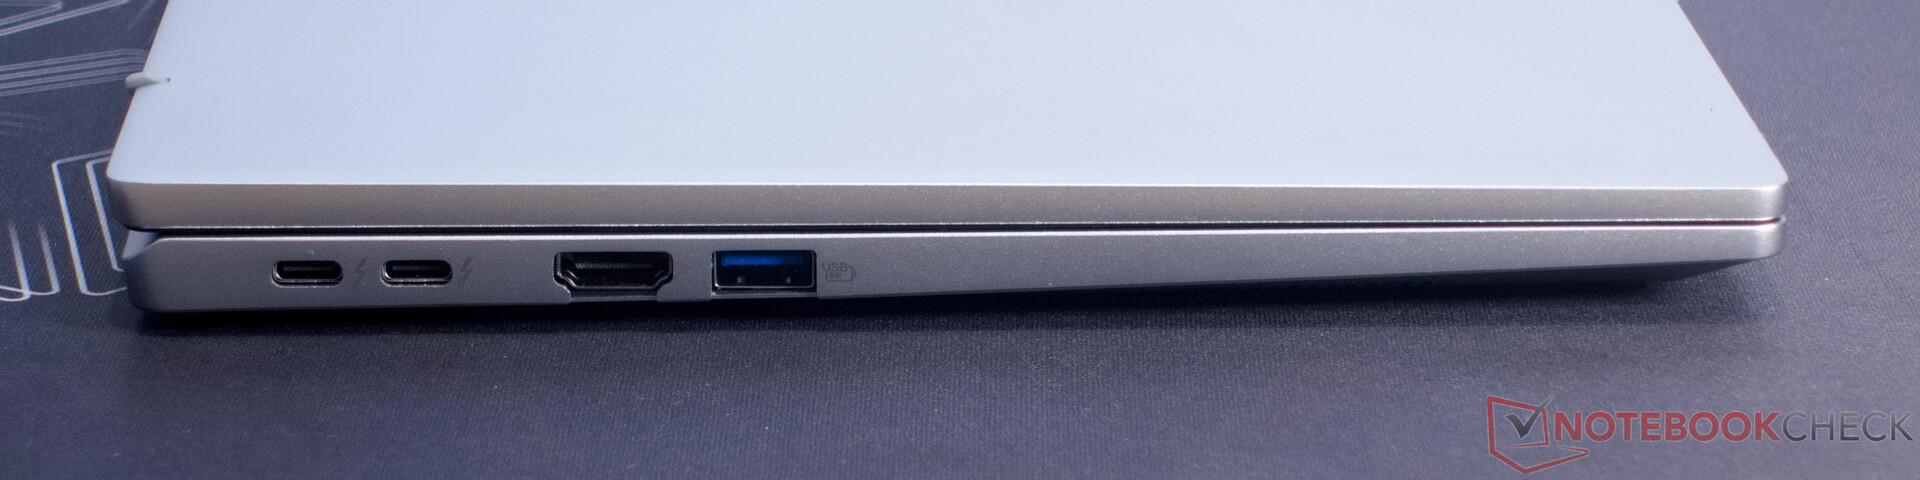
Features - Killer Wi-Fi and a superb webcam

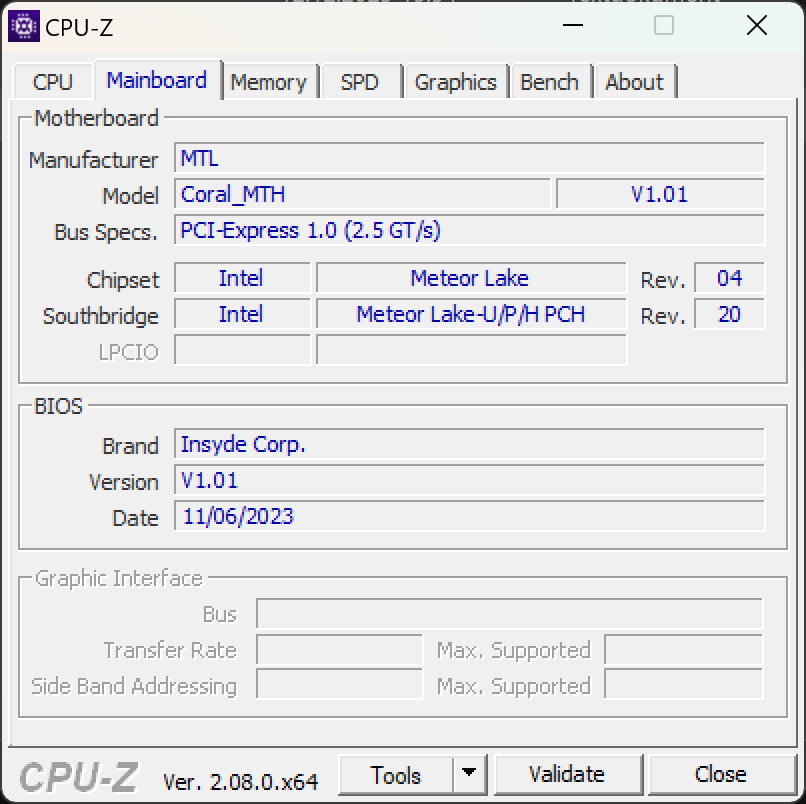
It is possible to connect up to three monitors to the small laptop via HDMI 2.1 and both Thunderbolt 4 ports. The current Intel Meteor Lake processor supports output to up to four monitors simultaneously. Likewise, Acer has even managed to house a microSD card reader and even a mini Kensington Lock slot.
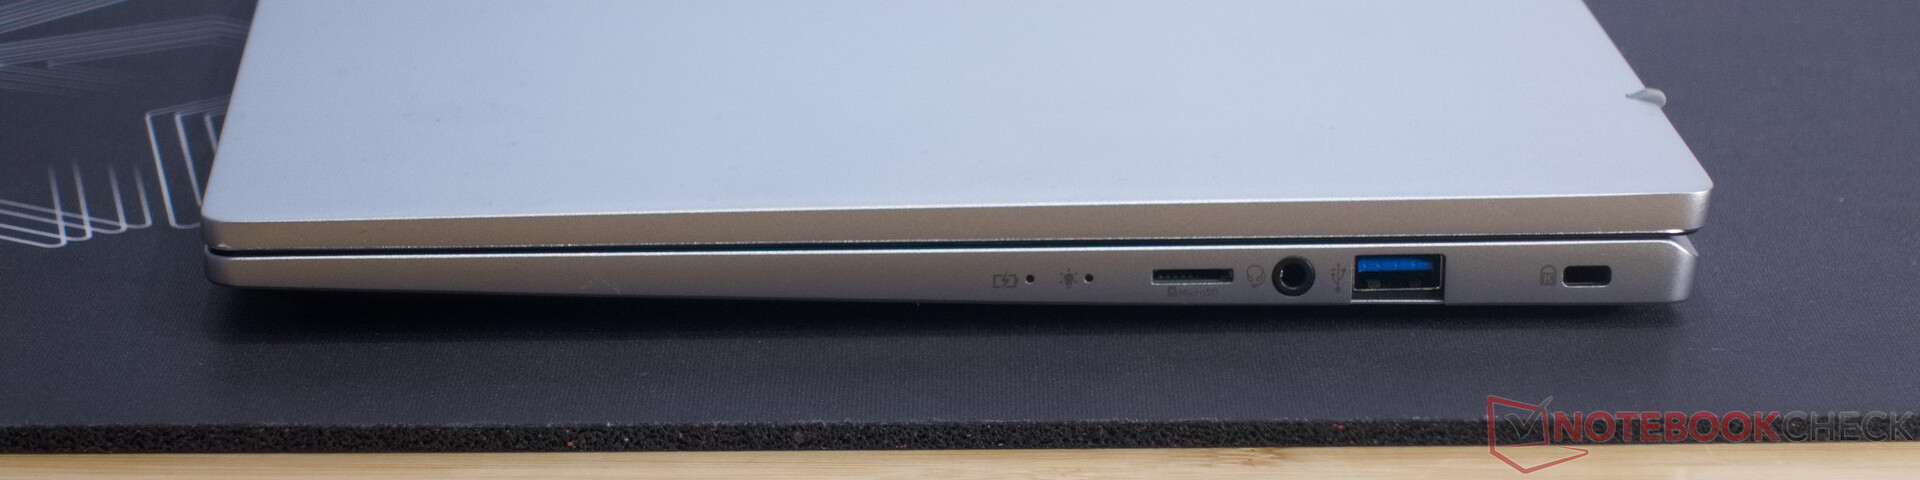
Memory card reader (MicroSD), 3.5 mm audio jack, USB 3.2 Gen 1 (USB-A), Kensington Lock slot
2x Thunderbolt 4/USB 4 (USB-C; PowerDelivery, Displayport), HDMI, USB 3.2 Gen 1 (USB-A)

SD card reader

There are no improvements to be seen in the microSD card reader. With its slow 28 MB/s read speed, it is comparable to last year's model and is only suitable for small amounts of data. Our AV Pro microSD is up to ten times faster.

SD Card Reader
average JPG Copy Test (av. of 3 runs)
Average of class Subnotebook
  (18.9 - 193.9, n=17, last 2 years)
66.7 MB/s +144%
Acer Swift Go 14 SFG14-72
Intel Core Ultra 7 155H
27.29 MB/s
maximum AS SSD Seq Read Test (1GB)
Average of class Subnotebook
  (23.6 - 239, n=17, last 2 years)
81.3 MB/s +227%
Acer Swift Go 14 SFG14-72
Intel Core Ultra 7 155H
24.85 MB/s

Communication

Using iPerf3 and the Asus GT-AXE11000, in our Wi-Fi test, the Acer Swift Go demonstrated considerably higher transfer speeds both in the 5 GHz and 6 GHz networks. At up to 1.9 GBit/s, uploads and downloads to a home network move along at a brisk pace.

Networking
iperf3 transmit AXE11000
Average Killer Wi-Fi 6E AX1675i 160MHz Wireless Network Adapter
  (942 - 1622, n=24)
1363 MBit/s +3%
Acer Swift Go 14 SFG14-72
Killer Wi-Fi 6E AX1675i 160MHz Wireless Network Adapter
1319 (961min - 1533max) MBit/s
Average of class Subnotebook
  (343 - 1824, n=47, last 2 years)
1263 MBit/s -4%
iperf3 receive AXE11000
Average Killer Wi-Fi 6E AX1675i 160MHz Wireless Network Adapter
  (872 - 1714, n=26)
1461 MBit/s +1%
Acer Swift Go 14 SFG14-72
Killer Wi-Fi 6E AX1675i 160MHz Wireless Network Adapter
1441 (726min - 1755max) MBit/s
Average of class Subnotebook
  (353 - 1775, n=47, last 2 years)
1407 MBit/s -2%
iperf3 transmit AXE11000 6GHz
Acer Swift Go 14 SFG14-72
Killer Wi-Fi 6E AX1675i 160MHz Wireless Network Adapter
1569 (1027min - 1730max) MBit/s
Average Killer Wi-Fi 6E AX1675i 160MHz Wireless Network Adapter
  (1229 - 1693, n=18)
1517 MBit/s -3%
Average of class Subnotebook
  (642 - 1735, n=29, last 2 years)
1299 MBit/s -17%
iperf3 receive AXE11000 6GHz
Acer Swift Go 14 SFG14-72
Killer Wi-Fi 6E AX1675i 160MHz Wireless Network Adapter
1742 (1441min - 1819max) MBit/s
Average Killer Wi-Fi 6E AX1675i 160MHz Wireless Network Adapter
  (1327 - 1788, n=19)
1547 MBit/s -11%
Average of class Subnotebook
  (951 - 1771, n=29, last 2 years)
1527 MBit/s -12%
05010015020025030035040045050055060065070075080085090095010001050110011501200125013001350140014501500155016001650170017501800Tooltip
Acer Swift Go 14 SFG14-72; iperf3 transmit AXE11000 6GHz; iperf 3.1.3: Ø1569 (1027-1730)
Acer Swift Go 14 SFG14-72; iperf3 receive AXE11000 6GHz; iperf 3.1.3: Ø1741 (1441-1819)
Acer Swift Go 14 SFG14-72; iperf3 transmit AXE11000; iperf 3.1.3: Ø1319 (961-1533)
Acer Swift Go 14 SFG14-72; iperf3 receive AXE11000; iperf 3.1.3: Ø1440 (726-1755)

Webcam

Windows Studio Effects and Task Manager

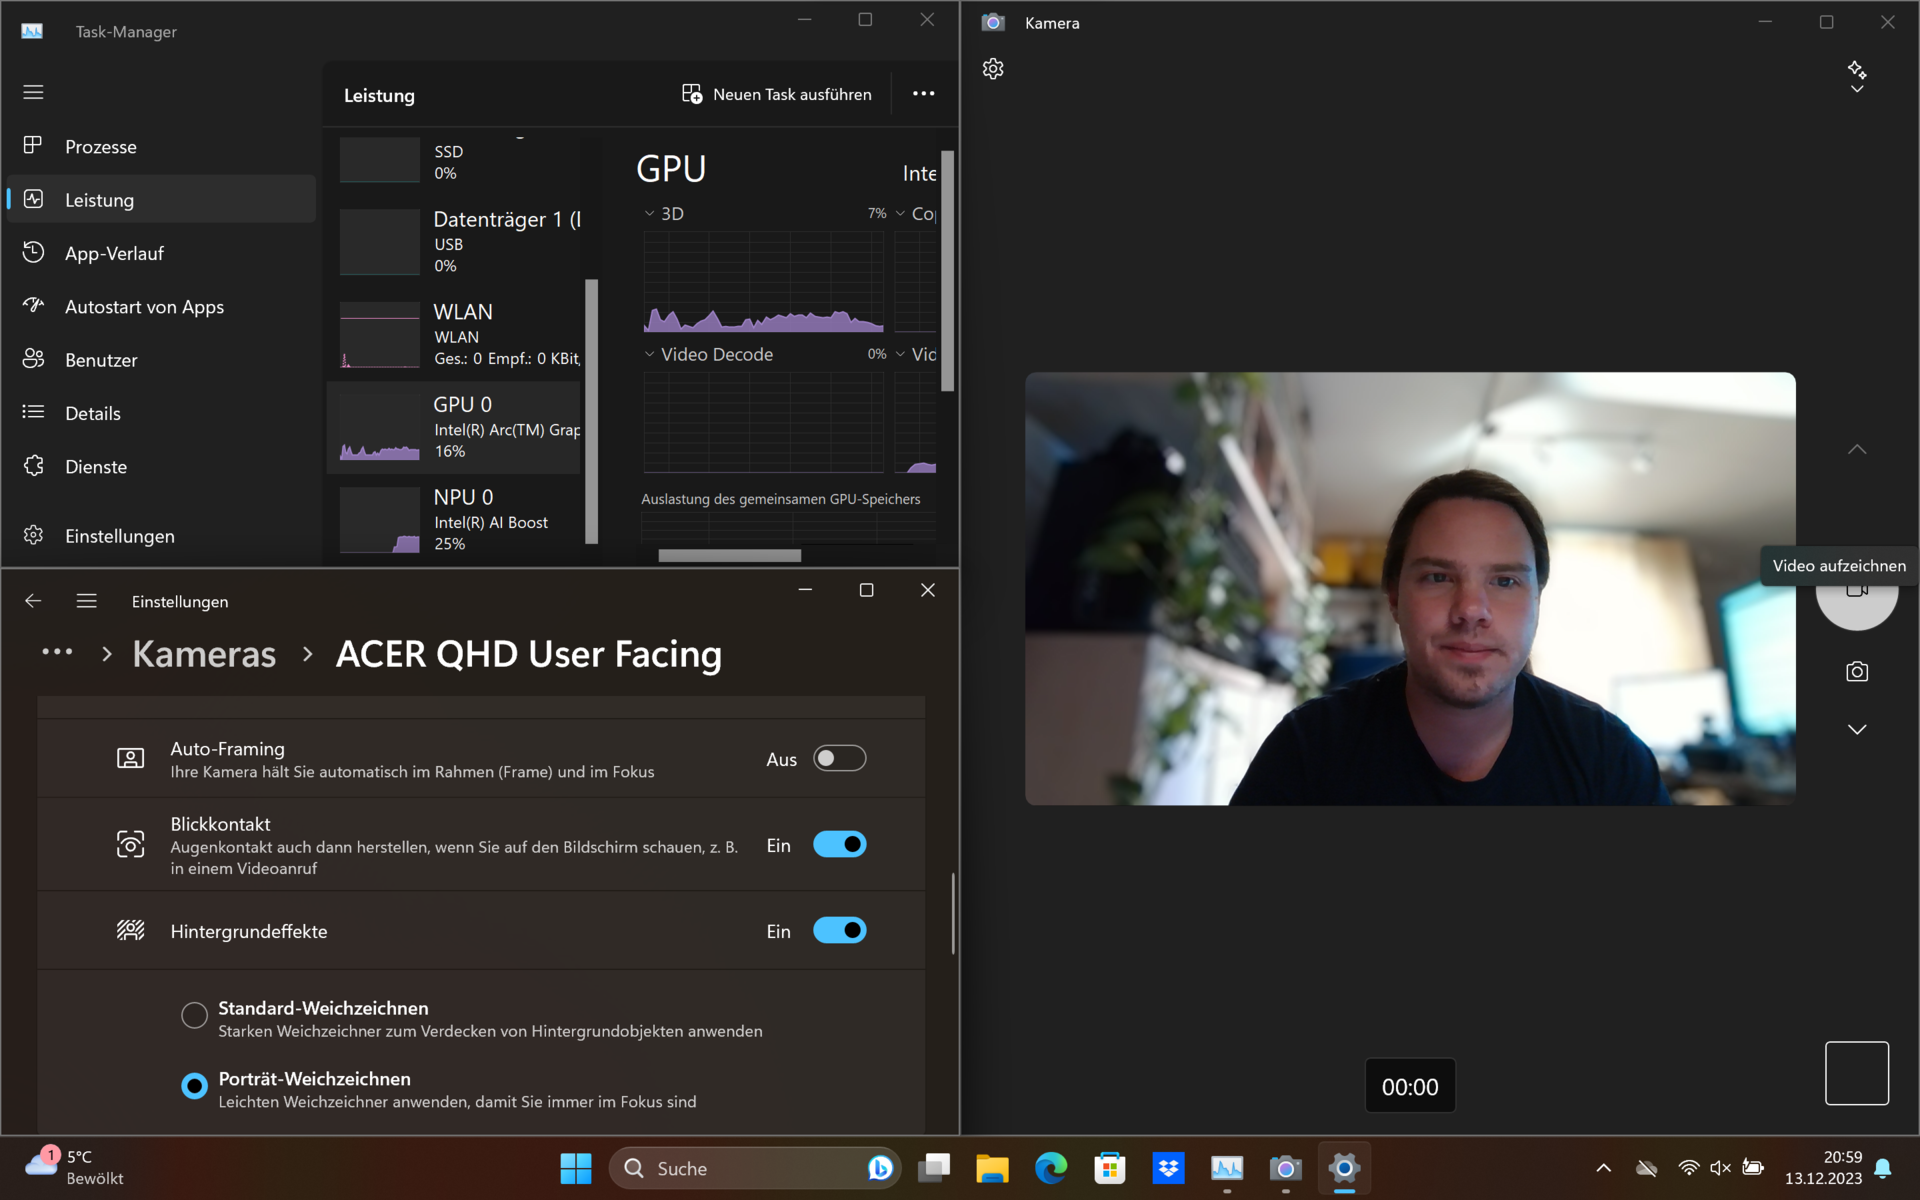
The Acer Swift Go's QHD webcam delivered very impressive results. The image quality can even be improved a touch more thanks to Intel's NPU and Windows Studio Effects. However, this taxes the iGPU and, as you would expect, the Acer Swift Go's fans make their presence felt both quickly and loudly.

ColorChecker
9.5 ∆E
9 ∆E
13.1 ∆E
9.8 ∆E
12.9 ∆E
9.7 ∆E
9.4 ∆E
15.8 ∆E
12.7 ∆E
6.1 ∆E
9 ∆E
6.3 ∆E
9.7 ∆E
4.8 ∆E
13.6 ∆E
7.4 ∆E
14.2 ∆E
10.2 ∆E
2.9 ∆E
5.6 ∆E
7.6 ∆E
9.8 ∆E
5 ∆E
4.6 ∆E
ColorChecker Acer Swift Go 14 SFG14-72: 9.11 ∆E min: 2.9 - max: 15.8 ∆E

Security

A fingerprint sensor, a Kensington Lock slot and a TPM 2.0 are on board. This means all the basic security requirements concerning physical theft and access protection are fulfilled. 
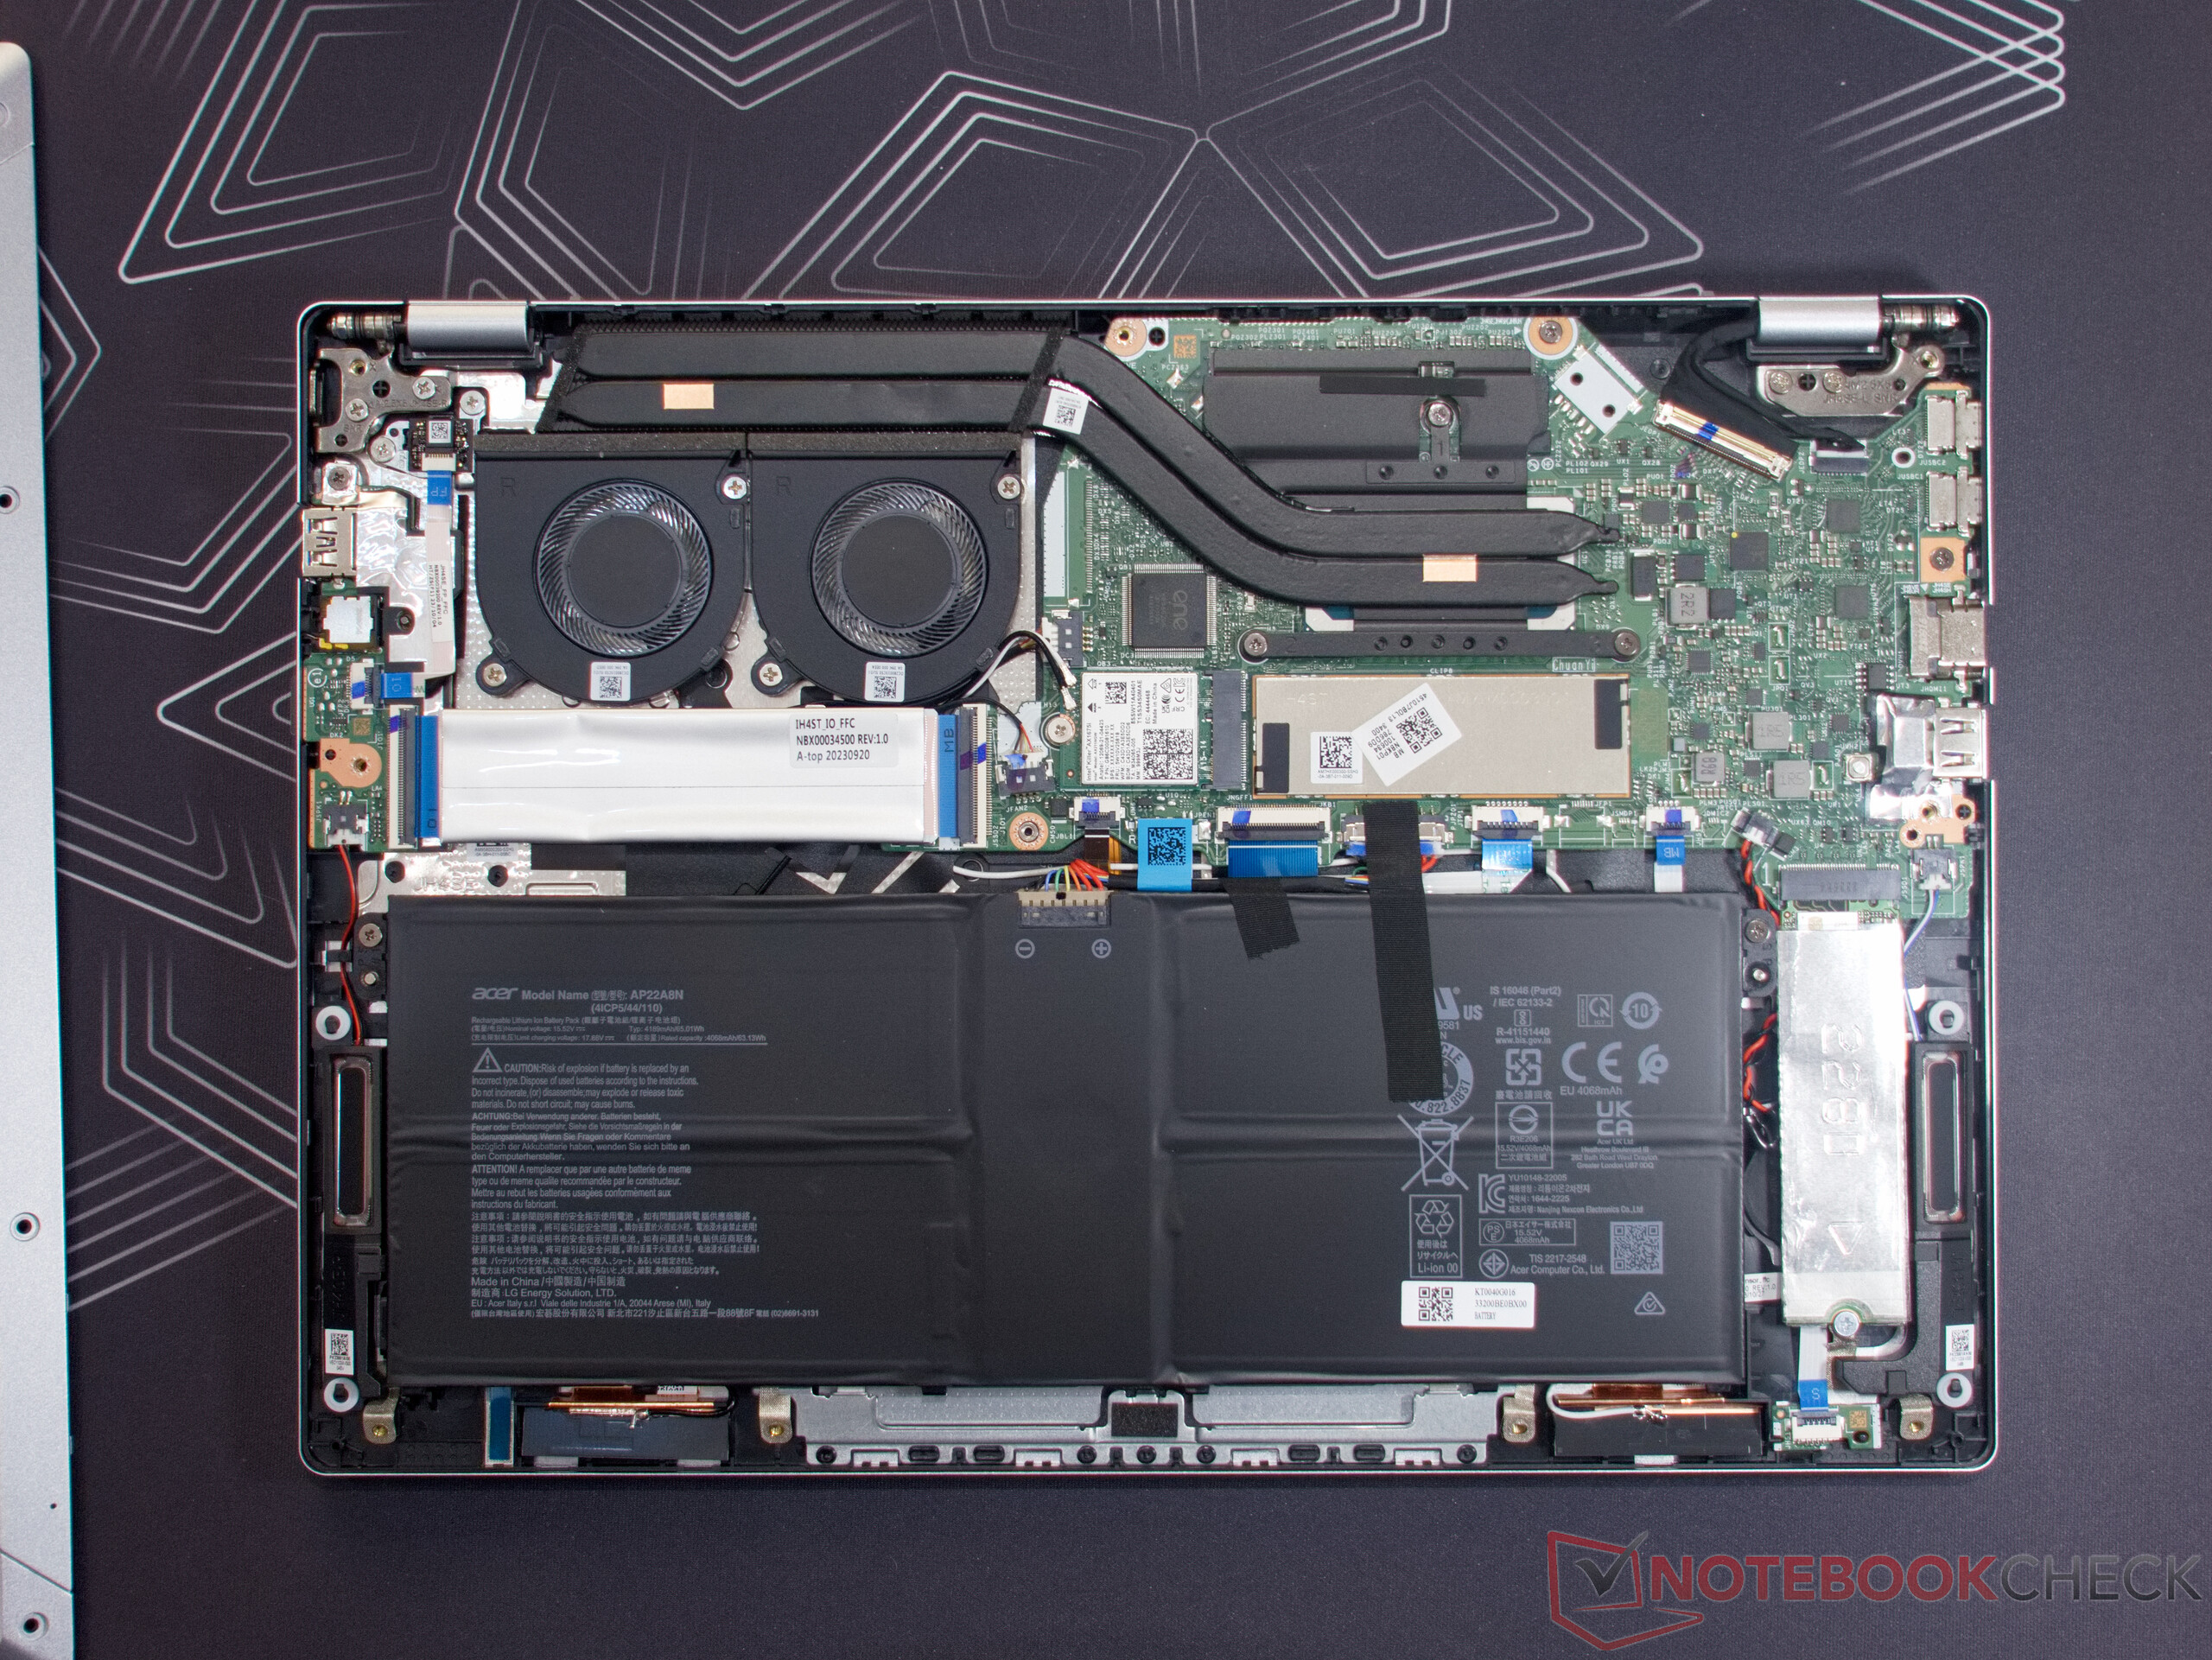
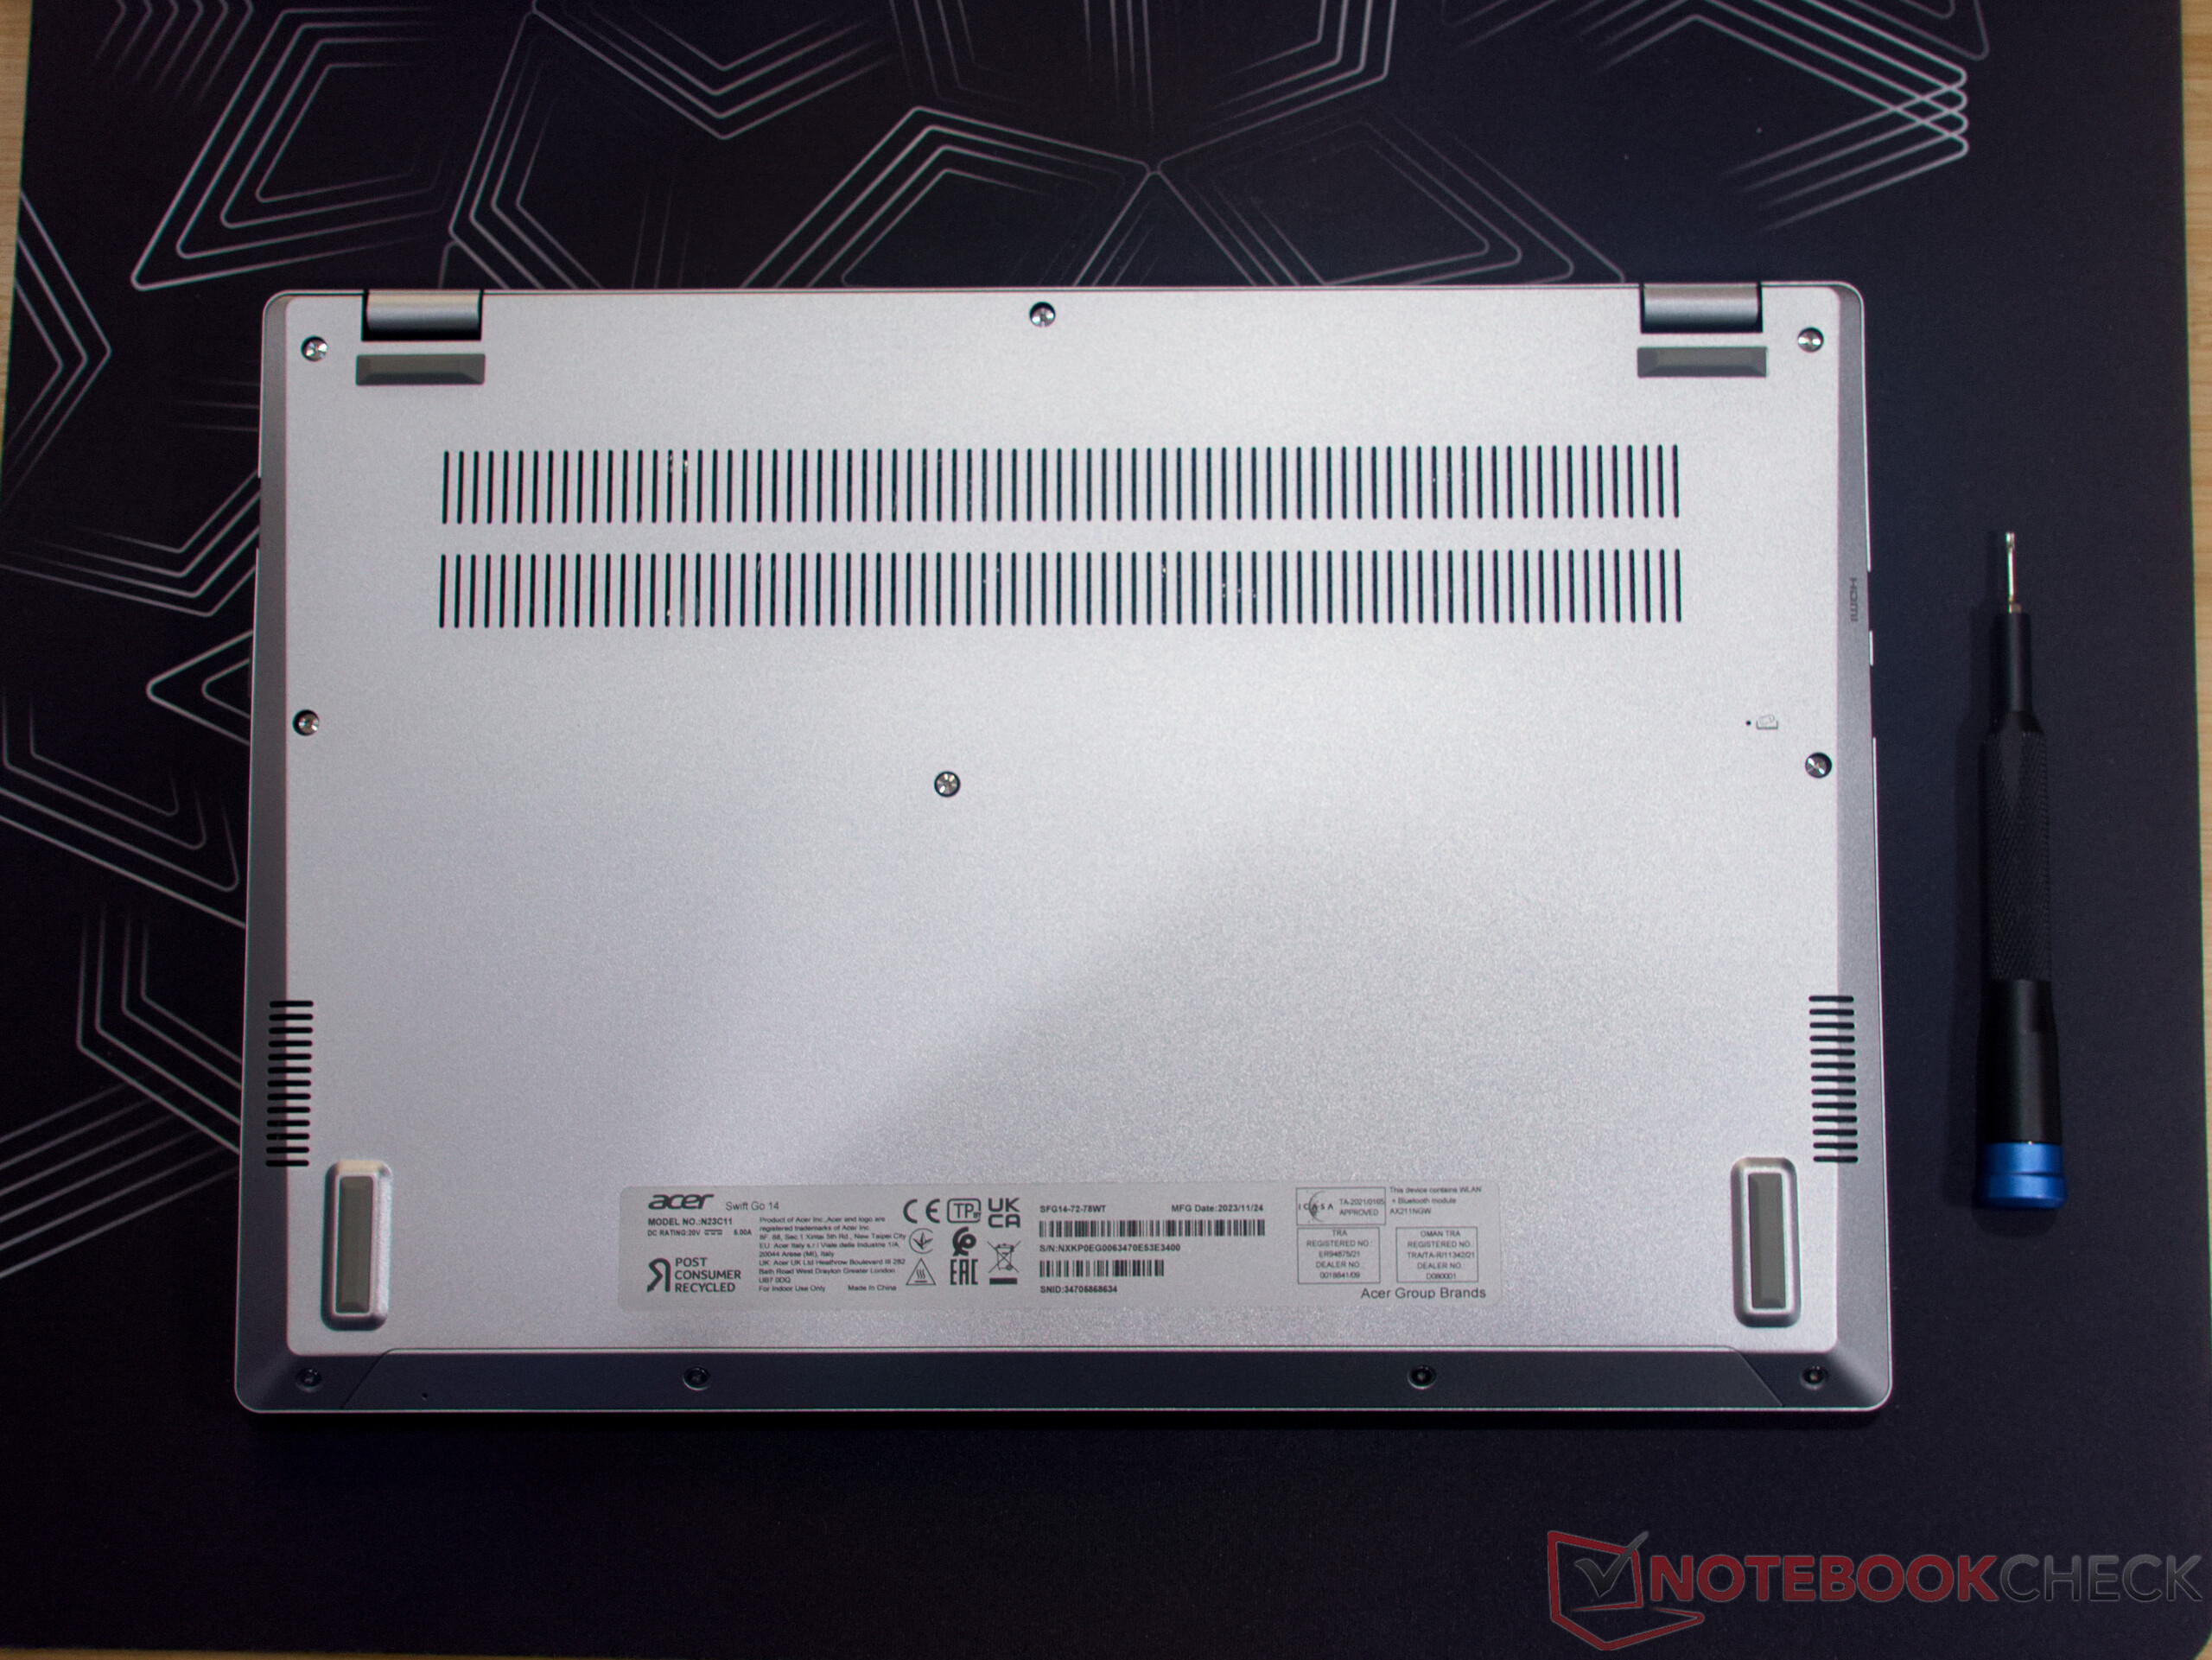
Maintenance

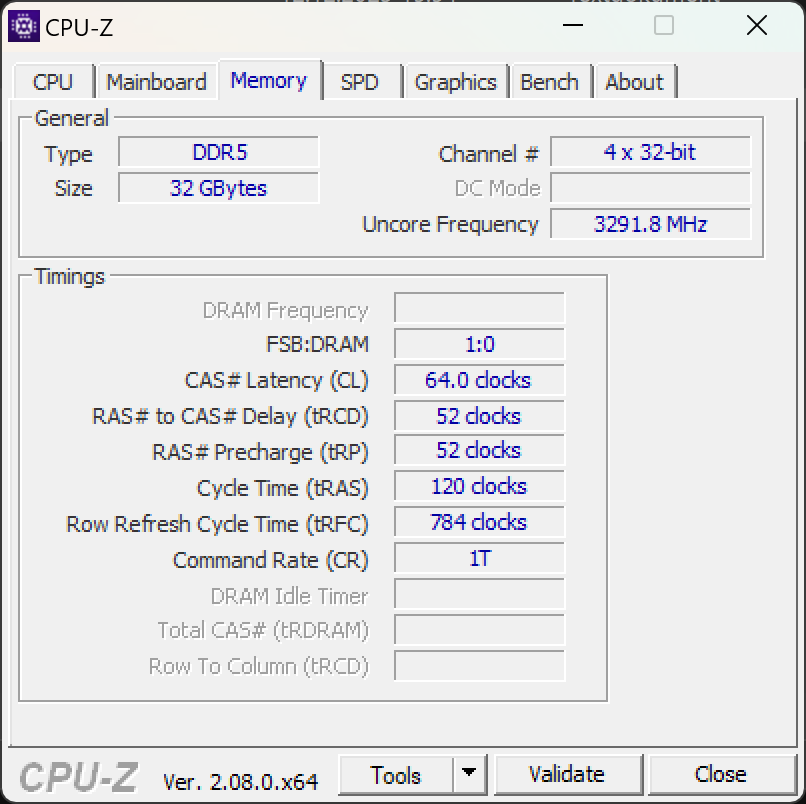
We required a TX5 screwdriver and a suction cup to open the Acer Swift Go. Just as with the predecessor, many maintenance options are to be found inside the laptop. Two M.2 slots, (one occupied) as well as an installed Wi-Fi module are available. The fans can be easily removed for cleaning purposes. Only the generously sized 32 GB RAM is soldered. Incidentally, the free M.2 slot can be found under the ribbon cable next to the fans. 

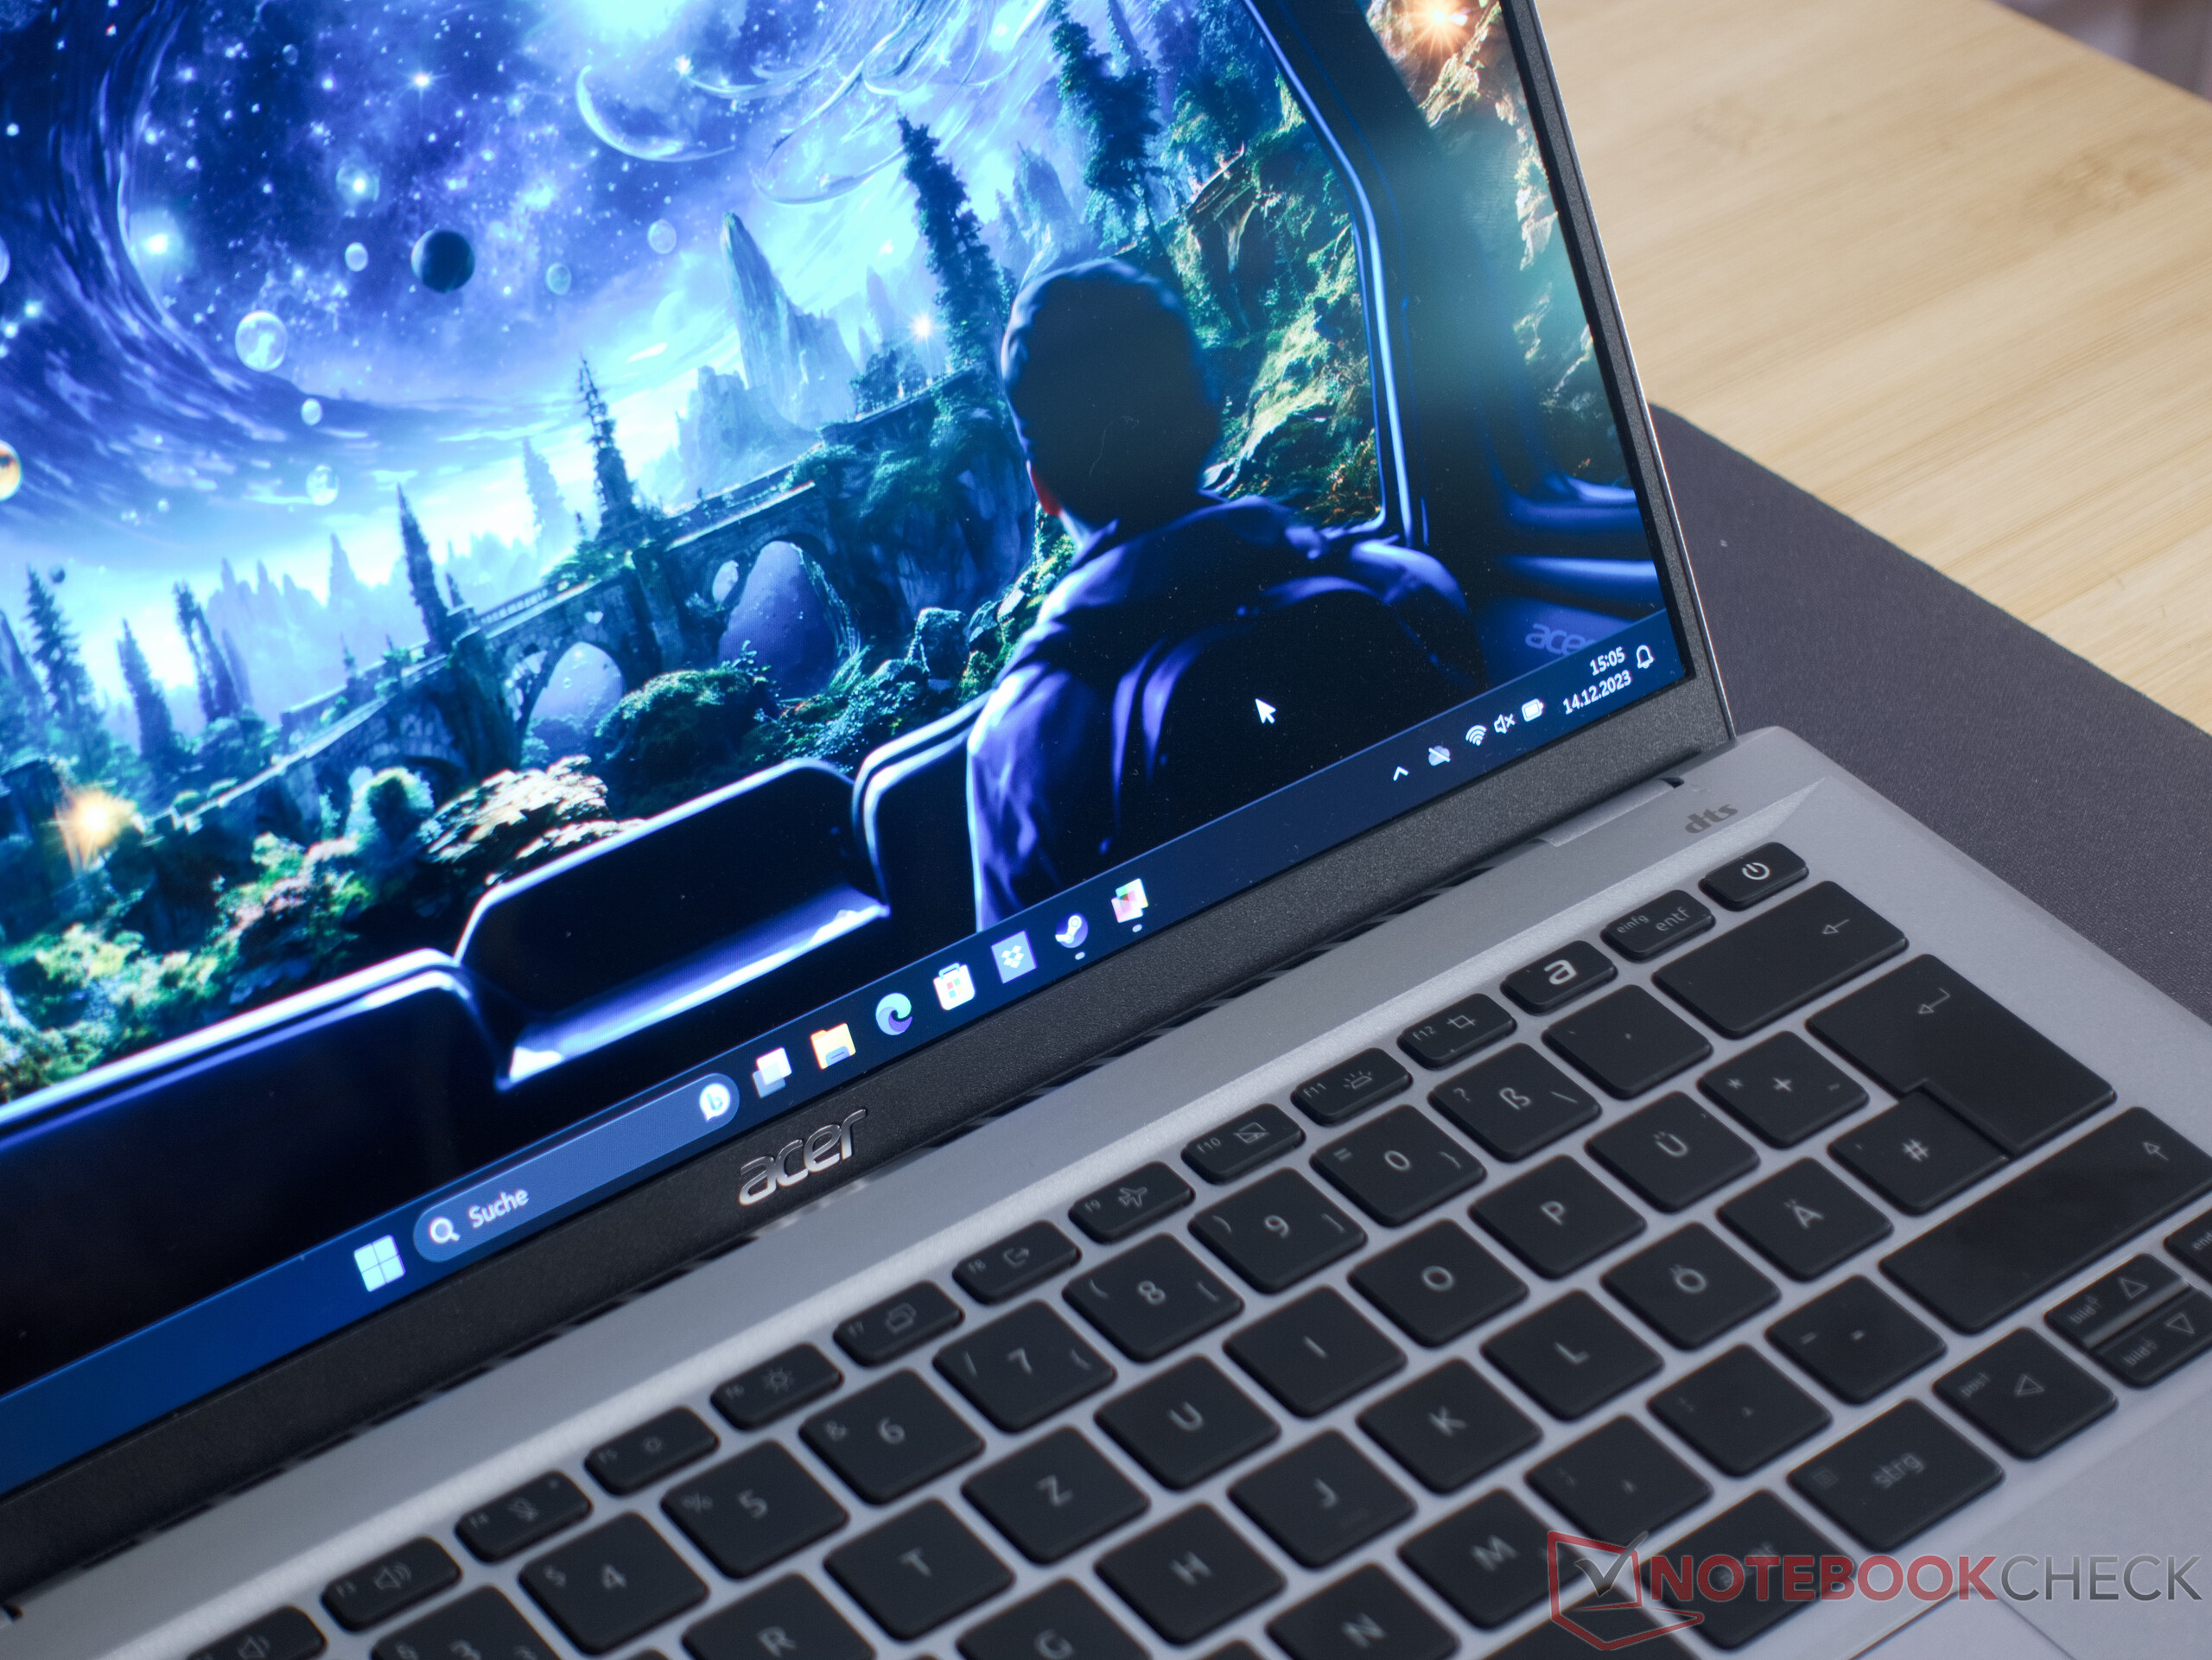
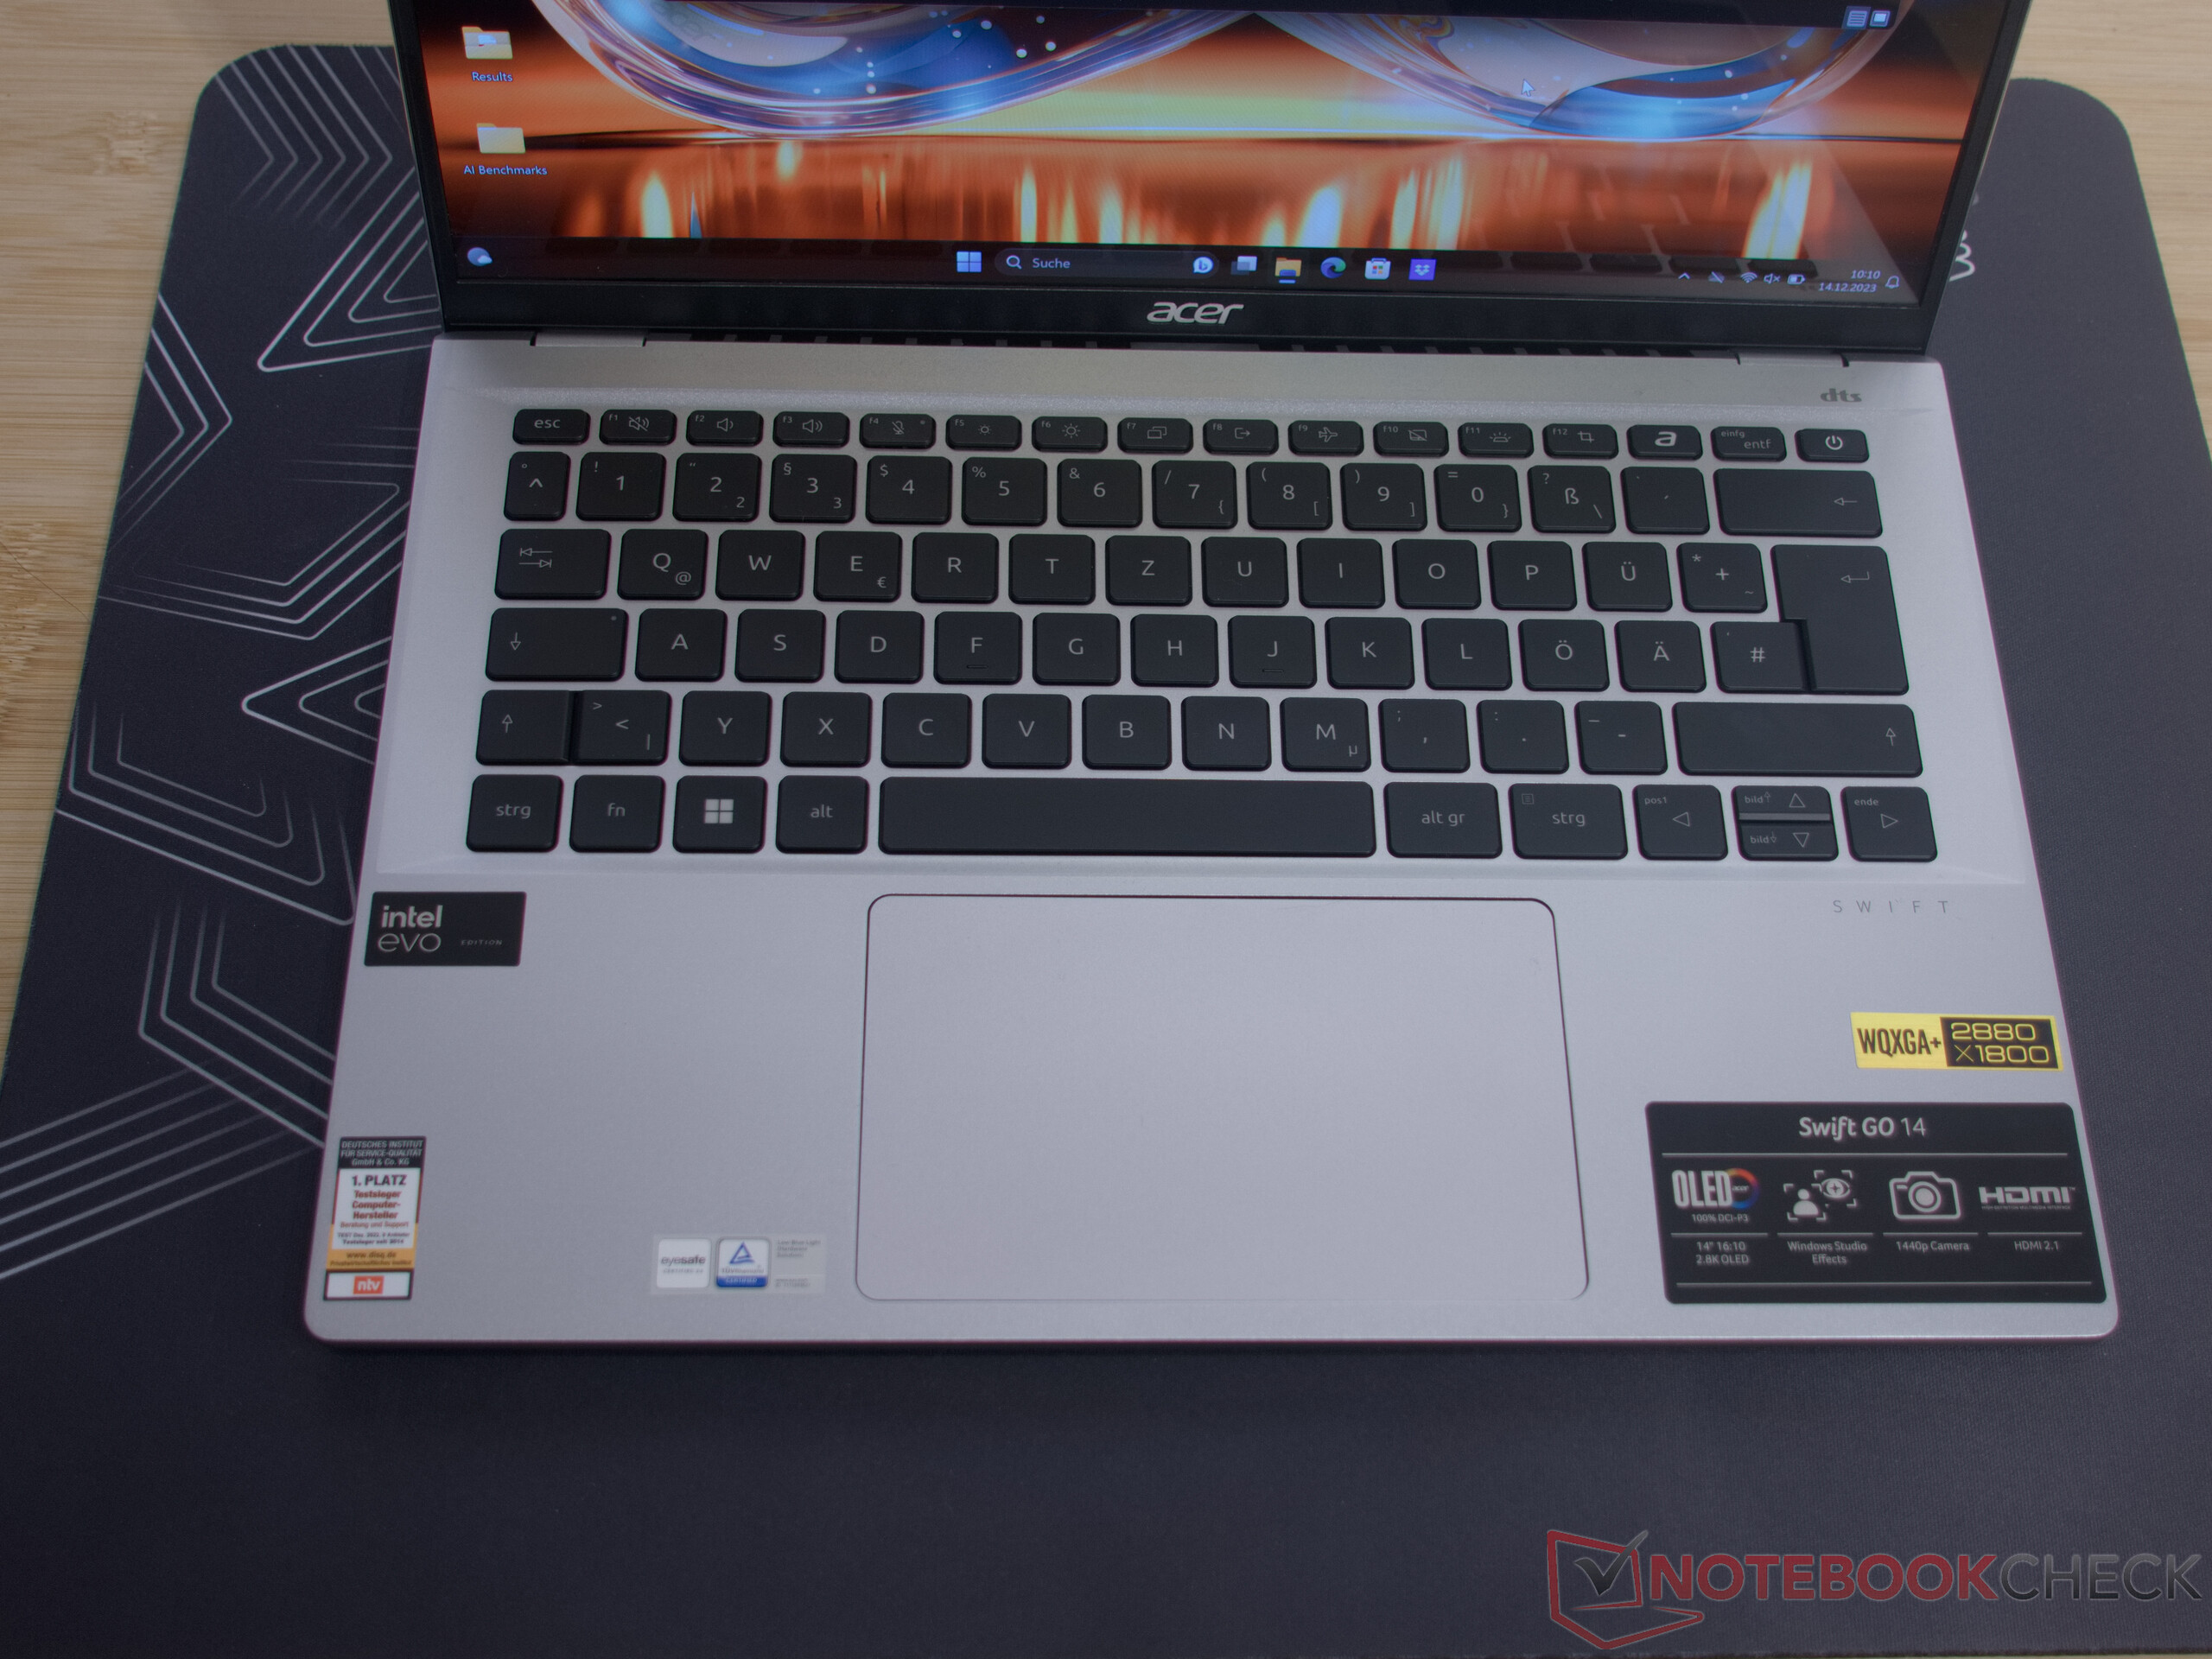
Input devices - A large touchpad


Keyboard

Above all, the backlit key's pressure point could be a little crisper. Otherwise, the keyboard offers a pleasant typing experience. In dark environments, the key backlighting can be adjusted to two levels. Similar to the predecessor, the upper shell can also be bent slightly and this could irritate some users when pressing the keys firmly.

Touchpad

In the new version, Acer has significantly increased the size of the Swift Go 14's touchpad but the radii in the corners remain. This change doesn't just benefit the looks. In practice, many things such as drag and drop and copying are easier to perform. Now 12 x 8 cm, the clickpad offers considerably more space for inputs and gesture control. 

The base unit with the backlit keyboard

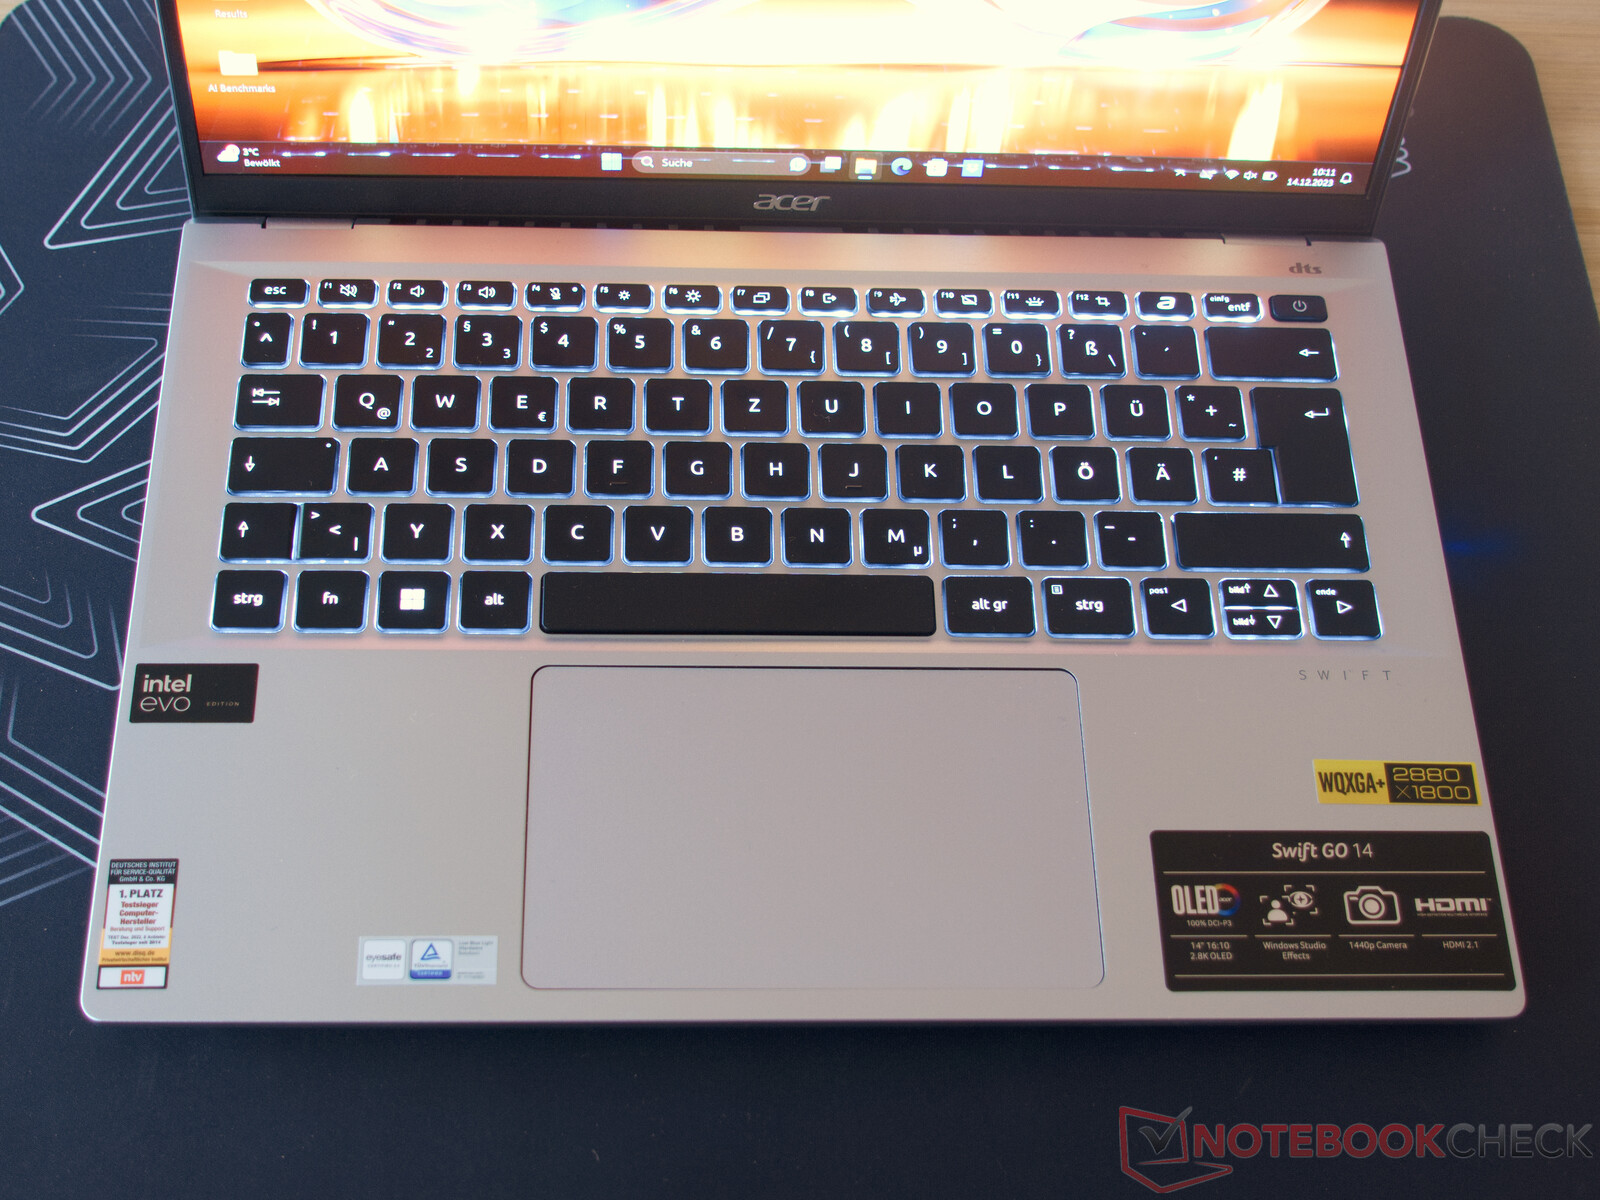
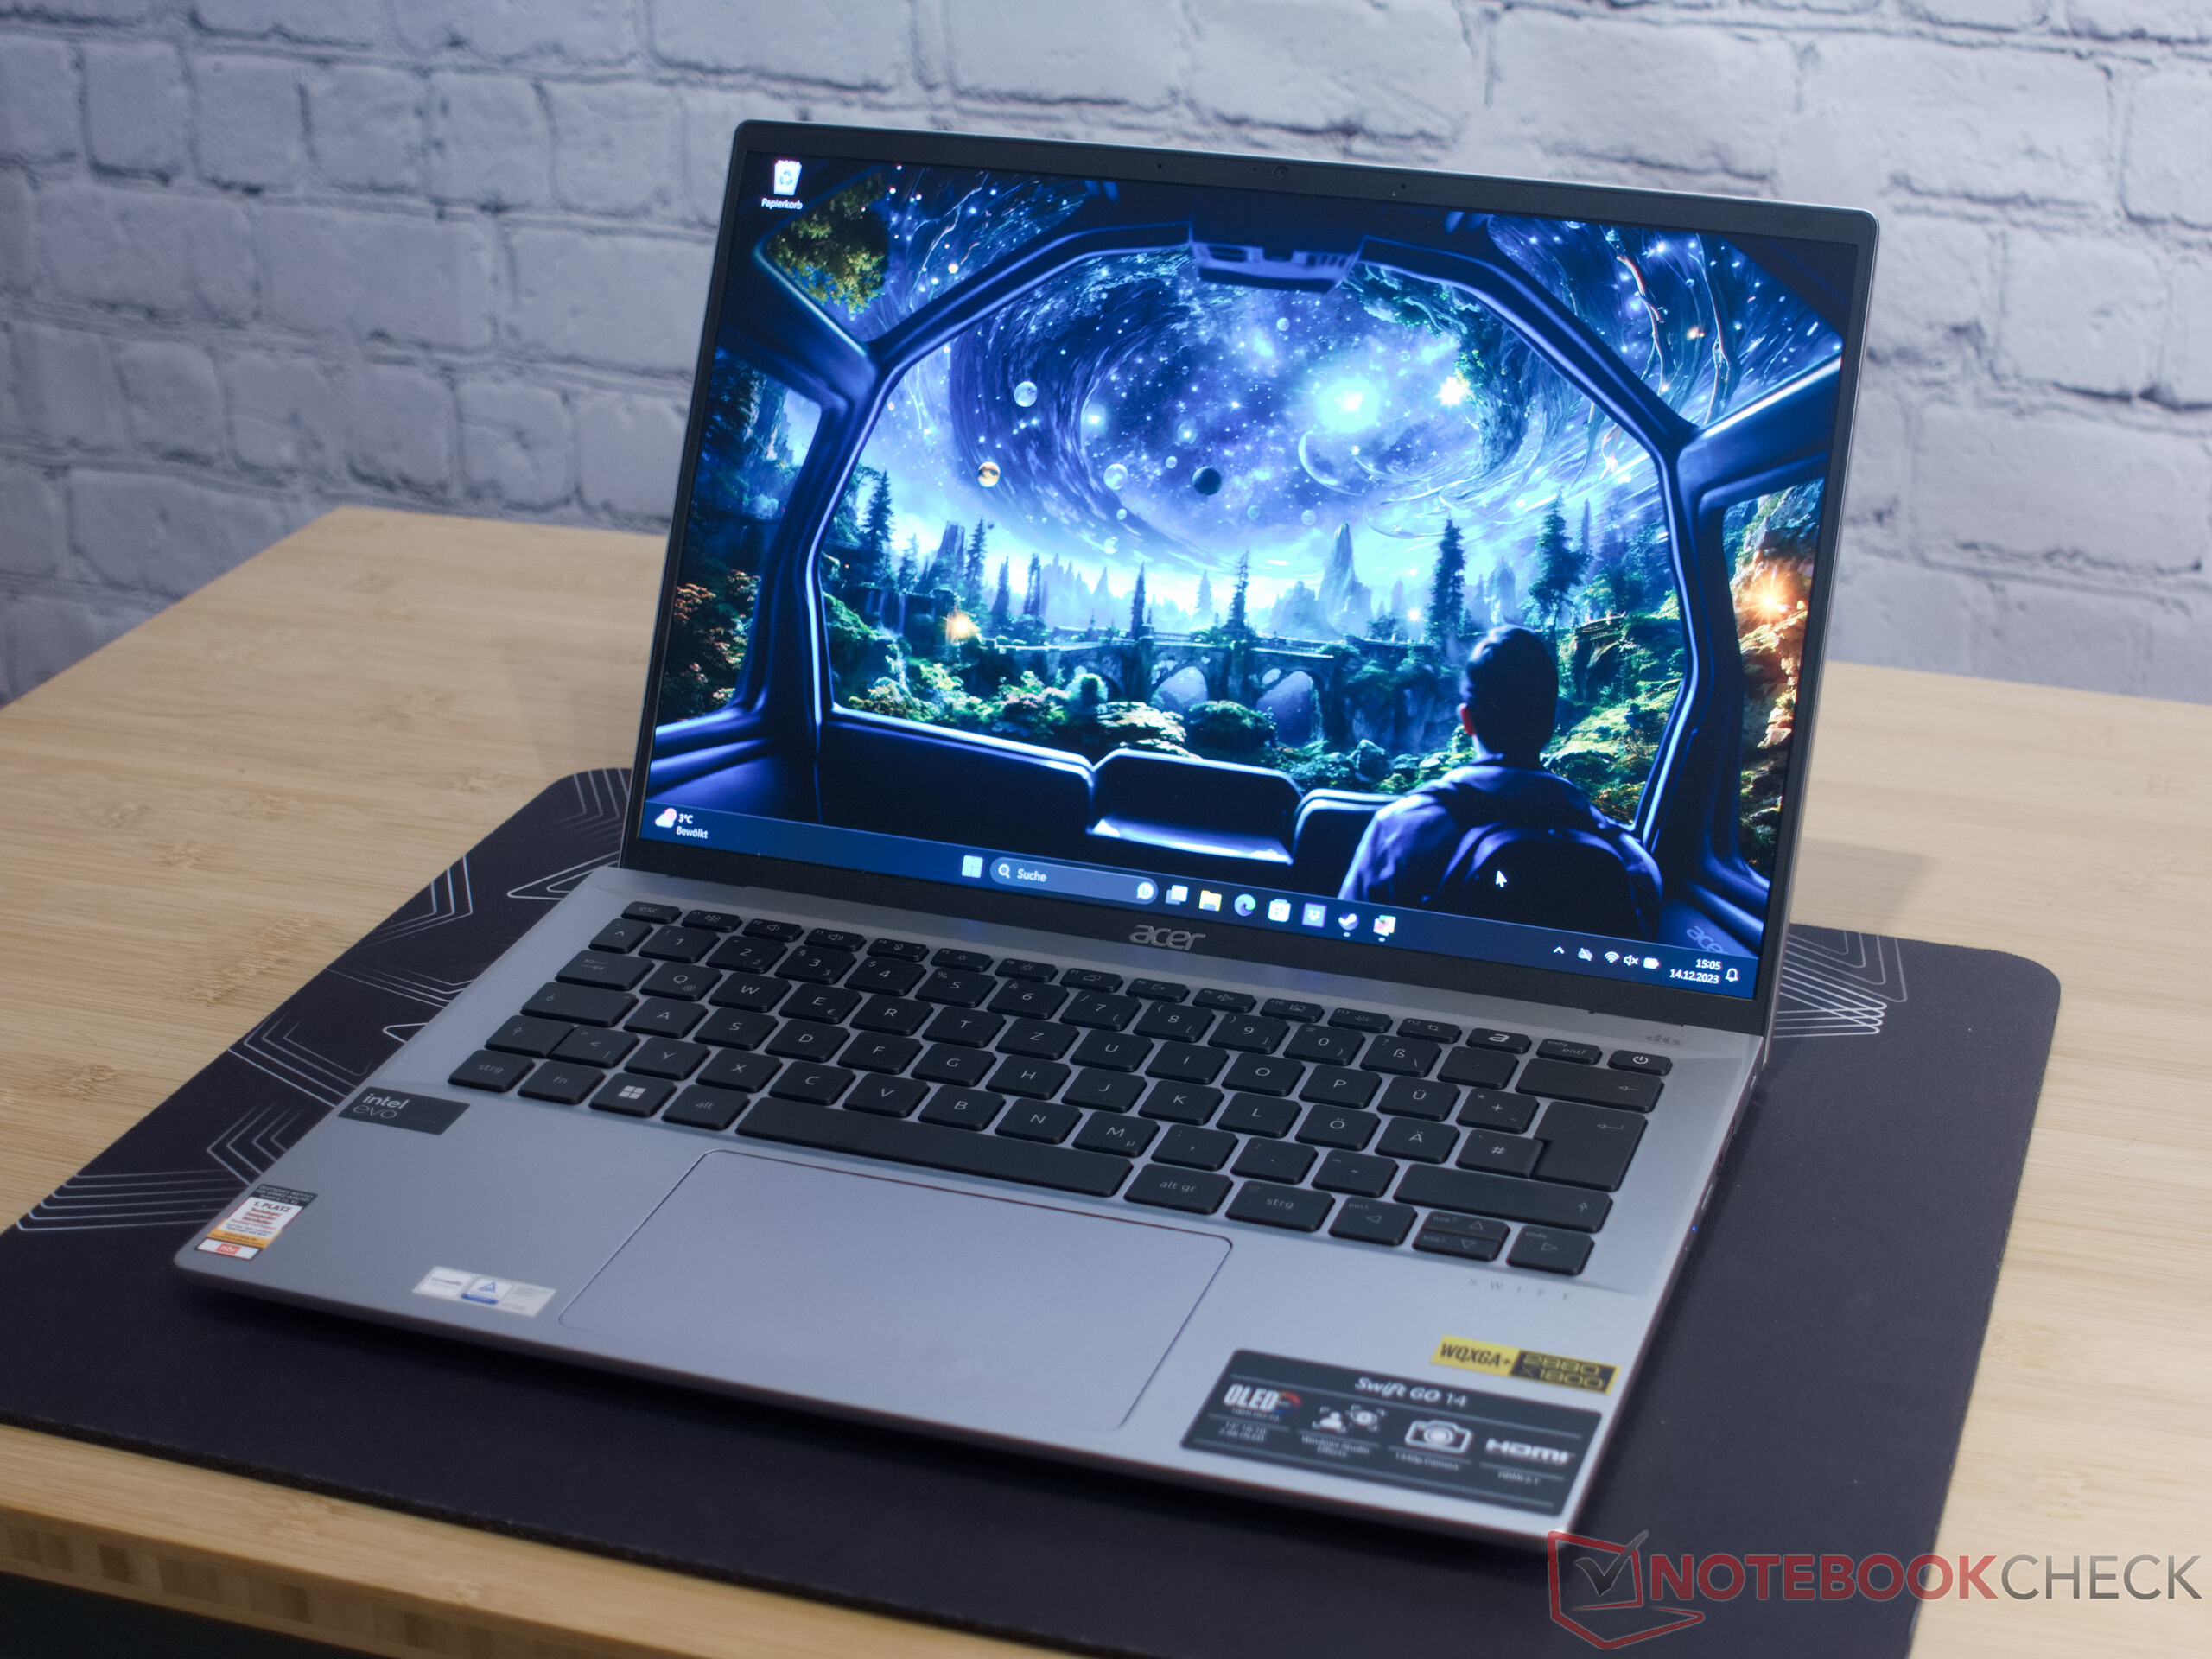
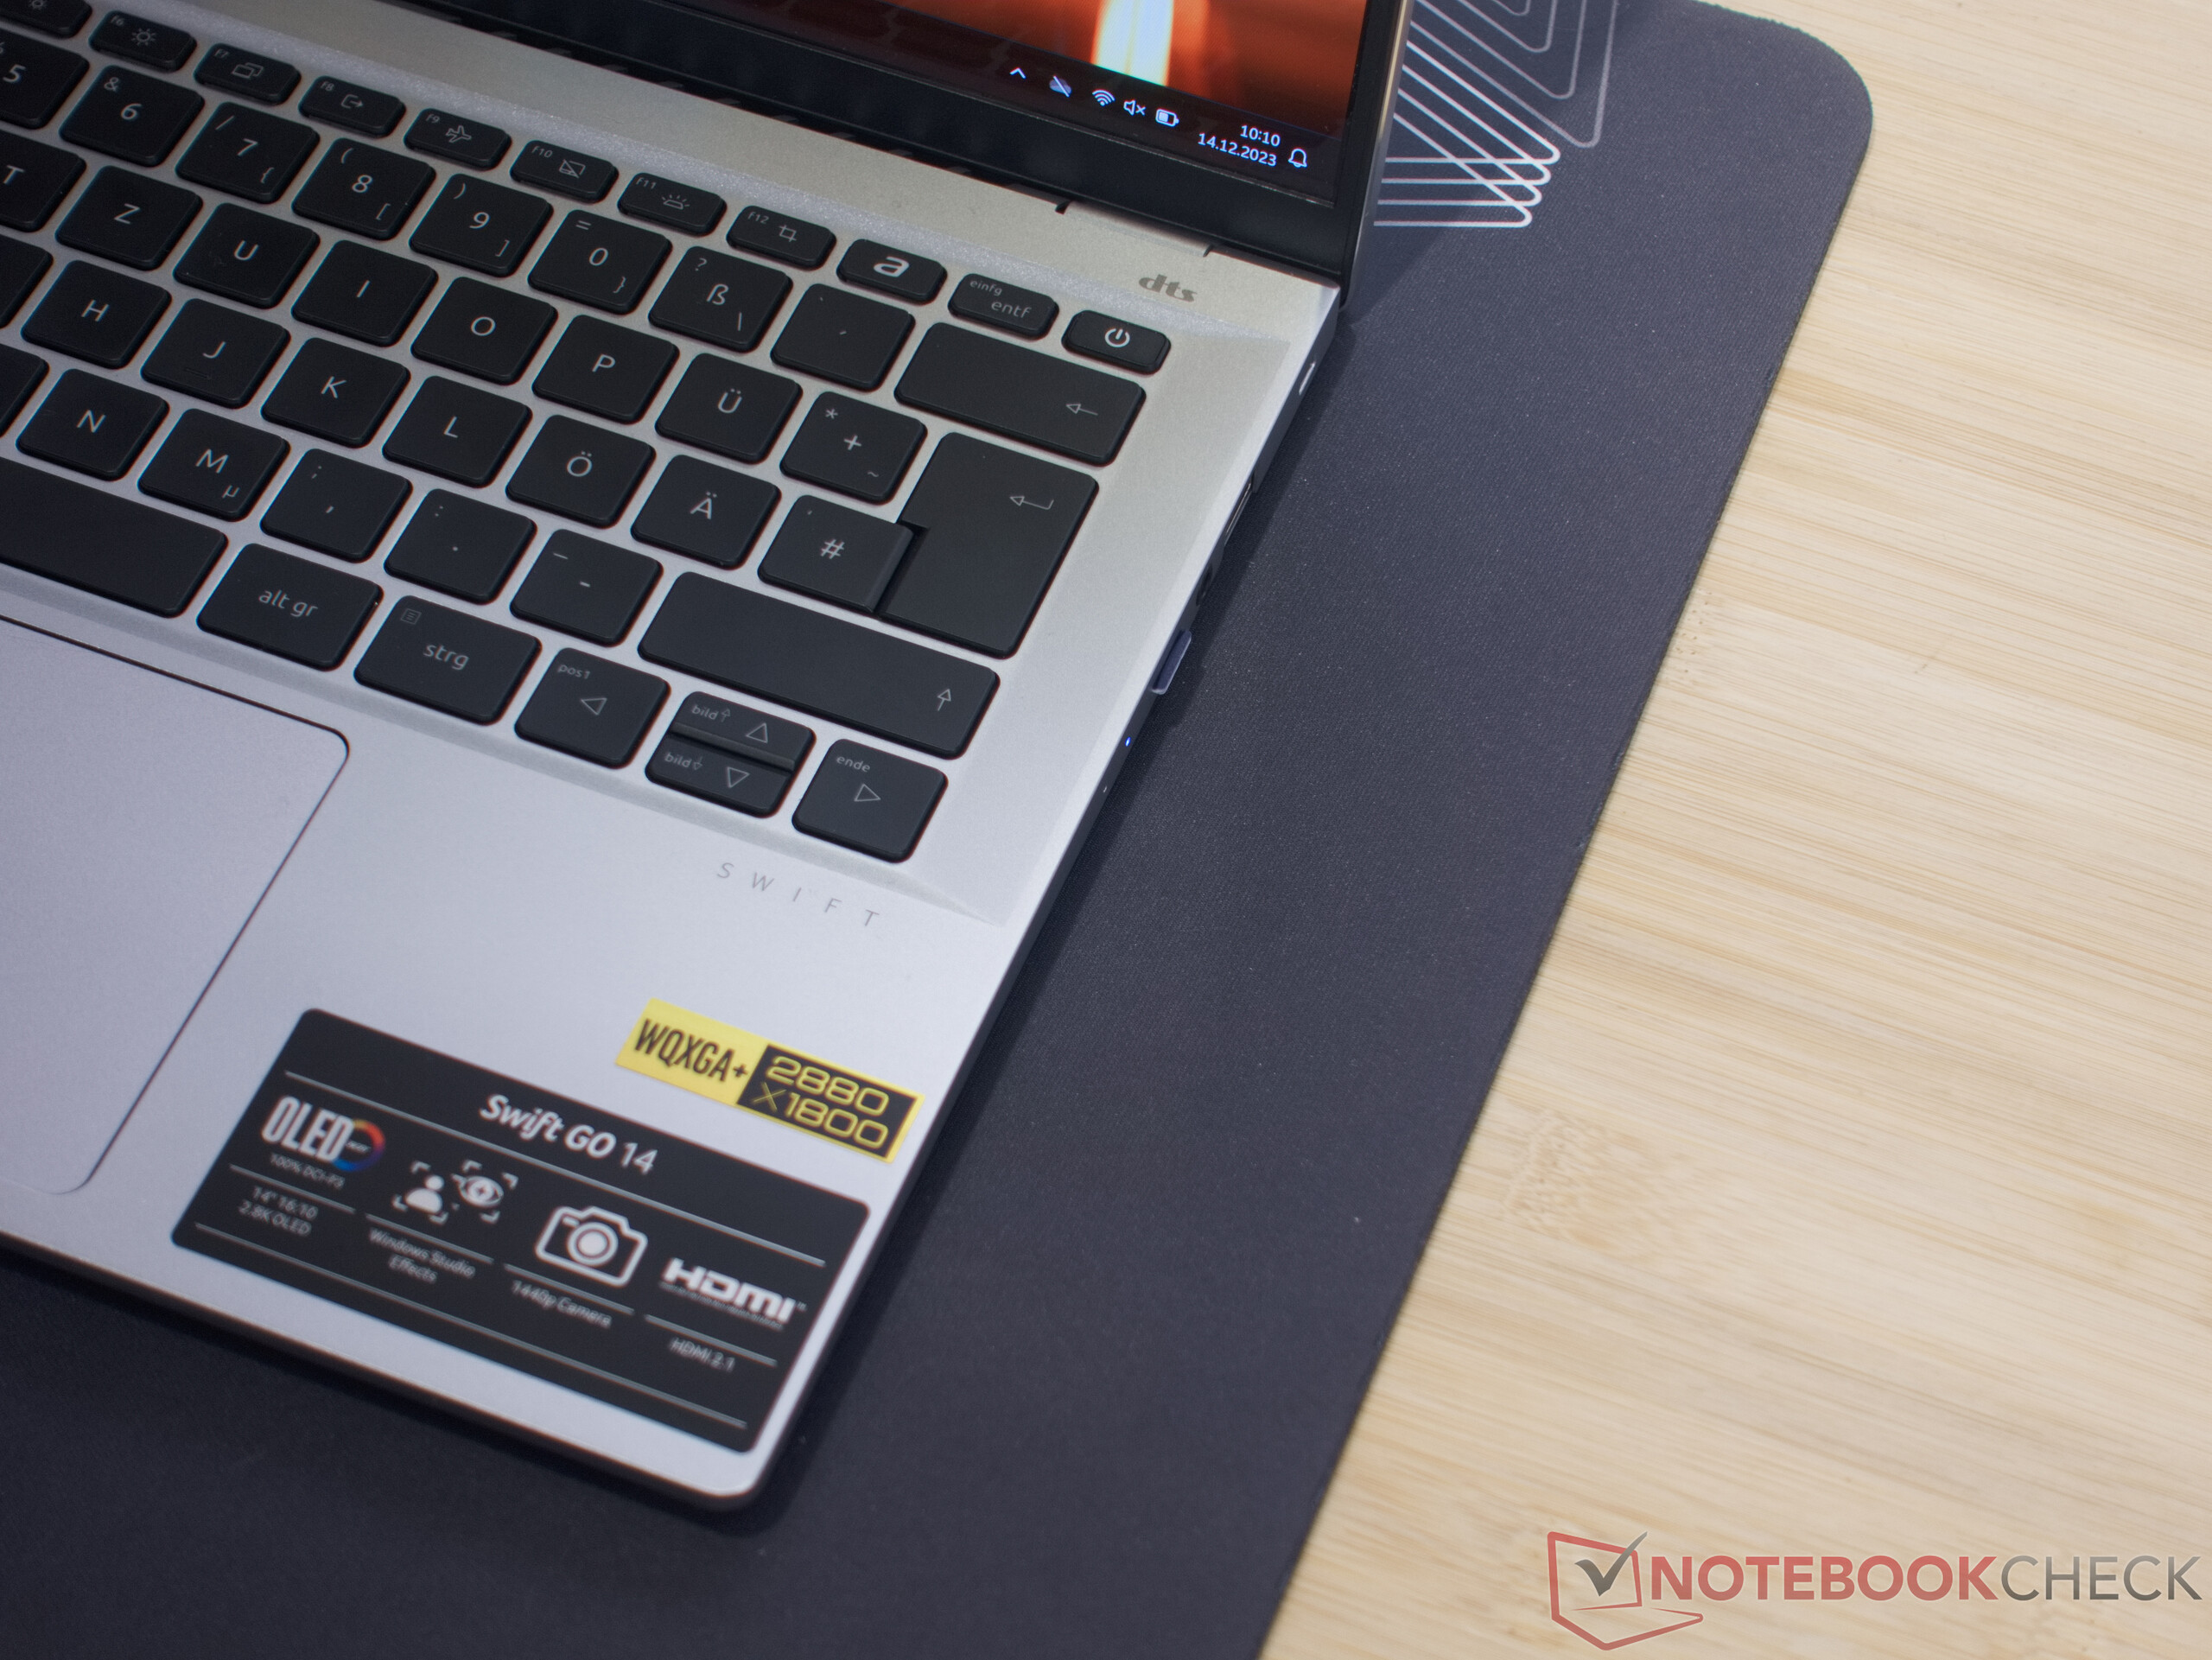
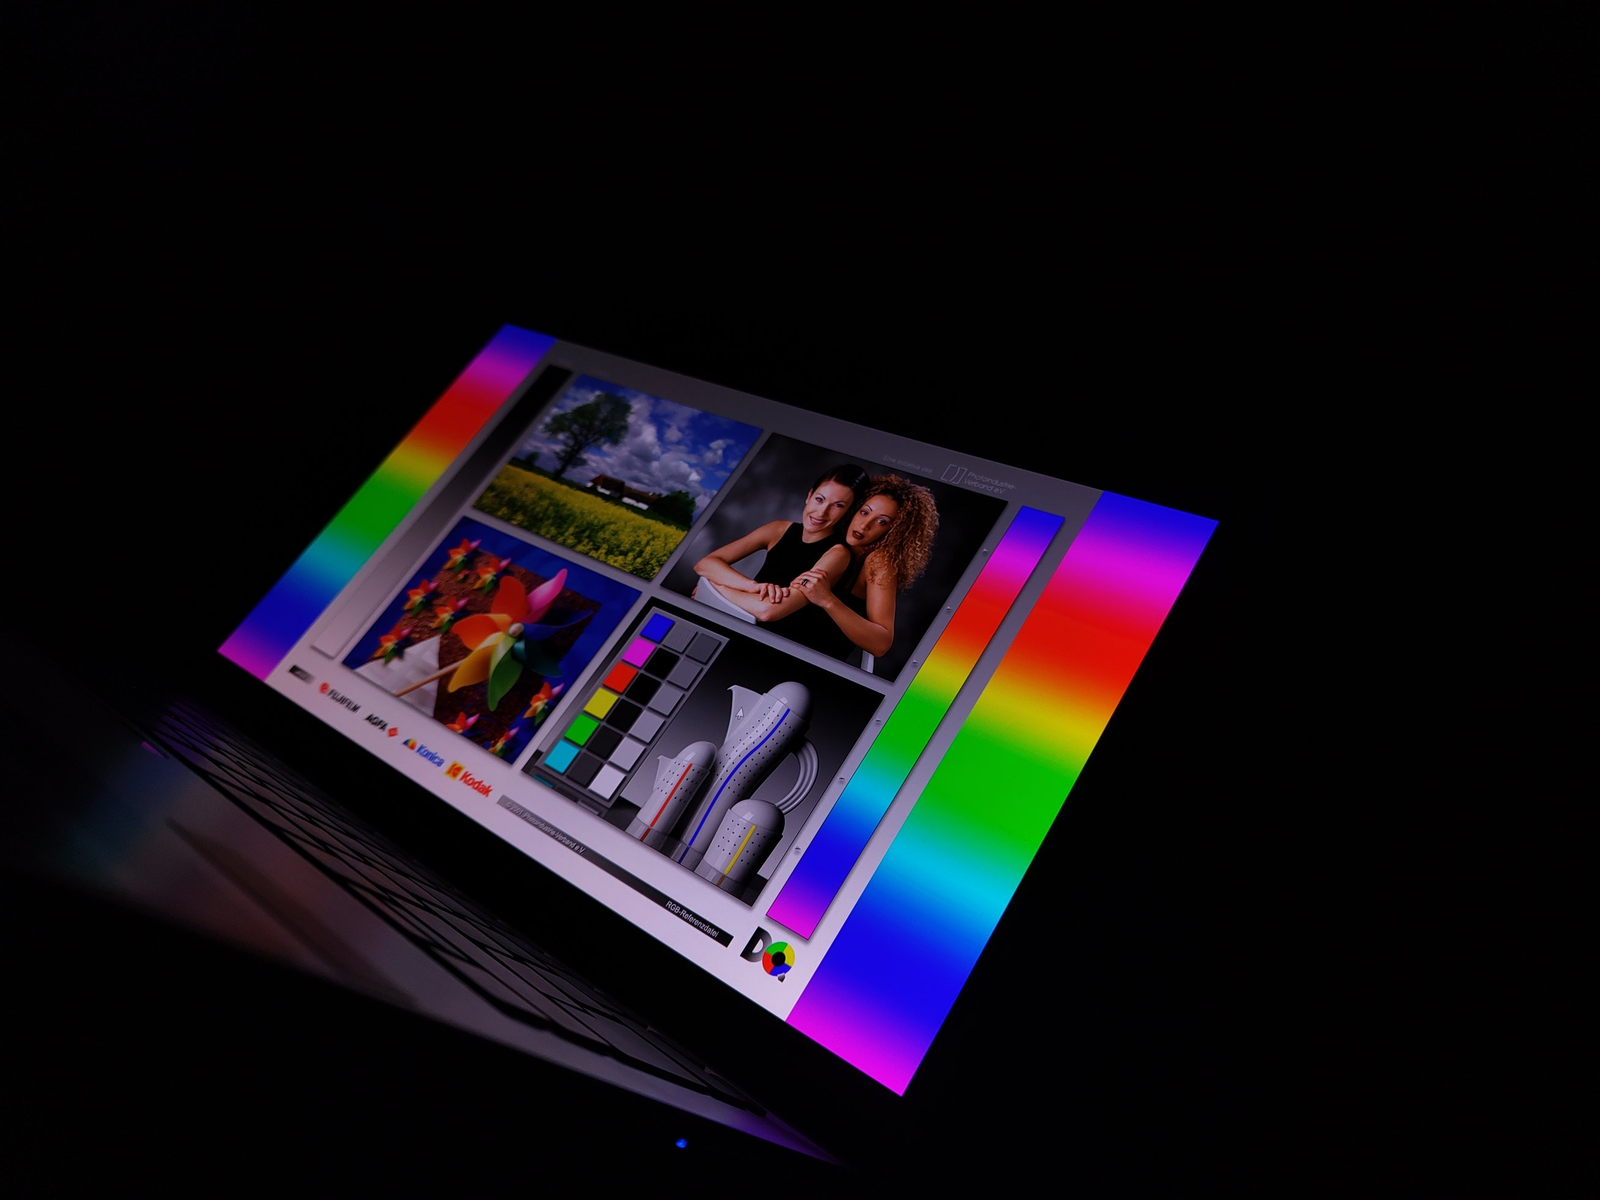
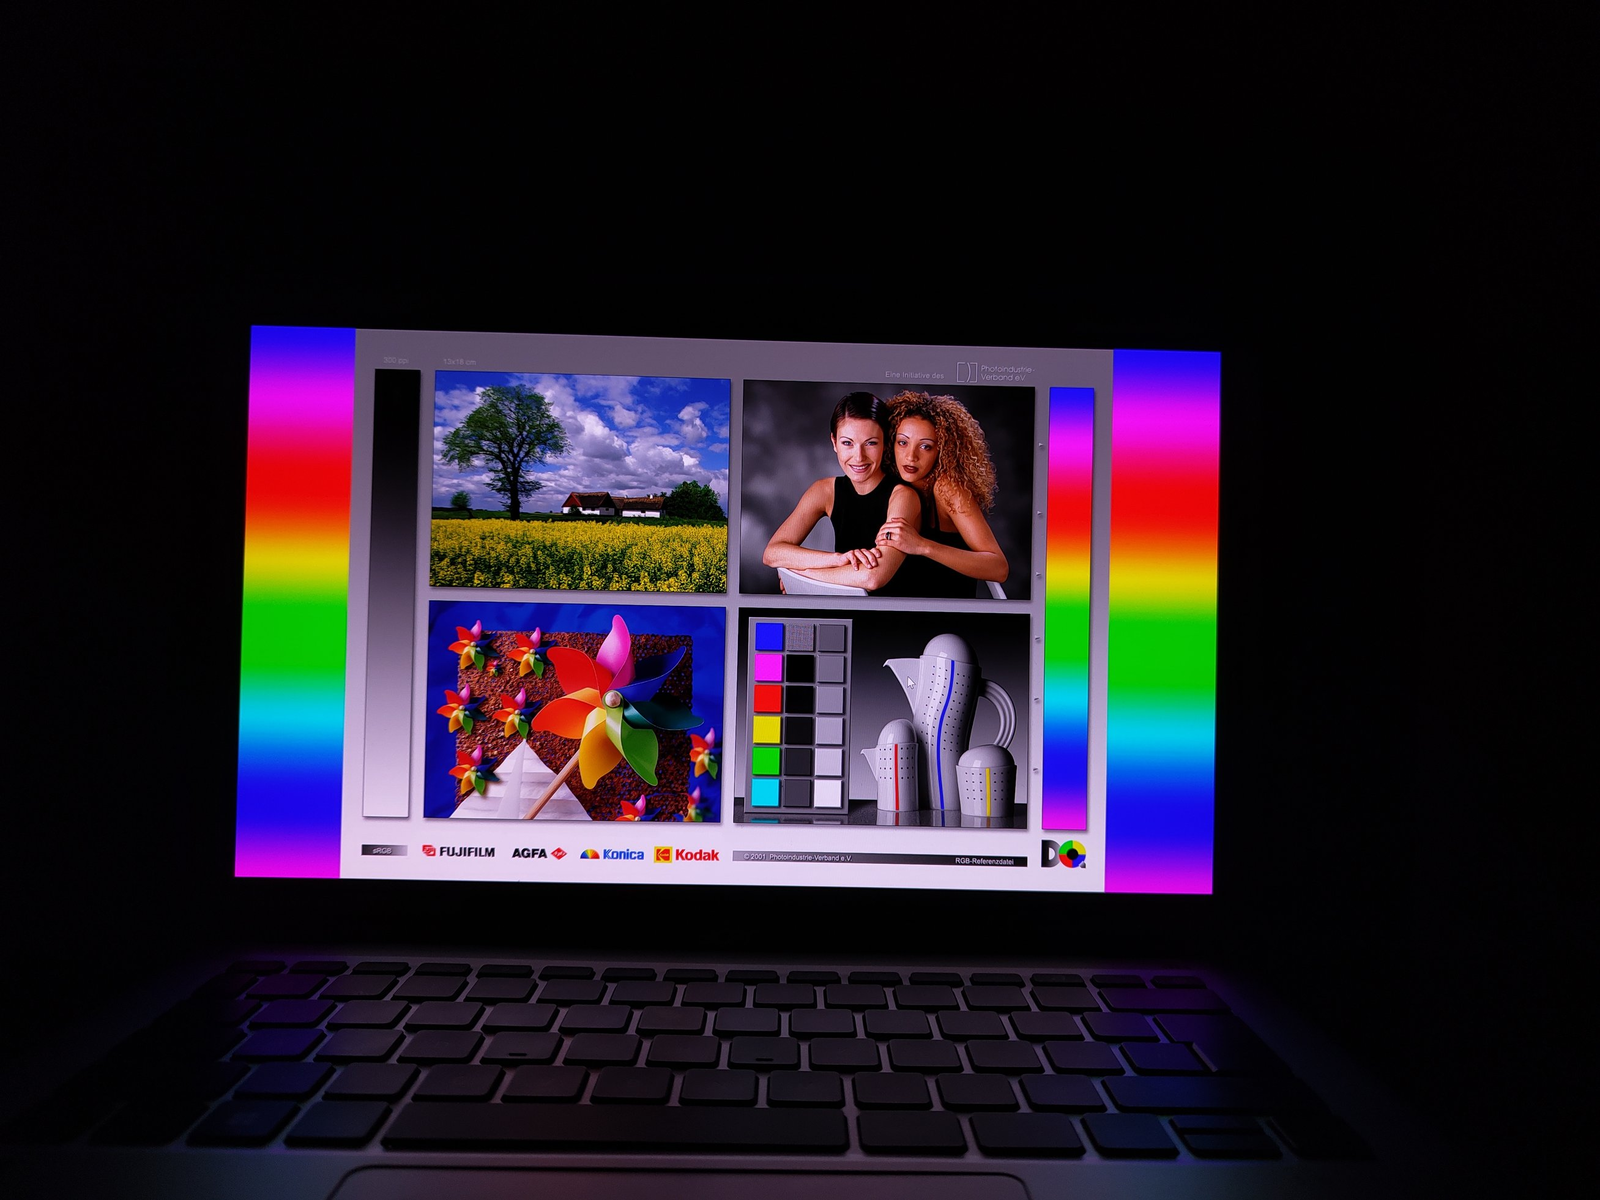
Display - 2.8K, 90Hz OLED and HDR500

Subpixels
Subpixels

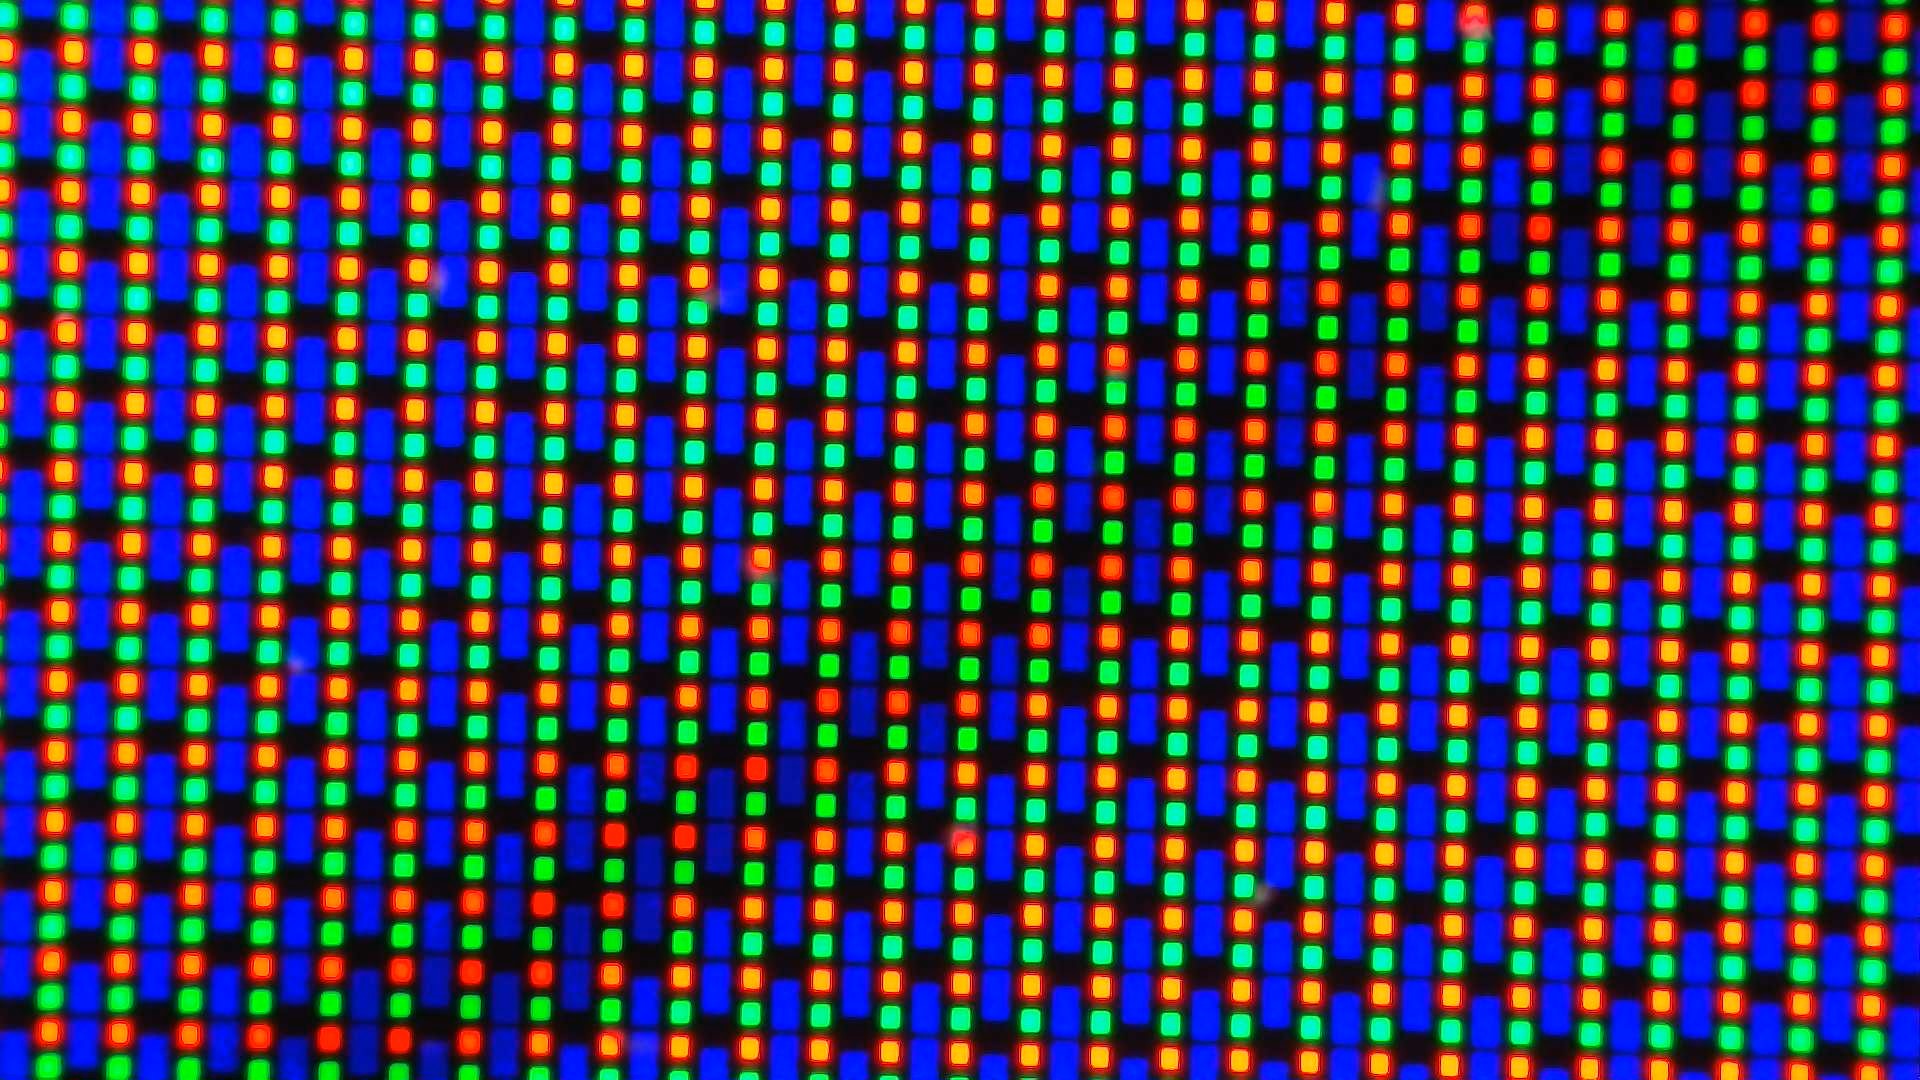
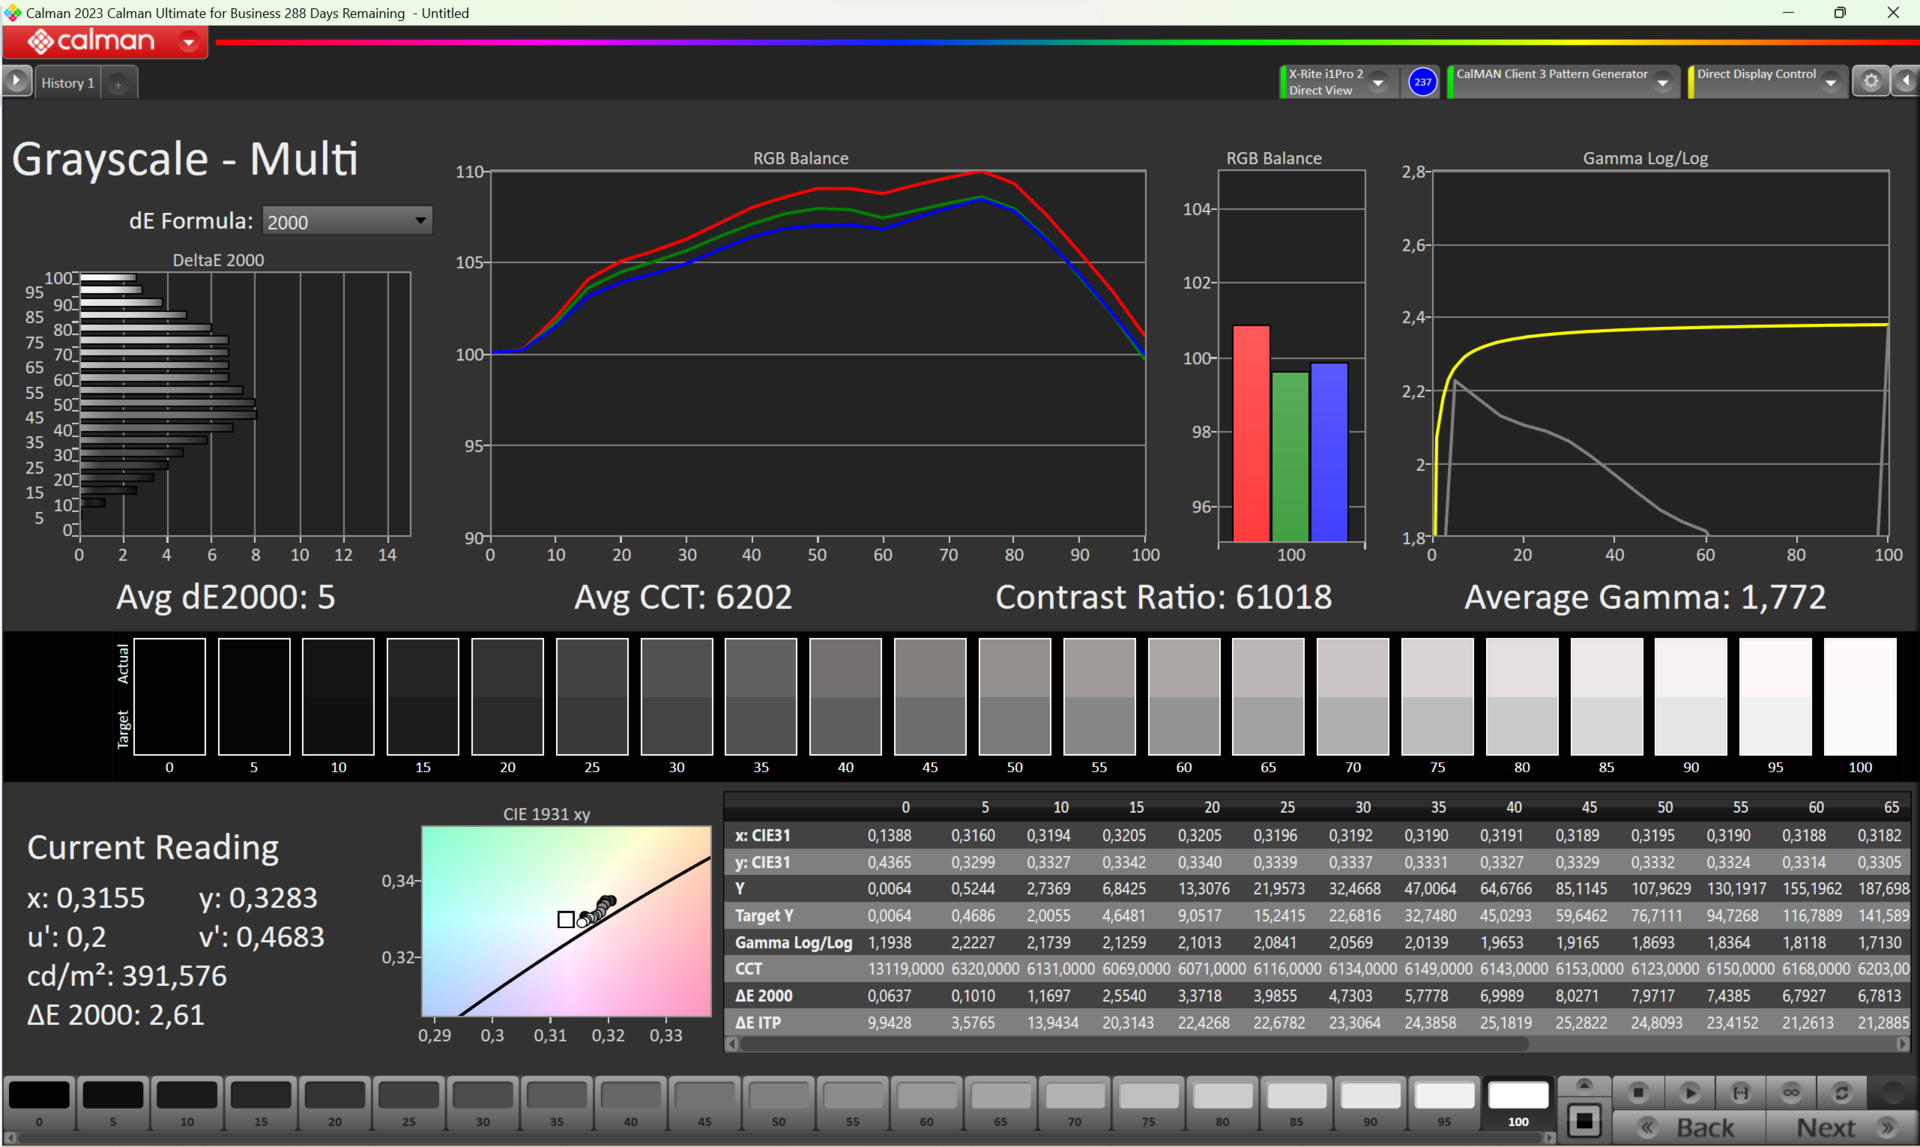
The Acer Swift Go Meteor Lake processor model now houses a much brighter OLED panel. It can reach 400 cd/m², and then some, when displaying HDR content. Deep blacks and high contrast levels are standard for this type of display technology. The brightness is even and at a resolution of 2.8K, in a 14-inch (around 36 cm) 16:10 aspect ratio you can hardly see individual pixels with the naked eye. That all ensures we get to enjoy wonderful image quality that can shine both outdoors and under studio lights.

The Swift Go's new AcerSense app offers more display profiles. However, we haven't yet observed any changes to the measured values in the various profiles. As mentioned at the start, Acer is still working on the laptop's final details.

395
cd/m²
390
cd/m²
392
cd/m²
391
cd/m²
388
cd/m²
389
cd/m²
392
cd/m²
388
cd/m²
396
cd/m²
Distribution of brightness
ATNA40YK11-0 tested with X-Rite i1Pro 2
Maximum: 396 cd/m² (Nits) Average: 391.2 cd/m² Minimum: 20.7 cd/m²
Brightness Distribution: 98 %
Center on Battery: 385 cd/m²
Contrast: 9440:1 (Black: 0.0411 cd/m²)
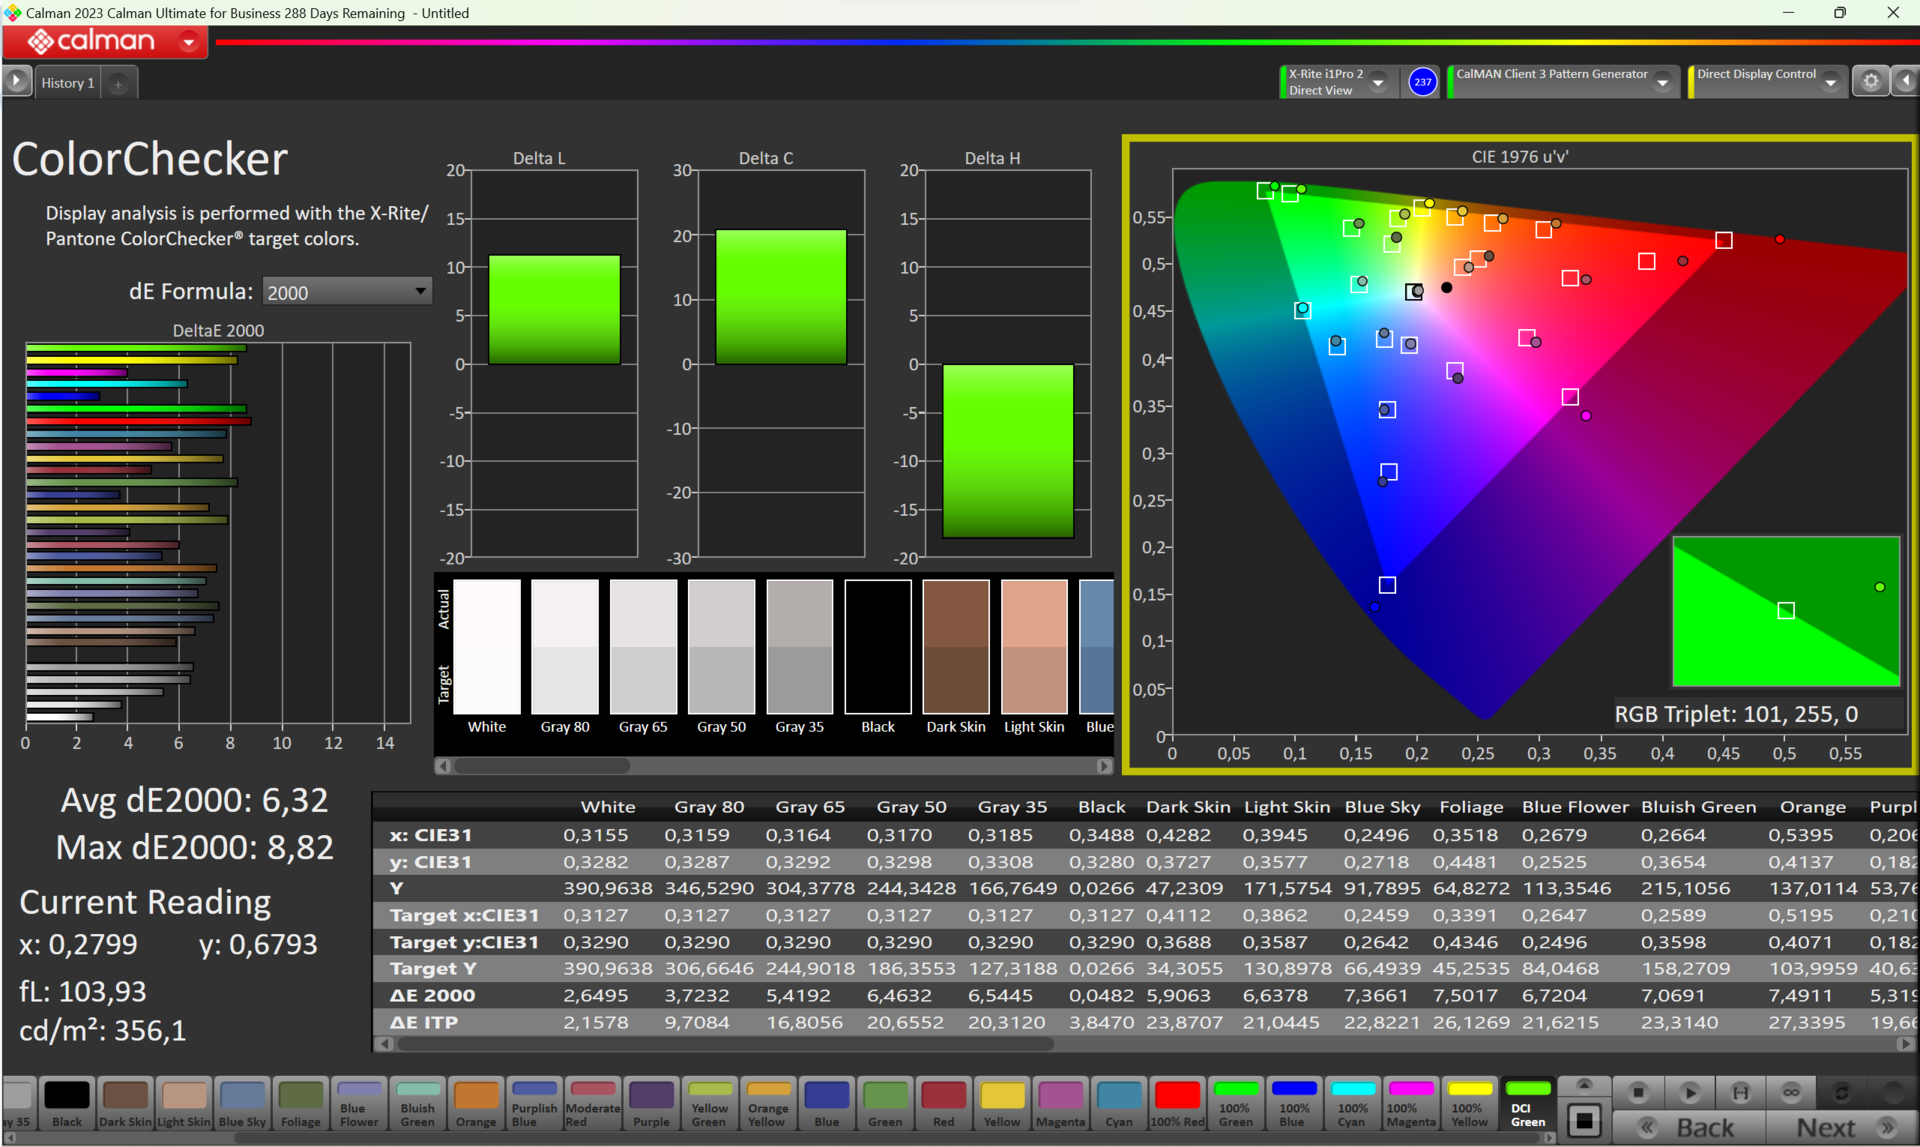
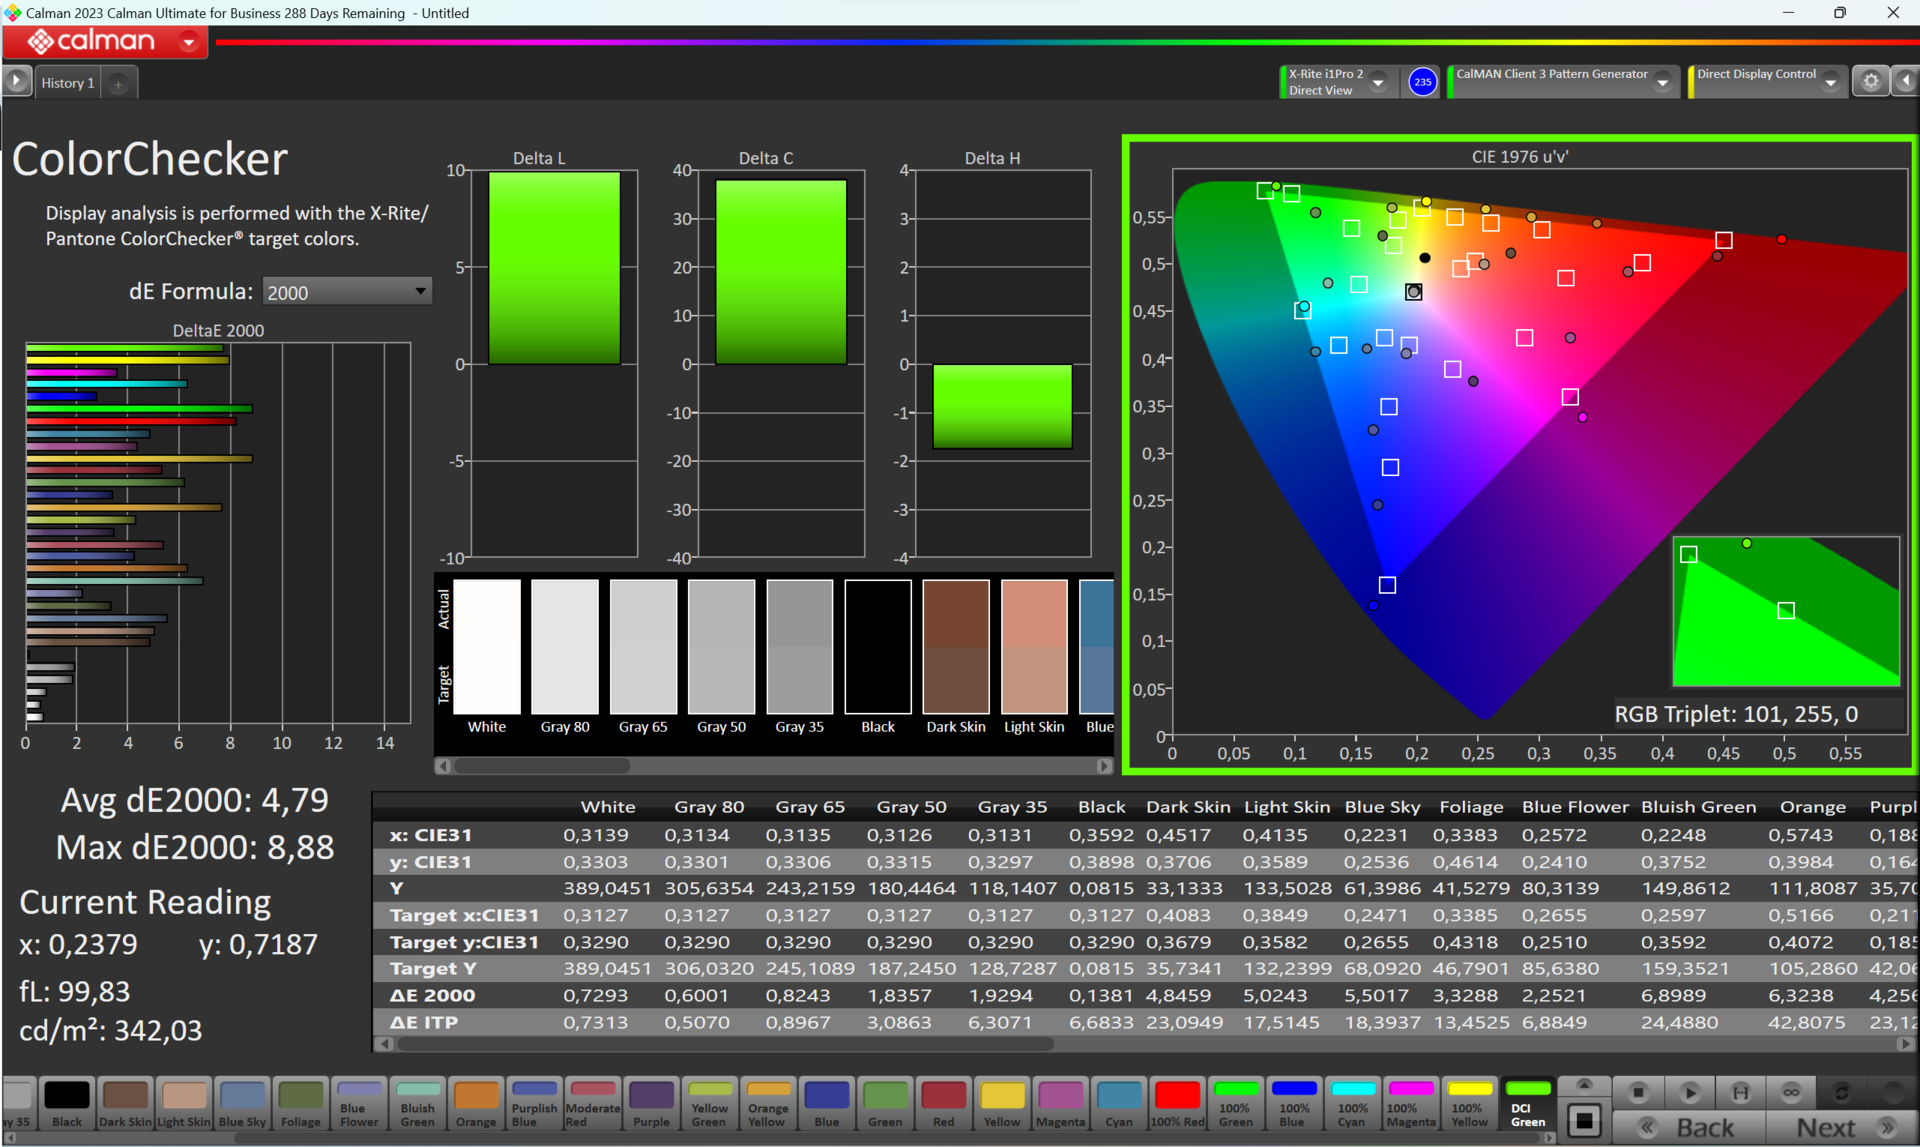
ΔE Color 6.32 | 0.5-29.43 Ø5, calibrated: 4.79
ΔE Greyscale 2.61 | 0.57-98 Ø5.3
98.56% AdobeRGB 1998 (Argyll 2.2.0 3D)
99.99% sRGB (Argyll 2.2.0 3D)
99.75% Display P3 (Argyll 2.2.0 3D)
Gamma: 1.772
Acer Swift Go 14 SFG14-72
ATNA40YK11-0, OLED, 2880x1800, 14.00
LG Gram 2in1 16 16T90R - G.AA78G
LP160WQ1-SPB2, IPS, 2560x1600, 16.00
HP Pavilion Plus 14-ew0153TU
Samsung SDC4197, OLED, 2880x1800, 14.00
Lenovo ThinkPad T14 G4 21K4S02000
MNE007JA1-1, IPS LED, 1920x1200, 14.00
Ayaneo Air 1S Retro Power
Ayaneo-OLED, OLED, 1920x1080, 5.50
HP Pavilion Plus 14-ey0095cl
Samsung SDC4197, OLED, 2880x1800, 14.00
Display
-6%
-3%
-22%
0%
-1%
Display P3 Coverage
99.75
96.5
-3%
97.9
-2%
67.1
-33%
99.85
0%
99.8
0%
sRGB Coverage
99.99
99.9
0%
99.6
0%
97.8
-2%
100
0%
100
0%
AdobeRGB 1998 Coverage
98.56
84.6
-14%
92.1
-7%
69.4
-30%
99.71
1%
95.8
-3%
Response Times
-856%
-141%
-871%
-20%
75%
Response Time Grey 50% / Grey 80% *
2.2 ?(1, 1.2)
38.4 ?(18.6, 19.8)
-1645%
10.8 ?(9.4, 1.4)
-391%
38.4 ?(18, 20.4)
-1645%
4.4 ?(2.6, 1.8)
-100%
0.82 ?(0.43, 0.39)
63%
Response Time Black / White *
12.8 ?(11.8, 1)
21.4 ?(9.8, 11.6)
-67%
9.29 ?(8.79, 0.5)
27%
25.1 ?(11.5, 13.6)
-96%
5 ?(2.5, 2.5)
61%
0.95 ?(0.44, 0.51)
93%
PWM Frequency
300
120 ?(100)
-60%
240 ?(300)
-20%
504.7 ?(100)
68%
Screen
-107%
65%
-32%
-42%
29%
Brightness middle
388
329
-15%
387
0%
398
3%
331
-15%
384
-1%
Brightness
391
310
-21%
387
-1%
379
-3%
339
-13%
386
-1%
Brightness Distribution
98
88
-10%
97
-1%
90
-8%
90
-8%
98
0%
Black Level *
0.0411
0.39
-849%
0.01
76%
0.23
-460%
0.07
-70%
Contrast
9440
844
-91%
38700
310%
1730
-82%
4729
-50%
Colorchecker dE 2000 *
6.32
3.52
44%
2.03
68%
1.3
79%
4.76
25%
4.06
36%
Colorchecker dE 2000 max. *
8.82
6.96
21%
3.86
56%
3.1
65%
9.2
-4%
6.73
24%
Colorchecker dE 2000 calibrated *
4.79
1.15
76%
1.6
67%
1.2
75%
5.04
-5%
0.49
90%
Greyscale dE 2000 *
2.61
5.75
-120%
2.3
12%
1.4
46%
8.79
-237%
1.1
58%
Gamma
1.772 124%
2.137 103%
2.23 99%
2.26 97%
2.155 102%
2.26 97%
CCT
6202 105%
7584 86%
6523 100%
6448 101%
7571 86%
6331 103%
Total Average (Program / Settings)
-323% / -192%
-26% / 10%
-308% / -149%
-21% / -29%
34% / 33%

* ... smaller is better

90 % brightness
90 % brightness
80 % brightness
80 % brightness
70 % brightness
70 % brightness
60 % brightness
60 % brightness
50 % brightness
50 % brightness
40 % brightness
40 % brightness
30 % brightness
30 % brightness
20 % brightness
20 % brightness
10 % brightness
10 % brightness
0 % brightness
0 % brightness

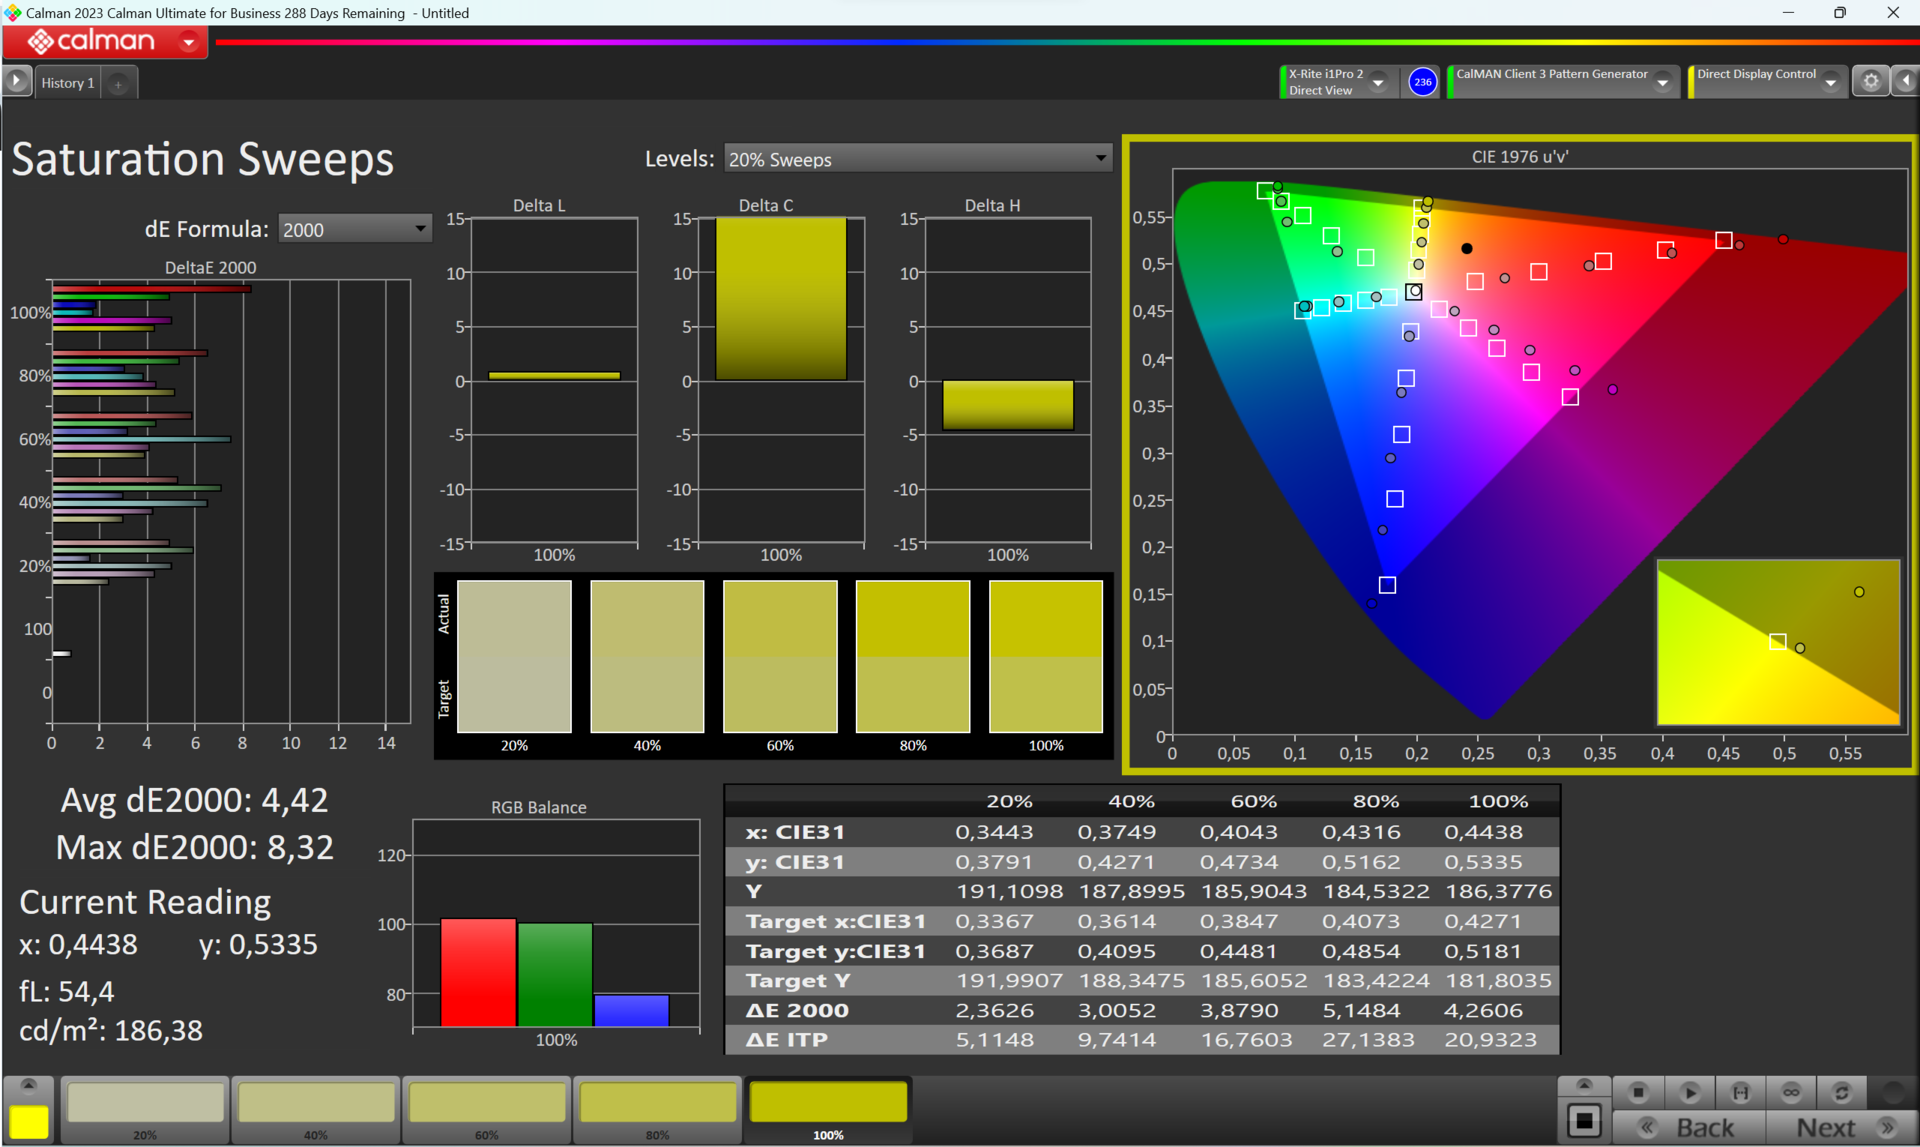
All three color spaces are almost completely covered by the excellent OLED. Only the Adobe RGB color space falls 3 % short of perfection.

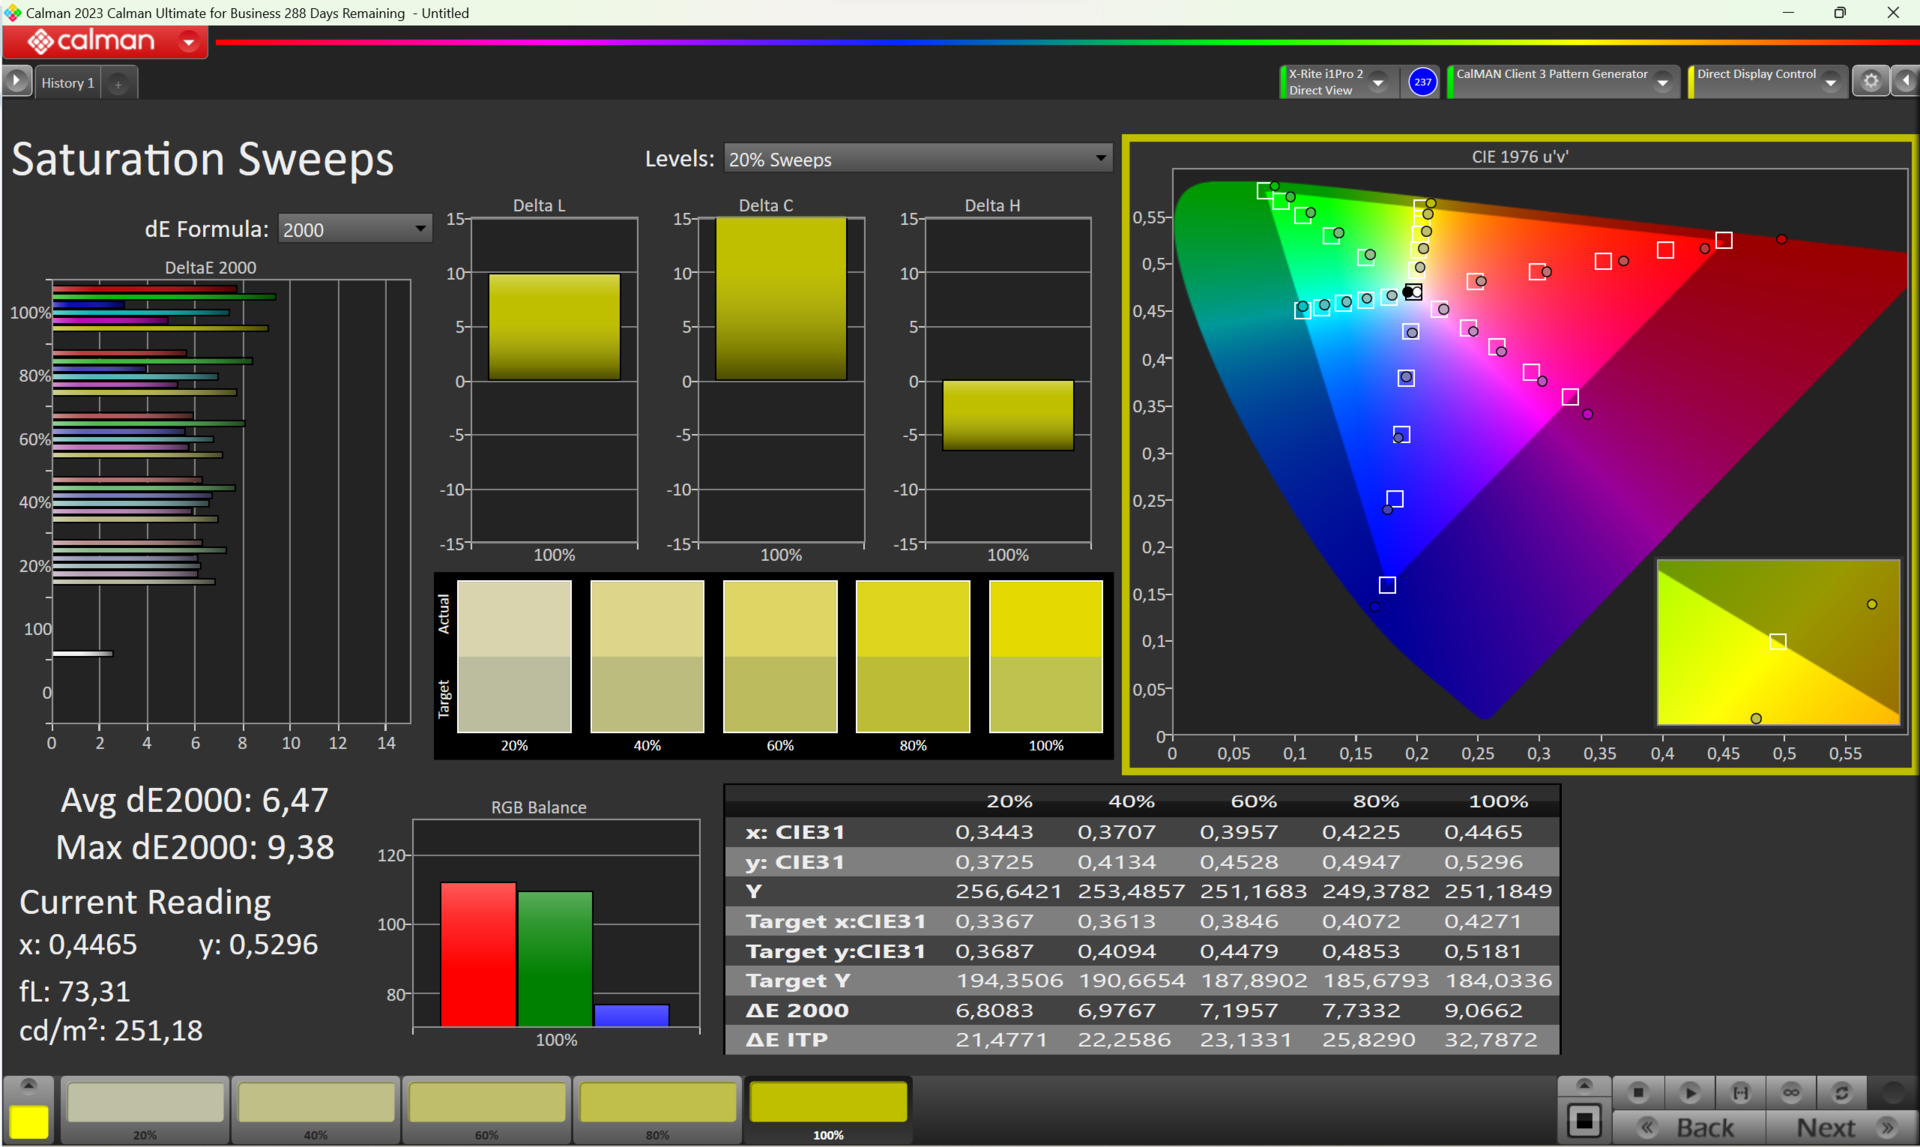
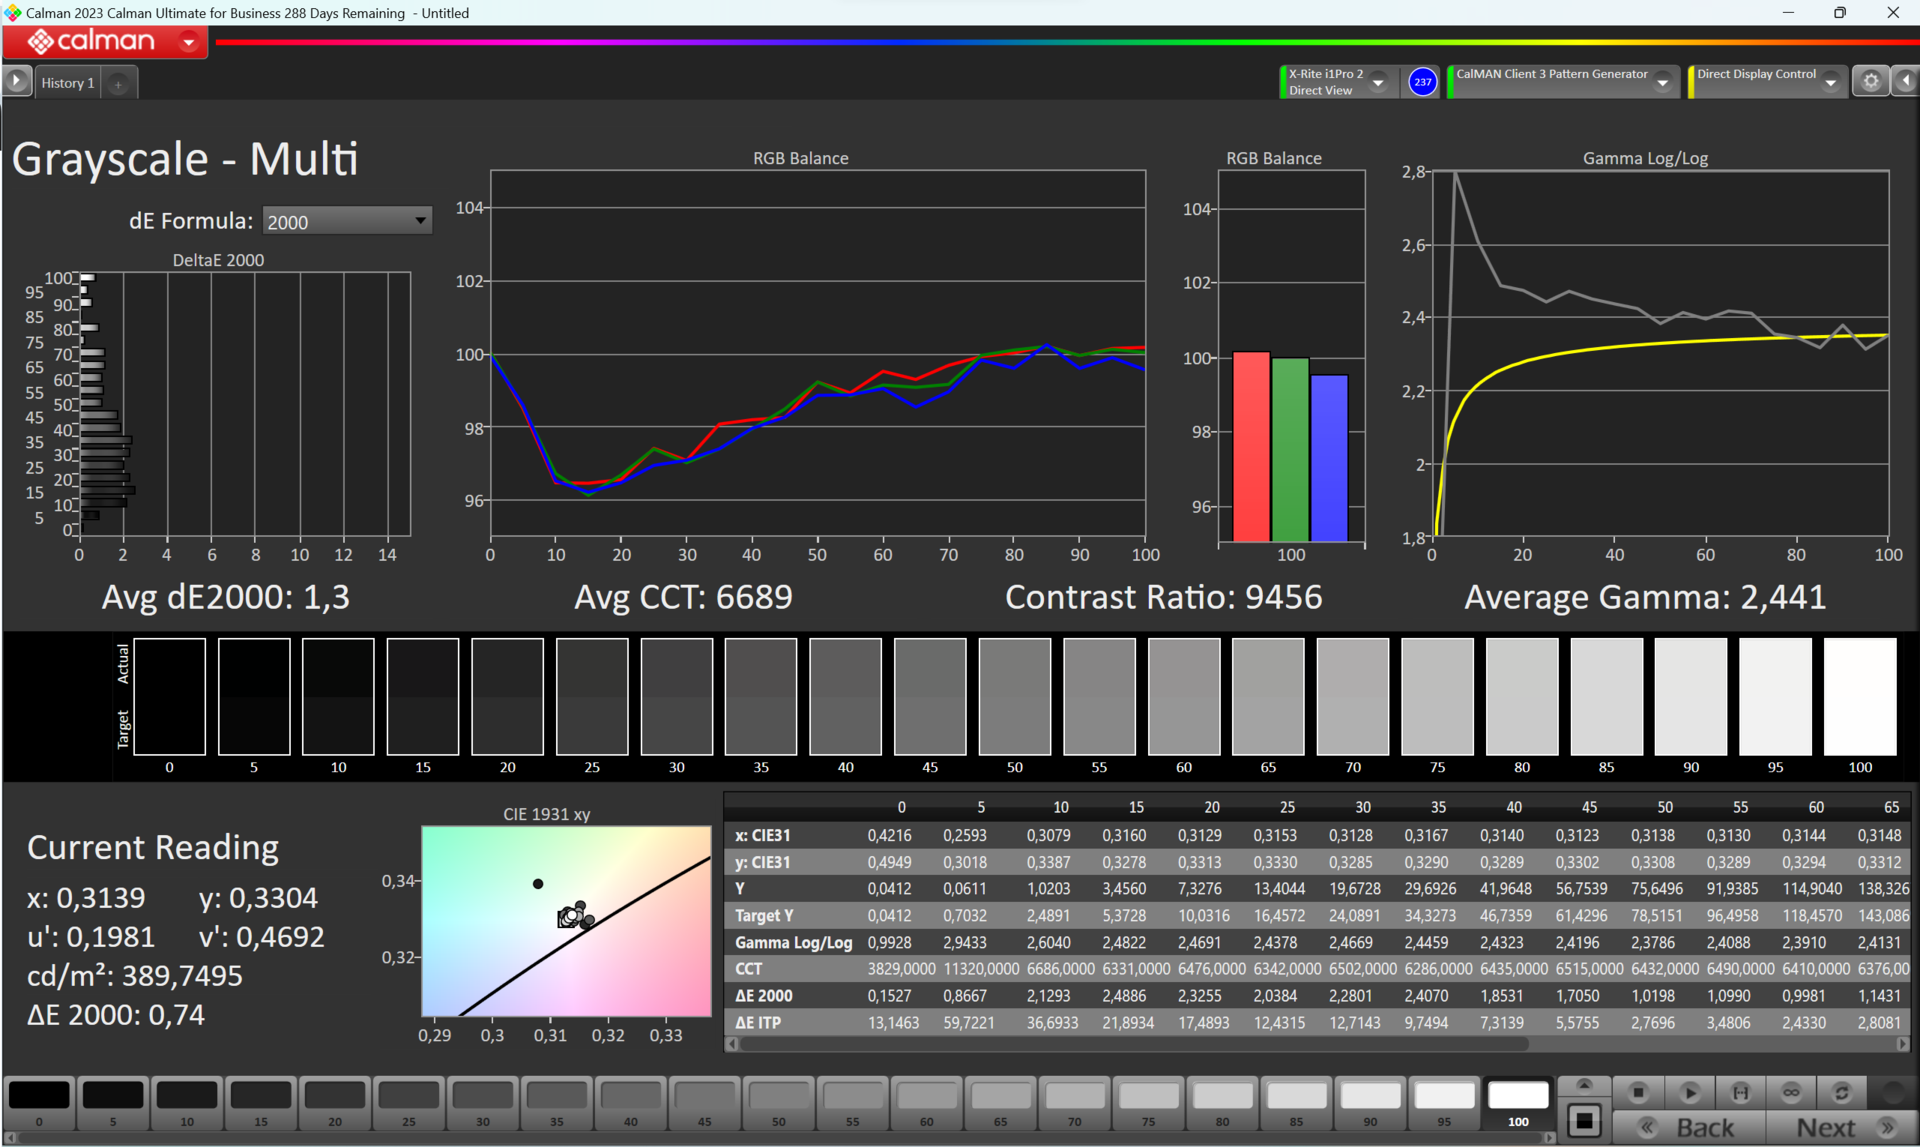
Up to now, the various display profiles have shown no improvements to the measured color deviations which, in their current state, are still very high. For example, in the Adobe RGB color space, our own ICC profile delivers small improvements to color reproduction. We can also assume that Acer will make improvements to this area in the finished software.

Calman ColorChecker uncalibrated
Calman saturation uncalibrated
Calman gray scales uncalibrated
Calman ColorChecker calibrated
Calman saturation calibrated
Calman gray scales calibrated

Display Response Times

Display response times show how fast the screen is able to change from one color to the next. Slow response times can lead to afterimages and can cause moving objects to appear blurry (ghosting). Gamers of fast-paced 3D titles should pay special attention to fast response times.
       Response Time Black to White
12.8 ms ... rise ↗ and fall ↘ combined↗ 11.8 ms rise
↘ 1 ms fall
The screen shows good response rates in our tests, but may be too slow for competitive gamers.
In comparison, all tested devices range from 0.1 (minimum) to 240 (maximum) ms. » 28 % of all devices are better.
This means that the measured response time is better than the average of all tested devices (21.5 ms).
       Response Time 50% Grey to 80% Grey
2.2 ms ... rise ↗ and fall ↘ combined↗ 1 ms rise
↘ 1.2 ms fall
The screen shows very fast response rates in our tests and should be very well suited for fast-paced gaming.
In comparison, all tested devices range from 0.2 (minimum) to 636 (maximum) ms. » 6 % of all devices are better.
This means that the measured response time is better than the average of all tested devices (33.7 ms).

Screen Flickering / PWM (Pulse-Width Modulation)

To dim the screen, some notebooks will simply cycle the backlight on and off in rapid succession - a method called Pulse Width Modulation (PWM) . This cycling frequency should ideally be undetectable to the human eye. If said frequency is too low, users with sensitive eyes may experience strain or headaches or even notice the flickering altogether.
Screen flickering / PWM detected 300 Hz

The display backlight flickers at 300 Hz (worst case, e.g., utilizing PWM) .

The frequency of 300 Hz is relatively high, so most users sensitive to PWM should not notice any flickering. However, there are reports that some users are still sensitive to PWM at 500 Hz and above, so be aware.

In comparison: 53 % of all tested devices do not use PWM to dim the display. If PWM was detected, an average of 17900 (minimum: 5 - maximum: 3846000) Hz was measured.

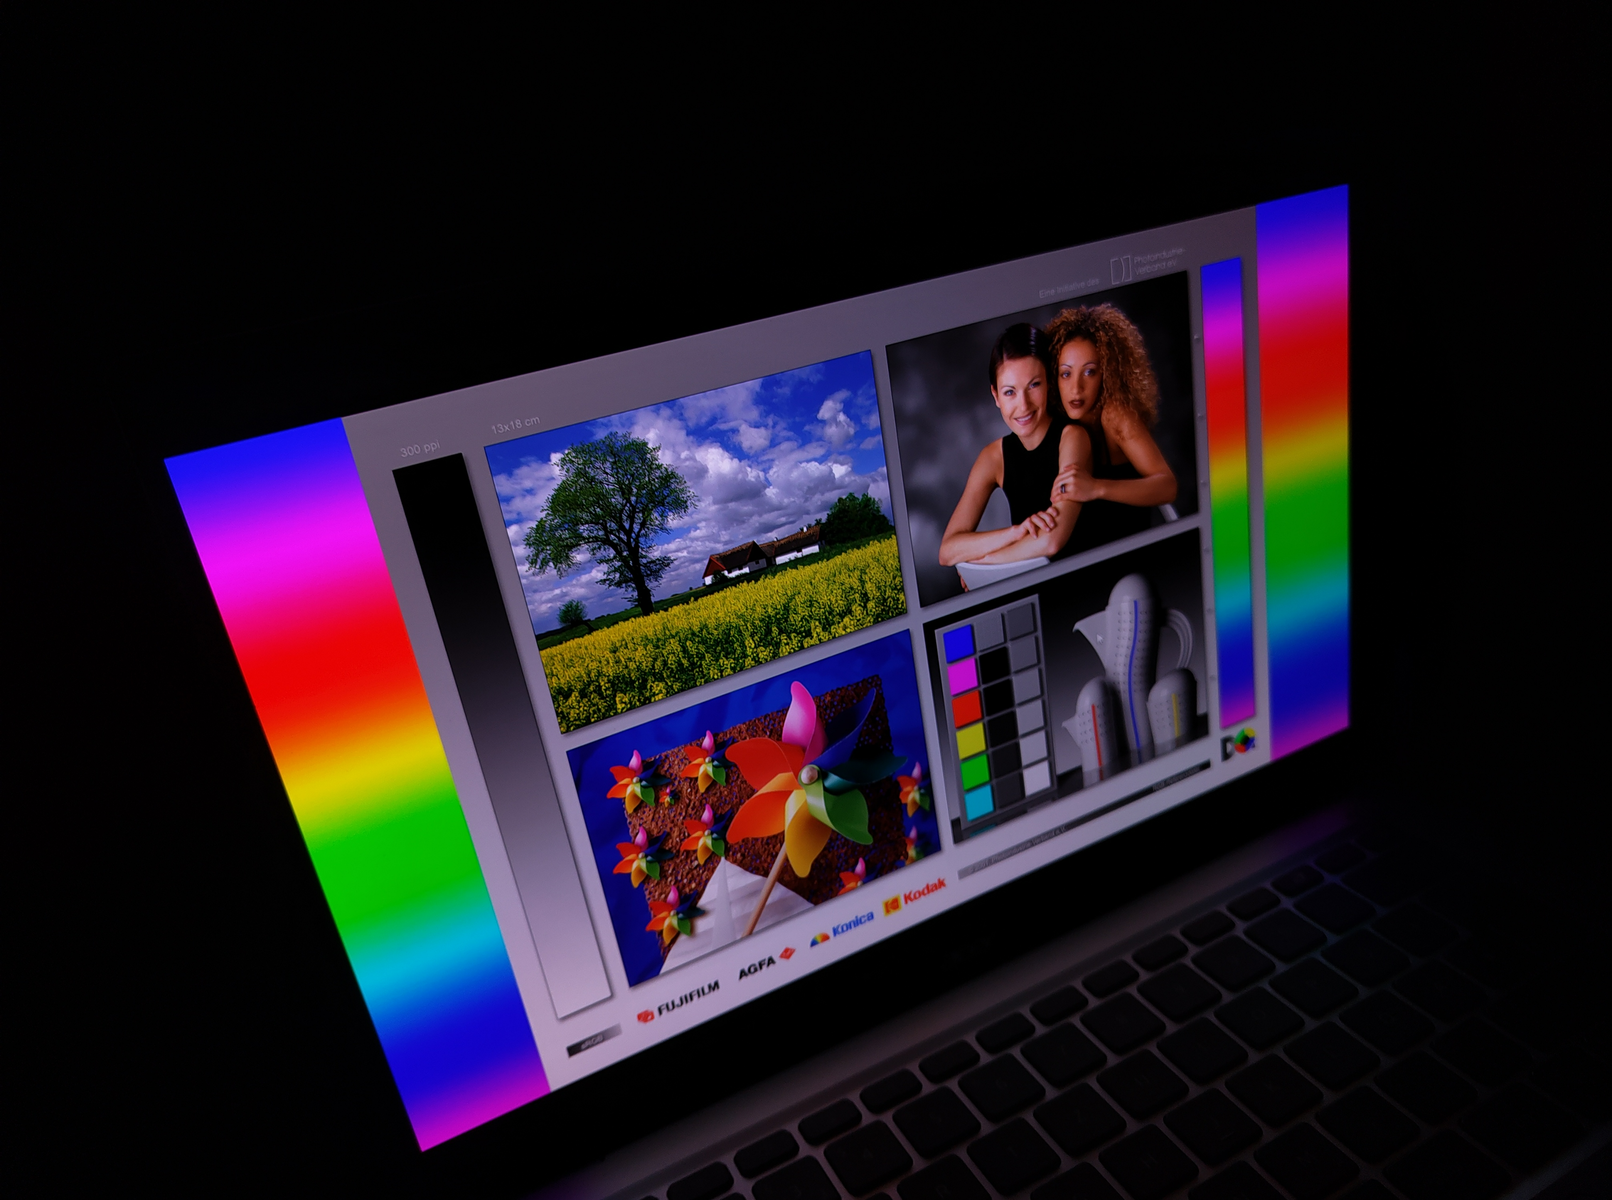
Thanks to its high brightness, the Acer Swift Go performs well in outdoor situations despite possessing a glossy display. The viewing angle analysis also didn't reveal any abnormalities.

Performance - Meteor Lake transforms the Swift Go into a small gaming machine

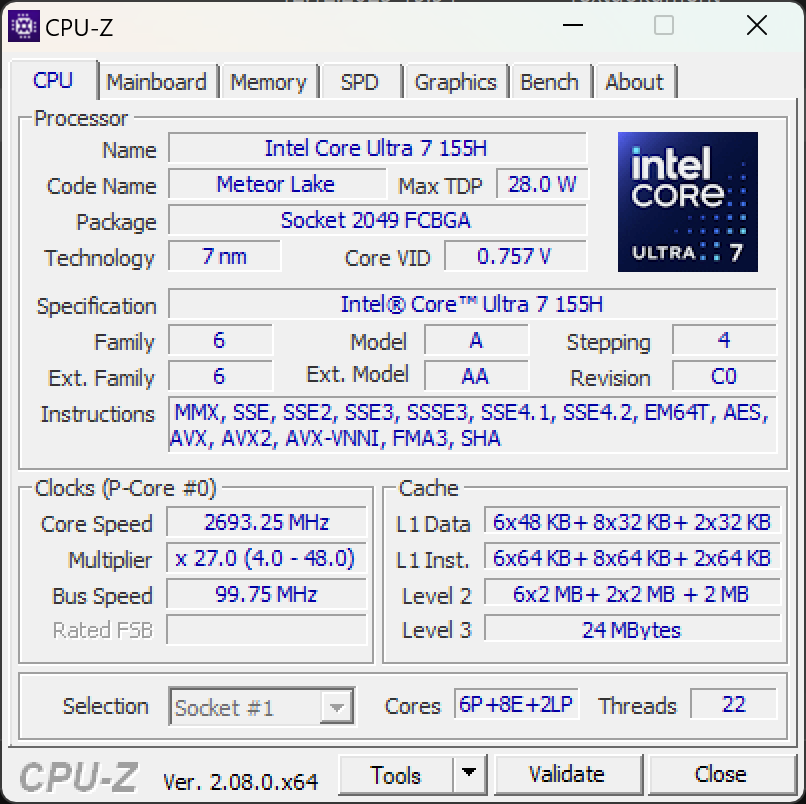
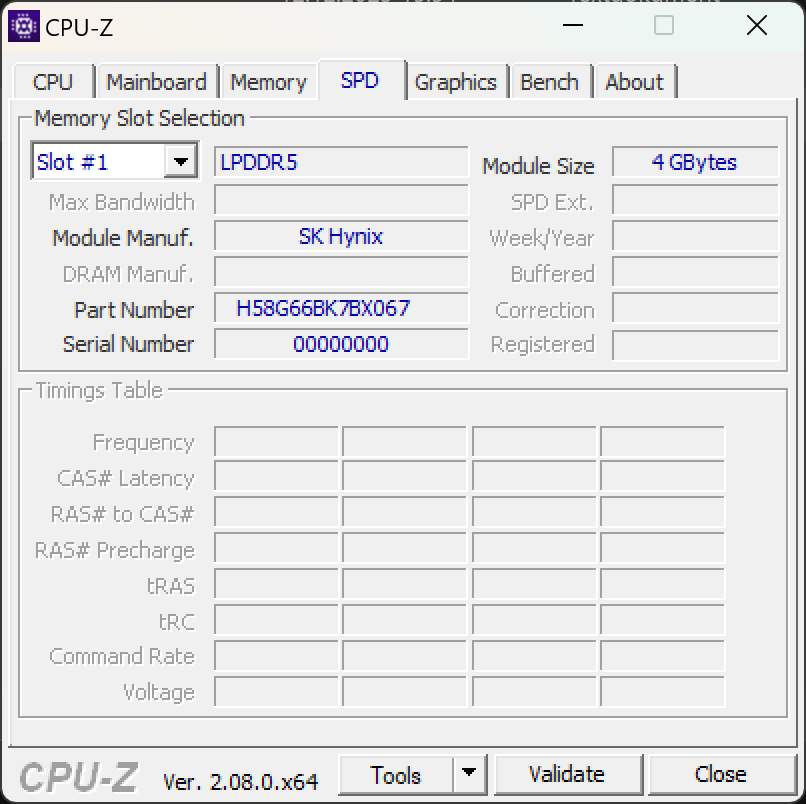
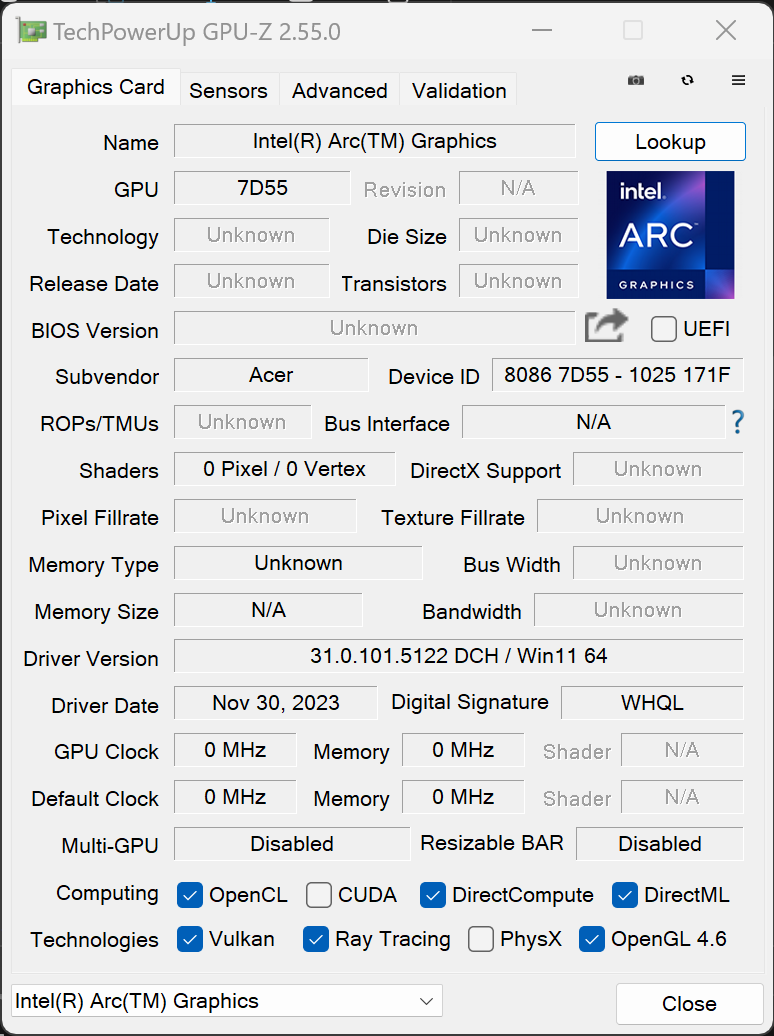
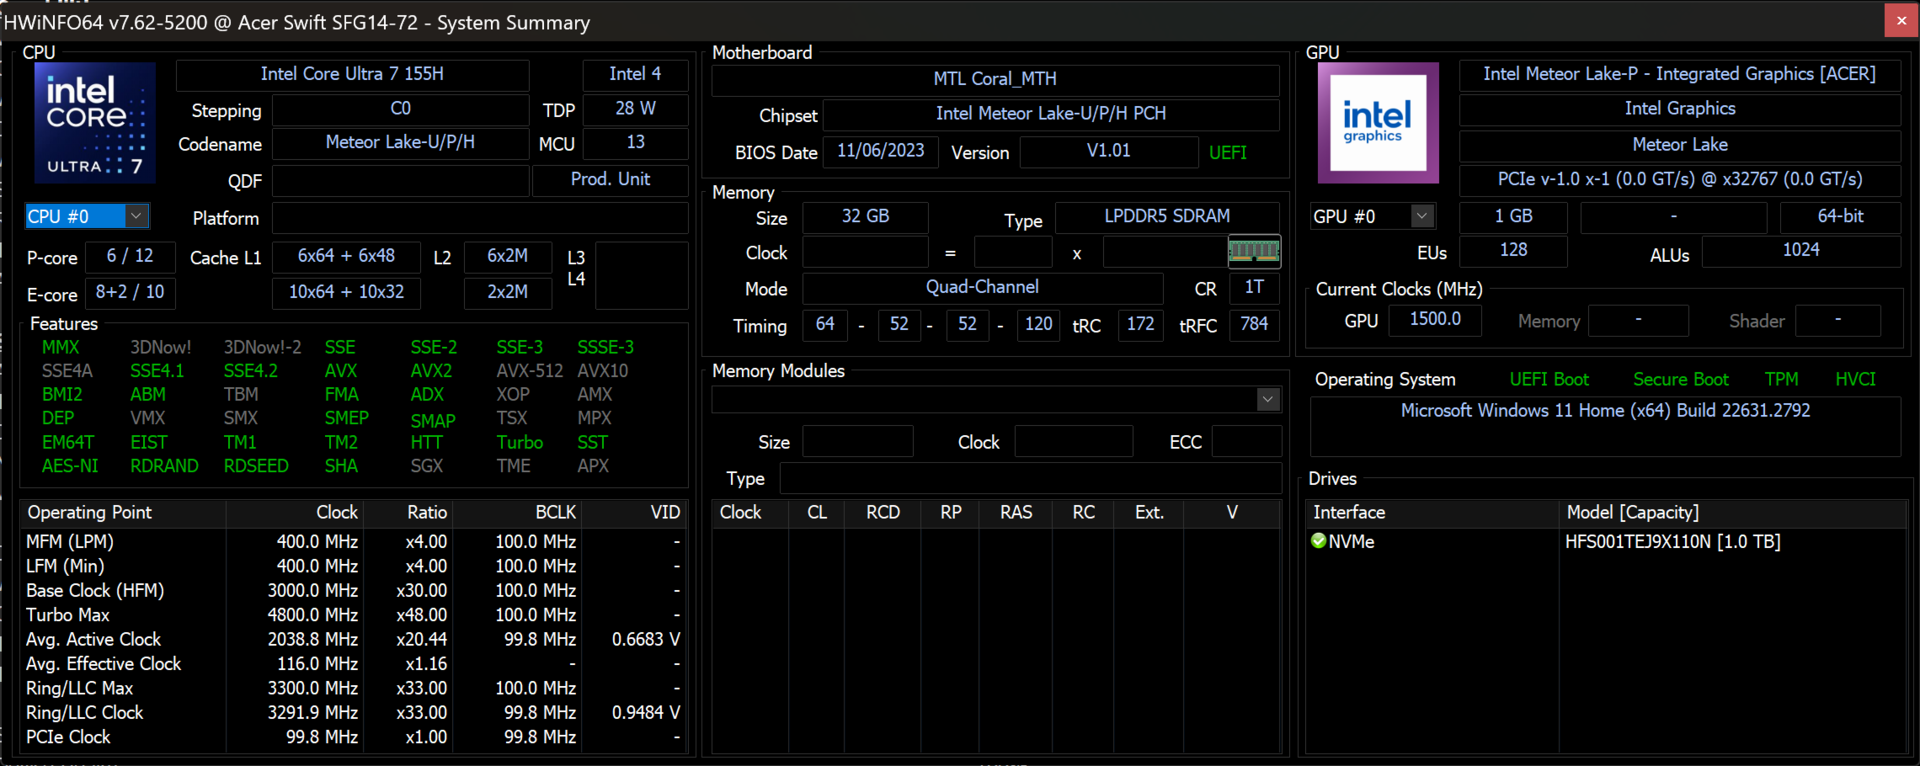
The new Acer Swift Go 14 offers an Intel Meteor Lake processor. For the first time, the Intel Core Ultra 7 155H is also home to an Arc iGPU with eight cores and an NPU. The device is rounded off with 32 GB of DDR5 RAM and an SK Hynix 1 TB NVMe SSD.


Test conditions

As mentioned at the beginning, the Acer Swift Go 14 we are dealing with is a device that corresponds to the standard spec hardware. Our review machine's software and firmware aren't yet quite perfected. For example, in our Swift Go 14, the values for the boost performance were initially configured somewhat too high. In the course of the test, we also had problems with the preinstalled AlterView which creates visually enticing 3D backgrounds. After a lively exchange with Acer, we decided to remove the software. We were also able to lower the PL2 to 55 watts while leaving the PL1 at 45 watts, all with the aid of TechPowerUp's Throttle Stop. This helped the laptop run considerably better and more stable. Acer will undertake some significantly more detailed fine-tuning when it comes the final performance management. This should result in the laptop enjoying better performance than it currently does. 
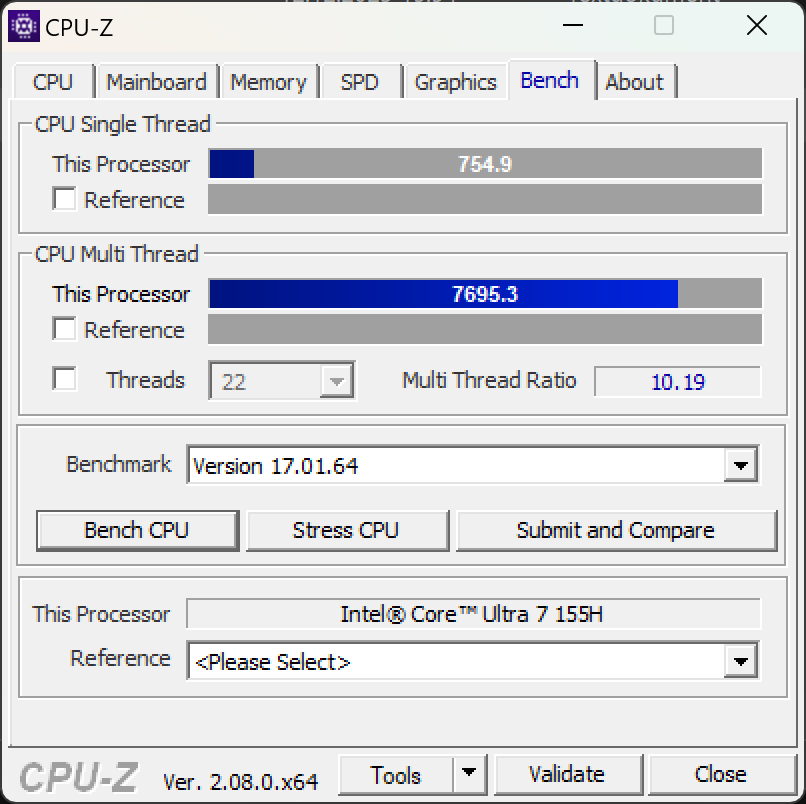
Processor

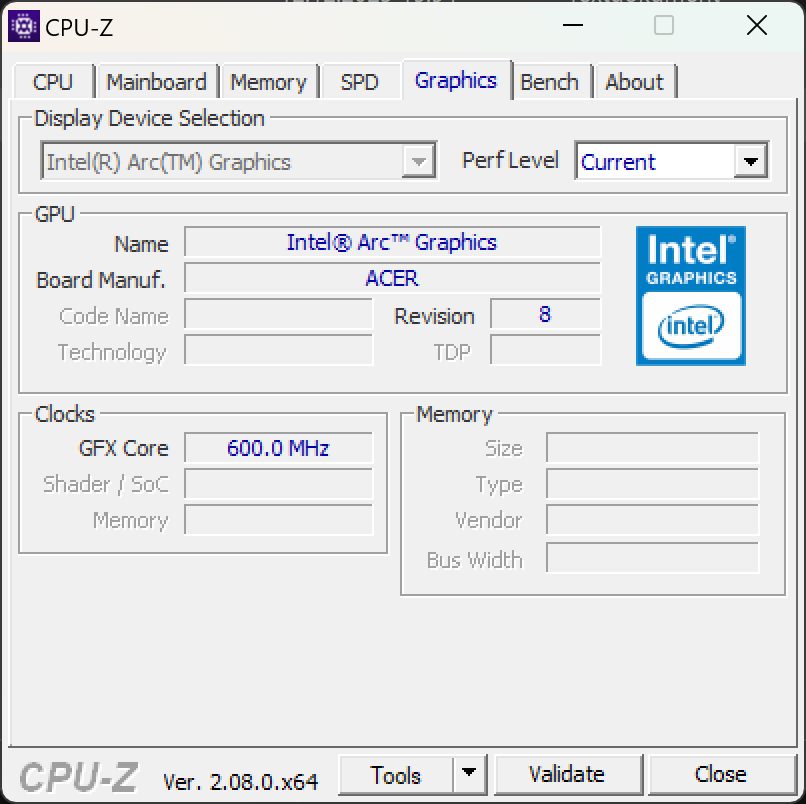
Intel's new processor brings with it some long-awaited changes. For the first time, the 7 nm manufacturing process chip now offers an NPU and the new Arc iGPU. The Core Ultra 7 155H houses six P-cores, eight E-cores and two additional LP E-cores which are said to be particularly energy efficient. This means a total of 22 threads are available.

The latest Intel processor generation doesn't enjoy a clear performance advantage over its most similar 13th-generation predecessor. Here we are dealing with two devices with the Intel Core i7-13700H. Likewise, it offers six P and eight E-cores. Only both low-power E-cores are missing. Intel's newest processor usually fares well compared to its direct competitor, the AMD Ryzen 7 7840U. In recent times (and surprisingly), the red team now has its nose in front when it comes to single-core performance in Cinebench R23. We have already published a detailed analysis of the new processor generation.

Cinebench R15 Multi Continuous Test

0125250375500625750875100011251250137515001625175018752000212522502375Tooltip
Acer Swift Go 14 SFG14-72 Intel Core Ultra 7 155H: Ø2151 (2090.3-2474.79)
Acer Swift Go 14 SFG14-71 Intel Core i5-1335U: Ø1179 (1105.64-1379.98)
LG Gram 2in1 16 16T90R - G.AA78G Intel Core i7-1360P: Ø1547 (1472-2214.1)
HP Pavilion Plus 14-ew0153TU Intel Core i7-1355U: Ø884 (855.52-1252.31)
Lenovo ThinkPad T14 G4 21K4S02000 AMD Ryzen 7 PRO 7840U: Ø1965 (1946.38-2013.69)
Ayaneo Air 1S Retro Power AMD Ryzen 7 7840U: Ø1855 (1830.91-1873.89)
HP Pavilion Plus 14-ey0095cl AMD Ryzen 7 7840U: Ø1746 (1507.22-1962.23)
SCHENKER Vision 14 2023 Intel Core i7-13700H: Ø1949 (1907.49-1999.5)
CPU Performance Rating: Percent
Cinebench R23: Multi Core | Single Core
Cinebench R20: CPU (Multi Core) | CPU (Single Core)
Cinebench R15: CPU Multi 64Bit | CPU Single 64Bit
Blender: v2.79 BMW27 CPU
7-Zip 18.03: 7z b 4 | 7z b 4 -mmt1
Geekbench 5.5: Multi-Core | Single-Core
HWBOT x265 Benchmark v2.2: 4k Preset
LibreOffice : 20 Documents To PDF
R Benchmark 2.5: Overall mean
CPU Performance Rating
Average Intel Core Ultra 7 155H
 
82.3 pt
Acer Swift Go 14 SFG14-72
Intel Core Ultra 7 155H
80.6 pt
Lenovo ThinkPad T14 G4 21K4S02000
AMD Ryzen 7 PRO 7840U
79.3 pt
HP Pavilion Plus 14-ey0095cl
AMD Ryzen 7 7840U
75.3 pt
Ayaneo Air 1S Retro Power
AMD Ryzen 7 7840U
73.8 pt
LG Gram 2in1 16 16T90R - G.AA78G
Intel Core i7-1360P
68 pt
Average of class Subnotebook
 
65.5 pt
HP Pavilion Plus 14-ew0153TU
Intel Core i7-1355U
57.8 pt
Acer Swift Go 14 SFG14-71
Intel Core i5-1335U
56.7 pt
Cinebench R23 / Multi Core
Acer Swift Go 14 SFG14-72
Intel Core Ultra 7 155H
15043 Points
Average Intel Core Ultra 7 155H
  (9769 - 19007, n=27)
14776 Points -2%
Lenovo ThinkPad T14 G4 21K4S02000
AMD Ryzen 7 PRO 7840U
12929 Points -14%
Ayaneo Air 1S Retro Power
AMD Ryzen 7 7840U
11829 Points -21%
HP Pavilion Plus 14-ey0095cl
AMD Ryzen 7 7840U
11739 (8847.85min - 11739.4max) Points -22%
LG Gram 2in1 16 16T90R - G.AA78G
Intel Core i7-1360P
11676 Points -22%
Average of class Subnotebook
  (2485 - 16201, n=68, last 2 years)
10289 Points -32%
Acer Swift Go 14 SFG14-71
Intel Core i5-1335U
7747 Points -49%
HP Pavilion Plus 14-ew0153TU
Intel Core i7-1355U
6936 Points -54%
Cinebench R23 / Single Core
Acer Swift Go 14 SFG14-72
Intel Core Ultra 7 155H
1779 Points
Lenovo ThinkPad T14 G4 21K4S02000
AMD Ryzen 7 PRO 7840U
1747 Points -2%
HP Pavilion Plus 14-ew0153TU
Intel Core i7-1355U
1740 Points -2%
Average Intel Core Ultra 7 155H
  (1496 - 1801, n=27)
1725 Points -3%
Ayaneo Air 1S Retro Power
AMD Ryzen 7 7840U
1721 Points -3%
LG Gram 2in1 16 16T90R - G.AA78G
Intel Core i7-1360P
1705 Points -4%
HP Pavilion Plus 14-ey0095cl
AMD Ryzen 7 7840U
1644 Points -8%
Average of class Subnotebook
  (598 - 1934, n=68, last 2 years)
1627 Points -9%
Acer Swift Go 14 SFG14-71
Intel Core i5-1335U
1532 Points -14%
Cinebench R20 / CPU (Multi Core)
Average Intel Core Ultra 7 155H
  (3798 - 7409, n=25)
5757 Points +11%
Acer Swift Go 14 SFG14-72
Intel Core Ultra 7 155H
5169 Points
Lenovo ThinkPad T14 G4 21K4S02000
AMD Ryzen 7 PRO 7840U
4970 Points -4%
Ayaneo Air 1S Retro Power
AMD Ryzen 7 7840U
4722 Points -9%
LG Gram 2in1 16 16T90R - G.AA78G
Intel Core i7-1360P
4506 Points -13%
HP Pavilion Plus 14-ey0095cl
AMD Ryzen 7 7840U
4469 Points -14%
Average of class Subnotebook
  (810 - 6314, n=64, last 2 years)
3963 Points -23%
HP Pavilion Plus 14-ew0153TU
Intel Core i7-1355U
2972 Points -43%
Acer Swift Go 14 SFG14-71
Intel Core i5-1335U
2899 Points -44%
Cinebench R20 / CPU (Single Core)
Lenovo ThinkPad T14 G4 21K4S02000
AMD Ryzen 7 PRO 7840U
684 Points +1%
Acer Swift Go 14 SFG14-72
Intel Core Ultra 7 155H
678 Points
Ayaneo Air 1S Retro Power
AMD Ryzen 7 7840U
669 Points -1%
Average Intel Core Ultra 7 155H
  (620 - 693, n=25)
667 Points -2%
HP Pavilion Plus 14-ew0153TU
Intel Core i7-1355U
660 Points -3%
LG Gram 2in1 16 16T90R - G.AA78G
Intel Core i7-1360P
658 Points -3%
HP Pavilion Plus 14-ey0095cl
AMD Ryzen 7 7840U
655 Points -3%
Average of class Subnotebook
  (216 - 738, n=64, last 2 years)
610 Points -10%
Acer Swift Go 14 SFG14-71
Intel Core i5-1335U
593 Points -13%
Cinebench R15 / CPU Multi 64Bit
Acer Swift Go 14 SFG14-72
Intel Core Ultra 7 155H
2475 (2090.3min - 2474.79max) Points
Average Intel Core Ultra 7 155H
  (1988 - 2858, n=29)
2461 Points -1%
LG Gram 2in1 16 16T90R - G.AA78G
Intel Core i7-1360P
2214 (1472min - 2214.1max) Points -11%
Lenovo ThinkPad T14 G4 21K4S02000
AMD Ryzen 7 PRO 7840U
2014 (1946.38min - 2013.69max) Points -19%
HP Pavilion Plus 14-ey0095cl
AMD Ryzen 7 7840U
1962 (1507.22min - 1962.23max) Points -21%
Ayaneo Air 1S Retro Power
AMD Ryzen 7 7840U
1874 (1830.91min - 1873.89max) Points -24%
Average of class Subnotebook
  (514 - 2581, n=70, last 2 years)
1757 Points -29%
Acer Swift Go 14 SFG14-71
Intel Core i5-1335U
1380 Points -44%
HP Pavilion Plus 14-ew0153TU
Intel Core i7-1355U
1252 (855.52min - 1252.31max) Points -49%
Cinebench R15 / CPU Single 64Bit
Lenovo ThinkPad T14 G4 21K4S02000
AMD Ryzen 7 PRO 7840U
273 Points +7%
HP Pavilion Plus 14-ey0095cl
AMD Ryzen 7 7840U
266 Points +4%
Ayaneo Air 1S Retro Power
AMD Ryzen 7 7840U
264 Points +4%
Acer Swift Go 14 SFG14-72
Intel Core Ultra 7 155H
255 Points
Average Intel Core Ultra 7 155H
  (230 - 268, n=26)
254 Points 0%
LG Gram 2in1 16 16T90R - G.AA78G
Intel Core i7-1360P
244 Points -4%
HP Pavilion Plus 14-ew0153TU
Intel Core i7-1355U
240 Points -6%
Average of class Subnotebook
  (91.8 - 280, n=62, last 2 years)
237 Points -7%
Acer Swift Go 14 SFG14-71
Intel Core i5-1335U
236 Points -7%
Blender / v2.79 BMW27 CPU
HP Pavilion Plus 14-ew0153TU
Intel Core i7-1355U
502 Seconds * -123%
Acer Swift Go 14 SFG14-71
Intel Core i5-1335U
404 Seconds * -80%
Average of class Subnotebook
  (201 - 1600, n=66, last 2 years)
386 Seconds * -72%
LG Gram 2in1 16 16T90R - G.AA78G
Intel Core i7-1360P
324 Seconds * -44%
HP Pavilion Plus 14-ey0095cl
AMD Ryzen 7 7840U
266 Seconds * -18%
Ayaneo Air 1S Retro Power
AMD Ryzen 7 7840U
262 Seconds * -16%
Lenovo ThinkPad T14 G4 21K4S02000
AMD Ryzen 7 PRO 7840U
248 Seconds * -10%
Average Intel Core Ultra 7 155H
  (178 - 349, n=23)
236 Seconds * -5%
Acer Swift Go 14 SFG14-72
Intel Core Ultra 7 155H
225 Seconds *
7-Zip 18.03 / 7z b 4
Acer Swift Go 14 SFG14-72
Intel Core Ultra 7 155H
59660 MIPS
Average Intel Core Ultra 7 155H
  (42601 - 70074, n=25)
58689 MIPS -2%
Lenovo ThinkPad T14 G4 21K4S02000
AMD Ryzen 7 PRO 7840U
57056 MIPS -4%
Ayaneo Air 1S Retro Power
AMD Ryzen 7 7840U
53198 MIPS -11%
HP Pavilion Plus 14-ey0095cl
AMD Ryzen 7 7840U
52555 MIPS -12%
Average of class Subnotebook
  (16223 - 67444, n=57, last 2 years)
44459 MIPS -25%
LG Gram 2in1 16 16T90R - G.AA78G
Intel Core i7-1360P
42886 MIPS -28%
Acer Swift Go 14 SFG14-71
Intel Core i5-1335U
34186 MIPS -43%
HP Pavilion Plus 14-ew0153TU
Intel Core i7-1355U
30592 MIPS -49%
7-Zip 18.03 / 7z b 4 -mmt1
HP Pavilion Plus 14-ey0095cl
AMD Ryzen 7 7840U
6110 MIPS +19%
Lenovo ThinkPad T14 G4 21K4S02000
AMD Ryzen 7 PRO 7840U
5988 MIPS +16%
Ayaneo Air 1S Retro Power
AMD Ryzen 7 7840U
5782 MIPS +12%
HP Pavilion Plus 14-ew0153TU
Intel Core i7-1355U
5513 MIPS +7%
Average Intel Core Ultra 7 155H
  (5037 - 5540, n=25)
5348 MIPS +4%
Average of class Subnotebook
  (2197 - 6403, n=58, last 2 years)
5328 MIPS +3%
Acer Swift Go 14 SFG14-72
Intel Core Ultra 7 155H
5156 MIPS
Acer Swift Go 14 SFG14-71
Intel Core i5-1335U
5093 MIPS -1%
LG Gram 2in1 16 16T90R - G.AA78G
Intel Core i7-1360P
4651 MIPS -10%
Geekbench 5.5 / Multi-Core
Average Intel Core Ultra 7 155H
  (10017 - 13556, n=27)
12179 Points +3%
Acer Swift Go 14 SFG14-72
Intel Core Ultra 7 155H
11781 Points
LG Gram 2in1 16 16T90R - G.AA78G
Intel Core i7-1360P
10450 Points -11%
Lenovo ThinkPad T14 G4 21K4S02000
AMD Ryzen 7 PRO 7840U
9663 Points -18%
HP Pavilion Plus 14-ey0095cl
AMD Ryzen 7 7840U
9248 Points -22%
Average of class Subnotebook
  (4274 - 12580, n=65, last 2 years)
9084 Points -23%
HP Pavilion Plus 14-ew0153TU
Intel Core i7-1355U
7776 Points -34%
Acer Swift Go 14 SFG14-71
Intel Core i5-1335U
7675 Points -35%
Ayaneo Air 1S Retro Power
AMD Ryzen 7 7840U
7399 Points -37%
Geekbench 5.5 / Single-Core
Lenovo ThinkPad T14 G4 21K4S02000
AMD Ryzen 7 PRO 7840U
1881 Points +10%
HP Pavilion Plus 14-ey0095cl
AMD Ryzen 7 7840U
1857 Points +8%
HP Pavilion Plus 14-ew0153TU
Intel Core i7-1355U
1822 Points +6%
Average Intel Core Ultra 7 155H
  (1689 - 1824, n=27)
1762 Points +3%
Acer Swift Go 14 SFG14-72
Intel Core Ultra 7 155H
1714 Points
Average of class Subnotebook
  (672 - 2350, n=65, last 2 years)
1701 Points -1%
Ayaneo Air 1S Retro Power
AMD Ryzen 7 7840U
1652 Points -4%
LG Gram 2in1 16 16T90R - G.AA78G
Intel Core i7-1360P
1648 Points -4%
Acer Swift Go 14 SFG14-71
Intel Core i5-1335U
1647 Points -4%
HWBOT x265 Benchmark v2.2 / 4k Preset
Average Intel Core Ultra 7 155H
  (9.93 - 21.2, n=25)
16.4 fps +2%
Acer Swift Go 14 SFG14-72
Intel Core Ultra 7 155H
16.1 fps
Lenovo ThinkPad T14 G4 21K4S02000
AMD Ryzen 7 PRO 7840U
15.9 fps -1%
HP Pavilion Plus 14-ey0095cl
AMD Ryzen 7 7840U
15 fps -7%
Ayaneo Air 1S Retro Power
AMD Ryzen 7 7840U
14.6 fps -9%
Average of class Subnotebook
  (1.5 - 19.4, n=56, last 2 years)
11.9 fps -26%
LG Gram 2in1 16 16T90R - G.AA78G
Intel Core i7-1360P
11.2 fps -30%
Acer Swift Go 14 SFG14-71
Intel Core i5-1335U
9.2 fps -43%
HP Pavilion Plus 14-ew0153TU
Intel Core i7-1355U
8.99 fps -44%
LibreOffice / 20 Documents To PDF
Acer Swift Go 14 SFG14-71
Intel Core i5-1335U
57.4 s * -3%
LG Gram 2in1 16 16T90R - G.AA78G
Intel Core i7-1360P
57.2 s * -3%
HP Pavilion Plus 14-ew0153TU
Intel Core i7-1355U
55.7 s * -0%
Acer Swift Go 14 SFG14-72
Intel Core Ultra 7 155H
55.5 s *
Average of class Subnotebook
  (40.1 - 120.5, n=57, last 2 years)
52.6 s * +5%
HP Pavilion Plus 14-ey0095cl
AMD Ryzen 7 7840U
50.9 s * +8%
Ayaneo Air 1S Retro Power
AMD Ryzen 7 7840U
48.1 s * +13%
Average Intel Core Ultra 7 155H
  (40.9 - 58.9, n=25)
47.6 s * +14%
Lenovo ThinkPad T14 G4 21K4S02000
AMD Ryzen 7 PRO 7840U
46.9 s * +15%
R Benchmark 2.5 / Overall mean
LG Gram 2in1 16 16T90R - G.AA78G
Intel Core i7-1360P
0.583 sec * -20%
Acer Swift Go 14 SFG14-71
Intel Core i5-1335U
0.524 sec * -8%
Average of class Subnotebook
  (0.4397 - 1.236, n=57, last 2 years)
0.52 sec * -7%
Acer Swift Go 14 SFG14-72
Intel Core Ultra 7 155H
0.4865 sec *
Average Intel Core Ultra 7 155H
  (0.4609 - 0.516, n=25)
0.4799 sec * +1%
HP Pavilion Plus 14-ew0153TU
Intel Core i7-1355U
0.4777 sec * +2%
Lenovo ThinkPad T14 G4 21K4S02000
AMD Ryzen 7 PRO 7840U
0.4676 sec * +4%
Ayaneo Air 1S Retro Power
AMD Ryzen 7 7840U
0.4651 sec * +4%
HP Pavilion Plus 14-ey0095cl
AMD Ryzen 7 7840U
0.4559 sec * +6%

* ... smaller is better

Cinebench R10 Rendering Single CPUs 64Bit
82102 Points
Cinebench R10 Shading 32Bit
17440
Cinebench R10 Shading 64Bit
18324 Points
Cinebench R10 Rendering Multiple CPUs 64Bit
13726 Points
Cinebench R10 Rendering Multiple CPUs 32Bit
56242
Cinebench R10 Rendering Single 32Bit
9919
Cinebench R11.5 CPU Multi 64Bit
29.98 Points
Cinebench R11.5 OpenGL 64Bit
101.92 fps
Cinebench R11.5 CPU Single 64Bit
3.07 Points
Cinebench R15 CPU Single 64Bit
255 Points
Cinebench R15 Ref. Match 64Bit
97.8 %
Cinebench R15 OpenGL 64Bit
149.1 fps
Cinebench R15 CPU Multi 64Bit
2475 Points
Help
Performance Rating
Lenovo ThinkPad T14 G4 21K4S02000
AMD Ryzen 7 PRO 7840U, Radeon 780M
97.1 pt
HP Pavilion Plus 14-ey0095cl
AMD Ryzen 7 7840U, Radeon 780M
85 pt
Ayaneo Air 1S Retro Power
AMD Ryzen 7 7840U, Radeon 780M
84.4 pt
Acer Swift Go 14 SFG14-72
Intel Core Ultra 7 155H, Arc 8-Cores
78.7 pt
Average Intel Core Ultra 7 155H
 
78 pt
LG Gram 2in1 16 16T90R - G.AA78G
Intel Core i7-1360P, Iris Xe G7 96EUs
64.6 pt
Average of class Subnotebook
 
60.9 pt
Acer Swift Go 14 SFG14-71
Intel Core i5-1335U, Iris Xe G7 80EUs
42 pt
HP Pavilion Plus 14-ew0153TU
Intel Core i7-1355U, Iris Xe G7 96EUs
40.6 pt
AIDA64 / FP32 Ray-Trace
Lenovo ThinkPad T14 G4 21K4S02000
AMD Ryzen 7 PRO 7840U, Radeon 780M
20130 KRay/s +48%
Ayaneo Air 1S Retro Power
AMD Ryzen 7 7840U, Radeon 780M
18736 KRay/s +38%
HP Pavilion Plus 14-ey0095cl
AMD Ryzen 7 7840U, Radeon 780M
18678 KRay/s +38%
Acer Swift Go 14 SFG14-72
Intel Core Ultra 7 155H, Arc 8-Cores
13563 KRay/s
Average Intel Core Ultra 7 155H
  (6670 - 18470, n=25)
13154 KRay/s -3%
Average of class Subnotebook
  (343 - 25961, n=57, last 2 years)
10054 KRay/s -26%
LG Gram 2in1 16 16T90R - G.AA78G
Intel Core i7-1360P, Iris Xe G7 96EUs
9693 KRay/s -29%
LG Gram 2in1 16 16T90R - G.AA78G
Intel Core i7-1360P, Iris Xe G7 96EUs
8619 KRay/s -36%
Acer Swift Go 14 SFG14-71
Intel Core i5-1335U, Iris Xe G7 80EUs
6963 KRay/s -49%
HP Pavilion Plus 14-ew0153TU
Intel Core i7-1355U, Iris Xe G7 96EUs
5673 KRay/s -58%
AIDA64 / FPU Julia
Lenovo ThinkPad T14 G4 21K4S02000
AMD Ryzen 7 PRO 7840U, Radeon 780M
84324 Points +21%
HP Pavilion Plus 14-ey0095cl
AMD Ryzen 7 7840U, Radeon 780M
79716 Points +14%
Ayaneo Air 1S Retro Power
AMD Ryzen 7 7840U, Radeon 780M
78607 Points +13%
Acer Swift Go 14 SFG14-72
Intel Core Ultra 7 155H, Arc 8-Cores
69767 Points
Average Intel Core Ultra 7 155H
  (43630 - 93181, n=25)
69102 Points -1%
Average of class Subnotebook
  (11867 - 111109, n=57, last 2 years)
52488 Points -25%
LG Gram 2in1 16 16T90R - G.AA78G
Intel Core i7-1360P, Iris Xe G7 96EUs
50702 Points -27%
Acer Swift Go 14 SFG14-71
Intel Core i5-1335U, Iris Xe G7 80EUs
32828 Points -53%
HP Pavilion Plus 14-ew0153TU
Intel Core i7-1355U, Iris Xe G7 96EUs
29580 Points -58%
AIDA64 / CPU SHA3
Lenovo ThinkPad T14 G4 21K4S02000
AMD Ryzen 7 PRO 7840U, Radeon 780M
3970 MB/s +22%
Ayaneo Air 1S Retro Power
AMD Ryzen 7 7840U, Radeon 780M
3691 MB/s +13%
HP Pavilion Plus 14-ey0095cl
AMD Ryzen 7 7840U, Radeon 780M
3555 MB/s +9%
Acer Swift Go 14 SFG14-72
Intel Core Ultra 7 155H, Arc 8-Cores
3263 MB/s
Average Intel Core Ultra 7 155H
  (1940 - 4436, n=25)
3215 MB/s -1%
LG Gram 2in1 16 16T90R - G.AA78G
Intel Core i7-1360P, Iris Xe G7 96EUs
2522 MB/s -23%
Average of class Subnotebook
  (453 - 4646, n=57, last 2 years)
2361 MB/s -28%
Acer Swift Go 14 SFG14-71
Intel Core i5-1335U, Iris Xe G7 80EUs
1687 MB/s -48%
HP Pavilion Plus 14-ew0153TU
Intel Core i7-1355U, Iris Xe G7 96EUs
1529 MB/s -53%
AIDA64 / CPU Queen
Lenovo ThinkPad T14 G4 21K4S02000
AMD Ryzen 7 PRO 7840U, Radeon 780M
95384 Points +12%
HP Pavilion Plus 14-ey0095cl
AMD Ryzen 7 7840U, Radeon 780M
93769 Points +10%
Ayaneo Air 1S Retro Power
AMD Ryzen 7 7840U, Radeon 780M
91289 Points +8%
Acer Swift Go 14 SFG14-72
Intel Core Ultra 7 155H, Arc 8-Cores
84870 Points
Average Intel Core Ultra 7 155H
  (64698 - 93266, n=25)
84034 Points -1%
LG Gram 2in1 16 16T90R - G.AA78G
Intel Core i7-1360P, Iris Xe G7 96EUs
82121 Points -3%
Average of class Subnotebook
  (15447 - 115300, n=57, last 2 years)
79878 Points -6%
HP Pavilion Plus 14-ew0153TU
Intel Core i7-1355U, Iris Xe G7 96EUs
60719 Points -28%
Acer Swift Go 14 SFG14-71
Intel Core i5-1335U, Iris Xe G7 80EUs
53839 Points -37%
AIDA64 / FPU SinJulia
Lenovo ThinkPad T14 G4 21K4S02000
AMD Ryzen 7 PRO 7840U, Radeon 780M
12858 Points +36%
Ayaneo Air 1S Retro Power
AMD Ryzen 7 7840U, Radeon 780M
12286 Points +30%
HP Pavilion Plus 14-ey0095cl
AMD Ryzen 7 7840U, Radeon 780M
12132 Points +28%
Acer Swift Go 14 SFG14-72
Intel Core Ultra 7 155H, Arc 8-Cores
9475 Points
Average Intel Core Ultra 7 155H
  (5639 - 10641, n=25)
9122 Points -4%
Average of class Subnotebook
  (1223 - 14944, n=57, last 2 years)
7617 Points -20%
LG Gram 2in1 16 16T90R - G.AA78G
Intel Core i7-1360P, Iris Xe G7 96EUs
6679 Points -30%
HP Pavilion Plus 14-ew0153TU
Intel Core i7-1355U, Iris Xe G7 96EUs
4045 Points -57%
Acer Swift Go 14 SFG14-71
Intel Core i5-1335U, Iris Xe G7 80EUs
3873 Points -59%
AIDA64 / FPU Mandel
Lenovo ThinkPad T14 G4 21K4S02000
AMD Ryzen 7 PRO 7840U, Radeon 780M
44731 Points +28%
HP Pavilion Plus 14-ey0095cl
AMD Ryzen 7 7840U, Radeon 780M
41822 Points +20%
Ayaneo Air 1S Retro Power
AMD Ryzen 7 7840U, Radeon 780M
41726 Points +19%
Acer Swift Go 14 SFG14-72
Intel Core Ultra 7 155H, Arc 8-Cores
34945 Points
Average Intel Core Ultra 7 155H
  (21052 - 47685, n=25)
33830 Points -3%
Average of class Subnotebook
  (6379 - 59053, n=57, last 2 years)
27533 Points -21%
LG Gram 2in1 16 16T90R - G.AA78G
Intel Core i7-1360P, Iris Xe G7 96EUs
24392 Points -30%
Acer Swift Go 14 SFG14-71
Intel Core i5-1335U, Iris Xe G7 80EUs
16256 Points -53%
HP Pavilion Plus 14-ew0153TU
Intel Core i7-1355U, Iris Xe G7 96EUs
14596 Points -58%
AIDA64 / CPU AES
Lenovo ThinkPad T14 G4 21K4S02000
AMD Ryzen 7 PRO 7840U, Radeon 780M
142329 MB/s +107%
LG Gram 2in1 16 16T90R - G.AA78G
Intel Core i7-1360P, Iris Xe G7 96EUs
92044 MB/s +34%
Average Intel Core Ultra 7 155H
  (45713 - 152179, n=25)
75133 MB/s +9%
Acer Swift Go 14 SFG14-72
Intel Core Ultra 7 155H, Arc 8-Cores
68795 MB/s
Ayaneo Air 1S Retro Power
AMD Ryzen 7 7840U, Radeon 780M
65903 MB/s -4%
Average of class Subnotebook
  (638 - 161430, n=57, last 2 years)
53217 MB/s -23%
HP Pavilion Plus 14-ey0095cl
AMD Ryzen 7 7840U, Radeon 780M
53018 MB/s -23%
Acer Swift Go 14 SFG14-71
Intel Core i5-1335U, Iris Xe G7 80EUs
33466 MB/s -51%
HP Pavilion Plus 14-ew0153TU
Intel Core i7-1355U, Iris Xe G7 96EUs
31432 MB/s -54%
AIDA64 / CPU ZLib
Acer Swift Go 14 SFG14-72
Intel Core Ultra 7 155H, Arc 8-Cores
960 MB/s
Average Intel Core Ultra 7 155H
  (557 - 1250, n=25)
950 MB/s -1%
Lenovo ThinkPad T14 G4 21K4S02000
AMD Ryzen 7 PRO 7840U, Radeon 780M
858 MB/s -11%
HP Pavilion Plus 14-ey0095cl
AMD Ryzen 7 7840U, Radeon 780M
808 MB/s -16%
Ayaneo Air 1S Retro Power
AMD Ryzen 7 7840U, Radeon 780M
807 MB/s -16%
LG Gram 2in1 16 16T90R - G.AA78G
Intel Core i7-1360P, Iris Xe G7 96EUs
752 MB/s -22%
Average of class Subnotebook
  (270 - 1123, n=57, last 2 years)
666 MB/s -31%
Acer Swift Go 14 SFG14-71
Intel Core i5-1335U, Iris Xe G7 80EUs
493 MB/s -49%
HP Pavilion Plus 14-ew0153TU
Intel Core i7-1355U, Iris Xe G7 96EUs
454 MB/s -53%
AIDA64 / FP64 Ray-Trace
Lenovo ThinkPad T14 G4 21K4S02000
AMD Ryzen 7 PRO 7840U, Radeon 780M
10555 KRay/s +50%
HP Pavilion Plus 14-ey0095cl
AMD Ryzen 7 7840U, Radeon 780M
9874 KRay/s +40%
Ayaneo Air 1S Retro Power
AMD Ryzen 7 7840U, Radeon 780M
9738 KRay/s +38%
Acer Swift Go 14 SFG14-72
Intel Core Ultra 7 155H, Arc 8-Cores
7057 KRay/s
Average Intel Core Ultra 7 155H
  (3569 - 9802, n=25)
6875 KRay/s -3%
LG Gram 2in1 16 16T90R - G.AA78G
Intel Core i7-1360P, Iris Xe G7 96EUs
5266 KRay/s -25%
Average of class Subnotebook
  (204 - 14018, n=57, last 2 years)
5239 KRay/s -26%
Acer Swift Go 14 SFG14-71
Intel Core i5-1335U, Iris Xe G7 80EUs
3482 KRay/s -51%
HP Pavilion Plus 14-ew0153TU
Intel Core i7-1355U, Iris Xe G7 96EUs
2991 KRay/s -58%
AIDA64 / CPU PhotoWorxx
Average Intel Core Ultra 7 155H
  (32719 - 54223, n=25)
46865 MPixel/s +2%
Acer Swift Go 14 SFG14-72
Intel Core Ultra 7 155H, Arc 8-Cores
46137 MPixel/s
LG Gram 2in1 16 16T90R - G.AA78G
Intel Core i7-1360P, Iris Xe G7 96EUs
42905 MPixel/s -7%
Lenovo ThinkPad T14 G4 21K4S02000
AMD Ryzen 7 PRO 7840U, Radeon 780M
38442 MPixel/s -17%
HP Pavilion Plus 14-ew0153TU
Intel Core i7-1355U, Iris Xe G7 96EUs
37141 MPixel/s -19%
Average of class Subnotebook
  (7622 - 53954, n=57, last 2 years)
35760 MPixel/s -22%
Acer Swift Go 14 SFG14-71
Intel Core i5-1335U, Iris Xe G7 80EUs
34266 MPixel/s -26%
HP Pavilion Plus 14-ey0095cl
AMD Ryzen 7 7840U, Radeon 780M
33689 MPixel/s -27%
Ayaneo Air 1S Retro Power
AMD Ryzen 7 7840U, Radeon 780M
26903 MPixel/s -42%

System performance

According to Intel, the new Arc iGPU is predominantly responsible for significant improvements in the graphics performance. This becomes clear as soon as we take a look at the digital content creation section in PCMark 10. In this area, the Swift Go 14 and its Arc iGPU are impressive. Overall, the Acer Swift Go 14's system performance is much higher than its predecessor and most of the comparison devices. This means we are dealing with a potent device that has no reason to back down even when faced with 3D applications.

PCMark 10 / Score
Lenovo ThinkPad T14 G4 21K4S02000
Radeon 780M, R7 PRO 7840U, Samsung PM9A1a MZVL21T0HDLU
6973 Points +5%
Average Intel Core Ultra 7 155H, Intel Arc 8-Cores iGPU
  (5159 - 7529, n=17)
6710 Points +1%
Acer Swift Go 14 SFG14-72
Arc 8-Cores, Ultra 7 155H, SK hynix HFS001TEJ9X110NA
6625 Points
HP Pavilion Plus 14-ey0095cl
Radeon 780M, R7 7840U, WDC PC SN810 1TB
6480 Points -2%
Average of class Subnotebook
  (4384 - 7428, n=55, last 2 years)
5879 Points -11%
Ayaneo Air 1S Retro Power
Radeon 780M, R7 7840U, Ayaneo CyberThunder-2TB
5866 Points -11%
LG Gram 2in1 16 16T90R - G.AA78G
Iris Xe G7 96EUs, i7-1360P, Samsung PM9A1 MZVL21T0HCLR
5781 Points -13%
HP Pavilion Plus 14-ew0153TU
Iris Xe G7 96EUs, i7-1355U, SK hynix PC801 HFS001TEJ9X101N
5455 Points -18%
Acer Swift Go 14 SFG14-71
Iris Xe G7 80EUs, i5-1335U, WD PC SN740 SDDQNQD-512G-1014
5328 Points -20%
PCMark 10 / Essentials
LG Gram 2in1 16 16T90R - G.AA78G
Iris Xe G7 96EUs, i7-1360P, Samsung PM9A1 MZVL21T0HCLR
11359 Points +11%
Lenovo ThinkPad T14 G4 21K4S02000
Radeon 780M, R7 PRO 7840U, Samsung PM9A1a MZVL21T0HDLU
10803 Points +6%
Average Intel Core Ultra 7 155H, Intel Arc 8-Cores iGPU
  (9557 - 11214, n=17)
10674 Points +5%
Average of class Subnotebook
  (8890 - 11168, n=55, last 2 years)
10247 Points 0%
Acer Swift Go 14 SFG14-72
Arc 8-Cores, Ultra 7 155H, SK hynix HFS001TEJ9X110NA
10212 Points
HP Pavilion Plus 14-ew0153TU
Iris Xe G7 96EUs, i7-1355U, SK hynix PC801 HFS001TEJ9X101N
10203 Points 0%
Acer Swift Go 14 SFG14-71
Iris Xe G7 80EUs, i5-1335U, WD PC SN740 SDDQNQD-512G-1014
10111 Points -1%
HP Pavilion Plus 14-ey0095cl
Radeon 780M, R7 7840U, WDC PC SN810 1TB
9781 Points -4%
Ayaneo Air 1S Retro Power
Radeon 780M, R7 7840U, Ayaneo CyberThunder-2TB
9068 Points -11%
PCMark 10 / Productivity
Lenovo ThinkPad T14 G4 21K4S02000
Radeon 780M, R7 PRO 7840U, Samsung PM9A1a MZVL21T0HDLU
9933 Points +17%
HP Pavilion Plus 14-ey0095cl
Radeon 780M, R7 7840U, WDC PC SN810 1TB
9647 Points +13%
Average Intel Core Ultra 7 155H, Intel Arc 8-Cores iGPU
  (7822 - 10591, n=17)
8756 Points +3%
Acer Swift Go 14 SFG14-72
Arc 8-Cores, Ultra 7 155H, SK hynix HFS001TEJ9X110NA
8500 Points
Ayaneo Air 1S Retro Power
Radeon 780M, R7 7840U, Ayaneo CyberThunder-2TB
8386 Points -1%
Average of class Subnotebook
  (6213 - 10279, n=55, last 2 years)
7857 Points -8%
Acer Swift Go 14 SFG14-71
Iris Xe G7 80EUs, i5-1335U, WD PC SN740 SDDQNQD-512G-1014
6966 Points -18%
HP Pavilion Plus 14-ew0153TU
Iris Xe G7 96EUs, i7-1355U, SK hynix PC801 HFS001TEJ9X101N
6763 Points -20%
LG Gram 2in1 16 16T90R - G.AA78G
Iris Xe G7 96EUs, i7-1360P, Samsung PM9A1 MZVL21T0HCLR
6572 Points -23%
PCMark 10 / Digital Content Creation
Acer Swift Go 14 SFG14-72
Arc 8-Cores, Ultra 7 155H, SK hynix HFS001TEJ9X110NA
9090 Points
Average Intel Core Ultra 7 155H, Intel Arc 8-Cores iGPU
  (4985 - 9999, n=17)
8831 Points -3%
Lenovo ThinkPad T14 G4 21K4S02000
Radeon 780M, R7 PRO 7840U, Samsung PM9A1a MZVL21T0HDLU
8575 Points -6%
HP Pavilion Plus 14-ey0095cl
Radeon 780M, R7 7840U, WDC PC SN810 1TB
7827 Points -14%
Ayaneo Air 1S Retro Power
Radeon 780M, R7 7840U, Ayaneo CyberThunder-2TB
7204 Points -21%
LG Gram 2in1 16 16T90R - G.AA78G
Iris Xe G7 96EUs, i7-1360P, Samsung PM9A1 MZVL21T0HCLR
7027 Points -23%
Average of class Subnotebook
  (4093 - 9749, n=55, last 2 years)
6923 Points -24%
HP Pavilion Plus 14-ew0153TU
Iris Xe G7 96EUs, i7-1355U, SK hynix PC801 HFS001TEJ9X101N
6386 Points -30%
Acer Swift Go 14 SFG14-71
Iris Xe G7 80EUs, i5-1335U, WD PC SN740 SDDQNQD-512G-1014
5826 Points -36%
CrossMark / Overall
Lenovo ThinkPad T14 G4 21K4S02000
Radeon 780M, R7 PRO 7840U, Samsung PM9A1a MZVL21T0HDLU
1669 Points +6%
Average Intel Core Ultra 7 155H, Intel Arc 8-Cores iGPU
  (1366 - 1903, n=17)
1656 Points +5%
Acer Swift Go 14 SFG14-72
Arc 8-Cores, Ultra 7 155H, SK hynix HFS001TEJ9X110NA
1579 Points
Average of class Subnotebook
  (718 - 1876, n=61, last 2 years)
1553 Points -2%
HP Pavilion Plus 14-ew0153TU
Iris Xe G7 96EUs, i7-1355U, SK hynix PC801 HFS001TEJ9X101N
1543 Points -2%
LG Gram 2in1 16 16T90R - G.AA78G
Iris Xe G7 96EUs, i7-1360P, Samsung PM9A1 MZVL21T0HCLR
1527 Points -3%
HP Pavilion Plus 14-ey0095cl
Radeon 780M, R7 7840U, WDC PC SN810 1TB
1523 Points -4%
Acer Swift Go 14 SFG14-71
Iris Xe G7 80EUs, i5-1335U, WD PC SN740 SDDQNQD-512G-1014
1470 Points -7%
Ayaneo Air 1S Retro Power
Radeon 780M, R7 7840U, Ayaneo CyberThunder-2TB
1256 Points -20%
CrossMark / Productivity
Lenovo ThinkPad T14 G4 21K4S02000
Radeon 780M, R7 PRO 7840U, Samsung PM9A1a MZVL21T0HDLU
1624 Points +8%
Average Intel Core Ultra 7 155H, Intel Arc 8-Cores iGPU
  (1291 - 1717, n=16)
1573 Points +4%
HP Pavilion Plus 14-ew0153TU
Iris Xe G7 96EUs, i7-1355U, SK hynix PC801 HFS001TEJ9X101N
1551 Points +3%
HP Pavilion Plus 14-ey0095cl
Radeon 780M, R7 7840U, WDC PC SN810 1TB
1513 Points 0%
Acer Swift Go 14 SFG14-72
Arc 8-Cores, Ultra 7 155H, SK hynix HFS001TEJ9X110NA
1510 Points
Average of class Subnotebook
  (685 - 1829, n=61, last 2 years)
1507 Points 0%
LG Gram 2in1 16 16T90R - G.AA78G
Iris Xe G7 96EUs, i7-1360P, Samsung PM9A1 MZVL21T0HCLR
1503 Points 0%
Acer Swift Go 14 SFG14-71
Iris Xe G7 80EUs, i5-1335U, WD PC SN740 SDDQNQD-512G-1014
1489 Points -1%
Ayaneo Air 1S Retro Power
Radeon 780M, R7 7840U, Ayaneo CyberThunder-2TB
1326 Points -12%
CrossMark / Creativity
Lenovo ThinkPad T14 G4 21K4S02000
Radeon 780M, R7 PRO 7840U, Samsung PM9A1a MZVL21T0HDLU
1824 Points +5%
Average Intel Core Ultra 7 155H, Intel Arc 8-Cores iGPU
  (1519 - 1929, n=16)
1821 Points +5%
Acer Swift Go 14 SFG14-72
Arc 8-Cores, Ultra 7 155H, SK hynix HFS001TEJ9X110NA
1730 Points
Average of class Subnotebook
  (776 - 2210, n=61, last 2 years)
1690 Points -2%
HP Pavilion Plus 14-ey0095cl
Radeon 780M, R7 7840U, WDC PC SN810 1TB
1646 Points -5%
HP Pavilion Plus 14-ew0153TU
Iris Xe G7 96EUs, i7-1355U, SK hynix PC801 HFS001TEJ9X101N
1603 Points -7%
LG Gram 2in1 16 16T90R - G.AA78G
Iris Xe G7 96EUs, i7-1360P, Samsung PM9A1 MZVL21T0HCLR
1558 Points -10%
Acer Swift Go 14 SFG14-71
Iris Xe G7 80EUs, i5-1335U, WD PC SN740 SDDQNQD-512G-1014
1445 Points -16%
Ayaneo Air 1S Retro Power
Radeon 780M, R7 7840U, Ayaneo CyberThunder-2TB
1251 Points -28%
CrossMark / Responsiveness
LG Gram 2in1 16 16T90R - G.AA78G
Iris Xe G7 96EUs, i7-1360P, Samsung PM9A1 MZVL21T0HCLR
1508 Points +10%
Acer Swift Go 14 SFG14-71
Iris Xe G7 80EUs, i5-1335U, WD PC SN740 SDDQNQD-512G-1014
1491 Points +9%
Lenovo ThinkPad T14 G4 21K4S02000
Radeon 780M, R7 PRO 7840U, Samsung PM9A1a MZVL21T0HDLU
1389 Points +1%
Acer Swift Go 14 SFG14-72
Arc 8-Cores, Ultra 7 155H, SK hynix HFS001TEJ9X110NA
1372 Points
Average Intel Core Ultra 7 155H, Intel Arc 8-Cores iGPU
  (939 - 1700, n=16)
1370 Points 0%
HP Pavilion Plus 14-ew0153TU
Iris Xe G7 96EUs, i7-1355U, SK hynix PC801 HFS001TEJ9X101N
1356 Points -1%
Average of class Subnotebook
  (652 - 1899, n=61, last 2 years)
1329 Points -3%
HP Pavilion Plus 14-ey0095cl
Radeon 780M, R7 7840U, WDC PC SN810 1TB
1231 Points -10%
Ayaneo Air 1S Retro Power
Radeon 780M, R7 7840U, Ayaneo CyberThunder-2TB
1082 Points -21%
WebXPRT 3 / Overall
Lenovo ThinkPad T14 G4 21K4S02000
Radeon 780M, R7 PRO 7840U, Samsung PM9A1a MZVL21T0HDLU
317 Points +10%
HP Pavilion Plus 14-ey0095cl
Radeon 780M, R7 7840U, WDC PC SN810 1TB
293 Points +2%
Acer Swift Go 14 SFG14-72
Arc 8-Cores, Ultra 7 155H, SK hynix HFS001TEJ9X110NA
287 Points
Average of class Subnotebook
  (119.2 - 448, n=63, last 2 years)
284 Points -1%
Average Intel Core Ultra 7 155H, Intel Arc 8-Cores iGPU
  (255 - 299, n=17)
278 Points -3%
HP Pavilion Plus 14-ew0153TU
Iris Xe G7 96EUs, i7-1355U, SK hynix PC801 HFS001TEJ9X101N
275 Points -4%
LG Gram 2in1 16 16T90R - G.AA78G
Iris Xe G7 96EUs, i7-1360P, Samsung PM9A1 MZVL21T0HCLR
251 Points -13%
Acer Swift Go 14 SFG14-71
Iris Xe G7 80EUs, i5-1335U, WD PC SN740 SDDQNQD-512G-1014
244 Points -15%
Ayaneo Air 1S Retro Power
Radeon 780M, R7 7840U, Ayaneo CyberThunder-2TB
235 Points -18%
WebXPRT 4 / Overall
HP Pavilion Plus 14-ew0153TU
Iris Xe G7 96EUs, i7-1355U, SK hynix PC801 HFS001TEJ9X101N
253 Points
Average Intel Core Ultra 7 155H, Intel Arc 8-Cores iGPU
  (241 - 263, n=13)
253 Points
Average of class Subnotebook
  (67.2 - 325, n=50, last 2 years)
240 Points
HP Pavilion Plus 14-ey0095cl
Radeon 780M, R7 7840U, WDC PC SN810 1TB
231 Points
Ayaneo Air 1S Retro Power
Radeon 780M, R7 7840U, Ayaneo CyberThunder-2TB
196.4 Points
Mozilla Kraken 1.1 / Total
LG Gram 2in1 16 16T90R - G.AA78G
Iris Xe G7 96EUs, i7-1360P, Samsung PM9A1 MZVL21T0HCLR
633 ms * -18%
Average of class Subnotebook
  (363 - 1913, n=67, last 2 years)
587 ms * -10%
HP Pavilion Plus 14-ey0095cl
Radeon 780M, R7 7840U, WDC PC SN810 1TB
562 ms * -5%
Acer Swift Go 14 SFG14-71
Iris Xe G7 80EUs, i5-1335U, WD PC SN740 SDDQNQD-512G-1014
559 ms * -4%
Acer Swift Go 14 SFG14-71
Iris Xe G7 80EUs, i5-1335U, WD PC SN740 SDDQNQD-512G-1014
559 ms * -4%
Average Intel Core Ultra 7 155H, Intel Arc 8-Cores iGPU
  (520 - 565, n=17)
536 ms * -0%
Acer Swift Go 14 SFG14-72
Arc 8-Cores, Ultra 7 155H, SK hynix HFS001TEJ9X110NA
535 ms *
Lenovo ThinkPad T14 G4 21K4S02000
Radeon 780M, R7 PRO 7840U, Samsung PM9A1a MZVL21T0HDLU
526 ms * +2%
Ayaneo Air 1S Retro Power
Radeon 780M, R7 7840U, Ayaneo CyberThunder-2TB
516 ms * +4%
HP Pavilion Plus 14-ew0153TU
Iris Xe G7 96EUs, i7-1355U, SK hynix PC801 HFS001TEJ9X101N
514 ms * +4%

* ... smaller is better

PCMark 10 Score
6625 points
Help
AIDA64 / Memory Copy
Average Intel Core Ultra 7 155H
  (62397 - 95631, n=25)
85966 MB/s +7%
Acer Swift Go 14 SFG14-72
Intel Core Ultra 7 155H, Arc 8-Cores
80515 MB/s
Average of class Subnotebook
  (22781 - 95353, n=57, last 2 years)
61239 MB/s -24%
AIDA64 / Memory Read
Average Intel Core Ultra 7 155H
  (60544 - 90647, n=25)
81502 MB/s +13%
Acer Swift Go 14 SFG14-72
Intel Core Ultra 7 155H, Arc 8-Cores
72244 MB/s
Average of class Subnotebook
  (23831 - 86433, n=57, last 2 years)
57245 MB/s -21%
AIDA64 / Memory Write
Acer Swift Go 14 SFG14-72
Intel Core Ultra 7 155H, Arc 8-Cores
75291 MB/s
Average Intel Core Ultra 7 155H
  (64852 - 93451, n=25)
74035 MB/s -2%
Average of class Subnotebook
  (23474 - 93382, n=57, last 2 years)
64603 MB/s -14%
AIDA64 / Memory Latency
Acer Swift Go 14 SFG14-72
Intel Core Ultra 7 155H, Arc 8-Cores
147.1 ns *
Average Intel Core Ultra 7 155H
  (125.8 - 173, n=25)
143.5 ns * +2%
Average of class Subnotebook
  (18.8 - 172, n=52, last 2 years)
104 ns * +29%

* ... smaller is better

Mass storage

In the Swift Go 14, a new NVMe SSD from SK Hynix does its job and manages to achieve average to high transfer speeds in every benchmark. In the DiskSpd loop, in which the storage's performance is analysed over a longer period, the read speed drops slightly.

SK hynix HFS001TEJ9X110NA
Sequential Read: 4224.68MB/s
Sequential Write: 3544.16MB/s
4K Read: 55.15MB/s
4K Write: 205.42MB/s
4K-64 Read: 1586.68MB/s
4K-64 Write: 2176.61MB/s
Access Time Read: 0.039ms
Access Time Write: 0.101ms
Score Read: 2064Points
Score Write: 3039Points
Score Total: 6129Points
Drive Performance Rating - Percent
LG Gram 2in1 16 16T90R - G.AA78G
Samsung PM9A1 MZVL21T0HCLR
88.9 pt
Acer Swift Go 14 SFG14-71
WD PC SN740 SDDQNQD-512G-1014
77.2 pt
Lenovo ThinkPad T14 G4 21K4S02000
Samsung PM9A1a MZVL21T0HDLU
75.1 pt
Acer Swift Go 14 SFG14-72
SK hynix HFS001TEJ9X110NA
71.6 pt
Average SK hynix HFS001TEJ9X110NA
 
71.6 pt
HP Pavilion Plus 14-ew0153TU
SK hynix PC801 HFS001TEJ9X101N
68.6 pt
HP Pavilion Plus 14-ey0095cl -11!
WDC PC SN810 1TB
67.3 pt
Average of class Subnotebook
 
61.4 pt
Ayaneo Air 1S Retro Power
Ayaneo CyberThunder-2TB
34.6 pt
DiskSpd
seq read
Lenovo ThinkPad T14 G4 21K4S02000
Samsung PM9A1a MZVL21T0HDLU
3417 (3399.9min - 3416.77max) MB/s +48%
HP Pavilion Plus 14-ey0095cl
WDC PC SN810 1TB
3265 (3244.93min - 3265.06max) MB/s +42%
LG Gram 2in1 16 16T90R - G.AA78G
Samsung PM9A1 MZVL21T0HCLR
2882 (2725.88min - 2882.22max) MB/s +25%
Average of class Subnotebook
  (452 - 4501, n=58, last 2 years)
2872 MB/s +25%
Acer Swift Go 14 SFG14-71
WD PC SN740 SDDQNQD-512G-1014
2763 (2353.54min - 2762.92max) MB/s +20%
HP Pavilion Plus 14-ew0153TU
SK hynix PC801 HFS001TEJ9X101N
2700 (2683.01min - 2699.82max) MB/s +17%
Acer Swift Go 14 SFG14-72
SK hynix HFS001TEJ9X110NA
2305 (2283.64min - 2304.98max) MB/s
Average SK hynix HFS001TEJ9X110NA
  ()
2305 MB/s 0%
Ayaneo Air 1S Retro Power
Ayaneo CyberThunder-2TB
2154 (2143.71min - 2153.78max) MB/s -7%
seq write
HP Pavilion Plus 14-ey0095cl
WDC PC SN810 1TB
3465 (3398.98min - 3464.7max) MB/s +15%
LG Gram 2in1 16 16T90R - G.AA78G
Samsung PM9A1 MZVL21T0HCLR
3431 (3289.51min - 3431.36max) MB/s +14%
Acer Swift Go 14 SFG14-71
WD PC SN740 SDDQNQD-512G-1014
3373 (2885.36min - 3372.81max) MB/s +12%
Lenovo ThinkPad T14 G4 21K4S02000
Samsung PM9A1a MZVL21T0HDLU
3233 (3089.31min - 3233.18max) MB/s +8%
Acer Swift Go 14 SFG14-72
SK hynix HFS001TEJ9X110NA
3001 (2954.22min - 3001.02max) MB/s
Average SK hynix HFS001TEJ9X110NA
  ()
3001 MB/s 0%
Average of class Subnotebook
  (153.3 - 5344, n=58, last 2 years)
2808 MB/s -6%
HP Pavilion Plus 14-ew0153TU
SK hynix PC801 HFS001TEJ9X101N
2792 (2724.62min - 2792.15max) MB/s -7%
Ayaneo Air 1S Retro Power
Ayaneo CyberThunder-2TB
1524 (244.88min - 1523.68max) MB/s -49%
seq q8 t1 read
Lenovo ThinkPad T14 G4 21K4S02000
Samsung PM9A1a MZVL21T0HDLU
7027 (5699.29min - 7026.72max) MB/s +121%
HP Pavilion Plus 14-ey0095cl
WDC PC SN810 1TB
6948 (6424.99min - 6948.07max) MB/s +119%
LG Gram 2in1 16 16T90R - G.AA78G
Samsung PM9A1 MZVL21T0HCLR
6562 (5825.59min - 6561.57max) MB/s +106%
HP Pavilion Plus 14-ew0153TU
SK hynix PC801 HFS001TEJ9X101N
6508 (5678.88min - 6508.32max) MB/s +105%
Average of class Subnotebook
  (558 - 7134, n=58, last 2 years)
4958 MB/s +56%
Acer Swift Go 14 SFG14-71
WD PC SN740 SDDQNQD-512G-1014
4714 (3899.2min - 4714.2max) MB/s +48%
Acer Swift Go 14 SFG14-72
SK hynix HFS001TEJ9X110NA
3179 (2816.5min - 3179.49max) MB/s
Average SK hynix HFS001TEJ9X110NA
  ()
3179 MB/s 0%
Ayaneo Air 1S Retro Power
Ayaneo CyberThunder-2TB
2553 (2224.87min - 2553.07max) MB/s -20%
seq q8 t1 write
HP Pavilion Plus 14-ey0095cl
WDC PC SN810 1TB
5153 (5061.06min - 5153.12max) MB/s +37%
LG Gram 2in1 16 16T90R - G.AA78G
Samsung PM9A1 MZVL21T0HCLR
4947 (4921.79min - 4946.59max) MB/s +32%
Lenovo ThinkPad T14 G4 21K4S02000
Samsung PM9A1a MZVL21T0HDLU
4924 (4892.94min - 4924.33max) MB/s +31%
HP Pavilion Plus 14-ew0153TU
SK hynix PC801 HFS001TEJ9X101N
4271 (4073.72min - 4270.7max) MB/s +14%
Average of class Subnotebook
  (60 - 6751, n=58, last 2 years)
3775 MB/s +1%
Acer Swift Go 14 SFG14-72
SK hynix HFS001TEJ9X110NA
3752 (3716.27min - 3752.48max) MB/s
Average SK hynix HFS001TEJ9X110NA
  ()
3752 MB/s 0%
Acer Swift Go 14 SFG14-71
WD PC SN740 SDDQNQD-512G-1014
3431 (3083.15min - 3431max) MB/s -9%
Ayaneo Air 1S Retro Power
Ayaneo CyberThunder-2TB
1698 (1529.75min - 1697.81max) MB/s -55%
4k q1 t1 read
LG Gram 2in1 16 16T90R - G.AA78G
Samsung PM9A1 MZVL21T0HCLR
81.6 (74.82min - 81.55max) MB/s +34%
Acer Swift Go 14 SFG14-71
WD PC SN740 SDDQNQD-512G-1014
79.4 (78.48min - 79.38max) MB/s +30%
Lenovo ThinkPad T14 G4 21K4S02000
Samsung PM9A1a MZVL21T0HDLU
70 (69.61min - 70max) MB/s +15%
HP Pavilion Plus 14-ew0153TU
SK hynix PC801 HFS001TEJ9X101N
68.3 (67.74min - 68.25max) MB/s +12%
Average of class Subnotebook
  (12.6 - 88.6, n=58, last 2 years)
61.6 MB/s +1%
Acer Swift Go 14 SFG14-72
SK hynix HFS001TEJ9X110NA
60.9 (60.46min - 60.93max) MB/s
Average SK hynix HFS001TEJ9X110NA
  ()
60.9 MB/s 0%
HP Pavilion Plus 14-ey0095cl
WDC PC SN810 1TB
57.8 (56.71min - 57.8max) MB/s -5%
Ayaneo Air 1S Retro Power
Ayaneo CyberThunder-2TB
43.5 (42.13min - 43.46max) MB/s -29%
4k q1 t1 write
Acer Swift Go 14 SFG14-71
WD PC SN740 SDDQNQD-512G-1014
273 (263.1min - 272.82max) MB/s +20%
Acer Swift Go 14 SFG14-72
SK hynix HFS001TEJ9X110NA
227 (221.95min - 227.04max) MB/s
Average SK hynix HFS001TEJ9X110NA
  ()
227 MB/s 0%
LG Gram 2in1 16 16T90R - G.AA78G
Samsung PM9A1 MZVL21T0HCLR
226 (219.95min - 225.84max) MB/s 0%
Average of class Subnotebook
  (22.5 - 360, n=58, last 2 years)
154.8 MB/s -32%
HP Pavilion Plus 14-ew0153TU
SK hynix PC801 HFS001TEJ9X101N
154.6 (151.31min - 154.61max) MB/s -32%
Lenovo ThinkPad T14 G4 21K4S02000
Samsung PM9A1a MZVL21T0HDLU
151 (149.72min - 151.04max) MB/s -33%
Ayaneo Air 1S Retro Power
Ayaneo CyberThunder-2TB
113.9 (109.63min - 113.92max) MB/s -50%
HP Pavilion Plus 14-ey0095cl
WDC PC SN810 1TB
100.6 (98.29min - 100.62max) MB/s -56%
4k q32 t16 read
LG Gram 2in1 16 16T90R - G.AA78G
Samsung PM9A1 MZVL21T0HCLR
3881 (3853min - 3881.23max) MB/s +44%
Acer Swift Go 14 SFG14-72
SK hynix HFS001TEJ9X110NA
2700 (2252.61min - 2700.15max) MB/s
Average SK hynix HFS001TEJ9X110NA
  ()
2700 MB/s 0%
Acer Swift Go 14 SFG14-71
WD PC SN740 SDDQNQD-512G-1014
1945 (1930.8min - 1944.66max) MB/s -28%
Lenovo ThinkPad T14 G4 21K4S02000
Samsung PM9A1a MZVL21T0HDLU
1347 (1309.66min - 1347.08max) MB/s -50%
Average of class Subnotebook
  (283 - 4286, n=58, last 2 years)
1215 MB/s -55%
HP Pavilion Plus 14-ey0095cl
WDC PC SN810 1TB
1000 (938.41min - 999.95max) MB/s -63%
Ayaneo Air 1S Retro Power
Ayaneo CyberThunder-2TB
666 (656.44min - 665.61max) MB/s -75%
HP Pavilion Plus 14-ew0153TU
SK hynix PC801 HFS001TEJ9X101N
594 (466.98min - 594.27max) MB/s -78%
4k q32 t16 write
LG Gram 2in1 16 16T90R - G.AA78G
Samsung PM9A1 MZVL21T0HCLR
3537 (3009.8min - 3536.52max) MB/s +101%
Acer Swift Go 14 SFG14-71
WD PC SN740 SDDQNQD-512G-1014
2151 (1983.74min - 2151.37max) MB/s +22%
Acer Swift Go 14 SFG14-72
SK hynix HFS001TEJ9X110NA
1760 (1708.14min - 1759.52max) MB/s
Average SK hynix HFS001TEJ9X110NA
  ()
1760 MB/s 0%
Average of class Subnotebook
  (157 - 4189, n=58, last 2 years)
869 MB/s -51%
Lenovo ThinkPad T14 G4 21K4S02000
Samsung PM9A1a MZVL21T0HDLU
502 (495.8min - 501.89max) MB/s -71%
HP Pavilion Plus 14-ey0095cl
WDC PC SN810 1TB
364 (331.19min - 364.14max) MB/s -79%
Ayaneo Air 1S Retro Power
Ayaneo CyberThunder-2TB
344 (235.14min - 343.5max) MB/s -80%
HP Pavilion Plus 14-ew0153TU
SK hynix PC801 HFS001TEJ9X101N
295 (241.31min - 294.53max) MB/s -83%
AS SSD
Score Total
LG Gram 2in1 16 16T90R - G.AA78G
Samsung PM9A1 MZVL21T0HCLR
6136 Points 0%
Acer Swift Go 14 SFG14-72
SK hynix HFS001TEJ9X110NA
6129 Points
Average SK hynix HFS001TEJ9X110NA
  ()
6129 Points 0%
Lenovo ThinkPad T14 G4 21K4S02000
Samsung PM9A1a MZVL21T0HDLU
5803 Points -5%
Acer Swift Go 14 SFG14-71
WD PC SN740 SDDQNQD-512G-1014
5486 Points -10%
Average of class Subnotebook
  (707 - 8892, n=56, last 2 years)
4437 Points -28%
HP Pavilion Plus 14-ew0153TU
SK hynix PC801 HFS001TEJ9X101N
4390 Points -28%
Ayaneo Air 1S Retro Power
Ayaneo CyberThunder-2TB
2412 Points -61%
Score Read
LG Gram 2in1 16 16T90R - G.AA78G
Samsung PM9A1 MZVL21T0HCLR
2943 Points +43%
Acer Swift Go 14 SFG14-72
SK hynix HFS001TEJ9X110NA
2064 Points
Average SK hynix HFS001TEJ9X110NA
  ()
2064 Points 0%
Acer Swift Go 14 SFG14-71
WD PC SN740 SDDQNQD-512G-1014
2056 Points 0%
Lenovo ThinkPad T14 G4 21K4S02000
Samsung PM9A1a MZVL21T0HDLU
1712 Points -17%
Average of class Subnotebook
  (253 - 3307, n=56, last 2 years)
1464 Points -29%
HP Pavilion Plus 14-ew0153TU
SK hynix PC801 HFS001TEJ9X101N
1186 Points -43%
Ayaneo Air 1S Retro Power
Ayaneo CyberThunder-2TB
842 Points -59%
Score Write
Lenovo ThinkPad T14 G4 21K4S02000
Samsung PM9A1a MZVL21T0HDLU
3300 Points +9%
Acer Swift Go 14 SFG14-72
SK hynix HFS001TEJ9X110NA
3039 Points
Average SK hynix HFS001TEJ9X110NA
  ()
3039 Points 0%
HP Pavilion Plus 14-ew0153TU
SK hynix PC801 HFS001TEJ9X101N
2690 Points -11%
Acer Swift Go 14 SFG14-71
WD PC SN740 SDDQNQD-512G-1014
2413 Points -21%
Average of class Subnotebook
  (327 - 3972, n=56, last 2 years)
2285 Points -25%
LG Gram 2in1 16 16T90R - G.AA78G
Samsung PM9A1 MZVL21T0HCLR
1731 Points -43%
Ayaneo Air 1S Retro Power
Ayaneo CyberThunder-2TB
1161 Points -62%
Seq Read
LG Gram 2in1 16 16T90R - G.AA78G
Samsung PM9A1 MZVL21T0HCLR
4943.25 MB/s +17%
HP Pavilion Plus 14-ew0153TU
SK hynix PC801 HFS001TEJ9X101N
4778.49 MB/s +13%
Lenovo ThinkPad T14 G4 21K4S02000
Samsung PM9A1a MZVL21T0HDLU
4589.8 MB/s +9%
Acer Swift Go 14 SFG14-71
WD PC SN740 SDDQNQD-512G-1014
4291.89 MB/s +2%
Average SK hynix HFS001TEJ9X110NA
  ()
4225 MB/s 0%
Acer Swift Go 14 SFG14-72
SK hynix HFS001TEJ9X110NA
4224.68 MB/s
Average of class Subnotebook
  (508 - 5525, n=56, last 2 years)
3827 MB/s -9%
Ayaneo Air 1S Retro Power
Ayaneo CyberThunder-2TB
2183.33 MB/s -48%
Seq Write
LG Gram 2in1 16 16T90R - G.AA78G
Samsung PM9A1 MZVL21T0HCLR
3967.06 MB/s +12%
Acer Swift Go 14 SFG14-72
SK hynix HFS001TEJ9X110NA
3544.16 MB/s
Average SK hynix HFS001TEJ9X110NA
  ()
3544 MB/s 0%
Acer Swift Go 14 SFG14-71
WD PC SN740 SDDQNQD-512G-1014
3362.08 MB/s -5%
Lenovo ThinkPad T14 G4 21K4S02000
Samsung PM9A1a MZVL21T0HDLU
2622.82 MB/s -26%
HP Pavilion Plus 14-ew0153TU
SK hynix PC801 HFS001TEJ9X101N
2489.13 MB/s -30%
Average of class Subnotebook
  (386 - 4961, n=56, last 2 years)
2355 MB/s -34%
Ayaneo Air 1S Retro Power
Ayaneo CyberThunder-2TB
1602.26 MB/s -55%
4K Read
LG Gram 2in1 16 16T90R - G.AA78G
Samsung PM9A1 MZVL21T0HCLR
78.02 MB/s +41%
Acer Swift Go 14 SFG14-71
WD PC SN740 SDDQNQD-512G-1014
71.67 MB/s +30%
HP Pavilion Plus 14-ew0153TU
SK hynix PC801 HFS001TEJ9X101N
69.2 MB/s +25%
Lenovo ThinkPad T14 G4 21K4S02000
Samsung PM9A1a MZVL21T0HDLU
64.68 MB/s +17%
Average of class Subnotebook
  (14.8 - 96.2, n=56, last 2 years)
59.4 MB/s +8%
Average SK hynix HFS001TEJ9X110NA
  ()
55.2 MB/s 0%
Acer Swift Go 14 SFG14-72
SK hynix HFS001TEJ9X110NA
55.15 MB/s
Ayaneo Air 1S Retro Power
Ayaneo CyberThunder-2TB
34.04 MB/s -38%
4K Write
Acer Swift Go 14 SFG14-71
WD PC SN740 SDDQNQD-512G-1014
235.83 MB/s +15%
HP Pavilion Plus 14-ew0153TU
SK hynix PC801 HFS001TEJ9X101N
234.99 MB/s +14%
Acer Swift Go 14 SFG14-72
SK hynix HFS001TEJ9X110NA
205.42 MB/s
Average SK hynix HFS001TEJ9X110NA
  ()
205 MB/s 0%
LG Gram 2in1 16 16T90R - G.AA78G
Samsung PM9A1 MZVL21T0HCLR
196.81 MB/s -4%
Average of class Subnotebook
  (65.5 - 256, n=56, last 2 years)
173.2 MB/s -16%
Lenovo ThinkPad T14 G4 21K4S02000
Samsung PM9A1a MZVL21T0HDLU
159.91 MB/s -22%
Ayaneo Air 1S Retro Power
Ayaneo CyberThunder-2TB
90.74 MB/s -56%
4K-64 Read
LG Gram 2in1 16 16T90R - G.AA78G
Samsung PM9A1 MZVL21T0HCLR
2370.92 MB/s +49%
Average SK hynix HFS001TEJ9X110NA
  ()
1587 MB/s 0%
Acer Swift Go 14 SFG14-72
SK hynix HFS001TEJ9X110NA
1586.68 MB/s
Acer Swift Go 14 SFG14-71
WD PC SN740 SDDQNQD-512G-1014
1554.73 MB/s -2%
Lenovo ThinkPad T14 G4 21K4S02000
Samsung PM9A1a MZVL21T0HDLU
1188.59 MB/s -25%
Average of class Subnotebook
  (187.3 - 2682, n=56, last 2 years)
1022 MB/s -36%
HP Pavilion Plus 14-ew0153TU
SK hynix PC801 HFS001TEJ9X101N
639.2 MB/s -60%
Ayaneo Air 1S Retro Power
Ayaneo CyberThunder-2TB
589.89 MB/s -63%
4K-64 Write
Lenovo ThinkPad T14 G4 21K4S02000
Samsung PM9A1a MZVL21T0HDLU
2878.08 MB/s +32%
HP Pavilion Plus 14-ew0153TU
SK hynix PC801 HFS001TEJ9X101N
2206.45 MB/s +1%
Average SK hynix HFS001TEJ9X110NA
  ()
2177 MB/s 0%
Acer Swift Go 14 SFG14-72
SK hynix HFS001TEJ9X110NA
2176.61 MB/s
Average of class Subnotebook
  (223 - 3410, n=56, last 2 years)
1873 MB/s -14%
Acer Swift Go 14 SFG14-71
WD PC SN740 SDDQNQD-512G-1014
1841.19 MB/s -15%
LG Gram 2in1 16 16T90R - G.AA78G
Samsung PM9A1 MZVL21T0HCLR
1137.26 MB/s -48%
Ayaneo Air 1S Retro Power
Ayaneo CyberThunder-2TB
910.02 MB/s -58%
Access Time Read
Ayaneo Air 1S Retro Power
Ayaneo CyberThunder-2TB
0.151 ms * -287%
Acer Swift Go 14 SFG14-71
WD PC SN740 SDDQNQD-512G-1014
0.09 ms * -131%
Average of class Subnotebook
  (0.021 - 0.257, n=56, last 2 years)
0.06214 ms * -59%
Lenovo ThinkPad T14 G4 21K4S02000
Samsung PM9A1a MZVL21T0HDLU
0.058 ms * -49%
Acer Swift Go 14 SFG14-72
SK hynix HFS001TEJ9X110NA
0.039 ms *
Average SK hynix HFS001TEJ9X110NA
  ()
0.039 ms * -0%
HP Pavilion Plus 14-ew0153TU
SK hynix PC801 HFS001TEJ9X101N
0.036 ms * +8%
LG Gram 2in1 16 16T90R - G.AA78G
Samsung PM9A1 MZVL21T0HCLR
0.028 ms * +28%
Access Time Write
Acer Swift Go 14 SFG14-72
SK hynix HFS001TEJ9X110NA
0.101 ms *
Average SK hynix HFS001TEJ9X110NA
  ()
0.101 ms * -0%
Average of class Subnotebook
  (0.016 - 0.523, n=56, last 2 years)
0.07618 ms * +25%
Ayaneo Air 1S Retro Power
Ayaneo CyberThunder-2TB
0.067 ms * +34%
Lenovo ThinkPad T14 G4 21K4S02000
Samsung PM9A1a MZVL21T0HDLU
0.026 ms * +74%
LG Gram 2in1 16 16T90R - G.AA78G
Samsung PM9A1 MZVL21T0HCLR
0.023 ms * +77%
Acer Swift Go 14 SFG14-71
WD PC SN740 SDDQNQD-512G-1014
0.019 ms * +81%
HP Pavilion Plus 14-ew0153TU
SK hynix PC801 HFS001TEJ9X101N
0.017 ms * +83%

* ... smaller is better

Continuous Performance Read: DiskSpd Read Loop, Queue Depth 8

035571010651420177521302485284031953550390542604615497053255680603563906745Tooltip
Acer Swift Go 14 SFG14-72 SK hynix HFS001TEJ9X110NA; diskspd 2.0.17 f: Ø3223 (2898.68-3275.12)
Acer Swift Go 14 SFG14-71 WD PC SN740 SDDQNQD-512G-1014: Ø4849 (4447.13-4884.48)
LG Gram 2in1 16 16T90R - G.AA78G Samsung PM9A1 MZVL21T0HCLR: Ø6206 (5714.21-6585.65)
HP Pavilion Plus 14-ew0153TU SK hynix PC801 HFS001TEJ9X101N; diskspd 2.0.17 f: Ø4259 (3371.17-6487.78)
Lenovo ThinkPad T14 G4 21K4S02000 Samsung PM9A1a MZVL21T0HDLU; diskspd 2.0.17 f: Ø7003 (6443.82-7032.38)
Ayaneo Air 1S Retro Power Ayaneo CyberThunder-2TB: Ø2546 (2208.3-2562.21)
HP Pavilion Plus 14-ey0095cl WDC PC SN810 1TB: Ø4588 (313.32-6954.37)

Graphics card

According to Intel, the new laptop processor's graphics performance is said to be double that of the 13th generation. At any rate, our first benchmarks confirm very high performance with the eight-core Arc iGPU even managing to beat the AMD Radeon 780M convincingly. Intel's dedicated laptop GPUs fall short in our analysis. Even leaving aside the 3D performance, the Acer Swift Go's iGPU performance is astoundingly high.

3DMark Performance Rating - Percent
Acer Swift Go 14 SFG14-72
Intel Arc 8-Cores iGPU, Intel Core Ultra 7 155H
98.9 pt
Average Intel Arc 8-Cores iGPU
 
94.1 pt
Lenovo ThinkPad T14 G4 21K4S02000
AMD Radeon 780M, AMD Ryzen 7 PRO 7840U
86.3 pt
Ayaneo Air 1S Retro Power
AMD Radeon 780M, AMD Ryzen 7 7840U
83.1 pt
HP Pavilion Plus 14-ey0095cl -1!
AMD Radeon 780M, AMD Ryzen 7 7840U
78.6 pt
Average of class Subnotebook
 
64.8 pt
LG Gram 2in1 16 16T90R - G.AA78G
Intel Iris Xe Graphics G7 96EUs, Intel Core i7-1360P
60.2 pt
HP Pavilion Plus 14-ew0153TU
Intel Iris Xe Graphics G7 96EUs, Intel Core i7-1355U
55.8 pt
Acer Swift Go 14 SFG14-71
Intel Iris Xe Graphics G7 80EUs, Intel Core i5-1335U
46.6 pt
3DMark 11 - 1280x720 Performance GPU
Acer Swift Go 14 SFG14-72
Intel Arc 8-Cores iGPU, Intel Core Ultra 7 155H
12866 Points
HP Pavilion Plus 14-ey0095cl
AMD Radeon 780M, AMD Ryzen 7 7840U
11840 Points -8%
Average Intel Arc 8-Cores iGPU
  (8064 - 13716, n=17)
11823 Points -8%
Lenovo ThinkPad T14 G4 21K4S02000
AMD Radeon 780M, AMD Ryzen 7 PRO 7840U
10862 Points -16%
Ayaneo Air 1S Retro Power
AMD Radeon 780M, AMD Ryzen 7 7840U
10671 Points -17%
Average of class Subnotebook
  (2979 - 16904, n=55, last 2 years)
8227 Points -36%
LG Gram 2in1 16 16T90R - G.AA78G
Intel Iris Xe Graphics G7 96EUs, Intel Core i7-1360P
7098 Points -45%
HP Pavilion Plus 14-ew0153TU
Intel Iris Xe Graphics G7 96EUs, Intel Core i7-1355U
6355 Points -51%
Acer Swift Go 14 SFG14-71
Intel Iris Xe Graphics G7 80EUs, Intel Core i5-1335U
5449 Points -58%
3DMark
1280x720 Cloud Gate Standard Graphics
Lenovo ThinkPad T14 G4 21K4S02000
AMD Radeon 780M, AMD Ryzen 7 PRO 7840U
45874 Points +4%
Acer Swift Go 14 SFG14-72
Intel Arc 8-Cores iGPU, Intel Core Ultra 7 155H
43941 Points
Average Intel Arc 8-Cores iGPU
  (35698 - 51286, n=10)
43071 Points -2%
Ayaneo Air 1S Retro Power
AMD Radeon 780M, AMD Ryzen 7 7840U
38676 Points -12%
LG Gram 2in1 16 16T90R - G.AA78G
Intel Iris Xe Graphics G7 96EUs, Intel Core i7-1360P
31618 Points -28%
HP Pavilion Plus 14-ew0153TU
Intel Iris Xe Graphics G7 96EUs, Intel Core i7-1355U
30249 Points -31%
Average of class Subnotebook
  (13768 - 65911, n=39, last 2 years)
29386 Points -33%
Acer Swift Go 14 SFG14-71
Intel Iris Xe Graphics G7 80EUs, Intel Core i5-1335U
24783 Points -44%
1920x1080 Fire Strike Graphics
Acer Swift Go 14 SFG14-72
Intel Arc 8-Cores iGPU, Intel Core Ultra 7 155H
8971 Points
Average Intel Arc 8-Cores iGPU
  (5568 - 9650, n=19)
8228 Points -8%
Ayaneo Air 1S Retro Power
AMD Radeon 780M, AMD Ryzen 7 7840U
7410 Points -17%
Lenovo ThinkPad T14 G4 21K4S02000
AMD Radeon 780M, AMD Ryzen 7 PRO 7840U
7197 Points -20%
HP Pavilion Plus 14-ey0095cl
AMD Radeon 780M, AMD Ryzen 7 7840U
6341 Points -29%
Average of class Subnotebook
  (2837 - 12349, n=59, last 2 years)
6026 Points -33%
LG Gram 2in1 16 16T90R - G.AA78G
Intel Iris Xe Graphics G7 96EUs, Intel Core i7-1360P
5779 Points -36%
HP Pavilion Plus 14-ew0153TU
Intel Iris Xe Graphics G7 96EUs, Intel Core i7-1355U
5263 Points -41%
Acer Swift Go 14 SFG14-71
Intel Iris Xe Graphics G7 80EUs, Intel Core i5-1335U
4468 Points -50%
2560x1440 Time Spy Graphics
Acer Swift Go 14 SFG14-72
Intel Arc 8-Cores iGPU, Intel Core Ultra 7 155H
3172 Points
Average Intel Arc 8-Cores iGPU
  (2018 - 3756, n=22)
3132 Points -1%
Ayaneo Air 1S Retro Power
AMD Radeon 780M, AMD Ryzen 7 7840U
2622 Points -17%
Lenovo ThinkPad T14 G4 21K4S02000
AMD Radeon 780M, AMD Ryzen 7 PRO 7840U
2551 Points -20%
HP Pavilion Plus 14-ey0095cl
AMD Radeon 780M, AMD Ryzen 7 7840U
2321 Points -27%
Average of class Subnotebook
  (811 - 4773, n=58, last 2 years)
2027 Points -36%
LG Gram 2in1 16 16T90R - G.AA78G
Intel Iris Xe Graphics G7 96EUs, Intel Core i7-1360P
1662 Points -48%
HP Pavilion Plus 14-ew0153TU
Intel Iris Xe Graphics G7 96EUs, Intel Core i7-1355U
1566 Points -51%
Acer Swift Go 14 SFG14-71
Intel Iris Xe Graphics G7 80EUs, Intel Core i5-1335U
1279 Points -60%
3DMark 06 Standard Score
 points
3DMark Vantage P Result
43185 points
3DMark 11 Performance
13075 points
3DMark Ice Storm Standard Score
157591 points
3DMark Cloud Gate Standard Score
29783 points
3DMark Fire Strike Score
8314 points
3DMark Time Spy Score
3471 points
Help
Blender - v3.3 Classroom CPU
HP Pavilion Plus 14-ew0153TU
Intel Iris Xe Graphics G7 96EUs, Intel Core i7-1355U
946 Seconds * -138%
Acer Swift Go 14 SFG14-71
Intel Iris Xe Graphics G7 80EUs, Intel Core i5-1335U
737 Seconds * -86%
Average of class Subnotebook
  (336 - 1548, n=54, last 2 years)
624 Seconds * -57%
LG Gram 2in1 16 16T90R - G.AA78G
Intel Iris Xe Graphics G7 96EUs, Intel Core i7-1360P
607 Seconds * -53%
HP Pavilion Plus 14-ey0095cl
AMD Radeon 780M, AMD Ryzen 7 7840U
503 Seconds * -27%
Average Intel Arc 8-Cores iGPU
  (301 - 637, n=18)
456 Seconds * -15%
Ayaneo Air 1S Retro Power
AMD Radeon 780M, AMD Ryzen 7 7840U
434 Seconds * -9%
Lenovo ThinkPad T14 G4 21K4S02000
AMD Radeon 780M, AMD Ryzen 7 PRO 7840U
410 Seconds * -3%
Acer Swift Go 14 SFG14-72
Intel Arc 8-Cores iGPU, Intel Core Ultra 7 155H
397 Seconds *

* ... smaller is better

Gaming performance

With its greatly improved graphics, the Intel Core Ultra 7 155H impresses when gaming, as long as you don't overdo it with the quality settings or resolution. Full HD games at medium or high quality are playable at over 60fps, in most of the games we tested. This means you could do without the type of dGPU found in many laptops such as the GeForce RTX 2050 or the Arc 530M

Performance Rating - Percent
Lenovo ThinkPad T14 G4 21K4S02000
AMD Ryzen 7 PRO 7840U, AMD Radeon 780M
92.6 pt
Ayaneo Air 1S Retro Power
AMD Ryzen 7 7840U, AMD Radeon 780M
91.1 pt
HP Pavilion Plus 14-ey0095cl
AMD Ryzen 7 7840U, AMD Radeon 780M
85.9 pt
Acer Swift Go 14 SFG14-72
Intel Core Ultra 7 155H, Intel Arc 8-Cores iGPU
83 pt
Average of class Subnotebook
 
76.1 pt
LG Gram 2in1 16 16T90R - G.AA78G
Intel Core i7-1360P, Intel Iris Xe Graphics G7 96EUs
67.4 pt
HP Pavilion Plus 14-ew0153TU
Intel Core i7-1355U, Intel Iris Xe Graphics G7 96EUs
54.3 pt
Acer Swift Go 14 SFG14-71
Intel Core i5-1335U, Intel Iris Xe Graphics G7 80EUs
54.1 pt
The Witcher 3 - 1920x1080 Ultra Graphics & Postprocessing (HBAO+)
Ayaneo Air 1S Retro Power
AMD Ryzen 7 7840U, AMD Radeon 780M
26.3 (24min, 24P1) fps +13%
HP Pavilion Plus 14-ey0095cl
AMD Ryzen 7 7840U, AMD Radeon 780M
26.1 (25min) fps +12%
Lenovo ThinkPad T14 G4 21K4S02000
AMD Ryzen 7 PRO 7840U, AMD Radeon 780M
25.3 (20min) fps +9%
Acer Swift Go 14 SFG14-72
Intel Core Ultra 7 155H, Intel Arc 8-Cores iGPU
23.3 (22min, 22P1) fps
Average of class Subnotebook
  (8 - 44.2, n=57, last 2 years)
18.9 fps -19%
LG Gram 2in1 16 16T90R - G.AA78G
Intel Core i7-1360P, Intel Iris Xe Graphics G7 96EUs
13.9 (13min, 13P1) fps -40%
HP Pavilion Plus 14-ew0153TU
Intel Core i7-1355U, Intel Iris Xe Graphics G7 96EUs
13.2 (12min, 12P1) fps -43%
Acer Swift Go 14 SFG14-71
Intel Core i5-1335U, Intel Iris Xe Graphics G7 80EUs
13.1 (6.5min, 7.63P0.1, 8.62P1) fps -44%
GTA V - 1920x1080 Highest Settings possible AA:4xMSAA + FX AF:16x
Ayaneo Air 1S Retro Power
AMD Ryzen 7 7840U, AMD Radeon 780M
26 (3.2min, 16.4P1) fps +98%
Lenovo ThinkPad T14 G4 21K4S02000
AMD Ryzen 7 PRO 7840U, AMD Radeon 780M
25.1 (2.96min, 17.2P1) fps +92%
HP Pavilion Plus 14-ey0095cl
AMD Ryzen 7 7840U, AMD Radeon 780M
20.4 (1.148min, 12.8P1) fps +56%
Average of class Subnotebook
  (5.01 - 67.5, n=47, last 2 years)
16.4 fps +25%
Acer Swift Go 14 SFG14-72
Intel Core Ultra 7 155H, Intel Arc 8-Cores iGPU
13.1 (2.12min, 9.35P1) fps
LG Gram 2in1 16 16T90R - G.AA78G
Intel Core i7-1360P, Intel Iris Xe Graphics G7 96EUs
9.85 (1.911min, 5.46P1) fps -25%
HP Pavilion Plus 14-ew0153TU
Intel Core i7-1355U, Intel Iris Xe Graphics G7 96EUs
9.38 (3.42min, 6.02P1) fps -28%
Acer Swift Go 14 SFG14-71
Intel Core i5-1335U, Intel Iris Xe Graphics G7 80EUs
9.23 (4.42min, 5.41P1) fps -30%
Final Fantasy XV Benchmark - 1920x1080 High Quality
Lenovo ThinkPad T14 G4 21K4S02000
AMD Ryzen 7 PRO 7840U, AMD Radeon 780M
26.5 fps +46%
Ayaneo Air 1S Retro Power
AMD Ryzen 7 7840U, AMD Radeon 780M
24.4 fps +34%
HP Pavilion Plus 14-ey0095cl
AMD Ryzen 7 7840U, AMD Radeon 780M
24.1 fps +32%
Average of class Subnotebook
  (5.24 - 50.1, n=51, last 2 years)
20.4 fps +12%
Acer Swift Go 14 SFG14-72
Intel Core Ultra 7 155H, Intel Arc 8-Cores iGPU
18.2 fps
LG Gram 2in1 16 16T90R - G.AA78G
Intel Core i7-1360P, Intel Iris Xe Graphics G7 96EUs
17.2 fps -5%
HP Pavilion Plus 14-ew0153TU
Intel Core i7-1355U, Intel Iris Xe Graphics G7 96EUs
16.8 fps -8%
Acer Swift Go 14 SFG14-71
Intel Core i5-1335U, Intel Iris Xe Graphics G7 80EUs
15.1 fps -17%
Strange Brigade - 1920x1080 ultra AA:ultra AF:16
Ayaneo Air 1S Retro Power
AMD Ryzen 7 7840U, AMD Radeon 780M
45.4 (33.1min, 36.3P1) fps +5%
Lenovo ThinkPad T14 G4 21K4S02000
AMD Ryzen 7 PRO 7840U, AMD Radeon 780M
44.6 (14.6min, 22.9P1) fps +3%
HP Pavilion Plus 14-ey0095cl
AMD Ryzen 7 7840U, AMD Radeon 780M
43.4 (7.3min, 9.3P1) fps 0%
Acer Swift Go 14 SFG14-72
Intel Core Ultra 7 155H, Intel Arc 8-Cores iGPU
43.2 (5.5min, 11.5P1) fps
Average of class Subnotebook
  (17.7 - 86, n=51, last 2 years)
33.4 fps -23%
LG Gram 2in1 16 16T90R - G.AA78G
Intel Core i7-1360P, Intel Iris Xe Graphics G7 96EUs
28.5 (5.7min, 7.83P1) fps -34%
HP Pavilion Plus 14-ew0153TU
Intel Core i7-1355U, Intel Iris Xe Graphics G7 96EUs
23.4 (5.4min, 6.24P1) fps -46%
Acer Swift Go 14 SFG14-71
Intel Core i5-1335U, Intel Iris Xe Graphics G7 80EUs
22.2 (5min, 6.24P1) fps -49%
Dota 2 Reborn - 1920x1080 ultra (3/3) best looking
Acer Swift Go 14 SFG14-72
Intel Core Ultra 7 155H, Intel Arc 8-Cores iGPU
73.4 (47.4min) fps
Lenovo ThinkPad T14 G4 21K4S02000
AMD Ryzen 7 PRO 7840U, AMD Radeon 780M
67 (58.8min) fps -9%
LG Gram 2in1 16 16T90R - G.AA78G
Intel Core i7-1360P, Intel Iris Xe Graphics G7 96EUs
62.9 (53.2min) fps -14%
HP Pavilion Plus 14-ey0095cl
AMD Ryzen 7 7840U, AMD Radeon 780M
62 (50.9min) fps -16%
Average of class Subnotebook
  (29.4 - 109.1, n=58, last 2 years)
59.6 fps -19%
Ayaneo Air 1S Retro Power
AMD Ryzen 7 7840U, AMD Radeon 780M
57 (50min) fps -22%
Acer Swift Go 14 SFG14-71
Intel Core i5-1335U, Intel Iris Xe Graphics G7 80EUs
56.5 (49.9min) fps -23%
HP Pavilion Plus 14-ew0153TU
Intel Core i7-1355U, Intel Iris Xe Graphics G7 96EUs
47.1 (38.4min) fps -36%
X-Plane 11.11 - 1920x1080 high (fps_test=3)
LG Gram 2in1 16 16T90R - G.AA78G
Intel Core i7-1360P, Intel Iris Xe Graphics G7 96EUs
37.95 fps +5%
Acer Swift Go 14 SFG14-72
Intel Core Ultra 7 155H, Intel Arc 8-Cores iGPU
36.1 fps
Average of class Subnotebook
  (21.2 - 97.1, n=55, last 2 years)
34.1 fps -6%
Ayaneo Air 1S Retro Power
AMD Ryzen 7 7840U, AMD Radeon 780M
29.1 fps -19%
Lenovo ThinkPad T14 G4 21K4S02000
AMD Ryzen 7 PRO 7840U, AMD Radeon 780M
27.9 fps -23%
HP Pavilion Plus 14-ey0095cl
AMD Ryzen 7 7840U, AMD Radeon 780M
25.4 fps -30%
HP Pavilion Plus 14-ew0153TU
Intel Core i7-1355U, Intel Iris Xe Graphics G7 96EUs
23 fps -36%
Acer Swift Go 14 SFG14-71
Intel Core i5-1335U, Intel Iris Xe Graphics G7 80EUs
21.4 fps -41%
The Witcher 3
1024x768 Low Graphics & Postprocessing
Average Intel Arc 8-Cores iGPU
  (92 - 157, n=15)
132.5 fps
Lenovo ThinkPad T14 G4 21K4S02000
AMD Ryzen 7 PRO 7840U, AMD Radeon 780M
119.8 (102min) fps
HP Pavilion Plus 14-ey0095cl
AMD Ryzen 7 7840U, AMD Radeon 780M
117.3 (97min) fps
Average of class Subnotebook
  (37 - 249, n=53, last 2 years)
102.1 fps
SCHENKER Vision 14 2023
Intel Core i7-13700H, Intel Iris Xe Graphics G7 96EUs
94 fps
Acer Swift Go 14 SFG14-71
Intel Core i5-1335U, Intel Iris Xe Graphics G7 80EUs
79.8 (3.84min, 10.1P0.1, 36.8P1) fps
HP Pavilion Plus 14-ew0153TU
Intel Core i7-1355U, Intel Iris Xe Graphics G7 96EUs
73.5 (46min, 52.56P1) fps
1366x768 Medium Graphics & Postprocessing
HP Pavilion Plus 14-ey0095cl
AMD Ryzen 7 7840U, AMD Radeon 780M
85.9 (74min) fps
Average Intel Arc 8-Cores iGPU
  (59 - 100, n=15)
82.3 fps
Lenovo ThinkPad T14 G4 21K4S02000
AMD Ryzen 7 PRO 7840U, AMD Radeon 780M
82 (74min) fps
Ayaneo Air 1S Retro Power
AMD Ryzen 7 7840U, AMD Radeon 780M
75.3 (44min, 55.16P1) fps
Average of class Subnotebook
  (29 - 264, n=46, last 2 years)
63.7 fps
SCHENKER Vision 14 2023
Intel Core i7-13700H, Intel Iris Xe Graphics G7 96EUs
63 fps
Acer Swift Go 14 SFG14-71
Intel Core i5-1335U, Intel Iris Xe Graphics G7 80EUs
52.3 (7.14min, 25.6P0.1, 30.6P1) fps
HP Pavilion Plus 14-ew0153TU
Intel Core i7-1355U, Intel Iris Xe Graphics G7 96EUs
50.8 (43min, 43P1) fps
LG Gram 2in1 16 16T90R - G.AA78G
Intel Core i7-1360P, Intel Iris Xe Graphics G7 96EUs
37.2 (10min) fps
1920x1080 High Graphics & Postprocessing (Nvidia HairWorks Off)
Average Intel Arc 8-Cores iGPU
  (36 - 57, n=15)
47.2 fps
HP Pavilion Plus 14-ey0095cl
AMD Ryzen 7 7840U, AMD Radeon 780M
45 (40min) fps
Lenovo ThinkPad T14 G4 21K4S02000
AMD Ryzen 7 PRO 7840U, AMD Radeon 780M
40.7 (34min) fps
SCHENKER Vision 14 2023
Intel Core i7-13700H, Intel Iris Xe Graphics G7 96EUs
36 fps
Ayaneo Air 1S Retro Power
AMD Ryzen 7 7840U, AMD Radeon 780M
34.9 (32min, 32P1) fps
Average of class Subnotebook
  (11.2 - 92, n=56, last 2 years)
34.9 fps
Acer Swift Go 14 SFG14-71
Intel Core i5-1335U, Intel Iris Xe Graphics G7 80EUs
28.1 (2.43min, 10.4P0.1, 16.1P1) fps
HP Pavilion Plus 14-ew0153TU
Intel Core i7-1355U, Intel Iris Xe Graphics G7 96EUs
28 (24min, 24P1) fps
1920x1080 Ultra Graphics & Postprocessing (HBAO+)
Ayaneo Air 1S Retro Power
AMD Ryzen 7 7840U, AMD Radeon 780M
26.3 (24min, 24P1) fps +13%
HP Pavilion Plus 14-ey0095cl
AMD Ryzen 7 7840U, AMD Radeon 780M
26.1 (25min) fps +12%
Lenovo ThinkPad T14 G4 21K4S02000
AMD Ryzen 7 PRO 7840U, AMD Radeon 780M
25.3 (20min) fps +9%
Acer Swift Go 14 SFG14-72
Intel Core Ultra 7 155H, Intel Arc 8-Cores iGPU
23.3 (22min, 22P1) fps
Average Intel Arc 8-Cores iGPU
  (14.5 - 28, n=19)
22.5 fps -3%
Average of class Subnotebook
  (8 - 44.2, n=57, last 2 years)
18.9 fps -19%
SCHENKER Vision 14 2023
Intel Core i7-13700H, Intel Iris Xe Graphics G7 96EUs
14.8 (13min, 14P1) fps -36%
LG Gram 2in1 16 16T90R - G.AA78G
Intel Core i7-1360P, Intel Iris Xe Graphics G7 96EUs
13.9 (13min, 13P1) fps -40%
HP Pavilion Plus 14-ew0153TU
Intel Core i7-1355U, Intel Iris Xe Graphics G7 96EUs
13.2 (12min, 12P1) fps -43%
Acer Swift Go 14 SFG14-71
Intel Core i5-1335U, Intel Iris Xe Graphics G7 80EUs
13.1 (6.5min, 7.63P0.1, 8.62P1) fps -44%

The near doubling of the graphics performance becomes evident when taking a look at the frame rates in The Witcher 3 in ultra-quality settings. The Swift Go 14 almost delivers double the frames per second as the Schenker Vision 14

Witcher 3 FPS diagram

0510152025Tooltip
Acer Swift Go 14 SFG14-72 Ultra 7 155H, Arc 8-Cores: Ø23.3 (22-26)
SCHENKER Vision 14 2023 i7-13700H, Iris Xe G7 96EUs: Ø14.8 (13-16)
low med. high ultraQHD
GTA V (2015) 124.1 120.8 34.8 13.1
The Witcher 3 (2015) 23.3
Dota 2 Reborn (2015) 99.4 90.4 76 73.4
Final Fantasy XV Benchmark (2018) 42.8 32.1 18.2 14
X-Plane 11.11 (2018) 54.5 42.5 36.1
Far Cry 5 (2018) 35 33
Strange Brigade (2018) 141.9 60.6 52 43.2
Horizon Zero Dawn (2020) 33 28 () 26
Dying Light 2 (2022) 31.1 29.9
Hogwarts Legacy (2023) 25.7 19.3 15.6
F1 23 (2023) 64.6 59 35.9 12.2
Ratchet & Clank Rift Apart (2023) 28.4 29 25.9 21.1
Baldur's Gate 3 (2023) 22.8 20.6 19.1
Starfield (2023) 11.5
Cyberpunk 2077 2.0 Phantom Liberty (2023) 34.1 29.6 24 13.1
EA Sports WRC (2023) 35.8 26.6 24.7 22.4

NPU performance

A Neural Processing Unit can be found inside the Intel Core Ultra 7 155H. This part of the processor is tasked with processing AI applications very efficiently. That means models such as Stable Diffusion or language models can already run on the device. Using the UL Procyon AI Interface benchmark, we put the GPU head-to-head with the NPU and simultaneously checked the power consumption. In both scenarios, it quickly became clear that the NPU's performance was only slightly below that of the Arc iGPU when it came to processing neural networks but the energy requirements were nearly halved. This definitely makes the AI accelerator more efficient than the graphics chip for the same applications.

Therefore, it's feasible that many of the AI applications which currently run via the cloud could soon be running locally on the laptop itself, in an energy-efficient manner, without the need for an internet connection.

Power consumption UL Procyon Ai Inference benchmark on an external monitor

0510152025303540455055606570Tooltip
Acer Swift Go 14 SFG14-72; UL Procyon AI GPU Integer Power Consumption - external Monitor: Ø32.9 (7.31-73.5)
Acer Swift Go 14 SFG14-72; UL Procyon AI NPU Integer Power Consumption - external Monitor: Ø17.1 (6.15-71.5)
UL Procyon AI Inference for Windows
Acer Swift Go 14 SFG14-72
Arc 8-Cores, Ultra 7 155H, SK hynix HFS001TEJ9X110NA
Overall Score Integer NPU
493 Points ∼100%
Overall Score Integer GPU
541 Points ∼100%

Intel kindly provided us with a version of Gimp that already includes Stable Diffusion with OpenVINO and NPU support. After a lengthy setup, the text-to-image program worked surprisingly quickly. Up to now, it was possible to run Stable Diffusion on Arc graphics cards.

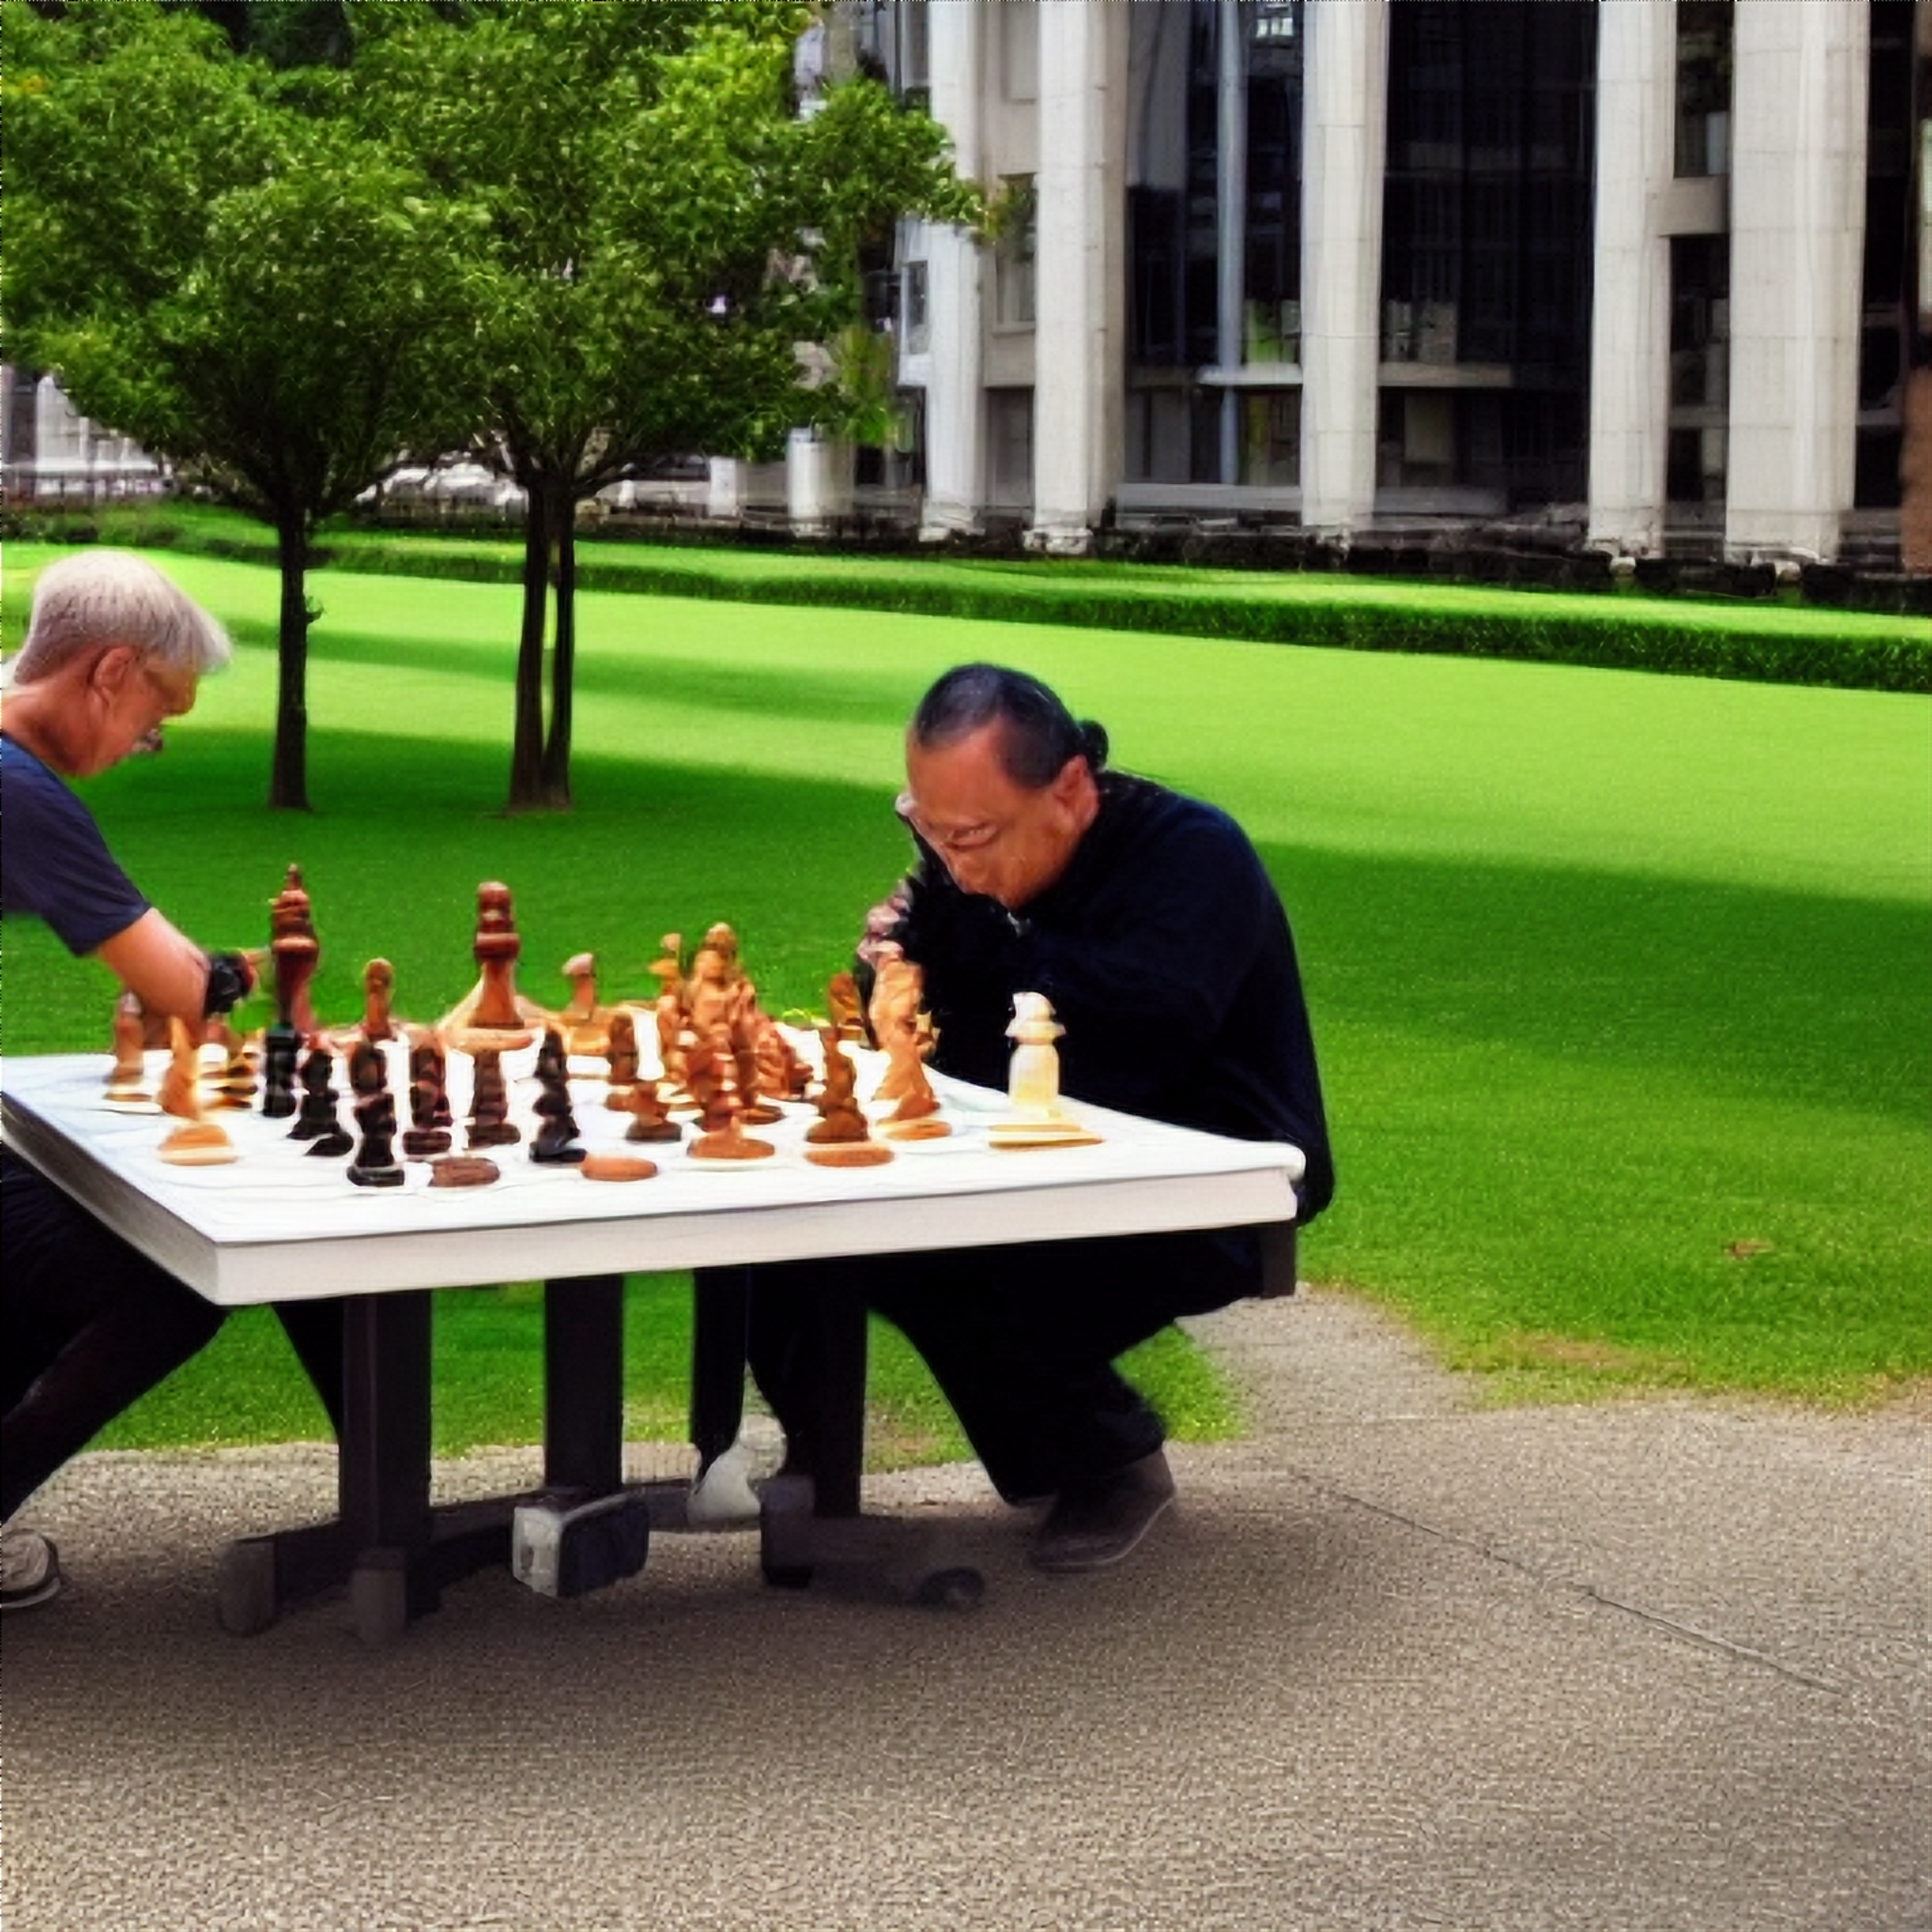
Admittedly, not every image created by the neural network is particularly usable. Stable Diffusion only has a limited ability to handle faces, feet and hands, viewed from a distance. But, the tasks you set for the program should also be defined as clearly as possible. Some experience is necessary in this area to ensure to get what you asked for. 

Emissions - Remaining mostly quiet

Noise emissions

Despite the high-level performance, the new Acer Swift Go hasn't gotten any louder. At almost 45 dB(A) under full load, you couldn't really call it quiet but it is tolerable. The Acer Swift Go handles small and medium-sized tasks usually without the audible presence of the fan. 

Noise Level

Idle
25 / 25 / 26.2 dB(A)
Load
35.7 / 45.5 dB(A)
  red to green bar
 
 
30 dB
silent
40 dB(A)
audible
50 dB(A)
loud
 
min: dark, med: mid, max: light   Earthworks M23R, Arta (15 cm distance)   environment noise: 25 dB(A)
dB(A) 0102030405060708090Deep BassMiddle BassHigh BassLower RangeMidsHigher MidsLower HighsMid HighsUpper HighsSuper Highs2037.841.74040.4253332.13429.83131.227.828.532.24033.737.134.235.55032.132.532.634.56337.233.632.234.78030.22835.828.110024.519.828.523.112519.217.320.617.116018.116.718.117.520019.515.717.721.72501920.317.621.33152418.715.122.340023.816.21624.150024.316.615.225.963027.113.713.227.880034.415.211.535.6100038.418.211.239.1125034.917.110.836.2160034.814.611.2362000341411.435.6250034.414.212.135.2315034.713.61235.9400033.813.51235.7500033.614.41234.9630033.814.412.635.4800026.614.312.327.71000023.513.812.824.21250019.913.912.319.61600017.613.111.415.2SPL45.827.32547N4.60.80.65.1median 26.6median 14.6median 12.3median 27.7Delta7.41.42.57.643.844.841.436.139.53838.340.142.539.442.639.736.739.939.427.831.732.218.518.120.218.22021.917.218.620.420.517.618.623.918.922.416.413.719.213.912.12115.711.625.514.611.922.717.111.924.516.311.224.220.611.626.719.911.627.720.711.831.820.411.831.318.512.230.321.912.633.621.41333.41913.234.721.613.633.817.913.630.417.113.722.217.913.719.317.713.116.131.92543.21.40.53.8median 18.2median 13median 24.52.32.15.3hearing rangehide median Fan NoiseAcer Swift Go 14 SFG14-72Acer Swift Go 14 SFG14-71
Acer Swift Go 14 SFG14-72
Arc 8-Cores, Ultra 7 155H, SK hynix HFS001TEJ9X110NA
Acer Swift Go 14 SFG14-71
Iris Xe G7 80EUs, i5-1335U, WD PC SN740 SDDQNQD-512G-1014
LG Gram 2in1 16 16T90R - G.AA78G
Iris Xe G7 96EUs, i7-1360P, Samsung PM9A1 MZVL21T0HCLR
HP Pavilion Plus 14-ew0153TU
Iris Xe G7 96EUs, i7-1355U, SK hynix PC801 HFS001TEJ9X101N
Lenovo ThinkPad T14 G4 21K4S02000
Radeon 780M, R7 PRO 7840U, Samsung PM9A1a MZVL21T0HDLU
Ayaneo Air 1S Retro Power
Radeon 780M, R7 7840U, Ayaneo CyberThunder-2TB
HP Pavilion Plus 14-ey0095cl
Radeon 780M, R7 7840U, WDC PC SN810 1TB
Noise
4%
5%
20%
14%
3%
6%
off / environment *
25
24.9
-0%
25.1
-0%
19.35
23%
23.1
8%
23
8%
23.4
6%
Idle Minimum *
25
24.9
-0%
25.1
-0%
20.57
18%
23.1
8%
24.7
1%
24.1
4%
Idle Average *
25
24.9
-0%
25.1
-0%
20.57
18%
23.1
8%
25.2
-1%
24.1
4%
Idle Maximum *
26.2
24.9
5%
26.1
-0%
20.57
21%
23.1
12%
25.2
4%
25.3
3%
Load Average *
35.7
31.9
11%
31.4
12%
32.18
10%
26.5
26%
32.1
10%
33.4
6%
Load Maximum *
45.5
43.2
5%
36.6
20%
32.26
29%
35.78
21%
47.1
-4%
39.4
13%
Witcher 3 ultra *
43.2
41.1
29.44
35.7
39.4

* ... smaller is better

Temperature

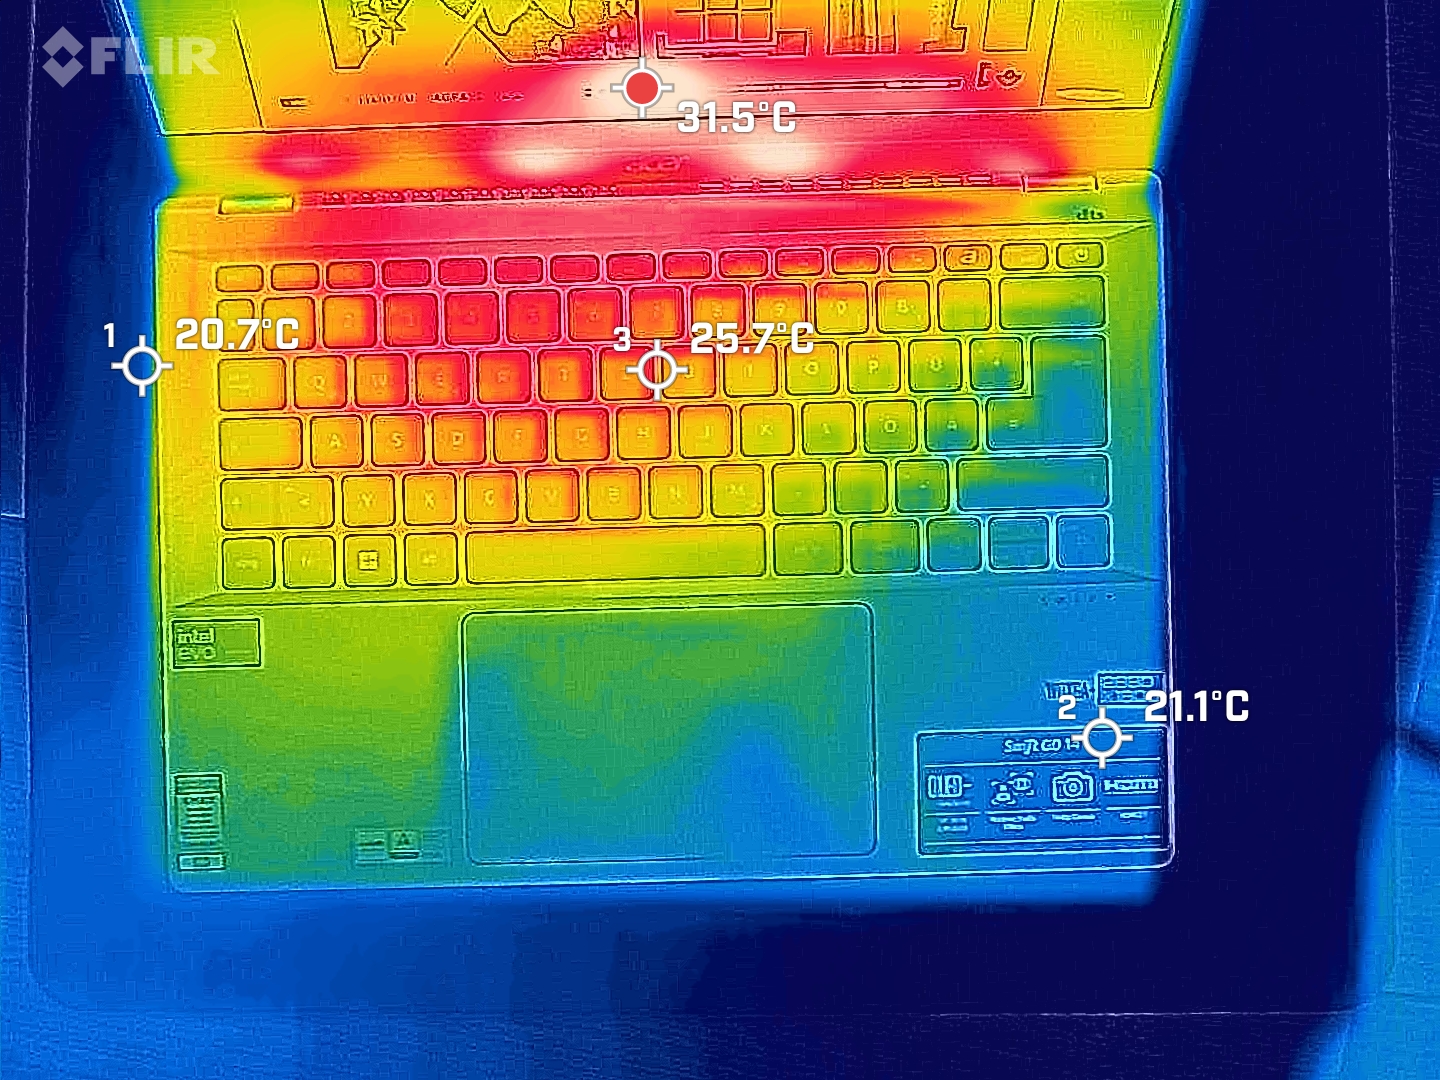
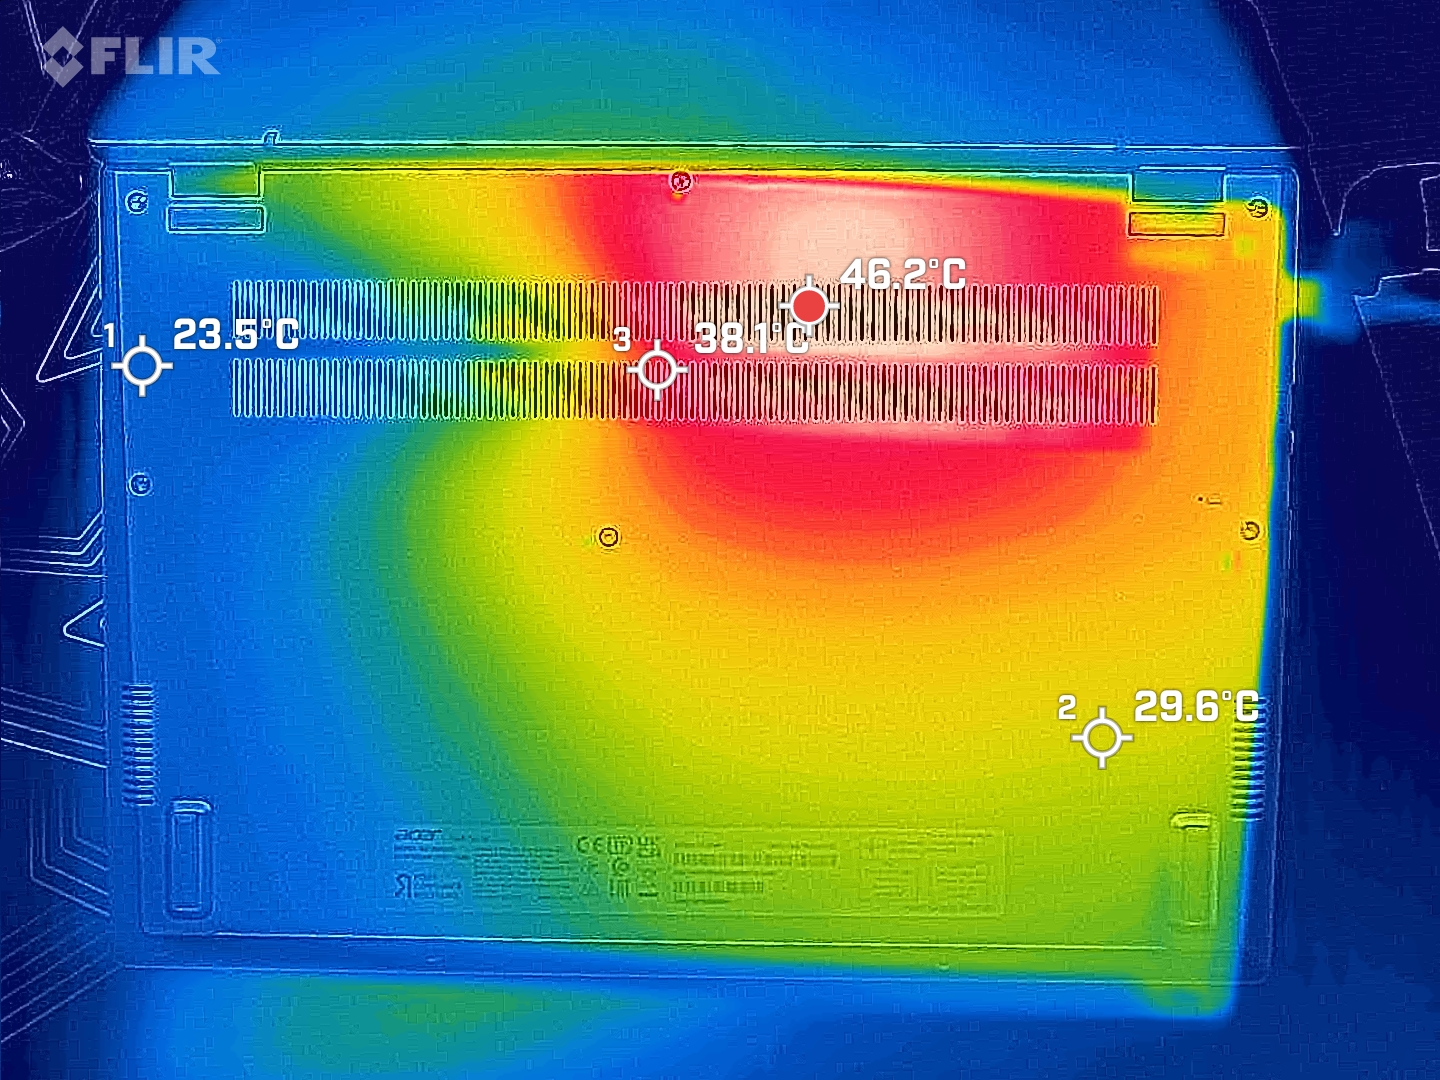
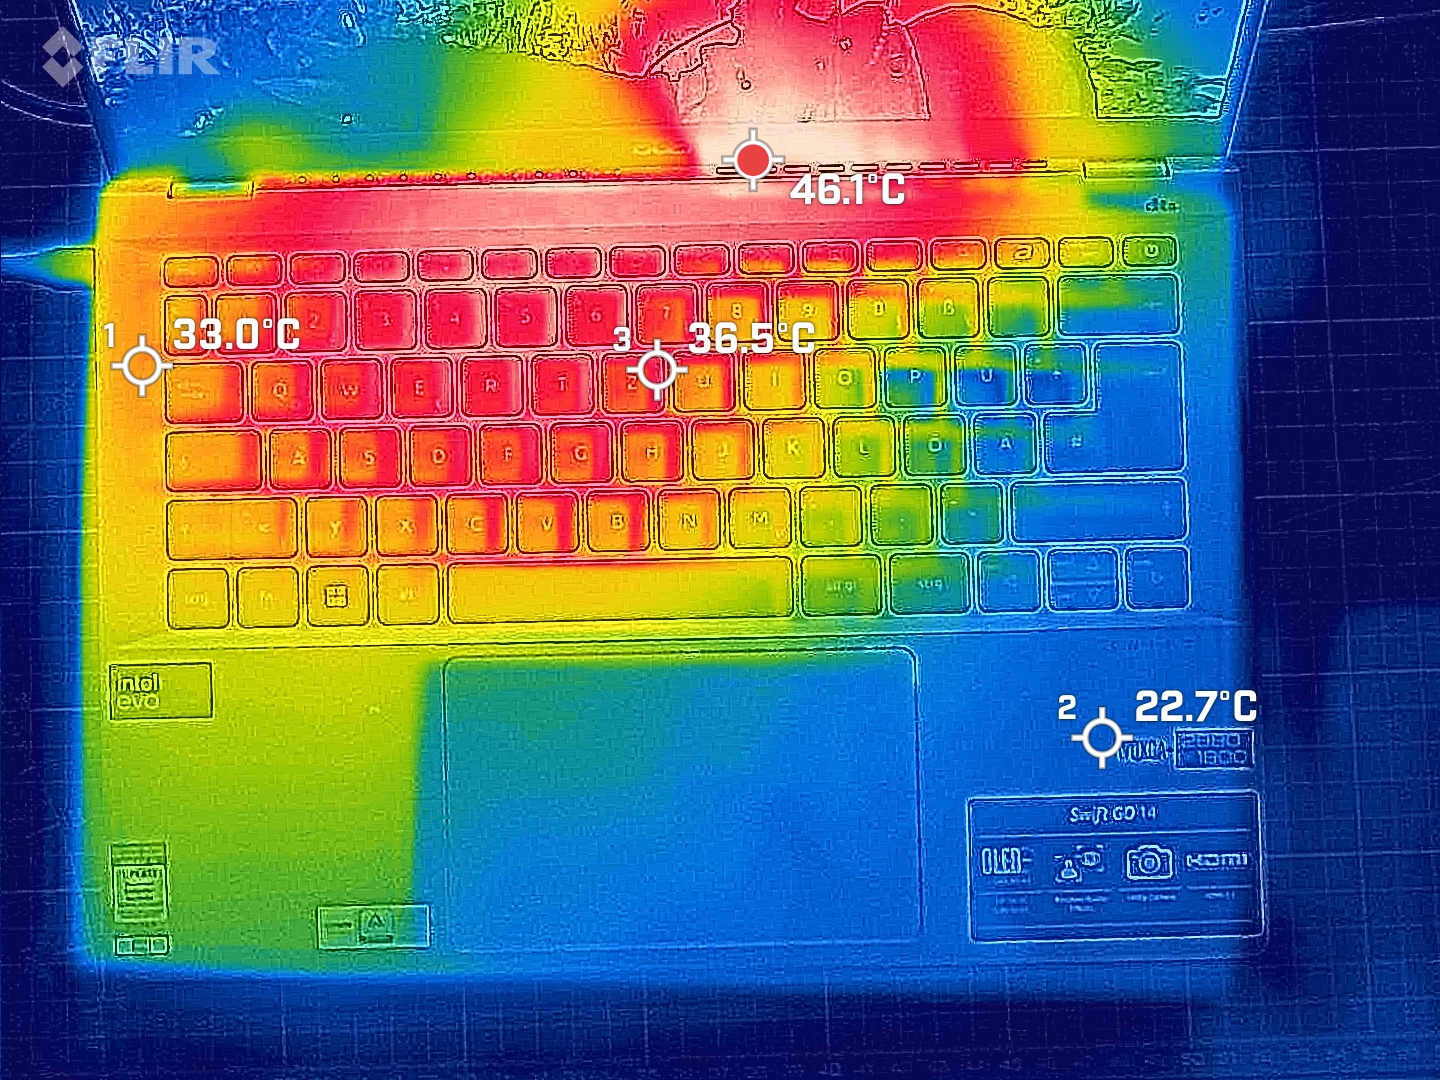
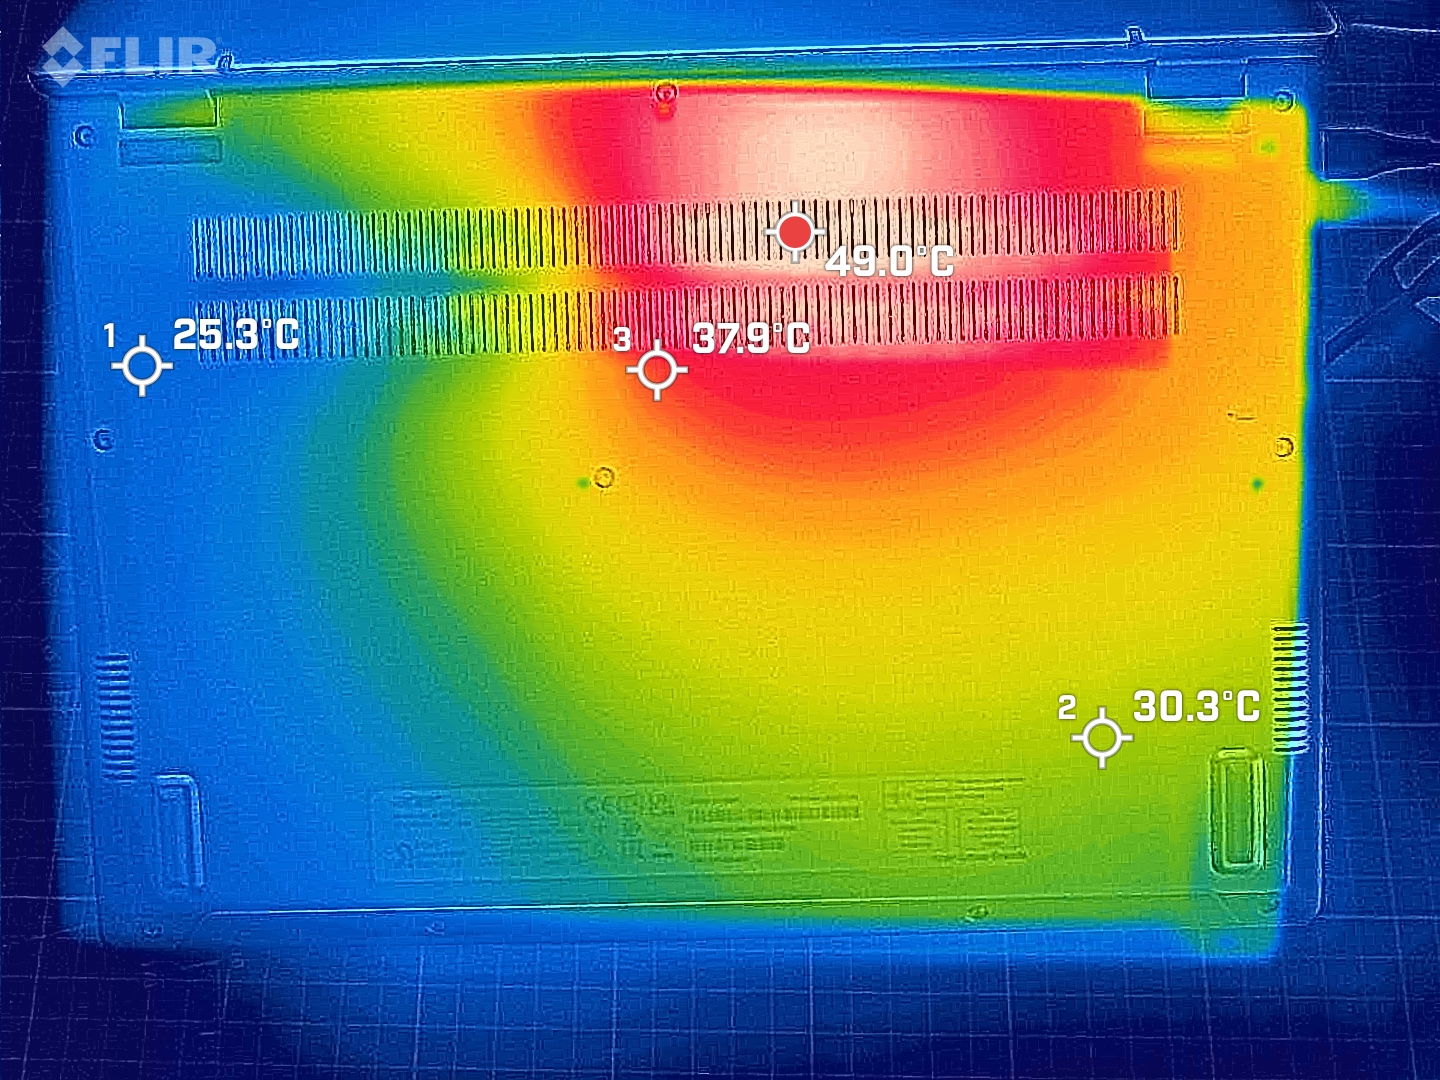
Unfortunately, what hasn't changed is the laptop's very high surface temperatures which we measured during testing. The bar behind the keyboard even managed to hit 40 °C. However, the area which heats up the most is the screen, onto which the fan's expelled air is directed.  Despite this, under normal operation when surfing the internet or using office applications, the laptop's surface only heats up to a little over room temperature.

Max. Load
 34.2 °C
94 F
36.5 °C
98 F
27.5 °C
82 F
 
 33.1 °C
92 F
34.5 °C
94 F
22.7 °C
73 F
 
 26.2 °C
79 F
22.5 °C
73 F
22.7 °C
73 F
 
Maximum: 36.5 °C = 98 F
Average: 28.9 °C = 84 F
25.3 °C
78 F
49.5 °C
121 F
45.2 °C
113 F
25.5 °C
78 F
37.8 °C
100 F
37.4 °C
99 F
22.5 °C
73 F
27.2 °C
81 F
30.1 °C
86 F
Maximum: 49.5 °C = 121 F
Average: 33.4 °C = 92 F
Power Supply (max.)  45.5 °C = 114 F | Room Temperature 21.1 °C = 70 F | Fluke t3000FC (calibrated), FIRT 550-Pocket
(+) The average temperature for the upper side under maximal load is 28.9 °C / 84 F, compared to the average of 30.7 °C / 87 F for the devices in the class Subnotebook.
(+) The maximum temperature on the upper side is 36.5 °C / 98 F, compared to the average of 35.9 °C / 97 F, ranging from 21.4 to 59 °C for the class Subnotebook.
(-) The bottom heats up to a maximum of 49.5 °C / 121 F, compared to the average of 39.4 °C / 103 F
(+) In idle usage, the average temperature for the upper side is 22.6 °C / 73 F, compared to the device average of 30.7 °C / 87 F.
(+) The palmrests and touchpad are cooler than skin temperature with a maximum of 26.2 °C / 79.2 F and are therefore cool to the touch.
(+) The average temperature of the palmrest area of similar devices was 28.3 °C / 82.9 F (+2.1 °C / 3.7 F).
Idle top
Idle top
Idle bottom
Idle bottom
Load top
Load top
Load bottom
Load bottom
Acer Swift Go 14 SFG14-72
Intel Core Ultra 7 155H, Intel Arc 8-Cores iGPU
Acer Swift Go 14 SFG14-71
Intel Core i5-1335U, Intel Iris Xe Graphics G7 80EUs
LG Gram 2in1 16 16T90R - G.AA78G
Intel Core i7-1360P, Intel Iris Xe Graphics G7 96EUs
HP Pavilion Plus 14-ew0153TU
Intel Core i7-1355U, Intel Iris Xe Graphics G7 96EUs
Lenovo ThinkPad T14 G4 21K4S02000
AMD Ryzen 7 PRO 7840U, AMD Radeon 780M
Ayaneo Air 1S Retro Power
AMD Ryzen 7 7840U, AMD Radeon 780M
HP Pavilion Plus 14-ey0095cl
AMD Ryzen 7 7840U, AMD Radeon 780M
Heat
-2%
-22%
4%
3%
-30%
12%
Maximum Upper Side *
36.5
44.8
-23%
55
-51%
36.6
-0%
43.5
-19%
55
-51%
39
-7%
Maximum Bottom *
49.5
34.8
30%
55.4
-12%
37.2
25%
47.4
4%
53.2
-7%
35.8
28%
Idle Upper Side *
25.5
30.7
-20%
34.9
-37%
31.6
-24%
24.9
2%
37.1
-45%
25.2
1%
Idle Bottom *
35
32.5
7%
30
14%
30
14%
26
26%
40.1
-15%
25.6
27%

* ... smaller is better

Stress test

As already mentioned, we set the processor's boost performance to a level slightly below Acer's set value. Our stress test revealed that the Core Ultra 7's continuous performance setting (PL1) sits somewhat too high. After a while, it settles to around 43 watts instead of 45 but manages to maintain its performance level there in the long run.

Speakers

Overall, the Acer Swift Go's speakers sound good. Only the bass could pack a bit more punch. We were unable to discern a difference to the predecessor.

dB(A) 0102030405060708090Deep BassMiddle BassHigh BassLower RangeMidsHigher MidsLower HighsMid HighsUpper HighsSuper Highs2042.94037.92535.63429.63133.628.529.94038.834.240.8503732.635.46334.432.229.88027.735.82710021.128.521.512518.820.616.516032.418.123.22004717.736.425051.217.641.331555.415.144.340060165050068.115.258.163069.313.25980074.111.564.1100073.611.263.4125075.710.865.2160076.311.265.920007811.467.5250074.612.164.1315078.41268.34000771266.6500067.31256.9630069.512.659.3800063.612.353.31000061.312.8511250059.412.349.11600058.411.448SPL86.72576.3N62.50.633.4median 67.3median 12.3median 56.9Delta11.62.512.144.84239.536.940.137.642.640.739.938.131.728.518.1192018.918.62117.633.818.944.513.747.112.15411.665.811.966.511.967.211.267.211.671.911.674.511.875.411.869.412.270.812.6671368.113.262.713.66713.665.313.764.513.760.913.156.82582.10.548.2median 13median 65.82.18.1hearing rangehide median Pink NoiseAcer Swift Go 14 SFG14-72Acer Swift Go 14 SFG14-71
Frequency diagram (checkboxes can be checked and unchecked to compare devices)
Acer Swift Go 14 SFG14-72 audio analysis

(+) | speakers can play relatively loud (86.7 dB)
Bass 100 - 315 Hz
(-) | nearly no bass - on average 29.6% lower than median
(±) | linearity of bass is average (13.8% delta to prev. frequency)
Mids 400 - 2000 Hz
(±) | higher mids - on average 6.4% higher than median
(+) | mids are linear (5.4% delta to prev. frequency)
Highs 2 - 16 kHz
(±) | higher highs - on average 5.7% higher than median
(±) | linearity of highs is average (7.4% delta to prev. frequency)
Overall 100 - 16.000 Hz
(±) | linearity of overall sound is average (22.6% difference to median)
Compared to same class
» 73% of all tested devices in this class were better, 5% similar, 22% worse
» The best had a delta of 5%, average was 19%, worst was 53%
Compared to all devices tested
» 62% of all tested devices were better, 6% similar, 32% worse
» The best had a delta of 4%, average was 25%, worst was 134%

Acer Swift Go 14 SFG14-71 audio analysis

(+) | speakers can play relatively loud (82.1 dB)
Bass 100 - 315 Hz
(-) | nearly no bass - on average 29.2% lower than median
(±) | linearity of bass is average (11.1% delta to prev. frequency)
Mids 400 - 2000 Hz
(+) | balanced mids - only 3.9% away from median
(+) | mids are linear (6.5% delta to prev. frequency)
Highs 2 - 16 kHz
(+) | balanced highs - only 2.1% away from median
(+) | highs are linear (5% delta to prev. frequency)
Overall 100 - 16.000 Hz
(±) | linearity of overall sound is average (20.4% difference to median)
Compared to same class
» 39% of all tested devices in this class were better, 11% similar, 51% worse
» The best had a delta of 7%, average was 22%, worst was 53%
Compared to all devices tested
» 48% of all tested devices were better, 8% similar, 44% worse
» The best had a delta of 4%, average was 25%, worst was 134%

Energy management - Meteor Lake can be economical

Power consumption

Intel's new Meteor Lake processors are said to be significantly more energy efficient than its predecessor. This was not entirely obvious to us in our tests, but, once more, this highlights the installed software's beta status. Strong fluctuations are apparent in nearly every energy measurement which indicates smaller load peaks. 

Power Consumption
Off / Standbydarklight 0.4 / 0.4 Watt
Idledarkmidlight 5.5 / 10.1 / 11.2 Watt
Load midlight 45.9 / 104.1 Watt
 color bar
Key: min: dark, med: mid, max: light        Metrahit Energy
Currently we use the Metrahit Energy, a professional single phase power quality and energy measurement digital multimeter, for our measurements. Find out more about it here. All of our test methods can be found here.
Acer Swift Go 14 SFG14-72
Ultra 7 155H, Arc 8-Cores, SK hynix HFS001TEJ9X110NA, OLED, 2880x1800, 14.00
LG Gram 2in1 16 16T90R - G.AA78G
i7-1360P, Iris Xe G7 96EUs, Samsung PM9A1 MZVL21T0HCLR, IPS, 2560x1600, 16.00
HP Pavilion Plus 14-ew0153TU
i7-1355U, Iris Xe G7 96EUs, SK hynix PC801 HFS001TEJ9X101N, OLED, 2880x1800, 14.00
Lenovo ThinkPad T14 G4 21K4S02000
R7 PRO 7840U, Radeon 780M, Samsung PM9A1a MZVL21T0HDLU, IPS LED, 1920x1200, 14.00
Ayaneo Air 1S Retro Power
R7 7840U, Radeon 780M, Ayaneo CyberThunder-2TB, OLED, 1920x1080, 5.50
HP Pavilion Plus 14-ey0095cl
R7 7840U, Radeon 780M, WDC PC SN810 1TB, OLED, 2880x1800, 14.00
Average Intel Arc 8-Cores iGPU
 
Average of class Subnotebook
 
Power Consumption
9%
14%
38%
22%
15%
5%
14%
Idle Minimum *
5.5
5.5
-0%
6.7
-22%
3.3
40%
7.01
-27%
6
-9%
4.96 ?(3 - 9.1, n=15)
10%
Idle Average *
10.1
7.2
29%
7.16
29%
5.6
45%
7.91
22%
6.5
36%
Idle Maximum *
11.2
12.9
-15%
11.17
-0%
6.1
46%
12.3
-10%
13.9
-24%
12.8 ?(4.9 - 49, n=15)
-14%
Load Average *
45.9
55
-20%
46.5
-1%
40.1
13%
19.66
57%
41.9
9%
50.6 ?(31.3 - 68.3, n=15)
-10%
Witcher 3 ultra *
60.9
47
23%
37.2
39%
41.4
32%
38.2
37%
43.9
28%
Load Maximum *
104.1
63.6
39%
64.36
38%
51.8
50%
50
52%
50.8
51%

* ... smaller is better

Power consumption Witcher 3 / stress test

0102030405060708090100Tooltip
Acer Swift Go 14 SFG14-72; Witcher 3 ultra: Ø60.9 (57.3-79.5)
Acer Swift Go 14 SFG14-72; 1280x720 Prime95 28.10 and Furmark 1.25: Ø77.1 (51-104.1)

Power consumption with an external monitor

0102030405060708090100Tooltip
Acer Swift Go 14 SFG14-72; Prime95 V2810 Stress (external Monitor): Ø67.6 (61.8-103.4)
Acer Swift Go 14 SFG14-72; Cinebench R23 Single (external Monitor): Ø40.9 (35.7-59.5)
Acer Swift Go 14 SFG14-72; Cinebench R23 Multi (external Monitor): Ø79.3 (68-83.8)
Acer Swift Go 14 SFG14-72; 1920x1080 The Witcher 3 ultra (external Monitor): Ø50.4 (47.7-84)
Acer Swift Go 14 SFG14-72; Idle 1min (external Monitor): Ø8.35 (6.24-16.6)

Battery life

The Acer Swift Go 14, with its Intel Meteor Lake processor and 65 Wh battery, fell just short of the eight-hour mark in the Wi-Fi internet surfing test. According to our energy measurements, it's the OLED panel that uses the most power when surfing. Visiting websites and running applications in dark mode ought to improve the runtimes considerably. With the predecessor, almost 45 additional runtime minutes were possible. 

Battery Runtime
WiFi Websurfing
7h 59min
Load (maximum brightness)
1h 14min
Acer Swift Go 14 SFG14-72
Ultra 7 155H, Arc 8-Cores, 65 Wh
Acer Swift Go 14 SFG14-71
i5-1335U, Iris Xe G7 80EUs, 54.6 Wh
LG Gram 2in1 16 16T90R - G.AA78G
i7-1360P, Iris Xe G7 96EUs, 80 Wh
HP Pavilion Plus 14-ew0153TU
i7-1355U, Iris Xe G7 96EUs, 68 Wh
Lenovo ThinkPad T14 G4 21K4S02000
R7 PRO 7840U, Radeon 780M, 52.5 Wh
Ayaneo Air 1S Retro Power
R7 7840U, Radeon 780M, 37.5 Wh
HP Pavilion Plus 14-ey0095cl
R7 7840U, Radeon 780M, 68 Wh
Average of class Subnotebook
 
Battery Runtime
-5%
57%
21%
44%
-21%
36%
44%
WiFi v1.3
479
453
-5%
716
49%
578
21%
729
52%
355
-26%
510
6%
Load
74
121
64%
100
35%
63
-15%
122
65%
H.264
720
185
Gaming
74
Reader / Idle
1011

Pros

+ significantly improved iGPU
+ OLED screen with a high range of colors
+ light and compact
+ a free m.2 NVMe SSD slot
+ moderately quiet
+ QHD webcam
+ 32 GB of RAM

Cons

- glossy display
- slow card reader
- soldered RAM

Verdict - Not just the office

The Acer Swift Go 14 (2024) - provided by Acer

Acer has gotten the Swift Go 14 to us quite a bit before the device hits the market and that means not everything works perfectly. But, we've already had the chance to experience Intel's latest processor generation and we were impressed by the Meteor Lake chip's high-level graphics performance. We will keep an eye on changes to the device into spring next year and then deliver our final verdict on the Swift Go 14 (2024). Nevertheless, it has already come to our attention that the compact machine benefits from the considerably more powerful Core Ultra 7. The increased graphics performance allows the laptop and its excellent OLED display to enjoy a wider application spectrum. This, at least, makes gaming and video editing a possibility. The NPU core in the Meteor Lake processor was also able to demonstrate its power in our tests.

Weighing 1.3 kg, the Acer Swift Go 14 is a lightweight powerhouse that packs a considerable punch inside its elegant case. Intel's Meteor Lake processor ensures a significantly wider range of application use cases. 

There's no question, the Swift Go 14 is a mobile device. Thanks to Thunderbolt 4, HDMI 2.1 and some additional ports, connectivity is not lacking. Shortly, there will be other alternatives with Meteor Lake processors with Asus already offering such a chipset in its ZenBook 14. Anyone too impatient to wait for laptops with Intel processors should take a look at 14-inch machines with the AMD Ryzen 7 7840U such as the HP Pavilion Plus 14.

Price and availability

The Swift Go 14 is expected to be available from February 2024. So far, an anticipated purchase price of just under 1,000 euros has been announced for Germany. 

Transparency

The present review sample was made available to the author as a loan by the manufacturer or a shop for the purposes of review. The lender had no influence on this review, nor did the manufacturer receive a copy of this review before publication. There was no obligation to publish this review.

Pricecompare

Read all 11 comments / answer
static version load dynamic
Loading Comments
Comment on this article
Please share our article, every link counts!
> Expert Reviews and News on Laptops, Smartphones and Tech Innovations > Reviews > Acer Swift Go 14 review - The Meteor Lake Core Ultra 7 impresses with its AI core
Marc Herter, 2023-12-18 (Update: 2023-12-18)