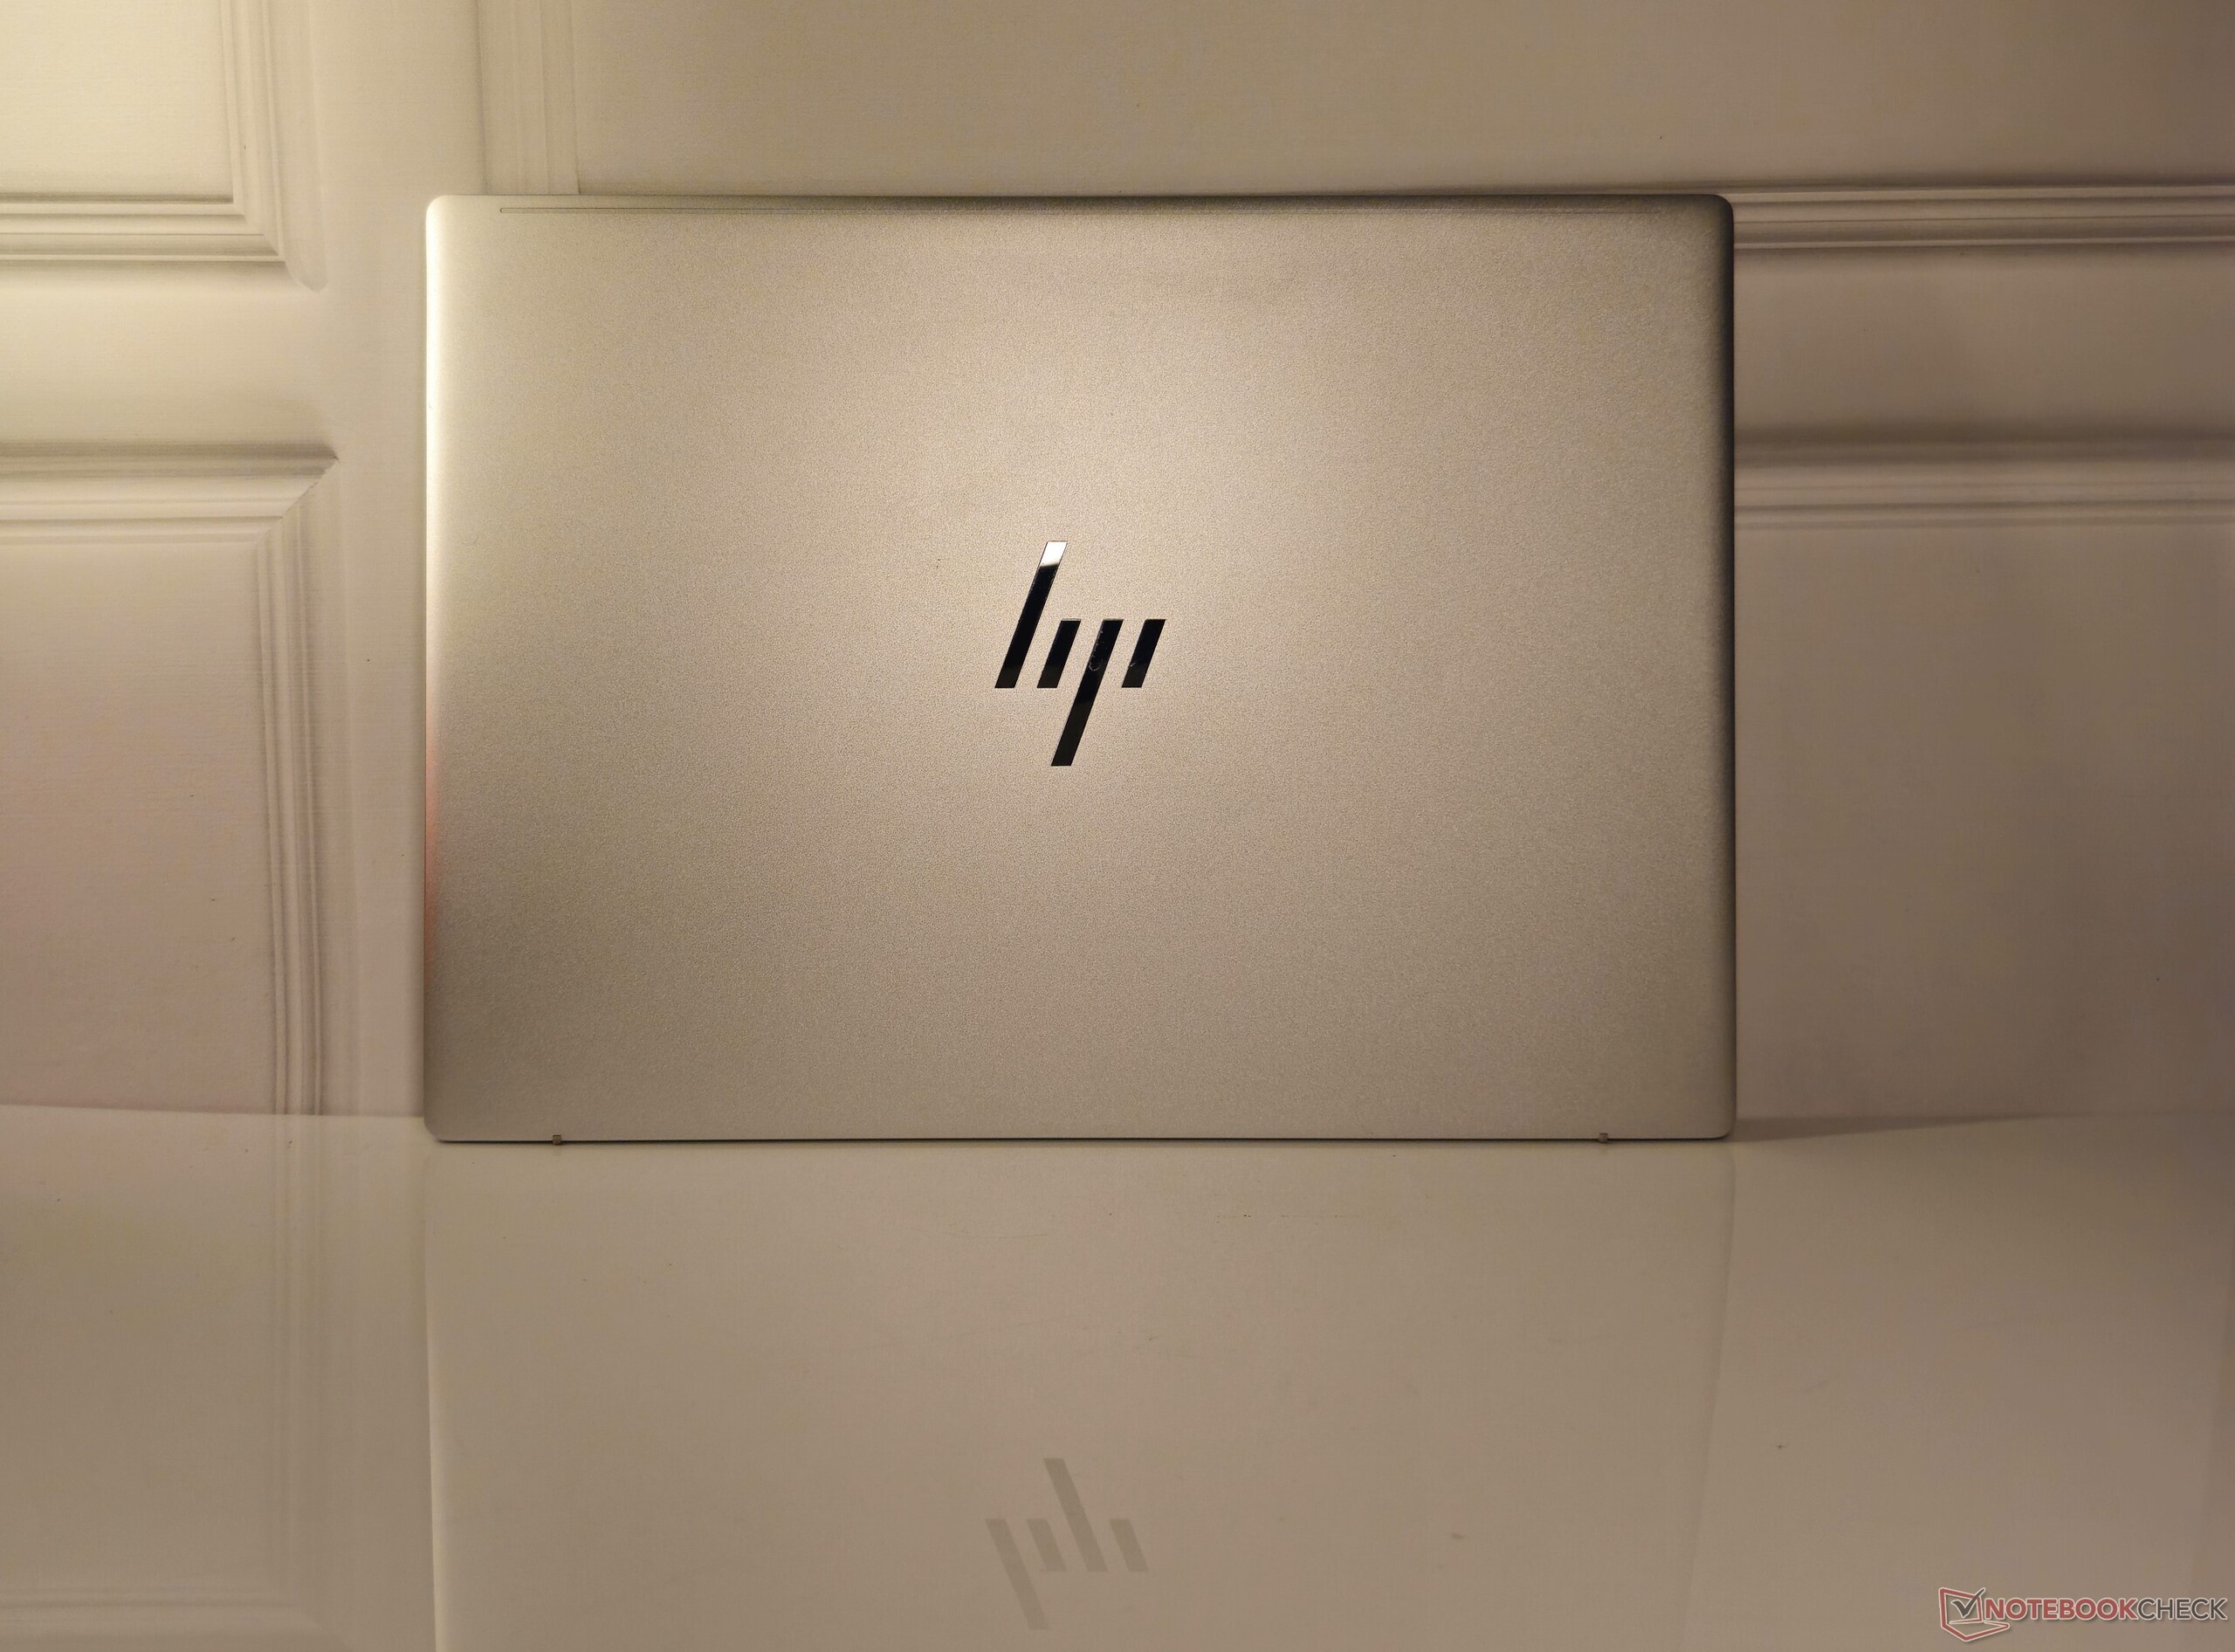
HP Pavilion Plus 14 Core i7 Review: Intel Raptor Lake or AMD Zen 4? The choice is clear

HP seems to have hit the right notes with its newly launched Pavilion Plus lineup. We've previously reviewed the AMD Ryzen 7 7840U-powered Pavilion Plus 14 and now turn our attention towards its Intel-based sibling.
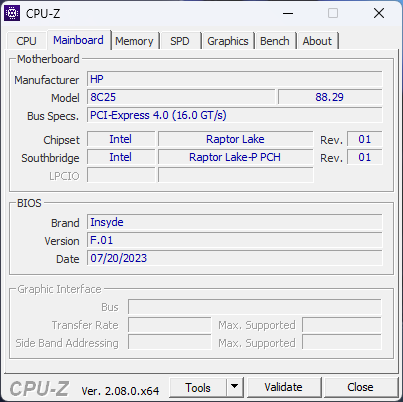
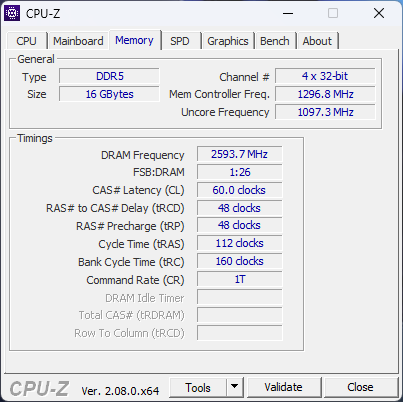
The current HP Pavilion Plus 14 configuration is based on the Intel Core i7-1355U and comes with 16 GB LPDDR5x memory and 1 TB of PCIe NVMe storage.
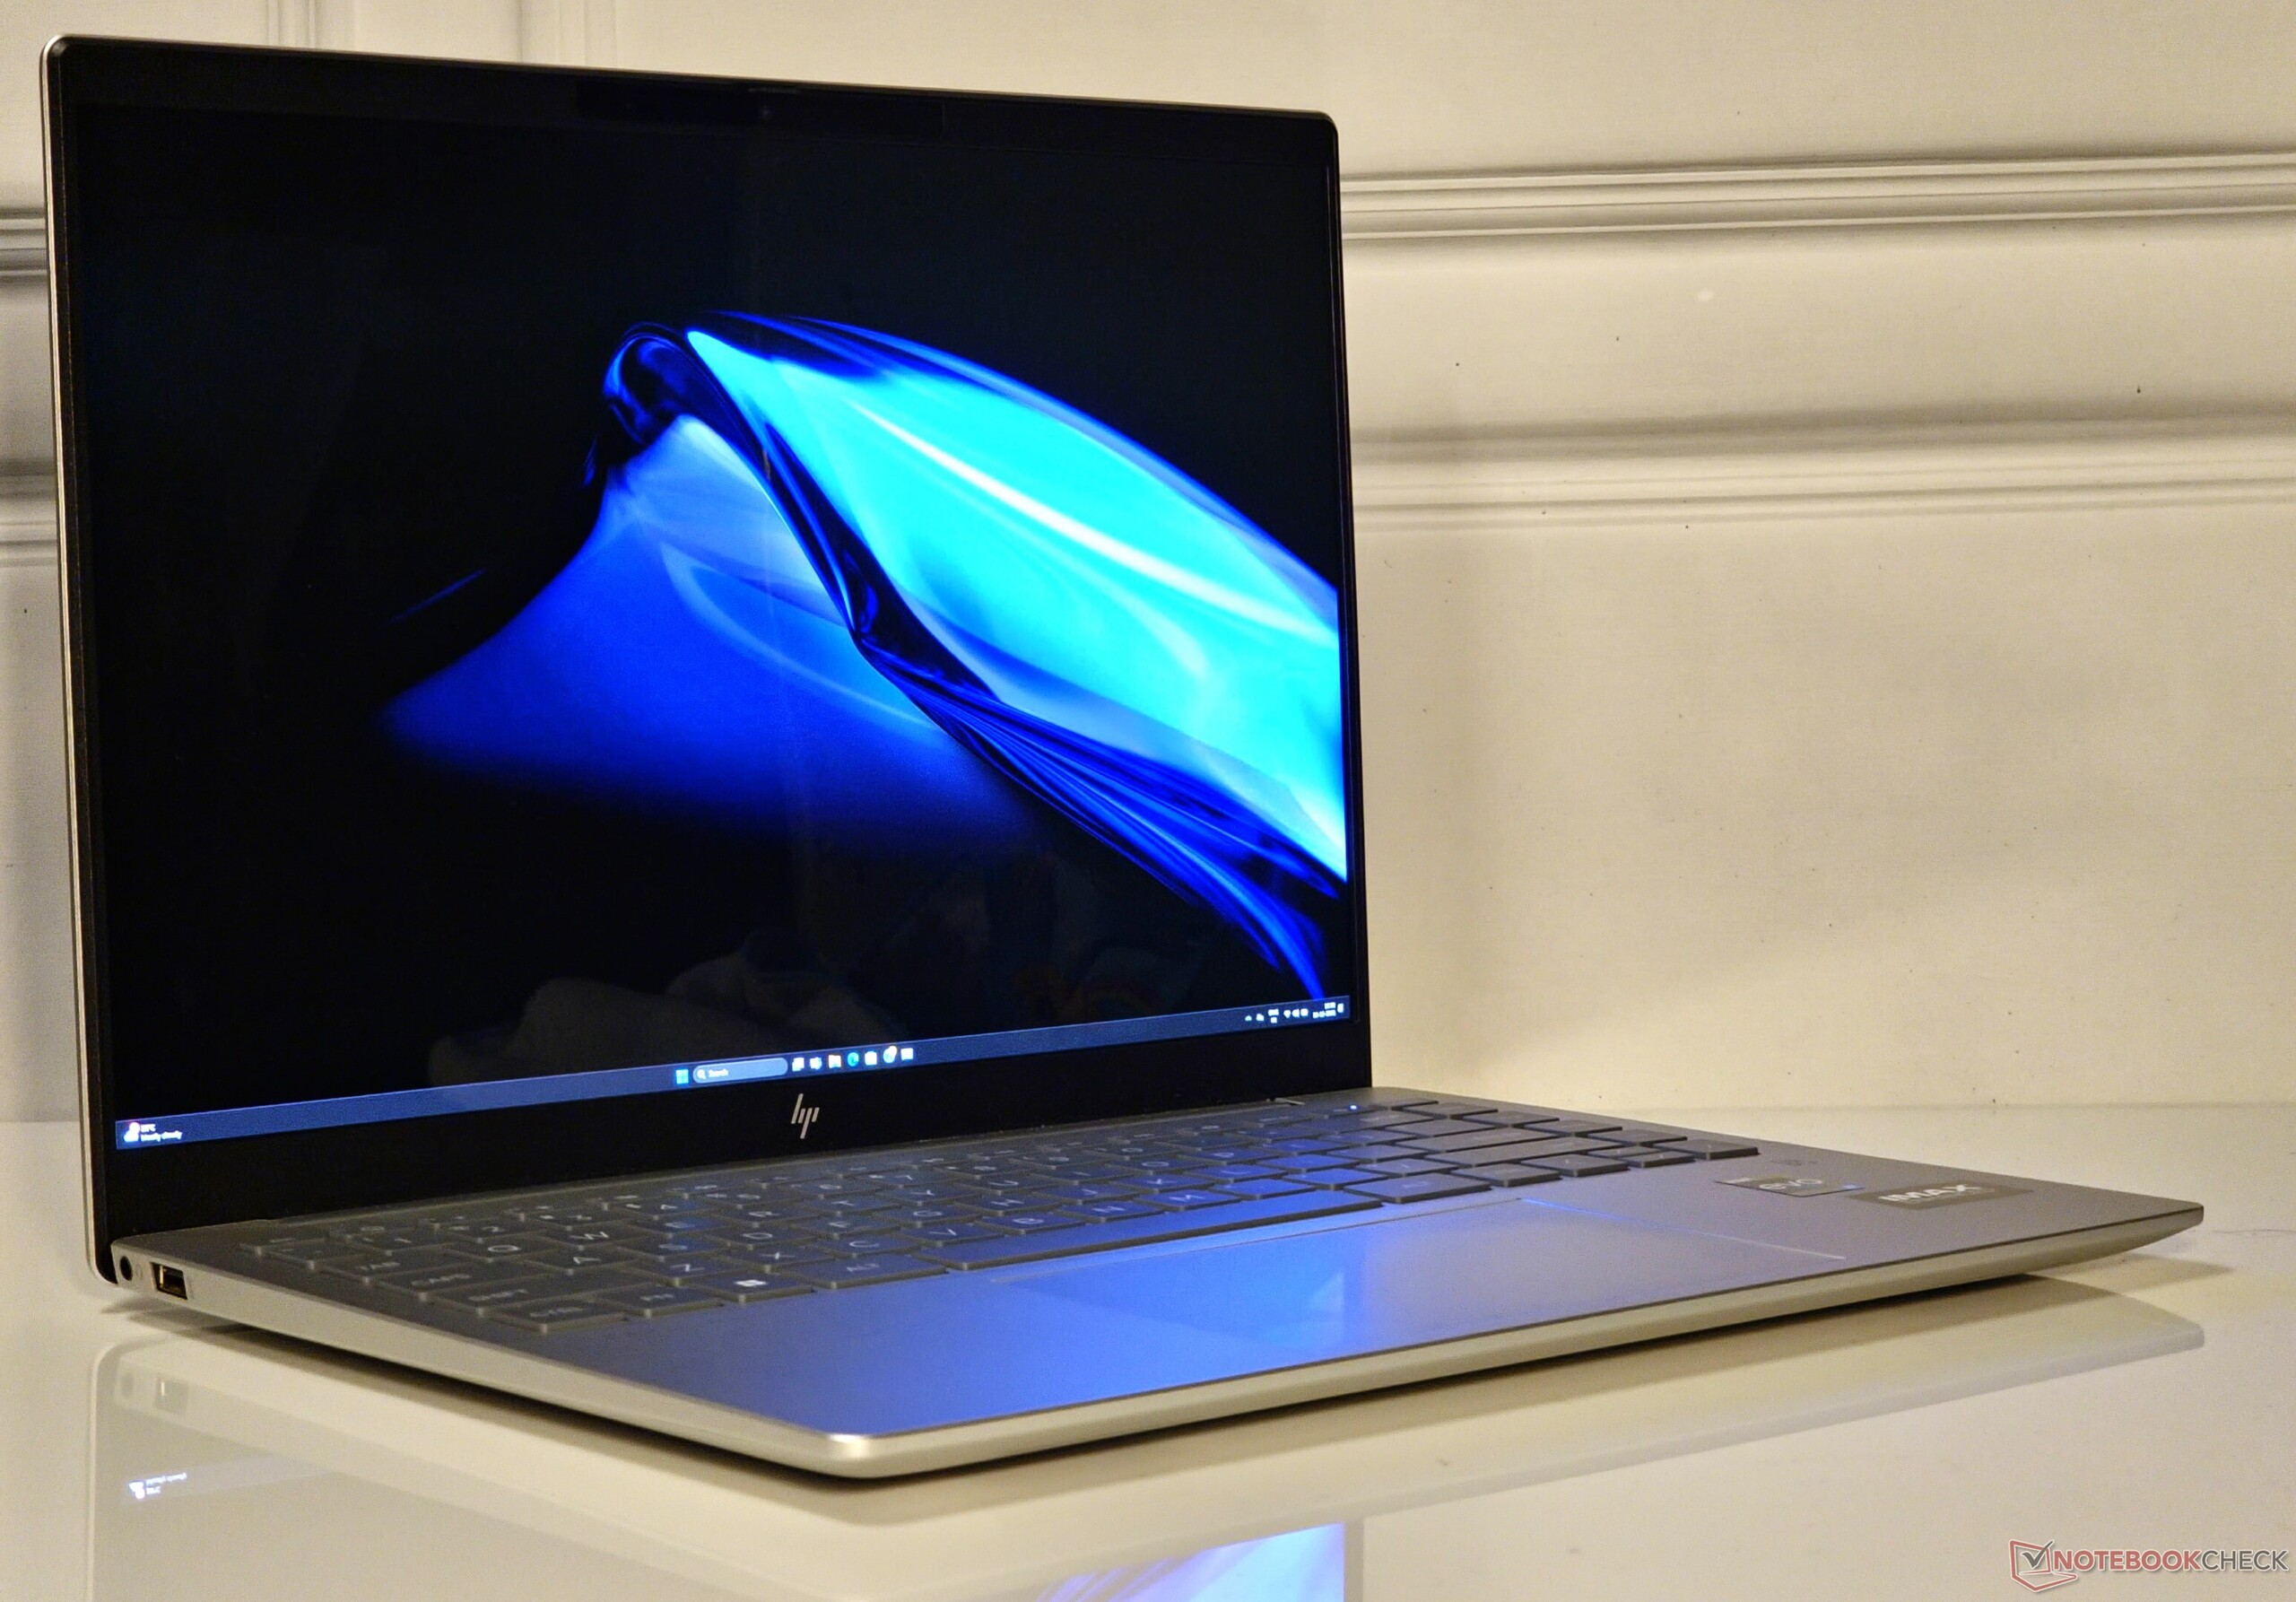
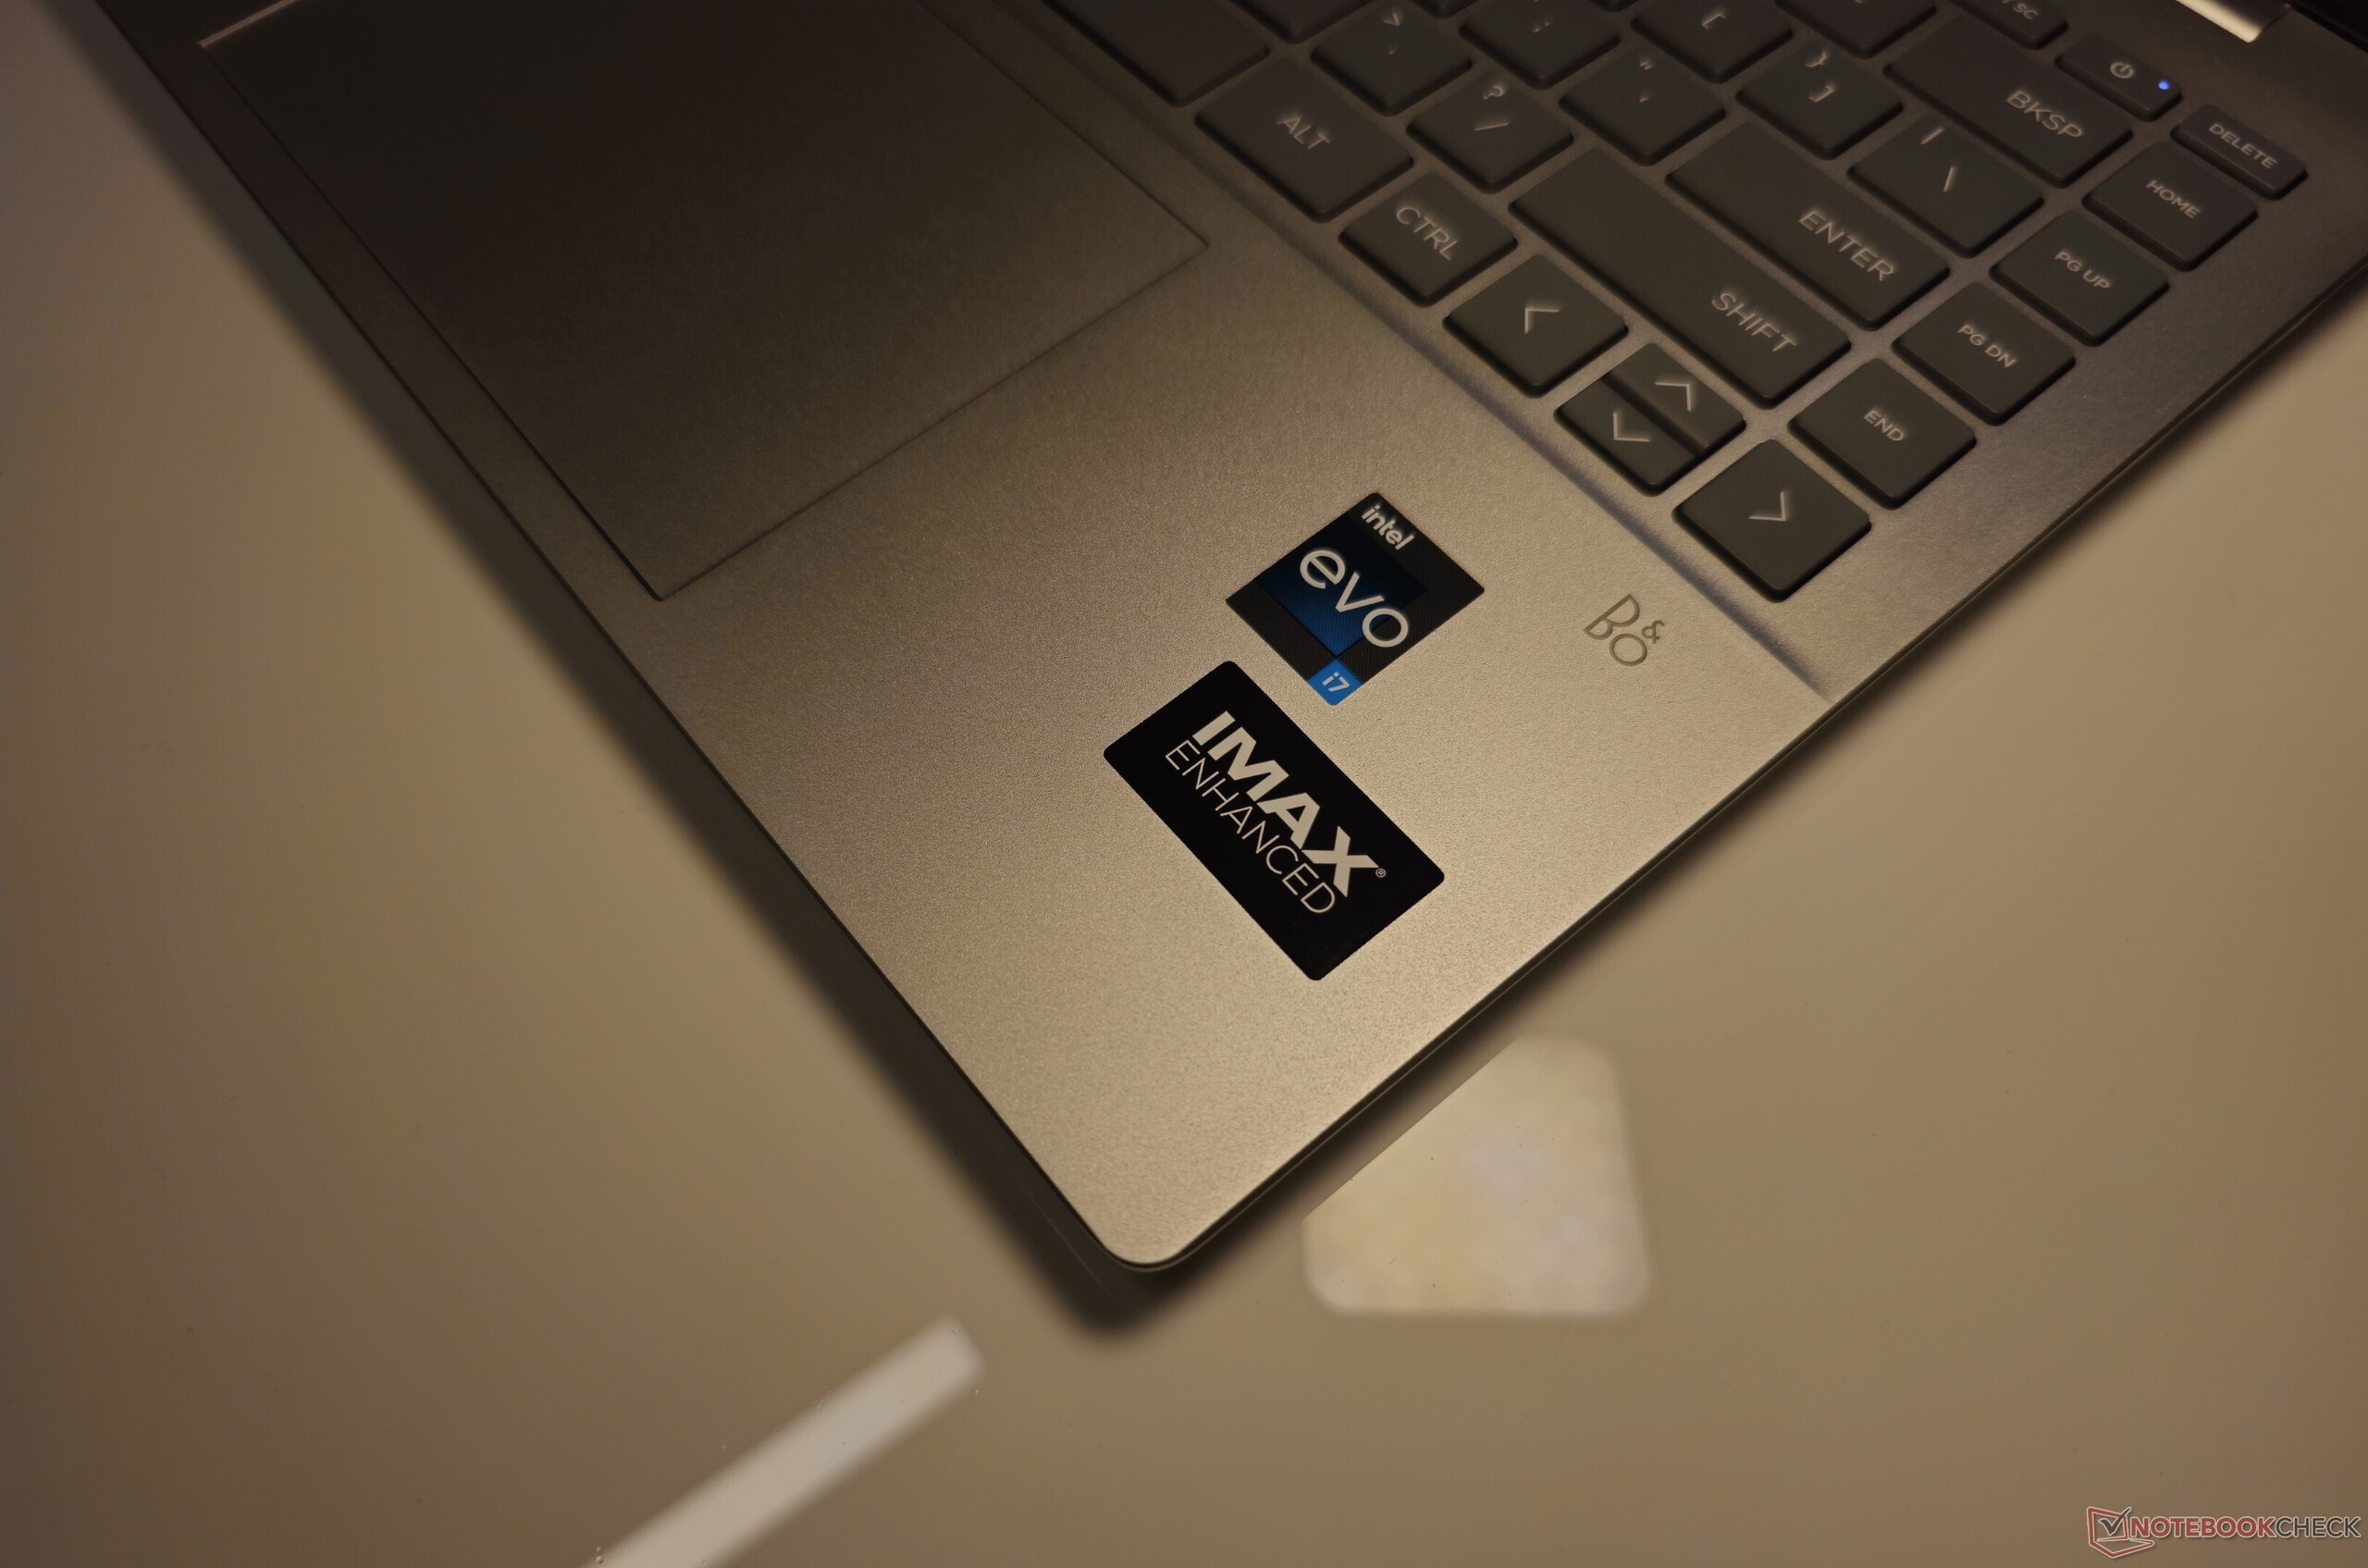
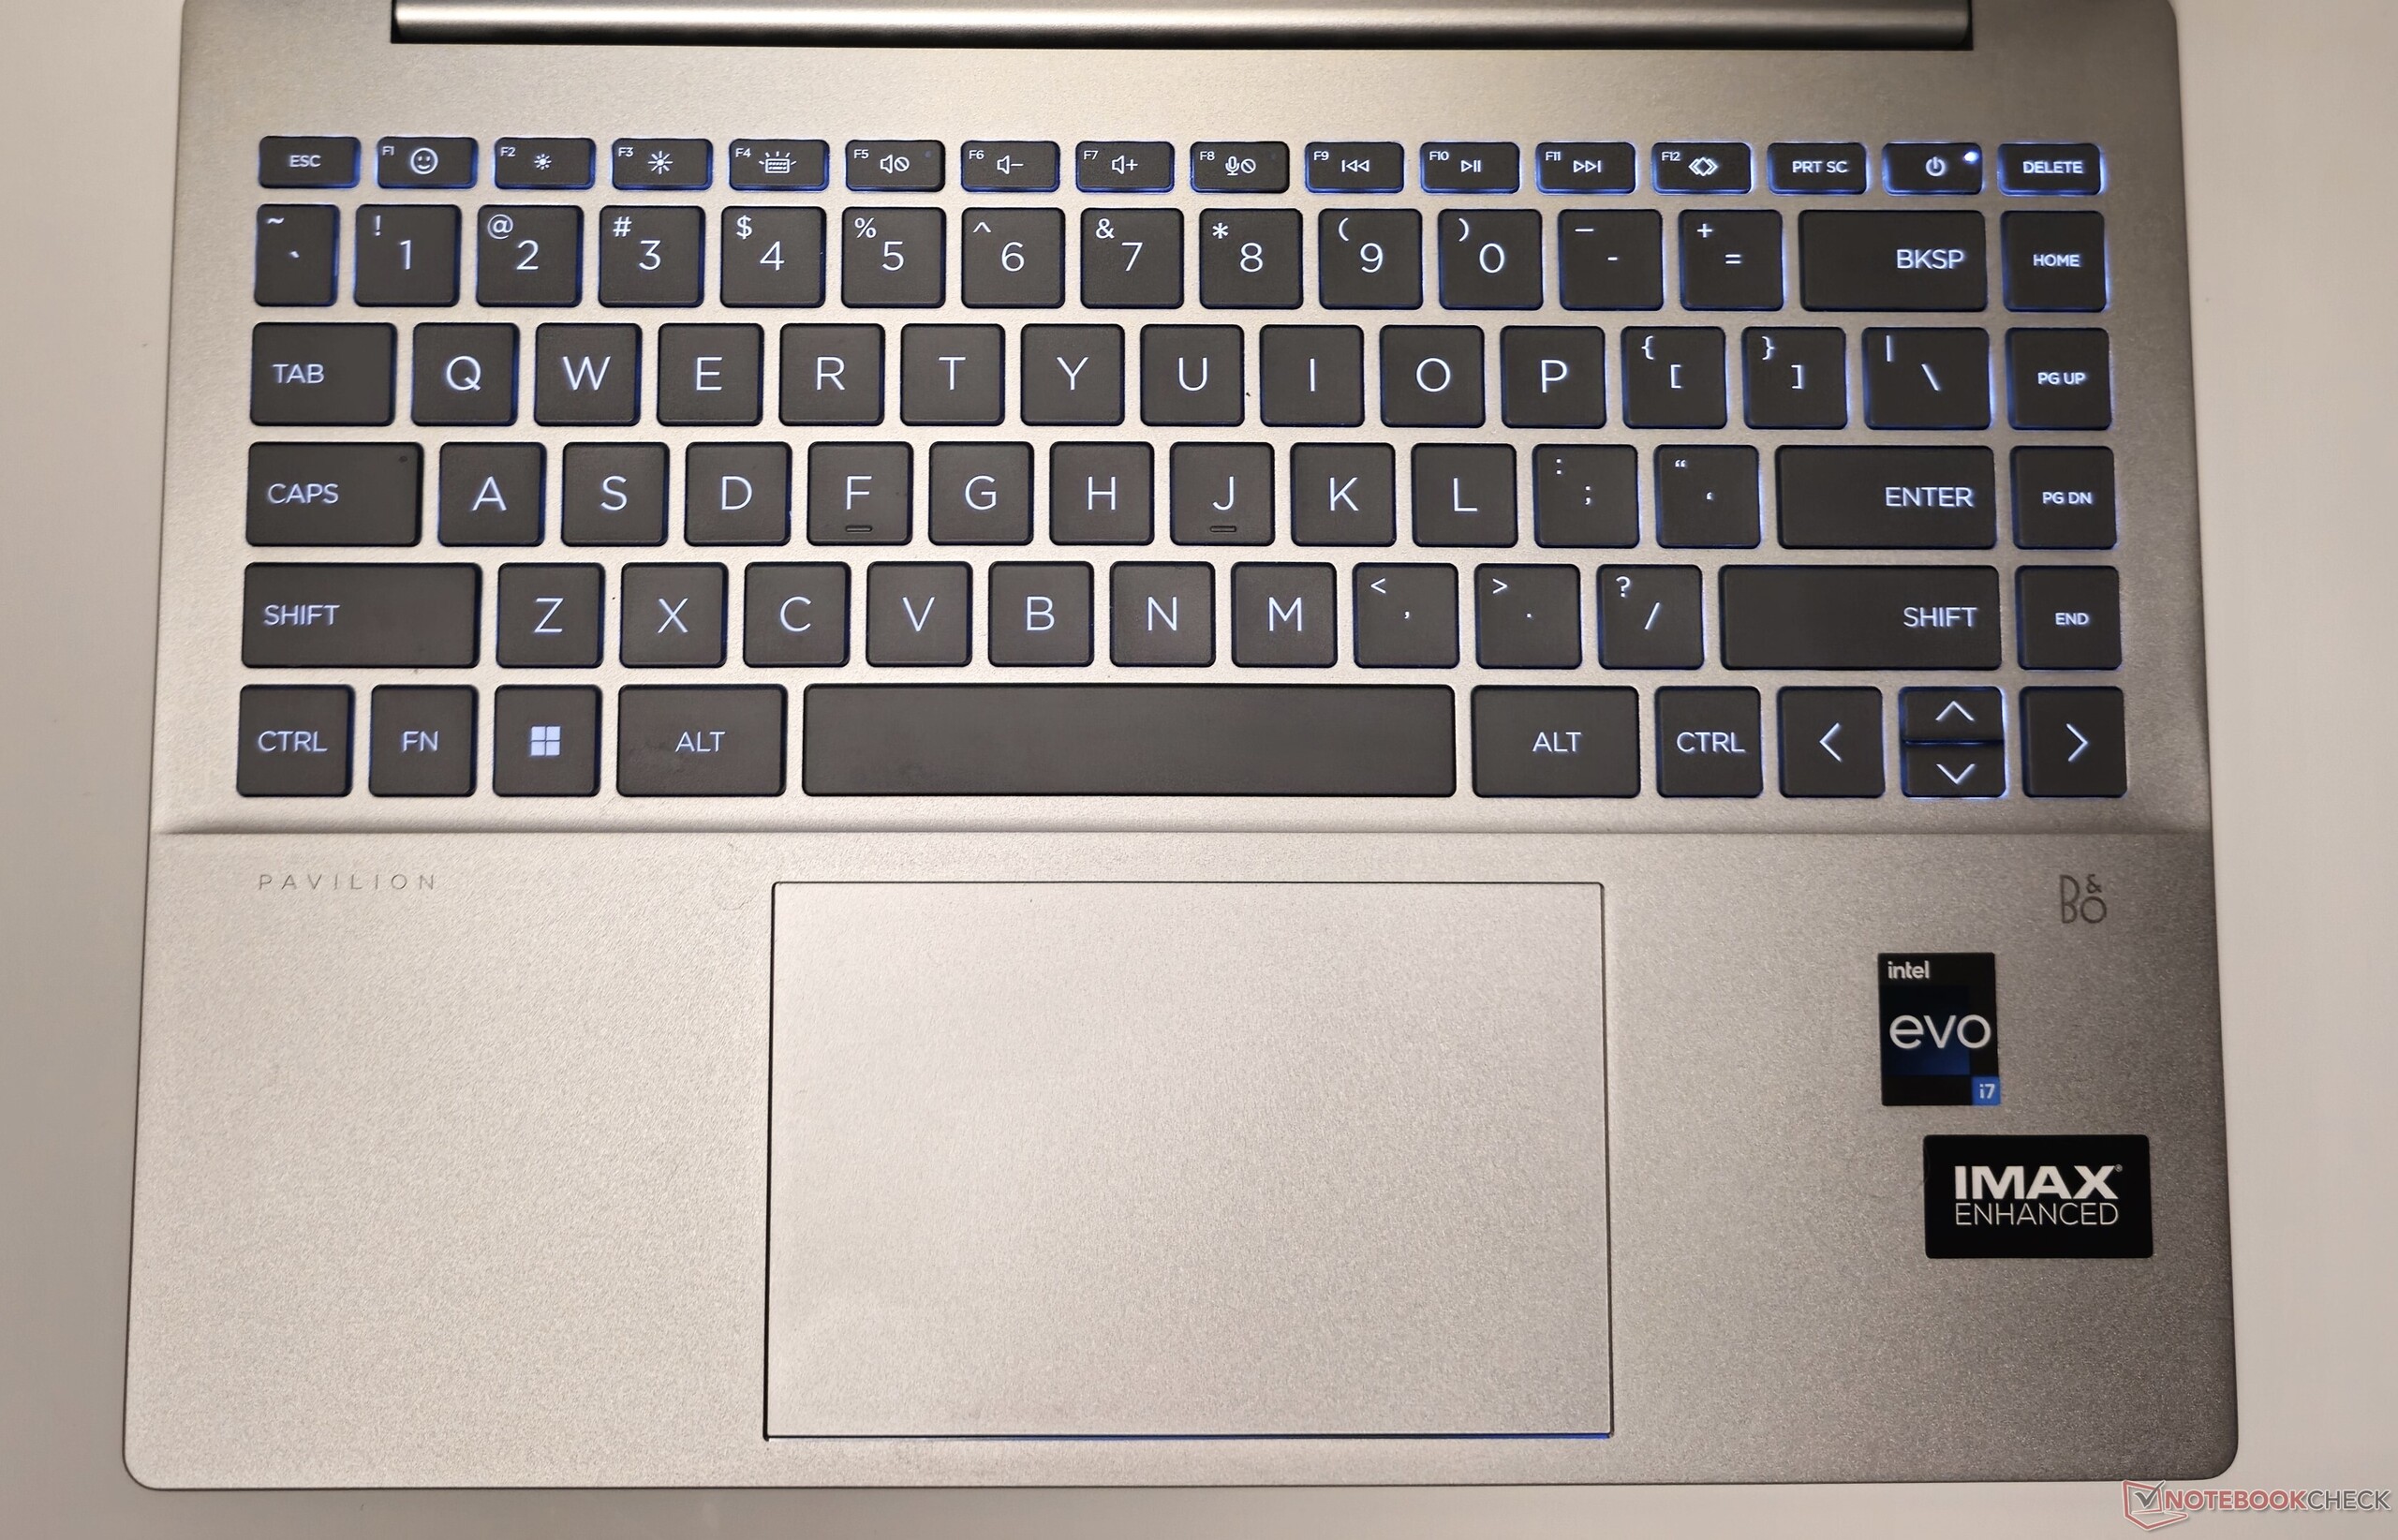
The two Pavilion Plus 14 models share numerous attributes, including the "IMAX Enhanced" 2.8K 120 Hz HDR OLED display. Therefore, we will focus mainly on the performance differences between the two versions in this review.
Our configuration officially retails for ₹99,999 in India but can be had for about ₹90,000 with various bank and card offers. In the US, this SKU is currently retailing at a discounted price of $1,019.99 on the official HP store.
Potential competitors in comparison
Rating | Date | Model | Weight | Height | Size | Resolution | Price |
|---|---|---|---|---|---|---|---|
| 87.5 % v7 (old) | 12 / 2023 | HP Pavilion Plus 14-ew0153TU i7-1355U, Iris Xe G7 96EUs | 1.4 kg | 17.5 mm | 14.00" | 2880x1800 | |
| 87.8 % v7 (old) | 11 / 2023 | HP Pavilion Plus 14-ey0095cl R7 7840U, Radeon 780M | 1.4 kg | 18.8 mm | 14.00" | 2880x1800 | |
| 88.9 % v7 (old) | 11 / 2023 | Lenovo ThinkPad T14s G4 i7-1365U i7-1365U, Iris Xe G7 96EUs | 1.4 kg | 16.9 mm | 14.00" | 1920x1200 | |
| 85.6 % v7 (old) | 11 / 2023 | Acer Swift Go 14 SFG14-71 i5-1335U, Iris Xe G7 80EUs | 1.3 kg | 14.9 mm | 14.00" | 2880x1800 | |
| 91.5 % v7 (old) | 11 / 2023 | Asus ExpertBook B9 B9403CVA-KM0153X i7-1355U, Iris Xe G7 96EUs | 1 kg | 17.6 mm | 14.00" | 2880x1800 | |
| 89.6 % v7 (old) | 06 / 2023 | Huawei MateBook X Pro 2023 i7-1360P, Iris Xe G7 96EUs | 1.3 kg | 15.6 mm | 14.20" | 3120x2080 |
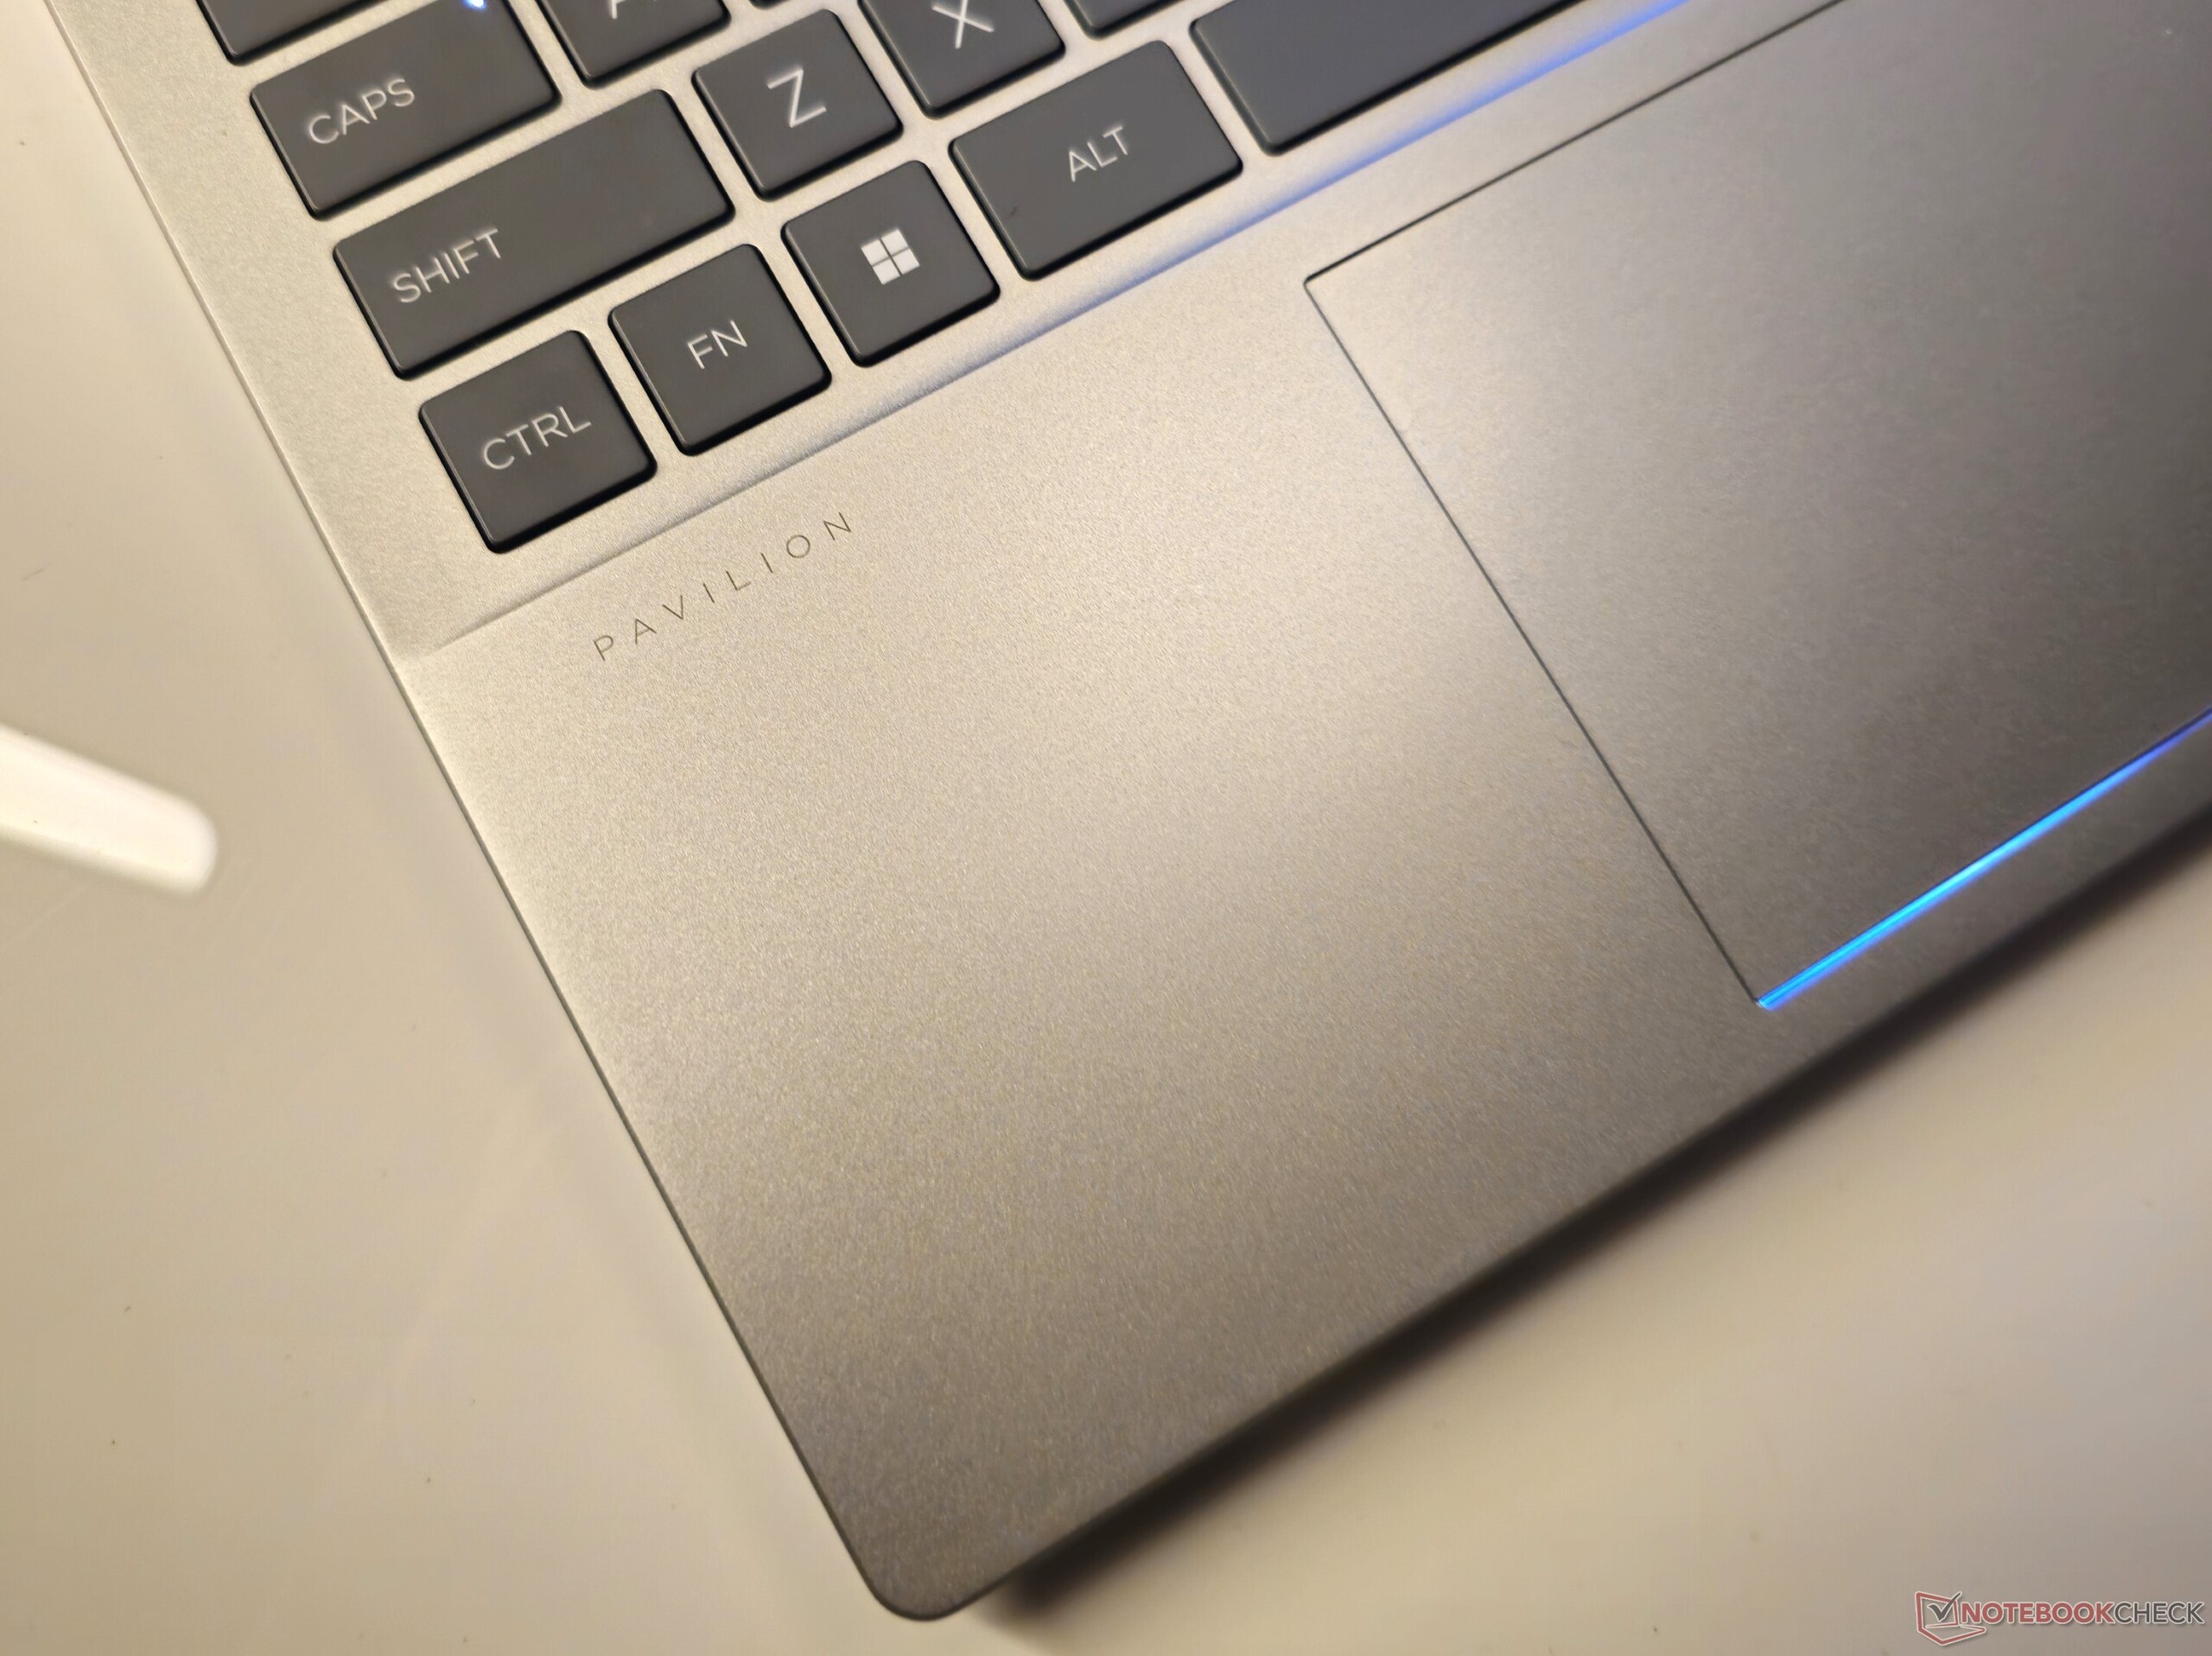
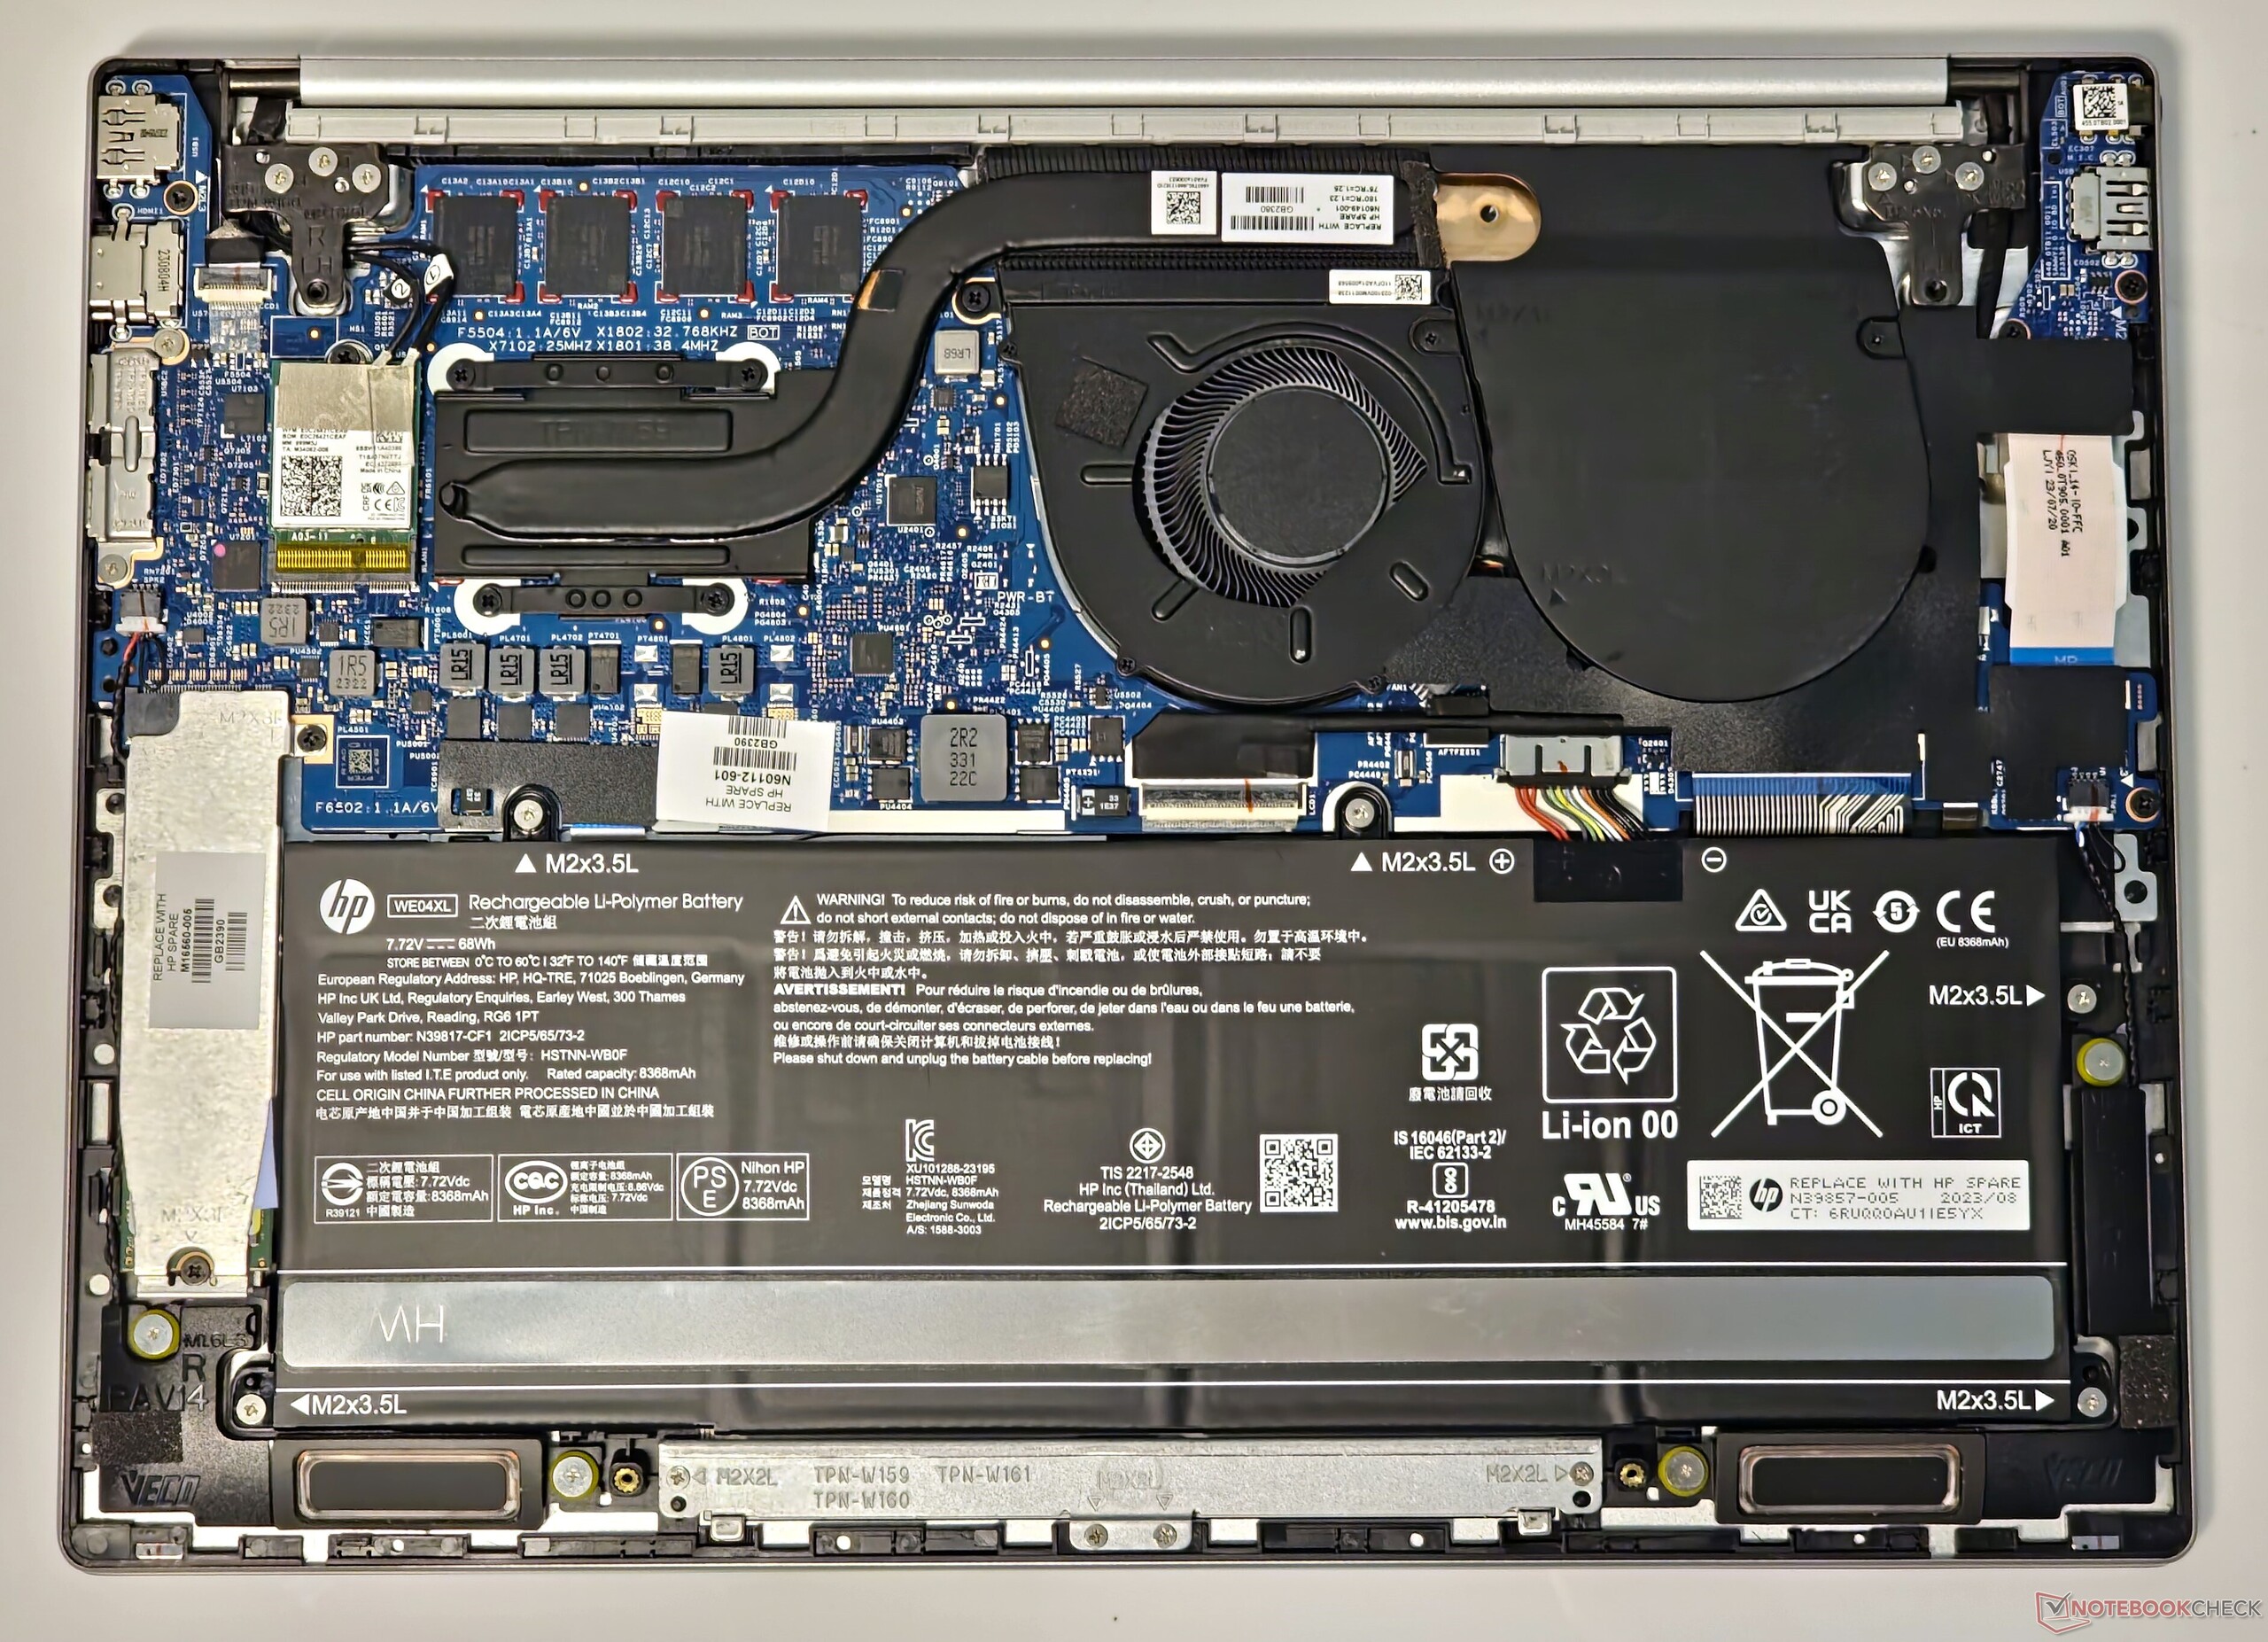
Chassis, Maintenance, and Input Devices
Aspects such as the laptop's full metal chassis, maintenance, and input devices match the previously reviewed AMD model. Check our prior coverage for more details on those fronts.


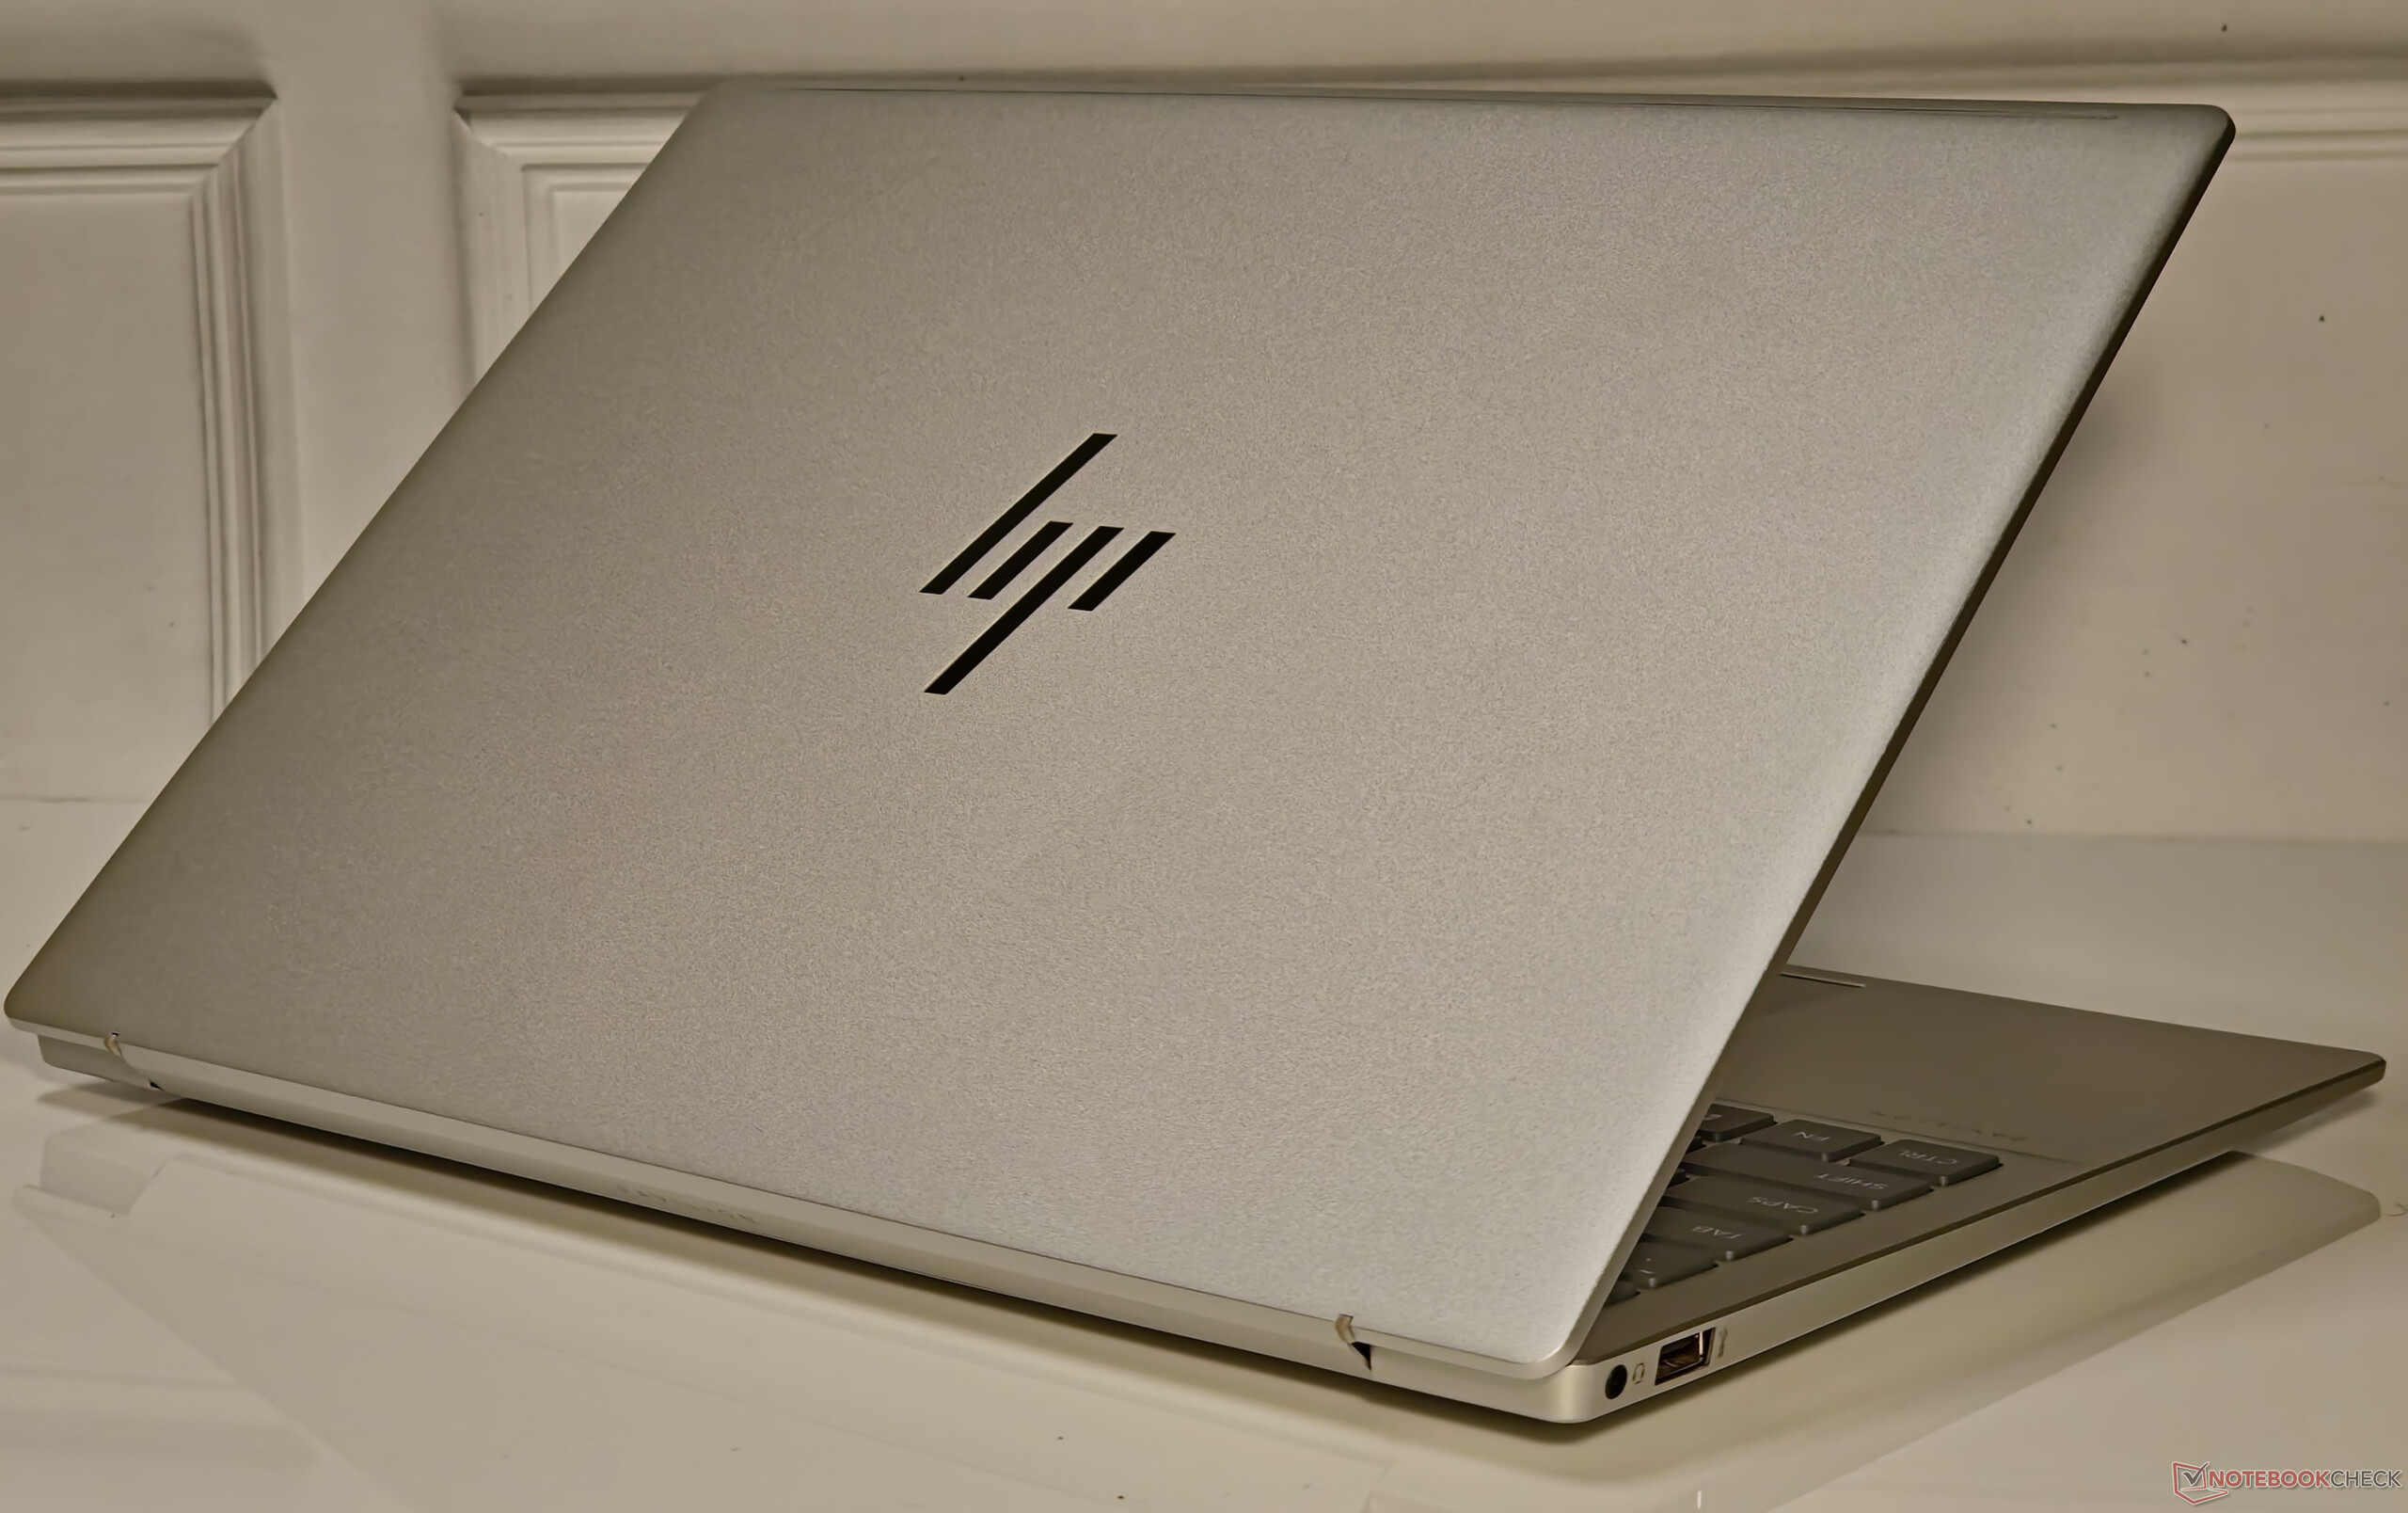
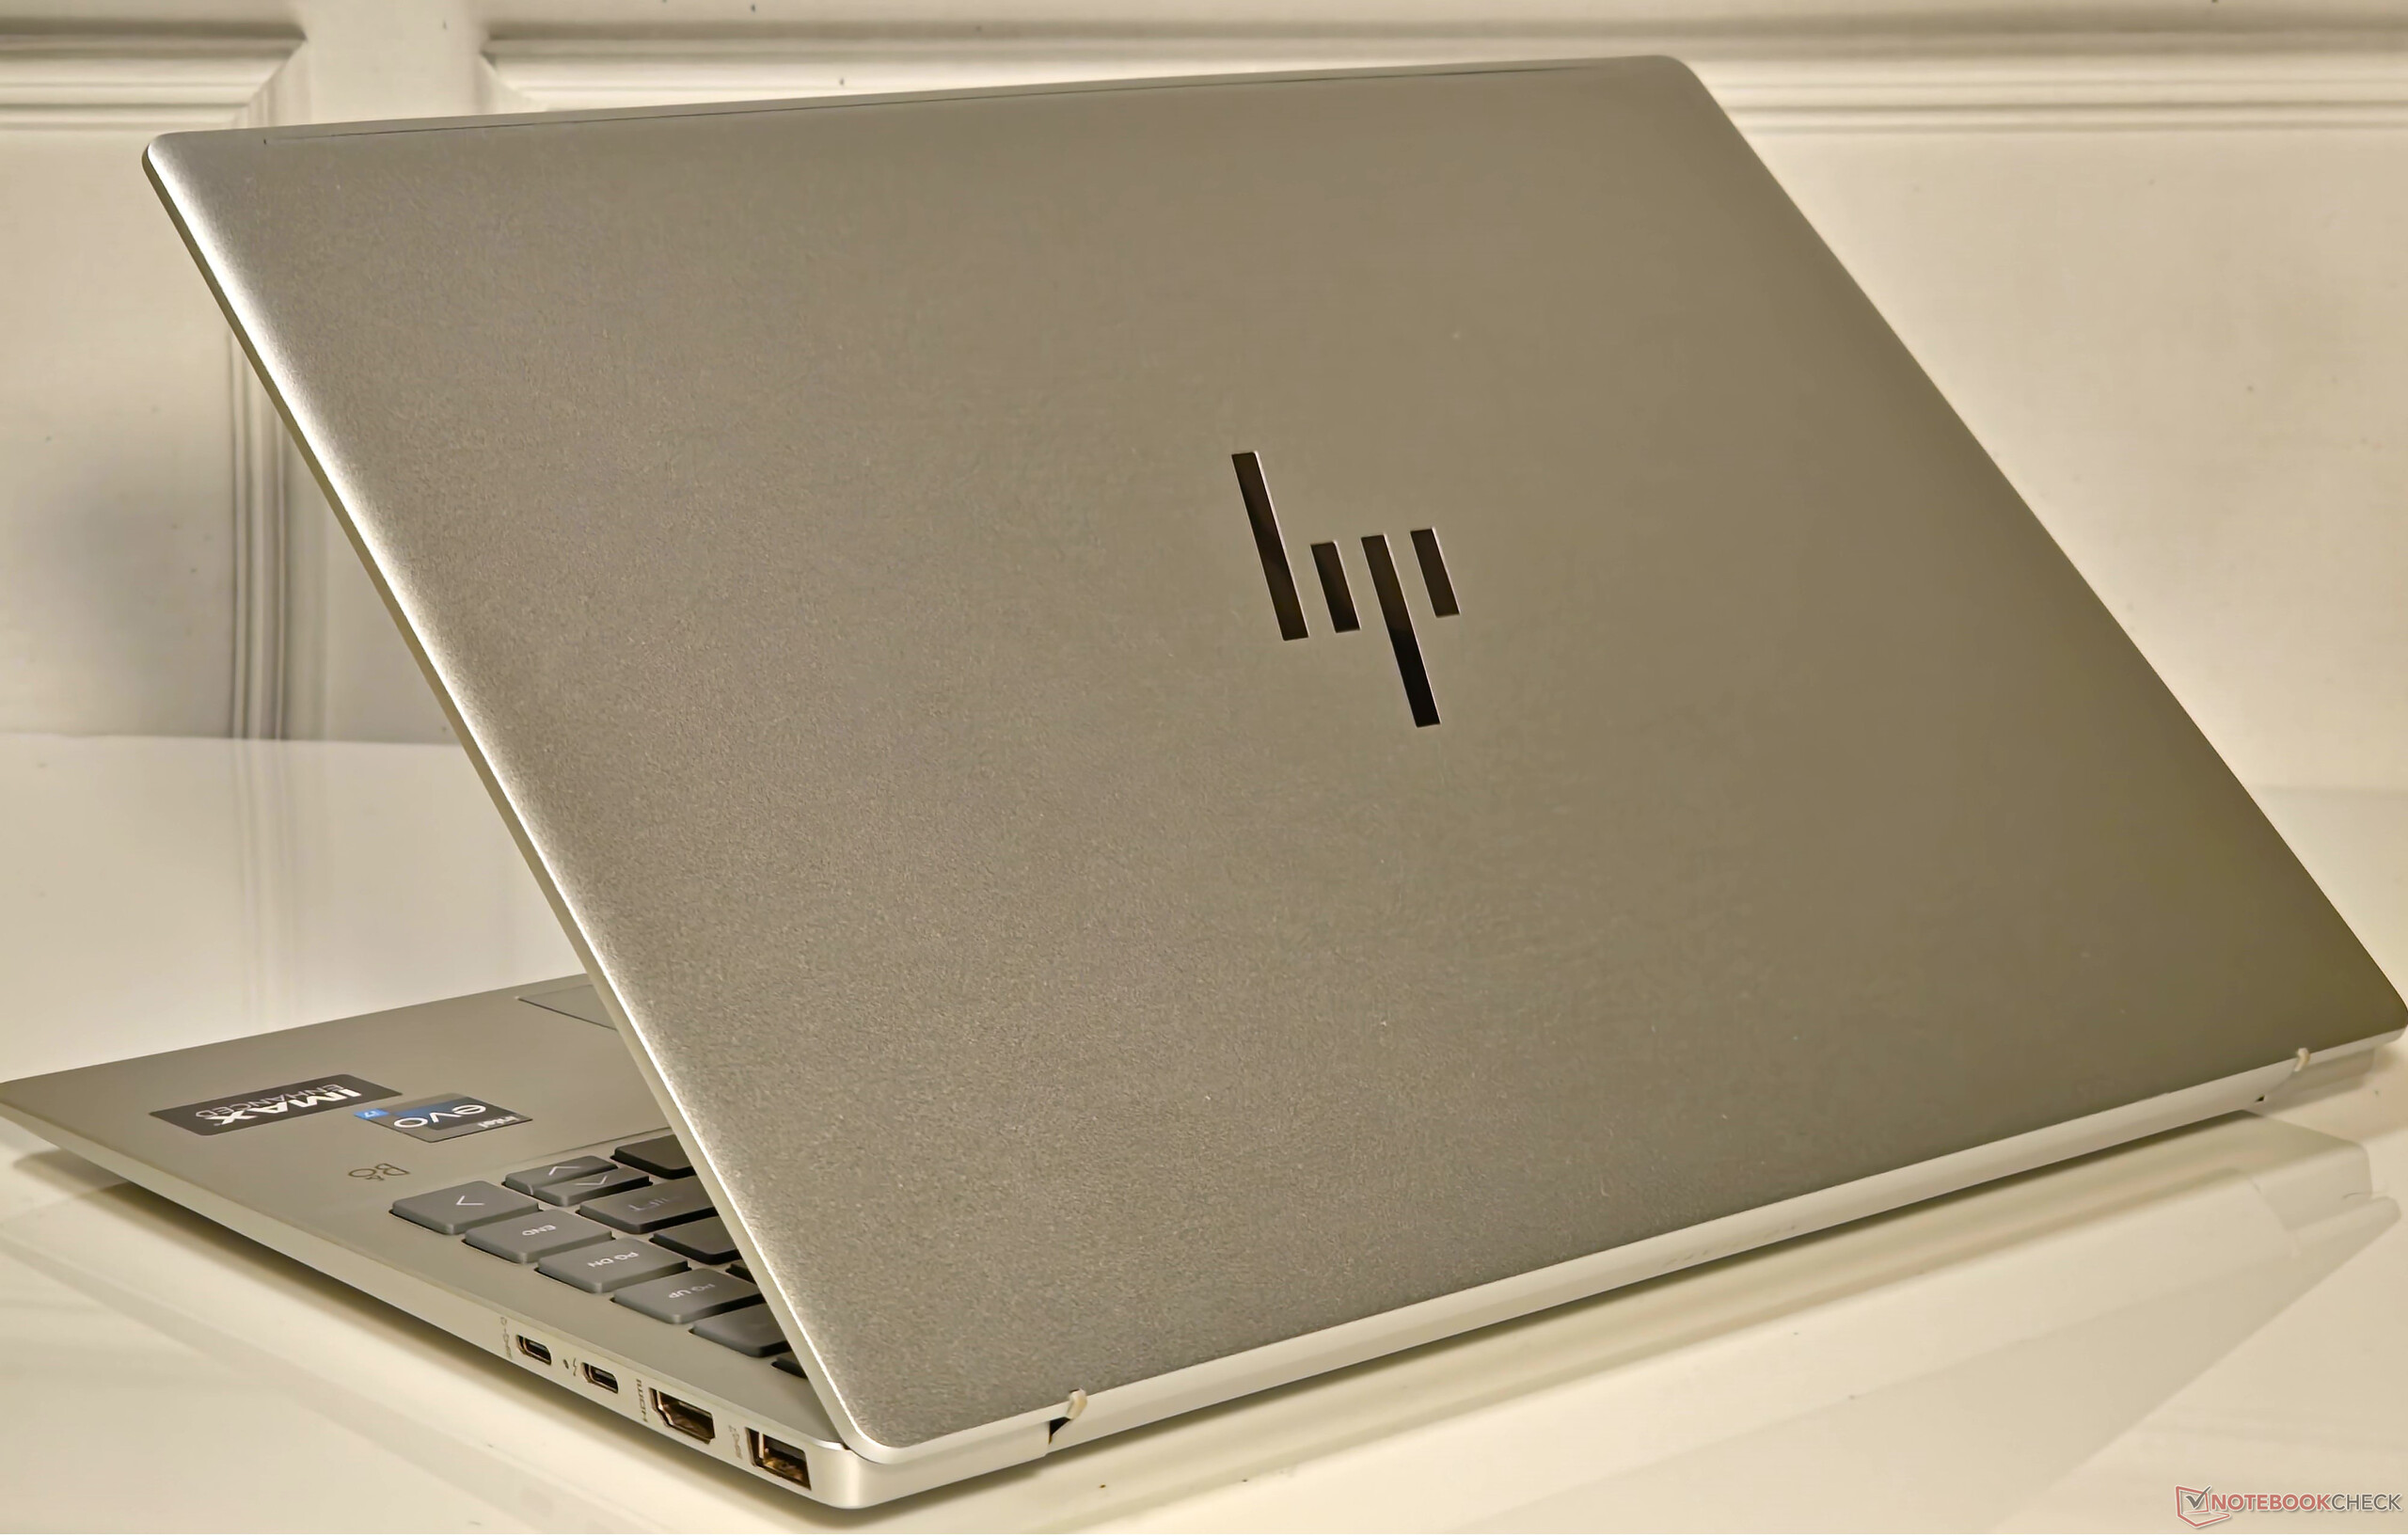
Connectivity: Thunderbolt 4 and stable Wi-Fi 6E speeds
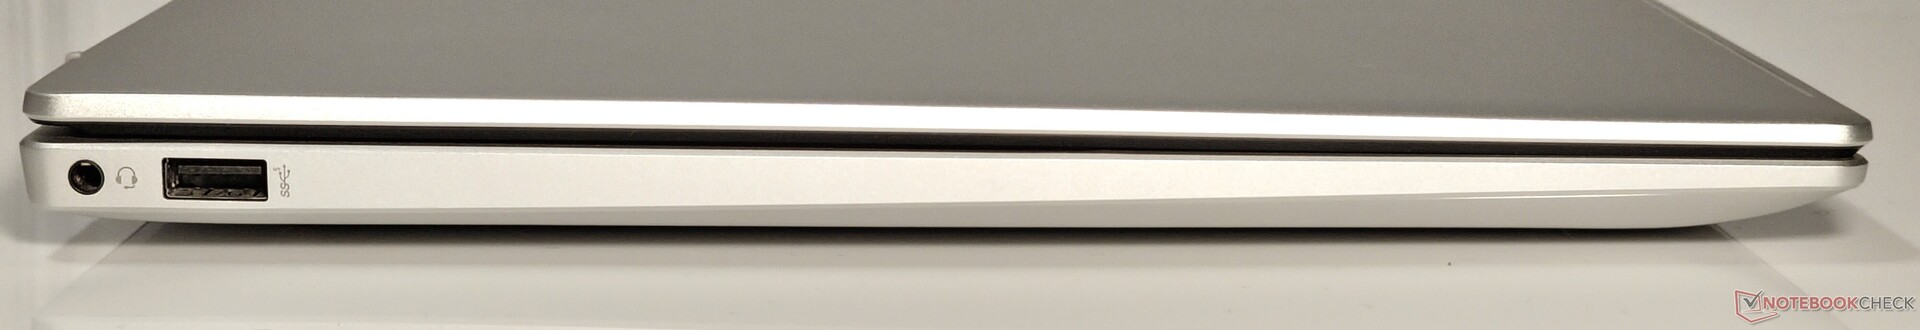
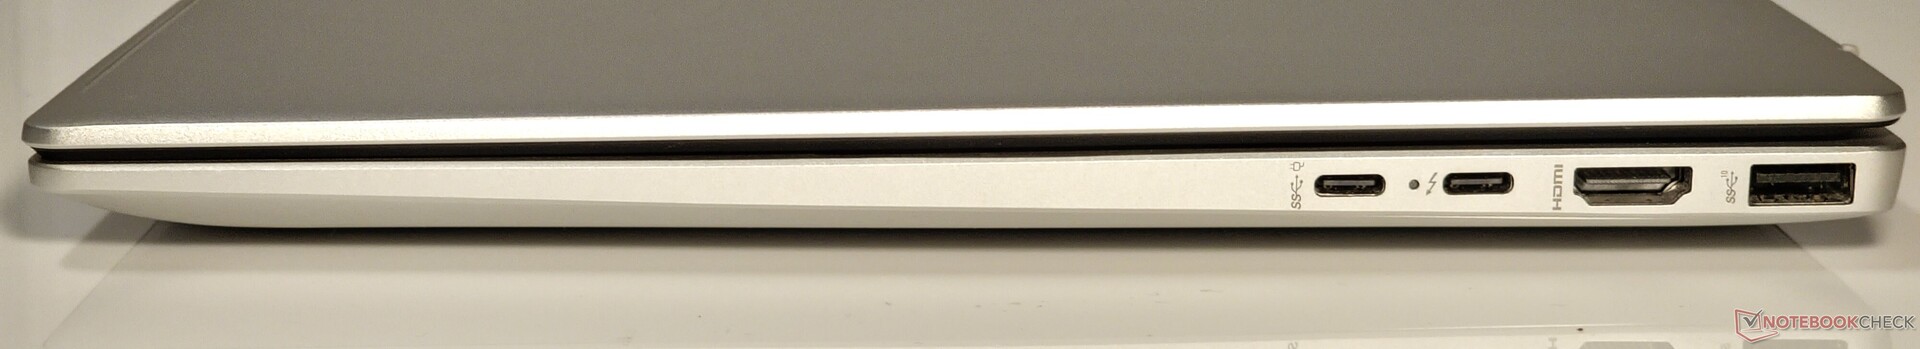
Port selection on the Pavilion Plus 14 is decent. The Intel variant one-ups its AMD cousin by offering a Thunderbolt 4 port while buyers of the latter have to make do with just a USB 3.2 Type-C port in lieu.
There is no dedicated DC-in, so one of the Type-C ports will be taken up by the power adapter when plugged in.
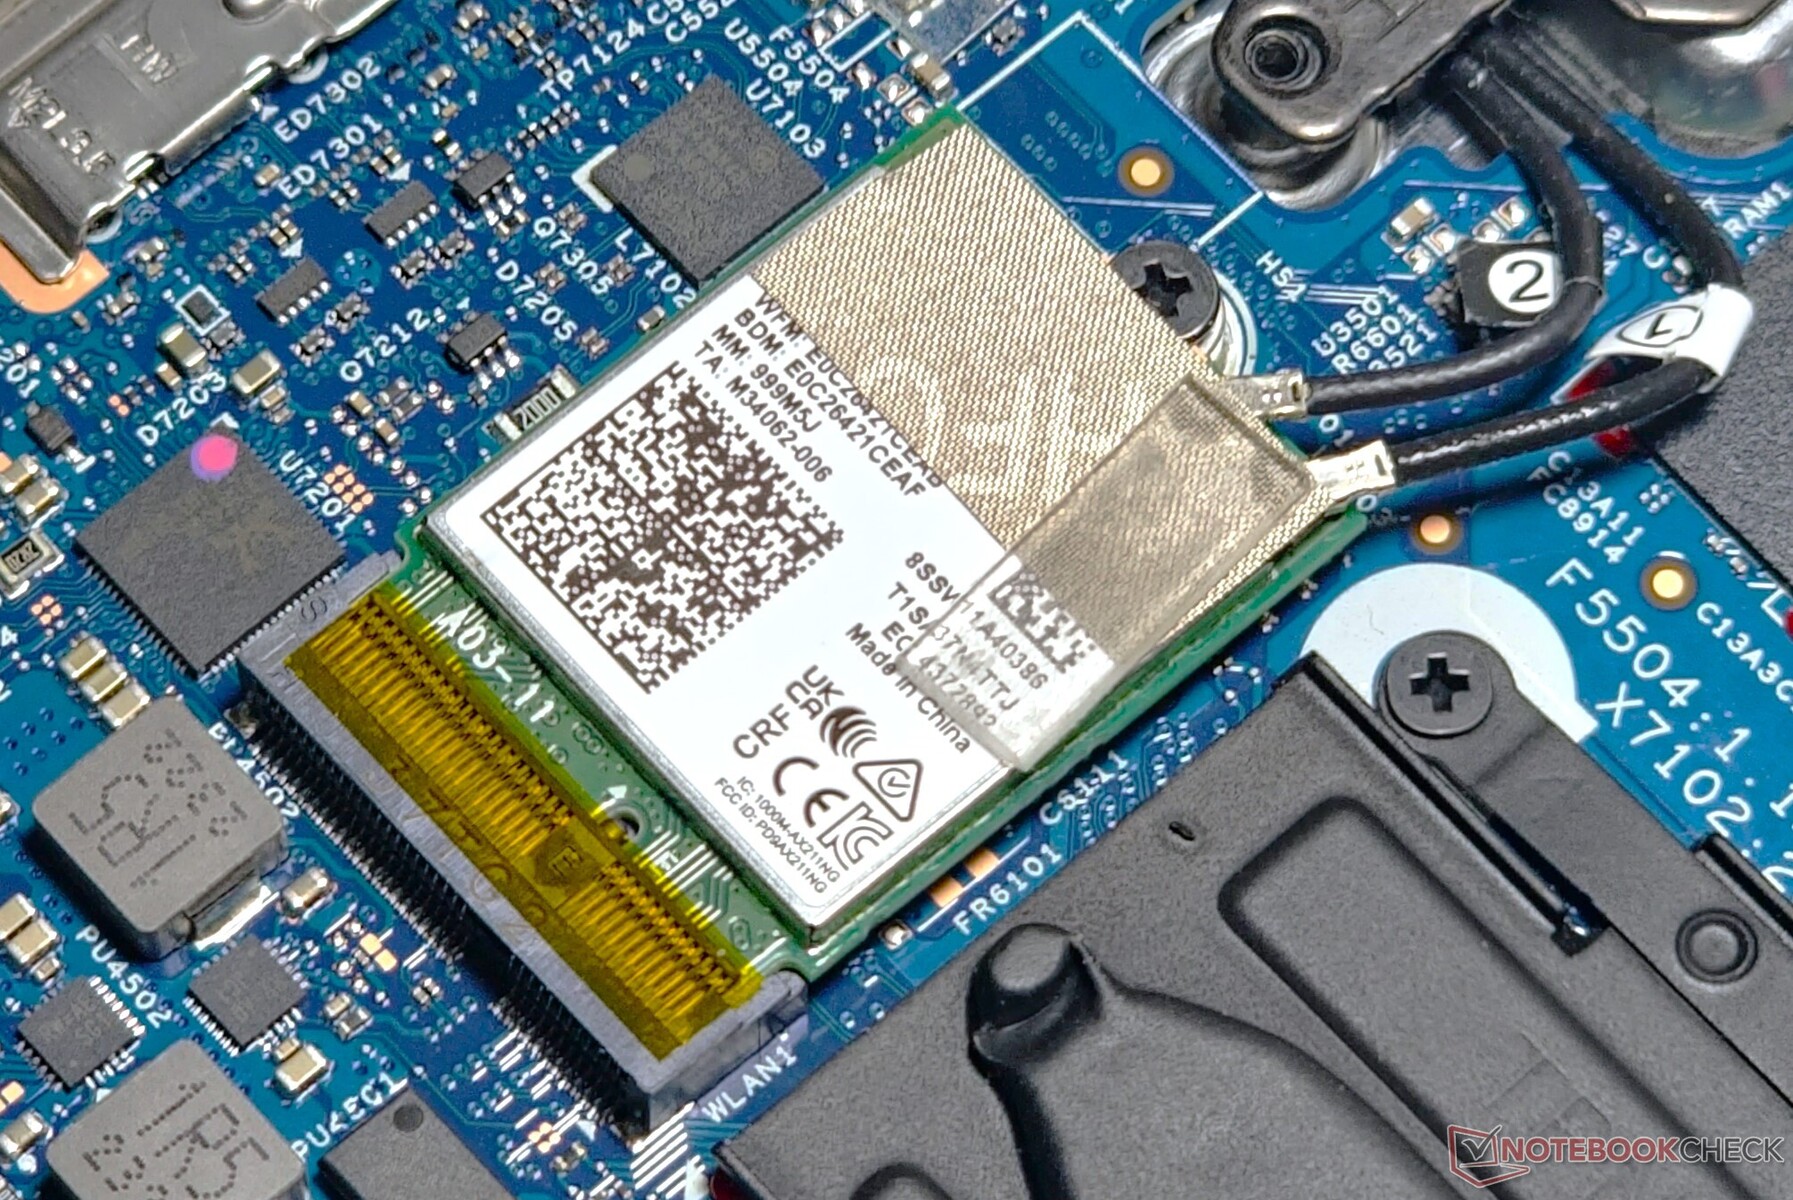
Being an Intel Evo design, the Pavilion Plus 14 naturally comes with the Intel Wi-Fi 6E AX211 WLAN card. This lends it a noticeable performance advantage over the MediaTek Wi-Fi 6E MT7922 used in the AMD SKU, particularly in iPerf3 receive tests when paired with our reference Asus ROG Rapture GT-AXE11000 router.
The 6 GHz band provides only marginal throughput gains, but we noticed more stable transmission speeds here without the performance dips seen in the 5 GHz band.
| Networking / iperf3 transmit AXE11000 | |
| HP Pavilion Plus 14-ew0153TU | |
| HP Pavilion Plus 14-ey0095cl | |
| Lenovo ThinkPad T14s G4 i7-1365U | |
| Average of class Multimedia (606 - 1978, n=61, last 2 years) | |
| Average Intel Wi-Fi 6E AX211 (64 - 1921, n=276) | |
| Asus ExpertBook B9 B9403CVA-KM0153X | |
| Acer Swift Go 14 SFG14-71 | |
| Huawei MateBook X Pro 2023 | |
| Networking / iperf3 receive AXE11000 | |
| HP Pavilion Plus 14-ew0153TU | |
| Average Intel Wi-Fi 6E AX211 (582 - 1890, n=276) | |
| Average of class Multimedia (682 - 1818, n=61, last 2 years) | |
| Lenovo ThinkPad T14s G4 i7-1365U | |
| HP Pavilion Plus 14-ey0095cl | |
| Huawei MateBook X Pro 2023 | |
| Acer Swift Go 14 SFG14-71 | |
| Asus ExpertBook B9 B9403CVA-KM0153X | |
| Networking / iperf3 transmit AXE11000 6GHz | |
| HP Pavilion Plus 14-ew0153TU | |
| Asus ExpertBook B9 B9403CVA-KM0153X | |
| HP Pavilion Plus 14-ey0095cl | |
| Average of class Multimedia (869 - 2373, n=25, last 2 years) | |
| Lenovo ThinkPad T14s G4 i7-1365U | |
| Average Intel Wi-Fi 6E AX211 (385 - 1851, n=226) | |
| Huawei MateBook X Pro 2023 | |
| Acer Swift Go 14 SFG14-71 | |
| Networking / iperf3 receive AXE11000 6GHz | |
| Huawei MateBook X Pro 2023 | |
| Average of class Multimedia (1212 - 2361, n=25, last 2 years) | |
| HP Pavilion Plus 14-ew0153TU | |
| Average Intel Wi-Fi 6E AX211 (700 - 1857, n=226) | |
| Asus ExpertBook B9 B9403CVA-KM0153X | |
| Lenovo ThinkPad T14s G4 i7-1365U | |
| Acer Swift Go 14 SFG14-71 | |
| HP Pavilion Plus 14-ey0095cl | |
Webcam
Unlike the AMD version, we had no qualms in snapping pictures at 5 MP with our unit using the default Windows Camera app. Image quality is a big improvement compared to most laptops with pedestrian 720p or 1080p webcams.
Our test chart shows ample details and adequate sharpness, but color accuracy leaves a lot to be desired. A manual physical webcam shutter allows for added privacy. The bundled HP Enhanced Camera and HP Enhanced Lighting apps offer even more quality-of-life features for video conferencing.


Security
The Pavilion Plus 14 comes with a TPM 2.0 module in line with Windows 11's security requirements. An IR camera allows for Windows Hello-based facial recognition. Unfortunately, the laptop skimps on a Kensington lock slot.
Accessories and Warranty
The standard packaging comes with a 65 W power adapter and the usual paperwork sans any accessories.
HP offers a standard one-year warranty for the Pavilion Plus 14 in India. Buyers can also opt for eligible HP Post Warranty Care Packs and accidental damage protection ranging from one year (₹10,763) to three years (up to ₹14,459 for next business day onsite), within 90 days of product purchase.
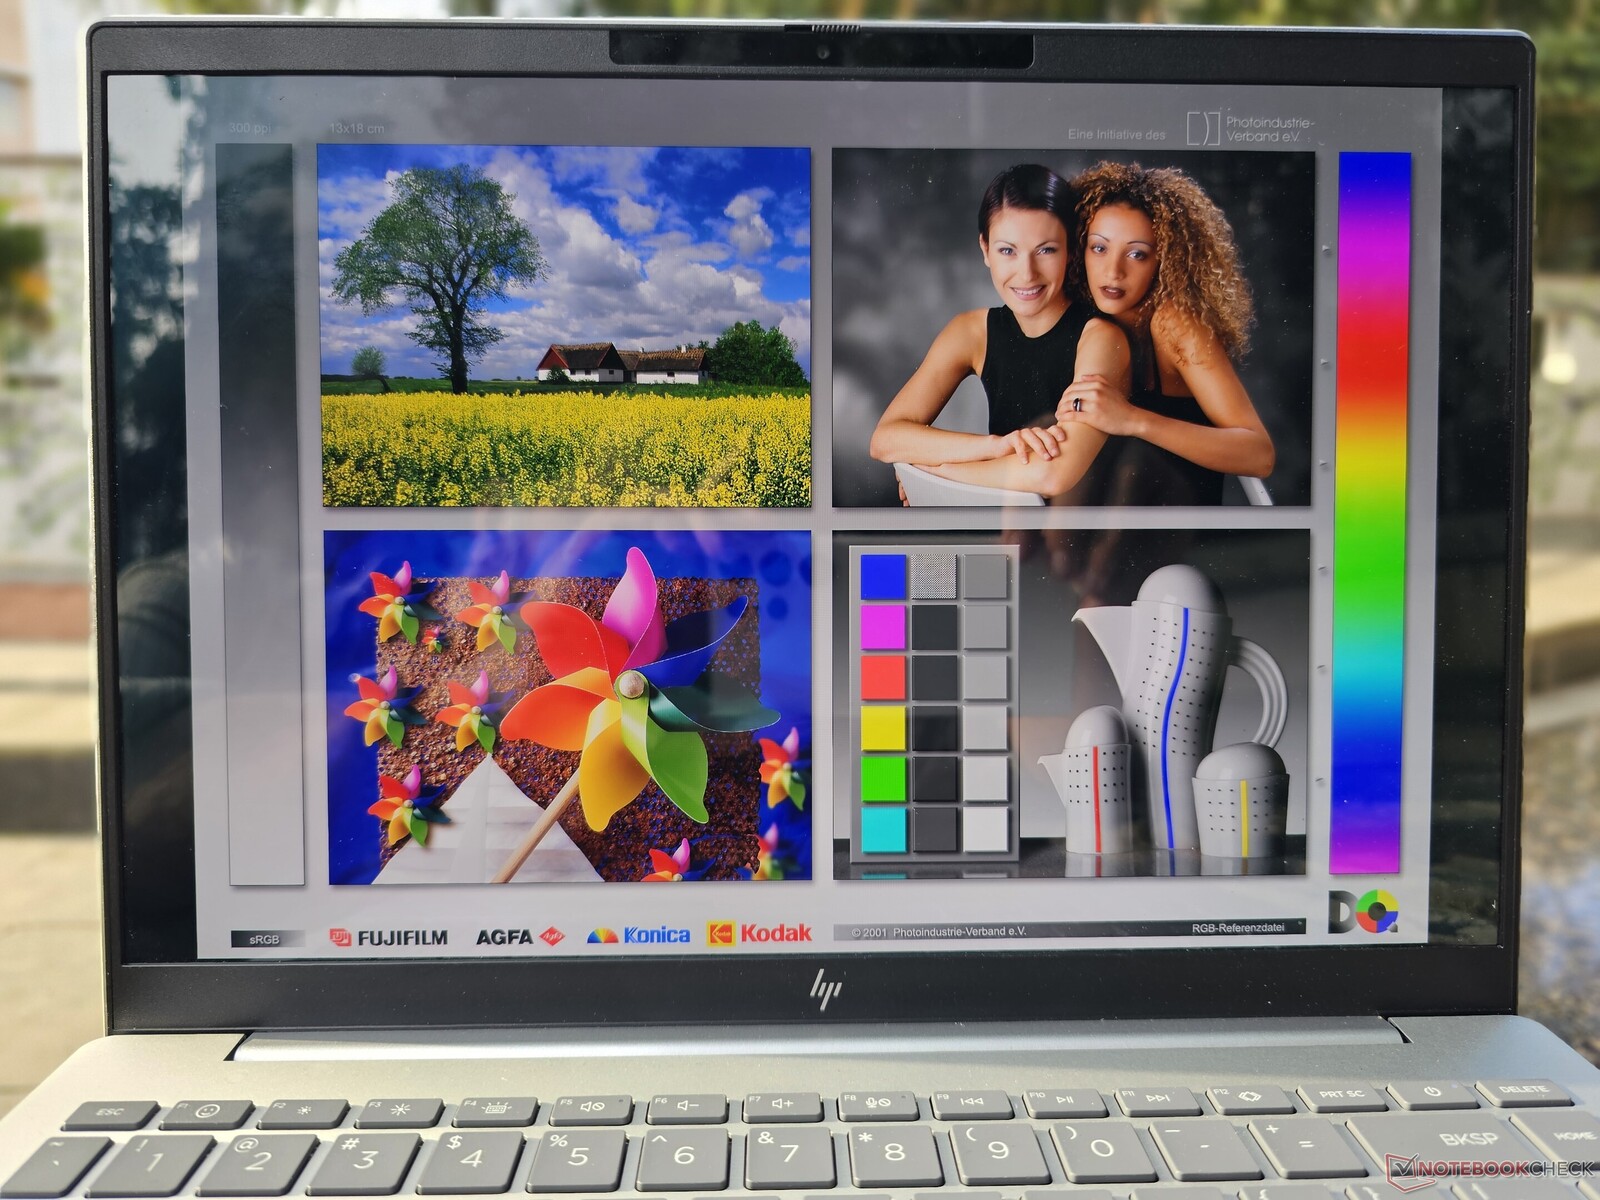
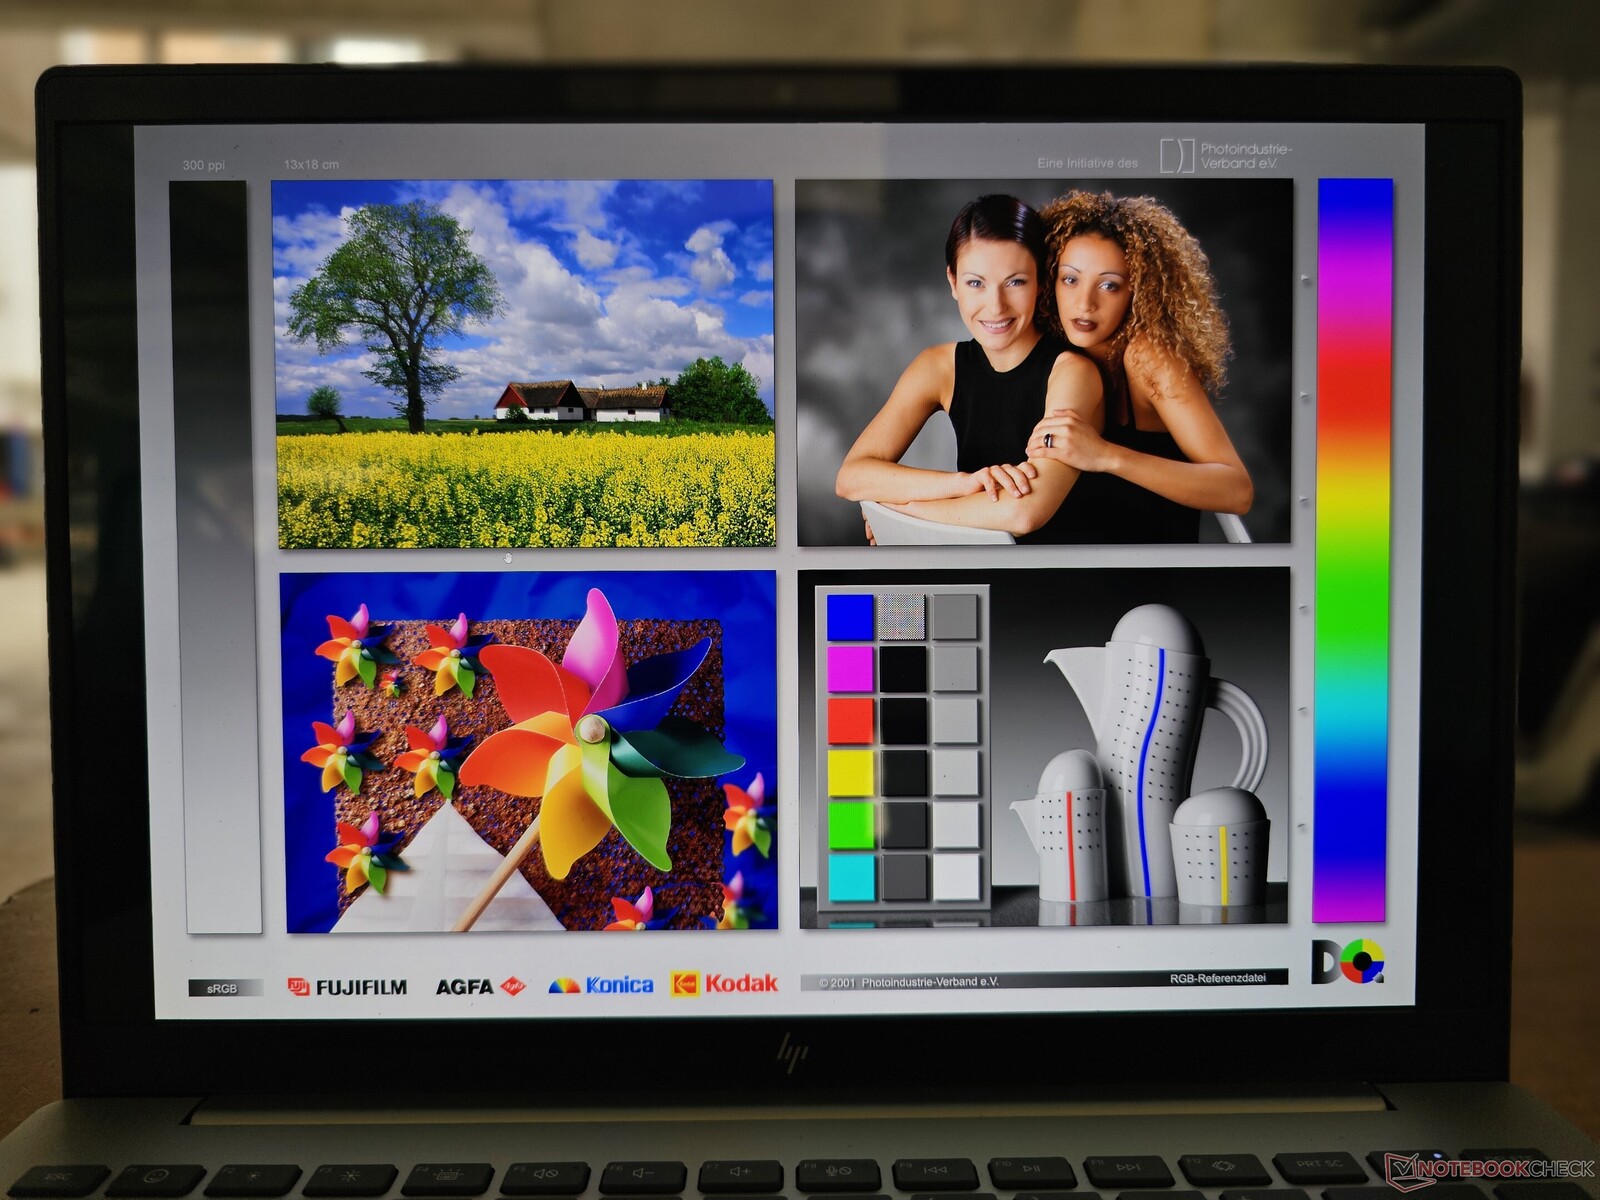
Display: 2.8K "IMAX Enhanced" OLED with HDR and 120 Hz PWM

The Core i7-powered Pavilion Plus 14 flaunts a 2880 x 1800 14-inch OLED panel with a 120 Hz refresh rate and 500 nits peak HDR brightness. This lends itself to a subjectively immersive viewing experience and a taller aspect ratio that aims to reflect the laptop's "IMAX Enhanced" branding.
Those opting for the Core i5 model can choose from FHD+ or QHD+ resolution options.
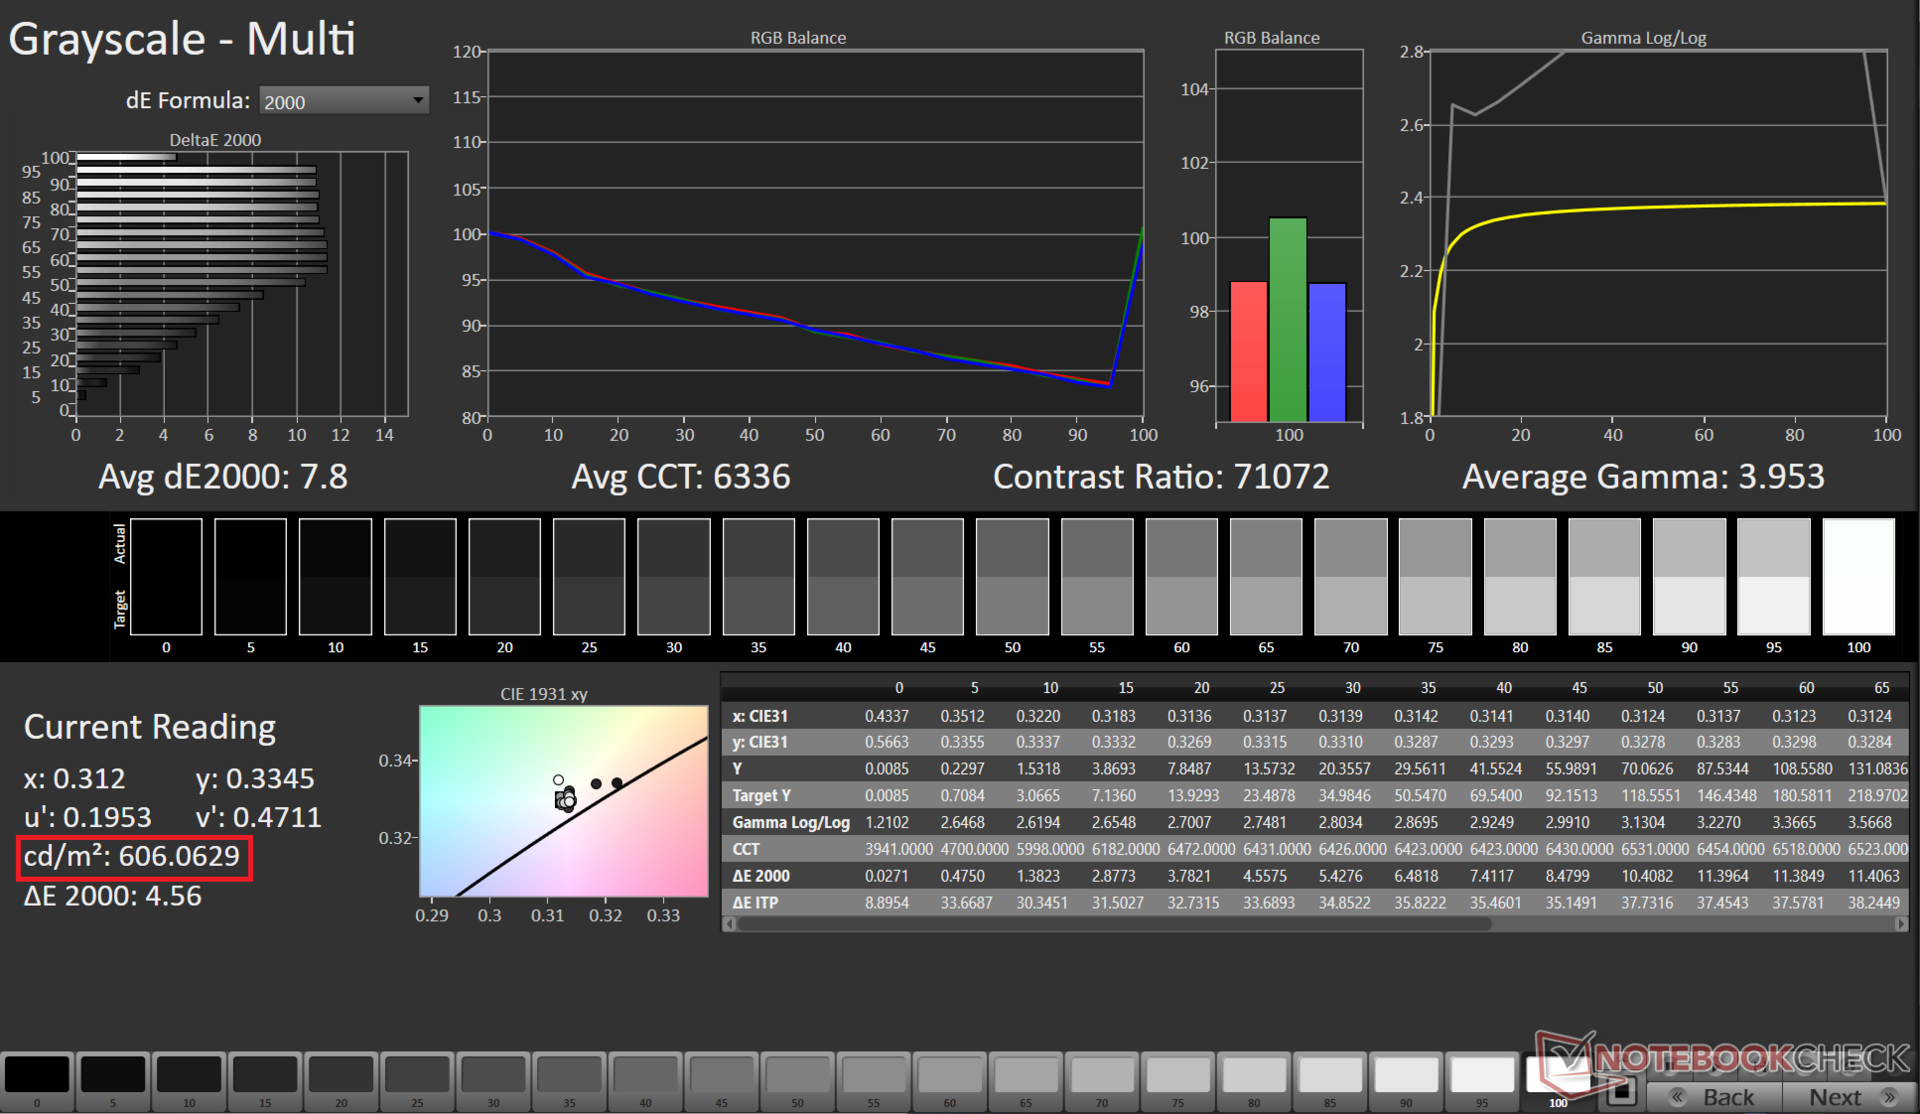
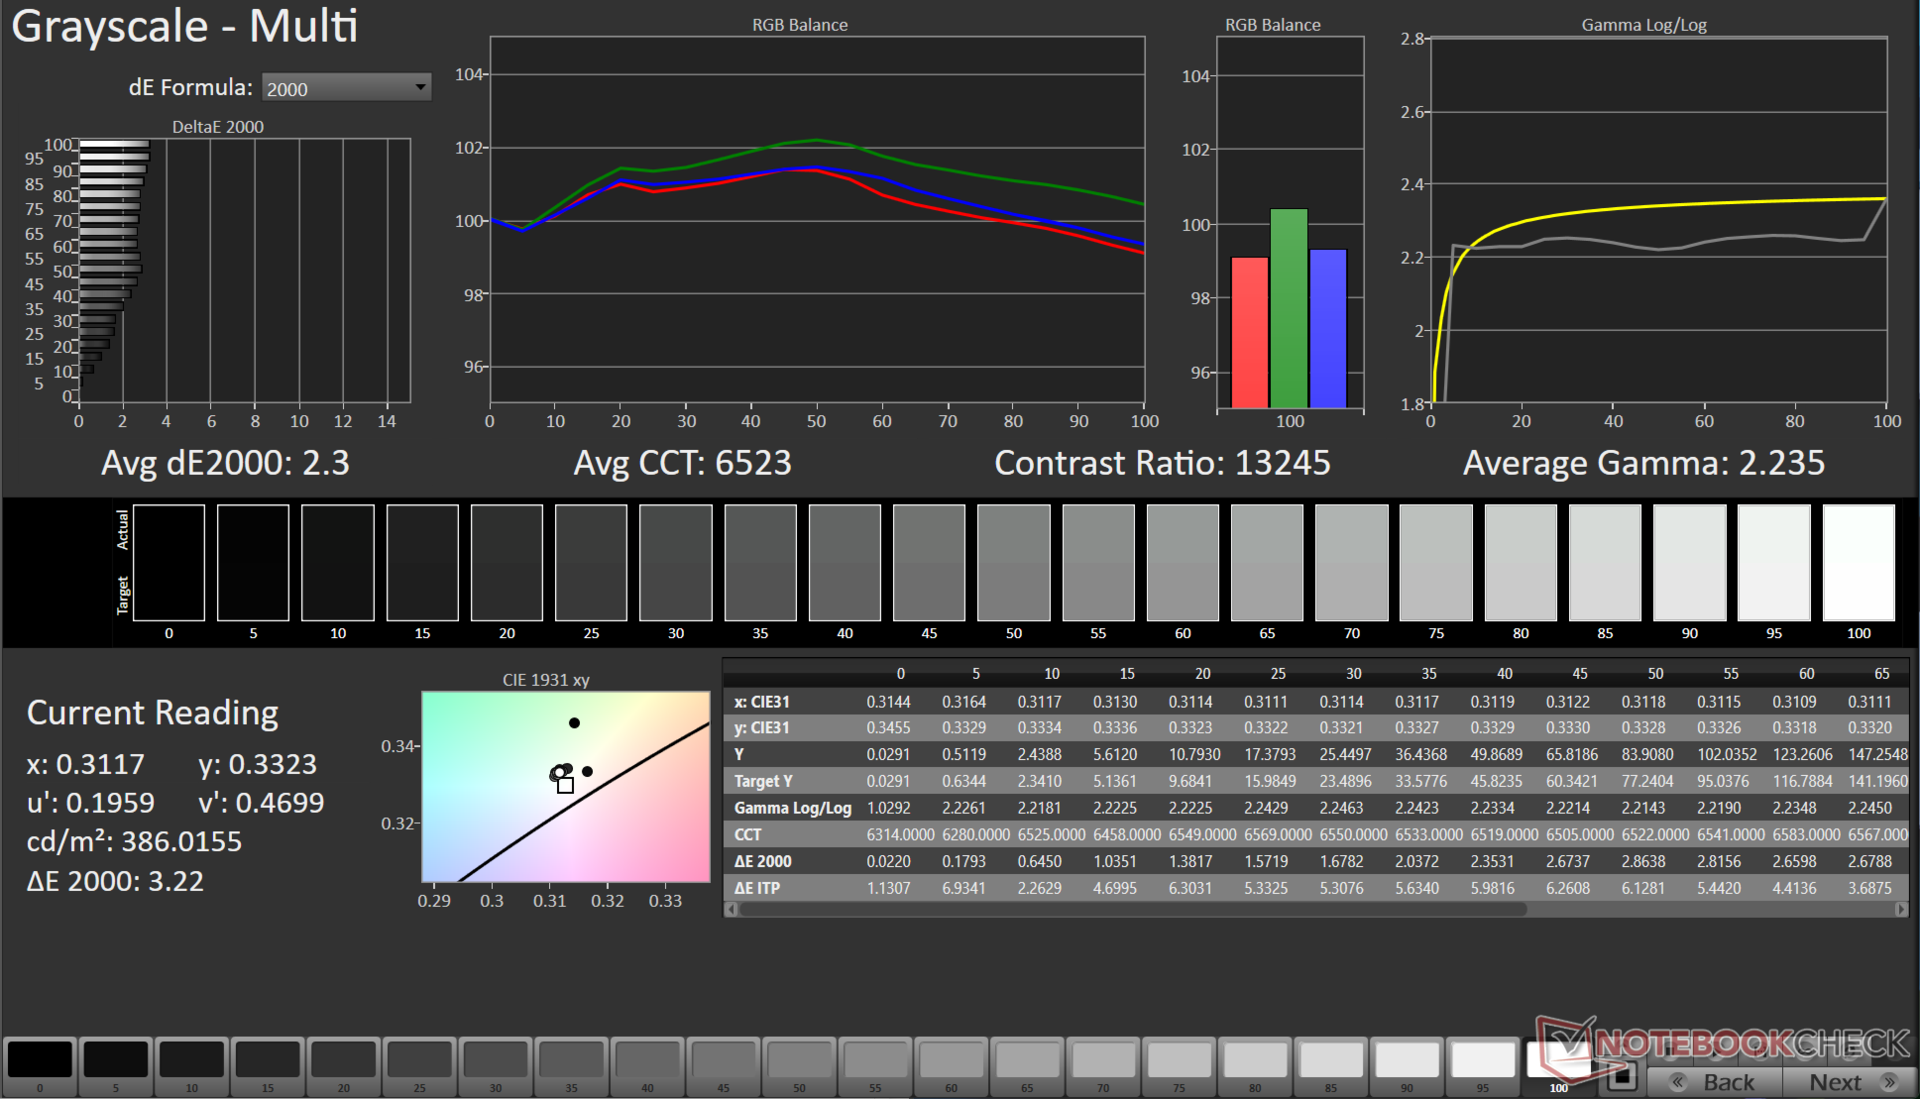
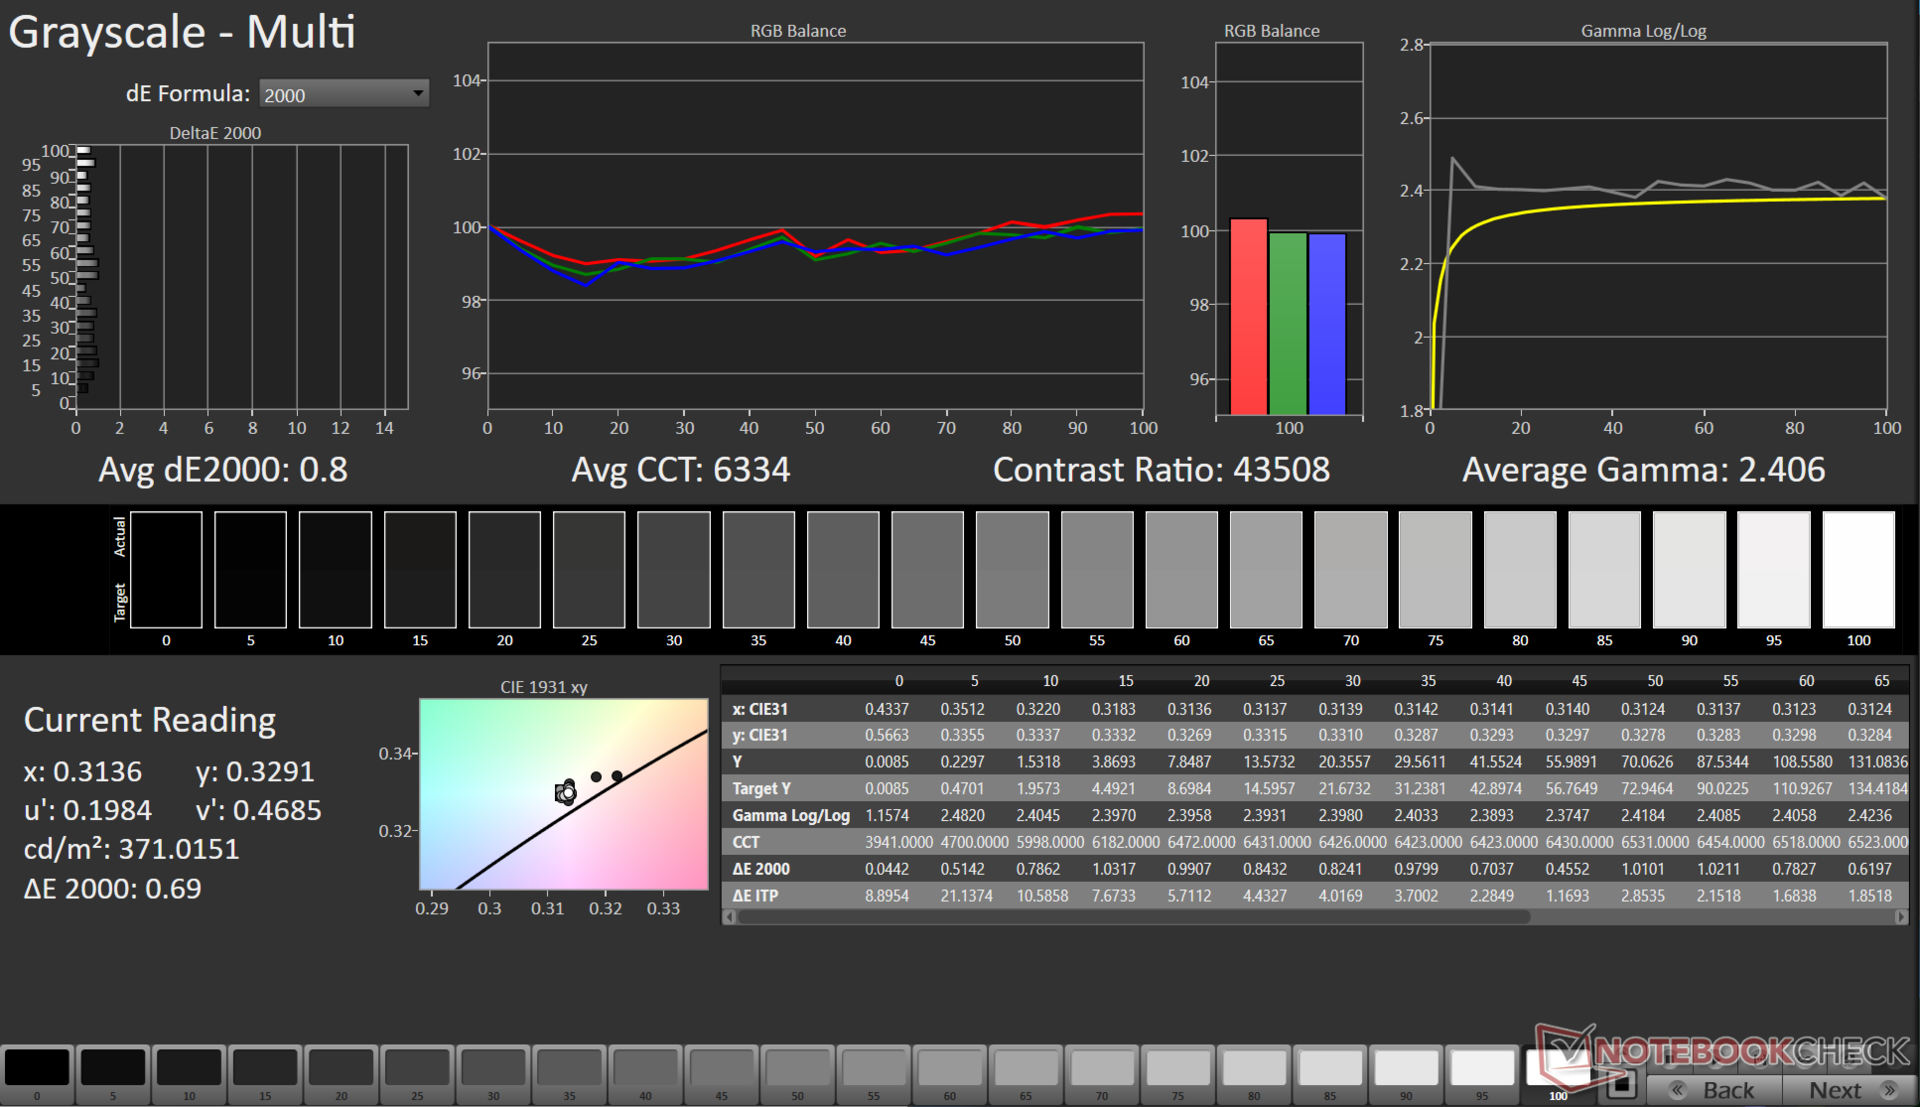
HP claims 400 nits of peak SDR brightness, and our testing validated that figure at 392 nits maximum. HDR fared even better, clocking an above-spec 606 nits peak luminance.
The panel shows an excellent 97% brightness uniformity and a near-infinite contrast ratio. There is no backlight bleed by virtue of this being an OLED panel.
| |||||||||||||||||||||||||
Brightness Distribution: 97 %
Center on Battery: 386 cd/m²
Contrast: 38700:1 (Black: 0.01 cd/m²)
ΔE ColorChecker Calman: 2.03 | ∀{0.5-29.43 Ø4.73}
calibrated: 1.6
ΔE Greyscale Calman: 2.3 | ∀{0.09-98 Ø4.97}
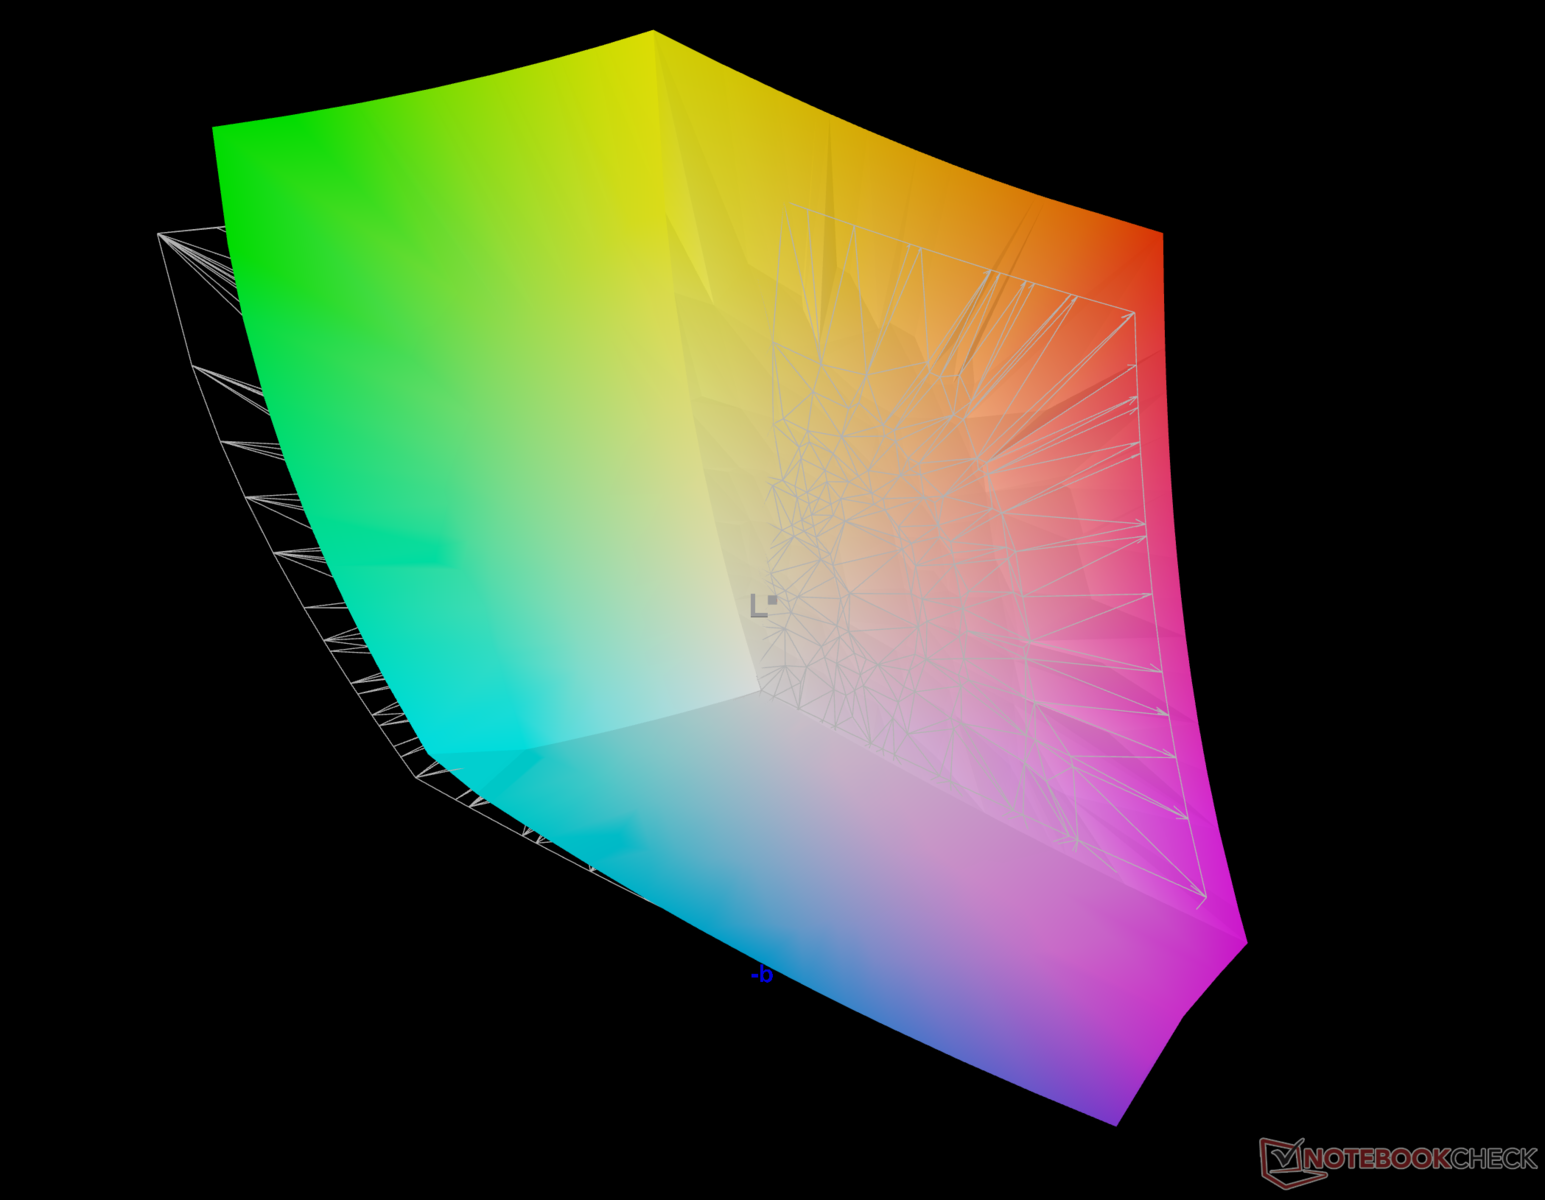
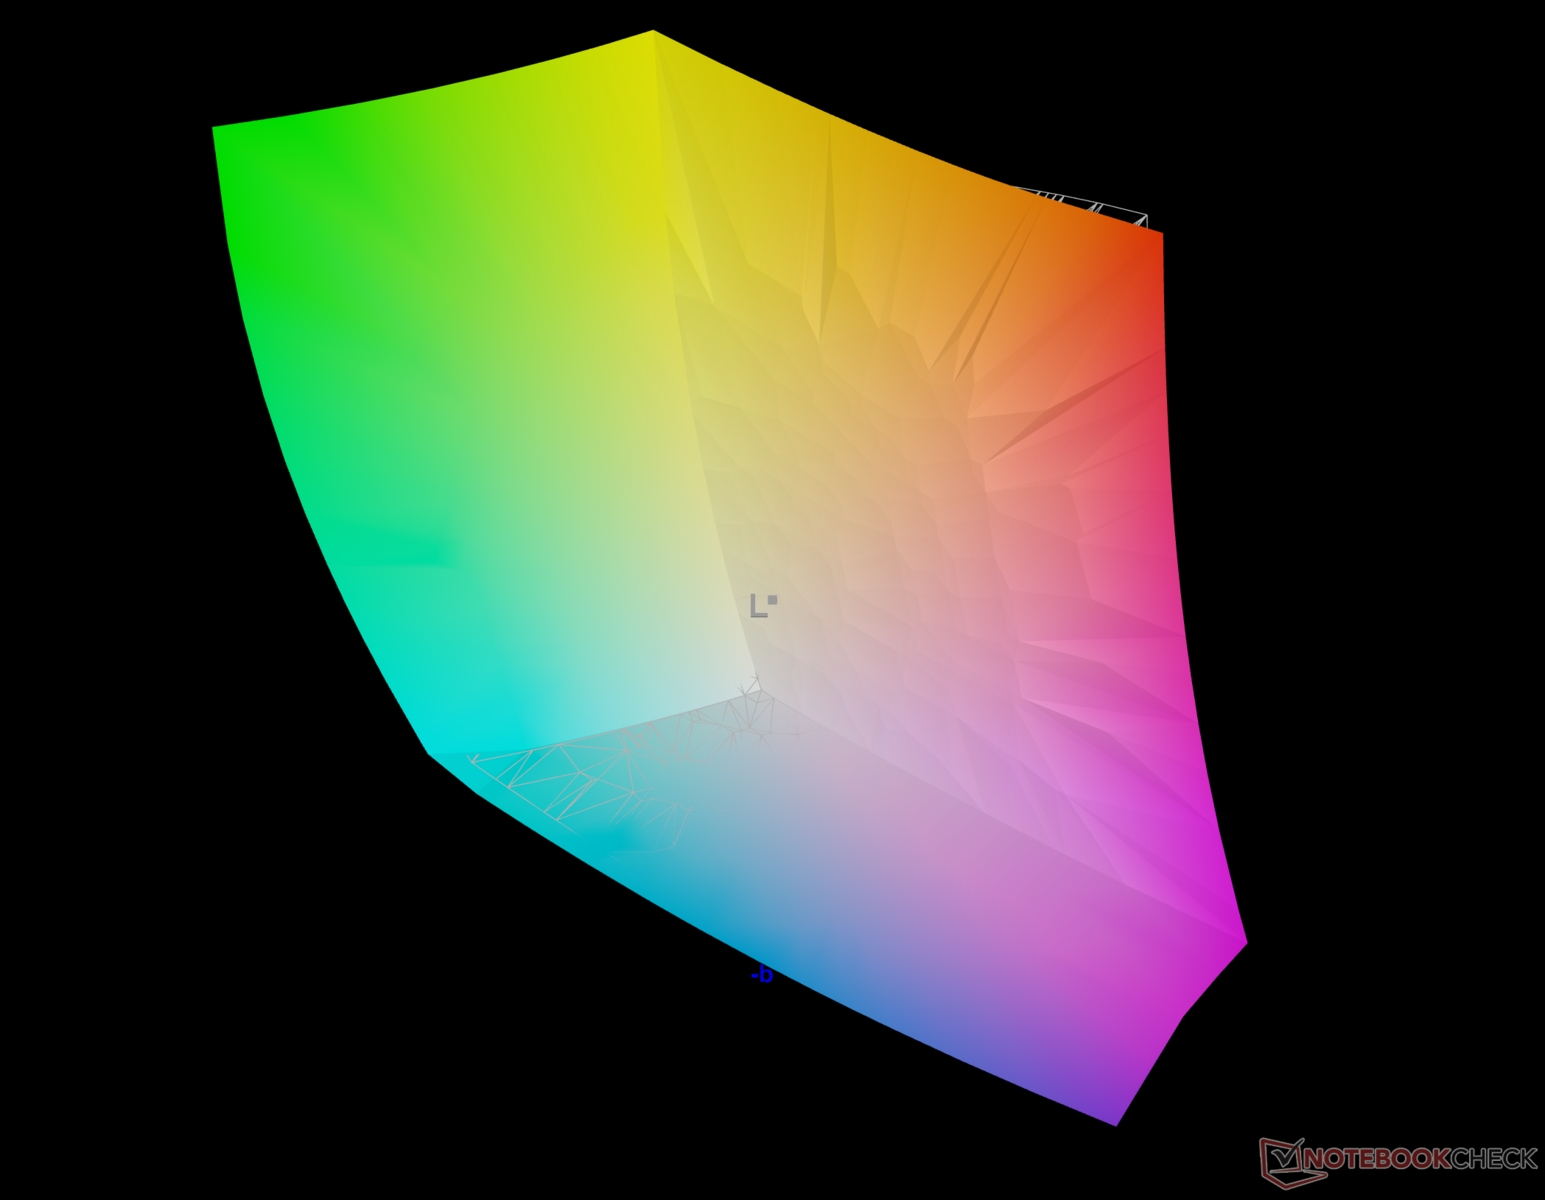
92.1% AdobeRGB 1998 (Argyll 3D)
99.6% sRGB (Argyll 3D)
97.9% Display P3 (Argyll 3D)
Gamma: 2.23
CCT: 6523 K
| HP Pavilion Plus 14-ew0153TU Samsung SDC4197, OLED, 2880x1800, 14" | HP Pavilion Plus 14-ey0095cl Samsung SDC4197, OLED, 2880x1800, 14" | Acer Swift Go 14 SFG14-71 Samsung ATNA40YK11-0, OLED, 2880x1800, 14" | Asus ExpertBook B9 B9403CVA-KM0153X ATNA40YK07-1 SDC4171, OLED, 2880x1800, 14" | Lenovo ThinkPad T14s G4 i7-1365U B140UAK01.2, IPS, 1920x1200, 14" | Huawei MateBook X Pro 2023 TMX1422, IPS, 3120x2080, 14.2" | |
|---|---|---|---|---|---|---|
| Display | 2% | 2% | 1% | -51% | -6% | |
| Display P3 Coverage (%) | 97.9 | 99.8 2% | 99.9 2% | 99.9 2% | 39.9 -59% | 89.8 -8% |
| sRGB Coverage (%) | 99.6 | 100 0% | 100 0% | 100 0% | 59.7 -40% | 99.4 0% |
| AdobeRGB 1998 Coverage (%) | 92.1 | 95.8 4% | 95.4 4% | 93.6 2% | 41.2 -55% | 84.2 -9% |
| Response Times | 91% | 81% | 80% | -114% | -30% | |
| Response Time Grey 50% / Grey 80% * (ms) | 10.8 ? | 0.82 ? 92% | 1.85 ? 83% | 2 ? 81% | 27.7 ? -156% | 20 ? -85% |
| Response Time Black / White * (ms) | 9.29 ? | 0.95 ? 90% | 2 ? 78% | 2 ? 78% | 15.9 ? -71% | 7 ? 25% |
| PWM Frequency (Hz) | 120 ? | 504.7 ? | 357 ? | 360 ? | 156000 ? | |
| Screen | -8% | -78% | -60% | -545% | -276% | |
| Brightness middle (cd/m²) | 387 | 384 -1% | 278 -28% | 389.9 1% | 322.5 -17% | 595 54% |
| Brightness (cd/m²) | 387 | 386 0% | 279 -28% | 390 1% | 296 -24% | 550 42% |
| Brightness Distribution (%) | 97 | 98 1% | 96 -1% | 99 2% | 85 -12% | 85 -12% |
| Black Level * (cd/m²) | 0.01 | 0.04 -300% | 0.0497 -397% | 0.44 -4300% | 0.25 -2400% | |
| Contrast (:1) | 38700 | 6950 -82% | 7845 -80% | 733 -98% | 2380 -94% | |
| Colorchecker dE 2000 * | 2.03 | 4.06 -100% | 3.01 -48% | 2.22 -9% | 3.72 -83% | 2.01 1% |
| Colorchecker dE 2000 max. * | 3.86 | 6.73 -74% | 4.43 -15% | 3.75 3% | 14.68 -280% | 6.9 -79% |
| Colorchecker dE 2000 calibrated * | 1.6 | 0.49 69% | 4.14 -159% | 1.9 -19% | 1.22 24% | |
| Greyscale dE 2000 * | 2.3 | 1.1 52% | 3.2 -39% | 2.4 -4% | 4 -74% | 2.74 -19% |
| Gamma | 2.23 99% | 2.26 97% | 2.194 100% | 2.187 101% | 2.29 96% | 2.4 92% |
| CCT | 6523 100% | 6331 103% | 6126 106% | 6426 101% | 6064 107% | 6319 103% |
| Total Average (Program / Settings) | 28% /
11% | 2% /
-38% | 7% /
-25% | -237% /
-378% | -104% /
-183% |
* ... smaller is better
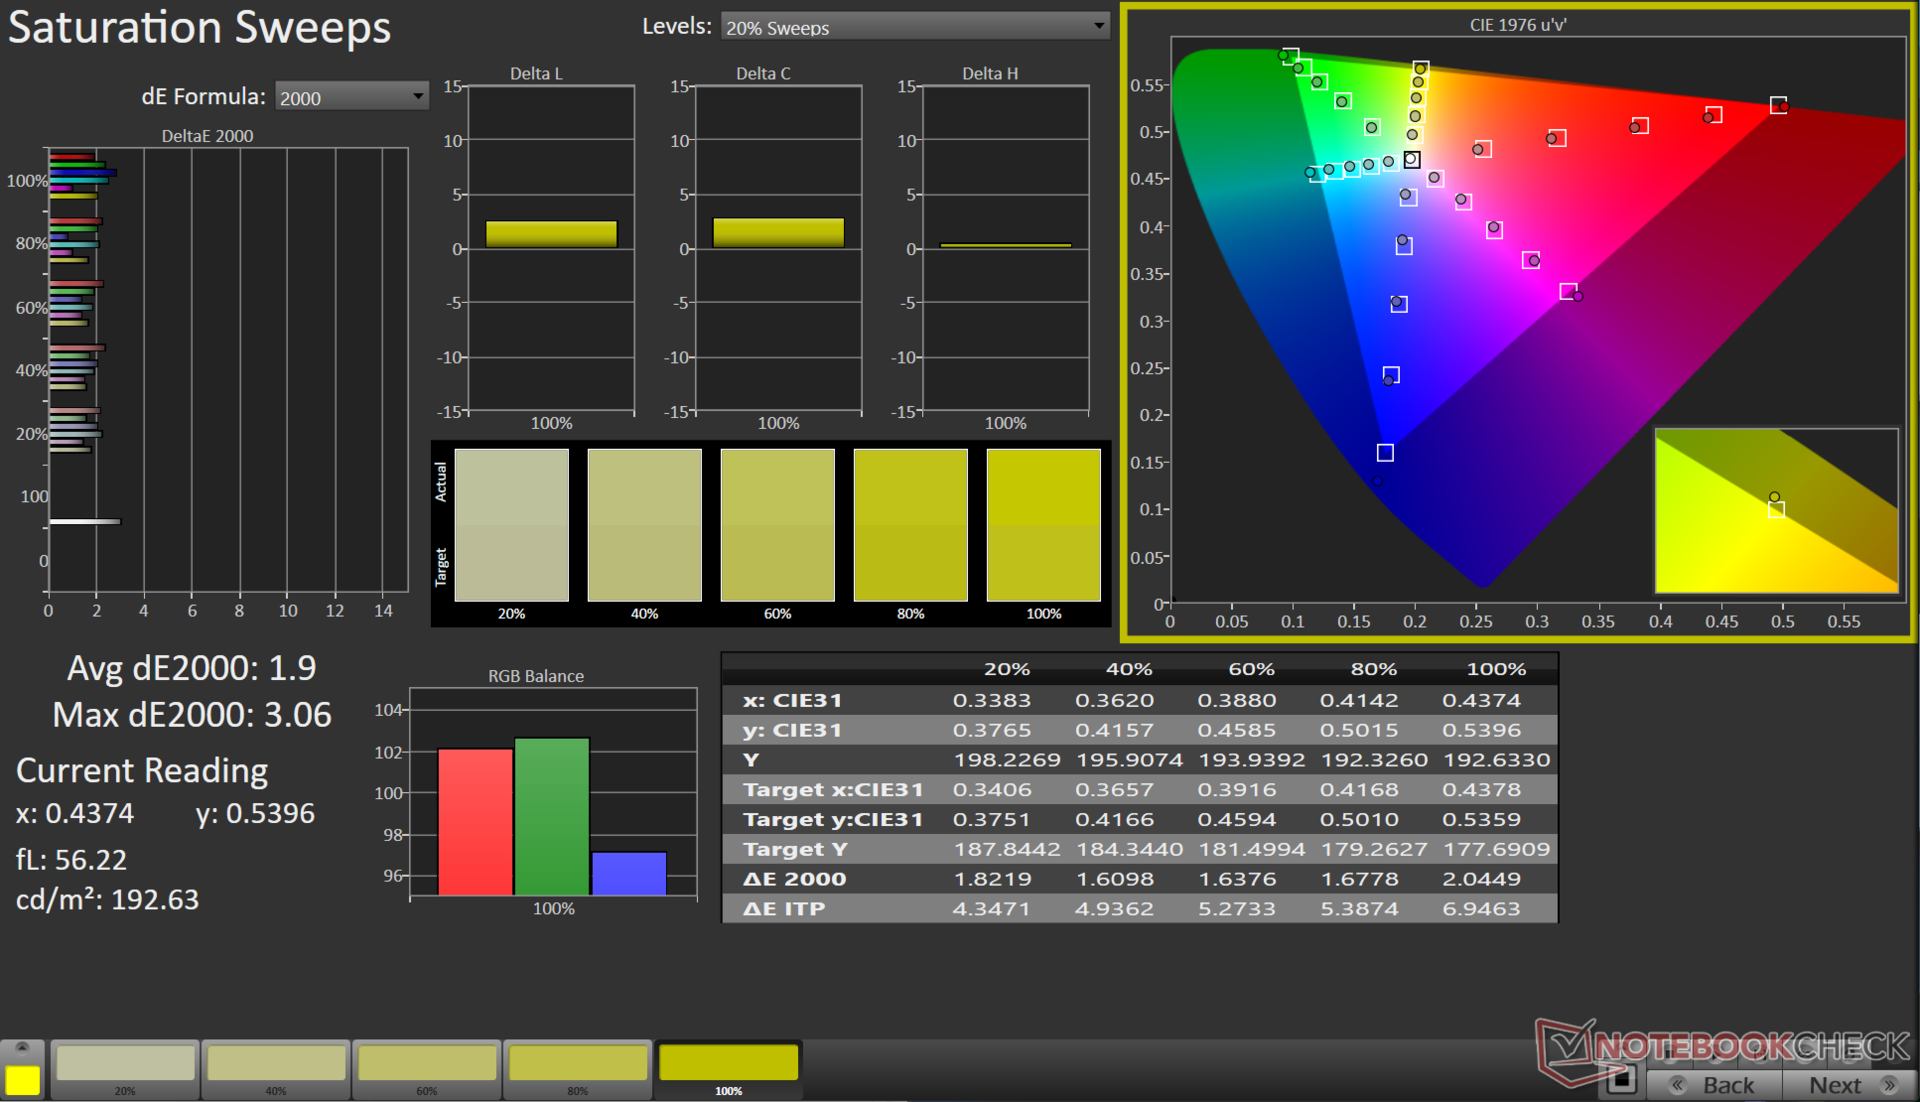
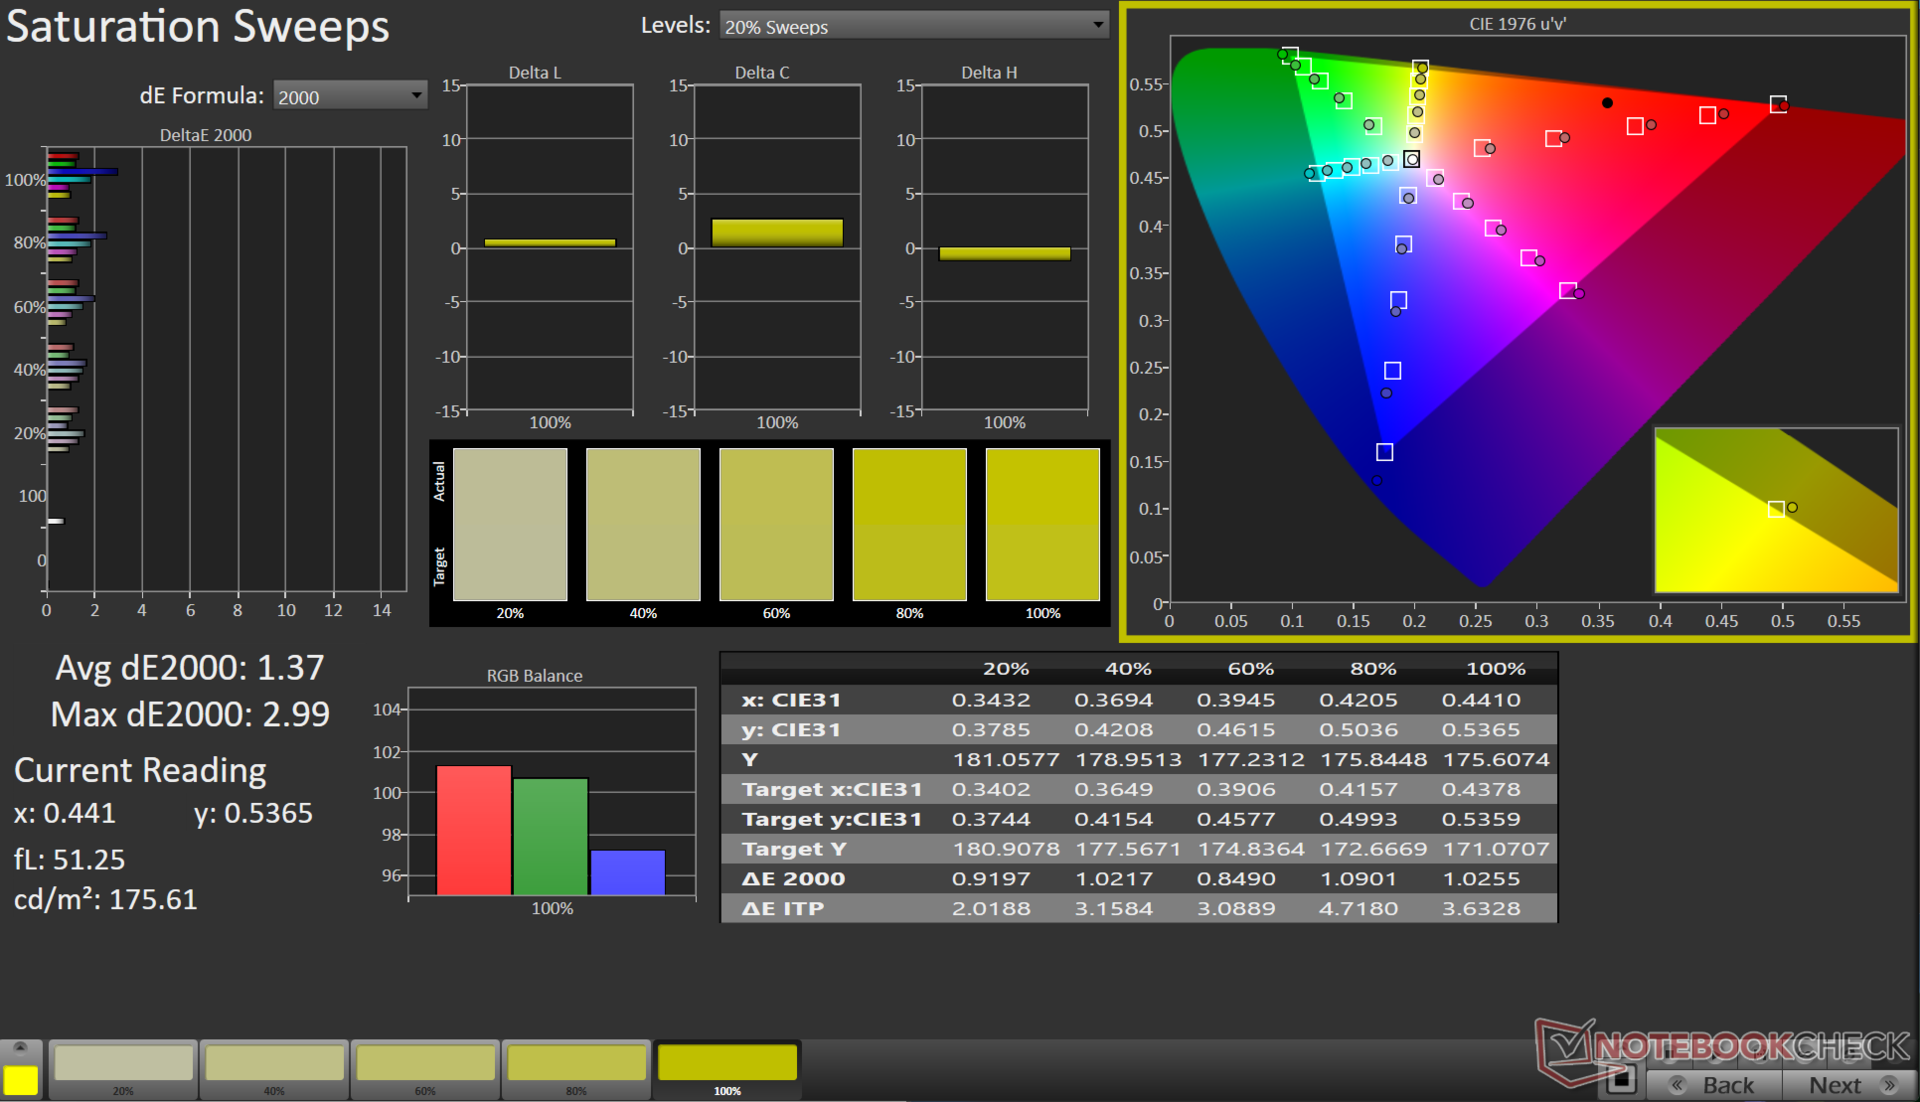
The display covers nearly 100% of the sRGB and Display P3 color spaces along with a very good 92.1% Adobe RGB coverage. This makes it highly amenable for both media editing and consumption.

Out-of-the-box color reproduction is decent with average Grayscale and ColorChecker Delta E 2000 values around 2.3 and 2.03, respectively.
Our calibration routine using the X-Rite i1Basic Pro 3 spectrophotometer and Calman Ultimate software from Portrait Displays further improves these corresponding values to 0.8 and 1.6.


Our calibrated ICC file can be downloaded from the link above.
Display Response Times
| ↔ Response Time Black to White | ||
|---|---|---|
| 9.29 ms ... rise ↗ and fall ↘ combined | ↗ 8.79 ms rise |  |
| ↘ 0.5 ms fall | ||
| The screen shows fast response rates in our tests and should be suited for gaming. In comparison, all tested devices range from 0.1 (minimum) to 240 (maximum) ms. » 26 % of all devices are better. This means that the measured response time is better than the average of all tested devices (19.9 ms). | ||
| ↔ Response Time 50% Grey to 80% Grey | ||
| 10.8 ms ... rise ↗ and fall ↘ combined | ↗ 9.4 ms rise |   |
| ↘ 1.4 ms fall | ||
| The screen shows good response rates in our tests, but may be too slow for competitive gamers. In comparison, all tested devices range from 0.165 (minimum) to 636 (maximum) ms. » 24 % of all devices are better. This means that the measured response time is better than the average of all tested devices (31.1 ms). | ||
Response times are decent but could have been better. We had to manually estimate the 50% grey to 80% grey response times as the pattern showed an unusually steep fall.
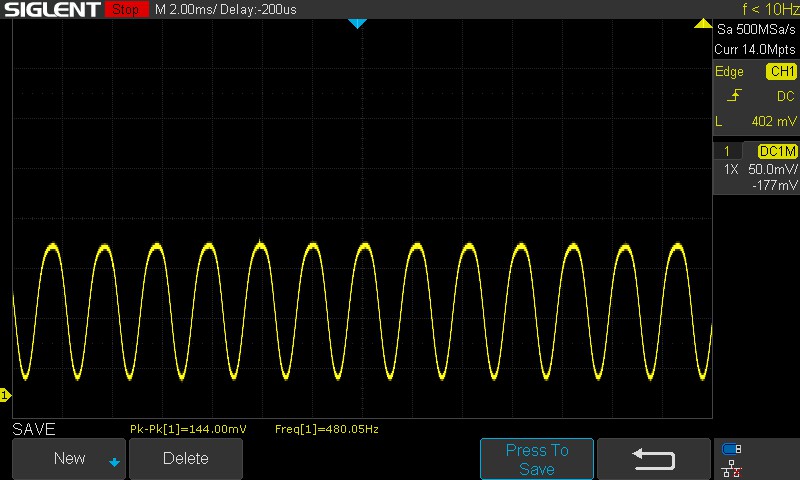
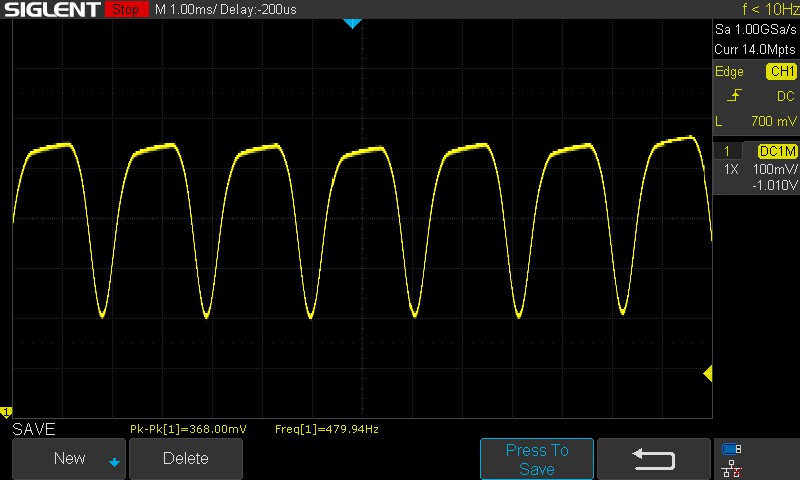
Screen Flickering / PWM (Pulse-Width Modulation)
| Screen flickering / PWM detected | 120 Hz | ≤ 100 % brightness setting |  |
The display backlight flickers at 120 Hz (worst case, e.g., utilizing PWM) Flickering detected at a brightness setting of 100 % and below. There should be no flickering or PWM above this brightness setting. The frequency of 120 Hz is very low, so the flickering may cause eyestrain and headaches after extended use. In comparison: 52 % of all tested devices do not use PWM to dim the display. If PWM was detected, an average of 7794 (minimum: 5 - maximum: 343500) Hz was measured. | |||
At a refresh rate of 120 Hz, the PWM can oscillate between 120 Hz or multiples thereof up to 480 Hz. The PWM drops to 60 Hz at the corresponding refresh rate.
In any case, the PWM frequency is on the lower side and can pose problems to those sensitive to it.


Check out our primer "Why PWM is such a headache" for more information. An overview of measured PWM across reviewed devices can be found in our PWM Ranking table.
The glossy display can be irksome to view in direct sunlight. Viewing angles are quite stable without perceivable brightness or color loss at the extremes.

Performance: No match for the Ryzen 7 7840U-based Pavilion Plus 14
HP offers the Pavilion Plus 14 in both Core i5-1335U and Core i7-1355U options. The myHP app only offers a Balanced power profile, so we used Windows power management set to Best Performance for all benchmarks.
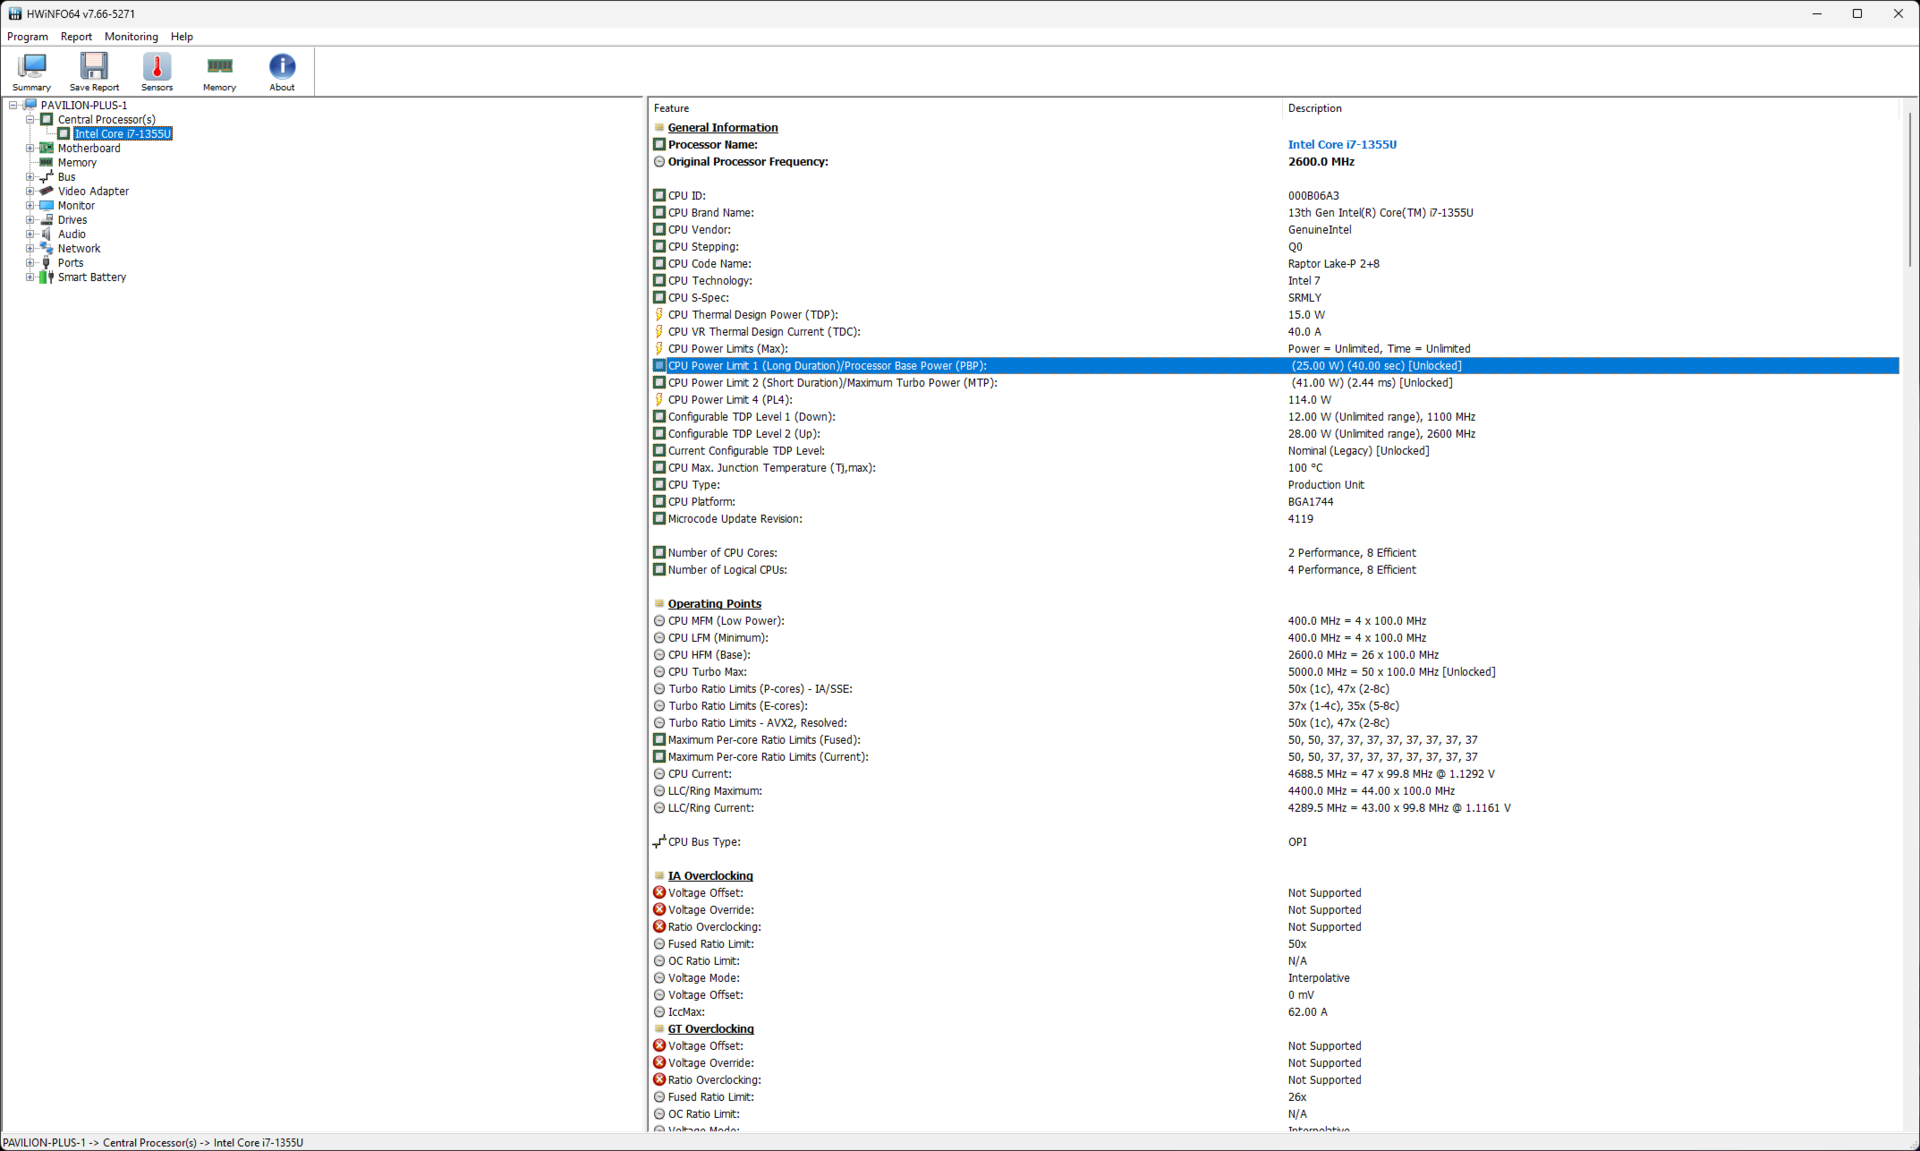
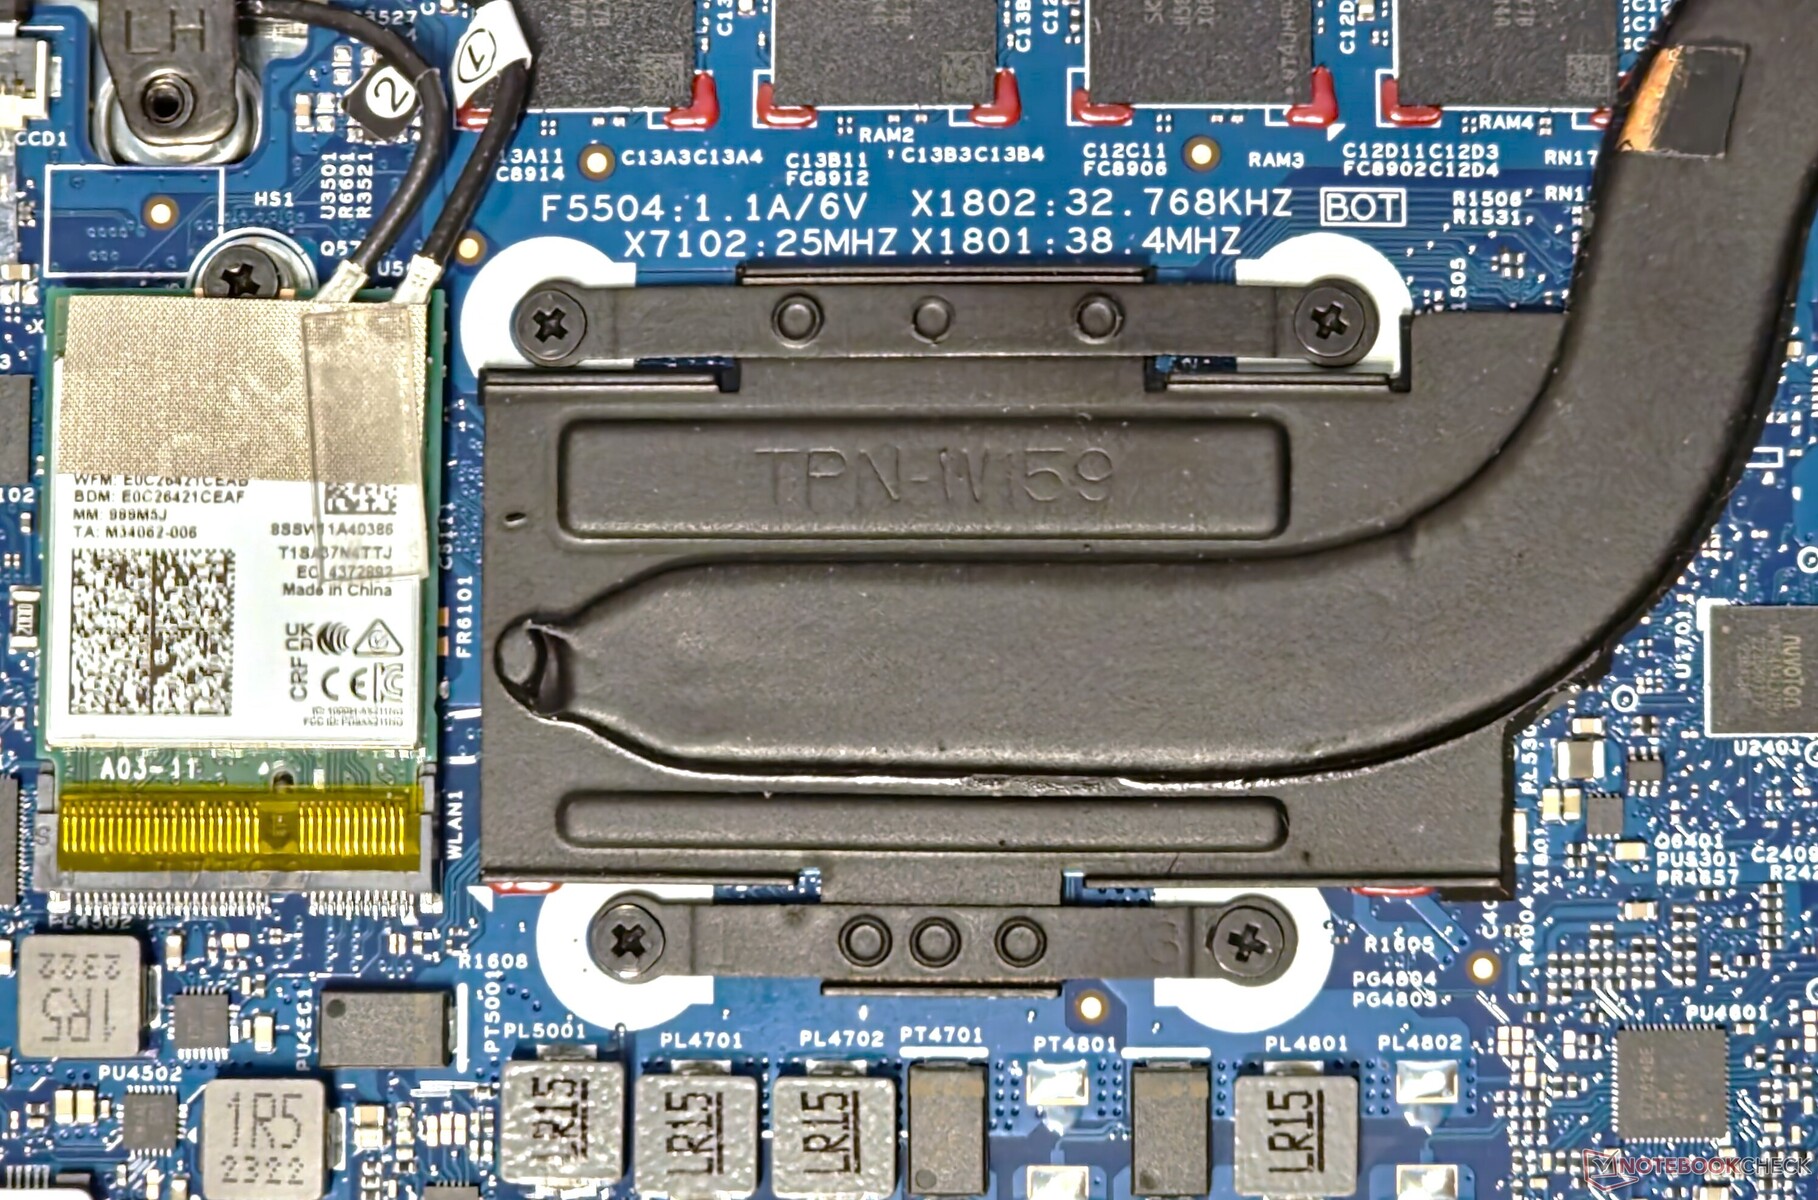
The Core i7-1355U is a 10-core (2P+8E) 12-thread part that operates at a PL1 of 25 W and a PL2 of 41 W in this device.
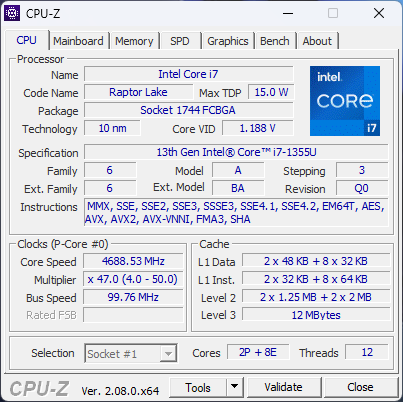

Processor
The Pavilion Plus 14 Core i7 lags considerably behind its AMD Ryzen 7 7840U-powered cousin in overall CPU benchmarks. This is on expected lines since the Core i7-1355U offers only two P-cores with hyperthreading while the rest are E-cores.
This results in a considerable hit to multi-core performance against the 8C/16T Ryzen 7 7840U, although the Core i7-1355U's single-core scores are generally on par or slightly ahead depending on the benchmark.
Cumulatively, our review sample trails by 8% compared to average Core i7-1355U scores. The lower PL2 also puts the Pavilion Plus 14 at a slight disadvantage, especially in multi-core, versus the Asus ExpertBook B9 that uses the same chip but at somewhat higher power limits.
Cinebench R15 Multi Loop
Cinebench R23: Multi Core | Single Core
Cinebench R20: CPU (Multi Core) | CPU (Single Core)
Cinebench R15: CPU Multi 64Bit | CPU Single 64Bit
Blender: v2.79 BMW27 CPU
7-Zip 18.03: 7z b 4 | 7z b 4 -mmt1
Geekbench 5.5: Multi-Core | Single-Core
HWBOT x265 Benchmark v2.2: 4k Preset
LibreOffice : 20 Documents To PDF
R Benchmark 2.5: Overall mean
| CPU Performance rating | |
| Average of class Multimedia | |
| HP Pavilion Plus 14-ey0095cl | |
| Huawei MateBook X Pro 2023 | |
| Lenovo ThinkPad T14s G4 i7-1365U | |
| Average Intel Core i7-1355U | |
| Asus ExpertBook B9 B9403CVA-KM0153X | |
| HP Pavilion Plus 14-ew0153TU | |
| Acer Swift Go 14 SFG14-71 | |
| Cinebench R23 / Multi Core | |
| Average of class Multimedia (4861 - 33362, n=81, last 2 years) | |
| HP Pavilion Plus 14-ey0095cl | |
| Huawei MateBook X Pro 2023 | |
| Average Intel Core i7-1355U (6936 - 10252, n=18) | |
| Lenovo ThinkPad T14s G4 i7-1365U | |
| Acer Swift Go 14 SFG14-71 | |
| Asus ExpertBook B9 B9403CVA-KM0153X | |
| HP Pavilion Plus 14-ew0153TU | |
| Cinebench R23 / Single Core | |
| Average of class Multimedia (1128 - 2459, n=73, last 2 years) | |
| Lenovo ThinkPad T14s G4 i7-1365U | |
| Huawei MateBook X Pro 2023 | |
| Average Intel Core i7-1355U (1687 - 1889, n=18) | |
| HP Pavilion Plus 14-ew0153TU | |
| Asus ExpertBook B9 B9403CVA-KM0153X | |
| HP Pavilion Plus 14-ey0095cl | |
| Acer Swift Go 14 SFG14-71 | |
| Cinebench R20 / CPU (Multi Core) | |
| Average of class Multimedia (1887 - 12912, n=64, last 2 years) | |
| Huawei MateBook X Pro 2023 | |
| HP Pavilion Plus 14-ey0095cl | |
| Average Intel Core i7-1355U (2849 - 3907, n=18) | |
| Lenovo ThinkPad T14s G4 i7-1365U | |
| HP Pavilion Plus 14-ew0153TU | |
| Asus ExpertBook B9 B9403CVA-KM0153X | |
| Acer Swift Go 14 SFG14-71 | |
| Cinebench R20 / CPU (Single Core) | |
| Lenovo ThinkPad T14s G4 i7-1365U | |
| Average of class Multimedia (425 - 853, n=64, last 2 years) | |
| Huawei MateBook X Pro 2023 | |
| Average Intel Core i7-1355U (654 - 725, n=18) | |
| Asus ExpertBook B9 B9403CVA-KM0153X | |
| HP Pavilion Plus 14-ew0153TU | |
| HP Pavilion Plus 14-ey0095cl | |
| Acer Swift Go 14 SFG14-71 | |
| Cinebench R15 / CPU Multi 64Bit | |
| Average of class Multimedia (856 - 5224, n=68, last 2 years) | |
| Huawei MateBook X Pro 2023 | |
| HP Pavilion Plus 14-ey0095cl | |
| Average Intel Core i7-1355U (1206 - 1735, n=18) | |
| Lenovo ThinkPad T14s G4 i7-1365U | |
| Acer Swift Go 14 SFG14-71 | |
| Asus ExpertBook B9 B9403CVA-KM0153X | |
| HP Pavilion Plus 14-ew0153TU | |
| Cinebench R15 / CPU Single 64Bit | |
| Average of class Multimedia (184.8 - 326, n=66, last 2 years) | |
| Huawei MateBook X Pro 2023 | |
| HP Pavilion Plus 14-ey0095cl | |
| Lenovo ThinkPad T14s G4 i7-1365U | |
| Average Intel Core i7-1355U (237 - 267, n=18) | |
| Asus ExpertBook B9 B9403CVA-KM0153X | |
| HP Pavilion Plus 14-ew0153TU | |
| Acer Swift Go 14 SFG14-71 | |
| Blender / v2.79 BMW27 CPU | |
| HP Pavilion Plus 14-ew0153TU | |
| Average Intel Core i7-1355U (328 - 503, n=18) | |
| Asus ExpertBook B9 B9403CVA-KM0153X | |
| Acer Swift Go 14 SFG14-71 | |
| Lenovo ThinkPad T14s G4 i7-1365U | |
| Huawei MateBook X Pro 2023 | |
| HP Pavilion Plus 14-ey0095cl | |
| Average of class Multimedia (100 - 557, n=65, last 2 years) | |
| 7-Zip 18.03 / 7z b 4 | |
| Average of class Multimedia (29095 - 130368, n=62, last 2 years) | |
| HP Pavilion Plus 14-ey0095cl | |
| Huawei MateBook X Pro 2023 | |
| Lenovo ThinkPad T14s G4 i7-1365U | |
| Average Intel Core i7-1355U (30255 - 42092, n=18) | |
| Asus ExpertBook B9 B9403CVA-KM0153X | |
| Acer Swift Go 14 SFG14-71 | |
| HP Pavilion Plus 14-ew0153TU | |
| 7-Zip 18.03 / 7z b 4 -mmt1 | |
| HP Pavilion Plus 14-ey0095cl | |
| Average of class Multimedia (3666 - 7545, n=63, last 2 years) | |
| Lenovo ThinkPad T14s G4 i7-1365U | |
| Huawei MateBook X Pro 2023 | |
| Average Intel Core i7-1355U (5301 - 5911, n=18) | |
| HP Pavilion Plus 14-ew0153TU | |
| Asus ExpertBook B9 B9403CVA-KM0153X | |
| Acer Swift Go 14 SFG14-71 | |
| Geekbench 5.5 / Multi-Core | |
| Average of class Multimedia (4652 - 20422, n=62, last 2 years) | |
| HP Pavilion Plus 14-ey0095cl | |
| Huawei MateBook X Pro 2023 | |
| Lenovo ThinkPad T14s G4 i7-1365U | |
| Average Intel Core i7-1355U (7507 - 9328, n=18) | |
| HP Pavilion Plus 14-ew0153TU | |
| Acer Swift Go 14 SFG14-71 | |
| Asus ExpertBook B9 B9403CVA-KM0153X | |
| Geekbench 5.5 / Single-Core | |
| Average of class Multimedia (805 - 2974, n=62, last 2 years) | |
| HP Pavilion Plus 14-ey0095cl | |
| Lenovo ThinkPad T14s G4 i7-1365U | |
| HP Pavilion Plus 14-ew0153TU | |
| Huawei MateBook X Pro 2023 | |
| Average Intel Core i7-1355U (1678 - 1872, n=18) | |
| Asus ExpertBook B9 B9403CVA-KM0153X | |
| Acer Swift Go 14 SFG14-71 | |
| HWBOT x265 Benchmark v2.2 / 4k Preset | |
| Average of class Multimedia (5.26 - 36.1, n=63, last 2 years) | |
| HP Pavilion Plus 14-ey0095cl | |
| Huawei MateBook X Pro 2023 | |
| Lenovo ThinkPad T14s G4 i7-1365U | |
| Average Intel Core i7-1355U (7.83 - 11.4, n=18) | |
| Acer Swift Go 14 SFG14-71 | |
| HP Pavilion Plus 14-ew0153TU | |
| Asus ExpertBook B9 B9403CVA-KM0153X | |
| LibreOffice / 20 Documents To PDF | |
| Acer Swift Go 14 SFG14-71 | |
| HP Pavilion Plus 14-ew0153TU | |
| Asus ExpertBook B9 B9403CVA-KM0153X | |
| Average Intel Core i7-1355U (41.1 - 108.6, n=18) | |
| HP Pavilion Plus 14-ey0095cl | |
| Average of class Multimedia (23.9 - 146.7, n=64, last 2 years) | |
| Lenovo ThinkPad T14s G4 i7-1365U | |
| Huawei MateBook X Pro 2023 | |
| R Benchmark 2.5 / Overall mean | |
| Acer Swift Go 14 SFG14-71 | |
| Average Intel Core i7-1355U (0.4481 - 0.832, n=18) | |
| Asus ExpertBook B9 B9403CVA-KM0153X | |
| HP Pavilion Plus 14-ew0153TU | |
| Average of class Multimedia (0.3604 - 0.947, n=63, last 2 years) | |
| Huawei MateBook X Pro 2023 | |
| HP Pavilion Plus 14-ey0095cl | |
| Lenovo ThinkPad T14s G4 i7-1365U | |
* ... smaller is better
A look at various CPU parameters while running the Cinebench R15 multi-core loop shows that the Core i7-1355U is able to hit a peak boost of 3.83 GHz while utilizing 42.2 W. The CPU coasts at an average of 2 GHz at 16 W during the run.
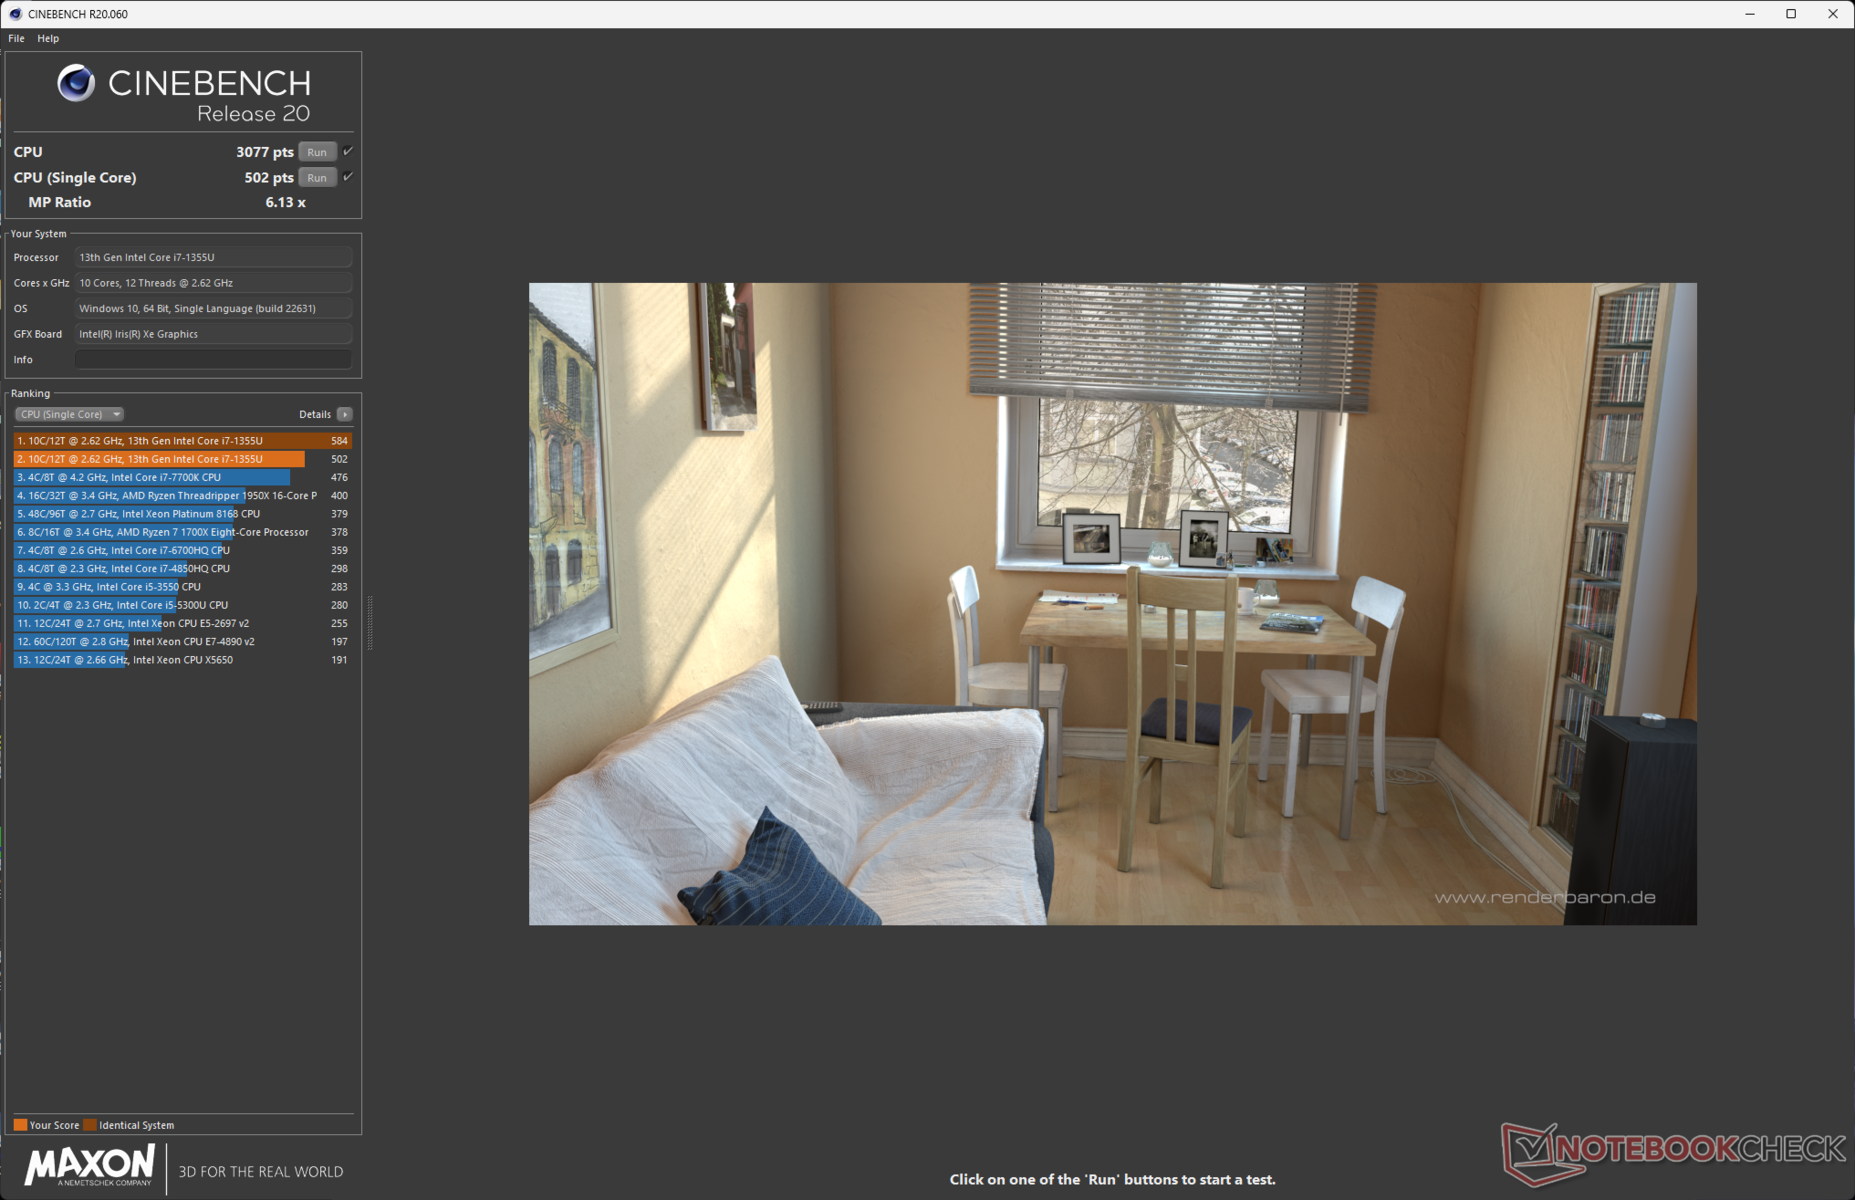
The Pavilion Plus 14 defaults to Best Performance when plugged in and to the Balanced profile on battery power. For some reason, the Core i7-1355U presents peculiar results with Cinebench on battery where it seems to favor the Balanced mode compared to the Best Performance mode.
Accordingly, while Cinebench R20 single-core performance expectedly drops by ~24%, the multi-core score interestingly shows a 3% increase on battery power. We observed the same anomalous result even after multiple runs and with Cinebench R23 as well.

AIDA64: FP32 Ray-Trace | FPU Julia | CPU SHA3 | CPU Queen | FPU SinJulia | FPU Mandel | CPU AES | CPU ZLib | FP64 Ray-Trace | CPU PhotoWorxx
| Performance rating | |
| Average of class Multimedia | |
| HP Pavilion Plus 14-ey0095cl | |
| Huawei MateBook X Pro 2023 | |
| Lenovo ThinkPad T14s G4 i7-1365U | |
| Average Intel Core i7-1355U | |
| Asus ExpertBook B9 B9403CVA-KM0153X | |
| Acer Swift Go 14 SFG14-71 | |
| HP Pavilion Plus 14-ew0153TU | |
| AIDA64 / FP32 Ray-Trace | |
| HP Pavilion Plus 14-ey0095cl | |
| Average of class Multimedia (2214 - 50388, n=60, last 2 years) | |
| Huawei MateBook X Pro 2023 | |
| Lenovo ThinkPad T14s G4 i7-1365U | |
| Average Intel Core i7-1355U (5673 - 8424, n=18) | |
| Asus ExpertBook B9 B9403CVA-KM0153X | |
| Acer Swift Go 14 SFG14-71 | |
| HP Pavilion Plus 14-ew0153TU | |
| AIDA64 / FPU Julia | |
| Average of class Multimedia (12867 - 201874, n=61, last 2 years) | |
| HP Pavilion Plus 14-ey0095cl | |
| Huawei MateBook X Pro 2023 | |
| Lenovo ThinkPad T14s G4 i7-1365U | |
| Average Intel Core i7-1355U (29580 - 42706, n=18) | |
| Asus ExpertBook B9 B9403CVA-KM0153X | |
| Acer Swift Go 14 SFG14-71 | |
| HP Pavilion Plus 14-ew0153TU | |
| AIDA64 / CPU SHA3 | |
| Average of class Multimedia (653 - 8623, n=61, last 2 years) | |
| HP Pavilion Plus 14-ey0095cl | |
| Huawei MateBook X Pro 2023 | |
| Lenovo ThinkPad T14s G4 i7-1365U | |
| Average Intel Core i7-1355U (1529 - 2200, n=18) | |
| Asus ExpertBook B9 B9403CVA-KM0153X | |
| Acer Swift Go 14 SFG14-71 | |
| HP Pavilion Plus 14-ew0153TU | |
| AIDA64 / CPU Queen | |
| HP Pavilion Plus 14-ey0095cl | |
| Huawei MateBook X Pro 2023 | |
| Average of class Multimedia (13483 - 181505, n=49, last 2 years) | |
| Lenovo ThinkPad T14s G4 i7-1365U | |
| Average Intel Core i7-1355U (21547 - 66907, n=18) | |
| HP Pavilion Plus 14-ew0153TU | |
| Asus ExpertBook B9 B9403CVA-KM0153X | |
| Acer Swift Go 14 SFG14-71 | |
| AIDA64 / FPU SinJulia | |
| HP Pavilion Plus 14-ey0095cl | |
| Average of class Multimedia (1240 - 28794, n=61, last 2 years) | |
| Huawei MateBook X Pro 2023 | |
| Lenovo ThinkPad T14s G4 i7-1365U | |
| Average Intel Core i7-1355U (4045 - 5426, n=18) | |
| Asus ExpertBook B9 B9403CVA-KM0153X | |
| HP Pavilion Plus 14-ew0153TU | |
| Acer Swift Go 14 SFG14-71 | |
| AIDA64 / FPU Mandel | |
| Average of class Multimedia (6395 - 105740, n=60, last 2 years) | |
| HP Pavilion Plus 14-ey0095cl | |
| Huawei MateBook X Pro 2023 | |
| Lenovo ThinkPad T14s G4 i7-1365U | |
| Average Intel Core i7-1355U (14596 - 21627, n=18) | |
| Asus ExpertBook B9 B9403CVA-KM0153X | |
| Acer Swift Go 14 SFG14-71 | |
| HP Pavilion Plus 14-ew0153TU | |
| AIDA64 / CPU AES | |
| Huawei MateBook X Pro 2023 | |
| Average of class Multimedia (13243 - 126790, n=61, last 2 years) | |
| HP Pavilion Plus 14-ey0095cl | |
| Average Intel Core i7-1355U (31432 - 75408, n=18) | |
| Lenovo ThinkPad T14s G4 i7-1365U | |
| Asus ExpertBook B9 B9403CVA-KM0153X | |
| Acer Swift Go 14 SFG14-71 | |
| HP Pavilion Plus 14-ew0153TU | |
| AIDA64 / CPU ZLib | |
| Average of class Multimedia (167.2 - 2022, n=61, last 2 years) | |
| HP Pavilion Plus 14-ey0095cl | |
| Huawei MateBook X Pro 2023 | |
| Lenovo ThinkPad T14s G4 i7-1365U | |
| Average Intel Core i7-1355U (454 - 684, n=18) | |
| Asus ExpertBook B9 B9403CVA-KM0153X | |
| Acer Swift Go 14 SFG14-71 | |
| HP Pavilion Plus 14-ew0153TU | |
| AIDA64 / FP64 Ray-Trace | |
| HP Pavilion Plus 14-ey0095cl | |
| Average of class Multimedia (1014 - 26875, n=61, last 2 years) | |
| Huawei MateBook X Pro 2023 | |
| Lenovo ThinkPad T14s G4 i7-1365U | |
| Asus ExpertBook B9 B9403CVA-KM0153X | |
| Average Intel Core i7-1355U (2991 - 4453, n=18) | |
| Acer Swift Go 14 SFG14-71 | |
| HP Pavilion Plus 14-ew0153TU | |
| AIDA64 / CPU PhotoWorxx | |
| Average of class Multimedia (12860 - 88154, n=61, last 2 years) | |
| Huawei MateBook X Pro 2023 | |
| Lenovo ThinkPad T14s G4 i7-1365U | |
| Asus ExpertBook B9 B9403CVA-KM0153X | |
| HP Pavilion Plus 14-ew0153TU | |
| Average Intel Core i7-1355U (21800 - 46154, n=18) | |
| Acer Swift Go 14 SFG14-71 | |
| HP Pavilion Plus 14-ey0095cl | |
Check out our dedicated Intel Core i7-1355U page for more information and performance comparisons.
System Performance
The AMD-based Pavilion Plus 14 takes a 19% lead over the Core i7 version in total PCMark 10 scores. However, both devices are virtually tied in cumulative CrossMark tests. Overall, the Pavilion Plus 14 poses no hiccups for daily computing and web browsing needs.
CrossMark: Overall | Productivity | Creativity | Responsiveness
AIDA64: Memory Copy | Memory Read | Memory Write | Memory Latency
WebXPRT 3: Overall
WebXPRT 4: Overall
Mozilla Kraken 1.1: Total
| PCMark 10 / Score | |
| Average of class Multimedia (4325 - 10386, n=58, last 2 years) | |
| HP Pavilion Plus 14-ey0095cl | |
| Lenovo ThinkPad T14s G4 i7-1365U | |
| Asus ExpertBook B9 B9403CVA-KM0153X | |
| Average Intel Core i7-1355U, Intel Iris Xe Graphics G7 96EUs (5455 - 5933, n=15) | |
| Huawei MateBook X Pro 2023 | |
| HP Pavilion Plus 14-ew0153TU | |
| Acer Swift Go 14 SFG14-71 | |
| PCMark 10 / Essentials | |
| Lenovo ThinkPad T14s G4 i7-1365U | |
| Average Intel Core i7-1355U, Intel Iris Xe Graphics G7 96EUs (10203 - 11822, n=15) | |
| Asus ExpertBook B9 B9403CVA-KM0153X | |
| Average of class Multimedia (8025 - 11664, n=57, last 2 years) | |
| HP Pavilion Plus 14-ew0153TU | |
| Acer Swift Go 14 SFG14-71 | |
| Huawei MateBook X Pro 2023 | |
| HP Pavilion Plus 14-ey0095cl | |
| PCMark 10 / Productivity | |
| Average of class Multimedia (7323 - 18233, n=57, last 2 years) | |
| HP Pavilion Plus 14-ey0095cl | |
| Lenovo ThinkPad T14s G4 i7-1365U | |
| Asus ExpertBook B9 B9403CVA-KM0153X | |
| Average Intel Core i7-1355U, Intel Iris Xe Graphics G7 96EUs (6763 - 7536, n=15) | |
| Huawei MateBook X Pro 2023 | |
| Acer Swift Go 14 SFG14-71 | |
| HP Pavilion Plus 14-ew0153TU | |
| PCMark 10 / Digital Content Creation | |
| Average of class Multimedia (3651 - 16240, n=57, last 2 years) | |
| HP Pavilion Plus 14-ey0095cl | |
| Huawei MateBook X Pro 2023 | |
| Lenovo ThinkPad T14s G4 i7-1365U | |
| HP Pavilion Plus 14-ew0153TU | |
| Average Intel Core i7-1355U, Intel Iris Xe Graphics G7 96EUs (5723 - 6712, n=15) | |
| Acer Swift Go 14 SFG14-71 | |
| Asus ExpertBook B9 B9403CVA-KM0153X | |
| CrossMark / Overall | |
| Huawei MateBook X Pro 2023 | |
| Average of class Multimedia (866 - 2728, n=67, last 2 years) | |
| Lenovo ThinkPad T14s G4 i7-1365U | |
| Average Intel Core i7-1355U, Intel Iris Xe Graphics G7 96EUs (1478 - 1643, n=15) | |
| Asus ExpertBook B9 B9403CVA-KM0153X | |
| HP Pavilion Plus 14-ew0153TU | |
| HP Pavilion Plus 14-ey0095cl | |
| Acer Swift Go 14 SFG14-71 | |
| CrossMark / Productivity | |
| Huawei MateBook X Pro 2023 | |
| Average of class Multimedia (931 - 2489, n=67, last 2 years) | |
| Lenovo ThinkPad T14s G4 i7-1365U | |
| HP Pavilion Plus 14-ew0153TU | |
| Average Intel Core i7-1355U, Intel Iris Xe Graphics G7 96EUs (1444 - 1665, n=15) | |
| Asus ExpertBook B9 B9403CVA-KM0153X | |
| HP Pavilion Plus 14-ey0095cl | |
| Acer Swift Go 14 SFG14-71 | |
| CrossMark / Creativity | |
| Average of class Multimedia (907 - 3465, n=67, last 2 years) | |
| Huawei MateBook X Pro 2023 | |
| Lenovo ThinkPad T14s G4 i7-1365U | |
| Asus ExpertBook B9 B9403CVA-KM0153X | |
| HP Pavilion Plus 14-ey0095cl | |
| Average Intel Core i7-1355U, Intel Iris Xe Graphics G7 96EUs (1563 - 1732, n=15) | |
| HP Pavilion Plus 14-ew0153TU | |
| Acer Swift Go 14 SFG14-71 | |
| CrossMark / Responsiveness | |
| Huawei MateBook X Pro 2023 | |
| Average of class Multimedia (605 - 2024, n=67, last 2 years) | |
| Acer Swift Go 14 SFG14-71 | |
| Lenovo ThinkPad T14s G4 i7-1365U | |
| Average Intel Core i7-1355U, Intel Iris Xe Graphics G7 96EUs (1217 - 1681, n=15) | |
| HP Pavilion Plus 14-ew0153TU | |
| Asus ExpertBook B9 B9403CVA-KM0153X | |
| HP Pavilion Plus 14-ey0095cl | |
| AIDA64 / Memory Copy | |
| Average of class Multimedia (21158 - 132135, n=61, last 2 years) | |
| HP Pavilion Plus 14-ey0095cl | |
| Huawei MateBook X Pro 2023 | |
| Asus ExpertBook B9 B9403CVA-KM0153X | |
| Average Intel Core i7-1355U, Intel Iris Xe Graphics G7 96EUs (35017 - 71600, n=15) | |
| HP Pavilion Plus 14-ew0153TU | |
| Lenovo ThinkPad T14s G4 i7-1365U | |
| Acer Swift Go 14 SFG14-71 | |
| AIDA64 / Memory Read | |
| Average of class Multimedia (19699 - 174586, n=61, last 2 years) | |
| Huawei MateBook X Pro 2023 | |
| Average Intel Core i7-1355U, Intel Iris Xe Graphics G7 96EUs (38551 - 58600, n=15) | |
| HP Pavilion Plus 14-ey0095cl | |
| Lenovo ThinkPad T14s G4 i7-1365U | |
| HP Pavilion Plus 14-ew0153TU | |
| Asus ExpertBook B9 B9403CVA-KM0153X | |
| Acer Swift Go 14 SFG14-71 | |
| AIDA64 / Memory Write | |
| HP Pavilion Plus 14-ey0095cl | |
| Huawei MateBook X Pro 2023 | |
| Average of class Multimedia (17733 - 134998, n=61, last 2 years) | |
| HP Pavilion Plus 14-ew0153TU | |
| Asus ExpertBook B9 B9403CVA-KM0153X | |
| Average Intel Core i7-1355U, Intel Iris Xe Graphics G7 96EUs (35910 - 93342, n=15) | |
| Lenovo ThinkPad T14s G4 i7-1365U | |
| Acer Swift Go 14 SFG14-71 | |
| AIDA64 / Memory Latency | |
| Average of class Multimedia (7 - 535, n=60, last 2 years) | |
| Average Intel Core i7-1355U, Intel Iris Xe Graphics G7 96EUs (80.3 - 346, n=15) | |
| Acer Swift Go 14 SFG14-71 | |
| HP Pavilion Plus 14-ey0095cl | |
| HP Pavilion Plus 14-ew0153TU | |
| Huawei MateBook X Pro 2023 | |
| Lenovo ThinkPad T14s G4 i7-1365U | |
| Asus ExpertBook B9 B9403CVA-KM0153X | |
| WebXPRT 3 / Overall | |
| Average of class Multimedia (136.4 - 596, n=70, last 2 years) | |
| Lenovo ThinkPad T14s G4 i7-1365U | |
| HP Pavilion Plus 14-ey0095cl | |
| Asus ExpertBook B9 B9403CVA-KM0153X | |
| HP Pavilion Plus 14-ew0153TU | |
| Average Intel Core i7-1355U, Intel Iris Xe Graphics G7 96EUs (149.2 - 295, n=15) | |
| Acer Swift Go 14 SFG14-71 | |
| WebXPRT 4 / Overall | |
| Average of class Multimedia (167.3 - 402, n=71, last 2 years) | |
| Lenovo ThinkPad T14s G4 i7-1365U | |
| HP Pavilion Plus 14-ew0153TU | |
| Average Intel Core i7-1355U, Intel Iris Xe Graphics G7 96EUs (94.2 - 256, n=13) | |
| Huawei MateBook X Pro 2023 | |
| HP Pavilion Plus 14-ey0095cl | |
| Mozilla Kraken 1.1 / Total | |
| Huawei MateBook X Pro 2023 | |
| Average Intel Core i7-1355U, Intel Iris Xe Graphics G7 96EUs (507 - 1449, n=15) | |
| HP Pavilion Plus 14-ey0095cl | |
| Acer Swift Go 14 SFG14-71 | |
| Acer Swift Go 14 SFG14-71 | |
| Asus ExpertBook B9 B9403CVA-KM0153X | |
| HP Pavilion Plus 14-ew0153TU | |
| Lenovo ThinkPad T14s G4 i7-1365U | |
| Average of class Multimedia (228 - 835, n=74, last 2 years) | |
* ... smaller is better
| PCMark 8 Home Score Accelerated v2 | 5169 points | |
| PCMark 8 Work Score Accelerated v2 | 3115 points | |
| PCMark 10 Score | 5455 points | |
Help | ||
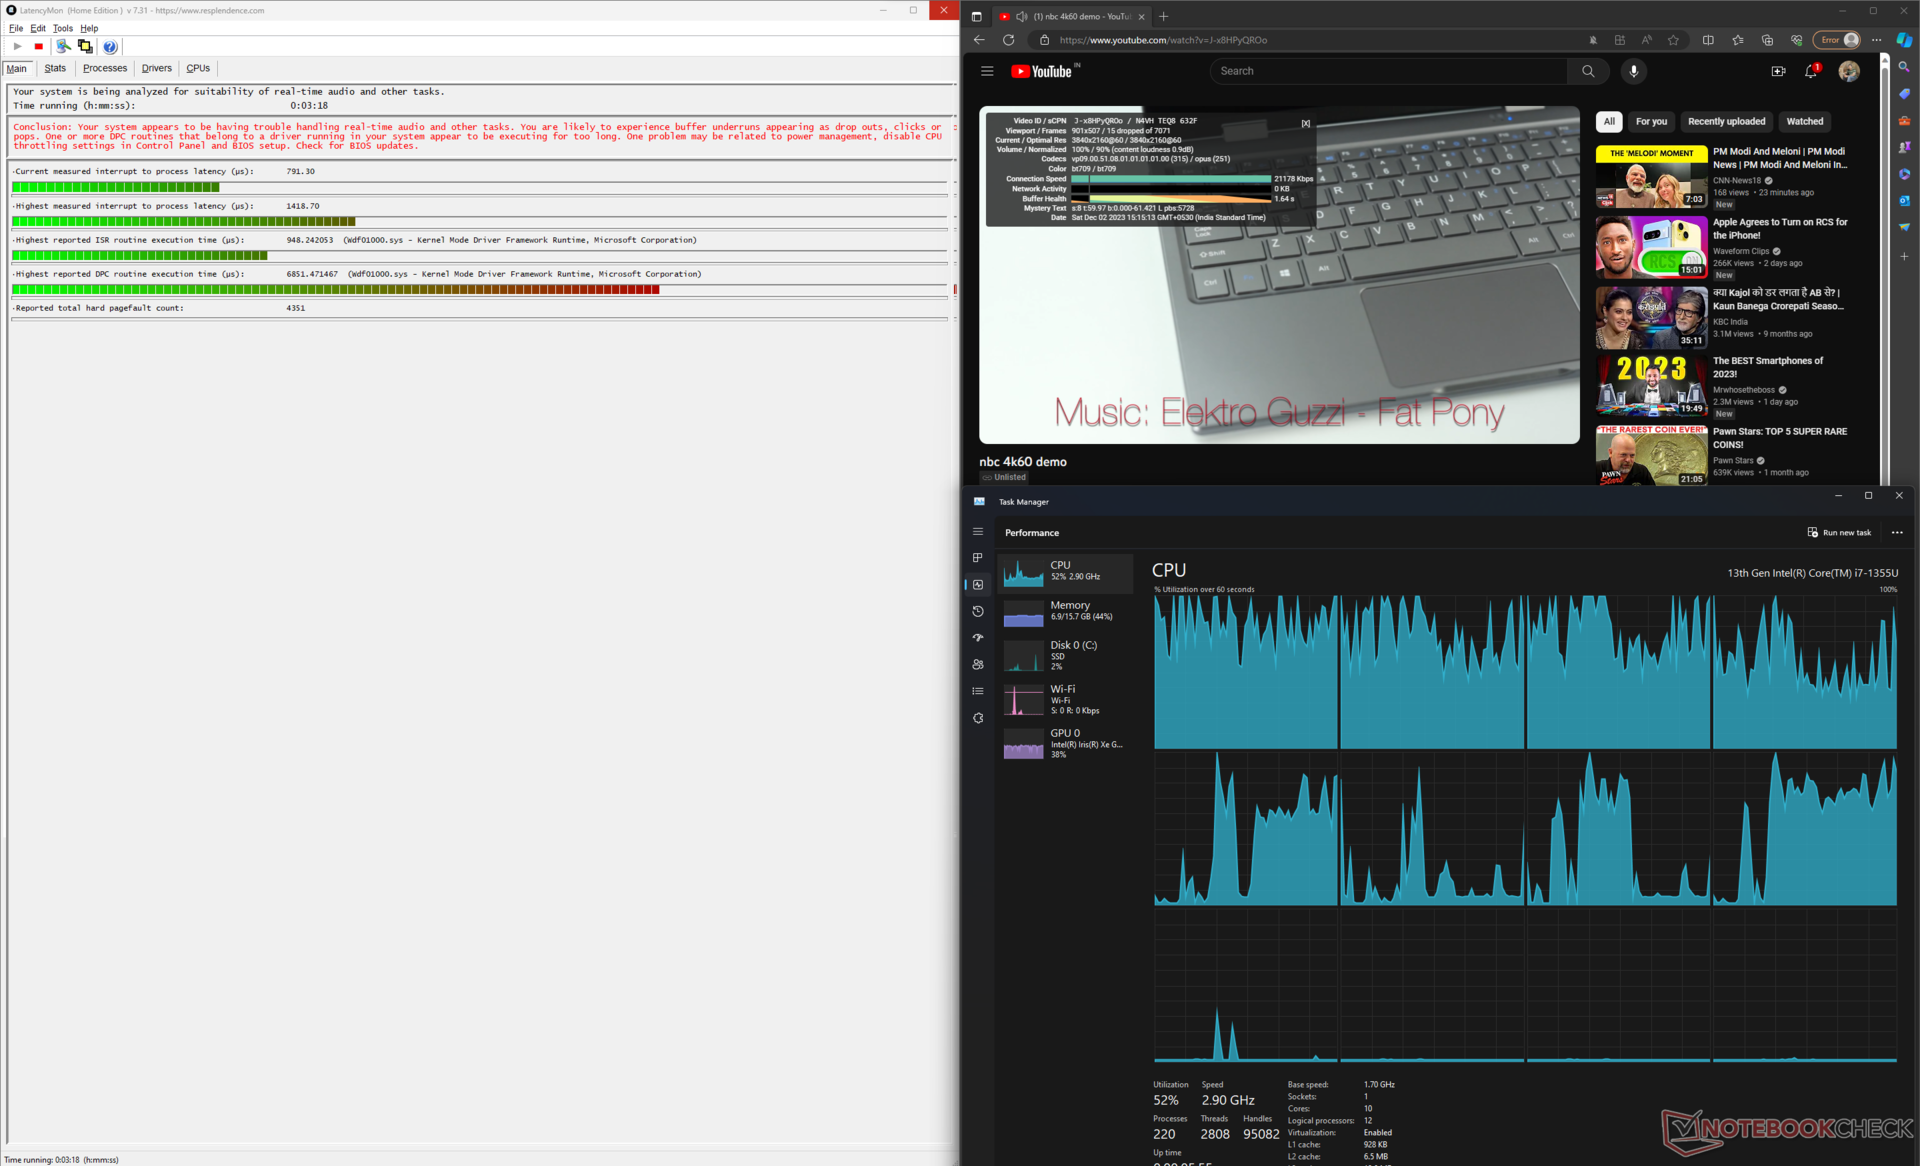
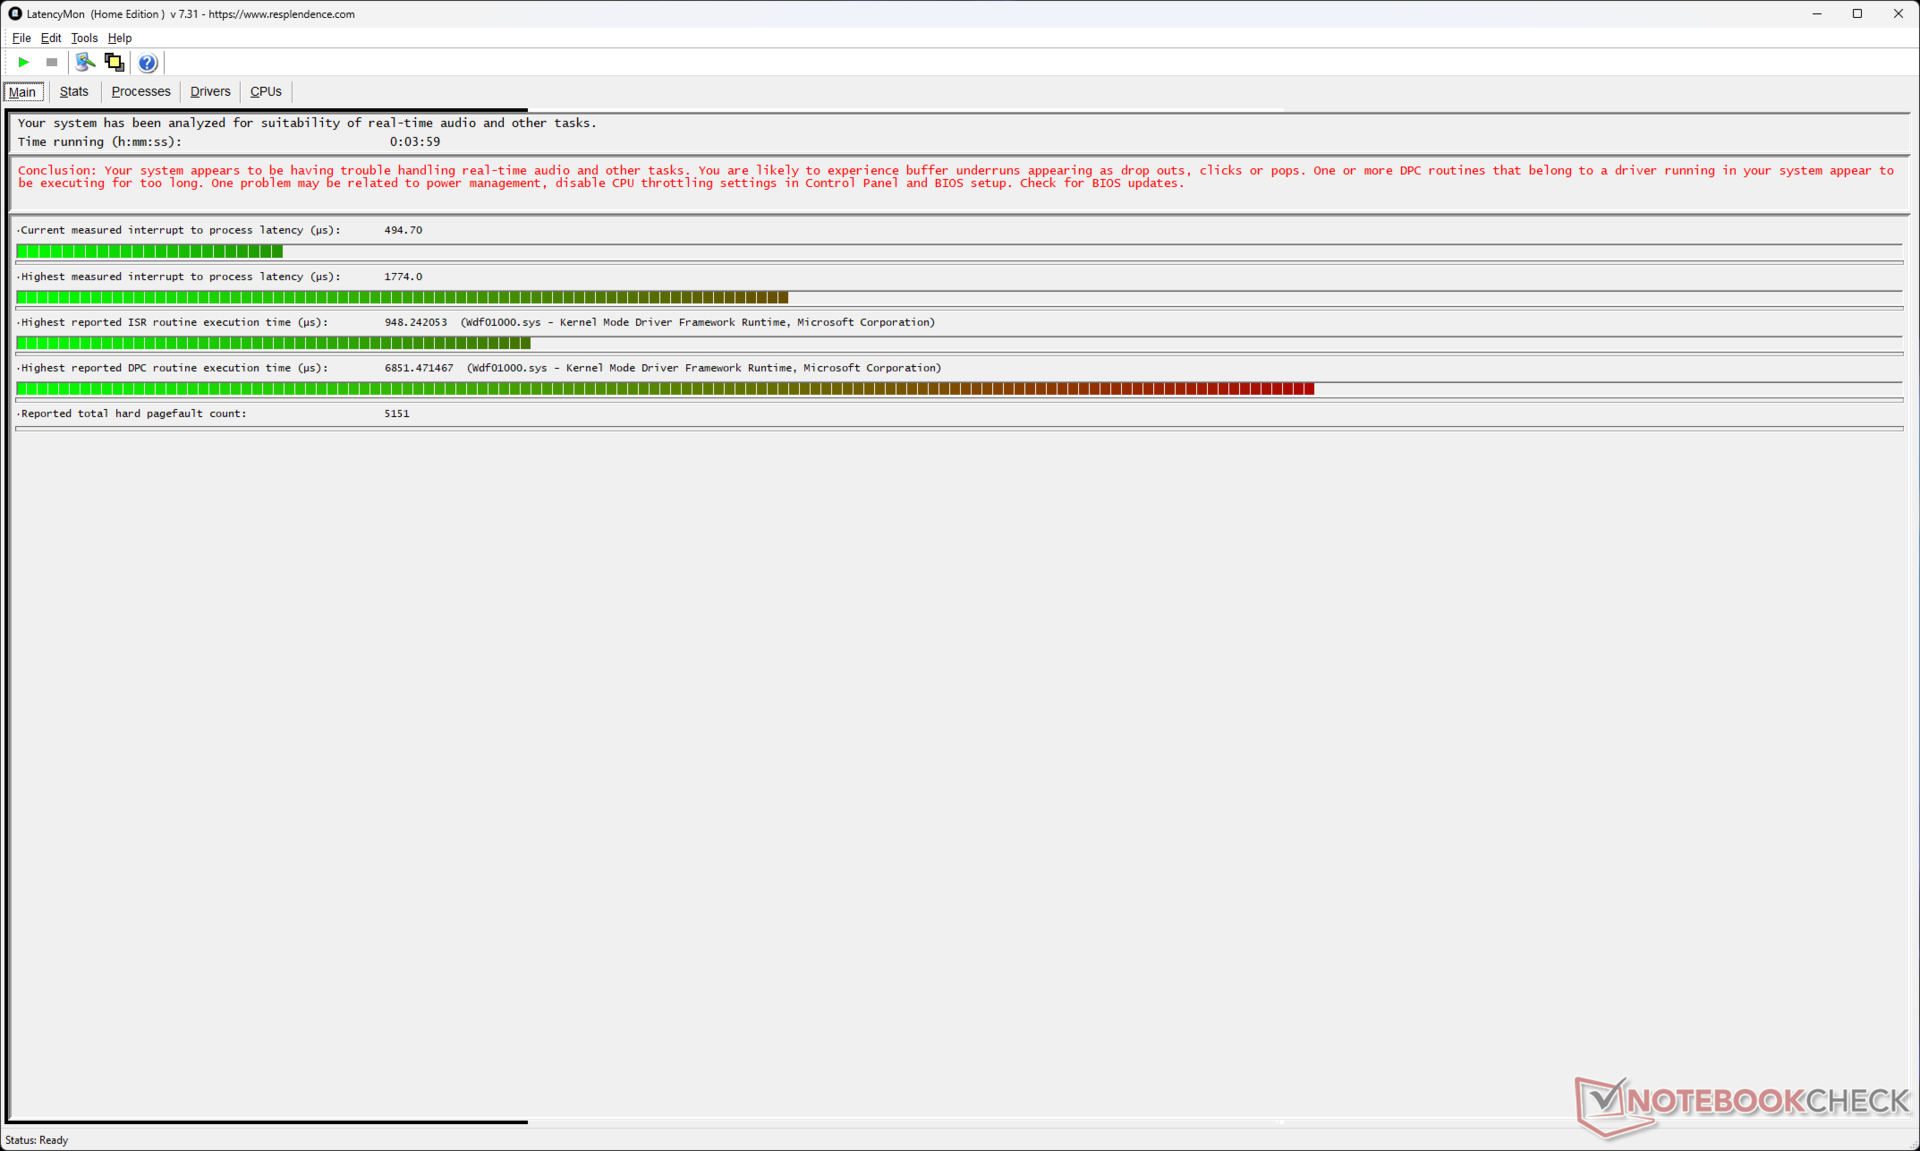
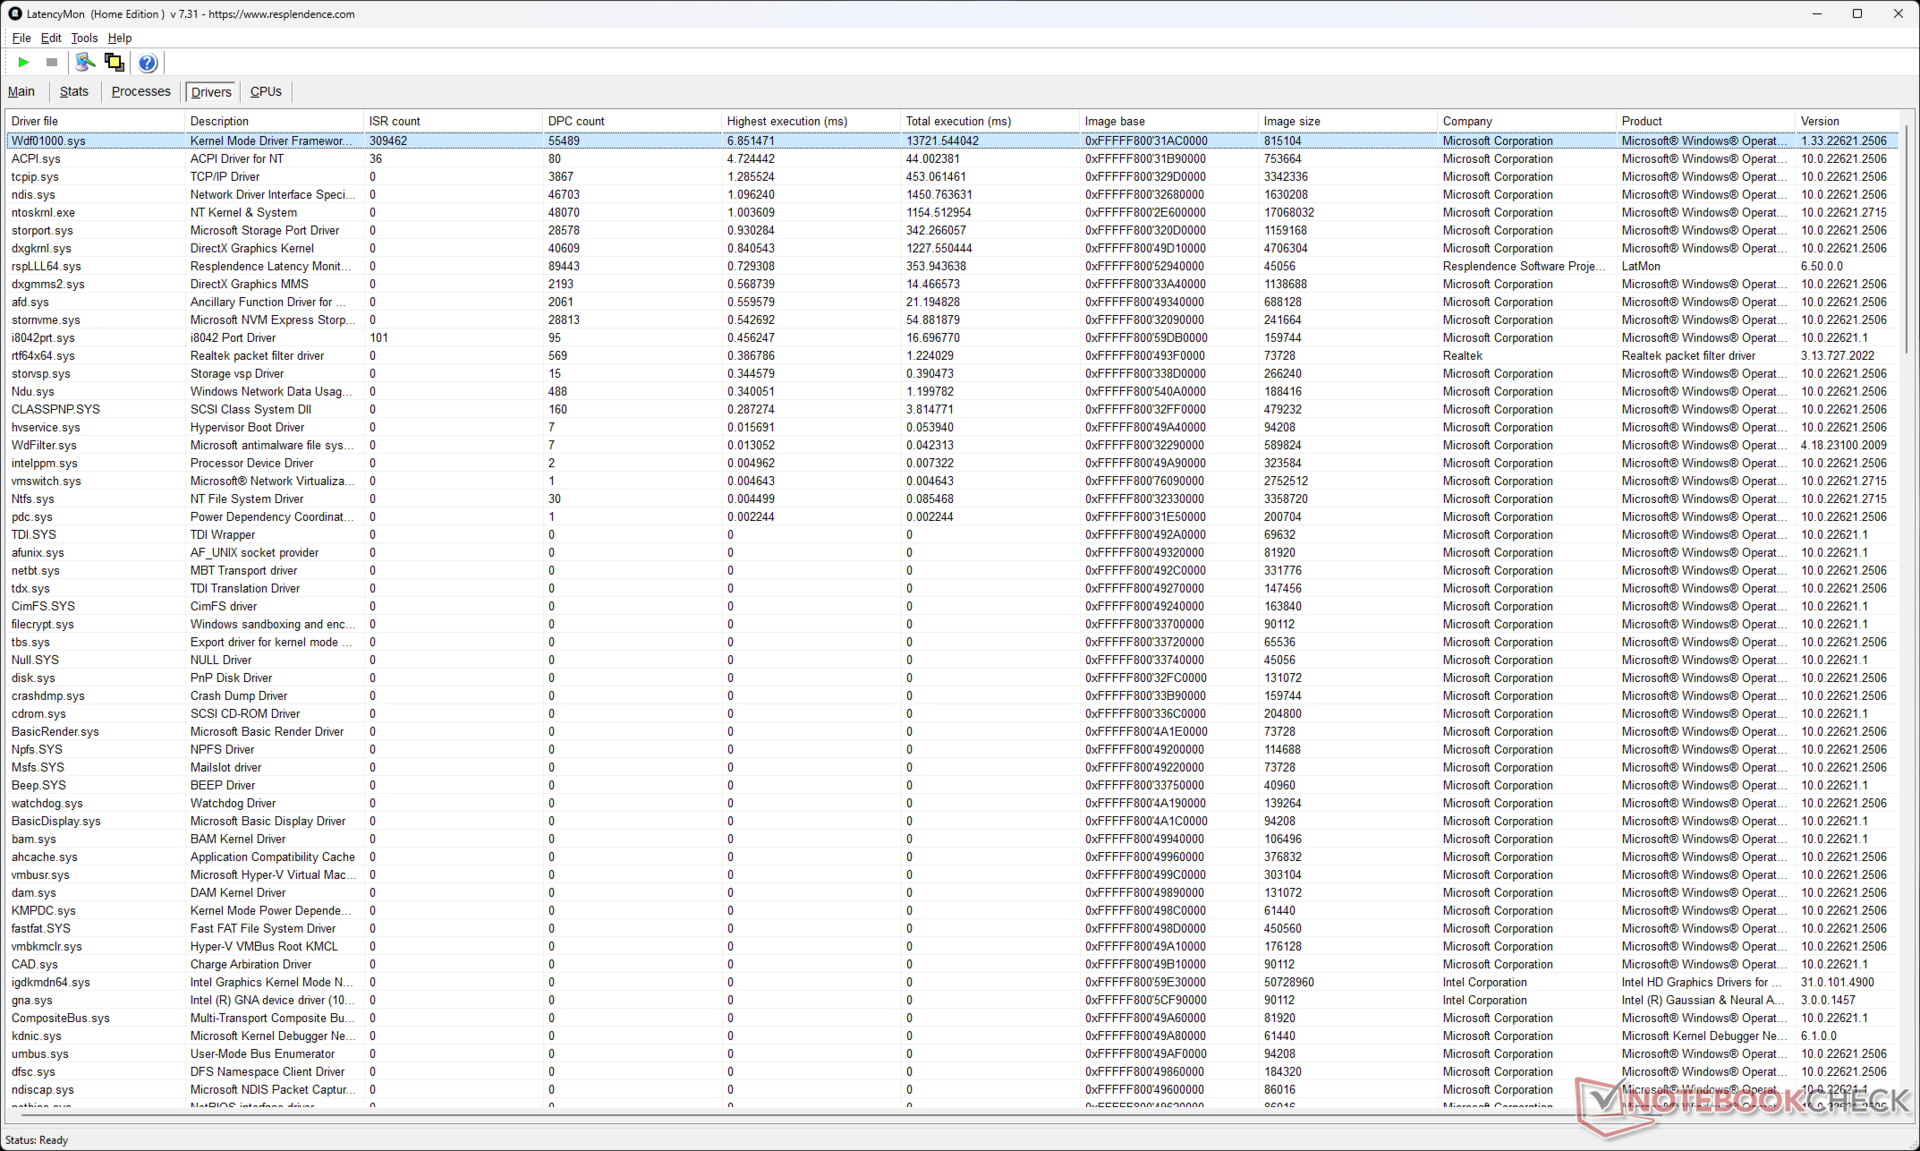
DPC Latency
DPC latency is better than some of the Pavilion Plus 14's competitors including the AMD variant, the Lenovo ThinkPad T14s, and the Huawei MateBook X Pro but is still on the higher side.
| DPC Latencies / LatencyMon - interrupt to process latency (max), Web, Youtube, Prime95 | |
| Huawei MateBook X Pro 2023 | |
| HP Pavilion Plus 14-ey0095cl | |
| Lenovo ThinkPad T14s G4 i7-1365U | |
| HP Pavilion Plus 14-ew0153TU | |
| Asus ExpertBook B9 B9403CVA-KM0153X | |
| Acer Swift Go 14 SFG14-71 | |
* ... smaller is better
Our DPC Latency Ranking page provides an overview of measured LatencyMon readings across reviewed devices.
Storage Devices

Our Pavilion Plus 14 unit came equipped with an SK Hynix PC801 PCIe Gen4 NVMe SSD. Cumulative performance is about 26% slower than the average results recorded for this drive but is right on the heels of the WDC PC SN810 used in the AMD version of this laptop.
The drive performance is relatively stable, but we observed a significant speed drop after 20 runs in our DiskSpd read loop test at a queue depth of 8.
There is no scope for further internal storage expansion.

* ... smaller is better
Disk Throttling: DiskSpd Read Loop, Queue Depth 8
More storage benchmarks can be found in our SSD comparison page.
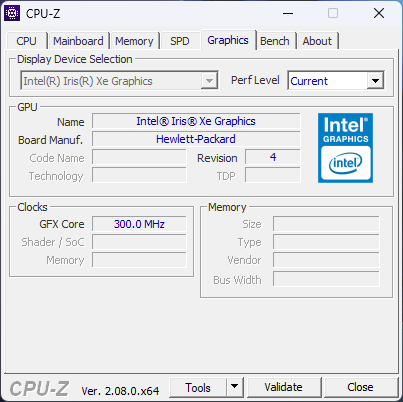
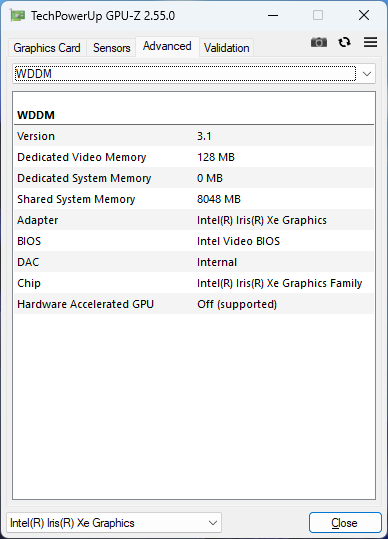
GPU Performance
The Pavilion Plus 14 relies on the integrated Iris Xe Graphics 96 EUs to drive visuals. Cumulative 3DMark performance is similar to other such laptops featuring this iGPU.
However, the Intel variant is outclassed by the AMD-powered Pavilion Plus 14 with its vastly superior Radeon 780M iGPU that shows 33% higher performance. The Radeon 780M can show as high as 86% gains in tests such as 3DMark 11 Performance GPU.

| 3DMark 11 Performance | 6907 points | |
| 3DMark Ice Storm Standard Score | 128665 points | |
| 3DMark Cloud Gate Standard Score | 21922 points | |
| 3DMark Fire Strike Score | 4926 points | |
| 3DMark Fire Strike Extreme Score | 2398 points | |
| 3DMark Time Spy Score | 1753 points | |
Help | ||
* ... smaller is better
Gaming Performance
The Pavilion Plus 14 is not intended to be a gaming notebook. The Iris Xe Graphics can only run yesteryear's titles, and in very low or medium settings at best.
Albeit quite low, the iGPU still manages relatively stable frame rates while stressing the system with The Witcher 3 at 1080p Ultra.
| The Witcher 3 - 1920x1080 Ultra Graphics & Postprocessing (HBAO+) | |
| Average of class Multimedia (11 - 121, n=13, last 2 years) | |
| HP Pavilion Plus 14-ey0095cl | |
| Huawei MateBook X Pro 2023 | |
| Lenovo ThinkPad T14s G4 i7-1365U | |
| Asus ExpertBook B9 B9403CVA-KM0153X | |
| HP Pavilion Plus 14-ew0153TU | |
| Acer Swift Go 14 SFG14-71 | |
The Witcher 3 FPS Chart
| low | med. | high | ultra | |
|---|---|---|---|---|
| GTA V (2015) | 88.5 | 74.3 | 22 | 9.38 |
| The Witcher 3 (2015) | 73.5 | 50.8 | 28 | 13.2 |
| Dota 2 Reborn (2015) | 97.7 | 71.7 | 55.2 | 47.1 |
| Final Fantasy XV Benchmark (2018) | 40.6 | 23.7 | 16.8 | |
| X-Plane 11.11 (2018) | 37.1 | 25.6 | 23 | |
| Far Cry 5 (2018) | 40 | 24 | 23 | 21 |
| Strange Brigade (2018) | 88.3 | 38.1 | 30.6 | 23.4 |
| F1 22 (2022) | 37.6 | 33.5 | 25.4 | 19.1 |
Check out our Intel Iris Xe Graphics 96 EUs page for more information.
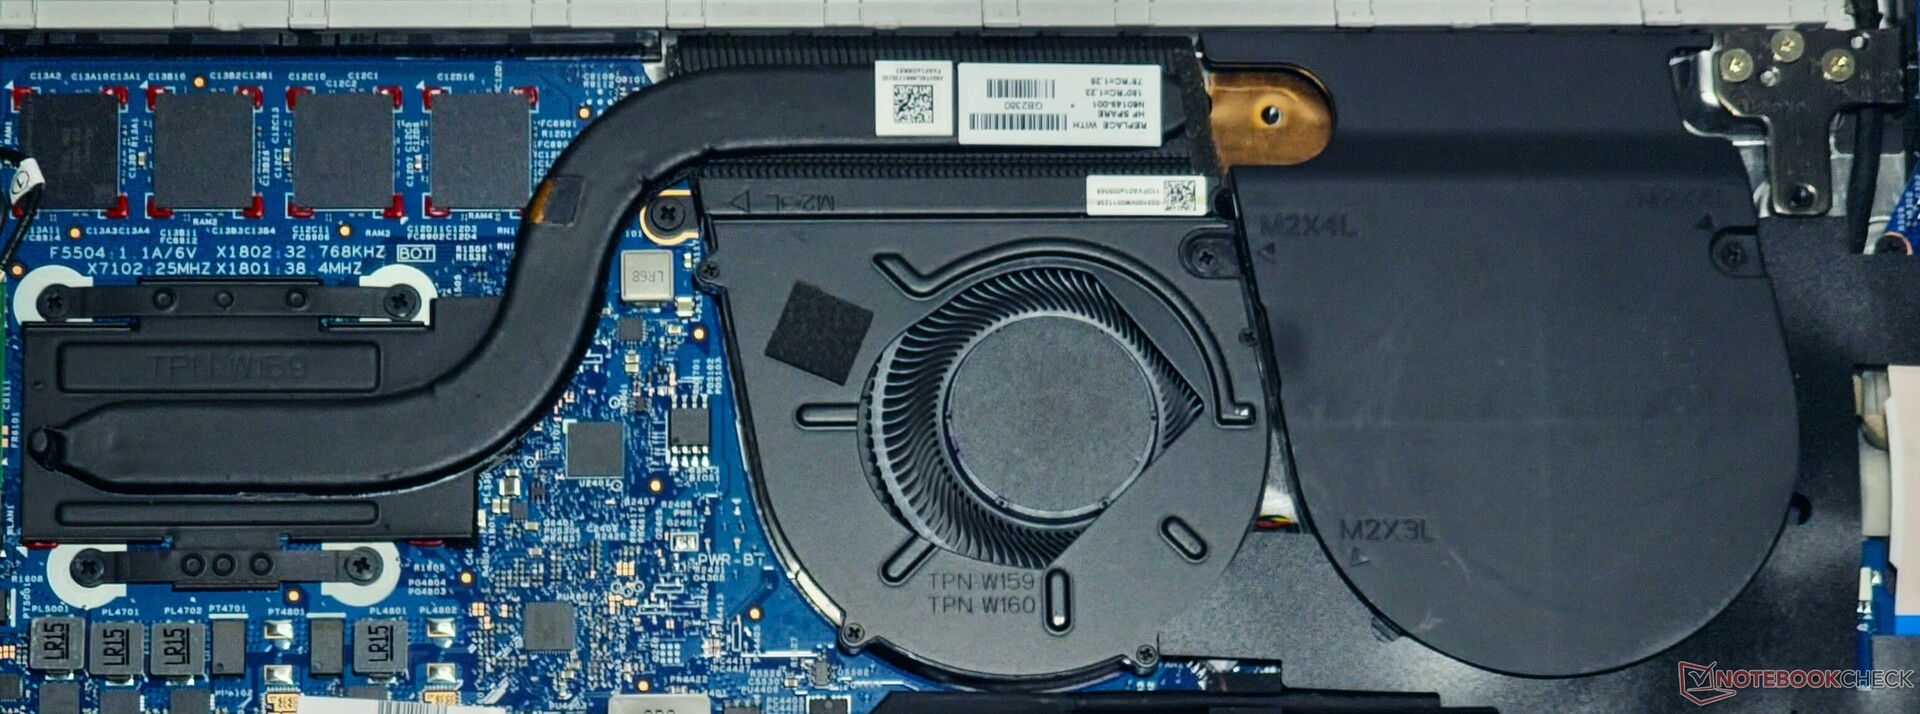
Emissions: Low surface temperatures and fan noise under load
System Noise
The Intel-based Pavilion Plus 14's fan is hardly audible in daily use. Even under load, the fan noise is just around the 32 db(A) mark. We did not notice any coil whine or stray noises from the chassis during usage.
Noise level
| Idle |
| 20.57 / 20.57 / 20.57 dB(A) |
| Load |
| 32.18 / 32.26 dB(A) |
 | ||
30 dB silent 40 dB(A) audible 50 dB(A) loud |
||
min: | ||
| HP Pavilion Plus 14-ew0153TU Iris Xe G7 96EUs, i7-1355U, SK hynix PC801 HFS001TEJ9X101N | HP Pavilion Plus 14-ey0095cl Radeon 780M, R7 7840U, WDC PC SN810 1TB | Lenovo ThinkPad T14s G4 i7-1365U Iris Xe G7 96EUs, i7-1365U | Acer Swift Go 14 SFG14-71 Iris Xe G7 80EUs, i5-1335U, WD PC SN740 SDDQNQD-512G-1014 | Asus ExpertBook B9 B9403CVA-KM0153X Iris Xe G7 96EUs, i7-1355U, Samsung PM9A1 MZVL21T0HCLR | Huawei MateBook X Pro 2023 Iris Xe G7 96EUs, i7-1360P | |
|---|---|---|---|---|---|---|
| Noise | -20% | -10% | -25% | -22% | -30% | |
| off / environment * (dB) | 19.35 | 23.4 -21% | 23.2 -20% | 24.9 -29% | 24.9 -29% | 25.4 -31% |
| Idle Minimum * (dB) | 20.57 | 24.1 -17% | 23.2 -13% | 24.9 -21% | 24.9 -21% | 25.4 -23% |
| Idle Average * (dB) | 20.57 | 24.1 -17% | 23.2 -13% | 24.9 -21% | 24.9 -21% | 25.4 -23% |
| Idle Maximum * (dB) | 20.57 | 25.3 -23% | 23.6 -15% | 24.9 -21% | 24.9 -21% | 29.6 -44% |
| Load Average * (dB) | 32.18 | 33.4 -4% | 24.3 24% | 31.9 1% | 33 -3% | 42 -31% |
| Witcher 3 ultra * (dB) | 29.44 | 39.4 -34% | 35.7 -21% | 43.2 -47% | ||
| Load Maximum * (dB) | 32.26 | 39.4 -22% | 35.7 -11% | 43.2 -34% | 45 -39% | 40.9 -27% |
* ... smaller is better
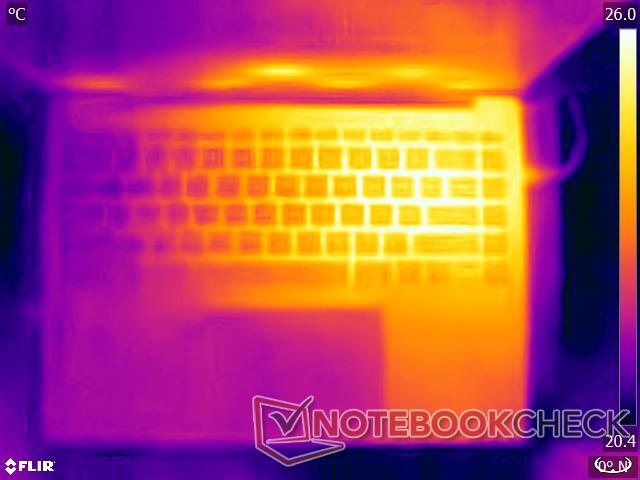
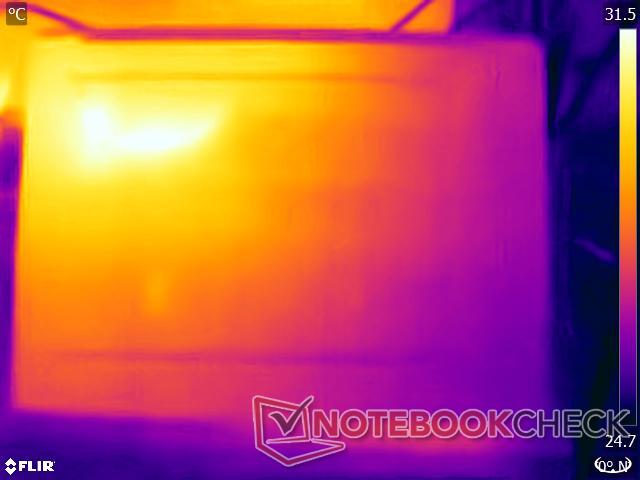
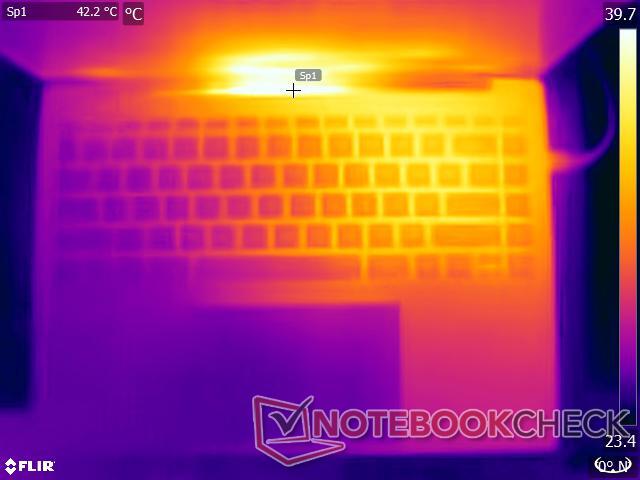
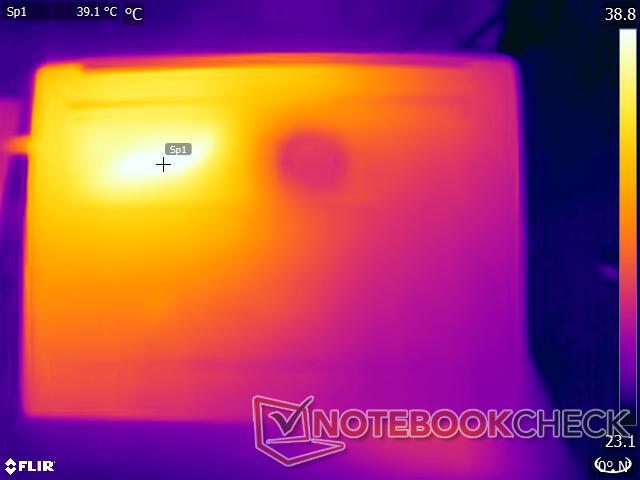
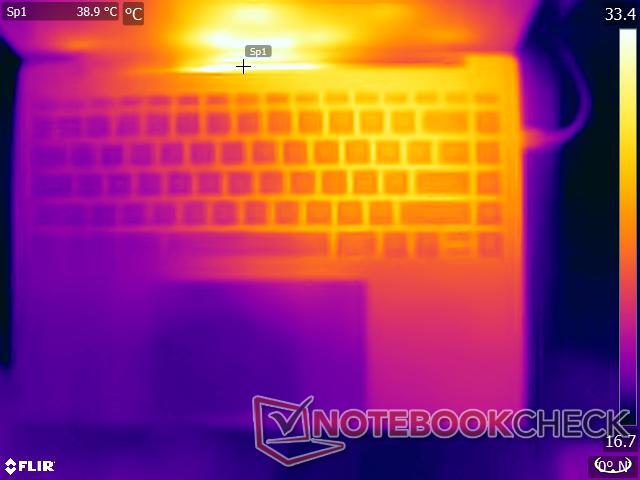
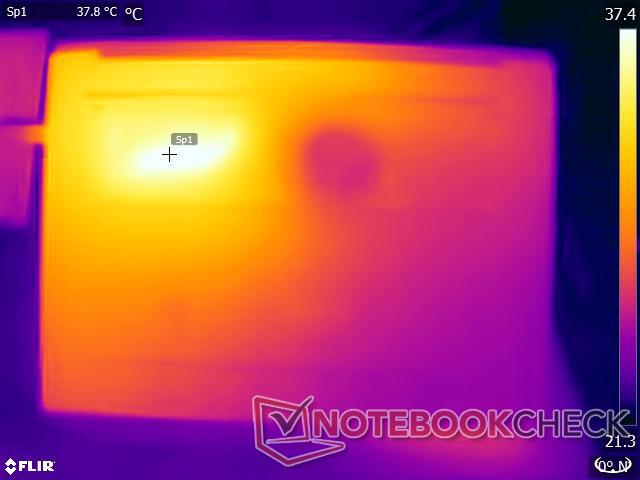
Temperature
The single-fan single-heatpipe combination seems adequate in maintaining manageable surface temperatures. The maximum hotspot we recorded was 39 °C on the extreme left of the bottom chassis while stressing with The Witcher 3 at 1080p Ultra.
The touchpad and palm rest areas remain cool no matter the load.
(+) The maximum temperature on the upper side is 36.6 °C / 98 F, compared to the average of 36.8 °C / 98 F, ranging from 21 to 71 °C for the class Multimedia.
(+) The bottom heats up to a maximum of 37.2 °C / 99 F, compared to the average of 39.1 °C / 102 F
(+) In idle usage, the average temperature for the upper side is 30 °C / 86 F, compared to the device average of 31.3 °C / 88 F.
(±) Playing The Witcher 3, the average temperature for the upper side is 32.6 °C / 91 F, compared to the device average of 31.3 °C / 88 F.
(+) The palmrests and touchpad are cooler than skin temperature with a maximum of 31.2 °C / 88.2 F and are therefore cool to the touch.
(-) The average temperature of the palmrest area of similar devices was 28.7 °C / 83.7 F (-2.5 °C / -4.5 F).
| HP Pavilion Plus 14-ew0153TU Intel Core i7-1355U, Intel Iris Xe Graphics G7 96EUs | HP Pavilion Plus 14-ey0095cl AMD Ryzen 7 7840U, AMD Radeon 780M | Lenovo ThinkPad T14s G4 i7-1365U Intel Core i7-1365U, Intel Iris Xe Graphics G7 96EUs | Acer Swift Go 14 SFG14-71 Intel Core i5-1335U, Intel Iris Xe Graphics G7 80EUs | Asus ExpertBook B9 B9403CVA-KM0153X Intel Core i7-1355U, Intel Iris Xe Graphics G7 96EUs | Huawei MateBook X Pro 2023 Intel Core i7-1360P, Intel Iris Xe Graphics G7 96EUs | |
|---|---|---|---|---|---|---|
| Heat | 8% | 9% | -5% | -27% | -17% | |
| Maximum Upper Side * (°C) | 36.6 | 39 -7% | 39.8 -9% | 44.8 -22% | 48.8 -33% | 46.5 -27% |
| Maximum Bottom * (°C) | 37.2 | 35.8 4% | 35.2 5% | 34.8 6% | 56.5 -52% | 44.7 -20% |
| Idle Upper Side * (°C) | 31.6 | 25.2 20% | 25.6 19% | 30.7 3% | 33.3 -5% | 34.9 -10% |
| Idle Bottom * (°C) | 30 | 25.6 15% | 24.4 19% | 32.5 -8% | 35 -17% | 32.9 -10% |
* ... smaller is better
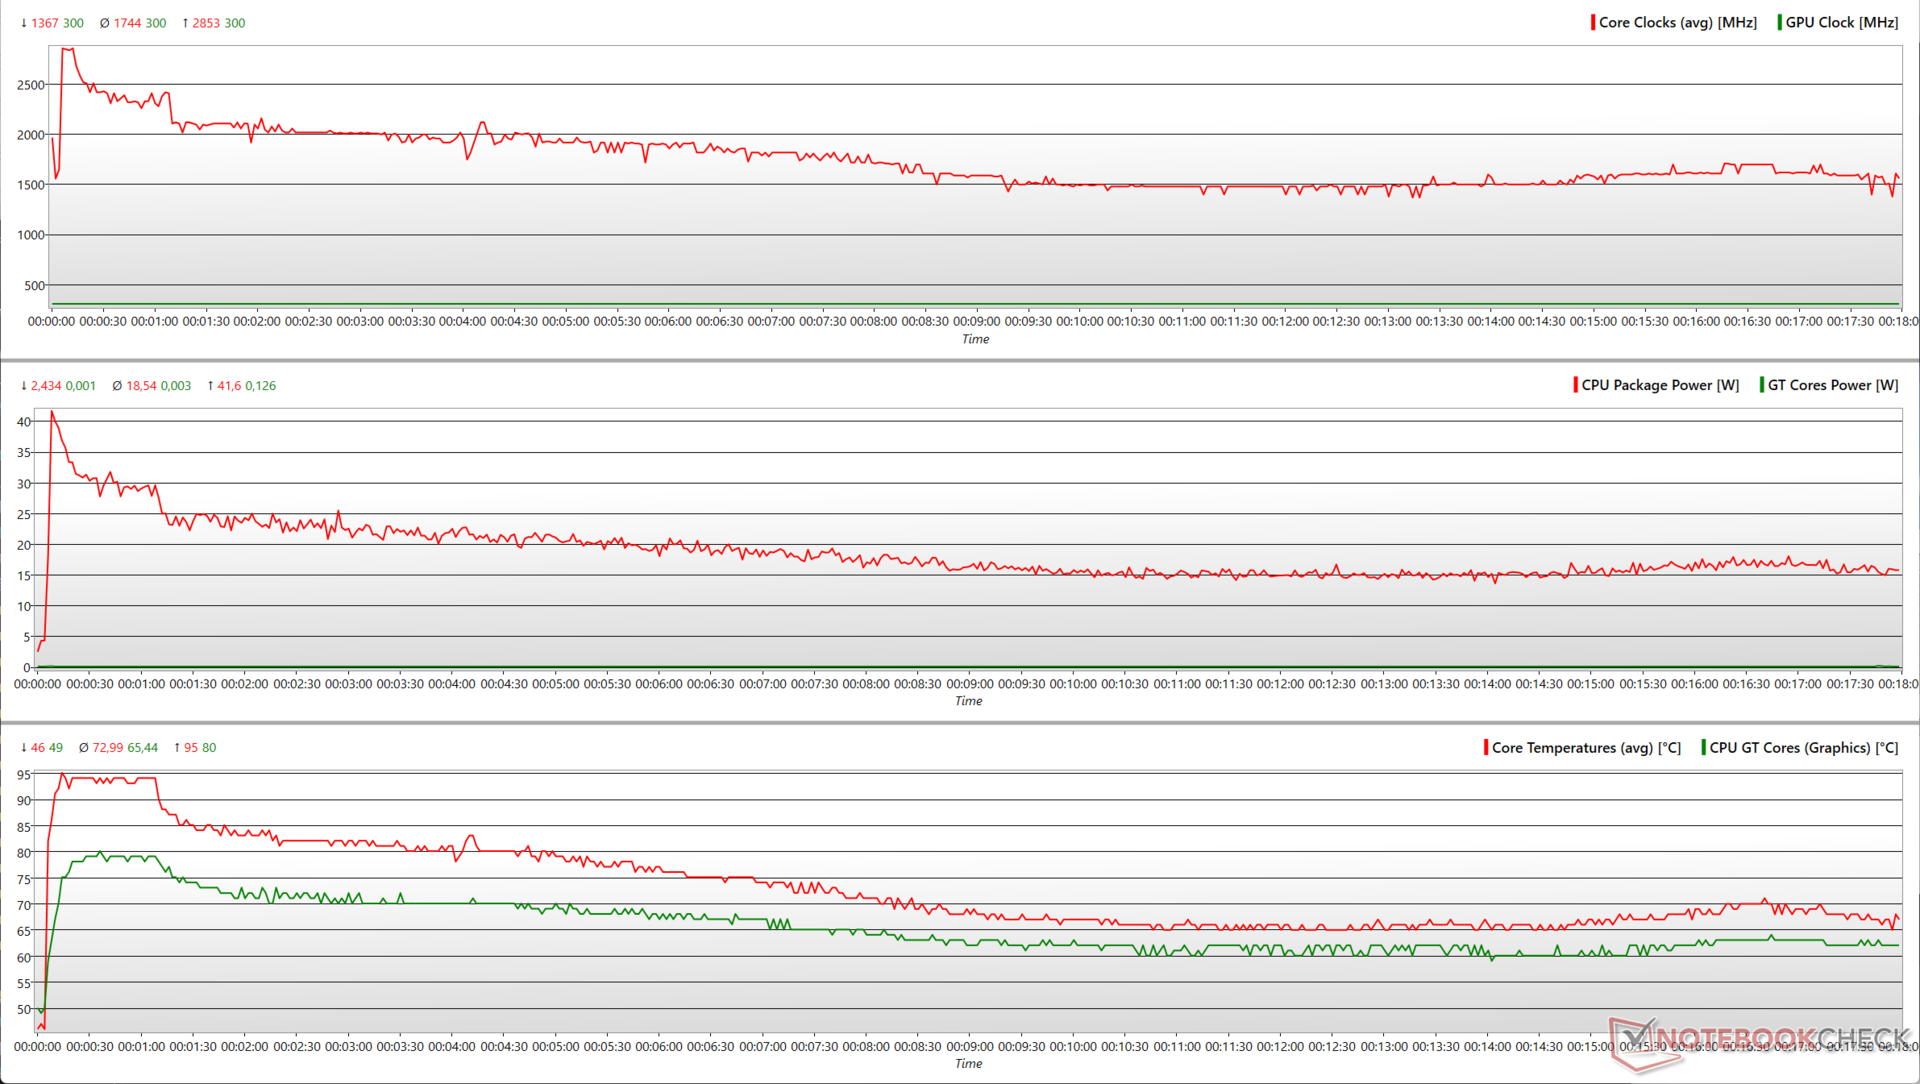
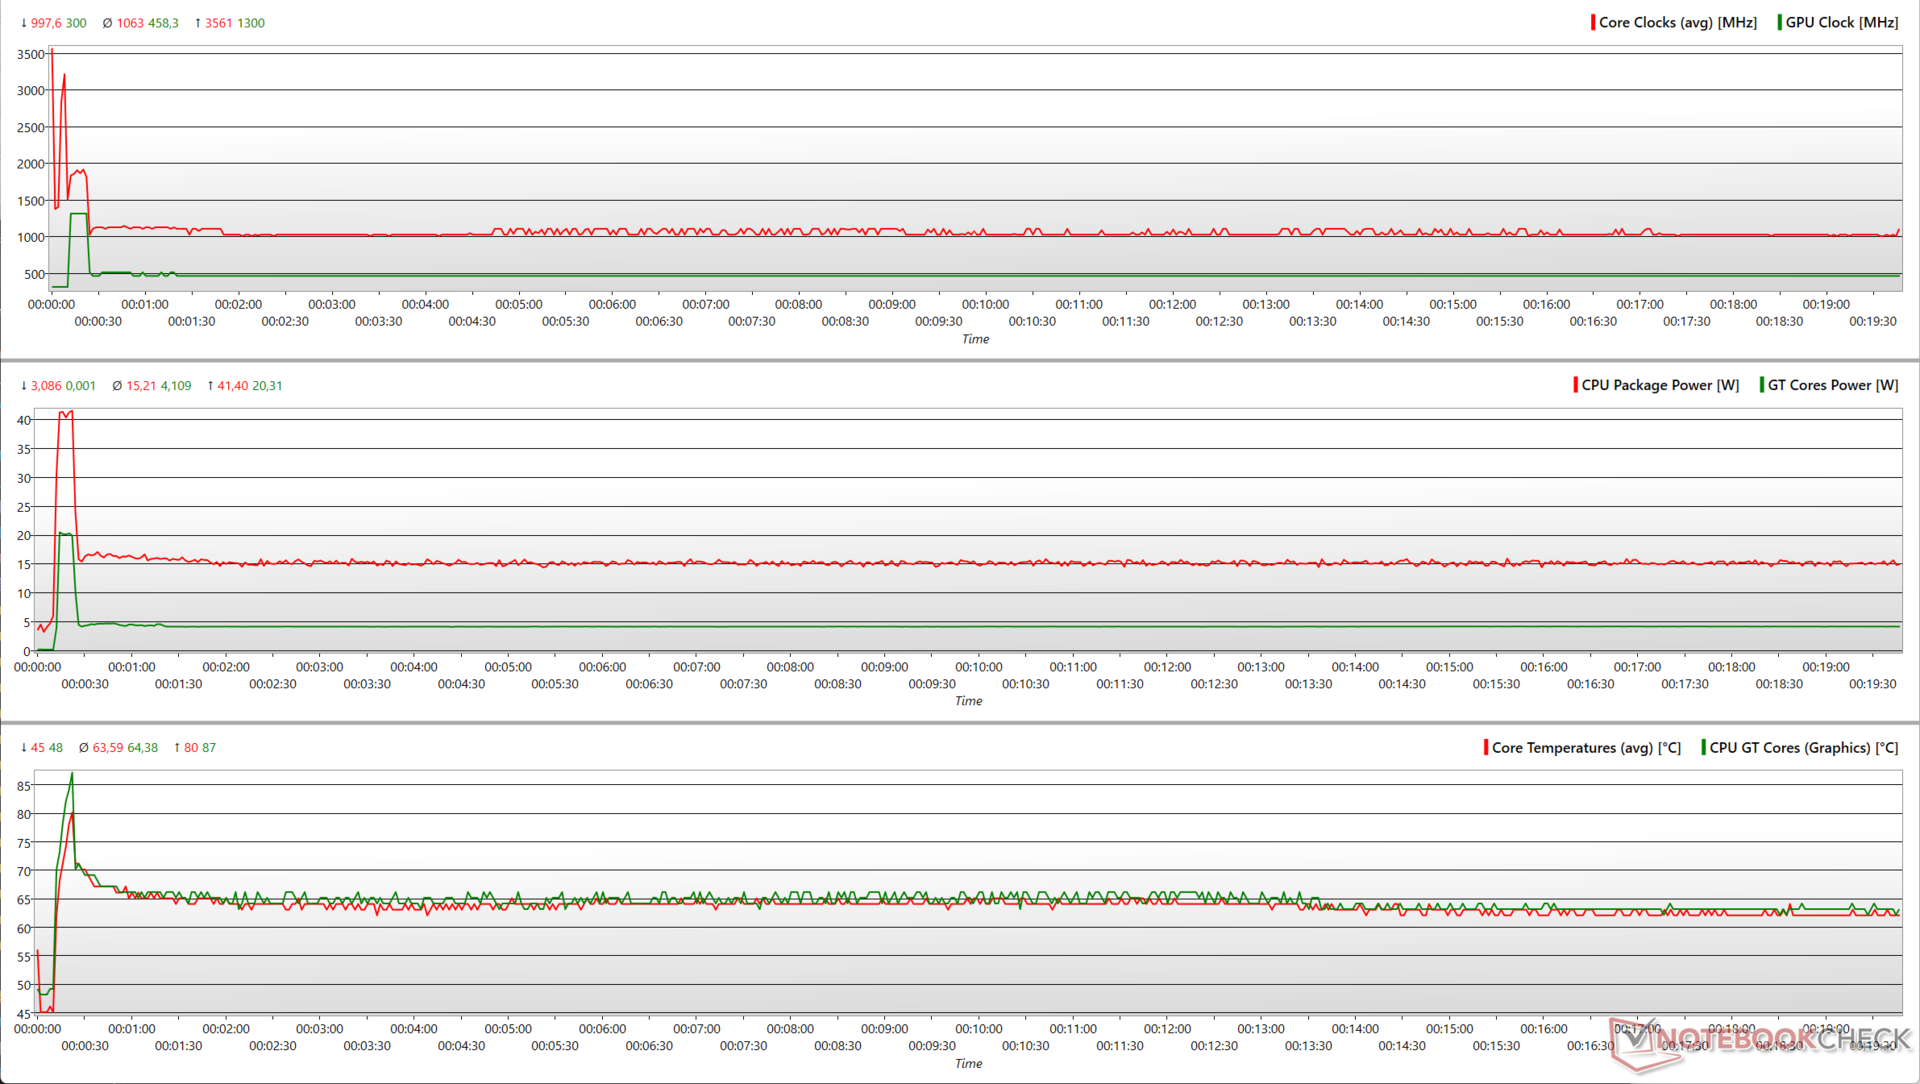
Stress Test
Stressing the Pavilion Plus 14 with Prime95 in-place large FFTs shows that the Core i7-1355U is able to attain 42 W peak package power and a boost of up to 2.85 GHz. However, these values settle at about 18.5 W and 1.74 GHz average, respectively during the test.
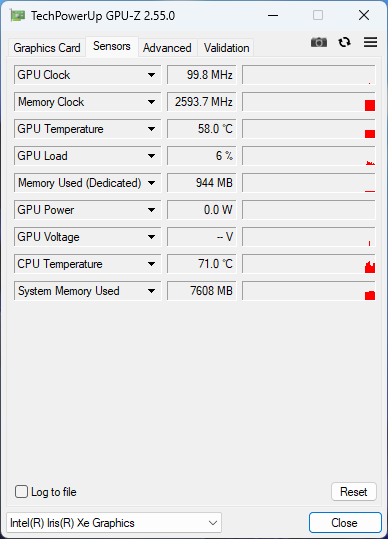
The integrated Iris Xe Graphics can momentarily consume 20.3 W and boost up to 1,300 MHz upon adding FurMark, but it cannot use more than 4 W overall.
However, the iGPU can utilize 9.23 W and boost up to 1,177 MHz average while stressing with The Witcher 3 at 1080p Ultra.
| Stress Test | CPU Clock (GHz) | GPU Clock (MHz) | Average CPU Temperature (°C) | Average GPU Temperature (°C) |
| System Idle | 1.16 | 300 | 43 | 46 |
| Prime95 | 1.55 | 300 | 73 | 62 |
| Prime95 + FurMark | 1.07 | 450 | 63 | 64 |
| The Witcher 3 1080p Ultra | 3.53 | 1,300 | 58 | 66 |
Speakers
The Pavilion Plus 14's B&O-tuned stereo speakers produce adequate loudness for an average-sized room, but it is lower than what its AMD-powered cousin can achieve. Bass output is lacking, but the mids and highs are reproduced well.
Those desiring better sound can make use of the 3.5 mm audio jack or Bluetooth 5.3.
HP Pavilion Plus 14-ew0153TU audio analysis
(±) | speaker loudness is average but good (78.6 dB)
Bass 100 - 315 Hz
(-) | nearly no bass - on average 15.8% lower than median
(±) | linearity of bass is average (10.7% delta to prev. frequency)
Mids 400 - 2000 Hz
(+) | balanced mids - only 3.2% away from median
(+) | mids are linear (4.3% delta to prev. frequency)
Highs 2 - 16 kHz
(+) | balanced highs - only 4% away from median
(+) | highs are linear (4.8% delta to prev. frequency)
Overall 100 - 16.000 Hz
(+) | overall sound is linear (13.5% difference to median)
Compared to same class
» 29% of all tested devices in this class were better, 4% similar, 67% worse
» The best had a delta of 5%, average was 17%, worst was 45%
Compared to all devices tested
» 14% of all tested devices were better, 4% similar, 82% worse
» The best had a delta of 4%, average was 24%, worst was 134%
Apple MacBook Pro 16 2021 M1 Pro audio analysis
(+) | speakers can play relatively loud (84.7 dB)
Bass 100 - 315 Hz
(+) | good bass - only 3.8% away from median
(+) | bass is linear (5.2% delta to prev. frequency)
Mids 400 - 2000 Hz
(+) | balanced mids - only 1.3% away from median
(+) | mids are linear (2.1% delta to prev. frequency)
Highs 2 - 16 kHz
(+) | balanced highs - only 1.9% away from median
(+) | highs are linear (2.7% delta to prev. frequency)
Overall 100 - 16.000 Hz
(+) | overall sound is linear (4.6% difference to median)
Compared to same class
» 0% of all tested devices in this class were better, 0% similar, 100% worse
» The best had a delta of 5%, average was 17%, worst was 45%
Compared to all devices tested
» 0% of all tested devices were better, 0% similar, 100% worse
» The best had a delta of 4%, average was 24%, worst was 134%
Energy Management: Frugal power consumption and good battery life
Power Consumption
Both the Intel and AMD Pavilion Plus 14s show a similar power consumption overall. However, the AMD version shows 18% higher power draws in The Witcher 3 at 1080p Ultra owing to the more capable Radeon 780M.
The Pavilion Plus 14 Core i7 sips minimal power in idle, which gives it a significant advantage over the Asus ExpertBook B9. The supplied 65 W power adapter is adequate to power the laptop under stress.
| Off / Standby | |
| Idle | |
| Load |
|
Key:
min: | |
| HP Pavilion Plus 14-ew0153TU i7-1355U, Iris Xe G7 96EUs, OLED, 2880x1800, 14" | HP Pavilion Plus 14-ey0095cl R7 7840U, Radeon 780M, OLED, 2880x1800, 14" | Lenovo ThinkPad T14s G4 i7-1365U i7-1365U, Iris Xe G7 96EUs, IPS, 1920x1200, 14" | Acer Swift Go 14 SFG14-71 i5-1335U, Iris Xe G7 80EUs, OLED, 2880x1800, 14" | Asus ExpertBook B9 B9403CVA-KM0153X i7-1355U, Iris Xe G7 96EUs, OLED, 2880x1800, 14" | Huawei MateBook X Pro 2023 i7-1360P, Iris Xe G7 96EUs, IPS, 3120x2080, 14.2" | Average Intel Iris Xe Graphics G7 96EUs | Average of class Multimedia | |
|---|---|---|---|---|---|---|---|---|
| Power Consumption | 1% | 14% | -3% | -18% | -8% | -1% | -30% | |
| Idle Minimum * (Watt) | 6.7 | 6 10% | 3.1 54% | 6.79 -1% | 4.9 27% | 4.1 39% | 5.51 ? 18% | 5.71 ? 15% |
| Idle Average * (Watt) | 7.16 | 6.5 9% | 6.5 9% | 6.83 5% | 12.5 -75% | 6.6 8% | 8.66 ? -21% | 10.1 ? -41% |
| Idle Maximum * (Watt) | 11.17 | 13.9 -24% | 7.9 29% | 10.5 6% | 16.8 -50% | 8 28% | 10.9 ? 2% | 12.4 ? -11% |
| Load Average * (Watt) | 46.5 | 41.9 10% | 40 14% | 45.9 1% | 43.8 6% | 61 -31% | 45.6 ? 2% | 65 ? -40% |
| Witcher 3 ultra * (Watt) | 37.2 | 43.9 -18% | 43.2 -16% | 45.6 -23% | 41.2 -11% | 56 -51% | ||
| Load Maximum * (Watt) | 64.36 | 50.8 21% | 69 -7% | 69.8 -8% | 68.1 -6% | 90 -40% | 67.8 ? -5% | 112.2 ? -74% |
* ... smaller is better
Power Consumption: The Witcher 3 / Stress test
Power Consumption: External monitor
Battery Life
The 68 WHr battery affords good run times that can easily last a typical workday. We could achieve nearly 9 hours 40 minutes run time with our standard web browsing script and 12 hours of H.264 1080p playback, both at 150 nits.
| HP Pavilion Plus 14-ew0153TU i7-1355U, Iris Xe G7 96EUs, 68 Wh | HP Pavilion Plus 14-ey0095cl R7 7840U, Radeon 780M, 68 Wh | Lenovo ThinkPad T14s G4 i7-1365U i7-1365U, Iris Xe G7 96EUs, 57 Wh | Acer Swift Go 14 SFG14-71 i5-1335U, Iris Xe G7 80EUs, 54.6 Wh | Asus ExpertBook B9 B9403CVA-KM0153X i7-1355U, Iris Xe G7 96EUs, 63 Wh | Huawei MateBook X Pro 2023 i7-1360P, Iris Xe G7 96EUs, 60 Wh | Average of class Multimedia | |
|---|---|---|---|---|---|---|---|
| Battery runtime | -11% | -18% | -21% | -5% | -13% | 31% | |
| H.264 (h) | 12 | 10.1 -16% | 8.8 -27% | 16.4 ? 37% | |||
| WiFi v1.3 (h) | 9.6 | 8.5 -11% | 7.9 -18% | 7.6 -21% | 10.2 6% | 9.7 1% | 12 ? 25% |
| Reader / Idle (h) | 16.9 | 21.5 | 25.2 ? | ||||
| Load (h) | 2 | 2.3 | 2.1 | 1.675 ? |
Pros
Cons
Verdict: Tough upsell against AMD Zen 4
The HP Pavilion Plus 14 comes across as a capable multimedia laptop that can very well double up for office use. It is built well, looks elegant, and offers decent connectivity including Thunderbolt 4. Features such as a 5 MP webcam with IR and the vibrant 2.8K IMAX Enhanced OLED display are shared between the top spec Intel and AMD variants.
While the Pavilion Plus 14 Intel Core i7-1355U variant offers adequate performance for daily use, it lags significantly behind that of the Pavilion Plus 14 powered by the AMD Ryzen 7 7840U. The AMD Zen 4 version offers better CPU and iGPU performance, which makes also makes it amenable for light gaming on the side.
The HP Pavilion Plus 14 Core i7 is hard to recommend, especially when the same laptop is being offered with a more performant, power-efficient, and cheaper Ryzen 7 option.
The Ryzen 7 variant is also more power-efficient and offers nearly the same battery life. Unless you are in real need of a Thunderbolt 4 port, the Pavilion Plus 14 with AMD Ryzen makes for a far better choice in almost every aspect.
The Ryzen 7 variant even retails for $100 less making it a vastly better value proposition compared to its Intel Core i7-based cousin.
Essentially, it's the whole Lenovo ThinkPad T14s story again — this time with a HP branding.
Price and Availability
The tested configuration of the HP Pavilion Plus 14-ew0153TU can be had from the HP India online store for ₹99,999. The Pavilion Plus 14 is available on the HP US store for $1,020 for the Intel Core i7 version while the AMD Ryzen 7 variant can be had for $920. Cheaper options can be configured directly on HP's website.
Amazon US is offering a Pavilion Plus 14 SKU featuring the Core i7-1355U and dedicated Nvidia GeForce RTX 2050 for $1,000.
HP Pavilion Plus 14-ew0153TU
- 12/10/2023 v7 (old)
Vaidyanathan Subramaniam
Transparency
The selection of devices to be reviewed is made by our editorial team. The test sample was provided to the author as a loan by the manufacturer or retailer for the purpose of this review. The lender had no influence on this review, nor did the manufacturer receive a copy of this review before publication. There was no obligation to publish this review. As an independent media company, Notebookcheck is not subjected to the authority of manufacturers, retailers or publishers.
This is how Notebookcheck is testing
Every year, Notebookcheck independently reviews hundreds of laptops and smartphones using standardized procedures to ensure that all results are comparable. We have continuously developed our test methods for around 20 years and set industry standards in the process. In our test labs, high-quality measuring equipment is utilized by experienced technicians and editors. These tests involve a multi-stage validation process. Our complex rating system is based on hundreds of well-founded measurements and benchmarks, which maintains objectivity. Further information on our test methods can be found here.
Price comparison
